Table of Contents
UNITED STATES
SECURITIES AND EXCHANGE COMMISSION
Washington, D.C. 20549
FORM N-CSR
CERTIFIED SHAREHOLDER REPORT OF REGISTERED MANAGEMENT
INVESTMENT COMPANIES
Investment Company Act file number 811-10263
GuideStone Funds
(Exact name of registrant as specified in charter)
2401 Cedar Springs Road
Dallas, TX 75201-1407
(Address of principal executive offices) (Zip code)
Harold R. Loftin, Esq.
GuideStone Financial Resources of the Southern Baptist Convention
2401 Cedar Springs Road
Dallas, TX 75201-1407
(Name and address of agent for service)
Registrant’s telephone number, including area code: 214-720-4640
Date of fiscal year end: December 31
Date of reporting period: December 31, 2015
EXPLANATORY NOTE: Registrant is filing this amendment to its Form N-CSR for the fiscal year ended December 31, 2015 originally filed with the Securities and Exchange Commission on March 4, 2016 (Accession Number 0001193125-16-492817). The purpose of this amendment is to correct the benchmark plotlines on the graph comparing the results of hypothetical $10,000 investments for a ten year period. Additionally, for several funds the benchmark Since Inception results were changed in the Average Annual Total Returns table to reflect correct inception dates. Except as set forth above, this amendment does not amend, update or change any other items or disclosures found in the original Form N-CSR filing.
Form N-CSR is to be used by management investment companies to file reports with the Commission not later than 10 days after the transmission to stockholders of any report that is required to be transmitted to stockholders under Rule 30e-1 under the Investment Company Act of 1940 (17 CFR 270.30e-1). The Commission may use the information provided on Form N-CSR in its regulatory, disclosure review, inspection, and policymaking roles.
A registrant is required to disclose the information specified by Form N-CSR, and the Commission will make this information public. A registrant is not required to respond to the collection of information contained in Form N-CSR unless the Form displays a currently valid Office of Management and Budget (“OMB”) control number. Please direct comments concerning the accuracy of the information collection burden estimate and any suggestions for reducing the burden to Secretary, Securities and Exchange Commission, 100 F Street, NE, Washington, DC 20549. The OMB has reviewed this collection of information under the clearance requirements of 44 U.S.C. § 3507.
Table of Contents
Item 1. Reports to Stockholders.
The Report to Shareholders is attached herewith.
Table of Contents
Table of Contents
GuideStone Funds
Privacy Notice
NOTICE CONCERNING YOUR PRIVACY RIGHTS
This notice will provide you with information concerning our policies with respect to non-public personal information that we collect about you in connection with the following financial products and services provided and/or serviced by the entities listed below: individual retirement accounts ( “IRAs”) and/or personal mutual fund accounts.
The confidentiality of your information is important to us, as we recognize that you depend on us to keep your information confidential, as described in this notice.
We collect non-public personal information about you with regard to your IRA and/or mutual fund accounts from the following sources:
| • | Information we receive from you on applications or other forms; |
| • | Information about your transactions with us, our affiliates or others (including our third-party service providers); |
| • | Information we receive from others, such as service providers, broker-dealers and your personal agents or representatives; and |
| • | Information you and others provide to us in correspondence sent to us, whether written, electronic or by telephone. |
We may disclose such non-public personal financial information about you to one or more of our affiliates as permitted by law. An affiliate of an organization means any entity that controls, is controlled by or is under common control with that organization. GuideStone Funds, GuideStone Financial Resources of the Southern Baptist Convention, GuideStone Capital Management, LLC, GuideStone Resource Management, Inc., GuideStone Investment Services, GuideStone Trust Services, GuideStone Financial Services and GuideStone Advisors (collectively “GuideStone”) are affiliates of one another. GuideStone and Foreside Funds Distributors LLC do not sell your personal information to non-affiliated third parties.
We may also disclose any of the personal information that we collect about you to non-affiliated third parties as permitted by law. For example, we may provide your information to non-affiliated companies that provide account services or that perform marketing services on our behalf and to other financial institutions with whom we have joint marketing agreements. We restrict access to non-public personal information about you to those of our employees who need to know that information in order for us to provide products and services to you. We also maintain physical, electronic and procedural safeguards to guard your personal information.
These procedures will continue to remain in effect after you cease to receive financial products and services from us.
If you have any questions concerning our customer information policy, please contact a customer relations specialist at 1-888-GS-FUNDS (1-888-473-8637).
Table of Contents
| 2 | ||||
| 4 | ||||
| 12 | ||||
| 15 | ||||
| 19 | ||||
| 20 | ||||
| 23 | ||||
| 26 | ||||
| 29 | ||||
| 32 | ||||
| 35 | ||||
| 38 | ||||
| 46 | ||||
| 47 | ||||
| 50 | ||||
| 53 | ||||
| 56 | ||||
| 60 | ||||
| 65 | ||||
| 67 | ||||
| 71 | ||||
| 90 | ||||
| 124 | ||||
| 131 | ||||
| 148 | ||||
| 158 | ||||
| 159 | ||||
| 172 | ||||
| 180 | ||||
| 186 | ||||
| 191 | ||||
| 199 | ||||
| 210 | ||||
| 221 | ||||
| 232 | ||||
| 244 | ||||
| 245 | ||||
| 250 | ||||
| 258 | ||||
| 261 | ||||
| 267 | ||||
| 272 | ||||
| 280 | ||||
| 351 | ||||
| 352 | ||||
| 354 | ||||
| 357 |
This report has been prepared for shareholders of GuideStone Funds. It is not authorized for distribution to prospective investors unless accompanied or preceded by a current prospectus, which contains more complete information about the Funds. Investors are reminded to read the prospectus carefully before investing. The performance data quoted represents past performance and does not guarantee future results. Current performance may be lower or higher. Performance data current to the most recent month-end may be obtained at www.GuideStoneFunds.org. The investment return and principal value of an investment will fluctuate so that shares, when redeemed, may be worth more or less than their original cost. Fund shares are distributed by Foreside Funds Distributors LLC, 400 Berwyn Park, 899 Cassatt Road, Suite 110, Berwyn, PA 19312.
1
Table of Contents

Dear Shareholder:
We are pleased to present you with the 2015 GuideStone Funds Annual Report. This report reflects our unwavering commitment to integrity in financial reporting so you may stay fully informed of your investments. We trust that you will find this information valuable when making investment decisions.
In 2015, GuideStone Funds was recognized for the fourth consecutive year by the Lipper Fund Awards. The Extended-Duration Bond Fund was recognized as the Best Fund Over 3 Years, and the Best Fund Over 5 Years in the Corporate Debt A-Rated Funds category for the fund’s risk-adjusted total return, ending November 30, 2014. The Extended-Duration Bond Fund won in the same categories the previous year. In 2012, the entire GuideStone Funds family was honored with Lipper’s Best Overall Small Fund Group in the U.S. over the 3-year period ending November 30, 2011, making it the first Christian-screened mutual fund family to receive this prestigious honor. In 2013, the MyDestination 2025 Fund was ranked No. 1 for its performance over the 3-year period ending November 30, 2012.
As previously communicated, on November 20 the Asset Allocation Funds I Series were closed and all assets were reorganized into the Institutional Share Class of the Asset Allocation Funds. The I Series Funds — the Conservative Allocation Fund I, Balanced Allocation Fund I, Growth Allocation Fund I and the Aggressive Allocation Fund I — were technically four stand-alone funds with an Institutional Share Class launched in 2003. During 2015, changes were made that eliminated any difference between the underlying investments of the Asset Allocation Funds I Series and the Asset Allocation Investor Share Class; therefore, the need to maintain four stand-alone I Series funds no longer existed.
Our affected investors experienced no fee change, nor did they incur a taxable event as a result of the reorganization. Additionally, no commission or trading costs from the reorganization were generated. This gives GuideStone a single set of Asset Allocation Funds with a multiple-class structure, similar to other funds in the GuideStone Funds family.
We invite you to learn more about the continued success of GuideStone Funds and the various investment options available by visiting our website, GuideStoneFunds.com/Disclosures, or contacting us at 1-888-GS-FUNDS (1-888-473-8637). Thank you for choosing to invest in GuideStone Funds.
Sincerely,

John R. Jones, CFA
President
2
Table of Contents
Lipper, a Thomson Reuters company, provides independent insight on global collective investments, including mutual funds, retirement funds, hedge funds, fund fees and expenses to the asset management and media communities. Lipper is the world’s leading fund research and analysis organization, covering more than 213,000 share classes and more than 117,000 funds in more than 61 registered for sale (RFS) universes. It provides the free Lipper Leader ratings for mutual funds registered for sale in more than 30 countries. Lipper Fund Awards are based on Lipper Ratings for Consistent Return (Effective Return), which reflect a fund’s historical risk-adjusted total returns relative to funds in the same Lipper Global Classification. Classification averages are calculated with all eligible share-classes for each eligible classification. The calculation periods extend over 36, 60 and 120 months. The highest Lipper Leader for Consistent Return (Effective Return) value within each eligible classification determines the fund classification winner over three, five or 10 years. The Institutional Class of the GuideStone Extended-Duration Bond Fund won the 2014 Lipper Funds Awards for 3-year and 5-year periods in the Corporate Debt A-Rated category. Additional information is available at lipperweb.com.
3
Table of Contents
FROM THE CHIEF INVESTMENT OFFICER
 | The calendar year-end serves as a time for everyone to make New Year’s resolutions and establish new goals. Related to investing, it serves as an opportunity to pause and reflect on what occurred over the previous 12 months while also projecting what will unfold in the upcoming year. Entering into 2015, there was cautious optimism but major questions existed as related to the sustainability of the U.S. economy, corresponding actions by the Federal Reserve (the “U.S. central bank” or the “Fed”), global monetary policy, China’s economy (and its position as a global economic engine) and demand/supply imbalances in commodities. In summary, most of the concern was over the health of the global economy and the ability of the United States and China to lead such growth. Let’s quickly review how these issues played out in 2015. | |
| Matt L. Peden, CFA |
| • | The U.S. economy continued to improve at a moderate pace, with real GDP coming in at roughly 2.0%. A key factor benefiting the U.S. economy included a healthier consumer as unemployment rates fell to 5.00% during the year and consumer confidence and housing trended positive. The domestic economy was also supported by very accommodative monetary policy and low oil prices. Amidst the economic growth, inflation remained somewhat at bay due to modest wage gains, global deflationary pressures, low oil and energy prices and cheaper imports due to a strengthening U.S. dollar. |
| • | A major theme throughout 2015 was when, not if, the Fed was going to “lift off “ and reverse course from its zero interest rate policy. Throughout the year, market and economic pundits were debating and forecasting when such an action by Chairman Yellen and the Fed would take place. The Fed was in a precarious position of raising rates “too soon” (causing the risk of an economic recession) or “too late” (causing the risk of higher inflation). After seven years of zero interest rate policy, the Fed made the decision to raise the fed funds rate by 0.25% during its December meeting. This anticipated move was the first time the Fed had raised rates in nine years. While the amount of the increase was not material, the actual move itself was a sign that “emergency accommodative monetary policy” was no longer needed. Further rate hikes in 2016 are being priced into the U.S. yield curve with the number of rate hikes largely being dependent on inflationary pressures and conditions surrounding economic growth. |
| • | Prior to 2015, global monetary policy had been “in sync”, with major central banks coordinating very accommodative monetary policy. However, the U.S. economy, through more aggressive stimulus, has been improving faster than most of its counterparts. As a result, the anticipation of a divergence in monetary policies between the United States and other developed market central banks arose, contributing to the market uncertainty. As stated, the U.S. central bank raised rates in December while most other central banks (including the European Central Bank and the Bank of Japan) maintained very accommodative monetary policies, including quantitative easing. The relative improvement in the U.S. economy, and relatively higher U.S. interest rates, led to a material appreciation in the U.S. dollar versus most currencies during the year. The appreciation of the U.S. dollar made imports less expensive for U.S. consumers, but provided a headwind for U.S. exporters and the performance of non-U.S. denominated investments. |
| • | The health of China’s economy remained in the headlines. Global economic growth has been reliant on both the United States and China for the past decade. China has a large impact on commodity prices, surrounding Pacific-rim economies and other emerging markets. Certain economic indicators, including low commodity prices and an August currency devaluation, made the market “question” whether or not China was actually growing at its annual stated target of about 7.00%. Other China questions included its high levels of debt and whether or not it could successfully transition its economy from a “heavy industrial” economy to a “consumer led” economy. While China has a great deal of options to stimulate its economy, the uncertainty in China’s actual growth and leadership effectiveness served as a cloud over the global markets, especially over the last half of the year. |
| • | Commodities across the board suffered materially during the year. When investors thought commodity prices could not fall further, they did. Oil, natural gas and base metals fell sharply due to material demand/supply imbalances. Oil prices were under pressure due to slow declines in production (especially in U.S. shale production) coupled with increases in Middle East production. Base metals were negatively impacted over concerns related to China’s economic growth as that country accounts for 40% to 50% of global demand. Having too much supply during times of slow global economic growth has hit commodity prices hard and caused sentiment to free fall. Supply rationalization has begun, but it appears that it will take time to come into equilibrium with actual demand. The good news from low commodity prices is the positive impact it has on consumers’ disposable income which should eventually lead to further consumer demand and economic stimulus. |
4
Table of Contents
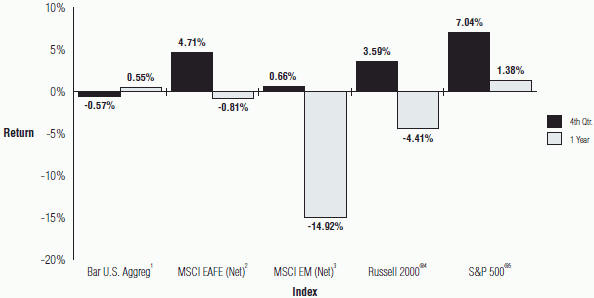
Given this economic backdrop, greater uncertainty entered the capital markets, which in turn, led to more volatility and investors taking a “risk-off” approach. The calendar year 2015 may be remembered as the “year of no return.” It was a difficult year for investors, even those with well diversified portfolios, to experience positive results as very few areas of the market posted material positive returns. The table below provides an overview of key capital market returns.
Index | Description | 2015 Calendar Year Return | ||||
S&P 500® Index | Large-cap U.S. Stocks | 1.38 | % | |||
Russell 2000 Index | Small-cap U.S. Stocks | (4.41 | )% | |||
MSCI EAFE – Net Dividend | Developed Market Stocks – Ex-U.S. | (0.81 | )% | |||
MSCI Emerging Markets | Emerging Markets Stocks | (14.92 | )% | |||
Barclays Aggregate Bond Index | U.S. Bonds | 0.55 | % | |||
Barclays Capital U.S. TIPS Index | U.S. TIPS | (1.44 | )% | |||
U.S. stocks led returns domestically with a modest annual return of 1.38%, extending another year of positive results for the long-running bull equity market. However, given concerns over the U.S. economy entering into the later stages of its growth cycle, the U.S. stock market appeared to be “less healthy” by year end, as the market, as represented by the S&P 500 Index® became very narrow and driven by a few large cap stocks, such as Facebook, Amazon, Netflix and Google. The equal weighted S&P 500® Index performed -2.20% for the year, providing evidence that many U.S. stocks generated negative returns. The best-performing sectors in the S&P 500® Index included defensive sectors such as health care and consumer staples, while the worst performers were the cyclical energy and materials sectors. Large-cap stocks outpaced small-cap stocks, while growth stocks outperformed value stocks. The best performing segment of the U.S. market was large-cap growth with the Russell 1000® Growth Index posting an annual return of 5.67%. Stocks of non-U.S. developed markets trailed U.S. stocks and posted an annual return of -0.81%. Slower economic growth and an appreciating U.S. dollar hurt performance. Emerging market stocks were materially hurt, down -14.92% for the year, reflecting downward pressure on commodity prices and slowing emerging economies (especially China) coupled with a rising U.S. dollar.
In addition to stocks, other asset classes struggled during 2015. Bonds surprised on the upside during 2014 but struggled to generate much return in 2015 as the Barclays U.S. Aggregate Bond Index, a proxy for the broad U.S. bond market, generated a modest annual return of 0.55%. Like stocks, higher quality bond sectors generally outpaced riskier ones. Headwinds for bonds during the year included rising interest rates and spread widening (increase in risk premiums). The best performing areas of the bond market were mortgages and U.S. Treasuries while corporates and high yield bonds (below investment grade) generally lagged. The shape of the U.S. Treasury yield curve was largely influenced by expectations of future Fed actions. The year ended with yields on the 10-year U.S. Treasury and the 30-year U.S. Treasury at 2.27% and 3.02%, respectively. With yields at low levels coupled with expectations for future rate hikes by the Fed, near-term prospects for bond returns are below long-term historical norms.
Despite accommodative monetary policies by central banks and historical amounts of liquidity in the markets, inflation expectations remained rather benign during 2015, especially on a global basis. Commodities were negatively impacted the most due to an oversupply (or supply shock) and fears of sluggish economic growth. The MSCI World Commodity Producers – Net Index, a proxy for the natural resource equities, fell 25.62% during the year. Many commodities ended the year at very low levels, but some positives exist for this market segment including cheap valuations, the occurrence of supply rationalization and economic fundamentals indicating prices should be higher.
After reflecting on 2015, what are our thoughts on the upcoming year?
We believe many of the same challenges that were faced in 2015 will persist into 2016, with prospects of higher asset price volatility. Economic growth is projected to muddle through (slow but positive), and asset class returns are forecasted well below historical annual averages for several reasons, including, currently high asset valuations, a slowdown in corporate earnings, low interest rate levels and projected muted economic growth. We must also take into consideration that the current economic expansion and bull equity market are “long in the tooth” coupled with prospects of the Fed implementing further tightening.
As a team, we believe the following factors will have a material impact during 2016 on the global economies, investors’ sentiment and asset class returns:
5
Table of Contents
| • | Divergence in monetary policy between the United States and other major central banks. |
| • | Potential for sluggish economic growth outside the United States in major economies such as Europe, Japan and China, as well as commodity export dependent emerging markets nations. |
| • | The resulting impact of very low commodity prices, including oil. |
| • | Heightened geopolitical risks, including terrorism. |
| • | The valuation of the U.S. dollar versus other major currencies. |
We continue to encourage investors to ensure their portfolio is well diversified and corresponds with their underlying risk/return profile. Often higher volatility leads to greater temptation to move away from the appropriate long-term asset allocation. Remember, investing is a long-term process and diversification is key. Also, given the prospects for lower absolute returns, it is prudent for investors to review their savings rate. Any ability to increase savings would be beneficial, especially for those nearing retirement.
On behalf of GuideStone Capital Management, LLC, I would like to thank you for your confidence and trust and for the opportunity to manage assets on your behalf. We consider it a privilege to work diligently on your investment portfolio. Wishing you a happy and prosperous year ahead.
A complete GuideStone Funds performance report can be found at www.GuideStoneFunds.com.
Sincerely,

Matt L. Peden, CFA
Vice President - Chief Investment Officer
GuideStone Funds
| Asset Class Performance Comparison |
The following graph illustrates the performance of the major assets classes during 2015.
1The Barclays U.S. Aggregate Bond Index represents securities that are SEC-registered, taxable and dollar denominated. The index covers the U.S. investment grade bond market, with index components for government and corporate securities, mortgage pass-through securities and asset-backed securities.
2The MSCI EAFE Index (Europe, Australasia, Far East) is a free float-adjusted market capitalization index that is designed to measure the equity market performance of developed markets, excluding the U.S. & Canada. The MSCI EAFE Index consists of the following 21 developed market country indices: Australia, Austria, Belgium, Denmark, Finland, France, Germany, Hong Kong, Ireland, Israel, Italy, Japan, the Netherlands, New Zealand, Norway, Portugal, Singapore, Spain, Sweden, Switzerland, and the United Kingdom.
6
Table of Contents
3The MSCI EM (Emerging Markets) Index is a free float-adjusted market capitalization index that is designed to measure equity market performance of emerging markets. The index consisted of the following 23 emerging market country indices: Brazil, Chile, China, Colombia, Czech Republic, Egypt, Greece, Hungary, India, Indonesia, Korea, Malaysia, Mexico, Peru, Philippines, Poland, Qatar, Russia, South Africa, Taiwan, Thailand, Turkey, and United Arab Emirates.
4The Russell 2000® Index measures the performance of the small-cap segment of the U.S. equity universe. The Russell 2000® Index is a subset of the Russell 3000® Index representing approximately 10% of the total market capitalization of that index. It includes approximately 2,000 of the smallest securities based on a combination of their market cap and current index membership. The Russell 2000® Index is constructed to provide a comprehensive and unbiased small-cap barometer and is completely reconstituted annually to ensure that larger stocks do not distort the performance and characteristics of the actual small-cap opportunity set.
5The S&P 500® Index is an unmanaged index (with no defined investment objective) of common stocks, includes reinvestment of dividends and is a registered trademark of McGraw-Hill Co., Inc. The S&P 500® Index includes 500 of the largest stocks (in terms of market value) in the United States.
7
Table of Contents
S&P 500® Index Returns
The U.S. large cap equity market, as measured by the S&P 500® Index, posted a positive annual return of 1.4%. Although this marks the seventh consecutive year of positive returns for the index, the market was much more volatile and gains were more concentrated than in years past. In fact, if the 10 largest securities by market capitalization are omitted, the index actually suffered a loss for the year.
After producing gains in each of the first two quarters, volatility spiked and the index posted a negative return in the third quarter, as fears about global growth caused a decline in investor confidence. During the quarter, the index suffered a loss of 6.5%, but a robust fourth quarter rally was sufficient to produce a positive full year return.
Only half of the 10 sectors produced a positive return for the year, led by Consumer Discretionary and the traditionally defensive Consumer Staples and Health Care sectors. The continued decline in commodity prices created a material headwind for Energy and Materials stocks, with both sectors suffering significant losses for the year.
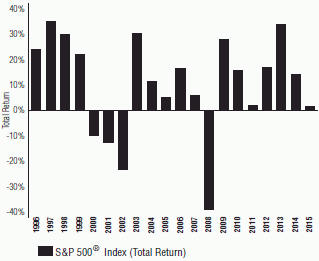
The S&P 500® Index includes 500 leading companies in major industries of the U.S. economy. The index represents about 75% of U.S. equity market capitalization. It is a capitalization-weighted index calculated on a total return basis with dividends reinvested. Constituents are selected by a team of Standard & Poor’s economists and analysts.
Data Source: Bloomberg, S&P website
Russell 2000® Index Returns
The U.S. small cap equity market, as represented by the Russell 2000®Index, posted a loss of 4.4% during 2015. The index produced a positive return the first half of the year, but then lost 7.7% in the third quarter before gaining some of that loss back in the fourth quarter. The rise in volatility during the third quarter coincided with a decline in investor risk appetite that negatively impacted small cap stocks.
The best performing sectors during the period included Health Care and Technology, while Energy and Materials were the worst performers. The significant decline in oil and other commodity prices was a major headwind for firms in these two sectors.
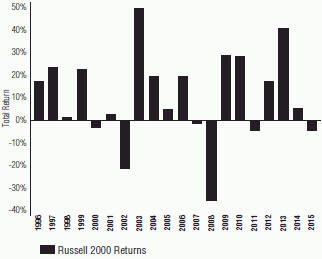
The Russell 2000® Index measures the performance of the small-cap segment of the U.S. equity universe. The Russell 2000® Index is a subset of the Russell 3000® Index representing approximately 8% of the total market capitalization of that index. It includes approximately 2,000 of the smallest securities based on a combination of their market cap and current index membership. The Russell 2000® Index is constructed to provide a comprehensive and unbiased small-cap barometer and is completely reconstituted annually to ensure that larger stocks do not distort the performance and characteristics of the actual small-cap opportunity set.
Data Source: Russell Investments, Bloomberg
8
Table of Contents
MSCI EAFE (Net) Returns
International developed market equities, as measured by the MSCI EAFE Index (Net), fell 0.8% during the year. This index underperformed the U.S. market as a result of slower economic growth, the strength of the U.S. dollar and a greater reliance on trade with the weakening Emerging Markets. Similar to U. S. stocks, the EAFE Index produced a positive return in the first and second quarters, but fell roughly 10% in the third quarter as volatility rose. A positive 5% fourth quarter return was insufficient to produce a gain for the full year.
The best performing regions included Ireland, Denmark and Belgium, while the worst performers included Norway, Singapore and Australia. Commodity price weakness and exposure to China were the key drivers of the poor performance in these countries.
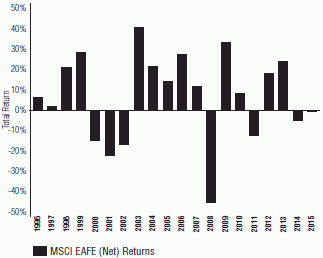
The MSCI EAFE Index (Europe, Australasia, Far East) is a free float-adjusted market capitalization index that is designed to measure the equity market performance of developed markets, excluding the U.S. & Canada. The MSCI EAFE Index consists of the following 21 developed market country indices: Australia, Austria, Belgium, Denmark, Finland, France, Germany, Hong Kong, Ireland, Israel, Italy, Japan, the Netherlands, New Zealand, Norway, Portugal, Singapore, Spain, Sweden, Switzerland, and the United Kingdom.
Data Source: Factset
MSCI EM (Net) Returns
International emerging market equities, as measured by the MSCI Emerging Market Index (Net), declined 14.9% during the year. The combination of falling commodity prices, weakening currencies and the slowdown in China had a dramatic impact on economic growth and equity performance in these markets. The third quarter was the worst period for the index, as it fell more than 17%.
Only two countries, Hungary and Russia, produced a gain for the year. Countries that produced significant losses were those that rely on commodity exports to drive their economies, including Brazil, South Africa and Colombia, as well as those that are dependent on trade with China, such as Indonesia, Malaysia and Thailand. The worst performer was Greece, which once again was required to restructure its huge debt burden with its creditors.
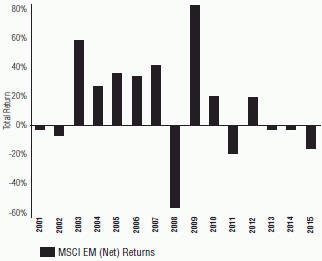
The MSCI EM (Emerging Markets) Index is a free float-adjusted market capitalization index that is designed to measure equity market performance of emerging markets. The index consisted of the following 23 emerging market country indices: Brazil, Chile, China, Colombia, Czech Republic, Egypt, Greece, Hungary, India, Indonesia, Korea, Malaysia, Mexico, Peru, Philippines, Poland, Qatar, Russia, South Africa, Taiwan, Thailand, Turkey and United Arab Emirates.
Data Source: Factset
9
Table of Contents
Barclays U.S. Aggregate Bond Index Returns
The broad U.S. bond market, as measured by the Barclays U.S. Aggregate Bond Index, produced a small gain of 0.6% during 2015. Higher quality and intermediate maturity debt securities were the best performers, while lower quality bonds, especially those issued by Energy firms, experienced material spread widening and significant losses as investors began to question the health of such firms.
The best performing sectors in the index included Financials, Asset-backed securities and Mortgage-backed securities, while bonds issued by Industrial and Utilities firms produced losses for the year.
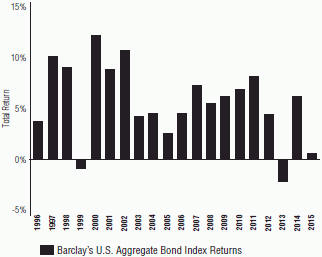
The Barclays U.S. Aggregate Bond Index is a broad-based benchmark representing approximately 8,200 U.S. dollar-denominated, taxable fixed income securities. To be included in this market capitalization-weighted index, bonds must be rated investment grade quality by Moody’s and Standard & Poor’s and have a maturity of at least one year. The types of fixed income instruments in this index primarily consist of U.S. Treasury securities, government-related securities, mortgage-backed securities, asset-backed securities and corporate bonds.
Data Source: Factset
Federal Reserve
Following much debate and analysis both inside and outside the Federal Reserve (“Fed”), the members of the Federal Open Market Committee finally voted to raise the target Fed Funds rate by 0.25% to a range of 0.25 - 0.50% at its December meeting. The long awaited beginning of the Fed tightening cycle is an event for which the markets were well positioned, so the impact on financial assets was negligible. Despite the rise in the Fed Funds rate, short term interest rates remain very low and accommodative by historical standards. In addition, the Fed signaled that further rate hikes will be very gradual and will be dependent on sustained economic strength. This marks the first rate hike since 2006, and ends an unprecedented 7-year period of a near zero Fed Funds rate.
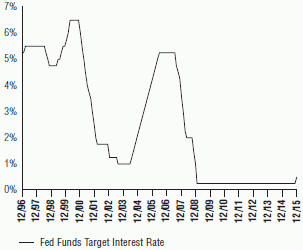
The Federal Reserve (“Fed”) is the central bank of the United States. It was created by Congress to provide the nation with a safer, more flexible, and more stable monetary and financial system. The Federal Funds Rate is the interest rate at which depository institutions lend balances at the Fed to other depository institutions overnight. The rate is one tool the Fed can use in their efforts of controlling the supply of money. Changes in the Federal Funds Rate trigger a chain of events that affect other short-term interest rates, foreign exchange rates, long-term interest rates, the amount of money and credit, and, ultimately, a range of economic variables, including employment, output, and prices of goods and services.
Data Source: Bloomberg, Federal Reserve
10
Table of Contents
U.S. Treasury Yield Curve
Despite some volatility in interest rates during the year, the yield curve ended 2015 in very similar shape as it started the year. Short term rates, from 3 months to 3-years, rose somewhat as result of the Fed Funds rate hike, but the 5-to 10-year portion of the curve was virtually unchanged from the start of the year. During the period, the 10-year Treasury yield fell to as low as 1.65%, and then rose to near 2.50% as investor expectations for inflation and economic growth varied. However, the yield ended 2015 at 2.27%, very close to the same level at which it began the year.
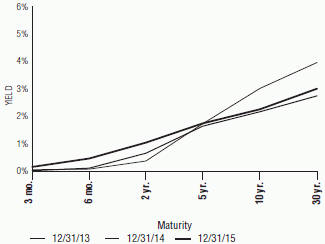
The Treasury yield curve illustrates the relationship between yields on short-term, intermediate-term and long-term Treasury securities. Normally, the shape of the yield curve is upward sloping with rates increasing from the short end of the curve moving higher to the long end. The short end of the curve is impacted more by monetary policy (demand for money) while inflationary expectations and market forces impact the long end of the curve.
Data Source: Bloomberg
11
Table of Contents
About Your Expenses (Unaudited)
As a shareholder of the Funds, you incur ongoing costs, including advisory fees and to the extent applicable, shareholder services fees, as well as other Fund expenses. This example is intended to help you to understand your ongoing costs (in dollars) of investing in the Funds and to compare these costs with the ongoing costs of investing in other mutual funds. It is based on an investment of $1,000 invested at the beginning of the period and held for the entire period from July 1, 2015 to December 31, 2015.
Actual Expenses
The first section of the table below provides information about actual account values and actual expenses. You may use the information in this section, together with the amount you invested, to estimate the expenses that you incurred over the period. Simply divide your account value by $1,000 (for example, an $8,600 account value divided by $1,000 = 8.6), then multiply the result by the number in the first section under the heading entitled “Expenses Paid During Period” to estimate the expenses attributable to your investment during this period.
Hypothetical Example for Comparison Purposes
The second section of the table below provides information about hypothetical account values and hypothetical expenses based on the Fund’s actual expense ratio and an assumed rate of return of 5% per year before expenses, which is not the Fund’s actual return. Thus, you should not use the hypothetical account values and expenses to estimate the actual ending account balance or your expenses for the period. Rather, these figures are provided to enable you to compare the ongoing costs of investing in the Fund and other funds. To do so, compare this 5% hypothetical example with the 5% hypothetical examples that appear in the shareholder reports of the other funds. Please note that the expenses shown in the table are meant to highlight your ongoing costs only. Therefore, the second section of the table is useful in comparing ongoing costs only and will not help you determine the relative total costs of owning different funds.
Actual | ||||||||||
Fund | Class | Beginning Account Value 07/01/15 | Ending Account Value 12/31/15 | Annualized Expense Ratio (1) | Expenses Paid During Period (2) | |||||
MyDestination 2005 | Investor | $1,000.00 | $ 973.55 | 0.35% | $1.74 | |||||
MyDestination 2015 | Investor | 1,000.00 | 967.82 | 0.35 | 1.74 | |||||
MyDestination 2025 | Investor | 1,000.00 | 958.36 | 0.35 | 1.73 | |||||
MyDestination 2035 | Investor | 1,000.00 | 939.96 | 0.35 | 1.71 | |||||
MyDestination 2045 | Investor | 1,000.00 | 934.88 | 0.35 | 1.71 | |||||
MyDestination 2055 | Investor | 1,000.00 | 934.49 | 0.35 | 1.71 | |||||
Conservative Allocation (3) | Institutional Investor | 1,000.00 1,000.00 | 990.11 973.80 | 0.18 0.35 | 0.19 1.75 | |||||
Balanced Allocation (3) | Institutional Investor | 1,000.00 1,000.00 | 983.65 957.51 | 0.12 0.37 | 0.13 1.80 | |||||
Growth Allocation (3) | Institutional Investor | 1,000.00 1,000.00 | 976.41 946.24 | 0.14 0.37 | 0.14 1.84 | |||||
Aggressive Allocation (3) | Institutional Investor | 1,000.00 1,000.00 | 971.52 948.48 | 0.15 0.39 | 0.16 1.89 | |||||
Money Market | Institutional Investor | 1,000.00 1,000.00 | 1,000.57 1,000.13 | 0.17 0.26 | 0.87 1.32 | |||||
Low-Duration Bond | Institutional Investor | 1,000.00 1,000.00 | 996.57 994.94 | 0.37 0.65 | 1.88 3.26 | |||||
Medium-Duration Bond | Institutional Investor | 1,000.00 1,000.00 | 1,000.07 999.25 | 0.45 0.74 | 2.29 3.70 | |||||
12
Table of Contents
Actual | ||||||||||
Fund | Class | Beginning Account Value 07/01/15 | Ending Account Value 12/31/15 | Annualized Expense Ratio (1) | Expenses Paid During Period (2) | |||||
Extended-Duration Bond | Institutional Investor | $1,000.00 1,000.00 | $ 990.48 990.26 | 0.60% 0.89 | $3.01 4.46 | |||||
Global Bond | Institutional Investor | 1,000.00 1,000.00 | 944.72 943.13 | 0.60 0.91 | 2.95 4.48 | |||||
Defensive Market Strategies (4) | Institutional Investor | 1,000.00 1,000.00 | 1,010.68 1,009.32 | 0.72 1.00 | 3.63 5.04 | |||||
Equity Index | Institutional Investor | 1,000.00 1,000.00 | 999.05 998.24 | 0.16 0.43 | 0.83 2.16 | |||||
Value Equity | Institutional Investor | 1,000.00 1,000.00 | 958.53 956.48 | 0.60 0.87 | 2.96 4.29 | |||||
Growth Equity | Institutional Investor | 1,000.00 1,000.00 | 1,024.21 1,023.58 | 0.76 1.02 | 3.86 5.21 | |||||
Small Cap Equity | Institutional Investor | 1,000.00 1,000.00 | 900.03 898.35 | 1.01 1.29 | 4.79 6.16 | |||||
International Equity Index | Institutional | 1,000.00 | 926.25 | 0.57 | 2.77 | |||||
International Equity (4) | Institutional Investor | 1,000.00 1,000.00 | 928.80 927.50 | 0.97 1.24 | 4.72 6.04 | |||||
Emerging Markets Equity | Institutional Investor | 1,000.00 1,000.00 | 808.08 807.69 | 1.28 1.55 | 5.82 7.05 | |||||
Inflation Protected Bond | Institutional Investor | 1,000.00 1,000.00 | 975.56 974.56 | 0.40 0.75 | 1.99 3.73 | |||||
Flexible Income | Investor | 1,000.00 | 959.85 | 1.12 | 5.53 | |||||
Real Assets | Investor | 1,000.00 | 887.10 | 0.35 | 1.66 | |||||
Real Estate Securities | Institutional Investor | 1,000.00 1,000.00 | 1,033.68 1,032.56 | 0.94 1.12 | 4.80 5.74 | |||||
Global Natural Resources Equity | Investor | 1,000.00 | 670.52 | 1.36 | 5.72 | |||||
HYPOTHETICAL (assuming a 5% return before expenses) | ||||||||||
Fund | Class | Beginning Account Value 07/01/15 | Ending Account Value 12/31/15 | Annualized Expense Ratio (1) | Expenses Paid During Period (2) | |||||
MyDestination 2005 | Investor | $1,000.00 | $1,023.42 | 0.35% | $1.79 | |||||
MyDestination 2015 | Investor | 1,000.00 | 1,023.42 | 0.35 | 1.79 | |||||
MyDestination 2025 | Investor | 1,000.00 | 1,023.42 | 0.35 | 1.79 | |||||
MyDestination 2035 | Investor | 1,000.00 | 1,023.42 | 0.35 | 1.79 | |||||
MyDestination 2045 | Investor | 1,000.00 | 1,023.42 | 0.35 | 1.79 | |||||
MyDestination 2055 | Investor | 1,000.00 | 1,023.42 | 0.35 | 1.79 | |||||
Conservative Allocation (3) | Institutional Investor | 1,000.00 1,000.00 | 1,005.15 1,023.42 | 0.18 0.35 | 0.92 1.79 | |||||
Balanced Allocation (3) | Institutional Investor | 1,000.00 1,000.00 | 1,005.21 1,023.35 | 0.12 0.37 | 0.62 1.86 | |||||
Growth Allocation (3) | Institutional Investor | 1,000.00 1,000.00 | 1,005.19 1,023.30 | 0.14 0.37 | 0.70 1.91 | |||||
13
Table of Contents
About Your Expenses (Unaudited) (Continued)
HYPOTHETICAL (assuming a 5% return before expenses) | ||||||||||
Fund | Class | Beginning Account Value 07/01/15 | Ending Account Value 12/31/15 | Annualized Expense Ratio (1) | Expenses Paid During Period (2) | |||||
Aggressive Allocation (3) | Institutional Investor | $1,000.00 1,000.00 | $ 1,005.18 1,023.24 | 0.15% 0.39 | $0.77 1.97 | |||||
Money Market | Institutional Investor | 1,000.00 1,000.00 | 1,024.33 1,023.88 | 0.17 0.26 | 0.88 1.33 | |||||
Low-Duration Bond | Institutional Investor | 1,000.00 1,000.00 | 1,023.31 1,021.91 | 0.37 0.65 | 1.90 3.30 | |||||
Medium-Duration Bond | Institutional Investor | 1,000.00 1,000.00 | 1,022.89 1,021.46 | 0.45 0.74 | 2.32 3.75 | |||||
Extended-Duration Bond | Institutional Investor | 1,000.00 1,000.00 | 1,022.14 1,020.67 | 0.60 0.89 | 3.07 4.54 | |||||
Global Bond | Institutional Investor | 1,000.00 1,000.00 | 1,022.14 1,020.54 | 0.60 0.91 | 3.07 4.67 | |||||
Defensive Market Strategies (4) | Institutional Investor | 1,000.00 1,000.00 | 1,021.56 1,020.13 | 0.72 1.00 | 3.65 5.08 | |||||
Equity Index | Institutional Investor | 1,000.00 1,000.00 | 1,024.37 1,023.02 | 0.16 0.43 | 0.84 2.19 | |||||
Value Equity | Institutional Investor | 1,000.00 1,000.00 | 1,022.14 1,020.77 | 0.60 0.87 | 3.07 4.44 | |||||
Growth Equity | Institutional Investor | 1,000.00 1,000.00 | 1,021.35 1,020.00 | 0.76 1.02 | 3.86 5.21 | |||||
Small Cap Equity | Institutional Investor | 1,000.00 1,000.00 | 1,020.11 1,018.64 | 1.01 1.29 | 5.10 6.57 | |||||
International Equity Index | Institutional | 1,000.00 | 1,022.30 | 0.57 | 2.91 | |||||
International Equity (4) | Institutional Investor | 1,000.00 1,000.00 | 1,020.26 1,018.87 | 0.97 1.24 | 4.95 6.34 | |||||
Emerging Markets Equity | Institutional Investor | 1,000.00 1,000.00 | 1,018.69 1,017.31 | 1.28 1.55 | 6.52 7.90 | |||||
Inflation Protected Bond | Institutional Investor | 1,000.00 1,000.00 | 1,023.17 1,021.39 | 0.40 0.75 | 2.04 3.82 | |||||
Flexible Income | Investor | 1,000.00 | 1,019.49 | 1.12 | 5.72 | |||||
Real Assets | Investor | 1,000.00 | 1,023.42 | 0.35 | 1.79 | |||||
Real Estate Securities | Institutional Investor | 1,000.00 1,000.00 | 1,020.43 1,019.49 | 0.94 1.12 | 4.78 5.72 | |||||
Global Natural Resources Equity | Investor | 1,000.00 | 1,018.27 | 1.36 | 6.94 | |||||
| (1) | Expenses include the effect of contractual waivers by GuideStone Capital Management. The Target Date Funds’, Asset Allocation Funds’ and Real Assets Fund’s proportionate share of the operating expenses of the Select Funds is not reflected in the tables above. |
| (2) | Expenses are equal to the Fund’s annualized expense ratios for the period July 1, 2015 through December 31, 2015, multiplied by the average account value over the period, multiplied by 184/365 (to reflect the one-half year period). |
| (3) | Actual expense calculation for Institutional Class of Conservative Allocation, Balanced Allocation, Growth Allocation and Aggressive Allocation are based on data since commencement of operations (November 23, 2015) and Hypothetical Expense calculation for the share class assumes the share class has been in existence for 184 days, and are based on data since July 1, 2015. |
| (4) | The expense ratios for the Defensive Market Strategies Fund and the International Equity Fund include the impact of dividend and interest expense on securities sold short. |
14
Table of Contents
ABBREVIATIONS, FOOTNOTES AND INDEX DEFINITIONS
| INVESTMENT ABBREVIATIONS: | ||||
| ADR | — | American Depositary Receipt | ||
| CDO | — | Collateralized Debt Obligation | ||
| CDX | — | A series of indices that track North American and emerging market credit derivative indexes. | ||
| CETIP | — | Latin America’s largest central depository for securities and derivatives. | ||
| CLO | — | Collateralized Loan Obligation | ||
| CMBX | — | A group of indices made up of 25 tranches of commercial mortgage-backed securities (CMBS), each with different credit ratings. | ||
| CONV | — | Convertible | ||
| CVA | — | Dutch Certificate | ||
| EURIBOR | — | Euro Interbank Offered Rate | ||
| GDR | — | Global Depositary Receipt | ||
| IO | — | Interest Only (Principal amount shown is notional) | ||
| iTraxx | — | A group of international credit derivative indices that are monitored by the International Index Company (IIC).iTraxx indices cover credit derivatives markets in Europe, Asia and Australia. | ||
| KLIBOR | — | Kuala Lumpur Interbank Offer Rate | ||
| KORIBOR | — | Korea Interbank Offer Rate | ||
| LIBOR | — | London Interbank Offered Rate | ||
| LLC | — | Limited Liability Company | ||
| LP | — | Limited Partnership | ||
| MXN- | — | The Equilibrium Interbank Interest Rate (“TIIE”) | ||
| TIIE- Banxico | represents interbank credit transactions in local currency (MXN). | |||
| NVDR | — | Non-Voting Depository Receipt | ||
| PCL | — | Public Company Limited | ||
| PIK | — | Payment-in-Kind Bonds | ||
| PLC | — | Public Limited Company | ||
| REIT | — | Real Estate Investment Trust | ||
| REMIC | — | Real Estate Mortgage Investment Conduit | ||
| SDR | — | Special Drawing Rights | ||
| STEP | — | Stepped Coupon Bonds: Interest rates shown reflect the rates currently in effect. | ||
| STRIP | — | Stripped Security | ||
| TBA | — | To be announced | ||
| TIPS | — | Treasury Inflation Protected Security. | ||
| 144A | — | Security was purchased pursuant to Rule 144A under the Securities Act of 1933 and may not be resold subject to that rule except to qualified institutional buyers. As of December 31, 2015, the total market values and percentages of net assets for 144A securities by fund were as follows: | ||
Fund | Value of 144A Securities | Percentage of Net Assets | ||||||||
Money Market | $ | 369,349,330 | 28.69 | % | ||||||
Low-Duration Bond | 187,908,875 | 21.85 | ||||||||
Medium-Duration Bond | 113,818,601 | 12.72 | ||||||||
Extended-Duration Bond | 21,471,023 | 8.39 | ||||||||
Global Bond | 89,527,396 | 22.96 | ||||||||
Defensive Market Strategies | 31,464,310 | 5.15 | ||||||||
Small Cap Equity | 1 | — | ||||||||
International Equity Index | 249,028 | 0.22 | ||||||||
International Equity | 4,815,871 | 0.38 | ||||||||
Emerging Markets Equity | 2,458,633 | 0.83 | ||||||||
Real Estate Securities | 800,267 | 0.31 | ||||||||
Flexible Income Fund | 3,681,125 | 2.60 | ||||||||
| INVESTMENT FOOTNOTES: | ||||
| ‡‡ | — | All or a portion of the security was held as collateral for open futures, options, securities sold short and/or swap contracts. | ||
| @ | — | Illiquid. | ||
| * | — | Non-income producing security. | ||
| # | — | Security in default. | ||
| § | — | Security purchased with the cash proceeds from securities loaned. | ||
| † | — | Variable rate security. Rate shown reflects the rate in effect as of December 31, 2015. Maturity date for money market instruments is the date of the next interest rate reset. | ||
W | — | Rates shown reflect the effective yields as of December 31, 2015. | ||
¥ | — | Affiliated fund. | ||
D | — | Security either partially or fully on loan. | ||
S | — | All or a portion of this position has not settled. Full contract rates do not take effect until settlement date. | ||
+ | — | Security is valued at fair value by the Valuation Committee (see Note 1 in Notes to Financial Statements). As of December 31, 2015, the total market values and percentages of net assets for Fair Valued securities by fund were as follows: | ||
Fund | Value of Fair Valued Securities | Percentage of Net Assets | ||||||||
Low-Duration Bond | $ | — | — | % | ||||||
Medium-Duration Bond | 7,490,740 | 0.84 | ||||||||
Global Bond | 3,206,279 | 0.82 | ||||||||
Defensive Market Strategies | 5,550,877 | 0.91 | ||||||||
Small Cap Equity | 1 | — | ||||||||
International Equity Index | 2,133 | — | ||||||||
International Equity | 174,050 | 0.01 | ||||||||
Emerging Markets Equity | 631,283 | 0.21 | ||||||||
15
Table of Contents
ABBREVIATIONS, FOOTNOTES AND INDEX DEFINITIONS
| FOREIGN BOND FOOTNOTES: | ||||
| (A) | — | Par is denominated in Australian Dollars (AUD). | ||
| (B) | — | Par is denominated in Brazilian Real (BRL). | ||
| (C) | — | Par is denominated in Canadian Dollars (CAD). | ||
| (E) | — | Par is denominated in Euro (EUR). | ||
| (K) | — | Par is denominated in Norwegian Krone (NOK). | ||
| (M) | — | Par is denominated in Mexican Pesos (MXN). | ||
| (P) | — | Par is denominated in Polish Zloty (PLN). | ||
| (U) | — | Par is denominated in British Pounds (GBP). | ||
| (V) | — | Par is denominated in Dominican Peso (DOP). | ||
| (X) | — | Par is denominated in Colombian Peso (COP). | ||
| (Z) | — | Par is denominated in New Zealand Dollars (NZD). | ||
| (Y) | — | Par is denominated in Chinese Yuan (CNY). | ||
| COUNTERPARTY ABBREVIATIONS: | ||||
| BAR | — | Counterparty to contract is Barclays Capital. | ||
| BNP | — | Counterparty to contract is BNP Paribas. | ||
| BNY | — | Counterparty to contract is Bank of New York Mellon. | ||
| BOA | — | Counterparty to contract is Bank of America. | ||
| CITI | — | Counterparty to contract is Citibank NA London. | ||
| CITIC | — | Counterparty to contract is Citicorp. | ||
| CITIG | — | Counterparty to contract is Citigroup. | ||
| CME | — | Counterparty to contract is Chicago Mercantile Exchange. | ||
| CS | — | Counterparty to contract is Credit Suisse International. | ||
| DEUT | — | Counterparty to contract is Deutsche Bank AG. | ||
| GSC | — | Counterparty to contract is Goldman Sachs Capital Markets, LP. | ||
| HKSB | — | Counterparty to contract is Hong Kong & Shanghai Bank. | ||
| HSBC | — | Counterparty to contract is HSBC Securities. | ||
| ICE | — | Counterparty to contract is Intercontinental Exchange. | ||
| JEFF | — | Counterparty to contract is Jefferies. | ||
| JPM | — | Counterparty to contract is JPMorgan Chase Bank. | ||
| MLCS | — | Counterparty to contract is Merrill Lynch Capital Services, Inc. | ||
| MSCS | — | Counterparty to contract is Morgan Stanley Capital Services. | ||
| NT | — | Counterparty to contract is Northern Trust Corporation. | ||
| RBC | — | Counterparty to contract is Royal Bank of Canada. | ||
| RBS | — | Counterparty to contract is Royal Bank of Scotland. | ||
| SC | — | Counterparty to contract is Standard Chartered PLC. | ||
| SS | — | Counterparty to contract is State Street Global Markets. | ||
| UBS | — | Counterparty to contract is UBS AG. | ||
| WEST | — | Counterparty to contract is Westpac Pollock. | ||
| WF | — | Counterparty to contract is Wells Fargo. | ||
16
Table of Contents
ABBREVIATIONS, FOOTNOTES AND INDEX DEFINITIONS
INDEX DEFINITIONS:
The Bank of America Merrill Lynch 1-3 Year Treasury Index is composed of all U.S. Treasury notes and bonds with maturities greater than or equal to one year and less than three years.
The Barclays Global Aggregate Bond Index — Unhedged provides a broad-based measure of the global investment grade fixed-rate debt markets.
The Barclays U.S. Aggregate Bond Index represents securities that are SEC-registered, taxable and dollar denominated. The index covers the U.S. investment grade fixed-rate bond market, with index components for government and corporate securities, mortgage pass-through securities, and asset-backed securities.
The Barclays U.S. Corporate High Yield – 2% Issuer Capped Index is an issuer-constrained version of the Barclays U.S. Corporate High Yield Index that measures the market of U.S. dollar denominated, non-investment grade, fixed-rate, taxable corporate bonds. The index follows the same rules as the uncapped index but limits the exposure of each issuer to 2% of the total market value and redistributes any excess market value index-wide on a pro rata basis.
The Barclays U.S. Long-Term Credit Bond Index is composed of a subset of the Barclays U.S. Credit Bond Index covering all corporate, publicly issued, fixed-rate, nonconvertible U.S. debt issues rated at least Baa with at least $50 million principal outstanding and maturity greater than 10 years.
The Barclays U.S. Long-Term Government Bond Index is composed of securities in the long (more than 10 years) range of the Barclays U.S. Government Index and is composed of a subset of the Barclays Credit Bond Index covering all corporate, publicly issued, fixed-rate, nonconvertible U.S. debt issues rated at least Baa with at least $50 million principal outstanding and maturity greater than 10 years.
The Barclays U.S. Treasury Inflation Protected Securities (TIPS) Index measures the performance of the U.S. Treasury Inflation Protected Securities (“TIPS”) market and includes TIPS with one or more years remaining until maturity with total outstanding issue size of $500 million or more.
The Bloomberg Commodity Index provides a broadly diversified representation of commodity markets as an asset class. The index is made up of exchange-traded futures on physical commodities and represents 20 commodities, which are weighted to account for economic significance and market liquidity. Weighting restrictions on individual commodities and commodity groups promote diversification.
The Citigroup 3-Month Treasury Bill Index is an unmanaged index that is generally representative of 3-month U.S. Treasury bills, consisting of an average of the last 3-month U.S. Treasury bill issues.
The CMBX Indexes are a group of indices made up of 25 tranches of commercial mortgage-backed securities (CMBS), each with different credit ratings.
The Dow Jones CDX Indexes are a series of indices that track North American and emerging market credit derivative indexes. This family of indices comprises a basket of credit derivatives that are representative of certain segments such as North American investment grade credit derivatives (NA.IG), high yield (NA.HY), and emerging markets (NA.EM).
The FTSE EPRA/NAREIT Developed Index is designed to track the performance of listed real estate companies and REITS worldwide. By making the index constituents free-float adjusted, liquidity, size and revenue screened, the series is suitable for use as the basis for investment products, such as derivatives and Exchange Traded Funds (“ETFs”).
The iTraxx Indexes are a group of international credit derivative indices that are monitored by the International Index Company (IIC). iTraxx indices cover credit derivatives markets in Europe, Asia and Australia.
The JPMorgan Emerging Markets Bond Index Plus is a traditional, market-capitalization weighted index comprised of U.S. dollar denominated Brady bonds, Eurobonds and traded loans issued by sovereign entities.
The MSCI ACWI (All Country World Index) Ex-U.S. Index is a free float-adjusted market capitalization index that is designed to measure equity market performance in the global developed (excluding U.S.) and emerging markets.
The MSCI World Commodity Producers Index is a free float-adjusted market capitalization index designed to reflect the performance of the three underlying commodity markets: energy, metals and agricultural products.
The MSCI EAFE Index (Europe, Australasia, Far East) is a free float-adjusted market capitalization index that is designed to measure the equity market performance of developed markets, excluding the U.S. & Canada. The MSCI EAFE Index consists of the following 21 developed market country indices: Australia, Austria, Belgium, Denmark, Finland, France, Germany, Hong Kong, Ireland, Israel, Italy, Japan, the Netherlands, New Zealand, Norway, Portugal, Singapore, Spain, Sweden, Switzerland, and the United Kingdom.
17
Table of Contents
ABBREVIATIONS, FOOTNOTES AND INDEX DEFINITIONS
The MSCI EM (Emerging Markets) Index is a free float-adjusted market capitalization index that is designed to measure equity market performance of emerging markets. The index consisted of the following 23 emerging market country indices: Brazil, Chile, China, Colombia, Czech Republic, Egypt, Greece, Hungary, India, Indonesia, Korea, Malaysia, Mexico, Peru, Philippines, Poland, Qatar, Russia, South Africa, Taiwan, Thailand, Turkey, and United Arab Emirates.
The NYSE Arca Gold Miners Index is a modified market capitalization weighted index comprised of publicly traded companies involved primarily in mining for gold and silver. The index is calculated and maintained by the American Stock Exchange.
The Russell 1000® Growth Index is a large-cap index consisting of those Russell 1000® Index securities with greater-than-average growth orientation. Companies in this index tend to exhibit higher price-to-book and price-to-earnings-ratios, lower dividend yields and higher forecasted growth values than the value universe.
The Russell 1000® Value Index is a large-cap index consisting of those Russell 1000® Index securities with a less-than-average growth orientation. Companies in this index tend to exhibit lower price-to-book and price-to-earnings ratios, higher dividend yields and lower forecasted growth values than the growth universe.
The Russell 2000® Index measures the performance of the small-cap segment of the U.S. equity universe. The Russell 2000® Index is a subset of the Russell 3000® Index representing approximately 10% of the total market capitalization of that index. It includes approximately 2,000 of the smallest securities based on a combination of their market cap and current index membership. The Russell 2000® Index is constructed to provide a comprehensive and unbiased small-cap barometer and is completely reconstituted annually to ensure that larger stocks do not distort the performance and characteristics of the actual small-cap opportunity set.
The Russell 3000® Index is composed of 3,000 large companies. This portfolio of securities represents approximately 98% of the investable U.S. equity market.
The S&P 500® Index is an unmanaged index (with no defined investment objective) of common stocks, includes reinvestment of dividends, and is a registered trademark of McGraw-Hill Co., Inc. The S&P 500® Index includes 500 of the largest stocks (in terms of market value) in the United States.
The S&P/LSTA Leveraged Loan Index is a daily total return index that tracks the current outstanding balance and spread over LIBOR for fully funded term loans. The facilities included in the S&P/LSTA Leveraged Loan Index represent a broad cross section of leveraged loans syndicated in the United States, including dollar-denominated loans to overseas issuers.
The S&P/LSTA U.S. B- Ratings and Above Loan Index is a daily total return index that tracks the current outstanding balance and spread over LIBOR for fully funded term loans. The facilities included in the S&P/LSTA U.S. B- Ratings and Above Loan Index represent a broad cross section of leveraged loans syndicated in the United States, including dollar-denominated loans to overseas issuers.
18
Table of Contents
The Target Date Funds, or MyDestination Funds®, maintain diversified exposure to all three asset classes of equities, fixed income and real assets.
Contribution to absolute performance from U.S. equities was roughly flat for the MyDestination Funds®. U.S. equities experienced moderate headwinds, with the broader equity market, as measured by the Russell 3000® Index, returning 0.48% for the calendar year 2015. U.S. equity market performance was hampered by a slowdown in earnings growth and the impact of a strong U.S. dollar, which rose more than 8.00% versus the currencies of key trading partners. Small-cap stocks underperformed large-cap stocks with the Russell 2000® Index returning -4.41%. From a sector perspective, performance was positive for five of the nine sectors within the Russell 3000® Index, with consumer staples and health care leading performance among the sectors. The energy and the materials sectors were the largest detractors, down 20.00% and 8.33% respectively, due largely to global oversupply and falling demand from China for several commodities.
Contribution to absolute performance from non-U.S. equity markets was negative for the MyDestination Funds®, with both developed non-U.S. equity markets and emerging markets equities detracting similarly from performance results. Developed non-U.S. equity markets underperformed the U.S. equity markets as the MSCI EAFE Index (Net), a measure of international developed country returns, posted a one-year return of -0.81%. Two main causes for the relative underperformance of the MSCI EAFE (Net) Index were slower economic growth outside the United States and the continued appreciation of the U.S. dollar versus global currencies. The only regions to post positive returns were Japan and Africa/Middle East, while Asia ex-Japan and Europe were the largest detractors. Asia ex-Japan was hit hard by moderating economic growth in China, and the region fell over 9.00% in the index for the year. From a sector perspective, utilities and health care outperformed with high single digit returns. The energy and the materials sectors were the largest detractors, falling 18.00% and 15.51%, respectively. Emerging markets equities were materially negative for the year, with the MSCI Emerging Markets Index falling 14.92%. Emerging markets experienced a difficult year due to the headwinds of slower Chinese growth, weak commodity prices and a strong U.S. dollar.
Contribution to absolute performance from fixed income was a slight detraction for the MyDestination Funds®, except for the more conservatively positioned MyDestination 2005 Fund. The U.S. fixed income markets had mixed returns as the yield curve flattened over the year given the short end of the curve rose more than the long end. This was a result of the Fed telegraphing the first federal funds rate hike of this cycle and executing it in December. The Barclays U.S. Aggregate Bond Index, a proxy for the broad U.S. domestic bond market, generated an annual return of 0.55%. Non-U.S. fixed income underperformed domestic, particularly due to U.S. dollar strength weighing heavily on returns, as the Barclays Global Aggregate ex-U.S. Index posted a -5.30% annual return. Credit spreads in high yield bonds widened, which led to the first annual decline in the Barclays U.S. High Yield Corporate Bond Index since 2008. In particular, falling oil prices caused acute price declines in the energy sector, which comprised about 15.00% of the index, dragging down total returns and causing a contagion effect that negatively impacted the rest of the high yield bond market.
Real assets detracted from absolute performance within the MyDestination Funds®, although the returns of the various underlying strategies varied significantly for the year. Key drivers of performance were subdued inflation and inflation expectations and falling commodity prices – all of which put downward pressure on most real assets strategies. The primary detractors to absolute performance for the MyDestination Funds® were negative performance across global natural resource equities and commodities. Global natural resource equities, as measured by the MSCI World Commodity Producers Index, fell 25.62% in 2015. The Bloomberg Commodity Index, a broad-based measure of returns for a diversified basket of commodity futures, posted a 24.66% decline for 2015. Commodity prices continued to have strong headwinds throughout 2015, as oversupply issues and the slowdown in China’s economic growth weighed heavily on the space.
19
Table of Contents
MyDestination 2005 Fund (Unaudited)
The Fund, through investments predominantly in the underlying GuideStone Funds Select Funds, combined a greater percentage of exposure to fixed income securities with a smaller percentage allocated to equity and real assets securities. The Fund followed an allocation glide path designed to become more conservative over time, and the December 31, 2015 targeted allocations were approximately 53.00% Fixed Income Select Funds, 21.00% U.S. Equity Select Funds, 8.00% Non-U.S. Equity Select Funds and 18.00% Real Assets Select Funds.
As a fund of funds, the Fund’s performance was based primarily on the performance of the underlying Select Funds. The Fund generated a return of -1.63% for the one-year period ended December 31, 2015. Contribution to absolute performance from the U.S. Equity Select Funds was roughly flat. The Defensive Market Strategies Fund was the largest U.S. Equity Select Fund contributor to absolute performance, benefiting from increased volatility and solid alpha generation. Non-U.S. Equity Select Funds exposure, including both developed and emerging markets, detracted from performance and was impacted by slower global growth, a strengthening U.S. dollar and poor performance from commodity sensitive emerging markets. The Fund’s Fixed Income Select Funds allocation slightly added to investment returns, as the Low-Duration Bond Fund was the largest contributor overall. Real assets exposure was the primary driver of negative absolute performance, led by the Global Natural Resources Equity Fund and the Credit Suisse Commodity Return Strategy Fund, as each fell significantly for the year. As of December 2015, the Credit Suisse Commodity Return Strategy Fund was no longer held by the Fund.
The Fund underperformed its composite benchmark in 2015 (-1.63% versus -0.82%). The largest detractors to relative underperformance were the Global Natural Resources Equity Fund and the Flexible Income Fund. The largest positive contributor to relative performance was the Defensive Market Strategies Fund.
Certain derivatives were utilized to provide market exposure for the cash positions held in the Fund. These derivative positions primarily included stock index futures and fixed income futures. Overall, derivative exposure had a slight negative impact on Fund performance for the year.
The Fund attempted to achieve its objective by investing predominantly in the GuideStone Funds Select Funds. The Fund is managed to a retirement date (“target date”) by adjusting the percentage of fixed income securities and equity securities to become more conservative each year until reaching the retirement year and then approximately 12 years thereafter. The target date in the name of the Fund is the approximate date when an investor plans to start withdrawing money. This Fund may be suitable for investors who want a simplified “one fund” retirement solution, are willing to pay slightly higher fees to get a diversified mix of investments that becomes more conservative over time and retired at an age that was near the year 2005. The Fund’s value will fluctuate due to changes in interest rates. There is a risk that the issuer of a fixed income investment may fail to pay interest or even principal due in a timely manner or at all. The Fund’s value will fluctuate due to business developments concerning a particular issuer, industry or country, as well as general market and economic conditions. The Fund is subject to risks presented by investments in foreign issuers, and changes in currency exchange rates relative to the U.S. dollar may negatively affect the values of foreign investments held by the Select Funds. By investing in this Fund, you will incur the expenses of the Fund, in addition to those of the underlying Select Funds. The principal risks of the Fund will change depending on the asset mix of the Select Funds in which it invests. You may directly invest in the Select Funds. The Fund’s value will go up and down in response to changes in the share prices of the investments that it owns. The amount invested in the Fund is not guaranteed to increase, is not guaranteed against loss nor is the amount of the original investment guaranteed at the target date. It is possible to lose money by investing in the Fund.
At December 31, 2015, the portfolio holdings of the Fund, as a percentage of net assets, is shown in the following table. Portfolio holdings are subject to risk and may change at any time.
| % | ||||
Fixed Income Select Funds | 53.8 | |||
U.S. Equity Select Funds | 21.1 | |||
Real Return Select Funds | 17.6 | |||
Non-U.S. Equity Select Funds | 7.4 | |||
|
| |||
| 99.9 | ||||
|
| |||
20
Table of Contents
MyDestination 2005 Fund (Unaudited)
| Average Annual Total Returns as of 12/31/15 | ||||
| Investor Class* | Benchmark** | ||
One Year | -1.63% | -0.82% | ||
Five Year | 3.64% | 3.64% | ||
Since Inception | 3.17% | 3.36% | ||
Inception Date | 12/29/06 | |||
Total Fund Operating Expenses (May 1, 2015 Prospectus, as amended on June 1, 2015)(1) | 0.91% | |||
(1)The Fund’s shareholders indirectly bear the expenses of the Investor Class shares of the Select Funds in which the Fund invests. Current information regarding the Fund’s Operating Expenses can be found in the Financial Highlights.
The performance data quoted represents past performance and does not guarantee future results. Current performance may be lower or higher. Performance data current to the most recent month-end may be obtained at www.GuideStoneFunds.org. The investment return and principal value of an investment will fluctuate so that shares, when redeemed, may be worth more or less than their original cost.
The graph illustrates the results of a hypothetical $10,000 investment in the Investor Class of the Fund since December 29, 2006 (commencement of operations), with all dividends and capital gains reinvested, with the Fund’s composite benchmark index.
*These returns reflect expense waivers by the Fund’s investment adviser. Without these waivers, returns would have been lower. Returns shown do not reflect the deduction of taxes that a shareholder would pay on Fund distributions or the redemption of Fund shares.
**Represents a composite index as of December 2015, consisting of 37.87% of the Bank of America Merrill Lynch 1-3 Year Treasury Index, 10.10% of the Barclays U.S. Aggregate Bond Index, 1.27% of the Barclays Global Aggregate Bond Index -Unhedged, 0.63% of the Barclays U.S. Corporate High Yield - 2% Issuer Capped Index, 0.63% of the J.P. Morgan Emerging Markets Bond Index Plus, 10.00% of the Barclays U.S. TIPS Index, 5.00% of the S&P/LSTA U.S. B- Ratings and Above Loan Index, 14.46% of the S&P 500® Index, 1.00% of the FTSE EPRA/NAREIT Developed Index, 3.71% of the Russell 1000® Value Index, 3.71% of the Russell 1000® Growth Index, 1.33% of the Russell 2000® Index, 2.00% of the MSCI World Commodity Producers Index, 6.55% of the MSCI EAFE Index and 1.74% of the MSCI EM Index.
The construction of the composite index corresponds to the target percentage allocations to the underlying asset classes as represented by the Fund’s investment in the Select Funds. As the target percentage allocations to the underlying investments change according to the MyDestination Funds® glide path, the target percentage allocations to the composite index also change.
Unlike a mutual fund, the performance of an index assumes no taxes, transaction costs, management fees or other expenses.
21
Table of Contents
MYDESTINATION 2005 FUND SCHEDULE OF INVESTMENTS | December 31, 2015 |
| Shares | Value | |||||||||||
MUTUAL FUNDS — 99.9% |
| |||||||||||
GuideStone Money Market Fund | 2,260,204 | $ | 2,260,204 | |||||||||
GuideStone Low-Duration Bond Fund | 4,431,889 | 37,094,911 | ||||||||||
GuideStone Medium-Duration Bond Fund (Institutional Class)¥ | 1,491,541 | 9,918,748 | ||||||||||
GuideStone Global Bond Fund | 271,864 | 2,468,525 | ||||||||||
GuideStone Defensive Market Strategies Fund (Institutional Class)¥ | 848,024 | 9,506,353 | ||||||||||
GuideStone Equity Index Fund | 374,765 | 3,230,478 | ||||||||||
GuideStone Value Equity Fund | 425,674 | 3,213,837 | ||||||||||
GuideStone Growth Equity Fund | 339,796 | 3,238,253 | ||||||||||
GuideStone Small Cap Equity Fund | 146,092 | 1,092,769 | ||||||||||
GuideStone International Equity Index Fund (Institutional Class)¥ | 209,809 | 1,875,689 | ||||||||||
| Shares | Value | |||||||||||
GuideStone International Equity Fund | 388,929 | $ | 3,784,279 | |||||||||
GuideStone Emerging Market Equity Fund | 199,570 | 1,464,847 | ||||||||||
GuideStone Inflation Protected Bond Fund | 946,214 | 9,443,214 | ||||||||||
GuideStone Flexible Income Fund | 509,498 | 4,733,235 | ||||||||||
GuideStone Real Estate Securities Fund (Institutional Class)¥ | 100,274 | 948,592 | ||||||||||
GuideStone Global Natural Resources Equity Fund (Investor Class)¥ | 344,035 | 1,758,019 | ||||||||||
|
| |||||||||||
Total Mutual Funds | 96,031,953 | |||||||||||
|
| |||||||||||
TOTAL INVESTMENTS — 99.9% |
| 96,031,953 | ||||||||||
Other Assets in Excess of | 60,334 | |||||||||||
|
| |||||||||||
NET ASSETS — 100.0% | $ | 96,092,287 | ||||||||||
|
| |||||||||||
VALUATION HIERARCHY
The following is a summary of the inputs used, as of December 31, 2015, in valuing the Fund’s investments carried at fair value:
| Total Value | Level 1 Quoted Prices | Level 2 Other Significant Observable Inputs | Level 3 Significant Unobservable Inputs | |||||||||||||||||
Assets: | ||||||||||||||||||||
Investments in Securities: | ||||||||||||||||||||
Mutual Funds | $ | 96,031,953 | $ | 96,031,953 | $ | — | $ | — | ||||||||||||
|
|
|
|
|
|
|
| |||||||||||||
Total Assets - Investments in Securities | $ | 96,031,953 | $ | 96,031,953 | $ | — | $ | — | ||||||||||||
|
|
|
|
|
|
|
| |||||||||||||
Liabilities: | ||||||||||||||||||||
Other Financial Instruments*** | ||||||||||||||||||||
Futures Contracts | $ | (6,502 | ) | $ | (6,502 | ) | $ | — | $ | — | ||||||||||
|
|
|
|
|
|
|
| |||||||||||||
Total Liabilities - Other Financial Instruments | $ | (6,502 | ) | $ | (6,502 | ) | $ | — | $ | — | ||||||||||
|
|
|
|
|
|
|
| |||||||||||||
***Other financial instruments are derivative instruments not reflected in the Schedule of Investments, such as futures, forwards and swap contracts, which are valued at the unrealized appreciation (depreciation) on the investment. Details of these investments can be found in the Notes to Financial Statements.
| 22 | See Notes to Financial Statements. |
Table of Contents
MyDestination 2015 Fund (Unaudited)
The Fund, through investments predominantly in the underlying GuideStone Funds Select Funds, combined a greater percentage of exposure to equity securities with a smaller percentage allocated to fixed income and real assets securities. The Fund followed an allocation glide path designed to become more conservative over time, and the December 31, 2015 targeted allocations were approximately 32.00% Fixed Income Select Funds, 37.00% U.S. Equity Select Funds, 13.00% Non-U.S. Equity Select Funds and 18.00% Real Assets Select Funds.
As a fund of funds, the Fund’s performance was primarily based on the performance of the underlying Select Funds. The Fund generated a return of -2.06% for the one-year period ended December 31, 2015. Contribution to absolute performance from the U.S. Equity Select Funds was roughly flat. The Defensive Market Strategies Fund was the largest contributor to absolute performance, benefiting from increased volatility and solid alpha generation. Non-U.S. Equity Select Funds exposure, including both developed and emerging markets, detracted from performance and was impacted by slower global growth, a strengthening U.S. dollar and poor performance from commodity sensitive emerging markets. The Fund’s Fixed Income Select Funds allocation detracted from investment returns, with the Global Bond Fund as the largest detractor. Real assets exposure was the primary driver of negative absolute performance, led by the Global Natural Resources Equity Fund and the Credit Suisse Commodity Return Strategy Fund, as each fell significantly for the year. As of December 2015, the Credit Suisse Commodity Return Strategy Fund was no longer held by the Fund.
The Fund underperformed its composite benchmark in 2015 (-2.06% versus -1.11%). The largest detractors to relative underperformance were the Global Natural Resources Equity Fund and the Global Bond Fund. The largest positive contributor to relative performance was the Defensive Market Strategies Fund.
Certain derivatives were utilized to provide market exposure for the cash positions held in the Fund. These derivative positions primarily included stock index futures and fixed income futures. Overall, derivative exposure had a slight positive impact on Fund performance for the year.
The Fund attempted to achieve its objective predominately by investing in the GuideStone Funds Select Funds. The Fund is managed to a retirement date (“target date”) by adjusting the percentage of fixed income securities and equity securities to become more conservative each year until reaching the retirement year and then approximately 12 years thereafter. The target date in the name of the Fund is the approximate date when an investor plans to start withdrawing money. This Fund may be suitable for investors who want a simplified “one fund” retirement solution, are willing to pay slightly higher fees to get a diversified mix of investments that becomes more conservative over time and plan to retire at an age that is near the year 2015. The Fund’s value will fluctuate due to changes in interest rates. There is a risk that the issuer of a fixed income investment may fail to pay interest or even principal due in a timely manner or at all. The Fund’s value will fluctuate due to business developments concerning a particular issuer, industry or country, as well as general market and economic conditions. The Fund is subject to risks presented by investments in foreign issuers, and changes in currency exchange rates relative to the U.S. dollar may negatively affect the values of foreign investments held by the Select Funds. By investing in this Fund, you will incur the expenses of the Fund, in addition to those of the underlying Select Funds. The principal risks of the Fund will change depending on the asset mix of the Select Funds in which it invests. You may directly invest in the Select Funds. The Fund’s value will go up and down in response to changes in the share prices of the investments that it owns. The amount invested in the Fund is not guaranteed to increase, is not guaranteed against loss nor is the amount of the original investment guaranteed at the target date. It is possible to lose money by investing in the Fund.
At December 31, 2015, the portfolio holdings of the Fund, as a percentage of net assets, is shown in the following table. Portfolio holdings are subject to risk and may change at any time.
| % | ||||
U.S. Equity Select Funds | 36.2 | |||
Fixed Income Select Funds | 33.8 | |||
Real Return Select Funds | 17.6 | |||
Non-U.S. Equity Select Funds | 12.4 | |||
|
| |||
| 100.0 | ||||
|
| |||
23
Table of Contents
MyDestination 2015 Fund (Unaudited)
| Average Annual Total Returns as of 12/31/15 | ||||
| Investor Class* | Benchmark** | ||
One Year | -2.06% | -1.11% | ||
Five Year | 4.98% | 5.00% | ||
Since Inception | 3.57% | 3.81% | ||
Inception Date | 12/29/06 | |||
Total Fund Operating Expenses (May 1, 2015 Prospectus, as amended on June 1, 2015)(1) | 0.98% | |||
(1)The Fund’s shareholders indirectly bear the expenses of the Investor Class shares of the Select Funds in which the Fund invests. Current information regarding the Fund’s Operating Expenses can be found in the Financial Highlights.
The performance data quoted represents past performance and does not guarantee future results. Current performance may be lower or higher. Performance data current to the most recent month-end may be obtained at www.GuideStoneFunds.org. The investment return and principal value of an investment will fluctuate so that shares, when redeemed, may be worth more or less than their original cost.
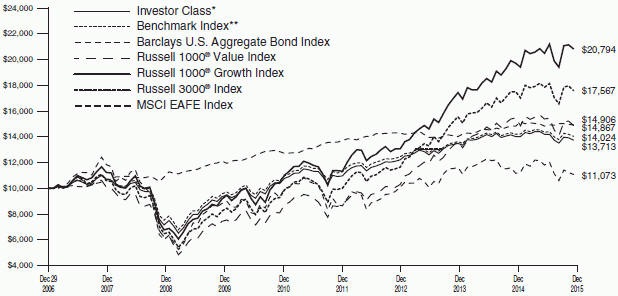
The graph illustrates the results of a hypothetical $10,000 investment in the Investor Class of the Fund since December 29, 2006 (commencement of operations), with all dividends and capital gains reinvested, with the Fund’s composite benchmark index.
*These returns reflect expense waivers by the Fund’s investment adviser. Without these waivers, returns would have been lower. Returns shown do not reflect the deduction of taxes that a shareholder would pay on Fund distributions or the redemption of Fund shares.
**Represents a composite index as of December 2015, consisting of 12.80% of the Bank of America Merrill Lynch 1-3 Year Treasury Index, 12.80% of the Barclays U.S. Aggregate Bond Index, 0.80% of the Barclays U.S. Long-Term Government Bond Index, 0.80% of the Barclays U.S. Long-Term Credit Bond Index, 2.40% of the Barclays Global Aggregate Bond Index - Unhedged, 1.20% of the Barclays U.S. Corporate High Yield - 2% Issuer Capped Index, 1.20% of the J.P. Morgan Emerging Markets Bond Index Plus, 10.00% of the Barclays U.S. TIPS Index, 23.66% of the S&P 500® Index, 5.00% of the S&P/LSTA U.S. B- Ratings and Above Loan Index, 5.66% of the Russell 1000® Value Index, 5.66% of the Russell 1000® Growth Index, 2.22% of the Russell 2000® Index, 1.00% of the FTSE EPRA/NAREIT Developed Index, 2.00% of the MSCI World Commodity Producers Index, 10.11% of the MSCI EAFE Index and 2.69% of the MSCI EM Index.
The construction of the composite index corresponds to the target percentage allocations to the underlying asset classes as represented by the Fund’s investment in the Select Funds. As the target percentage allocations to the underlying investments change according to the MyDestination Funds® glide path, the target percentage allocations to the composite index also change.
Unlike a mutual fund, the performance of an index assumes no taxes, transaction costs, management fees or other expenses.
24
Table of Contents
MYDESTINATION 2015 FUND SCHEDULE OF INVESTMENTS | December 31, 2015 |
| Shares | Value | |||||||||||
MUTUAL FUNDS — 100.0% |
| |||||||||||
GuideStone Money Market Fund | 7,564,983 | $ | 7,564,983 | |||||||||
GuideStone Low-Duration Bond Fund | 7,652,173 | 64,048,691 | ||||||||||
GuideStone Medium-Duration Bond Fund | 9,260,915 | 61,585,084 | ||||||||||
GuideStone Extended-Duration Bond Fund | 1,853,900 | 7,044,821 | ||||||||||
GuideStone Global Bond Fund | 2,378,495 | 21,596,735 | ||||||||||
GuideStone Defensive Market Strategies Fund | 7,493,720 | 84,004,598 | ||||||||||
GuideStone Equity Index Fund | 3,076,094 | 26,515,934 | ||||||||||
GuideStone Value Equity Fund | 3,470,823 | 26,204,711 | ||||||||||
GuideStone Growth Equity Fund | 2,791,524 | 26,603,227 | ||||||||||
GuideStone Small Cap Equity Fund | 1,370,723 | 10,253,010 | ||||||||||
GuideStone International Equity Index Fund | 1,766,084 | 15,788,788 | ||||||||||
| Shares | Value | |||||||||||
GuideStone International Equity Fund | 3,228,122 | $ | 31,409,631 | |||||||||
GuideStone Emerging Market Equity Fund | 1,670,908 | 12,264,465 | ||||||||||
GuideStone Inflation Protected Bond Fund | 4,754,501 | 47,449,917 | ||||||||||
GuideStone Flexible Income Fund | 2,523,044 | 23,439,077 | ||||||||||
GuideStone Real Estate Securities Fund | 533,153 | 5,043,631 | ||||||||||
GuideStone Global Natural Resources Equity Fund | 1,692,075 | 8,646,505 | ||||||||||
|
| |||||||||||
Total Mutual Funds |
| 479,463,808 | ||||||||||
|
| |||||||||||
TOTAL INVESTMENTS — 100.0% |
| 479,463,808 | ||||||||||
Other Assets in Excess of | 48,502 | |||||||||||
|
| |||||||||||
NET ASSETS — 100.0% | $ | 479,512,310 | ||||||||||
|
| |||||||||||
VALUATION HIERARCHY
The following is a summary of the inputs used, as of December 31, 2015, in valuing the Fund’s investments carried at fair value:
| Total Value | Level 1 Quoted Prices | Level 2 Other Significant Observable Inputs | Level 3 Significant Unobservable Inputs | |||||||||||||||||
Assets: | ||||||||||||||||||||
Investments in Securities: | ||||||||||||||||||||
Mutual Funds | $ | 479,463,808 | $ | 479,463,808 | $ | — | $ | — | ||||||||||||
|
|
|
|
|
|
|
| |||||||||||||
Total Assets - Investments in Securities | $ | 479,463,808 | $ | 479,463,808 | $ | — | $ | — | ||||||||||||
|
|
|
|
|
|
|
| |||||||||||||
Other Financial Instruments*** | ||||||||||||||||||||
Futures Contracts | $ | 9,612 | $ | 9,612 | $ | — | $ | — | ||||||||||||
|
|
|
|
|
|
|
| |||||||||||||
Total Assets - Other Financial Instruments | $ | 9,612 | $ | 9,612 | $ | — | $ | — | ||||||||||||
|
|
|
|
|
|
|
| |||||||||||||
***Other financial instruments are derivative instruments not reflected in the Schedule of Investments, such as futures, forwards and swap contracts, which are valued at the unrealized appreciation (depreciation) on the investment. Details of these investments can be found in the Notes to Financial Statements.
| See Notes to Financial Statements. | 25 |
Table of Contents
MyDestination 2025 Fund (Unaudited)
The Fund, through investments predominantly in the underlying GuideStone Funds Select Funds, combined a greater percentage of exposure to equity securities with smaller percentages allocated to fixed income and real assets securities. The Fund followed an allocation glide path designed to become more conservative over time, and the December 31, 2015 targeted allocations were approximately 25.00% Fixed Income Select Funds, 45.00% U.S. Equity Select Funds, 18.00% Non-U.S. Equity Select Funds and 12.00% Real Assets Select Funds.
As a fund of funds, the Fund’s performance was based primarily on the performance of the underlying Select Funds. The Fund generated a return of -2.91% for the one-year period ended December 31, 2015. Contribution to absolute performance from the U.S. Equity Select Funds was roughly flat. The Growth Equity Fund and the Defensive Market Strategies Fund were the largest contributors to absolute performance. Non-U.S. Equity Select Funds exposure, including both developed and emerging markets, detracted from performance and was impacted by slower global growth, a strengthening U.S. dollar and poor performance from commodity sensitive emerging markets. The Fund’s Fixed Income Select Funds allocation detracted from investment returns, with the Global Bond Fund as the largest detractor. Real assets exposure was the primary driver of negative absolute performance, led by the Global Natural Resources Equity Fund and the Credit Suisse Commodity Return Strategy Fund, as each fell significantly for the year. As of December 2015, the Credit Suisse Commodity Return Strategy Fund was no longer held by the Fund.
The Fund underperformed its composite benchmark in 2015 (-2.91% versus -1.81%). The largest detractors to relative underperformance were the Global Natural Resources Equity Fund and the Global Bond Fund. The largest positive contributor to relative performance was the Defensive Market Strategies Fund.
Certain derivatives were utilized to provide market exposure for the cash positions held in the Fund. These derivative positions primarily included stock index futures and fixed income futures. Overall, derivative exposure had a slight positive impact on Fund performance for the year.
The Fund attempted to achieve its objective predominantly by investing in the GuideStone Funds Select Funds. The Fund is managed to a retirement date (“target date”) by adjusting the percentage of fixed income securities and equity securities to become more conservative each year until reaching the retirement year and then approximately 12 years thereafter. The target date in the name of the Fund is the approximate date when an investor plans to start withdrawing money. This Fund may be suitable for investors who want a simplified “one fund” retirement solution, are willing to pay slightly higher fees to get a diversified mix of investments that becomes more conservative over time and plan to retire at an age that is near the year 2025. The Fund’s value will fluctuate due to changes in interest rates. There is a risk that the issuer of a fixed income investment may fail to pay interest or even principal due in a timely manner or at all. The Fund’s value will fluctuate due to business developments concerning a particular issuer, industry or country, as well as general market and economic conditions. The Fund is subject to risks presented by investments in foreign issuers, and changes in currency exchange rates relative to the U.S. dollar may negatively affect the values of foreign investments held by the Select Funds. By investing in this Fund, you will incur the expenses of the Fund, in addition to those of the underlying Select Funds. The principal risks of the Fund will change depending on the asset mix of the Select Funds in which it invests. You may directly invest in the Select Funds. The Fund’s value will go up and down in response to changes in the share prices of the investments that it owns. The amount invested in the Fund is not guaranteed to increase, is not guaranteed against loss nor is the amount of the original investment guaranteed at the target date. It is possible to lose money by investing in the Fund.
At December 31, 2015, the portfolio holdings of the Fund, as a percentage of net assets, is shown in the following table. Portfolio holdings are subject to risk and may change at any time.
| % | ||||
U.S. Equity Select Funds | 44.2 | |||
Fixed Income Select Funds | 26.1 | |||
Non-U.S. Equity Select Funds | 17.9 | |||
Real Return Select Funds | 11.8 | |||
|
| |||
| 100.0 | ||||
|
| |||
26
Table of Contents
MyDestination 2025 Fund (Unaudited)
| Average Annual Total Returns as of 12/31/15 | ||||
Investor Class* | Benchmark** | |||
One Year | -2.91% | -1.81% | ||
Five Year | 5.76% | 5.90% | ||
Since Inception | 3.46% | 3.88% | ||
Inception Date | 12/29/06 | |||
Total Fund Operating Expenses (May 1, 2015 Prospectus, as amended on June 1, 2015)(1) | 1.03% | |||
(1)The Fund’s shareholders indirectly bear the expenses of the Investor Class shares of the Select Funds in which the Fund invests. Current information regarding the Fund’s Operating Expenses can be found in the Financial Highlights.
The performance data quoted represents past performance and does not guarantee future results. Current performance may be lower or higher. Performance data current to the most recent month-end may be obtained at www.GuideStoneFunds.org. The investment return and principal value of an investment will fluctuate so that shares, when redeemed, may be worth more or less than their original cost.
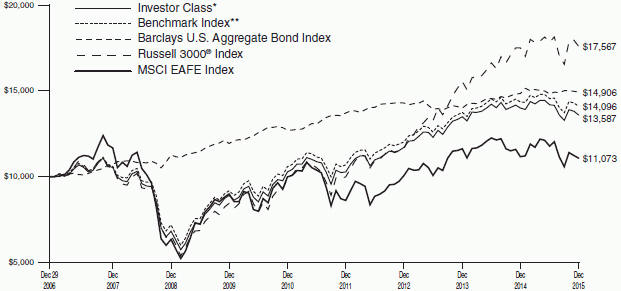
The graph illustrates the results of a hypothetical $10,000 investment in the Investor Class of the Fund since December 29, 2006 (commencement of operations), with all dividends and capital gains reinvested, with the Fund’s composite benchmark index.
*These returns reflect expense waivers by the Fund’s investment adviser. Without these waivers, returns would have been lower. Returns shown do not reflect the deduction of taxes that a shareholder would pay on Fund distributions or the redemption of Fund shares.
**Represents a composite index as of December 2015, consisting of 6.00% of the Bank of America Merrill Lynch 1-3 Year Treasury Index, 9.60% of the Barclays U.S. Aggregate Bond Index, 1.20% of the Barclays U.S. Long-Term Government Bond Index, 1.20% of the Barclays U.S. Long-Term Credit Bond Index, 3.00% of the Barclays Global Aggregate Bond Index -Unhedged, 1.50% of the Barclays U.S. Corporate High Yield - 2% Issuer Capped Index, 1.50% of the J.P. Morgan Emerging Markets Bond Index Plus, 4.00% of the Barclays U.S. TIPS Index, 25.80% of the S&P 500® Index, 1.50% of the S&P/LSTA U.S. B- Ratings and Above Loan Index, 2.75% of the FTSE EPRA/NAREIT Developed Index, 8.29% of the Russell 1000® Value Index, 8.29% of the Russell 1000® Growth Index, 3.47% of the Russell 2000® Index, 3.00% of the MSCI World Commodity Producers Index, 14.93% of the MSCI EAFE Index and 3.97% of the MSCI EM Index.
The construction of the composite index corresponds to the target percentage allocations to the underlying asset classes as represented by the Fund’s investment in the Select Funds. As the target percentage allocations to the underlying investments change according to the MyDestination Funds® glide path, the target percentage allocations to the composite index also change.
Unlike a mutual fund, the performance of an index assumes no taxes, transaction costs, management fees or other expenses.
27
Table of Contents
| MYDESTINATION 2025 FUND | ||||
| SCHEDULE OF INVESTMENTS | December 31, 2015 |
| Shares | Value | |||||||||||
MUTUAL FUNDS — 100.0% | ||||||||||||
GuideStone Money Market Fund | 11,309,093 | $ | 11,309,093 | |||||||||
GuideStone Low-Duration Bond Fund | 5,743,394 | 48,072,204 | ||||||||||
GuideStone Medium-Duration Bond Fund | 10,449,132 | 69,486,725 | ||||||||||
GuideStone Extended-Duration Bond Fund | 4,587,321 | 17,431,820 | ||||||||||
GuideStone Global Bond Fund | 4,246,740 | 38,560,397 | ||||||||||
GuideStone Defensive Market Strategies Fund | 11,015,762 | 123,486,696 | ||||||||||
GuideStone Equity Index Fund | 6,430,088 | 55,427,358 | ||||||||||
GuideStone Value Equity Fund | 7,341,375 | 55,427,379 | ||||||||||
GuideStone Growth Equity Fund | 5,864,179 | 55,885,629 | ||||||||||
GuideStone Small Cap Equity Fund | 3,024,170 | 22,620,789 | ||||||||||
GuideStone International Equity Index Fund | 3,730,662 | 33,352,119 | ||||||||||
| Shares | Value | |||||||||||
GuideStone International Equity Fund | 6,857,284 | $ | 66,721,372 | |||||||||
GuideStone Emerging Market Equity Fund | 3,585,405 | 26,316,876 | ||||||||||
GuideStone Inflation Protected Bond Fund | 3,097,117 | 30,909,229 | ||||||||||
GuideStone Flexible Income Fund | 1,458,826 | 13,552,494 | ||||||||||
GuideStone Real Estate Securities Fund | 1,989,749 | 18,823,024 | ||||||||||
GuideStone Global Natural Resources Equity Fund | 3,941,589 | 20,141,519 | ||||||||||
|
| |||||||||||
Total Mutual Funds | 707,524,723 | |||||||||||
|
| |||||||||||
TOTAL INVESTMENTS — 100.0% |
| 707,524,723 | ||||||||||
Other Assets in Excess of Liabilities — 0.0% | 173,366 | |||||||||||
|
| |||||||||||
NET ASSETS — 100.0% | $ | 707,698,089 | ||||||||||
|
| |||||||||||
VALUATION HIERARCHY
The following is a summary of the inputs used, as of December 31, 2015, in valuing the Fund’s investments carried at fair value:
| Total Value | Level 1 Quoted Prices | Level 2 Other Significant Observable Inputs | Level 3 Significant Unobservable Inputs | |||||||||||||||||
Assets: | ||||||||||||||||||||
Investments in Securities: | ||||||||||||||||||||
Mutual Funds | $ | 707,524,723 | $ | 707,524,723 | $ | — | $ | — | ||||||||||||
|
|
|
|
|
|
|
| |||||||||||||
Total Assets - Investments in Securities | $ | 707,524,723 | $ | 707,524,723 | $ | — | $ | — | ||||||||||||
|
|
|
|
|
|
|
| |||||||||||||
Other Financial Instruments*** | ||||||||||||||||||||
Futures Contracts | $ | 18,592 | $ | 18,592 | $ | — | $ | — | ||||||||||||
|
|
|
|
|
|
|
| |||||||||||||
Total Assets - Other Financial Instruments | $ | 18,592 | $ | 18,592 | $ | — | $ | — | ||||||||||||
|
|
|
|
|
|
|
| |||||||||||||
***Other financial instruments are derivative instruments not reflected in the Schedule of Investments, such as futures, forwards and swap contracts, which are valued at the unrealized appreciation (depreciation) on the investment. Details of these investments can be found in the Notes to Financial Statements.
| 28 | See Notes to Financial Statements. |
Table of Contents
MyDestination 2035 Fund (Unaudited)
The Fund, through investments predominantly in the underlying GuideStone Funds Select Funds, combined a high percentage of exposure to equity securities with only modest percentages to fixed income and real assets securities. The Fund followed an allocation glide path designed to become more conservative over time, and the December 31, 2015 targeted allocations were approximately 16.00% Fixed Income Select Funds, 47.00% U.S. Equity Select Funds, 30.00% Non-U.S. Equity Select Funds and 7.00% Real Assets Select Funds.
As a fund of funds, the Fund’s performance was primarily based on the performance of the underlying Select Funds. The Fund generated a return of -4.30% for the one-year period ended December 31, 2015. Contribution to absolute performance from the U.S. Equity Select Funds was roughly flat. The Growth Equity Fund was the largest contributor to absolute performance, which was offset by declines in the Value Equity Fund and the Small Cap Equity Fund. Non-U.S. Equity Select Funds exposure, including both developed and emerging markets, was a primary driver of negative performance and was impacted by slower global growth, a strengthening U.S. dollar and poor performance from commodity sensitive emerging markets. The Fund’s Fixed Income Select Funds allocation detracted from investment returns, with the Global Bond Fund as the largest detractor. Real assets exposure was another significant driver of negative performance, led by the Global Natural Resources Equity Fund and the Credit Suisse Commodity Return Strategy Fund, as each fell significantly for the year. As of December 2015, the Credit Suisse Commodity Return Strategy Fund was no longer held by the Fund.
The Fund underperformed its composite benchmark in 2015 (-4.30% versus -2.63%). The largest detractors to relative underperformance were the Global Bond Fund, Global Natural Resources Equity Fund and Emerging Markets Equity Fund.
Certain derivatives were utilized to provide market exposure for the cash positions held in the Fund. These derivative positions primarily included stock index futures and fixed income futures. Overall, derivative exposure had a slight positive impact on Fund performance for the year.
The Fund attempted to achieve its objective predominantly by investing in the GuideStone Funds Select Funds. The Fund is managed to a retirement date (“target date”) by adjusting the percentage of fixed income securities and equity securities to become more conservative each year until reaching the retirement year and then approximately 12 years thereafter. The target date in the name of the Fund is the approximate date when an investor plans to start withdrawing money. This Fund may be suitable for investors who want a simplified “one fund” retirement solution, are willing to pay slightly higher fees to get a diversified mix of investments that becomes more conservative over time and plan to retire at an age that is near the year 2035. The Fund’s value will fluctuate due to changes in interest rates. There is a risk that the issuer of a fixed income investment may fail to pay interest or even principal due in a timely manner or at all. The Fund’s value will fluctuate due to business developments concerning a particular issuer, industry or country, as well as general market and economic conditions. The Fund is subject to risks presented by investments in foreign issuers, and changes in currency exchange rates relative to the U.S. dollar may negatively affect the values of foreign investments held by the Select Funds. By investing in this Fund, you will incur the expenses of the Fund, in addition to those of the underlying Select Funds. The principal risks of the Fund will change depending on the asset mix of the Select Funds in which it invests. You may directly invest in the Select Funds. The Fund’s value will go up and down in response to changes in the share prices of the investments that it owns. The amount invested in the Fund is not guaranteed to increase, is not guaranteed against loss nor is the amount of the original investment guaranteed at the target date. It is possible to lose money by investing in the Fund.
At December 31, 2015, the portfolio holdings of the Fund, as a percentage of net assets, is shown in the following table. Portfolio holdings are subject to risk and may change at any time.
| % | ||||
|
| |||
U.S. Equity Select Funds | 45.8 | |||
Non-U.S. Equity Select Funds | 29.2 | |||
Fixed Income Select Funds | 18.3 | |||
Real Return Select Funds | 6.6 | |||
|
| |||
| 99.9 | ||||
|
| |||
29
Table of Contents
MyDestination 2035 Fund (Unaudited)
| Average Annual Total Returns as of 12/31/15 | ||||
Investor Class* | Benchmark** | |||
One Year | -4.30% | -2.63% | ||
Five Year | 6.13% | 6.87% | ||
Since Inception | 3.09% | 3.90% | ||
Inception Date | 12/29/06 | |||
Total Fund Operating Expenses (May 1, 2015 Prospectus, as amended on June 1, 2015)(1) | 1.07% | |||
(1)The Fund’s shareholders indirectly bear the expenses of the Investor Class shares of the Select Funds in which the Fund invests. Current information regarding the Fund’s Operating Expenses can be found in the Financial Highlights.
The performance data quoted represents past performance and does not guarantee future results. Current performance may be lower or higher. Performance data current to the most recent month-end may be obtained at www.GuideStoneFunds.org. The investment return and principal value of an investment will fluctuate so that shares, when redeemed, may be worth more or less than their original cost.
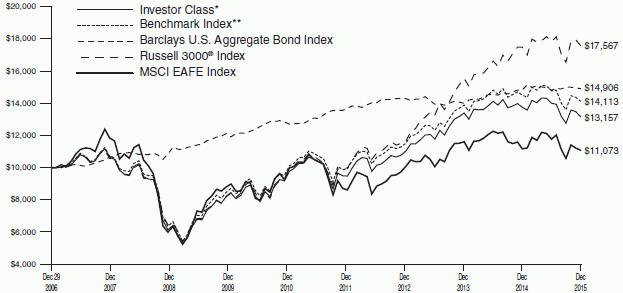
The graph illustrates the results of a hypothetical $10,000 investment in the Investor Class of the Fund since December 29, 2006 (commencement of operations), with all dividends and capital gains reinvested, with the Fund’s composite benchmark index.
*These returns reflect expense waivers by the Fund’s investment adviser. Without these waivers, returns would have been lower. Returns shown do not reflect the deduction of taxes that a shareholder would pay on Fund distributions or the redemption of Fund shares.
**Represents a composite index as of December 2015, consisting of 0.75% of the Bank of America Merrill Lynch 1-3 Year Index, 5.00% of the Barclays U.S. Aggregate Bond Index, 0.50% of the Barclays U.S. Long-Term Government Bond Index, 0.50% of the Barclays U.S. Long-Term Credit Bond Index, 4.25% of the Barclays Global Aggregate Bond Index - Unhedged, 2.13% of the Barclays U.S. Corporate High Yield - 2% Issuer Capped Index, 2.13% of the J.P. Morgan Emerging Markets Bond Index Plus, 3.33% of the FTSE EPRA/NAREIT Developed Index, 14.62% of the S&P 500® Index, 13.12% of the Russell 1000® Value Index, 13.12% of the Russell 1000® Growth Index, 6.58% of the Russell 2000® Index, 3.34% of the MSCI World Commodity Producers Index, 24.20% of the MSCI EAFE Index and 6.43% of the MSCI EM Index.
The construction of the composite index corresponds to the target percentage allocations to the underlying asset classes as represented by the Fund’s investment in the Select Funds. As the target percentage allocations to the underlying investments change according to the MyDestination Funds® glide path, the target percentage allocations to the composite index also change.
Unlike a mutual fund, the performance of an index assumes no taxes, transaction costs, management fees or other expenses.
30
Table of Contents
| MYDESTINATION 2035 FUND | ||||
| SCHEDULE OF INVESTMENTS | December 31, 2015 |
| Shares | Value | |||||||||||
MUTUAL FUNDS — 99.9% |
| |||||||||||
GuideStone Money | 8,731,577 | $ | 8,731,577 | |||||||||
GuideStone Low-Duration | 452,836 | 3,790,237 | ||||||||||
GuideStone Medium-Duration Bond Fund | 3,435,233 | 22,844,297 | ||||||||||
GuideStone Extended-Duration Bond Fund | 1,003,318 | 3,812,608 | ||||||||||
GuideStone Global Bond Fund | 3,581,513 | 32,520,137 | ||||||||||
GuideStone Defensive Market Strategies Fund | 672,689 | 7,540,848 | ||||||||||
GuideStone Equity Index Fund | 5,694,477 | 49,086,392 | ||||||||||
GuideStone Value Equity Fund | 6,486,516 | 48,973,198 | ||||||||||
GuideStone Growth Equity Fund | 5,154,997 | 49,127,124 | ||||||||||
GuideStone Small Cap Equity Fund | 3,271,144 | 24,468,156 | ||||||||||
| Shares | Value | |||||||||||
GuideStone International Equity Index Fund | 3,370,294 | �� | $ | 30,130,432 | ||||||||
GuideStone International Equity Fund | 6,200,508 | 60,330,943 | ||||||||||
GuideStone Emerging Market Equity Fund | 3,247,058 | 23,833,404 | ||||||||||
GuideStone Real Estate Securities Fund | 1,374,671 | 13,004,386 | ||||||||||
GuideStone Global Natural Resources Equity Fund | 2,508,189 | 12,816,847 | ||||||||||
|
| |||||||||||
Total Mutual Funds | 391,010,586 | |||||||||||
|
| |||||||||||
TOTAL INVESTMENTS — 99.9% |
| 391,010,586 | ||||||||||
Other Assets in Excess of Liabilities — 0.1% | 268,199 | |||||||||||
|
| |||||||||||
NET ASSETS — 100.0% | $ | 391,278,785 | ||||||||||
|
| |||||||||||
VALUATION HIERARCHY
The following is a summary of the inputs used, as of December 31, 2015, in valuing the Fund’s investments carried at fair value:
| Total Value | Level 1 Quoted Prices | Level 2 Other Significant Observable Inputs | Level 3 Significant Unobservable Inputs | |||||||||||||||||
Assets: | ||||||||||||||||||||
Investments in Securities: | ||||||||||||||||||||
Mutual Funds | $ | 391,010,586 | $ | 391,010,586 | $ | — | $ | — | ||||||||||||
|
|
|
|
|
|
|
| |||||||||||||
Total Assets - Investments in Securities | $ | 391,010,586 | $ | 391,010,586 | $ | — | $ | — | ||||||||||||
|
|
|
|
|
|
|
| |||||||||||||
Other Financial Instruments*** | ||||||||||||||||||||
Futures Contracts | $ | 25,682 | $ | 25,682 | $ | — | $ | — | ||||||||||||
|
|
|
|
|
|
|
| |||||||||||||
Total Assets - Other Financial Instruments | $ | 25,682 | $ | 25,682 | $ | — | $ | — | ||||||||||||
|
|
|
|
|
|
|
| |||||||||||||
***Other financial instruments are derivative instruments not reflected in the Schedule of Investments, such as futures, forwards and swap contracts, which are valued at the unrealized appreciation (depreciation) on the investment. Details of these investments can be found in the Notes to Financial Statements.
| See Notes to Financial Statements. | 31 |
Table of Contents
MyDestination 2045 Fund (Unaudited)
The Fund, through investments predominantly in the underlying GuideStone Funds Select Funds, combined a high percentage of exposure to equity securities with only modest percentages allocated to fixed income and real assets securities. The Fund followed an allocation glide path designed to become more conservative over time, and the December 31, 2015 targeted allocations were approximately 7.00% Fixed Income Select Funds, 52.00% U.S. Equity Select Funds, 34.00% Non-U.S. Equity Select Funds and 7.00% Real Assets Select Funds.
As a fund of funds, the Fund’s performance was based primarily on the performance of the underlying Select Funds. The Fund generated a return of -4.46% for the one-year period ended December 31, 2015. Contribution to absolute performance from the U.S. Equity Select Funds was roughly flat. The Growth Equity Fund was the largest contributor to absolute performance, which was offset by declines in the Value Equity Fund and the Small Cap Equity Fund. Non-U.S. Equity Select Funds exposure, including both developed and emerging markets, was a primary driver of negative performance and was impacted by slower global growth, a strengthening U.S. dollar and poor performance from commodity sensitive emerging markets. The Fund’s Fixed Income Select Funds allocation detracted from investment returns, with the Global Bond Fund as the largest detractor. Real assets exposure was another significant driver of negative performance, led by the Global Natural Resources Equity Fund and the Credit Suisse Commodity Return Strategy Fund, as each fell significantly for the year. As of December 2015, the Credit Suisse Commodity Return Strategy Fund was no longer held by the Fund.
The Fund underperformed its composite benchmark in 2015 (-4.46% versus -2.87%). The largest detractors to relative underperformance were the Global Natural Resources Equity Fund, International Equity Fund and Emerging Markets Equity Fund.
Certain derivatives were utilized to provide market exposure for the cash positions held in the Fund. These derivative positions primarily included stock index futures and fixed income futures. Overall, derivative exposure had a slight positive impact on Fund performance for the year.
The Fund attempted to achieve its objective by investing predominantly in the GuideStone Funds Select Funds. The Fund is managed to a retirement date (“target date”) by adjusting the percentage of fixed income securities and equity securities to become more conservative each year until reaching the retirement year and then approximately 12 years thereafter. The target date in the name of the Fund is the approximate date when an investor plans to start withdrawing money. This Fund may be suitable for investors who want a simplified “one fund” retirement solution, are willing to pay slightly higher fees to get a diversified mix of investments that becomes more conservative over time and plan to retire at an age that is near the year 2045. The Fund’s value will fluctuate due to changes in interest rates. There is a risk that the issuer of a fixed income investment may fail to pay interest or even principal due in a timely manner or at all. The Fund’s value will fluctuate due to business developments concerning a particular issuer, industry or country, as well as general market and economic conditions. The Fund is subject to risks presented by investments in foreign issuers, and changes in currency exchange rates relative to the U.S. dollar may negatively affect the values of foreign investments held by the Select Funds. By investing in this Fund, you will incur the expenses of the Fund, in addition to those of the underlying Select Funds. The principal risks of the Fund will change depending on the asset mix of the Select Funds in which it invests. You may directly invest in the Select Funds. The Fund’s value will go up and down in response to changes in the share prices of the investments that it owns. The amount invested in the Fund is not guaranteed to increase, is not guaranteed against loss nor is the amount of the original investment guaranteed at the target date. It is possible to lose money by investing in the Fund.
At December 31, 2015, the portfolio holdings of the Fund, as a percentage of net assets, is shown in the following table. Portfolio holdings are subject to risk and may change at any time.
| % | ||||
|
| |||
U.S. Equity Select Funds | 50.5 | |||
Non-U.S. Equity Select Funds | 33.6 | |||
Fixed Income Select Funds | 9.2 | |||
Real Return Select Funds | 6.6 | |||
|
| |||
| 99.9 | ||||
|
| |||
32
Table of Contents
MyDestination 2045 Fund (Unaudited)
| Average Annual Total Returns as of 12/31/15 | ||||
Investor Class* | Benchmark** | |||
One Year | -4.46% | -2.87% | ||
Five Year | 6.26% | 7.02% | ||
Since Inception | 2.87% | 3.74% | ||
Inception Date | 12/29/06 | |||
Total Fund Operating Expenses (May 1, 2015 Prospectus, as amended on June 1, 2015)(1) | 1.09% | |||
(1)The Fund’s shareholders indirectly bear the expenses of the Investor Class shares of the Select Funds in which the Fund invests. Current information regarding the Fund’s Operating Expenses can be found in the Financial Highlights.
The performance data quoted represents past performance and does not guarantee future results. Current performance may be lower or higher. Performance data current to the most recent month-end may be obtained at www.GuideStoneFunds.org. The investment return and principal value of an investment will fluctuate so that shares, when redeemed, may be worth more or less than their original cost.
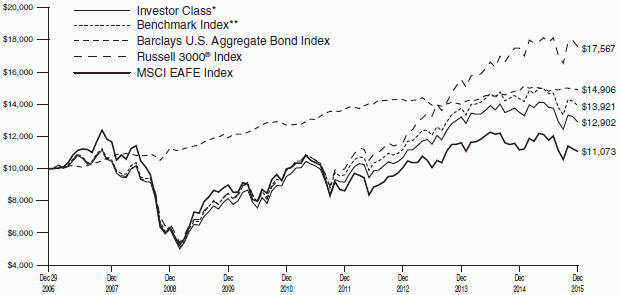
The graph illustrates the results of a hypothetical $10,000 investment in the Investor Class of the Fund since December 29, 2006 (commencement of operations), with all dividends and capital gains reinvested, with the Fund’s composite benchmark index.
*These returns reflect expense waivers by the Fund’s investment adviser. Without these waivers, returns would have been lower. Returns shown do not reflect the deduction of taxes that a shareholder would pay on Fund distributions or the redemption of Fund shares.
**Represents a composite index as of December 2015, consisting of 0.25% of the Barclays U.S. Aggregate Bond Index, 3.12% of the Barclays Global Aggregate Bond Index - Unhedged, 1.56% of the Barclays U.S. Corporate High Yield - 2% Issuer Capped Index, 1.56% of the J.P. Morgan Emerging Markets Bond Index Plus, 3.33% of the FTSE EPRA/NAREIT Developed Index, 14.66% of the S&P 500® Index, 14.66% of the Russell 1000® Value Index, 14.66% of the Russell 1000® Growth Index, 8.13% of the Russell 2000® Index, 3.34% of the MSCI World Commodity Producers Index, 27.44% of the MSCI EAFE Index and 7.29% of the MSCI EM Index.
The construction of the composite index corresponds to the target percentage allocations to the underlying asset classes as represented by the Fund’s investment in the Select Funds. As the target percentage allocations to the underlying investments change according to the MyDestination Funds® glide path, the target percentage allocations to the composite index also change.
Unlike a mutual fund, the performance of an index assumes no taxes, transaction costs, management fees or other expenses.
33
Table of Contents
MYDESTINATION 2045 FUND SCHEDULE OF INVESTMENTS | December 31, 2015 |
| Shares | Value | |||||||||||
MUTUAL FUNDS — 99.9% |
| |||||||||||
GuideStone Money | 6,667,359 | $ | 6,667,359 | |||||||||
GuideStone Medium-Duration Bond Fund | 295,721 | 1,966,542 | ||||||||||
GuideStone Global Bond Fund (Institutional Class)¥ | 1,894,933 | 17,205,989 | ||||||||||
GuideStone Equity Index Fund (Institutional Class)¥ | 4,649,495 | 40,078,647 | ||||||||||
GuideStone Value Equity Fund (Institutional Class)¥ | 5,304,292 | 40,047,404 | ||||||||||
GuideStone Growth Equity Fund (Institutional Class)¥ | 4,207,363 | 40,096,168 | ||||||||||
GuideStone Small Cap Equity Fund (Institutional Class)¥ | 2,954,811 | 22,101,990 | ||||||||||
GuideStone International Equity Index Fund (Institutional Class)¥ | 2,798,411 | 25,017,796 | ||||||||||
| Shares | Value | |||||||||||
GuideStone International Equity Fund | 5,137,801 | $ | 49,990,802 | |||||||||
GuideStone Emerging Market Equity Fund | 2,687,586 | 19,726,878 | ||||||||||
GuideStone Real Estate Securities Fund (Institutional Class)¥ | 988,604 | 9,352,191 | ||||||||||
GuideStone Global Natural Resources Equity Fund (Investor Class)¥ | 1,801,642 | 9,206,392 | ||||||||||
|
| |||||||||||
Total Mutual Funds | 281,458,158 | |||||||||||
|
| |||||||||||
TOTAL INVESTMENTS — 99.9% |
| 281,458,158 | ||||||||||
Other Assets in Excess of | 260,267 | |||||||||||
|
| |||||||||||
NET ASSETS — 100.0% | $ | 281,718,425 | ||||||||||
|
| |||||||||||
VALUATION HIERARCHY
The following is a summary of the inputs used, as of December 31, 2015, in valuing the Fund’s investments carried at fair value:
| Total Value | Level 1 Quoted Prices | Level 2 Other Significant Observable Inputs | Level 3 Significant Unobservable Inputs | |||||||||||||||||
Assets: | ||||||||||||||||||||
Investments in Securities: | ||||||||||||||||||||
Mutual Funds | $ | 281,458,158 | $ | 281,458,158 | $ | — | $ | — | ||||||||||||
|
|
|
|
|
|
|
| |||||||||||||
Total Assets - Investments in Securities | $ | 281,458,158 | $ | 281,458,158 | $ | — | $ | — | ||||||||||||
|
|
|
|
|
|
|
| |||||||||||||
Other Financial Instruments*** | ||||||||||||||||||||
Futures Contracts | $ | 21,751 | $ | 21,751 | $ | — | $ | — | ||||||||||||
|
|
|
|
|
|
|
| |||||||||||||
Total Assets - Other Financial Instruments | $ | 21,751 | $ | 21,751 | $ | — | $ | — | ||||||||||||
|
|
|
|
|
|
|
| |||||||||||||
***Other financial instruments are derivative instruments not reflected in the Schedule of Investments, such as futures, forwards and swap contracts, which are valued at the unrealized appreciation (depreciation) on the investment. Details of these investments can be found in the Notes to Financial Statements.
| 34 | See Notes to Financial Statements. |
Table of Contents
MyDestination 2055 Fund (Unaudited)
The Fund, through investments predominantly in the underlying GuideStone Funds Select Funds, combined a high percentage of exposure to equity securities with only modest percentages allocated to fixed income and real assets securities. The Fund followed an allocation glide path designed to become more conservative over time, and the December 31, 2015 targeted allocations were approximately 5.00% Fixed Income Select Funds, 53.00% U.S. Equity Select Funds, 35.00% Non-U.S. Equity Select Funds and 7.00% Real Assets Select Funds.
As a fund of funds, the Fund’s performance was based primarily on the performance of the underlying Select Funds. The Fund generated a return of -4.48% for the one-year period ended December 31, 2015. Contribution to absolute performance from the U.S. Equity Select Funds was roughly flat. The Growth Equity Fund was the largest contributor to absolute performance, which was offset by declines in the Value Equity Fund and the Small Cap Equity Fund. Non-U.S. Equity Select Funds exposure, including both developed and emerging markets, was a primary driver of negative performance and was impacted by slower global growth, a strengthening U.S. dollar and poor performance from commodity sensitive emerging markets. The Fund’s Fixed Income Select Funds allocation detracted from investment returns, with the Global Bond Fund as the largest detractor. Real assets exposure was another significant driver of negative performance, led by the Global Natural Resources Equity Fund and the Credit Suisse Commodity Return Strategy Fund, as each fell significantly for the year. Effective December 2015, the Credit Suisse Commodity Return Strategy Fund was no longer held by the Fund.
The Fund underperformed its composite benchmark in 2015 (-4.48% versus -2.89%). The largest detractors to relative underperformance were the Global Natural Resources Equity Fund, International Equity Fund and Emerging Markets Equity Fund.
Certain derivatives were utilized to provide market exposure for the cash positions held in the Fund. These derivative positions primarily included stock index futures. Overall, derivative exposure had a slight negative impact on Fund performance for the year.
The Fund attempted to achieve its objective by investing predominantly in the GuideStone Funds Select Funds. The Fund is managed to a retirement date (“target date”) by adjusting the percentage of fixed income securities and equity securities to become more conservative each year until reaching the retirement year and then approximately 12 years thereafter. The target date in the name of the Fund is the approximate date when an investor plans to start withdrawing money. This Fund may be suitable for investors who want a simplified “one fund” retirement solution, are willing to pay slightly higher fees to get a diversified mix of investments that becomes more conservative over time and plan to retire at an age that is near the year 2055. The Fund’s value will fluctuate due to changes in interest rates. There is a risk that the issuer of a fixed income investment may fail to pay interest or even principal due in a timely manner or at all. The Fund’s value will fluctuate due to business developments concerning a particular issuer, industry or country, as well as general market and economic conditions. The Fund is subject to risks presented by investments in foreign issuers, and changes in currency exchange rates relative to the U.S. dollar may negatively affect the values of foreign investments held by the Select Funds. By investing in this Fund, you will incur the expenses of the Fund, in addition to those of the underlying Select Funds. The principal risks of the Fund will change depending on the asset mix of the Select Funds in which it invests. You may directly invest in the Select Funds. The Fund’s value will go up and down in response to changes in the share prices of the investments that it owns. The amount invested in the Fund is not guaranteed to increase, is not guaranteed against loss nor is the amount of the original investment guaranteed at the target date. It is possible to lose money by investing in the Fund.
At December 31, 2015, the portfolio holdings of the Fund, as a percentage of net assets, is shown in the following table. Portfolio holdings are subject to risk and may change at any time.
| % | ||||
U.S. Equity Select Funds | 51.7 | |||
Non-U.S. Equity Select Funds | 34.4 | |||
Fixed Income Select Funds | 7.2 | |||
Real Return Select Funds | 6.5 | |||
|
| |||
| 99.8 | ||||
|
| |||
35
Table of Contents
MyDestination 2055 Fund (Unaudited)
| Average Annual Total Returns as of 12/31/15 | ||||||
Investor Class* | Benchmark** | |||||
One Year | -4.48% | -2.89% | ||||
Since Inception | 8.31% | 9.75% | ||||
Inception Date | 01/01/12 | |||||
Total Fund Operating Expenses (May 1, 2015 Prospectus, as amended on June 1, 2015)(1) | 1.09% | |||||
(1)The Fund’s shareholders indirectly bear the expenses of the Investor Class shares of the Select Funds in which the Fund invests. Current information regarding the Fund’s Operating Expenses can be found in the Financial Highlights.
The performance data quoted represents past performance and does not guarantee future results. Current performance may be lower or higher. Performance data current to the most recent month-end may be obtained at www.GuideStoneFunds.org. The investment return and principal value of an investment will fluctuate so that shares, when redeemed, may be worth more or less than their original cost.

The graph illustrates the results of a hypothetical $10,000 investment in the Investor Class of the Fund since January 1, 2012 (commencement of operations), with all dividends and capital gains reinvested, with the Fund’s composite benchmark index.
*These returns reflect expense waivers by the Fund’s investment adviser. Without these waivers, returns would have been lower. Returns shown do not reflect the deduction of taxes that a shareholder would pay on Fund distributions or the redemption of Fund shares.
**Represents a composite index as of December 2015 consisting of 2.50% of the Barclays Global Aggregate Bond Index -Unhedged, 1.25% of the Barclays U.S. Corporate High Yield - 2% Issuer Capped Index, 1.25% of the J.P. Morgan Emerging Markets Bond Index Plus, 3.33% of the FTSE EPRA/NAREIT Developed Index, 14.86% S&P 500® Index, 14.86% of the Russell 1000® Value Index, 14.86% of the Russell 1000® Growth Index, 8.42% of the Russell 2000® Index, 3.34% of the MSCI World Commodity Producers Index, 27.91% of the MSCI EAFE Index and 7.42% of the MSCI EM Index.
The construction of the composite index corresponds to the target percentage allocations to the underlying asset classes as represented by the Fund’s investment in the Select Funds. As the target percentage allocations to the underlying investments change according to the MyDestination Funds® glide path, the target percentage allocations to the composite index also change.
Unlike a mutual fund, the performance of an index assumes no taxes, transaction costs, management fees or other expenses.
36
Table of Contents
MYDESTINATION 2055 FUND SCHEDULE OF INVESTMENTS | December 31, 2015 |
| Shares | Value | |||||||||
MUTUAL FUNDS — 99.8% |
| |||||||||
GuideStone Money Market Fund | 864,216 | $ | 864,216 | |||||||
GuideStone Global Bond Fund | 207,718 | 1,886,080 | ||||||||
GuideStone Equity Index Fund | 647,120 | 5,578,177 | ||||||||
GuideStone Value Equity Fund | 738,207 | 5,573,463 | ||||||||
GuideStone Growth Equity Fund | 584,985 | 5,574,906 | ||||||||
GuideStone Small Cap Equity Fund | 420,926 | 3,148,528 | ||||||||
GuideStone International Equity Index Fund | 390,750 | 3,493,301 | ||||||||
GuideStone International Equity Fund | 718,351 | 6,989,558 | ||||||||
| Shares | Value | |||||||||
GuideStone Emerging Market Equity Fund | 376,580 | $ | 2,764,097 | |||||||
GuideStone Real Estate Securities Fund | 132,497 | 1,253,420 | ||||||||
GuideStone Global Natural Resources Equity Fund (Investor Class)¥ | 244,059 | 1,247,143 | ||||||||
|
| |||||||||
Total Mutual Funds | 38,372,889 | |||||||||
|
| |||||||||
TOTAL INVESTMENTS — 99.8% |
| 38,372,889 | ||||||||
Other Assets in Excess of | 92,422 | |||||||||
|
| |||||||||
NET ASSETS — 100.0% | $ | 38,465,311 | ||||||||
|
| |||||||||
VALUATION HIERARCHY
The following is a summary of the inputs used, as of December 31, 2015, in valuing the Fund’s investments carried at fair value:
| Total Value | Level 1 Quoted Prices | Level 2 Other Significant Observable Inputs | Level 3 Significant Unobservable Inputs | |||||||||||||||||
Assets: | ||||||||||||||||||||
Investments in Securities: | ||||||||||||||||||||
Mutual Funds | $ | 38,372,889 | $ | 38,372,889 | $ | — | $ | — | ||||||||||||
|
|
|
|
|
|
|
| |||||||||||||
Total Assets - Investments in Securities | $ | 38,372,889 | $ | 38,372,889 | $ | — | $ | — | ||||||||||||
|
|
|
|
|
|
|
| |||||||||||||
Liabilities: | ||||||||||||||||||||
Other Financial Instruments*** | ||||||||||||||||||||
Futures Contracts | $ | (3,520 | ) | $ | (3,520 | ) | $ | — | $ | — | ||||||||||
|
|
|
|
|
|
|
| |||||||||||||
Total Liabilities - Other Financial Instruments | $ | (3,520 | ) | $ | (3,520 | ) | $ | — | $ | — | ||||||||||
|
|
|
|
|
|
|
| |||||||||||||
***Other financial instruments are derivative instruments not reflected in the Schedule of Investments, such as futures, forwards and swap contracts, which are valued at the unrealized appreciation (depreciation) on the investment. Details of these investments can be found in the Notes to Financial Statements.
| See Notes to Financial Statements. | 37 |
Table of Contents
| MyDestination 2005 Fund | MyDestination 2015 Fund | |||||||
Assets | ||||||||
Investments in securities of affiliated issuers, at value (1) | $ | 96,031,953 | $ | 479,463,808 | ||||
Cash collateral for derivatives | 77,200 | 254,000 | ||||||
Receivables: | ||||||||
Dividends | 200 | 801 | ||||||
Receivable from advisor | 4,469 | — | ||||||
Fund shares sold | 32,745 | 112,564 | ||||||
Variation margin on financial futures contracts | 1,266 | 5,344 | ||||||
Prepaid expenses and other assets | 8,113 | 9,601 | ||||||
|
|
|
| |||||
Total Assets | 96,155,946 | 479,846,118 | ||||||
|
|
|
| |||||
Liabilities | ||||||||
Payables: | ||||||||
Fund shares redeemed | 4,823 | 121,996 | ||||||
Variation margin on financial futures contracts | 6,720 | 42,565 | ||||||
Accrued expenses: | ||||||||
Investment advisory fees | — | 21,544 | ||||||
Shareholder servicing fees | 20,328 | 100,506 | ||||||
Other expenses | 31,788 | 47,197 | ||||||
|
|
|
| |||||
Total Liabilities | 63,659 | 333,808 | ||||||
|
|
|
| |||||
Net Assets | $ | 96,092,287 | $ | 479,512,310 | ||||
|
|
|
| |||||
Net Assets Consist of: | ||||||||
Paid-in-capital | $ | 101,567,591 | $ | 515,654,755 | ||||
Undistributed net realized gain on investments and derivative transactions | 494,375 | 7,898,802 | ||||||
Net unrealized appreciation (depreciation) on investments and derivative transactions | (5,969,679 | ) | (44,041,247 | ) | ||||
|
|
|
| |||||
Net Assets | $ | 96,092,287 | $ | 479,512,310 | ||||
|
|
|
| |||||
Net Asset Value: | ||||||||
$0.001 par value, unlimited shares authorized | ||||||||
Net assets applicable to the Investor Class | $ | 96,092,287 | $ | 479,512,310 | ||||
|
|
|
| |||||
Investor shares outstanding | 9,896,246 | 52,187,338 | ||||||
|
|
|
| |||||
Net asset value, offering and redemption price per Investor share | $ | 9.71 | $ | 9.19 | ||||
|
|
|
| |||||
(1) Investments in securities of affiliated issuers, at cost | $ | 101,995,130 | $ | 523,514,667 | ||||
|
|
|
|
| 38 | See Notes to Financial Statements. |
Table of Contents
MyDestination 2025 Fund | MyDestination 2035 Fund | MyDestination 2045 Fund | MyDestination 2055 Fund | |||||||||||
| $ | 707,524,723 | $ | 391,010,586 | $ | 281,458,158 | $ | 38,372,889 | |||||||
| 359,000 | 382,900 | 275,500 | 51,000 | |||||||||||
| 1,359 | 921 | 685 | 99 | |||||||||||
| — | — | — | 7,861 | |||||||||||
| 155,838 | 92,525 | 156,715 | 72,385 | |||||||||||
| 6,531 | 2,969 | 594 | — | |||||||||||
| 8,617 | 7,599 | 7,792 | 6,774 | |||||||||||
|
|
|
|
|
|
|
| |||||||
| 708,056,068 | 391,497,500 | 281,899,444 | 38,511,008 | |||||||||||
|
|
|
|
|
|
|
| |||||||
| 43,047 | 7,382 | 12,795 | — | |||||||||||
| 74,580 | 70,110 | 61,105 | 6,720 | |||||||||||
| 36,561 | 15,329 | 7,555 | — | |||||||||||
| 148,191 | 81,633 | 58,655 | 7,933 | |||||||||||
| 55,600 | 44,261 | 40,909 | 31,044 | |||||||||||
|
|
|
|
|
|
|
| |||||||
| 357,979 | 218,715 | 181,019 | 45,697 | |||||||||||
|
|
|
|
|
|
|
| |||||||
| $ | 707,698,089 | $ | 391,278,785 | $ | 281,718,425 | $ | 38,465,311 | |||||||
|
|
|
|
|
|
|
| |||||||
| $ | 772,842,442 | $ | 436,475,300 | $ | 315,732,563 | $ | 42,558,812 | |||||||
| 15,546,906 | 12,909,597 | 10,745,451 | 1,417,893 | |||||||||||
| (80,691,259 | ) | (58,106,112 | ) | (44,759,589 | ) | (5,511,394 | ) | |||||||
|
|
|
|
|
|
|
| |||||||
| $ | 707,698,089 | $ | 391,278,785 | $ | 281,718,425 | $ | 38,465,311 | |||||||
|
|
|
|
|
|
|
| |||||||
| $ | 707,698,089 | $ | 391,278,785 | $ | 281,718,425 | $ | 38,465,311 | |||||||
|
|
|
|
|
|
|
| |||||||
| 79,738,336 | 46,791,775 | 35,445,200 | 3,481,891 | |||||||||||
|
|
|
|
|
|
|
| |||||||
| $ | 8.88 | $ | 8.36 | $ | 7.95 | $ | 11.05 | |||||||
|
|
|
|
|
|
|
| |||||||
| $ | 788,234,574 | $ | 449,142,380 | $ | 326,239,498 | $ | 43,880,763 | |||||||
|
|
|
|
|
|
|
| |||||||
| See Notes to Financial Statements. | 39 |
Table of Contents
STATEMENTS OF OPERATIONS | For the Year Ended December 31, 2015 |
| MyDestination 2005 Fund | MyDestination 2015 Fund | |||||||
Investment Income | ||||||||
Income distributions received from affiliated funds | $ | 1,438,257 | $ | 8,228,262 | ||||
|
|
|
| |||||
Total Investment Income | 1,438,257 | 8,228,262 | ||||||
|
|
|
| |||||
Expenses | ||||||||
Investment advisory fees | 97,549 | 493,383 | ||||||
Transfer agent fees: | ||||||||
Investor Shares | 21,198 | 27,760 | ||||||
Custodian fees | 9,031 | 21,378 | ||||||
Shareholder servicing fees: | ||||||||
Investor Shares | 160,751 | 812,776 | ||||||
Accounting and administration fees | 8,200 | 28,794 | ||||||
Professional fees | 56,523 | 56,523 | ||||||
Blue sky fees: | ||||||||
Investor Shares | 20,359 | 22,728 | ||||||
Shareholder reporting fees: | ||||||||
Investor Shares | 7,789 | 20,930 | ||||||
Trustee expenses | 1,293 | 6,567 | ||||||
Line of credit facility fees | 645 | 3,260 | ||||||
Other expenses | 11,714 | 13,897 | ||||||
|
|
|
| |||||
Total Expenses | 395,052 | 1,507,996 | ||||||
Expenses waived/reimbursed net of amount recaptured(1) | (107,461 | ) | (147,750 | ) | ||||
|
|
|
| |||||
Net Expenses | 287,591 | 1,360,246 | ||||||
|
|
|
| |||||
Net investment income | 1,150,666 | 6,868,016 | ||||||
|
|
|
| |||||
Realized and Unrealized Gain (Loss) | ||||||||
Capital gain distributions received from affiliated funds | 1,920,525 | 16,199,580 | ||||||
Net realized gain on investment securities of unaffiliated issuers | 2,947,805 | 44,431,532 | ||||||
Net realized gain (loss) on futures transactions | 6,564 | 50,011 | ||||||
|
|
|
| |||||
Net realized gain | 4,874,894 | 60,681,123 | ||||||
|
|
|
| |||||
Change in unrealized appreciation (depreciation) on investment securities of affiliated issuers | (7,924,498 | ) | (79,964,999 | ) | ||||
Change in unrealized appreciation (depreciation) on investment securities of unaffiliated issuers | 322,156 | 1,858,760 | ||||||
Change in unrealized appreciation (depreciation) on futures | (13,605 | ) | (4,222 | ) | ||||
|
|
|
| |||||
Net change in unrealized appreciation (depreciation) | (7,615,947 | ) | (78,110,461 | ) | ||||
|
|
|
| |||||
Net Realized and Unrealized (Loss) | (2,741,053 | ) | (17,429,338 | ) | ||||
|
|
|
| |||||
Net Decrease in Net Assets Resulting from Operations | $ | (1,590,387 | ) | $ | (10,561,322 | ) | ||
|
|
|
| |||||
| (1) | See Note 3a and 3c in Notes to Financial Statements. |
| 40 | See Notes to Financial Statements. |
Table of Contents
MyDestination | MyDestination 2035 Fund | MyDestination 2045 Fund | MyDestination 2055 Fund | |||||||||||
| $12,051,555 | $ | 6,455,615 | $ | 4,148,429 | $ | 523,659 | ||||||||
|
|
|
|
|
|
|
| |||||||
| 12,051,555 | 6,455,615 | 4,148,429 | 523,659 | |||||||||||
|
|
|
|
|
|
|
| |||||||
| 703,317 | 390,051 | 279,588 | 33,594 | |||||||||||
| 31,494 | 24,760 | 23,812 | 18,793 | |||||||||||
| 26,983 | 21,762 | 19,257 | 9,704 | |||||||||||
| 1,170,584 | 647,801 | 466,124 | 57,230 | |||||||||||
| 39,521 | 23,257 | 17,493 | 3,993 | |||||||||||
| 56,523 | 56,523 | 56,523 | 56,522 | |||||||||||
| 22,156 | 22,242 | 19,323 | 15,783 | |||||||||||
| 28,775 | 15,143 | 13,088 | 3,909 | |||||||||||
| 9,384 | 5,191 | 3,702 | 446 | |||||||||||
| 4,667 | 2,572 | 1,835 | 223 | |||||||||||
| 17,138 | 14,221 | 15,063 | 12,095 | |||||||||||
|
|
|
|
|
|
|
| |||||||
| 2,110,542 | 1,223,523 | 915,808 | 212,292 | |||||||||||
| (177,230) | (137,689 | ) | (112,959 | ) | (112,342 | ) | ||||||||
|
|
|
|
|
|
|
| |||||||
| 1,933,312 | 1,085,834 | 802,849 | 99,950 | |||||||||||
|
|
|
|
|
|
|
| |||||||
| 10,118,243 | 5,369,781 | 3,345,580 | 423,709 | |||||||||||
|
|
|
|
|
|
|
| |||||||
| 31,542,455 | 22,772,307 | 18,131,001 | 2,434,268 | |||||||||||
| 65,156,458 | 40,925,129 | 29,820,001 | 669,372 | |||||||||||
| (180,078) | (55,441 | ) | (54,616 | ) | 8,860 | |||||||||
|
|
|
|
|
|
|
| |||||||
| 96,518,835 | 63,641,995 | 47,896,386 | 3,112,500 | |||||||||||
|
|
|
|
|
|
|
| |||||||
| (132,046,160) | (88,538,785 | ) | (66,239,730 | ) | (5,366,995 | ) | ||||||||
| 3,527,865 | 2,127,435 | 1,574,746 | 165,720 | |||||||||||
| (20,110) | 5,082 | (8,605 | ) | (10,622 | ) | |||||||||
|
|
|
|
|
|
|
| |||||||
| (128,538,405) | (86,406,268 | ) | (64,673,589 | ) | (5,211,897 | ) | ||||||||
|
|
|
|
|
|
|
| |||||||
| (32,019,570) | (22,764,273 | ) | (16,777,203 | ) | (2,099,397 | ) | ||||||||
|
|
|
|
|
|
|
| |||||||
| $(21,901,327) | $ | (17,394,492 | ) | $ | (13,431,623 | ) | $ | (1,675,688 | ) | |||||
|
|
|
|
|
|
|
| |||||||
| See Notes to Financial Statements. | 41 |
Table of Contents
STATEMENTS OF CHANGES IN NET ASSETS
| MyDestination 2005 Fund | MyDestination 2015 Fund | |||||||||||||||
| For the Year Ended | For the Year Ended | |||||||||||||||
| 12/31/15 | 12/31/14 | 12/31/15 | 12/31/14 | |||||||||||||
Operations: | ||||||||||||||||
Net investment income | $ | 1,150,666 | $ | 1,092,696 | $ | 6,868,016 | $ | 6,032,526 | ||||||||
Net realized gain on investment securities and futures transactions | 4,874,894 | 2,918,216 | 60,681,123 | 20,072,402 | ||||||||||||
Net change in unrealized appreciation (depreciation) on investment securities and futures | (7,615,947 | ) | (1,743,938 | ) | (78,110,461 | ) | (8,404,973 | ) | ||||||||
|
|
|
|
|
|
|
| |||||||||
Net increase (decrease) in net assets resulting from operations | (1,590,387 | ) | 2,266,974 | (10,561,322 | ) | 17,699,955 | ||||||||||
|
|
|
|
|
|
|
| |||||||||
Dividends and Distributions to Shareholders: | ||||||||||||||||
Dividends from net investment income(1) | (1,152,425 | ) | (1,608,633 | ) | (6,878,105 | ) | (9,591,134 | ) | ||||||||
Distributions from net realized capital gains | (4,969,548 | ) | (2,064,197 | ) | (57,954,824 | ) | (14,318,200 | ) | ||||||||
|
|
|
|
|
|
|
| |||||||||
Total dividends and distributions | (6,121,973 | ) | (3,672,830 | ) | (64,832,929 | ) | (23,909,334 | ) | ||||||||
|
|
|
|
|
|
|
| |||||||||
Capital Share Transactions: | ||||||||||||||||
Proceeds from Investor shares sold | 27,506,031 | 26,180,994 | 73,578,395 | 76,410,888 | ||||||||||||
Reinvestment of dividends and distributions into Investor shares | 6,121,233 | 3,672,256 | 64,831,368 | 23,902,599 | ||||||||||||
|
|
|
|
|
|
|
| |||||||||
Total proceeds from shares sold and reinvested | 33,627,264 | 29,853,250 | 138,409,763 | 100,313,487 | ||||||||||||
|
|
|
|
|
|
|
| |||||||||
Value of Investor shares redeemed | (22,044,249 | ) | (21,042,438 | ) | (63,828,211 | ) | (54,260,161 | ) | ||||||||
|
|
|
|
|
|
|
| |||||||||
Net increase from capital share transactions(2) | 11,583,015 | 8,810,812 | 74,581,552 | 46,053,326 | ||||||||||||
|
|
|
|
|
|
|
| |||||||||
Total increase (decrease) in net assets | 3,870,655 | 7,404,956 | (812,699 | ) | 39,843,947 | |||||||||||
|
|
|
|
|
|
|
| |||||||||
Net Assets: | ||||||||||||||||
Beginning of Year | 92,221,632 | 84,816,676 | 480,325,009 | 440,481,062 | ||||||||||||
|
|
|
|
|
|
|
| |||||||||
End of Year* | $ | 96,092,287 | $ | 92,221,632 | $ | 479,512,310 | $ | 480,325,009 | ||||||||
|
|
|
|
|
|
|
| |||||||||
*Including undistributed net investment income | $ | — | $ | 2,654 | $ | — | $ | 11,815 | ||||||||
|
|
|
|
|
|
|
| |||||||||
| (1) | For the year ended December 31, 2014, Dividends from net investment income included dividends paid from the short-term portion of capital gain distributions received from affiliated funds. From December 31, 2015 forward, the short-term portion of capital gain distributions received from affiliated funds will be included in Distributions from net realized capital gains. |
| (2) | See Note 6 in Notes to Financial Statements. |
| 42 | See Notes to Financial Statements. |
Table of Contents
| MyDestination 2025 Fund | MyDestination 2035 Fund | MyDestination 2045 Fund | MyDestination 2055 Fund | |||||||||||||||||||||||||||
| For the Year Ended | For the Year Ended | For the Year Ended | For the Year Ended | |||||||||||||||||||||||||||
| 12/31/15 | 12/31/14 | 12/31/15 | 12/31/14 | 12/31/15 | 12/31/14 | 12/31/15 | 12/31/14 | |||||||||||||||||||||||
| $ | 10,118,243 | $ | 7,464,341 | $ | 5,369,781 | $ | 3,629,051 | $ | 3,345,580 | $ | 2,162,583 | $ | 423,709 | $ | 222,143 | |||||||||||||||
| | 96,518,835 | | 28,234,518 | 63,641,995 | 17,055,415 | 47,896,386 | 13,695,781 | 3,112,500 | 1,485,993 | |||||||||||||||||||||
| | (128,538,405 | ) | (13,801,389 | ) | (86,406,268 | ) | (12,766,541 | ) | (64,673,589 | ) | (11,093,247 | ) | (5,211,897 | ) | (1,347,538 | ) | ||||||||||||||
|
|
|
|
|
|
|
|
|
|
|
|
|
|
|
| |||||||||||||||
| (21,901,327 | ) | 21,897,470 | (17,394,492 | ) | 7,917,925 | (13,431,623 | ) | 4,765,117 | (1,675,688 | ) | 360,598 | |||||||||||||||||||
|
|
|
|
|
|
|
|
|
|
|
|
|
|
|
| |||||||||||||||
| (10,113,645 | ) | (13,308,504 | ) | (5,368,991 | ) | (6,498,605 | ) | (3,351,321 | ) | (4,349,803 | ) | (425,054 | ) | (460,778 | ) | |||||||||||||||
| (91,105,779 | ) | (19,891,012 | ) | (59,976,161 | ) | (12,938,463 | ) | (43,705,295 | ) | (10,268,393 | ) | (2,675,837 | ) | (894,166 | ) | |||||||||||||||
|
|
|
|
|
|
|
|
|
|
|
|
|
|
|
| |||||||||||||||
| (101,219,424 | ) | (33,199,516 | ) | (65,345,152 | ) | (19,437,068 | ) | (47,056,616 | ) | (14,618,196 | ) | (3,100,891 | ) | (1,354,944 | ) | |||||||||||||||
|
|
|
|
|
|
|
|
|
|
|
|
|
|
|
| |||||||||||||||
| 107,980,511 | 117,034,212 | 67,002,823 | 69,056,168 | 49,939,603 | 45,733,966 | 18,058,275 | �� | 14,017,411 | ||||||||||||||||||||||
| 101,215,951 | 33,198,784 | 65,345,152 | 19,437,068 | 47,056,616 | 14,618,196 | 3,100,891 | 1,354,944 | |||||||||||||||||||||||
|
|
|
|
|
|
|
|
|
|
|
|
|
|
|
| |||||||||||||||
| 209,196,462 | 150,232,996 | 132,347,975 | 88,493,236 | 96,996,219 | 60,352,162 | 21,159,166 | 15,372,355 | |||||||||||||||||||||||
|
|
|
|
|
|
|
|
|
|
|
|
|
|
|
| |||||||||||||||
| (37,073,023 | ) | (25,887,589 | ) | (17,141,728 | ) | (10,035,436 | ) | (8,184,280 | ) | (9,205,978 | ) | (5,729,952 | ) | (2,947,845 | ) | |||||||||||||||
|
|
|
|
|
|
|
|
|
|
|
|
|
|
|
| |||||||||||||||
| 172,123,439 | 124,345,407 | 115,206,247 | 78,457,800 | 88,811,939 | 51,146,184 | 15,429,214 | 12,424,510 | |||||||||||||||||||||||
|
|
|
|
|
|
|
|
|
|
|
|
|
|
|
| |||||||||||||||
| 49,002,688 | 113,043,361 | 32,466,603 | 66,938,657 | 28,323,700 | 41,293,105 | 10,652,635 | 11,430,164 | |||||||||||||||||||||||
|
|
|
|
|
|
|
|
|
|
|
|
|
|
|
| |||||||||||||||
| 658,695,401 | 545,652,040 | 358,812,182 | 291,873,525 | 253,394,725 | 212,101,620 | 27,812,676 | 16,382,512 | |||||||||||||||||||||||
|
|
|
|
|
|
|
|
|
|
|
|
|
|
|
| |||||||||||||||
| $ | 707,698,089 | $ | 658,695,401 | $ | 391,278,785 | $ | 358,812,182 | $ | 281,718,425 | $ | 253,394,725 | $ | 38,465,311 | $ | 27,812,676 | |||||||||||||||
|
|
|
|
|
|
|
|
|
|
|
|
|
|
|
| |||||||||||||||
| $ | — | $ | — | $ | — | $ | — | $ | — | $ | 7,410 | $ | — | $ | 1,069 | |||||||||||||||
|
|
|
|
|
|
|
|
|
|
|
|
|
|
|
| |||||||||||||||
| See Notes to Financial Statements. | 43 |
Table of Contents
FINANCIAL HIGHLIGHTS
| For a Share Outstanding For the Years Ending December 31, unless otherwise indicated | Ratios to Average Net Assets | |||||||||||||||||||||||||||||||||||||||||||||||||||
| Net Asset Value, Beginning of Year | Net Investment Income (1) | Capital Gain Distributions Received from Affiliated Funds | Realized (Loss) on | Dividends from Net Investment Income | Distributions from Net Realized Capital Gains | Net Asset Value, End of Year | Total Return | Net Assets, End of Year (000) | Expenses, Net(2)(3) | Expenses, Gross(2)(4) | Investment Income, Net (1)(3) | Portfolio Turnover Rate (5) | ||||||||||||||||||||||||||||||||||||||||
MyDestination 2005 Fund
|
| |||||||||||||||||||||||||||||||||||||||||||||||||||
Investor Class |
| |||||||||||||||||||||||||||||||||||||||||||||||||||
| 2015 | $ 10.54 | $0.13 | # | $0.21 | $(0.52 | ) | $(0.11 | ) | $ (0.54 | ) | $9.71 | (1.63 | )% | $96,092 | 0.30 | % | 0.41 | % | 1.20 | % | 110 | % | ||||||||||||||||||||||||||||||
| 2014 | 10.70 | 0.13 | # | 0.21 | (0.06 | ) | (0.19 | ) | (0.25 | ) | 10.54 | 2.54 | 92,222 | 0.20 | 0.24 | 1.22 | 9 | |||||||||||||||||||||||||||||||||||
| 2013 | 10.25 | 0.09 | # | 0.25 | 0.29 | (0.18 | ) | — | 10.70 | 6.18 | 84,817 | 0.20 | 0.25 | 0.87 | 27 | |||||||||||||||||||||||||||||||||||||
| 2012 | 9.60 | 0.13 | # | 0.18 | 0.55 | (0.21 | ) | — | 10.25 | 8.92 | 80,582 | 0.20 | 0.27 | 1.24 | 8 | |||||||||||||||||||||||||||||||||||||
| 2011 | 9.53 | 0.14 | # | 0.05 | 0.05 | (0.17 | ) | — | 9.60 | 2.52 | 64,608 | 0.20 | 0.35 | 1.43 | 31 | |||||||||||||||||||||||||||||||||||||
MyDestination 2015 Fund
|
| |||||||||||||||||||||||||||||||||||||||||||||||||||
Investor Class |
| |||||||||||||||||||||||||||||||||||||||||||||||||||
| 2015 | $ 10.84 | $0.15 | # | $0.36 | $(0.74 | ) | $(0.14 | ) | $ (1.28 | ) | $9.19 | (2.06 | )% | $479,512 | 0.28 | % | 0.31 | % | 1.41 | % | 108 | % | ||||||||||||||||||||||||||||||
| 2014 | 10.97 | 0.15 | # | 0.35 | (0.07 | ) | (0.22 | ) | (0.34 | ) | 10.84 | 3.92 | 480,325 | 0.14 | 0.14 | 1.29 | 6 | |||||||||||||||||||||||||||||||||||
| 2013 | 10.21 | 0.12 | # | 0.44 | 0.49 | (0.28 | ) | (0.01 | ) | 10.97 | 10.35 | 440,481 | 0.14 | 0.14 | 1.10 | 15 | ||||||||||||||||||||||||||||||||||||
| 2012 | 9.37 | 0.15 | # | 0.22 | 0.70 | (0.23 | ) | — | 10.21 | 11.46 | 352,576 | 0.15 | 0.15 | 1.47 | 2 | |||||||||||||||||||||||||||||||||||||
| 2011 | 9.36 | 0.14 | # | 0.05 | (0.02 | ) | (0.16 | ) | — | 9.37 | 1.84 | 274,096 | 0.17 | 0.17 | 1.46 | 33 | ||||||||||||||||||||||||||||||||||||
MyDestination 2025 Fund
|
| |||||||||||||||||||||||||||||||||||||||||||||||||||
Investor Class |
| |||||||||||||||||||||||||||||||||||||||||||||||||||
| 2015 | $ 10.66 | $0.16 | # | $0.49 | $(0.97 | ) | $(0.13 | ) | $ (1.33 | ) | $8.88 | (2.91 | )% | $707,698 | 0.28 | % | 0.31 | % | 1.46 | % | 110 | % | ||||||||||||||||||||||||||||||
| 2014 | 10.80 | 0.14 | # | 0.46 | (0.18 | ) | (0.22 | ) | (0.34 | ) | 10.66 | 3.88 | 658,695 | 0.14 | 0.14 | 1.23 | 3 | |||||||||||||||||||||||||||||||||||
| 2013 | 9.84 | 0.13 | # | 0.57 | 0.78 | (0.27 | ) | (0.25 | ) | 10.80 | 15.15 | 545,652 | 0.14 | 0.14 | 1.19 | 16 | ||||||||||||||||||||||||||||||||||||
| 2012 | 8.81 | 0.14 | # | 0.22 | 0.86 | (0.19 | ) | — | 9.84 | 13.90 | 375,238 | 0.15 | 0.15 | 1.51 | 2 | |||||||||||||||||||||||||||||||||||||
| 2011 | 8.94 | 0.13 | # | 0.03 | (0.16 | ) | (0.13 | ) | — | 8.81 | 0.03 | 278,239 | 0.17 | 0.17 | 1.42 | 24 | ||||||||||||||||||||||||||||||||||||
| # | Calculated using the average shares outstanding method. |
| (1) | Recognition of net investment income by the Fund is affected by the timing of the declaration of dividends by the underlying investment companies in which the Fund invests. |
| (2) | Does not include expenses of the investment companies in which the Fund invests. |
| (3) | The ratio includes expenses waived/reimbursed net of amount recaptured and fees paid indirectly, where applicable; if expenses waived/reimbursed net of amount recaptured and fees paid indirectly were excluded, the ratio would have been higher (lower), respectively, than the ratio shown. |
| (4) | The ratio excludes expenses waived/reimbursed net of amount recaptured and fees paid indirectly, where applicable; if expenses waived/reimbursed net of amount recaptured and fees paid indirectly were included, the ratio would have been lower than the ratio shown. |
| (5) | The portfolio turnover rate for the year ended December 31, 2015 reflects rebalancing of holdings in the Funds and is not representative of a change in investment strategy for the Funds. |
| 44 | See Notes to Financial Statements. |
Table of Contents
| For a Share Outstanding For the Years Ending December 31, unless otherwise indicated | Ratios to Average Net Assets | |||||||||||||||||||||||||||||||||||||||||||||||||||
| Net Asset Value, Beginning of Year | Net Investment Income (1) | Capital Gain tions | Realized (Loss) on | Dividends from Net Investment Income | Distributions from Net Realized Capital Gains | Net Asset | Total Return | Net Assets, End of Year (000) | Expenses, Net(2)(3) | Expenses, Gross(2)(4) | Investment Income, Net (1)(3) | Portfolio Turnover Rate (5) | ||||||||||||||||||||||||||||||||||||||||
MyDestination 2035 Fund
|
| |||||||||||||||||||||||||||||||||||||||||||||||||||
Investor Class |
| |||||||||||||||||||||||||||||||||||||||||||||||||||
| 2015 | $ 10.49 | $0.15 | # | $0.62 | $(1.24 | ) | $(0.12 | ) | $ (1.54 | ) | $8.36 | (4.30 | )% | $391,279 | 0.28 | % | 0.32 | % | 1.41 | % | 120 | % | ||||||||||||||||||||||||||||||
| 2014 | 10.79 | 0.12 | # | 0.51 | (0.34 | ) | (0.19 | ) | (0.40 | ) | 10.49 | 2.70 | 358,812 | 0.15 | 0.15 | 1.10 | 5 | |||||||||||||||||||||||||||||||||||
| 2013 | 9.40 | 0.11 | # | 0.64 | 1.26 | (0.22 | ) | (0.40 | ) | 10.79 | 21.41 | 291,874 | 0.19 | 0.16 | 1.05 | 17 | ||||||||||||||||||||||||||||||||||||
| 2012 | 8.22 | 0.11 | # | 0.21 | 1.02 | (0.11 | ) | (0.05 | ) | 9.40 | 16.30 | 188,242 | 0.20 | 0.18 | 1.23 | 1 | ||||||||||||||||||||||||||||||||||||
| 2011 | 8.62 | 0.10 | # | 0.01 | (0.37 | ) | (0.09 | ) | (0.05 | ) | 8.22 | (2.99 | ) | 131,446 | 0.20 | 0.23 | 1.13 | 10 | ||||||||||||||||||||||||||||||||||
MyDestination 2045 Fund
|
| |||||||||||||||||||||||||||||||||||||||||||||||||||
Investor Class |
| |||||||||||||||||||||||||||||||||||||||||||||||||||
| 2015 | $ 10.00 | $0.12 | # | $0.66 | $(1.25 | ) | $(0.09 | ) | $ (1.49 | ) | $7.95 | (4.46 | )% | $281,718 | 0.29 | % | 0.34 | % | 1.22 | % | 124 | % | ||||||||||||||||||||||||||||||
| 2014 | 10.37 | 0.10 | # | 0.53 | (0.40 | ) | (0.17 | ) | (0.43 | ) | 10.00 | 2.23 | 253,395 | 0.20 | 0.17 | 0.92 | 4 | |||||||||||||||||||||||||||||||||||
| 2013 | 9.14 | 0.10 | # | 0.68 | 1.35 | (0.21 | ) | (0.69 | ) | 10.37 | 23.44 | 212,102 | 0.20 | 0.18 | 0.94 | 18 | ||||||||||||||||||||||||||||||||||||
| 2012 | 7.96 | 0.10 | # | 0.21 | 1.01 | (0.09 | ) | (0.05 | ) | 9.14 | 16.60 | 135,196 | 0.20 | 0.21 | 1.14 | 1 | ||||||||||||||||||||||||||||||||||||
| 2011 | 8.52 | 0.07 | # | — | † | (0.38 | ) | (0.07 | ) | (0.18 | ) | 7.96 | (3.63 | ) | 89,954 | 0.20 | 0.29 | 0.87 | 25 | |||||||||||||||||||||||||||||||||
MyDestination 2055 Fund
|
| |||||||||||||||||||||||||||||||||||||||||||||||||||
Investor Class |
| |||||||||||||||||||||||||||||||||||||||||||||||||||
| 2015 | $ 12.60 | $0.16 | # | $0.93 | $(1.66 | ) | $(0.13 | ) | $ (0.85 | ) | $11.05 | (4.48 | )% | $38,465 | 0.30 | % | 0.65 | % | 1.29 | % | 124 | % | ||||||||||||||||||||||||||||||
| 2014 | 12.95 | 0.14 | # | 0.77 | (0.62 | ) | (0.21 | ) | (0.43 | ) | 12.60 | 2.25 | 27,813 | 0.20 | 0.62 | 1.02 | 5 | |||||||||||||||||||||||||||||||||||
| 2013 | 11.20 | 0.13 | # | 1.02 | 1.47 | (0.26 | ) | (0.61 | ) | 12.95 | 23.44 | 16,383 | 0.20 | 1.01 | 1.05 | 30 | ||||||||||||||||||||||||||||||||||||
| 2012* | 10.00 | 0.13 | # | 0.30 | 0.98 | (0.10 | ) | (0.11 | ) | 11.20 | 14.18 | 6,316 | 0.20 | 2.31 | 1.24 | 18 | ||||||||||||||||||||||||||||||||||||
| † | Amount represents less than $0.005 per share. |
| # | Calculated using the average shares outstanding method. |
| * | Inception date was January 1, 2012. |
| (1) | Recognition of net investment income by the Fund is affected by the timing of the declaration of dividends by the underlying investment companies in which the Fund invests. |
| (2) | Does not include expenses of the investment companies in which the Fund invests. |
| (3) | The ratio includes expenses waived/reimbursed net of amount recaptured and fees paid indirectly, where applicable; if expenses waived/reimbursed net of amount recaptured and fees paid indirectly were excluded, the ratio would have been higher (lower), respectively, than the ratio shown. |
| (4) | The ratio excludes expenses waived/reimbursed net of amount recaptured and fees paid indirectly, where applicable; if expenses waived/reimbursed net of amount recaptured and fees paid indirectly were included, the ratio would have been lower than the ratio shown. |
| (5) | The portfolio turnover rate for the year ended December 31, 2015 reflects rebalancing of holdings in the Funds and is not representative of a change in investment strategy for the Funds. |
| See Notes to Financial Statements. | 45 |
Table of Contents
ASSET ALLOCATION FUNDS (Unaudited)
Contribution to absolute performance from U.S. equities was roughly flat for the Asset Allocation Funds. U.S. equities experienced moderate headwinds, with the broader equity market, as measured by the Russell 3000® Index, returning 0.48% for the calendar year 2015. U.S. equity market performance was hampered by a slowdown in earnings growth and the impact of a strong U.S. dollar, which rose more than 8.00% versus the currencies of key trading partners. Small-cap stocks underperformed large-cap stocks with the Russell 2000® Index returning -4.41%. From a sector perspective, performance was positive for five of the nine sectors within the Russell 3000® Index, with consumer staples and health care leading performance among the sectors. The energy and the materials sectors were the largest detractors, down 20.00% and 8.33%, respectively, due largely to global oversupply and falling demand from China for several commodities.
Contribution to absolute performance from non-U.S. equity markets was negative for the Asset Allocation Funds, with both developed non-U.S. markets and emerging markets equities detracting similarly from performance results. Developed non-U.S. equity markets underperformed the U.S. equity markets as the MSCI EAFE Index (Net), a measure of international developed country returns, posted a one-year return of -0.81%. Two main causes for the relative underperformance of the MSCI EAFE Index were slower economic growth outside the United States and the continued appreciation of the U.S. dollar versus global currencies. The only regions to post positive returns were Japan and Africa/Middle East, while Asia ex-Japan and Europe were the largest detractors. Asia ex-Japan was hit hard by falling economic growth in China, and the region fell over 9.00% in the index for the year. From a sector perspective, utilities and health care outperformed with high single digit returns. The energy and the materials sectors were the largest detractors falling 18.00% and 15.51%, respectively. Emerging markets equities were materially negative for the year, with the MSCI Emerging Markets Index falling 14.92%. Emerging markets experienced a difficult year due to the headwinds of slower Chinese growth, weak commodity prices and a strong U.S. dollar.
Contribution to absolute performance from fixed income was a slight detraction for the Asset Allocation Funds, except for the more conservatively positioned Conservative Allocation Fund. The U.S. fixed income markets had mixed returns as the yield curve flattened over the year given the short end of the curve rose more than the long end. This was a result of the Fed telegraphing the first federal funds rate hike of this cycle and executing it in December. The Barclays U.S. Aggregate Bond Index, a proxy for the broad U.S. domestic bond market, generated an annual return of 0.55%. Non-U.S. fixed income underperformed domestic, particularly due to U.S. dollar strength weighing heavily on returns, as the Barclays Global Aggregate ex-U.S. Index posted a -5.30% annual return. Credit spreads in high yield bonds widened, which led to the first annual decline in the Barclays U.S. High Yield Corporate Bond Index since 2008. In particular, falling oil prices caused acute price declines in the energy sector, which comprises about 15% of the index, dragging down total returns and causing a contagion effect that negatively impacted the rest of the high yield bond market.
Real assets detracted from absolute performance within the Asset Allocation Funds, although the returns of the various underlying strategies varied significantly for the year. Key drivers of performance were subdued inflation and inflation expectations and falling commodity prices – all of which put downward pressure on most real assets strategies. The primary detractor to absolute performance for the Asset Allocation Funds was negative performance for global natural resources equites. Global natural resources equities, as measured by the MSCI World Commodity Producers Index, fell 25.62% in 2015.
46
Table of Contents
Conservative Allocation Fund (Unaudited)
The Fund, through investments in the underlying GuideStone Funds Select Funds, combined a greater percentage of exposure to fixed income securities with a smaller percentage to equity securities and real assets securities. The Fund had a target of, but was not limited to, an asset allocation of 55.00% Fixed Income Select Funds, 20.00% U.S. Equity Select Funds, 7.00% Non-U.S. Equity Select Funds and 18.00% Real Assets Select Funds.
As a fund of funds, the Fund’s performance was based on the performance of the underlying Select Funds. The Fund generated a return of -1.69% for the one-year period ended December 31, 2015, driven primarily by negative absolute performance of the underlying Real Assets Select Funds. Within this asset class, the Fund’s absolute return was most negatively influenced by its exposure to the Global Natural Resources Equity Fund, followed by exposure to the Inflation Protected Bond Fund and Flexible Income Fund. The Fund’s Fixed Income Select Funds allocation added to investment returns, as the Low-Duration Bond Fund contributed positively. Additionally, the U.S. Equity Select Funds allocation positively impacted the Fund’s performance, led by contributions from both the Defensive Market Strategies Fund and Growth Equity Fund.
The Fund underperformed its composite benchmark in 2015 (-1.69% versus -0.88%). Relative underperformance was primarily driven by the allocation to Real Assets Select Funds, with both the Global Natural Resources Equity Fund and the Flexible Income Fund detracting the most from relative returns. Lastly, the largest positive contributor to relative performance was the Defensive Market Strategies Fund.
Certain derivatives were utilized to provide market exposure for the cash positions held in the Fund. These derivative positions primarily included stock index futures and fixed income futures. Overall, derivative exposure had a slight positive impact on Fund performance for the year.
The Fund attempted to achieve its objective by investing in the GuideStone Funds Select Funds. By investing in the Fund you will also incur the expenses and risks of the underlying Select Funds. The principal risks of the Fund will change depending on the asset mix of the Select Funds in which it invests. You may directly invest in the Select Funds. The Fund’s value will go up and down in response to changes in the share prices of the investments that it owns. It is possible to lose money by investing in the Fund. The Fund may be suitable for investors who have a short- to medium-term investment horizon, possess a relatively low tolerance for risk and want some exposure to the growth potential of the stock market tempered by a larger allocation to short-term, fixed income securities. This Fund is subject to interest rate risk. Meaning, when interest rates rise, the value of the existing bonds decrease and vice versa. Changes in interest rates have a bigger impact on long duration holdings than on short duration holdings. It is possible to lose money by investing in the Fund.
At December 31, 2015, the portfolio holdings of the Fund, as a percentage of net assets, is shown in the following table. Portfolio holdings are subject to risk and may change at any time.
| % | ||||
Fixed Income Select Funds | 55.9 | |||
U.S. Equity Select Funds | 19.4 | |||
Real Return Select Funds | 17.7 | |||
Non-U.S. Equity Select Funds | 6.9 | |||
|
| |||
| 99.9 | ||||
|
| |||
47
Table of Contents
Conservative Allocation Fund (Unaudited)
| Average Annual Total Returns as of 12/31/15 | ||||||
Institutional Class | Investor Class* | Benchmark** | ||||
One Year | N/A | -1.69% | -0.88% | |||
Five Year | N/A | 2.38% | 2.89% | |||
Ten Year | N/A | 3.26% | 3.75% | |||
Since Inception(2) | -0.99% | 3.44% | 3.80% | |||
Inception Date | 11/23/15 | 08/27/01 | ||||
Total Fund Operating Expenses (May 1, 2015 Prospectus, as amended on June 1, 2015)(1) | 0.79% | 0.94% | ||||
(1)The Fund’s shareholders indirectly bear the expenses of the Investor or Institutional Class shares of the Select Funds in which the Fund invests. Current information regarding the Fund’s Operating Expenses can be found in the Financial Highlights.
(2)The Since Inception benchmark performance is based on the start date of August 27, 2001, which corresponds with the inception date of the Investor Class, the longest operating class of the Fund.
The performance data quoted represents past performance and does not guarantee future results. Current performance may be lower or higher. Performance data current to the most recent month-end may be obtained at www.GuideStoneFunds.org. The investment return and principal value of an investment will fluctuate so that shares, when redeemed, may be worth more or less than their original cost.

The graph compares the results of a hypothetical $10,000 investment in the Investor Class of the Fund for the 10-year period from December 31, 2005 to December 31, 2015, with all dividends and capital gains reinvested, with the Fund’s weighted composite benchmark index.
*These returns reflect expense waivers by the Fund’s investment adviser. Without these waivers, returns would have been lower. Returns shown do not reflect the deduction of taxes that a shareholder would pay on Fund distributions or the redemption of Fund shares.
**Represents a composite index as of December 2015, consisting of the Bank of America Merrill Lynch 1-3 Year Treasury Index, the Barclays U.S. Aggregate Bond Index, the Barclays U.S. TIPS Index, the Russell 3000® Index, the FTSE EPRA/ NAREIT Developed Index, the S&P/LSTA U.S. B- Ratings and Above Loan Index, the MSCI World Commodity Producers Index and the MSCI ACWI (All Country World Index) Ex-U.S. Index, weighted 41%, 14%, 10%, 20%, 1%, 5%, 2% and 7%, respectively.
Unlike a mutual fund, the performance of an index assumes no taxes, transaction costs, management fees or other expenses.
48
Table of Contents
CONSERVATIVE ALLOCATION FUND SCHEDULE OF INVESTMENTS | December 31, 2015 |
| Shares | Value | |||||||||||
MUTUAL FUNDS — 99.9% |
| |||||||||||
GuideStone Money Market Fund (Institutional | 4,583,563 | $ | 4,583,563 | |||||||||
GuideStone Low-Duration Bond Fund (Institutional Class)¥ | 17,947,748 | 150,222,650 | ||||||||||
GuideStone Medium-Duration Bond Fund (Institutional | 6,022,006 | 40,046,340 | ||||||||||
GuideStone Global Bond Fund (Institutional | 1,076,080 | 9,770,811 | ||||||||||
GuideStone Defensive Market Strategies Fund (Institutional | 2,909,324 | 32,613,520 | ||||||||||
GuideStone Value Equity Fund (Institutional | 2,260,331 | 17,065,496 | ||||||||||
GuideStone Growth Equity Fund (Institutional | 1,826,464 | 17,406,201 | ||||||||||
GuideStone Small Cap Equity Fund (Institutional | 503,069 | 3,762,956 | ||||||||||
GuideStone International Equity Fund (Institutional | 2,078,773 | 20,226,463 | ||||||||||
| Shares | Value | |||||||||||
GuideStone Emerging Market Equity Fund (Institutional Class)¥ | 693,547 | $ | 5,090,634 | |||||||||
GuideStone Inflation Protected Bond Fund (Institutional Class)*¥ | 3,623,615 | 36,163,674 | ||||||||||
GuideStone Flexible Income Fund (Investor Class)¥ | 1,934,787 | 17,974,169 | ||||||||||
GuideStone Real Estate Securities Fund (Institutional Class)¥ | 389,532 | 3,684,974 | ||||||||||
GuideStone Global Natural Resources Equity Fund (Investor Class)¥ | 1,345,583 | 6,875,930 | ||||||||||
|
| |||||||||||
Total Mutual Funds | 365,487,381 | |||||||||||
|
| |||||||||||
TOTAL INVESTMENTS — 99.9% |
| 365,487,381 | ||||||||||
Other Assets in Excess of Liabilities — 0.1% | 404,959 | |||||||||||
|
| |||||||||||
NET ASSETS — 100.0% | $ | 365,892,340 | ||||||||||
|
| |||||||||||
VALUATION HIERARCHY
The following is a summary of the inputs used, as of December 31, 2015, in valuing the Fund’s investments carried at fair value:
| Level 2 | Level 3 | |||||||||||||||||||
| Total | Level 1 | Other Significant | Significant | |||||||||||||||||
| Value | Quoted Prices | Observable Inputs | Unobservable Inputs | |||||||||||||||||
Assets: | ||||||||||||||||||||
Investments in Securities: | ||||||||||||||||||||
Mutual Funds | $ | 365,487,381 | $ | 365,487,381 | $ | — | $ | — | ||||||||||||
|
|
|
|
|
|
|
| |||||||||||||
Total Assets - Investments in Securities | $ | 365,487,381 | $ | 365,487,381 | $ | — | $ | — | ||||||||||||
|
|
|
|
|
|
|
| |||||||||||||
Liabilities: | ||||||||||||||||||||
Other Financial Instruments*** | ||||||||||||||||||||
Futures Contracts | $ | 3,230 | $ | 3,230 | $ | — | $ | — | ||||||||||||
|
|
|
|
|
|
|
| |||||||||||||
Total Liabilities - Other Financial Instruments | $ | 3,230 | $ | 3,230 | $ | — | $ | — | ||||||||||||
|
|
|
|
|
|
|
| |||||||||||||
***Other financial instruments are derivative instruments not reflected in the Schedule of Investments, such as futures, forwards and swap contracts, which are valued at the unrealized appreciation (depreciation) on the investment. Details of these investments can be found in the Notes to Financial Statements.
| See Notes to Financial Statements. | 49 |
Table of Contents
Balanced Allocation Fund (Unaudited)
The Fund, through investments in the underlying Select Funds, combined approximately equal percentages to equity securities and fixed income securities in addition to a smaller allocation to real assets securities. The Fund had a target of, but was not limited to, an asset allocation of 41.00% Fixed Income Select Funds, 30.00% U.S. Equity Select Funds, 14.00% Non-U.S. Equity Select Funds and 15.00% Real Assets Select Funds.
As a fund of funds, the Fund’s performance was based on the performance of the underlying Select Funds. The Fund generated a return of -3.43% for the one-year period ended December 31, 2015. While all underlying asset classes generated negative performance for the year, exposure to the underlying Real Assets Select Funds, in aggregate, detracted the most from absolute performance, followed by the Non-U.S. Equity Select Funds. The Fund’s absolute return was most negatively influenced by its exposure to the Global Natural Resources Equity Fund, the Emerging Markets Equity Fund and the International Equity Fund. The Fund’s Fixed Income Select Funds allocation detracted from investment returns, as the contribution from all underlying Fixed Income Select Funds was either roughly flat or marginally negative. The U.S. Equity Select Funds allocation provided mixed results with the most positive contributions coming from the Defensive Market Strategies Fund and Growth Equity Fund.
The Fund underperformed its composite benchmark in 2015 (-3.43% versus -1.73%), which was driven mostly by allocations to the Fixed Income Select Funds and Real Assets Select Funds. Within these asset classes, the Global Bond Fund and Global Natural Resources Equity Fund had material impacts on relative underperformance over the period. Additionally, the Non-U.S. Equity Select Funds allocation detracted from relative performance as both the International Equity Fund and Emerging Markets Equity Fund underperformed over the one-year period ended December 31, 2015.
Certain derivatives were utilized to provide market exposure for the cash positions held in the Fund. These derivative positions primarily included stock index futures and fixed income futures. Overall, derivative exposure had a slight positive impact on Fund performance for the year.
The Fund attempted to achieve its objective by investing in the Select Funds. By investing in the Fund you will also incur the expenses and risks of the underlying Select Funds. The principal risks of the Fund will change depending on the asset mix of the Select Funds in which it invests. You may directly invest in the Select Funds. The Fund’s value will go up and down in response to changes in the share prices of the investments that it owns. It is possible to lose money by investing in the Fund. This Fund may be suitable for investors who have a medium- to long-term investment horizon, possess a moderate tolerance for risk and seek to participate in the return potential of stocks but want to achieve this result more slowly and with less volatility through a balanced allocation of fixed income and equity investments. It is possible to lose money by investing in the Fund.
At December 31, 2015, the portfolio holdings of the Fund, as a percentage of net assets, is shown in the following table. Portfolio holdings are subject to risk and may change at any time.
| % | ||||
Fixed Income Select Funds | 43.0 | |||
U.S. Equity Select Funds | 28.7 | |||
Real Return Select Funds | 14.7 | |||
Non-U.S. Equity Select Funds | 13.5 | |||
|
| |||
| 99.9 | ||||
|
| |||
50
Table of Contents
Balanced Allocation Fund (Unaudited)
| Average Annual Total Returns as of 12/31/15 | ||||||
Institutional Class* | Investor Class* | Benchmark** | ||||
One Year | N/A | -3.43% | -1.73% | |||
Five Year | N/A | 4.44% | 5.51% | |||
Ten Year | N/A | 4.36% | 5.26% | |||
Since Inception(2) | -1.73% | 4.89% | 5.47% | |||
Inception Date | 11/23/15 | 08/27/01 | ||||
Total Fund Operating Expenses (May 1, 2015 Prospectus, as amended on June 1, 2015)(1) | 0.82% | 1.05% | ||||
(1)The Fund’s shareholders indirectly bear the expenses of the Investor or Institutional Class shares of the Select Funds in which the Fund invests. Current information regarding the Fund’s Operating Expenses can be found in the Financial Highlights.
(2)The Since Inception benchmark performance is based on the start date of August 27, 2001, which corresponds with the inception date of the Investor Class, the longest operating class of the Fund.
The performance data quoted represents past performance and does not guarantee future results. Current performance may be lower or higher. Performance data current to the most recent month-end may be obtained at www.GuideStoneFunds.org. The investment return and principal value of an investment will fluctuate so that shares, when redeemed, may be worth more or less than their original cost.
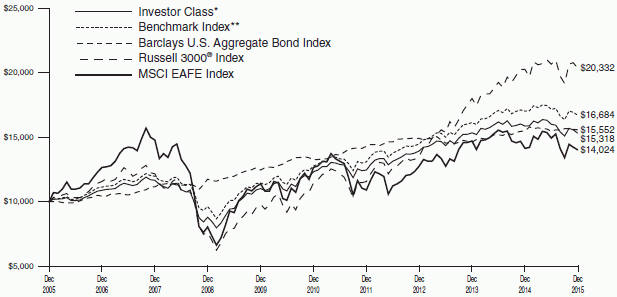
The graph compares the results of a hypothetical $10,000 investment in the Investor Class of the Fund for the 10-year period from December 31, 2005 to December 31, 2015, with all dividends and capital gains reinvested, with the Fund’s weighted composite benchmark index.
*These returns reflect expense waivers by the Fund’s investment adviser. Without these waivers, returns would have been lower. Returns shown do not reflect the deduction of taxes that a shareholder would pay on Fund distributions or the redemption of Fund shares.
**Represents a composite index as of December 2015, consisting of the Barclays U.S. Aggregate Bond Index, the Barclays U.S. TIPS Index, the Russell 3000® Index, the FTSE EPRA/NAREIT Developed Index, the S&P/LSTA U.S. B- Ratings and Above Loan Index, the MSCI World Commodity Producers Index and the MSCI ACWI (All Country World Index) Ex-U.S. Index, weighted 41%, 6%, 30%, 3%, 3%, 3% and 14%, respectively.
Unlike a mutual fund, the performance of an index assumes no taxes, transaction costs, management fees or other expenses.
51
Table of Contents
BALANCED ALLOCATION FUND SCHEDULE OF INVESTMENTS | December 31, 2015 |
| Shares | Value | |||||||||||
MUTUAL FUNDS — 99.9% |
| |||||||||||
GuideStone Money | 42,453,581 | $ | 42,453,581 | |||||||||
GuideStone Low-Duration | 21,711,558 | 181,725,741 | ||||||||||
GuideStone Medium-Duration | 36,964,265 | 245,812,360 | ||||||||||
GuideStone Extended-Duration | 17,145,318 | 65,152,208 | ||||||||||
GuideStone Global Bond Fund (Institutional | 13,276,239 | 120,548,248 | ||||||||||
GuideStone Defensive Market | 10,932,072 | 122,548,531 | ||||||||||
GuideStone Value Equity Fund | 18,641,232 | 140,741,304 | ||||||||||
GuideStone Growth | 15,021,245 | 143,152,463 | ||||||||||
GuideStone Small Cap | 4,143,090 | 30,990,313 | ||||||||||
GuideStone International | 16,992,195 | 165,334,059 | ||||||||||
| Shares | Value | |||||||||||
GuideStone Emerging Market | 5,579,460 | $ | 40,953,235 | |||||||||
GuideStone Inflation Protected Bond Fund | 9,011,266 | 89,932,438 | ||||||||||
GuideStone Flexible | 4,882,422 | 45,357,702 | ||||||||||
GuideStone Real Estate | 4,700,017 | 44,462,159 | ||||||||||
GuideStone Global Natural | 8,648,374 | 44,193,189 | ||||||||||
|
| |||||||||||
Total Mutual Funds | 1,523,357,531 | |||||||||||
|
| |||||||||||
TOTAL INVESTMENTS — 99.9% |
| 1,523,357,531 | ||||||||||
Other Assets in Excess of | 847,459 | |||||||||||
|
| |||||||||||
NET ASSETS — 100.0% | $ | 1,524,204,990 | ||||||||||
|
| |||||||||||
VALUATION HIERARCHY
The following is a summary of the inputs used, as of December 31, 2015, in valuing the Fund’s investments carried at fair value:
| Total Value | Level 1 Quoted Prices | Level 2 Other Significant Observable Inputs | Level 3 Significant Unobservable Inputs | |||||||||||||||||
Assets: | ||||||||||||||||||||
Investments in Securities: | ||||||||||||||||||||
Mutual Funds | $ | 1,523,357,531 | $ | 1,523,357,531 | $ | — | $ | — | ||||||||||||
|
|
|
|
|
|
|
| |||||||||||||
Total Assets - Investments in Securities | $ | 1,523,357,531 | $ | 1,523,357,531 | $ | — | $ | — | ||||||||||||
|
|
|
|
|
|
|
| |||||||||||||
Liabilities: | ||||||||||||||||||||
Other Financial Instruments*** | ||||||||||||||||||||
Futures Contracts | $ | 93,790 | $ | 93,790 | $ | — | $ | — | ||||||||||||
|
|
|
|
|
|
|
| |||||||||||||
Total Liabilities - Other Financial Instruments | $ | 93,790 | $ | 93,790 | $ | — | $ | — | ||||||||||||
|
|
|
|
|
|
|
| |||||||||||||
***Other financial instruments are derivative instruments not reflected in the Schedule of Investments, such as futures, forwards and swap contracts, which are valued at the unrealized appreciation (depreciation) on the investment. Details of these investments can be found in the Notes to Financial Statements.
| 52 | See Notes to Financial Statements. |
Table of Contents
Growth Allocation Fund (Unaudited)
The Fund, through investments in the underlying Select Funds, combined a greater percentage of exposure to equity securities with a smaller percentage to fixed income securities and real assets securities. The Fund had a target of, but was not limited to, an asset allocation of 25.00% Fixed Income Select Funds, 41.00% U.S. Equity Select Funds, 27.00% Non-U.S. Equity Select Funds and 7.00% Real Assets Select Funds.
As a fund of funds, the Fund’s performance was based on the performance of the underlying Select Funds. The Fund generated a return of -3.83% for the one-year period ended December 31, 2015. While all underlying asset classes generated negative performance for the year, exposure to non-U.S. equities detracted the most from performance. The Fund’s absolute return was most negatively influenced by its exposures to the Global Natural Resources Equity Fund, the Emerging Markets Equity Fund and the International Equity Fund. Additionally, the Fund’s Fixed Income Select Funds allocation detracted marginally from investment returns. Contributing positively to absolute performance was the allocation to the Growth Equity Fund, which benefitted from strong security selection.
The Fund underperformed its composite benchmark in 2015 (-3.83% versus -2.42%). While underlying Select Fund holdings detracted from relative performance results across all asset classes, the Fund’s relative performance was most negatively impacted by allocations to the International Equity Fund, the Global Natural Resources Equity Fund and the Emerging Markets Equity Fund.
Certain derivatives were utilized to provide market exposure for the cash positions held in the Fund. These derivative positions primarily included stock index futures and fixed income futures. Overall, derivative exposure had a slight positive impact on Fund performance for the year.
The Fund attempted to achieve its objective by investing in the Select Funds. By investing in the Fund you will also incur the expenses and risks of the underlying Select Funds. The principal risks of the Fund will change depending on the asset mix of the Select Funds in which it invests. You may directly invest in the Select Funds. The Fund’s value will go up and down in response to changes in the share prices of the investments that it owns. It is possible to lose money by investing in the Fund. This Fund may be suitable for investors who have a long-term investment horizon, possess a relatively high tolerance for risk and seek to participate in the return potential of stocks at a slightly lower risk level than an all stock portfolio. Foreign securities may be subject to greater risk than domestic securities due to currency volatility, reduced market liquidity and political and economic instability. Small company stocks are subject to greater risk than large company stocks due to more volatility and less liquidity. This Fund is subject to interest rate risk. Meaning, when interest rates rise, the value of the existing bonds decrease and vice versa. Changes in interest rates have a bigger impact on long duration holdings than on short duration holdings. It is possible to lose money by investing in the Fund.
At December 31, 2015, the portfolio holdings of the Fund, as a percentage of net assets, is shown in the following table. Portfolio holdings are subject to risk and may change at any time.
| % | ||||
U.S. Equity Select Funds | 39.9 | |||
Fixed Income Select Funds | 27.3 | |||
Non-U.S. Equity Select Funds | 25.9 | |||
Real Return Select Funds | 6.8 | |||
|
| |||
| 99.9 | ||||
|
| |||
53
Table of Contents
Growth Allocation Fund (Unaudited)
| Average Annual Total Returns as of 12/31/15 | ||||||
Institutional Class* | Investor Class* | Benchmark** | ||||
One Year | N/A | -3.83% | -2.42% | |||
Five Year | N/A | 5.63% | 6.43% | |||
Ten Year | N/A | 4.31% | 5.33% | |||
Since Inception(2) | -2.36% | 4.90% | 5.54% | |||
Inception Date | 11/23/15 | 08/27/01 | ||||
Total Fund Operating Expenses (May 1, 2015 Prospectus, as amended on June 1, 2015)(1) | 0.92% | 1.15% | ||||
(1)The Fund’s shareholders indirectly bear the expenses of the Investor or Institutional Class shares of the Select Funds in which the Fund invests. Current information regarding the Fund’s Operating Expenses can be found in the Financial Highlights.
(2)The Since Inception benchmark performance is based on the start date of August 27, 2001, which corresponds with the inception date of the Investor Class, the longest operating class of the Fund.
The performance data quoted represents past performance and does not guarantee future results. Current performance may be lower or higher. Performance data current to the most recent month-end may be obtained at www.GuideStoneFunds.org. The investment return and principal value of an investment will fluctuate so that shares, when redeemed, may be worth more or less than their original cost.

The graph compares the results of a hypothetical $10,000 investment in the Investor Class of the Fund for the 10-year period from December 31, 2005 to December 31, 2015, with all dividends and capital gains reinvested, with the Fund’s weighted composite benchmark index.
*These returns reflect expense waivers by the Fund’s investment adviser. Without these waivers, returns would have been lower. Returns shown do not reflect the deduction of taxes that a shareholder would pay on Fund distributions or the redemption of Fund shares.
**Represents a composite index as of December 2015, consisting of the Barclays U.S. Aggregate Bond Index, the Russell 3000® Index, the FTSE EPRA/NAREIT Developed Index, the MSCI World Commodity Producers Index and the MSCI ACWI (All Country World Index) Ex-U.S. Index, weighted 25%, 41%, 4%, 3% and 27%, respectively.
Unlike a mutual fund, the performance of an index assumes no taxes, transaction costs, management fees or other expenses.
54
Table of Contents
GROWTH ALLOCATION FUND SCHEDULE OF INVESTMENTS | December 31, 2015 |
| Shares | Value | |||||||||||
MUTUAL FUNDS — 99.9% | ||||||||||||
GuideStone Money | 27,757,264 | $ | 27,757,264 | |||||||||
GuideStone Low-Duration | 9,881,136 | 82,705,113 | ||||||||||
GuideStone Medium-Duration | 16,691,099 | 110,995,806 | ||||||||||
GuideStone Extended-Duration | 7,580,441 | 28,805,675 | ||||||||||
GuideStone Global Bond Fund | 5,947,510 | 54,003,392 | ||||||||||
GuideStone Value | 26,282,506 | 198,432,917 | ||||||||||
GuideStone Growth | 21,552,573 | 205,396,019 | ||||||||||
GuideStone Small Cap | 5,551,025 | 41,521,669 | ||||||||||
| Shares | Value | |||||||||||
GuideStone International | 23,739,602 | $ | 230,986,326 | |||||||||
GuideStone Emerging Market | 7,861,417 | 57,702,803 | ||||||||||
GuideStone Real Estate | 4,539,847 | 42,946,950 | ||||||||||
GuideStone Global Natural | 6,464,836 | 33,035,311 | ||||||||||
|
| |||||||||||
Total Mutual Funds | 1,114,289,245 | |||||||||||
|
| |||||||||||
TOTAL INVESTMENTS — 99.9% |
| 1,114,289,245 | ||||||||||
Other Assets in Excess of | 659,786 | |||||||||||
|
| |||||||||||
NET ASSETS — 100.0% | $ | 1,114,949,031 | ||||||||||
|
| |||||||||||
VALUATION HIERARCHY
The following is a summary of the inputs used, as of December 31, 2015, in valuing the Fund’s investments carried at fair value:
| Total Value | Level 1 Quoted Prices | Level 2 Other Significant Observable Inputs | Level 3 Significant Unobservable Inputs | |||||||||||||||||
Assets: | ||||||||||||||||||||
Investments in Securities: | ||||||||||||||||||||
Mutual Funds | $ | 1,114,289,245 | $ | 1,114,289,245 | $ | — | $ | — | ||||||||||||
|
|
|
|
|
|
|
| |||||||||||||
Total Assets - Investments in Securities | $ | 1,114,289,245 | $ | 1,114,289,245 | $ | — | $ | — | ||||||||||||
|
|
|
|
|
|
|
| |||||||||||||
Liabilities: | ||||||||||||||||||||
Other Financial Instruments*** | ||||||||||||||||||||
Futures Contracts | $ | 102,408 | $ | 102,408 | $ | — | $ | — | ||||||||||||
|
|
|
|
|
|
|
| |||||||||||||
Total Liabilities - Other Financial Instruments | $ | 102,408 | $ | 102,408 | $ | — | $ | — | ||||||||||||
|
|
|
|
|
|
|
| |||||||||||||
***Other financial instruments are derivative instruments not reflected in the Schedule of Investments, such as futures, forwards and swap contracts, which are valued at the unrealized appreciation (depreciation) on the investment. Details of these investments can be found in the Notes to Financial Statements.
| See Notes to Schedules of Investments. | 55 |
Table of Contents
Aggressive Allocation Fund (Unaudited)
The Fund, through investments in the underlying Select Funds, combined a greater percentage of exposure to U.S. equity securities with a smaller percentage to non-U.S. equity securities. The Fund had a target of, but was not limited to, an asset allocation of 60.00% U.S. Equity Select Funds and 40.00% Non-U.S. Equity Select Funds.
As a fund of funds, its performance was based on the performance of the underlying Select Funds. The Fund generated a return of -2.39% for the one-year period ended December 31, 2015. While exposure to the U.S. Equity Select Funds, in aggregate, generated positive performance, exposure to the non-U.S. Equity Select Funds detracted significantly from performance and led to a negative absolute return for the Fund in 2015. The largest detractors to absolute performance were the Emerging Markets Equity Fund and the Value Equity Fund. The largest contributor to absolute performance was the Growth Equity Fund, as U.S. growth stocks significantly outperformed the overall U.S. equity market.
The Fund underperformed its composite benchmark in 2015 (-2.39% versus -1.96%). The Fund’s relative performance was most negatively impacted by allocations to the Emerging Markets Equity Fund and the International Equity Fund.
Certain derivatives were utilized to provide market exposure for the cash positions held in the Fund. These derivative positions primarily included stock index futures. Overall, derivative exposure had a slight positive impact on Fund performance for the year.
The Fund attempted to achieve its objective by investing in the Select Funds. By investing in the Fund you will also incur the expenses and risks of the underlying Select Funds. The principal risks of the Fund will change depending on the asset mix of the Select Funds in which it invests. You may directly invest in the Select Funds. The Fund’s value will go up and down in response to changes in the share prices of the investments that it owns. It is possible to lose money by investing in the Fund. This Fund may be suitable for investors who have a long-term investment horizon, possess a relatively high tolerance for risk and want to diversify by adding an aggressive investment option that combines U.S. and international stocks. Foreign securities may be subject to greater risk than domestic securities due to currency volatility, reduced market liquidity and political and economic instability. Small company stocks are subject to greater risk than large company stocks due to more volatility and less liquidity. It is possible to lose money by investing in the Fund.
At December 31, 2015, the portfolio holdings of the Fund, as a percentage of net assets, is shown in the following table. Portfolio holdings are subject to risk and may change at any time.
| % | ||||
U.S. Equity Select Funds | 59.2 | |||
Non-U.S. Equity Select Funds | 38.3 | |||
Fixed Income Select Fund | 2.5 | |||
|
| |||
| 100.0 | ||||
|
| |||
56
Table of Contents
Aggressive Allocation Fund (Unaudited)
| Average Annual Total Returns as of 12/31/15 | ||||||
Institutional Class* | Investor Class* | Benchmark** | ||||
One Year | N/A | -2.39% | -1.96% | |||
Five Year | N/A | 7.40% | 7.90% | |||
Ten Year | N/A | 4.41% | 5.55% | |||
Since Inception(2) | -2.85% | 4.94% | 5.68% | |||
Inception Date | 11/23/15 | 08/27/01 | ||||
Total Fund Operating Expenses (May 1, 2015 Prospectus, as amended on June 1, 2015)(1) | 1.00% | 1.23% | ||||
(1)The Fund’s shareholders indirectly bear the expenses of the Investor or Institutional Class shares of the Select Funds in which the Fund invests. Current information regarding the Fund’s Operating Expenses can be found in the Financial Highlights.
(2)The Since Inception benchmark performance is based on the start date of August 27, 2001, which corresponds with the inception date of the Investor Class, the longest operating class of the Fund.
The performance data quoted represents past performance and does not guarantee future results. Current performance may be lower or higher. Performance data current to the most recent month-end may be obtained at www.GuideStoneFunds.org. The investment return and principal value of an investment will fluctuate so that shares, when redeemed, may be worth more or less than their original cost.
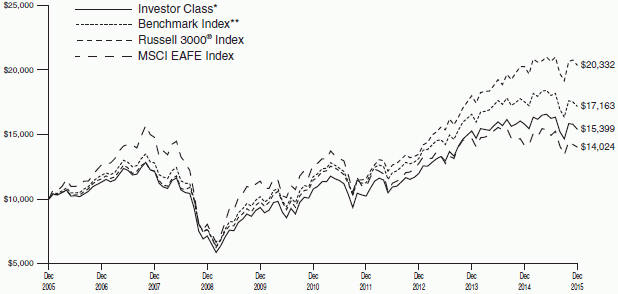
The graph compares the results of a hypothetical $10,000 investment in the Investor Class of the Fund for the 10-year period from December 31, 2005 to December 31, 2015, with all dividends and capital gains reinvested, with the Fund’s weighted composite benchmark index.
*These returns reflect expense waivers by the Fund’s investment adviser. Without these waivers, returns would have been lower. Returns shown do not reflect the deduction of taxes that a shareholder would pay on Fund distributions or the redemption of Fund shares.
**Represents a composite index as of December 2015, consisting of the Russell 3000® Index and the MSCI ACWI (All Country World Index) Ex-U.S. Index, weighted 60% and 40%, respectively.
Unlike a mutual fund, the performance of an index assumes no taxes, transaction costs, management fees or other expenses.
57
Table of Contents
AGGRESSIVE ALLOCATION FUND | ||
SCHEDULE OF INVESTMENTS | December 31, 2015 |
| Shares | Value | |||||||||||
MUTUAL FUNDS — 100.0% |
| |||||||||||
GuideStone Money | 23,772,781 | $ | 23,772,781 | |||||||||
GuideStone Value Equity Fund | 33,744,162 | 254,768,426 | ||||||||||
GuideStone Growth | 27,497,966 | 262,055,612 | ||||||||||
GuideStone Small Cap | 7,406,126 | 55,397,826 | ||||||||||
GuideStone International | 30,416,189 | 295,949,517 | ||||||||||
GuideStone Emerging Market | 10,070,671 | 73,918,724 | ||||||||||
|
| |||||||||||
Total Mutual Funds |
| 965,862,886 | ||||||||||
|
| |||||||||||
TOTAL INVESTMENTS — 100.0% |
| 965,862,886 | ||||||||||
Other Assets in Excess of Liabilities — 0.0% | 481,687 | |||||||||||
|
| |||||||||||
NET ASSETS — 100.0% | $ | 966,344,573 | ||||||||||
|
| |||||||||||
VALUATION HIERARCHY
The following is a summary of the inputs used, as of December 31, 2015, in valuing the Fund’s investments carried at fair value:
| Total Value | Level 1 Quoted Prices | Level 2 Other Significant Observable Inputs | Level 3 Significant Unobservable Inputs | |||||||||||||||||
Assets: | ||||||||||||||||||||
Investments in Securities: | ||||||||||||||||||||
Mutual Funds | $ | 965,862,886 | $ | 965,862,886 | $ | — | $ | — | ||||||||||||
|
|
|
|
|
|
|
| |||||||||||||
Total Assets - Investments in Securities | $ | 965,862,886 | $ | 965,862,886 | $ | — | $ | — | ||||||||||||
|
|
|
|
|
|
|
| |||||||||||||
Liabilities: | ||||||||||||||||||||
Other Financial Instruments*** | ||||||||||||||||||||
Futures Contracts | $ | 124,428 | $ | 124,428 | $ | — | $ | — | ||||||||||||
|
|
|
|
|
|
|
| |||||||||||||
Total Liabilities - Other Financial Instruments | $ | 124,428 | $ | 124,428 | $ | — | $ | — | ||||||||||||
|
|
|
|
|
|
|
| |||||||||||||
***Other financial instruments are derivative instruments not reflected in the Schedule of Investments, such as futures, forwards and swap contracts, which are valued at the unrealized appreciation (depreciation) on the investment. Details of these investments can be found in the Notes to Financial Statements.
| 58 | See Notes to Financial Statements. |
Table of Contents
(This page intentionally left blank)
59
Table of Contents
| Conservative Allocation Fund | Balanced Allocation Fund | Growth Allocation Fund | Aggressive Allocation Fund | |||||||||||||
Assets | ||||||||||||||||
Investments in securities of affiliated issuers, at value (1) | $ | 365,487,381 | $ | 1,523,357,531 | $ | 1,114,289,245 | $ | 965,862,886 | ||||||||
Cash collateral for derivatives | 122,200 | 1,106,600 | 1,051,000 | 1,069,000 | ||||||||||||
Receivables: | ||||||||||||||||
Dividends from affiliated funds | 560 | 4,549 | 3,103 | 2,549 | ||||||||||||
Fund shares sold | 421,743 | 391,335 | 149,002 | 87,670 | ||||||||||||
Variation margin on financial futures contracts | 844 | 33,516 | 11,500 | — | ||||||||||||
Prepaid expenses and other assets | 18,571 | 20,365 | 17,967 | 15,460 | ||||||||||||
|
|
|
|
|
|
|
| |||||||||
Total Assets | 366,051,299 | 1,524,913,896 | 1,115,521,817 | 967,037,565 | ||||||||||||
|
|
|
|
|
|
|
| |||||||||
Liabilities | ||||||||||||||||
Cash overdraft | — | — | — | 100,000 | ||||||||||||
Payables: | ||||||||||||||||
Fund shares redeemed | 2,161 | 25,804 | — | 32,914 | ||||||||||||
Variation margin on financial futures contracts | 14,430 | 211,980 | 212,440 | 230,585 | ||||||||||||
Accrued expenses: | ||||||||||||||||
Investment advisory fees | 12,419 | 112,986 | 89,483 | 83,088 | ||||||||||||
Professional fees | 32,595 | 32,596 | 32,595 | 32,595 | ||||||||||||
Shareholder servicing fees | 62,436 | 250,853 | 182,565 | 166,953 | ||||||||||||
Other expenses | 34,918 | 74,687 | 55,703 | 46,857 | ||||||||||||
|
|
|
|
|
|
|
| |||||||||
Total Liabilities | 158,959 | 708,906 | 572,786 | 692,992 | ||||||||||||
|
|
|
|
|
|
|
| |||||||||
Net Assets | $ | 365,892,340 | $ | 1,524,204,990 | $ | 1,114,949,031 | $ | 966,344,573 | ||||||||
|
|
|
|
|
|
|
| |||||||||
Net Assets Consist of: | ||||||||||||||||
Paid-in-capital | $ | 390,567,300 | $ | 1,692,053,097 | $ | 1,250,263,136 | $ | 1,065,088,532 | ||||||||
Undistributed net realized gain on investments and derivative transactions | 2,362,426 | 10,665,438 | 33,184,690 | 62,037,630 | ||||||||||||
Net unrealized appreciation (depreciation) on investments and derivative transactions | (27,037,386 | ) | (178,513,545 | ) | (168,498,795 | ) | (160,781,589 | ) | ||||||||
|
|
|
|
|
|
|
| |||||||||
Net Assets | $ | 365,892,340 | $ | 1,524,204,990 | $ | 1,114,949,031 | $ | 966,344,573 | ||||||||
|
|
|
|
|
|
|
| |||||||||
Net Asset Value: | ||||||||||||||||
$0.001 par value, unlimited shares authorized | ||||||||||||||||
Net assets applicable to the Institutional Class | $ | 70,895,279 | $ | 332,326,746 | $ | 247,745,712 | $ | 169,302,240 | ||||||||
|
|
|
|
|
|
|
| |||||||||
Institutional shares outstanding | 6,677,614 | 31,048,264 | 22,874,708 | 15,717,406 | ||||||||||||
|
|
|
|
|
|
|
| |||||||||
Net asset value, offering and redemption price per Institutional share | $ | 10.62 | $ | 10.70 | $ | 10.83 | $ | 10.77 | ||||||||
|
|
|
|
|
|
|
| |||||||||
Net assets applicable to the Investor Class | $ | 294,997,061 | $ | 1,191,878,244 | $ | 867,203,319 | $ | 797,042,333 | ||||||||
|
|
|
|
|
|
|
| |||||||||
Investor shares outstanding | 27,785,609 | 111,358,725 | 80,087,224 | 73,991,073 | ||||||||||||
|
|
|
|
|
|
|
| |||||||||
Net asset value, offering and redemption price per Investor share | $ | 10.62 | $ | 10.70 | $ | 10.83 | $ | 10.77 | ||||||||
|
|
|
|
|
|
|
| |||||||||
(1) Investments in securities of affiliated issuers, at cost | $ | 392,527,997 | $ | 1,701,964,866 | $ | 1,282,890,448 | $ | 1,126,768,903 | ||||||||
|
|
|
|
|
|
|
| |||||||||
| 60 | See Notes to Financial Statements. |
Table of Contents
STATEMENTS OF OPERATIONS | For the Year Ended December 31, 2015 |
| Conservative Allocation Fund | Balanced Allocation Fund | Growth Allocation Fund | Aggressive Allocation Fund | |||||||||||||
Investment Income | ||||||||||||||||
Income distributions received from affiliated funds | $ | 4,904,929 | $ | 25,823,572 | $ | 16,664,755 | $ | 11,318,531 | ||||||||
|
|
|
|
|
|
|
| |||||||||
Total Investment Income | 4,904,929 | 25,823,572 | 16,664,755 | 11,318,531 | ||||||||||||
|
|
|
|
|
|
|
| |||||||||
Expenses | ||||||||||||||||
Investment advisory fees | 317,787 | 1,326,045 | 980,216 | 889,257 | ||||||||||||
Transfer agent fees: | ||||||||||||||||
Investor shares | 35,832 | 71,733 | 48,433 | 39,434 | ||||||||||||
Custodian fees | 17,547 | 38,448 | 34,664 | 27,409 | ||||||||||||
Shareholder servicing fees: | ||||||||||||||||
Investor shares | 507,537 | 2,077,755 | 1,533,367 | 1,408,246 | ||||||||||||
Accounting and administration fees | 20,273 | 71,879 | 54,025 | 49,005 | ||||||||||||
Professional fees | 56,522 | 56,523 | 56,523 | 56,522 | ||||||||||||
Blue sky fees: | ||||||||||||||||
Institutional shares | 4,262 | 4,706 | 4,670 | 4,098 | ||||||||||||
Investor shares | 20,766 | 22,395 | 19,627 | 18,262 | ||||||||||||
Shareholder reporting fees: | ||||||||||||||||
Investor shares | 32,700 | 68,575 | 46,766 | 38,038 | ||||||||||||
Trustee expenses | 4,118 | 16,943 | 12,512 | 11,451 | ||||||||||||
Line of credit facility fees | 2,048 | 8,392 | 6,174 | 5,630 | ||||||||||||
Other expenses | 10,936 | 15,296 | 14,961 | 15,795 | ||||||||||||
|
|
|
|
|
|
|
| |||||||||
Total Expenses | 1,030,328 | 3,778,690 | 2,811,938 | 2,563,147 | ||||||||||||
Expenses waived/reimbursed(1) | (181,865 | ) | (203,960 | ) | (110,470 | ) | (26,722 | ) | ||||||||
|
|
|
|
|
|
|
| |||||||||
Net Expenses | 848,463 | 3,574,730 | 2,701,468 | 2,536,425 | ||||||||||||
|
|
|
|
|
|
|
| |||||||||
Net investment income | 4,056,466 | 22,248,842 | 13,963,287 | 8,782,106 | ||||||||||||
|
|
|
|
|
|
|
| |||||||||
Realized and Unrealized Gain (Loss) | ||||||||||||||||
Capital gain distributions received from affiliated funds | 8,260,441 | 65,015,556 | 77,985,892 | 94,655,300 | ||||||||||||
Net realized gain on investment securities of affiliated issuers | 13,124,999 | 144,740,576 | 111,850,397 | 141,600,813 | ||||||||||||
Net realized gain (loss) on futures transactions | (20,991 | ) | 97,044 | (122,119 | ) | (874,348 | ) | |||||||||
|
|
|
|
|
|
|
| |||||||||
Net realized gain | 21,364,449 | 209,853,176 | 189,714,170 | 235,381,765 | ||||||||||||
|
|
|
|
|
|
|
| |||||||||
Change in unrealized appreciation (depreciation) on investment securities of affiliated issuers | (34,119,353 | ) | (292,870,198 | ) | (248,571,586 | ) | (266,018,794 | ) | ||||||||
Change in unrealized appreciation (depreciation) on futures | (1,886 | ) | (59,341 | ) | 19,420 | 64,643 | ||||||||||
|
|
|
|
|
|
|
| |||||||||
Net change in unrealized appreciation (depreciation) | (34,121,239 | ) | (292,929,539 | ) | (248,552,166 | ) | (265,954,151 | ) | ||||||||
|
|
|
|
|
|
|
| |||||||||
Net Realized and Unrealized (Loss) | (12,756,790 | ) | (83,076,363 | ) | (58,837,996 | ) | (30,572,386 | ) | ||||||||
|
|
|
|
|
|
|
| |||||||||
Net Decrease in Net Assets Resulting from Operations | $ | (8,700,324 | ) | $ | (60,827,521 | ) | $ | (44,874,709 | ) | $ | (21,790,280 | ) | ||||
|
|
|
|
|
|
|
| |||||||||
(1) See Note 3a and 3c in Notes to Financial Statements.
| See Notes to Financial Statements. | 61 |
Table of Contents
STATEMENTS OF CHANGES IN NET ASSETS
| Conservative Allocation Fund | Balanced Allocation Fund | |||||||||||||||
| For the Year Ended | For the Year Ended | |||||||||||||||
| 12/31/15 | 12/31/14 | 12/31/15 | 12/31/14 | |||||||||||||
Operations: | ||||||||||||||||
Net investment income | $ | 4,056,466 | $ | 3,724,789 | $ | 22,248,842 | $ | 18,140,467 | ||||||||
Net realized gain on investment securities and futures transactions | 21,364,449 | 10,499,529 | 209,853,176 | 49,001,772 | ||||||||||||
Net change in unrealized appreciation (depreciation) on investment securities and futures | (34,121,239 | ) | (9,709,249 | ) | (292,929,539 | ) | (21,985,343 | ) | ||||||||
|
|
|
|
|
|
|
| |||||||||
Net increase (decrease) in net assets resulting from operations | (8,700,324 | ) | 4,515,069 | (60,827,521 | ) | 45,156,896 | ||||||||||
|
|
|
|
|
|
|
| |||||||||
Dividends and Distributions to Shareholders: | ||||||||||||||||
Dividends from net investment income(1) | ||||||||||||||||
Institutional shares | (807,878 | ) | — | (5,045,636 | ) | — | ||||||||||
Investor shares | (3,250,907 | ) | (5,082,503 | ) | (17,231,084 | ) | (26,663,373 | ) | ||||||||
Distributions from net realized capital gains | ||||||||||||||||
Institutional shares | (4,056,696 | ) | — | (42,122,169 | ) | — | ||||||||||
Investor shares | (16,914,391 | ) | (5,814,296 | ) | (151,904,855 | ) | (42,105,899 | ) | ||||||||
|
|
|
|
|
|
|
| |||||||||
Total dividends and distributions | (25,029,872 | ) | (10,896,799 | ) | (216,303,744 | ) | (68,769,272 | ) | ||||||||
|
|
|
|
|
|
|
| |||||||||
Capital Share Transactions(2): | ||||||||||||||||
Proceeds from shares sold | ||||||||||||||||
Institutional shares | 266,742 | — | 2,393,223 | — | ||||||||||||
Investor shares | 30,769,183 | 37,399,207 | 56,861,675 | 59,860,682 | ||||||||||||
Shares issued from Merger(2) | ||||||||||||||||
Institutional shares | 75,356,677 | — | 351,418,265 | — | ||||||||||||
Reinvestment of dividends and distributions | ||||||||||||||||
Institutional shares | 4,835,687 | — | 47,033,321 | — | ||||||||||||
Investor shares | 20,157,620 | 10,890,939 | 169,071,981 | 68,739,088 | ||||||||||||
|
|
|
|
|
|
|
| |||||||||
Total proceeds from shares sold and reinvested | 131,385,909 | 48,290,146 | 626,778,465 | 128,599,770 | ||||||||||||
|
|
|
|
|
|
|
| |||||||||
Value of shares redeemed | ||||||||||||||||
Institutional shares | (1,069,297 | ) | — | (2,356,453 | ) | — | ||||||||||
Investor shares | (42,131,709 | ) | (49,683,717 | ) | (114,945,036 | ) | (101,656,659 | ) | ||||||||
|
|
|
|
|
|
|
| |||||||||
Total value of shares redeemed | (43,201,006 | ) | (49,683,717 | ) | (117,301,489 | ) | (101,656,659 | ) | ||||||||
|
|
|
|
|
|
|
| |||||||||
Net increase (decrease) from capital share transactions(3) | 88,184,903 | (1,393,571 | ) | 509,476,976 | 26,943,111 | |||||||||||
|
|
|
|
|
|
|
| |||||||||
Total increase (decrease) in net assets | 54,454,707 | (7,775,301 | ) | 232,345,711 | 3,330,735 | |||||||||||
|
|
|
|
|
|
|
| |||||||||
Net Assets: | ||||||||||||||||
Beginning of Period | 311,437,633 | 319,212,934 | 1,291,859,279 | 1,288,528,544 | ||||||||||||
|
|
|
|
|
|
|
| |||||||||
End of Period* | $ | 365,892,340 | $ | 311,437,633 | $ | 1,524,204,990 | $ | 1,291,859,279 | ||||||||
|
|
|
|
|
|
|
| |||||||||
*Including undistributed net investment income | $ | — | $ | 695 | $ | — | $ | 31,791 | ||||||||
|
|
|
|
|
|
|
| |||||||||
| (1) | For the year ended December 31, 2014, Dividends from net investment income included dividends paid from the short-term portion of capital gain distributions received from affiliated funds. From December 31, 2015 forward, the short-term portion of capital gain distributions received from affiliated funds will be included in Distributions from net realized capital gains. |
| (2) | Inception date for Institutional Class for Conservative Allocation Fund, Balanced Allocation Fund, Growth Allocation Fund and Aggressive Allocation Fund was November 23, 2015. |
| (3) | See Note 6 in Notes to Financial Statements. |
| 62 | See Notes to Financial Statements. |
Table of Contents
| Growth Allocation Fund | Aggressive Allocation Fund | |||||||||||||
| For the Year Ended | For the Year Ended | |||||||||||||
| 12/31/15 | 12/31/14 | 12/31/15 | 12/31/14 | |||||||||||
| $ | 13,963,287 | $ | 10,338,909 | $ | 8,782,106 | $ | 6,918,431 | |||||||
|
189,714,170 |
| 54,953,676 | 235,381,765 | 68,721,169 | |||||||||
|
(248,552,166 |
) | (36,968,953 | ) | (265,954,151 | ) | (46,977,084 | ) | ||||||
|
|
|
|
|
|
|
| |||||||
| (44,874,709 | ) | 28,323,632 | (21,790,280 | ) | 28,662,516 | |||||||||
|
|
|
|
|
|
|
| |||||||
| (3,245,532 | ) | — | (1,573,444 | ) | — | |||||||||
| (10,728,514 | ) | (17,351,172 | ) | (7,205,082 | ) | (13,898,214 | ) | |||||||
| (37,114,828 | ) | — | (34,895,055 | ) | — | |||||||||
| (130,178,683 | ) | (48,439,446 | ) | (164,370,097 | ) | (59,010,154 | ) | |||||||
|
|
|
|
|
|
|
| |||||||
| (181,267,557 | ) | (65,790,618 | ) | (208,043,678 | ) | (72,908,368 | ) | |||||||
|
|
|
|
|
|
|
| |||||||
| 1,175,325 | — | 616,532 | — | |||||||||||
| 34,132,116 | 36,300,427 | 25,781,773 | 24,675,504 | |||||||||||
| 258,734,195 | — | 172,531,801 | — | |||||||||||
| 40,328,502 | — | 36,455,456 | — | |||||||||||
| 140,889,511 | 65,783,344 | 171,567,547 | 72,902,702 | |||||||||||
|
|
|
|
|
|
|
| |||||||
| 475,259,649 | 102,083,771 | 406,953,109 | 97,578,206 | |||||||||||
|
|
|
|
|
|
|
| |||||||
| (2,222,874 | ) | — | (1,914,451 | ) | — | |||||||||
| (84,048,090 | ) | (76,415,769 | ) | (78,585,909 | ) | (63,169,720 | ) | |||||||
|
|
|
|
|
|
|
| |||||||
| (86,270,964 | ) | (76,415,769 | ) | (80,500,360 | ) | (63,169,720 | ) | |||||||
|
|
|
|
|
|
|
| |||||||
| 388,988,685 | 25,668,002 | 326,452,749 | 34,408,486 | |||||||||||
|
|
|
|
|
|
|
| |||||||
| 162,846,419 | (11,798,984 | ) | 96,618,791 | (9,837,366 | ) | |||||||||
|
|
|
|
|
|
|
| |||||||
| 952,102,612 | 963,901,596 | 869,725,782 | 879,563,148 | |||||||||||
|
|
|
|
|
|
|
| |||||||
| $ | 1,114,949,031 | $ | 952,102,612 | $ | 966,344,573 | $ | 869,725,782 | |||||||
|
|
|
|
|
|
|
| |||||||
| $ | — | $ | 7,199 | $ | — | $ | — | |||||||
|
|
|
|
|
|
|
| |||||||
| See Notes to Financial Statements. | 63 |
Table of Contents
FINANCIAL HIGHLIGHTS
| For a Share Outstanding For the Years Ending December 31, unless otherwise indicated | Ratios to Average Net Assets | |||||||||||||||||||||||||||||||||||||||||||||||||||
Net Value, Beginn- ing of Year | Net Invest- ment Income (1) | Capital Gain tions Received from Affiliated Funds | Realized and Unrealized Gain (Loss) on Investments | Dividends from Net Investment Income | Distribu- tions from Net Realized Capital Gains | Net Asset Value, End of Year | Total Return | Net Assets, End of Year (000) | Expenses, Net(2)(3) | Expenses, Gross(2)(4) | Invest- Income, Net (1)(3) | Portfolio Turnover Rate (5) | ||||||||||||||||||||||||||||||||||||||||
Conservative Allocation Fund
|
| |||||||||||||||||||||||||||||||||||||||||||||||||||
Institutional Class |
| |||||||||||||||||||||||||||||||||||||||||||||||||||
2015(6) | $11.51 | $0.05 | # | $0.22 | $(0.39 | ) | $(0.12 | ) | $(0.65 | ) | $10.62 | (0.99 | )% | $70,895 | 0.18 | % | 0.20 | % | 4.36 | % | 92 | % | ||||||||||||||||||||||||||||||
Investor Class |
| |||||||||||||||||||||||||||||||||||||||||||||||||||
2015 | $11.59 | $0.14 | # | $0.26 | $(0.60 | ) | $(0.12 | ) | $(0.65 | ) | $10.62 | (1.69 | )% | $294,997 | 0.27 | % | 0.33 | % | 1.22 | % | 92 | % | ||||||||||||||||||||||||||||||
2014 | 11.84 | 0.14 | # | 0.19 | (0.17 | ) | (0.19 | ) | (0.22 | ) | 11.59 | 1.40 | 311,438 | 0.12 | 0.16 | 1.17 | 20 | |||||||||||||||||||||||||||||||||||
2013 | 12.27 | 0.11 | # | 0.21 | 0.12 | (0.17 | ) | (0.70 | ) | 11.84 | 3.67 | 319,213 | 0.12 | 0.16 | 0.85 | 12 | ||||||||||||||||||||||||||||||||||||
2012 | 11.70 | 0.16 | # | 0.16 | 0.50 | (0.22 | ) | (0.03 | ) | 12.27 | 7.02 | 327,321 | 0.12 | 0.16 | 1.29 | 3 | ||||||||||||||||||||||||||||||||||||
2011 | 11.87 | 0.18 | # | 0.05 | (0.03 | ) | (0.19 | ) | (0.18 | ) | 11.70 | 1.71 | 293,236 | 0.12 | 0.17 | 1.47 | 9 | |||||||||||||||||||||||||||||||||||
Balanced Allocation Fund
|
| |||||||||||||||||||||||||||||||||||||||||||||||||||
Institutional Class |
| |||||||||||||||||||||||||||||||||||||||||||||||||||
2015(6) | $12.67 | $0.09 | # | $0.45 | $(0.77 | ) | $(0.16 | ) | $(1.58 | ) | $10.70 | (1.73 | )% | $332,327 | 0.12 | % | 0.14 | % | 7.28 | % | 95 | % | ||||||||||||||||||||||||||||||
Investor Class |
| |||||||||||||||||||||||||||||||||||||||||||||||||||
2015 | $12.89 | $0.20 | # | $0.53 | $(1.18 | ) | $(0.16 | ) | $(1.58 | ) | $10.70 | (3.43 | )% | $1,191,878 | 0.28 | % | 0.30 | % | 1.56 | % | 95 | % | ||||||||||||||||||||||||||||||
2014 | 13.14 | 0.19 | # | 0.36 | (0.09 | ) | (0.27 | ) | (0.44 | ) | 12.89 | 3.53 | 1,291,859 | 0.12 | 0.13 | 1.38 | 3 | |||||||||||||||||||||||||||||||||||
2013 | 12.73 | 0.16 | # | 0.44 | 0.68 | (0.28 | ) | (0.59 | ) | 13.14 | 10.08 | 1,288,529 | 0.12 | 0.13 | 1.23 | 27 | ||||||||||||||||||||||||||||||||||||
2012 | 11.77 | 0.19 | # | 0.22 | 0.97 | (0.27 | ) | (0.15 | ) | 12.73 | 11.79 | 1,204,869 | 0.12 | 0.13 | 1.54 | 3 | ||||||||||||||||||||||||||||||||||||
2011 | 12.12 | 0.20 | # | 0.06 | (0.14 | ) | (0.26 | ) | (0.21 | ) | 11.77 | 1.01 | 1,097,275 | 0.12 | 0.13 | 1.65 | 16 | |||||||||||||||||||||||||||||||||||
Growth Allocation Fund
|
| |||||||||||||||||||||||||||||||||||||||||||||||||||
Institutional Class |
| |||||||||||||||||||||||||||||||||||||||||||||||||||
2015(6) | $13.23 | $0.11 | # | $0.76 | $(1.20 | ) | $(0.14 | ) | $(1.93 | ) | $10.83 | (2.36 | )% | $247,746 | 0.14 | % | 0.14 | % | 8.37 | % | 97 | % | ||||||||||||||||||||||||||||||
Investor Class |
| |||||||||||||||||||||||||||||||||||||||||||||||||||
2015 | $13.43 | $0.17 | # | $0.90 | $(1.61 | ) | $(0.13 | ) | $(1.93 | ) | $10.83 | (3.83 | )% | $867,203 | 0.29 | % | 0.30 | % | 1.26 | % | 97 | % | ||||||||||||||||||||||||||||||
2014 | 14.00 | 0.15 | # | 0.54 | (0.28 | ) | (0.25 | ) | (0.73 | ) | 13.43 | 2.93 | 952,103 | 0.12 | 0.13 | 1.07 | 4 | |||||||||||||||||||||||||||||||||||
2013 | 13.04 | 0.15 | # | 0.67 | 1.57 | (0.27 | ) | (1.16 | ) | 14.00 | 18.49 | 963,902 | 0.12 | 0.13 | 1.03 | 22 | ||||||||||||||||||||||||||||||||||||
2012 | 11.60 | 0.15 | # | 0.26 | 1.30 | (0.17 | ) | (0.10 | ) | 13.04 | 14.84 | 853,233 | 0.12 | 0.13 | 1.17 | 2 | ||||||||||||||||||||||||||||||||||||
2011 | 12.28 | 0.16 | # | 0.03 | (0.49 | ) | (0.17 | ) | (0.21 | ) | 11.60 | (2.39 | ) | 783,344 | 0.12 | 0.14 | 1.26 | 10 | ||||||||||||||||||||||||||||||||||
Aggressive Allocation Fund
|
| |||||||||||||||||||||||||||||||||||||||||||||||||||
Institutional Class |
| |||||||||||||||||||||||||||||||||||||||||||||||||||
2015(6) | $14.13 | $0.12 | # | $1.10 | $(1.67 | ) | $(0.09 | ) | $(2.82 | ) | $10.77 | (2.85 | )% | $169,302 | 0.15 | % | 0.15 | % | 8.75 | % | 103 | % | ||||||||||||||||||||||||||||||
Investor Class |
| |||||||||||||||||||||||||||||||||||||||||||||||||||
2015 | $14.06 | $0.12 | # | $1.32 | $(1.82 | ) | $(0.09 | ) | $(2.82 | ) | $10.77 | (2.39 | )% | $797,043 | 0.29 | % | 0.30 | % | 0.85 | % | 103 | % | ||||||||||||||||||||||||||||||
2014 | 14.82 | 0.12 | # | 0.80 | (0.41 | ) | (0.23 | ) | (1.04 | ) | 14.06 | 3.38 | 869,726 | 0.12 | 0.13 | 0.79 | 4 | |||||||||||||||||||||||||||||||||||
2013 | 12.46 | 0.11 | # | 0.90 | 2.39 | (0.29 | ) | (0.75 | ) | 14.82 | 27.41 | 879,563 | 0.12 | 0.13 | 0.77 | 12 | ||||||||||||||||||||||||||||||||||||
2012 | 10.89 | 0.11 | # | 0.26 | 1.50 | (0.11 | ) | (0.19 | ) | 12.46 | 17.19 | 726,665 | 0.12 | 0.13 | 0.91 | 5 | ||||||||||||||||||||||||||||||||||||
2011 | 11.79 | 0.10 | # | — | † | (0.71 | ) | (0.10 | ) | (0.19 | ) | 10.89 | (5.14 | ) | 674,790 | 0.12 | 0.14 | 0.83 | 9 | |||||||||||||||||||||||||||||||||
| † | Amount represents less than $0.005 per share. |
| # | Calculated using the average shares outstanding method. |
| (1) | Recognition of net investment income by the Fund is affected by the timing of the declaration of dividends by the underlying investment companies in which the Fund invests. |
| (2) | Does not include expenses of the investment companies in which the Fund invests. |
| (3) | The ratio includes expenses waived/reimbursed net of amount recaptured and fees paid indirectly, where applicable; if expenses waived/reimbursed net of amount recaptured and fees paid indirectly were excluded, the ratio would have been higher (lower), respectively, than the ratio shown. |
| (4) | The ratio excludes expenses waived/reimbursed net of amount recaptured and fees paid indirectly, where applicable; if expenses waived/reimbursed net of amount recaptured and fees paid indirectly were included, the ratio would have been lower than the ratio shown. |
| (5) | The portfolio turnover rate for the year ended December 31, 2015 reflects rebalancing of holdings in the Funds and is not representative of a change in investment strategy for the Funds. |
| (6) | Inception date was November 23, 2015. All ratios for the period have been annualized. Total return and portfolio turnover for the period have not been annualized. |
| 64 | See Notes to Financial Statements. |
Table of Contents
FIXED INCOME SELECT FUNDS (Unaudited)
2015 – A Review
The Federal Reserve (“Fed”) raised rates in December 2015 after keeping short-term interest rates near zero along with record high levels of quantitative easing for seven years. Motivated by signs that the U.S. economy no longer requires such emergency measures of support, the Fed increased the range for the over-night lending rate by 0.25%, marking the first rate increase in nine years. By raising rates, the Fed began the process of dismantling the safety net to which investors had grown accustomed since the financial crisis.
The increase in rates was widely anticipated and investors’ response to the increase was generally calm. Yields rose across the curve in anticipation of and immediately following the announcement with the largest impact being felt in bonds with maturities of two-years to five-years. The two-year U.S. Treasury Note yield ended the year at 1.05%, the first year-end above 1.00% since 2009. Yields on longer maturity bonds, such as the 10-year U.S. Treasury Note, did not experience much movement as they tend to be driven more by inflation concerns and economic expectations. The yield on the 10-year U.S. Treasury Bond ended the year at 2.27% for an increase of only 0.10% from the end of the previous year.
Importantly, the divergence in monetary policy of the major central banks, discussed in the 2014 review, continued in 2015. After multiple years of coordinated efforts among central banks to spur economic growth through low interest rates and accommodative monetary policies, the divergence of central bank policies grew wider in 2015. In the same month that the Fed announced a rate hike, the European Central Bank announced an increase in its quantitative easing measures to generate growth and boost inflation. As a result of these divergent actions, the yield on the 2-year U.S. Treasury Note rose, the yield on its German counterpart slid further into negative territory and ended the year at -0.35%.
Performance for the year was mixed, but generally weak, with a flattening of the yield curve and widening credit spreads being the primary determinants of returns. The Barclays U.S. Aggregate Bond Index, a proxy for the broad U.S. bond market, rose slightly for the year with a gain of 0.55% on the heels of a 0.57% loss in the final quarter. Corporate bonds generally underperformed U.S. Treasuries with calendar year returns of -0.68% and 0.84%, respectively. Below investment grade corporate bonds suffered losses for the full year as the yield spread between these bonds and U.S. Treasuries widened. As a result, high yield bonds lost 4.47% in 2015 as measured by the Barclays U.S. High Yield Corporate Index. This was the first annual year decline in high yield bonds outside of a recession since the 1990s and was driven by sharply declining oil prices in the energy sector (15% of the index). Emerging markets bonds outperformed U.S. bonds with an annual return of 1.82% as measured by the JP Morgan Emerging Market Bond Index.
In general, bonds with longer durations underperformed bonds with shorter durations. Ten-year U.S. Treasuries underperformed five-year U.S. Treasuries by 0.06% in the fourth quarter and underperformed by 0.40% for the full year. The effect of duration was even more evident for 30-year U.S. Treasury Bonds. After a surprisingly strong return of 29.38% in 2014, 30-year U.S. Treasury Bonds lost 3.17% in 2015 as expectations for growth and inflation were tempered heading into the new-year.
65
Table of Contents
Barclays U.S. Aggregate Bond Index – Sector Returns (as of December 31, 2015) | ||||||||
Sector | 4Q15 | 2015 | ||||||
U.S. Treasuries | -0.94% | 0.84% | ||||||
Corporates | -0.58% | -0.68% | ||||||
Corporates – Industrials | -0.96% | -1.75% | ||||||
Corporates – Utilities | -0.66% | -1.47% | ||||||
Corporates – Financials | 0.14% | 1.51% | ||||||
Commercial Mortgage-Backed Securities | -1.24% | 0.97% | ||||||
Asset-Backed Securities | -0.57% | 1.25% | ||||||
Mortgages | -0.10% | 1.51% | ||||||
Index - TOTAL | -0.57% | 0.55% | ||||||
2016 – A Preview
Looking forward in 2016, the Fed’s Federal Open Market Committee (“FOMC”) will continue to be closely watched and the subject of much speculation. The Fed is charged with maintaining employment while keeping prices stable by managing inflation. Although we have seen a strong recovery in employment, core inflation (the Fed’s preferred measure) continues to trend significantly below their 2.00% target. Combined with concerns regarding the strength of China and the pace of global growth, the Fed will continue to dominate the financial news. Based on the forward curve at year-end, investors anticipate that the Fed will increase interest rates twice during 2016 with some market pundits forecasting more rate hikes. We believe that this is a fair estimate; however, the Fed’s actions will remain very data dependent, and thus, expectations could certainly change as the year progresses.
Volatility increased in 2015, and we expect it to continue through 2016 – particularly if global monetary policies continue to diverge and/or the Fed continues raising rates. U.S. Treasury yields will continue to have conflicting pressures - upward pressure from the projected Fed rate increases and a strengthening U.S. economy offset by downward pressure from sluggish global economic growth, strong demand for U.S. debt and a low inflationary environment. The return expectations for fixed income securities during 2016 should remain somewhat muted compared to long-term averages.
66
Table of Contents
In December 2015, the Federal Reserve (“Fed”) saw sufficient evidence of economic strength to begin moving the federal funds rate target slightly higher. With a target range of 0.25% to 0.50%, the Fed continues to maintain a very accommodative monetary policy in an effort to stimulate further economic growth and thwart any deflationary pressures. Despite the decision to move off zero, short-term rates were at historically low levels throughout the year which negatively impacted the returns available to investors.
The Federal Open Market Committee (“FOMC”) members, including Chair Janet Yellen, have continued to communicate that future rate hikes will be data dependent. Inflation pressure will likely be the primary focus of the FOMC as the employment situation has improved significantly since the end of the recession in the summer of 2009. Inflation, however, remains significantly below their target of 2.0% and economic growth has remained below the long-term trend, which gives the Fed room to be patient. Voting members of the FOMC suggest that there may be as many as three or four rate increases in 2016. The forward market, which represents the aggregate of investor expectations, suggests that the number will be closer to two increases during 2016. We believe that the Fed will continue to move slowly and cautiously regarding interest rates in a concerted effort to avoid straining the economy and to encourage lenders to generate new consumer and business loans.
Given the low interest rate environment which persisted throughout 2015, money market funds (which are lenders to borrowers at short-term interest rates) experienced another year of “just-above-zero” returns. At the end of 2015, the 90-day U.S. Treasury Bill was yielding 0.16%, although the rate was nearly zero for most of the year. The low yield environment, coupled with the regulatory constraints of Rule 2a-7 of the Investment Company Act of 1940, made it incredibly difficult for money market funds across the industry to post positive returns after paying for fund-related expenses.
The Fund was invested in a broad range of high quality, short-term money market instruments denominated exclusively in U.S. dollars. The Fund maintained a stable per share price of $1.00, while paying monthly dividends based on the daily account value. The Investor Class of the Fund returned 0.02% for the one-year period ended December 31, 2015, as compared to a 0.03% return for the Citigroup 3-Month Treasury bill Index (the benchmark index).The low rate environment made it challenging to generate a strong absolute return net of expenses. In the midst of the difficult interest rate and economic environment, the management of the Fund remained true and steadfast to its primary objectives of preservation of capital and liquidity versus sacrificing quality and taking imprudent risk in an effort to stretch for incremental yield. Stretching for yield in this environment provided an asymmetrical payoff, providing little, if any upside, while increasing the potential for a material negative return event. Throughout 2015, the Fund remained well diversified across many sectors including commercial paper, certificates of deposits, time deposits, floating rate notes and U.S. Treasuries. At year-end, the Fund’s weighted average maturity was 39 days, compared to 42 days at the end of 2014.
This Fund may be suitable for investors who have a short-term investment horizon, seek to maintain a stable dollar value for their investment and can accept a long-term rate of return that may be lower than other fixed income and stock investments.
An investment in the Fund is not insured or guaranteed by the Federal Depository Insurance Corporation or any other governmental agency. Although the Fund seeks to maintain a value of $1.00 per share, it is possible to lose money by investing in the Fund.
At December 31, 2015, the portfolio holdings of the Fund, as a percentage of net assets, is shown in the following table. Portfolio holdings are subject to risk and may change at any time.
| % | ||||
Commercial Paper | 36.1 | |||
Certificates of Deposit | 29.1 | |||
Agency Obligations | 14.6 | |||
Repurchase Agreements | 5.0 | |||
U.S. Treasury Obligations | 4.9 | |||
Time Deposits | 4.6 | |||
Municipal Bonds | 3.5 | |||
Corporate Bonds | 2.2 | |||
|
| |||
| 100.0 | ||||
|
| |||
67
Table of Contents
Money Market Fund (Unaudited)
| Average Annual Total Returns as of 12/31/15 | ||||||
Institutional Class* | Investor Class* | Benchmark** | ||||
One Year | 0.08% | 0.02% | 0.03% | |||
Five Year | 0.07% | 0.02% | 0.05% | |||
Ten Year | 1.39% | 1.27% | 1.17% | |||
Since Inception | 1.51% | 1.39% | 1.37% | |||
Inception Date | 08/27/01 | 08/27/01 | ||||
Total Fund Operating Expenses (May 1, 2015 Prospectus, as amended on | 0.17% | 0.43% | ||||
| Yield as of 12/31/15(2) | ||||
Institutional Class* | Investor Class* | |||
7-Day Annualized Yield (Net) | 0.24% | 0.01% | ||
7-Day Annualized Yield (Gross) | 0.42% | 0.42% | ||
| (1) | Current information regarding the Fund’s Operating Expenses can be found in the Financial Highlights. |
| (2) | Yield for the Money Market Fund represents the annualization of the Fund’s declared dividends over the period indicated, excluding capital gains distributions. The yield more closely reflects the current earnings of the Fund than the total return. Gross Yield reflects the yield without fee waivers in effect. |
The performance data quoted represents past performance and does not guarantee future results. Current performance may be lower or higher. Performance data current to the most recent month-end may be obtained at www.GuideStoneFunds.org. Investment return will fluctuate so that shares, when redeemed, may be worth more or less than their original cost. The yield for the Money Market Fund represents annualization of the Fund’s declared dividends over the period indicated, excluding capital gains distributions. The 7-day annualized yield more closely reflects the current earnings of the Fund than the total return.
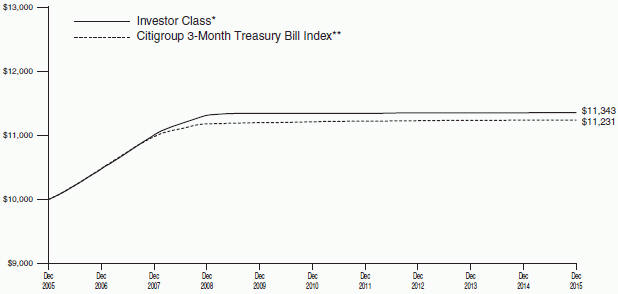
The graph compares the results of a hypothetical $10,000 investment in the Investor Class of the Fund for the 10-year period from December 31, 2005 to December 31, 2015, with all dividends and capital gains reinvested, with the Citigroup 3-Month Treasury Bill Index.
*These performance figures reflect expense waivers by the Fund’s investment adviser. Without these waivers, performance would have been lower. Performance figures shown do not reflect the deduction of taxes that a shareholder would pay on Fund distributions or the redemption of Fund shares.
Unlike a mutual fund, the performance of an index assumes no taxes, transaction costs, management fees or other expenses.
68
Table of Contents
MONEY MARKET FUND | ||
SCHEDULE OF INVESTMENTS | December 31, 2015 |
| Par | Value | |||||||||
AGENCY OBLIGATIONS — 14.6% |
| |||||||||
Federal Farm Credit Bank | ||||||||||
0.43%, 09/12/17† | $ | 6,400,000 | $ | 6,402,081 | ||||||
0.42%, 09/22/17† | 18,000,000 | 17,998,431 | ||||||||
0.41%, 09/25/17† | 15,000,000 | 14,994,896 | ||||||||
Federal Home Loan Bank | ||||||||||
0.26%, 07/06/16† | 12,000,000 | 12,000,000 | ||||||||
0.23%, 02/14/17† | 17,000,000 | 16,990,202 | ||||||||
Federal Home Loan Bank Discount Notes | ||||||||||
0.12%, 01/22/16 | 40,000,000 | 39,997,200 | ||||||||
0.36%, 02/11/16 | 15,000,000 | 14,993,850 | ||||||||
0.42%, 03/10/16 | 25,000,000 | 24,979,875 | ||||||||
0.59%, 06/03/16 | 9,590,000 | 9,565,796 | ||||||||
Federal Home Loan Mortgage Corporation | ||||||||||
0.46%, 04/27/17† | 10,000,000 | 9,997,311 | ||||||||
Federal National Mortgage Association | ||||||||||
0.35%, 08/16/17† | 15,000,000 | 14,997,536 | ||||||||
0.28%, 10/05/17† | 5,500,000 | 5,498,521 | ||||||||
|
| |||||||||
Total Agency Obligations | 188,415,699 | |||||||||
|
| |||||||||
CERTIFICATES OF DEPOSIT — 29.1% |
| |||||||||
Bank of Nova Scotia Houston | ||||||||||
0.48%, 04/14/16 | 25,000,000 | 25,000,000 | ||||||||
BMO Harris Bank NA | ||||||||||
0.47%, 03/04/16† | 24,000,000 | 24,000,000 | ||||||||
0.63%, 04/27/16† | 35,000,000 | 35,000,000 | ||||||||
BNP Paribas Finance, Inc. | ||||||||||
0.53%, 03/16/16 | 13,000,000 | 13,000,000 | ||||||||
Citibank NA | ||||||||||
0.44%, 01/20/16 | 25,000,000 | 25,000,000 | ||||||||
KBC Bank NV | ||||||||||
0.29%, 01/05/16 | 20,000,000 | 20,000,000 | ||||||||
Mitsubishi UFJ Trust & Banking Corporation | ||||||||||
0.36%, 01/04/16† | 14,000,000 | 14,000,000 | ||||||||
0.30%, 01/29/16 | 20,000,000 | 20,000,000 | ||||||||
Rabobank Nederland NY | ||||||||||
0.53%, 03/18/16† | 20,000,000 | 20,000,000 | ||||||||
Skandinaviska Enskilda Banken AB | ||||||||||
0.47%, 02/11/16† | 31,000,000 | 31,001,368 | ||||||||
0.60%, 02/29/16† | 19,000,000 | 19,000,000 | ||||||||
State Street Corporation | ||||||||||
0.59%, 03/29/16 | 30,000,000 | 30,000,000 | ||||||||
Sumitomo Mitsui Banking Corporation | ||||||||||
0.29%, 01/11/16 | 10,000,000 | 10,000,000 | ||||||||
0.51%, 04/08/16 | 28,500,000 | 28,500,000 | ||||||||
Sumitomo Mitsui Trust Bank, Ltd. | ||||||||||
0.49%, 01/04/16† | 12,000,000 | 12,000,000 | ||||||||
0.36%, 01/05/16 | 20,000,000 | 20,000,000 | ||||||||
Toronto-Dominion Bank NY | ||||||||||
0.55%, 04/15/16 | 8,000,000 | 8,000,000 | ||||||||
0.60%, 04/20/16 | 20,000,000 | 20,000,000 | ||||||||
|
| |||||||||
Total Certificates of Deposit |
| 374,501,368 | ||||||||
|
| |||||||||
| Par | Value | |||||||||
COMMERCIAL PAPER — 36.1% |
| |||||||||
Antalis SA | ||||||||||
0.40%, 01/07/16 144A | $ | 37,000,000 | $ | 36,997,533 | ||||||
Barton Capital LLC | ||||||||||
0.35%, 01/06/16 144A | 23,000,000 | 22,998,882 | ||||||||
BNP Paribas Finance, Inc. | ||||||||||
0.20%, 01/04/16 | 23,000,000 | 22,999,617 | ||||||||
Caisse Centrale Desjaudins Du Quebec | ||||||||||
0.37%, 01/06/16 144A | 40,000,000 | 39,997,944 | ||||||||
Caisse des Depots et Consignations | ||||||||||
0.50%, 02/01/16 144A | 25,000,000 | 24,989,236 | ||||||||
Chariot Funding LLC | ||||||||||
0.50%, 02/18/16 144A | 21,600,000 | 21,585,600 | ||||||||
Charta LLC | ||||||||||
0.35%, 01/04/16 144A | 15,000,000 | 14,999,562 | ||||||||
Collateralized Commercial Paper Co. LLC | ||||||||||
0.50%, 04/22/16 | 10,000,000 | 9,984,444 | ||||||||
0.48%, 04/25/16 | 35,000,000 | 34,946,333 | ||||||||
Credit Suisse AG | ||||||||||
0.42%, 01/04/16 144A | 9,000,000 | 8,999,685 | ||||||||
Erste Abwicklungsanstalt | ||||||||||
0.45%, 02/09/16 144A† | 8,000,000 | 8,000,000 | ||||||||
Jupiter Securitization Company LLC | ||||||||||
0.45%, 01/14/16 144A | 15,000,000 | 14,997,563 | ||||||||
Kells Funding LLC | ||||||||||
0.40%, 02/23/16 144A | 15,000,000 | 14,991,167 | ||||||||
LMA Americas LLC | ||||||||||
0.40%, 01/04/16 144A | 10,000,000 | 9,999,708 | ||||||||
National Australia Bank, Ltd. | ||||||||||
0.72%, 04/21/16 144A | 15,000,000 | 14,966,700 | ||||||||
Nieuw Amsterdam Receivables Corporation | ||||||||||
0.50%, 02/04/16 144A | 10,000,000 | 9,995,278 | ||||||||
0.70%, 03/18/16 144A | 15,000,000 | 14,977,542 | ||||||||
Old Line Funding LLC | ||||||||||
0.50%, 03/03/16 144A | 10,000,000 | 9,991,389 | ||||||||
0.48%, 03/21/16 144A | 20,000,000 | 19,978,667 | ||||||||
0.47%, 04/04/16 144A | 13,000,000 | 12,984,046 | ||||||||
Sumitomo Mitsui Banking Corporation | ||||||||||
0.30%, 01/07/16 144A | 15,000,000 | 14,999,250 | ||||||||
Victory Receivables Corporation | ||||||||||
0.35%, 01/04/16 | 40,130,000 | 40,128,830 | ||||||||
0.50%, 01/19/16 | 15,000,000 | 14,996,250 | ||||||||
Westpac Banking Corporation | ||||||||||
0.37%, 04/04/16 144A† | 17,000,000 | 17,000,000 | ||||||||
Working Captial Management | ||||||||||
0.38%, 01/06/16 144A | 8,000,000 | 7,999,578 | ||||||||
|
| |||||||||
Total Commercial Paper |
| 464,504,804 | ||||||||
|
| |||||||||
CORPORATE BONDS — 2.2% |
| |||||||||
Jets Stadium Development LLC | ||||||||||
0.40%, 01/07/16 144A† | 4,900,000 | 4,900,000 | ||||||||
Jets Stadium Finance Issuer 2015 LLC | ||||||||||
0.40%, 01/07/16 144A† | 23,000,000 | 23,000,000 | ||||||||
|
| |||||||||
Total Corporate Bonds | 27,900,000 | |||||||||
|
| |||||||||
| See Notes to Financial Statements. | 69 |
Table of Contents
MONEY MARKET FUND
SCHEDULE OF INVESTMENTS (Continued)
| Par | Value | |||||||||
MUNICIPAL BONDS — 3.5% | ||||||||||
California Statewide Communities Development Authority, Kimberly Woods Apartments, Revenue Bond, Series B | ||||||||||
0.02%, 01/07/16† | $ | 17,100,000 | $ | 17,100,000 | ||||||
Maryland Community Development Administration, Multifamily Barrington Apartments, Revenue Bond, Series A | ||||||||||
0.03%, 01/07/16† | 27,575,000 | 27,575,000 | ||||||||
|
| |||||||||
Total Municipal Bonds | 44,675,000 | |||||||||
|
| |||||||||
TIME DEPOSITS — 4.6% | ||||||||||
Credit Argicole Corporation | ||||||||||
0.25%, 01/04/16 | 17,500,000 | 17,500,000 | ||||||||
ING Bank NV | ||||||||||
0.37%, 01/05/16 | 7,000,000 | 7,000,000 | ||||||||
Natixis SA | ||||||||||
0.26%, 01/04/16 | 35,000,000 | 35,000,000 | ||||||||
|
| |||||||||
Total Time Deposits | 59,500,000 | |||||||||
|
| |||||||||
U.S. TREASURY OBLIGATIONS — 4.9% |
| |||||||||
U.S. Treasury Bills | ||||||||||
0.35%, 05/26/16 | 19,000,000 | 18,973,339 | ||||||||
0.35%, 06/16/16 | 28,000,000 | 27,923,950 | ||||||||
|
| |||||||||
| 46,897,289 | ||||||||||
|
| |||||||||
U.S. Treasury Notes | ||||||||||
0.50%, 07/31/16 | 15,000,000 | 14,987,408 | ||||||||
0.43%, 10/31/17† | 1,663,200 | 1,658,223 | ||||||||
|
| |||||||||
| 16,645,631 | ||||||||||
|
| |||||||||
Total U.S. Treasury Obligations | 63,542,920 | |||||||||
|
| |||||||||
| Par | Value | |||||||||
REPURCHASE AGREEMENTS — 5.0% |
| |||||||||
Bank of Nova Scotia (The) | ||||||||||
0.29% (dated 12/31/15, due 01/04/16, repurchase price $12,500,403, collateralized by U.S. Treasury Note and U.S. Treasury Bill, 0.000% to 0.125, due 06/09/16 to 07/15/22, total market value $12,750,072) | $ | 12,500,000 | $ | 12,500,000 | ||||||
Goldman Sachs & Co. | ||||||||||
0.32% (dated 12/31/15, due 01/04/16, repurchase price $40,001,422, collateralized by Federal National Mortgage Association and Federal Home Loan Mortgage Corporation, 2.550% to 4.000, due 03/01/23 to 12/01/34, total market value $41,200,000) | 40,000,000 | 40,000,000 | ||||||||
RBC Capital Markets LLC | ||||||||||
0.26% (dated 12/31/15, due 01/04/16, repurchase price $12,000,347, collateralized by U.S. Treasuty Notes, 0.375% to 5.250, due 08/15/20 to 02/15/29, total market value $12,240,067) | 12,000,000 | 12,000,000 | ||||||||
|
| |||||||||
Total Repurchase Agreements |
| 64,500,000 | ||||||||
|
| |||||||||
TOTAL INVESTMENTS — 100.0% |
| |||||||||
(Cost $1,287,539,791) | 1,287,539,791 | |||||||||
Liabilities in Excess of Other Assets — 0.0% | (237,191 | ) | ||||||||
|
| |||||||||
NET ASSETS — 100.0% | $ | 1,287,302,600 | ||||||||
|
| |||||||||
VALUATION HIERARCHY
The following is a summary of the inputs used, as of December 31, 2015, in valuing the Fund’s investments carried at fair value:
| Total Value | Level 1 Quoted Prices | Level 2 Other Significant Observable Inputs | Level 3 Significant Unobservable Inputs | |||||||||||||||||
Assets: | ||||||||||||||||||||
Investments in Securities: | ||||||||||||||||||||
Agency Obligations | $ | 188,415,699 | $ | — | $ | 188,415,699 | $ | — | ||||||||||||
Certificates of Deposit | 374,501,368 | — | 374,501,368 | — | ||||||||||||||||
Commercial Paper | 464,504,804 | — | 464,504,804 | — | ||||||||||||||||
Corporate Bonds | 27,900,000 | — | 27,900,000 | — | ||||||||||||||||
Municipal Bonds | 44,675,000 | — | 44,675,000 | — | ||||||||||||||||
Repurchase Agreements | 64,500,000 | — | 64,500,000 | — | ||||||||||||||||
Time Deposits | 59,500,000 | — | 59,500,000 | — | ||||||||||||||||
U.S. Treasury Obligations | 63,542,920 | — | 63,542,920 | — | ||||||||||||||||
|
|
|
|
|
|
|
| |||||||||||||
Total Assets - Investments in Securities | $ | 1,287,539,791 | $ | — | $ | 1,287,539,791 | $ | — | ||||||||||||
|
|
|
|
|
|
|
| |||||||||||||
| 70 | See Notes to Financial Statements. |
Table of Contents
Low-Duration Bond Fund (Unaudited)
The Fund invested in a diversified portfolio composed primarily of investment grade fixed income securities with an average dollar-weighted duration (a measure of bond prices’ sensitivity to changes in interest rates) normally between one to three years. The Investor Class of the Fund slightly underperformed its all-U.S. Treasury benchmark index, the Bank of America Merrill Lynch 1-3 Year Treasury Index, for the one-year period ended December 31, 2015 (0.49% versus 0.54%). This was only the second year in which the Fund did not outperform the index since the financial crisis in 2008. In an effort to outpace its benchmark index, the Fund tactically utilized spread sectors (such as investment grade corporates, mortgage-backed securities and asset-backed securities) that traded at a yield premium relative to their U.S. Treasury counterparts. The strategy of overweighting non-U.S. Treasuries sectors, particularly investment grade corporate bonds, detracted value relative to the benchmark, most notably during the third quarter of the year, a period that experienced spread widening due to elevated market volatility and fears regarding rate hikes and slowing economic growth outside of the United States. The Fund’s relative yield advantage versus the benchmark was a positive to relative returns.
Other strategies involving derivatives were utilized during the year resulting in an overall modest impact to performance. U.S. Treasury futures were used for the common purposes of duration management and yield curve positioning strategies. Over the course of the calendar year, these positions had a minimal impact on relative performance. Credit default swaps were utilized which slightly improved the Fund’s relative performance during the year as spreads widened within the corporate bond sector during the period the positions were held. In an effort to gain exposure to non-U.S. interest rates and duration, interest rate swaps were utilized and detracted modestly from relative performance. Currency forward contracts were used to hedge certain non-U.S. dollar positions. On an overall net basis, the currency strategies modestly benefitted relative performance.
During the year, the Fund remained true to its overall objective of seeking current income consistent with conservation of capital.
This Fund may be suitable for investors who have a short-term investment horizon, seek an investment return that is relatively stable and want to diversify their portfolio with a fixed income investment option. This Fund is subject to interest rate risk. Meaning, when interest rates rise, the value of the existing bonds decrease and vice versa. Changes in interest rates have a bigger impact on long duration holdings than on short duration holdings. To the extent that the investment adviser misjudges current market conditions, the Fund’s volatility may be amplified by its use of derivatives and by its ability to select sub-advisers to allocate assets. Some derivatives may increase the risk of loss and cause fluctuations in the market value of the Fund’s portfolio to have disproportionately large effects or cause the net asset value of the Fund generally to decline faster than it would otherwise. The use of certain derivatives may also have a leveraging effect which may increase the volatility of the Fund and may reduce its returns. It is possible to lose money by investing in the Fund.
At December 31, 2015, the portfolio holdings of the Fund, as a percentage of net assets, is shown in the following table. Portfolio holdings are subject to risk and may change at any time.
| % | ||||
Corporate Bonds | 28.6 | |||
U.S. Treasury Obligations | 26.9 | |||
Mortgage-Backed Securities | 15.9 | |||
Foreign Bonds | 13.0 | |||
Asset-Backed Securities | 11.8 | |||
Money Market Funds | 7.4 | |||
Municipal Bonds | 1.3 | |||
Agency Obligations | 0.7 | |||
Loan Agreements | 0.1 | |||
Purchased Options | — | ** | ||
Written Options | (0.1 | ) | ||
|
| |||
| 105.6 | ||||
|
| |||
| **Rounds to less than 0.005% |
71
Table of Contents
Low-Duration Bond Fund (Unaudited)
| Average Annual Total Returns as of 12/31/15 | ||||||
Institutional Class* | Investor Class* | Benchmark** | ||||
One Year | 0.79% | 0.49% | 0.54% | |||
Five Year | 1.61% | 1.39% | 0.70% | |||
Ten Year | 3.14% | 2.95% | 2.42% | |||
Since Inception | 3.10% | 2.95% | 2.58% | |||
Inception Date | 08/27/01 | 08/27/01 | ||||
Total Fund Operating Expenses (May 1, 2015 Prospectus, as amended on June 1, 2015)(1) | 0.41% | 0.66% | ||||
(1)Current information regarding the Fund’s Operating Expenses can be found in the Financial Highlights.
The performance data quoted represents past performance and does not guarantee future results. Current performance may be lower or higher. Performance data current to the most recent month-end may be obtained at www.GuideStoneFunds.org. The investment return and principal value of an investment will fluctuate so that shares, when redeemed, may be worth more or less than their original cost.
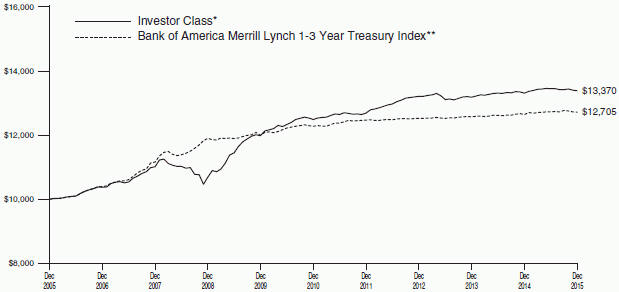
The graph compares the results of a hypothetical $10,000 investment in the Investor Class of the Fund for the 10-year period from December 31, 2005 to December 31, 2015, with all dividends and capital gains reinvested, with the Bank of America Merrill Lynch 1-3 Year Treasury Index.
*These returns reflect expense waivers by the Fund’s investment adviser. Without these waivers, returns would have been lower. Returns shown do not reflect the deduction of taxes that a shareholder would pay on Fund distributions or the redemption of Fund shares.
Unlike a mutual fund, the performance of an index assumes no taxes, transaction costs, management fees or other expenses.
72
Table of Contents
LOW-DURATION BOND FUND | ||||
SCHEDULE OF INVESTMENTS | December 31, 2015 |
| Par | Value | |||||||||||
AGENCY OBLIGATIONS — 0.7% |
| |||||||||||
Federal Home Loan Bank | ||||||||||||
0.75%, 08/28/17 | $ | 2,730,000 | $ | 2,716,978 | ||||||||
Federal National Mortgage Association | ||||||||||||
1.38%, 04/27/18 | 3,300,000 | 3,294,218 | ||||||||||
|
| |||||||||||
Total Agency Obligations | 6,011,196 | |||||||||||
|
| |||||||||||
ASSET-BACKED SECURITIES — 11.8% |
| |||||||||||
ABCLO, Ltd. | ||||||||||||
0.67%, 04/15/21 144A† | 93,761 | 93,743 | ||||||||||
ACAS CLO, Ltd. | ||||||||||||
0.55%, 04/20/21 144A† | 544,940 | 539,237 | ||||||||||
Aircraft Lease Securitisation, Ltd. | ||||||||||||
0.53%, 05/10/32 144A† | 133,620 | 131,949 | ||||||||||
Ally Master Owner Trust | ||||||||||||
0.78%, 04/15/18† | 1,400,000 | 1,399,300 | ||||||||||
American Express Credit | ||||||||||||
0.98%, 05/15/19 | 2,250,000 | 2,247,999 | ||||||||||
AmeriCredit Automobile | ||||||||||||
1.31%, 11/08/17 | 145,452 | 145,456 | ||||||||||
AmeriCredit Automobile | ||||||||||||
1.19%, 05/08/18 | 785,000 | 784,391 | ||||||||||
1.79%, 03/08/19 | 980,000 | 980,855 | ||||||||||
AmeriCredit Automobile | ||||||||||||
1.66%, 09/10/18 | 500,000 | 499,918 | ||||||||||
AmeriCredit Automobile | ||||||||||||
2.15%, 03/09/20 | 825,000 | 821,841 | ||||||||||
Apidos CDO V | ||||||||||||
0.55%, 04/15/21 144A† | 454,438 | 450,420 | ||||||||||
Apidos CDO XIV | ||||||||||||
1.47%, 04/15/25 144A† | 2,090,000 | 2,047,339 | ||||||||||
2.02%, 04/15/25 144A† | 250,000 | 237,536 | ||||||||||
ARES XXVI CLO, Ltd. | ||||||||||||
1.42%, 04/15/25 144A† | 515,000 | 506,226 | ||||||||||
Asset-Backed Securities | ||||||||||||
0.97%, 09/25/34† | 1,497 | 1,497 | ||||||||||
Atrium CDO Corporation | ||||||||||||
1.46%, 11/16/22 144A† | 821,648 | 818,291 | ||||||||||
Avalon IV Capital, Ltd. | ||||||||||||
1.49%, 04/17/23 144A† | 1,038,780 | 1,035,108 | ||||||||||
| Par | Value | |||||||||||
BA Credit Card Trust | ||||||||||||
0.71%, 06/15/21† | $ | 1,110,000 | $ | 1,108,081 | ||||||||
Babson CLO, Inc. | ||||||||||||
0.54%, 01/18/21 144A† | 622,363 | 614,950 | ||||||||||
Babson CLO, Ltd. | ||||||||||||
1.42%, 04/20/25 144A† | 1,200,000 | 1,175,332 | ||||||||||
Babson CLO, Ltd. | ||||||||||||
3.17%, 04/20/27 144A† | 600,000 | 587,114 | ||||||||||
Bear Stearns Asset-Backed | ||||||||||||
0.87%, 12/25/42† | 92,226 | 91,392 | ||||||||||
Bear Stearns Asset-Backed | ||||||||||||
1.42%, 10/25/37† | 654,420 | 603,900 | ||||||||||
BlueMountain CLO, Ltd. | ||||||||||||
1.64%, 07/20/23 144A† | 2,000,000 | 1,992,472 | ||||||||||
Cabela’s Credit Card Master | ||||||||||||
2.26%, 03/15/23 | 950,000 | 940,303 | ||||||||||
Capital Auto Receivables | ||||||||||||
1.29%, 04/20/18 | 260,000 | 259,384 | ||||||||||
1.74%, 10/22/18 | 270,000 | 269,749 | ||||||||||
Capital One Multi-Asset | ||||||||||||
2.08%, 03/15/23 | 1,000,000 | 990,932 | ||||||||||
Cent CLO 18, Ltd. | ||||||||||||
1.44%, 07/23/25 144A† | 1,400,000 | 1,377,320 | ||||||||||
CenterPoint Energy Transition | ||||||||||||
0.90%, 04/15/18 | 486,832 | 485,501 | ||||||||||
Chase Issuance Trust | ||||||||||||
1.59%, 02/18/20 | 2,725,000 | 2,724,620 | ||||||||||
CIFC Funding 2015-II, Ltd. | ||||||||||||
3.32%, 04/15/27 144A† | 700,000 | 674,246 | ||||||||||
Citibank Credit Card | ||||||||||||
5.65%, 09/20/19 | 3,500,000 | 3,738,908 | ||||||||||
Citibank Credit Card | ||||||||||||
1.02%, 02/22/19 | 2,600,000 | 2,593,771 | ||||||||||
Colony American Homes | ||||||||||||
1.40%, 05/17/31 144A† | 556,164 | 544,769 | ||||||||||
Colony American Homes | ||||||||||||
1.37%, 07/17/31 144A† | 835,983 | 814,484 | ||||||||||
Conseco Financial Corporation | ||||||||||||
6.04%, 11/01/29 | 3,856 | 3,921 | ||||||||||
| See Notes to Financial Statements. | 73 |
Table of Contents
LOW-DURATION BOND FUND
SCHEDULE OF INVESTMENTS (Continued)
Par | Value | |||||||||||
Credit Acceptance | ||||||||||||
2.00%, 07/15/22 144A | $ | 1,140,000 | $ | 1,130,924 | ||||||||
Credit-Based Asset Servicing and Securitization LLC | ||||||||||||
0.88%, 05/25/35† | 73,372 | 73,269 | ||||||||||
Crusade ABS Trust | ||||||||||||
3.06%, 07/12/23(A)† | 425,703 | 310,963 | ||||||||||
CSAB Mortgage-Backed Trust | ||||||||||||
5.72%, 09/25/36 STEP | 482,122 | 321,281 | ||||||||||
Dell Equipment Finance Trust | ||||||||||||
1.36%, 06/22/20 144A | 900,000 | 897,038 | ||||||||||
Drive Auto Receivables Trust | ||||||||||||
2.28%, 06/17/19 144A | 2,710,000 | 2,705,668 | ||||||||||
Drug Royalty II LP 2 | ||||||||||||
3.14%, 07/15/23 144A†@ | 241,112 | 243,959 | ||||||||||
Dryden XXII Senior | ||||||||||||
1.49%, 01/15/22 144A† | 1,128,916 | 1,125,605 | ||||||||||
Dryden XXV Senior | ||||||||||||
1.70%, 01/15/25 144A† | 800,000 | 794,703 | ||||||||||
Dryden XXVI Senior | ||||||||||||
1.42%, 07/15/25 144A† | 400,000 | 392,316 | ||||||||||
Dryden XXVIII Senior | ||||||||||||
1.46%, 08/15/25 144A† | 930,000 | 916,582 | ||||||||||
1.91%, 08/15/25 144A† | 1,175,000 | 1,126,873 | ||||||||||
Dryden XXXI Senior | ||||||||||||
3.17%, 04/18/26 144A† | 675,000 | 650,086 | ||||||||||
FHLMC Structured | ||||||||||||
0.68%, 08/25/31† | 490,330 | 480,523 | ||||||||||
Flatiron CLO, Ltd. | ||||||||||||
1.87%, 01/15/23 144A† | 700,000 | 697,349 | ||||||||||
GCAT Series 2015-2 | ||||||||||||
3.75%, 07/25/20 STEP 144A | 457,211 | 453,221 | ||||||||||
GoldenTree Loan Opportunities | ||||||||||||
1.47%, 04/25/25 144A† | 500,000 | 489,591 | ||||||||||
Great America Leasing | ||||||||||||
1.83%, 06/17/19 144A | 325,000 | 324,133 | ||||||||||
IFC SBA Loan-Backed | ||||||||||||
1.25%, 01/15/24 144A† | 74,392 | 74,207 | ||||||||||
| Par | Value | |||||||||||
Invitation Homes Trust | ||||||||||||
1.45%, 12/17/30 144A† | $ | 762,836 | $ | 747,615 | ||||||||
Invitation Homes Trust | ||||||||||||
1.35%, 06/17/31 144A† | 2,420,000 | 2,368,111 | ||||||||||
Invitation Homes Trust | ||||||||||||
1.45%, 09/17/31 144A† | 1,500,000 | 1,472,233 | ||||||||||
JP Morgan Mortgage | ||||||||||||
1.16%, 07/25/35† | 3,143 | 3,141 | ||||||||||
JP Morgan Mortgage | ||||||||||||
0.60%, 02/25/36† | 356,935 | 341,961 | ||||||||||
Kubota Credit Owner | ||||||||||||
0.94%, 12/15/17 144A | 1,021,023 | 1,019,090 | ||||||||||
LA Arena Funding LLC | ||||||||||||
7.66%, 12/15/26 144A | 225,237 | 247,971 | ||||||||||
LCM XII LP Series 12A | ||||||||||||
1.58%, 10/19/22 144A† | 1,190,000 | 1,184,368 | ||||||||||
Madison Park Funding XVII, | ||||||||||||
3.18%, 07/21/27 144A† | 400,000 | 389,898 | ||||||||||
MMAF Equipment | ||||||||||||
2.10%, 07/15/17 144A | 323,501 | 324,261 | ||||||||||
Navient Private Education | ||||||||||||
1.03%, 09/16/24 144A† | 192,812 | 190,416 | ||||||||||
North Texas Higher Education | ||||||||||||
1.71%, 04/01/40† | 265,404 | 264,178 | ||||||||||
Octagon Investment | ||||||||||||
1.84%, 04/15/26 144A† | 865,000 | 856,155 | ||||||||||
2.32%, 04/15/26 144A† | 905,000 | 873,948 | ||||||||||
OneMain Financial | ||||||||||||
2.47%, 09/18/24 144A | 2,605,000 | 2,599,868 | ||||||||||
OneMain Financial | ||||||||||||
3.19%, 03/18/26 144A | 2,300,000 | 2,290,570 | ||||||||||
OneMain Financial Issuance Trust | ||||||||||||
2.57%, 07/18/25 144A | 3,475,000 | 3,489,117 | ||||||||||
Option One Mortgage Loan Trust | ||||||||||||
0.68%, 11/25/35† | 609,814 | 604,879 | ||||||||||
OZLM Funding III, Ltd. | ||||||||||||
1.65%, 01/22/25 144A† | 500,000 | 495,442 | ||||||||||
Progress Residential | ||||||||||||
1.76%, 02/17/32 144A† | 465,000 | 458,870 | ||||||||||
| 74 | See Notes to Financial Statements. |
Table of Contents
| Par | Value | |||||||||||
Santander Drive Auto Receivables Trust | ||||||||||||
3.01%, 04/16/18 | $ | 454,643 | $ | 456,024 | ||||||||
Santander Drive Auto Receivables Trust | ||||||||||||
2.94%, 12/15/17 | 642,933 | 645,840 | ||||||||||
Santander Drive Auto Receivables Trust | ||||||||||||
2.70%, 08/15/18 | 225,035 | 225,940 | ||||||||||
Santander Drive Auto Receivables Trust | ||||||||||||
1.94%, 03/15/18 | 145,772 | 146,018 | ||||||||||
Santander Drive Auto Receivables Trust | ||||||||||||
1.78%, 11/15/18 144A | 1,642,196 | 1,644,696 | ||||||||||
Santander Drive Auto Receivables Trust | ||||||||||||
1.76%, 01/15/19 | 1,690,000 | 1,691,884 | ||||||||||
Santander Drive Auto Receivables Trust | ||||||||||||
3.12%, 10/15/19 144A | 1,025,000 | 1,036,763 | ||||||||||
Santander Drive Auto Receivables Trust | ||||||||||||
2.60%, 11/16/20 | 1,350,000 | 1,352,269 | ||||||||||
Securitized Asset-Backed Receivables LLC Trust | ||||||||||||
0.79%, 10/25/35† | 2,800,000 | 2,704,894 | ||||||||||
SLC Student Loan Trust | ||||||||||||
0.61%, 09/15/26† | 1,500,000 | 1,441,299 | ||||||||||
SLM Private Credit Student Loan Trust | ||||||||||||
0.91%, 03/15/22† | 244,018 | 239,594 | ||||||||||
SLM Private Credit Student Loan Trust | ||||||||||||
0.71%, 06/15/21† | 274,352 | 271,867 | ||||||||||
SLM Private Credit Student Loan Trust | ||||||||||||
0.71%, 06/15/23† | 1,276,029 | 1,227,366 | ||||||||||
SLM Private Education Loan Trust | ||||||||||||
3.58%, 05/16/44 144A† | 1,710,985 | 1,766,680 | ||||||||||
SLM Private Education Loan Trust | ||||||||||||
1.73%, 12/15/23 144A† | 35,751 | 35,755 | ||||||||||
SLM Private Education Loan Trust | ||||||||||||
1.43%, 08/15/23 144A† | 246,406 | 246,562 | ||||||||||
SLM Private Education Loan Trust | ||||||||||||
1.18%, 02/15/22 144A† | 509,443 | 509,544 | ||||||||||
| Par | Value | |||||||||||
SLM Private Education Loan Trust | ||||||||||||
1.48%, 01/15/26 144A† | $ | 1,245,000 | $ | 1,236,832 | ||||||||
2.59%, 01/15/26 144A | 555,000 | 552,084 | ||||||||||
SoFi Professional Loan Program LLC | ||||||||||||
1.62%, 03/25/33 144A† | 1,071,023 | 1,068,401 | ||||||||||
SoFi Professional Loan Program LLC | ||||||||||||
2.72%, 10/27/36 144A | 1,075,000 | 1,067,838 | ||||||||||
Springleaf Funding Trust | ||||||||||||
3.16%, 11/15/24 144A | 1,045,000 | 1,037,543 | ||||||||||
Structured Asset Securities Corporation Mortgage Loan Trust | ||||||||||||
1.74%, 04/25/35† | 503,280 | 478,209 | ||||||||||
Symphony CLO VIII, LP | ||||||||||||
1.42%, 01/09/23 144A† | 1,638,772 | 1,638,323 | ||||||||||
Symphony CLO XV, Ltd. | ||||||||||||
1.77%, 10/17/26 144A† | 2,650,000 | 2,627,441 | ||||||||||
Synchrony Credit Card Master Note Trust | ||||||||||||
1.60%, 04/15/21 | 1,500,000 | 1,488,932 | ||||||||||
Trade MAPS 1, Ltd. | ||||||||||||
0.99%, 12/10/18 144A† | 1,500,000 | 1,490,471 | ||||||||||
Tryon Park CLO, Ltd. | ||||||||||||
1.41%, 07/15/25 144A† | 500,000 | 492,245 | ||||||||||
1.44%, 07/15/25 144A† | 1,270,000 | 1,250,302 | ||||||||||
1.85%, 07/15/25 144A† | 1,175,000 | 1,120,501 | ||||||||||
U.S. Small Business Administration | ||||||||||||
6.95%, 11/01/16 | 21,035 | 21,339 | ||||||||||
Venture XVII CLO, Ltd. | ||||||||||||
3.17%, 07/15/26 144A† | 360,000 | 339,606 | ||||||||||
World Financial Network Credit Card Master Trust | ||||||||||||
0.81%, 02/15/22† | 1,190,000 | 1,182,808 | ||||||||||
World Omni Master Owner Trust | ||||||||||||
0.68%, 02/15/18 144A† | 750,000 | 749,873 | ||||||||||
|
| |||||||||||
Total Asset-Backed Securities | 101,248,381 | |||||||||||
|
| |||||||||||
| See Notes to Financial Statements. | 75 |
Table of Contents
LOW-DURATION BOND FUND
SCHEDULE OF INVESTMENTS (Continued)
| Par | Value | |||||||||||
CORPORATE BONDS — 28.6% |
| |||||||||||
AbbVie, Inc. | ||||||||||||
1.75%, 11/06/17 | $ | 1,130,000 | $ | 1,128,313 | ||||||||
1.80%, 05/14/18D | 870,000 | 866,491 | ||||||||||
2.50%, 05/14/20 | 1,000,000 | 990,961 | ||||||||||
AES Corporation | ||||||||||||
3.41%, 06/01/19† | 900,000 | 828,000 | ||||||||||
Air Lease Corporation | ||||||||||||
4.50%, 01/15/16D | 1,200,000 | 1,200,780 | ||||||||||
2.63%, 09/04/18 | 940,000 | 929,153 | ||||||||||
Ally Financial, Inc. | ||||||||||||
2.75%, 01/30/17D | 1,400,000 | 1,400,000 | ||||||||||
5.50%, 02/15/17 | 1,500,000 | 1,548,750 | ||||||||||
3.25%, 09/29/17D | 810,000 | 811,012 | ||||||||||
American Express Credit Corporation | ||||||||||||
1.13%, 06/05/17 | 630,000 | 627,227 | ||||||||||
1.08%, 03/18/19† | 4,900,000 | 4,846,590 | ||||||||||
American Honda Finance Corpoiration | ||||||||||||
1.60%, 07/13/18 | 1,330,000 | 1,323,647 | ||||||||||
American Tower Corporation | ||||||||||||
2.80%, 06/01/20 | 2,900,000 | 2,869,570 | ||||||||||
AmeriGas Partners LP | ||||||||||||
6.25%, 08/20/19 | 500,000 | 481,250 | ||||||||||
Anthem, Inc. | ||||||||||||
2.38%, 02/15/17 | 1,060,000 | 1,069,735 | ||||||||||
Ashland, Inc. | ||||||||||||
3.88%, 04/15/18D | 1,480,000 | 1,515,150 | ||||||||||
Astoria Financial Corporation | ||||||||||||
5.00%, 06/19/17 | 770,000 | 796,945 | ||||||||||
AT&T, Inc. | ||||||||||||
1.53%, 06/30/20† | 4,000,000 | 3,975,696 | ||||||||||
Autodesk, Inc. | ||||||||||||
1.95%, 12/15/17 | 350,000 | 348,998 | ||||||||||
Aviation Capital Group Corporation | ||||||||||||
3.88%, 09/27/16 144A | 1,900,000 | 1,916,625 | ||||||||||
4.63%, 01/31/18 144A | 500,000 | 510,000 | ||||||||||
2.88%, 09/17/18 144A@ | 400,000 | 398,205 | ||||||||||
Bank of America Corporation | ||||||||||||
3.75%, 07/12/16 | 920,000 | 931,655 | ||||||||||
3.88%, 03/22/17 | 130,000 | 132,882 | ||||||||||
1.70%, 08/25/17 | 570,000 | 568,598 | ||||||||||
6.40%, 08/28/17 | 400,000 | 428,648 | ||||||||||
5.75%, 12/01/17 | 1,700,000 | 1,819,400 | ||||||||||
1.66%, 03/22/18† | 1,200,000 | 1,204,502 | ||||||||||
6.88%, 04/25/18 | 800,000 | 883,081 | ||||||||||
1.36%, 01/15/19† | 280,000 | 281,235 | ||||||||||
2.60%, 01/15/19D | 1,300,000 | 1,305,180 | ||||||||||
2.65%, 04/01/19D | 5,000,000 | 5,016,065 | ||||||||||
2.63%, 10/19/20 | 350,000 | 345,983 | ||||||||||
Baxalta, Inc. | ||||||||||||
1.37%, 06/22/18 144A† | 380,000 | 379,043 | ||||||||||
2.00%, 06/22/18 144A | 210,000 | 207,969 | ||||||||||
Becton Dickinson and Co. | ||||||||||||
0.96%, 06/15/16† | 3,000,000 | 2,998,929 | ||||||||||
1.45%, 05/15/17 | 1,250,000 | 1,245,135 | ||||||||||
1.80%, 12/15/17D | 700,000 | 699,314 | ||||||||||
BellSouth LLC | ||||||||||||
4.82%, 04/26/21 144A | 400,000 | 404,789 | ||||||||||
Boston Scientific Corporation | ||||||||||||
2.65%, 10/01/18D | 1,800,000 | 1,810,651 | ||||||||||
| Par | Value | |||||||||||
3.38%, 05/15/22D | $ | 1,100,000 | $ | 1,086,696 | ||||||||
Burlington Northern Santa Fe LLC | ||||||||||||
3.40%, 09/01/24 | 500,000 | 501,401 | ||||||||||
Cameron International Corporation | ||||||||||||
1.40%, 06/15/17 | 270,000 | 266,265 | ||||||||||
Cantor Fitzgerald LP | ||||||||||||
6.50%, 06/17/22 144A@ | 750,000 | 781,381 | ||||||||||
Capital One NA | ||||||||||||
1.50%, 09/05/17 | 690,000 | 684,781 | ||||||||||
2.35%, 08/17/18 | 2,180,000 | 2,184,096 | ||||||||||
Case New Holland Industrial, Inc. | ||||||||||||
7.88%, 12/01/17 | 1,480,000 | 1,572,500 | ||||||||||
Caterpillar Financial Services Corporation | ||||||||||||
1.25%, 08/18/17D | 490,000 | 488,360 | ||||||||||
CC Holdings GS V LLC | ||||||||||||
2.38%, 12/15/17 | 300,000 | 300,472 | ||||||||||
CCO Safari II LLC | ||||||||||||
3.58%, 07/23/20 144A | 320,000 | 318,348 | ||||||||||
4.46%, 07/23/22 144A | 2,000,000 | 1,995,262 | ||||||||||
Celgene Corporation | ||||||||||||
2.13%, 08/15/18 | 310,000 | 310,264 | ||||||||||
Chesapeake Energy Corporation | ||||||||||||
3.57%, 04/15/19† | 3,300,000 | 932,250 | ||||||||||
Chevron Corporation | ||||||||||||
1.34%, 11/09/17 | 900,000 | 898,231 | ||||||||||
1.79%, 11/16/18 | 420,000 | 416,372 | ||||||||||
CHS/Community Health Systems, Inc. | ||||||||||||
5.13%, 08/15/18 | 200,000 | 202,000 | ||||||||||
CIT Group, Inc. | ||||||||||||
5.00%, 05/15/17D | 175,000 | 180,688 | ||||||||||
4.25%, 08/15/17D | 2,250,000 | 2,306,250 | ||||||||||
5.25%, 03/15/18 | 920,000 | 952,200 | ||||||||||
5.50%, 02/15/19 144A | 100,000 | 104,750 | ||||||||||
Citigroup, Inc. | ||||||||||||
1.55%, 08/14/17 | 1,300,000 | 1,295,533 | ||||||||||
1.80%, 02/05/18 | 2,030,000 | 2,023,256 | ||||||||||
1.20%, 07/30/18† | 3,200,000 | 3,200,518 | ||||||||||
2.05%, 12/07/18 | 450,000 | 447,938 | ||||||||||
Citizens Bank NA | ||||||||||||
1.60%, 12/04/17D | 900,000 | 892,027 | ||||||||||
2.30%, 12/03/18D | 350,000 | 349,831 | ||||||||||
CNH Industrial Capital LLC | ||||||||||||
3.88%, 07/16/18 | 530,000 | 514,100 | ||||||||||
4.38%, 11/06/20D | 240,000 | 226,800 | ||||||||||
Coca-Cola Co. | ||||||||||||
0.88%, 10/27/17D | 298,000 | 296,969 | ||||||||||
Compass Bank | ||||||||||||
1.85%, 09/29/17 | 500,000 | 495,936 | ||||||||||
ConAgra Foods, Inc. | ||||||||||||
1.30%, 01/25/16 | 240,000 | 240,038 | ||||||||||
ConocoPhillips Co. | ||||||||||||
1.26%, 05/15/22† | 1,600,000 | 1,578,690 | ||||||||||
Continental Airlines 2009-2 Class B Pass-Through Trust | ||||||||||||
9.25%, 11/10/18 | 374,089 | 400,743 | ||||||||||
Continental Airlines 2010-1 Class B Pass-Through Trust | ||||||||||||
6.00%, 07/12/20 | 352,398 | 368,256 | ||||||||||
Crown Castle Towers LLC | ||||||||||||
3.22%, 05/15/42 144A | 1,500,000 | 1,481,865 | ||||||||||
| 76 | See Notes to Financial Statements. |
Table of Contents
| Par | Value | |||||||||||
CVS Health Corporation | ||||||||||||
1.90%, 07/20/18 | $ | 550,000 | $ | 550,011 | ||||||||
2.80%, 07/20/20 | 500,000 | 502,769 | ||||||||||
D.R. Horton, Inc. | ||||||||||||
3.63%, 02/15/18 | 700,000 | 711,375 | ||||||||||
3.75%, 03/01/19 | 109,000 | 109,000 | ||||||||||
4.00%, 02/15/20 | 400,000 | 404,280 | ||||||||||
Daimler Finance North America LLC | ||||||||||||
1.25%, 01/11/16 144A | 530,000 | 530,023 | ||||||||||
1.13%, 03/10/17 144A | 300,000 | 297,776 | ||||||||||
1.38%, 08/01/17 144A | 660,000 | 654,183 | ||||||||||
1.65%, 03/02/18 144A | 750,000 | 741,252 | ||||||||||
2.00%, 08/03/18 144A | 3,000,000 | 2,981,109 | ||||||||||
DISH DBS Corporation | ||||||||||||
7.13%, 02/01/16 | 2,800,000 | 2,810,500 | ||||||||||
4.25%, 04/01/18 | 700,000 | 703,500 | ||||||||||
DTE Energy Co. | ||||||||||||
2.40%, 12/01/19 | 100,000 | 99,668 | ||||||||||
El Paso Natural Gas Co. LLC | ||||||||||||
5.95%, 04/15/17 | 1,500,000 | 1,517,580 | ||||||||||
Eli Lilly & Co. | ||||||||||||
1.25%, 03/01/18 | 410,000 | 409,120 | ||||||||||
ERAC USA Finance LLC | ||||||||||||
1.40%, 04/15/16 144A | 180,000 | 179,926 | ||||||||||
Express Scripts Holding Co. | ||||||||||||
1.25%, 06/02/17D | 380,000 | 377,598 | ||||||||||
Federal Express Corporation 2012 Pass-Through Trust | ||||||||||||
2.63%, 01/15/18 144A | 254,720 | 255,941 | ||||||||||
Fidelity National Information Services, Inc. | ||||||||||||
2.00%, 04/15/18 | 340,000 | 334,483 | ||||||||||
Fifth Third Bancorp | ||||||||||||
5.45%, 01/15/17 | 250,000 | 259,238 | ||||||||||
Ford Motor Credit Co., LLC | ||||||||||||
3.98%, 06/15/16 | 1,000,000 | 1,011,212 | ||||||||||
8.00%, 12/15/16 | 1,820,000 | 1,924,845 | ||||||||||
3.00%, 06/12/17 | 560,000 | 565,642 | ||||||||||
2.15%, 01/09/18 | 700,000 | 697,751 | ||||||||||
1.33%, 03/12/19† | 4,460,000 | 4,369,368 | ||||||||||
Freeport-McMoRan, Inc. | ||||||||||||
2.15%, 03/01/17 | 210,000 | 193,200 | ||||||||||
2.30%, 11/14/17D | 840,000 | 719,250 | ||||||||||
Freeport-McMoran Oil & Gas LLC | ||||||||||||
6.63%, 05/01/21D | 400,000 | 245,000 | ||||||||||
General Motors Co. | ||||||||||||
3.50%, 10/02/18 | 953,000 | 964,951 | ||||||||||
General Motors Financial Co., Inc. | ||||||||||||
2.63%, 07/10/17D | 250,000 | 250,855 | ||||||||||
4.75%, 08/15/17 | 4,000,000 | 4,147,372 | ||||||||||
3.00%, 09/25/17D | 600,000 | 602,551 | ||||||||||
2.40%, 04/10/18 | 1,300,000 | 1,294,326 | ||||||||||
3.10%, 01/15/19 | 175,000 | 174,871 | ||||||||||
3.70%, 11/24/20D | 245,000 | 245,931 | ||||||||||
Gilead Sciences, Inc. | ||||||||||||
1.85%, 09/04/18 | 220,000 | 221,043 | ||||||||||
Glencore Funding LLC | ||||||||||||
1.68%, 01/15/19 144A† | 1,200,000 | 993,535 | ||||||||||
Goldman Sachs Group, Inc. | ||||||||||||
5.35%, 01/15/16 | 761,000 | 761,801 | ||||||||||
3.63%, 02/07/16 | 2,874,000 | 2,881,349 | ||||||||||
5.75%, 10/01/16 | 135,000 | 139,256 | ||||||||||
| Par | Value | |||||||||||
1.46%, 11/15/18† | $ | 580,000 | $ | 582,761 | ||||||||
1.48%, 04/23/20† | 600,000 | 601,510 | ||||||||||
2.75%, 09/15/20D | 210,000 | 210,092 | ||||||||||
2.01%, 11/29/23† | 6,100,000 | 6,165,367 | ||||||||||
HCA, Inc. | ||||||||||||
3.75%, 03/15/19D | 2,350,000 | 2,373,500 | ||||||||||
Hess Corporation | ||||||||||||
1.30%, 06/15/17 | 310,000 | 303,442 | ||||||||||
Hewlett Packard Enterprise Co. | ||||||||||||
2.45%, 10/05/17 144A | 1,040,000 | 1,039,560 | ||||||||||
2.85%, 10/05/18 144A | 2,400,000 | 2,400,235 | ||||||||||
HSBC Finance Corporation | ||||||||||||
0.84%, 06/01/16† | 400,000 | 399,325 | ||||||||||
HSBC USA, Inc. | ||||||||||||
1.70%, 03/05/18 | 710,000 | 706,260 | ||||||||||
2.00%, 08/07/18 | 1,500,000 | 1,500,192 | ||||||||||
1.47%, 09/24/18† | 800,000 | 801,183 | ||||||||||
0.97%, 11/13/19† | 2,000,000 | 1,971,984 | ||||||||||
Huntington National Bank | ||||||||||||
1.30%, 11/20/16 | 500,000 | 499,774 | ||||||||||
0.75%, 04/24/17† | 250,000 | 248,828 | ||||||||||
1.38%, 04/24/17 | 290,000 | 288,342 | ||||||||||
2.20%, 11/06/18 | 300,000 | 299,375 | ||||||||||
Hyundai Capital America | ||||||||||||
3.75%, 04/06/16 144A | 190,000 | 191,048 | ||||||||||
1.45%, 02/06/17 144A | 800,000 | 796,479 | ||||||||||
2.40%, 10/30/18 144A | 240,000 | 239,256 | ||||||||||
IAC/InterActiveCorp | ||||||||||||
4.88%, 11/30/18 | 300,000 | 301,875 | ||||||||||
International Business Machines Corporation | ||||||||||||
1.13%, 02/06/18 | 450,000 | 447,124 | ||||||||||
International Lease Finance Corporation | ||||||||||||
5.75%, 05/15/16 | 1,000,000 | 1,015,000 | ||||||||||
6.75%, 09/01/16 144A | 1,365,000 | 1,404,244 | ||||||||||
3.88%, 04/15/18 | 795,000 | 802,950 | ||||||||||
Interpublic Group of Cos., Inc. | ||||||||||||
2.25%, 11/15/17 | 283,000 | 282,131 | ||||||||||
J.B. Hunt Transport Services, Inc. | ||||||||||||
2.40%, 03/15/19D | 620,000 | 624,359 | ||||||||||
Jabil Circuit, Inc. | ||||||||||||
7.75%, 07/15/16 | 295,000 | 303,112 | ||||||||||
Jackson National Life Global Funding | ||||||||||||
1.25%, 02/21/17 144AD | 600,000 | 598,527 | ||||||||||
John Deere Capital Corporation | ||||||||||||
1.35%, 01/16/18D | 400,000 | 398,511 | ||||||||||
Johnson Controls, Inc. | ||||||||||||
1.40%, 11/02/17 | 130,000 | 128,706 | ||||||||||
JPMorgan Chase & Co. | ||||||||||||
0.81%, 11/18/16† | 1,300,000 | 1,299,589 | ||||||||||
1.22%, 01/25/18† | 610,000 | 611,563 | ||||||||||
1.70%, 03/01/18 | 1,500,000 | 1,492,726 | ||||||||||
1.63%, 05/15/18D | 979,000 | 971,736 | ||||||||||
2.35%, 01/28/19 | 1,050,000 | 1,054,454 | ||||||||||
1.53%, 10/29/20† | 5,900,000 | 5,964,410 | ||||||||||
Kansas City Southern | ||||||||||||
1.02%, 10/28/16 144A† | 1,000,000 | 988,094 | ||||||||||
KeyBank NA | ||||||||||||
1.70%, 06/01/18 | 900,000 | 894,013 | ||||||||||
Kinder Morgan, Inc. | ||||||||||||
7.00%, 06/15/17 | 100,000 | 103,048 | ||||||||||
| See Notes to Financial Statements. | 77 |
Table of Contents
LOW-DURATION BOND FUND
SCHEDULE OF INVESTMENTS (Continued)
| Par | Value | |||||||||||
2.00%, 12/01/17D | $ | 210,000 | $ | 202,427 | ||||||||
3.05%, 12/01/19D | 210,000 | 194,533 | ||||||||||
4.30%, 06/01/25D | 100,000 | 86,562 | ||||||||||
Kinder Morgan Energy Partners LP | ||||||||||||
5.80%, 03/01/21 | 100,000 | 99,651 | ||||||||||
5.00%, 10/01/21 | 200,000 | 189,007 | ||||||||||
Kinder Morgan Finance Co. LLC | ||||||||||||
6.00%, 01/15/18 144A | 2,300,000 | 2,320,095 | ||||||||||
Kraft Heinz Foods Co. | ||||||||||||
1.60%, 06/30/17 144A | 850,000 | 847,847 | ||||||||||
2.00%, 07/02/18 144A | 1,830,000 | 1,822,462 | ||||||||||
Kroger Co. | ||||||||||||
2.20%, 01/15/17 | 500,000 | 504,661 | ||||||||||
L-3 Communications Corporation | ||||||||||||
1.50%, 05/28/17 | 300,000 | 296,385 | ||||||||||
Lehman Escrow Bonds | ||||||||||||
0.00%, 12/28/17+W†# | 2,600,000 | — | ||||||||||
0.00%, 12/31/99W†#@ | 600,000 | 45,000 | ||||||||||
Lennar Corporation | ||||||||||||
4.50%, 06/15/19 | 1,500,000 | 1,525,312 | ||||||||||
Liberty Property LP | ||||||||||||
6.63%, 10/01/17 | 375,000 | 402,603 | ||||||||||
Lockheed Martin Corporation | ||||||||||||
1.85%, 11/23/18 | 200,000 | 199,786 | ||||||||||
Manufacturers & Traders Trust Co. | ||||||||||||
1.25%, 01/30/17D | 700,000 | 699,467 | ||||||||||
1.40%, 07/25/17 | 780,000 | 776,598 | ||||||||||
Marathon Oil Corporation | ||||||||||||
6.00%, 10/01/17 | 1,000,000 | 1,019,744 | ||||||||||
Marathon Petroleum Corporation | ||||||||||||
2.70%, 12/14/18D | 670,000 | 662,989 | ||||||||||
Masco Corporation | ||||||||||||
6.13%, 10/03/16 | 500,000 | 516,240 | ||||||||||
McGraw Hill Financial, Inc. | ||||||||||||
2.50%, 08/15/18 144A | 270,000 | 271,856 | ||||||||||
3.30%, 08/14/20 | 800,000 | 807,678 | ||||||||||
McKesson Corporation | ||||||||||||
1.29%, 03/10/17 | 300,000 | 299,244 | ||||||||||
Medtronic, Inc. | ||||||||||||
1.50%, 03/15/18 | 270,000 | 269,931 | ||||||||||
2.50%, 03/15/20 | 1,700,000 | 1,713,080 | ||||||||||
Metropolitan Life Global Funding I | ||||||||||||
1.95%, 12/03/18 144AD | 670,000 | 668,651 | ||||||||||
Morgan Stanley | ||||||||||||
5.75%, 10/18/16 | 5,400,000 | 5,586,165 | ||||||||||
4.75%, 03/22/17 | 1,015,000 | 1,051,667 | ||||||||||
6.63%, 04/01/18 | 510,000 | 559,524 | ||||||||||
1.06%, 07/23/19† | 940,000 | 932,548 | ||||||||||
2.38%, 07/23/19 | 1,073,000 | 1,069,404 | ||||||||||
1.46%, 01/27/20† | 1,350,000 | 1,354,208 | ||||||||||
Motorola Solutions, Inc. | ||||||||||||
3.50%, 09/01/21D | 1,900,000 | 1,789,519 | ||||||||||
Nabors Industries, Inc. | ||||||||||||
2.35%, 09/15/16 | 1,100,000 | 1,094,721 | ||||||||||
National Oilwell Varco, Inc. | ||||||||||||
1.35%, 12/01/17 | 660,000 | 645,991 | ||||||||||
NBCUniversal Enterprise, Inc. | ||||||||||||
1.01%, 04/15/18 144A†D | 355,000 | 354,606 | ||||||||||
| Par | Value | |||||||||||
New York Life Global Funding | ||||||||||||
1.55%, 11/02/18 144A | $ | 710,000 | $ | 704,507 | ||||||||
Newell Rubbermaid, Inc. | ||||||||||||
2.15%, 10/15/18 | 240,000 | 232,418 | ||||||||||
Nissan Motor Acceptance Corporation | ||||||||||||
1.00%, 03/15/16 144A | 910,000 | 910,144 | ||||||||||
1.95%, 09/12/17 144AD | 520,000 | 521,067 | ||||||||||
Northwest Airlines 2002-1 Class G-2 Pass-Through Trust | ||||||||||||
6.26%, 05/20/23 | 117,880 | 122,955 | ||||||||||
Occidental Petroleum Corporation | ||||||||||||
2.50%, 02/01/16D | 5,000,000 | 5,004,235 | ||||||||||
Omnicom Group, Inc. | ||||||||||||
5.90%, 04/15/16 | 285,000 | 288,660 | ||||||||||
PACCAR Financial Corporation | ||||||||||||
0.75%, 05/16/16 | 270,000 | 269,835 | ||||||||||
1.10%, 06/06/17D | 250,000 | 248,787 | ||||||||||
1.05%, 12/06/18† | 250,000 | 250,669 | ||||||||||
Pennsylvania Electric Co. | ||||||||||||
5.20%, 04/01/20D | 500,000 | 533,534 | ||||||||||
Penske Truck Leasing Co. LP | ||||||||||||
2.50%, 03/15/16 144A | 1,650,000 | 1,652,934 | ||||||||||
2.50%, 06/15/19 144A | 190,000 | 187,050 | ||||||||||
3.20%, 07/15/20 144A | 1,000,000 | 990,999 | ||||||||||
Phillips 66 | ||||||||||||
2.95%, 05/01/17 | 210,000 | 212,923 | ||||||||||
Pioneer Natural Resources Co. | ||||||||||||
6.65%, 03/15/17 | 900,000 | 929,482 | ||||||||||
6.88%, 05/01/18 | 400,000 | 425,170 | ||||||||||
Plains All American Pipeline LP | ||||||||||||
2.60%, 12/15/19 | 900,000 | 798,842 | ||||||||||
Prudential Financial, Inc. | ||||||||||||
1.14%, 08/15/18† | 500,000 | 500,129 | ||||||||||
QUALCOMM, Inc. | ||||||||||||
3.00%, 05/20/22D | 1,200,000 | 1,189,000 | ||||||||||
Reliance Standard Life Global Funding II | ||||||||||||
2.15%, 10/15/18 144A | 490,000 | 487,301 | ||||||||||
Samsung Electronics America, Inc. | ||||||||||||
1.75%, 04/10/17 144A | 1,150,000 | 1,147,746 | ||||||||||
Santander Bank NA | ||||||||||||
2.00%, 01/12/18 | 600,000 | 595,880 | ||||||||||
Schlumberger Holdings Corporation | ||||||||||||
2.35%, 12/21/18 144A | 675,000 | 670,619 | ||||||||||
Scripps Networks Interactive, Inc. | ||||||||||||
3.50%, 06/15/22D | 900,000 | 867,180 | ||||||||||
Southern California Edison Co. | ||||||||||||
1.85%, 02/01/22 | 1,392,857 | 1,380,587 | ||||||||||
Southern Power Co. | ||||||||||||
1.85%, 12/01/17 | 190,000 | 190,006 | ||||||||||
Southwestern Energy Co. | ||||||||||||
4.05%, 01/23/20D | 200,000 | 145,250 | ||||||||||
Sprint Communications, Inc. | ||||||||||||
9.00%, 11/15/18 144AD | 1,350,000 | 1,424,250 | ||||||||||
St. Jude Medical, Inc. | ||||||||||||
2.00%, 09/15/18 | 1,245,000 | 1,243,501 | ||||||||||
Stanley Black & Decker, Inc. | ||||||||||||
2.45%, 11/17/18 | 530,000 | 532,434 | ||||||||||
| 78 | See Notes to Financial Statements. |
Table of Contents
| Par | Value | |||||||||||
SunTrust Bank | ||||||||||||
5.20%, 01/17/17 | $ | 890,000 | $ | 919,766 | ||||||||
Synchrony Financial | ||||||||||||
1.88%, 08/15/17 | 750,000 | 746,856 | ||||||||||
2.60%, 01/15/19 | 685,000 | 683,032 | ||||||||||
3.00%, 08/15/19 | 390,000 | 389,789 | ||||||||||
1.53%, 02/03/20† | 250,000 | 246,291 | ||||||||||
1.56%, 02/03/20† | 700,000 | 689,616 | ||||||||||
Thermo Fisher Scientific, Inc. | ||||||||||||
2.15%, 12/14/18 | 200,000 | 199,991 | ||||||||||
3.30%, 02/15/22D | 1,900,000 | 1,897,935 | ||||||||||
TIAA Asset Management Finance Co. LLC | ||||||||||||
2.95%, 11/01/19 144A | 1,400,000 | 1,404,050 | ||||||||||
T-Mobile USA, Inc. | ||||||||||||
5.25%, 09/01/18 | 600,000 | 613,620 | ||||||||||
Toyota Motor Credit Corporation | ||||||||||||
1.45%, 01/12/18 | 630,000 | 628,989 | ||||||||||
1.55%, 07/13/18D | 880,000 | 878,245 | ||||||||||
United Airlines 2009-1 Pass-Through Trust | ||||||||||||
10.40%, 05/01/18D | 202,866 | 215,320 | ||||||||||
United Airlines 2009-2A Pass-Through Trust | ||||||||||||
9.75%, 07/15/18 | 362,820 | 383,229 | ||||||||||
UnitedHealth Group, Inc. | ||||||||||||
1.45%, 07/17/17 | 370,000 | 370,094 | ||||||||||
1.90%, 07/16/18 | 420,000 | 421,419 | ||||||||||
US Airways 2011-1 Class B Pass-Through Trust | ||||||||||||
9.75%, 04/22/20 | 741,382 | 829,421 | ||||||||||
US Airways 2012-1 Class B Pass-Through Trust | ||||||||||||
8.00%, 04/01/21D | 292,154 | 315,891 | ||||||||||
Ventas Realty LP | ||||||||||||
1.55%, 09/26/16 | 414,000 | 414,360 | ||||||||||
1.25%, 04/17/17 | 230,000 | 228,376 | ||||||||||
Verizon Communications, Inc. | ||||||||||||
1.35%, 06/09/17 | 840,000 | 837,869 | ||||||||||
2.25%, 09/14/18†D | 570,000 | 584,024 | ||||||||||
1.30%, 06/17/19† | 5,900,000 | 5,864,919 | ||||||||||
2.55%, 06/17/19D | 600,000 | 608,060 | ||||||||||
2.63%, 02/21/20 | 1,125,000 | 1,130,010 | ||||||||||
Vesey Street Investment | ||||||||||||
4.40%, 09/01/16 STEP | 700,000 | 713,771 | ||||||||||
Volkswagen Group of America Finance LLC | ||||||||||||
1.25%, 05/23/17 144A | 1,060,000 | 1,035,010 | ||||||||||
1.60%, 11/20/17 144A | 470,000 | 456,551 | ||||||||||
1.65%, 05/22/18 144A | 619,000 | 594,338 | ||||||||||
Walgreens Boots Alliance, Inc. | ||||||||||||
1.75%, 11/17/17 | 230,000 | 229,656 | ||||||||||
WEA Finance LLC | ||||||||||||
1.75%, 09/15/17 144A | 220,000 | 218,203 | ||||||||||
2.70%, 09/17/19 144A | 260,000 | 258,084 | ||||||||||
Welltower, Inc. REIT | ||||||||||||
3.63%, 03/15/16 | 400,000 | 401,758 | ||||||||||
6.20%, 06/01/16 | 1,546,000 | 1,576,166 | ||||||||||
Whirlpool Corporation | ||||||||||||
1.65%, 11/01/17 | 340,000 | 338,395 | ||||||||||
Wm. Wrigley Jr. Co. | ||||||||||||
1.40%, 10/21/16 144A | 200,000 | 199,833 | ||||||||||
2.00%, 10/20/17 144A | 200,000 | 200,412 | ||||||||||
| Par | Value | |||||||||||
WPX Energy, Inc. | ||||||||||||
5.25%, 01/15/17D | $ | 780,000 | $ | 733,200 | ||||||||
Wyndham Worldwide Corporation | ||||||||||||
2.95%, 03/01/17 | 1,000,000 | 1,006,345 | ||||||||||
Zimmer Biomet Holdings, Inc. | ||||||||||||
2.00%, 04/01/18 | 820,000 | 815,391 | ||||||||||
2.70%, 04/01/20 | 190,000 | 187,798 | ||||||||||
Zoetis, Inc. | ||||||||||||
3.45%, 11/13/20D | 300,000 | 300,677 | ||||||||||
|
| |||||||||||
Total Corporate Bonds | 245,784,366 | |||||||||||
|
| |||||||||||
FOREIGN BONDS — 13.0% |
| |||||||||||
Australia — 1.1% |
| |||||||||||
Asciano Finance, Ltd. | ||||||||||||
5.00%, 04/07/18 144A@ | 1,500,000 | 1,545,205 | ||||||||||
Australia & New Zealand Banking Group, Ltd. | ||||||||||||
2.00%, 11/16/18 | 1,280,000 | 1,278,309 | ||||||||||
Commonwealth Bank of Australia | ||||||||||||
1.75%, 11/02/18D | 610,000 | 605,574 | ||||||||||
Macquarie Bank, Ltd. | ||||||||||||
5.00%, 02/22/17 144AD | 250,000 | 258,635 | ||||||||||
0.95%, 10/27/17 144A† | 480,000 | 477,969 | ||||||||||
1.60%, 10/27/17 144AD | 860,000 | 854,106 | ||||||||||
Macquarie Group, Ltd. | ||||||||||||
1.33%, 01/31/17 144A† | 1,240,000 | 1,241,972 | ||||||||||
4.88%, 08/10/17 144A | 355,000 | 367,563 | ||||||||||
National Australia Bank, Ltd. | ||||||||||||
1.30%, 06/30/17 144A | 390,000 | 388,467 | ||||||||||
Perpetual Trustee- Apollo | ||||||||||||
3.94%, 10/03/40(A) | 404,816 | 296,500 | ||||||||||
Virgin Australia 2013-1A Trust | ||||||||||||
5.00%, 04/23/25 144A | 514,363 | 532,366 | ||||||||||
Westpac Banking Corporation | ||||||||||||
1.95%, 11/23/18 | 1,270,000 | 1,268,305 | ||||||||||
|
| |||||||||||
| 9,114,971 | ||||||||||||
|
| |||||||||||
Bermuda — 0.2% |
| |||||||||||
Aircastle, Ltd. | ||||||||||||
6.75%, 04/15/17D | 1,546,000 | 1,616,544 | ||||||||||
|
| |||||||||||
Brazil — 0.1% |
| |||||||||||
Banco Santander Brasil SA | ||||||||||||
4.63%, 02/13/17 144A | 1,000,000 | 1,013,500 | ||||||||||
|
| |||||||||||
Canada — 0.7% |
| |||||||||||
Bell Canada | ||||||||||||
1.33%, 04/22/16(C)† | 1,150,000 | 830,889 | ||||||||||
Canadian Natural | ||||||||||||
Resources, Ltd. | ||||||||||||
1.75%, 01/15/18 | 480,000 | 467,090 | ||||||||||
Glencore Finance Canada, Ltd. | ||||||||||||
2.70%, 10/25/17 144AD | 1,031,000 | 943,767 | ||||||||||
Rogers Communications, Inc. | ||||||||||||
1.44%, 03/13/17(C)† | 550,000 | 396,320 | ||||||||||
Royal Bank of Canada | ||||||||||||
1.20%, 09/19/17 | 1,885,000 | 1,876,090 | ||||||||||
Shaw Communications, Inc. | ||||||||||||
1.52%, 02/01/16(C)† | 1,000,000 | 722,733 | ||||||||||
Thomson Reuters Corporation | ||||||||||||
1.65%, 09/29/17 | 640,000 | 636,984 | ||||||||||
| See Notes to Financial Statements. | 79 |
Table of Contents
LOW-DURATION BOND FUND
SCHEDULE OF INVESTMENTS (Continued)
| Par | Value | |||||||||||
TransAlta Corporation | ||||||||||||
1.90%, 06/03/17 | $ | 112,000 | $ | 108,811 | ||||||||
|
| |||||||||||
| 5,982,684 | ||||||||||||
|
| |||||||||||
Cayman Islands — 0.2% |
| |||||||||||
Alibaba Group Holding, Ltd. | ||||||||||||
1.63%, 11/28/17 144A | 400,000 | 395,346 | ||||||||||
Baidu, Inc. | ||||||||||||
2.25%, 11/28/17 | 440,000 | 440,600 | ||||||||||
Hutchison Whampoa International, (12) (II), Ltd. | ||||||||||||
2.00%, 11/08/17 144A | 370,000 | 370,507 | ||||||||||
Seagate HDD Cayman | ||||||||||||
3.75%, 11/15/18 | 200,000 | 198,527 | ||||||||||
3.75%, 11/15/18 144A | 660,000 | 655,050 | ||||||||||
|
| |||||||||||
| 2,060,030 | ||||||||||||
|
| |||||||||||
Chile — 0.3% |
| |||||||||||
Banco Santander Chile | ||||||||||||
1.92%, 01/19/16 144A† | 2,500,000 | 2,498,750 | ||||||||||
Corpbanca SA | ||||||||||||
3.88%, 09/22/19 144A | 500,000 | 496,528 | ||||||||||
|
| |||||||||||
| 2,995,278 | ||||||||||||
|
| |||||||||||
Denmark — 0.1% |
| |||||||||||
AP Moeller - Maersk A/S | ||||||||||||
2.55%, 09/22/19 144A | 670,000 | 663,640 | ||||||||||
|
| |||||||||||
France — 1.5% |
| |||||||||||
BPCE SA | ||||||||||||
1.63%, 02/10/17 | 440,000 | 439,322 | ||||||||||
Credit Agricole SA | ||||||||||||
1.12%, 04/15/19 144A† | 1,260,000 | 1,253,834 | ||||||||||
1.46%, 06/10/20 144A† | 1,400,000 | 1,400,496 | ||||||||||
Dexia Credit Local SA | ||||||||||||
0.72%, 01/11/17† | 9,800,000 | 9,796,893 | ||||||||||
|
| |||||||||||
| 12,890,545 | ||||||||||||
|
| |||||||||||
Germany — 0.1% |
| |||||||||||
FMS Wertmanagement | ||||||||||||
1.13%, 09/05/17 | 1,100,000 | 1,098,293 | ||||||||||
|
| |||||||||||
Guernsey — 0.1% |
| |||||||||||
Credit Suisse Group Funding Guernsey, Ltd. | ||||||||||||
3.80%, 09/15/22 144A | 450,000 | 450,304 | ||||||||||
|
| |||||||||||
Iceland — 0.1% |
| |||||||||||
Iceland Government International Bond | ||||||||||||
4.88%, 06/16/16 | 627,000 | 637,979 | ||||||||||
|
| |||||||||||
Ireland — 0.1% |
| |||||||||||
AerCap Ireland Capital, Ltd. | ||||||||||||
2.75%, 05/15/17 | 700,000 | 697,375 | ||||||||||
|
| |||||||||||
Italy — 0.5% |
| |||||||||||
Intesa Sanpaolo SpA | ||||||||||||
1.70%, 04/11/16† | 3,300,000 | 3,302,511 | ||||||||||
Italy Government International Bond | ||||||||||||
5.25%, 09/20/16 | 741,000 | 761,241 | ||||||||||
|
| |||||||||||
| 4,063,752 | ||||||||||||
|
| |||||||||||
Japan — 0.6% |
| |||||||||||
Bank of Tokyo-Mitsubishi UFJ, Ltd. | ||||||||||||
1.20%, 03/10/17 144A | 620,000 | 616,215 | ||||||||||
| Par | Value | |||||||||||
1.45%, 09/08/17 144A | $ | 750,000 | $ | 745,382 | ||||||||
1.52%, 09/14/18 144A† | 800,000 | 802,635 | ||||||||||
Japan Finance Organization for Municipalities | ||||||||||||
1.50%, 09/12/17 | 200,000 | 199,561 | ||||||||||
Mitsubishi UFJ Trust & Banking Corporation | ||||||||||||
1.60%, 10/16/17 144A | 500,000 | 496,851 | ||||||||||
2.65%, 10/19/20 144A | 700,000 | 700,059 | ||||||||||
Mizuho Bank, Ltd. | ||||||||||||
1.30%, 04/16/17 144A | 490,000 | 487,746 | ||||||||||
1.05%, 09/25/17 144A† | 300,000 | 298,197 | ||||||||||
1.70%, 09/25/17 144A | 1,110,000 | 1,104,994 | ||||||||||
|
| |||||||||||
| 5,451,640 | ||||||||||||
|
| |||||||||||
Luxembourg — 0.1% |
| |||||||||||
Pentair Finance SA | ||||||||||||
2.90%, 09/15/18D | 720,000 | 717,238 | ||||||||||
|
| |||||||||||
Mexico — 0.5% |
| |||||||||||
Mexico Cetes | ||||||||||||
3.22%, 03/10/16 IO(M)W | 545,000,000 | 3,142,877 | ||||||||||
Petroleos Mexicanos | ||||||||||||
5.50%, 01/21/21 | 1,400,000 | 1,415,680 | ||||||||||
|
| |||||||||||
| 4,558,557 | ||||||||||||
|
| |||||||||||
Netherlands — 1.3% |
| |||||||||||
ABN AMRO Bank NV | ||||||||||||
1.12%, 10/28/16 144A† | 600,000 | 601,740 | ||||||||||
EDP Finance BV | ||||||||||||
6.00%, 02/02/18 144A | 800,000 | 842,498 | ||||||||||
ING Bank NV | ||||||||||||
1.80%, 03/16/18 144AD | 645,000 | 643,367 | ||||||||||
2.00%, 11/26/18 144A | 1,260,000 | 1,255,696 | ||||||||||
1.30%, 10/01/19 144A†D | 250,000 | 248,865 | ||||||||||
LeasePlan Corporation NV | ||||||||||||
2.88%, 01/22/19 144A | 2,500,000 | 2,469,595 | ||||||||||
Petrobras Global Finance BV | ||||||||||||
3.88%, 01/27/16 | 1,900,000 | 1,894,775 | ||||||||||
1.99%, 05/20/16† | 300,000 | 293,250 | ||||||||||
2.89%, 03/17/17†D | 1,300,000 | 1,194,375 | ||||||||||
Shell International Finance BV | ||||||||||||
1.25%, 11/10/17D | 560,000 | 557,354 | ||||||||||
0.92%, 11/10/18† | 680,000 | 679,155 | ||||||||||
1.63%, 11/10/18 | 540,000 | 537,393 | ||||||||||
|
| |||||||||||
| 11,218,063 | ||||||||||||
|
| |||||||||||
New Zealand — 0.3% |
| |||||||||||
ANZ New Zealand International, Ltd. | ||||||||||||
1.40%, 04/27/17 144A | 660,000 | 659,428 | ||||||||||
BNZ International Funding, Ltd. | ||||||||||||
1.90%, 02/26/18 144A | 2,000,000 | 1,992,012 | ||||||||||
|
| |||||||||||
| 2,651,440 | ||||||||||||
|
| |||||||||||
Norway — 0.0% |
| |||||||||||
Eksportfinans ASA | ||||||||||||
2.38%, 05/25/16D | 300,000 | 300,398 | ||||||||||
|
| |||||||||||
Panama — 0.0% |
| |||||||||||
Carnival Corporation | ||||||||||||
1.20%, 02/05/16 | 310,000 | 310,103 | ||||||||||
|
| |||||||||||
Singapore — 0.0% |
| |||||||||||
DBS Group Holdings, Ltd. | ||||||||||||
0.82%, 07/16/19 144A† | 400,000 | 400,165 | ||||||||||
|
| |||||||||||
| 80 | See Notes to Financial Statements. |
Table of Contents
| Par | Value | |||||||||||
South Korea — 2.8% |
| |||||||||||
Export-Import Bank of Korea | ||||||||||||
1.38%, 09/17/16† | $ | 800,000 | $ | 801,223 | ||||||||
5.38%, 10/04/16 144A | 1,300,000 | 1,339,303 | ||||||||||
Hyundai Capital Services, Inc. | ||||||||||||
4.38%, 07/27/16 | 1,657,000 | 1,680,534 | ||||||||||
4.38%, 07/27/16 144A | 2,900,000 | 2,941,189 | ||||||||||
Industrial Bank of Korea | ||||||||||||
2.38%, 07/17/17 | 2,000,000 | 2,014,014 | ||||||||||
KEB Hana Bank | ||||||||||||
4.00%, 11/03/16 | 1,500,000 | 1,529,690 | ||||||||||
3.50%, 10/25/17D | 800,000 | 816,640 | ||||||||||
Korea Development Bank | ||||||||||||
3.88%, 05/04/17D | 4,800,000 | 4,926,504 | ||||||||||
Korea Land & Housing Corporation | ||||||||||||
1.88%, 08/02/17 144A | 2,000,000 | 1,996,894 | ||||||||||
Korea Western Power Co., Ltd. | ||||||||||||
2.88%, 10/10/18 | 3,000,000 | 3,046,776 | ||||||||||
KT Corporation | ||||||||||||
1.75%, 04/22/17 144A | 2,000,000 | 1,995,290 | ||||||||||
2.63%, 04/22/19@ | 800,000 | 803,559 | ||||||||||
|
| |||||||||||
| 23,891,616 | ||||||||||||
|
| |||||||||||
Spain — 0.2% |
| |||||||||||
Instituto de Credito Oficial | ||||||||||||
1.13%, 04/01/16 144A | 1,300,000 | 1,300,831 | ||||||||||
|
| |||||||||||
Switzerland — 0.6% |
| |||||||||||
Credit Suisse AG | ||||||||||||
1.38%, 05/26/17 | 1,480,000 | 1,473,310 | ||||||||||
1.75%, 01/29/18 | 500,000 | 498,746 | ||||||||||
2.30%, 05/28/19 | 335,000 | 335,288 | ||||||||||
3.63%, 09/09/24 | 500,000 | 504,492 | ||||||||||
UBS AG | ||||||||||||
1.80%, 03/26/18D | 2,200,000 | 2,197,030 | ||||||||||
|
| |||||||||||
| 5,008,866 | ||||||||||||
|
| |||||||||||
United Kingdom — 1.1% |
| |||||||||||
Abbey National Treasury Services PLC | ||||||||||||
1.65%, 09/29/17 | 1,150,000 | 1,151,534 | ||||||||||
Anglo American Capital PLC | ||||||||||||
1.27%, 04/15/16 144A† | 300,000 | 297,085 | ||||||||||
Barclays Bank PLC | ||||||||||||
0.94%, 02/17/17† | 890,000 | 889,743 | ||||||||||
Barclays PLC | ||||||||||||
2.00%, 03/16/18 | 1,350,000 | 1,345,640 | ||||||||||
BP Capital Markets PLC | ||||||||||||
3.47%, 06/01/16(E) | 700,000 | 770,901 | ||||||||||
HSBC Bank PLC | ||||||||||||
1.00%, 05/15/18 144A† | 1,190,000 | 1,186,113 | ||||||||||
Jaguar Land Rover Automotive PLC | ||||||||||||
4.13%, 12/15/18 144A | 700,000 | 706,125 | ||||||||||
Nationwide Building Society | ||||||||||||
2.35%, 01/21/20 144AD | 800,000 | 795,382 | ||||||||||
Standard Chartered PLC | ||||||||||||
1.50%, 09/08/17 144A | 1,320,000 | 1,312,740 | ||||||||||
Yorkshire Building Society | ||||||||||||
2.13%, 03/18/19(E) | 900,000 |
| 1,016,158 |
| ||||||||
|
| |||||||||||
| 9,471,421 | ||||||||||||
|
| |||||||||||
| Par | Value | |||||||||||
Virgin Islands (British) — 0.4% |
| |||||||||||
Sinopec Group Overseas Development 2014, Ltd. | ||||||||||||
1.10%, 04/10/17 144A† | $ | 3,000,000 | $ | 2,996,319 | ||||||||
TSMC Global, Ltd. | ||||||||||||
1.63%, 04/03/18 144A | 370,000 | 362,844 | ||||||||||
|
| |||||||||||
| 3,359,163 | ||||||||||||
|
| |||||||||||
Total Foreign Bonds | 111,924,396 | |||||||||||
|
| |||||||||||
LOAN AGREEMENTS — 0.1% |
| |||||||||||
Activision Blizzard, Inc. Term B Loan | ||||||||||||
3.25%, 10/11/20 | ||||||||||||
(Cost $642,654) | 635,375 | 633,558 | ||||||||||
|
| |||||||||||
MORTGAGE-BACKED SECURITIES — 15.9% |
| |||||||||||
American Home Mortgage Investment Trust | ||||||||||||
2.31%, 10/25/34† | 255,609 | 255,084 | ||||||||||
American Home Mortgage Assets Trust | ||||||||||||
1.18%, 11/25/46† | 845,999 | 429,271 | ||||||||||
American Homes 4 Rent | ||||||||||||
1.25%, 06/17/31† | 535,272 | 523,694 | ||||||||||
1.35%, 06/17/31† | 1,313,850 | 1,285,430 | ||||||||||
Arran Residential Mortgages Funding PLC | ||||||||||||
1.82%, 11/19/47 144A† | 221,374 | 221,625 | ||||||||||
Banc of America Commercial Mortgage Trust | ||||||||||||
5.62%, 07/10/46† | 287,749 | 290,264 | ||||||||||
Banc of America Commercial Mortgage Trust | ||||||||||||
5.81%, 02/10/51† | 1,290,000 | 1,348,346 | ||||||||||
Banc of America Commercial Mortgage Trust | ||||||||||||
5.49%, 02/10/51 | 1,818,365 | 1,883,366 | ||||||||||
Banc of America Funding Trust | ||||||||||||
3.01%, 01/20/47† | 408,271 | 343,274 | ||||||||||
Banc of America Mortgage Trust | ||||||||||||
2.71%, 01/25/34† | 181,783 | 177,844 | ||||||||||
Banc of America Mortgage Trust | ||||||||||||
6.50%, 10/25/31 | 50,194 | 52,656 | ||||||||||
Banc of America Mortgage Trust | ||||||||||||
2.84%, 10/25/34† | 294,713 | 292,152 | ||||||||||
BBCMS Trust | ||||||||||||
1.48%, 05/15/32 144A† | 2,200,000 | 2,181,303 | ||||||||||
| See Notes to Financial Statements. | 81 |
Table of Contents
LOW-DURATION BOND FUND
SCHEDULE OF INVESTMENTS (Continued)
| Par | Value | |||||||||||
Bear Stearns Adjustable Rate Mortgage Trust | ||||||||||||
2.87%, 01/25/34† | $ | 223,958 | $ | 223,857 | ||||||||
Bear Stearns Adjustable Rate Mortgage Trust | ||||||||||||
3.14%, 07/25/34† | 309,314 | 309,540 | ||||||||||
Bear Stearns Adjustable Rate Mortgage Trust | ||||||||||||
2.82%, 10/25/34† | 34,878 | 34,558 | ||||||||||
Bear Stearns Adjustable Rate Mortgage Trust | ||||||||||||
2.68%, 03/25/35† | 470,952 | 471,888 | ||||||||||
Bear Stearns ALT-A Trust | ||||||||||||
1.16%, 11/25/34† | 165,644 | 163,204 | ||||||||||
Bear Stearns Commercial Mortgage Securities Trust | ||||||||||||
5.51%, 03/11/39† | 495,067 | 494,571 | ||||||||||
Bear Stearns Commercial Mortgage Securities Trust | ||||||||||||
5.32%, 02/11/44 | 1,002,592 | 1,032,420 | ||||||||||
Bear Stearns Commercial Mortgage Securities Trust | ||||||||||||
5.69%, 06/11/50† | 1,843,390 | 1,922,596 | ||||||||||
Bear Stearns Commercial Mortgage Securities Trust | ||||||||||||
6.08%, 06/11/50† | 1,055,000 | 1,121,588 | ||||||||||
Bear Stearns Commercial Mortgage Securities Trust | ||||||||||||
5.51%, 01/12/45† | 845,000 | 872,623 | ||||||||||
BLCP Hotel Trust | ||||||||||||
1.28%, 08/15/29 144A† | 1,920,448 | 1,886,711 | ||||||||||
CD Commercial Mortgage Trust | ||||||||||||
5.37%, 12/11/49† | 395,000 | 403,163 | ||||||||||
CDGJ Commercial Mortgage Trust | ||||||||||||
1.73%, 12/15/27 144A† | 790,000 | 785,045 | ||||||||||
CGBAM Commercial Mortgage Trust | ||||||||||||
3.21%, 04/10/28 144A | 850,000 | 854,818 | ||||||||||
Citigroup Commercial Mortgage Trust | ||||||||||||
2.11%, 01/12/30 144A | 1,252,836 | 1,254,521 | ||||||||||
Citigroup Commercial Mortgage Trust | ||||||||||||
3.38%, 09/15/17 144A† | 1,185,000 | 1,160,941 | ||||||||||
COBALT Commercial Mortgage Trust | ||||||||||||
5.77%, 05/15/46† | 1,040,000 | 1,091,717 | ||||||||||
| Par | Value | |||||||||||
COMM Mortgage Trust | ||||||||||||
5.31%, 12/10/46 | $ | 1,072,275 | $ | 1,091,378 | ||||||||
COMM Mortgage Trust | ||||||||||||
1.83%, 08/15/45 IOW† | 1,955,164 | 163,721 | ||||||||||
COMM Mortgage Trust | ||||||||||||
1.50%, 03/10/46 IOW† | 5,584,831 | 379,081 | ||||||||||
COMM Mortgage Trust | ||||||||||||
1.17%, 10/10/46 IOW† | 5,926,110 | 372,144 | ||||||||||
COMM Mortgage Trust | ||||||||||||
2.90%, 10/10/46 | 2,055,000 | 2,089,364 | ||||||||||
COMM Mortgage Trust | ||||||||||||
1.87%, 04/12/35 144A | 593,097 | 578,778 | ||||||||||
COMM Mortgage Trust | ||||||||||||
2.48%, 10/15/31 144A† | 670,000 | 665,055 | ||||||||||
COMM Mortgage Trust | ||||||||||||
1.20%, 06/11/27 144A† | 3,400,000 | 3,360,547 | ||||||||||
COMM Mortgage Trust | ||||||||||||
0.89%, 07/10/48 IOW† | 6,861,878 | 356,046 | ||||||||||
Countrywide Home Loan Mortgage Pass-Through Trust | ||||||||||||
0.96%, 02/25/35† | 142,113 | 134,327 | ||||||||||
Credit Suisse Commercial Mortgage Trust | ||||||||||||
5.46%, 02/15/39† | 469,203 | 468,792 | ||||||||||
Credit Suisse Commercial Mortgage Trust | ||||||||||||
5.62%, 09/15/40† | 196,844 | 200,346 | ||||||||||
Credit Suisse Commercial Mortgage Trust | ||||||||||||
6.07%, 02/15/41† | 85,218 | 85,446 | ||||||||||
Crusade Global Trust | ||||||||||||
0.42%, 11/15/37† | 1,045,486 | 1,041,720 | ||||||||||
CSMC Trust | ||||||||||||
1.55%, 04/25/43 144A† | 1,022,538 | 958,502 | ||||||||||
DBRR Trust | ||||||||||||
5.71%, 06/17/49 144A† | 1,805,000 | 1,864,131 | ||||||||||
Del Coronado Trust | ||||||||||||
1.13%, 03/15/26 144A† | 530,000 | 527,270 | ||||||||||
Deutsche Alt-B Securities Mortgage Loan Trust | ||||||||||||
5.87%, 10/25/36 STEP | 359,070 | 297,008 | ||||||||||
5.89%, 10/25/36 STEP | 359,070 | 297,222 | ||||||||||
Eurosail-UK PLC | ||||||||||||
0.89%, 06/13/45(U)† | 413,856 | 606,200 | ||||||||||
Fannie Mae Connecticut Avenue Securities | ||||||||||||
2.42%, 10/25/23† | 741,757 | 747,140 | ||||||||||
| 82 | See Notes to Financial Statements. |
Table of Contents
| Par | Value | |||||||||||
Fannie Mae Connecticut Avenue Securities | ||||||||||||
2.02%, 01/25/24† | $ | 831,043 | $ | 832,320 | ||||||||
Fannie Mae Connecticut Avenue Securities | ||||||||||||
1.37%, 05/25/24† | 1,118,357 | 1,107,996 | ||||||||||
Fannie Mae Connecticut Avenue Securities | ||||||||||||
1.62%, 07/25/24† | 1,583,964 | 1,578,217 | ||||||||||
Fannie Mae Grantor Trust | ||||||||||||
3.31%, 02/25/32 | 33,460 | 33,855 | ||||||||||
FDIC Guaranteed Notes Trust | ||||||||||||
3.25%, 04/25/38 144A | 323,198 | 330,189 | ||||||||||
0.98%, 02/25/48 144A† | 87,102 | 87,120 | ||||||||||
FDIC Guaranteed Notes Trust | ||||||||||||
1.15%, 12/04/20 144A† | 1,454,011 | 1,463,659 | ||||||||||
FDIC Trust | ||||||||||||
2.18%, 05/25/50 144A | 507,872 | 504,126 | ||||||||||
Federal Home Loan Mortgage Corporation | ||||||||||||
5.00%, 01/01/19 | 75,796 | 79,651 | ||||||||||
5.00%, 02/01/19 | 94,688 | 99,476 | ||||||||||
5.00%, 12/01/19 | 189,781 | 199,770 | ||||||||||
5.50%, 05/01/22 | 596,796 | 630,835 | ||||||||||
2.61%, 07/01/27† | 10,255 | 10,873 | ||||||||||
3.00%, 01/01/31 TBA | 4,100,000 | 4,224,942 | ||||||||||
2.62%, 11/01/31† | 46,989 | 49,638 | ||||||||||
2.50%, 04/01/32† | 7,013 | 7,391 | ||||||||||
2.28%, 06/01/33† | 694,919 | 732,766 | ||||||||||
2.61%, 10/01/34† | 174,061 | 185,074 | ||||||||||
2.50%, 08/01/35† | 617,500 | 654,952 | ||||||||||
2.09%, 09/01/35† | 351,337 | 370,331 | ||||||||||
2.40%, 10/01/35† | 532,116 | 559,745 | ||||||||||
2.14%, 04/01/36† | 552,998 | 583,382 | ||||||||||
Federal Home Loan Mortgage Corporation REMIC | ||||||||||||
4.00%, 08/15/25 STEP | 302,153 | 321,369 | ||||||||||
Federal Home Loan Mortgage Corporation REMIC | ||||||||||||
4.50%, 11/15/41 | 749,008 | 810,637 | ||||||||||
Federal Home Loan Mortgage Corporation REMIC | ||||||||||||
4.50%, 09/15/41 | 762,032 | 820,417 | ||||||||||
Federal Home Loan Mortgage Corporation REMIC | ||||||||||||
4.00%, 12/15/43 | 513,870 | 548,794 | ||||||||||
Federal Home Loan Mortgage Corporation REMIC | ||||||||||||
3.50%, 06/15/50 | 734,985 | 762,692 | ||||||||||
Federal National Mortgage Association | ||||||||||||
5.00%, 07/01/19 | 41,792 | 43,556 | ||||||||||
5.00%, 05/01/21 | 344,489 | 361,597 | ||||||||||
5.00%, 11/01/21 | 148,143 | 155,229 | ||||||||||
| Par | Value | |||||||||||
2.25%, 12/01/24 CONV† | $ | 13,920 | $ | 14,269 | ||||||||
9.00%, 05/01/25 | 3,588 | 3,616 | ||||||||||
9.00%, 07/01/25 | 6,824 | 6,871 | ||||||||||
3.00%, 01/01/26 TBA | 765,000 | 788,059 | ||||||||||
3.50%, 01/01/26 TBA | 5,775,000 | 6,047,736 | ||||||||||
4.50%, 01/01/26 TBA | 510,000 | 527,006 | ||||||||||
3.00%, 02/01/26 TBA | 100,000 | 102,852 | ||||||||||
2.50%, 12/01/27 | 2,253,975 | 2,283,801 | ||||||||||
2.51%, 09/01/31† | 65,898 | 68,792 | ||||||||||
1.57%, 08/01/32† | 580,205 | 604,886 | ||||||||||
2.34%, 12/01/32† | 461,852 | 491,287 | ||||||||||
2.07%, 04/01/33† | 129,619 | 136,996 | ||||||||||
2.15%, 06/01/33† | 87,919 | 92,649 | ||||||||||
2.66%, 06/01/33† | 56,489 | 59,874 | ||||||||||
2.67%, 10/01/33† | 205,776 | 217,483 | ||||||||||
2.55%, 12/01/33† | 78,123 | 81,955 | ||||||||||
2.70%, 03/01/34† | 88,912 | 89,912 | ||||||||||
2.17%, 09/01/34† | 303,521 | 320,376 | ||||||||||
2.08%, 10/01/34† | 167,212 | 174,745 | ||||||||||
2.26%, 10/01/34† | 204,699 | 215,743 | ||||||||||
2.28%, 02/01/35† | 249,658 | 264,432 | ||||||||||
2.48%, 09/01/35† | 473,340 | 500,856 | ||||||||||
2.32%, 12/01/35† | 14,217 | 14,898 | ||||||||||
4.00%, 01/01/40 TBA | 1,445,000 | 1,506,638 | ||||||||||
1.44%, 08/01/42† | 404,514 | 413,978 | ||||||||||
3.60%, 09/01/42† | 1,234,716 | 1,286,906 | ||||||||||
1.44%, 07/01/44† | 274,386 | 281,029 | ||||||||||
1.44%, 10/01/44† | 208,193 | 213,153 | ||||||||||
2.73%, 06/01/45† | 1,977,786 | 1,998,929 | ||||||||||
Federal National Mortgage Association REMIC | ||||||||||||
4.00%, 11/25/19 | 47,118 | 48,124 | ||||||||||
Federal National Mortgage Association REMIC | ||||||||||||
4.00%, 06/25/26 STEP | 485,562 | 518,218 | ||||||||||
Federal National Mortgage Association REMIC | ||||||||||||
0.97%, 09/25/41† | 2,627,815 | 2,658,306 | ||||||||||
Federal National Mortgage Association REMIC | ||||||||||||
0.58%, 07/25/22 IOW† | 23,727,228 | 684,293 | ||||||||||
FHLMC Multifamily VRD Certificates | ||||||||||||
5.50%, 08/15/51 STEP | 3,000,000 | 3,067,500 | ||||||||||
FHLMC Structured Pass-Through Securities | ||||||||||||
1.42%, 05/25/43† | 698,192 | 709,739 | ||||||||||
FHLMC Structured Pass-Through Securities | ||||||||||||
1.64%, 07/25/44† | 1,005,211 | 1,021,506 | ||||||||||
First Horizon Alternative Mortgage Securities Trust | ||||||||||||
2.35%, 06/25/34† | 355,891 | 349,762 | ||||||||||
Freddie Mac Structured Agency Credit Risk Debt Notes | ||||||||||||
1.87%, 11/25/23† | 523,412 | 523,028 | ||||||||||
| See Notes to Financial Statements. | 83 |
Table of Contents
LOW-DURATION BOND FUND
SCHEDULE OF INVESTMENTS (Continued)
| Par | Value | |||||||||||
GAHR Commercial Mortgage Trust | ||||||||||||
1.63%, 12/15/16 144A† | $ | 1,990,000 | $ | 1,978,871 | ||||||||
GE Capital Commercial Mortgage Corporation | ||||||||||||
5.48%, 12/10/49† | 956,998 | 991,187 | ||||||||||
Giovecca Mortgages S.r.l. | ||||||||||||
0.55%, 04/23/48(E)† | 324,167 | 351,261 | ||||||||||
Government National Mortgage Association | ||||||||||||
1.75%, 06/20/17† | 1,796 | 1,811 | ||||||||||
2.00%, 06/20/21† | 2,360 | 2,428 | ||||||||||
1.75%, 03/20/22† | 134,611 | 138,722 | ||||||||||
1.75%, 01/20/23† | 22,135 | 22,807 | ||||||||||
1.75%, 05/20/24† | 42,847 | 44,182 | ||||||||||
1.88%, 07/20/25† | 56,311 | 58,018 | ||||||||||
1.88%, 08/20/25† | 14,870 | 15,389 | ||||||||||
1.63%, 11/20/25† | 47,534 | 49,265 | ||||||||||
1.63%, 12/20/26† | 67,301 | 70,000 | ||||||||||
1.88%, 07/20/27† | 1,588 | 1,647 | ||||||||||
1.63%, 10/20/27† | 26,406 | 27,481 | ||||||||||
8.50%, 10/15/29 | 23,505 | 24,260 | ||||||||||
8.50%, 03/15/30 | 714 | 717 | ||||||||||
8.50%, 04/15/30 | 4,957 | 5,080 | ||||||||||
8.50%, 05/15/30 | 62,917 | 66,049 | ||||||||||
1.75%, 05/20/30† | 42,674 | 43,775 | ||||||||||
8.50%, 07/15/30 | 49,484 | 53,180 | ||||||||||
8.50%, 08/15/30 | 12,598 | 13,612 | ||||||||||
8.50%, 11/15/30 | 7,971 | 8,424 | ||||||||||
8.50%, 12/15/30 | 28,262 | 32,497 | ||||||||||
8.50%, 02/15/31 | 16,676 | 17,517 | ||||||||||
Government National Mortgage Association | ||||||||||||
0.94%, 02/16/30† | 76,843 | 77,601 | ||||||||||
Government National Mortgage Association | ||||||||||||
0.70%, 05/20/37† | 231,917 | 232,495 | ||||||||||
Granite Mortgages PLC | ||||||||||||
0.33%, 01/20/44(E)† | 33,337 | 36,239 | ||||||||||
GreenPoint Mortgage Funding Trust | ||||||||||||
0.69%, 11/25/45† | 189,103 | 163,317 | ||||||||||
GreenPoint Mortgage Funding Trust | ||||||||||||
0.60%, 01/25/37† | 639,101 | 514,220 | ||||||||||
GS Mortgage Securities Trust | ||||||||||||
5.79%, 08/10/45† | 224,071 | 232,996 | ||||||||||
GSR Mortgage Loan Trust | ||||||||||||
2.82%, 09/25/34† | 380,673 | 367,830 | ||||||||||
GSR Mortgage Loan Trust | ||||||||||||
2.81%, 09/25/35† | 272,712 | 278,619 | ||||||||||
Hilton USA Trust | ||||||||||||
1.27%, 11/05/30 144A† | 1,106,192 | 1,100,640 | ||||||||||
| Par | Value | |||||||||||
Hilton USA Trust | ||||||||||||
4.41%, 11/05/30 144A | $ | 825,000 | $ | 821,079 | ||||||||
4.45%, 11/05/30 144A† | 975,000 | 970,314 | ||||||||||
Impac CMB Trust | ||||||||||||
1.22%, 03/25/33† | 298,246 | 290,838 | ||||||||||
IndyMac INDX Mortgage Loan Trust | ||||||||||||
0.61%, 09/25/46† | 723,586 | 588,394 | ||||||||||
IndyMac INDX Mortgage Loan Trust | ||||||||||||
0.49%, 06/25/37† | 414,151 | 284,259 | ||||||||||
JP Morgan Chase Commercial Mortgage Securities Trust | ||||||||||||
5.50%, 10/12/37 144A | 1,507,408 | 1,545,581 | ||||||||||
JP Morgan Chase Commercial Mortgage Securities Trust | ||||||||||||
5.81%, 06/12/43† | 2,784,526 | 2,806,174 | ||||||||||
JP Morgan Chase Commercial Mortgage Securities Trust | ||||||||||||
5.70%, 02/12/49† | 750,224 | 782,652 | ||||||||||
JP Morgan Chase Commercial Mortgage Securities Trust | ||||||||||||
5.85%, 02/15/51† | 1,227,959 | 1,285,818 | ||||||||||
JP Morgan Chase Commercial Mortgage Securities Trust | ||||||||||||
4.11%, 07/15/46 144A | 1,400,000 | 1,452,291 | ||||||||||
JP Morgan Chase Commercial Mortgage Securities Trust | ||||||||||||
1.73%, 11/15/31 144A† | 845,000 | 838,743 | ||||||||||
JP Morgan Chase Commercial Mortgage Securities Trust | ||||||||||||
1.58%, 01/15/32 144A† | 1,090,000 | 1,084,219 | ||||||||||
JP Morgan Mortgage Trust | ||||||||||||
2.71%, 02/25/35† | 82,525 | 82,315 | ||||||||||
JP Morgan Mortgage Trust | ||||||||||||
2.50%, 03/25/43 144A† | 387,681 | 384,126 | ||||||||||
Lanark Master Issuer PLC | ||||||||||||
1.78%, 12/22/54 144A† | 543,283 | 543,826 | ||||||||||
LB-UBS Commercial Mortgage Trust | ||||||||||||
5.42%, 02/15/40 | 1,151,419 | 1,177,808 | ||||||||||
LB-UBS Commercial Mortgage Trust | ||||||||||||
6.11%, 07/15/40† | 1,645,000 | 1,717,976 | ||||||||||
LB-UBS Commercial Mortgage Trust | ||||||||||||
6.16%, 09/15/45† | 2,130,000 | 2,279,377 | ||||||||||
Luminent Mortgage Trust | ||||||||||||
0.39%, 12/25/36† | 713,206 | 573,869 | ||||||||||
| 84 | See Notes to Financial Statements. |
Table of Contents
| Par | Value | |||||||||||
MASTR Adjustable Rate Mortgages Trust | ||||||||||||
2.74%, 12/25/33† | $ | 232,378 | $ | 229,858 | ||||||||
Merrill Lynch Mortgage Investors Trust | ||||||||||||
2.24%, 12/25/34† | 395,271 | 396,242 | ||||||||||
Merrill Lynch Mortgage Investors Trust | ||||||||||||
2.18%, 02/25/36† | 448,671 | 443,333 | ||||||||||
Merrill Lynch/Countrywide Commercial Mortgage Trust | ||||||||||||
5.20%, 12/12/49 | 915,000 | 939,043 | ||||||||||
Morgan Stanley Bank of America Merrill Lynch Trust | ||||||||||||
1.20%, 11/15/46 IOW† | 4,882,775 | 309,237 | ||||||||||
Morgan Stanley Capital I Trust | ||||||||||||
5.48%, 02/12/44† | 1,655,000 | 1,704,818 | ||||||||||
Morgan Stanley Capital I Trust | ||||||||||||
5.41%, 03/15/44 | 1,090,000 | 1,118,843 | ||||||||||
National RMBS Trust | ||||||||||||
3.17%, 06/20/44(A)† | 306,084 | 225,608 | ||||||||||
NCUA Guaranteed Notes Trust | ||||||||||||
1.84%, 10/07/20 | 7,299 | 7,302 | ||||||||||
NCUA Guaranteed Notes Trust | ||||||||||||
0.83%, 12/08/20† | 2,555,585 | 2,572,776 | ||||||||||
NCUA Guaranteed Notes Trust | ||||||||||||
0.95%, 03/09/21 STEP† | 1,334,514 | 1,327,786 | ||||||||||
RALI Trust | ||||||||||||
0.82%, 01/25/33† | 1,640 | 1,637 | ||||||||||
RCMC LLC | ||||||||||||
5.62%, 11/15/44 144A | 177,900 | 179,851 | ||||||||||
RFMSI Trust | ||||||||||||
6.50%, 03/25/32 | 13,672 | 14,161 | ||||||||||
Rochester Financing No. 1 PLC | ||||||||||||
2.03%, 07/16/46 STEP(U)† | 331,571 | 489,411 | ||||||||||
Selkirk No. 1, Ltd. | ||||||||||||
1.33%, 02/20/41 144A | 798,824 | 794,992 | ||||||||||
Sequoia Mortgage Trust | ||||||||||||
2.87%, 01/25/42† | 415,741 | 416,951 | ||||||||||
Sequoia Mortgage Trust | ||||||||||||
3.50%, 04/25/42† | 224,609 | 226,235 | ||||||||||
Sequoia Mortgage Trust | ||||||||||||
1.45%, 02/25/43† | 547,712 | 529,022 | ||||||||||
Sequoia Mortgage Trust | ||||||||||||
1.55%, 04/25/43† | 655,808 | 634,759 | ||||||||||
| Par | Value | |||||||||||
Springleaf Mortgage Loan Trust | ||||||||||||
1.27%, 06/25/58 144A† | $ | 502,567 | $ | 497,292 | ||||||||
Springleaf Mortgage Loan Trust | ||||||||||||
1.78%, 12/25/65 144A† | 333,112 | 332,832 | ||||||||||
STRIPs, Ltd. | ||||||||||||
1.50%, 12/25/44 144A | 133,732 | 132,448 | ||||||||||
Structured Adjustable Rate Mortgage Loan Trust | ||||||||||||
2.56%, 08/25/34† | 547,192 | 533,894 | ||||||||||
Structured Adjustable Rate Mortgage Loan Trust | ||||||||||||
0.72%, 09/25/34† | 123,800 | 106,964 | ||||||||||
Structured Asset Mortgage Investments II Trust | ||||||||||||
2.17%, 10/19/34† | 156,342 | 130,703 | ||||||||||
Structured Asset Mortgage Investments II Trust | ||||||||||||
0.65%, 07/19/35† | 114,083 | 98,645 | ||||||||||
Structured Asset Mortgage Investments II Trust | ||||||||||||
0.70%, 02/25/36† | 579,795 | 448,019 | ||||||||||
Talisman-6 Finance PLC | ||||||||||||
0.13%, 10/22/16(E)† | 13,969 | 15,059 | ||||||||||
TBW Mortgage-Backed Trust | ||||||||||||
6.01%, 07/25/37 STEP | 368,296 | 274,664 | ||||||||||
TORRENS Trust | ||||||||||||
3.01%, 04/12/44(A)† | 1,562,699 | 1,136,543 | ||||||||||
UBS-Barclays Commercial Mortgage Trust | ||||||||||||
1.71%, 05/10/63 IO 144AW† | 6,274,883 | 399,643 | ||||||||||
Wachovia Bank Commercial Mortgage Trust | ||||||||||||
5.71%, 06/15/49† | 836,397 | 865,779 | ||||||||||
Washington Mutual Mortgage Pass-Through Certificates | ||||||||||||
1.66%, 06/25/42† | 16,950 | 16,328 | ||||||||||
Washington Mutual Mortgage Pass-Through Certificates | ||||||||||||
2.48%, 08/25/33† | 382,900 | 392,074 | ||||||||||
Washington Mutual Mortgage Pass-Through Certificates | ||||||||||||
0.73%, 01/25/45† | 595,368 | 560,701 | ||||||||||
Washington Mutual Mortgage Pass-Through Certificates | ||||||||||||
1.24%, 06/25/46† | 1,092,605 | 1,017,391 | ||||||||||
Washington Mutual Mortgage Pass-Through Certificates | ||||||||||||
1.00%, 01/25/47† | 594,424 | 479,413 | ||||||||||
| See Notes to Financial Statements. | 85 |
Table of Contents
LOW-DURATION BOND FUND
SCHEDULE OF INVESTMENTS (Continued)
| Par | Value | |||||||
Washington Mutual Mortgage Pass-Through Certificates Series 2007-HY1 | ||||||||
2.21%, 02/25/37† | $ | 451,151 | $ | 391,839 | ||||
Washington Mutual Mortgage Pass-Through Certificates Series 2007-HY5 | ||||||||
2.16%, 05/25/37† | 512,802 | 419,244 | ||||||
Washington Mutual Mortgage Pass-Through Certificates Series 2007-HY7 | ||||||||
2.22%, 07/25/37† | 1,367,792 | 1,162,700 | ||||||
Washington Mutual Mortgage Pass-Through Certificates Series 2007-OA5 | ||||||||
1.10%, 05/25/47 IO† | 275,928 | 22,075 | ||||||
Wells Fargo Commercial Mortgage Trust Series 2010-C1 | ||||||||
3.35%, 11/15/43 144A | 954,513 | 979,425 | ||||||
Wells Fargo Commercial Mortgage Trust Series 2014-TISH | ||||||||
3.08%, 01/15/27 144A† | 790,000 | 767,810 | ||||||
Wells Fargo Mortgage-Backed Securities Trust Series 2004-EE | ||||||||
2.74%, 12/25/34† | 349,086 | 356,650 | ||||||
Wells Fargo Mortgage-Backed Securities Trust Series 2005-AR16 | ||||||||
2.74%, 08/25/33† | 65,431 | 66,478 | ||||||
WFRBS Commercial Mortgage Trust Series 2012-C8 | ||||||||
2.16%, 08/15/45 IO 144AW† | 3,541,967 | 296,762 | ||||||
|
| |||||||
Total Mortgage-Backed Securities | 137,188,126 | |||||||
|
| |||||||
MUNICIPAL BONDS — 1.3% |
| |||||||
California Earthquake Authority, Revenue Bond | ||||||||
1.82%, 07/01/17 | 480,000 | 483,053 | ||||||
2.81%, 07/01/19 | 1,300,000 | 1,315,587 | ||||||
Energy Northwest, Revenue Bond | ||||||||
1.79%, 07/01/18 | 400,000 | 404,152 | ||||||
Florida Hurricane Catastrophe Fund Finance Corporation, Series A, Revenue Bond | ||||||||
1.30%, 07/01/16 | 720,000 | 722,225 | ||||||
State of Texas, General Obligation, Series C-2 | ||||||||
0.83%, 06/01/19† | 3,300,000 | 3,302,871 | ||||||
University of California, Revenue Bond, Series Y-1 | ||||||||
0.93%, 07/01/41† | 1,100,000 | 1,099,835 | ||||||
University of California, Revenue Bond, Series Y-2 | ||||||||
0.93%, 07/01/41† | 1,000,000 | 999,850 | ||||||
University of Massachusetts Building Authority, Revenue Bond, Series 4 | ||||||||
1.31%, 11/01/17 | 3,000,000 | 3,013,140 | ||||||
|
| |||||||
Total Municipal Bonds | 11,340,713 | |||||||
|
| |||||||
| Number of Contracts | Value | |||||||
PURCHASED OPTIONS �� 0.0% |
| |||||||
Call Options — 0.0% | ||||||||
10-Year U.S. Treasury Note, Strike Price $128.00, Expires 02/19/16 (UBS) | 115 | $ | 26,953 | |||||
|
| |||||||
Put Options — 0.0% |
| |||||||
90-Day Euro, Strike Price $97.875, Expires 06/13/16 (UBS) | 215 | 1,344 | ||||||
90-Day Euro, Strike Price $98.625, Expires 06/13/16 (UBS) | 215 | 1,344 | ||||||
|
| |||||||
| 2,688 | ||||||||
|
| |||||||
Total Purchased Options | 29,641 | |||||||
|
| |||||||
| Par | ||||||||
U.S. TREASURY OBLIGATIONS — 26.9% |
| |||||||
U.S. Treasury Bills | ||||||||
0.29%, 06/23/16W | $ | 10,000,000 | 9,978,150 | |||||
|
| |||||||
U.S. Treasury Inflationary Index Bond 0.13%, 04/15/20D | 6,500,000 | 6,522,296 | ||||||
|
| |||||||
U.S. Treasury Notes | ||||||||
0.38%, 10/31/16D | 1,000,000 | 996,914 | ||||||
1.00%, 10/31/16D | 1,495,000 | 1,497,920 | ||||||
0.50%, 11/30/16 | 15,000,000 | 14,962,200 | ||||||
0.63%, 12/15/16 | 13,000,000 | 12,981,969 | ||||||
0.63%, 12/31/16 | 9,545,000 | 9,530,463 | ||||||
0.88%, 12/31/16D | 10,000,000 | 10,007,620 | ||||||
0.63%, 07/31/17 | 7,620,000 | 7,578,479 | ||||||
0.63%, 09/30/17 | 13,846,000 | 13,751,889 | ||||||
0.75%, 10/31/17 | 62,400,000 | 62,074,584 | ||||||
0.88%, 11/15/17 | 6,675,000 | 6,652,839 | ||||||
0.88%, 11/30/17D | 390,000 | 388,903 | ||||||
1.00%, 02/15/18D‡‡ | 25,575,000 | 25,498,071 | ||||||
1.13%, 06/15/18 | 5,000,000 | 4,988,965 | ||||||
1.00%, 08/15/18 | 15,380,000 | 15,282,675 | ||||||
1.00%, 09/15/18 | 6,170,000 | 6,126,736 | ||||||
0.88%, 10/15/18 | 11,565,000 | 11,439,184 | ||||||
1.25%, 12/15/18D | 10,000,000 | 9,979,490 | ||||||
1.63%, 06/30/19 | 800,000 | 803,703 | ||||||
|
| |||||||
| 214,542,604 | ||||||||
|
| |||||||
Total U.S. Treasury Obligations | 231,043,050 | |||||||
|
| |||||||
| Shares | ||||||||
MONEY MARKET FUNDS — 7.4% |
| |||||||
GuideStone Money Market Fund (Investor Class)¥ | 36,182,778 | 36,182,778 | ||||||
Northern Institutional Liquid Assets Portfolio§ | 27,068,175 | 27,068,175 | ||||||
|
| |||||||
Total Money Market Funds | 63,250,953 | |||||||
|
| |||||||
TOTAL INVESTMENTS — 105.7% | 908,454,380 | |||||||
|
| |||||||
| 86 | See Notes to Financial Statements. |
Table of Contents
| Number of Contracts | Value | |||||||
WRITTEN OPTIONS — (0.1)% |
| |||||||
Put Options — (0.1)% | ||||||||
90-Day Euro, Strike Price $98.25, Expires 06/13/16 (UBS) | (430 | ) | $ | (2,687 | ) | |||
90-Day Euro, Strike Price $98.75, Expires 06/13/16 (UBS) | (66 | ) | (58,575 | ) | ||||
90-Day Euro, Strike Price $98.75, Expires 12/19/16 (UBS) | (602 | ) | (252,087 | ) | ||||
90-Day Euro, Strike Price $98.75, Expires 12/19/16 (UBS) | (602 | ) | (282,188 | ) | ||||
|
| |||||||
| (595,537 | ) | |||||||
|
| |||||||
| Notional Amount | ||||||||
Put Swaptions — 0.0% |
| |||||||
3-Month LIBOR, Strike Price | ||||||||
1.92%, Expires | ||||||||
03/01/16 (CITI) | $ | (23,300,000 | ) | (66,163 | ) | |||
|
| |||||||
Total Written Options | ||||||||
(Premiums received $(1,194,980)) |
| (661,700 | ) | |||||
|
| |||||||
Liabilities in Excess of Other |
| (47,769,166 | ) | |||||
|
| |||||||
NET ASSETS — 100.0% |
| $ | 860,023,514 | |||||
|
| |||||||
Swap agreements outstanding at December 31, 2015:
Maturity Date | Reference Obligation | Implied Credit Spread | Fixed Deal (Pay) Rate | Currency | Notional Amount | Market Value | Counterparty | Unrealized Appreciation (Depreciation) | ||||||||||||||||||||||
Credit Default Swaps on Corporate Issues — Sell Protection |
| |||||||||||||||||||||||||||||
12/20/20 | Volvo Treasury AB, 5.00% due 05/31/17 | 1.09 | % | (1.00 | )% | EUR | 500,000 | $ | (2,311 | ) | BNP | $ | 5,627 | |||||||||||||||||
12/20/20 | Volvo Treasury AB, 5.00% due 05/31/17 | 1.09 | % | (1.00 | )% | EUR | 400,000 | (1,849 | ) | MSCS | 5,612 | |||||||||||||||||||
12/20/20 | Volvo Treasury AB, 5.00% due 05/31/17 | 1.09 | % | (1.00 | )% | EUR | 300,000 | (1,387 | ) | CITI | 4,995 | |||||||||||||||||||
|
|
|
| |||||||||||||||||||||||||||
| $ | (5,547 | ) | $ | 16,234 | ||||||||||||||||||||||||||
|
|
|
| |||||||||||||||||||||||||||
Maturity Date | Reference Obligation | Fixed Deal (Pay) Rate | Currency | Notional Amount | Market Value | Counterparty | Unrealized Appreciation (Depreciation) | |||||||||||||||||||||||
Credit Default Swaps on Credit Indices — Buy Protection |
| |||||||||||||||||||||||||||||
12/20/20 | ||||||||||||||||||||||||||||||
Dow Jones CDX.NA.IG25 | 1.00 | % | USD | 1,750,000 | $ | (9,703 | ) | CME | $ | 10,954 | ||||||||||||||||||||
|
|
|
| |||||||||||||||||||||||||||
Maturity Date | Reference Obligation | Fixed Deal (Pay) Rate | Currency | Notional Amount | Market Value | Counterparty | Unrealized Appreciation (Depreciation) | |||||||||||||||||||||||
Interest Rate Swaps |
| |||||||||||||||||||||||||||||
10/05/17 | MXN-TIIE-Banxico | 4.20 | % | MXN | 402,500,000 | $ | (47,258 | ) | CME | $ | (28,492 | ) | ||||||||||||||||||
12/15/17 | 3-Month LIBOR | 1.00 | % | CAD | 55,000,000 | 53,017 | CME | 9,529 | ||||||||||||||||||||||
06/15/18 | 3-Month LIBOR | (1.25 | )% | USD | 197,000,000 | 664,264 | CME | 396,851 | ||||||||||||||||||||||
|
|
|
| |||||||||||||||||||||||||||
| $ | 670,023 | $ | 377,888 | |||||||||||||||||||||||||||
|
|
|
| |||||||||||||||||||||||||||
Total Swap agreements outstanding at December 31, 2015 |
| $ | 654,773 | $ | 405,076 | |||||||||||||||||||||||||
|
|
|
| |||||||||||||||||||||||||||
| See Notes to Financial Statements. | 87 |
Table of Contents
LOW-DURATION BOND FUND
SCHEDULE OF INVESTMENTS (Continued)
VALUATION HIERARCHY
The following is a summary of the inputs used, as of December 31, 2015, in valuing the Fund’s investments carried at fair value:
| Total Value | Level 1 Quoted Prices | Level 2 Other Significant Observable Inputs | Level 3 Significant Unobservable Inputs | |||||||||||||
Assets: | ||||||||||||||||
Investments in Securities: | ||||||||||||||||
Agency Obligations | $ | 6,011,196 | $ | — | $ | 6,011,196 | $ | — | ||||||||
Asset-Backed Securities | 101,248,381 | — | 62,782,695 | 38,465,686 | ||||||||||||
Corporate Bonds | 245,784,366 | — | 245,784,366 | — | ||||||||||||
Foreign Bonds: | ||||||||||||||||
Australia | 9,114,971 | — | 8,818,471 | 296,500 | ||||||||||||
Bermuda | 1,616,544 | — | 1,616,544 | — | ||||||||||||
Brazil | 1,013,500 | — | 1,013,500 | — | ||||||||||||
Canada | 5,982,684 | — | 5,982,684 | — | ||||||||||||
Cayman Islands | 2,060,030 | — | 2,060,030 | — | ||||||||||||
Chile | 2,995,278 | — | 2,995,278 | — | ||||||||||||
Denmark | 663,640 | — | 663,640 | — | ||||||||||||
France | 12,890,545 | — | 12,890,545 | — | ||||||||||||
Germany | 1,098,293 | — | 1,098,293 | — | ||||||||||||
Guernsey | 450,304 | — | 450,304 | — | ||||||||||||
Iceland | 637,979 | — | 637,979 | — | ||||||||||||
Ireland | 697,375 | — | 697,375 | — | ||||||||||||
Italy | 4,063,752 | — | 4,063,752 | — | ||||||||||||
Japan | 5,451,640 | — | 5,451,640 | — | ||||||||||||
Luxembourg | 717,238 | — | 717,238 | — | ||||||||||||
Mexico | 4,558,557 | — | 4,558,557 | — | ||||||||||||
Netherlands | 11,218,063 | — | 11,218,063 | — | ||||||||||||
New Zealand | 2,651,440 | — | 2,651,440 | — | ||||||||||||
Norway | 300,398 | — | 300,398 | — | ||||||||||||
Panama | 310,103 | — | 310,103 | — | ||||||||||||
Singapore | 400,165 | — | 400,165 | — | ||||||||||||
South Korea | 23,891,616 | — | 23,891,616 | — | ||||||||||||
Spain | 1,300,831 | — | 1,300,831 | — | ||||||||||||
Switzerland | 5,008,866 | — | 5,008,866 | — | ||||||||||||
United Kingdom | 9,471,421 | — | 9,471,421 | — | ||||||||||||
Virgin Islands (British) | 3,359,163 | — | 3,359,163 | — | ||||||||||||
Loan Agreements | 633,558 | — | 633,558 | — | ||||||||||||
Money Market Funds | 63,250,953 | 63,250,953 | — | — | ||||||||||||
Mortgage-Backed Securities | 137,188,126 | — | 129,580,804 | 7,607,322 | ||||||||||||
Municipal Bonds | 11,340,713 | — | 11,340,713 | — | ||||||||||||
Purchased Options | 29,641 | 29,641 | — | — | ||||||||||||
U.S. Treasury Obligations | 231,043,050 | — | 231,043,050 | — | ||||||||||||
|
|
|
|
|
|
|
| |||||||||
Total Assets - Investments in Securities | $ | 908,454,380 | $ | 63,280,594 | $ | 798,804,278 | $ | 46,369,508 | ||||||||
|
|
|
|
|
|
|
| |||||||||
Other Financial Instruments*** | ||||||||||||||||
Swap Agreements | $ | 654,773 | $ | — | $ | 654,773 | $ | — | ||||||||
|
|
|
|
|
|
|
| |||||||||
Total Assets - Other Financial Instruments | $ | 654,773 | $ | — | $ | 654,773 | $ | — | ||||||||
|
|
|
|
|
|
|
| |||||||||
| 88 | See Notes to Financial Statements. |
Table of Contents
| Total Value | Level 1 Quoted Prices | Level 2 Other Significant Observable Inputs | Level 3 Significant Unobservable Inputs | |||||||||||||||||
Liabilities: | ||||||||||||||||||||
Investments in Securities: | ||||||||||||||||||||
Written Options | $ | (661,700 | ) | $ | (595,537 | ) | $ | (66,163 | ) | $ | — | |||||||||
|
|
|
|
|
|
|
| |||||||||||||
Total Liabilities - Investments in Securities | $ | (661,700 | ) | $ | (595,537 | ) | $ | (66,163 | ) | $ | — | |||||||||
|
|
|
|
|
|
|
| |||||||||||||
Other Financial Instruments*** | ||||||||||||||||||||
Forward Foreign Currency Contracts | $ | (227,924 | ) | $ | — | $ | (227,924 | ) | $ | — | ||||||||||
Futures Contracts | (247,600 | ) | (247,600 | ) | — | — | ||||||||||||||
|
|
|
|
|
|
|
| |||||||||||||
Total Liabilities - Other Financial Instruments | $ | (475,524 | ) | $ | (247,600 | ) | $ | (227,924 | ) | $ | — | |||||||||
|
|
|
|
|
|
|
| |||||||||||||
***Other financial instruments are derivative instruments not reflected in the Schedule of Investments, such as futures, forwards and swap contracts, which are valued at the unrealized appreciation (depreciation) on the investment. Details of these investments can be found in the Notes to Financial Statements.
There were no transfers between Level 1 and Level 2 during the year ended December 31, 2015.
The unobservable inputs used in the fair value measurement of the reporting entity’s agency obligations, asset-backed securities, corporate bonds, foreign bonds and mortgage-backed securities are values based on evaluated quotations received from dealers who make markets in such securities. Significant increases (decreases) in those evaluated quotations would result in a significantly higher (lower) fair value measurement.
The following is a reconciliation of assets in which significant unobservable inputs (Level 3) were used in determining fair value:
| Total Value | Asset-Backed Securities | Corporate Bonds | Foreign Bonds | Mortgage-Backed Securities | ||||||||||||||||
Balance, 12/31/14 | $ | 43,863,320 | $ | 25,455,737 | $ | 3,451,214 | $ | 1,157,486 | $ | 13,798,883 | ||||||||||
Accrued discounts/premiums | (22,533 | ) | 11,994 | (27,285 | ) | (31 | ) | (7,211 | ) | |||||||||||
Realized gain (loss)(1) | (163,134 | ) | 42,622 | (8,180 | ) | (64,230 | ) | (133,346 | ) | |||||||||||
Change in unrealized appreciation (depreciation)(2) | (832,448 | ) | (76,115 | ) | (624,592 | ) | 11,328 | (143,069 | ) | |||||||||||
Purchases | 19,935,840 | 19,169,381 | — | — | 766,459 | |||||||||||||||
Sales | (11,059,681 | ) | (6,668,938 | ) | (479,988 | ) | (163,540 | ) | (3,747,215 | ) | ||||||||||
Transfers in to Level 3(3) | 4,072,089 | 4,072,089 | — | — | — | |||||||||||||||
Transfers out of Level 3(4) | (1,622,125 | ) | — | (1,089,759 | ) | (532,366 | ) | — | ||||||||||||
Maturities | (880,000 | ) | — | (880,000 | ) | — | — | |||||||||||||
Paydowns | (6,921,820 | ) | (3,541,084 | ) | (341,410 | ) | (112,147 | ) | (2,927,179 | ) | ||||||||||
|
|
|
|
|
|
|
|
|
| |||||||||||
Balance, 12/31/15 | $ | 46,369,508 | $ | 38,465,686 | $ | — | $ | 296,500 | $ | 7,607,322 | ||||||||||
|
|
|
|
|
|
|
|
|
| |||||||||||
| (1) | Realized gain (loss) from the sale of Level 3 securities is included on the Statement of Operations in Net realized gain (loss) from: Investment securities. |
| (2) | Change in unrealized appreciation (depreciation) is located on the Statement of Operations in Net change in unrealized appreciation (depreciation) on: Investment securities. |
| (3) | Transfers in to Level 3 represent the value of a security at December 31, 2015 that was transferred from Level 2 to Level 3 of the fair value hierarchy as a result of the inability of the Fund to obtain a price using an objective method such as a pricing vendor. |
| (4) | Transfers out of Level 3 represent the value of securities at December 31, 2015 that were transferred from Level 3 to Level 2 of the fair value hierarchy as a result of the ability of the Fund to obtain a price using an objective method such as a pricing vendor. |
| See Notes to Financial Statements. | 89 |
Table of Contents
Medium-Duration Bond Fund (Unaudited)
The Fund invested in a diversified portfolio composed primarily of investment grade fixed income securities with an average dollar-weighted duration (a measure of bond prices’ sensitivity to changes in interest rates) normally between three to seven years. The Investor Class of the Fund underperformed its benchmark index, the Barclays U.S. Aggregate Bond Index, for the one-year period ended December 31, 2015 (-0.22% versus 0.55%).
The Fund outpaced its benchmark index for two of the four quarters of the year. However, these periods of positive performance were unable to fully offset the weakness experienced in the third quarter. Widening spreads and rising volatility combined with overweight positions in credit were the strongest contributors to relative underperformance in the third quarter. Spreads continued to widen in the fourth quarter in anticipation and reaction to the Fed’s decision to increase short-term interest rates. During the year, the Fund remained diversified across multiple spread sectors to take advantage of the relative yield advantage of these sectors compared to U.S. Treasuries. The Fund’s performance was positively impacted by the relative yield advantage.
Other strategies involving derivatives were utilized during the year. U.S. Treasury futures contracts, options on U.S. Treasuries and Euro-futures were used for the common purposes of managing duration, implementing yield curve positioning strategies and expressing cross-sector views. Overall, on a net basis, these positions had a positive impact on performance. In an effort to better express the desired credit exposures and risks from a synthetic perspective, credit default swaps were utilized on a very modest basis. The positions established through the use of swaps detracted from the performance of the Fund. Currency forward contracts were utilized to hedge foreign currency risk and to express active currency views. These currency strategies resulted in a positive impact to the Fund’s performance. Through the process of implementing interest rate views and emerging markets strategies during the year, interest rate swaps were used although they provided little impact on the performance of the Fund.
During the year, the Fund remained focused on its objective of seeking maximum total return consistent with preservation of capital.
This Fund may be suitable for investors who have a short- to medium-term investment horizon, seek higher returns than those offered by a shorter maturity bond fund, can accept some short-term fluctuations in account value and want to diversify their portfolio with a fixed income investment option. This Fund is subject to interest rate risk. Meaning, when interest rates rise, the value of the existing bonds decrease and vice versa. Changes in interest rates have a bigger impact on long duration holdings than on short duration holdings. To the extent that the investment adviser misjudges current market conditions, the Fund’s volatility may be amplified by its use of derivatives and by its ability to select sub-advisers to allocate assets. Some derivatives may increase the risk of loss and cause fluctuations in the market value of the Fund’s portfolio to have disproportionately large effects or cause the net asset value of the Fund generally to decline faster than it would otherwise. The use of certain derivatives may also have a leveraging effect which may increase the volatility of the Fund and may reduce its returns. It is possible to lose money by investing in the Fund.
90
Table of Contents
Medium-Duration Bond Fund (Unaudited)
At December 31, 2015, the portfolio holdings of the Fund, as a percentage of net assets, is shown in the following table. Portfolio holdings are subject to risk and may change at any time.
| % | ||||
| Mortgage-Backed Securities | 41.5 | |||
| U.S. Treasury Obligations | 24.2 | |||
| Corporate Bonds | 22.8 | |||
| Foreign Bonds | 13.1 | |||
| Money Market Funds | 5.5 | |||
| Asset-Backed Securities | 4.4 | |||
| Municipal Bonds | 1.5 | |||
| Agency Obligations | 1.1 | |||
| Commercial Paper | 0.8 | |||
| Loan Agreements | 0.3 | |||
| Foreign Government Inflation-Linked Bond | 0.1 | |||
| Preferred Stock | 0.1 | |||
| Purchased Options | 0.1 | |||
| Written Options | — | |||
| TBA Sale Commitments | (1.3 | ) | ||
|
| |||
| 114.2 | ||||
|
| |||
91
Table of Contents
Medium-Duration Bond Fund (Unaudited)
| Average Annual Total Returns as of 12/31/15 | ||||||
Institutional | Investor | Benchmark** | ||||
One Year | 0.03% | -0.22% | 0.55% | |||
Five Year | 3.66% | 3.48% | 3.25% | |||
Ten Year | 5.03% | 4.88% | 4.52% | |||
Since Inception | 5.23% | 5.13% | 4.73% | |||
Inception Date | 08/27/01 | 08/27/01 | ||||
Total Fund Operating Expenses (May 1, 2015 Prospectus, as amended on June 1, 2015)(1) | 0.46% | 0.72% | ||||
(1)Current information regarding the Fund’s Operating Expenses can be found in the Financial Highlights.
The performance data quoted represents past performance and does not guarantee future results. Current performance may be lower or higher. Performance data current to the most recent month-end may be obtained at www.GuideStoneFunds.org. The investment return and principal value of an investment will fluctuate so that shares, when redeemed, may be worth more or less than their original cost.
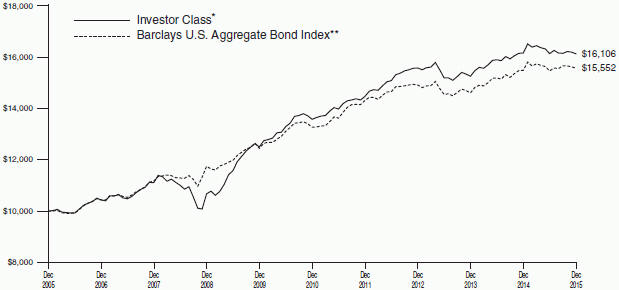
The graph compares the results of a hypothetical $10,000 investment in the Investor Class of the Fund for the 10-year period from December 31, 2005 to December 31, 2015, with all dividends and capital gains reinvested, with the Barclays U.S. Aggregate Bond Index.
*These returns reflect expense waivers by the Fund’s investment adviser. Without these waivers, returns would have been lower. Returns shown do not reflect the deduction of taxes that a shareholder would pay on Fund distributions or the redemption of Fund shares.
Unlike a mutual fund, the performance of an index assumes no taxes, transaction costs, management fees or other expenses.
92
Table of Contents
MEDIUM-DURATION BOND FUND SCHEDULE OF INVESTMENTS | December 31, 2015 |
| Par | Value | |||||||||||
AGENCY OBLIGATIONS — 1.1% |
| |||||||||||
Federal Farm Credit Bank | ||||||||||||
5.05%, 11/06/17 | $ | 400,000 | $ | 428,520 | ||||||||
Federal Home Loan Bank | ||||||||||||
0.24%, 01/26/16W | 1,300,000 | 1,299,783 | ||||||||||
0.88%, 05/24/17 | 20,000 | 19,976 | ||||||||||
3.38%, 12/08/23 | 200,000 | 213,334 | ||||||||||
Federal National Mortgage Association | ||||||||||||
2.01%, 10/09/19W†D | 3,350,000 | 3,103,889 | ||||||||||
2.63%, 09/06/24D | 1,000,000 | 1,010,559 | ||||||||||
6.25%, 05/15/29 | 500,000 | 678,879 | ||||||||||
6.63%, 11/15/30 | 1,170,000 | 1,659,468 | ||||||||||
Tennessee Valley Authority | ||||||||||||
3.88%, 02/15/21D | 1,000,000 | 1,092,307 | ||||||||||
5.25%, 09/15/39 | 230,000 | 277,036 | ||||||||||
4.63%, 09/15/60 | 200,000 | 209,682 | ||||||||||
|
| |||||||||||
Total Agency Obligations | 9,993,433 | |||||||||||
|
| |||||||||||
ASSET-BACKED SECURITIES — 4.4% |
| |||||||||||
Asset-Backed Securities Corporation Home Equity Loan Trust Series 2004-HE6 | ||||||||||||
0.97%, 09/25/34† | 2,494 | 2,495 | ||||||||||
AUTO ABS Series 2012-3 | ||||||||||||
0.60%, 09/27/24(E) | 779,917 | 845,873 | ||||||||||
Avis Budget Rental Car Funding AESOP LLC Series 2013-1A | ||||||||||||
1.92%, 09/20/19 144A | 160,000 | 158,800 | ||||||||||
Avis Budget Rental Car Funding AESOP LLC Series 2013-2A | ||||||||||||
2.97%, 02/20/20 144A | 160,000 | 162,837 | ||||||||||
Avis Budget Rental Car Funding AESOP LLC Series 2014-1A | ||||||||||||
2.46%, 07/20/20 144A | 150,000 | 150,475 | ||||||||||
Avis Budget Rental Car Funding AESOP LLC Series 2014-2A | ||||||||||||
2.50%, 02/20/21 144A | 550,000 | 548,816 | ||||||||||
Bayview Financial Mortgage Pass-Through Trust | ||||||||||||
0.87%, 02/28/44† | 51,245 | 51,126 | ||||||||||
Bear Stearns Asset-Backed Securities Trust | ||||||||||||
6.00%, 10/25/36 | 1,544,693 | 1,200,326 | ||||||||||
6.50%, 10/25/36 | 2,452,877 | 1,898,977 | ||||||||||
Chapel BV Series 2007 | ||||||||||||
0.31%, 07/17/66(E)† | 979,092 | 1,003,858 | ||||||||||
Citigroup Global Markets Mortgage Securities VII, Inc. Series 1998-NC1 | ||||||||||||
0.90%, 03/25/28† | 5,513 | 5,483 | ||||||||||
CWHEQ Revolving Home Equity Loan Trust | ||||||||||||
0.57%, 12/15/35† | 232,959 | 207,470 | ||||||||||
| Par | Value | |||||||||||
CWHEQ Revolving Home Equity Loan Trust | ||||||||||||
0.47%, 07/15/36† | $ | 441,222 | $ | 372,482 | ||||||||
Edsouth Indenture No. 7 LLC Series 2014-3 | ||||||||||||
1.02%, 02/25/36 144A† | 1,276,673 | 1,200,663 | ||||||||||
Education Funding Capital Trust Series 2004-1 | ||||||||||||
1.85%, 06/15/43† | 700,000 | 635,606 | ||||||||||
EMC Mortgage Loan Trust Series 2003-B | ||||||||||||
0.75%, 11/25/41 144A† | 17,956 | 17,035 | ||||||||||
Financial Asset Securities Corporation AAA Trust Series 2005-1A | ||||||||||||
0.83%, 02/27/35 144A† | 935,215 | 789,082 | ||||||||||
Ford Credit Floorplan Master Owner Trust A | ||||||||||||
0.93%, 08/15/20† | 500,000 | 498,796 | ||||||||||
Fremont Home Loan Trust Series 2005-E | ||||||||||||
0.66%, 01/25/36† | 1,260,620 | 1,223,102 | ||||||||||
GMACM Home Equity Loan Trust Series 2007-HE3 | ||||||||||||
6.66%, 09/25/37† | 114,935 | 118,899 | ||||||||||
7.00%, 09/25/37† | 54,231 | 53,525 | ||||||||||
Goal Capital Funding Trust Series 2007-1 | ||||||||||||
0.69%, 09/25/28† | 409,875 | 405,956 | ||||||||||
GSAMP Trust | ||||||||||||
1.27%, 02/25/47† | 954,712 | 930,023 | ||||||||||
Hertz Vehicle Financing LLC Series 2013-1A | ||||||||||||
1.83%, 08/25/19 144A | 210,000 | 207,213 | ||||||||||
Hertz Vehicle Financing LLC Series 2015-1A | ||||||||||||
3.52%, 05/15/21 144A | 500,000 | 485,800 | ||||||||||
Hertz Vehicle Financing LLC | ||||||||||||
2.73%, 05/25/21 144A | 350,000 | 343,070 | ||||||||||
JGWPT XXXIII LLC | ||||||||||||
3.50%, 06/15/77 144A | 429,832 | 427,467 | ||||||||||
Mississippi Higher Education Assistance Corporation Series 2014-1 | ||||||||||||
1.10%, 10/25/35† | 805,150 | 786,896 | ||||||||||
Nelnet Student Loan Trust Series 2006-2 | ||||||||||||
0.42%, 01/25/30† | 1,800,000 | 1,765,857 | ||||||||||
Panhandle-Plains Higher Education Authority, Inc. Series 2010-2 | ||||||||||||
1.74%, 10/01/35† | 439,156 | 440,189 | ||||||||||
Park Place Securities, Inc. Asset-Backed Pass-Through Trust Certificates | ||||||||||||
1.26%, 01/25/36† | 100,000 | 95,373 | ||||||||||
Penarth Master Issuer PLC Series 2015-2A | ||||||||||||
0.76%, 05/18/19 144A† | 1,700,000 | 1,695,565 | ||||||||||
| See Notes to Financial Statements. | 93 |
Table of Contents
MEDIUM-DURATION BOND FUND
SCHEDULE OF INVESTMENTS (Continued)
| Par | Value | |||||||||||
Provident Home Equity Loan Trust Series 2000-2 | ||||||||||||
0.96%, 08/25/31† | $ | 77,515 | $ | 56,060 | ||||||||
RAMP Trust Series 2004-RZ1 | ||||||||||||
0.90%, 03/25/34† | 164,664 | 164,622 | ||||||||||
RAMP Trust | ||||||||||||
0.85%, 11/25/35† | 1,900,000 | 1,689,659 | ||||||||||
RAMP Trust Series 2006-NC1 | ||||||||||||
0.61%, 01/25/36† | 229,228 | 228,791 | ||||||||||
Saxon Asset Securities Trust Series 2004-1 | ||||||||||||
1.22%, 03/25/35† | 799,708 | 724,486 | ||||||||||
Scholar Funding Trust | ||||||||||||
1.07%, 10/28/41 144A† | 420,914 | 410,754 | ||||||||||
SCLP Series 2015-1 | ||||||||||||
3.28%, 09/15/23+ | 1,908,929 | 1,902,820 | ||||||||||
SLC Student Loan Trust | ||||||||||||
0.63%, 06/15/29† | 900,000 | 850,137 | ||||||||||
SLM Private Education Loan Trust Series 2010-A | ||||||||||||
3.58%, 05/16/44 144A† | 712,910 | 736,117 | ||||||||||
SLM Student Loan EDC Repackaging Trust | ||||||||||||
3.50%, 10/28/29 144A | 311,472 | 304,620 | ||||||||||
SLM Student Loan Trust | ||||||||||||
1.26%, 12/15/25 144A† | 400,000 | 383,506 | ||||||||||
SLM Student Loan Trust | ||||||||||||
0.44%, 01/25/27† | 233,950 | 222,511 | ||||||||||
SLM Student Loan Trust | ||||||||||||
0.46%, 10/25/28† | 900,000 | 843,401 | ||||||||||
SLM Student Loan Trust | ||||||||||||
0.43%, 07/25/25† | 1,828,720 | 1,799,022 | ||||||||||
SLM Student Loan Trust | ||||||||||||
0.43%, 01/26/43† | 1,020,000 | 867,046 | ||||||||||
SLM Student Loan Trust | ||||||||||||
1.07%, 10/25/28† | 400,000 | 318,264 | ||||||||||
SLM Student Loan Trust | ||||||||||||
1.07%, 04/25/23† | 219,649 | 211,591 | ||||||||||
SLM Student Loan Trust | ||||||||||||
1.97%, 07/25/22† | 550,000 | 553,384 | ||||||||||
SLM Student Loan Trust | ||||||||||||
2.02%, 07/25/23† | 1,008,000 | 1,013,950 | ||||||||||
SLM Student Loan Trust | ||||||||||||
1.82%, 04/25/23† | 3,227,317 | 3,229,518 | ||||||||||
Soundview Home Loan Trust | ||||||||||||
0.60%, 05/25/36† | 1,141,962 | 1,079,133 | ||||||||||
| Par | Value | |||||||||||
SpringCastle America Funding LLC | ||||||||||||
2.70%, 05/25/23 144A | $ | 299,430 | $ | 298,871 | ||||||||
SPS Servicer Advance Receivables Trust | ||||||||||||
2.62%, 01/15/47+ 144A@ | 950,000 | 949,923 | ||||||||||
United States Small Business Administration | ||||||||||||
3.37%, 10/01/33 | 317,107 | 329,414 | ||||||||||
United States Small Business Administration | ||||||||||||
2.46%, 02/01/35 | 77,934 | 77,545 | ||||||||||
United States Small Business Administration | ||||||||||||
2.51%, 04/01/35 | 254,710 | 253,680 | ||||||||||
Utah State Board of Regents Series 2015-1 | ||||||||||||
1.02%, 02/25/43† | 932,745 | 913,680 | ||||||||||
|
| |||||||||||
Total Asset-Backed Securities |
| 39,141,640 | ||||||||||
|
| |||||||||||
COMMERCIAL PAPER — 0.8% |
| |||||||||||
Barclays Bank PLC | ||||||||||||
0.89%, 04/13/16W@ | 1,500,000 | 1,499,895 | ||||||||||
Federal Home Loan Bank | ||||||||||||
0.19%, 01/20/16 | 300,000 | 299,970 | ||||||||||
0.24%, 01/20/16 | 300,000 | 299,962 | ||||||||||
0.20%, 01/27/16 | 800,000 | 799,884 | ||||||||||
0.25%, 01/29/16 | 300,000 | 299,948 | ||||||||||
0.31%, 02/01/16 | 100,000 | 99,973 | ||||||||||
0.38%, 02/01/16 | 2,400,000 | 2,399,215 | ||||||||||
0.33%, 02/09/16 | 1,400,000 | 1,399,500 | ||||||||||
|
| |||||||||||
Total Commercial Paper |
| 7,098,347 | ||||||||||
|
| |||||||||||
CORPORATE BONDS — 22.8% |
| |||||||||||
21st Century Fox America, Inc. | ||||||||||||
3.70%, 09/15/24D | 725,000 | 732,304 | ||||||||||
ABB Finance USA, Inc. | ||||||||||||
4.38%, 05/08/42 | 40,000 | 39,795 | ||||||||||
AbbVie, Inc. | ||||||||||||
1.75%, 11/06/17 | 280,000 | 279,582 | ||||||||||
1.80%, 05/14/18D | 1,600,000 | 1,593,547 | ||||||||||
2.50%, 05/14/20 | 575,000 | 569,803 | ||||||||||
3.20%, 11/06/22 | 225,000 | 221,812 | ||||||||||
3.60%, 05/14/25 | 190,000 | 187,887 | ||||||||||
ACE INA Holdings, Inc. | ||||||||||||
2.30%, 11/03/20 | 90,000 | 89,414 | ||||||||||
2.88%, 11/03/22 | 100,000 | 99,333 | ||||||||||
3.35%, 05/03/26 | 220,000 | 219,611 | ||||||||||
AES Corporation | ||||||||||||
4.88%, 05/15/23 | 80,000 | 70,400 | ||||||||||
5.50%, 03/15/24 | 370,000 | 332,075 | ||||||||||
Amazon.com, Inc. | ||||||||||||
3.30%, 12/05/21D | 525,000 | 540,904 | ||||||||||
4.95%, 12/05/44 | 390,000 | 416,949 | ||||||||||
American Campus Communities Operating Partnership LP | ||||||||||||
3.75%, 04/15/23 | 525,000 | 517,197 | ||||||||||
| 94 | See Notes to Financial Statements. |
Table of Contents
| Par | Value | |||||||||||
American Express Co. | ||||||||||||
6.80%, 09/01/66† | $ | 1,215,000 | $ | 1,227,150 | ||||||||
American Express Credit Corporation | ||||||||||||
1.55%, 09/14/20†D | 1,000,000 | 1,009,671 | ||||||||||
American International Group, Inc. | ||||||||||||
2.30%, 07/16/19 | 200,000 | 198,473 | ||||||||||
3.75%, 07/10/25 | 705,000 | 700,083 | ||||||||||
4.50%, 07/16/44 | 100,000 | 92,834 | ||||||||||
6.25%, 03/15/87 | 278,000 | 304,410 | ||||||||||
American Tower Corporation REIT | ||||||||||||
3.40%, 02/15/19 | 200,000 | 205,309 | ||||||||||
Amgen, Inc. | ||||||||||||
3.63%, 05/22/24 | 100,000 | 100,142 | ||||||||||
5.38%, 05/15/43 | 350,000 | 373,197 | ||||||||||
Anadarko Petroleum Corporation | ||||||||||||
6.38%, 09/15/17 | 10,000 | 10,490 | ||||||||||
3.45%, 07/15/24D | 320,000 | 284,782 | ||||||||||
6.45%, 09/15/36 | 200,000 | 193,310 | ||||||||||
Antero Resources Corporation | ||||||||||||
5.38%, 11/01/21 | 100,000 | 80,500 | ||||||||||
5.63%, 06/01/23 144AD | 425,000 | 333,625 | ||||||||||
Anthem, Inc. | ||||||||||||
5.88%, 06/15/17 | 720,000 | 761,345 | ||||||||||
Apache Corporation | ||||||||||||
3.25%, 04/15/22 | 50,000 | 47,689 | ||||||||||
5.10%, 09/01/40 | 60,000 | 51,456 | ||||||||||
4.25%, 01/15/44D | 670,000 | 526,437 | ||||||||||
Arch Coal, Inc. | ||||||||||||
7.25%, 06/15/21# | 500,000 | 5,050 | ||||||||||
Argos Merger Sub, Inc. | ||||||||||||
7.13%, 03/15/23 144A | 200,000 | 198,800 | ||||||||||
AT&T, Inc. | ||||||||||||
2.95%, 05/15/16 | 425,000 | 427,626 | ||||||||||
4.45%, 05/15/21D | 80,000 | 85,250 | ||||||||||
3.00%, 02/15/22 | 170,000 | 166,878 | ||||||||||
3.40%, 05/15/25 | 1,955,000 | 1,882,651 | ||||||||||
5.55%, 08/15/41 | 160,000 | 161,328 | ||||||||||
4.35%, 06/15/45 | 100,000 | 85,878 | ||||||||||
Atwood Oceanics, Inc. | ||||||||||||
6.50%, 02/01/20D | 30,000 | 16,200 | ||||||||||
Axiall Corporation | ||||||||||||
4.88%, 05/15/23 | 30,000 | 27,113 | ||||||||||
Baker Hughes, Inc. | ||||||||||||
7.50%, 11/15/18 | 710,000 | 801,919 | ||||||||||
Bank of America Corporation | ||||||||||||
6.05%, 05/16/16 | 275,000 | 279,560 | ||||||||||
3.88%, 03/22/17 | 130,000 | 132,882 | ||||||||||
5.70%, 05/02/17D | 1,100,000 | 1,147,531 | ||||||||||
5.75%, 12/01/17 | 1,890,000 | 2,022,744 | ||||||||||
6.88%, 04/25/18 | 1,400,000 | 1,545,391 | ||||||||||
5.65%, 05/01/18 | 700,000 | 753,127 | ||||||||||
2.60%, 01/15/19 | 320,000 | 321,275 | ||||||||||
5.63%, 07/01/20 | 50,000 | 55,594 | ||||||||||
5.88%, 01/05/21 | 150,000 | 169,947 | ||||||||||
5.00%, 05/13/21 | 320,000 | 350,029 | ||||||||||
3.30%, 01/11/23 | 120,000 | 118,302 | ||||||||||
4.13%, 01/22/24 | 450,000 | 465,576 | ||||||||||
4.00%, 04/01/24 | 4,845,000 | 4,963,717 | ||||||||||
4.20%, 08/26/24 | 390,000 | 387,644 | ||||||||||
4.00%, 01/22/25 | 440,000 | 431,537 | ||||||||||
| Par | Value | |||||||||||
3.88%, 08/01/25 | $ | 330,000 | $ | 335,659 | ||||||||
4.25%, 10/22/26 | 440,000 | 436,461 | ||||||||||
5.00%, 01/21/44 | 750,000 | 785,765 | ||||||||||
4.88%, 04/01/44 | 370,000 | 384,605 | ||||||||||
6.25%, 09/29/49† | 300,000 | 301,125 | ||||||||||
6.50%, 10/29/49†D | 150,000 | 158,250 | ||||||||||
Bank of New York Mellon Corporation | ||||||||||||
2.60%, 08/17/20 | 700,000 | 703,214 | ||||||||||
Barrick North America Finance LLC | ||||||||||||
4.40%, 05/30/21 | 570,000 | 512,419 | ||||||||||
Baxalta, Inc. | ||||||||||||
5.25%, 06/23/45 144A | 150,000 | 150,841 | ||||||||||
Bear Stearns Cos. LLC | ||||||||||||
6.40%, 10/02/17 | 1,200,000 | 1,292,634 | ||||||||||
Becton, Dickinson and Co. | ||||||||||||
2.68%, 12/15/19 | 400,000 | 402,552 | ||||||||||
3.73%, 12/15/24 | 370,000 | 373,843 | ||||||||||
4.69%, 12/15/44 | 130,000 | 131,674 | ||||||||||
BellSouth LLC | ||||||||||||
4.82%, 04/26/21 144A | 1,600,000 | 1,619,155 | ||||||||||
Berkshire Hathaway Energy Co. | ||||||||||||
6.50%, 09/15/37 | 70,000 | 85,460 | ||||||||||
Boeing Capital Corporation | ||||||||||||
4.70%, 10/27/19 | 230,000 | 252,475 | ||||||||||
Boeing Co. | ||||||||||||
4.88%, 02/15/20D | 50,000 | 55,717 | ||||||||||
6.63%, 02/15/38 | 210,000 | 279,547 | ||||||||||
California Resources Corporation | ||||||||||||
5.50%, 09/15/21D | 170,000 | 54,400 | ||||||||||
Capital One Financial Corporation | ||||||||||||
4.20%, 10/29/25 | 475,000 | 469,926 | ||||||||||
Catholic Health Initiatives | ||||||||||||
4.35%, 11/01/42 | 40,000 | 37,497 | ||||||||||
CBRE Services, Inc. | ||||||||||||
5.25%, 03/15/25 | 400,000 | 405,889 | ||||||||||
CCO Holdings LLC | ||||||||||||
7.00%, 01/15/19 | 168,000 | 171,780 | ||||||||||
5.38%, 05/01/25 144AD | 280,000 | 279,300 | ||||||||||
CCO Safari II LLC | ||||||||||||
3.58%, 07/23/20 144A | 75,000 | 74,613 | ||||||||||
4.91%, 07/23/25 144A | 1,875,000 | 1,876,007 | ||||||||||
6.38%, 10/23/35 144A | 60,000 | 60,754 | ||||||||||
6.48%, 10/23/45 144A | 450,000 | 451,917 | ||||||||||
Celgene Corporation | ||||||||||||
3.55%, 08/15/22D | 290,000 | 293,248 | ||||||||||
3.88%, 08/15/25 | 600,000 | 598,760 | ||||||||||
5.25%, 08/15/43 | 90,000 | 92,295 | ||||||||||
5.00%, 08/15/45 | 520,000 | 524,022 | ||||||||||
Chesapeake Energy Corporation | ||||||||||||
3.57%, 04/15/19† | 850,000 | 240,125 | ||||||||||
6.13%, 02/15/21 | 290,000 | 83,230 | ||||||||||
8.00%, 12/15/22 144A@ | 227,000 | 112,365 | ||||||||||
CHS/Community Health Systems, Inc. | ||||||||||||
8.00%, 11/15/19 | 100,000 | 101,250 | ||||||||||
Chubb Corporation | ||||||||||||
6.38%, 03/29/67† | 400,000 | 385,132 | ||||||||||
Cimarex Energy Co. | ||||||||||||
4.38%, 06/01/24 | 75,000 | 66,650 | ||||||||||
| See Notes to Financial Statements. | 95 |
Table of Contents
MEDIUM-DURATION BOND FUND
SCHEDULE OF INVESTMENTS (Continued)
| Par | Value | |||||||||||
CIT Group, Inc. | ||||||||||||
4.25%, 08/15/17 | $ | 1,100,000 | $ | 1,127,500 | ||||||||
Citigroup, Inc. | ||||||||||||
3.50%, 05/15/23 | 220,000 | 216,655 | ||||||||||
3.75%, 06/16/24 | 300,000 | 305,937 | ||||||||||
4.40%, 06/10/25 | 450,000 | 455,376 | ||||||||||
5.50%, 09/13/25 | 290,000 | 315,390 | ||||||||||
4.30%, 11/20/26 | 1,600,000 | 1,595,533 | ||||||||||
4.45%, 09/29/27 | 350,000 | 348,470 | ||||||||||
6.63%, 06/15/32 | 50,000 | 59,162 | ||||||||||
6.68%, 09/13/43 | 10,000 | 12,305 | ||||||||||
4.65%, 07/30/45 | 840,000 | 855,868 | ||||||||||
5.35%, 04/29/49†D | 180,000 | 170,775 | ||||||||||
8.40%, 04/29/49† | 300,000 | 327,975 | ||||||||||
5.95%, 07/29/49† | 170,000 | 166,558 | ||||||||||
6.13%, 11/15/49†D | 250,000 | 255,313 | ||||||||||
5.80%, 11/29/49† | 1,700,000 | 1,687,675 | ||||||||||
5.88%, 12/29/49† | 175,000 | 173,906 | ||||||||||
5.95%, 12/29/49† | 690,000 | 664,988 | ||||||||||
Clean Harbors, Inc. | ||||||||||||
5.25%, 08/01/20 | 195,000 | 199,875 | ||||||||||
CNOOC Finance 2015 USA LLC | ||||||||||||
3.50%, 05/05/25 | 760,000 | 724,809 | ||||||||||
Comcast Corporation | ||||||||||||
5.70%, 05/15/18 | 1,250,000 | 1,366,805 | ||||||||||
3.38%, 08/15/25 | 400,000 | 405,434 | ||||||||||
6.95%, 08/15/37 | 70,000 | 91,513 | ||||||||||
6.55%, 07/01/39 | 30,000 | 37,859 | ||||||||||
6.40%, 03/01/40 | 120,000 | 149,236 | ||||||||||
Compass Bank | ||||||||||||
2.75%, 09/29/19 | 375,000 | 372,293 | ||||||||||
5.50%, 04/01/20 | 300,000 | 320,809 | ||||||||||
Concho Resources, Inc. | ||||||||||||
5.50%, 10/01/22 | 170,000 | 155,550 | ||||||||||
5.50%, 04/01/23 | 70,000 | 65,100 | ||||||||||
ConocoPhillips Co. | ||||||||||||
3.35%, 11/15/24D | 330,000 | 302,130 | ||||||||||
4.15%, 11/15/34D | 175,000 | 151,999 | ||||||||||
ConocoPhillips Holding Co. | ||||||||||||
6.95%, 04/15/29 | 220,000 | 252,325 | ||||||||||
Continental Airlines 1998-1 Class A Pass-Through Trust | ||||||||||||
6.65%, 03/15/19 | 81,052 | 83,025 | ||||||||||
Continental Resources, Inc. | ||||||||||||
5.00%, 09/15/22 | 10,000 | 7,388 | ||||||||||
Crown Castle International Corporation REIT | ||||||||||||
5.25%, 01/15/23 | 525,000 | 553,875 | ||||||||||
CSEMC 2015-3GNA A1 | ||||||||||||
3.07%, 03/09/17+W | 1,020,000 | 1,492,415 | ||||||||||
CSEMC 2015-3GNA A2 | ||||||||||||
4.33%, 03/09/17+W | 380,000 | 555,998 | ||||||||||
CVS Health Corporation | ||||||||||||
4.13%, 05/15/21 | 250,000 | 264,779 | ||||||||||
3.50%, 07/20/22 | 425,000 | 433,076 | ||||||||||
2.75%, 12/01/22 | 500,000 | 487,912 | ||||||||||
4.00%, 12/05/23 | 400,000 | 416,373 | ||||||||||
3.88%, 07/20/25 | 470,000 | 480,605 | ||||||||||
4.88%, 07/20/35 | 200,000 | 206,498 | ||||||||||
5.13%, 07/20/45 | 440,000 | 465,298 | ||||||||||
CVS Pass-Through Trust | ||||||||||||
6.94%, 01/10/30 | 708,968 | 811,903 | ||||||||||
| Par | Value | |||||||||||
DaVita HealthCare Partners, Inc. | ||||||||||||
5.13%, 07/15/24 | $ | 230,000 | $ | 230,431 | ||||||||
5.00%, 05/01/25 | 390,000 | 377,325 | ||||||||||
DDR Corporation REIT | ||||||||||||
4.63%, 07/15/22 | 400,000 | 413,806 | ||||||||||
Delta Air Lines 2007-1 Class A Pass-Through Trust | ||||||||||||
6.82%, 02/10/24 | 290,560 | 335,030 | ||||||||||
Depository Trust & Clearing Corporation | ||||||||||||
4.88%, 12/29/49 144A† | 750,000 | 746,250 | ||||||||||
Devon Energy Corporation | ||||||||||||
3.25%, 05/15/22D | 90,000 | 76,610 | ||||||||||
5.85%, 12/15/25D | 250,000 | 243,587 | ||||||||||
5.60%, 07/15/41 | 360,000 | 272,896 | ||||||||||
4.75%, 05/15/42 | 205,000 | 146,003 | ||||||||||
5.00%, 06/15/45D | 400,000 | 304,170 | ||||||||||
Devon Financing Corporation LLC | ||||||||||||
7.88%, 09/30/31 | 60,000 | 61,679 | ||||||||||
Digital Delta Holdings LLC REIT | ||||||||||||
3.40%, 10/01/20 144AD | 900,000 | 901,949 | ||||||||||
DIRECTV Holdings LLC | ||||||||||||
4.45%, 04/01/24 | 125,000 | 128,602 | ||||||||||
3.95%, 01/15/25 | 450,000 | 444,449 | ||||||||||
Discover Financial Services | ||||||||||||
3.75%, 03/04/25 | 450,000 | 432,964 | ||||||||||
DISH DBS Corporation | ||||||||||||
5.88%, 07/15/22 | 360,000 | 336,600 | ||||||||||
5.88%, 11/15/24 | 170,000 | 151,725 | ||||||||||
Dollar Tree, Inc. | ||||||||||||
5.75%, 03/01/23 144AD | 240,000 | 249,600 | ||||||||||
Duke Energy Corporation | ||||||||||||
3.75%, 04/15/24 | 200,000 | 202,989 | ||||||||||
Dynegy Finance I, Inc. | ||||||||||||
6.75%, 11/01/19 144A | 1,100,000 | 1,039,500 | ||||||||||
Eagle Spinco, Inc. | ||||||||||||
4.63%, 02/15/21D | 480,000 | 443,400 | ||||||||||
Eastman Chemical Co. | ||||||||||||
3.80%, 03/15/25 | 425,000 | 412,373 | ||||||||||
Eaton Corporation | ||||||||||||
1.50%, 11/02/17 | 120,000 | 119,296 | ||||||||||
2.75%, 11/02/22 | 710,000 | 688,084 | ||||||||||
4.15%, 11/02/42D | 200,000 | 185,146 | ||||||||||
Ecolab, Inc. | ||||||||||||
3.00%, 12/08/16 | 275,000 | 279,011 | ||||||||||
4.35%, 12/08/21 | 100,000 | 106,917 | ||||||||||
5.50%, 12/08/41 | 175,000 | 191,082 | ||||||||||
Education Realty Operating Partnership LP REIT | ||||||||||||
4.60%, 12/01/24 | 625,000 | 617,759 | ||||||||||
EMD Finance LLC | ||||||||||||
2.95%, 03/19/22 144A | 750,000 | 724,653 | ||||||||||
Energy Transfer Partners LP | ||||||||||||
3.60%, 02/01/23D | 75,000 | 61,830 | ||||||||||
4.75%, 01/15/26 | 25,000 | 21,067 | ||||||||||
Entergy Louisiana LLC | ||||||||||||
5.40%, 11/01/24 | 1,200,000 | 1,371,622 | ||||||||||
Enterprise Products Operating LLC | ||||||||||||
5.70%, 02/15/42 | 60,000 | 53,532 | ||||||||||
8.38%, 08/01/66† | 475,000 | 426,312 | ||||||||||
7.03%, 01/15/68†D | 475,000 | 483,313 | ||||||||||
| 96 | See Notes to Financial Statements. |
Table of Contents
| Par | Value | |||||||||||
EP Energy LLC Everest Acquisition Finance, Inc. | ||||||||||||
6.38%, 06/15/23D | $ | 160,000 | $ | 80,800 | ||||||||
ERP Operating LP REIT | ||||||||||||
4.63%, 12/15/21D | 250,000 | 271,661 | ||||||||||
Exelon Corporation | ||||||||||||
5.63%, 06/15/35 | 415,000 | 444,224 | ||||||||||
Express Scripts Holding Co. | ||||||||||||
2.65%, 02/15/17D | 250,000 | 252,524 | ||||||||||
Fidelity National Information Services, Inc. | ||||||||||||
3.63%, 10/15/20 | 475,000 | 481,704 | ||||||||||
First Data Corporation | ||||||||||||
6.75%, 11/01/20 144A | 490,000 | 515,113 | ||||||||||
5.38%, 08/15/23 144A | 70,000 | 70,525 | ||||||||||
5.00%, 01/15/24 144A | 160,000 | 159,600 | ||||||||||
FirstEnergy Corporation | ||||||||||||
2.75%, 03/15/18 | 120,000 | 120,608 | ||||||||||
4.25%, 03/15/23D | 490,000 | 499,267 | ||||||||||
7.38%, 11/15/31 | 770,000 | 940,185 | ||||||||||
Fiserv, Inc. | ||||||||||||
2.70%, 06/01/20D | 350,000 | 347,453 | ||||||||||
Florida Power & Light Co. | ||||||||||||
3.80%, 12/15/42 | 525,000 | 498,366 | ||||||||||
Ford Motor Co. | ||||||||||||
4.75%, 01/15/43D | 100,000 | 94,612 | ||||||||||
Ford Motor Credit Co., LLC | ||||||||||||
8.00%, 12/15/16 | 1,300,000 | 1,374,889 | ||||||||||
5.00%, 05/15/18 | 225,000 | 236,470 | ||||||||||
3.20%, 01/15/21D | 2,150,000 | 2,137,919 | ||||||||||
5.88%, 08/02/21 | 575,000 | 641,973 | ||||||||||
Freeport-McMoRan, Inc. | ||||||||||||
4.00%, 11/14/21D | 390,000 | 235,950 | ||||||||||
5.40%, 11/14/34 | 250,000 | 133,750 | ||||||||||
Freeport-McMoran Oil & Gas LLC | ||||||||||||
6.50%, 11/15/20 | 46,000 | 29,785 | ||||||||||
6.88%, 02/15/23 | 62,000 | 39,215 | ||||||||||
Frontier Communications Corporation | ||||||||||||
8.88%, 09/15/20 144A | 400,000 | 406,000 | ||||||||||
GE Capital Trust I | ||||||||||||
6.38%, 11/15/67† | 321,000 | 334,442 | ||||||||||
General Electric Capital Corporation | ||||||||||||
8.50%, 04/06/18(M) | 2,000,000 | 125,910 | ||||||||||
6.00%, 08/07/19 | 301,000 | 341,152 | ||||||||||
4.38%, 09/16/20 | 198,000 | 215,082 | ||||||||||
5.30%, 02/11/21 | 104,000 | 117,352 | ||||||||||
4.65%, 10/17/21 | 140,000 | 155,122 | ||||||||||
3.15%, 09/07/22 | 230,000 | 235,614 | ||||||||||
5.88%, 01/14/38 | 72,000 | 88,272 | ||||||||||
6.88%, 01/10/39 | 30,000 | 40,973 | ||||||||||
General Electric Co. | ||||||||||||
4.50%, 03/11/44 | 100,000 | 103,162 | ||||||||||
General Motors Co. | ||||||||||||
6.25%, 10/02/43 | 110,000 | 116,612 | ||||||||||
General Motors Financial Co., Inc. | ||||||||||||
2.75%, 05/15/16 | 90,000 | 90,271 | ||||||||||
3.25%, 05/15/18 | 320,000 | 321,783 | ||||||||||
3.50%, 07/10/19D | 325,000 | 326,356 | ||||||||||
3.20%, 07/13/20 | 1,000,000 | 985,629 | ||||||||||
4.38%, 09/25/21 | 400,000 | 406,131 | ||||||||||
3.45%, 04/10/22 | 40,000 | 38,424 | ||||||||||
| Par | Value | |||||||||||
4.25%, 05/15/23D | $ | 40,000 | $ | 39,627 | ||||||||
Gilead Sciences, Inc. | ||||||||||||
3.70%, 04/01/24 | 340,000 | 348,628 | ||||||||||
3.65%, 03/01/26 | 260,000 | 262,530 | ||||||||||
4.50%, 02/01/45 | 100,000 | 98,051 | ||||||||||
4.75%, 03/01/46 | 200,000 | 202,889 | ||||||||||
GlaxoSmithKline Capital, Inc. | ||||||||||||
5.65%, 05/15/18 | 380,000 | 414,292 | ||||||||||
Glencore Funding LLC | ||||||||||||
2.50%, 01/15/19 144AD | 750,000 | 626,688 | ||||||||||
2.88%, 04/16/20 144AD | 690,000 | 538,718 | ||||||||||
Goldman Sachs Capital II | ||||||||||||
4.00%, 12/29/49† | 60,000 | 42,450 | ||||||||||
Goldman Sachs Group, Inc. | ||||||||||||
5.95%, 01/18/18 | 1,000,000 | 1,077,497 | ||||||||||
1.46%, 11/15/18† | 3,800,000 | 3,818,092 | ||||||||||
5.38%, 03/15/20 | 200,000 | 219,916 | ||||||||||
6.00%, 06/15/20 | 540,000 | 610,862 | ||||||||||
5.25%, 07/27/21 | 560,000 | 619,899 | ||||||||||
4.00%, 03/03/24 | 900,000 | 925,345 | ||||||||||
3.85%, 07/08/24 | 150,000 | 153,339 | ||||||||||
4.25%, 10/21/25 | 230,000 | 228,695 | ||||||||||
6.75%, 10/01/37 | 440,000 | 515,895 | ||||||||||
6.25%, 02/01/41 | 750,000 | 897,661 | ||||||||||
5.15%, 05/22/45 | 270,000 | 263,251 | ||||||||||
4.75%, 10/21/45 | 230,000 | 229,382 | ||||||||||
Goodyear Tire & Rubber Co. | ||||||||||||
5.13%, 11/15/23 | 100,000 | 103,000 | ||||||||||
Halliburton Co. | ||||||||||||
2.70%, 11/15/20 | 100,000 | 98,912 | ||||||||||
3.38%, 11/15/22 | 1,975,000 | 1,945,434 | ||||||||||
3.80%, 11/15/25 | 595,000 | 580,071 | ||||||||||
HCA, Inc. | ||||||||||||
7.69%, 06/15/25 | 250,000 | 270,625 | ||||||||||
HCP, Inc. REIT | ||||||||||||
6.00%, 01/30/17 | 300,000 | 312,591 | ||||||||||
2.63%, 02/01/20 | 300,000 | 295,658 | ||||||||||
HD Supply, Inc. | ||||||||||||
5.25%, 12/15/21 144A | 200,000 | 204,750 | ||||||||||
Hess Corporation | ||||||||||||
8.13%, 02/15/19 | 110,000 | 124,758 | ||||||||||
Hewlett Packard Enterprise Co. | ||||||||||||
4.90%, 10/15/25 144A | 325,000 | 319,311 | ||||||||||
Hilton Worldwide Finance LLC | ||||||||||||
5.63%, 10/15/21 | 220,000 | 229,075 | ||||||||||
HSBC USA, Inc. | ||||||||||||
1.11%, 08/07/18† | 1,700,000 | 1,699,772 | ||||||||||
Humana, Inc. | ||||||||||||
7.20%, 06/15/18 | 480,000 | 537,385 | ||||||||||
3.15%, 12/01/22 | 70,000 | 68,150 | ||||||||||
4.63%, 12/01/42 | 60,000 | 56,595 | ||||||||||
Hyundai Capital America | ||||||||||||
2.13%, 10/02/17 144A | 130,000 | 129,262 | ||||||||||
ILFC E-Capital Trust II | ||||||||||||
4.74%, 12/21/65 144A† | 280,000 | 257,600 | ||||||||||
Intel Corporation | ||||||||||||
3.70%, 07/29/25 | 605,000 | 626,523 | ||||||||||
4.90%, 07/29/45 | 110,000 | 116,542 | ||||||||||
International Lease Finance Corporation | ||||||||||||
6.75%, 09/01/16 144A | 990,000 | 1,018,463 | ||||||||||
8.88%, 09/01/17 | 100,000 | 109,125 | ||||||||||
7.13%, 09/01/18 144A | 1,975,000 | 2,170,031 | ||||||||||
8.63%, 01/15/22 | 250,000 | 303,438 | ||||||||||
| See Notes to Financial Statements. | 97 |
Table of Contents
MEDIUM-DURATION BOND FUND
SCHEDULE OF INVESTMENTS (Continued)
| Par | Value | |||||||||||
John Deere Capital Corporation | ||||||||||||
2.25%, 04/17/19 | $ | 160,000 | $ | 160,769 | ||||||||
1.70%, 01/15/20 | 80,000 | 77,991 | ||||||||||
JPMorgan Chase & Co. | ||||||||||||
0.87%, 04/25/18† | 2,200,000 | 2,185,876 | ||||||||||
2.25%, 01/23/20 | 1,700,000 | 1,673,390 | ||||||||||
4.40%, 07/22/20 | 980,000 | 1,046,680 | ||||||||||
4.35%, 08/15/21 | 70,000 | 74,552 | ||||||||||
4.50%, 01/24/22 | 700,000 | 755,626 | ||||||||||
3.38%, 05/01/23D | 190,000 | 187,035 | ||||||||||
3.88%, 09/10/24 | 1,070,000 | 1,066,322 | ||||||||||
4.25%, 10/01/27 | 260,000 | 259,973 | ||||||||||
4.95%, 06/01/45 | 400,000 | 401,468 | ||||||||||
5.30%, 12/29/49† | 1,450,000 | 1,448,188 | ||||||||||
Kerr-McGee Corporation | ||||||||||||
6.95%, 07/01/24 | 290,000 | 312,050 | ||||||||||
7.88%, 09/15/31 | 280,000 | 302,780 | ||||||||||
Kimberly-Clark Corporation | ||||||||||||
3.70%, 06/01/43 | 500,000 | 462,793 | ||||||||||
Kinder Morgan Energy Partners LP | ||||||||||||
6.00%, 02/01/17 | 500,000 | 505,975 | ||||||||||
Kinder Morgan, Inc. | ||||||||||||
7.00%, 06/15/17 | 710,000 | 731,638 | ||||||||||
5.63%, 11/15/23 144A | 900,000 | 823,984 | ||||||||||
KKR Group Finance Co. II LLC | ||||||||||||
5.50%, 02/01/43 144A | 30,000 | 31,343 | ||||||||||
Kraft Foods Group, Inc. | ||||||||||||
5.38%, 02/10/20 | 223,000 | 244,398 | ||||||||||
3.50%, 06/06/22 | 320,000 | 323,965 | ||||||||||
Kraft Heinz Foods Co. | ||||||||||||
2.80%, 07/02/20 144A | 250,000 | 249,615 | ||||||||||
4.88%, 02/15/25 144A | 114,000 | 121,292 | ||||||||||
3.95%, 07/15/25 144A | 520,000 | 525,855 | ||||||||||
5.00%, 07/15/35 144A | 150,000 | 154,151 | ||||||||||
5.20%, 07/15/45 144A | 100,000 | 104,889 | ||||||||||
Kroger Co. | ||||||||||||
6.15%, 01/15/20D | 360,000 | 407,806 | ||||||||||
Laredo Petroleum, Inc. | ||||||||||||
6.25%, 03/15/23D | 100,000 | 87,500 | ||||||||||
Lehman Escrow Bonds | ||||||||||||
0.00%, 07/19/17+W†# | 150,000 | — | ||||||||||
0.00%, 12/28/47+W†# | 140,000 | — | ||||||||||
0.00%, 11/30/49+W†# | 2,330,000 | — | ||||||||||
0.00%, 12/31/99W†# | 3,200,000 | — | ||||||||||
0.00%, 12/31/99W†#@ | 2,500,000 | 187,500 | ||||||||||
Liberty Property LP REIT | ||||||||||||
4.75%, 10/01/20 | 575,000 | 611,548 | ||||||||||
Lockheed Martin Corporation | ||||||||||||
3.10%, 01/15/23 | 1,090,000 | 1,090,990 | ||||||||||
3.55%, 01/15/26 | 210,000 | 211,172 | ||||||||||
M&T Bank Corporation | ||||||||||||
6.88%, 12/29/49 | 750,000 | 751,875 | ||||||||||
MarkWest Energy Partners LP | ||||||||||||
4.88%, 12/01/24 | 320,000 | 287,200 | ||||||||||
4.88%, 06/01/25 | 240,000 | 214,800 | ||||||||||
McDonald’s Corporation | ||||||||||||
3.70%, 01/30/26 | 315,000 | 315,398 | ||||||||||
MDC Holdings, Inc. | ||||||||||||
5.63%, 02/01/20 | 325,000 | 334,750 | ||||||||||
5.50%, 01/15/24 | 250,000 | 253,750 | ||||||||||
6.00%, 01/15/43 | 175,000 | 139,125 | ||||||||||
| Par | Value | |||||||||||
Medtronic, Inc. | ||||||||||||
2.50%, 03/15/20 | $ | 125,000 | $ | 125,962 | ||||||||
4.45%, 03/15/20 | 300,000 | 323,225 | ||||||||||
3.15%, 03/15/22 | 300,000 | 303,530 | ||||||||||
3.50%, 03/15/25 144A | 1,700,000 | 1,715,900 | ||||||||||
4.63%, 03/15/45 | 300,000 | 310,187 | ||||||||||
Medtronic, Inc. | ||||||||||||
3.50%, 03/15/25 | 830,000 | 837,763 | ||||||||||
MetLife Capital Trust IV | ||||||||||||
7.88%, 12/15/67 144A | 300,000 | 367,500 | ||||||||||
MetLife, Inc. | ||||||||||||
4.75%, 02/08/21 | 270,000 | 295,725 | ||||||||||
6.40%, 12/15/66 | 50,000 | 54,750 | ||||||||||
Microsoft Corporation | ||||||||||||
3.13%, 11/03/25 | 450,000 | 452,946 | ||||||||||
Mondelez International, Inc. | ||||||||||||
4.00%, 02/01/24D | 450,000 | 464,634 | ||||||||||
Moody’s Corporation | ||||||||||||
4.50%, 09/01/22 | 800,000 | 849,035 | ||||||||||
Morgan Stanley | ||||||||||||
0.77%, 10/18/16† | 340,000 | 339,367 | ||||||||||
4.75%, 03/22/17 | 60,000 | 62,168 | ||||||||||
6.63%, 04/01/18 | 700,000 | 767,974 | ||||||||||
5.50%, 07/24/20 | 250,000 | 278,436 | ||||||||||
3.88%, 04/29/24 | 275,000 | 280,825 | ||||||||||
3.70%, 10/23/24 | 1,475,000 | 1,484,860 | ||||||||||
4.00%, 07/23/25 | 100,000 | 103,181 | ||||||||||
5.55%, 12/29/49†D | 375,000 | 375,469 | ||||||||||
MUFG Union Bank NA | ||||||||||||
0.73%, 05/05/17† | 1,700,000 | 1,692,408 | ||||||||||
Murray Energy Corporation | ||||||||||||
11.25%, 04/15/21 144A | 550,000 | 103,125 | ||||||||||
Navient Corporation | ||||||||||||
8.45%, 06/15/18 | 300,000 | 316,500 | ||||||||||
NBCUniversal Media LLC | ||||||||||||
2.88%, 01/15/23 | 750,000 | 745,416 | ||||||||||
NCUA Guaranteed Notes | ||||||||||||
3.00%, 06/12/19 | 300,000 | 313,155 | ||||||||||
Netflix, Inc. | ||||||||||||
5.50%, 02/15/22 144A | 100,000 | 103,000 | ||||||||||
Nielsen Finance LLC | ||||||||||||
4.50%, 10/01/20 | 300,000 | 305,625 | ||||||||||
Noble Energy, Inc. | ||||||||||||
4.15%, 12/15/21 | 620,000 | 601,648 | ||||||||||
Northwestern Mutual Life Insurance Co. | ||||||||||||
6.06%, 03/30/40 144A | 500,000 | 601,981 | ||||||||||
Occidental Petroleum Corporation | ||||||||||||
3.13%, 02/15/22 | 100,000 | 97,858 | ||||||||||
2.70%, 02/15/23 | 20,000 | 18,841 | ||||||||||
4.63%, 06/15/45D | 130,000 | 126,397 | ||||||||||
Oracle Corporation | ||||||||||||
1.20%, 10/15/17D | 470,000 | 470,373 | ||||||||||
2.50%, 05/15/22 | 375,000 | 368,390 | ||||||||||
Pacific Gas & Electric Co. | ||||||||||||
8.25%, 10/15/18 | 130,000 | 151,190 | ||||||||||
6.05%, 03/01/34 | 550,000 | 649,911 | ||||||||||
5.80%, 03/01/37 | 210,000 | 244,949 | ||||||||||
Penske Truck Leasing Co. LP | ||||||||||||
3.05%, 01/09/20 144A@D | 575,000 | 570,774 | ||||||||||
PepsiCo, Inc. | ||||||||||||
7.90%, 11/01/18 | 140,000 | 164,110 | ||||||||||
| 98 | See Notes to Financial Statements. |
Table of Contents
| Par | Value | |||||||||||
Pioneer Natural Resources Co. | ||||||||||||
3.45%, 01/15/21 | $ | 275,000 | $ | 254,209 | ||||||||
PNC Preferred Funding Trust II | ||||||||||||
1.73%, 03/29/49 144A† | 500,000 | 448,750 | ||||||||||
Pride International, Inc. | ||||||||||||
8.50%, 06/15/19D | 400,000 | 396,154 | ||||||||||
6.88%, 08/15/20 | 50,000 | 46,470 | ||||||||||
Principal Life Global Funding II | ||||||||||||
2.38%, 09/11/19 144A@D | 2,900,000 | 2,902,659 | ||||||||||
Private Export Funding Corporation | ||||||||||||
5.45%, 09/15/17 | 1,600,000 | 1,711,731 | ||||||||||
Progress Energy, Inc. | ||||||||||||
7.75%, 03/01/31 | 350,000 | 452,140 | ||||||||||
Prudential Financial, Inc. | ||||||||||||
5.38%, 05/15/45†D | 75,000 | 75,000 | ||||||||||
Puget Sound Energy, Inc. | ||||||||||||
6.97%, 06/01/67† | 200,000 | 163,000 | ||||||||||
QEP Resources, Inc. | ||||||||||||
5.25%, 05/01/23 | 80,000 | 57,200 | ||||||||||
QUALCOMM, Inc. | ||||||||||||
3.00%, 05/20/22 | 75,000 | 74,312 | ||||||||||
Quicken Loans, Inc. | ||||||||||||
5.75%, 05/01/25 144AD | 110,000 | 105,188 | ||||||||||
Range Resources Corporation | ||||||||||||
5.00%, 03/15/23D | 410,000 | 307,500 | ||||||||||
4.88%, 05/15/25 144AD | 30,000 | 22,912 | ||||||||||
Raytheon Co. | ||||||||||||
3.13%, 10/15/20D | 200,000 | 207,454 | ||||||||||
Regency Energy Partners LP | ||||||||||||
4.50%, 11/01/23 | 310,000 | 268,620 | ||||||||||
Reliance Standard Life Global Funding | ||||||||||||
2.50%, 01/15/20 144A | 475,000 | 470,787 | ||||||||||
Rensselaer Polytechnic Institute | ||||||||||||
5.60%, 09/01/20 | 675,000 | 755,627 | ||||||||||
Roche Holdings, Inc. | ||||||||||||
3.35%, 09/30/24 144A | 1,700,000 | 1,741,817 | ||||||||||
Roper Technologies, Inc. | ||||||||||||
2.05%, 10/01/18 | 375,000 | 372,816 | ||||||||||
3.00%, 12/15/20 | 250,000 | 249,246 | ||||||||||
Sally Holdings LLC | ||||||||||||
5.63%, 12/01/25 | 250,000 | 253,750 | ||||||||||
Santander Bank NA | ||||||||||||
2.00%, 01/12/18 | 450,000 | 446,910 | ||||||||||
Schlumberger Holdings Corporation | ||||||||||||
3.00%, 12/21/20 144A | 250,000 | 247,052 | ||||||||||
4.00%, 12/21/25 144A | 190,000 | 187,870 | ||||||||||
Select Income REIT | ||||||||||||
2.85%, 02/01/18 | 75,000 | 74,934 | ||||||||||
3.60%, 02/01/20D | 125,000 | 125,979 | ||||||||||
4.15%, 02/01/22D | 175,000 | 168,172 | ||||||||||
Senior Housing Properties Trust REIT | ||||||||||||
3.25%, 05/01/19 | 250,000 | 249,303 | ||||||||||
SESI LLC | ||||||||||||
7.13%, 12/15/21 | 80,000 | 71,400 | ||||||||||
Solvay Finance America LLC | ||||||||||||
3.40%, 12/03/20 144A | 300,000 | 297,922 | ||||||||||
Southern Copper Corporation | ||||||||||||
5.25%, 11/08/42 | 760,000 | 551,850 | ||||||||||
Southern Natural Gas Co. LLC | ||||||||||||
8.00%, 03/01/32 | 400,000 | 393,670 | ||||||||||
| Par | Value | |||||||||||
Spectrum Brands, Inc. | ||||||||||||
5.75%, 07/15/25 144A | $ | 110,000 | $ | 113,300 | ||||||||
Spirit Airlines 2015-1 Pass-Through Trust A | ||||||||||||
4.10%, 10/01/29 | 1,500,000 | 1,479,375 | ||||||||||
Sprint Capital Corporation | ||||||||||||
8.75%, 03/15/32 | 120,000 | 90,300 | ||||||||||
Sprint Communications, Inc. | ||||||||||||
9.00%, 11/15/18 144A | 80,000 | 84,400 | ||||||||||
Sprint Corporation | ||||||||||||
7.25%, 09/15/21 | 40,000 | 30,288 | ||||||||||
7.63%, 02/15/25 | 850,000 | 624,750 | ||||||||||
State Street Corporation | ||||||||||||
4.96%, 03/15/18 | 480,000 | 503,880 | ||||||||||
Sunoco Logistics Partners Operations LP | ||||||||||||
4.25%, 04/01/24 | 100,000 | 86,633 | ||||||||||
SunTrust Banks, Inc. | ||||||||||||
3.60%, 04/15/16D | 300,000 | 301,555 | ||||||||||
Synchrony Financial | ||||||||||||
2.60%, 01/15/19 | 300,000 | 299,138 | ||||||||||
3.00%, 08/15/19 | 375,000 | 374,798 | ||||||||||
2.70%, 02/03/20 | 200,000 | 196,353 | ||||||||||
4.25%, 08/15/24 | 200,000 | 197,645 | ||||||||||
Teachers Insurance & Annuity Association of America | ||||||||||||
6.85%, 12/16/39 144A | 540,000 | 668,941 | ||||||||||
4.90%, 09/15/44 144A | 660,000 | 668,199 | ||||||||||
Tenet Healthcare Corporation | ||||||||||||
8.13%, 04/01/22 | 60,000 | 60,150 | ||||||||||
6.75%, 06/15/23D | 100,000 | 92,938 | ||||||||||
Tennessee Gas Pipeline Co. LLC | ||||||||||||
7.50%, 04/01/17D | 250,000 | 256,837 | ||||||||||
Thermo Fisher Scientific, Inc. | ||||||||||||
3.60%, 08/15/21D | 160,000 | 162,668 | ||||||||||
3.65%, 12/15/25 | 200,000 | 199,284 | ||||||||||
5.30%, 02/01/44 | 30,000 | 32,175 | ||||||||||
Time Warner Cable, Inc. | ||||||||||||
5.00%, 02/01/20D | 100,000 | 105,954 | ||||||||||
4.13%, 02/15/21 | 400,000 | 408,878 | ||||||||||
7.30%, 07/01/38 | 100,000 | 108,726 | ||||||||||
5.88%, 11/15/40 | 230,000 | 218,655 | ||||||||||
Time Warner, Inc. | ||||||||||||
4.70%, 01/15/21 | 10,000 | 10,775 | ||||||||||
3.88%, 01/15/26D | 200,000 | 198,687 | ||||||||||
7.70%, 05/01/32 | 610,000 | 763,291 | ||||||||||
6.10%, 07/15/40 | 140,000 | 151,716 | ||||||||||
6.25%, 03/29/41 | 40,000 | 44,571 | ||||||||||
Time Warner Entertainment Co. LP | ||||||||||||
8.38%, 07/15/33 | 390,000 | 461,216 | ||||||||||
Toyota Motor Credit Corporation | ||||||||||||
1.25%, 10/05/17 | 520,000 | 518,607 | ||||||||||
Transatlantic Holdings, Inc. | ||||||||||||
8.00%, 11/30/39 | 200,000 | 257,731 | ||||||||||
Tyson Foods, Inc. | ||||||||||||
5.15%, 08/15/44 | 60,000 | 62,889 | ||||||||||
United Airlines 1995 Pass-Through Trust | ||||||||||||
9.56%, 10/19/18 | 107,754 | 183 | ||||||||||
United Airlines 2009-2A Pass-Through Trust | ||||||||||||
9.75%, 07/15/18 | 67,043 | 70,814 | ||||||||||
| See Notes to Financial Statements. | 99 |
Table of Contents
MEDIUM-DURATION BOND FUND
SCHEDULE OF INVESTMENTS (Continued)
| Par | Value | |||||||||||
United Rentals North America, Inc. | ||||||||||||
5.50%, 07/15/25D | $ | 140,000 | $ | 136,325 | ||||||||
United Technologies Corporation | ||||||||||||
4.50%, 06/01/42 | 250,000 | 252,342 | ||||||||||
UnitedHealth Group, Inc. | ||||||||||||
1.63%, 03/15/19 | 170,000 | 168,199 | ||||||||||
3.75%, 07/15/25 | 270,000 | 278,670 | ||||||||||
4.63%, 07/15/35 | 225,000 | 234,030 | ||||||||||
4.75%, 07/15/45 | 590,000 | 622,949 | ||||||||||
Univision Com-munications, Inc. | ||||||||||||
6.75%, 09/15/22 144A | 334,000 | 347,360 | ||||||||||
Valero Energy Corporation | ||||||||||||
3.65%, 03/15/25 | 325,000 | 307,136 | ||||||||||
Vereit Operating Partnership LP | ||||||||||||
3.00%, 02/06/19 | 500,000 | 482,250 | ||||||||||
Verizon Communications, Inc. | ||||||||||||
2.04%, 09/15/16† | 1,200,000 | 1,207,554 | ||||||||||
2.25%, 09/14/18†D | 400,000 | 409,842 | ||||||||||
2.63%, 02/21/20 | 1,056,000 | 1,060,702 | ||||||||||
4.50%, 09/15/20 | 975,000 | 1,048,657 | ||||||||||
5.15%, 09/15/23 | 1,510,000 | 1,662,641 | ||||||||||
4.15%, 03/15/24 | 925,000 | 952,190 | ||||||||||
6.40%, 09/15/33 | 459,000 | 524,371 | ||||||||||
6.55%, 09/15/43 | 2,679,000 | 3,191,608 | ||||||||||
4.67%, 03/15/55 144A | 247,000 | 214,826 | ||||||||||
Visa, Inc. | ||||||||||||
4.30%, 12/14/45 | 150,000 | 152,566 | ||||||||||
3.15%, 12/14/25 | 1,290,000 | 1,293,203 | ||||||||||
Voya Financial, Inc. | ||||||||||||
2.90%, 02/15/18 | 60,000 | 60,680 | ||||||||||
5.70%, 07/15/43 | 500,000 | 569,755 | ||||||||||
Wachovia Capital Trust III | ||||||||||||
5.57%, 03/29/49†D | 580,000 | 559,410 | ||||||||||
Walgreens Boots Alliance, Inc. | ||||||||||||
2.70%, 11/18/19 | 425,000 | 424,587 | ||||||||||
3.80%, 11/18/24 | 325,000 | 315,891 | ||||||||||
Waste Management, Inc. | ||||||||||||
3.50%, 05/15/24 | 150,000 | 151,468 | ||||||||||
7.38%, 05/15/29 | 140,000 | 181,903 | ||||||||||
WEA Finance LLC | ||||||||||||
3.75%, 09/17/24 144A | 400,000 | 398,498 | ||||||||||
Wells Fargo & Co. | ||||||||||||
3.68%, 06/15/16 STEP | 290,000 | 293,644 | ||||||||||
2.60%, 07/22/20 | 800,000 | 798,461 | ||||||||||
4.60%, 04/01/21 | 70,000 | 76,363 | ||||||||||
3.45%, 02/13/23 | 200,000 | 200,659 | ||||||||||
4.48%, 01/16/24 | 2,196,000 | 2,312,012 | ||||||||||
3.55%, 09/29/25 | 1,700,000 | 1,717,398 | ||||||||||
4.10%, 06/03/26 | 440,000 | 444,695 | ||||||||||
4.30%, 07/22/27 | 790,000 | 808,110 | ||||||||||
5.38%, 11/02/43 | 190,000 | 203,800 | ||||||||||
4.65%, 11/04/44 | 90,000 | 87,764 | ||||||||||
3.90%, 05/01/45 | 40,000 | 36,977 | ||||||||||
4.90%, 11/17/45 | 220,000 | 222,484 | ||||||||||
5.88%, 12/29/49† | 900,000 | 948,375 | ||||||||||
Wells Fargo Capital X | ||||||||||||
5.95%, 12/01/86 | 140,000 | 142,100 | ||||||||||
West Corporation | ||||||||||||
5.38%, 07/15/22 144A | 200,000 | 172,500 | ||||||||||
Western Gas Partners LP | ||||||||||||
3.95%, 06/01/25 | 225,000 | 189,184 | ||||||||||
| Par | Value | |||||||||||
WestRock Co. | ||||||||||||
3.50%, 03/01/20 | $ | 150,000 | $ | 151,649 | ||||||||
4.00%, 03/01/23 | 30,000 | 30,147 | ||||||||||
Whiting Petroleum Corporation | ||||||||||||
5.00%, 03/15/19D | 30,000 | 22,800 | ||||||||||
6.25%, 04/01/23D | 130,000 | 94,250 | ||||||||||
Whole Foods Market, Inc. | ||||||||||||
5.20%, 12/03/25 144A | 200,000 | 200,087 | ||||||||||
Williams Cos., Inc. | ||||||||||||
7.50%, 01/15/31 | 10,000 | 6,932 | ||||||||||
7.75%, 06/15/31 | 25,000 | 17,739 | ||||||||||
8.75%, 03/15/32 | 451,000 | 340,535 | ||||||||||
Williams Partners LP | ||||||||||||
4.00%, 11/15/21 | 600,000 | 501,074 | ||||||||||
3.60%, 03/15/22 | 500,000 | 393,731 | ||||||||||
4.88%, 05/15/23 | 60,000 | 48,711 | ||||||||||
3.90%, 01/15/25 | 475,000 | 357,579 | ||||||||||
Wm. Wrigley Jr. Co. | ||||||||||||
2.40%, 10/21/18 144A | 60,000 | 60,199 | ||||||||||
2.90%, 10/21/19 144A | 230,000 | 232,332 | ||||||||||
3.38%, 10/21/20 144A | 70,000 | 71,442 | ||||||||||
WPX Energy, Inc. | ||||||||||||
8.25%, 08/01/23 | 100,000 | 80,250 | ||||||||||
Zimmer Biomet Holdings, Inc. | ||||||||||||
4.45%, 08/15/45 | 360,000 | 332,373 | ||||||||||
|
| |||||||||||
Total Corporate Bonds | 204,126,882 | |||||||||||
|
| |||||||||||
FOREIGN BONDS — 13.1% |
| |||||||||||
Australia — 0.6% | ||||||||||||
BHP Billiton Finance (USA), Ltd. | ||||||||||||
3.25%, 11/21/21 | 920,000 | 865,295 | ||||||||||
5.00%, 09/30/43 | 220,000 | 198,441 | ||||||||||
6.75%, 10/19/75 144A†D | 360,000 | 345,600 | ||||||||||
CNOOC Finance 2015 Australia Proprietary, Ltd. | ||||||||||||
2.63%, 05/05/20D | 2,500,000 | 2,446,388 | ||||||||||
Commonwealth Bankof Australia | ||||||||||||
5.00%, 10/15/19 144A | 50,000 | 54,637 | ||||||||||
FMG Resources August 2006 Proprietary, Ltd. | ||||||||||||
9.75%, 03/01/22 144AD | 490,000 | 450,800 | ||||||||||
Macquarie Bank, Ltd. | ||||||||||||
6.63%, 04/07/21 144A@ | 375,000 | 420,576 | ||||||||||
Rio Tinto Finance USA, Ltd. | ||||||||||||
3.50%, 11/02/20D | 280,000 | 274,772 | ||||||||||
3.75%, 09/20/21D | 10,000 | 9,733 | ||||||||||
|
| |||||||||||
| 5,066,242 | ||||||||||||
|
| |||||||||||
Austria — 0.0% | ||||||||||||
Sappi Papier Holding GmbH | ||||||||||||
7.75%, 07/15/17 144A@ | 225,000 | 234,844 | ||||||||||
|
| |||||||||||
Belgium — 0.1% | ||||||||||||
KBC Bank NV | ||||||||||||
8.00%, 01/25/23† | 800,000 | 874,040 | ||||||||||
|
| |||||||||||
Bermuda — 0.1% | ||||||||||||
Allied World Assurance Co. Holdings. Ltd. | ||||||||||||
4.35%, 10/29/25 | 350,000 | 345,215 | ||||||||||
Arch Capital Group, Ltd. | ||||||||||||
7.35%, 05/01/34 | 175,000 | 223,673 | ||||||||||
| 100 | See Notes to Financial Statements. |
Table of Contents
| Par | Value | |||||||||||
Digicel, Ltd. | ||||||||||||
6.75%, 03/01/23 144AD | $ | 300,000 | $ | 252,000 | ||||||||
|
| |||||||||||
| 820,888 | ||||||||||||
|
| |||||||||||
Brazil — 0.2% | ||||||||||||
Brazil Notas do Tesouro Nacional Serie F | ||||||||||||
10.00%, 01/01/17(B) | 3,249,000 | 783,800 | ||||||||||
Brazilian Government International Bond | ||||||||||||
5.63%, 01/07/41 | 750,000 | 547,500 | ||||||||||
5.00%, 01/27/45 | 200,000 | 134,500 | ||||||||||
|
| |||||||||||
| 1,465,800 | ||||||||||||
|
| |||||||||||
Canada — 0.2% | ||||||||||||
Barrick Gold Corporation | ||||||||||||
4.10%, 05/01/23D | 73,000 | 62,719 | ||||||||||
Enbridge, Inc. | ||||||||||||
3.50%, 06/10/24 | 150,000 | 125,833 | ||||||||||
Glencore Finance Canada, Ltd. | ||||||||||||
5.80%, 11/15/16 144AD | 70,000 | 69,752 | ||||||||||
2.70%, 10/25/17 144AD | 420,000 | 384,464 | ||||||||||
MEG Energy Corporation | ||||||||||||
6.50%, 03/15/21 144A | 40,000 | 28,200 | ||||||||||
6.38%, 01/30/23 144A | 350,000 | 241,500 | ||||||||||
Potash Corporation of Saskatchewan, Inc. | ||||||||||||
4.88%, 03/30/20D | 110,000 | 119,364 | ||||||||||
TransCanada PipeLines, Ltd. | ||||||||||||
6.35%, 05/15/67† | 200,000 | 151,500 | ||||||||||
Videotron, Ltd. | ||||||||||||
5.00%, 07/15/22 | 300,000 | 301,125 | ||||||||||
|
| |||||||||||
| 1,484,457 | ||||||||||||
|
| |||||||||||
Cayman Islands — 0.1% |
| |||||||||||
Brazil Minas SPE | ||||||||||||
5.33%, 02/15/28 | 470,000 | 356,025 | ||||||||||
Shelf Drilling Holdings, Ltd. | ||||||||||||
8.63%, 11/01/18 144AD | 70,000 | 51,100 | ||||||||||
Transocean, Inc. | ||||||||||||
5.80%, 12/15/16 | 130,000 | 126,587 | ||||||||||
Vale Overseas, Ltd. | ||||||||||||
6.88%, 11/21/36D | 591,000 | 416,088 | ||||||||||
|
| |||||||||||
| 949,800 | ||||||||||||
|
| |||||||||||
Chile — 0.2% | ||||||||||||
Celulosa Arauco y Constitucion SA | ||||||||||||
4.75%, 01/11/22 | 240,000 | 244,903 | ||||||||||
Chile Government International Bond | ||||||||||||
3.63%, 10/30/42 | 160,000 | 140,000 | ||||||||||
Corporation Nacional del Cobre de Chile | ||||||||||||
4.50%, 09/16/25 144AD | 800,000 | 755,382 | ||||||||||
Latam Airlines 2015-1 Pass-Through Trust A | ||||||||||||
4.20%, 08/15/29 144A | 900,000 | 846,000 | ||||||||||
|
| |||||||||||
| 1,986,285 | ||||||||||||
|
| |||||||||||
China — 0.2% | ||||||||||||
China Government Bond | ||||||||||||
3.38%, 11/21/24(Y) | 2,500,000 | 381,510 | ||||||||||
| Par | Value | |||||||||||
3.39%, 05/21/25(Y) | $ | 2,000,000 | $ | 305,316 | ||||||||
3.31%, 11/30/25(Y) | 6,000,000 | 911,328 | ||||||||||
|
| |||||||||||
| 1,598,154 | ||||||||||||
|
| |||||||||||
Colombia — 0.2% | ||||||||||||
Colombia Government International Bond | ||||||||||||
4.00%, 02/26/24 | 394,000 | 376,270 | ||||||||||
5.63%, 02/26/44 | 930,000 | 848,625 | ||||||||||
Ecopetrol SA | ||||||||||||
5.38%, 06/26/26 | 380,000 | 324,425 | ||||||||||
5.88%, 05/28/45 | 290,000 | 207,350 | ||||||||||
|
| |||||||||||
| 1,756,670 | ||||||||||||
|
| |||||||||||
Costa Rica — 0.0% | ||||||||||||
Costa Rica Government International Bond | ||||||||||||
7.00%, 04/04/44 | 200,000 | 167,500 | ||||||||||
|
| |||||||||||
Croatia (Hrvatska) — 0.0% |
| |||||||||||
Croatia Government International Bond | ||||||||||||
5.50%, 04/04/23 | 200,000 | 203,500 | ||||||||||
|
| |||||||||||
Dominican Republic — 0.0% |
| |||||||||||
Dominican Republic International Bond | ||||||||||||
10.38%, 03/04/22+(V) | 800,000 | 17,607 | ||||||||||
14.50%, 02/10/23(V) | 1,300,000 | 33,209 | ||||||||||
11.38%, 07/06/29+(V) | 700,000 | 15,741 | ||||||||||
7.45%, 04/30/44 144AD | 320,000 | 324,000 | ||||||||||
|
| |||||||||||
| 390,557 | ||||||||||||
|
| |||||||||||
France — 1.2% | ||||||||||||
BNP Paribas SA | ||||||||||||
2.38%, 09/14/17 | 270,000 | 273,320 | ||||||||||
4.38%, 09/28/25 144A | 425,000 | 417,027 | ||||||||||
BPCE SA | ||||||||||||
4.63%, 07/11/24 144A | 700,000 | 682,197 | ||||||||||
4.50%, 03/15/25 144AD | 1,300,000 | 1,249,394 | ||||||||||
Credit Agricole SA | ||||||||||||
4.38%, 03/17/25 144A | 710,000 | 688,889 | ||||||||||
7.88%, 01/29/49 144A†D | 1,600,000 | 1,641,137 | ||||||||||
8.38%, 10/29/49 144A† | 720,000 | 810,000 | ||||||||||
Dexia Credit Local SA | ||||||||||||
0.72%, 11/07/16 144A† | 3,200,000 | 3,201,082 | ||||||||||
Numericable-SFR SAS | ||||||||||||
6.25%, 05/15/24 144A | 330,000 | 319,275 | ||||||||||
Societe Generale SA | ||||||||||||
4.25%, 04/14/25 144A@D | 1,400,000 | 1,323,685 | ||||||||||
|
| |||||||||||
| 10,606,006 | ||||||||||||
|
| |||||||||||
Germany — 0.2% | ||||||||||||
KFW | ||||||||||||
1.13%, 08/06/18 | 1,800,000 | 1,786,423 | ||||||||||
|
| |||||||||||
Greece — 0.1% | ||||||||||||
Hellenic Railways Organization SA | ||||||||||||
4.03%, 03/17/17(E)@ | 700,000 | 707,478 | ||||||||||
5.01%, 12/27/17(E)@ | 100,000 | 100,525 | ||||||||||
|
| |||||||||||
| 808,003 | ||||||||||||
|
| |||||||||||
| See Notes to Financial Statements. | 101 |
Table of Contents
MEDIUM-DURATION BOND FUND
SCHEDULE OF INVESTMENTS (Continued)
| Par | Value | |||||||||||
Guernsey — 0.1% | ||||||||||||
Credit Suisse Group Funding Guernsey, Ltd. | ||||||||||||
3.75%, 03/26/25 144A | $ | 500,000 | $ | 484,573 | ||||||||
4.88%, 05/15/45 144A | 350,000 | 346,465 | ||||||||||
|
| |||||||||||
| 831,038 | ||||||||||||
|
| |||||||||||
Iceland — 0.0% | ||||||||||||
Glitnir HF | ||||||||||||
6.69%, 06/15/16+ 144A#D | 1,000,000 | 10 | ||||||||||
7.45%, 03/29/49+ 144A# | 100,000 | 1 | ||||||||||
Kaupthing Bank HF | ||||||||||||
7.13%, 05/19/16+ 144A# | 350,000 | 3 | ||||||||||
|
| |||||||||||
| 14 | ||||||||||||
|
| |||||||||||
India — 0.1% | ||||||||||||
Bharti Airtel, Ltd. | ||||||||||||
4.38%, 06/10/25 144AD | 530,000 | 518,953 | ||||||||||
|
| |||||||||||
Indonesia — 0.2% | ||||||||||||
Indonesia Government International Bond | ||||||||||||
4.88%, 05/05/21 | 770,000 | 800,467 | ||||||||||
5.38%, 10/17/23 | 200,000 | 208,438 | ||||||||||
4.75%, 01/08/26 144A | 250,000 | 247,378 | ||||||||||
7.75%, 01/17/38 | 100,000 | 117,484 | ||||||||||
|
| |||||||||||
| 1,373,767 | ||||||||||||
|
| |||||||||||
Ireland — 0.3% | ||||||||||||
GE Capital International Funding Co. | ||||||||||||
2.34%, 11/15/20 144A | 848,000 | 841,503 | ||||||||||
3.37%, 11/15/25 144AD | 597,000 | 608,559 | ||||||||||
4.42%, 11/15/35 144A | 229,000 | 234,154 | ||||||||||
GE Capital International Funding Co. | ||||||||||||
2.34%, 11/15/20 | 875,000 | 868,297 | ||||||||||
|
| |||||||||||
| 2,552,513 | ||||||||||||
|
| |||||||||||
Israel — 0.3% | ||||||||||||
Israel Government AID Bond | ||||||||||||
5.50%, 09/18/23 | 1,200,000 | 1,440,143 | ||||||||||
5.50%, 12/04/23D | 200,000 | 240,924 | ||||||||||
5.50%, 04/26/24 | 500,000 | 605,701 | ||||||||||
|
| |||||||||||
| 2,286,768 | ||||||||||||
|
| |||||||||||
Italy — 0.5% | ||||||||||||
Intesa Sanpaolo SpA | ||||||||||||
1.70%, 04/11/16† | 1,700,000 | 1,701,294 | ||||||||||
2.38%, 01/13/17 | 1,075,000 | 1,078,766 | ||||||||||
3.88%, 01/16/18 | 600,000 | 615,546 | ||||||||||
5.02%, 06/26/24 144A | 975,000 | 960,888 | ||||||||||
|
| |||||||||||
| 4,356,494 | ||||||||||||
|
| |||||||||||
Japan — 0.2% | ||||||||||||
Meiji Yasuda Life Insurance Co. | ||||||||||||
5.20%, 10/20/45 144A† | 300,000 | 309,430 | ||||||||||
Mitsubishi UFJ Trust & Banking Corporation | ||||||||||||
2.65%, 10/19/20 144A | 625,000 | 625,052 | ||||||||||
Resona Bank, Ltd. | ||||||||||||
5.85%, 09/29/49 144A†@ | 250,000 | 252,500 | ||||||||||
Sumitomo Mitsui Financial Group, Inc. | ||||||||||||
4.44%, 04/02/24 144A | 550,000 | 566,019 | ||||||||||
|
| |||||||||||
| 1,753,001 | ||||||||||||
|
| |||||||||||
| Par | Value | |||||||||||
Jersey — 0.1% | ||||||||||||
UBM PLC | ||||||||||||
5.75%, 11/03/20 144A | $ | 230,000 | $ | 246,068 | ||||||||
UBS Group Funding Jersey, Ltd. | ||||||||||||
4.13%, 09/24/25 144A | 890,000 | 890,844 | ||||||||||
|
| |||||||||||
| 1,136,912 | ||||||||||||
|
| |||||||||||
Jordan — 0.1% | ||||||||||||
Hashemite Kingdom of Jordan Government AID Bond | ||||||||||||
2.50%, 10/30/20 | 1,200,000 | 1,230,030 | ||||||||||
|
| |||||||||||
Luxembourg — 0.1% |
| |||||||||||
Altice Financing SA | ||||||||||||
6.63%, 02/15/23 144A | 400,000 | 396,000 | ||||||||||
ArcelorMittal | ||||||||||||
6.50%, 03/01/21D | 80,000 | 64,791 | ||||||||||
7.25%, 02/25/22D | 50,000 | 40,500 | ||||||||||
6.13%, 06/01/25D | 150,000 | 109,875 | ||||||||||
8.00%, 10/15/39 STEP | 100,000 | 68,750 | ||||||||||
Intelsat Jackson Holdings SA | ||||||||||||
7.50%, 04/01/21D | 500,000 | 437,500 | ||||||||||
Mallinckrodt International Finance SA | ||||||||||||
4.88%, 04/15/20 144A | 90,000 | 87,075 | ||||||||||
|
| |||||||||||
| 1,204,491 | ||||||||||||
|
| |||||||||||
Mexico — 1.6% | ||||||||||||
America Movil SAB de CV | ||||||||||||
5.63%, 11/15/17 | 370,000 | 395,512 | ||||||||||
6.00%, 06/09/19(M) | 3,030,000 | 175,740 | ||||||||||
5.00%, 03/30/20 | 240,000 | 260,931 | ||||||||||
Mexican Bonos | ||||||||||||
8.00%, 06/11/20(M) | 8,040,600 | 513,898 | ||||||||||
6.50%, 06/10/21(M) | 1,625,000 | 98,014 | ||||||||||
6.50%, 06/09/22(M) | 22,995,700 | 1,376,285 | ||||||||||
8.00%, 12/07/23(M) | 1,761,600 | 114,608 | ||||||||||
10.00%, 12/05/24(M) | 25,130,000 | 1,839,195 | ||||||||||
7.50%, 06/03/27(M) | 1,334,300 | 84,234 | ||||||||||
8.50%, 05/31/29(M) | 964,000 | 65,537 | ||||||||||
7.75%, 11/13/42(M) | 45,505,200 | 2,891,957 | ||||||||||
Mexico Cetes | ||||||||||||
0.00%, 01/14/16(M)W | 33,656,200 | 195,054 | ||||||||||
5.14%, 01/21/16(M)W | 12,090,400 | 70,027 | ||||||||||
0.00%, 01/28/16(M)W | 22,165,800 | 128,313 | ||||||||||
0.00%, 02/18/16(M)W | 35,330,200 | 204,163 | ||||||||||
0.00%, 03/17/16(M)W | 186,895,100 | 1,076,866 | ||||||||||
Mexico Government International Bond | ||||||||||||
3.60%, 01/30/25D | 440,000 | 429,880 | ||||||||||
6.05%, 01/11/40 | 134,000 | 147,233 | ||||||||||
4.75%, 03/08/44 | 1,498,000 | 1,368,423 | ||||||||||
5.55%, 01/21/45 | 1,220,000 | 1,255,075 | ||||||||||
4.60%, 01/23/46 | 200,000 | 177,750 | ||||||||||
Petroleos Mexicanos | ||||||||||||
5.50%, 01/21/21 | 190,000 | 192,128 | ||||||||||
6.63%, 06/15/35 | 159,000 | 142,901 | ||||||||||
5.50%, 06/27/44 144A | 170,000 | 128,748 | ||||||||||
6.38%, 01/23/45 | 580,000 | 493,801 | ||||||||||
Trust F/1401 | ||||||||||||
5.25%, 12/15/24 144A | 200,000 | 199,500 | ||||||||||
|
| |||||||||||
| 14,025,773 | ||||||||||||
|
| |||||||||||
| 102 | See Notes to Financial Statements. |
Table of Contents
| Par | Value | |||||||||||
Morocco & Antilles — 0.0% |
| |||||||||||
OCP SA | ||||||||||||
4.50%, 10/22/25 144A | $ | 450,000 | $ | 420,779 | ||||||||
|
| |||||||||||
Netherlands — 1.3% | ||||||||||||
ABN AMRO Bank NV | ||||||||||||
4.75%, 07/28/25 144A | 1,700,000 | 1,697,705 | ||||||||||
Cooperatieve Centrale Raiffeisen- Boerenleenbank BA | ||||||||||||
4.63%, 12/01/23 | 400,000 | 417,547 | ||||||||||
4.38%, 08/04/25 | 370,000 | 377,043 | ||||||||||
5.25%, 08/04/45 | 390,000 | 410,242 | ||||||||||
8.38%, 07/29/49† | 100,000 | 103,187 | ||||||||||
11.00%, 12/29/49 144A† | 487,000 | 603,028 | ||||||||||
Deutsche Telekom International Finance BV | ||||||||||||
5.75%, 03/23/16 | 510,000 | 514,739 | ||||||||||
Fiat Chrysler Automobiles NV | ||||||||||||
4.50%, 04/15/20 | 200,000 | 203,500 | ||||||||||
ING Bank NV | ||||||||||||
5.80%, 09/25/23 144A | 340,000 | 369,979 | ||||||||||
4.13%, 11/21/23† | 600,000 | 612,996 | ||||||||||
ING Groep NV | ||||||||||||
6.00%, 12/29/49†D | 375,000 | 376,406 | ||||||||||
Majapahit Holding BV | ||||||||||||
7.75%, 01/20/20 | 240,000 | 269,100 | ||||||||||
Petrobras Global Finance BV | ||||||||||||
3.88%, 01/27/16 | 200,000 | 199,450 | ||||||||||
1.99%, 05/20/16† | 300,000 | 293,250 | ||||||||||
2.89%, 03/17/17† | 2,500,000 | 2,296,875 | ||||||||||
3.25%, 03/17/17 | 200,000 | 185,500 | ||||||||||
2.46%, 01/15/19† | 300,000 | 228,750 | ||||||||||
5.75%, 01/20/20D | 635,000 | 500,063 | ||||||||||
5.38%, 01/27/21D | 1,230,000 | 919,425 | ||||||||||
6.25%, 03/17/24 | 380,000 | 273,600 | ||||||||||
6.85%, 06/05/15 | 350,000 | 228,375 | ||||||||||
Royal Bank of Scotland NV | ||||||||||||
4.65%, 06/04/18 | 130,000 | 134,267 | ||||||||||
Shell International Finance BV | ||||||||||||
4.38%, 03/25/20D | 320,000 | 344,022 | ||||||||||
4.13%, 05/11/35 | 140,000 | 134,071 | ||||||||||
4.38%, 05/11/45 | 230,000 | 218,009 | ||||||||||
|
| |||||||||||
| 11,911,129 | ||||||||||||
|
| |||||||||||
Peru — 0.1% | ||||||||||||
Peruvian Government International Bond | ||||||||||||
6.55%, 03/14/37D | 210,000 | 243,600 | ||||||||||
5.63%, 11/18/50 | 330,000 | 337,425 | ||||||||||
|
| |||||||||||
| 581,025 | ||||||||||||
|
| |||||||||||
Poland — 0.5% | ||||||||||||
Poland Government Bond | ||||||||||||
3.25%, 07/25/25(P) | 12,160,000 | 3,190,647 | ||||||||||
Poland Government International Bond | ||||||||||||
4.00%, 01/22/24 | 980,000 | 1,032,421 | ||||||||||
|
| |||||||||||
| 4,223,068 | ||||||||||||
|
| |||||||||||
Russia — 0.1% | ||||||||||||
Russian Foreign Bond | ||||||||||||
4.50%, 04/04/22 | 400,000 | 403,266 | ||||||||||
7.50%, 03/31/30 STEPD | 285,005 | 342,115 | ||||||||||
| Par | Value | |||||||||||
7.50%, 03/31/30 STEP 144A | $ | 160,650 | $ | 192,842 | ||||||||
|
| |||||||||||
| 938,223 | ||||||||||||
|
| |||||||||||
South Africa — 0.0% | ||||||||||||
South Africa Government International Bond | ||||||||||||
5.88%, 09/16/25D | 200,000 | 205,330 | ||||||||||
|
| |||||||||||
South Korea — 0.6% | ||||||||||||
Export-Import Bank of Korea | ||||||||||||
5.00%, 04/11/22 | 1,500,000 | 1,682,124 | ||||||||||
Hyundai Capital Services, Inc. | ||||||||||||
4.38%, 07/27/16 144A | 3,400,000 | 3,448,290 | ||||||||||
|
| |||||||||||
| 5,130,414 | ||||||||||||
|
| |||||||||||
Spain — 0.2% | ||||||||||||
Banco Bilbao Vizcaya Argentaria SA | ||||||||||||
3.00%, 10/20/20 | 625,000 | 623,007 | ||||||||||
Santander Issuances SAU | ||||||||||||
5.18%, 11/19/25 | 600,000 | 592,037 | ||||||||||
Telefonica Emisiones SA Unipersonal | ||||||||||||
6.42%, 06/20/16 | 90,000 | 92,079 | ||||||||||
6.22%, 07/03/17 | 20,000 | 21,263 | ||||||||||
5.88%, 07/15/19 | 70,000 | 76,994 | ||||||||||
5.46%, 02/16/21 | 675,000 | 755,238 | ||||||||||
|
| |||||||||||
| 2,160,618 | ||||||||||||
|
| |||||||||||
Sri Lanka — 0.0% | ||||||||||||
Sri Lanka Government International Bond | ||||||||||||
6.85%, 11/03/25 144A | 200,000 | 189,145 | ||||||||||
|
| |||||||||||
Supranational — 0.0% | ||||||||||||
Inter-American Development Bank | ||||||||||||
1.00%, 02/27/18 | 400,000 | 395,128 | ||||||||||
|
| |||||||||||
Sweden — 0.2% | ||||||||||||
Nordea Bank AB | ||||||||||||
4.88%, 05/13/21 144A | 640,000 | 691,487 | ||||||||||
Stadshypotek AB | ||||||||||||
1.88%, 10/02/19 144AD | 900,000 | 888,216 | ||||||||||
|
| |||||||||||
| 1,579,703 | ||||||||||||
|
| |||||||||||
Switzerland — 0.9% | ||||||||||||
Credit Suisse AG | ||||||||||||
0.79%, 03/11/16† | 1,700,000 | 1,698,752 | ||||||||||
1.38%, 05/26/17 | 1,500,000 | 1,493,220 | ||||||||||
6.50%, 08/08/23 144AD | 225,000 | 242,955 | ||||||||||
Credit Suisse Group AG | ||||||||||||
7.50%, 12/29/49 144A† | 525,000 | 553,516 | ||||||||||
UBS AG | ||||||||||||
0.97%, 06/01/17† | 2,700,000 | 2,695,445 | ||||||||||
1.26%, 06/01/20†D | 1,000,000 | 997,222 | ||||||||||
|
| |||||||||||
| 7,681,110 | ||||||||||||
|
| |||||||||||
Turkey — 0.3% | ||||||||||||
Turkey Government International Bond | ||||||||||||
5.63%, 03/30/21 | 160,000 | 169,600 | ||||||||||
6.25%, 09/26/22 | 550,000 | 598,895 | ||||||||||
5.75%, 03/22/24 | 410,000 | 434,301 | ||||||||||
4.25%, 04/14/26D | 270,000 | 253,976 | ||||||||||
| See Notes to Financial Statements. | 103 |
Table of Contents
MEDIUM-DURATION BOND FUND
SCHEDULE OF INVESTMENTS (Continued)
| Par | Value | |||||||||||
Turkish Airlines 2015-1 Class A Pass-Through Trust | ||||||||||||
4.20%, 03/15/27 144A | $ | 1,563,470 | $ | 1,500,931 | ||||||||
|
| |||||||||||
| 2,957,703 | ||||||||||||
|
| |||||||||||
United Kingdom — 1.4% | ||||||||||||
Bank of Scotland PLC | ||||||||||||
5.25%, 02/21/17 144A | 100,000 | 104,371 | ||||||||||
Barclays Bank PLC | ||||||||||||
6.05%, 12/04/17 144A | 230,000 | 245,556 | ||||||||||
2.50%, 02/20/19 | 300,000 | 300,814 | ||||||||||
Barclays PLC | ||||||||||||
6.50%, 12/29/49(E)† | 800,000 | 882,772 | ||||||||||
BP Capital Markets PLC | ||||||||||||
3.56%, 11/01/21 | 30,000 | 30,625 | ||||||||||
3.51%, 03/17/25D | 390,000 | 378,116 | ||||||||||
Ensco PLC | ||||||||||||
4.70%, 03/15/21D | 130,000 | 104,788 | ||||||||||
GlaxoSmithKline Capital PLC | ||||||||||||
2.85%, 05/08/22 | 350,000 | 353,024 | ||||||||||
HSBC Bank PLC | ||||||||||||
4.75%, 01/19/21 144A | 200,000 | 220,451 | ||||||||||
HSBC Holdings PLC | ||||||||||||
4.25%, 03/14/24 | 240,000 | 241,284 | ||||||||||
4.25%, 08/18/25 | 420,000 | 417,627 | ||||||||||
6.50%, 09/15/37 | 1,000,000 | 1,203,466 | ||||||||||
6.38%, 12/29/49† | 1,700,000 | 1,687,125 | ||||||||||
LBG Capital No.1 PLC | ||||||||||||
8.00%, 12/29/49 144A† | 300,000 | 315,225 | ||||||||||
Lloyds Bank PLC | ||||||||||||
2.30%, 11/27/18 | 275,000 | 276,284 | ||||||||||
12.00%, 12/29/49 144A†@ | 1,600,000 | 2,282,880 | ||||||||||
Lloyds Banking Group PLC | ||||||||||||
4.50%, 11/04/24D | 240,000 | 244,072 | ||||||||||
Nationwide Building Society | ||||||||||||
3.90%, 07/21/25 144A | 200,000 | 206,299 | ||||||||||
Royal Bank of Scotland Group PLC | ||||||||||||
6.40%, 10/21/19D | 160,000 | 177,667 | ||||||||||
6.13%, 12/15/22 | 180,000 | 196,244 | ||||||||||
6.00%, 12/19/23 | 410,000 | 442,278 | ||||||||||
5.13%, 05/28/24 | 280,000 | 284,164 | ||||||||||
7.64%, 03/29/49† | 100,000 | 105,000 | ||||||||||
7.50%, 12/29/49†D | 300,000 | 313,125 | ||||||||||
Santander UK Group Holdings PLC | ||||||||||||
4.75%, 09/15/25 144A | 675,000 | 669,356 | ||||||||||
Standard Chartered PLC | ||||||||||||
5.70%, 03/26/44 144A | 680,000 | 683,897 | ||||||||||
Virgin Media Finance PLC | ||||||||||||
6.00%, 10/15/24 144A | 600,000 | 600,750 | ||||||||||
|
| |||||||||||
| 12,967,260 | ||||||||||||
|
| |||||||||||
Virgin Islands (British) — 0.5% |
| |||||||||||
Sinopec Group Overseas Development 2012, Ltd. | ||||||||||||
2.75%, 05/17/17 144A | 230,000 | 232,107 | ||||||||||
Sinopec Group Overseas Development 2014, Ltd. | ||||||||||||
1.10%, 04/10/17 144A† | 3,200,000 | 3,196,074 | ||||||||||
4.38%, 04/10/24 144A | 750,000 | 776,470 | ||||||||||
|
| |||||||||||
| 4,204,651 | ||||||||||||
|
| |||||||||||
Total Foreign Bonds | 117,014,209 | |||||||||||
|
| |||||||||||
| Par | Value | |||||||||||
FOREIGN GOVERNMENT INFLATION-LINKED |
| |||||||||||
Brazil — 0.1% | ||||||||||||
Brazil Notas do Tesouro Nacional Serie B | $ | 1,812,000 | $ | 1,083,744 | ||||||||
LOAN AGREEMENTS — 0.3% | ||||||||||||
Avago Technologies Cayman, Ltd. Term B Loan | 2,739,254 | 2,730,132 | ||||||||||
|
| |||||||||||
MORTGAGE-BACKED SECURITIES — 41.5% |
| |||||||||||
Aire Valley Mortgages PLC Series 2005-1X | ||||||||||||
0.91%, 09/20/66† | 371,357 | 356,924 | ||||||||||
Aire Valley Mortgages PLC Series 2006-1A | ||||||||||||
0.79%, 09/20/66 144A† | 114,207 | 109,133 | ||||||||||
Aire Valley Mortgages PLC Series 2006-1X | ||||||||||||
0.17%, 09/20/66(E)† | 368,949 | 389,847 | ||||||||||
Aire Valley Mortgages PLC Series 2007-1A | ||||||||||||
0.81%, 09/20/66 144A† | 273,343 | 261,336 | ||||||||||
Alba PLC Series 2007-1 | ||||||||||||
0.76%, 03/17/39(U)† | 1,053,118 | 1,398,333 | ||||||||||
Alba PLC Series 2015-1 | ||||||||||||
1.75%, 04/24/49(U)† | 992,089 | 1,454,102 | ||||||||||
Alternative Loan Trust Series 2005-72 | ||||||||||||
0.69%, 01/25/36† | 380,534 | 339,130 | ||||||||||
Alternative Loan Trust Series 2006-OA11 | ||||||||||||
0.61%, 09/25/46† | 710,916 | 618,754 | ||||||||||
American Home Mortgage Investment Trust Series 2005-2 | ||||||||||||
2.15%, 09/25/45† | 1,319,400 | 1,285,502 | ||||||||||
American Home Mortgage Assets Trust Series 2006-5 | ||||||||||||
1.18%, 11/25/46† | 973,298 | 493,864 | ||||||||||
Banc of America Commercial Mortgage Trust Series 2007-2 | ||||||||||||
5.63%, 04/10/49† | 75,000 | 77,415 | ||||||||||
Banc of America Funding Trust Series 2005-D | ||||||||||||
2.75%, 05/25/35† | 1,344,457 | 1,367,370 | ||||||||||
Banc of America Mortgage Trust Series 2004-F | ||||||||||||
2.68%, 07/25/34† | 114,957 | 116,978 | ||||||||||
Banc of America Re-REMIC Trust Series 2010-UB5 | ||||||||||||
5.65%, 02/17/51 144A† | 86,826 | 87,855 | ||||||||||
| 104 | See Notes to Financial Statements. |
Table of Contents
| Par | Value | |||||||||||
Bayview Commercial Asset Trust Series 2004-3 | ||||||||||||
0.79%, 01/25/35 144A† | $ | 578,227 | $ | 522,033 | ||||||||
BBCCRE Trust Series 2015-GTP | ||||||||||||
3.97%, 08/10/33 144A | 1,600,000 | 1,648,671 | ||||||||||
4.56%, 08/10/33 144A† | 1,800,000 | 1,610,698 | ||||||||||
BBCMS Trust Series 2015-RRI | ||||||||||||
1.48%, 05/15/32 144A† | 1,700,000 | 1,685,552 | ||||||||||
BBCMS Trust Series 2015-STP | ||||||||||||
3.32%, 09/10/28 144A | 1,600,000 | 1,618,500 | ||||||||||
Bear Stearns Adjustable Rate Mortgage Trust | ||||||||||||
2.43%, 02/25/33† | 10,445 | 10,345 | ||||||||||
Bear Stearns Adjustable Rate Mortgage Trust | ||||||||||||
2.50%, 05/25/34† | 52,620 | 49,690 | ||||||||||
Bear Stearns Adjustable Rate Mortgage Trust | ||||||||||||
2.68%, 03/25/35† | 461,141 | 462,057 | ||||||||||
Bear Stearns ALT-A Trust Series 2005-4 | ||||||||||||
2.60%, 05/25/35† | 339,271 | 334,845 | ||||||||||
Bear Stearns Commercial Mortgage Securities Trust Series 2007-PW18 | ||||||||||||
5.60%, 06/11/50 | 814,379 | 854,386 | ||||||||||
Bear Stearns Structured Products, Inc. Trust Series 2007-R6 | ||||||||||||
2.69%, 01/26/36† | 903,805 | 742,554 | ||||||||||
Berica 8 Residential MBS S.r.l. Series 8 | ||||||||||||
0.23%, 03/31/48(E)† | 138,856 | 148,101 | ||||||||||
Berica ABS S.r.l. Series 2011-1 | ||||||||||||
0.17%, 12/31/55(E)† | 867,148 | 933,750 | ||||||||||
Chevy Chase Funding LLC Series 2004-4A | ||||||||||||
0.65%, 10/25/35 144A† | 269,359 | 248,249 | ||||||||||
CHL Mortgage Pass-Through Trust Series 2003-58 | ||||||||||||
2.86%, 02/19/34† | 522,760 | 521,182 | ||||||||||
CHL Mortgage Pass-Through Trust Series 2004-HYB5 | ||||||||||||
2.56%, 04/20/35† | 1,134,476 | 1,129,535 | ||||||||||
Citigroup Commercial Mortgage Trust | ||||||||||||
6.05%, 12/10/49† | 598,678 | 635,777 | ||||||||||
Citigroup Commercial Mortgage Trust | ||||||||||||
1.08%, 06/15/33 144A† | 200,000 | 197,921 | ||||||||||
Citigroup Commercial Mortgage Trust | ||||||||||||
5.02%, 05/10/47 IOW† | 1,228,700 | 95,097 | ||||||||||
| Par | Value | |||||||||||
Citigroup Commercial Mortgage Trust | ||||||||||||
3.77%, 02/10/48 | $ | 170,000 | $ | 161,366 | ||||||||
Citigroup Commercial Mortgage Trust | ||||||||||||
3.11%, 04/10/48 144A | 420,000 | 293,540 | ||||||||||
COMM Mortgage Trust Series 2007-C9 | ||||||||||||
5.80%, 12/10/49† | 1,178,286 | 1,226,729 | ||||||||||
COMM Mortgage Trust Series 2013-CR12 | ||||||||||||
4.30%, 10/10/46 | 100,000 | 105,371 | ||||||||||
4.76%, 10/10/46† | 40,000 | 42,377 | ||||||||||
5.08%, 10/10/46† | 20,000 | 20,728 | ||||||||||
COMM Mortgage Trust Series 2013-CR13 | ||||||||||||
4.96%, 12/10/23 IOW† | 1,105,259 | 53,772 | ||||||||||
COMM Mortgage Trust Series 2014-277P | ||||||||||||
3.61%, 08/10/49 144A† | 160,000 | 162,935 | ||||||||||
COMM Mortgage Trust Series 2014-CR19 | ||||||||||||
4.72%, 08/10/47† | 218,000 | 216,512 | ||||||||||
COMM Mortgage Trust Series 2014-SAVA | ||||||||||||
3.43%, 06/15/34 144A† | 400,000 | 394,199 | ||||||||||
COMM Mortgage Trust Series 2015-DC1 | ||||||||||||
4.04%, 02/10/48† | 100,000 | 100,163 | ||||||||||
4.35%, 02/10/48† | 80,000 | 77,057 | ||||||||||
COMM Mortgage Trust Series 2015-LC19 | ||||||||||||
3.83%, 02/10/48† | 100,000 | 99,203 | ||||||||||
4.26%, 02/10/48† | 190,000 | 181,928 | ||||||||||
Commercial Mortgage Pass-Through Certificates Series 2012-CR3 | ||||||||||||
2.82%, 10/15/45 | 30,000 | 29,659 | ||||||||||
Community Funding CLO, Ltd. Series 2015-1A | ||||||||||||
5.75%, 11/01/27+ STEP 144A | 860,000 | 854,952 | ||||||||||
Core Industrial Trust Series 2015-TEXW | ||||||||||||
3.85%, 02/10/34 144A† | 460,000 | 415,447 | ||||||||||
Credit Suisse Commercial Mortgage Trust | ||||||||||||
5.60%, 01/15/49† | 101,000 | 104,240 | ||||||||||
Credit Suisse First Boston Mortgage Securities Corporation | ||||||||||||
5.25%, 07/25/33 IOW | 5,984 | 171 | ||||||||||
Credit Suisse First Boston Mortgage Securities Corporation | ||||||||||||
(3.00)%, 07/25/33 IOW† | 66,521 | — | ||||||||||
Credit Suisse First Boston Mortgage Securities Corporation Series 2003-AR20 | ||||||||||||
(3.00)%, 08/25/33 IOW† | 72,467 | — | ||||||||||
| See Notes to Financial Statements. | 105 |
Table of Contents
MEDIUM-DURATION BOND FUND
SCHEDULE OF INVESTMENTS (Continued)
| Par | Value | |||||||||||
CSAIL Commercial Mortgage Trust Series 2015-C1 | ||||||||||||
4.04%, 04/15/50 | $ | 60,000 | $ | 59,467 | ||||||||
CSMC Trust Series 2014-TIKI | ||||||||||||
1.28%, 09/15/38 144A† | 300,000 | 295,430 | ||||||||||
CSMC Trust Series 2014-USA | ||||||||||||
4.19%, 09/15/37 144A | 300,000 | 305,255 | ||||||||||
4.37%, 09/15/37 144A | 310,000 | 295,069 | ||||||||||
DECO Series 2015-HRPA | ||||||||||||
1.20%, 04/27/27 144A(E)†@ | 1,484,242 | 1,602,524 | ||||||||||
Dell Equipment Finance Trust Series 2015-2 | ||||||||||||
0.53%, 10/24/16 144A | 596,301 | 596,302 | ||||||||||
EQTY Mortgage Trust Series 2014-INNS | ||||||||||||
2.63%, 05/08/31 144A† | 300,000 | 294,728 | ||||||||||
Federal Home Loan Mortgage Corporation | ||||||||||||
8.50%, 06/01/18 | 658 | 679 | ||||||||||
4.50%, 09/01/18 | 2,642 | 2,728 | ||||||||||
8.00%, 08/01/24 | 1,304 | 1,452 | ||||||||||
4.00%, 10/01/25 | 349,870 | 369,516 | ||||||||||
5.50%, 02/01/27 | 54,107 | 59,749 | ||||||||||
7.50%, 11/01/29 | 5,132 | 6,243 | ||||||||||
7.50%, 12/01/29 | 6,727 | 8,157 | ||||||||||
7.50%, 02/01/31 | 12,213 | 12,769 | ||||||||||
2.48%, 07/01/31† | 13,187 | 13,650 | ||||||||||
7.50%, 11/01/31 | 8,878 | 8,935 | ||||||||||
2.60%, 04/01/32† | 2,196 | 2,298 | ||||||||||
3.50%, 08/01/33 | 1,478,845 | 1,549,246 | ||||||||||
5.00%, 08/01/33 | 7,946 | 8,795 | ||||||||||
5.00%, 09/01/33 | 1,590 | 1,756 | ||||||||||
5.00%, 10/01/33 | 5,098 | 5,629 | ||||||||||
2.59%, 03/01/34† | 2,887 | 3,070 | ||||||||||
5.00%, 12/01/34 | 130,092 | 142,511 | ||||||||||
5.50%, 05/01/35 | 270,908 | 299,112 | ||||||||||
5.00%, 07/01/35 | 7,371 | 8,135 | ||||||||||
5.00%, 11/01/35 | 241,460 | 264,327 | ||||||||||
5.50%, 11/01/35 | 51,981 | 57,703 | ||||||||||
5.00%, 12/01/35 | 19,755 | 21,944 | ||||||||||
5.50%, 01/01/36 | 35,317 | 39,280 | ||||||||||
6.00%, 02/01/36 | 373,868 | 419,936 | ||||||||||
2.76%, 01/01/37† | 568,567 | 603,333 | ||||||||||
5.00%, 02/01/37 | 24,629 | 26,936 | ||||||||||
5.50%, 07/01/37 | 62,362 | 69,832 | ||||||||||
1.94%, 09/01/37† | 56,709 | 59,563 | ||||||||||
5.50%, 04/01/38 | 15,044 | 16,731 | ||||||||||
7.00%, 02/01/39 | 195,239 | 225,381 | ||||||||||
7.00%, 03/01/39 | 36,552 | 39,726 | ||||||||||
5.50%, 04/01/39 | 380,740 | 420,399 | ||||||||||
4.50%, 06/01/39 | 164,288 | 177,127 | ||||||||||
6.50%, 09/01/39 | 64,968 | 73,989 | ||||||||||
5.50%, 08/01/40 | 326,101 | 362,733 | ||||||||||
5.00%, 06/01/41 | 5,225 | 5,719 | ||||||||||
3.50%, 01/01/42 TBA | 1,400,000 | 1,441,139 | ||||||||||
3.50%, 10/01/42 | 169,417 | 175,041 | ||||||||||
4.00%, 10/01/42 | 81,136 | 86,407 | ||||||||||
3.50%, 11/01/42 | 338,030 | 349,255 | ||||||||||
3.50%, 12/01/42 | 80,914 | 83,598 | ||||||||||
| Par | Value | |||||||||||
3.50%, 01/01/43 | $ | 530,766 | $ | 548,342 | ||||||||
3.50%, 02/01/43 | 368,599 | 380,826 | ||||||||||
3.50%, 04/01/43 | 888,101 | 915,923 | ||||||||||
4.00%, 04/01/43 | 174,250 | 185,536 | ||||||||||
3.50%, 05/01/43 | 651,631 | 672,820 | ||||||||||
4.00%, 05/01/43 | 87,952 | 94,212 | ||||||||||
4.00%, 06/01/43 | 86,168 | 92,089 | ||||||||||
4.00%, 07/01/43 | 326,171 | 348,664 | ||||||||||
4.00%, 08/01/43 | 181,638 | 193,481 | ||||||||||
4.50%, 12/01/43 | 1,180,345 | 1,299,079 | ||||||||||
3.50%, 02/01/44 | 92,289 | 95,352 | ||||||||||
4.50%, 02/01/44 | 905,608 | 996,534 | ||||||||||
4.50%, 03/01/44 | 279,837 | 308,084 | ||||||||||
3.50%, 03/01/45 | 998,903 | 1,032,002 | ||||||||||
3.50%, 02/11/46 TBA | 2,000,000 | 2,054,394 | ||||||||||
Federal Home Loan Mortgage Corporation REMIC | ||||||||||||
0.83%, 06/15/37† | 248,993 | 251,499 | ||||||||||
Federal Home Loan Mortgage Corporation REMIC | ||||||||||||
4.30%, 07/15/37 IOW† | 1,796,430 | 322,722 | ||||||||||
Federal Home Loan Mortgage Corporation REMIC | ||||||||||||
0.83%, 01/15/40 IOW† | 442,528 | 80,360 | ||||||||||
Federal Home Loan Mortgage Corporation REMIC | ||||||||||||
7.99%, 10/15/41 IOW† | 307,288 | 52,717 | ||||||||||
Federal Home Loan Mortgage Corporation REMIC | ||||||||||||
5.27%, 11/15/41 IOW† | 306,079 | 53,580 | ||||||||||
Federal Home Loan Mortgage Corporation REMIC | ||||||||||||
4.70%, 07/15/42 IOW† | 73,467 | 17,403 | ||||||||||
Federal Home Loan Mortgage Corporation REMIC | ||||||||||||
4.72%, 09/15/31 IOW | 636,802 | 73,387 | ||||||||||
Federal Home Loan Mortgage Corporation REMIC | ||||||||||||
11.72%, 08/15/42 IOW† | 70,579 | 11,727 | ||||||||||
Federal Home Loan Mortgage Corporation REMIC | ||||||||||||
6.49%, 08/15/42 IOW† | 364,927 | 77,043 | ||||||||||
Federal Home Loan Mortgage Corporation REMIC | ||||||||||||
6.53%, 11/15/42 IOW† | 72,369 | 15,442 | ||||||||||
6.56%, 11/15/42 IOW† | 74,168 | 15,956 | ||||||||||
8.60%, 11/15/42 IOW† | 77,075 | 15,310 | ||||||||||
Federal Home Loan Mortgage Corporation REMIC | ||||||||||||
7.40%, 12/15/42 IOW† | 217,142 | 45,365 | ||||||||||
Federal Home Loan Mortgage Corporation REMIC | ||||||||||||
6.35%, 04/15/43 IOW | 1,401,941 | 216,856 | ||||||||||
| 106 | See Notes to Financial Statements. |
Table of Contents
| Par | Value | |||||||||
Federal Home Loan Mortgage Corporation REMIC Series 4206 | ||||||||||
3.00%, 05/15/43 | $ | 108,048 | $ | 102,200 | ||||||
Federal Home Loan Mortgage Corporation REMIC Series 4210 | ||||||||||
3.00%, 05/15/43 | 317,423 | 290,301 | ||||||||
Federal Home Loan Mortgage Corporation REMIC Series 4226 | ||||||||||
3.00%, 07/15/43 | 215,019 | 194,055 | ||||||||
Federal Home Loan Mortgage Corporation REMIC Series 4239 | ||||||||||
2.26%, 06/15/27 IOW | 638,298 | 73,904 | ||||||||
Federal Home Loan Mortgage Corporation REMIC Series 4298 | ||||||||||
3.95%, 04/15/43 IOW | 628,010 | 96,827 | ||||||||
Federal Home Loan Mortgage Corporation REMIC Series 4310 | ||||||||||
5.08%, 02/15/44 IOW† | 177,359 | 35,076 | ||||||||
Federal Home Loan Mortgage Corporation REMIC Series 4335 | ||||||||||
5.22%, 05/15/44 IOW† | 179,043 | 36,511 | ||||||||
Federal Home Loan Mortgage Corporation REMIC Series 4415 | ||||||||||
(1.00)%, 04/15/41 IOW† | 419,552 | 30,092 | ||||||||
Federal Home Loan Mortgage Corporation REMIC Series R007 | ||||||||||
6.00%, 05/15/36 | 340,428 | 381,845 | ||||||||
Federal Housing Administration | ||||||||||
7.43%, 10/01/18@ | 25,742 | 26,114 | ||||||||
Federal National Mortgage Association | ||||||||||
5.00%, 12/01/17 | 5,818 | 6,113 | ||||||||
2.80%, 03/01/18 | 542,064 | 554,888 | ||||||||
3.74%, 05/01/18 | 1,306,020 | 1,360,941 | ||||||||
3.84%, 05/01/18 | 420,000 | 438,713 | ||||||||
4.51%, 06/01/19 | 1,000,000 | 1,043,079 | ||||||||
3.42%, 10/01/20 | 265,250 | 280,444 | ||||||||
3.62%, 12/01/20 | 170,293 | 179,715 | ||||||||
4.38%, 06/01/21 | 642,357 | 700,529 | ||||||||
9.50%, 05/01/22 | 448 | 486 | ||||||||
1.89%, 07/01/22† | 4,611 | 4,724 | ||||||||
3.00%, 01/01/23 TBA | 10,000,000 | 10,000,091 | ||||||||
5.50%, 09/01/23 | 69,964 | 75,843 | ||||||||
5.50%, 10/01/23 | 15,744 | 17,069 | ||||||||
5.00%, 05/01/24 | 55,068 | 60,567 | ||||||||
9.50%, 07/01/24 | 892 | 968 | ||||||||
2.81%, 04/01/25 | 130,000 | 128,445 | ||||||||
5.50%, 05/01/25 | 302,438 | 315,174 | ||||||||
3.00%, 01/01/26 TBA | 6,200,000 | 6,386,887 | ||||||||
3.50%, 01/01/26 TBA | 1,100,000 | 1,151,950 | ||||||||
1.90%, 07/01/27† | 14,776 | 15,419 | ||||||||
2.37%, 08/01/27† | 27,360 | 28,927 | ||||||||
1.90%, 11/01/27 CONV† | 14,207 | 14,972 | ||||||||
2.50%, 01/01/28 TBA | 300,000 | 302,372 | ||||||||
2.89%, 02/01/30† | 89,778 | 91,918 | ||||||||
2.63%, 06/01/30 CONV† | 14,697 | 15,059 | ||||||||
| Par | Value | |||||||||
8.00%, 10/01/30 | $ | 17,863 | $ | 22,078 | ||||||
2.74%, 12/01/30 CONV† | 5,419 | 5,543 | ||||||||
1.90%, 01/01/31† | 6,230 | 6,352 | ||||||||
4.50%, 04/01/31 | 98,994 | 107,766 | ||||||||
2.45%, 05/01/31† | 13,122 | 13,244 | ||||||||
4.50%, 05/01/31 | 348,068 | 378,980 | ||||||||
4.50%, 06/01/31 | 102,931 | 112,080 | ||||||||
4.50%, 11/01/31 | 144,154 | 156,962 | ||||||||
6.00%, 11/01/31 | 2,579 | 2,941 | ||||||||
4.50%, 12/01/31 | 218,298 | 237,803 | ||||||||
6.00%, 01/01/32 | 61,923 | 69,913 | ||||||||
6.00%, 03/01/32 | 11,914 | 13,502 | ||||||||
6.00%, 04/01/32 | 150,260 | 169,971 | ||||||||
1.90%, 06/01/32† | 7,859 | 8,050 | ||||||||
1.89%, 08/01/32† | 9,529 | 9,844 | ||||||||
6.00%, 08/01/32 | 1,616 | 1,842 | ||||||||
2.38%, 02/01/33† | 1,046 | 1,072 | ||||||||
5.50%, 04/01/33 | 33,209 | 37,963 | ||||||||
1.89%, 05/01/33† | 37,244 | 39,727 | ||||||||
6.00%, 05/01/33 | 496 | 559 | ||||||||
5.00%, 07/01/33 | 44,483 | 49,211 | ||||||||
5.00%, 08/01/33 | 3,808 | 4,244 | ||||||||
5.00%, 09/01/33 | 53,993 | 59,733 | ||||||||
5.50%, 09/01/33 | 1,881 | 2,111 | ||||||||
5.50%, 12/01/33 | 8,463 | 9,530 | ||||||||
6.00%, 12/01/33 | 433 | 489 | ||||||||
5.50%, 02/01/34 | 2,706 | 3,046 | ||||||||
5.50%, 04/01/34 | 452 | 509 | ||||||||
3.50%, 05/01/34 | 250,430 | 262,410 | ||||||||
5.50%, 08/01/34 | 3,596 | 4,084 | ||||||||
5.50%, 10/01/34 | 161 | 183 | ||||||||
6.00%, 10/01/34 | 29,941 | 33,787 | ||||||||
1.95%, 12/01/34† | 61,618 | 65,435 | ||||||||
5.50%, 12/01/34 | 16,727 | 18,838 | ||||||||
6.00%, 05/01/35 | 1,031,506 | 1,167,143 | ||||||||
5.50%, 07/01/35 | 207 | 235 | ||||||||
6.00%, 07/01/35 | 148,886 | 168,049 | ||||||||
5.50%, 08/01/35 | 359 | 407 | ||||||||
6.00%, 08/01/35 | 44 | 49 | ||||||||
5.50%, 09/01/35 | 71,843 | 80,027 | ||||||||
5.00%, 10/01/35 | 149,246 | 165,069 | ||||||||
6.00%, 10/01/35 | 35,978 | 40,670 | ||||||||
1.90%, 11/01/35† | 11,264 | 11,728 | ||||||||
2.11%, 11/01/35† | 64,377 | 67,363 | ||||||||
2.17%, 11/01/35† | 70,900 | 74,359 | ||||||||
2.23%, 11/01/35† | 76,426 | 80,117 | ||||||||
2.23%, 11/01/35† | 62,336 | 65,687 | ||||||||
2.25%, 11/01/35† | 88,419 | 92,711 | ||||||||
6.00%, 11/01/35 | 457,458 | 517,679 | ||||||||
5.50%, 12/01/35 | 1,718 | 1,951 | ||||||||
6.00%, 12/01/35 | 6,354 | 7,189 | ||||||||
6.00%, 01/01/36 | 104,708 | 118,160 | ||||||||
6.00%, 02/01/36 | 4,104 | 4,682 | ||||||||
6.00%, 03/01/36 | 4,504 | 5,136 | ||||||||
5.50%, 04/01/36 | 37,884 | 40,620 | ||||||||
6.00%, 04/01/36 | 5,798 | 6,614 | ||||||||
3.82%, 05/01/36† | 84,799 | 89,171 | ||||||||
6.00%, 09/01/36 | 95,816 | 108,396 | ||||||||
5.50%, 11/01/36 | 132,114 | 147,664 | ||||||||
6.00%, 01/01/37 | 626,555 | 707,048 | ||||||||
1.78%, 02/01/37† | 599,426 | 626,379 | ||||||||
5.50%, 02/01/37 | 193 | 218 | ||||||||
6.00%, 02/01/37 | 534,865 | 605,986 | ||||||||
5.50%, 03/01/37 | 7,767 | 8,703 | ||||||||
| See Notes to Financial Statements. | 107 |
Table of Contents
MEDIUM-DURATION BOND FUND
SCHEDULE OF INVESTMENTS (Continued)
| Par | Value | |||||||||
6.00%, 03/01/37 | $ | 404,500 | $ | 457,813 | ||||||
5.50%, 04/01/37 | 363 | 408 | ||||||||
5.50%, 05/01/37 | 126 | 140 | ||||||||
5.50%, 06/01/37 | 148 | 164 | ||||||||
6.00%, 07/01/37 | 1,029,218 | 1,171,916 | ||||||||
5.50%, 08/01/37 | 364,531 | 409,503 | ||||||||
6.00%, 08/01/37 | 81,163 | 91,767 | ||||||||
6.00%, 09/01/37 | 136,782 | 154,354 | ||||||||
6.50%, 10/01/37 | 56,534 | 64,610 | ||||||||
7.00%, 10/01/37 | 8,287 | 9,956 | ||||||||
7.00%, 11/01/37 | 8,426 | 9,929 | ||||||||
1.90%, 12/01/37† | 43,465 | 45,213 | ||||||||
6.00%, 12/01/37 | 399,582 | 451,030 | ||||||||
7.00%, 12/01/37 | 5,260 | 6,222 | ||||||||
1.90%, 01/01/38† | 31,625 | 33,630 | ||||||||
6.00%, 01/01/38 | 287,358 | 327,712 | ||||||||
5.50%, 02/01/38 | 4,381 | 4,915 | ||||||||
7.00%, 02/01/38 | 5,534 | 6,145 | ||||||||
4.50%, 03/01/38 | 8,137 | 8,788 | ||||||||
5.50%, 03/01/38 | 452 | 503 | ||||||||
6.00%, 03/01/38 | 1,082 | 1,221 | ||||||||
4.50%, 04/01/38 | 151,590 | 163,721 | ||||||||
5.00%, 04/01/38 | 154,811 | 170,270 | ||||||||
5.50%, 05/01/38 | 177 | 198 | ||||||||
6.00%, 05/01/38 | 35,141 | 39,706 | ||||||||
5.00%, 06/01/38 | 163,836 | 180,196 | ||||||||
5.50%, 06/01/38 | 571 | 640 | ||||||||
5.50%, 07/01/38 | 96,140 | 108,194 | ||||||||
5.50%, 08/01/38 | 100,686 | 112,521 | ||||||||
7.00%, 08/01/38 | 4,533 | 4,908 | ||||||||
5.50%, 09/01/38 | 507 | 570 | ||||||||
6.00%, 11/01/38 | 44,331 | 50,143 | ||||||||
7.00%, 11/01/38 | 32,569 | 38,230 | ||||||||
5.50%, 12/01/38 | 150 | 167 | ||||||||
6.00%, 12/01/38 | 54,623 | 61,691 | ||||||||
6.00%, 01/01/39 | 233,601 | 264,257 | ||||||||
7.00%, 02/01/39 | 16,751 | 19,476 | ||||||||
4.50%, 02/12/39 TBA | 14,000,000 | 15,095,279 | ||||||||
7.00%, 03/01/39 | 146,063 | 169,168 | ||||||||
6.00%, 09/01/39 | 31,358 | 35,467 | ||||||||
6.00%, 10/01/39 | 35,010 | 39,605 | ||||||||
6.00%, 12/01/39 | 534,528 | 605,717 | ||||||||
5.00%, 01/01/40 TBA | 2,600,000 | 2,861,767 | ||||||||
1.62%, 06/01/40† | 49,183 | 51,360 | ||||||||
1.62%, 10/01/40† | 126,761 | 129,841 | ||||||||
1.64%, 10/01/40† | 9,252 | 9,510 | ||||||||
1.90%, 11/01/40† | 18,255 | 19,062 | ||||||||
4.00%, 01/01/41 TBA | 1,000,000 | 1,058,172 | ||||||||
4.00%, 02/01/41 TBA | 19,000,000 | 20,067,416 | ||||||||
4.50%, 04/01/41 | 151,504 | 164,237 | ||||||||
4.50%, 08/01/41 | 118,512 | 128,160 | ||||||||
4.50%, 11/01/41 | 451,119 | 488,125 | ||||||||
3.50%, 01/12/42 TBA | 6,000,000 | 6,190,339 | ||||||||
3.50%, 02/01/42 TBA | 25,000,000 | 25,739,369 | ||||||||
4.00%, 06/01/42 | 79,862 | 84,836 | ||||||||
3.00%, 08/01/42 | 171,818 | 172,465 | ||||||||
3.50%, 09/01/42 | 81,363 | 84,076 | ||||||||
2.50%, 10/01/42 | 560,218 | 541,348 | ||||||||
4.00%, 10/01/42 | 326,126 | 347,231 | ||||||||
2.50%, 11/01/42 | 30,794 | 29,758 | ||||||||
3.00%, 11/01/42 | 43,860 | 44,139 | ||||||||
4.00%, 11/01/42 | 742,585 | 790,671 | ||||||||
2.50%, 12/01/42 | 23,535 | 22,744 | ||||||||
3.00%, 12/01/42 | 648,920 | 653,085 | ||||||||
| Par | Value | |||||||||
4.00%, 12/01/42 | $ | 221,119 | $ | 234,541 | ||||||
2.50%, 01/01/43 | 21,170 | 20,458 | ||||||||
3.00%, 01/01/43 | 508,617 | 509,644 | ||||||||
3.50%, 01/01/43 | 2,434,099 | 2,515,235 | ||||||||
2.50%, 02/01/43 | 21,517 | 20,794 | ||||||||
2.50%, 03/01/43 | 1,821,171 | 1,759,907 | ||||||||
3.00%, 03/01/43 | 279,110 | 281,403 | ||||||||
3.50%, 03/01/43 | 250,729 | 259,226 | ||||||||
2.50%, 04/01/43 | 1,660,739 | 1,604,913 | ||||||||
3.00%, 04/01/43 | 413,611 | 417,010 | ||||||||
3.50%, 04/01/43 | 1,227,296 | 1,268,767 | ||||||||
4.00%, 04/01/43 | 78,874 | 84,276 | ||||||||
2.50%, 05/01/43 | 37,089 | 35,842 | ||||||||
3.00%, 05/01/43 | 2,159,101 | 2,165,346 | ||||||||
3.50%, 05/01/43 | 83,777 | 86,619 | ||||||||
2.50%, 06/01/43 | 36,059 | 34,847 | ||||||||
3.00%, 06/01/43 | 80,718 | 81,381 | ||||||||
4.00%, 06/01/43 | 808,203 | 861,310 | ||||||||
3.00%, 07/01/43 | 716,795 | 722,686 | ||||||||
3.50%, 07/01/43 | 1,441,455 | 1,489,006 | ||||||||
4.00%, 07/01/43 | 805,236 | 857,688 | ||||||||
2.50%, 08/01/43 | 909,069 | 878,612 | ||||||||
3.50%, 08/01/43 | 398,577 | 411,734 | ||||||||
4.00%, 08/01/43 | 268,095 | 285,425 | ||||||||
4.50%, 09/01/43 | 1,093,078 | 1,185,883 | ||||||||
2.50%, 10/01/43 | 46,883 | 45,309 | ||||||||
4.50%, 10/01/43 | 268,923 | 295,875 | ||||||||
4.50%, 11/01/43 | 177,112 | 194,891 | ||||||||
5.00%, 11/01/43 | 864,125 | 950,414 | ||||||||
4.50%, 12/01/43 | 264,241 | 290,767 | ||||||||
4.50%, 01/01/44 | 175,283 | 192,741 | ||||||||
4.50%, 02/01/44 | 1,295,989 | 1,399,703 | ||||||||
4.50%, 07/01/44 | 176,834 | 194,001 | ||||||||
4.50%, 10/01/44 | 790,635 | 865,074 | ||||||||
4.00%, 01/01/45 | 283,235 | 301,558 | ||||||||
4.50%, 02/01/45 | 1,499,880 | 1,654,276 | ||||||||
3.00%, 03/01/45 | 1,058,831 | 1,060,223 | ||||||||
3.50%, 10/01/45 | 5,542,438 | 5,722,494 | ||||||||
3.00%, 11/01/45 | 1,996,422 | 1,998,155 | ||||||||
3.50%, 12/01/45 | 3,495,301 | 3,609,255 | ||||||||
Federal National Mortgage Association Interest STRIP Series 409 | ||||||||||
4.21%, 04/25/27 IOW | 514,867 | 53,445 | ||||||||
1.68%, 11/25/39 IOW | 93,527 | 19,673 | ||||||||
0.79%, 11/25/41 IOW | 291,934 | 61,599 | ||||||||
5.00%, 11/25/41 IOW | 385,509 | 77,971 | ||||||||
5.42%, 04/25/42 IOW | 706,111 | 147,578 | ||||||||
Federal National Mortgage Association REMIC Series 1991-97 | ||||||||||
15.52%, 08/25/21 IOW | 45 | 761 | ||||||||
Federal National Mortgage Association REMIC Series 2015-M13 | ||||||||||
2.71%, 06/25/25† | 90,000 | 88,578 | ||||||||
Federal National Mortgage Association REMIC Series 1991-137 | ||||||||||
0.94%, 10/25/21 IOW | 69 | 1,135 | ||||||||
Federal National Mortgage Association REMIC Series 2000-32 | ||||||||||
0.81%, 10/18/30† | 13,742 | 13,916 | ||||||||
| 108 | See Notes to Financial Statements. |
Table of Contents
| Par | Value | |||||||||
Federal National Mortgage Association REMIC Series 2005-29 | ||||||||||
5.50%, 04/25/35 | $ | 673,061 | $ | 736,455 | ||||||
Federal National Mortgage Association REMIC Series 2007-24 | ||||||||||
10.64%, 03/25/37 IOW† | 1,060,095 | 164,353 | ||||||||
Federal National Mortgage Association REMIC Series 2011-52 | ||||||||||
5.00%, 06/25/41 | 646,615 | 708,245 | ||||||||
Federal National Mortgage Association REMIC Series 2011-59 | ||||||||||
5.50%, 07/25/41 | 1,024,076 | 1,157,683 | ||||||||
Federal National Mortgage Association REMIC Series 2011-87 | ||||||||||
0.97%, 09/25/41† | 3,109,581 | 3,145,663 | ||||||||
Federal National Mortgage Association REMIC Series 2011-96 | ||||||||||
4.82%, 10/25/41 IOW† | 711,237 | 123,555 | ||||||||
Federal National Mortgage Association REMIC Series 2012-28 | ||||||||||
6.50%, 06/25/39 | 35,150 | 39,021 | ||||||||
Federal National Mortgage Association REMIC Series 2012-46 | ||||||||||
6.00%, 05/25/42 | 282,490 | 319,358 | ||||||||
Federal National Mortgage Association REMIC Series 2012-70 | ||||||||||
7.33%, 02/25/41 IOW† | 63,538 | 10,347 | ||||||||
5.28%, 07/25/42 IOW† | 124,314 | 25,561 | ||||||||
Federal National Mortgage Association REMIC Series 2012-74 | ||||||||||
0.26%, 07/25/27 IOW | 1,408,827 | 158,693 | ||||||||
5.53%, 03/25/42 IOW† | 309,449 | 52,821 | ||||||||
Federal National Mortgage Association REMIC Series 2012-75 | ||||||||||
4.50%, 07/25/42 IOW† | 95,152 | 18,938 | ||||||||
Federal National Mortgage Association REMIC Series 2012-93 | ||||||||||
6.96%, 09/25/42 IOW† | 206,702 | 40,716 | ||||||||
Federal National Mortgage Association REMIC Series 2012-111 | ||||||||||
7.00%, 10/25/42 | 60,734 | 67,618 | ||||||||
Federal National Mortgage Association REMIC Series 2012-118 | ||||||||||
8.01%, 12/25/39 IOW | 500,924 | 66,733 | ||||||||
Federal National Mortgage Association REMIC Series 2012-128 | ||||||||||
5.05%, 11/25/42 IOW† | 234,084 | 54,605 | ||||||||
5.69%, 11/25/42 IOW† | 155,857 | 34,841 | ||||||||
Federal National Mortgage Association REMIC Series 2012-133 | ||||||||||
7.81%, 12/25/42 IOW† | 75,372 | 15,413 | ||||||||
8.27%, 12/25/42 IOW† | 215,843 | 41,432 | ||||||||
| Par | Value | |||||||||
Federal National Mortgage Association REMIC Series 2012-153 | ||||||||||
7.00%, 07/25/42 | $ | 193,394 | $ | 224,741 | ||||||
Federal National Mortgage Association REMIC Series 2013-9 | ||||||||||
5.50%, 04/25/42 | 1,114,538 | 1,239,065 | ||||||||
6.50%, 07/25/42 | 491,773 | 560,432 | ||||||||
Federal National Mortgage Association REMIC Series 2013-14 | ||||||||||
6.96%, 03/25/43 IOW | 462,929 | 71,691 | ||||||||
Federal National Mortgage Association REMIC Series 2013-19 | ||||||||||
6.28%, 03/25/43 IOW† | 530,772 | 117,405 | ||||||||
Federal National Mortgage Association REMIC Series 2013-29 | ||||||||||
5.89%, 04/25/43 IOW | 1,350,304 | 213,405 | ||||||||
Federal National Mortgage Association REMIC Series 2013-67 | ||||||||||
5.86%, 07/25/43 IOW† | 161,127 | 36,157 | ||||||||
Federal National Mortgage Association REMIC Series 2014-47 | ||||||||||
0.01%, 08/25/44 IOW† | 2,195,835 | 138,214 | ||||||||
Federal National Mortgage Association REMIC Series 2015-37 | ||||||||||
5.66%, 06/25/45 IOW† | 471,857 | 85,536 | ||||||||
Federal National Mortgage Association REMIC Series 2015-48 | ||||||||||
4.45%, 07/25/45 IOW† | 386,845 | 94,738 | ||||||||
4.86%, 07/25/45 IOW† | 285,352 | 67,199 | ||||||||
Federal National Mortgage Association REMIC Series 2015-55 | ||||||||||
12.57%, 08/25/55 IOW† | 375,541 | 21,328 | ||||||||
Federal National Mortgage Association REMIC Series 2015-56 | ||||||||||
4.72%, 08/25/45 IOW† | 97,231 | 24,994 | ||||||||
Federal National Mortgage Association REMIC Series 2015-60 | ||||||||||
5.40%, 08/25/45 IOW† | 293,037 | 68,171 | ||||||||
FHLMC Multifamily Structured Pass-Through Certificates Series K005 | ||||||||||
4.32%, 11/25/19 | 1,100,000 | 1,190,266 | ||||||||
FHLMC Multifamily Structured Pass-Through Certificates Series K008 | ||||||||||
6.29%, 06/25/20 IOW† | 719,352 | 38,601 | ||||||||
FHLMC Multifamily Structured Pass-Through Certificates Series K015 | ||||||||||
4.41%, 07/25/21 IOW† | 619,572 | 46,014 | ||||||||
FHLMC Multifamily Structured Pass-Through Certificates Series K016 | ||||||||||
4.36%, 10/25/21 IOW† | 203,733 | 14,983 | ||||||||
| See Notes to Financial Statements. | 109 |
Table of Contents
MEDIUM-DURATION BOND FUND
SCHEDULE OF INVESTMENTS (Continued)
| Par | Value | |||||||||
FHLMC Multifamily Structured Pass-Through Certificates Series K030 | ||||||||||
2.78%, 09/25/22 | $ | 262,582 | $ | 269,552 | ||||||
FHLMC Multifamily Structured Pass-Through Certificates Series K035 | ||||||||||
3.46%, 08/25/23† | 100,000 | 104,496 | ||||||||
FHLMC Multifamily Structured Pass-Through Certificates Series K044 | ||||||||||
2.81%, 01/25/25 | 400,000 | 396,161 | ||||||||
FHLMC Multifamily Structured Pass-Through Certificates Series K714 | ||||||||||
3.03%, 10/25/20† | 800,000 | 827,092 | ||||||||
FHLMC Multifamily Structured Pass Through Certificates Series KF11 | ||||||||||
0.84%, 09/25/25† | 1,700,000 | 1,685,773 | ||||||||
FHLMC Multifamily VRD Certificates Series M012 | ||||||||||
5.50%, 08/15/51 STEP | 3,500,000 | 3,578,750 | ||||||||
FHLMC Structured Pass-Through Securities Series T-61 | ||||||||||
1.64%, 07/25/44† | 1,014,187 | 1,030,627 | ||||||||
First Horizon Alternative Mortgage Securities Trust Series 2004-AA1 | ||||||||||
2.35%, 06/25/34† | 474,522 | 466,350 | ||||||||
FNMA 30Yr Pool | ||||||||||
3.50%, 01/01/46+ | 600,000 | 617,526 | ||||||||
FREMF Mortgage Trust Series 2012-K20 | ||||||||||
4.53%, 05/25/45 IO 144AW | 5,692,998 | 57,326 | ||||||||
FREMF Mortgage Trust Series 2014-K40 | ||||||||||
4.07%, 11/25/47 144A† | 550,000 | 486,527 | ||||||||
FREMF Mortgage Trust Series 2014-K41 | ||||||||||
3.83%, 11/25/47 144A† | 300,000 | 271,655 | ||||||||
FREMF Mortgage Trust Series 2015-K47 | ||||||||||
3.60%, 06/25/48 144A† | 380,000 | 338,410 | ||||||||
GE Business Loan Trust Series 2007-1A | ||||||||||
0.50%, 04/16/35 144A† | 516,237 | 489,155 | ||||||||
GE Commercial Mortgage Corporation Trust Series 2007-C1 | ||||||||||
5.54%, 12/10/49 | 800,000 | 822,903 | ||||||||
German Residential Funding, Ltd. Series 2013-2 | ||||||||||
0.90%, 11/27/24(E)† | 1,068,690 | 1,168,083 | ||||||||
Giovecca Mortgages S.r.l. Series 2011-1 | ||||||||||
0.55%, 04/23/48(E)† | 324,167 | 351,261 | ||||||||
Government National Mortgage Association | ||||||||||
3.95%, 07/15/25 | 124,797 | 132,401 | ||||||||
7.00%, 01/15/26 | 4,921 | 5,441 | ||||||||
7.00%, 07/15/27 | 48,361 | 56,062 | ||||||||
7.00%, 12/15/27 | 1,204 | 1,238 | ||||||||
7.00%, 01/15/28 | 14,415 | 14,775 | ||||||||
| Par | Value | |||||||||
7.00%, 03/15/28 | $ | 63,984 | $ | 75,211 | ||||||
7.00%, 07/15/28 | 9,203 | 10,135 | ||||||||
7.50%, 07/15/28 | 12,175 | 12,520 | ||||||||
6.50%, 08/15/28 | 3,997 | 4,573 | ||||||||
7.00%, 08/15/28 | 13,198 | 14,482 | ||||||||
7.50%, 08/15/28 | 8,926 | 10,002 | ||||||||
6.50%, 09/15/28 | 21,485 | 24,582 | ||||||||
7.00%, 10/15/28 | 36,103 | 38,424 | ||||||||
7.50%, 03/15/29 | 20,525 | 24,746 | ||||||||
1.63%, 11/20/29† | 37,602 | 39,130 | ||||||||
8.50%, 08/15/30 | 751 | 807 | ||||||||
8.50%, 11/20/30 | 8,215 | 9,741 | ||||||||
6.50%, 08/15/31 | 36,452 | 41,790 | ||||||||
7.50%, 08/15/31 | 10,342 | 11,682 | ||||||||
6.50%, 10/15/31 | 73,487 | 84,396 | ||||||||
6.00%, 11/15/31 | 170,194 | 191,074 | ||||||||
6.50%, 11/15/31 | 91,716 | 105,148 | ||||||||
6.00%, 12/15/31 | 36,771 | 41,282 | ||||||||
6.00%, 01/15/32 | 96,816 | 110,146 | ||||||||
6.00%, 02/15/32 | 211,510 | 237,458 | ||||||||
6.50%, 02/15/32 | 112,617 | 128,972 | ||||||||
6.00%, 04/15/32 | 47,138 | 52,891 | ||||||||
7.50%, 04/15/32 | 56,033 | 57,923 | ||||||||
6.50%, 06/15/32 | 102,280 | 117,260 | ||||||||
6.50%, 07/15/32 | 1,909 | 2,189 | ||||||||
6.50%, 08/15/32 | 155,477 | 178,247 | ||||||||
6.50%, 09/15/32 | 128,105 | 146,866 | ||||||||
6.00%, 10/15/32 | 109,587 | 123,032 | ||||||||
5.50%, 11/15/32 | 26,714 | 30,268 | ||||||||
6.00%, 11/15/32 | 87,065 | 98,707 | ||||||||
6.00%, 12/15/32 | 36,253 | 40,701 | ||||||||
6.50%, 12/15/32 | 16,134 | 18,497 | ||||||||
5.50%, 01/15/33 | 14,527 | 16,187 | ||||||||
6.00%, 01/15/33 | 58,570 | 65,756 | ||||||||
5.50%, 02/15/33 | 24,909 | 28,339 | ||||||||
6.00%, 02/15/33 | 43,967 | 49,361 | ||||||||
5.50%, 03/15/33 | 28,498 | 32,416 | ||||||||
6.50%, 04/15/33 | 282,641 | 324,036 | ||||||||
6.00%, 06/15/33 | 20,822 | 23,376 | ||||||||
5.50%, 07/15/33 | 25,830 | 29,105 | ||||||||
5.50%, 08/15/33 | 13,229 | 14,764 | ||||||||
5.50%, 09/15/33 | 10,194 | 11,592 | ||||||||
6.00%, 10/15/33 | 96,506 | 108,345 | ||||||||
6.50%, 10/15/33 | 126,364 | 144,870 | ||||||||
6.00%, 12/15/33 | 222,663 | 249,980 | ||||||||
5.50%, 04/15/34 | 13,444 | 15,226 | ||||||||
5.50%, 05/15/34 | 16,687 | 18,612 | ||||||||
6.50%, 08/15/34 | 261,231 | 300,698 | ||||||||
5.50%, 09/15/34 | 125,801 | 141,809 | ||||||||
5.50%, 12/15/34 | 106,810 | 120,982 | ||||||||
5.50%, 01/15/35 | 107,208 | 121,459 | ||||||||
6.00%, 09/20/38 | 330,777 | 370,102 | ||||||||
5.00%, 07/20/40 | 28,492 | 31,480 | ||||||||
5.00%, 09/20/40 | 117,054 | 129,333 | ||||||||
6.00%, 10/20/40 | 45,868 | 52,152 | ||||||||
4.00%, 01/01/41 TBA | 6,200,000 | 6,584,109 | ||||||||
3.50%, 01/15/41 TBA | 200,000 | 208,074 | ||||||||
6.00%, 01/20/41 | 49,306 | 56,219 | ||||||||
4.50%, 04/20/41 | 564,257 | 614,651 | ||||||||
3.50%, 01/01/43 TBA | 400,000 | 416,984 | ||||||||
4.00%, 08/20/43 | 977,137 | 1,040,296 | ||||||||
4.00%, 02/20/44 | 1,960,786 | 2,090,334 | ||||||||
4.00%, 09/20/44 | 2,925,268 | 3,109,668 | ||||||||
3.00%, 01/15/45 | 6,591,518 | 6,682,228 | ||||||||
| 110 | See Notes to Financial Statements. |
Table of Contents
| Par | Value | |||||||||||
3.00%, 02/15/45 | $ | 239,814 | $ | 243,114 | ||||||||
3.00%, 03/15/45 | 2,123,616 | 2,160,424 | ||||||||||
3.50%, 04/15/45 | 1,996,609 | 2,079,130 | ||||||||||
4.00%, 08/20/45 | 3,316,274 | 3,523,794 | ||||||||||
4.00%, 09/20/45 | 1,268,844 | 1,349,376 | ||||||||||
4.00%, 10/20/45 | 2,355,472 | 2,505,067 | ||||||||||
3.50%, 01/01/46 TBA | 3,000,000 | 3,127,383 | ||||||||||
4.00%, 01/01/46 TBA | 16,000,000 | 16,991,248 | ||||||||||
3.50%, 01/21/46 TBA | 1,000,000 | 1,042,461 | ||||||||||
4.00%, 01/21/46 TBA | 1,000,000 | 1,061,953 | ||||||||||
4.00%, 02/22/46 TBA | 1,000,000 | 1,059,863 | ||||||||||
Government National Mortgage Association Series 2007-30 | ||||||||||||
0.70%, 05/20/37† | 239,398 | 239,995 | ||||||||||
Government National Mortgage Association Series 2010-31 | ||||||||||||
5.44%, 03/20/39 IOW† | 72,595 | 7,185 | ||||||||||
Government National Mortgage Association Series 2010-85 | ||||||||||||
7.06%, 01/20/40 IOW† | 99,779 | 13,879 | ||||||||||
Government National Mortgage Association Series 2010-H28 | ||||||||||||
0.59%, 12/20/60† | 377,168 | 374,637 | ||||||||||
Government National Mortgage Association Series 2011-H08 | ||||||||||||
0.67%, 03/20/61† | 461,963 | 460,153 | ||||||||||
Government National Mortgage Association Series 2011-H09 | ||||||||||||
0.69%, 03/20/61† | 306,344 | 305,198 | ||||||||||
Government National Mortgage Association Series 2012-34 | ||||||||||||
5.54%, 03/20/42 IOW† | 66,398 | 14,209 | ||||||||||
Government National Mortgage Association Series 2012-44 | ||||||||||||
2.17%, 04/16/41 | 297,329 | 298,958 | ||||||||||
Government National Mortgage Association Series 2012-66 | ||||||||||||
7.75%, 02/20/38 IOW | 312,616 | 34,408 | ||||||||||
Government National Mortgage Association Series 2012-H30 | ||||||||||||
0.54%, 12/20/62† | 1,464,640 | 1,453,504 | ||||||||||
Government National Mortgage Association Series 2013-113 | ||||||||||||
6.36%, 08/16/43 IOW†@ | 273,685 | 53,843 | ||||||||||
Government National Mortgage Association Series 2013-178 | ||||||||||||
3.69%, 06/16/55 IOW† | 877,344 | 49,358 | ||||||||||
Government National Mortgage Association Series 2014-117 | ||||||||||||
4.76%, 08/20/44 IOW† | 83,243 | 12,824 | ||||||||||
Government National Mortgage Association Series 2014-118 | ||||||||||||
4.72%, 08/20/44 IOW† | 362,937 | 84,833 | ||||||||||
| Par | Value | |||||||||||
Government National Mortgage Association Series 2014-135 | ||||||||||||
4.50%, 01/16/56 IOW† | $ | 7,669,337 | $ | 531,839 | ||||||||
Government National Mortgage Association Series 2014-93 | ||||||||||||
5.32%, 11/16/55 IOW† | 4,248,980 | 262,043 | ||||||||||
Government National Mortgage Association Series 2015-167 | ||||||||||||
5.28%, 04/16/45 IOW† | 198,328 | 45,966 | ||||||||||
Government National Mortgage Association Series 2015-H11 | ||||||||||||
0.74%, 05/20/65† | 3,257,093 | 3,238,875 | ||||||||||
Government National Mortgage Association Series 2015-H14 | ||||||||||||
0.62%, 05/20/65† | 3,160,312 | 3,131,838 | ||||||||||
0.76%, 06/20/65† | 4,985,555 | 4,927,878 | ||||||||||
Government National Mortgage Association Series 2015-H15 | ||||||||||||
0.77%, 06/20/65† | 2,100,950 | 2,077,387 | ||||||||||
0.79%, 06/20/65† | 4,861,510 | 4,812,909 | ||||||||||
Government National Mortgage Association Series 2015-H16 | ||||||||||||
0.79%, 07/20/65† | 4,994,355 | 4,967,695 | ||||||||||
Government National Mortgage Association Series 2015-H17 | ||||||||||||
0.65%, 06/20/65† | 770,492 | 764,454 | ||||||||||
Government National Mortgage Association Series 2015-H18 | ||||||||||||
0.79%, 07/20/65† | 800,680 | 794,221 | ||||||||||
Government National Mortgage Association Series 2015-H19 | ||||||||||||
0.79%, 08/20/65† | 798,942 | 790,949 | ||||||||||
Government National Mortgage Association Series 2015-H22 | ||||||||||||
0.79%, 09/20/65† | 797,668 | 789,417 | ||||||||||
Government National Mortgage Association Series 2015-H23 | ||||||||||||
0.81%, 09/20/65† | 897,590 | 889,414 | ||||||||||
Government National Mortgage Association Series 2015-H26 | ||||||||||||
0.71%, 10/20/65†@ | 1,701,644 | 1,688,999 | ||||||||||
Government National Mortgage Association Series 2015-H30 | ||||||||||||
0.87%, 11/20/65†@ | 981,561 | 980,738 | ||||||||||
Granite Mortgages PLC Series 2003-3 | ||||||||||||
0.33%, 01/20/44(E)† | 27,781 | 30,199 | ||||||||||
0.96%, 01/20/44(U)† | 8,434 | 12,437 | ||||||||||
GreenPoint Mortgage Funding Trust Series 2006-OH1 | ||||||||||||
0.60%, 01/25/37† | 809,528 | 651,345 | ||||||||||
| See Notes to Financial Statements. | 111 |
Table of Contents
MEDIUM-DURATION BOND FUND
SCHEDULE OF INVESTMENTS (Continued)
| Par | Value | |||||||||||
GS Mortgage Securities | ||||||||||||
3.38%, 05/10/50 | $ | 490,000 | $ | 341,851 | ||||||||
3.78%, 05/10/50 | 370,000 | 369,676 | ||||||||||
GS Mortgage Securities Trust | ||||||||||||
5.79%, 08/10/45† | 4,479,736 | 4,602,844 | ||||||||||
5.80%, 08/10/45† | 870,000 | 856,404 | ||||||||||
GS Mortgage Securities Trust | ||||||||||||
5.38%, 08/10/44 IO 144AW† | 446,689 | 19,290 | ||||||||||
GS Mortgage Securities Trust | ||||||||||||
5.16%, 11/10/46† | 130,000 | 140,500 | ||||||||||
GSMPS Mortgage Loan Trust | ||||||||||||
0.88%, 02/25/35 144A† | 56,257 | 53,242 | ||||||||||
GSR Mortgage Loan Trust | ||||||||||||
2.81%, 09/25/35† | 1,315,432 | 1,343,926 | ||||||||||
Impac CMB Trust | ||||||||||||
1.14%, 10/25/34† | 58,769 | 50,395 | ||||||||||
IndyMac ARM Trust | ||||||||||||
1.84%, 01/25/32† | 6,836 | 6,366 | ||||||||||
IndyMac INDX Mortgage Loan Trust | ||||||||||||
0.61%, 09/25/46† | 905,310 | 736,165 | ||||||||||
JP Morgan Alternative Loan Trust | ||||||||||||
0.94%, 01/25/36† | 280,012 | 258,188 | ||||||||||
JP Morgan Chase Commercial | ||||||||||||
5.19%, 05/15/45† | 280,000 | 288,390 | ||||||||||
JP Morgan Mortgage Trust | ||||||||||||
2.71%, 02/25/35† | 108,314 | 108,039 | ||||||||||
JPMBB Commercial Mortgage Securities Trust | ||||||||||||
5.08%, 11/15/45† | 90,000 | 93,577 | ||||||||||
JPMBB Commercial Mortgage | ||||||||||||
4.89%, 01/15/47† | 50,000 | 53,483 | ||||||||||
JPMBB Commercial Mortgage | ||||||||||||
3.41%, 11/15/47 | 840,000 | 852,961 | ||||||||||
JPMBB Commercial Mortgage | ||||||||||||
3.82%, 07/15/48 | 880,000 | 901,541 | ||||||||||
JPMBB Commercial Mortgage | ||||||||||||
3.80%, 08/15/48 | 1,700,000 | 1,738,483 | ||||||||||
JPMBB Commercial Mortgage | ||||||||||||
3.36%, 11/15/48 | 800,000 | 805,949 | ||||||||||
| Par | Value | |||||||||||
Kensington Mortgage | ||||||||||||
0.67%, 06/14/40† | $ | 1,283,688 | $ | 1,165,463 | ||||||||
LB Commercial Mortgage Trust | ||||||||||||
5.85%, 07/15/44† | 561,969 | 582,098 | ||||||||||
LB-UBS Commercial | ||||||||||||
0.00%, 06/15/36 IO 144AW†@ | 398,209 | 1,069 | ||||||||||
Leek Finance Number | ||||||||||||
0.13%, 09/21/38(E)† | 42,655 | 49,002 | ||||||||||
0.83%, 09/21/38† | 341,240 | 360,247 | ||||||||||
Leek Finance Number | ||||||||||||
0.85%, 12/21/37 144A† | 135,295 | 143,998 | ||||||||||
Leek Finance Number | ||||||||||||
0.15%, 12/21/37(E)† | 54,118 | 63,151 | ||||||||||
0.87%, 12/21/37(U)† | 27,059 | 42,802 | ||||||||||
Lehman XS Trust | ||||||||||||
0.72%, 11/25/35† | 453,531 | 408,586 | ||||||||||
Ludgate Funding PLC | ||||||||||||
0.75%, 01/01/61(U)† | 1,031,223 | 1,367,985 | ||||||||||
Ludgate Funding PLC | ||||||||||||
1.19%, 01/01/61(U)† | 892,013 | 1,237,506 | ||||||||||
Luminent Mortgage Trust | ||||||||||||
0.62%, 02/25/46† | 597,407 | 408,240 | ||||||||||
Luminent Mortgage Trust | ||||||||||||
0.39%, 12/25/36† | 1,953,990 | 1,572,244 | ||||||||||
Mansard Mortgages PLC | ||||||||||||
0.76%, 04/15/47(U)† | 1,045,829 | 1,401,567 | ||||||||||
MASTR Adjustable Rate | ||||||||||||
2.58%, 05/25/34† | 184,265 | 178,272 | ||||||||||
MASTR Adjustable Rate Mortgages Trust | ||||||||||||
1.06%, 11/25/34† | 171,534 | 171,064 | ||||||||||
MASTR Adjustable Rate | ||||||||||||
2.77%, 11/21/34† | 632,602 | 646,297 | ||||||||||
MASTR Adjustable Rate | ||||||||||||
2.63%, 11/25/35 144A† | 736,775 | 564,585 | ||||||||||
Merrill Lynch Mortgage | ||||||||||||
1.90%, 10/25/35† | 42,169 | 40,887 | ||||||||||
| 112 | See Notes to Financial Statements. |
Table of Contents
| Par | Value | |||||||||||
ML-CFC Commercial | ||||||||||||
5.88%, 06/12/46† | $ | 569,869 | $ | 570,040 | ||||||||
Morgan Stanley Bank of | ||||||||||||
2.92%, 02/15/46 | 70,000 | 69,466 | ||||||||||
3.21%, 02/15/46 | 41,000 | 40,822 | ||||||||||
Morgan Stanley Bank of | ||||||||||||
3.10%, 05/15/46 | 300,000 | 299,839 | ||||||||||
3.46%, 05/15/46 | 140,000 | 140,422 | ||||||||||
Morgan Stanley Bank of | ||||||||||||
4.00%, 12/15/47 | 370,000 | 370,937 | ||||||||||
Morgan Stanley Bank of | ||||||||||||
3.56%, 04/15/48 | 480,000 | 472,528 | ||||||||||
Morgan Stanley Capital I Trust | ||||||||||||
5.48%, 02/12/44† | 50,000 | 51,505 | ||||||||||
Morgan Stanley Capital I Trust | ||||||||||||
1.47%, 08/14/31 144A† | 260,356 | 259,372 | ||||||||||
Morgan Stanley | ||||||||||||
5.79%, 08/12/45 144A† | 1,537,787 | 1,579,789 | ||||||||||
MortgageIT Trust | ||||||||||||
0.70%, 10/25/35† | 760,819 | 694,670 | ||||||||||
Motel 6 Trust | ||||||||||||
4.53%, 02/05/30 144A | 350,000 | 344,910 | ||||||||||
MSCG Trust | ||||||||||||
3.46%, 06/07/35 144A† | 580,000 | 579,047 | ||||||||||
Nomura Resecuritization Trust | ||||||||||||
0.42%, 12/26/35 144A†@ | 551,219 | 467,795 | ||||||||||
Paragon Mortgages No. 15 PLC | ||||||||||||
0.11%, 12/15/39(E)† | 1,152,853 | 1,151,258 | ||||||||||
Prime Mortgage Trust | ||||||||||||
5.50%, 05/25/35 144A | 2,677,371 | 2,515,171 | ||||||||||
6.00%, 05/25/35 144A | 2,307,838 | 2,242,330 | ||||||||||
Quadrivio Finance SRL | ||||||||||||
0.45%, 07/25/60(E)† | 175,627 | 190,077 | ||||||||||
RBSCF Trust | ||||||||||||
5.95%, 02/16/51 144A† | 2,477,354 | 2,514,089 | ||||||||||
Reperforming Loan | ||||||||||||
0.84%, 11/25/34 144A† | 9,616 | 8,410 | ||||||||||
ResLoC UK PLC | ||||||||||||
0.03%, 12/15/43(E)† | 1,473,290 | 1,457,453 | ||||||||||
0.74%, 12/15/43(U)† | 368,322 | 492,980 | ||||||||||
| Par | Value | |||||||||||
RFT 2015-FL1 Issuer, Ltd. | ||||||||||||
2.08%, 08/15/30 144A† | $ | 1,600,000 | $ | 1,589,120 | ||||||||
Sequoia Mortgage Trust | ||||||||||||
1.12%, 07/20/33† | 109,561 | 102,912 | ||||||||||
Sequoia Mortgage Trust | ||||||||||||
1.04%, 04/19/27† | 666,165 | 618,883 | ||||||||||
Structured Adjustable Rate | ||||||||||||
2.55%, 05/25/34† | 373,268 | 372,225 | ||||||||||
Structured Adjustable Rate | ||||||||||||
0.76%, 08/25/35† | 213,825 | 204,118 | ||||||||||
Structured Adjustable Rate | ||||||||||||
0.72%, 10/25/35† | 1,542,739 | 1,434,465 | ||||||||||
Structured Asset Mortgage | ||||||||||||
0.65%, 07/19/35† | 149,734 | 129,472 | ||||||||||
Structured Asset Securities | ||||||||||||
0.77%, 06/25/35 144A† | 138,078 | 111,542 | ||||||||||
Thornburg Mortgage | ||||||||||||
1.06%, 09/25/43† | 15,069 | 14,551 | ||||||||||
Thornburg Mortgage | ||||||||||||
2.27%, 04/25/45† | 123,733 | 123,612 | ||||||||||
Thrones PLC | ||||||||||||
2.08%, 07/20/44(U)† | 65,410 | 96,294 | ||||||||||
Trinity Square | ||||||||||||
1.79%, 07/15/51 144A(U)†@ | 400,000 | 585,946 | ||||||||||
UBS Commercial | ||||||||||||
4.57%, 05/10/45 IO 144AW† | 2,468,284 | 248,664 | ||||||||||
UBS-Barclays Commercial | ||||||||||||
4.50%, 12/10/45 144A† | 320,000 | 299,333 | ||||||||||
VNDO Mortgage Trust | ||||||||||||
3.00%, 11/15/30 144A | 100,000 | 98,517 | ||||||||||
Wachovia Bank Commercial | ||||||||||||
5.75%, 07/15/45† | 724,779 | 730,778 | ||||||||||
Wachovia Bank Commercial Mortgage Trust | ||||||||||||
5.56%, 10/15/48 | 377,931 | 385,363 | ||||||||||
| See Notes to Financial Statements. | 113 |
Table of Contents
MEDIUM-DURATION BOND FUND
SCHEDULE OF INVESTMENTS (Continued)
| Par | Value | |||||||||||
Wachovia Bank Commercial | ||||||||||||
0.55%, 12/15/43 144A† | $ | 398,000 | $ | 381,077 | ||||||||
Washington Mutual Mortgage | ||||||||||||
1.66%, 06/25/42† | 20,128 | 19,389 | ||||||||||
Washington Mutual Mortgage | ||||||||||||
0.71%, 07/25/45† | 222,290 | 208,873 | ||||||||||
Washington Mutual Mortgage | ||||||||||||
0.71%, 10/25/45† | 1,621,439 | 1,493,464 | ||||||||||
Washington Mutual Mortgage | ||||||||||||
2.45%, 02/25/33† | 8,985 | 8,841 | ||||||||||
Washington Mutual Mortgage | ||||||||||||
2.21%, 02/25/37† | 451,675 | 392,293 | ||||||||||
2.30%, 02/25/37† | 312,553 | 278,449 | ||||||||||
Washington Mutual Mortgage | ||||||||||||
1.02%, 04/25/47† | 858,973 | 721,370 | ||||||||||
Waterfall Commercial | ||||||||||||
4.10%, 09/19/22 144A† | 948,630 | 939,657 | ||||||||||
Wells Fargo Alternative | ||||||||||||
2.74%, 12/28/37† | 984,818 | 840,126 | ||||||||||
Wells Fargo Commercial | ||||||||||||
4.30%, 07/15/46† | 20,000 | 20,507 | ||||||||||
Wells Fargo Commercial | ||||||||||||
5.24%, 08/15/50 IOW† | 3,041,178 | 227,589 | ||||||||||
Wells Fargo Commercial | ||||||||||||
3.66%, 05/15/48† | 350,000 | 334,300 | ||||||||||
Wells Fargo Mortgage-Backed | ||||||||||||
2.64%, 03/25/35† | 128,170 | 130,160 | ||||||||||
Wells Fargo Mortgage-Backed | ||||||||||||
2.74%, 05/25/35† | 56,132 | 56,393 | ||||||||||
Wells Fargo Mortgage-Backed | ||||||||||||
2.74%, 08/25/33† | 196,294 | 199,433 | ||||||||||
WFRBS Commercial | ||||||||||||
5.25%, 06/15/45 IO 144AW† | 304,576 | 22,001 | ||||||||||
| Par | Value | |||||||||||
WFRBS Commercial | ||||||||||||
5.21%, 12/15/45 IO 144AW† | $ | 2,366,691 | $ | 194,991 | ||||||||
WFRBS Commercial | ||||||||||||
4.59%, 05/15/45 IO 144AW† | 2,992,289 | 207,230 | ||||||||||
WFRBS Commercial | ||||||||||||
5.08%, 03/15/47 IOW† | 1,061,113 | 70,744 | ||||||||||
WFRBS Commercial | ||||||||||||
4.96%, 08/15/47 IOW† | 3,640,028 | 250,585 | ||||||||||
WFRBS Commercial | ||||||||||||
3.93%, 11/15/47 | 290,000 | 298,808 | ||||||||||
4.29%, 11/15/47 | 300,000 | 288,804 | ||||||||||
|
| |||||||||||
Total Mortgage-Backed Securities | 371,450,295 | |||||||||||
|
| |||||||||||
MUNICIPAL BONDS — 1.5% | ||||||||||||
Alameda County Joint Powers | ||||||||||||
7.05%, 12/01/44 | 3,300,000 | 4,331,019 | ||||||||||
American Municipal Power, | ||||||||||||
8.08%, 02/15/50 | 600,000 | 885,504 | ||||||||||
American Municipal Power, | ||||||||||||
6.27%, 02/15/50 | 250,000 | 290,982 | ||||||||||
Bay Area Toll Authority, | ||||||||||||
7.04%, 04/01/50 | 600,000 | 827,622 | ||||||||||
Chicago Transit Authority, | ||||||||||||
6.90%, 12/01/40 | 700,000 | 814,254 | ||||||||||
Chicago Transit Authority, | ||||||||||||
6.90%, 12/01/40 | 300,000 | 348,966 | ||||||||||
Commonwealth of Puerto Rico, | ||||||||||||
5.50%, 07/01/32 | 5,000 | 3,244 | ||||||||||
6.00%, 07/01/34 | 10,000 | 6,575 | ||||||||||
8.00%, 07/01/35 | 380,000 | 276,450 | ||||||||||
5.25%, 07/01/37 | 20,000 | 12,875 | ||||||||||
5.50%, 07/01/39 | 85,000 | 55,038 | ||||||||||
5.00%, 07/01/41 | 10,000 | 6,400 | ||||||||||
5.75%, 07/01/41 | 10,000 | 6,525 | ||||||||||
Commonwealth of Puerto Rico, | ||||||||||||
5.88%, 07/01/36 | 10,000 | 6,550 | ||||||||||
Commonwealth of Puerto Rico, | ||||||||||||
6.00%, 07/01/39 | 10,000 | 6,575 | ||||||||||
County of Clark Department of | ||||||||||||
6.82%, 07/01/45 | 200,000 | 278,792 | ||||||||||
| 114 | See Notes to Financial Statements. |
Table of Contents
| Par | Value | |||||||||||
Los Angeles Community | ||||||||||||
6.68%, 08/01/36 | $ | 300,000 | $ | 395,475 | ||||||||
Municipal Electric Authority of | ||||||||||||
6.66%, 04/01/57 | 700,000 | 831,936 | ||||||||||
Port Authority of New York & | ||||||||||||
5.65%, 11/01/40 | 500,000 | 591,695 | ||||||||||
Puerto Rico Commonwealth | ||||||||||||
5.75%, 07/01/37 | 20,000 | 13,400 | ||||||||||
6.00%, 07/01/44 | 55,000 | 37,194 | ||||||||||
Puerto Rico Sales Tax | ||||||||||||
5.25%, 08/01/40 | 10,000 | 5,725 | ||||||||||
Puerto Rico Sales Tax | ||||||||||||
5.00%, 08/01/43 | 20,000 | 8,050 | ||||||||||
5.25%, 08/01/43 | 10,000 | 4,025 | ||||||||||
Puerto Rico Sales Tax | ||||||||||||
5.25%, 08/01/27 | 5,000 | 2,131 | ||||||||||
5.50%, 08/01/28 | 60,000 | 25,650 | ||||||||||
17.43%, 08/01/32W | 85,000 | 33,405 | ||||||||||
14.81%, 08/01/33W | 25,000 | 7,532 | ||||||||||
5.50%, 08/01/37 | 65,000 | 26,325 | ||||||||||
5.75%, 08/01/37 | 45,000 | 18,450 | ||||||||||
5.38%, 08/01/39 | 35,000 | 14,087 | ||||||||||
6.38%, 08/01/39 | 5,000 | 2,112 | ||||||||||
5.50%, 08/01/42 | 120,000 | 48,600 | ||||||||||
6.00%, 08/01/42 | 100,000 | 41,500 | ||||||||||
Puerto Rico Sales Tax | ||||||||||||
11.14%, 08/01/37W† | 10,000 | 977 | ||||||||||
5.38%, 08/01/38 | 15,000 | 6,038 | ||||||||||
6.00%, 08/01/39 | 35,000 | 14,525 | ||||||||||
5.25%, 08/01/41 | 100,000 | 40,250 | ||||||||||
State of California, General | ||||||||||||
7.95%, 03/01/36 | 265,000 | 317,287 | ||||||||||
7.55%, 04/01/39 | 85,000 | 123,548 | ||||||||||
7.35%, 11/01/39 | 800,000 | 1,133,960 | ||||||||||
7.60%, 11/01/40 | 800,000 | 1,188,200 | ||||||||||
State of Illinois, General | ||||||||||||
7.35%, 07/01/35 | 375,000 | 411,390 | ||||||||||
|
| |||||||||||
Total Municipal Bonds | 13,500,838 | |||||||||||
|
| |||||||||||
| Number of Contracts | ||||||||||||
PURCHASED OPTIONS — 0.1% |
| |||||||||||
Call Options — 0.0% | ||||||||||||
10-Year U.S. Treasury Note, | 24 | 7,500 | ||||||||||
| Number of Contracts | Value | |||||||||||
10-Year U.S. Treasury | 21 | $ | 2,297 | |||||||||
5-Year U.S. Treasury | 32 | 8,750 | ||||||||||
5-Year U.S. Treasury | 27 | 4,852 | ||||||||||
90-Day Euro, Strike Price | 67 | 837 | ||||||||||
Long U.S. Treasury Bond, | 30 | 27,187 | ||||||||||
Long U.S. Treasury Bond, | 14 | 8,531 | ||||||||||
Long U.S. Treasury Bond, | 31 | 12,594 | ||||||||||
|
| |||||||||||
| 72,548 | ||||||||||||
|
| |||||||||||
Put Options — 0.1% | ||||||||||||
10-Year U.S. Treasury | 33 | 7,734 | ||||||||||
1-Year Eurodollar Mid | 72 | 9,450 | ||||||||||
1-Year Eurodollar Mid | 48 | 16,800 | ||||||||||
1-Year Eurodollar Mid | 53 | 34,119 | ||||||||||
90-Day Euro, Strike | 113 | 14,831 | ||||||||||
90-Day Euro, Strike | 265 | 81,157 | ||||||||||
Long U.S. Treasury | 17 | 7,969 | ||||||||||
Long U.S. Treasury | 13 | 30,875 | ||||||||||
Long U.S. Treasury Bond, | 13 | 38,391 | ||||||||||
|
| |||||||||||
| 241,326 | ||||||||||||
|
| |||||||||||
| Notional Amount | ||||||||||||
Put Swaptions — 0.0% | ||||||||||||
3-Month LIBOR, Strike | $ | 170,000,000 | 10,674 | |||||||||
3-Month LIBOR, Strike | 380,000,000 | 26,334 | ||||||||||
3-Month LIBOR, Strike | 160,000,000 | 135,705 | ||||||||||
| See Notes to Financial Statements. | 115 |
Table of Contents
MEDIUM-DURATION BOND FUND
SCHEDULE OF INVESTMENTS (Continued)
| Notional Amount | Value | |||||||||||
3-Month LIBOR, Strike Price | $ | 50,000,000 | $ | 40,820 | ||||||||
|
| |||||||||||
| 213,533 | ||||||||||||
|
| |||||||||||
Total Purchased Options | 527,407 | |||||||||||
|
| |||||||||||
| Par | ||||||||||||
U.S. TREASURY OBLIGATIONS — 24.2% | ||||||||||||
U.S. Treasury Bonds | ||||||||||||
4.38%, 11/15/39 | 200,000 | 251,562 | ||||||||||
3.13%, 02/15/42 | 300,000 | 309,861 | ||||||||||
3.00%, 05/15/42 | 2,200,000 | 2,214,265 | ||||||||||
2.75%, 08/15/42D | 600,000 | 573,703 | ||||||||||
2.75%, 11/15/42 | 3,830,000 | 3,653,012 | ||||||||||
2.88%, 05/15/43D | 8,240,000 | 8,036,736 | ||||||||||
3.63%, 08/15/43‡‡ | 7,570,000 | 8,528,226 | ||||||||||
3.75%, 11/15/43D | 2,000,000 | 2,304,258 | ||||||||||
3.38%, 05/15/44D | 12,740,000 | 13,676,594 | ||||||||||
3.13%, 08/15/44D | 5,600,000 | 5,724,796 | ||||||||||
3.00%, 11/15/44D | 4,300,000 | 4,285,724 | ||||||||||
2.50%, 02/15/45 | 600,000 | 538,500 | ||||||||||
2.88%, 05/15/45 | 900,000 | 896,115 | ||||||||||
2.88%, 08/15/45 | 8,000,000 | 7,771,560 | ||||||||||
3.00%, 11/15/45 | 2,320,000 | 2,313,430 | ||||||||||
|
| |||||||||||
| 61,078,342 | ||||||||||||
|
| |||||||||||
U.S. Treasury Inflationary Index Bonds | ||||||||||||
2.00%, 01/15/16 | 5,390,000 | 6,459,128 | ||||||||||
0.13%, 04/15/17 | 1,100,000 | 1,149,979 | ||||||||||
0.13%, 04/15/18D | 2,400,000 | 2,465,535 | ||||||||||
0.13%, 04/15/20D | 9,070,000 | 9,101,112 | ||||||||||
1.13%, 01/15/21D | 3,800,000 | 4,263,443 | ||||||||||
0.13%, 01/15/22D | 500,000 | 509,726 | ||||||||||
0.13%, 07/15/22D | 6,800,000 | 6,826,923 | ||||||||||
0.38%, 07/15/23 | 2,040,000 | 2,039,096 | ||||||||||
0.63%, 01/15/24 | 2,040,000 | 2,058,206 | ||||||||||
0.13%, 07/15/24D | 12,350,000 | 11,926,741 | ||||||||||
0.25%, 01/15/25D | 2,000,000 | 1,918,840 | ||||||||||
0.38%, 07/15/25 | 8,130,000 | 7,900,577 | ||||||||||
2.38%, 01/15/27 | 500,000 | 682,545 | ||||||||||
1.75%, 01/15/28 | 8,000,000 | 9,937,072 | ||||||||||
2.50%, 01/15/29D | 7,100,000 | 9,332,221 | ||||||||||
2.13%, 02/15/40 | 1,280,000 | 1,661,986 | ||||||||||
1.38%, 02/15/44D | 2,530,000 | 2,633,572 | ||||||||||
0.75%, 02/15/45 | 4,100,000 | 3,620,888 | ||||||||||
|
| |||||||||||
| 84,487,590 | ||||||||||||
|
| |||||||||||
U.S. Treasury Notes | ||||||||||||
0.38%, 01/15/16 | 9,000 | 9,000 | ||||||||||
0.25%, 05/15/16 | 4,245,000 | 4,242,597 | ||||||||||
0.63%, 11/30/17 | 3,390,000 | 3,362,388 | ||||||||||
1.50%, 08/31/18 | 1,410,000 | 1,419,556 | ||||||||||
1.50%, 12/31/18D | 2,800,000 | 2,813,236 | ||||||||||
1.63%, 07/31/19 | 760,000 | 762,761 | ||||||||||
1.63%, 12/31/19 | 4,470,000 | 4,470,697 | ||||||||||
1.38%, 04/30/20 | 250,000 | 246,797 | ||||||||||
1.38%, 08/31/20 | 80,000 | 78,728 | ||||||||||
1.38%, 09/30/20 | 30,000 | 29,485 | ||||||||||
1.38%, 10/31/20D | 100,000 | 98,244 | ||||||||||
2.63%, 11/15/20 | 670,000 | 696,251 | ||||||||||
1.75%, 12/31/20 | 3,000,000 | 2,997,306 | ||||||||||
| Par | Value | |||||||||||
2.00%, 10/31/21 | $ | 1,770,000 | $ | 1,775,151 | ||||||||
2.13%, 12/31/21 | 19,450,000 | 19,624,369 | ||||||||||
1.50%, 01/31/22 | 3,040,000 | 2,955,689 | ||||||||||
1.75%, 03/31/22 | 1,100,000 | 1,083,221 | ||||||||||
1.88%, 05/31/22 | 2,400,000 | 2,377,078 | ||||||||||
2.00%, 07/31/22 | 800,000 | 797,953 | ||||||||||
1.75%, 09/30/22 | 1,100,000 | 1,078,300 | ||||||||||
1.88%, 10/31/22 | 2,360,000 | 2,330,361 | ||||||||||
2.00%, 11/30/22D | 6,340,000 | 6,306,068 | ||||||||||
2.13%, 12/31/22 | 3,400,000 | 3,406,773 | ||||||||||
2.75%, 02/15/24D | 400,000 | 416,711 | ||||||||||
2.25%, 11/15/24D | 3,590,000 | 3,588,736 | ||||||||||
2.00%, 08/15/25 | 2,740,000 | 2,671,927 | ||||||||||
2.13%, 11/15/25D | 1,220,000 | 1,217,403 | ||||||||||
|
| |||||||||||
| 70,856,786 | ||||||||||||
|
| |||||||||||
Total U.S. Treasury Obligations |
| 216,422,718 | ||||||||||
|
| |||||||||||
| Shares | ||||||||||||
PREFERRED STOCK — 0.1% |
| |||||||||||
GMAC Capital Trust I, | 23,879 | 605,572 | ||||||||||
MONEY MARKET FUNDS — 5.5% |
| |||||||||||
GuideStone Money | 14,520,090 | 14,520,090 | ||||||||||
Northern Institutional Liquid | 35,137,912 | 35,137,912 | ||||||||||
Total Money Market Funds |
| 49,658,002 | ||||||||||
TOTAL INVESTMENTS — 115.5% |
| 1,033,353,219 | ||||||||||
| Number of Contracts | ||||||||||||
WRITTEN OPTIONS — 0.0% |
| |||||||||||
Call Options — 0.0% | ||||||||||||
10-Year U.S. Treasury | (19 | ) | (7,422 | ) | ||||||||
10-Year U.S. Treasury | (14 | ) | (4,594 | ) | ||||||||
10-Year U.S. Treasury | (20 | ) | (3,437 | ) | ||||||||
10-Year U.S. Treasury | (13 | ) | (609 | ) | ||||||||
90-Day Euro, Strike Price | (30 | ) | (3,938 | ) | ||||||||
Long U.S. Treasury Bond, | (13 | ) | (3,453 | ) | ||||||||
Long U.S. Treasury Bond, | (17 | ) | (2,125 | ) | ||||||||
Long U.S. Treasury Bond, | (28 | ) | (13,562 | ) | ||||||||
Long U.S. Treasury Bond, | (36 | ) | (10,688 | ) | ||||||||
| 116 | See Notes to Financial Statements. |
Table of Contents
| Number of Contracts | Value | |||||||||||
Long U.S. Treasury Bond, | (53 | ) | $ | (11,594 | ) | |||||||
|
| |||||||||||
| (61,422 | ) | |||||||||||
|
| |||||||||||
Put Options — 0.0% | ||||||||||||
1-Year Eurodollar Mid | (145 | ) | (4,531 | ) | ||||||||
90-Day Euro, Strike Price | (468 | ) | (43,875 | ) | ||||||||
Long U.S. Treasury Bond, | (47 | ) | (8,078 | ) | ||||||||
Long U.S. Treasury Bond, | (6 | ) | (4,407 | ) | ||||||||
|
| |||||||||||
| (60,891 | ) | |||||||||||
|
| |||||||||||
| Notional Amount | ||||||||||||
Euro vs. U.S. Dollar, | $ | (1,100,000 | ) | (6,711 | ) | |||||||
U.S. Dollar vs. Brazilian Real, | (1,900,000 | ) | (10,103 | ) | ||||||||
U.S. Dollar vs. Brazilian | (1,100,000 | ) | (12,739 | ) | ||||||||
U.S. Dollar vs. Brazilian | (1,600,000 | ) | (15,078 | ) | ||||||||
U.S. Dollar vs. Russian | (700,000 | ) | (35,648 | ) | ||||||||
|
| |||||||||||
| (80,279 | ) | |||||||||||
|
| |||||||||||
Put Swaptions — 0.0% | ||||||||||||
3-Month LIBOR, Strike | (460,000,000 | ) | (10,327 | ) | ||||||||
3-Month LIBOR, Strike | (1,610,000,000 | ) | (36,145 | ) | ||||||||
3-Month LIBOR, Strike | (1,580,000,000 | ) | (8,513 | ) | ||||||||
3-Month LIBOR, Strike | (3,680,000,000 | ) | (22,143 | ) | ||||||||
3-Month LIBOR, Strike | (230,000,000 | ) | (38,997 | ) | ||||||||
3-Month LIBOR, Strike | (710,000,000 | ) | (120,383 | ) | ||||||||
|
| |||||||||||
| (236,508 | ) | |||||||||||
|
| |||||||||||
Total Written Options | (439,100 | ) | ||||||||||
|
| |||||||||||
| Par | Value | |||||||||||
TBA SALE COMMITMENTS — (1.3)% | ||||||||||||
Federal National Mortgage Association | ||||||||||||
3.00%, 01/01/23 TBA | $ | (2,000,000 | ) | $ | (2,000,018 | ) | ||||||
3.50%, 01/12/42 TBA | (6,400,000 | ) | (6,603,028 | ) | ||||||||
3.00%, 02/12/43 TBA | (3,000,000 | ) | (2,994,051 | ) | ||||||||
|
| |||||||||||
Total TBA Sale Commitments | (11,597,097 | ) | ||||||||||
|
| |||||||||||
Liabilities in Excess of Other | (126,694,039 | ) | ||||||||||
|
| |||||||||||
NET ASSETS — 100.0% | $ | 894,622,983 | ||||||||||
|
| |||||||||||
| See Notes to Financial Statements. | 117 |
Table of Contents
MEDIUM-DURATION BOND FUND
SCHEDULE OF INVESTMENTS (Continued)
Swap agreements outstanding at December 31, 2015:
Maturity Date | Reference Obligation | Fixed Deal (Pay) Rate | Currency | Notional Amount | Market Value | Counterparty | Unrealized Appreciation (Depreciation) | |||||||||||||||
Credit Default Swaps on Corporate and Sovereign Issues — Buy Protection | ||||||||||||||||||||||
| 06/20/19 | People’s Republic of China, | |||||||||||||||||||||
4.25% due 10/28/14 | (1.00 | )% | USD | 950,000 | $ | (7,363 | ) | CITI | $ | (7,363 | ) | |||||||||||
| 06/20/19 | People’s Republic of China, | |||||||||||||||||||||
4.25% due 10/28/14 | (1.00 | )% | USD | 430,000 | (3,871 | ) | CITI | (2,161 | ) | |||||||||||||
| 06/20/19 | People’s Republic of China, | |||||||||||||||||||||
4.25% due 10/28/14 | (1.00 | )% | USD | 250,000 | (1,938 | ) | CITI | (784 | ) | |||||||||||||
| 06/20/19 | People’s Republic of China, | |||||||||||||||||||||
4.25% due 10/28/14 | (1.00 | )% | USD | 220,000 | (1,980 | ) | CITI | (1,045 | ) | |||||||||||||
| 06/20/19 | People’s Republic of China, | |||||||||||||||||||||
4.25% due 10/28/14 | (1.00 | )% | USD | 210,000 | (1,628 | ) | CITI | (605 | ) | |||||||||||||
| 06/20/19 | People’s Republic of China, | |||||||||||||||||||||
4.25% due 10/28/14 | (1.00 | )% | USD | 190,000 | (1,710 | ) | CITI | (1,385 | ) | |||||||||||||
| 06/20/19 | People’s Republic of China, | |||||||||||||||||||||
4.25% due 10/28/14 | (1.00 | )% | USD | 190,000 | (1,710 | ) | CITI | (1,296 | ) | |||||||||||||
| 06/20/19 | People’s Republic of China, | |||||||||||||||||||||
4.25% due 10/28/14 | (1.00 | )% | USD | 180,000 | (1,620 | ) | CITI | (1,336 | ) | |||||||||||||
| 06/20/19 | People’s Republic of China, | |||||||||||||||||||||
4.25% due 10/28/14 | (1.00 | )% | USD | 140,000 | (1,260 | ) | CITI | (763 | ) | |||||||||||||
| 06/20/19 | People’s Republic of China, | |||||||||||||||||||||
4.25% due 10/28/14 | (1.00 | )% | USD | 130,000 | (1,170 | ) | CITI | (1,027 | ) | |||||||||||||
| 06/20/19 | People’s Republic of China, | |||||||||||||||||||||
4.25% due 10/28/14 | (1.00 | )% | USD | 120,000 | (927 | ) | CITI | (398 | ) | |||||||||||||
| 06/20/19 | People’s Republic of China, | |||||||||||||||||||||
4.25% due 10/28/14 | (1.00 | )% | USD | 120,000 | (927 | ) | CITI | (388 | ) | |||||||||||||
| 06/20/19 | People’s Republic of China, | |||||||||||||||||||||
4.25% due 10/28/14 | (1.00 | )% | USD | 120,000 | (930 | ) | CITI | 146 | ||||||||||||||
| 06/20/19 | People’s Republic of China, | |||||||||||||||||||||
4.25% due 10/28/14 | (1.00 | )% | USD | 120,000 | (1,080 | ) | CITI | (934 | ) | |||||||||||||
| 06/20/19 | People’s Republic of China, | |||||||||||||||||||||
4.25% due 10/28/14 | (1.00 | )% | USD | 120,000 | (1,080 | ) | JPM | (824 | ) | |||||||||||||
| 06/20/19 | People’s Republic of China, | |||||||||||||||||||||
4.25% due 10/28/14 | (1.00 | )% | USD | 80,000 | (618 | ) | CITI | 231 | ||||||||||||||
| 06/20/19 | People’s Republic of China, | |||||||||||||||||||||
4.25% due 10/28/14 | (1.00 | )% | USD | 80,000 | (720 | ) | CITI | (511 | ) | |||||||||||||
| 06/20/19 | People’s Republic of China, | |||||||||||||||||||||
4.25% due 10/28/14 | (1.00 | )% | USD | 60,000 | (463 | ) | CITI | (197 | ) | |||||||||||||
| 06/20/19 | People’s Republic of China, | |||||||||||||||||||||
4.25% due 10/28/14 | (1.00 | )% | USD | 60,000 | (465 | ) | CITI | (203 | ) | |||||||||||||
| 06/20/19 | People’s Republic of China, | |||||||||||||||||||||
4.25% due 10/28/14 | (1.00 | )% | USD | 60,000 | (540 | ) | JPM | (394 | ) | |||||||||||||
| 06/20/19 | People’s Republic of China, | |||||||||||||||||||||
4.25% due 10/28/14 | (1.00 | )% | USD | 50,000 | (388 | ) | CITI | (149 | ) | |||||||||||||
| 06/20/19 | People’s Republic of China, | |||||||||||||||||||||
4.25% due 10/28/14 | (1.00 | )% | USD | 30,000 | (233 | ) | BOA | (108 | ) | |||||||||||||
| 06/20/19 | People’s Republic of China, | |||||||||||||||||||||
4.25% due 10/28/14 | (1.00 | )% | USD | 20,000 | (155 | ) | BOA | (63 | ) | |||||||||||||
| 06/20/19 | People’s Republic of China, | |||||||||||||||||||||
4.25% due 10/28/14 | (1.00 | )% | USD | 20,000 | (180 | ) | CITI | (97 | ) | |||||||||||||
| 06/20/19 | People’s Republic of China, | |||||||||||||||||||||
4.25% due 10/28/14 | (1.00 | )% | USD | 10,000 | (78 | ) | JPM | (35 | ) | |||||||||||||
| 09/20/20 | Credit Suisse, Inc., | |||||||||||||||||||||
6.50%, due 01/15/12 | (1.00 | )% | USD | 300,000 | (5,252 | ) | GSC | (8,902 | ) | |||||||||||||
|
|
|
| |||||||||||||||||||
| $ | (38,286 | ) | $ | (30,591 | ) | |||||||||||||||||
|
|
|
| |||||||||||||||||||
| 118 | See Notes to Financial Statements. |
Table of Contents
| Implied | Fixed | Unrealized | ||||||||||||||||||||||||||||
| Credit | Deal | Notional | Appreciation | |||||||||||||||||||||||||||
Maturity Date | Reference Obligation | Spread | (Pay) Rate | Currency | Amount | Market Value | Counterparty | (Depreciation) | ||||||||||||||||||||||
Credit Default Swaps on Corporate Issues — Sell Protection |
| |||||||||||||||||||||||||||||
05/20/17 | Federated Republic of Brazil, | |||||||||||||||||||||||||||||
12.50% due 03/06/30 | 2.88 | % | (1.04 | )% | USD | 1,000,000 | $ | (24,072 | ) | DEUT | $ | (24,072 | ) | |||||||||||||||||
12/20/17 | Volkswagon International, | |||||||||||||||||||||||||||||
5.375% due 05/22/18 | 1.31 | % | 0.00 | % | EUR | 900,000 | (5,653 | ) | JPM | 10,523 | ||||||||||||||||||||
12/20/18 | Goldman Sachs Group, Inc., | |||||||||||||||||||||||||||||
5.95% due 01/18/18 | 0.55 | % | (1.00 | )% | USD | 700,000 | 9,296 | MSCS | 4,291 | |||||||||||||||||||||
|
|
|
| |||||||||||||||||||||||||||
| $ | (20,429 | ) | $ | (9,258 | ) | |||||||||||||||||||||||||
|
|
|
| |||||||||||||||||||||||||||
| Fixed | Unrealized | |||||||||||||||||||||||||
| Deal | Notional | Appreciation | ||||||||||||||||||||||||
Maturity Date | Reference Obligation | (Pay) Rate | Currency | Amount | Market Value | Counterparty | (Depreciation) | |||||||||||||||||||
Credit Default Swaps on Credit Indices — Buy Protection |
| |||||||||||||||||||||||||
| 12/20/20 | Dow Jones CDX.NA.HY25 Index | 5.00 | % | USD | 3,900,000 | $ | (45,472 | ) | ICE | $ | (35,848 | ) | ||||||||||||||
|
|
|
| |||||||||||||||||||||||
| Implied | Fixed | Unrealized | ||||||||||||||||||||||||||||
| Credit | Deal | Notional | Appreciation | |||||||||||||||||||||||||||
Maturity Date | Reference Obligation | Spread | (Pay) Rate | Currency | Amount | Market Value | Counterparty | (Depreciation) | ||||||||||||||||||||||
Credit Default Swaps on Credit Indices — Sell Protection |
| |||||||||||||||||||||||||||||
| 06/20/16 | Dow Jones CDX.NA.IG16 Index | 0.22 | % | 1.00 | % | USD | 4,825,000 | $ | 19,396 | JPM | $ | 17,499 | ||||||||||||||||||
| 06/20/16 | Dow Jones CDX.NA.IG16 Index | 0.22 | % | 1.00 | % | USD | 3,000,000 | 12,060 | BOA | 11,421 | ||||||||||||||||||||
| 12/20/20 | Dow Jones CDX.NA.HY25 Index | 0.89 | % | 1.00 | % | USD | 4,225,000 | 20,872 | ICE | 7,371 | ||||||||||||||||||||
|
|
|
| |||||||||||||||||||||||||||
| $ | 52,328 | $ | 36,291 | |||||||||||||||||||||||||||
|
|
|
| |||||||||||||||||||||||||||
| Fixed | Unrealized | |||||||||||||||||||||||||
| Deal | Notional | Appreciation | ||||||||||||||||||||||||
Maturity Date | Reference Obligation | (Pay) Rate | Currency | Amount | Market Value | Counterparty | (Depreciation) | |||||||||||||||||||
Interest Rate Swaps |
| |||||||||||||||||||||||||
06/17/16 | U.S. Federal Funds Rate | (0.50 | )% | USD | 6,700,000 | $ | (1,885 | ) | CME | $ | 5,418 | |||||||||||||||
11/07/16 | MXN-TIIE-Banxico | 3.91 | % | MXN | 15,260,000 | (124 | ) | CME | (124 | ) | ||||||||||||||||
11/08/16 | MXN-TIIE-Banxico | 3.92 | % | MXN | 6,490,000 | (19 | ) | CME | (19 | ) | ||||||||||||||||
11/09/16 | MXN-TIIE-Banxico | 3.92 | % | MXN | 13,130,000 | (133 | ) | CME | (133 | ) | ||||||||||||||||
01/02/17 | Brazil CETIP Interbank Deposit | 12.27 | % | BRL | 20,000 | (130 | ) | DEUT | (130 | ) | ||||||||||||||||
01/02/17 | Brazil CETIP Interbank Deposit | 12.65 | % | BRL | 10,000 | (42 | ) | DEUT | (42 | ) | ||||||||||||||||
03/07/17 | 3-Month KORIBOR | 2.88 | % | KRW | 706,340,000 | 9,516 | CITI | 9,516 | ||||||||||||||||||
10/06/17 | 6-Month LIBOR | (1.84 | )% | GBP | 10,000,000 | (206,193 | ) | CME | (34,103 | ) | ||||||||||||||||
10/15/17 | 3-Month KORIBOR | 2.53 | % | KRW | 3,619,650,000 | 40,017 | DEUT | 40,017 | ||||||||||||||||||
10/28/17 | 3-Month KORIBOR | 2.17 | % | KRW | 382,410,000 | 3,685 | CITI | 3,685 | ||||||||||||||||||
12/14/17 | 3-Month LIBOR | (1.75 | )% | USD | 16,600,000 | (49,073 | ) | CME | (49,073 | ) | ||||||||||||||||
12/16/17 | 6-Month LIBOR | (1.50 | )% | GBP | 6,700,000 | (80,122 | ) | CME | (65,130 | ) | ||||||||||||||||
06/15/18 | 6-Month LIBOR | (1.00 | )% | GBP | 4,000,000 | 34,581 | CME | 20,452 | ||||||||||||||||||
09/21/18 | 6-Month LIBOR | (1.25 | )% | GBP | 3,900,000 | 19,114 | CME | 5,989 | ||||||||||||||||||
09/21/18 | 6-Month LIBOR | (1.50 | )% | GBP | 900,000 | (2,094 | ) | CME | (636 | ) | ||||||||||||||||
11/14/18 | 3-Month KLIBOR | (3.88 | )% | MYR | 860,000 | 68 | DEUT | 68 | ||||||||||||||||||
11/19/18 | 3-Month KLIBOR | (3.92 | )% | MYR | 960,000 | (212 | ) | CITI | (212 | ) | ||||||||||||||||
12/11/18 | 3-Month KLIBOR | (3.97 | )% | MYR | 1,570,000 | (974 | ) | JPM | (974 | ) | ||||||||||||||||
12/16/19 | 3-Month LIBOR | (2.00 | )% | USD | 3,500,000 | (57,654 | ) | CME | (41,529 | ) | ||||||||||||||||
02/05/20 | MXN-TIIE-Banxico | 5.27 | % | MXN | 211,800,000 | 23,895 | CME | 32,113 | ||||||||||||||||||
06/02/20 | 3-Month LIBOR | 5.62 | % | MXN | 12,200,000 | 7,892 | CME | 2,079 | ||||||||||||||||||
| See Notes to Financial Statements. | 119 |
Table of Contents
MEDIUM-DURATION BOND FUND
SCHEDULE OF INVESTMENTS (Continued)
| Fixed | Unrealized | |||||||||||||||||||||||||
| Deal | Notional | Appreciation | ||||||||||||||||||||||||
Maturity Date | Reference Obligation | (Pay) Rate | Currency | Amount | Market Value | Counterparty | (Depreciation) | |||||||||||||||||||
| 07/27/20 | MXN-TIIE-Banxico | 6.96 | % | MXN | 17,700,000 | $ | 74,474 | CME | $ | 4,774 | ||||||||||||||||
| 09/22/20 | MXN-TIIE-Banxico | 5.50 | % | MXN | 14,800,000 | 6,429 | CME | 6,429 | ||||||||||||||||||
| 12/16/20 | 3-Month LIBOR | (2.00 | )% | USD | 13,600,000 | (185,907 | ) | CS | (244,951 | ) | ||||||||||||||||
| 06/24/21 | 3-Month LIBOR | 2.92 | % | USD | 9,400,000 | 107,014 | BAR | 116,419 | ||||||||||||||||||
| 09/21/21 | MXN-TIIE-Banxico | 6.07 | % | MXN | 5,400,000 | 3,475 | CME | 3,475 | ||||||||||||||||||
| 11/17/21 | MXN-TIIE-Banxico | 5.43 | % | MXN | 30,100,000 | (29,937 | ) | CME | (18,445 | ) | ||||||||||||||||
| 06/07/22 | MXN-TIIE-Banxico | 6.00 | % | MXN | 40,800,000 | 12,805 | CME | (15,195 | ) | |||||||||||||||||
| 07/13/22 | MXN-TIIE-Banxico | 5.94 | % | MXN | 10,200,000 | 1,760 | CME | 6,360 | ||||||||||||||||||
| 09/02/22 | 3-Month LIBOR | 2.81 | % | USD | 16,620,000 | 89,720 | LCH | 60,176 | ||||||||||||||||||
| 09/02/22 | MXN-TIIE-Banxico | 5.50 | % | MXN | 46,400,000 | (30,619 | ) | CME | 55,051 | |||||||||||||||||
| 09/16/22 | MXN-TIIE-Banxico | 5.97 | % | MXN | 37,300,000 | 21,084 | CME | 21,084 | ||||||||||||||||||
| 09/22/22 | MXN-TIIE-Banxico | (5.91 | )% | MXN | 9,800,000 | (1,980 | ) | CME | 676 | |||||||||||||||||
| 12/16/22 | 3-Month LIBOR | (2.25 | )% | USD | 49,400,000 | (998,680 | ) | CS | (1,396,341 | ) | ||||||||||||||||
| 08/08/23 | 3-Month KORIBOR | (3.45 | )% | KRW | 1,328,210,000 | (135,861 | ) | CITI | (135,861 | ) | ||||||||||||||||
| 08/14/23 | 3-Month KLIBOR | (4.49 | )% | MYR | 220,000 | (910 | ) | DEUT | (910 | ) | ||||||||||||||||
| 08/16/23 | 3-Month KORIBOR | (3.49 | )% | KRW | 185,320,000 | (19,260 | ) | CITI | (19,260 | ) | ||||||||||||||||
| 08/19/23 | 3-Month KORIBOR | (3.56 | )% | KRW | 228,920,000 | (25,033 | ) | JPM | (25,038 | ) | ||||||||||||||||
| 09/26/23 | 3-Month KLIBOR | (4.33 | )% | MYR | 370,000 | (501 | ) | JPM | (501 | ) | ||||||||||||||||
| 11/15/23 | 3-Month KLIBOR | (4.45 | )% | MYR | 600,000 | (1,978 | ) | CITI | (1,978 | ) | ||||||||||||||||
| 12/23/23 | 3-Month KORIBOR | (3.47 | )% | KRW | 239,520,000 | (25,139 | ) | CITI | (25,139 | ) | ||||||||||||||||
| 01/05/24 | 3-Month KORIBOR | (3.45 | )% | KRW | 71,390,000 | (7,632 | ) | JPM | (7,632 | ) | ||||||||||||||||
| 07/01/24 | 3-Month KORIBOR | (3.47 | )% | KRW | 172,160,000 | (18,810 | ) | CITI | (18,810 | ) | ||||||||||||||||
| 11/13/24 | 6-Month LIBOR | (2.45 | )% | GBP | 1,200,000 | (75,049 | ) | CME | (74,958 | ) | ||||||||||||||||
| 08/05/25 | 3-Month LIBOR | (2.35 | )% | USD | 4,000,000 | (104,736 | ) | CME | (104,736 | ) | ||||||||||||||||
| 12/16/25 | 3-Month LIBOR | (2.50 | )% | USD | 1,500,000 | (43,532 | ) | CS | (66,291 | ) | ||||||||||||||||
| 06/15/26 | 3-Month LIBOR | (2.25 | )% | USD | 2,600,000 | (9,124 | ) | LCH | 3,670 | |||||||||||||||||
| 06/24/29 | 3-Month LIBOR | (3.22 | )% | USD | 2,400,000 | (99,935 | ) | BAR | (115,047 | ) | ||||||||||||||||
| 11/29/29 | MXN-TIIE-Banxico | 6.77 | % | MXN | 23,400,000 | 4,060 | CME | 4,060 | ||||||||||||||||||
| 01/14/30 | United Kingdom Retail Price Index | 3.14 | % | GBP | 1,410,000 | 11,878 | GSC | 11,878 | ||||||||||||||||||
| 09/02/30 | 3-Month LIBOR | (3.00 | )% | USD | 3,870,000 | (59,918 | ) | LCH | (56,725 | ) | ||||||||||||||||
| 03/16/31 | 3-Month LIBOR | 2.75 | % | USD | 2,900,000 | 110,189 | LCH | (13,766 | ) | |||||||||||||||||
| 12/18/43 | 3-Month LIBOR | (3.00 | )% | USD | 2,700,000 | (220,076 | ) | MLCS | (665,161 | ) | ||||||||||||||||
| 12/15/44 | United Kingdom Retail Price Index | (3.53 | )% | GBP | 100,000 | 15,337 | CS | 14,533 | ||||||||||||||||||
| 12/15/44 | United Kingdom Retail Price Index | 3.45 | % | GBP | 100,000 | 4,821 | CS | 5,168 | ||||||||||||||||||
| 12/16/45 | 3-Month LIBOR | (2.75 | )% | USD | 23,900,000 | (694,852 | ) | CS | (1,668,388 | ) | ||||||||||||||||
| 12/16/45 | 3-Month LIBOR | (2.75 | )% | USD | 3,000,000 | (87,220 | ) | CS | (182,442 | ) | ||||||||||||||||
| 06/15/46 | 3-Month LIBOR | (2.50 | )% | USD | 600,000 | 19,693 | LCH | 1,496 | ||||||||||||||||||
|
|
|
| |||||||||||||||||||||||
| $ | (2,653,837 | ) | $ | (4,615,094 | ) | |||||||||||||||||||||
|
|
|
| |||||||||||||||||||||||
| Notional | Notional | |||||||||||||||||||||||||||
| Amount of | Fixed | Amount of | Unrealized | |||||||||||||||||||||||||
| Maturity | Fixed Deal | Currency | Deal | Currency | Market | Counter- | Appreciation | |||||||||||||||||||||
| Date | Rate | Received | Currency | (Pay) Rate | Delivered | Currency | Value | party | (Depreciation) | |||||||||||||||||||
Cross Currency Swap |
| |||||||||||||||||||||||||||
| 03/16/26 | 3-Month EURIBOR | 5,900,000 | USD | 0.00 | % | 6,395,600 | EUR | $ | 97,582 | CITI | $ | 25,302 | ||||||||||||||||
|
|
|
| |||||||||||||||||||||||||
Total Swap agreements outstanding at December 31, 2015 |
| $ | (2,608,114 | ) | $ | (4,629,198 | ) | |||||||||||||||||||||
|
|
|
| |||||||||||||||||||||||||
| 120 | See Notes to Financial Statements. |
Table of Contents
VALUATION HIERARCHY
The following is a summary of the inputs used, as of December 31, 2015, in valuing the Fund’s investments carried at fair value:
| Total Value | Level 1 Quoted Prices | Level 2 Other Significant Observable Inputs | Level 3 Significant Unobservable Inputs | |||||||||||||||||
Assets: | ||||||||||||||||||||
Investments in Securities: | ||||||||||||||||||||
Agency Obligations | $ | 9,993,433 | $ | — | $ | 9,993,433 | $ | — | ||||||||||||
Asset-Backed Securities | 39,141,640 | — | 32,324,438 | 6,817,202 | ||||||||||||||||
Commercial Paper | 7,098,347 | — | 7,098,347 | — | ||||||||||||||||
Corporate Bonds | 204,126,882 | — | 203,813,544 | 313,338 | ||||||||||||||||
Foreign Bonds: | ||||||||||||||||||||
Australia | 5,066,242 | — | 5,066,242 | — | ||||||||||||||||
Austria | 234,844 | — | 234,844 | — | ||||||||||||||||
Belgium | 874,040 | — | 874,040 | — | ||||||||||||||||
Bermuda | 820,888 | — | 820,888 | — | ||||||||||||||||
Brazil | 1,465,800 | — | 1,465,800 | — | ||||||||||||||||
Canada | 1,484,457 | — | 1,484,457 | — | ||||||||||||||||
Cayman Islands | 949,800 | — | 949,800 | — | ||||||||||||||||
Chile | 1,986,285 | — | 1,986,285 | — | ||||||||||||||||
China | 1,598,154 | — | 1,598,154 | — | ||||||||||||||||
Colombia | 1,756,670 | — | 1,756,670 | — | ||||||||||||||||
Costa Rica | 167,500 | — | 167,500 | — | ||||||||||||||||
Croatia (Hrvatska) | 203,500 | — | 203,500 | — | ||||||||||||||||
Dominican Republic | 390,557 | — | 390,557 | — | ||||||||||||||||
France | 10,606,006 | — | 10,606,006 | — | ||||||||||||||||
Germany | 1,786,423 | — | 1,786,423 | — | ||||||||||||||||
Greece | 808,003 | — | 808,003 | — | ||||||||||||||||
Guernsey | 831,038 | — | 831,038 | — | ||||||||||||||||
Iceland | 14 | — | — | 14 | ||||||||||||||||
India | 518,953 | — | 518,953 | — | ||||||||||||||||
Indonesia | 1,373,767 | — | 1,373,767 | — | ||||||||||||||||
Ireland | 2,552,513 | — | 2,552,513 | — | ||||||||||||||||
Israel | 2,286,768 | — | 2,286,768 | — | ||||||||||||||||
Italy | 4,356,494 | — | 4,356,494 | — | ||||||||||||||||
Japan | 1,753,001 | — | 1,753,001 | — | ||||||||||||||||
Jersey | 1,136,912 | — | 1,136,912 | — | ||||||||||||||||
Jordan | 1,230,030 | — | 1,230,030 | — | ||||||||||||||||
Luxembourg | 1,204,491 | — | 1,204,491 | — | ||||||||||||||||
Mexico | 14,025,773 | — | 14,025,773 | — | ||||||||||||||||
Morocco & Antilles | 420,779 | — | 420,779 | — | ||||||||||||||||
Netherlands | 11,911,129 | — | 11,911,129 | — | ||||||||||||||||
Peru | 581,025 | — | 581,025 | — | ||||||||||||||||
Poland | 4,223,068 | — | 4,223,068 | — | ||||||||||||||||
Russia | 938,223 | — | 938,223 | — | ||||||||||||||||
South Africa | 205,330 | — | 205,330 | — | ||||||||||||||||
South Korea | 5,130,414 | — | 5,130,414 | — | ||||||||||||||||
Spain | 2,160,618 | — | 2,160,618 | — | ||||||||||||||||
Sri Lanka | 189,145 | — | 189,145 | — | ||||||||||||||||
Supranational | 395,128 | — | 395,128 | — | ||||||||||||||||
Sweden | 1,579,703 | — | 1,579,703 | — | ||||||||||||||||
Switzerland | 7,681,110 | — | 7,681,110 | — | ||||||||||||||||
Turkey | 2,957,703 | — | 1,456,772 | 1,500,931 | ||||||||||||||||
United Kingdom | 12,967,260 | — | 12,967,260 | — | ||||||||||||||||
Virgin Islands (British) | 4,204,651 | — | 4,204,651 | — | ||||||||||||||||
Foreign Government Inflation-Linked Bond | 1,083,744 | — | 1,083,744 | — | ||||||||||||||||
Loan Agreements | 2,730,132 | — | 2,730,132 | — | ||||||||||||||||
Money Market Funds | 49,658,002 | 49,658,002 | — | — | ||||||||||||||||
Mortgage-Backed Securities | 371,450,295 | — | 361,307,224 | 10,143,071 | ||||||||||||||||
Municipal Bonds | 13,500,838 | — | 13,500,838 | — | ||||||||||||||||
Preferred Stock | 605,572 | 605,572 | — | — | ||||||||||||||||
| See Notes to Financial Statements. | 121 |
Table of Contents
MEDIUM-DURATION BOND FUND
SCHEDULE OF INVESTMENTS (Continued)
| Total Value | Level 1 Quoted Prices | Level 2 Other Significant Observable Inputs | Level 3 Significant Unobservable Inputs | |||||||||||||||||
Purchased Options | $ | 527,407 | $ | 313,874 | $ | 213,533 | $ | — | ||||||||||||
U.S. Treasury Obligations | 216,422,718 | — | 216,422,718 | — | ||||||||||||||||
|
|
|
|
|
|
|
| |||||||||||||
Total Assets - Investments in Securities | $ | 1,033,353,219 | $ | 50,577,448 | $ | 964,001,215 | $ | 18,774,556 | ||||||||||||
|
|
|
|
|
|
|
| |||||||||||||
Other Financial Instruments*** | ||||||||||||||||||||
Forward Foreign Currency Contracts | $ | 656,096 | $ | — | $ | 656,096 | $ | — | ||||||||||||
|
|
|
|
|
|
|
| |||||||||||||
Total Assets - Other Financial Instruments | $ | 656,096 | $ | — | $ | 656,096 | $ | — | ||||||||||||
|
|
|
|
|
|
|
| |||||||||||||
Liabilities: | ||||||||||||||||||||
Investments in Securities: | ||||||||||||||||||||
TBA Sale Commitments | $ | (11,597,097 | ) | $ | — | $ | (11,597,097 | ) | $ | — | ||||||||||
Written Options | (439,100 | ) | (157,961 | ) | (281,139 | ) | — | |||||||||||||
|
|
|
|
|
|
|
| |||||||||||||
Total Liabilities - Investments in Securities | $ | (12,036,197 | ) | $ | (157,961 | ) | $ | (11,878,236 | ) | $ | — | |||||||||
|
|
|
|
|
|
|
| |||||||||||||
Other Financial Instruments*** | ||||||||||||||||||||
Futures Contracts | $ | (1,085,279 | ) | $ | (1,085,279 | ) | $ | — | $ | — | ||||||||||
Swap Agreements | (2,608,114 | ) | — | (2,608,114 | ) | — | ||||||||||||||
|
|
|
|
|
|
|
| |||||||||||||
Total Liabilities - Other Financial Instruments | $ | (3,693,393 | ) | $ | (1,085,279 | ) | $ | (2,608,114 | ) | $ | — | |||||||||
|
|
|
|
|
|
|
| |||||||||||||
***Other financial instruments are derivative instruments not reflected in the Schedule of Investments, such as futures, forwards and swap contracts, which are valued at the unrealized appreciation (depreciation) on the investment. Details of these investments can be found in the Notes to Financial Statements.
There were no transfers between Level 1 and Level 2 during the year ended December 31, 2015.
The unobservable inputs used in the fair value measurement of the reporting entity’s asset-backed securities, corporate bonds, foreign bonds, foreign government inflation-linked note and mortgage-backed securities are values based on evaluated quotations received from dealers who make markets in such securities. Significant increases (decreases) in those evaluated quotations would result in a significantly higher (lower) fair value measurement.
| 122 | See Notes to Financial Statements. |
Table of Contents
The following is a reconciliation of assets in which significant unobservable inputs (Level 3) were used in determining fair value:
| Total Value | Asset-Backed Securities | Corporate Bonds | Foreign Bonds | Foreign Government Inflation- Linked Note | Mortgage-Backed Securities | |||||||||||||||||||
Balance, 12/31/14 | $ | 12,902,321 | $ | 2,138,585 | $ | 1,259,902 | $ | 211,147 | $ | 1,903,946 | $ | 7,388,741 | ||||||||||||
Accrued discounts/premiums | 11,775 | 15,997 | (3,268 | ) | 577 | (401 | ) | (1,130 | ) | |||||||||||||||
Realized gain (loss)(1) | 1,876,494 | 65,077 | 52,584 | 1,887,201 | (139,021 | ) | 10,653 | |||||||||||||||||
Change in unrealized appreciation (depreciation)(2) | (906,078 | ) | (25,296 | ) | (178,830 | ) | (73,748 | ) | (524,887 | ) | (103,317 | ) | ||||||||||||
Purchases | 13,616,360 | 5,867,876 | (55,177 | ) | 1,612,000 | — | 6,191,661 | |||||||||||||||||
Sales | (4,436,779 | ) | (1,408,671 | ) | (86,896 | ) | (36,530 | ) | (155,893 | ) | (2,748,789 | ) | ||||||||||||
Transfers in to Level 3(3) | 358,045 | 304,620 | 183 | — | — | 53,242 | ||||||||||||||||||
Transfers out of Level 3(4) | (1,745,114 | ) | — | (661,370 | ) | — | (1,083,744 | ) | — | |||||||||||||||
Maturities | (2,099,702 | ) | — | — | (2,099,702 | ) | — | — | ||||||||||||||||
Paydowns | (802,766 | ) | (140,986 | ) | (13,790 | ) | — | — | (647,990 | ) | ||||||||||||||
|
|
|
|
|
|
|
|
|
|
|
| |||||||||||||
Balance, 12/31/15 | $ | 18,774,556 | $ | 6,817,202 | $ | 313,338 | $ | 1,500,945 | $ | — | $ | 10,143,071 | ||||||||||||
|
|
|
|
|
|
|
|
|
|
|
| |||||||||||||
| (1) | Realized gain (loss) from the sale of Level 3 securities is included on the Statement of Operations in Net realized gain (loss) from: Investment securities. |
| (2) | Change in unrealized appreciation (depreciation) is located on the Statement of Operations in Net change in unrealized appreciation (depreciation) on: Investment securities and Net change in unrealized appreciation (depreciation) on: Option contracts written. |
| (3) | Transfers in to Level 3 represent the value of securities at December 31, 2015 that were transferred from Level 1 and Level 2 to Level 3 of the fair value hierarchy as a result of the inability of the Fund to obtain a price using an objective method such as a pricing vendor. |
| (4) | Transfers out of Level 3 represent the value of securities at December 31, 2015 that were transferred from Level 3 to Level 2 of the fair value hierarchy as a result of the ability of the Fund to obtain a price using an objective method such as a pricing vendor. |
| See Notes to Financial Statements. | 123 |
Table of Contents
Extended-Duration Bond Fund (Unaudited)
The Fund invested in a diversified portfolio composed primarily of investment grade fixed income securities with an average dollar-weighted duration (a measure of bond prices’ sensitivity to changes in interest rates) normally greater than or equal to seven years. The extended-duration space was challenging in 2015 with both the Fund and the composite benchmark index, 50% Barclays U.S. Long-Term Government Index and 50% Barclays U.S. Long-Term Credit Index, posting negative returns (-5.30% and -2.84%, respectively). Throughout the year, the Fund underweighted lower yielding U.S. Treasury securities in favor of higher yielding corporate bonds, non-U.S. bonds and high yield bonds. The Fund’s benchmark-relative performance was positively impacted by the Fund’s higher-than-benchmark yield, and shorter duration. In contrast, the Fund’s relative performance was negatively impacted by security selection within both investment grade corporate and high yield bonds within market sectors.
During the year, the Fund remained focused on its objective of seeking maximum total return consistent with preservation of capital.
The Fund did not invest in derivative investments during the year.
This Fund may be suitable for investors who are seeking higher returns without investing in stocks, can accept short-term fluctuations in account value and want to diversify their portfolio with a fixed income investment option. This Fund is subject to interest rate risk. Meaning, when interest rates rise, the value of the existing bonds decrease and vice versa. Changes in interest rates have a bigger impact on long duration holdings than on short duration holdings. To the extent that the investment adviser misjudges current market conditions, the Fund’s volatility may be amplified by its use of derivatives and by its ability to select sub-advisers to allocate assets. Some derivatives may increase the risk of loss and cause fluctuations in the market value of the Fund’s portfolio to have disproportionately large effects or cause the net asset value of the Fund generally to decline faster than it would otherwise. The use of certain derivatives may also have a leveraging effect which may increase the volatility of the Fund and may reduce its returns. It is possible to lose money by investing in the Fund.
At December 31, 2015, the portfolio holdings of the Fund, as a percentage of net assets, is shown in the following table. Portfolio holdings are subject to risk and may change at any time.
| % | ||||
Corporate Bonds | 53.5 | |||
Foreign Bonds | 20.9 | |||
U.S. Treasury Obligations | 18.5 | |||
Money Market Funds | 6.4 | |||
Municipal Bonds | 2.2 | |||
Asset-Backed Security | 1.2 | |||
Preferred Stocks | 0.1 | |||
|
| |||
| 102.8 | ||||
|
| |||
124
Table of Contents
Extended-Duration Bond Fund (Unaudited)
| Average Annual Total Returns as of 12/31/15 | ||||||
Institutional Class* | Investor Class* | Benchmark** | ||||
One Year | -5.01% | -5.30% | -2.84% | |||
Five Year | 6.73% | 6.51% | 7.15% | |||
Ten Year | 7.35% | 7.14% | 6.54% | |||
Since Inception | 7.76% | 7.59% | 7.00% | |||
Inception Date | 08/27/01 | 08/27/01 | ||||
Total Fund Operating Expenses (May 1, 2015 Prospectus, as amended on June 1, 2015)(1) | 0.58% | 0.85% | ||||
(1)Current information regarding the Fund’s Operating Expenses can be found in the Financial Highlights.
The performance data quoted represents past performance and does not guarantee future results. Current performance may be lower or higher. Performance data current to the most recent month-end may be obtained at www.GuideStoneFunds.org. The investment return and principal value of an investment will fluctuate so that shares, when redeemed, may be worth more or less than their original cost.
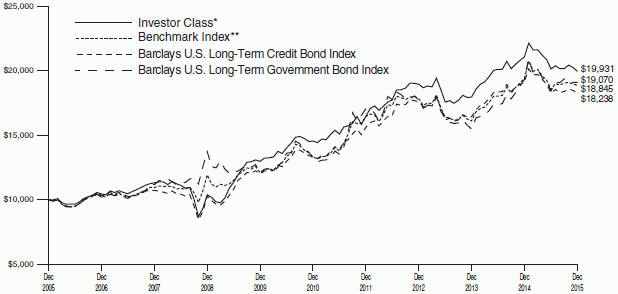
The graph compares the results of a hypothetical $10,000 investment in the Investor Class of the Fund for the 10-year period from December 31, 2005 to December 31, 2015, with all dividends and capital gains reinvested, with the weighted composite benchmark index.
*These returns reflect expense waivers by the Fund’s investment adviser. Without these waivers, returns would have been lower. Returns shown do not reflect the deduction of taxes that a shareholder would pay on Fund distributions or the redemption of Fund shares.
**Represents a weighted composite benchmark index consisting of 50% Barclays U.S. Long-Term Credit Bond Index and 50% Barclays U.S. Long-Term Government Bond Index.
Unlike a mutual fund, the performance of an index assumes no taxes, transaction costs, management fees or other expenses.
125
Table of Contents
EXTENDED-DURATION BOND FUND SCHEDULE OF INVESTMENTS | December 31, 2015 |
| Par | Value | |||||||||
ASSET-BACKED SECURITY — 1.2% |
| |||||||||
Citibank Credit Card Issuance Trust Series 2007-A3 | $ | 2,300,000 | $ | 2,920,422 | ||||||
|
| |||||||||
CORPORATE BONDS — 53.5% |
| |||||||||
21st Century Fox America, Inc. | ||||||||||
4.75%, 09/15/44 | 1,847,000 | 1,783,369 | ||||||||
AbbVie, Inc. | ||||||||||
4.70%, 05/14/45 | 1,154,000 | 1,132,431 | ||||||||
AES Corporation | ||||||||||
4.88%, 05/15/23 | 145,000 | 127,600 | ||||||||
Aflac, Inc. | ||||||||||
6.45%, 08/15/40 | 3,005,000 | 3,693,707 | ||||||||
Alcatel-Lucent USA, Inc. | ||||||||||
6.45%, 03/15/29 | 105,000 | 106,706 | ||||||||
Alcoa, Inc. | ||||||||||
5.87%, 02/23/22 | 10,000 | 9,800 | ||||||||
6.75%, 01/15/28 | 235,000 | 224,425 | ||||||||
5.95%, 02/01/37 | 85,000 | 68,850 | ||||||||
Ally Financial, Inc. | ||||||||||
8.00%, 11/01/31 | 177,000 | 205,099 | ||||||||
Alta Wind Holdings LLC | ||||||||||
7.00%, 06/30/35 144A | 456,780 | 490,206 | ||||||||
American International Group, Inc. | ||||||||||
4.38%, 01/15/55 | 3,170,000 | 2,735,640 | ||||||||
Andarko Holding Co. | ||||||||||
7.15%, 05/15/28 | 250,000 | 256,112 | ||||||||
Antero Resources Corporation | ||||||||||
5.38%, 11/01/21 | 125,000 | 100,625 | ||||||||
5.13%, 12/01/22 | 35,000 | 26,775 | ||||||||
Anthem, Inc. | ||||||||||
6.38%, 06/15/37 | 1,208,000 | 1,436,970 | ||||||||
Apple, Inc. | ||||||||||
4.38%, 05/13/45 | 676,000 | 684,257 | ||||||||
AT&T, Inc. | ||||||||||
4.50%, 05/15/35 | 529,000 | 490,787 | ||||||||
4.30%, 12/15/42 | 1,242,000 | 1,065,244 | ||||||||
4.35%, 06/15/45 | 1,120,000 | 961,830 | ||||||||
4.75%, 05/15/46 | 3,279,000 | 3,013,785 | ||||||||
Bank of America Corporation | ||||||||||
6.11%, 01/29/37 | 900,000 | 1,024,395 | ||||||||
Bank of America NA | ||||||||||
6.00%, 10/15/36 | 2,900,000 | 3,453,775 | ||||||||
Barrick North America Finance LLC | ||||||||||
5.70%, 05/30/41 | 2,582,000 | 1,735,742 | ||||||||
Brocade Communications Systems, Inc. | ||||||||||
1.38%, 01/01/20 CONV 144A | 140,000 | 134,750 | ||||||||
Bruce Mansfield Unit 1 2007 Pass-Through Trust | ||||||||||
6.85%, 06/01/34 | 942,217 | 934,070 | ||||||||
Burlington Northern Santa Fe LLC | ||||||||||
4.15%, 04/01/45 | 879,000 | 799,893 | ||||||||
California Institute of Technology | ||||||||||
4.70%, 11/01/11 | 2,010,000 | 1,933,431 | ||||||||
CBS Corporation | ||||||||||
4.60%, 01/15/45 | 1,000,000 | 861,086 | ||||||||
| Par | Value | |||||||||
CenturyLink, Inc. | ||||||||||
6.45%, 06/15/21D | $ | 260,000 | $ | 254,800 | ||||||
6.88%, 01/15/28 | 65,000 | 48,750 | ||||||||
7.65%, 03/15/42 | 295,000 | 227,150 | ||||||||
Chesapeake Energy Corporation | ||||||||||
6.63%, 08/15/20 | 25,000 | 7,375 | ||||||||
6.88%, 11/15/20 | 15,000 | 4,350 | ||||||||
4.88%, 04/15/22D | 70,000 | 19,779 | ||||||||
5.75%, 03/15/23 | 20,000 | 5,900 | ||||||||
2.50%, 05/15/37 CONV | 275,000 | 130,625 | ||||||||
2.25%, 12/15/38 CONV | 50,000 | 16,938 | ||||||||
Ciena Corporation | ||||||||||
3.75%, 10/15/18 CONV 144A | 155,000 | 192,975 | ||||||||
Citigroup, Inc. | ||||||||||
8.13%, 07/15/39 | 1,997,000 | 2,873,224 | ||||||||
Cliffs Natural Resources, Inc. | ||||||||||
4.80%, 10/01/20D | 40,000 | 7,800 | ||||||||
4.88%, 04/01/21 | 25,000 | 4,625 | ||||||||
6.25%, 10/01/40D | 75,000 | 14,250 | ||||||||
Comcast Corporation | ||||||||||
4.20%, 08/15/34 | 2,000,000 | 1,984,988 | ||||||||
4.50%, 01/15/43 | 1,460,000 | 1,457,381 | ||||||||
ConocoPhillips Co. | ||||||||||
4.30%, 11/15/44D | 1,983,000 | 1,651,674 | ||||||||
Continental Airlines 1999-2 Class B Pass-Through Trust | ||||||||||
7.57%, 09/15/21 | 25,620 | 25,828 | ||||||||
Continental Resources, Inc. | ||||||||||
4.50%, 04/15/23 | 5,000 | 3,597 | ||||||||
3.80%, 06/01/24D | 70,000 | 49,393 | ||||||||
Corning, Inc. | ||||||||||
7.25%, 08/15/36 | 850,000 | 983,290 | ||||||||
Cummins, Inc. | ||||||||||
5.65%, 03/01/98 | 1,620,000 | 1,695,975 | ||||||||
CVS Health Corporation | ||||||||||
5.13%, 07/20/45 | 240,000 | 253,799 | ||||||||
Darden Restaurants, Inc. | ||||||||||
6.00%, 08/15/35D | 990,000 | 907,017 | ||||||||
DCP Midstream LLC | ||||||||||
6.45%, 11/03/36 144A | 490,000 | 331,804 | ||||||||
Devon Energy Corporation | ||||||||||
5.00%, 06/15/45D | 970,000 | 737,611 | ||||||||
Dillard’s, Inc. | ||||||||||
7.00%, 12/01/28 | 500,000 | 555,034 | ||||||||
Dow Chemical Co. | ||||||||||
9.40%, 05/15/39 | 920,000 | 1,325,963 | ||||||||
DPL, Inc. | ||||||||||
6.75%, 10/01/19 | 173,000 | 173,000 | ||||||||
Enbridge Energy Partners LP | ||||||||||
7.38%, 10/15/45 | 1,000,000 | 958,077 | ||||||||
Energy Transfer Partners LP | ||||||||||
5.15%, 03/15/45 | 1,128,000 | 799,776 | ||||||||
Enterprise Products Operating LLC | ||||||||||
5.10%, 02/15/45 | 595,000 | 500,118 | ||||||||
4.95%, 10/15/54 | 515,000 | 404,363 | ||||||||
Foot Locker, Inc. | ||||||||||
8.50%, 01/15/22 | 1,000,000 | 1,216,250 | ||||||||
Ford Motor Co. | ||||||||||
6.63%, 10/01/28 | 680,000 | 786,879 | ||||||||
6.38%, 02/01/29 | 1,255,000 | 1,416,857 | ||||||||
| 126 | See Notes to Financial Statements. |
Table of Contents
| Par | Value | |||||||||||
Freeport-McMoRan, Inc. | ||||||||||||
5.45%, 03/15/43 | $ | 160,000 | $ | 84,000 | ||||||||
FTS International, Inc. | ||||||||||||
6.25%, 05/01/22D | 90,000 | 25,650 | ||||||||||
General Electric Capital Corporation | ||||||||||||
6.75%, 03/15/32 | 573,000 | 749,887 | ||||||||||
5.88%, 01/14/38 | 150,000 | 183,900 | ||||||||||
General Motors Financial Co., Inc. | ||||||||||||
3.45%, 04/10/22 | 130,000 | 124,877 | ||||||||||
Genworth Holdings, Inc. | ||||||||||||
4.90%, 08/15/23 | 115,000 | 77,050 | ||||||||||
4.80%, 02/15/24D | 45,000 | 30,600 | ||||||||||
6.50%, 06/15/34D | 50,000 | 30,500 | ||||||||||
Global Marine, Inc. | ||||||||||||
7.00%, 06/01/28D | 20,000 | 9,800 | ||||||||||
Goldman Sachs Group, Inc. | ||||||||||||
6.75%, 10/01/37 | 500,000 | 586,244 | ||||||||||
Halliburton Co. | ||||||||||||
5.00%, 11/15/45 | 1,722,000 | 1,706,195 | ||||||||||
HCA, Inc. | ||||||||||||
7.58%, 09/15/25 | 1,000,000 | 1,087,500 | ||||||||||
7.05%, 12/01/27 | 500,000 | 508,750 | ||||||||||
HSBC Bank USA NA | ||||||||||||
7.00%, 01/15/39 | 3,498,000 | 4,417,190 | ||||||||||
Intel Corporation | ||||||||||||
3.25%, 08/01/39 CONV | 1,155,000 | 1,923,081 | ||||||||||
International Paper Co. | ||||||||||||
8.70%, 06/15/38 | 2,643,000 | 3,409,158 | ||||||||||
iStar, Inc. | ||||||||||||
7.13%, 02/15/18D | 180,000 | 186,975 | ||||||||||
Jefferies Group LLC | ||||||||||||
6.45%, 06/08/27 | 50,000 | 53,058 | ||||||||||
3.88%, 11/01/29 CONV | 65,000 | 64,919 | ||||||||||
6.25%, 01/15/36 | 185,000 | 171,836 | ||||||||||
6.50%, 01/20/43 | 1,990,000 | 1,845,631 | ||||||||||
JPMorgan Chase & Co. | ||||||||||||
4.25%, 11/02/18(Z) | 385,000 | 266,547 | ||||||||||
5.60%, 07/15/41 | 2,547,000 | 2,946,270 | ||||||||||
4.95%, 06/01/45 | 1,912,000 | 1,919,015 | ||||||||||
KB Home | ||||||||||||
1.38%, 02/01/19 CONV | 95,000 | 85,441 | ||||||||||
Kinder Morgan Energy Partners LP | ||||||||||||
5.80%, 03/15/35 | 280,000 | 225,828 | ||||||||||
Kinder Morgan, Inc. | ||||||||||||
5.55%, 06/01/45 | 2,218,000 | 1,736,885 | ||||||||||
Kraft Foods Group, Inc. | ||||||||||||
6.88%, 01/26/39 | 267,000 | 317,434 | ||||||||||
6.50%, 02/09/40 | 1,000,000 | 1,169,532 | ||||||||||
Kraft Heinz Foods Co. | ||||||||||||
5.20%, 07/15/45 144A | 655,000 | 687,024 | ||||||||||
Level 3 Communications, Inc. | ||||||||||||
5.75%, 12/01/22D | 65,000 | 66,463 | ||||||||||
Level 3 Financing, Inc. | ||||||||||||
5.63%, 02/01/23 | 430,000 | 438,600 | ||||||||||
Liberty Mutual Group, Inc. | ||||||||||||
6.50%, 03/15/35 144A | 1,400,000 | 1,656,938 | ||||||||||
Lockheed Martin Corporation | ||||||||||||
4.70%, 05/15/46 | 1,238,000 | 1,273,302 | ||||||||||
Macy’s Retail Holdings, Inc. | ||||||||||||
6.38%, 03/15/37D | 240,000 | 243,576 | ||||||||||
| Par | Value | |||||||||||
Marathon Petroleum Corporation | ||||||||||||
5.00%, 09/15/54 | $ | 1,241,000 | $ | 997,667 | ||||||||
Masco Corporation | ||||||||||||
7.75%, 08/01/29 | 275,000 | 305,938 | ||||||||||
6.50%, 08/15/32 | 55,000 | 55,688 | ||||||||||
McDonald’s Corporation | ||||||||||||
4.88%, 12/09/45 | 1,520,000 | 1,535,233 | ||||||||||
MeadWestvaco Corporation | ||||||||||||
7.55%, 03/01/47@ | 515,000 | 609,912 | ||||||||||
Medtronic, Inc. | ||||||||||||
4.63%, 03/15/45 | 1,852,000 | 1,914,888 | ||||||||||
MetLife, Inc. | ||||||||||||
5.88%, 02/06/41 | 500,000 | 588,485 | ||||||||||
6.40%, 12/15/66 | 310,000 | 339,450 | ||||||||||
Microchip Technology, Inc. | ||||||||||||
1.63%, 02/15/25 CONV 144AD | 85,000 | 84,894 | ||||||||||
Microsoft Corporation | ||||||||||||
4.45%, 11/03/45 | 1,566,000 | 1,618,899 | ||||||||||
Monsanto Co. | ||||||||||||
4.70%, 07/15/64 | 537,000 | 409,351 | ||||||||||
Morgan Stanley | ||||||||||||
4.75%, 11/16/18(A) | 295,000 | 221,501 | ||||||||||
3.13%, 08/05/21(C) | 235,000 | 174,999 | ||||||||||
4.10%, 05/22/23 | 300,000 | 303,540 | ||||||||||
6.25%, 08/09/26 | 600,000 | 703,856 | ||||||||||
4.35%, 09/08/26 | 410,000 | 412,213 | ||||||||||
4.30%, 01/27/45 | 1,092,000 | 1,046,113 | ||||||||||
Motorola Solutions, Inc. | ||||||||||||
6.63%, 11/15/37 | 46,000 | 47,191 | ||||||||||
Mutual of Omaha Insurance Co. | ||||||||||||
6.80%, 06/15/36 144A | 100,000 | 125,778 | ||||||||||
Navient Corporation | ||||||||||||
5.00%, 06/15/18 | 335,000 | 319,925 | ||||||||||
5.88%, 10/25/24 | 30,000 | 24,113 | ||||||||||
5.63%, 08/01/33@ | 1,460,000 | 978,200 | ||||||||||
New Albertsons, Inc. | ||||||||||||
7.45%, 08/01/29 | 55,000 | 48,950 | ||||||||||
8.70%, 05/01/30D | 25,000 | 23,750 | ||||||||||
8.00%, 05/01/31 | 295,000 | 269,925 | ||||||||||
Newell Rubbermaid, Inc. | ||||||||||||
4.00%, 12/01/24 | 200,000 | 184,964 | ||||||||||
Noble Energy, Inc. | ||||||||||||
5.05%, 11/15/44 | 1,016,000 | 823,109 | ||||||||||
Old Republic International Corporation | ||||||||||||
3.75%, 03/15/18 CONV | 2,255,000 | 2,866,669 | ||||||||||
4.88%, 10/01/24 | 230,000 | 236,526 | ||||||||||
ON Semiconductor Corporation | ||||||||||||
1.00%, 12/01/20 CONV 144AD | 85,000 | 79,581 | ||||||||||
ONEOK Partners LP | ||||||||||||
4.90%, 03/15/25 | 15,000 | 12,656 | ||||||||||
6.20%, 09/15/43 | 5,000 | 3,823 | ||||||||||
Owens Corning | ||||||||||||
7.00%, 12/01/36 | 2,360,000 | 2,594,556 | ||||||||||
Penn Mutual Life Insurance Co. | ||||||||||||
7.63%, 06/15/40 144A | 1,750,000 | 2,314,513 | ||||||||||
Phillips 66 | ||||||||||||
4.65%, 11/15/34 | 1,271,000 | 1,194,913 | ||||||||||
4.88%, 11/15/44 | 1,000,000 | 895,429 | ||||||||||
Phillips 66 Partners LP | ||||||||||||
4.68%, 02/15/45 | 417,000 | 309,321 | ||||||||||
| See Notes to Financial Statements. | 127 |
Table of Contents
EXTENDED-DURATION BOND FUND
SCHEDULE OF INVESTMENTS (Continued)
| Par | Value | |||||||||||
Plains All American Pipeline LP | ||||||||||||
4.90%, 02/15/45 | $ | 995,000 | $ | 717,915 | ||||||||
Priceline Group, Inc. | ||||||||||||
0.90%, 09/15/21 CONVD | 110,000 | 110,963 | ||||||||||
Prudential Financial, Inc. | ||||||||||||
6.63%, 06/21/40 | 3,912,000 | 4,825,605 | ||||||||||
PulteGroup, Inc. | ||||||||||||
6.38%, 05/15/33D | 1,000,000 | 1,020,000 | ||||||||||
Quicken Loans, Inc. | ||||||||||||
5.75%, 05/01/25 144AD | 125,000 | 119,531 | ||||||||||
Qwest Corporation | ||||||||||||
7.25%, 09/15/25 | 490,000 | 522,157 | ||||||||||
6.88%, 09/15/33D | 1,918,000 | 1,845,300 | ||||||||||
RPM International, Inc. | ||||||||||||
2.25%, 12/15/20 CONVD | 22,000 | 25,149 | ||||||||||
Sealed Air Corporation | ||||||||||||
4.88%, 12/01/22 144A | 10,000 | 10,025 | ||||||||||
Sempra Energy | ||||||||||||
6.00%, 10/15/39 | 991,000 | 1,114,868 | ||||||||||
SM Energy Co. | ||||||||||||
5.00%, 01/15/24D | 15,000 | 9,825 | ||||||||||
Sprint Capital Corporation | ||||||||||||
6.88%, 11/15/28D | 1,025,000 | 717,500 | ||||||||||
8.75%, 03/15/32 | 20,000 | 15,050 | ||||||||||
Sprint Communications, Inc. | ||||||||||||
6.00%, 11/15/22 | 40,000 | 28,300 | ||||||||||
Sprint Corporation | ||||||||||||
7.13%, 06/15/24D | 15,000 | 10,894 | ||||||||||
Tenet Healthcare Corporation | ||||||||||||
5.00%, 03/01/19D | 225,000 | 207,563 | ||||||||||
Textron, Inc. | ||||||||||||
6.63%, 04/07/20(U) | 160,000 | 264,267 | ||||||||||
Time Warner Cable, Inc. | ||||||||||||
5.50%, 09/01/41 | 25,000 | 22,591 | ||||||||||
4.50%, 09/15/42 | 45,000 | 35,438 | ||||||||||
Time Warner, Inc. | ||||||||||||
4.85%, 07/15/45 | 1,039,000 | 993,172 | ||||||||||
Toro Co. | ||||||||||||
6.63%, 05/01/37@ | 300,000 | 336,756 | ||||||||||
Tyson Foods, Inc. | ||||||||||||
5.15%, 08/15/44 | 895,000 | 938,090 | ||||||||||
United Airlines 2014-1 Class A Pass-Through Trust | ||||||||||||
4.00%, 10/11/27 | 111,582 | 114,093 | ||||||||||
United States Steel Corporation | ||||||||||||
6.65%, 06/01/37 | 95,000 | 39,425 | ||||||||||
University of Pennsylvania | ||||||||||||
4.67%, 09/01/12 | 3,370,000 | 3,394,571 | ||||||||||
US Airways 2012-1 Class A Pass-Through Trust | ||||||||||||
5.90%, 04/01/26 | 382,024 | 422,614 | ||||||||||
Verizon Communications, Inc. | ||||||||||||
6.00%, 04/01/41 | 2,593,000 | 2,810,309 | ||||||||||
4.86%, 08/21/46 | 717,000 | 681,429 | ||||||||||
5.01%, 08/21/54 | 491,000 | 451,374 | ||||||||||
4.67%, 03/15/55 | 580,000 | 505,639 | ||||||||||
Verizon Maryland LLC | ||||||||||||
5.13%, 06/15/33D | 150,000 | 148,848 | ||||||||||
Visa, Inc. | ||||||||||||
4.30%, 12/14/45 | 1,798,000 | 1,828,757 | ||||||||||
Wells Fargo & Co. | ||||||||||||
5.61%, 01/15/44 | 4,912,000 | 5,468,844 | ||||||||||
| Par | Value | |||||||||||
Weyerhaeuser Co. | ||||||||||||
6.88%, 12/15/33 | $ | 580,000 | $ | 670,194 | ||||||||
|
| |||||||||||
Total Corporate Bonds | 136,931,806 | |||||||||||
|
| |||||||||||
FOREIGN BONDS — 20.9% |
| |||||||||||
Australia — 2.7% | ||||||||||||
Barrick PD Australia Finance Proprietary, Ltd. | ||||||||||||
5.95%, 10/15/39 | 2,870,000 | 1,963,797 | ||||||||||
BHP Billiton Finance (USA), Ltd. | ||||||||||||
5.00%, 09/30/43 | 1,846,000 | 1,665,098 | ||||||||||
New South Wales Treasury Corporation | ||||||||||||
6.00%, 02/01/18(A) | 730,000 | 573,343 | ||||||||||
3.50%, 03/20/19(A) | 60,000 | 45,446 | ||||||||||
Rio Tinto Finance USA, Ltd. | ||||||||||||
5.20%, 11/02/40 | 2,946,000 | 2,712,367 | ||||||||||
|
| |||||||||||
| 6,960,051 | ||||||||||||
|
| |||||||||||
Brazil — 0.2% |
| |||||||||||
Brazilian Government International Bond | ||||||||||||
10.25%, 01/10/28(B) | 2,525,000 | 568,025 | ||||||||||
|
| |||||||||||
Canada — 3.9% |
| |||||||||||
Bombardier, Inc. | ||||||||||||
6.00%, 10/15/22 144AD | 745,000 | 525,970 | ||||||||||
Canadian Government Bond Residual STRIP | ||||||||||||
.43%, 06/01/25(C)W† | 3,685,000 | 2,331,854 | ||||||||||
Glencore Finance Canada, Ltd. | ||||||||||||
6.00%, 11/15/41 144A | 1,979,000 | 1,438,703 | ||||||||||
Ontario Generic | ||||||||||||
Residual STRIP | ||||||||||||
3.07%, 03/08/29(C)W† | 4,600,000 | 2,231,683 | ||||||||||
Saskatchewan Residual STRIP | ||||||||||||
1.90%, 02/04/22(C)W† | 3,000,000 | 1,926,725 | ||||||||||
TransCanada PipeLines, Ltd. | ||||||||||||
6.20%, 10/15/37 | 1,541,000 | 1,626,361 | ||||||||||
|
| |||||||||||
| 10,081,296 | ||||||||||||
|
| |||||||||||
Cayman Islands — 0.1% |
| |||||||||||
Transocean, Inc. | ||||||||||||
6.50%, 11/15/20D | 5,000 | 3,475 | ||||||||||
7.13%, 12/15/21D | 40,000 | 25,950 | ||||||||||
4.30%, 10/15/22 | 205,000 | 109,675 | ||||||||||
6.80%, 03/15/38 | 20,000 | 10,875 | ||||||||||
|
| |||||||||||
| 149,975 | ||||||||||||
|
| |||||||||||
Ireland — 2.0% |
| |||||||||||
eircom Finance, Ltd. | ||||||||||||
9.25%, 05/15/20 144A(E) | 200,000 | 234,413 | ||||||||||
GE Capital International Funding Co. | ||||||||||||
4.42%, 11/15/35 144A | 4,811,000 | 4,919,286 | ||||||||||
|
| |||||||||||
| 5,153,699 | ||||||||||||
|
| |||||||||||
Italy — 0.7% |
| |||||||||||
Telecom Italia Capital SA | ||||||||||||
6.38%, 11/15/33 | 755,000 | 724,800 | ||||||||||
6.00%, 09/30/34 | 1,010,000 | 936,775 | ||||||||||
|
| |||||||||||
| 1,661,575 | ||||||||||||
|
| |||||||||||
| 128 | See Notes to Financial Statements. |
Table of Contents
| Par | Value | |||||||||
Luxembourg — 0.7% | ||||||||||
ArcelorMittal | ||||||||||
8.00%, 10/15/39 STEP | $ | 215,000 | $ | 147,812 | ||||||
7.75%, 03/01/41 STEPD | 975,000 | 664,219 | ||||||||
Tyco International Finance SA | ||||||||||
5.13%, 09/14/45D | 916,000 | 954,646 | ||||||||
|
| |||||||||
| 1,766,677 | ||||||||||
|
| |||||||||
Malaysia — 0.1% | ||||||||||
Telekom Malaysia Bhd | ||||||||||
7.88%, 08/01/25 144A | 225,000 | 290,381 | ||||||||
|
| |||||||||
Mexico — 1.1% |
| |||||||||
America Movil SAB de CV | ||||||||||
6.45%, 12/05/22(M) | 2,600,000 | 143,770 | ||||||||
8.46%, 12/18/36(M) | 12,000,000 | 666,722 | ||||||||
Mexican Bonos | ||||||||||
8.00%, 12/07/23(M) | 21,300,000 | 1,385,760 | ||||||||
10.00%, 12/05/24(M) | 3,500,000 | 256,155 | ||||||||
7.50%, 06/03/27(M) | 3,500,000 | 220,955 | ||||||||
8.50%, 05/31/29(M) | 500,000 | 33,993 | ||||||||
7.75%, 05/29/31(M) | 1,000,000 | 63, 756 | ||||||||
|
| |||||||||
| 2,771,111 | ||||||||||
|
| |||||||||
Netherlands — 2.9% |
| |||||||||
Cooperatieve Centrale Raiffeisen-Boerenleen-bank BA | ||||||||||
4.63%, 12/01/23 | 2,996,000 | 3,127,429 | ||||||||
5.25%, 05/24/41 | 1,023,000 | 1,170,882 | ||||||||
Enel Finance International NV | ||||||||||
6.80%, 09/15/37 144A | 100,000 | 122,474 | ||||||||
6.00%, 10/07/39 144A | 500,000 | 560,920 | ||||||||
Koninklijke Philips NV | ||||||||||
6.88%, 03/11/38 | 2,000,000 | 2,325,800 | ||||||||
Petrobras Global Finance BV | ||||||||||
5.63%, 05/20/43D | 120,000 | 72,900 | ||||||||
|
| |||||||||
| 7,380,405 | ||||||||||
|
| |||||||||
New Zealand — 0.3% |
| |||||||||
New Zealand Government Bond | ||||||||||
5.00%, 03/15/19(Z) | 945,000 | 689,980 | ||||||||
|
| |||||||||
Norway — 0.4% | ||||||||||
Norway Government Bond | ||||||||||
4.25%, 05/19/17 144A(K) | 7,670,000 | 909,007 | ||||||||
4.50%, 05/22/19 144A(K) | 265,000 | 33,729 | ||||||||
3.75%, 05/25/21 144A(K) | 196,000 | 25,320 | ||||||||
|
| |||||||||
| 968,056 | ||||||||||
|
| |||||||||
Spain — 0.8% |
| |||||||||
Telefonica Emisiones SA Unipersonal | ||||||||||
5.13%, 04/27/20 | 75,000 | 81,969 | ||||||||
7.05%, 06/20/36 | 1,720,000 | 2,073,035 | ||||||||
|
| |||||||||
| 2,155,004 | ||||||||||
|
| |||||||||
Supranational — 0.9% |
| |||||||||
Inter-American Development Bank | ||||||||||
6.00%, 12/15/17(Z) | 3,115,000 | 2,244,201 | ||||||||
|
| |||||||||
United Kingdom — 4.1% |
| |||||||||
Barclays PLC | ||||||||||
5.25%, 08/17/45 | 1,494,000 | 1,525,478 | ||||||||
Ensco PLC | ||||||||||
5.75%, 10/01/44 | 2,434,000 | 1,608,845 | ||||||||
| Par | Value | |||||||||
Lloyds Banking Group PLC | ||||||||||
5.30%, 12/01/45 144A | $ | 1,056,000 | $ | 1,071,599 | ||||||
Rio Tinto Finance USA PLC | ||||||||||
4.13%, 08/21/42 | 1,548,000 | 1,215,604 | ||||||||
Standard Chartered PLC | ||||||||||
5.20%, 01/26/24 144AD | 2,514,000 | 2,588,970 | ||||||||
5.70%, 03/26/44 144A | 2,492,000 | 2,506,282 | ||||||||
|
| |||||||||
| 10,516,778 | ||||||||||
|
| |||||||||
Total Foreign Bonds | 53,357,214 | |||||||||
|
| |||||||||
MUNICIPAL BONDS — 2.2% |
| |||||||||
State of Illinois, General Obligation | ||||||||||
5.10%, 06/01/33 | 635,000 | 601,123 | ||||||||
State of Illinois, General Obligation, Series B | ||||||||||
5.52%, 04/01/38 | 425,000 | 380,039 | ||||||||
University of California, Revenue Bond, Series AD | ||||||||||
4.86%, 05/15/12 | 4,912,000 | 4,673,129 | ||||||||
|
| |||||||||
Total Municipal Bonds | 5,654,291 | |||||||||
|
| |||||||||
U.S. TREASURY OBLIGATIONS — 18.5% |
| |||||||||
U.S. Treasury Bonds | ||||||||||
2.75%, 11/15/42 | 1,200,000 | 1,144,547 | ||||||||
2.88%, 05/15/43D | 1,345,000 | 1,311,822 | ||||||||
3.63%, 02/15/44 | 300,000 | 337,558 | ||||||||
3.13%, 08/15/44D | 22,163,000 | 22,656,902 | ||||||||
3.00%, 11/15/44 | 4,506,400 | 4,491,439 | ||||||||
3.00%, 05/15/45 | 3,852,000 | 3,835,375 | ||||||||
2.88%, 08/15/45 | 8,419,000 | 8,178,595 | ||||||||
|
| |||||||||
| 41,956,238 | ||||||||||
|
| |||||||||
U.S. Treasury Note | ||||||||||
2.13%, 05/15/25 | 5,480,000 | 5,409,143 | ||||||||
|
| |||||||||
Total U.S. Treasury Obligations |
| 47,365,381 | ||||||||
|
| |||||||||
| Shares | ||||||||||
PREFERRED STOCKS — 0.1% |
| |||||||||
Alcoa, Inc., | ||||||||||
5.38%, 10/01/17 CONV | 1,660 | 55,295 | ||||||||
Chesapeake Energy Corporation, | ||||||||||
5.00%, 12/31/49 CONVD | 620 | 10,850 | ||||||||
5.75%, 12/31/49 CONV 144AD | 80 | 15,950 | ||||||||
El Paso Energy Capital Trust I, | ||||||||||
4.75%, 03/31/28 CONVD | 5,350 | 216,675 | ||||||||
|
| |||||||||
Total Preferred Stocks | 298,770 | |||||||||
|
| |||||||||
| See Notes to Financial Statements. | 129 |
Table of Contents
EXTENDED-DURATION BOND FUND
SCHEDULE OF INVESTMENTS (Continued)
| Shares | Value | |||||||||||
MONEY MARKET FUNDS — 6.4% | ||||||||||||
GuideStone Money Market Fund (Investor Class)¥ | 7,390,825 | $ | 7,390,825 | |||||||||
Northern Institutional Liquid Assets Portfolio§ | 9,010,504 | 9,010,504 | ||||||||||
|
| |||||||||||
Total Money Market Funds |
| 16,401,329 | ||||||||||
|
| |||||||||||
TOTAL INVESTMENTS — 102.8% |
| 262,929,213 | ||||||||||
Liabilities in Excess of Other |
| (7,091,332 | ) | |||||||||
|
| |||||||||||
NET ASSETS — 100.0% | $ | 255,837,881 | ||||||||||
|
| |||||||||||
VALUATION HIERARCHY
The following is a summary of the inputs used, as of December 31, 2015, in valuing the Fund’s investments carried at fair value:
| Total Value | Level 1 Quoted Prices | Level 2 Other Significant Observable Inputs | Level 3 Significant Unobservable Inputs | |||||||||||||||||
Assets: | ||||||||||||||||||||
Investments in Securities: | ||||||||||||||||||||
Asset-Backed Security | $ | 2,920,422 | $ | — | $ | 2,920,422 | $ | — | ||||||||||||
Corporate Bonds | 136,931,806 | — | 136,905,978 | 25,828 | ||||||||||||||||
Foreign Bonds | 53,357,214 | — | 53,357,214 | — | ||||||||||||||||
Money Market Funds | 16,401,329 | 16,401,329 | — | — | ||||||||||||||||
Municipal Bonds | 5,654,291 | — | 5,654,291 | — | ||||||||||||||||
Preferred Stocks | 298,770 | 298,770 | — | — | ||||||||||||||||
U.S. Treasury Obligations | 47,365,381 | — | 47,365,381 | — | ||||||||||||||||
|
|
|
|
|
|
|
| |||||||||||||
Total Assets - Investments in Securities | $ | 262,929,213 | $ | 16,700,099 | $ | 246,203,286 | $ | 25,828 | ||||||||||||
|
|
|
|
|
|
|
| |||||||||||||
There were no transfers between Level 1 and Level 2 during the year ended December 31, 2015.
Management has determined that the amount of Level 3 securities compared to total net assets is not material; therefore, the reconciliation of Level 3 securities and assumptions is not shown for the period ending December 31, 2015.
| 130 | See Notes to Financial Statements. |
Table of Contents
The divergence in monetary policies among the major central banks, which began in 2014, accelerated in 2015. Although still very accommodating, the Federal Reserve (“Fed”) increased the fed funds rate in December in response to a stronger employment situation and an improving economic outlook. Risks to the U.S. economy continue, and the Fed is expected to be cautious and patient in their pace of further rate hikes, which will be based upon improving data. Outside the United States, however, central banks such as those in Japan, China and Continental Europe have continued their efforts to stimulate economic growth. This dynamic of differing policies will continue to be a major factor in the relative attractiveness of bonds and currencies around the globe. The U.S. dollar continued to gain in value relative to other major currencies including the Great Britain pound, the Japanese yen and the euro. This dollar strength dampened returns for U.S. investors on international bonds (denominated in U.S. dollars), and in many cases, turned small gains in local currency to more substantial losses in U.S. dollar terms. This trend may well continue should the Fed continue to increase short-term interest rates in the United States while the other major central banks maintain their stimulus efforts. The global bond market, as measured by the Barclays Global Aggregate Bond Index, posted an annual return of -3.15%. Emerging market debt, as measured by the J.P. Morgan Emerging Markets Bond Index Plus (“J.P. Morgan EMBI+”) (a U.S. dollar denominated index), generated an annual return of 1.82%.
The Fund is actively managed and invests in a diversified portfolio composed primarily of global fixed income securities with an average dollar-weighted duration (a measure of bond prices’ sensitivity to changes in interest rates) normally between three to 10 years. The Fund maintained its global focus, seeking investment opportunities across a wide array of economies, credits, yield curves and currencies. For the one-year period ended December 31, 2015, the Investor Class of the Fund underperformed its composite benchmark, 50% Barclays Global Aggregate Bond Index – Unhedged, 25% J.P. Morgan EMBI+ and 25% Barclays U.S. Corporate High Yield Index – 2% Issuer Capped, (-6.00% versus -2.21%). The underperformance was primarily due to widening credit spreads and a strengthening U.S. dollar. The yield curve strategy provided minimal performance variation relative to the composite benchmark. During the year, the Fund utilized U.S. and non-U.S. government futures and options to manage yield curve and duration strategies. These strategies were mixed in their impacts on the Fund’s performance. Additionally, the Fund used currency forward contracts and options on currency forwards for hedging purposes which benefited the Fund’s relative performance during the year.
During the year, the Fund remained focused on its objective of seeking to maximize total return through capital gains and current income while preserving principal value.
This Fund may be suitable for investors who have a medium- to long-term investment horizon, seek higher returns than those offered by a shorter maturity bond fund, can accept short-term fluctuations in account value and want to diversify their portfolio with a globally diversified fixed-income investment option. This Fund may invest, to a large extent, in high yield securities, commonly known as junk bonds. While offering higher current yields, these securities may be considered speculative and are subject to greater risks than higher-rated bonds. Securities of emerging countries may involve additional risks including price volatility, reduced liquidity, currency fluctuation and financial reporting requirements as well as political and economic instability. This Fund is subject to interest rate risk. Meaning, when interest rates rise, the value of the existing bonds decrease and vice versa. Changes in interest rates have a bigger impact on long duration holdings than on short duration holdings. To the extent that the investment adviser misjudges current market conditions, the Fund’s volatility may be amplified by its use of derivatives and by its ability to select sub-advisers to allocate assets. Some derivatives may increase the risk of loss and cause fluctuations in the market value of the Fund’s portfolio to have disproportionately large effects or cause the net asset value of the Fund generally to decline faster than it would otherwise. The use of certain derivatives may also have a leveraging effect which may increase the volatility of the Fund and may reduce its returns. It is possible to lose money by investing in the Fund.
131
Table of Contents
Global Bond Fund (Unaudited)
At December 31, 2015, the portfolio holdings of the Fund, as a percentage of net assets, is shown in the following table. Portfolio holdings are subject to risk and may change at any time.
| % | ||||
Corporate Bonds | 43.8 | |||
Foreign Bonds | 33.2 | |||
Money Market Funds | 14.0 | |||
U.S. Treasury Obligations | 10.5 | |||
Mortgage-Backed Securities | 2.1 | |||
Loan Agreements | 2.0 | |||
Common Stocks | 1.0 | |||
Foreign Government Inflation-Linked Bond | 0.6 | |||
Preferred Stocks | 0.5 | |||
Foreign Common Stocks | 0.2 | |||
Municipal Bond | 0.1 | |||
Purchased Option | — | |||
|
| |||
| 108.0 | ||||
|
| |||
132
Table of Contents
Global Bond Fund (Unaudited)
| Average Annual Total Returns as of 12/31/15 | ||||||
| Institutional Class* | Investor Class* | Benchmark** | ||||
One Year | N/A | -6.00% | -2.21% | |||
Five Year | N/A | 2.64% | 2.99% | |||
Since Inception(2) | -7.54% | 4.49% | 5.03% | |||
Inception Date | 04/30/15 | 12/29/06 | ||||
Total Fund Operating Expenses (May 1, 2015 Prospectus, as amended on June 1, 2015)(1) | 0.63% | 0.89% | ||||
(1)Current information regarding the Fund’s Operating Expenses can be found in the Financial Highlights.
(2)The Since Inception benchmark performance is based on the start date of December 29, 2006, which corresponds with the inception date of the Investor Class, the longest operating class of the Fund.
The performance data quoted represents past performance and does not guarantee future results. Current performance may be lower or higher. Performance data current to the most recent month-end may be obtained at www.GuideStoneFunds.org. The investment return and principal value of an investment will fluctuate so that shares, when redeemed, may be worth more or less than their original cost.
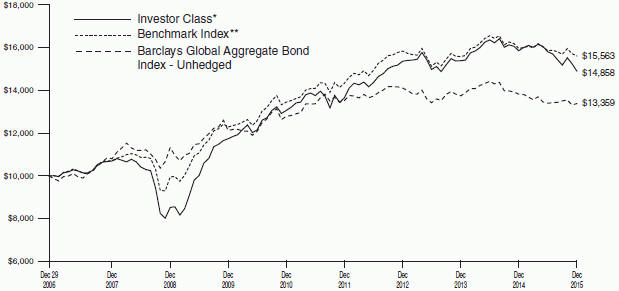
The graph compares the results of a hypothetical $10,000 investment in the Investor Class of the Fund since December 29, 2006 (commencement of operations), with all dividends and capital gains reinvested, with the weighted composite index.
*These returns reflect expense waivers by the Fund’s investment adviser. Without these waivers, returns would have been lower. Returns shown do not reflect the deduction of taxes that a shareholder would pay on Fund distributions or the redemption of Fund shares.
**Represents a weighted composite benchmark index consisting of 25% JPMorgan Emerging Markets Bond Index Plus, 50% Barclays Global Aggregate Bond Index — Unhedged and 25% Barclays U.S. Corporate High Yield – 2% Issuer Capped Index.
Unlike a mutual fund, the performance of an index assumes no taxes, transaction costs, management fees or other expenses.
133
Table of Contents
GLOBAL BOND FUND SCHEDULE OF INVESTMENTS | December 31, 2015 |
| Par | Value | |||||||||
CORPORATE BONDS — 43.8% |
| |||||||||
Activision Blizzard, Inc. | ||||||||||
5.63%, 09/15/21 144A | $ | 70,000 | $ | 73,500 | ||||||
6.13%, 09/15/23 144A | 60,000 | 63,750 | ||||||||
AECOM | ||||||||||
5.75%, 10/15/22 | 55,000 | 56,856 | ||||||||
5.88%, 10/15/24 | 245,000 | 249,900 | ||||||||
AES Corporation | ||||||||||
8.00%, 06/01/20D | 350,000 | 386,750 | ||||||||
7.38%, 07/01/21D | 170,000 | 174,250 | ||||||||
4.88%, 05/15/23 | 1,710,000 | 1,504,800 | ||||||||
Air Medical Merger Sub Corporation | ||||||||||
6.38%, 05/15/23 144AD | 200,000 | 179,000 | ||||||||
Alcatel-Lucent USA, Inc. | ||||||||||
6.45%, 03/15/29 | 275,000 | 279,469 | ||||||||
Alcoa, Inc. | ||||||||||
5.87%, 02/23/22 | 5,000 | 4,900 | ||||||||
5.90%, 02/01/27D | 825,000 | 761,062 | ||||||||
6.75%, 01/15/28 | 1,380,000 | 1,317,900 | ||||||||
5.95%, 02/01/37 | 65,000 | 52,650 | ||||||||
Ally Financial, Inc. | ||||||||||
5.50%, 02/15/17 | 70,000 | 72,275 | ||||||||
8.00%, 12/31/18 | 104,000 | 113,880 | ||||||||
3.50%, 01/27/19 | 1,000,000 | 988,750 | ||||||||
8.00%, 03/15/20 | 161,000 | 183,942 | ||||||||
5.13%, 09/30/24D | 920,000 | 945,300 | ||||||||
8.00%, 11/01/31 | 345,000 | 399,769 | ||||||||
American Airlines Group, Inc. | ||||||||||
5.50%, 10/01/19 144AD | 1,825,000 | 1,806,750 | ||||||||
American Axle & Manufacturing, Inc. | ||||||||||
6.63%, 10/15/22 | 150,000 | 157,500 | ||||||||
Anadarko Petroleum Corporation | ||||||||||
5.95%, 09/15/16 | 10,000 | 10,277 | ||||||||
6.38%, 09/15/17 | 80,000 | 83,924 | ||||||||
4.50%, 07/15/44 | 55,000 | 42,256 | ||||||||
Antero Resources Corporation | ||||||||||
5.38%, 11/01/21 | 365,000 | 293,825 | ||||||||
5.13%, 12/01/22 | 475,000 | 363,375 | ||||||||
Anthem, Inc. | ||||||||||
6.38%, 06/15/37 | 221,000 | 262,889 | ||||||||
Appvion, Inc. | ||||||||||
9.00%, 06/01/20 144A | 140,000 | 56,700 | ||||||||
Arch Coal, Inc. | ||||||||||
9.88%, 06/15/19# | 400,000 | 5,000 | ||||||||
Argos Merger Sub, Inc. | ||||||||||
7.13%, 03/15/23 144A | 400,000 | 397,600 | ||||||||
Ashtead Capital, Inc. | ||||||||||
5.63%, 10/01/24 144AD | 330,000 | 335,775 | ||||||||
AT&T, Inc. | ||||||||||
3.88%, 08/15/21 | 60,000 | 61,978 | ||||||||
Atrium Windows & Doors, Inc. | ||||||||||
7.75%, 05/01/19 144A | 565,000 | 420,925 | ||||||||
Atwood Oceanics, Inc. | ||||||||||
6.50%, 02/01/20 | 100,000 | 54,000 | ||||||||
Avon Products, Inc. | ||||||||||
8.70%, 03/15/43 | 115,000 | 83,375 | ||||||||
Ball Corporation | ||||||||||
5.25%, 07/01/25 | 460,000 | 472,075 | ||||||||
Bank of America Corporation | ||||||||||
5.49%, 03/15/19 | 100,000 | 107,988 | ||||||||
4.25%, 10/22/26 | 100,000 | 99,196 | ||||||||
| Par | Value | |||||||||
6.05%, 06/01/34@ | $ | 700,000 | $ | 767,486 | ||||||
6.11%, 01/29/37 | 1,300,000 | 1,479,682 | ||||||||
6.50%, 10/29/49†D | 920,000 | 970,600 | ||||||||
5.20%, 12/29/49†D | 300,000 | 279,750 | ||||||||
Barrick North America Finance LLC | ||||||||||
5.75%, 05/01/43 | 1,000,000 | 725,337 | ||||||||
Baxalta, Inc. | ||||||||||
5.25%, 06/23/45 144A | 120,000 | 120,673 | ||||||||
Beazer Homes USA, Inc. | ||||||||||
7.25%, 02/01/23D | 50,000 | 44,250 | ||||||||
Best Buy Co., Inc. | ||||||||||
5.00%, 08/01/18D | 3,455,000 | 3,592,336 | ||||||||
Blue Cube Spinco, Inc. | ||||||||||
10.00%, 10/15/25 144A | 1,525,000 | 1,685,125 | ||||||||
Blue Racer Midstream LLC | ||||||||||
6.13%, 11/15/22 144A | 200,000 | 139,000 | ||||||||
BreitBurn Energy Partners LP | ||||||||||
8.63%, 10/15/20 | 60,000 | 12,300 | ||||||||
Brocade Communications Systems, Inc. | ||||||||||
1.38%, 01/01/20 CONV 144A | 345,000 | 332,062 | ||||||||
CalAtlantic Group, Inc. | ||||||||||
0.25%, 06/01/19 CONV | 140,000 | 125,912 | ||||||||
California Resources Corporation | ||||||||||
6.00%, 11/15/24D | 970,000 | 298,275 | ||||||||
Calpine Corporation | ||||||||||
5.88%, 01/15/24 144AD | 304,000 | 313,120 | ||||||||
Calumet Specialty Products Partners LP | ||||||||||
6.50%, 04/15/21 | 230,000 | 201,250 | ||||||||
Carrizo Oil & Gas, Inc. | ||||||||||
6.25%, 04/15/23 | 330,000 | 268,950 | ||||||||
CBC Ammo LLC | ||||||||||
7.25%, 11/15/21 144AD | 350,000 | 290,675 | ||||||||
CCO Holdings LLC | ||||||||||
7.00%, 01/15/19 | 230,000 | 235,175 | ||||||||
5.38%, 05/01/25 144AD | 130,000 | 129,675 | ||||||||
Celgene Corporation | ||||||||||
5.00%, 08/15/45 | 980,000 | 987,579 | ||||||||
Cemex Finance LLC | ||||||||||
9.38%, 10/12/22 | 550,000 | 581,625 | ||||||||
Century Intermediate Holding Co. 2 Cash coupon | ||||||||||
9.75%, 02/15/19 PIK 144A | 130,000 | 133,412 | ||||||||
CenturyLink, Inc. | ||||||||||
5.63%, 04/01/20D | 295,000 | 292,788 | ||||||||
7.60%, 09/15/39 | 810,000 | 623,700 | ||||||||
7.65%, 03/15/42 | 165,000 | 127,050 | ||||||||
Chemours Co. | ||||||||||
6.63%, 05/15/23 144A | 1,055,000 | 743,775 | ||||||||
7.00%, 05/15/25 144AD | 195,000 | 133,575 | ||||||||
Chesapeake Energy Corporation | ||||||||||
7.25%, 12/15/18D | 80,000 | 32,000 | ||||||||
3.57%, 04/15/19† | 20,000 | 5,650 | ||||||||
6.63%, 08/15/20 | 145,000 | 42,775 | ||||||||
6.88%, 11/15/20 | 75,000 | 21,750 | ||||||||
6.13%, 02/15/21 | 665,000 | 190,855 | ||||||||
4.88%, 04/15/22D | 2,620,000 | 740,307 | ||||||||
5.75%, 03/15/23 | 350,000 | 103,250 | ||||||||
2.50%, 05/15/37 CONV | 560,000 | 266,000 | ||||||||
| 134 | See Notes to Financial Statements. |
Table of Contents
| Par | Value | |||||||||
2.25%, 12/15/38 CONV | $ | 1,560,000 | $ | 528,450 | ||||||
Ciena Corporation | ||||||||||
0.88%, 06/15/17 CONVD | 2,090,000 | 2,059,956 | ||||||||
3.75%, 10/15/18 CONV 144A | 415,000 | 516,675 | ||||||||
Cincinnati Bell Telephone Co. LLC | ||||||||||
6.30%, 12/01/28 | 155,000 | 141,050 | ||||||||
CIT Group, Inc. | ||||||||||
5.00%, 08/15/22 | 500,000 | 514,690 | ||||||||
5.00%, 08/01/23 | 670,000 | 681,725 | ||||||||
Citigroup, Inc. | ||||||||||
5.13%, 11/12/19(Z) | 640,000 | 450,584 | ||||||||
3.50%, 05/15/23 | 1,305,000 | 1,285,160 | ||||||||
5.35%, 04/29/49†D | 360,000 | 341,550 | ||||||||
5.95%, 12/29/49† | 250,000 | 240,938 | ||||||||
6.30%, 12/29/49†D | 1,330,000 | 1,298,412 | ||||||||
Clear Channel Worldwide Holdings, Inc. | ||||||||||
7.63%, 03/15/20 | 345,000 | 319,988 | ||||||||
Cleaver-Brooks, Inc. | ||||||||||
8.75%, 12/15/19 144A | 110,000 | 106,700 | ||||||||
Cliffs Natural Resources, Inc. | ||||||||||
6.25%, 10/01/40D | 1,920,000 | 364,800 | ||||||||
Cloud Peak Energy Resources LLC | ||||||||||
6.38%, 03/15/24D | 60,000 | 18,000 | ||||||||
CME Group, Inc. | ||||||||||
5.30%, 09/15/43 | 860,000 | 986,891 | ||||||||
Comcast Corporation | ||||||||||
5.15%, 03/01/20 | 170,000 | 190,054 | ||||||||
Communications Sales & Leasing, Inc. | ||||||||||
8.25%, 10/15/23 | 410,000 | 348,500 | ||||||||
Compiler Finance Sub, Inc. | ||||||||||
7.00%, 05/01/21 144A | 360,000 | 158,400 | ||||||||
Concho Resources, Inc. | ||||||||||
5.50%, 10/01/22 | 260,000 | 237,900 | ||||||||
5.50%, 04/01/23 | 700,000 | 651,000 | ||||||||
ConocoPhillips | ||||||||||
6.50%, 02/01/39 | 20,000 | 21,115 | ||||||||
Consolidated Comm-unications, Inc. | ||||||||||
6.50%, 10/01/22 | 60,000 | 50,700 | ||||||||
Continental Airlines 2007-1 Class A Pass-Through Trust | ||||||||||
5.98%, 10/19/23 | 430,758 | 476,225 | ||||||||
Continental Airlines 2009-1 Pass-Through Trust | ||||||||||
9.00%, 01/08/18 | 853,551 | 881,504 | ||||||||
Continental Resources, Inc. | ||||||||||
4.50%, 04/15/23 | 15,000 | 10,792 | ||||||||
3.80%, 06/01/24D | 145,000 | 102,313 | ||||||||
Countrywide Financial Corporation | ||||||||||
6.25%, 05/15/16 | 280,000 | 284,745 | ||||||||
Crestwood Midstream Partners LP | ||||||||||
6.00%, 12/15/20 | 250,000 | 185,000 | ||||||||
6.13%, 03/01/22 | 120,000 | 84,000 | ||||||||
CSC Holdings LLC | ||||||||||
6.75%, 11/15/21 | 210,000 | 206,850 | ||||||||
5.25%, 06/01/24D | 140,000 | 123,200 | ||||||||
CST Brands, Inc. | ||||||||||
5.00%, 05/01/23 | 170,000 | 169,150 | ||||||||
| Par | Value | |||||||||
CTR Partnership LP | ||||||||||
5.88%, 06/01/21 | $ | 500,000 | $ | 506,875 | ||||||
Cummins, Inc. | ||||||||||
5.65%, 03/01/98 | 860,000 | 900,332 | ||||||||
D.R. Horton, Inc. | ||||||||||
4.38%, 09/15/22 | 1,405,000 | 1,403,244 | ||||||||
DaVita HealthCare Partners, Inc. | ||||||||||
5.13%, 07/15/24 | 90,000 | 90,169 | ||||||||
Delta Air Lines 2007-1 Class B Pass-Through Trust | ||||||||||
8.02%, 02/10/24 | 57,260 | 64,346 | ||||||||
Dillard’s, Inc. | ||||||||||
7.75%, 07/15/26 | 890,000 | 1,030,765 | ||||||||
DISH DBS Corporation | ||||||||||
5.88%, 07/15/22 | 600,000 | 561,000 | ||||||||
5.00%, 03/15/23 | 410,000 | 356,700 | ||||||||
5.88%, 11/15/24 | 1,510,000 | 1,347,675 | ||||||||
DJO Finance LLC | ||||||||||
8.13%, 06/15/21 144A | 830,000 | 738,700 | ||||||||
Dollar Tree, Inc. | ||||||||||
5.75%, 03/01/23 144AD | 920,000 | 956,800 | ||||||||
DPL, Inc. | ||||||||||
6.75%, 10/01/19 | 390,000 | 390,000 | ||||||||
DS Services of America, Inc. | ||||||||||
10.00%, 09/01/21 144A | 265,000 | 300,775 | ||||||||
Eagle Spinco, Inc. | ||||||||||
4.63%, 02/15/21 | 520,000 | 480,350 | ||||||||
El Paso Natural Gas Co. LLC | ||||||||||
8.63%, 01/15/22D | 90,000 | 97,975 | ||||||||
8.38%, 06/15/32 | 75,000 | 72,467 | ||||||||
Embarq Corporation | ||||||||||
8.00%, 06/01/36 | 995,000 | 1,027,338 | ||||||||
Enbridge Energy Partners LP | ||||||||||
5.88%, 10/15/25 | 460,000 | 443,330 | ||||||||
7.38%, 10/15/45 | 435,000 | 416,764 | ||||||||
Enterprise Products Operating LLC | ||||||||||
8.38%, 08/01/66† | 60,000 | 53,850 | ||||||||
ERAC USA Finance LLC | ||||||||||
7.00%, 10/15/37 144A | 1,065,000 | 1,301,849 | ||||||||
ExamWorks Group, Inc. | ||||||||||
5.63%, 04/15/23 | 310,000 | 309,612 | ||||||||
First Cash Financial Services, Inc. | ||||||||||
6.75%, 04/01/21 | 40,000 | 39,400 | ||||||||
First Data Corporation | ||||||||||
7.00%, 12/01/23 144A | 310,000 | 310,775 | ||||||||
FirstEnergy Corporation | ||||||||||
7.38%, 11/15/31 | 185,000 | 225,889 | ||||||||
Florida East Coast Holdings Corporation | ||||||||||
6.75%, 05/01/19 144A | 630,000 | 578,025 | ||||||||
9.75%, 05/01/20 144A | 40,000 | 27,400 | ||||||||
Ford Motor Co. | ||||||||||
6.63%, 10/01/28 | 850,000 | 983,599 | ||||||||
Freeport-McMoRan, Inc. | ||||||||||
2.38%, 03/15/18 | 330,000 | 259,050 | ||||||||
3.55%, 03/01/22D | 380,000 | 222,300 | ||||||||
5.40%, 11/14/34 | 115,000 | 61,525 | ||||||||
5.45%, 03/15/43 | 1,715,000 | 900,375 | ||||||||
Fresenius Medical Care US Finance, Inc. | ||||||||||
5.75%, 02/15/21 144A | 750,000 | 806,250 | ||||||||
| See Notes to Financial Statements. | 135 |
Table of Contents
GLOBAL BOND FUND
SCHEDULE OF INVESTMENTS (Continued)
| Par | Value | |||||||||
Frontier Communications Corporation | ||||||||||
11.00%, 09/15/25 144A | $ | 105,000 | $ | 104,213 | ||||||
7.88%, 01/15/27 | 405,000 | 334,125 | ||||||||
FTS International, Inc. | ||||||||||
6.25%, 05/01/22D | 210,000 | 59,850 | ||||||||
GameStop Corporation | ||||||||||
5.50%, 10/01/19 144AD | 295,000 | 291,681 | ||||||||
Gates Global LLC | ||||||||||
6.00%, 07/15/22 144A | 195,000 | 141,375 | ||||||||
General Electric Capital Corporation | ||||||||||
6.75%, 09/26/16(Z) | 150,000 | 104,898 | ||||||||
3.15%, 09/07/22 | 95,000 | 97,319 | ||||||||
6.75%, 03/15/32 | 30,000 | 39,261 | ||||||||
6.88%, 01/10/39 | 161,000 | 219,888 | ||||||||
General Motors Co. | ||||||||||
6.25%, 10/02/43 | 840,000 | 890,489 | ||||||||
General Motors Financial Co., Inc. | ||||||||||
2.75%, 05/15/16 | 10,000 | 10,030 | ||||||||
4.38%, 09/25/21 | 120,000 | 121,839 | ||||||||
3.45%, 04/10/22 | 300,000 | 288,178 | ||||||||
Genesis Energy LP | ||||||||||
6.75%, 08/01/22 | 120,000 | 102,600 | ||||||||
6.00%, 05/15/23 | 230,000 | 185,150 | ||||||||
Genworth Holdings, Inc. | ||||||||||
4.90%, 08/15/23 | 250,000 | 167,500 | ||||||||
4.80%, 02/15/24D | 105,000 | 71,400 | ||||||||
6.50%, 06/15/34D | 110,000 | 67,100 | ||||||||
GEO Group, Inc. | ||||||||||
5.88%, 10/15/24 | 100,000 | 97,500 | ||||||||
Georgia-Pacific LLC | ||||||||||
8.88%, 05/15/31 | 605,000 | 849,357 | ||||||||
Gilead Sciences, Inc. | ||||||||||
4.75%, 03/01/46 | 970,000 | 984,012 | ||||||||
Global Marine, Inc. | ||||||||||
7.00%, 06/01/28D | 45,000 | 22,050 | ||||||||
Goldman Sachs Capital II | ||||||||||
4.00%, 12/29/49† | 1,290,000 | 912,675 | ||||||||
Goldman Sachs Group, Inc. | ||||||||||
2.90%, 07/19/18 | 130,000 | 132,622 | ||||||||
6.75%, 10/01/37 | 355,000 | 416,233 | ||||||||
Goodyear Tire & Rubber Co. | ||||||||||
5.13%, 11/15/23 | 1,030,000 | 1,060,900 | ||||||||
7.00%, 03/15/28 | 690,000 | 731,400 | ||||||||
Guitar Center, Inc. | ||||||||||
6.50%, 04/15/19 144A | 300,000 | 253,500 | ||||||||
9.63%, 04/15/20 144AD | 200,000 | 141,000 | ||||||||
Gulfmark Offshore, Inc. | ||||||||||
6.38%, 03/15/22D | 220,000 | 119,350 | ||||||||
Gulfport Energy Corporation | ||||||||||
7.75%, 11/01/20 | 30,000 | 27,000 | ||||||||
Halcon Resources Corporation | ||||||||||
8.88%, 05/15/21 | 270,000 | 79,650 | ||||||||
9.25%, 02/15/22 | 1,440,000 | 417,600 | ||||||||
Hardwoods Acquisition, Inc. | ||||||||||
7.50%, 08/01/21 144A | 90,000 | 74,700 | ||||||||
HCA, Inc. | ||||||||||
7.50%, 02/15/22 | 500,000 | 556,250 | ||||||||
7.50%, 12/15/23 | 770,000 | 827,750 | ||||||||
8.36%, 04/15/24 | 90,000 | 102,150 | ||||||||
5.38%, 02/01/25 | 370,000 | 365,838 | ||||||||
7.69%, 06/15/25 | 815,000 | 882,238 | ||||||||
| Par | Value | |||||||||
7.58%, 09/15/25 | $ | 715,000 | $ | 777,562 | ||||||
5.88%, 02/15/26 | 1,060,000 | 1,066,625 | ||||||||
7.05%, 12/01/27 | 20,000 | 20,350 | ||||||||
7.50%, 11/06/33 | 205,000 | 220,375 | ||||||||
7.75%, 07/15/36 | 120,000 | 128,400 | ||||||||
Hercules, Inc. | ||||||||||
6.50%, 06/30/29 | 250,000 | 212,500 | ||||||||
Hexion, Inc. | ||||||||||
6.63%, 04/15/20D | 200,000 | 156,500 | ||||||||
9.00%, 11/15/20 | 185,000 | 71,688 | ||||||||
Hiland Partners LP | ||||||||||
7.25%, 10/01/20 144A | 545,000 | 551,131 | ||||||||
Hilton Worldwide Finance LLC | ||||||||||
5.63%, 10/15/21 | 380,000 | 395,675 | ||||||||
Howard Hughes Corporation | ||||||||||
6.88%, 10/01/21 144A | 640,000 | 656,000 | ||||||||
IASIS Healthcare LLC | ||||||||||
8.38%, 05/15/19 | 520,000 | 481,000 | ||||||||
Iconix Brand Group, Inc. | ||||||||||
1.50%, 03/15/18 CONV | 225,000 | 111,375 | ||||||||
Intel Corporation | ||||||||||
2.95%, 12/15/35 CONV | 580,000 | 743,488 | ||||||||
3.25%, 08/01/39 CONV | 460,000 | 765,902 | ||||||||
International Lease Finance Corporation | ||||||||||
3.88%, 04/15/18 | 10,000 | 10,100 | ||||||||
6.25%, 05/15/19 | 75,000 | 80,531 | ||||||||
4.63%, 04/15/21D | 300,000 | 308,250 | ||||||||
5.88%, 08/15/22 | 230,000 | 245,525 | ||||||||
INVISTA Finance LLC | ||||||||||
4.25%, 10/15/19 144A | 915,000 | 892,125 | ||||||||
iStar, Inc. | ||||||||||
3.88%, 07/01/16 | 30,000 | 29,962 | ||||||||
7.13%, 02/15/18 | 150,000 | 155,812 | ||||||||
4.88%, 07/01/18D | 95,000 | 93,456 | ||||||||
J.C. Penney Corporation, Inc. | ||||||||||
6.38%, 10/15/36 | 480,000 | 298,800 | ||||||||
7.63%, 03/01/97 | 815,000 | 533,825 | ||||||||
Jefferies Finance LLC | ||||||||||
7.50%, 04/15/21 144AD | 275,000 | 243,031 | ||||||||
6.88%, 04/15/22 144A | 200,000 | 169,000 | ||||||||
Jefferies Group LLC | ||||||||||
5.13%, 04/13/18 | 55,000 | 57,265 | ||||||||
6.88%, 04/15/21 | 270,000 | 302,719 | ||||||||
5.13%, 01/20/23D | 305,000 | 303,040 | ||||||||
6.45%, 06/08/27 | 35,000 | 37,141 | ||||||||
3.88%, 11/01/29 CONV | 55,000 | 54,931 | ||||||||
6.25%, 01/15/36 | 1,135,000 | 1,054,239 | ||||||||
6.50%, 01/20/43 | 510,000 | 473,001 | ||||||||
Joseph T. Ryerson & Son, Inc. | ||||||||||
9.00%, 10/15/17 | 90,000 | 69,750 | ||||||||
JPMorgan Chase & Co. | ||||||||||
4.25%, 11/02/18(Z) | 360,000 | 249,239 | ||||||||
3.38%, 05/01/23D | 370,000 | 364,227 | ||||||||
6.13%, 12/29/49† | 260,000 | 263,250 | ||||||||
K. Hovnanian Enterprises, Inc. | ||||||||||
7.00%, 01/15/19 144AD | 115,000 | 77,625 | ||||||||
8.00%, 11/01/19 144A | 165,000 | 103,125 | ||||||||
5.00%, 11/01/21 | 795,000 | 535,631 | ||||||||
KB Home | ||||||||||
1.38%, 02/01/19 CONV | 440,000 | 395,725 | ||||||||
Kinder Morgan Energy Partners LP | ||||||||||
6.50%, 02/01/37 | 75,000 | 64,600 | ||||||||
| 136 | See Notes to Financial Statements. |
Table of Contents
| Par | Value | |||||||||
6.95%, 01/15/38 | $ | 90,000 | $ | 77,502 | ||||||
Kinder Morgan, Inc. | ||||||||||
7.75%, 01/15/32 | 80,000 | 76,252 | ||||||||
Kindred Healthcare, Inc. | ||||||||||
8.00%, 01/15/20 | 200,000 | 188,000 | ||||||||
Kraft Heinz Foods Co. | ||||||||||
4.88%, 02/15/25 144A | 196,000 | 208,537 | ||||||||
5.20%, 07/15/45 144A | 960,000 | 1,006,935 | ||||||||
Lennar Corporation | ||||||||||
4.75%, 11/15/22 | 315,000 | 313,898 | ||||||||
Level 3 Communications, Inc. | ||||||||||
5.75%, 12/01/22 | 150,000 | 153,375 | ||||||||
Level 3 Financing, Inc. | ||||||||||
7.00%, 06/01/20 | 730,000 | 764,675 | ||||||||
5.63%, 02/01/23 | 980,000 | 999,600 | ||||||||
5.38%, 05/01/25 144A | 5,000 | 4,994 | ||||||||
Linn Energy LLC | ||||||||||
6.50%, 05/15/19 | 190,000 | 34,200 | ||||||||
LStar Securities Investment | ||||||||||
7.42%, 09/15/20+ | 1,000,000 | 997,400 | ||||||||
Magnum Hunter Resources Corporation | ||||||||||
9.75%, 05/15/20#@D | 470,000 | 124,550 | ||||||||
Masco Corporation | ||||||||||
5.85%, 03/15/17 | 90,000 | �� | 93,880 | |||||||
7.75%, 08/01/29 | 250,000 | 278,125 | ||||||||
6.50%, 08/15/32 | 175,000 | 177,188 | ||||||||
MBIA Insurance Corporation | ||||||||||
11.58%, 01/15/33 144A† | 435,000 | 85,912 | ||||||||
MeadWestvaco Corporation | ||||||||||
8.20%, 01/15/30 | 145,000 | 188,319 | ||||||||
7.95%, 02/15/31 | 45,000 | 55,655 | ||||||||
Meccanica Holdings USA, Inc. | ||||||||||
6.25%, 01/15/40 144A | 335,000 | 312,388 | ||||||||
Michael Baker International LLC | ||||||||||
8.25%, 10/15/18 144A | 100,000 | 90,500 | ||||||||
Microchip Technology, Inc. | ||||||||||
1.63%, 02/15/25 CONV 144AD | 280,000 | 279,650 | ||||||||
Micron Technology, Inc. | ||||||||||
5.25%, 08/01/23 144A | 430,000 | 388,075 | ||||||||
5.50%, 02/01/25D | 1,815,000 | 1,583,588 | ||||||||
5.63%, 01/15/26 144A | 985,000 | 854,488 | ||||||||
Midas Intermediate Holdco II LLC | ||||||||||
7.88%, 10/01/22 144A | 1,015,000 | 913,500 | ||||||||
Miran Mid Atlantic Series C Pass-Through Trust | ||||||||||
10.06%, 12/30/28 | 769,693 | 759,610 | ||||||||
Molina Healthcare, Inc. | ||||||||||
5.38%, 11/15/22 144A | 470,000 | 471,175 | ||||||||
Morgan Stanley | ||||||||||
4.75%, 11/16/18(A) | 275,000 | 206,484 | ||||||||
5.75%, 01/25/21 | 205,000 | 230,419 | ||||||||
3.13%, 08/05/21(C) | 535,000 | 398,402 | ||||||||
3.75%, 02/25/23 | 125,000 | 128,233 | ||||||||
4.10%, 05/22/23 | 370,000 | 374,366 | ||||||||
6.25%, 08/09/26 | 400,000 | 469,237 | ||||||||
4.35%, 09/08/26 | 940,000 | 945,073 | ||||||||
Motorola Solutions, Inc. | ||||||||||
6.63%, 11/15/37 | 105,000 | 107,718 | ||||||||
MPLX LP | ||||||||||
5.50%, 02/15/23 144AD | 240,000 | 211,200 | ||||||||
4.50%, 07/15/23 144A | 20,000 | 17,994 | ||||||||
| Par | Value | |||||||||
4.88%, 12/01/24 144A | $ | 460,000 | $ | 415,150 | ||||||
4.88%, 06/01/25 144A | 75,000 | 67,500 | ||||||||
Murphy Oil USA, Inc. | ||||||||||
6.00%, 08/15/23D | 160,000 | 168,800 | ||||||||
Murray Energy Corporation | ||||||||||
11.25%, 04/15/21 144AD | 710,000 | 133,125 | ||||||||
Mutual of Omaha Insurance Co. | ||||||||||
6.80%, 06/15/36 144A | 1,200,000 | 1,509,341 | ||||||||
Natural Resource Partners LP | ||||||||||
9.13%, 10/01/18D | 70,000 | 45,850 | ||||||||
Navient Corporation | ||||||||||
5.00%, 06/15/18 | 700,000 | 668,500 | ||||||||
8.45%, 06/15/18 | 472,000 | 497,960 | ||||||||
5.50%, 01/15/19 | 75,000 | 70,312 | ||||||||
4.88%, 06/17/19 | 220,000 | 202,950 | ||||||||
8.00%, 03/25/20 | 600,000 | 594,300 | ||||||||
5.88%, 03/25/21D | 320,000 | 286,000 | ||||||||
5.50%, 01/25/23 | 1,720,000 | 1,382,450 | ||||||||
6.13%, 03/25/24 | 1,480,000 | 1,211,750 | ||||||||
5.88%, 10/25/24 | 600,000 | 482,250 | ||||||||
Neiman Marcus Group, Ltd. LLC Cash coupon 8.75% or PIK | ||||||||||
9.50%, 10/15/21 144A | 130,000 | 81,250 | ||||||||
Neptune Finco Corporation | ||||||||||
10.88%, 10/15/25 144AD | 1,070,000 | 1,123,500 | ||||||||
NES Rentals Holdings, Inc. | ||||||||||
7.88%, 05/01/18 144A | 60,000 | 54,900 | ||||||||
Netflix, Inc. | ||||||||||
5.50%, 02/15/22 144AD | 560,000 | 576,800 | ||||||||
5.88%, 02/15/25 144A | 380,000 | 391,400 | ||||||||
New Albertsons, Inc. | ||||||||||
7.75%, 06/15/26 | 410,000 | 379,250 | ||||||||
7.45%, 08/01/29 | 1,375,000 | 1,223,750 | ||||||||
8.00%, 05/01/31 | 1,200,000 | 1,098,000 | ||||||||
Newell Rubbermaid, Inc. | ||||||||||
4.00%, 12/01/24 | 445,000 | 411,544 | ||||||||
Newfield Exploration Co. | ||||||||||
5.63%, 07/01/24 | 955,000 | 818,912 | ||||||||
Newmont Mining Corporation | ||||||||||
4.88%, 03/15/42 | 575,000 | 412,162 | ||||||||
Nine West Holdings, Inc. | ||||||||||
6.13%, 11/15/34 | 125,000 | 20,000 | ||||||||
NRG REMA LLC | ||||||||||
9.68%, 07/02/26 | 300,000 | 291,375 | ||||||||
Nuance Communications, Inc. | ||||||||||
1.00%, 12/15/35 CONV 144A | 730,000 | 705,819 | ||||||||
NWH Escrow Corporation | ||||||||||
7.50%, 08/01/21 144A | 100,000 | 80,500 | ||||||||
Oasis Petroleum, Inc. | ||||||||||
7.25%, 02/01/19D | 320,000 | 231,200 | ||||||||
6.88%, 03/15/22D | 580,000 | 374,100 | ||||||||
6.88%, 01/15/23 | 170,000 | 105,400 | ||||||||
Old Republic International Corporation | ||||||||||
3.75%, 03/15/18 CONVD | 1,600,000 | 2,034,000 | ||||||||
4.88%, 10/01/24 | 520,000 | 534,754 | ||||||||
ON Semiconductor Corporation | ||||||||||
1.00%, 12/01/20 CONV 144AD | 455,000 | 425,994 | ||||||||
ONEOK Partners LP | ||||||||||
4.90%, 03/15/25 | 40,000 | 33,749 | ||||||||
6.20%, 09/15/43 | 20,000 | 15,294 | ||||||||
| See Notes to Financial Statements. | 137 |
Table of Contents
GLOBAL BOND FUND
SCHEDULE OF INVESTMENTS (Continued)
| Par | Value | |||||||||
Outfront Media Capital LLC | ||||||||||
5.25%, 02/15/22 | $ | 110,000 | $ | 112,888 | ||||||
5.88%, 03/15/25 | 170,000 | 172,338 | ||||||||
Owens Corning | ||||||||||
7.00%, 12/01/36 | 1,800,000 | 1,978,898 | ||||||||
Owens-Brockway Glass Container, Inc. | ||||||||||
5.38%, 01/15/25 144AD | 1,500,000 | 1,471,875 | ||||||||
Pactiv LLC | ||||||||||
8.38%, 04/15/27 | 200,000 | 187,000 | ||||||||
Parker Drilling Co. | ||||||||||
6.75%, 07/15/22 | 80,000 | 55,200 | ||||||||
Parsley Energy LLC | ||||||||||
7.50%, 02/15/22 144AD | 330,000 | 316,800 | ||||||||
Penn Mutual Life Insurance Co. | ||||||||||
7.63%, 06/15/40 144A | 685,000 | 905,967 | ||||||||
Pioneer Natural Resources Co. | ||||||||||
5.88%, 07/15/16 | 900,000 | 914,183 | ||||||||
Priceline Group, Inc. | ||||||||||
0.90%, 09/15/21 CONVD | 390,000 | 393,412 | ||||||||
PulteGroup, Inc. | ||||||||||
7.88%, 06/15/32 | 1,500,000 | 1,706,250 | ||||||||
6.38%, 05/15/33 | 470,000 | 479,400 | ||||||||
6.00%, 02/15/35 | 180,000 | 177,300 | ||||||||
QEP Resources, Inc. | ||||||||||
6.88%, 03/01/21 | 695,000 | 573,375 | ||||||||
5.38%, 10/01/22 | 135,000 | 97,200 | ||||||||
5.25%, 05/01/23D | 2,310,000 | 1,651,650 | ||||||||
Quicken Loans, Inc. | ||||||||||
5.75%, 05/01/25 144AD | 1,395,000 | 1,333,969 | ||||||||
Quicksilver Resources, Inc. | ||||||||||
11.00%, 07/01/21# | 90,000 | 2,925 | ||||||||
Qwest Capital Funding, Inc. | ||||||||||
6.50%, 11/15/18 | 225,000 | 230,625 | ||||||||
Qwest Corporation | ||||||||||
7.25%, 09/15/25 | 615,000 | 655,361 | ||||||||
6.88%, 09/15/33 | 2,124,000 | 2,043,492 | ||||||||
7.25%, 10/15/35D | 110,000 | 108,350 | ||||||||
R.R. Donnelley & Sons Co. | ||||||||||
7.00%, 02/15/22 | 495,000 | 470,250 | ||||||||
6.00%, 04/01/24D | 465,000 | 415,012 | ||||||||
Rain CII Carbon LLC | ||||||||||
8.50%, 01/15/21(E) | 100,000 | 80,310 | ||||||||
Range Resources Corporation | ||||||||||
5.00%, 08/15/22D | 520,000 | 391,300 | ||||||||
5.00%, 03/15/23D | 1,690,000 | 1,267,500 | ||||||||
4.88%, 05/15/25 144AD | 240,000 | 183,300 | ||||||||
Regency Energy Partners LP | ||||||||||
5.88%, 03/01/22 | 340,000 | 320,875 | ||||||||
5.00%, 10/01/22 | 80,000 | 70,968 | ||||||||
Reliance Holding USA, Inc. | ||||||||||
4.50%, 10/19/20 144AD | 540,000 | �� | 572,502 | |||||||
Resolute Forest Products, Inc. | ||||||||||
5.88%, 05/15/23D | 190,000 | 139,175 | ||||||||
Reynolds Group Issuer, Inc. | ||||||||||
5.75%, 10/15/20D | 60,000 | 61,181 | ||||||||
Rice Energy, Inc. | ||||||||||
6.25%, 05/01/22D | 160,000 | 116,000 | ||||||||
7.25%, 05/01/23 144A | 140,000 | 102,900 | ||||||||
Rovi Corporation | ||||||||||
0.50%, 03/01/20 CONV 144A | 985,000 | 865,569 | ||||||||
RPM International, Inc. | ||||||||||
2.25%, 12/15/20 CONVD | 47,000 | 53,727 | ||||||||
| Par | Value | |||||||||
Sabine Pass Liquefaction LLC | ||||||||||
5.63%, 02/01/21 | $ | 540,000 | $ | 499,500 | ||||||
Samson Investment Co. | ||||||||||
9.75%, 02/15/20# | 330,000 | 743 | ||||||||
Sanchez Energy Corporation | ||||||||||
7.75%, 06/15/21 | 330,000 | 202,950 | ||||||||
6.13%, 01/15/23D | 330,000 | 179,850 | ||||||||
Sealed Air Corporation | ||||||||||
4.88%, 12/01/22 144A | 25,000 | 25,062 | ||||||||
5.50%, 09/15/25 144A | 555,000 | 567,488 | ||||||||
ServiceMaster Co. LLC | ||||||||||
7.45%, 08/15/27 | 1,195,000 | 1,195,000 | ||||||||
Sidewinder Drilling, Inc. | ||||||||||
9.75%, 11/15/19 144A | 820,000 | 364,900 | ||||||||
Simmons Foods, Inc. | ||||||||||
7.88%, 10/01/21 144A | 500,000 | 453,750 | ||||||||
SM Energy Co. | ||||||||||
5.00%, 01/15/24D | 40,000 | 26,200 | ||||||||
Southern Copper Corporation | ||||||||||
5.25%, 11/08/42 | 550,000 | 399,365 | ||||||||
Spectrum Brands, Inc. | ||||||||||
5.75%, 07/15/25 144A | 910,000 | 937,300 | ||||||||
Springleaf Finance Corporation | ||||||||||
5.75%, 09/15/16 | 700,000 | 710,500 | ||||||||
6.50%, 09/15/17 | 400,000 | 409,000 | ||||||||
7.75%, 10/01/21 | 145,000 | 143,369 | ||||||||
8.25%, 10/01/23D | 55,000 | 55,550 | ||||||||
Sprint Capital Corporation | ||||||||||
6.88%, 11/15/28 | 2,915,000 | 2,040,500 | ||||||||
8.75%, 03/15/32 | 945,000 | 711,112 | ||||||||
Sprint Communications, Inc. | ||||||||||
11.50%, 11/15/21D | 390,000 | 360,750 | ||||||||
Sprint Corporation | ||||||||||
7.88%, 09/15/23 | 510,000 | 384,285 | ||||||||
Steel Dynamics, Inc. | ||||||||||
6.38%, 08/15/22D | 400,000 | 386,000 | ||||||||
Targa Resources Partners LP | ||||||||||
5.00%, 01/15/18 144A | 255,000 | 237,150 | ||||||||
4.13%, 11/15/19 | 2,060,000 | 1,714,950 | ||||||||
4.25%, 11/15/23D | 110,000 | 85,250 | ||||||||
6.75%, 03/15/24 144A | 1,050,000 | 897,750 | ||||||||
Taylor Morrison Communities, Inc. | ||||||||||
5.25%, 04/15/21 144A | 410,000 | 412,050 | ||||||||
Tenet Healthcare Corporation | ||||||||||
5.00%, 03/01/19 144A | 560,000 | 519,400 | ||||||||
8.13%, 04/01/22 | 770,000 | 771,925 | ||||||||
6.75%, 06/15/23 144AD | 285,000 | 264,872 | ||||||||
6.88%, 11/15/31 | 85,000 | 69,275 | ||||||||
Tesoro Logistics LP | ||||||||||
6.25%, 10/15/22 144A | 100,000 | 95,250 | ||||||||
Textron, Inc. | ||||||||||
6.63%, 04/07/20(U) | 130,000 | 214,717 | ||||||||
Time Warner Cable, Inc. | ||||||||||
8.75%, 02/14/19 | 190,000 | 220,563 | ||||||||
8.25%, 04/01/19 | 40,000 | 45,965 | ||||||||
5.50%, 09/01/41 | 60,000 | 54,219 | ||||||||
4.50%, 09/15/42D | 105,000 | 82,689 | ||||||||
Time Warner, Inc. | ||||||||||
4.00%, 01/15/22D | 100,000 | 103,741 | ||||||||
TMX Finance LLC | ||||||||||
8.50%, 09/15/18 144AD | 50,000 | 37,500 | ||||||||
Toys “R” Us, Inc. | ||||||||||
7.38%, 10/15/18D | 210,000 | 101,850 | ||||||||
| 138 | See Notes to Financial Statements. |
Table of Contents
| Par | Value | |||||||||
TransDigm, Inc. | ||||||||||
7.50%, 07/15/21D | $ | 970,000 | $ | 1,008,800 | ||||||
6.50%, 07/15/24 | 199,000 | 198,900 | ||||||||
6.50%, 05/15/25 144A | 195,000 | 188,906 | ||||||||
TRI Pointe Holdings, Inc. | ||||||||||
4.38%, 06/15/19 | 100,000 | 97,750 | ||||||||
5.88%, 06/15/24 | 5,000 | 4,862 | ||||||||
United Airlines 2007-1 Pass-Through Trust | ||||||||||
6.64%, 01/02/24 | 194,617 | 207,510 | ||||||||
United Airlines 2009-1 Pass-Through Trust | ||||||||||
10.40%, 05/01/18D | 20,581 | 21,844 | ||||||||
United Airlines 2014-1 Class A Pass-Through Trust | ||||||||||
4.00%, 10/11/27 | 242,570 | 248,028 | ||||||||
United Airlines 2014-2 Class B Pass-Through Trust | ||||||||||
4.63%, 03/03/24 | 90,000 | 90,338 | ||||||||
United Rentals North America, Inc. | ||||||||||
6.13%, 06/15/23D | 400,000 | 411,000 | ||||||||
5.75%, 11/15/24D | 540,000 | 537,300 | ||||||||
United States Steel Corporation | ||||||||||
6.65%, 06/01/37D | 760,000 | 315,400 | ||||||||
UnitedHealth Group, Inc. | ||||||||||
4.75%, 07/15/45 | 250,000 | 263,962 | ||||||||
Universal Hospital Services, Inc. | ||||||||||
7.63%, 08/15/20 | 440,000 | 415,250 | ||||||||
US Airways 2012-1 Class A Pass-Through Trust | ||||||||||
5.90%, 04/01/26 | 278,213 | 307,773 | ||||||||
US Airways 2012-1 Class B Pass-Through Trust | ||||||||||
8.00%, 04/01/21 | 488,314 | 527,989 | ||||||||
US Airways 2012-2 Class A Pass-Through Trust | ||||||||||
4.63%, 12/03/26 | 223,870 | 233,105 | ||||||||
Verizon Communications, Inc. | ||||||||||
6.00%, 04/01/41 | 70,000 | 75,866 | ||||||||
6.55%, 09/15/43 | 762,000 | 907,803 | ||||||||
5.01%, 08/21/54 | 341,000 | 313,480 | ||||||||
Verizon Pennsylvania LLC | ||||||||||
6.00%, 12/01/28 | 35,000 | 36,961 | ||||||||
Wells Fargo & Co. | ||||||||||
4.48%, 01/16/24 | 124,000 | 130,551 | ||||||||
5.88%, 12/29/49† | 700,000 | 737,625 | ||||||||
West Corporation | ||||||||||
5.38%, 07/15/22 144A | 490,000 | 422,625 | ||||||||
WestRock Co. | ||||||||||
4.00%, 03/01/23 | 430,000 | 432,103 | ||||||||
WEX, Inc. | ||||||||||
4.75%, 02/01/23 144A | 440,000 | 402,600 | ||||||||
Weyerhaeuser Co. | ||||||||||
8.50%, 01/15/25 | 405,000 | 520,554 | ||||||||
6.95%, 10/01/27 | 55,000 | 64,964 | ||||||||
7.38%, 03/15/32 | 370,000 | 441,396 | ||||||||
6.88%, 12/15/33 | 490,000 | 566,198 | ||||||||
Whiting Petroleum Corporation | ||||||||||
6.50%, 10/01/18D | 430,000 | 327,875 | ||||||||
5.00%, 03/15/19D | 480,000 | 364,800 | ||||||||
6.25%, 04/01/23D | 410,000 | 297,250 | ||||||||
William Lyon Homes, Inc. | ||||||||||
7.00%, 08/15/22D | 20,000 | 20,150 | ||||||||
| Par | Value | |||||||||
Williams Cos., Inc. | ||||||||||
7.50%, 01/15/31 | $ | 60,000 | $ | 41,590 | ||||||
Williams Partners LP | ||||||||||
6.13%, 07/15/22 | 150,000 | 142,082 | ||||||||
Windstream Services LLC | ||||||||||
7.75%, 10/01/21D | 585,000 | 463,247 | ||||||||
7.50%, 06/01/22 | 40,000 | 30,700 | ||||||||
7.50%, 04/01/23 | 235,000 | 177,966 | ||||||||
WPX Energy, Inc. | ||||||||||
8.25%, 08/01/23D | 430,000 | 345,075 | ||||||||
XPO Logistics, Inc. | ||||||||||
7.88%, 09/01/19 144AD | 40,000 | 40,821 | ||||||||
5.75%, 06/15/21 144A(E) | 250,000 | 253,853 | ||||||||
6.50%, 06/15/22 144A | 50,000 | 46,438 | ||||||||
ZF North America Capital, Inc. | ||||||||||
4.00%, 04/29/20 144AD | 150,000 | 151,800 | ||||||||
4.50%, 04/29/22 144A | 150,000 | 147,188 | ||||||||
4.75%, 04/29/25 144A | 150,000 | 143,438 | ||||||||
|
| |||||||||
Total Corporate Bonds | 170,957,544 | |||||||||
|
| |||||||||
FOREIGN BONDS — 33.2% |
| |||||||||
Armenia — 0.1% |
| |||||||||
Armenia International Bond | ||||||||||
6.00%, 09/30/20 | 520,000 | 506,600 | ||||||||
|
| |||||||||
Australia — 0.7% | ||||||||||
Barminco Finance Proprietary, Ltd. | ||||||||||
9.00%, 06/01/18 144AD | 20,000 | 15,900 | ||||||||
FMG Resources August 2006 Proprietary, Ltd. | ||||||||||
9.75%, 03/01/22 144AD | 650,000 | 598,000 | ||||||||
New South Wales Treasury Corporation | ||||||||||
6.00%, 02/01/18(A) | 2,620,000 | 2,057,750 | ||||||||
Queensland Treasury Corporation | ||||||||||
7.13%, 09/18/17 144A(Z) | 275,000 | 200,556 | ||||||||
|
| |||||||||
| 2,872,206 | ||||||||||
|
| |||||||||
Bermuda — 0.7% | ||||||||||
Digicel Group, Ltd. | ||||||||||
8.25%, 09/30/20D | 550,000 | 456,500 | ||||||||
NCL Corporation, Ltd. | ||||||||||
4.63%, 11/15/20 144A | 600,000 | 590,532 | ||||||||
Ooredoo International Finance, Ltd. | ||||||||||
4.75%, 02/16/21 144A | 200,000 | 219,840 | ||||||||
Sirius International Group, Ltd. | ||||||||||
6.38%, 03/20/17 144A | 1,250,000 | 1,277,260 | ||||||||
|
| |||||||||
| 2,544,132 | ||||||||||
|
| |||||||||
Brazil — 1.1% | ||||||||||
Brazil Notas do Tesouro Nacional Serie F | ||||||||||
10.00%, 01/01/17(B) | 7,284,000 | 1,757,218 | ||||||||
Brazilian Government International Bond | ||||||||||
4.25%, 01/07/25D | 1,050,000 | 846,563 | ||||||||
Federal Republic of Brazil | ||||||||||
10.25%, 01/10/28(B) | 5,250,000 | 1,181,043 | ||||||||
Oi Brasil Holdings Cooperatief UA | ||||||||||
5.75%, 02/10/22 144AD | 933,000 | 433,845 | ||||||||
| See Notes to Financial Statements. | 139 |
Table of Contents
GLOBAL BOND FUND
SCHEDULE OF INVESTMENTS (Continued)
| Par | Value | |||||||||
Telemar Norte Leste SA | ||||||||||
5.50%, 10/23/20D | $ | 200,000 | $ | 106,000 | ||||||
|
| |||||||||
| 4,324,669 | ||||||||||
|
| |||||||||
Canada — 4.1% | ||||||||||
Air Canada | ||||||||||
7.63%, 10/01/19 144A(C) | 1,520,000 | 1,164,414 | ||||||||
Bombardier, Inc. | ||||||||||
6.00%, 10/15/22 144AD | 1,645,000 | 1,161,370 | ||||||||
Canadian Government Bond | ||||||||||
1.25%, 02/01/16(C) | 3,545,000 | 2,563,304 | ||||||||
0.25%, 05/01/17(C) | 4,720,000 | 3,401,286 | ||||||||
Entertainment One, Ltd. | ||||||||||
6.88%, 12/15/22 144A(U) | 180,000 | 265,358 | ||||||||
Methanex Corporation | ||||||||||
5.25%, 03/01/22 | 75,000 | 73,942 | ||||||||
New Red Finance, Inc. | ||||||||||
6.00%, 04/01/22 144A | 890,000 | 918,925 | ||||||||
Ontario Generic Residual STRIP | ||||||||||
2.07%, 07/13/22(C)W† | 2,600,000 | 1,648,164 | ||||||||
3.07%, 03/08/29(C)W† | 2,400,000 | 1,164,356 | ||||||||
Pacific Exploration and Production Corporation | ||||||||||
5.38%, 01/26/19 144A | 540,000 | 105,300 | ||||||||
Province of Ontario | ||||||||||
2.10%, 09/08/18(C) | 3,500,000 | 2,605,561 | ||||||||
Stone Container Finance Company of Canada II Escrow | ||||||||||
0.00%, 07/15/14+W† | 330,000 | 6,600 | ||||||||
Teine Energy, Ltd. | ||||||||||
6.88%, 09/30/22 144A | 60,000 | 48,600 | ||||||||
Ultra Petroleum Corporation | ||||||||||
5.75%, 12/15/18 144AD | 340,000 | 83,300 | ||||||||
Valeant Pharmaceuticals International, Inc. | ||||||||||
6.13%, 04/15/25 144AD | 990,000 | 886,050 | ||||||||
|
| |||||||||
| 16,096,530 | ||||||||||
|
| |||||||||
Cayman Islands — 1.0% | ||||||||||
Braskem Finance, Ltd. | ||||||||||
5.75%, 04/15/21D | 900,000 | 787,500 | ||||||||
Odebrecht Finance, Ltd. | ||||||||||
4.38%, 04/25/25 144AD | 1,070,000 | 567,100 | ||||||||
Odebrecht Offshore Drilling Finance, Ltd. | ||||||||||
6.75%, 10/01/23 144A | 446,300 | 107,112 | ||||||||
Transocean, Inc. | ||||||||||
6.50%, 11/15/20D | 10,000 | 6,950 | ||||||||
7.13%, 12/15/21D | 95,000 | 61,631 | ||||||||
4.30%, 10/15/22 | 430,000 | 230,050 | ||||||||
6.80%, 03/15/38 | 50,000 | 27,188 | ||||||||
UPCB Finance IV, Ltd. | ||||||||||
5.38%, 01/15/25 144A | 250,000 | 236,875 | ||||||||
Vale Overseas, Ltd. | ||||||||||
6.88%, 11/21/36D | 592,000 | 416,792 | ||||||||
XLIT, Ltd. | ||||||||||
6.38%, 11/15/24 | 585,000 | 683,116 | ||||||||
6.25%, 05/15/27D | 640,000 | 737,764 | ||||||||
|
| |||||||||
| 3,862,078 | ||||||||||
|
| |||||||||
Chile — 0.3% | ||||||||||
AES Gener SA | ||||||||||
5.25%, 08/15/21 144A | 420,000 | 431,785 | ||||||||
| Par | Value | |||||||||
Corporation Nacional del Cobre de Chile | ||||||||||
3.88%, 11/03/21 144AD | $ | 420,000 | $ | 404,693 | ||||||
Empresa Nacional de Telecomunicaciones SA | ||||||||||
4.88%, 10/30/24 144A | 220,000 | 211,959 | ||||||||
|
| |||||||||
| 1,048,437 | ||||||||||
|
| |||||||||
Colombia — 1.0% | ||||||||||
Colombia Government International Bond | ||||||||||
5.63%, 02/26/44 | 3,257,000 | 2,972,012 | ||||||||
Colombian TES | ||||||||||
10.00%, 07/24/24(X) | 23,100,000 | 8,044 | ||||||||
Ecopetrol SA | ||||||||||
5.88%, 09/18/23 | 220,000 | 202,950 | ||||||||
4.13%, 01/16/25 | 230,000 | 184,575 | ||||||||
Empresa de Energia de Bogota SA ESP | ||||||||||
6.13%, 11/10/21 144A | 250,000 | 257,500 | ||||||||
Transportadora de Gas Internacional SA ESP | ||||||||||
5.70%, 03/20/22 | 260,000 | 261,950 | ||||||||
|
| |||||||||
| 3,887,031 | ||||||||||
|
| |||||||||
Cote D’Ivoire (Ivory Coast) — 0.1% |
| |||||||||
Ivory Coast Government International Bond | ||||||||||
5.38%, 07/23/24 144A | 520,000 | 463,590 | ||||||||
|
| |||||||||
Dominican Republic — 0.1% |
| |||||||||
Dominican Republic International Bond | ||||||||||
5.50%, 01/27/25 144A | 480,000 | 464,400 | ||||||||
|
| |||||||||
France — 1.0% | ||||||||||
AXA SA | ||||||||||
6.21%, 10/29/49(E)† | 210,000 | 245,846 | ||||||||
Electricite de France SA | ||||||||||
5.25%, 01/29/49 144A† | 380,000 | 358,625 | ||||||||
5.63%, 12/29/49 144A† | 1,360,000 | 1,298,460 | ||||||||
Europcar Groupe SA | ||||||||||
5.75%, 06/15/22 144A(E) | 170,000 | 192,554 | ||||||||
Numericable-SFR | ||||||||||
4.88%, 05/15/19 144A | 870,000 | 864,563 | ||||||||
5.63%, 05/15/24 144A(E) | 160,000 | 176,706 | ||||||||
Rexel SA | ||||||||||
5.25%, 06/15/20 144A | 210,000 | 217,350 | ||||||||
Societe Generale SA | ||||||||||
5.63%, 11/24/45 144A | 675,000 | 648,998 | ||||||||
|
| |||||||||
| 4,003,102 | ||||||||||
|
| |||||||||
Germany — 1.3% | ||||||||||
Bundesrepublik Deutschland | ||||||||||
1.00%, 08/15/24(E) | 2,180,000 | 2,475,421 | ||||||||
Deutsche Bundesrepublik Inflation-Linked Bond | ||||||||||
0.10%, 04/15/23(E)D | 1,406,000 | 1,660,783 | ||||||||
0.50%, 04/15/30(E) | 565,000 | 681,907 | ||||||||
KraussMaffei Group GmbH | ||||||||||
8.75%, 12/15/20(E) | 128,000 | 149,885 | ||||||||
8.75%, 12/15/20 144A(E) | 80,000 | 93,678 | ||||||||
ProGroup AG | ||||||||||
5.13%, 05/01/22 144A(E) | 100,000 | 114,316 | ||||||||
|
| |||||||||
| 5,175,990 | ||||||||||
|
| |||||||||
| 140 | See Notes to Financial Statements. |
Table of Contents
| Par | Value | |||||||||
Honduras — 0.1% | ||||||||||
Honduras Government International Bond | ||||||||||
7.50%, 03/15/24 | $ | 460,000 | $ | 486,450 | ||||||
|
| |||||||||
Hong Kong — 0.2% | ||||||||||
AIA Group, Ltd. | ||||||||||
4.88%, 03/11/44 144A | 910,000 | 960,599 | ||||||||
|
| |||||||||
Iceland — 0.0% | ||||||||||
Kaupthing Bank HF | ||||||||||
7.13%, 05/19/16+ 144A# | 150,000 | 2 | ||||||||
|
| |||||||||
India — 0.3% | ||||||||||
ICICI Bank, Ltd. | ||||||||||
4.80%, 05/22/19 144A | 920,000 | 972,123 | ||||||||
|
| |||||||||
Indonesia — 0.9% | ||||||||||
Indonesia Government International Bond | ||||||||||
5.88%, 01/15/24 144AD | 400,000 | 429,526 | ||||||||
6.63%, 02/17/37 | 225,000 | 236,314 | ||||||||
5.25%, 01/17/42 144A | 1,710,000 | 1,550,553 | ||||||||
Pertamina Persero PT | ||||||||||
5.25%, 05/23/21 144A | 400,000 | 399,987 | ||||||||
4.88%, 05/03/22 | 900,000 | 864,474 | ||||||||
|
| |||||||||
| 3,480,854 | �� | |||||||||
|
| |||||||||
Ireland — 0.3% | ||||||||||
Ardagh Packaging Finance PLC | ||||||||||
9.13%, 10/15/20 144A | 200,000 | 205,500 | ||||||||
7.00%, 11/15/20 144A | 35,294 | 34,853 | ||||||||
eircom Finance, Ltd. | ||||||||||
9.25%, 05/15/20 144A(E) | 200,000 | 234,413 | ||||||||
GE Capital International Funding Co. | ||||||||||
3.37%, 11/15/25 144AD | 246,000 | 250,763 | ||||||||
4.42%, 11/15/35 144A | 569,000 | 581,807 | ||||||||
|
| |||||||||
| 1,307,336 | ||||||||||
|
| |||||||||
Italy — 3.4% | ||||||||||
Enel SpA | ||||||||||
7.75%, 09/10/75(U)† | 440,000 | 701,895 | ||||||||
Italy Buoni Poliennali Del Tesoro | ||||||||||
3.75%, 05/01/21(E) | 3,120,000 | 3,928,677 | ||||||||
4.50%, 03/01/24(E) | 5,490,000 | 7,414,570 | ||||||||
Telecom Italia Capital SA | ||||||||||
6.38%, 11/15/33 | 995,000 | 955,200 | ||||||||
6.00%, 09/30/34 | 250,000 | 231,875 | ||||||||
|
| |||||||||
| 13,232,217 | ||||||||||
|
| |||||||||
Jersey — 0.2% | ||||||||||
AA Bond Co., Ltd. | ||||||||||
5.50%, 07/31/43 144A(U) | 430,000 | 604,592 | ||||||||
|
| |||||||||
Kenya — 0.1% | ||||||||||
Kenya Government International Bond | ||||||||||
6.88%, 06/24/24 144A | 470,000 | 413,600 | ||||||||
|
| |||||||||
Luxembourg — 2.3% | ||||||||||
Altice Financing SA | ||||||||||
5.25%, 02/15/23 144A(E) | 100,000 | 108,692 | ||||||||
6.63%, 02/15/23 144A | 400,000 | 396,000 | ||||||||
ArcelorMittal | ||||||||||
6.13%, 06/01/18 | 740,000 | 680,800 | ||||||||
6.50%, 03/01/21D | 30,000 | 24,297 | ||||||||
| Par | Value | |||||||||
8.00%, 10/15/39 STEP | $ | 510,000 | $ | 350,625 | ||||||
7.75%, 03/01/41 STEPD | 690,000 | 470,062 | ||||||||
Ardagh Finance Holdings SA Cash coupon | ||||||||||
8.63%, 06/15/19 PIK 144A | 272,594 | 270,037 | ||||||||
Beverage Packaging Holdings Luxembourg II SA | ||||||||||
6.00%, 06/15/17 144A | 345,000 | 333,787 | ||||||||
ConvaTec Healthcare E SA | ||||||||||
10.88%, 12/15/18(E) | 100,000 | 111,958 | ||||||||
Coveris Holdings SA | ||||||||||
7.88%, 11/01/19 144A | 210,000 | 184,275 | ||||||||
DH Services Luxembourg S.à r.l | ||||||||||
7.75%, 12/15/20 144A | 90,000 | 90,900 | ||||||||
Evraz Group SA | ||||||||||
6.75%, 04/27/18 144A | 440,000 | 438,900 | ||||||||
6.50%, 04/22/20 144AD | 480,000 | 451,200 | ||||||||
Globe Luxembourg SCA | ||||||||||
9.63%, 05/01/18 144A | 200,000 | 162,500 | ||||||||
INEOS Group Holdings SA | ||||||||||
6.13%, 08/15/18 144AD | 600,000 | 596,250 | ||||||||
Intelsat Jackson Holdings SA | ||||||||||
7.25%, 10/15/20 | 170,000 | 149,600 | ||||||||
7.50%, 04/01/21D | 30,000 | 26,250 | ||||||||
5.50%, 08/01/23 | 2,490,000 | 1,967,100 | ||||||||
LSF9 Balta Issuer SA | ||||||||||
7.75%, 09/15/22 144A(E) | 360,000 | 411,388 | ||||||||
Mallinckrodt International Finance SA | ||||||||||
5.63%, 10/15/23 144AD | 360,000 | 343,800 | ||||||||
Play Finance 1 SA | ||||||||||
6.50%, 08/01/19 144A(E) | 120,000 | 136,279 | ||||||||
Puma International Financing SA | ||||||||||
6.75%, 02/01/21 144A | 420,000 | 415,065 | ||||||||
SIG Combibloc Holdings SCA | ||||||||||
7.75%, 02/15/23 144A(E) | 160,000 | 182,132 | ||||||||
Wind Acquisition Finance SA | ||||||||||
7.00%, 04/23/21(E)D | 430,000 | 463,800 | ||||||||
|
| |||||||||
| 8,765,697 | ||||||||||
|
| |||||||||
Marshall Islands — 0.0% |
| |||||||||
Navios Maritime Acquisition Corporation | ||||||||||
8.13%, 11/15/21 144AD | 90,000 | 78,862 | ||||||||
|
| |||||||||
Mexico — 3.3% | ||||||||||
Alpek SA de CV | ||||||||||
4.50%, 11/20/22 144AD | 200,000 | 190,250 | ||||||||
Axtel SAB de CV | ||||||||||
9.00%, 01/31/20 STEP 144A | 104,000 | 108,420 | ||||||||
9.00%, 01/31/20 STEP CONV 144A(M) | 141,300 | 17,217 | ||||||||
Cemex SAB de CV | ||||||||||
6.50%, 12/10/19 144AD | 1,100,000 | 1,064,250 | ||||||||
Mexican Bonos | ||||||||||
6.50%, 06/09/22(M) | 45,803,100 | 2,741,300 | ||||||||
8.00%, 12/07/23(M) | 41,500,000 | 2,699,955 | ||||||||
10.00%, 12/05/24(M) | 31,500,000 | 2,305,397 | ||||||||
7.50%, 06/03/27(M) | 7,500,000 | 473,475 | ||||||||
8.50%, 05/31/29(M) | 2,000,000 | 135,969 | ||||||||
7.75%, 05/29/31(M) | 3,000,000 | 191,267 | ||||||||
7.75%, 11/13/42(M) | 22,750,000 | 1,445,813 | ||||||||
| See Notes to Financial Statements. | 141 |
Table of Contents
GLOBAL BOND FUND
SCHEDULE OF INVESTMENTS (Continued)
| Par | Value | |||||||||
Petroleos Mexicanos | ||||||||||
5.50%, 01/21/21 | $ | 750,000 | $ | 758,400 | ||||||
6.50%, 06/02/41 | 135,000 | 117,383 | ||||||||
5.50%, 06/27/44 | 600,000 | 454,404 | ||||||||
6.38%, 01/23/45 | 303,000 | 257,969 | ||||||||
|
| |||||||||
| 12,961,469 | ||||||||||
|
| |||||||||
Morocco & Antilles — 0.3% |
| |||||||||
OCP SA | ||||||||||
5.63%, 04/25/24 144A | 550,000 | 560,262 | ||||||||
4.50%, 10/22/25 144AD | 520,000 | 486,233 | ||||||||
|
| |||||||||
| 1,046,495 | ||||||||||
|
| |||||||||
Netherlands — 2.4% | ||||||||||
Bharti Airtel International Netherlands BV | ||||||||||
5.35%, 05/20/24 144A | 280,000 | 294,934 | ||||||||
CIMPOR Financial Operations BV | ||||||||||
5.75%, 07/17/24 144A | 360,000 | 243,000 | ||||||||
Cooperatieve Centrale Raiffeisen-Boerenleen-bank BA | ||||||||||
5.75%, 12/01/43 | 880,000 | 989,081 | ||||||||
DPx Holdings BV | ||||||||||
7.50%, 02/01/22 144A | 90,000 | 88,087 | ||||||||
EDP Finance BV | ||||||||||
6.00%, 02/02/18 144A | 600,000 | 631,874 | ||||||||
4.90%, 10/01/19 144A | 1,600,000 | 1,650,530 | ||||||||
4.13%, 01/15/20 144A | 540,000 | 542,471 | ||||||||
Grupo Isolux Corsan Finance BV | ||||||||||
6.63%, 04/15/21(E)D | 490,000 | 131,003 | ||||||||
JLL/ Delta Dutch Pledgeco BV Cash coupon 8.75% or PIK | ||||||||||
9.50%, 05/01/20 144A | 440,000 | 425,700 | ||||||||
LyondellBasell Industries NV | ||||||||||
5.75%, 04/15/24 | 260,000 | 286,903 | ||||||||
NXP BV/NXP Funding LLC | ||||||||||
4.63%, 06/15/22 144A | 430,000 | 423,550 | ||||||||
Petrobras Global Finance BV | ||||||||||
4.38%, 05/20/23 | 250,000 | 165,625 | ||||||||
6.25%, 03/17/24 | 1,160,000 | 835,200 | ||||||||
6.88%, 01/20/40 | 390,000 | 255,450 | ||||||||
6.75%, 01/27/41 | 270,000 | 174,150 | ||||||||
5.63%, 05/20/43D | 275,000 | 167,062 | ||||||||
Schaeffler Holding Finance BV | ||||||||||
Cash coupon 6.88%, 8/15/18 PIK 144A(E) | 100,000 | 112,724 | ||||||||
Cash coupon 6.88% or PIK 7.63%, 08/15/18 144A | 200,000 | 206,500 | ||||||||
Swiss Reinsurance Co. Via ELM BV | ||||||||||
5.25%, 05/29/49(E)†D | 400,000 | 442,831 | ||||||||
Telefonica Europe BV | ||||||||||
6.75%, 11/29/49(U)†D | 300,000 | 454,593 | ||||||||
VimpelCom Holdings BV | ||||||||||
7.50%, 03/01/22 | 200,000 | 201,000 | ||||||||
Volkswagen International Finance NV | ||||||||||
4.63%, 03/29/49(E)† | 420,000 | 443,698 | ||||||||
Ziggo Bond Finance BV | ||||||||||
5.88%, 01/15/25 144A | 200,000 | 186,250 | ||||||||
|
| |||||||||
| 9,352,216 | ||||||||||
|
| |||||||||
| Par | Value | |||||||||
New Zealand — 0.4% |
| |||||||||
New Zealand Government Bond | ||||||||||
5.00%, 03/15/19(Z) | $ | 2,385,000 | $ | 1,741,377 | ||||||
|
| |||||||||
Norway — 0.4% | ||||||||||
Norway Government Bond | ||||||||||
4.25%, 05/19/17 144A(K) | 12,330,000 | 1,461,285 | ||||||||
4.50%, 05/22/19 144A(K) | 172,000 | 21,892 | ||||||||
3.75%, 05/25/21 144A(K) | 129,000 | 16,665 | ||||||||
|
| |||||||||
| 1,499,842 | ||||||||||
|
| |||||||||
Panama — 0.0% | ||||||||||
Panama Government International Bond | ||||||||||
6.70%, 01/26/36 | 3,000 | 3,577 | ||||||||
|
| |||||||||
Peru — 0.1% | ||||||||||
Transportadora de Gasdel Peru SA | ||||||||||
4.25%, 04/30/28 144A | 550,000 | 517,000 | ||||||||
|
| |||||||||
Philippines — 0.1% | ||||||||||
Philippine Government International Bond | ||||||||||
4.00%, 01/15/21 | 200,000 | 216,923 | ||||||||
|
| |||||||||
Portugal — 0.4% | ||||||||||
Portugal Government International Bond | ||||||||||
5.13%, 10/15/24 144A | 1,600,000 | 1,636,480 | ||||||||
|
| |||||||||
Singapore — 0.3% | ||||||||||
BOC Aviation Pte, Ltd. | ||||||||||
3.00%, 03/30/20 144AD | 1,000,000 | 984,636 | ||||||||
|
| |||||||||
Spain — 0.1% | ||||||||||
Santander Issuances SA Unipersonal | ||||||||||
5.91%, 06/20/16 144A | 100,000 | 101,598 | ||||||||
Telefonica Emisiones SA Unipersonal | ||||||||||
5.13%, 04/27/20 | 75,000 | 81,968 | ||||||||
|
| |||||||||
| 183,566 | ||||||||||
|
| |||||||||
Supranational — 0.6% |
| |||||||||
Inter-American Development Bank | ||||||||||
6.00%, 12/15/17(Z) | 3,250,000 | 2,341,461 | ||||||||
|
| |||||||||
Sweden — 0.1% | ||||||||||
Unilabs Subholding AB | ||||||||||
8.50%, 07/15/18(E) | 410,000 | 464,223 | ||||||||
|
| |||||||||
Trinidad and Tobago — 0.1% |
| |||||||||
Petroleum Co. of Trinidad & Tobago, Ltd. | ||||||||||
9.75%, 08/14/19 144AD | 340,000 | 355,300 | ||||||||
|
| |||||||||
Turkey — 0.7% | ||||||||||
Turk Telekomunikasyon AS | ||||||||||
3.75%, 06/19/19 144A | 480,000 | 476,544 | ||||||||
4.88%, 06/19/24 144A | 680,000 | 645,565 | ||||||||
Turkey Government International Bond | ||||||||||
7.00%, 03/11/19 | 100,000 | 109,668 | ||||||||
6.25%, 09/26/22 | 875,000 | 952,787 | ||||||||
6.88%, 03/17/36 | 73,000 | 81,913 | ||||||||
4.88%, 04/16/43 | 500,000 | 441,300 | ||||||||
|
| |||||||||
| 2,707,777 | ||||||||||
|
| |||||||||
| 142 | See Notes to Financial Statements. |
Table of Contents
| Par | Value | |||||||||
United Kingdom — 4.4% |
| |||||||||
Anglian Water Osprey Financing PLC | ||||||||||
7.00%, 01/31/18(U)D | $ | 310,000 | $ | 499,375 | ||||||
Annington Finance No. 4 PLC | ||||||||||
1.75%, 01/10/23(U)† | 460,000 | 675,288 | ||||||||
Boparan Finance PLC | ||||||||||
5.50%, 07/15/21(U) | 270,000 | 354,252 | ||||||||
BUPA Finance PLC | ||||||||||
5.00%, 04/25/23(U)D | 590,000 | 899,749 | ||||||||
EC Finance PLC | ||||||||||
5.13%, 07/15/21 144A(E) | 400,000 | 451,091 | ||||||||
Ephios Bondco PLC | ||||||||||
6.25%, 07/01/22(E) | 270,000 | 305,836 | ||||||||
6.25%, 07/01/22 144A(E) | 650,000 | 736,272 | ||||||||
HBOS PLC | ||||||||||
6.75%, 05/21/18 144A | 500,000 | 546,577 | ||||||||
HSBC Holdings PLC | ||||||||||
6.00%, 06/10/19(E) | 270,000 | 341,565 | ||||||||
6.38%, 12/29/49†D | 600,000 | 600,750 | ||||||||
Interoute Finco PLC | ||||||||||
7.38%, 10/15/20 144A(E) | 600,000 | 683,352 | ||||||||
KCA Deutag UK Finance PLC | ||||||||||
7.25%, 05/15/21 144A | 540,000 | 368,550 | ||||||||
Lloyds Bank PLC | ||||||||||
6.50%, 03/24/20(E) | 326,000 | 429,344 | ||||||||
Lloyds Banking Group PLC | ||||||||||
5.30%, 12/01/45 144A | 1,581,000 | 1,604,355 | ||||||||
Paragon Offshore PLC | ||||||||||
6.75%, 07/15/22 144A | 177,000 | 25,665 | ||||||||
7.25%, 08/15/24 144A@D | 410,000 | 59,450 | ||||||||
Priory Group No. 3 PLC | ||||||||||
8.88%, 02/15/19(U) | 350,000 | 534,290 | ||||||||
R&R Ice Cream PLC | ||||||||||
8.25%, 05/15/20 144A(A) | 260,000 | 197,040 | ||||||||
Rio Tinto Finance USA PLC | ||||||||||
4.13%, 08/21/42 | 145,000 | 113,865 | ||||||||
Royal Bank of Scotland PLC | ||||||||||
6.13%, 01/11/21 | 350,000 | 402,522 | ||||||||
Royal Bank of Scotland Group PLC | ||||||||||
6.10%, 06/10/23 | 1,880,000 | 2,022,983 | ||||||||
6.00%, 12/19/23 | 275,000 | 296,650 | ||||||||
Santander UK Group Holdings PLC | ||||||||||
7.38%, 12/29/49(U)† | 390,000 | 585,457 | ||||||||
Scottish Widows PLC | ||||||||||
5.50%, 06/16/23(U) | 590,000 | 909,797 | ||||||||
Southern Gas Networks PLC | ||||||||||
4.88%, 12/21/20(U) | 270,000 | 445,797 | ||||||||
Standard Chartered PLC | ||||||||||
5.13%, 06/06/34(U) | 321,000 | 425,914 | ||||||||
Tesco Property Finance 3 PLC | ||||||||||
5.74%, 04/13/40(U) | 276,330 | 358,712 | ||||||||
Tesco Property Finance 6 PLC | ||||||||||
5.41%, 07/13/44(U) | 596,573 | 748,371 | ||||||||
Vedanta Resources PLC | ||||||||||
7.13%, 05/31/23D | 200,000 | 110,396 | ||||||||
7.13%, 05/31/23 144AD | 400,000 | 220,791 | ||||||||
Virgin Media Finance PLC | ||||||||||
6.38%, 10/15/24 144A(U) | 360,000 | 537,402 | ||||||||
Virgin Media Secured Finance PLC | ||||||||||
5.50%, 01/15/21(U)D | 100,000 | 157,003 | ||||||||
| Par | Value | |||||||||
Vougeot Bidco PLC | ||||||||||
7.88%, 07/15/20(U) | $ | 360,000 | $ | 560,515 | ||||||
|
| |||||||||
| 17,208,976 | ||||||||||
Virgin Islands (British) — 0.2% |
| |||||||||
GTL Trade Finance, Inc. | ||||||||||
5.89%, 04/29/24 144AD | 941,000 | 672,815 | ||||||||
Pacific Drilling V, Ltd. | ||||||||||
7.25%, 12/01/17 144AD | 270,000 | 140,400 | ||||||||
|
| |||||||||
| 813,215 | ||||||||||
|
| |||||||||
Total Foreign Bonds | 129,585,630 | |||||||||
|
| |||||||||
FOREIGN GOVERNMENT INFLATION-LINKED BOND — 0.6% |
| |||||||||
Brazil — 0.6% | ||||||||||
Brazil Notas do Tesouro Nacional Serie B | 3,613,000 | 2,160,910 | ||||||||
|
| |||||||||
LOAN AGREEMENTS — 2.0% | ||||||||||
American Airlines, Inc. Term B Loan | ||||||||||
3.25%, 06/27/20 | 997,462 | 980,784 | ||||||||
American Builders & Contractors Supply Co., Inc. Term B Loan | ||||||||||
3.50%, 04/16/20 | 589,015 | 583,307 | ||||||||
Energy Future Intermediate Holding Co. LLC DIP Term Loan | ||||||||||
4.25%, 12/19/16 | 847,944 | 843,916 | ||||||||
First Data Corporation Term C-1 Loan | ||||||||||
3.92%, 03/24/18 | 750,000 | 739,267 | ||||||||
FMG Resources August 2006 Proprietary, Ltd. Term B Loan | ||||||||||
4.25%, 06/30/19 | 39,796 | 29,404 | ||||||||
Hilton Worldwide Finance LLC Term B Loan | ||||||||||
3.50%, 10/25/20 | 621,324 | 619,578 | ||||||||
Magnum Hunter Resources Corporation DIP Term B Loan | ||||||||||
9.00%, 03/17/16@ | 30,000 | 30,000 | ||||||||
MPH Acquisition Holdings LLC Term B Loan | ||||||||||
3.75%, 03/31/21 | 447,028 | 434,364 | ||||||||
Pacific Drilling SA Term B Loan | ||||||||||
4.50%, 06/03/18 | 50,000 | 21,375 | ||||||||
Party City Holdings, Inc Term B Loan | ||||||||||
4.25%, 08/19/22 | 744,332 | 721,541 | ||||||||
PetSmart, Inc. Term B Loan | ||||||||||
4.25%, 03/10/22 | 995,000 | 967,389 | ||||||||
Univision Communications, Inc. Term C-4 Loan | ||||||||||
4.00%, 03/01/20 | 740,200 | 723,176 | ||||||||
| See Notes to Financial Statements. | 143 |
Table of Contents
GLOBAL BOND FUND
SCHEDULE OF INVESTMENTS (Continued)
| Par | Value | |||||||||
Valeant Pharmaceuticals International, Inc. Term BF1 Loan | ||||||||||
4.00%, 04/01/22 | $ | 744,375 | $ | 714,414 | ||||||
Virgin Media Investment Holdings, Ltd. Term F Loan | ||||||||||
3.50%, 06/30/23 | 504,991 | 493,866 | ||||||||
|
| |||||||||
Total Loan Agreements | 7,902,381 | |||||||||
|
| |||||||||
MORTGAGE-BACKED SECURITIES — 2.1% |
| |||||||||
Commercial Mortgage Trust Series 2007-CD4 | ||||||||||
5.40%, 12/11/49† | 200,000 | 167,150 | ||||||||
Credit Suisse Commercial Mortgage Trust | ||||||||||
5.37%, 12/15/39 | 230,000 | 223,562 | ||||||||
Credit Suisse Commercial Mortgage Trust | ||||||||||
5.70%, 09/15/40† | 211,387 | 218,395 | ||||||||
5.87%, 09/15/40† | 240,000 | 240,335 | ||||||||
Credit Suisse Mortgage Capital Certificates Series 2006-C4 | ||||||||||
5.54%, 09/15/39† | 210,000 | 203,383 | ||||||||
CSMC Trust Series | ||||||||||
5.93%, 08/15/22 144A† | 1,000,000 | 997,800 | ||||||||
Fannie Mae Connecticut Avenue Securities | ||||||||||
3.02%, 05/25/24† | 1,600,000 | 1,439,759 | ||||||||
Fannie Mae Connecticut Avenue Securities | ||||||||||
5.42%, 07/25/25† | 1,530,000 | 1,521,209 | ||||||||
JP Morgan Chase Commercial Mortgage Securities Trust | ||||||||||
6.01%, 02/15/51† | 130,000 | 131,234 | ||||||||
Lone Star Portfolio Trust | ||||||||||
7.23%, 09/15/28 144A† | 900,000 | 898,726 | ||||||||
Morgan Stanley Resecuri-tization Trust | ||||||||||
0.45%, 10/26/46 144A† | 2,390,000 | 1,478,900 | ||||||||
Morgan Stanley Resecuri-tization Trust | ||||||||||
0.48%, 07/26/45 144A† | 1,197,082 | 501,529 | ||||||||
|
| |||||||||
Total Mortgage-Backed Securities |
| 8,021,982 | ||||||||
|
| |||||||||
| Par | Value | |||||||||
MUNICIPAL BOND — 0.1% | ||||||||||
State of Illinois, General Obligation | $ | 435,000 | $ | 411,793 | ||||||
|
| |||||||||
| Notional Amount | ||||||||||
PURCHASED OPTION — 0.0% |
| |||||||||
Put Options — 0.0% |
| |||||||||
U.S. Dollar vs. Japanese Yen, Strike Price $121.00, Expires 01/07/16 (UBS) | $ | 13,850,000 | 108,972 | |||||||
|
| |||||||||
| Par | ||||||||||
U.S. TREASURY OBLIGATIONS — 10.5% |
| |||||||||
U.S. Treasury Bonds | ||||||||||
3.50%, 02/15/39 | 860,000 | 951,576 | ||||||||
4.25%, 05/15/39 | 40,000 | 49,427 | ||||||||
3.88%, 08/15/40 | 30,000 | 35,085 | ||||||||
2.75%, 08/15/42 | 120,000 | 114,741 | ||||||||
3.13%, 02/15/43 | 9,116,000 | 9,346,216 | ||||||||
2.88%, 05/15/43D | 120,000 | 117,040 | ||||||||
3.00%, 05/15/45 | 40,000 | 39,827 | ||||||||
|
| |||||||||
| 10,653,912 | ||||||||||
|
| |||||||||
U.S. Treasury Notes | ||||||||||
0.25%, 02/29/16 | 4,435,000 | 4,435,173 | ||||||||
0.88%, 04/15/17 | 30,000 | 29,998 | ||||||||
0.75%, 10/31/17 | 15,020,000 | 14,941,671 | ||||||||
0.63%, 04/30/18 | 530,000 | 523,261 | ||||||||
1.38%, 09/30/18 | 250,000 | 250,835 | ||||||||
1.63%, 06/30/19 | 10,000 | 10,046 | ||||||||
1.25%, 10/31/19 | 110,000 | 108,719 | ||||||||
3.63%, 02/15/21 | 5,810,000 | 6,317,352 | ||||||||
2.00%, 02/15/22 | 120,000 | 120,244 | ||||||||
1.63%, 08/15/22 | 3,380,000 | 3,292,924 | ||||||||
2.75%, 02/15/24D | 150,000 | 156,267 | ||||||||
2.25%, 11/15/24D | 30,000 | 29,989 | ||||||||
2.00%, 02/15/25 | 100,000 | 97,770 | ||||||||
|
| |||||||||
| 30,314,249 | ||||||||||
|
| |||||||||
Total U.S. Treasury Obligations |
| 40,968,161 | ||||||||
|
| |||||||||
| Shares | ||||||||||
COMMON STOCKS — 1.0% | ||||||||||
Consumer Discretionary — 0.4% | ||||||||||
Ford Motor Co. | 96,849 | 1,364,602 | ||||||||
|
| |||||||||
Energy — 0.0% | ||||||||||
Hercules Offshore, Inc.D* | 46,644 | 101,219 | ||||||||
|
| |||||||||
Healthcare — 0.3% | ||||||||||
Bristol-Myers Squibb Co. | 15,400 | 1,059,366 | ||||||||
|
| |||||||||
Materials & Processing — 0.0% | ||||||||||
PPG Industries, Inc. | 820 | 81,032 | ||||||||
|
| |||||||||
Technology — 0.3% | ||||||||||
Corning, Inc.D | 70,534 | 1,289,362 | ||||||||
|
| |||||||||
Total Common Stocks | 3,895,581 | |||||||||
|
| |||||||||
| 144 | See Notes to Financial Statements. |
Table of Contents
| Shares | Value | |||||||||
FOREIGN COMMON STOCKS — 0.2% |
| |||||||||
Norway — 0.0% | ||||||||||
Deep Ocean Group Holding+@ | 8,860 | $ | 41,367 | |||||||
|
| |||||||||
Spain — 0.1% | ||||||||||
Repsol SA ADRD | 15,820 | 176,077 | ||||||||
Telefonica SA ADRD | 22,180 | 245,311 | ||||||||
|
| |||||||||
| 421,388 | ||||||||||
|
| |||||||||
United Kingdom — 0.1% | ||||||||||
Royal Dutch Shell PLC ADR Class A | 6,443 | 295,025 | ||||||||
|
| |||||||||
Total Foreign Common Stocks | 757,780 | |||||||||
|
| |||||||||
PREFERRED STOCKS — 0.5% | ||||||||||
Alcoa, Inc., | ||||||||||
5.38%, 10/01/17 CONV | 9,400 | 313,114 | ||||||||
Bank of America Corporation, | ||||||||||
7.25%, 12/31/49 CONV | 602 | 658,148 | ||||||||
Chesapeake Energy Corporation, | ||||||||||
4.50%, 12/31/49 CONV | 1,229 | 21,139 | ||||||||
5.00%, 12/31/49 CONVD | 3,950 | 69,125 | ||||||||
5.75%, 12/31/49 CONV 144AD | 50 | 9,969 | ||||||||
5.75%, 12/31/49 CONVD | 810 | 154,050 | ||||||||
El Paso Energy Capital Trust I, | ||||||||||
4.75%, 03/31/28 CONV | 1,588 | 64,314 | ||||||||
iStar, Inc., | ||||||||||
4.50%, 12/31/49 CONV | 50 | 2,485 | ||||||||
Stanley Black & Decker, Inc. | ||||||||||
6.25%, 11/17/16 CONVD | 2,900 | 338,691 | ||||||||
Weyerhaeuser Co., | ||||||||||
6.38%, 07/01/16 CONVD | 7,615 | 382,882 | ||||||||
|
| |||||||||
Total Preferred Stocks | 2,013,917 | |||||||||
|
| |||||||||
| Shares | Value | |||||||||
MONEY MARKET FUNDS — 14.0% |
| |||||||||
GuideStone Money Market Fund (Investor Class)¥ | 15,382,420 | $ | 15,382,420 | |||||||
Northern Institutional Liquid Assets Portfolio§ | 39,026,281 | 39,026,281 | ||||||||
|
| |||||||||
Total Money Market Funds | 54,408,701 | |||||||||
|
| |||||||||
TOTAL INVESTMENTS — 108.0% |
| 421,193,352 | ||||||||
Liabilities in Excess of Other |
| (31,183,815 | ) | |||||||
|
| |||||||||
NET ASSETS — 100.0% | $ | 390,009,537 | ||||||||
|
| |||||||||
| See Notes to Financial Statements. | 145 |
Table of Contents
GLOBAL BOND FUND
SCHEDULE OF INVESTMENTS (Continued)
VALUATION HIERARCHY
The following is a summary of the inputs used, as of December 31, 2015, in valuing the Fund’s investments carried at fair value:
| Total Value | Level 1 Quoted Prices | Level 2 Other Significant Observable Inputs | Level 3 Significant Unobservable Inputs | |||||||||||||||||
Assets: | ||||||||||||||||||||
Investments in Securities: | ||||||||||||||||||||
Common Stocks | $ | 3,895,581 | $ | 3,895,581 | $ | — | $ | — | ||||||||||||
Corporate Bonds | 170,957,544 | — | 169,668,769 | 1,288,775 | ||||||||||||||||
Foreign Bonds: | ||||||||||||||||||||
Armenia | 506,600 | — | 506,600 | — | ||||||||||||||||
Australia | 2,872,206 | — | 2,872,206 | — | ||||||||||||||||
Bermuda | 2,544,132 | — | 2,544,132 | — | ||||||||||||||||
Brazil | 4,324,669 | — | 4,324,669 | — | ||||||||||||||||
Canada | 16,096,530 | — | 16,089,930 | 6,600 | ||||||||||||||||
Cayman Islands | 3,862,078 | — | 3,862,078 | — | ||||||||||||||||
Chile | 1,048,437 | — | 1,048,437 | — | ||||||||||||||||
Colombia | 3,887,031 | — | 3,887,031 | — | ||||||||||||||||
Cote D’Ivoire (Ivory Coast) | 463,590 | — | 463,590 | — | ||||||||||||||||
Dominican Republic | 464,400 | — | 464,400 | — | ||||||||||||||||
France | 4,003,102 | — | 4,003,102 | — | ||||||||||||||||
Germany | 5,175,990 | — | 5,175,990 | — | ||||||||||||||||
Honduras | 486,450 | — | 486,450 | — | ||||||||||||||||
Hong Kong | 960,599 | — | 960,599 | — | ||||||||||||||||
Iceland | 2 | — | — | 2 | ||||||||||||||||
India | 972,123 | — | 972,123 | — | ||||||||||||||||
Indonesia | 3,480,854 | — | 3,480,854 | — | ||||||||||||||||
Ireland | 1,307,336 | — | 1,307,336 | — | ||||||||||||||||
Italy | 13,232,217 | — | 13,232,217 | — | ||||||||||||||||
Jersey | 604,592 | — | 604,592 | — | ||||||||||||||||
Kenya | 413,600 | — | 413,600 | — | ||||||||||||||||
Luxembourg | 8,765,697 | — | 8,765,697 | — | ||||||||||||||||
Marshall Islands | 78,862 | — | 78,862 | — | ||||||||||||||||
Mexico | 12,961,469 | — | 12,961,469 | — | ||||||||||||||||
Morocco & Antilles | 1,046,495 | — | 1,046,495 | — | ||||||||||||||||
Netherlands | 9,352,216 | — | 9,352,216 | — | ||||||||||||||||
New Zealand | 1,741,377 | — | 1,741,377 | — | ||||||||||||||||
Norway | 1,499,842 | — | 1,499,842 | — | ||||||||||||||||
Panama | 3,577 | — | 3,577 | — | ||||||||||||||||
Peru | 517,000 | — | 517,000 | — | ||||||||||||||||
Philippines | 216,923 | — | 216,923 | — | ||||||||||||||||
Portugal | 1,636,480 | — | 1,636,480 | — | ||||||||||||||||
Singapore | 984,636 | — | 984,636 | — | ||||||||||||||||
Spain | 183,566 | — | 183,566 | — | ||||||||||||||||
Supranational | 2,341,461 | — | 2,341,461 | — | ||||||||||||||||
Sweden | 464,223 | — | 464,223 | — | ||||||||||||||||
Trinidad and Tobago | 355,300 | — | 355,300 | — | ||||||||||||||||
Turkey | 2,707,777 | — | 2,707,777 | — | ||||||||||||||||
United Kingdom | 17,208,976 | — | 17,208,976 | — | ||||||||||||||||
Virgin Islands (British) | 813,215 | — | 813,215 | — | ||||||||||||||||
Foreign Common Stocks: | ||||||||||||||||||||
Norway | 41,367 | — | — | 41,367 | ||||||||||||||||
Spain | 421,388 | 421,388 | — | — | ||||||||||||||||
United Kingdom | 295,025 | 295,025 | — | — | ||||||||||||||||
Foreign Government Inflation-Linked Bond | 2,160,910 | — | 2,160,910 | — | ||||||||||||||||
Loan Agreements | 7,902,381 | — | 7,872,381 | 30,000 | ||||||||||||||||
Money Market Funds | 54,408,701 | 54,408,701 | — | — | ||||||||||||||||
Mortgage-Backed Securities | 8,021,982 | — | 5,043,753 | 2,978,229 | ||||||||||||||||
Municipal Bond | 411,793 | — | 411,793 | — | ||||||||||||||||
Preferred Stocks | 2,013,917 | 2,013,917 | — | — | ||||||||||||||||
Purchased Option | 108,972 | — | 108,972 | — | ||||||||||||||||
U.S. Treasury Obligations | 40,968,161 | — | 40,968,161 | — | ||||||||||||||||
|
|
|
|
|
|
|
| |||||||||||||
Total Assets - Investments in Securities | $ | 421,193,352 | $ | 61,034,612 | $ | 355,813,767 | $ | 4,344,973 | ||||||||||||
|
|
|
|
|
|
|
| |||||||||||||
| 146 | See Notes to Financial Statements. |
Table of Contents
| Total Value | Level 1 Quoted Prices | Level 2 Other Significant Observable Inputs | Level 3 Significant Unobservable Inputs | |||||||||||||||||
Other Financial Instruments*** | ||||||||||||||||||||
Forward Foreign Currency Contracts | $ | 490,053 | $ | — | $ | 490,053 | $ | — | ||||||||||||
Futures Contracts | 30,389 | 30,389 | — | — | ||||||||||||||||
|
|
|
|
|
|
|
| |||||||||||||
Total Assets - Other Financial Instruments | $ | 520,442 | $ | 30,389 | $ | 490,053 | $ | — | ||||||||||||
|
|
|
|
|
|
|
| |||||||||||||
***Other financial instruments are derivative instruments not reflected in the Schedule of Investments, such as futures, forwards and swap contracts, which are valued at the unrealized appreciation (depreciation) on the investment. Details of these investments can be found in the Notes to Financial Statements.
There were no transfers between Level 1 and Level 2 during the year ended December 31, 2015.
The unobservable inputs used in the fair value measurement of the reporting entity’s mortgage backed securities, corporate bonds, foreign bonds, foreign common stock and foreign government inflation-linked note are values based on evaluated quotations received from dealers who make markets in such securities. Significant increases (decreases) in those evaluated quotations would result in a significantly higher (lower) fair value measurement.
The following is a reconciliation of assets in which significant unobservable inputs (Level 3) were used in determining fair value:
| Total Value | Mortgage- Backed Securities | Corporate Bonds | Foreign Bonds | Foreign Common Stocks | Foreign Government Inflation- Linked Note | Loan Agreements | ||||||||||||||||||||||
Balance, 12/31/14 | $ | 7,511,796 | $ | — | $ | 3,985,315 | $ | 6,602 | $ | 216,969 | $ | 3,302,910 | $ | — | ||||||||||||||
Accrued discounts/premiums | 33,469 | 26,952 | 6,197 | — | — | 320 | — | |||||||||||||||||||||
Realized gain (loss)(1) | 3,134 | (19 | ) | 3,153 | — | — | — | — | ||||||||||||||||||||
Change in unrealized appreciation (depreciation)(2) | (1,518,241 | ) | (53,608 | ) | (146,711 | ) | — | (175,602 | ) | (1,142,320 | ) | — | ||||||||||||||||
Purchases | 4,036,132 | 3,006,132 | 1,000,000 | — | — | — | 30,000 | |||||||||||||||||||||
Sales | (99,339 | ) | (1,228 | ) | (98,111 | ) | — | — | — | — | ||||||||||||||||||
Transfers in to Level 3 | — | — | — | — | — | — | — | |||||||||||||||||||||
Transfers out of Level 3(3) | (5,219,573 | ) | — | (3,058,663 | ) | — | — | (2,160,910 | ) | — | ||||||||||||||||||
Maturities | (217,637 | ) | — | (217,637 | ) | — | — | — | — | |||||||||||||||||||
Paydowns | (184,768 | ) | — | (184,768 | ) | — | — | — | — | |||||||||||||||||||
|
|
|
|
|
|
|
|
|
|
|
|
|
| |||||||||||||||
Balance, 12/31/15 | $ | 4,344,973 | $ | 2,978,229 | $ | 1,288,775 | $ | 6,602 | $ | 41,367 | $ | — | $ | 30,000 | ||||||||||||||
|
|
|
|
|
|
|
|
|
|
|
|
|
| |||||||||||||||
| (1) | Realized gain (loss) from the sale of Level 3 securities is included on the Statement of Operations in Net realized gain (loss) from: Investment securities. |
| (2) | Change in unrealized appreciation (depreciation) is located on the Statement of Operations in Net change in unrealized appreciation (depreciation) on: Investment securities. |
| (3) | Transfers out of Level 3 represent the value of securities at December 31, 2015 that were transferred from Level 3 to Level 2 of the fair value hierarchy as a result of the ability of the Fund to obtain a price using an objective method such as a pricing vendor. |
| See Notes to Financial Statements. | 147 |
Table of Contents
| Money Market Fund | Low-Duration Bond Fund | |||||||
Assets | ||||||||
Investments in securities of unaffiliated issuers, at value | $ | 1,223,039,791 | $ | 872,271,602 | ||||
Investments in repurchase agreements, at value | 64,500,000 | — | ||||||
Investments in securities of affiliated issuers, at value | — | 36,182,778 | ||||||
|
|
|
| |||||
Total investments, at value (1)(2) | 1,287,539,791 | 908,454,380 | ||||||
Cash | 385 | 1,296,416 | ||||||
Cash collateral for derivatives | — | 2,665,640 | ||||||
Foreign currency(3) | — | 1,244,557 | ||||||
Upfront premiums paid from swap contracts | — | 310,901 | ||||||
Receivables: | ||||||||
Dividends and reclaims | — | 287 | ||||||
Interest | 197,738 | 3,595,231 | ||||||
Securities lending | — | 28,621 | ||||||
Investment securities sold | — | 11,945,700 | ||||||
Maturities | — | 26,104 | ||||||
Fund shares sold | 25,248,694 | 247,981 | ||||||
Variation margin on exchange traded swaps | — | — | ||||||
Variation margin on financial futures contracts | — | 76,501 | ||||||
Unrealized appreciation on foreign currency exchange contracts | — | 319,042 | ||||||
Unrealized appreciation on swap agreements | — | 433,568 | ||||||
Prepaid expenses and other assets | 51,928 | 25,370 | ||||||
|
|
|
| |||||
Total Assets | 1,313,038,536 | 930,670,299 | ||||||
|
|
|
| |||||
Liabilities | ||||||||
TBA sale commitments, at value (5) | — | — | ||||||
Options written, at value (6) | — | 661,700 | ||||||
Upfront premiums received from swap contracts | — | 61,204 | ||||||
Unrealized depreciation on foreign currency exchange contracts | — | 546,966 | ||||||
Unrealized depreciation on swap agreements | — | 28,492 | ||||||
Collateral held for securities on loan, at value | — | 27,068,175 | ||||||
Collateral held for derivatives | — | 90,000 | ||||||
Payables: | ||||||||
Investment securities purchased | — | 40,634,594 | ||||||
Fund shares redeemed | 25,345,039 | — | ||||||
Variation margin on exchange traded swaps | — | 1,017,453 | ||||||
Variation margin on financial futures contracts | — | 80,398 | ||||||
Distributions | 25,190 | — | ||||||
Securities lending | — | 4,292 | ||||||
Accrued expenses: | ||||||||
Investment advisory fees | 133,667 | 213,543 | ||||||
Shareholder servicing fees | 139,001 | 51,323 | ||||||
Other expenses | 93,039 | 188,766 | ||||||
|
|
|
| |||||
Total Liabilities | 25,735,936 | 70,646,906 | ||||||
|
|
|
| |||||
Net Assets | $ | 1,287,302,600 | $ | 860,023,393 | ||||
|
|
|
| |||||
Net Assets Consist of: | ||||||||
Paid-in-capital | $ | 1,287,295,922 | $ | 873,774,892 | ||||
Accumulated (distributions in excess of) net investment income | — | 356,265 | ||||||
Undistributed (accumulated) net realized gain (loss) on investments, foreign currency and derivative transactions | 6,678 | (3,153,042 | ) | |||||
Net unrealized appreciation (depreciation) on investments, foreign currency and derivative transactions | — | (10,954,722 | ) | |||||
|
|
|
| |||||
Net Assets | $ | 1,287,302,600 | $ | 860,023,393 | ||||
|
|
|
| |||||
Net Asset Value: | ||||||||
$0.001 par value, unlimited shares authorized | ||||||||
Net assets applicable to the Institutional Class | $ | 245,882,239 | $ | 617,698,014 | ||||
|
|
|
| |||||
Institutional shares outstanding | 245,881,858 | 73,839,090 | ||||||
|
|
|
| |||||
Net asset value, offering and redemption price per Institutional share | $ | 1.00 | $ | 8.37 | ||||
|
|
|
| |||||
Net assets applicable to the Investor Class | $ | 1,041,420,361 | $ | 242,325,379 | ||||
|
|
|
| |||||
Investor shares outstanding | 1,041,379,408 | 18,267,387 | ||||||
|
|
|
| |||||
Net asset value, offering and redemption price per Investor share | $ | 1.00 | $ | 13.27 | ||||
|
|
|
| |||||
(1) Investments in securities of unaffiliated issuers, at cost | $ | 1,223,039,791 | $ | 883,675,973 | ||||
Investments in repurchase agreements, at cost | 64,500,000 | — | ||||||
Investments in securities of affiliated issuers, at cost | — | 36,182,778 | ||||||
|
|
|
| |||||
Total investments, at cost | $ | 1,287,539,791 | $ | 919,858,751 | ||||
|
|
|
| |||||
(2) Includes securities loaned of: | $ | — | $ | 59,576,949 | ||||
|
|
|
| |||||
(3) Foreign currency, at cost | $ | — | $ | 1,257,565 | ||||
|
|
|
| |||||
(5) TBA sale commitments, at cost | $ | — | $ | — | ||||
|
|
|
| |||||
(6) Premiums received on options written | $ | — | $ | 1,194,980 | ||||
|
|
|
| |||||
| 148 | See Notes to Financial Statements. |
Table of Contents
| Medium-Duration Bond Fund | Extended-Duration Bond Fund | Global Bond Fund | ||||||||
| $ | 1,018,833,129 | $ | 255,538,388 | $ | 405,810,932 | |||||
| — | — | — | ||||||||
| 14,520,090 | 7,390,825 | 15,382,420 | ||||||||
|
|
|
|
|
| |||||
| 1,033,353,219 | 262,929,213 | 421,193,352 | ||||||||
| 10,827,723 | 9,992 | 434,700 | ||||||||
| 2,570,577 | — | 163,045 | ||||||||
| 1,755,603 | — | 1,974,737 | ||||||||
| 2,408,663 | — | — | ||||||||
| 199 | 1,168 | 46,364 | ||||||||
| 5,516,760 | 2,980,128 | 5,037,967 | ||||||||
| 35,757 | 11,893 | 48,008 | ||||||||
| 106,879,891 | — | 28,719 | ||||||||
| 80 | — | — | ||||||||
| 31,551 | 11,125 | 48,903 | ||||||||
| 632,394 | — | — | ||||||||
| 576,509 | — | 42,189 | ||||||||
| 2,069,681 | — | 560,811 | ||||||||
| 511,370 | — | — | ||||||||
| 23,370 | 13,236 | 26,128 | ||||||||
|
|
|
|
|
| |||||
| 1,167,193,347 | 265,956,755 | 429,604,923 | ||||||||
|
|
|
|
|
| |||||
| 11,597,097 | — | — | ||||||||
| 439,100 | — | — | ||||||||
| 387,579 | — | — | ||||||||
| 1,413,585 | — | 70,758 | ||||||||
| 5,140,568 | — | — | ||||||||
| 35,137,912 | 9,010,504 | 39,026,281 | ||||||||
| 720,560 | — | — | ||||||||
| 216,896,303 | 859,240 | 101,715 | ||||||||
| 14,003 | 30,711 | 5,324 | ||||||||
| — | — | — | ||||||||
| 329,920 | — | 62,798 | ||||||||
| — | — | — | ||||||||
| 5,360 | 1,783 | 7,197 | ||||||||
| 251,616 | 107,332 | 163,860 | ||||||||
| 40,017 | 23,124 | 16,732 | ||||||||
| 196,744 | 86,180 | 140,721 | ||||||||
|
|
|
|
|
| |||||
| 272,570,364 | 10,118,874 | 39,595,386 | ||||||||
|
|
|
|
|
| |||||
| $ | 894,622,983 | $ | 255,837,881 | $ | 390,009,537 | |||||
|
|
|
|
|
| |||||
| $ | 915,976,810 | $ | 256,923,487 | $ | 430,907,256 | |||||
| 194,284 | (696 | ) | (399,581 | ) | ||||||
| (858,595 | ) | 998,429 | (7,850,774 | ) | ||||||
| (20,689,516 | ) | (2,083,339 | ) | (32,647,364 | ) | |||||
|
|
|
|
|
| |||||
| $ | 894,622,983 | $ | 255,837,881 | $ | 390,009,537 | |||||
|
|
|
|
|
| |||||
| $ | 706,759,682 | $ | 148,919,919 | $ | 311,373,911 | |||||
| 106,223,156 | 39,156,524 | 34,279,279 | ||||||||
| $ | 6.65 | $ | 3.80 | $ | 9.08 | |||||
|
|
|
|
|
| |||||
| $ | 187,863,301 | $ | 106,917,962 | $ | 78,635,626 | |||||
|
|
|
|
|
| |||||
| 13,123,738 | 6,380,233 | 8,658,669 | ||||||||
|
|
|
|
|
| |||||
| $ | 14.31 | $ | 16.76 | $ | 9.08 | |||||
|
|
|
|
|
| |||||
| $ | 1,034,856,905 | $ | 257,617,882 | $ | 438,754,025 | |||||
| — | — | — | ||||||||
| 14,520,090 | 7,390,825 | 15,382,420 | ||||||||
|
|
|
|
|
| |||||
| $ | 1,049,376,995 | $ | 265,008,707 | $ | 454,136,445 | |||||
|
|
|
|
|
| |||||
| $ | 117,889,973 | $ | 33,229,660 | $ | 44,640,846 | |||||
|
|
|
|
|
| |||||
| $ | 1,775,854 | $ | — | $ | 2,174,188 | |||||
|
|
|
|
|
| |||||
| $ | 11,607,242 | $ | — | $ | — | |||||
|
|
|
|
|
| |||||
| $ | 804,120 | $ | — | $ | — | |||||
|
|
|
|
|
| |||||
| See Notes to Financial Statements. | 149 |
Table of Contents
STATEMENTS OF OPERATIONS | For the Year Ended December 31, 2015 |
| Money Market Fund | Low-Duration Bond Fund | |||||||
Investment Income | ||||||||
Dividends | $ | — | $ | — | ||||
Income distributions received from affiliated funds | — | 3,264 | ||||||
Interest | 3,140,802 | 15,639,746 | ||||||
Securities lending | 598 | 143,561 | ||||||
Less foreign taxes withheld | — | — | ||||||
|
|
|
| |||||
Total Investment Income | 3,141,400 | 15,786,571 | ||||||
|
|
|
| |||||
Expenses | ||||||||
Investment advisory fees | 1,798,993 | 2,648,291 | ||||||
Transfer agent fees: | ||||||||
Institutional shares | 4,210 | 4,546 | ||||||
Investor shares | 41,331 | 26,630 | ||||||
Custodian fees | 31,847 | 85,425 | ||||||
Shareholder servicing fees: | ||||||||
Investor shares | 2,650,276 | 961,467 | ||||||
Accounting and administration fees | 266,177 | 351,497 | ||||||
Professional fees | 63,907 | 145,725 | ||||||
Blue sky fees: | ||||||||
Institutional shares | 17,004 | 13,756 | ||||||
Investor shares | 38,769 | 20,485 | ||||||
Shareholder reporting fees: | ||||||||
Institutional shares | 1,466 | 1,739 | ||||||
Investor shares | 39,422 | 16,950 | ||||||
Trustee expenses | 17,115 | 11,748 | ||||||
Line of credit facility fees | 8,357 | 6,001 | ||||||
Other expenses | 39,486 | 53,228 | ||||||
|
|
|
| |||||
Total expenses | 5,018,360 | 4,347,488 | ||||||
Expenses waived/reimbursed net of amount recaptured(1) | (2,144,404 | ) | (252,592 | ) | ||||
|
|
|
| |||||
Net expenses | 2,873,956 | 4,094,896 | ||||||
|
|
|
| |||||
Net Investment Income | 267,444 | 11,691,675 | ||||||
|
|
|
| |||||
Realized and Unrealized Gain (Loss) | ||||||||
Net realized gain (loss) from: | ||||||||
Investment securities | 88,237 | 347,536 | ||||||
Investment securities sold short | — | 15,469 | ||||||
Futures transactions | — | 1,039,424 | ||||||
Swap agreements | — | (2,715,513 | ) | |||||
Option contracts written | — | 685,708 | ||||||
Option contracts purchased | — | (189,905 | ) | |||||
Foreign currency | — | (460,566 | ) | |||||
|
|
|
| |||||
Net realized gain (loss) | 88,237 | (1,277,847 | ) | |||||
|
|
|
| |||||
Net change in unrealized appreciation (depreciation) on: | ||||||||
Investment securities | — | (6,296,302 | ) | |||||
Investment securities sold short | — | (9,609 | ) | |||||
Futures | — | 470,890 | ||||||
Swap agreements | — | 831,077 | ||||||
Option contracts written | — | 526,983 | ||||||
Option contracts purchased | — | (108,034 | ) | |||||
Foreign currency | — | (1,013,886 | ) | |||||
|
|
|
| |||||
Net change in unrealized appreciation (depreciation) | — | (5,598,881 | ) | |||||
|
|
|
| |||||
Net Realized and Unrealized Gain (Loss) | 88,237 | (6,876,728 | ) | |||||
|
|
|
| |||||
Net Increase (Decrease) in Net Assets Resulting from Operations | $ | 355,681 | $ | 4,814,947 | ||||
|
|
|
| |||||
| (1) | See Note 3a and 3c in Notes to Financial Statements. |
| 150 | See Notes to Financial Statements. |
Table of Contents
Medium-Duration Bond Fund | Extended-Duration Bond Fund | Global Bond Fund | ||||||||
| $ | 48,528 | $ | 28,878 | $ | 346,232 | |||||
| 5,238 | 883 | 3,973 | ||||||||
| 25,178,508 | 12,837,970 | 17,500,962 | ||||||||
| 180,706 | 74,858 | 239,654 | ||||||||
| (32,885 | ) | — | (8,971 | ) | ||||||
|
|
|
|
|
| |||||
| 25,380,095 | 12,942,589 | 18,081,850 | ||||||||
|
|
|
|
|
| |||||
| 3,292,107 | 1,384,305 | 1,951,623 | ||||||||
| 4,487 | 4,030 | 2,901 | ||||||||
| 26,760 | 26,677 | 21,224 | ||||||||
| 261,765 | 19,400 | 75,072 | ||||||||
| 851,547 | 397,193 | 458,100 | ||||||||
| 442,460 | 90,890 | 202,538 | ||||||||
| 145,726 | 122,255 | 125,725 | ||||||||
| 13,721 | 13,020 | 160 | ||||||||
| 16,950 | 17,570 | 19,974 | ||||||||
| 1,667 | 776 | 1,261 | ||||||||
| 16,884 | 16,273 | 7,474 | ||||||||
| 12,208 | 3,838 | 5,483 | ||||||||
| 6,661 | 1,929 | 3,631 | ||||||||
| 148,125 | 18,881 | 34,203 | ||||||||
|
|
|
|
|
| |||||
| 5,241,068 | 2,117,037 | 2,909,369 | ||||||||
| (377,824 | ) | (69,433 | ) | (87,495 | ) | |||||
|
|
|
|
|
| |||||
| 4,863,244 | 2,047,604 | 2,821,874 | ||||||||
|
|
|
|
|
| |||||
| 20,516,851 | 10,894,985 | 15,259,976 | ||||||||
|
|
|
|
|
| |||||
| 7,722,780 | 8,479,998 | 586,405 | ||||||||
| (507,502 | ) | — | — | |||||||
| 4,513,918 | — | 524,248 | ||||||||
| (4,435,516 | ) | — | — | |||||||
| 3,491,303 | — | 68,500 | ||||||||
| (1,271,782 | ) | — | (126,063 | ) | ||||||
| 2,771,595 | (46,705 | ) | (1,957,146 | ) | ||||||
|
|
|
|
|
| |||||
| 12,284,796 | 8,433,293 | (904,056 | ) | |||||||
|
|
|
|
|
| |||||
| (31,392,207 | ) | (34,275,311 | ) | (38,312,776 | ) | |||||
| 64,957 | — | — | ||||||||
| (596,367 | ) | — | 388,465 | |||||||
| (560,335 | ) | — | — | |||||||
| (372,586 | ) | — | — | |||||||
| 547,255 | — | 56,117 | ||||||||
| (286,121 | ) | 7,898 | (408,581 | ) | ||||||
|
|
|
|
|
| |||||
| (32,595,404 | ) | (34,267,413 | ) | (38,276,775 | ) | |||||
|
|
|
|
|
| |||||
| (20,310,608 | ) | (25,834,120 | ) | (39,180,831 | ) | |||||
|
|
|
|
|
| |||||
| $ | 206,243 | $ | (14,939,135 | ) | $ | (23,920,855 | ) | |||
|
|
|
|
|
| |||||
| See Notes to Financial Statements. | 151 |
Table of Contents
STATEMENTS OF CHANGES IN NET ASSETS
| Money Market Fund | ||||||||
| For the Year Ended | ||||||||
| 12/31/15 | 12/31/14 | |||||||
Operations: | ||||||||
Net investment income | $ | 267,444 | $ | 103,141 | ||||
Net realized gain (loss) on investment securities, foreign currency and derivatives | 88,237 | 80,098 | ||||||
Net change in unrealized appreciation (depreciation) on investment securities, foreign currency and derivatives | — | — | ||||||
|
|
|
| |||||
Net increase in net assets resulting from operations | 355,681 | 183,239 | ||||||
|
|
|
| |||||
Dividends and Distributions to Shareholders: | ||||||||
Dividends from net investment income | ||||||||
Institutional shares | (159,948 | ) | (19,760 | ) | ||||
Investor shares | (107,496 | ) | (119,994 | ) | ||||
Distributions from net realized capital gains | ||||||||
Institutional shares | (17,343 | ) | (8,005 | ) | ||||
Investor shares | (71,893 | ) | (75,633 | ) | ||||
|
|
|
| |||||
Total dividends and distributions | (356,680 | ) | (223,392 | ) | ||||
|
|
|
| |||||
Capital Share Transactions: | ||||||||
Proceeds from shares sold | ||||||||
Institutional shares | 716,417,103 | 169,689,475 | ||||||
Investor shares | 3,839,326,751 | 3,811,246,128 | ||||||
Reinvestment of dividends and distributions | ||||||||
Institutional shares | 93,916 | 25,034 | ||||||
Investor shares | 113,201 | 117,713 | ||||||
|
|
|
| |||||
Total proceeds from shares sold and reinvested | 4,555,950,971 | 3,981,078,350 | ||||||
|
|
|
| |||||
Value of shares redeemed | ||||||||
Institutional shares | (592,248,516 | ) | (154,146,430 | ) | ||||
Investor shares | (3,961,518,030 | ) | (3,910,770,582 | ) | ||||
|
|
|
| |||||
Total value of shares redeemed | (4,553,766,546 | ) | (4,064,917,012 | ) | ||||
|
|
|
| |||||
Net increase (decrease) from capital share transactions(1) | 2,184,425 | (83,838,662 | ) | |||||
|
|
|
| |||||
Total increase (decrease) in net assets | 2,183,426 | (83,878,815 | ) | |||||
|
|
|
| |||||
Net Assets: | ||||||||
Beginning of Year | 1,285,119,174 | 1,368,997,989 | ||||||
|
|
|
| |||||
End of Year* | $ | 1,287,302,600 | $ | 1,285,119,174 | ||||
|
|
|
| |||||
*Including undistributed (distributions in excess of) net investment income | $ | — | $ | — | ||||
|
|
|
| |||||
| (1) | See Note 6 in Notes to Financial Statements. |
| 152 | See Notes to Financial Statements. |
Table of Contents
| Low-Duration Bond Fund | Medium-Duration Bond Fund | |||||||||||||
| For the Year Ended | For the Year Ended | |||||||||||||
| 12/31/15 | 12/31/14 | 12/31/15 | 12/31/14 | |||||||||||
| $ | 11,691,675 | $ | 7,709,712 | $ | 20,516,851 | $ | 17,113,203 | |||||||
| (1,277,847 | ) | 2,756,436 | 12,284,796 | 20,404,741 | ||||||||||
| (5,598,881 | ) | (1,921,486 | ) | (32,595,404 | ) | 10,073,625 | ||||||||
|
|
|
|
|
|
|
| |||||||
| 4,814,947 | 8,544,662 | 206,243 | 47,591,569 | |||||||||||
|
|
|
|
|
|
|
| |||||||
| (6,206,090 | ) | (3,246,651 | ) | (19,835,112 | ) | (9,760,378 | ) | |||||||
| (4,004,414 | ) | (8,748,258 | ) | (5,372,791 | ) | (11,514,324 | ) | |||||||
| — | (106,638 | ) | (8,134,050 | ) | (1,259,574 | ) | ||||||||
| — | (357,017 | ) | (2,134,885 | ) | (1,688,475 | ) | ||||||||
|
|
|
|
|
|
|
| |||||||
| (10,210,504 | ) | (12,458,564 | ) | (35,476,838 | ) | (24,222,751 | ) | |||||||
|
|
|
|
|
|
|
| |||||||
| 533,537,034 | 34,760,024 | 538,487,348 | 57,541,784 | |||||||||||
| 56,861,484 | 94,065,721 | 35,790,325 | 133,368,406 | |||||||||||
| 6,202,579 | 3,348,188 | 27,940,007 | 10,995,994 | |||||||||||
| 4,003,486 | 9,104,484 | 7,503,003 | 13,200,112 | |||||||||||
|
|
|
|
|
|
|
| |||||||
| 600,604,583 | 141,278,417 | 609,720,683 | 215,106,296 | |||||||||||
|
|
|
|
|
|
|
| |||||||
| (56,796,481 | ) | (31,908,875 | ) | (65,371,757 | ) | (58,724,889 | ) | |||||||
| (524,728,254 | ) | (97,380,779 | ) | (523,381,325 | ) | (80,447,236 | ) | |||||||
|
|
|
|
|
|
|
| |||||||
| (581,524,735 | ) | (129,289,654 | ) | (588,753,082 | ) | (139,172,125 | ) | |||||||
|
|
|
|
|
|
|
| |||||||
| 19,079,848 | 11,988,763 | 20,967,601 | 75,934,171 | |||||||||||
|
|
|
|
|
|
|
| |||||||
| 13,684,291 | 8,074,861 | (14,302,994 | ) | 99,302,989 | ||||||||||
|
|
|
|
|
|
|
| |||||||
| 846,339,102 | 838,264,241 | 908,925,977 | 809,622,988 | |||||||||||
|
|
|
|
|
|
|
| |||||||
| $ | 860,023,393 | $ | 846,339,102 | $ | 894,622,983 | $ | 908,925,977 | |||||||
|
|
|
|
|
|
|
| |||||||
| $ | 356,265 | $ | (1,016,162 | ) | $ | 194,284 | $ | 1,210,249 | ||||||
|
|
|
|
|
|
|
| |||||||
| See Notes to Financial Statements. | 153 |
Table of Contents
STATEMENTS OF CHANGES IN NET ASSETS
| Extended-Duration Bond Fund | ||||||||
| For the Year Ended | ||||||||
| 12/31/15 | 12/31/14 | |||||||
Operations: | ||||||||
Net investment income | $ | 10,894,985 | $ | 11,698,563 | ||||
Net realized gain (loss) on investment securities, foreign currency and derivative | 8,433,293 | 13,621,292 | ||||||
Net change in unrealized appreciation (depreciation) on investment securities, foreign currency and derivative | (34,267,413 | ) | 20,316,746 | |||||
|
|
|
| |||||
Net increase (decrease) in net assets resulting from operations | (14,939,135 | ) | 45,636,601 | |||||
|
|
|
| |||||
Dividends and Distributions to Shareholders: | ||||||||
Dividends from net investment income | ||||||||
Institutional shares | (8,255,611 | ) | (5,678,669 | ) | ||||
Investor shares | (2,613,268 | ) | (6,555,965 | ) | ||||
Distributions from net realized capital gains | ||||||||
Institutional shares | (8,221,411 | ) | (4,378,841 | ) | ||||
Investor shares | (3,229,289 | ) | (5,208,316 | ) | ||||
|
|
|
| |||||
Total dividends and distributions | (22,319,579 | ) | (21,821,791 | ) | ||||
|
|
|
| |||||
Capital Share Transactions: | ||||||||
Proceeds from shares sold | ||||||||
Institutional shares | 119,793,129 | 16,428,518 | ||||||
Investor shares | 28,567,162 | 59,631,376 | ||||||
Reinvestment of dividends and distributions | ||||||||
Institutional shares | 16,470,485 | 10,047,722 | ||||||
Investor shares | 5,835,124 | 11,755,354 | ||||||
|
|
|
| |||||
Total proceeds from shares sold and reinvested | 170,665,900 | 97,862,970 | ||||||
|
|
|
| |||||
Value of shares redeemed | ||||||||
Institutional shares | (18,375,581 | ) | (20,788,920 | ) | ||||
Investor shares | (160,827,372 | ) | (70,036,593 | ) | ||||
|
|
|
| |||||
Total value of shares redeemed | (179,202,953 | ) | (90,825,513 | ) | ||||
|
|
|
| |||||
Net increase (decrease) from capital share transactions(1) | (8,537,053 | ) | 7,037,457 | |||||
|
|
|
| |||||
Total increase (decrease) in net assets | (45,795,767 | ) | 30,852,267 | |||||
|
|
|
| |||||
Net Assets: | ||||||||
Beginning of Year | 301,633,648 | 270,781,381 | ||||||
|
|
|
| |||||
End of Year* | $ | 255,837,881 | $ | 301,633,648 | ||||
|
|
|
| |||||
*Including distributions in excess of net investment income | $ | (696 | ) | $ | (696 | ) | ||
|
|
|
| |||||
| (1) | See Note 6 in Notes to Financial Statements. |
| 154 | See Notes to Financial Statements. |
Table of Contents
| Global Bond Fund | ||||||
| For the Year Ended | ||||||
| 12/31/15 | 12/31/14 | |||||
| $ | 15,259,976 | $ | 13,952,255 | |||
| (904,056 | ) | 1,883,868 | ||||
| (38,276,775 | ) | (5,892,886 | ) | |||
|
|
|
| |||
| (23,920,855 | ) | 9,943,237 | ||||
|
|
|
| |||
| (8,590,342 | ) | — | ||||
| (7,161,903 | ) | (13,252,051 | ) | |||
| — | — | |||||
| — | — | |||||
|
|
|
| |||
| (15,752,245 | ) | (13,252,051 | ) | |||
|
|
|
| |||
| 344,440,917 | — | |||||
| 18,823,824 | 65,529,567 | |||||
| 8,590,341 | — | |||||
| 7,159,800 | 13,251,586 | |||||
|
|
|
| |||
| 379,014,882 | 78,781,153 | |||||
|
|
|
| |||
| (8,005,220 | ) | — | ||||
| (342,648,454 | ) | (31,992,897 | ) | |||
|
|
|
| |||
| (350,653,674 | ) | (31,992,897 | ) | |||
|
|
|
| |||
| 28,361,208 | 46,788,256 | |||||
|
|
|
| |||
| (11,311,892 | ) | 43,479,442 | ||||
|
|
|
| |||
| 401,321,429 | 357,841,987 | |||||
|
|
|
| |||
| $ | 390,009,537 | $ | 401,321,429 | |||
|
|
|
| |||
| $ | (399,581 | ) | $ | (214,427 | ) | |
|
|
|
| |||
| See Notes to Financial Statements. | 155 |
Table of Contents
FINANCIAL HIGHLIGHTS
| For a Share Outstanding For the Years Ending December 31, unless otherwise indicated | Ratios to Average Net Assets | |||||||||||||||||||||||||||||||||||||||||||||||
| Net Asset Value, Beginning of Year | Net Investment | Realized (Loss) on | Dividends from Net Investment Income | Distributions from Net Realized Capital Gains | Net Asset Value, End of | Total Return | Net Assets, Year (000) | Expenses, Net(1) | Expenses, Gross(2) | Investment Income, Net(1) | Portfolio Turnover Rate | |||||||||||||||||||||||||||||||||||||
| Money Market Fund
| ||||||||||||||||||||||||||||||||||||||||||||||||
Institutional Class |
| |||||||||||||||||||||||||||||||||||||||||||||||
2015 | $ | 1.00 | $ | — | †# | $ | — | † | $ | — | † | $ | — | † | $ | 1.00 | 0.08 | % | $ | 245,882 | 0.17 | % | 0.18 | % | 0.08 | % | N/A | |||||||||||||||||||||
2014 | 1.00 | — | †# | — | † | — | † | — | † | 1.00 | 0.02 | 121,624 | 0.18 | 0.19 | 0.01 | N/A | ||||||||||||||||||||||||||||||||
2013(3) | 1.00 | — | †# | — | † | — | † | — | † | 1.00 | 0.04 | 106,060 | 0.18 | 0.20 | 0.04 | N/A | ||||||||||||||||||||||||||||||||
2012 | 1.00 | — | †# | — | † | — | † | — | † | 1.00 | 0.10 | 106,664 | 0.18 | 0.20 | 0.10 | N/A | ||||||||||||||||||||||||||||||||
2011 | 1.00 | — | †# | — | † | — | † | — | † | 1.00 | 0.10 | 116,298 | 0.18 | 0.19 | 0.09 | N/A | ||||||||||||||||||||||||||||||||
Investor Class |
| |||||||||||||||||||||||||||||||||||||||||||||||
2015 | $ | 1.00 | $ | — | †# | $ | — | † | $ | — | † | $ | — | † | $ | 1.00 | 0.02 | % | $ | 1,041,421 | 0.24 | % | 0.43 | % | 0.01 | % | N/A | |||||||||||||||||||||
2014 | 1.00 | — | †# | — | † | — | † | — | † | 1.00 | 0.02 | 1,163,495 | 0.19 | 0.44 | 0.01 | N/A | ||||||||||||||||||||||||||||||||
2013(3) | 1.00 | — | †# | — | † | — | † | — | † | 1.00 | 0.02 | 1,262,938 | 0.21 | 0.44 | 0.01 | N/A | ||||||||||||||||||||||||||||||||
2012 | 1.00 | — | †# | — | † | — | † | — | † | 1.00 | 0.01 | 1,131,756 | 0.27 | 0.44 | 0.01 | N/A | ||||||||||||||||||||||||||||||||
2011 | 1.00 | — | †# | — | † | — | † | — | † | 1.00 | 0.01 | 1,161,630 | 0.27 | 0.42 | 0.01 | N/A | ||||||||||||||||||||||||||||||||
Low-Duration Bond Fund
|
| |||||||||||||||||||||||||||||||||||||||||||||||
Institutional Class |
| |||||||||||||||||||||||||||||||||||||||||||||||
2015 | $ | 8.44 | $ | 0.13 | # | $ | (0.06 | )(4) | $ | (0.14 | ) | $ | — | $ | 8.37 | 0.79 | % | $ | 617,698 | 0.37 | % | 0.38 | % | 1.52 | % | 746 | % | |||||||||||||||||||||
2014 | 8.54 | 0.09 | # | 0.01 | (4) | (0.19 | ) | (0.01 | ) | 8.44 | 1.16 | 141,461 | 0.36 | 0.42 | 1.06 | 529 | ||||||||||||||||||||||||||||||||
2013(5) | 8.71 | 0.11 | # | (0.11 | )(4) | (0.16 | ) | (0.01 | ) | 8.54 | 0.02 | 136,966 | 0.36 | 0.42 | 1.26 | 202 | ||||||||||||||||||||||||||||||||
2012 | 8.59 | 0.15 | # | 0.22 | (4) | (0.22 | ) | (0.03 | ) | 8.71 | 4.35 | 135,526 | 0.36 | 0.41 | 1.68 | 228 | ||||||||||||||||||||||||||||||||
2011 | 8.70 | 0.16 | # | (0.01 | )(4) | (0.23 | ) | (0.03 | ) | 8.59 | 1.77 | 122,462 | 0.36 | 0.42 | 1.84 | 221 | ||||||||||||||||||||||||||||||||
Investor Class |
| |||||||||||||||||||||||||||||||||||||||||||||||
2015 | $ | 13.31 | $ | 0.16 | # | $ | (0.09 | )(4) | $ | (0.11 | ) | $ | — | $ | 13.27 | 0.49 | % | $ | 242,325 | 0.60 | % | 0.65 | % | 1.17 | % | 746 | % | |||||||||||||||||||||
2014 | 13.35 | 0.11 | # | 0.02 | (4) | (0.16 | ) | (0.01 | ) | 13.31 | 0.97 | 704,878 | 0.57 | 0.66 | 0.85 | 529 | ||||||||||||||||||||||||||||||||
2013(5) | 13.52 | 0.14 | # | (0.16 | )(4) | (0.14 | ) | (0.01 | ) | 13.35 | (0.20 | ) | 701,299 | 0.57 | 0.66 | 1.04 | 202 | |||||||||||||||||||||||||||||||
2012 | 13.20 | 0.20 | # | 0.35 | (4) | (0.20 | ) | (0.03 | ) | 13.52 | 4.15 | 678,099 | 0.57 | 0.65 | 1.47 | 228 | ||||||||||||||||||||||||||||||||
2011 | 13.23 | 0.22 | # | (0.01 | )(4) | (0.21 | ) | (0.03 | ) | 13.20 | 1.58 | 621,713 | 0.55 | 0.65 | 1.64 | 221 | ||||||||||||||||||||||||||||||||
Medium-Duration Bond Fund
|
| |||||||||||||||||||||||||||||||||||||||||||||||
Institutional Class |
| |||||||||||||||||||||||||||||||||||||||||||||||
2015 | $ | 6.99 | $ | 0.17 | # | $ | (0.16 | )(4) | $ | (0.25 | ) | $ | (0.10 | ) | $ | 6.65 | 0.03 | % | $ | 706,760 | 0.45 | % | 0.47 | % | 2.46 | % | 346 | % | ||||||||||||||||||||
2014 | 6.91 | 0.15 | # | 0.26 | (4) | (0.29 | ) | (0.04 | ) | 6.99 | 6.03 | 239,389 | 0.48 | 0.52 | 2.14 | 408 | ||||||||||||||||||||||||||||||||
2013(6) | 7.32 | 0.16 | # | (0.29 | )(4) | (0.27 | ) | (0.01 | ) | 6.91 | (1.90 | ) | 227,172 | 0.48 | 0.52 | 2.21 | 409 | |||||||||||||||||||||||||||||||
2012 | 7.24 | 0.17 | # | 0.39 | (4) | (0.28 | ) | (0.20 | ) | 7.32 | 7.93 | 251,565 | 0.48 | 0.51 | 2.32 | 570 | ||||||||||||||||||||||||||||||||
2011 | 7.25 | 0.20 | # | 0.27 | (4) | (0.35 | ) | (0.13 | ) | 7.24 | 6.56 | 228,024 | 0.48 | 0.52 | 2.76 | 609 | ||||||||||||||||||||||||||||||||
Investor Class |
| |||||||||||||||||||||||||||||||||||||||||||||||
2015 | $ | 14.65 | $ | 0.28 | # | $ | (0.31 | )(4) | $ | (0.21 | ) | $ | (0.10 | ) | $ | 14.31 | (0.22 | )% | $ | 187,863 | 0.66 | % | 0.75 | % | 1.92 | % | 346 | % | ||||||||||||||||||||
2014 | 14.14 | 0.29 | # | 0.53 | (4) | (0.27 | ) | (0.04 | ) | 14.65 | 5.82 | 669,537 | 0.63 | 0.77 | 1.98 | 408 | ||||||||||||||||||||||||||||||||
2013(6) | 14.68 | 0.30 | # | (0.59 | )(4) | (0.24 | ) | (0.01 | ) | 14.14 | (1.98 | ) | 582,451 | 0.63 | 0.77 | 2.06 | 409 | |||||||||||||||||||||||||||||||
2012 | 14.07 | 0.32 | # | 0.75 | (4) | (0.26 | ) | (0.20 | ) | 14.68 | 7.68 | 620,945 | 0.63 | 0.75 | 2.18 | 570 | ||||||||||||||||||||||||||||||||
2011 | 13.65 | 0.37 | # | 0.51 | (4) | (0.33 | ) | (0.13 | ) | 14.07 | 6.49 | 636,218 | 0.61 | 0.75 | 2.62 | 609 | ||||||||||||||||||||||||||||||||
| † | Amount represents less than $0.005 per share. |
| # | Calculated using the average shares outstanding method. |
| (1) | The ratio includes expenses waived/reimbursed net of amount recaptured and fees paid indirectly, where applicable; if expenses waived/reimbursed net of amount recaptured and fees paid indirectly were excluded, the ratio would have been higher (lower), respectively, than the ratio shown. |
| (2) | The ratio excludes expenses waived/reimbursed net of amount recaptured and fees paid indirectly, where applicable; if expenses waived/reimbursed net of amount recaptured and fees paid indirectly were included, the ratio would have been lower than the ratio shown. |
| (3) | An out of period adjustment to Investment Income had no impact on Net Investment Income per Share, Total Return or the Ratio of Net Investment Income to Average Net Assets for Institutional Class and Investor Class. |
| (4) | Amount includes Capital Gains distributions received by the Fund from the GuideStone Money Market Fund. The amount of these distributions represents less than $0.005 per share. |
| (5) | An out of period adjustment to Investment Income had no impact on Net Investment Income per Share or Total Return; however, the Ratio of Net Investment Income to Average Net Assets increased by 0.02% and 0.02% for Institutional Class and Investor Class, respectively. |
| (6) | An out of period adjustment to Investment Income increased Net Investment Income per Share by $0.00 and $0.01, Total Return by 0.00% and 0.07%, and the Ratio of Net Investment Income to Average Net Assets by 0.04% and 0.04% for Institutional Class and Investor Class, respectively. |
| 156 | See Notes to Financial Statements. |
Table of Contents
| For a Share Outstanding For the Years Ending December 31, unless otherwise indicated | Ratios to Average Net Assets | |||||||||||||||||||||||||||||||||||||||||||||||
| Net Asset Value, Beginning of Period | Net Investment | Realized (Loss) on | Dividends from Net Investment Income | Distributions from Net Realized Capital Gains | Net Asset End of | Total Return | Net Period | Expenses, Net(1) | Expenses, Gross(2) | Investment Income, Net(1) | Portfolio Turnover Rate | |||||||||||||||||||||||||||||||||||||
Extended-Duration Bond Fund
|
| |||||||||||||||||||||||||||||||||||||||||||||||
Institutional Class |
| |||||||||||||||||||||||||||||||||||||||||||||||
| 2015 | $ | 4.65 | $ | 0.17 | # | $ | (0.38 | )(3) | $ | (0.31 | ) | $ | (0.33 | ) | $ | 3.80 | (5.01 | )% | $ | 148,920 | 0.60 | % | 0.60 | % | 4.09 | % | 42 | % | ||||||||||||||||||||
| 2014 | 4.78 | 0.21 | # | 0.59 | (3) | (0.53 | ) | (0.40 | ) | 4.65 | 17.47 | 56,216 | 0.56 | 0.57 | 4.19 | 48 | ||||||||||||||||||||||||||||||||
| 2013(4) | 6.36 | 0.27 | # | (0.58 | )(3) | (0.63 | ) | (0.64 | ) | 4.78 | (5.10 | ) | 51,959 | 0.55 | 0.55 | 4.61 | 37 | |||||||||||||||||||||||||||||||
| 2012 | 6.48 | 0.31 | # | 0.64 | (3) | (0.65 | ) | (0.42 | ) | 6.36 | 15.41 | 86,268 | 0.52 | 0.53 | 4.68 | 27 | ||||||||||||||||||||||||||||||||
| 2011 | 6.93 | 0.37 | # | 0.49 | (3) | (0.74 | ) | (0.57 | ) | 6.48 | 13.33 | 74,591 | 0.54 | 0.55 | 5.32 | 41 | ||||||||||||||||||||||||||||||||
Investor Class |
| |||||||||||||||||||||||||||||||||||||||||||||||
| 2015 | $ | 18.30 | $ | 0.66 | # | $ | (1.60 | )(3) | $ | (0.27 | ) | $ | (0.33 | ) | $ | 16.76 | (5.30 | )% | $ | 106,918 | 0.82 | % | 0.85 | % | 3.65 | % | 42 | % | ||||||||||||||||||||
| 2014 | 16.39 | 0.71 | # | 2.10 | (3) | (0.50 | ) | (0.40 | ) | 18.30 | 17.32 | 245,417 | 0.75 | 0.83 | 3.99 | 48 | ||||||||||||||||||||||||||||||||
| 2013(4) | 18.58 | 0.78 | # | (1.74 | )(3) | (0.59 | ) | (0.64 | ) | 16.39 | (5.24 | ) | 218,822 | 0.75 | 0.80 | 4.40 | 37 | |||||||||||||||||||||||||||||||
| 2012 | 17.08 | 0.81 | # | 1.72 | (3) | (0.61 | ) | (0.42 | ) | 18.58 | 15.06 | 384,705 | 0.75 | 0.78 | 4.45 | 27 | ||||||||||||||||||||||||||||||||
| 2011 | 16.28 | 0.86 | # | 1.22 | (3) | (0.71 | ) | (0.57 | ) | 17.08 | 13.14 | 330,879 | 0.73 | 0.78 | 5.13 | 41 | ||||||||||||||||||||||||||||||||
Global Bond Fund
|
| |||||||||||||||||||||||||||||||||||||||||||||||
Institutional Class |
| |||||||||||||||||||||||||||||||||||||||||||||||
| 2015(5) | $ | 10.09 | $ | 0.27 | # | $ | (1.02 | )(3) | $ | (0.26 | ) | $ | — | $ | 9.08 | (7.54 | )% | $ | 311,374 | 0.59 | % | 0.62 | % | 4.15 | % | 30 | % | |||||||||||||||||||||
Investor Class |
| |||||||||||||||||||||||||||||||||||||||||||||||
| 2015 | $ | 10.03 | $ | 0.33 | # | $ | (0.92 | )(3) | $ | (0.36 | ) | $ | — | $ | 9.08 | (6.00 | )% | $ | 78,636 | 0.82 | % | 0.84 | % | 3.35 | % | 30 | % | |||||||||||||||||||||
| 2014 | 10.09 | 0.37 | # | (0.07 | )(3) | (0.36 | ) | — | 10.03 | 2.90 | 401,321 | 0.79 | 0.82 | 3.64 | 57 | |||||||||||||||||||||||||||||||||
| 2013(6) | 10.38 | 0.39 | # | (0.36 | )(3) | (0.32 | ) | — | 10.09 | 0.30 | 357,842 | 0.80 | 0.83 | 3.77 | 101 | |||||||||||||||||||||||||||||||||
| 2012 | 9.73 | 0.45 | # | 0.74 | (3) | (0.54 | ) | — | 10.38 | 12.52 | 232,856 | 0.83 | 0.86 | 4.41 | 64 | |||||||||||||||||||||||||||||||||
| 2011 | 9.83 | 0.51 | # | (0.09 | )(3) | (0.52 | ) | — | 9.73 | 4.35 | 170,167 | 0.86 | 0.88 | 5.09 | 68 | |||||||||||||||||||||||||||||||||
| # | Calculated using the average shares outstanding method. |
| (1) | The ratio includes expenses waived/reimbursed net of amount recaptured and fees paid indirectly, where applicable; if expenses waived/reimbursed net of amount recaptured and fees paid indirectly were excluded, the ratio would have been higher (lower), respectively, than the ratio shown. |
| (2) | The ratio excludes expenses waived/reimbursed net of amount recaptured and fees paid indirectly, where applicable; if expenses waived/reimbursed net of amount recaptured and fees paid indirectly were included, the ratio would have been lower than the ratio shown. |
| (3) | Amount includes Capital Gains distributions received by the Fund from the GuideStone Money Market Fund. The amount of these distributions represents less than $0.005 per share. |
| (4) | An out of period adjustment to Investment Income increased Net Investment Income per Share by $0.00 and $0.01, Total Return by 0.00% and 0.05%, and the Ratio of Net Investment Income to Average Net Assets by 0.04% and 0.04% for Institutional Class and Investor Class, respectively. |
| (5) | Inception date was April 30, 2015. All ratios for the period have been annualized. Total return and portfolio turnover for the period have not been annualized. |
| (6) | An out of period adjustment to Investment Income increased Net Investment Income per Share by $0.01, Total Return by 0.10%, and the Ratio of Net Investment Income to Average Net Assets by 0.02%. |
| See Notes to Financial Statements. | 157 |
Table of Contents
EQUITY SELECT FUNDS (Unaudited)
Global equity markets showed resilience in the fourth quarter and erased a good portion of the losses suffered in the prior quarter. Familiar themes such as moderating growth expectations in China, Federal Reserve (“Fed”) policy related to the timing of potential interest rate hikes and falling commodity prices continued to dominate the headlines and contributed to market uncertainty throughout the year. In the United States, equity markets continued to be volatile towards year-end as the S&P 500® Index advanced in October and November but declined in December. The result was an overall fourth quarter return of 7.04%, bringing the annual return to a positive 1.38% for 2015. The broader U.S. market, as measured by the Russell 3000® Index, posted returns of 6.27% for the fourth quarter and 0.48% for calendar year 2015.
From a sector perspective, performance was mixed as only five of nine sectors within the Russell 3000® Index advanced during the year. The best performance came from defensive sectors such as health care and consumer staples, while the worst performance came from the cyclical energy and materials & processing sector. The energy sector was clearly the weakest performer for the year and was negatively impacted by the continued decline in oil and gas prices.
Companies with larger capitalization, higher price-to-earnings ratios and lower dividend yield characteristics generally performed well during the year. In terms of equity market capitalization, large-cap companies outperformed their small-cap counterparts as the Russell 1000® Index posted a one-year return of 0.92%, while the Russell 2000® Index declined -4.41%. Style differentiation was evident during the year as growth-oriented stocks outperformed value-oriented stocks across all market capitalization segments. In the large capitalization segment, the Russell 1000® Growth Index and Russell 1000® Value Index had one-year returns of 5.67% and -3.83%, respectively. In the small capitalization segment, the Russell 2000® Growth Index posted a one-year return of -1.38%, while the Russell 2000® Value Index declined -7.47%. The fact that growth-oriented stocks outperformed their value-oriented counterparts is consistent with performance normally experienced in the late stages of an economic cycle.
Developed non-U.S. markets underperformed their U.S. counterparts and were negatively impacted by the U.S. dollar, which strengthened against most currencies during the year. The MSCI EAFE Index (Net), a measure of international developed country returns, posted a fourth quarter return of 4.71%, bringing the one-year return to -0.81%. Growth styles outperformed value styles and small capitalization stocks generally outperformed large capitalization stocks during the year. From a country perspective, Singapore, Spain and Norway posted the worst performance, while Denmark, Ireland and Belgium were among the best performing countries for the year. From a sector perspective, the weakest performance was registered in the energy and materials sectors, which were negatively impacted by the fall in oil prices, while the strongest performance came from the more defensive health care and consumer staples sectors.
Emerging markets experienced a difficult year and continued to face the headwinds of slower Chinese growth, weak commodity prices and a strong U.S. dollar. The MSCI Emerging Markets Index (Net) posted a small gain of 0.66% in the fourth quarter but was down -14.92% for the year, making it the weakest period since 2011. The worst performance was experienced in countries such as Greece, Brazil and Columbia, while Russia and Hungary were among the few positive performing countries for the year. All sectors were negative and seven of the ten groups experienced double-digit declines for the one-year period. The materials and utilities sectors were the worst performers, while the technology and health care sectors were the strongest performing sectors for calendar year 2015.
| 158 |
Table of Contents
Defensive Market Strategies Fund (Unaudited)
The Defensive Market Strategies Fund combines multiple strategies that in aggregate seek to provide long-term capital appreciation with reduced volatility compared to the equity markets.
The Investor Class of the Fund achieved its investment objective during 2015, outperforming its composite benchmark of 50% S&P 500® Index and 50% Citigroup 3-month Treasury Bill Index (2.16% versus 0.91%). The Fund also outperformed its reference benchmark, represented by the S&P 500® Index, which posted a modestly positive return of just 1.38% for the year. The greater capital appreciation of the Fund, relative to that of the S&P 500® Index, was due to the outperformance of the sub-adviser composite despite the Fund having materially lower market sensitivity (equity beta) and volatility (standard deviation) compared to the S&P 500® Index.
The Fund currently has assets allocated between three principal investment strategies, including long-only equity, options equity and convertible bonds. For the calendar year 2015, the long-only equity and options equity strategies contributed positively to absolute and benchmark-relative returns, while the convertible bonds strategy detracted from both absolute and benchmark-relative results.
The long-only equity strategy outperformed the S&P 500® Index for the year, benefiting from strong security selection, most notably in financial services and utilities. Strong security selection overcame defensive posturing in an environment where, in general, the highest beta stocks outperformed. Sector positioning detracted from results relative to the S&P 500® Index, mostly due to underweight positioning in technology and consumer discretionary stocks.
The options equity strategy contributed positively to benchmark relative performance, benefiting from an environment where the option premiums collected from option selling outperformed that of the equity risk premium, which was close to zero.
The convertible bonds strategy produced modestly negative returns. Strong security selection in the less equity sensitive securities of the convertible bond market boosted returns relative to a broad convertible bond index, but the allocation still underperformed the Fund’s benchmark. The Merrill Lynch All U.S. Convertibles Index fell 2.89% for the year and was impacted most negatively by declining share prices of the convertible bond issuers, which reduced the value of the imbedded options of the convertible bonds in the index.
Some underlying strategies may utilize derivative instruments within the Fund. During 2015, the Fund sold equity options in order to hedge (reduce) equity exposure and to collect the option premium from selling. The use of equity options contributed meaningfully to performance during 2015. Currency forwards were used to hedge foreign currency exposure back to the U.S. dollar and also contributed positively to the Fund’s performance.
This Fund may be suitable for investors who have a medium- to long-term investment horizon, possess a moderate tolerance for risk and seek to participate in the return potential of stocks at a slightly lower risk level than an all stock portfolio. Convertible securities valuations generally are more closely aligned with a company’s bonds than common stock. This Fund is subject to interest rate risk. Meaning, when interest rates rise, the value of the existing bonds decrease and vice versa. Foreign securities may be subject to greater risk than domestic securities due to currency volatility, reduced market liquidity and political and economic instability. To the extent that the investment adviser misjudges current market conditions, the Fund’s volatility may be amplified by its use of short sales and derivatives, and by its ability to select sub-advisers to allocate assets. Short sales by a fund theoretically involve unlimited loss potential since the market price of securities sold short may continuously increase. Leverage may increase the risk of loss and cause fluctuations in the market value of the Fund’s portfolio to have disproportionately large effects or cause the net asset value of the Fund to generally decline faster than it would otherwise. The use of certain derivatives may also have a leveraging effect which may increase the volatility of the Fund and may reduce its returns. It is possible to lose money by investing in the Fund.
159
Table of Contents
Defensive Market Strategies Fund (Unaudited)
At December 31, 2015, the portfolio holdings of the Fund, as a percentage of net assets, is shown in the following table. Portfolio holdings are subject to risk and may change at any time.
| % | ||||
Corporate Bonds | 22.8 | |||
U.S. Treasury Obligations | 18.2 | |||
Money Market Funds | 15.4 | |||
Financial Services | 7.9 | |||
Consumer Staples | 7.2 | |||
Utilities | 6.7 | |||
Consumer Discretionary | 5.9 | |||
Healthcare | 5.7 | |||
Producer Durables | 4.9 | |||
Preferred Stocks | 4.0 | |||
Foreign Common Stocks | 4.0 | |||
Technology | 3.4 | |||
Energy | 2.4 | |||
Synthetic Convertible Instruments | 0.9 | |||
Materials & Processing | 0.8 | |||
Master Limited Partnership | 0.5 | |||
Written Options | (0.1 | ) | ||
|
| |||
| 110.6 | ||||
|
| |||
160
Table of Contents
Defensive Market Strategies Fund (Unaudited)
| Average Annual Total Returns as of 12/31/15 | ||||||
Institutional Class* | Investor Class* | Benchmark** | ||||
One Year | 2.43% | 2.16% | 0.91% | |||
Since Inception | 9.77% | 9.50% | 7.52% | |||
Inception Date | 09/01/11 | 09/01/11 | ||||
Total Fund Operating Expenses (May 1, 2015 Prospectus, as amended on June 1, 2015)(1) | 0.82% | 1.07% | ||||
(1)Current information regarding the Fund’s Operating Expenses can be found in the Financial Highlights.
The performance data quoted represents past performance and does not guarantee future results. Current performance may be lower or higher. Performance data current to the most recent month-end may be obtained at www.GuideStoneFunds.org. The investment return and principal value of an investment will fluctuate so that shares, when redeemed, may be worth more or less than their original cost.
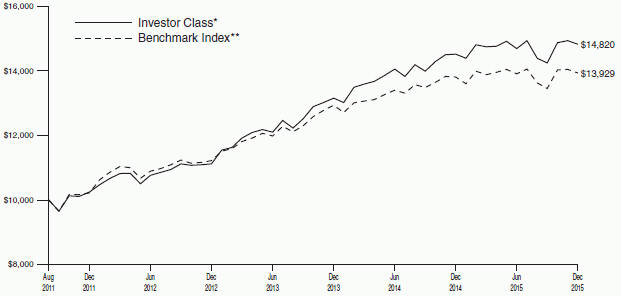
The graph compares the results of a hypothetical $10,000 investment in the Investor Class of the Fund since September 1, 2011 (commencement of operations), with all dividends and capital gains reinvested, with the weighted composite index.
*These returns reflect expense waivers by the Fund’s investment adviser. Without these waivers, returns would have been lower. Returns shown do not reflect the deduction of taxes that a shareholder would pay on Fund distributions or the redemption of Fund shares.
**Represents a weighted composite benchmark index as a reference benchmark consisting of 50% S&P 500® Index and 50% Citigroup 3-Month Treasury Bill Index.
Unlike a mutual fund, the performance of an index assumes no taxes, transaction costs, management fees or other expenses.
161
Table of Contents
DEFENSIVE MARKET STRATEGIES FUND SCHEDULE OF INVESTMENTS | December 31, 2015 |
| Shares | Value | |||||||||
COMMON STOCKS — 44.9% |
| |||||||||
Consumer Discretionary — 5.9% |
| |||||||||
Advance Auto Parts, Inc. | 262 | $ | 39,434 | |||||||
Amazon.com, Inc.* | 2,115 | 1,429,507 | ||||||||
AutoNation, Inc.* | 58 | 3,460 | ||||||||
AutoZone, Inc.* | 1,838 | 1,363,631 | ||||||||
Bed Bath & Beyond, Inc.D* | 6,508 | 314,011 | ||||||||
Best Buy Co., Inc. | 307 | 9,348 | ||||||||
BorgWarner, Inc. | 232 | 10,029 | ||||||||
Cablevision Systems Corporation Class A | 805 | 25,680 | ||||||||
CarMax, Inc.* | 253 | 13,654 | ||||||||
CBS Corporation Class B (Non-Voting Shares) | 421 | 19,842 | ||||||||
Chipotle Mexican Grill, Inc.* | 1,237 | 593,574 | ||||||||
Coach, Inc. | 313 | 10,245 | ||||||||
Comcast Corporation Class A | 3,132 | 176,739 | ||||||||
Costco Wholesale Corporation | 12,433 | 2,007,930 | ||||||||
D.R. Horton, Inc. | 377 | 12,075 | ||||||||
Darden Restaurants, Inc. | 149 | 9,482 | ||||||||
Discovery Communications, Inc. Class A* | 180 | 4,802 | ||||||||
Discovery Communications, Inc. Class C* | 364 | 9,180 | ||||||||
Dollar General Corporation | 302 | 21,705 | ||||||||
Dollar Tree, Inc.* | 8,314 | 642,007 | ||||||||
Domino’s Pizza, Inc.D | 3,000 | 333,750 | ||||||||
eBay, Inc.* | 4,125 | 113,355 | ||||||||
Estee Lauder Cos., Inc. (The) Class A | 11,958 | 1,053,022 | ||||||||
Expedia, Inc.D | 1,083 | 134,617 | ||||||||
Ford Motor Co. | 4,478 | 63,095 | ||||||||
GameStop Corporation Class A | 130 | 3,645 | ||||||||
Gap, Inc. (The)D | 1,501 | 37,075 | ||||||||
General Motors Co. | 1,773 | 60,300 | ||||||||
Genuine Parts Co.D | 47,864 | 4,111,039 | ||||||||
Goodyear Tire & Rubber Co. (The) | 280 | 9,148 | ||||||||
H&R Block, Inc. | 314 | 10,459 | ||||||||
Hanesbrands, Inc. | 225 | 6,622 | ||||||||
Harley-Davidson, Inc. | 250 | 11,348 | ||||||||
Harman International Industries, Inc. | 76 | 7,160 | ||||||||
Hasbro, Inc. | 91 | 6,130 | ||||||||
Home Depot, Inc. (The) | 13,435 | 1,776,779 | ||||||||
Interpublic Group of Cos., Inc. (The) | 481 | 11,198 | ||||||||
Johnson Controls, Inc. | 755 | 29,815 | ||||||||
Kohl’s Corporation | 228 | 10,860 | ||||||||
L Brands, Inc. | 443 | 42,448 | ||||||||
Lennar Corporation Class A | 243 | 11,885 | ||||||||
Lowe’s Cos., Inc. | 9,042 | 687,554 | ||||||||
Macy’s, Inc. | 419 | 14,657 | ||||||||
Madison Square Garden Co. (The) Class A* | 703 | 113,745 | ||||||||
Marriott International, Inc. Class A | 425 | 28,492 | ||||||||
Mattel, Inc.D | 10,887 | 295,800 | ||||||||
McDonald’s Corporation | 26,058 | 3,078,492 | ||||||||
Mohawk Industries, Inc.* | 62 | 11,742 | ||||||||
Netflix, Inc.* | 525 | 60,050 | ||||||||
Newell Rubbermaid, Inc. | 363 | 16,001 | ||||||||
News Corporation Class A | 567 | 7,575 | ||||||||
| Shares | Value | |||||||||
NIKE, Inc. Class B | 16,090 | $ | 1,005,625 | |||||||
Nordstrom, Inc. | 287 | 14,295 | ||||||||
Omnicom Group, Inc. | 293 | 22,168 | ||||||||
O’Reilly Automotive, Inc.* | 3,321 | 841,608 | ||||||||
Panera Bread Co. Class AD* | 2,200 | 428,516 | ||||||||
Priceline Group, Inc. (The)* | 164 | 209,092 | ||||||||
PulteGroup, Inc. | 257 | 4,580 | ||||||||
PVH Corporation | 92 | 6,776 | ||||||||
Ralph Lauren Corporation | 53 | 5,908 | ||||||||
Ross Stores, Inc. | 4,286 | 230,630 | ||||||||
Scripps Networks Interactive, Inc. Class AD | 5,121 | 282,730 | ||||||||
Staples, Inc. | 437 | 4,138 | ||||||||
Starbucks Corporation | 23,437 | 1,406,923 | ||||||||
Starwood Hotels & Resorts Worldwide, Inc. | 337 | 23,347 | ||||||||
Target CorporationD | 10,917 | 792,683 | ||||||||
TEGNA, Inc. | 255 | 6,508 | ||||||||
Tiffany & Co. | 162 | 12,359 | ||||||||
Time Warner Cable, Inc. | 315 | 58,461 | ||||||||
Time Warner, Inc. | 4,554 | 294,507 | ||||||||
TJX Cos., Inc. (The) | 10,907 | 773,415 | ||||||||
Tractor Supply Co. | 2,059 | 176,045 | ||||||||
TripAdvisor, Inc.D* | 4,547 | 387,632 | ||||||||
Tupperware Brands CorporationD | 12,603 | 701,357 | ||||||||
Twenty-First Century Fox, Inc. Class A | 1,877 | 50,979 | ||||||||
Under Armour, Inc. Class A* | 210 | 16,928 | ||||||||
Urban Outfitters, Inc.* | 140 | 3,185 | ||||||||
VF Corporation | 493 | 30,689 | ||||||||
Wal-Mart Stores, Inc. | 104,724 | 6,419,581 | ||||||||
Walt Disney Co. (The) | 8,253 | 867,225 | ||||||||
Whirlpool Corporation | 3,768 | 553,406 | ||||||||
Williams-Sonoma, Inc.D | 4,891 | 285,683 | ||||||||
Wyndham Worldwide Corporation | 274 | 19,906 | ||||||||
Yum! Brands, Inc. | 15,165 | 1,107,803 | ||||||||
|
| |||||||||
| 35,918,881 | ||||||||||
|
| |||||||||
Consumer Staples — 7.2% |
| |||||||||
Archer-Daniels-Midland Co. | 746 | 27,363 | ||||||||
Campbell Soup Co.D | 18,855 | 990,830 | ||||||||
Church & Dwight Co., Inc. | 10,194 | 865,267 | ||||||||
Clorox Co. (The)D | 5,512 | 699,087 | ||||||||
Coca-Cola Co. (The) | 49,718 | 2,135,885 | ||||||||
Coca-Cola Enterprises, Inc. | 469 | 23,094 | ||||||||
Colgate-Palmolive Co. | 28,287 | 1,884,480 | ||||||||
ConAgra Foods, Inc. | 781 | 32,927 | ||||||||
CVS Health Corporation | 10,806 | 1,056,503 | ||||||||
Dr. Pepper Snapple Group, Inc. | 1,169 | 108,951 | ||||||||
Flowers Foods, Inc.D | 1,296 | 27,851 | ||||||||
General Mills, Inc.D | 63,260 | 3,647,572 | ||||||||
Hershey Co. (The)D | 11,934 | 1,065,348 | ||||||||
Hormel Foods CorporationD | 10,055 | 795,149 | ||||||||
J.M. Smucker Co. (The) | 160 | 19,734 | ||||||||
Kellogg Co. | 7,244 | 523,524 | ||||||||
Keurig Green Mountain, Inc. | 1,126 | 101,317 | ||||||||
Kimberly-Clark Corporation | 14,266 | 1,816,062 | ||||||||
Kraft Heinz Co. (The) | 846 | 61,555 | ||||||||
Kroger Co. (The) | 24,190 | 1,011,868 | ||||||||
McCormick & Co., Inc. (Non-Voting Shares)D | 10,686 | 914,294 | ||||||||
Mead Johnson Nutrition Co. | 36,097 | 2,849,858 | ||||||||
Mondelez International, Inc. Class A | 2,203 | 98,783 | ||||||||
| 162 | See Notes to Financial Statements. |
Table of Contents
| Shares | Value | |||||||||
Monster Beverage Corporation* | 5,400 | $ | 804,384 | |||||||
PepsiCo, Inc. | 74,949 | 7,488,904 | ||||||||
Procter & Gamble Co. (The) | 93,929 | 7,458,902 | ||||||||
Sysco Corporation | 162,799 | 6,674,759 | ||||||||
Tyson Foods, Inc. Class A | 397 | 21,172 | ||||||||
Walgreens Boots Alliance, Inc. | 8,306 | 707,297 | ||||||||
Whole Foods Market, Inc.D | 2,984 | 99,964 | ||||||||
|
| |||||||||
| 44,012,684 | ||||||||||
|
| |||||||||
Energy — 2.4% |
| |||||||||
Anadarko Petroleum Corporation | 632 | 30,703 | ||||||||
Apache Corporation | 533 | 23,703 | ||||||||
Baker Hughes, Inc. | 497 | 22,937 | ||||||||
Cabot Oil & Gas Corporation | 422 | 7,465 | ||||||||
Cameron International Corporation* | 295 | 18,644 | ||||||||
Chesapeake Energy Corporation | 577 | 2,596 | ||||||||
Chevron Corporation | 21,203 | 1,907,422 | ||||||||
Cimarex Energy Co. | 65 | 5,810 | ||||||||
Columbia Pipeline Group, Inc. | 357 | 7,140 | ||||||||
ConocoPhillips | 1,531 | 71,482 | ||||||||
CONSOL Energy, Inc. | 259 | 2,046 | ||||||||
Devon Energy Corporation | 598 | 19,136 | ||||||||
EOG Resources, Inc. | 1,089 | 77,090 | ||||||||
EQT Corporation | 171 | 8,914 | ||||||||
Exxon Mobil Corporation | 109,259 | 8,516,739 | ||||||||
First Solar, Inc.* | 87 | 5,741 | ||||||||
FMC Technologies, Inc.* | 280 | 8,123 | ||||||||
Halliburton Co. | 1,119 | 38,091 | ||||||||
Helmerich & Payne, Inc. | 122 | 6,533 | ||||||||
Hess Corporation | 311 | 15,077 | ||||||||
Kinder Morgan, Inc. | 2,302 | 34,346 | ||||||||
Marathon Oil Corporation | 789 | 9,934 | ||||||||
Marathon Petroleum Corporation | 1,961 | 101,658 | ||||||||
Murphy Oil Corporation | 194 | 4,355 | ||||||||
National Oilwell Varco, Inc. | 635 | 21,266 | ||||||||
Newfield Exploration Co.* | 175 | 5,698 | ||||||||
Noble Energy, Inc. | 408 | 13,435 | ||||||||
Occidental Petroleum Corporation | 54,249 | 3,667,775 | ||||||||
ONEOK, Inc. | 236 | 5,820 | ||||||||
Phillips 66 | 549 | 44,908 | ||||||||
Pioneer Natural Resources Co. | 213 | 26,706 | ||||||||
Range Resources Corporation | 186 | 4,577 | ||||||||
Spectra Energy CorporationD | 2,565 | 61,406 | ||||||||
Tesoro Corporation | 143 | 15,068 | ||||||||
Valero Energy Corporation | 605 | 42,780 | ||||||||
Williams Cos., Inc. (The)* | 895 | 23,002 | ||||||||
|
| |||||||||
| 14,878,126 | ||||||||||
|
| |||||||||
Financial Services — 7.9% |
| |||||||||
Affiliated Managers Group, Inc.* | 64 | 10,225 | ||||||||
Aflac, Inc. | 665 | 39,834 | ||||||||
Alleghany Corporation* | 963 | 460,247 | ||||||||
Alliance Data Systems Corporation* | 78 | 21,572 | ||||||||
Allstate Corporation (The) | 5,007 | 310,885 | ||||||||
American Express Co. | 7,795 | 542,142 | ||||||||
American International Group, Inc. | 1,660 | 102,870 | ||||||||
American Tower Corporation REIT | 834 | 80,856 | ||||||||
| Shares | Value | |||||||||
Ameriprise Financial, Inc. | 217 | $ | 23,093 | |||||||
Apartment Investment & Management Co. Class A REIT | 481 | 19,254 | ||||||||
Assurant, Inc. | 75 | 6,040 | ||||||||
AvalonBay Communities, Inc. REIT | 172 | 31,670 | ||||||||
Bank of America Corporation | 13,035 | 219,379 | ||||||||
Bank of Hawaii CorporationD | 10,900 | 685,610 | ||||||||
Bank of New York Mellon Corporation (The) | 1,007 | 41,509 | ||||||||
BB&T Corporation | 4,373 | 165,343 | ||||||||
Berkshire Hathaway, Inc. Class B* | 2,345 | 309,634 | ||||||||
BlackRock, Inc. | 159 | 54,143 | ||||||||
Boston Properties, Inc. REIT | 174 | 22,192 | ||||||||
Capital One Financial Corporation | 10,914 | 787,773 | ||||||||
Capitol Federal Financial, Inc.D | 405,400 | 5,091,824 | ||||||||
CBRE Group, Inc. Class A* | 315 | 10,893 | ||||||||
Charles Schwab Corporation (The) | 1,326 | 43,665 | ||||||||
Chubb Corporation (The) | 416 | 55,178 | ||||||||
Cincinnati Financial Corporation | 105 | 6,213 | ||||||||
Citigroup, Inc. | 4,463 | 230,960 | ||||||||
CME Group, Inc. | 384 | 34,790 | ||||||||
CNA Financial Corporation | 1,331 | 46,785 | ||||||||
Comerica, Inc. | 2,152 | 90,018 | ||||||||
Commerce Bancshares, Inc.D | 42,638 | 1,813,821 | ||||||||
Crown Castle International Corporation REIT | 1,012 | 87,487 | ||||||||
Cullen/Frost Bankers, Inc.D | 11,946 | 716,760 | ||||||||
Discover Financial Services | 1,099 | 58,928 | ||||||||
Dun & Bradstreet Corporation (The) | 354 | 36,791 | ||||||||
E*TRADE Financial Corporation* | 326 | 9,663 | ||||||||
Equifax, Inc. | 138 | 15,369 | ||||||||
Equinix, Inc. REIT | 56 | 16,934 | ||||||||
Equity Residential REIT | 467 | 38,103 | ||||||||
Essex Property Trust, Inc. REIT | 90 | 21,547 | ||||||||
FactSet Research Systems, Inc. | 5,000 | 812,850 | ||||||||
Fidelity National Information Services, Inc. | 329 | 19,937 | ||||||||
Fifth Third Bancorp | 1,381 | 27,758 | ||||||||
Fiserv, Inc.* | 888 | 81,216 | ||||||||
Franklin Resources, Inc. | 12,590 | 463,564 | ||||||||
General Growth Properties, Inc. REIT | 589 | 16,027 | ||||||||
Goldman Sachs Group, Inc. (The) | 466 | 83,987 | ||||||||
Hartford Financial Services Group, Inc. (The) | 507 | 22,034 | ||||||||
HCP, Inc. REIT | 516 | 19,732 | ||||||||
Host Hotels & Resorts, Inc. REIT | 861 | 13,208 | ||||||||
Huntington Bancshares, Inc. | 953 | 10,540 | ||||||||
Intercontinental Exchange, Inc. | 139 | 35,620 | ||||||||
Iron Mountain, Inc. REIT | 206 | 5,564 | ||||||||
Jack Henry & Associates, Inc.D | 2,600 | 202,956 | ||||||||
JPMorgan Chase & Co. | 34,353 | 2,268,329 | ||||||||
KeyCorp | 867 | 11,436 | ||||||||
Kimco Realty Corporation REIT | 228 | 6,033 | ||||||||
Leucadia National Corporation | 355 | 6,173 | ||||||||
Lincoln National Corporation | 300 | 15,078 | ||||||||
| See Notes to Financial Statements. | 163 |
Table of Contents
DEFENSIVE MARKET STRATEGIES FUND
SCHEDULE OF INVESTMENTS (Continued)
| Shares | Value | |||||||||
Loews Corporation | 130 | $ | 4,992 | |||||||
M&T Bank Corporation | 10,083 | 1,221,858 | ||||||||
Macerich Co. (The) REIT | 159 | 12,830 | ||||||||
Markel Corporation* | 1,618 | 1,429,260 | ||||||||
Marsh & McLennan Cos., Inc. | 75,698 | 4,197,454 | ||||||||
MasterCard, Inc. Class A | 12,031 | 1,171,338 | ||||||||
McGraw Hill Financial, Inc. | 309 | 30,461 | ||||||||
Mercury General Corporation | 7,577 | 352,861 | ||||||||
MetLife, Inc. | 16,598 | 800,190 | ||||||||
Moody’s Corporation | 279 | 27,995 | ||||||||
Morgan Stanley | 1,593 | 50,673 | ||||||||
Navient Corporation | 520 | 5,954 | ||||||||
New York Community Bancorp, Inc.D | 61,920 | 1,010,534 | ||||||||
Northern Trust CorporationD | 32,153 | 2,317,910 | ||||||||
PayPal Holdings, Inc.* | 4,125 | 149,325 | ||||||||
People’s United Financial, Inc.D | 64,574 | 1,042,870 | ||||||||
Piedmont Office Realty Trust, Inc. Class A REIT | 31,418 | 593,172 | ||||||||
Plum Creek Timber Co., Inc. REIT | 202 | 9,639 | ||||||||
PNC Financial Services Group, Inc. (The) | 54,982 | 5,240,334 | ||||||||
Principal Financial Group, Inc. | 312 | 14,034 | ||||||||
ProAssurance Corporation | 2,500 | 121,325 | ||||||||
Progressive Corporation (The) | 25,934 | 824,701 | ||||||||
Prologis, Inc. REIT | 334 | 14,335 | ||||||||
Prudential Financial, Inc. | 524 | 42,659 | ||||||||
Public Storage REIT | 108 | 26,752 | ||||||||
Realty Income Corporation REIT | 312 | 16,109 | ||||||||
Regions Financial Corporation | 1,188 | 11,405 | ||||||||
Signature BankD* | 1,800 | 276,066 | ||||||||
Simon Property Group, Inc. REIT | 415 | 80,693 | ||||||||
State Street Corporation | 490 | 32,516 | ||||||||
SunTrust Banks, Inc. | 37,007 | 1,585,380 | ||||||||
Synchrony Financial* | 664 | 20,192 | ||||||||
T. Rowe Price Group, Inc. | 297 | 21,233 | ||||||||
Torchmark Corporation | 321 | 18,348 | ||||||||
Total System Services, Inc. | 261 | 12,998 | ||||||||
Travelers Cos., Inc. (The) | 13,401 | 1,512,437 | ||||||||
U.S. Bancorp | 40,406 | 1,724,124 | ||||||||
Unum Group | 295 | 9,821 | ||||||||
Ventas, Inc. REIT | 333 | 18,791 | ||||||||
Visa, Inc. Class AD | 25,740 | 1,996,137 | ||||||||
Vornado Realty Trust REIT | 197 | 19,692 | ||||||||
W.R. Berkley Corporation | 1,900 | 104,025 | ||||||||
Wells Fargo & Co. | 37,887 | 2,059,537 | ||||||||
Welltower, Inc. REIT | 570 | 38,777 | ||||||||
Western Union Co. (The) | 622 | 11,140 | ||||||||
Weyerhaeuser Co. REIT | 42,611 | 1,277,478 | ||||||||
Zions Bancorporation | 159 | 4,341 | ||||||||
|
| |||||||||
| 48,046,738 | ||||||||||
|
| |||||||||
Healthcare — 5.7% | ||||||||||
Abbott Laboratories | 19,906 | 893,978 | ||||||||
AbbVie, Inc. | 10,605 | 628,240 | ||||||||
Aetna, Inc. | 8,611 | 931,021 | ||||||||
Agilent Technologies, Inc. | 17,277 | 722,351 | ||||||||
Alexion Pharmaceuticals, Inc.* | 298 | 56,844 | ||||||||
Amgen, Inc. | 2,551 | 414,104 | ||||||||
Anthem, Inc. | 4,800 | 669,312 | ||||||||
athenahealth, Inc.D* | 479 | 77,105 | ||||||||
Baxalta, Inc. | 1,106 | 43,167 | ||||||||
| Shares | Value | |||||||||
Baxter International, Inc. | 71,468 | $ | 2,726,504 | |||||||
Becton Dickinson and Co. | 7,137 | 1,099,740 | ||||||||
Biogen, Inc.* | 994 | 304,512 | ||||||||
Bio-Rad Laboratories, Inc. Class A* | 292 | 40,489 | ||||||||
Boston Scientific Corporation* | 1,348 | 24,857 | ||||||||
Bristol-Myers Squibb Co. | 25,659 | 1,765,083 | ||||||||
C.R. Bard, Inc. | 4,228 | 800,952 | ||||||||
Cardinal Health, Inc. | 14,225 | 1,269,866 | ||||||||
Celgene Corporation* | 3,590 | 429,938 | ||||||||
Centene CorporationD* | 3,100 | 204,011 | ||||||||
Cerner Corporation* | 1,935 | 116,429 | ||||||||
Cigna Corporation | 310 | 45,362 | ||||||||
DaVita HealthCare Partners, Inc.* | 200 | 13,942 | ||||||||
DENTSPLY International, Inc. | 161 | 9,797 | ||||||||
Edwards Lifesciences Corporation* | 3,936 | 310,865 | ||||||||
Eli Lilly & Co. | 20,277 | 1,708,540 | ||||||||
Express Scripts Holding Co.* | 6,045 | 528,393 | ||||||||
Gilead Sciences, Inc. | 3,151 | 318,850 | ||||||||
HCA Holdings, Inc.* | 500 | 33,815 | ||||||||
Henry Schein, Inc.D* | 3,511 | 555,405 | ||||||||
Humana, Inc. | 176 | 31,418 | ||||||||
IDEXX Laboratories, Inc.* | 3,740 | 272,721 | ||||||||
Illumina, Inc.* | 164 | 31,479 | ||||||||
Intuitive Surgical, Inc.* | 443 | 241,949 | ||||||||
Johnson & Johnson | 93,801 | 9,635,239 | ||||||||
Laboratory Corporation of America Holdings* | 2,051 | 253,586 | ||||||||
McKesson Corporation | 5,681 | 1,120,464 | ||||||||
MEDNAX, Inc.* | 465 | 33,322 | ||||||||
Patterson Cos., Inc.D | 3,219 | 145,531 | ||||||||
PerkinElmer, Inc. | 128 | 6,857 | ||||||||
Quest Diagnostics, Inc.D | 40,343 | 2,870,001 | ||||||||
Quintiles Transnational Holdings, Inc.* | 361 | 24,786 | ||||||||
Regeneron Pharma-ceuticals, Inc.* | 108 | 58,630 | ||||||||
St. Jude Medical, Inc. | 321 | 19,828 | ||||||||
Stryker Corporation | 11,613 | 1,079,312 | ||||||||
Tenet Healthcare Corporation* | 747 | 22,634 | ||||||||
Thermo Fisher Scientific, Inc. | 444 | 62,981 | ||||||||
UnitedHealth Group, Inc. | 16,009 | 1,883,299 | ||||||||
Universal Health Services, Inc. Class B | 40 | 4,780 | ||||||||
Vertex Pharmaceuticals, Inc.* | 308 | 38,756 | ||||||||
Zimmer Biomet Holdings, Inc.D | 1,672 | 171,530 | ||||||||
Zoetis, Inc. | 1,989 | 95,313 | ||||||||
|
| |||||||||
| 34,847,888 | ||||||||||
|
| |||||||||
Materials & Processing — 0.8% |
| |||||||||
Air Products & Chemicals, Inc.D | 19,024 | 2,475,213 | ||||||||
Airgas, Inc. | 46 | 6,363 | ||||||||
Alcoa, Inc. | 1,077 | 10,630 | ||||||||
Ball Corporation | 161 | 11,709 | ||||||||
Bemis Co., Inc. | 4,500 | 201,105 | ||||||||
CF Industries Holdings, Inc. | 315 | 12,855 | ||||||||
Dow Chemical Co. (The) | 1,623 | 83,552 | ||||||||
E.I. du Pont de Nemours & Co. | 2,183 | 145,388 | ||||||||
Eastman Chemical Co. | 174 | 11,747 | ||||||||
Ecolab, Inc. | 384 | 43,922 | ||||||||
Fastenal Co.D | 5,308 | 216,672 | ||||||||
FMC Corporation | 151 | 5,909 | ||||||||
| 164 | See Notes to Financial Statements. |
Table of Contents
| Shares | Value | |||||||||
Freeport-McMoRan, Inc. | 1,109 | $ | 7,508 | |||||||
International Flavors & Fragrances, Inc.D | 693 | 82,910 | ||||||||
International Paper Co. | 550 | 20,735 | ||||||||
Martin Marietta Materials, Inc. | 107 | 14,614 | ||||||||
Masco Corporation | 401 | 11,348 | ||||||||
Monsanto Co. | 513 | 50,541 | ||||||||
Mosaic Co. (The) | 346 | 9,546 | ||||||||
NewMarket CorporationD | 60 | 22,844 | ||||||||
Newmont Mining Corporation | 511 | 9,193 | ||||||||
Nucor Corporation | 354 | 14,266 | ||||||||
Owens-Illinois, Inc.* | 127 | 2,212 | ||||||||
PPG Industries, Inc. | 3,914 | 386,781 | ||||||||
Praxair, Inc. | 2,080 | 212,992 | ||||||||
Precision Castparts Corporation | 182 | 42,226 | ||||||||
Sealed Air Corporation | 225 | 10,035 | ||||||||
Sherwin-Williams Co. (The) | 2,606 | 676,518 | ||||||||
Vulcan Materials Co. | 147 | 13,961 | ||||||||
WestRock Co. | 198 | 9,033 | ||||||||
|
| |||||||||
| 4,822,328 | ||||||||||
|
| |||||||||
Producer Durables — 4.9% |
| |||||||||
3M Co. | 13,382 | 2,015,864 | ||||||||
ADT Corporation (The)D | 10,708 | 353,150 | ||||||||
Alaska Air Group, Inc. | 300 | 24,153 | ||||||||
American Airlines Group, Inc. | 837 | 35,447 | ||||||||
AMETEK, Inc. | 278 | 14,898 | ||||||||
Automatic Data Processing, Inc. | 10,969 | 929,294 | ||||||||
Boeing Co. (The) | 4,795 | 693,309 | ||||||||
C.H. Robinson Worldwide, Inc. | 2,398 | 148,724 | ||||||||
Caterpillar, Inc.D | 4,505 | 306,160 | ||||||||
Cintas Corporation | 3,375 | 307,294 | ||||||||
Covanta Holding CorporationD | 10,905 | 168,918 | ||||||||
CSX Corporation | 1,157 | 30,024 | ||||||||
Cummins, Inc. | 196 | 17,250 | ||||||||
Danaher Corporation | 4,214 | 391,396 | ||||||||
Deere & Co. | 419 | 31,957 | ||||||||
Delta Air Lines, Inc. | 1,218 | 61,740 | ||||||||
Dover Corporation | 192 | 11,772 | ||||||||
Emerson Electric Co. | 6,901 | 330,075 | ||||||||
Expeditors International of Washington, Inc. | 129 | 5,818 | ||||||||
FedEx Corporation | 3,254 | 484,813 | ||||||||
FLIR Systems, Inc. | 1,545 | 43,368 | ||||||||
Flowserve Corporation | 133 | 5,597 | ||||||||
Fluor Corporation | 182 | 8,594 | ||||||||
General Dynamics Corporation | 4,569 | 627,598 | ||||||||
General Electric Co. | 55,592 | 1,731,691 | ||||||||
Honeywell International, Inc. | 4,771 | 494,132 | ||||||||
Huntington Ingalls Industries, Inc. | 1,631 | 206,892 | ||||||||
Illinois Tool Works, Inc. | 443 | 41,057 | ||||||||
J.B. Hunt Transport Services, Inc.D | 900 | 66,024 | ||||||||
Jacobs Engineering Group, Inc.* | 78 | 3,272 | ||||||||
Kansas City Southern | 102 | 7,616 | ||||||||
Landstar System, Inc.D | 1,384 | 81,172 | ||||||||
Lockheed Martin Corporation | 5,164 | 1,121,363 | ||||||||
Mettler-Toledo International, Inc.* | 1,400 | 474,782 | ||||||||
MSC Industrial Direct Co., Inc. Class A | 3,700 | 208,199 | ||||||||
Norfolk Southern Corporation | 332 | 28,084 | ||||||||
| Shares | Value | |||||||||
Northrop Grumman Corporation | 4,162 | $ | 785,827 | |||||||
PACCAR, Inc. | 409 | 19,387 | ||||||||
Parker-Hannifin Corporation | 153 | 14,838 | ||||||||
Paychex, Inc.D | 21,169 | 1,119,628 | ||||||||
Pitney Bowes, Inc. | 332 | 6,856 | ||||||||
Quanta Services, Inc.* | 139 | 2,815 | ||||||||
Raytheon Co. | 6,236 | 776,569 | ||||||||
Republic Services, Inc. | 106,022 | 4,663,908 | ||||||||
Robert Half International, Inc. | 115 | 5,421 | ||||||||
Rockwell Automation, Inc.D | 8,141 | 835,348 | ||||||||
Rockwell Collins, Inc.D | 3,303 | 304,867 | ||||||||
Roper Technologies, Inc. | 70 | 13,285 | ||||||||
Ryder System, Inc. | 111 | 6,308 | ||||||||
Snap-on, Inc. | 44 | 7,543 | ||||||||
Southwest Airlines Co. | 908 | 39,098 | ||||||||
Stanley Black & Decker, Inc. | 7,620 | 813,283 | ||||||||
Stericycle, Inc.* | 13,299 | 1,603,859 | ||||||||
Textron, Inc. | 272 | 11,427 | ||||||||
Union Pacific Corporation | 18,214 | 1,424,335 | ||||||||
United Continental Holdings, Inc.* | 298 | 17,075 | ||||||||
United Parcel Service, Inc. Class B | 22,656 | 2,180,187 | ||||||||
United Rentals, Inc.* | 69 | 5,005 | ||||||||
United Technologies Corporation | 7,759 | 745,407 | ||||||||
Verisk Analytics, Inc.* | 195 | 14,992 | ||||||||
W.W. Grainger, Inc. | 8 | 1,621 | ||||||||
Waste Connections, Inc.D | 4,700 | 264,704 | ||||||||
Waste Management, Inc. | 48,084 | 2,566,243 | ||||||||
Xerox Corporation | 1,257 | 13,362 | ||||||||
Xylem, Inc. | 389 | 14,199 | ||||||||
|
| |||||||||
| 29,788,894 | ||||||||||
|
| |||||||||
Technology — 3.4% | ||||||||||
Activision Blizzard, Inc. | 631 | 24,426 | ||||||||
Adobe Systems, Inc.* | 1,186 | 111,413 | ||||||||
Akamai Technologies, Inc.* | 203 | 10,684 | ||||||||
Alphabet, Inc. Class A* | 1,964 | 1,528,012 | ||||||||
Alphabet, Inc. Class C* | 372 | 282,303 | ||||||||
Amphenol Corporation Class A | 428 | 22,354 | ||||||||
Analog Devices, Inc. | 354 | 19,583 | ||||||||
Apple, Inc. | 13,040 | 1,372,590 | ||||||||
Applied Materials, Inc. | 127,070 | 2,372,397 | ||||||||
Autodesk, Inc.* | 257 | 15,659 | ||||||||
Broadcom Corporation Class A | 627 | 36,253 | ||||||||
CA, Inc. | 368 | 10,510 | ||||||||
Cisco Systems, Inc. | 51,249 | 1,391,667 | ||||||||
Citrix Systems, Inc.* | 176 | 13,314 | ||||||||
Cognizant Technology Solutions Corporation Class A* | 2,272 | 136,365 | ||||||||
Corning, Inc. | 1,580 | 28,882 | ||||||||
CSRA, Inc. | 165 | 4,950 | ||||||||
Electronic Arts, Inc.* | 423 | 29,069 | ||||||||
EMC Corporation | 2,300 | 59,064 | ||||||||
F5 Networks, Inc.* | 2,946 | 285,644 | ||||||||
Facebook, Inc. Class A* | 2,843 | 297,548 | ||||||||
Gartner, Inc.* | 4,526 | 410,508 | ||||||||
Harris Corporation | 120 | 10,428 | ||||||||
Hewlett Packard Enterprise Co. | 2,151 | 32,695 | ||||||||
HP, Inc. | 2,151 | 25,468 | ||||||||
Intel Corporation | 32,741 | 1,127,928 | ||||||||
| See Notes to Financial Statements. | 165 |
Table of Contents
DEFENSIVE MARKET STRATEGIES FUND
SCHEDULE OF INVESTMENTS (Continued)
| Shares | Value | |||||||||
International Business Machines Corporation | 9,454 | $ | 1,301,060 | |||||||
Intuit, Inc. | 13,822 | 1,333,823 | ||||||||
Juniper Networks, Inc. | 571 | 15,760 | ||||||||
KLA-Tencor Corporation | 188 | 13,038 | ||||||||
Lam Research Corporation | 181 | 14,375 | ||||||||
Linear Technology CorporationD | 16,593 | 704,705 | ||||||||
Microchip Technology, Inc. | 228 | 10,611 | ||||||||
Micron Technology, Inc.* | 1,206 | 17,077 | ||||||||
Microsoft Corporation | 94,003 | 5,215,287 | ||||||||
Motorola Solutions, Inc. | 226 | 15,470 | ||||||||
NetApp, Inc. | 13,274 | 352,159 | ||||||||
NVIDIA Corporation | 633 | 20,864 | ||||||||
Oracle Corporation | 24,242 | 885,560 | ||||||||
Qorvo, Inc.* | 175 | 8,908 | ||||||||
QUALCOMM, Inc. | 7,288 | 364,291 | ||||||||
Red Hat, Inc.* | 180 | 14,906 | ||||||||
salesforce.com, Inc.* | 781 | 61,230 | ||||||||
SanDisk Corporation | 256 | 19,453 | ||||||||
Skyworks Solutions, Inc. | 143 | 10,987 | ||||||||
Symantec Corporation | 785 | 16,485 | ||||||||
Synopsys, Inc.* | 600 | 27,366 | ||||||||
Tableau Software, Inc. Class A* | 500 | 47,110 | ||||||||
Teradata CorporationD* | 3,703 | 97,833 | ||||||||
Texas Instruments, Inc. | 6,520 | 357,361 | ||||||||
VeriSign, Inc.* | 180 | 15,725 | ||||||||
Western Digital Corporation | 239 | 14,352 | ||||||||
Xilinx, Inc. | 304 | 14,279 | ||||||||
Yahoo!, Inc.* | 1,008 | 33,526 | ||||||||
|
| |||||||||
| 20,663,315 | ||||||||||
|
| |||||||||
Utilities — 6.7% | ||||||||||
AES Corporation | 1,420 | 13,589 | ||||||||
AGL Resources, Inc. | 200 | 12,762 | ||||||||
Alliant Energy Corporation | 1,900 | 118,655 | ||||||||
Ameren Corporation | 174 | 7,522 | ||||||||
American Electric Power Co., Inc. | 12,746 | 742,709 | ||||||||
American Water Works Co., Inc. | 20,800 | 1,242,800 | ||||||||
Aqua America, Inc. | 3,000 | 89,400 | ||||||||
AT&T, Inc.D | 51,754 | 1,780,855 | ||||||||
Atmos Energy Corporation | 19,800 | 1,248,192 | ||||||||
CenterPoint Energy, Inc. | 11,288 | 207,248 | ||||||||
CenturyLink, Inc. | 4,361 | 109,723 | ||||||||
CMS Energy Corporation | 355 | 12,808 | ||||||||
Consolidated Edison, Inc.D | 13,628 | 875,872 | ||||||||
Dominion Resources, Inc.D | 14,963 | 1,012,097 | ||||||||
DTE Energy Co. | 7,501 | 601,505 | ||||||||
Duke Energy Corporation | 13,455 | 960,553 | ||||||||
Edison InternationalD | 45,671 | 2,704,180 | ||||||||
Entergy Corporation | 204 | 13,945 | ||||||||
Eversource Energy | 453 | 23,135 | ||||||||
Exelon Corporation | 974 | 27,048 | ||||||||
FirstEnergy Corporation | 633 | 20,085 | ||||||||
Frontier Communications Corporation | 2,478 | 11,572 | ||||||||
Level 3 Communications, Inc.* | 391 | 21,255 | ||||||||
NextEra Energy, Inc. | 8,076 | 839,016 | ||||||||
NiSource, Inc.D | 9,257 | 180,604 | ||||||||
NRG Energy, Inc. | 370 | 4,355 | ||||||||
OGE Energy CorporationD | 7,642 | 200,908 | ||||||||
ONE Gas, Inc. | 113,949 | 5,716,821 | ||||||||
Pepco Holdings, Inc. | 466 | 12,121 | ||||||||
| Shares | Value | |||||||||
PG&E Corporation | 63,795 | $ | 3,393,256 | |||||||
Pinnacle West Capital Corporation | 9,096 | 586,510 | ||||||||
PPL Corporation | 5,163 | 176,213 | ||||||||
Public Service Enterprise Group, Inc. | 45,853 | 1,774,053 | ||||||||
Questar CorporationD | 18,400 | 358,432 | ||||||||
SCANA Corporation | 161 | 9,739 | ||||||||
Sempra Energy | 16,825 | 1,581,718 | ||||||||
Southern Co. (The) | 31,437 | 1,470,937 | ||||||||
TECO Energy, Inc. | 293 | 7,809 | ||||||||
UGI Corporation | 8,200 | 276,832 | ||||||||
Vectren Corporation | 13,410 | 568,852 | ||||||||
Verizon Communications, Inc. | 113,697 | 5,255,075 | ||||||||
WEC Energy Group, Inc. | 5,809 | 298,060 | ||||||||
Westar Energy, Inc.D | 81,500 | 3,456,415 | ||||||||
WGL Holdings, Inc.D | 41,600 | 2,620,384 | ||||||||
Xcel Energy, Inc. | 9,067 | 325,596 | ||||||||
|
| |||||||||
| 40,971,216 | ||||||||||
|
| |||||||||
Total Common Stocks |
| 273,950,070 | ||||||||
|
| |||||||||
FOREIGN COMMON STOCKS — 4.0% |
| |||||||||
Bermuda — 0.6% | ||||||||||
Arch Capital Group, Ltd.D* | 14,300 | 997,425 | ||||||||
Assured Guaranty, Ltd. | 16,948 | 447,936 | ||||||||
AXIS Capital Holdings, Ltd. | 3,742 | 210,375 | ||||||||
Everest Re Group, Ltd. | 6,384 | 1,168,846 | ||||||||
Invesco, Ltd. | 543 | 18,180 | ||||||||
RenaissanceRe Holdings, Ltd. | 4,600 | 520,674 | ||||||||
|
| |||||||||
| 3,363,436 | ||||||||||
|
| |||||||||
British Virgin Islands — 0.0% |
| |||||||||
Michael Kors Holdings, Ltd.* | 280 | 11,217 | ||||||||
|
| |||||||||
Canada — 0.3% | ||||||||||
Imperial Oil, Ltd. | 34,500 | 1,123,986 | ||||||||
Potash Corporation of Saskatchewan, Inc.D | 54,400 | 931,328 | ||||||||
|
| |||||||||
| 2,055,314 | ||||||||||
|
| |||||||||
Curacao — 0.6% | ||||||||||
Schlumberger, Ltd. | 56,459 | 3,938,015 | ||||||||
|
| |||||||||
France — 0.7% | ||||||||||
TOTAL SA | 89,739 | 4,023,146 | ||||||||
|
| |||||||||
Ireland — 1.4% | ||||||||||
Accenture PLC Class A | 10,698 | 1,117,941 | ||||||||
Allegion PLC | 94 | 6,197 | ||||||||
Eaton Corporation PLC | 12,933 | �� | 673,033 | |||||||
Ingersoll-Rand PLC | 294 | 16,255 | ||||||||
Mallinckrodt PLC* | 1,040 | 77,615 | ||||||||
Medtronic PLC | 57,226 | 4,401,824 | ||||||||
Pentair PLC | 224 | 11,095 | ||||||||
Seagate Technology PLC | 372 | 13,638 | ||||||||
Tyco International PLC | 62,666 | 1,998,419 | ||||||||
XL Group PLC | 302 | 11,832 | ||||||||
|
| |||||||||
| 8,327,849 | ||||||||||
|
| |||||||||
Jersey — 0.0% | ||||||||||
Delphi Automotive PLC | 351 | 30,091 | ||||||||
|
| |||||||||
Liberia — 0.0% | ||||||||||
Royal Caribbean Cruises, Ltd. | 107 | 10,829 | ||||||||
|
| |||||||||
Netherlands — 0.1% | ||||||||||
Frank’s International NVD | 44,300 | 739,367 | ||||||||
LyondellBasell Industries NV Class A | 489 | 42,494 | ||||||||
| 166 | See Notes to Financial Statements. |
Table of Contents
| Shares | Value | |||||||||
Mylan NV* | 1,759 | $ | 95,109 | |||||||
|
| |||||||||
| 876,970 | ||||||||||
|
| |||||||||
Panama — 0.0% | ||||||||||
Carnival Corporation | 498 | 27,131 | ||||||||
|
| |||||||||
Singapore — 0.0% | ||||||||||
Avago Technologies, Ltd. | 328 | 47,609 | ||||||||
|
| |||||||||
Switzerland — 0.2% | ||||||||||
ACE, Ltd.D | 7,534 | 880,348 | ||||||||
Garmin, Ltd. | 139 | 5,167 | ||||||||
TE Connectivity, Ltd. | 347 | 22,420 | ||||||||
Transocean, Ltd. | 893 | 11,055 | ||||||||
|
| |||||||||
| 918,990 | ||||||||||
|
| |||||||||
United Kingdom — 0.1% |
| |||||||||
Aon PLC | 5,419 | 499,686 | ||||||||
Nielsen Holdings PLC | 438 | 20,411 | ||||||||
|
| |||||||||
| 520,097 | ||||||||||
|
| |||||||||
Total Foreign Common Stocks |
| 24,150,694 | ||||||||
|
| |||||||||
PREFERRED STOCKS — 4.0% |
| |||||||||
Bank of America Corporation, | ||||||||||
7.25%, 12/31/49 CONV | 7,915 | 8,653,232 | ||||||||
Laclede Group, Inc. (The), | ||||||||||
6.75%, 04/01/17 CONV | 18,576 | 1,025,953 | ||||||||
U.S. Bancorp, | ||||||||||
6.00%, 12/31/49†D | 205,900 | 5,522,238 | ||||||||
Wells Fargo & Co., | ||||||||||
7.50%, 12/31/49 CONV | 7,654 | 8,886,294 | ||||||||
Welltower, Inc., | ||||||||||
6.50%, 12/31/49 CONV | 8,400 | 511,644 | ||||||||
|
| |||||||||
Total Preferred Stocks | 24,599,361 | |||||||||
|
| |||||||||
MASTER LIMITED PARTNERSHIP — 0.5% |
| |||||||||
Spectra Energy Partners LP | 67,973 | 3,242,312 | ||||||||
|
| |||||||||
MONEY MARKET FUNDS — 15.4% |
| |||||||||
GuideStone Money Market Fund (Investor Class)¥ | 25,859,833 | 25,859,833 | ||||||||
Northern Institutional Liquid Assets Portfolio§ | 67,919,378 | 67,919,378 | ||||||||
|
| |||||||||
Total Money Market Funds |
| 93,779,211 | ||||||||
|
| |||||||||
SYNTHETIC CONVERTIBLE INSTRUMENTS — 0.9% |
| |||||||||
Credit Suisse AG+ 144A@ | 18,200 | 1,921,738 | ||||||||
Credit Suisse Securities USA LLC+ 144A@ | 14,400 | 510,768 | ||||||||
Goldman Sachs Group, Inc.+@ | 8,100 | 421,968 | ||||||||
Merrill Lynch International & Co. CV+@ | 5,900 | 907,833 | ||||||||
UBS AG+@ | 11,900 | 1,788,570 | ||||||||
|
| |||||||||
Total Synthetic Convertible Instruments |
| 5,550,877 | ||||||||
|
| |||||||||
| Par | Value | |||||||||
CORPORATE BONDS — 22.8% |
| |||||||||
Akamai Technologies, Inc. | ||||||||||
1.25%, 02/15/19 CONVW | $ | 2,835,000 | $ | 2,723,386 | ||||||
Alere, Inc. | ||||||||||
3.00%, 05/15/16 CONV | 1,485,000 | 1,542,544 | ||||||||
Allscripts Healthcare Solutions, Inc. | ||||||||||
1.25%, 07/01/20 CONV | 1,200,000 | 1,288,500 | ||||||||
Ares Capital Corporation | ||||||||||
4.38%, 01/15/19 CONV | 2,470,000 | 2,453,019 | ||||||||
BioMarin Pharmaceutical, Inc. | ||||||||||
0.75%, 10/15/18 CONV | 1,415,000 | 1,823,581 | ||||||||
Blucora, Inc. | ||||||||||
4.25%, 04/01/19 CONV | 1,815,000 | 1,513,256 | ||||||||
Brocade Communications Systems, Inc. | ||||||||||
1.38%, 01/01/20 CONV 144AD | 1,280,000 | 1,232,000 | ||||||||
Brookdale Senior Living, Inc. | ||||||||||
2.75%, 06/15/18 CONV | 1,470,000 | 1,469,081 | ||||||||
CalAtlantic Group, Inc. | ||||||||||
0.25%, 06/01/19 CONV | 2,404,000 | 2,162,098 | ||||||||
Cardtronics, Inc. | ||||||||||
1.00%, 12/01/20 CONVD | 1,685,000 | 1,572,316 | ||||||||
Cepheid | ||||||||||
1.25%, 02/01/21 CONV | 2,590,000 | 2,313,194 | ||||||||
Chart Industries, Inc. | ||||||||||
2.00%, 08/01/18 CONV | 2,570,000 | 2,235,900 | ||||||||
Citigroup, Inc. | ||||||||||
5.95%, 07/29/49† | 3,630,000 | 3,556,492 | ||||||||
Citrix Systems, Inc. | ||||||||||
0.50%, 04/15/19 CONVD | 1,695,000 | 1,851,788 | ||||||||
Clearwire Com-munications LLC | ||||||||||
8.25%, 12/01/40 CONV 144A | 2,130,000 | 2,135,325 | ||||||||
Echo Global Logistics, Inc. | ||||||||||
2.50%, 05/01/20 CONV | 1,015,000 | 893,200 | ||||||||
Electronics For Imaging, Inc. | ||||||||||
0.75%, 09/01/19 CONVD | 1,180,000 | 1,259,650 | ||||||||
Envestnet, Inc. | ||||||||||
1.75%, 12/15/19 CONV | 725,000 | 638,906 | ||||||||
Euronet Worldwide, Inc. | ||||||||||
1.50%, 10/01/44 CONVD | 755,000 | 895,147 | ||||||||
Extra Space Storage LP | ||||||||||
2.38%, 07/01/33 CONV 144A | 225,000 | 362,672 | ||||||||
3.13%, 10/01/35 CONV 144AD | 2,725,000 | 2,982,172 | ||||||||
FireEye, Inc. 1.00%, | ||||||||||
06/01/35 CONV 144AD | 1,855,000 | 1,587,184 | ||||||||
Forest City Realty Trust Inc. | ||||||||||
3.63%, 08/15/20 CONV | 1,165,000 | 1,239,269 | ||||||||
General Electric Co. | ||||||||||
4.10%, 12/29/49† | 3,908,190 | 3,903,305 | ||||||||
Griffon Corporation | ||||||||||
4.00%, 01/15/17 CONV 144A | 250,000 | 325,000 | ||||||||
Hologic, Inc. | ||||||||||
2.00%, 03/01/42 STEP CONV | 1,407,000 | 1,883,621 | ||||||||
1.67%, 12/15/43 STEP CONVWD | 500,000 | 637,500 | ||||||||
| See Notes to Financial Statements. | 167 |
Table of Contents
DEFENSIVE MARKET STRATEGIES FUND
SCHEDULE OF INVESTMENTS (Continued)
| Par | Value | |||||||||
HomeAway, Inc. | ||||||||||
0.13%, 04/01/19 CONVD | $ | 2,725,000 | $ | 2,735,219 | ||||||
Hornbeck Offshore Services, Inc. | ||||||||||
1.50%, 09/01/19 CONV | 1,250,000 | 710,938 | ||||||||
Huron Consulting Group, Inc. | ||||||||||
1.25%, 10/01/19 CONVD | 1,675,000 | 1,665,578 | ||||||||
Illumina, Inc. | ||||||||||
(2.51)%, 06/15/19 CONVWD | 1,550,000 | 1,692,406 | ||||||||
Impax Laboratories, Inc. | ||||||||||
2.00%, 06/15/22 CONV 144A | 1,730,000 | 1,704,050 | ||||||||
Integra LifeSciences Holdings Corporation | ||||||||||
1.63%, 12/15/16 CONVD | 1,555,000 | 2,031,219 | ||||||||
Intel Corporation | ||||||||||
2.95%, 12/15/35 CONV | 2,296,000 | 2,943,185 | ||||||||
InterDigital, Inc. | ||||||||||
1.50%, 03/01/20 CONV 144A | 1,275,000 | 1,226,391 | ||||||||
Jarden Corporation | ||||||||||
1.50%, 06/15/19 CONV | 480,000 | 716,100 | ||||||||
Jazz Investments I, Ltd. | ||||||||||
1.88%, 08/15/21 CONVD | 905,000 | 951,381 | ||||||||
Lam Research Corporation | ||||||||||
1.25%, 05/15/18 CONVD | 1,141,000 | 1,639,474 | ||||||||
LinkedIn Corporation | ||||||||||
0.50%, 11/01/19 CONVD | 1,760,000 | 1,854,600 | ||||||||
Live Nation Entertainment, Inc. | ||||||||||
2.50%, 05/15/19 CONV | 1,490,000 | 1,522,594 | ||||||||
Macquarie Infrastructure Co. LLC | ||||||||||
2.88%, 07/15/19 CONVD | 2,530,000 | 2,841,506 | ||||||||
Medidata Solutions, Inc. | ||||||||||
1.00%, 08/01/18 CONVD | 1,520,000 | 1,665,350 | ||||||||
Meritor, Inc. | ||||||||||
4.00%, 02/15/27 STEP CONV | 1,280,000 | 1,216,800 | ||||||||
Microchip Technology, Inc. | ||||||||||
1.63%, 02/15/25 CONV 144A@ | 8,241,000 | 8,230,699 | ||||||||
Molina Healthcare, Inc. | ||||||||||
1.63%, 08/15/44 CONV | 1,265,000 | 1,525,116 | ||||||||
National Health Investors, Inc. | ||||||||||
3.25%, 04/01/21 CONV | 2,105,000 | 2,077,372 | ||||||||
Navistar International Corporation | ||||||||||
4.75%, 04/15/19 CONVD | 545,000 | 262,962 | ||||||||
NetSuite, Inc. | ||||||||||
0.25%, 06/01/18 CONV | 990,000 | 980,100 | ||||||||
Newmont Mining Corporation | ||||||||||
1.63%, 07/15/17 CONV | 2,625,000 | 2,580,703 | ||||||||
NRG Yield, Inc. | ||||||||||
3.50%, 02/01/19 CONV 144A | 1,005,000 | 925,856 | ||||||||
3.25%, 06/01/20 CONV 144AD | 2,225,000 | 1,878,734 | ||||||||
Nuance Communications, Inc. | ||||||||||
2.75%, 11/01/31 CONVD | 1,640,000 | 1,655,375 | ||||||||
NuVasive, Inc. | ||||||||||
2.75%, 07/01/17 CONV | 1,215,000 | 1,663,791 | ||||||||
NVIDIA Corporation | ||||||||||
1.00%, 12/01/18 CONV | 860,000 | 1,436,738 | ||||||||
| Par | Value | |||||||||
ON Semiconductor Corporation | ||||||||||
1.00%, 12/01/20 CONV 144AD | $ | 680,000 | $ | 636,650 | ||||||
Pattern Energy Group, Inc. | ||||||||||
4.00%, 07/15/20 CONV 144A | 1,120,000 | 1,037,400 | ||||||||
Priceline Group, Inc. | ||||||||||
0.35%, 06/15/20 CONVD | 530,000 | 633,019 | ||||||||
0.90%, 09/15/21 CONVD | 2,080,000 | 2,098,200 | ||||||||
Proofpoint, Inc. | ||||||||||
0.75%, 06/15/20 CONV 144AD | 1,380,000 | 1,449,862 | ||||||||
Restoration Hardware Holdings, Inc. | ||||||||||
2.31%, 06/15/19 CONV 144AW | 1,305,000 | 1,208,756 | ||||||||
Royal Gold, Inc. | ||||||||||
2.88%, 06/15/19 CONV | 3,025,000 | 2,760,312 | ||||||||
RTI International Metals, Inc. | ||||||||||
1.63%, 10/15/19 CONV | 1,965,000 | 2,020,266 | ||||||||
salesforce.com, Inc. | ||||||||||
0.25%, 04/01/18 CONV | 1,230,000 | 1,585,162 | ||||||||
SanDisk Corporation | ||||||||||
1.50%, 08/15/17 CONV | 245,000 | 385,416 | ||||||||
0.50%, 10/15/20 CONV | 2,000,000 | 2,080,000 | ||||||||
SEACOR Holdings, Inc. | ||||||||||
2.50%, 12/15/27 CONV | 1,995,000 | 1,890,262 | ||||||||
Siemens Financierings-maatschappij NV | ||||||||||
1.05%, 08/16/17 CONV | 2,500,000 | 2,633,750 | ||||||||
Starwood Property Trust, Inc. | ||||||||||
4.55%, 03/01/18 CONV | 2,525,000 | 2,580,234 | ||||||||
Synchronoss Technologies, Inc. | ||||||||||
0.75%, 08/15/19 CONVD | 620,000 | 626,200 | ||||||||
Tesla Motors, Inc. | ||||||||||
0.25%, 03/01/19 CONVD | 2,570,000 | 2,422,225 | ||||||||
TiVo, Inc. | ||||||||||
2.00%, 10/01/21 CONVD | 2,180,000 | 1,896,600 | ||||||||
Toll Brothers Finance Corporation | ||||||||||
0.50%, 09/15/32 CONVD | 1,920,000 | 1,926,000 | ||||||||
Twitter, Inc. | ||||||||||
0.25%, 09/15/19 CONV | 1,825,000 | 1,559,234 | ||||||||
1.00%, 09/15/21 CONVD | 730,000 | 613,656 | ||||||||
Walter Investment Management Corporation | ||||||||||
4.50%, 11/01/19 CONV | 1,156,000 | 747,065 | ||||||||
Web.com Group, Inc. | ||||||||||
1.00%, 08/15/18 CONV | 1,625,000 | 1,525,469 | ||||||||
WebMD Health Corporation | ||||||||||
2.50%, 01/31/18 CONV | 1,000,000 | 1,033,750 | ||||||||
1.50%, 12/01/20 CONV | 1,165,000 | 1,306,984 | ||||||||
Whiting Petroleum Corporation | ||||||||||
1.25%, 04/01/20 CONV 144A | 1,205,000 | 825,425 | ||||||||
Workday, Inc. | ||||||||||
0.75%, 07/15/18 CONVD | 1,680,000 | 1,926,750 | ||||||||
Wright Medical Group, Inc. | ||||||||||
2.00%, 02/15/20 CONV 144AD | 1,235,000 | 1,283,628 | ||||||||
Yahoo!, Inc. | ||||||||||
0.74%, 12/01/18 CONVW | 1,985,000 | 1,940,338 | ||||||||
|
| |||||||||
Total Corporate Bonds | 139,446,956 | |||||||||
|
| |||||||||
| 168 | See Notes to Financial Statements. |
Table of Contents
| Par | Value | |||||||||
U.S. TREASURY OBLIGATIONS — 18.2% |
| |||||||||
U.S. Treasury Bills | ||||||||||
0.10%, 01/07/16 | $ | 500,000 | $ | 499,995 | ||||||
0.18%, 01/07/16 | 1,750,000 | 1,749,982 | ||||||||
0.20%, 01/07/16 | 1,400,000 | 1,399,986 | ||||||||
0.24%, 01/07/16 | 23,900,000 | 23,899,755 | ||||||||
0.20%, 03/03/16 | 30,550,000 | 30,545,173 | ||||||||
0.25%, 06/23/16 | 27,000,000 | 26,941,005 | ||||||||
0.38%, 06/23/16 | 1,000,000 | 997,815 | ||||||||
0.25%, 09/15/16 | 25,000,000 | 24,910,700 | ||||||||
|
| |||||||||
Total U.S. Treasury Obligations |
| 110,944,411 | ||||||||
|
| |||||||||
TOTAL INVESTMENTS — 110.7% |
| 675,663,892 | ||||||||
|
| |||||||||
| Number of Contracts | Value | |||||||||
WRITTEN OPTIONS — (0.1)% |
| |||||||||
Call Options — 0.0% | ||||||||||
S&P 500® Index, Strike Price $2,080.00, Expires 01/22/16 (MSCS) | (11 | ) | (15,345 | ) | ||||||
S&P 500® Index, Strike Price $2,085.00, Expires 01/15/16 (MSCS) | (11 | ) | (9,900 | ) | ||||||
S&P 500® Index, Strike Price $2,090.00, Expires 01/08/16 (MSCS) | (12 | ) | (2,532 | ) | ||||||
S&P 500® Index, Strike Price $2,090.00, Expires 01/15/16 (MSCS) | (11 | ) | (5,940 | ) | ||||||
S&P 500® Index, Strike Price $2,110.00, Expires 01/29/16 (MSCS) | (13 | ) | (9,438 | ) | ||||||
S&P 500® Index, Strike Price $2,110.00, Expires 01/29/16 (MSCS) | (12 | ) | (8,712 | ) | ||||||
S&P 500® Index, Strike Price $2,120.00, Expires 01/08/16 (MSCS) | (11 | ) | (220 | ) | ||||||
|
| |||||||||
| (52,087 | ) | |||||||||
|
| |||||||||
Put Options — (0.1)% | ||||||||||
S&P 500® Index, Strike Price $1,875.00, Expires 01/15/16 (MSCS) | (68 | ) | (11,560 | ) | ||||||
S&P 500® Index, Strike Price $1,900.00, Expires 01/08/16 (MSCS) | (63 | ) | (3,780 | ) | ||||||
S&P 500® Index, Strike Price $1,905.00, Expires 01/22/16 (MSCS) | (66 | ) | (106,920 | ) | ||||||
S&P 500® Index, Strike Price $1,920.00, Expires 01/15/16 (MSCS) | (65 | ) | (22,100 | ) | ||||||
S&P 500® Index, Strike Price $1,955.00, Expires 01/29/16 (MSCS) | (65 | ) | (88,400 | ) | ||||||
S&P 500® Index, Strike Price $1,960.00, Expires 01/29/16 (MSCS) | (61 | ) | (89,975 | ) | ||||||
S&P 500® Index, Strike Price $1,975.00, Expires 01/08/16 (MSCS) | (61 | ) | (22,570 | ) | ||||||
| Number of Contracts | Value | |||||||||
S&P 500® Index, Strike Price $1,985.00, Expires 01/22/16 (MSCS) | (64 | ) | $ | (92,800 | ) | |||||
S&P 500® Index, Strike Price $2,115.00, Expires 01/22/16 (MSCS) | (12 | ) | (3,396 | ) | ||||||
|
| |||||||||
| (441,501 | ) | |||||||||
|
| |||||||||
Total Written Options | ||||||||||
(Premiums received $(840,327)) |
| (493,588 | ) | |||||||
|
| |||||||||
Liabilities in Excess of Other Assets — (10.6)% | (64,554,784 | ) | ||||||||
|
| |||||||||
NET ASSETS — 100.0% | $ | 610,615,520 | ||||||||
|
| |||||||||
| See Notes to Financial Statements. | 169 |
Table of Contents
DEFENSIVE MARKET STRATEGIES FUND
SCHEDULE OF INVESTMENTS (Continued)
VALUATION HIERARCHY
The following is a summary of the inputs used, as of December 31, 2015, in valuing the Fund’s investments carried at fair value:
| Total Value | Level 1 Quoted Prices | Level 2 Other Significant Observable Inputs | Level 3 Significant Unobservable Inputs | |||||||||||||
Assets: | ||||||||||||||||
Investments in Securities: | ||||||||||||||||
Common Stocks | $ | 273,950,070 | $ | 273,950,070 | $ | — | $ | — | ||||||||
Corporate Bonds | 139,446,956 | — | 139,446,956 | — | ||||||||||||
Foreign Common Stocks: | ||||||||||||||||
Bermuda | 3,363,436 | 3,363,436 | — | — | ||||||||||||
British Virgin Islands | 11,217 | 11,217 | — | — | ||||||||||||
Canada | 2,055,314 | 2,055,314 | — | — | ||||||||||||
Curacao | 3,938,015 | 3,938,015 | — | — | ||||||||||||
France | 4,023,146 | — | 4,023,146 | — | ||||||||||||
Ireland | 8,327,849 | 8,327,849 | — | — | ||||||||||||
Jersey | 30,091 | 30,091 | — | — | ||||||||||||
Liberia | 10,829 | 10,829 | — | — | ||||||||||||
Netherlands | 876,970 | 876,970 | — | — | ||||||||||||
Panama | 27,131 | 27,131 | — | — | ||||||||||||
Singapore | 47,609 | 47,609 | — | — | ||||||||||||
Switzerland | 918,990 | 918,990 | — | — | ||||||||||||
United Kingdom | 520,097 | 520,097 | — | — | ||||||||||||
Master Limited Partnership | 3,242,312 | 3,242,312 | — | — | ||||||||||||
Money Market Funds | 93,779,211 | 93,779,211 | — | — | ||||||||||||
Preferred Stocks | 24,599,361 | 24,599,361 | — | — | ||||||||||||
U.S. Treasury Obligations | 110,944,411 | — | 110,944,411 | — | ||||||||||||
Synthetic Convertible Instruments | 5,550,877 | — | — | 5,550,877 | ||||||||||||
|
|
|
|
|
|
|
| |||||||||
Total Assets - Investments in Securities | $ | 675,663,892 | $ | 415,698,502 | $ | 254,414,513 | $ | 5,550,877 | ||||||||
|
|
|
|
|
|
|
| |||||||||
Other Financial Instruments*** | ||||||||||||||||
Forward Foreign Currency Contracts | $ | 12,837 | $ | — | $ | 12,837 | $ | — | ||||||||
|
|
|
|
|
|
|
| |||||||||
Total Assets - Other Financial Instruments | $ | 12,837 | $ | — | $ | 12,837 | $ | — | ||||||||
|
|
|
|
|
|
|
| |||||||||
| 170 | See Notes to Financial Statements. |
Table of Contents
| Total Value | Level 1 Quoted Prices | Level 2 Other Significant Observable Inputs | Level 3 Significant Unobservable Inputs | |||||||||||||
Liabilities: | ||||||||||||||||
Investments in Securities: | ||||||||||||||||
Written Options | $ | (493,588 | ) | $ | (131,413 | ) | $ | (362,175 | ) | $ | — | |||||
|
|
|
|
|
|
|
| |||||||||
Total Liabilities - Investments in Securities | $ | (493,588 | ) | $ | (131,413 | ) | $ | (362,175 | ) | $ | — | |||||
|
|
|
|
|
|
|
| |||||||||
Other Financial Instruments*** | ||||||||||||||||
Futures Contracts | $ | (73,717 | ) | $ | (73,717 | ) | $ | — | $ | — | ||||||
|
|
|
|
|
|
|
| |||||||||
Total Liabilities - Other Financial Instruments | $ | (73,717 | ) | $ | (73,717 | ) | $ | — | $ | — | ||||||
|
|
|
|
|
|
|
| |||||||||
***Other financial instruments are derivative instruments not reflected in the Schedule of Investments, such as futures, forwards and swap contracts, which are valued at the unrealized appreciation (depreciation) on the investment. Details of these investments can be found in the Notes to Financial Statements.
There were no transfers between Level 1 and Level 2 during the year ended December 31, 2015.
The unobservable inputs used in the fair value measurement of the reporting entity’s synthetic convertible instruments are values based on evaluated quotations received from dealers who make markets in such securities. Significant increases (decreases) in those evaluated quotations would result in a significantly higher (lower) fair value measurement.
The following is a reconciliation of assets in which significant unobservable inputs (Level 3) were used in determining fair value:
| Total Value | Preferred Stock | Synthetic Convertible Instruments | |||||||||||||
Balance, 12/31/14 | $ | 13,851,501 | $ | 8,530,038 | $ | 5,321,463 | |||||||||
Accrued discounts/premiums | — | — | — | ||||||||||||
Realized gain (loss)(1) | 345,860 | 187,364 | 158,496 | ||||||||||||
Change in unrealized appreciation (depreciation)(2) | (784,134 | ) | (474,529 | ) | (309,605 | ) | |||||||||
Purchases | 10,245,605 | 4,481,880 | 5,763,725 | ||||||||||||
Sales | (9,221,661 | ) | (3,838,459 | ) | (5,383,202 | ) | |||||||||
Transfers in to Level 3 | — | — | — | ||||||||||||
Transfers out of Level 3(3) | (8,886,294 | ) | (8,886,294 | ) | — | ||||||||||
Maturities | — | — | — | ||||||||||||
Paydowns | — | — | — | ||||||||||||
|
|
|
|
|
| ||||||||||
Balance, 12/31/15 | $ | 5,550,877 | $ | — | $ | 5,550,877 | |||||||||
|
|
|
|
|
| ||||||||||
| (1) | Realized gain (loss) from the sale of Level 3 securities is included on the Statement of Operations in Net realized gain (loss) from: Investment securities. |
| (2) | Change in unrealized appreciation (depreciation) is located on the Statement of Operations in Net change in unrealized appreciation (depreciation) on: Investment securities. |
| (3) | Transfers out of Level 3 represent the value of securities at December 31, 2015 that were transferred from Level 3 to Level 1 of the fair value hierarchy as a result of the ability of the Fund to obtain a price using an objective method such as a pricing vendor. |
| See Notes to Financial Statements. | 171 |
Table of Contents
The Fund was passively managed and benchmarked against the S&P 500® Index. The Fund was comprised of domestic, large-cap equity stocks with both value- and growth-style orientations. The objective of the Fund was to provide investment results approximating the aggregate price and dividend performance of the securities included in the S&P 500® Index. The correlation between the Fund’s performance and the S&P 500® Index is expected to be greater than 98%. However, it could be lower in certain market environments and due to certain stocks that may be excluded from the Fund’s portfolio because of social investment policies and restrictions (100% would indicate perfect correlation). The Investor Class of the Fund returned 0.70% for the one-year period ended December 31, 2015, as compared to a 1.38% return for the S&P 500® Index. The return differential was primarily a result of social restrictions and expenses of the Fund.
In 2015, derivative positions, exchange listed equity index futures contracts, were utilized to provide market exposure to the cash positions held in the Fund. Overall, derivative exposure had a slight negative impact on Fund performance for the year.
This Fund may be suitable for investors who seek higher, long-term rates of return, can accept significant short-term fluctuations in account value and want to diversify their portfolio by adding a potentially higher return, higher risk option of stocks. It is possible to lose money by investing in the Fund.
At December 31, 2015, the portfolio holdings of the Fund, as a percentage of total investments, is shown in the following table. Portfolio holdings are subject to risk and may change at any time.
| % | ||||
Financial Services | 18.3 | |||
Technology | 17.6 | |||
Consumer Discretionary | 13.7 | |||
Healthcare | 11.6 | |||
Money Market Funds | 9.9 | |||
Producer Durables | 9.8 | |||
Consumer Staples | 7.2 | |||
Energy | 6.1 | |||
Utilities | 5.5 | |||
Foreign Common Stocks | 3.8 | |||
Materials & Processing | 2.9 | |||
U.S. Treasury Obligation | 0.1 | |||
|
| |||
| 106.5 | ||||
|
| |||
172
Table of Contents
Equity Index Fund (Unaudited)
| Average Annual Total Returns as of 12/31/15 | ||||||||||
| Institutional Class* | Investor Class* | Benchmark** | ||||||||
One Year | 0.92% | 0.70% | 1.38% | |||||||
Five Year | 12.55% | 12.36% | 12.57% | |||||||
Ten Year | 7.12% | 6.95% | 7.31% | |||||||
Since Inception | 5.72% | 5.61% | 5.97% | |||||||
Inception Date | 08/27/01 | 08/27/01 | ||||||||
Total Fund Operating Expenses (May 1, 2015 Prospectus, as amended on June 1, 2015)(1) | 0.18% | 0.45% | ||||||||
(1)Current information regarding the Fund’s Operating Expenses can be found in the Financial Highlights.
The performance data quoted represents past performance and does not guarantee future results. Current performance may be lower or higher. Performance data current to the most recent month-end may be obtained at www.GuideStoneFunds.org. The investment return and principal value of an investment will fluctuate so that shares, when redeemed, may be worth more or less than their original cost.
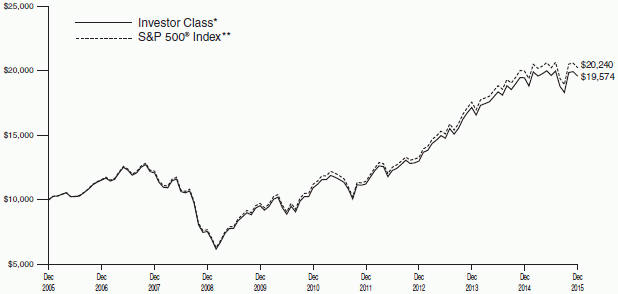
The graph compares the results of a hypothetical $10,000 investment in the Investor Class of the Fund for the 10-year period from December 31, 2005 to December 31, 2015, with all dividends and capital gains reinvested, with the S&P 500® Index.
*These returns reflect expense waivers by the Fund’s investment adviser. Without these waivers, returns would have been lower. Returns shown do not reflect the deduction of taxes that a shareholder would pay on Fund distributions or the redemption of Fund shares.
Unlike a mutual fund, the performance of an index assumes no taxes, transaction costs, management fees or other expenses.
173
Table of Contents
EQUITY INDEX FUND SCHEDULE OF INVESTMENTS | December 31, 2015 |
| Shares | Value | |||||||||
COMMON STOCKS — 92.7% |
| |||||||||
Consumer Discretionary — 13.7% |
| |||||||||
Advance Auto Parts, Inc. | 2,558 | $ | 385,005 | |||||||
Amazon.com, Inc.* | 13,261 | 8,962,977 | ||||||||
AutoNation, Inc.D* | 2,553 | 152,312 | ||||||||
AutoZone, Inc.* | 1,049 | 778,264 | ||||||||
Bed Bath & Beyond, Inc.D* | 5,741 | 277,003 | ||||||||
Best Buy Co., Inc.D | 10,434 | 317,715 | ||||||||
BorgWarner, Inc.D | 7,721 | 333,779 | ||||||||
Cablevision Systems Corporation Class A | 7,501 | 239,282 | ||||||||
CarMax, Inc.D* | 7,000 | 377,790 | ||||||||
CBS Corporation Class B (Non-Voting Shares) | 14,988 | 706,384 | ||||||||
Chipotle Mexican Grill, Inc.* | 1,069 | 512,960 | ||||||||
Coach, Inc. | 9,769 | 319,739 | ||||||||
Comcast Corporation | 84,210 | 4,751,970 | ||||||||
Costco Wholesale Corporation | 15,110 | 2,440,265 | ||||||||
D.R. Horton, Inc. | 11,332 | 362,964 | ||||||||
Darden Restaurants, Inc. | 3,881 | 246,987 | ||||||||
Discovery Communications, Inc. Class AD* | 5,065 | 135,134 | ||||||||
Discovery Communications, | 8,821 | 222,466 | ||||||||
Dollar General Corporation | 10,030 | 720,856 | ||||||||
Dollar Tree, Inc.* | 8,052 | 621,775 | ||||||||
eBay, Inc.* | 37,960 | 1,043,141 | ||||||||
Estee Lauder Cos., Inc. (The) Class A | 7,637 | 672,514 | ||||||||
Expedia, Inc. | 4,101 | 509,754 | ||||||||
Ford Motor Co. | 134,627 | 1,896,894 | ||||||||
Fossil Group, Inc.D* | 1,323 | 48,369 | ||||||||
GameStop Corporation | 3,705 | 103,888 | ||||||||
Gap, Inc. (The)D | 8,085 | 199,700 | ||||||||
General Motors Co. | 48,851 | 1,661,423 | ||||||||
Genuine Parts Co. | 5,243 | 450,321 | ||||||||
Goodyear Tire & Rubber Co. (The) | 9,194 | 300,368 | ||||||||
H&R Block, Inc.D | 7,980 | 265,814 | ||||||||
Hanesbrands, Inc. | 13,687 | 402,808 | ||||||||
Harley-Davidson, Inc.D | 6,573 | 298,348 | ||||||||
Harman International Industries, Inc. | 2,439 | 229,778 | ||||||||
Hasbro, Inc.D | 3,818 | 257,180 | ||||||||
Home Depot, Inc. (The) | 43,722 | 5,782,235 | ||||||||
Interpublic Group of Cos., Inc. (The) | 14,061 | 327,340 | ||||||||
Johnson Controls, Inc. | 22,474 | 887,498 | ||||||||
Kohl’s CorporationD | 6,693 | 318,788 | ||||||||
L Brands, Inc. | 8,740 | 837,467 | ||||||||
Leggett & Platt, Inc.D | 4,728 | 198,671 | ||||||||
Lennar Corporation | ||||||||||
Class AD | 6,253 | 305,834 | ||||||||
Lowe’s Cos., Inc. | 31,537 | 2,398,073 | ||||||||
Macy’s, Inc. | 10,861 | 379,918 | ||||||||
Marriott International, Inc. | 6,615 | 443,470 | ||||||||
Mattel, Inc.D | 11,543 | 313,623 | ||||||||
McDonald’s Corporation | 31,672 | 3,741,730 | ||||||||
Mohawk Industries, Inc.* | 2,172 | 411,355 | ||||||||
Netflix, Inc.* | 14,747 | 1,686,762 | ||||||||
Newell Rubbermaid, Inc.D | 9,289 | 409,459 | ||||||||
News Corporation Class A | 12,950 | 173,012 | ||||||||
| Shares | Value | |||||||||
News Corporation | 3,661 | $ | 51,108 | |||||||
NIKE, Inc. Class B | 46,648 | 2,915,500 | ||||||||
Nordstrom, Inc.D | 4,617 | 229,973 | ||||||||
Omnicom Group, Inc.D | 8,437 | 638,343 | ||||||||
O’Reilly Automotive, Inc.* | 3,420 | 866,696 | ||||||||
Priceline Group, Inc. (The)* | 1,717 | 2,189,089 | ||||||||
PulteGroup, Inc.D | 10,728 | 191,173 | ||||||||
PVH Corporation | 2,811 | 207,030 | ||||||||
Ralph Lauren CorporationD | 2,056 | 229,203 | ||||||||
Ross Stores, Inc. | 13,978 | 752,156 | ||||||||
Scripps Networks Interactive, Inc. | 3,367 | 185,892 | ||||||||
Staples, Inc. | 21,855 | 206,967 | ||||||||
Starbucks Corporation | 51,234 | 3,075,577 | ||||||||
Starwood Hotels & Resorts Worldwide, Inc. | 5,898 | 408,613 | ||||||||
Target Corporation | 21,254 | 1,543,253 | ||||||||
TEGNA, Inc. | 7,742 | 197,576 | ||||||||
Tiffany & Co. | 3,840 | 292,954 | ||||||||
Time Warner Cable, Inc. | 9,771 | 1,813,400 | ||||||||
Time Warner, Inc. | 27,584 | 1,783,857 | ||||||||
TJX Cos., Inc. (The) | 23,112 | 1,638,872 | ||||||||
Tractor Supply Co. | 4,650 | 397,575 | ||||||||
TripAdvisor, Inc.D* | 3,939 | 335,800 | ||||||||
Twenty-First Century Fox, Inc. | 40,372 | 1,096,504 | ||||||||
Twenty-First Century Fox, Inc. Class B | 15,072 | 410,411 | ||||||||
Under Armour, Inc. | 6,265 | 505,022 | ||||||||
Urban Outfitters, Inc.D* | 3,039 | 69,137 | ||||||||
VF Corporation | 11,720 | 729,570 | ||||||||
Wal-Mart Stores, Inc. | 54,059 | 3,313,817 | ||||||||
Walt Disney Co. (The) | 52,469 | 5,513,443 | ||||||||
Whirlpool Corporation | 2,676 | 393,024 | ||||||||
Wyndham Worldwide | ||||||||||
CorporationD | 3,958 | 287,549 | ||||||||
Yum! Brands, Inc. | 14,816 | 1,082,309 | ||||||||
|
| |||||||||
| 83,372,555 | ||||||||||
|
| |||||||||
Consumer Staples — 7.2% |
| |||||||||
Archer-Daniels-Midland Co. | 20,573 | 754,618 | ||||||||
Campbell Soup Co. | 6,292 | 330,645 | ||||||||
Church & Dwight Co., Inc. | 4,524 | 383,997 | ||||||||
Clorox Co. (The) | 4,477 | 567,818 | ||||||||
Coca-Cola Co. (The) | 135,065 | 5,802,392 | ||||||||
Coca-Cola Enterprises, Inc. | 7,129 | 351,032 | ||||||||
Colgate-Palmolive Co. | 31,026 | 2,066,952 | ||||||||
ConAgra Foods, Inc. | 14,877 | 627,214 | ||||||||
CVS Health Corporation | 38,179 | 3,732,761 | ||||||||
Dr. Pepper Snapple Group, Inc. | 6,467 | 602,724 | ||||||||
General Mills, Inc. | 20,713 | 1,194,312 | ||||||||
Hershey Co. (The)D | 4,922 | 439,387 | ||||||||
Hormel Foods CorporationD | 4,597 | 363,531 | ||||||||
J.M. Smucker Co. (The) | 4,153 | 512,231 | ||||||||
Kellogg Co. | 8,873 | 641,252 | ||||||||
Keurig Green Mountain, Inc.D | 3,971 | 357,311 | ||||||||
Kimberly-Clark Corporation | 12,480 | 1,588,704 | ||||||||
Kraft Heinz Co. (The) | 20,528 | 1,493,617 | ||||||||
Kroger Co. (The) | 33,633 | 1,406,868 | ||||||||
McCormick & Co., Inc. | ||||||||||
(Non-Voting Shares)D | 3,952 | 338,133 | ||||||||
Mead Johnson Nutrition Co. | 6,772 | 534,649 | ||||||||
Mondelez International, | 54,879 | 2,460,774 | ||||||||
Monster Beverage Corporation* | 5,175 | 770,868 | ||||||||
| 174 | See Notes to Financial Statements. |
Table of Contents
| Shares | Value | |||||||||
PepsiCo, Inc. | 50,305 | $ | 5,026,476 | |||||||
Procter & Gamble Co. (The) | 93,846 | 7,452,311 | ||||||||
Sysco Corporation | 17,982 | 737,262 | ||||||||
Tyson Foods, Inc. Class A | 10,139 | 540,713 | ||||||||
Walgreens Boots Alliance, Inc. | 30,077 | 2,561,207 | ||||||||
Whole Foods Market, Inc.D | 11,810 | 395,635 | ||||||||
|
|
| ||||||||
| 44,035,394 | ||||||||||
|
|
| ||||||||
Energy — 6.1% | ||||||||||
Anadarko Petroleum Corporation | 17,432 | 846,847 | ||||||||
Apache Corporation | 12,960 | 576,331 | ||||||||
Archrock, Inc. | 13 | 98 | ||||||||
Baker Hughes, Inc. | 14,974 | 691,050 | ||||||||
Cabot Oil & Gas CorporationD | 14,102 | 249,464 | ||||||||
Cameron International Corporation* | 6,565 | 414,908 | ||||||||
Chesapeake Energy CorporationD | 17,647 | 79,412 | ||||||||
Chevron Corporation | 64,963 | 5,844,071 | ||||||||
Cimarex Energy Co. | 3,310 | 295,848 | ||||||||
Columbia Pipeline Group, Inc. | 13,330 | 266,600 | ||||||||
ConocoPhillipsD | 42,673 | 1,992,402 | ||||||||
CONSOL Energy, Inc.D | 7,857 | 62,070 | ||||||||
Devon Energy Corporation | 13,282 | 425,024 | ||||||||
Diamond Offshore Drilling, Inc.D | 2,290 | 48,319 | ||||||||
EOG Resources, Inc. | 19,045 | 1,348,196 | ||||||||
EQT Corporation | 5,184 | 270,242 | ||||||||
Exterran Corporation* | 6 | 96 | ||||||||
Exxon Mobil Corporation | 143,655 | 11,197,907 | ||||||||
First Solar, Inc.D* | 2,565 | 169,264 | ||||||||
FMC Technologies, Inc.* | 7,897 | 229,092 | ||||||||
Halliburton Co. | 29,661 | 1,009,660 | ||||||||
Helmerich & Payne, Inc.D | 3,670 | 196,529 | ||||||||
Hess Corporation | 8,298 | 402,287 | ||||||||
Kinder Morgan, Inc. | 63,200 | 942,944 | ||||||||
Marathon Oil CorporationD | 23,357 | 294,065 | ||||||||
Marathon Petroleum Corporation | 18,418 | 954,789 | ||||||||
Murphy Oil CorporationD | 5,682 | 127,561 | ||||||||
National Oilwell Varco, Inc.D | 13,040 | 436,710 | ||||||||
Newfield Exploration Co.* | 5,484 | 178,559 | ||||||||
Noble Energy, Inc.D | 14,885 | 490,163 | ||||||||
Occidental Petroleum Corporation | 26,434 | 1,787,203 | ||||||||
ONEOK, Inc.D | 7,110 | 175,333 | ||||||||
Phillips 66 | 16,409 | 1,342,256 | ||||||||
Pioneer Natural Resources Co. | 5,120 | 641,946 | ||||||||
Range Resources CorporationD | 5,659 | 139,268 | ||||||||
Southwestern Energy Co.D* | 13,122 | 93,297 | ||||||||
Spectra Energy CorporationD | 23,113 | 553,325 | ||||||||
Tesoro Corporation | 4,130 | 435,178 | ||||||||
Valero Energy Corporation | 16,633 | 1,176,119 | ||||||||
Williams Cos., Inc. (The)* | 23,391 | 601,149 | ||||||||
|
| |||||||||
| 36,985,582 | ||||||||||
|
| |||||||||
Financial Services — 18.3% |
| |||||||||
Affiliated Managers | ||||||||||
Group, Inc.* | 1,846 | 294,917 | ||||||||
Aflac, Inc. | 14,638 | 876,816 | ||||||||
Alliance Data Systems | ||||||||||
Corporation* | 2,108 | 583,010 | ||||||||
Allstate Corporation (The) | 13,373 | 830,330 | ||||||||
American Express Co. | 28,874 | 2,008,187 | ||||||||
| Shares | Value | |||||||||
American International Group, Inc. | 42,688 | $ | 2,645,375 | |||||||
American Tower Corporation REIT | 14,626 | 1,417,991 | ||||||||
Ameriprise Financial, Inc. | 6,049 | 643,735 | ||||||||
Apartment Investment & Management Co. Class A REIT | 5,345 | 213,960 | ||||||||
Assurant, Inc. | 2,201 | 177,269 | ||||||||
AvalonBay Communities, Inc. REIT | 4,738 | 872,408 | ||||||||
Bank of America Corporation | 359,310 | 6,047,187 | ||||||||
Bank of New York Mellon | ||||||||||
Corporation (The) | 37,847 | 1,560,053 | ||||||||
BB&T Corporation | 27,152 | 1,026,617 | ||||||||
Berkshire Hathaway, Inc. | 64,590 | 8,528,464 | ||||||||
BlackRock, Inc. | 4,351 | 1,481,603 | ||||||||
Boston Properties, Inc. REIT | 5,277 | 673,029 | ||||||||
Capital One Financial Corporation | 18,374 | 1,326,235 | ||||||||
CBRE Group, Inc. Class A* | 9,902 | 342,411 | ||||||||
Charles Schwab Corporation (The) | 41,413 | 1,363,730 | ||||||||
Chubb Corporation (The) | 7,869 | 1,043,744 | ||||||||
Cincinnati Financial Corporation | 5,056 | 299,164 | ||||||||
Citigroup, Inc. | 102,799 | 5,319,848 | ||||||||
CME Group, Inc. | 11,688 | 1,058,933 | ||||||||
Comerica, Inc. | 6,109 | 255,539 | ||||||||
Crown Castle International Corporation REIT | 11,463 | 990,976 | ||||||||
Discover Financial Services | 14,762 | 791,538 | ||||||||
Dun & Bradstreet Corporation (The) | 1,233 | 128,146 | ||||||||
E*TRADE Financial Corporation* | 9,982 | 295,867 | ||||||||
Equifax, Inc. | 4,080 | 454,390 | ||||||||
Equinix, Inc. REITD | 2,143 | 648,043 | ||||||||
Equity Residential REIT | 12,491 | 1,019,141 | ||||||||
Essex Property Trust, Inc. REIT | 2,291 | 548,488 | ||||||||
Fidelity National Information Services, Inc. | 9,546 | 578,488 | ||||||||
Fifth Third Bancorp | 27,353 | 549,795 | ||||||||
Fiserv, Inc.* | 7,894 | 721,985 | ||||||||
Franklin Resources, Inc. | 12,919 | 475,678 | ||||||||
General Growth Properties, Inc. REIT | 20,295 | 552,227 | ||||||||
Goldman Sachs Group, Inc. (The) | 13,694 | 2,468,070 | ||||||||
Hartford Financial Services Group, Inc. (The) | 14,214 | 617,740 | ||||||||
HCP, Inc. REIT | 16,072 | 614,593 | ||||||||
Host Hotels & Resorts, Inc. REIT | 25,898 | 397,275 | ||||||||
Huntington Bancshares, Inc. | 27,751 | 306,926 | ||||||||
Intercontinental Exchange, Inc. | 4,097 | 1,049,897 | ||||||||
Iron Mountain, Inc. REITD | 6,823 | 184,289 | ||||||||
JPMorgan Chase & Co. | 127,015 | 8,386,800 | ||||||||
KeyCorp | 28,599 | 377,221 | ||||||||
Kimco Realty Corporation REIT | 14,037 | 371,419 | ||||||||
Legg Mason, Inc. | 3,731 | 146,367 | ||||||||
Leucadia National Corporation | 11,518 | 200,298 | ||||||||
Lincoln National Corporation | 8,588 | 431,633 | ||||||||
Loews Corporation | 9,770 | 375,168 | ||||||||
M&T Bank Corporation | 5,510 | 667,702 | ||||||||
| See Notes to Financial Statements. | 175 |
Table of Contents
EQUITY INDEX FUND
SCHEDULE OF INVESTMENTS (Continued)
| Shares | Value | |||||||||
Macerich Co. (The) REIT | 4,573 | $ | 368,995 | |||||||
Marsh & McLennan Cos., Inc. | 18,092 | 1,003,201 | ||||||||
MasterCard, Inc. Class A | 34,159 | 3,325,720 | ||||||||
McGraw Hill Financial, Inc. | 9,373 | 923,990 | ||||||||
MetLife, Inc. | 38,258 | 1,844,418 | ||||||||
Moody’s Corporation | 5,882 | 590,200 | ||||||||
Morgan Stanley | 52,213 | 1,660,896 | ||||||||
Nasdaq, Inc. | 4,073 | 236,926 | ||||||||
Navient Corporation | 12,116 | 138,728 | ||||||||
Northern Trust Corporation | 7,400 | 533,466 | ||||||||
PayPal Holdings, Inc.* | 38,373 | 1,389,103 | ||||||||
People’s United Financial, Inc.D | 10,672 | 172,353 | ||||||||
Plum Creek Timber Co., Inc. REIT | 6,028 | 287,656 | ||||||||
PNC Financial Services Group, Inc. (The) | 17,469 | 1,664,970 | ||||||||
Principal Financial Group, Inc. | 9,398 | 422,722 | ||||||||
Progressive Corporation (The) | 20,310 | 645,858 | ||||||||
Prologis, Inc. REIT | 18,132 | 778,225 | ||||||||
Prudential Financial, Inc. | 15,448 | 1,257,622 | ||||||||
Public Storage REIT | 5,090 | 1,260,793 | ||||||||
Realty Income Corporation REITD | 8,682 | 448,252 | ||||||||
Regions Financial Corporation | 44,937 | 431,395 | ||||||||
Simon Property Group, Inc. REIT | 10,679 | 2,076,425 | ||||||||
SL Green Realty Corporation REIT | 3,468 | 391,815 | ||||||||
State Street Corporation | 13,975 | 927,381 | ||||||||
SunTrust Banks, Inc. | 17,731 | 759,596 | ||||||||
Synchrony Financial* | 28,648 | 871,186 | ||||||||
T. Rowe Price Group, Inc. | 8,682 | 620,676 | ||||||||
Torchmark CorporationD | 3,970 | 226,925 | ||||||||
Total System Services, Inc. | 5,853 | 291,479 | ||||||||
Travelers Cos., Inc. (The) | 10,505 | 1,185,594 | ||||||||
U.S. Bancorp | 56,659 | 2,417,640 | ||||||||
Unum Group | 8,238 | 274,243 | ||||||||
Ventas, Inc. REIT | 11,451 | 646,180 | ||||||||
Visa, Inc. Class AD | 67,149 | 5,207,405 | ||||||||
Vornado Realty Trust REIT | 6,121 | 611,855 | ||||||||
Wells Fargo & Co. | 160,349 | 8,716,572 | ||||||||
Welltower, Inc. REIT | 12,148 | 826,428 | ||||||||
Western Union Co. (The)D | 17,238 | 308,733 | ||||||||
Weyerhaeuser Co. REIT | 17,651 | 529,177 | ||||||||
Zions Bancorporation | 6,966 | 190,172 | ||||||||
|
| |||||||||
| 111,705,686 | ||||||||||
|
| |||||||||
Healthcare — 11.6% |
| |||||||||
Abbott Laboratories | 51,457 | 2,310,934 | ||||||||
AbbVie, Inc. | 56,411 | 3,341,788 | ||||||||
Aetna, Inc. | 12,057 | 1,303,603 | ||||||||
Agilent Technologies, Inc. | 11,517 | 481,526 | ||||||||
Alexion Pharmaceuticals, Inc.* | 7,755 | 1,479,266 | ||||||||
Amgen, Inc. | 26,038 | 4,226,749 | ||||||||
Anthem, Inc. | 8,972 | 1,251,056 | ||||||||
Baxalta, Inc. | 18,861 | 736,145 | ||||||||
Baxter International, Inc. | 18,837 | 718,632 | ||||||||
Becton, Dickinson and Co. | 7,296 | 1,124,241 | ||||||||
Biogen, Inc.* | 7,693 | 2,356,751 | ||||||||
Boston Scientific Corporation* | 46,195 | 851,836 | ||||||||
Bristol-Myers Squibb Co. | 57,566 | 3,959,965 | ||||||||
C.R. Bard, Inc. | 2,545 | 482,125 | ||||||||
Cardinal Health, Inc. | 11,352 | 1,013,393 | ||||||||
Celgene Corporation* | 27,076 | 3,242,622 | ||||||||
Cerner CorporationD* | 10,456 | 629,137 | ||||||||
| Shares | Value | |||||||||
Cigna Corporation | 8,918 | $ | 1,304,971 | |||||||
DaVita HealthCare Partners, Inc.* | 5,774 | 402,506 | ||||||||
DENTSPLY International, Inc.D | 4,803 | 292,263 | ||||||||
Edwards Lifesciences Corporation* | 7,503 | 592,587 | ||||||||
Eli Lilly & Co. | 33,681 | 2,837,961 | ||||||||
Express Scripts Holding Co.* | 23,328 | 2,039,100 | ||||||||
Gilead Sciences, Inc. | 49,725 | 5,031,673 | ||||||||
HCA Holdings, Inc.* | 10,849 | 733,718 | ||||||||
Henry Schein, Inc.D* | 2,855 | 451,632 | ||||||||
Humana, Inc. | 5,107 | 911,651 | ||||||||
Illumina, Inc.D* | 5,053 | 969,898 | ||||||||
Intuitive Surgical, Inc.* | 1,278 | 697,992 | ||||||||
Johnson & Johnson | 95,446 | 9,804,213 | ||||||||
Laboratory Corporation of | 3,518 | 434,965 | ||||||||
McKesson Corporation | 7,967 | 1,571,331 | ||||||||
Patterson Cos., Inc.D | 2,919 | 131,968 | ||||||||
PerkinElmer, Inc.D | 3,875 | 207,584 | ||||||||
Quest Diagnostics, Inc. | 4,925 | 350,364 | ||||||||
Regeneron Pharmaceuticals, Inc.* | 2,680 | 1,454,892 | ||||||||
St. Jude Medical, Inc. | 9,843 | 608,002 | ||||||||
Stryker Corporation | 10,844 | 1,007,841 | ||||||||
Tenet Healthcare CorporationD* | 3,361 | 101,838 | ||||||||
Thermo Fisher Scientific, Inc. | 13,743 | 1,949,445 | ||||||||
UnitedHealth Group, Inc. | 32,886 | 3,868,709 | ||||||||
Universal Health Services, | 3,109 | 371,494 | ||||||||
Varian Medical Systems, Inc.* | 3,413 | 275,770 | ||||||||
Vertex Pharmaceuticals, Inc.* | 8,486 | 1,067,793 | ||||||||
Zimmer Biomet Holdings, Inc. | 5,932 | 608,564 | ||||||||
Zoetis, Inc. | 15,858 | 759,915 | ||||||||
|
| |||||||||
| 70,350,409 | ||||||||||
|
| |||||||||
Materials & Processing — 2.9% |
| |||||||||
Air Products & | 6,724 | 874,860 | ||||||||
Airgas, Inc. | 2,222 | 307,347 | ||||||||
Alcoa, Inc.D | 45,734 | 451,395 | ||||||||
Ball CorporationD | 4,684 | 340,667 | ||||||||
CF Industries Holdings, Inc. | 8,022 | 327,378 | ||||||||
Dow Chemical Co. (The) | 38,802 | 1,997,527 | ||||||||
E.I. du Pont de | 30,238 | 2,013,851 | ||||||||
Eastman Chemical Co. | 5,099 | 344,233 | ||||||||
Ecolab, Inc. | 9,218 | 1,054,355 | ||||||||
Fastenal Co.D | 9,869 | 402,853 | ||||||||
FMC CorporationD | 4,552 | 178,120 | ||||||||
Freeport-McMoRan, Inc.D | 40,458 | 273,901 | ||||||||
International Flavors & | 2,757 | 329,847 | ||||||||
International Paper Co. | 14,240 | 536,848 | ||||||||
Martin Marietta | 2,287 | 312,358 | ||||||||
Masco Corporation | 11,611 | 328,591 | ||||||||
Monsanto Co. | 15,197 | 1,497,208 | ||||||||
Mosaic Co. (The) | 11,445 | 315,767 | ||||||||
Newmont Mining Corporation | 18,493 | 332,689 | ||||||||
Nucor Corporation | 10,932 | 440,560 | ||||||||
Owens-Illinois, Inc.* | 5,595 | 97,465 | ||||||||
PPG Industries, Inc. | 9,315 | 920,508 | ||||||||
Praxair, Inc.D | 9,832 | 1,006,797 | ||||||||
Precision Castparts Corporation | 4,760 | 1,104,368 | ||||||||
Sealed Air Corporation | 6,950 | 309,970 | ||||||||
| 176 | See Notes to Financial Statements. |
Table of Contents
| Shares | Value | |||||||||
Sherwin-Williams Co. (The) | 2,722 | $ | 706,631 | |||||||
Vulcan Materials Co. | 4,637 | 440,376 | ||||||||
WestRock Co. | 8,810 | 401,912 | ||||||||
|
| |||||||||
| 17,648,382 | ||||||||||
|
| |||||||||
Producer Durables — 9.8% | ||||||||||
3M Co. | 21,233 | 3,198,539 | ||||||||
ADT Corporation (The)D | 5,832 | 192,339 | ||||||||
American Airlines Group, Inc. | 21,884 | 926,787 | ||||||||
AMETEK, Inc. | 8,236 | 441,367 | ||||||||
Automatic Data | 15,957 | 1,351,877 | ||||||||
Avery Dennison Corporation | 3,088 | 193,494 | ||||||||
Boeing Co. (The) | 21,721 | 3,140,639 | ||||||||
C.H. Robinson Worldwide, Inc. | 5,009 | 310,658 | ||||||||
Caterpillar, Inc.D | 20,081 | 1,364,705 | ||||||||
Cintas Corporation | 3,026 | 275,517 | ||||||||
CSX Corporation | 33,720 | 875,034 | ||||||||
Cummins, Inc. | 5,710 | 502,537 | ||||||||
Danaher Corporation | 20,547 | 1,908,405 | ||||||||
Deere & Co.D | 10,754 | 820,208 | ||||||||
Delta Air Lines, Inc. | 27,145 | 1,375,980 | ||||||||
Dover CorporationD | 5,396 | 330,829 | ||||||||
Emerson Electric Co. | 22,583 | 1,080,145 | ||||||||
Expeditors International of | 6,560 | 295,856 | ||||||||
FedEx Corporation | 9,075 | 1,352,084 | ||||||||
FLIR Systems, Inc. | 4,772 | 133,950 | ||||||||
Flowserve CorporationD | 4,590 | 193,147 | ||||||||
Fluor Corporation | 4,879 | 230,386 | ||||||||
General Dynamics Corporation | 10,243 | 1,406,979 | ||||||||
General Electric Co. | 325,572 | 10,141,568 | ||||||||
Honeywell International, Inc. | 26,569 | 2,751,751 | ||||||||
Illinois Tool Works, Inc. | 11,325 | 1,049,601 | ||||||||
J.B. Hunt Transport | 3,121 | 228,957 | ||||||||
Jacobs Engineering | 4,112 | 172,499 | ||||||||
Kansas City Southern | 3,767 | 281,282 | ||||||||
L-3 Communications | 2,708 | 323,633 | ||||||||
Lockheed Martin Corporation | 9,086 | 1,973,025 | ||||||||
Norfolk Southern Corporation | 10,244 | 866,540 | ||||||||
Northrop Grumman | 6,292 | 1,187,993 | ||||||||
PACCAR, Inc.D | 12,218 | 579,133 | ||||||||
Parker-Hannifin Corporation | 4,670 | 452,897 | ||||||||
Paychex, Inc.D | 10,971 | 580,256 | ||||||||
Pitney Bowes, Inc. | 6,878 | 142,031 | ||||||||
Quanta Services, Inc.* | 5,514 | 111,659 | ||||||||
Raytheon Co. | 10,395 | 1,294,489 | ||||||||
Republic Services, Inc. | 8,171 | 359,442 | ||||||||
Robert Half International, Inc. | 4,610 | 217,316 | ||||||||
Rockwell Automation, Inc.D | 4,546 | 466,465 | ||||||||
Rockwell Collins, Inc.D | 4,583 | 423,011 | ||||||||
Roper Technologies, Inc. | 3,452 | 655,155 | ||||||||
Ryder System, Inc. | 1,813 | 103,033 | ||||||||
Snap-on, Inc. | 1,986 | 340,460 | ||||||||
Southwest Airlines Co. | 22,405 | 964,759 | ||||||||
Stanley Black & Decker, Inc. | 5,151 | 549,766 | ||||||||
Stericycle, Inc.* | 2,898 | 349,499 | ||||||||
Textron, Inc. | 9,493 | 398,801 | ||||||||
Union Pacific Corporation | 29,462 | 2,303,928 | ||||||||
| Shares | Value | |||||||||
United Continental | 12,777 | $ | 732,122 | |||||||
United Parcel Service, Inc. | 24,022 | 2,311,637 | ||||||||
United Rentals, Inc.D* | 3,295 | 239,019 | ||||||||
United Technologies Corporation | 28,497 | 2,737,707 | ||||||||
Verisk Analytics, Inc.D* | 5,398 | 414,998 | ||||||||
W.W. Grainger, Inc.D | 1,996 | 404,370 | ||||||||
Waste Management, Inc. | 14,259 | 761,003 | ||||||||
Waters Corporation* | 2,833 | 381,265 | ||||||||
Xerox Corporation | 33,395 | 354,989 | ||||||||
Xylem, Inc. | 6,226 | 227,249 | ||||||||
|
| |||||||||
| 59,734,770 | ||||||||||
|
| |||||||||
Technology — 17.6% | ||||||||||
Activision Blizzard, Inc.D | 17,349 | 671,580 | ||||||||
Adobe Systems, Inc.* | 17,215 | 1,617,177 | ||||||||
Akamai Technologies, Inc.* | 6,108 | 321,464 | ||||||||
Alphabet, Inc. Class A* | 10,051 | 7,819,779 | ||||||||
Alphabet, Inc. Class C* | 10,251 | 7,779,279 | ||||||||
Amphenol Corporation | 10,640 | 555,727 | ||||||||
Analog Devices, Inc. | 10,692 | 591,481 | ||||||||
Apple, Inc. | 192,362 | 20,248,025 | ||||||||
Applied Materials, Inc. | 39,806 | 743,178 | ||||||||
Autodesk, Inc.* | 7,748 | 472,086 | ||||||||
Broadcom Corporation | 19,420 | 1,122,864 | ||||||||
CA, Inc. | 10,916 | 311,761 | ||||||||
Cisco Systems, Inc. | 175,071 | 4,754,053 | ||||||||
Citrix Systems, Inc.* | 5,310 | 401,702 | ||||||||
Cognizant Technology Solutions | 21,068 | 1,264,501 | ||||||||
Corning, Inc. | 40,852 | 746,775 | ||||||||
CSRA, Inc. | 4,813 | 144,390 | ||||||||
Electronic Arts, Inc.* | 10,802 | 742,313 | ||||||||
EMC Corporation | 66,911 | 1,718,274 | ||||||||
F5 Networks, Inc.* | 2,480 | 240,461 | ||||||||
Facebook, Inc. Class A* | 78,337 | 8,198,750 | ||||||||
Harris Corporation | 4,318 | 375,234 | ||||||||
Hewlett Packard Enterprise Co. | 62,007 | 942,506 | ||||||||
HP, Inc. | 61,974 | 733,772 | ||||||||
Intel Corporation | 162,917 | 5,612,491 | ||||||||
International Business | 30,784 | 4,236,494 | ||||||||
Intuit, Inc. | 9,111 | 879,212 | ||||||||
Juniper Networks, Inc. | 12,328 | 340,253 | ||||||||
KLA-Tencor Corporation | 5,346 | 370,745 | ||||||||
Lam Research Corporation | 5,471 | 434,507 | ||||||||
Linear Technology | 8,166 | 346,810 | ||||||||
Microchip Technology, Inc.D | 6,955 | 323,686 | ||||||||
Micron Technology, Inc.* | 37,150 | 526,044 | ||||||||
Microsoft Corporation | 275,590 | 15,289,733 | ||||||||
Motorola Solutions, Inc. | 5,562 | 380,719 | ||||||||
NetApp, Inc. | 10,228 | 271,349 | ||||||||
NVIDIA CorporationD | 17,550 | 578,448 | ||||||||
Oracle Corporation | 110,410 | 4,033,277 | ||||||||
Qorvo, Inc.* | 4,842 | 246,458 | ||||||||
QUALCOMM, Inc. | 51,864 | 2,592,422 | ||||||||
Red Hat, Inc.* | 6,261 | 518,473 | ||||||||
salesforce.com, Inc.* | 21,542 | 1,688,893 | ||||||||
SanDisk Corporation | 6,856 | 520,987 | ||||||||
Skyworks Solutions, Inc.D | 6,556 | 503,697 | ||||||||
Symantec Corporation | 23,526 | 494,046 | ||||||||
| See Notes to Financial Statements. | 177 |
Table of Contents
EQUITY INDEX FUND
SCHEDULE OF INVESTMENTS (Continued)
| Shares | Value | |||||||||
Teradata CorporationD* | 4,516 | $ | 119,313 | |||||||
Texas Instruments, Inc. | 34,966 | 1,916,486 | ||||||||
VeriSign, Inc.D* | 3,402 | 297,199 | ||||||||
Western Digital Corporation | 8,034 | 482,442 | ||||||||
Xilinx, Inc. | 8,927 | 419,301 | ||||||||
Yahoo!, Inc.* | 30,079 | 1,000,428 | ||||||||
|
| |||||||||
| 106,941,045 | ||||||||||
|
| |||||||||
Utilities — 5.5% | ||||||||||
AES Corporation | 23,299 | 222,971 | ||||||||
AGL Resources, Inc. | 4,072 | 259,834 | ||||||||
Ameren Corporation | 8,286 | 358,204 | ||||||||
American Electric | 16,887 | 984,005 | ||||||||
AT&T, Inc. | 212,184 | 7,301,251 | ||||||||
CenterPoint Energy, Inc. | 14,671 | 269,360 | ||||||||
CenturyLink, Inc. | 18,997 | 477,965 | ||||||||
CMS Energy CorporationD | 9,409 | 339,477 | ||||||||
Consolidated Edison, Inc.D | 10,047 | 645,721 | ||||||||
Dominion Resources, Inc. | 20,569 | 1,391,287 | ||||||||
DTE Energy Co. | 6,189 | 496,296 | ||||||||
Duke Energy Corporation | 23,782 | 1,697,797 | ||||||||
Edison International | 11,181 | 662,027 | ||||||||
Entergy Corporation | 6,152 | 420,551 | ||||||||
Eversource Energy | 11,087 | 566,213 | ||||||||
Exelon Corporation | 31,959 | 887,501 | ||||||||
FirstEnergy Corporation | 14,629 | 464,178 | ||||||||
Frontier Communications | 41,604 | 194,291 | ||||||||
Level 3 Communications, Inc.* | 9,961 | 541,480 | ||||||||
NextEra Energy, Inc. | 15,894 | 1,651,228 | ||||||||
NiSource, Inc.D | 10,836 | 211,410 | ||||||||
NRG Energy, Inc.D | 10,926 | 128,599 | ||||||||
Pepco Holdings, Inc. | 8,644 | 224,830 | ||||||||
PG&E Corporation | 17,019 | 905,241 | ||||||||
Pinnacle West Capital Corporation | 3,771 | 243,154 | ||||||||
PPL Corporation | 23,138 | 789,700 | ||||||||
Public Service Enterprise | 17,674 | 683,807 | ||||||||
SCANA CorporationD | 4,864 | 294,223 | ||||||||
Sempra Energy | 8,182 | 769,190 | ||||||||
Southern Co. (The) | 31,404 | 1,469,393 | ||||||||
TECO Energy, Inc. | 8,072 | 215,119 | ||||||||
Verizon Communications, Inc. | 140,331 | 6,486,099 | ||||||||
WEC Energy Group, Inc.D | 10,827 | 555,533 | ||||||||
Xcel Energy, Inc. | 17,672 | 634,602 | ||||||||
|
| |||||||||
| 33,442,537 | ||||||||||
|
| |||||||||
Total Common Stocks | 564,216,360 | |||||||||
|
| |||||||||
FOREIGN COMMON STOCKS — 3.8% | ||||||||||
Bermuda — 0.1% | ||||||||||
Invesco, Ltd. | 14,469 | 484,422 | ||||||||
Signet Jewelers, Ltd. | 2,719 | 336,313 | ||||||||
|
| |||||||||
| 820,735 | ||||||||||
|
| |||||||||
British Virgin Islands — 0.0% |
| |||||||||
Michael Kors Holdings, Ltd.* | 6,331 | 253,620 | ||||||||
|
| |||||||||
Curacao — 0.5% | ||||||||||
Schlumberger, Ltd. | 43,538 | 3,036,775 | ||||||||
|
| |||||||||
Ireland — 1.6% | ||||||||||
Accenture PLC Class A | 21,534 | 2,250,303 | ||||||||
Allegion PLC | 3,292 | 217,009 | ||||||||
Eaton Corporation PLC | 16,081 | 836,855 | ||||||||
| Shares | Value | |||||||||
Ingersoll-Rand PLC | 9,020 | $ | 498,716 | |||||||
Mallinckrodt PLC* | 3,998 | 298,371 | ||||||||
Medtronic PLC | 48,553 | 3,734,697 | ||||||||
Pentair PLCD | 6,230 | 308,572 | ||||||||
Seagate Technology PLCD | 10,285 | 377,048 | ||||||||
Tyco International PLC | 14,741 | 470,090 | ||||||||
XL Group PLC | 10,319 | 404,298 | ||||||||
|
| |||||||||
| 9,395,959 | ||||||||||
|
| |||||||||
Jersey — 0.1% | ||||||||||
Delphi Automotive PLC | 9,650 | 827,294 | ||||||||
|
| |||||||||
Liberia — 0.1% | ||||||||||
Royal Caribbean Cruises, Ltd.D | 5,960 | 603,212 | ||||||||
|
| |||||||||
Netherlands — 0.3% |
| |||||||||
LyondellBasell Industries NV | 12,410 | 1,078,429 | ||||||||
Mylan NVD* | 14,236 | 769,740 | ||||||||
|
| |||||||||
| 1,848,169 | ||||||||||
|
| |||||||||
Panama — 0.2% | ||||||||||
Carnival Corporation | 15,972 | 870,155 | ||||||||
|
| |||||||||
Singapore — 0.2% | ||||||||||
Avago Technologies, Ltd.D | 9,058 | 1,314,769 | ||||||||
|
| |||||||||
Switzerland — 0.4% | ||||||||||
ACE, Ltd.D | 11,198 | 1,308,486 | ||||||||
Garmin, Ltd.D | 4,121 | 153,178 | ||||||||
TE Connectivity, Ltd. | 13,343 | 862,091 | ||||||||
Transocean, Ltd.D | 11,608 | 143,707 | ||||||||
|
| |||||||||
| 2,467,462 | ||||||||||
|
| |||||||||
United Kingdom — 0.3% |
| |||||||||
Aon PLC | 9,466 | 872,860 | ||||||||
Ensco PLC Class AD | 7,992 | 122,997 | ||||||||
Nielsen Holdings PLC | 12,453 | 580,310 | ||||||||
|
| |||||||||
| 1,576,167 | ||||||||||
|
| |||||||||
Total Foreign Common Stocks |
| 23,014,317 | ||||||||
|
| |||||||||
MONEY MARKET FUNDS — 9.9% |
| |||||||||
GuideStone Money | 19,879,456 | 19,879,456 | ||||||||
Northern Institutional Liquid | 40,316,383 | 40,316,383 | ||||||||
|
| |||||||||
Total Money Market Funds |
| 60,195,839 | ||||||||
|
| |||||||||
| Par | ||||||||||
U.S. TREASURY OBLIGATION — 0.1% |
| |||||||||
U.S. Treasury Bill | $ | 560,000 | 559,773 | |||||||
|
| |||||||||
TOTAL INVESTMENTS — 106.5% |
| |||||||||
(Cost $502,193,448) | 647,986,289 | |||||||||
Liabilities in Excess of Other |
| (39,382,471 | ) | |||||||
|
| |||||||||
NET ASSETS — 100.0% |
| $ | 608,603,818 | |||||||
|
| |||||||||
| 178 | See Notes to Financial Statements. |
Table of Contents
VALUATION HIERARCHY
The following is a summary of the inputs used, as of December 31, 2015, in valuing the Fund’s investments carried at fair value:
| Total Value | Level 1 Quoted Prices | Level 2 Other Significant Observable Inputs | Level 3 Significant Unobservable Inputs | |||||||||||||
Assets: | ||||||||||||||||
Investments in Securities: | ||||||||||||||||
Common Stocks | $ | 564,216,360 | $ | 564,216,360 | $ | — | $ | — | ||||||||
Foreign Common Stocks | 23,014,317 | 23,014,317 | — | — | ||||||||||||
Money Market Funds | 60,195,839 | 60,195,839 | — | — | ||||||||||||
U.S. Treasury Obligation | 559,773 | — | 559,773 | — | ||||||||||||
|
|
|
|
|
|
|
| |||||||||
Total Assets - Investments in Securities | $ | 647,986,289 | $ | 647,426,516 | $ | 559,773 | $ | — | ||||||||
|
|
|
|
|
|
|
| |||||||||
Liabilities: | ||||||||||||||||
Other Financial Instruments*** | ||||||||||||||||
Futures Contracts | $ | (41,549 | ) | $ | (41,549 | ) | $ | — | $ | — | ||||||
|
|
|
|
|
|
|
| |||||||||
Total Liabilities - Other Financial Instruments | $ | (41,549 | ) | $ | (41,549 | ) | $ | — | $ | — | ||||||
|
|
|
|
|
|
|
| |||||||||
***Other financial instruments are derivative instruments not reflected in the Schedule of Investments, such as futures, forwards and swap contracts, which are valued at the unrealized appreciation (depreciation) on the investment. Details of these investments can be found in the Notes to Financial Statements.
There were no transfers between Level 1 and Level 2 during the year ended December 31, 2015.
| See Notes to Financial Statements. | 179 |
Table of Contents
The Fund invested in a diversified portfolio of large- and medium-sized U.S. companies whose stocks were considered to be attractive from a valuation perspective. The Investor Class of the Fund slightly outperformed its benchmark, the Russell 1000® Value Index, for the one-year period ended December 31, 2015 (-3.70% versus -3.83%). Underweight exposure and security selection to the energy sector contributed to benchmark-relative performance, while security selection to the financial services and consumer discretionary sectors detracted from benchmark-relative performance for the year.
In 2015, derivative positions, exchange listed equity index futures contracts, were utilized to provide market exposure to the cash positions held in the Fund. Overall, derivative exposure had a slight negative impact on Fund performance for the year.
This Fund may be suitable for investors who seek higher, long-term rates of return, can accept significant short-term fluctuations in account value and want to diversify their portfolio by adding a potentially higher return, higher risk option of value stocks. This Fund is subject to value investing risk. This involves the risk that an investment in companies whose securities are believed to be undervalued, relative to their underlying profitability, will not appreciate in value as anticipated. It is possible to lose money by investing in the Fund.
At December 31, 2015, the portfolio holdings of the Fund, as a percentage of total investments, is shown in the following table. Portfolio holdings are subject to risk and may change at any time.
| % | ||||
Financial Services | 25.7 | |||
Money Market Funds | 14.2 | |||
Technology | 12.3 | |||
Producer Durables | 11.3 | |||
Foreign Common Stocks | 9.3 | |||
Healthcare | 8.9 | |||
Energy | 7.8 | |||
Consumer Discretionary | 7.8 | |||
Utilities | 6.9 | |||
Consumer Staples | 3.8 | |||
Materials & Processing | 2.5 | |||
U.S. Treasury Obligation | — | |||
|
| |||
| 110.5 | ||||
|
| |||
180
Table of Contents
Value Equity Fund (Unaudited)
| Average Annual Total Returns as of 12/31/15 | ||||||||||
Institutional Class* | Investor Class* | Benchmark** | ||||||||
One Year | -3.44% | -3.70% | -3.83% | |||||||
Five Year | 11.39% | 11.10% | 11.27% | |||||||
Ten Year | 5.81% | 5.60% | 6.16% | |||||||
Since Inception | 6.12% | 5.85% | 6.32% | |||||||
Inception Date | 08/27/01 | 08/27/01 | ||||||||
Total Fund Operating Expenses (May 1, 2015 Prospectus, as amended on June 1, 2015)(1) | 0.60% | 0.85% | ||||||||
(1)Current information regarding the Fund’s Operating Expenses can be found in the Financial Highlights.
The performance data quoted represents past performance and does not guarantee future results. Current performance may be lower or higher. Performance data current to the most recent month-end may be obtained at www.GuideStoneFunds.org. The investment return and principal value of an investment will fluctuate so that shares, when redeemed, may be worth more or less than their original cost.
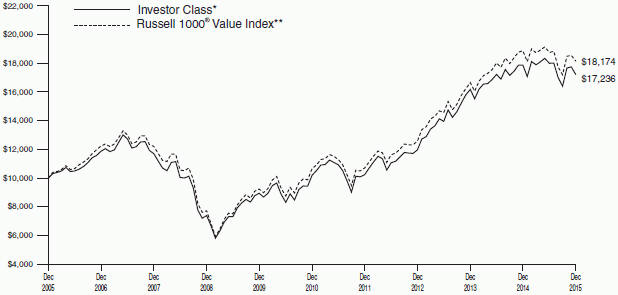
The graph compares the results of a hypothetical $10,000 investment in the Investor Class of the Fund for the 10-year period from December 31, 2005 to December 31, 2015, with all dividends and capital gains reinvested, with the Russell 1000® Value Index.
*These returns reflect expense waivers by the Fund’s investment adviser. Without these waivers, returns would have been lower. Returns shown do not reflect the deduction of taxes that a shareholder would pay on Fund distributions or the redemption of Fund shares.
Unlike a mutual fund, the performance of an index assumes no taxes, transaction costs, management fees or other expenses.
181
Table of Contents
VALUE EQUITY FUND SCHEDULE OF INVESTMENTS | December 31, 2015 |
| Shares | Value | |||||||||
COMMON STOCKS — 87.0% |
| |||||||||
Consumer Discretionary — 7.8% |
| |||||||||
Bed Bath & Beyond, Inc.D* | 36,961 | $ | 1,783,368 | |||||||
Big Lots, Inc.D | 5,047 | 194,511 | ||||||||
Comcast Corporation | 208,962 | 11,791,726 | ||||||||
Cooper Tire & Rubber Co.D | 36,196 | 1,370,019 | ||||||||
Dana Holding CorporationD | 386,495 | 5,333,631 | ||||||||
DISH Network Corporation | 2,256 | 128,998 | ||||||||
eBay, Inc.* | 172,210 | 4,732,331 | ||||||||
Foot Locker, Inc.D | 31,620 | 2,058,146 | ||||||||
Ford Motor Co. | 927,932 | 13,074,562 | ||||||||
Gap, Inc. (The)D | 222,900 | 5,505,630 | ||||||||
General Motors Co. | 116,895 | 3,975,599 | ||||||||
Goodyear Tire & Rubber | 122,105 | 3,989,170 | ||||||||
Home Depot, Inc. (The) | 53,008 | 7,010,308 | ||||||||
J.C. Penney Co., Inc.D* | 670,556 | 4,465,903 | ||||||||
Johnson Controls, Inc. | 260,928 | 10,304,047 | ||||||||
Lear Corporation | 39,735 | 4,880,650 | ||||||||
Lennar Corporation | 156,651 | 7,661,800 | ||||||||
NVR, Inc.* | 500 | 821,500 | ||||||||
Target Corporation | 19,066 | 1,384,382 | ||||||||
Time Warner, Inc. | 13,103 | 847,371 | ||||||||
Twenty-First Century Fox, Inc. | 12,863 | 349,359 | ||||||||
Twenty-First Century Fox, Inc. | 4,956 | 134,952 | ||||||||
Wal-Mart Stores, Inc. | 84,013 | 5,149,997 | ||||||||
|
| |||||||||
| 96,947,960 | ||||||||||
|
| |||||||||
Consumer Staples — 3.8% | ||||||||||
Archer-Daniels-Midland Co. | 20,150 | 739,102 | ||||||||
Cal-Maine Foods, Inc.D | 51,491 | 2,386,093 | ||||||||
Colgate-Palmolive Co. | 3,535 | 235,502 | ||||||||
ConAgra Foods, Inc. | 29,900 | 1,260,584 | ||||||||
CVS Health Corporation | 2,717 | 265,641 | ||||||||
Dr. Pepper Snapple Group, Inc. | 49,530 | 4,616,196 | ||||||||
Ingredion, Inc. | 14,760 | 1,414,598 | ||||||||
Kimberly-Clark CorporationD | 2,403 | 305,902 | ||||||||
Kroger Co. (The) | 115,052 | 4,812,625 | ||||||||
Mondelez International, Inc. | 53,339 | 2,391,721 | ||||||||
Nu Skin Enterprises, Inc. Class AD | 10,847 | 410,993 | ||||||||
PepsiCo, Inc. | 124,615 | 12,451,531 | ||||||||
Procter & Gamble Co. (The) | 88,720 | 7,045,255 | ||||||||
Sysco CorporationD | 146,200 | 5,994,200 | ||||||||
Walgreens Boots Alliance, Inc. | 23,936 | 2,038,270 | ||||||||
Whole Foods Market, Inc.D | 24,160 | 809,360 | ||||||||
|
| |||||||||
| 47,177,573 | ||||||||||
|
| |||||||||
Energy — 7.8% | ||||||||||
Anadarko Petroleum | 16,617 | 807,254 | ||||||||
Apache CorporationD | 12,237 | 544,179 | ||||||||
Baker Hughes, Inc. | 111,703 | 5,155,093 | ||||||||
Chesapeake Energy | 369,179 | 1,661,306 | ||||||||
Chevron Corporation | 183,578 | 16,514,677 | ||||||||
ConocoPhillipsD | 254,737 | 11,893,671 | ||||||||
Devon Energy Corporation | 13,435 | 429,920 | ||||||||
Dril-Quip, Inc.* | 7,559 | 447,720 | ||||||||
EOG Resources, Inc. | 27,496 | 1,946,442 | ||||||||
| Shares | Value | |||||||||
Exxon Mobil CorporationD | 157,469 | $ | 12,274,709 | |||||||
Halliburton Co. | 27,736 | 944,133 | ||||||||
Helmerich & Payne, Inc.D | 11,350 | 607,792 | ||||||||
Hess Corporation | 8,930 | 432,926 | ||||||||
Kinder Morgan, Inc.D | 58,239 | 868,926 | ||||||||
Marathon Oil CorporationD | 80,820 | 1,017,524 | ||||||||
Marathon Petroleum | 122,417 | 6,346,097 | ||||||||
Murphy Oil CorporationD | 61,348 | 1,377,263 | ||||||||
National Oilwell Varco, Inc.D | 19,810 | 663,437 | ||||||||
Occidental Petroleum | 184,450 | 12,470,664 | ||||||||
Oceaneering International, Inc. | 52,023 | 1,951,903 | ||||||||
Oil States International, Inc.* | 82,460 | 2,247,035 | ||||||||
Phillips 66 | 17,670 | 1,445,406 | ||||||||
Spectra Energy CorporationD | 21,736 | 520,360 | ||||||||
Tesoro Corporation | 47,303 | 4,984,317 | ||||||||
Valero Energy Corporation | 103,453 | 7,315,162 | ||||||||
Western Refining, Inc.D | 61,297 | 2,183,399 | ||||||||
|
| |||||||||
| 97,051,315 | ||||||||||
|
| |||||||||
Financial Services — 25.7% |
| |||||||||
Aflac, Inc.D | 30,672 | 1,837,253 | ||||||||
Allstate Corporation (The) | 99,931 | 6,204,716 | ||||||||
Ally Financial, Inc.* | 182,207 | 3,396,338 | ||||||||
American Express Co. | 185,193 | 12,880,173 | ||||||||
American International | 333,865 | 20,689,614 | ||||||||
Ameriprise Financial, Inc. | 72,768 | 7,743,971 | ||||||||
Assurant, Inc. | 25,190 | 2,028,803 | ||||||||
Bank of America Corporation | 1,581,754 | 26,620,920 | ||||||||
Bank of New York Mellon Corporation (The) | 32,598 | 1,343,690 | ||||||||
BB&T CorporationD | 25,422 | 961,206 | ||||||||
Berkshire Hathaway, Inc. | 56,819 | 7,502,381 | ||||||||
BlackRock, Inc. | 2,828 | 962,990 | ||||||||
Capital One Financial | 220,124 | 15,888,550 | ||||||||
CBL & Associates Properties, | 122,924 | 1,520,570 | ||||||||
CBRE Group, Inc. Class A* | 101,256 | 3,501,432 | ||||||||
Corporation (The) | 10,991 | 361,934 | ||||||||
Chubb Corporation (The) | 7,517 | 997,055 | ||||||||
Citigroup, Inc. | 710,131 | 36,749,279 | ||||||||
CME Group, Inc.D | 10,492 | 950,575 | ||||||||
Discover Financial Services | 14,643 | 785,158 | ||||||||
Equity Residential REIT | 11,925 | 972,961 | ||||||||
Franklin Resources, Inc. | 12,639 | 465,368 | ||||||||
Genworth Financial, Inc. | 226,485 | 844,789 | ||||||||
Goldman Sachs | 26,247 | 4,730,497 | ||||||||
Hartford Financial Services | 181,913 | 7,905,939 | ||||||||
Host Hotels & Resorts, Inc. | 63,460 | 973,476 | ||||||||
Huntington Bancshares, Inc.D | 250,220 | 2,767,433 | ||||||||
Intercontinental Exchange, Inc. | 19,705 | 5,049,603 | ||||||||
Jones Lang LaSalle, Inc. | 8,047 | 1,286,393 | ||||||||
JPMorgan Chase & Co. | 706,701 | 46,663,467 | ||||||||
Lincoln National Corporation | 41,880 | 2,104,889 | ||||||||
Mack-Cali Realty Corporation | 23,470 | 548,024 | ||||||||
Marsh & McLennan Cos., Inc. | 6,930 | 384,268 | ||||||||
| 182 | See Notes to Financial Statements. |
Table of Contents
| Shares | Value | |||||||||
MetLife, Inc. | 30,837 | $ | 1,486,652 | |||||||
MGIC Investment Corporation* | 220,208 | 1,944,437 | ||||||||
Moody’s Corporation | 41,970 | 4,211,270 | ||||||||
Morgan Stanley | 50,371 | 1,602,301 | ||||||||
PNC Financial Services | 16,924 | 1,613,026 | ||||||||
Prudential Financial, Inc. | 24,422 | 1,988,195 | ||||||||
Public Storage REIT | 427 | 105,768 | ||||||||
Reinsurance Group of | 11,766 | 1,006,581 | ||||||||
RLJ Lodging Trust REITD | 30,900 | 668,367 | ||||||||
State Street Corporation | 273,061 | 18,120,328 | ||||||||
SunTrust Banks, Inc. | 125,341 | 5,369,608 | ||||||||
Synchrony Financial* | 52,089 | 1,584,034 | ||||||||
T. Rowe Price Group, Inc. | 22,689 | 1,622,037 | ||||||||
Travelers Cos., Inc. (The) | 127,780 | 14,421,251 | ||||||||
U.S. Bancorp | 54,811 | 2,338,785 | ||||||||
Unum Group | 60,120 | 2,001,395 | ||||||||
Voya Financial, Inc. | 125,827 | 4,644,275 | ||||||||
Waddell & Reed Financial, Inc. | 17,777 | 509,489 | ||||||||
Wells Fargo & Co. | 426,477 | 23,183,290 | ||||||||
Zions Bancorporation | 110,000 | 3,003,000 | ||||||||
|
| |||||||||
| 319,047,804 | ||||||||||
|
| |||||||||
Healthcare — 8.9% | ||||||||||
Abbott Laboratories | 48,865 | 2,194,527 | ||||||||
Aetna, Inc. | 8,649 | 935,130 | ||||||||
Amgen, Inc. | 11,680 | 1,896,014 | ||||||||
Anthem, Inc.D | 103,464 | 14,427,020 | ||||||||
Baxalta, Inc. | 6,479 | 252,875 | ||||||||
Baxter International, Inc. | 24,479 | 933,874 | ||||||||
Cardinal Health, Inc. | 56,346 | 5,030,007 | ||||||||
Cigna Corporation | 44,511 | 6,513,295 | ||||||||
Express Scripts Holding Co.* | 3,479 | 304,099 | ||||||||
Gilead Sciences, Inc. | 86,184 | 8,720,959 | ||||||||
HCA Holdings, Inc.* | 9,673 | 654,185 | ||||||||
Humana, Inc. | 333 | 59,444 | ||||||||
Johnson & Johnson | 434,989 | 44,682,070 | ||||||||
Ligand Pharmaceuticals, Inc.D* | 8,623 | 934,906 | ||||||||
McKesson Corporation | 21,860 | 4,311,448 | ||||||||
Owens & Minor, Inc.D | 36,959 | 1,329,785 | ||||||||
Quest Diagnostics, Inc. | 39,100 | 2,781,574 | �� | |||||||
Stryker Corporation | 12,256 | 1,139,073 | ||||||||
Thermo Fisher Scientific, Inc. | 8,692 | 1,232,960 | ||||||||
United Therapeutics | 30,430 | 4,765,642 | ||||||||
UnitedHealth Group, Inc. | 61,884 | 7,280,034 | ||||||||
|
| |||||||||
| 110,378,921 | ||||||||||
|
| |||||||||
Materials & Processing — 2.5% | ||||||||||
Air Products & | ||||||||||
Chemicals, Inc.D | 84,669 | 11,016,284 | ||||||||
Allegheny Technologies, Inc.D | 169,385 | 1,905,581 | ||||||||
CF Industries Holdings, Inc. | 79,250 | 3,234,192 | ||||||||
Chemours Co. (The)D | 3,183 | 17,061 | ||||||||
Domtar CorporationD | 19,579 | 723,444 | ||||||||
Dow Chemical Co. (The)D | 31,920 | 1,643,242 | ||||||||
E.I. du Pont de | 15,915 | 1,059,939 | ||||||||
International Paper Co. | 53,553 | 2,018,948 | ||||||||
Mosaic Co. (The) | 8,685 | 239,619 | ||||||||
Praxair, Inc. | 1,535 | 157,184 | ||||||||
Precision Castparts Corporation | 3,654 | 847,765 | ||||||||
Sealed Air Corporation | 172,534 | 7,695,016 | ||||||||
| Shares | Value | |||||||||
Southern Copper CorporationD | 2,315 | $ | 60,468 | |||||||
|
| |||||||||
| 30,618,743 | ||||||||||
|
| |||||||||
Producer Durables — 11.3% |
| |||||||||
ADT Corporation (The)D | 112,635 | 3,714,702 | ||||||||
Alaska Air Group, Inc.D | 56,420 | 4,542,374 | ||||||||
American Airlines Group, Inc. | 7,342 | 310,934 | ||||||||
Automatic Data | 2,974 | 251,957 | ||||||||
Caterpillar, Inc.D | 16,281 | 1,106,457 | ||||||||
CSX Corporation | 24,020 | 623,319 | ||||||||
Cummins, Inc. | 1,482 | 130,431 | ||||||||
Danaher Corporation | 15,709 | 1,459,052 | ||||||||
Deere & Co.D | 72,873 | 5,558,024 | ||||||||
Delta Air Lines, Inc. | 92,880 | 4,708,087 | ||||||||
Emerson Electric Co. | 187,394 | 8,963,055 | ||||||||
FedEx Corporation | 27,448 | 4,089,477 | ||||||||
General Dynamics Corporation | 76,341 | 10,486,200 | ||||||||
General Electric Co.D | 740,464 | 23,065,449 | ||||||||
Honeywell International, Inc. | 66,900 | 6,928,833 | ||||||||
Huntington Ingalls | 13,862 | 1,758,395 | ||||||||
JetBlue Airways Corporation* | 37,030 | 838,729 | ||||||||
Lockheed Martin Corporation | 2,489 | 540,486 | ||||||||
Norfolk Southern Corporation | 121,001 | 10,235,474 | ||||||||
Northrop Grumman | 34,981 | 6,604,763 | ||||||||
Raytheon Co. | 10,026 | 1,248,538 | ||||||||
Southwest Airlines Co. | 81,108 | 3,492,510 | ||||||||
Spirit AeroSystems Holdings, | 59,470 | 2,977,663 | ||||||||
Stanley Black & Decker, Inc. | 34,600 | 3,692,858 | ||||||||
Terex CorporationD | 191,360 | 3,536,333 | ||||||||
Textron, Inc.D | 230,395 | 9,678,894 | ||||||||
Trinity Industries, Inc. | 44,334 | 1,064,903 | ||||||||
United Continental | 71,900 | 4,119,870 | ||||||||
United Technologies | 142,691 | 13,708,324 | ||||||||
Waste Management, Inc. | 13,683 | 730,262 | ||||||||
|
| |||||||||
| 140,166,353 | ||||||||||
|
| |||||||||
Technology — 12.3% | ||||||||||
Apple, Inc. | 7,627 | 802,818 | ||||||||
Applied Materials, Inc. | 263,520 | 4,919,918 | ||||||||
Aspen Technology, Inc.D* | 24,565 | 927,574 | ||||||||
Avnet, Inc. | 8,690 | 372,280 | ||||||||
Broadcom Corporation | 16,729 | 967,271 | ||||||||
Cisco Systems, Inc. | 483,346 | 13,125,261 | ||||||||
Citrix Systems, Inc.* | 20,392 | 1,542,655 | ||||||||
Corning, Inc.D | 291,774 | 5,333,629 | ||||||||
Cypress Semiconductor | ||||||||||
CorporationD* | 266,200 | 2,611,422 | ||||||||
EMC Corporation | 58,071 | 1,491,263 | ||||||||
Hewlett Packard Enterprise Co. | 59,643 | 906,574 | ||||||||
HP, Inc. | 59,782 | 707,819 | ||||||||
Intel Corporation | 729,633 | 25,135,857 | ||||||||
International Business | 13,206 | 1,817,410 | ||||||||
Jabil Circuit, Inc.D | 97,012 | 2,259,409 | ||||||||
Juniper Networks, Inc. | 66,900 | 1,846,440 | ||||||||
Micron Technology, Inc.* | 32,546 | 460,851 | ||||||||
Microsoft Corporation | 646,009 | 35,840,579 | ||||||||
NetApp, Inc.D | 73,800 | 1,957,914 | ||||||||
Oracle Corporation | 341,844 | 12,487,561 | ||||||||
| See Notes to Financial Statements. | 183 |
Table of Contents
VALUE EQUITY FUND
SCHEDULE OF INVESTMENTS (Continued)
| Shares | Value | |||||||||
QUALCOMM, Inc. | 206,901 | $ | 10,341,947 | |||||||
Symantec Corporation | 219,492 | 4,609,332 | ||||||||
Take-Two Interactive Software, Inc.D* | 81,368 | 2,834,861 | ||||||||
Texas Instruments, Inc. | 165,100 | 9,049,131 | ||||||||
VeriSign, Inc.D* | 46,948 | 4,101,377 | ||||||||
Western Digital Corporation | 80,325 | 4,823,516 | ||||||||
Yahoo!, Inc.* | 30,658 | 1,019,685 | ||||||||
|
| |||||||||
| 152,294,354 | ||||||||||
|
| |||||||||
Utilities — 6.9% | ||||||||||
AES Corporation | 881,095 | 8,432,079 | ||||||||
American Electric Power Co., Inc. | 146,750 | 8,551,123 | ||||||||
AT&T, Inc. | 650,921 | 22,398,192 | ||||||||
Dominion Resources, Inc.D | 18,410 | 1,245,253 | ||||||||
Duke Energy CorporationD | 133,383 | 9,522,212 | ||||||||
Edison International | 62,686 | 3,711,638 | ||||||||
Entergy Corporation | 77,052 | 5,267,275 | ||||||||
Exelon Corporation | 49,642 | 1,378,558 | ||||||||
FirstEnergy Corporation | 13,181 | 418,233 | ||||||||
NextEra Energy, Inc.D | 14,574 | 1,514,093 | ||||||||
NRG Energy, Inc.D | 103,621 | 1,219,619 | ||||||||
PG&E Corporation | 15,716 | 835,934 | ||||||||
Public Service Enterprise Group, Inc. | 78,280 | 3,028,653 | ||||||||
Southern Co. (The) | 29,787 | 1,393,734 | ||||||||
T-Mobile US, Inc.* | 8,861 | 346,642 | ||||||||
Verizon Communications, Inc. | 363,159 | 16,785,209 | ||||||||
|
| |||||||||
| 86,048,447 | ||||||||||
|
| |||||||||
Total Common Stocks | 1,079,731,470 | |||||||||
|
| |||||||||
FOREIGN COMMON STOCKS — 9.3% |
| |||||||||
Bermuda — 0.9% | ||||||||||
Assured Guaranty, Ltd. | 114,001 | 3,013,046 | ||||||||
AXIS Capital Holdings, Ltd. | 13,580 | 763,468 | ||||||||
Bunge, Ltd. | 24,771 | 1,691,364 | ||||||||
Everest Re Group, Ltd. | 13,840 | 2,533,966 | ||||||||
Nabors Industries, Ltd.D | 399,079 | 3,396,162 | ||||||||
|
| |||||||||
| 11,398,006 | ||||||||||
|
| |||||||||
British Virgin Islands — 0.2% |
| |||||||||
Michael Kors Holdings, Ltd.D* | 43,106 | 1,726,826 | ||||||||
|
| |||||||||
Canada — 0.0% | ||||||||||
Thomson Reuters CorporationD | 10,858 | 410,975 | ||||||||
|
| |||||||||
Cayman Islands — 0.2% |
| |||||||||
Herbalife, Ltd.D* | 53,635 | 2,875,909 | ||||||||
|
| |||||||||
Curacao — 0.2% | ||||||||||
Schlumberger, Ltd. | 36,605 | 2,553,199 | ||||||||
|
| |||||||||
France — 1.0% | ||||||||||
Sanofi ADRD | 281,000 | 11,984,650 | ||||||||
|
| |||||||||
Guernsey — 0.1% | ||||||||||
Amdocs, Ltd. | 25,920 | 1,414,454 | ||||||||
|
| |||||||||
Ireland — 3.1% | ||||||||||
CRH PLC ADR | 360,400 | 10,386,728 | ||||||||
Eaton Corporation PLCD | 15,313 | 796,889 | ||||||||
Medtronic PLC | 253,277 | 19,482,067 | ||||||||
Pentair PLCD | 66,664 | 3,301,868 | ||||||||
Tyco International PLC | 148,270 | 4,728,330 | ||||||||
|
| |||||||||
| 38,695,882 | ||||||||||
|
| |||||||||
| Shares | Value | |||||||||
Netherlands — 0.4% |
| |||||||||
AerCap Holdings NV* | 43,945 | $ | 1,896,666 | |||||||
LyondellBasell Industries NV | 39,364 | 3,420,732 | ||||||||
Mylan NVD* | 2,026 | 109,546 | ||||||||
|
| |||||||||
| 5,426,944 | ||||||||||
|
| |||||||||
Panama — 0.1% | ||||||||||
Carnival CorporationD | 13,836 | 753,785 | ||||||||
|
| |||||||||
Singapore — 0.2% | ||||||||||
Flextronics International, Ltd.* | 217,610 | 2,439,408 | ||||||||
|
| |||||||||
Switzerland — 0.2% |
| |||||||||
ACE, Ltd.D | 10,705 | 1,250,879 | ||||||||
Transocean, Ltd.D | 79,116 | 979,456 | ||||||||
|
| |||||||||
| 2,230,335 | ||||||||||
|
| |||||||||
United Kingdom — 2.7% |
| |||||||||
BP PLC ADRD | 344,700 | 10,775,322 | ||||||||
Ensco PLC Class AD | 303,517 | 4,671,127 | ||||||||
GlaxoSmithKline PLC ADRD | 249,000 | 10,047,150 | ||||||||
Noble Corporation PLCD | 365,584 | 3,856,911 | ||||||||
Rowan Cos. PLC Class AD | 243,606 | 4,129,122 | ||||||||
|
| |||||||||
| 33,479,632 | ||||||||||
|
| |||||||||
Total Foreign Common Stocks |
| 115,390,005 | ||||||||
|
| |||||||||
MONEY MARKET FUNDS — 14.2% |
| |||||||||
GuideStone Money | 40,813,334 | 40,813,334 | ||||||||
Northern Institutional Liquid | 135,055,536 | 135,055,536 | ||||||||
|
| |||||||||
Total Money Market Funds |
| 175,868,870 | ||||||||
|
| |||||||||
| Par | ||||||||||
U.S. TREASURY OBLIGATION — 0.0% |
| |||||||||
U.S. Treasury Bill 0.05%, 03/31/16‡‡ (Cost $649,923) | $ | 650,000 | 649,737 | |||||||
|
| |||||||||
TOTAL INVESTMENTS — 110.5% | 1,371,640,082 | |||||||||
Liabilities in Excess of Other |
| (129,992,033 | ) | |||||||
|
| |||||||||
Net Assets — 100.0% |
| $ | 1,241,648,049 | |||||||
|
| |||||||||
| 184 | See Notes to Financial Statements. |
Table of Contents
VALUATION HIERARCHY
The following is a summary of the inputs used, as of December 31, 2015, in valuing the Fund’s investments carried at fair value:
| Total Value | Level 1 Quoted Prices | Level 2 Other Significant Observable Inputs | Level 3 Significant Unobservable Inputs | |||||||||||||
Assets: | ||||||||||||||||
Investments in Securities: | ||||||||||||||||
Common Stocks | $ | 1,079,731,470 | $ | 1,079,731,470 | $ | — | $ | — | ||||||||
Foreign Common Stocks | 115,390,005 | 115,390,005 | — | — | ||||||||||||
Money Market Funds | 175,868,870 | 175,868,870 | — | — | ||||||||||||
U.S. Treasury Obligation | 649,737 | — | 649,737 | — | ||||||||||||
|
|
|
|
|
|
|
| |||||||||
Total Assets - Investments in Securities | $ | 1,371,640,082 | $ | 1,370,990,345 | $ | 649,737 | $ | — | ||||||||
|
|
|
|
|
|
|
| |||||||||
Liabilities: | ||||||||||||||||
Other Financial Instruments*** | ||||||||||||||||
Futures Contracts | $ | (94,897 | ) | $ | (94,897 | ) | $ | — | $ | — | ||||||
|
|
|
|
|
|
|
| |||||||||
Total Liabilities - Other Financial Instruments | $ | (94,897 | ) | $ | (94,897 | ) | $ | — | $ | — | ||||||
|
|
|
|
|
|
|
| |||||||||
***Other financial instruments are derivative instruments not reflected in the Schedule of Investments, such as futures, forwards and swap contracts, which are valued at the unrealized appreciation (depreciation) on the investment. Details of these investments can be found in the Notes to Financial Statements.
There were no transfers between Level 1 and Level 2 during the year ended December 31, 2015.
| See Notes to Financial Statements. | 185 |
Table of Contents
Growth Equity Fund (Unaudited)
The Fund invested in a diversified portfolio of large- and medium-sized U.S. companies whose stocks were considered to have above average potential for growth in revenue and earnings. The Investor Class of the Fund slightly underperformed its benchmark, the Russell 1000® Growth Index, for the one-year period ended December 31, 2015 (5.44% versus 5.67%). Overweight exposure within the energy sector and security selection within the consumer staples and health care sectors detracted from benchmark-relative returns, while security selection within the consumer discretionary and technology sectors contributed to benchmark-relative performance during the year.
In 2015, derivative positions, exchange listed equity index futures contracts, were utilized to provide market exposure to the cash positions held in the Fund. Overall, derivative exposure had a slight negative impact on Fund performance for the year.
This Fund may be suitable for investors who seek high, long-term rates of return, can accept significant short-term fluctuations in account value, want to invest in growth-oriented stocks and would like to diversify their portfolio by adding a potentially higher return, higher risk option of stocks. The Fund will not concentrate in any particular industry, but at times, it may be heavily invested in a particular economic sector. This may result in greater short-term price volatility. It is possible to lose money by investing in the Fund.
At December 31, 2015, the portfolio holdings of the Fund, as a percentage of total investments, is shown in the following table. Portfolio holdings are subject to risk and may change at any time.
| % | ||||
Technology | 29.3 | |||
Money Market Funds | 22.6 | |||
Consumer Discretionary | 15.7 | |||
Financial Services | 15.2 | |||
Healthcare | 14.4 | |||
Foreign Common Stocks | 10.4 | |||
Consumer Staples | 4.8 | |||
Producer Durables | 3.9 | |||
Materials & Processing | 1.9 | |||
Energy | 0.7 | |||
|
| |||
| 118.9 | ||||
|
| |||
186
Table of Contents
Growth Equity Fund (Unaudited)
| Average Annual Total Returns as of 12/31/15 | ||||||||||
Institutional Class* | Investor Class* | Benchmark** | ||||||||
One Year | 5.67% | 5.44% | 5.67% | |||||||
Five Year | 12.71% | 12.49% | 13.53% | |||||||
Ten Year | 6.95% | 6.80% | 8.53% | |||||||
Since Inception | 5.62% | 5.47% | 6.08% | |||||||
Inception Date | 08/27/01 | 08/27/01 | ||||||||
Total Fund Operating Expenses (May 1, 2015 Prospectus, as amended on June 1, 2015)(1) | 0.77% | 1.02% | ||||||||
(1)Current information regarding the Fund’s Operating Expenses can be found in the Financial Highlights.
The performance data quoted represents past performance and does not guarantee future results. Current performance may be lower or higher. Performance data current to the most recent month-end may be obtained at www.GuideStoneFunds.org. The investment return and principal value of an investment will fluctuate so that shares, when redeemed, may be worth more or less than their original cost.
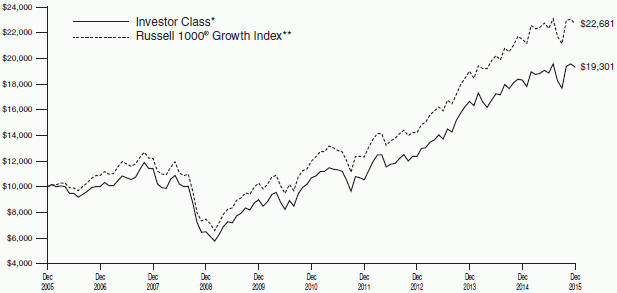
The graph compares the results of a hypothetical $10,000 investment in the Investor Class of the Fund for the 10-year period from December 31, 2005 to December 31, 2015, with all dividends and capital gains reinvested, with the Russell 1000® Growth Index.
*These returns reflect expense waivers by the Fund’s investment adviser. Without these waivers, returns would have been lower. Returns shown do not reflect the deduction of taxes that a shareholder would pay on Fund distributions or the redemption of Fund shares.
Unlike a mutual fund, the performance of an index assumes no taxes, transaction costs, management fees or other expenses.
187
Table of Contents
GROWTH EQUITY FUND SCHEDULE OF INVESTMENTS | December 31, 2015 |
| Shares | Value | |||||||||
COMMON STOCKS — 85.9% |
| |||||||||
Consumer Discretionary — 15.7% |
| |||||||||
Amazon.com, Inc.* | 82,519 | $ | 55,773,767 | |||||||
Chipotle Mexican Grill, Inc.* | 19,387 | 9,302,852 | ||||||||
Costco Wholesale Corporation | 69,993 | 11,303,869 | ||||||||
Discovery Communications, Inc. Class AD* | 89,904 | 2,398,639 | ||||||||
Discovery Communications, Inc. Class C* | 166,041 | 4,187,554 | ||||||||
eBay, Inc.* | 432,291 | 11,879,357 | ||||||||
Estee Lauder Cos., Inc. (The) Class AD | 131,226 | 11,555,762 | ||||||||
L Brands, Inc. | 111,912 | 10,723,408 | ||||||||
Liberty Interactive Corporation QVC Group Class A* | 583,383 | 15,938,024 | ||||||||
Lowe’s Cos., Inc. | 76,338 | 5,804,741 | ||||||||
Netflix, Inc.* | 92,129 | 10,537,715 | ||||||||
NIKE, Inc. Class B | 23,584 | 1,474,000 | ||||||||
Priceline Group, Inc. (The)* | 10,992 | 14,014,250 | ||||||||
Starbucks Corporation | 232,618 | 13,964,058 | ||||||||
TripAdvisor, Inc.D* | 264,039 | 22,509,325 | ||||||||
Under Armour, Inc. Class AD* | 159,274 | 12,839,077 | ||||||||
Yum! Brands, Inc. | 111,291 | 8,129,808 | ||||||||
|
| |||||||||
| 222,336,206 | ||||||||||
|
| |||||||||
Consumer Staples — 4.8% |
| |||||||||
Coca-Cola Co. (The) | 304,788 | 13,093,692 | ||||||||
Mead Johnson Nutrition Co. | 122,726 | 9,689,218 | ||||||||
Monster Beverage Corporation* | 109,787 | 16,353,872 | ||||||||
Procter & Gamble Co. (The) | 153,588 | 12,196,423 | ||||||||
Walgreens Boots Alliance, Inc. | 188,188 | 16,025,149 | ||||||||
|
| |||||||||
| 67,358,354 | ||||||||||
|
| |||||||||
Energy — 0.7% |
| |||||||||
FMC Technologies, Inc.* | 342,648 | 9,940,218 | ||||||||
|
| |||||||||
Financial Services — 15.2% |
| |||||||||
American Express Co. | 56,926 | 3,959,203 | ||||||||
Charles Schwab Corporation (The) | 653,674 | 21,525,485 | ||||||||
Crown Castle International Corporation REIT | 180,145 | 15,573,535 | ||||||||
Equinix, Inc. REITD | 51,851 | 15,679,742 | ||||||||
FactSet Research Systems, Inc. | 43,959 | 7,146,415 | ||||||||
FleetCor Technologies, Inc.* | 51,341 | 7,338,169 | ||||||||
Greenhill & Co., Inc.D | 31,706 | 907,109 | ||||||||
Intercontinental Exchange, Inc. | 46,484 | 11,911,990 | ||||||||
LendingClub CorporationD* | 536,185 | 5,924,844 | ||||||||
MasterCard, Inc. Class A | 154,955 | 15,086,419 | ||||||||
PayPal Holdings, Inc.* | 361,732 | 13,094,699 | ||||||||
SEI Investments Co. | 226,593 | 11,873,473 | ||||||||
Visa, Inc. Class AD | 1,106,467 | 85,806,516 | ||||||||
|
| |||||||||
| 215,827,599 | ||||||||||
|
| |||||||||
Healthcare — 14.4% | ||||||||||
Alexion Pharmaceuticals, Inc.* | 117,818 | 22,473,784 | ||||||||
Amgen, Inc. | 53,571 | 8,696,181 | ||||||||
athenahealth, Inc.D* | 50,463 | 8,123,029 | ||||||||
Biogen, Inc.* | 70,616 | 21,633,212 | ||||||||
BioMarin Pharmaceutical, Inc.* | 103,416 | 10,833,860 | ||||||||
Bristol-Myers Squibb Co. | 163,950 | 11,278,121 | ||||||||
Celgene Corporation* | 169,607 | 20,312,134 | ||||||||
Cerner CorporationD* | 210,537 | 12,668,011 | ||||||||
DaVita HealthCare | ||||||||||
Partners, Inc.* | 97,140 | 6,771,629 | ||||||||
| Shares | Value | |||||||||
DENTSPLY International, Inc.D | 64,576 | $ | 3,929,450 | |||||||
Edwards Lifesciences Corporation* | 92,130 | 7,276,427 | ||||||||
Express Scripts Holding Co.* | 139,954 | 12,233,379 | ||||||||
Illumina, Inc.D* | 55,657 | 10,683,083 | ||||||||
Incyte Corporation* | 54,800 | 5,943,060 | ||||||||
Intuitive Surgical, Inc.* | 20,571 | 11,235,057 | ||||||||
Regeneron Pharmaceuticals, Inc.* | 33,300 | 18,077,571 | ||||||||
Sirona Dental Systems, Inc.D* | 35,205 | 3,857,412 | ||||||||
Varian Medical Systems, Inc.* | 105,289 | 8,507,351 | ||||||||
|
| |||||||||
| 204,532,751 | ||||||||||
|
| |||||||||
Materials & Processing — 1.9% |
| |||||||||
Ecolab, Inc. | 87,968 | 10,061,780 | ||||||||
Fastenal Co.D | 169,400 | 6,914,908 | ||||||||
Monsanto Co. | 101,125 | 9,962,835 | ||||||||
|
| |||||||||
| 26,939,523 | ||||||||||
|
| |||||||||
Producer Durables — 3.9% | ||||||||||
Automatic Data | ||||||||||
Processing, Inc. | 39,454 | 3,342,543 | ||||||||
Colfax CorporationD* | 44,303 | 1,034,475 | ||||||||
Danaher Corporation | 126,215 | 11,722,849 | ||||||||
Expeditors International of Washington, Inc.D | 236,154 | 10,650,545 | ||||||||
National Instruments Corporation | 156,518 | 4,490,502 | ||||||||
Stericycle, Inc.* | 90,505 | 10,914,903 | ||||||||
United Parcel Service, Inc. Class B | 99,618 | 9,586,240 | ||||||||
Wabtec CorporationD | 51,635 | 3,672,281 | ||||||||
|
| |||||||||
| 55,414,338 | ||||||||||
|
| |||||||||
Technology — 29.3% | ||||||||||
Adobe Systems, Inc.* | 158,481 | 14,887,705 | ||||||||
Akamai Technologies, Inc.* | 121,078 | 6,372,335 | ||||||||
Alphabet, Inc. Class A* | 64,649 | 50,297,568 | ||||||||
Alphabet, Inc. Class C* | 48,617 | 36,894,469 | ||||||||
Amphenol Corporation Class A | 181,336 | 9,471,179 | ||||||||
Analog Devices, Inc. | 26,312 | 1,455,580 | ||||||||
ANSYS, Inc.D* | 67,186 | 6,214,705 | ||||||||
Apple, Inc. | 79,748 | 8,394,274 | ||||||||
Autodesk, Inc.* | 167,962 | 10,233,925 | ||||||||
Cisco Systems, Inc. | 601,140 | 16,323,957 | ||||||||
Cognizant Technology Solutions Corporation Class A* | 149,766 | 8,988,955 | ||||||||
Electronic Arts, Inc.* | 197,745 | 13,589,036 | ||||||||
Facebook, Inc. Class A* | 703,125 | 73,589,063 | ||||||||
Intuit, Inc. | 71,048 | 6,856,132 | ||||||||
LinkedIn Corporation | 77,641 | 17,475,436 | ||||||||
Microsoft Corporation | 463,023 | 25,688,516 | ||||||||
NetSuite, Inc.D* | 64,262 | 5,437,850 | ||||||||
Oracle Corporation | 417,154 | 15,238,636 | ||||||||
Palo Alto Networks, Inc.* | 43,267 | 7,621,049 | ||||||||
QUALCOMM, Inc. | 604,699 | 30,225,880 | ||||||||
Rovi Corporation* | 7 | 117 | ||||||||
salesforce.com, Inc.* | 486,324 | 38,127,802 | ||||||||
Splunk, Inc.D* | 154,183 | 9,067,502 | ||||||||
Yelp, Inc.D* | 63,976 | 1,842,509 | ||||||||
|
| |||||||||
| 414,294,180 | ||||||||||
|
| |||||||||
Total Common Stocks | 1,216,643,169 | |||||||||
|
| |||||||||
| 188 | See Notes to Financial Statements. |
Table of Contents
| Shares | Value | |||||||||
FOREIGN COMMON STOCKS — 10.4% |
| |||||||||
Bermuda — 0.6% | ||||||||||
Genpact, Ltd.* | 320,483 | $ | 8,005,665 | |||||||
|
| |||||||||
Canada — 0.8% | ||||||||||
Valeant Pharmaceuticals International, Inc.* | 114,256 | 11,614,123 | ||||||||
|
| |||||||||
China — 4.6% | ||||||||||
Alibaba Group Holding, Ltd. ADRD* | 425,012 | 34,540,725 | ||||||||
Baidu, Inc. ADRD* | 159,653 | 30,180,803 | ||||||||
|
| |||||||||
| 64,721,528 | ||||||||||
|
| |||||||||
Curacao — 1.1% | ||||||||||
Schlumberger, Ltd. | 219,356 | 15,300,081 | ||||||||
|
| |||||||||
France — 0.9% | ||||||||||
Danone SA ADR | 983,031 | 13,379,052 | ||||||||
|
| |||||||||
Netherlands — 1.1% | ||||||||||
Mobileye NVD* | 154,581 | 6,535,685 | ||||||||
NXP Semiconductor NV* | 110,730 | 9,329,002 | ||||||||
|
| |||||||||
| 15,864,687 | ||||||||||
|
| |||||||||
Switzerland — 0.7% | ||||||||||
Novartis AG ADRD | 113,540 | 9,768,982 | ||||||||
|
| |||||||||
United Kingdom — 0.6% | ||||||||||
ARM Holdings PLC ADRD | 173,000 | 7,826,520 | ||||||||
Nielsen Holdings PLC | 17,690 | 824,354 | ||||||||
|
| |||||||||
| 8,650,874 | ||||||||||
|
| |||||||||
Total Foreign Common Stocks | 147,304,992 | |||||||||
|
| |||||||||
| Shares | Value | |||||||||
MONEY MARKET FUNDS — 22.6% |
| |||||||||
GuideStone Money Market Fund (Investor Class)¥ | 50,737,188 | $ | 50,737,188 | |||||||
Northern Institutional Liquid Assets Portfolio§ | 268,680,558 | 268,680,558 | ||||||||
|
| |||||||||
Total Money Market Funds |
| 319,417,746 | ||||||||
|
| |||||||||
TOTAL INVESTMENTS — 118.9% |
| 1,683,365,907 | ||||||||
Liabilities in Excess of Other |
| (267,749,364 | ) | |||||||
|
| |||||||||
NET ASSETS — 100.0% |
| $ | 1,415,616,543 | |||||||
|
| |||||||||
| See Notes to Financial Statements. | 189 |
Table of Contents
GROWTH EQUITY FUND
SCHEDULE OF INVESTMENTS (Continued)
VALUATION HIERARCHY
The following is a summary of the inputs used, as of December 31, 2015, in valuing the Fund’s investments carried at fair value:
| Total Value | Level 1 Quoted Prices | Level 2 Other Significant Observable Inputs | Level 3 Significant Unobservable Inputs | |||||||||||||||||
Assets: | ||||||||||||||||||||
Investments in Securities: | ||||||||||||||||||||
Common Stocks | $ | 1,216,643,169 | $ | 1,216,643,169 | $ | — | $ | — | ||||||||||||
Foreign Common Stocks | 147,304,992 | 147,304,992 | — | — | ||||||||||||||||
Money Market Funds | 319,417,746 | 319,417,746 | — | — | ||||||||||||||||
|
|
|
|
|
|
|
| |||||||||||||
Total Assets - Investments in Securities | $ | 1,683,365,907 | $ | 1,683,365,907 | $ | — | $ | — | ||||||||||||
|
|
|
|
|
|
|
| |||||||||||||
Liabilities: | ||||||||||||||||||||
Other Financial Instruments*** | ||||||||||||||||||||
Futures Contracts | $ | (144,600 | ) | $ | (144,600 | ) | $ | — | $ | — | ||||||||||
|
|
|
|
|
|
|
| |||||||||||||
Total Liabilities - Other Financial Instruments | $ | (144,600 | ) | $ | (144,600 | ) | $ | — | $ | — | ||||||||||
|
|
|
|
|
|
|
| |||||||||||||
***Other financial instruments are derivative instruments not reflected in the Schedule of Investments, such as futures, forwards and swap contracts, which are valued at the unrealized appreciation (depreciation) on the investment. Details of these investments can be found in the Notes to Financial Statements.
There were no transfers between Level 1 and Level 2 during the year ended December 31, 2015.
| 190 | See Notes to Financial Statements. |
Table of Contents
Small Cap Equity Fund (Unaudited)
The Fund was comprised of domestic, small-cap stocks with both value- and growth-style orientations. The Investor Class of the Fund underperformed its benchmark, the Russell 2000® Index, for the one-year period ended December 31, 2015 (-5.91% versus -4.41%). Security selection within the materials & processing sector as well as underweight exposure and security selection to the health care sector detracted from benchmark-relative returns, while security selection within the consumer discretionary and energy sectors contributed to benchmark-relative performance during the year.
In 2015, derivative positions, exchange listed equity index futures contracts, were utilized to provide market exposure to the cash positions held in the Fund. Overall, derivative exposure had a slight positive impact on Fund performance for the year.
This Fund may be suitable for investors who seek higher, long-term rates of return, can accept significant short-term fluctuations in account value, want to invest in stocks of small- to medium-sized U.S. companies and would like to diversify their portfolio by adding a potentially higher return, higher risk option of stocks. Small company stocks are subject to greater risk than large company stocks due to more volatility and less liquidity. It is possible to lose money by investing in the Fund.
At December 31, 2015, the portfolio holdings of the Fund, as a percentage of total investments, is shown in the following table. Portfolio holdings are subject to risk and may change at any time.
| % | ||||
Money Market Funds | 39.6 | |||
Financial Services | 19.1 | |||
Producer Durables | 17.2 | |||
Technology | 13.3 | |||
Consumer Discretionary | 12.9 | |||
Healthcare | 10.7 | |||
Foreign Common Stocks | 8.3 | |||
Materials & Processing | 5.9 | |||
Utilities | 4.6 | |||
Energy | 2.2 | |||
Consumer Staples | 1.5 | |||
Foreign Bond | — | ** | ||
Corporate Bonds | — | ** | ||
Rights/Warrants | — | ** | ||
|
| |||
| 135.3 | ||||
|
| |||
| ** | Rounds to less than 0.005% |
191
Table of Contents
Small Cap Equity Fund (Unaudited)
| Average Annual Total Returns as of 12/31/15 | ||||||||||||
| Institutional Class* | Investor Class* | Benchmark** | |||||||||
One Year | -5.66% | -5.91% | -4.41% | |||||||||
Five Year | 9.68% | 9.45% | 9.19% | |||||||||
Ten Year | 6.29% | 6.10% | 6.80% | |||||||||
Since Inception | 6.87% | 6.69% | 7.59% | |||||||||
Inception Date | 08/27/01 | 08/27/01 | ||||||||||
Total Fund Operating Expenses (May 1, 2015 Prospectus, as amended on June 1, 2015)(1) | 1.04% | 1.30% | ||||||||||
(1)Current information regarding the Fund’s Operating Expenses can be found in the Financial Highlights.
The performance data quoted represents past performance and does not guarantee future results. Current performance may be lower or higher. Performance data current to the most recent month-end may be obtained at www.GuideStoneFunds.org. The investment return and principal value of an investment will fluctuate so that shares, when redeemed, may be worth more or less than their original cost.
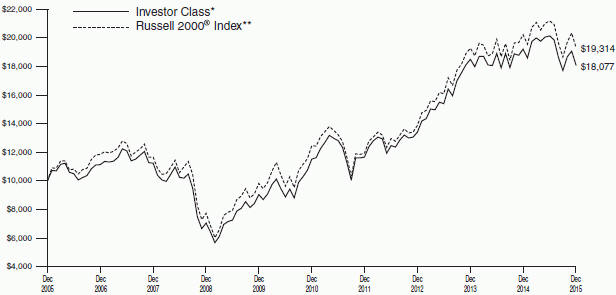
The graph compares the results of a hypothetical $10,000 investment in the Investor Class of the Fund for the 10-year period from December 31, 2005 to December 31, 2015, with all dividends and capital gains reinvested, with the Russell 2000® Index.
*These returns reflect expense waivers by the Fund’s investment adviser. Without these waivers, returns would have been lower. Returns shown do not reflect the deduction of taxes that a shareholder would pay on Fund distributions or the redemption of Fund shares.
Unlike a mutual fund, the performance of an index assumes no taxes, transaction costs, management fees or other expenses.
192
Table of Contents
SMALL CAP EQUITY FUND SCHEDULE OF INVESTMENTS | December 31, 2015 |
| Shares | Value | |||||||||
COMMON STOCKS — 87.4% | ||||||||||
Consumer Discretionary — 12.9% | ||||||||||
2U, Inc.D* | 64,666 | $ | 1,809,355 | |||||||
Aaron’s, Inc. | 43,342 | 970,427 | ||||||||
AMC Networks, Inc. Class AD* | 9,000 | 672,120 | ||||||||
American Axle & Manufacturing Holdings, Inc.D* | 30,514 | 577,935 | ||||||||
American Eagle Outfitters, Inc.D | 67,100 | 1,040,050 | ||||||||
Avon Products, Inc.D | 61,889 | 250,650 | ||||||||
Big Lots, Inc.D | 31,456 | 1,212,314 | ||||||||
Bravo Brio Restaurant Group, Inc.* | 40,167 | 361,503 | ||||||||
Bright Horizons Family Solutions, Inc.* | 41,000 | 2,738,800 | ||||||||
Brinker International, Inc.D | 5,000 | 239,750 | ||||||||
Burlington Stores, Inc.* | 47,800 | 2,050,620 | ||||||||
Cable One, Inc.D | 3,510 | 1,522,147 | ||||||||
CalAtlantic Group, Inc.D | 19,386 | 735,117 | ||||||||
Cavco Industries, Inc.* | 3,830 | 319,077 | ||||||||
Children’s Place, Inc. (The)D | 2,960 | 163,392 | ||||||||
Chuy’s Holdings, Inc.D* | 9,900 | 310,266 | ||||||||
Columbia Sportswear Co.D | 9,600 | 468,096 | ||||||||
Cooper Tire & Rubber Co. | 52,600 | 1,990,910 | ||||||||
Dana Holding Corporation | 26,800 | 369,840 | ||||||||
Dave & Buster’s Entertainment, Inc.* | 18,700 | 780,538 | ||||||||
Deckers Outdoor Corporation* | 5,895 | 278,244 | ||||||||
Destination Maternity CorporationD | 32,000 | 279,040 | ||||||||
Destination XL Group, Inc.D* | 330,288 | 1,823,190 | ||||||||
Drew Industries, Inc.* | 31,110 | 1,894,288 | ||||||||
Express, Inc.D* | 110,622 | 1,911,548 | ||||||||
Five Below, Inc.D* | 18,500 | 593,850 | ||||||||
Fox Factory Holding CorporationD* | 80,410 | 1,329,177 | ||||||||
Francesca’s Holdings Corporation* | 7,971 | 138,775 | ||||||||
Genesco, Inc.D* | 12,400 | 704,692 | ||||||||
G-III Apparel Group, Ltd.* | 43,944 | 1,944,961 | ||||||||
Goodyear Tire & Rubber Co. (The) | 27,767 | 907,148 | ||||||||
Grand Canyon Education, Inc.D* | 53,920 | 2,163,270 | ||||||||
Gray Television, Inc.* | 22,200 | 361,860 | ||||||||
Inter Parfums, Inc. | 29,400 | 700,308 | ||||||||
Kona Grill, Inc.D* | 46,890 | 743,675 | ||||||||
Lear Corporation | 13,436 | 1,650,344 | ||||||||
Libbey, Inc. | 109,906 | 2,343,196 | ||||||||
Lithia Motors, Inc. Class AD | 11,000 | 1,173,370 | ||||||||
Malibu Boats, Inc. Class A* | 62,755 | 1,027,299 | ||||||||
Mattress Firm Holding CorporationD* | 27,800 | 1,240,714 | ||||||||
Meritor, Inc.* | 92,790 | 774,797 | ||||||||
Monro Muffler Brake, Inc.D | 30,950 | 2,049,509 | ||||||||
Movado Group, Inc.D | 19,750 | 507,773 | ||||||||
MSG Networks, Inc. Class A* | 15,492 | 322,234 | ||||||||
Nutrisystem, Inc.D | 15,200 | 328,928 | ||||||||
NVR, Inc.* | 1,000 | 1,643,000 | ||||||||
Ollie’s Bargain Outlet Holdings, Inc.D* | 61,500 | 1,046,115 | ||||||||
Oxford Industries, Inc. | 10,400 | 663,728 | ||||||||
Pier 1 Imports, Inc.D | 42,210 | 214,849 | ||||||||
Shutterfly, Inc.D* | 3,777 | 168,303 | ||||||||
Smith & Wesson Holding Corporation* | 114,466 | 2,515,963 | ||||||||
| Shares | Value | |||||||||
Sotheby’sD | 24,300 | $ | 625,968 | |||||||
Steven Madden, Ltd.D* | 32,570 | 984,265 | ||||||||
Tower International, Inc. | 59,440 | 1,698,201 | ||||||||
Universal Electronics, Inc.* | 82,884 | 4,256,093 | ||||||||
Vail Resorts, Inc.D | 3,800 | 486,362 | ||||||||
Visteon Corporation* | 8,300 | 950,350 | ||||||||
VOXX International CorporationD* | 71,129 | 374,139 | ||||||||
William Lyon Homes Class AD* | 56,300 | 928,950 | ||||||||
ZAGG, Inc.D* | 171,053 | 1,871,320 | ||||||||
Zoe’s Kitchen, Inc.D* | 11,909 | 333,214 | ||||||||
|
| |||||||||
| 64,535,917 | ||||||||||
|
| |||||||||
Consumer Staples — 1.5% | ||||||||||
Andersons, Inc. (The)D | 28,100 | 888,803 | ||||||||
Blue Buffalo Pet Products, Inc.D* | 12,400 | 232,004 | ||||||||
Dean Foods Co.D | 116,872 | 2,004,355 | ||||||||
Diplomat Pharmacy, Inc.D* | 10,435 | 357,086 | ||||||||
Ingredion, Inc. | 1,084 | 103,891 | ||||||||
Medifast, Inc.D | 12,700 | 385,826 | ||||||||
Omega Protein CorporationD* | 90,077 | 1,999,709 | ||||||||
Sanderson Farms, Inc.D | 2,110 | 163,567 | ||||||||
United Natural Foods, Inc.D* | 34,700 | 1,365,792 | ||||||||
|
| |||||||||
| 7,501,033 | ||||||||||
|
| |||||||||
Energy — 2.2% | ||||||||||
American Standard Energy Corporation@* | 8,702 | 10 | ||||||||
Atwood Oceanics, Inc.D | 124,888 | 1,277,604 | ||||||||
CARBO Ceramics, Inc.D | 57,700 | 992,440 | ||||||||
Diamondback Energy, Inc.D* | 4,800 | 321,120 | ||||||||
Gulfport Energy Corporation* | 46,180 | 1,134,643 | ||||||||
Hornbeck Offshore Services, Inc.D* | 29,150 | 289,751 | ||||||||
Matador Resources Co.D* | 37,300 | 737,421 | ||||||||
Oil States International, Inc.* | 17,700 | 482,325 | ||||||||
PBF Energy, Inc. Class AD | 43,875 | 1,615,039 | ||||||||
PDC Energy, Inc.D* | 15,100 | 806,038 | ||||||||
REX American Resources CorporationD* | 5,790 | 313,065 | ||||||||
Ring Energy, Inc.D* | 145,489 | 1,025,698 | ||||||||
RSP Permian, Inc.D* | 39,470 | 962,673 | ||||||||
Southwestern Energy Co.D* | 19,000 | 135,090 | ||||||||
Stone Energy CorporationD* | 96,500 | 413,985 | ||||||||
Synergy Resources CorporationD* | 67,010 | 570,925 | ||||||||
|
| |||||||||
| 11,077,827 | ||||||||||
|
| |||||||||
Financial Services — 19.1% | ||||||||||
American Equity Investment Life Holding Co.D | 10,600 | 254,718 | ||||||||
AMERISAFE, Inc. | 74,665 | 3,800,449 | ||||||||
AmTrust Financial Services, Inc.D | 37,160 | 2,288,313 | ||||||||
Armada Hoffler Properties, Inc. REITD | 97,181 | 1,018,457 | ||||||||
Ashford Hospitality Prime, Inc. REIT | 28,387 | 411,612 | ||||||||
Ashford Hospitality Trust, Inc. REIT | 317,867 | 2,005,741 | ||||||||
Assurant, Inc. | 19,431 | 1,564,973 | ||||||||
Banc of California, Inc. | 50,771 | 742,272 | ||||||||
BancFirst CorporationD | 6,110 | 358,168 | ||||||||
Bancorp, Inc. (The)D* | 115,500 | 735,735 | ||||||||
Bank of the Ozarks, Inc.D | 10,800 | 534,168 | ||||||||
| See Notes to Financial Statements. | 193 |
Table of Contents
SMALL CAP EQUITY FUND
SCHEDULE OF INVESTMENTS (Continued)
| Shares | Value | |||||||||
Berkshire Hills Bancorp, Inc. | 44,610 | $ | 1,298,597 | |||||||
Blackhawk Network Holdings, Inc.* | 43,100 | 1,905,451 | ||||||||
BlackRock Capital Investment Corporation | 57,213 | 537,802 | ||||||||
Bofl Holding, Inc.D* | 74,000 | 1,557,700 | ||||||||
Cardinal Financial Corporation | 17,911 | 407,475 | ||||||||
Cardtronics, Inc.D* | 32,300 | 1,086,895 | ||||||||
Cash America International, Inc.D | 67,478 | 2,020,966 | ||||||||
Cathay General BancorpD | 23,500 | 736,255 | ||||||||
CBL & Associates Properties, Inc. REIT | 140,510 | 1,738,109 | ||||||||
Chemical Financial Corporation | 37,331 | 1,279,333 | ||||||||
Community Bank System, Inc.D | 20,030 | 799,998 | ||||||||
Compass Diversified Holdings | 213,585 | 3,393,866 | ||||||||
CoreSite Realty Corporation REITD | 19,783 | 1,122,092 | ||||||||
Customers Bancorp, Inc.* | 21,331 | 580,630 | ||||||||
Encore Capital Group, Inc.D* | 10,290 | 299,233 | ||||||||
Enterprise Financial Services Corporation | 15,749 | 446,484 | ||||||||
EverBank Financial Corporation | 34,250 | 547,315 | ||||||||
Fair Isaac Corporation | 7,700 | 725,186 | ||||||||
FBL Financial Group, Inc. Class AD | 10,400 | 661,856 | ||||||||
FBR & Co. | 16,480 | 327,952 | ||||||||
Federal Agricultural Mortgage Corporation Class CD | 15,749 | 497,196 | ||||||||
Federated National Holding Co. | 14,247 | 421,141 | ||||||||
Fidelity Southern Corporation | 31,082 | 693,439 | ||||||||
Financial Engines, Inc.D | 24,200 | 814,814 | ||||||||
First Commonwealth Financial CorporationD | 90,410 | 820,019 | ||||||||
First Niagara Financial Group, Inc. | 126,080 | 1,367,968 | ||||||||
Flagstar Bancorp, Inc.* | 88,512 | 2,045,512 | ||||||||
FNB CorporationD | 74,000 | 987,160 | ||||||||
Genworth Financial, Inc. | 190,205 | 709,465 | ||||||||
Gramercy Property Trust REITD | 77,560 | 598,763 | ||||||||
Green Dot Corporation Class A* | 132,450 | 2,174,829 | ||||||||
Hanmi Financial Corporation | 28,922 | 686,030 | ||||||||
HCI Group, Inc.D | 48,700 | 1,697,195 | ||||||||
Heartland Payment Systems, Inc. | 14,000 | 1,327,480 | ||||||||
Hersha Hospitality Trust REIT | 88,092 | 1,916,882 | ||||||||
Highwoods Properties, Inc. REIT | 64,060 | 2,793,016 | ||||||||
Hospitality Properties Trust REITD | 85,680 | 2,240,532 | ||||||||
Huntington Bancshares, Inc.D | 239,570 | 2,649,644 | ||||||||
Independent Bank Corporation | 23,032 | 350,777 | ||||||||
Jones Lang LaSalle, Inc. | 13,500 | 2,158,110 | ||||||||
Kennedy-Wilson Holdings, Inc. | 87,625 | 2,110,010 | ||||||||
LaSalle Hotel Properties REITD | 40,300 | 1,013,948 | ||||||||
LendingTree, Inc.D* | 3,084 | 275,340 | ||||||||
Mack-Cali Realty Corporation REITD | 94,385 | 2,203,890 | ||||||||
Manning & Napier, Inc.D | 24,600 | 208,854 | ||||||||
MGIC Investment Corporation* | 182,028 | 1,607,307 | ||||||||
National General Holdings Corporation | 75,760 | 1,656,114 | ||||||||
| Shares | Value | |||||||||
Net 1 UEPS Technologies, Inc.* | 77,730 | $ | 1,050,132 | |||||||
Northrim BanCorp, Inc. | 1,504 | 40,006 | ||||||||
Old Republic International CorporationD | 128,955 | 2,402,432 | ||||||||
PennyMac Financial Services, Inc. Class AD* | 10,560 | 162,202 | ||||||||
Pinnacle Financial Partners, Inc. | 14,820 | 761,155 | ||||||||
PrivateBancorp, Inc.D | 26,450 | 1,084,979 | ||||||||
ProAssurance Corporation | 21,120 | 1,024,954 | ||||||||
RE/MAX Holdings, Inc. | 8,950 | 333,835 | ||||||||
Reinsurance Group of America, Inc. | 27,100 | 2,318,405 | ||||||||
RLJ Lodging Trust REITD | 38,843 | 840,174 | ||||||||
RMR Group, Inc. (The) Class A* | — | 4 | ||||||||
Ryman Hospitality Properties, | ||||||||||
Inc. REIT | 37,532 | 1,938,152 | ||||||||
Safeguard Scientifics, Inc.D* | 62,940 | 913,259 | ||||||||
Safety Insurance Group, Inc.D | 1,000 | 56,380 | ||||||||
Selective Insurance Group, Inc.D | 15,875 | 533,082 | ||||||||
Summit Hotel Properties, Inc. REIT | 169,980 | 2,031,261 | ||||||||
Sunstone Hotel Investors, Inc. REIT | 75,582 | 944,019 | ||||||||
TCF Financial Corporation | 43,400 | 612,808 | ||||||||
Texas Capital Bancshares, Inc.D* | 29,950 | 1,480,129 | ||||||||
THL Credit, Inc.D | 111,708 | 1,195,276 | ||||||||
United Community Banks, Inc. | 20,900 | 407,341 | ||||||||
Waddell & Reed Financial, Inc. Class AD | 11,389 | 326,409 | ||||||||
Walker & Dunlop, Inc.* | 6,633 | 191,097 | ||||||||
WEX, Inc.D* | 21,900 | 1,935,960 | ||||||||
WisdomTree Investments, Inc.D | 92,700 | 1,453,536 | ||||||||
WP Glimcher, Inc. REIT | 18,225 | 193,367 | ||||||||
Xenia Hotels & Resorts, Inc. REIT | 31,870 | 488,567 | ||||||||
|
| |||||||||
| 95,932,157 | ||||||||||
|
| |||||||||
Healthcare — 10.7% | ||||||||||
Adeptus Health, Inc. Class AD* | 6,800 | 370,736 | ||||||||
Aegerion Pharmaceuticals, Inc.D* | 14,370 | 145,137 | ||||||||
Air Methods CorporationD* | 46,960 | 1,969,033 | ||||||||
Align Technology, Inc.D* | 16,200 | 1,066,770 | ||||||||
Amedisys, Inc.* | 2,946 | 115,837 | ||||||||
AMN Healthcare Services, Inc.* | 14,186 | 440,475 | ||||||||
Anacor Pharmaceuticals, Inc.D* | 2,900 | 327,613 | ||||||||
Analogic CorporationD | 23,530 | 1,943,578 | ||||||||
AtriCure, Inc.D* | 11,647 | 261,359 | ||||||||
BioScrip, Inc.D* | 131,389 | 229,931 | ||||||||
Cempra, Inc.D* | 27,500 | 856,075 | ||||||||
Civitas Solutions, Inc.D* | 49,300 | 1,419,347 | ||||||||
Community Health | ||||||||||
Systems, Inc.D* | 62,400 | 1,655,472 | ||||||||
Cross Country | ||||||||||
Healthcare, Inc.D* | 11,095 | 181,847 | ||||||||
Cynosure, Inc. Class AD* | 49,278 | 2,201,248 | ||||||||
Dermira, Inc.D* | 31,500 | 1,090,215 | ||||||||
DexCom, Inc.* | 5,752 | 471,089 | ||||||||
Emergent BioSolutions, Inc.D* | 49,538 | 1,982,015 | ||||||||
| 194 | See Notes to Financial Statements. |
Table of Contents
| Shares | Value | |||||||||
Endologix, Inc.D* | 80,100 | $ | 792,990 | |||||||
Esperion Therapeutics, Inc.D* | 15,756 | 350,729 | ||||||||
ExamWorks Group, Inc.D* | 45,300 | 1,204,980 | ||||||||
FibroGen, Inc.* | 3,400 | 103,598 | ||||||||
Five Star Quality Care, Inc.+ | 2,086 | — | ||||||||
Globus Medical, Inc. | 63,500 | 1,766,570 | ||||||||
Hanger, Inc.D* | 14,410 | 237,045 | ||||||||
Hill-Rom Holdings, Inc. | 27,737 | 1,333,040 | ||||||||
Inogen, Inc.* | 29,000 | 1,162,610 | ||||||||
Integra LifeSciences Holdings CorporationD* | 32,461 | 2,200,207 | ||||||||
Intercept Pharmaceuticals, Inc.D* | 2,175 | 324,836 | ||||||||
Intra-Cellular Therapies, Inc.D* | 26,500 | 1,425,435 | ||||||||
Kindred Healthcare, Inc.D | 62,000 | 738,420 | ||||||||
LDR Holding CorporationD* | 14,300 | 359,073 | ||||||||
Lexicon Pharmaceuticals, Inc.D* | 18,100 | 240,911 | ||||||||
Ligand Pharmaceuticals, Inc.D* | 4,010 | 434,764 | ||||||||
Masimo Corporation* | 33,010 | 1,370,245 | ||||||||
Molina Healthcare, Inc.D* | 3,994 | 240,159 | ||||||||
Neurocrine Biosciences, Inc.* | 12,500 | 707,125 | ||||||||
Nevro CorporationD* | 9,536 | 643,775 | ||||||||
NuVasive, Inc.D* | 18,953 | 1,025,547 | ||||||||
Owens & Minor, Inc.D | 34,797 | 1,251,996 | ||||||||
Pacira Pharmaceuticals, Inc.D* | 14,920 | 1,145,707 | ||||||||
PharMerica Corporation* | 14,203 | 497,105 | ||||||||
PRA Health Sciences, Inc.D* | 36,100 | 1,634,247 | ||||||||
Press Ganey Holdings, Inc.D* | 40,000 | 1,262,000 | ||||||||
PTC Therapeutics, Inc.D* | 12,371 | 400,820 | ||||||||
Quality Systems, Inc. | 12,176 | 196,277 | ||||||||
Repligen Corporation* | 19,990 | 565,517 | ||||||||
SciClone Pharmaceuticals, Inc.* | 28,210 | 259,532 | ||||||||
Seres Therapeutics, Inc.D* | 14,700 | 515,823 | ||||||||
Stemline Therapeutics, Inc.* | 36,700 | 231,577 | ||||||||
Surgical Care Affiliates, Inc.* | 40,500 | 1,612,305 | ||||||||
Team Health Holdings, Inc.D* | 45,000 | 1,975,050 | ||||||||
Ultragenyx Pharmaceutical, Inc.D* | 4,305 | 482,935 | ||||||||
United Therapeutics CorporationD* | 8,300 | 1,299,863 | ||||||||
US Physical Therapy, Inc.D | 36,720 | 1,971,130 | ||||||||
VCA, Inc.* | 19,300 | 1,061,500 | ||||||||
WellCare Health Plans, Inc.* | 7,600 | 594,396 | ||||||||
West Pharmaceutical Services, Inc. | 51,000 | 3,071,220 | ||||||||
Zeltiq Aesthetics, Inc.D* | 4,061 | 115,860 | ||||||||
|
| |||||||||
| 53,534,696 | ||||||||||
|
| |||||||||
Materials & Processing — 5.9% |
| |||||||||
American Vanguard CorporationD | 24,000 | 336,240 | ||||||||
Comfort Systems USA, Inc. | 17,000 | 483,140 | ||||||||
Domtar CorporationD | 54,981 | 2,031,548 | ||||||||
Ferro Corporation* | 56,040 | 623,165 | ||||||||
FMC Corporation | 3,000 | 117,390 | ||||||||
FutureFuel Corporation | 61,457 | 829,670 | ||||||||
Insteel Industries, Inc. | 69,690 | 1,457,915 | ||||||||
Interface, Inc. | 105,590 | 2,020,993 | ||||||||
Kaiser Aluminum Corporation | 24,882 | 2,081,628 | ||||||||
Koppers Holdings, Inc.* | 43,020 | 785,115 | ||||||||
Kraton Performance Polymers, Inc.* | 95,750 | 1,590,408 | ||||||||
Landec CorporationD* | 50,610 | 598,716 | ||||||||
LB Foster Co. Class AD | 67,323 | 919,632 | ||||||||
| Shares | Value | |||||||||
LSB Industries, Inc.D* | 51,536 | $ | 373,636 | |||||||
Mercer International, Inc. | 86,000 | 778,300 | ||||||||
NN, Inc.D | 138,094 | 2,201,218 | ||||||||
OMNOVA Solutions, Inc.D* | 174,210 | 1,067,907 | ||||||||
P.H. Glatfelter Co. | 45,670 | 842,155 | ||||||||
Patrick Industries, Inc.* | 74,030 | 3,220,305 | ||||||||
PolyOne CorporationD | 81,075 | 2,574,942 | ||||||||
RBC Bearings, Inc.D* | 23,900 | 1,543,701 | ||||||||
Reliance Steel & Aluminum Co. | 7,740 | 448,223 | ||||||||
Rexnord Corporation* | 77,100 | 1,397,052 | ||||||||
Summit Materials, Inc. | 34,930 | 699,997 | ||||||||
United States Steel CorporationD | 28,000 | 223,440 | ||||||||
Universal Stainless & Alloy Products, Inc.D* | 55,449 | 515,121 | ||||||||
|
| |||||||||
| 29,761,557 | ||||||||||
|
| |||||||||
Producer Durables — 17.2% | ||||||||||
ACCO Brands Corporation* | 401,000 | 2,859,130 | ||||||||
Actuant Corporation | 24,200 | 579,832 | ||||||||
Advisory Board Co. (The)* | 38,200 | 1,895,102 | ||||||||
Aegion Corporation* | 104,963 | 2,026,836 | ||||||||
Alaska Air Group, Inc.D | 25,130 | 2,023,216 | ||||||||
Albany International Corporation Class A | 66,900 | 2,445,195 | ||||||||
Allegiant Travel Co.D | 9,550 | 1,602,776 | ||||||||
Argan, Inc. | 29,983 | 971,449 | ||||||||
Astronics CorporationD* | 62,871 | 2,559,478 | ||||||||
Atlas Air Worldwide Holdings, Inc.D* | 43,915 | 1,815,446 | ||||||||
Avery Dennison Corporation | 5,000 | 313,300 | ||||||||
AZZ, Inc.D | 56,651 | 3,148,096 | ||||||||
Booz Allen Hamilton Holding Corporation | 7,900 | 243,715 | ||||||||
Brink’s Co. (The) | 10,987 | 317,085 | ||||||||
Bristow Group, Inc.D | 11,913 | 308,547 | ||||||||
CAI International, Inc.* | 19,750 | 199,080 | ||||||||
CEB, Inc. | 21,100 | 1,295,329 | ||||||||
Chart Industries, Inc.* | 24,700 | 443,612 | ||||||||
Columbus McKinnon CorporationD | 107,035 | 2,022,962 | ||||||||
Crane Co. | 24,700 | 1,181,648 | ||||||||
DHI Group, Inc.* | 14,088 | 129,187 | ||||||||
Ducommun, Inc.* | 43,997 | 713,631 | ||||||||
DXP Enterprises, Inc.D* | 20,100 | 458,280 | ||||||||
Dycom Industries, Inc.* | 10,300 | 720,588 | ||||||||
Electronics For Imaging, Inc.D* | 17,100 | 799,254 | ||||||||
EMCOR Group, Inc. | 74,709 | 3,589,020 | ||||||||
EnerSys, Inc. | 40,360 | 2,257,335 | ||||||||
Ennis, Inc. | 44,790 | 862,208 | ||||||||
ExlService Holdings, Inc.* | 54,950 | 2,468,904 | ||||||||
FARO Technologies, Inc.D* | 25,500 | 752,760 | ||||||||
Forward Air CorporationD | 5,600 | 240,856 | ||||||||
General Cable CorporationD | 109,312 | 1,468,060 | ||||||||
GP Strategies Corporation* | 40,940 | 1,028,003 | ||||||||
Greenbrier Cos., Inc. (The)D | 57,520 | 1,876,302 | ||||||||
Hawaiian Holdings, Inc.D* | 25,790 | 911,161 | ||||||||
Healthcare Services Group, Inc.D | 36,950 | 1,288,446 | ||||||||
Huntington Ingalls Industries, Inc. | 16,170 | 2,051,164 | ||||||||
Huron Consulting Group, Inc.* | 22,900 | 1,360,260 | ||||||||
| See Notes to Financial Statements. | 195 |
Table of Contents
SMALL CAP EQUITY FUND
SCHEDULE OF INVESTMENTS (Continued)
| Shares | Value | |||||||||
Hyster-Yale Materials Handling, Inc.D | 8,700 | $ | 456,315 | |||||||
ICF International, Inc.* | 21,000 | 746,760 | ||||||||
Insperity, Inc.D | 13,290 | 639,914 | ||||||||
JetBlue Airways Corporation* | 41,362 | 936,849 | ||||||||
KBR, Inc. | 45,500 | 769,860 | ||||||||
Keysight Technologies, Inc.* | 8,100 | 229,473 | ||||||||
Knight Transportation, Inc.D | 48,000 | 1,163,040 | ||||||||
Littelfuse, Inc. | 17,400 | 1,861,974 | ||||||||
MAXIMUS, Inc.D | 28,000 | 1,575,000 | ||||||||
MYR Group, Inc.* | 23,308 | 480,378 | ||||||||
Old Dominion Freight Line, Inc.* | 22,010 | 1,300,131 | ||||||||
On Assignment, Inc.* | 64,800 | 2,912,760 | ||||||||
Orbital ATK, Inc. | 27,731 | 2,477,488 | ||||||||
OSI Systems, Inc.* | 26,730 | 2,369,882 | ||||||||
Park-Ohio Holdings CorporationD | 21,000 | 772,380 | ||||||||
SkyWest, Inc.D | 16,950 | 322,389 | ||||||||
Spirit AeroSystems Holdings, Inc. Class A* | 27,931 | 1,398,505 | ||||||||
Spirit Airlines, Inc.D* | 44,200 | 1,761,370 | ||||||||
Tidewater, Inc.D | 132,185 | 920,008 | ||||||||
Titan Machinery, Inc.D* | 50,745 | 554,643 | ||||||||
TriNet Group, Inc.D* | 39,200 | 758,520 | ||||||||
Trinity Industries, Inc. | 18,640 | 447,733 | ||||||||
Triumph Group, Inc. | 47,200 | 1,876,200 | ||||||||
TrueBlue, Inc.* | 23,053 | 593,845 | ||||||||
Wabash National CorporationD* | 166,594 | 1,970,807 | ||||||||
Wabtec CorporationD | 16,360 | 1,163,523 | ||||||||
WageWorks, Inc.* | 42,450 | 1,925,956 | ||||||||
Wesco Aircraft Holdings, Inc.* | 164,300 | 1,966,671 | ||||||||
WESCO International, Inc.D* | 20,500 | 895,440 | ||||||||
|
| |||||||||
| 86,475,067 | ||||||||||
|
| |||||||||
Technology — 13.3% | ||||||||||
Acacia Research CorporationD | 227,649 | 976,614 | ||||||||
ARRIS Group, Inc.* | 5,100 | 155,907 | ||||||||
Aspen Technology, Inc.D* | 48,780 | 1,841,933 | ||||||||
Bankrate, Inc.* | 23,400 | 311,220 | ||||||||
Black Box Corporation | 61,967 | 590,546 | ||||||||
BroadSoft, Inc.* | 32,000 | 1,131,520 | ||||||||
Cavium, Inc.D* | 11,161 | 733,389 | ||||||||
Ciena CorporationD* | 41,900 | 866,911 | ||||||||
Cirrus Logic, Inc.D* | 3,995 | 117,972 | ||||||||
CommScope Holding Co., Inc.* | 27,700 | 717,153 | ||||||||
comScore, Inc.* | 31,484 | 1,295,567 | ||||||||
Cypress Semiconductor Corporation* | 13,000 | 127,530 | ||||||||
Demandware, Inc.D* | 22,200 | 1,198,134 | ||||||||
EarthLink Holdings Corporation | 17,842 | 132,566 | ||||||||
Envestnet, Inc.D* | 67,200 | 2,005,920 | ||||||||
Evolent Health, Inc. | 30,800 | 372,988 | ||||||||
Extreme Networks, Inc.* | 184,277 | 751,850 | ||||||||
Global Eagle Entertainment, Inc.D* | 54,900 | 541,863 | ||||||||
IAC/InterActiveCorp | 12,756 | 765,998 | ||||||||
Imperva, Inc.* | 12,400 | 785,044 | ||||||||
Infinera CorporationD* | 50,800 | 920,496 | ||||||||
Insight Enterprises, Inc.* | 6,540 | 164,285 | ||||||||
Integrated Device Technology, Inc.D* | 56,808 | 1,496,891 | ||||||||
Interactive Intelligence Group, Inc.D* | 50,539 | 1,587,935 | ||||||||
| Shares | Value | |||||||||
InterDigital, Inc. | 33,410 | $ | 1,638,426 | |||||||
Jabil Circuit, Inc. | 33,517 | 780,611 | ||||||||
KEYW Holding Corporation (The)D* | 44,811 | 269,762 | ||||||||
LogMeIn, Inc.D* | 7,100 | 476,410 | ||||||||
MA-COM Technology Solutions Holdings, Inc.D* | 44,300 | 1,811,427 | ||||||||
MaxLinear, Inc. Class A* | 20,973 | 308,932 | ||||||||
MKS Instruments, Inc. | 59,500 | 2,142,000 | ||||||||
NCR CorporationD* | 1,759 | 43,025 | ||||||||
NeuStar, Inc. Class AD* | 56,250 | 1,348,312 | ||||||||
NIC, Inc.* | 73,000 | 1,436,640 | ||||||||
Nuance Communications, Inc.* | 50,700 | 1,008,423 | ||||||||
Paycom Software, Inc.D* | 37,400 | 1,407,362 | ||||||||
Progress Software Corporation* | 18,840 | 452,160 | ||||||||
Proofpoint, Inc.D* | 21,900 | 1,423,719 | ||||||||
Q2 Holdings, Inc.* | 63,500 | 1,674,495 | ||||||||
Qlik Technologies, Inc.* | 50,500 | 1,598,830 | ||||||||
Rackspace Hosting, Inc.* | 18,337 | 464,293 | ||||||||
RetailMeNot, Inc.D* | 85,518 | 848,339 | ||||||||
RingCentral, Inc. Class A* | 54,100 | 1,275,678 | ||||||||
Sanmina Corporation* | 38,174 | 785,621 | ||||||||
Silicon Graphics International Corporation* | 220,262 | 1,299,546 | ||||||||
Synaptics, Inc.D* | 42,660 | 3,427,304 | ||||||||
Synchronoss Technologies, Inc.D* | 123,090 | 4,336,461 | ||||||||
Take-Two Interactive Software, Inc.D* | 103,234 | 3,596,673 | ||||||||
TESSCO Technologies, Inc. | 50,499 | 983,216 | ||||||||
Tyler Technologies, Inc.* | 35,850 | 6,249,372 | ||||||||
Ultimate Software Group, Inc. (The)D* | 13,800 | 2,698,038 | ||||||||
United Online, Inc.* | 35,710 | 421,021 | ||||||||
Universal Display Corporation* | 21,280 | 1,158,483 | ||||||||
Web.com Group, Inc.* | 77,915 | 1,559,079 | ||||||||
Zendesk, Inc.D* | 14,500 | 383,380 | ||||||||
|
| |||||||||
| 66,897,270 | ||||||||||
|
| |||||||||
Utilities — 4.6% | ||||||||||
8x8, Inc.* | 34,270 | 392,392 | ||||||||
CMS Energy CorporationD | 32,191 | 1,161,451 | ||||||||
Cogent Communications Holdings, Inc.D | 34,400 | 1,193,336 | ||||||||
El Paso Electric Co. | 16,600 | 639,100 | ||||||||
FairPoint Communications, Inc.D* | 35,100 | 564,057 | ||||||||
General Communication, Inc. Class AD* | 9,945 | 196,712 | ||||||||
Gogo, Inc.D* | 23,400 | 416,520 | ||||||||
Great Plains Energy, Inc. | 29,200 | 797,452 | ||||||||
Inteliquent, Inc. | 19,373 | 344,258 | ||||||||
j2 Global, Inc.D | 35,800 | 2,947,056 | ||||||||
Laclede Group, Inc. (The)D | 29,300 | 1,740,713 | ||||||||
National Fuel Gas Co.D | 11,142 | 476,321 | ||||||||
NRG Energy, Inc.D | 68,628 | 807,752 | ||||||||
Pinnacle West Capital Corporation | 6,200 | 399,776 | ||||||||
PNM Resources, Inc. | 32,900 | 1,005,753 | ||||||||
Portland General Electric Co. | 59,100 | 2,149,467 | ||||||||
Southwest Gas Corporation | 22,070 | 1,217,381 | ||||||||
Talen Energy CorporationD* | 191,956 | 1,195,886 | ||||||||
UGI Corporation | 73,100 | 2,467,856 | ||||||||
Vectren CorporationD | 34,610 | 1,468,156 | ||||||||
| 196 | See Notes to Financial Statements. |
Table of Contents
| Shares | Value | |||||||||
West Corporation | 69,450 | $ | 1,498,036 | |||||||
|
| |||||||||
| 23,079,431 | ||||||||||
|
| |||||||||
Total Common Stocks | 438,794,955 | |||||||||
|
| |||||||||
FOREIGN COMMON STOCKS — 8.3% |
| |||||||||
Bermuda — 2.9% | ||||||||||
Aspen Insurance Holdings, Ltd. | 47,130 | 2,276,379 | ||||||||
Assured Guaranty, Ltd. | 85,610 | 2,262,672 | ||||||||
AXIS Capital Holdings, Ltd. | 12,213 | 686,615 | ||||||||
ChipMOS Technologies Bermuda, Ltd. | 52,300 | 1,035,540 | ||||||||
Everest Re Group, Ltd. | 14,679 | 2,687,578 | ||||||||
Helen of Troy, Ltd.* | 21,900 | 2,064,075 | ||||||||
Tsakos Energy Navigation, Ltd. | 132,003 | 1,045,464 | ||||||||
Validus Holdings, Ltd. | 50,700 | 2,346,903 | ||||||||
|
| |||||||||
| 14,405,226 | ||||||||||
|
| |||||||||
Canada — 1.9% | ||||||||||
Canadian Solar, Inc.D* | 13,000 | 376,480 | ||||||||
Colliers International Group, Inc. | 29,100 | 1,296,405 | ||||||||
Dominion Diamond CorporationD | 23,668 | 242,124 | ||||||||
IMAX CorporationD* | 66,600 | 2,366,964 | ||||||||
MDC Partners, Inc. Class A | 24,198 | 525,581 | ||||||||
Mitel Networks CorporationD* | 125,780 | 967,248 | ||||||||
Nevsun Resources, Ltd.D | 281,550 | 763,000 | ||||||||
Open Text CorporationD | 25,800 | 1,236,594 | ||||||||
Performance Sports Group, Ltd.D* | 153,740 | 1,480,516 | ||||||||
Silver Standard Resources, Inc.D* | 24,754 | 128,226 | ||||||||
|
| |||||||||
| �� | 9,383,138 | |||||||||
|
| |||||||||
Cayman Islands — 0.2% | ||||||||||
Nord Anglia Education, Inc.D* | 63,600 | 1,289,808 | ||||||||
|
| |||||||||
Curacao — 0.0% | ||||||||||
Orthofix International NV* | 5,247 | 205,735 | ||||||||
|
| |||||||||
France — 0.3% | ||||||||||
Criteo SA ADRD* | 18,700 | 740,520 | ||||||||
DBV Technologies SA ADRD* | 20,800 | 755,248 | ||||||||
|
| |||||||||
| 1,495,768 | ||||||||||
|
| |||||||||
Ireland — 0.3% | ||||||||||
Horizon Pharma PLCD* | 61,000 | 1,321,870 | ||||||||
Prothena Corporation PLC* | 5,268 | 358,803 | ||||||||
|
| |||||||||
| 1,680,673 | ||||||||||
|
| |||||||||
Israel — 0.6% | ||||||||||
magicJack VocalTec, Ltd.D* | 45,572 | 430,655 | ||||||||
Orbotech, Ltd.* | 85,475 | 1,891,562 | ||||||||
SodaStream International, Ltd.D* | 45,000 | 733,950 | ||||||||
|
| |||||||||
| 3,056,167 | ||||||||||
|
| |||||||||
Luxembourg — 0.1% | ||||||||||
Altisource Portfolio Solutions SAD* | 22,169 | 616,520 | ||||||||
|
| |||||||||
Marshall Islands — 0.1% | ||||||||||
Ocean Rig UDW, Inc.D | 176,130 | 287,092 | ||||||||
|
| |||||||||
Netherlands — 0.1% | ||||||||||
AVG Technologies NV* | 21,409 | 429,250 | ||||||||
|
| |||||||||
| Shares | Value | |||||||||
Puerto Rico — 0.4% | ||||||||||
OFG BancorpD | 261,049 | $ | 1,910,879 | |||||||
|
| |||||||||
Supranational — 0.1% | ||||||||||
Banco Latinoamericano de Comercio Exterior SA Class ED | 27,539 | 714,086 | ||||||||
|
| |||||||||
Switzerland — 0.1% | ||||||||||
Allied World Assurance Company Holdings AG | 8,450 | 314,256 | ||||||||
|
| |||||||||
Taiwan — 0.1% |
| |||||||||
Silicon Motion Technology Corporation ADRD | 11,800 | 370,048 | ||||||||
|
| |||||||||
United Kingdom — 1.1% |
| |||||||||
Ensco PLC Class AD | 110,359 | 1,698,425 | ||||||||
Noble Corporation PLCD | 142,724 | 1,505,738 | ||||||||
Rowan Cos. PLC Class AD | 84,400 | 1,430,580 | ||||||||
STERIS PLCD | 9,100 | 685,594 | ||||||||
|
| |||||||||
| 5,320,337 | ||||||||||
|
| |||||||||
Total Foreign Common Stocks |
| 41,478,983 | ||||||||
|
| |||||||||
RIGHTS/WARRANTS — 0.0% |
| |||||||||
Asen Warrants A+@ | 25,000 | — | ||||||||
Asen Warrants B+@ | 25,000 | — | ||||||||
Asen Warrants C+@ | 25,000 | — | ||||||||
|
| |||||||||
Total Rights/Warrants |
| — | ||||||||
|
| |||||||||
MONEY MARKET FUNDS — 39.6% |
| |||||||||
GuideStone Money Market Fund (Investor Class)¥ | 21,115,220 | 21,115,220 | ||||||||
Northern Institutional Liquid Assets Portfolio§ | 177,804,961 | 177,804,961 | ||||||||
|
| |||||||||
Total Money Market Funds |
| 198,920,181 | ||||||||
|
| |||||||||
| Par | ||||||||||
CORPORATE BONDS — 0.0% |
| |||||||||
Lehman Escrow Bonds | ||||||||||
0.00%, 07/19/17+W†# | $ | 160,000 | — | |||||||
0.00%, 12/28/17+W†# | 120,000 | — | ||||||||
0.00%, 08/19/45+W†# | 50,000 | — | ||||||||
0.00%, 11/30/49+W†# | 10,000 | — | ||||||||
|
| |||||||||
Total Corporate Bonds |
| — | ||||||||
|
| |||||||||
FOREIGN BOND — 0.0% |
| |||||||||
Iceland — 0.0% | ||||||||||
Glitnir HF | 130,000 | 1 | ||||||||
|
| |||||||||
Total Foreign Bond | 1 | |||||||||
|
| |||||||||
TOTAL INVESTMENTS — 135.3% | 679,194,120 | |||||||||
Liabilities in Excess of Other |
| (177,382,515 | ) | |||||||
|
| |||||||||
NET ASSETS — 100.0% |
| $ | 501,811,605 | |||||||
|
| |||||||||
| See Notes to Financial Statements. | 197 |
Table of Contents
SMALL CAP EQUITY FUND
SCHEDULE OF INVESTMENTS (Continued)
VALUATION HIERARCHY
The following is a summary of the inputs used, as of December 31, 2015, in valuing the Fund’s investments carried at fair value:
| Total Value | Level 1 Quoted Prices | Level 2 Other Significant Observable Inputs | Level 3 Significant Unobservable Inputs | |||||||||||||
Assets: | ||||||||||||||||
Investments in Securities: | ||||||||||||||||
Common Stocks: | ||||||||||||||||
Consumer Discretionary | $ | 64,535,917 | $ | 64,535,917 | $ | — | $ | — | ||||||||
Consumer Staples | 7,501,033 | 7,501,033 | — | — | ||||||||||||
Energy | 11,077,827 | 11,077,827 | — | — | ||||||||||||
Financial Services | 95,932,157 | 95,932,157 | — | — | ||||||||||||
Healthcare | 53,534,696 | 53,534,696 | — | — | ||||||||||||
Materials & Processing | 29,761,557 | 29,761,557 | — | — | ||||||||||||
Producer Durables | 86,475,067 | 86,475,067 | — | — | ||||||||||||
Technology | 66,897,270 | 66,897,270 | — | — | ||||||||||||
Utilities | 23,079,431 | 23,079,431 | — | — | ||||||||||||
Corporate Bonds | — | — | — | — | ||||||||||||
Foreign Bond: | ||||||||||||||||
Iceland | 1 | — | — | 1 | ||||||||||||
Foreign Common Stocks | 41,478,983 | 41,478,983 | — | — | ||||||||||||
Money Market Funds | 198,920,181 | 198,920,181 | — | — | ||||||||||||
Rights/Warrants | — | — | — | — | ||||||||||||
|
|
|
|
|
|
|
| |||||||||
Total Assets - Investments in Securities | $ | 679,194,120 | $ | 679,194,119 | $ | — | $ | 1 | ||||||||
|
|
|
|
|
|
|
| |||||||||
Other Financial Instruments*** | ||||||||||||||||
Futures Contracts | $ | 241,324 | $ | 241,324 | $ | — | $ | — | ||||||||
|
|
|
|
|
|
|
| |||||||||
Total Assets - Other Financial Instruments | $ | 241,324 | $ | 241,324 | $ | — | $ | — | ||||||||
|
|
|
|
|
|
|
| |||||||||
***Other financial instruments are derivative instruments not reflected in the Schedule of Investments, such as futures, forwards and swap contracts, which are valued at the unrealized appreciation (depreciation) on the investment. Details of these investments can be found in the Notes to Financial Statements.
There were no transfers between Level 1 and Level 2 during the year ended December 31, 2015.
Management has determined that the amount of Level 3 securities compared to total net assets is not material; therefore, the reconciliation of Level 3 securities and assumptions is not shown for the period ending December 31, 2015.
| 198 | See Notes to Financial Statements. |
Table of Contents
International Equity Index Fund (Unaudited)
Developed non-U.S. markets underperformed their U.S. counterparts and were negatively impacted by the U.S. dollar which strengthened against most currencies during the year. The MSCI EAFE Index (Net), a measure of international developed country returns, posted a fourth quarter return of 4.71%, bringing the one-year return to -0.81%. Growth styles outperformed value styles and small capitalization stocks generally outperformed large capitalization stocks during the year. From a country perspective, Singapore, Spain and Norway posted the worst performance, while Denmark, Ireland and Belgium were among the best performing countries for the year. From a sector perspective, the weakest performance was registered in the energy and materials sectors which were negatively impacted by the fall in oil prices, while the strongest performance came from the more defensive health care and consumer staples sectors.
The Fund was passively managed and attempts to duplicate the investment composition and performance of its benchmark, the MSCI EAFE Index (Net). The MSCI EAFE Index (Net) is an equity index which captures large- and mid-cap representation across developed market countries around the world, excluding the United States and Canada. The objective of the Fund was to provide investment results approximating the aggregate price and dividend performance of the securities included in the MSCI EAFE Index (Net). The correlation between the Fund’s performance and the MSCI EAFE Index (Net) is expected to be greater than 98%. However, it could be lower in certain market environments and due to certain stocks that may be excluded from the Fund’s portfolio because of social investment policies and restrictions (100% would indicate perfect correlation). The Fund was incepted in June 2015 and does not have a full calendar year of performance. The Fund returned -9.88% for the since inception period ended December 31, 2015, as compared to a -8.67% return for the MSCI EAFE Index (Net). The return differential was primarily a result of social restrictions and expenses of the Fund.
In 2015, derivative positions, exchange listed equity index futures contracts, were utilized to provide market exposure to the cash positions held in the Fund. Overall, derivative exposure had a slight negative impact on Fund performance for the year.
The Fund invests in foreign market securities which involves certain risks such as currency volatility, political and social instability and reduced market liquidity. It is possible to lose money by investing in the Fund.
At December 31, 2015, the portfolio holdings of the Fund, as a percentage of net assets, is shown in the following table. Portfolio holdings are subject to risk and may change at any time.
| % | ||||
Financial Services | 26.4 | |||
Consumer Discretionary | 15.0 | |||
Producer Durables | 11.9 | |||
Technology | 11.0 | |||
Healthcare | 9.7 | |||
Materials & Processing | 7.5 | |||
Money Market Funds | 6.4 | |||
Consumer Staples | 4.9 | |||
Energy | 4.6 | |||
Utilities | 3.8 | |||
Foreign Preferred Stocks | 0.5 | |||
Rights | — | ** | ||
|
| |||
| 101.7 | ||||
|
| |||
| ** | Rounds to less than 0.005% |
199
Table of Contents
INTERNATIONAL EQUITY INDEX FUND SCHEDULE OF INVESTMENTS | December 31, 2015 |
| Shares | Value | |||||||||
FOREIGN COMMON STOCKS — 94.8% |
| |||||||||
Australia — 6.6% | ||||||||||
AGL Energy, Ltd. | 6,148 | $ | 80,447 | |||||||
Alumina, Ltd.D | 20,465 | 17,079 | ||||||||
Amcor, Ltd. | 11,424 | 110,987 | ||||||||
AMP, Ltd. | 28,576 | 120,404 | ||||||||
APA Group | 10,068 | 63,351 | ||||||||
Asciano, Ltd. | 5,505 | 34,999 | ||||||||
ASX, Ltd. | 1,900 | 58,454 | ||||||||
Aurizon Holdings, Ltd. | 18,927 | 60,085 | ||||||||
AusNet Services | 13,974 | 15,044 | ||||||||
Australia & New Zealand Banking Group, Ltd. | 26,845 | 541,725 | ||||||||
Bank of Queensland, Ltd. | 3,948 | 39,826 | ||||||||
Bendigo and Adelaide | ||||||||||
Bank, Ltd.D | 3,661 | 31,667 | ||||||||
BHP Billiton, Ltd. | 29,742 | 382,766 | ||||||||
Boral, Ltd. | 6,338 | 27,098 | ||||||||
Brambles, Ltd. | 14,086 | 117,969 | ||||||||
Caltex Australia, Ltd. | 2,589 | 70,767 | ||||||||
Challenger, Ltd. | 5,442 | 34,297 | ||||||||
CIMIC Group, Ltd. | 826 | 14,490 | ||||||||
Coca-Cola Amatil, Ltd. | 4,614 | 31,112 | ||||||||
Cochlear, Ltd. | 613 | 42,420 | ||||||||
Commonwealth Bank of Australia | 15,802 | 976,948 | ||||||||
Computershare, Ltd. | 3,815 | 32,101 | ||||||||
CSL, Ltd. | 4,272 | 325,695 | ||||||||
Dexus Property Group REIT | 9,600 | 52,072 | ||||||||
DUET Group | 22,568 | 37,376 | ||||||||
Flight Centre Travel Group, Ltd.D | 449 | 12,949 | ||||||||
Fortescue Metals Group, Ltd.D | 12,611 | 16,971 | ||||||||
Goodman Group REIT | 15,859 | 71,864 | ||||||||
GPT Group (The) REIT | 16,654 | 57,676 | ||||||||
Harvey Norman Holdings, Ltd. | 4,519 | 13,661 | ||||||||
Healthscope, Ltd. | 14,000 | 26,978 | ||||||||
Iluka Resources, Ltd. | 3,392 | 15,004 | ||||||||
Incitec Pivot, Ltd. | 17,247 | 49,282 | ||||||||
Insurance Australia Group, Ltd. | 23,408 | 94,007 | ||||||||
Lend Lease Group | 5,556 | 57,324 | ||||||||
Macquarie Group, Ltd. | 2,723 | 162,898 | ||||||||
Medibank Pvt, Ltd. | 28,244 | 44,041 | ||||||||
Mirvac Group REIT | 37,367 | 53,492 | ||||||||
National Australia Bank, Ltd. | 24,376 | 531,927 | ||||||||
Newcrest Mining, Ltd.* | 7,513 | 71,089 | ||||||||
Orica, Ltd. | 3,852 | 43,157 | ||||||||
Origin Energy, Ltd. | 17,239 | 58,315 | ||||||||
Platinum Asset Management, Ltd. | 1,896 | 11,079 | ||||||||
Qantas Airways, Ltd.* | 4,384 | 12,994 | ||||||||
QBE Insurance Group, Ltd. | 12,580 | 114,417 | ||||||||
Ramsay Health Care, Ltd. | 1,330 | 65,399 | ||||||||
REA Group, Ltd.D | 425 | 16,910 | ||||||||
Rio Tinto, Ltd. | 3,842 | 124,248 | ||||||||
Santos, Ltd. | 15,855 | 42,229 | ||||||||
Scentre Group REIT | 48,734 | 147,817 | ||||||||
SEEK, Ltd. | 2,626 | 29,228 | ||||||||
Sonic Healthcare, Ltd. | 3,771 | 48,824 | ||||||||
South32, Ltd.* | 53,136 | 40,819 | ||||||||
Stockland REIT | 22,520 | 66,850 | ||||||||
Suncorp Group, Ltd. | 12,386 | 108,749 | ||||||||
Sydney Airport | 10,990 | 50,579 | ||||||||
Telstra Corporation, Ltd. | 39,692 | 161,296 | ||||||||
TPG Telecom, Ltd. | 2,252 | 16,123 | ||||||||
| Shares | Value | |||||||||
Transurban Group | 19,396 | $ | 147,021 | |||||||
Vicinity Centres REIT | 29,590 | 60,028 | ||||||||
Wesfarmers, Ltd. | 10,504 | 316,675 | ||||||||
Westfield Corporation REIT | 17,946 | 123,467 | ||||||||
Westpac Banking Corporation | 31,131 | 754,607 | ||||||||
Woodside Petroleum, Ltd. | 7,026 | 146,379 | ||||||||
|
| |||||||||
| 7,305,552 | ||||||||||
|
| |||||||||
Austria — 0.2% | ||||||||||
ANDRITZ AG | 825 | 40,152 | ||||||||
Erste Group Bank AG* | 2,506 | 78,413 | ||||||||
OMV AG | 1,545 | 43,855 | ||||||||
Raiffeisen Bank International AG* | 950 | 13,923 | ||||||||
Voestalpine AG | 1,220 | 37,318 | ||||||||
|
| |||||||||
| 213,661 | ||||||||||
|
| |||||||||
Belgium — 0.6% | ||||||||||
Ageas | 1,871 | 86,841 | �� | |||||||
Colruyt SA | 568 | 29,220 | ||||||||
Delhaize Group | 996 | 96,938 | ||||||||
Groupe Bruxelles Lambert SA | 695 | 59,470 | ||||||||
KBC Groep NV | 2,319 | 144,999 | ||||||||
Proximus | 1,289 | 41,945 | ||||||||
Solvay SA | 674 | 71,909 | ||||||||
Telenet Group Holding NV* | 423 | 22,861 | ||||||||
UCB SA | 1,201 | 108,406 | ||||||||
Umicore SA | 1,008 | 42,272 | ||||||||
|
| |||||||||
| 704,861 | ||||||||||
|
| |||||||||
Bermuda — 0.2% | ||||||||||
Cheung Kong Infrastructure Holdings, Ltd. | 6,000 | 55,433 | ||||||||
First Pacific Co., Ltd. | 18,000 | 11,924 | ||||||||
Kerry Properties, Ltd. | 5,000 | 13,607 | ||||||||
Li & Fung, Ltd. | 60,000 | 40,577 | ||||||||
Noble Group, Ltd.D | 42,800 | 11,963 | ||||||||
NWS Holdings, Ltd.D | 12,385 | 18,488 | ||||||||
Shangri-La Asia, Ltd. | 10,000 | 9,737 | ||||||||
Yue Yuen Industrial Holdings, Ltd. | 8,000 | 27,100 | ||||||||
|
| |||||||||
| 188,829 | ||||||||||
|
| |||||||||
Denmark — 0.9% | ||||||||||
AP Moeller - Maersk A/S Class A | 39 | 50,221 | ||||||||
AP Moeller - Maersk A/S Class B | 64 | 83,475 | ||||||||
Chr. Hansen Holding A/S | 918 | 57,421 | ||||||||
Coloplast A/S Class B | 983 | 79,365 | ||||||||
Danske Bank A/S | 6,570 | 176,288 | ||||||||
DSV A/S | 1,751 | 68,926 | ||||||||
ISS A/S | 1,498 | 53,998 | ||||||||
Novozymes A/S, B Shares | 2,080 | 99,588 | ||||||||
Pandora A/S | 1,026 | 129,362 | ||||||||
TDC A/S | 8,509 | 42,367 | ||||||||
Tryg A/S | 970 | 19,275 | ||||||||
Vestas Wind Systems A/S | 2,153 | 150,363 | ||||||||
William Demant Holding A/S* | 207 | 19,718 | ||||||||
|
| |||||||||
| 1,030,367 | ||||||||||
|
| |||||||||
| 200 | See Notes to Financial Statements. |
Table of Contents
| Shares | Value | |||||||||
Finland — 0.9% | ||||||||||
Elisa OYJ | 1,415 | $ | 53,239 | |||||||
Fortum OYJ* | 4,227 | 63,686 | ||||||||
Kone OYJ Class BD | 3,215 | 136,127 | ||||||||
Metso OYJ | 913 | 20,452 | ||||||||
Neste OYJ | 1,040 | 31,040 | ||||||||
Nokia OYJ | 34,787 | 246,103 | ||||||||
Nokian Renkaat OYJD | 1,196 | 42,699 | ||||||||
Orion OYJ, Class B | 816 | 28,232 | ||||||||
Sampo OYJ, A Shares | 4,158 | 211,154 | ||||||||
Stora Enso OYJ, R Shares | 4,715 | 42,634 | ||||||||
UPM-Kymmene OYJ | 4,732 | 87,852 | ||||||||
Wartsila OYJ Abp | 1,310 | 59,812 | ||||||||
|
| |||||||||
| 1,023,030 | ||||||||||
|
| |||||||||
France — 9.0% | ||||||||||
Accor SA | 2,001 | 86,664 | ||||||||
Aeroports de Paris | 242 | 28,161 | ||||||||
Air Liquide SA | 3,235 | 363,184 | ||||||||
Alcatel-Lucent* | 26,576 | 104,995 | ||||||||
Alstom SAD* | 1,873 | 57,211 | ||||||||
Arkema SA | 687 | 48,089 | ||||||||
Atos SE | 867 | 72,787 | ||||||||
AXA SA | 18,113 | 494,915 | ||||||||
BNP Paribas SA | 9,940 | 562,382 | ||||||||
Bollore SA* | 9,300 | 43,333 | ||||||||
Bouygues SA | 1,998 | 79,222 | ||||||||
Bureau Veritas SA | 2,626 | 52,340 | ||||||||
Cap Gemini SA | 1,574 | 146,045 | ||||||||
Carrefour SA | 5,096 | 147,069 | ||||||||
Casino Guichard Perrachon SA | 458 | 21,041 | ||||||||
Christian Dior SE | 519 | 88,159 | ||||||||
Cie de St-Gobain | 4,616 | 200,037 | ||||||||
Cie Generale des Etablissements Michelin | 1,705 | 162,287 | ||||||||
CNP Assurances | 1,390 | 18,750 | ||||||||
Credit Agricole SA | 9,560 | 112,657 | ||||||||
Danone SA | 5,470 | 369,629 | ||||||||
Dassault Systemes | 1,229 | 98,236 | ||||||||
Edenred | 2,172 | 41,058 | ||||||||
Electricite de France SA | 1,956 | 28,807 | ||||||||
Engie | 13,599 | 240,883 | ||||||||
Essilor International SA | 1,887 | 235,189 | ||||||||
Eurazeo SA | 324 | 22,346 | ||||||||
Eutelsat Communications SA | 1,634 | 48,923 | ||||||||
Fonciere Des Regions REIT | 244 | 21,824 | ||||||||
Gecina SA REIT | 363 | 44,131 | ||||||||
Groupe Eurotunnel SE | 4,194 | 52,178 | ||||||||
Hermes International* | 253 | 85,521 | ||||||||
ICADE REIT | 271 | 18,190 | ||||||||
Iliad SA | 257 | 61,264 | ||||||||
Imerys SA | 277 | 19,349 | ||||||||
Ingenico Group | 483 | 60,965 | ||||||||
JCDecaux SA | 633 | 24,266 | ||||||||
Kering | 695 | 118,828 | ||||||||
Klepierre REIT | 1,965 | 87,344 | ||||||||
Lagardere SCA | 957 | 28,558 | ||||||||
Legrand SA | 2,408 | 136,210 | ||||||||
L’Oreal SA | 2,335 | 392,760 | ||||||||
Natixis SA* | 9,336 | 52,815 | ||||||||
Numericable-SFR SAS* | 1,016 | 36,909 | ||||||||
Orange SA* | 18,708 | 312,907 | ||||||||
Peugeot SA* | 4,189 | 73,429 | ||||||||
Publicis Groupe SA | 1,849 | 122,951 | ||||||||
| Shares | Value | |||||||||
Renault SA | 1,809 | $ | 181,074 | |||||||
Rexel SA | 3,212 | 42,770 | ||||||||
Safran SA | 2,914 | 200,201 | ||||||||
Sanofi | 11,043 | 941,109 | ||||||||
Schneider Electric SE | 5,248 | 298,109 | ||||||||
SCOR SE | 1,503 | 56,239 | ||||||||
Societe BIC SA | 295 | 48,544 | ||||||||
Societe Generale SA | 6,651 | 306,494 | ||||||||
Sodexo SA | 875 | 85,485 | ||||||||
Suez Environnement Co. | 2,560 | 47,881 | ||||||||
Technip SA | 970 | 48,239 | ||||||||
Thales SA | 993 | 74,326 | ||||||||
TOTAL SA | 20,275 | 908,961 | ||||||||
Unibail-Rodamco SE REIT | 930 | 236,157 | ||||||||
Valeo SA | 745 | 114,861 | ||||||||
Veolia Environnement SA | 4,090 | 97,039 | ||||||||
Vinci SA | 4,372 | 280,224 | ||||||||
Vivendi SA | 11,072 | 237,795 | ||||||||
Wendel SA | 233 | 27,710 | ||||||||
Zodiac Aerospace* | 2,009 | 47,835 | ||||||||
|
| |||||||||
| 10,005,851 | ||||||||||
|
| |||||||||
Germany — 8.0% | ||||||||||
Adidas AGD | 1,985 | 192,663 | ||||||||
Allianz SE | 4,264 | 751,654 | ||||||||
Axel Springer SED | 360 | 20,020 | ||||||||
BASF SE | 8,582 | 653,764 | ||||||||
Bayerische Motoren Werke AGD | 3,050 | 321,324 | ||||||||
Beiersdorf AG | 977 | 88,801 | ||||||||
Brenntag AG | 1,400 | 72,951 | ||||||||
Commerzbank AG* | 10,003 | 103,217 | ||||||||
Continental AG | 1,022 | 247,233 | ||||||||
Daimler AG | 8,938 | 746,810 | ||||||||
Deutsche Bank AG | 12,964 | 314,828 | ||||||||
Deutsche Boerse AG | 1,772 | 155,762 | ||||||||
Deutsche Lufthansa AGD* | 1,968 | 30,998 | ||||||||
Deutsche Post AG | 8,869 | 247,959 | ||||||||
Deutsche Telekom AG | 30,268 | 543,636 | ||||||||
Deutsche Wohnen AG | 3,313 | 91,611 | ||||||||
E.ON SE | 18,900 | 181,479 | ||||||||
Evonik Industries AG | 1,417 | 46,870 | ||||||||
Fraport AG Frankfurt Airport Services WorldwideD | 338 | 21,555 | ||||||||
Fresenius Medical Care AG & Co. KGaA | 2,004 | 168,406 | ||||||||
Fresenius SE & Co. KGaA | 3,609 | 257,079 | ||||||||
GEA Group AG | 1,679 | 67,833 | ||||||||
Hannover Rueck SE | 608 | 69,428 | ||||||||
HeidelbergCement AG | 1,278 | 104,155 | ||||||||
Henkel AG & Co KGaA | 1,000 | 95,653 | ||||||||
HUGO BOSS AG | 677 | 55,859 | ||||||||
Infineon Technologies AG | 10,234 | 149,199 | ||||||||
K+S AGD | 1,931 | 49,224 | ||||||||
Kabel Deutschland Holding AG | 179 | 22,118 | ||||||||
LANXESS AG | 939 | 43,210 | ||||||||
Linde AG | 1,705 | 246,303 | ||||||||
MAN SE | 286 | 28,741 | ||||||||
Merck KGaA | 1,184 | 114,637 | ||||||||
METRO AG | 1,673 | 53,298 | ||||||||
Muenchener | ||||||||||
Rueckversicherungs- | ||||||||||
Gesellschaft AG | 1,541 | 307,026 | ||||||||
OSRAM Licht AG | 722 | 30,165 | ||||||||
ProSiebenSat.1 Media SE | 2,122 | 107,058 | ||||||||
| See Notes to Financial Statements. | 201 |
Table of Contents
INTERNATIONAL EQUITY INDEX FUND
SCHEDULE OF INVESTMENTS (Continued)
| Shares | Value | |||||||||
RWE AGD | 4,702 | $ | 59,280 | |||||||
SAP SE | 9,118 | 723,546 | ||||||||
Siemens AG* | 7,430 | 718,826 | ||||||||
Symrise AG | 1,117 | 73,944 | ||||||||
Telefonica Deutschland | ||||||||||
Holding AGD | 4,816 | 25,403 | ||||||||
ThyssenKrupp AGD | 3,534 | 70,056 | ||||||||
TUI AG* | 4,413 | 78,795 | ||||||||
United Internet AG | 1,153 | 63,391 | ||||||||
Volkswagen AG | 361 | 55,474 | ||||||||
Vonovia SE | 4,479 | 138,371 | ||||||||
Zalando SE 144A* | 800 | 31,646 | ||||||||
|
| |||||||||
| 8,841,259 | ||||||||||
|
| |||||||||
Hong Kong — 2.9% | ||||||||||
AIA Group, Ltd. | 111,800 | 668,014 | ||||||||
ASM Pacific Technology, Ltd.D | 1,900 | 14,834 | ||||||||
Bank of East Asia, Ltd. (The)D | 12,200 | 45,256 | ||||||||
BOC Hong Kong Holdings, Ltd. | 33,500 | 101,941 | ||||||||
Cathay Pacific Airways, Ltd. | 10,000 | 17,207 | ||||||||
Cheung Kong Property Holdings, Ltd. | 26,000 | 168,194 | ||||||||
CK Hutchison Holdings, Ltd. | 25,500 | 342,769 | ||||||||
CLP Holdings, Ltd. | 17,500 | 148,330 | ||||||||
Hang Lung Properties, Ltd. | 20,000 | 45,317 | ||||||||
Hang Seng Bank, Ltd. | 7,100 | 134,569 | ||||||||
Henderson Land Development Co., Ltd. | 11,800 | 71,980 | ||||||||
HK Electric Investments & HK Electric Investments, Ltd. 144A | 25,000 | 20,948 | ||||||||
HKT Trust and HKT, Ltd. | 29,000 | 37,045 | ||||||||
Hong Kong & China Gas Co., Ltd. | 63,100 | 123,489 | ||||||||
Hong Kong Exchanges and | ||||||||||
Clearing, Ltd. | 10,769 | 274,338 | ||||||||
Hongkong Land Holdings, Ltd. | 5,300 | 36,305 | ||||||||
Hysan Development Co., Ltd. | 5,000 | 20,428 | ||||||||
Link REIT | 20,500 | 122,219 | ||||||||
MTR Corporation, Ltd. | 13,583 | 67,070 | ||||||||
New World Development Co., Ltd.D | 48,000 | 47,133 | ||||||||
PCCW, Ltd. | 33,000 | 19,290 | ||||||||
Power Assets Holdings, Ltd. | 13,500 | 123,762 | ||||||||
Sino Land Co., Ltd. | 30,000 | 43,703 | ||||||||
Sun Hung Kai Properties, Ltd. | 16,000 | 192,313 | ||||||||
Swire Pacific, Ltd. Class A | 5,500 | 61,436 | ||||||||
Swire Properties, Ltd. | 13,000 | 37,379 | ||||||||
Techtronic Industries Co., Ltd. | 14,000 | 56,675 | ||||||||
WH Group, Ltd. 144A* | 47,000 | 26,159 | ||||||||
Wharf Holdings, Ltd. (The) | 12,000 | 66,162 | ||||||||
Wheelock & Co., Ltd. | 8,000 | 33,570 | ||||||||
|
| |||||||||
| 3,167,835 | ||||||||||
|
| |||||||||
Ireland — 0.4% | ||||||||||
Bank of Ireland* | 257,722 | 94,367 | ||||||||
CRH PLC | 7,790 | 224,657 | ||||||||
James Hardie Industries PLC | 4,486 | 56,559 | ||||||||
Kerry Group PLC Class A | 1,503 | 124,358 | ||||||||
|
| |||||||||
| 499,941 | ||||||||||
|
| |||||||||
Israel — 0.3% | ||||||||||
Azrieli Group | 296 | 11,027 | ||||||||
| Shares | Value | |||||||||
Bank Hapoalim BM | 10,524 | $ | 54,325 | |||||||
Bank Leumi Le-Israel BM* | 14,030 | 48,646 | ||||||||
Bezeq The Israeli Telecommunication Corporation, Ltd. | 20,080 | 44,203 | ||||||||
Check Point Software Technologies, Ltd.D* | 600 | 48,828 | ||||||||
Delek Group, Ltd. | 38 | 7,610 | ||||||||
Israel Chemicals, Ltd. | 4,122 | 16,732 | ||||||||
Mizrahi Tefahot Bank, Ltd. | 1,129 | 13,484 | ||||||||
NICE-Systems, Ltd. | 471 | 27,064 | ||||||||
Taro Pharmaceuticals Industries* | 100 | 15,455 | ||||||||
|
| |||||||||
| 287,374 | ||||||||||
|
| |||||||||
Italy — 2.2% | ||||||||||
Assicurazioni Generali SpA | 11,052 | 201,885 | ||||||||
Atlantia SpA | 4,046 | 107,051 | ||||||||
Banca Monte dei Paschi di Siena SpA* | 24,049 | 31,837 | ||||||||
Banco Popolare SC* | 3,633 | 50,064 | ||||||||
Enel Green Power SpA | 14,149 | 28,759 | ||||||||
Enel SpA | 64,729 | 271,430 | ||||||||
Eni SpA | 23,638 | 351,220 | ||||||||
EXOR SpA | 1,031 | 46,794 | ||||||||
Finmeccanica SpA* | 3,992 | 55,506 | ||||||||
Intesa Sanpaolo SpA | 124,604 | 411,788 | ||||||||
Luxottica Group SpA* | 1,527 | 99,508 | ||||||||
Mediobanca SpA | 5,560 | 53,299 | ||||||||
Prysmian SpA | 2,060 | 45,009 | ||||||||
Saipem SpAD* | 2,138 | 17,281 | ||||||||
Snam SpA | 19,896 | 103,837 | ||||||||
Telecom Italia SpA* | 168,026 | 198,843 | ||||||||
Terna Rete Elettrica Nazionale SpA | 13,904 | 71,507 | ||||||||
UniCredit SpA | 43,713 | 241,677 | ||||||||
Unione di Banche Italiane SCpAD | 8,127 | 54,300 | ||||||||
UnipolSai SpA | 11,476 | 29,196 | ||||||||
|
| |||||||||
| 2,470,791 | ||||||||||
|
| |||||||||
Japan — 23.4% | ||||||||||
ABC-Mart, Inc. | 200 | 10,948 | ||||||||
Acom Co., Ltd.* | 3,200 | 15,069 | ||||||||
Aeon Co., Ltd. | 6,300 | 97,068 | ||||||||
AEON Credit Service Co., Ltd. | 800 | 17,871 | ||||||||
Aeon Mall Co., Ltd. | 900 | 15,437 | ||||||||
Air Water, Inc. | 1,000 | 16,083 | ||||||||
Aisin Seiki Co., Ltd. | 1,900 | 81,773 | ||||||||
Ajinomoto Co., Inc. | 5,000 | 118,379 | ||||||||
Alfresa Holdings Corporation | 1,900 | 37,526 | ||||||||
Alps Electric Co., Ltd. | 1,600 | 43,389 | ||||||||
Amada Holdings Co., Ltd. | 2,800 | 26,720 | ||||||||
ANA Holdings, Inc. | 13,000 | 37,506 | ||||||||
Aozora Bank, Ltd. | 12,000 | 41,878 | ||||||||
Asahi Glass Co., Ltd.D | 8,000 | 45,831 | ||||||||
Asahi Kasei Corporation | 13,000 | 87,907 | ||||||||
Asics CorporationD | 1,300 | 26,972 | ||||||||
Astellas Pharma, Inc. | 19,600 | 279,021 | ||||||||
Bandai Namco Holdings, Inc. | 1,800 | 38,029 | ||||||||
Bank of Kyoto, Ltd. (The) | 3,000 | 27,821 | ||||||||
Bank of Yokohama, Ltd. (The) | 11,000 | 67,426 | ||||||||
Benesse Holdings, Inc. | 500 | 14,399 | ||||||||
Bridgestone CorporationD | 5,900 | 202,378 | ||||||||
Brother Industries, Ltd. | 1,900 | 21,827 | ||||||||
Calbee, Inc. | 600 | 25,337 | ||||||||
Canon, Inc. | 10,000 | 302,500 | ||||||||
| 202 | See Notes to Financial Statements. |
Table of Contents
| Shares | Value | |||||||||
Casio Computer Co., Ltd. | 2,100 | $ | 49,091 | |||||||
Central Japan Railway Co. | 1,300 | 230,794 | ||||||||
Chiba Bank, Ltd. (The) | 7,000 | 49,674 | ||||||||
Chubu Electric Power Co., Inc. | 6,200 | 84,901 | ||||||||
Chugai Pharmaceutical Co., Ltd. | 2,000 | 69,713 | ||||||||
Chugoku Bank, Ltd. (The) | 1,300 | 17,347 | ||||||||
Chugoku Electric Power Co., Inc. (The) | 3,100 | 40,930 | ||||||||
Citizen Holdings Co., Ltd. | 2,100 | 15,093 | ||||||||
Credit Saison Co., Ltd. | 1,200 | 23,643 | ||||||||
Dai Nippon Printing Co., Ltd. | 5,000 | 49,443 | ||||||||
Daicel Corporation | 2,400 | 35,717 | ||||||||
Daihatsu Motor Co., Ltd. | 1,600 | 21,584 | ||||||||
Dai-ichi Life Insurance Co., Ltd. (The) | 10,300 | 171,368 | ||||||||
Daiichi Sankyo Co., Ltd. | 6,000 | 123,838 | ||||||||
Daikin Industries, Ltd. | 2,200 | 160,208 | ||||||||
Daito Trust Construction Co., Ltd. | 700 | 80,857 | ||||||||
Daiwa House Industry Co., Ltd. | 5,800 | 166,729 | ||||||||
Daiwa Securities Group, Inc. | 16,000 | 97,819 | ||||||||
Denso Corporation | 4,600 | 219,813 | ||||||||
Dentsu, Inc. | 2,000 | 109,424 | ||||||||
Don Quijote Holdings Co., Ltd. | 1,000 | 35,119 | ||||||||
East Japan Railway Co. | 3,100 | 291,914 | ||||||||
Eisai Co., Ltd. | 2,300 | 152,147 | ||||||||
Electric Power Development Co., Ltd. | 1,500 | 53,425 | ||||||||
FamilyMart Co., Ltd. | 500 | 23,267 | ||||||||
FANUC Corporation | 1,800 | 310,122 | ||||||||
Fast Retailing Co., Ltd. | 500 | 174,906 | ||||||||
Fuji Electric Co., Ltd. | 5,000 | 20,969 | ||||||||
Fuji Heavy Industries, Ltd. | 5,600 | 230,699 | ||||||||
FUJIFILM Holdings Corporation | 4,400 | 183,623 | ||||||||
Fujitsu, Ltd. | 18,000 | 89,840 | ||||||||
Fukuoka Financial Group, Inc. | 8,000 | 39,669 | ||||||||
GungHo Online Entertainment, Inc.D | 3,200 | 8,693 | ||||||||
Gunma Bank, Ltd. (The) | 3,000 | 17,443 | ||||||||
Hachijuni Bank, Ltd. (The) | 5,000 | 30,600 | ||||||||
Hakuhodo DY Holdings, Inc. | 1,900 | 20,557 | ||||||||
Hamamatsu Photonics KK | 1,200 | 32,898 | ||||||||
Hankyu Hanshin Holdings, Inc. | 10,000 | 64,999 | ||||||||
Hikari Tsushin, Inc. | 200 | 13,620 | ||||||||
Hino Motors, Ltd. | 2,100 | 24,271 | ||||||||
Hirose Electric Co., Ltd. | 300 | 36,322 | ||||||||
Hiroshima Bank, Ltd. (The) | 6,000 | 34,103 | ||||||||
Hisamitsu Pharmaceutical Co., Inc. | 500 | 20,991 | ||||||||
Hitachi Chemical Co., Ltd. | 800 | 12,692 | ||||||||
Hitachi Construction Machinery Co., Ltd.D | 900 | 13,997 | ||||||||
Hitachi High-Technologies Corporation | 600 | 16,226 | ||||||||
Hitachi Metals, Ltd. | 2,000 | 24,676 | ||||||||
Hitachi, Ltd. | 45,000 | 254,987 | ||||||||
Hokuhoku Financial Group, Inc. | 10,000 | 20,385 | ||||||||
Hokuriku Electric Power Co. | 1,400 | 20,690 | ||||||||
Honda Motor Co., Ltd. | 15,100 | 482,619 | ||||||||
Hoshizaki Electric Co., Ltd. | 400 | 24,866 | ||||||||
| Shares | Value | |||||||||
Hoya Corporation | 3,900 | $ | 159,481 | |||||||
Hulic Co., Ltd. | 2,400 | 21,073 | ||||||||
Idemitsu Kosan Co., Ltd. | 700 | 11,177 | ||||||||
IHI Corporation | 15,000 | 41,407 | ||||||||
Iida Group Holdings Co., Ltd. | 1,200 | 22,241 | ||||||||
Inpex Corporation | 9,300 | 90,665 | ||||||||
Isetan Mitsukoshi Holdings, Ltd. | 3,600 | 46,948 | ||||||||
Isuzu Motors, Ltd. | 5,400 | 58,172 | ||||||||
ITOCHU Corporation | 14,600 | 172,695 | ||||||||
Itochu Techno-Solutions Corporation | 400 | 7,970 | ||||||||
Iyo Bank, Ltd. (The) | 2,000 | 19,431 | ||||||||
J. Front Retailing Co., Ltd. | 2,000 | 29,075 | ||||||||
Japan Airlines Co., Ltd. | 1,300 | 46,531 | ||||||||
Japan Airport Terminal Co., Ltd. | 400 | 17,708 | ||||||||
Japan Exchange Group, Inc. | 5,200 | 81,285 | ||||||||
Japan Post Bank Co., Ltd.* | 3,800 | 55,327 | ||||||||
Japan Post Holdings Co., Ltd.* | 4,200 | 65,169 | ||||||||
Japan Prime Realty Investment Corporation REIT | 9 | 30,734 | ||||||||
Japan Real Estate Investment Corporation REIT | 13 | 63,086 | ||||||||
Japan Retail Fund Investment Corporation REIT | 25 | 48,097 | ||||||||
JFE Holdings, Inc. | 4,400 | 69,091 | ||||||||
JGC Corporation | 2,000 | 30,612 | ||||||||
Joyo Bank, Ltd. | 5,000 | 23,644 | ||||||||
JSR Corporation | 1,500 | 23,377 | ||||||||
JTEKT Corporation | 1,700 | 27,826 | ||||||||
JX Holdings, Inc. | 22,100 | 92,755 | ||||||||
Kajima Corporation | 7,000 | 41,660 | ||||||||
Kakaku.com, Inc.D | 1,200 | 23,604 | ||||||||
Kamigumi Co., Ltd. | 2,000 | 17,220 | ||||||||
Kaneka Corporation | 3,000 | 31,183 | ||||||||
Kansai Electric Power Co., Inc. (The)* | 6,200 | 74,337 | ||||||||
Kansai Paint Co., Ltd. | 2,000 | 30,316 | ||||||||
Kao Corporation | 4,700 | 241,527 | ||||||||
Kawasaki Heavy Industries, Ltd. | 15,000 | 55,498 | ||||||||
KDDI Corporation | 16,500 | 428,508 | ||||||||
Keihan Electric Railway Co., Ltd. | 6,000 | 40,183 | ||||||||
Keikyu Corporation | 4,000 | 33,053 | ||||||||
Keio Corporation | 5,000 | 43,179 | ||||||||
Keisei Electric Railway Co., Ltd. | 3,000 | 38,275 | ||||||||
Keyence Corporation | 400 | 219,842 | ||||||||
Kikkoman Corporation | 1,000 | 34,647 | ||||||||
Kintetsu Group Holdings Co., Ltd. | 17,000 | 69,118 | ||||||||
Kobe Steel, Ltd. | 25,000 | 27,163 | ||||||||
Koito Manufacturing Co., Ltd. | 1,100 | 45,108 | ||||||||
Komatsu, Ltd. | 8,500 | 139,081 | ||||||||
Konami Corporation | 800 | 19,044 | ||||||||
Konica Minolta, Inc. | 4,700 | 47,071 | ||||||||
Kose Corporation | 300 | 27,738 | ||||||||
Kubota Corporation | 10,000 | 154,486 | ||||||||
Kuraray Co., Ltd. | 3,600 | 43,606 | ||||||||
Kurita Water Industries, Ltd. | 900 | 18,847 | ||||||||
Kyocera Corporation | 3,000 | 139,322 | ||||||||
Kyowa Hakko Kirin Co., Ltd. | 2,000 | 31,469 | ||||||||
Kyushu Electric Power Co., Inc.* | 4,400 | 47,956 | ||||||||
| See Notes to Financial Statements. | 203 |
Table of Contents
INTERNATIONAL EQUITY INDEX FUND
SCHEDULE OF INVESTMENTS (Continued)
| Shares | Value | |||||||||
Kyushu Financial Group, Inc.* | 3,700 | $ | 26,073 | |||||||
Lawson, Inc. | 600 | 48,703 | ||||||||
LIXIL Group Corporation | 2,600 | 57,745 | ||||||||
M3, Inc.D | 2,100 | 43,542 | ||||||||
Mabuchi Motor Co., Ltd. | 400 | 21,678 | ||||||||
Makita Corporation | 1,200 | 69,152 | ||||||||
Marubeni Corporation | 16,300 | 83,800 | ||||||||
Marui Group Co., Ltd. | 1,900 | 30,918 | ||||||||
Maruichi Steel Tube, Ltd. | 400 | 11,809 | ||||||||
Mazda Motor Corporation | 4,900 | 101,110 | ||||||||
McDonald’s Holdings Co. Japan, Ltd.D | 500 | 10,873 | ||||||||
Medipal Holdings Corporation | 1,100 | 18,748 | ||||||||
MEIJI Holdings Co., Ltd. | 1,200 | 99,120 | ||||||||
Minebea Co., Ltd. | 3,000 | 25,686 | ||||||||
Miraca Holdings, Inc. | 500 | 22,001 | ||||||||
Mitsubishi Chemical Holdings Corporation | 12,200 | 77,406 | ||||||||
Mitsubishi Corporation | 12,600 | 209,577 | ||||||||
Mitsubishi Electric Corporation | 18,000 | 188,943 | ||||||||
Mitsubishi Estate Co., Ltd. | 12,000 | 249,520 | ||||||||
Mitsubishi Gas Chemical Co., Inc. | 3,000 | 15,341 | ||||||||
Mitsubishi Heavy Industries, Ltd. | 28,000 | 122,430 | ||||||||
Mitsubishi Logistics Corporation | 1,000 | 13,176 | ||||||||
Mitsubishi Materials Corporation | 12,000 | 37,796 | ||||||||
Mitsubishi Motors Corporation | 6,300 | 53,301 | ||||||||
Mitsubishi Tanabe Pharma Corporation | 2,400 | 41,349 | ||||||||
Mitsubishi UFJ Financial Group, Inc. | 118,700 | 735,257 | ||||||||
Mitsubishi UFJ Lease & Finance Co., Ltd. | 4,000 | 20,585 | ||||||||
Mitsui & Co., Ltd. | 15,900 | 188,924 | ||||||||
Mitsui Chemicals, Inc. | 7,000 | 31,045 | ||||||||
Mitsui Fudosan Co., Ltd. | 9,000 | 225,881 | ||||||||
Mitsui OSK Lines, Ltd. | 13,000 | 32,790 | ||||||||
Mixi, Inc. | 300 | 11,221 | ||||||||
Mizuho Financial Group, Inc. | 218,000 | 436,000 | ||||||||
MS&AD Insurance Group Holdings, Inc. | 4,600 | 134,893 | ||||||||
Murata Manufacturing Co., Ltd. | 1,900 | 273,374 | ||||||||
Nabtesco Corporation | 1,000 | 20,315 | ||||||||
Nagoya Railroad Co., Ltd. | 7,000 | 29,135 | ||||||||
NEC Corporation | 25,000 | 79,213 | ||||||||
Nexon Co., Ltd. | 1,000 | 16,268 | ||||||||
NGK Insulators, Ltd. | 2,000 | 45,080 | ||||||||
NGK Spark Plug Co., Ltd. | 1,900 | 50,024 | ||||||||
NH Foods, Ltd. | 2,000 | 39,200 | ||||||||
NHK Spring Co., Ltd. | 1,300 | 13,034 | ||||||||
Nidec Corporation | 2,100 | 152,284 | ||||||||
Nikon CorporationD | 3,500 | 46,877 | ||||||||
Nintendo Co., Ltd. | 1,000 | 137,510 | ||||||||
Nippon Building Fund, Inc. REIT | 14 | 66,900 | ||||||||
Nippon Electric Glass Co., Ltd. | 3,000 | 15,121 | ||||||||
Nippon Express Co., Ltd. | 7,000 | 32,895 | ||||||||
Nippon Paint Holdings Co., Ltd. | 1,200 | 29,042 | ||||||||
Nippon Prologis, Inc. REIT | 12 | 21,707 | ||||||||
Nippon Steel & Sumitomo Metal Corporation | 7,000 | 138,477 | ||||||||
| Shares | Value | |||||||||
Nippon Telegraph & Telephone Corporation | 7,100 | $ | 282,567 | |||||||
Nippon Yusen KK | 17,000 | 41,203 | ||||||||
Nissan Motor Co., Ltd. | 23,600 | 247,110 | ||||||||
Nisshin Seifun Group, Inc. | 2,300 | 37,569 | ||||||||
Nissin Foods Holdings Co., Ltd. | 700 | 37,145 | ||||||||
Nitori Holdings Co., Ltd. | 700 | 58,787 | ||||||||
Nitto Denko Corporation | 1,600 | 116,809 | ||||||||
NOK Corporation | 800 | 18,689 | ||||||||
Nomura Holdings, Inc. | 33,800 | 188,268 | ||||||||
Nomura Real Estate Master Fund, Inc. REIT* | 37 | 45,990 | ||||||||
Nomura Real Estate Holdings, Inc. | 1,000 | 18,552 | ||||||||
Nomura Research Institute, Ltd. | 1,290 | 49,541 | ||||||||
NSK, Ltd. | 4,700 | 51,070 | ||||||||
NTT Data Corporation | 1,200 | 58,015 | ||||||||
NTT DOCOMO, Inc. | 13,600 | 278,958 | ||||||||
NTT Urban Development Corporation | 900 | 8,647 | ||||||||
Obayashi Corporation | 6,000 | 55,363 | ||||||||
Obic Co., Ltd.D | 600 | 31,761 | ||||||||
Odakyu Electric Railway Co., Ltd. | 6,000 | 64,601 | ||||||||
Oji Holdings Corporation | 8,000 | 32,152 | ||||||||
Olympus Corporation | 2,500 | 98,422 | ||||||||
Omron Corporation | 1,700 | 56,690 | ||||||||
Ono Pharmaceutical Co., Ltd. | 800 | 142,649 | ||||||||
Oracle Corporation | 300 | 13,968 | ||||||||
Oriental Land Co., Ltd. | 1,900 | 114,943 | ||||||||
ORIX Corporation | 12,200 | 171,147 | ||||||||
Osaka Gas Co., Ltd. | 17,000 | 61,403 | ||||||||
Otsuka Corporation | 400 | 19,650 | ||||||||
Otsuka Holdings Co., Ltd. | 3,700 | 131,457 | ||||||||
Panasonic Corporation | 20,300 | 205,792 | ||||||||
Park24 Co., Ltd. | 800 | 19,382 | ||||||||
Rakuten, Inc. | 8,400 | 96,749 | ||||||||
Recruit Holdings Co., Ltd. | 1,400 | 41,151 | ||||||||
Resona Holdings, Inc. | 20,700 | 100,524 | ||||||||
Ricoh Co., Ltd. | 6,400 | 65,900 | ||||||||
Rinnai Corporation | 300 | 26,581 | ||||||||
Rohm Co., Ltd. | 1,000 | 50,651 | ||||||||
Ryohin Keikaku Co., Ltd. | 200 | 40,502 | ||||||||
Sanrio Co., Ltd.D | 400 | 9,397 | ||||||||
Santen Pharmaceutical Co., Ltd. | 3,600 | 59,268 | ||||||||
SBI Holdings, Inc. | 1,700 | 18,345 | ||||||||
Secom Co., Ltd. | 2,000 | 135,540 | ||||||||
Seibu Holdings, Inc. | 1,000 | 20,422 | ||||||||
Seiko Epson CorporationD | 2,300 | 35,418 | ||||||||
Sekisui Chemical Co., Ltd. | 4,000 | 52,225 | ||||||||
Sekisui House, Ltd. | 5,600 | 94,157 | ||||||||
Seven & i Holdings Co., Ltd. | 7,000 | 320,492 | ||||||||
Seven Bank, Ltd. | 4,800 | 21,050 | ||||||||
Shikoku Electric Power Co., Inc. | 1,400 | 21,870 | ||||||||
Shimadzu Corporation | 3,000 | 50,220 | ||||||||
Shimamura Co., Ltd. | 200 | 23,422 | ||||||||
Shimano, Inc. | 800 | 122,847 | ||||||||
Shimizu Corporation | 5,000 | 40,771 | ||||||||
Shin-Etsu Chemical Co., Ltd. | 3,800 | 206,590 | ||||||||
Shinsei Bank, Ltd. | 19,000 | 34,966 | ||||||||
Shionogi & Co., Ltd. | 2,900 | 131,168 | ||||||||
Shiseido Co., Ltd. | 3,200 | 66,396 | ||||||||
Shizuoka Bank, Ltd. (The) | 5,000 | 48,490 | ||||||||
| 204 | See Notes to Financial Statements. |
Table of Contents
| Shares | Value | |||||||||
Showa Shell Sekiyu KK | 1,500 | $ | 12,240 | |||||||
SMC Corporation | 500 | 129,867 | ||||||||
SoftBank Group Corporation | 8,900 | 449,187 | ||||||||
Sohgo Security Services Co., Ltd. | 600 | 28,139 | ||||||||
Sompo Japan Nipponkoa Holdings, Inc. | 3,200 | 105,071 | ||||||||
Sony Corporation | 11,600 | 285,091 | ||||||||
Sony Financial Holdings, Inc. | 1,400 | 25,042 | ||||||||
Stanley Electric Co., Ltd. | 1,200 | 26,325 | ||||||||
Sumitomo Chemical Co., Ltd. | 13,000 | 74,660 | ||||||||
Sumitomo Corporation | 10,500 | 107,051 | ||||||||
Sumitomo Dainippon Pharma Co., Ltd. | 1,300 | 15,316 | ||||||||
Sumitomo Electric Industries, Ltd. | 7,200 | 101,670 | ||||||||
Sumitomo Heavy Industries, Ltd. | 6,000 | 26,897 | ||||||||
Sumitomo Metal Mining Co., Ltd. | 5,000 | 60,695 | ||||||||
Sumitomo Mitsui Financial Group, Inc. | 11,800 | 445,344 | ||||||||
Sumitomo Mitsui Trust Holdings, Inc. | 30,000 | 113,620 | ||||||||
Sumitomo Realty & Development Co., Ltd. | 3,000 | 85,628 | ||||||||
Sumitomo Rubber Industries, Inc. | 1,400 | 18,205 | ||||||||
Suntory Beverage & Food, Ltd. | 1,300 | 56,909 | ||||||||
Suruga Bank, Ltd. | 1,500 | 30,913 | ||||||||
Suzuken Co., Ltd. | 900 | 34,202 | ||||||||
Suzuki Motor Corporation | 3,300 | 100,267 | ||||||||
Sysmex Corporation | 1,300 | 83,388 | ||||||||
T&D Holdings, Inc. | 5,300 | 69,926 | ||||||||
Taiheiyo Cement Corporation | 12,000 | 35,044 | ||||||||
Taisei Corporation | 10,000 | 65,870 | ||||||||
Taisho Pharmaceutical Holdings Co., Ltd. | 300 | 21,188 | ||||||||
Taiyo Nippon Sanso Corporation | 1,200 | 10,853 | ||||||||
Takashimaya Co., Ltd. | 3,000 | 27,016 | ||||||||
Takeda Pharmaceutical Co., Ltd. | 7,300 | 363,974 | ||||||||
TDK Corporation | 1,100 | 70,448 | ||||||||
Teijin, Ltd. | 8,000 | 27,263 | ||||||||
Terumo Corporation | 2,700 | 83,682 | ||||||||
THK Co., Ltd. | 1,000 | 18,534 | ||||||||
Tobu Railway Co., Ltd. | 10,000 | 49,324 | ||||||||
Toho Co., Ltd. | 900 | 24,905 | ||||||||
Toho Gas Co., Ltd. | 5,000 | 32,291 | ||||||||
Tohoku Electric Power Co., Inc. | 4,100 | 51,255 | ||||||||
Tokio Marine Holdings, Inc. | 6,200 | 239,473 | ||||||||
Tokyo Electric Power Co., Inc.* | 14,000 | 80,616 | ||||||||
Tokyo Electron, Ltd. | 1,500 | 90,877 | ||||||||
Tokyo Gas Co., Ltd. | 22,000 | 103,373 | ||||||||
Tokyo Tatemono Co., Ltd. | 2,300 | 25,033 | ||||||||
Tokyu Corporation | 11,000 | 86,926 | ||||||||
Tokyu Fudosan Holdings Corporation | 5,600 | 35,100 | ||||||||
TonenGeneral Sekiyu KKD | 3,000 | 25,326 | ||||||||
Toppan Printing Co., Ltd. | 5,000 | 46,066 | ||||||||
Toray Industries, Inc. | 14,000 | 130,095 | ||||||||
Toshiba Corporation* | 36,000 | 73,988 | ||||||||
TOTO, Ltd. | 1,200 | 42,158 | ||||||||
| Shares | Value | |||||||||
Toyo Seikan Group Holdings, Ltd. | 1,300 | $ | 24,114 | |||||||
Toyo Suisan Kaisha, Ltd. | 1,000 | 34,853 | ||||||||
Toyoda Gosei Co., Ltd. | 500 | 11,358 | ||||||||
Toyota Industries Corporation | 1,600 | 85,557 | ||||||||
Toyota Motor Corporation | 25,400 | 1,564,107 | ||||||||
Toyota Tsusho Corporation | 2,100 | 49,125 | ||||||||
Trend Micro, Inc. | 900 | 36,519 | ||||||||
Unicharm CorporationD | 3,300 | 67,392 | ||||||||
United Urban Investment Corporation REIT | 28 | 38,012 | ||||||||
USS Co., Ltd. | 1,800 | 27,046 | ||||||||
West Japan Railway Co. | 1,600 | 110,597 | ||||||||
Yahoo Japan Corporation | 12,200 | 49,592 | ||||||||
Yakult Honsha Co., Ltd. | 900 | 44,050 | ||||||||
Yamada Denki Co., Ltd. | 5,500 | 23,757 | ||||||||
Yamaguchi Financial Group, Inc. | 2,000 | 23,694 | ||||||||
Yamaha Corporation | 1,800 | 43,478 | ||||||||
Yamaha Motor Co., Ltd. | 2,400 | 53,797 | ||||||||
Yamato Holdings Co., Ltd. | 3,000 | 63,564 | ||||||||
Yamazaki Baking Co., Ltd. | 1,000 | 22,486 | ||||||||
Yaskawa Electric Corporation | 2,600 | 35,377 | ||||||||
Yokogawa Electric Corporation | 1,800 | 21,647 | ||||||||
Yokohama Rubber Co., Ltd. (The) | 1,000 | 15,358 | ||||||||
|
| |||||||||
| 26,005,106 | ||||||||||
|
| |||||||||
Jersey — 1.0% | ||||||||||
Experian PLC | 8,860 | 156,596 | ||||||||
Glencore PLC* | 115,184 | 152,635 | ||||||||
Petrofac, Ltd. | 2,095 | 24,574 | ||||||||
Randgold Resources, Ltd. | 803 | 49,470 | ||||||||
Shire PLC | 5,571 | 382,214 | ||||||||
Wolseley PLC | 2,337 | 126,930 | ||||||||
WPP PLC | 11,992 | 275,839 | ||||||||
|
| |||||||||
| 1,168,258 | ||||||||||
|
| |||||||||
Luxembourg — 0.2% | ||||||||||
ArcelorMittalD | 9,982 | 42,116 | ||||||||
Millicom International Cellular SA SDR | 536 | 30,756 | ||||||||
RTL Group SA | 313 | 26,065 | ||||||||
SES SA | 3,223 | 89,309 | ||||||||
Tenaris SAD | 4,049 | 47,946 | ||||||||
|
| |||||||||
| 236,192 | ||||||||||
|
| |||||||||
Mauritius — 0.0% | ||||||||||
Golden Agri-Resources, Ltd. | 62,700 | 14,977 | ||||||||
|
| |||||||||
Netherlands — 3.4% | ||||||||||
Aegon NVD | 17,407 | 98,445 | ||||||||
AerCap Holdings NV* | 800 | 34,528 | ||||||||
Airbus Group SED | 5,447 | 367,061 | ||||||||
Akzo Nobel NV | 2,379 | 158,963 | ||||||||
Altice NV Class A* | 3,520 | 50,573 | ||||||||
Altice NV Class B* | 730 | 10,640 | ||||||||
ASML Holding NVD | 3,279 | 291,346 | ||||||||
Boskalis Westminster | 918 | 37,447 | ||||||||
CNH Industrial NVD | 8,208 | 56,216 | ||||||||
Fiat Chrysler Automobiles NVD* | 8,663 | 120,311 | ||||||||
Gemalto NV | 809 | 48,542 | ||||||||
ING Groep NV CVA | 36,379 | 492,212 | ||||||||
Koninklijke Ahold NV | 7,710 | 162,631 | ||||||||
Koninklijke DSM NV | 1,644 | 82,440 | ||||||||
Koninklijke KPN NV | 30,143 | 114,012 | ||||||||
| See Notes to Financial Statements. | 205 |
Table of Contents
INTERNATIONAL EQUITY INDEX FUND
SCHEDULE OF INVESTMENTS (Continued)
| Shares | Value | |||||||||
Koninklijke Philips NV | 8,793 | $ | 224,436 | |||||||
Koninklijke Vopak NV | 570 | 24,547 | ||||||||
Mobileye NVD* | 800 | 33,824 | ||||||||
NN Group NV | 2,321 | 81,892 | ||||||||
NXP Semiconductor NVD* | 1,262 | 106,324 | ||||||||
OCI NV* | 684 | 16,889 | ||||||||
QIAGEN NV* | 2,001 | 54,236 | ||||||||
Randstad Holding NV | 1,201 | 74,788 | ||||||||
RELX NV | 9,275 | 156,213 | ||||||||
STMicroelectronics NV | 6,571 | 43,992 | ||||||||
TNT Express NV | 5,216 | 44,122 | ||||||||
Unilever NV CVA | 15,038 | 655,421 | ||||||||
Wolters Kluwer NV | 2,894 | 97,191 | ||||||||
|
| |||||||||
| 3,739,242 | ||||||||||
|
| |||||||||
New Zealand — 0.2% | ||||||||||
Auckland International Airport, Ltd. | 8,625 | 33,837 | ||||||||
Contact Energy, Ltd. | 7,151 | 23,145 | ||||||||
Fletcher Building, Ltd. | 7,654 | 38,358 | ||||||||
Meridian Energy, Ltd. | 12,874 | 20,994 | ||||||||
Mighty River Power, Ltd.D | 4,302 | 8,163 | ||||||||
Ryman Healthcare, Ltd. | 2,667 | 15,478 | ||||||||
Spark New Zealand, Ltd. | 18,489 | 41,631 | ||||||||
|
| |||||||||
| 181,606 | ||||||||||
|
| |||||||||
Norway — 0.6% | ||||||||||
DNB ASA | 8,673 | 106,862 | ||||||||
Gjensidige Forsikring ASA | 1,624 | 25,992 | ||||||||
Norsk Hydro ASA | 13,545 | 50,348 | ||||||||
Orkla ASA | 7,423 | 58,560 | ||||||||
Schibsted ASA Class A | 715 | 23,507 | ||||||||
Schibsted ASA, B Shares* | 846 | 26,962 | ||||||||
Statoil ASA | 10,732 | 149,677 | ||||||||
Telenor ASA | 6,985 | 116,430 | ||||||||
Yara International ASA | 1,747 | 75,135 | ||||||||
|
| |||||||||
| 633,473 | ||||||||||
|
| |||||||||
Papua New Guinea — 0.1% | ||||||||||
Oil Search, Ltd. | 12,840 | 62,497 | ||||||||
|
| |||||||||
Portugal — 0.1% | ||||||||||
Banco Comercial Portugues SA, Series R* | 308,177 | 16,331 | ||||||||
EDP - Energias de Portugal SA | 21,802 | 78,561 | ||||||||
Galp Energia SGPS SA | 4,056 | 47,328 | ||||||||
Jeronimo Martins SGPS SA | 2,049 | 26,663 | ||||||||
|
| |||||||||
| 168,883 | ||||||||||
|
| |||||||||
Singapore — 1.2% | ||||||||||
Ascendas Real Estate | ||||||||||
Investment Trust REIT | 18,100 | 29,008 | ||||||||
CapitaLand Commercial Trust, Ltd. REIT | 16,400 | 15,560 | ||||||||
CapitaLand Mall Trust REIT | 20,600 | 27,952 | ||||||||
CapitaLand, Ltd. | 23,800 | 55,942 | ||||||||
City Developments, Ltd. | 3,800 | 20,442 | ||||||||
ComfortDelGro Corporation, Ltd. | 19,600 | 41,969 | ||||||||
DBS Group Holdings, Ltd. | 16,400 | 192,200 | ||||||||
Global Logistic Properties, Ltd. | 28,000 | 42,284 | ||||||||
Hutchison Port Holdings Trust Class U | 53,700 | 28,461 | ||||||||
Jardine Cycle & Carriage, Ltd. | 1,111 | 27,161 | ||||||||
Keppel Corporation, Ltd. | 14,700 | 67,152 | ||||||||
| Shares | Value | |||||||||
Oversea-Chinese Banking Corporation, Ltd. | 28,647 | $ | 177,108 | |||||||
Sembcorp Industries, Ltd. | 9,800 | 21,006 | ||||||||
Sembcorp Marine, Ltd. | 9,200 | 11,320 | ||||||||
Singapore Airlines, Ltd. | 5,600 | 44,125 | ||||||||
Singapore Exchange, Ltd. | 7,800 | 42,186 | ||||||||
Singapore Press Holdings, Ltd. | 13,400 | 37,142 | ||||||||
Singapore Technologies | ||||||||||
Engineering, Ltd. | 16,100 | 34,034 | ||||||||
Singapore Telecommunications, Ltd. | 73,600 | 189,760 | ||||||||
StarHub, Ltd. | 4,000 | 10,410 | ||||||||
Suntec Real Estate Investment Trust REIT | 18,200 | 19,821 | ||||||||
United Overseas Bank, Ltd. | 12,300 | 169,578 | ||||||||
UOL Group, Ltd. | 4,400 | 19,284 | ||||||||
Wilmar International, Ltd.D | 17,200 | 35,489 | ||||||||
Yangzijiang Shipbuilding Holdings, Ltd. | 23,400 | 18,078 | ||||||||
|
| |||||||||
| 1,377,472 | ||||||||||
|
| |||||||||
Spain — 3.3% | ||||||||||
Abertis Infraestructuras SA | 3,351 | 52,408 | ||||||||
ACS Actividades de Construccion y Servicios SA | 1,773 | 51,874 | ||||||||
Aena SA 144A* | 664 | 76,035 | ||||||||
Amadeus IT Holding SA, A Shares | 4,140 | 182,470 | ||||||||
Banco Bilbao Vizcaya Argentaria SA | 58,875 | 430,189 | ||||||||
Banco de Sabadell SA | 48,736 | 86,375 | ||||||||
Banco Popular Espanol SA | 15,176 | 50,003 | ||||||||
Banco Santander SA | 135,219 | 665,195 | ||||||||
Bankia SA | 45,814 | 53,315 | ||||||||
Bankinter SA | 6,854 | 48,604 | ||||||||
CaixaBank SA | 25,824 | 89,884 | ||||||||
Distribuidora Internacional de Alimentacion SA* | 6,556 | 38,668 | ||||||||
Enagas SA | 1,879 | 53,003 | ||||||||
Endesa SA | 3,073 | 61,736 | ||||||||
Ferrovial SA | 4,151 | 93,870 | ||||||||
Gas Natural SDG SA | 3,184 | 64,929 | ||||||||
Grifols SA | 1,338 | 61,845 | ||||||||
Iberdrola SA | 49,608 | 351,672 | ||||||||
Industria de Diseno Textil SA | 10,190 | 350,070 | ||||||||
International Consolidated Airlines Group SA | 7,281 | 65,261 | ||||||||
Mapfre SAD | 8,693 | 21,760 | ||||||||
Red Electrica Corporacion SA | 1,056 | 88,208 | ||||||||
Repsol SA | 9,629 | 106,009 | ||||||||
Telefonica SA* | 41,788 | 463,595 | ||||||||
Zardoya Otis SA | 1,462 | 17,099 | ||||||||
|
| |||||||||
| 3,624,077 | ||||||||||
|
| |||||||||
Sweden — 2.8% | ||||||||||
Alfa Laval AB | 2,935 | 53,582 | ||||||||
Assa Abloy AB Class B | 9,569 | 200,305 | ||||||||
Atlas Copco AB, A Shares | 6,139 | 150,558 | ||||||||
Atlas Copco AB, B Shares | 3,756 | 86,352 | ||||||||
Boliden AB | 2,787 | 46,694 | ||||||||
Electrolux AB, Series B | 2,409 | 58,123 | ||||||||
Getinge AB, B Shares | 2,020 | 52,914 | ||||||||
Hennes & Mauritz AB, B Shares | 8,991 | 319,812 | ||||||||
Hexagon AB, B Shares | 2,571 | 95,109 | ||||||||
Husqvarna AB, B Shares | 3,327 | 21,956 | ||||||||
| 206 | See Notes to Financial Statements. |
Table of Contents
| Shares | Value | |||||||||
ICA Gruppen AB | 628 | $ | 22,807 | |||||||
Industrivarden AB, C Shares | 1,472 | 25,183 | ||||||||
Investment AB Kinnevik, B Shares | 2,101 | 64,713 | ||||||||
Investor AB, B Shares | 4,225 | 155,270 | ||||||||
Lundin Petroleum ABD* | 1,760 | 25,396 | ||||||||
Nordea Bank AB | 27,863 | 305,706 | ||||||||
Sandvik AB | 10,264 | 89,471 | ||||||||
Securitas AB, B Shares Skandinaviska Enskilda | 3,202 | 48,961 | ||||||||
Banken AB Class A | 13,934 | 146,537 | ||||||||
Skanska AB, B Shares | 3,403 | 65,996 | ||||||||
SKF AB, B Shares | 3,452 | 55,754 | ||||||||
Svenska Cellulosa AB SCA Class B | 5,338 | 154,696 | ||||||||
Svenska Handelsbanken AB, A Shares | 13,680 | 181,691 | ||||||||
Swedbank AB, A Shares | 8,570 | 188,742 | ||||||||
Tele2 AB, B Shares | 2,588 | 25,809 | ||||||||
Telefonaktiebolaget LM Ericsson, B Shares | 27,951 | 269,484 | ||||||||
TeliaSonera AB | 25,067 | 124,480 | ||||||||
Volvo AB, B Shares | 14,022 | 130,020 | ||||||||
|
| |||||||||
| 3,166,121 | ||||||||||
|
| |||||||||
Switzerland — 9.8% | ||||||||||
ABB, Ltd.* | 20,377 | 363,681 | ||||||||
Actelion, Ltd.* | 989 | 137,415 | ||||||||
Adecco SA* | 1,536 | 105,128 | ||||||||
Aryzta AGD* | 919 | 46,491 | ||||||||
Baloise Holding AG | 489 | 61,975 | ||||||||
Barry Callebaut AGD* | 18 | 19,552 | ||||||||
Chocoladefabriken Lindt & Spruengli AG | 11 | 136,948 | ||||||||
Cie Financiere Richemont SAD | 4,807 | 344,051 | ||||||||
Coca-Cola HBC AG* | 2,037 | 43,379 | ||||||||
Credit Suisse Group AG* | 16,972 | 365,610 | ||||||||
Dufry AGD* | 354 | 42,120 | ||||||||
EMS-Chemie Holding AG | 67 | 29,486 | ||||||||
Galenica AG | 36 | 56,324 | ||||||||
Geberit AG | 348 | 117,869 | ||||||||
Givaudan SA* | 84 | 152,457 | ||||||||
Julius Baer Group, Ltd.* | 2,120 | 102,560 | ||||||||
Kuehne + Nagel International AG* | 545 | 74,665 | ||||||||
LafargeHolcim, Ltd.D* | 3,935 | 197,775 | ||||||||
Lonza Group AG* | 488 | 79,366 | ||||||||
Nestle SA | 29,700 | 2,204,787 | ||||||||
Novartis AG | 21,201 | 1,823,695 | ||||||||
Pargesa Holding SA | 251 | 15,857 | ||||||||
Partners Group Holding AG | 149 | 53,585 | ||||||||
Roche Holding AG | 6,544 | 1,813,397 | ||||||||
Schindler Holding AGD | 586 | 98,261 | ||||||||
SGS SA | 52 | 98,826 | ||||||||
Sika AG | 20 | 72,276 | ||||||||
Sonova Holding AGD | 503 | 63,908 | ||||||||
Sulzer AG | 195 | 18,329 | ||||||||
Swatch Group AG (The)D | 690 | 127,439 | ||||||||
Swiss Life Holding AG* | 296 | 79,727 | ||||||||
Swiss Prime Site AG* | 669 | 52,247 | ||||||||
Swiss Re AG* | 3,242 | 316,634 | ||||||||
Swisscom AG | 239 | 119,597 | ||||||||
Syngenta AG | 876 | 342,869 | ||||||||
Transocean, Ltd.D | 3,598 | 44,977 | ||||||||
UBS Group AG* | 34,295 | 665,305 | ||||||||
| Shares | Value | |||||||||
Zurich Insurance Group AG* | 1,419 | $ | 364,541 | |||||||
|
| |||||||||
| 10,853,109 | ||||||||||
|
| |||||||||
United Kingdom — 16.5% | ||||||||||
3i Group PLC | 9,582 | 67,878 | ||||||||
Aberdeen Asset Management PLC | 7,861 | 33,498 | ||||||||
Admiral Group PLC | 2,090 | 51,071 | ||||||||
Aggreko PLC | 2,730 | 36,751 | ||||||||
Amec Foster Wheeler PLC | 3,137 | 19,803 | ||||||||
Anglo American PLC* | 13,517 | 59,302 | ||||||||
Antofagasta PLC | 3,193 | 21,964 | ||||||||
ARM Holdings PLC | 12,827 | 195,511 | ||||||||
Ashtead Group PLC | 4,397 | 72,366 | ||||||||
Associated British Foods PLC | 3,336 | 164,156 | ||||||||
AstraZeneca PLC | 11,715 | 791,322 | ||||||||
Auto Trader Group PLC 144A* | 6,879 | 44,850 | ||||||||
Aviva PLC | 37,791 | 286,853 | ||||||||
Babcock International Group PLC | 2,030 | 30,379 | ||||||||
BAE Systems PLC | 29,209 | 215,053 | ||||||||
Barclays PLC | 155,347 | 500,029 | ||||||||
Barratt Developments PLC | 9,738 | 89,733 | ||||||||
BG Group PLC | 31,700 | 459,521 | ||||||||
BHP Billiton PLC | 19,978 | 222,792 | ||||||||
BP PLC | 169,706 | 881,914 | ||||||||
British Land Co. PLC (The) REIT | 9,258 | 107,124 | ||||||||
BT Group PLC | 78,237 | 543,248 | ||||||||
Bunzl PLC | 3,114 | 86,396 | ||||||||
Burberry Group PLC | 4,342 | 76,394 | ||||||||
Capita PLC | 6,181 | 109,976 | ||||||||
Carnival PLC | 1,766 | 100,649 | ||||||||
Centrica PLC | 47,501 | 152,525 | ||||||||
Cobham PLC | 11,462 | 47,864 | ||||||||
Compass Group PLC | 15,106 | 261,762 | ||||||||
Croda International PLC | 1,331 | 59,636 | ||||||||
Direct Line Insurance Group PLC | 12,441 | 74,573 | ||||||||
Dixons Carphone PLC | 9,192 | 67,645 | ||||||||
easyJet PLC | 1,707 | 43,780 | ||||||||
Fresnillo PLC | 1,790 | 18,611 | ||||||||
G4S PLC | 14,238 | 47,296 | ||||||||
GKN PLC | 16,263 | 73,800 | ||||||||
GlaxoSmithKline PLC | 45,066 | 910,151 | ||||||||
Hammerson PLC REIT | 6,909 | 61,078 | ||||||||
Hargreaves Lansdown PLC | 2,583 | 57,345 | ||||||||
HSBC Holdings PLC | 182,364 | 1,439,630 | ||||||||
ICAP PLC | 4,817 | 36,157 | ||||||||
IMI PLC | 2,914 | 36,977 | ||||||||
Inmarsat PLC | 3,933 | 65,935 | ||||||||
InterContinental Hotels Group PLC | 2,298 | 89,573 | ||||||||
Intertek Group PLC | 1,393 | 56,983 | ||||||||
Intu Properties PLC REIT | 9,574 | 44,729 | ||||||||
Investec PLC | 4,759 | 33,556 | ||||||||
ITV PLC | 35,424 | 144,224 | ||||||||
J Sainsbury PLCD | 13,356 | 50,863 | ||||||||
Johnson Matthey PLC | 1,818 | 71,117 | ||||||||
Kingfisher PLC | 21,820 | 105,685 | ||||||||
Land Securities Group PLC REIT | 7,421 | 128,644 | ||||||||
Legal & General Group PLC | 55,832 | 220,309 | ||||||||
Lloyds Banking Group PLC | 534,152 | 574,748 | ||||||||
London Stock Exchange Group PLC | 2,836 | 114,740 | ||||||||
| See Notes to Financial Statements. | 207 |
Table of Contents
INTERNATIONAL EQUITY INDEX FUND
SCHEDULE OF INVESTMENTS (Continued)
| Shares | Value | |||||||||
Marks & Spencer Group PLC | 15,273 | $ | 101,691 | |||||||
Meggitt PLC | 6,459 | 35,662 | ||||||||
Melrose Industries PLC | 10,395 | 44,527 | ||||||||
Merlin Entertainments PLC 144A | 7,366 | 49,390 | ||||||||
Mondi PLC | 3,268 | 64,056 | ||||||||
National Grid PLC | 35,104 | 484,143 | ||||||||
Next PLC* | 1,350 | 144,952 | ||||||||
Old Mutual PLC | 47,053 | 123,781 | ||||||||
Pearson PLC | 7,882 | 85,209 | ||||||||
Persimmon PLC* | 2,787 | 83,146 | ||||||||
Provident Financial PLC | 1,367 | 67,780 | ||||||||
Prudential PLC | 23,992 | 540,531 | ||||||||
Reckitt Benckiser Group PLC | 5,883 | 544,336 | ||||||||
RELX PLC | 10,479 | 184,808 | ||||||||
Rexam PLC | 7,173 | 63,980 | ||||||||
Rio Tinto PLC | 11,617 | 338,234 | ||||||||
Rolls-Royce Holdings PLC+* | 1,447,047 | 2,133 | ||||||||
Rolls-Royce Holdings PLC * | 17,583 | 148,936 | ||||||||
Royal Bank of Scotland Group PLC* | 32,432 | 144,163 | ||||||||
Royal Dutch Shell PLC, A Shares | 36,389 | 824,185 | ||||||||
Royal Dutch Shell PLC, B Shares | 22,817 | 520,024 | ||||||||
Royal Mail PLC | 8,349 | 54,685 | ||||||||
RSA Insurance Group PLC | 9,714 | 60,969 | ||||||||
Sage Group PLC (The) | 10,537 | 93,623 | ||||||||
Schroders PLC | 1,096 | 48,004 | ||||||||
Segro PLC REIT | 7,550 | 47,780 | ||||||||
Severn Trent PLC | 2,099 | 67,098 | ||||||||
Sky PLC | 9,606 | 157,470 | ||||||||
Smith & Nephew PLC | 8,551 | 152,397 | ||||||||
Smiths Group PLC | 3,594 | 49,701 | ||||||||
Sports Direct International PLC* | 2,184 | 18,560 | ||||||||
SSE PLC | 9,083 | 203,949 | ||||||||
St. James’s Place PLC | 4,861 | 72,049 | ||||||||
Standard Chartered PLC | 30,979 | 257,039 | ||||||||
Standard Life PLC | 19,127 | 109,532 | ||||||||
Tate & Lyle PLC | 4,869 | 42,888 | ||||||||
Taylor Wimpey PLC | 29,291 | 87,562 | ||||||||
Tesco PLC* | 77,304 | 169,859 | ||||||||
Travis Perkins PLC | 2,298 | 66,666 | ||||||||
Unilever PLC | 11,898 | 510,334 | ||||||||
United Utilities Group PLC | 6,575 | 90,534 | ||||||||
Vodafone Group PLC | 248,735 | 806,595 | ||||||||
Weir Group PLC (The) | 2,307 | 33,887 | ||||||||
Whitbread PLC | 1,673 | 108,439 | ||||||||
WM Morrison Supermarkets PLCD | 22,203 | 48,378 | ||||||||
|
| |||||||||
| 18,312,134 | ||||||||||
|
| |||||||||
Total Foreign Common Stocks |
| 105,282,498 | ||||||||
|
| |||||||||
FOREIGN PREFERRED STOCKS — 0.5% |
| |||||||||
Germany — 0.5% |
| |||||||||
Bayerische Motoren Werke AG | ||||||||||
2.92%, 05/14/15 | 563 | 47,104 | ||||||||
FUCHS PETROLUB SE | ||||||||||
0.77%, 05/07/15 | 564 | 26,557 | ||||||||
Henkel AG & Co. KGaA | ||||||||||
1.31%, 04/14/15 | 1,694 | 189,055 | ||||||||
| Shares | Value | |||||||||
Porsche Automobil Holding SE | ||||||||||
2.01%, 05/14/15 | 1,453 | $ | 78,197 | |||||||
Volkswagen AG | ||||||||||
4.86%, 05/06/15 | 1,524 | 220,035 | ||||||||
|
| |||||||||
Total Foreign Preferred Stocks |
| 560,948 | ||||||||
|
| |||||||||
RIGHTS — 0.0% | ||||||||||
Ascendas Real Estate+ | 678 | — | ||||||||
Repsol SA* | 9,629 | 4,803 | ||||||||
Unione di Banche+ | 7,313 | — | ||||||||
|
| |||||||||
Total Rights | 4,803 | |||||||||
|
| |||||||||
MONEY MARKET FUNDS — 6.4% |
| |||||||||
GuideStone Money Market Fund (Institutional | 3,754,870 | 3,754,870 | ||||||||
Northern Institutional Liquid Assets Portfolio§ | 3,330,445 | 3,330,445 | ||||||||
|
| |||||||||
Total Money Market Funds |
| 7,085,315 | ||||||||
|
| |||||||||
TOTAL INVESTMENTS — 101.7% |
| 112,933,564 | ||||||||
|
| |||||||||
Liabilities in Excess of Other Assets — (1.7)% | (1,908,948 | ) | ||||||||
|
| |||||||||
NET ASSETS — 100.0% | $ | 111,024,616 | ||||||||
|
| |||||||||
| 208 | See Notes to Financial Statements. |
Table of Contents
VALUATION HIERARCHY
The following is a summary of the inputs used, as of December 31, 2015, in valuing the Fund’s investments carried at fair value:
| Total Value | Level 1 Quoted Prices | Level 2 Other Significant Observable Inputs | Level 3 Significant Unobservable Inputs | |||||||||||||||||
Assets: | ||||||||||||||||||||
Investments in Securities: | ||||||||||||||||||||
Foreign Common Stocks: | ||||||||||||||||||||
Australia | $ | 7,305,552 | $ | — | $ | 7,305,552 | $ | — | ||||||||||||
Austria | 213,661 | — | 213,661 | — | ||||||||||||||||
Belgium | 704,861 | — | 704,861 | — | ||||||||||||||||
Bermuda | 188,829 | — | 188,829 | — | ||||||||||||||||
Denmark | 1,030,367 | — | 1,030,367 | — | ||||||||||||||||
Finland | 1,023,030 | — | 1,023,030 | — | ||||||||||||||||
France | 10,005,851 | 147 | 10,005,704 | — | ||||||||||||||||
Germany | 8,841,259 | 31,646 | 8,809,613 | — | ||||||||||||||||
Hong Kong | 3,167,835 | 73,350 | 3,094,485 | — | ||||||||||||||||
Ireland | 499,941 | — | 499,941 | — | ||||||||||||||||
Israel | 287,374 | 64,283 | 223,091 | — | ||||||||||||||||
Italy | 2,470,791 | — | 2,470,791 | — | ||||||||||||||||
Japan | 26,005,106 | 192,560 | 25,812,546 | — | ||||||||||||||||
Jersey | 1,168,258 | — | 1,168,258 | — | ||||||||||||||||
Luxembourg | 236,192 | — | 236,192 | — | ||||||||||||||||
Mauritius | 14,977 | — | 14,977 | — | ||||||||||||||||
Netherlands | 3,739,242 | 1,322,309 | 2,416,933 | — | ||||||||||||||||
New Zealand | 181,606 | — | 181,606 | — | ||||||||||||||||
Norway | 633,473 | 26,962 | 606,511 | — | ||||||||||||||||
Papua New Guinea | 62,497 | — | 62,497 | — | ||||||||||||||||
Portugal | 168,883 | — | 168,883 | — | ||||||||||||||||
Singapore | 1,377,472 | 28,461 | 1,349,011 | — | ||||||||||||||||
Spain | 3,624,077 | — | 3,624,077 | — | ||||||||||||||||
Sweden | 3,166,121 | — | 3,166,121 | — | ||||||||||||||||
Switzerland | 10,853,109 | 74,501 | 10,778,608 | — | ||||||||||||||||
United Kingdom | 18,312,134 | 100,649 | 18,209,352 | 2,133 | ||||||||||||||||
Foreign Preferred Stocks: | ||||||||||||||||||||
Germany | 560,948 | — | 560,948 | — | ||||||||||||||||
Money Market Funds | 7,085,315 | 7,085,315 | — | — | ||||||||||||||||
Rights | 4,803 | 4,803 | — | — | ||||||||||||||||
|
|
|
|
|
|
|
| |||||||||||||
Total Assets - Investments in Securities | $ | 112,933,564 | $ | 9,004,986 | $ | 103,926,445 | $ | 2,133 | ||||||||||||
|
|
|
|
|
|
|
| |||||||||||||
Other Financial Instruments*** | ||||||||||||||||||||
Futures Contracts | 87,181 | 87,181 | — | — | ||||||||||||||||
|
|
|
|
|
|
|
| |||||||||||||
Total Assets - Other Financial Instruments | $ | 87,181 | $ | 87,181 | $ | — | $ | — | ||||||||||||
|
|
|
|
|
|
|
| |||||||||||||
***Other financial instruments are derivative instruments not reflected in the Schedule of Investments, such as futures, forwards and swap contracts, which are valued at the unrealized appreciation (depreciation) on the investment. Details of these investments can be found in the Notes to Financial Statements.
There were no transfers between Level 1 and Level 2 during the year ended December 31, 2015.
Management has determined that the amount of Level 3 securities compared to total net assets is not material; therefore, the reconciliation of Level 3 securities and assumptions is not shown for the period ending December 31, 2015.
| See Notes to Financial Statements. | 209 |
Table of Contents
International Equity Fund (Unaudited)
Developed non-U.S. markets underperformed their U.S. counterparts and were negatively impacted by the U.S. dollar which strengthened against most currencies during the year. The MSCI EAFE Index (Net), a measure of international developed country returns, posted a fourth quarter return of 4.71%, bringing the one-year return to -0.81%. Growth styles outperformed value styles and small capitalization stocks generally outperformed large capitalization stocks during the year. From a country perspective, Singapore, Spain and Norway posted the worst performance, while Denmark, Ireland and Belgium were among the best performing countries for the year. From a sector perspective, the weakest performance was registered in the energy and materials sectors which were negatively impacted by the fall in oil prices, while the strongest performance came from the more defensive health care and consumer staples sectors.
The International Equity Fund continued to be invested in markets deemed to be developed and, to a much lesser extent, in markets deemed to be emerging or non-developed. The Fund was primarily comprised of equities of foreign companies and was diversified among a large number of companies across different industries and economic sectors. The Investor Class of the Fund underperformed its benchmark, the MSCI EAFE Index (Net), for the one-year period ended December 31, 2015 (-2.16% versus -0.81%). On a country basis, underweight exposure and security selection within Japan and security selection within France and the Netherlands negatively impacted benchmark relative performance. Tactical exposure to emerging markets also had a negative impact during the period. On the positive side, underweight exposure to Australia as well as security selection to Germany positively impacted performance. On a sector basis, security selection to the industrials and financials sectors detracted, while security selection to the materials and consumer discretionary sectors contributed to benchmark-relative returns during the year.
Within the Fund, certain derivatives were utilized to express active views in currency and country selection and to hedge foreign currency exposure back to the U.S. dollar. These derivative positions primarily included currency forward contracts, stock index futures and stock index future swaps. Overall, derivative exposure had a slight positive impact on Fund performance over the course of the year.
This Fund may be suitable to investors who seek higher, long-term rates of return, can accept significant short-term fluctuations in account value and want to diversify their portfolio with international stocks. The Fund invests in foreign and emerging market securities which involve certain risks such as currency volatility, political and social instability and reduced market liquidity. To the extent that the investment adviser misjudges current market conditions, the Fund’s volatility may be amplified by its use of short sales and derivatives and by its ability to select sub-advisers to allocate assets. Short sales by a fund theoretically involve unlimited loss potential since the market price of securities sold short may continuously increase. Leverage may increase the risk of loss and cause fluctuations in the market value of the Fund’s portfolio to have disproportionately large effects or cause the net asset value of the Fund generally to decline faster than it would otherwise. It is possible to lose money by investing in the Fund.
At December 31, 2015, the portfolio holdings of the Fund, as a percentage of net assets, is shown in the following table. Portfolio holdings are subject to risk and may change at any time.
| % | ||||
Consumer Discretionary | 19.6 | |||
Financial Services | 19.4 | |||
Technology | 17.6 | |||
Producer Durables | 13.5 | |||
Money Market Funds | 12.6 | |||
Healthcare | 9.7 | |||
Consumer Staples | 6.0 | |||
Materials & Processing | 5.7 | |||
Energy | 4.2 | |||
Utilities | 3.7 | |||
Foreign Preferred Stock | — | |||
Rights | — | ** | ||
Warrant | — | ** | ||
Foreign Common Stocks Sold Short | (5.2 | ) | ||
|
| |||
| 106.8 | ||||
|
| |||
**Rounds to less than 0.005%
| 210 |
Table of Contents
International Equity Fund (Unaudited)
| Average Annual Total Returns as of 12/31/15 | ||||||||||||
Institutional Class* | Investor Class* | Benchmark** | ||||||||||
One Year | -1.93% | -2.16% | -0.81% | |||||||||
Five Year | 2.06% | 1.82% | 3.60% | |||||||||
Ten Year | 2.55% | 2.33% | 3.03% | |||||||||
Since Inception | 5.17% | 4.96% | 4.91% | |||||||||
Inception Date | 08/27/01 | 08/27/01 | ||||||||||
Total Fund Operating Expenses (May 1, 2015 Prospectus, as amended on June 1, 2015)(1) | 1.07% | 1.32% | ||||||||||
(1)Current information regarding the Fund’s Operating Expenses can be found in the Financial Highlights.
The performance data quoted represents past performance and does not guarantee future results. Current performance may be lower or higher. Performance data current to the most recent month-end may be obtained at www.GuideStoneFunds.org. The investment return and principal value of an investment will fluctuate so that shares, when redeemed, may be worth more or less than their original cost.
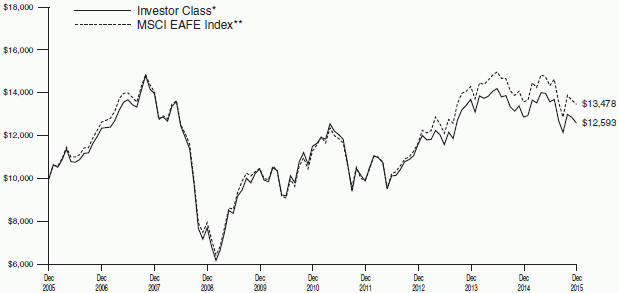
The graph compares the results of a hypothetical $10,000 investment in the Investor Class of the Fund for the 10-year period from December 31, 2005 to December 31, 2015, with all dividends and capital gains reinvested, with the MSCI EAFE Index.
*These returns reflect expense waivers by the Fund’s investment adviser. Without these waivers, returns would have been lower. Returns shown do not reflect the deduction of taxes that a shareholder would pay on Fund distributions or the redemption of Fund shares.
Unlike a mutual fund, the performance of an index assumes no taxes, transaction costs, management fees or other expenses.
211
Table of Contents
INTERNATIONAL EQUITY FUND SCHEDULE OF INVESTMENTS | December 31, 2015 |
| Shares | Value | |||||||
FOREIGN COMMON STOCKS — 99.4% |
| |||||||
Australia — 1.7% | ||||||||
Amcor, Ltd. | 35,285 | $ | 342,801 | |||||
Ansell, Ltd. | 10,998 | 170,438 | ||||||
Asciano, Ltd. | 22,350 | 142,094 | ||||||
ASX, Ltd. | 2,303 | 70,853 | ||||||
Aurizon Holdings, Ltd. | 130,334 | 413,757 | ||||||
Australia & New Zealand Banking Group, Ltd. | 76,884 | 1,551,499 | ||||||
Bendigo and Adelaide Bank, Ltd. | 38,450 | 332,586 | ||||||
BHP Billiton, Ltd. | 58,894 | 757,938 | ||||||
Boral, Ltd. | 122,396 | 523,309 | ||||||
CIMIC Group, Ltd. | 64,424 | 1,130,109 | ||||||
Coca-Cola Amatil, Ltd. | 28,264 | 190,582 | ||||||
Cochlear, Ltd. | 1,868 | 129,268 | ||||||
Computershare, Ltd. | 5,607 | 47,180 | ||||||
CSL, Ltd. | 6,536 | 498,301 | ||||||
Dexus Property Group REIT | 12,849 | 69,695 | ||||||
Flight Centre Travel Group, Ltd. | 27,754 | 800,443 | ||||||
Goodman Group REIT | 30,218 | 136,931 | ||||||
GPT Group (The) REIT | 23,870 | 82,666 | ||||||
GPT Group (The) REIT +@ | 63,198 | — | ||||||
Iluka Resources, Ltd. | 31,420 | 138,984 | ||||||
Lend Lease Group | 245,251 | 2,530,383 | ||||||
Macquarie Group, Ltd. | 28,478 | 1,703,634 | ||||||
Mirvac Group REIT | 43,401 | 62,130 | ||||||
National Australia Bank, Ltd. | 47,040 | 1,026,496 | ||||||
Qantas Airways, Ltd.* | 876,633 | 2,598,395 | ||||||
QBE Insurance Group, Ltd. | 429,508 | 3,906,441 | ||||||
Rio Tinto, Ltd. | 8,019 | 259,330 | ||||||
Scentre Group REIT | 93,514 | 283,641 | ||||||
Sonic Healthcare, Ltd. | 55,999 | 725,026 | ||||||
Stockland REIT | 41,895 | 124,364 | ||||||
Suncorp Group, Ltd. | 37,052 | 325,316 | ||||||
Telstra Corporation, Ltd. | 81,376 | 330,687 | ||||||
Vicinity Centres REIT | 52,801 | 107,116 | ||||||
Westfield Corporation REIT | 35,358 | 243,260 | ||||||
WorleyParsons, Ltd. | 32,343 | 108,496 | ||||||
|
| |||||||
| 21,864,149 | ||||||||
|
| |||||||
Austria — 0.4% | ||||||||
Erste Group Bank AG* | 178,540 | 5,586,559 | ||||||
|
| |||||||
Belgium — 0.4% | ||||||||
Ageas | 17,128 | 794,981 | ||||||
bpost SA | 46,543 | 1,142,049 | ||||||
Delhaize Group | 1,867 | 181,710 | ||||||
Groupe Bruxelles Lambert SA | 415 | 35,511 | ||||||
KBC Groep NV | 15,574 | 973,788 | ||||||
Proximus | 77,055 | 2,507,454 | ||||||
|
| |||||||
| 5,635,493 | ||||||||
|
| |||||||
Bermuda — 0.5% | ||||||||
Cheung Kong Infrastructure Holdings, Ltd. | 11,000 | 101,628 | ||||||
Credicorp, Ltd. | 25,326 | 2,464,726 | ||||||
Jardine Matheson Holdings, Ltd. | 54,200 | 2,624,773 | ||||||
Kerry Properties, Ltd. | 179,000 | 487,125 | ||||||
Li & Fung, Ltd. | 584,000 | 394,951 | ||||||
NWS Holdings, Ltd. | 19,000 | 28,362 | ||||||
Yue Yuen Industrial Holdings, Ltd. | 207,000 | 701,217 | ||||||
|
| |||||||
| 6,802,782 | ||||||||
|
| |||||||
| Shares | Value | |||||||
Brazil — 0.4% | ||||||||
Embraer SA ADRD | 166,400 | $ | 4,915,456 | |||||
|
| |||||||
Canada — 0.6% | ||||||||
Canadian National Railway Co.D | 131,449 | 7,345,370 | ||||||
|
| |||||||
China — 3.6% | ||||||||
Alibaba Group Holding, Ltd. ADRD* | 118,339 | 9,617,411 | ||||||
Baidu, Inc. ADRD* | 82,729 | 15,639,090 | ||||||
Ctrip.com International, Ltd. ADRD* | 15,021 | 695,923 | ||||||
JD.com, Inc. ADR* | 43,100 | 1,390,621 | ||||||
New Oriental Education & Technology Group, Inc. ADR* | 110,200 | 3,456,974 | ||||||
Tencent Holdings, Ltd. | 769,700 | 15,070,715 | ||||||
|
| |||||||
| 45,870,734 | ||||||||
|
| |||||||
Denmark — 2.0% | ||||||||
AP Moeller - Maersk A/S Class B | 53 | 69,128 | ||||||
Chr. Hansen Holding A/S | 38,538 | 2,410,567 | ||||||
Danske Bank A/S | 273,095 | 7,327,768 | ||||||
DSV A/S | 1,937 | 76,247 | ||||||
Genmab A/S* | 13,807 | 1,835,834 | ||||||
ISS A/S | 75,310 | 2,714,680 | ||||||
Novozymes A/S, B Shares | 66,918 | 3,203,960 | ||||||
Pandora A/S | 34,328 | 4,328,207 | ||||||
TDC A/S | 357,325 | 1,779,137 | ||||||
Vestas Wind Systems A/S | 18,982 | 1,325,680 | ||||||
|
| |||||||
| 25,071,208 | ||||||||
|
| |||||||
Finland — 0.3% | ||||||||
Amer Sports OYJ | 5,571 | 162,651 | ||||||
Cargotec OYJ, B Shares | 2,331 | 86,958 | ||||||
Elisa OYJ | 4,664 | 175,483 | ||||||
Kesko OYJ, B Shares | 19,401 | 680,047 | ||||||
Nokia OYJ | 32,553 | 230,298 | ||||||
Orion OYJ, Class B | 23,535 | 814,275 | ||||||
Stora Enso OYJ, R Shares | 57,238 | 517,557 | ||||||
UPM-Kymmene OYJ | 71,612 | 1,329,507 | ||||||
|
| |||||||
| 3,996,776 | ||||||||
|
| |||||||
France — 7.6% | ||||||||
Air France-KLM* | 29,731 | 226,324 | ||||||
Alcatel-Lucent* | 50,486 | 199,457 | ||||||
Atos SE | 809 | 67,918 | ||||||
AXA SA | 43,802 | 1,196,833 | ||||||
Cap Gemini SA | 25,659 | 2,380,799 | ||||||
Casino Guichard Perrachon SAD | 14,627 | 671,978 | ||||||
Christian Dior SE | 25,012 | 4,248,621 | ||||||
Cie de St-Gobain | 166,177 | 7,201,365 | ||||||
Cie Generale des Etablissements Michelin | 11,140 | 1,060,340 | ||||||
Danone SA | 95,711 | 6,467,561 | ||||||
Eiffage SA | 4,060 | 262,392 | ||||||
Engie | 243,187 | 4,307,647 | ||||||
Essilor International SA | 13,443 | 1,675,490 | ||||||
Faurecia | 31,073 | 1,245,094 | ||||||
Kering | 25,482 | 4,356,808 | ||||||
Klepierre REIT | 4,327 | 192,335 | ||||||
Lagardere SCA | 70,693 | 2,109,592 | ||||||
L’Oreal SA | 33,692 | 5,667,188 | ||||||
Natixis SA* | 14,692 | 83,114 | ||||||
Numericable-SFR SAS* | 2,671 | 97,032 | ||||||
| 212 | See Notes to Financial Statements. |
Table of Contents
| Shares | Value | |||||||
Orange SA* | 86,261 | $ | 1,442,786 | |||||
Peugeot SA* | 272,206 | 4,771,503 | ||||||
Renault SA | 792 | 79,276 | ||||||
Safran SA | 4,000 | 274,812 | ||||||
Sanofi | 252,316 | 21,502,929 | ||||||
Schneider Electric SE | 119,719 | 6,800,548 | ||||||
SCOR SE | 13,764 | 515,020 | ||||||
Societe BIC SA | 11,429 | 1,880,709 | ||||||
Societe Generale SA | 124,385 | 5,731,958 | ||||||
Societe Television Francaise 1 | 21,767 | 241,698 | ||||||
Suez Environnement Co. | 18,627 | 348,389 | ||||||
Technip SA | 50,100 | 2,491,500 | ||||||
Thales SA | 3,330 | 249,251 | ||||||
TOTAL SA | 7,670 | 343,859 | ||||||
Unibail-Rodamco SE REIT | 1,666 | 423,052 | ||||||
Valeo SA | 17,390 | 2,681,112 | ||||||
Vallourec SAD | 115,629 | 1,076,485 | ||||||
Veolia Environnement SA | 30,314 | 719,227 | ||||||
Vinci SA | 9,965 | 638,708 | ||||||
Vivendi SA | 33,975 | 729,687 | ||||||
|
| |||||||
| 96,660,397 | ||||||||
|
| |||||||
Germany — 8.1% | ||||||||
AIXTRON SED* | 123,245 | 546,738 | ||||||
Allianz SE | 41,694 | 7,349,776 | ||||||
Aurubis AG | 18,383 | 930,849 | ||||||
BASF SE | 34,785 | 2,649,868 | ||||||
Beiersdorf AG | 74,887 | 6,806,619 | ||||||
Continental AG | 1,857 | 449,229 | ||||||
Daimler AGD | 109,382 | 9,139,353 | ||||||
Deutsche Bank AG | 19,649 | 477,172 | ||||||
Deutsche Boerse AG | 87,264 | 7,670,650 | ||||||
Deutsche Lufthansa AG* | 209,191 | 3,294,999 | ||||||
Deutsche Telekom AG | 421,077 | 7,562,857 | ||||||
E.ON SE | 34,343 | 329,764 | ||||||
Freenet AG | 75,295 | 2,540,832 | ||||||
Fresenius Medical Care AG & Co. KGaA | 35,828 | 3,010,807 | ||||||
Fresenius SE & Co. KGaA | 5,433 | 387,007 | ||||||
Hannover Rueck SE | 6,895 | 787,341 | ||||||
HeidelbergCement AG | 1,750 | 142,621 | ||||||
HOCHTIEF AG | 6,614 | 613,435 | ||||||
K+S AG | 30,853 | 786,482 | ||||||
KION Group AG* | 12,114 | 600,709 | ||||||
Linde AG | 36,704 | 5,302,232 | ||||||
MorphoSys AGD* | 20,344 | 1,265,905 | ||||||
Muenchener Rueckversicherungs- Gesellschaft AG | 17,544 | 3,495,435 | ||||||
OSRAM Licht AG | 48,258 | 2,016,181 | ||||||
ProSiebenSat.1 Media SE | 51,698 | 2,608,246 | ||||||
Rheinmetall AG | 10,207 | 678,482 | ||||||
RHOEN KLINIKUM AG | 17,893 | 536,770 | ||||||
Rocket Internet SE 144AD* | 61,162 | 1,863,223 | ||||||
RWE AGD | 395,427 | 4,985,327 | ||||||
Salzgitter AG | 7,970 | 194,766 | ||||||
SAP SE | 226,610 | 17,982,321 | ||||||
Siemens AG* | 1,016 | 98,294 | ||||||
Software AG | 11,114 | 316,770 | ||||||
STADA Arzneimittel AG | 14,964 | 603,433 | ||||||
Suedzucker AG | 12,791 | 253,524 | ||||||
Talanx AG | 6,850 | 210,670 | ||||||
United Internet AG | 1,389 | 76,366 | ||||||
Vonovia SE | 8,154 | 251,904 | ||||||
| Shares | Value | |||||||
Zalando SE 144A* | 114,654 | $ | 4,535,472 | |||||
|
| |||||||
| 103,352,429 | ||||||||
|
| |||||||
Hong Kong — 2.4% | ||||||||
AIA Group, Ltd. | 2,734,800 | 16,340,658 | ||||||
ASM Pacific Technology, Ltd. | 3,100 | 24,203 | ||||||
Cheung Kong Property Holdings, Ltd. | 49,500 | 320,215 | ||||||
China Mobile, Ltd. | 429,000 | 4,828,869 | ||||||
CLP Holdings, Ltd. | 36,000 | 305,136 | ||||||
Global Brands Group Holding, Ltd.* | 4,456,924 | 844,004 | ||||||
Guangdong Investment, Ltd. | 1,466,700 | 2,071,315 | ||||||
Hong Kong & China Gas Co., Ltd. | 133,000 | 260,286 | ||||||
Hong Kong Exchanges and Clearing, Ltd. | 116,607 | 2,970,539 | ||||||
Link REIT | 41,000 | 244,437 | ||||||
New World Development Co., Ltd. | 421,000 | 413,396 | ||||||
PCCW, Ltd. | 62,000 | 36,243 | ||||||
Power Assets Holdings, Ltd. | 26,500 | 242,940 | ||||||
Sino Land Co., Ltd. | 428,000 | 623,492 | ||||||
Sun Hung Kai Properties, Ltd. | 33,000 | 396,646 | ||||||
Swire Pacific, Ltd. Class A | 12,000 | 134,041 | ||||||
WH Group, Ltd. 144A* | 646,500 | 359,823 | ||||||
Wharf Holdings, Ltd. (The) | 40,000 | 220,539 | ||||||
Wheelock & Co., Ltd. | 39,000 | 163,651 | ||||||
|
| |||||||
| 30,800,433 | ||||||||
|
| |||||||
India — 0.4% | ||||||||
Housing Development Finance Corporation, Ltd. | 169,909 | 3,231,642 | ||||||
Tata Consultancy Services, Ltd. | 59,461 | 2,185,999 | ||||||
|
| |||||||
| 5,417,641 | ||||||||
|
| |||||||
Indonesia — 0.1% | ||||||||
PT Telekomunikasi Indonesia Persero Tbk | 4,812,900 | 1,077,980 | ||||||
|
| |||||||
Ireland — 0.9% | ||||||||
Bank of Ireland* | 6,962,114 | 2,569,960 | ||||||
CRH PLC | 253,351 | 7,334,990 | ||||||
DCC PLC | 4,864 | 406,351 | ||||||
James Hardie Industries PLC | 141,869 | 1,788,671 | ||||||
|
| |||||||
| 12,099,972 | ||||||||
|
| |||||||
Italy — 2.4% | ||||||||
A2A SpA | 1,574,176 | 2,131,533 | ||||||
Autogrill SpA* | 49,521 | 471,954 | ||||||
Banca Generali SpA | 3,521 | 110,757 | ||||||
Banca Popolare di Milano Scarl | 1,229,267 | 1,217,548 | ||||||
Banco Popolare SC* | 77,226 | 1,064,205 | ||||||
Eni SpA | 820,201 | 12,186,775 | ||||||
EXOR SpA | 67,927 | 3,082,999 | ||||||
FinecoBank Banca Fineco SpA | 114,621 | 942,523 | ||||||
Finmeccanica SpA* | 194,302 | 2,701,640 | ||||||
Intesa Sanpaolo SpA | 244,138 | 810,787 | ||||||
Mediaset SpA | 72,347 | 299,800 | ||||||
Mediobanca SpA | 21,415 | 205,286 | ||||||
Prysmian SpA | 44,684 | 976,312 | ||||||
Recordati SpA | 15,964 | 416,516 | ||||||
UniCredit SpA | 683,183 | 3,777,128 | ||||||
Unipol Gruppo Finanziario SpA | 35,002 | 180,037 | ||||||
| See Notes to Financial Statements. | 213 |
Table of Contents
INTERNATIONAL EQUITY FUND
SCHEDULE OF INVESTMENTS (Continued)
| Shares | Value | |||||||
UnipolSai SpA | 127,476 | $ | 324,314 | |||||
|
| |||||||
| 30,900,114 | ||||||||
|
| |||||||
Japan — 16.5% | ||||||||
Ajinomoto Co., Inc. | 21,000 | 497,190 | ||||||
Alfresa Holdings Corporation | 5,100 | 100,726 | ||||||
Alps Electric Co., Ltd. | 29,200 | 791,846 | ||||||
Astellas Pharma, Inc. | 163,700 | 2,330,395 | ||||||
Bandai Namco Holdings, Inc. | 69,200 | 1,461,997 | ||||||
Brother Industries, Ltd. | 12,700 | 145,895 | ||||||
Canon, Inc.D | 462,950 | 14,004,252 | ||||||
Central Japan Railway Co. | 4,100 | 727,889 | ||||||
Chiba Bank, Ltd. (The) | 30,000 | 212,887 | ||||||
Chubu Electric Power Co., Inc. | 28,700 | 393,010 | ||||||
COOKPAD, Inc.D | 20,100 | 426,691 | ||||||
Daicel Corporation | 27,100 | 403,300 | ||||||
Daiichi Sankyo Co., Ltd. | 23,900 | 493,289 | ||||||
Daito Trust Construction Co., Ltd. | 1,000 | 115,510 | ||||||
Daiwa House Industry Co., Ltd. | 9,100 | 261,592 | ||||||
Daiwa Securities Group, Inc. | 11,000 | 67,251 | ||||||
DeNA Co., Ltd. | 70,000 | 1,094,544 | ||||||
Denso Corporation | 197,500 | 9,437,636 | ||||||
Don Quijote Holdings Co., Ltd. | 43,300 | 1,520,641 | ||||||
Ezaki Glico Co., Ltd. | 3,400 | 183,681 | ||||||
Fuji Electric Co., Ltd. | 1,373,000 | 5,758,183 | ||||||
Fuji Heavy Industries, Ltd. | 56,500 | 2,327,590 | ||||||
FUJIFILM Holdings Corporation | 38,100 | 1,590,008 | ||||||
Fujitsu, Ltd. | 87,000 | 434,228 | ||||||
Fukuoka Financial Group, Inc. | 115,000 | 570,241 | ||||||
Gunma Bank, Ltd. (The) | 12,000 | 69,771 | ||||||
Hachijuni Bank, Ltd. (The) | 35,000 | 214,200 | ||||||
Haseko Corporation | 111,500 | 1,232,785 | ||||||
Hitachi High-Technologies Corporation | 15,200 | 411,055 | ||||||
Hitachi, Ltd. | 843,000 | 4,776,755 | ||||||
Hokuhoku Financial Group, Inc. | 170,000 | 346,552 | ||||||
Honda Motor Co., Ltd. | 487,500 | 15,581,250 | ||||||
Hoya Corporation | 274,400 | 11,220,925 | ||||||
IHI Corporation | 1,265,000 | 3,492,031 | ||||||
Inpex Corporation | 436,800 | 4,258,325 | ||||||
Isetan Mitsukoshi Holdings, Ltd. | 31,700 | 413,401 | ||||||
Isuzu Motors, Ltd. | 40,750 | 438,985 | ||||||
J. Front Retailing Co., Ltd. | 38,100 | 553,883 | ||||||
Japan Airlines Co., Ltd. | 75,700 | 2,709,523 | ||||||
Japan Real Estate Investment Corporation REIT | 13 | 63,086 | ||||||
Japan Retail Fund Investment Corporation REIT | 18 | 34,630 | ||||||
JSR Corporation | 4,500 | 70,130 | ||||||
JTEKT Corporation | 29,100 | 476,311 | ||||||
Kajima Corporation | 16,000 | 95,223 | ||||||
Kaken Pharmaceutical Co., Ltd. | 26,200 | 1,790,328 | ||||||
Kamigumi Co., Ltd. | 8,000 | 68,878 | ||||||
Kao Corporation | 68,700 | 3,530,407 | ||||||
KDDI Corporation | 14,100 | 366,180 | ||||||
Kewpie Corporation | 8,400 | 207,495 | ||||||
Kobe Steel, Ltd. | 507,000 | 550,864 | ||||||
Koito Manufacturing Co., Ltd. | 14,800 | 606,910 | ||||||
| Shares | Value | |||||||
Konami Corporation | 9,500 | $ | 226,143 | |||||
Konica Minolta, Inc. | 160,500 | 1,607,437 | ||||||
Kose Corporation | 8,900 | 822,902 | ||||||
Kyowa Hakko Kirin Co., Ltd. | 5,000 | 78,673 | ||||||
M3, Inc.D | 208,500 | 4,323,077 | ||||||
Mabuchi Motor Co., Ltd. | 41,300 | 2,238,250 | ||||||
Mazda Motor Corporation | 6,600 | 136,189 | ||||||
Medipal Holdings Corporation | 32,300 | 550,521 | ||||||
MEIJI Holdings Co., Ltd. | 17,800 | 1,470,274 | ||||||
Mitsubishi Electric Corporation | 69,800 | 732,680 | ||||||
Mitsubishi Estate Co., Ltd. | 22,000 | 457,453 | ||||||
Mitsubishi Motors Corporation | 51,000 | 431,487 | ||||||
Mitsubishi Tanabe Pharma Corporation | 24,400 | 420,379 | ||||||
Mitsubishi UFJ Financial Group, Inc. | 189,600 | 1,174,430 | ||||||
Mitsui Chemicals, Inc. | 32,000 | 141,920 | ||||||
Mitsui Fudosan Co., Ltd. | 16,000 | 401,566 | ||||||
Mixi, Inc. | 46,300 | 1,731,778 | ||||||
MS&AD Insurance Group Holdings, Inc. | 61,800 | 1,812,265 | ||||||
Murata Manufacturing Co., Ltd. | 5,300 | 762,571 | ||||||
Nexon Co., Ltd. | 110,900 | 1,804,092 | ||||||
NHK Spring Co., Ltd. | 55,100 | 552,448 | ||||||
Nintendo Co., Ltd. | 4,600 | 632,547 | ||||||
Nippon Building Fund, Inc. REIT | 15 | 71,678 | ||||||
Nippon Express Co., Ltd. | 243,000 | 1,141,912 | ||||||
Nippon Telegraph & Telephone Corporation | 12,600 | 501,456 | ||||||
Nippon Yusen KK | 71,800 | 174,021 | ||||||
Nitto Denko Corporation | 8,000 | 584,045 | ||||||
NOK Corporation | 44,200 | 1,032,550 | ||||||
Nomura Holdings, Inc. | 66,100 | 368,181 | ||||||
NTN Corporation | 93,000 | 392,150 | ||||||
NTT DOCOMO, Inc. | 180,700 | 3,706,446 | ||||||
Olympus Corporation | 15,300 | 602,341 | ||||||
ORIX Corporation | 116,200 | 1,630,107 | ||||||
Otsuka Corporation | 5,300 | 260,356 | ||||||
Otsuka Holdings Co., Ltd. | 23,000 | 817,166 | ||||||
Pola Orbis Holdings, Inc. | 4,700 | 309,770 | ||||||
Rakuten, Inc. | 529,400 | 6,097,500 | ||||||
Resona Holdings, Inc. | 60,200 | 292,345 | ||||||
Rohm Co., Ltd. | 11,400 | 577,420 | ||||||
Ryohin Keikaku Co., Ltd. | 900 | 182,260 | ||||||
Santen Pharmaceutical Co., Ltd. | 11,600 | 190,976 | ||||||
SBI Holdings, Inc. | 128,000 | 1,381,235 | ||||||
Secom Co., Ltd. | 117,700 | 7,976,501 | ||||||
Seiko Epson Corporation | 24,600 | 378,819 | ||||||
Sekisui House, Ltd. | 7,300 | 122,740 | ||||||
Shimadzu Corporation | 31,000 | 518,938 | ||||||
Shimamura Co., Ltd. | 2,100 | 245,929 | ||||||
Shionogi & Co., Ltd. | 57,000 | 2,578,123 | ||||||
SMC Corporation | 18,700 | 4,857,024 | ||||||
SoftBank Group Corporation | 179,700 | 9,069,532 | ||||||
Sojitz Corporation | 267,300 | 560,950 | ||||||
Sompo Japan Nipponkoa Holdings, Inc. | 31,900 | 1,047,427 | ||||||
Sony Corporation | 41,000 | 1,007,649 | ||||||
Sumitomo Chemical Co., Ltd. | 143,000 | 821,263 | ||||||
Sumitomo Corporation | 412,800 | 4,208,633 | ||||||
Sumitomo Heavy Industries, Ltd. | 226,000 | 1,013,126 | ||||||
Sumitomo Mitsui Financial Group, Inc. | 42,100 | 1,588,898 | ||||||
| 214 | See Notes to Financial Statements. |
Table of Contents
| Shares | Value | |||||||
Sumitomo Osaka Cement Co., Ltd. | 407,000 | $ | 1,492,665 | |||||
Sumitomo Realty & Development Co., Ltd. | 6,000 | 171,256 | ||||||
Sumitomo Rubber Industries, Inc. | 9,600 | 124,832 | ||||||
Suzuken Co., Ltd. | 9,900 | 376,222 | ||||||
Sysmex Corporation | 1,400 | 89,803 | ||||||
T&D Holdings, Inc. | 13,400 | 176,793 | ||||||
Takashimaya Co., Ltd. | 47,000 | 423,258 | ||||||
Takeda Pharmaceutical Co., Ltd. | 201,500 | 10,046,683 | ||||||
TDK Corporation | 19,000 | 1,216,835 | ||||||
Teijin, Ltd. | 186,000 | 633,863 | ||||||
Terumo Corporation | 7,700 | 238,649 | ||||||
Tokio Marine Holdings, Inc. | 191,700 | 7,404,341 | ||||||
Tokyo Electric Power Co., Inc.* | 332,900 | 1,916,924 | ||||||
Tokyo Electron, Ltd. | 48,800 | 2,956,540 | ||||||
Tosoh Corporation | 67,000 | 344,649 | ||||||
Toyota Motor Corporation | 2,660 | 163,800 | ||||||
Trend Micro, Inc. | 75,400 | 3,059,516 | ||||||
West Japan Railway Co. | 8,900 | 615,195 | ||||||
Yamaha Corporation | 21,500 | 519,319 | ||||||
Yamazaki Baking Co., Ltd. | 18,000 | 404,744 | ||||||
|
| |||||||
| 210,124,791 | ||||||||
|
| |||||||
Jersey — 0.9% | ||||||||
Glencore PLC* | 281,681 | 373,266 | ||||||
Randgold Resources, Ltd. | 1,392 | 85,757 | ||||||
Shire PLC | 17,790 | 1,220,533 | ||||||
Wolseley PLC | 44,645 | 2,424,814 | ||||||
WPP PLC | 292,908 | 6,737,447 | ||||||
|
| |||||||
| 10,841,817 | ||||||||
|
| |||||||
Netherlands — 6.1% | ||||||||
Aegon NVD | 554,390 | 3,135,348 | ||||||
Airbus Group SED | 104,597 | 7,048,556 | ||||||
Akzo Nobel NV | 2,782 | 185,891 | ||||||
ASML Holding NV | 42,317 | 3,759,949 | ||||||
Boskalis Westminster | 8,814 | 359,544 | ||||||
CNH Industrial NVD | 645,051 | 4,416,782 | ||||||
Delta Lloyd NVD | 187,713 | 1,106,562 | ||||||
Fiat Chrysler Automobiles NVD* | 1,055,697 | 14,661,447 | ||||||
ING Groep NV CVA | 1,140,623 | 15,432,753 | ||||||
Koninklijke Ahold NV | 493,557 | 10,410,873 | ||||||
Koninklijke Philips NV | 182,861 | 4,667,418 | ||||||
NN Group NV | 17,631 | 622,076 | ||||||
Randstad Holding NV | 166,966 | 10,397,265 | ||||||
TNT Express NV | 8,789 | 74,345 | ||||||
Unilever NV CVA | 8,357 | 364,234 | ||||||
Wolters Kluwer NV | 47,417 | 1,592,439 | ||||||
|
| |||||||
| 78,235,482 | ||||||||
|
| |||||||
New Zealand — 0.1% | ||||||||
Spark New Zealand, Ltd. | 292,942 | 661,511 | ||||||
|
| |||||||
Nigeria — 0.0% | ||||||||
Afriland Properties PLC REIT+* | 331,249 | — | ||||||
|
| |||||||
Norway — 0.7% | ||||||||
Marine Harvest ASA* | 65,874 | 886,323 | ||||||
Orkla ASA | 517,563 | 4,083,015 | ||||||
Schibsted ASA Class A | 42,591 | 1,400,249 | ||||||
Schibsted ASA, B Shares* | 45,543 | 1,451,445 | ||||||
| Shares | Value | |||||||
Yara International ASA | 35,347 | $ | 1,520,213 | |||||
|
| |||||||
| 9,341,245 | ||||||||
|
| |||||||
Portugal — 0.1% | ||||||||
Jeronimo Martins SGPS SA | 107,816 | 1,402,951 | ||||||
NOS SGPS SA | 44,789 | 352,398 | ||||||
|
| |||||||
| 1,755,349 | ||||||||
|
| |||||||
Russia — 0.2% | ||||||||
Magnit PJSC GDR | 47,234 | 1,899,751 | ||||||
|
| |||||||
Singapore — 2.3% | ||||||||
Ascendas Real Estate Investment Trust REIT | 27,200 | 43,592 | ||||||
CapitaLand Commercial Trust, Ltd. REIT | 34,500 | 32,733 | ||||||
CapitaLand Mall Trust REIT | 46,300 | 62,824 | ||||||
CapitaLand, Ltd. | 85,300 | 200,497 | ||||||
ComfortDelGro Corporation, Ltd. | 52,200 | 111,774 | ||||||
DBS Group Holdings, Ltd. | 314,200 | 3,682,268 | ||||||
Global Logistic Properties, Ltd. | 83,200 | 125,645 | ||||||
Jardine Cycle & Carriage, Ltd. | 201,400 | 4,923,666 | ||||||
Sembcorp Industries, Ltd. | 1,171,000 | 2,510,015 | ||||||
Singapore Airlines, Ltd. | 29,100 | 229,293 | ||||||
Singapore Exchange, Ltd. | 13,600 | 73,554 | ||||||
Singapore Technologies Engineering, Ltd. | 23,600 | 49,888 | ||||||
Singapore Telecommunications, Ltd. | 2,092,200 | 5,394,246 | ||||||
Suntec Real Estate Investment Trust REIT | 40,500 | 44,107 | ||||||
United Overseas Bank, Ltd. | 856,225 | 11,804,616 | ||||||
UOL Group, Ltd. | 25,586 | 112,135 | ||||||
|
| |||||||
| 29,400,853 | ||||||||
|
| |||||||
South Korea — 1.0% | ||||||||
Celltrion, Inc.* | 41,163 | 2,936,743 | ||||||
Hankook Tire Co., Ltd.* | 61,668 | 2,459,676 | ||||||
NAVER Corporation* | 6,801 | 3,792,506 | ||||||
Shinhan Financial Group Co., Ltd.* | 117,586 | 3,949,920 | ||||||
|
| |||||||
| 13,138,845 | ||||||||
|
| |||||||
Spain — 5.8% | ||||||||
Abengoa SA, B Shares | 1,032,478 | 218,800 | ||||||
ACS Actividades de Construccion y Servicios SA | 32,719 | 957,281 | ||||||
Amadeus IT Holding SA, A Shares | 162,637 | 7,168,207 | ||||||
Banco Bilbao Vizcaya Argentaria SA | 85,125 | 621,994 | ||||||
Banco de Sabadell SA | 2,338,800 | 4,145,057 | ||||||
Banco Popular Espanol SAD | 1,453,006 | 4,787,514 | ||||||
Banco Santander SA | 1,957,057 | 9,627,541 | ||||||
Distribuidora Internacional de Alimentacion SA* | 271,667 | 1,602,326 | ||||||
Ebro Foods SA | 255,008 | 5,016,242 | ||||||
Endesa SA | 64,157 | 1,288,898 | ||||||
Gamesa Corporacion Tecnologica SA | 115,741 | 1,981,492 | ||||||
Iberdrola SA | 1,698,013 | 12,037,232 | ||||||
Industria de Diseno Textil SA | 428,419 | 14,718,040 | ||||||
International Consolidated Airlines Group | 172,401 | 1,550,079 | ||||||
Mediaset Espana Comunicacion SA* | 51,545 | 560,803 | ||||||
| See Notes to Financial Statements. | 215 |
Table of Contents
INTERNATIONAL EQUITY FUND
SCHEDULE OF INVESTMENTS (Continued)
| Shares | Value | |||||||
Repsol SA | 5,941 | $ | 65,407 | |||||
Telefonica SAD* | 656,275 | 7,280,706 | ||||||
|
| |||||||
| 73,627,619 | ||||||||
|
| |||||||
Sweden — 3.9% | ||||||||
Alfa Laval AB | 121,936 | 2,226,071 | ||||||
Atlas Copco AB, A Shares | 281,737 | 6,909,545 | ||||||
BillerudKorsnas AB | 34,154 | 632,075 | ||||||
Boliden AB | 82,290 | 1,378,703 | ||||||
Electrolux AB, Series B | 68,858 | 1,661,365 | ||||||
Elekta AB, B Shares | 228,120 | 1,938,303 | ||||||
Hennes & Mauritz AB, B Shares | 173,191 | 6,160,454 | ||||||
Hexpol AB | 44,700 | 479,284 | ||||||
Investment AB Kinnevik, B Shares | 197,222 | 6,074,691 | ||||||
Investor AB, B Shares | 3,071 | 112,860 | ||||||
NCC AB, B Shares | 2,720 | 84,383 | ||||||
Skanska AB, B Shares | 37,287 | 723,129 | ||||||
Svenska Cellulosa AB SCA Class B | 113,715 | 3,295,474 | ||||||
Svenska Handelsbanken AB, A Shares | 337,607 | 4,483,922 | ||||||
Tele2 AB, B Shares | 94,351 | 940,914 | ||||||
Telefonaktiebolaget LM Ericsson, B Shares | 418,345 | 4,033,392 | ||||||
TeliaSonera AB | 1,674,953 | 8,317,623 | ||||||
|
| |||||||
| 49,452,188 | ||||||||
|
| |||||||
Switzerland — 10.2% | ||||||||
ABB, Ltd.* | 691,028 | 12,333,202 | ||||||
ABB, Ltd. ADRD* | 77,500 | 1,374,075 | ||||||
Actelion, Ltd.* | 1,878 | 260,936 | ||||||
Adecco SA* | 17,548 | 1,201,033 | ||||||
Baloise Holding AG | 3,839 | 486,549 | ||||||
Cie Financiere Richemont SAD | 62,719 | 4,488,983 | ||||||
Coca-Cola HBC AG* | 6,141 | 130,778 | ||||||
Credit Suisse Group AG* | 228,014 | 4,911,869 | ||||||
Galenica AG | 1,031 | 1,613,051 | ||||||
GAM Holding AG* | 16,379 | 271,115 | ||||||
Helvetia Holding AG | 4,060 | 2,287,033 | ||||||
Julius Baer Group, Ltd.* | 2,768 | 133,908 | ||||||
Lonza Group AG* | 15,528 | 2,525,395 | ||||||
Nestle SA | 231,445 | 17,181,378 | ||||||
Novartis AG | 239,765 | 20,624,412 | ||||||
OC Oerlikon Corporation AG* | 258,860 | 2,304,226 | ||||||
Roche Holding AG | 67,447 | 18,690,131 | ||||||
Swiss Life Holding AG* | 25,237 | 6,797,582 | ||||||
Swiss Re AG* | 24,435 | 2,386,476 | ||||||
Syngenta AG | 39,127 | 15,314,430 | ||||||
UBS Group AG* | 373,283 | 7,241,493 | ||||||
Zurich Insurance Group AG* | 32,078 | 8,240,839 | ||||||
|
| |||||||
| 130,798,894 | ||||||||
|
| |||||||
Taiwan — 1.1% | ||||||||
Taiwan Semiconductor Manufacturing Co., Ltd. ADRD | 487,023 | 11,079,773 | ||||||
Teco Electric and Machinery Co., Ltd. | 2,918,500 | 2,325,551 | ||||||
|
| |||||||
| 13,405,324 | ||||||||
|
| |||||||
| Shares | Value | |||||||
Thailand — 0.3% | ||||||||
Bangkok Bank PCL | 166,500 | $ | 710,974 | |||||
Charoen Pokphand Foods PCL | 4,879,100 | 2,481,243 | ||||||
|
| |||||||
| 3,192,217 | ||||||||
|
| |||||||
Turkey — 0.2% | ||||||||
BIM Birlesik Magazalar AS | 148,297 | 2,610,344 | ||||||
Türkiye Garanti Bankasi AS | — | 1 | ||||||
Yapi ve Kredi Bankasi AS | 1 | 1 | ||||||
|
| |||||||
| 2,610,346 | ||||||||
|
| |||||||
United Kingdom — 17.4% | ||||||||
3i Group PLC | 34,312 | 243,061 | ||||||
Aggreko PLC | 166,340 | 2,239,235 | ||||||
Amec Foster Wheeler PLC | 444,158 | 2,803,835 | ||||||
ARM Holdings PLC | 472,909 | 7,208,136 | ||||||
AstraZeneca PLC | 79,808 | 5,390,852 | ||||||
Aviva PLC | 83,758 | 635,767 | ||||||
BAE Systems PLC | 146,860 | 1,081,266 | ||||||
Barclays PLC | 201,026 | 647,060 | ||||||
Barratt Developments PLC | 47,811 | 440,567 | ||||||
Berkeley Group Holdings PLC | 49,418 | 2,686,553 | ||||||
BG Group PLC | 523,643 | 7,590,691 | ||||||
BP PLC | 2,351,129 | 12,218,151 | ||||||
BP PLC ADR | 72,500 | 2,266,350 | ||||||
British Land Co. PLC (The) REIT | 18,907 | 218,772 | ||||||
Britvic PLC | 6,566 | 70,350 | ||||||
BT Group PLC | 351,297 | 2,439,272 | ||||||
Close Brothers Group PLC | 5,093 | 100,432 | ||||||
Compass Group PLC | 751,194 | 13,016,937 | ||||||
Dairy Crest Group PLCD | 640,153 | 6,406,786 | ||||||
Dialog Semiconductor PLC* | 13,083 | 436,564 | ||||||
DS Smith PLC | 1,631,616 | 9,544,305 | ||||||
G4S PLC | 1,849,548 | 6,143,847 | ||||||
GKN PLC | 197,336 | 895,490 | ||||||
GlaxoSmithKline PLC | 818,820 | 16,536,860 | ||||||
Hammerson PLC REIT | 15,352 | 135,718 | ||||||
Hikma Pharmaceuticals PLC | 2,765 | 93,733 | ||||||
Howden Joinery Group PLC | 37,643 | 291,661 | ||||||
HSBC Holdings PLC | 991,675 | 7,828,544 | ||||||
ICAP PLC | 9,687 | 72,712 | ||||||
Inchcape PLC | 114,021 | 1,315,546 | ||||||
Intermediate Capital Group PLC | 131,408 | 1,211,398 | ||||||
Intu Properties PLC REIT | 18,465 | 86,268 | ||||||
Investec PLC | 31,016 | 218,695 | ||||||
ITV PLC | 623,301 | 2,537,693 | ||||||
John Wood Group PLC | 20,744 | 186,826 | ||||||
Just Eat PLC* | 38,508 | 279,607 | ||||||
Kingfisher PLC | 1,858,236 | 9,000,391 | ||||||
Land Securities Group PLC REIT | 15,437 | 267,602 | ||||||
Lloyds Banking Group PLC | 2,911,636 | 3,132,925 | ||||||
London Stock Exchange Group PLC | 5,849 | 236,641 | ||||||
Man Strategic Holdings PLC | 1,496,863 | 3,850,716 | ||||||
Mondi PLC | 79,732 | 1,562,815 | ||||||
National Grid PLC | 1,140,726 | 15,732,517 | ||||||
Ocado Group PLCD* | 302,908 | 1,353,319 | ||||||
Pearson PLC | 335,221 | 3,623,913 | ||||||
Persimmon PLC* | 99,497 | 2,968,346 | ||||||
Prudential PLC | 297,333 | 6,698,802 | ||||||
Reckitt Benckiser Group PLC | 16,774 | 1,552,046 | ||||||
| 216 | See Notes to Financial Statements. |
Table of Contents
| Shares | Value | |||||||
RELX PLC | 20,897 | $ | 368,540 | |||||
Rexam PLC | 12,257 | 109,327 | ||||||
Rolls-Royce Holdings PLC+* | 130,903,430 | 192,979 | ||||||
Rolls-Royce Holdings PLC * | 1,457,011 | 12,341,573 | ||||||
Royal Dutch Shell PLC, A SharesD | 314,941 | 7,173,626 | ||||||
Royal Dutch Shell PLC, B Shares | 41,902 | 954,991 | ||||||
Royal Mail PLC | 41,496 | 271,795 | ||||||
RSA Insurance Group PLC | 19,189 | 120,438 | ||||||
Sage Group PLC (The) | 86,075 | 764,787 | ||||||
Segro PLC REIT | 14,592 | 92,346 | ||||||
Sky PLC | 360,716 | 5,913,164 | ||||||
Standard Chartered PLC | 247,211 | 2,051,160 | ||||||
Tate & Lyle PLC | 20,521 | 180,757 | ||||||
Taylor Wimpey PLC | 1,123,368 | 3,358,176 | ||||||
Tesco PLC* | 3,135,727 | 6,890,100 | ||||||
Thomas Cook Group PLC* | 42,293 | 75,464 | ||||||
Travis Perkins PLC | 76,727 | 2,225,900 | ||||||
Unilever PLC | 241,382 | 10,353,458 | ||||||
Vodafone Group PLC | 1,144,428 | 3,711,136 | ||||||
|
| |||||||
| 222,649,290 | ||||||||
|
| |||||||
United States of America — 0.8% |
| |||||||
Joy Global, Inc.D | 19,800 | 249,678 | ||||||
MercadoLibre, Inc.D | 27,573 | 3,152,697 | ||||||
Yum! Brands, Inc. | 85,985 | 6,281,204 | ||||||
|
| |||||||
| 9,683,579 | ||||||||
|
| |||||||
Total Foreign Common Stocks |
| 1,268,216,594 | ||||||
|
| |||||||
FOREIGN PREFERRED STOCK — 0.0% |
| |||||||
Germany — 0.0% | ||||||||
Porsche Automobil Holding SE | ||||||||
2.01%, 05/14/15 | 6,053 | 325,759 | ||||||
|
| |||||||
RIGHTS — 0.0% | ||||||||
Ascendas Real Estate+ | ||||||||
(Cost $0) | 1,020 | — | ||||||
|
| |||||||
WARRANT — 0.0% | ||||||||
Sun Hung Kai Properties, Ltd.* | ||||||||
(Cost $0) | 1 | — | ||||||
|
| |||||||
MONEY MARKET FUNDS — 12.6% |
| |||||||
GuideStone Money Market Fund (Investor Class)¥ | 68,102,593 | 68,102,593 | ||||||
Northern Institutional Liquid Assets Portfolio§ | 93,208,109 | 93,208,109 | ||||||
|
| |||||||
Total Money Market Funds |
| 161,310,702 | ||||||
|
| |||||||
TOTAL INVESTMENTS — 112.0% |
| 1,429,853,055 | ||||||
|
| |||||||
FOREIGN COMMON STOCKS SOLD SHORT — (5.2)% |
| |||||||
Australia — (0.4)% | ||||||||
ALS, Ltd. | (141,605 | ) | (385,374 | ) | ||||
Alumina, Ltd. | (1,129,592 | ) | (942,689 | ) | ||||
Newcrest Mining, Ltd.* | (103,073 | ) | (975,297 | ) | ||||
REA Group, Ltd. | (23,737 | ) | (944,445 | ) | ||||
Seek, Ltd. | (105,661 | ) | (1,176,021 | ) | ||||
Sydney Airport | (35,518 | ) | (163,465 | ) | ||||
TPG Telecom, Ltd. | (13,280 | ) | (95,080 | ) | ||||
| Shares | Value | |||||||
Transurban Group | (46,106 | ) | $ | (349,480 | ) | |||
Transurban Group +* | (2,488 | ) | (18,929 | ) | ||||
|
| |||||||
| (5,050,780 | ) | |||||||
|
| |||||||
Finland — (0.1)% | ||||||||
Neste Oil OYJ | (10,846 | ) | (323,710 | ) | ||||
Nokian Renkaat OYJ | (19,994 | ) | (713,815 | ) | ||||
Outokumpu OYJ* | (114,926 | ) | (336,666 | ) | ||||
|
| |||||||
| (1,374,191 | ) | |||||||
|
| |||||||
France — (0.6)% | ||||||||
Bollore SA | (385,854 | ) | (1,797,948 | ) | ||||
Casino Guichard Perrachon SA | (9,724 | ) | (446,730 | ) | ||||
Edenred | (96,128 | ) | (1,817,123 | ) | ||||
Electricite de France SA | (74,082 | ) | (1,091,047 | ) | ||||
Groupe Eurotunnel SE | (8,717 | ) | (108,450 | ) | ||||
Kering | (3,801 | ) | (649,879 | ) | ||||
Plastic Omnium SA | (4,413 | ) | (140,276 | ) | ||||
Technip SA | (18,834 | ) | (936,625 | ) | ||||
Vallourec SA | (68,870 | ) | (641,167 | ) | ||||
Zodiac Aerospace* | (4,299 | ) | (102,361 | ) | ||||
|
| |||||||
| (7,731,606 | ) | |||||||
|
| |||||||
Germany — (0.2)% | ||||||||
Adidas AG | (1,207 | ) | (117,151 | ) | ||||
Bilfinger SE | (22,485 | ) | (1,056,678 | ) | ||||
Fraport AG Frankfurt Airport Services Worldwide | (3,373 | ) | (215,105 | ) | ||||
MAN SE | (1,105 | ) | (111,044 | ) | ||||
RWE AG | (52,571 | ) | (662,786 | ) | ||||
Telefonica Deutschland Holding AG | (63,311 | ) | (333,947 | ) | ||||
|
| |||||||
| (2,496,711 | ) | |||||||
|
| |||||||
Ireland — 0.0% | ||||||||
James Hardie Industries PLC | (19,437 | ) | (245,060 | ) | ||||
|
| |||||||
Italy — (0.3)% | ||||||||
Atlantia SpA | (12,157 | ) | (321,657 | ) | ||||
Banca Mediolanum SpA | (19,429 | ) | (154,347 | ) | ||||
Enel Green Power SpA | (235,852 | ) | (479,388 | ) | ||||
Saipem SpA* | (130,223 | ) | (1,052,568 | ) | ||||
Salvatore Ferragamo SpA | (85,314 | ) | (1,999,611 | ) | ||||
|
| |||||||
| (4,007,571 | ) | |||||||
|
| |||||||
Japan — (1.3)% | ||||||||
Acom Co., Ltd.* | (130,100 | ) | (612,643 | ) | ||||
AEON Financial Service Co., Ltd. | (36,900 | ) | (824,299 | ) | ||||
Chugoku Electric Power Co., Inc. (The) | (16,700 | ) | (220,496 | ) | ||||
Denso Corporation | (2,400 | ) | (114,685 | ) | ||||
Electric Power Development Co., Ltd. | (10,700 | ) | (381,098 | ) | ||||
Honda Motor Co., Ltd. | (6,700 | ) | (214,142 | ) | ||||
Idemitsu Kosan Co., Ltd. | (11,600 | ) | (185,219 | ) | ||||
IHI Corporation | (124,000 | ) | (342,302 | ) | ||||
Inpex Corporation | (41,900 | ) | (408,479 | ) | ||||
Japan Airport Terminal Co., Ltd. | (9,900 | ) | (438,264 | ) | ||||
Kakaku.com, Inc. | (71,100 | ) | (1,398,509 | ) | ||||
Keikyu Corporation | (16,000 | ) | (132,212 | ) | ||||
Kyushu Electric Power Co., Inc.* | (245,700 | ) | (2,677,911 | ) | ||||
LIXIL Group Corporation | (12,400 | ) | (275,400 | ) | ||||
Marubeni Corporation | (89,400 | ) | (459,614 | ) | ||||
| See Notes to Financial Statements. | 217 |
Table of Contents
INTERNATIONAL EQUITY FUND
SCHEDULE OF INVESTMENTS (Continued)
| Shares | Value | |||||||
Mitsubishi Logistics Corporation | (7,000 | ) | $ | (92,233 | ) | |||
Mitsui & Co., Ltd. | (7,400 | ) | (87,927 | ) | ||||
Nagoya Railroad Co., Ltd. | (31,000 | ) | (129,025 | ) | ||||
NGK Spark Plug Co., Ltd. | (14,500 | ) | (381,763 | ) | ||||
Nikon Corporation | (40,700 | ) | (545,114 | ) | ||||
Nippon Paint Holdings Co., Ltd. | (35,100 | ) | (849,492 | ) | ||||
Nissin Foods Holdings Co., Ltd. | (3,800 | ) | (201,642 | ) | ||||
Ricoh Co., Ltd. | (128,700 | ) | (1,325,199 | ) | ||||
Rinnai Corporation | (15,000 | ) | (1,329,052 | ) | ||||
Seven Bank, Ltd. | (64,500 | ) | (282,865 | ) | ||||
Shikoku Electric Power Co., Inc. | (41,000 | ) | (640,472 | ) | ||||
Stanley Electric Co., Ltd. | (4,200 | ) | (92,138 | ) | ||||
Sumitomo Corporation | (37,900 | ) | (386,403 | ) | ||||
Toyota Tsusho Corporation | (7,000 | ) | (163,750 | ) | ||||
Yakult Honsha Co., Ltd. | (5,400 | ) | (264,301 | ) | ||||
Yaskawa Electric Corporation | (70,400 | ) | (957,911 | ) | ||||
|
| |||||||
| (16,414,560 | ) | |||||||
|
| |||||||
Luxembourg — (0.3)% | ||||||||
ArcelorMittal | (208,174 | ) | (878,333 | ) | ||||
Millicom International Cellular SA | (13,493 | ) | (774,230 | ) | ||||
Tenaris SA | (208,030 | ) | (2,463,369 | ) | ||||
|
| |||||||
| (4,115,932 | ) | |||||||
|
| |||||||
Netherlands — (0.4)% | ||||||||
CNH Industrial NV | (132,303 | ) | (906,141 | ) | ||||
Delta Lloyd NV | (49,546 | ) | (292,072 | ) | ||||
Fugro NV* | (15,428 | ) | (253,052 | ) | ||||
Gemalto NV | (5,220 | ) | (313,212 | ) | ||||
Koninklijke Vopak NV | (25,164 | ) | (1,083,689 | ) | ||||
OCI NV* | (4,460 | ) | (110,125 | ) | ||||
Qiagen NV* | (4,376 | ) | (118,609 | ) | ||||
SBM Offshore NV* | (155,097 | ) | (1,959,310 | ) | ||||
|
| |||||||
| (5,036,210 | ) | |||||||
|
| |||||||
Norway — (0.3)% | ||||||||
Schibsted ASA Class A | (54,630 | ) | (1,796,050 | ) | ||||
Schibsted ASA, B Shares* | (47,540 | ) | (1,515,089 | ) | ||||
|
| |||||||
| (3,311,139 | ) | |||||||
|
| |||||||
Portugal — 0.0% | ||||||||
Banco Comercial Portugues SA* | (5,368,850 | ) | (284,514 | ) | ||||
|
| |||||||
Spain — (0.3)% | ||||||||
Abertis Infraestructuras SA | (32,412 | ) | (506,907 | ) | ||||
Aena SA 144A* | (13,353 | ) | (1,529,049 | ) | ||||
Applus Services SA | (16,339 | ) | (147,854 | ) | ||||
| Shares | Value | |||||||
Atresmedia Corporation de Medios de Comunicacion SA | (20,514 | ) | $ | (218,519 | ) | |||
CaixaBank SA | (57,801 | ) | (201,184 | ) | ||||
Cellnex Telecom SAU 144A | (22,121 | ) | (413,598 | ) | ||||
Zardoya Otis SA | (83,618 | ) | (977,954 | ) | ||||
|
| |||||||
| (3,995,065 | ) | |||||||
|
| |||||||
Sweden — (0.1)% | ||||||||
Alfa Laval AB | (20,144 | ) | (367,750 | ) | ||||
Meda AB, A Shares | (17,320 | ) | (218,351 | ) | ||||
Modern Times Group MTG AB, B Shares | (2,545 | ) | (64,984 | ) | ||||
|
| |||||||
| (651,085 | ) | |||||||
|
| |||||||
Switzerland — (0.2)% | ||||||||
Aryzta AG* | (5,121 | ) | (259,065 | ) | ||||
Barry Callebaut AG* | (322 | ) | (349,763 | ) | ||||
Cie Financiere Richemont SA | (14,972 | ) | (1,071,590 | ) | ||||
Dufry AG* | (6,509 | ) | (774,456 | ) | ||||
Flughafen Zuerich AG | (95 | ) | (71,280 | ) | ||||
Swatch Group AG (The) | (1,126 | ) | (391,020 | ) | ||||
|
| |||||||
| (2,917,174 | ) | |||||||
|
| |||||||
United Kingdom — (0.7)% |
| |||||||
Admiral Group PLC | (36,464 | ) | (891,026 | ) | ||||
Aggreko PLC | (28,123 | ) | (378,586 | ) | ||||
Anglo American PLC* | (122,517 | ) | (537,511 | ) | ||||
Antofagasta PLC | (222,637 | ) | (1,531,486 | ) | ||||
BTG PLC* | (37,762 | ) | (382,642 | ) | ||||
Drax Group PLC | (107,290 | ) | (386,288 | ) | ||||
Hargreaves Lansdown PLC | (94,809 | ) | (2,104,832 | ) | ||||
Intertek Group PLC | (1,807 | ) | (73,919 | ) | ||||
Ocado Group PLC* | (26,456 | ) | (118,199 | ) | ||||
Pennon Group PLC | (9,640 | ) | (122,298 | ) | ||||
Serco Group PLC* | (655,011 | ) | (911,487 | ) | ||||
Severn Trent PLC | (7,701 | ) | (246,176 | ) | ||||
Sports Direct International PLC* | (14,705 | ) | (124,965 | ) | ||||
St. James’s Place PLC | (10,640 | ) | (157,704 | ) | ||||
Standard Life PLC | (44,970 | ) | (257,523 | ) | ||||
Tesco PLC* | (66,990 | ) | (147,196 | ) | ||||
|
| |||||||
| (8,371,838 | ) | |||||||
|
| |||||||
Total Foreign Common Stocks Sold Short |
| (66,003,436 | ) | |||||
|
| |||||||
Liabilities in Excess of Other |
| (87,144,196 | ) | |||||
|
| |||||||
NET ASSETS — 100.0% |
| $ | 1,276,705,423 | |||||
|
| |||||||
Swap agreements outstanding at December 31, 2015:
Reference Obligation | Maturity Date | Counterparty | Currency | Notional Amount | Market Value | Upfront Premiums Paid/ (Received) | Unrealized Appreciation (Depreciation) | |||||||||||||||||||||
Total Return Swap | ||||||||||||||||||||||||||||
Bank of East Asia Ltd. | 11/23/16 | GS | HKD | 1,084,770 | $ | 333 | $ | — | $ | 333 | ||||||||||||||||||
HKT Trust | 11/23/16 | GS | HKD | 564,726 | (1,777 | ) | — | (1,777 | ) | |||||||||||||||||||
|
|
|
|
|
| |||||||||||||||||||||||
Total Swap agreement outstanding at December 31, 2015 |
| $ | (1,444 | ) | $ | — | $ | (1,444 | ) | |||||||||||||||||||
|
|
|
|
|
| |||||||||||||||||||||||
| 218 | See Notes to Financial Statements. |
Table of Contents
VALUATION HIERARCHY
The following is a summary of the inputs used, as of December 31, 2015, in valuing the Fund’s investments carried at fair value:
| Total Value | Level 1 Quoted Prices | Level 2 Othe Significant Observable Inputs | Level 3 Significant Unobservable Inputs | |||||||||||||||||
Assets: | ||||||||||||||||||||
Investments in Securities: | ||||||||||||||||||||
Foreign Common Stocks: | ||||||||||||||||||||
Australia | $ | 21,864,149 | $ | — | $ | 21,864,149 | $ | — | ||||||||||||
Austria | 5,586,559 | — | 5,586,559 | — | ||||||||||||||||
Belgium | 5,635,493 | — | 5,635,493 | — | ||||||||||||||||
Bermuda | 6,802,782 | 2,464,726 | 4,338,056 | — | ||||||||||||||||
Brazil | 4,915,456 | 4,915,456 | — | — | ||||||||||||||||
Canada | 7,345,370 | 7,345,370 | — | — | ||||||||||||||||
China | 45,870,734 | d30,800,019 | 15,070,715 | — | ||||||||||||||||
Denmark | 25,071,208 | — | 25,071,208 | — | ||||||||||||||||
Finland | 3,996,776 | — | 3,996,776 | — | ||||||||||||||||
France | 96,660,397 | — | 96,660,397 | — | ||||||||||||||||
Germany | 103,352,429 | 4,535,473 | 98,816,956 | — | ||||||||||||||||
Hong Kong | 30,800,433 | — | 30,800,433 | — | ||||||||||||||||
India | 5,417,641 | — | 5,417,641 | — | ||||||||||||||||
Indonesia | 1,077,980 | — | 1,077,980 | — | ||||||||||||||||
Ireland | 12,099,972 | — | 12,099,972 | — | ||||||||||||||||
Italy | 30,900,114 | — | 30,900,114 | — | ||||||||||||||||
Japan | 210,124,791 | — | 210,124,791 | — | ||||||||||||||||
Jersey | 10,841,817 | — | 10,841,817 | — | ||||||||||||||||
Netherlands | 78,235,482 | 16,680,031 | 61,555,451 | — | ||||||||||||||||
New Zealand | 661,511 | — | 661,511 | — | ||||||||||||||||
Nigeria | — | — | — | — | ||||||||||||||||
Norway | 9,341,245 | 1,451,445 | 7,889,800 | — | ||||||||||||||||
Portugal | 1,755,349 | — | 1,755,349 | — | ||||||||||||||||
Russia | 1,899,751 | 1,899,751 | — | — | ||||||||||||||||
Singapore | 29,400,853 | — | 29,400,853 | — | ||||||||||||||||
South Korea | 13,138,845 | — | 13,138,845 | — | ||||||||||||||||
Spain | 73,627,619 | 218,800 | 73,408,819 | — | ||||||||||||||||
Sweden | 49,452,188 | — | 49,452,188 | — | ||||||||||||||||
Switzerland | 130,798,894 | 1,374,075 | 129,424,819 | — | ||||||||||||||||
Taiwan | 13,405,324 | 11,079,773 | 2,325,551 | — | ||||||||||||||||
Thailand | 3,192,217 | 2,481,243 | 710,974 | — | ||||||||||||||||
Turkey | 2,610,346 | — | 2,610,346 | — | ||||||||||||||||
United Kingdom | 222,649,290 | 2,266,350 | 220,189,961 | 192,979 | ||||||||||||||||
United States of America | 9,683,579 | 9,683,579 | — | — | ||||||||||||||||
Foreign Preferred Stock: | ||||||||||||||||||||
Germany | 325,759 | — | 325,759 | — | ||||||||||||||||
Money Market Funds | 161,310,702 | 161,310,702 | — | — | ||||||||||||||||
Warrant | — | — | — | — | ||||||||||||||||
Rights | — | — | — | — | ||||||||||||||||
|
|
|
|
|
|
|
| |||||||||||||
Total Assets - Investments in Securities | $ | 1,429,853,055 | $ | 258,506,793 | $ | 1,171,153,283 | $ | 192,979 | ||||||||||||
|
|
|
|
|
|
|
| |||||||||||||
Other Financial Instruments*** | ||||||||||||||||||||
Forward Foreign Currency Contracts | $ | 3,475,346 | $ | — | $ | 3,475,346 | $ | — | ||||||||||||
Futures Contracts | 1,035,348 | 1,035,348 | — | — | ||||||||||||||||
|
|
|
|
|
|
|
| |||||||||||||
Total Assets - Other Financial Instruments | $ | 4,510,694 | $ | 1,035,348 | $ | 3,475,346 | $ | — | ||||||||||||
|
|
|
|
|
|
|
| |||||||||||||
| See Notes to Financial Statements. | 219 |
Table of Contents
INTERNATIONAL EQUITY FUND
SCHEDULE OF INVESTMENTS (Continued)
| Total Value | Level 1 Quoted Prices | Level 2 Other Significant Observable Inputs | Level 3 Significant Unobservable Inputs | |||||||||||||||||
Liabilities: | ||||||||||||||||||||
Investments in Securities: | ||||||||||||||||||||
Foreign Common Stocks Sold Short: | ||||||||||||||||||||
Australia | $ | (5,050,780 | ) | $ | — | $ | (5,050,780 | ) | $ | — | ||||||||||
Finland | (1,374,191 | ) | — | (1,374,191 | ) | — | ||||||||||||||
France | (7,731,606 | ) | — | (7,731,606 | ) | — | ||||||||||||||
Germany | (2,496,711 | ) | — | (2,496,711 | ) | — | ||||||||||||||
Ireland | (245,060 | ) | — | (245,060 | ) | — | ||||||||||||||
Italy | (4,007,571 | ) | (154,347 | ) | (3,853,224 | ) | — | |||||||||||||
Japan | (16,414,560 | ) | — | (16,414,560 | ) | — | ||||||||||||||
Luxembourg | (4,115,932 | ) | — | (4,115,932 | ) | — | ||||||||||||||
Netherlands | (5,036,210 | ) | — | (5,036,210 | ) | — | ||||||||||||||
Norway | (3,311,139 | ) | (1,515,089 | ) | (1,796,050 | ) | — | |||||||||||||
Portugal | (284,514 | ) | — | (284,514 | ) | — | ||||||||||||||
Spain | (3,995,065 | ) | — | (3,995,065 | ) | — | ||||||||||||||
Sweden | (651,085 | ) | — | (651,085 | ) | — | ||||||||||||||
Switzerland | (2,917,174 | ) | — | (2,917,174 | ) | — | ||||||||||||||
United Kingdom | (8,371,838 | ) | — | (8,371,838 | ) | — | ||||||||||||||
|
|
|
|
|
|
|
| |||||||||||||
Total Liabilities - Investments in Securities | $ | (66,003,436 | ) | $ | (1,669,436 | ) | $ | (64,334,000 | ) | $ | — | |||||||||
|
|
|
|
|
|
|
| |||||||||||||
Other Financial Instruments*** | ||||||||||||||||||||
Swap Agreements | (1,444 | ) | — | (1,444 | ) | — | ||||||||||||||
|
|
|
|
|
|
|
| |||||||||||||
Total Liabilities - Other Financial Instruments | $ | (1,444 | ) | $ | — | $ | (1,444 | ) | $ | — | ||||||||||
|
|
|
|
|
|
|
| |||||||||||||
***Other financial instruments are derivative instruments not reflected in the Schedule of Investments, such as futures, forwards and swap contracts, which are valued at the unrealized appreciation (depreciation) on the investment. Details of these investments can be found in the Notes to Financial Statements.
The Fund had securities that transferred from Level 1 to Level 2 of the fair value hierarchy as a result of foreign equities that were being valued based on quoted prices at December 31, 2014 that are now being fair valued. The value of the securities that were transferred to Level 2 as of December 31, 2015 is $14,722,944.
The Fund had securities that transferred from Level 2 to Level 1 of the fair value hierarchy as a result of foreign equities that were fair valued at December 31, 2014 that are now being valued based on quoted prices. The value of the securities that were transferred to Level 1 as of December 31, 2015 is $15,432,753.
Management has determined that the amount of Level 3 securities compared to total net assets is not material; therefore, the reconciliation of Level 3 securities and assumptions is not shown for the period ending December 31, 2015.
| 220 | See Notes to Financial Statements. |
Table of Contents
Emerging Markets Equity Fund (Unaudited)
Emerging markets experienced a difficult year and continued to face the headwinds of slower Chinese growth, weak commodity prices and a strong U.S. dollar. The MSCI Emerging Markets Index (Net) posted a small gain of 0.66% in the fourth quarter but was down -14.92% for the year, making it the weakest period since 2011. The worst performance was experienced in countries such as Greece, Brazil and Columbia, while Russia and Hungary were among the few positive performing countries for the year. All sectors were negative and seven of the ten groups experienced double-digit declines for the one-year period. The materials and utilities sectors were the worst performers, while the technology and health care sectors were the stronger performing sectors for calendar year 2015.
The Emerging Markets Equity Fund is actively managed and invests mainly in a diversified portfolio of stocks of foreign companies of any market capitalization located in emerging markets. The Investor Class of the Fund underperformed its benchmark, the MSCI Emerging Markets Index (Net), for the one-year period ended December 31, 2015 (-19.14% versus -14.92%). On a country basis, security selection in Brazil and South Africa detracted from benchmark-relative performance, while underweight exposure and security selection to China positively impacted performance. On a sector basis, security selection to the materials, energy and consumer staples sectors detracted from benchmark-relative returns, while security selection to the financials sector was one of the few contributors to benchmark-relative returns during the one-year period.
Within the Fund, certain derivatives were utilized to express active views in currency and country selection. These derivative positions primarily included currency forward contracts, stock index futures and stock index future swaps. Overall, derivative exposure had a slight negative impact on Fund performance over the course of the year.
This Fund may be suitable to investors who seek higher, long-term rates of return, can accept significant short-term fluctuations in account value and want to diversify their portfolio with emerging market stocks. The Fund invests in emerging market securities which involves certain risks such as currency volatility, political and social instability and reduced market liquidity. Medium and small companies have limited product lines, markets and financial resources, and their stocks historically have been more volatile and less liquid than large company stocks. To the extent that the investment advisor misjudges current market conditions, the Fund’s volatility may be amplified by its use of derivatives, and by its ability to select sub-advisers to allocate assets. Some derivatives may increase the risk of loss and cause fluctuations in the market value of the Fund’s portfolio to have disproportionately large effects or cause the net asset value of the Fund generally to decline faster than it would otherwise. The use of certain derivatives may also have a leveraging effect which may increase the volatility of the Fund and may reduce its returns. It is possible to lose money by investing in the Fund.
At December 31, 2015, the portfolio holdings of the Fund, as a percentage of net assets, is shown in the following table. Portfolio holdings are subject to risk and may change at any time.
| % | ||||
Financial Services | 28.4 | |||
Technology | 26.1 | |||
Money Market Funds | 12.6 | |||
Consumer Discretionary | 10.4 | |||
Consumer Staples | 8.7 | |||
Materials & Processing | 6.2 | |||
Energy | 3.5 | |||
Producer Durables | 3.4 | |||
Healthcare | 2.9 | |||
Foreign Preferred Stocks | 2.1 | |||
Utilities | 0.9 | |||
Rights | — | ** | ||
|
| |||
| 105.2 | ||||
|
| |||
**Rounds to less than 0.005%
221
Table of Contents
Emerging Markets Equity Fund (Unaudited)
| Average Annual Total Returns as of 12/31/15 | ||||||
| Institutional Class* | Investor Class* | Benchmark** | |||
One Year | -18.93% | -19.14% | -14.92% | |||
Since Inception | -12.02% | -12.22% | -9.36% | |||
Inception Date | 10/31/13 | 10/31/13 | ||||
Total Fund Operating Expenses (May 1, 2015 Prospectus, as amended on June 1, 2015)(1) | 1.30% | 1.57% | ||||
(1)Current information regarding the Fund’s Operating Expenses can be found in the Financial Highlights.
The performance data quoted represents past performance and does not guarantee future results. Current performance may be lower or higher. Performance data current to the most recent month-end may be obtained at www.GuideStoneFunds.org. The investment return and principal value of an investment will fluctuate so that shares, when redeemed, may be worth more or less than their original cost.
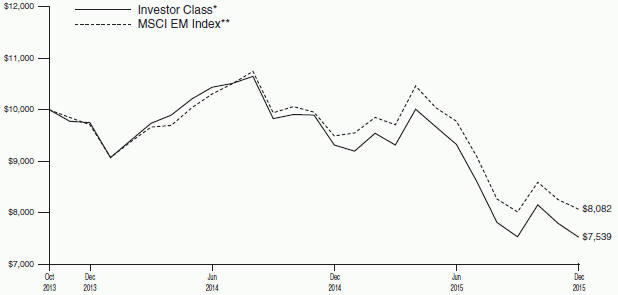
The graph compares the results of a hypothetical $10,000 investment in the Investor Class of the Fund since October 31, 2013 (commencement of operations), with all dividends and capital gains reinvested, with the MSCI EM Index.
*These returns reflect expense waivers by the Fund’s investment adviser. Without these waivers, returns would have been lower. Returns shown do not reflect the deduction of taxes that a shareholder would pay on Fund distributions or the redemption of Fund shares.
Unlike a mutual fund, the performance of an index assumes no taxes, transaction costs, management fees or other expenses.
222
Table of Contents
EMERGING MARKETS EQUITY FUND SCHEDULE OF INVESTMENTS | December 31, 2015 |
| Shares | Value | |||||||
FOREIGN COMMON STOCKS — 90.5% |
| |||||||
Argentina — 0.2% | ||||||||
Banco Macro SA ADR* | 8,435 | $ | 490,242 | |||||
|
| |||||||
Austria — 0.2% | ||||||||
Vienna Insurance Group AG Wiener Versicherung Gruppe | 23,188 | 634,265 | ||||||
|
| |||||||
Bermuda — 1.2% | ||||||||
Credicorp, Ltd.D | 18,687 | 1,818,619 | ||||||
GOME Electrical Appliances Holdings, Ltd. | 4,615,000 | 765,013 | ||||||
Kosmos Energy, Ltd.* | 84,300 | 438,360 | ||||||
Nine Dragons Paper Holdings, Ltd. | 820,000 | 481,522 | ||||||
|
| |||||||
| 3,503,514 | ||||||||
|
| |||||||
Brazil — 3.3% | ||||||||
Banco Bradesco SA ADRD | 92,925 | 446,969 | ||||||
Banco do Brasil SA | 60,600 | 225,781 | ||||||
Banco Santander Brasil SA ADR D | 244,404 | 950,732 | ||||||
BM&FBovespa SA | 124,000 | 341,323 | ||||||
BRF SA | 78,200 | 1,095,047 | ||||||
BTG Pactual Group | 108,100 | 409,858 | ||||||
CCR SA | 112,100 | 355,603 | ||||||
Cia Brasileira de Distribuicao ADRD | 18,947 | 199,322 | ||||||
CiaEnergeticade Minas Gerais ADRD | 14,018 | 21,027 | ||||||
Itau Unibanco Holding SA ADR Class HD | 187,567 | 1,221,061 | ||||||
JBS SA | 524,000 | 1,635,741 | ||||||
Linx SA | 28,000 | 313,529 | ||||||
Natura Cosmeticos SA | 9,200 | 54,625 | ||||||
Odontoprev SA | 104,000 | 248,417 | ||||||
Porto Seguro SA | 11,800 | 85,870 | ||||||
Rumo Logistica Operadora Multimodal SA* | 112,004 | 176,658 | ||||||
TOTVS SA | 67,500 | 529,422 | ||||||
Tractebel Energia SA | 93,000 | 787,253 | ||||||
Ultrapar Participacoes SA | 50,400 | 770,093 | ||||||
Ultrapar Participacoes SA ADRD | 7,704 | 117,486 | ||||||
|
| |||||||
| 9,985,817 | ||||||||
|
| |||||||
Canada — 0.5% | ||||||||
First Quantum Minerals, Ltd. | 301,902 | 1,130,196 | ||||||
Platinum Group Metals, Ltd.* | 432,000 | 60,880 | ||||||
Torex Gold Resources, Inc.D* | 343,450 | 312,747 | ||||||
|
| |||||||
| 1,503,823 | ||||||||
|
| |||||||
Chile — 0.7% | ||||||||
Banco de Chile ADRD | 3,452 | 205,083 | ||||||
Banco Santander Chile ADRD | 28,952 | 510,713 | ||||||
Cencosud SA | 94,285 | 188,288 | ||||||
Embotelladora Andina SA ADR Class BD | 41,783 | 727,442 | ||||||
Enersis SA ADRD | 35,984 | 437,206 | ||||||
Latam Airlines Group SA ADRD* | 13,442 | 72,453 | ||||||
|
| |||||||
| 2,141,185 | ||||||||
|
| |||||||
China — 14.0% | ||||||||
AAC Technologies Holdings, Inc. | 194,500 | 1,265,291 | ||||||
Air China, Ltd. Class H | 1,010,000 | 792,140 | ||||||
| Shares | Value | |||||||
Alibaba Group Holding, Ltd. ADRD* | 41,878 | $ | 3,403,425 | |||||
Anhui Conch Cement Co., Ltd. Class HD | 1,299,500 | 3,473,665 | ||||||
ANTA Sports Products, Ltd. | 332,000 | 907,643 | ||||||
AviChina Industry & Technology Co., Ltd. Class H | 289,000 | 225,818 | ||||||
Baidu, Inc. ADRD* | 5,042 | 953,140 | ||||||
Bank of China, Ltd. Class H | 1,986,000 | 881,215 | ||||||
Bank of Communications Co., Ltd. Class H | 1,088,000 | 762,990 | ||||||
China Cinda Asset Management Co., Ltd. Class H | 2,122,000 | 781,021 | ||||||
China CITIC Bank Corporation, Ltd. Class H* | 717,000 | 462,116 | ||||||
China Communications Construction Co., Ltd. Class H | 158,426 | 160,519 | ||||||
China Communications Services Corporation, Ltd. Class H | 78,000 | 29,177 | ||||||
China Construction Bank Corporation Class H | 3,173,000 | 2,164,456 | ||||||
China Everbright Bank Co., Ltd. Class H | 190,000 | 91,999 | ||||||
China Galaxy Securities Co., Ltd. Class H | 41,000 | 37,262 | ||||||
China Life Insurance Co., Ltd. Class H | 202,000 | 648,460 | ||||||
China Longyuan Power Group Corporation, Ltd. Class H | 46,605 | 35,046 | ||||||
China Merchants Bank Co., Ltd. Class H | 350,314 | 820,029 | ||||||
China Petroleum & Chemical Corporation Class H | 164,000 | 98,486 | ||||||
China Shenhua Energy Co., Ltd. Class H | 276,000 | 430,974 | ||||||
China Southern Airlines Co., Ltd. Class H | 367,273 | 283,131 | ||||||
China Telecom Corporation, Ltd. Class H | 192,000 | 89,562 | ||||||
China Vanke Co., Ltd. Class H+@ | 79,800 | 237,166 | ||||||
Chongqing Rural Commercial Bank Co., Ltd. Class H | 513,000 | 308,118 | ||||||
Country Garden Holdings Co., Ltd. | 121,000 | 49,315 | ||||||
Ctrip.com International, Ltd. ADRD* | 5,294 | 245,271 | ||||||
Dalian Wanda Commercial Properties Co., Ltd. Class H 144A | 36,100 | 209,525 | ||||||
Dongfeng Motor Group Co., Ltd. Class H | 826,000 | 1,094,217 | ||||||
Evergrande Real Estate Group, Ltd.D | 342,000 | 299,412 | ||||||
Fuyao Glass Industry Group Co., Ltd. Class H 144A* | 271,600 | 652,308 | ||||||
Geely Automobile Holdings, Ltd. | 3,225,000 | 1,704,114 | ||||||
Great Wall Motor Co., Ltd. Class H | 297,500 | 343,620 | ||||||
Huadian Power International Corporation, Ltd. Class H | 168,000 | 108,709 | ||||||
Industrial & Commercial Bankof China, Ltd. Class H | 7,343,000 | 4,401,531 | ||||||
JD.com, Inc. ADRD* | 6,331 | 204,270 | ||||||
| See Notes to Financial Statements. | 223 |
Table of Contents
EMERGING MARKETS EQUITY FUND
SCHEDULE OF INVESTMENTS (Continued)
| Shares | Value | |||||||||||
Kingsoft Corporation, Ltd. | 85,000 | $ | 206,408 | |||||||||
Longfor Properties Co., Ltd. | 894,000 | 1,329,649 | ||||||||||
Mindray Medical International, Ltd. ADR | 24,685 | 669,457 | ||||||||||
NetEase, Inc. ADR | 1,447 | 262,254 | ||||||||||
People’s Insurance Co. Groupof China, Ltd. (The) Class H | 1,910,000 | 929,931 | ||||||||||
PICC Property & Casualty Co., Ltd. Class H | 432,000 | 852,559 | ||||||||||
Qinhuangdao Port Co., Ltd. Class H | 550,000 | 258,683 | ||||||||||
Semiconductor Manufacturing International Corporation* | 1,562,000 | 158,848 | ||||||||||
Sinopec Shanghai Petrochemical Co., Ltd. Class H* | 542,000 | 214,364 | ||||||||||
Sinopharm Group Co., Ltd. Class H | 218,000 | 870,305 | ||||||||||
Tencent Holdings, Ltd. | 154,000 | 3,015,318 | ||||||||||
Tingyi Cayman Islands Holding CorporationD | 1,594,000 | 2,264,565 | ||||||||||
Weichai Power Co., Ltd. Class H | 626,000 | 689,388 | ||||||||||
Wumart Stores, Inc. Class H+* | 496,000 | 394,117 | ||||||||||
Zhejiang Expressway Co., Ltd. Class H | 136,000 | 162,499 | ||||||||||
Zhuzhou CSR Times Electric Co., Ltd. Class H | 109,000 | 628,555 | ||||||||||
|
|
|
| |||||||||
| 41,562,041 | ||||||||||||
|
|
|
| |||||||||
Colombia — 0.3% | ||||||||||||
Bancolombia SA | 82,896 | 547,853 | ||||||||||
Bancolombia SA ADRD | 9,155 | 244,896 | ||||||||||
|
|
|
| |||||||||
| 792,749 | ||||||||||||
|
|
|
| |||||||||
Cyprus — 0.1% | ||||||||||||
Global Ports Investments PLC GDR* | 49,037 | 159,370 | ||||||||||
QIWI PLC ADRD | 10,520 | 188,834 | ||||||||||
|
|
|
| |||||||||
| 348,204 | ||||||||||||
|
|
|
| |||||||||
Egypt — 0.1% | ||||||||||||
ElSewedy Electric Co. | 82,700 | 389,261 | ||||||||||
|
|
|
| |||||||||
Estonia — 0.1% | ||||||||||||
Tallink Grupp AS | 399,345 | 371,930 | ||||||||||
|
|
|
| |||||||||
Hong Kong — 6.2% | ||||||||||||
AIA Group, Ltd. | 451,758 | 2,699,292 | ||||||||||
ASM Pacific Technology, Ltd. | 207,200 | 1,617,713 | ||||||||||
Belle International Holdings, Ltd. | 967,000 | 723,516 | ||||||||||
China Agri-Industries Holdings, Ltd.D* | 93,597 | 31,930 | ||||||||||
China Everbright International, Ltd.D | 64,000 | 81,836 | ||||||||||
China Mengniu Dairy Co., Ltd. | 1,203,000 | 1,952,879 | ||||||||||
China Merchants Holdings International Co., Ltd. | 30,000 | 94,886 | ||||||||||
China Mobile, Ltd. | 370,500 | 4,170,387 | ||||||||||
China Overseas Land & Investment, Ltd.D | 966,000 | 3,362,996 | ||||||||||
China Resources Land, Ltd. | 176,000 | 509,292 | ||||||||||
China Taiping Insurance Holdings Co., Ltd.* | 169,400 | 519,975 | ||||||||||
CNOOC, Ltd. | 530,000 | 551,611 | ||||||||||
| Shares | Value | |||||||||||
CSPC Pharmaceutical Group, Ltd. | 98,000 | $ | 99,912 | |||||||||
Far East Horizon, Ltd. | 58,000 | 53,736 | ||||||||||
Shimao Property Holdings, Ltd. | 36,000 | 63,459 | ||||||||||
Sino Biopharmaceutical, Ltd. | 436,000 | 394,195 | ||||||||||
Sino-Ocean Land Holdings, Ltd. | 78,000 | 49,734 | ||||||||||
WH Group, Ltd. 144A* | 2,869,000 | 1,596,800 | ||||||||||
|
|
|
| |||||||||
| 18,574,149 | ||||||||||||
|
|
|
| |||||||||
Hungary — 0.4% | ||||||||||||
OTP Bank PLC | 57,190 | 1,175,905 | ||||||||||
|
|
|
| |||||||||
India — 8.4% | ||||||||||||
Ambuja Cements, Ltd. | 75,165 | 229,861 | ||||||||||
Aurobindo Pharma, Ltd. | 24,452 | 322,511 | ||||||||||
Axis Bank, Ltd. | 615,587 | 4,152,293 | ||||||||||
Bajaj Auto, Ltd. | 2,129 | 81,224 | ||||||||||
Bharat Petroleum Corporation, Ltd. | 16,532 | 222,060 | ||||||||||
Dabur India, Ltd. | 259,276 | 1,083,309 | ||||||||||
Divi’s Laboratories, Ltd. | 26,351 | 459,121 | ||||||||||
Dr. Reddy’s Laboratories, Ltd. | 28,216 | 1,324,626 | ||||||||||
Eicher Motors, Ltd. | 173 | 43,916 | ||||||||||
Glenmark Pharmaceuticals, Ltd. | 7,003 | 97,227 | ||||||||||
Godrej Consumer Products, Ltd. | 14,426 | 286,872 | ||||||||||
HCL Technologies, Ltd. | 32,364 | 417,397 | ||||||||||
Hero MotoCorp, Ltd. | 40,611 | 1,647,890 | ||||||||||
Housing Development Finance Corporation, Ltd. | 14,437 | 274,589 | ||||||||||
Idea Cellular, Ltd. | 123,390 | 267,005 | ||||||||||
Indiabulls Housing Finance, Ltd. | 12,003 | 133,122 | ||||||||||
Indraprastha Gas, Ltd. | 20,722 | 165,032 | ||||||||||
Infosys, Ltd. | 115,431 | 1,923,489 | ||||||||||
Infosys, Ltd. ADR D | 130,049 | 2,178,321 | ||||||||||
Kotak Mahindra Bank, Ltd. | 293,144 | 3,175,174 | ||||||||||
LIC Housing Finance, Ltd. | 30,007 | 231,019 | ||||||||||
Marico, Ltd. | 117,564 | 401,286 | ||||||||||
Motherson Sumi Systems, Ltd. | 127,015 | 560,837 | ||||||||||
Nestle India, Ltd. | 848 | 74,548 | ||||||||||
Power Finance Corporation, Ltd. | 215,254 | 651,481 | ||||||||||
Siemens, Ltd. | 1,860 | 33,657 | ||||||||||
State Bank of India | 30,737 | 103,869 | ||||||||||
Tata Consultancy Services, Ltd. | 108,575 | 3,991,605 | ||||||||||
Tata Motors, Ltd. ADRD* | 9,986 | 294,287 | ||||||||||
Wipro, Ltd. | 29,949 | 252,416 | ||||||||||
|
|
|
| |||||||||
| 25,080,044 | ||||||||||||
|
|
|
| |||||||||
Indonesia — 1.5% | ||||||||||||
PT Astra Agro Lestari Tbk | 53,903 | 61,444 | ||||||||||
PT Astra International Tbk | 40,723 | 17,541 | ||||||||||
PT Bank Central Asia Tbk | 409,200 | 392,046 | ||||||||||
PT Bank Mandiri Persero Tbk | 135,000 | 89,645 | ||||||||||
PT Bank Negara Indonesia Persero Tbk | 1,232,700 | 441,329 | ||||||||||
PT Bank Rakyat Indonesia Persero Tbk | 269,400 | 221,097 | ||||||||||
PT Bank Tabungan Pensiunan Nasional Tbk@* | 237,000 | 41,262 | ||||||||||
PT Indofood Sukses Makmur Tbk | 603,235 | 224,536 | ||||||||||
PT Kalbe Farma Tbk | 864,400 | 82,243 | ||||||||||
PT Lippo Karawaci Tbk | 1,182,900 | 88,529 | ||||||||||
| 224 | See Notes to Financial Statements. |
Table of Contents
| Shares | Value | |||||||||||
PT Matahari Department Store Tbk | 306,583 | $ | 388,114 | |||||||||
PT Ramayana Lestari Sentosa Tbk | 3,631,300 | 169,381 | ||||||||||
PT Semen Indonesia Persero Tbk | 1,039,700 | 851,921 | ||||||||||
PT Telekomunikasi Indonesia Persero Tbk ADRD | 10,932 | 485,381 | ||||||||||
PT Unilever Indonesia Tbk | 53,700 | 143,348 | ||||||||||
PT United Tractors Tbk | 701,669 | 854,361 | ||||||||||
|
|
|
| |||||||||
| 4,552,178 | ||||||||||||
|
|
|
| |||||||||
Isle of Man (U.K.) — 0.1% | ||||||||||||
New Europe Property Investments PLC | 14,284 | 164,231 | ||||||||||
|
|
|
| |||||||||
Jersey — 0.1% | ||||||||||||
West China Cement, Ltd. | 1,414,000 | 290,806 | ||||||||||
|
|
|
| |||||||||
Kenya — 0.5% | ||||||||||||
Equity Group Holdings, Ltd. | 1,634,223 | 638,458 | ||||||||||
Safaricom, Ltd. | 6,315,400 | 1,006,266 | ||||||||||
|
|
|
| |||||||||
| 1,644,724 | ||||||||||||
|
|
|
| |||||||||
Luxembourg — 0.2% | ||||||||||||
O’Key Group SA GDR | 6,025 | 12,050 | ||||||||||
Ternium SA ADR | 42,528 | 528,623 | ||||||||||
|
|
|
| |||||||||
| 540,673 | ||||||||||||
|
|
|
| |||||||||
Malaysia — 1.3% | ||||||||||||
AirAsia Bhd | 2,187,700 | 654,479 | ||||||||||
AMMB Holdings Bhd | 188,467 | 198,333 | ||||||||||
Astro Malaysia Holdings Bhd | 161,358 | 103,415 | ||||||||||
Axiata Group Bhd | 84,800 | 126,372 | ||||||||||
CIMB Group Holdings Bhd | 84,291 | 88,875 | ||||||||||
IHH Healthcare Bhd | 242,300 | 371,337 | ||||||||||
Lafarge Malaysia Bhd | 86,100 | 178,076 | ||||||||||
Malayan Banking Bhd | 185,100 | 361,466 | ||||||||||
Petronas Chemicals Group Bhd | 416,300 | 703,196 | ||||||||||
Petronas Dagangan Bhd | 3,900 | 22,582 | ||||||||||
Public Bank Bhd | 68,100 | 293,430 | ||||||||||
Tenaga Nasional Bhd | 148,100 | 458,546 | ||||||||||
Westports Holdings Bhd | 356,400 | 341,013 | ||||||||||
|
|
|
| |||||||||
| 3,901,120 | ||||||||||||
|
|
|
| |||||||||
Malta — 0.1% | ||||||||||||
Brait SE* | 23,428 | 252,759 | ||||||||||
|
|
|
| |||||||||
Mexico — 4.1% | ||||||||||||
Alfa SAB de CV Class A | 254,100 | 502,760 | ||||||||||
America Movil SAB de CV ADR Class LD | 81,757 | 1,149,503 | ||||||||||
America Movil SAB de CV, Series L | 718,703 | 505,421 | ||||||||||
Arca Continental SAB de CV | 67,600 | 410,593 | ||||||||||
Cemex SAB de CV ADRD* | 28,878 | 160,851 | ||||||||||
Corp Moctezuma SAB de CV | 199,309 | 635,356 | ||||||||||
El Puerto de Liverpool SAB de CV Class C1 | 13,121 | 159,961 | ||||||||||
Fibra Uno Administracion SA de CV REIT | 153,900 | 339,242 | ||||||||||
Genomma Lab Internacional SAB de CV Class B* | 655,200 | 526,532 | ||||||||||
Gentera SAB de CV | 54,100 | 104,687 | ||||||||||
Gruma SAB de CV Class B | 98,600 | 1,383,072 | ||||||||||
Grupo Financiero Banorte SAB de CV Class O | 526,387 | 2,901,245 | ||||||||||
| Shares | Value | |||||||||||
Grupo Financiero Inbursa SAB de CV Class O | 420,700 | $ | 759,162 | |||||||||
Grupo Lala SAB de CV | 21,300 | 49,522 | ||||||||||
Grupo Televisa SAB ADR | 14,876 | 404,776 | ||||||||||
Kimberly-Clark de Mexico SAB de CV Class A | 90,600 | 212,221 | ||||||||||
Megacable Holdings SAB de CV | 289,900 | 1,079,734 | ||||||||||
OHL Mexico SAB de CV* | 138,051 | 144,503 | ||||||||||
Telesites SAB* | 188,150 | 122,380 | ||||||||||
Wal-Mart de Mexico SAB de CV | 276,900 | 698,737 | ||||||||||
|
| |||||||||||
| 12,250,258 | ||||||||||||
|
| |||||||||||
Mongolia — 0.0% | ||||||||||||
Mongolian Mining CorporationD* | 4,213,750 | 94,622 | ||||||||||
|
| |||||||||||
Morocco & Antilles — 0.1% |
| |||||||||||
Attijariwafa Bank | 7,003 | 238,693 | ||||||||||
|
| |||||||||||
Netherlands — 1.0% | ||||||||||||
OCI NV* | 34,397 | 849,319 | ||||||||||
Steinhoff International Holdings NV@ | 8,590 | 43,608 | ||||||||||
X5 Retail Group NV GDR* | 106,350 | 2,015,333 | ||||||||||
|
| |||||||||||
| 2,908,260 | ||||||||||||
|
| |||||||||||
Nigeria — 0.7% | ||||||||||||
FCMB Group PLC@ | 12,000,000 | 101,884 | ||||||||||
Guaranty Trust Bank PLC | 14,478,359 | 1,322,364 | ||||||||||
Nestle Nigeria PLC | 134,884 | 582,769 | ||||||||||
United Bank for Africa PLC | 7,896,545 | 134,089 | ||||||||||
|
| |||||||||||
| 2,141,106 | ||||||||||||
|
| |||||||||||
Philippines — 1.0% | ||||||||||||
Bank of the Philippine Islands | 271,043 | 482,750 | ||||||||||
International Container Terminal Services, Inc. | 573,060 | 853,580 | ||||||||||
Universal Robina Corporation | 394,850 | 1,558,092 | ||||||||||
|
| |||||||||||
| 2,894,422 | ||||||||||||
|
| |||||||||||
Poland — 1.2% | ||||||||||||
Alior Bank SA* | 45,850 | 777,287 | ||||||||||
Bank Pekao SA | 3,373 | 123,191 | ||||||||||
Energa SA | 94,243 | 303,389 | ||||||||||
Eurocash SA | 95,806 | 1,180,665 | ||||||||||
Orange Polska SA* | 71,254 | 119,161 | ||||||||||
PGE Polska Grupa Energetyczna SA | 106,824 | 346,331 | ||||||||||
Polskie Gornictwo Naftowe i Gazownictwo SA | 251,674 | 328,476 | ||||||||||
Powszechna Kasa Oszczednosci Bank Polski SA* | 39,512 | 274,436 | ||||||||||
|
| |||||||||||
| 3,452,936 | ||||||||||||
|
| |||||||||||
Portugal — 0.2% | ||||||||||||
Jeronimo Martins SGPS SA | 39,085 | 508,592 | ||||||||||
|
| |||||||||||
Russia — 3.4% | ||||||||||||
Gazprom PAO ADR | 184,688 | 677,805 | ||||||||||
LSR Group PJSC GDR | 163,892 | 327,784 | ||||||||||
Lukoil PJSC ADR | 18,365 | 596,587 | ||||||||||
Magnit PJSC GDR | 1,582 | 63,628 | ||||||||||
Mobile Telesystems PJSC ADR | 86,791 | 536,368 | ||||||||||
NOVATEK OAO GDR | 47,296 | 3,882,731 | ||||||||||
Novolipetsk Steel OJSC GDR | 48,869 | 418,866 | ||||||||||
Rosneft OAO GDR | 27,856 | 96,591 | ||||||||||
Sberbank of Russia PJSC ADR | 423,287 | 2,450,832 | ||||||||||
| See Notes to Financial Statements. | 225 |
Table of Contents
EMERGING MARKETS EQUITY FUND
SCHEDULE OF INVESTMENTS (Continued)
| Shares | Value | |||||||||||
Severstal PAO GDR | 30,311 | $ | 252,954 | |||||||||
Sistema JSFC GDR | 120,535 | 711,157 | ||||||||||
Surgutneftegas OAO ADR | 42,924 | 195,733 | ||||||||||
Tatneft PAO ADR | 2,759 | 72,948 | ||||||||||
|
|
|
| |||||||||
| 10,283,984 | ||||||||||||
|
|
|
| |||||||||
South Africa — 4.6% | ||||||||||||
African Bank Investments, Ltd.+* | 642,081 | — | ||||||||||
Aspen Pharmacare Holdings, Ltd.* | 91,251 | 1,821,796 | ||||||||||
Bidvest Group, Ltd. (The) | 138,923 | 2,948,669 | ||||||||||
Capitec Bank Holdings, Ltd.D | 16,520 | 574,496 | ||||||||||
Discovery, Ltd. | 43,017 | 368,941 | ||||||||||
Foschini Group, Ltd. (The) | 50,104 | 393,711 | ||||||||||
Growthpoint Properties, Ltd. REIT | 142,322 | 213,613 | ||||||||||
Hyprop Investments, Ltd. REIT | 10,764 | 72,042 | ||||||||||
Imperial Holdings, Ltd. | 6,022 | 46,680 | ||||||||||
Investec, Ltd. | 45,710 | 322,906 | ||||||||||
MMI Holdings, Ltd. | 76,487 | 108,466 | ||||||||||
Mondi, Ltd. | 27,820 | 550,535 | ||||||||||
MTN Group, Ltd. | 101,551 | 874,797 | ||||||||||
Naspers, Ltd. N Shares | 8,982 | 1,227,699 | ||||||||||
Netcare, Ltd. | 283,543 | 621,011 | ||||||||||
Pick n Pay Stores, Ltd. | 256,364 | 1,076,846 | ||||||||||
Rand Merchant Insurance Holdings, Ltd. | 10,247 | 25,615 | ||||||||||
Redefine Properties, Ltd. REIT | 190,199 | 119,392 | ||||||||||
Remgro, Ltd. | 11,242 | 177,955 | ||||||||||
Resilient, Ltd. REIT | 12,543 | 93,320 | ||||||||||
RMB Holdings, Ltd. | 85,591 | 306,873 | ||||||||||
Sasol, Ltd. | 1,744 | 47,084 | ||||||||||
Shoprite Holdings, Ltd. | 12,628 | 117,025 | ||||||||||
Standard Bank Group, Ltd. | 95,616 | 700,888 | ||||||||||
Telkom SA SOC, Ltd. | 151,090 | 627,738 | ||||||||||
Truworths International, Ltd. | 34,276 | 202,057 | ||||||||||
|
|
|
| |||||||||
| 13,640,155 | ||||||||||||
|
|
|
| |||||||||
South Korea — 14.1% | ||||||||||||
Amorepacific Corporation* | 1,445 | 507,090 | ||||||||||
AMOREPACIFIC Group* | 668 | 83,454 | ||||||||||
BGF retail Co., Ltd.* | 337 | 48,788 | ||||||||||
Celltrion, Inc.* | 8,951 | 638,585 | ||||||||||
CJ CheilJedang Corporation* | 869 | 277,955 | ||||||||||
Coway Co., Ltd.* | 7,750 | 551,815 | ||||||||||
Daelim Industrial Co., Ltd.* | 3,368 | 190,177 | ||||||||||
Daewoo International Corporation* | 13,676 | 188,326 | ||||||||||
Daewoo Securities Co., Ltd.* | 6,370 | 50,424 | ||||||||||
DGB Financial Group, Inc.* | 9,740 | 82,975 | ||||||||||
Dongbu Insurance Co., Ltd.* | 2,987 | 178,717 | ||||||||||
E-MART, Inc.* | 3,996 | 641,196 | ||||||||||
Hana Financial Group, Inc. | 14,724 | 294,228 | ||||||||||
Hanwha Corporation* | 39,441 | 1,307,690 | ||||||||||
Hanwha Life Insurance Co., Ltd.* | 123,776 | 780,099 | ||||||||||
Hyosung Corporation* | 1,029 | 101,772 | ||||||||||
Hyundai Development Co-Engineering & Construction* | 6,365 | 207,996 | ||||||||||
Hyundai Engineering & Construction Co., Ltd.* | 7,790 | 187,009 | ||||||||||
Hyundai Mobis Co., Ltd.* | 2,678 | 560,317 | ||||||||||
Hyundai Motor Co. | 1,041 | 131,295 | ||||||||||
Hyundai Wia Corporation* | 2,449 | 231,554 | ||||||||||
| Shares | Value | |||||||||||
KB Financial Group, Inc.* | 7,661 | $ | 215,840 | |||||||||
Kia Motors Corporation* | 39,586 | 1,765,139 | ||||||||||
KIWOOM Securities Co., Ltd.* | 7,364 | 384,549 | ||||||||||
Korea Electric Power Corporation* | 3,172 | 134,389 | ||||||||||
Korea Investment Holdings Co., Ltd.* | 3,362 | 140,492 | ||||||||||
Korean Air Lines Co., Ltd.* | 17,521 | 411,299 | ||||||||||
LG Chem, Ltd.* | 2,213 | 610,972 | ||||||||||
LG Uplus Corporation* | 10,297 | 90,925 | ||||||||||
Lotte Chemical Corporation* | 7,474 | 1,525,049 | ||||||||||
Mirae Asset Securities Co., Ltd.* | 5,201 | 94,629 | ||||||||||
NAVER Corporation* | 3,232 | 1,802,290 | ||||||||||
NCSoft Corporation | 5,796 | 1,044,877 | ||||||||||
NH Investment & Securities Co., Ltd.* | 11,565 | 97,853 | ||||||||||
Samsung Electro-Mechanics Co., Ltd.* | 2,740 | 145,582 | ||||||||||
Samsung Electronics Co., Ltd. | 11,225 | 11,972,386 | ||||||||||
Samsung Fire & Marine Insurance Co., Ltd.* | 26,263 | 6,865,312 | ||||||||||
Samsung SDI Co., Ltd. | 5,397 | 518,840 | ||||||||||
Samsung Securities Co., Ltd.* | 1,984 | 69,631 | ||||||||||
Shinhan Financial Group Co., Ltd.* | 105,601 | 3,547,323 | ||||||||||
Shinsegae Co., Ltd.* | 5,913 | 1,150,436 | ||||||||||
SK Hynix, Inc.* | 40,950 | 1,057,860 | ||||||||||
SK Innovation Co., Ltd.* | 5,273 | 578,295 | ||||||||||
SK Networks Co., Ltd.* | 13,269 | 61,554 | ||||||||||
S-Oil Corporation | 1,383 | 92,642 | ||||||||||
Woori Bank | 29,668 | 221,895 | ||||||||||
Yuhan Corporation* | 99 | 22,839 | ||||||||||
|
|
| ||||||||||
| 41,864,360 | ||||||||||||
|
|
| ||||||||||
Switzerland — 0.9% | ||||||||||||
Coca-Cola HBC AG* | 121,410 | 2,585,521 | ||||||||||
|
|
| ||||||||||
Taiwan — 10.3% | ||||||||||||
AU Optronics Corporation | 320,642 | 94,530 | ||||||||||
Casetek Holdings, Ltd. | 48,000 | 194,933 | ||||||||||
Cathay Financial Holding Co., Ltd. | 133,000 | 186,325 | ||||||||||
China Airlines, Ltd.* | 1,576,000 | 574,410 | ||||||||||
China Development Financial Holding Corporation | 353,000 | 88,048 | ||||||||||
China Life Insurance Co., Ltd. | 1,160,058 | 885,854 | ||||||||||
Compal Electronics, Inc. | 684,000 | 382,767 | ||||||||||
CTBC Financial Holding Co., Ltd. | 1,365,642 | 699,211 | ||||||||||
Eclat Textile Co., Ltd. | 19,000 | 261,083 | ||||||||||
Eva Airways Corporation* | 662,000 | 373,850 | ||||||||||
Feng TAY Enterprise Co., Ltd. | 131,000 | 666,202 | ||||||||||
First Financial Holding Co., Ltd. | 109,000 | 50,628 | ||||||||||
Foxconn Technology Co., Ltd. | 123,220 | 259,566 | ||||||||||
Fubon Financial Holding Co., Ltd. | 692,000 | 941,279 | ||||||||||
Hon Hai Precision Industry Co., Ltd. | 751,344 | 1,838,763 | ||||||||||
HTC Corporation | 231,000 | 545,804 | ||||||||||
Innolux Corporation | 1,472,000 | 442,440 | ||||||||||
Inotera Memories, Inc.* | 83,000 | 70,010 | ||||||||||
Largan Precision Co., Ltd. | 6,000 | 410,549 | ||||||||||
MediaTek, Inc. | 307,000 | 2,321,994 | ||||||||||
Mega Financial Holding Co, Ltd. | 125,000 | 80,589 | ||||||||||
| 226 | See Notes to Financial Statements. |
Table of Contents
| Shares | Value | |||||||||||
Nan Ya Plastics Corporation | 35,000 | $ | 64,659 | |||||||||
Pegatron Corporation | 235,000 | 511,117 | ||||||||||
Pou Chen Corporation | 597,000 | 779,038 | ||||||||||
Powertech Technology, Inc. | 476,000 | 938,572 | ||||||||||
President Chain Store Corporation | 65,000 | 405,679 | ||||||||||
Shin Kong Financial Holding Co., Ltd. | 825,000 | 178,728 | ||||||||||
Siliconware Precision Industries Co., Ltd. | 241,000 | 380,582 | ||||||||||
SinoPac Financial Holdings Co., Ltd. | 225,000 | 63,886 | ||||||||||
Taiwan Fertilizer Co., Ltd. | 101,000 | 131,754 | ||||||||||
Taiwan Semiconductor Manufacturing Co., Ltd. | 2,323,000 | 10,021,982 | ||||||||||
Taiwan Semiconductor Manufacturing Co., Ltd. ADRD | 213,893 | 4,866,066 | ||||||||||
Teco Electric and Machinery Co., Ltd. | 121,000 | 96,417 | ||||||||||
Wan Hai Lines, Ltd. | 83,877 | 46,222 | ||||||||||
Zhen Ding Technology Holding, Ltd. | 387,510 | 883,540 | ||||||||||
|
|
|
| |||||||||
| 30,737,077 | ||||||||||||
|
|
|
| |||||||||
Thailand — 3.7% | ||||||||||||
Advanced Info Service PCL NVDR | 56,700 | 238,557 | ||||||||||
Bangkok Bank PCL NVDR | 53,700 | 226,557 | ||||||||||
Bangkok Dusit Medical Services PCL Class FD | 142,800 | 88,493 | ||||||||||
Big C Supercenter PCL NVDR@ | 304,000 | 1,699,059 | ||||||||||
Bumrungrad Hospital PCL NVDR | 61,300 | 357,935 | ||||||||||
Central Pattana PCL | 2,301,500 | 3,005,989 | ||||||||||
Delta Electronics Thailand PCL NVDR | 106,800 | 225,674 | ||||||||||
Indorama Ventures PCL NVDR | 218,200 | 127,777 | ||||||||||
Kasikornbank PCL | 47,800 | 197,573 | ||||||||||
Kasikornbank PCL NVDR | 353,231 | 1,468,239 | ||||||||||
Krung Thai Bank PCL NVDRD | 385,300 | 177,699 | ||||||||||
PTT Global Chemical PCL NVDR | 639,054 | 883,982 | ||||||||||
Robinson Department Store PCL | 462,600 | 559,208 | ||||||||||
Siam Cement PCL (The) NVDRD | 6,500 | 82,711 | ||||||||||
Siam Commercial Bank PCL (The) | 41,500 | 137,814 | ||||||||||
Thai Oil PCL NVDR | 25,800 | 47,026 | ||||||||||
Thai Union Group PCL NVDR | 1,294,800 | 615,088 | ||||||||||
TMB Bank PCL | 10,991,300 | 739,168 | ||||||||||
TMB Bank PCL NVDR | 747,500 | 49,978 | ||||||||||
|
|
|
| |||||||||
| 10,928,527 | ||||||||||||
|
|
|
| |||||||||
Turkey — 2.5% | ||||||||||||
Arcelik AS | 23,131 | 110,732 | ||||||||||
Coca-Cola Icecek AS | 40,399 | 514,467 | ||||||||||
Emlak Konut Gayrimenkul Yatirim Ortakligi AS REIT | 115,512 | 102,833 | ||||||||||
Eregli Demir ve Celik Fabrikalari TAS | 43,748 | 45,525 | ||||||||||
Ford Otomotiv Sanayi AS | 21,031 | 218,151 | ||||||||||
TAV Havalimanlari Holding AS | 43,334 | 270,122 | ||||||||||
Tofas Turk Otomobil Fabrikasi AS | 97,323 | 631,817 | ||||||||||
| Shares | Value | |||||||||||
Tupras Turkiye Petrol Rafinerileri AS* | 22,744 | $ | 542,450 | |||||||||
Turk Hava Yollari AO* | 140,205 | 354,635 | ||||||||||
Turk Telekomunikasyon AS | 43,392 | 81,153 | ||||||||||
Türkiye Garanti Bankasi AS | 1,076,873 | 2,623,444 | ||||||||||
Türkiye Halk Bankasi AS | 100,098 | 355,772 | ||||||||||
Türkiye Is Bankasi Class C | 39,859 | 62,721 | ||||||||||
Turkiye Sise ve Cam Fabrikalari AS | 88,305 | 96,511 | ||||||||||
Ulker Biskuvi Sanayi AS | 106,104 | 640,387 | ||||||||||
Yapi ve Kredi Bankasi AS | 767,455 | 863,665 | ||||||||||
|
|
|
| |||||||||
| 7,514,385 | ||||||||||||
|
|
|
| |||||||||
United Arab Emirates — 0.0% | ||||||||||||
Orascom Construction, Ltd.* | 11,446 | 80,122 | ||||||||||
|
|
|
| |||||||||
United Kingdom — 2.0% | ||||||||||||
Anglo American PLC* | 582,065 | 2,575,314 | ||||||||||
Cable & Wireless Communications PLC | 1,617,406 | 1,769,483 | ||||||||||
Tullow Oil PLC* | 607,680 | 1,488,492 | ||||||||||
|
|
|
| |||||||||
| 5,833,289 | ||||||||||||
|
|
|
| |||||||||
United States of America — 1.2% | ||||||||||||
Cognizant Technology Solutions Corporation Class A* | 45,200 | 2,712,904 | ||||||||||
First Cash Financial Services, Inc.D* | 18,400 | 688,712 | ||||||||||
Southern Copper CorporationD | 4,037 | 105,446 | ||||||||||
|
|
|
| |||||||||
| 3,507,062 | ||||||||||||
|
|
|
| |||||||||
Total Foreign Common Stocks | 269,362,991 | |||||||||||
|
|
|
| |||||||||
FOREIGN PREFERRED STOCKS — 2.1% |
| |||||||||||
Brazil — 1.1% | ||||||||||||
Braskem SA Class A 0.61%, 04/10/15 | 92,000 | 642,285 | ||||||||||
Centrais Eletricas Brasileiras SA Class B | ||||||||||||
0.10%, 05/04/15* | 10,000 | 26,389 | ||||||||||
Cia Brasileira de Distribuicao | ||||||||||||
1.21%, 11/03/15 | 58,000 | 613,682 | ||||||||||
Cia Energetica de Sao Paulo, Class B | ||||||||||||
4.85%, 04/30/15 | 11,509 | 38,982 | ||||||||||
Gerdau SA | ||||||||||||
0.19%, 11/10/15 | 43,279 | 50,868 | ||||||||||
Itau Unibanco Holding SA | ||||||||||||
1.48%, 12/10/15 | 51,770 | 344,544 | ||||||||||
Itausa Investimentos Itau SA | ||||||||||||
0.51%, 12/10/15 | 381,484 | 663,409 | ||||||||||
Petroleo Brasileiro SA | ||||||||||||
1.00%, 4/03/14* | 477,500 | 808,657 | ||||||||||
|
|
|
| |||||||||
| 3,188,816 | ||||||||||||
|
|
|
| |||||||||
Chile — 0.0% | ||||||||||||
Embotelladora Andina SA Class B | ||||||||||||
0.80%, 10/26/15 | 1,770 | 5,265 | ||||||||||
|
|
|
| |||||||||
South Korea — 1.0% | ||||||||||||
Samsung Electronics Co., Ltd. | ||||||||||||
2.16%, 06/29/15 | 3,180 | 2,939,554 | ||||||||||
|
|
|
| |||||||||
Total Foreign Preferred Stocks |
| 6,133,635 | ||||||||||
|
|
|
| |||||||||
RIGHTS — 0.0% | ||||||||||||
Rumo Logistica Operadora Multimodal SA* | 40,243 | 1,526 | ||||||||||
|
|
|
| |||||||||
| See Notes to Financial Statements. | 227 |
Table of Contents
EMERGING MARKETS EQUITY FUND
SCHEDULE OF INVESTMENTS (Continued)
| Shares | Value | |||||||||||
MONEY MARKET FUNDS — 12.6% |
| |||||||||||
GuideStone Money Market Fund (Investor | 15,162,635 | $ | 15,162,635 | |||||||||
Northern Institutional Liquid Assets Portfolio§ | 22,484,517 | 22,484,517 | ||||||||||
|
| |||||||||||
Total Money Market Funds |
| 37,647,152 | ||||||||||
|
|
| ||||||||||
TOTAL INVESTMENTS — 105.2% |
| 313,145,304 | ||||||||||
Liabilities in Excess of Other |
| (15,362,969 | ) | |||||||||
|
|
| ||||||||||
NET ASSETS — 100.0% |
| $ | 297,782,335 | |||||||||
|
|
| ||||||||||
Swap agreements outstanding at December 31, 2015:
Reference Obligation | Maturity Date | Counterparty | Currency | Notional Amount | Market Value | Upfront Premiums Paid/ (Received) | Unrealized Appreciation (Depreciation) | |||||||||||||||||||||
Total Return Swap | ||||||||||||||||||||||||||||
MSCI Mexico Index | 03/16/16 | GS | MXN | (4,435,781 | ) | $ | (1,293 | ) | $ | — | $ | (1,293 | ) | |||||||||||||||
MSCI Singapore Index | 03/16/16 | GS | SGD | (380,612 | ) | (17,686 | ) | — | (17,686 | ) | ||||||||||||||||||
|
|
|
|
|
| |||||||||||||||||||||||
Total Swap agreements outstanding at December 31, 2015 |
| $ | (18,979 | ) | $ | — | $ | (18,979 | ) | |||||||||||||||||||
|
|
|
|
|
| |||||||||||||||||||||||
| 228 | See Notes to Financial Statements. |
Table of Contents
VALUATION HIERARCHY
The following is a summary of the inputs used, as of December 31, 2015, in valuing the Fund’s investments carried at fair value:
| Total Value | Level 1 Quoted Prices | Level 2 Other Significant Observable Inputs | Level 3 Significant Unobservable Inputs | |||||||||||||||||
Assets: | ||||||||||||||||||||
Investments in Securities: | ||||||||||||||||||||
Foreign Common Stocks: | ||||||||||||||||||||
Argentina | $ | 490,242 | $ | 490,242 | $ | — | $ | — | ||||||||||||
Austria | 634,265 | — | 634,265 | — | ||||||||||||||||
Bermuda | 3,503,514 | 2,256,979 | 1,246,535 | — | ||||||||||||||||
Brazil | 9,985,817 | 9,985,817 | — | — | ||||||||||||||||
Canada | 1,503,823 | 1,503,823 | — | — | ||||||||||||||||
Chile | 2,141,185 | 2,141,185 | — | — | ||||||||||||||||
China | 41,562,041 | 5,737,817 | 35,824,224 | — | ||||||||||||||||
Colombia | 792,749 | 792,749 | — | — | ||||||||||||||||
Cyprus | 348,204 | 348,204 | — | — | ||||||||||||||||
Egypt | 389,261 | — | 389,261 | — | ||||||||||||||||
Estonia | 371,930 | 371,930 | — | — | ||||||||||||||||
Hong Kong | 18,574,149 | — | 18,574,149 | — | ||||||||||||||||
Hungary | 1,175,905 | — | 1,175,905 | — | ||||||||||||||||
India | 25,080,044 | 2,472,608 | 22,607,436 | — | ||||||||||||||||
Indonesia | 4,552,178 | 526,643 | 4,025,535 | — | ||||||||||||||||
Isle of Man (U.K.) | 164,231 | 164,231 | — | — | ||||||||||||||||
Jersey | 290,806 | — | 290,806 | — | ||||||||||||||||
Kenya | 1,644,724 | 1,006,266 | 638,458 | — | ||||||||||||||||
Luxembourg | 540,673 | 540,673 | — | — | ||||||||||||||||
Malaysia | 3,901,120 | 571,994 | 3,329,126 | — | ||||||||||||||||
Malta | 252,759 | — | 252,759 | — | ||||||||||||||||
Mexico | 12,250,258 | 12,250,258 | — | — | ||||||||||||||||
Mongolia | 94,622 | — | 94,622 | — | ||||||||||||||||
Morocco & Antilles | 238,693 | 238,693 | — | — | ||||||||||||||||
Netherlands | 2,908,260 | 2,058,941 | 849,319 | — | ||||||||||||||||
Nigeria | 2,141,106 | 2,141,106 | — | — | ||||||||||||||||
Philippines | 2,894,422 | — | 2,894,422 | — | ||||||||||||||||
Poland | 3,452,936 | 896,448 | 2,556,488 | — | ||||||||||||||||
Portugal | 508,592 | — | 508,592 | — | ||||||||||||||||
Russia | 10,283,984 | 10,283,984 | — | — | ||||||||||||||||
South Africa | 13,640,155 | — | 13,640,155 | — | ||||||||||||||||
South Korea | 41,864,360 | 780,099 | 41,084,261 | — | ||||||||||||||||
Switzerland | 2,585,521 | — | 2,585,521 | — | ||||||||||||||||
Taiwan | 30,737,077 | 4,866,066 | 25,871,011 | — | ||||||||||||||||
Thailand | 10,928,527 | 4,530,672 | 6,397,855 | — | ||||||||||||||||
Turkey | 7,514,385 | — | 7,514,385 | — | ||||||||||||||||
United Arab Emirates | 80,122 | 80,122 | — | — | ||||||||||||||||
United Kingdom | 5,833,289 | — | 5,833,289 | — | ||||||||||||||||
United States of America | 3,507,062 | 3,507,062 | — | — | ||||||||||||||||
Foreign Preferred Stocks: | ||||||||||||||||||||
Brazil | 3,188,816 | 3,188,816 | — | — | ||||||||||||||||
Chile | 5,265 | 5,265 | — | — | ||||||||||||||||
South Korea | 2,939,554 | — | 2,939,554 | — | ||||||||||||||||
Money Market Funds | 37,647,152 | 37,647,152 | — | — | ||||||||||||||||
Rights | 1,526 | 1,526 | — | — | ||||||||||||||||
|
|
|
|
|
|
|
| |||||||||||||
Total Assets - Investments in Securities | $ | 313,145,304 | $ | 111,387,371 | $ | 201,757,933 | $ | — | ||||||||||||
|
|
|
|
|
|
|
| |||||||||||||
Other Financial Instruments*** | ||||||||||||||||||||
Forward Foreign Currency Contracts | $ | 501,908 | $ | — | $ | 501,908 | $ | — | ||||||||||||
|
|
|
|
|
|
|
| |||||||||||||
Total Assets - Other Financial Instruments | $ | 501,908 | $ | — | $ | 501,908 | $ | — | ||||||||||||
|
|
|
|
|
|
|
| |||||||||||||
Liabilities: | ||||||||||||||||||||
Other Financial Instruments*** | ||||||||||||||||||||
Futures Contracts | $ | (154,581 | ) | $ | (154,581 | ) | $ | — | $ | — | ||||||||||
Swap Agreements | (18,979 | ) | — | — | (18,979 | ) | ||||||||||||||
|
|
|
|
|
|
|
| |||||||||||||
Total Liabilities - Other Financial Instruments | $ | (173,560 | ) | $ | (154,581 | ) | $ | — | $ | (18,979 | ) | |||||||||
|
|
|
|
|
|
|
| |||||||||||||
| See Notes to Financial Statements. | 229 |
Table of Contents
EMERGING MARKETS EQUITY FUND
SCHEDULE OF INVESTMENTS (Continued)
***Other financial instruments are derivative instruments not reflected in the Schedule of Investments, such as futures, forwards and swap contracts, which are valued at the unrealized appreciation (depreciation) on the investment. Details of these investments can be found in the Notes to Financial Statements.
The Fund had securities that transferred from Level 1 to Level 2 of the fair value hierarchy as a result of foreign equities that were being valued based on quoted prices at December 31, 2014 that are now being fair valued. The value of the securities that were transferred to Level 2 as of December 31, 2015 is $12,143,003.
The Fund had securities that transferred from Level 2 to Level 1 of the fair value hierarchy as a result of foreign equities that were fair valued at December 31, 2014 that are now being valued based on quoted prices. The value of the securities that were transferred to Level 1 as of December 31, 2015 is $3,174,261.
Management has determined that the amount of Level 3 securities compared to total net assets is not material; therefore, the reconciliation of Level 3 securities and assumptions is not shown for the year ended December 31, 2015.
| 230 | See Notes to Financial Statements. |
Table of Contents
(This page intentionally left blank)
| 231 |
Table of Contents
| Defensive Market Strategies Fund | Equity Index Fund | |||||||||
Assets | ||||||||||
Investments in securities of unaffiliated issuers, at value | $ | 649,804,059 | $ | 628,106,833 | ||||||
Investments in securities of affiliated issuers, at value | 25,859,833 | 19,879,456 | ||||||||
|
|
|
| |||||||
Total investments, at value (1)(2) | 675,663,892 | 647,986,289 | ||||||||
Cash | 1,298,491 | — | ||||||||
Cash collateral for derivatives | 2,316,000 | 709,000 | ||||||||
Deposits with broker for securities sold short | 5,263 | — | ||||||||
Foreign currency(3) | 36,749 | — | ||||||||
Receivables: | ||||||||||
Dividends and reclaims | 800,779 | 675,753 | ||||||||
Interest | 692,549 | — | ||||||||
Securities lending | 49,508 | 28,785 | ||||||||
Investment securities sold | 1,740,876 | — | ||||||||
Fund shares sold | 185,200 | 88,376 | ||||||||
Variation margin on financial futures contracts | — | — | ||||||||
Unrealized appreciation on foreign currency exchange contracts | 26,730 | — | ||||||||
Unrealized appreciation on swap agreements | — | — | ||||||||
Prepaid expenses and other assets | 23,531 | 19,586 | ||||||||
|
|
|
| |||||||
Total Assets | 682,839,568 | 649,507,789 | ||||||||
|
|
|
| |||||||
Liabilities | ||||||||||
Cash overdraft | — | — | ||||||||
Securities sold short, at value (4) | — | — | ||||||||
Options written, at value (5) | 493,588 | — | ||||||||
Unrealized depreciation on foreign currency exchange contracts | 13,893 | — | ||||||||
Unrealized depreciation on swap agreements | — | — | ||||||||
Collateral held for securities on loan, at value | 67,919,378 | 40,316,383 | ||||||||
Collateral held for derivatives | — | — | ||||||||
Collateral held for securities sold short | �� | — | — | |||||||
Payables: | ||||||||||
Investment securities purchased | 3,040,493 | 82,440 | ||||||||
Dividends on short sales | — | — | ||||||||
Fund shares redeemed | 25,537 | 13,671 | ||||||||
Variation margin on financial futures contracts | 251,520 | 199,680 | ||||||||
Securities lending | 7,421 | 4,314 | ||||||||
Deferred foreign capital gains taxes | — | — | ||||||||
Accrued expenses: | ||||||||||
Investment advisory fees | 328,043 | 47,697 | ||||||||
Shareholder servicing fees | 34,994 | 70,506 | ||||||||
Other expenses | 109,181 | 169,280 | ||||||||
|
|
|
| |||||||
Total Liabilities | 72,224,048 | 40,903,971 | ||||||||
|
|
|
| |||||||
Net Assets | $ | 610,615,520 | $ | 608,603,818 | ||||||
|
|
|
| |||||||
Net Assets Consist of: | ||||||||||
Paid-in-capital | $ | 576,763,937 | $ | 467,995,727 | ||||||
Accumulated (distributions in excess of) net investment income (loss) | 445,399 | 159,956 | ||||||||
Undistributed (accumulated) net realized gain (loss) on investments, foreign currency and derivative transactions | (3,198,863 | ) | (5,303,157 | ) | ||||||
Net unrealized appreciation (depreciation) on investments, foreign currency and derivative transactions | 36,605,047 | 145,751,292 | ||||||||
|
|
|
| |||||||
Net Assets | $ | 610,615,520 | $ | 608,603,818 | ||||||
|
|
|
| |||||||
Net Asset Value: | ||||||||||
$0.001 par value, unlimited shares authorized | ||||||||||
Net assets applicable to the Institutional Class | $ | 443,498,596 | $ | 276,598,939 | ||||||
|
|
|
| |||||||
Institutional shares outstanding | 39,570,745 | 32,081,927 | ||||||||
|
|
|
| |||||||
Net asset value, offering and redemption price per Institutional share | $ | 11.21 | $ | 8.62 | ||||||
|
|
|
| |||||||
Net assets applicable to the Investor Class | $ | 167,116,924 | $ | 332,004,879 | ||||||
|
|
|
| |||||||
Investor shares outstanding | 14,896,273 | 14,704,561 | ||||||||
|
|
|
| |||||||
Net asset value, offering and redemption price per Investor share | $ | 11.22 | $ | 22.58 | ||||||
|
|
|
| |||||||
___________ | ||||||||||
| (1) Investments in securities of unaffiliated issuers, at cost | $613,474,574 | $482,313,992 | ||||||||
Investments in securities of affiliated issuers, at cost | 25,859,833 | 19,879,456 | ||||||||
|
|
|
| |||||||
Total investments, at cost | $ | 639,334,407 | $ | 502,193,448 | ||||||
|
|
|
| |||||||
(2) Includes securities loaned of: | $ | 69,633,866 | $ | 41,262,749 | ||||||
|
|
|
| |||||||
(3) Foreign currency, at cost | $ | 41,784 | $ | — | ||||||
|
|
|
| |||||||
(4) Proceeds from securities sold short | $ | — | $ | — | ||||||
|
|
|
| |||||||
(5) Premiums received on options written | $ | 840,327 | $ | — | ||||||
|
|
|
| |||||||
(6) Net of $(974) and $(20,034) accrued foreign capital gains taxes on appreciated securities for International Equity Fund and Emerging Markets Equity Fund, respectively | ||||||||||
| 232 | See Notes to Financial Statements. |
Table of Contents
| Value Equity Fund | Growth Equity Fund | Small Cap Equity Fund | International Equity Index Fund | International Equity Fund | Emerging Markets Equity Fund | |||||||||||||||||
| $ | 1,330,826,748 | $ | 1,632,628,719 | $ | 658,078,900 | $ | 109,178,694 | $ | 1,361,750,462 | $ | 297,982,669 | |||||||||||
| 40,813,334 | 50,737,188 | 21,115,220 | 3,754,870 | 68,102,593 | 15,162,635 | |||||||||||||||||
|
|
|
|
|
|
|
|
|
|
|
| |||||||||||
| 1,371,640,082 | 1,683,365,907 | 679,194,120 | 112,933,564 | 1,429,853,055 | 313,145,304 | |||||||||||||||||
| — | — | 163 | 193,123 | 1,085,529 | 11,743,371 | |||||||||||||||||
| 1,843,000 | 2,231,000 | 1,043,000 | 186,000 | 6,668,269 | 1,322,255 | |||||||||||||||||
| — | — | — | — | — | — | |||||||||||||||||
| — | — | 2 | 1,119,063 | 10,149,715 | 629,545 | |||||||||||||||||
| 1,413,005 | 429,509 | 694,891 | 135,874 | 4,752,590 | 680,516 | |||||||||||||||||
| — | — | 24 | — | — | — | |||||||||||||||||
| 198,535 | 123,652 | 140,079 | 4,224 | 109,977 | 14,001 | |||||||||||||||||
| 5,813,402 | 1,062,533 | 160,052 | — | 1,929,065 | 14,437,777 | |||||||||||||||||
| 15,931 | 58,576 | 18,847 | — | 130,584 | 73,277 | |||||||||||||||||
| — | — | — | — | 160,395 | 45,072 | |||||||||||||||||
| — | — | — | — | 4,580,057 | 1,072,049 | |||||||||||||||||
| — | — | — | — | 333 | — | |||||||||||||||||
| 9,890 | 33,641 | 19,059 | 5,064 | 31,180 | 22,498 | |||||||||||||||||
|
|
|
|
|
|
|
|
|
|
|
| |||||||||||
| 1,380,933,845 | 1,687,304,818 | 681,270,237 | 114,576,912 | 1,459,450,749 | 343,185,665 | |||||||||||||||||
|
|
|
|
|
|
|
|
|
|
|
| |||||||||||
| 1,031 | — | — | — | — | — | |||||||||||||||||
| — | — | — | — | 66,003,436 | — | |||||||||||||||||
| — | — | — | — | — | — | |||||||||||||||||
| — | — | — | — | 1,104,711 | 570,141 | |||||||||||||||||
| — | — | — | — | 1,777 | 18,979 | |||||||||||||||||
| 135,055,536 | 268,680,558 | 177,804,961 | 3,330,445 | 93,208,109 | 22,484,517 | |||||||||||||||||
| — | — | — | — | 3,150,000 | 600,000 | |||||||||||||||||
| — | — | — | — | 14,982,399 | — | |||||||||||||||||
| 3,004,759 | 1,139,466 | 723,841 | — | 2,175,196 | 18,696,837 | |||||||||||||||||
| — | — | — | — | 40,248 | — | |||||||||||||||||
| 17,036 | 307,788 | 118,333 | — | — | 2,369,054 | |||||||||||||||||
| 395,520 | 465,600 | 215,050 | 64,125 | 777,420 | 67,036 | |||||||||||||||||
| 29,775 | 18,542 | 20,970 | 633 | 16,495 | 2,097 | |||||||||||||||||
| — | — | — | — | 2,080 | 36,781 | |||||||||||||||||
| 591,281 | 858,072 | 412,100 | 18,340 | 785,004 | 270,543 | |||||||||||||||||
| 69,322 | 101,847 | 50,813 | — | 50,412 | 5,690 | |||||||||||||||||
| 121,536 | 116,402 | 112,564 | 138,753 | 448,039 | 281,655 | |||||||||||||||||
|
|
|
|
|
|
|
|
|
|
|
| |||||||||||
| 139,285,796 | 271,688,275 | 179,458,632 | 3,552,296 | 182,745,326 | 45,403,330 | |||||||||||||||||
|
|
|
|
|
|
|
|
|
|
|
| |||||||||||
| $ | 1,241,648,049 | $ | 1,415,616,543 | $ | 501,811,605 | $ | 111,024,616 | $ | 1,276,705,423 | $ | 297,782,335 | |||||||||||
|
|
|
|
|
|
|
|
|
|
|
| |||||||||||
| $ | 1,115,911,881 | $ | 1,173,001,926 | $ | 500,338,465 | $ | 122,708,427 | $ | 1,300,976,850 | $ | 388,430,022 | |||||||||||
| 776,388 | — | 189,221 | (64,289 | ) | (198,895 | ) | (484,679 | ) | ||||||||||||||
| | (21,024,294) | | 14,180,862 | (5,288,316 | ) | (790,240 | ) | (26,608,652 | ) | (20,146,157 | ) | |||||||||||
| | 145,984,074 | | 228,433,755 | 6,572,235 | (10,829,282 | ) | 2,536,120 | (6) | (70,016,851 | )(6) | ||||||||||||
|
|
|
|
|
|
|
|
|
|
|
| |||||||||||
| $ | 1,241,648,049 | $ | 1,415,616,543 | $ | 501,811,605 | $ | 111,024,616 | $ | 1,276,705,423 | $ | 297,782,335 | |||||||||||
|
|
|
|
|
|
|
|
|
|
|
| |||||||||||
| $ | 917,207,666 | $ | 932,231,692 | $ | 264,961,751 | $ | 111,024,616 | $ | 1,030,729,325 | $ | 272,123,541 | |||||||||||
|
|
|
|
|
|
|
|
|
|
|
| |||||||||||
| 121,476,419 | 97,775,667 | 35,432,994 | 12,423,964 | 105,962,834 | 37,068,485 | |||||||||||||||||
|
|
|
|
|
|
|
|
|
|
|
| |||||||||||
| $ | 7.55 | $ | 9.53 | $ | 7.48 | $ | 8.94 | $ | 9.73 | $ | 7.34 | |||||||||||
|
|
|
|
|
|
|
|
|
|
|
| |||||||||||
| $ | 324,440,383 | $ | 483,384,851 | $ | 236,849,854 | N/A | $ | 245,976,098 | $ | 25,658,794 | ||||||||||||
|
|
|
|
|
|
|
|
|
|
|
| |||||||||||
| 16,669,311 | 21,956,787 | 15,615,888 | N/A | 18,669,364 | 3,492,386 | |||||||||||||||||
|
|
|
|
|
|
|
|
|
|
|
| |||||||||||
| $ | 19.46 | $ | 22.02 | $ | 15.17 | N/A | $ | 13.18 | $ | 7.35 | ||||||||||||
|
|
|
|
|
|
|
|
|
|
|
| |||||||||||
| $ | 1,184,747,777 | $ | 1,404,050,364 | $ | 651,747,988 | $ | 120,102,456 | $ | 1,370,232,011 | $ | 368,315,965 | |||||||||||
| 40,813,334 | 50,737,188 | 21,115,220 | 3,754,870 | 68,102,593 | 15,162,635 | |||||||||||||||||
|
|
|
|
|
|
|
|
|
|
|
| |||||||||||
| $ | 1,225,561,111 | $ | 1,454,787,552 | $ | 672,863,208 | $ | 123,857,326 | $ | 1,438,334,604 | $ | 383,478,600 | |||||||||||
|
|
|
|
|
|
|
|
|
|
|
| |||||||||||
| $ | 139,449,792 | $ | 265,809,884 | $ | 186,891,501 | $ | 3,854,449 | $ | 100,295,176 | $ | 23,148,368 | |||||||||||
|
|
|
|
|
|
|
|
|
|
|
| |||||||||||
| $ | — | $ | — | $ | 3 | $ | 1,109,882 | $ | 10,495,087 | $ | 629,964 | |||||||||||
|
|
|
|
|
|
|
|
|
|
|
| |||||||||||
| $ | — | $ | — | $ | — | $ | — | $ | 73,152,298 | $ | — | |||||||||||
|
|
|
|
|
|
|
|
|
|
|
| |||||||||||
| $ | — | $ | — | $ | — | $ | — | $ | — | $ | — | |||||||||||
|
|
|
|
|
|
|
|
|
|
|
| |||||||||||
| See Notes to Financial Statements. | 233 |
Table of Contents
| STATEMENTS OF OPERATIONS | For the Year Ended December 31, 2015 |
| Defensive Market Strategies Fund | Equity Index Fund | |||||||||
Investment Income | ||||||||||
Dividends | $ | 9,342,200 | $ | 11,100,064 | ||||||
Income distributions received from affiliated funds | 2,142 | 1,555 | ||||||||
Interest | 3,261,147 | — | ||||||||
Securities lending | 270,907 | 121,524 | ||||||||
Less foreign taxes withheld | (81,142 | ) | (812 | ) | ||||||
|
|
|
| |||||||
Total Investment Income | 12,795,254 | 11,222,331 | ||||||||
|
|
|
| |||||||
Expenses | ||||||||||
Investment advisory fees | 3,930,721 | 610,467 | ||||||||
Transfer agent fees: | ||||||||||
Institutional shares | 4,388 | 3,957 | ||||||||
Investor shares | 22,242 | 29,333 | ||||||||
Custodian fees | 71,142 | 41,409 | ||||||||
Shareholder servicing fees: | ||||||||||
Investor shares | 645,928 | 825,132 | ||||||||
Accounting and administration fees | 173,552 | 134,864 | ||||||||
Professional fees | 115,491 | 113,872 | ||||||||
Blue sky fees: | ||||||||||
Institutional shares | 15,868 | 12,725 | ||||||||
Investor shares | 18,289 | 16,884 | ||||||||
Shareholder reporting fees: | ||||||||||
Institutional shares | 1,801 | 811 | ||||||||
Investor shares | 12,701 | 24,209 | ||||||||
Trustee expenses | 8,075 | 7,446 | ||||||||
Line of credit facility fees | 4,033 | 3,664 | ||||||||
Other expenses | 44,774 | 28,066 | ||||||||
|
|
|
| |||||||
Total expenses before dividends and interest on securities sold short | 5,069,005 | 1,852,839 | ||||||||
Dividends and interest on securities sold short | — | — | ||||||||
Expenses waived/reimbursed net of amount recaptured(2) | (46,895 | ) | (121,711 | ) | ||||||
Fees paid indirectly | (6,000 | ) | — | |||||||
|
|
|
| |||||||
Net expenses | 5,016,110 | 1,731,128 | ||||||||
|
|
|
| |||||||
Net Investment Income (Loss) | 7,779,144 | 9,491,203 | ||||||||
|
|
|
| |||||||
Realized and Unrealized Gain (Loss) | ||||||||||
Net realized gain (loss) from: | ||||||||||
Investment securities | 18,755,310 | 13,722,094 | ||||||||
Investment securities sold short | — | — | ||||||||
Futures transactions | 132,275 | 322,059 | ||||||||
Swap agreements | — | — | ||||||||
Option contracts written | 5,504,166 | — | ||||||||
Foreign currency | 853,916 | — | ||||||||
|
|
|
| |||||||
Net realized gain (loss) | 25,245,667 | 14,044,153 | ||||||||
|
|
|
| |||||||
Net change in unrealized appreciation (depreciation) on: | ||||||||||
Investment securities | ||||||||||
(net of estimated capital gains taxes of $(974) and $(20,034) for International Equity Fund and Emerging Markets Fund, respectively) | (19,462,133 | ) | (21,783,775 | ) | ||||||
Investment securities sold short | — | — | ||||||||
Futures | (477,764 | ) | (239,205 | ) | ||||||
Swap agreements | — | — | ||||||||
Option contracts written | 105,480 | — | ||||||||
Foreign currency | (57,199 | ) | — | |||||||
|
|
|
| |||||||
Net change in unrealized appreciation (depreciation) | (19,891,616 | ) | (22,022,980 | ) | ||||||
|
|
|
| |||||||
Net Realized and Unrealized Gain (Loss) | 5,354,051 | (7,978,827 | ) | |||||||
|
|
|
| |||||||
Net Increase (Decrease) in Net Assets Resulting from Operations | $ | 13,133,195 | $ | 1,512,376 | ||||||
|
|
|
| |||||||
| ||||||||||
(1) Inception Date was June 1, 2015. | ||||||||||
(2) See Note 3a and 3c in Notes to Financial Statements. | ||||||||||
| 234 | See Notes to Financial Statements. |
Table of Contents
| Value Equity Fund | Growth Equity Fund | Small Cap Equity Fund | International Equity Index Fund(1) | International Equity Fund | Emerging Markets Equity Fund | |||||||||||||||||
| $ | 29,510,289 | $ | 11,730,452 | $ | 6,475,883 | $ | 1,204,691 | $ | 39,753,775 | $ | 8,152,949 | |||||||||||
| 3,985 | 5,857 | 1,750 | 1,999 | 7,003 | 1,216 | |||||||||||||||||
| — | — | 7,555 | — | — | 33,104 | |||||||||||||||||
| 606,903 | 504,220 | 1,091,153 | 12,701 | 965,955 | 85,071 | |||||||||||||||||
| (128,637 | ) | (87,394 | ) | (8,273 | ) | (62,961 | ) | (3,571,391 | ) | (896,208 | ) | |||||||||||
|
|
|
|
|
|
|
|
|
|
|
| |||||||||||
| 29,992,540 | 12,153,135 | 7,568,068 | 1,156,430 | 37,155,342 | 7,376,132 | |||||||||||||||||
|
|
|
|
|
|
|
|
|
|
|
| |||||||||||
| 7,738,864 | 10,856,950 | 5,091,834 | 109,596 | 10,686,010 | 3,475,613 | |||||||||||||||||
| 4,534 | 4,447 | 4,395 | 2,267 | 4,489 | 4,251 | |||||||||||||||||
| 31,342 | 30,105 | 29,849 | — | 28,703 | 19,455 | |||||||||||||||||
| 81,984 | 69,640 | 64,896 | 54,720 | 663,105 | 632,819 | |||||||||||||||||
| 1,487,695 | 1,805,069 | 809,394 | — | 1,391,021 | 256,528 | |||||||||||||||||
| 290,355 | 313,285 | 123,730 | 108,672 | 480,821 | 180,949 | |||||||||||||||||
| 114,872 | 114,872 | 120,778 | 81,723 | 117,761 | 134,132 | |||||||||||||||||
| 14,554 | 13,721 | 13,721 | 12,021 | 13,659 | 9,742 | |||||||||||||||||
| 16,921 | 19,572 | 17,622 | — | 16,834 | 16,922 | |||||||||||||||||
| 1,728 | 1,730 | 2,125 | 241 | 1,695 | 1,352 | |||||||||||||||||
| 25,159 | 27,525 | 33,443 | — | 21,141 | 4,542 | |||||||||||||||||
| 18,026 | 19,477 | 7,243 | 601 | 18,244 | 4,029 | |||||||||||||||||
| 8,887 | 9,632 | 3,582 | 511 | 8,927 | 1,966 | |||||||||||||||||
| 77,213 | 51,480 | 31,173 | 33,246 | 603,808 | 162,100 | |||||||||||||||||
|
|
|
|
|
|
|
|
|
|
|
| |||||||||||
| 9,912,134 | 13,337,505 | 6,353,785 | 403,598 | 14,056,218 | 4,904,400 | |||||||||||||||||
| — | — | — | — | 2,143,504 | — | |||||||||||||||||
| (86,427 | ) | (188,996 | ) | (75,004 | ) | (57,568 | ) | (374,637 | ) | (769,277 | ) | |||||||||||
| (21,830 | ) | (36,000 | ) | (91,080 | ) | — | (20,000 | ) | (4,516 | ) | ||||||||||||
|
|
|
|
|
|
|
|
|
|
|
| |||||||||||
| 9,803,877 | 13,112,509 | 6,187,701 | 346,030 | 15,805,085 | 4,130,607 | |||||||||||||||||
|
|
|
|
|
|
|
|
|
|
|
| |||||||||||
| 20,188,663 | (959,374 | ) | 1,380,367 | 810,400 | 21,350,257 | 3,245,525 | ||||||||||||||||
|
|
|
|
|
|
|
|
|
|
|
| |||||||||||
| 114,919,414 | 203,918,448 | 31,296,055 | (303,203 | ) | 44,459,717 | (10,859,945 | ) | |||||||||||||||
| — | — | — | — | 4,600,766 | — | |||||||||||||||||
| 1,385,763 | (786,257 | ) | 170,469 | (486,810 | ) | 4,653,696 | (6,825,596 | ) | ||||||||||||||
| — | — | — | — | (9,339 | ) | (185,600 | ) | |||||||||||||||
| — | — | — | — | — | — | |||||||||||||||||
| — | (3,731 | ) | — | 1,064 | (3,024 | ) | (3,048,892 | ) | ||||||||||||||
|
|
|
|
|
|
|
|
|
|
|
| |||||||||||
| 116,305,177 | 203,128,460 | 31,466,524 | (788,949 | ) | 53,701,816 | (20,920,033 | ) | |||||||||||||||
|
|
|
|
|
|
|
|
|
|
|
| |||||||||||
| | (179,857,161 | ) | | (123,289,209 | ) | (63,235,982 | ) | (10,923,762 | ) | (90,623,621 | ) | (45,748,684 | ) | |||||||||
| — | — | — | — | (5,129,916 | ) | — | ||||||||||||||||
| (567,504 | ) | (877,837 | ) | (419,122 | ) | 87,181 | 1,124,431 | (390,481 | ) | |||||||||||||
| — | — | — | — | (1,444 | ) | (10,703 | ) | |||||||||||||||
| — | — | — | — | — | — | |||||||||||||||||
| — | — | (1 | ) | 7,299 | 2,612,247 | 1,725,773 | ||||||||||||||||
|
|
|
|
|
|
|
|
|
|
|
| |||||||||||
| (180,424,665 | ) | (124,167,046 | ) | (63,655,105 | ) | (10,829,282 | ) | (92,018,303 | ) | (44,424,095 | ) | |||||||||||
|
|
|
|
|
|
|
|
|
|
|
| |||||||||||
| (64,119,488 | ) | 78,961,414 | (32,188,581 | ) | (11,618,231 | ) | (38,316,487 | ) | (65,344,128 | ) | ||||||||||||
|
|
|
|
|
|
|
|
|
|
|
| |||||||||||
| $ | (43,930,825 | ) | $ | 78,002,040 | $ | (30,808,214 | ) | $ | (10,807,831 | ) | $ | (16,966,230 | ) | $ | (62,098,603 | ) | ||||||
|
|
|
|
|
|
|
|
|
|
|
| |||||||||||
| See Notes to Financial Statements. | 235 |
Table of Contents
STATEMENTS OF CHANGES IN NET ASSETS
| Defensive Market Strategies Fund | ||||||||
| For the Year Ended | ||||||||
| 12/31/15 | 12/31/14 | |||||||
Operations: | ||||||||
Net investment income (loss) | $ | 7,779,144 | $ | 5,679,260 | ||||
Net realized gain on investment securities, foreign currency and derivatives | 25,245,667 | 43,547,231 | ||||||
Net change in unrealized appreciation (depreciation) on investment securities, foreign currency and derivatives | (19,891,616 | ) | 2,920,919 | |||||
|
|
|
| |||||
Net increase (decrease) in net assets resulting from operations | 13,133,195 | 52,147,410 | ||||||
|
|
|
| |||||
Dividends and Distributions to Shareholders: | ||||||||
Dividends from net investment income | ||||||||
Institutional shares | (6,575,193 | ) | (1,254,685 | ) | ||||
Investor shares | (1,657,589 | ) | (5,098,936 | ) | ||||
Distributions from net realized capital gains | ||||||||
Institutional shares | (19,172,510 | ) | (6,847,432 | ) | ||||
Investor shares | (7,060,542 | ) | (33,030,236 | ) | ||||
|
|
|
| |||||
Total dividends and distributions | (34,465,834 | ) | (46,231,289 | ) | ||||
|
|
|
| |||||
Capital Share Transactions: | ||||||||
Proceeds from shares sold | ||||||||
Institutional shares | 370,644,668 | 14,287,796 | ||||||
Investor shares | 63,439,406 | 77,761,494 | ||||||
Reinvestment of dividends and distributions | ||||||||
Institutional shares | 25,741,918 | 8,093,389 | ||||||
Investor shares | 8,711,001 | 38,118,253 | ||||||
|
|
|
| |||||
Total proceeds from shares sold and reinvested | 468,536,993 | 138,260,932 | ||||||
|
|
|
| |||||
Value of shares redeemed | ||||||||
Institutional shares | (30,412,966 | ) | (14,119,591 | ) | ||||
Investor shares | (381,207,938 | ) | (39,732,402 | ) | ||||
|
|
|
| |||||
Total value of shares redeemed | (411,620,904 | ) | (53,851,993 | ) | ||||
|
|
|
| |||||
Net increase from capital share transactions(1) | 56,916,089 | 84,408,939 | ||||||
|
|
|
| |||||
Total increase (decrease) in net assets | 35,583,450 | 90,325,060 | ||||||
|
|
|
| |||||
Net Assets: | ||||||||
Beginning of Year | 575,032,070 | 484,707,010 | ||||||
|
|
|
| |||||
End of Year* | $ | 610,615,520 | $ | 575,032,070 | ||||
|
|
|
| |||||
* Including undistributed (distributions in excess of) net investment income | $ | 445,399 | $ | 130,097 | ||||
|
|
|
| |||||
(1) See Note 6 in Notes to Financial Statements.
| 236 | See Notes to Financial Statements. |
Table of Contents
| Equity Index Fund | Value Equity Fund | Growth Equity Fund | ||||||||||||||||||||
| For the Year Ended | For the Year Ended | For the Year Ended | ||||||||||||||||||||
| 12/31/15 | 12/31/14 | 12/31/15 | 12/31/14 | 12/31/15 | 12/31/14 | |||||||||||||||||
| $ | 9,491,203 | $ | 6,066,082 | $ | 20,188,663 | $ | 16,524,077 | $ | (959,374 | ) | $ | (4,266,633 | ) | |||||||||
| 14,044,153 | 7,369,848 | 116,305,177 | 133,269,634 | 203,128,460 | 187,560,259 | |||||||||||||||||
| (22,022,980 | ) | 34,564,458 | (180,424,665 | ) | (9,650,226 | ) | (124,167,046 | ) | (42,442,015 | ) | ||||||||||||
|
|
|
|
|
|
|
|
|
|
|
| |||||||||||
| 1,512,376 | 48,000,388 | (43,930,825 | ) | 140,143,485 | 78,002,040 | 140,851,611 | ||||||||||||||||
|
|
|
|
|
|
|
|
|
|
|
| |||||||||||
| (7,056,268 | ) | (2,795,369 | ) | (19,036,191 | ) | (6,934,603 | ) | — | — | |||||||||||||
| (2,560,882 | ) | (3,424,898 | ) | (1,264,602 | ) | (10,111,242 | ) | — | (2,956 | ) | ||||||||||||
| (9,195,422 | ) | (2,888,526 | ) | (105,461,430 | ) | (44,372,038 | ) | (174,932,173 | ) | (44,790,894 | ) | |||||||||||
| (4,373,863 | ) | (4,123,156 | ) | (15,752,143 | ) | (85,874,706 | ) | (42,957,853 | ) | (119,231,347 | ) | |||||||||||
|
|
|
|
|
|
|
|
|
|
|
| |||||||||||
| (23,186,435 | ) | (13,231,949 | ) | (141,514,366 | ) | (147,292,589 | ) | (217,890,026 | ) | (164,025,197 | ) | |||||||||||
|
|
|
|
|
|
|
|
|
|
|
| |||||||||||
| 368,510,576 | 24,208,822 | 836,419,140 | 29,113,839 | 831,966,195 | 26,081,224 | |||||||||||||||||
| 43,778,466 | 56,551,053 | 37,097,759 | 69,207,136 | 63,629,886 | 82,908,616 | |||||||||||||||||
| 16,244,073 | 5,678,210 | 124,476,508 | 51,265,204 | 174,915,603 | 44,768,446 | |||||||||||||||||
| 6,930,359 | 7,547,753 | 17,001,799 | 95,971,401 | 42,949,552 | 119,225,614 | |||||||||||||||||
|
|
|
|
|
|
|
|
|
|
|
| |||||||||||
| 435,463,474 | 93,985,838 | 1,014,995,206 | 245,557,580 | 1,113,461,236 | 272,983,900 | |||||||||||||||||
|
|
|
|
|
|
|
|
|
|
|
| |||||||||||
| (186,575,659 | ) | (5,909,757 | ) | (151,854,454 | ) | (37,075,379 | ) | (176,712,798 | ) | (33,341,160 | ) | |||||||||||
| (48,577,199 | ) | (49,192,217 | ) | (851,404,094 | ) | (128,991,146 | ) | (865,778,812 | ) | (150,578,096 | ) | |||||||||||
|
|
|
|
|
|
|
|
|
|
|
| |||||||||||
| (235,152,858 | ) | (55,101,974 | ) | (1,003,258,548 | ) | (166,066,525 | ) | (1,042,491,610 | ) | (183,919,256 | ) | |||||||||||
|
|
|
|
|
|
|
|
|
|
|
| |||||||||||
| 200,310,616 | 38,883,864 | 11,736,658 | 79,491,055 | 70,969,626 | 89,064,644 | |||||||||||||||||
|
|
|
|
|
|
|
|
|
|
|
| |||||||||||
| 178,636,557 | 73,652,303 | (173,708,533 | ) | 72,341,951 | (68,918,360 | ) | 65,891,058 | |||||||||||||||
|
|
|
|
|
|
|
|
|
|
|
| |||||||||||
| 429,967,261 | 356,314,958 | 1,415,356,582 | 1,343,014,631 | 1,484,534,903 | 1,418,643,845 | |||||||||||||||||
|
|
|
|
|
|
|
|
|
|
|
| |||||||||||
| $ | 608,603,818 | $ | 429,967,261 | $ | 1,241,648,049 | $ | 1,415,356,582 | $ | 1,415,616,543 | $ | 1,484,534,903 | |||||||||||
|
|
|
|
|
|
|
|
|
|
|
| |||||||||||
| $ | 159,956 | $ | — | $ | 776,388 | $ | — | $ | — | $ | — | |||||||||||
|
|
|
|
|
|
|
|
|
|
|
| |||||||||||
| See Notes to Financial Statements. | 237 |
Table of Contents
STATEMENTS OF CHANGES IN NET ASSETS
| Small Cap Equity Fund | ||||||||
| For the Year Ended | ||||||||
| 12/31/15 | 12/31/14 | |||||||
Operations: | ||||||||
Net investment income (loss) | $ | 1,380,367 | $ | 381,791 | ||||
Net realized gain (loss) on investment securities, foreign currency and derivatives | 31,466,524 | 56,608,788 | ||||||
Net change in unrealized appreciation (depreciation) on investment securities, foreign currency and derivatives | (63,655,105 | ) | (36,490,090 | ) | ||||
|
|
|
| |||||
Net increase (decrease) in net assets resulting from operations | (30,808,214 | ) | 20,500,489 | |||||
|
|
|
| |||||
Dividends and Distributions to Shareholders: | ||||||||
Dividends from net investment income | ||||||||
Institutional shares | (1,207,226 | ) | (557,635 | ) | ||||
Investor shares | — | (529,161 | ) | |||||
Distributions from net realized capital gains | ||||||||
Institutional shares | (27,812,036 | ) | (13,926,249 | ) | ||||
Investor shares | (13,086,307 | ) | (43,963,905 | ) | ||||
|
|
|
| |||||
Total dividends and distributions | (42,105,569 | ) | (58,976,950 | ) | ||||
|
|
|
| |||||
Capital Share Transactions: | ||||||||
Proceeds from shares sold | ||||||||
Institutional shares | 219,772,080 | 14,222,531 | ||||||
Investor shares | 25,998,341 | 44,659,040 | ||||||
Reinvestment of dividends and distributions | ||||||||
Institutional shares | 29,017,402 | 14,478,415 | ||||||
Investor shares | 13,081,613 | 44,487,566 | ||||||
|
|
|
| |||||
Total proceeds from shares sold and reinvested | 287,869,436 | 117,847,552 | ||||||
|
|
|
| |||||
Value of shares redeemed | ||||||||
Institutional shares | (18,395,855 | ) | (17,662,984 | ) | ||||
Investor shares | (248,011,005 | ) | (83,290,126 | ) | ||||
|
|
|
| |||||
Total value of shares redeemed | (266,406,860 | ) | (100,953,110 | ) | ||||
|
|
|
| |||||
Net increase (decrease) from capital share transactions(1) | 21,462,576 | 16,894,442 | ||||||
|
|
|
| |||||
Total increase (decrease) in net assets | (51,451,207 | ) | (21,582,019 | ) | ||||
|
|
|
| |||||
Net Assets: | ||||||||
Beginning of Year | 553,262,812 | 574,844,831 | ||||||
|
|
|
| |||||
End of Year* | $ | 501,811,605 | $ | 553,262,812 | ||||
|
|
|
| |||||
* Including undistributed (distributions in excess of) net investment income | $ | 189,221 | $ | 4,713 | ||||
|
|
|
| |||||
(1) See Note 6 in Notes to Financial Statements.
| 238 | See Notes to Financial Statements. |
Table of Contents
| International Equity Index Fund | International Equity Fund | Emerging Markets Equity Fund | ||||||||||||||||
| For the Period | For the Year Ended | For the Year Ended | ||||||||||||||||
| 06/01/2015(1) -12/31/2015 | 12/31/15 | 12/31/14 | 12/31/15 | 12/31/14 | ||||||||||||||
| $ | 810,400 | $ | 21,350,257 | $ | 30,193,054 | $ | 3,245,525 | $ | 2,597,651 | |||||||||
| (788,949 | ) | 53,701,816 | 46,135,477 | (20,920,033 | ) | 4,924,878 | ||||||||||||
| (10,829,282 | ) | (92,018,303 | ) | (162,331,669 | ) | (44,424,095 | ) | (20,463,164 | ) | ||||||||
|
|
|
|
|
|
|
|
|
| |||||||||
| (10,807,831 | ) | (16,966,230 | ) | (86,003,138 | ) | (62,098,603 | ) | (12,940,635 | ) | |||||||||
|
|
|
|
|
|
|
|
|
| |||||||||
| (896,896 | ) | (20,206,965 | ) | (7,250,352 | ) | (1,112,618 | ) | (333,727 | ) | |||||||||
| — | (2,298,387 | ) | (23,926,985 | ) | — | (1,244,698 | ) | |||||||||||
| — | (41,580,822 | ) | — | — | (903,226 | ) | ||||||||||||
| — | (7,475,378 | ) | — | — | (5,100,935 | ) | ||||||||||||
|
|
|
|
|
|
|
|
|
| |||||||||
| (896,896 | ) | (71,561,552 | ) | (31,177,337 | ) | (1,112,618 | ) | (7,582,586 | ) | |||||||||
|
|
|
|
|
|
|
|
|
| |||||||||
| 122,367,899 | 1,031,090,766 | 28,094,169 | 308,789,283 | 7,821,760 | ||||||||||||||
| — | 38,211,464 | 119,606,111 | 27,025,822 | 48,217,316 | ||||||||||||||
| 896,896 | 61,783,296 | 7,247,726 | 1,112,618 | 1,236,953 | ||||||||||||||
| — | 9,767,134 | 23,924,829 | — | 6,345,423 | ||||||||||||||
|
|
|
|
|
|
|
|
|
| |||||||||
| 123,264,795 | 1,140,852,660 | 178,872,835 | 336,927,723 | 63,621,452 | ||||||||||||||
|
|
|
|
|
|
|
|
|
| |||||||||
| (535,452 | ) | (147,652,014 | ) | (47,636,508 | ) | (8,070,282 | ) | (7,376,414 | ) | |||||||||
| — | (1,007,234,140 | ) | (51,470,030 | ) | (268,123,636 | ) | (26,063,154 | ) | ||||||||||
|
|
|
|
|
|
|
|
|
| |||||||||
| (535,452 | ) | (1,154,886,154 | ) | (99,106,538 | ) | (276,193,918 | ) | (33,439,568 | ) | |||||||||
|
|
|
|
|
|
|
|
|
| |||||||||
| 122,729,343 | (14,033,494 | ) | 79,766,297 | 60,733,805 | 30,181,884 | |||||||||||||
|
|
|
|
|
|
|
|
|
| |||||||||
| 111,024,616 | (102,561,276 | ) | (37,414,178 | ) | (2,477,416 | ) | 9,658,663 | |||||||||||
|
|
|
|
|
|
|
|
|
| |||||||||
| — | 1,379,266,699 | 1,416,680,877 | 300,259,751 | 290,601,088 | ||||||||||||||
|
|
|
|
|
|
|
|
|
| |||||||||
| $ | 111,024,616 | $ | 1,276,705,423 | $ | 1,379,266,699 | $ | 297,782,335 | $ | 300,259,751 | |||||||||
|
|
|
|
|
|
|
|
|
| |||||||||
| $ | (64,289 | ) | $ | (198,895 | ) | $ | (2,369,963 | ) | $ | (484,679 | ) | $ | 464,812 | |||||
|
|
|
|
|
|
|
|
|
| |||||||||
| See Notes to Financial Statements. | 239 |
Table of Contents
FINANCIAL HIGHLIGHTS
| For a Share Outstanding For the Years Ending December 31, unless otherwise indicated | Ratios to Average Net Assets | |||||||||||||||||||||||||||||||||||||||||||||||
Net Asset Beginning of Period | Net ment Income/ | Realized and Unrealized Gain (Loss) on Invest- ments | Dividends Investment Income | Distributions from Net Realized Capital Gains | Net Asset Value, End of Period | Total Return | Net Assets, End of Year (000) | Expenses, Net(1) | Expenses, Gross(2) | Investment Income/ (Loss), Net(1) | Portfolio Turnover Rate | |||||||||||||||||||||||||||||||||||||
Defensive Market Strategies Fund
|
| |||||||||||||||||||||||||||||||||||||||||||||||
Institutional Class |
| |||||||||||||||||||||||||||||||||||||||||||||||
2015 | $ | 11.61 | $ | 0.17 | # | $ | 0.11 | (3) | $ | (0.17 | ) | $ | (0.51 | ) | $ | 11.21 | 2.43 | % | $ | 443,499 | 0.72%(5) | 0.73 | % | 1.46 | % | 55 | % | |||||||||||||||||||||
2014 | 11.43 | 0.15 | # | 1.05 | (3) | (0.15 | ) | (0.87 | ) | 11.61 | 10.55 | 98,903 | 0.88(4)(5) | 0.8 | (4) | 1.24 | 102 | |||||||||||||||||||||||||||||||
2013(6) | 10.61 | 0.14 | # | 1.80 | (3) | (0.15 | ) | (0.97 | ) | 11.43 | 18.47 | 89,430 | 1.10(4)(5) | 1.13 | (4) | 1.25 | 208 | |||||||||||||||||||||||||||||||
2012 | 10.20 | 0.18 | # | 0.73 | (3) | (0.18 | ) | (0.32 | ) | 10.61 | 8.93 | 85,347 | 1.04(4) | 1.12 | (4) | 1.67 | 304 | |||||||||||||||||||||||||||||||
2011(7) | 10.00 | 0.04 | # | 0.21 | (3) | (0.04 | ) | (0.01 | ) | 10.20 | 2.51 | 74,516 | 1.03(4) | 1.10 | (4) | 1.11 | 120 | |||||||||||||||||||||||||||||||
Investor Class |
| |||||||||||||||||||||||||||||||||||||||||||||||
2015 | $ | 11.60 | $ | 0.13 | # | $ | 0.12 | (3) | $ | (0.12 | ) | $ | (0.51 | ) | $ | 11.22 | 2.16 | % | $ | 167,117 | 0.99%(5) | 1.00 | % | 1.12 | % | 55 | % | |||||||||||||||||||||
2014 | 11.42 | 0.12 | # | 1.06 | (3) | (0.13 | ) | (0.87 | ) | 11.60 | 10.35 | 476,129 | 1.09(4)(5) | 1.07 | (4) | 1.03 | 102 | |||||||||||||||||||||||||||||||
2013(6) | 10.60 | 0.12 | # | 1.79 | (3) | (0.12 | ) | (0.97 | ) | 11.42 | 18.22 | 395,277 | 1.36(4)(5) | 1.38 | (4) | 0.99 | 208 | |||||||||||||||||||||||||||||||
2012 | 10.20 | 0.15 | # | 0.72 | (3) | (0.15 | ) | (0.32 | ) | 10.60 | 8.57 | 314,638 | 1.30(4) | 1.37 | (4) | 1.42 | 304 | |||||||||||||||||||||||||||||||
2011(7) | 10.00 | 0.03 | # | 0.21 | (3) | (0.03 | ) | (0.01 | ) | 10.20 | 2.43 | 240,529 | 1.29(4) | 1.35 | (4) | 0.86 | 120 | |||||||||||||||||||||||||||||||
Equity Index Fund
|
| |||||||||||||||||||||||||||||||||||||||||||||||
Institutional Class |
| |||||||||||||||||||||||||||||||||||||||||||||||
2015 | $ | 9.07 | $ | 0.18 | # | $ | (0.10 | )(3) | $ | (0.23 | ) | $ | (0.30 | ) | $ | 8.62 | 0.92 | % | $ | 276,599 | 0.17 | % | 0.18 | % | 1.94 | % | 6 | % | ||||||||||||||||||||
2014 | 8.50 | 0.15 | # | 0.99 | (3) | (0.28 | ) | (0.29 | ) | 9.07 | 13.54 | 95,134 | 0.22 | 0.22 | 1.72 | 5 | ||||||||||||||||||||||||||||||||
2013(8) | 6.85 | 0.14 | # | 2.02 | (3) | (0.26 | ) | (0.25 | ) | 8.50 | 32.04 | 66,378 | 0.23 | 0.24 | 1.81 | 4 | ||||||||||||||||||||||||||||||||
2012 | 6.29 | 0.13 | # | 0.86 | (3) | (0.25 | ) | (0.18 | ) | 6.85 | 15.92 | 47,071 | 0.23 | 0.24 | 1.95 | 3 | ||||||||||||||||||||||||||||||||
2011 | 8.63 | 0.15 | # | 0.04 | (3) | (0.31 | ) | (2.22 | ) | 6.29 | 3.00 | 36,721 | 0.23 | 0.24 | 1.71 | 4 | ||||||||||||||||||||||||||||||||
Investor Class |
| |||||||||||||||||||||||||||||||||||||||||||||||
2015 | $ | 22.90 | $ | 0.37 | # | $ | (0.21 | )(3) | $ | (0.18 | ) | $ | (0.30 | ) | $ | 22.58 | 0.70 | % | $ | 332,005 | 0.41 | % | 0.44 | % | 1.62 | % | 6 | % | ||||||||||||||||||||
2014 | 20.69 | 0.34 | # | 2.40 | (3) | (0.24 | ) | (0.29 | ) | 22.90 | 13.31 | 334,833 | 0.38 | 0.48 | 1.56 | 5 | ||||||||||||||||||||||||||||||||
2013(8) | 16.07 | 0.31 | # | 4.79 | (3) | (0.23 | ) | (0.25 | ) | 20.69 | 31.95 | 289,937 | 0.38 | 0.48 | 1.66 | 4 | ||||||||||||||||||||||||||||||||
2012 | 14.24 | 0.28 | # | 1.95 | (3) | (0.22 | ) | (0.18 | ) | 16.07 | 15.76 | 208,192 | 0.38 | 0.49 | 1.79 | 3 | ||||||||||||||||||||||||||||||||
2011 | 16.36 | 0.26 | # | 0.12 | (3) | (0.28 | ) | (2.22 | ) | 14.24 | 2.75 | 183,076 | 0.38 | 0.47 | 1.57 | 4 | ||||||||||||||||||||||||||||||||
| # | Calculated using the average shares outstanding method. |
| (1) | The ratio includes expenses waived/reimbursed net of amount recaptured and fees paid indirectly, where applicable; if expenses waived/reimbursed net of amount recaptured and fees paid indirectly were excluded, the ratio would have been higher (lower), respectively, than the ratio shown. |
| (2) | The ratio excludes expenses waived/reimbursed net of amount recaptured and fees paid indirectly, where applicable; if expenses waived/reimbursed net of amount recaptured and fees paid indirectly were included, the ratio would have been lower than the ratio shown. |
| (3) | Amount includes Capital Gains distributions received by the Fund from the GuideStone Money Market Fund. The amount of these distributions represents less than $0.005 per share. |
| (4) | The ratio for the Defensive Market Strategies Fund includes the effect of dividend expense on securities sold short which increased the ratio by 0.04%, 0.05%, 0.11% and 0.02% for the years 2011, 2012, 2013 and 2014. |
| (5) | The ratio for the Defensive Market Strategies Fund includes the effect of fees paid indirectly which decreased the ratio by 0.00%, 0.01% and 0.00% for the years 2013, 2014 and 2015. |
| (6) | An out of period adjustment to Investment Income increased Net Investment Income per Share by $0.00 and $0.01, the Total Return did not change, and the Ratio of Net Investment Income to Average Net Assets increased by 0.01% and 0.00% for Institutional Class and Investor Class, respectively. |
| (7) | Inception date was September 1, 2011. All ratios for the period have been annualized. Total return and portfolio turnover for the period have not been annualized. |
| (8) | An out of period adjustment to Investment Income increased Net Investment Income per Share by $0.00 and $0.01, the Total Return did not change, and the Ratio of Net Investment Income to Average Net Assets increased by 0.03% and 0.03% for Institutional Class and Investor Class, respectively. |
| 240 | See Notes to Financial Statements. |
Table of Contents
| For a Share Outstanding For the Years Ending December 31, unless otherwise indicated | Ratios to Average Net Assets | |||||||||||||||||||||||||||||||||||||||||||||||
| Net Asset Value, Beginning of Year | Net Investment Income/ (Loss) | Realized and Unrealized Gain (Loss) on Investments | Dividends from Net Investment Income | Distributions from Net Realized Capital Gains | Net Asset Value, End of Year | Total Return | Net Assets, End of Year (000) | Expenses, Net(1) | Expenses, Gross(2) | Investment (Loss), | Portfolio Turnover Rate | |||||||||||||||||||||||||||||||||||||
Value Equity Fund
|
| |||||||||||||||||||||||||||||||||||||||||||||||
Institutional Class |
| |||||||||||||||||||||||||||||||||||||||||||||||
2015 | $ | 9.01 | $ | 0.15 | # | $ | (0.46 | )(3) | $ | (0.17 | ) | $ | (0.98 | ) | $ | 7.55 | (3.44 | )% | $ | 917,208 | 0.61%(4) | 0.62% | 1.73 | % | 32 | % | ||||||||||||||||||||||
2014 | 9.90 | 0.14 | # | 0.94 | (3) | (0.25 | ) | (1.72 | ) | 9.01 | 10.91 | 273,359 | 0.65(4) | 0.67 | 1.40 | 41 | ||||||||||||||||||||||||||||||||
2013(5) | 7.99 | 0.15 | # | 2.64 | (3) | (0.34 | ) | (0.54 | ) | 9.90 | 35.52 | 253,988 | 0.66(4) | 0.67 | 1.61 | 45 | ||||||||||||||||||||||||||||||||
2012 | 7.03 | 0.15 | # | 1.06 | (3) | (0.25 | ) | — | 7.99 | 17.47 | 215,512 | 0.67(4) | 0.68 | 1.90 | 27 | |||||||||||||||||||||||||||||||||
2011 | 7.18 | 0.12 | # | (0.07 | )(3) | (0.20 | ) | — | 7.03 | 0.57 | 200,308 | 0.67(4) | 0.68 | 1.62 | 35 | |||||||||||||||||||||||||||||||||
Investor Class |
| |||||||||||||||||||||||||||||||||||||||||||||||
2015 | $ | 21.31 | $ | 0.27 | # | $ | (1.06 | )(3) | $ | (0.08 | ) | (0.98 | ) | $ | 19.46 | (3.70 | )% | $ | 324,440 | 0.89%(4) | 0.89% | 1.26 | % | 32 | % | |||||||||||||||||||||||
2014 | 21.00 | 0.25 | # | 1.97 | (3) | (0.19 | ) | (1.72 | ) | 21.31 | 10.61 | 1,141,998 | 0.90(4) | 0.91 | 1.16 | 41 | ||||||||||||||||||||||||||||||||
�� 2013(5) | 16.18 | 0.26 | # | 5.39 | (3) | (0.29 | ) | (0.54 | ) | 21.00 | 35.22 | 1,089,026 | 0.90(4) | 0.91 | 1.36 | 45 | ||||||||||||||||||||||||||||||||
2012 | 14.00 | 0.25 | # | 2.14 | (3) | (0.21 | ) | — | 16.18 | 17.20 | 933,110 | 0.92(4) | 0.92 | 1.66 | 27 | |||||||||||||||||||||||||||||||||
2011 | 14.12 | 0.20 | # | (0.16 | )(3) | (0.16 | ) | — | 14.00 | 0.27 | 852,958 | 0.89(4) | 0.91 | 1.39 | 35 | |||||||||||||||||||||||||||||||||
Growth Equity Fund
|
| |||||||||||||||||||||||||||||||||||||||||||||||
Institutional Class |
| |||||||||||||||||||||||||||||||||||||||||||||||
2015 | $ | 11.05 | $ | 0.01 | # | $ | 0.59 | (3) | $ | — | $ | (2.12 | ) | $ | 9.53 | 5.67 | % | $ | 932,232 | 0.77%(6) | 0.78% | 0.09 | % | 79 | % | |||||||||||||||||||||||
2014 | 12.20 | (0.02 | )# | 1.25 | (3) | — | (2.38 | ) | 11.05 | 10.12 | 244,281 | 0.85(6) | 0.87 | (0.12 | ) | 54 | ||||||||||||||||||||||||||||||||
2013(7) | 12.19 | — | †# | 4.12 | (3) | — | (4.11 | ) | 12.20 | 34.83 | 227,934 | 0.84(6) | 0.88 | 0.00 | 83 | |||||||||||||||||||||||||||||||||
2012 | 11.76 | 0.04 | # | 2.00 | (3) | (0.06 | ) | (1.55 | ) | 12.19 | 17.39 | 198,329 | 0.87(6) | 0.89 | 0.33 | 67 | ||||||||||||||||||||||||||||||||
2011 | 11.91 | — | †# | (0.15 | )(3) | — | — | 11.76 | (1.26 | ) | 184,418 | 0.87(6) | 0.89 | 0.02 | 60 | |||||||||||||||||||||||||||||||||
Investor Class |
| |||||||||||||||||||||||||||||||||||||||||||||||
2015 | $ | 22.92 | $ | (0.05 | )# | $ | 1.27 | (3) | $ | — | $ | (2.12 | ) | $ | 22.02 | 5.44 | % | $ | 483,385 | 1.04%(6) | 1.06% | (0.21 | )% | 79 | % | |||||||||||||||||||||||
2014 | 23.02 | (0.08 | )# | 2.36 | (3) | — | (2.38 | ) | 22.92 | 9.93 | 1,240,254 | 1.06(6) | 1.11 | (0.33 | ) | 54 | ||||||||||||||||||||||||||||||||
2013(7) | 20.26 | (0.05 | )# | 6.92 | (3) | — | (4.11 | ) | 23.02 | 34.52 | 1,190,710 | 1.05(6) | 1.12 | (0.22 | ) | 83 | ||||||||||||||||||||||||||||||||
2012 | 18.63 | 0.03 | # | 3.17 | (3) | (0.02 | ) | (1.55 | ) | 20.26 | 17.21 | 1,022,934 | 1.05(6) | 1.13 | 0.15 | 67 | ||||||||||||||||||||||||||||||||
2011 | 18.90 | (0.02 | )# | (0.25 | )(3) | — | — | 18.63 | (1.43 | ) | 915,960 | 1.02(6) | 1.11 | (0.13 | ) | 60 | ||||||||||||||||||||||||||||||||
| † | Amount represents less than $0.005 per share. |
| # | Calculated using the average shares outstanding method. |
| (1) | The ratio includes expenses waived/reimbursed net of amount recaptured and fees paid indirectly, where applicable; if expenses waived/reimbursed net of amount recaptured and fees paid indirectly were excluded, the ratio would have been higher (lower), respectively, than the ratio shown. |
| (2) | The ratio excludes expenses waived/reimbursed net of amount recaptured and fees paid indirectly, where applicable; if expenses waived/reimbursed net of amount recaptured and fees paid indirectly were included, the ratio would have been lower than the ratio shown. |
| (3) | Amount includes Capital Gains distributions received by the Fund from the GuideStone Money Market Fund. The amount of these distributions represents less than $0.005 per share. |
| (4) | The ratio for the Value Equity Fund includes the effect of fees paid indirectly which decreased the ratio by 0.01% for the years 2011, 2012, 2013 and 2014, and 0.00% for the year 2015. |
| (5) | An out of period adjustment to Investment Income increased Net Investment Income per Share by $0.00 and $0.01, the Total Return did not change, and the Ratio of Net Investment Income to Average Net Assets increased by 0.02% and 0.02% for Institutional Class and Investor Class, respectively. |
| (6) | The ratio for the Growth Equity Fund includes the effect of fees paid indirectly which decreased the ratio by 0.01% for the years 2011, 2012 and 2013, and 0.00% for the years 2014 and 2015. |
| (7) | An out of period adjustment to Investment Income increased Net Investment Income per Share by $0.00 and $0.01, Total Return by 0.00% and 0.05%, and the Ratio of Net Investment Income to Average Net Assets by 0.03% and 0.03% for Institutional Class and Investor Class, respectively. |
| See Notes to Financial Statements. | 241 |
Table of Contents
FINANCIAL HIGHLIGHTS (Continued)
| For a Share Outstanding For the Years Ended December 31, unless otherwise indicated | Ratios to Average Net Assets | |||||||||||||||||||||||||||||||||||||||||||||||
| Net Asset Value, Beginning of Year | Net Investment Income | Realized and Unrealized Gain (Loss) on Investments | Dividends from Net Investment Income | Distributions from Net Realized Capital Gains | Net Asset Value, End of Year | Total Return | Net Assets, End of Year (000) | Expenses, Net(1) | Expenses, Gross(2) | Investment Income/ (Loss), Net(1) | Portfolio Turnover Rate | |||||||||||||||||||||||||||||||||||||
Small Cap Equity Fund
|
| |||||||||||||||||||||||||||||||||||||||||||||||
Institutional Class |
| |||||||||||||||||||||||||||||||||||||||||||||||
2015 | $ | 8.92 | $ | 0.04 | # | $ | (0.56 | )(3) | $ | (0.03 | ) | $ | (0.89 | ) | $ | 7.48 | (5.66 | )% | $ | 264,962 | 1.00%(4) | 1.03 | % | 0.45 | % | 74 | % | |||||||||||||||||||||
2014 | 10.35 | 0.03 | # | 0.37 | (3) | (0.06 | ) | (1.77 | ) | 8.92 | 4.03 | 84,324 | 0.97(4) | 0.99 | 0.27 | 103 | ||||||||||||||||||||||||||||||||
2013(5) | 10.27 | 0.06 | # | 3.82 | (3) | (0.08 | ) | (3.72 | ) | 10.35 | 38.39 | 84,139 | 0.92(4) | 0.94 | 0.45 | 161 | ||||||||||||||||||||||||||||||||
2012 | 9.70 | 0.08 | # | 1.40 | (3) | (0.13 | ) | (0.78 | ) | 10.27 | 15.25 | 67,723 | 0.99(4) | 1.02 | 0.79 | 128 | ||||||||||||||||||||||||||||||||
2011 | 9.61 | 0.03 | # | 0.11 | (3) | (0.05 | ) | — | 9.70 | 1.40 | 63,903 | 1.00(4) | 1.03 | 0.27 | 165 | |||||||||||||||||||||||||||||||||
Investor Class |
| |||||||||||||||||||||||||||||||||||||||||||||||
2015 | $ | 17.08 | $ | 0.02 | # | $ | (1.04 | )(3) | $ | — | $ | (0.89 | ) | $ | 15.17 | (5.91 | )% | $ | 236,850 | 1.24%(4) | 1.27 | % | 0.13 | % | 74 | % | ||||||||||||||||||||||
2014 | 18.19 | 0.01 | # | 0.67 | (3) | (0.02 | ) | (1.77 | ) | 17.08 | 3.83 | 468,938 | 1.20(4) | 1.24 | 0.03 | 103 | ||||||||||||||||||||||||||||||||
2013(5) | 15.94 | 0.04 | # | 5.97 | (3) | (0.04 | ) | (3.72 | ) | 18.19 | 38.09 | 490,706 | 1.16(4) | 1.19 | 0.22 | 161 | ||||||||||||||||||||||||||||||||
2012 | 14.62 | 0.09 | # | 2.10 | (3) | (0.09 | ) | (0.78 | ) | 15.94 | 15.02 | 377,101 | 1.19(4) | 1.27 | 0.59 | 128 | ||||||||||||||||||||||||||||||||
2011 | 14.46 | 0.01 | # | 0.17 | (3) | (0.02 | ) | — | 14.62 | 1.22 | 354,013 | 1.17(4) | 1.26 | 0.10 | 165 | |||||||||||||||||||||||||||||||||
International Equity Index Fund
|
| |||||||||||||||||||||||||||||||||||||||||||||||
Institutional Class |
| |||||||||||||||||||||||||||||||||||||||||||||||
2015(6) | $ | 10.00 | $ | 0.07 | # | $ | (1.06 | )(3) | $ | (0.07 | ) | $ | — | $ | 8.94 | (9.88 | )% | $ | 111,025 | 0.57% | 0.66 | % | 1.33 | % | 4 | % | ||||||||||||||||||||||
| # | Calculated using the average shares outstanding method. |
| (1) | The ratio includes expenses waived/reimbursed net of amount recaptured and fees paid indirectly, where applicable; if expenses waived/reimbursed net of amount recaptured and fees paid indirectly were excluded, the ratio would have been higher (lower), respectively, than the ratio shown. |
| (2) | The ratio excludes expenses waived/reimbursed net of amount recaptured and fees paid indirectly, where applicable; if expenses waived/reimbursed net of amount recaptured and fees paid indirectly were included, the ratio would have been lower than the ratio shown. |
| (3) | Amount includes Capital Gains distributions received by the Fund from the GuideStone Money Market Fund. The amount of these distributions represents less than $0.005 per share. |
| (4) | The ratio for the Small Cap Equity Fund includes the effect of fees paid indirectly which decreased the ratio by 0.02%, 0.02%, 0.01%, 0.01% and 0.02% for the years 2011, 2012, 2013, 2014 and 2015. |
| (5) | An out of period adjustment to Investment Income increased Net Investment Income per Share by $0.01 and $0.01, Total Return by 0.14% and 0.08%, and the Ratio of Net Investment Income to Average Net Assets by 0.07% and 0.08% for Institutional Class and Investor Class, respectively. |
| (6) | Inception date was June 1, 2015. All ratios for the period have been annualized. Total return and portfolio turnover for the period have not been annualized. |
| 242 | See Notes to Financial Statements. |
Table of Contents
| For a Share Outstanding For the Years Ended December 31, unless otherwise indicated | Ratios to Average Net Assets | |||||||||||||||||||||||||||||||||||||||||||||||
| Net Asset Value, Beginning of Year | Net Investment Income | Realized (Loss) on | Dividends from Net Investment Income | Distributions from Net Realized Capital Gains | Net Asset Value, End of Year | Total Return | Net Assets, End of Year (000) | Expenses, Net(1) | Expenses, Gross(2) | Investment (Loss), | Portfolio Turnover Rate | |||||||||||||||||||||||||||||||||||||
International Equity Fund
|
| |||||||||||||||||||||||||||||||||||||||||||||||
Institutional Class |
| |||||||||||||||||||||||||||||||||||||||||||||||
2015 | $ | 10.55 | $ | 0.16 | # | $ | (0.37 | )(3) | $ | (0.19 | ) | $ | (0.42 | ) | $ | 9.73 | (1.93 | )% | $ | 1,030,729 | 1.03%(4)(5) | 1.05 | %(5) | 1.49 | % | 43 | % | |||||||||||||||||||||
2014 | 11.55 | 0.27 | # | (0.93 | )(3) | (0.34 | ) | — | 10.55 | (5.80 | ) | 235,545 | 1.13(4)(5) | 1.20 | (5) | 2.36 | 36 | |||||||||||||||||||||||||||||||
2013(6) | 9.96 | 0.18 | # | 1.66 | (3) | (0.25 | ) | — | 11.55 | 18.49 | 269,499 | 1.11(4)(5) | 1.25 | (5) | 1.69 | 51 | ||||||||||||||||||||||||||||||||
2012 | 8.67 | 0.18 | # | 1.33 | (3) | (0.22 | ) | — | 9.96 | 17.43 | 270,130 | 1.15(4)(5) | 1.32 | (5) | 1.89 | 53 | ||||||||||||||||||||||||||||||||
2011 | 10.35 | 0.22 | # | (1.66 | )(3) | (0.24 | ) | — | 8.67 | (13.86 | ) | 223,677 | 1.02(4)(5) | 1.22 | (5) | 2.17 | 82 | |||||||||||||||||||||||||||||||
Investor Class |
| |||||||||||||||||||||||||||||||||||||||||||||||
2015 | $ | 14.03 | $ | 0.24 | # | $ | (0.55 | )(3) | $ | (0.12 | ) | $ | (0.42 | ) | $ | 13.18 | (2.16 | )% | $ | 245,976 | 1.35%(4)(5) | 1.39 | %(5) | 1.68 | % | 43 | % | |||||||||||||||||||||
2014 | 15.24 | 0.32 | # | (1.23 | )(3) | (0.30 | ) | — | 14.03 | (6.00 | ) | 1,143,722 | 1.37(4)(5) | 1.44 | (5) | 2.09 | 36 | |||||||||||||||||||||||||||||||
2013(6) | 13.07 | 0.20 | # | 2.18 | (3) | (0.21 | ) | — | 15.24 | 18.23 | 1,147,181 | 1.35(4)(5) | 1.49 | (5) | 1.44 | 51 | ||||||||||||||||||||||||||||||||
2012 | 11.33 | 0.20 | # | 1.73 | (3) | (0.19 | ) | — | 13.07 | 17.05 | 1,156,306 | 1.39(4)(5) | 1.57 | (5) | 1.65 | 53 | ||||||||||||||||||||||||||||||||
2011 | 13.43 | 0.25 | # | (2.13 | )(3) | (0.22 | ) | — | 11.33 | (14.01 | ) | 955,305 | 1.24(4)(5) | 1.45 | (5) | 1.95 | 82 | |||||||||||||||||||||||||||||||
Emerging Markets Equity Fund
|
| |||||||||||||||||||||||||||||||||||||||||||||||
Institutional Class |
| |||||||||||||||||||||||||||||||||||||||||||||||
2015 | $ | 9.09 | $ | 0.11 | # | $ | (1.83 | )(3) | $ | (0.03 | ) | $ | — | $ | 7.34 | (18.93 | )% | $ | 272,123 | 1.28%(7) | 1.50 | % | 1.36 | % | 39 | % | ||||||||||||||||||||||
2014 | 9.75 | 0.11 | # | (0.51 | )(3) | (0.07 | ) | (0.19 | ) | 9.09 | (4.14 | ) | 45,058 | 1.25 | 1.63 | 1.07 | 39 | |||||||||||||||||||||||||||||||
2013(8)(9) | 10.00 | (0.01 | )# | (0.24 | )(3) | — | — | 9.75 | (2.50 | ) | 46,420 | 1.25 | 1.55 | (0.34 | ) | 6 | ||||||||||||||||||||||||||||||||
Investor Class |
| |||||||||||||||||||||||||||||||||||||||||||||||
2015 | $ | 9.09 | $ | 0.05 | # | $ | (1.79 | )(3) | $ | — | $ | — | $ | 7.35 | (19.14 | )% | $ | 25,659 | 1.51%(7) | 1.83 | % | 0.58 | % | 39 | % | |||||||||||||||||||||||
2014 | 9.75 | 0.08 | # | (0.51 | )(3) | (0.04 | ) | (0.19 | ) | 9.09 | (4.38 | ) | 255,202 | 1.50 | 1.84 | 0.81 | 39 | |||||||||||||||||||||||||||||||
2013(8)(9) | 10.00 | (0.01 | )# | (0.24 | )(3) | — | — | 9.75 | (2.50 | ) | 244,181 | 1.50 | 1.78 | (0.58 | ) | 6 | ||||||||||||||||||||||||||||||||
| # | Calculated using the average shares outstanding method. |
| (1) | The ratio includes expenses waived/reimbursed net of amount recaptured and fees paid indirectly, where applicable; if expenses waived/reimbursed net of amount recaptured and fees paid indirectly were excluded, the ratio would have been higher (lower), respectively, than the ratio shown. |
| (2) | The ratio excludes expenses waived/reimbursed net of amount recaptured and fees paid indirectly, where applicable; if expenses waived/reimbursed net of amount recaptured and fees paid indirectly were included, the ratio would have been lower than the ratio shown. |
| (3) | Amount includes Capital Gains distributions received by the Fund from the GuideStone Money Market Fund. The amount of these distributions represents less than $0.005 per share. |
| (4) | The ratio for the International Equity Fund includes the effect of fees paid indirectly which decreased the ratio by 0.00% for the years 2011, 2012, 2013, 2014 and 2015. |
| (5) | The ratio for the International Equity Fund includes the effect of dividend expense on securities sold short which increased the ratio by 0.08%, 0.20%, 0.15%, 0.17% and 0.17% for the years 2011, 2012, 2013, 2014 and 2015. |
| (6) | An out of period adjustment to Investment Income had no impact on Net Investment Income per Share or Total Return; however, the Ratio of Net Investment Income to Average Net Assets increased by 0.02% and 0.03% for Institutional Class and Investor Class, respectively. |
| (7) | The ratio for the Emerging Markets Equity Fund includes the effect of fees paid indirectly which decreased the ratio by 0.00% for the year 2015. |
| (8) | An out of period adjustment to Investment Income had no impact on Net Investment Income per Share or Total Return; however, the Ratio of Net Investment Income to Average Net Assets increased by 0.00% and 0.01% for Institutional Class and Investor Class, respectively. |
| (9) | Inception Date was October 31, 2013. All ratios for the period have been annualized. Total return and portfolio turnover for the period have not been annualized. |
| See Notes to Financial Statements. | 243 |
Table of Contents
REAL ASSET SELECT FUNDS (Unaudited)
Real asset returns were mixed for the year, with a wide dispersion of results and some Funds delivering significantly negative performance. The Real Assets Select Funds include funds that invest in various real asset strategies that are commonly used as a strategic diversifier to traditional equity and fixed income investments and as inflation hedges within a broader investment portfolio. Real assets represent a broadly diverse set of investments that can be classified into several sub-categories including inflation-linked bonds, commodities, global natural resource equities, real estate securities and floating-rate bank loans.
U.S. Treasury Inflation Protected Securities (“TIPS”) historically have been the least volatile of the real asset categories. TIPS, as measured by the Barclays U.S. TIPS Index, fell 1.44% in 2015. The sector was hurt by failing inflation expectations, as commodity prices tumbled, and rising real rates. In comparison, the U.S. 10-Year U.S. Treasury was up 0.91% for the year.
Commodities were one of the worst performing real asset categories for the year, as the Bloomberg Commodity Index posted a -24.66% return for 2015. This index represents diversified exposure to a basket of commodities futures across energy, agriculture, livestock and industrial and precious metals. Commodities faced headwinds all year as several experienced negative price pressure due to global excess supply, a strong U.S. dollar and falling demand expectations out of a slower growing China. West Texas Intermediate (WTI) crude oil suffered roughly a 30% loss and copper fell prices fell around 25%.
Declining commodity prices throughout the year put downward pressure on the global natural resource equity category, and the MSCI World Commodity Producers Index returned -25.62%. Both energy producers and mining companies experienced double digit declines for the year, as it has become difficult for many firms in these sectors to operate profitably and service debts under current commodity prices.
The global real estate investment trust (REIT) market fell -0.79% for the year as measured by the FTSE EPRA/NAREIT Developed Index - Net. Overall, macro concerns led to a volatile 2015 and negatively impacted performance. From a regional perspective, Europe was the top performer returning over 6.00%, while Asia was the top detractor from absolute performance, down roughly 7.00% due in part to the economic and local stock market issues out of China.
Bank loans, predominately senior-secured, were up a modest 0.80% for the year based on the S&P® U.S. B- Ratings and Above Loan Index. Bank loans are generally below-investment grade investments that provide higher yields and lower duration (a measure of bond prices’ sensitivity to changes in interest rates) than in traditional fixed income instruments. While bank loans benefited from a low default rate environment, widening credit spreads hurt returns for the year. Bank loans outperformed the broader universe of high yield bonds and investment grade corporate bonds. As of December 31, 2015, the current yield on the index was 4.96%.
| 244 |
Table of Contents
Inflation Protected Bond Fund (Unaudited)
The Fund was actively managed and was primarily comprised of inflation-indexed debt securities with an average dollar-weighted duration (a measure of bond prices’ sensitivity to changes in interest rates) normally between four and 10 years. The Fund underperformed its benchmark index, the Barclays U.S. TIPS Index, for the one year period ended December 31, 2015 (-2.25% versus -1.44%).
The Fund was invested predominately in U.S. Treasury Inflation Protected Securities (“TIPS”) throughout the year. U.S. TIPS were positive in the first quarter, with the benchmark index rising 1.42% in part due to Fed forward guidance viewed as dovish -thus delaying rate hike expectations. Additionally, TIPS enjoyed a strong bid from investors on continued U.S. dollar strength on the back of monetary policy divergence, which helped the Fund outperform in the first quarter. However, over the rest of the year, TIPS gave up all of their gains and turned negative as inflation expectations continued to weaken due in large part to the free fall in commodity prices. Additionally, interest rate increases outpaced inflation, causing real rates to rise and hurting the absolute performance of the relatively longer duration securities in the Fund (duration of the benchmark index is just over seven years). Throughout the year, the Fund had a higher duration than the benchmark index which contributed to relative underperformance for the year.
The Fund was consistently managed to provide inflation protection and income consistent with investment in inflation-indexed securities.
Certain strategies involving derivatives were utilized during the year. Interest rate futures and options were utilized to manage duration and yield curve exposure and to express active views on valuations of securities. The portfolio’s overall duration and yield curve posture contributed negatively to relative performance for the year. The Fund also utilized currency forwards and options to hedge non-dollar positions and to express active views in foreign currencies. The use of currency forwards and futures contributed to performance over the year.
This Fund may be suitable for investors who have a long-term investment horizon, want protection from inflation, can accept short-term fluctuations in account value and want to diversify their portfolio with a fixed income investment option. This Fund is subject to interest rate risk. Meaning, when interest rates rise, the value of the existing bonds decrease and vice versa. Changes in interest rates have a bigger impact on long duration holdings than on short duration holdings. To the extent that the investment adviser misjudges current market conditions, the Fund’s volatility may be amplified by its use of derivatives, and by its ability to select sub-advisers to allocate assets. Some derivatives may increase the risk of loss and cause fluctuations in the market value of the Fund’s portfolio to have disproportionately large effects or cause the net asset value of the Fund generally to decline faster than it would otherwise. The use of certain derivatives may also have a leveraging effect which may increase the volatility of the Fund and may reduce its returns. It is possible to lose money by investing in the Fund.
At December 31, 2015, the portfolio holdings of the Fund, as a percentage of net assets, is shown in the following table. Portfolio holdings are subject to risk and may change at any time.
| % | ||||
U.S. Treasury Obligations | 93.4 | |||
Foreign Government Inflation-Linked Bonds | 4.8 | |||
Money Market Fund | 1.1 | |||
Purchased Options | 0.2 | |||
Written Options | (0.1 | ) | ||
|
| |||
| 99.4 | ||||
|
| |||
| 245 |
Table of Contents
Inflation Protected Bond Fund (Unaudited)
Average Annual Total Returns as of 12/31/15 | ||||||
Institutional | Investor | Benchmark** | ||||
One Year | N/A | -2.25% | -1.44% | |||
Five Year | N/A | 1.74% | 2.55% | |||
Since Inception(2) | -4.13% | 3.00% | 3.80% | |||
Inception Date | 04/30/15 | 06/25/09 | ||||
Total Fund Operating Expenses (May 1, 2015 Prospectus, as amended on June 1, 2015)(1) | 0.39% | 0.65% | ||||
(1) Current information regarding the Fund’s Operating Expenses can be found in the Financial Highlights.
(2) The Since Inception benchmark performance is based on the start date of June 25, 2009, which corresponds with the inception date of the Investor Class, the longest operating class of the Fund.
The performance data quoted represents past performance and does not guarantee future results. Current performance may be lower or higher. Performance data current to the most recent month-end may be obtained at www.GuideStoneFunds.org. The investment return and principal value of an investment will fluctuate so that shares, when redeemed, may be worth more or less than their original cost.
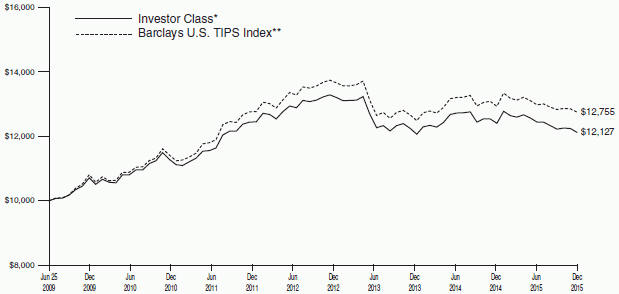
The graph compares the results of a hypothetical $10,000 investment in the Investor Class of the Fund since June 25, 2009 (commencement of operations), with all dividends and capital gains reinvested, with the Barclays U.S. TIPS Index.
*These returns reflect expense waivers by the Fund’s investment adviser. Without these waivers, returns would have been lower. Returns shown do not reflect the deduction of taxes that a shareholder would pay on Fund distributions or the redemption of Fund shares.
Unlike a mutual fund, the performance of an index assumes no taxes, transaction costs, management fees or other expenses.
| 246 |
Table of Contents
INFLATION PROTECTED BOND FUND SCHEDULE OF INVESTMENTS | December 31, 2015 |
| Par | Value | |||||||||||
U.S. TREASURY OBLIGATIONS — 93.4% |
| |||||||||||
U.S. Treasury Inflationary Index Bonds | ||||||||||||
2.38%, 01/15/17 | $ | 150,000 | $ | 181,339 | ||||||||
0.13%, 04/15/17 | 4,683,300 | 4,896,087 | ||||||||||
0.13%, 04/15/18 | 38,535,000 | 39,587,246 | ||||||||||
1.38%, 07/15/18 | 3,300,000 | 3,770,028 | ||||||||||
0.13%, 04/15/19 | 5,985,000 | 6,041,694 | ||||||||||
1.38%, 01/15/20 | 5,560,000 | 6,362,540 | ||||||||||
0.13%, 04/15/20 | 13,925,000 | 13,972,766 | ||||||||||
1.25%, 07/15/20 | 5,480,000 | 6,220,624 | ||||||||||
1.13%, 01/15/21 | 11,510,000 | 12,913,746 | ||||||||||
0.63%, 07/15/21 | 1,080,000 | 1,148,277 | ||||||||||
0.13%, 01/15/22 | 6,874,200 | 7,007,913 | ||||||||||
0.13%, 07/15/22 | 4,945,000 | 4,964,579 | ||||||||||
0.13%, 01/15/23 | 14,509,000 | 14,350,655 | ||||||||||
0.38%, 07/15/23 | 16,440,000 | 16,432,717 | ||||||||||
0.63%, 01/15/24 | 21,231,000 | 21,420,480 | ||||||||||
0.13%, 07/15/24 | 6,762,000 | 6,530,253 | ||||||||||
0.25%, 01/15/25‡‡ | 10,885,000 | 10,443,289 | ||||||||||
2.38%, 01/15/25 | 10,485,200 | 15,056,036 | ||||||||||
0.38%, 07/15/25 | 12,035,000 | 11,695,380 | ||||||||||
2.00%, 01/15/26 | 4,675,000 | 6,231,381 | ||||||||||
2.38%, 01/15/27 | 4,275,000 | 5,835,758 | ||||||||||
1.75%, 01/15/28 | 7,330,000 | 9,104,842 | ||||||||||
3.63%, 04/15/28 | 3,300,000 | 6,352,603 | ||||||||||
2.50%, 01/15/29 | 5,415,000 | 7,117,461 | ||||||||||
3.88%, 04/15/29 | 4,875,000 | 9,596,285 | ||||||||||
3.38%, 04/15/32 | 627,100 | 1,138,807 | ||||||||||
2.13%, 02/15/40 | 2,787,600 | 3,619,494 | ||||||||||
2.13%, 02/15/41 | 4,138,900 | 5,334,071 | ||||||||||
0.75%, 02/15/42 | 7,369,400 | 6,833,434 | ||||||||||
0.63%, 02/15/43 | 10,635,000 | 9,337,130 | ||||||||||
1.38%, 02/15/44 | 4,903,700 | 5,104,445 | ||||||||||
0.75%, 02/15/45 | 3,590,000 | 3,170,484 | ||||||||||
|
| |||||||||||
Total U.S. Treasury Obligations | 281,771,844 | |||||||||||
|
| |||||||||||
FOREIGN GOVERNMENT INFLATION-LINKED BOND — 4.8% |
| |||||||||||
Germany — 1.8% | ||||||||||||
Bundesrepublik Deutschland Bundesobligation Inflation-Linked Bond 0.75%, 04/15/18(E) | 1,045,000 | 1,239,397 | ||||||||||
Deutsche Bundesrepublik Inflation-Linked Bond 1.50%, 04/15/16(E) | 5,000 | 6,263 | ||||||||||
0.10%, 04/15/23(E)D | 3,460,000 | 4,086,990 | ||||||||||
|
| |||||||||||
| 5,332,650 | ||||||||||||
|
| |||||||||||
Italy — 2.4% | ||||||||||||
Italy Buoni Poliennali Del Tesoro | ||||||||||||
2.10%, 09/15/16(E) | 5,000 | 5,903 | ||||||||||
2.60%, 09/15/23(E) | 235,000 | 343,490 | ||||||||||
2.35%, 09/15/24(E) | 3,730,000 | 4,712,092 | ||||||||||
1.25%, 09/15/32(E) | 1,316,000 | 1,483,110 | ||||||||||
2.55%, 09/15/41(E) | 415,000 | 618,308 | ||||||||||
|
| |||||||||||
| 7,162,903 | ||||||||||||
|
| |||||||||||
| Par | Value | |||||||||||
New Zealand — 0.6% | ||||||||||||
New Zealand Government Bond 3.00%, 09/20/30(Z) | $ | 2,536,000 | $ | 1,953,689 | ||||||||
|
| |||||||||||
Total Foreign Government Inflation-Linked Bonds | 14,449,242 | |||||||||||
|
| |||||||||||
| Notional Amount | ||||||||||||
PURCHASED OPTIONS — 0.2% |
| |||||||||||
Call Options — 0.1% | ||||||||||||
Euro vs. United Kingdom Pound, Strike Price $0.74, Expires 02/16/16 (BAR) | $ | 2,725,000 | 32,617 | |||||||||
Euro vs. United Kingdom Pound, Strike Price $0.77, Expires 01/14/16 (BAR) | 2,690,000 | 243 | ||||||||||
New Zealand Dollar vs. U.S. Dollar, Strike Price $0.70, Expires 01/27/16 (HSBC) | 4,475,000 | 16,910 | ||||||||||
U.S. Dollar vs. Canadian Dollar, Strike Price $1.35, Expires 01/08/16 (BNP) | 8,110,000 | 722 | ||||||||||
U.S. Dollar vs. Japanese Yen, Strike Price $119.25, Expires 03/17/16 (BNP) | 2,980,000 | 34,735 | ||||||||||
U.S. Dollar vs. Japanese Yen, Strike Price $120.502, Expires 01/15/16 (DEUT) | 7,485,000 | 53,645 | ||||||||||
U.S. Dollar vs. Mexican Peso, Strike Price $16.15, Expires 02/26/16 (MSCS) | 2,990,000 | 3,112 | ||||||||||
|
| |||||||||||
| 141,984 | ||||||||||||
|
| |||||||||||
| Number of Contracts | ||||||||||||
Put Options — 0.1% |
| |||||||||||
Long U.S. Treasury Bond, Strike Price $150.00, Expires 02/19/16 (JPM) | 18 | 15,469 | ||||||||||
| Notional Amount | ||||||||||||
Canadian Dollar vs. Japanese Yen, Strike Price $85.50, Expires 01/15/16 (BAR) | $ | 7,965,000 | 18,040 | |||||||||
Canadian Dollar vs. Japanese Yen, Strike Price $86.00, Expires 01/15/16 (BAR) | 7,965,000 | 24,982 | ||||||||||
Canadian Dollar vs. Japanese Yen, Strike Price $88.00, Expires 01/15/16 (BAR) | 7,965,000 | 92,463 | ||||||||||
Euro vs. United Kingdom Pound, Strike Price $0.72, Expires 01/14/16 (HSBC) | 2,690,000 | 623 | ||||||||||
Euro vs. United Kingdom Pound, Strike Price $0.72, Expires 02/16/16 (BAR) | 2,725,000 | 9,663 | ||||||||||
Switzerland Franc vs. Norwegian Krone, Strike Price $7.72, Expires 08/02/16 (DEUT) | 5,910,000 | 16,793 | ||||||||||
Switzerland Frank vs. Sweden Krona, Strike Price $8.26, Expires 03/18/16 (JPM) | 3,195,000 | 22,808 | ||||||||||
U.S. Dollar vs. Canadian Dollar, Strike Price $1.38, | 8,110,000 | 69,276 | ||||||||||
| See Notes to Financial Statements. | 247 |
Table of Contents
INFLATION PROTECTED BOND FUND
SCHEDULE OF INVESTMENTS (Continued)
| Notional Amount | Value | |||||||||||
U.S. Dollar vs. Canadian Dollar, Strike Price $1.39, Expires 01/11/16 (HSBC) | $ | 8,110,000 | $ | 23,851 | ||||||||
U.S. Dollar vs. Canadian Dollar, Strike Price $1.42, Expires 01/08/16 (BAR) | 16,220,000 | 4,250 | ||||||||||
U.S. Dollar vs. Japanese Yen, Strike Price $121.75, Expires 03/17/16 (BNP) | 2,980,000 | 23,831 | ||||||||||
U.S. Dollar vs. Japanese Yen, Strike Price $127.00, Expires 01/15/16 (BNP) | 3,740,000 | 4 | ||||||||||
United Kingdom Pound vs. U.S. Dollar, Strike Price $1.48, Expires 02/05/16 (HKSB) | 3,915,000 | 68,583 | ||||||||||
|
| |||||||||||
| 390,636 | ||||||||||||
|
| |||||||||||
Total Purchased Options |
| 532,620 | ||||||||||
|
| |||||||||||
| Shares | ||||||||||||
MONEY MARKET FUND — 1.1% |
| |||||||||||
GuideStone Money Market Fund (Investor Class)¥ (Cost $3,447,125) | 3,447,125 | 3,447,125 | ||||||||||
|
| |||||||||||
TOTAL INVESTMENTS — 99.5% | 300,200,831 | |||||||||||
|
| |||||||||||
| Notional Amount | ||||||||||||
WRITTEN OPTIONS — (0.1)% |
| |||||||||||
Call Options — 0.0% |
| |||||||||||
Euro vs. United Kingdom Pound, Strike Price $0.77, Expires 01/14/16 (HSBC) | $ | (2,690,000 | ) | (237 | ) | |||||||
New Zealand Dollar vs. U.S. Dollar, Strike Price $0.70, Expires 01/27/16 (CITI) | (4,475,000 | ) | (16,785 | ) | ||||||||
Switzerland Frank vs. Sweden Krona, Strike Price $9.10, Expires 03/18/16 (JPM) | (3,195,000 | ) | (7,850 | ) | ||||||||
U.S. Dollar vs. Japanese Yen, Strike Price $120.500, Expires 01/15/16 (DEUT) | (3,745,000 | ) | (27,196 | ) | ||||||||
|
| |||||||||||
| (52,068 | ) | |||||||||||
|
| |||||||||||
| Notional Amount | Value | |||||||||||
Put Options — (0.1)% |
| |||||||||||
Canadian Dollar vs. Japanese Yen, Strike Price $84.5000, Expires 01/15/16 (BAR) | $ | (7,965,000 | ) | $ | (9,342 | ) | ||||||
Canadian Dollar vs. Japanese Yen, Strike Price $85.50, Expires 01/15/16 (BAR) | (7,965,000 | ) | (18,006 | ) | ||||||||
Canadian Dollar vs. Japanese Yen, Strike Price $88.000, Expires 01/15/16 (BAR) | (7,965,000 | ) | (92,463 | ) | ||||||||
Euro vs. United Kingdom Pound, Strike Price $0.72, Expires 01/14/16 (BAR) | (2,690,000 | ) | (626 | ) | ||||||||
U.S. Dollar vs. Canadian Dollar, Strike Price $1.38, Expires 01/11/16 (HSBC) | (8,110,000 | ) | (70,095 | ) | ||||||||
U.S. Dollar vs. Canadian Dollar, Strike Price $1.39, Expires 01/11/16 (BAR) | (8,110,000 | ) | (24,046 | ) | ||||||||
U.S. Dollar vs. Japanese Yen, Strike Price $127.00, Expires 01/15/16 (DEUT) | (3,740,000 | ) | (4 | ) | ||||||||
U.S. Dollar vs. Mexican Peso, Strike Price $18.00, Expires 02/26/16 (MSCS) | (2,990,000 | ) | (17,324 | ) | ||||||||
|
| |||||||||||
| (231,906 | ) | |||||||||||
|
| |||||||||||
Total Written Options | (283,974 | ) | ||||||||||
|
| |||||||||||
Other Assets in Excess of Liabilities — 0.6% | 1,910,817 | |||||||||||
|
| |||||||||||
NET ASSETS — 100.0% |
| $ | 301,827,674 | |||||||||
|
| |||||||||||
| 248 | See Notes to Financial Statements. |
Table of Contents
VALUATION HIERARCHY
The following is a summary of the inputs used, as of December 31, 2015, in valuing the Fund’s investments carried at fair value:
| Total Value | Level 1 Quoted Prices | Level 2 Other Significant Observable Inputs | Level 3 Significant Unobservable Inputs | |||||||||||||||||
Assets: | ||||||||||||||||||||
Investments in Securities: | ||||||||||||||||||||
Foreign Government Inflation-Linked Bonds | $ | 14,449,242 | $ | — | $ | 14,449,242 | $ | — | ||||||||||||
Money Market Fund | 3,447,125 | 3,447,125 | — | — | ||||||||||||||||
Purchased Options | 532,620 | 15,469 | 517,151 | — | ||||||||||||||||
U.S. Treasury Obligations | 281,771,844 | — | 281,771,844 | — | ||||||||||||||||
|
|
|
|
|
|
|
| |||||||||||||
Total Assets - Investments in Securities | $ | 300,200,831 | $ | 3,462,594 | $ | 296,738,237 | $ | — | ||||||||||||
|
|
|
|
|
|
|
| |||||||||||||
Liabilities: | ||||||||||||||||||||
Investments in Securities: | ||||||||||||||||||||
Written Options | $ | (283,974 | ) | $ | — | $ | (283,974 | ) | $ | — | ||||||||||
|
|
|
|
|
|
|
| |||||||||||||
Total Liabilities - Investments in Securities | $ | (283,974 | ) | $ | — | $ | (283,974 | ) | $ | — | ||||||||||
|
|
|
|
|
|
|
| |||||||||||||
Other Financial Instruments*** | ||||||||||||||||||||
Forward Foreign Currency Contracts | $ | (439,581 | ) | $ | — | $ | (439,581 | ) | $ | — | ||||||||||
Futures Contracts | (147,222 | ) | (147,222 | ) | — | — | ||||||||||||||
|
|
|
|
|
|
|
| |||||||||||||
Total Liabilities - Other Financial Instruments | $ | (586,803 | ) | $ | (147,222 | ) | $ | (439,581 | ) | $ | — | |||||||||
|
|
|
|
|
|
|
| |||||||||||||
***Other financial instruments are derivative instruments not reflected in the Schedule of Investments, such as futures, forwards and swap contracts, which are valued at the unrealized appreciation (depreciation) on the investment. Details of these investments can be found in the Notes to Financial Statements.
There were no transfers between Level 1 and Level 2 during the year ended December 31, 2015.
| See Notes to Financial Statements. | 249 |
Table of Contents
Flexible Income Fund (Unaudited)
The Flexible Income Fund primarily invests in below investment grade, senior secured floating rate loans issued by U.S. banks or other financial institutions, otherwise referred to as “bank loans” or “leveraged loans.” To a lesser extent, the Fund may also invest in other below investment grade corporate fixed income securities or unsecured floating rate loans and may include non-U.S. securities. The Fund underperformed its benchmark, the S&P LSTA U.S. B- Ratings & Above Leveraged Loan Index, for the 2015 calendar year (-1.54% vs. 0.80%).
Overall, it was a challenging year for bank loans and high yield bonds as credit spreads widened led by concerns in the energy sector. The Fund’s underweight exposure to BB loans relative to the benchmark hurt relative performance, as lower rated bank loans underperformed. Security selection within BB rated securities negatively impacted relative performance as well. In addition, the Fund’s modest exposure to high yield bonds lowered returns relative to its benchmark index. Underweight exposure and negative selection in the electronics/electrical industry along with negative stock selection within forest products detracted from benchmark relative performance for the Fund. Positive security selection within and an underweight to the utilities sector contributed positively to benchmark relative results.
During the year, the Fund remained focused on its objective of seeking a high level of current income. At year-end, the current yield of the Fund was 4.96%.
The Fund did not invest in derivative instruments during the year.
This Fund may be suitable for investors who have a medium- to long-term investment horizon, possess a moderate tolerance for risk and are seeking income which may be more sensitive to interest rates than traditional bonds.
There is a risk that the issuer of a fixed-income investment owned by the Fund may fail to pay interest or principal due in a timely manner or at all. If the Fund acquires a participation interest in a senior secured or unsecured floating rate loan (“Senior Loans”), the Fund may not be able to control the exercise of any remedies that the lender would have under the loan and likely would not have any rights against the borrower directly. Senior Loans made to finance highly leveraged corporate acquisitions may be especially vulnerable to adverse changes in economic or market conditions. The Fund is subject to collateral risk in that the value of collateral securing a Senior Loan may decline after investment and that the collateral may not be sufficient to cover the amount owed. The Fund might not be able to sell a security promptly and at an acceptable price, which could have the effect of decreasing the overall level of the Fund’s liquidity. High yield securities (“junk bonds”) involve greater risks of default and are more volatile than securities rated investment grade. It is possible to lose money by investing in the Fund.
At December 31, 2015, the portfolio holdings of the Fund, as a percentage of net assets, is shown in the following table. Portfolio holdings are subject to risk and may change at any time.
| % | ||||
Loan Agreements | 82.1 | |||
Money Market Funds | 10.6 | |||
Corporate Bonds | 6.2 | |||
Foreign Bonds | 1.0 | |||
|
| |||
| 99.9 | ||||
|
| |||
250
Table of Contents
Flexible Income Fund (Unaudited)
| Average Annual Total Returns as of 12/31/15 | ||||
| Investor Class* | Benchmark** | ||
One Year | -1.54% | 0.80% | ||
Since Inception | 0.09% | 2.04% | ||
Inception Date | 07/01/13 | |||
Total Fund Operating Expenses (May 1, 2015 Prospectus, as amended on June 1, 2015)(1) | 1.16% | |||
(1)Current information regarding the Fund’s Operating Expenses can be found in the Financial Highlights.
The performance data quoted represents past performance and does not guarantee future results. Current performance may be lower or higher. Performance data current to the most recent month-end may be obtained at www.GuideStoneFunds.org. The investment return and principal value of an investment will fluctuate so that shares, when redeemed, may be worth more or less than their original cost.
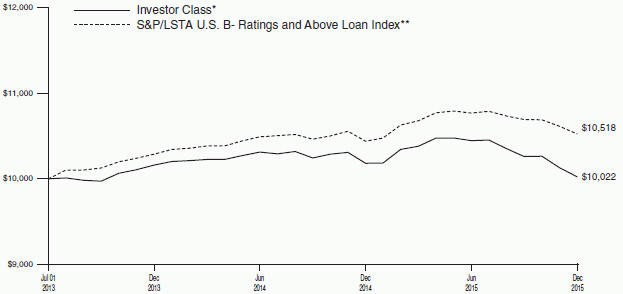
The graph compares the results of a hypothetical $10,000 investment in the Investor Class of the Fund since July 1, 2013 (commencement of operations), with all dividends and capital gains reinvested, with the S&P/LSTA U.S. B- Ratings & Above Loan Index.
*These returns reflect expense waivers by the Fund’s investment adviser. Without these waivers, returns would have been lower. Returns shown do not reflect the deduction of taxes that a shareholder would pay on Fund distributions or the redemption of Fund shares.
Unlike a mutual fund, the performance of an index assumes no taxes, transaction costs, management fees or other expenses.
251
Table of Contents
FLEXIBLE INCOME FUND SCHEDULE OF INVESTMENTS | December 31, 2015 |
| Par |
| Value | |||||||||
CORPORATE BONDS — 6.2% |
| |||||||||||
Ally Financial, Inc. | ||||||||||||
5.50%, 02/15/17 | $ | 650,000 | $ | 671,125 | ||||||||
4.75%, 09/10/18 | 650,000 | 667,062 | ||||||||||
CHS/Community Health Systems, Inc. | ||||||||||||
8.00%, 11/15/19 | 750,000 | 759,375 | ||||||||||
CIT Group, Inc. | ||||||||||||
5.25%, 03/15/18 | 300,000 | 310,500 | ||||||||||
6.63%, 04/01/18 144A | 1,000,000 | 1,057,500 | ||||||||||
Clear Channel Worldwide Holdings, Inc. | ||||||||||||
7.63%, 03/15/20 | 350,000 | 324,625 | ||||||||||
CommScope Holding Co., Inc. Cash coupon 6.63% or PIK | ||||||||||||
7.38%, 06/01/20 144A | 375,000 | 380,625 | ||||||||||
Hertz Corporation | ||||||||||||
6.75%, 04/15/19 | 1,200,000 | 1,228,800 | ||||||||||
NBTY, Inc. | ||||||||||||
9.00%, 10/01/18 | 600,000 | 608,934 | ||||||||||
Sprint Communications, Inc. | ||||||||||||
9.00%, 11/15/18 144A | 1,200,000 | 1,266,000 | ||||||||||
T-Mobile USA, Inc. | ||||||||||||
6.46%, 04/28/19 | 1,200,000 | 1,238,784 | ||||||||||
Valeant Pharmaceuticals International | ||||||||||||
6.38%, 10/15/20 144A | 300,000 | 291,000 | ||||||||||
|
| |||||||||||
Total Corporate Bonds | 8,804,330 | |||||||||||
|
| |||||||||||
FOREIGN BONDS — 1.0% |
| |||||||||||
Canada — 0.5% | ||||||||||||
Bombardier, Inc. | ||||||||||||
7.50%, 03/15/18 144A | 700,000 | 686,000 | ||||||||||
|
| |||||||||||
Luxembourg — 0.5% | ||||||||||||
ArcelorMittal | ||||||||||||
5.13%, 06/01/20D | 300,000 | 250,500 | ||||||||||
Intelsat Jackson Holdings SA | ||||||||||||
7.25%, 04/01/19 | 550,000 | 507,375 | ||||||||||
|
| |||||||||||
| 757,875 | ||||||||||||
|
| |||||||||||
Total Foreign Bonds | 1,443,875 | |||||||||||
|
| |||||||||||
LOAN AGREEMENTS — 82.1% | ||||||||||||
1011778 BC ULC Term B-2 Loan | ||||||||||||
3.75%, 12/12/21 | 869,201 | 860,509 | ||||||||||
ABG Intermediate Holdings 2 LLC Term B Loan | ||||||||||||
0.05%, 05/27/21 | 120,865 | 118,650 | ||||||||||
ABG Intermediate Holdings 2 LLC Term Loan | ||||||||||||
5.50%, 05/27/21 | 360,764 | 353,253 | ||||||||||
Access CIG LLC | ||||||||||||
6.00%, 10/17/21 | 650,000 | 640,259 | ||||||||||
Acosta, Inc. Term B Loan | ||||||||||||
4.25%, 09/26/21 | 696,500 | 660,930 | ||||||||||
ADS Waste Holdings, Inc. Term B Loan | ||||||||||||
3.75%, 10/09/19 | 1,176,368 | 1,136,666 | ||||||||||
| Par | Value | |||||||
Advantage Sales & Marketing, Inc. Term B Loan | ||||||||
4.25%, 07/25/21 | $ | 987,500 | $ | 947,723 | ||||
Affinia Group, Inc. Term B-2 Loan | ||||||||
4.75%, 04/25/20 | 698,529 | 695,477 | ||||||
Air Medical Group Holdings, Inc. Term B Loan | ||||||||
4.50%, 04/28/22 | 497,500 | 480,401 | ||||||
Albertsons LLC Term B Loan | ||||||||
0.00%, 12/21/22 S | 162,273 | 161,137 | ||||||
Albertsons LLC Term B-4 Loan | ||||||||
0.00%, 08/25/21 S | 692,620 | 685,957 | ||||||
AlixPartners LLP Term B Loan | ||||||||
4.50%, 07/28/22 | 997,500 | 988,153 | ||||||
Allflex Holdings III, Inc. Term B Loan | ||||||||
4.25%, 07/17/20 | 917,873 | 897,982 | ||||||
Allied Security Holdings LLC Term B Loan | ||||||||
4.25%, 02/14/21 | 362,902 | 351,714 | ||||||
American Energy- Marcellus LLC Term Loan | ||||||||
5.25%, 08/04/20 | 765,000 | 200,812 | ||||||
American Tire Distributors, Inc. Term B Loan | ||||||||
5.25%, 09/26/21 | 324,183 | 318,241 | ||||||
Ancestry.com, Inc. Term B Loan | ||||||||
5.00%, 08/29/22 | 693,262 | 686,330 | ||||||
Aramark Services, Inc. Term F Loan | ||||||||
3.25%, 02/24/21 | 982,500 | 971,447 | ||||||
Ascena Retail Group, Inc. Term B Loan | ||||||||
5.25%, 08/21/22 | 460,000 | 428,950 | ||||||
AssuredPartners, Inc. Term Loan | ||||||||
5.75%, 10/21/22 | 365,000 | 361,960 | ||||||
Asurion LLC Term B-1 Loan | ||||||||
5.00%, 05/24/19 | 587,406 | 549,042 | ||||||
Asurion LLC Term B-2 Loan | ||||||||
5.00%, 07/08/20 | 696,500 | 635,208 | ||||||
Asurion LLC Term Loan | ||||||||
8.50%, 03/03/21 | 500,000 | 423,750 | ||||||
Atlantic Power LP Term Loan | ||||||||
4.75%, 02/24/21 | 604,146 | 586,306 | ||||||
Atrium Innovations, Inc. Term B Loan | ||||||||
4.25%, 02/15/21 | 535,438 | 492,603 | ||||||
Avago Technologies Cayman Finance Ltd. Term B Loan | ||||||||
0.00%, 11/13/22 S | 1,400,000 | 1,383,382 | ||||||
Azure Midstream Energy LLC Term B Loan | ||||||||
7.50%, 11/15/18 | 196,030 | 111,737 | ||||||
| 252 | See Notes to Financial Statements. |
Table of Contents
| Par | Value | |||||||
B&G Foods, Inc. Term B Loan | ||||||||
3.75%, 10/05/22 | $ | 775,000 | $ | 773,303 | ||||
B/E Aerospace, Inc. Term B Loan | ||||||||
4.00%, 12/16/21 | 1,125,818 | 1,123,285 | ||||||
Berry Plastics Group, Inc. Term D Loan | ||||||||
3.50%, 02/08/20 | 731,203 | 716,082 | ||||||
BJ’s Wholesale Club, Inc. Term B Loan | ||||||||
4.50%, 09/26/19 | 1,221,626 | 1,167,666 | ||||||
BMC Software Finance, Inc. Term B Loan | ||||||||
5.00%, 09/10/20 | 699,338 | 573,954 | ||||||
Brickman Group, Ltd. LLC (The) Term B Loan | ||||||||
4.00%, 12/18/20 | 1,477,443 | 1,427,919 | ||||||
BWAY Holding Co. Term B Loan | ||||||||
5.50%, 08/14/20 | 295,500 | 282,758 | ||||||
Calpine Corporation Term B-5 Loan | ||||||||
3.50%, 05/27/22 | 995,000 | 946,742 | ||||||
Catalent Pharma Solutions, Inc. Term B Loan | ||||||||
4.25%, 05/20/21 | 742,464 | 735,039 | ||||||
CCO Safari III LLC Term I Loan | ||||||||
3.50%, 01/21/23 | 1,050,000 | 1,047,816 | ||||||
CDHR Parent, Inc. Term Loan | ||||||||
5.25%, 07/01/21 | 1,238,741 | 969,315 | ||||||
Checkout Holding Corporation Term B Loan | ||||||||
4.50%, 04/09/21 | 689,500 | 548,152 | ||||||
Chemours Co. (The) Term B Loan | ||||||||
3.75%, 05/12/22 | 373,125 | 340,786 | ||||||
Chemstralia Proprietary, Ltd. Term B Loan | ||||||||
7.25%, 02/26/22 | 347,002 | 336,592 | ||||||
Cincinnati Bell, Inc. Term B Loan | ||||||||
4.00%, 09/10/20 | 723,845 | 697,005 | ||||||
Communications Sales & Leasing, Inc. Term B Loan | ||||||||
5.00%,10/24/22 | 646,750 | 596,019 | ||||||
Concordia Healthcare Corporation Term B Loan | ||||||||
5.25%, 10/21/21 | 400,000 | 383,252 | ||||||
Coveris Holdings SA Term B Loan | ||||||||
4.50%, 05/08/19 | 553,958 | 536,647 | ||||||
CPG International, Inc. Term B Loan | ||||||||
4.75% ,09/30/20 | 977,500 | 913,962 | ||||||
CS Intermediate Holdco 2 LLC Term B Loan | ||||||||
4.00%, 04/04/21 | 738,750 | 725,822 | ||||||
Cumulus Media Holdings, Inc. Term B Loan | ||||||||
4.25%, 12/23/20 | 848,130 | 638,922 | ||||||
| Par | Value | |||||||
CWGS Group LLC Term B Loan | ||||||||
5.25%, 02/20/20 | $ | 657,468 | $ | 638,698 | ||||
DaVita HealthCare Partners, Inc. Term B Loan | ||||||||
3.50%, 06/24/21 | 492,500 | 489,831 | ||||||
Dealer Tire LLC Term B Loan | ||||||||
5.13%-5.50%, 12/22/21 | 990,000 | 988,762 | ||||||
Dell International LLC Term B-2 Loan | ||||||||
4.00%, 04/29/20 | 1,257,680 | 1,247,568 | ||||||
Delta 2 Lux S.à r.l. Term B Loan | ||||||||
4.75%, 04/30/19 | 1,984,962 | 1,914,556 | ||||||
Dole Food Co., Inc. Term B Loan | ||||||||
4.50%-6.00%, 11/01/18 | 462,095 | 458,245 | ||||||
Dollar Tree, Inc. Term B-1 Loan | ||||||||
3.50%, 07/06/22 | 423,625 | 421,774 | ||||||
Doosan Infracore International, Inc. Term B Loan | ||||||||
4.50%, 05/28/21 | 986,422 | 974,091 | ||||||
DPx Holdings BV Term B Loan | ||||||||
4.25%, 03/11/21 | 1,379,000 | 1,327,287 | ||||||
Drillships Ocean Ventures, Inc. Term B Loan | ||||||||
5.50%, 07/25/21 | 646,725 | 302,344 | ||||||
Entegris, Inc. Term B Loan | ||||||||
3.50%, 04/30/21 | 671,413 | 663,020 | ||||||
Envision Health Term Loan | ||||||||
4.50%, 10/28/22 | 350,000 | 347,375 | ||||||
Equinix, Inc. Term B Loan | ||||||||
0.00%, 12/08/22 S | 210,000 | 210,525 | ||||||
Fairmount Santrol, Inc. Term B-2 Loan | ||||||||
4.50%, 09/05/19 | 1,225,000 | 595,350 | ||||||
FCA US LLC Term B Loan | ||||||||
3.50%, 05/24/17 | 498,695 | 496,545 | ||||||
Federal-Mogul Holdings Corporation Term C Loan | ||||||||
4.75%, 04/15/21 | 370,312 | 324,794 | ||||||
Filtration Group, Inc. Term B Loan | ||||||||
4.25%, 11/21/20 | 492,767 | 477,984 | ||||||
First Data Corporation Term C-1 Loan | ||||||||
3.92%, 03/24/18 | 750,000 | 739,267 | ||||||
FMG Resources August 2006 Proprietary, Ltd. Term B Loan | ||||||||
4.25%, 06/30/19 | 343,956 | 254,132 | ||||||
Garda World Security Corporation Delayed Draw Term B-DD Loan | ||||||||
4.00%-5.50%, 11/08/20 | 240,967 | 229,321 | ||||||
| See Notes to Financial Statements. | 253 |
Table of Contents
FLEXIBLE INCOME FUND
SCHEDULE OF INVESTMENTS (Continued)
| Par | Value | |||||||
Garda World Security Corporation Term B Loan | ||||||||
4.00%, 11/08/20 | $ | 941,962 | $ | 896,437 | ||||
Gardner Denver, Inc. Term Loan | ||||||||
4.25%, 07/30/20 | 1,225,587 | 1,099,658 | ||||||
Genesys Telecommunications Laboratories, Inc. Term B Loan | ||||||||
4.00%, 02/08/20 | 974,938 | 954,221 | ||||||
Granite Acquisition, Inc. Term B Loan | ||||||||
5.00%, 12/17/21 | 948,276 | 843,966 | ||||||
Granite Acquisition, Inc. Term C Loan | ||||||||
5.00%, 12/17/21 | 42,146 | 37,510 | ||||||
Granite Acquisition, Inc. Term Loan | ||||||||
8.25%, 12/17/22 | 150,000 | 114,000 | ||||||
Gray Television, Inc. Term Loan | ||||||||
3.75%, 06/13/21 | 720,900 | 710,541 | ||||||
Greatbatch, Ltd. Term B Loan | ||||||||
5.25%, 10/27/22 | 560,000 | 553,700 | ||||||
HC Group Holdings III, Inc. Term B Loan | ||||||||
6.00%, 04/07/22 | 294,262 | 292,056 | ||||||
HD Supply, Inc. Term Loan | ||||||||
3.75%, 08/13/21 | 349,125 | 340,107 | ||||||
Headwaters, Inc. Term B Loan | ||||||||
4.50%, 03/24/22 | 995,000 | 987,538 | ||||||
Hertz Corporation Term B-2 Loan | ||||||||
3.00%, 03/11/18 | 323,338 | 319,800 | ||||||
HGIM Corporation Term B Loan | ||||||||
5.50%, 06/18/20 | 731,897 | 428,160 | ||||||
Hill-Rom Holdings, Inc. Term B Loan | ||||||||
3.50%, 09/08/22 | 607,812 | 607,162 | ||||||
Hilton Worldwide Finance LLC Term B Loan | ||||||||
3.50%, 10/25/20 | 999,088 | 996,281 | ||||||
HUB International, Ltd. Term B Loan | ||||||||
4.00%, 10/02/20 | 962,682 | 906,124 | ||||||
Hubbard Radio LLC Term B Loan | ||||||||
4.25%, 05/27/22 | 628,670 | 579,426 | ||||||
Husky Injection Molding Systems, Ltd. Term B Loan | ||||||||
4.25%, 06/30/21 | 982,392 | 941,868 | ||||||
Infinity Acquisition LLC Term B Loan | ||||||||
4.00%, 08/06/21 | 690,841 | 661,825 | ||||||
Infor US, Inc. Term B-3 Loan | ||||||||
3.75%, 06/03/20 | 1,199,841 | 1,124,851 | ||||||
Informatica Term B Loan | ||||||||
4.50%, 06/03/22 | 324,188 | 311,337 | ||||||
| Par | Value | |||||||
ION Media Networks, Inc. Term B Loan | ||||||||
4.75%, 12/18/20 | $ | 984,060 | $ | 966,839 | ||||
J. Crew Group, Inc. Term B Loan | ||||||||
4.00%, 03/05/21 | 640,806 | 413,160 | ||||||
Jazz Acquisition, Inc. Term Loan | ||||||||
4.50%, 06/19/21 | 435,073 | 389,934 | ||||||
Jo-Ann Stores LLC Term Loan | ||||||||
4.00%, 03/18/18 | 290,106 | 270,524 | ||||||
KIK Custom Products, Inc. Term B Loan | ||||||||
6.00%, 08/27/22 | 673,313 | 651,430 | ||||||
Kronos, Inc. Term B Loan | ||||||||
4.50%, 10/30/19 | 545,524 | 535,639 | ||||||
Level 3 Financing, Inc. Term B Loan | ||||||||
3.50%, 01/31/22 | 650,000 | 639,112 | ||||||
Liberty Cablevision of Puerto Rico LLC Term Loan | ||||||||
4.50%, 01/07/22 | 800,000 | 773,000 | ||||||
Life Time Fitness, Inc. Term B Loan | ||||||||
4.25%, 06/10/22 | 348,250 | 338,893 | ||||||
Lineage Logistics LLC Term B Loan | ||||||||
4.50%, 04/07/21 | 581,659 | 523,493 | ||||||
LTS Buyer LLC Term B Loan | ||||||||
4.00%, 04/13/20 | 1,029,719 | 1,000,372 | ||||||
Lully Finance LLC Term B-1 Loan | ||||||||
5.00%, 07/11/22 | 400,000 | 389,000 | ||||||
MacDermid, Inc. Term B-2 Loan | ||||||||
5.50%, 06/07/20 | 495,000 | 477,675 | ||||||
Mallinckrodt International Finance SA Term B Loan | ||||||||
3.25%, 03/19/21 | 505,517 | 489,088 | ||||||
Match Group, Inc. Term B Loan | ||||||||
5.50%, 11/16/22 | 630,000 | 621,338 | ||||||
Mauser Holding S.à.r.l Term Loan | ||||||||
4.50%, 07/31/21 | 620,289 | 604,782 | ||||||
McJunkin Red Man Corporation Term B Loan | ||||||||
4.75%-6.00%, 11/09/19 | 332,470 | 303,066 | ||||||
Media General, Inc. Term B Loan | ||||||||
4.00%, 07/31/20 | 758,332 | 747,192 | ||||||
Methanol Holdings Trinidad, Ltd. Term B Loan | ||||||||
4.25%, 06/30/22 | 299,250 | 275,310 | ||||||
Michaels Stores, Inc. Term B Loan | ||||||||
3.75%, 01/28/20 | 569,036 | 563,346 | ||||||
Microsemi Corporation Term B Loan | ||||||||
0.00%, 12/17/22 S | 480,000 | 470,640 | ||||||
| 254 | See Notes to Financial Statements. |
Table of Contents
| Par | Value | |||||||
Mission Broadcasting, Inc. Term B-2 Loan | ||||||||
3.75%, 10/01/20 | $ | 575,031 | $ | 570,241 | ||||
Mitel US Holdings, Inc. Term B Loan | ||||||||
5.50%, 04/29/22 | 447,625 | 441,658 | ||||||
MoneyGram International, Inc. Term B Loan | ||||||||
4.25%, 03/28/20 | 199,270 | 181,501 | ||||||
MPH Acquisition Holdings LLC Term B Loan | ||||||||
3.75%, 03/31/21 | 1,082,027 | 1,051,373 | ||||||
Multi Packaging Solutions, Inc. Term B Loan | ||||||||
4.25%, 09/30/20 | 796,306 | 764,454 | ||||||
National Financial Partners Corporation Term Loan | ||||||||
4.50%, 07/01/20 | 987,506 | 946,356 | ||||||
Nautilus Merger Sub, Inc. Term B Loan | ||||||||
4.00%, 03/13/21 | 332,243 | 318,538 | ||||||
Navistar, Inc. Term B Loan | ||||||||
6.50%-7.75%, 08/07/20 | 425,000 | 372,585 | ||||||
Neiman Marcus Group, Ltd. LLC Term Loan | ||||||||
4.25%, 10/25/20 | 706,436 | 623,430 | ||||||
Neptune Finco Corporation Term B Loan | ||||||||
5.00%, 09/25/22 | 770,000 | 767,836 | ||||||
Nexstar Broadcasting, Inc. Term B-2 Loan | ||||||||
3.75%, 10/01/20 | 652,094 | 646,662 | ||||||
North American Lifting Holdings, Inc. Term Loan | ||||||||
5.50%, 11/27/20 | 490,192 | 352,119 | ||||||
10.00%, 11/27/21 | 250,000 | 185,000 | ||||||
Numericable US LLC Term B-1 Loan | ||||||||
4.50%, 05/21/20 | 849,268 | 816,146 | ||||||
Numericable US LLC Term B-2 Loan | ||||||||
4.50%, 05/21/20 | 734,732 | 706,078 | ||||||
Orion Engineered Carbons GmbH Term B Loan | ||||||||
5.00%, 07/25/21 | 790,000 | 726,939 | ||||||
Pacific Drilling SA Term B Loan | ||||||||
4.50%, 06/03/18 | 381,023 | 162,887 | ||||||
Party City Holdings, Inc Term B Loan | ||||||||
4.25%, 08/19/22 | 299,250 | 290,087 | ||||||
Penn Products Terminals LLC Term B Loan | ||||||||
4.75%, 04/14/22 | 595,500 | 556,792 | ||||||
Performance Food Group, Inc. Term Loan | ||||||||
6.25%, 11/14/19 | 336,648 | 334,012 | ||||||
PetSmart, Inc. Term B Loan | ||||||||
4.25%, 03/10/22 | 895,500 | 870,650 | ||||||
| Par | Value | |||||||
Pharmaceutical Product Development LLC Term B Loan | ||||||||
4.25%, 08/18/22 | $ | 696,500 | $ | 675,605 | ||||
Prestige Brand, Inc. Term B-3 Loan | ||||||||
3.50%, 09/03/21 | 97,067 | 96,360 | ||||||
Quebecor Media, Inc. Term B-1 Loan | ||||||||
3.25%, 08/17/20 | 1,719,905 | 1,661,325 | ||||||
Quincy Newspapers Inc. Term B Loan | ||||||||
5.50%-7.00%, 11/02/22 | 495,000 | 487,164 | ||||||
Quintiles Transnational Corporation Term B Loan | ||||||||
3.25%, 05/12/22 | 480,774 | 478,770 | ||||||
RCS Capital Corporation Term Loan | ||||||||
7.50%, 04/29/19 | 708,708 | 572,112 | ||||||
Reynolds Group Holdings, Inc. Term B Loan | ||||||||
4.50%, 12/01/18 | 972,216 | 961,483 | ||||||
Sabre GLBL, Inc. | ||||||||
4.00%, 02/19/19 | 977,500 | 965,897 | ||||||
SAM Finance Lux S.à r.l. Term B Loan | ||||||||
4.25%, 12/17/20 | 480,007 | 478,605 | ||||||
Sandy Creek Energy Associates LP Term B Loan | ||||||||
5.00%-6.25%, 11/08/20 | 272,216 | 185,295 | ||||||
SBA Senior Finance II LLC Term B-2 Loan | ||||||||
3.25%, 06/10/22 | 992,015 | 966,282 | ||||||
Seadrill Operating LP Term B Loan | ||||||||
4.00%, 02/21/21 | 490,000 | 202,532 | ||||||
SeaWorld Parks & Entertainment, Inc. Term B-2 Loan | ||||||||
3.00%, 05/14/20 | 249,346 | 231,891 | ||||||
Sedgwick Claims Management Services, Inc. Term Loan | ||||||||
3.75%, 02/28/21 | 609,948 | 584,025 | ||||||
6.75%, 02/28/22 | 500,000 | 450,000 | ||||||
Sequa Corporation Term B Loan | ||||||||
5.25%, 06/19/17 | 1,166,601 | 803,986 | ||||||
ServiceMaster Co. LLC (The) Term B Loan | ||||||||
4.25%, 07/01/21 | 892,341 | 881,187 | ||||||
SIG Combibloc PurchaseCo S.à.r.l Term B Loan | ||||||||
4.25%, 03/13/22 | 472,619 | 464,424 | ||||||
Signode Industrial Group US, Inc. Term B Loan | ||||||||
3.75%, 05/01/21 | 350,000 | 326,293 | ||||||
Solenis International LP Term Loan | ||||||||
4.25%, 07/31/21 | 689,761 | 660,019 | ||||||
| See Notes to Financial Statements. | 255 |
Table of Contents
FLEXIBLE INCOME FUND
SCHEDULE OF INVESTMENTS (Continued)
| Par | Value | |||||||
Southcross Holdings Borrower LP Term Loan | ||||||||
6.00%, 07/29/21 | $ | 985,000 | $ | 538,470 | ||||
Spectrum Brands, Inc. Term Loan | ||||||||
3.75%-5.25%, 06/23/22 | 643,078 | 638,625 | ||||||
Spin Holdco, Inc. Term B Loan | ||||||||
4.25%, 11/08/19 | 977,650 | 937,077 | ||||||
Styrolution Group GmbH Term B-1 Loan | ||||||||
6.50%, 09/30/19 | 494,256 | 490,138 | ||||||
Summit Materials LLC Term B Loan | ||||||||
4.25%, 07/17/22 | 497,500 | 489,625 | ||||||
Team Health, Inc. Term B Loan | ||||||||
4.50%, 11/23/22 | 560,000 | 557,553 | ||||||
TierPoint LLC | ||||||||
5.25%, 12/02/21 | 990,000 | 967,725 | ||||||
Time, Inc. Delayed Draw Term B-DD Loan | ||||||||
4.25%, 04/24/21 | 989,950 | 975,101 | ||||||
T-Mobile USA, Inc. Term B Loan | ||||||||
3.50%, 11/09/22 | 360,000 | 359,608 | ||||||
Tower Automotive Holdings USA LLC Term B Loan | ||||||||
4.00%, 04/23/20 | 300,000 | 286,500 | ||||||
TPF II Power LLC Term B Loan | ||||||||
5.50%, 10/02/21 | 737,738 | 720,217 | ||||||
TransUnion LLC | ||||||||
3.50%, 04/09/21 | 1,156,614 | 1,121,430 | ||||||
Tribune Media Co. Term B Loan | ||||||||
3.75%, 12/27/20 | 746,250 | 733,892 | ||||||
Tribune Publishing Co. Term B Loan | ||||||||
5.75%, 08/04/21 | 471,856 | 432,338 | ||||||
TTM Technologies, Inc. Term B Loan | ||||||||
6.00%, 05/31/21 | 324,188 | 292,579 | ||||||
Univar USA, Inc. Term B Loan | ||||||||
4.25%, 07/01/22 | 344,138 | 332,426 | ||||||
Univision Com-munications, Inc. Term C-4 Loan | ||||||||
4.00%. 03/01/20 | 1,336,761 | 1,306,016 | ||||||
UPC Financing Partnership Term AH Loan | ||||||||
3.25%, 06/30/21 | 400,000 | 392,124 | ||||||
Valeant Pharmaceuticals International, Inc. Term BF1 Loan | ||||||||
4.00%, 04/01/22 | 1,637,625 | 1,571,711 | ||||||
Virgin Media Investment Holdings, Ltd. Term F Loan | ||||||||
3.50%, 06/30/23 | 500,000 | 488,985 | ||||||
| Par | Value | |||||||
Walter Investment Management Corporation Term Loan | ||||||||
4.75%, 12/18/20 | $ | 473,333 | $ | 405,590 | ||||
WaveDivision Holdings LLC Term Loan | ||||||||
4.00%,10/15/19 | 328,819 | 323,065 | ||||||
Weather Channel Term Loan | ||||||||
5.75%, 02/13/20 | 669,938 | 668,979 | ||||||
West Corporation Term B-10 Loan | ||||||||
3.25%, 06/30/18 | 639,803 | 628,376 | ||||||
Westmoreland Coal Co. Term B Loan | ||||||||
7.50%, 12/16/20 | 346,417 | 209,582 | ||||||
WideOpenWest Finance LLC Term B Loan | ||||||||
4.50%, 04/01/19 | 902,264 | 865,968 | ||||||
William Morris Endeavor Entertainment LLC Term B Loan | ||||||||
5.25%, 05/06/21 | 1,477,500 | 1,449,339 | ||||||
WMG Acquisition Corporation Term B Loan | ||||||||
3.75%, 07/01/20 | 1,136,290 | 1,073,317 | ||||||
XPO Logistics Inc. Term B Loan | ||||||||
5.50%, 10/30/21 | 360,000 | 358,049 | ||||||
Yankee Cable Acquisition LLC. Term B Loan | ||||||||
4.25%, 03/01/20 | 473,774 | 466,222 | ||||||
Zayo Group LLC Term B Loan | ||||||||
3.75%, 07/02/19 | 487,486 | 478,692 | ||||||
Zebra Technologies Corporation Term B Loan | ||||||||
4.75%, 10/27/21 | 555,000 | 555,000 | ||||||
Ziggo BV Delayed Draw Term B3-DD Loan | ||||||||
3.50%, 01/15/22 | 509,489 | 494,133 | ||||||
Ziggo BV Term B-1 Loan | ||||||||
3.50%, 01/15/22 | 480,723 | 466,234 | ||||||
Ziggo BV Term B-2 Loan | ||||||||
3.50%, 01/15/22 | 309,787 | 300,450 | ||||||
|
| |||||||
Total Loan Agreements | 116,055,222 | |||||||
|
| |||||||
| 256 | See Notes to Financial Statements. |
Table of Contents
| Shares | Value | |||||||
MONEY MARKET FUNDS — 10.6% |
| |||||||
GuideStone Money Market Fund (Investor Class)¥ | 14,734,600 | $ | 14,734,600 | |||||
Northern Institutional Liquid Assets Portfolio§ | 255,750 | 255,750 | ||||||
|
| |||||||
Total Money Market Funds | 14,990,350 | |||||||
|
| |||||||
TOTAL INVESTMENTS — 99.9% |
| 141,293,777 | ||||||
Other Assets in Excess of Liabilities — 0.1% | 145,282 | |||||||
|
| |||||||
NET ASSETS — 100.0% | $ | 141,439,059 | ||||||
|
| |||||||
VALUATION HIERARCHY
The following is a summary of the inputs used, as of December 31, 2015, in valuing the Fund’s investments carried at fair value:
| Total Value | Level 1 Quoted Prices | Level 2 Other Significant Observable Inputs | Level 3 Significant Unobservable Inputs | |||||||||||||||||
Assets: | ||||||||||||||||||||
Investments in Securities: | ||||||||||||||||||||
Corporate Bonds | $ | 8,804,330 | $ | — | $ | 8,804,330 | $ | — | ||||||||||||
Foreign Bonds | 1,443,875 | — | 1,443,875 | — | ||||||||||||||||
Loan Agreements | 116,055,222 | — | 108,106,464 | 7,948,758 | ||||||||||||||||
Money Market Funds | 14,990,350 | 14,990,350 | — | — | ||||||||||||||||
|
|
|
|
|
|
|
| |||||||||||||
Total Assets - Investments in Securities | $ | 141,293,777 | $ | 14,990,350 | $ | 118,354,669 | $ | 7,948,758 | ||||||||||||
|
|
|
|
|
|
|
| |||||||||||||
There were no transfers between Level 1 and Level 2 during the year ended December 31, 2015.
The unobservable inputs used in the fair value measurement of the reporting entity’s loan agreements are values based on evaluated quotations received from dealers who make markets in such securities. Significant increases (decreases) in those evaluated quotations would result in a significantly higher (lower) fair value measurement.
The following is a reconciliation of assets in which significant unobservable inputs (Level 3) were used in determining fair value:
| Total Value | Loan Agreements | |||||||
Balance, 12/31/14 | $ | 11,263,387 | $ | 11,263,387 | ||||
Accrued discounts/premiums | 16,805 | 16,805 | ||||||
Realized gain (loss)(1) | (65,295 | ) | (65,295 | ) | ||||
Change in unrealized appreciation (depreciation)(2) | (688,352 | ) | (688,352 | ) | ||||
Purchases | 3,281,527 | 3,281,527 | ||||||
Sales | (2,763,343 | ) | (2,763,343 | ) | ||||
Transfers in to Level 3(3) | 2,312,634 | 2,312,634 | ||||||
Transfers out of Level 3(4) | (5,408,605 | ) | (5,408,605 | ) | ||||
Maturities | — | — | ||||||
Paydowns | — | — | ||||||
|
|
|
| |||||
Balance, 12/31/15 | $ | 7,948,758 | $ | 7,948,758 | ||||
|
|
|
| |||||
| (1) | Realized gain (loss) from the sale of Level 3 securities is included on the Statement of Operations in Net realized gain (loss) from: Investment securities. |
| (2) | Change in unrealized appreciation (depreciation) is located on the Statement of Operations in Net change in unrealized appreciation (depreciation) on: Investment securities. |
| (3) | Transfers in to Level 3 represent the value of securities at December 31, 2015 that were transferred from Level 1 and Level 2 to Level 3 of the fair value hierarchy as a result of the inability of the Fund to obtain a price using an objective method such as a pricing vendor. |
| (4) | Transfers out of Level 3 represent the value of securities at December 31, 2015 that were transferred from Level 3 to Level 2 of the fair value hierarchy as a result of the ability of the Fund to obtain a price using an objective method such as a pricing vendor. |
| See Notes to Financial Statements. | 257 |
Table of Contents
The Real Assets Fund, through investments in other funds, invests mainly in securities or physical assets with real return characteristics.
The Fund had a target asset allocation to Real Assets Select Funds and another real return fund including 33% Inflation Protected Bond Fund, 15% Real Estate Securities Fund, 17.5% Credit Suisse Commodity Return Strategy Fund (a third party mutual fund), 17.5% Global Natural Resources Equity Fund and 17% Flexible Income Fund.
As a fund of funds, its performance was based on the performance of the underlying funds. The Fund underperformed its composite benchmark index (33% Barclays U.S. TIPS Index, 17% S&P/LSTA Leveraged Loan Index, 15% FTSE EPRA / NAREIT Developed Index, 14% MSCI World Commodity Producers Index, 4% NYSE Arca Gold Miners Index and 17% S&P Dow Jones-UBS Commodity Index) during 2015 (-11.77% versus -8.83%).
On an absolute basis, only the Real Estate Securities Fund had positive performance for the year as the other underlying Funds delivered negative returns. The Real Estate Securities Fund contributed to performance while the largest detractors were the Credit Suisse Commodity Return Strategy Fund and Global Natural Resources Equity Fund.
The Real Estate Securities Fund contributed positively to benchmark relative performance, while other underlying Real Asset Select Funds underperformed their respective benchmarks. The dominant driver of benchmark relative underperformance was the Fund’s allocation to the Global Natural Resources Equity Fund, which trailed its benchmark in 2015.
The Fund did not invest in derivative instruments during the year.
This Fund may be suitable for investors who have a medium- to long-term investment horizon, possess a moderate tolerance for risk and seek to participate in the return potential of real return related securities. The Fund attempts to achieve its objective by investing in selected GuideStone Funds Select Funds and other investments. By investing in the Fund, you will also incur the expenses and risks of underlying fund investments. The principal risks of the Fund will change depending on the asset mix of the Select Funds and other investments in which it invests. You may directly invest in only those Select Funds which are eligible for direct investment. The Fund’s value will go up and down in response to changes in the share prices of the investments that it owns. It is possible to lose money by investing in the Fund.
At December 31, 2015, the portfolio holdings of the Fund, as a percentage of net assets, is shown in the following table. Portfolio holdings are subject to risk and may change at any time.
| % | ||||
Real Return Select Funds | 81.2 | |||
Credit Suisse Commodity Return Strategy | 17.2 | |||
Fixed Income Select Fund | 1.6 | |||
|
| |||
| 100.0 | ||||
|
| |||
258
Table of Contents
Real Assets Fund (Unaudited)
| Average Annual Total Returns as of 12/31/15 | ||||
Investor Class* | Benchmark** | |||
One Year | -11.77% | -8.83% | ||
Since Inception | -6.39% | -3.82% | ||
Inception Date | 07/01/13 | |||
Total Fund Operating Expenses (May 1, 2015 Prospectus, as amended on June 1, 2015)(1) | 1.16% | |||
(1)Current information regarding the Fund’s Operating Expenses can be found in the Financial Highlights.
The performance data quoted represents past performance and does not guarantee future results. Current performance may be lower or higher. Performance data current to the most recent month-end may be obtained at www.GuideStoneFunds.org. The investment return and principal value of an investment will fluctuate so that shares, when redeemed, may be worth more or less than their original cost.
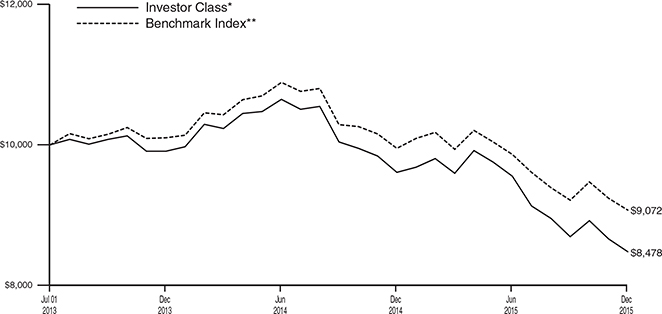
The graph compares the results of a hypothetical $10,000 investment in the Investor Class of the Fund since July 1, 2013 (commencement of operations), with all dividends and capital gains reinvested, with the weighted composite benchmark index.
*These returns reflect expense waivers by the Fund’s investment adviser. Without these waivers, returns would have been lower. Returns shown do not reflect the deduction of taxes that a shareholder would pay on Fund distributions or the redemption of Fund shares.
**Represents a weighted composite benchmark index consisting of 33% Barclays U.S. TIPS Index (Series-L), 17% S&P/LSTA U.S. B- Ratings and Above Loan Index, 15% FTSE EPRA / NAREIT Developed Index—Net, 14% MSCI World Commodity Producers Index, 4% NYSE Arca Gold Miners Index and 17% S&P Dow Jones-UBS Commodity Index.
Unlike a mutual fund, the performance of an index assumes no taxes, transaction costs, management fees or other expenses.
259
Table of Contents
REAL ASSETS FUND SCHEDULE OF INVESTMENTS | December 31, 2015 |
| Shares | Value | |||||||||
MUTUAL FUNDS — 100.0% |
| |||||||||
GuideStone Money Market Fund (Institutional Class)¥ | 537,345 | $ | 537,345 | |||||||
GuideStone Inflation Protected Bond Fund (Institutional Class)*¥ | 1,082,502 | 10,803,373 | ||||||||
GuideStone Flexible Income Fund (Investor Class)¥ | 596,685 | 5,543,201 | ||||||||
GuideStone Real Estate Securities Fund (Institutional Class)¥ | 510,562 | 4,829,919 | ||||||||
GuideStone Global Natural Resources Equity Fund (Investor Class)¥ | 1,098,023 | 5,610,899 | ||||||||
Credit Suisse Commodity Return Strategy Fund (Class I)* | 1,257,152 | 5,669,758 | ||||||||
|
| |||||||||
Total Mutual Funds |
| 32,994,495 | ||||||||
|
| |||||||||
TOTAL INVESTMENTS — 100.0% |
| 32,994,495 | ||||||||
Other Assets in Excess of | 5,265 | |||||||||
|
| |||||||||
NET ASSETS — 100.0% |
| $ | 32,999,760 | |||||||
|
| |||||||||
VALUATION HIERARCHY
The following is a summary of the inputs used, as of December 31, 2015, in valuing the Fund’s investments carried at fair value:
| Total Value | Level 1 Quoted Prices | Level 2 Other Significant Observable Inputs | Level 3 Significant Unobservable Inputs | |||||||||||||
Assets: | ||||||||||||||||
Investments in Securities: | ||||||||||||||||
Mutual Funds | $ | 32,994,495 | $ | 32,994,495 | $ | — | $ | — | ||||||||
|
|
|
|
|
|
|
| |||||||||
Total Assets - Investments in Securities | $ | 32,994,495 | $ | 32,994,495 | $ | — | $ | — | ||||||||
|
|
|
|
|
|
|
| |||||||||
There were no transfers between Level 1 and Level 2 during the year ended December 31, 2015.
| 260 | See Notes to Financial Statements. |
Table of Contents
Real Estate Securities Fund (Unaudited)
Global real estate markets experienced volatility during the year but showed resilience in the fourth quarter and erased a good portion of the losses suffered in the prior two quarters. Familiar themes such as moderating growth expectations in China, Federal Reserve policy related to the timing of potential interest rate hikes and falling commodity prices continued to dominate the headlines and contributed to market uncertainty throughout the year. The FTSE EPRA / NAREIT Developed Index – Net, posted a fourth quarter return of 4.19%, bringing the one-year return to -0.79%.
The Real Estate Securities Fund provides exposure to real estate by investing in public real estate securities with strong cash flow growth potential that provides the capacity for sustained dividend increases. The Fund was diversified among property sectors and geographical locations. The Fund outperformed its benchmark, the FTSE EPRA / NAREIT Developed Index - Net, for the 2015 calendar year (0.34% vs. -0.79%). Stock selection in the Americas, Japan, Continental Europe and Asia ex-Japan contributed, while stock selection in the United Kingdom detracted from benchmark-relative returns. From a regional allocation perspective, an underweight in the Americas region and an overweight in the U. K. region were the largest contributors. An underweight in the Asia ex-Japan region and an overweight in the Japan region detracted the most during the year.
In 2015, derivative positions, exchange listed equity index futures contracts, were utilized to provide market exposure to the cash positions held in the Fund. Overall, derivative exposure had a slight positive impact on Fund performance for the year.
This Fund may be suitable for investors who seek the potential for current income and long-term capital appreciation. Investors should be willing to accept significant short-term fluctuations in account value and want to diversify their portfolio through exposure to publicly traded real estate securities.
This Fund invests substantial assets in real estate investment trusts (REITs) that involve equity market risks as well as risks linked directly to the real estate market. Risks include declines in the value of real estate, general and economic conditions, changes in the value of the underlying property and defaults by borrowers. The value of assets in the real estate industry may go through cycles of relative underperformance and outperformance in comparison to equity securities markets in general. It is possible to lose money by investing in the Fund.
At December 31, 2015, the portfolio holdings of the Fund, as a percentage of total investments, is shown in the following table. Portfolio holdings are subject to risk and may change at any time.
| % | ||||
Financial Services | 51.9 | |||
Foreign Common Stocks | 44.4 | |||
Money Market Funds | 12.1 | |||
|
| |||
| 108.4 | ||||
|
| |||
261
Table of Contents
Real Estate Securities Fund (Unaudited)
| Average Annual Total Returns as of 12/31/15 | ||||||
| Institutional Class* | Investor Class* | Benchmark** | |||
One Year | N/A | 0.34% | -0.79% | |||
Five Year | N/A | 8.48% | 7.17% | |||
Since Inception(2) | -1.89% | 2.72% | 1.25% | |||
Inception Date | 04/30/15 | 12/29/06 | ||||
Total Fund Operating Expenses (May 1, 2015 Prospectus, as amended on June 1, 2015)(1) | 0.92% | 1.13% | ||||
(1) Current information regarding the Fund’s Operating Expenses can be found in the Financial Highlights.
(2) The Since Inception benchmark performance is based on the start date of December 29, 2006, which corresponds with the inception date of the Investor Class, the longest operating class of the Fund.
The performance data quoted represents past performance and does not guarantee future results. Current performance may be lower or higher. Performance data current to the most recent month-end may be obtained at www.GuideStoneFunds.org. The investment return and principal value of an investment will fluctuate so that shares, when redeemed, may be worth more or less than their original cost.
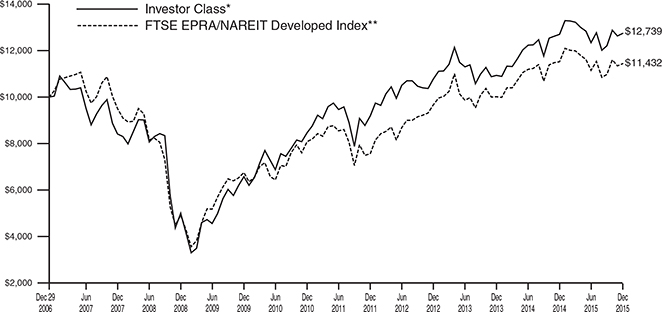
The graph compares the results of a hypothetical $10,000 investment in the Investor Class of the Fund since December 29, 2006 (commencement of operations), with all dividends and capital gains reinvested, with the FTSE EPRA/NAREIT Developed Index.
*These returns reflect expense waivers by the Fund’s investment adviser. Without these waivers, returns would have been lower. Returns shown do not reflect the deduction of taxes that a shareholder would pay on Fund distributions or the redemption of Fund shares.
Unlike a mutual fund, the performance of an index assumes no taxes, transaction costs, management fees or other expenses.
262
Table of Contents
REAL ESTATE SECURITIES FUND SCHEDULE OF INVESTMENTS | December 31, 2015 |
| Shares | Value | |||||||
COMMON STOCKS — 51.9% | ||||||||
Financial Services — 51.9% | ||||||||
Agree Realty Corporation REITD | 23,363 | $ | 794,108 | |||||
Alexandria Real Estate Equities, Inc. REITD | 11,078 | 1,001,008 | ||||||
American Residential Properties, Inc. REIT | 69,605 | 1,315,535 | ||||||
AvalonBay Communities, Inc. REIT | 20,537 | 3,781,478 | ||||||
Boston Properties, Inc. REIT | 28,495 | 3,634,252 | ||||||
Brandywine Realty Trust REITD | 119,871 | 1,637,438 | ||||||
Camden Property Trust REITD | 11,859 | 910,297 | ||||||
Chesapeake Lodging Trust REITD | 89,499 | 2,251,795 | ||||||
CoreSite Realty Corporation REITD | 13,102 | 743,145 | ||||||
Crown Castle International Corporation REITD | 6,384 | 551,897 | ||||||
CubeSmart REIT | 59,739 | 1,829,208 | ||||||
CyrusOne, Inc. REITD | 25,295 | 947,298 | ||||||
DCT Industrial Trust, Inc. REITD | 81,656 | 3,051,485 | ||||||
Duke Realty Corporation REITD | 94,840 | 1,993,537 | ||||||
Education Realty Trust, Inc. REITD | 90,215 | 3,417,344 | ||||||
Equinix, Inc. REITD | 10,150 | 3,069,360 | ||||||
Equity LifeStyle Properties, Inc. REITD | 18,089 | 1,205,994 | ||||||
Equity One, Inc. REITD | 45,316 | 1,230,329 | ||||||
Equity Residential REITD | 98,065 | 8,001,123 | ||||||
Essex Property Trust, Inc. REIT | 11,357 | 2,718,979 | ||||||
Extra Space Storage, Inc. REIT | 25,740 | 2,270,525 | ||||||
Federal Realty Investment Trust REIT | 20,281 | 2,963,054 | ||||||
First Industrial Realty Trust, Inc. REITD | 20,770 | 459,640 | ||||||
Four Corners Property Trust, Inc. REITD* | 20,192 | 487,839 | ||||||
General Growth Properties, Inc. REIT | 131,073 | 3,566,496 | ||||||
Healthcare Trust of America, Inc. Class A REITD | 50,479 | 1,361,419 | ||||||
Host Hotels & Resorts, Inc. REITD | 28,931 | 443,802 | ||||||
Kilroy Realty Corporation REIT | 14,661 | 927,748 | ||||||
LaSalle Hotel Properties REITD | 27,743 | 698,014 | ||||||
Macerich Co. (The) REITD | 50,936 | 4,110,026 | ||||||
Mack-Cali Realty Corporation REITD | 22,135 | 516,852 | ||||||
Mid-America Apartment Communities, Inc. REITD | 18,751 | 1,702,778 | ||||||
National Health Investors, Inc. REITD | 14,127 | 859,910 | ||||||
National Retail Properties, Inc. REIT | 49,130 | 1,967,656 | ||||||
New York REIT, Inc. REIT | 63,931 | 735,206 | ||||||
Paramount Group, Inc. REIT | 68,690 | 1,243,289 | ||||||
Pebblebrook Hotel Trust REITD | 46,291 | 1,297,074 | ||||||
Physicians Realty Trust REITD | 73,525 | 1,239,632 | ||||||
Piedmont Office Realty Trust, Inc. Class A REIT | 51,994 | 981,647 | ||||||
Post Properties, Inc. REIT | 27,782 | 1,643,583 | ||||||
Prologis, Inc. REIT | 77,464 | 3,324,755 | ||||||
| Shares | Value | |||||||
Public Storage REIT | 23,250 | $ | 5,759,025 | |||||
Retail Properties of America, Inc. Class A REITD | 252,704 | 3,732,438 | ||||||
Rexford Industrial Realty, Inc. REITD | 48,473 | 793,018 | ||||||
RMR Group, Inc. (The) Class A* | — | 4 | ||||||
Senior Housing Properties Trust REITD | 64,627 | 959,065 | ||||||
Simon Property Group, Inc. REIT | 66,685 | 12,966,232 | ||||||
Sovran Self Storage, Inc. REITD | 7,870 | 844,530 | ||||||
Spirit Realty Capital, Inc. REIT | 375,103 | 3,758,532 | ||||||
STORE Capital Corporation REITD | 39,827 | 923,986 | ||||||
Sunstone Hotel Investors, Inc. REITD | 200,498 | 2,504,220 | ||||||
Taubman Centers, Inc. REITD | 18,491 | 1,418,630 | ||||||
UDR, Inc. REITD | 52,670 | 1,978,812 | ||||||
Urban Edge Properties REITD | 74,915 | 1,756,757 | ||||||
Vornado Realty Trust REITD | 71,934 | 7,190,523 | ||||||
Washington Real Estate Investment Trust REITD | 40,949 | 1,108,080 | ||||||
Weingarten Realty Investors REITD | 48,077 | 1,662,503 | ||||||
Welltower, Inc. REIT | 133,316 | 9,069,487 | ||||||
WP Glimcher, Inc. REIT | 77,140 | 818,455 | ||||||
|
| |||||||
| 134,130,852 | ||||||||
|
| |||||||
Total Common Stocks | 134,130,852 | |||||||
|
| |||||||
FOREIGN COMMON STOCKS — 44.4% |
| |||||||
Australia — 5.8% | ||||||||
Dexus Property Group REIT | 102,758 | 557,376 | ||||||
Goodman Group REIT | 336,728 | 1,525,862 | ||||||
GPT Group (The) REIT | 174,490 | 604,292 | ||||||
Ingenia Communities Group REIT | 238,735 | 515,586 | ||||||
Investa Office Fund REIT | 492,146 | 1,424,655 | ||||||
Mirvac Group REIT | 1,201,274 | 1,719,668 | ||||||
Scentre Group REIT | 1,137,265 | 3,449,482 | ||||||
Vicinity Centres REIT | 1,268,948 | 2,574,278 | ||||||
Westfield Corporation REIT | 380,492 | 2,617,746 | ||||||
|
| |||||||
| 14,988,945 | ||||||||
|
| |||||||
Austria — 0.1% | ||||||||
BUWOG AG* | 10,987 | 238,335 | ||||||
|
| |||||||
Canada — 1.6% | ||||||||
Allied Properties Real Estate Investment Trust REIT | 28,020 | 639,294 | ||||||
Chartwell Retirement Residences | 97,766 | 897,325 | ||||||
First Capital Realty, Inc.D | 61,070 | 809,882 | ||||||
Pure Industrial Real Estate Trust REIT | 134,020 | 423,262 | ||||||
Smart Real Estate Investment Trust REIT | 57,034 | 1,244,386 | ||||||
|
| |||||||
| 4,014,149 | ||||||||
|
| |||||||
Finland — 0.3% | ||||||||
Citycon OYJ* | 330,940 | 859,555 | ||||||
|
| |||||||
France — 3.9% | ||||||||
Gecina SA REIT | 19,570 | 2,379,167 | ||||||
Klepierre REIT | 82,011 | 3,645,392 | ||||||
| See Notes to Financial Statements. | 263 |
Table of Contents
REAL ESTATE SECURITIES FUND SCHEDULE OF INVESTMENTS (Continued) |
| Shares | Value | |||||||
Unibail-Rodamco SE REIT | 15,639 | $ | 3,971,251 | |||||
|
| |||||||
| 9,995,810 | ||||||||
|
| |||||||
Germany — 2.9% | ||||||||
alstria office REIT-AG* | 62,631 | 834,346 | ||||||
LEG Immobilien AG* | 26,526 | 2,161,896 | ||||||
Vonovia SE | 149,629 | 4,622,526 | ||||||
|
| |||||||
| 7,618,768 | ||||||||
|
| |||||||
Hong Kong — 6.2% | ||||||||
Cheung Kong Property Holdings, Ltd. | 575,307 | 3,721,652 | ||||||
Hang Lung Properties, Ltd. | 724,209 | 1,640,955 | ||||||
Henderson Land Development Co., Ltd. | 165,413 | 1,009,022 | ||||||
Hongkong Land Holdings, Ltd. | 252,500 | 1,729,625 | ||||||
Link REIT | 357,749 | 2,132,858 | ||||||
New World Development Co., Ltd. | 625,831 | 614,527 | ||||||
Sun Hung Kai Properties, Ltd. | 312,951 | 3,761,541 | ||||||
Swire Properties, Ltd. | 389,036 | 1,118,610 | ||||||
Wharf Holdings, Ltd. (The) | 57,904 | 319,253 | ||||||
|
| |||||||
| 16,048,043 | ||||||||
|
| |||||||
Ireland — 0.5% | ||||||||
Green REIT PLC | 229,327 | 396,887 | ||||||
Hibernia REIT PLC | 551,385 | 843,191 | ||||||
|
| |||||||
| 1,240,078 | ||||||||
|
| |||||||
Italy — 0.1% | ||||||||
Beni Stabili SpA REITD | 453,311 | 341,671 | ||||||
|
| |||||||
Japan — 10.9% | ||||||||
Daibiru Corporation | 46,400 | 382,233 | ||||||
Frontier Real Estate Investment Corporation REIT | 92 | 369,079 | ||||||
Global One Real Estate Investment Corporation REITD | 293 | 1,050,262 | ||||||
GLP J-REIT | 531 | 513,857 | ||||||
Hulic Reit, Inc. REITD | 315 | 439,549 | ||||||
Industrial & Infrastructure Fund Investment Corporation REIT | 111 | 529,672 | ||||||
Invesco Office J-Reit, Inc. REIT | 474 | 402,303 | ||||||
Invincible Investment Corporation REITD | 772 | 448,383 | ||||||
Japan Logistics Fund, Inc. REIT | 614 | 1,191,501 | ||||||
Japan Real Estate Investment Corporation REIT | 333 | 1,615,960 | ||||||
Japan Retail Fund Investment Corporation REIT | 762 | 1,465,994 | ||||||
Kenedix Office Investment Corporation REIT | 181 | 846,180 | ||||||
Kenedix Residential Investment Corporation REITD | 147 | 362,390 | ||||||
Mitsubishi Estate Co., Ltd. | 217,643 | 4,525,523 | ||||||
Mitsui Fudosan Co., Ltd. | 243,729 | 6,117,083 | ||||||
Mori Hills REIT Investment Corporation | 1,146 | 1,468,175 | ||||||
Nippon Accommodations Fund, Inc. REIT | 203 | 707,345 | ||||||
Nippon Building Fund, Inc. REIT | 104 | 496,969 | ||||||
Nomura Real Estate Master Fund, Inc. REIT* | 49 | 60,906 | ||||||
| Shares | Value | |||||||
NTT Urban Development Corporation | 141,000 | $ | 1,354,769 | |||||
Sumitomo Realty & Development Co., Ltd. | 51,003 | 1,455,763 | ||||||
Tokyo Tatemono Co., Ltd. | 123,000 | 1,338,708 | ||||||
Top REIT, Inc. | 97 | 367,407 | ||||||
United Urban Investment Corporation REIT | 490 | 665,202 | ||||||
|
| |||||||
| 28,175,213 | ||||||||
|
| |||||||
Jersey — 0.1% | ||||||||
LXB Retail Properties PLC* | 107,910 | 152,719 | ||||||
|
| |||||||
Luxembourg — 0.3% | ||||||||
ADO Properties SA 144A* | 27,788 | 800,267 | ||||||
|
| |||||||
Netherlands — 0.9% | ||||||||
Eurocommercial Properties NV CVA | 11,570 | 499,830 | ||||||
InterXion Holding NV* | 32,590 | 982,589 | ||||||
Wereldhave NV REIT | 16,605 | 931,442 | ||||||
|
| |||||||
| 2,413,861 | ||||||||
|
| |||||||
Singapore — 1.9% | ||||||||
CapitaLand Commercial Trust, Ltd. REIT | 234,700 | 222,679 | ||||||
CapitaLand Mall Trust REIT | 949,236 | 1,288,009 | ||||||
CapitaLand, Ltd. | 838,864 | 1,971,742 | ||||||
Fortune Real Estate Investment Trust REIT | 695,563 | 714,803 | ||||||
Mapletree Greater China Commercial Trust REIT | 331,085 | 213,147 | ||||||
Mapletree Industrial Trust REIT | 9,000 | 9,648 | ||||||
Mapletree Logistics Trust REITD | 586,900 | 408,932 | ||||||
|
| |||||||
| 4,828,960 | ||||||||
|
| |||||||
Spain — 0.6% | ||||||||
Inmobiliaria Colonial SA* | 975,010 | 679,341 | ||||||
Merlin Properties Socimi SA REIT | 67,436 | 844,790 | ||||||
|
| |||||||
| 1,524,131 | ||||||||
|
| |||||||
Sweden — 1.4% | ||||||||
Fabege AB | 129,952 | 2,147,150 | ||||||
Hemfosa Fastigheter AB | 5,242 | 58,240 | ||||||
Hufvudstaden AB, A Shares | 55,724 | 787,748 | ||||||
Pandox AB* | 12,102 | 222,178 | ||||||
Wihlborgs Fastigheter AB | 23,854 | 481,032 | ||||||
|
| |||||||
| 3,696,348 | ||||||||
|
| |||||||
Switzerland — 0.4% | ||||||||
PSP Swiss Property AG* | 12,896 | 1,130,848 | ||||||
|
| |||||||
United Kingdom — 6.5% | ||||||||
Assura PLC REIT | 487,776 | 397,653 | ||||||
Big Yellow Group PLC REIT | 47,390 | 562,121 | ||||||
British Land Co. PLC (The) REIT | 319,008 | 3,691,222 | ||||||
Derwent London PLC REIT | 18,447 | 997,758 | ||||||
Great Portland Estates PLC REIT | 85,469 | 1,041,741 | ||||||
Hammerson PLC REIT | 295,413 | 2,611,574 | ||||||
Helical Bar PLC | 46,849 | 327,887 | ||||||
Intu Properties PLC REIT | 268,578 | 1,254,783 | ||||||
Land Securities Group PLC REIT | 140,284 | 2,431,842 | ||||||
LondonMetric Property PLC REIT | 214,731 | 518,740 | ||||||
| 264 | See Notes to Financial Statements. |
Table of Contents
| Shares | Value | |||||||
Safestore Holdings PLC REIT | 62,698 | $ | 329,631 | |||||
Segro PLC REIT | 214,176 | 1,355,416 | ||||||
St. Modwen Properties PLC | 125,064 | 765,235 | ||||||
Workspace Group PLC REIT | 37,043 | 521,705 | ||||||
|
| |||||||
| 16,807,308 | ||||||||
|
| |||||||
Total Foreign Common Stocks |
| 114,875,009 | ||||||
|
| |||||||
MONEY MARKET FUNDS — 12.1% |
| |||||||
GuideStone Money Market Fund (Investor Class)¥ | 7,407,916 | 7,407,916 | ||||||
Northern Institutional Liquid Assets Portfolio§ | 23,903,069 | 23,903,069 | ||||||
|
| |||||||
Total Money Market Funds |
| 31,310,985 | ||||||
|
| |||||||
TOTAL INVESTMENTS — 108.4% |
| 280,316,846 | ||||||
Liabilities in Excess of Other Assets — (8.4)% | (21,763,516 | ) | ||||||
|
| |||||||
NET ASSETS — 100.0% | $ | 258,553,330 | ||||||
|
| |||||||
| See Notes to Financial Statements. | 265 |
Table of Contents
REAL ESTATE SECURITIES FUND SCHEDULE OF INVESTMENTS (Continued) |
VALUATION HIERARCHY
The following is a summary of the inputs used, as of December 31, 2015, in valuing the Fund’s investments carried at fair value:
| Total Value | Level 1 Quoted Prices | Level 2 Other Significant Observable Inputs | Level 3 Significant Unobservable Inputs | |||||||||||||
Assets: | ||||||||||||||||
Investments in Securities: | ||||||||||||||||
Common Stocks | $ | 134,130,852 | $ | 134,130,852 | $ | — | $ | — | ||||||||
Foreign Common Stocks: | ||||||||||||||||
Australia | 14,988,945 | — | 14,988,945 | — | ||||||||||||
Austria | 238,335 | — | 238,335 | — | ||||||||||||
Canada | 4,014,149 | 4,014,149 | — | — | ||||||||||||
Finland | 859,555 | — | 859,555 | — | ||||||||||||
France | 9,995,810 | — | 9,995,810 | — | ||||||||||||
Germany | 7,618,768 | — | 7,618,768 | — | ||||||||||||
Hong Kong | 16,048,043 | 1,729,625 | 14,318,418 | — | ||||||||||||
Ireland | 1,240,078 | — | 1,240,078 | — | ||||||||||||
Italy | 341,671 | — | 341,671 | — | ||||||||||||
Japan | 28,175,213 | 60,906 | 28,114,307 | — | ||||||||||||
Jersey | 152,719 | 152,719 | — | — | ||||||||||||
Luxembourg | 800,267 | 800,267 | — | — | ||||||||||||
Netherlands | 2,413,861 | 982,589 | 1,431,272 | — | ||||||||||||
Singapore | 4,828,960 | 9,648 | 4,819,312 | — | ||||||||||||
Spain | 1,524,131 | — | 1,524,131 | — | ||||||||||||
Sweden | 3,696,348 | — | 3,696,348 | — | ||||||||||||
Switzerland | 1,130,848 | — | 1,130,848 | — | ||||||||||||
United Kingdom | 16,807,308 | 725,540 | 16,081,768 | — | ||||||||||||
Money Market Funds | 31,310,985 | 31,310,985 | — | — | ||||||||||||
|
|
|
|
|
|
|
| |||||||||
Total Assets - Investments in Securities | $ | 280,316,846 | $ | 173,917,280 | $ | 106,399,566 | $ | — | ||||||||
|
|
|
|
|
|
|
| |||||||||
Other Financial Instruments*** | ||||||||||||||||
Futures Contracts | $ | 39,530 | $ | 39,530 | $ | — | $ | — | ||||||||
|
|
|
|
|
|
|
| |||||||||
Total Assets - Other Financial Instruments | $ | 39,530 | $ | 39,530 | $ | — | $ | — | ||||||||
|
|
|
|
|
|
|
| |||||||||
***Other financial instruments are derivative instruments not reflected in the Schedule of Investments, such as futures, forwards and swap contracts, which are valued at the unrealized appreciation (depreciation) on the investment. Details of these investments can be found in the Notes to Financial Statements.
The Fund had securities that transferred from Level 1 to Level 2 of the fair value hierarchy as a result of foreign equities that were being valued based on quoted prices at December 31, 2014 that are now being fair valued. The value of the securities that were transferred to Level 2 as of December 31, 2015 is $5,344,027.
The Fund had securities that transferred from Level 2 to Level 1 of the fair value hierarchy as a result of foreign equities that were fair valued at December 31, 2014 that are now being valued based on quoted prices. The value of the securities that were transferred to Level 1 as of December 31, 2015 is $9,648.
| 266 | See Notes to Financial Statements. |
Table of Contents
Global Natural Resources Equity Fund (Unaudited)
The Global Natural Resources Equity Fund primarily invests in equity securities of companies considered to be principally engaged in natural resources industries and related sectors or that supply goods, technology and services to such companies. The benchmark index was changed during the fourth quarter from the 75% MSCI World Commodity Producers Index / 25% NYSE Gold Miners Arca Index to the MSCI World Commodity Producers Index. From January through November, the Fund underperformed its former benchmark (-29.07% versus -20.07%). During December, the Fund underperformed its new benchmark (-3.53% versus -0.11%). Overall, the Fund underperformed its new benchmark for the 2015 calendar year (-34.49% versus -25.62%).
From an allocation perspective, the Fund’s smaller capitalization bias hurt benchmark-relative results. For example, the Fund held no exposure to integrated oil companies (which includes the oil “majors,” such as ExxonMobil or Conoco Phillips), and instead had overweight exposures to “regional” independent players in the North American natural gas and oil sectors. These sectors significantly underperformed integrated oil companies and the MSCI World Commodity Producers Index for the one-year period ended December 31, 2015. The Fund was also overweight base metals (copper miners in particular), which hurt performance as declining economic growth concerns out of China weighed heavily on the sector.
From a stock selection perspective, the Fund’s benchmark relative results benefited from strong stock selection within the base metals and fertilizers industries. Stock selection within North American natural oil and gas sub-sectors was a slight detractor to relative performance.
During the year, the Fund remained focused on achieving its objective of seeking long-term capital appreciation.
The Fund did not invest in derivative instruments during the year.
This Fund may be suitable for investors who have a medium- to long-term investment horizon, possess a high tolerance for risk and seek to participate in the return potential of natural resources related equity securities. An investment in medium-, small- and micro-cap companies may involve greater risk and be more volatile and less liquid than an investment in a larger company. Investment in companies in natural resources industries may be significantly affected by (often rapid) changes in supply of, or demand for various natural resources. Concentrating investments in the natural resources sector increases the risk of loss because the securities of many or all of the companies in the sector may decline in value due to developments adversely affecting the sector, including market, economic, political or regulatory developments. Prices of precious metals and of precious metal-related securities have historically been very volatile due to various economic, financial, social and political factors and may adversely affect the financial condition of companies involved with precious metals. It is possible to lose money by investing in the Fund.
At December 31, 2015, the portfolio holdings of the Fund, as a percentage of net assets, is shown in the following table. Portfolio holdings are subject to risk and may change at any time.
| % | ||||
Foreign Common Stocks | 53.1 | |||
Money Market Funds | 40.0 | |||
Energy | 36.0 | |||
Materials & Processing | 1.7 | |||
Consumer Staples | 0.3 | |||
Rights | — | |||
|
| |||
| 131.1 | ||||
|
| |||
267
Table of Contents
Global Natural Resources Equity Fund (Unaudited)
| Average Annual Total Returns as of 12/31/15 | ||||
| Investor Class* | Benchmark** | ||
One Year | -34.49% | -25.62% | ||
Since Inception | -22.34% | -11.11% | ||
Inception Date | 07/01/13 | |||
Total Fund Operating Expenses (May 1, 2015 Prospectus, as amended on June 1, 2015)(1) | 1.36% | |||
(1) Current information regarding the Fund’s Operating Expenses can be found in the Financial Highlights.
The performance data quoted represents past performance and does not guarantee future results. Current performance may be lower or higher. Performance data current to the most recent month-end may be obtained at www.GuideStoneFunds.org. The investment return and principal value of an investment will fluctuate so that shares, when redeemed, may be worth more or less than their original cost.
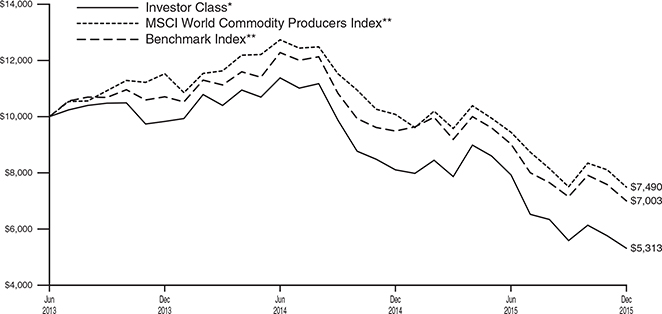
The graph compares the results of a hypothetical $10,000 investment in the Investor Class of the Fund since July 1, 2013 (commencement of operations), with all dividends and capital gains reinvested, with the weighted composite benchmark index.
*These returns reflect expense waivers by the Fund’s investment adviser. Without these waivers, returns would have been lower. Returns shown do not reflect the deduction of taxes that a shareholder would pay on Fund distributions or the redemption of Fund shares.
**The benchmark index was changed during the fourth quarter from the 75% MSCIWorld Commodity Producers Index / 25% NYSE Gold Miners Arca Index (the “Benchmark Index”) to the MSCI World Commodity Producers Index.
Unlike a mutual fund, the performance of an index assumes no taxes, transaction costs, management fees or other expenses.
268
Table of Contents
| GLOBAL NATURAL RESOURCES EQUITY FUND SCHEDULE OF INVESTMENTS | December 31, 2015 |
| Shares | Value | |||||||
COMMON STOCKS — 38.0% |
| |||||||
Consumer Staples — 0.3% |
| |||||||
Archer-Daniels-Midland Co.D | 14,600 | $ | 535,528 | |||||
|
| |||||||
Energy — 36.0% | ||||||||
Anadarko Petroleum CorporationD | 12,200 | 592,676 | ||||||
Antero Resources CorporationD* | 309,877 | 6,755,319 | ||||||
Apache CorporationD | 9,100 | 404,677 | ||||||
Cabot Oil & Gas CorporationD | 348,382 | 6,162,878 | ||||||
Chesapeake Energy CorporationD | 14,400 | 64,800 | ||||||
Chevron Corporation | 45,200 | 4,066,192 | ||||||
Cimarex Energy Co.D | 2,300 | 205,574 | ||||||
Concho Resources, Inc.D* | 3,100 | 287,866 | ||||||
ConocoPhillipsD | 29,700 | 1,386,693 | ||||||
Continental Resources, Inc.D* | 2,000 | 45,960 | ||||||
Denbury Resources, Inc.D | 1,607,170 | 3,246,483 | ||||||
Devon Energy Corporation | 9,400 | 300,800 | ||||||
Energen CorporationD | 1,900 | 77,881 | ||||||
EOG Resources, Inc. | 59,648 | 4,222,482 | ||||||
EQT CorporationD | 3,700 | 192,881 | ||||||
Exxon Mobil CorporationD | 100,300 | 7,818,385 | ||||||
Hess Corporation | 6,200 | 300,576 | ||||||
Laredo Petroleum, Inc.D* | 584,658 | 4,671,417 | ||||||
Marathon Oil CorporationD | 16,300 | 205,217 | ||||||
Murphy Oil CorporationD | 3,900 | 87,555 | ||||||
Noble Energy, Inc.D | 300,392 | 9,891,909 | ||||||
Occidental Petroleum Corporation | 18,400 | 1,244,024 | ||||||
Pioneer Natural Resources Co. | 3,600 | 451,368 | ||||||
Range Resources CorporationD | 252,563 | 6,215,575 | ||||||
Southwestern Energy Co.D* | 975,030 | 6,932,463 | ||||||
Whiting Petroleum CorporationD* | 4,900 | 46,256 | ||||||
|
| |||||||
| 65,877,907 | ||||||||
|
| |||||||
Materials & Processing — 1.7% | ||||||||
Alcoa, Inc.D | 31,500 | 310,905 | ||||||
CF Industries Holdings, Inc. | 5,600 | 228,536 | ||||||
FMC CorporationD | 3,200 | 125,216 | ||||||
Freeport-McMoRan, Inc.D | 25,000 | 169,250 | ||||||
International Paper Co. | 9,500 | 358,150 | ||||||
Monsanto Co.D | 11,300 | 1,113,276 | ||||||
Mosaic Co. (The) | 7,700 | 212,443 | ||||||
Newmont Mining CorporationD | 12,700 | 228,473 | ||||||
Nucor CorporationD | 7,700 | 310,310 | ||||||
|
| |||||||
| 3,056,559 | ||||||||
|
| |||||||
Total Common Stocks | 69,469,994 | |||||||
|
| |||||||
FOREIGN COMMON STOCKS — 53.1% |
| |||||||
Australia — 6.6% | ||||||||
Alumina, Ltd. | 60,784 | 50,727 | ||||||
BHP Billiton, Ltd. | 77,296 | 994,763 | ||||||
Fortescue Metals Group, Ltd. | 37,470 | 50,425 | ||||||
Iluka Resources, Ltd.D | 1,547,426 | 6,844,907 | ||||||
Mineral Resources, Ltd.D | 1,008,797 | 2,917,497 | ||||||
Newcrest Mining, Ltd.* | 18,448 | 174,559 | ||||||
Origin Energy, Ltd. | 41,966 | 141,959 | ||||||
Rio Tinto, Ltd. | 10,209 | 330,153 | ||||||
Santos, Ltd. | 40,364 | 107,508 | ||||||
South32, Ltd.* | 128,127 | 98,427 | ||||||
Woodside Petroleum, Ltd. | 17,846 | 371,802 | ||||||
|
| |||||||
| 12,082,727 | ||||||||
|
| |||||||
| Shares | Value | |||||||
Austria — 0.1% | ||||||||
OMV AG | 3,544 | $ | 100,598 | |||||
voestalpine AG | 2,737 | 83,720 | ||||||
|
| |||||||
| 184,318 | ||||||||
|
| |||||||
Bermuda — 2.8% | ||||||||
Bunge, Ltd.D | 3,500 | 238,980 | ||||||
Kosmos Energy, Ltd.* | 926,020 | 4,815,304 | ||||||
|
| |||||||
| 5,054,284 | ||||||||
|
| |||||||
Canada — 24.9% | ||||||||
Agnico Eagle Mines, Ltd. | 5,200 | 136,680 | ||||||
Agrium, Inc. | 3,300 | 294,942 | ||||||
ARC Resources, Ltd. | 8,200 | 98,966 | ||||||
Barrick Gold Corporation | 28,000 | 207,212 | ||||||
Cameco Corporation | 9,500 | 117,197 | ||||||
Canadian Natural Resources, Ltd. | 26,300 | 574,392 | ||||||
Canadian Oil Sands Ltd | 11,700 | 69,928 | ||||||
Cenovus Energy Inc | 20,000 | 252,945 | ||||||
Crescent Point Energy Corporation | 12,000 | 139,799 | ||||||
Eldorado Gold Corp | 17,200 | 50,965 | ||||||
EnCana Corporation | 20,300 | 103,136 | ||||||
First Quantum Minerals, Ltd.D | 1,804,540 | 6,755,451 | ||||||
Franco-Nevada Corp | 3,800 | 173,838 | ||||||
Goldcorp, Inc.D | 616,299 | 7,124,336 | ||||||
HudBay Minerals, Inc.D | 574,560 | 2,194,819 | ||||||
Husky Energy Inc | 8,400 | 86,871 | ||||||
Imperial Oil, Ltd.D | 7,100 | 231,313 | ||||||
Kinross Gold Corporation* | 27,600 | 50,066 | ||||||
MEG Energy Corp* | 3,300 | 19,127 | ||||||
Painted Pony Petroleum, Ltd.D* | 350,970 | 882,688 | ||||||
Peyto Exploration & Development CorporationD | 329,658 | 5,925,124 | ||||||
Potash Corporation of Saskatchewan | 20,100 | 344,273 | ||||||
Prairiesky Royalty Ltd | 3,600 | 57,030 | ||||||
Seven Generations Energy Ltd, Class A* | 3,400 | 33,123 | ||||||
Silver Wheaton Corp | 9,700 | 120,575 | ||||||
Suncor Energy, Inc. | 34,800 | 898,356 | ||||||
Teck Resources, Ltd. Class B | 13,600 | 52,485 | ||||||
Tourmaline Oil Corporation* | 339,779 | 5,488,228 | ||||||
Turquoise Hill Resources, Ltd.D* | 5,039,458 | 12,800,143 | ||||||
Vermilion Energy Inc | 2,600 | 70,670 | ||||||
West Fraser Timber CO Ltd | 1,700 | 64,538 | ||||||
Yamana Gold, Inc. | 22,800 | 42,347 | ||||||
|
| |||||||
| 45,461,563 | ||||||||
|
| |||||||
Chile — 7.2% | ||||||||
Sociedad Quimica y Minera de Chile SA ADRD | 690,783 | 13,131,785 | ||||||
|
| |||||||
Finland — 0.2% | ||||||||
Stora Enso OYJ, R Shares | 13,257 | 119,872 | ||||||
UPM-Kymmene OYJ | 12,845 | 238,473 | ||||||
|
| |||||||
| 358,345 | ||||||||
|
| |||||||
France — 1.3% | ||||||||
TOTAL SA | 52,296 | 2,344,515 | ||||||
|
| |||||||
Germany — 0.2% | ||||||||
K+S AGD | 4,606 | 117,413 | ||||||
ThyssenKrupp AGD | 8,853 | 175,497 | ||||||
|
| |||||||
| 292,910 | ||||||||
|
| |||||||
| See Notes to Financial Statements. | 269 |
Table of Contents
GLOBAL NATURAL RESOURCES EQUITY FUND
SCHEDULE OF INVESTMENTS (Continued)
| Shares | Value | |||||||
Israel — 0.0% | ||||||||
Israel Chemicals, Ltd. | 12,275 | $ | 49,828 | |||||
|
| |||||||
Italy — 0.5% | ||||||||
Eni SpA | 61,225 | 909,698 | ||||||
|
| |||||||
Japan — 0.7% | ||||||||
Hitachi Metals, Ltd. | 5,200 | 64,159 | ||||||
Inpex Corporation | 22,900 | 223,250 | ||||||
JFE Holdings, Inc. | 11,800 | 185,288 | ||||||
Kobe Steel, Ltd. | 74,000 | 80,402 | ||||||
Maruichi Steel Tube, Ltd. | 1,000 | 29,522 | ||||||
Mitsubishi Materials Corporation | 27,000 | 85,040 | ||||||
Nippon Steel & Sumitomo Metal Corporation | 18,300 | 362,017 | ||||||
Oji Holdings Corporation | 19,000 | 76,361 | ||||||
Sumitomo Metal Mining Co., Ltd. | 12,000 | 145,667 | ||||||
|
| |||||||
| 1,251,706 | ||||||||
|
| |||||||
Jersey — 0.3% | ||||||||
Glencore PLC* | 294,472 | 390,216 | ||||||
Randgold Resources, Ltd. | 2,245 | 138,308 | ||||||
|
| |||||||
| 528,524 | ||||||||
|
| |||||||
Luxembourg — 0.0% | ||||||||
ArcelorMittalD | 24,049 | 101,468 | ||||||
|
| |||||||
Mauritius — 0.0% | ||||||||
Golden Agri-Resources, Ltd. | 147,900 | 35,328 | ||||||
|
| |||||||
Netherlands — 0.0% | ||||||||
OCI NV* | 2,028 | 50,075 | ||||||
|
| |||||||
Norway — 0.4% | ||||||||
Norsk Hydro ASA | 32,366 | 120,308 | ||||||
Statoil ASA | 26,859 | 374,596 | ||||||
Yara International ASA | 4,303 | 185,065 | ||||||
|
| |||||||
| 679,969 | ||||||||
|
| |||||||
Papua New Guinea — 0.1% | ||||||||
Oil Search, Ltd. | 32,982 | 160,534 | ||||||
|
| |||||||
Portugal — 0.1% | ||||||||
Galp Energia SGPS SA | 9,280 | 108,286 | ||||||
|
| |||||||
Singapore — 0.0% | ||||||||
Wilmar International, Ltd. | 46,200 | 95,326 | ||||||
|
| |||||||
Spain — 0.1% | ||||||||
Repsol SA | 25,277 | 278,283 | ||||||
|
| |||||||
Sweden — 0.1% | ||||||||
Boliden AB | 6,583 | 110,293 | ||||||
Lundin Petroleum ABD* | 5,240 | 75,610 | ||||||
|
| |||||||
| 185,903 | ||||||||
|
| |||||||
Switzerland — 0.5% | ||||||||
Syngenta AG | 2,237 | 875,569 | ||||||
|
| |||||||
United Kingdom — 7.0% | ||||||||
Anglo American PLC* | 33,738 | 148,017 | ||||||
Antofagasta PLC | 9,491 | 65,287 | ||||||
BG Group PLC | 82,205 | 1,191,638 | ||||||
BHP Billiton PLC | 50,831 | 566,861 | ||||||
BP PLC | 440,154 | 2,287,355 | ||||||
Fresnillo PLC | 5,320 | 55,313 | ||||||
Mondi PLC | 8,838 | 173,232 | ||||||
Ophir Energy PLC* | 2,776,161 | 4,004,965 | ||||||
Rio Tinto PLC | 30,169 | 878,384 | ||||||
Royal Dutch Shell PLC A Shares | 94,295 | 2,135,716 | ||||||
| Shares | Value | |||||||
Royal Dutch Shell PLC B Shares | 58,733 | $ | 1,338,588 | |||||
|
| |||||||
| 12,845,356 | ||||||||
|
| |||||||
Total Foreign Common Stocks |
| 97,066,300 | ||||||
|
| |||||||
RIGHTS — 0.0% | ||||||||
Repsol SA* | 22,769 | 11,358 | ||||||
|
| |||||||
MONEY MARKET FUNDS — 40.0% |
| |||||||
GuideStone Money Market Fund (Investor Class)¥ | 16,074,034 | 16,074,034 | ||||||
Northern Institutional Liquid Assets Portfolio§ | 56,959,458 | 56,959,458 | ||||||
|
| |||||||
Total Money Market Funds |
| 73,033,492 | ||||||
|
| |||||||
TOTAL INVESTMENTS — 131.1% |
| 239,581,144 | ||||||
Liabilities in Excess of |
| (56,850,681 | ) | |||||
|
| |||||||
NET ASSETS — 100.0% |
| $ | 182,730,463 | |||||
|
| |||||||
| 270 | See Notes to Financial Statements. |
Table of Contents
VALUATION HIERARCHY
The following is a summary of the inputs used, as of December 31, 2015, in valuing the Fund’s investments carried at fair value:
| Total Value | Level 1 Quoted Prices | Level 2 Other Significant Observable Inputs | Level 3 Significant Unobservable Inputs | |||||||||||||
Assets: | ||||||||||||||||
Investments in Securities: | ||||||||||||||||
Common Stocks | $ | 69,469,994 | $ | 69,469,994 | $ | — | $ | — | ||||||||
Foreign Common Stocks: | ||||||||||||||||
Australia | 12,082,727 | — | 12,082,727 | — | ||||||||||||
Austria | 184,318 | — | 184,318 | — | ||||||||||||
Bermuda | 5,054,284 | 5,054,284 | — | — | ||||||||||||
Canada | 45,461,563 | 45,461,563 | — | — | ||||||||||||
Chile | 13,131,785 | 13,131,785 | — | — | ||||||||||||
Finland | 358,345 | — | 358,345 | — | ||||||||||||
France | 2,344,515 | — | 2,344,515 | — | ||||||||||||
Germany | 292,910 | — | 292,910 | — | ||||||||||||
Israel | 49,828 | — | 49,828 | — | ||||||||||||
Italy | 909,698 | — | 909,698 | — | ||||||||||||
Japan | 1,251,706 | — | 1,251,706 | — | ||||||||||||
Jersey | 528,524 | — | 528,524 | — | ||||||||||||
Luxembourg | 101,468 | — | 101,468 | — | ||||||||||||
Mauritius | 35,328 | — | 35,328 | — | ||||||||||||
Netherlands | 50,075 | — | 50,075 | — | ||||||||||||
Norway | 679,969 | — | 679,969 | — | ||||||||||||
Papua New Guinea | 160,534 | — | 160,534 | — | ||||||||||||
Portugal | 108,286 | — | 108,286 | — | ||||||||||||
Singapore | 95,326 | — | 95,326 | — | ||||||||||||
Spain | 278,283 | — | 278,283 | — | ||||||||||||
Sweden | 185,903 | — | 185,903 | — | ||||||||||||
Switzerland | 875,569 | — | 875,569 | — | ||||||||||||
United Kingdom | 12,845,356 | — | 12,845,356 | — | ||||||||||||
Money Market Funds | 73,033,492 | 73,033,492 | — | — | ||||||||||||
Rights | 11,358 | 11,358 | — | — | ||||||||||||
|
|
|
|
|
|
|
| |||||||||
Total Assets - Investments in Securities | $ | 239,581,144 | $ | 206,162,476 | $ | 33,418,668 | $ | — | ||||||||
|
|
|
|
|
|
|
| |||||||||
There were no transfers between Level 1 and Level 2 during the year ended December 31, 2015.
| See Notes to Financial Statements. | 271 |
Table of Contents
| Inflation Protected Bond Fund | Flexible Income Fund | |||||||
Assets | ||||||||
Investments in securities of unaffiliated issuers, at value | $ | 296,753,706 | $ | 126,559,177 | ||||
Investments in securities of affiliated issuers, at value | 3,447,125 | 14,734,600 | ||||||
|
|
|
| |||||
Total investments, at value (1)(2) | 300,200,831 | 141,293,777 | ||||||
Cash | 930,585 | 1,343,484 | ||||||
Cash collateral for derivatives | — | — | ||||||
Foreign currency(3) | 2,061,709 | — | ||||||
Receivables: | ||||||||
Dividends and reclaims | 57 | 95 | ||||||
Interest | 1,015,060 | 577,549 | ||||||
Securities lending | 104 | 793 | ||||||
Receivable from advisor | — | — | ||||||
Investment securities sold | 2,620,824 | 1,589,205 | ||||||
Fund shares sold | 56,650 | 146,279 | ||||||
Variation margin on financial futures contracts | 18,032 | — | ||||||
Unrealized appreciation on foreign currency exchange contracts | 474,371 | — | ||||||
Prepaid expenses and other assets | 18,614 | 3,193 | ||||||
|
|
|
| |||||
Total Assets | 307,396,837 | 144,954,375 | ||||||
|
|
|
| |||||
Liabilities | ||||||||
Options written, at value (4) | 283,974 | — | ||||||
Unrealized depreciation on foreign currency exchange contracts | 913,952 | — | ||||||
Collateral held for securities on loan, at value | — | 255,750 | ||||||
Payables: | ||||||||
Investment securities purchased | 4,147,732 | 3,021,828 | ||||||
Fund shares redeemed | — | — | ||||||
Variation margin on financial futures contracts | 70,910 | — | ||||||
Securities lending | 16 | 119 | ||||||
Deferred foreign capital gains taxes | — | — | ||||||
Accrued expenses: | ||||||||
Investment advisory fees | 78,084 | 73,297 | ||||||
Shareholder servicing fees | 14,278 | 30,001 | ||||||
Other expenses | 60,217 | 134,321 | ||||||
|
|
|
| |||||
Total Liabilities | 5,569,163 | 3,515,316 | ||||||
|
|
|
| |||||
Net Assets | $ | 301,827,674 | $ | 141,439,059 | ||||
|
|
|
| |||||
Net Assets Consist of: | ||||||||
Paid-in-capital | $ | 316,689,263 | $ | 151,762,298 | ||||
Undistributed (distributions in excess of) net investment income | 387,537 | — | ||||||
Accumulated net realized loss on investments, foreign currency translations and derivative transactions | (7,895,299 | ) | (2,386,992 | ) | ||||
Net unrealized appreciation (depreciation) on investments, foreign currency translations and derivative transactions | (7,353,827 | ) | (7,936,247 | ) | ||||
|
|
|
| |||||
Net Assets | $ | 301,827,674 | $ | 141,439,059 | ||||
|
|
|
| |||||
Net Asset Value: | ||||||||
$0.001 par value, unlimited shares authorized | ||||||||
Net assets applicable to the Institutional Class | $ | 234,583,384 | N/A | |||||
|
|
|
| |||||
Institutional shares outstanding | 23,515,039 | N/A | ||||||
|
|
|
| |||||
Net asset value, offering and redemption price per Institutional share | $ | 9.98 | N/A | |||||
|
|
|
| |||||
Net assets applicable to the Investor Class | $ | 67,244,290 | $ | 141,439,059 | ||||
|
|
|
| |||||
Investor shares outstanding | 6,754,096 | 15,217,098 | ||||||
|
|
|
| |||||
Net asset value, offering and redemption price per Investor share | $ | 9.96 | $ | 9.29 | ||||
|
|
|
| |||||
(1) Investments in securities of unaffiliated issuers, at cost | $ | 303,669,444 | $ | 134,495,424 | ||||
Investments in securities of affiliated issuers, at cost | 3,447,125 | 14,734,600 | ||||||
|
|
|
| |||||
Total investments, at cost | $ | 307,116,569 | $ | 149,230,024 | ||||
|
|
|
| |||||
(2) Includes securities loaned of: | $ | 3,543,683 | $ | 250,452 | ||||
|
|
|
| |||||
(3) Foreign currency, at cost | $ | 2,050,749 | $ | — | ||||
|
|
|
| |||||
(4) Premiums received on options written | $ | 423,332 | $ | — | ||||
|
|
|
| |||||
(6) Net of $(974) accrued foreign capital gains taxes on appreciated securities | ||||||||
| 272 | See Notes to Financial Statements. |
Table of Contents
Real Assets | Real Estate Securities Fund | Global Natural Resources Equity Fund | ||||||||
| $ | 5,669,758 | $ | 272,908,930 | $ | 223,507,110 | |||||
| 27,324,737 | 7,407,916 | 16,074,034 | ||||||||
|
|
|
|
|
| |||||
| 32,994,495 | 280,316,846 | 239,581,144 | ||||||||
| — | — | 16,319 | ||||||||
| — | 396,000 | — | ||||||||
| — | 1,272,170 | 36,697 | ||||||||
| 59 | 1,332,326 | 75,916 | ||||||||
| — | — | — | ||||||||
| — | 12,080 | 159,464 | ||||||||
| 7,755 | — | — | ||||||||
| — | 1,233,522 | — | ||||||||
| 35,413 | 37,969 | 85,368 | ||||||||
| — | — | — | ||||||||
| — | — | — | ||||||||
| 1,049 | 25,073 | 7,180 | ||||||||
|
|
|
|
|
| |||||
| 33,038,771 | 284,625,986 | 239,962,088 | ||||||||
|
|
|
|
|
| |||||
| — | — | — | ||||||||
| — | — | — | ||||||||
| — | 23,903,069 | 56,959,458 | ||||||||
| — | 1,689,455 | — | ||||||||
| — | 106,387 | 4,350 | ||||||||
| — | 76,700 | — | ||||||||
| — | 1,809 | 23,915 | ||||||||
| — | — | 2,640 | ||||||||
| — | 147,842 | 124,852 | ||||||||
| 7,020 | 20,878 | 37,922 | ||||||||
| 31,991 | 126,516 | 78,488 | ||||||||
|
|
|
|
|
| |||||
| 39,011 | 26,072,656 | 57,231,625 | ||||||||
|
|
|
|
|
| |||||
| $ | 32,999,760 | $ | 258,553,330 | $ | 182,730,463 | |||||
|
|
|
|
|
| |||||
| $ | 43,477,770 | $ | 265,919,495 | $ | 351,680,050 | |||||
| 73,873 | (994,893 | ) | (430,342 | ) | ||||||
| (2,173,886) |
| (4,850,353 | ) | (82,220,256 | ) | ||||
| (8,377,997) |
| (1,520,919 | ) | (86,298,989 | ) | ||||
|
|
|
|
|
| |||||
| $ | 32,999,760 | $ | 258,553,330 | $ | 182,730,463 | |||||
|
|
|
|
|
| |||||
| N/A | $ | 159,195,844 | N/A | |||||||
|
|
|
|
|
| |||||
| N/A | 16,822,631 | N/A | ||||||||
|
|
|
|
|
| |||||
| N/A | $ | 9.46 | N/A | |||||||
|
|
|
|
|
| |||||
| $ | 32,999,760 | $ | 99,357,486 | $ | 182,730,463 | |||||
|
|
|
|
|
| |||||
| 4,094,328 | 10,469,436 | 35,729,924 | ||||||||
|
|
|
|
|
| |||||
| $ | 8.06 | $ | 9.49 | $ | 5.11 | |||||
|
|
|
|
|
| |||||
$ | 9,132,865 |
| $ | 274,461,804 | $ | 309,804,513 | ||||
| 32,239,627 | 7,407,916 | 16,074,034 | ||||||||
|
|
|
|
|
| |||||
| $ | 41,372,492 | $ | 281,869,720 | $ | 325,878,547 | |||||
|
|
|
|
|
| |||||
| $ | — | $ | 26,449,358 | $ | 73,398,820 | |||||
|
|
|
|
|
| |||||
| $ | — | $ | 1,272,377 | $ | 36,923 | |||||
|
|
|
|
|
| |||||
| $ | — | $ | — | $ | — | |||||
|
|
|
|
|
| |||||
| See Notes to Financial Statements. | 273 |
Table of Contents
| STATEMENTS OF OPERATIONS | For the Year Ended December 31, 2015 |
| Inflation Protected Bond Fund | Flexible Income Fund | |||||||
Investment Income | ||||||||
Dividends | $ | — | $ | — | ||||
Income distributions received from affiliated funds | 1,042 | 1,199 | ||||||
Interest | 354,185 | (1) | 6,339,608 | |||||
Securities lending | 282 | 3,282 | ||||||
Less foreign taxes withheld | — | — | ||||||
|
|
|
| |||||
Total Investment Income | 355,509 | 6,344,089 | ||||||
|
|
|
| |||||
Expenses | ||||||||
Investment advisory fees | 948,668 | 990,791 | ||||||
Transfer agent fees: | ||||||||
Institutional shares | 2,662 | — | ||||||
Investor shares | 21,481 | 18,240 | ||||||
Custodian fees | 71,128 | 125,670 | ||||||
Shareholder servicing fees: | ||||||||
Investor shares | 357,115 | 346,494 | ||||||
Accounting and administration fees | 73,913 | 60,371 | ||||||
Professional fees | 68,855 | 83,306 | ||||||
Blue sky fees: | ||||||||
Institutional shares | 160 | — | ||||||
Investor shares | 26,783 | 22,687 | ||||||
Shareholder reporting fees: | ||||||||
Institutional shares | 579 | — | ||||||
Investor shares | 7,622 | 2,938 | ||||||
Trustee expenses | 4,213 | 1,922 | ||||||
Line of credit facility fees | 2,091 | 15,926 | ||||||
Other expenses | 48,794 | 15,700 | ||||||
|
|
|
| |||||
Total Expenses | 1,634,064 | 1,684,045 | ||||||
Expenses waived/reimbursed net of amount recaptured(2) | (23,599 | ) | (76,508 | ) | ||||
Fees paid indirectly | — | — | ||||||
|
|
|
| |||||
Net expenses | �� | 1,610,465 | 1,607,537 | |||||
|
|
|
| |||||
Net Investment Income (Loss) | (1,254,956 | ) | 4,736,552 | |||||
|
|
|
| |||||
Realized and Unrealized Gain (Loss) | ||||||||
Net realized gain (loss) from: | ||||||||
Capital gain distributions received from affiliated funds | 559 | 943 | ||||||
Investment securities | (287,776 | ) | (2,276,907 | ) | ||||
Futures transactions | (778,822 | ) | — | |||||
Option contracts written | 2,054,927 | — | ||||||
Option contracts purchased | (3,547,971 | ) | — | |||||
Foreign currency | 3,985,500 | — | ||||||
|
|
|
| |||||
Net realized gain (loss) | 1,426,417 | (2,275,964 | ) | |||||
|
|
|
| |||||
Net change in unrealized appreciation (depreciation) on: | ||||||||
Investment securities | (6,765,246 | ) | (4,835,703 | ) | ||||
Investment securities of unaffiliated issuers | — | — | ||||||
Futures | 996,397 | — | ||||||
Option contracts written | 163,827 | — | ||||||
Option contracts purchased | (258,553 | ) | — | |||||
Foreign currency | (1,090,684 | ) | — | |||||
|
|
|
| |||||
Net change in unrealized appreciation (depreciation) | (6,954,259 | ) | (4,835,703 | ) | ||||
|
|
|
| |||||
Net Realized and Unrealized (Loss) | (5,527,842 | ) | (7,111,667 | ) | ||||
|
|
|
| |||||
Net Increase (Decrease) in Net Assets Resulting from Operations | $ | (6,782,798 | ) | $ | (2,375,115 | ) | ||
|
|
|
| |||||
| (1) | Includes amortization of bond premiums and deflationary adjustments for U.S. Treasury and Foreign Government Inflation Bonds which exceeded the aggregate of interest. See Note 3 in Notes to Financial Statements. |
| (2) | See Note 3a and 3c in Notes to Financial Statements. |
| 274 | See Notes to Financial Statements. |
Table of Contents
| Real Assets Fund | Real Estate Securities Fund | Global Natural Resources Equity Fund | ||||||||
| $ | — | $ | 7,250,188 | $ | 2,682,984 | |||||
| 453,454 | 576 | 1,682 | ||||||||
| — | — | — | ||||||||
| — | 96,265 | 898,042 | ||||||||
| — | (177,973 | ) | (207,201 | ) | ||||||
|
|
|
|
|
| |||||
| 453,454 | 7,169,056 | 3,375,507 | ||||||||
|
|
|
|
|
| |||||
| 45,339 | 1,933,773 | 2,620,240 | ||||||||
| — | 2,741 | — | ||||||||
| 19,766 | 25,070 | 17,763 | ||||||||
| 5,751 | 217,767 | 50,497 | ||||||||
| 67,059 | 397,173 | 643,073 | ||||||||
| 4,138 | 104,321 | 76,053 | ||||||||
| 57,312 | 112,842 | 115,722 | ||||||||
| — | 160 | — | ||||||||
| 17,745 | 21,293 | 24,159 | ||||||||
| — | 831 | — | ||||||||
| 4,825 | 16,214 | 2,792 | ||||||||
| 681 | 3,579 | 3,582 | ||||||||
| 331 | 1,779 | 1,735 | ||||||||
| 9,757 | 64,259 | 26,594 | ||||||||
|
|
|
|
|
| |||||
| 232,704 | 2,901,802 | 3,582,210 | ||||||||
| (117,409 | ) | (88,028 | ) | (35,624 | ) | |||||
| — | (14,117 | ) | (3,626 | ) | ||||||
|
|
|
|
|
| |||||
| 115,295 | 2,799,657 | 3,542,960 | ||||||||
|
|
|
|
|
| |||||
| 338,159 | 4,369,399 | (167,453 | ) | |||||||
|
|
|
|
|
| |||||
| 311,238 | 516 | 1,234 | ||||||||
| (2,106,874 | ) | 9,763,982 | (77,867,440 | ) | ||||||
| — | 75,056 | — | ||||||||
| — | — | — | ||||||||
| — | — | — | ||||||||
| — | (122,916 | ) | (68,467 | ) | ||||||
|
|
|
|
|
| |||||
| (1,795,636 | ) | 9,716,638 | (77,934,673 | ) | ||||||
|
|
|
|
|
| |||||
| (1,881,066 | ) | (13,338,679 | ) | (21,817,831 | ) | |||||
| (1,370,465 | ) | — | — | |||||||
| — | (111,119 | ) | — | |||||||
| — | — | — | ||||||||
| — | — | — | ||||||||
| — | 2,703 | (1,562 | ) | |||||||
|
|
|
|
|
| |||||
| (3,251,531 | ) | (13,447,095 | ) | (21,819,393 | ) | |||||
|
|
|
|
|
| |||||
| (5,047,167 | ) | (3,730,457 | ) | (99,754,066 | ) | |||||
|
|
|
|
|
| |||||
| $ | (4,709,008 | ) | $ | 638,942 | $ | (99,921,519 | ) | |||
|
|
|
|
|
| |||||
| See Notes to Financial Statements. | 275 |
Table of Contents
STATEMENTS OF CHANGES IN NET ASSETS
| Inflation Protected Bond Fund | ||||||||
| For the Year Ended | ||||||||
| 12/31/15 | 12/31/14 | |||||||
Operations: | ||||||||
Net investment income (loss) | $ | (1,254,956 | ) | $ | 1,848,773 | |||
Net realized gain (loss) on investment securities, foreign currency and derivative | 1,426,417 | (2,019,972 | ) | |||||
Net change in unrealized appreciation (depreciation) on investment securities, foreign currency and derivatives | (6,954,259 | ) | 7,575,645 | |||||
|
|
|
| |||||
Net increase (decrease) in net assets resulting from operations | (6,782,798 | ) | 7,404,446 | |||||
|
|
|
| |||||
Dividends and Distributions to Shareholders: | ||||||||
Dividends from net investment income(1) | ||||||||
Institutional shares | — | — | ||||||
Investor shares | (939,144 | ) | (6,199,837 | ) | ||||
Distributions from net realized capital gains | ||||||||
Institutional shares | — | — | ||||||
Investor shares | — | — | ||||||
|
|
|
| |||||
Total dividends and distributions | (939,144 | ) | (6,199,837 | ) | ||||
|
|
|
| |||||
Capital Share Transactions(2): | ||||||||
Proceeds from shares sold | ||||||||
Institutional shares | 259,093,292 | — | ||||||
Investor shares | 20,592,691 | 59,688,149 | ||||||
Reinvestment of dividends and distributions | ||||||||
Institutional shares | — | — | ||||||
Investor shares | 938,919 | 6,198,245 | ||||||
|
|
|
| |||||
Total proceeds from shares sold and reinvested | 280,624,902 | 65,886,394 | ||||||
|
|
|
| |||||
Value of shares redeemed | ||||||||
Institutional shares | (14,235,444 | ) | — | |||||
Investor shares | (259,752,863 | ) | (38,288,496 | ) | ||||
|
|
|
| |||||
Total value of shares redeemed | (273,988,307 | ) | (38,288,496 | ) | ||||
|
|
|
| |||||
Net increase (decrease) from capital share transactions(3) | 6,636,595 | 27,597,898 | ||||||
|
|
|
| |||||
Total increase (decrease) in net assets | (1,085,347 | ) | 28,802,507 | |||||
|
|
|
| |||||
Net Assets: | ||||||||
Beginning of Year | 302,913,021 | 274,110,514 | ||||||
|
|
|
| |||||
End of Year* | $ | 301,827,674 | $ | 302,913,021 | ||||
|
|
|
| |||||
*Including undistributed (distributions in excess of) net investment income | $ | 387,537 | $ | (1,888,970 | ) | |||
|
|
|
| |||||
| (1) | For the year ended December 31, 2014, Dividends from net investment income included dividends paid from the short-term portion of capital gain distributions received from affiliated funds for the Real Assets Fund. From December 31, 2015 forward, the short-term portion of capital gain distributions received from affiliated funds will be included in Distributions from net realized capital gains. |
| (2) | Inception date for Institutional Class for Inflation Protected Bond Fund and Real Estate Securities Fund was May 1, 2015. |
| (3) | See Note 6 in Notes to Financial Statements. |
| 276 | See Notes to Financial Statements. |
Table of Contents
Flexible Income Fund | Real Assets Fund | Real Estate Securities Fund | Global Natural Resources Equity Fund | |||||||||||||||||||||||||||
| For the Year Ended | For the Year Ended | For the Year Ended | For the Year Ended | |||||||||||||||||||||||||||
| 12/31/15 | 12/31/14 | 12/31/15 | 12/31/14 | 12/31/15 | 12/31/14 | 12/31/15 | 12/31/14 | |||||||||||||||||||||||
| $ | 4,736,552 | $ | 3,662,738 | $ | 338,159 | $ | 756,020 | $ | 4,369,399 | $ | 5,638,480 | $ | (167,453 | ) | $ | (467,389 | ) | |||||||||||||
| (2,275,964) | 40,485 | (1,795,636 | ) | 266,616 | 9,716,638 | 13,572,357 | (77,934,673 | ) | 3,148,999 | |||||||||||||||||||||
| (4,835,703) |
| (3,617,619 | ) | (3,251,531 | ) | (4,194,316 | ) | (13,447,095 | ) | 18,175,114 | (21,819,393 | ) | (52,013,354 | ) | |||||||||||||||
|
|
|
|
|
|
|
|
|
|
|
|
|
|
|
| |||||||||||||||
| (2,375,115) | 85,604 | (4,709,008 | ) | (3,171,680 | ) | 638,942 | 37,385,951 | (99,921,519 | ) | (49,331,744 | ) | |||||||||||||||||||
|
|
|
|
|
|
|
|
|
|
|
|
|
|
|
| |||||||||||||||
| — | — | — | — | (4,450,951 | ) | — | — | — | ||||||||||||||||||||||
| (4,764,206) | (3,640,055 | ) | (265,242 | ) | (1,184,011 | ) | (2,446,585 | ) | (6,325,626 | ) | (220,488 | ) | (791,002 | ) | ||||||||||||||||
| — | — | — | — | (8,892,323 | ) | — | — | — | ||||||||||||||||||||||
| — | (265,840 | ) | (179,385 | ) | (356,473 | ) | (5,666,016 | ) | (8,938,244 | ) | — | (5,814,539 | ) | |||||||||||||||||
|
|
|
|
|
|
|
|
|
|
|
|
|
|
|
| |||||||||||||||
| (4,764,206) | (3,905,895 | ) | (444,627 | ) | (1,540,484 | ) | (21,455,875 | ) | (15,263,870 | ) | (220,488 | ) | (6,605,541 | ) | ||||||||||||||||
|
|
|
|
|
|
|
|
|
|
|
|
|
|
|
| |||||||||||||||
| — | — | — | — | 169,837,132 | — | — | — | |||||||||||||||||||||||
| 31,155,171 | 26,735,107 | 6,474,572 | 40,888,566 | 34,118,123 | 40,370,589 | 82,083,602 | 82,926,908 | |||||||||||||||||||||||
| — | — | — | — | 13,324,780 | — | — | — | |||||||||||||||||||||||
| 4,746,733 | 3,905,895 | 443,898 | 1,539,255 | 8,108,339 | 15,248,884 | 220,392 | 6,602,552 | |||||||||||||||||||||||
|
|
|
|
|
|
|
|
|
|
|
|
|
|
|
| |||||||||||||||
| 35,901,904 | 30,641,002 | 6,918,470 | 42,427,821 | 225,388,374 | 55,619,473 | 82,303,994 | 89,529,460 | |||||||||||||||||||||||
|
|
|
|
|
|
|
|
|
|
|
|
|
|
|
| |||||||||||||||
| — | — | — | — | (7,513,684 | ) | — | — | — | ||||||||||||||||||||||
| (17,964,410) | (5,342,480 | ) | (24,719,666 | ) | (9,411,678 | ) | (208,387,457 | ) | (42,761,237 | ) | (64,793,444 | ) | (28,952,108 | ) | ||||||||||||||||
|
|
|
|
|
|
|
|
|
|
|
|
|
|
|
| |||||||||||||||
| (17,964,410) | (5,342,480 | ) | (24,719,666 | ) | (9,411,678 | ) | (215,901,141 | ) | (42,761,237 | ) | (64,793,444 | ) | (28,952,108 | ) | ||||||||||||||||
|
|
|
|
|
|
|
|
|
|
|
|
|
|
|
| |||||||||||||||
| 17,937,494 | 25,298,522 | (17,801,196 | ) | 33,016,143 | 9,487,233 | 12,858,236 | 17,510,550 | 60,577,352 | ||||||||||||||||||||||
|
|
|
|
|
|
|
|
|
|
|
|
|
|
|
| |||||||||||||||
| 10,798,173 | 21,478,231 | (22,954,831 | ) | 28,303,979 | (11,329,700 | ) | 34,980,317 | (82,631,457 | ) | 4,640,067 | ||||||||||||||||||||
|
|
|
|
|
|
|
|
|
|
|
|
|
|
|
| |||||||||||||||
| 130,640,886 | 109,162,655 | 55,954,591 | 27,650,612 | 269,883,030 | 234,902,713 | 265,361,920 | 260,721,853 | |||||||||||||||||||||||
|
|
|
|
|
|
|
|
|
|
|
|
|
|
|
| |||||||||||||||
| $ | 141,439,059 | $ | 130,640,886 | $ | 32,999,760 | $ | 55,954,591 | $ | 258,553,330 | $ | 269,883,030 | $ | 182,730,463 | $ | 265,361,920 | |||||||||||||||
|
|
|
|
|
|
|
|
|
|
|
|
|
|
|
| |||||||||||||||
| $ | — | $ | — | $ | 73,873 | $ | 1,012 | $ | (994,893 | ) | $ | (343,324 | ) | $ | (430,342 | ) | $ | (638,069 | ) | |||||||||||
|
|
|
|
|
|
|
|
|
|
|
|
|
|
|
| |||||||||||||||
| See Notes to Financial Statements. | 277 |
Table of Contents
FINANCIAL HIGHLIGHTS
| For a Share Outstanding For the Years Ending December 31, unless otherwise indicated | Ratios to Average Net Assets | |||||||||||||||||||||||||||||||||||||||||||||||||||
| Net Asset Value, Beginning of Period | Net Investment Income (1) | Capital Gain | Realized (Loss) on | Dividends from Net Investment Income | Distribu- tions from Net Realized Capital Gains(2) | Net Asset Value, End of Period | Total Return | Net Assets, End | Expenses, Net(3)(4) | Expenses, Gross(3)(5) | Invest- ment | Portfolio Turnover Rate | ||||||||||||||||||||||||||||||||||||||||
Inflation Protected Bond Fund
|
| |||||||||||||||||||||||||||||||||||||||||||||||||||
Institutional Class |
| |||||||||||||||||||||||||||||||||||||||||||||||||||
2015(6) | $ | 10.41 | $ | 0.12 | # | $ | — | † | $ | (0.55 | ) | $ | — | $ | — | $ | 9.98 | (4.13 | )% | $ | 234,584 | 0.40 | % | 0.41 | % | 1.75 | % | 45 | % | |||||||||||||||||||||||
Investor Class |
| |||||||||||||||||||||||||||||||||||||||||||||||||||
2015 | $ | 10.22 | $ | (0.28 | )# | $ | — | † | $ | 0.05 | $ | (0.03 | ) | $ | — | $ | 9.96 | (2.25 | )% | $ | 67,244 | 0.66 | % | 0.67 | % | (2.77 | )% | 45 | % | |||||||||||||||||||||||
2014 | 10.15 | 0.06 | # | — | † | 0.22 | (0.21 | ) | — | 10.22 | 2.77 | 302,913 | 0.62 | 0.63 | 0.61 | 88 | ||||||||||||||||||||||||||||||||||||
2013(7) | 11.25 | 0.10 | # | — | † | (1.06 | ) | (0.09 | ) | (0.05 | ) | 10.15 | (8.64 | ) | 274,111 | 0.64 | 0.65 | 0.98 | 75 | |||||||||||||||||||||||||||||||||
2012 | 11.16 | 0.21 | # | — | † | 0.46 | (0.20 | ) | (0.38 | ) | 11.25 | 6.06 | 197,762 | 0.65 | 0.66 | 1.80 | 94 | |||||||||||||||||||||||||||||||||||
2011
|
| 10.43
|
|
| 0.29
| #
|
| —
| †
|
| 0.94
|
|
| (0.31
| )
|
| (0.19
| )
|
| 11.16
|
|
| 12.00
|
|
| 163,156
|
|
| 0.66
|
|
| 0.68
|
|
| 2.65
|
|
| 114
|
| |||||||||||||
Flexible Income Fund
|
| |||||||||||||||||||||||||||||||||||||||||||||||||||
Investor Class |
| |||||||||||||||||||||||||||||||||||||||||||||||||||
2015 | $ | 9.76 | $ | 0.33 | # | $ | — | † | $ | (0.47 | ) | $ | (0.33 | ) | $ | — | $ | 9.29 | (1.54 | )% | $ | 141,439 | 1.15 | % | 1.20 | % | 3.37 | % | 50 | % | ||||||||||||||||||||||
2014 | 10.06 | 0.31 | # | — | † | (0.29 | ) | (0.30 | ) | (0.02 | ) | 9.76 | 0.22 | 130,641 | 1.20 | 1.23 | 3.06 | 77 | ||||||||||||||||||||||||||||||||||
2013(8)
|
| 10.00
|
|
| 0.11
| #
|
| —
| †
|
| 0.05
|
|
| (0.10
| )
|
| —
| †
|
| 10.06
|
|
| 1.57
|
|
| 109,163
|
|
| 1.20
|
|
| 1.26
|
|
| 2.22
|
|
| 25
|
| |||||||||||||
Real Assets Fund
|
| |||||||||||||||||||||||||||||||||||||||||||||||||||
Investor Class |
| |||||||||||||||||||||||||||||||||||||||||||||||||||
2015 | $ | 9.26 | $ | 0.07 | # | $ | 0.06 | $ | (1.22 | ) | $ | (0.06 | ) | $ | (0.05 | ) | $ | 8.06 | (11.77 | )% | $ | 33,000 | 0.26 | % | 0.52 | % | 0.76 | % | 64 | %(9) | ||||||||||||||||||||||
2014 | 9.82 | 0.16 | # | 0.11 | (0.57 | ) | (0.20 | ) | (0.06 | ) | 9.26 | (3.07 | ) | 55,955 | 0.12 | 0.35 | 1.55 | 14 | ||||||||||||||||||||||||||||||||||
2013(8) | 10.00 | 0.06 | # | 0.27 | (0.42 | ) | (0.09 | ) | — | 9.82 | (0.87 | ) | 27,651 | 0.12 | 0.89 | 1.22 | 1 | |||||||||||||||||||||||||||||||||||
| † | Amount represents less than $0.005 per share. |
| # | Calculated using the average shares outstanding method. |
| (1) | Recognition of net investment income by the Fund is affected by the timing of the declaration of dividends by the underlying investment companies in which the Fund invests. |
| (2) | Includes dividends paid from the short-term portion of capital gain distributions received from affiliated Funds. |
| (3) | Does not include expenses of the investment companies in which the Fund invests. |
| (4) | The ratio includes expenses waived/reimbursed net of amount recaptured and fees paid indirectly, where applicable; if expenses waived/reimbursed net of amount recaptured and fees paid indirectly were excluded, the ratio would have been higher (lower), respectively, than the ratio shown. |
| (5) | The ratio excludes expenses waived/reimbursed net of amount recaptured and fees paid indirectly, where applicable; if expenses waived/reimbursed net of amount recaptured and fees paid indirectly were included, the ratio would have been lower than the ratio shown. |
| (6) | Inception date was April 30, 2015. All ratios for the period have been annualized. Total return and portfolio turnover for the period have not been annualized. |
| (7) | An out of period adjustment to Investment Income had no impact on Net Investment Income per Share or Total Return; however, the Ratio of Net Investment Income to Average Net Assets increased by 0.01%. |
| (8) | Inception date was July 1, 2013. All ratios for the period have been annualized. Total return and portfolio turnover for the period have not been annualized. |
| (9) | The portfolio turnover rate for the year ended December 31, 2015 reflects rebalancing of holdings in the Fund and is not representative of a change in investment strategy for the Fund. |
| 278 | See Notes to Financial Statements. |
Table of Contents
| For a Share Outstanding For the Years Ending December 31, unless otherwise indicated | Ratios to Average Net Assets | |||||||||||||||||||||||||||||||||||||||||||||||||||
Net Asset | Net Investment Income | Capital Gain | Realized and Unrealized Gain (Loss) on Investments | Dividends from Net Investment Income | Distribu- tions from Net Realized Capital Gains | Net Asset Value, End of Year | Total Return | Net Assets, End of Year | Expenses, Net | Expenses, Gross | Invest- (Loss), (1) | Portfolio Turnover Rate | ||||||||||||||||||||||||||||||||||||||||
Real Estate Securities Fund
|
| |||||||||||||||||||||||||||||||||||||||||||||||||||
Institutional Class |
| |||||||||||||||||||||||||||||||||||||||||||||||||||
2015(2) | $ | 10.50 | $ | 0.12 | # | $ | — | † | $ | (0.33 | ) | $ | (0.27 | ) | $ | (0.56 | ) | $ | 9.46 | (1.89 | )% | $ | 159,196 | 0.93 | %(3) | 0.94 | % | 1.83 | % | 137 | % | |||||||||||||||||||||
Investor Class |
| |||||||||||||||||||||||||||||||||||||||||||||||||||
2015 | $ | 10.26 | $ | 0.16 | # | $ | — | † | $ | (0.13 | ) | $ | (0.24 | ) | $ | (0.56 | ) | $ | 9.49 | 0.34 | % | $ | 99,357 | 1.12 | %(3) | 1.17 | % | 1.50 | % | 137 | % | |||||||||||||||||||||
2014 | 9.36 | 0.23 | # | — | † | 1.28 | (0.25 | ) | (0.36 | ) | 10.26 | 16.13 | 269,883 | 1.15 | 1.15 | 2.23 | 129 | |||||||||||||||||||||||||||||||||||
2013(4) | 10.60 | 0.17 | # | — | † | (0.02 | ) | (0.21 | ) | (1.18 | ) | 9.36 | 1.49 | 234,903 | 1.05 | 1.05 | 1.56 | 168 | ||||||||||||||||||||||||||||||||||
2012 | 9.18 | 0.17 | # | — | † | 1.40 | (0.15 | ) | — | 10.60 | 17.09 | 191,148 | 1.05 | 1.06 | 1.62 | 95 | ||||||||||||||||||||||||||||||||||||
2011
|
| 8.52
|
|
| 0.08
| #
|
| —
| †
|
| 0.65
|
|
| (0.07
| )
|
| —
|
|
| 9.18
|
|
| 8.51
|
|
| 150,227
|
|
| 1.14
|
|
| 1.14
|
|
| 0.85
|
|
| 90
|
| |||||||||||||
Global Natural Resources Equity Fund
|
| |||||||||||||||||||||||||||||||||||||||||||||||||||
Investor Class |
| |||||||||||||||||||||||||||||||||||||||||||||||||||
2015 | $ | 7.81 | $ | — | # | $ | — | † | $ | (2.69 | ) | $ | (0.01 | ) | $ | — | $ | 5.11 | (34.49 | )% | $ | 182,730 | 1.36 | % | 1.37 | % | (0.06 | )% | 63 | % | ||||||||||||||||||||||
2014 | 9.71 | (0.02 | )# | — | † | (1.68 | ) | (0.02 | ) | (0.18 | ) | 7.81 | (17.49 | ) | 265,362 | 1.35 | (5) | 1.37 | (0.17 | ) | 37 | |||||||||||||||||||||||||||||||
2013(6)(7) | 10.00 | (0.01 | )# | — | † | (0.16 | ) | (0.03 | ) | (0.09 | ) | 9.71 | 1.69 | 260,722 | 1.42 | 1.42 | (0.24 | ) | 18 | |||||||||||||||||||||||||||||||||
| † | Amount represents less than $0.005 per share. |
| # | Calculated using the average shares outstanding method. |
| (1) | The ratio includes expenses waived/reimbursed net of amount recaptured and fees paid indirectly, where applicable; if expenses waived/reimbursed net of amount recaptured and fees paid indirectly were excluded, the ratio would have been higher (lower), respectively, than the ratio shown. |
| (2) | Inception date was April 30, 2015. All ratios for the period have been annualized. Total return and portfolio turnover for the period have not been annualized. |
| (3) | The ratio for the Real Estate Securities Fund includes the effect of fees paid indirectly which decreased the ratio by 0.01% for the year 2015. |
| (4) | An out of period adjustment to Investment Income had no impact on Net Investment Income per Share or Total Return; however, the Ratio of Net Investment Income to Average Net Assets increased by 0.03%. |
| (5) | The ratio for the Global Natural Resources Equity Fund includes the effect of fees paid indirectly which decreased the ratio by 0.01% and 0.00% for the years 2014 and 2015. |
| (6) | An out of period adjustment to Investment Income had no impact on Net Investment Income per Share or Total Return; however, the Ratio of Net Investment Income to Average Net Assets increased by 0.01%. |
| (7) | Inception date was July 1, 2013. All ratios for the period have been annualized. Total return and portfolio turnover for the period have not been annualized. |
| See Notes to Financial Statements. | 279 |
Table of Contents
1. DESCRIPTION OF THE FUNDS
GuideStone Funds (the “Trust”) was organized as a Delaware statutory trust on March 2, 2000. The Trust has established twenty-eight series (each, a “Fund” and together, the “Funds”). Each Fund is a diversified, open-end management investment company, registered under the Investment Company Act of 1940, as amended (the “1940 Act”).
The MyDestination 2005, MyDestination 2015, MyDestination 2025, MyDestination 2035, MyDestination 2045 and MyDestination 2055 Fund are each referred to as a “Target Date Fund” and together as the “Target Date Funds.”
The Conservative Allocation Fund, Balanced Allocation Fund, Growth Allocation Fund and Aggressive Allocation Fund are each referred to as an “Asset Allocation Fund” and together as the “Asset Allocation Funds.”
The remaining Funds are each referred to as a “Select Fund” and are together referred to as the “Select Funds.” The Money Market Fund is referred to as the “Money Market Fund.” The Low-Duration Bond Fund, Medium-Duration Bond Fund, Extended-Duration Bond Fund and Global Bond Fund are together referred to as the “Fixed Income Funds.”
The Defensive Market Strategies Fund, Equity Index Fund, Value Equity Fund, Growth Equity Fund, Small Cap Equity Fund, International Equity Index Fund, International Equity Fund and Emerging Markets Equity Fund are together referred to as the “Equity Funds.”
The Inflation Protected Bond Fund, Flexible Income Fund, Real Assets Fund, Real Estate Securities Fund and the Global Natural Resources Equity Fund are together referred to as the “Real Return Select Funds.”
The International Equity Index Fund commenced operations as a registered investment company on June 1, 2015.
There are two classes of shares issued by the Funds — the Institutional Class and the Investor Class (each, a “Class” and together the “Classes”). The International Equity Index Fund issued the Institutional Class only. The Target Date Funds, Flexible Income Fund, Real Assets Fund and the Global Natural Resources Equity Fund issued the Investor Class only. All Classes of shares have identical voting, dividend and liquidation rights. Income, expenses (other than class specific expenses) and realized and unrealized gains or losses on investments are allocated to each Class of shares based upon its relative net assets. The Global Bond Fund, Inflation Protected Bond Fund and Real Estate Securities Fund issued Institutional Class shares on May 1, 2015. The Asset Allocation Funds issued Institutional Class shares on November 23, 2015.
Each Fund is a separate mutual fund with its own investment objective, strategies and risks. The Select Funds invest directly in particular types of fixed-income obligations, stocks and other investments. The Target Date, Asset Allocation and Real Assets Funds primarily invest in a different mix of the Select Funds to meet a specified investment strategy. The Target Date Funds, Asset Allocation Funds and Real Assets Fund are commonly referred to as “Fund of Funds.”
Following the close of business on November 20, 2015, pursuant to the Plan, the Asset Allocation Funds received all of the assets and liabilities of the I Series Funds. The transfer was treated as a non-taxable event and, accordingly, the I Series Funds’ basis in securities transferred reflected historical cost basis as of the date of the transfer. The shareholders of the I Series Funds received Institutional Class Shares of the respective Allocation Fund with an aggregate net asset value equal to the aggregate net asset value of their shares in the I Series Fund immediately prior to the transfer.
280
Table of Contents
I Series Funds | Asset Allocation Funds | |
| Conservative Allocation I | Conservative Allocation | |
| Institutional Class | Institutional Class | |
| Balanced Allocation I | Balanced Allocation | |
| Institutional Class | Institutional Class | |
| Growth Allocation I | Growth Allocation | |
| Institutional Class | Institutional Class | |
| Aggressive Allocation I | Aggressive Allocation | |
| Institutional Class | Institutional Class |
The plan of reorganization and termination was completed at the close of business on November 20, 2015, with the transfer of all of the assets of each I Series Fund to the corresponding Asset Allocation Fund in exchange solely for the Asset Allocation Fund’s assumption of all of the liabilities of the I Series Fund and Institutional Class shares of the Asset Allocation Fund having an aggregate net asset value equal to the aggregate net asset value of the shares held in the I Series Fund.
The table below summarized the asset transfers and conversion ratios for each exchange.
| Net Assets | Unrealized | Accumulated | Share | Net Assets | ||||||||||||||||||||||||||
| Shares | on | Appreciation | Net Realized | Conversion | Shares | on | ||||||||||||||||||||||||
| I Series Fund | Redeemed | 11/20/15 | (Depreciation) | Gains | Ratio | Asset Allocation Fund | Issued | 11/20/15 | ||||||||||||||||||||||
Conservative Allocation I |
| Conservative Allocation | ||||||||||||||||||||||||||||
Institutional Class | 7,794,876 | $ | 72,465,073 | $ | (2,891,208 | ) | $ | (458,962 | ) | 0.807689 | Institutional Class | 6,295,836 | $ | 299,192,438 | ||||||||||||||||
Balanced Allocation I |
| Balanced Allocation | ||||||||||||||||||||||||||||
Institutional Class | 35,336,274 | 338,149,233 | (13,269,032 | ) | 3,517,469 | 0.755288 | Institutional Class | 26,689,066 | 1,213,930,818 | |||||||||||||||||||||
Growth Allocation I |
| Growth Allocation | ||||||||||||||||||||||||||||
Institutional Class | 24,036,312 | 254,805,506 | (3,928,689 | ) | 2,404,171 | 0.801277 | Institutional Class | 19,259,753 | 892,421,579 | |||||||||||||||||||||
Aggressive Allocation I |
| Aggressive Allocation | ||||||||||||||||||||||||||||
Institutional Class | 14,571,696 | 175,568,965 | 3,037,164 | 1,172,794 | 0.852696 | Institutional Class | 12,425,233 | 822,337,476 | ||||||||||||||||||||||
The table below summarizes the operations of the I Series Funds for the period from January 1, 2015 to November 20, 2015, the operations of the Asset Allocation Funds for the year ended December 31, 2015 as presented in the Statements of Operations, and the combined I Series and Asset Allocation Funds’ pro-forma results of operations for the year ended December 31, 2015, assuming the acquisition had been completed on January 1, 2015.
| I Series Fund | Asset Allocation Fund | |||||||||||||||||||||||||
| For the Period | For the Year Ended | |||||||||||||||||||||||||
01/01/15 — 11/20/15 | 12/31/2015 | |||||||||||||||||||||||||
| Net Realized | Net Realized | |||||||||||||||||||||||||
| Net | and Unrealized | Net Increase | Net | and Unrealized | Net Increase | |||||||||||||||||||||
| Investment | Gain on | from | Investment | Gain on | from | |||||||||||||||||||||
| I Series Fund | Income | Investments | Operations | Asset Allocation Fund | Income | Investments | Operations | |||||||||||||||||||
Conservative Allocation I |
| Conservative Allocation | ||||||||||||||||||||||||
Fund Total | $ | 784,941 | $ | (1,117,508 | ) | $ | (332,567 | ) | Fund Total | $ | 4,912,357 | $ | (13,874,298 | ) | $ | (8,961,941 | ) | |||||||||
Balanced Allocation I |
| Balanced Allocation | ||||||||||||||||||||||||
Fund Total | 4,431,020 | (9,880,253 | ) | (5,449,233 | ) | Fund Total | 26,773,844 | (92,956,616 | ) | (66,182,772 | ) | |||||||||||||||
Growth Allocation I |
| Growth Allocation | ||||||||||||||||||||||||
Fund Total | 1,922,294 | (5,501,089 | ) | (3,578,795 | ) | Fund Total | 24,260,904 | (64,339,084 | ) | (40,078,180 | ) | |||||||||||||||
Aggressive Allocation I |
| Aggressive Allocation | ||||||||||||||||||||||||
Fund Total | 189,534 | 981,745 | 1,171,279 | Fund Total | 22,517,865 | (29,590,640 | ) | (7,072,775 | ) | |||||||||||||||||
281
Table of Contents
Because each of the combined I Series and Asset Allocation Funds have been managed as a single Fund since the transfer was completed, it is not practicable to separate the amounts of revenue and earnings of the I Series Fund that has been included in the Asset Allocation Funds’ statements of operations.
2. SUMMARY OF SIGNIFICANT ACCOUNTING POLICIES
The following is a summary of significant accounting policies followed by the Funds in the accounting and the preparation of its financial statements. The Funds are investment companies and follow accounting and reporting guidance in the Financial Accounting Standards Board Accounting Standards Codification Topic 946 (“ASC 946”). The policies are in conformity with accounting principles generally accepted in the United States of America (“U.S. GAAP”), including but not limited to ASC 946. The preparation of financial statements requires the Funds’ management to make estimates and assumptions that affect the reported amounts of assets and liabilities, the disclosure of contingent assets and liabilities at the date of the financial statements, and the reported amounts of income and expenses for the period. The Funds utilize various methods to measure the value of its investments on a recurring basis. Amounts received upon the sale of such investments could differ from estimated values and those differences could be significant.
a. Valuation of Securities
The Funds (except the Money Market Fund) each value securities traded on national securities exchanges or included in national market systems at the last quoted sale price, or official close price, on the principal exchange on which they were traded, or, in the absence of any sale or official close price, at the closing bid price. The valuation committee is comprised of individuals from GuideStone Capital Management (“GSCM” or “Adviser”) and BNY Mellon Investment Servicing (US) Inc. who previously have been identified to the Board of Trustees. Non-exchange traded securities for which an over-the-counter quotation is readily available are valued at the last quoted bid price.
Debt securities, excluding asset-backed and mortgage-backed securities, are valued at the mean of the last bid and ask prices available, which approximates fair value. Asset-backed and mortgage-backed securities are generally valued at the last bid price, if available.
Short-term securities maturing in more than 60 days from the valuation date are valued at the mean of the last bid and ask prices; those maturing in 60 days or less are generally valued at amortized cost which approximates current market value in accordance with Rule 2a-7 of the 1940 Act.
Forward foreign exchange contracts are valued based upon closing exchange rates from each respective foreign market.
Futures contracts are valued at the closing settlement price on the exchange on which they are primarily traded.
Options, rights and warrants for which the primary market is a national securities exchange are valued at the last sale price on the exchange on which they are traded, or, in the absence of any sale, at the closing bid price. Options, rights and warrants not traded on a national securities exchange are valued at the last quoted bid price.
Swap agreements are valued daily based upon the terms specific to each agreement with its counterparty. (Please see Note 2i, “Derivative Financial Instruments” for additional information regarding the valuation of swap agreements).
To the extent available, valuations of portfolio securities are provided by independent pricing services approved by the Board of Trustees. Securities for which market quotations are not readily available are valued at fair value according to methods established in good faith by the Board of Trustees. Due to the potential excessive volatility at the time valuations are developed, pricing techniques may materially vary from the actual amounts realized upon sale of the securities.
For securities that principally trade on a foreign market or exchange, a significant gap in time can exist between the time of a particular security’s last trade and the time at which a Fund calculates its Net Asset Value (“NAV”). The closing prices of such
282
Table of Contents
securities may no longer reflect their market value at the time the Fund calculates its NAV if an event that could materially affect the value of those securities (a “Significant Event”) has occurred between the time of the security’s last close and the time that the Fund calculates its NAV. A Significant Event may relate to a single issuer or to an entire market sector. If a Fund becomes aware of a Significant Event that has occurred with respect to a security or group of securities after the closing of the exchange or market on which the security or securities principally trade, but before the time at which the Fund calculates its NAV, a Valuation Committee meeting may be called. The Trust uses Interactive Data Corporation (“IDC”) as a third party fair valuation vendor. IDC provides a fair value for foreign equity securities held by the Trust based on certain factors and methodologies applied by IDC in the event that there is movement in the U.S. market that exceeds a specific threshold established by the Valuation Committee in consultation with, and approved by, the Board of Trustees. Such methodologies generally involve tracking valuation correlations between the U.S. market and each non-U.S. security. As part of the valuation procedures, a “confidence interval” is used, when the threshold is exceeded, to determine the level of correlation between the value of a foreign equity security and movements in the U.S. market before a particular security will be fair valued. In the event that the threshold established by the Valuation Committee is exceeded on a specific day, the Trust will typically value non-U.S. equity securities in its portfolio that exceed the applicable confidence interval based upon the fair values provided by IDC.
The Target Date, Asset Allocation and Real Assets Funds value their investments in the underlying Select Funds and the Credit Suisse Commodity Return Strategy Fund daily at the closing NAV of each respective Fund.
The Financial Accounting Standards Board’s (“FASB”) “Fair Value Measurements and Disclosures” defines fair value as the price that a fund would receive to sell an asset or pay to transfer a liability in an orderly transaction between market participants at the measurement date. It establishes and requires disclosure of a fair value hierarchy, separately for each major category of assets and liabilities, that segregates fair value measurements into levels (Levels 1, 2, and 3). Categorizations of fair value measurements, and the criteria used to determine each categorization, are as follows:
Level 1 | – | quoted prices in active markets for identical securities which include: |
Equity securities, including restricted securities, for which market quotations are readily available, that are valued at the last reported sale price or official closing price as reported by an independent pricing service on the primary market or exchange on which they are traded; and
Investments in open-end mutual funds, including the GuideStone Select Funds, Credit Suisse Commodity Return Strategy Fund and the Northern Institutional Liquid Assets Portfolio, which are valued at their closing NAV each business day.
Derivative financial instruments such as financial futures contracts and written and purchased put and call options for which market quotations are readily available, that are valued at the last reported sale price or official closing price as reported by an independent pricing service on the primary market or exchange on which they are traded.
Level 2 | – | prices determined using other significant observable inputs (including quoted prices for similar securities, interest rates, prepayment speeds, credit risk, etc.) which include: |
Equity securities for which there were no sales or closing prices for that day, that are valued at the last quoted bid price or that may be valued using the last available price;
Foreign equity securities for which a Significant Event has occurred and a fair value price is provided by IDC;
283
Table of Contents
Debt securities, including restricted securities that are valued based on evaluated quotations received from independent pricing. For corporate bonds, pricing services that utilize matrix pricing which considers yield or price of bonds of comparable quality, coupon, maturity and type as well as dealer supplied prices; and
Short-term securities with remaining maturities of sixty days or less for which quotations are not readily available and are valued at amortized cost which approximates fair value.
Derivative financial instruments such as forward foreign exchange contracts and swap agreements that are valued based on pricing models using inputs observed on actively quoted markets or observable correlated market inputs.
Level 3 | – | prices determined using significant unobservable inputs (including the valuation committee’s own assumptions in determining the fair value of investments) which include: |
Restricted equity securities, private placements and derivative financial instruments where observable inputs are limited, assumptions about market activity and risk are used; and
Debt securities, including restricted securities, and derivative financial instruments that are valued based on evaluated quotations received from dealers who make markets in such securities.
Valuation levels are not necessarily an indication of the risk associated with investing in those securities. Changes in valuation techniques may result in transfers into or out of an assigned level within the disclosure hierarchy. Transfers between different levels of the fair value disclosure hierarchy are deemed to have occurred as of the end of the reporting period.
In accordance with FASB “Amendments to Achieve Common Fair Value Measurement and Disclosure Requirements in U.S.GAAP and International Financial Reporting Standards (“IFRS”),” management has not presented quantitative disclosures for the securities which are advisor priced or valued by the valuation committee as there have been no adjustments to prices received from third parties as of December 31, 2015.
A valuation hierarchy including information regarding transfers between levels and Level 3 securities, where applicable, is shown at the end of each Fund’s Schedule of Investments.
b. Fixed Income Securities
The Fixed Income Funds, Defensive Market Strategies Fund and the Small Cap Equity Fund may invest in mortgage-related and other asset-backed securities. These securities include mortgage pass-through securities, collateralized mortgage obligations, commercial mortgage-backed securities, stripped mortgage-backed securities, asset-backed securities, collateralized debt obligations and other securities that directly or indirectly represent a participation in, or are secured by and payable from, mortgage loans on real property. Mortgage-related and other asset-backed securities are interests in pools of loans or other receivables. Mortgage-related securities are created from pools of residential or commercial mortgage loans, including mortgage loans made by savings and loan institutions, mortgage bankers, commercial banks and others. Asset-backed securities are created from many types of assets, including auto loans, credit card receivables, home equity loans and student loans. These securities provide a monthly payment which consists of both interest and principal payments. Interest payments may be determined by fixed or adjustable rates. The rate of pre-payments on underlying mortgages will affect the price and volatility of a mortgage-related security and may have the effect of shortening or extending the effective duration of the security relative to what was anticipated at the time of purchase. The timely payment of principal and interest of certain mortgage-related securities is guaranteed with the full faith and credit of the United States Government. Pools created and guaranteed by non-governmental
284
Table of Contents
issuers, including government-sponsored corporations, may be supported by various forms of insurance or guarantees, but there can be no assurance that the private insurers or guarantors can meet their obligations under the insurance policies or guarantee arrangements.
Collateralized Mortgage Obligations (“CMOs”) are debt obligations of a legal entity that are collateralized by mortgages and divided into classes. CMOs are structured into multiple classes, often referred to as “tranches,” with each class bearing a different stated maturity and entitled to a different schedule for payments of principal and interest, including pre-payments. Commercial Mortgage-Backed Securities (“CMBS”) include securities that reflect an interest in, and are secured by, mortgage loans on commercial real property. Many of the risks of investing in CMBS reflect the risks of investing in the real estate securing the underlying mortgage loans. These risks reflect the effects of local and other economic conditions on real estate markets, the ability of tenants to make loan payments, and the ability of a property to attract and retain tenants. CMOs and CMBS may be less liquid and may exhibit greater price volatility than other types of mortgage- or asset-backed securities. Stripped Mortgage-Backed Securities (“SMBS”) are derivative multi-class mortgage securities. SMBS are usually structured with two classes that receive different proportions of the interest and principal distributions on a pool of mortgage assets. A common type of SMBS will have one class receiving some of the interest and most of the principal from the mortgage assets, while the other class will receive most of the interest and the remainder of the principal. In the most extreme case, one class will receive all of the interest (the interest-only or “IO” class), while the other class will receive the entire principal (the principal-only or “PO” class). Payments received for IOs are included in interest income on the Statements of Operations. Because little to no principal will be received at the maturity of an IO, adjustments are made to the book value of the security on a monthly basis until maturity. These adjustments are included in interest income on the Statements of Operations. Payments received for POs are treated as reductions to the cost and par value of the securities.
Inflation-indexed bonds are fixed-income securities whose principal value is periodically adjusted to the rate of inflation. The interest rate on these bonds is generally fixed at issuance at a rate lower than typical bonds. Over the life of an inflation-indexed bond, however, interest will be paid based on a principal value, which is adjusted for inflation. Any increase or decrease in the principal amount of an inflation-indexed bond will be included as interest income on the Statements of Operations, even though investors do not receive their principal until maturity.
“TBA” (to be announced) commitments are commitments to purchase or sell mortgage-backed securities for a fixed price at a future date, typically not exceeding 45 days. TBAs may be considered securities in themselves and involve a risk of loss if the value of the security to be purchased declines prior to settlement date. This risk is in addition to the risk of decline in each Fund’s other assets. Unsettled TBAs are valued at the current market value of the underlying securities, according to the procedures described in the section entitled “Valuation of Securities”.
The Low-Duration Bond Fund and Medium-Duration Bond Fund may enter into dollar roll transactions, pursuant to which they sell a mortgage-backed TBA or security and simultaneously purchase a similar, but not identical, TBA with the same issuer, rate and terms. The Funds may execute a “roll” to obtain better underlying mortgage securities or to increase yield. The Funds account for dollar roll transactions as purchases and sales, which has the effect of increasing their portfolio turnover rates. Risks associated with dollar rolls are that actual mortgages received by the Funds may be less favorable than those anticipated or that counterparties may fail to perform under the terms of the contracts. At December 31, 2015, there were no dollar roll transactions.
U.S. Government securities are obligations of and, in certain cases, guaranteed by, the U.S. Government, its agencies or instrumentalities. The U.S. Government does not guarantee the NAV of the Funds’ shares. Some U.S. Government securities, such as Treasury bills, notes and bonds, and securities guaranteed by the Government National Mortgage Association (“GNMA” or “Ginnie Mae”), are supported by the full faith and credit of the United States Government; others, such as those of the Federal Home Loan Bank, are supported by the right of the issuer to borrow from the U.S. Department of the Treasury (the “U.S.
285
Table of Contents
Treasury”); others, such as those of the Federal National Mortgage Association (“FNMA” or “Fannie Mae”), are supported by the discretionary authority of the U.S. Government to purchase the agency’s obligations; and still others, such as those of the Student Loan Marketing Association, are supported only by the credit of the instrumentality. U.S. Government securities may include zero coupon securities, which do not distribute interest on a current basis and tend to be subject to greater risk than interest-paying securities of similar maturities.
Government-related guarantors (i.e., not backed by the full faith and credit of the United States Government) include FNMA and the Federal Home Loan Mortgage Corporation (“FHLMC” or “Freddie Mac”). FNMA is a government-sponsored corporation, the common stock of which is owned entirely by private stockholders. FNMA purchases conventional (i.e., not insured or guaranteed by any government agency) residential mortgages from a list of approved seller/servicers which include state and federally chartered savings and loan associations, mutual savings banks, commercial banks and credit unions and mortgage bankers. Pass-through securities issued by FNMA are guaranteed as to timely payment of principal and interest by FNMA, but are not backed by the full faith and credit of the United States Government. FHLMC issues Participation Certificates (“PCs”), which are pass-through securities, each representing an undivided interest in a pool of residential mortgages. FHLMC guarantees the timely payment of interest and ultimate collection of principal, but PCs are not backed by the full faith and credit of the United States Government.
c. Foreign Currency Translations
Investment securities and other assets and liabilities denominated in foreign currencies are translated into U.S. dollar amounts at the date of valuation. Purchases and sales of investment securities and income and expense items denominated in foreign currencies are translated into U.S. dollar amounts on the respective dates of such transactions.
The Funds isolate that portion of the results of operations resulting from changes in foreign exchange rates on investments from the fluctuations arising from changes in market prices of securities held.
Reported net realized foreign exchange gains or losses arise from sales of portfolio securities, sales and maturities of short-term securities, sales of foreign currencies, currency gains or losses realized between the trade and settlement dates on securities transactions, and the difference between the amounts of dividends, interest, and foreign withholding taxes recorded on the Fund’s books and the U.S. dollar equivalent of the amounts actually received or paid. Net unrealized foreign exchange gains and losses arise from changes in the values of assets and liabilities, including investments in securities at fiscal period end, resulting from changes in the exchange rate.
d. Loan Participations
The Fixed Income Funds, the Small Cap Equity Fund and the Flexible Income Fund may invest in direct debt instruments which are interests in amounts owed to lenders or lending syndicates by corporate borrowers. Investments in loans may be in the form of participations in loans. A loan is often administered by a bank or other financial institution (the “lender”) that acts as agent for all holders. The agent administers the terms of the loan, as specified in the loan agreement. The holder may invest in multiple series of a loan, which may have varying terms and carry different associated risks. The holder generally has no right to enforce compliance with the terms of the loan agreement with the borrower. As a result, these instruments may be subject to the credit risk of both the borrower and the lender that is selling the loan agreement. When investing in a loan participation, the holder has the right to receive payments of principal, interest and any fees to which it is entitled only from the lender selling the loan agreement and only upon receipt of payments by the lender from the borrower.
The Fixed Income Funds, the Small Cap Equity Fund and the Flexible Income Fund may invest in floating rate loans some of which may be unfunded corporate loan commitments (“commitments”). Commitments may obligate the holder to furnish temporary financing to a borrower until permanent financing can be arranged. The holder may receive a commitment fee based
286
Table of Contents
on the undrawn portion of the underlying line of credit portion of a floating rate loan. In certain circumstances, the holder may receive a prepayment penalty fee upon the prepayment of a floating rate loan by a borrower. Fees earned or paid are recorded as a component of interest income or interest expense on the Statements of Operations.
| Security | Unfunded | |||||||
Fund | Name | Commitment | ||||||
Global Bond | Magnum Hunter Resources | 120,000 | ||||||
e. REITs
The Real Estate Securities Fund invests substantial assets in real estate investment trusts (“REITs”) that involve risks not associated with investing in stocks. Risks include declines in the value of real estate, general and economic conditions, changes in the value of the underlying property and defaults by borrowers. The value of assets in the real estate industry may go through cycles of relative underperformance and outperformance in comparison to equity securities markets in general.
Dividend income is recorded using management’s estimate of the income included in distributions received from REIT investments. The actual amounts of income, return of capital and capital gains are only determined by each REIT after its fiscal year-end and may differ from the estimated amount. Estimates of income are adjusted in the Funds to the actual amounts when the amounts are determined.
f. Repurchase Agreements
Each Fund may agree to purchase securities from financial institutions subject to the seller’s agreement to repurchase them at a mutually agreed upon date and price. It is the Fund’s policy that repurchase agreements are fully collateralized by U.S. Treasury and Government Agency securities. All collateral is held by the Fund’s custodian bank or a bank with which the custodian bank has entered into a subcustodian agreement, or is segregated in the Federal Reserve Book Entry System. In connection with transactions in repurchase agreements, if the seller defaults and the value of the collateral declines, or if the seller enters an insolvency proceeding, realization of the collateral by the Fund may be delayed or limited.
Repurchase transactions are entered into by the Funds under Master Repurchase Agreements (“MRA”) which permit the Funds, under certain circumstances including an event of default (such as bankruptcy or insolvency), to offset payables and/or receivables under the MRA with collateral held and/or posted to the counterparty and create one single net payment due to or from the Fund.
At December 31, 2015, the open repurchase agreements by counterparty which are subject to an MRA on a net payment basis are as follows:
| Fund/Counterparty | Repurchase Agreements | Fair Value of Non-cash Collateral Received(1) | Cash Collateral Received | Net Amount(2) | ||||||||||||
Money Market | ||||||||||||||||
Bank of Nova Scotia (The) | $ | 12,500,000 | $ | (12,500,000 | ) | $ | — | $ | — | |||||||
Goldman Sachs & Co. | 40,000,000 | (40,000,000 | ) | — | — | |||||||||||
RBC Capital Markets LLC | 12,000,000 | (12,000,000 | ) | — | — | |||||||||||
|
|
|
|
|
|
|
| |||||||||
Total Repurchase Agreements | $ | 64,500,000 | $ | (64,500,000 | ) | $ | — | $ | — | |||||||
|
|
|
|
|
|
|
| |||||||||
| (1) | The value of the related collateral received exceeded the value of the repurchase agreements as of December 31, 2015. |
| (2) | Net amount represents the net amount receivable due from (payable to) the counterparty in the event of default. |
Additional information about master netting arrangements can be found in the Derivative Financial Instruments and Securities Lending sections of the Notes to Financial Statements.
287
Table of Contents
The type and maturity of non-cash collateral in relation to the value of repurchase agreements on the Statement of Assets and Liabilities is as follows:
| Fund/Collateral Type | Up to 30 Days | 30—90 Days | Greater than 90 Days | Total | ||||||||||||
Money Market | ||||||||||||||||
Agency Obligations | $ | — | $ | — | $ | 40,000,000 | $ | 40,000,000 | ||||||||
U.S. Treasury Obligations | — | — | 24,500,000 | 24,500,000 | ||||||||||||
|
|
|
|
|
|
|
| |||||||||
Total Value of Collateral | $ | — | $ | — | $ | 64,500,000 | $ | 64,500,000 | ||||||||
|
|
|
|
|
|
|
| |||||||||
g. Short Sales
A short sale is a transaction in which a Fund sells a security it does not own. The Fund’s obligation to replace the security borrowed and sold short will be fully collateralized at all times by cash equivalents deposited in an account with the Fund’s custodian. If the price of the security sold short increases between the time of the short sale and the time the Fund replaces the borrowed security, the Fund will realize a loss; and if the price declines during the period, the Fund will realize a gain. Any realized gain will be decreased, and any realized loss increased, by the amount of transaction costs.
The Equity Funds may sell short exchange-listed equity futures contracts to reduce market exposure. The Target Date Funds, Asset Allocation Funds, Fixed Income Funds and Small Cap Equity Fund may sell short U.S. Treasury securities and exchange-listed U.S. Treasury futures contracts to reduce market exposure. The Low-Duration Bond and Medium-Duration Bond Funds will occasionally enter into a short sale to initiate a dollar roll transaction. The Defensive Market Strategies Fund may establish short positions in stocks of companies with a market value of up to 30% of the Fund’s assets. The International Equity Fund may establish short positions in stocks of foreign companies with a market value of up to 7% of the Fund’s assets.
At December 31, 2015, the value of securities sold short in the International Equity Fund amounted to $66,003,436.
h. Synthetic Convertible Instruments
The Defensive Market Strategies Fund invests in synthetic convertible instruments. Synthetic convertible instruments are hybrid financial instruments that generally combine both debt and equity characteristics into a single note form. Income received from synthetic convertible instruments will be recorded as realized gains in the Statement of Operations and may be based on the performance of an underlying equity security, an equity index, or an option position. The risks of investing in synthetic convertible instruments include unfavorable price movements in the underlying security and the credit risk of the issuing financial institution. There may be no guarantee of a return of principal with synthetic convertible instruments and the appreciation potential may be limited. Synthetic convertible instruments may be more volatile and less liquid than other investments held by the Fund.
i. Derivative Financial Instruments
The Funds may engage in various portfolio strategies to seek to increase their return by hedging their portfolios against adverse movements in the equity, debt and currency markets. Losses may arise due to changes in the value of the contract if the counterparty does not perform under the contract. The Funds, in their normal course of business, may enter into contracts that contain a variety of representations and warranties and which provide general indemnifications. The Funds’ exposure may include future claims that may be made against the Funds that have not yet occurred.
Financial Futures Contracts — The Funds (except the Money Market Fund) may purchase or sell financial futures contracts and the options on such futures contracts for the purpose of hedging risk on existing securities, demonstrating purchase of securities or gaining market exposure on cash balances. Financial futures contracts are contracts for the
288
Table of Contents
delivery of securities at a specified future date at an agreed upon price or yield. Upon entering into a contract, the Funds deposit and maintain as collateral such initial margin as required by the exchange on which the transaction is effected.
Pursuant to the contract, the Funds agree to pay to or receive from the broker an amount of cash equal to the daily fluctuation in the value of the contract. Such payments or receipts are known as variation margin and are recorded by the Funds as unrealized gains or losses until the contract is closed or settled.
Risks of entering into futures contracts include the possibility that there will be an imperfect price correlation between the futures and the underlying securities. Second, it is possible that a lack of liquidity for futures contracts could exist in the secondary market, resulting in an inability to close a futures position prior to its maturity date. Third, the purchase of a futures contract involves the risk that a Fund could lose more than the original margin deposit required to initiate a futures transaction. Futures contracts involve, to varying degrees, risk of loss in excess of the variation margin disclosed on the Statements of Assets and Liabilities.
Foreign Currency Options and Futures — The Fixed Income Funds, Defensive Market Strategies Fund, Small Cap Equity Fund and International Equity Fund may also enter into futures contracts on foreign currencies and related options on transactions as a short or long hedge against possible variations in foreign exchange rates.
Forward Foreign Exchange Contracts — Certain Funds may enter into forward foreign currency exchange contracts to hedge against adverse exchange rate fluctuation to the U.S. dollar or between different foreign currencies in connection with either specific security transactions or portfolio positions. Each contract is valued daily and the change in value is recorded as an unrealized gain or loss. When the contract is closed, a realized gain or loss is recorded equal to the difference between the opening value and the closing value of the contract. These contracts may involve market risk in excess of the unrealized gain or loss reflected on the Statements of Assets and Liabilities. The Funds could be exposed to risk if the counterparties to the contracts are unable to meet the terms of the contract and from unanticipated movements in the value of a foreign currency relative to the U.S. dollar.
Options — Certain Funds are authorized to write and purchase put and call options. The risk in writing a call option is that the Funds give up the opportunity for profit if the market price of the security increases. The risk in writing a put option is that the Funds may incur a loss if the market price of the security decreases and the option is exercised. The risk in purchasing an option is that the Funds pay a premium whether or not the option is exercised. The Funds also have the additional risk of being unable to enter into a closing transaction at an acceptable price if a liquid secondary market does not exist. The Funds also may write over-the-counter options where completing the obligation depends upon the credit standing of the other party and that party’s ability to perform. Option contracts also involve the risk that they may not work as intended due to unanticipated developments in market conditions or other causes.
Options purchased are recorded as an asset, and written options are recorded as liabilities to the extent of premiums paid or received. Each Fund will realize a gain or loss when the option transaction expires or closes. When an option is exercised, the proceeds on sales for a written call option, the purchase cost for a written put option or the cost of a security for a purchased put or call option is adjusted by the amount of the premium received or paid.
When a Fund writes a call or put option, an amount equal to the premium received is recorded as a liability and subsequently marked to market to reflect the current value of the option written. These liabilities are reflected as written options outstanding on the Statements of Assets and Liabilities.
Certain Funds may write swaption contracts to manage exposure to fluctuations in interest rates and to enhance portfolio yield. Swaption contracts written by the Funds represent an option that gives the purchaser the right, but not the obligation, to enter into a previously agreed upon swap contract on a future date. If a written call swaption is exercised, the writer will enter a swap and is obligated to pay the fixed-rate and receive a floating rate in exchange. If a written put swaption is
289
Table of Contents
exercised, the writer will enter a swap and is obligated to pay the floating rate and receive a fixed rate in exchange. Swaptions are marked-to-market daily based upon quotations from market makers. When a Fund writes a swaption, the premium received is recorded as a liability and is subsequently adjusted to the current market value of the swaption.
Entering into a swaption contract involves, to varying degrees, the elements of credit, market and interest rate risk in excess of the associated option and swap contract amounts reported in the Statement of Assets and Liabilities. The Funds bear the market risk arising from any change in index values or interest rates.
Swap Agreements — Each Select Fund, except the Money Market Fund, may enter into swap agreements. The Equity Funds may enter into equity swap contracts and the Fixed Income Funds and the Small Cap Equity Fund may enter into interest rate and credit default swaps. The Fixed Income Funds and International Equity Fund may enter into cross-currency swaps, and each Select Fund may enter into total return swaps.
Swap agreements are privately negotiated agreements between a Fund and a counterparty to exchange or swap investment cash flows, assets, foreign currencies or market-linked returns at specified, future intervals. A swap may be entered into in order to, among other things, change the maturity of a Fund’s portfolio, to protect a Fund’s value from changes in interest rates, to expose a Fund to a different security or market, or to help a Fund achieve a strategy relative to an index or other benchmark. By entering into a swap agreement, a Fund is exposed to the risk of unanticipated movements in interest rates or in the value of an underlying security or index (or the risk that the counterparty will not fulfill its obligation under the agreement). Credit default swaps involve the payment of amounts based on a specified rate multiplied by a notional amount as well as upon an event of default. In connection with these agreements, securities are set aside as collateral by the Fund’s custodian.
Swaps are marked-to-market daily based upon values from third party vendors or quotations from market makers to the extent available; and the change in value, if any, is recorded as an unrealized gain or loss on the Statements of Assets and Liabilities. In the event that market quotations are not readily available or deemed reliable, certain swap agreements may be valued pursuant to guidelines established by the Board of Trustees. In the event that market quotes are not readily available and the swap cannot be valued pursuant to one of the valuation methods, the value of the swap will be determined in good faith by the Valuation Committee, generally based upon recommendations provided by the Fund’s sub-adviser.
Payments received or made at the beginning of the measurement period are reflected as such on the Statements of Assets and Liabilities and represent payments made or received upon entering into the swap agreement to compensate for differences between the stated terms of the swap agreement and prevailing market conditions (credit spreads, currency exchange rates, interest rates, and other relevant factors). These upfront payments are recorded as realized gains or losses on the Statements of Operations upon termination or maturity of the swap. A liquidation payment received or made at the termination of the swap is recorded as realized gain or loss on the Statements of Operations. Net periodic payments received or paid by a Fund are included as part of realized gains or losses on the Statements of Operations.
Certain of the Funds’ derivative agreements contain provisions that require the Fund to maintain a predetermined level of net assets, and/or provide limits regarding the decline of the Fund’s NAV over one-month, three-month and 12-month periods. If a Fund were to violate such provisions, the counterparties to the derivative instruments could request immediate payment or demand immediate collateralization on derivative instruments in net liability positions. For the year ended December 31, 2015, all of the Funds maintained the required level of net assets and/or the NAVs of the Funds did not decline below the limits set forth in the derivative agreements.
Entering into these agreements involves, to varying degrees, elements of credit, market and documentation risk in excess of the amounts recognized on the Statements of Assets and Liabilities. Such risks involve the possibility that there will be no liquid market for these agreements, that the counterparty to the agreements may default on its obligation to perform or disagree as to the meaning of contractual terms in the agreements and that there may be unfavorable changes in interest rates.
290
Table of Contents
Credit Default Swaps — Credit default swap (“CDS”) agreements involve one party making a stream of payments (referred to as the buyer of protection) to another party (the seller of protection) in exchange for the right to receive a specified return in the event of a default or other credit event for the referenced entity, obligation or index. As a seller of protection on CDS agreements, a Fund will generally receive from the buyer of protection a fixed rate of income throughout the term of the swap provided that there is no credit event. As the seller, a Fund would effectively add leverage to its portfolio because, in addition to its total net assets, a Fund would be subject to investment exposure on the notional amount of the swap.
Upfront payments made or received in connection with CDS agreements are amortized over the expected life of the CDS agreements as unrealized gains or losses on swap agreements. The change in value of the CDS agreements is recorded daily as unrealized appreciation or depreciation. A realized gain or loss is recorded upon a credit event (as defined in the CDS agreement) or the maturity or termination of the agreement.
The sub-advisers monitor a variety of factors including cash flow assumptions, market activity, market sentiment and valuation as part of their ongoing process of assessing payment and performance risk. As payment and performance risk increases, the value of a CDS increases, resulting in recognition of unrealized gains for long positions and unrealized losses for short positions. Conversely, as payment and performance risk decreases, unrealized gains are recognized for short positions and unrealized losses are recognized for long positions. Any current or future declines in the fair value of the swap may be partially offset by upfront payments received by the Fund as a seller of protection if applicable. The change in value is recorded within unrealized appreciation (depreciation) until the occurrence of a credit event or the termination of the swap, at which time a realized gain (loss) is recorded.
If a Fund is a seller of protection and a credit event occurs, as defined under the terms of that particular swap agreement, a Fund will either (i) pay to the buyer of protection an amount equal to the notional amount of the swap and take delivery of the referenced obligation, other deliverable obligations or underlying securities comprising the referenced index or (ii) pay a net settlement amount in the form of cash or securities equal to the notional amount of the swap less the recovery value of the referenced obligation or underlying securities comprising the referenced index. If a Fund is a buyer of protection and a credit event occurs, as defined under the terms of that particular swap agreement, a Fund will either (i) receive from the seller of protection an amount equal to the notional amount of the swap and deliver the referenced obligation, other deliverable obligations or underlying securities comprising the referenced index or (ii) receive a net settlement amount in the form of cash or securities equal to the notional amount of the swap less the recovery value of the referenced obligation or underlying securities comprising the referenced index. Recovery values are assumed by market makers considering either industry standard recovery rates or entity specific factors and considerations until a credit event occurs. If a credit event has occurred, the recovery value is determined by a facilitated auction whereby a minimum number of allowable broker bids, together with a specified valuation method, are used to calculate the settlement value.
CDS agreements on corporate issues or sovereign issues of an emerging country involve one party making a stream of payments to another party in exchange for the right to receive a specified return in the event of a default or other credit event. If a credit event occurs and cash settlement is not elected, a variety of other deliverable obligations may be delivered in lieu of the specific referenced obligation. The ability to deliver other obligations may result in a cheapest-to-deliver option (the buyer of protection’s right to choose the deliverable obligation with the lowest value following a credit event). A Fund may use CDS on corporate issues or sovereign issues of an emerging country to provide a measure of protection against defaults of the issuers (i.e., to reduce risk where a Fund owns or has exposure to the referenced obligation) or to take an active long or short position with respect to the likelihood of a particular issuer’s default.
291
Table of Contents
CDS agreements on asset-backed securities involve one party making a stream of payments to another party in exchange for the right to receive a specified return in the event of a default or other credit event. Unlike CDS on corporate issues or sovereign issues of an emerging country, deliverable obligations in most instances would be limited to the specific referenced obligation as performance for asset-backed securities can vary across deals. Prepayments, principal paydowns, and other write down or loss events on the underlying loans will reduce the outstanding principal balance of the referenced obligation. These reductions may be temporary or permanent as defined under the terms of the swap agreement and the notional amount for the swap agreement will be adjusted by corresponding amounts. A Fund may use CDS on asset-backed securities to provide a measure of protection against defaults of the referenced obligation or to take an active long or short position with respect to the likelihood of a particular referenced obligation’s default. At December 31, 2015, there were no investments in CDS agreements on asset-backed securities.
CDS agreements on credit indices involve one party making a stream of payments to another party in exchange for the right to receive a specified return in the event of a write-down, principal shortfall, interest shortfall or default of all or part of the referenced entities comprising the credit index. A credit index is a list of a basket of credit instruments or exposures designed to be representative of some part of the credit market as a whole. These indices are made up of reference credits that are judged by a poll of dealers to be the most liquid entities in the CDS market based on the sector of the index. Components of the indices may include, but are not limited to, investment grade securities, high yield securities, asset-backed securities, emerging markets, and/or various credit ratings within each sector. Credit indices are traded using CDS with standardized terms including a fixed spread and standard maturity dates. An index CDS references all the names in the index, and if there is a default, the credit event is settled based on that name’s weight in the index. The composition of the indices changes periodically, usually every six months, and for most indices, each name has an equal weight in the index. A Fund may use CDS on credit indices to hedge a portfolio of CDS or bonds with a CDS on indices which is less expensive than it would be to buy many CDS to achieve a similar effect. CDS on indices are benchmarks for protecting investors owning bonds against default, and traders use them to speculate on changes in credit quality.
Implied credit spreads, represented in absolute terms, utilized in determining the market value of CDS agreements on corporate issues or sovereign issues of an emerging country as of period end are disclosed in the footnotes to the Schedules of Investments and serve as an indicator of the current status of the payment/performance risk and represent the likelihood or risk of default for the credit derivative. The implied credit spread of a particular referenced entity reflects the cost of buying/selling protection and may include upfront payments required to be made to enter into the agreement. For CDS agreements on asset-backed securities and credit indices, the quoted market prices and resulting values serve as the indicator of the current status of the payment/performance risk. Wider credit spreads and increasing market values, in absolute terms when compared to the notional amount of the swap, represent a deterioration of the referenced entity’s credit soundness and a greater likelihood or risk of default or other credit event occurring as defined under the terms of the agreement.
The maximum potential amount of future payments (undiscounted) that a Fund as a seller of protection could be required to make under a CDS agreement would be an amount equal to the notional amount of the agreement. These potential amounts would be partially offset by any recovery values of the respective referenced obligations, upfront payments received upon entering into the agreement, or net amounts received from the settlement of buy protection CDS agreements entered into by a Fund for the same referenced entity or entities.
292
Table of Contents
CDS involve greater risks than if the Funds had invested in the referenced obligation directly. In addition to general market risks, CDS are subject to liquidity risk and counterparty credit risk. The Funds enter into CDS with counterparties meeting defined criteria for financial strength. A buyer also may lose its investment and recover nothing should a credit event not occur. If a credit event did occur, the value of the referenced obligation received by the seller, coupled with the periodic payments previously received, may be less than the full notional value it pays to the buyer, resulting in a loss of value.
Exchange Traded Swap Agreements — Exchange traded swaps are either interest rate or CDS agreements brokered by the Chicago Mercantile Exchange or the Intercontinental Exchange (the “Exchanges”) where the Exchanges are the counterparty to both the buyer and seller of protection. Exchange traded swaps involve a lesser degree of risk because the Exchanges, as counterparties, monitor risk factors for the involved parties. Exchange traded swaps are subject to general market risks and to liquidity risk. Pursuant to the agreement, the Funds agree to pay to or receive from the broker an amount of cash equal to the daily fluctuation in the value of the contract (the “Margin”) and daily interest on the margin. In the case of exchange traded interest rate swaps, the daily settlement also includes the daily portion of interest. Such payments are recorded by the Funds as unrealized gains or losses until the contract is closed or settled.
Exchange traded swaps require no payments at the beginning of the measurement period nor are there liquidation payments at the termination of the swap.
Cross-Currency Swap Agreements — Cross-currency swap agreements involve two parties exchanging two different currencies with an agreement to reverse the exchange at a later date at specified exchange rates. The exchange of currencies at the inception date of the contract takes place at the current spot rate. The re-exchange at maturity may take place at the same exchange rate, a specified rate, or the then current spot rate. Interest payments, if applicable, are made between the parties based on interest rates available in the two currencies at the inception of the contract. The terms of cross-currency swap contracts may extend for many years. Cross-currency swaps are usually negotiated with commercial and investment banks. Some cross-currency swaps may not provide for exchanging principal cash flows but only for exchanging interest cash flows.
Interest Rate Swap Agreements — Interest rate swap agreements involve the exchange by a Fund with another party of their respective commitments to pay or receive interest with respect to the notional amount of principal. Certain forms of interest rate swap agreements may include: (i) interest rate caps, under which, in return for a premium, one party agrees to make payments to the other to the extent that interest rates exceed a specified rate, or “cap”, (ii) interest rate floors, under which, in return for a premium, one party agrees to make payments to the other to the extent that interest rates fall below a specified rate, or “floor”, (iii) interest rate collars, under which a party sells a cap and purchases a floor or vice versa in an attempt to protect itself against interest rate movements exceeding given minimum or maximum levels, (iv) callable interest rate swaps, under which the counterparty may terminate the swap transaction in whole at zero cost by a predetermined date and time prior to the maturity date, (v) spread locks, which allow the interest rate swap users to lock in the forward differential (or spread) between the interest rate swap rate and a specified benchmark, or (vi) basis swap, under which two parties can exchange variable interest rates based on different money markets.
Total Return Swap Agreements — Total return swap agreements on commodities involve commitments where exchanged cash flows are based on the price of a commodity and in return a Fund receives either fixed or determined by floating price rate. One party would receive payments based on the market value of the commodity involved and pay a fixed amount. Total return swap agreements on indices involve commitments to pay interest in exchange for a market-linked return. One counterparty pays out the total return of a specific reference asset, which may be an equity, index, or bond, and in return receives a regular stream of payments. To the extent the total return of the security or index underlying the transaction exceeds or falls short of the offsetting interest rate obligation, a Fund will receive a payment from or make a payment to the counterparty.
293
Table of Contents
FASB “Derivatives and Hedging” includes required disclosure for (i) the nature and terms of the derivative, reasons for entering into the derivative, the events or circumstances that would require the seller to perform under the derivative, and the current status of the payment/performance risk of the derivative, (ii) the maximum potential amount of future payments (undiscounted) the seller could be required to make under the derivative, (iii) the fair value of the derivative, and (iv) the nature of any recourse provisions and assets held either as collateral or by third parties. FASB “Guarantees” require additional disclosures about the current status of the payment/performance risk of a guarantee. All of this information has been incorporated for the current period as part of the Schedules of Investments within the Swap agreements outstanding disclosure and in the Notes to Financial Statements.
As of December 31, 2015, the Low-Duration Bond Fund and the Medium-Duration Bond Fund are the buyers (“receiving protection”) on a total notional amount of $1,750,000 and $8,160,000, respectively, and the sellers (“providing protection”) on a total notional amount of $1,200,000 and $14,650,000, respectively. The notional amounts of the swaps are not recorded in the financial statements; however, the notional amount does approximate the maximum potential amount of future payments that the Funds could be required to make if the Funds were the seller of protection and a credit event was to occur. Those credit default swaps for which the Funds are providing protection at balance sheet date are summarized as follows:
| Written Credit Derivative Contracts | Single Name Credit Default Swaps | Credit Default Swap Index | ||||||||||||||||||
| Reference Asset | Corporate Debt | Sovereign Debt | Asset-Backed Securities | Corporate Debt | Total | |||||||||||||||
| Low-Duration Bond Fund | ||||||||||||||||||||
Fair value of written credit derivatives | $ | (5,547 | ) | $ | — | $ | — | $ | — | $ | (5,547 | ) | ||||||||
Maximum potential amount of future payments | 1,200,000 | — | — | — | 1,200,000 | |||||||||||||||
Recourse provisions with third parties to recover any amounts paid under the credit derivative (including any purchased credit protection) | — | — | — | — | — | |||||||||||||||
Collateral held by the Funds or other third parties which the Funds can obtain upon occurrence of triggering event | — | — | — | — | — | |||||||||||||||
| Medium-Duration Bond Fund | ||||||||||||||||||||
Fair value of written credit derivatives | $ | 3,643 | $ | (24,072 | ) | $ | 52,328 | $ | — | $ | 31,899 | |||||||||
Maximum potential amount of future payments | 1,600,000 | 1,000,000 | 12,050,000 | — | 14,650,000 | |||||||||||||||
Recourse provisions with third parties to recover any amounts paid under the credit derivative (including any purchased credit protection) | — | — | — | — | — | |||||||||||||||
Collateral held by the Funds or other third parties which the Funds can obtain upon occurrence of triggering event | — | — | — | — | — | |||||||||||||||
At December 31, 2015, there were no recourse provisions with third parties to recover any amounts paid under the credit derivative agreement (including any purchased credit protection) nor was any collateral held by the Funds or other third parties which the Funds can obtain upon occurrence of a triggering event.
The credit spread disclosed below for each referenced obligation where the Funds are the seller of protection is a representation of the current payment/performance risk of the swap.
294
Table of Contents
| Maximum Potential Amount of Future Payments by Contract Term | ||||||||||||||||||||||||
Current credit spread on underlying (in basis points) | 0-6 Months | 6-12 Months | 1-5 Years | 5-10 Years | More Than 10 Years | Total | ||||||||||||||||||
Low-Duration Bond Fund | ||||||||||||||||||||||||
0 - 100 | $ | — | $ | — | $ | — | $ | — | $ | — | $ | — | ||||||||||||
101 - 250 | — | — | 1,200,000 | — | — | 1,200,000 | ||||||||||||||||||
251 - 500 | — | — | — | — | — | — | ||||||||||||||||||
501 - 1,000 | — | — | — | — | — | — | ||||||||||||||||||
Greater than 1,000 | — | — | — | — | — | — | ||||||||||||||||||
|
|
|
|
|
|
|
|
|
|
|
| |||||||||||||
Total | $ | — | $ | — | $ | 1,200,000 | $ | — | $ | — | $ | 1,200,000 | ||||||||||||
|
|
|
|
|
|
|
|
|
|
|
| |||||||||||||
Medium-Duration Bond Fund | ||||||||||||||||||||||||
0 - 100 | $ | — | $ | 7,825,000 | $ | 4,925,000 | $ | — | $ | — | $ | 12,750,000 | ||||||||||||
101 - 250 | — | — | 900,000 | — | — | 900,000 | ||||||||||||||||||
251 - 500 | — | — | 1,000,000 | — | — | 1,000,000 | ||||||||||||||||||
501 - 1,000 | — | — | — | — | — | — | ||||||||||||||||||
Greater than 1,000 | — | — | — | — | — | — | ||||||||||||||||||
|
|
|
|
|
|
|
|
|
|
|
| |||||||||||||
Total | $ | — | $ | 7,825,000 | $ | 6,825,000 | $ | — | $ | — | $ | 14,650,000 | ||||||||||||
|
|
|
|
|
|
|
|
|
|
|
| |||||||||||||
Offsetting of Financial and Derivative Assets and Liabilities
Certain Funds are parties to International Swap and Derivatives Association, Inc. (“ISDA”) Master Agreements (“MA”) with various counterparties that govern over-the-counter derivative and foreign exchange contracts entered into from time to time. The ISDA MA may contain provisions regarding, among other things, the parties’ general obligations, representations, agreements, collateral requirements, events of default and early termination. With respect to certain counterparties, in accordance with the terms of the ISDA MA, collateral posted to the Fund is held in a segregated account by the Fund’s custodian and with respect to those amounts which can be sold or repledged, are presented in the Fund’s portfolio or Statements of Assets and Liabilities.
For financial reporting purposes, the Funds do not offset derivative assets and derivative liabilities that are subject to an ISDA MA in the Statements of Assets and Liabilities.
At December 31, 2015, derivative assets and liabilities (by type) held by the Funds are as follows:
| Fund | Assets | Liabilities | ||||||
MyDestination 2005 | ||||||||
Derivative Financial Instruments: | ||||||||
Financial futures contracts | $ | 1,266 | $ | 6,720 | ||||
|
|
|
| |||||
Total derivative assets and liabilities in the Statements of Assets and Liabilities | 1,266 | 6,720 | ||||||
Derivatives not subject to an MA or similar agreement | 1,266 | 6,720 | ||||||
|
|
|
| |||||
Total assets and liabilities subject to an MA | $ | — | $ | — | ||||
|
|
|
| |||||
MyDestination 2015 | ||||||||
Derivative Financial Instruments: | ||||||||
Financial futures contracts | $ | 5,344 | $ | 42,565 | ||||
|
|
|
| |||||
Total derivative assets and liabilities in the Statements of Assets and Liabilities | 5,344 | 42,565 | ||||||
Derivatives not subject to an MA or similar agreement | 5,344 | 42,565 | ||||||
|
|
|
| |||||
Total assets and liabilities subject to an MA | $ | — | $ | — | ||||
|
|
|
| |||||
295
Table of Contents
| Fund | Assets | Liabilities | ||||||
MyDestination 2025 | ||||||||
Derivative Financial Instruments: | ||||||||
Financial futures contracts | $ | 6,531 | $ | 74,580 | ||||
|
|
|
| |||||
Total derivative assets and liabilities in the Statements of Assets and Liabilities | 6,531 | 74,580 | ||||||
Derivatives not subject to an MA or similar agreement | 6,531 | 74,580 | ||||||
|
|
|
| |||||
Total assets and liabilities subject to an MA | $ | — | $ | — | ||||
|
|
|
| |||||
MyDestination 2035 | ||||||||
Derivative Financial Instruments: | ||||||||
Financial futures contracts | $ | 2,969 | $ | 70,110 | ||||
|
|
|
| |||||
Total derivative assets and liabilities in the Statements of Assets and Liabilities | 2,969 | 70,110 | ||||||
Derivatives not subject to an MA or similar agreement | 2,969 | 70,110 | ||||||
|
|
|
| |||||
Total assets and liabilities subject to an MA | $ | — | $ | — | ||||
|
|
|
| |||||
MyDestination 2045 | ||||||||
Derivative Financial Instruments: | ||||||||
Financial futures contracts | $ | 594 | $ | 61,105 | ||||
|
|
|
| |||||
Total derivative assets and liabilities in the Statements of Assets and Liabilities | 594 | 61,105 | ||||||
Derivatives not subject to an MA or similar agreement | 594 | 61,105 | ||||||
|
|
|
| |||||
Total assets and liabilities subject to an MA | $ | — | $ | — | ||||
|
|
|
| |||||
MyDestination 2055 | ||||||||
Derivative Financial Instruments: | ||||||||
Financial futures contracts | $ | — | $ | 6,720 | ||||
|
|
|
| |||||
Total derivative assets and liabilities in the Statements of Assets and Liabilities | — | 6,720 | ||||||
Derivatives not subject to an MA or similar agreement | — | 6,720 | ||||||
|
|
|
| |||||
Total assets and liabilities subject to an MA | $ | — | $ | — | ||||
|
|
|
| |||||
Conservative Allocation | ||||||||
Derivative Financial Instruments: | ||||||||
Financial futures contracts | $ | 844 | $ | 14,430 | ||||
|
|
|
| |||||
Total derivative assets and liabilities in the Statements of Assets and Liabilities | 844 | 14,430 | ||||||
Derivatives not subject to an MA or similar agreement | 844 | 14,430 | ||||||
|
|
|
| |||||
Total assets and liabilities subject to an MA | $ | — | $ | — | ||||
|
|
|
| |||||
Balanced Allocation | ||||||||
Derivative Financial Instruments: | ||||||||
Financial futures contracts | $ | 33,516 | $ | 211,980 | ||||
|
|
|
| |||||
Total derivative assets and liabilities in the Statements of Assets and Liabilities | 33,516 | 211,980 | ||||||
Derivatives not subject to an MA or similar agreement | 33,516 | 211,980 | ||||||
|
|
|
| |||||
Total assets and liabilities subject to an MA | $ | — | $ | — | ||||
|
|
|
| |||||
Growth Allocation | ||||||||
Derivative Financial Instruments: | ||||||||
Financial futures contracts | $ | 11,500 | $ | 212,440 | ||||
|
|
|
| |||||
Total derivative assets and liabilities in the Statements of Assets and Liabilities | 11,500 | 212,440 | ||||||
Derivatives not subject to an MA or similar agreement | 11,500 | 212,440 | ||||||
|
|
|
| |||||
Total assets and liabilities subject to an MA | $ | — | $ | — | ||||
|
|
|
| |||||
296
Table of Contents
| Fund | Assets | Liabilities | ||||||
Aggressive Allocation | ||||||||
Derivative Financial Instruments: | ||||||||
Financial futures contracts | $ | — | $ | 230,585 | ||||
|
|
|
| |||||
Total derivative assets and liabilities in the Statements of Assets and Liabilities | — | 230,585 | ||||||
Derivatives not subject to an MA or similar agreement | — | 230,585 | ||||||
|
|
|
| |||||
Total assets and liabilities subject to an MA | $ | — | $ | — | ||||
|
|
|
| |||||
Low-Duration Bond | ||||||||
Derivative Financial Instruments: | ||||||||
Financial futures contracts | $ | 76,501 | $ | 80,398 | ||||
Forward foreign exchange contracts | 319,042 | 546,966 | ||||||
Options | 29,641 | 661,700 | ||||||
Swaps | 433,568 | 28,492 | ||||||
|
|
|
| |||||
Total derivative assets and liabilities in the Statements of Assets and Liabilities | 858,752 | 1,317,556 | ||||||
Derivatives not subject to an MA or similar agreement | 157,729 | 128,139 | ||||||
|
|
|
| |||||
Total assets and liabilities subject to an MA | $ | 701,023 | $ | 1,189,417 | ||||
|
|
|
| |||||
Medium-Duration Bond | ||||||||
Derivative Financial Instruments: | ||||||||
Financial futures contracts | $ | 576,509 | $ | 329,920 | ||||
Forward foreign exchange contracts | 2,069,681 | 1,413,585 | ||||||
Options | 527,407 | 439,100 | ||||||
Swaps | 511,370 | 5,140,568 | ||||||
|
|
|
| |||||
Total derivative assets and liabilities in the Statements of Assets and Liabilities | 3,684,967 | 7,323,173 | ||||||
Derivatives not subject to an MA or similar agreement | 993,436 | 549,159 | ||||||
|
|
|
| |||||
Total assets and liabilities subject to an MA | $ | 2,691,531 | $ | 6,774,014 | ||||
|
|
|
| |||||
Global Bond | ||||||||
Derivative Financial Instruments: | ||||||||
Financial futures contracts | $ | 42,189 | $ | 62,798 | ||||
Forward foreign exchange contracts | 560,811 | 70,758 | ||||||
Options | 108,972 | — | ||||||
|
|
|
| |||||
Total derivative assets and liabilities in the Statements of Assets and Liabilities | 711,972 | 133,556 | ||||||
Derivatives not subject to an MA or similar agreement | 151,161 | 62,798 | ||||||
|
|
|
| |||||
Total assets and liabilities subject to an MA | $ | 560,811 | $ | 70,758 | ||||
|
|
|
| |||||
Defensive Market Strategies | ||||||||
Derivative Financial Instruments: | ||||||||
Financial futures contracts | $ | — | $ | 251,520 | ||||
Forward foreign exchange contracts | 26,730 | 13,893 | ||||||
Options | — | 493,588 | ||||||
|
|
|
| |||||
Total derivative assets and liabilities in the Statements of Assets and Liabilities | 26,730 | 759,001 | ||||||
Derivatives not subject to an MA or similar agreement | 26,730 | 759,001 | ||||||
|
|
|
| |||||
Total assets and liabilities subject to an MA | $ | — | $ | — | ||||
|
|
|
| |||||
297
Table of Contents
| Fund | Assets | Liabilities | ||||||
Equity Index | ||||||||
Derivative Financial Instruments: | ||||||||
Financial futures contracts | $ | — | $ | 199,680 | ||||
|
|
|
| |||||
Total derivative assets and liabilities in the Statements of Assets and Liabilities | — | 199,680 | ||||||
Derivatives not subject to an MA or similar agreement | — | 199,680 | ||||||
|
|
|
| |||||
Total assets and liabilities subject to an MA | $ | — | $ | — | ||||
|
|
|
| |||||
Value Equity | ||||||||
Derivative Financial Instruments: | ||||||||
Financial futures contracts | $ | — | $ | 395,520 | ||||
|
|
|
| |||||
Total derivative assets and liabilities in the Statements of Assets and Liabilities | — | 395,520 | ||||||
Derivatives not subject to an MA or similar agreement | — | 395,520 | ||||||
|
|
|
| |||||
Total assets and liabilities subject to an MA | $ | — | $ | — | ||||
|
|
|
| |||||
Growth Equity | ||||||||
Derivative Financial Instruments: | ||||||||
Financial futures contracts | $ | — | $ | 465,600 | ||||
|
|
|
| |||||
Total derivative assets and liabilities in the Statements of Assets and Liabilities | — | 465,600 | ||||||
Derivatives not subject to an MA or similar agreement | — | 465,600 | ||||||
|
|
|
| |||||
Total assets and liabilities subject to an MA | $ | — | $ | — | ||||
|
|
|
| |||||
Small Cap Equity | ||||||||
Derivative Financial Instruments: | ||||||||
Financial futures contracts | $ | — | $ | 215,050 | ||||
|
|
|
| |||||
Total derivative assets and liabilities in the Statements of Assets and Liabilities | — | 215,050 | ||||||
Derivatives not subject to an MA or similar agreement | — | 215,050 | ||||||
|
|
|
| |||||
Total assets and liabilities subject to an MA | $ | — | $ | — | ||||
|
|
|
| |||||
International Equity Index | ||||||||
Derivative Financial Instruments: | ||||||||
Financial futures contracts | $ | — | $ | 64,125 | ||||
|
|
|
| |||||
Total derivative assets and liabilities in the Statements of Assets and Liabilities | — | 64,125 | ||||||
Derivatives not subject to an MA or similar agreement | — | 64,125 | ||||||
|
|
|
| |||||
Total assets and liabilities subject to an MA | $ | — | $ | — | ||||
|
|
|
| |||||
International Equity | ||||||||
Derivative Financial Instruments: | ||||||||
Financial futures contracts | $ | 160,395 | $ | 777,420 | ||||
Forward foreign exchange contracts | 4,580,057 | 1,104,711 | ||||||
Swaps | 333 | 1,777 | ||||||
|
|
|
| |||||
Total derivative assets and liabilities in the Statements of Assets and Liabilities | 4,740,785 | 1,883,908 | ||||||
Derivatives not subject to an MA or similar agreement | 160,395 | 626,864 | ||||||
|
|
|
| |||||
Total assets and liabilities subject to an MA | $ | 4,580,390 | $ | 1,257,044 | ||||
|
|
|
| |||||
Emerging Markets Equity | ||||||||
Derivative Financial Instruments: | ||||||||
Financial futures contracts | $ | 45,072 | $ | 67,036 | ||||
Forward foreign exchange contracts | 1,072,049 | 570,141 | ||||||
Swaps | — | 18,979 | ||||||
|
|
|
| |||||
Total derivative assets and liabilities in the Statements of Assets and Liabilities | 1,117,121 | 656,156 | ||||||
Derivatives not subject to an MA or similar agreement | 36,312 | 55,431 | ||||||
|
|
|
| |||||
Total assets and liabilities subject to an MA | $ | 1,080,809 | $ | 600,725 | ||||
|
|
|
| |||||
298
Table of Contents
| Fund | Assets | Liabilities | ||||||
Inflation Protected Bond | ||||||||
Derivative Financial Instruments: | ||||||||
Financial futures contracts | $ | 18,032 | $ | 70,910 | ||||
Forward foreign exchange contracts | 474,371 | 913,952 | ||||||
Options | 532,620 | 283,974 | ||||||
|
|
|
| |||||
Total derivative assets and liabilities in the Statements of Assets and Liabilities | 1,025,023 | 1,268,836 | ||||||
Derivatives not subject to an MA or similar agreement | 18,032 | 70,910 | ||||||
|
|
|
| |||||
Total assets and liabilities subject to an MA | $ | 1,006,991 | $ | 1,197,926 | ||||
|
|
|
| |||||
Real Estate Securities | ||||||||
Derivative Financial Instruments: | ||||||||
Financial futures contracts | $ | — | $ | 76,700 | ||||
|
|
|
| |||||
Total derivative assets and liabilities in the Statements of Assets and Liabilities | — | 76,700 | ||||||
Derivatives not subject to an MA or similar agreement | — | 76,700 | ||||||
|
|
|
| |||||
Total assets and liabilities subject to an MA | $ | — | $ | — | ||||
|
|
|
| |||||
At December 31, 2015, derivative assets and liabilities by counterparty net of amounts available for offset under an MA and net of the related collateral (received)/pledged by the Trust are as follows:
| Fund/Sub-adviser/Counterparty | Derivative Assets Subject to an MA | Derivative Liabilities Subject to an MA | Value of Derivatives Subject to an MA | Collateral (Received)/ Pledged | Net Exposure | |||||||||||||||
Low-Duration Bond |
| |||||||||||||||||||
Sub-adviser A | ||||||||||||||||||||
Other Counterparties* | $ | 42,589 | $ | (101,249 | ) | $ | (58,660 | ) | $ | — | $ | (58,660 | ) | |||||||
|
|
|
|
|
|
|
|
|
| |||||||||||
| 42,589 | (101,249 | ) | (58,660 | ) | — | (58,660 | ) | |||||||||||||
|
|
|
|
|
|
|
|
|
| |||||||||||
Sub-adviser B | ||||||||||||||||||||
UBS | 44,655 | (671,494 | ) | (626,839 | ) | — | (626,839 | ) | ||||||||||||
Other Counterparties* | 613,779 | (416,674 | ) | 197,105 | — | 197,105 | ||||||||||||||
|
|
|
|
|
|
|
|
|
| |||||||||||
| 658,434 | (1,088,168 | ) | (429,734 | ) | — | (429,734 | ) | |||||||||||||
|
|
|
|
|
|
|
|
|
| |||||||||||
Sub-adviser C | ||||||||||||||||||||
Other Counterparties* | — | — | — | — | — | |||||||||||||||
|
|
|
|
|
|
|
|
|
| |||||||||||
Total Derivatives | $ | 701,023 | $ | (1,189,417 | ) | $ | (488,394 | ) | $ | — | $ | (488,394 | ) | |||||||
|
|
|
|
|
|
|
|
|
| |||||||||||
Medium-Duration Bond | ||||||||||||||||||||
Sub-adviser A | ||||||||||||||||||||
MLCS | $ | — | $ | (665,162 | ) | $ | (665,162 | ) | $ | — | $ | (665,162 | ) | |||||||
Other Counterparties* | 266,545 | (480,211 | ) | (213,666 | ) | — | (213,666 | ) | ||||||||||||
|
|
|
|
|
|
|
|
|
| |||||||||||
| 266,545 | (1,145,373 | ) | (878,828 | ) | — | (878,828 | ) | |||||||||||||
|
|
|
|
|
|
|
|
|
| |||||||||||
Sub-adviser B | ||||||||||||||||||||
CS | 34,741 | (3,574,931 | ) | (3,540,190 | ) | — | (3,540,190 | ) | ||||||||||||
Other Counterparties* | 1,617,410 | (2,019,064 | ) | (401,654 | ) | — | (401,654 | ) | ||||||||||||
|
|
|
|
|
|
|
|
|
| |||||||||||
| 1,652,151 | (5,593,995 | ) | (3,941,844 | ) | — | (3,941,844 | ) | |||||||||||||
|
|
|
|
|
|
|
|
|
| |||||||||||
Sub-adviser C | ||||||||||||||||||||
Other Counterparties* | 772,835 | (34,646 | ) | 738,189 | — | 738,189 | ||||||||||||||
|
|
|
|
|
|
|
|
|
| |||||||||||
| 772,835 | (34,646 | ) | 738,189 | — | 738,189 | |||||||||||||||
|
|
|
|
|
|
|
|
|
| |||||||||||
Total Derivatives | $ | 2,691,531 | $ | (6,774,014 | ) | $ | (4,082,483 | ) | $ | — | $ | (4,082,483 | ) | |||||||
|
|
|
|
|
|
|
|
|
| |||||||||||
299
Table of Contents
| Fund/Sub-adviser/Counterparty | Derivative Assets Subject to an MA | Derivative Liabilities Subject to an MA | Value of Derivatives Subject to an MA | Collateral (Received)/ Pledged | Net Exposure | |||||||||||||||
Global Bond | ||||||||||||||||||||
Sub-adviser A | ||||||||||||||||||||
DEUT | $ | 243,656 | $ | (29,351 | ) | $ | 214,305 | $ | — | $ | 214,305 | |||||||||
Other Counterparties* | 317,155 | (41,407 | ) | 275,748 | — | 275,748 | ||||||||||||||
|
|
|
|
|
|
|
|
|
| |||||||||||
Total Derivatives | $ | 560,811 | $ | (70,758 | ) | $ | 490,053 | $ | — | $ | 490,053 | |||||||||
|
|
|
|
|
|
|
|
|
| |||||||||||
International Equity | ||||||||||||||||||||
Sub-adviser A | ||||||||||||||||||||
CITIG | $ | 4,580,057 | $ | (1,104,711 | ) | $ | 3,475,346 | $ | — | $ | 3,475,346 | |||||||||
Other Counterparties* | 333 | (152,333 | ) | (152,000 | ) | — | (152,000 | ) | ||||||||||||
|
|
|
|
|
|
|
|
|
| |||||||||||
Total Derivatives | $ | 4,580,390 | $ | (1,257,044 | ) | $ | 3,323,346 | $ | — | $ | 3,323,346 | |||||||||
|
|
|
|
|
|
|
|
|
| |||||||||||
Emerging Markets Equity | ||||||||||||||||||||
Sub-adviser A | ||||||||||||||||||||
CITIG | $ | 1,072,049 | $ | (570,141 | ) | $ | 501,908 | $ | — | $ | 501,908 | |||||||||
Other Counterparties* | 8,760 | (30,854 | ) | (21,824 | ) | — | (21,824 | ) | ||||||||||||
|
|
|
|
|
|
|
|
|
| |||||||||||
Total Derivatives | $ | 1,080,809 | $ | (600,725 | ) | $ | 480,084 | $ | — | $ | 480,084 | |||||||||
|
|
|
|
|
|
|
|
|
| |||||||||||
Inflation Protected Bond | ||||||||||||||||||||
Sub-adviser A | ||||||||||||||||||||
BNP | $ | 160,276 | $ | — | $ | 160,276 | $ | — | $ | 160,276 | ||||||||||
UBS | 4,662 | (329,741 | ) | (325,079 | ) | — | (325,079 | ) | ||||||||||||
Other Counterparties* | 842,053 | (868,185 | ) | (26,132 | ) | — | (26,132 | ) | ||||||||||||
|
|
|
|
|
|
|
|
|
| |||||||||||
Total Derivatives | $ | 1,006,991 | $ | (1,197,926 | ) | $ | (190,935 | ) | $ | — | $ | (190,935 | ) | |||||||
|
|
|
|
|
|
|
|
|
| |||||||||||
*Other Counterparties represent amounts that are held with counterparties where the absolute value of the total is less than 0.05% of the net assets of the respective Fund. Those holdings are deemed immaterial to the respective Fund and are listed collectively.
Additional information about master netting arrangements can be found in the Repurchase Agreements and Securities Lending sections of the Notes to Financial Statements.
300
Table of Contents
Derivative Holdings Categorized by Risk Exposure
FASB “Derivatives and Hedging” also requires all companies to disclose information intended to enable financial statement users to understand how and why the entity uses derivative instruments, how derivatives are accounted for, and how derivative instruments affect the entity’s financial position, results of operations, and cash flows.
Location on the Statements of Assets and Liabilities | ||||
Derivative Type | Asset Derivatives | Liability Derivatives | ||
| Interest rate contracts | Investments in securities of unaffiliated issuers, at value | Options written at value | ||
| Receivables: Variation margin* | Payables: Variation margin* | |||
| Unrealized appreciation on swap agreements | Unrealized depreciation on swap agreements | |||
| Foreign exchange contracts | Investments in securities of unaffiliated issuers, at value | Options written at value | ||
| Unrealized appreciation on foreign currency exchange contracts | Unrealized depreciation on foreign currency exchange contracts | |||
| Credit contracts | Unrealized appreciation on swap agreements | Unrealized depreciation on swap agreements | ||
| Equity contracts | Investments in securities of unaffiliated issuers, at value | Options written at value | ||
| Receivables: Variation margin* | Payables: Variation margin* | |||
*The variation margin shown on the Statements of Assets and Liabilities is the daily change in the unrealized appreciation (depreciation) for open futures and exchange traded swap contracts. The variation margin presented below is the cumulative change in unrealized appreciation (depreciation) from the date the contract was opened until December 31, 2015.
| Asset Derivative Value | ||||||||||||||||||||
| Fund | Total Value at 12/31/15 | Interest Rate Contracts | Foreign Exchange Contracts | Credit Contracts | Equity Contracts | |||||||||||||||
MyDestination 2005 | ||||||||||||||||||||
Futures | $ | (6,502 | ) | $ | (1,867 | ) | $ | — | $ | — | $ | (4,635 | ) | |||||||
|
|
|
|
|
|
|
|
|
| |||||||||||
MyDestination 2015 | ||||||||||||||||||||
Futures | $ | 9,612 | $ | (4,921 | ) | $ | — | $ | — | $ | 14,533 | |||||||||
|
|
|
|
|
|
|
|
|
| |||||||||||
MyDestination 2025 | ||||||||||||||||||||
Futures | $ | 18,592 | $ | (5,976 | ) | $ | — | $ | — | $ | 24,568 | |||||||||
|
|
|
|
|
|
|
|
|
| |||||||||||
MyDestination 2035 | ||||||||||||||||||||
Futures | $ | 25,682 | $ | (1,796 | ) | $ | — | $ | — | $ | 27,478 | |||||||||
|
|
|
|
|
|
|
|
|
| |||||||||||
MyDestination 2045 | ||||||||||||||||||||
Futures | $ | 21,751 | $ | (359 | ) | $ | — | $ | — | $ | 22,110 | |||||||||
|
|
|
|
|
|
|
|
|
| |||||||||||
MyDestination 2055 | ||||||||||||||||||||
Futures | $ | (3,520 | ) | $ | — | $ | — | $ | — | $ | (3,520 | ) | ||||||||
|
|
|
|
|
|
|
|
|
| |||||||||||
Conservative Allocation | ||||||||||||||||||||
Futures | $ | 3,230 | $ | (5,514 | ) | $ | — | $ | — | $ | 8,744 | |||||||||
|
|
|
|
|
|
|
|
|
| |||||||||||
Balanced Allocation | ||||||||||||||||||||
Futures | $ | 93,790 | $ | (7,303 | ) | $ | — | $ | — | $ | 101,093 | |||||||||
|
|
|
|
|
|
|
|
|
| |||||||||||
Growth Allocation | ||||||||||||||||||||
Futures | $ | 102,408 | $ | (2,945 | ) | $ | — | $ | — | $ | 105,353 | |||||||||
|
|
|
|
|
|
|
|
|
| |||||||||||
Aggressive Allocation | ||||||||||||||||||||
Futures | $ | 124,428 | $ | — | $ | — | $ | — | $ | 124,428 | ||||||||||
|
|
|
|
|
|
|
|
|
| |||||||||||
301
Table of Contents
| Asset Derivative Value | ||||||||||||||||||||
| Fund | Total Value at 12/31/15 | Interest Rate Contracts | Foreign Exchange Contracts | Credit Contracts | Equity Contracts | |||||||||||||||
Low-Duration Bond | ||||||||||||||||||||
Forwards | $ | 319,042 | $ | — | $ | 319,042 | $ | — | $ | — | ||||||||||
Futures | (365,655 | ) | (365,655 | ) | — | — | — | |||||||||||||
Purchased Options | 29,641 | 29,641 | — | — | — | |||||||||||||||
Swaps | 433,568 | 406,380 | — | 27,188 | — | |||||||||||||||
|
|
|
|
|
|
|
|
|
| |||||||||||
Totals | $ | 416,596 | $ | 70,366 | $ | 319,042 | $ | 27,188 | $ | — | ||||||||||
|
|
|
|
|
|
|
|
|
| |||||||||||
Medium-Duration Bond | ||||||||||||||||||||
Forwards | $ | 2,069,681 | $ | — | $ | 2,069,681 | $ | — | $ | — | ||||||||||
Futures | (32,860 | ) | (32,860 | ) | — | — | — | |||||||||||||
Purchased Options | 527,407 | 527,407 | — | — | — | |||||||||||||||
Swaps | 511,370 | 434,586 | — | 76,784 | — | |||||||||||||||
|
|
|
|
|
|
|
|
|
| |||||||||||
Totals | $ | 3,075,598 | $ | 929,133 | $ | 2,069,681 | $ | 76,784 | $ | — | ||||||||||
|
|
|
|
|
|
|
|
|
| |||||||||||
Global Bond Fund | ||||||||||||||||||||
Forwards | $ | 560,811 | $ | — | $ | 560,811 | $ | — | $ | — | ||||||||||
Futures | (93,584 | ) | (93,584 | ) | — | — | — | |||||||||||||
Purchased Options | 108,972 | — | 108,972 | — | — | |||||||||||||||
|
|
|
|
|
|
|
|
|
| |||||||||||
Totals | $ | 576,199 | $ | (93,584 | ) | $ | 669,783 | $ | — | $ | — | |||||||||
|
|
|
|
|
|
|
|
|
| |||||||||||
Defensive Market Strategies | ||||||||||||||||||||
Forwards | $ | 26,730 | $ | — | $ | 26,730 | $ | — | $ | — | ||||||||||
Futures | (73,717 | ) | — | — | — | (73,717 | ) | |||||||||||||
|
|
|
|
|
|
|
|
|
| |||||||||||
Totals | $ | (46,987 | ) | $ | — | $ | 26,730 | $ | — | $ | (73,717 | ) | ||||||||
|
|
|
|
|
|
|
|
|
| |||||||||||
Equity Index | ||||||||||||||||||||
Futures | $ | (41,549 | ) | $ | — | $ | — | $ | — | $ | (41,549 | ) | ||||||||
|
|
|
|
|
|
|
|
|
| |||||||||||
Value Equity | ||||||||||||||||||||
Futures | $ | (94,897 | ) | $ | — | $ | — | $ | — | $ | (94,897 | ) | ||||||||
|
|
|
|
|
|
|
|
|
| |||||||||||
Growth Equity Fund | ||||||||||||||||||||
Futures | $ | (144,600 | ) | $ | — | $ | — | $ | — | $ | (144,600 | ) | ||||||||
|
|
|
|
|
|
|
|
|
| |||||||||||
Small Cap Equity | ||||||||||||||||||||
Futures | $ | 241,324 | $ | — | $ | — | $ | — | $ | 241,324 | ||||||||||
|
|
|
|
|
|
|
|
|
| |||||||||||
International Equity Index | ||||||||||||||||||||
Futures | $ | 87,181 | $ | — | $ | — | $ | — | $ | 87,181 | ||||||||||
|
|
|
|
|
|
|
|
|
| |||||||||||
International Equity | ||||||||||||||||||||
Forwards | $ | 4,580,057 | $ | — | $ | 4,580,057 | $ | — | $ | — | ||||||||||
Futures | 1,643,888 | — | — | — | 1,643,888 | |||||||||||||||
Swaps | 333 | — | — | 333 | — | |||||||||||||||
|
|
|
|
|
|
|
|
|
| |||||||||||
Totals | $ | 6,224,278 | $ | — | $ | 4,580,057 | $ | 333 | $ | 1,643,888 | ||||||||||
|
|
|
|
|
|
|
|
|
| |||||||||||
Emerging Markets Equity | ||||||||||||||||||||
Forwards | $ | 1,072,049 | $ | — | $ | 1,072,049 | $ | — | $ | — | ||||||||||
Futures | (92,861 | ) | — | — | — | (92,861 | ) | |||||||||||||
|
|
|
|
|
|
|
|
|
| |||||||||||
Totals | $ | 979,188 | $ | — | $ | 1,072,049 | $ | — | $ | (92,861 | ) | |||||||||
|
|
|
|
|
|
|
|
|
| |||||||||||
302
Table of Contents
| Asset Derivative Value | ||||||||||||||||||||
| Fund | Total Value at 12/31/15 | Interest Rate Contracts | Foreign Exchange Contracts | Credit Contracts | Equity Contracts | |||||||||||||||
Inflation Protected Bond | ||||||||||||||||||||
Forwards | $ | 474,371 | $ | — | $ | 474,371 | $ | — | $ | — | ||||||||||
Futures | (26,435 | ) | (26,435 | ) | — | — | — | |||||||||||||
Purchased Options | 532,620 | 15,469 | 517,151 | — | — | |||||||||||||||
|
|
|
|
|
|
|
|
|
| |||||||||||
Totals | $ | 980,556 | $ | (10,966 | ) | $ | 991,522 | $ | — | $ | — | |||||||||
|
|
|
|
|
|
|
|
|
| |||||||||||
Real Estate Securities | ||||||||||||||||||||
Futures | $ | 39,530 | $ | — | $ | — | $ | — | $ | 39,530 | ||||||||||
|
|
|
|
|
|
|
|
|
| |||||||||||
| Liability Derivative Value | ||||||||||||||||||||
| Fund | Total Value at 12/31/15 | Interest Rate Contracts | Foreign Exchange Contracts | Credit Contracts | Equity Contracts | |||||||||||||||
Low-Duration Bond | ||||||||||||||||||||
Forwards | $ | 546,966 | $ | — | $ | 546,966 | $ | — | $ | — | ||||||||||
Futures | (118,055 | ) | (118,055 | ) | — | — | — | |||||||||||||
Swaps | 28,492 | 28,492 | — | — | — | |||||||||||||||
Written Options | 661,700 | 661,700 | — | — | — | |||||||||||||||
|
|
|
|
|
|
|
|
|
| |||||||||||
Totals | $ | 1,119,103 | $ | 572,137 | $ | 546,966 | $ | — | $ | — | ||||||||||
|
|
|
|
|
|
|
|
|
| |||||||||||
Medium-Duration Bond | ||||||||||||||||||||
Forwards | $ | 1,413,585 | $ | — | $ | 1,413,585 | $ | — | $ | — | ||||||||||
Futures | 1,052,419 | 1,050,993 | 1,426 | — | — | |||||||||||||||
Swaps | 5,140,568 | 5,049,680 | — | 90,888 | — | |||||||||||||||
Written Options | 439,100 | 358,821 | 80,279 | — | — | |||||||||||||||
|
|
|
|
|
|
|
|
|
| |||||||||||
Totals | $ | 8,045,672 | $ | 6,459,494 | $ | 1,495,290 | $ | 90,888 | $ | — | ||||||||||
|
|
|
|
|
|
|
|
|
| |||||||||||
Global Bond Fund | ||||||||||||||||||||
Forwards | $ | 70,758 | $ | — | $ | 70,758 | $ | — | $ | — | ||||||||||
Futures | (123,973 | ) | (123,973 | ) | — | — | — | |||||||||||||
|
|
|
|
|
|
|
|
|
| |||||||||||
Totals | $ | (53,215 | ) | $ | (123,973 | ) | $ | 70,758 | $ | — | $ | — | ||||||||
|
|
|
|
|
|
|
|
|
| |||||||||||
Defensive Market Strategies | ||||||||||||||||||||
Forwards | $ | 13,893 | $ | — | $ | 13,893 | $ | — | $ | — | ||||||||||
Written Options | 493,588 | — | — | — | 493,588 | |||||||||||||||
|
|
|
|
|
|
|
|
|
| |||||||||||
Totals | $ | 507,481 | $ | — | $ | 13,893 | $ | — | $ | 493,588 | ||||||||||
|
|
|
|
|
|
|
|
|
| |||||||||||
International Equity | ||||||||||||||||||||
Forwards | $ | 1,104,711 | $ | — | $ | 1,104,711 | $ | — | $ | — | ||||||||||
Futures | 608,540 | — | — | — | 608,540 | |||||||||||||||
Swaps | 1,777 | — | — | 1,777 | — | |||||||||||||||
|
|
|
|
|
|
|
|
|
| |||||||||||
Totals | $ | 1,715,028 | $ | — | $ | 1,104,711 | $ | 1,777 | $ | 608,540 | ||||||||||
|
|
|
|
|
|
|
|
|
| |||||||||||
Emerging Markets Equity | ||||||||||||||||||||
Forwards | $ | 570,141 | $ | — | $ | 570,141 | $ | — | $ | — | ||||||||||
Futures | 61,720 | — | — | — | 61,720 | |||||||||||||||
Swaps | 18,979 | — | — | 18,979 | — | |||||||||||||||
|
|
|
|
|
|
|
|
|
| |||||||||||
Totals | $ | 650,840 | $ | — | $ | 570,141 | $ | 18,979 | $ | 61,720 | ||||||||||
|
|
|
|
|
|
|
|
|
| |||||||||||
Inflation Protected Bond | ||||||||||||||||||||
Forwards | $ | 913,952 | $ | — | $ | 913,952 | $ | — | $ | — | ||||||||||
Futures | 120,787 | 120,787 | — | — | — | |||||||||||||||
Written Options | 283,974 | — | 283,974 | — | — | |||||||||||||||
|
|
|
|
|
|
|
|
|
| |||||||||||
Totals | $ | 1,318,713 | $ | 120,787 | $ | 1,197,926 | $ | — | $ | — | ||||||||||
|
|
|
|
|
|
|
|
|
| |||||||||||
303
Table of Contents
Derivative Type | Location on the Statements of Operations | |
| Interest rate contracts | Net realized gain (loss) from: Futures transactions | |
Net realized gain (loss) from: Swap agreements | ||
Net realized gain (loss) from: Option contracts written | ||
Net realized gain (loss) from: Option contracts purchased | ||
Net change in unrealized appreciation (depreciation) on: Futures | ||
Net change in unrealized appreciation (depreciation) on: Swap agreements | ||
Net change in unrealized appreciation (depreciation) on: Option contracts written | ||
Net change in unrealized appreciation (depreciation) on: Option contracts purchased | ||
| Foreign exchange contracts | Net realized gain (loss) from: Foreign currency | |
Net realized gain (loss) from: Option contracts written | ||
Net realized gain (loss) from: Option contracts purchased | ||
Net change in unrealized appreciation (depreciation) on: Foreign currency | ||
Net change in unrealized appreciation (depreciation) on: Option contracts purchased | ||
Net change in unrealized appreciation (depreciation) on: Option contracts written | ||
| Credit contracts | Net realized gain (loss) from: Swap agreements | |
Net change in unrealized appreciation (depreciation) on: Swap agreements | ||
| Equity contracts | Net realized gain (loss) from: Futures transactions | |
Net realized gain (loss) from: Option contracts written | ||
Net realized gain (loss) from: Option contracts purchased | ||
Net change in unrealized appreciation (depreciation) on: Futures | ||
Net change in unrealized appreciation (depreciation) on: Option contracts written | ||
Net change in unrealized appreciation (depreciation) on: Option contracts purchased |
| Realized Gain (Loss) on Derivatives Recognized in Income | ||||||||||||||||||||
| Total Value at 12/31/15 | Interest Rate Contracts | Foreign Exchange Contracts | Credit Contracts | Equity Contracts | ||||||||||||||||
MyDestination 2005 | ||||||||||||||||||||
Futures | $ | 6,564 | $ | (5,412 | ) | $ | — | $ | — | $ | 11,976 | |||||||||
|
|
|
|
|
|
|
|
|
| |||||||||||
MyDestination 2015 | ||||||||||||||||||||
Futures | $ | 50,011 | $ | 29,494 | $ | — | $ | — | $ | 20,517 | ||||||||||
|
|
|
|
|
|
|
|
|
| |||||||||||
MyDestination 2025 | ||||||||||||||||||||
Futures | $ | (180,078 | ) | $ | 53,792 | $ | — | $ | — | $ | (233,870 | ) | ||||||||
|
|
|
|
|
|
|
|
|
| |||||||||||
MyDestination 2035 | ||||||||||||||||||||
Futures | $ | (55,441 | ) | $ | 22,352 | $ | — | $ | — | $ | (77,793 | ) | ||||||||
|
|
|
|
|
|
|
|
|
| |||||||||||
MyDestination 2045 | ||||||||||||||||||||
Futures | $ | (54,616 | ) | $ | 11,473 | $ | — | $ | — | $ | (66,089 | ) | ||||||||
|
|
|
|
|
|
|
|
|
| |||||||||||
MyDestination 2055 | ||||||||||||||||||||
Futures | $ | 8,860 | $ | — | $ | — | $ | — | $ | 8,860 | ||||||||||
|
|
|
|
|
|
|
|
|
| |||||||||||
Conservative Allocation | ||||||||||||||||||||
Futures | $ | (20,991 | ) | $ | 15,509 | $ | — | $ | — | $ | (36,500 | ) | ||||||||
|
|
|
|
|
|
|
|
|
| |||||||||||
Balanced Allocation | ||||||||||||||||||||
Futures | $ | 97,044 | $ | 266,539 | $ | — | $ | — | $ | (169,495 | ) | |||||||||
|
|
|
|
|
|
|
|
|
| |||||||||||
Growth Allocation | ||||||||||||||||||||
Futures | $ | (122,119 | ) | $ | (55,096 | ) | $ | — | $ | — | $ | (67,023 | ) | |||||||
|
|
|
|
|
|
|
|
|
| |||||||||||
Aggressive Allocation | ||||||||||||||||||||
Futures | $ | (874,348 | ) | $ | — | $ | — | $ | — | $ | (874,348 | ) | ||||||||
|
|
|
|
|
|
|
|
|
| |||||||||||
304
Table of Contents
| Realized Gain (Loss) on Derivatives Recognized in Income | ||||||||||||||||||||
| Total Value at 12/31/15 | Interest Rate Contracts | Foreign Exchange Contracts | Credit Contracts | Equity Contracts | ||||||||||||||||
Low-Duration Bond | ||||||||||||||||||||
Forwards | $ | 3,865,972 | $ | — | $ | 3,865,972 | $ | — | $ | — | ||||||||||
Futures | 1,039,424 | 1,039,424 | — | — | — | |||||||||||||||
Purchased Options | (189,905 | ) | (189,905 | ) | — | — | — | |||||||||||||
Swaps | (2,715,513 | ) | (2,150,169 | ) | — | (565,344 | ) | — | ||||||||||||
Written Options | 685,708 | 682,599 | 3,109 | |||||||||||||||||
|
|
|
|
|
|
|
|
|
| |||||||||||
Totals | $ | 2,685,686 | $ | (618,051 | ) | $ | 3,869,081 | $ | (565,344 | ) | $ | — | ||||||||
|
|
|
|
|
|
|
|
|
| |||||||||||
Medium-Duration Bond | ||||||||||||||||||||
Forwards | $ | 4,773,984 | $ | — | $ | 4,773,984 | $ | — | $ | — | ||||||||||
Futures | 4,513,918 | 4,538,720 | (24,802 | ) | — | — | ||||||||||||||
Purchased Options | (1,271,782 | ) | (1,268,537 | ) | (3,245 | ) | — | — | ||||||||||||
Swaps | (4,435,516 | ) | (4,887,672 | ) | 315,679 | 136,477 | — | |||||||||||||
Written Options | 3,491,303 | 3,172,530 | 300,981 | 17,792 | — | |||||||||||||||
|
|
|
|
|
|
|
|
|
| |||||||||||
Totals | $ | 7,071,907 | $ | 1,555,041 | $ | 5,362,597 | $ | 154,269 | $ | — | ||||||||||
|
|
|
|
|
|
|
|
|
| |||||||||||
Global Bond | ||||||||||||||||||||
Forwards | $ | 4,442,244 | $ | — | $ | 4,442,244 | $ | — | $ | — | ||||||||||
Futures | 524,248 | 524,248 | — | — | — | |||||||||||||||
Purchased Options | (126,063 | ) | — | (126,063 | ) | — | — | |||||||||||||
Written Options | 68,500 | 68,500 | — | — | — | |||||||||||||||
|
|
|
|
|
|
|
|
|
| |||||||||||
Totals | $ | 4,908,929 | $ | 592,748 | $ | 4,316,181 | $ | — | $ | — | ||||||||||
|
|
|
|
|
|
|
|
|
| |||||||||||
Defensive Market Strategies | ||||||||||||||||||||
Forwards | $ | 886,393 | $ | — | $ | 886,393 | $ | — | $ | — | ||||||||||
Futures | 132,275 | — | — | — | 132,275 | |||||||||||||||
Purchased Options | 5,504,166 | — | — | — | 5,504,166 | |||||||||||||||
|
|
|
|
|
|
|
|
|
| |||||||||||
Totals | $ | 6,522,834 | $ | — | $ | 886,393 | $ | — | $ | 5,636,441 | ||||||||||
|
|
|
|
|
|
|
|
|
| |||||||||||
Equity Index | ||||||||||||||||||||
Futures | $ | 322,059 | $ | — | $ | — | $ | — | $ | 322,059 | ||||||||||
|
|
|
|
|
|
|
|
|
| |||||||||||
Value Equity | ||||||||||||||||||||
Futures | $ | 1,385,763 | $ | — | $ | — | $ | — | $ | 1,385,763 | ||||||||||
|
|
|
|
|
|
|
|
|
| |||||||||||
Growth Equity | ||||||||||||||||||||
Futures | $ | (786,257 | ) | $ | — | $ | — | $ | — | $ | (786,257 | ) | ||||||||
|
|
|
|
|
|
|
|
|
| |||||||||||
Small Cap Equity | ||||||||||||||||||||
Futures | $ | 170,469 | $ | — | $ | — | $ | — | $ | 170,469 | ||||||||||
|
|
|
|
|
|
|
|
|
| |||||||||||
International Equity Index | ||||||||||||||||||||
Futures | $ | (486,810 | ) | — | — | — | $ | (486,810 | ) | |||||||||||
|
|
|
|
|
|
|
|
|
| |||||||||||
International Equity | ||||||||||||||||||||
Forwards | $ | 7,931 | $ | — | $ | 7,931 | $ | — | $ | — | ||||||||||
Futures | 4,653,696 | — | — | — | 4,653,696 | |||||||||||||||
Swaps | (9,339 | ) | — | — | (9,339 | ) | — | |||||||||||||
|
|
|
|
|
|
|
|
|
| |||||||||||
Totals | $ | 4,652,288 | $ | — | $ | 7,931 | $ | (9,339 | ) | $ | 4,653,696 | |||||||||
|
|
|
|
|
|
|
|
|
| |||||||||||
Emerging Markets Equity | ||||||||||||||||||||
Forwards | $ | (2,755,664 | ) | $ | — | $ | (2,755,664 | ) | $ | — | $ | — | ||||||||
Futures | (6,825,596 | ) | — | — | — | (6,825,596 | ) | |||||||||||||
Swaps | (185,600 | ) | — | — | — | (185,600 | ) | |||||||||||||
|
|
|
|
|
|
|
|
|
| |||||||||||
Totals | $ | (9,766,860 | ) | $ | — | $ | (2,755,664 | ) | $ | — | $ | (7,011,196 | ) | |||||||
|
|
|
|
|
|
|
|
|
| |||||||||||
305
Table of Contents
| Realized Gain (Loss) on Derivatives Recognized in Income | ||||||||||||||||||||
| Total Value at 12/31/15 | Interest Rate Contracts | Foreign Exchange Contracts | Credit Contracts | Equity Contracts | ||||||||||||||||
Inflation Protected Bond | ||||||||||||||||||||
Forwards | $ | 1,882,071 | $ | — | $ | 1,882,071 | $ | — | $ | — | ||||||||||
Futures | (778,822 | ) | (778,822 | ) | — | — | — | |||||||||||||
Purchased Options | (3,547,971 | ) | (1,116,511 | ) | (2,431,460 | ) | — | — | ||||||||||||
Written Options | 2,054,927 | 55,607 | 1,999,320 | — | — | |||||||||||||||
|
|
|
|
|
|
|
|
|
| |||||||||||
Totals | $ | (389,795 | ) | $ | (1,839,726 | ) | $ | 1,449,931 | $ | — | $ | — | ||||||||
|
|
|
|
|
|
|
|
|
| |||||||||||
Real Estate Securities | ||||||||||||||||||||
Futures | $ | 75,056 | $ | — | $ | — | $ | — | $ | 75,056 | ||||||||||
|
|
|
|
|
|
|
|
|
| |||||||||||
| Change in Unrealized Appreciation (Depreciation) on Derivatives Recognized in Income | ||||||||||||||||||||
| Total Value at 12/31/15 | Interest Rate Contracts | Foreign Exchange Contracts | Credit Contracts | Equity Contracts | ||||||||||||||||
MyDestination 2005 | ||||||||||||||||||||
Futures | $ | (13,605 | ) | $ | (1,867 | ) | $ | — | $ | — | $ | (11,738 | ) | |||||||
|
|
|
|
|
|
|
|
|
| |||||||||||
MyDestination 2015 | ||||||||||||||||||||
Futures | $ | (4,222 | ) | $ | (18,106 | ) | $ | — | $ | — | $ | 13,884 | ||||||||
|
|
|
|
|
|
|
|
|
| |||||||||||
MyDestination 2025 | ||||||||||||||||||||
Futures | $ | (20,110 | ) | $ | (16,010 | ) | $ | — | $ | — | $ | (4,100 | ) | |||||||
|
|
|
|
|
|
|
|
|
| |||||||||||
MyDestination 2035 | ||||||||||||||||||||
Futures | $ | 5,082 | $ | (8,986 | ) | $ | — | $ | — | $ | 14,068 | |||||||||
|
|
|
|
|
|
|
|
|
| |||||||||||
MyDestination 2045 | ||||||||||||||||||||
Futures | $ | (8,605 | ) | $ | (1,956 | ) | $ | — | $ | — | $ | (6,649 | ) | |||||||
|
|
|
|
|
|
|
|
|
| |||||||||||
MyDestination 2055 | ||||||||||||||||||||
Futures | $ | (10,622 | ) | $ | — | $ | — | $ | — | $ | (10,622 | ) | ||||||||
|
|
|
|
|
|
|
|
|
| |||||||||||
Conservative Allocation | ||||||||||||||||||||
Futures | $ | (1,886 | ) | $ | (1,858 | ) | $ | — | $ | — | $ | (28 | ) | |||||||
|
|
|
|
|
|
|
|
|
| |||||||||||
Balanced Allocation | ||||||||||||||||||||
Futures | $ | (59,341 | ) | $ | (115,583 | ) | $ | — | $ | — | $ | 56,242 | ||||||||
|
|
|
|
|
|
|
|
|
| |||||||||||
Growth Allocation | ||||||||||||||||||||
Futures | $ | 19,420 | $ | (39,603 | ) | $ | — | $ | — | $ | 59,023 | |||||||||
|
|
|
|
|
|
|
|
|
| |||||||||||
Aggressive Allocation | ||||||||||||||||||||
Futures | $ | 64,643 | $ | — | $ | — | $ | — | $ | 64,643 | ||||||||||
|
|
|
|
|
|
|
|
|
| |||||||||||
Low-Duration Bond | ||||||||||||||||||||
Forwards | $ | (1,053,827 | ) | $ | — | $ | (1,053,827 | ) | $ | — | $ | — | ||||||||
Futures | 470,890 | 470,890 | — | — | — | |||||||||||||||
Purchased Options | (108,034 | ) | (108,034 | ) | — | — | — | |||||||||||||
Swaps | 831,077 | 660,321 | — | 170,756 | — | |||||||||||||||
Written Options | 526,983 | 526,983 | — | — | — | |||||||||||||||
|
|
|
|
|
|
|
|
|
| |||||||||||
Totals | $ | 667,089 | $ | 1,550,160 | $ | (1,053,827 | ) | $ | 170,756 | $ | — | |||||||||
|
|
|
|
|
|
|
|
|
| |||||||||||
306
Table of Contents
| Change in Unrealized Appreciation (Depreciation) on Derivatives Recognized in Income | ||||||||||||||||||||
| Total Value at 12/31/15 | Interest Rate Contracts | Foreign Exchange Contracts | Credit Contracts | Equity Contracts | ||||||||||||||||
Medium-Duration Bond | ||||||||||||||||||||
Forwards | $ | (347,008 | ) | $ | — | $ | (347,008 | ) | $ | — | $ | — | ||||||||
Futures | (596,367 | ) | (560,667 | ) | (35,700 | ) | — | — | ||||||||||||
Purchased Options | 547,255 | 547,255 | — | — | — | |||||||||||||||
Swaps | (560,335 | ) | (58,726 | ) | 25,302 | (526,911 | ) | — | ||||||||||||
Written Options | (372,586 | ) | (478,649 | ) | 113,804 | (7,741 | ) | — | ||||||||||||
|
|
|
|
|
|
|
|
|
| |||||||||||
Totals | $ | (1,329,041 | ) | $ | (550,787 | ) | $ | (243,602 | ) | $ | (534,652 | ) | $ | — | ||||||
|
|
|
|
|
|
|
|
|
| |||||||||||
Global Bond | ||||||||||||||||||||
Forwards | $ | (365,075 | ) | $ | — | $ | (365,075 | ) | $ | — | $ | — | ||||||||
Futures | 388,465 | 388,465 | — | — | — | |||||||||||||||
Purchased Options | 56,117 | — | 56,117 | — | — | |||||||||||||||
|
|
|
|
|
|
|
|
|
| |||||||||||
Totals | $ | 79,507 | $ | 388,465 | $ | (308,958 | ) | $ | — | $ | — | |||||||||
|
|
|
|
|
|
|
|
|
| |||||||||||
Defensive Market Strategies | ||||||||||||||||||||
Forwards | $ | (50,591 | ) | $ | — | $ | (50,591 | ) | $ | — | $ | — | ||||||||
Futures | (477,764 | ) | — | — | — | (477,764 | ) | |||||||||||||
Written Options | 105,480 | — | — | — | 105,480 | |||||||||||||||
|
|
|
|
|
|
|
|
|
| |||||||||||
Totals | $ | (422,875 | ) | $ | — | $ | (50,591 | ) | $ | — | $ | (372,284 | ) | |||||||
|
|
|
|
|
|
|
|
|
| |||||||||||
Equity Index | ||||||||||||||||||||
Futures | $ | (239,205 | ) | $ | — | $ | — | $ | — | $ | (239,205 | ) | ||||||||
|
|
|
|
|
|
|
|
|
| |||||||||||
Value Equity | ||||||||||||||||||||
Futures | $ | (567,504 | ) | $ | — | $ | — | $ | — | $ | (567,504 | ) | ||||||||
|
|
|
|
|
|
|
|
|
| |||||||||||
Growth Equity | ||||||||||||||||||||
Futures | $ | (877,837 | ) | $ | — | $ | — | $ | — | $ | (877,837 | ) | ||||||||
|
|
|
|
|
|
|
|
|
| |||||||||||
Small Cap Equity | ||||||||||||||||||||
Futures | $ | (419,122 | ) | $ | — | $ | — | $ | — | $ | (419,122 | ) | ||||||||
|
|
|
|
|
|
|
|
|
| |||||||||||
International Equity Index | ||||||||||||||||||||
Futures | $ | 87,181 | $ | — | $ | — | $ | — | $ | 87,181 | ||||||||||
|
|
|
|
|
|
|
|
|
| |||||||||||
International Equity | ||||||||||||||||||||
Forwards | $ | 2,885,704 | $ | — | $ | 2,885,704 | $ | — | $ | — | ||||||||||
Futures | 1,124,431 | — | — | — | 1,124,431 | |||||||||||||||
Swaps | (1,444 | ) | — | — | — | (1,444 | ) | |||||||||||||
|
|
|
|
|
|
|
|
|
| |||||||||||
Totals | $ | 4,008,691 | $ | — | $ | 2,885,704 | $ | — | $ | 1,122,987 | ||||||||||
|
|
|
|
|
|
|
|
|
| |||||||||||
Emerging Markets Equity | ||||||||||||||||||||
Forwards | $ | 1,712,978 | $ | — | $ | 1,712,978 | $ | — | $ | — | ||||||||||
Futures | (390,481 | ) | — | — | — | (390,481 | ) | |||||||||||||
Swaps | (10,703 | ) | — | — | — | (10,703 | ) | |||||||||||||
|
|
|
|
|
|
|
|
|
| |||||||||||
Totals | $ | 1,311,794 | $ | — | $ | 1,712,978 | $ | — | $ | (401,184 | ) | |||||||||
|
|
|
|
|
|
|
|
|
| |||||||||||
Inflation Protected Bond | ||||||||||||||||||||
Forwards | $ | (1,106,417 | ) | $ | — | $ | (1,106,417 | ) | $ | — | $ | — | ||||||||
Futures | 996,397 | 996,397 | — | — | — | |||||||||||||||
Purchased Options | (258,553 | ) | (303 | ) | (335,282 | ) | 77,032 | — | ||||||||||||
Written Options | 163,827 | (47,006 | ) | 210,833 | — | — | ||||||||||||||
|
|
|
|
|
|
|
|
|
| |||||||||||
Totals | $ | (204,746 | ) | $ | 949,088 | $ | (1,230,866 | ) | $ | 77,032 | $ | — | ||||||||
|
|
|
|
|
|
|
|
|
| |||||||||||
Real Estate Securities | ||||||||||||||||||||
Futures | $ | (111,119 | ) | $ | — | $ | — | $ | — | $ | (111,119 | ) | ||||||||
|
|
|
|
|
|
|
|
|
| |||||||||||
307
Table of Contents
Volume of Derivative Transactions
The table below summarizes the average balance of derivative holdings by fund during the year ended December 31, 2015. The average balance of derivatives held is indicative of the trading volume of each Fund.
| Long Derivative Volume | ||||||||||||||||
| Forward Foreign Currency Contracts (Average Cost) | Futures Contracts (Average Notional Value) | Purchased Option Contracts (Average Notional Cost) | Swap Contracts (Average Notional Amount) | |||||||||||||
MyDestination 2005 | $ | — | $ | 1,189,161 | $ | — | $ | — | ||||||||
MyDestination 2015 | — | 6,377,844 | — | — | ||||||||||||
MyDestination 2025 | — | 10,888,029 | — | — | ||||||||||||
MyDestination 2035 | — | 8,131,306 | — | — | ||||||||||||
MyDestination 2045 | — | 5,747,878 | — | — | ||||||||||||
MyDestination 2055 | — | 605,166 | — | — | ||||||||||||
Conservative Allocation | — | 4,816,199 | — | — | ||||||||||||
Balanced Allocation | — | 25,382,308 | — | — | ||||||||||||
Growth Allocation | — | 20,358,457 | — | — | ||||||||||||
Aggressive Allocation | — | 18,023,355 | — | — | ||||||||||||
Low-Duration Bond | 18,580,817 | 468,096,098 | 359,158 | 94,500,000 | ||||||||||||
Medium-Duration Bond | 53,111,577 | 278,409,624 | 548,175 | 5,199,860,000 | ||||||||||||
Global Bond | 24,831,077 | 34,606,966 | 87,932 | |||||||||||||
Defensive Market Strategies | 1,292,959 | 22,669,875 | — | — | ||||||||||||
Equity Index | — | 15,954,143 | — | — | ||||||||||||
Value Equity | — | 42,689,436 | — | — | ||||||||||||
Growth Equity | — | 61,411,856 | — | — | ||||||||||||
Small Cap Equity | — | 17,909,992 | — | — | ||||||||||||
International Equity Index | — | 3,931,447 | — | — | ||||||||||||
International Equity | 317,715,663 | 118,573,551 | — | 361,590 | ||||||||||||
Emerging Markets Equity | 104,794,480 | 48,622,834 | — | — | ||||||||||||
Inflation Protected Bond | 26,053,854 | 40,350,177 | 649,660 | — | ||||||||||||
Real Estate Securities | — | 5,805,749 | — | — | ||||||||||||
| Short Derivative Volume | ||||||||||||||||
| Forward Foreign Currency Contracts (Average Cost) | Futures Contracts (Average Notional Value) | Written Option Contracts (Average Notional Cost) | Swap Contracts (Average Notional Amount) | |||||||||||||
Low-Duration Bond | $ | 47,672,555 | $ | 153,804,296 | $ | 1,286,651 | $ | 252,298,108 | ||||||||
Medium-Duration Bond | 122,270,542 | 485,236,779 | 808,424 | 2,565,088,688 | ||||||||||||
Global Bond | 47,683,775 | 10,719,607 | 68,500 | — | ||||||||||||
Defensive Market Strategies | 8,417,232 | — | 701,020 | — | ||||||||||||
International Equity | 274,928,710 | 19,920,794 | — | 564,727 | ||||||||||||
Emerging Markets Equity | 94,883,442 | 8,434,897 | — | 2,156,320 | ||||||||||||
Inflation Protected Bond | 39,748,132 | 112,423,024 | 385,778 | — | ||||||||||||
j. Dividends and Distributions to Shareholders
The Low-Duration Bond Fund, Medium-Duration Bond Fund, Extended-Duration Bond Fund, Inflation Protected Bond Fund, Global Bond Fund and Flexible Income Fund declare and pay dividends from net investment income monthly. The Money Market Fund declares income dividends daily and pays them monthly. Each of the Defensive Market Strategies Fund, Equity Index Fund, Real Estate Securities Fund, Value Equity Fund and Growth Equity Fund declares and pays dividends from net investment income semi-annually. Each of the other Funds (including all the Target Date Funds and Asset Allocation Funds) declares and pays dividends from net investment income annually. Each Fund also distributes to its shareholders at least annually any realized net capital gains and net gains, if any, from certain foreign currency transactions. Dividends and distributions to shareholders are recorded on the ex-dividend date.
308
Table of Contents
k. Expenses
Expenses arising in connection with a Fund are charged directly to that Fund. Expenses common to all Funds are generally allocated to each Fund in proportion to their relative net assets. Each Class of shares bears its pro-rata portion of expenses attributable to its Class, except that each Class separately bears expenses related specifically to that Class, such as shareholder reporting, registration, transfer agent, shareholder servicing and distribution fees.
l. Security Transactions, Income and Realized Gains and Losses
Security transactions are accounted for on the date securities are purchased or sold (the trade date). Dividend income is recognized on the ex-dividend date, except certain dividends from foreign securities where the ex-date may have passed, which are recorded as soon as the Fund is informed of the ex-dividend date. Interest income is accrued daily, including the amortization of market premium and the accretion of market discount using the effective interest method. Realized gains and losses from security transactions are on an identified cost basis.
3. FEES AND OTHER TRANSACTIONS
a. Investment Advisory Fees (Affiliate)
Pursuant to a separate investment advisory agreement, GSCM acts as the Adviser to the Funds. As Adviser, it supervises the investments of the Funds and for such services is paid a fee. GSCM and the Trust have entered into sub-advisory agreements with various sub-advisers to manage each Select Fund’s investments. Under the general supervision of GSCM, the sub-advisers make the day-to-day investment decisions for the Select Funds, and for such services, each sub-adviser receives a fee from the Funds. The aggregate advisory fees and sub-adviser fees are included in the Statements of Assets and Liabilities and Statements of Operations under “Investment advisory fees”.
The advisory fees paid to GSCM and aggregate sub-advisory fees paid to the sub-advisers are computed daily based upon the net assets of each Fund. The actual advisory fees accrued and the sub-advisory fees accrued during the year ended December 31, 2015, based upon average daily net assets, were as follows:
| For the Period January 1, 2015 to April 30, 2015 | For the Period May 1, 2015 to December 31, 2015 | |||||||
Fund | Advisory Fees | Sub-Adviser Fees | Advisory Fees | Sub-Adviser Fees | ||||
MyDestination 2005 | 0.10% | 0.00% | 0.10% | 0.00% | ||||
MyDestination 2015 | 0.10% | 0.00% | 0.10% | 0.00% | ||||
MyDestination 2025 | 0.10% | 0.00% | 0.10% | 0.00% | ||||
MyDestination 2035 | 0.10% | 0.00% | 0.10% | 0.00% | ||||
MyDestination 2045 | 0.10% | 0.00% | 0.10% | 0.00% | ||||
MyDestination 2055 | 0.10% | 0.00% | 0.10% | 0.00% | ||||
Conservative Allocation | 0.10% | 0.00% | 0.10% | 0.00% | ||||
Balanced Allocation | 0.10% | 0.00% | 0.10% | 0.00% | ||||
Growth Allocation | 0.10% | 0.00% | 0.10% | 0.00% | ||||
Aggressive Allocation | 0.10% | 0.00% | 0.10% | 0.00% | ||||
Money Market | 0.09% | 0.06% | 0.07% | 0.07% | ||||
Low-Duration Bond | 0.13% | 0.19% | 0.11% | 0.19% | ||||
Medium-Duration Bond | 0.21% | 0.21% | 0.13% | 0.21% | ||||
Extended-Duration Bond | 0.25% | 0.23% | 0.25% | 0.24% | ||||
309
Table of Contents
| For the Period January 1, 2015 to April 30, 2015 | For the Period May 1, 2015 to December 31, 2015 | |||||||
Fund | Advisory Fees | Sub-Adviser Fees | Advisory Fees | Sub-Adviser Fees | ||||
Global Bond* | 0.21% | 0.25% | 0.25% | 0.25% | ||||
Defensive Market Strategies | 0.37% | 0.32% | 0.33% | 0.32% | ||||
Equity Index | 0.13% | 0.02% | 0.08% | 0.02% | ||||
Value Equity | 0.40% | 0.22% | 0.33% | 0.23% | ||||
Growth Equity | 0.45% | 0.36% | 0.33% | 0.39% | ||||
Small Cap Equity* | 0.27% | 0.64% | 0.33% | 0.64% | ||||
International Equity Index** | N/A | N/A | 0.10% | 0.08% | ||||
International Equity | 0.47% | 0.40% | 0.33% | 0.41% | ||||
Emerging Markets Equity | 0.47% | 0.77% | 0.33% | 0.76% | ||||
Inflation Protected Bond | 0.20% | 0.11% | 0.20% | 0.11% | ||||
Flexible Income | 0.25% | 0.49% | 0.20% | 0.49% | ||||
Real Assets | 0.10% | 0.00% | 0.10% | 0.00% | ||||
Real Estate Securities* | 0.28% | 0.43% | 0.30% | 0.43% | ||||
Global Natural Resources Equity | 0.39% | 0.64% | 0.36% | 0.63% | ||||
| * | Rate change effective 6/16/15. |
| ** | Commencement of operations was June 1, 2015. |
310
Table of Contents
For the year ended December 31, 2015, advisory fees and waivers for each Fund were as follows:
| Gross Advisory Fee | Waiver/ Reimbursements | Net Advisory Fee (Reimbursement) | ||||||||||
MyDestination 2005 | $ | 95,570 | $ | (107,461 | ) | $ | (11,891 | ) | ||||
MyDestination 2015 | 485,632 | (147,750 | ) | 337,882 | ||||||||
MyDestination 2025 | 690,981 | (177,230 | ) | 513,751 | ||||||||
MyDestination 2035 | 381,291 | (137,689 | ) | 243,602 | ||||||||
MyDestination 2045 | 273,297 | (112,959 | ) | 160,338 | ||||||||
MyDestination 2055 | 32,806 | (112,342 | ) | (79,536 | ) | |||||||
Conservative Allocation | 313,357 | (181,865 | ) | 131,492 | ||||||||
Balanced Allocation | 1,297,004 | (203,960 | ) | 1,093,044 | ||||||||
Growth Allocation | 958,191 | (110,470 | ) | 847,721 | ||||||||
Aggressive Allocation | 870,654 | (26,722 | ) | 843,932 | ||||||||
Money Market(1) | 972,494 | — | 972,494 | |||||||||
Low-Duration Bond | 1,001,521 | (252,592 | ) | 748,929 | ||||||||
Medium-Duration Bond | 1,423,312 | (377,824 | ) | 1,045,488 | ||||||||
Extended-Duration Bond | 709,650 | (69,433 | ) | 640,217 | ||||||||
Global Bond | 936,734 | (87,495 | ) | 849,239 | ||||||||
Defensive Market Strategies | 2,045,159 | (46,895 | ) | 1,998,264 | ||||||||
Equity Index | 508,372 | (121,711 | ) | 386,661 | ||||||||
Value Equity | 4,719,462 | (86,427 | ) | 4,633,035 | ||||||||
Growth Equity | 5,366,034 | (188,996 | ) | 5,177,038 | ||||||||
Small Cap Equity | 1,631,498 | (75,004 | ) | 1,556,494 | ||||||||
International Equity Index | 60,686 | (57,568 | ) | 3,118 | ||||||||
International Equity | 5,140,890 | (374,637 | ) | 4,766,253 | ||||||||
Emerging Markets Equity | 1,147,595 | (769,277 | ) | 378,318 | ||||||||
Inflation Protected Bond | 615,385 | (23,599 | ) | 591,786 | ||||||||
Flexible Income | 302,870 | (76,508 | ) | 226,362 | ||||||||
Real Assets | 44,667 | (117,409 | ) | (72,742 | ) | |||||||
Real Estate Securities | 779,805 | (88,028 | ) | 691,777 | ||||||||
Global Natural Resources Equity | 968,077 | (35,624 | ) | 932,453 | ||||||||
| (1) | The Statement of Operations “Expenses waived/reimbursed net of amount recaptured” for the Money Market Fund includes shareholder servicing fee waiver and other waivers. |
b. Shareholder Servicing Fees (Affiliate)
The Board of Trustees has adopted a Shareholder Service Plan for the Investor Class of each Fund. Under this Plan from January 1 to April 30, 2015, the Investor Class of each Select Fund, with the exception of the Real Assets Fund, was authorized to pay fees of 0.24% of average daily net assets to parties that provide services for and maintain shareholder accounts. Beginning May 1, 2015, each Fund is authorized to pay fees of 0.25% of average daily net assets to parties that provide services for and maintain shareholder accounts.
GuideStone Financial Resources (or its affiliate) voluntarily agreed to waive shareholder servicing fees and/or reimburse expenses for the Investor Class of the Money Market Fund to the extent necessary to maintain a minimum daily net yield of at least 0.01%. This voluntary shareholder servicing fee waiver and expense reimbursement may be changed or terminated with the consent of the Board of Trustees at any time.
311
Table of Contents
c. Expense Limitation (Affiliate)
GSCM has agreed, through April 30, 2016, to waive fees and reimburse expenses of the Institutional Class and Investor Class of each Fund (excluding interest, taxes, brokerage commissions, expense incurred in connection with acquired fund fees, expenses on securities sold short, and extraordinary expenses) which exceed, in the aggregate, the annual percentage rate of each Class’s average daily net assets as follows:
| For the Period January 1, 2015 to April 30, 2015 | For the Period May 1, 2015 to December 31, 2015 | |||||||||||||||
Fund | Institutional Class | Investor Class | Institutional Class | Investor Class | ||||||||||||
MyDestination 2005 | N/A | 0.20% | N/A | 0.35% | ||||||||||||
MyDestination 2015 | N/A | 0.20% | N/A | 0.35% | ||||||||||||
MyDestination 2025 | N/A | 0.20% | N/A | 0.35% | ||||||||||||
MyDestination 2035 | N/A | 0.20% | N/A | 0.35% | ||||||||||||
MyDestination 2045 | N/A | 0.20% | N/A | 0.35% | ||||||||||||
MyDestination 2055 | N/A | 0.20% | N/A | 0.35% | ||||||||||||
Conservative Allocation | N/A | 0.12% | N/A | 0.35% | ||||||||||||
Balanced Allocation | N/A | 0.12% | N/A | N/A | ||||||||||||
Growth Allocation | N/A | 0.12% | N/A | N/A | ||||||||||||
Aggressive Allocation | N/A | 0.12% | N/A | N/A | ||||||||||||
Money Market | 0.20% | 0.39% | N/A | N/A | ||||||||||||
Low-Duration Bond | 0.36% | 0.57% | N/A | N/A | ||||||||||||
Medium-Duration Bond | 0.48% | 0.63% | N/A | N/A | ||||||||||||
Extended-Duration Bond | 0.63% | 0.75% | N/A | N/A | ||||||||||||
Global Bond | N/A | 1.02% | N/A | 0.92% | ||||||||||||
Defensive Market Strategies | 0.99% | 1.25% | N/A | N/A | ||||||||||||
Equity Index | 0.23% | 0.38% | N/A | N/A | ||||||||||||
Value Equity | 0.74% | 0.94% | N/A | N/A | ||||||||||||
Growth Equity | 0.88% | 1.06% | N/A | N/A | ||||||||||||
Small Cap Equity | 1.12% | 1.21% | 1.03% | 1.29% | ||||||||||||
International Equity Index | N/A | N/A | 0.57% | N/A | ||||||||||||
International Equity | 0.96% | 1.20% | N/A | N/A | ||||||||||||
Emerging Markets Equity | 1.25% | 1.50% | 1.28% | 1.55% | ||||||||||||
Inflation Protected Bond | N/A | 0.67% | N/A | N/A | ||||||||||||
Flexible Income | N/A | 1.20% | N/A | 1.12% | ||||||||||||
Real Assets | N/A | 0.12% | N/A | 0.35% | ||||||||||||
Real Estate Securities | N/A | 1.29% | N/A | 1.12% | ||||||||||||
Global Natural Resources Equity | N/A | 1.50% | N/A | N/A | ||||||||||||
Each Fund in turn agrees to reimburse GSCM for any operating expenses in excess of the expense limitation paid, waived or assumed by GSCM for that Fund during the limitation period, provided GSCM would not be entitled to reimbursement for any amount that would cause operating expenses to exceed the expense limitation during the year in which the reimbursement would be made, and provided further that no amount will be reimbursed by the Fund more than three years after the year in which it was incurred or waived by GSCM.
312
Table of Contents
At December 31, 2015, the amounts subject to possible future reimbursement under the expense limitation agreement are as follows:
| Institutional Class | Investor Class | |||||||||||||||||||||||||||||||||
| 2013 | 2014 | 2015 | 2013 | 2014 | 2015 | |||||||||||||||||||||||||||||
MyDestination 2005 | N/A | N/A | N/A | $ | 40,223 | $ | 32,879 | $ | 96,582 | |||||||||||||||||||||||||
MyDestination 2015 | N/A | N/A | N/A | N/A | N/A | 93,914 | ||||||||||||||||||||||||||||
MyDestination 2025 | N/A | N/A | N/A | N/A | N/A | 126,742 | ||||||||||||||||||||||||||||
MyDestination 2035 | N/A | N/A | N/A | N/A | N/A | 118,651 | ||||||||||||||||||||||||||||
MyDestination 2045 | N/A | N/A | N/A | N/A | N/A | 98,363 | ||||||||||||||||||||||||||||
MyDestination 2055 | N/A | N/A | N/A | 87,450 | 91,150 | 110,496 | ||||||||||||||||||||||||||||
Small Cap Equity | N/A | N/A | N/A | N/A | 88,208 | 37,104 | ||||||||||||||||||||||||||||
Emerging Markets Equity | $ | 22,538 | $ | 176,022 | $ | 415,435 | 111,351 | 849,038 | 327,548 | |||||||||||||||||||||||||
Flexible Income | N/A | N/A | N/A | 28,255 | 10,828 | 50,597 | ||||||||||||||||||||||||||||
Real Assets | N/A | N/A | N/A | 67,124 | 112,332 | 95,031 | ||||||||||||||||||||||||||||
Real Estate Securities | N/A | N/A | N/A | N/A | N/A | 75,521 | ||||||||||||||||||||||||||||
d. Brokerage Service Arrangements
The Adviser directs the sub-advisers to place a certain percentage of security trades (if feasible) with designated brokers who have agreed to pay certain custody, transfer agency or other operating expenses through the use of Brokerage Service Arrangements on behalf of the Funds as follows:
Fund | Expenses Paid Through Brokerage Service Arrangements | ||||
Defensive Market Strategies | $ | 6,000 | |||
Value Equity | 21,830 | ||||
Growth Equity | 36,000 | ||||
Small Cap Equity | 91,080 | ||||
International Equity | 20,000 | ||||
Emerging Markets Equity | 4,516 | ||||
Real Estate Securities | 14,117 | ||||
Global Natural Resources Equity | 3,626 | ||||
e. Administrator, Transfer Agent and Distributor
For its services as Administrator, BNY Mellon Investment Servicing (US) Inc. (“BNY Mellon”) is entitled to receive fees, computed daily and paid monthly, based upon the average daily net assets of each Fund. The fees, excluding out of pocket expenses, currently range between 0.004% and 0.02% of average daily net assets. For its services as Transfer Agent, BNY Mellon receives a fee based mainly upon the number of accounts serviced. Certain minimum fees and transaction charges may apply. For the year ended December 31, 2015, BNY Mellon received $3,259,577 in aggregate fees and expenses for services rendered under the various agreements described above.
Foreside Funds Distributors LLC serves as the Underwriter and does not receive any fees in its capacity as Underwriter from GuideStone Funds. The fees are paid by GSCM.
313
Table of Contents
f. Investments in Affiliates
The Target Date, Asset Allocation Funds and the Real Asset Fund do not invest in the underlying Select Funds for the purpose of exercising management or control; however, investments made by each Target Date, Asset Allocation Fund and the Real Asset Fund within each of its principal investment strategies may represent a significant portion of an underlying Select Fund’s net assets. At December 31, 2015, the Target Date, Asset Allocation Funds and the Real Asset Fund were the owner of record of the following approximate percentages of the total outstanding shares of the underlying Select Funds as detailed below:
Fund | MyDestination 2005 | MyDestination 2015 | MyDestination 2025 | MyDestination 2035 | MyDestination 2045 | MyDestination 2055 | ||||||||||||||||||
Low-Duration Bond | 4.81 | % | 8.31 | % | 6.24 | % | 0.49 | % | — | — | ||||||||||||||
Medium-Duration Bond | 1.25 | 7.76 | 8.76 | 2.88 | 0.25 | % | — | |||||||||||||||||
Extended-Duration Bond | — | 4.07 | 10.07 | 2.20 | — | — | ||||||||||||||||||
Global Bond | 0.63 | 5.54 | 9.89 | 8.34 | 4.41 | 0.48 | % | |||||||||||||||||
Defensive Market Strategies | 1.56 | 13.76 | 20.22 | 1.24 | — | — | ||||||||||||||||||
Equity Index | 0.80 | 6.57 | 13.74 | 12.17 | 9.94 | 1.38 | ||||||||||||||||||
Value Equity | 0.31 | 2.51 | 5.31 | 4.70 | 3.84 | 0.53 | ||||||||||||||||||
Growth Equity | 0.28 | 2.33 | 4.90 | 4.31 | 3.51 | 0.49 | ||||||||||||||||||
Small Cap Equity | 0.29 | 2.69 | 5.92 | 6.41 | 5.79 | 0.82 | ||||||||||||||||||
International Equity Index | 1.69 | 14.22 | 30.03 | 27.13 | 22.52 | 3.15 | ||||||||||||||||||
International Equity | 0.31 | 2.59 | 5.50 | 4.98 | 4.12 | 0.58 | ||||||||||||||||||
Emerging Markets Equity | 0.49 | 4.12 | 8.84 | 8.01 | 6.63 | 0.93 | ||||||||||||||||||
Inflation Protected Bond | 3.13 | 15.71 | 10.23 | — | — | — | ||||||||||||||||||
Flexible Income | 3.35 | 16.58 | 9.59 | — | — | — | ||||||||||||||||||
Real Estate Securities | 0.37 | 1.95 | 7.29 | 5.04 | 3.62 | 0.49 | ||||||||||||||||||
Global Natural Resources Equity | 0.96 | 4.74 | 11.03 | 7.02 | 5.04 | 0.68 | ||||||||||||||||||
Fund | Conservative Allocation Fund | Balanced Allocation Fund | Growth Allocation Fund | Aggressive Allocation Fund | Real Assets Fund | |||||||||||||||
Low-Duration Bond | 19.49 | % | 23.57 | % | 10.73 | % | — | — | ||||||||||||
Medium-Duration Bond | 5.05 | 30.97 | 13.99 | — | — | |||||||||||||||
Extended-Duration Bond | — | 37.65 | 16.65 | — | — | |||||||||||||||
Global Bond | 2.51 | 30.92 | 13.85 | — | — | |||||||||||||||
Defensive Market Strategies | 5.34 | 20.07 | — | — | — | |||||||||||||||
Value Equity | 1.64 | 13.49 | 19.03 | 24.43 | % | — | ||||||||||||||
Growth Equity | 1.53 | 12.55 | 18.00 | 22.97 | — | |||||||||||||||
Small Cap Equity | 0.99 | 8.12 | 10.87 | 14.51 | — | |||||||||||||||
International Equity | 1.67 | 13.63 | 19.05 | 24.40 | — | |||||||||||||||
Emerging Markets Equity | 1.71 | 13.76 | 19.38 | 24.83 | — | |||||||||||||||
Inflation Protected Bond | 11.97 | 29.77 | — | — | 3.58 | % | ||||||||||||||
Flexible Income | 12.71 | 32.09 | — | — | 3.92 | |||||||||||||||
Real Estate Securities | 1.43 | 17.22 | 16.63 | — | 1.87 | |||||||||||||||
Global Natural Resources Equity | 3.77 | 24.20 | 18.09 | — | 3.07 | |||||||||||||||
314
Table of Contents
A summary of the Fund of Fund’s total long-term and short-term purchases and sales of the shares of the underlying Select Funds during the year ended December 31, 2015 is as follows:
| Total Value at 12/31/14 | Total Value at 12/31/15 | Purchases | Sales Proceeds | Dividend Income | Distributions of Realized Gains | |||||||||||||||||||
MyDestination 2005 | ||||||||||||||||||||||||
Money Market | $ | 1,910,861 | $ | 2,260,204 | $ | 31,308,813 | $ | 30,959,470 | $ | 1,168 | $ | 118 | ||||||||||||
Low-Duration Bond | 33,794,181 | 37,094,911 | 43,033,857 | 39,492,544 | 456,813 | — | ||||||||||||||||||
Medium-Duration Bond | 9,488,036 | 9,918,748 | 11,488,439 | 10,654,011 | 284,218 | 118,710 | ||||||||||||||||||
Global Bond | 2,331,291 | 2,468,525 | 2,904,767 | 2,524,408 | 95,859 | — | ||||||||||||||||||
Defensive Market Strategies | 9,987,044 | 9,506,353 | 11,048,129 | 11,213,611 | 141,261 | 411,256 | ||||||||||||||||||
Equity Index | — | 3,230,478 | 3,850,453 | 424,000 | 80,772 | 107,182 | ||||||||||||||||||
Value Equity | 4,673,762 | 3,213,837 | 5,789,053 | 6,763,512 | 62,967 | 364,074 | ||||||||||||||||||
Growth Equity | 4,664,644 | 3,238,253 | 5,865,499 | 6,924,343 | — | 598,656 | ||||||||||||||||||
Small Cap Equity | 1,158,017 | 1,092,769 | 1,489,613 | 1,389,735 | 4,989 | 115,130 | ||||||||||||||||||
International Equity Index | — | 1,875,689 | 2,218,672 | 155,000 | 15,172 | — | ||||||||||||||||||
International Equity | 5,316,895 | 3,784,279 | 6,560,125 | 7,979,105 | 74,214 | 152,806 | ||||||||||||||||||
Emerging Markets Equity | 1,398,322 | 1,464,847 | 1,949,292 | 1,594,235 | 6,003 | — | ||||||||||||||||||
Inflation Protected Bond | 9,093,029 | 9,443,214 | 10,983,491 | 10,415,377 | 28,614 | — | ||||||||||||||||||
Flexible Income | 4,486,247 | 4,733,235 | 621,490 | 142,000 | 157,990 | — | ||||||||||||||||||
Real Estate Securities | 933,078 | 948,592 | 1,170,826 | 1,086,391 | 26,342 | 52,593 | ||||||||||||||||||
Global Natural Resources Equity | 1,607,567 | 1,758,019 | 1,268,631 | 407,500 | 2,131 | — | ||||||||||||||||||
|
|
|
|
|
|
|
|
|
|
|
| |||||||||||||
| $ | 90,842,974 | $ | 96,031,953 | $ | 141,551,150 | $ | 132,125,242 | $ | 1,438,513 | $ | 1,920,525 | |||||||||||||
|
|
|
|
|
|
|
|
|
|
|
| |||||||||||||
MyDestination 2015 | ||||||||||||||||||||||||
Money Market | $ | 6,850,488 | $ | 7,564,983 | $ | 83,704,208 | $ | 82,989,713 | $ | 4,644 | $ | 514 | ||||||||||||
Low-Duration Bond | 59,822,143 | 64,048,691 | 70,227,183 | 65,590,033 | 787,150 | — | ||||||||||||||||||
Medium-Duration Bond | 60,578,712 | 61,585,084 | 68,932,991 | 65,349,321 | 1,792,231 | 741,439 | ||||||||||||||||||
Extended-Duration Bond | 7,928,977 | 7,044,821 | 8,813,117 | 8,612,474 | 360,285 | 362,358 | ||||||||||||||||||
Global Bond | 22,334,469 | 21,596,735 | 24,241,002 | 22,755,318 | 885,685 | — | ||||||||||||||||||
Defensive Market Strategies | 86,850,243 | 84,004,598 | 93,289,424 | 93,171,092 | 1,255,887 | 3,647,445 | ||||||||||||||||||
Equity Index | — | 26,515,934 | 28,294,666 | — | 674,509 | 880,157 | ||||||||||||||||||
Value Equity | 38,758,256 | 26,204,711 | 45,191,503 | 53,577,522 | 528,233 | 2,982,748 | ||||||||||||||||||
Growth Equity | 38,605,800 | 26,603,227 | 45,894,516 | 54,678,422 | — | 4,968,094 | ||||||||||||||||||
Small Cap Equity | 10,339,751 | 10,253,010 | 12,515,006 | 10,948,524 | 46,804 | 1,069,678 | ||||||||||||||||||
International Equity Index | — | 15,788,788 | 17,454,713 | — | 127,713 | — | ||||||||||||||||||
International Equity | 43,717,885 | 31,409,631 | 52,326,815 | 63,397,547 | 615,974 | 1,268,294 | ||||||||||||||||||
Emerging Markets Equity | 11,354,421 | 12,264,465 | 16,272,631 | 12,868,584 | 49,047 | — | ||||||||||||||||||
Inflation Protected Bond | 48,017,050 | 47,449,917 | 50,238,386 | 49,658,919 | 148,468 | — | ||||||||||||||||||
Flexible Income | 22,456,356 | 23,439,077 | 2,867,631 | 694,000 | 802,631 | — | ||||||||||||||||||
Real Estate Securities | 5,262,519 | 5,043,631 | 5,705,120 | 5,564,564 | 139,703 | 278,853 | ||||||||||||||||||
Global Natural Resources Equity | 8,599,479 | 8,646,505 | 3,796,099 | 335,000 | 10,240 | — | ||||||||||||||||||
|
|
|
|
|
|
|
|
|
|
|
| |||||||||||||
| $ | 471,476,549 | $ | 479,463,808 | $ | 629,765,011 | $ | 590,191,033 | $ | 8,229,204 | $ | 16,199,580 | |||||||||||||
|
|
|
|
|
|
|
|
|
|
|
| |||||||||||||
315
Table of Contents
| Total Value | Total Value | Distributions | ||||||||||||||||||||||
| at | at | Dividend | of Realized | |||||||||||||||||||||
| 12/31/14 | 12/31/15 | Purchases | Sales Proceeds | Income | Gains | |||||||||||||||||||
MyDestination 2025 | ||||||||||||||||||||||||
Money Market | $ | 12,981,724 | $ | 11,309,093 | $ | 79,485,748 | $ | 81,158,379 | $ | 7,517 | $ | 954 | ||||||||||||
Low-Duration Bond | 38,289,787 | 48,072,204 | 52,471,943 | 42,369,081 | 547,863 | — | ||||||||||||||||||
Medium-Duration Bond | 62,492,952 | 69,486,725 | 75,734,774 | 65,885,088 | 1,973,625 | 826,060 | ||||||||||||||||||
Extended-Duration Bond | 16,075,404 | 17,431,820 | 21,179,299 | 17,219,350 | 856,854 | 867,095 | ||||||||||||||||||
Global Bond | 38,981,786 | 38,560,397 | 43,291,990 | 39,816,278 | 1,550,712 | — | ||||||||||||||||||
Defensive Market Strategies | 113,348,211 | 123,486,696 | 135,032,542 | 120,435,973 | 1,803,213 | 5,313,356 | ||||||||||||||||||
Equity Index | — | 55,427,358 | 59,208,453 | 110,000 | 1,398,679 | 1,839,774 | ||||||||||||||||||
Value Equity | 76,719,945 | 55,427,379 | 94,114,484 | 106,713,298 | 1,099,287 | 6,251,017 | ||||||||||||||||||
Growth Equity | 76,205,257 | 55,885,629 | 93,843,226 | 107,341,327 | — | 10,371,899 | ||||||||||||||||||
Small Cap Equity | 21,861,453 | 22,620,789 | 27,687,578 | 23,238,626 | 102,367 | 2,362,585 | ||||||||||||||||||
International Equity Index | — | 33,352,119 | 36,831,780 | — | 269,780 | — | ||||||||||||||||||
International Equity | 89,478,946 | 66,721,372 | 109,765,515 | 129,807,431 | 1,308,471 | 2,669,613 | ||||||||||||||||||
Emerging Markets Equity | 23,663,760 | 26,316,876 | 34,638,577 | 26,750,734 | 107,844 | — | ||||||||||||||||||
Inflation Protected Bond | 25,148,288 | 30,909,229 | 34,927,388 | 28,402,035 | 80,352 | — | ||||||||||||||||||
Flexible Income | 9,251,864 | 13,552,494 | 4,981,029 | — | 401,029 | — | ||||||||||||||||||
Real Estate Securities | 18,659,251 | 18,823,024 | 21,679,959 | 20,093,751 | 521,107 | 1,040,102 | ||||||||||||||||||
Global Natural Resources Equity | 17,313,698 | 20,141,519 | 11,114,171 | 750,000 | 24,171 | — | ||||||||||||||||||
|
|
|
|
|
|
|
|
|
|
|
| |||||||||||||
| $ | 640,472,326 | $ | 707,524,723 | $ | 935,988,456 | $ | 810,091,351 | $ | 12,052,871 | 31,542,455 | ||||||||||||||
|
|
|
|
|
|
|
|
|
|
|
| |||||||||||||
MyDestination 2035 | ||||||||||||||||||||||||
Money Market | $ | 7,156,947 | $ | 8,731,577 | $ | 51,394,576 | $ | 49,819,946 | $ | 5,298 | $ | 614 | ||||||||||||
Low-Duration Bond | 2,604,914 | 3,790,237 | 4,215,642 | 3,003,781 | 40,361 | — | ||||||||||||||||||
Medium-Duration Bond | 17,700,463 | 22,844,297 | 25,855,528 | 19,771,469 | 626,467 | 268,092 | ||||||||||||||||||
Extended-Duration Bond | 3,762,080 | 3,812,608 | 4,488,979 | 3,845,877 | 193,426 | 193,676 | ||||||||||||||||||
Global Bond | 30,050,179 | 32,520,137 | 37,221,115 | 31,517,948 | 1,260,166 | — | ||||||||||||||||||
Defensive Market Strategies | 4,303,574 | 7,540,848 | 9,671,892 | 6,126,961 | 104,532 | 319,399 | ||||||||||||||||||
Equity Index | — | 49,086,392 | 52,874,734 | 499,500 | 1,245,119 | 1,629,615 | ||||||||||||||||||
Value Equity | 66,846,825 | 48,973,198 | 85,492,980 | 95,707,966 | 973,205 | 5,529,310 | ||||||||||||||||||
Growth Equity | 66,774,924 | 49,127,124 | 82,290,829 | 93,892,843 | — | 9,144,985 | ||||||||||||||||||
Small Cap Equity | 23,090,120 | 24,468,156 | 29,609,477 | 24,230,041 | 110,801 | 2,536,135 | ||||||||||||||||||
International Equity Index | — | 30,130,432 | 33,328,928 | — | 242,528 | — | ||||||||||||||||||
International Equity | 80,240,442 | 60,330,943 | 100,716,146 | 117,968,229 | 1,180,258 | 2,430,160 | ||||||||||||||||||
Emerging Markets Equity | 21,382,838 | 23,833,404 | 31,551,212 | 24,163,949 | 97,263 | — | ||||||||||||||||||
Real Estate Securities | 12,141,095 | 13,004,386 | 15,616,552 | 13,738,413 | 360,819 | 720,321 | ||||||||||||||||||
Global Natural Resources Equity | 11,897,628 | 12,816,847 | 6,003,533 | 320,000 | 15,532 | — | ||||||||||||||||||
|
|
|
|
|
|
|
|
|
|
|
| |||||||||||||
| $ | 347,952,029 | $ | 391,010,586 | $ | 570,332,123 | $ | 484,606,923 | $ | 6,455,775 | $ | 22,772,307 | |||||||||||||
|
|
|
|
|
|
|
|
|
|
|
| |||||||||||||
316
Table of Contents
| Total Value at 12/31/14 | Total Value at 12/31/15 | Purchases | Sales Proceeds | Dividend Income | Distributions of Realized Gains | |||||||||||||||||||
MyDestination 2045 | ||||||||||||||||||||||||
Money Market | $ | 5,036,721 | $ | 6,667,359 | $ | 38,829,316 | $ | 37,198,679 | $ | 3,822 | $ | 449 | ||||||||||||
Medium-Duration Bond | 954,926 | 1,966,542 | 2,224,869 | 1,140,838 | 45,403 | 21,628 | ||||||||||||||||||
Global Bond | 15,384,277 | 17,205,989 | 20,597,553 | 17,048,071 | 671,482 | — | ||||||||||||||||||
Equity Index | — | 40,078,647 | 42,958,204 | 191,000 | 1,012,420 | 1,329,284 | ||||||||||||||||||
Value Equity | 52,906,662 | 40,047,404 | 70,793,266 | 77,362,543 | 791,756 | 4,499,468 | ||||||||||||||||||
Growth Equity | 52,573,836 | 40,096,168 | 69,331,824 | 76,898,611 | — | 7,459,213 | ||||||||||||||||||
Small Cap Equity | 19,853,981 | 22,101,990 | 27,248,534 | 21,342,185 | 100,446 | 2,291,902 | ||||||||||||||||||
International Equity Index | — | 25,017,796 | 27,897,865 | 195,000 | 202,365 | — | ||||||||||||||||||
International Equity | 64,750,708 | 49,990,802 | 83,876,235 | 96,288,921 | 976,514 | 2,010,649 | ||||||||||||||||||
Emerging Markets Equity | 17,237,150 | 19,726,878 | 26,562,148 | 20,007,632 | 80,516 | — | ||||||||||||||||||
Real Estate Securities | 8,497,709 | 9,352,191 | 11,432,866 | 9,831,796 | 259,662 | 518,408 | ||||||||||||||||||
Global Natural Resources Equity | 8,436,522 | 9,206,392 | 5,137,157 | 730,000 | 11,157 | — | ||||||||||||||||||
|
|
|
|
|
|
|
|
|
|
|
| |||||||||||||
| $ | 245,632,492 | $ | 281,458,158 | $ | 426,889,837 | $ | 358,235,276 | $ | 4,155,543 | $ | 18,131,001 | |||||||||||||
|
|
|
|
|
|
|
|
|
|
|
| |||||||||||||
MyDestination 2055 | ||||||||||||||||||||||||
Money Market | $ | 709,183 | $ | 864,216 | $ | 12,585,439 | $ | 12,430,406 | $ | 498 | $ | 69 | ||||||||||||
Global Bond | 1,361,445 | 1,886,080 | 2,401,842 | 1,704,458 | 65,884 | — | ||||||||||||||||||
Equity Index | — | 5,578,177 | 5,984,081 | 64,500 | 131,992 | 177,882 | ||||||||||||||||||
Value Equity | 5,826,452 | 5,573,463 | 9,789,597 | 9,210,125 | 102,761 | 605,711 | ||||||||||||||||||
Growth Equity | 5,880,705 | 5,574,906 | 9,680,372 | 9,313,052 | — | 983,320 | ||||||||||||||||||
Small Cap Equity | 2,268,008 | 3,148,528 | 4,060,607 | 2,670,441 | 14,241 | 324,425 | ||||||||||||||||||
International Equity Index | — | 3,493,301 | 3,823,995 | — | 27,995 | — | ||||||||||||||||||
International Equity | 7,171,664 | 6,989,558 | 11,834,250 | 11,650,555 | 135,424 | 277,271 | ||||||||||||||||||
Emerging Markets Equity | 1,938,503 | 2,764,097 | 3,753,919 | 2,412,806 | 11,113 | — | ||||||||||||||||||
Real Estate Securities | 881,955 | 1,253,420 | 1,563,769 | 1,096,082 | 33,098 | 65,590 | ||||||||||||||||||
Global Natural Resources Equity | 922,666 | 1,247,143 | 1,018,063 | 242,750 | 1,563 | — | ||||||||||||||||||
|
|
|
|
|
|
|
|
|
|
|
| |||||||||||||
| $ | 26,960,581 | $ | 38,372,889 | $ | 66,495,934 | $ | 50,795,175 | $ | 524,569 | $ | 2,434,268 | |||||||||||||
|
|
|
|
|
|
|
|
|
|
|
| |||||||||||||
Conservative Allocation | ||||||||||||||||||||||||
Money Market | $ | 3,302,579 | $ | 4,583,563 | $ | 40,205,584 | $ | 38,924,600 | $ | 2,869 | $ | 353 | ||||||||||||
Low-Duration Bond | 128,115,480 | 150,222,650 | 157,882,256 | 134,071,680 | 1,602,040 | — | ||||||||||||||||||
Medium-Duration Bond | 33,734,297 | 40,046,340 | 43,231,233 | 35,107,480 | 1,032,661 | 470,410 | ||||||||||||||||||
Global Bond | 8,464,633 | 9,770,811 | 10,938,988 | 8,622,597 | 345,368 | — | ||||||||||||||||||
Defensive Market Strategies | 27,931,117 | 32,613,520 | 35,433,381 | 29,894,704 | 446,802 | 1,376,575 | ||||||||||||||||||
Value Equity | 13,416,106 | 17,065,496 | 20,413,326 | 14,093,520 | 308,763 | 1,891,565 | ||||||||||||||||||
Growth Equity | 13,369,667 | 17,406,201 | 20,924,389 | 14,342,024 | — | 3,114,373 | ||||||||||||||||||
Small Cap Equity | 3,025,072 | 3,762,956 | 4,541,321 | 3,114,798 | 17,177 | 396,451 | ||||||||||||||||||
International Equity | 15,146,967 | 20,226,463 | 22,943,660 | 16,481,576 | 396,661 | 816,727 | ||||||||||||||||||
Emerging Markets Equity | 3,932,432 | 5,090,634 | 6,500,180 | 4,223,031 | 20,861 | — | ||||||||||||||||||
Inflation Protected Bond | 31,179,137 | 36,163,674 | 38,310,493 | 32,349,115 | 93,838 | — | ||||||||||||||||||
Flexible Income | 15,453,603 | 17,974,169 | 4,306,290 | 820,000 | 532,240 | — | ||||||||||||||||||
Real Estate Securities | 3,196,748 | 3,684,974 | 4,289,855 | 3,504,065 | 97,593 | 193,987 | ||||||||||||||||||
Global Natural Resources Equity | 10,982,229 | 6,875,930 | 3,159,903 | 2,300,000 | 8,333 | — | ||||||||||||||||||
|
|
|
|
|
|
|
|
|
|
|
| |||||||||||||
| $ | 311,250,067 | $ | 365,487,381 | $ | 413,080,859 | $ | 337,849,190 | $ | 4,905,206 | $ | 8,260,441 | |||||||||||||
|
|
|
|
|
|
|
|
|
|
|
| |||||||||||||
317
Table of Contents
| Total Value at 12/31/14 | Total Value at 12/31/15 | Purchases | Sales Proceeds | Dividend Income | Distributions of Realized Gains | |||||||||||||||||||
Balanced Allocation | ||||||||||||||||||||||||
Money Market | $ | 31,194,352 | $ | 42,453,581 | $ | 161,074,279 | $ | 149,815,050 | $ | 18,749 | $ | 3,002 | ||||||||||||
Low-Duration Bond | 155,358,696 | 181,725,741 | 199,645,578 | 171,207,853 | 1,941,951 | — | ||||||||||||||||||
Medium-Duration Bond | 209,350,903 | 245,812,360 | 277,462,391 | 227,373,357 | 6,266,762 | 2,890,000 | ||||||||||||||||||
Extended-Duration Bond | 53,087,969 | 65,152,208 | 81,518,076 | 56,814,538 | 2,750,728 | 3,197,699 | ||||||||||||||||||
Global Bond | 102,585,859 | 120,548,248 | 137,192,985 | 106,615,461 | 4,226,683 | — | ||||||||||||||||||
Defensive Market Strategies | 103,864,940 | 122,548,531 | 135,520,905 | 114,945,065 | 1,686,645 | 5,179,640 | ||||||||||||||||||
Value Equity | 115,024,563 | 140,741,304 | 168,466,139 | 122,592,761 | 2,604,055 | 15,693,840 | ||||||||||||||||||
Growth Equity | 114,790,336 | 143,152,463 | 177,739,966 | 128,320,657 | — | 25,812,009 | ||||||||||||||||||
Small Cap Equity | 26,216,986 | 30,990,313 | 38,213,413 | 27,793,059 | 141,469 | 3,265,024 | ||||||||||||||||||
International Equity | 126,897,358 | 165,334,059 | 191,300,123 | 144,755,482 | 3,242,363 | 6,676,050 | ||||||||||||||||||
Emerging Markets Equity | 33,071,501 | 40,953,235 | 53,061,168 | 35,778,564 | 167,822 | — | ||||||||||||||||||
Inflation Protected Bond | 73,637,055 | 89,932,438 | 97,289,075 | 78,437,576 | 228,450 | — | ||||||||||||||||||
Flexible Income | 38,412,620 | 45,357,702 | 11,799,282 | 2,340,000 | 1,337,359 | — | ||||||||||||||||||
Real Estate Securities | 36,573,726 | 44,462,159 | 49,302,492 | 37,823,037 | 1,158,110 | 2,298,292 | ||||||||||||||||||
Global Natural Resources Equity | 70,996,359 | 44,193,189 | 25,700,519 | 20,250,000 | 53,556 | — | ||||||||||||||||||
|
|
|
|
|
|
|
|
|
|
|
| |||||||||||||
| $ | 1,291,063,223 | $ | 1,523,357,531 | $ | 1,805,286,391 | $ | 1,424,862,460 | $ | 25,824,702 | $ | 65,015,556 | |||||||||||||
|
|
|
|
|
|
|
|
|
|
|
| |||||||||||||
Growth Allocation | ||||||||||||||||||||||||
Money Market | $ | 22,955,888 | $ | 27,757,264 | $ | 102,629,447 | $ | 97,828,071 | $ | 13,720 | $ | 1,983 | ||||||||||||
Low-Duration Bond | 69,123,237 | 82,705,113 | 90,737,076 | 76,195,709 | 873,626 | — | ||||||||||||||||||
Medium-Duration Bond | 93,623,667 | 110,995,806 | 124,103,398 | 100,821,654 | 2,829,655 | 1,303,701 | ||||||||||||||||||
Extended-Duration Bond | 23,969,654 | 28,805,675 | 37,196,035 | 26,817,797 | 1,224,695 | 1,416,770 | ||||||||||||||||||
Global Bond | 46,197,272 | 54,003,392 | 61,778,874 | 48,311,654 | 1,890,033 | — | ||||||||||||||||||
Value Equity | 165,791,412 | 198,432,917 | 236,819,253 | 176,537,660 | 3,721,534 | 22,208,427 | ||||||||||||||||||
Growth Equity | 165,543,750 | 205,396,019 | 254,160,069 | 184,959,257 | — | 37,135,591 | ||||||||||||||||||
Small Cap Equity | 37,662,459 | 41,521,669 | 51,396,956 | 39,945,415 | 189,544 | 4,374,568 | ||||||||||||||||||
International Equity | 187,390,627 | 230,986,326 | 265,663,153 | 208,784,330 | 4,529,868 | 9,327,033 | ||||||||||||||||||
Emerging Markets Equity | 48,143,848 | 57,702,803 | 74,344,073 | 52,232,825 | 236,460 | — | ||||||||||||||||||
Real Estate Securities | 33,926,470 | 42,946,950 | 47,324,334 | 34,787,593 | 1,117,656 | 2,217,819 | ||||||||||||||||||
Global Natural Resources Equity | 56,893,117 | 33,035,311 | 18,033,331 | 17,175,000 | 40,034 | — | ||||||||||||||||||
|
|
|
|
|
|
|
|
|
|
|
| |||||||||||||
| $ | 951,221,401 | $ | 1,114,289,245 | $ | 1,364,185,999 | $ | 1,064,396,965 | $ | 16,666,825 | $ | 77,985,892 | |||||||||||||
|
|
|
|
|
|
|
|
|
|
|
| |||||||||||||
Aggressive Allocation | ||||||||||||||||||||||||
Money Market | $ | 19,468,875 | $ | 23,772,781 | $ | 87,729,684 | $ | 83,425,777 | $ | 11,635 | $ | 1,630 | ||||||||||||
Value Equity | 232,399,206 | 254,768,426 | 311,157,000 | 248,808,470 | 4,947,611 | 28,789,477 | ||||||||||||||||||
Growth Equity | 231,696,900 | 262,055,612 | 329,494,041 | 261,911,801 | — | 48,077,493 | ||||||||||||||||||
Small Cap Equity | 53,626,378 | 55,397,826 | 68,126,555 | 56,477,119 | 252,887 | 5,836,508 | ||||||||||||||||||
International Equity | 263,844,623 | 295,949,517 | 346,374,840 | 294,492,903 | 5,803,860 | 11,950,192 | ||||||||||||||||||
Emerging Markets Equity | 67,987,625 | 73,918,724 | 98,054,489 | 74,563,280 | 302,911 | — | ||||||||||||||||||
|
|
|
|
|
|
|
|
|
|
|
| |||||||||||||
| $ | 869,023,607 | $ | 965,862,886 | $ | 1,240,936,609 | $ | 1,019,679,350 | $ | 11,318,904 | $ | 94,655,300 | |||||||||||||
|
|
|
|
|
|
|
|
|
|
|
| |||||||||||||
318
Table of Contents
| Total Value at 12/31/14 | Total Value at 12/31/15 | Purchases | Sales Proceeds | Dividend Income | Distributions of Realized Gains | |||||||||||||||||||
Real Assets | ||||||||||||||||||||||||
Money Market | $ | 605,669 | $ | 537,345 | $ | 15,314,094 | $ | 15,382,417 | $ | 381 | $ | 44 | ||||||||||||
Inflation Protected Bond | 18,226,105 | 10,803,373 | 17,172,071 | 24,332,746 | 52,337 | — | ||||||||||||||||||
Flexible Income | 9,524,262 | 5,543,201 | 411,103 | 4,141,604 | 241,103 | — | ||||||||||||||||||
Real Estate Securities | 8,272,816 | 4,829,919 | 8,302,861 | 11,363,494 | 153,459 | 311,194 | ||||||||||||||||||
Global Natural Resources Equity | 9,880,345 | 5,610,899 | 2,485,341 | 4,250,829 | 6,641 | — | ||||||||||||||||||
|
|
|
|
|
|
|
|
|
|
|
| |||||||||||||
| $ | 46,509,197 | $ | 27,324,737 | $ | 43,685,470 | $ | 59,471,090 | $ | 453,921 | $ | 311,238 | |||||||||||||
|
|
|
|
|
|
|
|
|
|
|
| |||||||||||||
4. SECURITIES LENDING
Through an agreement with The Northern Trust Company (“Northern Trust”) (the Funds’ custodian) the Select Funds may lend portfolio securities to certain brokers, dealers and other financial institutions that pay the Select Funds a negotiated fee. The Select Funds receive cash or U.S. government securities as collateral against the loaned securities in an amount at least equal to the market value of the loaned securities. The Funds continue to own the loaned securities and the securities remain in the investment portfolio. However, in the event of default or bankruptcy by the other party to the agreement, realization and/or retention of the collateral may be subject to legal proceedings. Cash collateral has been invested in a short-term money market fund of Northern Trust, an affiliate of the Funds, which invests in securities that satisfy the quality requirements of Rule 2a-7 and have short maturities. This investment is presented on the Funds’ Schedules of Investments. The Funds do not have control of non-cash securities lending collateral: as such, this amount is not presented on the Funds’ Schedules of Investments. At December 31, 2015, the market values of loaned securities and collateral received were as follows:
Fund | Value of Securities Loaned | Value of Non-cash Collateral | Value of Cash Collateral | Total Value of Collateral | ||||||||||||
Low-Duration Bond | $ | 59,576,949 | $ | 33,749,226 | $ | 27,068,175 | $ | 60,817,401 | ||||||||
Medium-Duration Bond | 117,889,973 | 85,289,567 | 35,137,912 | 120,427,479 | ||||||||||||
Extended-Duration Bond | 33,229,660 | 24,680,922 | 9,010,504 | 33,691,426 | ||||||||||||
Global Bond | 44,640,846 | 6,696,645 | 39,026,281 | 45,722,926 | ||||||||||||
Defensive Market Strategies | 69,633,866 | 3,929,834 | 67,919,378 | 71,849,212 | ||||||||||||
Equity Index | 41,262,749 | 2,270,071 | 40,316,383 | 42,586,454 | ||||||||||||
Value Equity | 139,449,792 | 8,645,963 | 135,055,536 | 143,701,499 | ||||||||||||
Growth Equity | 265,809,884 | 5,186,673 | 268,680,558 | 273,867,231 | ||||||||||||
Small Cap Equity | 186,891,501 | 16,109,153 | 177,804,961 | 193,914,114 | ||||||||||||
International Equity Index | 3,854,449 | 781,212 | 3,330,445 | 4,111,657 | ||||||||||||
International Equity | 100,295,176 | 11,909,742 | 93,208,109 | 105,117,851 | ||||||||||||
Emerging Markets Equity | 23,148,368 | 1,696,875 | 22,484,517 | 24,181,392 | ||||||||||||
Inflation Protected Bond | 3,543,683 | 3,752,917 | — | 3,752,917 | ||||||||||||
Flexible Income | 250,452 | — | 255,750 | 255,750 | ||||||||||||
Real Estate Securities | 26,449,358 | 3,494,222 | 23,903,069 | 27,397,291 | ||||||||||||
Global Natural Resources Equity | 73,398,820 | 17,753,356 | 56,959,458 | 74,712,814 | ||||||||||||
Securities lending transactions are entered into by the Funds under a Securities Lending Authorization Agreement which permit the Funds, under certain circumstances including an event of default (such as bankruptcy or insolvency), to offset amounts payable by the Fund to the same counterparty against amounts to be received and create one single net payment due to or from the Fund.
319
Table of Contents
At December 31, 2015, the securities loaned which are subject to an MA on a net payment basis are as follows:
| Fair Value of | Cash | |||||||||||||||
| Value of | Non-cash | Collateral | ||||||||||||||
Fund | Securities Loaned | Collateral | (Pledged) | Net Amount(1) | ||||||||||||
Low-Duration Bond | $ | 59,576,949 | $ | (33,749,226 | ) | $ | (25,827,723 | ) | $ | — | ||||||
Medium-Duration Bond | 117,889,973 | (85,289,567 | ) | (32,600,406 | ) | — | ||||||||||
Extended-Duration Bond | 33,229,660 | (24,680,922 | ) | (8,548,738 | ) | — | ||||||||||
Global Bond | 44,640,846 | (6,696,645 | ) | (37,944,201 | ) | — | ||||||||||
Defensive Market Strategies | 69,633,866 | (3,929,834 | ) | (65,704,032 | ) | — | ||||||||||
Equity Index | 41,262,749 | (2,270,071 | ) | (38,992,678 | ) | — | ||||||||||
Value Equity | 139,449,792 | (8,645,963 | ) | (130,803,829 | ) | — | ||||||||||
Growth Equity | 265,809,884 | (5,186,673 | ) | (260,623,211 | ) | — | ||||||||||
Small Cap Equity | 186,891,501 | (16,109,153 | ) | (170,782,348 | ) | — | ||||||||||
International Equity Index | 3,854,449 | (781,212 | ) | (3,073,237 | ) | — | ||||||||||
International Equity | 100,295,176 | (11,909,742 | ) | (88,385,434 | ) | — | ||||||||||
Emerging Markets Equity | 23,148,368 | (1,696,875 | ) | (21,451,493 | ) | — | ||||||||||
Inflation Protected Bond | 3,543,683 | (3,543,683 | ) | — | — | |||||||||||
Flexible Income | 250,452 | — | (250,452 | ) | — | |||||||||||
Real Estate Securities | 26,449,358 | (3,494,222 | ) | (22,955,136 | ) | — | ||||||||||
Global Natural Resources Equity | 73,398,820 | (17,753,356 | ) | (55,645,464 | ) | — | ||||||||||
| (1) | Net amount represents the net amount receivable due from (payable to) the counterparty in the event of default. |
Additional information about master netting arrangements can be found in the Repurchase Agreements and Derivative Financial Instruments sections of the Notes to Financial Statements.
The type and maturity of non-cash collateral in relation to the securities lending total value of collateral is as follows:
| Greater | ||||||||||||||||
| Up to | 30 — 90 | than 90 | ||||||||||||||
Fund | 30 Days | Days | Days | Total | ||||||||||||
Low-Duration Bond | ||||||||||||||||
U.S. Treasury Obligations | $ | — | $ | — | $ | 33,749,226 | $ | 33,749,226 | ||||||||
Medium-Duration Bond | ||||||||||||||||
U.S. Treasury Obligations | 10,140 | 37,776 | 85,241,651 | 85,289,567 | ||||||||||||
Extended-Duration Bond | ||||||||||||||||
U.S. Treasury Obligations | 29 | 110 | 24,680,783 | 24,680,922 | ||||||||||||
Global Bond | ||||||||||||||||
U.S. Treasury Obligations | 25,789 | 94,681 | 6,576,175 | 6,696,645 | ||||||||||||
Defensive Market Strategies | ||||||||||||||||
U.S. Treasury Obligations | 27,113 | 265,361 | 3,637,360 | 3,929,834 | ||||||||||||
Equity Index | ||||||||||||||||
U.S. Treasury Obligations | 187 | 83,349 | 2,186,535 | 2,270,071 | ||||||||||||
Value Equity | ||||||||||||||||
U.S. Treasury Obligations | 325,944 | 200,936 | 8,119,083 | 8,645,963 | ||||||||||||
Growth Equity | ||||||||||||||||
U.S. Treasury Obligations | 12,310 | 43,855 | 5,130,508 | 5,186,673 | ||||||||||||
Small Cap Equity | ||||||||||||||||
U.S. Treasury Obligations | 135,425 | 430,239 | 15,543,489 | 16,109,153 | ||||||||||||
International Equity Index | ||||||||||||||||
U.S. Treasury Obligations | 1,950 | 7,429 | 771,833 | 781,212 | ||||||||||||
International Equity | ||||||||||||||||
U.S. Treasury Obligations | — | — | 11,909,742 | 11,909,742 | ||||||||||||
Emerging Markets Equity | ||||||||||||||||
U.S. Treasury Obligations | 94 | 24,799 | 1,671,982 | 1,696,875 | ||||||||||||
320
Table of Contents
Fund | Up to 30 Days | 30 — 90 Days | Greater than 90 Days | Total | ||||||||||||
Inflation Protected Bond | ||||||||||||||||
U.S. Treasury Obligations | $ | — | $ | — | $ | 3,543,683 | $ | 3,543,683 | ||||||||
Real Estate Securities | ||||||||||||||||
U.S. Treasury Obligations | — | — | 3,494,222 | 3,494,222 | ||||||||||||
Global Natural Resources Equity | ||||||||||||||||
U.S. Treasury Obligations | 5,212 | 67,873 | 17,680,271 | 17,753,356 | ||||||||||||
5. INVESTMENT TRANSACTIONS
For the year ended December 31, 2015, the cost of purchases and proceeds from sales and maturities for each Fund were as follows:
| Cost of Purchases and Proceeds from Sales and Maturities of Long-Term Securities (other than U.S. Government Obligations) | Cost of Purchases and Proceeds from Sales and Maturities of Long-Term U.S. Government Obligations | |||||||||||||||
| Purchases | Sale and Maturity Proceeds | Purchases | Sale and Maturity Proceeds | |||||||||||||
MyDestination 2005 | $ | 107,460,086 | $ | 102,898,843 | $ | — | $ | — | ||||||||
MyDestination 2015 | 523,087,178 | 515,200,971 | — | — | ||||||||||||
MyDestination 2025 | 818,366,352 | 747,237,177 | — | — | ||||||||||||
MyDestination 2035 | 493,815,377 | 446,563,415 | — | — | ||||||||||||
MyDestination 2045 | 368,528,248 | 329,309,663 | — | — | ||||||||||||
MyDestination 2055 | 51,469,725 | 39,447,579 | — | — | ||||||||||||
Conservative Allocation | 288,135,590 | 298,924,590 | — | — | ||||||||||||
Balanced Allocation | 1,216,656,910 | 1,275,047,410 | — | — | ||||||||||||
Growth Allocation | 919,153,893 | 966,568,893 | — | — | ||||||||||||
Aggressive Allocation | 882,103,573 | 936,253,573 | — | — | ||||||||||||
Low-Duration Bond | 653,532,554 | 642,973,967 | 5,606,981,988 | 5,590,999,234 | ||||||||||||
Medium-Duration Bond | 2,690,348,858 | 2,460,420,283 | 661,385,020 | 776,758,247 | ||||||||||||
Extended-Duration Bond | 49,468,302 | 46,929,666 | 63,458,198 | 79,028,888 | ||||||||||||
Global Bond | 135,865,970 | 88,661,687 | 19,630,680 | 18,823,038 | ||||||||||||
Defensive Market Strategies | 279,664,489 | 256,104,197 | — | — | ||||||||||||
Equity Index | 207,646,058 | 33,101,883 | — | — | ||||||||||||
Value Equity | 414,955,111 | 554,866,465 | — | — | ||||||||||||
Growth Equity | 1,088,586,101 | 1,232,986,897 | — | — | ||||||||||||
Small Cap Equity | 381,455,505 | 406,079,986 | — | — | ||||||||||||
International Equity Index | 120,806,230 | — | 3,893,650 | — | ||||||||||||
International Equity | 616,439,180 | 670,188,665 | — | — | ||||||||||||
Emerging Markets Equity | 160,284,327 | 107,051,852 | — | — | ||||||||||||
Inflation Protected Bond | 10,089,002 | 11,962,016 | 148,738,985 | 122,833,304 | ||||||||||||
Flexible Income | 77,725,960 | 64,818,446 | — | — | ||||||||||||
Real Assets | 27,941,643 | 46,247,733 | — | — | ||||||||||||
Real Estate Securities | 354,751,219 | 361,550,391 | — | — | ||||||||||||
Global Natural Resources Equity | 169,214,684 | 150,806,197 | — | — | ||||||||||||
321
Table of Contents
Financial Futures Contracts
Investments as of December 31, 2015, included cash and securities that were valued and pledged as collateral to cover initial margin deposits. The market value of the open futures contracts is as follows:
Fund/Future Type | Expiration Date | Open Long (Short) Contracts | Notional Market Value of Contracts | Counter- party | Net Unrealized Appreciation (Depreciation) on Futures | ||||||||||||||||||||
MyDestination 2005 Fund | |||||||||||||||||||||||||
S&P 500® E-Mini | 03/2016 | 7 | $ | 712,390 | GSC | $ | (4,635 | ) | |||||||||||||||||
5-Year U.S. Treasury Note | 04/2016 | 9 | 1,064,883 | GSC | (1,867 | ) | |||||||||||||||||||
|
|
|
| ||||||||||||||||||||||
| $ | 1,777,273 | $ | (6,502 | ) | |||||||||||||||||||||
|
|
|
| ||||||||||||||||||||||
MyDestination 2015 Fund | |||||||||||||||||||||||||
10-Year U.S. Treasury Note | 03/2016 | 18 | $ | 2,266,313 | GSC | $ | (4,921 | ) | |||||||||||||||||
MSCI EAFE Index E-Mini | 03/2016 | 17 | 1,443,470 | GSC | 20,425 | ||||||||||||||||||||
MSCI Emerging Markets E-Mini | 03/2016 | 4 | 157,500 | GSC | 590 | ||||||||||||||||||||
S&P 500® E-Mini | 03/2016 | 24 | 2,442,480 | GSC | (6,482 | ) | |||||||||||||||||||
|
|
|
| ||||||||||||||||||||||
| $ | 6,309,763 | $ | 9,612 | ||||||||||||||||||||||
|
|
|
| ||||||||||||||||||||||
MyDestination 2025 Fund | |||||||||||||||||||||||||
10-Year U.S. Treasury Note | 03/2016 | 22 | $ | 2,769,938 | GSC | $ | (5,976 | ) | |||||||||||||||||
MSCI EAFE Index E-Mini | 03/2016 | 28 | 2,377,480 | GSC | 42,735 | ||||||||||||||||||||
MSCI Emerging Markets E-Mini | 03/2016 | 18 | 708,750 | GSC | (4,910 | ) | |||||||||||||||||||
S&P 500® E-Mini | 03/2016 | 43 | 4,376,110 | GSC | (13,257 | ) | |||||||||||||||||||
|
|
|
| ||||||||||||||||||||||
| $ | 10,232,278 | $ | 18,592 | ||||||||||||||||||||||
|
|
|
| ||||||||||||||||||||||
MyDestination 2035 Fund | |||||||||||||||||||||||||
10-Year U.S. Treasury Note | 03/2016 | 10 | $ | 1,259,063 | GSC | $ | (1,796 | ) | |||||||||||||||||
MSCI EAFE Index E-Mini | 03/2016 | 26 | 2,207,660 | GSC | 50,090 | ||||||||||||||||||||
MSCI Emerging Markets E-Mini | 03/2016 | 15 | 590,625 | GSC | (4,080 | ) | |||||||||||||||||||
S&P 500® E-Mini | 03/2016 | 41 | 4,172,570 | GSC | (18,532 | ) | |||||||||||||||||||
|
|
|
| ||||||||||||||||||||||
| $ | 8,229,918 | $ | 25,682 | ||||||||||||||||||||||
|
|
|
| ||||||||||||||||||||||
MyDestination 2045 Fund | |||||||||||||||||||||||||
10-Year U.S. Treasury Note | 03/2016 | 2 | $ | 251,813 | GSC | $ | (359 | ) | |||||||||||||||||
MSCI EAFE Index E-Mini | 03/2016 | 21 | 1,783,110 | GSC | 40,530 | ||||||||||||||||||||
MSCI Emerging Markets E-Mini | 03/2016 | 10 | 393,750 | GSC | (1,865 | ) | |||||||||||||||||||
S&P 500® E-Mini | 03/2016 | 38 | 3,867,260 | GSC | (16,555 | ) | |||||||||||||||||||
|
|
|
| ||||||||||||||||||||||
| $ | 6,295,933 | $ | 21,751 | ||||||||||||||||||||||
|
|
|
| ||||||||||||||||||||||
MyDestination 2055 Fund | |||||||||||||||||||||||||
S&P 500® E-Mini | 03/2016 | 7 | $ | 712,390 | GSC | $ | (3,520 | ) | |||||||||||||||||
|
|
|
| ||||||||||||||||||||||
Conservative Allocation Fund | |||||||||||||||||||||||||
MSCI EAFE Index E-Mini | 03/2016 | 6 | $ | 509,460 | GSC | $ | 10,904 | ||||||||||||||||||
S&P 500® E-Mini | 03/2016 | 8 | 814,160 | GSC | (2,160 | ) | |||||||||||||||||||
2-Year U.S. Treasury Note | 04/2016 | 18 | 3,910,219 | GSC | (5,514 | ) | |||||||||||||||||||
|
|
|
| ||||||||||||||||||||||
| $ | 5,233,839 | $ | 3,230 | ||||||||||||||||||||||
|
|
|
| ||||||||||||||||||||||
Balanced Allocation Fund | |||||||||||||||||||||||||
10-Year U.S. Treasury Note | 03/2016 | 51 | $ | 6,421,219 | GSC | $ | (9,162 | ) | |||||||||||||||||
MSCI EAFE Index E-Mini | 03/2016 | 76 | 6,453,160 | GSC | 146,635 | ||||||||||||||||||||
MSCI Emerging Markets E-Mini | 03/2016 | 36 | 1,417,500 | GSC | (10,975 | ) | |||||||||||||||||||
S&P 500® E-Mini | 03/2016 | 128 | 13,026,560 | GSC | (34,567 | ) | |||||||||||||||||||
Long U.S. Treasury Bond | 03/2016 | 21 | 3,228,750 | GSC | 14,109 | ||||||||||||||||||||
5-Year U.S. Treasury Note | 04/2016 | 56 | 6,625,938 | GSC | (12,250 | ) | |||||||||||||||||||
|
|
|
| ||||||||||||||||||||||
| $ | 37,173,127 | $ | 93,790 | ||||||||||||||||||||||
|
|
|
| ||||||||||||||||||||||
322
Table of Contents
Fund/Future Type | Expiration Date | Open Long (Short) Contracts | Notional Market Value of Contracts | Counter- party | Net Unrealized Appreciation (Depreciation) on Futures | ||||||||||||||||||||
Growth Allocation Fund | |||||||||||||||||||||||||
10-Year U.S. Treasury Note | 03/2016 | 17 | $ | 2,140,406 | GSC | $ | (3,054 | ) | |||||||||||||||||
MSCI EAFE Index E-Mini | 03/2016 | 80 | 6,792,800 | GSC | 150,125 | ||||||||||||||||||||
MSCI Emerging Markets E-Mini | 03/2016 | 34 | 1,338,750 | GSC | (11,285 | ) | |||||||||||||||||||
S&P 500® E-Mini | 03/2016 | 124 | 12,619,480 | GSC | (33,487 | ) | |||||||||||||||||||
Long U.S. Treasury Bond | 03/2016 | 7 | 1,076,250 | GSC | 4,703 | ||||||||||||||||||||
5-Year U.S. Treasury Note | 04/2016 | 21 | 2,484,727 | GSC | (4,594 | ) | |||||||||||||||||||
|
|
|
| ||||||||||||||||||||||
| $ | 26,452,413 | $ | 102,408 | ||||||||||||||||||||||
|
|
|
| ||||||||||||||||||||||
Aggressive Allocation Fund | |||||||||||||||||||||||||
MSCI EAFE Index E-Mini | 03/2016 | 85 | $ | 7,217,350 | GSC | $ | 169,135 | ||||||||||||||||||
MSCI Emerging Markets E-Mini | 03/2016 | 44 | 1,732,500 | GSC | (7,980 | ) | |||||||||||||||||||
S&P 500® E-Mini | 03/2016 | 136 | 13,840,720 | GSC | (36,727 | ) | |||||||||||||||||||
|
|
|
| ||||||||||||||||||||||
| $ | 22,790,570 | $ | 124,428 | ||||||||||||||||||||||
|
|
|
| ||||||||||||||||||||||
Low-Duration Bond Fund | |||||||||||||||||||||||||
Euro-Bund | 03/2016 | (2 | ) | $ | (343,241 | ) | UBS | $ | 1,393 | ||||||||||||||||
3-Year Australia Treasury Bond | 03/2016 | 346 | 75,972,914 | CITI | 75,154 | ||||||||||||||||||||
10-Year U.S. Treasury Note | 03/2016 | (38 | ) | (4,784,438 | ) | UBS | 2,189 | ||||||||||||||||||
5-Year U.S. Treasury Note | 04/2016 | (35 | ) | (4,141,211 | ) | GSC | 14,311 | ||||||||||||||||||
5-Year U.S. Treasury Note | 04/2016 | (66 | ) | (7,809,141 | ) | UBS | 24,758 | ||||||||||||||||||
2-Year U.S. Treasury Note | 04/2016 | 1,130 | 245,474,845 | CITI | (401,869 | ) | |||||||||||||||||||
2-Year U.S. Treasury Note | 04/2016 | 419 | 91,021,204 | UBS | (151,689 | ) | |||||||||||||||||||
2-Year U.S. Treasury Note | 04/2016 | 115 | 24,981,953 | GSC | (3,570 | ) | |||||||||||||||||||
3-Month EURIBOR | 03/2018 | 267 | 72,493,792 | CITI | 116,319 | ||||||||||||||||||||
3-Month Sterling | 03/2018 | (398 | ) | (72,183,096 | ) | CITI | (15,108 | ) | |||||||||||||||||
90-Day Euro | 09/2018 | (182 | ) | (44,576,350 | ) | CITI | 65,742 | ||||||||||||||||||
90-Day Euro | 12/2018 | (135 | ) | (33,037,875 | ) | CITI | 24,770 | ||||||||||||||||||
|
|
|
| ||||||||||||||||||||||
| $ | 343,069,356 | $ | (247,600 | ) | |||||||||||||||||||||
|
|
|
| ||||||||||||||||||||||
Medium-Duration Bond Fund | |||||||||||||||||||||||||
Euro-BOBL | 03/2016 | 64 | $ | 9,088,408 | DEUT | $ | (14,146 | ) | |||||||||||||||||
Euro-BOBL | 03/2016 | 46 | 6,532,293 | GSC | (57,431 | ) | |||||||||||||||||||
Euro-Bund | 03/2016 | (43 | ) | (7,379,680 | ) | GSC | 112,674 | ||||||||||||||||||
90-Day Euro | 03/2016 | (348 | ) | (86,360,550 | ) | GSC | 114,344 | ||||||||||||||||||
Euro | 03/2016 | (8 | ) | (1,088,600 | ) | GSC | (1,426 | ) | |||||||||||||||||
Euro-Bund | 03/2016 | 2 | 343,241 | DEUT | (2,349 | ) | |||||||||||||||||||
Ultra Long U.S. Treasury Bond | 03/2016 | (7 | ) | (1,110,813 | ) | CITI | (9,231 | ) | |||||||||||||||||
10-Year U.S. Treasury Note | 03/2016 | (8 | ) | (1,007,250 | ) | UBS | 5,361 | ||||||||||||||||||
10-Year U.S. Treasury Note | 03/2016 | (28 | ) | (3,525,375 | ) | DEUT | (5,191 | ) | |||||||||||||||||
10-Year U.S. Treasury Note | 03/2016 | (45 | ) | (5,665,781 | ) | CITI | 13,949 | ||||||||||||||||||
10-Year U.S. Treasury Note | 03/2016 | (754 | ) | (94,933,313 | ) | GSC | 227,276 | ||||||||||||||||||
Euro-Schatz | 03/2016 | 8 | 969,473 | DEUT | 80 | ||||||||||||||||||||
Long U.S. Treasury Bond | 03/2016 | 22 | 3,382,500 | DEUT | (5,985 | ) | |||||||||||||||||||
Long U.S. Treasury Bond | 03/2016 | (7 | ) | (1,076,250 | ) | CITI | (4,789 | ) | |||||||||||||||||
Long U.S. Treasury Bond | 03/2016 | (48 | ) | (7,380,000 | ) | GSC | 36,219 | ||||||||||||||||||
Ultra Long U.S. Treasury Bond | 03/2016 | 256 | 40,624,000 | GSC | 248,207 | ||||||||||||||||||||
Ultra Long U.S. Treasury Bond | 03/2016 | 136 | 21,581,500 | DEUT | 106,514 | ||||||||||||||||||||
5-Year U.S. Treasury Note | 04/2016 | 796 | 94,182,969 | DEUT | (218,484 | ) | |||||||||||||||||||
5-Year U.S. Treasury Note | 04/2016 | 230 | 27,213,672 | GSC | (9,583 | ) | |||||||||||||||||||
5-Year U.S. Treasury Note | 04/2016 | 114 | 13,488,516 | CITI | (34,071 | ) | |||||||||||||||||||
323
Table of Contents
Fund/Future Type | Expiration Date | Open Long (Short) Contracts | Notional Market Value of Contracts | Counter- party | Net Unrealized Appreciation (Depreciation) on Futures | ||||||||||||||||||||
2-Year U.S. Treasury Note | 04/2016 | 54 | $ | 11,730,656 | CITI | $ | (19,412 | ) | |||||||||||||||||
2-Year U.S. Treasury Note | 04/2016 | 50 | 10,861,719 | GSC | (15,803 | ) | |||||||||||||||||||
3-Month Sterling | 12/2016 | (82 | ) | (14,956,514 | ) | DEUT | 12,846 | ||||||||||||||||||
90-Day Euro | 12/2016 | (74 | ) | (18,272,450 | ) | GSC | 23,822 | ||||||||||||||||||
90-Day Euro | 03/2017 | 53 | 13,067,150 | GSC | (10,397 | ) | |||||||||||||||||||
90-Day Euro | 03/2017 | (75 | ) | (18,491,250 | ) | DEUT | (58,880 | ) | |||||||||||||||||
3-Month Sterling | 03/2017 | (183 | ) | (33,331,350 | ) | DEUT | (18,194 | ) | |||||||||||||||||
90-Day Euro | 06/2017 | (189 | ) | (46,527,075 | ) | DEUT | (515,567 | ) | |||||||||||||||||
3-Month Sterling | 06/2017 | (70 | ) | (12,731,637 | ) | JPM | (35,249 | ) | |||||||||||||||||
90-Day Euro | 09/2017 | (334 | ) | (82,118,075 | ) | DEUT | (981,726 | ) | |||||||||||||||||
3-Month Sterling | 09/2017 | (16 | ) | (2,906,845 | ) | DEUT | 6,561 | ||||||||||||||||||
90-Day Euro | 12/2017 | (70 | ) | (17,189,375 | ) | DEUT | 45,610 | ||||||||||||||||||
90-Day Euro | 03/2018 | (23 | ) | (5,642,763 | ) | DEUT | (20,828 | ) | |||||||||||||||||
|
|
|
| ||||||||||||||||||||||
| $ | (208,628,849 | ) | $ | (1,085,279 | ) | ||||||||||||||||||||
|
|
|
| ||||||||||||||||||||||
Global Bond Fund | |||||||||||||||||||||||||
Euro-Bund | 03/2016 | (17 | ) | $ | (2,917,548 | ) | GSC | $ | 44,526 | ||||||||||||||||
Euro-Buxl® | 03/2016 | (3 | ) | (493,604 | ) | GSC | 10,166 | ||||||||||||||||||
Ultra Long U.S. Treasury Bond | 03/2016 | (24 | ) | (3,808,500 | ) | GSC | (29,578 | ) | |||||||||||||||||
10-Year U.S. Treasury Note | 03/2016 | (129 | ) | (16,241,906 | ) | GSC | 97,362 | ||||||||||||||||||
Long U.S. Treasury Bond | 03/2016 | (1 | ) | (153,750 | ) | GSC | 1,497 | ||||||||||||||||||
5-Year U.S. Treasury Note | 04/2016 | 300 | 35,496,094 | GSC | (93,584 | ) | |||||||||||||||||||
|
|
|
| ||||||||||||||||||||||
| $ | 11,880,786 | $ | 30,389 | ||||||||||||||||||||||
|
|
|
| ||||||||||||||||||||||
Defensive Market Strategies Fund | |||||||||||||||||||||||||
S&P 500® E-Mini | 03/2016 | 262 | $ | 26,663,740 | GSC | $ | (73,717 | ) | |||||||||||||||||
|
|
|
| ||||||||||||||||||||||
Equity Index Fund | |||||||||||||||||||||||||
S&P 500® E-Mini | 03/2016 | 208 | $ | 21,168,160 | GSC | $ | (41,549 | ) | |||||||||||||||||
|
|
|
| ||||||||||||||||||||||
Value Equity Fund | |||||||||||||||||||||||||
S&P 500® E-Mini | 03/2016 | 412 | $ | 41,929,240 | GSC | $ | (94,897 | ) | |||||||||||||||||
|
|
|
| ||||||||||||||||||||||
Growth Equity Fund | |||||||||||||||||||||||||
S&P 500® E-Mini | 03/2016 | 485 | $ | 49,358,450 | GSC | $ | (144,600 | ) | |||||||||||||||||
|
|
|
| ||||||||||||||||||||||
Small Cap Equity Fund | |||||||||||||||||||||||||
Russell 2000® IMM-Mini | 03/2016 | 187 | $ | 21,159,050 | GSC | $ | 241,324 | ||||||||||||||||||
|
|
|
| ||||||||||||||||||||||
International Equity Index Fund | |||||||||||||||||||||||||
MSCI EAFE Index E-Mini | 03/2016 | 57 | $ | 4,839,870 | GSC | $ | 87,181 | ||||||||||||||||||
|
|
|
| ||||||||||||||||||||||
International Equity Fund | |||||||||||||||||||||||||
AEX Index | 01/2016 | (13 | ) | $ | (1,248,476 | ) | BAR | $ | (21,412 | ) | |||||||||||||||
BIST 30 Index | 01/2016 | 93 | 2,122,491 | BAR | 6,784 | ||||||||||||||||||||
CAC40 Index | 01/2016 | 141 | 7,107,692 | BAR | 29,818 | ||||||||||||||||||||
Hang Seng Index | 01/2016 | 71 | 10,036,129 | BAR | (51,832 | ) | |||||||||||||||||||
IBEX 35 | 01/2016 | 62 | 6,418,712 | BAR | (55,152 | ) | |||||||||||||||||||
OMX 30 Index | 01/2016 | 1 | 17,153 | BAR | 422 | ||||||||||||||||||||
MSCI EAFE Index E-Mini | 03/2016 | 363 | 30,822,330 | GSC | 650,215 | ||||||||||||||||||||
ASX SPI 200 Index | 03/2016 | 153 | 14,652,678 | BAR | 968,331 | ||||||||||||||||||||
DAX Index | 03/2016 | 22 | 6,438,593 | BAR | 132,078 | ||||||||||||||||||||
FTSE 100 Index® | 03/2016 | (90 | ) | (8,223,433 | ) | BAR | (297,580 | ) | |||||||||||||||||
FTSE MIB Index | 03/2016 | (29 | ) | (3,378,821 | ) | BAR | (51,200 | ) | |||||||||||||||||
S&P/TSE 60 Index | 03/2016 | (96 | ) | (10,558,127 | ) | BAR | (102,442 | ) | |||||||||||||||||
Swiss Market Index Future | 03/2016 | (33 | ) | (2,798,948 | ) | GSC | (113,780 | ) | |||||||||||||||||
324
Table of Contents
Fund/Future Type | Expiration Date | Open Long (Short) Contracts | Notional Market Value of Contracts | Counter- party | Net Unrealized Appreciation (Depreciation) on Futures | ||||||||||||||||||||
TOPIX Index® | 03/2016 | (23 | ) | $ | (2,961,230 | ) | BAR | $ | (22,126 | ) | |||||||||||||||
Hang Seng Index | 01/2016 | 44 | 6,255,914 | GSC | (36,776 | ) | |||||||||||||||||||
|
|
|
| ||||||||||||||||||||||
| $ | 54,702,657 | $ | 1,035,348 | ||||||||||||||||||||||
|
|
|
| ||||||||||||||||||||||
Emerging Markets Equity Fund | |||||||||||||||||||||||||
TAIEX | 01/2016 | (5 | ) | $ | (251,926 | ) | GSC | $ | 823 | ||||||||||||||||
HSCEI Index | 01/2016 | 104 | 6,511,700 | BAR | (97,258 | ) | |||||||||||||||||||
TA-25 Index | 01/2016 | 46 | 1,807,300 | GSC | 20,064 | ||||||||||||||||||||
BIST 30 Index | 01/2016 | 45 | 1,027,012 | BAR | 3,332 | ||||||||||||||||||||
FTSE Bursa Malaysia KLCI | 01/2016 | 48 | 943,845 | BAR | 5,999 | ||||||||||||||||||||
SGX CNX Nifty Index | 02/2016 | (226 | ) | (3,592,496 | ) | GSC | (4,214 | ) | |||||||||||||||||
HSCEI Index | 02/2016 | 12 | 751,350 | GSC | (7,392 | ) | |||||||||||||||||||
MSCI Taiwan Index | 02/2016 | 60 | 1,826,400 | GSC | (15,931 | ) | |||||||||||||||||||
Bovespa Index | 02/2016 | (15 | ) | (166,313 | ) | GSC | 1,778 | ||||||||||||||||||
BIST 30 Index | 02/2016 | (350 | ) | (1,068,998 | ) | JPM | 32,440 | ||||||||||||||||||
KOSPI 200 Index | 03/2016 | 2 | 205,236 | JPM | (605 | ) | |||||||||||||||||||
FTSE/JSE Top 40 Index | 03/2016 | (77 | ) | (2,303,876 | ) | BAR | (93,553 | ) | |||||||||||||||||
Mexican Bolsa IPC Index | 03/2016 | 22 | 550,673 | JPM | (2,374 | ) | |||||||||||||||||||
WIG20 Index | 03/2016 | (9 | ) | (2,026 | ) | GSC | 2,026 | ||||||||||||||||||
MSCI Emerging Markets E-Mini | 03/2016 | 506 | 19,923,750 | GSC | 1,305 | ||||||||||||||||||||
SET50 Index | 04/2016 | (59 | ) | (260,561 | ) | BAR | (1,021 | ) | |||||||||||||||||
|
|
|
| ||||||||||||||||||||||
| $ | 25,901,070 | $ | (154,581 | ) | |||||||||||||||||||||
|
|
|
| ||||||||||||||||||||||
Inflation Protected Bond Fund | |||||||||||||||||||||||||
Euro-BOBL | 03/2016 | (1 | ) | $ | (142,006 | ) | UBS | $ | 173 | ||||||||||||||||
Euro-Bund | 03/2016 | (19 | ) | (3,260,789 | ) | UBS | 8,288 | ||||||||||||||||||
Euro-Buxl® | 03/2016 | (1 | ) | (164,535 | ) | UBS | 1,542 | ||||||||||||||||||
FTSE Bursa Malaysia KLCI | 03/2016 | (67 | ) | (10,042,318 | ) | UBS | (20,104 | ) | |||||||||||||||||
10-Year U.S. Treasury Note | 03/2016 | 10 | 1,259,063 | UBS | (7,434 | ) | |||||||||||||||||||
10-Year Japanese Bond | 03/2016 | (16 | ) | (19,839,760 | ) | UBS | (46,634 | ) | |||||||||||||||||
Ultra Long U.S. Treasury Bond | 03/2016 | (63 | ) | (9,997,313 | ) | UBS | (128,825 | ) | |||||||||||||||||
Long U.S. Treasury Bond | 03/2016 | 29 | 4,458,750 | UBS | (14,222 | ) | |||||||||||||||||||
5-Year U.S. Treasury Note | 04/2016 | (15 | ) | (1,774,805 | ) | UBS | 861 | ||||||||||||||||||
2-Year U.S. Treasury Note | 04/2016 | 12 | 2,606,813 | UBS | (4,779 | ) | |||||||||||||||||||
90-Day Euro | 12/2016 | (124 | ) | (30,618,700 | ) | UBS | 71,131 | ||||||||||||||||||
90-Day Euro | 12/2017 | (23 | ) | (5,647,938 | ) | UBS | (7,219 | ) | |||||||||||||||||
|
|
|
| ||||||||||||||||||||||
| $ | (73,163,538 | ) | $ | (147,222 | ) | ||||||||||||||||||||
|
|
|
| ||||||||||||||||||||||
Real Estate Securities Fund | |||||||||||||||||||||||||
S&P 500® MidCap 400 | 03/2016 | 59 | $ | 8,221,650 | GSC | $ | 39,530 | ||||||||||||||||||
|
|
|
| ||||||||||||||||||||||
Forward Foreign Currency Contracts
As of December 31, 2015, the following Funds have forward foreign currency exchange contracts that obligate them to deliver currencies at specified future dates. The unrealized appreciation and/or depreciation on these contracts is included in the accompanying statements of assets and liabilities. The terms of the open contracts are as follows:
Fund/Expiration Date | Currency Purchased | Amount of Currency Purchased | Currency Sold | Amount of Currency Sold | Counter- party | Net Unrealized Appreciation (Depreciation) | ||||||||||||||
Low-Duration Bond Fund |
| |||||||||||||||||||
01/05/16 | U.S. Dollars | 2,743,470 | Euro | 2,537,000 | CITI | $ | (13,975 | ) | ||||||||||||
01/05/16 | Japanese Yen | 360,100,000 | U.S. Dollars | 2,919,714 | GSC | 76,573 | ||||||||||||||
01/05/16 | Japanese Yen | 281,700,000 | U.S. Dollars | 2,327,980 | JPM | 15,964 | ||||||||||||||
325
Table of Contents
Fund/Expiration Date | Currency Purchased | Amount of Currency Purchased | Currency Sold | Amount of Currency Sold | Counter- party | Net Unrealized Appreciation (Depreciation) | ||||||||||||
01/05/16 | Euro | 8,256,000 | U.S. Dollars | 9,018,029 | UBS | $ | (44,647 | ) | ||||||||||
01/05/16 | U.S. Dollars | 6,094,596 | Euro | 5,719,000 | HSBC | (121,342 | ) | |||||||||||
01/05/16 | U.S. Dollars | 5,254,196 | Japanese Yen | 641,800,000 | GSC | (86,035 | ) | |||||||||||
01/06/16 | U.S. Dollars | 2,919,175 | Euro | 2,756,000 | UBS | (76,376 | ) | |||||||||||
01/06/16 | U.S. Dollars | 1,786,622 | Australian Dollars | 2,483,000 | SC | (22,186 | ) | |||||||||||
01/06/16 | Euro | 1,448,000 | U.S. Dollars | 1,573,096 | MSCS | 763 | ||||||||||||
01/06/16 | Euro | 1,408,000 | U.S. Dollars | 1,498,727 | RBS | 31,656 | ||||||||||||
01/06/16 | U.S. Dollars | 396,678 | British Pounds | 264,000 | BNP | 7,482 | ||||||||||||
01/11/16 | U.S. Dollars | 2,049,691 | Canadian Dollars | 2,739,000 | RBC | 70,168 | ||||||||||||
01/11/16 | U.S. Dollars | 1,781,775 | Euro | 1,683,000 | CITI | (47,741 | ) | |||||||||||
01/11/16 | Canadian Dollars | 38,000 | U.S. Dollars | 27,358 | RBC | 106 | ||||||||||||
02/02/16 | U.S. Dollars | 9,024,387 | Euro | 8,256,000 | UBS | 44,655 | ||||||||||||
02/02/16 | U.S. Dollars | 2,329,298 | Japanese Yen | 281,700,000 | JPM | (16,053 | ) | |||||||||||
02/11/16 | U.S. Dollars | 186,251 | British Pounds | 124,000 | JPM | 3,434 | ||||||||||||
02/11/16 | Norwegian Krone | 3,585,000 | U.S. Dollars | 416,540 | HSBC | (11,709 | ) | |||||||||||
02/11/16 | U.S. Dollars | 3,009,225 | Australian Dollars | 4,189,000 | JPM | (36,770 | ) | |||||||||||
02/11/16 | U.S. Dollars | 2,047,318 | British Pounds | 1,349,000 | JPM | 58,447 | ||||||||||||
02/11/16 | British Pounds | 878,000 | U.S. Dollars | 1,307,238 | JPM | (12,776 | ) | |||||||||||
02/11/16 | Australian Dollars | 424,000 | U.S. Dollars | 305,823 | BNP | 2,485 | ||||||||||||
02/11/16 | U.S. Dollars | 177,161 | Canadian Dollars | 235,000 | JPM | 7,309 | ||||||||||||
02/11/16 | U.S. Dollars | 146,101 | Australian Dollars | 208,000 | JPM | (5,144 | ) | |||||||||||
02/12/16 | U.S. Dollars | 701,316 | Japanese Yen | 86,300,000 | JPM | (17,342 | ) | |||||||||||
03/10/16 | U.S. Dollars | 3,087,971 | Mexican Pesos | 54,081,171 | UBS | (33,997 | ) | |||||||||||
03/14/16 | U.S. Dollars | 139,422 | Mexican Pesos | 2,431,000 | CITI | (873 | ) | |||||||||||
|
| |||||||||||||||||
| $ | (227,924 | ) | ||||||||||||||||
|
| |||||||||||||||||
Medium-Duration Bond Fund | ||||||||||||||||||
01/05/16 | Japanese Yen | 945,100,000 | U.S. Dollars | 7,724,561 | GSC | $ | 139,341 | |||||||||||
01/05/16 | Brazilian Reals | 960,481 | U.S. Dollars | 253,767 | CITI | (11,436 | ) | |||||||||||
01/05/16 | U.S. Dollars | 691,572 | Euro | 637,000 | CITI | (779 | ) | |||||||||||
01/05/16 | U.S. Dollars | 426,778 | Japanese Yen | 52,500,000 | GSC | (10,059 | ) | |||||||||||
01/05/16 | U.S. Dollars | (326,488 | ) | Japanese Yen | (39,700,000 | ) | CITI | (3,844 | ) | |||||||||
01/05/16 | Japanese Yen | 1,570,013,212 | U.S. Dollars | 12,974,651 | JPM | 88,971 | ||||||||||||
01/05/16 | Japanese Yen | 146,000,000 | U.S. Dollars | 1,202,184 | UBS | 12,639 | ||||||||||||
01/05/16 | Japanese Yen | 98,500,000 | U.S. Dollars | 800,932 | UBS | 18,658 | ||||||||||||
01/05/16 | Japanese Yen | 62,700,000 | U.S. Dollars | 508,487 | CITI | 13,221 | ||||||||||||
01/05/16 | Euro | 17,255,119 | U.S. Dollars | 18,847,766 | UBS | (93,313 | ) | |||||||||||
01/05/16 | U.S. Dollars | 13,083,203 | Japanese Yen | 1,598,113,212 | GSC | (214,231 | ) | |||||||||||
01/05/16 | U.S. Dollars | 11,459,421 | Euro | 10,597,000 | CITI | (58,375 | ) | |||||||||||
01/05/16 | U.S. Dollars | 10,980,843 | Euro | 10,304,119 | HSBC | (218,624 | ) | |||||||||||
01/05/16 | U.S. Dollars | 7,728,978 | British Pounds | 5,127,000 | DEUT | 170,617 | ||||||||||||
01/05/16 | U.S. Dollars | 6,222,129 | Japanese Yen | 767,400,000 | GSC | (163,183 | ) | |||||||||||
01/05/16 | U.S. Dollars | 5,501,027 | Brazilian Reals | 20,777,379 | DEUT | 258,857 | ||||||||||||
01/05/16 | British Pounds | 5,127,000 | U.S. Dollars | 7,608,705 | CITI | (50,345 | ) | |||||||||||
01/05/16 | Euro | 3,296,000 | U.S. Dollars | 3,513,199 | GSC | 69,198 | ||||||||||||
01/05/16 | U.S. Dollars | 2,554,613 | Euro | 2,347,000 | CITI | 3,677 | ||||||||||||
01/05/16 | Brazilian Reals | 2,537,584 | U.S. Dollars | 652,000 | DEUT | (11,763 | ) | |||||||||||
01/05/16 | Brazilian Reals | 2,345,828 | U.S. Dollars | 613,000 | DEUT | (21,143 | ) | |||||||||||
01/05/16 | Brazilian Reals | 2,240,200 | U.S. Dollars | 575,000 | GSC | (9,794 | ) | |||||||||||
01/05/16 | Brazilian Reals | 1,998,726 | U.S. Dollars | 508,000 | GSC | (3,718 | ) | |||||||||||
01/05/16 | U.S. Dollars | 1,919,025 | Japanese Yen | 232,800,000 | GSC | (18,036 | ) | |||||||||||
01/05/16 | Brazilian Reals | 1,883,979 | U.S. Dollars | 486,000 | DEUT | (10,669 | ) | |||||||||||
326
Table of Contents
Fund/Expiration Date | Currency Purchased | Amount of Currency Purchased | Currency Sold | Amount of Currency Sold | Counter- party | Net Unrealized Appreciation (Depreciation) | ||||||||||||||
01/05/16 | Euro | 1,462,000 | U.S. Dollars | 1,587,616 | GSC | $ | 1,420 | |||||||||||||
01/05/16 | Euro | 1,438,000 | U.S. Dollars | 1,525,138 | JPM | 37,813 | ||||||||||||||
01/05/16 | Brazilian Reals | 1,419,675 | U.S. Dollars | 373,000 | DEUT | (14,813 | ) | |||||||||||||
01/05/16 | Brazilian Reals | 1,342,474 | U.S. Dollars | 354,000 | DEUT | (15,291 | ) | |||||||||||||
01/05/16 | Brazilian Reals | 1,277,888 | U.S. Dollars | 333,000 | DEUT | (10,587 | ) | |||||||||||||
01/05/16 | Brazilian Reals | 1,128,974 | U.S. Dollars | 296,000 | DEUT | (11,158 | ) | |||||||||||||
01/05/16 | U.S. Dollars | 1,073,805 | Japanese Yen | 131,800,000 | UBS | (22,864 | ) | |||||||||||||
01/05/16 | Euro | 949,000 | U.S. Dollars | 1,027,952 | JPM | 3,508 | ||||||||||||||
01/05/16 | Brazilian Reals | 800,800 | U.S. Dollars | 208,000 | BNP | (5,957 | ) | |||||||||||||
01/05/16 | Brazilian Reals | 777,166 | U.S. Dollars | 201,000 | GSC | (4,920 | ) | |||||||||||||
01/05/16 | Brazilian Reals | 768,791 | U.S. Dollars | 203,508 | BNP | (9,540 | ) | |||||||||||||
01/05/16 | Brazilian Reals | 694,794 | U.S. Dollars | 172,000 | RBC | 3,298 | ||||||||||||||
01/05/16 | U.S. Dollars | 564,116 | Euro | 515,000 | JPM | 4,366 | ||||||||||||||
01/05/16 | Brazilian Reals | 451,994 | U.S. Dollars | 116,000 | DEUT | (1,961 | ) | |||||||||||||
01/05/16 | Brazilian Reals | 420,000 | U.S. Dollars | 105,000 | BAR | 967 | ||||||||||||||
01/05/16 | Brazilian Reals | 364,116 | U.S. Dollars | 95,000 | DEUT | (3,133 | ) | |||||||||||||
01/05/16 | Brazilian Reals | 352,890 | U.S. Dollars | 90,000 | DEUT | (965 | ) | |||||||||||||
01/05/16 | U.S. Dollars | 155,507 | Brazilian Reals | 621,560 | HSBC | (1,314 | ) | |||||||||||||
01/05/16 | Brazilian Reals | 52,578 | U.S. Dollars | 13,000 | DEUT | 266 | ||||||||||||||
01/14/16 | U.S. Dollars | 821,000 | Taiwan Dollars | 27,019,110 | JPM | (1,633 | ) | |||||||||||||
01/14/16 | U.S. Dollars | 193,239 | Mexican Pesos | 3,227,285 | HSBC | 6,177 | ||||||||||||||
01/19/16 | U.S. Dollars | 1,087,532 | Brazilian Reals | 4,184,000 | CITIC | 37,287 | ||||||||||||||
01/19/16 | South Korean Won | 379,127,400 | U.S. Dollars | 324,370 | DEUT | (1,209 | ) | |||||||||||||
01/19/16 | U.S. Dollars | 6,090,071 | Euro | 5,320,000 | CITIC | 305,763 | ||||||||||||||
01/19/16 | U.S. Dollars | 3,782,312 | Euro | 3,300,000 | BAR | 194,302 | ||||||||||||||
01/19/16 | U.S. Dollars | 3,412,463 | Chinese Yuan Renminbi | 21,850,000 | CITIC | 51,692 | ||||||||||||||
01/19/16 | U.S. Dollars | 1,731,353 | Chinese Yuan Renminbi | 11,130,000 | BOA | 19,436 | ||||||||||||||
01/19/16 | U.S. Dollars | 1,722,948 | Chinese Yuan Renminbi | 11,060,000 | CITIC | 21,798 | ||||||||||||||
01/19/16 | U.S. Dollars | 1,185,933 | Euro | 1,040,000 | BOA | 55,166 | ||||||||||||||
01/19/16 | Malaysian Ringgits | 1,171,800 | U.S. Dollars | 270,187 | DEUT | 2,345 | ||||||||||||||
01/19/16 | U.S. Dollars | 801,449 | Malaysian Ringgits | 3,508,743 | DEUT | (14,600 | ) | |||||||||||||
01/19/16 | Euro | 627,541 | U.S. Dollars | 694,813 | CITIC | (12,503 | ) | |||||||||||||
01/19/16 | Euro | 606,145 | U.S. Dollars | 668,798 | CITIC | (9,751 | ) | |||||||||||||
01/19/16 | Euro | 484,057 | U.S. Dollars | 535,783 | CITIC | (9,479 | ) | |||||||||||||
01/19/16 | U.S. Dollars | 332,000 | South Korean Won | 379,127,400 | JPM | 8,839 | ||||||||||||||
01/19/16 | U.S. Dollars | 322,029 | Malaysian Ringgits | 1,412,258 | UBS | (6,428 | ) | |||||||||||||
01/19/16 | U.S. Dollars | 318,722 | Brazilian Reals | 1,227,000 | BAR | 10,727 | ||||||||||||||
01/19/16 | Malaysian Ringgits | 120,750 | U.S. Dollars | 28,000 | UBS | 84 | ||||||||||||||
01/20/16 | Turkish Lira | 3,803,402 | U.S. Dollars | 1,302,000 | GSC | (5,596 | ) | |||||||||||||
01/20/16 | U.S. Dollars | 1,621,113 | Turkish Lira | 4,734,947 | DEUT | 7,189 | ||||||||||||||
01/20/16 | Turkish Lira | 845,859 | U.S. Dollars | 289,000 | BAR | (686 | ) | |||||||||||||
01/21/16 | South Korean Won | 1,547,061,500 | U.S. Dollars | 1,323,406 | JPM | (4,794 | ) | |||||||||||||
01/21/16 | South Korean Won | 502,554,500 | U.S. Dollars | 430,159 | GSC | (1,815 | ) | |||||||||||||
01/21/16 | South Korean Won | 382,173,000 | U.S. Dollars | 326,923 | DEUT | (1,184 | ) | |||||||||||||
01/21/16 | South Korean Won | 214,507,500 | U.S. Dollars | 185,000 | HSBC | (2,168 | ) | |||||||||||||
01/21/16 | South Korean Won | 209,688,500 | U.S. Dollars | 181,000 | GSC | (2,276 | ) | |||||||||||||
01/21/16 | Indian Rupees | 81,153,358 | U.S. Dollars | 1,221,214 | UBS | 1,145 | ||||||||||||||
01/21/16 | U.S. Dollars | 1,082,209 | Indian Rupees | 71,872,196 | CITI | (355 | ) | |||||||||||||
01/21/16 | U.S. Dollars | 736,575 | South Korean Won | 866,359,668 | JPM | (1,852 | ) | |||||||||||||
01/21/16 | U.S. Dollars | 593,000 | South Korean Won | 678,095,500 | CS | 15,037 | ||||||||||||||
01/21/16 | U.S. Dollars | 488,115 | South Korean Won | 566,164,300 | JPM | 5,554 | ||||||||||||||
01/21/16 | U.S. Dollars | 324,318 | South Korean Won | 379,127,400 | DEUT | 1,175 | ||||||||||||||
327
Table of Contents
Fund/Expiration Date | Currency Purchased | Amount of Currency Purchased | Currency Sold | Amount of Currency Sold | Counter- party | Net Unrealized Appreciation (Depreciation) | ||||||||||||||
01/21/16 | U.S. Dollars | 307,000 | South Korean Won | 352,006,200 | JPM | $ | 6,973 | |||||||||||||
01/28/16 | U.S. Dollars | 203,872 | Mexican Pesos | 3,370,591 | MLCS | 8,707 | ||||||||||||||
01/29/16 | Chinese Yuan Renminbi | 5,659,274 | U.S. Dollars | 882,607 | BNP | (12,703 | ) | |||||||||||||
01/29/16 | Chinese Yuan Renminbi | 2,541,696 | U.S. Dollars | 389,234 | HKSB | 1,458 | ||||||||||||||
01/29/16 | U.S. Dollars | 1,258,932 | Chinese Yuan Renminbi | 8,263,376 | CITI | (11,256 | ) | |||||||||||||
02/02/16 | U.S. Dollars | 18,861,055 | Euro | 17,255,119 | UBS | 93,329 | ||||||||||||||
02/02/16 | U.S. Dollars | 12,981,995 | Japanese Yen | 1,570,013,212 | JPM | (89,469 | ) | |||||||||||||
02/02/16 | U.S. Dollars | 7,608,935 | British Pounds | 5,127,000 | CITI | 50,093 | ||||||||||||||
02/02/16 | Brazilian Reals | 621,560 | U.S. Dollars | 153,886 | HSBC | 1,383 | ||||||||||||||
02/02/16 | U.S. Dollars | 614,364 | Brazilian Reals | 2,361,000 | JPM | 24,575 | ||||||||||||||
02/05/16 | U.S. Dollars | 696,994 | Mexican Pesos | 11,915,041 | CITI | 7,486 | ||||||||||||||
02/10/16 | U.S. Dollars | 1,917,761 | Euro | 1,765,715 | CITI | (3,135 | ) | |||||||||||||
02/11/16 | Euro | 767,000 | U.S. Dollars | 842,978 | JPM | (8,548 | ) | |||||||||||||
02/11/16 | U.S. Dollars | 540,369 | Euro | 494,000 | JPM | 2,940 | ||||||||||||||
02/11/16 | U.S. Dollars | 475,912 | British Pounds | 317,000 | JPM | 8,549 | ||||||||||||||
02/11/16 | U.S. Dollars | 220,411 | British Pounds | 145,000 | CITI | 6,633 | ||||||||||||||
02/12/16 | Japanese Yen | 449,600,000 | U.S. Dollars | 3,675,806 | UBS | 68,207 | ||||||||||||||
02/12/16 | Japanese Yen | 104,800,000 | U.S. Dollars | 853,191 | CITI | 19,524 | ||||||||||||||
02/12/16 | Japanese Yen | 93,700,000 | U.S. Dollars | 762,301 | CITI | 17,979 | ||||||||||||||
02/12/16 | U.S. Dollars | 865,413 | Japanese Yen | 106,600,000 | JPM | (22,291 | ) | |||||||||||||
02/12/16 | U.S. Dollars | 400,636 | Japanese Yen | 49,300,000 | JPM | (9,907 | ) | |||||||||||||
02/16/16 | U.S. Dollars | 2,433,248 | Euro | 2,233,116 | CITIC | 3,497 | ||||||||||||||
02/16/16 | U.S. Dollars | 2,116,639 | British Pounds | 1,389,500 | BOA | 68,049 | ||||||||||||||
02/16/16 | U.S. Dollars | 921,594 | Euro | 842,308 | BOA | 5,118 | ||||||||||||||
02/16/16 | Euro | 849,687 | U.S. Dollars | 926,731 | UBS | (2,225 | ) | |||||||||||||
02/16/16 | Euro | 125,000 | U.S. Dollars | 136,695 | CITIC | (688 | ) | |||||||||||||
02/17/16 | U.S. Dollars | 367,000 | Brazilian Reals | 1,491,855 | JPM | (10,088 | ) | |||||||||||||
02/18/16 | U.S. Dollars | 203,668 | Mexican Pesos | 3,436,291 | CITI | 5,000 | ||||||||||||||
02/26/16 | U.S. Dollars | 737,958 | Singapore Dollars | 1,041,000 | HKSB | 5,168 | ||||||||||||||
02/26/16 | U.S. Dollars | 1,333,000 | Thailand Baht | 48,214,610 | JPM | (4,836 | ) | |||||||||||||
02/26/16 | U.S. Dollars | 1,331,000 | Malaysian Ringgits | 5,709,990 | BAR | 6,591 | ||||||||||||||
02/26/16 | U.S. Dollars | 995,000 | Singapore Dollars | 1,404,244 | JPM | 6,513 | ||||||||||||||
02/26/16 | U.S. Dollars | 498,000 | Taiwan Dollars | 16,351,830 | BAR | (99 | ) | |||||||||||||
03/14/16 | Mexican Pesos | 9,048,000 | U.S. Dollars | 525,527 | JPM | (3,360 | ) | |||||||||||||
03/14/16 | Mexican Pesos | 1,782,000 | U.S. Dollars | 104,348 | JPM | (1,507 | ) | |||||||||||||
03/14/16 | U.S. Dollars | 1,242,553 | Mexican Pesos | 21,306,800 | GSC | 12,920 | ||||||||||||||
03/16/16 | U.S. Dollars | 242,000 | Japanese Yen | 29,069,257 | HSBC | (316 | ) | |||||||||||||
03/16/16 | Canadian Dollars | 87,113 | U.S. Dollars | 62,729 | HSBC | 240 | ||||||||||||||
03/16/16 | U.S. Dollars | 67,553 | Australian Dollars | 92,649 | JPM | 297 | ||||||||||||||
03/16/16 | U.S. Dollars | 53,140 | Australian Dollars | 73,334 | HSBC | (96 | ) | |||||||||||||
03/16/16 | British Pounds | 35,698 | U.S. Dollars | 53,140 | CS | (507 | ) | |||||||||||||
03/16/16 | Japanese Yen | 29,569,375 | U.S. Dollars | 242,000 | CS | 4,485 | ||||||||||||||
03/16/16 | Japanese Yen | 14,889,776 | U.S. Dollars | 121,000 | UBS | 3,119 | ||||||||||||||
03/16/16 | Swedish Kronor | 2,054,787 | Euro | 221,000 | RBS | 3,315 | ||||||||||||||
03/16/16 | Norwegian Krone | 1,767,123 | U.S. Dollars | 207,588 | SS | (8,095 | ) | |||||||||||||
03/16/16 | Swedish Kronor | 1,037,055 | Euro | 112,000 | JPM | 1,171 | ||||||||||||||
03/16/16 | Swedish Kronor | 1,021,196 | Euro | 110,000 | UBS | 1,466 | ||||||||||||||
03/16/16 | Swedish Kronor | 938,119 | U.S. Dollars | 111,181 | JPM | 200 | ||||||||||||||
03/16/16 | Canadian Dollars | 662,796 | U.S. Dollars | 485,000 | SS | (5,899 | ) | |||||||||||||
03/16/16 | Norwegian Krone | 548,680 | U.S. Dollars | 63,166 | HSBC | (1,225 | ) | |||||||||||||
03/16/16 | Swedish Kronor | 534,075 | Euro | 57,475 | JPM | 825 | ||||||||||||||
03/16/16 | Norwegian Krone | 506,097 | U.S. Dollars | 57,891 | JPM | (757 | ) | |||||||||||||
328
Table of Contents
Fund/Expiration Date | Currency Purchased | Amount of Currency Purchased | Currency Sold | Amount of Currency Sold | Counter- party | Net Unrealized Appreciation (Depreciation) | ||||||||||||||
03/16/16 | Norwegian Krone | 505,942 | U.S. Dollars | 58,030 | MSCS | $ | (913 | ) | ||||||||||||
03/16/16 | Norwegian Krone | 467,071 | U.S. Dollars | 53,435 | JPM | (706 | ) | |||||||||||||
03/16/16 | U.S. Dollars | 426,702 | Japanese Yen | 52,485,678 | UBS | (10,809 | ) | |||||||||||||
03/16/16 | Norwegian Krone | 422,478 | U.S. Dollars | 48,391 | BNP | (697 | ) | |||||||||||||
03/16/16 | Norwegian Krone | 421,297 | U.S. Dollars | 48,336 | HSBC | (775 | ) | |||||||||||||
03/16/16 | U.S. Dollars | 361,186 | Australian Dollars | 502,000 | SS | (3,230 | ) | |||||||||||||
03/16/16 | U.S. Dollars | 340,606 | Euro | 308,714 | CITI | 4,448 | ||||||||||||||
03/16/16 | Australian Dollars | 336,000 | U.S. Dollars | 241,856 | WEST | 2,056 | ||||||||||||||
03/16/16 | U.S. Dollars | 243,094 | Australian Dollars | 334,000 | UBS | 633 | ||||||||||||||
03/16/16 | U.S. Dollars | 242,000 | Canadian Dollars | 338,494 | MLCS | (2,680 | ) | |||||||||||||
03/16/16 | U.S. Dollars | 242,000 | Japanese Yen | 29,468,098 | HSBC | (3,641 | ) | |||||||||||||
03/16/16 | Euro | 237,094 | U.S. Dollars | 259,521 | UBS | (1,350 | ) | |||||||||||||
03/16/16 | U.S. Dollars | 229,975 | Japanese Yen | 27,802,046 | CITI | (1,778 | ) | |||||||||||||
03/16/16 | Euro | 223,000 | U.S. Dollars | 242,670 | SS | 154 | ||||||||||||||
03/16/16 | Canadian Dollars | 175,309 | U.S. Dollars | 129,337 | RBC | (2,615 | ) | |||||||||||||
03/16/16 | Australian Dollars | 170,000 | U.S. Dollars | 120,421 | STAN | 2,987 | ||||||||||||||
03/16/16 | Australian Dollars | 149,256 | U.S. Dollars | 107,020 | SS | 1,329 | ||||||||||||||
03/16/16 | U.S. Dollars | 146,118 | British Pounds | 97,344 | JPM | 2,594 | ||||||||||||||
03/16/16 | U.S. Dollars | 125,768 | Euro | 115,416 | CS | 91 | ||||||||||||||
03/16/16 | U.S. Dollars | 122,000 | Japanese Yen | 14,944,634 | DEUT | (2,576 | ) | |||||||||||||
03/16/16 | U.S. Dollars | 121,055 | Australian Dollars | 169,000 | CITI | (1,627 | ) | |||||||||||||
03/16/16 | U.S. Dollars | 121,052 | Australian Dollars | 167,000 | MLCS | (178 | ) | |||||||||||||
03/16/16 | U.S. Dollars | 121,023 | Australian Dollars | 169,998 | MSCS | (2,383 | ) | |||||||||||||
03/16/16 | U.S. Dollars | 121,000 | Canadian Dollars | 163,146 | RBC | 3,070 | ||||||||||||||
03/16/16 | U.S. Dollars | 121,000 | Canadian Dollars | 168,478 | CITI | (784 | ) | |||||||||||||
03/16/16 | U.S. Dollars | 120,821 | New Zealand Dollars | 180,000 | SS | (1,712 | ) | |||||||||||||
03/16/16 | U.S. Dollars | 120,672 | New Zealand Dollars | 180,000 | SS | (1,862 | ) | |||||||||||||
03/16/16 | U.S. Dollars | 116,444 | New Zealand Dollars | 174,133 | MSCS | (2,096 | ) | |||||||||||||
03/16/16 | U.S. Dollars | 111,884 | Euro | 102,800 | BNP | (54 | ) | |||||||||||||
03/16/16 | U.S. Dollars | 106,833 | Euro | 97,496 | BNP | 669 | ||||||||||||||
03/16/16 | Canadian Dollars | 105,401 | U.S. Dollars | 77,859 | CITI | (1,670 | ) | |||||||||||||
03/16/16 | Australian Dollars | 102,009 | U.S. Dollars | 72,841 | UBS | 1,210 | ||||||||||||||
03/16/16 | U.S. Dollars | 94,136 | Canadian Dollars | 127,644 | JPM | 1,869 | ||||||||||||||
03/16/16 | New Zealand Dollars | 88,743 | U.S. Dollars | 58,273 | SS | 2,138 | ||||||||||||||
03/16/16 | Australian Dollars | 86,242 | U.S. Dollars | 62,886 | CITI | (280 | ) | |||||||||||||
03/16/16 | Canadian Dollars | 85,620 | U.S. Dollars | 63,209 | MLCS | (1,319 | ) | |||||||||||||
03/16/16 | U.S. Dollars | 82,641 | New Zealand Dollars | 125,172 | UBS | (2,569 | ) | |||||||||||||
03/16/16 | British Pounds | 82,060 | Euro | 111,000 | CS | 121 | ||||||||||||||
03/16/16 | Canadian Dollars | 80,817 | U.S. Dollars | 58,061 | CS | 357 | ||||||||||||||
03/16/16 | Canadian Dollars | 79,505 | U.S. Dollars | 58,069 | JPM | (599 | ) | |||||||||||||
03/16/16 | Canadian Dollars | 79,099 | U.S. Dollars | 58,234 | SC | (1,057 | ) | |||||||||||||
03/16/16 | Canadian Dollars | 78,271 | U.S. Dollars | 58,561 | HSBC | (1,983 | ) | |||||||||||||
03/16/16 | U.S. Dollars | 78,098 | Swedish Kronor | 663,530 | JPM | (682 | ) | |||||||||||||
03/16/16 | U.S. Dollars | 77,989 | Swedish Kronor | 658,348 | CITI | (175 | ) | |||||||||||||
03/16/16 | Australian Dollars | 74,629 | Euro | 48,780 | CS | 1,059 | ||||||||||||||
03/16/16 | U.S. Dollars | 73,136 | Australian Dollars | 100,393 | CITI | 258 | ||||||||||||||
03/16/16 | Canadian Dollars | 72,887 | U.S. Dollars | 53,334 | CS | (647 | ) | |||||||||||||
03/16/16 | U.S. Dollars | 72,528 | New Zealand Dollars | 107,124 | CS | (396 | ) | |||||||||||||
03/16/16 | Canadian Dollars | 71,044 | U.S. Dollars | 53,253 | JPM | (1,899 | ) | |||||||||||||
03/16/16 | U.S. Dollars | 68,305 | Australian Dollars | 93,688 | BNP | 294 | ||||||||||||||
03/16/16 | U.S. Dollars | 68,305 | New Zealand Dollars | 103,180 | CITI | (1,934 | ) | |||||||||||||
03/16/16 | U.S. Dollars | 68,260 | New Zealand Dollars | 103,268 | MSCS | (2,039 | ) | |||||||||||||
329
Table of Contents
Fund/Expiration Date | Currency Purchased | Amount of Currency Purchased | Currency Sold | Amount of Currency Sold | Counter- party | Net Unrealized Appreciation (Depreciation) | ||||||||||||||
03/16/16 | U.S. Dollars | 67,797 | Swedish Kronor | 571,953 | CITI | $ | (109 | ) | ||||||||||||
03/16/16 | U.S. Dollars | 63,198 | New Zealand Dollars | 94,456 | UBS | (1,102 | ) | |||||||||||||
03/16/16 | U.S. Dollar | 62,939 | Euro | 57,708 | BAR | 101 | ||||||||||||||
03/16/16 | U.S. Dollars | 62,924 | New Zealand Dollars | 93,164 | BNP | (497 | ) | |||||||||||||
03/16/16 | British Pounds | 61,897 | U.S. Dollars | 91,869 | SS | (609 | ) | |||||||||||||
03/16/16 | British Pounds | 58,760 | U.S. Dollars | 87,763 | CS | (1,128 | ) | |||||||||||||
03/16/16 | U.S. Dollars | 58,205 | Swedish Kronor | 484,469 | CS | 685 | ||||||||||||||
03/16/16 | U.S. Dollars | 58,161 | Japanese Yen | 7,022,200 | CS | (374 | ) | |||||||||||||
03/16/16 | U.S. Dollars | 57,949 | Japanese Yen | 6,970,522 | BNP | (156 | ) | |||||||||||||
03/16/16 | U.S. Dollars | 57,883 | New Zealand Dollars | 84,875 | DEUT | 105 | ||||||||||||||
03/16/16 | U.S. Dollars | 56,061 | New Zealand Dollars | 84,883 | SS | (1,723 | ) | |||||||||||||
03/16/16 | U.S. Dollars | 53,632 | Japanese Yen | 6,585,458 | SS | (1,263 | ) | |||||||||||||
03/16/16 | U.S. Dollars | 53,548 | Japanese Yen | 6,554,740 | HSBC | (1,091 | ) | |||||||||||||
03/16/16 | British Pounds | 51,894 | U.S. Dollars | 78,062 | HSBC | (1,550 | ) | |||||||||||||
03/16/16 | Euro | 50,616 | U.S. Dollars | 53,633 | UBS | 1,483 | ||||||||||||||
03/16/16 | U.S. Dollars | 48,508 | Swedish Kronor | 407,135 | HSBC | 169 | ||||||||||||||
03/16/16 | U.S. Dollars | 48,415 | New Zealand Dollars | 72,988 | BAR | (1,271 | ) | |||||||||||||
03/16/16 | U.S. Dollars | 48,292 | New Zealand Dollars | 71,965 | BAR | (698 | ) | |||||||||||||
03/16/16 | British Pounds | 42,265 | U.S. Dollars | 62,706 | BNP | (391 | ) | |||||||||||||
03/16/16 | British Pounds | 39,057 | U.S. Dollars | 58,093 | HSBC | (507 | ) | |||||||||||||
03/16/16 | British Pounds | 35,737 | Japanese Yen | 6,462,525 | CS | (1,180 | ) | |||||||||||||
03/16/16 | British Pounds | 35,210 | U.S. Dollars | 53,256 | BAR | (1,342 | ) | |||||||||||||
03/16/16 | British Pounds | 35,111 | U.S. Dollars | 53,244 | SS | (1,476 | ) | |||||||||||||
03/17/16 | U.S. Dollars | 1,067,987 | Mexican Pesos | 18,381,664 | MSCS | 7,396 | ||||||||||||||
03/23/16 | Russian Rubles | 30,269,900 | U.S. Dollars | 421,000 | DEUT | (15,520 | ) | |||||||||||||
03/23/16 | Russian Rubles | 24,751,890 | U.S. Dollars | 333,000 | CS | (1,437 | ) | |||||||||||||
03/23/16 | Russian Rubles | 17,531,400 | U.S. Dollars | 244,000 | BNP | (9,159 | ) | |||||||||||||
03/23/16 | Russian Rubles | 31,015,912 | U.S. Dollars | 421,000 | JPM | (5,527 | ) | |||||||||||||
03/23/16 | Russian Rubles | 5,754,029 | U.S. Dollars | 78,000 | JPM | (922 | ) | |||||||||||||
05/24/16 | Malaysian Ringgits | 2,286,576 | U.S. Dollars | 536,000 | DEUT | (8,515 | ) | |||||||||||||
05/24/16 | Malaysian Ringgits | 1,192,485 | U.S. Dollars | 277,000 | CITI | (1,908 | ) | |||||||||||||
05/24/16 | Malaysian Ringgits | 118,580 | U.S. Dollars | 28,000 | HSBC | (645 | ) | |||||||||||||
09/14/16 | U.S. Dollars | 593,000 | Chinese Yuan Renminbi | 3,900,161 | UBS | 322 | ||||||||||||||
09/14/16 | U.S. Dollars | 570,000 | Chinese Yuan Renminbi | 3,750,315 | BNP | 93 | ||||||||||||||
09/30/16 | U.S. Dollars | 1,160,000 | Chinese Yuan Renminbi | 7,610,760 | JPM | 4,260 | ||||||||||||||
10/11/16 | U.S. Dollars | 1,491,000 | Chinese Yuan Renminbi | 9,748,158 | JPM | 11,395 | ||||||||||||||
10/11/16 | U.S. Dollars | 332,000 | Chinese Yuan Renminbi | 2,178,916 | HSBC | 1,278 | ||||||||||||||
12/05/16 | U.S. Dollars | 1,235,000 | Chinese Yuan Renminbi | 8,221,395 | JPM | (9,872 | ) | |||||||||||||
12/07/16 | U.S. Dollars | 1,336,000 | Chinese Yuan Renminbi | 8,877,052 | HSBC | (8,033 | ) | |||||||||||||
|
| |||||||||||||||||||
| $ | 656,096 | |||||||||||||||||||
|
| |||||||||||||||||||
Global Bond Fund | ||||||||||||||||||||
01/19/16 | Indian Rupees | 156,237,535 | U.S. Dollars | 2,351,204 | CITIC | $ | 2,890 | |||||||||||||
01/19/16 | Indian Rupees | 129,220,000 | U.S. Dollars | 1,954,207 | JPM | (7,197 | ) | |||||||||||||
01/19/16 | Indian Rupees | 54,770,000 | U.S. Dollars | 823,238 | JPM | 2,004 | ||||||||||||||
01/19/16 | Indian Rupees | 51,960,000 | U.S. Dollars | 786,439 | JPM | (3,536 | ) | |||||||||||||
01/19/16 | U.S. Dollars | 715,578 | Brazilian Reals | 2,809,000 | BAR | 10,477 | ||||||||||||||
02/16/16 | Japanese Yen | 744,255,000 | U.S. Dollars | 6,117,730 | DEUT | 80,516 | ||||||||||||||
02/16/16 | Mexican Pesos | 15,669,581 | U.S. Dollars | 935,414 | DEUT | (29,351 | ) | |||||||||||||
02/16/16 | U.S. Dollars | 11,493,542 | Euro | 10,553,878 | HSBC | 10,354 | ||||||||||||||
02/16/16 | U.S. Dollars | 7,557,568 | Euro | 6,935,966 | CITIC | 10,862 | ||||||||||||||
02/16/16 | U.S. Dollars | 6,346,565 | British Pounds | 4,194,041 | DEUT | 163,141 | ||||||||||||||
330
Table of Contents
Fund/Expiration Date | Currency Purchased | Amount of Currency Purchased | Currency Sold | Amount of Currency Sold | Counter- party | Net Unrealized Appreciation (Depreciation) | ||||||||||||||
02/16/16 | Swedish Kronor | 5,133,306 | U.S. Dollars | 599,719 | BAR | $ | 9,234 | |||||||||||||
02/16/16 | U.S. Dollars | 3,793,367 | Euro | 3,500,000 | JPM | (14,822 | ) | |||||||||||||
02/16/16 | U.S. Dollars | 3,113,808 | Euro | 2,854,942 | UBS | 7,477 | ||||||||||||||
02/16/16 | Euro | 2,550,000 | U.S. Dollars | 2,706,621 | UBS | 67,916 | ||||||||||||||
02/16/16 | U.S. Dollars | 1,978,467 | Euro | 1,808,255 | HSBC | 10,987 | ||||||||||||||
02/16/16 | U.S. Dollars | 1,492,053 | British Pounds | 970,000 | RBC | 61,947 | ||||||||||||||
02/16/16 | U.S. Dollars | 1,246,135 | British Pounds | 809,710 | BAR | 52,351 | ||||||||||||||
02/16/16 | U.S. Dollars | 1,001,644 | British Pounds | 650,000 | CS | 43,325 | ||||||||||||||
02/16/16 | Euro | 950,000 | U.S. Dollars | 1,029,628 | JPM | 4,023 | ||||||||||||||
02/16/16 | Euro | 926,514 | U.S. Dollars | 850,000 | HSBC | (1,668 | ) | |||||||||||||
02/16/16 | U.S. Dollars | 597,400 | Swedish Kronor | 5,130,000 | UBS | (11,162 | ) | |||||||||||||
02/16/16 | U.S. Dollars | 307,938 | British Pounds | 200,000 | GSC | 13,071 | ||||||||||||||
02/16/16 | U.S. Dollars | 264,644 | Japanese Yen | 32,140,000 | HSBC | (3,021 | ) | |||||||||||||
02/16/16 | U.S. Dollars | 113,845 | South African Rand | 1,616,591 | CITIC | 10,235 | ||||||||||||||
|
| |||||||||||||||||||
| $ | 490,053 | |||||||||||||||||||
|
| |||||||||||||||||||
Defensive Market Strategies Fund |
| |||||||||||||||||||
01/29/16 | U.S. Dollars | 3,108,925 | Euro | 2,835,731 | UBS | $ | 24,927 | |||||||||||||
01/29/16 | U.S. Dollars | 1,762,639 | Canadian Dollars | 2,457,648 | JPM | (13,614 | ) | |||||||||||||
01/29/16 | Canadian Dollars | 145,943 | U.S. Dollars | 104,770 | JPM | 710 | ||||||||||||||
01/29/16 | U.S. Dollars | 105,958 | Euro | 96,787 | UBS | 696 | ||||||||||||||
01/29/16 | U.S. Dollars | 101,282 | Euro | 92,763 | UBS | 397 | ||||||||||||||
01/29/16 | U.S. Dollars | 83,454 | Canadian Dollars | 115,768 | JPM | (217 | ) | |||||||||||||
01/29/16 | Canadian Dollars | 72,804 | U.S. Dollars | 52,645 | JPM | (27 | ) | |||||||||||||
01/29/16 | Canadian Dollars | 59,289 | U.S. Dollars | 42,886 | NT | (35 | ) | |||||||||||||
|
| |||||||||||||||||||
| $ | 12,837 | |||||||||||||||||||
|
| |||||||||||||||||||
International Equity Fund | ||||||||||||||||||||
03/16/16 | Japanese Yen | 2,222,145,153 | U.S. Dollars | 18,171,184 | CITIG | $ | 352,232 | |||||||||||||
03/16/16 | Japanese Yen | 1,138,394,033 | U.S. Dollars | 9,280,398 | CITIG | 209,057 | ||||||||||||||
03/16/16 | Japanese Yen | 1,120,541,633 | U.S. Dollars | 9,113,391 | CITIG | 227,249 | ||||||||||||||
03/16/16 | Japanese Yen | 1,120,491,357 | U.S. Dollars | 9,123,444 | CITIG | 216,778 | ||||||||||||||
03/16/16 | Japanese Yen | 1,118,783,412 | U.S. Dollars | 9,099,424 | CITIG | 226,560 | ||||||||||||||
03/16/16 | Japanese Yen | 1,118,405,936 | U.S. Dollars | 9,122,806 | CITIG | 200,031 | ||||||||||||||
03/16/16 | Japanese Yen | 729,621,000 | U.S. Dollars | 5,956,260 | CITIG | 125,733 | ||||||||||||||
03/16/16 | Japanese Yen | 654,559,476 | U.S. Dollars | 5,343,600 | CITIG | 112,694 | ||||||||||||||
03/16/16 | Japanese Yen | 380,772,000 | U.S. Dollars | 3,166,937 | CITIG | 7,112 | ||||||||||||||
03/16/16 | Japanese Yen | 310,226,000 | U.S. Dollars | 2,529,948 | CITIG | 56,042 | ||||||||||||||
03/16/16 | Japanese Yen | 225,596,000 | U.S. Dollars | 1,845,661 | CITIG | 34,868 | ||||||||||||||
03/16/16 | Swedish Kronor | 138,116,000 | U.S. Dollars | 15,932,052 | CITIG | 466,215 | ||||||||||||||
03/16/16 | U.S. Dollars | 53,697,377 | British Pounds | 35,791,000 | CITIG | 927,492 | ||||||||||||||
03/16/16 | Norwegian Krone | 45,162,000 | U.S. Dollars | 5,212,444 | CITIG | (114,051 | ) | |||||||||||||
03/16/16 | U.S. Dollars | 18,903,625 | Switzerland Francs | 18,777,691 | CITIG | 93,845 | ||||||||||||||
03/16/16 | Swedish Kronor | 16,840,000 | U.S. Dollars | 1,945,996 | CITIG | 53,387 | ||||||||||||||
03/16/16 | Euro | 16,411,369 | U.S. Dollars | 17,489,027 | CITIG | 381,271 | ||||||||||||||
03/16/16 | Australian Dollars | 11,141,201 | U.S. Dollars | 8,107,373 | CITIG | (19,654 | ) | |||||||||||||
03/16/16 | Switzerland Francs | 10,228,000 | U.S. Dollars | 10,328,225 | CITIG | (82,746 | ) | |||||||||||||
03/16/16 | Hong Kong Dollars | 9,430,376 | U.S. Dollars | 1,217,252 | CITIG | 297 | ||||||||||||||
03/16/16 | Hong Kong Dollars | 8,856,624 | U.S. Dollars | 1,143,278 | CITIG | 194 | ||||||||||||||
03/16/16 | Euro | 8,665,631 | U.S. Dollars | 9,204,285 | CITIG | 231,698 | ||||||||||||||
03/16/16 | Australian Dollars | 7,745,000 | U.S. Dollars | 5,510,396 | CITIG | 111,924 | ||||||||||||||
03/16/16 | U.S. Dollars | 6,951,639 | Swedish Kronor | 59,386,000 | CITIG | (99,155 | ) | |||||||||||||
331
Table of Contents
Fund/Expiration Date | Currency Purchased | Amount of Currency Purchased | Currency Sold | Amount of Currency Sold | Counter- party | Net Unrealized Appreciation (Depreciation) | ||||||||||||||
03/16/16 | British Pounds | 6,560,000 | U.S. Dollars | 9,776,833 | CITIG | $ | (104,836 | ) | ||||||||||||
03/16/16 | Israeli Shekels | 6,236,000 | U.S. Dollars | 1,612,655 | CITIG | (7,375 | ) | |||||||||||||
03/16/16 | Australian Dollars | 5,797,905 | U.S. Dollars | 4,226,284 | CITIG | (17,418 | ) | |||||||||||||
03/16/16 | Australian Dollars | 5,589,894 | U.S. Dollars | 4,052,130 | CITIG | 5,735 | ||||||||||||||
03/16/16 | U.S. Dollars | 5,190,808 | New Zealand Dollars | 7,826,000 | CITIG | (136,691 | ) | |||||||||||||
03/16/16 | Australian Dollars | 4,671,000 | U.S. Dollars | 3,363,624 | CITIG | 27,190 | ||||||||||||||
03/16/16 | Canadian Dollars | 4,636,000 | U.S. Dollars | 3,411,168 | CITIG | (60,045 | ) | |||||||||||||
03/16/16 | U.S. Dollars | 4,575,568 | Euro | 4,195,000 | CITIG | 7,643 | ||||||||||||||
03/16/16 | U.S. Dollars | 4,367,961 | New Zealand Dollars | 6,534,000 | CITIG | (80,017 | ) | |||||||||||||
03/16/16 | U.S. Dollars | 4,343,609 | Norwegian Krone | 38,043,000 | CITIG | 48,888 | ||||||||||||||
03/16/16 | Norwegian Krone | 4,340,000 | U.S. Dollars | 499,348 | CITIG | (9,400 | ) | |||||||||||||
03/16/16 | U.S. Dollars | 4,240,933 | British Pounds | 2,810,000 | CITIG | 97,898 | ||||||||||||||
03/16/16 | U.S. Dollars | 4,064,986 | Swedish Kronor | 33,957,000 | CITIG | 33,332 | ||||||||||||||
03/16/16 | U.S. Dollars | 3,735,154 | Switzerland Francs | 3,726,055 | CITIG | 2,731 | ||||||||||||||
03/16/16 | U.S. Dollars | 3,502,484 | Japanese Yen | 424,769,000 | CITIG | (38,316 | ) | |||||||||||||
03/16/16 | U.S. Dollars | 3,433,722 | Switzerland Francs | 3,500,254 | CITIG | (72,514 | ) | |||||||||||||
03/16/16 | U.S. Dollars | 3,350,123 | Switzerland Francs | 3,416,000 | CITIG | (71,715 | ) | |||||||||||||
03/16/16 | U.S. Dollars | 3,061,157 | Switzerland Francs | 3,094,000 | CITIG | (38,131 | ) | |||||||||||||
03/16/16 | U.S. Dollars | 3,012,690 | Australian Dollars | 4,140,000 | CITIG | 7,345 | ||||||||||||||
03/16/16 | U.S. Dollars | 2,576,329 | Euro | 2,370,000 | CITIG | (4,358 | ) | |||||||||||||
03/16/16 | U.S. Dollars | 2,346,996 | Canadian Dollars | 3,275,000 | CITIG | (20,330 | ) | |||||||||||||
03/16/16 | Hong Kong Dollars | 2,325,000 | U.S. Dollars | 300,148 | CITIG | 31 | ||||||||||||||
03/16/16 | U.S. Dollars | 1,820,271 | Canadian Dollars | 2,431,190 | CITIG | 62,891 | ||||||||||||||
03/16/16 | U.S. Dollars | 1,705,113 | Canadian Dollars | 2,283,810 | CITIG | 54,266 | ||||||||||||||
03/16/16 | Euro | 1,495,000 | U.S. Dollars | 1,594,785 | CITIG | 33,117 | ||||||||||||||
03/16/16 | U.S. Dollars | 1,327,665 | Norwegian Krone | 11,505,603 | CITIG | 28,783 | ||||||||||||||
03/16/16 | British Pounds | 1,238,000 | U.S. Dollars | 1,845,168 | CITIG | (19,874 | ) | |||||||||||||
03/16/16 | U.S. Dollars | 1,107,149 | Swedish Kronor | 9,396,000 | CITIG | (8,422 | ) | |||||||||||||
03/16/16 | New Zealand Dollars | 1,087,000 | U.S. Dollars | 703,813 | CITIG | 36,155 | ||||||||||||||
03/16/16 | Euro | 1,054,000 | U.S. Dollars | 1,126,400 | CITIG | 21,298 | ||||||||||||||
03/16/16 | Singapore Dollars | 936,259 | U.S. Dollars | 661,127 | CITIG | (2,487 | ) | |||||||||||||
03/16/16 | Singapore Dollars | 936,259 | U.S. Dollars | 662,296 | CITIG | (3,656 | ) | |||||||||||||
03/16/16 | U.S. Dollars | 921,712 | New Zealand Dollars | 1,398,000 | CITIG | (29,968 | ) | |||||||||||||
03/16/16 | U.S. Dollars | 907,932 | Danish Kroner | 6,240,695 | CITIG | (2,989 | ) | |||||||||||||
03/16/16 | U.S. Dollars | 891,147 | British Pounds | 602,000 | CITIG | 3,564 | ||||||||||||||
03/16/16 | Singapore Dollars | 797,732 | U.S. Dollars | 569,278 | CITIG | (8,089 | ) | |||||||||||||
03/16/16 | Israeli Shekels | 795,000 | U.S. Dollars | 205,806 | CITIG | (1,156 | ) | |||||||||||||
03/16/16 | Switzerland Francs | 740,000 | U.S. Dollars | 747,698 | CITIG | (6,433 | ) | |||||||||||||
03/16/16 | U.S. Dollars | 722,934 | Japanese Yen | 87,613,000 | CITIG | (7,393 | ) | |||||||||||||
03/16/16 | U.S. Dollars | 689,875 | Canadian Dollars | 919,000 | CITIG | 25,578 | ||||||||||||||
03/16/16 | Singapore Dollars | 659,750 | U.S. Dollars | 466,450 | CITIG | (2,329 | ) | |||||||||||||
03/16/16 | U.S. Dollars | 642,569 | Norwegian Krone | 5,637,987 | CITIG | 6,090 | ||||||||||||||
03/16/16 | British Pounds | 579,000 | U.S. Dollars | 868,312 | CITIG | (14,641 | ) | |||||||||||||
03/16/16 | Danish Kroner | 500,000 | U.S. Dollars | 71,627 | CITIG | 1,356 | ||||||||||||||
03/16/16 | U.S. Dollars | 474,120 | Danish Kroner | 3,248,305 | CITIG | (18 | ) | |||||||||||||
03/16/16 | U.S. Dollars | 452,063 | Australian Dollars | 633,000 | CITIG | (7,450 | ) | |||||||||||||
03/16/16 | U.S. Dollars | 451,296 | Australian Dollars | 629,000 | CITIG | (5,313 | ) | |||||||||||||
03/16/16 | U.S. Dollars | 436,783 | Hong Kong Dollars | 3,384,000 | CITIG | (122 | ) | |||||||||||||
03/16/16 | U.S. Dollars | 368,313 | Canadian Dollars | 510,000 | CITIG | (339 | ) | |||||||||||||
03/16/16 | U.S. Dollars | 352,076 | Swedish Kronor | 3,006,000 | CITIG | (4,821 | ) | |||||||||||||
03/16/16 | Israeli Shekels | 326,000 | U.S. Dollars | 83,743 | CITIG | 177 | ||||||||||||||
03/16/16 | Hong Kong Dollars | 321,000 | U.S. Dollars | 41,444 | CITIG | — | ||||||||||||||
332
Table of Contents
Fund/Expiration Date | Currency Purchased | Amount of Currency Purchased | Currency Sold | Amount of Currency Sold | Counter- party | Net Unrealized Appreciation (Depreciation) | ||||||||||||||
03/16/16 | U.S. Dollars | 302,349 | Euro | 278,000 | CITIG | $ | (365 | ) | ||||||||||||
03/16/16 | New Zealand Dollars | 269,782 | U.S. Dollars | 177,939 | CITIG | 5,713 | ||||||||||||||
03/16/16 | New Zealand Dollars | 268,040 | U.S. Dollars | 177,829 | CITIG | 4,637 | ||||||||||||||
03/16/16 | U.S. Dollars | 253,816 | Hong Kong Dollars | 1,967,000 | CITIG | (142 | ) | |||||||||||||
03/16/16 | U.S. Dollars | 242,590 | Norwegian Krone | 2,107,797 | CITIG | 4,638 | ||||||||||||||
03/16/16 | New Zealand Dollars | 223,830 | U.S. Dollars | 147,544 | CITIG | 4,827 | ||||||||||||||
03/16/16 | New Zealand Dollars | 222,348 | U.S. Dollars | 147,207 | CITIG | 4,155 | ||||||||||||||
03/16/16 | Danish Kroner | 216,000 | U.S. Dollars | 31,415 | CITIG | 113 | ||||||||||||||
03/16/16 | U.S. Dollars | 214,177 | Norwegian Krone | 1,845,570 | CITIG | 5,828 | ||||||||||||||
03/16/16 | U.S. Dollars | 214,137 | Norwegian Krone | 1,828,043 | CITIG | 7,767 | ||||||||||||||
03/16/16 | U.S. Dollars | 211,461 | Singapore Dollars | 300,000 | CITIG | 416 | ||||||||||||||
03/16/16 | Hong Kong Dollars | 205,000 | U.S. Dollars | 26,465 | CITIG | 2 | ||||||||||||||
03/16/16 | Israeli Shekels | 145,000 | U.S. Dollars | 37,529 | CITIG | (203 | ) | |||||||||||||
03/16/16 | U.S. Dollars | 139,090 | Euro | 127,000 | CITIG | 800 | ||||||||||||||
03/16/16 | Israeli Shekels | 137,000 | U.S. Dollars | 35,283 | CITIG | (16 | ) | |||||||||||||
03/16/16 | U.S. Dollars | 111,901 | Norwegian Krone | 980,000 | CITIG | 1,267 | ||||||||||||||
03/16/16 | Danish Kroner | 104,000 | U.S. Dollars | 15,219 | CITIG | (39 | ) | |||||||||||||
03/16/16 | Israeli Shekels | 95,000 | U.S. Dollars | 24,609 | CITIG | (154 | ) | |||||||||||||
03/16/16 | U.S. Dollars | 83,287 | Norwegian Krone | 732,000 | CITIG | 651 | ||||||||||||||
03/16/16 | U.S. Dollars | 65,647 | Danish Kroner | 450,000 | CITIG | (38 | ) | |||||||||||||
03/16/16 | Singapore Dollars | 63,000 | U.S. Dollars | 44,687 | CITIG | (368 | ) | |||||||||||||
03/16/16 | Euro | 59,000 | U.S. Dollars | 64,480 | CITIG | (235 | ) | |||||||||||||
03/16/16 | U.S. Dollars | 35,203 | Singapore Dollars | 50,000 | CITIG | 29 | ||||||||||||||
03/16/16 | U.S. Dollars | 26,870 | Singapore Dollars | 38,000 | CITIG | 138 | ||||||||||||||
03/16/16 | Norwegian Krone | 15,000 | U.S. Dollars | 1,710 | CITIG | (17 | ) | |||||||||||||
03/16/16 | U.S. Dollars | 14,981 | Danish Kroner | 105,000 | CITIG | (346 | ) | |||||||||||||
03/16/16 | Singapore Dollars | 14,000 | U.S. Dollars | 9,905 | CITIG | (56 | ) | |||||||||||||
03/16/16 | British Pounds | 14,000 | U.S. Dollars | 21,089 | CITIG | (448 | ) | |||||||||||||
03/16/16 | U.S. Dollars | 8,951 | British Pounds | 6,000 | CITIG | 104 | ||||||||||||||
03/16/16 | U.S. Dollars | 7,049 | Singapore Dollars | 10,000 | CITIG | 14 | ||||||||||||||
03/16/16 | U.S. Dollars | 6,069 | Switzerland Francs | 6,000 | CITIG | 58 | ||||||||||||||
03/16/16 | Switzerland Francs | 6,000 | U.S. Dollars | 5,860 | CITIG | 151 | ||||||||||||||
03/16/16 | U.S. Dollars | 3,872 | Hong Kong Dollars | 30,000 | CITIG | (1 | ) | |||||||||||||
03/16/16 | Euro | 2,000 | U.S. Dollars | 2,196 | CITIG | (18 | ) | |||||||||||||
03/16/16 | U.S. Dollars | 1,530 | Swedish Kronor | 13,000 | CITIG | (13 | ) | |||||||||||||
03/16/16 | U.S. Dollars | 440 | Danish Kroner | 3,000 | CITIG | 2 | ||||||||||||||
|
| |||||||||||||||||||
| $ | 3,475,346 | |||||||||||||||||||
|
| |||||||||||||||||||
Emerging Markets Equity Fund |
| |||||||||||||||||||
03/16/16 | Indonesian Rupiahs | 11,000,903,431 | U.S. Dollars | 779,934 | CITIG | $ | 2,993 | |||||||||||||
03/16/16 | Indonesian Rupiahs | 10,680,739,856 | U.S. Dollars | 755,628 | CITIG | 4,513 | ||||||||||||||
03/16/16 | Indonesian Rupiahs | 10,496,765,876 | U.S. Dollars | 741,249 | CITIG | 5,798 | ||||||||||||||
03/16/16 | Indonesian Rupiahs | 5,933,032,625 | U.S. Dollars | 420,934 | CITIG | 1,316 | ||||||||||||||
03/16/16 | Columbian Peso | 5,330,000,000 | U.S. Dollars | 1,599,170 | CITIG | 65,268 | ||||||||||||||
03/16/16 | Chilean Peso | 3,063,457,595 | U.S. Dollars | 4,309,899 | CITIG | (24,044 | ) | |||||||||||||
03/16/16 | South Korean Won | 1,016,131,000 | U.S. Dollars | 874,721 | CITIG | (9,573 | ) | |||||||||||||
03/16/16 | Chilean Peso | 869,279,405 | U.S. Dollars | 1,229,888 | CITIG | (13,744 | ) | |||||||||||||
03/16/16 | Indonesian Rupiahs | 589,687,000 | U.S. Dollars | 42,235 | CITIG | (268 | ) | |||||||||||||
03/16/16 | Hungarian Forint | 539,057,160 | U.S. Dollars | 1,829,242 | CITIG | 26,054 | ||||||||||||||
03/16/16 | Hungarian Forint | 473,619,020 | U.S. Dollars | 1,645,774 | CITIG | (15,699 | ) | |||||||||||||
03/16/16 | Hungarian Forint | 420,424,370 | U.S. Dollars | 1,463,319 | CITIG | (16,326 | ) | |||||||||||||
03/16/16 | Hungarian Forint | 390,163,446 | U.S. Dollars | 1,349,702 | CITIG | (6,860 | ) | |||||||||||||
333
Table of Contents
Fund/Expiration Date | Currency Purchased | Amount of Currency Purchased | Currency Sold | Amount of Currency Sold | Counter- party | Net Unrealized Appreciation (Depreciation) | ||||||||||||||
03/16/16 | Hungarian Forint | 316,426,004 | U.S. Dollars | 1,096,916 | CITIG | $ | (7,859 | ) | ||||||||||||
03/16/16 | South Korean Won | 270,000,000 | U.S. Dollars | 230,889 | CITIG | (1,007 | ) | |||||||||||||
03/16/16 | South Korean Won | 200,000,000 | U.S. Dollars | 172,564 | CITIG | (2,281 | ) | |||||||||||||
03/16/16 | South Korean Won | 190,000,000 | U.S. Dollars | 161,158 | CITIG | 611 | ||||||||||||||
03/16/16 | Mexican Pesos | 93,100,000 | U.S. Dollars | 5,401,671 | CITIG | (29,568 | ) | |||||||||||||
03/16/16 | Indian Rupees | 89,889,580 | U.S. Dollars | 1,329,342 | CITIG | 12,208 | ||||||||||||||
03/16/16 | Philippine Peso | 79,000,000 | U.S. Dollars | 1,652,384 | CITIG | 19,167 | ||||||||||||||
03/16/16 | Indian Rupees | 53,906,795 | U.S. Dollars | 796,030 | CITIG | 8,498 | ||||||||||||||
03/16/16 | Indian Rupees | 35,934,970 | U.S. Dollars | 529,101 | CITIG | 7,208 | ||||||||||||||
03/16/16 | Indian Rupees | 35,904,621 | U.S. Dollars | 529,648 | CITIG | 6,208 | ||||||||||||||
03/16/16 | Czech Republic Koruna | 34,308,850 | U.S. Dollars | 1,383,230 | CITIG | (279 | ) | |||||||||||||
03/16/16 | Taiwan Dollars | 30,966,000 | U.S. Dollars | 947,546 | CITIG | (3,962 | ) | |||||||||||||
03/16/16 | Indian Rupees | 30,927,034 | U.S. Dollars | 455,952 | CITIG | 5,616 | ||||||||||||||
03/16/16 | Czech Republic Koruna | 18,457,647 | U.S. Dollars | 725,625 | CITIG | 18,382 | ||||||||||||||
03/16/16 | Czech Republic Koruna | 15,779,255 | U.S. Dollars | 640,654 | CITIG | (4,610 | ) | |||||||||||||
03/16/16 | Czech Republic Koruna | 12,654,248 | U.S. Dollars | 516,806 | CITIG | (6,727 | ) | |||||||||||||
03/16/16 | Turkish Lira | 12,350,578 | U.S. Dollars | 4,140,685 | CITIG | 3,272 | ||||||||||||||
03/16/16 | Hong Kong Dollars | 12,000,000 | U.S. Dollars | 1,549,093 | CITIG | 218 | ||||||||||||||
03/16/16 | Turkish Lira | 10,279,132 | U.S. Dollars | 3,433,584 | CITIG | 15,346 | ||||||||||||||
03/16/16 | Thailand Baht | 10,100,000 | U.S. Dollars | 278,466 | CITIG | 1,686 | ||||||||||||||
03/16/16 | Taiwan Dollars | 10,100,000 | U.S. Dollars | 308,682 | CITIG | (918 | ) | |||||||||||||
03/16/16 | Israeli Shekels | 8,800,000 | U.S. Dollars | 2,275,716 | CITIG | (10,407 | ) | |||||||||||||
03/16/16 | South African Rand | 7,200,000 | U.S. Dollars | 493,366 | CITIG | (34,406 | ) | |||||||||||||
03/16/16 | Hong Kong Dollars | 6,800,000 | U.S. Dollars | 877,893 | CITIG | 50 | ||||||||||||||
03/16/16 | South African Rand | 6,700,000 | U.S. Dollars | 469,456 | CITIG | (42,368 | ) | |||||||||||||
03/16/16 | U.S. Dollars | 6,677,778 | Mexican Pesos | 111,030,745 | CITIG | 271,027 | ||||||||||||||
03/16/16 | Hong Kong Dollars | 6,480,644 | U.S. Dollars | 836,507 | CITIG | 204 | ||||||||||||||
03/16/16 | Hong Kong Dollars | 6,086,356 | U.S. Dollars | 785,671 | CITIG | 134 | ||||||||||||||
03/16/16 | U.S. Dollars | 5,564,907 | Mexican Pesos | 92,727,578 | CITIG | 214,294 | ||||||||||||||
03/16/16 | Turkish Lira | 5,140,920 | U.S. Dollars | 1,728,381 | CITIG | (3,462 | ) | |||||||||||||
03/16/16 | Singapore Dollars | 5,090,000 | U.S. Dollars | 3,583,638 | CITIG | (2,921 | ) | |||||||||||||
03/16/16 | U.S. Dollars | 4,204,993 | Turkish Lira | 12,780,000 | CITIG | (83,046 | ) | |||||||||||||
03/16/16 | Mexican Pesos | 4,170,000 | U.S. Dollars | 240,809 | CITIG | (189 | ) | |||||||||||||
03/16/16 | Turkish Lira | 4,159,712 | U.S. Dollars | 1,389,962 | CITIG | 5,735 | ||||||||||||||
03/16/16 | Malaysian Ringgits | 3,600,000 | U.S. Dollars | 833,821 | CITIG | 77 | ||||||||||||||
03/16/16 | Brazilian Reals | 3,540,000 | U.S. Dollars | 881,619 | CITIG | (9,275 | ) | |||||||||||||
03/16/16 | South African Rand | 3,400,000 | U.S. Dollars | 233,278 | CITIG | (16,547 | ) | |||||||||||||
03/16/16 | Brazilian Reals | 3,330,000 | U.S. Dollars | 818,277 | CITIG | 2,318 | ||||||||||||||
03/16/16 | Hong Kong Dollars | 3,200,000 | U.S. Dollars | 413,107 | CITIG | 43 | ||||||||||||||
03/16/16 | Turkish Lira | 3,078,701 | U.S. Dollars | 1,037,267 | CITIG | (4,279 | ) | |||||||||||||
03/16/16 | Turkish Lira | 3,063,957 | U.S. Dollars | 1,034,845 | CITIG | (6,804 | ) | |||||||||||||
03/16/16 | U.S. Dollars | 2,870,817 | Hong Kong Dollars | 22,241,000 | CITIG | (702 | ) | |||||||||||||
03/16/16 | South Korean Won | 2,854,000 | U.S. Dollars | 2,423 | CITIG | 7 | ||||||||||||||
03/16/16 | U.S. Dollars | 2,494,208 | Hungarian Forint | 722,000,000 | CITIG | 9,269 | ||||||||||||||
03/16/16 | U.S. Dollars | 2,342,898 | Singapore Dollars | 3,312,051 | CITIG | 12,934 | ||||||||||||||
03/16/16 | U.S. Dollars | 2,338,762 | Singapore Dollars | 3,312,051 | CITIG | 8,798 | ||||||||||||||
03/16/16 | Singapore Dollars | 2,290,000 | U.S. Dollars | 1,620,148 | CITIG | (9,177 | ) | |||||||||||||
03/16/16 | Singapore Dollars | 2,040,000 | U.S. Dollars | 1,448,201 | CITIG | (13,100 | ) | |||||||||||||
03/16/16 | U.S. Dollars | 2,013,841 | Singapore Dollars | 2,822,006 | CITIG | 28,613 | ||||||||||||||
03/16/16 | U.S. Dollars | 1,918,850 | Columbian Peso | 6,155,069,296 | CITIG | (3,237 | ) | |||||||||||||
03/16/16 | U.S. Dollars | 1,785,205 | Chilean Peso | 1,280,000,000 | CITIG | (5,547 | ) | |||||||||||||
03/16/16 | U.S. Dollars | 1,650,087 | Singapore Dollars | 2,333,892 | CITIG | 8,238 | ||||||||||||||
334
Table of Contents
Fund/Expiration Date | Currency Purchased | Amount of Currency Purchased | Currency Sold | Amount of Currency Sold | Counter- party | Net Unrealized Appreciation (Depreciation) | ||||||||||||||
03/16/16 | U.S. Dollars | 1,440,908 | Mexican Pesos | 24,600,000 | CITIG | $ | 21,427 | |||||||||||||
03/16/16 | Singapore Dollars | 1,300,000 | U.S. Dollars | 925,738 | CITIG | (11,213 | ) | |||||||||||||
03/16/16 | U.S. Dollars | 1,241,853 | Mexican Pesos | 20,734,677 | CITIG | 45,410 | ||||||||||||||
03/16/16 | U.S. Dollars | 1,164,498 | Indian Rupees | 79,000,000 | CITIG | (14,532 | ) | |||||||||||||
03/16/16 | U.S. Dollars | 1,048,353 | Czech Republic Koruna | 25,800,000 | CITIG | 8,384 | ||||||||||||||
03/16/16 | U.S. Dollars | 1,019,086 | Philippine Peso | 48,498,592 | CITIG | (7,090 | ) | |||||||||||||
03/16/16 | U.S. Dollars | 1,004,853 | Philippine Peso | 47,856,432 | CITIG | (7,735 | ) | |||||||||||||
03/16/16 | Hong Kong Dollars | 1,000,000 | U.S. Dollars | 129,109 | CITIG | — | ||||||||||||||
03/16/16 | U.S. Dollars | 981,927 | Taiwan Dollars | 32,200,000 | CITIG | 740 | ||||||||||||||
03/16/16 | U.S. Dollars | 948,091 | Indonesian Rupiahs | 13,700,000,000 | CITIG | (26,928 | ) | |||||||||||||
03/16/16 | U.S. Dollars | 920,678 | Brazilian Reals | 3,600,000 | CITIG | 33,549 | ||||||||||||||
03/16/16 | U.S. Dollars | 915,868 | Polish Zloty | 3,660,000 | CITIG | (15,767 | ) | |||||||||||||
03/16/16 | Thailand Baht | 900,000 | U.S. Dollars | 24,959 | CITIG | 6 | ||||||||||||||
03/16/16 | Singapore Dollars | 870,000 | U.S. Dollars | 617,111 | CITIG | (5,083 | ) | |||||||||||||
03/16/16 | Mexican Pesos | 800,000 | U.S. Dollars | 46,635 | CITIG | (473 | ) | |||||||||||||
03/16/16 | U.S. Dollars | 784,227 | Israeli Shekels | 3,040,000 | CITIG | 1,666 | ||||||||||||||
03/16/16 | U.S. Dollars | 777,457 | Philippine Peso | 36,944,976 | CITIG | (4,257 | ) | |||||||||||||
03/16/16 | U.S. Dollars | 768,081 | Mexican Pesos | 13,400,000 | CITIG | (5,132 | ) | |||||||||||||
03/16/16 | Singapore Dollars | 740,000 | U.S. Dollars | 526,655 | CITIG | (6,079 | ) | |||||||||||||
03/16/16 | U.S. Dollars | 665,793 | Columbian Peso | 2,070,000,000 | CITIG | 19,379 | ||||||||||||||
03/16/16 | U.S. Dollars | 610,082 | South Korean Won | 716,846,000 | CITIG | (251 | ) | |||||||||||||
03/16/16 | U.S. Dollars | 602,125 | Brazilian Reals | 2,320,000 | CITIG | 30,420 | ||||||||||||||
03/16/16 | Hong Kong Dollars | 600,000 | U.S. Dollars | 77,444 | CITIG | 21 | ||||||||||||||
03/16/16 | Hong Kong Dollars | 600,000 | U.S. Dollars | 77,456 | CITIG | 10 | ||||||||||||||
03/16/16 | Hong Kong Dollars | 600,000 | U.S. Dollars | 77,458 | CITIG | 8 | ||||||||||||||
03/16/16 | U.S. Dollars | 599,220 | Columbian Peso | 1,904,930,704 | CITIG | 4,353 | ||||||||||||||
03/16/16 | U.S. Dollars | 595,181 | Brazilian Reals | 2,310,000 | CITIG | 25,940 | ||||||||||||||
03/16/16 | U.S. Dollars | 578,311 | South African Rand | 9,000,000 | CITIG | 4,611 | ||||||||||||||
03/16/16 | Singapore Dollars | 510,000 | U.S. Dollars | 359,888 | CITIG | (1,113 | ) | |||||||||||||
03/16/16 | U.S. Dollars | 489,437 | Mexican Pesos | 8,400,000 | CITIG | 4,736 | ||||||||||||||
03/16/16 | U.S. Dollars | 483,637 | Taiwan Dollars | 15,800,000 | CITIG | 2,185 | ||||||||||||||
03/16/16 | U.S. Dollars | 480,424 | Columbian Peso | 1,620,000,000 | CITIG | (25,465 | ) | |||||||||||||
03/16/16 | Malaysian Ringgits | 470,000 | U.S. Dollars | 109,096 | CITIG | (226 | ) | |||||||||||||
03/16/16 | U.S. Dollars | 462,076 | Columbian Peso | 1,530,000,000 | CITIG | (15,708 | ) | |||||||||||||
03/16/16 | U.S. Dollars | 462,019 | Mexican Pesos | 7,900,000 | CITIG | 6,169 | ||||||||||||||
03/16/16 | U.S. Dollars | 451,731 | Hong Kong Dollars | 3,500,000 | CITIG | (152 | ) | |||||||||||||
03/16/16 | U.S. Dollars | 404,487 | South African Rand | 6,200,000 | CITIG | 9,271 | ||||||||||||||
03/16/16 | U.S. Dollars | 366,393 | Brazilian Reals | 1,461,000 | CITIG | 6,366 | ||||||||||||||
03/16/16 | U.S. Dollars | 365,439 | Turkish Lira | 1,090,000 | CITIG | (286 | ) | |||||||||||||
03/16/16 | U.S. Dollars | 352,940 | South African Rand | 5,400,000 | CITIG | 8,720 | ||||||||||||||
03/16/16 | U.S. Dollars | 348,486 | Hong Kong Dollars | 2,700,000 | CITIG | (109 | ) | |||||||||||||
03/16/16 | Peruvian Nuevos Soles | 342,000 | U.S. Dollars | 99,898 | CITIG | (968 | ) | |||||||||||||
03/16/16 | U.S. Dollars | 338,428 | Mexican Pesos | 5,800,000 | CITIG | 3,753 | ||||||||||||||
03/16/16 | U.S. Dollars | 331,281 | Columbian Peso | 1,120,000,000 | CITIG | (18,470 | ) | |||||||||||||
03/16/16 | U.S. Dollars | 324,084 | Thailand Baht | 11,646,000 | CITIG | 1,049 | ||||||||||||||
03/16/16 | Thailand Baht | 300,000 | U.S. Dollars | 8,371 | CITIG | (49 | ) | |||||||||||||
03/16/16 | U.S. Dollars | 289,192 | Taiwan Dollars | 9,500,000 | CITIG | (289 | ) | |||||||||||||
03/16/16 | U.S. Dollars | 272,522 | South African Rand | 4,232,000 | CITIG | 2,756 | ||||||||||||||
03/16/16 | U.S. Dollars | 256,117 | Thailand Baht | 9,296,000 | CITIG | (1,734 | ) | |||||||||||||
03/16/16 | Polish Zloty | 220,000 | U.S. Dollars | 55,395 | CITIG | 605 | ||||||||||||||
03/16/16 | U.S. Dollars | 217,856 | Indian Rupees | 14,598,000 | CITIG | (11 | ) | |||||||||||||
03/16/16 | U.S. Dollars | 213,625 | Brazilian Reals | 830,000 | CITIG | 9,092 | ||||||||||||||
335
Table of Contents
Fund/Expiration Date | Currency Purchased | Amount of Currency Purchased | Currency Sold | Amount of Currency Sold | Counter- party | Net Unrealized Appreciation (Depreciation) | ||||||||||||||
03/16/16 | U.S. Dollars | 212,662 | Taiwan Dollars | 6,995,000 | CITIG | $ | (487 | ) | ||||||||||||
03/16/16 | U.S. Dollars | 211,826 | Turkish Lira | 650,000 | CITIG | (6,267 | ) | |||||||||||||
03/16/16 | U.S. Dollars | 210,430 | Turkish Lira | 630,000 | CITIG | (952 | ) | |||||||||||||
03/16/16 | U.S. Dollars | 206,744 | South African Rand | 3,012,531 | CITIG | 14,712 | ||||||||||||||
03/16/16 | U.S. Dollars | 203,851 | Turkish Lira | 610,000 | CITIG | (821 | ) | |||||||||||||
03/16/16 | Thailand Baht | 200,000 | U.S. Dollars | 5,539 | CITIG | 9 | ||||||||||||||
03/16/16 | Thailand Baht | 200,000 | U.S. Dollars | 5,569 | CITIG | (22 | ) | |||||||||||||
03/16/16 | South African Rand | 200,000 | U.S. Dollars | 13,542 | CITIG | (793 | ) | |||||||||||||
03/16/16 | U.S. Dollars | 198,811 | Brazilian Reals | 770,000 | CITIG | 9,064 | ||||||||||||||
03/16/16 | U.S. Dollars | 193,913 | Brazilian Reals | 771,000 | CITIG | 3,920 | ||||||||||||||
03/16/16 | U.S. Dollars | 182,358 | Turkish Lira | 540,000 | CITIG | 1,173 | ||||||||||||||
03/16/16 | U.S. Dollars | 180,705 | Hong Kong Dollars | 1,400,000 | CITIG | (48 | ) | |||||||||||||
03/16/16 | Singapore Dollars | 180,000 | U.S. Dollars | 127,194 | CITIG | (567 | ) | |||||||||||||
03/16/16 | U.S. Dollars | 157,835 | Malaysian Ringgits | 665,516 | CITIG | 3,676 | ||||||||||||||
03/16/16 | U.S. Dollars | 157,237 | Malaysian Ringgits | 667,082 | CITIG | 2,715 | ||||||||||||||
03/16/16 | U.S. Dollars | 156,332 | Malaysian Ringgits | 662,619 | CITIG | 2,845 | ||||||||||||||
03/16/16 | U.S. Dollars | 152,434 | Malaysian Ringgits | 656,000 | CITIG | 479 | ||||||||||||||
03/16/16 | U.S. Dollars | 149,916 | Thailand Baht | 5,400,000 | CITIG | 132 | ||||||||||||||
03/16/16 | U.S. Dollars | 136,879 | Columbian Peso | 440,000,000 | CITIG | (523 | ) | |||||||||||||
03/16/16 | Mexican Pesos | 133,000 | U.S. Dollars | 7,638 | CITIG | 37 | ||||||||||||||
03/16/16 | U.S. Dollars | 127,872 | Turkish Lira | 380,000 | CITIG | 372 | ||||||||||||||
03/16/16 | U.S. Dollars | 122,679 | Malaysian Ringgits | 516,753 | CITIG | 2,980 | ||||||||||||||
03/16/16 | U.S. Dollars | 119,655 | Brazilian Reals | 480,000 | CITIG | 1,371 | ||||||||||||||
03/16/16 | U.S. Dollars | 119,523 | Malaysian Ringgits | 510,030 | CITIG | 1,380 | ||||||||||||||
03/16/16 | U.S. Dollars | 109,982 | South Korean Won | 130,000,000 | CITIG | (701 | ) | |||||||||||||
03/16/16 | Czech Republic Koruna | 100,000 | U.S. Dollars | 3,959 | CITIG | 71 | ||||||||||||||
03/16/16 | Thailand Baht | 100,000 | U.S. Dollars | 2,774 | CITIG | (1 | ) | |||||||||||||
03/16/16 | U.S. Dollars | 90,892 | Polish Zloty | 353,000 | CITIG | 1,038 | ||||||||||||||
03/16/16 | U.S. Dollars | 73,749 | Turkish Lira | 219,000 | CITIG | 269 | ||||||||||||||
03/16/16 | U.S. Dollars | 68,984 | South African Rand | 1,015,516 | CITIG | 4,250 | ||||||||||||||
03/16/16 | U.S. Dollars | 60,904 | Turkish Lira | 180,000 | CITIG | 509 | ||||||||||||||
03/16/16 | U.S. Dollars | 51,700 | South African Rand | 750,953 | CITIG | 3,831 | ||||||||||||||
03/16/16 | U.S. Dollars | 43,313 | Chilean Peso | 30,981,000 | CITIG | (30 | ) | |||||||||||||
03/16/16 | U.S. Dollars | 33,376 | Turkish Lira | 100,000 | CITIG | (177 | ) | |||||||||||||
03/16/16 | Indian Rupees | 30,000 | U.S. Dollars | 447 | CITIG | 1 | ||||||||||||||
03/16/16 | U.S. Dollars | 23,433 | Peruvian Nuevos Soles | 80,000 | CITIG | 291 | ||||||||||||||
03/16/16 | U.S. Dollars | 22,589 | Hong Kong Dollars | 175,000 | CITIG | (5 | ) | |||||||||||||
03/16/16 | U.S. Dollars | 22,392 | Taiwan Dollars | 743,000 | CITIG | (248 | ) | |||||||||||||
03/16/16 | U.S. Dollars | 19,277 | Thailand Baht | 700,000 | CITIG | (139 | ) | |||||||||||||
03/16/16 | U.S. Dollars | 11,664 | Peruvian Nuevos Soles | 40,000 | CITIG | 93 | ||||||||||||||
03/16/16 | Peruvian Nuevos Soles | 10,000 | U.S. Dollars | 2,908 | CITIG | (15 | ) | |||||||||||||
03/16/16 | U.S. Dollars | 5,834 | Peruvian Nuevos Soles | 20,000 | CITIG | 49 | ||||||||||||||
03/16/16 | Turkish Lira | 4,000 | U.S. Dollars | 1,340 | CITIG | 2 | ||||||||||||||
03/16/16 | Brazilian Reals | 4,000 | U.S. Dollars | 985 | CITIG | 1 | ||||||||||||||
03/16/16 | U.S. Dollars | 2,915 | Peruvian Nuevos Soles | 10,000 | CITIG | 23 | ||||||||||||||
03/16/16 | U.S. Dollars | 2,912 | Peruvian Nuevos Soles | 10,000 | CITIG | 19 | ||||||||||||||
03/16/16 | U.S. Dollars | 2,751 | Thailand Baht | 100,000 | CITIG | (22 | ) | |||||||||||||
03/16/16 | U.S. Dollars | 1,535 | Polish Zloty | 6,000 | CITIG | 8 | ||||||||||||||
03/16/16 | U.S. Dollars | 1,268 | South African Rand | 20,000 | CITIG | (7 | ) | |||||||||||||
336
Table of Contents
Fund/Expiration Date | Currency Purchased | Amount of Currency Purchased | Currency Sold | Amount of Currency Sold | Counter- party | Net Unrealized Appreciation (Depreciation) | ||||||||||||||
03/16/16 | U.S. Dollars | 1,042 | Chilean Peso | 747,000 | CITIG | $ | (3 | ) | ||||||||||||
03/16/16 | U.S. Dollars | 116 | Indonesian Rupiahs | 1,640,000 | CITIG | (1 | ) | |||||||||||||
|
| |||||||||||||||||||
| $ | 501,908 | |||||||||||||||||||
|
| |||||||||||||||||||
Inflation Protected Bond Fund | ||||||||||||||||||||
01/06/16 | Mexican Pesos | 24,343,000 | U.S. Dollars | 1,465,399 | BOA | $ | (53,574 | ) | ||||||||||||
01/06/16 | U.S. Dollars | 12,437,209 | Euro | 11,742,000 | UBS | (325,400 | ) | |||||||||||||
01/06/16 | U.S. Dollars | 1,782,992 | New Zealand Dollars | 2,725,000 | SC | (79,986 | ) | |||||||||||||
01/06/16 | Euro | 1,616,000 | U.S. Dollars | 1,753,686 | GSC | 2,776 | ||||||||||||||
01/06/16 | U.S. Dollars | 777,003 | New Zealand Dollars | 1,130,000 | GSC | 4,465 | ||||||||||||||
01/06/16 | U.S. Dollars | 756,602 | Euro | 710,000 | DEUT | (15,111 | ) | |||||||||||||
01/06/16 | U.S. Dollars | 750,436 | Euro | 690,000 | RBS | 461 | ||||||||||||||
01/06/16 | U.S. Dollars | 130,694 | Euro | 120,000 | CITI | 263 | ||||||||||||||
01/06/16 | U.S. Dollars | 59,818 | British Pounds | 40,000 | DEUT | 849 | ||||||||||||||
01/06/16 | U.S. Dollars | 44,970 | Canadian Dollars | 60,000 | DEUT | 1,608 | ||||||||||||||
01/06/16 | U.S. Dollars | 40,411 | Euro | 37,000 | MSCS | 195 | ||||||||||||||
01/06/16 | U.S. Dollars | 19,623 | Euro | 18,000 | DEUT | 58 | ||||||||||||||
01/07/16 | U.S. Dollars | 203,564 | Japanese Yen | 25,000,000 | MSCS | (4,462 | ) | |||||||||||||
01/07/16 | U.S. Dollars | 22,326 | Japanese Yen | 2,752,000 | RBS | (573 | ) | |||||||||||||
01/11/16 | Canadian Dollars | 5,605,750 | U.S. Dollars | 4,030,000 | BNY | 21,372 | ||||||||||||||
01/11/16 | U.S. Dollars | 1,490,000 | Canadian Dollars | 2,068,387 | MSCS | (4,859 | ) | |||||||||||||
01/11/16 | Canadian Dollars | 1,379,064 | U.S. Dollars | 991,904 | GSC | 4,769 | ||||||||||||||
01/11/16 | U.S. Dollars | 1,360,000 | Canadian Dollars | 1,878,593 | CITI | 2,308 | ||||||||||||||
01/11/16 | Canadian Dollars | 511,620 | U.S. Dollars | 368,096 | MSCS | 1,661 | ||||||||||||||
01/15/16 | Japanese Yen | 769,722,697 | U.S. Dollars | 6,321,275 | GSC | 84,741 | ||||||||||||||
01/15/16 | Japanese Yen | 135,492,437 | U.S. Dollars | 1,113,725 | HSBC | 13,911 | ||||||||||||||
01/19/16 | Japanese Yen | 166,691,250 | U.S. Dollars | 1,382,651 | DEUT | 4,756 | ||||||||||||||
01/19/16 | Japanese Yen | 145,049,888 | Canadian Dollars | 1,625,000 | BAR | 32,845 | ||||||||||||||
01/19/16 | Japanese Yen | 81,153,689 | Canadian Dollars | 925,000 | DEUT | 6,935 | ||||||||||||||
01/19/16 | Japanese Yen | 63,035,960 | U.S. Dollars | 520,000 | UBS | 4,662 | ||||||||||||||
01/19/16 | Japanese Yen | 58,810,590 | Canadian Dollars | 670,000 | BAR | 5,265 | ||||||||||||||
01/19/16 | U.S. Dollars | 3,715,000 | Japanese Yen | 452,373,692 | HSBC | (50,204 | ) | |||||||||||||
01/19/16 | Canadian Dollars | 3,245,000 | Japanese Yen | 291,977,026 | GSC | (84,930 | ) | |||||||||||||
01/19/16 | U.S. Dollars | 1,857,500 | Japanese Yen | 224,840,452 | DEUT | (13,895 | ) | |||||||||||||
01/19/16 | U.S. Dollars | 1,385,000 | Japanese Yen | 166,923,662 | UBS | (4,341 | ) | |||||||||||||
01/19/16 | U.S. Dollars | 1,375,000 | Japanese Yen | 166,773,818 | DEUT | (13,094 | ) | |||||||||||||
01/19/16 | U.S. Dollars | 1,180,000 | Japanese Yen | 142,184,100 | RBS | (3,429 | ) | |||||||||||||
01/19/16 | U.S. Dollars | 1,180,000 | Japanese Yen | 142,214,190 | HSBC | (3,679 | ) | |||||||||||||
01/19/16 | Euro | 672,500 | British Pounds | 494,910 | HSBC | 1,559 | ||||||||||||||
01/19/16 | Euro | 665,000 | British Pounds | 487,567 | HSBC | 4,230 | ||||||||||||||
01/19/16 | British Pounds | 494,423 | Euro | 685,000 | BAR | (15,866 | ) | |||||||||||||
01/19/16 | British Pounds | 483,922 | Euro | 665,000 | CITI | (9,604 | ) | |||||||||||||
01/19/16 | U.S. Dollars | 475,000 | Japanese Yen | 57,087,974 | MSCS | (155 | ) | |||||||||||||
01/29/16 | New Zealand Dollars | 1,125,000 | U.S. Dollars | 736,174 | BNP | 31,708 | ||||||||||||||
02/09/16 | British Pounds | 510,000 | U.S. Dollars | 755,850 | HSBC | (3,943 | ) | |||||||||||||
02/09/16 | British Pounds | 475,000 | U.S. Dollars | 704,072 | MSCS | (3,766 | ) | |||||||||||||
02/16/16 | Euro | 1,365,000 | British Pounds | 999,080 | CITI | 12,213 | ||||||||||||||
02/16/16 | British Pounds | 532,078 | U.S. Dollars | 1,188,057 | MSCS | 2,685 | ||||||||||||||
02/16/16 | British Pounds | 504,861 | Euro | 682,500 | DEUT | 1,738 | ||||||||||||||
02/16/16 | British Pounds | 504,108 | Euro | 682,500 | MSCS | 628 | ||||||||||||||
02/16/16 | British Pounds | 478,810 | Euro | 646,491 | BAR | 2,511 | ||||||||||||||
03/22/16 | Swedish Kronor | 19,131,237 | Switzerland Francs | 2,239,274 | DEUT | 28,146 | ||||||||||||||
337
Table of Contents
Fund/Expiration Date | Currency Purchased | Amount of Currency Purchased | Currency Sold | Amount of Currency Sold | Counter- party | Net Unrealized Appreciation (Depreciation) | ||||||||||||||
03/22/16 | Switzerland Francs | 2,239,274 | Swedish Kronor | 19,133,029 | JPM | $ | (28,359 | ) | ||||||||||||
03/22/16 | Switzerland Francs | 600,000 | Swedish Kronor | 5,128,811 | GSC | (7,863 | ) | |||||||||||||
05/16/16 | Japanese Yen | 89,251,460 | British Pounds | 500,000 | MSCS | 8,194 | ||||||||||||||
|
| |||||||||||||||||||
| $ | (439,581 | ) | ||||||||||||||||||
|
| |||||||||||||||||||
Options Written
Transactions in options written during the year ended December 31, 2015 were as follows:
| Fund | Number of Contracts | Premiums Received | Notional Amount | Premiums Received | Total Premiums Received | |||||||||||||||
Low-Duration Bond | ||||||||||||||||||||
Options written, 12/31/14 | — | $ | — | $ | 90,800,000 | $ | 716,294 | $ | 716,294 | |||||||||||
|
|
|
|
|
|
|
|
|
| |||||||||||
Options written | 3,848 | 2,563,922 | 373,200,000 | 663,452 | 3,227,374 | |||||||||||||||
Options expired | — | — | (38,500,000 | ) | (33,269 | ) | (33,269 | ) | ||||||||||||
Options closed | (2,148 | ) | (1,468,192 | ) | (402,200,000 | ) | (1,247,227 | ) | (2,715,419 | ) | ||||||||||
|
|
|
|
|
|
|
|
|
| |||||||||||
Options written, 12/31/15 | 1,700 | $ | 1,095,730 | $ | 23,300,000 | $ | 99,250 | $ | 1,194,980 | |||||||||||
|
|
|
|
|
|
|
|
|
| |||||||||||
Medium-Duration Bond | ||||||||||||||||||||
Options written, 12/31/14 | 657 | $ | 203,480 | $ | 81,320,000 | $ | 739,335 | $ | 942,815 | |||||||||||
|
|
|
|
|
|
|
|
|
| |||||||||||
Options written | 8,724 | 2,790,376 | 8,386,250,000 | 1,164,975 | 3,955,351 | |||||||||||||||
Options expired | (4,815 | ) | (1,673,084 | ) | (139,970,000 | ) | (798,414 | ) | (2,471,498 | ) | ||||||||||
Options closed | (3,657 | ) | (1,138,549 | ) | (51,200,000 | ) | (483,999 | ) | (1,622,548 | ) | ||||||||||
|
|
|
|
|
|
|
|
|
| |||||||||||
Options written, 12/31/15 | 909 | $ | 182,223 | $ | 8,276,400,000 | $ | 621,897 | $ | 804,120 | |||||||||||
|
|
|
|
|
|
|
|
|
| |||||||||||
Global Bond | ||||||||||||||||||||
Options written, 12/31/14 | — | $ | — | $ | — | $ | — | $ | — | |||||||||||
|
|
|
|
|
|
|
|
|
| |||||||||||
Options written | — | — | 125,000 | 68,500 | 68,500 | |||||||||||||||
Options expired | — | — | (125,000 | ) | (68,500 | ) | (68,500 | ) | ||||||||||||
Options closed | — | — | — | — | — | |||||||||||||||
|
|
|
|
|
|
|
|
|
| |||||||||||
Options written, 12/31/15 | — | $ | — | $ | — | $ | — | $ | — | |||||||||||
|
|
|
|
|
|
|
|
|
| |||||||||||
Defensive Market Strategies | ||||||||||||||||||||
Options written, 12/31/14 | 612 | $ | 637,832 | $ | — | $ | — | $ | 637,832 | |||||||||||
|
|
|
|
|
|
|
|
|
| |||||||||||
Options written | 8,062 | 9,482,604 | — | — | 9,482,604 | |||||||||||||||
Options expired | (6,411 | ) | (7,582,212 | ) | — | — | (7,582,212 | ) | ||||||||||||
Options closed | (1,657 | ) | (1,697,897 | ) | — | — | (1,697,897 | ) | ||||||||||||
|
|
|
|
|
|
|
|
|
| |||||||||||
Options written, 12/31/15 | 606 | $ | 840,327 | $ | — | $ | — | $ | 840,327 | |||||||||||
|
|
|
|
|
|
|
|
|
| |||||||||||
Inflation Protected Bond | ||||||||||||||||||||
Options written, 12/31/14 | 148 | $ | 120,754 | $ | 34,297,000 | $ | 218,881 | $ | 339,635 | |||||||||||
|
|
|
|
|
|
|
|
|
| |||||||||||
Options written | 34,967 | 269,653 | 275,035,625 | 2,510,361 | 2,780,014 | |||||||||||||||
Options expired | (34,593 | ) | (175,350 | ) | (177,430,625 | ) | (1,897,157 | ) | (2,072,507 | ) | ||||||||||
Options closed | (522 | ) | (215,057 | ) | (68,262,000 | ) | (408,753 | ) | (623,810 | ) | ||||||||||
|
|
|
|
|
|
|
|
|
| |||||||||||
Options written, 12/31/15 | — | $ | — | $ | 63,640,000 | $ | 423,332 | $ | 423,332 | |||||||||||
|
|
|
|
|
|
|
|
|
| |||||||||||
338
Table of Contents
6. CAPITAL SHARE TRANSACTIONS
Transactions in shares of capital stock were as follows:
| Year Ended 12/31/15 | Year Ended 12/31/14 | |||||||||||||
| Institutional Class | Investor Class | Institutional Class | Investor Class | |||||||||||
MyDestination 2005 | ||||||||||||||
Shares sold | 2,607,627 | 2,397,742 | ||||||||||||
Shares reinvested | 625,352 | 344,332 | ||||||||||||
Shares redeemed | (2,083,197 | ) | (1,923,942 | ) | ||||||||||
|
|
|
| |||||||||||
Net increase | 1,149,782 | 818,132 | ||||||||||||
|
|
|
| |||||||||||
MyDestination 2015 | ||||||||||||||
Shares sold | 6,806,840 | 6,770,402 | ||||||||||||
Shares reinvested | 6,982,808 | 2,173,184 | ||||||||||||
Shares redeemed | (5,903,256 | ) | (4,804,080 | ) | ||||||||||
|
|
|
| |||||||||||
Net increase | 7,886,392 | 4,139,506 | ||||||||||||
|
|
|
| |||||||||||
MyDestination 2025 | ||||||||||||||
Shares sold | 10,150,281 | 10,525,623 | ||||||||||||
Shares reinvested | 11,307,203 | 3,065,748 | ||||||||||||
Shares redeemed | (3,524,510 | ) | (2,327,812 | ) | ||||||||||
|
|
|
| |||||||||||
Net increase | 17,932,974 | 11,263,559 | ||||||||||||
|
|
|
| |||||||||||
MyDestination 2035 | ||||||||||||||
Shares sold | 6,443,510 | 6,242,604 | ||||||||||||
Shares reinvested | 7,779,306 | 1,822,344 | ||||||||||||
Shares redeemed | (1,642,409 | ) | (912,341 | ) | ||||||||||
|
|
|
| |||||||||||
Net increase | 12,580,407 | 7,152,607 | ||||||||||||
|
|
|
| |||||||||||
MyDestination 2045 | ||||||||||||||
Shares sold | 5,025,680 | 4,317,668 | ||||||||||||
Shares reinvested | 5,909,639 | 1,436,263 | ||||||||||||
Shares redeemed | (823,435 | ) | (870,438 | ) | ||||||||||
|
|
|
| |||||||||||
Net increase | 10,111,884 | 4,883,493 | ||||||||||||
|
|
|
| |||||||||||
MyDestination 2055 | ||||||||||||||
Shares sold | 1,438,059 | 1,061,681 | ||||||||||||
Shares reinvested | 280,164 | 105,787 | ||||||||||||
Shares redeemed | (444,155 | ) | (224,376 | ) | ||||||||||
|
|
|
| |||||||||||
Net increase (decrease) | 1,274,068 | 943,092 | ||||||||||||
|
|
|
| |||||||||||
Conservative Allocation(1) | ||||||||||||||
Shares sold | 23,991 | 2,657,646 | 3,108,659 | |||||||||||
Shares issued for merger | 6,295,836 | — | — | |||||||||||
Shares reinvested | 451,701 | 1,882,885 | 930,425 | |||||||||||
Shares redeemed | (93,914 | ) | (3,628,514 | ) | (4,137,007 | ) | ||||||||
|
|
|
|
|
| |||||||||
Net increase (decrease) | 6,677,614 | 912,017 | (97,923 | ) | ||||||||||
|
|
|
|
|
| |||||||||
339
Table of Contents
| Year Ended 12/31/15 | Year Ended 12/31/14 | |||||||||||||||
| Institutional Class | Investor Class | Institutional Class | Investor Class | |||||||||||||
Balanced Allocation(1) | ||||||||||||||||
Shares sold | 203,852 | 4,465,243 | 4,429,822 | |||||||||||||
Shares issued for merger | 26,689,066 | — | — | |||||||||||||
Shares reinvested | 4,345,704 | 15,621,502 | 5,256,931 | |||||||||||||
Shares redeemed | (190,358 | ) | (8,977,571 | ) | (7,513,346 | ) | ||||||||||
|
|
|
|
|
| |||||||||||
Net increase | 31,048,264 | 11,109,174 | 2,173,407 | |||||||||||||
|
|
|
|
|
| |||||||||||
Growth Allocation(1) | ||||||||||||||||
Shares sold | 96,179 | 2,556,121 | 2,541,653 | |||||||||||||
Shares issued for merger | 19,259,753 | — | — | |||||||||||||
Shares reinvested | 3,697,139 | 12,926,773 | 4,815,305 | |||||||||||||
Shares redeemed | (178,363 | ) | (6,281,510 | ) | (5,320,529 | ) | ||||||||||
|
|
|
|
|
| |||||||||||
Net increase | 22,874,708 | 9,201,384 | 2,036,429 | |||||||||||||
|
|
|
|
|
| |||||||||||
Aggressive Allocation(1) | ||||||||||||||||
Shares sold | 50,824 | 1,828,001 | 1,630,041 | |||||||||||||
Shares issued for merger | 12,425,233 | — | — | |||||||||||||
Shares reinvested | 3,380,597 | 15,910,154 | 5,092,630 | |||||||||||||
Shares redeemed | (139,248 | ) | (5,608,985 | ) | (4,212,364 | ) | ||||||||||
|
|
|
|
|
| |||||||||||
Net increase | 15,717,406 | 12,129,170 | 2,510,307 | |||||||||||||
|
|
|
|
|
| |||||||||||
Money Market | ||||||||||||||||
Shares sold | 716,417,103 | 3,839,326,751 | 169,689,475 | 3,811,246,128 | ||||||||||||
Shares reinvested | 93,907 | 113,202 | 25,034 | 117,713 | ||||||||||||
Shares redeemed | (592,248,517 | ) | (3,961,518,030 | ) | (154,146,430 | ) | (3,910,770,582 | ) | ||||||||
|
|
|
|
|
|
|
| |||||||||
Net increase (decrease) | 124,262,493 | (122,078,077 | ) | 15,568,079 | (99,406,741 | ) | ||||||||||
|
|
|
|
|
|
|
| |||||||||
Low-Duration Bond | ||||||||||||||||
Shares sold | 63,077,817 | 4,257,195 | 4,063,942 | 7,018,714 | ||||||||||||
Shares reinvested | 736,181 | 299,903 | 393,822 | 681,680 | ||||||||||||
Shares redeemed | (6,732,790 | ) | (39,250,353 | ) | (3,737,141 | ) | (7,262,097 | ) | ||||||||
|
|
|
|
|
|
|
| |||||||||
Net increase (decrease) | 57,081,208 | (34,693,255 | ) | 720,623 | 438,297 | |||||||||||
|
|
|
|
|
|
|
| |||||||||
Medium-Duration Bond | ||||||||||||||||
Shares sold | 77,326,867 | 2,440,961 | 8,168,870 | 9,117,338 | ||||||||||||
Shares reinvested | 4,123,376 | 511,606 | 1,570,128 | 908,367 | ||||||||||||
Shares redeemed | (9,492,242 | ) | (35,543,020 | ) | (8,348,990 | ) | (5,510,348 | ) | ||||||||
|
|
|
|
|
|
|
| |||||||||
Net increase (decrease) | 71,958,001 | (32,590,453 | ) | 1,390,008 | 4,515,357 | |||||||||||
|
|
|
|
|
|
|
| |||||||||
Extended-Duration Bond | ||||||||||||||||
Shares sold | 27,278,516 | 1,561,833 | 3,264,201 | 3,322,036 | ||||||||||||
Shares reinvested | 4,048,908 | 323,774 | 2,093,574 | 654,801 | ||||||||||||
Shares redeemed | (4,252,725 | ) | (8,917,404 | ) | (4,141,145 | ) | (3,912,203 | ) | ||||||||
|
|
|
|
|
|
|
| |||||||||
Net increase (decrease) | 27,074,699 | (7,031,797 | ) | 1,216,630 | 64,634 | |||||||||||
|
|
|
|
|
|
|
| |||||||||
340
Table of Contents
| Year Ended 12/31/15 | Year Ended 12/31/14 | |||||||||||||||
| Institutional Class | Investor Class | Institutional Class | Investor Class | |||||||||||||
Global Bond(2) | ||||||||||||||||
Shares sold | 34,205,252 | 1,898,836 | 6,389,263 | |||||||||||||
Shares reinvested | 911,828 | 724,012 | 1,287,159 | |||||||||||||
Shares redeemed | (837,801 | ) | (33,991,846 | ) | (3,128,070 | ) | ||||||||||
|
|
|
|
|
| |||||||||||
Net increase (decrease) | 34,279,279 | (31,368,998 | ) | 4,548,352 | ||||||||||||
|
|
|
|
|
| |||||||||||
Defensive Market Strategies | ||||||||||||||||
Shares sold | 31,370,314 | 5,411,179 | 1,184,929 | 6,522,910 | ||||||||||||
Shares reinvested | 2,278,236 | 773,706 | 687,829 | 3,245,553 | ||||||||||||
Shares redeemed | (2,594,668 | ) | (32,333,107 | ) | (1,177,763 | ) | (3,323,066 | ) | ||||||||
|
|
|
|
|
|
|
| |||||||||
Net increase (decrease) | 31,053,882 | (26,148,222 | ) | 694,995 | 6,445,397 | |||||||||||
|
|
|
|
|
|
|
| |||||||||
Equity Index | ||||||||||||||||
Shares sold | 40,038,801 | 1,906,716 | 2,729,593 | 2,574,571 | ||||||||||||
Shares reinvested | 1,855,299 | 306,429 | 622,444 | 331,565 | ||||||||||||
Shares redeemed | (20,300,843 | ) | (2,129,453 | ) | (668,356 | ) | (2,296,400 | ) | ||||||||
|
|
|
|
|
|
|
| |||||||||
Net increase | 21,593,257 | 83,692 | 2,683,681 | 609,736 | ||||||||||||
|
|
|
|
|
|
|
| |||||||||
Value Equity | ||||||||||||||||
Shares sold | 92,023,549 | 1,766,957 | 2,847,915 | 3,204,628 | ||||||||||||
Shares reinvested | 16,044,577 | 869,607 | 5,502,833 | 4,449,662 | ||||||||||||
Shares redeemed | (16,940,789 | ) | (39,567,421 | ) | (3,647,127 | ) | (5,904,998 | ) | ||||||||
|
|
|
|
|
|
|
| |||||||||
Net increase (decrease) | 91,127,337 | (36,930,857 | ) | 4,703,621 | 1,749,292 | |||||||||||
|
|
|
|
|
|
|
| |||||||||
Growth Equity | ||||||||||||||||
Shares sold | 73,296,647 | 2,711,820 | 2,120,266 | 3,578,689 | ||||||||||||
Shares reinvested | 18,063,368 | 1,950,186 | 3,962,268 | 5,146,174 | ||||||||||||
Shares redeemed | (15,686,991 | ) | (36,823,684 | ) | (2,665,269 | ) | (6,337,327 | ) | ||||||||
|
|
|
|
|
|
|
| |||||||||
Net increase (decrease) | 75,673,024 | (32,161,678 | ) | 3,417,265 | 2,387,536 | |||||||||||
|
|
|
|
|
|
|
| |||||||||
Small Cap Equity | ||||||||||||||||
Shares sold | 24,090,495 | 1,485,794 | 1,399,917 | 2,495,255 | ||||||||||||
Shares reinvested | 3,922,272 | 876,783 | 1,626,024 | 2,624,103 | ||||||||||||
Shares redeemed | (2,031,098 | ) | (14,204,642 | ) | (1,703,202 | ) | (4,632,110 | ) | ||||||||
|
|
|
|
|
|
|
| |||||||||
Net increase (decrease) | 25,981,669 | (11,842,065 | ) | 1,322,739 | 487,248 | |||||||||||
|
|
|
|
|
|
|
| |||||||||
International Equity Index(3) | ||||||||||||||||
Shares sold | 12,379,725 | |||||||||||||||
Shares reinvested | 99,655 | |||||||||||||||
Shares redeemed | (55,416 | ) | ||||||||||||||
|
| |||||||||||||||
Net increase | 12,423,964 | |||||||||||||||
|
| |||||||||||||||
341
Table of Contents
| Year Ended 12/31/15 | Year Ended 12/31/14 | |||||||||||||||
| Institutional Class | Investor Class | Institutional Class | Investor Class | |||||||||||||
International Equity | ||||||||||||||||
Shares sold | 90,434,655 | 2,594,470 | 2,437,760 | 7,992,902 | ||||||||||||
Shares reinvested | 6,310,992 | 742,205 | 675,464 | 1,676,582 | ||||||||||||
Shares redeemed | (13,117,618 | ) | (66,207,107 | ) | (4,114,501 | ) | (3,380,883 | ) | ||||||||
|
|
|
|
|
|
|
| |||||||||
Net increase (decrease) | 83,628,029 | (62,870,432 | ) | (1,001,277 | ) | 6,288,601 | ||||||||||
|
|
|
|
|
|
|
| |||||||||
Emerging Markets Equity | ||||||||||||||||
Shares sold | 32,938,017 | 3,178,785 | 791,628 | 4,915,611 | ||||||||||||
Shares reinvested | 148,746 | — | 136,107 | 700,396 | ||||||||||||
Shares redeemed | (974,451 | ) | (27,771,992 | ) | (731,088 | ) | (2,577,480 | ) | ||||||||
|
|
|
|
|
|
|
| |||||||||
Net increase (decrease) | 32,112,312 | (24,593,207 | ) | 196,647 | 3,038,527 | |||||||||||
|
|
|
|
|
|
|
| |||||||||
Inflation Protected Bond(2) | ||||||||||||||||
Shares sold | 24,922,762 | 2,005,829 | 5,722,346 | |||||||||||||
Shares reinvested | — | 90,455 | 593,439 | |||||||||||||
Shares redeemed | (1,407,723 | ) | (24,973,021 | ) | (3,680,855 | ) | ||||||||||
|
|
|
|
|
| |||||||||||
Net increase (decrease) | 23,515,039 | (22,876,737 | ) | 2,634,930 | ||||||||||||
|
|
|
|
|
| |||||||||||
Flexible Income | ||||||||||||||||
Shares sold | 3,180,615 | 2,674,874 | ||||||||||||||
Shares reinvested | 490,290 | 392,444 | ||||||||||||||
Shares redeemed | (1,841,459 | ) | (535,915 | ) | ||||||||||||
|
|
|
| |||||||||||||
Net increase | 1,829,446 | 2,531,403 | ||||||||||||||
|
|
|
| |||||||||||||
Real Assets | ||||||||||||||||
Shares sold | 718,854 | 4,013,055 | ||||||||||||||
Shares reinvested | 54,870 | 164,684 | ||||||||||||||
Shares redeemed | (2,723,779 | ) | (949,385 | ) | ||||||||||||
|
|
|
| |||||||||||||
Net increase (decrease) | (1,950,055 | ) | 3,228,354 | |||||||||||||
|
|
|
| |||||||||||||
Real Estate Securities(2) | ||||||||||||||||
Shares sold | 16,192,141 | 3,237,393 | 3,955,264 | |||||||||||||
Shares reinvested | 1,381,699 | 838,902 | 1,466,882 | |||||||||||||
Shares redeemed | (751,209 | ) | (19,905,339 | ) | (4,212,142 | ) | ||||||||||
|
|
|
|
|
| |||||||||||
Net increase (decrease) | 16,822,631 | �� | (15,829,044 | ) | 1,210,004 | |||||||||||
|
|
|
|
|
| |||||||||||
Global Natural Resources Equity | ||||||||||||||||
Shares sold | 12,135,519 | 9,038,907 | ||||||||||||||
Shares reinvested | 42,140 | 837,310 | ||||||||||||||
Shares redeemed | (10,422,963 | ) | (2,761,078 | ) | ||||||||||||
|
|
|
| |||||||||||||
Net increase | 1,754,696 | 7,115,139 | ||||||||||||||
|
|
|
| |||||||||||||
(1)Inception date for Institutional Class for Conservative Allocation Fund, Balanced Allocation Fund, Growth Allocation Fund and Aggressive Allocation Fund was November 23, 2015.
(2) Inception date for Institutional Class for Global Bond Fund, Inflation Protected Bond Fund and Real Estate Securities Fund was May 1, 2015.
(3) Commencement of operations was June 1, 2015
342
Table of Contents
7. BANK BORROWINGS
The Board of Trustees approved the renewal of a credit agreement with Bank of America, N.A. (the Bank) dated November 27, 2015 through November 25, 2016. The terms of the credit agreement did not change with the renewal. The agreement permits the Funds to borrow cash from the Bank up to a limit of $50 million, collectively. Each Fund was individually, and not jointly, liable for its particular advances, if any, under the line of credit. Interest is charged to each Fund based on its borrowings at a rate equal to the Bank Prime plus 0.60% or the Wall Street Journal LIBOR One Month Floating Rate plus 1.00%. Each Fund also pays a facility fee equal to its pro rata share of the amount of the credit facility at a rate of 0.23% per annum.
| Fund | Loan Date | Loan Amount | Loan Rate | Repayment Date | Repayment Amount | |||||||||||||||
Conservative Allocation I | 03/18/15 | $ | 500,000 | 1.18 | % | 03/19/15 | $ | 500,016 | ||||||||||||
Conservative Allocation I | 04/02/15 | 2,750,000 | 1.18 | % | 04/06/15 | 2,750,355 | ||||||||||||||
Balanced Allocation I | 04/02/15 | 750,000 | 1.18 | % | 04/06/15 | 750,097 | ||||||||||||||
Real Assets | 07/16/15 | 250,000 | 1.18 | % | 07/17/15 | 250,008 | ||||||||||||||
There were no outstanding loans at December 31, 2015.
8. FEDERAL INCOME TAXES
Each Fund’s policy is to comply with all sections of the Internal Revenue Code of 1986, as amended, that apply to regulated investment companies and to distribute substantially all of its taxable income and capital gains to shareholders. No provision for income or excise taxes is thus required. Each Fund is treated as a separate entity for federal income tax purposes.
The Funds may be subject to taxes imposed by countries in which they invest in issuers existing or operating in such countries. Such taxes are generally based on income earned. The Funds accrue such taxes when the related income is earned. Gains realized by the Funds on the sale of securities in certain countries are subject to non-U.S. taxes. The Funds record a liability based on unrealized gains to provide for potential non-U.S. taxes payable upon the sale of these securities. For year ended December 31, 2015, the International Equity Fund and Emerging Markets Equity Fund accrued non-U.S. taxes on unrealized gains of $974 and $20,034, respectively.
Management has analyzed the Funds’ tax positions and has concluded that no provision for income tax is required in the Funds’ financial statements except as noted above. The Funds are not aware of any tax positions for which it is reasonably possible that the total amounts of unrecognized tax benefits will significantly change in the next twelve months. However, management’s conclusions may be subject to review and adjustment at a later date based on factors including, but not limited to new tax laws, regulations and administrative interpretations (including court decisions). Each of the Funds’ federal tax returns for the prior three fiscal years (years ended December 31, 2012 through December 31, 2015) remains subject to examination by the Internal Revenue Service. In regard to foreign taxes only, certain Funds have open tax years in certain foreign countries they invest in that may date back to the inception of the Funds.
The character of distributions made during the year from net investment income or net realized gains may differ from their ultimate characterization for federal income tax purposes. Also, due to the timing of dividend distributions, the fiscal year in which amounts are distributed may differ from the year that the income or realized gains (losses) were recorded by the Funds. Income dividends and capital gain distributions are determined in accordance with federal income tax regulations, which may differ from GAAP. These differences are primarily due to differing treatments for futures and options transactions, foreign currency transactions, paydowns, losses deferred due to wash sales, straddles and investments in Passive Foreign Investment Companies (“PFIC’s”). Distributions during the years ended December 31, 2015 and December 31, 2014, were characterized as follows for tax purposes:
343
Table of Contents
Fund | Year | Ordinary Income | Long-Term Capital Gain | Return of Capital | Total Distribution | |||||||||||||||
MyDestination 2005 | 2015 | $ | 1,488,763 | $ | 4,633,210 | $ | — | $ | 6,121,973 | |||||||||||
| 2014 | 1,647,310 | 2,025,520 | — | 3,672,830 | ||||||||||||||||
MyDestination 2015 | 2015 | 9,221,001 | 55,611,928 | — | 64,832,929 | |||||||||||||||
| 2014 | 9,893,987 | 14,015,347 | — | 23,909,334 | ||||||||||||||||
MyDestination 2025 | 2015 | 14,743,086 | 86,476,338 | — | 101,219,424 | |||||||||||||||
| 2014 | 13,629,226 | 19,570,290 | — | 33,199,516 | ||||||||||||||||
MyDestination 2035 | 2015 | 7,786,505 | 57,558,647 | — | 65,345,152 | |||||||||||||||
| 2014 | 6,771,198 | 12,665,870 | — | 19,437,068 | ||||||||||||||||
MyDestination 2045 | 2015 | 5,286,977 | 41,769,639 | — | 47,056,616 | |||||||||||||||
| 2014 | 4,564,423 | 10,053,773 | — | 14,618,196 | ||||||||||||||||
MyDestination 2055 | 2015 | 722,260 | 2,378,631 | — | 3,100,891 | |||||||||||||||
| 2014 | 488,935 | 866,009 | — | 1,354,944 | ||||||||||||||||
Conservative Allocation | 2015 | 5,146,319 | 19,883,553 | — | 25,029,872 | |||||||||||||||
| 2014 | 5,199,569 | 5,697,230 | — | 10,896,799 | ||||||||||||||||
Balanced Allocation | 2015 | 30,811,159 | 185,492,585 | — | 216,303,744 | |||||||||||||||
| 2014 | 27,727,181 | 41,042,091 | — | 68,769,272 | ||||||||||||||||
Growth Allocation | 2015 | 21,827,804 | 159,439,753 | — | 181,267,557 | |||||||||||||||
| 2014 | 18,169,049 | 47,621,569 | — | 65,790,618 | ||||||||||||||||
Aggressive Allocation | 2015 | 15,096,267 | 192,947,411 | — | 208,043,678 | |||||||||||||||
| 2014 | 14,556,180 | 58,352,188 | — | 72,908,368 | ||||||||||||||||
Money Market | 2015 | 354,779 | 1,901 | — | 356,680 | |||||||||||||||
| 2014 | 223,392 | — | — | 223,392 | ||||||||||||||||
Low-Duration Bond | 2015 | 10,210,504 | — | — | 10,210,504 | |||||||||||||||
| 2014 | 11,995,934 | 462,630 | — | 12,458,564 | ||||||||||||||||
Medium-Duration Bond | 2015 | 29,877,794 | 5,599,044 | — | 35,476,838 | |||||||||||||||
| 2014 | 21,274,702 | 2,948,049 | — | 24,222,751 | ||||||||||||||||
Extended-Duration Bond | 2015 | 15,068,462 | 7,251,117 | — | 22,319,579 | |||||||||||||||
| 2014 | 14,965,018 | 6,856,773 | — | 21,821,791 | ||||||||||||||||
Global Bond | 2015 | 15,752,245 | — | — | 15,752,245 | |||||||||||||||
| 2014 | 13,252,051 | — | — | 13,252,051 | ||||||||||||||||
Defensive Market Strategies | 2015 | 14,319,869 | 20,145,965 | — | 34,465,834 | |||||||||||||||
| 2014 | 19,332,753 | 26,898,536 | — | 46,231,289 | ||||||||||||||||
Equity Index | 2015 | 10,123,913 | 13,062,522 | — | 23,186,435 | |||||||||||||||
| 2014 | 7,055,940 | 6,176,009 | — | 13,231,949 | ||||||||||||||||
Value Equity | 2015 | 23,442,851 | 118,071,515 | — | 141,514,366 | |||||||||||||||
| 2014 | 33,781,242 | 113,511,347 | — | 147,292,589 | ||||||||||||||||
Growth Equity | 2015 | 18,902,593 | 198,987,433 | — | 217,890,026 | |||||||||||||||
| 2014 | 13,122,409 | 150,902,788 | — | 164,025,197 | ||||||||||||||||
Small Cap Equity | 2015 | 4,060,828 | 38,044,741 | — | 42,105,569 | |||||||||||||||
| 2014 | 18,688,929 | 40,288,021 | — | 58,976,950 | ||||||||||||||||
International Equity Index | 2015 | 896,896 | — | — | 896,896 | |||||||||||||||
International Equity | 2015 | 26,090,595 | 45,470,957 | — | 71,561,552 | |||||||||||||||
| 2014 | 31,177,337 | — | — | 31,177,337 | ||||||||||||||||
Emerging Markets Equity | 2015 | 1,112,618 | — | — | 1,112,618 | |||||||||||||||
| 2014 | 7,517,589 | 64,997 | — | 7,582,586 | ||||||||||||||||
Inflation Protected Bond | 2015 | 939,144 | — | — | 939,144 | |||||||||||||||
| 2014 | 6,199,837 | — | — | 6,199,837 | ||||||||||||||||
Flexible Income | 2015 | 4,764,206 | — | — | 4,764,206 | |||||||||||||||
| 2014 | 3,905,895 | — | — | 3,905,895 | ||||||||||||||||
Real Assets | 2015 | 370,544 | 74,083 | — | 444,627 | |||||||||||||||
| 2014 | 1,207,736 | 332,748 | — | 1,540,484 | ||||||||||||||||
344
Table of Contents
Fund | Year | Ordinary Income | Long-Term Capital Gain | Return of Capital | Total Distribution | |||||||||||||||
Real Estate Securities | 2015 | $ | 11,697,003 | $ | 9,758,872 | $ | — | $ | 21,455,875 | |||||||||||
| 2014 | 11,864,438 | 3,399,432 | — | 15,263,870 | ||||||||||||||||
Global Natural Resources Equity | 2015 | 220,488 | — | — | 220,488 | |||||||||||||||
| 2014 | 6,605,541 | — | — | 6,605,541 | ||||||||||||||||
At December 31, 2015, the components of distributable earnings on a tax basis were as follows:
Fund | Undistributed Ordinary Income | Undistributed Long-Term Capital Gain/(Capital Loss Carryforward) | Late Year Loss Deferrals | Net Unrealized Appreciation (Depreciation) on Investments | ||||||||||||
MyDestination 2005 | $ | — | $ | 765,817 | $ | (93,295 | ) | $ | (6,147,826 | ) | ||||||
MyDestination 2015 | — | 8,312,948 | (328,463 | ) | (44,126,930 | ) | ||||||||||
MyDestination 2025 | — | 16,863,236 | (1,208,776 | ) | (80,798,813 | ) | ||||||||||
MyDestination 2035 | — | 13,907,776 | (830,573 | ) | (58,273,718 | ) | ||||||||||
MyDestination 2045 | — | 11,651,723 | (691,526 | ) | (44,974,335 | ) | ||||||||||
MyDestination 2055 | — | 1,669,888 | (89,548 | ) | (5,673,841 | ) | ||||||||||
Conservative Allocation | — | 4,228,248 | (75,698 | ) | (28,827,510 | ) | ||||||||||
Balanced Allocation | — | 35,666,753 | (241,402 | ) | (203,273,458 | ) | ||||||||||
Growth Allocation | — | 50,364,706 | (190,313 | ) | (185,488,498 | ) | ||||||||||
Aggressive Allocation | — | 76,295,396 | (314,058 | ) | (174,725,297 | ) | ||||||||||
Money Market | 6,678 | — | — | — | ||||||||||||
Low-Duration Bond | 165,039 | (162,217 | ) | (2,455,599 | ) | (11,298,722 | ) | |||||||||
Medium-Duration Bond | 980,377 | — | (178,443 | ) | (22,155,761 | ) | ||||||||||
Extended-Duration Bond | — | 1,241,973 | — | (2,327,579 | ) | |||||||||||
Global Bond | 185,995 | (7,443,880 | ) | — | (33,639,834 | ) | ||||||||||
Defensive Market Strategies | 504,851 | 2,491,518 | — | 30,855,214 | ||||||||||||
Equity Index | 159,956 | 1,450,473 | (133,308 | ) | 139,130,970 | |||||||||||
Value Equity | 776,388 | 12,059,616 | (1,985,461 | ) | 114,885,625 | |||||||||||
Growth Equity | — | 23,904,442 | (1,313,213 | ) | 220,023,388 | |||||||||||
Small Cap Equity | 189,221 | — | (1,567,115 | ) | 2,851,034 | |||||||||||
International Equity Index | — | (450,802 | ) | (32,457 | ) | (11,200,552 | ) | |||||||||
International Equity | 190,713 | — | (1,825,158 | ) | (22,636,982 | ) | ||||||||||
Emerging Markets Equity | 115,137 | (19,098,013 | ) | — | (71,664,811 | ) | ||||||||||
Inflation Protected Bond | — | (7,997,938 | ) | (22,622 | ) | (6,841,029 | ) | |||||||||
Flexible Income | — | (2,386,973 | ) | — | (7,936,266 | ) | ||||||||||
Real Assets | 73,873 | (890,654 | ) | — | (9,661,229 | ) | ||||||||||
Real Estate Securities | 560,480 | 633,874 | (553,518 | ) | (8,007,001 | ) | ||||||||||
Global Natural Resources Equity | — | (65,237,401 | ) | (427,973 | ) | (103,284,213 | ) | |||||||||
345
Table of Contents
For Federal income tax purposes, realized capital losses may be carried forward and applied against future realized capital gains.
Capital loss carryovers and their expiration dates, were as follows as of December 31, 2015:
|
|
|
|
|
|
|
| |||||||||
| Expiring December 31, | 2017 | 2018 | Unlimited | Total | ||||||||||||
Low-Duration Bond | $ | — | $ | — | $ | 162,217 | $ | 162,217 | ||||||||
Global Bond | 6,001,516 | — | 1,442,364 | 7,443,880 | ||||||||||||
International Equity Index | — | — | 450,802 | 450,802 | ||||||||||||
Emerging Markets Equity | — | — | 19,098,013 | 19,098,013 | ||||||||||||
Inflation Protected Bond | — | — | 7,997,938 | 7,997,938 | ||||||||||||
Flexible Income | — | — | 2,386,973 | 2,386,973 | ||||||||||||
Real Assets | — | — | 890,654 | 890,654 | ||||||||||||
Global Natural Resources Equity | — | — | 65,237,401 | 65,237,401 | ||||||||||||
Under the Regulated Investment Company Modernization Act of 2010, Funds will be permitted to carry forward capital losses incurred in taxable years beginning after December 22, 2010, for an unlimited period. Such losses are presented in the table above under the column heading “Unlimited.” However, any losses incurred during those future taxable years will be required to be utilized prior to the losses incurred in pre-enactment taxable years. As a result of this ordering rule, pre-enactment capital loss carryforwards may be more likely to expire unused. Additionally, post-enactment capital losses that are carried forward will retain their character as either short-term or long-term capital losses rather than being considered all short-term losses as under previous law.
During the year ended December 31, 2015, the following Funds utilized capital loss carryforwards to offset capital gains:
| Carryforward Utilized | ||||
Low-Duration Bond | $ | 425,307 | ||
International Equity | 1,498,318 | |||
For federal income tax purposes, late year loss deferrals, which will reverse in 2016, were as follows as of December 31, 2015:
| Capital | Ordinary Income | Total | ||||||||||
MyDestination 2005 | $ | 93,295 | $ | — | $ | 93,295 | ||||||
MyDestination 2015 | 328,463 | — | 328,463 | |||||||||
MyDestination 2025 | 1,208,776 | — | 1,208,776 | |||||||||
MyDestination 2035 | 830,573 | — | 830,573 | |||||||||
MyDestination 2045 | 691,526 | — | 691,526 | |||||||||
MyDestination 2055 | 89,548 | — | 89,548 | |||||||||
Conservative Allocation | 75,698 | — | 75,698 | |||||||||
Balanced Allocation | 241,402 | — | 241,402 | |||||||||
Growth Allocation | 190,313 | — | 190,313 | |||||||||
Aggressive Allocation | 314,058 | — | 314,058 | |||||||||
Low-Duration Bond | 2,455,599 | — | 2,455,599 | |||||||||
Medium-Duration Bond | 178,443 | — | 178,443 | |||||||||
Equity Index | 133,308 | — | 133,308 | |||||||||
Value Equity | 1,985,461 | — | 1,985,461 | |||||||||
Growth Equity | 1,313,213 | — | 1,313,213 | |||||||||
Small Cap Equity | 1,567,115 | — | 1,567,115 | |||||||||
International Equity Index | — | 32,457 | 32,457 | |||||||||
International Equity | 1,825,158 | — | 1,825,158 | |||||||||
Inflation Protected Bond | — | 22,622 | 22,622 | |||||||||
Real Estate Securities | 553,518 | — | 553,518 | |||||||||
Global Natural Resources Equity | — | 427,973 | 427,973 | |||||||||
346
Table of Contents
At December 31, 2015, the aggregate cost of investment securities for federal income tax purposes (excluding foreign currency, securities sold short and derivative related items) and the net unrealized appreciation from investments for those securities having an excess of value over cost and net unrealized depreciation from investments for those securities having an excess of cost over value (based on cost for federal income tax purposes) were as follows:
Fund | Federal Tax Cost | Net Unrealized Appreciation (Depreciation) | Appreciated Securities | Depreciated Securities | ||||||||||||
MyDestination 2005 | $ | 102,179,779 | $ | (6,147,826 | ) | $ | 7 | $ | (6,147,833 | ) | ||||||
MyDestination 2015 | 523,590,738 | (44,126,930 | ) | 12 | (44,126,942 | ) | ||||||||||
MyDestination 2025 | 788,323,536 | (80,798,813 | ) | 12 | (80,798,825 | ) | ||||||||||
MyDestination 2035 | 449,284,304 | (58,273,718 | ) | 5 | (58,273,723 | ) | ||||||||||
MyDestination 2045 | 326,432,493 | (44,974,335 | ) | 5 | (44,974,340 | ) | ||||||||||
MyDestination 2055 | 44,046,730 | (5,673,841 | ) | — | (5,673,841 | ) | ||||||||||
Conservative Allocation | 394,314,891 | (28,827,510 | ) | — | (28,827,510 | ) | ||||||||||
Balanced Allocation | 1,726,630,989 | (203,273,458 | ) | — | (203,273,458 | ) | ||||||||||
Growth Allocation | 1,299,777,743 | (185,488,498 | ) | — | (185,488,498 | ) | ||||||||||
Aggressive Allocation | 1,140,588,183 | (174,725,297 | ) | — | (174,725,297 | ) | ||||||||||
Money Market | 1,287,539,791 | — | — | — | ||||||||||||
Low-Duration Bond | 920,169,548 | (11,715,168 | ) | 1,990,438 | (13,705,606 | ) | ||||||||||
Medium-Duration Bond | 1,050,992,208 | (17,638,989 | ) | 14,813,219 | (32,452,208 | ) | ||||||||||
Extended-Duration Bond | 265,252,251 | (2,323,038 | ) | 16,180,790 | (18,503,828 | ) | ||||||||||
Global Bond | 454,585,856 | (33,392,504 | ) | 14,710,202 | (48,102,706 | ) | ||||||||||
Defensive Market Strategies | 644,785,944 | 30,877,948 | 50,691,532 | (19,813,584 | ) | |||||||||||
Equity Index | 508,855,319 | 139,130,970 | 158,990,507 | (19,859,537 | ) | |||||||||||
Value Equity | 1,256,754,457 | 114,885,625 | 221,210,339 | (106,324,714 | ) | |||||||||||
Growth Equity | 1,463,342,519 | 220,023,388 | 275,503,342 | (55,479,954 | ) | |||||||||||
Small Cap Equity | 676,343,085 | 2,851,035 | 61,457,716 | (58,606,681 | ) | |||||||||||
International Equity Index | 124,141,415 | (11,207,851 | ) | 1,894,770 | (13,102,621 | ) | ||||||||||
International Equity | 1,459,842,644 | (29,989,589 | ) | 143,867,973 | (173,857,562 | ) | ||||||||||
Emerging Markets Equity | 384,631,211 | (71,485,907 | ) | 12,363,096 | (83,849,003 | ) | ||||||||||
Inflation Protected Bond | 307,116,569 | (6,915,738 | ) | 1,550,724 | (8,466,462 | ) | ||||||||||
Flexible Income | 149,230,043 | (7,936,266 | ) | 115,670 | (8,051,936 | ) | ||||||||||
Real Assets | 42,655,724 | (9,661,229 | ) | — | (9,661,229 | ) | ||||||||||
Real Estate Securities | 288,316,273 | (7,999,427 | ) | 8,048,954 | (16,048,381 | ) | ||||||||||
Global Natural Resources | 342,863,771 | (103,282,627 | ) | 82,776 | (103,365,403 | ) | ||||||||||
The differences between book basis and tax-basis unrealized appreciation (depreciation) is attributable primarily to the tax deferral of losses on wash sales, the deferral of losses on straddles, gains on constructive sales and investments in PFIC’s, partnerships and other securities with book and tax cost differences.
347
Table of Contents
At December 31, 2015, capital contributions, accumulated undistributed net investment income and accumulated net realized gain (loss) from investments have been adjusted for current period permanent book/tax differences which arose principally from differing book/tax treatments of PFICs, paydown losses, net operating losses, swaps, foreign currency transactions, distributions received from regulated investment companies, defaulted bonds, reclassifications of dividends paid and non-deductible expenses. Adjustments were also made due to the transfer of tax attributes received from the reorganization of the I Series Funds. The following amounts were reclassified within the capital accounts:
Fund | Paid in Capital | Undistributed Net Investment Income | Accumulated Net Realized Gain (Loss) on Investments, Currency Translations and Derivative Transactions | |||||||||||||
MyDestination 2005 | $ | — | $ | (895) | $ | 895 | ||||||||||
MyDestination 2015 | — | (1,726) | 1,726 | |||||||||||||
MyDestination 2025 | — | (4,598) | 4,598 | |||||||||||||
MyDestination 2035 | — | (790) | 790 | |||||||||||||
MyDestination 2045 | — | (1,669) | 1,669 | |||||||||||||
MyDestination 2055 | — | 276 | (276) | |||||||||||||
Conservative Allocation | 2,133,508 | 1,624 | (2,135,132) | |||||||||||||
Balanced Allocation | 24,445,146 | (3,913) | (24,441,233) | |||||||||||||
Growth Allocation | 16,808,249 | 3,560 | (16,811,809) | |||||||||||||
Aggressive Allocation | 13,816,629 | (3,580) | (13,813,049) | |||||||||||||
Low-Duration Bond | — | (108,744) | 108,744 | |||||||||||||
Medium-Duration Bond | — | 3,675,087 | (3,675,087) | |||||||||||||
Extended-Duration Bond | — | (26,106) | 26,106 | |||||||||||||
Global Bond | — | 307,115 | (307,115) | |||||||||||||
Defensive Market Strategies | (269) | 768,940 | (768,671) | |||||||||||||
Equity Index | — | 285,903 | (285,903) | |||||||||||||
Value Equity | — | 888,518 | (888,518) | |||||||||||||
Growth Equity | — | 959,374 | (959,374) | |||||||||||||
Small Cap Equity | — | 11,367 | (11,367) | |||||||||||||
International Equity Index | (20,916) | 22,207 | (1,291) | |||||||||||||
International Equity | — | 3,326,163 | (3,326,163) | |||||||||||||
Emerging Markets Equity | — | (3,082,398) | 3,082,398 | |||||||||||||
Inflation Protected Bond | (484,548) | 4,470,607 | (3,986,059) | |||||||||||||
Flexible Income | (26,711) | 27,654 | (943) | |||||||||||||
Real Assets | — | (56) | 56 | |||||||||||||
Real Estate Securities | — | 1,876,568 | (1,876,568) | |||||||||||||
Global Natural Resources Equity | (45,811) | 595,668 | (549,857) | |||||||||||||
Net investment income, net realized gain (loss) on investments and net assets were not affected by these reclassifications.
9. MARKET AND CREDIT RISK
In the normal course of business, the Funds trade financial instruments and enter into financial transactions where the risk of potential loss exists due to changes in the market (market risk) or due to the failure of the other party to a transaction to perform (credit and counterparty risks).
Market Risks — A Fund’s investments in derivatives and other financial instruments expose the Fund to various risks such as, but not limited to, interest rate, foreign currency, equity and commodity risks.
Interest rate risk is the risk that fixed income securities will decline in value because of changes in interest rates. As nominal interest rates rise, the value of certain fixed income securities held by a Fund is likely to decrease. A nominal interest rate can be described as the sum of a real interest rate and an expected inflation rate. Fixed income securities with longer durations tend to be more sensitive to changes in interest rates, usually making them more volatile than securities with shorter durations. Duration is useful primarily as a measure of the sensitivity of a fixed income’s market price to interest rate (i.e. yield) movements.
348
Table of Contents
If a Fund invests directly in foreign currencies or in securities that trade in, and receive revenues in, foreign currencies, or in derivatives that provide exposure to foreign currencies, it will be subject to the risk that those currencies will decline in value relative to the base currency of the Fund, or, in the case of hedging positions, that the Fund’s base currency will decline in value relative to the currency being hedged. Currency rates in foreign countries may fluctuate significantly over short periods of time for a number of reasons, including changes in interest rates, intervention (or the failure to intervene) by U.S. or foreign governments, central banks or supranational entities such as the International Monetary Fund, or by the imposition of currency controls or other political developments in the United States or abroad. As a result, a Fund’s investments in foreign currency denominated securities may reduce the returns of the Fund.
The market values of equities, such as common stocks and preferred stocks, or equity related investments such as futures and options, may decline due to general market conditions which are not specifically related to a particular company, such as real or perceived adverse economic conditions, changes in the general outlook for corporate earnings, changes in interest or currency rates or adverse investor sentiment. Market values may also decline due to factors which affect a particular industry or industries, such as labor shortages or increased production costs and competitive conditions within an industry. Equity securities and equity related investments generally have greater market price volatility than fixed income securities.
A Fund’s investments in commodity-linked derivative instruments may subject the Fund to greater market price volatility than investments in traditional securities. The value of commodity-linked derivative instruments may be affected by changes in overall market movements, commodity index volatility, changes in interest rates, or factors affecting a particular industry or commodity, such as drought, floods, weather, livestock disease, embargoes, tariffs and international economic, political and regulatory developments.
In countries with limited or developing markets, investments may present greater risks than in more developed markets and the prices of such investments may be volatile. The consequences of political, social or economic changes in these markets may have disruptive effects on the market prices of these investments and the income they generate, as well as the Fund’s ability to repatriate such amounts.
Credit and Counterparty Risks — A Fund will be exposed to credit risk on parties with whom it trades and will also bear the risk of settlement default. A Fund minimizes concentrations of credit risk by undertaking transactions with a large number of customers and counterparties on recognized and reputable exchanges. A Fund could lose money if the issuer or guarantor of a fixed income security, or the counterparty to a derivatives contract, repurchase agreement or a loan of portfolio securities, is unable or unwilling to make timely principal and/or interest payments, or to otherwise honor its obligations. Securities are subject to varying degrees of credit risk, which are often reflected in credit ratings.
Similar to credit risk, a Fund may be exposed to counterparty risk, or the risk that an institution or other entity with which the Fund has unsettled or open transactions will default. Financial assets, which potentially expose a Fund to counterparty risk, consist principally of cash due from counterparties and investments. The investment advisers minimize counterparty risks to the Funds by performing extensive reviews of each counterparty and obtaining approval from the Counterparty Risk Committee prior to entering into transactions with a third party. All transactions in listed securities are settled/paid for upon delivery using approved counterparties. The risk of default is considered minimal, as delivery of securities sold is only made once a Fund has received payment. Payment is made on a purchase once the securities have been delivered by the counterparty. The trade will fail if either party fails to meet its obligation.
349
Table of Contents
10. RECENT SEC RULE AMENDMENT
On July 23, 2014, the U.S. Securities and Exchange Commission adopted amendments to money market fund regulations, which structurally change the way that certain money market funds will be required to operate. These amendments are generally not effective until sometime in 2016.
The Board, on behalf of the Money Market Fund, has approved an investment policy in order for the Fund to meet the definition of a “government money market fund” under Rule 2a-7 under the Investment Company Act of 1940, as amended. Under amended Rule 2a-7, a government money market fund is a money market fund that invests at least 99.5% of its total assets in U.S. government securities, cash, and/or repurchase agreements that are fully collateralized by U.S. government securities or cash. These changes will become effective on or about May 1, 2016.
11. REGULATORY EXAMINATIONS
Federal and state regulatory authorities from time to time make inquiries and conduct examinations regarding compliance by the Trust and its affiliates with securities and other laws and regulations affecting the Funds. There are currently no such matters which the Trust and its affiliates believe will be material to these financial statements.
12. SUBSEQUENT EVENTS
On February 26, 2016 the Board approved a plan to liquidate the Real Assets Fund on or about April 29, 2016.
Subsequent events have been evaluated through the date that the financial statements were available to be issued. All subsequent events determined to be relevant and material to the financial statements have been appropriately recorded or disclosed.
350
Table of Contents
REPORT OF INDEPENDENT REGISTERED PUBLIC ACCOUNTING FIRM
To the Board of Trustees and
Shareholders of GuideStone Funds, as defined:
In our opinion, the accompanying statements of assets and liabilities, including the schedules of investments, and the related statements of operations and of changes in net assets and the financial highlights present fairly, in all material respects, the financial position of MyDestination 2005 Fund, MyDestination 2015 Fund, MyDestination 2025 Fund, MyDestination 2035 Fund, MyDestination 2045 Fund, MyDestination 2055 Fund, Conservative Allocation Fund, Balanced Allocation Fund, Growth Allocation Fund, Aggressive Allocation Fund, Money Market Fund, Low-Duration Bond Fund, Medium-Duration Bond Fund, Extended-Duration Bond Fund, Inflation Protected Bond Fund, Global Bond Fund, Flexible Income Fund, Defensive Market Strategies Fund, Real Assets Fund, Equity Index Fund, Real Estate Securities Fund, Value Equity Fund, Growth Equity Fund, Small Cap Equity Fund, International Equity Index Fund, International Equity Fund, Emerging Markets Equity Fund and Global Natural Resources Equity Fund (constituting GuideStone Funds, hereafter referred to as the “Trust”) at December 31, 2015, the results of each of their operations, the changes in each of their net assets and the financial highlights for each of the periods indicated, in conformity with accounting principles generally accepted in the United States of America. These financial statements and financial highlights (hereafter referred to as “financial statements”) are the responsibility of the Trust’s management. Our responsibility is to express an opinion on these financial statements based on our audits. We conducted our audits of these financial statements in accordance with the standards of the Public Company Accounting Oversight Board (United States). Those standards require that we plan and perform the audit to obtain reasonable assurance about whether the financial statements are free of material misstatement. An audit includes examining, on a test basis, evidence supporting the amounts and disclosures in the financial statements, assessing the accounting principles used and significant estimates made by management, and evaluating the overall financial statement presentation. We believe that our audits, which included confirmation of securities at December 31, 2015 by correspondence with the custodian, brokers and transfer agents of the investee funds, provide a reasonable basis for our opinion.

PricewaterhouseCoopers LLP
Philadelphia, Pennsylvania
February 29, 2016
351
Table of Contents
NOTICE TO SHAREHOLDERS (Unaudited)
Each Fund is required by Subchapter M of the Internal Revenue Code of 1986, as amended, to advise its shareholders of the federal tax status of distributions received by each Fund’s shareholders. During the year ended December 31, 2015, the Funds hereby designate the following dividends and distributions paid by each of the Funds:
Fund | Ordinary Income | Long-Term Capital Gain (20% rate) | Return of Capital | |||||||||
MyDestination 2005 | $ | 1,488,763 | $ | 4,633,210 | $ | — | ||||||
MyDestination 2015 | 9,221,001 | 55,611,928 | — | |||||||||
MyDestination 2025 | 14,743,086 | 86,476,338 | — | |||||||||
MyDestination 2035 | 7,786,505 | 57,558,647 | — | |||||||||
MyDestination 2045 | 5,286,977 | 41,769,639 | — | |||||||||
MyDestination 2055 | 722,260 | 2,378,631 | — | |||||||||
Conservative Allocation | 5,146,319 | 19,883,553 | — | |||||||||
Balanced Allocation | 30,811,159 | 185,492,585 | — | |||||||||
Growth Allocation | 21,827,804 | 159,439,753 | — | |||||||||
Aggressive Allocation | 15,096,267 | 192,947,411 | — | |||||||||
Money Market | 354,779 | 1,901 | — | |||||||||
Low-Duration Bond | 10,210,504 | — | — | |||||||||
Medium-Duration Bond | 29,877,794 | 5,599,044 | — | |||||||||
Extended-Duration Bond | 15,068,462 | 7,251,117 | — | |||||||||
Global Bond | 15,752,245 | — | — | |||||||||
Defensive Market Strategies | 14,319,869 | 20,145,965 | — | |||||||||
Equity Index | 10,123,913 | 13,062,522 | — | |||||||||
Value Equity | 23,442,851 | 118,071,515 | — | |||||||||
Growth Equity | 18,902,593 | 198,987,433 | — | |||||||||
Small Cap Equity | 4,060,828 | 38,044,741 | — | |||||||||
International Equity Index | 896,896 | — | — | |||||||||
International Equity | 26,090,595 | 45,470,957 | — | |||||||||
Emerging Markets Equity | 1,112,618 | — | — | |||||||||
Inflation Protected Bond | 939,144 | — | — | |||||||||
Flexible Income | 4,764,206 | — | — | |||||||||
Real Assets | 370,544 | 74,083 | — | |||||||||
Real Estate Securities | 11,697,003 | 9,758,872 | — | |||||||||
Global Natural Resources Equity | 220,488 | — | — | |||||||||
Dividends from net investment income and short-term capital gains are treated as ordinary income dividends for federal income tax purposes. Long-term capital gain distributions are taxable as capital gain dividends.
352
Table of Contents
NOTICE TO SHAREHOLDERS (Continued)
The following percentages of ordinary income dividends paid for the year ended December 31, 2015, have been designated as qualified for the reduced tax rate under The Job and Growth Tax Relief Reconciliation Act of 2003.
Fund | ||||
MyDestination 2005 | 27.49 | % | ||
MyDestination 2015 | 37.75 | % | ||
MyDestination 2025 | 44.35 | % | ||
MyDestination 2035 | 57.09 | % | ||
MyDestination 2045 | 67.67 | % | ||
MyDestination 2055 | 64.40 | % | ||
Conservative Allocation | 27.27 | % | ||
Balanced Allocation | 31.45 | % | ||
Growth Allocation | 52.18 | % | ||
Aggressive Allocation | 96.47 | % | ||
Defensive Market Strategies | 56.77 | % | ||
Equity Index | 88.05 | % | ||
Value Equity | 97.68 | % | ||
Growth Equity | 47.25 | % | ||
Small Cap Equity | 79.07 | % | ||
International Equity Index | 100.00 | % | ||
International Equity | 100.00 | % | ||
Emerging Markets Equity | 100.00 | % | ||
Real Assets | 7.38 | % | ||
Real Estate Securities | 8.37 | % | ||
Global Natural Resources Equity | 100.00 | % | ||
All above designations are based on financial information available as of the date of this annual report, and accordingly, are subject to change. It is the intention of the Funds to designate the maximum amount permitted under the Internal Revenue Code and the regulations thereunder. Shareholders are advised to consult their own tax advisers with respect to the tax consequences of their investment in the Funds.
353
Table of Contents
Information pertaining to the Trustees and officers of the Trust is set forth below. The statement of additional information (SAI) includes additional information about the Trustees and is available without charge, upon request, by calling 1-888-GS-FUNDS(1-888-473-8637).
Name, (DOB), Address and Position(s) with Trust | Term of Office and Length of Time Served1 | Principal Occupation(s) During Past 5 Years | Number of Portfolios in Fund Complex Overseen by Trustee | Other Trusteeships/ Directorships Held by Trusteee During Past 5 Years | ||||||
| INDEPENDENT TRUSTEES2 | ||||||||||
Michael R. Buster (1957) 2401 Cedar Springs Road Dallas, TX 75201-1498 Trustee | Since 2002 | Executive Pastor, Prestonwood Baptist Church, 1989 - present. | 28 | N/A | ||||||
Carson L. Eddy (1943) 2401 Cedar Springs Road Dallas, TX 75201-1498 Trustee | Since 2011 | Retired – Partner in Charge (Orlando office), Carr, Riggs & Ingram, LLC, 2007 - 2013 – Certified Public Accountants; President, Quantum Consulting Group LLC, 2000 - 2013. | 28 | N/A | ||||||
William Craig George (1958) 2401 Cedar Springs Road Dallas, TX 75201-1498 Trustee | Since 2004 | Senior Credit Officer, NewBridge Bank, 2014 - present; Chief Credit Officer, CapStone Bank, 2011 - 2014 (bank acquired by NewBridge Bank); Executive Vice President/Regional Credit Officer, SunTrust Bank, 1995 - 2011. | 28 | N/A | ||||||
Barry D. Hartis (1945) 2401 Cedar Springs Road Dallas, TX 75201-1498 Trustee | Since 2014 | Certified Public Accountant, 1987 – Present; Client Services and Firm Development, Haynes Strand and Company, PLLC, 2005 – 2010; Vice President of Business and Finance, Greensboro College, 1998 – 2005. | 28 | GuideStone Financial Resources – Board of Trustees Member, 2004 – 2012; GuideStone Funds – Board of Trustees, Interested Trustee, 2005 – 2012. | ||||||
Grady R. Hazel (1947) 2401 Cedar Springs Road Dallas, TX 75201-1498 Trustee | Since 2011 | G400 Relations Manager, American Institute of Certified Public Accountants, 2012 - present; Executive Director, Society of Louisiana CPAs, 1995 - 2012. | 28 | Neighbors Federal Credit Union — Board of Directors Member and Chairman of Audit Committee; Stonetrust Commercial Insurance Company — Board of Directors Member and Member of Audit Committee. | ||||||
Joseph A. Mack (1939) 2401 Cedar Springs Road Dallas, TX 75201-1498 Trustee | Since 2002 | Independent Consultant, 2010 - present; Retired - Director, Office of Public Policy, South Carolina Baptist Convention, 1999 - 2011. | 28 | N/A | ||||||
Franklin R. Morgan (1943) 2401 Cedar Springs Road Dallas, TX 75201-1498 Trustee | Since 2005 | Retired - Senior Vice President, Director of International Administration, Prudential Securities, Inc., 1960 - 2003. | 28 | N/A | ||||||
Kyle Tucker (1981) 2401 Cedar Springs Road Dallas, TX 75201-1498 Trustee | Since 2013 | Vice President and Financial Advisor - CAPTRUST Financial Advisors, 2006 - Present. | 28 | N/A | ||||||
354
Table of Contents
FUND MANAGEMENT (Continued)
Name, (DOB), Address and Position(s) with Trust | Term of Office | Principal Occupation(s) During Past 5 Years | Number of | Other Trusteeships/ Directorships Held by Trusteee During Past 5 Years | ||||||
| INTERESTED TRUSTEES2,3 | ||||||||||
Thomas G. Evans (1961) 2401 Cedar Springs Road Dallas, TX 75201-1498 Trustee | Since 2012 | Appraiser, Manager and Owner, Encompass Financial Services, Inc., 1984 – present, President and Owner, Custom Land Management, LLC, 1984 – present; Manager, Private Partners Opportunity Fund, LLC, 2011 – present. | 28 | GuideStone Financial Resources – Board of Trustees Member, June 2010 – present; Baptist Foundation of Oklahoma, Board of Directors Member and Chairman, 2004 – present; Pioneer Spirit Foundation – Board of Trustees Member, 1993 – present; GuideStone Capital Management, Board of Directors Member, July 2011 – July 2012; Cherokee Strip Foundation – Board of Trustees Member, 2013 – present; Enid Regional Development Alliance – Board of Trustees member, 2010 – present. | ||||||
James W. Hixson (1931) 2401 Cedar Springs Road Dallas, TX 75201-1498 Trustee | Since 2010 | Retired. | 28 | GuideStone Financial Resources – Board of Trustees Member, June 2008 – present; GuideStone Advisors – Board of Directors Member, July 2008 – present; GuideStone Financial Services – Board of Directors Member, July 2008 – present. | ||||||
| OFFICERS WHO ARE NOT TRUSTEES4 | ||||||||||
Ron W. Bass (1966) 2401 Cedar Springs Road Dallas, TX 75201-1498 Chief Compliance Officer and AML Officer. | Since 2009 | Director of Broker/Dealer and RIA Compliance, GuideStone Financial Resources, June 2009 – present; Manager of Broker/Dealer and RIA Compliance, GuideStone Financial Resources, 2008 – May 2009. | N/A | N/A | ||||||
Melanie Childers (1971) 2401 Cedar Springs Road Dallas, TX 75201-1498 Vice President – Fund Operations | Since 2014 | Managing Director, Fund Operations, GuideStone Financial Resources, 2014 - present; Director, Funds Administration and Operations, GuideStone Financial Resources, 2009 - 2014. | N/A | N/A | ||||||
Ronald C. Dugan, Jr. (1962) 2401 Cedar Springs Road Dallas, TX 75201-1498 Vice President and Investment Officer | Since 2010 | Vice President and Chief Strategic Investment Officer, GuideStone Financial Resources, 2013 - present; Director of Global Investment Strategies, GuideStone Financial Resources, 2010 - 2013; Managing Director, Equities, Russell Investments, 2000 - 2010. | N/A | N/A | ||||||
John R. Jones (1953) 2401 Cedar Springs Road Dallas, TX 75201-1498 President | Since 2000 | Executive Vice President and Chief Operating Officer, GuideStone Financial Resources, 1997 - present. | N/A | N/A | ||||||
Harold R. Loftin, Jr. (1959) 2401 Cedar Springs Road Dallas, TX 75201-1498 Chief Legal Officer and Secretary | Since 2015 | Vice President, General Counsel and Secretary, GuideStone Financial Resources, 2014 - present; Associate Counsel Fiduciary and Corporate Services, GuideStone Financial Resources, 2013 - 2014; Counsel, Dentons, 2011 - 2013; Trial Attorney, U.S. Securities and Exchange Commission, 2000 - 2011. | N/A | N/A | ||||||
Patrick Pattison (1974) 2401 Cedar Springs Road Dallas, TX 75201-1498 Vice President and Treasurer | Since 2008 | Chief Accounting Officer, GuideStone Financial Resources, 2015 - present; Director of Financial Reporting & Process Review, GuideStone Financial Resources, 2008 - 2015. | N/A | N/A | ||||||
Matt L. Peden (1967) 2401 Cedar Springs Road Dallas, TX 75201-1498 Vice President and Investment Officer | Since 2001 | Vice President and Chief Investment Officer, GuideStone Financial Resources, 2015 - present; Director of Portfolio Management, GuideStone Financial Resources, 2010 - 2015. | N/A | N/A | ||||||
| 1 | Each Independent Trustee serves until his or her resignation, removal or mandatory retirement. Each Interested Trustee serves until his or her resignation, removal or mandatory retirement or until he or she ceases to be a member of the board of trustees of GuideStone Financial Resources. All Trustees must retire after reaching the age of seventy-seven years or after achieving ten years of service, whichever occurs last. Officers serve at the pleasure of the Board of Trustees. |
| 2 | The Trust pays no compensation to the Trustees. The Trust reimburses the Trustees for any expenses incurred in attending meetings. The Trust does not compensate the officers for the services they provide to the Funds. |
| 3 | Messrs. Evans and Hixson are “interested persons” of the Trust as the term is defined in the Investment Company Act of 1940, due to their positions on the Board of Trustees of GuideStone Financial Resources. |
| 4 | The officers of the Trust may be deemed to be affiliates of the Adviser due to their positions with the Adviser and/or GuideStone Financial Resources. |
355
Table of Contents
PROXY VOTING
A description of the policies and procedures that GuideStone Funds uses to determine how to vote proxies relating to their portfolio securities as well as information regarding how GuideStone Funds voted proxies during the most recent 12-month period ended June 30 is available without charge by calling 1-888-GS-FUNDS (1-888-473-8637), by visiting our website at www.GuideStoneFunds.com or by visiting the SEC’s website at www.sec.gov.
FORM N-MFP
Beginning December 2009, the GuideStone Money Market Fund began filing Form N-MFP with the SEC. Form N-MFP is filed on a monthly basis by money market mutual funds and includes detailed information about a money market fund’s investments and the market-based price of its portfolio known as its “shadow NAV” or mark-to-market valuation. The portfolio holdings information is posted on our website, www.GuideStoneFunds.com within five business days after the end of the month. Form N-MFP is made available online with a 60-day delay at www.sec.gov.
QUARTERLY SCHEDULES OF INVESTMENTS
In addition to the semi-annual and annual reports that GuideStone Funds delivers to shareholders and makes available through its website, GuideStone Funds files a complete schedule of portfolio holdings with the SEC for each Fund’s first and third fiscal quarters on Form N-Q. GuideStone Funds does not deliver the schedule for the first and third fiscal quarters to shareholders; however, the schedule is posted to our website, www.GuideStoneFunds.com. You may also obtain the Form N-Q filings by accessing the SEC’s website at www.sec.gov or copy them at the SEC’s Public Reference Room in Washington, DC. Information on the operation of the SEC’s Public Reference Room may be obtained by calling the SEC at (800) 732-0330. You can also request copies of this information, upon payment of a fee for duplication, at the SEC’s email address (publicinfo@sec.gov) or by writing the Public Reference section of the SEC, Washington, DC 20549-0102.
356
Table of Contents
BOARD REVIEW OF ADVISORY AGREEMENT AND SUB-ADVISORY AGREEMENTS (Unaudited)
As required by the Investment Company Act of 1940, as amended (the “1940 Act”), the Board of Trustees (the “Board”) of GuideStone Funds (the “Trust”), including the Trustees who are not “interested persons” of the Trust, as that term is defined in Section 2(a)(19) of the 1940 Act (the “Independent Trustees”), recently considered the renewal of (i) the investment advisory agreement between GuideStone Capital Management, LLC (the “Adviser” or “GSCM”) and the Trust on behalf of the Date Target, Asset Allocation and Select Funds (each a “Fund” and together, the “Funds”) (the “Advisory Agreement”); (ii) the sub-advisory agreements among the Adviser, each sub-adviser and the Trust on behalf of each Select Fund; and (iii) the sub-advisory agreement among the Adviser, Parametric Portfolio Associates LLC (“Parametric”) and the Trust on behalf of each Fund participating in the cash overlay program (“Cash Overlay Program”) (items ii and iii referred to collectively as the “Sub-Advisory Agreements”). The Advisory Agreement and the Sub-Advisory Agreements presented for renewal (each, an “Agreement,” and collectively, the “Agreements”) were approved for an additional one-year term, except as noted below, at a meeting of the Board held on September 17-18, 2015. The Board’s decision to approve the Agreements reflects the exercise of its business judgment to continue each existing arrangement. In approving the Agreements, the Board considered information provided by the Adviser, each applicable sub-adviser and a consulting firm engaged by the Adviser with the assistance and advice of counsel to the Independent Trustees (“Independent Counsel”) and counsel to the Trust. Because the Board had recently approved them for an initial two-year term, the following agreements were not subject to annual renewal at the September 17-18, 2015 Board meeting: the Sub-Advisory Agreements for the Growth Equity Fund with Jackson Square Partners, LLC (“Jackson Square”) and Loomis, Sayles & Company, L.P. (“Loomis”).
The Board’s consideration of various factors and its conclusions with respect to such factors formed the basis for the Board’s determination to continue the Agreements. The factors considered by the Board included, but were not limited to: (i) the personnel resources of the Adviser and sub-advisers; (ii) the experience and expertise of the Adviser and sub-advisers; (iii) the financial capabilities and resources of the Adviser and sub-advisers; (iv) the compliance procedures and history of the Adviser and sub-advisers; (v) the performance of the Fund or portfolio account in comparison to relevant benchmarks, peer universes of similarly managed funds and the Adviser’s and sub-advisers’ other clients; (vi) the amount of the contractual advisory fee in comparison to similarly managed funds and the Adviser’s and sub-advisers’ other clients and the effect of any fee waiver and expense reimbursement arrangement; (vii) the total expenses of the Fund in comparison to similarly managed funds and the use of past and anticipated expense caps; (viii) the profitability of the Adviser and sub-advisers with respect to the Fund or portfolio account and its overall business, as well as the effect of fee waivers and expense caps on profitability; (ix) the extent of any economies of scale and whether the fee structure reflects such economies of scale through breakpoints; (x) the existence of any collateral benefits realized by the Adviser and sub-advisers, such as affiliated brokerage arrangements or the use of soft dollars; and (xi) the existence of any collateral benefits realized by the Fund resulting from its relationship with the Adviser and sub-advisers. In addition, with respect to the Funds that utilize a multi-manager approach (i.e., the Fund is advised by multiple sub-advisers), the Board considered the ongoing role each sub-adviser plays in the overall structure of the Fund’s portfolio, including how each sub-adviser’s strategy complements the strategies of the other sub-advisers.
In its decision to renew the Agreements, the Board was also mindful of the potential disruptions of the Trust’s operations and various risks, uncertainties and other effects that could occur as a result of a decision to terminate or not renew an Agreement. The Board also evaluated whether the approval of each Agreement is in the best interests of the applicable Fund and its shareholders. No one factor was determinative in the Board’s consideration of the Agreements.
The Board undertook a review of the terms of the Agreements and the nature, extent and quality of the services provided by the Adviser and each applicable sub-adviser. The Board conducted its analysis on a Fund-by-Fund basis with respect to the Adviser and each applicable sub-adviser. The Adviser provided the Board with substantial detailed information in the form of reports about each Date Target Fund, Asset Allocation Fund, Select Fund, applicable sub-advisory firm and the Adviser prior to and during the meeting, which addressed the factors listed previously. The Adviser also provided additional information about the Adviser and each sub-adviser in presentations made during the meeting and responded to questions from the Trustees. In addition, the Independent Trustees met separately in executive session with counsel to the Independent Trustees to discuss and consider information presented in connection with the continuation of the Agreements as well as the Trustees’ responsibilities and duties in approving the Agreements.
357
Table of Contents
BOARD APPROVAL OF CONTINUATION OF THE ADVISORY AGREEMENT WITH GSCM
In considering the renewal of the existing Advisory Agreement with GSCM, the Board took into account all the materials provided prior to and during the meeting, the presentations made during the meeting and the comprehensive discussions during the meeting, including the discussions between the Independent Trustees and their Independent Counsel during the executive sessions.
The Board examined the nature, extent and quality of the services to be provided by the Adviser to the Funds. The Board evaluated the Adviser’s experience in serving as an investment adviser, including overseeing and managing the allocation of each Fund’s assets among the sub-advisers and continually reviewing the investment performance of each Fund, the nature and quality of the services provided by each sub-adviser for that Fund, and recommending changes to the sub-advisers as and when appropriate. The Board considered the experience of key personnel at the Adviser in providing investment management and administrative services and the systems used by such persons and the ability of the Adviser to attract and retain capable personnel. The Board considered the reputation, compliance history, compliance program and financial condition of the Adviser. The Board also considered the terms of the advisory and sub-advisory agreements and the responsibilities that the Adviser has as investment adviser to the Funds, including oversight of sub-adviser compliance with each Fund’s policies and objectives, oversight of general Fund compliance, including compliance with social restrictions and the implementation of Board directives as they relate to the Funds. The Board concluded that each Fund is likely to benefit from the nature, extent and quality of these services as a result of the Adviser’s experience, personnel, operations and resources. In their deliberations, the Board members did not identify any particular information that was all-important or controlling, and each Trustee may have attributed different weights to the various factors deliberated upon, among others.
The Board also examined fee and expense information for the Select Funds, as compared to other funds in the Funds’ asset-stratified peer groups for the Investor Class, provided by the report of an outside consulting firm, as of June 30, 2015. The Board took into account that the management fees, net of any fee waiver or expense reimbursement, and as compared to similar funds with similar asset levels, for the Money Market, Low-Duration Bond, Medium-Duration Bond and Inflation Protected Bond Funds ranked in the first quartile; the Equity Index, Global Bond, Defensive Market Strategies, Real Estate Securities, Value Equity and International Equity Funds ranked in the second quartile; the Extended-Duration Bond, Flexible Income, Growth Equity, Small Cap Equity and Emerging Markets Equity Funds ranked in the third quartile; and the Global Natural Resources Equity Fund ranked in the fourth quartile. The Board also evaluated the total expense ratios for other funds in the Funds’ asset-stratified peer groups and determined that each Fund’s total expense ratio, with the exception of the Money Market, Extended-Duration Bond, Flexible Income, International Equity and Global Natural Resources Equity Funds, was the same as, or lower than, the median total expense ratio for such other funds. The Board took into account that the total expense ratio for the Extended-Duration Bond, Flexible Income, International Equity and Global Natural Resources Equity Funds ranked in the third quartile, and that the Money Market Fund ranked in the fourth quartile, among similar funds at similar asset levels. The Board inquired into factors that contributed to a Fund’s ranking in the third or fourth quartile for expenses among its peer group.
The Board also examined the fee and expense information for the Select Funds, as compared to other funds in the peer groups for the Institutional Class, provided by the Mack report, as of June 30, 2015. The Board determined that the management fees, net of any fee waiver or expense reimbursement, for the Real Estate Securities Fund ranked in the first quartile; the Money Market, Low-Duration Bond, Medium-Duration Bond, Inflation Protected Bond, Global Bond, Value Equity and International Equity Funds ranked in the second quartile; the Extended-Duration Bond, Defensive Market Strategies, Equity Index, Growth Equity and International Equity Index Funds ranked in the third quartile; and the Small Cap Equity and Emerging Markets Equity Funds ranked in the fourth quartile among each Fund’s broad peer group. The Board also evaluated the total expense ratios for other funds in each Fund’s broad peer group and determined that each Fund’s total expense ratio was the same as, or lower than, the median total expense ratio for such other funds, except for the Money Market, Small Cap Equity, International Equity and International Equity Index Funds. The Board took into account that the total expense ratios for the Money Market, Small Cap Equity and International Equity Funds ranked in the third quartile and the International Equity Index Fund ranked in the fourth quartile. The Board inquired into factors that contributed to a Fund’s ranking in the third or fourth quartile for expenses among its peer group.
358
Table of Contents
The Board also examined fee and expense information for the Date Target Funds and the Asset Allocation Funds, as compared to other funds in the Funds’ asset-stratified peer groups for the Investor Class of the Date Target Funds and the Institutional and Investor Classes of the Asset Allocation Funds, provided by the report of an outside consulting firm, as of June 30, 2015. The Board determined that the management fees, net of any fee waiver or expense reimbursement, for each Date Target Fund were higher than the median management fees for other mutual funds in each Fund’s asset-stratified peer group but that the total expense ratios for each Date Target Fund were slightly lower than the median total expense ratio (second quartile) for such other funds. For the Asset Allocation Funds, the Board determined that the management fees, net of any fee waiver or expense reimbursement, for each Asset Allocation Fund for the Institutional and Investor Classes were slightly higher than the median management fees for other mutual funds in each Fund’s asset-stratified peer group and that the total expense ratios for each Asset Allocation Fund for the Institutional and Investor Class were slightly lower than the median total expense ratio for such other funds.
The Board examined the performance information for the Investor Class of the Select Funds compared to the relevant benchmark and to Morningstar peer rankings, specifically for the three-, five- and 10-year average annual total returns for the period ended June 30, 2015. Among Morningstar peers, the Board noted that the average annual total returns for the three-, five- and 10-year periods ended June 30, 2015 for the Money Market and Extended-Duration Bond Funds ranked in the first quartile.
For the period ended June 30, 2015, the Board noted that for the three-year average annual total return, the Global Bond and Value Equity Funds ranked in the first quartile; the Low-Duration Bond, Medium-Duration Bond, Inflation Protected Bond, Defensive Market Strategies and Small Cap Equity Funds ranked in the second quartile; the Growth Equity and International Equity Funds ranked in the third quartile; and the Real Estate Securities Fund ranked in the fourth quartile.
For the five-year average annual total return for the period ended June 30, 2015, the Board noted that the Global Bond, Real Estate Securities, Value Equity and Small Cap Equity Funds ranked in the first quartile; the Medium-Duration Bond, Inflation Protected Bond, Growth Equity and International Equity Funds ranked in the second quartile; the Low-Duration Bond Fund ranked in the third quartile; and no Funds ranked in the fourth quartile.
For the 10-year average annual total return for the period ended June 30, 2015, the Board noted that the Medium-Duration Bond and Real Estate Securities Funds ranked in the first quartile; the Low-Duration Bond Fund ranked in the second quartile; and the Value Equity, Growth Equity, Small Cap Equity and International Equity Funds ranked in the third quartile; and no Funds ranked in the fourth quartile.
The Board then examined the performance information included in the Report of the Investment Adviser for the Investor Class of each Asset Allocation Fund compared to the relevant benchmark and to Lipper peer rankings for the three-, five- and 10-year periods ended June 30, 2015, and for the Date Target Funds for the three- and five-year periods ended June 30, 2015.
Among Lipper peers, the Board noted that the Conservative Allocation Fund ranked in the fourth quartile for the three-, five- and 10-year periods ended June 30, 2015; the Balanced Allocation Fund ranked in the third quartile for the five- and 10-year periods and the fourth quartile for the three-year period ended June 30, 2015; the Growth Allocation Fund ranked in the third quartile for the five- and 10-year periods and the fourth quartile for the three-year period ended June 30, 2015; and the Aggressive Allocation Fund ranked in the first quartile for the five-year period, the second quartile for the three-year period and the third quartile for the 10-year period ended June 30, 2015.
The Board also noted that the MyDestination 2015, 2025 and 2035 Funds each ranked in the third quartile among Lipper peers for the three-year period ended June 30, 2015, and the MyDestination 2005, 2045 and 2055 Funds ranked in the fourth quartile among Lipper peers for the same period. Among Lipper peers for the five-year period ended June 30, 2015, the Board noted that the MyDestination 2015, 2025, 2035 and 2045 Funds each ranked in the second quartile among Lipper peers for the five-year period ended June 30, 2015, and the MyDestination 2005 Fund ranked in the fourth quartile among Lipper peers for the same period. The Board recognized the inception date of the MyDestination 2055 Fund in 2012.
The Board and GSCM discussed the reasons why a Fund’s performance would be in the third or fourth quartile among its peer group, including with respect to the performances of the International Equity Fund, Extended-Duration Bond Fund, Emerging Markets Equity Fund and Global Natural Resources Equity Fund. The Board considered the reasons explained by GSCM, including the composition of the Fund’s peer group and market conditions.
359
Table of Contents
The Board considered the costs to GSCM of serving as the Adviser to the Funds, including the costs associated with the personnel, systems and equipment necessary to manage the Funds in accordance with the existing advisory agreement. The Board considered the revenues that GSCM received for serving as the Adviser to the Funds and the fact that any profit realized by the Adviser is forwarded to GuideStone Financial Resources, which for many years operated at a deficit with respect to the Trust. The Board also considered the profitability information for the Adviser, first, without taking into account sub-advisory fees, and second, taking into account sub-advisory fees. The Board then considered whether any direct or indirect collateral benefits inured to either the Adviser or the Trust as a result of their affiliation with one another. In light of these considerations, the Board concluded that any profits realized in connection with the Adviser’s services appeared reasonable.
The Board also considered the extent to which the advisory fee to be paid to the Adviser reflected economies of scale. The Board noted that as of May 1, 2015, only certain Funds are subject to an expense cap. The Board considered the amount of any fees waived by the Adviser for each Fund and the total amount of fees waived for the Trust as a whole during the past year. The Board also noted that the total expense ratios net of any fee waiver and expense reimbursement were below the median total expense ratio for other similar funds at the same asset levels for the Investor Class, except for the Money Market, Flexible Income and Global Natural Resources Equity Funds.
The Board also considered that they recently had performed a review of the current Advisory Agreement at the February 26-27, 2015 Board meeting, at which time the Board reviewed detailed presentations by the Adviser regarding the comprehensive review process it used to recommend changes to the advisory fee schedule, including increases in the advisory fees for the Global Bond Fund, Real Estate Securities Fund and Small Cap Equity Fund. At that meeting, the Board considered the Adviser’s rationale for the changes to the advisory fees. In addition, the Board considered the information provided by the Adviser to demonstrate the advisory fee previously set for each of the Global Bond Fund, Real Estate Securities Fund and Small Cap Equity Fund was too low given the complexity of managing that Fund.
In connection with considering the revised advisory fee schedule at the February meeting, the Board considered that the Adviser proposed to eliminate fee waivers for the majority of the Funds and discussed the Adviser’s rationale for such elimination. The Board had noted that the Adviser had expressed its intent to continue to offer fee waivers in connection with new funds. The Board had further noted that the proposed advisory fee schedule changes would result in an overall decrease in fee revenue to the Adviser. Based on their review, the Board had concluded that each Fund’s advisory fee was reasonable. The Board then concluded that based on the presentations made in February and the information provided at the current meeting, that each Fund’s advisory fee was reasonable.
Based on all of the information presented to the Board and its consideration of relevant factors, the Board concluded that the fee paid to the Adviser by each Fund was fair and reasonable in light of the services to be performed, and in the exercise of its business judgment, determined to approve the continuation of the Advisory Agreement for each Fund. The Board also determined that approval of the continuation of each Advisory Agreement is in the best interests of each Fund and its shareholders.
BOARD APPROVAL OF CONTINUATION OF SUB-ADVISORY AGREEMENTS FOR THE SELECT FUNDS AND THE FUNDS PARTICIPATING IN THE CASH OVERLAY PROGRAM
In considering the existing Sub-Advisory Agreements with each of the applicable sub-advisers, the Board took into account the materials provided prior to and during the meeting, the presentations made during the meeting and the extensive discussions during the meeting, including the discussions the Independent Trustees had during their executive sessions with their Independent Counsel. The Board also took into account the Investment Management Committee’s (the “Committee”) review of information related to the Trust’s sub-advisers, questions submitted by the Committee to GSCM and Trust management regarding various sub-advisers, GSCM and Trust management’s responses to those questions and recommendations made by the Committee. More specifically, the Board examined the nature, extent and quality of the services to be provided by the sub-advisers. The Board evaluated each sub-adviser’s experience in serving as a sub-adviser to a Fund. The Board noted that each sub-adviser currently provides investment advice to various clients, including, in some cases, other pooled investment vehicles. The Board noted the experience of key personnel at each sub-adviser in providing investment management services and the systems used by such persons and the ability of each sub-adviser to attract and retain capable personnel. The Board noted the reputation, compliance history, compliance program and financial condition of each sub-adviser. The Board also noted the terms
360
Table of Contents
of the existing sub-advisory agreements and the responsibilities that each sub-adviser has towards a Fund, including the responsibility of the day-to-day management of the investment portfolio of each Fund, compliance with each Fund’s policies and objectives and the implementation of Board directives as they relate to the Funds. The Board also took into account the overall structure of each Fund and the particular role each sub-adviser plays in that structure and in achieving each Fund’s overall investment objective. The Board also noted that market conditions presented challenges for certain active management strategies during recent periods. The Board concluded that each Fund is likely to benefit from the nature, extent and quality of these services as a result of each sub-adviser’s experience, personnel, operations and resources. In their deliberations, the Board members did not identify any particular information that was all-important or controlling, and each Trustee may have attributed different weights to the various factors deliberated upon, among others.
The Board examined performance information for each segment of a Fund managed by a sub-adviser. The Board noted that, for many of the sub-advisers, the performance record of the segment of the Fund managed by the sub-adviser compared favorably to the relevant benchmark, the composite performance for the sub-adviser’s clients (on a gross fee basis) and/or the peer universe of similarly managed funds. In cases where the sub-adviser’s performance lagged behind the relevant benchmark, the Board also considered more recent investment performance, performance measured against other relevant benchmarks or how the sub-adviser’s strategy deviated from the composition of the benchmark, any recent reductions in the sub-advisory fee and the sub-adviser’s role within the Fund.
To the extent that a segment of a Fund underperformed the relevant benchmark, the Board and GSCM discussed the reasons for the underperformance and the outlook for the Fund’s future performance. The Board noted that, in certain cases, market trends that have developed since the recent economic downturn have contributed to the underperformance of some of the sub-advisers. The Board also considered whether a sub-adviser’s underperformance was within the expected tracking error for the sub-adviser’s investment strategy. The Board concluded that, although past performance is no guarantee of future performance, the performance of each Fund was satisfactory and the Funds were likely to benefit from each sub-adviser continuing to serve as sub-adviser to the Trust.
The Board examined the fee schedule for each sub-adviser, noting how the fee levels charged to the Trust compared with available information about fees charged by the sub-advisers to their other similarly situated clients, which in many cases include separately managed accounts, as well as how the sub-adviser fee levels for each Select Fund compared to the median sub-advisory fee for the peer universe of similarly managed funds.
The Board also took into account the profitability and the financial capability of each sub-adviser in light of information presented at the meeting. In light of these considerations, the Board concluded that the profits realized by each sub-adviser who completed a profitability questionnaire appeared reasonable. For the limited number of sub-advisers that did not provide profitability information, the Board relied upon other relevant information, particularly the independent negotiation of the fee schedules, the level of the fees, the sub-adviser’s performance history and feedback received from the sub-adviser regarding the firm’s inability to estimate profitability. The Board noted that, based on the Adviser’s representations, the financial statements of the sub-advisers did not appear to raise any significant concerns regarding the financial capability of those sub-advisers. The Board also considered the Adviser’s representations in the materials prepared for this meeting, and the discussions earlier in the meeting, that no sub-adviser experienced any material adverse change in its financial condition since the date of its most recent audited financial statements, and took into account the Adviser’s representation that it would continue to monitor the financial condition of each sub-adviser.
The Board considered the extent to which sub-adviser fees to be paid to each sub-adviser reflected economies of scale. The Board noted that each sub-adviser’s fee schedule either reflected economies of scale by reducing the fee on assets in excess of certain stated breakpoints or the fee level negotiated was below or on par with the standard fee level for the sub-adviser.
In evaluating the benefits that are expected to accrue to each sub-adviser through its relationship as sub-adviser to a Select Fund, the Board noted that certain sub-advisers allocate portfolio brokerage to affiliated broker-dealers that receive commissions from the execution of Fund trades. The Board also noted that certain sub-advisers expect to benefit from “soft dollar” arrangements by which brokers will provide research and other services to the sub-adviser in exchange for commissions on trades of the portfolio securities of the Select Fund. The Board considered whether any direct or indirect collateral benefits inured to the Trust as a result of its affiliation with each sub-adviser.
361
Table of Contents
Based on all of the information presented to the Board and its consideration of relevant factors, the Board, in the exercise of its reasonable business judgment, determined to approve the continuation of each Sub-Advisory Agreement. The Board also determined that approval of the continuation of each Sub-Advisory Agreement is in the best interest of each Select Fund and each Fund participating in the Cash Overlay Program and their respective shareholders.
BOARD REVIEW OF NEW SUB-ADVISORY AGREEMENTS FOR THE EMERGING MARKETS EQUITY FUND AND GLOBAL NATURAL RESOURCES EQUITY FUND
As required by the 1940 Act, the Board of the Trust, including all of the Independent Trustees, considered the approval of the following new sub-advisory agreements among: (i) AQR Capital Management, LLC (“AQR”), the Adviser and the Trust on behalf of the Emerging Markets Equity Fund; and (ii) Northern Trust Investments, Inc. (“NTI”), the Adviser and the Trust on behalf of the Global Natural Resources Equity Fund (each a “New Sub-Advisory Agreement” and collectively, the “New Sub-Advisory Agreements”).
The Board approved each New Sub-Advisory Agreement at an in-person meeting of the Board held on November 5-6, 2015.
The Board’s decision to approve each New Sub-Advisory Agreement on behalf of the Emerging Markets Equity Fund and Global Natural Resources Equity Fund reflects the exercise of its business judgment to enter into such agreements. In approving each New Sub-Advisory Agreement, the Board considered information provided by the Adviser and each sub-adviser with the assistance and advice of Independent Counsel to the Independent Trustees and counsel to the Trust.
The Board’s consideration of various factors and its conclusions with respect to such factors formed the basis for the Board’s determination to approve each New Sub-Advisory Agreement. The factors considered by the Board included, but were not limited to: (i) the personnel resources of each sub-adviser; (ii) the experience and expertise of each sub-adviser; (iii) the financial capabilities and financial resources of each sub-adviser; (iv) the compliance procedures and history of each sub-adviser; (v) the performance of each proposed investment strategy in comparison to any relevant benchmarks, similarly managed funds and each sub-adviser’s other clients; (vi) the amount of the contractual sub-advisory fee in comparison to fees for similarly managed funds and available information for each sub-adviser’s other clients and the effect of any fee waiver and expense reimbursement arrangement; (vii) the total expected expenses of the Emerging Markets Equity Fund and Global Natural Resources Equity Fund in comparison to those for similarly managed funds and the use of any anticipated expense caps; (viii) the expected profitability of each sub-adviser with respect to the Emerging Markets Equity Fund and Global Natural Resources Equity Fund and its overall business; (ix) the extent of any economies of scale and whether the fee structure reflects such economies of scale; (x) the existence of any collateral benefits realized by each sub-adviser, such as affiliate brokerage arrangements or the use of soft dollars; and (xi) the existence of any collateral benefits realized by the Emerging Markets Equity Fund and Global Natural Resources Equity Fund. The Board also evaluated whether the approval of each New Sub-Advisory Agreement was in the best interest of each of the Emerging Markets Equity Fund and Global Natural Resources Equity Fund and their respective shareholders or future shareholders. No one factor was determinative in the Board’s consideration of the agreements, and each Trustee may have attributed different weights to the factors considered.
The Board undertook a review of the terms of each New Sub-Advisory Agreement, and the nature, extent and quality of the services to be provided by each sub-adviser under the New Sub-Advisory Agreements. The Adviser provided the Board with information in the form of reports about each sub-adviser prior to the meeting, which addressed the factors listed above. The Adviser also provided additional information about each sub-adviser in a presentation made during the meeting, discussed the comprehensive screening process used to recommend each sub-adviser and responded to questions from the Board.
The Independent Trustees met separately in executive session with Independent Counsel to discuss and consider the information presented in connection with the approval of each New Sub-Advisory Agreement, as well as the Board’s responsibilities and duties in approving the agreements.
BOARD APPROVAL OF NEW SUB-ADVISORY AGREEMENTS FOR THE EMERGING MARKETS EQUITY FUND AND GLOBAL NATURAL RESOURCES EQUITY FUND
In considering the approval of each New Sub-Advisory Agreement for the Emerging Markets Equity Fund and Global Natural Resources Equity Fund, the Board took into account the materials provided prior to and during the November 5-6, 2015 meeting, the presentations made during the meeting and the extensive discussions during the meeting, including the discussion the
362
Table of Contents
Independent Trustees had during their executive session with Independent Counsel. The Board also took into account the Committee’s review of information related to each New Sub-Advisory Agreement, questions submitted by the Committee to Trust management regarding each sub-adviser, Trust management’s responses to those questions and recommendations made by the Committee. The Board considered its responsibilities with respect to reviewing and approving the terms of each New Sub-Advisory Agreement, the investment management teams at each sub-adviser, the reasonableness of the sub-advisory fees, and whether the appointment of each sub-adviser would be reasonable and fair to each of the Emerging Markets Equity Fund and Global Natural Resources Equity Fund and their respective shareholders and future shareholders. The Board reviewed the factors that they should consider in evaluating whether to approve each New Sub-Advisory Agreement and the materials provided to support each factor.
The Board considered the reputation, compliance history, compliance program and financial condition of AQR and NTI. The Board noted the experience of key personnel at each sub-adviser who would be providing investment management services to each applicable Fund, the systems and resources used by such persons to implement and manage each applicable strategy and the ability of each sub-adviser to attract and retain capable personnel. The Board also noted the terms of each New Sub-Advisory Agreement and the responsibilities that each sub-adviser would have to the applicable Fund, including the responsibility of day-to-day management and compliance with each Fund’s investment objectives and policies. The Board concluded that the Emerging Markets Equity Fund and Global Natural Resources Equity Fund were likely to benefit from the nature, extent and quality of the services with respect to each applicable sub-adviser’s experience, personnel, operations and resources.
The Board noted the terms of each New Sub-Advisory Agreement and the responsibilities of each sub-adviser, including oversight of general Fund compliance and compliance with the Trust’s social restrictions. The Board considered the Adviser’s assessment of each sub-adviser’s financial condition. The Board noted that the Adviser, after reviewing certain financial information provided by each sub-adviser, felt comfortable that each sub-adviser was financially sound.
Emerging Markets Equity Fund
The Board, including the Independent Trustees advised by Independent Counsel, considered a number of factors, including the nature, extent and quality of the services to be provided by AQR, the past performance records of similar accounts managed by relevant personnel of AQR, fees charged to comparable clients and information regarding AQR’s ownership structure, investment management experience, investment philosophies and processes, clients, key personnel, ability to attract and retain capable personnel, assets under management, compliance policies and procedures, compliance history, reputation, and brokerage and soft dollar practices. The Board also reviewed presentations by the Adviser regarding the comprehensive review process it used to recommend AQR. The Board received and considered information about the potential of AQR to contribute economies of scale as the Fund grows in size. The Board considered that the Adviser had been able to negotiate fees that were favorable compared to AQR’s stated fee schedule. In addition, the Trustees noted that the sub-adviser’s fee schedule included a breakpoint that would reduce the sub-advisory fee charged if a specified asset level is reached in the future.
The Board noted that there was no historical profitability information with regard to AQR’s assignment within the Fund. The Board did note, however, that AQR did provide an estimate of profitability, which appeared reasonable to the Board. The Trustees considered the Adviser’s assessment of AQR’s financial condition. The Trustees noted that the Adviser, after reviewing certain financial information provided by AQR, believed that AQR was financially sound.
The Board considered the fees to be paid to AQR under the New Sub-Advisory Agreement, as well as the overall fee structure under the New Sub-Advisory Agreement, in light of the nature, extent and quality of the services to be provided. The Board acknowledged that the Adviser was able to negotiate a favorable fee schedule below that of AQR’s standard fee schedule. The Board noted that the Fund’s aggregate management fees would not increase as a result of the appointment of AQR. The Board also noted that the Fund, and not the Adviser, would pay fees to AQR directly and, as a result, the appointment of AQR would not be expected to affect the Adviser’s profitability. The Board noted that the aggregate management fee for the Fund would continue to be competitive with fees paid by other mutual funds to other advisers. The Board also considered how AQR calculates costs and how, and the extent to which, such costs would be allocated to the Fund.
The Board considered potential “fall-out” or ancillary benefits anticipated to be received by AQR and its affiliates as a result of its arrangements with the Fund. The Board concluded that any potential benefits to be derived by AQR included potential access to additional research resources, larger assets under management and reputational benefits, which were consistent with those generally derived by sub-advisers to mutual funds.
363
Table of Contents
The Board considered the Emerging Markets Integrated Alpha Strategy (“Integrated Alpha Strategy”) proposed to be implemented by AQR with respect to approximately 19% of the Fund’s assets that the Adviser intends to allocate to AQR. The Board noted the Adviser’s determination that the strategy would complement the other strategies currently utilized in the Fund and, as such, would maintain the Fund’s dedicated, emerging markets exposure and potential return source diversification. While noting that past performance does not indicate future results, the Trustees considered the back-tested performance results of the Integrated Alpha Strategy being proposed considering its limited performance history (inception date of June 1, 2015). The Trustees noted that the back-tested Integrated Alpha Strategy’s performance would have outperformed its benchmark (MSCI EM Index), gross of fees, over the one-, three-, five-, seven- and 10-year and since inception periods ended May 31, 2015. The Trustees further noted that a transition manager would not be utilized due to the reallocation of assets among the two AQR strategies within the Fund but did consider the anticipated costs of the transition.
The Board noted that the proposed Integrated Alpha Strategy is very similar to AQR’s existing Emerging Markets Equity Strategy. The Board noted that the Integrated Alpha Strategy would provide diversification benefits when combined with the strategy used by the Fund’s other sub-advisers, Genesis Asset Partners LLP and Genesis Investment Management LLP (together, “Genesis”). In addition, the Trustees believe that the inclusion of the Integrated Alpha Strategy in the Emerging Markets Equity Fund will allow for additional assets to be invested in the Emerging Markets Equity Fund, particularly given that the Genesis strategy is currently hard closed and AQR’s Emerging Markets Equity Strategy will be hard closed by year-end, but yet maintain the Emerging Markets Equity Fund’s current risk/return profile and investment characteristics.
Based on all the information presented to the Board and its consideration of relevant factors, the Board, in the exercise of its reasonable business judgment, concluded that the Emerging Markets Equity Fund was likely to benefit from the nature, extent and quality of AQR’s services under the New Sub-Advisory Agreement and determined to approve the New Sub-Advisory Agreement with AQR. The Board also determined that the approval of the New Sub-Advisory Agreement with AQR was in the best interests of the Emerging Markets Equity Fund and its present and future shareholders.
Global Natural Resources Equity Fund
In making its determination to approve the New Sub-Advisory Agreement with NTI, the Board, including the Independent Trustees advised by Independent Counsel, considered a number of factors, including the nature, extent and quality of the services to be provided by NTI, the past performance records of similar accounts managed by relevant personnel of NTI, fees charged to comparable clients and information regarding NTI’s ownership structure, investment management experience, investment philosophies and processes, assets under management, clients, key personnel, ability to attract and retain capable personnel, compliance policies and procedures, compliance history, reputation, and brokerage and soft dollar practices. The Board also reviewed presentations by the Adviser regarding the comprehensive review process it used to recommend NTI. The Board received and considered information about the potential of NTI to contribute economies of scale as the Fund grows in size. The Board considered that the Adviser had been able to negotiate fees that were favorable compared to NTI’s standard fee schedule. In addition, the Trustees noted that NTI’s fee schedule included a breakpoint that would reduce the sub-advisory fee charged if a specified asset level is reached in the future.
The Board noted that there was no historical profitability information with regard to NTI’s assignment within the Fund. The Board did note, however, that NTI did provide an estimate of profitability, which appeared reasonable to the Board. The Trustees considered the Adviser’s assessment of NTI’s financial condition. The Trustees noted that the Adviser, after reviewing certain financial information provided by NTI, believed that NTI was financially sound.
The Board considered the fees to be paid to NTI under the New Sub-Advisory Agreement, as well as the overall fee structure under the New Sub-Advisory Agreement, in light of the nature, extent and quality of the services to be provided. The Board acknowledged that the Adviser was able to negotiate a favorable fee schedule below that of NTI’s standard fee schedule. The Board noted that the Fund’s aggregate management fees would not increase as a result of the appointment of NTI. The Board also noted that the Fund, and not the Adviser, would pay fees to NTI directly and, as a result, the appointment of NTI would not be expected to affect the Adviser’s profitability. The Board noted that the aggregate management fee for the Fund would continue to be competitive with fees paid by other mutual funds to other advisers. The Board also considered how NTI calculates costs and how, and the extent to which, such costs would be allocated to the Fund.
364
Table of Contents
The Board considered potential “fall-out” or ancillary benefits anticipated to be received by NTI and its affiliates as a result of its arrangements with the Fund. The Board concluded that any potential benefits to be derived by NTI included potential access to additional research resources, larger assets under management and reputational benefits, which were consistent with those generally derived by sub-advisers to mutual funds.
The Board considered the passively managed index strategy proposed to be implemented by NTI with respect to approximately 25% of the Fund’s assets that the Adviser intends to allocate to NTI. The Board noted the Adviser’s determination that the strategy would complement the other strategy currently utilized in the Fund and, as such, would enhance the Fund’s potential to provide long-term capital appreciation. While noting that past performance does not indicate future results, the Trustees considered the performance results of the strategy’s benchmark index (MSCI World Commodity Producers Index) being proposed, noting NTI does not currently manage a passive strategy to this benchmark. The Board did note, however, that NTI is an existing sub-adviser managing passive investment strategies for three series of the Trust, and the Adviser believes that NTI can manage this strategy effectively and efficiently for the Fund. The Trustees noted that the Adviser will utilize a transition manager to transition to NTI its allocation of the Fund’s assets and considered the anticipated costs of the transition.
The Board noted that the Adviser had determined to change the Fund’s benchmark index and, after further discussing the reasons for the change to the Fund’s benchmark index, concluded the Adviser’s decision to restructure the Fund by removing the strategic exposure to gold miners equities, and consequently terminating Van Eck Associates Corporation as a sub-adviser to the Fund, was appropriate to enhance (i) the structure of the Fund as a stand-alone fund, (ii) the Fund’s risk/return profile relative to the new benchmark index, (iii) and the Fund’s stock selection risk to factor risk composition. The Board noted that the inclusion of NTI in the Fund’s sub-adviser composite would provide diversifying exposure to SailingStone Capital Partners LLC, the other sub-adviser to the Fund.
Based on all the information presented to the Board and its consideration of relevant factors, the Board, in the exercise of its reasonable business judgment, concluded that the Global Natural Resources Equity Fund was likely to benefit from the nature, extent and quality of NTI’s services under the New Sub-Advisory Agreement and determined to approve the New Sub-Advisory Agreement with NTI. The Board also determined that the approval of the New Sub-Advisory Agreement with NTI was in the best interests of the Global Natural Resources Equity Fund and its present and future shareholders.
365
Table of Contents
(This page intentionally left blank)
Table of Contents
(This page intentionally left blank)
Table of Contents
(This page intentionally left blank)
Table of Contents
INVESTMENT SUB-ADVISERS (Assets under management as of December 31, 2015) (Unaudited)
GuideStone Funds employs a broad array of proven investment managers for the benefit of their investors. Each manager is distinctive in its investment management process and business approach.
Fund | Sub-Adviser | Firm Established | Total Assets Managed | |||||||||
Money Market | BlackRock Advisors, LLC | 1994 | $ | 4.6Tr | ||||||||
Low-Duration Bond | BlackRock Financial Management, Inc. | 1988 | $ | 4.6Tr | ||||||||
| Pacific Investment Management Company LLC | 1971 | $ | 1.4Tr | |||||||||
| Payden & Rygel | 1983 | $ | 95.3B | |||||||||
Medium-Duration Bond | Goldman Sachs Asset Management, L.P. | 1984 | $ | 1.1Tr | ||||||||
| Pacific Investment Management Company LLC | 1971 | $ | 1.4Tr | |||||||||
| Western Asset Management Company and | ||||||||||||
| Western Asset Management Company Limited | 1971 | $ | 433.7B | |||||||||
Extended-Duration Bond | Loomis, Sayles & Company, L.P. | 1926 | $ | 229.1B | ||||||||
| Schroder Investment Management North America Inc. | 1804 | $ | 446.5B | |||||||||
Global Bond | Loomis, Sayles & Company, L.P. | 1926 | $ | 229.1B | ||||||||
| Western Asset Management Company and | ||||||||||||
| Western Asset Management Company Limited | 1971 | $ | 433.7B | |||||||||
Defensive Market Strategies | American Century Investment Management, Inc. | 1958 | $ | 146.2B | ||||||||
| AQR Capital Management, LLC | 1998 | $ | 141.4B | |||||||||
| Parametric Portfolio Associates LLC | 1992 | $ | 152.3B | |||||||||
| Shenkman Capital Management, Inc. | 1985 | $ | 28.7B | |||||||||
Equity Index | Northern Trust Investments, Inc. | 1889 | $ | 875.3B | ||||||||
Value Equity | AJO, LP | 1984 | $ | 26.3B | ||||||||
| Barrow, Hanley, Mewhinney & Strauss, LLC | 1979 | $ | 89.2B | |||||||||
| Northern Trust Investments, Inc. | 1889 | $ | 875.3B | |||||||||
| TCW Investment Management Company | 1971 | $ | 180.7B | |||||||||
Growth Equity | Brown Advisory, LLC | 1993 | $ | 43.8B | ||||||||
| Jackson Square Partners, LLC | 2013 | $ | 28.8B | |||||||||
| Loomis, Sayles & Company, L.P. | 1926 | $ | 229.1B | |||||||||
| Sands Capital Management, LLC | 1992 | $ | 44.2B | |||||||||
Small Cap Equity | AJO, LP | 1984 | $ | 26.3B | ||||||||
| Columbus Circle Investors | 1975 | $ | 13.9B | |||||||||
| RBC Global Asset Management (U.S.) Inc. | 1983 | $ | 43.5B | |||||||||
| Snow Capital Management L.P. | 1980 | $ | 3.2B | |||||||||
| TimesSquare Capital Management, LLC | 2000 | $ | 17.0B | |||||||||
International Equity Index | Northern Trust Investments, Inc. | 1889 | $ | 875.3B | ||||||||
International Equity | AQR Capital Management, LLC | 1998 | $ | 141.4B | ||||||||
| Baillie Gifford Overseas Limited | 1983 | $ | 181.3B | |||||||||
| Barrow, Hanley, Mewhinney & Strauss, LLC | 1979 | $ | 89.2B | |||||||||
| MFS Institutional Advisors, Inc. | 1970 | $ | 413.0B | |||||||||
| Mondrian Investment Partners Ltd. | 1990 | $ | 56.8B | |||||||||
Emerging Markets Equity | AQR Capital Management, LLC | 1998 | $ | 141.4B | ||||||||
| Genesis Asset Managers, LLP and | ||||||||||||
| Genesis Investment Management, LLP | 1989 | $ | 26.4B | |||||||||
Inflation Protected Bond | BlackRock Financial Management, Inc. | 1988 | $ | 4.6Tr | ||||||||
Flexible Income | Shenkman Capital Management, Inc. | 1985 | $ | 28.7B | ||||||||
Real Estate Securities | Heitman Real Estate Securities, LLC, | |||||||||||
| Heitman International Real Estate Securities GMBH and | ||||||||||||
| Heitman International Real Estate Securities HK Limited | 1989 | $ | 35.2B | |||||||||
| RREEF America L.L.C., | ||||||||||||
| Deutsche Investments Australia Limited and | ||||||||||||
| Deutsche Alternative Asset Management (Global) Limited | 1975 | $ | 52.2B | |||||||||
Global Natural Resources Equity | Northern Trust Investments, Inc. | 1889 | $ | 875.3B | ||||||||
| SailingStone Capital Partners LLC | 2014 | $ | 4.6B | |||||||||
Custodian for GuideStone Funds Assets | The Northern Trust Company | 1889 | $ | 6.1Tr | ||||||||
Cash Overlay for Target Date, Asset Allocation, Fixed Income, Equity and Real Return Funds | Parametric Portfolio Associates LLC | 1992 | $ | 152.3B | ||||||||
366
Table of Contents
 | ||||
2401 Cedar Springs Road, Dallas, TX 75201-1498 1-888-GS-FUNDS • GuideStoneFunds.com | Funds distributed by Foreside Funds Distributors LLC 400 Berwyn Park, 899 Cassatt Road, Suite 110, Berwyn, PA 19312 | |||
27245 1/16 2233 | ||||
Table of Contents
Item 2. Code of Ethics.
| (a) | The registrant, as of the end of the period covered by this report, has adopted a code of ethics that applies to the registrant’s principal executive officer, principal financial officer, principal accounting officer or controller, or persons performing similar functions, regardless of whether these individuals are employed by the registrant or a third party. |
| (c) | There have been no amendments, during the period covered by this report, to a provision of the code of ethics that applies to the registrant’s principal executive officer, principal financial officer, principal accounting officer or controller, or persons performing similar functions, regardless of whether these individuals are employed by the registrant or a third party, and that relates to any element of the code of ethics description. |
| (d) | The registrant has not granted any waivers, including an implicit waiver, from a provision of the code of ethics that applies to the registrant’s principal executive officer, principal financial officer, principal accounting officer or controller, or persons performing similar functions, regardless of whether these individuals are employed by the registrant or a third party, that relates to one or more of the items set forth in paragraph (b) of this item’s instructions. |
Item 3. Audit Committee Financial Expert.
As of the end of the period covered by the report, the registrant’s board of directors has determined that Carson L. Eddy is qualified to serve as an audit committee financial expert serving on its audit committee and that he is “independent,” as defined by Item 3 of Form N-CSR.
Item 4. Principal Accountant Fees and Services.
Audit Fees
| (a) | The aggregate fees billed for each of the last two fiscal years for professional services rendered by the principal accountant for the audit of the registrant’s annual financial statements or services that are normally provided by the accountant in connection with statutory and regulatory filings or engagements for those fiscal years are $755,000 and $763,000 for 2014 and 2015, respectively. |
Audit-Related Fees
| (b) | The aggregate fees billed in each of the last two fiscal years for assurance and related services by the principal accountant that are reasonably related to the performance of the audit of the registrant’s financial statements and are not reported under paragraph (a) of this Item are $40,000 and $67,000 for 2014 and 2015, respectively. Audit-related fees are related to procedures performed and the issuance of the auditors’ reports in connection with the Funds’ 17F-2 security counts. |
Table of Contents
Tax Fees
| (c) | The aggregate fees billed in each of the last two fiscal years for professional services rendered by the principal accountant for tax compliance, tax advice, and tax planning are $133,000 and $142,000 for 2014 and 2015, respectively. Tax fees are related to tax services in connection with Funds’ excise tax calculations and review of the Funds’ applicable tax returns. |
All Other Fees
| (d) | The aggregate fees billed in each of the last two fiscal years for products and services provided by the principal accountant, other than the services reported in paragraphs (a) through (c) of this Item are $62,000 and $67,000 for 2014 and 2015, respectively. Other fees relate to: (i) for fiscal year 2014, procedures performed in connection with an assessment of the medical claims processed by Highmark Blue Cross Blue Shield; and (ii) for fiscal year 2015, procedures performed in connection with an assessment of the pharmacy claims processed by Express Scripts during the 2014 plan year. | |
| (e)(1) | Disclose the audit committee’s pre-approval policies and procedures described in paragraph (c)(7) of Rule 2-01 of Regulation S-X. | |
GuideStone
Non-Audit Services Provided to the Company, Advisor, and Others
The Audit Committee shall pre-approve all permissible non-audit services (e.g., tax services) to be provided to the Company by the Auditors, including the fees therefor;
provided, that if the Committee chooses to delegate the authority to grant pre-approvals to one or more Committee members, each acting on behalf of the Committee, then the Committee shall adopt policies and procedures detailed as to the particular service and designed to safeguard the continued independence of the auditors, consistent with the requirements of the Sarbanes-Oxley Act of 2002 (the “S-O Act”) and related SEC regulations, which shall then be used in making such pre-approvals; and,
further provided, that each delegated pre-approval shall be reported to the Committee during its next regularly scheduled meeting.
The pre-approval requirement for a permitted non-audit service may be waived if:
| (1) | the aggregate amount of all such non-audit services provided constitutes not more than 5% of the total revenues paid by the Company to the Auditors in the fiscal year in which the non-audit services are provided; |
| (2) | such services were not recognized by the Company at the time of the engagement to be non-audit services; and |
| (3) | such services are promptly brought to the attention of, and approved by, the Audit Committee or by a member of the Audit Committee to whom the Committee has delegated the authority to grant such approvals, if any, prior to the Auditors’ completion of the Company’s audit. |
Table of Contents
Additionally, if the Auditors’ engagement relates directly to the operations and financial reporting of the Company, to the extent required by Rule 2-01 of Regulation S-X, the Audit Committee shall pre-approve their engagements for non-audit services with:
| (1) | the Advisor (excluding any subadviser whose role is primarily portfolio management and is sub-contracted or overseen by the Advisor), and |
| (2) | any entity controlling, controlled by, or under common control with such Advisor that provides ongoing services to the Company (each, a “Control Entity”) |
in accordance with the foregoing paragraph, unless the aggregate amount of all services provided constitutes no more than 5% of the total amount of revenues paid to the Auditors by the Company, the Advisor and any such Control Entity during the fiscal year in which the services are provided that would have to be pre-approved by the Audit Committee pursuant to this paragraph (in the absence of this exception). The Auditors may not perform contemporaneously any prohibited non-audit services for the Company, which currently include the following:
| 1. | bookkeeping or other services related to the accounting records or financial statements of the Company; |
| 2. | financial information systems design and implementation; |
| 3. | appraisal or valuation services, fairness opinions, or contribution-in-kind reports; |
| 4. | actuarial services; |
| 5. | internal audit outsourcing services; |
| 6. | management functions or human resources; |
| 7. | broker or dealer, investment adviser, or investment banking services; |
| 8. | legal services and expert services unrelated to the audit; and |
| 9. | any other service that the Public Company Accounting Oversight Board determines, by regulation, is impermissible. |
| (e)(2) | The percentage of services described in each of paragraphs (b) through (d) of this Item that were approved by the audit committee pursuant to paragraph (c)(7)(i)(C) of Rule 2-01 of Regulation S-X are as follows: |
| (b) | 100% |
| (c) | 100% |
| (d) | N/A |
Table of Contents
| (f) | The percentage of hours expended on the principal accountant’s engagement to audit the registrant’s financial statements for the most recent fiscal year that were attributed to work performed by persons other than the principal accountant’s full-time, permanent employees was less than fifty percent.
| |
| (g) | The aggregate non-audit fees billed by the registrant’s accountant for services rendered to the registrant, and rendered to the registrant’s investment adviser (not including any sub-adviser whose role is primarily portfolio management and is subcontracted with or overseen by another investment adviser), and any entity controlling, controlled by, or under common control with the adviser that provides ongoing services to the registrant for each of the last two fiscal years of the registrant was $0 and $0 for 2014 and 2015, respectively.
| |
| (h) | The registrant’s audit committee of the board of directors has considered whether the provision of non-audit services that were rendered to the registrant’s investment adviser (not including any sub-adviser whose role is primarily portfolio management and is subcontracted with or overseen by another investment adviser), and any entity controlling, controlled by, or under common control with the investment adviser that provides ongoing services to the registrant that were not pre-approved pursuant to paragraph (c)(7)(ii) of Rule 2-01 of Regulation S-X is compatible with maintaining the principal accountant’s independence. |
| Item 5. | Audit Committee of Listed Registrants. |
Not applicable.
| Item 6. | Investments. |
| (a) | Schedule of Investments in securities of unaffiliated issuers as of the close of the reporting period is included as part of the report to shareholders filed under Item 1 of this form. |
| (b) | Not applicable. |
| Item 7. | Disclosure of Proxy Voting Policies and Procedures for Closed-End Management Investment Companies. |
Not applicable.
| Item 8. | Portfolio Managers of Closed-End Management Investment Companies. |
Not applicable.
Table of Contents
| Item 9. | Purchases of Equity Securities by Closed-End Management Investment Company and Affiliated Purchasers. |
Not applicable.
| Item 10. | Submission of Matters to a Vote of Security Holders. |
There have been no material changes to the procedures by which the shareholders may recommend nominees to the registrant’s board of directors, where those changes were implemented after the registrant last provided disclosure in response to the requirements of Item 407(c)(2)(iv) of Regulation S-K (17 CFR 229.407) (as required by Item 22(b)(15) of Schedule 14A (17 CFR 240.14a-101)), or this Item.
| Item 11. | Controls and Procedures. |
| (a) | The registrant’s principal executive and principal financial officers, or persons performing similar functions, have concluded that the registrant’s disclosure controls and procedures (as defined in Rule 30a-3(c) under the Investment Company Act of 1940, as amended (the “1940 Act”) (17 CFR 270.30a-3(c))) are effective, as of a date within 90 days of the filing date of the report that includes the disclosure required by this paragraph, based on their evaluation of these controls and procedures required by Rule 30a-3(b) under the 1940 Act (17 CFR 270.30a-3(b)) and Rules 13a-15(b) or 15d-15(b) under the Securities Exchange Act of 1934, as amended (17 CFR 240.13a-15(b) or 240.15d-15(b)). |
| (b) | There were no changes in the registrant’s internal control over financial reporting (as defined in Rule 30a-3(d) under the 1940 Act (17 CFR 270.30a-3(d)) that occurred during the registrant’s second fiscal quarter of the period covered by this report that has materially affected, or is reasonably likely to materially affect, the registrant’s internal control over financial reporting. |
| Item 12. | Exhibits. |
| (a)(1) | Code of ethics, or any amendment thereto, that is the subject of disclosure required by Item 2 is attached hereto. | |
| (a)(2) | Certifications pursuant to Rule 30a-2(a) under the 1940 Act and Section 302 of the Sarbanes-Oxley Act of 2002 are attached hereto. | |
| (a)(3) | Not applicable. | |
| (b) | Certifications pursuant to Rule 30a-2(b) under the 1940 Act and Section 906 of the Sarbanes-Oxley Act of 2002 are attached hereto. | |
| (12.other) | Not applicable. | |
Table of Contents
SIGNATURES
Pursuant to the requirements of the Securities Exchange Act of 1934 and the Investment Company Act of 1940, the registrant has duly caused this report to be signed on its behalf by the undersigned, thereunto duly authorized.
| (Registrant) | GuideStone Funds |
| By (Signature and Title)* | /s/ John R. Jones | |||
| John R. Jones, President | ||||
| (principal executive officer) | ||||
| Date | June 21, 2016 | |||
Pursuant to the requirements of the Securities Exchange Act of 1934 and the Investment Company Act of 1940, this report has been signed below by the following persons on behalf of the registrant and in the capacities and on the dates indicated.
| By (Signature and Title)* | /s/ John R. Jones | |||
| John R. Jones, President | ||||
| (principal executive officer) | ||||
| Date | June 21, 2016 | |||
| By (Signature and Title)* | /s/ Patrick Pattison | |||
| Patrick Pattison, Vice President and Treasurer | ||||
| (principal financial officer) | ||||
| Date | June 21, 2016 | |||
* Print the name and title of each signing officer under his or her signature.