UNITED STATES
SECURITIES AND EXCHANGE COMMISSION
Washington, D.C. 20549
FORM N-CSR
CERTIFIED SHAREHOLDER REPORT OF REGISTERED MANAGEMENT
INVESTMENT COMPANIES
Investment Company Act file number 811-10263
GuideStone Funds
(Exact name of registrant as specified in charter)
2401 Cedar Springs Road
Dallas, TX 75201-1407
(Address of principal executive offices) (Zip code)
Cherika N. Latham, Esq.
GuideStone Financial Resources of the Southern Baptist Convention
2401 Cedar Springs Road
Dallas, TX 75201-1407
(Name and address of agent for service)
Registrant’s telephone number, including area code: 214-720-4640
Date of fiscal year end: December 31
Date of reporting period: December 31, 2013
Form N-CSR is to be used by management investment companies to file reports with the Commission not later than 10 days after the transmission to stockholders of any report that is required to be transmitted to stockholders under Rule 30e-1 under the Investment Company Act of 1940 (17 CFR 270.30e-1). The Commission may use the information provided on Form N-CSR in its regulatory, disclosure review, inspection, and policymaking roles.
A registrant is required to disclose the information specified by Form N-CSR, and the Commission will make this information public. A registrant is not required to respond to the collection of information contained in Form N-CSR unless the Form displays a currently valid Office of Management and Budget (“OMB”) control number. Please direct comments concerning the accuracy of the information collection burden estimate and any suggestions for reducing the burden to Secretary, Securities and Exchange Commission, 100 F Street, NE, Washington, DC 20549. The OMB has reviewed this collection of information under the clearance requirements of 44 U.S.C. § 3507.
Item 1. Reports to Stockholders.
The Report to Shareholders is attached herewith.
Annual Report
December 31, 2013
GS2
GS4
DATE TARGET FUNDS
MyDestination 2005 Fund
GMIZX
MyDestination 2015 Fund
GMTZX
MyDestination 2025 Fund
GMWZX
MyDestination 2035 Fund
GMHZX
MyDestination 2045 Fund
GMFZX
MyDestination 2055 Fund
GMGZX
ASSET ALLOCATION FUNDS
Conservative Allocation Fund
GFIZX
Balanced Allocation Fund
GGIZX
Growth Allocation Fund
GCOZX
Aggressive Allocation Fund
GGBZX
Conservative Allocation Fund I
GFIYX
Balanced Allocation Fund I
GGIYX
Growth Allocation Fund I
GCOYX
Aggressive Allocation Fund I
GGBYX
SELECT FUNDS
Money Market Fund
GMYXX
GMZXX
Low-Duration Bond Fund
GLDYX
GLDZX
Medium-Duration Bond Fund
GMDYX
GMDZX
Extended-Duration Bond Fund
GEDYX
GEDZX
Inflation Protected Bond Fund
GIPZX
Global Bond Fund
GGBFX
Flexible Income Fund
GFLZX
Defensive Market Strategies Fund
GDMYX
GDMZX
Real Assets Fund
GRAZX
Equity Index Fund
GEQYX
GEQZX
Real Estate Securities Fund
GREZX
Value Equity Fund
GVEYX
GVEZX
Growth Equity Fund
GGEYX
GGEZX
Small Cap Equity Fund
GSCYX
GSCZX
International Equity Fund
GIEYX
GIEZX
Emerging Markets Equity Fund
GEMYX
GEMZX
Global Natural Resources Equity Fund
GNRZX
GuideStone® Funds
Well Done…good and faithful servant. MATTHEW 25:21
GuideStone Funds
Privacy Notice
NOTICE CONCERNING YOUR PRIVACY RIGHTS
This notice will provide you with information concerning our policies with respect to nonpublic personal information that we collect about you in connection with the following financial products and services provided and/or serviced by the entities listed below: individual retirement accounts (“IRAs”) and/or personal mutual fund accounts.
The confidentiality of your information is important to us as we recognize that you depend on us to keep your information confidential, as described in this notice.
We collect nonpublic personal information about you with regard to your IRA and/or personal mutual fund accounts from the following sources:
| | • | | Information we receive from you on applications or other forms; |
| | • | | Information about your transactions with us, our affiliates or others (including our third-party service providers); |
| | • | | Information we receive from others such as service providers, broker-dealers and your personal agents or representatives; and |
| | • | | Information you and others provide to us in correspondence sent to us, whether written, electronic or by telephone. |
We may disclose such nonpublic personal financial information about you to one or more of our affiliates as permitted by law. An affiliate of an organization means any entity that controls, is controlled by or is under common control with that organization. GuideStone Funds, GuideStone Financial Resources of the Southern Baptist Convention (“GuideStone Financial Resources”), GuideStone Capital Management (“GSCM”), GuideStone Trust Services (“GSTS”), GuideStone Financial Services (“GFS”) and GuideStone Advisors (“GA”) are affiliates of one another. GuideStone Funds, GuideStone Financial Resources, GSCM, GSTS, GFS, GA and Foreside Funds Distributors LLC do not sell your personal information to nonaffiliated third parties.
We may also disclose any of the personal information that we collect about you to nonaffiliated third parties as permitted by law. For example, we may provide your information to nonaffiliated companies that provide account services or that perform marketing services on our behalf and to other financial institutions with whom we have joint marketing agreements. We restrict access to nonpublic personal information about you to those of our employees who need to know that information in order for us to provide products and services to you. We also maintain physical, electronic and procedural safeguards to guard your personal information.
These procedures will continue to remain in effect after you cease to receive financial products and services from us.
If you have any questions concerning our customer information policy, please contact a customer relations specialist at 1-888-98-GUIDE (1-888-984-8433).
TABLE OF CONTENTS
This report has been prepared for shareholders of GuideStone Funds. It is not authorized for distribution to prospective investors unless accompanied or preceded by a current prospectus, which contains more complete information about the Funds. Investors are reminded to read the prospectus carefully before investing. Past performance is no guarantee of future results. Share prices will fluctuate and there may be a gain or loss when shares are redeemed. Fund shares are distributed by Foreside Funds Distributors LLC, 400 Berwyn Park, 899 Cassatt Road, Suite 110, Berwyn, PA 19312.
1
LETTER FROM THE PRESIDENT

Dear Shareholder:
We are pleased to present you with the 2013 GuideStone Funds Annual Report. This report reflects our unwavering commitment to integrity in financial reporting; we believe this helps you stay fully informed of your investments. We hope that you will find this information valuable when making investment decisions.
For the second year in a row, GuideStone was recognized by the Lipper Fund Awards. This time, Lipper awarded GuideStone’s MyDestination 2025 Fund the Best Fund Over Three Years in the Mixed-Asset Target 2025 category, ranking No. 1 out of 92 similar funds.
We have worked diligently to enhance the products and services delivered to our shareholders. Several examples of our ongoing commitment are noted below:
| • | | Emerging Markets Equity Fund launched. This Fund offers GuideStone participants an investment that seeks long-term capital appreciation and invests mainly in a diversified portfolio of equity securities of international companies located within emerging markets, for example Brazil, Russia, India and China. Because this new fund focuses on companies in emerging markets, the International Equity Fund has shifted its strategy to investing primarily in companies located in developed markets. |
| • | | eDelivery of Shareholder reports. Shareholders will be able to choose whether to receive shareholder disclosure reports electronically or through U.S. Mail. Visit www.GuideStoneFunds.org/Disclosures to view frequently asked questions about GuideStone Funds eDelivery. |
We invite you to learn more about the new products and services offered by GuideStone Funds. Please visit our website at www.GuideStoneFunds.org or contact us at 1-888-98-GUIDE (1-888-984-8433). Thank you for entrusting GuideStone Funds with your investment assets, and we look forward to continuing to serve you.
| | |
| Sincerely, |
|
 |
|
John R. Jones, CFA President |
2
Lipper, a Thomson Reuters company, provides independent insight on global collective investments including mutual funds, retirement funds, hedge funds, fund fees and expenses to the asset management and media communities. Lipper is the world’s leading fund research and analysis organization, covering over 231,000 share classes and over 122,000 funds in 61 registered for sale (RFS) universes. It provides the free Lipper Leader ratings for mutual funds registered for sale in over 30 countries. Additional information is available at www.lipperweb.com.
About the 2013 Mixed-Asset Target 2025 Funds Award (3 year): Classification averages are calculated with all eligible share classes for each eligible classification. The calculation periods extend over 36, 60 and 120 months. The highest Lipper Leader for Consistent Return (Effective Return) value within each eligible classification determines the fund classification winner over three, five or ten years. The GuideStone MyDestination 2025 Fund-GS4 won for the three-year period ended November 30, 2012. 92 funds were eligible for this award.
The MyDestination Funds® (“Funds”) attempt to achieve their objectives by investing in the GuideStone Select Funds and other investments. The Funds are managed to a retirement date (“target date”) by adjusting the percentage of fixed income securities and equity securities to become more conservative each year until reaching the retirement year and then approximately 15 years thereafter. The target date in the name of the Funds is the approximate date when an investor plans to start withdrawing money. By investing in the Funds, you will also incur the expenses and risks of the underlying Select Funds and other investments. The principal risks of the Funds will change depending on the asset mix of the Select Funds in which they invest. You may directly invest in the Select Funds and other investments, except the Flexible Income Fund and Global Natural Resources Equity Fund. The Funds’ value will go up and down in response to changes in the share prices of the investments that they own. The amount invested in the Fund is not guaranteed to increase, is not guaranteed against loss, nor is the amount of the original investment guaranteed at the target date. It is possible to lose money by investing in the Funds.
The Emerging Markets Equity Fund invests in emerging market securities which involves certain risks such as currency volatility, political and social instability and reduced market liquidity. Medium and small companies have limited product lines, markets and financial resources, and their stocks historically have been more volatile and less liquid than large company stocks. To the extent that the investment advisor misjudges current market conditions, the fund’s volatility may be amplified by its use of derivatives and by its ability to select sub-advisers to allocate assets. Some derivatives may increase the risk of loss and cause fluctuations in the market value of the fund’s portfolio to have disproportionately large effects or cause the NAV of the fund generally to decline faster than it would otherwise. This fund may be suitable to investors who seek higher, long-term rates of return, can accept significant short-term fluctuations in account value and want to diversity their portfolio with emerging market stocks.
3
FROM THE CHIEF INVESTMENT OFFICER
| | |

Rodric E. Cummins, CFA | | Stock markets finished the year just as they started, posting double digit gains in the fourth quarter, resulting in another banner year in 2013. Despite the many headlines and worries by investors during the year, the story line for the 2013 investment markets turned out to be quite simple. Slow and steady global economic growth, engineered by the central banks’ low interest rate policies, continued to produce an ideal backdrop for risk-based investments. This resulted in another year of powerful gains in equity markets worldwide. While bonds and real assets did not fare well in 2013 — and in fact, generally produced negative returns — investors with well-balanced and well-diversified portfolios produced another exceptional year. Equity investments, and more specifically U.S. stocks, were the easy winners among the three asset classes of stocks, bonds and real assets. |
In the U.S., the S&P 500® Index returned 10.51% in the fourth quarter, bringing 2013 returns to 32.39%, the highest calendar year return in more than 15 years. U.S. stocks more than doubled the return for stocks in foreign markets which consist of both developed and emerging countries. Within the U.S., small cap stocks performed the best in 2013, returning 38.82% as measured the Russell 2000® Index.
Bond investors, who were already yield starved, continued to find the going difficult as the improving economy and the Federal Reserve’s tapering of quantitative easing activities proved to be stiff headwinds. For the fourth quarter, the U.S. bond market returned -0.14%, as measured by the Barclays U.S. Aggregate Bond Index. For the year, bonds returned -2.02%, the lowest calendar year of performance for bonds since 1994. Negative returns in bonds occurred in 2013 as the income received from bonds was more than offset by a decline in value that resulted from a rise in interest rates.
Real assets are typically inflation sensitive investments that play an important role in portfolios by providing investors a defense from unexpected spikes in inflation. Like bonds, these assets also had a difficult year in 2013 as excess capacity and high unemployment continued to curb inflation expectations in the market. Treasury Inflation Protected Securities fell 2.02% for investors in the fourth quarter and posted a return of -8.61% for the year. Other real assets, such as commodities and real estate securities, also posted a disappointing year.
What can investors expect as we turn the calendar to a new year?
First, global central banks’ monetary policies are likely to continue to set the tone for the investment markets in 2014. Global excess capacity is constraining inflation and permitting extraordinary measures by central banks to stimulate economies, all in an effort to keep growth moving forward and put people back to work. We believe this trend will continue as countries aggressively vie for a larger and larger share of the global economic pie. This should provide both support and opportunities for risky assets held by long-term investors.
Secondly, it’s important for investors to have realistic expectations about market returns. Over the past two years, U.S. stocks have returned over 50%, a trend that is clearly not sustainable. With stock market valuations now near historical averages, equity returns in the coming years are more likely to reflect the slow economic growth pattern of world economies.
Finally, expect the unexpected. The capital markets will be met through time with surprises on many fronts, be it economic, political or social developments. It is important for investors to be prepared for periods of high volatility and any surprises that 2014 may hold. We continue to encourage investors to stay well-balanced, stay well-diversified and stay invested. We believe this provides the best opportunity for you to achieve your investment goals.
*This report may include statements that constitute “forward-looking statements” under the U.S. securities laws. Forward-looking statements include, among other things, projections, estimates, and information about possible or future results related to GuideStone Funds, market or regulatory developments. The views expressed are not guarantees of future performance or economic results and involve certain risks, uncertainties and assumptions that could cause actual outcomes and results to differ materially from the views expressed herein. The views expressed are subject to change at any time based upon economic, market, or other conditions and GuideStone Funds undertakes no obligation to update the views expressed herein. Any discussions of specific securities should not be considered a recommendation to buy or sell those securities. The views expressed (including any forward-looking statement) may not be relied upon as investment advice or as an indication of GuideStone Funds’ trading intent.
4
|
| Asset Class Performance Comparison |
The following graph illustrates the performance of the major assets classes during 2013.
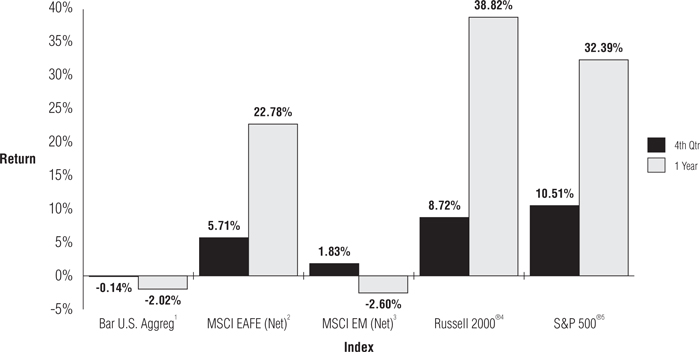
1The Barclays U.S. Aggregate Bond Index represents securities that are SEC-registered, taxable and dollar denominated. The index covers the U.S. investment grade bond market, with index components for government and corporate securities, mortgage pass-through securities and asset-backed securities.
2The MSCI EAFE Index (Europe, Australasia, Far East) is a free float-adjusted market capitalization index that is designed to measure the equity market performance of developed markets, excluding the U.S. & Canada. The MSCI EAFE Index consists of the following 21 developed market country indices: Australia, Austria, Belgium, Denmark, Finland, France, Germany, Hong Kong, Ireland, Israel, Italy, Japan, the Netherlands, New Zealand, Norway, Portugal, Singapore, Spain, Sweden, Switzerland, and the United Kingdom.
3The MSCI EM (Emerging Markets) Index is a free float-adjusted market capitalization index that is designed to measure equity market performance of emerging markets. The index consisted of the following 21 emerging market country indices: Brazil, Chile, China, Colombia, Czech Republic, Egypt, Greece, Hungary, India, Indonesia, Korea, Malaysia, Mexico, Peru, Philippines, Poland, Russia, South Africa, Taiwan, Thailand, and Turkey.
4The Russell 2000® Index measures the performance of the small-cap segment of the U.S. equity universe. The Russell 2000® Index is a subset of the Russell 3000® Index representing approximately 10% of the total market capitalization of that index. It includes approximately 2,000 of the smallest securities based on a combination of their market cap and current index membership. The Russell 2000® Index is constructed to provide a comprehensive and unbiased small-cap barometer and is completely reconstituted annually to ensure that larger stocks do not distort the performance and characteristics of the actual small-cap opportunity set.
5The S&P 500® Index is an unmanaged index (with no defined investment objective) of common stocks, includes reinvestment of dividends and is a registered trademark of McGraw-Hill Co., Inc. The S&P 500® Index includes 500 of the largest stocks (in terms of market value) in the United States.
5
S&P 500® Index Returns
The U.S. large cap equity market, as represented by the S&P 500® Index, posted a positive annual return of 32.39%. This was the fifth consecutive year of positive results and tenth out of the last eleven years. It was a strong year for the index as ten of the twelve months were positive with June and August being the exception. Performance got off to a quick start with the first quarter up about 10%. The second and third quarters were both positive at around 3% and 5% respectively. The fourth quarter finished the year strong up about 10.5%. All sectors in the index finished positive for the year, and the best performing sectors were Health Care, Consumer Discretionary, and Producer Durables. The sectors in the index that lagged the most this year were Utilities, Energy, and Technology. Overall, stocks with higher beta and lower market capitalization were the largest positive contributors to performance this year.
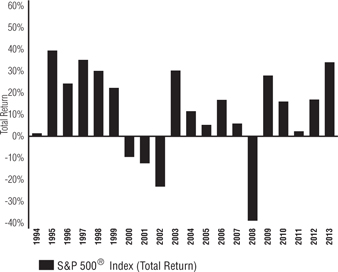
The S&P 500® Index includes 500 leading companies in major industries of the U.S. economy. The index represents about 75% of U.S. equity market capitalization. It is a capitalization-weighted index calculated on a total return basis with dividends reinvested. Constituents are selected by a team of Standard & Poor’s economists and analysts.
Data Source: Bloomberg,S&P website
Russell 2000® Index Returns
The U.S. small cap equity market, as represented by the Russell 2000® Index, posted a positive return of 38.82% for the year. The index was up about 12% the first quarter followed by a more volatile second quarter performance of roughly 3%. The second half of the year finished strong with the third quarter and the fourth quarter up around 10% and 9% respectively. The calendars year’s best two performing sectors were Health Care and Consumer Staples. The sectors in the index that lagged the most this year were Materials, Financials, and Utilities. Overall, stocks with higher beta, higher earnings growth, and smaller market capitalization were the largest positive contributors to performance this year.
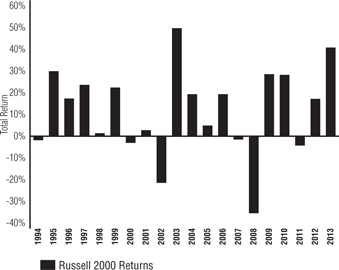
The Russell 2000® Index measures the performance of the small-cap segment of the U.S. equity universe. The Russell 2000® Index is a subset of the Russell 3000® Index representing approximately 10% of the total market capitalization of that index. It includes approximately 2,000 of the smallest securities based on a combination of their market cap and current index membership. The Russell 2000® Index is constructed to provide a comprehensive and unbiased small-cap barometer and is completely reconstituted annually to ensure that larger stocks do not distort the performance and characteristics of the actual small-cap opportunity set.
Data Source: Russell Investments, Bloomberg
6
MSCI EAFE (Net) Returns
The international equity developed markets, as represented by the MSCI EAFE Index (net), posted a positive annual return of 22.78%. The year started with mixed signals due to weakness in Europe but a strengthening Japan, but ultimately the index finished the 1st quarter up 5.13%. However, the next few months saw the index give back some of those gains posting a -0.98% for the 2nd quarter. The second half of the year continued the upward trend of the 1st quarter, as the index posted 3rd and 4th quarter returns of 11.56% and 5.71% respectively. The best performing countries during this calendar year were Greece, Finland and Ireland. The countries which had the worst relative performance were Singapore and Australia. The sectors that led performance results this year were Consumer Discretionary, Health Care, and Telecommunications. The sectors in the index that lagged the most this year were Materials and Energy. All sectors posted positive returns for the year.
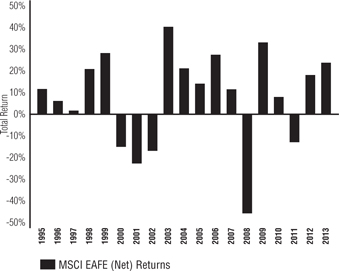
The MSCI EAFE Index (Europe, Australasia, Far East) is a free float-adjusted market capitalization index that is designed to measure the equity market performance of developed markets, excluding the U.S. & Canada. The MSCI EAFE Index consists of the following 21 developed market country indices: Australia, Austria, Belgium, Denmark, Finland, France, Germany, Hong Kong, Ireland, Israel, Italy, Japan, the Netherlands, New Zealand, Norway, Portugal, Singapore, Spain, Sweden, Switzerland, and the United Kingdom.
Data Source: Factset
MSCI EM (Net) Returns
The international equity emerging markets, as represented by the MSCI Emerging Market Index (net), posted a negative annual return of -2.60%. Emerging market equities started the year on a negative note, posting two consecutive down quarters of -1.62% and -8.08% for the 1st and 2nd quarters respectively. The 3rd quarter, however, saw positive returns for the period of 5.77%. The index finished out the year with a positive 1.83% return for the 4th quarter but still finished down overall, for the year. The best performing countries during this calendar year were Egypt, Hong Kong and Taiwan. The countries which had the worst performance were Turkey and Peru. The sectors that led in performance results for the year were Consumer Discretionary, Health Care, and Information Technology. These were the only sectors to post positive returns for 2013. The sectors in the index that lagged the most this year were Materials and Energy.
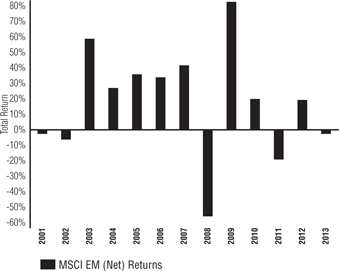
The MSCI EM (Emerging Markets) Index is a free float-adjusted market capitalization index that is designed to measure equity market performance of emerging markets. The index consisted of the following 21 emerging market country indices: Brazil, Chile, China, Colombia, Czech Republic, Egypt, Greece, Hungary, India, Indonesia, Korea, Malaysia, Mexico, Peru, Philippines, Poland, Russia, South Africa, Taiwan, Thailand, and Turkey.
Data Source: Factset
7
Barclays U.S. Aggregate Bond Index Returns
The broad U.S. bond market, as measured by the Barclays U.S. Aggregate Bond Index, posted a negative return of -2.02% for the year. The index had its first negative return in fourteen years, with rising interest rates as the primary factor contributing to its negative performance. Areas of the market that performed the best consisted of debt securities that possessed shorter maturities and/or lower credit quality. The best performing sub sectors were auto asset backed securities and corporate financial institution bonds. The U.S. Treasury sector posted an annual return of -2.75%, due to the increasing yield environment. The U.S. Treasury sector was the worst performing sector within the Barclays U.S. Aggregate Bond Index during the year.
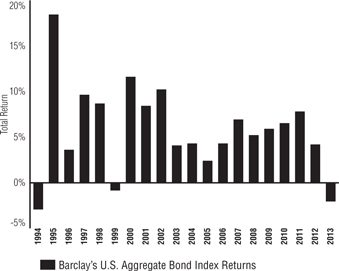
The Barclays U.S. Aggregate Bond Index is a broad-based benchmark representing approximately 8,200 U.S. dollar-denominated, taxable fixed income securities. To be included in this market capitalization-weighted index, bonds must be rated investment grade quality by Moody’s and Standard & Poor’s and have a maturity of at least one year. The types of fixed income instruments in this index primarily consist of U.S. Treasury securities, government-related securities, mortgage-backed securities, asset-backed securities and corporate bonds.
Data Source: Factset
Federal Reserve
The Federal Reserve (“Fed”) maintained the same targeted Fed Funds level of 0-0.25% for the fifth consecutive year. Although the Fed formally met to review this rate level on eight separate occasions during the year, no action on changing this rate was taken. The last time an action was taken was December 2008 when the Fed cut rates to their current levels. The Fed has maintained an accommodative monetary policy stance throughout the year as unemployment levels, while falling, remained elevated and inflation ran consistently below the Fed’s 2% targeted level. In addition to maintain its historically low Fed Funds rate, the Fed kept in place all year its quantitative easing (“QE”) program, which included monthly purchases of $85 billion in fixed income securities (including both U.S. Treasuries and mortgages). In mid-December, the Fed announced that it will trim its monthly asset purchase by a modest $10 billion beginning in January, lowering both the purchase of Treasury Securities and Mortgage Backed Securities by $5 billion each. The Fed provided guidance that they intend to gradually continue to taper for as along as economic conditions warrant. It was also announced that the Fed will maintain the Fed Funds target range of 0-0.25% well after the unemployment rate falls below the Fed’s original threshold of 6.5%. This is as long as inflation is below 2.5% and longer term inflation expectations “continue to be well anchored”.
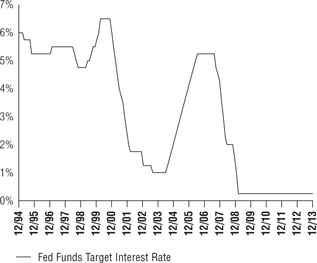
The Federal Reserve (“Fed”) is the central bank of the United States. It was created by Congress to provide the nation with a safer, more flexible, and more stable monetary and financial system. The Federal Funds Rate is the interest rate at which depository institutions lend balances at the Fed to other depository institutions overnight. The rate is one tool the Fed can use in their efforts of controlling the supply of money. Changes in the Federal Funds Rate trigger a chain of events that affect other short-term interest rates, foreign exchange rates, long-term interest rates, the amount of money and credit, and, ultimately, a range of economic variables, including employment, output, and prices of goods and services.
Data Source: Bloomberg, Federal Reserve
8
U.S. Treasury Yield Curve
Short-term rates remained at historically low levels as the Federal Reserve (the “Fed”) maintained its aggressively accommodative monetary policy and left unchanged the target federal funds rate at 0-0.25% throughout the year in an effort to stimulate economic growth. The very short end of the curve, where the maturity is less than two years, remained basically unchanged again this year. Starting at the 2-year maturity level and longer, there was a considerable increase in yield levels as the yield curve steepened significantly compared to the end of 2012. At year-end 2013, yields on the 2-year, 5-year, 10-year and 30-year U.S. Treasury securities were 0.38%, 1.74%, 3.03% and 3.97%, respectively.
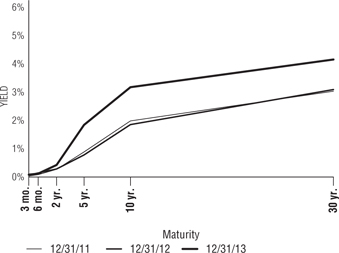
The Treasury yield curve illustrates the relationship between yields on short-term, intermediate-term and long-term Treasury securities. Normally, the shape of the yield curve is upward sloping with rates increasing from the short end of the curve moving higher to the long end. The short end of the curve is impacted more by monetary policy (demand for money) while inflationary expectations and market forces impact the long end of the curve.
Data Source: Bloomberg
9
About Your Expenses (Unaudited)
As a shareholder of the Funds, you incur ongoing costs, including advisory fees and to the extent applicable, shareholder services fees, as well as other Fund expenses. This example is intended to help you to understand your ongoing costs (in dollars) of investing in the Funds and to compare these costs with the ongoing costs of investing in other mutual funds. It is based on an investment of $1,000 invested at the beginning of the period and held for the entire period from July 1, 2013 to December 31, 2013.
Actual Expenses
The first section of the table below provides information about actual account values and actual expenses. You may use the information in this section, together with the amount you invested, to estimate the expenses that you incurred over the period. Simply divide your account value by $1,000 (for example, an $8,600 account value divided by $1,000 = 8.6), then multiply the result by the number in the first section under the heading entitled “Expenses Paid During Period” to estimate the expenses attributable to your investment during this period.
Hypothetical Example for Comparison Purposes
The second section of the table below provides information about hypothetical account values and hypothetical expenses based on the Fund’s actual expense ratio and an assumed rate of return of 5% per year before expenses, which is not the Fund’s actual return. Thus, you should not use the hypothetical account values and expenses to estimate the actual ending account balance or your expenses for the period. Rather, these figures are provided to enable you to compare the ongoing costs of investing in the Fund and other funds. To do so, compare this 5% hypothetical example with the 5% hypothetical examples that appear in the shareholder reports of the other funds. Please note that the expenses shown in the table are meant to highlight your ongoing costs only. Therefore, the second section of the table is useful in comparing ongoing costs only and will not help you determine the relative total costs of owning different funds.
| | | | | | | | | | | | | | | | | | | | | | | | | |
Actual |
Fund | | Class | | Beginning
Account Value
07/01/13 | | Ending
Account Value
12/31/13 | | Annualized
Expense
Ratio (1) | | Expenses
Paid During
Period (2) |
MyDestination 2005 | | | | GS4 | | | | $ | 1,000.00 | | | | $ | 1,046.51 | | | | | 0.20 | % | | | $ | 1.03 | |
MyDestination 2015 | | | | GS4 | | | | | 1,000.00 | | | | | 1,070.95 | | | | | 0.14 | | | | | 0.74 | |
MyDestination 2025 | | | | GS4 | | | | | 1,000.00 | | | | | 1,096.84 | | | | | 0.14 | | | | | 0.74 | |
MyDestination 2035 | | | | GS4 | | | | | 1,000.00 | | | | | 1,136.69 | | | | | 0.19 | | | | | 1.01 | |
MyDestination 2045 | | | | GS4 | | | | | 1,000.00 | | | | | 1,146.64 | | | | | 0.20 | | | | | 1.08 | |
MyDestination 2055 | | | | GS4 | | | | | 1,000.00 | | | | | 1,148.30 | | | | | 0.20 | | | | | 1.10 | |
Conservative Allocation | | | | GS4 | | | | | 1,000.00 | | | | | 1,029.99 | | | | | 0.12 | | | | | 0.62 | |
Balanced Allocation | | | | GS4 | | | | | 1,000.00 | | | | | 1,068.11 | | | | | 0.12 | | | | | 0.63 | |
Growth Allocation | | | | GS4 | | | | | 1,000.00 | | | | | 1,118.01 | | | | | 0.12 | | | | | 0.64 | |
Aggressive Allocation | | | | GS4 | | | | | 1,000.00 | | | | | 1,178.58 | | | | | 0.12 | | | | | 0.66 | |
Conservative Allocation I | | | | GS2 | | | | | 1,000.00 | | | | | 1,031.13 | | | | | 0.15 | | | | | 0.77 | |
Balanced Allocation I | | | | GS2 | | | | | 1,000.00 | | | | | 1,069.24 | | | | | 0.13 | | | | | 0.69 | |
Growth Allocation I | | | | GS2 | | | | | 1,000.00 | | | | | 1,119.19 | | | | | 0.14 | | | | | 0.75 | |
Aggressive Allocation I | | | | GS2 | | | | | 1,000.00 | | | | | 1,179.71 | | | | | 0.15 | | | | | 0.83 | |
Money Market | | | | GS2 | | | | | 1,000.00 | | | | | 1,000.15 | | | | | 0.18 | | | | | 0.91 | |
| | | | GS4 | | | | | 1,000.00 | | | | | 1,000.11 | | | | | 0.19 | | | | | 0.97 | |
Low-Duration Bond | | | | GS2 | | | | | 1,000.00 | | | | | 1,007.28 | | | | | 0.36 | | | | | 1.82 | |
| | | | GS4 | | | | | 1,000.00 | | | | | 1,005.82 | | | | | 0.57 | | | | | 2.88 | |
Medium-Duration Bond | | | | GS2 | | | | | 1,000.00 | | | | | 1,005.25 | | | | | 0.48 | | | | | 2.43 | |
| | | | GS4 | | | | | 1,000.00 | | | | | 1,005.28 | | | | | 0.63 | | | | | 3.19 | |
10
| | | | | | | | | | | | | | | | | | | | | | | | | |
Actual |
Fund | | Class | | Beginning
Account Value
07/01/13 | | Ending
Account Value
12/31/13 | | Annualized
Expense
Ratio (1) | | Expenses
Paid During
Period (2) |
Extended-Duration Bond | | | | GS2 | | | | $ | 1,000.00 | | | | $ | 1,022.86 | | | | | 0.57 | % | | | $ | 2.91 | |
| | | | GS4 | | | | | 1,000.00 | | | | | 1,022.42 | | | | | 0.75 | | | | | 3.82 | |
Global Bond | | | | GS4 | | | | | 1,000.00 | | | | | 1,028.91 | | | | | 0.80 | | | | | 4.08 | |
Defensive Market Strategies (3) | | | | GS2 | | | | | 1,000.00 | | | | | 1,087.75 | | | | | 1.09 | | | | | 5.71 | |
| | | | GS4 | | | | | 1,000.00 | | | | | 1,086.51 | | | | | 1.35 | | | | | 7.08 | |
Equity Index | | | | GS2 | | | | | 1,000.00 | | | | | 1,161.10 | | | | | 0.23 | | | | | 1.25 | |
| | | | GS4 | | | | | 1,000.00 | | | | | 1,161.45 | | | | | 0.38 | | | | | 2.07 | |
Value Equity | | | | GS2 | | | | | 1,000.00 | | | | | 1,160.05 | | | | | 0.65 | | | | | 3.56 | |
| | | | GS4 | | | | | 1,000.00 | | | | | 1,159.16 | | | | | 0.90 | | | | | 4.89 | |
Growth Equity | | | | GS2 | | | | | 1,000.00 | | | | | 1,214.97 | | | | | 0.83 | | | | | 4.66 | |
| | | | GS4 | | | | | 1,000.00 | | | | | 1,214.14 | | | | | 1.05 | | | | | 5.87 | |
Small Cap Equity | | | | GS2 | | | | | 1,000.00 | | | | | 1,203.40 | | | | | 0.95 | | | | | 5.29 | |
| | | | GS4 | | | | | 1,000.00 | | | | | 1,202.12 | | | | | 1.20 | | | | | 6.65 | |
International Equity (3) | | | | GS2 | | | | | 1,000.00 | | | | | 1,183.72 | | | | | 1.05 | | | | | 5.75 | |
| | | | GS4 | | | | | 1,000.00 | | | | | 1,182.26 | | | | | 1.29 | | | | | 7.07 | |
Emerging Markets Equity | | | | GS2 | | | | | 1,000.00 | | | | | 975.00 | | | | | 1.25 | | | | | 2.06 | |
| | | | GS4 | | | | | 1,000.00 | | | | | 975.00 | | | | | 1.50 | | | | | 2.48 | |
Inflation Protected Bond | | | | GS4 | | | | | 1,000.00 | | | | | 983.65 | | | | | 0.64 | | | | | 3.18 | |
Flexible Income | | | | GS4 | | | | | 1,000.00 | | | | | 1,015.70 | | | | | 1.20 | | | | | 6.06 | |
Real Assets | | | | GS4 | | | | | 1,000.00 | | | | | 991.27 | | | | | 0.12 | | | | | 0.60 | |
Real Estate Securities | | | | GS4 | | | | | 1,000.00 | | | | | 967.14 | | | | | 1.06 | | | | | 5.26 | |
Global Natural Resources Equity | | | | GS4 | | | | | 1,000.00 | | | | | 983.06 | | | | | 1.42 | | | | | 7.07 | |
|
HYPOTHETICAL (assuming a 5% return before expenses) |
Fund | | Class | | Beginning
Account Value
07/01/13 | | Ending
Account Value
12/31/13 | | Annualized
Expense
Ratio (1) | | Expenses
Paid During
Period (2) |
MyDestination 2005 | | | | GS4 | | | | $ | 1,000.00 | | | | $ | 1,024.20 | | | | | 0.20 | % | | | $ | 1.02 | |
MyDestination 2015 | | | | GS4 | | | | | 1,000.00 | | | | | 1,024.49 | | | | | 0.14 | | | | | 0.73 | |
MyDestination 2025 | | | | GS4 | | | | | 1,000.00 | | | | | 1,024.50 | | | | | 0.14 | | | | | 0.72 | |
MyDestination 2035 | | | | GS4 | | | | | 1,000.00 | | | | | 1,024.26 | | | | | 0.19 | | | | | 0.96 | |
MyDestination 2045 | | | | GS4 | | | | | 1,000.00 | | | | | 1,024.20 | | | | | 0.20 | | | | | 1.02 | |
MyDestination 2055 | | | | GS4 | | | | | 1,000.00 | | | | | 1,024.18 | | | | | 0.20 | | | | | 1.03 | |
Conservative Allocation | | | | GS4 | | | | | 1,000.00 | | | | | 1,024.60 | | | | | 0.12 | | | | | 0.61 | |
Balanced Allocation | | | | GS4 | | | | | 1,000.00 | | | | | 1,024.60 | | | | | 0.12 | | | | | 0.61 | |
Growth Allocation | | | | GS4 | | | | | 1,000.00 | | | | | 1,024.60 | | | | | 0.12 | | | | | 0.61 | |
Aggressive Allocation | | | | GS4 | | | | | 1,000.00 | | | | | 1,024.60 | | | | | 0.12 | | | | | 0.61 | |
Conservative Allocation I | | | | GS2 | | | | | 1,000.00 | | | | | 1,024.44 | | | | | 0.15 | | | | | 0.77 | |
Balanced Allocation I | | | | GS2 | | | | | 1,000.00 | | | | | 1,024.54 | | | | | 0.13 | | | | | 0.68 | |
Growth Allocation I | | | | GS2 | | | | | 1,000.00 | | | | | 1,024.49 | | | | | 0.14 | | | | | 0.72 | |
Aggressive Allocation I | | | | GS2 | | | | | 1,000.00 | | | | | 1,024.45 | | | | | 0.15 | | | | | 0.77 | |
Money Market | | | | GS2 | | | | | 1,000.00 | | | | | 1,024.29 | | | | | 0.18 | | | | | 0.93 | |
| | | | GS4 | | | | | 1,000.00 | | | | | 1,024.24 | | | | | 0.19 | | | | | 0.98 | |
11
About Your Expenses (Unaudited) (Continued)
| | | | | | | | | | | | | | | | | | | | | | | | | |
HYPOTHETICAL (assuming a 5% return before expenses) |
Fund | | Class | | Beginning
Account Value
07/01/13 | | Ending
Account Value
12/31/13 | | Annualized
Expense
Ratio (1) | | Expenses
Paid During
Period (2) |
Low-Duration Bond | | | | GS2 | | | | $ | 1,000.00 | | | | $ | 1,023.39 | | | | | 0.36 | % | | | $ | 1.84 | |
| | | | GS4 | | | | | 1,000.00 | | | | | 1,022.33 | | | | | 0.57 | | | | | 2.91 | |
Medium-Duration Bond | | | | GS2 | | | | | 1,000.00 | | | | | 1,022.79 | | | | | 0.48 | | | | | 2.45 | |
| | | | GS4 | | | | | 1,000.00 | | | | | 1,022.03 | | | | | 0.63 | | | | | 3.21 | |
Extended-Duration Bond | | | | GS2 | | | | | 1,000.00 | | | | | 1,022.33 | | | | | 0.57 | | | | | 2.91 | |
| | | | GS4 | | | | | 1,000.00 | | | | | 1,021.42 | | | | | 0.75 | | | | | 3.82 | |
Global Bond | | | | GS4 | | | | | 1,000.00 | | | | | 1,021.19 | | | | | 0.80 | | | | | 4.06 | |
Defensive Market Strategies (3) | | | | GS2 | | | | | 1,000.00 | | | | | 1,019.73 | | | | | 1.09 | | | | | 5.53 | |
| | | | GS4 | | | | | 1,000.00 | | | | | 1,018.41 | | | | | 1.35 | | | | | 6.85 | |
Equity Index | | | | GS2 | | | | | 1,000.00 | | | | | 1,024.05 | | | | | 0.23 | | | | | 1.17 | |
| | | | GS4 | | | | | 1,000.00 | | | | | 1,023.29 | | | | | 0.38 | | | | | 1.94 | |
Value Equity | | | | GS2 | | | | | 1,000.00 | | | | | 1,021.91 | | | | | 0.65 | | | | | 3.33 | |
| | | | GS4 | | | | | 1,000.00 | | | | | 1,020.68 | | | | | 0.90 | | | | | 4.57 | |
Growth Equity | | | | GS2 | | | | | 1,000.00 | | | | | 1,021.00 | | | | | 0.83 | | | | | 4.25 | |
| | | | GS4 | | | | | 1,000.00 | | | | | 1,019.91 | | | | | 1.05 | | | | | 5.35 | |
Small Cap Equity | | | | GS2 | | | | | 1,000.00 | | | | | 1,020.41 | | | | | 0.95 | | | | | 4.85 | |
| | | | GS4 | | | | | 1,000.00 | | | | | 1,019.17 | | | | | 1.20 | | | | | 6.10 | |
International Equity (3) | | | | GS2 | | | | | 1,000.00 | | | | | 1,019.94 | | | | | 1.05 | | | | | 5.32 | |
| | | | GS4 | | | | | 1,000.00 | | | | | 1,018.73 | | | | | 1.29 | | | | | 6.54 | |
Emerging Markets Equity | | | | GS2 | | | | | 1,000.00 | | | | | 1,006.27 | | | | | 1.25 | | | | | 2.10 | |
| | | | GS4 | | | | | 1,000.00 | | | | | 1,005.85 | | | | | 1.50 | | | | | 2.51 | |
Inflation Protected Fund | | | | GS4 | | | | | 1,000.00 | | | | | 1,022.00 | | | | | 0.64 | | | | | 3.24 | |
Flexible Income | | | | GS4 | | | | | 1,000.00 | | | | | 1,019.05 | | | | | 1.20 | | | | | 6.07 | |
Real Assets | | | | GS4 | | | | | 1,000.00 | | | | | 1,024.47 | | | | | 0.12 | | | | | 0.61 | |
Real Estate Securities Fund | | | | GS4 | | | | | 1,000.00 | | | | | 1,019.86 | | | | | 1.06 | | | | | 5.40 | |
Global Natural Resources Equity | | | | GS4 | | | | | 1,000.00 | | | | | 1,017.94 | | | | | 1.42 | | | | | 7.19 | |
| (1) | Expenses include the effect of contractual waivers by GuideStone Capital Management. The Date Target Funds’, Asset Allocation Funds’ and Real Assets Fund proportionate share of the operating expenses of the Select Funds is not reflected in the tables above. |
| (2) | Expenses are equal to the Fund’s annualized expense ratios for the period July 1, 2013 through December 31, 2013, multiplied by the average account value over the period, multiplied by 184/365 (to reflect the one-half year period). |
| (3) | The expense ratios for the Defensive Market Strategies Fund and the International Equity Fund include the impact of dividend and interest expense on securities sold short. |
12
ABBREVIATIONS, FOOTNOTES AND INDEX DEFINITIONS
INVESTMENT ABBREVIATIONS:
| | | | |
ADR | | — | | American Depository Receipt |
AGM | | — | | Assured Guaranty Municipal Corporation |
CDO | | — | | Collateralized Debt Obligation |
CLO | | — | | Collateralized Loan Obligation |
CMBS | | — | | Commercial Mortgage-Backed Securities |
CONV | | — | | Convertible |
ETF | | — | | Exchange Traded Fund |
EURIBOR | | — | | Euro Interbank Offered Rate |
GDR | | — | | Global Depository Receipt |
IO | | — | | Interest Only (Principal amount shown is notional) |
KLIBOR | | — | | Kuala Lumpur Interbank Offer Rate |
KORIBOR | | — | | Korea Interbank Offer Rate |
KRW-CD | | — | | Korean Won-Certificates of Deposit-Korean |
KDSA | | | | Securities Dealers Association |
LIBOR | | — | | London Interbank Offered Rate |
LLC | | — | | Limited Liability Company |
LOC | | — | | Letter of Credit |
LP | | — | | Limited Partnership |
NVDR | | — | | Non-Voting Depository Receipt |
PIK | | — | | Payment-in-Kind Bonds |
PLC | | — | | Public Limited Company |
PO | | — | | Principal Only |
REIT | | — | | Real Estate Investment Trust |
REMIC | | — | | Real Estate Mortgage Investment Conduit |
SPDR | | — | | Standard & Poor’s Depositary Receipt |
STEP | | — | | Stepped Coupon Bonds: Interest rates shown reflect the rates currently in effect. |
STRIP | | — | | Stripped Security |
TBA | | — | | To be announced |
VVPR | | — | | Voter Verified Paper Record |
WIBOR | | — | | Warsaw Interbank Offered Rate |
144A | | — | | Security was purchased pursuant to Rule 144A under the Securities Act of 1933 and may not be resold subject to that rule except to qualified institutional buyers. As of December 31, 2013, the total market values and percentages of net assets for 144A securities by fund were as follows: |
| | | | | | | | | | |
Fund | | Value of
144A Securities | | Percentage of
Net Assets |
Money Market | | | $ | 9,800,000 | | | | | 0.72 | % |
Low-Duration Bond | | | | 152,012,027 | | | | | 18.14 | |
Medium-Duration Bond | | | | 83,087,617 | | | | | 10.27 | |
Extended-Duration Bond | | | | 25,556,407 | | | | | 9.44 | |
Global Bond | | | | 55,863,790 | | | | | 15.61 | |
Defensive Market Strategies | | | | 19,526,120 | | | | | 4.03 | |
Small Cap Equity | | | | 5,091,578 | | | | | 0.89 | |
INVESTMENT FOOTNOTES:
| | | | |
‡‡ | | — | | All or a portion of the security was held as collateral for open futures, options, securities sold short and/or swap contracts. |
@ | | — | | Illiquid. |
* | | — | | Non-income producing security. |
# | | — | | Security in default. |
§ | | — | | Security purchased with the cash proceeds from securities loaned. |
† | | — | | Variable rate security. Interest rates shown reflect the rates currently in effect. Maturity date for money market instruments is the date of the next interest rate reset. |
W | | — | | Interest rates shown reflect the effective yields as of December 31, 2013. |
¥ | | — | | Affiliated fund. |
D | | — | | Security either partially or fully on loan. |
S | | — | | All or a portion of this position has not settled. Full contract rates do not take effect until settlement date. |
+ | | — | | Security is valued at fair value. As of December 31, 2013, the total market values and percentages of net assets for Fair Valued securities by fund were as follows: |
| | | | | | | | | | |
Fund | | Value of
Fair
Valued
Securities | | Percentage of
Net Assets |
Low-Duration Bond | | | $ | 1,725,282 | | | | | 0.21 | % |
Medium-Duration Bond | | | | 503,234 | | | | | 0.06 | |
Global Bond | | | | 298,588 | | | | | 0.08 | |
Defensive Market Strategies | | | | 2,103,692 | | | | | 0.43 | |
Equity Index | | | | — | | | | | — | |
Growth Equity | | | | 36,154 | | | | | — | |
Small Cap Equity | | | | 157,814 | | | | | 0.03 | |
International Equity | | | | 65,244 | | | | | — | |
Emerging Markets Equity | | | | 33,708 | | | | | 0.01 | |
13
ABBREVIATIONS, FOOTNOTES AND INDEX DEFINITIONS
| | | | | | |
| FOREIGN BOND FOOTNOTES: |
(A) | | | — | | | Par is denominated in Australian Dollars (AUD). |
(B) | | | — | | | Par is denominated in Brazilian Real (BRL). |
(C) | | | — | | | Par is denominated in Canadian Dollars (CAD). |
(E) | | | — | | | Par is denominated in Euro (EUR). |
(G) | | | — | | | Par is denominated in Singapore Dollars (SGD). |
(K) | | | — | | | Par is denominated in Norwegian Krone (NOK). |
(M) | | | — | | | Par is denominated in Mexican Pesos (MXN). |
(P) | | | — | | | Par is denominated in Polish Zloty (PLN). |
(S) | | | — | | | Par is denominated in South African Rand (ZAR). |
(T) | | | — | | | Par is denominated in Turkish Lira (TRL). |
(U) | | | — | | | Par is denominated in British Pounds (GBP). |
(V) | | | — | | | Par is denominated in Dominican Peso (DOP). |
(W) | | | — | | | Par is denominated in South Korean Won (KRW). |
(Z) | | | — | | | Par is denominated in New Zealand Dollars(NZD). |
| | | | | | |
| COUNTERPARTY ABBREVIATIONS: |
BAR | | | — | | | Counterparty to contract is Barclays Capital. |
BNP | | | — | | | Counterparty to contract is BNP Paribas. |
BOA | | | — | | | Counterparty to contract is Bank of America. |
CITI | | | — | | | Counterparty to contract is Citibank NA London. |
CITIC | | | — | | | Counterparty to contract is Citicorp. |
CITIG | | | — | | | Counterparty to contract is Citigroup. |
CME | | | — | | | Counterparty to contract is Chicago Mercantile Exchange. |
CS | | | — | | | Counterparty to contract is Credit Suisse International. |
DEUT | | | — | | | Counterparty to contract is Deutsche Bank AG. |
FCM | | | — | | | Counterparty to contract is LCH.Clearnet Group, Ltd. |
GSC | | | — | | | Counterparty to contract is Goldman Sachs Capital Markets, LP. |
HKSB | | | — | | | Counterparty to contract is HongKong & Shanghai Bank. |
HSBC | | | — | | | Counterparty to contract is HSBC Securities. |
JPM | | | — | | | Counterparty to contract is JPMorgan Chase Bank. |
KS | | | — | | | Counterparty to contract is Knight Securities. |
MLCS | | | — | | | Counterparty to contract is Merrill Lynch Capital Services, Inc. |
MSCS | | | — | | | Counterparty to contract is Morgan Stanley Capital Services. |
NT | | | — | | | Counterparty to contract is Northern Trust Corporation. |
RBC | | | — | | | Counterparty to contract is Royal Bank of Canada. |
RBS | | | — | | | Counterparty to contract is Royal Bank of Scotland. |
RJ | | | — | | | Counterparty to contract is Raymond James. |
SC | | | — | | | Counterparty to contract is Standard Chartered PLC. |
SS | | | — | | | Counterparty to contract is State Street Global Markets. |
UBS | | | — | | | Counterparty to contract is UBS AG. |
WEST | | | — | | | Counterparty to contract is Westpac Pollock. |
14
ABBREVIATIONS, FOOTNOTES AND INDEX DEFINITIONS
INDEX DEFINITIONS:
The Bank of America Merrill Lynch 1-3Year Treasury Index is composed of all U.S. Treasury notes and bonds with maturities greater than or equal to one year and less than three years.
The Barclays Global Aggregate Bond Index — Unhedged provides a broad-based measure of the global investment grade fixed-rate debt markets.
The Barclays U.S. Aggregate Bond Index represents securities that are SEC-registered, taxable and dollar denominated. The index covers the U.S. investment grade fixed-rate bond market, with index components for government and corporate securities, mortgage pass-through securities, and asset-backed securities.
The Barclays U.S. Corporate High Yield — 2% Issuer Capped Index is an issuer-constrained version of the Barclays U.S. Corporate High Yield Index that measures the market of U.S. dollar denominated, non-investment grade, fixed-rate, taxable corporate bonds. The index follows the same rules as the uncapped index but limits the exposure of each issuer to 2% of the total market value and redistributes any excess market value index-wide on a pro rata basis.
The Barclays U.S. Long-Term Credit Bond Index is composed of a subset of the Barclays U.S. Credit Bond Index covering all corporate, publicly issued, fixed-rate, nonconvertible U.S. debt issues rated at least Baa with at least $50 million principal outstanding and maturity greater than 10 years.
The Barclays U.S. Long-Term Government Bond Index is composed of securities in the long (more than 10 years) range of the Barclays U.S. Government Index and is composed of a subset of the Barclays Credit Bond Index covering all corporate, publicly issued, fixed-rate, nonconvertible U.S. debt issues rated at least Baa with at least $50 million principal outstanding and maturity greater than 10 years.
The Barclays U.S. TIPS Index measures the performance of the U.S. Treasury Inflation Protected Securities (“TIPS”) market and includes TIPS with one or more years remaining until maturity with total outstanding issue size of $500 million or more.
The Citigroup 3-MonthTreasury Bill Index is an unmanaged index that is generally representative of 3-month U.S. Treasury bills, consisting of an average of the last 3-month U.S. Treasury bill issues.
The CMBX Indexes are a group of indices made up of 25 tranches of commercial mortgage-backed securities (CMBS), each with different credit ratings.
The Dow Jones CDX Indexes are series of indices that track North American and emerging market credit derivative indexes. This family of indices comprises a basket of credit derivatives that are representative of certain segments such as North American investment grade credit derivatives (NA.IG), high yield (NA.HY), and emerging markets (NA.EM).
The Dow Jones U.S. Select Real Estate Securities IndexSM is an unmanaged, broad-based, market capitalization-weighted index comprised of publicly traded REITs and real estate operating companies, not including special purpose or healthcare REITs. It is comprised of major companies engaged in the equity ownership and operation of commercial real estate.
The FTSE EPRA/NAREIT Developed Index is designed to track the performance of listed real estate companies and REITS worldwide. By making the index constituents free-float adjusted, liquidity, size and revenue screened, the series is suitable for use as the basis for investment products, such as derivatives and Exchange Traded Funds (“ETFs”).
The iTraxx Indexes are a group of international credit derivative indices that are monitored by the International Index Company (IIC). iTraxx indices cover credit derivatives markets in Europe, Asia and Australia.
The JPMorgan Emerging Markets Bond Index Plus is a traditional, market-capitalization weighted index comprised of U.S. dollar denominated Brady bonds, Eurobonds and traded loans issued by sovereign entities.
The MSCI ACWI (All Country World Index) Ex-U.S. Index is a free float-adjusted market capitalization index that is designed to measure equity market performance in the global developed (excluding U.S.) and emerging markets.
The MSCI Commodity Producers Index is a free float-adjusted market capitalization index designed to reflect the performance of the three underlying commodity markets: energy, metals and agricultural products.
The MSCI EAFE Index (Europe, Australasia, Far East) is a free float-adjusted market capitalization index that is designed to measure the equity market performance of developed markets, excluding the U.S. & Canada. The MSCI EAFE Index consists of the following 21 developed market country indices: Australia, Austria, Belgium, Denmark, Finland, France, Germany, Hong Kong, Ireland, Israel, Italy, Japan, the Netherlands, New Zealand, Norway, Portugal, Singapore, Spain, Sweden, Switzerland, and the United Kingdom.
15
ABBREVIATIONS, FOOTNOTES AND INDEX DEFINITIONS
The MSCI EM (Emerging Markets) Index is a free float-adjusted market capitalization index that is designed to measure equity market performance of emerging markets. The index consisted of the following 21 emerging market country indices: Brazil, Chile, China, Colombia, Czech Republic, Egypt, Greece, Hungary, India, Indonesia, Korea, Malaysia, Mexico, Peru, Philippines, Poland, Russia, South Africa, Taiwan, Thailand, and Turkey
The NYSE Arca Gold Miners Index is a modified market capitalization weighted index comprised of publicly traded companies involved primarily in mining for gold and silver. The index is calculated and maintained by the American Stock Exchange.
The Russell 1000® Growth Index is a large-cap index consisting of those Russell 1000® Index securities with greater-than-average growth orientation. Companies in this index tend to exhibit higher price-to-book and price-to-earnings-ratios, lower dividend yields and higher forecasted growth values than the value universe.
The Russell 1000® Value Index is a large-cap index consisting of those Russell 1000® Index securities with a less-than-average growth orientation. Companies in this index tend to exhibit lower price-to-book and price-to-earnings ratios, higher dividend yields and lower forecasted growth values than the growth universe.
The Russell 2000® Index measures the performance of the small-cap segment of the U.S. equity universe. The Russell 2000® Index is a subset of the Russell 3000® Index representing approximately 10% of the total market capitalization of that index. It includes approximately 2,000 of the smallest securities based on a combination of their market cap and current index membership. The Russell 2000® Index is constructed to provide a comprehensive and unbiased small-cap barometer and is completely reconstituted annually to ensure that larger stocks do not distort the performance and characteristics of the actual small-cap opportunity set.
The Russell 3000® Index is composed of 3,000 large companies. This portfolio of securities represents approximately 98% of the investable U.S. equity market.
The S&P 500® Index is an unmanaged index (with no defined investment objective) of common stocks, includes reinvestment of dividends, and is a registered trademark of McGraw-Hill Co., Inc. The S&P 500® Index includes 500 of the largest stocks (in terms of market value) in the United States.
16
TARGET DATE FUNDS (Unaudited)
The MyDestination Funds® maintain diversified exposure to all three asset classes of equities, fixed income and real assets.
Exposure to both U.S. and non-U.S. equities contributed positively to performance for the MyDestination Funds®. U.S. equities experienced a banner year for performance, with the broader equity market, as measured by the Russell 3000® Index, advancing 33.55% for the calendar year 2013. Equity market gains were spurred on by exceptionally accommodative monetary policy and generally improving economic conditions that encouraged investors to take on risk. From a sector perspective, performance was unanimously in positive territory as all sectors within the Russell 3000® Index experienced double-digit gains for the year.
Developed non-U.S. markets also experienced solid gains as the MSCI EAFE Index (Net), a measure of international developed country returns, posted a one-year return of 22.78%. All regions ended the period in positive territory as Japan and Europe advanced the most as a result of the regions’ improved outlooks. From a sector perspective, all groups generated positive results during the period.
Bond markets generally posted negative returns during 2013, as bond yields rose over the course of the year, particularly for maturities greater than two years. The Barclays U.S. Aggregate Bond Index, a proxy for the broad domestic bond market, generated an annual return of -2.02%, its first annual decline since 1999. Exposure to fixed income within the MyDestination Funds®, while an important part of a properly diversified portfolio, detracted from performance during 2013.
Exposure to real assets detracted from performance within the MyDestination Funds®, although the returns of the various underlying strategies were mixed for the year. Key drivers of performance for the year were subdued inflation and inflation expectations, rising yields, and falling commodity prices — all of which put downward pressure on most real asset strategies. The primary detractors to absolute performance for the MyDestination Funds® were negative performance across Treasury Inflation Protected Securities and commodities. TIPS, as measured by the Barclays U.S. TIPS Index, fell 8.61% in 2013. The S&P Dow-Jones UBS Commodity Index, a broad-based measure of returns for a diversified basket of commodity futures, posted a 9.52% decline for 2013.
17
MyDestination 2005 Fund (Unaudited)
The Fund, through investments in the underlying Select Funds, combined a greater percentage of exposure to fixed income securities with a smaller percentage allocated to equity and real asset securities. The Fund followed an allocation glide path designed to become more conservative over time, and the December 2013 targeted allocations were approximately 46.18% Fixed Income Select Funds, 23.76% U.S. Equity Select Funds, 8.06% Non-U.S. Equity Select Funds, 20.00% Real Return Select Funds and 2.00% Credit Suisse Commodity Return Strategy.
As a fund of funds, its performance was based on the performance of the underlying Select Funds. The Fund generated a positive return of 6.18% for the one-year period ending December 31, 2013. Overall exposure to the Equity Select Funds was a primary contributor to the Fund’s performance. The Defensive Market Strategies Fund was the largest contributor to absolute performance, followed by the Value Equity Fund and the Growth Equity Fund. The Fund’s fixed income allocation detracted from investment returns, as the two largest fixed income allocations, the Low-Duration Bond Fund and the Medium-Duration Bond Fund, had negative investment returns for the year. Real assets also detracted from absolute performance, with the Inflation Protected Bond Fund being the primary detractor as it fell 8.64% for the year.
The Fund outperformed its composite benchmark in 2013 (6.18% versus 6.06%). The largest two contributors to relative outperformance were the Defensive Market Strategies Fund and the Value Equity Fund. The largest detractors to relative performance were the Global Natural Resources Equity Fund and the Low-Duration Bond Fund.
The Fund attempted to achieve its objective by investing in the Select Funds. The Fund is managed to a retirement date (“target date”) by adjusting the percentage of fixed income securities and equity securities to become more conservative each year until reaching the retirement year and then approximately 15 years thereafter. The target date in the name of the Fund is the approximate date when an investor plans to start withdrawing money. This Fund may be suitable for investors who want a simplified “one fund” retirement solution, are willing to pay slightly higher fees to get a diversified mix of investments that becomes more conservative over time and retired at an age that was near the year 2005. The Fund’s value will fluctuate due to changes in interest rates. There is a risk that the issuer of a fixed-income investment may fail to pay interest or even principal due in a timely manner or at all. The Fund’s value will fluctuate due to business developments concerning a particular issuer, industry or country, as well as general market and economic conditions. The Fund is subject to risks presented by investments in foreign issuers, and changes in currency exchange rates relative to the U.S. dollar may negatively affect the values of foreign investments held by the Select Funds. By investing in this Fund, you will incur the expenses of the Fund, in addition to those of the underlying Select Funds. The principal risks of the Fund will change depending on the asset mix of the Select Funds in which it invests. You may directly invest in the Select Funds. The Fund’s value will go up and down in response to changes in the share prices of the investments that it owns. The amount invested in the Fund is not guaranteed to increase, is not guaranteed against loss nor is the amount of the original investment guaranteed at the target date. It is possible to lose money by investing in the Fund.
At December 31, 2013, the portfolio holdings of the Fund, as a percentage of net assets, is shown in the following table. Portfolio holdings are subject to risk and may change at any time.
| | | | |
| | | % | |
Fixed Income Select Funds | | | 47.1 | |
U.S. Equity Select Funds | | | 23.3 | |
Real Return Select Funds | | | 19.5 | |
Non-U.S. Equity Select Funds | | | 8.0 | |
Credit Suisse Commodity Return Strategy | | | 2.0 | |
| | | | |
U.S. Equity Select Funds | | | 99.9 | |
| | | | |
18
MyDestination 2005 Fund (Unaudited)
| | | | |
| Average Annual Total Returns as of 12/31/13 |
| | GS4 Class* | | Benchmark** |
One Year | | 6.18% | | 6.06% |
Five Year | | 9.85% | | 8.80% |
Since Inception | | 3.96% | | 4.05% |
Inception Date | | 12/29/06 | | |
Total Fund Operating Expenses (May 1, 2013 Prospectus, as amended on October 31, 2013)(1) | | 1.13% | | |
(1)The Fund’s shareholders indirectly bear the expenses of the GS4 Class shares of the Select Funds in which the Fund invests. Current information regarding the Fund’s Operating Expenses can be found in the Financial Highlights.
The performance data quoted represents past performance and does not guarantee future results. Current performance may be lower or higher. Performance data current to the most recent month-end may be obtained at www.GuideStoneFunds.org. The investment return and principal value of an investment will fluctuate so that shares, when redeemed, may be worth more or less than their original cost.
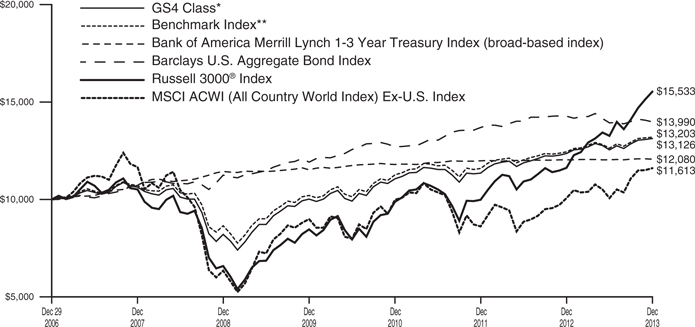
The graph illustrates the results of a hypothetical $10,000 investment in the GS4 Class of the Fund since December 29, 2006 (commencement of operations), with all dividends and capital gains reinvested, with the Fund’s composite benchmark index.
*These returns reflect expense waivers by the Fund’s investment adviser. Without these waivers, returns would have been lower. Returns shown do not reflect the deduction of taxes that a shareholder would pay on Fund distributions or the redemption of Fund shares.
**Represents a composite index as of December 2013, consisting of 32.55% of the Bank of America Merrill Lynch 1-3 Year Treasury Index, 11.16% of the Barclays U.S. Aggregate Bond Index, 1.39% of the Barclays Global Aggregate Bond Index — Unhedged, 0.70% of the Barclays U.S. Corporate High Yield — 2% Issuer Capped Index, 0.70% of the J.P. Morgan Emerging Markets Bond Index Plus, 12.00% of the Barclays U.S. TIPS Index, 11.50% of the S&P 500® Index, 5.00% of the S&P U.S. BB-Ratings and Above Loan Index, 1.00% of the FTSE EPRA/NAREIT Developed Index, 5.36% of the Russell 1000® Value Index, 5.36% of the Russell 1000® Growth Index, 1.28% of the Russell 2000® Index, 2.00% of the Dow Jones — UBS Commodity Index, 1.50% of the MSCI World Commodity Producers Index, 0.50% of the NYSE Gold Miners Index, 6.24% of the MSCI EAFE Index and 1.76% of the MSCI EM Index.
The construction of the composite index corresponds to the target percentage allocations to the underlying asset classes as represented by the Fund’s investment in the Select Funds. As the target percentage allocations to the underlying investments change according to the MyDestination Funds® glide path, the target percentage allocations to the composite index also change.
Unlike a mutual fund, the performance of an index assumes no taxes, transaction costs, management fees or other expenses.
19
| | | | |
MYDESTINATION 2005 FUND SCHEDULE OF INVESTMENTS | | | December 31, 2013 | |
| | | | | | | | | | | | |
| | | Shares | | | Value | |
MUTUAL FUNDS — 99.9% | | | | | | | |
GuideStone Money Market Fund (GS4 Class)¥ | | | | | 1,750,776 | | | | | $ | 1,750,776 | |
GuideStone Low-Duration Bond Fund (GS4 Class)¥ | | | | | 1,995,753 | | | | | | 26,643,303 | |
GuideStone Medium-Duration Bond Fund (GS4 Class)¥ | | | | | 659,172 | | | | | | 9,314,107 | |
GuideStone Global Bond Fund (GS4 Class)¥ | | | | | 228,546 | | | | | | 2,303,743 | |
GuideStone Defensive Market Strategies Fund (GS4 Class)¥ | | | | | 841,960 | | | | | | 9,615,183 | |
GuideStone Value Equity Fund (GS4 Class)¥ | | | | | 215,730 | | | | | | 4,530,323 | |
GuideStone Growth Equity Fund (GS4 Class)¥ | | | | | 196,232 | | | | | | 4,515,306 | |
GuideStone Small Cap Equity Fund
(GS4 Class)¥ | | | | | 59,935 | | | | | | 1,089,610 | |
GuideStone International Equity Fund
(GS4 Class)¥ | | | | | 349,026 | | | | | | 5,319,158 | |
GuideStone Emerging Market Equity Fund (GS4 Class)*¥ | | | | | 151,347 | | | | | | 1,475,630 | |
GuideStone Inflation Protected Bond Fund (GS4 Class)¥ | | | | | 973,987 | | | | | | 9,885,972 | |
GuideStone Flexible Income Fund (GS4 Class)¥ | | | | | 410,804 | | | | | | 4,132,693 | |
GuideStone Real Estate Securities Fund
(GS4 Class)¥ | | | | | 88,772 | | | | | | 830,902 | |
GuideStone Global Natural Resources Equity Fund
(GS4 Class)¥ | | | | | 169,969 | | | | | | 1,650,400 | |
Credit Suisse Commodity Return Strategy Fund | | | | | 232,564 | | | | | | 1,681,440 | |
| | | | | | | | | | | | |
| | | | |
Total Mutual Funds
(Cost $81,366,443) | | | | | | | | | | | 84,738,546 | |
| | | | | | | | | | | | |
| | |
TOTAL INVESTMENTS — 99.9%
(Cost $81,366,443) | | | | | | 84,738,546 | |
| | | | |
Other Assets in Excess of
Liabilities — 0.1% | | | | | | | | | | | 78,130 | |
| | | | | | | | | | | | |
NET ASSETS — 100.0% | | | | | | | | | | $ | 84,816,676 | |
| | | | | | | | | | | | |
|
|
VALUATION HIERARCHY The following is a summary of the inputs used, as of December 31, 2013, in valuing the Fund’s investments carried at fair value: |
| | | | | | | | | | | | | | | | | | | | |
| | | Total
Value | | Level 1
Quoted Prices | | Level 2
Other Significant
Observable Inputs | | Level 3
Significant
Unobservable Inputs |
Assets: | | | | | | | | | | | | | | | | | | | | |
Investments in Securities: | | | | | | | | | | | | | | | | | | | | |
Mutual Funds | | | $ | 84,738,546 | | | | $ | 84,738,546 | | | | $ | — | | | | $ | — | |
| | | | | | | | | | | | | | | | | | | | |
Total Assets - Investments in Securities | | | $ | 84,738,546 | | | | $ | 84,738,546 | | | | $ | — | | | | $ | — | |
| | | | | | | | | | | | | | | | | | | | |
| | | | |
Other Financial Instruments*** | | | | | | | | | | | | | | | | | | | | |
Futures Contracts | | | $ | 18,103 | | | | $ | 18,103 | | | | $ | — | | | | $ | — | |
| | | | | | | | | | | | | | | | | | | | |
Total Assets - Other Financial Instruments | | | $ | 18,103 | | | | $ | 18,103 | | | | $ | — | | | | $ | — | |
| | | | | | | | | | | | | | | | | | | | |
***Other financial instruments are derivative instruments not reflected in the Schedule of Investments, such as futures, forwards and swap contracts, which are valued at the unrealized appreciation (depreciation) on the investment. Details of these investments can be found in the Notes to Financial Statements.
| | | | |
| 20 | | See Notes to Financial Statements. | | |
MyDestination 2015 Fund (Unaudited)
The Fund, through investments in the underlying Select Funds, combined a greater percentage of exposure to equity securities with a smaller percentage allocated to fixed income and real asset securities. The Fund followed an allocation glide path designed to become more conservative over time, and the December 2013 targeted allocations were approximately 30.01% Fixed income Select Funds, 37.19% U.S. Equity Select Funds, 12.47% Non-U.S. Equity Select Funds, 18.04% Real Return Select Funds and 2.29% Credit Suisse Commodity Return Strategy.
As a fund of funds, its performance was based on the performance of the underlying Select Funds. The Fund generated a positive return of 10.35% for the one-year period ended December 31, 2013. Overall exposure to the Equity Select Funds was a primary contributor to the Fund’s performance. The Defensive Market Strategies Fund was the largest contributor to absolute performance, followed by the Value Equity Fund and Growth Equity Fund. The Fund’s fixed income allocation detracted from investment returns, as the two largest fixed income allocations, the Low-Duration Bond Fund and the Medium-Duration Bond Fund, had negative investment returns for the year. Real assets also detracted from absolute performance, with the Inflation Protected Bond Fund being the primary detractor as it fell 8.64% for the year.
The Fund outperformed its composite benchmark in 2013 (10.35% versus 9.56%). The largest two contributors to relative outperformance were the Defensive Market Strategies Fund and the Value Equity Fund. The largest detractors to relative performance were the Global Natural Resources Equity Fund and the Low-Duration Bond Fund.
The Fund attempted to achieve its objective by investing in the Select Funds. The Fund is managed to a retirement date (“target date”) by adjusting the percentage of fixed income securities and equity securities to become more conservative each year until reaching the retirement year and then approximately 15 years thereafter. The target date in the name of the Fund is the approximate date when an investor plans to start withdrawing money. This Fund may be suitable for investors who want a simplified “one fund” retirement solution, are willing to pay slightly higher fees to get a diversified mix of investments that becomes more conservative over time and plan to retire at an age that is near the year 2015. The Fund’s value will fluctuate due to changes in interest rates. There is a risk that the issuer of a fixed-income investment may fail to pay interest or even principal due in a timely manner or at all. The Fund’s value will fluctuate due to business developments concerning a particular issuer, industry or country, as well as general market and economic conditions. The Fund is subject to risks presented by investments in foreign issuers, and changes in currency exchange rates relative to the U.S. dollar may negatively affect the values of foreign investments held by the Select Funds. By investing in this Fund, you will incur the expenses of the Fund, in addition to those of the underlying Select Funds. The principal risks of the Fund will change depending on the asset mix of the Select Funds in which it invests. You may directly invest in the Select Funds. The Fund’s value will go up and down in response to changes in the share prices of the investments that it owns. The amount invested in the Fund is not guaranteed to increase, is not guaranteed against loss nor is the amount of the original investment guaranteed at the target date. It is possible to lose money by investing in the Fund.
At December 31, 2013, the portfolio holdings of the Fund, as a percentage of net assets, is shown in the following table. Portfolio holdings are subject to risk and may change at any time.
| | | | |
| | | % | |
U.S. Equity Select Funds | | | 37.1 | |
Fixed Income Select Funds | | | 30.4 | |
Real Return Select Funds | | | 17.7 | |
Non-U.S. Equity Select Funds | | | 12.5 | |
Credit Suisse Commodity Return Strategy | | | 2.2 | |
| | | | |
| | | 99.9 | |
| | | | |
21
MyDestination 2015 Fund (Unaudited)
| | | | |
| Average Annual Total Returns as of 12/31/13 |
| | GS4 Class* | | Benchmark** |
One Year | | 10.35% | | 9.56% |
Five Year | | 12.42% | | 11.60% |
Since Inception | | 4.35% | | 4.50% |
Inception Date | | 12/29/06 | | |
Total Fund Operating Expenses (May 1, 2013 Prospectus, as amended on October 31, 2013)(1) | | 1.13% | | |
(1)The Fund’s shareholders indirectly bear the expenses of the GS4 Class shares of the Select Funds in which the Fund invests. Current information regarding the Fund’s Operating Expenses can be found in the Financial Highlights.
The performance data quoted represents past performance and does not guarantee future results. Current performance may be lower or higher. Performance data current to the most recent month-end may be obtained at www.GuideStoneFunds.org. The investment return and principal value of an investment will fluctuate so that shares, when redeemed, may be worth more or less than their original cost.
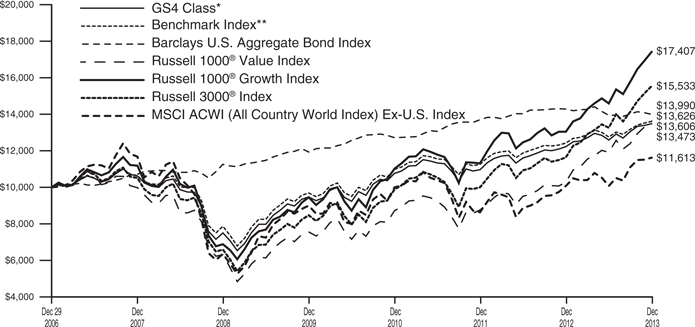
The graph illustrates the results of a hypothetical $10,000 investment in the GS4 Class of the Fund since December 29, 2006 (commencement of operations), with all dividends and capital gains reinvested, with the Fund’s composite benchmark index.
*These returns reflect expense waivers by the Fund’s investment adviser. Without these waivers, returns would have been lower. Returns shown do not reflect the deduction of taxes that a shareholder would pay on Fund distributions or the redemption of Fund shares.
**Represents a composite index as of December 2013, consisting of 11.70% of the Bank of America Merrill Lynch 1-3 Year Treasury Index, 12.00% of the Barclays U.S. Aggregate Bond Index, 0.82% of the Barclays U.S. Long-Term Government Bond Index, 0.83% of the Barclays U.S. Long-Term Credit Bond Index, 2.33% of the Barclays Global Aggregate Bond Index — Unhedged, 1.16% of the Barclays U.S. Corporate High Yield — 2% Issuer Capped Index, 1.16% of the J.P. Morgan Emerging Markets Bond Index Plus, 10.00% of the Barclays U.S. TIPS Index, 18.50% of the S&P 500® Index, 4.00% of the S&P U.S. BB-Ratings and Above Loan Index, 2.00% of the FTSE EPRA/NAREIT Developed Index, 8.22% of the Russell 1000® Value Index, 8.22% of the Russell 1000® Growth Index, 2.16% of the Russell 2000® Index, 2.25% of the Dow Jones — UBS Commodity Index, 1.69% of the MSCI World Commodity Producers Index, 0.56% of the NYSE Gold Miners Index, 9.67% of the MSCI EAFE Index and 2.73% of the MSCI EM Index.
The construction of the composite index corresponds to the target percentage allocations to the underlying asset classes as represented by the Fund’s investment in the Select Funds. As the target percentage allocations to the underlying investments change according to the MyDestination Funds® glide path, the target percentage allocations to the composite index also change.
Unlike a mutual fund, the performance of an index assumes no taxes, transaction costs, management fees or other expenses.
22
| | |
MYDESTINATION 2015 FUND SCHEDULE OF INVESTMENTS | | December 31, 2013 |
| | | | | | | | | | | | |
| | | Shares | | | Value | |
MUTUAL FUNDS — 99.9% | |
GuideStone Money Market Fund (GS4 Class)¥ | | | | | 6,090,835 | | | | | $ | 6,090,835 | |
GuideStone Low-Duration Bond Fund
(GS4 Class)¥ | | | | | 3,742,460 | | | | | | 49,961,846 | |
GuideStone Medium-Duration Bond Fund (GS4 Class)¥ | | | | | 3,626,918 | | | | | | 51,248,345 | |
GuideStone Extended-Duration Bond Fund (GS4 Class)¥ | | | | | 435,006 | | | | | | 7,125,395 | |
GuideStone Global Bond Fund (GS4 Class)¥ | | | | | 1,953,115 | | | | | | 19,687,399 | |
GuideStone Defensive Market Strategies Fund (GS4 Class)¥ | | | | | 6,929,959 | | | | | | 79,140,133 | |
GuideStone Value Equity Fund (GS4 Class)¥ | | | | | 1,753,852 | | | | | | 36,830,884 | |
GuideStone Growth Equity Fund (GS4 Class)¥ | | | | | 1,623,662 | | | | | | 37,360,474 | |
GuideStone Small Cap Equity Fund
(GS4 Class)¥ | | | | | 543,366 | | | | | | 9,878,392 | |
GuideStone International Equity Fund
(GS4 Class)¥ | | | | | 2,859,281 | | | | | | 43,575,438 | |
GuideStone Emerging Market Equity Fund (GS4 Class)*¥ | | | | | 1,195,130 | | | | | | 11,652,513 | |
GuideStone Inflation Protected Bond Fund (GS4 Class)¥ | | | | | 4,180,850 | | | | | | 42,435,631 | |
GuideStone Flexible Income Fund
(GS4 Class)¥ | | | | | 1,697,044 | | | | | | 17,072,258 | |
GuideStone Real Estate Securities Fund (GS4 Class)¥ | | | | | 931,983 | | | | | | 8,723,360 | |
GuideStone Global Natural Resources Equity Fund
(GS4 Class)¥ | | | | | 1,015,658 | | | | | | 9,862,035 | |
Credit Suisse Commodity Return Strategy Fund | | | | | 1,306,830 | | | | | | 9,448,379 | |
| | | | | | | | | | | | |
| | | | |
Total Mutual Funds
(Cost $397,719,630) | | | | | | | | | | | 440,093,317 | |
| | | | | | | | | | | | |
| | |
TOTAL INVESTMENTS — 99.9%
(Cost $397,719,630) | | | | | | 440,093,317 | |
| | | | |
Other Assets in Excess of
Liabilities — 0.1% | | | | | | | | | | | 387,745 | |
| | | | | | | | | | | | |
NET ASSETS — 100.0% | | | | | | | | | | $ | 440,481,062 | |
| | | | | | | | | | | | |
VALUATION HIERARCHY
The following is a summary of the inputs used, as of December 31, 2013, in valuing the Fund’s investments carried at fair value:
| | | | | | | | | | | | | | | | | | | | |
| | | Total
Value | | Level 1
Quoted Prices | | Level 2
Other Significant
Observable Inputs | | Level 3
Significant
Unobservable Inputs |
Assets: | | | | | | | | | | | | | | | | | | | | |
Investments in Securities: | | | | | | | | | | | | | | | | | | | | |
Mutual Funds | | | $ | 440,093,317 | | | | $ | 440,093,317 | | | | $ | — | | | | $ | — | |
| | | | | | | | | | | | | | | | | | | | |
Total Assets - Investments in Securities | | | $ | 440,093,317 | | | | $ | 440,093,317 | | | | $ | — | | | | $ | — | |
| | | | | | | | | | | | | | | | | | | | |
| | | | |
Other Financial Instruments*** | | | | | | | | | | | | | | | | | | | | |
Futures Contracts | | | $ | 100,500 | | | | $ | 100,500 | | | | $ | — | | | | $ | — | |
| | | | | | | | | | | | | | | | | | | | |
Total Assets - Other Financial Instruments | | | $ | 100,500 | | | | $ | 100,500 | | | | $ | — | | | | $ | — | |
| | | | | | | | | | | | | | | | | | | | |
***Other financial instruments are derivative instruments not reflected in the Schedule of Investments, such as futures, forwards and swap contracts, which are valued at the unrealized appreciation (depreciation) on the investment. Details of these investments can be found in the Notes to Financial Statements.
| | | | |
| | See Notes to Financial Statements. | | 23 |
MyDestination 2025 Fund (Unaudited)
The Fund, through investments in the underlying Select Funds, combined a greater percentage of exposure to equity securities with smaller percentages allocated to fixed income and real asset securities. The Fund followed an allocation glide path designed to become more conservative over time, and the December 2013 targeted allocations were approximately 24.42% Fixed Income Select Funds, 44.45% U.S. Equity Select Funds, 18.30% Non-U.S. Equity Select Funds, 9.83% Real Return Select Funds and 3.00% Credit Suisse Commodity Return Strategy.
As a fund of funds, its performance was based on the performance of the underlying Select Funds. The Fund generated a positive return of 15.15% for the one-year period ended December 31, 2013. Overall exposure to the Equity Select Funds was a primary contributor to the Fund’s performance. The Value Equity Fund was the largest contributor to absolute performance, followed by the Growth Equity Fund and Defensive Market Strategies Fund. The Fund’s fixed income allocation detracted from investment returns, with the Extended-Duration Bond Fund being the largest single detractor with a -5.29% return in 2013. Real assets also detracted from absolute performance, with the Inflation Protected Bond Fund being the primary detractor as it fell 8.64% for the year.
The Fund outperformed its composite benchmark in 2013 (15.15% versus 14.05%). The largest two contributors to relative outperformance were the Defensive Market Strategies Fund and the Value Equity Fund. The largest detractor to relative performance was the Global Natural Resources Equity Fund.
The Fund attempted to achieve its objective by investing in the Select Funds. The Fund is managed to a retirement date (“target date”) by adjusting the percentage of fixed income securities and equity securities to become more conservative each year until reaching the retirement year and then approximately 15 years thereafter. The target date in the name of the Fund is the approximate date when an investor plans to start withdrawing money. This Fund may be suitable for investors who want a simplified “one fund” retirement solution, are willing to pay slightly higher fees to get a diversified mix of investments that becomes more conservative over time and plan to retire at an age that is near the year 2025. The Fund’s value will fluctuate due to changes in interest rates. There is a risk that the issuer of a fixed-income investment may fail to pay interest or even principal due in a timely manner or at all. The Fund’s value will fluctuate due to business developments concerning a particular issuer, industry or country, as well as general market and economic conditions. The Fund is subject to risks presented by investments in foreign issuers, and changes in currency exchange rates relative to the U.S. dollar may negatively affect the values of foreign investments held by the Select Funds. By investing in this Fund, you will incur the expenses of the Fund, in addition to those of the underlying Select Funds. The principal risks of the Fund will change depending on the asset mix of the Select Funds in which it invests. You may directly invest in the Select Funds. The Fund’s value will go up and down in response to changes in the share prices of the investments that it owns. The amount invested in the Fund is not guaranteed to increase, is not guaranteed against loss nor is the amount of the original investment guaranteed at the target date. It is possible to lose money by investing in the Fund.
At December 31, 2013, the portfolio holdings of the Fund, as a percentage of net assets, is shown in the following table. Portfolio holdings are subject to risk and may change at any time.
| | | | |
| | | % | |
U.S. Equity Select Funds | | | 43.7 | |
Fixed Income Select Funds | | | 25.4 | |
Non-U.S. Equity Select Funds | | | 18.0 | |
Real Return Select Funds | | | 9.8 | |
Credit Suisse Commodity Return Strategy | | | 2.9 | |
| | | | |
| | | 99.8 | |
| | | | |
24
MyDestination 2025 Fund (Unaudited)
| | | | |
| Average Annual Total Returns as of 12/31/13 |
| | GS4 Class* | | Benchmark** |
One Year | | 15.15% | | 14.05% |
Five Year | | 14.54% | | 13.78% |
Since Inception | | 4.35% | | 4.63% |
Inception Date | | 12/29/06 | | |
Total Fund Operating Expenses (May 1, 2013 Prospectus, as amended on October 31, 2013)(1) | | 1.21% | | |
(1)The Fund’s shareholders indirectly bear the expenses of the GS4 Class shares of the Select Funds in which the Fund invests. Current information regarding the Fund’s Operating Expenses can be found in the Financial Highlights.
The performance data quoted represents past performance and does not guarantee future results. Current performance may be lower or higher. Performance data current to the most recent month-end may be obtained at www.GuideStoneFunds.org. The investment return and principal value of an investment will fluctuate so that shares, when redeemed, may be worth more or less than their original cost.
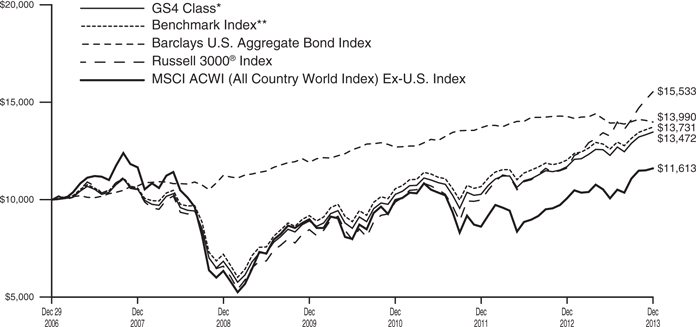
The graph illustrates the results of a hypothetical $10,000 investment in the GS4 Class of the Fund since December 29, 2006 (commencement of operations), with all dividends and capital gains reinvested, with the Fund’s composite benchmark index.
*These returns reflect expense waivers by the Fund’s investment adviser. Without these waivers, returns would have been lower. Returns shown do not reflect the deduction of taxes that a shareholder would pay on Fund distributions or the redemption of Fund shares.
**Represents a composite index as of December 2013, consisting of 5.39% of the Bank of America Merrill Lynch 1-3 Year Treasury Index, 9.80% of the Barclays U.S. Aggregate Bond Index, 1.22% of the Barclays U.S. Long-Term Government Bond Index, 1.23% of the Barclays U.S. Long-Term Credit Bond Index, 3.43% of the Barclays Global Aggregate Bond Index — Unhedged, 1.72% of the Barclays U.S. Corporate High Yield — 2% Issuer Capped Index, 1.71% of the J.P. Morgan Emerging Markets Bond Index Plus, 3.00% of the Barclays U.S. TIPS Index, 17.25% of the S&P 500® Index, 1.00% of the S&P U.S. BB-Ratings and Above Loan Index, 3.00% of the FTSE EPRA/NAREIT Developed Index, 11.85% of the Russell 1000® Value Index, 11.85% of the Russell 1000® Growth Index, 3.45% of the Russell 2000® Index, 3.00% of the Dow Jones — UBS Commodity Index, 2.25% of the MSCI World Commodity Producers Index, 0.75% of the NYSE Gold Miners Index, 14.12% of the MSCI EAFE Index and 3.98% of the MSCI EM Index.
The construction of the composite index corresponds to the target percentage allocations to the underlying asset classes as represented by the Fund’s investment in the Select Funds. As the target percentage allocations to the underlying investments change according to the MyDestination Funds® glide path, the target percentage allocations to the composite index also change.
Unlike a mutual fund, the performance of an index assumes no taxes, transaction costs, management fees or other expenses.
25
| | |
MYDESTINATION 2025 FUND SCHEDULE OF INVESTMENTS | | December 31, 2013 |
| | | | | | | | | | | | |
| | | Shares | | | Value | |
MUTUAL FUNDS — 99.8% | | | | | | | |
GuideStone Money Market Fund (GS4 Class)¥ | | | | | 8,386,521 | | | | | $ | 8,386,521 | |
GuideStone Low-Duration Bond Fund
(GS4 Class)¥ | | | | | 2,142,581 | | | | | | 28,603,451 | |
GuideStone Medium-Duration Bond Fund (GS4 Class)¥ | | | | | 3,685,288 | | | | | | 52,073,121 | |
GuideStone Extended-Duration Bond Fund (GS4 Class)¥ | | | | | 794,032 | | | | | | 13,006,251 | |
GuideStone Global Bond Fund (GS4 Class)¥ | | | | | 3,621,086 | | | | | | 36,500,550 | |
GuideStone Defensive Market Strategies Fund (GS4 Class)¥ | | | | | 7,919,283 | | | | | | 90,438,214 | |
GuideStone Value Equity Fund (GS4 Class)¥ | | | | | 3,070,994 | | | | | | 64,490,884 | |
GuideStone Growth Equity Fund (GS4 Class)¥ | | | | | 2,816,864 | | | | | | 64,816,050 | |
GuideStone Small Cap Equity Fund
(GS4 Class)¥ | | | | | 1,037,984 | | | | | | 18,870,550 | |
GuideStone International Equity Fund
(GS4 Class)¥ | | | | | 5,057,072 | | | | | | 77,069,778 | |
GuideStone Emerging Market Equity Fund (GS4 Class)*¥ | | | | | 2,169,546 | | | | | | 21,153,075 | |
GuideStone Inflation Protected Bond Fund (GS4 Class)¥ | | | | | 1,562,428 | | | | | | 15,858,641 | |
GuideStone Flexible Income Fund
(GS4 Class)¥ | | | | | 517,829 | | | | | | 5,209,362 | |
GuideStone Real Estate Securities Fund (GS4 Class)¥ | | | | | 1,714,866 | | | | | | 16,051,144 | |
GuideStone Global Natural Resources Equity Fund (GS4 Class)¥ | | | | | 1,677,256 | | | | | | 16,286,154 | |
Credit Suisse Commodity Return Strategy Fund | | | | | 2,194,800 | | | | | | 15,868,402 | |
| | | | | | | | | | | | |
Total Mutual Funds
(Cost $483,216,107) | | | | | | 544,682,148 | |
| | | | | | | | | | | | |
TOTAL INVESTMENTS — 99.8%
(Cost $483,216,107) | | | | | | 544,682,148 | |
Other Assets in Excess of
Liabilities — 0.2% | | | | | | 969,892 | |
| | | | | | | | | | | | |
NET ASSETS — 100.0% | | | | | $ | 545,652,040 | |
| | | | | | | | | | | | |
|
VALUATION HIERARCHY |
| The following is a summary of the inputs used, as of December 31, 2013, in valuing the Fund’s investments carried at fair value: |
| | | | | | | | | | | | | | | | | | | | |
| | | Total
Value | | Level 1
Quoted Prices | | Level 2
Other Significant
Observable Inputs | | Level 3
Significant
Unobservable Inputs |
Assets: | | | | | | | | | | | | | | | | | | | | |
Investments in Securities: | | | | | | | | | | | | | | | | | | | | |
Mutual Funds | | | $ | 544,682,148 | | | | $ | 544,682,148 | | | | $ | — | | | | $ | — | |
| | | | | | | | | | | | | | | | | | | | |
Total Assets - Investments in Securities | | | $ | 544,682,148 | | | | $ | 544,682,148 | | | | $ | — | | | | $ | — | |
| | | | | | | | | | | | | | | | | | | | |
| | | | |
Other Financial Instruments*** | | | | | | | | | | | | | | | | | | | | |
Futures Contracts | | | $ | 182,494 | | | | $ | 182,494 | | | | $ | — | | | | $ | — | |
| | | | | | | | | | | | | | | | | | | | |
Total Assets - Other Financial Instruments | | | $ | 182,494 | | | | $ | 182,494 | | | | $ | — | | | | $ | — | |
| | | | | | | | | | | | | | | | | | | | |
***Other financial instruments are derivative instruments not reflected in the Schedule of Investments, such as futures, forwards and swap contracts, which are valued at the unrealized appreciation (depreciation) on the investment. Details of these investments can be found in the Notes to Financial Statements.
| | | | |
| 26 | | See Notes to Financial Statements. | | |
MyDestination 2035 Fund (Unaudited)
The Fund, through investments in the underlying Select Funds, combines a high percentage of exposure to equity securities with only modest percentages to fixed income and real asset securities. The Fund followed an allocation glide path designed to become more conservative over time, and the December 2013 targeted allocations were approximately 14.00% Fixed Income Select Funds, 45.60% U.S. Equity Select Funds, 30.40% Non-U.S. Equity Select Funds, 6.67% Real Return Select Funds and 3.33% Credit Suisse Commodity Return Strategy.
As a fund of funds, its performance was based on the performance of the underlying Select Funds. Equity exposure represented approximately 76% of the Fund and, therefore, contributed most of the Fund’s return. The Fund generated a positive return of 21.41% for the one-year period ended December 31, 2013. The Value Equity Fund was the largest contributor to absolute performance, followed by the Growth Equity Fund and International Equity Fund. The Fund’s fixed income allocation detracted from investment returns, with the Extended-Duration Bond Fund being the largest single detractor with a -5.29% return in 2013. Real assets had a modestly positive contribution to absolute performance, with the Real Estate Securities Fund being the primary contributor.
The Fund outperformed its composite benchmark in 2013 (21.41% versus 20.55%). The largest two contributors to relative outperformance were the Value Equity Fund and International Equity Fund. The largest detractor to relative performance was the Global Natural Resources Equity Fund.
The Fund attempted to achieve its objective by investing in the Select Funds. The Fund is managed to a retirement date (“target date”) by adjusting the percentage of fixed income securities and equity securities to become more conservative each year until reaching the retirement year and then approximately 15 years thereafter. The target date in the name of the Fund is the approximate date when an investor plans to start withdrawing money. This Fund may be suitable for investors who want a simplified “one fund” retirement solution, are willing to pay slightly higher fees to get a diversified mix of investments that becomes more conservative over time and plan to retire at an age that is near the year 2035. The Fund’s value will fluctuate due to changes in interest rates. There is a risk that the issuer of a fixed-income investment may fail to pay interest or even principal due in a timely manner or at all. The Fund’s value will fluctuate due to business developments concerning a particular issuer, industry or country, as well as general market and economic conditions. The Fund is subject to risks presented by investments in foreign issuers, and changes in currency exchange rates relative to the U.S. dollar may negatively affect the values of foreign investments held by the Select Funds. By investing in this Fund, you will incur the expenses of the Fund, in addition to those of the underlying Select Funds. The principal risks of the Fund will change depending on the asset mix of the Select Funds in which it invests. You may directly invest in the Select Funds. The Fund’s value will go up and down in response to changes in the share prices of the investments that it owns. The amount invested in the Fund is not guaranteed to increase, is not guaranteed against loss nor is the amount of the original investment guaranteed at the target date. It is possible to lose money by investing in the Fund.
At December 31, 2013, the portfolio holdings of the Fund, as a percentage of net assets, is shown in the following table. Portfolio holdings are subject to risk and may change at any time.
| | | | |
| | | % | |
U.S. Equity Select Funds | | | 44.7 | |
Non-U.S. Equity Select Funds | | | 30.0 | |
Fixed Income Select Funds | | | 15.5 | |
Real Return Select Funds | | | 6.5 | |
Credit Suisse Commodity Return Strategy | | | 3.2 | |
| | | | |
| | | 99.9 | |
| | | | |
27
MyDestination 2035 Fund (Unaudited)
| | | | | | |
| Average Annual Total Returns as of 12/31/13 |
| | | GS4 Class* | | | | Benchmark** |
One Year | | 21.41% | | | | 20.55% |
Five Year | | 15.79% | | | | 15.81% |
Since Inception | | 4.25% | | | | 4.79% |
Inception Date | | 12/29/06 | | | | |
Total Fund Operating Expenses (May 1, 2013 Prospectus, as amended on October 31, 2013)(1) | | 1.27% | | | | |
(1)The Fund’s shareholders indirectly bear the expenses of the GS4 Class shares of the Select Funds in which the Fund invests. Current information regarding the Fund’s Operating Expenses can be found in the Financial Highlights.
The performance data quoted represents past performance and does not guarantee future results. Current performance may be lower or higher. Performance data current to the most recent month-end may be obtained at www.GuideStoneFunds.org. The investment return and principal value of an investment will fluctuate so that shares, when redeemed, may be worth more or less than their original cost.
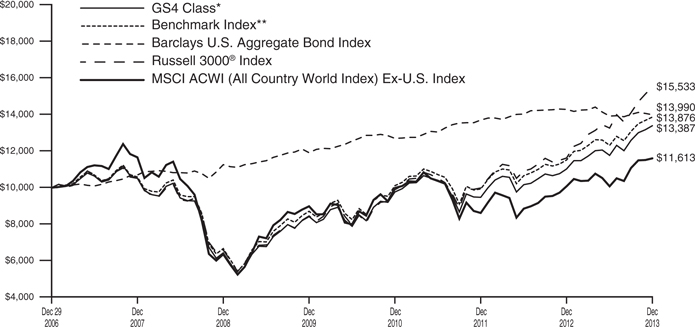
The graph illustrates the results of a hypothetical $10,000 investment in the GS4 Class of the Fund since December 29, 2006 (commencement of operations), with all dividends and capital gains reinvested, with the Fund’s composite benchmark index.
*These returns reflect expense waivers by the Fund’s investment adviser. Without these waivers, returns would have been lower. Returns shown do not reflect the deduction of taxes that a shareholder would pay on Fund distributions or the redemption of Fund shares.
**Represents a composite index as of December 2013, consisting of 3.08% of the Barclays U.S. Aggregate Bond Index, 1.47% of the Barclays U.S. Long-Term Government Bond Index, 1.47% of the Barclays U.S. Long-Term Credit Bond Index, 3.99% of the Barclays Global Aggregate Bond Index — Unhedged, 1.99% of the Barclays U.S. Corporate High Yield — 2% Issuer Capped Index, 2.00% of the J.P. Morgan Emerging Markets Bond Index Plus, 3.33% of the FTSE EPRA/NAREIT Developed Index, 19.49% of the Russell 1000® Value Index, 19.49% of the Russell 1000® Growth Index, 6.62% of the Russell 2000® Index, 3.33% of the Dow Jones — UBS Commodity Index, 2.50% of the MSCI World Commodity Producers Index, 0.84% of the NYSE Gold Miners Index, 23.71% of the MSCI EAFE Index and 6.69% of the MSCI EM Index.
The construction of the composite index corresponds to the target percentage allocations to the underlying asset classes as represented by the Fund’s investment in the Select Funds. As the target percentage allocations to the underlying investments change according to the MyDestination Funds® glide path, the target percentage allocations to the composite index also change.
Unlike a mutual fund, the performance of an index assumes no taxes, transaction costs, management fees or other expenses.
28
| | |
MYDESTINATION 2035 FUND SCHEDULE OF INVESTMENTS | | December 31, 2013 |
| | | | | | | | | | | | |
| | | Shares | | | Value | |
MUTUAL FUNDS — 99.9% | | | | | | | |
GuideStone Money Market Fund (GS4 Class)¥ | | | | | 5,601,401 | | | | | $ | 5,601,401 | |
GuideStone Medium-Duration Bond Fund (GS4 Class)¥ | | | | | 616,657 | | | | | | 8,713,362 | |
GuideStone Extended-Duration Bond Fund (GS4 Class)¥ | | | | | 508,683 | | | | | | 8,332,236 | |
GuideStone Global Bond Fund (GS4 Class)¥ | | | | | 2,236,710 | | | | | | 22,546,037 | |
GuideStone Value Equity Fund (GS4 Class)¥ | | | | | 2,654,596 | | | | | | 55,746,522 | |
GuideStone Growth Equity Fund (GS4 Class)¥ | | | | | 2,423,521 | | | | | | 55,765,221 | |
GuideStone Small Cap Equity Fund
(GS4 Class)¥ | | | | | 1,042,445 | | | | | | 18,951,646 | |
GuideStone International Equity Fund
(GS4 Class)¥ | | | | | 4,486,899 | | | | | | 68,380,341 | |
GuideStone Emerging Market Equity Fund (GS4 Class)*¥ | | | | | 1,953,930 | | | | | | 19,050,818 | |
GuideStone Real Estate Securities Fund (GS4 Class)¥ | | | | | 1,019,166 | | | | | | 9,539,390 | |
GuideStone Global Natural Resources Equity Fund
(GS4 Class)¥ | | | | | 981,429 | | | | | | 9,529,671 | |
Credit Suisse Commodity Return Strategy Fund | | | | | 1,284,784 | | | | | | 9,288,985 | |
| | | | | | | | | | | | |
Total Mutual Funds
(Cost $250,539,163) | | | | | | | | | | | 291,445,630 | |
| | | | | | | | | | | | |
TOTAL INVESTMENTS — 99.9%
(Cost $250,539,163) | | | | | | 291,445,630 | |
Other Assets in Excess of
Liabilities — 0.1% | | | | | | | | | | | 427,895 | |
| | | | | | | | | | | | |
NET ASSETS — 100.0% | | | | | | | | | | $ | 291,873,525 | |
| | | | | | | | | | | | |
VALUATION HIERARCHY
The following is a summary of the inputs used, as of December 31, 2013, in valuing the Fund’s investments carried at fair value:
| | | | | | | | | | | | | | | | | | | | |
| | | Total
Value | | Level 1
Quoted Prices | | Level 2
Other Significant
Observable Inputs | | Level 3
Significant
Unobservable Inputs |
Assets: | | | | | | | | | | | | | | | | | | | | |
Investments in Securities: | | | | | | | | | | | | | | | | | | | | |
Mutual Funds | | | $ | 291,445,630 | | | | $ | 291,445,630 | | | | $ | — | | | | $ | — | |
| | | | | | | | | | | | | | | | | | | | |
Total Assets - Investments in Securities | | | $ | 291,445,630 | | | | $ | 291,445,630 | | | | $ | — | | | | $ | — | |
| | | | | | | | | | | | | | | | | | | | |
| | | | |
Liabilities: | | | | | | | | | | | | | | | | | | | | |
Other Financial Instruments*** | | | | | | | | | | | | | | | | | | | | |
Futures Contracts | | | $ | 160,230 | | | | $ | 160,230 | | | | $ | — | | | | $ | — | |
| | | | | | | | | | | | | | | | | | | | |
Total Liabilities - Other Financial Instruments | | | $ | 160,230 | | | | $ | 160,230 | | | | $ | — | | | | $ | — | |
| | | | | | | | | | | | | | | | | | | | |
***Other financial instruments are derivative instruments not reflected in the Schedule of Investments, such as futures, forwards and swap contracts, which are valued at the unrealized appreciation (depreciation) on the investment. Details of these investments can be found in the Notes to Financial Statements.
| | | | |
| | See Notes to Financial Statements. | | 29 |
MyDestination 2045 Fund (Unaudited)
The Fund, through investments in the underlying Select Funds, combined a high percentage of exposure to equity securities with only modest percentages allocated to fixed income and real asset securities. The Fund followed an allocation glide path designed to become more conservative over time, and the December 2013 targeted allocations were approximately 6.50% Fixed Income Select Funds, 50.10% U.S. Equity Select Funds, 33.40% Non-U.S. Equity Select Funds, 6.67% Real Return Select Funds and 3.33% Credit Suisse Commodity Return Strategy.
As a fund of funds, its performance was based on the performance of the underlying Select Funds. Equity exposure represented approximately 83.5% of the Fund and, therefore, contributed most of the Fund’s returns. The Fund generated a positive return of 23.44% for the one-year period ended December 31, 2013. The Value Equity Fund was the largest contributor to absolute performance, followed by the Growth Equity Fund and the International Equity Fund. The Fund’s fixed income allocation detracted modestly from investment returns, with the Extended-Duration Bond Fund being the largest single detractor with a -5.29% return in 2013. The Real Assets Fund had a modestly positive contribution to absolute performance, with the Real Estate Securities Fund being the primary contributor.
The Fund outperformed its composite benchmark in 2013 (23.44% versus 22.88%). The largest two contributors to relative outperformance were the Value Equity Fund and International Equity Fund. The largest detractor to relative performance was the Global Natural Resources Equity Fund.
The Fund attempted to achieve its objective by investing in the Select Funds. The Fund is managed to a retirement date (“target date”) by adjusting the percentage of fixed income securities and equity securities to become more conservative each year until reaching the retirement year and then approximately 15 years thereafter. The target date in the name of the Fund is the approximate date when an investor plans to start withdrawing money. This Fund may be suitable for investors who want a simplified “one fund” retirement solution, are willing to pay slightly higher fees to get a diversified mix of investments that becomes more conservative over time and plan to retire at an age that is near the year 2045. The Fund’s value will fluctuate due to changes in interest rates. There is a risk that the issuer of a fixed-income investment may fail to pay interest or even principal due in a timely manner or at all. The Fund’s value will fluctuate due to business developments concerning a particular issuer, industry or country, as well as general market and economic conditions. The Fund is subject to risks presented by investments in foreign issuers, and changes in currency exchange rates relative to the U.S. dollar may negatively affect the values of foreign investments held by the Select Funds. By investing in this Fund, you will incur the expenses of the Fund, in addition to those of the underlying Select Funds. The principal risks of the Fund will change depending on the asset mix of the Select Funds in which it invests. You may directly invest in the Select Funds. The Fund’s value will go up and down in response to changes in the share prices of the investments that it owns. The amount invested in the Fund is not guaranteed to increase, is not guaranteed against loss nor is the amount of the original investment guaranteed at the target date. It is possible to lose money by investing in the Fund.
At December 31, 2013, the portfolio holdings of the Fund, as a percentage of net assets, is shown in the following table. Portfolio holdings are subject to risk and may change at any time.
| | | | |
| | | % | |
U.S. Equity Select Funds | | | 48.8 | |
Non-U.S. Equity Select Funds | | | 32.9 | |
Fixed Income Select Funds | | | 8.3 | |
Real Return Select Funds | | | 6.5 | |
Credit Suisse Commodity Return Strategy | | | 3.2 | |
| | | | |
| | | 99.7 | |
| | | | |
30
MyDestination 2045 Fund (Unaudited)
| | | | | | |
| Average Annual Total Returns as of 12/31/13 |
| | | GS4 Class* | | | | Benchmark** |
One Year | | 23.44% | | | | 22.88% |
Five Year | | 16.19% | | | | 16.54% |
Since Inception | | 4.05% | | | | 4.66% |
Inception Date | | 12/29/06 | | | | |
Total Fund Operating Expenses (May 1, 2013 Prospectus, as amended on October 31, 2013)(1) | | 1.33% | | | | |
(1)The Fund’s shareholders indirectly bear the expenses of the GS4 Class shares of the Select Funds in which the Fund invests. Current information regarding the Fund’s Operating Expenses can be found in the Financial Highlights.
The performance data quoted represents past performance and does not guarantee future results. Current performance may be lower or higher. Performance data current to the most recent month-end may be obtained at www.GuideStoneFunds.org. The investment return and principal value of an investment will fluctuate so that shares, when redeemed, may be worth more or less than their original cost.
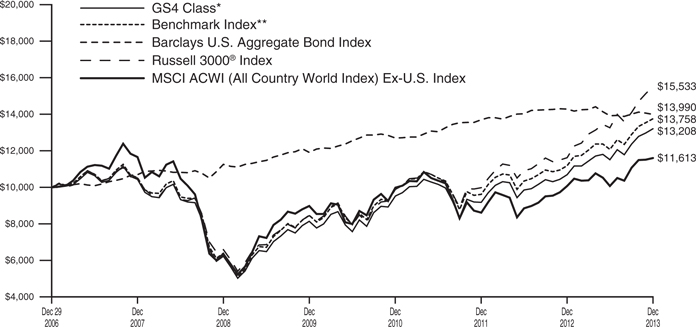
The graph illustrates the results of a hypothetical $10,000 investment in the GS4 Class of the Fund since December 29, 2006 (commencement of operations), with all dividends and capital gains reinvested, with the Fund’s composite benchmark index.
*These returns reflect expense waivers by the Fund’s investment adviser. Without these waivers, returns would have been lower. Returns shown do not reflect the deduction of taxes that a shareholder would pay on Fund distributions or the redemption of Fund shares.
**Represents a composite index as of December 2013, consisting of 0.50% of the Barclays U.S. Long-Term Government Bond Index, 0.50% of the Barclays U.S. Long-Term Credit Bond Index, 2.75% of the Barclays Global Aggregate Bond Index — Unhedged, 1.38% of the Barclays U.S. Corporate High Yield — 2% Issuer Capped Index, 1.37% of the J.P. Morgan Emerging Markets Bond Index Plus, 3.33% of the FTSE EPRA/NAREIT Developed Index, 21.14% of the Russell 1000® Value Index, 21.14% of the Russell 1000® Growth Index, 7.82% of the Russell 2000® Index, 3.33% of the Dow Jones — UBS Commodity Index, 2.50% of the MSCI World Commodity Producers Index, 0.84% of the NYSE Gold Miners Index, 26.05% of the MSCI EAFE Index and 7.35% of the MSCI EM Index.
The construction of the composite index corresponds to the target percentage allocations to the underlying asset classes as represented by the Fund’s investment in the Select Funds. As the target percentage allocations to the underlying investments change according to the MyDestination Funds® glide path, the target percentage allocations to the composite index also change. Unlike a mutual fund, the performance of an index assumes no taxes, transaction costs, management fees or other expenses.
31
| | |
MYDESTINATION 2045 FUND SCHEDULE OF INVESTMENTS | | December 31, 2013 |
| | | | | | | | | | | | |
| | | Shares | | | Value | |
MUTUAL FUNDS — 99.7% | | | | | | | |
GuideStone Money Market Fund (GS4 Class)¥ | | | | | 4,335,152 | | | | | $ | 4,335,152 | |
GuideStone Extended-Duration Bond Fund
(GS4 Class)¥ | | | | | 125,115 | | | | | | 2,049,390 | |
GuideStone Global Bond Fund (GS4 Class)¥ | | | | | 1,120,652 | | | | | | 11,296,170 | |
GuideStone Value Equity Fund (GS4 Class)¥ | | | | | 2,085,072 | | | | | | 43,786,511 | |
GuideStone Growth Equity Fund (GS4 Class)¥ | | | | | 1,898,119 | | | | | | 43,675,710 | |
GuideStone Small Cap Equity Fund
(GS4 Class)¥ | | | | | 887,344 | | | | | | 16,131,917 | |
GuideStone International Equity Fund
(GS4 Class)¥ | | | | | 3,576,294 | | | | | | 54,502,717 | |
GuideStone Emerging Market Equity Fund
(GS4 Class)*¥ | | | | | 1,557,837 | | | | | | 15,188,913 | |
GuideStone Real Estate Securities Fund
(GS4 Class)¥ | | | | | 744,039 | | | | | | 6,964,203 | |
GuideStone Global Natural Resources Equity Fund
(GS4 Class)¥ | | | | | 710,685 | | | | | | 6,900,755 | |
Credit Suisse Commodity
Return Strategy Fund | | | | | 931,174 | | | | | | 6,732,385 | |
| | | | | | | | | | | | |
Total Mutual Funds
(Cost $180,686,098) | | | | | | | | | | | 211,563,823 | |
| | | | | | | | | | | | |
TOTAL INVESTMENTS — 99.7%
(Cost $180,686,098) | | | | | | 211,563,823 | |
Other Assets in Excess of
Liabilities — 0.3% | | | | | | | | | | | 537,797 | |
| | | | | | | | | | | | |
NET ASSETS — 100.0% | | | | | | | | | | $ | 212,101,620 | |
| | | | | | | | | | | | |
VALUATION HIERARCHY
The following is a summary of the inputs used, as of December 31, 2013, in valuing the Fund’s investments carried at fair value:
| | | | | | | | | | | | | | | | | | | | |
| | | Total
Value | | Level 1
Quoted Prices | | Level 2
Other Significant
Observable Inputs | | Level 3
Significant
Unobservable Inputs |
Assets: | | | | | | | | | | | | | | | | | | | | |
Investments in Securities: | | | | | | | | | | | | | | | | | | | | |
Mutual Funds | | | $ | 211,563,823 | | | | $ | 211,563,823 | | | | $ | — | | | | $ | — | |
| | | | | | | | | | | | | | | | | | | | |
Total Assets - Investments in Securities | | | $ | 211,563,823 | | | | $ | 211,563,823 | | | | $ | — | | | | $ | — | |
| | | | | | | | | | | | | | | | | | | | |
| | | | |
Other Financial Instruments*** | | | | | | | | | | | | | | | | | | | | |
Futures Contracts | | | $ | 129,522 | | | | $ | 129,522 | | | | $ | — | | | | $ | — | |
| | | | | | | | | | | | | | | | | | | | |
Total Assets - Other Financial Instruments | | | $ | 129,522 | | | | $ | 129,522 | | | | $ | — | | | | $ | — | |
| | | | | | | | | | | | | | | | | | | | |
***Other financial instruments are derivative instruments not reflected in the Schedule of Investments, such as futures, forwards and swap contracts, which are valued at the unrealized appreciation (depreciation) on the investment. Details of these investments can be found in the Notes to Financial Statements.
| | | | |
| 32 | | See Notes to Financial Statements. | | |
MyDestination 2055 Fund (Unaudited)
The Fund, through investments in the underlying Select Funds, combined a high percentage of exposure to equity securities with only modest percentages allocated to fixed income and real asset securities. The Fund followed an allocation glide path designed to become more conservative over time, and the December 2013 targeted allocations were approximately 5.00% Fixed Income Select Funds, 51.00% U.S. Equity Select Funds, 34.00% Non-U.S. Equity Select Funds, 6.67% Real Return Select Funds and 3.33% Credit Suisse Commodity Return Strategy.
As a fund of funds, its performance was based on the performance of the underlying Select Funds. Equity exposure represented approximately 85% of the Fund and, therefore, contributed most of the Fund’s returns. The Fund generated a positive return of 23.44% for the one-year period ended December 31, 2013. The Value Equity Fund was the largest contributor to absolute performance, followed by the Growth Equity Fund and the International Equity Fund. The Fund’s fixed income allocation contributed marginally to investment returns, as the Global Bond Fund had a slightly positive return for the year. Real Assets had a modestly positive contribution to absolute performance, with the Real Estate Securities Fund being the primary contributor.
The Fund marginally outperformed its composite benchmark in 2013 (23.44% versus 23.33%). The largest two contributors to relative outperformance were the Value Equity Fund and International Equity Fund. The largest detractor to relative performance was the Global Natural Resources Equity Fund.
The Fund attempted to achieve its objective by investing in the Select Funds. The Fund is managed to a retirement date (“target date”) by adjusting the percentage of fixed income securities and equity securities to become more conservative each year until reaching the retirement year and then approximately 15 years thereafter. The target date in the name of the Fund is the approximate date when an investor plans to start withdrawing money. This Fund may be suitable for investors who want a simplified “one fund” retirement solution, are willing to pay slightly higher fees to get a diversified mix of investments that becomes more conservative over time and plan to retire at an age that is near the year 2055. The Fund’s value will fluctuate due to changes in interest rates. There is a risk that the issuer of a fixed-income investment may fail to pay interest or even principal due in a timely manner or at all. The Fund’s value will fluctuate due to business developments concerning a particular issuer, industry or country, as well as general market and economic conditions. The Fund is subject to risks presented by investments in foreign issuers, and changes in currency exchange rates relative to the U.S. dollar may negatively affect the values of foreign investments held by the Select Funds. By investing in this Fund, you will incur the expenses of the Fund, in addition to those of the underlying Select Funds. The principal risks of the Fund will change depending on the asset mix of the Select Funds in which it invests. You may directly invest in the Select Funds. The Fund’s value will go up and down in response to changes in the share prices of the investments that it owns. The amount invested in the Fund is not guaranteed to increase, is not guaranteed against loss nor is the amount of the original investment guaranteed at the target date. It is possible to lose money by investing in the Fund.
At December 31, 2013, the portfolio holdings of the Fund, as a percentage of net assets, is shown in the following table. Portfolio holdings are subject to risk and may change at any time.
| | | | |
| | | % | |
U.S. Equity Select Funds | | | 49.3 | |
Non-U.S. Equity Select Funds | | | 33.2 | |
Fixed Income Select Funds | | | 7.3 | |
Real Return Select Funds | | | 6.5 | |
Credit Suisse Commodity Return Strategy | | | 3.2 | |
| | | | |
| | | 99.5 | |
| | | | |
33
MyDestination 2055 Fund (Unaudited)
| | | | | | |
| Average Annual Total Returns as of 12/31/13 |
| | | GS4 Class* | | | | Benchmark** |
One Year | | 23.44% | | | | 23.33% |
Since Inception | | 18.69% | | | | 19.85% |
Inception Date | | 01/01/12 | | | | |
Total Fund Operating Expenses (May 1, 2013 Prospectus, as amended on October 31, 2013)(1) | | 3.45% | | | | |
(1)The Fund’s shareholders indirectly bear the expenses of the GS4 Class shares of the Select Funds in which the Fund invests. Current information regarding the Fund’s Operating Expenses can be found in the Financial Highlights.
The performance data quoted represents past performance and does not guarantee future results. Current performance may be lower or higher. Performance data current to the most recent month-end may be obtained at www.GuideStoneFunds.org. The investment return and principal value of an investment will fluctuate so that shares, when redeemed, may be worth more or less than their original cost.
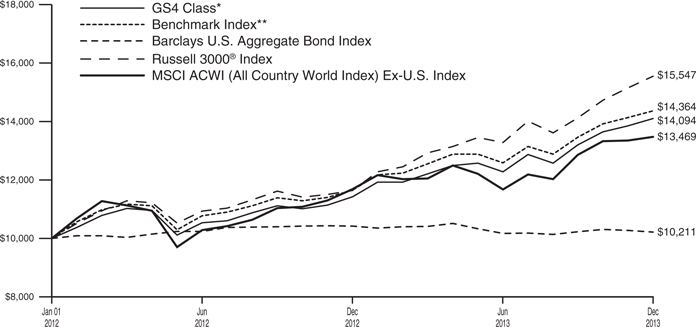
The graph illustrates the results of a hypothetical $10,000 investment in the GS4 Class of the Fund since January 1, 2012 (commencement of operations), with all dividends and capital gains reinvested, with the Fund’s composite benchmark index.
*These returns reflect expense waivers by the Fund’s investment adviser. Without these waivers, returns would have been lower. Returns shown do not reflect the deduction of taxes that a shareholder would pay on Fund distributions or the redemption of Fund shares.
**Represents a composite index as of December 2013, consisting of 2.50% of the Barclays Global Aggregate Bond Index — Unhedged, 1.25% of the Barclays U.S. Corporate High Yield — 2% Issuer Capped Index, 1.25% of the J.P. Morgan Emerging Markets Bond Index Plus, 3.33% of the FTSE EPRA/NAREIT Developed Index, 21.45% of the Russell 1000® Value Index, 21.45% of the Russell 1000® Growth Index, 8.10% of the Russell 2000® Index, 3.33% of the Dow Jones — UBS Commodity Index, 2.50% of the MSCI World Commodity Producers Index, 0.84% of the NYSE Gold Miners Index, 26.52% of the MSCI EAFE Index and 7.48% of the MSCI EM Index.
The construction of the composite index corresponds to the target percentage allocations to the underlying asset classes as represented by the Fund’s investment in the Select Funds. As the target percentage allocations to the underlying investments change according to the MyDestination Funds® glide path, the target percentage allocations to the composite index also change. Unlike a mutual fund, the performance of an index assumes no taxes, transaction costs, management fees or other expenses.
34
| | |
MYDESTINATION 2055 FUND SCHEDULE OF INVESTMENTS | | December 31, 2013 |
| | | | | | | | | | | | |
| | | Shares | | | Value | |
MUTUAL FUNDS — 99.5% | | | | | | | | | | |
GuideStone Money Market Fund (GS4 Class)¥ | | | | | 415,075 | | | | | $ | 415,075 | |
GuideStone Global Bond Fund (GS4 Class)¥ | | | | | 78,328 | | | | | | 789,543 | |
GuideStone Value Equity
Fund (GS4 Class)¥ | | | | | 162,261 | | | | | | 3,407,487 | |
GuideStone Growth Equity
Fund (GS4 Class)¥ | | | | | 147,475 | | | | | | 3,393,408 | |
GuideStone Small Cap
Equity Fund (GS4 Class)¥ | | | | | 70,449 | | | | | | 1,280,757 | |
GuideStone International
Equity Fund
(GS4 Class)¥ | | | | | 278,415 | | | | | | 4,243,038 | |
GuideStone Emerging Market
Equity Fund
(GS4 Class)*¥ | | | | | 122,157 | | | | | | 1,191,035 | |
GuideStone Real Estate
Securities Fund
(GS4 Class)¥ | | | | | 56,493 | | | | | | 528,778 | |
GuideStone Global Natural
Resources Equity Fund
(GS4 Class)¥ | | | | | 54,829 | | | | | | 532,392 | |
Credit Suisse Commodity
Return Strategy Fund | | | | | 71,778 | | | | | | 518,954 | |
| | | | | | | | | | | | |
Total Mutual Funds
(Cost $15,263,288) | | | | | | | | | | | 16,300,467 | |
| | | | | | | | | | | | |
TOTAL INVESTMENTS — 99.5%
(Cost $15,263,288) | | | | | | 16,300,467 | |
Other Assets in Excess of
Liabilities — 0.5% | | | | | | | | | | | 82,045 | |
| | | | | | | | | | | | |
NET ASSETS — 100.0% | | | | | | | | | | $ | 16,382,512 | |
| | | | | | | | | | | | |
VALUATION HIERARCHY
The following is a summary of the inputs used, as of December 31, 2013, in valuing the Fund’s investments carried at fair value:
| | | | | | | | | | | | | | | | | | | | |
| | | Total
Value | | Level 1
Quoted Prices | | Level 2
Other Significant
Observable Inputs | | Level 3
Significant
Unobservable Inputs |
Assets: | | | | | | | | | | | | | | | | | | | | |
Investments in Securities: | | | | | | | | | | | | | | | | | | | | |
Mutual Funds | | | $ | 16,300,467 | | | | $ | 16,300,467 | | | | $ | — | | | | $ | — | |
| | | | | | | | | | | | | | | | | | | | |
Total Assets - Investments in Securities | | | $ | 16,300,467 | | | | $ | 16,300,467 | | | | $ | — | | | | $ | — | |
| | | | | | | | | | | | | | | | | | | | |
| | | | |
Other Financial Instruments*** | | | | | | | | | | | | | | | | | | | | |
Futures Contracts | | | $ | 10,862 | | | | $ | 10,862 | | | | $ | — | | | | $ | — | |
| | | | | | | | | | | | | | | | | | | | |
Total Assets - Other Financial Instruments | | | $ | 10,862 | | | | $ | 10,862 | | | | $ | — | | | | $ | — | |
| | | | | | | | | | | | | | | | | | | | |
***Other financial instruments are derivative instruments not reflected in the Schedule of Investments, such as futures, forwards and swap contracts, which are valued at the unrealized appreciation (depreciation) on the investment. Details of these investments can be found in the Notes to Financial Statements.
| | | | |
| | See Notes to Financial Statements. | | 35 |
| | |
STATEMENTS OF ASSETS AND LIABILITIES | | December 31, 2013 |
| | | | | | | | |
| | | MyDestination
2005 Fund | | | MyDestination
2015 Fund | |
Assets | | | | | | | | |
Investments in securities of unaffiliated issuers, at value | | $ | 1,681,440 | | | $ | 9,448,379 | |
Investments in securities of affiliated issuers, at value | | | 83,057,106 | | | | 430,644,938 | |
| | | | | | | | |
Total investments(1) | | | 84,738,546 | | | | 440,093,317 | |
Cash collateral for derivatives | | | 77,200 | | | | 274,000 | |
Receivables: | | | | | | | | |
Dividends and reclaims | | | 11 | | | | 61 | |
Receivable from advisor | | | — | | | | — | |
Fund shares sold | | | 28,582 | | | | 177,323 | |
Variation margin on financial futures contracts | | | 1,600 | | | | 13,255 | |
Prepaid expenses and other assets | | | 16,821 | | | | 18,191 | |
| | | | | | | | |
Total Assets | | | 84,862,760 | | | | 440,576,147 | |
| | | | | | | | |
Liabilities | | | | | | | | |
Payables: | | | | | | | | |
Investment securities purchased | | | — | | | | 447 | |
Fund shares redeemed | | | 10,000 | | | | 12,066 | |
Variation margin on financial futures contracts | | | — | | | | 2,750 | |
Accrued expenses: | | | | | | | | |
Investment advisory fees | | | 4,222 | | | | 37,473 | |
Other expenses | | | 31,862 | | | | 42,349 | |
| | | | | | | | |
Total Liabilities | | | 46,084 | | | | 95,085 | |
| | | | | | | | |
Net Assets | | $ | 84,816,676 | | | $ | 440,481,062 | |
| | | | | | | | |
Net Assets Consist of: | | | | | | | | |
Paid-in-capital | | $ | 81,173,764 | | | $ | 395,019,877 | |
Accumulated net investment income | | | 83,785 | | | | — | |
Undistributed net realized gain on investments and derivative transactions | | | 168,921 | | | | 2,986,998 | |
Net unrealized appreciation (depreciation) on investments and derivative transactions | | | 3,390,206 | | | | 42,474,187 | |
| | | | | | | | |
Net Assets | | $ | 84,816,676 | | | $ | 440,481,062 | |
| | | | | | | | |
| | |
Net Asset Value: | | | | | | | | |
$0.001 par value, unlimited shares authorized | | | | | | | | |
Net assets applicable to the GS4 Class | | $ | 84,816,676 | | | $ | 440,481,062 | |
| | | | | | | | |
GS4 shares outstanding | | | 7,928,332 | | | | 40,161,440 | |
| | | | | | | | |
Net asset value, offering and redemption price per GS4 share | | $ | 10.70 | | | $ | 10.97 | |
| | | | | | | | |
| | |
(1) Investments in securities of unaffiliated issuers, at cost | | $ | 1,693,281 | | | $ | 9,596,400 | |
Investments in securities of affiliated issuers, at cost | | | 79,673,162 | | | | 388,123,230 | |
| | | | | | | | |
Total investments at cost | | $ | 81,366,443 | | | $ | 397,719,630 | |
| | | | | | | | |
| | | | |
| 36 | | See Notes to Financial Statements. | | |
| | | | | | | | | | | | | | |
MyDestination
2025 Fund | | | MyDestination
2035 Fund | | | MyDestination
2045 Fund | | | MyDestination
2055 Fund | |
| | | | | | | | | | | | | | |
| $ | 15,868,402 | | | $ | 9,288,985 | | | $ | 6,732,385 | | | $ | 518,954 | |
| | 528,813,746 | | | | 282,156,645 | | | | 204,831,438 | | | | 15,781,513 | |
| | | | | | | | | | | | | | |
| | 544,682,148 | | | | 291,445,630 | | | | 211,563,823 | | | | 16,300,467 | |
| | 384,300 | | | | 306,900 | | | | 236,500 | | | | 35,000 | |
| | | | | | | | | | | | | | |
| | 78 | | | | 52 | | | | 38 | | | | 3 | |
| | — | | | | — | | | | — | | | | 7,659 | |
| | 643,706 | | | | 150,567 | | | | 330,058 | | | | 47,615 | |
| | 20,755 | | | | 17,600 | | | | 14,445 | | | | 960 | |
| | 18,650 | | | | 17,858 | | | | 16,975 | | | | 15,279 | |
| | | | | | | | | | | | | | |
| | 545,749,637 | | | | 291,938,607 | | | | 212,161,839 | | | | 16,406,983 | |
| | | | | | | | | | | | | | |
| | | | | | | | | | | | | | |
| | | | | | | | | | | | | | |
| | — | | | | — | | | | — | | | | — | |
| | 1,600 | | | | — | | | | 1,436 | | | | — | |
| | 2,750 | | | | 1,375 | | | | 344 | | | | — | |
| | | | | | | | | | | | | | |
| | 45,944 | | | | 24,525 | | | | 21,554 | | | | — | |
| | 47,303 | | | | 39,182 | | | | 36,885 | | | | 24,471 | |
| | | | | | | | | | | | | | |
| | 97,597 | | | | 65,082 | | | | 60,219 | | | | 24,471 | |
| | | | | | | | | | | | | | |
| $ | 545,652,040 | | | $ | 291,873,525 | | | $ | 212,101,620 | | | $ | 16,382,512 | |
| | | | | | | | | | | | | | |
| | | | | | | | | | | | | | |
| $ | 476,373,596 | | | $ | 242,811,253 | | | $ | 175,774,440 | | | $ | 14,705,088 | |
| | — | | | | — | | | | — | | | | — | |
| | 7,629,909 | | | | 7,995,575 | | | | 5,319,933 | | | | 629,383 | |
| | 61,648,535 | | | | 41,066,697 | | | | 31,007,247 | | | | 1,048,041 | |
| | | | | | | | | | | | | | |
| $ | 545,652,040 | | | $ | 291,873,525 | | | $ | 212,101,620 | | | $ | 16,382,512 | |
| | | | | | | | | | | | | | |
| | | |
| | | | | | | | | | | | | | |
| | | | | | | | | | | | | | |
| $ | 545,652,040 | | | $ | 291,873,525 | | | $ | 212,101,620 | | | $ | 16,382,512 | |
| | | | | | | | | | | | | | |
| | 50,541,803 | | | | 27,058,761 | | | | 20,449,823 | | | | 1,264,731 | |
| | | | | | | | | | | | | | |
| $ | 10.80 | | | $ | 10.79 | | | $ | 10.37 | | | $ | 12.95 | |
| | | | | | | | | | | | | | |
| | | |
| $ | 15,958,700 | | | $ | 9,338,950 | | | $ | 6,823,900 | | | $ | 521,480 | |
| | 467,257,407 | | | | 241,200,213 | | | | 173,862,198 | | | | 14,741,808 | |
| | | | | | | | | | | | | | |
| $ | 483,216,107 | | | $ | 250,539,163 | | | $ | 180,686,098 | | | $ | 15,263,288 | |
| | | | | | | | | | | | | | |
| | | | |
| | See Notes to Financial Statements. | | 37 |
| | |
STATEMENTS OF OPERATIONS | | For the Year Ended December 31, 2013 |
| | | | | | | | |
| | | MyDestination
2005 Fund | | | MyDestination
2015 Fund | |
Investment Income | | | | | | | | |
Income dividends received from affiliated funds | | $ | 905,931 | | | $ | 4,934,382 | |
Interest | | | 6 | | | | — | |
| | | | | | | | |
Total Investment Income | | | 905,937 | | | | 4,934,382 | |
| | | | | | | | |
Expenses | | | | | | | | |
Investment advisory fees | | | 86,007 | | | | 405,196 | |
Transfer agent fees: | | | | | | | | |
GS4 Shares | | | 19,539 | | | | 23,314 | |
Custodian fees | | | 15,619 | | | | 21,958 | |
Accounting and administration fees | | | 7,802 | | | | 24,151 | |
Professional fees | | | 46,087 | | | | 46,087 | |
Blue sky fees: | | | | | | | | |
GS4 Shares | | | 18,197 | | | | 20,012 | |
Shareholder reporting fees: | | | | | | | | |
GS4 Shares | | | 5,257 | | | | 13,085 | |
Trustee expenses | | | 870 | | | | 4,130 | |
Line of credit facility fees | | | 841 | | | | 3,976 | |
Other expenses | | | 8,719 | | | | 8,719 | |
| | | | | | | | |
Total Expenses | | | 208,938 | | | | 570,628 | |
Expenses waived/reimbursed net of amount recaptured(1) | | | (40,223 | ) | | | — | |
| | | | | | | | |
Net Expenses | | | 168,715 | | | | 570,628 | |
| | | | | | | | |
Net investment income | | | 737,222 | | | | 4,363,754 | |
| | | | | | | | |
Realized and Unrealized Gain (Loss) | | | | | | | | |
Capital gain distributions received from affiliated funds | | | 1,994,694 | | | | 16,220,949 | |
Net realized gain on investment securities of affiliated issuers | | | 4,530,323 | | | | 13,355,994 | |
Net realized gain (loss) on investment securities of unaffiliated issuers | | | (19 | ) | | | — | |
Net realized gain on futures transactions | | | 110,903 | | | | 608,511 | |
| | | | | | | | |
Net realized gain | | | 6,635,901 | | | | 30,185,454 | |
| | | | | | | | |
Change in unrealized appreciation (depreciation) on investment securities of affiliated issuers | | | (2,368,076 | ) | | | 4,163,023 | |
Change in unrealized appreciation (depreciation) on investment securities of unaffiliated issuers | | | (11,841 | ) | | | (148,021 | ) |
Change in unrealized appreciation (depreciation) on futures | | | 11,191 | | | | 84,121 | |
| | | | | | | | |
Net change in unrealized appreciation (depreciation) | | | (2,368,726 | ) | | | 4,099,123 | |
| | | | | | | | |
Net Realized and Unrealized Gain | | | 4,267,175 | | | | 34,284,577 | |
| | | | | | | | |
Net Increase in Net Assets Resulting from Operations | | $ | 5,004,397 | | | $ | 38,648,331 | |
| | | | | | | | |
| (1) | See Note 3a and 3c in Notes to Financial Statements. |
| | | | |
| 38 | | See Notes to Financial Statements. | | |
| | | | | | | | | | | | | | |
MyDestination
2025 Fund | | | MyDestination
2035 Fund | | | MyDestination
2045 Fund | | | MyDestination
2055 Fund | |
| | | | | | | | | | | | | | |
| $ | 6,084,829 | | | $ | 2,955,041 | | | $ | 1,945,589 | | | $ | 135,305 | |
| | — | | | | — | | | | — | | | | — | |
| | | | | | | | | | | | | | |
| | 6,084,829 | | | | 2,955,041 | | | | 1,945,589 | | | | 135,305 | |
| | | | | | | | | | | | | | |
| | | | | | | | | | | | | | |
| | 464,404 | | | | 243,094 | | | | 175,210 | | | | 10,950 | |
| | | | | | | | | | | | | | |
| | 24,481 | | | | 21,312 | | | | 20,996 | | | | 17,522 | |
| | 27,896 | | | | 21,748 | | | | 20,201 | | | | 3,644 | |
| | 27,123 | | | | 15,698 | | | | 12,229 | | | | 3,198 | |
| | 46,087 | | | | 46,087 | | | | 46,087 | | | | 46,049 | |
| | | | | | | | | | | | | | |
| | 21,050 | | | | 18,192 | | | | 18,279 | | | | 17,206 | |
| | | | | | | | | | | | | | |
| | 15,689 | | | | 9,213 | | | | 8,720 | | | | 1,470 | |
| | 4,756 | | | | 2,491 | | | | 1,798 | | | | 116 | |
| | 4,563 | | | | 2,378 | | | | 1,724 | | | | 151 | |
| | 8,719 | | | | 8,719 | | | | 8,718 | | | | 8,718 | |
| | | | | | | | | | | | | | |
| | 644,768 | | | | 388,932 | | | | 313,962 | | | | 109,024 | |
| | — | | | | 70,071 | | | | 28,663 | | | | (87,450 | ) |
| | | | | | | | | | | | | | |
| | 644,768 | | | | 459,003 | | | | 342,625 | | | | 21,574 | |
| | | | | | | | | | | | | | |
| | 5,440,061 | | | | 2,496,038 | | | | 1,602,964 | | | | 113,731 | |
| | | | | | | | | | | | | | |
| | | | | | | | | | | | | | |
| | 24,420,985 | | | | 14,615,169 | | | | 11,431,857 | | | | 870,342 | |
| | 7,554,445 | | | | 5,248,980 | | | | 9,388,217 | | | | 525,804 | |
| | — | | | | — | | | | — | | | | (320 | ) |
| | 948,591 | | | | 770,941 | | | | 653,358 | | | | 19,936 | |
| | | | | | | | | | | | | | |
| | 32,924,021 | | | | 20,635,090 | | | | 21,473,432 | | | | 1,415,762 | |
| | | | | | | | | | | | | | |
| | 24,992,238 | | | | 22,622,319 | | | | 12,852,073 | | | | 708,912 | |
| | (90,298) | | | | (49,965 | ) | | | (91,515 | ) | | | (2,527 | ) |
| | 155,142 | | | | 140,792 | | | | 114,984 | | | | 10,862 | |
| | | | | | | | | | | | | | |
| | 25,057,082 | | | | 22,713,146 | | | | 12,875,542 | | | | 717,247 | |
| | | | | | | | | | | | | | |
| | 57,981,103 | | | | 43,348,236 | | | | 34,348,974 | | | | 2,133,009 | |
| | | | | | | | | | | | | | |
| $ | 63,421,164 | | | $ | 45,844,274 | | | $ | 35,951,938 | | | $ | 2,246,740 | |
| | | | | | | | | | | | | | |
| | | | |
| | See Notes to Financial Statements. | | 39 |
STATEMENTS OF CHANGES IN NET ASSETS
| | | | | | | | | | | | | | | | |
| | | MyDestination 2005 Fund | | | MyDestination 2015 Fund | |
| | | For the Year
Ended
12/31/13 | | | For the Year
Ended
12/31/12 | | | For the Year
Ended
12/31/13 | | | For the Year
Ended
12/31/12 | |
Operations: | | | | | | | | | | | | | | | | |
Net investment income | | $ | 737,222 | | | $ | 904,191 | | | $ | 4,363,754 | | | $ | 4,702,611 | |
Net realized gain on investment securities
and futures transactions | | | 6,635,901 | | | | 3,091,766 | | | | 30,185,454 | | | | 8,618,302 | |
Net change in unrealized appreciation (depreciation)
on investment securities and futures | | | (2,368,726 | ) | | | 2,098,167 | | | | 4,099,123 | | | | 20,301,429 | |
| | | | | | | | | | | | | | | | |
Net increase in net assets resulting from operations | | | 5,004,397 | | | | 6,094,124 | | | | 38,648,331 | | | | 33,622,342 | |
| | | | | | | | | | | | | | | | |
Dividends and Distributions to Shareholders: | | | | | | | | | | | | | | | | |
Dividends from net investment income(1) | | | (1,430,800 | ) | | | (1,578,267 | ) | | | (11,087,547 | ) | | | (7,838,073 | ) |
Distributions from net realized capital gains | | | — | | | | — | | | | (502,477 | ) | | | — | |
| | | | | | | | | | | | | | | | |
Total dividends and distributions | | | (1,430,800 | ) | | | (1,578,267 | ) | | | (11,590,024 | ) | | | (7,838,073 | ) |
| | | | | | | | | | | | | | | | |
Capital Share Transactions: | | | | | | | | | | | | | | | | |
Proceeds from shares sold | | | | | | | | | | | | | | | | |
Proceeds from GS4 shares sold | | | 25,244,242 | | | | 22,149,640 | | | | 84,263,438 | | | | 71,866,425 | |
Reinvestment of dividends and distributions into GS4 shares | | | 1,430,198 | | | | 1,578,267 | | | | 11,589,750 | | | | 7,838,073 | |
Value of GS4 shares redeemed | | | (26,013,585 | ) | | | (12,269,397 | ) | | | (35,006,811 | ) | | | (27,008,482 | ) |
| | | | | | | | | | | | | | | | |
Net increase from capital share transactions(2) | | | 660,855 | | | | 11,458,510 | | | | 60,846,377 | | | | 52,696,016 | |
| | | | | | | | | | | | | | | | |
Total increase in net assets | | | 4,234,452 | | | | 15,974,367 | | | | 87,904,684 | | | | 78,480,285 | |
| | | | | | | | | | | | | | | | |
Net Assets: | | | | | | | | | | | | | | | | |
Beginning of Year | | | 80,582,224 | | | | 64,607,857 | | | | 352,576,378 | | | | 274,096,093 | |
| | | | | | | | | | | | | | | | |
End of Year* | | $ | 84,816,676 | | | $ | 80,582,224 | | | $ | 440,481,062 | | | $ | 352,576,378 | |
| | | | | | | | | | | | | | | | |
*Including undistributed net investment income | | $ | 83,785 | | | $ | 102,131 | | | $ | — | | | $ | 1,380,527 | |
| | | | | | | | | | | | | | | | |
| (1) | Includes dividends paid from the short-term portion of capital gain distributions received from affiliated funds. |
| (2) | See Note 6 in Notes to Financial Statements. |
| | | | |
| 40 | | See Notes to Financial Statements. | | |
| | | | | | | | | | | | | | | | | | | | | | | | | | | | | | |
| MyDestination 2025 Fund | | | MyDestination 2035 Fund | | | MyDestination 2045 Fund | | | MyDestination 2055 Fund | |
For the Year
Ended
12/31/13 | | | For the Year
Ended
12/31/12 | | | For the Year
Ended
12/31/13 | | | For the Year
Ended
12/31/12 | | | For the Year
Ended
12/31/13 | | | For the Year
Ended
12/31/12 | | | For the Year
Ended
12/31/13 | | | For the Year
Ended
12/31/12 | |
| | | | | | | | | | | | | | | | | | | | | | | | | | | | | | |
| $ | 5,440,061 | | | $ | 4,983,671 | | | $ | 2,496,038 | | | $ | 1,997,691 | | | $ | 1,602,964 | | | $ | 1,279,369 | | | $ | 113,731 | | | $ | 56,129 | |
| | | | | | | |
| | 32,924,021 | | | | 9,719,715 | | | | 20,635,090 | | | | 4,951,298 | | | | 21,473,432 | | | | 3,401,790 | | | | 1,415,762 | | | | 188,926 | |
| | | | | | | |
| | 25,057,082 | | | | 26,643,843 | | | | 22,713,146 | | | | 16,449,734 | | | | 12,875,542 | | | | 11,904,561 | | | | 717,247 | | | | 330,794 | |
| | | | | | | | | | | | | | | | | | | | | | | | | | | | | | |
| | | | | | | |
| | 63,421,164 | | | | 41,347,229 | | | | 45,844,274 | | | | 23,398,723 | | | | 35,951,938 | | | | 16,585,720 | | | | 2,246,740 | | | | 575,849 | |
| | | | | | | | | | | | | | | | | | | | | | | | | | | | | | |
| | | | | | | | | | | | | | | | | | | | | | | | | | | | | | |
| | (13,457,157 | ) | | | (7,215,597 | ) | | | (5,775,453 | ) | | | (2,098,516 | ) | | | (4,223,953 | ) | | | (1,290,110 | ) | | | (317,866 | ) | | | (56,171 | ) |
| | (12,131,890 | ) | | | — | | | | (10,105,288 | ) | | | (1,022,785 | ) | | | (12,839,584 | ) | | | (750,228 | ) | | | (708,786 | ) | | | (62,706 | ) |
| | | | | | | | | | | | | | | | | | | | | | | | | | | | | | |
| | (25,589,047 | ) | | | (7,215,597 | ) | | | (15,880,741 | ) | | | (3,121,301 | ) | | | (17,063,537 | ) | | | (2,040,338 | ) | | | (1,026,652 | ) | | | (118,877 | ) |
| | | | | | | | | | | | | | | | | | | | | | | | | | | | | | |
| | | | | | | | | | | | | | | | | | | | | | | | | | | | | | |
| | | | | | | | | | | | | | | | | | | | | | | | | | | | | | |
| | 122,536,784 | | | | 75,379,767 | | | | 64,052,474 | | | | 40,637,718 | | | | 45,024,377 | | | | 31,566,664 | | | | 9,768,081 | | | | 13,215,155 | |
| | 25,589,047 | | | | 7,215,597 | | | | 15,880,741 | | | | 3,121,301 | | | | 17,063,537 | | | | 2,040,186 | | | | 1,026,652 | | | | 118,877 | |
| | (15,543,835 | ) | | | (19,728,424 | ) | | | (6,265,695 | ) | | | (7,240,011 | ) | | | (4,070,598 | ) | | | (2,910,235 | ) | | | (1,948,729 | ) | | | (7,474,584 | ) |
| | | | | | | | | | | | | | | | | | | | | | | | | | | | | | |
| | 132,581,996 | | | | 62,866,940 | | | | 73,667,520 | | | | 36,519,008 | | | | 58,017,316 | | | | 30,696,615 | | | | 8,846,004 | | | | 5,859,448 | |
| | | | | | | | | | | | | | | | | | | | | | | | | | | | | | |
| | 170,414,113 | | | | 96,998,572 | | | | 103,631,053 | | | | 56,796,430 | | | | 76,905,717 | | | | 45,241,997 | | | | 10,066,092 | | | | 6,316,420 | |
| | | | | | | | | | | | | | | | | | | | | | | | | | | | | | |
| | | | | | | | | | | | | | | | | | | | | | | | | | | | | | |
| | 375,237,927 | | | | 278,239,355 | | | | 188,242,472 | | | | 131,446,042 | | | | 135,195,903 | | | | 89,953,906 | | | | 6,316,420 | | | | — | |
| | | | | | | | | | | | | | | | | | | | | | | | | | | | | | |
| $ | 545,652,040 | | | $ | 375,237,927 | | | $ | 291,873,525 | | | $ | 188,242,472 | | | $ | 212,101,620 | | | $ | 135,195,903 | | | $ | 16,382,512 | | | $ | 6,316,420 | |
| | | | | | | | | | | | | | | | | | | | | | | | | | | �� | | | |
| $ | — | | | $ | 606,875 | | | $ | — | | | $ | 3,087 | | | $ | — | | | $ | 307 | | | $ | — | | | $ | — | |
| | | | | | | | | | | | | | | | | | | | | | | | | | | | | | |
| | | | |
| | See Notes to Financial Statements. | | 41 |
FINANCIAL HIGHLIGHTS
| | | | | | | | | | | | | | | | | | | | | | | | | | | | | | | | | | | | | | | | | | | | | | | | | | | | |
| For a Share Outstanding For the Years Ending December 31, unless otherwise indicated | | | | | | Ratios to Average Net Assets | | | | |
| | | Net Asset
Value,
Beginning
of Year | | | Net
Investment
Income (1) | | | Capital Gain
Distribu- tions
Received
from
Affiliated
Funds | | | Realized
and
Unrealized
Gain (Loss) on
Investments | | | Dividends
from Net
Investment
Income (2) | | | Distribu- tions
from Net
Realized
Capital
Gains | | | Net
Asset
Value,
End of
Year | | | Total
Return | | | Net Assets, End of Year (000) | | | Expenses,
Net(3)(4) | | | Expenses,
Gross(3)(5) | | | Investment
Income,
Net (1)(4) | | | Portfolio
Turnover
Rate | |
MyDestination 2005 Fund | |
| | | | | | | | | | | |
GS4 Class | | | | | | | | | | | | | | | | | | | | | | | | | | | | | | | | | | | | | | | | | | | | | |
| 2013 | | | $ 10.25 | | | | $0.09 | # | | | $0.25 | | | | $0.29 | | | | $(0.18 | ) | | | $ — | | | | $10.70 | | | | 6.18 | % | | | $84,817 | | | | 0.20 | % | | | 0.25 | % | | | 0.87 | % | | | 27 | % |
| 2012 | | | 9.60 | | | | 0.13 | # | | | 0.18 | | | | 0.55 | | | | (0.21 | ) | | | — | | | | 10.25 | | | | 8.92 | | | | 80,582 | | | | 0.20 | | | | 0.27 | | | | 1.24 | | | | 8 | |
| 2011 | | | 9.53 | | | | 0.14 | # | | | 0.05 | | | | 0.05 | | | | (0.17 | ) | | | — | | | | 9.60 | | | | 2.52 | | | | 64,608 | | | | 0.20 | | | | 0.35 | | | | 1.43 | | | | 31 | |
| 2010 | | | 8.84 | | | | 0.14 | # | | | 0.09 | | | | 0.70 | | | | (0.24 | ) | | | — | | | | 9.53 | | | | 10.56 | | | | 54,683 | | | | 0.20 | | | | 0.26 | | | | 1.50 | | | | 19 | |
| 2009 | | | 7.44 | | | | 0.18 | # | | | 0.04 | | | | 1.40 | | | | (0.22 | ) | | | — | | | | 8.84 | | | | 21.84 | | | | 66,830 | | | | 0.20 | | | | 0.26 | | | | 2.31 | | | | 57 | |
MyDestination 2015 Fund | |
| | | | | | | | | | | |
GS4 Class | | | | | | | | | | | | | | | | | | | | | | | | | | | | | | | | | | | | | | | | | | | | | |
| 2013 | | | $ 10.21 | | | | $0.12 | # | | | $0.44 | | | | $0.49 | | | | $(0.28 | ) | | | $ (0.01 | ) | | | $10.97 | | | | 10.35 | % | | | $440,481 | | | | 0.14 | % | | | 0.14 | % | | | 1.10 | % | | | 15 | % |
| 2012 | | | 9.37 | | | | 0.15 | # | | | 0.22 | | | | 0.70 | | | | (0.23 | ) | | | — | | | | 10.21 | | | | 11.46 | | | | 352,576 | | | | 0.15 | | | | 0.15 | | | | 1.47 | | | | 2 | |
| 2011 | | | 9.36 | | | | 0.14 | # | | | 0.05 | | | | (0.02 | ) | | | (0.16 | ) | | | — | | | | 9.37 | | | | 1.84 | | | | 274,096 | | | | 0.17 | | | | 0.17 | | | | 1.46 | | | | 33 | |
| 2010 | | | 8.42 | | | | 0.14 | # | | | 0.06 | | | | 0.94 | | | | (0.20 | ) | | | — | | | | 9.36 | | | | 13.54 | | | | 245,672 | | | | 0.16 | | | | 0.16 | | | | 1.65 | | | | 28 | |
| 2009 | | | 6.83 | | | | 0.17 | # | | | 0.02 | | | | 1.58 | | | | (0.18 | ) | | | — | | | | 8.42 | | | | 26.27 | | | | 219,264 | | | | 0.16 | | | | 0.16 | | | | 2.25 | | | | 25 | |
MyDestination 2025 Fund | |
| | | | | | | | | | | |
GS4 Class | | | | | | | | | | | | | | | | | | | | | | | | | | | | | | | | | | | | | | | | | | | | | |
| 2013 | | | $ 9.84 | | | | $0.13 | # | | | $0.57 | | | | $0.78 | | | | $(0.27 | ) | | | $ (0.25 | ) | | | $10.80 | | | | 15.15 | % | | | $545,652 | | | | 0.14 | % | | | 0.14 | % | | | 1.19 | % | | | 16 | % |
| 2012 | | | 8.81 | | | | 0.14 | # | | | 0.22 | | | | 0.86 | | | | (0.19 | ) | | | — | | | | 9.84 | | | | 13.90 | | | | 375,238 | | | | 0.15 | | | | 0.15 | | | | 1.51 | | | | 2 | |
| 2011 | | | 8.94 | | | | 0.13 | # | | | 0.03 | | | | (0.16 | ) | | | (0.13 | ) | | | — | | | | 8.81 | | | | 0.03 | | | | 278,239 | | | | 0.17 | | | | 0.17 | | | | 1.42 | | | | 24 | |
| 2010 | | | 7.88 | | | | 0.14 | # | | | 0.03 | | | | 1.04 | | | | (0.15 | ) | | | — | | | | 8.94 | | | | 15.32 | | | | 236,502 | | | | 0.20 | | | | 0.17 | | | | 1.72 | | | | 15 | |
| 2009 | | | 6.18 | | | | 0.14 | # | | | 0.01 | | | | 1.69 | | | | (0.14 | ) | | | — | | | | 7.88 | | | | 30.12 | | | | 169,563 | | | | 0.20 | | | | 0.19 | | | | 2.11 | | | | 13 | |
| # | Calculated using the average shares outstanding method. |
| (1) | Recognition of net investment income by the Fund is affected by the timing of the declaration of dividends by the underlying investment companies in which the Fund invests. |
| (2) | Includes dividends paid from the short-term portion of capital gain distributions received from affiliated Funds. |
| (3) | Does not include expenses of the investment companies in which the Fund invests. |
| (4) | The ratio includes expenses waived/reimbursed net of amount recaptured and fees paid indirectly, where applicable; if expenses waived/reimbursed net of amount recaptured and fees paid indirectly were excluded, the ratio would have been higher (lower) than the ratio shown. |
| (5) | The ratio excludes expenses waived/reimbursed net of amount recaptured and fees paid indirectly, where applicable; if expenses waived/reimbursed net of amount recaptured and fees paid indirectly were included, the ratio would have been lower than the ratio shown. |
| | | | |
| 42 | | See Notes to Financial Statements. | | |
| | | | | | | | | | | | | | | | | | | | | | | | | | | | | | | | | | | | | | | | | | | | | | | | | | | | |
| For a Share Outstanding For the Years Ending December 31, unless otherwise indicated | | | | | | Ratios to Average Net Assets | | | | |
| | | Net Asset
Value,
Beginning
of Year | | | Net
Investment
Income (1) | | | Capital Gain
Distribu- tions
Received
from
Affiliated
Funds | | | Realized
and
Unrealized
Gain (Loss) on
Investments | | | Dividends
from Net
Investment
Income (2) | | | Distribu- tions
from Net
Realized
Capital
Gains | | | Net
Asset
Value,
End of
Year | | | Total
Return | | | Net Assets, End of Year (000) | | | Expenses,
Net(3)(4) | | | Expenses,
Gross (3)(5) | | | Investment
Income,
Net (1)(4) | | | Portfolio
Turnover
Rate | |
MyDestination 2035 Fund | |
|
GS4 Class | |
| 2013 | | $ | 9.40 | | | $ | 0.11 | # | | $ | 0.64 | | | $ | 1.26 | | | $ | (0.22 | ) | | $ | (0.40 | ) | | $ | 10.79 | | | | 21.41 | % | | $ | 291,874 | | | | 0.19 | % | | | 0.16 | % | | | 1.05 | % | | | 17 | % |
| 2012 | | | 8.22 | | | | 0.11 | # | | | 0.21 | | | | 1.02 | | | | (0.11 | ) | | | (0.05 | ) | | | 9.40 | | | | 16.30 | | | | 188,242 | | | | 0.20 | | | | 0.18 | | | | 1.23 | | | | 1 | |
| 2011 | | | 8.62 | | | | 0.10 | # | | | 0.01 | | | | (0.37 | ) | | | (0.09 | ) | | | (0.05 | ) | | | 8.22 | | | | (2.99 | ) | | | 131,446 | | | | 0.20 | | | | 0.23 | | | | 1.13 | | | | 10 | |
| 2010 | | | 7.52 | | | | 0.10 | # | | | 0.01 | | | | 1.10 | | | | (0.10 | ) | | | (0.01 | ) | | | 8.62 | | | | 16.02 | | | | 110,206 | | | | 0.20 | | | | 0.23 | | | | 1.32 | | | | 9 | |
| 2009 | | | 5.85 | | | | 0.10 | # | | | — | † | | | 1.70 | | | | (0.11 | ) | | | (0.02 | ) | | | 7.52 | | | | 30.99 | | | | 75,419 | | | | 0.20 | | | | 0.28 | | | | 1.57 | | | | 4 | |
MyDestination 2045 Fund | |
|
GS4 Class | |
| 2013 | | $ | 9.14 | | | $ | 0.10 | # | | $ | 0.68 | | | $ | 1.35 | | | $ | (0.21 | ) | | $ | (0.69 | ) | | $ | 10.37 | | | | 23.44 | % | | $ | 212,102 | | | | 0.20 | % | | | 0.18 | % | | | 0.94 | % | | | 18 | % |
| 2012 | | | 7.96 | | | | 0.10 | # | | | 0.21 | | | | 1.01 | | | | (0.09 | ) | | | (0.05 | ) | | | 9.14 | | | | 16.60 | | | | 135,196 | | | | 0.20 | | | | 0.21 | | | | 1.14 | | | | 1 | |
| 2011 | | | 8.52 | | | | 0.07 | # | | | — | † | | | (0.38 | ) | | | (0.07 | ) | | | (0.18 | ) | | | 7.96 | | | | (3.63 | ) | | | 89,954 | | | | 0.20 | | | | 0.29 | | | | 0.87 | | | | 25 | |
| 2010 | | | 7.38 | | | | 0.08 | # | | | — | † | | | 1.16 | | | | (0.07 | ) | | | (0.03 | ) | | | 8.52 | | | | 16.80 | | | | 75,803 | | | | 0.20 | | | | 0.30 | | | | 1.08 | | | | 1 | |
| 2009 | | | 5.75 | | | | 0.08 | # | | | — | † | | | 1.67 | | | | (0.09 | ) | | | (0.03 | ) | | | 7.38 | | | | 30.71 | | | | 44,159 | | | | 0.20 | | | | 0.41 | | | | 1.23 | | | | 7 | |
MyDestination 2055 Fund | |
|
GS4 Class | |
| 2013 | | $ | 11.20 | | | $ | 0.13 | # | | $ | 1.02 | | | $ | 1.47 | | | $ | (0.26 | ) | | $ | (0.61 | ) | | $ | 12.95 | | | | 23.44 | % | | $ | 16,383 | | | | 0.20 | % | | | 1.01 | % | | | 1.05 | % | | | 30 | % |
| 2012* | | | 10.00 | | | | 0.13 | # | | | 0.30 | | | | 0.98 | | | | (0.10 | ) | | | (0.11 | ) | | | 11.20 | | | | 14.18 | | | | 6,316 | | | | 0.20 | | | | 2.31 | | | | 1.24 | | | | 18 | |
| † | Amount represents less than $0.005 per share. |
| # | Calculated using the average shares outstanding method. |
| * | Inception date was January 1, 2012. |
| (1) | Recognition of net investment income by the Fund is affected by the timing of the declaration of dividends by the underlying investment companies in which the Fund invests. |
| (2) | Includes dividends paid from the short-term portion of capital gain distributions received from affiliated Funds. |
| (3) | Does not include expenses of the investment companies in which the Fund invests. |
| (4) | The ratio includes expenses waived/reimbursed net of amount recaptured and fees paid indirectly, where applicable; if expenses waived/reimbursed net of amount recaptured and fees paid indirectly were excluded, the ratio would have been higher (lower) than the ratio shown. |
| (5) | The ratio excludes expenses waived/reimbursed net of amount recaptured and fees paid indirectly, where applicable; if expenses waived/reimbursed net of amount recaptured and fees paid indirectly were included, the ratio would have been lower than the ratio shown. |
| | | | |
| | See Notes to Financial Statements. | | 43 |
ASSET ALLOCATION FUNDS (Unaudited)
Capital market performance in 2013 was characterized by strength in the developed economies. Asset class performance was strongest in the equity markets as illustrated by the S&P 500® Index which posted positive returns for each quarter of the year, resulting in an annual of 32.39%. Within U.S. equity markets, performance dispersions were evident among both capitalization and style segments. Large-cap companies underperformed small-cap companies by a measure of 5.71% as indicated by the Russell 1000® Index and Russell 2000®.
Along the capitalization spectrum, growth-oriented equities outperformed value-oriented equities during the year. This outcome was most notable among small capitalization stocks as the Russell 2000® Growth Index led the Russell 2000® Value Index by 8.78% over the one-year.
Supporting this equity rally was the Federal Reserve’s continued theme of easy monetary policies. However, despite record high equity prices and improvement in housing, inflation was absent by most measures throughout the year. Within bond markets, this environment proved to be beneficial in segments higher on the risk spectrum. As evidence, the Barclays U.S. High Yield — Corporate Index and the BofA Merrill Lynch All U.S. Convertibles Index generated returns of 7.44% and 25.00%, respectively.
Developed non-U.S. markets also experienced solid gains as the MSCI EAFE Index (Net), a measure of international developed country returns, posted a one-year return of 22.78%. All regions ended the period in positive territory as Japan and Europe advanced the most as a result of the regions’ improved outlooks. From a sector perspective all groups generated positive results during the period.
The story of emerging market economies drew a stark contrast to that of developed markets. Slower growth in emerging markets has been accompanied by much higher inflation and tighter monetary policies than experienced in developed markets. Consequently, the MSCI Emerging Markets Index posted a -2.60% return for the year.
44
Conservative Allocation Fund (Unaudited)
The Fund, through investments in the underlying Select Funds, combined a greater percentage of exposure to fixed income securities with a smaller percentage to equity securities and real asset securities. The Fund had a target of, but was not limited to, an asset allocation of 58.00% Fixed Income Select Funds, 16.00% U.S. Equity Select Funds, 5.00% Non-U.S. Equity Select Funds, and 21.00% Real Return Select Funds.
As a fund of funds, its performance was based on the performance of the underlying Select Funds. The Fund generated a return of 3.67% for the one-year period ended December 31, 2013, benefiting from positive absolute performance of certain underlying Equity Select Funds. Detracting from absolute performance was the allocation to the Real Return Select Funds. The Fund’s absolute return was most positively influenced by its exposure to the Value Equity Fund, followed by exposure to the Growth Equity Fund and International Equity Fund.
The Fund underperformed its composite benchmark in 2013 (3.67% versus 5.43%). While the Value Equity Fund was the largest contributor to the Fund’s absolute return, it also served as the leading driver in the Fund’s relative outperformance during the year. At a target weight of approximately 59.93%, the Low-Duration Bond Fund was the primary detractor. Additionally, allocations to the Defensive Market Strategies Fund and Global Natural Resources Equity Fund had a material impact on relative underperformance over the period.
The Fund attempted to achieve its objective by investing in the Select Funds. By investing in the Fund you will also incur the expenses and risks of the underlying Select Funds. The principal risks of the Fund will change depending on the asset mix of the Select Funds in which it invests. You may directly invest in the Select Funds. The Fund’s value will go up and down in response to changes in the share prices of the investments that it owns. It is possible to lose money by investing in the Fund. The Fund may be suitable for investors who have a short- to medium-time investment horizon, possess a relatively low tolerance for risk and want some exposure to the growth potential of the stock market tempered by a larger allocation to short-term, fixed income securities. This Fund is subject to interest rate risk. Meaning, when interest rates rise, the value of the existing bonds decrease and vice versa. Changes in interest rates have a bigger impact on long duration holdings than on short duration holdings.
At December 31, 2013, the portfolio holdings of the Fund, as a percentage of net assets, is shown in the following table. Portfolio holdings are subject to risk and may change at any time.
| | | | |
| | | % | |
Fixed Income Select Funds | | | 58.1 | |
Real Return Select Funds | | | 21.1 | |
U.S. Equity Select Funds | | | 15.6 | |
Non-U.S. Equity Select Funds | | | 5.2 | |
| | | | |
| | | 100.0 | |
| | | | |
45
Conservative Allocation Fund (Unaudited)
| | | | |
| Average Annual Total Returns as of 12/31/13 |
| | | GS4 Class* | | Benchmark** |
One Year | | 3.67% | | 5.43% |
Five Year | | 7.14% | | 5.77% |
Ten Year | | 4.11% | | 4.38% |
Inception Date | | 08/27/01 | | |
Total Fund Operating Expenses (May 1, 2013 Prospectus, as amended on October 31, 2013)(1) | | 0.94% | | |
(1)The Fund’s shareholders indirectly bear the expenses of the GS4 Class shares of the Select Funds in which the Fund invests. Current information regarding the Fund’s Operating Expenses can be found in the Financial Highlights.
The performance data quoted represents past performance and does not guarantee future results. Current performance may be lower or higher. Performance data current to the most recent month-end may be obtained at www.GuideStoneFunds.org. The investment return and principal value of an investment will fluctuate so that shares, when redeemed, may be worth more or less than their original cost.
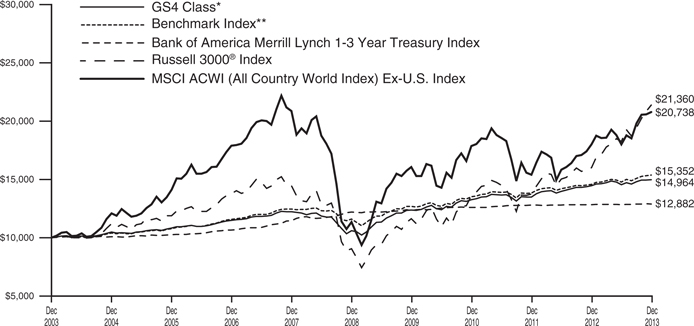
The graph compares the results of a hypothetical $10,000 investment in the GS4 Class of the Fund for the 10-year period from December 31, 2003 to December 31, 2013, with all dividends and capital gains reinvested, with the Fund’s weighted composite benchmark index.
*These returns reflect expense waivers by the Fund’s investment adviser. Without these waivers, returns would have been lower. Returns shown do not reflect the deduction of taxes that a shareholder would pay on Fund distributions or the redemption of Fund shares.
**Represents a composite index as of December 2013, consisting of the Bank of America Merrill Lynch 1-3 Year Treasury Index, the Barclays U.S. TIPS Index, the Russell 3000® Index, the FTSE EPRA/NAREIT Developed Index, the S&P U.S. BB-Ratings and Above Loan Index, the MSCI World Commodity Producers Index and the MSCI ACWI (All Country World Index) Ex-U.S. Index, weighted 58%, 12%, 15%, 1%, 5%, 4% and 5%, respectively.
Unlike a mutual fund, the performance of an index assumes no taxes, transaction costs, management fees or other expenses.
46
| | |
CONSERVATIVE ALLOCATION FUND SCHEDULE OF INVESTMENTS | | December 31, 2013 |
| | | | | | | | | | |
| | | Shares | | | Value | |
MUTUAL FUNDS — 100.0% | | | | | | | |
GuideStone Money Market Fund (GS4 Class)¥ | | | 4,124,830 | | | | | $ | 4,124,830 | |
GuideStone Low-Duration Bond Fund (GS4 Class)¥ | | | 13,584,841 | | | | | | 181,357,631 | |
GuideStone Defensive Market Strategies Fund (GS4 Class)¥ | | | 2,110,470 | | | | | | 24,101,563 | |
GuideStone Value Equity Fund (GS4 Class)¥ | | | 553,128 | | | | | | 11,615,696 | |
GuideStone Growth Equity Fund (GS4 Class)¥ | | | 503,545 | | | | | | 11,586,568 | |
GuideStone Small Cap Equity Fund
(GS4 Class)¥ | | | 140,409 | | | | | | 2,552,633 | |
GuideStone International Equity Fund
(GS4 Class)¥ | | | 853,008 | | | | | | 12,999,842 | |
GuideStone Emerging Market Equity Fund (GS4 Class)*¥ | | | 356,542 | | | | | | 3,476,288 | |
GuideStone Inflation Protected Bond Fund (GS4 Class)¥ | | | 3,651,401 | | | | | | 37,061,722 | |
| | | | | | | | | | |
| | | Shares | | | Value | |
GuideStone Flexible Income Fund (GS4 Class)¥ | | | 1,393,377 | | | | | $ | 14,017,375 | |
GuideStone Real Estate Securities Fund (GS4 Class)¥ | | | 366,988 | | | | | | 3,435,007 | |
GuideStone Global Natural Resources Equity Fund (GS4 Class)¥ | | | 1,323,169 | | | | | | 12,847,970 | |
| | | | | | | | | | |
Total Mutual Funds
(Cost $302,422,214) | | | | | | | | | 319,177,125 | |
| | | | | | | | | | |
TOTAL INVESTMENTS — 100.0%
(Cost $302,422,214) | | | | | | 319,177,125 | |
Other Assets in Excess of
Liabilities — 0.0% | | | | | | | | | 35,809 | |
| | | | | | | | | | |
NET ASSETS — 100.0% | | | | | | | | $ | 319,212,934 | |
| | | | | | | | | | |
VALUATION HIERARCHY
The following is a summary of the inputs used, as of December 31, 2013, in valuing the Fund’s investments carried at fair value:
| | | | | | | | | | | | | | | | | | | | |
| | | Total
Value | | Level 1
Quoted Prices | | Level 2
Other Significant
Observable Inputs | | Level 3
Significant
Unobservable Inputs |
Assets: | | | | | | | | | | | | | | | | | | | | |
Investments in Securities: | | | | | | | | | | | | | | | | | | | | |
Mutual Funds | | | $ | 319,177,125 | | | | $ | 319,177,125 | | | | $ | — | | | | $ | — | |
| | | | | | | | | | | | | | | | | | | | |
| | | | |
Total Assets - Investments in Securities | | | $ | 319,177,125 | | | | $ | 319,177,125 | | | | $ | — | | | | $ | — | |
| | | | | | | | | | | | | | | | | | | | |
| | | | |
Other Financial Instruments*** | | | | | | | | | | | | | | | | | | | | |
Futures Contracts | | | $ | 38,191 | | | | $ | 38,191 | | | | $ | — | | | | $ | — | |
| | | | | | | | | | | | | | | | | | | | |
| | | | |
Total Assets - Other Financial Instruments | | | $ | 38,191 | | | | $ | 38,191 | | | | $ | — | | | | $ | — | |
| | | | | | | | | | | | | | | | | | | | |
***Other financial instruments are derivative instruments not reflected in the Schedule of Investments, such as futures, forwards and swap contracts, which are valued at the unrealized appreciation (depreciation) on the investment. Details of these investments can be found in the Notes to Financial Statements.
| | | | |
| | See Notes to Financial Statements. | | 47 |
Balanced Allocation Fund (Unaudited)
The Fund, through investments in the underlying Select Funds, combined approximately equal percentages to equity securities and fixed income securities in addition to a smaller allocation to real asset securities. The Fund had a target of, but was not limited to, an asset allocation of 42.00% Fixed Income Select Funds, 28.00% U.S. Equity Select Funds, 13.00% Non-U.S. Equity Select Funds, and 17.00% Real Return Select Funds.
As a fund of funds, its performance is based on the performance of the underlying Select Funds. The Fund generated a return of 10.08% for the one-year period ending December 31, 2013, benefiting from positive absolute performance of the underlying Equity Select Funds. The Fund’s absolute return was most positively influenced by its exposure to the Value Equity Fund. The Growth Equity Fund and the International Equity Fund also provided material benefits over the period.
The Fund underperformed its composite benchmark in 2013 (10.08% versus 11.51%), which was primarily driven by the allocation to the Real Return Select Funds. Within this asset class, both the Global Natural Resources Equity Fund and the Flexible Income Fund were material detractors to relative performance versus their respective benchmarks. The most positive contributor to relative performance came from the Extended–Duration Bond Fund allocation.
The Fund attempted to achieve its objective by investing in the Select Funds. By investing in the Fund you will also incur the expenses and risks of the underlying Select Funds. The principal risks of the Fund will change depending on the asset mix of the Select Funds in which it invests. You may directly invest in the Select Funds. The Fund’s value will go up and down in response to changes in the share prices of the investments that it owns. It is possible to lose money by investing in the Fund. This Fund may be suitable for investors who have a medium- to long-term investment horizon, possess a moderate tolerance for risk, and seek to participate in the return potential of stocks but want to achieve this result more slowly and with less volatility through a balanced allocation of fixed-income and equity investments.
At December 31, 2013, the portfolio holdings of the Fund, as a percentage of net assets, is shown in the following table. Portfolio holdings are subject to risk and may change at any time.
| | | | |
| | | % | |
Fixed Income Select Funds | | | 41.6 | |
U.S. Equity Select Funds | | | 28.1 | |
Real Return Select Funds | | | 17.1 | |
Non-U.S. Equity Select Funds | | | 13.1 | |
| | | | |
| | | 99.9 | |
| | | | |
48
Balanced Allocation Fund (Unaudited)
| | | | |
| Average Annual Total Returns as of 12/31/13 |
| | | GS4 Class* | | Benchmark** |
One Year | | 10.08% | | 11.51% |
Five Year | | 11.70% | | 10.87% |
Ten Year | | 6.01% | | 6.42% |
Inception Date | | 08/27/01 | | |
Total Fund Operating Expenses (May 1, 2013 Prospectus, as amended on October 31, 2013)(1) | | 1.10% | | |
(1)The Fund’s shareholders indirectly bear the expenses of the GS4 Class shares of the Select Funds in which the Fund invests. Current information regarding the Fund’s Operating Expenses can be found in the Financial Highlights.
The performance data quoted represents past performance and does not guarantee future results. Current performance may be lower or higher. Performance data current to the most recent month-end may be obtained at www.GuideStoneFunds.org. The investment return and principal value of an investment will fluctuate so that shares, when redeemed, may be worth more or less than their original cost.
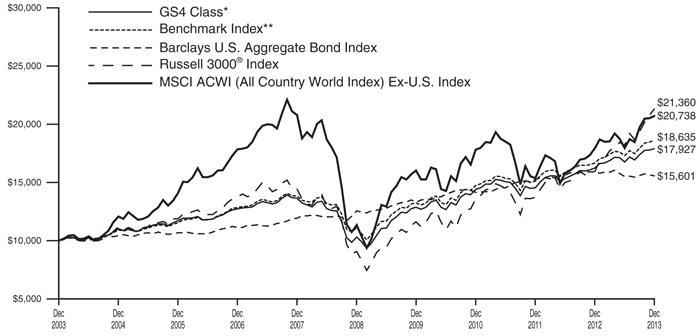
The graph compares the results of a hypothetical $10,000 investment in the GS4 Class of the Fund for the 10-year period from December 31, 2003 to December 31, 2013, with all dividends and capital gains reinvested, with the Fund’s weighted composite benchmark index.
*These returns reflect expense waivers by the Fund’s investment adviser. Without these waivers, returns would have been lower. Returns shown do not reflect the deduction of taxes that a shareholder would pay on Fund distributions or the redemption of Fund shares.
**Represents a composite index as of December 2013, consisting of the Barclays U.S. Aggregate Bond Index, the Barclays U.S. TIPS Index, the Russell 3000® Index, the FTSE EPRA/NAREIT Developed Index, the S&P U.S. BB- Ratings and Above Loan Index, the MSCI World Commodity Producers Index and the MSCI ACWI (All Country World Index) Ex-U.S. Index, weighted 41%, 6%, 28%, 3%, 3%, 6% and 13%, respectively.
Unlike a mutual fund, the performance of an index assumes no taxes, transaction costs, management fees or other expenses.
49
| | |
BALANCED ALLOCATION FUND SCHEDULE OF INVESTMENTS | | December 31, 2013 |
| | | | | | | | | | |
| | | Shares | | | Value | |
MUTUAL FUNDS — 99.9% | | | | | | | |
GuideStone Money Market Fund (GS4 Class)¥ | | | 28,394,843 | | | | | $ | 28,394,843 | |
GuideStone Low-Duration Bond Fund (GS4 Class)¥ | | | 11,332,320 | | | | | | 151,286,470 | |
GuideStone Medium-Duration Bond Fund (GS4 Class)¥ | | | 14,411,363 | | | | | | 203,632,561 | |
GuideStone Extended-Duration Bond Fund (GS4 Class)¥ | | | 3,116,631 | | | | | | 51,050,418 | |
GuideStone Global Bond Fund (GS4 Class)¥ | | | 10,070,645 | | | | | | 101,512,097 | |
GuideStone Defensive Market Strategies Fund (GS4 Class)¥ | | | 9,080,580 | | | | | | 103,700,222 | |
GuideStone Value Equity Fund (GS4 Class)¥ | | | 5,494,563 | | | | | | 115,385,816 | |
GuideStone Growth Equity Fund (GS4 Class)¥ | | | 5,108,903 | | | | | | 117,555,854 | |
GuideStone Small Cap Equity Fund (GS4 Class)¥ | | | 1,423,719 | | | | | | 25,883,218 | |
GuideStone International Equity Fund (GS4 Class)¥ | | | 8,715,615 | | | | | | 132,825,976 | |
| | | | | | | | | | |
| | | Shares | | | Value | |
GuideStone Emerging Market Equity Fund (GS4 Class)*¥ | | | 3,686,132 | | | | | $ | 35,939,786 | |
GuideStone Inflation Protected Bond Fund (GS4 Class)¥ | | | 7,125,520 | | | | | | 72,324,031 | |
GuideStone Flexible Income Fund (GS4 Class)¥ | | | 3,815,254 | | | | | | 38,381,452 | |
GuideStone Real Estate Securities Fund (GS4 Class)¥ | | | 3,596,760 | | | | | | 33,665,678 | |
GuideStone Global Natural Resources Equity Fund (GS4 Class)¥ | | | 7,823,879 | | | | | | 75,969,866 | |
| | | | | | | | | | |
Total Mutual Funds
(Cost $1,151,500,094) | | | | | | | | | 1,287,508,288 | |
| | | | | | | | | | |
TOTAL INVESTMENTS — 99.9%
(Cost $1,151,500,094) | | | | | | 1,287,508,288 | |
Other Assets in Excess of
Liabilities — 0.1% | | | | | | | | | 1,020,256 | |
| | | | | | | | | | |
NET ASSETS — 100.0% | | | | | | | | $ | 1,288,528,544 | |
| | | | | | | | | | |
VALUATION HIERARCHY
The following is a summary of the inputs used, as of December 31, 2013, in valuing the Fund’s investments carried at fair value:
| | | | | | | | | | | | | | | | | | | | |
| | | Total
Value | | Level 1
Quoted Prices | | Level 2
Other Significant
Observable Inputs | | Level 3
Significant
Unobservable Inputs |
Assets: | | | | | | | | | | | | | | | | | | | | |
Investments in Securities: | | | | | | | | | | | | | | | | | | | | |
Mutual Funds | | | $ | 1,287,508,288 | | | | $ | 1,287,508,288 | | | | $ | — | | | | $ | — | |
| | | | | | | | | | | | | | | | | | | | |
Total Assets - Investments in Securities | | | $ | 1,287,508,288 | | | | $ | 1,287,508,288 | | | | $ | — | | | | $ | — | |
| | | | | | | | | | | | | | | | | | | | |
| | | | |
Other Financial Instruments*** | | | | | | | | | | | | | | | | | | | | |
Futures Contracts | | | $ | 393,143 | | | | $ | 393,143 | | | | $ | — | | | | $ | — | |
| | | | | | | | | | | | | | | | | | | | |
Total Assets - Other Financial Instruments | | | $ | 393,143 | | | | $ | 393,143 | | | | $ | — | | | | $ | — | |
| | | | | | | | | | | | | | | | | | | | |
***Other financial instruments are derivative instruments not reflected in the Schedule of Investments, such as futures, forwards and swap contracts, which are valued at the unrealized appreciation (depreciation) on the investment. Details of these investments can be found in the Notes to Financial Statements.
| | | | |
| 50 | | See Notes to Financial Statements. | | |
Growth Allocation Fund (Unaudited)
The Fund, through investments in the underlying Select Funds, combined a greater percentage of exposure to equity securities with a smaller percentage to fixed income securities and real asset securities. The Fund had a target of, but was not limited to, an asset allocation of 26.00% Fixed Income Select Funds, 40.00% U.S. Equity Select Funds, 25.00% Non-U.S. Equity Select Funds, and 9.00% Real Return Select Funds.
As a fund of funds, its performance is based on the performance of the underlying Select Funds. The Fund generated a return of 18.49% for the one-year period ended December 31, 2013, largely attributable to positive absolute performance of the underlying Equity Select Funds. The Fund’s absolute return was most positively influenced by its exposure to the Value Equity Fund. The Growth Equity Fund and the International Equity Fund also provided material benefits over the period.
The Fund outperformed its composite benchmark in 2013 (18.49% versus 18.16%). The largest contributor to the Fund’s relative performance was exposure to the Value Equity Fund, which outperformed its respective benchmark primarily due to security selection. The Fund’s relative performance was negatively impacted by allocations to both the Global Natural Resources Equity Fund and the Low-Duration Bond Fund.
The Fund attempted to achieve its objective by investing in the Select Funds. By investing in the Fund you will also incur the expenses and risks of the underlying Select Funds. The principal risks of the Fund will change depending on the asset mix of the Select Funds in which it invests. You may directly invest in the Select Funds. The Fund’s value will go up and down in response to changes in the share prices of the investments that it owns. It is possible to lose money by investing in the Fund. This Fund may be suitable for investors who have a long-term investment horizon, possess a relatively high tolerance for risk and seek to participate in the return potential of stocks at a slightly lower risk level than an all stock portfolio. Foreign securities may be subject to greater risk than domestic securities due to currency volatility, reduced market liquidity and political and economic instability. Small company stocks are subject to greater risk than large company stocks due to more volatility and less liquidity. This Fund is subject to interest rate risk. Meaning, when interest rates rise, the value of the existing bonds decrease and vice versa. Changes in interest rates have a bigger impact on long duration holdings than on short duration holdings.
At December 31, 2013, the portfolio holdings of the Fund, as a percentage of net assets, is shown in the following table. Portfolio holdings are subject to risk and may change at any time.
| | | | |
| | | % | |
U.S. Equity Select Funds | | | 39.3 | |
Non-U.S. Equity Select Funds | | | 25.8 | |
Fixed Income Select Funds | | | 25.6 | |
Real Return Select Funds | | | 9.2 | |
| | | | |
| | | 99.9 | |
| | | | |
51
Growth Allocation Fund (Unaudited)
| | | | |
| Average Annual Total Returns as of 12/31/13 |
| | | GS4 Class* | | Benchmark** |
One Year | | 18.49% | | 18.16% |
Five Year | | 14.10% | | 13.65% |
Ten Year | | 6.50% | | 6.97% |
Inception Date | | 08/27/01 | | |
Total Fund Operating Expenses (May 1, 2013 Prospectus, as amended on October 31, 2013)(1) | | 1.17% | | |
(1)The Fund’s shareholders indirectly bear the expenses of the GS4 Class shares of the Select Funds in which the Fund invests. Current information regarding the Fund’s Operating Expenses can be found in the Financial Highlights.
The performance data quoted represents past performance and does not guarantee future results. Current performance may be lower or higher. Performance data current to the most recent month-end may be obtained at www.GuideStoneFunds.org. The investment return and principal value of an investment will fluctuate so that shares, when redeemed, may be worth more or less than their original cost.
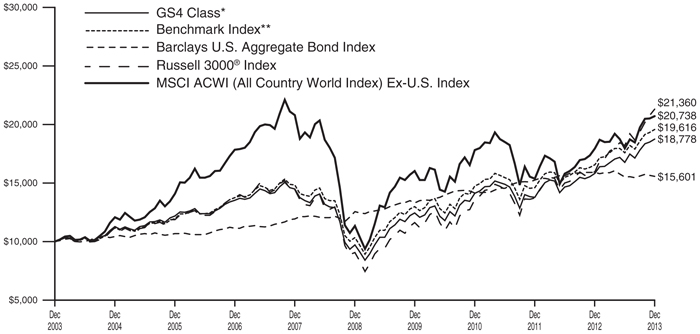
The graph compares the results of a hypothetical $10,000 investment in the GS4 Class of the Fund for the 10-year period from December 31, 2003 to December 31, 2013, with all dividends and capital gains reinvested, with the Fund’s weighted composite benchmark index.
*These returns reflect expense waivers by the Fund’s investment adviser. Without these waivers, returns would have been lower. Returns shown do not reflect the deduction of taxes that a shareholder would pay on Fund distributions or the redemption of Fund shares.
**Represents a composite index as of December 2013, consisting of the Barclays U.S. Aggregate Bond Index, the Russell 3000® Index, the FTSE EPRA/NAREIT Developed Index, the MSCI World Commodity Producers Index and the MSCI ACWI (All Country World Index) Ex-U.S. Index, weighted 25%, 40%, 4%, 6% and 25%, respectively.
Unlike a mutual fund, the performance of an index assumes no taxes, transaction costs, management fees or other expenses.
52
| | |
GROWTH ALLOCATION FUND SCHEDULE OF INVESTMENTS | | December 31, 2013 |
| | | | | | | | | | |
| | | Shares | | | Value | |
MUTUAL FUNDS — 99.9% | | | | | | | |
GuideStone Money Market Fund (GS4 Class)¥ | | | 19,336,501 | | | | | $ | 19,336,501 | |
GuideStone Low-Duration Bond Fund (GS4 Class)¥ | | | 5,056,858 | | | | | | 67,509,057 | |
GuideStone Medium-Duration Bond Fund (GS4 Class)¥ | | | 6,440,352 | | | | | | 91,002,174 | |
GuideStone Extended-Duration Bond Fund (GS4 Class)¥ | | | 1,422,648 | | | | | | 23,302,975 | |
GuideStone Global Bond Fund (GS4 Class)¥ | | | 4,536,099 | | | | | | 45,723,874 | |
GuideStone Value Equity Fund (GS4 Class)¥ | | | 8,123,949 | | | | | | 170,602,934 | |
GuideStone Growth Equity Fund (GS4 Class)¥ | | | 7,416,473 | | | | | | 170,653,044 | |
GuideStone Small Cap Equity Fund
(GS4 Class)¥ | | | 2,064,105 | | | | | | 37,525,434 | |
GuideStone International Equity Fund
(GS4 Class)¥ | | | 12,831,083 | | | | | | 195,545,699 | |
| | | | | | | | | | |
| | | Shares | | | Value | |
GuideStone Emerging Market Equity Fund (GS4 Class)*¥ | | | 5,418,243 | | | | | $ | 52,827,873 | |
GuideStone Real Estate Securities Fund (GS4 Class)¥ | | | 3,439,694 | | | | | | 32,195,539 | |
GuideStone Global Natural Resources Equity Fund (GS4 Class)¥ | | | 5,843,828 | | | | | | 56,743,574 | |
| | | | | | | | | | |
Total Mutual Funds
(Cost $846,501,755) | | | | | | | | | 962,968,678 | |
| | | | | | | | | | |
TOTAL INVESTMENTS — 99.9%
(Cost $846,501,755) | | | | | | 962,968,678 | |
Other Assets in Excess of
Liabilities — 0.1% | | | | | | | | | 932,918 | |
| | | | | | | | | | |
NET ASSETS — 100.0% | | | | | | | | $ | 963,901,596 | |
| | | | | | | | | | |
VALUATION HIERARCHY
The following is a summary of the inputs used, as of December 31, 2013, in valuing the Fund’s investments carried at fair value:
| | | | | | | | | | | | | | | | | | | | |
| | | Total Value | | Level 1
Quoted Prices | | Level 2
Other Significant
Observable Inputs | | Level 3 Significant
Unobservable Inputs |
Assets: | | | | | | | | | | | | | | | | | | | | |
Investments in Securities: | | | | | | | | | | | | | | | | | | | | |
Mutual Funds | | | $ | 962,968,678 | | | | $ | 962,968,678 | | | | $ | — | | | | $ | — | |
| | | | | | | | | | | | | | | | | | | | |
Total Assets - Investments in Securities | | | $ | 962,968,678 | | | | $ | 962,968,678 | | | | $ | — | | | | $ | — | |
| | | | | | | | | | | | | | | | | | | | |
| | | | |
Other Financial Instruments*** | | | | | | | | | | | | | | | | | | | | |
Futures Contracts | | | $ | 555,401 | | | | $ | 555,401 | | | | $ | — | | | | $ | — | |
| | | | | | | | | | | | | | | | | | | | |
Total Assets - Other Financial Instruments | | | $ | 555,401 | | | | $ | 555,401 | | | | $ | — | | | | $ | — | |
| | | | | | | | | | | | | | | | | | | | |
***Other financial instruments are derivative instruments not reflected in the Schedule of Investments, such as futures, forwards and swap contracts, which are valued at the unrealized appreciation (depreciation) on the investment. Details of these investments can be found in the Notes to Financial Statements.
| | | | |
| | See Notes to Schedules of Investments. | | 53 |
Aggressive Allocation Fund (Unaudited)
The Fund, through investments in the underlying Select Funds, combined a greater percentage of exposure to U.S. equity securities with a smaller percentage to non-U.S. equity securities. The Fund had a target of, but was not limited to, an asset allocation of 60.00% U.S. Equity Select Funds and 40.00% Non-U.S. Select Funds.
As a fund of funds, its performance was based on the performance of the underlying Select Funds. The Fund generated a return of 27.41% for the one-year period ended December 31, 2013, as absolute performance was largely attributable to exposure to the Value Equity Fund and Growth Equity Fund.
The Fund outperformed its composite benchmark in 2013 (27.41% versus 26.04%). The Value Equity Fund served as the key driver in the Fund’s relative outperformance for the year. The Growth Equity Fund and the International Equity Fund also made material relative contributions to the Fund during the second half of the year.
The Fund attempted to achieve its objective by investing in the Select Funds. By investing in the Fund you will also incur the expenses and risks of the underlying Select Funds. The principal risks of the Fund will change depending on the asset mix of the Select Funds in which it invests. You may directly invest in the Select Funds. The Fund’s value will go up and down in response to changes in the share prices of the investments that it owns. It is possible to lose money by investing in the Fund. This Fund may be suitable for investors who have a long-term investment horizon, possess a relatively high tolerance for risk and want to diversify by adding an aggressive investment option that combines U.S. and international stocks. Foreign securities may be subject to greater risk than domestic securities due to currency volatility, reduced market liquidity and political and economic instability. Small company stocks are subject to greater risk than large company stocks due to more volatility and less liquidity.
At December 31, 2013, the portfolio holdings of the Fund, as a percentage of net assets, is shown in the following table. Portfolio holdings are subject to risk and may change at any time.
| | | | |
| | | % | |
U.S. Equity Select Funds | | | 59.2 | |
Non-U.S. Equity Select Funds | | | 38.7 | |
Fixed Income Select Fund | | | 2.0 | |
| | | | |
| | | 99.9 | |
| | | | |
54
Aggressive Allocation Fund (Unaudited)
| | | | |
| Average Annual Total Returns as of 12/31/13 |
| | | GS4 Class* | | Benchmark** |
One Year | | 27.41% | | 26.04% |
Five Year | | 16.37% | | 16.55% |
Ten Year | | 6.82% | | 7.47% |
Inception Date | | 08/27/01 | | |
Total Fund Operating Expenses (May 1, 2013 Prospectus, as amended on October 31, 2013)(1) | | 1.27% | | |
(1)The Fund’s shareholders indirectly bear the expenses of the GS4 Class shares of the Select Funds in which the Fund invests. Current information regarding the Fund’s Operating Expenses can be found in the Financial Highlights.
The performance data quoted represents past performance and does not guarantee future results. Current performance may be lower or higher. Performance data current to the most recent month-end may be obtained at www.GuideStoneFunds.org. The investment return and principal value of an investment will fluctuate so that shares, when redeemed, may be worth more or less than their original cost.

The graph compares the results of a hypothetical $10,000 investment in the GS4 Class of the Fund for the 10-year period from December 31, 2003 to December 31, 2013, with all dividends and capital gains reinvested, with the Fund’s weighted composite benchmark index.
*These returns reflect expense waivers by the Fund’s investment adviser. Without these waivers, returns would have been lower. Returns shown do not reflect the deduction of taxes that a shareholder would pay on Fund distributions or the redemption of Fund shares.
**Represents a composite index as of December 2013, consisting of the Russell 3000® Index and the MSCI ACWI (All Country World Index) Ex-U.S. Index, weighted 60.00% and 40.00%, respectively.
Unlike a mutual fund, the performance of an index assumes no taxes, transaction costs, management fees or other expenses.
55
| | |
AGGRESSIVE ALLOCATION FUND SCHEDULE OF INVESTMENTS | | December 31, 2013 |
| | | | | | | | |
| | | Shares | | Value | |
MUTUAL FUNDS — 99.9% | | | | | | |
GuideStone Money Market Fund (GS4 Class)¥ | | 17,878,395 | | | | | $17,878,395 | |
GuideStone Value Equity Fund (GS4 Class)¥ | | 11,075,192 | | | | | 232,579,031 | |
GuideStone Growth Equity Fund (GS4 Class)¥ | | 10,263,763 | | | | | 236,169,182 | |
GuideStone Small Cap Equity Fund (GS4 Class)¥ | | 2,850,341 | | | | | 51,819,192 | |
GuideStone International Equity Fund (GS4 Class)¥ | | 17,565,949 | | | | | 267,705,065 | |
GuideStone Emerging Market Equity Fund (GS4 Class)*¥ | | 7,420,218 | | | | | 72,347,121 | |
| | | | | | | | |
Total Mutual Funds
(Cost $727,104,394) | | | | | 878,497,986 | |
| | | | | | | | |
TOTAL INVESTMENTS — 99.9%
(Cost $727,104,394) | | | | | 878,497,986 | |
Other Assets in Excess of
Liabilities — 0.1% | | | | | | | 1,065,162 | |
| | | | | | | | |
NET ASSETS — 100.0% | | | | $ | 879,563,148 | |
| | | | | | | | |
VALUATION HIERARCHY
The following is a summary of the inputs used, as of December 31, 2013, in valuing the Fund’s investments carried at fair value:
| | | | | | | | | | | | | | | | | | | | |
| | | Total
Value | | Level 1
Quoted Prices | | Level 2
Other Significant
Observable Inputs | | Level 3
Significant
Unobservable Inputs |
Assets: | | | | | | | | | | | | | | | | | | | | |
Investments in Securities: | | | | | | | | | | | | | | | | | | | | |
Mutual Funds | | | $ | 878,497,986 | | | | $ | 878,497,986 | | | | $ | — | | | | $ | — | |
| | | | | | | | | | | | | | | | | | | | |
Total Assets - Investments in Securities | | | $ | 878,497,986 | | | | $ | 878,497,986 | | | | $ | — | | | | $ | — | |
| | | | | | | | | | | | | | | | | | | | |
| | | | |
Other Financial Instruments*** | | | | | | | | | | | | | | | | | | | | |
Futures Contracts | | | $ | 756,054 | | | | $ | 756,054 | | | | $ | — | | | | $ | — | |
| | | | | | | | | | | | | | | | | | | | |
Total Assets - Other Financial Instruments | | | $ | 756,054 | | | | $ | 756,054 | | | | $ | — | | | | $ | — | |
| | | | | | | | | | | | | | | | | | | | |
***Other financial instruments are derivative instruments not reflected in the Schedule of Investments, such as futures, forwards and swap contracts, which are valued at the unrealized appreciation (depreciation) on the investment. Details of these investments can be found in the Notes to Financial Statements.
| | | | |
| 56 | | See Notes to Financial Statements. | | |
| | |
| STATEMENTS OF ASSETS AND LIABILITIES | | December 31, 2013 |
| | | | | | | | | | | | | | | | |
| | | Conservative
Allocation Fund | | | Balanced
Allocation Fund | | | Growth
Allocation Fund | | | Aggressive
Allocation Fund | |
Assets | | | | | | | | | | | | | | | | |
Investments in securities of affiliated issuers, at value (1) | | $ | 319,177,125 | | | $ | 1,287,508,288 | | | $ | 962,968,678 | | | $ | 878,497,986 | |
Cash collateral for derivatives | | | 74,200 | | | | 811,600 | | | | 796,400 | | | | 925,200 | |
Receivables: | | | | | | | | | | | | | | | | |
Dividends from affiliated funds | | | 33 | | | | 232 | | | | 160 | | | | 155 | |
Fund shares sold | | | 40,890 | | | | 368,012 | | | | 212,747 | | | | 182,649 | |
Variation margin on financial futures contracts | | | 3,430 | | | | 50,470 | | | | 54,265 | | | | 66,700 | |
Prepaid expenses and other assets | | | 16,892 | | | | 15,359 | | | | 13,103 | | | | 12,695 | |
| | | | | | | | | | | | | | | | |
Total Assets | | | 319,312,570 | | | | 1,288,753,961 | | | | 964,045,353 | | | | 879,685,385 | |
| | | | | | | | | | | | | | | | |
Liabilities | | | | | | | | | | | | | | | | |
Payables: | | | | | | | | | | | | | | | | |
Fund shares redeemed | | | 36,262 | | | | 24,965 | | | | — | | | | — | |
Variation margin on financial futures contracts | | | — | | | | 18,891 | | | | 6,687 | | | | — | |
Accrued expenses: | | | | | | | | | | | | | | | | |
Investment advisory fees | | | 14,838 | | | | 98,136 | | | | 72,386 | | | | 67,356 | |
Professional fees | | | 17,479 | | | | 17,479 | | | | 17,479 | | | | 17,479 | |
Other expenses | | | 31,057 | | | | 65,946 | | | | 47,205 | | | | 37,402 | |
| | | | | | | | | | | | | | | | |
Total Liabilities | | | 99,636 | | | | 225,417 | | | | 143,757 | | | | 122,237 | |
| | | | | | | | | | | | | | | | |
Net Assets | | $ | 319,212,934 | | | $ | 1,288,528,544 | | | $ | 963,901,596 | | | $ | 879,563,148 | |
| | | | | | | | | | | | | | | | |
Net Assets Consist of: | | | | | | | | | | | | | | | | |
Paid-in-capital | | $ | 301,642,460 | | | $ | 1,131,187,864 | | | $ | 818,798,200 | | | $ | 690,410,668 | |
Undistributed net realized gain on investments and derivative transactions | | | 777,372 | | | | 20,939,343 | | | | 28,081,072 | | | | 37,002,834 | |
Net unrealized appreciation (depreciation) on investments and derivative transactions | | | 16,793,102 | | | | 136,401,337 | | | | 117,022,324 | | | | 152,149,646 | |
| | | | | | | | | | | | | | | | |
Net Assets | | $ | 319,212,934 | | | $ | 1,288,528,544 | | | $ | 963,901,596 | | | $ | 879,563,148 | |
| | | | | | | | | | | | | | | | |
Net Asset Value: | | | | | | | | | | | | | | | | |
$0.001 par value, unlimited shares authorized | | | | | | | | | | | | | | | | |
Net assets applicable to the GS4 Class | | $ | 319,212,934 | | | $ | 1,288,528,544 | | | $ | 963,901,596 | | | $ | 879,563,148 | |
| | | | | | | | | | | | | | | | |
GS4 shares outstanding | | | 26,971,515 | | | | 98,076,144 | | | | 68,849,411 | | | | 59,351,596 | |
| | | | | | | | | | | | | | | | |
Net asset value, offering and redemption price per GS4 share | | $ | 11.84 | | | $ | 13.14 | | | $ | 14.00 | | | $ | 14.82 | |
| | | | | | | | | | | | | | | | |
| | | | |
(1) Investments in securities of affiliated issuers, at cost | | $ | 302,422,214 | | | $ | 1,151,500,094 | | | $ | 846,501,755 | | | $ | 727,104,394 | |
| | | | | | | | | | | | | | | | |
| | | | |
| | See Notes to Financial Statements. | | 57 |
| | |
STATEMENTS OF OPERATIONS | | For the Year Ended December 31, 2013 |
| | | | | | | | | | | | | | | | |
| | | Conservative
Allocation Fund | | | Balanced
Allocation Fund | | | Growth
Allocation Fund | | | Aggressive
Allocation Fund | |
Investment Income | | | | | | | | | | | | | | | | |
Income dividends received from affiliated funds | | $ | 3,120,041 | | | $ | 16,953,761 | | | $ | 10,402,047 | | | $ | 7,069,421 | |
Interest | | | — | | | | — | | | | — | | | | 558 | |
| | | | | | | | | | | | | | | | |
Total Investment Income | | | 3,120,041 | | | | 16,953,761 | | | | 10,402,047 | | | | 7,069,979 | |
| | | | | | | | | | | | | | | | |
Expenses | | | | | | | | | | | | | | | | |
Investment advisory fees | | | 327,776 | | | | 1,286,542 | | | | 925,339 | | | | 812,928 | |
Transfer agent fees: | | | | | | | | | | | | | | | | |
GS4 shares | | | 31,715 | | | | 57,732 | | | | 37,538 | | | | 33,502 | |
Custodian fees | | | 19,028 | | | | 35,729 | | | | 28,981 | | | | 22,608 | |
Accounting and administration fees | | | 20,851 | | | | 69,366 | | | | 51,076 | | | | 45,069 | |
Professional fees | | | 46,087 | | | | 46,087 | | | | 46,087 | | | | 46,087 | |
Blue sky fees: | | | | | | | | | | | | | | | | |
GS4 shares | | | 20,833 | | | | 17,620 | | | | 18,339 | | | | 16,644 | |
Shareholder reporting fees: | | | | | | | | | | | | | | | | |
GS4 shares | | | 28,390 | | | | 57,648 | | | | 37,597 | | | | 32,618 | |
Trustee expenses | | | 3,288 | | | | 12,808 | | | | 9,222 | | | | 8,121 | |
Line of credit facility fees | | | 3,186 | | | | 12,334 | | | | 8,858 | | | | 7,779 | |
Other expenses | | | 8,719 | | | | 10,026 | | | | 10,313 | | | | 9,523 | |
| | | | | | | | | | | | | | | | |
Total Expenses | | | 509,873 | | | | 1,605,892 | | | | 1,173,350 | | | | 1,034,879 | |
Expenses waived/reimbursed(1) | | | (122,093 | ) | | | (98,366 | ) | | | (87,577 | ) | | | (79,432 | ) |
| | | | | | | | | | | | | | | | |
Net Expenses | | | 387,780 | | | | 1,507,526 | | | | 1,085,773 | | | | 955,447 | |
| | | | | | | | | | | | | | | | |
Net investment income | | | 2,732,261 | | | | 15,446,235 | | | | 9,316,274 | | | | 6,114,532 | |
| | | | | | | | | | | | | | | | |
Realized and Unrealized Gain (Loss) | | | | | | | | | | | | | | | | |
Capital gain distributions received from affiliated funds | | | 5,310,243 | | | | 40,924,872 | | | | 42,499,573 | | | | 50,860,955 | |
Net realized gain on investment securities of affiliated issuers | | | 15,455,343 | | | | 35,472,898 | | | | 49,833,057 | | | | 15,511,241 | |
Net realized gain on futures transactions | | | 254,012 | | | | 2,239,119 | | | | 2,683,817 | | | | 2,654,901 | |
| | | | | | | | | | | | | | | | |
Net realized gain | | | 21,019,598 | | | | 78,636,889 | | | | 95,016,447 | | | | 69,027,097 | |
| | | | | | | | | | | | | | | | |
Change in unrealized appreciation (depreciation) on investment securities of affiliated issuers | | | (12,285,298 | ) | | | 25,114,031 | | | | 48,422,347 | | | | 117,587,900 | |
Change in unrealized appreciation (depreciation) on futures | | | 26,458 | | | | 322,838 | | | | 452,871 | | | | 653,729 | |
| | | | | | | | | | | | | | | | |
Net change in unrealized appreciation | | | (12,258,840 | ) | | | 25,436,869 | | | | 48,875,218 | | | | 118,241,629 | |
| | | | | | | | | | | | | | | | |
Net Realized and Unrealized Gain | | | 8,760,758 | | | | 104,073,758 | | | | 143,891,665 | | | | 187,268,726 | |
| | | | | | | | | | | | | | | | |
Net Increase in Net Assets Resulting from Operations | | $ | 11,493,019 | | | $ | 119,519,993 | | | $ | 153,207,939 | | | $ | 193,383,258 | |
| | | | | | | | | | | | | | | | |
| (1) | See Note 3a and 3c in Notes to Financial Statements. |
| | | | |
| 58 | | See Notes to Financial Statements. | | |
(This page intentionally left blank)
59
STATEMENTS OF CHANGES IN NET ASSETS
| | | | | | | | | | | | | | | | |
| | | Conservative Allocation Fund | | | Balanced Allocation Fund | |
| | | For the Year Ended | | | For the Year Ended | |
| | | 12/31/13 | | | 12/31/12 | | | 12/31/13 | | | 12/31/12 | |
Operations: | | | | | | | | | | | | | | | | |
Net investment income | | $ | 2,732,261 | | | $ | 3,981,573 | | | $ | 15,446,235 | | | $ | 17,917,465 | |
Net realized gain on investment securities and futures transactions | | | 21,019,598 | | | | 4,388,403 | | | | 78,636,889 | | | | 33,920,005 | |
Net change in unrealized appreciation (depreciation) on investment securities and futures | | | (12,258,840 | ) | | | 12,269,712 | | | | 25,436,869 | | | | 76,537,794 | |
| | | | | | | | | | | | | | | | |
Net increase in net assets resulting from operations | | | 11,493,019 | | | | 20,639,688 | | | | 119,519,993 | | | | 128,375,264 | |
| | | | | | | | | | | | | | | | |
Dividends and Distributions to Shareholders: | | | | | | | | | | | | | | | | |
Dividends from net investment income(1) | | | (4,587,228 | ) | | | (5,748,208 | ) | | | (26,717,331 | ) | | | (25,053,190 | ) |
Distributions from net realized capital gains | | | (17,676,838 | ) | | | (780,975 | ) | | | (54,188,791 | ) | | | (14,173,968 | ) |
| | | | | | | | | | | | | | | | |
Total dividends and distributions | | | (22,264,066 | ) | | | (6,529,183 | ) | | | (80,906,122 | ) | | | (39,227,158 | ) |
| | | | | | | | | | | | | | | | |
Capital Share Transactions: | | | | | | | | | | | | | | | | |
Proceeds from GS4 shares sold | | | 44,406,970 | | | | 45,857,397 | | | | 81,882,324 | | | | 60,529,162 | |
Reinvestment of dividends and distributions into GS4 shares | | | 22,243,595 | | | | 6,526,106 | | | | 80,865,441 | | | | 39,204,104 | |
| | | | | | | | | | | | | | | | |
Total proceeds from shares sold and reinvested | | | 66,650,565 | | | | 52,383,503 | | | | 162,747,765 | | | | 99,733,266 | |
| | | | | | | | | | | | | | | | |
Value of GS4 shares redeemed | | | (63,987,436 | ) | | | (32,409,160 | ) | | | (117,701,721 | ) | | | (81,287,742 | ) |
| | | | | | | | | | | | | | | | |
Total value of shares redeemed | | | (63,987,436 | ) | | | (32,409,160 | ) | | | (117,701,721 | ) | | | (81,287,742 | ) |
| | | | | | | | | | | | | | | | |
Net increase (decrease) from capital share transactions(2) | | | 2,663,129 | | | | 19,974,343 | | | | 45,046,044 | | | | 18,445,524 | |
| | | | | | | | | | | | | | | | |
Total increase (decrease) in net assets | | | (8,107,918 | ) | | | 34,084,848 | | | | 83,659,915 | | | | 107,593,630 | |
| | | | | | | | | | | | | | | | |
Net Assets: | | | | | | | | | | | | | | | | |
Beginning of Year | | | 327,320,852 | | | | 293,236,004 | | | | 1,204,868,629 | | | | 1,097,274,999 | |
| | | | | | | | | | | | | | | | |
End of Year* | | $ | 319,212,934 | | | $ | 327,320,852 | | | $ | 1,288,528,544 | | | $ | 1,204,868,629 | |
| | | | | | | | | | | | | | | | |
*Including undistributed net investment income | | $ | — | | | $ | 1,189 | | | $ | — | | | $ | 1,695 | |
| | | | | | | | | | | | | | | | |
| (1) | Includes dividends paid from the short-term portion of capital gain distributions received from affiliated funds. |
| (2) | See Note 6 in Notes to Financial Statements. |
| | | | |
| 60 | | See Notes to Financial Statements. | | |
| | | | | | | | | | | | | | |
| Growth Allocation Fund | | | Aggressive Allocation Fund | |
| For the Year Ended | | | For the Year Ended | |
| 12/31/13 | | | 12/31/12 | | | 12/31/13 | | | 12/31/12 | |
| | | | | | | | | | | | | | |
| $ | 9,316,274 | | | $ | 9,759,054 | | | $ | 6,114,532 | | | $ | 6,546,308 | |
| | | |
| | 95,016,447 | | | | 24,287,794 | | | | 69,027,097 | | | | 30,188,593 | |
| | | |
| | 48,875,218 | | | | 79,796,586 | | | | 118,241,629 | | | | 75,596,122 | |
| | | | | | | | | | | | | | |
| | 153,207,939 | | | | 113,843,434 | | | | 193,383,258 | | | | 112,331,023 | |
| | | | | | | | | | | | | | |
| | | | | | | | | | | | | | |
| | (18,512,739 | ) | | | (11,303,246 | ) | | | (16,817,289 | ) | | | (6,549,181 | ) |
| | (72,279,436 | ) | | | (6,704,077 | ) | | | (41,616,328 | ) | | | (10,630,919 | ) |
| | | | | | | | | | | | | | |
| | (90,792,175 | ) | | | (18,007,323 | ) | | | (58,433,617 | ) | | | (17,180,100 | ) |
| | | | | | | | | | | | | | |
| | | | | | | | | | | | | | |
| | 43,881,701 | | | | 31,477,784 | | | | 30,036,829 | | | | 76,004,191 | |
| | 90,787,186 | | | | 18,005,817 | | | | 58,430,316 | | | | 17,178,628 | |
| | | | | | | | | | | | | | |
| | 134,668,887 | | | | 49,483,601 | | | | 88,467,145 | | | | 93,182,819 | |
| | | | | | | | | | | | | | |
| | (86,415,713 | ) | | | (75,431,090 | ) | | | (70,518,946 | ) | | | (136,458,221 | ) |
| | | | | | | | | | | | | | |
| | (86,415,713 | ) | | | (75,431,090 | ) | | | (70,518,946 | ) | | | (136,458,221 | ) |
| | | | | | | | | | | | | | |
| | 48,253,174 | | | | (25,947,489 | ) | | | 17,948,199 | | | | (43,275,402 | ) |
| | | | | | | | | | | | | | |
| | 110,668,938 | | | | 69,888,622 | | | | 152,897,840 | | | | 51,875,521 | |
| | | | | | | | | | | | | | |
| | | | | | | | | | | | | | |
| | 853,232,658 | | | | 783,344,036 | | | | 726,665,308 | | | | 674,789,787 | |
| | | | | | | | | | | | | | |
| $ | 963,901,596 | | | $ | 853,232,658 | | | $ | 879,563,148 | | | $ | 726,665,308 | |
| | | | | | | | | | | | | | |
| $ | — | | | $ | 7,260 | | | $ | — | | | $ | — | |
| | | | | | | | | | | | | | |
| | | | |
| | See Notes to Financial Statements. | | 61 |
FINANCIAL HIGHLIGHTS
| | | | | | | | | | | | | | | | | | | | | | | | | | | | | | | | | | | | | | | | | | | | | | | | | | | | |
| For a Share Outstanding For the Years Ending December 31, unless otherwise indicated | | | | | | Ratios to Average Net Assets | | | | |
| | | Net Asset
Value,
Beginning
of Year | | | Net
Investment
Income (1) | | | Capital Gain
Distribu- tions
Received
from
Affiliated
Funds | | | Realized
and
Unrealized
Gain (Loss) on
Investments | | | Dividends
from Net
Investment
Income (2) | | | Distribu- tions
from Net
Realized
Capital
Gains | | | Net
Asset
Value,
End of
Year | | | Total
Return | | | Net Assets, End of Year (000) | | | Expenses,
Net(3)(4) | | | Expenses,
Gross (3)(5) | | | Investment
Income,
Net (1)(4) | | | Portfolio
Turnover
Rate | |
Conservative Allocation Fund | |
| | | | | | | | | | | | |
GS4 Class | | | | | | | | | | | | | | | | | | | | | | | | | | | | | | | | | | | | | | | | | | | | | | | | | |
| 2013 | | $ | 12.27 | | | $ | 0.11 | # | | $ | 0.21 | | | $ | 0.12 | | | $ | (0.17 | ) | | $ | (0.70 | ) | | $ | 11.84 | | | | 3.67 | % | | $ | 319,213 | | | | 0.12 | % | | | 0.16 | % | | | 0.85 | % | | | 12 | % |
| 2012 | | | 11.70 | | | | 0.16 | # | | | 0.16 | | | | 0.50 | | | | (0.22 | ) | | | (0.03 | ) | | | 12.27 | | | | 7.02 | | | | 327,321 | | | | 0.12 | | | | 0.16 | | | | 1.29 | | | | 3 | |
| 2011 | | | 11.87 | | | | 0.18 | # | | | 0.05 | | | | (0.03 | ) | | | (0.19 | ) | | | (0.18 | ) | | | 11.70 | | | | 1.71 | | | | 293,236 | | | | 0.12 | | | | 0.17 | | | | 1.47 | | | | 9 | |
| 2010 | | | 11.39 | | | | 0.18 | # | | | 0.08 | | | | 0.56 | | | | (0.27 | ) | | | (0.07 | ) | | | 11.87 | | | | 7.19 | | | | 261,993 | | | | 0.12 | | | | 0.15 | | | | 1.57 | | | | 19 | |
| 2009 | | | 10.33 | | | | 0.26 | # | | | — | † | | | 1.44 | | | | (0.26 | ) | | | (0.38 | ) | | | 11.39 | | | | 16.58 | | | | 284,750 | | | | 0.12 | | | | 0.16 | | | | 2.37 | | | | 32 | |
Balanced Allocation Fund | |
| | | | | | | | | | | | |
GS4 Class | | | | | | | | | | | | | | | | | | | | | | | | | | | | | | | | | | | | | | | | | | | | | | | | | |
| 2013 | | $ | 12.73 | | | $ | 0.16 | # | | $ | 0.44 | | | $ | 0.68 | | | $ | (0.28 | ) | | $ | (0.59 | ) | | $ | 13.14 | | | | 10.08 | % | | $ | 1,288,529 | | | | 0.12 | % | | | 0.13 | % | | | 1.23 | % | | | 27 | % |
| 2012 | | | 11.77 | | | | 0.19 | # | | | 0.22 | | | | 0.97 | | | | (0.27 | ) | | | (0.15 | ) | | | 12.73 | | | | 11.79 | | | | 1,204,869 | | | | 0.12 | | | | 0.13 | | | | 1.54 | | | | 3 | |
| 2011 | | | 12.12 | | | | 0.20 | # | | | 0.06 | | | | (0.14 | ) | | | (0.26 | ) | | | (0.21 | ) | | | 11.77 | | | | 1.01 | | | | 1,097,275 | | | | 0.12 | | | | 0.13 | | | | 1.65 | | | | 16 | |
| 2010 | | | 11.14 | | | | 0.23 | # | | | 0.09 | | | | 1.00 | | | | (0.34 | ) | | | — | | | | 12.12 | | | | 11.87 | | | | 1,120,981 | | | | 0.12 | | | | 0.12 | | | | 1.95 | | | | 17 | |
| 2009 | | | 9.20 | | | | 0.26 | # | | | 0.05 | | | | 1.97 | | | | (0.27 | ) | | | (0.07 | ) | | | 11.14 | | | | 25.05 | | | | 1,132,991 | | | | 0.12 | | | | 0.13 | | | | 2.58 | | | | 19 | |
Growth Allocation Fund | |
| | | | | | | | | | | | |
GS4 Class | | | | | | | | | | | | | | | | | | | | | | | | | | | | | | | | | | | | | | | | | | | | | | | | | |
| 2013 | | $ | 13.04 | | | $ | 0.15 | # | | $ | 0.67 | | | $ | 1.57 | | | $ | (0.27 | ) | | $ | (1.16 | ) | | $ | 14.00 | | | | 18.49 | % | | $ | 963,902 | | | | 0.12 | % | | | 0.13 | % | | | 1.03 | % | | | 22 | % |
| 2012 | | | 11.60 | | | | 0.15 | # | | | 0.26 | | | | 1.30 | | | | (0.17 | ) | | | (0.10 | ) | | | 13.04 | | | | 14.84 | | | | 853,233 | | | | 0.12 | | | | 0.13 | | | | 1.17 | | | | 2 | |
| 2011 | | | 12.28 | | | | 0.16 | # | | | 0.03 | | | | (0.49 | ) | | | (0.17 | ) | | | (0.21 | ) | | | 11.60 | | | | (2.39 | ) | | | 783,344 | | | | 0.12 | | | | 0.14 | | | | 1.26 | | | | 10 | |
| 2010 | | | 11.11 | | | | 0.16 | # | | | 0.05 | | | | 1.31 | | | | (0.27 | ) | | | (0.08 | ) | | | 12.28 | | | | 13.65 | | | | 841,926 | | | | 0.12 | | | | 0.13 | | | | 1.43 | | | | 8 | |
| 2009 | | | 8.86 | | | | 0.18 | # | | | 0.02 | | | | 2.25 | | | | (0.15 | ) | | | (0.05 | ) | | | 11.11 | | | | 27.96 | | | | 840,810 | | | | 0.12 | | | | 0.13 | | | | 1.88 | | | | 11 | |
Aggressive Allocation Fund | |
| | | | | | | | | | | | |
GS4 Class | | | | | | | | | | | | | | | | | | | | | | | | | | | | | | | | | | | | | | | | | | | | | | | | | |
| 2013 | | $ | 12.46 | | | $ | 0.11 | # | | $ | 0.90 | | | $ | 2.39 | | | $ | (0.29 | ) | | $ | (0.75 | ) | | $ | 14.82 | | | | 27.41 | % | | $ | 879,563 | | | | 0.12 | % | | | 0.13 | % | | | 0.77 | % | | | 12 | % |
| 2012 | | | 10.89 | | | | 0.11 | # | | | 0.26 | | | | 1.50 | | | | (0.11 | ) | | | (0.19 | ) | | | 12.46 | | | | 17.19 | | | | 726,665 | | | | 0.12 | | | | 0.13 | | | | 0.91 | | | | 5 | |
| 2011 | | | 11.79 | | | | 0.10 | # | | | — | † | | | (0.71 | ) | | | (0.10 | ) | | | (0.19 | ) | | | 10.89 | | | | (5.14 | ) | | | 674,790 | | | | 0.12 | | | | 0.14 | | | | 0.83 | | | | 9 | |
| 2010 | | | 10.43 | | | | 0.10 | # | | | — | † | | | 1.48 | | | | (0.10 | ) | | | (0.12 | ) | | | 11.79 | | | | 15.16 | | | | 745,493 | | | | 0.12 | | | | 0.13 | | | | 0.91 | | | | 1 | |
| 2009 | | | 8.13 | | | | 0.10 | # | | | — | † | | | 2.38 | | | | (0.10 | ) | | | (0.08 | ) | | | 10.43 | | | | 30.82 | | | | 729,734 | | | | 0.12 | | | | 0.14 | | | | 1.17 | | | | 3 | |
| † | Amount represents less than $0.005 per share. |
| # | Calculated using the average shares outstanding method. |
| (1) | Recognition of net investment income by the Fund is affected by the timing of the declaration of dividends by the underlying investment companies in which the Fund invests. |
| (2) | Includes dividends paid from the short-term portion of capital gain distributions received from affiliated Funds. |
| (3) | Does not include expenses of the investment companies in which the Fund invests. |
| (4) | The ratio includes expenses waived/reimbursed net of amount recaptured and fees paid indirectly, where applicable; if expenses waived/reimbursed net of amount recaptured and fees paid indirectly were excluded, the ratio would have been higher (lower) than the ratio shown. |
| (5) | The ratio excludes expenses waived/reimbursed net of amount recaptured and fees paid indirectly, where applicable; if expenses waived/reimbursed net of amount recaptured and fees paid indirectly were included, the ratio would have been lower than the ratio shown. |
| | | | |
| 62 | | See Notes to Financial Statements. | | |
Conservative Allocation Fund I (Unaudited)
The Fund, through investments in the underlying Select Funds, combined a greater percentage of exposure to fixed income securities with a smaller percentage to equity securities and real asset securities. The Fund had a target of, but was not limited to, an asset allocation of 58.00% Fixed Income Select Funds, 16.00% U.S. Equity Select Funds, 5.00% Non-U.S. Equity Select Funds, and 21.00% Real Return Select Funds.
As a fund of funds, its performance was based on the performance of the underlying Select Funds. The Fund generated a return of 3.85% for the one-year period ended December 31, 2013, benefiting from positive absolute performance of certain underlying Equity Select Funds. Detracting from absolute performance was the allocation to the Real Return Select Funds. The Fund’s absolute return was most positively influenced by its exposure to the Value Equity Fund, followed by exposure to the Growth Equity Fund and International Equity Fund.
The Fund underperformed its composite benchmark in 2013 (3.85% versus 5.43%). While the Value Equity Fund was the largest contributor to the Fund’s absolute return, it also served as the leading driver in the Fund’s relative outperformance during the year. At a target weight of approximately 59.93%, the Low-Duration Bond Fund was the primary detractor. Additionally, allocations to the Defensive Market Strategies Fund and Global Natural Resources Equity Fund had a material impact on relative underperformance over the period.
The Fund attempted to achieve its objective by investing in the Select Funds. By investing in the Fund you will also incur the expenses and risks of the underlying Select Funds. The principal risks of the Fund will change depending on the asset mix of the Select Funds in which it invests. You may directly invest in the Select Funds. The Fund’s value will go up and down in response to changes in the share prices of the investments that it owns. It is possible to lose money by investing in the Fund. The Fund may be suitable for investors who have a short—to medium-time investment horizon, possess a relatively low tolerance for risk and want some exposure to the growth potential of the stock market tempered by a larger allocation to short-term, fixed income securities. This Fund is subject to interest rate risk. Meaning, when interest rates rise, the value of the existing bonds decrease and vice versa. Changes in interest rates have a bigger impact on long duration holdings than on short duration holdings.
At December 31, 2013, the portfolio holdings of the Fund, as a percentage of net assets, is shown in the following table. Portfolio holdings are subject to risk and may change at any time.
| | | | |
| | | % | |
Fixed Income Select Funds | | | 58.0 | |
Real Return Select Funds | | | 21.1 | |
U.S. Equity Select Funds | | | 15.6 | |
Non-U.S. Equity Select Funds | | | 5.2 | |
| | | | |
| | | 99.9 | |
| | | | |
Conservative Allocation Fund I (Unaudited)
| | | | |
| Average Annual Total Returns as of 12/31/13 |
| | | GS2 Class* | | Benchmark** |
One Year | | 3.85% | | 5.43% |
Five Year | | 7.32% | | 5.77% |
Ten Year | | 4.27% | | 4.38% |
Inception Date | | 07/01/03 | | |
Total Fund Operating Expenses (May 1, 2013 Prospectus, as amended on October 31, 2013)(1) | | 0.82% | | |
(1)The Fund’s shareholders indirectly bear the expenses of the shares of the Select Funds in which the Fund invests. Current information regarding the Fund’s Operating Expenses can be found in the Financial Highlights.
The performance data quoted represents past performance and does not guarantee future results. Current performance may be lower or higher. Performance data current to the most recent month-end may be obtained at www.GuideStoneFunds.org. The investment return and principal value of an investment will fluctuate so that shares, when redeemed, may be worth more or less than their original cost.
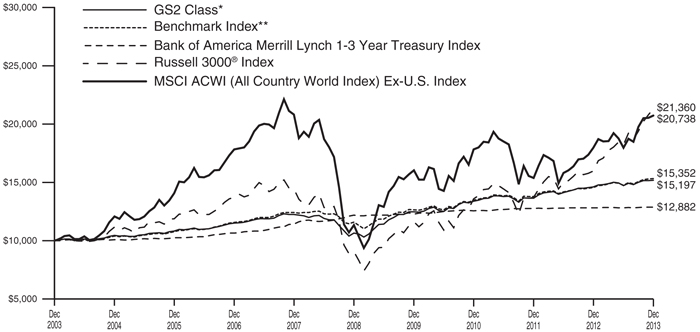
The graph compares the results of a hypothetical $10,000 investment in the GS2 Class of the Fund for the 10-year period from December 31, 2003 to December 31, 2013, with all dividends and capital gains reinvested, with the Fund’s weighted composite benchmark index.
*These returns reflect expense waivers by the Fund’s investment adviser. Without these waivers, returns would have been lower. Returns shown do not reflect the deduction of taxes that a shareholder would pay on Fund distributions or the redemption of Fund shares.
**Represents a composite index as of December 2013, consisting of the Bank of America Merrill Lynch 1-3 Year Treasury Index, the Barclays U.S. TIPS Index, the Russell 3000® Index, the FTSE EPRA/NAREIT Developed Index, the S&P U.S. BB-Ratings and Above Loan Index, the MSCI World Commodity Producers Index and the MSCI ACWI (All Country World Index) Ex-U.S. Index, weighted 58%, 12%, 15%, 1%, 5%, 4% and 5%, respectively.
Unlike a mutual fund, the performance of an index assumes no taxes, transaction costs, management fees or other expenses.
| | |
CONSERVATIVE ALLOCATION FUND I SCHEDULE OF INVESTMENTS | | December 31, 2013 |
| | | | | | | | | | |
| | | Shares | | | Value | |
MUTUAL FUNDS — 99.9% | | | | | | | |
GuideStone Money Market Fund (GS2 Class)¥ | | | 1,003,363 | | | | | $ | 1,003,363 | |
GuideStone Low-Duration Bond Fund
(GS2 Class)¥ | | | 5,562,198 | | | | | | 47,501,174 | |
GuideStone Defensive Market Strategies Fund (GS2 Class)¥ | | | 552,376 | | | | | | 6,313,658 | |
GuideStone Value Equity Fund (GS2 Class)¥ | | | 307,129 | | | | | | 3,040,580 | |
GuideStone Growth Equity Fund (GS2 Class)¥ | | | 249,054 | | | | | | 3,038,462 | |
GuideStone Small Cap Equity Fund (GS2 Class)¥ | | | 64,648 | | | | | | 668,463 | |
GuideStone International Equity Fund (GS2 Class)¥ | | | 294,857 | | | | | | 3,405,600 | |
GuideStone Funds Emerging Market Equity Fund (GS2 Class)*¥ | | | 93,595 | | | | | | 912,549 | |
GuideStone Inflation Protected Bond Fund (GS4 Class)¥ | | | 956,137 | | | | | | 9,704,788 | |
GuideStone Flexible Income Fund (GS4 Class)¥ | | | 365,135 | | | | | | 3,673,259 | |
GuideStone Real Estate Securities Fund (GS4 Class)¥ | | | 96,202 | | | | | | 900,449 | |
GuideStone Global Natural Resources Equity Fund (GS4 Class)¥ | | | 346,522 | | | | | | 3,364,729 | |
| | | | | | | | | | |
Total Mutual Funds
(Cost $83,400,666) | | | | | | 83,527,074 | |
| | | | | | | | | | |
TOTAL INVESTMENTS — 99.9%
(Cost $83,400,666) | | | | | | 83,527,074 | |
| | | |
Other Assets in Excess of Liabilities — 0.1% | | | | | | | | | 111,811 | |
| | | | | | | | | | |
NET ASSETS — 100.0% | | | | | $ | 83,638,885 | |
| | | | | | | | | | |
VALUATION HIERARCHY
The following is a summary of the inputs used, as of December 31, 2013, in valuing the Fund’s investments carried at fair value:
| | | | | | | | | | | | | | | | | | | | |
| | | Total
Value | | Level 1
Quoted Prices | | Level 2
Other Significant
Observable Inputs | | Level 3
Significant
Unobservable Inputs |
Assets: | | | | | | | | | | | | | | | | | | | | |
Investments in Securities: | | | | | | | | | | | | | | | | | | | | |
Mutual Funds | | | $ | 83,527,074 | | | | $ | 83,527,074 | | | | $ | — | | | | $ | — | |
| | | | | | | | | | | | | | | | | | | | |
Total Assets - Investments in Securities | | | $ | 83,527,074 | | | | $ | 83,527,074 | | | | $ | — | | | | $ | — | |
| | | | | | | | | | | | | | | | | | | | |
| | | | |
Other Financial Instruments*** | | | | | | | | | | | | | | | | | | | | |
Futures Contracts | | | $ | 7,241 | | | | $ | 7,241 | | | | $ | — | | | | $ | — | |
| | | | | | | | | | | | | | | | | | | | |
Total Assets - Other Financial Instruments | | | $ | 7,241 | | | | $ | 7,241 | | | | $ | — | | | | $ | — | |
| | | | | | | | | | | | | | | | | | | | |
***Other financial instruments are derivative instruments not reflected in the Schedule of Investments, such as futures, forwards and swap contracts, which are valued at the unrealized appreciation (depreciation) on the investment. Details of these investments can be found in the Notes to Financial Statements.
| | | | |
| | See Notes to Financial Statements. | | 65 |
Balanced Allocation Fund I (Unaudited)
The Fund, through investments in the underlying Select Funds, combined approximately equal percentages to equity securities and fixed income securities in addition to a smaller allocation to real asset securities. The Fund had a target of, but was not limited to, an asset allocation of 42.00% Fixed Income Select Funds, 28.00% U.S. Equity Select Funds, 13.00% Non-U.S. Equity Select Funds, and 17.00% Real Return Select Funds.
As a fund of funds, its performance is based on the performance of the underlying Select Funds. The Fund generated a return of 10.22% for the one-year period ending December 31, 2013, benefiting from positive absolute performance of the underlying Equity Select Funds. The Fund’s absolute return was most positively influenced by its exposure to the Value Equity Fund. The Growth Equity Fund and the International Equity Fund also provided material benefits over the period.
The Fund underperformed its composite benchmark in 2013 (10.22% versus 11.51%), which was primarily driven by the allocation to the Real Return Select Funds. Within this asset class, both the Global Natural Resources Equity Fund and the Flexible Income Fund were material detractors to relative performance versus their respective benchmarks. The most positive contributor to relative performance came from the Extended–Duration Bond Fund allocation.
The Fund attempted to achieve its objective by investing in the Select Funds. By investing in the Fund you will also incur the expenses and risks of the underlying Select Funds. The principal risks of the Fund will change depending on the asset mix of the Select Funds in which it invests. You may directly invest in the Select Funds. The Fund’s value will go up and down in response to changes in the share prices of the investments that it owns. It is possible to lose money by investing in the Fund. This Fund may be suitable for investors who have a medium- to long-term investment horizon, possess a moderate tolerance for risk, and seek to participate in the return potential of stocks but want to achieve this result more slowly and with less volatility through a balanced allocation of fixed-income and equity investments.
At December 31, 2013, the portfolio holdings of the Fund, as a percentage of net assets, is shown in the following table. Portfolio holdings are subject to risk and may change at any time.
| | | | |
| | | % | |
Fixed Income Select Funds | | | 41.4 | |
U.S. Equity Select Funds | | | 28.2 | |
Real Return Select Funds | | | 17.2 | |
Non-U.S. Equity Select Funds | | | 13.1 | |
| | | | |
| | | 99.9 | |
| | | | |
Balanced Allocation Fund I (Unaudited)
| | | | |
| Average Annual Total Returns as of 12/31/13 |
| | | GS2 Class* | | Benchmark** |
One Year | | 10.22% | | 11.51% |
Five Year | | 11.88% | | 10.87% |
Ten Year | | 6.17% | | 6.42% |
Inception Date | | 07/01/03 | | |
Total Fund Operating Expenses (May 1, 2013 Prospectus, as amended on October 31, 2013)(1) | | 0.93% | | |
(1)The Fund’s shareholders indirectly bear the expenses of the shares of the Select Funds in which the Fund invests. Current information regarding the Fund’s Operating Expenses can be found in the Financial Highlights.
The performance data quoted represents past performance and does not guarantee future results. Current performance may be lower or higher. Performance data current to the most recent month-end may be obtained at www.GuideStoneFunds.org. The investment return and principal value of an investment will fluctuate so that shares, when redeemed, may be worth more or less than their original cost.
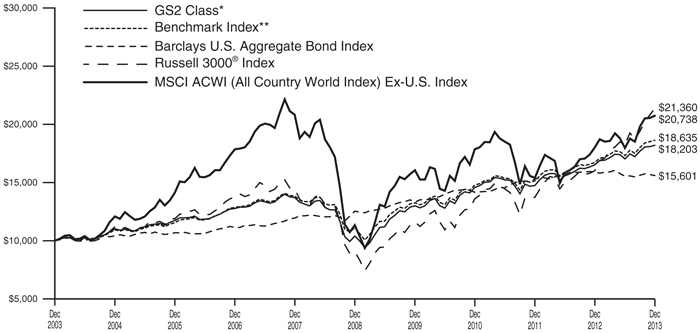
The graph compares the results of a hypothetical $10,000 investment in the GS2 Class of the Fund for the 10-year period from December 31, 2003 to December 31, 2013, with all dividends and capital gains reinvested, with the Fund’s weighted composite benchmark index.
*These returns reflect expense waivers by the Fund’s investment adviser. Without these waivers, returns would have been lower. Returns shown do not reflect the deduction of taxes that a shareholder would pay on Fund distributions or the redemption of Fund shares.
**Represents a composite index as of December 2013, consisting of the Barclays U.S. Aggregate Bond Index, the Barclays U.S. TIPS Index, the Russell 3000® Index, the FTSE EPRA/NAREIT Developed Index, the S&P U.S. BB- Ratings and Above Loan Index, the MSCI World Commodity Producers Index and the MSCI ACWI (All Country World Index) Ex-U.S. Index, weighted 41%, 6%, 28%, 3%, 3%, 6% and 13%, respectively.
Unlike a mutual fund, the performance of an index assumes no taxes, transaction costs, management fees or other expenses.
| | |
BALANCED ALLOCATION FUND I SCHEDULE OF INVESTMENTS | | December 31, 2013 |
| | | | | | | | | | |
| | | Shares | | | Value | |
MUTUAL FUNDS — 99.9% | |
GuideStone Money Market Fund (GS2 Class)¥ | | | 7,009,585 | | | | | $ | 7,009,585 | |
GuideStone Low-Duration Bond Fund (GS2 Class)¥ | | | 5,339,710 | | | | | | 45,601,127 | |
GuideStone Medium-Duration Bond Fund (GS2 Class)¥ | | | 8,894,945 | | | | | | 61,464,073 | |
GuideStone Extended-Duration Bond Fund (GS2 Class)¥ | | | 3,224,864 | | | | | | 15,414,850 | |
GuideStone Global Bond Fund (GS4 Class)¥ | | | 3,037,827 | | | | | | 30,621,300 | |
GuideStone Defensive Market Strategies Fund (GS2 Class)¥ | | | 2,737,784 | | | | | | 31,292,866 | |
GuideStone Value Equity Fund (GS2 Class)¥ | | | 3,516,759 | | | | | | 34,815,915 | |
GuideStone Growth Equity Fund (GS2 Class)¥ | | | 2,907,769 | | | | | | 35,474,776 | |
GuideStone Small Cap Equity Fund
(GS2 Class)¥ | | | 755,377 | | | | | | 7,810,599 | |
GuideStone International Equity Fund
(GS2 Class)¥ | | | 3,471,264 | | | | | | 40,093,098 | |
GuideStone Funds Emerging Market Equity Fund (GS2 Class)*¥ | | | 1,111,873 | | | | | | 10,840,765 | |
GuideStone Inflation Protected Bond Fund (GS4 Class)¥ | | | 2,149,497 | | | | | | 21,817,397 | |
GuideStone Flexible Income Fund (GS4 Class)¥ | | | 1,150,763 | | | | | | 11,576,680 | |
GuideStone Real Estate Securities Fund (GS4 Class)¥ | | | 1,084,991 | | | | | | 10,155,515 | |
GuideStone Global Natural Resources Equity Fund (GS4 Class)¥ | | | 2,360,226 | | | | | | 22,917,798 | |
| | | | | | | | | | |
Total Mutual Funds
(Cost $366,448,483) | | | | | | 386,906,344 | |
| | | | | | | | | | |
TOTAL INVESTMENTS — 99.9%
(Cost $366,448,483) | | | | | | 386,906,344 | |
| | | |
Other Assets in Excess of
Liabilities — 0.1% | | | | | | | | | 461,011 | |
| | | | | | | | | | |
| | |
NET ASSETS — 100.0% | | | | | $ | 387,367,355 | |
| | | | | | | | | | |
The following is a summary of the inputs used, as of December 31, 2013, in valuing the Fund’s investments carried at fair value:
| | | | | | | | | | | | | | | | | | | | |
| | | Total
Value | | Level 1
Quoted Prices | | Level 2
Other Significant
Observable Inputs | | Level 3
Significant
Unobservable Inputs |
Assets: | | | | | | | | | | | | | | | | | | | | |
Investments in Securities: | | | | | | | | | | | | | | | | | | | | |
Mutual Funds | | | $ | 386,906,344 | | | | $ | 386,906,344 | | | | $ | — | | | | $ | — | |
| | | | | | | | | | | | | | | | | | | | |
Total Assets - Investments in Securities | | | $ | 386,906,344 | | | | $ | 386,906,344 | | | | $ | — | | | | $ | — | |
| | | | | | | | | | | | | | | | | | | | |
| | | | |
Other Financial Instruments*** | | | | | | | | | | | | | | | | | | | | |
Futures Contracts | | | $ | 92,697 | | | | $ | 92,697 | | | | $ | — | | | | $ | — | |
| | | | | | | | | | | | | | | | | | | | |
Total Assets - Other Financial Instruments | | | $ | 92,697 | | | | $ | 92,697 | | | | $ | — | | | | $ | — | |
| | | | | | | | | | | | | | | | | | | | |
***Other financial instruments are derivative instruments not reflected in the Schedule of Investments, such as futures, forwards and swap contracts, which are valued at the unrealized appreciation (depreciation) on the investment. Details of these investments can be found in the Notes to Financial Statements.
| | | | |
| 68 | | See Notes to Financial Statements. | | |
Growth Allocation Fund I (Unaudited)
The Fund, through investments in the underlying Select Funds, combined a greater percentage of exposure to equity securities with a smaller percentage to fixed income securities and real asset securities. The Fund had a target of, but was not limited to, an asset allocation of 26.00% Fixed Income Select Funds, 40.00% U.S. Equity Select Funds, 25.00% Non-U.S. Equity Select Funds, and 9.00% Real Return Select Funds.
As a fund of funds, its performance is based on the performance of the underlying Select Funds. The Fund generated a return of 18.72% for the one-year period ended December 31, 2013, largely attributable to positive absolute performance of the underlying Equity Select Funds. The Fund’s absolute return was most positively influenced by its exposure to the Value Equity Fund. The Growth Equity Fund and the International Equity Fund also provided material benefits over the period.
The Fund outperformed its composite benchmark in 2013 (18.72% versus 18.16%). The largest contributor to the Fund’s relative performance was exposure to the Value Equity Fund, which outperformed its respective benchmark primarily due to security selection. The Fund’s relative performance was negatively impacted by allocations to both the Global Natural Resources Equity Fund and the Low-Duration Bond Fund.
The Fund attempted to achieve its objective by investing in the Select Funds. By investing in the Fund you will also incur the expenses and risks of the underlying Select Funds. The principal risks of the Fund will change depending on the asset mix of the Select Funds in which it invests. You may directly invest in the Select Funds. The Fund’s value will go up and down in response to changes in the share prices of the investments that it owns. It is possible to lose money by investing in the Fund. This Fund may be suitable for investors who have a long-term investment horizon, possess a relatively high tolerance for risk and seek to participate in the return potential of stocks at a slightly lower risk level than an all stock portfolio. Foreign securities may be subject to greater risk than domestic securities due to currency volatility, reduced market liquidity and political and economic instability. Small company stocks are subject to greater risk than large company stocks due to more volatility and less liquidity. This Fund is subject to interest rate risk. Meaning, when interest rates rise, the value of the existing bonds decrease and vice versa. Changes in interest rates have a bigger impact on long duration holdings than on short duration holdings.
At December 31, 2013, the portfolio holdings of the Fund, as a percentage of net assets, is shown in the following table. Portfolio holdings are subject to risk and may change at any time.
| | | | |
| | | % | |
U.S. Equity Select Funds | | | 39.4 | |
Non-U.S. Equity Select Funds | | | 25.8 | |
Fixed Income Select Funds | | | 25.5 | |
Real Return Select Funds | | | 9.2 | |
| | | | |
| | | 99.9 | |
| | | | |
69
Growth Allocation Fund I (Unaudited)
| | | | |
| Average Annual Total Returns as of 12/31/13 |
| | | GS2 Class* | | Benchmark** |
One Year | | 18.72% | | 18.16% |
Five Year | | 14.26% | | 13.65% |
Ten Year | | 6.68% | | 6.97% |
Inception Date | | 07/01/03 | | |
Total Fund Operating Expenses (May 1, 2013 Prospectus, as amended on October 31, 2013)(1) | | 1.01% | | |
(1)The Fund’s shareholders indirectly bear the expenses of the shares of the Select Funds in which the Fund invests. Current information regarding the Fund’s Operating Expenses can be found in the Financial Highlights.
The performance data quoted represents past performance and does not guarantee future results. Current performance may be lower or higher. Performance data current to the most recent month-end may be obtained at www.GuideStoneFunds.org. The investment return and principal value of an investment will fluctuate so that shares, when redeemed, may be worth more or less than their original cost.
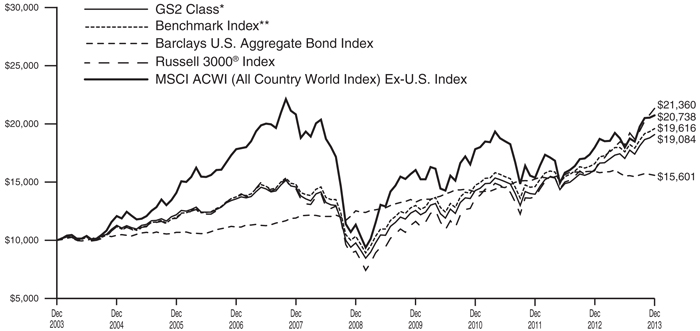
The graph compares the results of a hypothetical $10,000 investment in the GS2 Class of the Fund for the 10-year period from December 31, 2003 to December 31, 2013, with all dividends and capital gains reinvested, with the Fund’s weighted composite benchmark index.
*These returns reflect expense waivers by the Fund’s investment adviser. Without these waivers, returns would have been lower. Returns shown do not reflect the deduction of taxes that a shareholder would pay on Fund distributions or the redemption of Fund shares.
**Represents a composite index as of December 2013, consisting of the Barclays U.S. Aggregate Bond Index, the Russell 3000® Index, the FTSE EPRA/NAREIT Developed Index, the MSCI World Commodity Producers Index and the MSCI ACWI (All Country World Index) Ex-U.S. Index, weighted 25%, 40%, 4%, 6% and 25%, respectively.
Unlike a mutual fund, the performance of an index assumes no taxes, transaction costs, management fees or other expenses.
70
| | |
GROWTH ALLOCATION FUND I SCHEDULE OF INVESTMENTS | | December 31, 2013 |
| | | | | | | | | | |
| | | Shares | | | Value | |
MUTUAL FUNDS — 99.9% | | | | | | | | | | |
GuideStone Money Market Fund (GS2 Class)¥ | | | 5,114,024 | | | | | $ | 5,114,024 | |
GuideStone Low-Duration Bond Fund (GS2 Class)¥ | | | 2,224,366 | | | | | | 18,996,085 | |
GuideStone Medium-Duration Bond Fund (GS2 Class)¥ | | | 3,708,806 | | | | | | 25,627,848 | |
GuideStone Extended-Duration Bond Fund (GS2 Class)¥ | | | 1,372,505 | | | | | | 6,560,575 | |
GuideStone Global Bond Fund (GS4 Class)¥ | | | 1,276,577 | | | | | | 12,867,895 | |
GuideStone Value Equity Fund (GS2 Class)¥ | | | 4,846,909 | | | | | | 47,984,403 | |
GuideStone Growth Equity Fund (GS2 Class)¥ | | | 3,937,905 | | | | | | 48,042,442 | |
GuideStone Small Cap Equity Fund (GS2 Class)¥ | | | 1,020,727 | | | | | | 10,554,319 | |
GuideStone International Equity Fund (GS2 Class)¥ | | | 4,766,219 | | | | | | 55,049,827 | |
GuideStone Funds Emerging Market Equity Fund (GS2 Class)*¥ | | | 1,524,795 | | | | | | 14,866,752 | |
GuideStone Real Estate Securities Fund (GS4 Class)¥ | | | 967,868 | | | | | | 9,059,241 | |
GuideStone Global Natural Resources Equity Fund (GS4 Class)¥ | | | 1,644,780 | | | | | | 15,970,817 | |
| | | | | | | | | | |
| | | |
Total Mutual Funds
(Cost $247,601,518) | | | | | | | | | 270,694,228 | |
| | | | | | | | | | |
| | |
TOTAL INVESTMENTS — 99.9%
(Cost $247,601,518) | | | | | | 270,694,228 | |
| | | |
Other Assets in Excess of
Liabilities — 0.1% | | | | | | | | | 401,775 | |
| | | | | | | | | | |
| | | |
NET ASSETS — 100.0% | | | | | | | | $ | 271,096,003 | |
| | | | | | | | | | |
VALUATION HIERARCHY
The following is a summary of the inputs used, as of December 31, 2013, in valuing the Fund’s investments carried at fair value:
| | | | | | | | | | | | | | | | | | | | |
| | | Total
Value | | Level 1
Quoted Prices | | Level 2
Other Significant
Observable Inputs | | Level 3
Significant
Unobservable Inputs |
Assets: | | | | | | | | | | | | | | | | | | | | |
Investments in Securities: | | | | | | | | | | | | | | | | | | | | |
Mutual Funds | | | $ | 270,694,228 | | | | $ | 270,694,228 | | | | $ | — | | | | $ | — | |
| | | | | | | | | | | | | | | | | | | | |
Total Assets - Investments in Securities | | | $ | 270,694,228 | | | | $ | 270,694,228 | | | | $ | — | | | | $ | — | |
| | | | | | | | | | | | | | | | | | | | |
|
Other Financial Instruments*** | |
Futures Contracts | | | $ | 140,579 | | | | $ | 140,579 | | | | $ | — | | | | $ | — | |
| | | | | | | | | | | | | | | | | | | | |
Total Assets - Other Financial Instruments | | | $ | 140,579 | | | | $ | 140,579 | | | | $ | — | | | | $ | — | |
| | | | | | | | | | | | | | | | | | | | |
***Other financial instruments are derivative instruments not reflected in the Schedule of Investments, such as futures, forwards and swap contracts, which are valued at the unrealized appreciation (depreciation) on the investment. Details of these investments can be found in the Notes to Financial Statements.
| | | | |
| | See Notes to Financial Statements. | | 71 |
Aggressive Allocation Fund I (Unaudited)
The Fund, through investments in the underlying Select Funds, combined a greater percentage of exposure to U.S. equity securities with a smaller percentage to non-U.S. equity securities. The Fund had a target of, but was not limited to, an asset allocation of 60.00% U.S. Equity Select Funds and 40.00% Non-U.S. Select Funds.
As a fund of funds, its performance was based on the performance of the underlying Select Funds. The Fund generated a return of 27.73% for the one-year period ended December 31, 2013, as absolute performance was largely attributable to exposure to the Value Equity Fund and Growth Equity Fund.
The Fund outperformed its composite benchmark in 2013 (27.73% versus 26.04%). The Value Equity Fund served as the key driver in the Fund’s relative outperformance for the year. The Growth Equity Fund and the International Equity Fund also made material relative contributions to the Fund during the second half of the year.
The Fund attempted to achieve its objective by investing in the Select Funds. By investing in the Fund you will also incur the expenses and risks of the underlying Select Funds. The principal risks of the Fund will change depending on the asset mix of the Select Funds in which it invests. You may directly invest in the Select Funds. The Fund’s value will go up and down in response to changes in the share prices of the investments that it owns. It is possible to lose money by investing in the Fund. This Fund may be suitable for investors who have a long-term investment horizon, possess a relatively high tolerance for risk and want to diversify by adding an aggressive investment option that combines U.S. and international stocks. Foreign securities may be subject to greater risk than domestic securities due to currency volatility, reduced market liquidity and political and economic instability. Small company stocks are subject to greater risk than large company stocks due to more volatility and less liquidity.
At December 31, 2013, the portfolio holdings of the Fund, as a percentage of net assets, is shown in the following table. Portfolio holdings are subject to risk and may change at any time.
| | | | |
| | | % | |
U.S. Equity Select Funds | | | 59.3 | |
Non-U.S. Equity Select Funds | | | 38.7 | |
Fixed Income Select Fund | | | 1.9 | |
| | | | |
| | | 99.9 | |
| | | | |
Aggressive Allocation Fund I (Unaudited)
| | | | |
| Average Annual Total Returns as of 12/31/13 |
| | | GS2 Class* | | Benchmark** |
One year | | 27.73% | | 26.04% |
Five year | | 16.55% | | 16.55% |
Ten Year | | 6.98% | | 7.47% |
Inception Date | | 07/01/03 | | |
Total Fund Operating Expenses (May 1, 2013 Prospectus, as amended on October 31, 2013)(1) | | 1.08% | | |
(1)The Fund’s shareholders indirectly bear the expenses of the GS2 Class shares of the Select Funds in which the Fund invests. Current information regarding the Fund’s Operating Expenses can be found in the Financial Highlights.
The performance data quoted represents past performance and does not guarantee future results. Current performance may be lower or higher. Performance data current to the most recent month-end may be obtained at www.GuideStoneFunds.org. The investment return and principal value of an investment will fluctuate so that shares, when redeemed, may be worth more or less than their original cost.
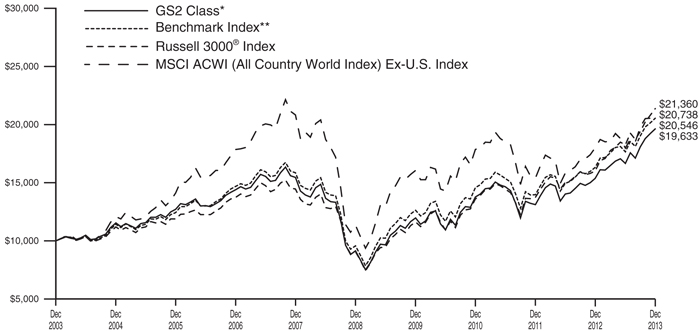
The graph compares the results of a hypothetical $10,000 investment in the GS2 Class of the Fund for the 10-year period from December 31, 2003 to December 31, 2013, with all dividends and capital gains reinvested, with the Fund’s weighted composite benchmark index.
*These returns reflect expense waivers by the Fund’s investment adviser. Without these waivers, returns would have been lower. Returns shown do not reflect the deduction of taxes that a shareholder would pay on Fund distributions or the redemption of Fund shares.
**Represents a composite index as of December 2013, consisting of the Russell 3000® Index and the MSCI ACWI (All Country World Index) Ex-U.S. Index, weighted 60.00% and 40.00%, respectively.
Unlike a mutual fund, the performance of an index assumes no taxes, transaction costs, management fees or other expenses.
| | |
AGGRESSIVE ALLOCATION FUND I SCHEDULE OF INVESTMENTS | | December 31, 2013 |
| | | | | | | | | | | | |
| | | Shares | | | Value | |
MUTUAL FUNDS — 99.9% | | | | | | | | | | | | |
GuideStone Money Market Fund (GS2 Class)¥ | | | 3,618,856 | | | $ | | | | | 3,618,856 | |
GuideStone Value Equity Fund (GS2 Class)¥ | | | 5,046,886 | | | | | | | | 49,964,167 | |
GuideStone Growth Equity Fund (GS2 Class)¥ | | | 4,162,693 | | | | | | | | 50,784,861 | |
GuideStone Small Cap Equity Fund
(GS2 Class)¥ | | | 1,077,028 | | | | | | | | 11,136,469 | |
GuideStone International Equity Fund
(GS2 Class)¥ | | | 4,984,837 | | | | | | | | 57,574,864 | |
GuideStone Funds Emerging Market Equity Fund (GS2 Class)*¥ | | | 1,593,383 | | | | | | | | 15,535,488 | |
| | | | | | | | | | | | |
Total Mutual Funds
(Cost $169,246,343) | | | | | | | | 188,614,705 | |
| | | | | | | | | | | | |
| | |
TOTAL INVESTMENTS — 99.9%
(Cost $169,246,343) | | | | | | | | 188,614,705 | |
| | |
Other Assets in Excess of
Liabilities — 0.1% | | | | | | | | 246,697 | |
| | | | | | | | | | | | |
NET ASSETS — 100.0% | | | | | | | $ | 188,861,402 | |
| | | | | | | | | | | | |
VALUATION HIERARCHY
The following is a summary of the inputs used, as of December 31, 2013, in valuing the Fund’s investments carried at fair value:
| | | | | | | | | | | | | | | | | | | | |
| | | Total
Value | | Level 1
Quoted Prices | | Level 2
Other Significant
Observable Inputs | | Level 3
Significant
Unobservable Inputs |
Assets: | | | | | | | | | | | | | | | | | | | | |
Investments in Securities: | | | | | | | | | | | | | | | | | | | | |
Mutual Funds | | | $ | 188,614,705 | | | | $ | 188,614,705 | | | | $ | — | | | | $ | — | |
| | | | | | | | | | | | | | | | | | | | |
Total Assets - Investments in Securities | | | $ | 188,614,705 | | | | $ | 188,614,705 | | | | $ | — | | | | $ | — | |
| | | | | | | | | | | | | | | | | | | | |
| | | | |
Other Financial Instruments*** | | | | | | | | | | | | | | | | | | | | |
Futures Contracts | | | $ | 139,848 | | | | $ | 139,848 | | | | $ | — | | | | $ | — | |
| | | | | | | | | | | | | | | | | | | | |
Total Assets - Other Financial Instruments | | | $ | 139,848 | | | | $ | 139,848 | | | | $ | — | | | | $ | — | |
| | | | | | | | | | | | | | | | | | | | |
***Other financial instruments are derivative instruments not reflected in the Schedule of Investments, such as futures, forwards and swap contracts, which are valued at the unrealized appreciation (depreciation) on the investment. Details of these investments can be found in the Notes to Financial Statements.
| | | | |
| 74 | | See Notes to Financial Statements. | | |
(This page intentionally left blank)
| | |
STATEMENTS OF ASSETS AND LIABILITIES | | December 31, 2013 |
| | | | | | | | | | | | | | | | |
| | | Conservative
Allocation
Fund I | | | Balanced
Allocation
Fund I | | | Growth
Allocation
Fund I | | | Aggressive
Allocation
Fund I | |
Assets | | | | | | | | | | | | | | | | |
Investments in securities of affiliated issuers, at value (1) | | $ | 83,527,074 | | | $ | 386,906,344 | | | $ | 270,694,228 | | | $ | 188,614,705 | |
Cash collateral for derivatives | | | 50,400 | | | | 230,850 | | | | 221,950 | | | | 177,000 | |
Receivables: | | | | | | | | | | | | | | | | |
Dividends from affiliated funds | | | 9 | | | | 63 | | | | 48 | | | | 32 | |
Fund shares sold | | | 86,935 | | | | 285,116 | | | | 218,149 | | | | 94,758 | |
Variation margin on financial futures contracts | | | 640 | | | | 12,755 | | | | 13,215 | | | | 13,895 | |
Prepaid expenses and other assets | | | 4,064 | | | | 4,064 | | | | 4,064 | | | | 4,064 | |
| | | | | | | | | | | | | | | | |
Total Assets | | | 83,669,122 | | | | 387,439,192 | | | | 271,151,654 | | | | 188,904,454 | |
| | | | | | | | | | | | | | | | |
Liabilities | | | | | | | | | | | | | | | | |
Payables: | | | | | | | | | | | | | | | | |
Variation margin on financial futures contracts | | | — | | | | 4,781 | | | | 1,750 | | | | — | |
Accrued expenses: | | | | | | | | | | | | | | | | |
Investment advisory fees | | | 4,724 | | | | 33,118 | | | | 23,015 | | | | 16,191 | |
Professional fees | | | 17,479 | | | | 17,479 | | | | 17,479 | | | | 17,479 | |
Other expenses | | | 8,034 | | | | 16,459 | | | | 13,407 | | | | 9,382 | |
| | | | | | | | | | | | | | | | |
Total Liabilities | | | 30,237 | | | | 71,837 | | | | 55,651 | | | | 43,052 | |
| | | | | | | | | | | | | | | | |
Net Assets | | $ | 83,638,885 | | | $ | 387,367,355 | | | $ | 271,096,003 | | | $ | 188,861,402 | |
| | | | | | | | | | | | | | | | |
Net Assets Consist of: | | | | | | | | | | | | | | | | |
Paid-in-capital | | $ | 85,213,058 | | | $ | 388,353,451 | | | $ | 255,304,846 | | | $ | 174,165,219 | |
Undistributed net investment income | | | — | | | | 5,275,083 | | | | 1,464,856 | | | | 4,390,854 | |
Accumulated net realized loss on investments and futures transactions | | | (1,707,822 | ) | | | (26,811,737 | ) | | | (8,906,988 | ) | | | (9,202,881 | ) |
Net unrealized appreciation (depreciation) on investments and futures | | | 133,649 | | | | 20,550,558 | | | | 23,233,289 | | | | 19,508,210 | |
| | | | | | | | | | | | | | | | |
Net Assets | | $ | 83,638,885 | | | $ | 387,367,355 | | | $ | 271,096,003 | | | $ | 188,861,402 | |
| | | | | | | | | | | | | | | | |
Net Asset Value: | | | | | | | | | | | | | | | | |
$0.001 par value, unlimited shares authorized | | | | | | | | | | | | | | | | |
Net assets applicable to the GS2 Class | | $ | 83,638,885 | | | $ | 387,367,355 | | | $ | 271,096,003 | | | $ | 188,861,402 | |
| | | | | | | | | | | | | | | | |
GS2 shares outstanding | | | 8,573,030 | | | | 36,244,583 | | | | 22,119,953 | | | | 13,492,830 | |
| | | | | | | | | | | | | | | | |
Net asset value, offering and redemption price per GS2 share | | $ | 9.76 | | | $ | 10.69 | | | $ | 12.26 | | | $ | 14.00 | |
| | | | | | | | | | | | | | | | |
(1) Investments in securities of affiliated issuers, at cost | | $ | 83,400,666 | | | $ | 366,448,483 | | | $ | 247,601,518 | | | $ | 169,246,343 | |
| | | | | | | | | | | | | | | | |
| | | | |
| 76 | | See Notes to Financial Statements. | | |
| | | | |
STATEMENTS OF OPERATIONS | | | For the Year Ended December 31, 2013 | |
| | | | | | | | | | | | | | | | |
| | | Conservative
Allocation
Fund I | | | Balanced
Allocation
Fund I | | | Growth
Allocation
Fund I | | | Aggressive
Allocation
Fund I | |
Investment Income | | | | | | | | | | | | | | | | |
Income dividends received from affiliated funds | | $ | 1,388,170 | | | $ | 9,892,226 | | | $ | 5,784,044 | | | $ | 2,979,731 | |
| | | | | | | | | | | | | | | | |
Total Investment Income | | | 1,388,170 | | | | 9,892,226 | | | | 5,784,044 | | | | 2,979,731 | |
| | | | | | | | | | | | | | | | |
Expenses | | | | | | | | | | | | | | | | |
Investment advisory fees | | | 86,193 | | | | 381,121 | | | | 256,568 | | | | 171,479 | |
Transfer agent fees: | | | | | | | | | | | | | | | | |
GS2 Shares | | | 3,879 | | | | 4,050 | | | | 3,851 | | | | 3,866 | |
Custodian fees | | | 11,714 | | | | 22,458 | | | | 18,490 | | | | 12,325 | |
Accounting and administration fees | | | 8,103 | | | | 23,391 | | | | 16,976 | | | | 12,289 | |
Professional fees | | | 46,087 | | | | 46,087 | | | | 46,087 | | | | 46,087 | |
Blue sky fees: | | | | | | | | | | | | | | | | |
GS2 Shares | | | 4,358 | | | | 4,081 | | | | 4,081 | | | | 4,081 | |
Shareholder reporting fees | | | 419 | | | | 735 | | | | 380 | | | | 379 | |
Trustee expenses | | | 866 | | | | 3,833 | | | | 2,591 | | | | 1,732 | |
Line of credit facility fees | | | 834 | | | | 3,673 | | | | 2,466 | | | | 1,648 | |
Other expenses | | | 8,719 | | | | 8,719 | | | | 8,719 | | | | 8,719 | |
| | | | | | | | | | | | | | | | |
Total Expenses | | | 171,172 | | | | 498,148 | | | | 360,209 | | | | 262,605 | |
Expenses waived/reimbursed net of amount recaptured(1) | | | (43,252 | ) | | | — | | | | — | | | | (9,637 | ) |
| | | | | | | | | | | | | | | | |
Net expenses | | | 127,920 | | | | 498,148 | | | | 360,209 | | | | 252,968 | |
| | | | | | | | | | | | | | | | |
Net investment income | | | 1,260,250 | | | | 9,394,078 | | | | 5,423,835 | | | | 2,726,763 | |
| | | | | | | | | | | | | | | | |
Realized and Unrealized Gain (Loss) | | | | | | | | | | | | | | | | |
Capital gain distributions received from affiliated funds | | | 1,884,592 | | | | 19,233,894 | | | | 19,868,191 | | | | 18,521,018 | |
Net realized gain (loss) on investment securities of affiliated issuers | | | 3,178,397 | | | | 1,844,311 | | | | (3,624,340 | ) | | | (5,627,335 | ) |
Net realized gain on futures transactions | | | 39,184 | | | | 577,566 | | | | 637,020 | | | | 494,098 | |
| | | | | | | | | | | | | | | | |
Net realized gain | | | 5,102,173 | | | | 21,655,771 | | | | 16,880,871 | | | | 13,387,781 | |
| | | | | | | | | | | | | | | | |
Change in unrealized appreciation (depreciation) on investment securities of affiliated issuers | | | (3,240,856 | ) | | | 4,917,604 | | | | 20,092,815 | | | | 24,686,374 | |
Change in unrealized depreciation on futures | | | 5,786 | | | | 79,027 | | | | 119,943 | | | | 122,117 | |
| | | | | | | | | | | | | | | | |
Net change in unrealized appreciation | | | (3,235,070 | ) | | | 4,996,631 | | | | 20,212,758 | | | | 24,808,491 | |
| | | | | | | | | | | | | | | | |
Net Realized and Unrealized Gain | | | 1,867,103 | | | | 26,652,402 | | | | 37,093,629 | | | | 38,196,272 | |
| | | | | | | | | | | | | | | | |
Net Increase in Net Assets Resulting from Operations | | $ | 3,127,353 | | | $ | 36,046,480 | | | $ | 42,517,464 | | | $ | 40,923,035 | |
| | | | | | | | | | | | | | | | |
| (1) | See Note 3a and 3c in Notes to Financial Statements. |
| | | | |
| | See Notes to Financial Statements. | | 77 |
STATEMENTS OF CHANGES IN NET ASSETS
| | | | | | | | | | | | | | | | |
| | | Conservative Allocation Fund I | | | Balanced Allocation Fund I | |
| | | For the Year Ended | | | For the Year Ended | |
| | | 12/31/13 | | | 12/31/12 | | | 12/31/13 | | | 12/31/12 | |
Operations: | | | | | | | | | | | | | | | | |
Net investment income | | $ | 1,260,250 | | | $ | 1,649,298 | | | $ | 9,394,078 | | | $ | 10,157,308 | |
Net realized gain on investment securities and futures transactions | | | 5,102,173 | | | | 2,170,590 | | | | 21,655,771 | | | | 7,558,339 | |
Net change in unrealized appreciation (depreciation) on investment securities and futures | | | (3,235,070 | ) | | | 1,520,272 | | | | 4,996,631 | | | | 19,489,434 | |
| | | | | | | | | | | | | | | | |
Net increase in net assets resulting from operations | | | 3,127,353 | | | | 5,340,160 | | | | 36,046,480 | | | | 37,205,081 | |
| | | | | | | | | | | | | | | | |
Dividends to Shareholders: | | | | | | | | | | | | | | | | |
Dividends from net investment income(1) | | | (2,555,816 | ) | | | (2,141,071 | ) | | | (13,881,599 | ) | | | (13,614,253 | ) |
Distributions from net realized capital gains | | | (476,714 | ) | | | — | | | | — | | | | — | |
| | | | | | | | | | | | | | | | |
Total dividends | | | (3,032,530 | ) | | | (2,141,071 | ) | | | (13,881,599 | ) | | | (13,614,253 | ) |
| | | | | | | | | | | | | | | | |
Capital Share Transactions: | | | | | | | | | | | | | | | | |
Proceeds from GS2 shares sold | | | 10,446,277 | | | | 12,716,837 | | | | 30,704,095 | | | | 20,064,388 | |
Reinvestment of dividends and distributions into GS2 shares | | | 3,015,087 | | | | 2,125,628 | | | | 13,840,284 | | | | 13,566,365 | |
Value of GS2 shares redeemed | | | (12,635,464 | ) | | | (9,464,251 | ) | | | (24,596,392 | ) | | | (22,233,722 | ) |
| | | | | | | | | | | | | | | | |
Net increase (decrease) from capital share transactions(2) | | | 825,900 | | | | 5,378,214 | | | | 19,947,987 | | | | 11,397,031 | |
| | | | | | | | | | | | | | | | |
Total increase in net assets | | | 920,723 | | | | 8,577,303 | | | | 42,112,868 | | | | 34,987,859 | |
| | | | | | | | | | | | | | | | |
Net Assets: | | | | | | | | | | | | | | | | |
Beginning of Year | | | 82,718,162 | | | | 74,140,859 | | | | 345,254,487 | | | | 310,266,628 | |
| | | | | | | | | | | | | | | | |
End of Year* | | $ | 83,638,885 | | | $ | 82,718,162 | | | $ | 387,367,355 | | | $ | 345,254,487 | |
| | | | | | | | | | | | | | | | |
*Including undistributed net investment income | | $ | — | | | $ | 705,405 | | | $ | 5,275,083 | | | $ | 5,274,456 | |
| | | | | | | | | | | | | | | | |
| (1) | Includes dividends paid from the short-term portion of capital gain distributions received from affiliated funds. |
| (2) | See Note 6 in Notes to Financial Statements. |
| | | | |
| 78 | | See Notes to Financial Statements. | | |
| | | | | | | | | | | | | | |
| Growth Allocation Fund I | | | Aggressive Allocation Fund I | |
For the Year Ended | | | For the Year Ended | |
| 12/31/13 | | | 12/31/12 | | | 12/31/13 | | | 12/31/12 | |
| | | | | | | | | | | | | | |
| $ | 5,423,835 | | | $ | 5,051,180 | | | $ | 2,726,763 | | | $ | 2,573,267 | |
| | 16,880,871 | | | | 3,596,208 | | | | 13,387,781 | | | | 2,229,394 | |
| | 20,212,758 | | | | 20,569,665 | | | | 24,808,491 | | | | 17,103,003 | |
| | | | | | | | | | | | | | |
| | 42,517,464 | | | | 29,217,053 | | | | 40,923,035 | | | | 21,905,664 | |
| | | | | | | | | | | | | | |
| | | | | | | | | | | | | | |
| | (9,414,953) | | | | (5,883,636 | ) | | | (4,675,371 | ) | | | (2,288,303 | ) |
| | — | | | | — | | | | — | | | | — | |
| | | | | | | | | | | | | | |
| | (9,414,953) | | | | (5,883,636 | ) | | | (4,675,371 | ) | | | (2,288,303 | ) |
| | | | | | | | | | | | | | |
| | | | | | | | | | | | | | |
| | 29,753,490 | | | | 10,082,428 | | | | 17,600,936 | | | | 6,044,994 | |
| | 9,406,951 | | | | 5,877,919 | | | | 4,673,297 | | | | 2,286,963 | |
| | (17,497,829) | | | | (20,845,946 | ) | | | (12,491,272 | ) | | | (14,584,673 | ) |
| | | | | | | | | | | | | | |
| | 21,662,612 | | | | (4,885,599 | ) | | | 9,782,961 | | | | (6,252,716 | ) |
| | | | | | | | | | | | | | |
| | 54,765,123 | | | | 18,447,818 | | | | 46,030,625 | | | | 13,364,645 | |
| | | | | | | | | | | | | | |
| | | | | | | | | | | | | | |
| | 216,330,880 | | | | 197,883,062 | | | | 142,830,777 | | | | 129,466,132 | |
| | | | | | | | | | | | | | |
| $ | 271,096,003 | | | $ | 216,330,880 | | | $ | 188,861,402 | | | $ | 142,830,777 | |
| | | | | | | | | | | | | | |
| $ | 1,464,856 | | | $ | 1,465,336 | | | $ | 4,390,854 | | | $ | 2,572,546 | |
| | | | | | | | | | | | | | |
| | | | |
| | See Notes to Financial Statements. | | 79 |
FINANCIAL HIGHLIGHTS
| | | | | | | | | | | | | | | | | | | | | | | | | | | | | | | | | | | | | | | | | | | | | | | | | | | | |
| For a Share Outstanding For the Years Ending December 31, unless otherwise indicated | | | | | | Ratios to Average Net Assets | | | | |
| | | Net Asset
Value,
Beginning
of Year | | | Net
Investment
Income (1) | | | Capital
Gain
Distribu- tions
Received
from
Affiliated
Funds | | | Realized
and
Unrealized
Gain (Loss) on
Investments | | | Dividends
from Net
Investment
Income (2) | | | Distribu- tions
from Net
Realized
Capital
Gains | | | Net
Asset
Value,
End of
Year | | | Total
Return | | | Net Assets, End of Year (000) | | | Expenses,
Net(3)(4) | | | Expenses, Gross (3)(5) | | | Investment
Income,
Net (1)(4) | | | Portfolio
Turnover
Rate | |
Conservative Allocation Fund I | |
GS2 Class | | | | | | | | | | | | | | | | | | | | | | | | | | | | | | | | | | | | | |
| 2013 | | $ | 9.75 | | | $ | 0.15 | # | | $ | 0.22 | | | $ | 0.01 | | | $ | (0.31 | ) | | $ | (0.06 | ) | | $ | 9.76 | | | | 3.85 | % | | $ | 83,639 | | | | 0.15 | % | | | 0.20 | % | | | 1.48 | % | | | 21 | % |
| 2012 | | | 9.35 | | | | 0.20 | # | | | 0.15 | | | | 0.31 | | | | (0.26 | ) | | | — | | | | 9.75 | | | | 7.07 | | | | 82,718 | | | | 0.15 | | | | 0.21 | | | | 2.10 | | | | 8 | |
| 2011 | | | 9.42 | | | | 0.22 | # | | | 0.05 | | | | (0.09 | ) | | | (0.25 | ) | | | — | | | | 9.35 | | | | 1.92 | | | | 74,141 | | | | 0.15 | | | | 0.24 | | | | 2.26 | | | | 26 | |
| 2010 | | | 9.06 | | | | 0.23 | # | | | 0.10 | | | | 0.33 | | | | (0.30 | ) | | | — | | | | 9.42 | | | | 7.25 | | | | 71,926 | | | | 0.15 | | | | 0.20 | | | | 2.50 | | | | 12 | |
| 2009 | | | 8.00 | | | | 0.32 | # | | | — | † | | | 1.05 | | | | (0.31 | ) | | | — | | | | 9.06 | | | | 17.13 | | | | 64,230 | | | | 0.15 | | | | 0.23 | | | | 3.70 | | | | 35 | |
Balanced Allocation Fund I | |
GS2 Class | | | | | | | | | | | | | | | | | | | | | | | | | | | | | | | | | | | | | |
| 2013 | | $ | 10.06 | | | $ | 0.27 | # | | $ | 0.55 | | | $ | 0.21 | | | $ | (0.40 | ) | | $ | — | | | $ | 10.69 | | | | 10.22 | % | | $ | 387,367 | | | | 0.13 | % | | | 0.13 | % | | | 2.51 | % | | | 31 | % |
| 2012 | | | 9.35 | | | | 0.31 | # | | | 0.30 | | | | 0.51 | | | | (0.41 | ) | | | — | | | | 10.06 | | | | 12.05 | | | | 345,254 | | | | 0.14 | | | | 0.14 | | | | 3.06 | | | | 5 | |
| 2011 | | | 9.64 | | | | 0.31 | # | | | 0.11 | | | | (0.31 | ) | | | (0.40 | ) | | | — | | | | 9.35 | | | | 1.14 | | | | 310,267 | | | | 0.14 | | | | 0.14 | | | | 3.14 | | | | 18 | |
| 2010 | | | 9.00 | | | | 0.33 | # | | | 0.15 | | | | 0.60 | | | | (0.44 | ) | | | — | | | | 9.64 | | | | 12.04 | | | | 347,489 | | | | 0.13 | | | | 0.13 | | | | 3.56 | | | | 19 | |
| 2009 | | | 7.53 | | | | 0.37 | # | | | 0.08 | | | | 1.46 | | | | (0.44 | ) | | | — | | | | 9.00 | | | | 25.28 | | | | 326,676 | | | | 0.14 | | | | 0.14 | | | | 4.46 | | | | 20 | |
Growth Allocation Fund I | |
GS2 Class | | | | | | | | | | | | | | | | | | | | | | | | | | | | | | | | | | | | | |
| 2013 | | $ | 10.70 | | | $ | 0.25 | # | | $ | 0.92 | | | $ | 0.83 | | | $ | (0.44 | ) | | $ | — | | | $ | 12.26 | | | | 18.72 | % | | $ | 271,096 | | | | 0.14 | % | | | 0.14 | % | | | 2.15 | % | | | 28 | % |
| 2012 | | | 9.56 | | | | 0.25 | # | | | 0.36 | | | | 0.83 | | | | (0.30 | ) | | | — | | | | 10.70 | | | | 15.09 | | | | 216,331 | | | | 0.15 | | | | 0.15 | | | | 2.41 | | | | 4 | |
| 2011 | | | 10.08 | | | | 0.24 | # | | | 0.05 | | | | (0.51 | ) | | | (0.30 | ) | | | — | | | | 9.56 | | | | (2.21 | ) | | | 197,883 | | | | 0.15 | | | | 0.15 | | | | 2.34 | | | | 13 | |
| 2010 | | | 9.13 | | | | 0.24 | # | | | 0.07 | | | | 0.94 | | | | (0.30 | ) | | | — | | | | 10.08 | | | | 13.68 | | | | 233,557 | | | | 0.14 | | | | 0.14 | | | | 2.60 | | | | 13 | |
| 2009 | | | 7.35 | | | | 0.26 | # | | | 0.04 | | | | 1.78 | | | | (0.30 | ) | | | — | | | | 9.13 | | | | 28.22 | | | | 209,059 | | | | 0.15 | | | | 0.15 | | | | 3.28 | | | | 13 | |
Aggressive Allocation Fund I | |
GS2 Class | | | | | | | | | | | | | | | | | | | | | | | | | | | | | | | | | | | | | |
| 2013 | | $ | 11.24 | | | $ | 0.21 | # | | $ | 1.40 | | | $ | 1.51 | | | $ | (0.36 | ) | | $ | — | | | $ | 14.00 | | | | 27.73 | % | | $ | 188,861 | | | | 0.15 | % | | | 0.16 | % | | | 1.62 | % | | | 17 | % |
| 2012 | | | 9.74 | | | | 0.20 | # | | | 0.37 | | | | 1.11 | | | | (0.18 | ) | | | — | | | | 11.24 | | | | 17.31 | | | | 142,831 | | | | 0.15 | | | | 0.16 | | | | 1.87 | | | | 8 | |
| 2011 | | | 10.44 | | | | 0.16 | # | | | 0.01 | | | | (0.69 | ) | | | (0.18 | ) | | | — | | | | 9.74 | | | | (4.93 | ) | | | 129,466 | | | | 0.15 | | | | 0.18 | | | | 1.51 | | | | 9 | |
| 2010 | | | 9.21 | | | | 0.16 | # | | | — | † | | | 1.24 | | | | (0.17 | ) | | | — | | | | 10.44 | | | | 15.23 | | | | 157,310 | | | | 0.15 | | | | 0.16 | | | | 1.67 | | | | 5 | |
| 2009 | | | 7.20 | | | | 0.16 | # | | | — | † | | | 2.06 | | | | (0.21 | ) | | | — | | | | 9.21 | | | | 30.87 | | | | 143,264 | | | | 0.15 | | | | 0.17 | | | | 2.10 | | | | 5 | |
| † | Amount represents less than $0.005 per share. |
| # | Calculated using the average shares outstanding method. |
| (1) | Recognition of net investment income by the Fund is affected by the timing of the declaration of dividends by the underlying investment companies in which the Fund invests. |
| (2) | Includes dividends paid from the short-term portion of capital gain distributions received from affiliated Funds. |
| (3) | Does not include expenses of the investment companies in which the Fund invests. |
| (4) | The ratio includes expenses waived/reimbursed net of amount recaptured and fees paid indirectly, where applicable; if expenses waived/reimbursed net of amount recaptured and fees paid indirectly were excluded, the ratio would have been higher (lower) than the ratio shown. |
| (5) | The ratio excludes expenses waived/reimbursed net of amount recaptured and fees paid indirectly, where applicable; if expenses waived/reimbursed net of amount recaptured and fees paid indirectly were included, the ratio would have been lower than the ratio shown. |
| | | | |
| 80 | | See Notes to Financial Statements. | | |
FIXED INCOME SELECT FUNDS (Unaudited)
The central theme in the bond market during 2013 was the continuation of the Federal Reserve’s (the central bank of the United States) monetary policy and the impact to its returns. Since the fall out from the financial crisis in 2008, the heavy burden of stimulating the domestic economy has fallen squarely on the shoulders of the Federal Reserve. While many pundits debate whether or not the Federal Reserve’s policies are sound and will result in positive outcomes, most agree that they have been aggressive in an attempt to avoid recessionary and deflationary environments.
During 2013, the Federal Reserve maintained the federal funds rate at 0% - 0.25%, keeping very short-term rates tethered near zero. Additionally, the Federal Reserve implemented quantitative easing (“QE”), or the monthly purchase of $85 billion in fixed income securities (including both U.S. Treasuries and mortgages) for most of the year, in an effort to keep interest rates artificially low. What has been the Federal Reserve’s plan behind its policies? The Federal Reserve’s goal has been to stimulate economic activity to a level whereby the economy is more “self-sufficient” or “balanced” and does not need external support from the central bank. First, the Federal Reserve has been trying to stimulate credit expansion. The low interest rate environment has been expected to stimulate the economy by enabling consumers and businesses to borrow money at lower interest rates, which makes borrowing more attractive. Credit expansion is typically bullish for the economy, leading to spending and investment activity. This is especially true in the housing market, a very important sector to the U.S. economy. Secondly, the Federal Reserve has been successful in pushing or directing cash or funds into riskier assets, such as stocks, as more conservative assets such as certificates of deposit, money market funds and fixed income securities have become increasingly less attractive to investors. As asset prices of riskier assets appreciate, investors’ net worth increases which is expected to elevate consumer confidence and stimulate spending.
You may have heard the old adage “do not fight the Fed!” This motto was especially true in 2013 as riskier assets, such as equities, greatly outpaced the performance of cash and fixed income securities. As evidence, the S&P 500® Index, representing the broad domestic equity market, posted an annual return of 32.39%, compared to the Barclays U.S. Aggregate Bond Index, a proxy for the broad domestic bond market, that generated an annual return of -2.02%. Thus, the domestic equity market outperformed the domestic fixed income market by approximately 35.00% during the year, representing a very wide margin. As the year came to an end, the focus remained on the Federal Reserve with many contemplating the sustainability of economic growth and the possible impact of further tapering (reducing the bond repurchase program) on the economy and interest rate levels.
Recently, a question often asked by many has been why and/or how did the bond market generate a negative return during 2013? The answer is the simple inverse relationship between bond prices and interest rates. Due to the aggressive monetary policy, interest rates have been at historically low levels for some time. However, with some signs of improved economic conditions (third quarter GDP at 4.10%) and the beginning of the Federal Reserve reducing its bond repurchase program in December, yields have increased off their lows during the year. Given the inverse relationship between bond prices and interest rates, bond prices generally moved downward during 2013 as yields moderately increased. The price depreciation, in many cases, was greater than the interest income generated from the bonds, causing a negative total return across most bond sectors. Bond investors have generally experienced positive returns in the broad bond market over the past few decades as a secular decline in interest rates during this time period has provided a nice tailwind for bond investors. Thus, the negative absolute return for the broad bond market in 2013 caught some by surprise. In fact, the year 1999 was the last year the Barclays U.S. Aggregate Bond Index posted a negative calendar year return, and the index has only posted a negative calendar year return on three occasions (including 2013) since its inception in 1976.
81
As referenced, U.S. Treasury yields, primarily in the belly and long-end of the U.S. Treasury yield curve, increased during 2013, providing a headwind for bond prices. For illustration, the yield on the 10-year U.S. Treasury increased from 1.76% to 3.03%, during the year while the yield on the 30-year U.S. Treasury elevated from 2.95% to 3.97%. In general, bonds with longer maturities (or durations) underperformed their shorter-maturity (or duration) counterparts given longer maturity bonds are more sensitive to interest rate movements. For example, the Barclays U.S. Aggregate Government – Long Index (proxy for long maturity bonds) posted an annual return of -12.48% for the year compared to the Barclays U.S. Treasury Intermediate Bond Index (proxy for intermediate maturity bonds) that generated an annual return of -1.34%. Therefore, an investor’s return during the year for his or her bond portfolio was largely dependent upon the portfolio’s duration position.
With the exception of cash equivalents and the high yield bond sector, most bond sectors posted negative absolute returns for the period. The U.S. Treasury sector, as measured by the Barclays U.S. Aggregate Government Treasury Index, posted an annual return of -2.75%, due to the increasing yield environment. The U.S. Treasury sector was the worst performing sector within the Barclays U.S. Aggregate Bond Index during the year.
The U.S. investment grade (defined as credit quality of BBB- or higher) credit sector posted an annual return of -1.53%. This segment of the bond market, albeit negative for the year, performed better than many given its yield orientation and the benefit from modest risk premium, or spread, compression. Within the corporate bond sector, financials performed best followed by industrials and then utilities. New issuance within the corporate bond sector was robust during the year as companies took advantage of cheap financing. U.S. agency mortgages, a large constituent of the Barclays U.S. Aggregate Bond Index, posted an annual return -1.41%.
The high yield bond sector (defined as below investment grade corporate bonds) was one of the lone bright spots in the bond market, posting an annual return of 7.44% as measured by the Barclays U.S. Aggregate Credit-Corporate High Yield 2% Issuer Capped Index. This sector is considered one of the more risky segments in the bond market, and like equities, benefited from the “risk-on” environment during 2013. The sector was in high demand as investors were seeking higher yielding securities. With the Federal Reserve’s policies coupled with modest economic improvement, default risk in the sector remained low.
Emerging markets debt lagged most other sectors during the year as the sector was down -8.31% for the year. The sector suffered due to concerns over the ongoing growth prospects and negative current account balances of several emerging market countries.
82
Money Market Fund (Unaudited)
During 2013, the Federal Reserve maintained a very aggressive monetary policy, keeping the federal funds rate at 0% - 0.25% in a concerted effort to stimulate economic growth and improve unemployment. As a result, short-term rates remained at historically low levels throughout the year. At its regularly scheduled Federal Open Market Committee meeting in December, the Federal Reserve announced its decision to modestly reduce the pace of its asset repurchase program. The committee decided to reduce the pace of its U.S. Treasury security purchases from $45 billion per month to $40 billion per month. Despite the Federal Reserve’s announcement related to its plans to reduce its asset purchases, the committee expressed a dovish view stating that “it likely will be appropriate to maintain the current target range for the federal funds rate well past the time the unemployment rate declines below 6.5%, especially if projected inflation continues to run below the committee’s 2% longer-run goal.” Therefore, expectations were for monetary policy to remain very accommodative over the near-term which will most likely result in a low, short-term yield environment.
Given the environment of historically low interest rates, money market funds (which are lenders to borrowers at short-term interest rates) experienced another year of “just-above-zero” returns. At the end of 2013, the 90-day U.S. Treasury bill was yielding a very modest 0.07%. The low yield environment, coupled with the regulatory constraints of Rule 2a-7 of the Investment Company Act of 1940, made it incredibly difficult for money market funds across the industry to post positive returns after paying for fund-related expenses.
The Fund was invested in a broad range of high quality, short-term money market instruments denominated exclusively in U.S. dollars. The Fund maintained a stable per share price of $1.00, while paying monthly dividends based on the daily account value. The GS4 Class of the Fund returned 0.02% for the one-year period ended December 31, 2013, as compared to a 0.05% return for the Citigroup 3-Month Treasury bill Index (the benchmark index). The Fund’s relative underperformance was due to the impact of Fund expenses as the low-rate environment provided little opportunity to generate returns sufficient to cover expenses and outpace the benchmark index. In the midst of the difficult interest rate and economic environment, the management of the Fund remained true and steadfast to its primary objectives of preservation of capital and liquidity versus sacrificing quality and taking imprudent risk in an effort to stretch for incremental yield. Stretching for yield in this environment provided an asymmetrical payoff, providing little, if any upside, while increasing the potential for a material negative return event. Throughout 2013, the Fund remained well diversified across many sectors including commercial paper, certificates of deposits, time deposits, floating rate notes and U.S. Treasuries. At year-end, the Fund’s weighted average maturity was 47 days. During the year, the Fund’s weighted average maturity peaked at 58 days in April.
This Fund may be suitable for investors who have a short-term investment horizon, seek to maintain a stable dollar value for their investment and can accept a long-term rate of return that may be lower than other fixed income and stock investments.
An investment in the Fund is not insured or guaranteed by the Federal Depository Insurance Corporation or any other governmental agency. Although the Fund seeks to maintain a value of $1.00 per share, it is possible to lose money.
At December 31, 2013, the portfolio holdings of the Fund, as a percentage of net assets, is shown in the following table. Portfolio holdings are subject to risk and may change at any time.
| | | | |
| | | % | |
Commercial Paper | | | 46.5 | |
Certificates of Deposit | | | 26.5 | |
Municipal Bonds | | | 13.4 | |
U.S. Treasury Obligations | | | 9.4 | |
Repurchase Agreements | | | 2.2 | |
Time Deposits | | | 2.0 | |
| | | | |
| | | 100.0 | |
| | | | |
Money Market Fund (Unaudited)
| | | | | | |
| Average Annual Total Returns as of 12/31/13 |
| | | GS2 Class* | | GS4 Class* | | Benchmark** |
One Year | | 0.04% | | 0.02% | | 0.05% |
Five Year | | 0.18% | | 0.07% | | 0.10% |
Ten Year | | 1.80% | | 1.65% | | 1.59% |
Inception Date | | 08/27/01 | | 08/27/01 | | |
Total Fund Operating Expenses (May 1, 2013 Prospectus, as amended on October 31, 2013)(1) | | 0.20% | | 0.44% | | |
| | | | |
| Yield as of 12/31/13(2) |
| | | GS2 Class* | | GS4 Class* |
7-Day Annualized Yield (Net) | | 0.01% | | 0.01% |
7-Day Annualized Yield (Gross) | | 0.19% | | 0.19% |
| (1) | Current information regarding the Fund’s Operating Expenses can be found in the Financial Highlights. |
| (2) | Yield for the Money Market Fund represents the annualization of the Fund’s declared dividends over the period indicated, excluding capital gains distributions. The yield more closely reflects the current earnings of the Fund than the total return. Gross Yield reflects the yield without fee waivers in effect. |
The performance data quoted represents past performance and does not guarantee future results. Current performance may be lower or higher. Performance data current to the most recent month-end may be obtained at www.GuideStoneFunds.org. Investment return will fluctuate so that shares, when redeemed, may be worth more or less than their original cost. The yield for the Money Market Fund represents annualization of the Fund’s declared dividends over the period indicated, excluding capital gains distributions. The 7-day annualized yield more closely reflects the current earnings of the Fund than the total return.
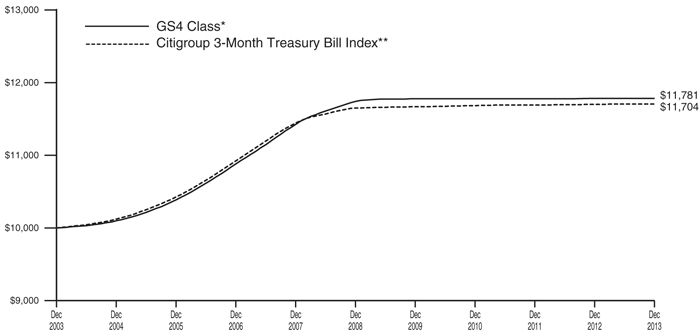
The graph compares the results of a hypothetical $10,000 investment in the GS4 Class of the Fund for the 10-year period from December 31, 2003 to December 31, 2013, with all dividends and capital gains reinvested, with the Citigroup 3-Month Treasury Bill Index.
*These performance figures reflect expense waivers by the Fund’s investment adviser. Without these waivers, performance would have been lower. Performance figures shown do not reflect the deduction of taxes that a shareholder would pay on Fund distributions or the redemption of Fund shares.
Unlike a mutual fund, the performance of an index assumes no taxes, transaction costs, management fees or other expenses.
84
| | |
MONEY MARKET FUND SCHEDULE OF INVESTMENTS | | December 31, 2013 |
| | | | | | | | | | |
| | | Par | | | Value | |
CERTIFICATES OF DEPOSIT — 26.5% | |
Bank of Montreal CHI | | | | | | | | | | |
0.34%, 01/10/14† | | $ | 6,000,000 | | | | | $ | 6,000,000 | |
0.24%, 09/05/14† | | | 15,000,000 | | | | | | 15,000,000 | |
Bank of Nova Scotia Houston | | | | | | | | | | |
0.39%, 10/06/14† | | | 7,000,000 | | | | | | 7,006,878 | |
0.24%, 12/04/14† | | | 10,000,000 | | | | | | 10,000,000 | |
BNP Paribas NY | | | | | | | | | | |
0.33%, 02/03/14† | | | 5,000,000 | | | | | | 5,000,000 | |
BNP Paribas SA | | | | | | | | | | |
0.70%, 02/14/14 | | | 10,000,000 | | | | | | 10,005,173 | |
Canadian Imperial Bank of Commerce NY | | | | | | | | | | |
0.27%, 02/04/14† | | | 10,000,000 | | | | | | 10,000,000 | |
0.29%, 06/02/14† | | | 10,000,000 | | | | | | 10,000,000 | |
0.24%, 06/13/14† | | | 3,750,000 | | | | | | 3,750,000 | |
0.23%, 08/08/14† | | | 13,000,000 | | | | | | 13,000,000 | |
Cooperatieve Centrale Raiffeisen-Boerenleenbank BA NY | | | | | | | | | | |
0.28%, 09/16/14† | | | 20,500,000 | | | | | | 20,500,000 | |
Credit Suisse NY | | | | | | | | | | |
0.26%, 03/18/14 | | | 6,000,000 | | | | | | 6,000,000 | |
0.26%, 04/17/14 | | | 20,000,000 | | | | | | 20,000,000 | |
0.32%, 06/06/14† | | | 5,000,000 | | | | | | 5,000,000 | |
Deutsche Bank AG NY | | | | | | | | | | |
0.29%, 02/28/14† | | | 8,000,000 | | | | | | 8,000,000 | |
HSBC Bank PLC | | | | | | | | | | |
0.30%, 01/15/14 | | | 15,000,000 | | | | | | 15,000,000 | |
Mitsubishi UFJ Trust & Banking Corporation NY | | | | | | | | | | |
0.22%, 03/12/14† | | | 15,000,000 | | | | | | 15,000,000 | |
Mitsubishi UFJ Trust and Bank | | | | | | | | | | |
0.28%, 02/20/14 | | | 9,000,000 | | | | | | 9,000,000 | |
National Australia Bank, Ltd. NY | | | | | | | | | | |
0.24%, 08/08/14† | | | 11,000,000 | | | | | | 11,000,772 | |
0.24%, 08/14/14† | | | 15,000,000 | | | | | | 15,000,000 | |
Natixis NY | | | | | | | | | | |
0.29%, 03/06/14† | | | 13,000,000 | | | | | | 12,999,114 | |
Nederlandse Water-schapsbank NV | | | | | | | | | | |
1.38%, 05/16/14 | | | 5,000,000 | | | | | | 5,021,087 | |
Nordea Bank Finland PLC | | | | | | | | | | |
0.25%, 01/30/14 | | | 10,000,000 | | | | | | 9,999,960 | |
Norinchukin Bank NY | | | | | | | | | | |
0.11%, 01/08/14 | | | 20,000,000 | | | | | | 20,000,000 | |
Rabobank Nederland NV NY | | | | | | | | | | |
0.41%, 01/08/14 | | | 5,000,000 | | | | | | 5,000,000 | |
0.26%, 04/22/14† | | | 8,000,000 | | | | | | 8,000,000 | |
Royal Bank of Canada NY | | | | | | | | | | |
0.23%, 01/15/14† | | | 9,250,000 | | | | | | 9,250,000 | |
Skandinaviska Enskilda Banken | | | | | | | | | | |
0.30%, 05/28/14 | | | 12,000,000 | | | | | | 12,000,729 | |
Societe Generale NY | | | | | | | | | | |
0.25%, 01/31/14 | | | 5,000,000 | | | | | | 5,000,000 | |
0.34%, 03/06/14† | | | 7,000,000 | | | | | | 7,000,000 | |
Sumitomo Mitsui Banking Corporation NY | | | | | | | | | | |
0.22%, 03/10/14† | | | 5,000,000 | | | | | | 5,000,000 | |
Svenska Handelsbanken AB | | | | | | | | | | |
0.28%, 06/15/14 144A† | | | 9,800,000 | | | | | | 9,800,000 | |
Toronto Dominion Bank NY | | | | | | | | | | |
0.25%, 08/12/14 | | | 10,000,000 | | | | | | 10,000,000 | |
| | | | | | | | | | |
| | | Par | | | Value | |
Toronto-Dominion Bank NY | | | | | | | | | | |
0.23%, 07/24/14† | | $ | 7,000,000 | | | | | $ | 7,000,000 | |
UBS AG CT | | | | | | | | | | |
1.24%, 01/28/14† | | | 11,745,000 | | | | | | 11,753,847 | |
Westpac Banking Corporation NY | | | | | | | | | | |
0.28%, 07/18/14† | | | 10,750,000 | | | | | | 10,750,000 | |
| | | | | | | | | | |
Total Certificates of Deposit (Cost $362,837,560) | | | | | | | | | 362,837,560 | |
| | | | | | | | | | |
COMMERCIAL PAPER — 46.5% | |
Atlantic Asset Securitization LLC | | | | | | | | | | |
0.09%, 01/02/14 | | | 16,124,000 | | | | | | 16,123,960 | |
Bedford Row Funding Corporation | | | | | | | | | | |
0.30%, 04/03/14 | | | 14,000,000 | | | | | | 13,989,267 | |
BNP Paribas Finance | | | | | | | | | | |
0.34%, 03/13/14 | | | 13,000,000 | | | | | | 12,991,283 | |
Caisse Centrale Desjardins Quebec Du | | | | | | | | | | |
0.21%, 01/29/14 | | | 29,500,000 | | | | | | 29,495,182 | |
0.26%, 02/19/14 | | | 10,000,000 | | | | | | 9,996,529 | |
Charta LLC | | | | | | | | | | |
0.25%, 02/10/14 | | | 13,000,000 | | | | | | 12,996,389 | |
Collateralized CP Co., LLC | | | | | | | | | | |
0.30%, 01/30/14 | | | 12,000,000 | | | | | | 11,997,100 | |
0.30%, 03/11/14 | | | 10,000,000 | | | | | | 9,994,250 | |
Commonwealth Bank of Australia | | | | | | | | | | |
0.26%, 03/28/14 | | | 22,000,000 | | | | | | 22,003,260 | |
0.24%, 05/02/14 | | | 7,500,000 | | | | | | 7,500,000 | |
0.24%, 05/16/14 | | | 13,000,000 | | | | | | 12,999,741 | |
CPPIB Capital, Inc. | | | | | | | | | | |
0.24%, 01/03/14 | | | 12,000,000 | | | | | | 11,999,840 | |
DNB Bank ASA | | | | | | | | | | |
0.26%, 01/27/14 | | | 15,000,000 | | | | | | 14,997,183 | |
0.26%, 02/06/14 | | | 15,000,000 | | | | | | 14,996,175 | |
Erste Abwicklungsanstalt | | | | | | | | | | |
0.19%, 02/19/14 | | | 25,066,000 | | | | | | 25,059,518 | |
Fairway Finance Co., LLC | | | | | | | | | | |
0.21%, 04/04/14 | | | 15,000,000 | | | | | | 15,000,000 | |
0.20%, 07/18/14 | | | 20,000,000 | | | | | | 20,000,000 | |
Gemini Securitization Corporation LLC | | | | | | | | | | |
0.10%, 01/02/14 | | | 36,050,000 | | | | | | 36,049,900 | |
General Electric Capital Corporation | | | | | | | | | | |
0.21%, 02/10/14 | | | 22,000,000 | | | | | | 21,994,867 | |
HSBC Bank PLC | | | | | | | | | | |
0.25%, 10/22/14 | | | 15,000,000 | | | | | | 15,000,000 | |
0.24%, 10/30/14 | | | 12,000,000 | | | | | | 12,000,000 | |
Kells Funding LLC | | | | | | | | | | |
0.20%, 02/03/14 | | | 9,000,000 | | | | | | 9,000,008 | |
0.24%, 05/12/14 | | | 14,500,000 | | | | | | 14,487,337 | |
0.21%, 07/07/14 | | | 15,000,000 | | | | | | 15,000,000 | |
0.24%, 10/15/14 | | | 15,000,000 | | | | | | 14,998,804 | |
Nederlandse Waterschapsbank | | | | | | | | | | |
0.28%, 07/28/14 | | | 2,000,000 | | | | | | 2,000,231 | |
0.28%, 07/30/14 | | | 2,000,000 | | | | | | 2,000,233 | |
Nordea Bank AB | | | | | | | | | | |
0.25%, 01/17/14 | | | 15,000,000 | | | | | | 14,998,333 | |
Northern Pines Funding LLC | | | | | | | | | | |
0.25%, 03/06/14 | | | 10,000,000 | | | | | | 9,995,555 | |
| | | | |
| | See Notes to Financial Statements. | | 85 |
MONEY MARKET FUND
SCHEDULE OF INVESTMENTS (Continued)
| | | | | | | | | | |
| | | Par | | | Value | |
Old Line Funding LLC | | | | | | | | | | |
0.24%, 03/17/14 | | $ | 14,000,000 | | | | | $ | 13,993,000 | |
0.21%, 05/09/14 | | | 10,000,000 | | | | | | 10,000,000 | |
0.23%, 05/20/14 | | | 12,000,000 | | | | | | 11,989,343 | |
0.23%, 06/09/14 | | | 15,000,000 | | | | | | 14,984,762 | |
Societe Generale North America | | | | | | | | | | |
0.25%, 03/03/14 | | | 10,000,000 | | | | | | 9,995,764 | |
Svenska Handelsbanken AB | | | | | | | | | | |
0.25%, 01/21/14 | | | 17,000,000 | | | | | | 16,997,639 | |
0.25%, 02/07/14 | | | 15,000,000 | | | | | | 14,996,146 | |
Sydney Capital Corporation | | | | | | | | | | |
0.22%, 01/24/14 | | | 10,000,000 | | | | | | 9,998,594 | |
0.22%, 02/14/14 | | | 12,000,000 | | | | | | 11,996,773 | |
Thunder Bay Funding LLC | | | | | | | | | | |
0.24%, 01/27/14 | | | 10,000,000 | | | | | | 9,998,267 | |
0.24%, 03/03/14 | | | 15,000,000 | | | | | | 14,993,900 | |
0.24%, 03/20/14 | | | 10,000,000 | | | | | | 9,994,800 | |
0.23%, 03/26/14 | | | 15,000,000 | | | | | | 15,000,000 | |
Victory Receivables Corporation | | | | | | | | | | |
0.16%, 01/29/14 | | | 12,000,000 | | | | | | 11,998,507 | |
Westpac Banking Corporation | | | | | | | | | | |
0.25%, 04/24/14 | | | 30,000,000 | | | | | | 30,000,632 | |
| | | | | | | | | | |
Total Commercial Paper
(Cost $636,603,072) | | | | | | | | | 636,603,072 | |
| | | | | | | | | | |
MUNICIPAL BONDS — 13.4% | |
California Housing Finance Agency, Revenue Bond, Series D | | | | | | | | | | |
0.06%, 01/07/14† | | | 4,500,000 | | | | | | 4,500,000 | |
California Housing Finance Agency, Multi-Family III, Revenue Bond, Series E (LOC-Fannie Mae, Freddie Mac) | | | | | | | | | | |
0.05%, 01/07/14† | | | 9,400,000 | | | | | | 9,400,000 | |
California Statewide Communities Development Authority, Hallmark House Apartments, Revenue Bond, Series ZZ | | | | | | | | | | |
0.05%, 01/07/14† | | | 6,420,000 | | | | | | 6,420,000 | |
California Statewide Communities Development Authority, Kimberly Woods Apartments, Revenue Bond, Series B | | | | | | | | | | |
0.05%, 01/07/14† | | | 17,100,000 | | | | | | 17,100,000 | |
Connecticut State Health & Educational Facility Authority, Yale-New Haven Hospital, Revenue Bond, Series K2 (LOC-JPMorgan Chase Bank NA) | | | | | | | | | | |
0.04%, 01/07/14† | | | 11,160,000 | | | | | | 11,160,000 | |
Los Angeles Community Redevelopment Agency, Hollywood & Vine Apartments, Revenue Bond, Series A | | | | | | | | | | |
0.05%, 01/07/14† | | | 7,700,000 | | | | | | 7,700,000 | |
Los Angeles County Housing Authority, Malibu Meadows II, Revenue Bond, Series C | | | | | | | | | | |
0.04%, 01/07/14† | | | 5,799,000 | | | | | | 5,799,000 | |
| | | | | | | | | | |
| | | Par | | | Value | |
Maryland Community Development Administration, Multifamily Barrington Apartments Project, Revenue Bond, Series A | | | | | | | | | | |
0.06%, 01/07/14† | | $ | 27,575,000 | | | | | $ | 27,575,000 | |
New York City Housing Development Corporation, Multi-Family Housing (155 West 21st Street), Revenue Bond, Series A | | | | | | | | | | |
0.04%, 01/07/14† | | | 3,100,000 | | | | | | 3,100,000 | |
New York City Housing Development Corporation, Multi-Family Housing (90 West Street), Revenue Bond, Series A | | | | | | | | | | |
0.04%, 01/07/14† | | | 6,000,000 | | | | | | 6,000,000 | |
New York City Housing Development Corporation, Multi-Family Housing (West 61st Street Apartments), Revenue Bond, Series A | | | | | | | | | | |
0.04%, 01/07/14† | | | 3,000,000 | | | | | | 3,000,000 | |
New York City Industrial Development Agency, New York Law School Project, Revenue Bond, Series A (LOC-JPMorgan Chase Bank NA) | | | | | | | | | | |
0.04%, 01/07/14† | | | 7,400,000 | | | | | | 7,400,000 | |
New York City Municipal Water Finance Authority, Revenue Bond, Series B-1B | | | | | | | | | | |
0.04%, 01/07/14† | | | 5,000,000 | | | | | | 5,000,000 | |
New York State Dormitory Authority, City University, Revenue Bond, Series B (LOC-TD Bank NA) | | | | | | | | | | |
0.04%, 01/07/14† | | | 10,000,000 | | | | | | 10,000,000 | |
New York State Housing Finance Agency, 10 Barclay Street Housing, Revenue Bond, Series A | | | | | | | | | | |
0.04%, 01/07/14† | | | 10,000,000 | | | | | | 10,000,000 | |
New York State Housing Finance Agency, 10 Liberty Housing, Revenue Bond, Series A | | | | | | | | | | |
0.03%, 01/07/14† | | | 18,000,000 | | | | | | 18,000,000 | |
New York State Housing Finance Agency, Biltmore Tower Housing Project, Revenue Bond, Series A | | | | | | | | | | |
0.04%, 01/07/14† | | | 4,000,000 | | | | | | 4,000,000 | |
New York State Housing Finance Agency, Gotham West Project, Revenue Bond, Series A (LOC-Wells Fargo Bank N.A.) | | | | | | | | | | |
0.11%, 01/07/14† | | | 10,000,000 | | | | | | 10,000,000 | |
New York State Housing Finance Agency, The Victory Housing, Revenue Bond, Series 2001-A | | | | | | | | | | |
0.04%, 01/07/14† | | | 2,700,000 | | | | | | 2,700,000 | |
| | | | |
| 86 | | See Notes to Financial Statements. | | |
| | | | | | | | | | |
| | | Par | | | Value | |
Pennsylvania Higher Educational Facilities Authority, Thomas Jefferson University, Revenue Bond, Series B (LOC-JP Morgan Chase Bank NA) | | | | | | | | | | |
0.04%, 01/07/14† | | $ | 4,700,000 | | | | | $ | 4,700,000 | |
Sacramento Housing Authority, The Lofts at Natomas Apartments, Revenue Bond, Series F | | | | | | | | | | |
0.06%, 01/07/14† | | | 10,190,000 | | | | | | 10,190,000 | |
| | | | | | | | | | |
Total Municipal Bonds
(Cost $183,744,000) | | | | | | | | | 183,744,000 | |
| | | | | | | | | | |
TIME DEPOSITS — 2.0% | |
ING Bank NV | | | | | | | | | | |
0.12%, 01/03/14 | | | 18,000,000 | | | | | | 18,000,000 | |
0.12%, 01/06/14 | | | 9,000,000 | | | | | | 9,000,000 | |
| | | | | | | | | | |
Total Time Deposits
(Cost $27,000,000) | | | | | | | | | 27,000,000 | |
| | | | | | | | | | |
U.S. TREASURY OBLIGATIONS — 9.4% | |
U.S. Treasury Bills | | | | | | | | | | |
0.05%, 03/13/14 | | | 18,000,000 | | | | | | 17,998,403 | |
0.09%, 06/19/14 | | | 25,000,000 | | | | | | 24,989,320 | |
0.08%, 06/26/14 | | | 35,000,000 | | | | | | 34,986,311 | |
0.09%, 06/26/14 | | | 30,000,000 | | | | | | 29,987,533 | |
| | | | | | | | | | |
| | | | | | | | | 107,961,567 | |
| | | | | | | | | | |
U.S. Treasury Note | | | | | | | | | | |
2.38%, 09/30/14 | | | 20,000,000 | | | | | | 20,334,571 | |
| | | | | | | | | | |
Total U.S. Treasury Obligations
(Cost $128,296,138) | | | | | | 128,296,138 | |
| | | | | | | | | | |
REPURCHASE AGREEMENTS — 2.2% | |
Goldman Sachs & Co. | | | | | | | | | | |
0.01% (dated 12/31/13, due 01/02/14, repurchase price $30,361,017, collateralized by Federal National Mortgage Association, 2.294% to 7.000%, due 01/08/46, total market value $31,271,830) | | | | | | | | | | |
(Cost $30,361,000) | | | 30,361,000 | | | | | | 30,361,000 | |
| | | | | | | | | | |
TOTAL INVESTMENTS — 100.0%
(Cost $1,368,841,770) | | | | | | 1,368,841,770 | |
Other Assets in Excess of Liabilities — 0.0% | | | | | | 156,219 | |
| | | | | | | | | | |
NET ASSETS — 100.0% | | | | | $ | 1,368,997,989 | |
| | | | | | | | | | |
| | | | |
| | See Notes to Financial Statements. | | 87 |
MONEY MARKET FUND
SCHEDULE OF INVESTMENTS (Continued)
VALUATION HIERARCHY
The following is a summary of the inputs used, as of December 31, 2013, in valuing the Fund’s investments carried at fair value:
| | | | | | | | | | | | | | | | | | | | |
| | | Total
Value | | Level 1
Quoted Prices | | Level 2
Other Significant
Observable Inputs | | Level 3
Significant
Unobservable Inputs |
Assets: | | | | | | | | | | | | | | | | | | | | |
Investments in Securities: | | | | | | | | | | | | | | | | | | | | |
Certificates of Deposit | | | $ | 362,837,560 | | | | $ | — | | | | $ | 362,837,560 | | | | $ | — | |
Commercial Paper | | | | 636,603,072 | | | | | — | | | | | 636,603,072 | | | | | — | |
Municipal Bonds | | | | 183,744,000 | | | | | — | | | | | 183,744,000 | | | | | — | |
Repurchase Agreements | | | | 30,361,000 | | | | | — | | | | | 30,361,000 | | | | | — | |
Time Deposits | | | | 27,000,000 | | | | | — | | | | | 27,000,000 | | | | | ��� | |
U.S. Treasury Obligations | | | | 128,296,138 | | | | | — | | | | | 128,296,138 | | | | | — | |
| | | | | | | | | | | | | | | | | | | | |
Total Assets - Investments in Securities | | | $ | 1,368,841,770 | | | | $ | — | | | | $ | 1,368,841,770 | | | | $ | — | |
| | | | | | | | | | | | | | | | | | | | |
| | | | |
| 88 | | See Notes to Financial Statements. | | |
Low-Duration Bond Fund (Unaudited)
The Fund invested in a diversified portfolio composed primarily of investment grade fixed income securities with an average dollar-weighted duration (a measure of bond prices’ sensitivity to changes in interest rates) normally between one to three years. The GS4 Class of the Fund underperformed its all-U.S. Treasury benchmark index, the Bank of America Merrill Lynch 1-3 Year Treasury Index, for the one-year period ended December 31, 2013 (-0.20% versus 0.36%). In an effort to outperform its benchmark index, the Fund tactically utilized spread sectors (such as corporates, mortgage-backed securities, asset-backed securities, Yankees and non-U.S. bonds) that traded at a yield premium relative to their U.S. Treasury counterparts. The strategy of overweighting to non-U.S. Treasuries sectors added value relative to the benchmark index for most of the year with the exception of the second quarter. During the second quarter, many non-U.S. Treasury sectors (or sectors that trade at a risk premium relative to U.S. Treasuries) came under pressure and declined in value due to elevated concerns over the Federal Reserve scaling back its bond purchase program. The “risk-off” environment during the second quarter coupled with the portfolio’s underweight to U.S. Treasury positioning was the primary cause of the Fund’s relative underperformance for the calendar year.
Other strategies involving derivatives were utilized during the year resulting in an overall modest impact to performance. U.S. Treasury futures and Eurodollar futures contracts were used for the common purposes of duration management and yield curve positioning strategies. Overall, these positions detracted from relative performance. Credit default swaps were utilized which positively impacted the Fund during the year as spreads compressed within the corporate bond sector. In an effort to gain exposure to non-U.S. interest rates and duration, interest rate swaps detracted from relative performance as interest rates rose in Mexico, Brazil and Australia. Currency forward contracts were used to hedge certain non-U.S. dollar positions and to take on active currency exposures in a few currencies. On an overall net basis, the currency strategies modestly detracted from performance.
During the year, the Fund remained true to its overall objective of seeking current income consistent with conservation of capital.
This Fund may be suitable for investors who have a short-term investment horizon, seek an investment return that is relatively stable and want to diversify their portfolio with a fixed income investment option. This Fund is subject to interest rate risk. Meaning, when interest rates rise, the value of the existing bonds decrease and vice versa. Changes in interest rates have a bigger impact on long duration holdings than on short duration holdings. To the extent that the investment adviser misjudges current market conditions, the Fund’s volatility may be amplified by its use of short sales and derivatives and by its ability to select sub-advisers to allocate assets. Short sales by a fund theoretically involve unlimited loss potential since the market price of securities sold short may continuously increase. Leverage may increase the risk of loss and cause fluctuations in the market value of the Fund’s portfolio to have disproportionately large effects or cause the net asset value of the Fund generally to decline faster than it would otherwise.
89
Low-Duration Bond Fund (Unaudited)
At December 31, 2013, the portfolio holdings of the Fund, as a percentage of net assets, is shown in the following table. Portfolio holdings are subject to risk and may change at any time.
| | | | |
| | | % | |
U.S. Treasury Obligations | | | 26.3 | |
Corporate Bonds | | | 23.8 | |
Mortgage-Backed Securities | | | 20.7 | |
Money Market Funds | | | 13.8 | |
Foreign Bonds | | | 10.5 | |
Asset-Backed Securities | | | 10.0 | |
Repurchase Agreements | | | 4.7 | |
Agency Obligations | | | 3.2 | |
Municipal Bonds | | | 0.8 | |
Loan Agreements | | | 0.1 | |
Purchased Option | | | 0.1 | |
Written Options | | | (0.1 | ) |
Securities Sold Short | | | (0.4 | ) |
TBA Sale Commitments | | | (2.1 | ) |
| | | | |
| | | 111.4 | |
| | | | |
90
Low-Duration Bond Fund (Unaudited)
| | | | | | |
| Average Annual Total Returns as of 12/31/13 |
| | | GS2 Class* | | GS4 Class* | | Benchmark** |
One Year | | 0.02% | | -0.20% | | 0.36% |
Five Year | | 4.47% | | 4.26% | | 1.09% |
Ten Year | | 3.26% | | 3.08% | | 2.57% |
Inception Date | | 08/27/01 | | 08/27/01 | | |
Total Fund Operating Expenses (May 1, 2013 Prospectus, as amended on October 31, 2013)(1) | | 0.42% | | 0.66% | | |
(1)Current information regarding the Fund’s Operating Expenses can be found in the Financial Highlights.
The performance data quoted represents past performance and does not guarantee future results. Current performance may be lower or higher. Performance data current to the most recent month-end may be obtained at www.GuideStoneFunds.org. The investment return and principal value of an investment will fluctuate so that shares, when redeemed, may be worth more or less than their original cost.
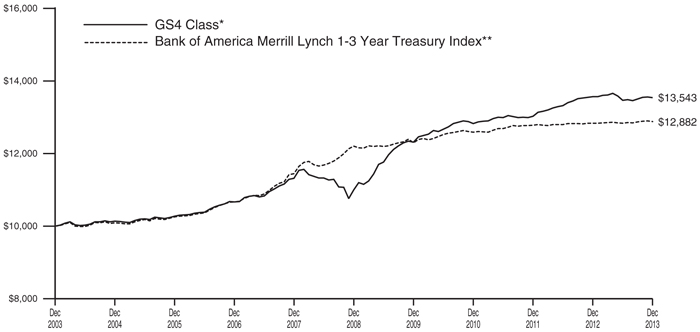
The graph compares the results of a hypothetical $10,000 investment in the GS4 Class of the Fund for the 10-year period from December 31, 2003 to December 31, 2013, with all dividends and capital gains reinvested, with the Bank of America Merrill Lynch 1-3 Year Treasury Index.
*These returns reflect expense waivers by the Fund’s investment adviser. Without these waivers, returns would have been lower. Returns shown do not reflect the deduction of taxes that a shareholder would pay on Fund distributions or the redemption of Fund shares.
Unlike a mutual fund, the performance of an index assumes no taxes, transaction costs, management fees or other expenses.
| | |
LOW-DURATION BOND FUND SCHEDULE OF INVESTMENTS | | December 31, 2013 |
| | | | | | | | | | | | |
| | | Par | | | Value | |
AGENCY OBLIGATIONS — 3.2% | |
Federal Home Loan Bank | | | | | | | | | | | | |
0.06%, 01/02/14 | | | | $ | 7,100,000 | | | | | $ | 7,099,994 | |
0.05%, 01/08/14 | | | | | 5,200,000 | | | | | | 5,199,971 | |
0.13%, 01/08/14 | | | | | 2,000,000 | | | | | | 1,999,989 | |
0.07%, 01/22/14 | | | | | 300,000 | | | | | | 299,997 | |
0.07%, 01/31/14 | | | | | 2,100,000 | | | | | | 2,099,949 | |
Federal Home Loan Mortgage Corporation | | | | | | | | | | | | |
0.07%, 01/06/14 | | | | | 6,100,000 | | | | | | 6,099,983 | |
0.15%, 01/13/14 | | | | | 2,600,000 | | | | | | 2,599,983 | |
0.13%, 08/01/14 | | | | | 1,500,000 | | | | | | 1,499,210 | |
Small Business Administration | | | | | | | | | | | | |
6.95%, 11/01/16 | | | | | 107,806 | | | | | | 113,152 | |
| | | | | | | | | | | | |
Total Agency Obligations
(Cost $27,006,835) | | | | | | | | | | | 27,012,228 | |
| | | | | | | | | | | | |
ASSET-BACKED SECURITIES — 10.0% | |
Aircraft Certificate Owner Trust | | | | | | | | | | | | |
6.46%, 09/20/22+ 144A | | | | | 107,551 | | | | | | 107,014 | |
Aircraft Lease
Securitisation, Ltd. | | | | | | | | | | | | |
0.43%, 05/10/32 144A† | | | | | 575,347 | | | | | | 550,142 | |
Ally Master Owner Trust | | | | | | | | | | | | |
0.62%, 02/15/18† | | | | | 1,100,000 | | | | | | 1,098,822 | |
0.62%, 04/15/18† | | | | | 1,400,000 | | | | | | 1,397,099 | |
American Express Credit
Account Master Trust | | | | | | | | | | | | |
0.98%, 05/15/19 | | | | | 2,250,000 | | | | | | 2,243,677 | |
AmeriCredit Automobile
Receivables Trust | | | | | | | | | | | | |
4.04%, 07/10/17 | | | | | 1,226,000 | | | | | | 1,276,618 | |
1.31%, 11/08/17 | | | | | 370,000 | | | | | | 371,160 | |
0.96%, 04/09/18 | | | | | 1,200,000 | | | | | | 1,202,227 | |
1.19%, 05/08/18 | | | | | 785,000 | | | | | | 782,192 | |
1.66%, 09/10/18 | | | | | 500,000 | | | | | | 501,731 | |
1.79%, 03/08/19 | | | | | 980,000 | | | | | | 972,683 | |
2.72%, 09/09/19 | | | | | 400,000 | | | | | | 404,698 | |
2.29%, 11/08/19 | | | | | 655,000 | | | | | | 655,018 | |
Apidos CDO | | | | | | | | | | | | |
1.39%, 04/15/25 144A† | | | | | 2,090,000 | | | | | | 2,049,937 | |
1.94%, 04/15/25 144A† | | | | | 250,000 | | | | | | 243,711 | |
Asset-Backed Securities
Corporation Home Equity Loan Trust | | | | | | | | | | | | |
0.44%, 09/25/34† | | | | | 66,606 | | | | | | 66,111 | |
Babson CLO, Ltd. | | | | | | | | | | | | |
1.34%, 04/20/25 144A† | | | | | 2,300,000 | | | | | | 2,258,057 | |
Bear Stearns Asset-Backed
Securities Trust | | | | | | | | | | | | |
1.16%, 10/25/37† | | | | | 798,865 | | | | | | 748,823 | |
0.35%, 01/25/47† | | | | | 301,723 | | | | | | 299,074 | |
BNC Mortgage Loan Trust | | | | | | | | | | | | |
0.28%, 11/25/36† | | | | | 12,792 | | | | | | 12,761 | |
0.22%, 03/25/37† | | | | | 241,075 | | | | | | 236,106 | |
Capital Auto Receivables
Asset Trust | | | | | | | | | | | | |
1.29%, 04/20/18 | | | | | 260,000 | | | | | | 257,317 | |
1.74%, 10/22/18 | | | | | 270,000 | | | | | | 266,638 | |
Cent CLO 18, Ltd. | | | | | | | | | | | | |
1.37%, 07/23/25 144A† | | | | | 1,400,000 | | | | | | 1,373,208 | |
CenterPoint Energy
Transition Bond Co., LLC | | | | | | | | | | | | |
0.90%, 04/15/18 | | | | | 1,125,372 | | | | | | 1,125,525 | |
| | | | | | | | | | | | |
| | | Par | | | Value | |
Chester Asset Receivables Dealings PLC | | | | | | | | | | | | |
0.71%, 04/15/16(U)† | | | | $ | 730,000 | | | | | $ | 1,208,737 | |
Citibank Credit Card Issuance Trust | | | | | | | | | | | | |
1.32%, 09/07/18 | | | | | 1,493,000 | | | | | | 1,503,193 | |
5.65%, 09/20/19 | | | | | 3,500,000 | | | | | | 4,008,707 | |
Conseco Financial Corporation | | | | | | | | | | | | |
6.04%, 11/01/29 | | | | | 8,933 | | | | | | 9,248 | |
Credit Acceptance Auto Loan Trust | | | | | | | | | | | | |
2.61%, 03/15/19 144A | | | | | 720,661 | | | | | | 725,027 | |
1.50%, 04/15/21 144A | | | | | 1,410,000 | | | | | | 1,409,128 | |
Crusade ABS Trust | | | | | | | | | | | | |
3.61%, 07/12/23(A)† | | | | | 1,600,000 | | | | | | 1,426,249 | |
CSAB Mortgage Backed Trust | | | | | | | | | | | | |
5.72%, 09/25/36 STEP | | | | | 599,135 | | | | | | 450,739 | |
Discover Card Execution Note Trust | | | | | | | | | | | | |
0.81%, 08/15/17 | | | | | 1,100,000 | | | | | | 1,103,534 | |
Dryden XXVIII Senior Loan Fund | | | | | | | | | | | | |
1.34%, 08/15/25 144A† | | | | | 930,000 | | | | | | 914,338 | |
1.79%, 08/15/25 144A† | | | | | 1,175,000 | | | | | | 1,128,188 | |
DT Auto Owner Trust | | | | | | | | | | | | |
1.85%, 04/17/17 144A | | | | | 1,620,000 | | | | | | 1,622,710 | |
Enterprise Fleet Financing LLC | | | | | | | | | | | | |
1.14%, 11/20/17 144A | | | | | 1,254,992 | | | | | | 1,258,862 | |
FHLMC Structured Pass-Through Securities | | | | | | | | | | | | |
0.42%, 08/25/31† | | | | | 634,621 | | | | | | 619,802 | |
First Investors Auto Owner Trust | | | | | | | | | | | | |
3.40%, 03/15/16 144A | | | | | 410,594 | | | | | | 411,531 | |
Ford Credit Floorplan Master Owner Trust | | | | | | | | | | | | |
1.39%, 09/15/16 | | | | | 790,000 | | | | | | 792,336 | |
GE Capital Credit Card Master Note Trust | | | | | | | | | | | | |
1.03%, 01/15/18 | | | | | 1,500,000 | | | | | | 1,504,141 | |
Gracechurch Card Funding PLC | | | | | | | | | | | | |
0.87%, 02/15/17 144A† | | | | | 1,050,000 | | | | | | 1,055,328 | |
1.02%, 02/15/17 144A(E)† | | | �� | | 800,000 | | | | | | 1,106,461 | |
Great America Leasing Receivables | | | | | | | | | | | | |
1.83%, 06/17/19 144A | | | | | 200,000 | | | | | | 198,163 | |
HLSS Servicer Advance Receivables Backed Notes | | | | | | | | | | | | |
1.29%, 09/15/44 144A | | | | | 735,000 | | | | | | 734,559 | |
1.50%, 01/16/46 144A | | | | | 700,000 | | | | | | 697,410 | |
1.79%, 05/15/46 144A | | | | | 900,000 | | | | | | 884,271 | |
Huntington Auto Trust | | | | | | | | | | | | |
0.38%, 09/15/15 | | | | | 1,115,414 | | | | | | 1,115,484 | |
IFC SBA Loan-Backed Adjustable Rate Certificate | | | | | | | | | | | | |
1.25%, 01/15/24 144A† | | | | | 103,523 | | | | | | 103,653 | |
Invitation Homes 2013-SFR1 Trust | | | | | | | | | | | | |
1.31%, 12/17/30 144A† | | | | | 790,000 | | | | | | 791,032 | |
LA Arena Funding LLC | | | | | | | | | | | | |
7.66%, 12/15/26 144A | | | | | 336,893 | | | | | | 380,387 | |
MMAF Equipment Finance LLC | | | | | | | | | | | | |
1.27%, 09/15/15 144A | | | | | 646,330 | | | | | | 647,030 | |
| | | | |
| 92 | | See Notes to Financial Statements. | | |
| | | | | | | | | | | | |
| | | Par | | | Value | |
Motor 2012 PLC | | | | | | | | | | | | |
1.29%, 02/25/20 144A | | | | $ | 252,000 | | | | | $ | 253,131 | |
Nissan Master Owner Trust Receivables | | | | | | | | | | | | |
0.47%, 02/15/18† | | | | | 2,525,000 | | | | | | 2,520,431 | |
Oaktree Enhanced Income Funding, Ltd. | | | | | | | | | | | | |
1.44%, 07/20/23 144A† | | | | | 900,000 | | | | | | 890,260 | |
1.89%, 07/20/23 144A† | | | | | 1,300,000 | | | | | | 1,270,246 | |
OHA Intrepid Leveraged Loan Fund, Ltd. | | | | | | | | | | | | |
1.16%, 04/20/21+ 144A† | | | | | 1,622,324 | | | | | | 1,618,268 | |
Red & Black Auto France | | | | | | | | | | | | |
1.08%, 12/28/21(E)† | | | | | 360,370 | | | | | | 496,963 | |
Santander Consumer Acquired Receivables Trust | | | | | | | | | | | | |
1.66%, 08/15/16 144A | | | | | 478,849 | | | | | | 479,751 | |
2.01%, 08/15/16 144A | | | | | 354,981 | | | | | | 355,872 | |
Santander Drive Auto Receivables Trust | | | | | | | | | | | | |
0.80%, 10/17/16 144A | | | | | 1,750,000 | | | | | | 1,751,640 | |
1.94%, 03/15/18 | | | | | 270,000 | | | | | | 271,463 | |
3.01%, 04/16/18 | | | | | 1,305,000 | | | | | | 1,342,990 | |
2.70%, 08/15/18 | | | | | 300,000 | | | | | | 306,286 | |
1.78%, 11/15/18 144A | | | | | 1,770,000 | | | | | | 1,757,710 | |
1.76%, 01/15/19 | | | | | 580,000 | | | | | | 575,373 | |
2.73%, 10/15/19 | | | | | 675,000 | | | | | | 668,774 | |
3.12%, 10/15/19 144A | | | | | 1,025,000 | | | | | | 1,045,215 | |
3.78%, 10/15/19 144A | | | | | 905,000 | | | | | | 919,020 | |
SLC Private Student Loan Trust | | | | | | | | | | | | |
0.36%, 01/15/19† | | | | | 84,971 | | | | | | 84,945 | |
SLM Private Credit Student Loan Trust | | | | | | | | | | | | |
0.44%, 06/15/21† | | | | | 730,245 | | | | | | 721,621 | |
0.64%, 03/15/22† | | | | | 512,042 | | | | | | 500,861 | |
SLM Private Education Loan Trust | | | | | | | | | | | | |
1.82%, 12/15/17 144A† | | | | | 25,559 | | | | | | 25,566 | |
1.27%, 12/15/21 144A† | | | | | 259,406 | | | | | | 260,606 | |
1.02%, 02/15/22 144A† | | | | | 1,207,938 | | | | | | 1,208,249 | |
1.27%, 08/15/23 144A† | | | | | 1,057,360 | | | | | | 1,063,342 | |
0.92%, 10/16/23 144A† | | | | | 383,296 | | | | | | 382,896 | |
3.42%, 05/16/44 144A† | | | | | 2,451,232 | | | | | | 2,597,907 | |
SLM Student Loan Trust | | | | | | | | | | | | |
0.24%, 07/25/17† | | | | | 391,497 | | | | | | 390,700 | |
0.35%, 10/25/24† | | | | | 717,760 | | | | | | 714,708 | |
0.71%, 06/25/27† | | | | | 1,165,688 | | | | | | 1,163,021 | |
Structured Asset Securities Corporation Mortgage Loan Trust | | | | | | | | | | | | |
1.67%, 04/25/35† | | | | | 667,826 | | | | | | 634,656 | |
Trade MAPS 1, Ltd. | | | | | | | | | | | | |
0.87%, 12/10/18 144A† | | | | | 1,500,000 | | | | | | 1,502,760 | |
Turbo Finance 2 PLC | | | | | | | | | | | | |
5.50%, 02/20/19(U) | | | | | 848,000 | | | | | | 1,447,762 | |
Tyron Park CLO, Ltd. | | | | | | | | | | | | |
1.39%, 07/15/25 144A† | | | | | 1,270,000 | | | | | | 1,251,692 | |
1.82%, 07/15/25 144A† | | | | | 1,175,000 | | | | | | 1,157,552 | |
Volkswagen Auto Loan Enhanced Trust | | | | | | | | | | | | |
0.46%, 01/20/17 | | | | | 3,375,000 | | | | | | 3,373,682 | |
Wells Fargo Home Equity Asset-Backed Securities 2007-2 Trust | | | | | | | | | | | | |
0.25%, 04/25/37† | | | | | 17,895 | | | | | | 17,867 | |
| | | | | | | | | | | | |
| | | Par | | | Value | |
World Omni Master Owner Trust | | | | | | | | | | | | |
0.52%, 02/15/18 144A† | | | | $ | 750,000 | | | | | $ | 750,322 | |
| | | | | | | | | | | | |
Total Asset-Backed Securities
(Cost $84,382,214) | | | | | | | | | | | 84,084,705 | |
| | | | | | | | | | | | |
CORPORATE BONDS — 23.8% | |
AbbVie, Inc. | | | | | | | | | | | | |
1.75%, 11/06/17 | | | | | 1,130,000 | | | | | | 1,129,108 | |
Air Lease Corporation | | | | | | | | | | | | |
3.38%, 01/15/19 | | | | | 625,000 | | | | | | 628,125 | |
American Express Credit Corporation | | | | | | | | | | | | |
1.75%, 06/12/15 | | | | | 240,000 | | | | | | 243,960 | |
0.75%, 07/29/16† | | | | | 940,000 | | | | | | 945,168 | |
American Express, Co. | | | | | | | | | | | | |
0.83%, 05/22/18† | | | | | 1,240,000 | | | | | | 1,240,475 | |
American Honda Finance Corporation | | | | | | | | | | | | |
0.61%, 05/26/16 144A† | | | | | 1,200,000 | | | | | | 1,203,475 | |
1.13%, 10/07/16 | | | | | 500,000 | | | | | | 502,384 | |
American International Group, Inc. | | | | | | | | | | | | |
3.00%, 03/20/15 | | | | | 1,050,000 | | | | | | 1,078,762 | |
2.38%, 08/24/15 | | | | | 320,000 | | | | | | 326,993 | |
4.88%, 09/15/16 | | | | | 1,748,000 | | | | | | 1,921,103 | |
AmeriGas Partners LP | | | | | | | | | | | | |
6.25%, 08/20/19 | | | | | 500,000 | | | | | | 540,000 | |
Amsouth Bank | | | | | | | | | | | | |
5.20%, 04/01/15 | | | | | 1,000,000 | | | | | | 1,047,818 | |
Apple, Inc. | | | | | | | | | | | | |
0.45%, 05/03/16 | | | | | 540,000 | | | | | | 536,390 | |
0.49%, 05/03/18† | | | | | 1,250,000 | | | | | | 1,249,221 | |
1.00%, 05/03/18D | | | | | 605,000 | | | | | | 585,619 | |
Ashland, Inc. | | | | | | | | | | | | |
3.00%, 03/15/16 | | | | | 770,000 | | | | | | 789,250 | |
Astoria Financial Corporation | | | | | | | | | | | | |
5.00%, 06/19/17 | | | | | 770,000 | | | | | | 826,576 | |
Autodesk, Inc. | | | | | | | | | | | | |
1.95%, 12/15/17 | | | | | 350,000 | | | | | | 346,559 | |
Aviation Capital Group Corporation | | | | | | | | | | | | |
3.88%, 09/27/16 144A | | | | | 900,000 | | | | | | 927,927 | |
4.63%, 01/31/18 144AD | | | | | 850,000 | | | | | | 880,812 | |
Bank of America Corporation | | | | | | | | | | | | |
1.25%, 01/11/16D | | | | | 919,000 | | | | | | 923,597 | |
3.75%, 07/12/16 | | | | | 920,000 | | | | | | 978,660 | |
6.50%, 08/01/16 | | | | | 1,582,000 | | | | | | 1,787,295 | |
6.00%, 09/01/17D | | | | | 850,000 | | | | | | 971,332 | |
5.75%, 12/01/17 | | | | | 1,700,000 | | | | | | 1,936,509 | |
2.00%, 01/11/18 | | | | | 800,000 | | | | | | 799,349 | |
1.32%, 03/22/18†D | | | | | 1,200,000 | | | | | | 1,217,184 | |
Bank of New York Mellon Corporation | | | | | | | | | | | | |
0.80%, 08/01/18† | | | | | 640,000 | | | | | | 642,459 | |
Baxter International, Inc. | | | | | | | | | | | | |
0.95%, 06/01/16 | | | | | 230,000 | | | | | | 230,112 | |
BB&T Corporation | | | | | | | | | | | | |
1.60%, 08/15/17 | | | | | 340,000 | | | | | | 337,260 | |
Berkshire Hathaway Finance Corporation | | | | | | | | | | | | |
0.95%, 08/15/16 | | | | | 260,000 | | | | | | 261,348 | |
| | | | |
| | See Notes to Financial Statements. | | 93 |
LOW-DURATION BOND FUND
SCHEDULE OF INVESTMENTS (Continued)
| | | | | | | | | | | | |
| | | Par | | | Value | |
Capital One Financial Corporation | | | | | | | | | | | | |
1.00%, 11/06/15D | | | | $ | 2,870,000 | | | | | $ | 2,870,055 | |
3.15%, 07/15/16D | | | | | 500,000 | | | | | | 522,856 | |
Caterpillar Financial Services Corporation | | | | | | | | | | | | |
0.70%, 11/06/15D | | | | | 1,160,000 | | | | | | 1,161,933 | |
CC Holdings GS V LLC | | | | | | | | | | | | |
2.38%, 12/15/17D | | | | | 300,000 | | | | | | 297,423 | |
Citigroup, Inc. | | | | | | | | | | | | |
2.25%, 08/07/15 | | | | | 730,000 | | | | | | 745,461 | |
4.59%, 12/15/15 | | | | | 400,000 | | | | | | 427,647 | |
1.25%, 01/15/16 | | | | | 1,015,000 | | | | | | 1,018,878 | |
1.04%, 04/01/16†D | | | | | 1,160,000 | | | | | | 1,168,220 | |
3.95%, 06/15/16D | | | | | 3,842,000 | | | | | | 4,089,913 | |
1.20%, 07/25/16† | | | | | 3,200,000 | | | | | | 3,235,293 | |
4.45%, 01/10/17 | | | | | 450,000 | | | | | | 488,056 | |
CMS Energy Corporation | | | | | | | | | | | | |
4.25%, 09/30/15D | | | | | 255,000 | | | | | | 268,775 | |
Computer Sciences Corporation | | | | | | | | | | | | |
2.50%, 09/15/15D | | | | | 210,000 | | | | | | 214,440 | |
ConAgra Foods, Inc. | | | | | | | | | | | | |
1.35%, 09/10/15 | | | | | 160,000 | | | | | | 161,178 | |
1.30%, 01/25/16 | | | | | 240,000 | | | | | | 240,538 | |
Continental Airlines 2010-1 Class B Pass Through Trust | | | | | | | | | | | | |
6.00%, 07/12/20 | | | | | 547,201 | | | | | | 552,673 | |
Coventry Health Care, Inc. | | | | | | | | | | | | |
5.95%, 03/15/17 | | | | | 1,000,000 | | | | | | 1,132,750 | |
Crane Co. | | | | | | | | | | | | |
2.75%, 12/15/18D | | | | | 600,000 | | | | | | 597,760 | |
CSX Corporation | | | | | | | | | | | | |
6.25%, 03/15/18 | | | | | 500,000 | | | | | | 578,376 | |
Daimler Finance North America LLC | | | | | | | | | | | | |
0.86%, 03/28/14 144A† | | | | | 2,600,000 | | | | | | 2,603,752 | |
1.30%, 07/31/15 144A | | | | | 500,000 | | | | | | 503,129 | |
1.25%, 01/11/16 144A | | | | | 530,000 | | | | | | 530,639 | |
0.92%, 08/01/16 144A† | | | | | 690,000 | | | | | | 691,859 | |
0.95%, 08/01/16 | | | | | 200,000 | | | | | | 200,539 | |
2.95%, 01/11/17 144AD | | | | | 238,000 | | | | | | 245,759 | |
Delphi Corporation | | | | | | | | | | | | |
5.88%, 05/15/19D | | | | | 880,000 | | | | | | 935,000 | |
Delta Air Lines 2010-2 Class B Pass Through Trust | | | | | | | | | | | | |
6.75%, 05/23/17D | | | | | 300,000 | | | | | | 320,250 | |
Devon Energy Corporation | | | | | | | | | | | | |
1.20%, 12/15/16 | | | | | 560,000 | | | | | | 560,170 | |
Digital Realty Trust LP | | | | | | | | | | | | |
4.50%, 07/15/15D | | | | | 905,000 | | | | | | 941,647 | |
DIRECTV Holdings LLC | | | | | | | | | | | | |
3.13%, 02/15/16 | | | | | 320,000 | | | | | | 333,043 | |
Discover Bank | | | | | | | | | | | | |
2.00%, 02/21/18 | | | | | 1,380,000 | | | | | | 1,356,722 | |
Duke Energy Corporation | | | | | | | | | | | | |
1.63%, 08/15/17 | | | | | 1,500,000 | | | | | | 1,491,824 | |
Eaton Corporation | | | | | | | | | | | | |
0.95%, 11/02/15 | | | | | 450,000 | | | | | | 451,888 | |
Enterprise Products Operating LLC | | | | | | | | | | | | |
1.25%, 08/13/15 | | | | | 230,000 | | | | | | 231,620 | |
EOG Resources, Inc. | | | | | | | | | | | | |
0.99%, 02/03/14† | | | | | 2,900,000 | | | | | | 2,901,882 | |
Equifax, Inc. | | | | | | | | | | | | |
4.45%, 12/01/14 | | | | | 140,000 | | | | | | 144,420 | |
| | | | | | | | | | | | |
| | | Par | | | Value | |
ERAC USA Finance LLC | | | | | | | | | | | | |
1.40%, 04/15/16 144A | | | | $ | 180,000 | | | | | $ | 180,243 | |
6.38%, 10/15/17 144A | | | | | 1,000,000 | | | | | | 1,158,172 | |
ERP Operating LP | | | | | | | | | | | | |
6.58%, 04/13/15 | | | | | 1,100,000 | | | | | | 1,182,413 | |
5.13%, 03/15/16 | | | | | 432,000 | | | | | | 469,591 | |
5.38%, 08/01/16 | | | | | 568,000 | | | | | | 626,644 | |
Federal Express Corporation 2012 Pass-Through Trust | | | | | | | | | | | | |
2.63%, 01/15/18 144A | | | | | 484,832 | | | | | | 489,072 | |
Fidelity National Information Services, Inc. | | | | | | | | | | | | |
2.00%, 04/15/18 | | | | | 340,000 | | | | | | 330,952 | |
Fifth Third Bank | | | | | | | | | | | | |
1.15%, 11/18/16 | | | | | 700,000 | | | | | | 700,008 | |
Fiserv, Inc. | | | | | | | | | | | | |
3.13%, 10/01/15D | | | | | 1,250,000 | | | | | | 1,294,731 | |
FMG Resources | | | | | | | | | | | | |
3.74%, 06/30/19W† | | | | | 850,000 | | | | | | 860,362 | |
Ford Motor Credit Co., LLC | | | | | | | | | | | | |
3.88%, 01/15/15 | | | | | 505,000 | | | | | | 521,219 | |
12.00%, 05/15/15 | | | | | 500,000 | | | | | | 574,203 | |
4.21%, 04/15/16 | | | | | 100,000 | | | | | | 106,612 | |
1.49%, 05/09/16† | | | | | 610,000 | | | | | | 619,308 | |
3.98%, 06/15/16 | | | | | 1,600,000 | | | | | | 1,702,437 | |
8.00%, 12/15/16 | | | | | 1,820,000 | | | | | | 2,155,717 | |
3.00%, 06/12/17 | | | | | 560,000 | | | | | | 582,494 | |
2.38%, 01/16/18 | | | | | 500,000 | | | | | | 505,464 | |
5.00%, 05/15/18D | | | | | 750,000 | | | | | | 836,258 | |
2.88%, 10/01/18D | | | | | 550,000 | | | | | | 563,600 | |
Freeport-McMoRan Copper & Gold, Inc. | | | | | | | | | | | | |
1.40%, 02/13/15D | | | | | 200,000 | | | | | | 201,172 | |
2.15%, 03/01/17 | | | | | 210,000 | | | | | | 211,529 | |
GATX Corporation | | | | | | | | | | | | |
2.50%, 03/15/19 | | | | | 500,000 | | | | | | 496,354 | |
General Electric Capital Corporation | | | | | | | | | | | | |
1.00%, 12/11/15 | | | | | 2,000,000 | | | | | | 2,016,990 | |
0.89%, 07/12/16† | | | | | 1,380,000 | | | | | | 1,390,549 | |
General Motors Co. | | | | | | | | | | | | |
3.50%, 10/02/18 144A | | | | | 953,000 | | | | | | 979,208 | |
General Motors
Financial Co., Inc. | | | | | | | | | | | | |
2.75%, 05/15/16 144A | | | | | 1,303,000 | | | | | | 1,322,545 | |
4.75%, 08/15/17 144A | | | | | 800,000 | | | | | | 853,000 | |
Genzyme Corporation | | | | | | | | | | | | |
3.63%, 06/15/15 | | | | | 395,000 | | | | | | 412,641 | |
Glencore Funding LLC | | | | | | | | | | | | |
1.60%, 01/15/19 144A† | | | | | 1,200,000 | | | | | | 1,178,498 | |
Goldman Sachs Group, Inc. | | | | | | | | | | | | |
1.60%, 11/23/15D | | | | | 640,000 | | | | | | 647,180 | |
5.35%, 01/15/16D | | | | | 761,000 | | | | | | 823,935 | |
3.63%, 02/07/16 | | | | | 2,874,000 | | | | | | 3,017,734 | |
5.75%, 10/01/16 | | | | | 135,000 | | | | | | 150,756 | |
6.25%, 09/01/17 | | | | | 2,003,000 | | | | | | 2,295,059 | |
1.44%, 04/30/18† | | | | | 1,250,000 | | | | | | 1,266,094 | |
1.34%, 11/15/18† | | | | | 580,000 | | | | | | 582,045 | |
Harley-Davidson Financial Services, Inc. | | | | | | | | | | | | |
1.15%, 09/15/15 144A | | | | | 340,000 | | | | | | 341,264 | |
Hartford Financial Services Group, Inc. | | | | | | | | | | | | |
4.00%, 03/30/15 | | | | | 320,000 | | | | | | 332,547 | |
| | | | |
| 94 | | See Notes to Financial Statements. | | |
| | | | | | | | | | | | |
| | | Par | | | Value | |
HCA, Inc. | | | | | | | | | | | | |
7.88%, 02/15/20 | | | | $ | 687,000 | | | | | $ | 739,384 | |
7.25%, 09/15/20 | | | | | 360,000 | | | | | | 393,300 | |
Health Care REIT, Inc. | | | | | | | | | | | | |
3.63%, 03/15/16 | | | | | 400,000 | | | | | | 419,303 | |
6.20%, 06/01/16 | | | | | 1,546,000 | | | | | | 1,719,769 | |
Hewlett-Packard Co. | | | | | | | | | | | | |
2.63%, 12/09/14 | | | | | 590,000 | | | | | | 599,942 | |
2.35%, 03/15/15 | | | | | 800,000 | | | | | | 812,760 | |
2.20%, 12/01/15D | | | | | 625,000 | | | | | | 639,054 | |
HSBC USA, Inc. | | | | | | | | | | | | |
2.38%, 02/13/15 | | | | | 400,000 | | | | | | 408,259 | |
1.13%, 09/24/18† | | | | | 800,000 | | | | | | 802,031 | |
Huntington National Bank | | | | | | | | | | | | |
1.30%, 11/20/16 | | | | | 500,000 | | | | | | 500,428 | |
Hyundai Capital America | | | | | | | | | | | | |
1.63%, 10/02/15 144A | | | | | 500,000 | | | | | | 502,718 | |
3.75%, 04/06/16 144A | | | | | 190,000 | | | | | | 199,116 | |
IAC/InterActiveCorp | | | | | | | | | | | | |
4.88%, 11/30/18 144A | | | | | 300,000 | | | | | | 308,250 | |
ING US, Inc. | | | | | | | | | | | | |
2.90%, 02/15/18 | | | | | 1,400,000 | | | | | | 1,433,285 | |
Ingredion, Inc. | | | | | | | | | | | | |
3.20%, 11/01/15 | | | | | 200,000 | | | | | | 207,175 | |
International Lease Finance Corporation | | | | | | | | | | | | |
4.88%, 04/01/15D | | | | | 1,250,000 | | | | | | 1,298,437 | |
8.63%, 09/15/15 | | | | | 100,000 | | | | | | 111,375 | |
5.75%, 05/15/16 | | | | | 600,000 | | | | | | 644,250 | |
Jabil Circuit, Inc. | | | | | | | | | | | | |
7.75%, 07/15/16 | | | | | 295,000 | | | | | | 337,038 | |
JB Hunt Transport Services, Inc. | | | | | | | | | | | | |
3.38%, 09/15/15 | | | | | 550,000 | | | | | | 569,980 | |
John Deere Capital Corporation | | | | | | | | | | | | |
1.05%, 10/11/16 | | | | | 480,000 | | | | | | 481,709 | |
Johnson & Johnson | | | | | | | | | | | | |
0.31%, 11/28/16† | | | | | 3,300,000 | | | | | | 3,304,257 | |
JPMorgan Chase & Co. | | | | | | | | | | | | |
3.70%, 01/20/15 | | | | | 1,000,000 | | | | | | 1,031,470 | |
0.86%, 02/26/16† | | | | | 1,100,000 | | | | | | 1,105,110 | |
3.45%, 03/01/16 | | | | | 1,249,000 | | | | | | 1,310,692 | |
3.15%, 07/05/16 | | | | | 2,252,000 | | | | | | 2,362,382 | |
1.14%, 01/25/18† | | | | | 610,000 | | | | | | 616,706 | |
KeyCorp | | | | | | | | | | | | |
3.75%, 08/13/15D | | | | | 360,000 | | | | | | 376,615 | |
2.30%, 12/13/18 | | | | | 850,000 | | | | | | 844,814 | |
Kroger Co. | | | | | | | | | | | | |
0.80%, 10/17/16† | | | | | 760,000 | | | | | | 762,193 | |
2.20%, 01/15/17 | | | | | 500,000 | | | | | | 506,452 | |
Lehman Escrow Bonds | | | | | | | | | | | | |
0.00%, 12/28/17+W†# | | | | | 2,600,000 | | | | | | — | |
6.63%, 12/31/99W†# | | | | | 600,000 | | | | | | 129,000 | |
Life Technologies Corporation | | | | | | | | | | | | |
3.50%, 01/15/16 | | | | | 800,000 | | | | | | 833,732 | |
Lincoln National Corporation | | | | | | | | | | | | |
4.30%, 06/15/15 | | | | | 1,210,000 | | | | | | 1,268,969 | |
Marathon Oil Corporation | | | | | | | | | | | | |
0.90%, 11/01/15 | | | | | 490,000 | | | | | | 490,630 | |
Marsh & McLennan Cos., Inc. | | | | | | | | | | | | |
2.55%, 10/15/18 | | | | | 495,000 | | | | | | 496,276 | |
Masco Corporation | | | | | | | | | | | | |
4.80%, 06/15/15 | | | | | 365,000 | | | | | | 382,338 | |
| | | | | | | | | | | | |
| | | Par | | | Value | |
Maxim Integrated Products, Inc. | | | | | | | | | | | | |
2.50%, 11/15/18 | | | | $ | 1,350,000 | | | | | $ | 1,340,117 | |
Merrill Lynch & Co., Inc. | | | | | | | | | | | | |
5.00%, 01/15/15 | | | | | 2,700,000 | | | | | | 2,813,916 | |
6.40%, 08/28/17 | | | | | 400,000 | | | | | | 461,544 | |
6.88%, 04/25/18 | | | | | 800,000 | | | | | | 946,795 | |
Morgan Stanley | | | | | | | | | | | | |
1.49%, 02/25/16† | | | | | 930,000 | | | | | | 942,592 | |
4.75%, 03/22/17 | | | | | 1,015,000 | | | | | | 1,108,521 | |
1.52%, 04/25/18† | | | | | 1,520,000 | | | | | | 1,543,326 | |
Motorola Solutions, Inc. | | | | | | | | | | | | |
6.00%, 11/15/17 | | | | | 400,000 | | | | | | 455,380 | |
Mylan, Inc. | | | | | | | | | | | | |
1.80%, 06/24/16 144A | | | | | 180,000 | | | | | | 183,613 | |
Nabors Industries, Inc. | | | | | | | | | | | | |
2.35%, 09/15/16 144A | | | | | 1,100,000 | | | | | | 1,111,807 | |
National Oilwell Varco, Inc. | | | | | | | | | | | | |
1.35%, 12/01/17D | | | | | 660,000 | | | | | | 649,047 | |
NBCUniversal Enterprise, Inc. | | | | | | | | | | | | |
0.93%, 04/15/18 144A† | | | | | 490,000 | | | | | | 492,310 | |
NBCUniversal Media LLC | | | | | | | | | | | | |
3.65%, 04/30/15 | | | | | 550,000 | | | | | | 572,186 | |
NCUA Guaranteed Notes | | | | | | | | | | | | |
1.40%, 06/12/15 | | | | | 1,180,000 | | | | | | 1,198,207 | |
New York Life Global Funding | | | | | | | | | | | | |
1.65%, 05/15/17 144A | | | | | 2,500,000 | | | | | | 2,504,790 | |
NextEra Energy Capital Holdings, Inc. | | | | | | | | | | | | |
1.20%, 06/01/15 | | | | | 170,000 | | | | | | 170,931 | |
1.34%, 09/01/15 | | | | | 4,300,000 | | | | | | 4,330,414 | |
Nissan Motor Acceptance Corporation | | | | | | | | | | | | |
1.00%, 03/15/16 144AD | | | | | 910,000 | | | | | | 906,067 | |
1.95%, 09/12/17 144A | | | | | 520,000 | | | | | | 516,484 | |
Northwest Airlines 2002-1 Class G-2 Pass Through Trust | | | | | | | | | | | | |
6.26%, 05/20/23 | | | | | 155,687 | | | | | | 167,177 | |
Novus USA Trust | | | | | | | | | | | | |
1.54%, 02/28/14 144A† | | | | | 2,000,000 | | | | | | 2,002,493 | |
Omnicom Group, Inc. | | | | | | | | | | | | |
5.90%, 04/15/16 | | | | | 285,000 | | | | | | 315,215 | |
Overseas Private Investment Corporation | | | | | | | | | | | | |
0.00%, 04/15/16W† | | | | | 1,550,720 | | | | | | 2,092,090 | |
PACCAR Financial Corporation | | | | | | | | | | | | |
1.05%, 06/05/15 | | | | | 220,000 | | | | | | 221,873 | |
0.75%, 05/16/16 | | | | | 270,000 | | | | | | 268,867 | |
0.84%, 12/06/18† | | | | | 250,000 | | | | | | 250,661 | |
Parker Hannifin Corporation | | | | | | | | | | | | |
4.13%, 11/11/15(E) | | | | | 700,000 | | | | | | 1,016,203 | |
Penske Truck Leasing Co. LP | | | | | | | | | | | | |
2.50%, 07/11/14 144A | | | | | 230,000 | | | | | | 231,902 | |
3.13%, 05/11/15 144A | | | | | 600,000 | | | | | | 617,294 | |
2.50%, 03/15/16 144A | | | | | 1,650,000 | | | | | | 1,691,359 | |
3.38%, 03/15/18 144AD | | | | | 1,115,000 | | | | | | 1,143,749 | |
PepsiCo, Inc. | | | | | | | | | | | | |
0.44%, 07/30/15† | | | | | 700,000 | | | | | | 701,387 | |
Phillips 66 | | | | | | | | | | | | |
2.95%, 05/01/17 | | | | | 210,000 | | | | | | 218,655 | |
Pioneer Natural Resources Co. | | | | | | | | | | | | |
5.88%, 07/15/16 | | | | | 2,410,000 | | | | | | 2,674,972 | |
Plains Exploration & Production Co. | | | | | | | | | | | | |
6.50%, 11/15/20 | | | | | 540,000 | | | | | | 596,629 | |
| | | | |
| | See Notes to Financial Statements. | | 95 |
LOW-DURATION BOND FUND
SCHEDULE OF INVESTMENTS (Continued)
| | | | | | | | | | | | |
| | | Par | | | Value | |
Principal Life Global Funding II | | | | | | | | | | | | |
1.00%, 12/11/15 144A | | | | $ | 530,000 | | | | | $ | 531,333 | |
Procter & Gamble Co. | | | | | | | | | | | | |
3.50%, 02/15/15D | | | | | 200,000 | | | | | | 206,675 | |
ProLogis LP | | | | | | | | | | | | |
6.63%, 05/15/18 | | | | | 1,000,000 | | | | | | 1,169,098 | |
Prudential Covered Trust | | | | | | | | | | | | |
3.00%, 09/30/15 144A | | | | | 680,000 | | | | | | 701,364 | |
Prudential Financial, Inc. | | | | | | | | | | | | |
6.00%, 12/01/17 | | | | | 2,000,000 | | | | | | 2,301,834 | |
1.02%, 08/15/18† | | | | | 500,000 | | | | | | 502,152 | |
PSEG Power LLC | | | | | | | | | | | | |
2.45%, 11/15/18 | | | | | 250,000 | | | | | | 247,037 | |
Regions Financial Corporation | | | | | | | | | | | | |
2.00%, 05/15/18 | | | | | 1,250,000 | | | | | | 1,211,644 | |
Retail Property Trust | | | | | | | | | | | | |
7.88%, 03/15/16 144A | | | | | 2,000,000 | | | | | | 2,260,866 | |
Samsung Electronics America, Inc. | | | | | | | | | | | | |
1.75%, 04/10/17 144AD | | | | | 1,150,000 | | | | | | 1,143,538 | |
SBA Tower Trust | | | | | | | | | | | | |
4.25%, 04/15/40 144AD | | | | | 510,000 | | | | | | 517,049 | |
Simon Property Group LP REIT | | | | | | | | | | | | |
4.20%, 02/01/15D | | | | | 140,000 | | | | | | 144,146 | |
Starbucks Corporation | | | | | | | | | | | | |
0.88%, 12/05/16 | | | | | 450,000 | | | | | | 447,488 | |
SteelRiver Trans-mission Co., LLC | | | | | | | | | | | | |
4.71%, 06/30/17 144A | | | | | 523,094 | | | | | | 541,344 | |
TD Ameritrade Holding Corporation | | | | | | | | | | | | |
4.15%, 12/01/14 | | | | | 660,000 | | | | | | 681,577 | |
Tennessee Gas Pipeline Co. LLC | | | | | | | | | | | | |
8.00%, 02/01/16 | | | | | 518,000 | | | | | | 588,469 | |
Tesoro Corporation | | | | | | | | | | | | |
4.25%, 10/01/17 | | | | | 550,000 | | | | | | 576,125 | |
Thermo Fisher Scientific, Inc. | | | | | | | | | | | | |
2.25%, 08/15/16D | | | | | 1,500,000 | | | | | | 1,534,993 | |
T-Mobile USA, Inc. | | | | | | | | | | | | |
5.25%, 09/01/18 144AD | | | | | 600,000 | | | | | | 633,750 | |
Toll Brothers Finance Corporation | | | | | | | | | | | | |
4.00%, 12/31/18 | | | | | 390,000 | | | | | | 397,800 | |
Total System Services, Inc. | | | | | | | | | | | | |
2.38%, 06/01/18 | | | | | 610,000 | | | | | | 594,075 | |
Union Bank NA | | | | | | | | | | | | |
1.19%, 06/06/14† | | | | | 3,000,000 | | | | | | 3,011,082 | |
1.50%, 09/26/16D | | | | | 270,000 | | | | | | 273,238 | |
United Air Lines 2009-1 Pass-Through Trust | | | | | | | | | | | | |
10.40%, 05/01/18D | | | | | 446,817 | | | | | | 507,138 | |
United Airline 2009-2A Pass Through Trust | | | | | | | | | | | | |
9.75%, 07/15/18 | | | | | 606,165 | | | | | | 697,089 | |
UnitedHealth Group, Inc. | | | | | | | | | | | | |
1.40%, 10/15/17 | | | | | 210,000 | | | | | | 207,539 | |
Ventas Realty LP | | | | | | | | | | | | |
1.55%, 09/26/16 | | | | | 1,780,000 | | | | | | 1,793,827 | |
Verizon Communications, Inc. | | | | | | | | | | | | |
1.77%, 09/15/16† | | | | | 240,000 | | | | | | 247,418 | |
1.99%, 09/14/18† | | | | | 570,000 | | | | | | 600,027 | |
3.65%, 09/14/18 | | | | | 3,200,000 | | | | | | 3,391,066 | |
| | | | | | | | | | | | |
| | | Par | | | Value | |
5.15%, 09/15/23 | | | | $ | 400,000 | | | | | $ | 430,302 | |
Vesey Street Investment Trust I | | | | | | | | | | | | |
4.40%, 09/01/16 STEP | | | | | 700,000 | | | | | | 752,072 | |
Vornado Realty LP | | | | | | | | | | | | |
4.25%, 04/01/15 | | | | | 700,000 | | | | | | 722,040 | |
Wachovia Bank NA | | | | | | | | | | | | |
4.80%, 11/01/14D | | | | | 360,000 | | | | | | 373,445 | |
Wal-Mart Stores, Inc. | | | | | | | | | | | | |
0.60%, 04/11/16D | | | | | 270,000 | | | | | | 269,759 | |
WellPoint, Inc. | | | | | | | | | | | | |
1.25%, 09/10/15 | | | | | 440,000 | | | | | | 443,243 | |
2.38%, 02/15/17 | | | | | 1,060,000 | | | | | | 1,073,833 | |
1.88%, 01/15/18 | | | | | 900,000 | | | | | | 890,789 | |
Wells Fargo & Co. | | | | | | | | | | | | |
0.87%, 04/23/18† | | | | | 270,000 | | | | | | 271,778 | |
Wells Fargo Bank NA | | | | | | | | | | | | |
4.75%, 02/09/15 | | | | | 1,000,000 | | | | | | 1,045,213 | |
Western Union Co. | | | | | | | | | | | | |
3.35%, 05/22/19D | | | | | 600,000 | | | | | | 599,659 | |
Wm. Wrigley Jr. Co. | | | | | | | | | | | | |
1.40%, 10/21/16 144AD | | | | | 1,200,000 | | | | | | 1,202,640 | |
2.00%, 10/20/17 144A | | | | | 1,700,000 | | | | | | 1,696,821 | |
WPX Energy, Inc. | | | | | | | | | | | | |
5.25%, 01/15/17D | | | | | 780,000 | | | | | | 836,550 | |
Xcel Energy, Inc. | | | | | | | | | | | | |
0.75%, 05/09/16 | | | | | 410,000 | | | | | | 406,778 | |
| | | | | | | | | | | | |
Total Corporate Bonds
(Cost $197,388,861) | | | | | | | | | | | 199,313,273 | |
| | | | | | | | | | | | |
FOREIGN BONDS — 10.5% | |
Australia — 0.7% | |
Australia & New Zealand Banking Group, Ltd. | | | | | | | | | | | | |
0.90%, 02/12/16 | | | | | 700,000 | | | | | | 699,582 | |
0.80%, 05/15/18† | | | | | 1,230,000 | | | | | | 1,230,298 | |
Macquarie Bank, Ltd. | | | | | | | | | | | | |
3.45%, 07/27/15 144A | | | | | 750,000 | | | | | | 775,909 | |
2.00%, 08/15/16 144A | | | | | 1,100,000 | | | | | | 1,113,215 | |
Perpetual Trustee- Apollo | | | | | | | | | | | | |
3.87%, 10/03/40(A) | | | | | 917,011 | | | | | | 826,355 | |
QBE Insurance Group, Ltd. | | | | | | | | | | | | |
6.13%, 09/28/15(U) | | | | | 250,000 | | | | | | 442,085 | |
Rio Tinto Finance USA PLC | | | | | | | | | | | | |
1.13%, 03/20/15 | | | | | 500,000 | | | | | | 502,934 | |
Virgin Australia 2013-1A Trust | | | | | | | | | | | | |
5.00%, 10/23/23 144A | | | | | 700,000 | | | | | | 717,938 | |
| | | | | | | | | | | | |
| | | | | | | | | | | 6,308,316 | |
| | | | | | | | | | | | |
|
Bermuda — 0.1% | |
Aircastle, Ltd. | | | | | | | | | | | | |
9.75%, 08/01/18D | | | | | 405,000 | | | | | | 443,475 | |
Qtel International Finance, Ltd. | | | | | | | | | | | | |
6.50%, 06/10/14 144A | | | | | 660,000 | | | | | | 675,708 | |
| | | | | | | | | | | | |
| | | | | | | | | | | 1,119,183 | |
| | | | | | | | | | | | |
Brazil — 0.2% | |
Banco Bradesco SA | | | | | | | | | | | | |
2.34%, 05/16/14 144A† | | | | | 520,000 | | | | | | 520,531 | |
Banco do Nordeste do Brasil SA | | | | | | | | | | | | |
3.63%, 11/09/15 144AD | | | | | 710,000 | | | | | | 716,213 | |
BRF SA | | | | | | | | | | | | |
7.75%, 05/22/18 144A(B) | | | | | 2,500,000 | | | | | | 882,696 | |
| | | | | | | | | | | | |
| | | | | | | | | | | 2,119,440 | |
| | | | | | | | | | | | |
| | | | |
| 96 | | See Notes to Financial Statements. | | |
| | | | | | | | | | | | |
| | | Par | | | Value | |
Canada — 0.7% | |
Bank of Montreal | | | | | | | | | | | | |
0.84%, 04/09/18† | | | | $ | 610,000 | | | | | $ | 613,718 | |
Canadian Imperial Bank of Commerce | | | | | | | | | | | | |
1.55%, 01/23/18D | | | | | 890,000 | | | | | | 871,363 | |
Manulife Financial Corporation | | | | | | | | | | | | |
3.40%, 09/17/15 | | | | | 5,000 | | | | | | 5,207 | |
Nexen Energy ULC | | | | | | | | | | | | |
5.20%, 03/10/15 | | | | | 790,000 | | | | | | 826,718 | |
Thomson Reuters Corporation | | | | | | | | | | | | |
0.88%, 05/23/16 | | | | | 600,000 | | | | | | 596,129 | |
1.30%, 02/23/17 | | | | | 400,000 | | | | | | 398,541 | |
Total Capital Canada, Ltd. | | | | | | | | | | | | |
0.62%, 01/15/16† | | | | | 300,000 | | | | | | 301,738 | |
TransCanada PipeLines, Ltd. | | | | | | | | | | | | |
0.93%, 06/30/16† | | | | | 580,000 | | | | | | 585,811 | |
Xstrata Finance Canada, Ltd. | | | | | | | | | | | | |
2.70%, 10/25/17 144A | | | | | 1,740,000 | | | | | | 1,761,338 | |
| | | | | | | | | | | | |
| | | | | | | | | | | 5,960,563 | |
| | | | | | | | | | | | |
|
Cayman Islands — 0.4% | |
Baidu, Inc. | | | | | | | | | | | | |
2.25%, 11/28/17 | | | | | 440,000 | | | | | | 438,064 | |
Hutchison Whampoa International, (12) (II) Ltd. | | | | | | | | | | | | |
2.00%, 11/08/17 144A | | | | | 370,000 | | | | | | 366,101 | |
IPIC GMTN, Ltd. | | | | | | | | | | | | |
3.13%, 11/15/15 144AD | | | | �� | 330,000 | | | | | | 342,787 | |
Petrobras International Finance Co. | | | | | | | | | | | | |
3.88%, 01/27/16 | | | | | 590,000 | | | | | | 610,333 | |
Seagate HDD Cayman | | | | | | | | | | | | |
3.75%, 11/15/18 144A | | | | | 985,000 | | | | | | 998,544 | |
Trafford Centre Finance, Ltd. | | | | | | | | | | | | |
0.72%, 07/28/15(U)† | | | | | 48,217 | | | | | | 78,814 | |
XLIT, Ltd. | | | | | | | | | | | | |
2.30%, 12/15/18 | | | | | 400,000 | | | | | | 393,332 | |
| | | | | | | | | | | | |
| | | | | | | | | | | 3,227,975 | |
| | | | | | | | | | | | |
Chile — 0.6% | |
Banco del Estado de Chile | | | | | | | | | | | | |
2.00%, 11/09/17 144A | | | | | 1,100,000 | | | | | | 1,083,218 | |
Banco Santander Chile | | | | | | | | | | | | |
1.84%, 01/19/16 144A†@ | | | | | 2,500,000 | | | | | | 2,510,611 | |
Celulosa Arauco y Constitucion SA | | | | | | | | | | | | |
5.63%, 04/20/15 | | | | | 1,260,000 | | | | | | 1,329,077 | |
| | | | | | | | | | | | |
| | | | | | | | | | | 4,922,906 | |
| | | | | | | | | | | | |
Colombia — 0.0% | |
Bancolombia SA | | | | | | | | | | | | |
4.25%, 01/12/16D | | | | | 210,000 | | | | | | 218,925 | |
| | | | | | | | | | | | |
Costa Rica — 0.0% | |
Banco Nacional de Costa Rica | | | | | | | | | | | | |
4.88%, 11/01/18 144A | | | | | 500,000 | | | | | | 491,250 | |
| | | | | | | | | | | | |
France — 1.8% | |
Banque Federative du Credit Mutuel SA | | | | | | | | | | | | |
1.09%, 10/28/16 144A† | | | | | 1,825,000 | | | | | | 1,831,837 | |
Banque PSA Finance SA | | | | | | | | | | | | |
2.14%, 04/04/14 144A†@ | | | | | 800,000 | | | | | | 799,720 | |
BNP Paribas SA | | | | | | | | | | | | |
0.83%, 12/12/16† | | | | | 1,280,000 | | | | | | 1,282,799 | |
| | | | | | | | | | | | |
| | | Par | | | Value | |
1.25%, 12/12/16 | | | | $ | 2,500,000 | | | | | $ | 2,492,134 | |
BPCE SA | | | | | | | | | | | | |
1.99%, 02/07/14 144A† | | | | | 2,300,000 | | | | | | 2,303,503 | |
1.49%, 04/25/16† | | | | | 680,000 | | | | | | 689,240 | |
Credit Agricole SA | | | | | | | | | | | | |
1.40%, 04/15/16 144A† | | | | | 960,000 | | | | | | 972,485 | |
Dexia Credit Local SA | | | | | | | | | | | | |
0.62%, 11/07/16 144A†@ | | | | | 3,200,000 | | | | | | 3,202,929 | |
RCI Banque SA | | | | | | | | | | | | |
1.12%, 04/07/15(E)† | | | | | 900,000 | | | | | | 1,228,780 | |
| | | | | | | | | | | | |
| | | | | | | | | | | 14,803,427 | |
| | | | | | | | | | | | |
Germany — 0.5% | |
Deutsche Bank AG | | | | | | | | | | | | |
6.00%, 09/01/17D | | | | | 1,070,000 | | | | | | 1,223,144 | |
State of North Rhine-Westphalia | | | | | | | | | | | | |
1.63%, 09/17/14 | | | | | 3,100,000 | | | | | | 3,128,225 | |
| | | | | | | | | | | | |
| | | | | | | | | | | 4,351,369 | |
| | | | | | | | | | | | |
Italy — 0.3% | |
Intesa Sanpaolo SpA | | | | | | | | | | | | |
2.64%, 02/24/14 144A†D | | | | | 2,300,000 | | | | | | 2,306,803 | |
| | | | | | | | | | | | |
Japan — 0.1% | |
Softbank Corporation | | | | | | | | | | | | |
4.50%, 04/15/20 144AD | | | | | 400,000 | | | | | | 392,000 | |
Sumitomo Mitsui Banking Corporation | | | | | | | | | | | | |
0.90%, 01/18/16 | | | | | 390,000 | | | | | | 389,453 | |
0.91%, 07/19/16†D | | | | | 290,000 | | | | | | 291,794 | |
| | | | | | | | | | | | |
| | | | | | | | | | | 1,073,247 | |
| | | | | | | | | | | | |
Luxembourg — 0.1% | |
ArcelorMittal | | | | | | | | | | | | |
4.25%, 08/05/15 | | | | | 600,000 | | | | | | 623,250 | |
| | | | | | | | | | | | |
Mexico — 1.4% | |
Grupo Idesa SA de CV | | | | | | | | | | | | |
7.88%, 12/18/20 144A | | | | | 700,000 | | | | | | 710,500 | |
Kansas City Southern de Mexico SA de CV | | | | | | | | | | | | |
0.94%, 10/28/16† | | | | | 1,000,000 | | | | | | 1,000,271 | |
2.35%, 05/15/20 | | | | | 510,000 | | | | | | 475,820 | |
Mexican Bonos | | | | | | | | | | | | |
5.00%, 06/15/17(M) | | | | | 21,500,000 | | | | | | 1,661,630 | |
Mexico Cetes | | | | | | | | | | | | |
0.00%, 02/06/14(M)W† | | | | | 364,000,000 | | | | | | 2,778,850 | |
0.00%, 02/20/14(M)W† | | | | | 390,000,000 | | | | | | 2,973,696 | |
Petroleos Mexicanos | | | | | | | | | | | | |
2.27%, 07/18/18†D | | | | | 820,000 | | | | | | 846,650 | |
5.50%, 01/21/21 | | | | | 1,400,000 | | | | | | 1,512,000 | |
| | | | | | | | | | | | |
| | | | | | | | | | | 11,959,417 | |
| | | | | | | | | | | | |
Netherlands — 0.5% | |
ABN AMRO Bank NV | | | | | | | | | | | | |
1.04%, 10/28/16 144A† | | | | | 600,000 | | | | | | 601,080 | |
Achmea Hypotheekbank NV | | | | | | | | | | | | |
3.20%, 11/03/14 144A | | | | | 121,000 | | | | | | 123,859 | |
ING Bank NV | | | | | | | | | | | | |
3.75%, 03/07/17 144A | | | | | 900,000 | | | | | | 948,610 | |
Volkswagen International Finance NV | | | | | | | | | | | | |
1.00%, 03/21/14 144A† | | | | | 100,000 | | | | | | 100,174 | |
| | | | |
| | See Notes to Financial Statements. | | 97 |
LOW-DURATION BOND FUND
SCHEDULE OF INVESTMENTS (Continued)
| | | | | | | | | | | | |
| | | Par | | | Value | |
0.86%, 04/01/14 144A† | | | | $ | 1,200,000 | | | | | $ | 1,201,371 | |
1.13%, 11/18/16 144A | | | | | 1,220,000 | | | | | | 1,217,780 | |
| | | | | | | | | | | | |
| | | | | | | | | | | 4,192,874 | |
| | | | | | | | | | | | |
New Zealand — 0.1% | |
ANZ New Zealand International, Ltd. | | | | | | | | | | | | |
1.13%, 03/24/16 144A | | | | | 580,000 | | | | | | 579,202 | |
| | | | | | | | | | | | |
Norway — 0.7% | |
Nordea Eiendomskreditt AS | | | | | | | | | | | | |
2.13%, 09/22/17 144A | | | | | 1,250,000 | | | | | | 1,283,339 | |
SpareBank 1 Boligkreditt AS | | | | | | | | | | | | |
2.63%, 05/26/17 144A | | | | | 1,000,000 | | | | | | 1,041,510 | |
Statoil ASA | | | | | | | | | | | | |
0.70%, 11/08/18† | | | | | 3,300,000 | | | | | | 3,319,681 | |
| | | | | | | | | | | | |
| | | | | | | | | | | 5,644,530 | |
| | | | | | | | | | | | |
Panama — 0.0% | |
Carnival Corporation | | | | | | | | | | | | |
1.20%, 02/05/16 | | | | | 310,000 | | | | | | 309,302 | |
| | | | | | | | | | | | |
Peru — 0.1% | |
BBVA Banco Continental SA | | | | | | | | | | | | |
2.25%, 07/29/16 144AD | | | | | 500,000 | | | | | | 500,000 | |
| | | | | | | | | | | | |
Qatar — 0.1% | |
Qatar Government International Bond | | | | | | | | | | | | |
3.13%, 01/20/17 144AD | | | | | 580,000 | | | | | | 609,000 | |
| | | | | | | | | | | | |
Singapore — 0.1% | |
Oversea-Chinese Banking Corporation, Ltd. | | | | | | | | | | | | |
1.63%, 03/13/15 144A | | | | | 500,000 | | | | | | 507,017 | |
| | | | | | | | | | | | |
Slovenia — 0.1% | |
Slovenia Government Bond | | | | | | | | | | | | |
4.38%, 04/02/14(E) | | | | | 450,000 | | | | | | 623,247 | |
| | | | | | | | | | | | |
South Korea — 0.5% | |
Export-Import Bank of Korea | | | | | | | | | | | | |
1.09%, 09/17/16† | | | | | 800,000 | | | | | | 803,667 | |
Hyundai Capital Services, Inc. | | | | | | | | | | | | |
4.38%, 07/27/16 144A | | | | | 2,900,000 | | | | | | 3,087,244 | |
| | | | | | | | | | | | |
| | | | | | | | | | | 3,890,911 | |
| | | | | | | | | | | | |
Sweden — 0.5% | |
Nordea Bank AB | | | | | | | | | | | | |
1.14%, 01/14/14 144A†D | | | | | 2,900,000 | | | | | | 2,900,971 | |
0.88%, 05/13/16 144A | | | | | 1,320,000 | | | | | | 1,314,199 | |
| | | | | | | | | | | | |
| | | | | | | | | | | 4,215,170 | |
| | | | | | | | | | | | |
United Kingdom — 0.3% | |
BP Capital Markets PLC | | | | | | | | | | | | |
0.75%, 05/10/18† | | | | | 210,000 | | | | | | 210,052 | |
HSBC Bank PLC | | | | | | | | | | | | |
0.88%, 05/15/18 144A† | | | | | 1,190,000 | | | | | | 1,193,858 | |
Jaguar Land Rover Automotive PLC | | | | | | | | | | | | |
4.13%, 12/15/18 144A | | | | | 1,200,000 | | | | | | 1,213,500 | |
| | | | | | | | | | | | |
| | | | | | | | | | | 2,617,410 | |
| | | | | | | | | | | | |
Virgin Islands (British) — 0.6% | |
CNOOC Finance 2013, Ltd. | | | | | | | | | | | | |
1.13%, 05/09/16 | | | | | 4,800,000 | | | | | | 4,785,082 | |
| | | | | | | | | | | | |
| | | Par | | | Value | |
TSMC Global, Ltd. | | | | | | | | | | | | |
1.63%, 04/03/18 144A | | | | $ | 370,000 | | | | | $ | 355,250 | |
| | | | | | | | | | | | |
| | | | | | | | | | | 5,140,332 | |
| | | | | | | | | | | | |
Total Foreign Bonds
(Cost $88,294,739) | | | | | | | | | | | 88,315,066 | |
| | | | | | | | | | | | |
LOAN AGREEMENTS — 0.1% | |
Activision Blizzard, Inc. Term B Loan | | | | | | | | | | | | |
0.00%, 10/11/20 S | | | | | 850,000 | | | | | | 854,879 | |
H.J. Heinz Co. Bank Loan | | | | | | | | | | | | |
0.01%,06/05/20W† | | | | | 208,950 | | | | | | 210,404 | |
| | | | | | | | | | | | |
Total Loan Agreements
(Cost $1,064,854) | | | | | | | | | | | 1,065,283 | |
| | | | | | | | | | | | |
MORTGAGE-BACKED SECURITIES — 20.7% | |
Adjustable Rate Mortgage Trust | | | | | | | | | | | | |
3.73%, 03/25/37† | | | | | 1,853,512 | | | | | | 1,397,363 | |
Alternative Loan Trust | | | | | | | | | | | | |
6.00%, 10/25/32 | | | | | 21,340 | | | | | | 20,788 | |
American Home Mortgage Investment Trust | | | | | | | | | | | | |
2.17%, 10/25/34† | | | | | 437,202 | | | | | | 430,243 | |
American Home Mortgage Assets Trust | | | | | | | | | | | | |
1.06%, 11/25/46† | | | | | 967,595 | | | | | | 491,088 | |
Arran Residential Mortgages Funding PLC | | | | | | | | | | | | |
1.69%, 11/19/47 144A† | | | | | 1,499,410 | | | | | | 1,521,019 | |
Banc of America Commercial Mortgage Trust | | | | | | | | | | | | |
5.45%, 01/15/49 | | | | | 371,989 | | | | | | 371,623 | |
5.65%, 06/10/49† | | | | | 876,215 | | | | | | 954,138 | |
5.80%, 06/10/49† | | | | | 80,873 | | | | | | 80,794 | |
Banc of America Funding 2006 J Trust | | | | | | | | | | | | |
3.69%, 01/20/47† | | | | | 553,533 | | | | | | 442,506 | |
Banc of America Mortgage Trust | | | | | | | | | | | | |
6.50%, 10/25/31 | | | | | 77,818 | | | | | | 81,742 | |
Bear Stearns Adjustable Rate Mortgage Trust | | | | | | | | | | | | |
2.79%, 01/25/34† | | | | | 308,370 | | | | | | 305,791 | |
3.17%, 07/25/34† | | | | | 446,099 | | | | | | 442,229 | |
2.80%, 10/25/34† | | | | | 113,694 | | | | | | 112,111 | |
2.60%, 03/25/35† | | | | | 746,879 | | | | | | 751,860 | |
Bear Stearns Alt-A Trust | | | | | | | | | | | | |
0.90%, 11/25/34† | | | | | 244,490 | | | | | | 239,330 | |
Bear Stearns Commercial Mortgage Securities Trust | | | | | | | | | | | | |
5.32%, 02/11/44 | | | | | 1,206,188 | | | | | | 1,320,868 | |
5.74%, 06/11/50 | | | | | 559,158 | | | | | | 573,964 | |
CD 2007-CD4 Commercial Mortgage Trust | | | | | | | | | | | | |
5.37%, 12/11/49† | | | | | 395,000 | | | | | | 407,939 | |
COMM 2006-C8 Mortgage Trust | | | | | | | | | | | | |
5.31%, 12/10/46 | | | | | 1,160,000 | | | | | | 1,263,865 | |
COMM 2010-C1 Mortgage Trust | | | | | | | | | | | | |
3.16%, 07/10/46 144A | | | | | 1,232,239 | | | | | | 1,268,928 | |
COMM 2012-CCRE2 Mortgage Trust | | | | | | | | | | | | |
0.00%, 08/15/45 IOW† | | | | | 2,059,562 | | | | | | 227,320 | |
| | | | |
| 98 | | See Notes to Financial Statements. | | |
| | | | | | | | | | | | |
| | | Par | | | Value | |
COMM 2013-CCRE11 Mortgage Trust | | | | | | | | | | | | |
0.00%, 10/10/46W† | | | | $ | 5,997,651 | | | | | $ | 482,469 | |
COMM 2013-CCRE12 Mortgage Trust | | | | | | | | | | | | |
2.90%, 10/10/46 | | | | | 2,055,000 | | | | | | 2,102,480 | |
COMM 2013-CCRE7 Mortgage Trust | | | | | | | | | | | | |
0.00%, 03/10/46 IOW† | | | | | 5,870,394 | | | | | | 520,043 | |
COMM 2013-SFS Mortgage Trust | | | | | | | | | | | | |
1.87%, 04/12/35 144A | | | | | 733,307 | | | | | | 703,401 | |
Commercial Mortgage Pass Through Certificates | | | | | | | | | | | | |
1.68%, 10/13/28 144A† | | | | | 1,335,000 | | | | | | 1,339,546 | |
Commercial Mortgage Trust | | | | | | | | | | | | |
5.48%, 03/10/39 | | | | | 760,000 | | | | | | 808,718 | |
5.74%, 12/10/49 | | | | | 2,185,387 | | | | | | 2,440,559 | |
Countrywide Home Loan Mortgage Pass-Through Trust | | | | | | | | | | | | |
0.70%, 02/25/35† | | | | | 185,115 | | | | | | 173,545 | |
Credit Suisse Commercial Mortgage Trust | | | | | | | | | | | | |
5.76%, 09/15/39† | | | | | 1,155,000 | | | | | | 1,164,660 | |
5.62%, 09/15/40† | | | | | 599,544 | | | | | | 641,849 | |
6.03%, 02/15/41† | | | | | 560,300 | | | | | | 563,117 | |
Crusade Global Trust | | | | | | | | | | | | |
0.30%, 11/15/37† | | | | | 1,779,765 | | | | | | 1,750,522 | |
CSMC Series 2011-1R | | | | | | | | | | | | |
1.17%, 02/27/47 144A† | | | | | 716,296 | | | | | | 714,012 | |
CSMC Trust 13-IVR3 | | | | | | | | | | | | |
1.55%, 05/25/43 144A† | | | | | 645,433 | | | | | | 593,024 | |
CSMC Trust 2013-IVR2 | | | | | | | | | | | | |
1.55%, 04/25/43 144A† | | | | | 1,278,569 | | | | | | 1,226,361 | |
DBRR 2011-C32 Trust | | | | | | | | | | | | |
5.73%, 06/17/49 144A† | | | | | 1,805,000 | | | | | | 1,967,365 | |
DBRR 2012- EZ1 Trust | | | | | | | | | | | | |
0.95%, 09/25/45 144A | | | | | 606,964 | | | | | | 606,992 | |
Del Coronado Trust 2013-DEL | | | | | | | | | | | | |
0.97%, 03/15/26 144A† | | | | | 530,000 | | | | | | 527,775 | |
Deutsche Alt-B Securities Mortgage Loan Trust | | | | | | | | | | | | |
5.87%, 10/25/36 STEP | | | | | 495,687 | | | | | | 365,355 | |
5.89%, 10/25/36 STEP | | | | | 495,687 | | | | | | 365,693 | |
Fannie Mae Connecticut Avenue Securities | | | | | | | | | | | | |
2.16%, 10/25/23† | | | | | 555,849 | | | | | | 558,386 | |
Fannie Mae Grantor Trust | | | | | | | | | | | | |
3.31%, 02/25/32 | | | | | 97,931 | | | | | | 100,472 | |
FDIC 2010-R1 Trust | | | | | | | | | | | | |
2.18%, 05/25/50 144A | | | | | 848,752 | | | | | | 846,835 | |
FDIC Guaranteed Notes Trust | | | | | | | | | | | | |
0.72%, 12/04/20 144A† | | | | | 1,741,097 | | | | | | 1,751,868 | |
3.25%, 04/25/38 144A | | | | | 482,644 | | | | | | 498,629 | |
0.72%, 02/25/48 144A† | | | | | 263,835 | | | | | | 264,452 | |
Federal Home Loan Mortgage Corporation | | | | | | | | | | | | |
5.00%, 01/01/19 | | | | | 183,457 | | | | | | 194,311 | |
5.00%, 02/01/19 | | | | | 218,609 | | | | | | 231,557 | |
5.00%, 12/01/19 | | | | | 403,006 | | | | | | 426,803 | |
5.50%, 05/01/22 | | | | | 1,319,734 | | | | | | 1,415,386 | |
2.48%, 07/01/27† | | | | | 13,193 | | | | | | 13,880 | |
2.38%, 11/01/31† | | | | | 61,541 | | | | | | 65,492 | |
2.38%, 04/01/32† | | | | | 10,379 | | | | | | 11,009 | |
| | | | | | | | | | | | |
| | | Par | | | Value | |
2.17%, 06/01/33† | | | | $ | 992,421 | | | | | $ | 1,045,093 | |
2.38%, 10/01/34† | | | | | 237,073 | | | | | | 252,070 | |
2.50%, 08/01/35† | | | | | 845,081 | | | | | | 902,032 | |
2.01%, 09/01/35† | | | | | 470,329 | | | | | | 495,465 | |
2.27%, 10/01/35† | | | | | 720,768 | | | | | | 769,406 | |
2.41%, 04/01/36† | | | | | 595,450 | | | | | | 634,730 | |
5.50%, 05/01/38 | | | | | 797,305 | | | | | | 868,962 | |
5.50%, 02/01/40 | | | | | 247,004 | | | | | | 269,204 | |
Federal Home Loan Mortgage Corporation REMIC | | | | | | | | | | | | |
4.00%, 08/15/25 STEP | | | | | 452,168 | | | | | | 472,331 | |
3.50%, 08/15/41 | | | | | 3,388,757 | | | | | | 3,525,788 | |
4.50%, 09/15/41 | | | | | 1,054,888 | | | | | | 1,126,673 | |
4.50%, 11/15/41 | | | | | 1,148,139 | | | | | | 1,243,147 | |
Federal National Mortgage Association | | | | | | | | | | | | |
5.00%, 01/01/18 | | | | | 365,850 | | | | | | 389,710 | |
5.00%, 07/01/19 | | | | | 91,934 | | | | | | 98,439 | |
5.00%, 05/01/21 | | | | | 815,929 | | | | | | 873,522 | |
5.00%, 11/01/21 | | | | | 342,268 | | | | | | 366,490 | |
2.29%, 12/01/24 CONV† | | | | | 19,701 | | | | | | 19,981 | |
9.00%, 05/01/25 | | | | | 9,243 | | | | | | 9,282 | |
9.00%, 07/01/25 | | | | | 23,485 | | | | | | 23,583 | |
3.00%, 01/01/26 TBA | | | | | 8,300,000 | | | | | | 8,470,215 | |
3.50%, 01/01/26 TBA | | | | | 4,600,000 | | | | | | 4,810,414 | |
2.50%, 12/01/27 | | | | | 3,018,749 | | | | | | 2,991,097 | |
2.50%, 01/07/28 TBA | | | | | 2,385,000 | | | | | | 2,360,405 | |
2.50%, 02/01/28 | | | | | 359,220 | | | | | | 356,217 | |
2.50%, 03/01/28 | | | | | 277,850 | | | | | | 275,527 | |
2.50%, 04/01/28 | | | | | 2,662,551 | | | | | | 2,639,179 | |
2.50%, 05/01/28 | | | | | 3,085,125 | | | | | | 3,057,889 | |
2.34%, 09/01/31† | | | | | 87,535 | | | | | | 92,491 | |
1.46%, 08/01/32† | | | | | 831,170 | | | | | | 863,703 | |
5.50%, 10/01/32‡‡ | | | | | 441,357 | | | | | | 485,793 | |
2.29%, 12/01/32† | | | | | 505,640 | | | | | | 532,350 | |
2.04%, 04/01/33† | | | | | 170,455 | | | | | | 182,039 | |
2.16%, 06/01/33† | | | | | 152,404 | | | | | | 161,334 | |
2.54%, 06/01/33† | | | | | 63,855 | | | | | | 67,820 | |
2.55%, 10/01/33† | | | | | 308,522 | | | | | | 325,995 | |
2.35%, 12/01/33† | | | | | 107,750 | | | | | | 113,311 | |
2.95%, 03/01/34† | | | | | 98,743 | | | | | | 99,521 | |
2.06%, 09/01/34† | | | | | 194,226 | | | | | | 205,331 | |
2.07%, 09/01/34† | | | | | 249,777 | | | | | | 263,924 | |
1.94%, 10/01/34† | | | | | 268,405 | | | | | | 281,275 | |
2.11%, 10/01/34† | | | | | 285,633 | | | | | | 300,831 | |
2.50%, 02/01/35† | | | | | 337,767 | | | | | | 358,907 | |
2.33%, 09/01/35† | | | | | 618,156 | | | | | | 654,056 | |
2.53%, 12/01/35† | | | | | 29,006 | | | | | | 30,556 | |
4.00%, 02/01/41 TBA | | | | | 2,000,000 | | | | | | 2,052,500 | |
1.34%, 08/01/42† | | | | | 528,584 | | | | | | 540,187 | |
2.50%, 10/01/42 | | | | | 42,461 | | | | | | 38,476 | |
2.50%, 01/01/43 TBA | | | | | 1,000,000 | | | | | | 904,922 | |
2.50%, 02/01/43 | | | | | 1,956,130 | | | | | | 1,772,585 | |
1.34%, 07/01/44† | | | | | 377,515 | | | | | | 383,810 | |
1.34%, 10/01/44† | | | | | 278,290 | | | | | | 282,809 | |
2.00%, 01/16/46 TBA | | | | | 1,150,000 | | | | | | 1,107,414 | |
Federal National Mortgage Association REMIC | | | | | | | | | | | | |
4.00%, 11/25/19 | | | | | 96,454 | | | | | | 101,269 | |
4.00%, 06/25/26 STEP | | | | | 801,556 | | | | | | 844,400 | |
0.76%, 05/25/30† | | | | | 26,750 | | | | | | 26,752 | |
0.81%, 05/25/30† | | | | | 21,151 | | | | | | 21,151 | |
0.71%, 09/25/41† | | | | | 4,293,954 | | | | | | 4,337,083 | |
| | | | |
| | See Notes to Financial Statements. | | 99 |
LOW-DURATION BOND FUND
SCHEDULE OF INVESTMENTS (Continued)
| | | | | | | | | | | | |
| | | Par | | | Value | |
FHLMC Multifamily Structured Pass-Through Certificates | | | | | | | | | | | | |
3.61%, 06/25/14 | | | | $ | 302,059 | | | | | $ | 303,910 | |
0.00%, 05/25/19 IOW† | | | | | 5,310,755 | | | | | | 427,925 | |
FHLMC Multifamily VRD Certificates | | | | | | | | | | | | |
5.50%, 08/15/51 | | | | | 3,000,000 | | | | | | 3,320,835 | |
FHLMC Structured Pass-Through Securities | | | | | | | | | | | | |
1.16%, 05/25/43† | | | | | 867,971 | | | | | | 888,410 | |
1.54%, 07/25/44† | | | | | 1,294,981 | | | | | | 1,317,467 | |
First Horizon Alternative Mortgage Securities Trust | | | | | | | | | | | | |
2.21%, 06/25/34† | | | | | 493,323 | | | | | | 477,257 | |
GE Capital Commercial Mortgage Corporation | | | | | | | | | | | | |
5.48%, 12/10/49† | | | | | 1,016,529 | | | | | | 1,110,235 | |
GMAC Commercial Mortgage Securities, Inc. | | | | | | | | | | | | |
5.23%, 11/10/45† | | | | | 1,387,367 | | | | | | 1,483,027 | |
Government National Mortgage Association | | | | | | | | | | | | |
1.63%, 06/20/17† | | | | | 4,732 | | | | | | 4,897 | |
2.00%, 06/20/21† | | | | | 3,519 | | | | | | 3,671 | |
1.63%, 03/20/22† | | | | | 215,352 | | | | | | 223,332 | |
1.63%, 01/20/23† | | | | | 30,786 | | | | | | 31,928 | |
1.63%, 05/20/24† | | | | | 61,126 | | | | | | 63,292 | |
1.63%, 07/20/25† | | | | | 77,577 | | | | | | 80,586 | |
1.63%, 08/20/25† | | | | | 20,231 | | | | | | 21,016 | |
1.63%, 11/20/25† | | | | | 64,517 | | | | | | 66,895 | |
1.63%, 12/20/26† | | | | | 88,839 | | | | | | 92,114 | |
1.63%, 07/20/27† | | | | | 2,047 | | | | | | 2,123 | |
1.63%, 10/20/27† | | | | | 34,117 | | | | | | 35,376 | |
8.50%, 10/15/29 | | | | | 25,136 | | | | | | 26,127 | |
0.77%, 02/16/30† | | | | | 115,178 | | | | | | 116,573 | |
8.50%, 03/15/30 | | | | | 899 | | | | | | 903 | |
8.50%, 04/15/30 | | | | | 5,299 | | | | | | 5,479 | |
8.50%, 05/15/30 | | | | | 105,013 | | | | | | 111,252 | |
1.63%, 05/20/30† | | | | | 54,390 | | | | | | 56,325 | |
8.50%, 06/15/30 | | | | | 6,409 | | | | | | 6,580 | |
8.50%, 07/15/30 | | | | | 55,535 | | | | | | 61,030 | |
8.50%, 08/15/30 | | | | | 15,758 | | | | | | 17,826 | |
8.50%, 09/15/30 | | | | | 1,758 | | | | | | 1,778 | |
8.50%, 11/15/30 | | | | | 8,698 | | | | | | 9,383 | |
8.50%, 12/15/30 | | | | | 30,120 | | | | | | 34,744 | |
8.50%, 02/15/31 | | | | | 17,644 | | | | | | 18,838 | |
5.16%, 06/16/31 | | | | | 153,765 | | | | | | 154,029 | |
0.47%, 03/20/37† | | | | | 948,465 | | | | | | 951,048 | |
0.47%, 05/20/37† | | | | | 410,627 | | | | | | 410,969 | |
Granite Mortgages 03-3 PLC | | | | | | | | | | | | |
0.60%, 01/20/44(E)† | | | | | 176,253 | | | | | | 241,466 | |
Granite Mortgages 04-1 PLC | | | | | | | | | | | | |
0.84%, 03/20/44(U)† | | | | | 410,663 | | | | | | 675,451 | |
Granite Mortgages 04-2 PLC | | | | | | | | | | | | |
0.84%, 06/20/44(U)† | | | | | 1,577,509 | | | | | | 2,593,871 | |
GreenPoint Mortgage Funding Trust | | | | | | | | | | | | |
0.34%, 01/25/37† | | | | | 761,297 | | | | | | 531,399 | |
0.43%, 11/25/45† | | | | | 206,561 | | | | | | 155,055 | |
GS Mortgage Securities Trust | | | | | | | | | | | | |
5.80%, 08/10/45† | | | | | 1,520,105 | | | | | | 1,668,775 | |
GSR Mortgage Loan Trust | | | | | | | | | | | | |
2.74%, 09/25/34† | | | | | 493,242 | | | | | | 461,745 | |
2.65%, 09/25/35† | | | | | 436,124 | | | | | | 433,178 | |
| | | | | | | | | | | | |
| | | Par | | | Value | |
HarborView Mortgage Loan Trust | | | | | | | | | | | | |
2.72%, 12/19/35† | | | | $ | 1,168,921 | | | | | $ | 1,023,743 | |
Hilton USA Trust 2013-HLF | | | | | | | | | | | | |
1.17%, 11/05/30 144A† | | | | | 1,220,000 | | | | | | 1,220,793 | |
Hilton USA Trust 2013-HLT | | | | | | | | | | | | |
4.41%, 11/05/30 144A | | | | | 825,000 | | | | | | 826,068 | |
5.22%, 11/05/30 144A† | | | | | 975,000 | | | | | | 977,280 | |
Holmes Master Issuer PLC | | | | | | | | | | | | |
1.59%, 10/15/54 144A† | | | | | 216,032 | | | | | | 216,996 | |
1.64%, 10/15/54 144A† | | | | | 680,931 | | | | | | 682,722 | |
1.79%, 10/15/54 144A† | | | | | 501,270 | | | | | | 506,026 | |
1.89%, 10/15/54 144A† | | | | | 1,472,409 | | | | | | 1,493,295 | |
2.27%, 10/15/54(U)† | | | | | 1,033,348 | | | | | | 1,734,827 | |
Holmes Master Issuer PLC | | | | | | | | | | | | |
1.64%, 10/15/54† | | | | | 414,972 | | | | | | 415,977 | |
1.79%, 10/15/54† | | | | | 700,789 | | | | | | 707,087 | |
IndyMac INDX Mortgage Loan Trust | | | | | | | | | | | | |
0.43%, 06/25/37† | | | | | 507,099 | | | | | | 160,282 | |
0.35%, 09/25/46† | | | | | 837,932 | | | | | | 694,423 | |
JP Morgan Chase Commercial Mortgage Securities Trust | | | | | | | | | | | | |
5.34%, 08/12/37† | | | | | 1,062,600 | | | | | | 1,104,888 | |
5.43%, 06/12/47† | | | | | 1,546,321 | | | | | | 1,695,396 | |
5.71%, 02/12/49† | | | | | 780,975 | | | | | | 873,856 | |
5.85%, 02/15/51† | | | | | 1,436,227 | | | | | | 1,612,043 | |
JP Morgan Mortgage Trust | | | | | | | | | | | | |
3.55%, 02/25/35† | | | | | 121,923 | | | | | | 122,392 | |
2.50%, 03/25/43 144A† | | | | | 585,048 | | | | | | 567,139 | |
JPMBB Commercial Mortgage Securities Trust | | | | | | | | | | | | |
0.00%, 01/15/47W† | | | | | 4,140,000 | | | | | | 287,145 | |
Lanark Master Issuer PLC | | | | | | | | | | | | |
1.64%, 12/22/54 144A† | | | | | 837,401 | | | | | | 849,543 | |
LB-UBS Commercial Mortgage Trust | | | | | | | | | | | | |
5.42%, 02/15/40 | | | | | 1,215,000 | | | | | | 1,338,996 | |
6.11%, 07/15/40† | | | | | 455,000 | | | | | | 498,867 | |
6.16%, 09/15/45† | | | | | 1,600,000 | | | | | | 1,828,792 | |
Luminent Mortgage Trust | | | | | | | | | | | | |
0.33%, 12/25/36† | | | | | 885,061 | | | | | | 653,799 | |
MASTR Adjustable Rate Mortgages Trust | | | | | | | | | | | | |
2.83%, 12/25/33† | | | | | 316,558 | | | | | | 313,177 | |
Merrill Lynch Floating Trust | | | | | | | | | | | | |
0.73%, 07/09/21 144A† | | | | | 124,945 | | | | | | 124,672 | |
Merrill Lynch Mortgage Investors Trust | | | | | | | | | | | | |
2.14%, 12/25/34† | | | | | 596,709 | | | | | | 609,547 | |
2.14%, 02/25/36† | | | | | 671,382 | | | | | | 637,188 | |
Morgan Stanley Bank of America Merrill Lynch Trust | | | | | | | | | | | | |
5.30%, 08/15/45 IO 144AW† | | | | | 9,681,806 | | | | | | 916,944 | |
0.00%, 11/15/46W† | | | | | 5,000,000 | | | | | | 401,060 | |
Morgan Stanley Capital I Trust | | | | | | | | | | | | |
5.41%, 03/15/44 | | | | | 1,090,000 | | | | | | 1,184,825 | |
Morgan Stanley Re-REMIC Trust | | | | | | | | | | | | |
2.50%, 03/23/51 144A | | | | | 227,688 | | | | | | 230,603 | |
1.00%, 03/27/51 144A | | | | | 482,743 | | | | | | 482,733 | |
Motel 6 Trust | | | | | | | | | | | | |
1.50%, 10/05/25 144A | | | | | 364,593 | | | | | | 359,755 | |
1.95%, 10/05/25 144A | | | | | 1,695,000 | | | | | | 1,674,839 | |
| | | | |
| 100 | | See Notes to Financial Statements. | | |
| | | | | | | | | | | | |
| | | Par | | | Value | |
National RMBS Trust | | | | | | | | | | | | |
3.72%, 06/20/44(A)† | | | | $ | 722,130 | | | | | $ | 654,423 | |
NCUA Guaranteed Notes Trust | | | | | | | | | | | | |
1.84%, 10/07/20 | | | | | 122,103 | | | | | | 123,105 | |
0.73%, 12/08/20† | | | | | 3,239,296 | | | | | | 3,258,732 | |
0.70%, 03/09/21 | | | | | 2,183,616 | | | | | | 2,186,712 | |
Opteum Mortgage Acceptance Corporation Trust | | | | | | | | | | | | |
0.44%, 11/25/35† | | | | | 69,246 | | | | | | 69,058 | |
Progress 2007-1G Trust | | | | | | | | | | | | |
0.38%, 08/19/38 144A† | | | | | 310,580 | | | | | | 308,028 | |
Provident Funding Mortgage Loan Trust | | | | | | | | | | | | |
2.57%, 04/25/34† | | | | | 698,295 | | | | | | 693,910 | |
RALI Series 2003-QS1 Trust | | | | | | | | | | | | |
0.56%, 01/25/33† | | | | | 88,327 | | | | | | 86,007 | |
RCMC LLC | | | | | | | | | | | | |
5.62%, 11/15/44 144A | | | | | 514,557 | | | | | | 515,028 | |
Residential Asset Securitization Trust | | | | | | | | | | | | |
0.46%, 05/25/35† | | | | | 81,930 | | | | | | 81,176 | |
RFMSI Series 2003-S9 Trust | | | | | | | | | | | | |
6.50%, 03/25/32 | | | | | 17,093 | | | | | | 17,924 | |
Sequoia Mortgage Trust | | | | | | | | | | | | |
2.87%, 01/25/42† | | | | | 852,470 | | | | | | 847,618 | |
3.50%, 04/25/42† | | | | | 790,280 | | | | | | 793,941 | |
1.45%, 02/25/43† | | | | | 871,917 | | | | | | 856,671 | |
1.55%, 04/25/43† | | | | | 849,622 | | | | | | 816,082 | |
SMHL Global Fund | | | | | | | | | | | | |
0.42%, 06/12/40(E)† | | | | | 390,112 | | | | | | 535,784 | |
Springleaf Mortgage Loan Trust | | | | | | | | | | | | |
2.22%, 10/25/57 144A† | | | | | 416,991 | | | | | | 424,799 | |
1.27%, 06/25/58 144A† | | | | | 1,181,433 | | | | | | 1,175,511 | |
1.57%, 12/25/59 144A† | | | | | 574,344 | | | | | | 572,083 | |
1.78%, 12/25/65 144A† | | | | | 571,840 | | | | | | 570,234 | |
STRIPs 2012-1, Ltd. | | | | | | | | | | | | |
1.50%, 12/25/44 144A | | | | | 535,408 | | | | | | 530,054 | |
Structured Adjustable Rate Mortgage Loan Trust | | | | | | | | | | | | |
2.48%, 08/25/34† | | | | | 809,966 | | | | | | 795,227 | |
0.46%, 09/25/34† | | | | | 154,770 | | | | | | 134,022 | |
Structured Agency Credit Risk Debt Notes | | | | | | | | | | | | |
1.62%, 11/25/23† | | | | | 935,571 | | | | | | 935,582 | |
Structured Asset Mortgage Investments II Trust | | | | | | | | | | | | |
2.02%, 10/19/34† | | | | | 387,862 | | | | | | 305,929 | |
0.42%, 07/19/35† | | | | | 136,090 | | | | | | 125,627 | |
0.44%, 02/25/36† | | | | | 675,762 | | | | | | 520,069 | |
Talisman-6 Finance PLC | | | | | | | | | | | | |
0.40%, 10/22/16(E)† | | | | | 736,762 | | | | | | 954,020 | |
TBW Mortgage Backed Trust | | | | | | | | | | | | |
6.01%, 07/25/37 STEP | | | | | 449,147 | | | | | | 332,533 | |
Titan Europe 2007-2, Ltd. | | | | | | | | | | | | |
0.39%, 04/23/17(E)† | | | | | 202,339 | | | | | | 276,967 | |
Torrens Trust | | | | | | | | | | | | |
3.56%, 04/12/44(A)† | | | | | 2,796,196 | | | | | | 2,496,710 | |
UBS-Barclays Commercial Mortgage Trust | | | | | | | | | | | | |
0.00%, 05/10/63 IO 144AW† | | | | | 6,517,350 | | | | | | 580,481 | |
Wachovia Bank Commercial
Mortgage Trust | | | | | | | | | | | | |
5.42%, 01/15/45† | | | | | 1,265,629 | | | | | | 1,349,238 | |
5.73%, 06/15/49† | | | | | 1,090,942 | | | | | | 1,203,826 | |
| | | | | | | | | | | | |
| | | Par | | | Value | |
Washington Mutual Mortgage Pass-Through Certificates | | | | | | | | | | | | |
2.41%, 02/25/37† | | | | $ | 617,789 | | | | | $ | 496,629 | |
4.47%, 05/25/37† | | | | | 754,560 | | | | | | 615,077 | |
2.28%, 07/25/37† | | | | | 1,761,196 | | | | | | 1,452,495 | |
1.54%, 06/25/42† | | | | | 22,941 | | | | | | 20,991 | |
0.47%, 01/25/45† | | | | | 775,425 | | | | | | 727,336 | |
1.12%, 06/25/46† | | | | | 1,298,720 | | | | | | 1,199,786 | |
0.88%, 01/25/47† | | | | | 731,928 | | | | | | 590,333 | |
0.98%, 05/25/47† | | | | | 544,387 | | | | | | 43,020 | |
Wells Fargo Mortgage-Backed Securities 2004-EE Trust | | | | | | | | | | | | |
2.61%, 12/25/34† | | | | | 580,598 | | | | | | 584,987 | |
WF-RBS Commercial Mortgage Trust | | | | | | | | | | | | |
0.00%, 08/15/45 IO 144AW† | | | | | 3,668,641 | | | | | | 429,690 | |
0.00%, 11/15/45 IO 144AW† | | | | | 6,269,252 | | | | | | 770,541 | |
| | | | | | | | | | | | |
Total Mortgage-Backed Securities
(Cost $176,938,198) | | | | | | 173,705,355 | |
| | | | | | | | | | | | |
MUNICIPAL BONDS — 0.8% | | | | |
Chicago Transit Authority, Revenue Bond, Series B | | | | | | | | | | | | |
6.90%, 12/01/40 | | | | | 1,300,000 | | | | | | 1,460,134 | |
Florida Hurricane Catastrophe Fund Finance Corporation, Series A, Revenue Bond | | | | | | | | | | | | |
1.30%, 07/01/16 | | | | | 720,000 | | | | | | 722,592 | |
Irvine Ranch Water District Joint Powers Agency, Revenue Bond, Escrowed to Maturity | | | | | | | | | | | | |
2.61%, 03/15/14 | | | | | 2,800,000 | | | | | | 2,812,992 | |
North Texas Higher Education Authority, Inc. Taxable Student Loan, Revenue Bond, Series 1 | | | | | | | | | | | | |
1.35%, 04/01/40† | | | | | 348,539 | | | | | | 354,203 | |
State of California, General Obligation | | | | | | | | | | | | |
5.10%, 08/01/14 | | | | | 40,000 | | | | | | 41,082 | |
State of Illinois, General Obligation | | | | | | | | | | | | |
4.07%, 01/01/14 | | | | | 830,000 | | | | | | 830,000 | |
| | | | | | | | | | | | |
Total Municipal Bonds
(Cost $6,038,920) | | | | | | 6,221,003 | |
| | | | | | | | | | | | |
| | | Notional
Amount | | | | | | |
PURCHASED OPTIONS — 0.1% | | | | | | | |
Put Swaptions — 0.1% | | | | | | | | | | | | |
3-Month LIBOR, Strike Price 3.45%, Expires 09/21/15 (RBS)
(Cost $151,446) | | | | $ | 1,900,000 | | | | | | 306,971 | |
| | | | | | | | | | | | |
| | | Par | | | | | | |
U.S. TREASURY OBLIGATIONS — 26.3% | |
U.S. Treasury Bills | | | | | | | | | | | | |
0.04%, 01/02/14 | | | | | 316,000 | | | | | | 316,000 | |
0.13%, 05/29/14‡‡ | | | | | 698,000 | | | | | | 697,847 | |
0.13%, 11/13/14D | | | | | 500,000 | | | | | | 499,579 | |
| | | | | | | | | | | | |
| | | | | | | | | | | 1,513,426 | |
| | | | | | | | | | | | |
| | | | |
| | See Notes to Financial Statements. | | 101 |
LOW-DURATION BOND FUND
SCHEDULE OF INVESTMENTS (Continued)
| | | | | | | | | | | | |
| | | Par | | | | | | |
U.S. Treasury Inflationary Index Bonds | | | | | | | | | | | | |
1.13%, 01/15/21 | | | | $ | 1,700,000 | | | | | $ | 1,909,496 | |
0.13%, 01/15/22D | | | | | 11,000,000 | | | | | | 10,921,332 | |
0.13%, 07/15/22 | | | | | 3,700,000 | | | | | | 3,603,256 | |
0.13%, 01/15/23 | | | | | 1,300,000 | | | | | | 1,243,517 | |
| | | | | | | | | | | | |
| | | | | | | | | | | 17,677,601 | |
| | | | | | | | | | | | |
U.S. Treasury Notes | | | | | | | | | | | | |
1.00%, 05/15/14D | | | | | 18,200,000 | | | | | | 18,261,498 | |
0.25%, 05/31/14D | | | | | 5,500,000 | | | | | | 5,503,548 | |
0.63%, 07/15/14 | | | | | 38,094,000 | | | | | | 38,202,644 | |
2.63%, 07/31/14 | | | | | 500,000 | | | | | | 507,304 | |
0.50%, 08/15/14D | | | | | 100,000 | | | | | | 100,242 | |
0.25%, 08/31/14D | | | | | 9,000,000 | | | | | | 9,008,262 | |
0.25%, 09/15/14 | | | | | 428,000 | | | | | | 428,393 | |
0.25%, 09/30/14D | | | | | 2,800,000 | | | | | | 2,802,461 | |
0.50%, 10/15/14 | | | | | 5,829,000 | | | | | | 5,845,852 | |
0.13%, 12/31/14D | | | | | 6,500,000 | | | | | | 6,498,479 | |
0.25%, 01/15/15 | | | | | 9,500,000 | | | | | | 9,508,531 | |
0.25%, 02/15/15D | | | | | 8,600,000 | | | | | | 8,606,717 | |
0.38%, 04/15/15D | | | | | 3,500,000 | | | | | | 3,508,271 | |
0.25%, 05/15/15D | | | | | 8,690,000 | | | | | | 8,696,109 | |
0.38%, 06/30/15D‡‡ | | | | | 840,000 | | | | | | 841,804 | |
0.38%, 08/31/15D | | | | | 9,721,000 | | | | | | 9,736,379 | |
0.25%, 10/15/15 | | | | | 2,700,000 | | | | | | 2,696,730 | |
0.25%, 12/15/15 | | | | | 640,000 | | | | | | 638,625 | |
0.38%, 01/15/16D | | | | | 3,500,000 | | | | | | 3,498,908 | |
0.38%, 02/15/16 | | | | | 6,700,000 | | | | | | 6,694,767 | |
2.13%, 02/29/16D | | | | | 4,772,000 | | | | | | 4,946,851 | |
0.38%, 03/15/16D | | | | | 7,165,000 | | | | | | 7,154,647 | |
0.25%, 05/15/16 | | | | | 9,860,000 | | | | | | 9,800,298 | |
0.50%, 06/15/16 | | | | | 4,140,000 | | | | | | 4,135,955 | |
1.50%, 06/30/16D | | | | | 2,300,000 | | | | | | 2,353,277 | |
0.63%, 07/15/16D | | | | | 18,250,000 | | | | | | 18,273,524 | |
0.63%, 08/15/16 | | | | | 8,000,000 | | | | | | 8,002,184 | |
1.00%, 09/30/16 | | | | | 2,500,000 | | | | | | 2,521,777 | |
1.75%, 10/31/20D | | | | | 2,700,000 | | | | | | 2,590,628 | |
| | | | | | | | | | | | |
| | | | | | | | | | | 201,364,665 | |
| | | | | | | | | | | | |
Total U.S. Treasury Obligations
(Cost $222,029,152) | | | | | | 220,555,692 | |
| | | | | | | | | | | | |
| | | Shares | | | | |
MONEY MARKET FUNDS — 13.8% | |
GuideStone Money Market Fund (GS4 Class)¥ | | | | | 35,793,992 | | | | | | 35,793,992 | |
Northern Institutional Liquid Assets Portfolio§ | | | | | 79,891,920 | | | | | | 79,891,920 | |
| | | | | | | | | | | | |
Total Money Market Funds
(Cost $115,685,912) | | | | | | 115,685,912 | |
| | | | | | | | | | | | |
| | | | | | | | | | | | |
| | | Par | | | Value | |
REPURCHASE AGREEMENTS — 4.7% | |
Barclays Capital, Inc. | | | | | | | | | | | | |
0.03% (dated 01/02/14, due 01/03/14, repurchase price $12,200,010, collateralized by U.S. Treasury Inflationary Index Bond, 0.125%, due 04/15/18, total market value | | | | | | | | | | | | |
$12,435,890) | | | | $ | 12,200,000 | | | | | $ | 12,200,000 | |
Citigroup Global Markets, Inc. | | | | | | | | | | | | |
0.05% (dated 12/31/13, due 01/02/14, repurchase price $15,800,044, collateralized by U.S. Treasury Note, 1.375%, due 07/31/18, total market value | | | | | | | | | | | | |
$16,104,603) | | | | | 15,800,000 | | | | | | 15,800,000 | |
0.03% (dated 01/02/14, due 01/03/14, repurchase price $11,100,009, collateralized by U.S. Treasury Note, 0.875%, due 07/31/19, total market value | | | | | | | | | | | | |
$11,325,465) | | | | | 11,100,000 | | | | | | 11,100,000 | |
| | | | | | | | | | | | |
Total Repurchase Agreements
(Cost $39,100,000) | | | | | | 39,100,000 | |
| | | | | | | | | | | | |
TOTAL INVESTMENTS — 114.0%
(Cost $958,081,131) | | | | | | 955,365,488 | |
| | | | | | | | | | | | |
| | | Number of
Contracts | | | | |
WRITTEN OPTIONS — (0.1)% | |
Call Options — 0.0% | |
10-Year U.S. Treasury Note Futures, Strike Price $127.50, Expires 03/20/14 | | | | | | | | | | | | |
(CITIG) | | | | | (116 | ) | | | | | (3,625 | ) |
| | | | | | | | | | | | |
Put Options — 0.0% | |
10-Year U.S. Treasury Note Futures, Strike Price $123.00, Expires 03/20/14 | | | | | | | | | | | | |
(BAR) | | | | | (116 | ) | | | | | (106,937 | ) |
90-Day Euro, Strike Price $97.38, Expires 03/14/14 | | | | | | | | | | | | |
(BAR) | | | | | (164 | ) | | | | | (82,000 | ) |
| | | | | | | | | | | | |
| | | | | | | | | | | (188,937 | ) |
| | | | | | | | | | | | |
| | | Notional
Amount | | | | |
Put Swaptions — (0.1)% | |
3-Month LIBOR, Strike Price 2.00%, Expires 03/31/14 | | | | | | | | | | | | |
(GSC) | | | | $ | (82,200,000 | ) | | | | | (151,865 | ) |
3-Month LIBOR, Strike Price 2.50%, Expires 09/21/15 | | | | | | | | | | | | |
(RBS) | | | | | (8,000,000 | ) | | | | | (318,233 | ) |
| | | | | | | | | | | | |
| | | | | | | | | | | (470,098 | ) |
| | | | | | | | | | | | |
Total Written Options | | | | | | | | | | | | |
(Premiums received $(404,812)) | | | | | | | | | | | (662,660 | ) |
| | | | | | | | | | | | |
| | | | |
| 102 | | See Notes to Financial Statements. | | |
| | | | | | | | | | | | |
| | | Par | | | Value | |
SECURITIES SOLD SHORT — (0.4)% | |
U.S. Treasury Notes | | | | | | | | | | | | |
1.50%, 08/31/18
(Cost $(3,091,420)) | | | | $ | (3,100,000 | ) | | | | $ | (3,084,500 | ) |
| | | | | | | | | | | | |
TBA SALE COMMITMENTS — (2.1)% | |
Federal Home Loan Mortgage Corporation | | | | | | | | | | | | |
5.50%, 01/01/39 TBA | | | | | (3,000,000 | ) | | | | | (3,276,562 | ) |
Federal National Mortgage Association | | | | | | | | | | | | |
2.50%, 01/17/28 TBA | | | | | (1,000,000 | ) | | | | | (989,688 | ) |
5.50%, 01/01/40 TBA | | | | | (7,000,000 | ) | | | | | (7,699,726 | ) |
3.50%, 01/01/41 TBA | | | | | (4,000,000 | ) | | | | | (3,973,438 | ) |
3.00%, 01/01/43 TBA | | | | | (2,000,000 | ) | | | | | (1,898,594 | ) |
| | | | | | | | | | | | |
Total TBA Sale Commitments
(Cost $(17,806,133)) | | | | | | (17,838,008 | ) |
| | | | | | | | | | | | |
Liabilities in Excess of
Other Assets — (11.4)% | | | | | | (95,516,079 | ) |
| | | | | | | | | | | | |
NET ASSETS — 100.0% | | | | | $ | 838,264,241 | |
| | | | | | | | | | | | |
| | | | |
| | See Notes to Financial Statements. | | 103 |
LOW-DURATION BOND FUND
SCHEDULE OF INVESTMENTS (Continued)
Swap agreements outstanding at December 31, 2013:
| | | | | | | | | | | | | | | | | | | | | | | | | | | | | | | | |
Reference Obligation | | Fixed
Deal
(Pay) Rate | | | Maturity
Date | | | Counterparty | | | Currency | | | Notional
Amount | | | Market Value | | | Upfront
Premiums
Paid/
(Received) | | | Unrealized
Appreciation
(Depreciation) | |
Credit Default Swaps on Corporate Issues — Buy Protection | |
Morgan Stanley ABS Capital I, | | | | | | | | | | | | | | | | | | | | | | | | | | | | | | | | |
7.02% due 12/27/33 | | | (1.39 | )% | | | 12/27/33 | | | | MSCS | | | | USD | | | $ | 267,461 | | | $ | 3,599 | | | $ | — | | | $ | 3,599 | |
Long Beach Mortgage Trust, | | | | | | | | | | | | | | | | | | | | | | | | | | | | | | | | |
6.72% due 02/25/34 | | | (1.19 | )% | | | 02/25/34 | | | | BAR | | | | USD | | | | 290,155 | | | | 131,215 | | | | — | | | | 131,215 | |
Specialty Underwriting & Residential Finance, | | | | | | | | | | | | | | | | | | | | | | | | | | | | | | | | |
6.62% due 02/25/35 | | | (1.24 | )% | | | 02/25/35 | | | | BAR | | | | USD | | | | 353,593 | | | | 217,872 | | | | — | | | | 217,872 | |
| | | | | | | | | | | | | | | | | | | | | | | | | | | | | | | | |
| | | | | | | | | | | | | | | | | | $ | 911,209 | | | $ | 352,686 | | | $ | — | | | $ | 352,686 | |
| | | | | | | | | | | | | | | | | | | | | | | | | | | | | | | | |
| | | | | | | | | | | | | | | | | | | | | | | | | | | | | | | | | | | | |
Reference Obligation | | Implied
Credit
Spread | | | Fixed
Deal
(Pay) Rate | | | Maturity
Date | | | Counterparty | | | Currency | | | Notional
Amount | | | Market Value | | | Upfront
Premiums
Paid/
(Received) | | | Unrealized
Appreciation
(Depreciation) | |
Credit Default Swaps on Corporate Issues — Sell Protection | |
Barclays Bank PLC, | | | | | | | | | | | | | | | | | | | | | | | | | | | | | | | | | | | | |
1.551% due 10/27/15 | | | 0.69 | % | | | 1.00 | % | | | 12/20/17 | | | | GSC | | | | EUR | | | $ | 1,200,000 | | | $ | 20,560 | | | $ | (39,370 | ) | | $ | 59,930 | |
| | | | | | | | | | | | | | | | | | | | | | | | | | | | | | | | | | | | |
| | | | | | | | | | | | | | | | | | | | | | | | | | | | | | | | |
Reference Obligation | | Fixed
Deal
(Pay) Rate | | | Maturity
Date | | | Counterparty | | | Currency | | | Notional
Amount | | | Market Value | | | Upfront
Premiums
Paid/
(Received) | | | Unrealized
Appreciation
(Depreciation) | |
Credit Default Swaps on Credit Indices — Buy Protection | |
Dow Jones iTraxx | | | (1.00 | )% | | | 06/20/17 | | | | CME | | | | EUR | | | $ | 1,100,000 | | | $ | (29,309 | ) | | $ | (2,971 | ) | | $ | (26,338 | ) |
Dow Jones CDX.NA.IG21
Index | | | (1.00 | )% | | | 12/20/18 | | | | CME | | | | USD | | | | 21,000,000 | | | | (385,456 | ) | | | (302,741 | ) | | | (82,715 | ) |
CMBX.NA.AAA.4
Index | | | (0.35 | )% | | | 02/17/51 | | | | GSC | | | | USD | | | | 5,618,680 | | | | 87,048 | | | | 770,184 | | | | (683,136 | ) |
| | | | | | | | | | | | | | | | | | | | | | | | | | | | | | | | |
| | | | | | | | | | | | | | | | | | $ | 27,718,680 | | | $ | (327,717 | ) | | $ | 464,472 | | | $ | (792,189 | ) |
| | | | | | | | | | | | | | | | | | | | | | | | | | | | | | | | |
| | | | |
| 104 | | See Notes to Financial Statements. | | |
| | | | | | | | | | | | | | | | | | | | | | | | | | | | | | | | |
Reference Obligation | | Fixed
Deal
(Pay) Rate | | | Maturity
Date | | | Counterparty | | | Currency | | | Notional
Amount | | | Market Value | | | Upfront
Premiums
Paid/
(Received) | | | Unrealized
Appreciation
(Depreciation) | |
Interest Rate Swaps | | | | | | | | | | | | | | | | | |
Brazil CETIP Interbank Deposit | | | 10.14 | % | | | 01/02/15 | | | | HKSB | | | | BRL | | | $ | 3,800,000 | | | $ | 45,514 | | | $ | 4,372 | | | $ | 41,142 | |
Brazil CETIP Interbank Deposit | | | 7.55 | % | | | 01/02/15 | | | | GSC | | | | BRL | | | | 3,800,000 | | | | (47,979 | ) | | | (5,204 | ) | | | (42,775 | ) |
Brazil CETIP Interbank Deposit | | | 8.08 | % | | | 01/02/15 | | | | HSBC | | | | BRL | | | | 3,200,000 | | | | (25,428 | ) | | | 5,571 | | | | (30,999 | ) |
Brazil CETIP Interbank Deposit | | | 8.27 | % | | | 01/02/15 | | | | MSCS | | | | BRL | | | | 2,500,000 | | | | (20,445 | ) | | | (3,103 | ) | | | (17,342 | ) |
Brazil CETIP Interbank Deposit | | | 8.56 | % | | | 01/02/15 | | | | UBS | | | | BRL | | | | 2,200,000 | | | | (14,143 | ) | | | 57 | | | | (14,200 | ) |
Brazil CETIP Interbank Deposit | | | 7.62 | % | | | 01/02/15 | | | | DEUT | | | | BRL | | | | 1,100,000 | | | | (13,337 | ) | | | (1,302 | ) | | | (12,035 | ) |
Brazil CETIP Interbank Deposit | | | 8.43 | % | | | 01/02/15 | | | | DEUT | | | | BRL | | | | 1,000,000 | | | | (4,378 | ) | | | 5,742 | | | | (10,120 | ) |
Brazil CETIP Interbank Deposit | | | 7.92 | % | | | 01/02/15 | | | | BAR | | | | BRL | | | | 600,000 | | | | (6,151 | ) | | | (42 | ) | | | (6,109 | ) |
Brazil CETIP Interbank Deposit | | | 9.93 | % | | | 01/02/15 | | | | UBS | | | | BRL | | | | 400,000 | | | | 3,972 | | | | 168 | | | | 3,804 | |
Brazil CETIP Interbank Deposit | | | 8.83 | % | | | 01/02/15 | | | | HSBC | | | | BRL | | | | 200,000 | | | | (134 | ) | | | 338 | | | | (472 | ) |
Brazil CETIP Interbank Deposit | | | 8.59 | % | | | 01/02/17 | | | | BAR | | | | BRL | | | | 15,800,000 | | | | (491,159 | ) | | | 20,725 | | | | (511,884 | ) |
Brazil CETIP Interbank Deposit | | | 8.50 | % | | | 01/02/17 | | | | CS | | | | BRL | | | | 2,700,000 | | | | (86,538 | ) | | | (1,718 | ) | | | (84,820 | ) |
Brazil CETIP Interbank Deposit | | | 8.94 | % | | | 01/02/17 | | | | CS | | | | BRL | | | | 2,400,000 | | | | (64,692 | ) | | | (1,047 | ) | | | (63,645 | ) |
Brazil CETIP Interbank Deposit | | | 8.90 | % | | | 01/02/17 | | | | UBS | | | | BRL | | | | 2,100,000 | | | | (57,450 | ) | | | (1,694 | ) | | | (55,756 | ) |
Brazil CETIP Interbank Deposit | | | 8.60 | % | | | 01/02/17 | | | | DEUT | | | | BRL | | | | 1,600,000 | | | | (49,438 | ) | | | 720 | | | | (50,158 | ) |
Brazil CETIP Interbank Deposit | | | 8.59 | % | | | 01/02/17 | | | | UBS | | | | BRL | | | | 1,200,000 | | | | (38,617 | ) | | | (1,098 | ) | | | (37,519 | ) |
Brazil CETIP Interbank Deposit | | | 8.49 | % | | | 01/02/17 | | | | BNP | | | | BRL | | | | 900,000 | | | | (27,960 | ) | | | — | | | | (27,960 | ) |
6-Month EURIBOR | | | 2.00 | % | | | 03/21/17 | | | | CME | | | | EUR | | | | 3,600,000 | | | | 255,828 | | | | 106,493 | | | | 149,335 | |
6-Month BBR BBSW Index | | | 5.50 | % | | | 12/15/17 | | | | BAR | | | | AUD | | | | 1,500,000 | | | | 100,738 | | | | (3,999 | ) | | | 104,737 | |
6-Month BBR BBSW Index | | | 5.50 | % | | | 12/15/17 | | | | DEUT | | | | AUD | | | | 1,000,000 | | | | 67,161 | | | | (2,372 | ) | | | 69,533 | |
6-Month BBR BBSW Index | | | 3.75 | % | | | 03/15/18 | | | | CME | | | | AUD | | | | 1,800,000 | | | | 14,471 | | | | 2,257 | | | | 12,214 | |
6-Month BBR BBSW Index | | | 3.75 | % | | | 12/11/18 | | | | CME | | | | AUD | | | | 3,600,000 | | | | 1,269 | | | | (8,057 | ) | | | 9,326 | |
3-Month LIBOR | | | 2.00 | % | | | 12/18/18 | | | | CME | | | | USD | | | | 47,100,000 | | | | 566,232 | | | | 678,672 | | | | (112,440 | ) |
MXN-TIIE-Banxico | | | 7.50 | % | | | 06/02/21 | | | | UBS | | | | MXN | | | | 300,000 | | | | 1,646 | | | | 759 | | | | 887 | |
6-Month BBR BBSW Index | | | 3.75 | % | | | 03/15/23 | | | | CME | | | | AUD | | | | 2,600,000 | | | | (128,125 | ) | | | (16,958 | ) | | | (111,167 | ) |
6-Month BBR BBSW Index | | | 4.25 | % | | | 03/15/23 | | | | CME | | | | AUD | | | | 200,000 | | | | (2,773 | ) | | | 1,093 | | | | (3,866 | ) |
6-Month BBR BBSW Index | | | 4.00 | % | | | 03/15/23 | | | | CME | | | | AUD | | | | 100,000 | | | | (3,157 | ) | | | (708 | ) | | | (2,449 | ) |
3-Month LIBOR | | | 2.65 | % | | | 07/31/23 | | | | CME | | | | USD | | | | 5,300,000 | | | | (105,521 | ) | | | — | | | | (105,521 | ) |
6-Month BBR BBSW Index | | | 4.25 | % | | | 12/11/23 | | | | CME | | | | AUD | | | | 1,300,000 | | | | (29,801 | ) | | | 8,852 | | | | (38,653 | ) |
6-Month EURIBOR | | | 2.25 | % | | | 03/19/24 | | | | CME | | | | EUR | | | | 800,000 | | | | (2,960 | ) | | | 10,771 | | | | (13,731 | ) |
3-Month LIBOR | | | 3.50 | % | | | 12/18/43 | | | | CME | | | | USD | | | | 20,400,000 | | | | 1,533,928 | | | | 1,147,411 | | | | 386,517 | |
| | | | | | | | | | | | | | | | | | | | | | | | | | | | | | | | |
| | | | | | | | | | | | | | | | | | $ | 135,100,000 | | | $ | 1,370,573 | | | $ | 1,946,699 | | | $ | (576,126 | ) |
| | | | | | | | | | | | | | | | | | | | | | | | | | | | | | | | |
Total Swap agreements outstanding at December 31, 2013 | | | $ | 164,929,889 | | | $ | 1,416,102 | | | $ | 2,371,801 | | | $ | (955,699 | ) |
| | | | | | | | | | | | | | | | | | | | | | | | | | | | | | | | |
| | | | |
| | See Notes to Financial Statements. | | 105 |
LOW-DURATION BOND FUND
SCHEDULE OF INVESTMENTS (Continued)
VALUATION HIERARCHY
The following is a summary of the inputs used, as of December 31, 2013, in valuing the Fund’s investments carried at fair value:
| | | | | | | | | | | | | | | | | | | | |
| | | Total
Value | | Level 1
Quoted Prices | | Level 2
Other Significant
Observable Inputs | | Level 3
Significant
Unobservable Inputs |
Assets: | | | | | | | | | | | | | | | | | | | | |
Investments in Securities: | | | | | | | | | | | | | | | | | | | | |
Agency Obligations | | | $ | 27,012,228 | | | | $ | — | | | | $ | 27,012,228 | | | | $ | — | |
Asset-Backed Securities | | | | 84,084,705 | | | | | — | | | | | 80,202,868 | | | | | 3,881,837 | |
Corporate Bonds | | | | 199,313,273 | | | | | — | | | | | 195,870,739 | | | | | 3,442,534 | |
Foreign Bonds: | | | | | | | | | | | | | | | | | | | | |
Australia | | | | 6,308,316 | | | | | — | | | | | 4,764,024 | | | | | 1,544,292 | |
Bermuda | | | | 1,119,183 | | | | | — | | | | | 1,119,183 | | | | | — | |
Brazil | | | | 2,119,440 | | | | | — | | | | | 2,119,440 | | | | | — | |
Canada | | | | 5,960,563 | | | | | — | | | | | 5,960,563 | | | | | — | |
Cayman Islands | | | | 3,227,975 | | | | | — | | | | | 3,227,975 | | | | | — | |
Chile | | | | 4,922,906 | | | | | — | | | | | 4,922,906 | | | | | — | |
Colombia | | | | 218,925 | | | | | — | | | | | 218,925 | | | | | — | |
Costa Rica | | | | 491,250 | | | | | — | | | | | 491,250 | | | | | — | |
France | | | | 14,803,427 | | | | | — | | | | | 14,803,427 | | | | | — | |
Germany | | | | 4,351,369 | | | | | — | | | | | 4,351,369 | | | | | — | |
Italy | | | | 2,306,803 | | | | | — | | | | | 2,306,803 | | | | | — | |
Japan | | | | 1,073,247 | | | | | — | | | | | 1,073,247 | | | | | — | |
Luxembourg | | | | 623,250 | | | | | — | | | | | 623,250 | | | | | — | |
Mexico | | | | 11,959,417 | | | | | — | | | | | 11,959,417 | | | | | — | |
Netherlands | | | | 4,192,874 | | | | | — | | | | | 4,192,874 | | | | | — | |
New Zealand | | | | 579,202 | | | | | — | | | | | 579,202 | | | | | — | |
Norway | | | | 5,644,530 | | | | | — | | | | | 5,644,530 | | | | | — | |
Panama | | | | 309,302 | | | | | — | | | | | 309,302 | | | | | — | |
Peru | | | | 500,000 | | | | | — | | | | | 500,000 | | | | | — | |
Qatar | | | | 609,000 | | | | | — | | | | | 609,000 | | | | | — | |
Singapore | | | | 507,017 | | | | | — | | | | | 507,017 | | | | | — | |
Slovenia | | | | 623,247 | | | | | — | | | | | 623,247 | | | | | — | |
South Korea | | | | 3,890,911 | | | | | — | | | | | 3,890,911 | | | | | — | |
Sweden | | | | 4,215,170 | | | | | — | | | | | 4,215,170 | | | | | — | |
United Kingdom | | | | 2,617,410 | | | | | — | | | | | 2,617,410 | | | | | — | |
Virgin Islands (British) | | | | 5,140,332 | | | | | — | | | | | 5,140,332 | | | | | — | |
Loan Agreements | | | | 1,065,283 | | | | | — | | | | | 1,065,283 | | | | | — | |
Money Market Funds | | | | 115,685,912 | | | | | 115,685,912 | | | | | — | | | | | — | |
Mortgage-Backed Securities | | | | 173,705,355 | | | | | — | | | | | 162,156,962 | | | | | 11,548,393 | |
Municipal Bonds | | | | 6,221,003 | | | | | — | | | | | 6,221,003 | | | | | — | |
Purchased Options | | | | 306,971 | | | | | — | | | | | 306,971 | | | | | — | |
Repurchase Agreements | | | | 39,100,000 | | | | | — | | | | | 39,100,000 | | | | | — | |
U.S. Treasury Obligations | | | | 220,555,692 | | | | | — | | | | | 220,555,692 | | | | | — | |
| | | | | | | | | | | | | | | | | | | | |
Total Assets - Investments in Securities | | | $ | 955,365,488 | | | | $ | 115,685,912 | | | | $ | 819,262,520 | | | | $ | 20,417,056 | |
| | | | | | | | | | | | | | | | | | | | |
| | | | |
Other Financial Instruments*** | | | | | | | | | | | | | | | | | | | | |
Forward Foreign Currency Contracts | | | $ | 133,675 | | | | $ | — | | | | $ | 133,675 | | | | $ | — | |
Futures Contracts | | | | 389,347 | | | | | 389,347 | | | | | — | | | | | — | |
Swap Agreements | | | | 1,416,102 | | | | | — | | | | | 1,416,102 | | | | | — | |
| | | | | | | | | | | | | | | | | | | | |
Total Assets - Other Financial Instruments | | | $ | 1,939,124 | | | | $ | 389,347 | | | | $ | 1,549,777 | | | | $ | — | |
| | | | | | | | | | | | | | | | | | | | |
| | | | |
| 106 | | See Notes to Financial Statements. | | |
| | | | | | | | | | | | | | | | | | | | |
| | | Total
Value | | Level 1
Quoted Prices | | Level 2
Other Significant
Observable Inputs | | Level 3
Significant
Unobservable Inputs |
Liabilities: | | | | | | | | | | | | | | | | | | | | |
Investments in Securities: | | | | | | | | | | | | | | | | | | | | |
Securities Sold Short | | | $ | (3,084,500 | ) | | | $ | — | | | | $ | (3,084,500 | ) | | | $ | — | |
TBA Sale Commitments | | | | (17,838,008 | ) | | | | — | | | | | (17,838,008 | ) | | | | — | |
Written Options | | | | (662,660 | ) | | | | (192,562 | ) | | | | (318,233 | ) | | | | (151,865 | ) |
| | | | | | | | | | | | | | | | | | | | |
Total Liabilities - Investments in Securities | | | $ | (21,585,168 | ) | | | $ | (192,562 | ) | | | $ | (21,240,741 | ) | | | $ | (151,865 | ) |
| | | | | | | | | | | | | | | | | | | | |
***Other financial instruments are derivative instruments not reflected in the Schedule of Investments, such as futures, forwards and swap contracts, which are valued at the unrealized appreciation (depreciation) on the investment. Details of these investments can be found in the Notes to Financial Statements.
There were no transfers between Level 1 and Level 2 during the year ended December 31, 2013.
The unobservable inputs used in the fair value measurement of the reporting entity’s asset-backed securities, corporate bonds, foreign bonds, mortgage-backed securities and written option are values based on evaluated quotations received from dealers who make markets in such securities. Significant increases (decreases) in those evaluated quotations would result in a significantly higher (lower) fair value measurement.
The following is a reconciliation of assets in which significant unobservable inputs (Level 3) were used in determining fair value:
| | | | | | | | | | | | | | | | | | | | | | | | | | | | | | |
| | | Total
Value | | Asset-Backed
Securities | | Corporate
Bonds | | Foreign
Bonds | | Mortgage-Backed
Securities | | Written
Option |
Balance, 12/31/12 | | | $ | 30,924,326 | | | | $ | 4,445,836 | | | | $ | 5,116,094 | | | | $ | 1,455,253 | | | | $ | 19,907,143 | | | | $ | — | |
Accrued discounts/premiums | | | | (41,772 | ) | | | | 228 | | | | | (35,030 | ) | | | | (87 | ) | | | | (6,883 | ) | | | | — | |
Realized gain (loss)(1) | | | | (209,233 | ) | | | | (75,521 | ) | | | | (44,823 | ) | | | | (28,858 | ) | | | | (60,031 | ) | | | | — | |
Change in unrealized appreciation (depreciation)(2) | | | | (957,847 | ) | | | | (177,804 | ) | | | | (3,447 | ) | | | | (101,798 | ) | | | | (601,802 | ) | | | | (72,996 | ) |
Purchases | | | | 8,529,897 | | | | | 4,070,418 | | | | | 319,500 | | | | | 700,000 | | | | | 3,518,848 | | | | | (78,869 | ) |
Sales | | | | (5,537,174 | ) | | | | (1,903,607 | ) | | | | (1,587,206 | ) | | | | (480,218 | ) | | | | (1,566,143 | ) | | | | — | |
Transfers in to Level 3 | | | | — | | | | | — | | | | | — | | | | | — | | | | | — | | | | | — | |
Transfers out of Level 3(3) | | | | (7,531,161 | ) | | | | (1,426,249 | ) | | | | — | | | | | — | | | | | (6,104,912 | ) | | | | — | |
Maturities | | | | — | | | | | — | | | | | — | | | | | — | | | | | — | | | | | — | |
Paydowns | | | | (4,911,845 | ) | | | | (1,051,464 | ) | | | | (322,554 | ) | | | | — | | | | | (3,537,827 | ) | | | | — | |
| | | | | | | | | | | | | | | | | | | | | | | | | | | | | | |
Balance, 12/31/13 | | | $ | 20,265,191 | | | | $ | 3,881,837 | | | | $ | 3,442,534 | | | | $ | 1,544,292 | | | | $ | 11,548,393 | | | | $ | (151,865 | ) |
| | | | | | | | | | | | | | | | | | | | | | | | | | | | | | |
| (1) | Realized gain (loss) from the sale of Level 3 securities can be found on the Statement of Operations in Net realized gain (loss) from: Investment securities. |
| (2) | Change in unrealized appreciation (depreciation) can be found on the Statement of Operations in Net change in unrealized appreciation (depreciation) on: Investment securities and Net change in unrealized appreciation (depreciation) on: Option contracts written. |
| (3) | Transfers out of Level 3 represent the value of securities at December 31, 2013 that were transferred from Level 3 to Level 2 of the fair value hierarchy as a result of the ability of the Fund to obtain a price which was determined using observable inputs. |
| | | | |
| | See Notes to Financial Statements. | | 107 |
Medium-Duration Bond Fund (Unaudited)
The Fund invested in a diversified portfolio composed of investment grade fixed income securities with an average dollar-weighted duration (a measure of bond prices’ sensitivity to changes in interest rates) normally between three to seven years. The GS4 Class of the Fund underperformed its benchmark index, the Barclays U.S. Aggregate Bond Index, for the one-year period ended December 31, 2013 (-1.98% versus -2.02%).
The Fund’s benchmark-relative performance for the year was negatively impacted by the Fund’s exposure to spread sectors (such as corporates, mortgaged-backed securities, Yankees and non-U.S. bonds) during the second quarter. During this period, spread sectors came under pressure due to concerns over the Federal Reserve scaling back its pace of bond purchases sooner rather than originally anticipated. The second quarter was a “risk-off” quarter as the market was fearful of the prospects of slower economic growth and rising interest rates when the Federal Reserve started its tapering process. During the year, the Fund remained diversified across multiple spread sectors to take advantage of the relative yield advantage of these sectors compared to U.S. Treasuries. This strategy served the Fund well over most time periods with the exception of the second quarter. Other sectors, such as high yield bonds and emerging market bonds, were also utilized on a tactical basis in an effort to add relative value.
Other strategies involving derivatives were utilized during the year. U.S. Treasury futures contracts, options on U.S. Treasuries and Euro-futures were used to manage duration, implement yield curve positioning strategies and express cross-sector views. Overall, on a net basis, these positions had little impact on relative performance. In an effort to better manage credit risk and to express views on credit from a synthetic perspective, credit default swaps were utilized. Such strategies were additive to the Fund’s relative performance during an environment of spread compression during most of the year. Currency forward contracts were utilized to hedge foreign currency risk and to express active currency views. These currency strategies resulted in a positive impact to the Fund’s performance. Through the process of implementing interest rate views and strategies during the year, interest rate swaps were used and resulted in mixed results.
During the year, the Fund remained focused on its objective of seeking maximum total return consistent with preservation of capital.
This Fund may be suitable for investors who have a short- to medium-term investment horizon, seek higher returns than those offered by a shorter maturity bond fund, can accept some short-term fluctuations in account value and want to diversify their portfolio with a fixed income investment option. This Fund is subject to interest rate risk. Meaning, when interest rates rise, the value of the existing bonds decrease and vice versa. Changes in interest rates have a bigger impact on long duration holdings than on short duration holdings. To the extent that the investment adviser misjudges current market conditions, the Fund’s volatility may be amplified by its use of short sales and derivatives and by its ability to select sub-advisers to allocate assets. Short sales by a fund theoretically involve unlimited loss potential since the market price of securities sold short may continuously increase. Leverage may increase the risk of loss and cause fluctuations in the market value of the Fund’s portfolio to have disproportionately large effects or cause the net asset value of the Fund generally to decline faster than it would otherwise.
108
Medium-Duration Bond Fund (Unaudited)
At December 31, 2013, the portfolio holdings of the Fund, as a percentage of net assets, is shown in the following table. Portfolio holdings are subject to risk and may change at any time.
| | | | |
| | | % | |
Mortgage-Backed Securities | | | 31.9 | |
U.S. Treasury Obligations | | | 28.0 | |
Corporate Bonds | | | 18.9 | |
Money Market Funds | | | 15.7 | |
Foreign Bonds | | | 14.6 | |
Municipal Bonds | | | 3.0 | |
Asset-Backed Securities | | | 2.4 | |
Agency Obligations | | | 1.9 | |
Repurchase Agreements | | | 1.4 | |
Preferred Stocks | | | 0.4 | |
Purchased Options | | | 0.1 | |
Written Options | | | (0.1 | ) |
TBA Sale Commitments | | | (0.3 | ) |
Security Sold Short | | | (0.9 | ) |
| | | | |
| | | 117.0 | |
| | | | |
109
Medium-Duration Bond Fund (Unaudited)
| | | | | | |
| Average Annual Total Returns as of 12/31/13 |
| | | GS2 Class* | | GS4 Class* | | Benchmark** |
One Year | | -1.90% | | -1.98% | | -2.02% |
Five Year | | 7.53% | | 7.41% | | 4.44% |
Ten Year | | 5.23% | | 5.10% | | 4.55% |
Inception Date | | 08/27/01 | | 08/27/01 | | |
Total Fund Operating Expenses (May 1, 2013 Prospectus, as amended on October 31, 2013)(1) | | 0.53% | | 0.77% | | |
(1) Current information regarding the Fund’s Operating Expenses can be found in the Financial Highlights.
The performance data quoted represents past performance and does not guarantee future results. Current performance may be lower or higher. Performance data current to the most recent month-end may be obtained at www.GuideStoneFunds.org. The investment return and principal value of an investment will fluctuate so that shares, when redeemed, may be worth more or less than their original cost.
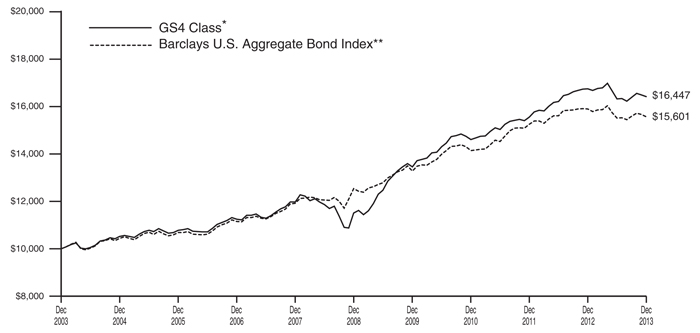
The graph compares the results of a hypothetical $10,000 investment in the GS4 Class of the Fund for the 10-year period from December 31, 2003 to December 31, 2013, with all dividends and capital gains reinvested, with the Barclays U.S. Aggregate Bond Index.
*These returns reflect expense waivers by the Fund’s investment adviser. Without these waivers, returns would have been lower. Returns shown do not reflect the deduction of taxes that a shareholder would pay on Fund distributions or the redemption of Fund shares.
Unlike a mutual fund, the performance of an index assumes no taxes, transaction costs, management fees or other expenses.
110
| | |
MEDIUM-DURATION BOND FUND SCHEDULE OF INVESTMENTS | | December 31, 2013 |
| | | | | | | | | | | | |
| | | Par | | | Value | |
AGENCY OBLIGATIONS — 1.9% | |
Federal Farm Credit Bank | | | | | | | | | | | | |
5.05%, 11/06/17 | | | | $ | 400,000 | | | | | $ | 455,233 | |
Federal Home Loan Bank | | | | | | | | | | | | |
3.00%, 09/10/21 | | | | | 800,000 | | | | | | 805,042 | |
Federal Home Loan Mortgage Corporation | | | | | | | | | | | | |
4.38%, 01/15/14(E) | | | | | 400,000 | | | | | | 550,638 | |
0.11%, 01/21/14 | | | | | 1,800,000 | | | | | | 1,799,980 | |
0.11%, 02/04/14 | | | | | 1,500,000 | | | | | | 1,499,943 | |
2.38%, 01/13/22D | | | | | 1,500,000 | | | | | | 1,436,542 | |
Federal National Mortgage Association | | | | | | | | | | | | |
0.12%, 02/24/14‡‡ | | | | | 330,000 | | | | | | 329,980 | |
1.88%, 09/18/18D | | | | | 3,300,000 | | | | | | 3,325,456 | |
3.03%, 10/09/19W† | | | | | 1,570,000 | | | | | | 1,336,858 | |
6.25%, 05/15/29 | | | | | 500,000 | | | | | | 628,470 | |
6.63%, 11/15/30D | | | | | 1,170,000 | | | | | | 1,526,113 | |
Tennessee Valley Authority | | | | | | | | | | | | |
3.88%, 02/15/21 | | | | | 1,000,000 | | | | | | 1,057,575 | |
5.25%, 09/15/39 | | | | | 350,000 | | | | | | 374,910 | |
4.63%, 09/15/60 | | | | | 200,000 | | | | | | 179,682 | |
| | | | | | | | | | | | |
Total Agency Obligations
(Cost $15,399,263) | | | | | | | | | | | 15,306,422 | |
| | | | | | | | | | | | |
ASSET-BACKED SECURITIES — 2.4% | |
Access Group, Inc. | | | | | | | | | | | | |
1.54%, 10/27/25† | | | | | 1,005,794 | | | | | | 1,014,046 | |
Amortizing Residential Collateral Trust | | | | | | | | | | | | |
0.85%, 01/01/32† | | | | | 28,840 | | | | | | 20,081 | |
Asset-Backed Securities Corporation Home Equity Loan Trust | | | | | | | | | | | | |
0.44%, 09/25/34† | | | | | 111,009 | | | | | | 110,185 | |
Avis Budget Rental Car Funding AESOP LLC | | | | | | | | | | | | |
3.15%, 03/20/17 144A | | | | | 160,000 | | | | | | 166,312 | |
2.80%, 05/20/18 144A | | | | | 550,000 | | | | | | 567,216 | |
1.92%, 09/20/19 144A | | | | | 160,000 | | | | | | 156,945 | |
2.97%, 02/20/20 144A | | | | | 160,000 | | | | | | 163,046 | |
Bayview Financial Acquisition Trust | | | | | | | | | | | | |
0.84%, 02/28/44† | | | | | 199,076 | | | | | | 196,753 | |
Bear Stearns Asset-Backed Securities Trust | | | | | | | | | | | | |
6.00%, 10/25/36 | | | | | 1,827,751 | | | | | | 1,465,390 | |
6.50%, 10/25/36 | | | | | 2,791,523 | | | | | | 2,386,987 | |
Brazos Higher Education Authority | | | | | | | | | | | | |
0.36%, 09/25/23† | | | | | 83,887 | | | | | | 83,819 | |
College Loan Corporation Trust | | | | | | | | | | | | |
0.43%, 04/25/24† | | | | | 500,000 | | | | | | 476,436 | |
0.33%, 10/25/25† | | | | | 787,741 | | | | | | 785,793 | |
CWHEQ Revolving Home Equity Loan Trust | | | | | | | | | | | | |
0.41%, 12/15/35† | | | | | 360,757 | | | | | | 281,172 | |
0.31%, 07/15/36† | | | | | 584,052 | | | | | | 451,696 | |
Education Funding Capital Trust IV | | | | | | | | | | | | |
3.18%, 06/15/43W† | | | | | 700,000 | | | | | | 594,212 | |
EMC Mortgage Loan Trust | | | | | | | | | | | | |
0.71%, 11/25/41 144A† | | | | | 54,379 | | | | | | 53,059 | |
Financial Asset Securities Corporation AAA Trust | | | | | | | | | | | | |
0.58%, 02/27/35 144A† | | | | | 952,453 | | | | | | 715,686 | |
| | | | | | | | | | | | |
| | | Par | | | Value | |
GMACM Home Equity Loan Trust | | | | | | | | | | | | |
7.00%, 09/25/37 | | | | $ | 256,391 | | | | | $ | 261,675 | |
Hertz Vehicle Financing LLC | | | | | | | | | | | | |
5.29%, 03/25/16 144A | | | | | 140,000 | | | | | | 146,399 | |
1.83%, 08/25/19 144A | | | | | 210,000 | | | | | | 205,692 | |
Nelnet Education Loan Funding, Inc. | | | | | | | | | | | | |
1.09%, 02/25/39† | | | | | 800,000 | | | | | | 768,188 | |
Panhandle-Plains Higher Education Authority, Inc. | | | | | | | | | | | | |
1.38%, 10/01/35† | | | | | 593,931 | | | | | | 603,526 | |
Provident Home Equity Loan Trust | | | | | | | | | | | | |
0.70%, 08/25/31† | | | | | 92,480 | | | | | | 59,342 | |
RAMP Series 2004-RZ1 Trust | | | | | | | | | | | | |
0.64%, 03/25/34† | | | | | 327,519 | | | | | | 303,215 | |
Salomon Brothers Mortgage Securities VII, Inc. | | | | | | | | | | | | |
0.64%, 03/25/28† | | | | | 15,749 | | | | | | 15,401 | |
SLM Private Education Loan Trust | | | | | | | | | | | | |
3.42%, 05/16/44 144A† | | | | | 1,021,347 | | | | | | 1,082,461 | |
SLM Student Loan EDC Repackaging Trust | | | | | | | | | | | | |
3.50%, 10/28/29+ 144A | | | | | 514,845 | | | | | | 503,220 | |
SLM Student Loan Trust | | | | | | | | | | | | |
1.74%, 04/25/23† | | | | | 4,274,616 | | | | | | 4,404,274 | |
0.99%, 12/15/25 144A† | | | | | 400,000 | | | | | | 396,072 | |
0.36%, 01/25/27† | | | | | 900,000 | | | | | | 877,956 | |
Structured Asset Investment Loan Trust | | | | | | | | | | | | |
1.00%, 08/25/34† | | | | | 434,744 | | | | | | 418,520 | |
| | | | | | | | | | | | |
Total Asset-Backed Securities
(Cost $20,420,307) | | | | | | 19,734,775 | |
| | | | | | | | | | | | |
CORPORATE BONDS — 18.9% | |
ABB Finance USA, Inc. | | | | | | | | | | | | |
4.38%, 05/08/42 | | | | | 20,000 | | | | | | 18,400 | |
AbbVie, Inc. | | | | | | | | | | | | |
1.75%, 11/06/17D | | | | | 1,520,000 | | | | | | 1,518,801 | |
2.90%, 11/06/22 | | | | | 320,000 | | | | | | 299,664 | |
Access Midstream Partners LP | | | | | | | | | | | | |
5.88%, 04/15/21 | | | | | 330,000 | | | | | | 353,100 | |
AES Corporation | | | | | | | | | | | | |
4.88%, 05/15/23D | | | | | 80,000 | | | | | | 75,200 | |
AIG Life Holdings, Inc. | | | | | | | | | | | | |
8.50%, 07/01/30 | | | | | 250,000 | | | | | | 315,000 | |
American Campus Communities Operating Partnership LP | | | | | | | | | | | | |
3.75%, 04/15/23 | | | | | 525,000 | | | | | | 488,144 | |
American Express Co. | | | | | | | | | | | | |
6.80%, 09/01/66† | | | | | 1,320,000 | | | | | | 1,411,410 | |
American Express Credit Corporation | | | | | | | | | | | | |
5.13%, 08/25/14 | | | | | 160,000 | | | | | | 164,898 | |
American Honda Finance Corporation | | | | | | | | | | | | |
1.00%, 08/11/15 144A | | | | | 480,000 | | | | | | 482,073 | |
American International Group, Inc. | | | | | | | | | | | | |
2.38%, 08/24/15 | | | | | 175,000 | | | | | | 178,824 | |
5.60%, 10/18/16 | | | | | 600,000 | | | | | | 669,089 | |
5.45%, 05/18/17 | | | | | 125,000 | | | | | | 139,824 | |
| | | | |
| | See Notes to Financial Statements. | | 111 |
MEDIUM-DURATION BOND FUND
SCHEDULE OF INVESTMENTS (Continued)
| | | | | | | | | | | | |
| | | Par | | | Value | |
8.25%, 08/15/18 144AD | | | | $ | 1,200,000 | | | | | $ | 1,504,038 | |
6.40%, 12/15/20 | | | | | 150,000 | | | | | | 177,534 | |
6.25%, 03/15/87 | | | | | 380,000 | | | | | | 381,900 | |
American Tower Corporation REIT | | | | | | | | | | | | |
3.40%, 02/15/19 | | | | | 375,000 | | | | | | 382,216 | |
Anadarko Petroleum Corporation | | | | | | | | | | | | |
6.38%, 09/15/17 | | | | | 50,000 | | | | | | 57,452 | |
6.45%, 09/15/36D | | | | | 125,000 | | | | | | 140,805 | |
Arch Coal, Inc. | | | | | | | | | | | | |
7.25%, 06/15/21 | | | | | 500,000 | | | | | | 385,000 | |
Arizona Public Service Co. | | | | | | | | | | | | |
8.75%, 03/01/19 | | | | | 525,000 | | | | | | 667,989 | |
Ashland, Inc. | | | | | | | | | | | | |
4.75%, 08/15/22 | | | | | 250,000 | | | | | | 238,750 | |
AT&T, Inc. | | | | | | | | | | | | |
2.50%, 08/15/15 | | | | | 540,000 | | | | | | 554,636 | |
2.95%, 05/15/16 | | | | | 425,000 | | | | | | 443,422 | |
4.45%, 05/15/21 | | | | | 80,000 | | | | | | 84,359 | |
3.88%, 08/15/21 | | | | | 200,000 | | | | | | 202,952 | |
4.35%, 06/15/45D | | | | | 102,000 | | | | | | 86,694 | |
Avon Products, Inc. | | | | | | | | | | | | |
4.60%, 03/15/20D | | | | | 525,000 | | | | | | 521,306 | |
Axiall Corporation | | | | | | | | | | | | |
4.88%, 05/15/23 144AD | | | | | 50,000 | | | | | | 47,438 | |
Baker Hughes, Inc. | | | | | | | | | | | | |
7.50%, 11/15/18D | | | | | 710,000 | | | | | | 875,681 | |
Ball Corporation | | | | | | | | | | | | |
5.00%, 03/15/22 | | | | | 915,000 | | | | | | 910,425 | |
4.00%, 11/15/23 | | | | | 80,000 | | | | | | 72,000 | |
Bank of America Corporation | | | | | | | | | | | | |
0.50%, 10/14/16†D | | | | | 1,700,000 | | | | | | 1,682,983 | |
3.88%, 03/22/17 | | | | | 130,000 | | | | | | 138,857 | |
6.00%, 09/01/17D | | | | | 325,000 | | | | | | 371,392 | |
5.75%, 12/01/17 | | | | | 2,340,000 | | | | | | 2,665,548 | |
5.65%, 05/01/18 | | | | | 950,000 | | | | | | 1,082,408 | |
2.60%, 01/15/19 | | | | | 450,000 | | | | | | 452,517 | |
5.88%, 01/05/21 | | | | | 150,000 | | | | | | 172,660 | |
5.00%, 05/13/21 | | | | | 20,000 | | | | | | 21,889 | |
Bank of America NA | | | | | | | | | | | | |
0.71%, 11/14/16† | | | | | 3,900,000 | | | | | | 3,910,479 | |
Barrick North America Finance LLC | | | | | | | | | | | | |
4.40%, 05/30/21 | | | | | 610,000 | | | | | | 588,251 | |
Bear Stearns Cos. LLC | | | | | | | | | | | | |
5.70%, 11/15/14 | | | | | 1,000,000 | | | | | | 1,044,745 | |
6.40%, 10/02/17D | | | | | 1,200,000 | | | | | | 1,393,854 | |
Berkshire Hathaway, Inc. | | | | | | | | | | | | |
3.20%, 02/11/15D | | | | | 280,000 | | | | | | 288,674 | |
Boeing Capital Corporation | | | | | | | | | | | | |
4.70%, 10/27/19D | | | | | 230,000 | | | | | | 258,404 | |
Boeing Co. | | | | | | | | | | | | |
4.88%, 02/15/20 | | | | | 50,000 | | | | | | 55,821 | |
6.63%, 02/15/38 | | | | | 210,000 | | | | | | 269,748 | |
Calpine Corporation | | | | | | | | | | | | |
7.88%, 01/15/23 144A | | | | | 620,000 | | | | | | 680,450 | |
Capital One Financial Corporation | | | | | | | | | | | | |
1.00%, 11/06/15 | | | | | 325,000 | | | | | | 325,006 | |
Caterpillar, Inc. | | | | | | | | | | | | |
3.80%, 08/15/42D | | | | | 225,000 | | | | | | 189,978 | |
Catholic Health Initiatives | | | | | | | | | | | | |
4.35%, 11/01/42 | | | | | 40,000 | | | | | | 34,832 | |
| | | | | | | | | | | | |
| | | Par | | | Value | |
CBL & Associates LP REIT | | | | | | | | | | | | |
5.25%, 12/01/23 | | | | $ | 275,000 | | | | | $ | 275,160 | |
CCO Holdings LLC | | | | | | | | | | | | |
5.25%, 09/30/22D | | | | | 600,000 | | | | | | 563,250 | |
Cellco Partnership | | | | | | | | | | | | |
8.50%, 11/15/18D | | | | | 520,000 | | | | | | 659,070 | |
Chesapeake Energy Corporation | | | | | | | | | | | | |
6.13%, 02/15/21D | | | | | 220,000 | | | | | | 237,050 | |
5.75%, 03/15/23D | | | | | 70,000 | | | | | | 72,450 | |
Chubb Corporation | | | | | | | | | | | | |
6.38%, 03/29/67† | | | | | 375,000 | | | | | | 407,812 | |
Cigna Corporation | | | | | | | | | | | | |
2.75%, 11/15/16 | | | | | 225,000 | | | | | | 234,346 | |
CitiFinancial, Inc. | | | | | | | | | | | | |
6.63%, 06/01/15 | | | | | 300,000 | | | | | | 319,287 | |
Citigroup, Inc. | | | | | | | | | | | | |
5.13%, 05/05/14 | | | | | 69,000 | | | | | | 70,014 | |
5.00%, 09/15/14 | | | | | 500,000 | | | | | | 514,332 | |
6.01%, 01/15/15 | | | | | 101,000 | | | | | | 106,384 | |
5.50%, 02/15/17D | | | | | 1,160,000 | | | | | | 1,279,052 | |
6.13%, 11/21/17 | | | | | 1,205,000 | | | | | | 1,390,234 | |
3.38%, 03/01/23 | | | | | 175,000 | | | | | | 166,663 | |
3.50%, 05/15/23D | | | | | 410,000 | | | | | | 382,784 | |
5.50%, 09/13/25D | | | | | 290,000 | | | | | | 306,101 | |
6.68%, 09/13/43 | | | | | 60,000 | | | | | | 69,278 | |
5.35%, 04/29/49†D | | | | | 180,000 | | | | | | 158,717 | |
5.95%, 07/29/49† | | | | | 170,000 | | | | | | 157,522 | |
Clean Harbors, Inc. | | | | | | | | | | | | |
5.25%, 08/01/20D | | | | | 195,000 | | | | | | 201,825 | |
Cliffs Natural Resources, Inc. | | | | | | | | | | | | |
3.95%, 01/15/18D | | | | | 400,000 | | | | | | 404,292 | |
4.80%, 10/01/20D | | | | | 150,000 | | | | | | 149,300 | |
4.88%, 04/01/21D | | | | | 60,000 | | | | | | 58,440 | |
Comcast Corporation | | | | | | | | | | | | |
5.70%, 05/15/18 | | | | | 1,250,000 | | | | | | 1,436,725 | |
Compass Bank | | | | | | | | | | | | |
5.50%, 04/01/20D | | | | | 275,000 | | | | | | 282,931 | |
Concho Resources, Inc. | | | | | | | | | | | | |
5.50%, 10/01/22D | | | | | 260,000 | | | | | | 269,750 | |
5.50%, 04/01/23D | | | | | 30,000 | | | | | | 31,050 | |
ConocoPhillips Holding Co. | | | | | | | | | | | | |
6.95%, 04/15/29D | | | | | 220,000 | | | | | | 279,087 | |
Continental Airlines 1998-1 Class A Pass Through Trust | | | | | | | | | | | | |
6.65%, 03/15/19 | | | | | 180,674 | | | | | | 189,924 | |
Continental Resources, Inc. | | | | | | | | | | | | |
5.00%, 09/15/22 | | | | | 500,000 | | | | | | 520,000 | |
COX Communications, Inc. | | | | | | | | | | | | |
5.45%, 12/15/14D | | | | | 69,000 | | | | | | 72,125 | |
6.95%, 06/01/38 144A | | | | | 10,000 | | | | | | 10,521 | |
Crown Americas LLC | | | | | | | | | | | | |
4.50%, 01/15/23 | | | | | 550,000 | | | | | | 517,000 | |
Crown Castle International Corporation | | | | | | | | | | | | |
5.25%, 01/15/23D | | | | | 425,000 | | | | | | 418,625 | |
CVS Caremark Corporation | | | | | | | | | | | | |
2.75%, 12/01/22D | | | | | 500,000 | | | | | | 462,384 | |
CVS Pass-Through Trust | | | | | | | | | | | | |
6.94%, 01/10/30 | | | | | 764,555 | | | | | | 877,840 | |
D.R. Horton, Inc. | | | | | | | | | | | | |
4.38%, 09/15/22D | | | | | 550,000 | | | | | | 515,625 | |
| | | | |
| 112 | | See Notes to Financial Statements. | | |
| | | | | | | | | | | | |
| | | Par | | | Value | |
Daimler Finance North America LLC | | | | | | | | | | | | |
0.86%, 03/28/14 144A† | | | | $ | 3,400,000 | | | | | $ | 3,404,906 | |
1.30%, 07/31/15 144AD | | | | | 640,000 | | | | | | 644,005 | |
DDR Corporation REIT | | | | | | | | | | | | |
4.63%, 07/15/22 | | | | | 400,000 | | | | | | 408,689 | |
Delta Air Lines 2007-1 Class A Pass Through Trust | | | | | | | | | | | | |
6.82%, 02/10/24 | | | | | 336,375 | | | | | | 379,263 | |
Devon Energy Corporation | | | | | | | | | | | | |
3.25%, 05/15/22D | | | | | 90,000 | | | | | | 85,975 | |
5.60%, 07/15/41 | | | | | 230,000 | | | | | | 240,531 | |
Devon Financing Corporation LLC | | | | | | | | | | | | |
7.88%, 09/30/31 | | | | | 60,000 | | | | | | 77,375 | |
DISH DBS Corporation | | | | | | | | | | | | |
6.63%, 10/01/14 | | | | | 30,000 | | | | | | 31,275 | |
7.75%, 05/31/15 | | | | | 200,000 | | | | | | 217,500 | |
5.88%, 07/15/22 | | | | | 360,000 | | | | | | 361,800 | |
DPL, Inc. | | | | | | | | | | | | |
7.25%, 10/15/21 | | | | | 350,000 | | | | | | 356,125 | |
Eastman Chemical Co. | | | | | | | | | | | | |
2.40%, 06/01/17 | | | | | 575,000 | | | | | | 581,636 | |
Eaton Corporation | | | | | | | | | | | | |
1.50%, 11/02/17D | | | | | 180,000 | | | | | | 176,623 | |
2.75%, 11/02/22 | | | | | 650,000 | | | | | | 607,530 | |
4.15%, 11/02/42D | | | | | 200,000 | | | | | | 178,377 | |
Ecolab, Inc. | | | | | | | | | | | | |
3.00%, 12/08/16 | | | | | 275,000 | | | | | | 288,322 | |
4.35%, 12/08/21D | | | | | 130,000 | | | | | | 135,027 | |
El Paso LLC | | | | | | | | | | | | |
7.00%, 06/15/17 | | | | | 710,000 | | | | | | 806,302 | |
7.80%, 08/01/31 | | | | | 750,000 | | | | | | 764,825 | |
El Paso Natural Gas Co. LLC | | | | | | | | | | | | |
7.50%, 11/15/26D | | | | | 300,000 | | | | | | 365,435 | |
Energy Transfer Partners LP | | | | | | | | | | | | |
3.26%, 11/01/66† | | | | | 700,000 | | | | | | 640,500 | |
Enterprise Products Operating LLC | | | | | | | | | | | | |
5.70%, 02/15/42D | | | | | 220,000 | | | | | | 232,778 | |
8.38%, 08/01/66† | | | | | 475,000 | | | | | | 526,608 | |
7.03%, 01/15/68† | | | | | 475,000 | | | | | | 525,339 | |
EOG Resources, Inc. | | | | | | | | | | | | |
0.99%, 02/03/14† | | | | | 3,500,000 | | | | | | 3,502,272 | |
Equinix, Inc. | | | | | | | | | | | | |
7.00%, 07/15/21 | | | | | 450,000 | | | | | | 493,312 | |
ERP Operating LP REIT | | | | | | | | | | | | |
4.63%, 12/15/21 | | | | | 250,000 | | | | | | 263,992 | |
Exelon Corporation | | | | | | | | | | | | |
5.63%, 06/15/35 | | | | | 655,000 | | | | | | 651,355 | |
Express Scripts Holding, Co. | | | | | | | | | | | | |
3.50%, 11/15/16 | | | | | 1,020,000 | | | | | | 1,079,099 | |
2.65%, 02/15/17 | | | | | 250,000 | | | | | | 257,862 | |
Fifth Third Bancorp | | | | | | | | | | | | |
3.63%, 01/25/16 | | | | | 175,000 | | | | | | 183,945 | |
First Niagara Financial Group, Inc. | | | | | | | | | | | | |
6.75%, 03/19/20 | | | | | 250,000 | | | | | | 287,746 | |
FirstEnergy Corporation | | | | | | | | | | | | |
2.75%, 03/15/18 | | | | | 120,000 | | | | | | 118,024 | |
4.25%, 03/15/23 | | | | | 490,000 | | | | | | 457,607 | |
7.38%, 11/15/31 | | | | | 770,000 | | | | | | 838,806 | |
Florida Power & Light Co. | | | | | | | | | | | | |
3.80%, 12/15/42 | | | | | 525,000 | | | | | | 460,454 | |
| | | | | | | | | | | | |
| | | Par | | | Value | |
Ford Motor Co. | | | | | | | | | | | | |
4.75%, 01/15/43 | | | | $ | 420,000 | | | | | $ | 380,205 | |
Ford Motor Credit Co., LLC | | | | | | | | | | | | |
1.34%, 08/28/14† | | | | | 700,000 | | | | | | 703,368 | |
5.63%, 09/15/15 | | | | | 3,100,000 | | | | | | 3,344,187 | |
8.00%, 12/15/16D | | | | | 1,475,000 | | | | | | 1,747,078 | |
5.00%, 05/15/18D | | | | | 225,000 | | | | | | 250,877 | |
5.88%, 08/02/21D | | | | | 300,000 | | | | | | 340,641 | |
Freeport-McMoRan Copper & Gold, Inc. | | | | | | | | | | | | |
2.38%, 03/15/18 | | | | | 80,000 | | | | | | 79,884 | |
3.10%, 03/15/20D | | | | | 230,000 | | | | | | 223,764 | |
Freeport-McMoRan Copper & Gold, Inc. | | | | | | | | | | | | |
3.55%, 03/01/22D | | | | | 370,000 | | | | | | 352,262 | |
Fresenius Medical Care US Finance, Inc. | | | | | | | | | | | | |
6.88%, 07/15/17D | | | | | 250,000 | | | | | | 283,750 | |
Frontier Communications Corporation | | | | | | | | | | | | |
8.50%, 04/15/20D | | | | | 450,000 | | | | | | 506,250 | |
GE Capital Trust I | | | | | | | | | | | | |
6.38%, 11/15/67†D | | | | | 321,000 | | | | | | 347,482 | |
General Electric Capital Corporation | | | | | | | | | | | | |
1.63%, 07/02/15 | | | | | 1,170,000 | | | | | | 1,189,454 | |
6.00%, 08/07/19 | | | | | 1,850,000 | | | | | | 2,173,256 | |
4.38%, 09/16/20 | | | | | 330,000 | | | | | | 358,172 | |
5.88%, 01/14/38 | | | | | 150,000 | | | | | | 171,446 | |
General Electric Co. | | | | | | | | | | | | |
0.85%, 10/09/15D | | | | | 210,000 | | | | | | 211,073 | |
General Motors Financial Co., Inc. | | | | | | | | | | | | |
2.75%, 05/15/16 144A | | | | | 90,000 | | | | | | 91,350 | |
3.25%, 05/15/18 144A | | | | | 70,000 | | | | | | 70,175 | |
4.25%, 05/15/23 144A | | | | | 80,000 | | | | | | 76,300 | |
Genworth Holdings, Inc. | | | | | | | | | | | | |
7.70%, 06/15/20D | | | | | 125,000 | | | | | | 149,213 | |
7.20%, 02/15/21 | | | | | 175,000 | | | | | | 203,501 | |
7.63%, 09/24/21D | | | | | 400,000 | | | | | | 476,713 | |
GlaxoSmithKline Capital, Inc. | | | | | | | | | | | | |
5.65%, 05/15/18D | | | | | 380,000 | | | | | | 437,863 | |
Glencore Funding LLC | | | | | | | | | | | | |
1.70%, 05/27/16 144A | | | | | 225,000 | | | | | | 225,322 | |
2.50%, 01/15/19 144A | | | | | 400,000 | | | | | | 387,781 | |
Goldman Sachs Capital II | | | | | | | | | | | | |
4.00%, 12/01/49†D | | | | | 60,000 | | | | | | 42,480 | |
Goldman Sachs Group, Inc. | | | | | | | | | | | | |
6.00%, 05/01/14 | | | | | 90,000 | | | | | | 91,615 | |
5.75%, 10/01/16 | | | | | 1,900,000 | | | | | | 2,121,745 | |
5.95%, 01/18/18 | | | | | 1,000,000 | | | | | | 1,137,973 | |
6.00%, 06/15/20 | | | | | 460,000 | | | | | | 528,142 | |
5.25%, 07/27/21 | | | | | 110,000 | | | | | | 120,622 | |
6.75%, 10/01/37 | | | | | 40,000 | | | | | | 44,640 | |
6.25%, 02/01/41 | | | | | 550,000 | | | | | | 636,032 | |
HCA, Inc. | | | | | | | | | | | | |
6.50%, 02/15/16 | | | | | 686,000 | | | | | | 752,028 | |
7.88%, 02/15/20 | | | | | 125,000 | | | | | | 134,531 | |
7.69%, 06/15/25D | | | | | 250,000 | | | | | | 262,500 | |
HCP, Inc. REIT | | | | | | | | | | | | |
6.00%, 01/30/17 | | | | | 300,000 | | | | | | 336,459 | |
2.63%, 02/01/20 | | | | | 300,000 | | | | | | 286,354 | |
Hess Corporation | | | | | | | | | | | | |
8.13%, 02/15/19 | | | | | 220,000 | | | | | | 273,561 | |
7.88%, 10/01/29 | | | | | 260,000 | | | | | | 332,155 | |
| | | | |
| | See Notes to Financial Statements. | | 113 |
MEDIUM-DURATION BOND FUND
SCHEDULE OF INVESTMENTS (Continued)
| | | | | | | | | | | | |
| | | Par | | | Value | |
Hewlett-Packard Co. | | | | | | | | | | | | |
3.00%, 09/15/16D | | | | $ | 300,000 | | | | | $ | 312,269 | |
2.60%, 09/15/17D | | | | | 300,000 | | | | | | 305,081 | |
HSBC USA, Inc. | | | | | | | | | | | | |
2.38%, 02/13/15D | | | | | 1,700,000 | | | | | | 1,735,102 | |
Humana, Inc. | | | | | | | | | | | | |
7.20%, 06/15/18 | | | | | 480,000 | | | | | | 568,416 | |
3.15%, 12/01/22D | | | | | 90,000 | | | | | | 83,473 | |
Hyundai Capital America | | | | | | | | | | | | |
2.13%, 10/02/17 144A | | | | | 130,000 | | | | | | 129,227 | |
ILFC E-Capital Trust II | | | | | | | | | | | | |
6.25%, 12/21/65 144A† | | | | | 280,000 | | | | | | 266,000 | |
ING US, Inc. | | | | | | | | | | | | |
2.90%, 02/15/18 | | | | | 60,000 | | | | | | 61,426 | |
International Lease Finance Corporation | | | | | | | | | | | | |
6.50%, 09/01/14 144A | | | | | 240,000 | | | | | | 249,000 | |
6.75%, 09/01/16 144A | | | | | 840,000 | | | | | | 940,800 | |
8.63%, 01/15/22 | | | | | 250,000 | | | | | | 296,688 | |
John Deere Capital Corporation | | | | | | | | | | | | |
2.25%, 04/17/19D | | | | | 160,000 | | | | | | 159,856 | |
1.70%, 01/15/20D | | | | | 80,000 | | | | | | 75,441 | |
JPMorgan Chase & Co. | | | | | | | | | | | | |
5.15%, 10/01/15D | | | | | 1,890,000 | | | | | | 2,020,882 | |
1.10%, 10/15/15D | | | | | 750,000 | | | | | | 753,192 | |
4.40%, 07/22/20 | | | | | 980,000 | | | | | | 1,054,965 | |
4.35%, 08/15/21 | | | | | 70,000 | | | | | | 73,894 | |
3.38%, 05/01/23D | | | | | 430,000 | | | | | | 401,548 | |
Kerr-McGee Corporation | | | | | | | | | | | | |
6.95%, 07/01/24 | | | | | 420,000 | | | | | | 488,834 | |
7.88%, 09/15/31 | | | | | 490,000 | | | | | | 614,754 | |
Kimberly-Clark Corporation | | | | | | | | | | | | |
3.70%, 06/01/43 | | | | | 500,000 | | | | | | 421,444 | |
Kraft Foods Group, Inc. | | | | | | | | | | | | |
5.38%, 02/10/20 | | | | | 223,000 | | | | | | 251,920 | |
3.50%, 06/06/22D | | | | | 320,000 | | | | | | 312,433 | |
Kroger Co. | | | | | | | | | | | | |
6.15%, 01/15/20D | | | | | 360,000 | | | | | | 410,831 | |
Lehman Escrow Bonds | | | | | | | | | | | | |
0.00%, 07/19/17+W†# | | | | | 150,000 | | | | | | — | |
0.00%, 12/28/47+W†# | | | | | 140,000 | | | | | | — | |
0.00%, 11/30/49+W†# | | | | | 2,330,000 | | | | | | — | |
0.00%, 12/31/99+W†# | | | | | 3,200,000 | | | | | | — | |
Lehman Escrow Bonds | | | | | | | | | | | | |
5.63%, 12/31/99W†# | | | | | 2,300,000 | | | | | | 494,500 | |
6.63%, 12/31/99W†# | | | | | 200,000 | | | | | | 43,000 | |
Liberty Property LP REIT | | | | | | | | | | | | |
4.75%, 10/01/20 | | | | | 575,000 | | | | | | 605,130 | |
M&T Bank Corporation | | | | | | | | | | | | |
6.88%, 12/29/49 144A | | | | | 750,000 | | | | | | 724,131 | |
MarkWest Energy Partners LP | | | | | | | | | | | | |
6.25%, 06/15/22 | | | | | 190,000 | | | | | | 201,875 | |
4.50%, 07/15/23 | | | | | 425,000 | | | | | | 400,562 | |
MDC Holdings, Inc. | | | | | | | | | | | | |
5.63%, 02/01/20 | | | | | 325,000 | | | | | | 342,063 | |
6.00%, 01/15/43D | | | | | 225,000 | | | | | | 194,735 | |
Medtronic, Inc. | | | | | | | | | | | | |
4.45%, 03/15/20 | | | | | 300,000 | | | | | | 329,224 | |
Merrill Lynch & Co., Inc. | | | | | | | | | | | | |
6.05%, 05/16/16 | | | | | 275,000 | | | | | | 302,730 | |
5.70%, 05/02/17 | | | | | 1,100,000 | | | | | | 1,223,660 | |
MetLife Capital Trust IV | | | | | | | | | | | | |
7.88%, 12/15/67 144A | | | | | 300,000 | | | | | | 345,750 | |
| | | | | | | | | | | | |
| | | Par | | | Value | |
MetLife, Inc. | | | | | | | | | | | | |
4.75%, 02/08/21D | | | | $ | 270,000 | | | | | $ | 292,261 | |
6.40%, 12/15/66 | | | | | 50,000 | | | | | | 51,625 | |
MetroPCS Wireless, Inc. | | | | | | | | | | | | |
6.25%, 04/01/21 144AD | | | | | 150,000 | | | | | | 156,188 | |
6.63%, 04/01/23 144A | | | | | 150,000 | | | | | | 155,438 | |
MidAmerican Energy Holdings Co. | | | | | | | | | | | | |
6.50%, 09/15/37 | | | | | 70,000 | | | | | | 81,570 | |
Mondelez International, Inc. | | | | | | | | | | | | |
5.38%, 02/10/20D | | | | | 367,000 | | | | | | 415,032 | |
Morgan Stanley | | | | | | | | | | | | |
0.70%, 10/18/16†D | | | | | 340,000 | | | | | | 337,433 | |
4.75%, 03/22/17 | | | | | 60,000 | | | | | | 65,528 | |
6.25%, 08/28/17 | | | | | 350,000 | | | | | | 400,812 | |
6.63%, 04/01/18 | | | | | 1,400,000 | | | | | | 1,639,676 | |
NBCUniversal Media LLC | | | | | | | | | | | | |
2.88%, 01/15/23D | | | | | 750,000 | | | | | | 695,691 | |
NCUA Guaranteed Notes | | | | | | | | | | | | |
3.00%, 06/12/19 | | | | | 300,000 | | | | | | 313,800 | |
NetApp, Inc. | | | | | | | | | | | | |
2.00%, 12/15/17 | | | | | 375,000 | | | | | | 373,427 | |
Nielsen Finance LLC | | | | | | | | | | | | |
4.50%, 10/01/20D | | | | | 300,000 | | | | | | 293,250 | |
NIKE, Inc. | | | | | | | | | | | | |
3.63%, 05/01/43 | | | | | 375,000 | | | | | | 315,915 | |
Noble Energy, Inc. | | | | | | | | | | | | |
4.15%, 12/15/21 | | | | | 620,000 | | | | | | 638,590 | |
Northwestern Mutual Life Insurance Co. | | | | | | | | | | | | |
6.06%, 03/30/40 144A | | | | | 500,000 | | | | | | 563,698 | |
Occidental Petroleum Corporation | | | | | | | | | | | | |
3.13%, 02/15/22D | | | | | 260,000 | | | | | | 253,682 | |
2.70%, 02/15/23D | | | | | 320,000 | | | | | | 293,532 | |
Oracle Corporation | | | | | | | | | | | | |
1.20%, 10/15/17 | | | | | 470,000 | | | | | | 462,933 | |
Pacific Gas & Electric Co. | | | | | | | | | | | | |
8.25%, 10/15/18 | | | | | 130,000 | | | | | | 162,754 | |
6.05%, 03/01/34 | | | | | 40,000 | | | | | | 45,960 | |
5.80%, 03/01/37 | | | | | 210,000 | | | | | | 232,268 | |
Peabody Energy Corporation | | | | | | | | | | | | |
7.88%, 11/01/26 | | | | | 1,100,000 | | | | | | 1,122,000 | |
Pemex Project Funding Master Trust | | | | | | | | | | | | |
6.63%, 06/15/35 | | | | | 159,000 | | | | | | 168,143 | |
Penske Truck Leasing Co. LP | | | | | | | | | | | | |
2.88%, 07/17/18 144AD | | | | | 575,000 | | | | | | 578,995 | |
PepsiCo, Inc. | | | | | | | | | | | | |
0.70%, 08/13/15 | | | | | 520,000 | | | | | | 520,759 | |
7.90%, 11/01/18D | | | | | 140,000 | | | | | | 175,179 | |
Pfizer, Inc. | | | | | | | | | | | | |
7.20%, 03/15/39 | | | | | 600,000 | | | | | | 809,169 | |
Plains Exploration & Production Co. | | | | | | | | | | | | |
6.50%, 11/15/20 | | | | | 70,000 | | | | | | 77,341 | |
6.88%, 02/15/23 | | | | | 20,000 | | | | | | 22,400 | |
Private Export Funding Corporation | | | | | | | | | | | | |
5.45%, 09/15/17 | | | | | 1,600,000 | | | | | | 1,833,624 | |
Progress Energy, Inc. | | | | | | | | | | | | |
7.75%, 03/01/31 | | | | | 350,000 | | | | | | 451,889 | |
PVH Corporation | | | | | | | | | | | | |
4.50%, 12/15/22 | | | | | 410,000 | | | | | | 390,525 | |
| | | | |
| 114 | | See Notes to Financial Statements. | | |
| | | | | | | | | | |
| | | Par | | | Value | |
PVNGS II Funding Corporation, Inc. | | | | | | | | | | |
8.00%, 12/30/15 | | $ | 287,000 | | | | | $ | 302,872 | |
QEP Resources, Inc. | | | | | | | | | | |
5.25%, 05/01/23 | | | 80,000 | | | | | | 75,400 | |
Range Resources Corporation | | | | | | | | | | |
5.00%, 03/15/23 | | | 150,000 | | | | | | 147,375 | |
Raytheon Co. | | | | | | | | | | |
3.13%, 10/15/20D | | | 200,000 | | | | | | 200,532 | |
Regency Energy Partners LP | | | | | | | | | | |
4.50%, 11/01/23D | | | 310,000 | | | | | | 283,650 | |
Rensselaer Polytechnic Institute | | | | | | | | | | |
5.60%, 09/01/20 | | | 675,000 | | | | | | 722,071 | |
Reynolds Group Issuer, Inc. | | | | | | | | | | |
7.13%, 04/15/19 | | | 400,000 | | | | | | 428,000 | |
Roche Holdings, Inc. | | | | | | | | | | |
6.00%, 03/01/19 144A | | | 300,000 | | | | | | 351,467 | |
Rock Tenn Co. | | | | | | | | | | |
3.50%, 03/01/20D | | | 150,000 | | | | | | 147,740 | |
4.00%, 03/01/23 | | | 70,000 | | | | | | 66,983 | |
Roper Industries, Inc. | | | | | | | | | | |
2.05%, 10/01/18 | | | 450,000 | | | | | | 437,811 | |
Santander Holdings USA, Inc. | | | | | | | | | | |
3.00%, 09/24/15 | | | 300,000 | | | | | | 309,926 | |
Service Corporation International | | | | | | | | | | |
7.63%, 10/01/18 | | | 90,000 | | | | | | 103,950 | |
7.50%, 04/01/27 | | | 200,000 | | | | | | 212,000 | |
SESI LLC | | | | | | | | | | |
7.13%, 12/15/21D | | | 80,000 | | | | | | 89,600 | |
SLM Corporation | | | | | | | | | | |
3.88%, 09/10/15 | | | 480,000 | | | | | | 498,600 | |
Southern Copper Corporation | | | | | | | | | | |
5.25%, 11/08/42 | | | 660,000 | | | | | | 538,545 | |
Southern Natural Gas Co. LLC | | | | | | | | | | |
8.00%, 03/01/32D | | | 400,000 | | | | | | 513,469 | |
Sprint Capital Corporation | | | | | | | | | | |
6.88%, 11/15/28 | | | 40,000 | | | | | | 37,900 | |
8.75%, 03/15/32 | | | 120,000 | | | | | | 129,300 | |
Sprint Communications, Inc. | | | | | | | | | | |
9.00%, 11/15/18 144A | | | 80,000 | | | | | | 96,600 | |
7.00%, 08/15/20D | | | 40,000 | | | | | | 43,500 | |
State Street Corporation | | | | | | | | | | |
4.96%, 03/15/18 | | | 530,000 | | | | | | 575,544 | |
SunTrust Banks, Inc. | | | | | | | | | | |
3.60%, 04/15/16 | | | 300,000 | | | | | | 316,169 | |
SunTrust Preferred Capital I | | | | | | | | | | |
4.00%, 06/29/49† | | | 357,000 | | | | | | 269,981 | |
Teachers Insurance & Annuity Association of America | | | | | | | | | | |
6.85%, 12/16/39 144AD | | | 540,000 | | | | | | 668,809 | |
Tenet Healthcare Corporation | | | | | | | | | | |
9.25%, 02/01/15 | | | 1,262,000 | | | | | | 1,362,960 | |
Tennessee Gas Pipeline Co. LLC | | | | | | | | | | |
7.50%, 04/01/17 | | | 250,000 | | | | | | 292,200 | |
Thermo Fisher Scientific, Inc. | | | | | | | | | | |
3.60%, 08/15/21D | | | 160,000 | | | | | | 158,829 | |
5.30%, 02/01/44 | | | 30,000 | | | | | | 30,450 | |
Time Warner Cable, Inc. | | | | | | | | | | |
4.13%, 02/15/21D | | | 50,000 | | | | | | 47,460 | |
5.88%, 11/15/40 | | | 130,000 | | | | | | 112,807 | |
Time Warner, Inc. | | | | | | | | | | |
4.70%, 01/15/21 | | | 10,000 | | | | | | 10,633 | |
| | | | | | | | | | |
| | | Par | | | Value | |
7.70%, 05/01/32 | | $ | 180,000 | | | | | $ | 231,740 | |
6.10%, 07/15/40 | | | 140,000 | | | | | | 153,314 | |
6.25%, 03/29/41D | | | 40,000 | | | | | | 44,572 | |
Time Warner Entertainment Co. LP | | | | | | | | | | |
8.38%, 07/15/33 | | | 390,000 | | | | | | 425,957 | |
Toll Brothers Finance Corporation | | | | | | | | | | |
4.00%, 12/31/18 | | | 250,000 | | | | | | 255,000 | |
Toyota Motor Credit Corporation | | | | | | | | | | |
1.25%, 10/05/17D | | | 520,000 | | | | | | 510,937 | |
Transatlantic Holdings, Inc. | | | | | | | | | | |
8.00%, 11/30/39 | | | 200,000 | | | | | | 249,455 | |
Union Bank NA | | | | | | | | | | |
1.19%, 06/06/14† | | | 2,600,000 | | | | | | 2,609,604 | |
2.13%, 06/16/17 | | | 700,000 | | | | | | 703,809 | |
United Airline 1995 Pass Through Trust A | | | | | | | | | | |
9.56%, 10/19/18@ | | | 126,094 | | | | | | 42,241 | |
United Airline 2009-2A Pass Through Trust | | | | | | | | | | |
9.75%, 07/15/18 | | | 112,009 | | | | | | 128,810 | |
United Technologies Corporation | | | | | | | | | | |
4.50%, 06/01/42 | | | 250,000 | | | | | | 243,731 | |
UnitedHealth Group, Inc. | | | | | | | | | | |
1.63%, 03/15/19D | | | 170,000 | | | | | | 163,908 | |
Univision Communications, Inc. | | | | | | | | | | |
6.75%, 09/15/22 144A | | | 370,000 | | | | | | 407,000 | |
Verizon Communications, Inc. | | | | | | | | | | |
1.77%, 09/15/16† | | | 1,200,000 | | | | | | 1,237,091 | |
1.99%, 09/14/18† | | | 400,000 | | | | | | 421,072 | |
3.65%, 09/14/18 | | | 775,000 | | | | | | 821,274 | |
6.35%, 04/01/19D | | | 90,000 | | | | | | 105,905 | |
4.50%, 09/15/20 | | | 1,760,000 | | | | | | 1,886,929 | |
2.45%, 11/01/22 | | | 10,000 | | | | | | 8,870 | |
5.15%, 09/15/23D | | | 5,250,000 | | | | | | 5,647,709 | |
6.40%, 09/15/33 | | | 930,000 | | | | | | 1,072,759 | |
6.55%, 09/15/43 | | | 910,000 | | | | | | 1,068,450 | |
Vesey Street Investment
Trust I | | | | | | | | | | |
4.40%, 09/01/16 STEP | | | 160,000 | | | | | | 171,902 | |
Wachovia Capital Trust III | | | | | | | | | | |
5.57%, 03/29/49† | | | 580,000 | | | | | | 533,600 | |
Walgreen Co. | | | | | | | | | | |
1.80%, 09/15/17 | | | 300,000 | | | | | | 302,348 | |
Waste Management, Inc. | | | | | | | | | | |
7.38%, 05/15/29 | | | 140,000 | | | | | | 170,766 | |
WEA Finance LLC | | | | | | | | | | |
7.13%, 04/15/18 144A | | | 400,000 | | | | | | 475,380 | |
WellPoint, Inc. | | | | | | | | | | |
1.25%, 09/10/15 | | | 110,000 | | | | | | 110,811 | |
5.88%, 06/15/17D | | | 720,000 | | | | | | 812,745 | |
Wells Fargo & Co. | | | | | | | | | | |
3.68%, 06/15/16 STEPD | | | 290,000 | | | | | | 308,958 | |
4.60%, 04/01/21D | | | 70,000 | | | | | | 76,855 | |
3.45%, 02/13/23 | | | 280,000 | | | | | | 265,231 | |
4.48%, 01/16/24 144A | | | 2,196,000 | | | | | | 2,190,374 | |
5.38%, 11/02/43D | | | 190,000 | | | | | | 195,291 | |
Wells Fargo Capital X | | | | | | | | | | |
5.95%, 12/01/86D | | | 200,000 | | | | | | 198,300 | |
Williams Cos., Inc. | | | | | | | | | | |
7.50%, 01/15/31 | | | 10,000 | | | | | | 10,595 | |
7.75%, 06/15/31 | | | 25,000 | | | | | | 26,871 | |
| | | | |
| | See Notes to Financial Statements. | | 115 |
MEDIUM-DURATION BOND FUND
SCHEDULE OF INVESTMENTS (Continued)
| | | | | | | | | | |
| | | Par | | | Value | |
8.75%, 03/15/32D | | $ | 451,000 | | | | | $ | 527,831 | |
Wm. Wrigley Jr. Co. | | | | | | | | | | |
2.40%, 10/21/18 144A | | | 60,000 | | | | | | 59,699 | |
2.90%, 10/21/19 144A | | | 230,000 | | | | | | 228,401 | |
3.38%, 10/21/20 144A | | | 70,000 | | | | | | 69,300 | |
Xylem, Inc. | | | | | | | | | | |
3.55%, 09/20/16 | | | 350,000 | | | | | | 368,346 | |
| | | | | | | | | | |
Total Corporate Bonds
(Cost $145,886,789) | | | | | | 152,770,691 | |
| | | | | | | | | | |
FOREIGN BONDS — 14.6% | |
Australia — 0.6% | |
Australia Government Bond | | | | | | | | | | |
5.75%, 05/15/21(A) | | | 1,500,000 | | | | | | 1,499,316 | |
BHP Billiton Finance (USA), Ltd. | | | | | | | | | | |
3.25%, 11/21/21 | | | 940,000 | | | | | | 936,043 | |
5.00%, 09/30/43 | | | 220,000 | | | | | | 224,553 | |
CNOOC Curtis Funding No. 1 Proprietary, Ltd. | | | | | | | | | | |
4.50%, 10/03/23 144A | | | 240,000 | | | | | | 237,256 | |
Commonwealth Bank of Australia | | | | | | | | | | |
3.75%, 10/15/14 144A | | | 440,000 | | | | | | 451,305 | |
1.25%, 09/18/15 | | | 570,000 | | | | | | 576,500 | |
5.00%, 10/15/19 144A | | | 50,000 | | | | | | 55,802 | |
Rio Tinto Finance USA, Ltd. | | | | | | | | | | |
2.50%, 05/20/16D | | | 30,000 | | | | | | 30,956 | |
3.50%, 11/02/20D | | | 770,000 | | | | | | 787,339 | |
4.13%, 05/20/21D | | | 110,000 | | | | | | 114,283 | |
3.75%, 09/20/21D | | | 90,000 | | | | | | 91,015 | |
| | | | | | | | | | |
| | | | | | | | | 5,004,368 | |
| | | | | | | | | | |
Bermuda — 0.1% | |
Arch Capital Group, Ltd. | | | | | | | | | | |
7.35%, 05/01/34 | | | 175,000 | | | | | | 222,631 | |
Endurance Specialty Holdings, Ltd. | | | | | | | | | | |
6.15%, 10/15/15 | | | 150,000 | | | | | | 161,606 | |
Weatherford International, Ltd. | | | | | | | | | | |
9.63%, 03/01/19D | | | 265,000 | | | | | | 340,850 | |
| | | | | | | | | | |
| | | | | | | | | 725,087 | |
| | | | | | | | | | |
Canada — 0.5% | |
Barrick Gold Corporation | | | | | | | | | | |
3.85%, 04/01/22D | | | 130,000 | | | | | | 117,284 | |
4.10%, 05/01/23 144AD | | | 450,000 | | | | | | 407,519 | |
Nexen, Inc. | | | | | | | | | | |
6.40%, 05/15/37 | | | 225,000 | | | | | | 256,940 | |
Pacific Rubiales Energy Corporation | | | | | | | | | | |
5.38%, 01/26/19 144A | | | 200,000 | | | | | | 202,000 | |
Potash Corporation of Saskatchewan, Inc. | | | | | | | | | | |
4.88%, 03/30/20D | | | 110,000 | | | | | | 119,174 | |
PTTEP Canada International Finance, Ltd. | | | | | | | | | | |
5.69%, 04/05/21 144A | | | 320,000 | | | | | | 341,408 | |
Rogers Communications, Inc. | | | | | | | | | | |
6.38%, 03/01/14D | | | 90,000 | | | | | | 90,862 | |
6.75%, 03/15/15 | | | 10,000 | | | | | | 10,716 | |
TransCanada PipeLines, Ltd. | | | | | | | | | | |
6.35%, 05/15/67† | | | 400,000 | | | | | | 411,194 | |
| | | | | | | | | | |
| | | Par | | | Value | |
Videotron, Ltd. | | | | | | | | | | |
5.00%, 07/15/22D | | $ | 300,000 | | | | | $ | 294,750 | |
Xstrata Finance Canada, Ltd. | | | | | | | | | | |
2.05%, 10/23/15 144A | | | 390,000 | | | | | | 395,138 | |
5.80%, 11/15/16 144AD | | | 80,000 | | | | | | 88,200 | |
2.70%, 10/25/17 144A | | | 1,140,000 | | | | | | 1,153,980 | |
| | | | | | | | | | |
| | | | | | | | | 3,889,165 | |
| | | | | | | | | | |
Cayman Islands — 0.6% | |
Petrobras International Finance Co. | | | | | | | | | | |
3.88%, 01/27/16D | | | 250,000 | | | | | | 258,615 | |
6.13%, 10/06/16 | | | 271,000 | | | | | | 294,865 | |
5.75%, 01/20/20D | | | 235,000 | | | | | | 242,976 | |
5.38%, 01/27/21D | | | 990,000 | | | | | | 987,414 | |
Resona Preferred Global Securities Cayman, Ltd. | | | | | | | | | | |
7.19%, 12/29/49 144A†D | | | 325,000 | | | | | | 346,531 | |
Transocean, Inc. | | | | | | | | | | |
5.05%, 12/15/16D | | | 130,000 | | | | | | 143,707 | |
6.50%, 11/15/20D | | | 525,000 | | | | | | 600,362 | |
6.38%, 12/15/21D | | | 120,000 | | | | | | 135,059 | |
Vale Overseas, Ltd. | | | | | | | | | | |
4.38%, 01/11/22 | | | 932,000 | | | | | | 910,185 | |
8.25%, 01/17/34D | | | 80,000 | | | | | | 92,955 | |
6.88%, 11/21/36 | | | 511,000 | | | | | | 530,292 | |
| | | | | | | | | | |
| | | | | | | | | 4,542,961 | |
| | | | | | | | | | |
Chile — 0.1% | |
Celulosa Arauco y Constitucion SA | | | | | | | | | | |
4.75%, 01/11/22 | | | 240,000 | | | | | | 235,018 | |
Chile Government International Bond | | | | | | | | | | |
3.63%, 10/30/42 | | | 460,000 | | | | | | 363,630 | |
Corporacion Nacional del Cobre de Chile | | | | | | | | | | |
4.75%, 10/15/14 144A | | | 210,000 | | | | | | 216,127 | |
| | | | | | | | | | |
| | | | | | | | | 814,775 | |
| | | | | | | | | | |
Colombia — 0.1% | |
Colombia Government International Bond | | | | | | | | | | |
4.38%, 07/12/21 | | | 341,000 | | | | | | 352,083 | |
Ecopetrol SA | | | | | | | | | | |
5.88%, 09/18/23D | | | 170,000 | | | | | | 179,775 | |
| | | | | | | | | | |
| | | | | | | | | 531,858 | |
| | | | | | | | | | |
Dominican Republic — 0.0% | |
Dominican Republic International Bond | | | | | | | | | | |
14.50%, 02/10/23(V)@ | | | 2,600,000 | | | | | | 63,076 | |
6.60%, 01/28/24 144A | | | 140,000 | | | | | | 141,050 | |
| | | | | | | | | | |
| | | | | | | | | 204,126 | |
| | | | | | | | | | |
France — 0.7% | |
Banque PSA Finance SA | | | | | | | | | | |
2.14%, 04/04/14 144A†@ | | | 800,000 | | | | | | 799,720 | |
BNP Paribas SA | | | | | | | | | | |
2.38%, 09/14/17D | | | 270,000 | | | | | | 275,904 | |
BPCE SA | | | | | | | | | | |
5.70%, 10/22/23 144A | | | 225,000 | | | | | | 232,263 | |
CGG SA | | | | | | | | | | |
9.50%, 05/15/16D | | | 229,000 | | | | | | 242,168 | |
7.75%, 05/15/17D | | | 155,000 | | | | | | 160,038 | |
| | | | |
| 116 | | See Notes to Financial Statements. | | |
| | | | | | | | | | |
| | | Par | | | Value | |
Credit Agricole SA | | | | | | | | | | |
8.38%, 10/29/49 144A† | | $ | 720,000 | | | | | $ | 820,800 | |
Dexia Credit Local SA | | | | | | | | | | |
0.62%, 11/07/16 144A†@ | | | 3,200,000 | | | | | | 3,202,929 | |
| | | | | | | | | | |
| | | | | | | | | 5,733,822 | |
| | | | | | | | | | |
Germany — 0.3% | |
State of North
Rhine-Westphalia | | | | | | | | | | |
1.63%, 09/17/14 | | | 2,500,000 | | | | | | 2,522,763 | |
| | | | | | | | | | |
Honduras — 0.0% | |
Republic of Honduras | | | | | | | | | | |
8.75%, 12/16/20 144A | | | 200,000 | | | | | | 201,626 | |
| | | | | | | | | | |
Iceland — 0.0% | |
Glitnir HF | | | | | | | | | | |
6.69%, 06/15/16+ 144A#D | | | 1,000,000 | | | | | | 10 | |
7.45%, 03/29/49+ 144A# | | | 100,000 | | | | | | 1 | |
Kaupthing Bank HF | | | | | | | | | | |
7.13%, 05/19/16+ 144A# | | | 350,000 | | | | | | 3 | |
| | | | | | | | | | |
| | | | | | | | | 14 | |
| | | | | | | | | | |
India — 0.4% | |
ICICI Bank, Ltd. | | | | | | | | | | |
1.99%, 02/24/14 144A† | | | 3,400,000 | | | | | | 3,401,091 | |
| | | | | | | | | | |
Indonesia — 0.2% | |
Indonesia Government International Bond | | | | | | | | | | |
5.38%, 10/17/23 144AD | | | 360,000 | | | | | | 360,000 | |
8.50%, 10/12/35 | | | 230,000 | | | | | | 279,450 | |
7.75%, 01/17/38 | | | 490,000 | | | | | | 555,538 | |
Perusahaan Penerbit SBSN Indonesia | | | | | | | | | | |
6.13%, 03/15/19 144A | | | 200,000 | | | | | | 214,250 | |
| | | | | | | | | | |
| | | | | | | | | 1,409,238 | |
| | | | | | | | | | |
Ireland — 0.1% | | | | | | | | | | |
Rosneft Oil Co. via Rosneft International Finance, Ltd. | | | | | | | | | | |
4.20%, 03/06/22 144A | | | 320,000 | | | | | | 294,400 | |
Vimpel Communications Via VIP Finance Ireland, Ltd. OJSC | | | | | | | | | | |
6.49%, 02/02/16 144AD | | | 230,000 | | | | | | 246,675 | |
7.75%, 02/02/21 144A | | | 200,000 | | | | | | 217,750 | |
| | | | | | | | | | |
| | | | | | | | | 758,825 | |
| | | | | | | | | | |
Israel — 0.3% | | | | | | | | | | |
Israel Government AID Bond | | | | | | | | | | |
5.50%, 09/18/23 | | | 1,200,000 | | | | | | 1,388,108 | |
5.50%, 12/04/23D | | | 200,000 | | | | | | 230,901 | |
5.50%, 04/26/24 | | | 500,000 | | | | | | 578,847 | |
| | | | | | | | | | |
| | | | | | | | | 2,197,856 | |
| | | | | | | | | | |
Italy — 1.3% | | | | | | | | | | |
Intesa Sanpaolo SpA | | | | | | | | | | |
2.64%, 02/24/14 144A†D | | | 2,500,000 | | | | | | 2,507,395 | |
3.63%, 08/12/15 144A | | | 290,000 | | | | | | 298,510 | |
3.88%, 01/16/18 | | | 1,000,000 | | | | | | 1,024,934 | |
Italy Buoni Poliennali Del Tesoro | | | | | | | | | | |
3.50%, 12/01/18(E) | | | 4,960,000 | | | | | | 7,078,696 | |
| | | | | | | | | | |
| | | | | | | | | 10,909,535 | |
| | | | | | | | | | |
| | | | | | | | | | |
| | | Par | | | Value | |
Japan — 0.2% | |
Bank of Tokyo-Mitsubishi UFJ, Ltd. | | | | | | | | | | |
3.85%, 01/22/15 144A | | $ | 330,000 | | | | | $ | 340,507 | |
Resona Bank, Ltd. | | | | | | | | | | |
5.85%, 09/29/49 144A†@D | | | 250,000 | | | | | | 268,750 | |
Softbank Corporation | | | | | | | | | | |
4.50%, 04/15/20 144A | | | 660,000 | | | | | | 646,800 | |
Sumitomo Mitsui Banking Corporation | | | | | | | | | | |
3.15%, 07/22/15 144A | | | 330,000 | | | | | | 341,370 | |
| | | | | | | | | | |
| | | | | | | | | 1,597,427 | |
| | | | | | | | | | |
Jersey — 0.0% | |
UBM PLC | | | | | | | | | | |
5.75%, 11/03/20 144A | | | 230,000 | | | | | | 239,448 | |
| | | | | | | | | | |
Jordan — 0.1% | |
Hashemite Kingdom of Jordan Government AID Bond | | | | | | | | | | |
2.50%, 10/30/20 | | | 1,200,000 | | | | | | 1,176,567 | |
| | | | | | | | | | |
Luxembourg — 0.6% | |
Gazprom OAO Via Gaz Capital SA | | | | | | | | | | |
9.25%, 04/23/19D | | | 290,000 | | | | | | 358,150 | |
6.51%, 03/07/22 144AD | | | 3,100,000 | | | | | | 3,344,125 | |
Intelsat Jackson Holdings SA | | | | | | | | | | |
7.50%, 04/01/21 | | | 500,000 | | | | | | 553,750 | |
Rosneft Finance SA | | | | | | | | | | |
7.25%, 02/02/20D | | | 190,000 | | | | | | 215,175 | |
| | | | | | | | | | |
| | | | | | | | | 4,471,200 | |
| | | | | | | | | | |
Mexico — 3.0% | |
America Movil SAB de CV | | | | | | | | | | |
5.63%, 11/15/17 | | | 270,000 | | | | | | 305,482 | |
5.00%, 03/30/20D | | | 240,000 | | | | | | 261,135 | |
Mexican Bonos | | | | | | | | | | |
8.00%, 06/11/20(M) | | | 14,667,000 | | | | | | 1,260,716 | |
6.50%, 06/10/21(M) | | | 1,625,000 | | | | | | 128,313 | |
6.50%, 06/09/22(M) | | | 50,264,700 | | | | | | 3,901,428 | |
8.00%, 12/07/23(M) | | | 1,761,600 | | | | | | 150,336 | |
7.50%, 06/03/27(M) | | | 1,606,300 | | | | | | 131,495 | |
8.50%, 05/31/29(M) | | | 964,000 | | | | | | 84,048 | |
7.75%, 05/29/31(M) | | | 6,105,300 | | | | | | 490,466 | |
10.00%, 11/20/36(M) | | | 1,930,300 | | | | | | 188,148 | |
8.50%, 11/18/38(M) | | | 1,104,400 | | | | | | 93,853 | |
7.75%, 11/13/42(M) | | | 4,486,300 | | | | | | 351,587 | |
Mexico Cetes | | | | | | | | | | |
0.00%, 01/02/14(M)W† | | | 140,000,000 | | | | | | 1,072,081 | |
0.00%, 02/06/14(M)W† | | | 355,000,000 | | | | | | 2,710,143 | |
0.00%, 02/20/14(M)W† | | | 860,000,000 | | | | | | 6,557,381 | |
0.00%, 03/06/14(M)W† | | | 530,000,000 | | | | | | 4,036,265 | |
Mexico Government International Bond | | | | | | | | | | |
6.05%, 01/11/40D | | | 134,000 | | | | | | 146,395 | |
4.75%, 03/08/44 | | | 1,578,000 | | | | | | 1,430,062 | |
Petroleos Mexicanos | | | | | | | | | | |
3.50%, 07/18/18D | | | 90,000 | | | | | | 92,587 | |
5.50%, 01/21/21 | | | 370,000 | | | | | | 399,600 | |
4.88%, 01/18/24 | | | 90,000 | | | | | | 90,225 | |
| | | | | | | | | | |
| | | | | | | | | 23,881,746 | |
| | | | | | | | | | |
| | | | |
| | See Notes to Financial Statements. | | 117 |
MEDIUM-DURATION BOND FUND
SCHEDULE OF INVESTMENTS (Continued)
| | | | | | | | | | |
| | | Par | | | Value | |
Netherlands — 0.7% | | | | | | | | | | |
Achmea Hypotheekbank NV | | | | | | | | | | |
3.20%, 11/03/14 144A | | $ | 161,000 | | | | | $ | 164,805 | |
Cooperatieve Centrale Raiffeisen-Boerenleenbank BA | | | | | | | | | | |
4.63%, 12/01/23D | | | 400,000 | | | | | | 403,603 | |
11.00%, 12/29/49 144A† | | | 487,000 | | | | | | 645,884 | |
Deutsche Telekom International Finance BV | | | | | | | | | | |
5.75%, 03/23/16 | | | 510,000 | | | | | | 560,257 | |
ING Bank NV | | | | | | | | | | |
2.00%, 09/25/15 144A | | | 725,000 | | | | | | 737,324 | |
5.80%, 09/25/23 144A | | | 340,000 | | | | | | 356,163 | |
Lukoil International Finance BV | | | | | | | | | | |
4.56%, 04/24/23D | | | 540,000 | | | | | | 508,140 | |
Shell International Finance BV | | | | | | | | | | |
4.38%, 03/25/20D | | | 700,000 | | | | | | 768,425 | |
Volkswagen International Finance NV | | | | | | | | | | |
1.00%, 03/21/14 144A† | | | 100,000 | | | | | | 100,174 | |
0.86%, 04/01/14 144A† | | | 1,500,000 | | | | | | 1,501,714 | |
| | | | | | | | | | |
| | | | | | | | | 5,746,489 | |
| | | | | | | | | | |
New Zealand — 0.0% | |
ANZ New Zealand International, Ltd. | | | | | | | | | | |
1.85%, 10/15/15 144A | | | 220,000 | | | | | | 223,457 | |
| | | | | | | | | | |
Norway — 0.1% | | | | | | | | | | |
Kommunalbanken AS | | | | | | | | | | |
1.00%, 09/26/17 144AD | | | 500,000 | | | | | | 492,511 | |
| | | | | | | | | | |
Russia — 0.3% | | | | | | | | | | |
Russian Foreign Bond | | | | | | | | | | |
4.88%, 09/16/23 144A | | | 1,800,000 | | | | | | 1,822,500 | |
7.50%, 03/31/30 STEP | | | 585,585 | | | | | | 683,495 | |
| | | | | | | | | | |
| | | | | | | | | 2,505,995 | |
| | | | | | | | | | |
Singapore — 0.0% | | | | | | | | | | |
Temasek Financial I, Ltd. | | | | | | | | | | |
2.38%, 01/23/23 144A | | | 330,000 | | | | | | 297,774 | |
| | | | | | | | | | |
South Africa — 0.1% | | | | | | | | | | |
South Africa Government International Bond | | | | | | | | | | |
5.88%, 09/16/25D | | | 660,000 | | | | | | 688,380 | |
| | | | | | | | | | |
South Korea — 0.5% | | | | | | | | | | |
Export-Import Bank of Korea | | | | | | | | | | |
5.25%, 02/10/14 144A | | | 235,000 | | | | | | 236,165 | |
Hyundai Capital Services, Inc. | | | | | | | | | | |
4.38%, 07/27/16 144A | | | 3,400,000 | | | | | | 3,619,528 | |
| | | | | | | | | | |
| | | | | | | | | 3,855,693 | |
| | | | | | | | | | |
Spain — 0.3% | | | | | | | | | | |
BBVA US Senior SA Unipersonal | | | | | | | | | | |
3.25%, 05/16/14 | | | 560,000 | | | | | | 564,550 | |
4.66%, 10/09/15 | | | 460,000 | | | | | | 483,794 | |
Santander US Debt SA Unipersonal | | | | | | | | | | |
3.72%, 01/20/15 144A | | | 300,000 | | | | | | 306,057 | |
3.78%, 10/07/15 144A | | | 100,000 | | | | | | 103,089 | |
Telefonica Emisiones SA Unipersonal | | | | | | | | | | |
6.42%, 06/20/16 | | | 90,000 | | | | | | 100,516 | |
| | | | | | | | | | |
| | | Par | | | Value | |
6.22%, 07/03/17D | | $ | 20,000 | | | | | $ | 22,596 | |
3.19%, 04/27/18 | | | 350,000 | | | | | | 356,804 | |
5.88%, 07/15/19 | | | 70,000 | | | | | | 78,232 | |
5.13%, 04/27/20 | | | 140,000 | | | | | | 149,080 | |
5.46%, 02/16/21 | | | 200,000 | | | | | | 211,529 | |
| | | | | | | | | | |
| | | | | | | | | 2,376,247 | |
| | | | | | | | | | |
Supranational — 0.1% | |
Inter-American Development Bank | | | | | | | | | | |
1.00%, 02/27/18 | | | 400,000 | | | | | | 391,845 | |
| | | | | | | | | | |
Sweden — 0.6% | |
Nordea Bank AB | | | | | | | | | | |
1.14%, 01/14/14 144A†D | | | 3,400,000 | | | | | | 3,401,139 | |
3.70%, 11/13/14 144A | | | 200,000 | | | | | | 205,602 | |
4.88%, 05/13/21 144A | | | 640,000 | | | | | | 662,538 | |
Stadshypotek AB | | | | | | | | | | |
1.88%, 10/02/19 144AD | | | 900,000 | | | | | | 868,592 | |
| | | | | | | | | | |
| | | | | | | | | 5,137,871 | |
| | | | | | | | | | |
Switzerland — 0.1% | |
Credit Suisse AG | | | | | | | | | | |
6.50%, 08/08/23 144A | | | 225,000 | | | | | | 239,906 | |
Credit Suisse Group AG | | | | | | | | | | |
7.50%, 12/11/49 144A† | | | 275,000 | | | | | | 290,895 | |
UBS AG | | | | | | | | | | |
2.25%, 01/28/14 | | | 413,000 | | | | | | 413,539 | |
| | | | | | | | | | |
| | | | | | | | | 944,340 | |
| | | | | | | | | | |
Turkey — 0.2% | |
Turkey Government International Bond | | | | | | | | | | |
7.00%, 03/11/19 | | | 230,000 | | | | | | 252,712 | |
5.63%, 03/30/21D | | | 160,000 | | | | | | 161,440 | |
6.25%, 09/26/22D | | | 820,000 | | | | | | 853,620 | |
| | | | | | | | | | |
| | | | | | | | | 1,267,772 | |
| | | | | | | | | | |
United Kingdom — 2.0% | |
Abbey National Treasury Services PLC | | | | | | | | | | |
3.88%, 11/10/14 144A | | | 2,900,000 | | | | | | 2,979,817 | |
2.12%, 02/16/16(U)† | | | 200,000 | | | | | | 337,661 | |
Bank of Scotland PLC | | | | | | | | | | |
5.25%, 02/21/17 144AD | | | 100,000 | | | | | | 111,695 | |
Barclays Bank PLC | | | | | | | | | | |
1.28%, 01/13/14† | | | 2,800,000 | | | | | | 2,800,787 | |
6.05%, 12/04/17 144A@D | | | 755,000 | | | | | | 847,056 | |
BP Capital Markets PLC | | | | | | | | | | |
3.88%, 03/10/15D | | | 310,000 | | | | | | 322,587 | |
3.56%, 11/01/21 | | | 30,000 | | | | | | 30,146 | |
GlaxoSmithKline Capital PLC | | | | | | | | | | |
2.85%, 05/08/22D | | | 350,000 | | | | | | 330,706 | |
Lloyds Bank PLC | | | | | | | | | | |
2.30%, 11/27/18 | | | 275,000 | | | | | | 274,603 | |
12.00%, 12/29/49 144A† | | | 3,200,000 | | | | | | 4,347,862 | |
Northern Rock Asset Management PLC | | | | | | | | | | |
5.63%, 06/22/17 144A | | | 1,400,000 | | | | | | 1,588,286 | |
Royal Bank of Scotland PLC | | | | | | | | | | |
9.50%, 03/16/22† | | | 175,000 | | | | | | 205,369 | |
Royal Bank of Scotland Group PLC | | | | | | | | | | |
5.00%, 10/01/14 | | | 40,000 | | | | | | 40,886 | |
2.55%, 09/18/15D | | | 560,000 | | | | | | 572,984 | |
6.40%, 10/21/19 | | | 160,000 | | | | | | 184,599 | |
| | | | |
| 118 | | See Notes to Financial Statements. | | |
| | | | | | | | | | |
| | | Par | | | Value | |
6.00%, 12/19/23 | | $ | 300,000 | | | | | $ | 302,511 | |
7.64%, 03/29/49† | | | 200,000 | | | | | | 197,000 | |
Standard Chartered PLC | | | | | | | | | | |
5.50%, 11/18/14 144A@ | | | 250,000 | | | | | | 260,546 | |
3.95%, 01/11/23 144A | | | 375,000 | | | | | | 348,468 | |
WPP Finance 2010 | | | | | | | | | | |
5.63%, 11/15/43 | | | 40,000 | | | | | | 39,739 | |
WPP Finance UK | | | | | | | | | | |
8.00%, 09/15/14 | | | 336,000 | | | | | | 352,781 | |
| | | | | | | | | | |
| | | | | | | | | 16,476,089 | |
| | | | | | | | | | |
Virgin Islands (British) — 0.4% | |
Gerdau Trade, Inc. | | | | | | | | | | |
5.75%, 01/30/21 144AD | | | 3,000,000 | | | | | | 3,075,000 | |
Sinopec Group Overseas Development 2012, Ltd. | | | | | | | | | | |
2.75%, 05/17/17 144A | | | 230,000 | | | | | | 235,746 | |
| | | | | | | | | | |
| | | | | | | | | 3,310,746 | |
| | | | | | | | | | |
Total Foreign Bonds
(Cost $117,508,682) | | | | | | | | | 117,928,707 | |
| | | | | | | | | | |
MORTGAGE-BACKED SECURITIES — 31.9% | |
Aire Valley Mortgages PLC | | | | | | | | | | |
0.47%, 09/20/66 144A† | | | 146,341 | | | | | | 140,325 | |
0.49%, 09/20/66 144A† | | | 350,254 | | | | | | 333,792 | |
0.59%, 09/20/66† | | | 475,845 | | | | | | 457,287 | |
Alternative Loan Trust | | | | | | | | | | |
5.50%, 10/25/33 | | | 87,283 | | | | | | 92,310 | |
0.49%, 11/20/35† | | | 806,118 | | | | | | 645,479 | |
0.50%, 11/20/35† | | | 1,554,496 | | | | | | 1,184,244 | |
0.43%, 01/25/36† | | | 443,416 | | | | | | 380,210 | |
0.35%, 09/25/46† | | | 995,998 | | | | | | 717,464 | |
American Home Mortgage Assets Trust | | | | | | | | | | |
1.06%, 11/25/46† | | | 1,113,191 | | | | | | 564,984 | |
Banc of America Commercial Mortgage Trust | | | | | | | | | | |
5.89%, 07/10/44† | | | 894,981 | | | | | | 973,612 | |
5.42%, 09/10/45† | | | 117,000 | | | | | | 126,161 | |
5.45%, 09/10/47 | | | 40,000 | | | | | | 42,807 | |
5.63%, 04/10/49† | | | 75,000 | | | | | | 83,355 | |
Banc of America Mortgage 2004-F Trust | | | | | | | | | | |
2.62%, 07/25/34† | | | 165,696 | | | | | | 166,140 | |
Banc of America
Re-REMIC Trust | | | | | | | | | | |
5.63%, 02/17/51 144A† | | | 100,000 | | | | | | 107,075 | |
Bear Stearns Adjustable Rate Mortgage Trust | | | | | | | | | | |
2.36%, 02/25/33† | | | 17,421 | | | | | | 17,398 | |
5.23%, 05/25/34† | | | 82,419 | | | | | | 79,519 | |
2.60%, 03/25/35† | | | 731,319 | | | | | | 736,196 | |
Bear Stearns ALT-A Trust | | | | | | | | | | |
2.65%, 05/25/35† | | | 448,023 | | | | | | 445,149 | |
Bear Stearns Commercial Mortgage Securities Trust | | | | | | | | | | |
5.60%, 06/11/50 | | | 2,528,129 | | | | | | 2,836,530 | |
Bear Stearns Structured Products, Inc. Trust | | | | | | | | | | |
2.50%, 01/26/36† | | | 1,123,471 | | | | | | 853,791 | |
Berica ABS Srl | | | | | | | | | | |
0.59%, 12/30/55(E)† | | | 1,468,771 | | | | | | 1,948,856 | |
CHL Mortgage Pass-Through Trust | | | | | | | | | | |
2.60%, 02/19/34† | | | 801,518 | | | | | | 791,507 | |
| | | | | | | | | | |
| | | Par | | | Value | |
0.40%, 03/25/36† | | $ | 325,358 | | | | | $ | 256,303 | |
Citigroup Commercial Mortgage Trust | | | | | | | | | | |
6.05%, 12/10/49† | | | 1,644,627 | | | | | | 1,856,001 | |
Citigroup Global/Royal Bank of Scotland PLC | | | | | | | | | | |
3.37%, 03/01/35 | | | 100,000 | | | | | | 95,372 | |
COBALT CMBS Commercial Mortgage Trust | | | | | | | | | | |
5.53%, 04/15/47† | | | 60,000 | | | | | | 66,328 | |
COMM 2006-C8 Mortgage Trust | | | | | | | | | | |
5.31%, 12/10/46 | | | 500,000 | | | | | | 544,769 | |
COMM 2013-CCRE11 Mortgage Trust | | | | | | | | | | |
4.72%, 10/10/46† | | | 205,000 | | | | | | 212,579 | |
5.17%, 10/10/46 144A† | | | 79,000 | | | | | | 69,745 | |
COMM 2013-CCRE12 Mortgage Trust | | | | | | | | | | |
4.05%, 10/10/46 | | | 320,000 | | | | | | 322,963 | |
4.30%, 10/10/46 | | | 100,000 | | | | | | 100,466 | |
4.76%, 10/10/46† | | | 40,000 | | | | | | 39,988 | |
5.09%, 10/10/46† | | | 20,000 | | | | | | 19,740 | |
Commercial Mortgage
Pass-Through Certificates | | | | | | | | | | |
2.82%, 10/15/45 | | | 30,000 | | | | | | 28,199 | |
Commercial Mortgage Trust | | | | | | | | | | |
5.82%, 07/10/38† | | | 177,000 | | | | | | 193,226 | |
Credit Suisse Commercial Mortgage Trust | | | | | | | | | | |
5.38%, 02/15/40 | | | 1,510,221 | | | | | | 1,630,102 | |
5.61%, 01/15/49† | | | 203,000 | | | | | | 215,503 | |
Credit Suisse First Boston Mortgage Securities Corporation | | | | | | | | | | |
0.00%, 07/25/33 IOW† | | | 121,700 | | | | | | 866 | |
0.00%, 08/25/33 IOW | | | 114,088 | | | | | | — | |
DBUBS 2011-LC3 Mortgage Trust | | | | | | | | | | |
9.32%, 08/10/44 IO 144AW† | | | 1,257,067 | | | | | | 42,885 | |
Extended Stay America Trust | | | | | | | | | | |
2.96%, 12/05/31 144A | | | 100,000 | | | | | | 97,039 | |
Federal Home Loan Mortgage Corporation | | | | | | | | | | |
7.00%, 11/01/14 | | | 890 | | | | | | 892 | |
7.00%, 04/01/15 | | | 3,295 | | | | | | 3,305 | |
7.00%, 12/01/15 | | | 2,616 | | | | | | 2,623 | |
8.50%, 06/01/18 | | | 2,158 | | | | | | 2,317 | |
4.50%, 09/01/18 | | | 7,088 | | | | | | 7,514 | |
8.00%, 08/01/24 | | | 1,894 | | | | | | 2,144 | |
4.00%, 10/01/25 | | | 609,601 | | | | | | 643,796 | |
5.50%, 02/01/27 | | | 97,450 | | | | | | 106,859 | |
7.50%, 11/01/29 | | | 6,275 | | | | | | 7,327 | |
7.50%, 12/01/29 | | | 10,026 | | | | | | 11,474 | |
7.50%, 02/01/31 | | | 23,196 | | | | | | 26,046 | |
2.36%, 07/01/31† | | | 25,160 | | | | | | 25,532 | |
2.36%, 08/01/31† | | | 3,232 | | | | | | 3,256 | |
7.50%, 11/01/31 | | | 9,406 | | | | | | 9,547 | |
2.73%, 04/01/32† | | | 2,396 | | | | | | 2,561 | |
3.50%, 01/01/33 | | | 4,733 | | | | | | 4,824 | |
3.50%, 07/01/33 | | | 5,956 | | | | | | 6,070 | |
5.00%, 08/01/33 | | | 14,459 | | | | | | 15,659 | |
5.00%, 09/01/33 | | | 2,811 | | | | | | 3,045 | |
| | | | |
| | See Notes to Financial Statements. | | 119 |
MEDIUM-DURATION BOND FUND
SCHEDULE OF INVESTMENTS (Continued)
| | | | | | | | | | |
| | | Par | | | Value | |
5.00%, 10/01/33 | | $ | 9,598 | | | | | $ | 10,397 | |
2.49%, 03/01/34† | | | 3,675 | | | | | | 3,877 | |
5.00%, 12/01/34 | | | 239,205 | | | | | | 258,683 | |
5.00%, 03/01/35 | | | 439,583 | | | | | | 475,438 | |
5.00%, 05/01/35 | | | 3,603 | | | | | | 3,896 | |
5.50%, 05/01/35 | | | 543,142 | | | | | | 596,437 | |
5.00%, 07/01/35 | | | 12,535 | | | | | | 13,567 | |
5.00%, 08/01/35 | | | 187,218 | | | | | | 202,359 | |
5.00%, 09/01/35 | | | 15,242 | | | | | | 16,448 | |
5.00%, 10/01/35 | | | 4,359 | | | | | | 4,707 | |
5.00%, 11/01/35 | | | 480,466 | | | | | | 517,856 | |
5.50%, 11/01/35 | | | 87,497 | | | | | | 95,626 | |
5.00%, 12/01/35 | | | 32,673 | | | | | | 35,802 | |
5.50%, 01/01/36 | | | 51,904 | | | | | | 57,165 | |
6.00%, 02/01/36 | | | 781,390 | | | | | | 872,464 | |
5.00%, 05/01/36 | | | 9,739 | | | | | | 10,506 | |
2.99%, 01/01/37† | | | 673,351 | | | | | | 712,254 | |
5.00%, 02/01/37 | | | 65,945 | | | | | | 70,993 | |
5.50%, 07/01/37 | | | 113,526 | | | | | | 125,228 | |
1.86%, 09/01/37† | | | 60,120 | | | | | | 62,641 | |
5.00%, 03/01/38 | | | 1,741,773 | | | | | | 1,875,916 | |
5.50%, 04/01/38 | | | 31,882 | | | | | | 34,748 | |
7.00%, 02/01/39 | | | 382,754 | | | | | | 427,000 | |
7.00%, 03/01/39 | | | 67,723 | | | | | | 77,007 | |
5.50%, 04/01/39 | | | 691,893 | | | | | | 756,674 | |
4.50%, 06/01/39 | | | 302,054 | | | | | | 319,725 | |
6.50%, 09/01/39 | | | 117,112 | | | | | | 130,332 | |
5.50%, 08/01/40 | | | 750,783 | | | | | | 818,259 | |
4.50%, 03/01/41 | | | 11,973 | | | | | | 12,687 | |
5.00%, 06/01/41 | | | 11,728 | | | | | | 12,648 | |
4.00%, 10/01/42 | | | 95,177 | | | | | | 97,013 | |
3.50%, 11/01/42 | | | 768,388 | | | | | | 754,909 | |
3.50%, 12/01/42 | | | 90,576 | | | | | | 88,984 | |
3.50%, 01/01/43 | | | 579,842 | | | | | | 569,675 | |
3.50%, 02/01/43 | | | 393,674 | | | | | | 386,759 | |
3.50%, 04/01/43 | | | 195,796 | | | | | | 193,019 | |
4.00%, 04/01/43 | | | 196,735 | | | | | | 200,534 | |
3.50%, 05/01/43 | | | 776,325 | | | | | | 771,574 | |
4.00%, 05/01/43 | | | 98,672 | | | | | | 101,969 | |
4.00%, 06/01/43 | | | 99,117 | | | | | | 102,437 | |
4.00%, 07/01/43 | | | 390,773 | | | | | | 403,669 | |
4.00%, 08/01/43 | | | 198,498 | | | | | | 202,306 | |
Federal Home Loan Mortgage
Corporation REMIC | | | | | | | | | | |
0.51%, 04/15/22 POW† | | | 8,895 | | | | | | 8,822 | |
2.99%, 06/15/27 IOW† | | | 946,953 | | | | | | 138,067 | |
0.48%, 09/15/31 IOW† | | | 840,319 | | | | | | 132,507 | |
6.00%, 05/15/36 | | | 612,511 | | | | | | 677,612 | |
0.67%, 06/15/37† | | | 522,981 | | | | | | 523,897 | |
17.48%, 07/15/37 IOW† | | | 2,980,937 | | | | | | 407,759 | |
13.18%, 01/15/40 IOW† | | | 747,138 | | | | | | 99,504 | |
3.26%, 05/15/40 IOW† | | | 289,358 | | | | | | 60,945 | |
4.53%, 10/15/41 IOW† | | | 428,100 | | | | | | 85,829 | |
5.17%, 11/15/41 IOW† | | | 415,817 | | | | | | 79,281 | |
4.36%, 06/15/42 IOW† | | | 87,359 | | | | | | 17,398 | |
2.49%, 07/15/42 IOW† | | | 90,909 | | | | | | 22,414 | |
3.50%, 08/15/42 IOW† | | | 90,506 | | | | | | 20,491 | |
3.82%, 10/15/42 IOW† | | | 374,167 | | | | | | 82,442 | |
2.49%, 11/15/42 IOW† | | | 92,229 | | | | | | 22,447 | |
3.51%, 11/15/42 IOW† | | | 93,982 | | | | | | 22,071 | |
4.30%, 11/15/42 IOW† | | | 93,784 | | | | | | 21,402 | |
4.51%, 12/15/42 IOW† | | | 190,979 | | | | | | 44,123 | |
5.98%, 01/15/43 IO† | | | 3,338 | | | | | | 699 | |
| | | | | | | | | | |
| | | Par | | | Value | |
3.00%, 05/15/43 | | $ | 400,723 | | | | | $ | 308,830 | |
3.00%, 07/15/43 | | | 202,513 | | | | | | 151,243 | |
Federal Housing Administration | | | | | | | | | | |
7.43%, 10/01/18@ | | | 52,686 | | | | | | 54,462 | |
Federal National Mortgage
Association | | | | | | | | | | |
8.00%, 06/01/15 | | | 4,566 | | | | | | 4,690 | |
8.00%, 09/01/15 | | | 4,741 | | | | | | 4,894 | |
3.07%, 12/01/17 | | | 950,350 | | | | | | 996,015 | |
5.00%, 12/01/17 | | | 17,159 | | | | | | 18,297 | |
2.80%, 03/01/18 | | | 567,655 | | | | | | 592,130 | |
3.74%, 05/01/18 | | | 1,350,047 | | | | | | 1,450,295 | |
3.84%, 05/01/18 | | | 420,000 | | | | | | 453,129 | |
4.51%, 06/01/19 | | | 1,000,000 | | | | | | 1,096,285 | |
3.42%, 10/01/20 | | | 286,907 | | | | | | 296,242 | |
3.63%, 12/01/20 | | | 191,532 | | | | | | 199,199 | |
4.38%, 06/01/21 | | | 689,479 | | | | | | 748,488 | |
9.50%, 05/01/22 | | | 1,121 | | | | | | 1,240 | |
2.20%, 07/01/22† | | | 6,660 | | | | | | 6,696 | |
5.50%, 09/01/23 | | | 132,388 | | | | | | 145,110 | |
5.50%, 10/01/23 | | | 27,341 | | | | | | 29,975 | |
5.00%, 05/01/24 | | | 92,261 | | | | | | 100,112 | |
9.50%, 07/01/24 | | | 2,106 | | | | | | 2,341 | |
5.50%, 05/01/25 | | | 812,435 | | | | | | 868,486 | |
3.00%, 01/01/26 TBA | | | 6,000,000 | | | | | | 6,123,047 | |
3.50%, 01/01/26 TBA | | | 400,000 | | | | | | 418,297 | |
3.50%, 09/01/26 TBA | | | 1,000,000 | | | | | | 1,045,742 | |
2.21%, 07/01/27† | | | 20,124 | | | | | | 20,706 | |
2.27%, 08/01/27† | | | 38,897 | | | | | | 41,536 | |
2.21%, 11/01/27 CONV† | | | 24,137 | | | | | | 24,844 | |
2.50%, 01/01/28 TBA | | | 1,000,000 | | | | | | 989,688 | |
2.50%, 07/01/28 | | | 753,899 | | | | | | 746,993 | |
2.50%, 08/01/28 | | | 1,012,777 | | | | | | 1,003,500 | |
2.50%, 09/01/28 | | | 211,146 | | | | | | 209,212 | |
2.76%, 02/01/30† | | | 113,508 | | | | | | 121,628 | |
2.51%, 06/01/30 CONV† | | | 16,639 | | | | | | 16,924 | |
8.00%, 10/01/30 | | | 25,508 | | | | | | 30,388 | |
2.63%, 12/01/30 CONV† | | | 6,270 | | | | | | 6,406 | |
2.21%, 01/01/31† | | | 7,041 | | | | | | 7,081 | |
4.50%, 04/01/31 | | | 159,917 | | | | | | 171,883 | |
2.32%, 05/01/31† | | | 15,003 | | | | | | 15,319 | |
4.50%, 05/01/31 | | | 540,349 | | | | | | 580,874 | |
4.50%, 06/01/31 | | | 162,257 | | | | | | 174,418 | |
4.50%, 11/01/31 | | | 225,306 | | | | | | 241,327 | |
6.00%, 11/01/31 | | | 5,196 | | | | | | 5,832 | |
4.50%, 12/01/31 | | | 314,944 | | | | | | 337,166 | |
6.00%, 01/01/32 | | | 66,278 | | | | | | 73,402 | |
6.00%, 03/01/32 | | | 18,899 | | | | | | 20,971 | |
6.00%, 04/01/32 | | | 248,629 | | | | | | 275,996 | |
2.21%, 06/01/32† | | | 8,586 | | | | | | 8,796 | |
2.20%, 08/01/32† | | | 10,946 | | | | | | 11,503 | |
6.00%, 08/01/32 | | | 2,729 | | | | | | 3,065 | |
2.25%, 02/01/33† | | | 2,853 | | | | | | 2,879 | |
5.50%, 04/01/33 | | | 50,219 | | | | | | 56,021 | |
2.20%, 05/01/33† | | | 44,975 | | | | | | 47,088 | |
6.00%, 05/01/33 | | | 551 | | | | | | 613 | |
5.00%, 07/01/33 | | | 74,662 | | | | | | 81,317 | |
3.50%, 08/01/33 | | | 97,743 | | | | | | 99,529 | |
5.00%, 08/01/33 | | | 5,848 | | | | | | 6,383 | |
5.00%, 09/01/33 | | | 698,629 | | | | | | 760,308 | |
5.50%, 09/01/33 | | | 10,157 | | | | | | 11,212 | |
3.50%, 10/01/33 | | | 198,006 | | | | | | 201,626 | |
3.50%, 11/01/33 | | | 99,267 | | | | | | 101,084 | |
| | | | |
| 120 | | See Notes to Financial Statements. | | |
| | | | | | | | | | |
| | | Par | | | Value | |
3.50%, 12/01/33 | | $ | 99,787 | | | | | $ | 101,611 | |
5.00%, 12/01/33 | | | 577,020 | | | | | | 628,545 | |
5.50%, 12/01/33 | | | 14,245 | | | | | | 15,784 | |
6.00%, 12/01/33 | | | 940 | | | | | | 1,055 | |
5.50%, 02/01/34 | | | 25,775 | | | | | | 28,436 | |
5.50%, 04/01/34 | | | 2,699 | | | | | | 2,984 | |
5.50%, 05/01/34 | | | 125,193 | | | | | | 137,935 | |
5.50%, 08/01/34 | | | 5,865 | | | | | | 6,547 | |
5.50%, 10/01/34 | | | 276 | | | | | | 307 | |
6.00%, 10/01/34 | | | 31,769 | | | | | | 35,205 | |
5.50%, 11/01/34 | | | 12,767 | | | | | | 14,050 | |
2.19%, 12/01/34† | | | 126,135 | | | | | | 133,138 | |
5.50%, 12/01/34 | | | 28,586 | | | | | | 31,656 | |
6.00%, 12/01/34 | | | 703 | | | | | | 778 | |
5.50%, 02/01/35 | | | 3,118 | | | | | | 3,429 | |
6.00%, 05/01/35 | | | 1,301,936 | | | | | | 1,452,020 | |
5.50%, 07/01/35 | | | 334 | | | | | | 373 | |
6.00%, 07/01/35 | | | 282,805 | | | | | | 313,310 | |
5.50%, 08/01/35 | | | 568 | | | | | | 626 | |
6.00%, 08/01/35 | | | 150 | | | | | | 166 | |
5.50%, 09/01/35 | | | 99,912 | | | | | | 109,929 | |
5.00%, 10/01/35 | | | 250,664 | | | | | | 273,016 | |
6.00%, 10/01/35 | | | 54,483 | | | | | | 60,878 | |
2.09%, 11/01/35† | | | 99,106 | | | | | | 104,318 | |
2.11%, 11/01/35† | | | 90,693 | | | | | | 95,697 | |
2.12%, 11/01/35† | | | 130,027 | | | | | | 136,878 | |
2.14%, 11/01/35† | | | 87,019 | | | | | | 91,554 | |
2.14%, 11/01/35† | | | 120,576 | | | | | | 126,916 | |
2.21%, 11/01/35† | | | 17,661 | | | | | | 18,179 | |
6.00%, 11/01/35 | | | 675,883 | | | | | | 758,389 | |
5.50%, 12/01/35 | | | 2,613 | | | | | | 2,916 | |
6.00%, 12/01/35 | | | 12,514 | | | | | | 13,991 | |
6.00%, 01/01/36 | | | 109,505 | | | | | | 122,292 | |
6.00%, 02/01/36 | | | 6,373 | | | | | | 7,058 | |
6.00%, 03/01/36 | | | 7,612 | | | | | | 8,437 | |
5.50%, 04/01/36 | | | 92,889 | | | | | | 99,231 | |
6.00%, 04/01/36 | | | 12,187 | | | | | | 13,571 | |
3.85%, 05/01/36† | | | 153,877 | | | | | | 161,008 | |
5.50%, 09/01/36 | | | 21,356 | | | | | | 23,524 | |
5.50%, 11/01/36 | | | 239,487 | | | | | | 263,082 | |
6.00%, 01/01/37 | | | 1,526 | | | | | | 1,689 | |
1.77%, 02/01/37† | | | 731,287 | | | | | | 760,200 | |
5.50%, 02/01/37 | | | 325 | | | | | | 358 | |
6.00%, 02/01/37 | | | 992,739 | | | | | | 1,103,114 | |
5.50%, 03/01/37 | | | 14,285 | | | | | | 15,705 | |
6.00%, 03/01/37 | | | 54,196 | | | | | | 60,508 | |
5.50%, 04/01/37 | | | 588 | | | | | | 647 | |
5.50%, 05/01/37 | | | 618 | | | | | | 682 | |
5.50%, 06/01/37 | | | 248 | | | | | | 273 | |
6.00%, 06/01/37 | | | 402 | | | | | | 445 | |
6.00%, 07/01/37 | | | 2,211,365 | | | | | | 2,464,610 | |
5.50%, 08/01/37 | | | 648,321 | | | | | | 712,805 | |
6.50%, 10/01/37 | | | 152,625 | | | | | | 169,658 | |
7.00%, 10/01/37 | | | 12,992 | | | | | | 13,698 | |
7.00%, 11/01/37 | | | 11,111 | | | | | | 12,951 | |
2.21%, 12/01/37† | | | 67,512 | | | | | | 70,303 | |
7.00%, 12/01/37 | | | 8,972 | | | | | | 9,745 | |
2.21%, 01/01/38† | | | 42,063 | | | | | | 43,765 | |
6.00%, 01/01/38 | | | 540,476 | | | | | | 598,980 | |
5.00%, 02/01/38 TBA | | | 1,000,000 | | | | | | 1,082,891 | |
5.50%, 02/01/38 | | | 8,392 | | | | | | 9,229 | |
6.00%, 02/01/38 | | | 4,532 | | | | | | 5,014 | |
7.00%, 02/01/38 | | | 13,847 | | | | | | 16,139 | |
4.50%, 03/01/38 | | | 17,423 | | | | | | 18,440 | |
| | | | | | | | | | |
| | | Par | | | Value | |
5.50%, 03/01/38 | | $ | 789 | | | | | $ | 866 | |
6.00%, 03/01/38 | | | 1,404 | | | | | | 1,558 | |
4.50%, 04/01/38 | | | 659,356 | | | | | | 698,119 | |
6.00%, 04/01/38 | | | 812 | | | | | | 899 | |
5.50%, 05/01/38 | | | 253 | | | | | | 280 | |
6.00%, 05/01/38 | | | 80,371 | | | | | | 88,979 | |
5.50%, 06/01/38 | | | 1,281 | | | | | | 1,419 | |
5.50%, 07/01/38 | | | 129,816 | | | | | | 142,983 | |
5.50%, 08/01/38 | | | 197,151 | | | | | | 217,213 | |
7.00%, 08/01/38 | | | 13,356 | | | | | | 15,455 | |
5.50%, 09/01/38 | | | 633 | | | | | | 701 | |
6.00%, 11/01/38 | | | 98,023 | | | | | | 108,479 | |
7.00%, 11/01/38 | | | 70,627 | | | | | | 76,357 | |
5.50%, 12/01/38 | | | 409 | | | | | | 449 | |
7.00%, 02/01/39 | | | 31,864 | | | | | | 35,769 | |
7.00%, 03/01/39 | | | 287,696 | | | | | | 322,492 | |
6.00%, 09/01/39 | | | 226,500 | | | | | | 250,837 | |
6.00%, 10/01/39 | | | 74,440 | | | | | | 82,661 | |
5.50%, 12/01/39 | | | 328,009 | | | | | | 363,501 | |
6.00%, 12/01/39 | | | 1,098,733 | | | | | | 1,215,470 | |
5.00%, 01/01/40 TBA | | | 2,900,000 | | | | | | 3,149,445 | |
1.54%, 06/01/40† | | | 63,049 | | | | | | 65,599 | |
5.00%, 08/01/40 | | | 67,105 | | | | | | 73,053 | |
1.54%, 10/01/40† | | | 164,849 | | | | | | 171,548 | |
6.00%, 10/01/40 | | | 516,347 | | | | | | 571,813 | |
2.21%, 11/01/40† | | | 26,866 | | | | | | 27,694 | |
4.00%, 01/01/41 TBA | | | 6,000,000 | | | | | | 6,176,250 | |
4.50%, 01/01/41 | | | 1,464,375 | | | | | | 1,550,381 | |
4.00%, 02/01/41 TBA | | | 3,000,000 | | | | | | 3,078,750 | |
6.00%, 05/01/41 | | | 3,129,326 | | | | | | 3,465,665 | |
4.50%, 06/01/41 | | | 793,548 | | | | | | 840,978 | |
4.50%, 08/01/41 | | | 167,667 | | | | | | 177,729 | |
4.50%, 09/01/41 | | | 494,595 | | | | | | 524,134 | |
4.50%, 10/01/41 | | | 44,785 | | | | | | 47,465 | |
4.50%, 11/01/41 | | | 623,843 | | | | | | 662,823 | |
4.50%, 01/01/42 TBA | | | 1,000,000 | | | | | | 1,059,570 | |
5.00%, 05/01/42 | | | 234,049 | | | | | | 255,417 | |
4.00%, 06/01/42 | | | 97,267 | | | | | | 100,268 | |
3.00%, 08/01/42 | | | 357,841 | | | | | | 340,222 | |
3.00%, 09/01/42 | | | 309,218 | | | | | | 294,022 | |
2.50%, 10/01/42 | | | 660,775 | | | | | | 598,850 | |
3.50%, 10/01/42 | | | 1,818,912 | | | | | | 1,785,376 | |
4.00%, 10/01/42 | | | 382,381 | | | | | | 390,123 | |
3.00%, 11/01/42 | | | 138,176 | | | | | | 131,386 | |
3.00%, 12/01/42 | | | 1,909,853 | | | | | | 1,815,831 | |
3.50%, 12/01/42 | | | 573,869 | | | | | | 565,320 | |
4.00%, 12/01/42 | | | 275,758 | | | | | | 289,216 | |
2.50%, 01/01/43 TBA | | | 1,000,000 | | | | | | 904,922 | |
3.00%, 01/01/43 | | | 1,788,080 | | | | | | 1,694,498 | |
3.00%, 01/01/43 TBA | | | 2,400,000 | | | | | | 2,278,313 | |
2.50%, 02/01/43 | | | 7,944,815 | | | | | | 7,199,348 | |
3.00%, 02/01/43 | | | 493,344 | | | | | | 469,058 | |
3.00%, 03/01/43 | | | 434,313 | | | | | | 412,968 | |
3.50%, 03/01/43 | | | 291,503 | | | | | | 287,159 | |
3.00%, 04/01/43 | | | 533,431 | | | | | | 507,239 | |
3.50%, 04/01/43 | | | 1,267,917 | | | | | | 1,249,027 | |
4.00%, 04/01/43 | | | 96,937 | | | | | | 100,101 | |
2.50%, 05/01/43 | | | 957,636 | | | | | | 867,729 | |
3.00%, 05/01/43 | | | 22,170,236 | | | | | | 21,071,692 | |
3.50%, 05/01/43 | | | 97,969 | | | | | | 96,509 | |
4.00%, 05/01/43 | | | 388,677 | | | | | | 400,970 | |
3.00%, 06/01/43 | | | 1,097,356 | | | | | | 1,043,109 | |
4.00%, 06/01/43 | | | 974,376 | | | | | | 1,005,469 | |
| | | | |
| | See Notes to Financial Statements. | | 121 |
MEDIUM-DURATION BOND FUND
SCHEDULE OF INVESTMENTS (Continued)
| | | | | | | | | | |
| | | Par | | | Value | |
3.00%, 07/01/43 | | $ | 832,575 | | | | | $ | 791,683 | |
4.00%, 07/01/43 | | | 974,698 | | | | | | 1,005,514 | |
4.00%, 08/01/43 | | | 297,803 | | | | | | 303,808 | |
3.00%, 09/01/43 | | | 505,772 | | | | | | 480,717 | |
3.00%, 12/01/43 | | | 2,494,227 | | | | | | 2,370,636 | |
Federal National
Mortgage Association Interest STRIP | | | | | | | | | | |
6.50%, 04/25/27 IOW† | | | 719,395 | | | | | | 81,600 | |
10.43%, 11/25/39 IOW† | | | 155,910 | | | | | | 28,734 | |
3.79%, 11/25/41 IOW† | | | 385,516 | | | | | | 83,514 | |
5.18%, 04/25/42 IOW† | | | 986,306 | | | | | | 240,253 | |
Federal National
Mortgage Association REMIC | | | | | | | | | | |
18.60%, 08/25/21 IOW† | | | 76 | | | | | | 1,462 | |
18.06%, 10/25/21 IOW† | | | 125 | | | | | | 2,480 | |
3.26%, 07/25/27 IOW† | | | 1,956,627 | | | | | | 254,567 | |
0.76%, 05/25/30† | | | 22,084 | | | | | | 22,086 | |
0.62%, 10/18/30† | | | 23,056 | | | | | | 23,017 | |
0.00%, 10/25/35 IOW†@ | | | 236,440 | | | | | | 37,879 | |
13.03%, 03/25/37 IOW† | | | 1,784,842 | | | | | | 276,713 | |
15.34%, 11/25/37 IOW† | | | 19,636 | | | | | | 2,715 | |
6.50%, 06/25/39 | | | 68,178 | | | | | | 76,012 | |
2.02%, 07/25/39 IOW† | | | 231,384 | | | | | | 41,934 | |
2.20%, 12/25/39 IOW† | | | 653,304 | | | | | | 129,295 | |
0.00%, 05/25/40 IOW†@ | | | 482,976 | | | | | | 66,902 | |
7.36%, 07/25/40 IOW† | | | 557,228 | | | | | | 100,215 | |
4.37%, 10/25/40 IOW† | | | 882,439 | | | | | | 166,339 | |
0.00%, 11/25/40 IOW†@ | | | 755,004 | | | | | | 104,308 | |
13.42%, 12/25/40 IOW† | | | 197,696 | | | | | | 22,418 | |
14.87%, 01/25/41 IOW† | | | 333,962 | | | | | | 49,929 | |
1.14%, 02/25/41 IOW† | | | 86,322 | | | | | | 18,193 | |
6.50%, 05/15/41 | | | 1,472,942 | | | | | | 1,657,759 | |
5.00%, 06/25/41 | | | 750,000 | | | | | | 812,218 | |
5.50%, 07/25/41 | | | 917,633 | | | | | | 1,003,369 | |
15.06%, 07/25/41 IOW† | | | 379,858 | | | | | | 50,788 | |
0.71%, 09/25/41† | | | 5,081,179 | | | | | | 5,132,214 | |
7.61%, 09/25/41 IOW† | | | 1,001,923 | | | | | | 155,851 | |
13.33%, 10/25/41 IOW† | | | 1,088,827 | | | | | | 159,267 | |
9.78%, 03/25/42 IOW† | | | 484,004 | | | | | | 75,447 | |
5.50%, 04/25/42 | | | 1,875,668 | | | | | | 2,044,439 | |
6.00%, 05/25/42 | | | 574,528 | | | | | | 628,215 | |
6.50%, 07/25/42 | | | 944,290 | | | | | | 1,034,284 | |
6.94%, 07/25/42 IOW† | | | 154,159 | | | | | | 30,234 | |
7.00%, 07/25/42 | | | 380,756 | | | | | | 420,670 | |
4.36%, 09/25/42 IOW† | | | 272,724 | | | | | | 58,182 | |
7.00%, 10/25/42 | | | 140,118 | | | | | | 154,794 | |
4.34%, 11/25/42 IOW† | | | 189,812 | | | | | | 43,168 | |
4.63%, 11/25/42 IOW† | | | 282,418 | | | | | | 64,278 | |
2.69%, 12/25/42 IOW† | | | 94,808 | | | | | | 23,011 | |
3.81%, 12/25/42 IOW† | | | 277,277 | | | | | | 61,186 | |
4.20%, 12/25/42 IOW† | | | 186,693 | | | | | | 40,491 | |
3.02%, 03/25/43 IOW† | | | 191,391 | | | | | | 46,450 | |
2.50%, 04/25/43 | | | 202,513 | | | | | | 137,317 | |
FHLMC Multifamily Structured
Pass Through Certificates | | | | | | | | | | |
4.56%, 05/25/18 IOW† | | | 1,945,502 | | | | | | 150,928 | |
4.32%, 11/25/19 | | | 1,100,000 | | | | | | 1,201,281 | |
4.63%, 01/25/20 IOW† | | | 3,779,655 | | | | | | 191,402 | |
3.85%, 04/25/20 IOW† | | | 2,454,546 | | | | | | 139,451 | |
4.84%, 06/25/20 IOW† | | | 1,366,661 | | | | | | 109,585 | |
4.57%, 08/25/20 IOW† | | | 1,208,277 | | | | | | 88,110 | |
4.64%, 07/25/21 IOW† | | | 1,423,613 | | | | | | 139,501 | |
4.55%, 10/25/21 IOW† | | | 898,714 | | | | | | 86,000 | |
4.75%, 12/25/21 IOW† | | | 736,532 | | | | | | 64,116 | |
| | | | | | | | | | |
| | | Par | | | Value | |
2.78%, 09/25/22 | | $ | 296,334 | | | | | $ | 301,712 | |
4.55%, 09/25/22 IOW† | | | 149,220 | | | | | | 8,937 | |
2.52%, 01/25/23 | | | 1,100,000 | | | | | | 1,030,768 | |
2.64%, 01/25/23 | | | 1,800,000 | | | | | | 1,690,436 | |
3.25%, 04/25/23 | | | 1,700,000 | | | | | | 1,677,235 | |
3.53%, 07/25/23 | | | 900,000 | | | | | | 900,094 | |
FHLMC Multifamily VRD Certificates | | | | | | | | | | |
5.50%, 08/15/51 | | | 3,500,000 | | | | | | 3,874,308 | |
FHLMC Structured Pass-Through Securities | | | | | | | | | | |
1.54%, 07/25/44† | | | 1,306,543 | | | | | | 1,329,230 | |
First Horizon Alternative Mortgage Securities Trust | | | | | | | | | | |
2.21%, 06/25/34† | | | 657,764 | | | | | | 636,343 | |
FREMF Mortgage Trust | | | | | | | | | | |
4.02%, 11/25/44 144A | | | 300,000 | | | | | | 299,722 | |
3.88%, 01/25/47 144A | | | 225,000 | | | | | | 215,735 | |
Government National
Mortgage
Association | | | | | | | | | | |
3.95%, 07/15/25 | | | 155,264 | | | | | | 160,560 | |
7.00%, 10/15/25 | | | 12,818 | | | | | | 13,154 | |
7.00%, 01/15/26 | | | 5,563 | | | | | | 6,221 | |
7.00%, 07/15/27 | | | 69,772 | | | | | | 81,120 | |
7.00%, 12/15/27 | | | 1,319 | | | | | | 1,366 | |
7.00%, 01/15/28 | | | 15,803 | | | | | | 16,294 | |
7.00%, 03/15/28 | | | 95,726 | | | | | | 109,350 | |
7.00%, 07/15/28 | | | 11,797 | | | | | | 13,198 | |
7.50%, 07/15/28 | | | 13,215 | | | | | | 13,679 | |
6.50%, 08/15/28 | | | 6,792 | | | | | | 7,655 | |
7.00%, 08/15/28 | | | 20,742 | | | | | | 23,963 | |
7.50%, 08/15/28 | | | 9,971 | | | | | | 11,320 | |
6.50%, 09/15/28 | | | 31,460 | | | | | | 35,517 | |
7.00%, 10/15/28 | | | 39,268 | | | | | | 42,430 | |
7.50%, 03/15/29 | | | 26,988 | | | | | | 31,836 | |
7.50%, 11/15/29 | | | 21,239 | | | | | | 22,180 | |
1.63%, 11/20/29† | | | 46,618 | | | | | | 48,339 | |
8.50%, 08/15/30 | | | 1,605 | | | | | | 1,872 | |
8.50%, 11/20/30 | | | 9,625 | | | | | | 11,327 | |
6.50%, 08/15/31 | | | 52,223 | | | | | | 58,613 | |
7.50%, 08/15/31 | | | 11,768 | | | | | | 13,397 | |
6.50%, 10/15/31 | | | 94,329 | | | | | | 106,674 | |
6.00%, 11/15/31 | | | 263,546 | | | | | | 292,593 | |
6.50%, 11/15/31 | | | 199,590 | | | | | | 224,013 | |
6.00%, 12/15/31 | | | 60,074 | | | | | | 66,695 | |
6.00%, 01/15/32 | | | 129,295 | | | | | | 145,118 | |
6.00%, 02/15/32 | | | 226,878 | | | | | | 251,884 | |
6.50%, 02/15/32 | | | 163,234 | | | | | | 182,625 | |
6.00%, 04/15/32 | | | 85,056 | | | | | | 94,606 | |
7.50%, 04/15/32 | | | 67,512 | | | | | | 70,368 | |
6.50%, 06/15/32 | | | 109,247 | | | | | | 122,616 | |
6.50%, 07/15/32 | | | 2,040 | | | | | | 2,289 | |
6.50%, 08/15/32 | | | 245,221 | | | | | | 275,228 | |
6.50%, 09/15/32 | | | 220,103 | | | | | | 247,036 | |
6.00%, 10/15/32 | | | 147,211 | | | | | | 163,436 | |
5.50%, 11/15/32 | | | 42,582 | | | | | | 47,147 | |
6.00%, 11/15/32 | | | 120,068 | | | | | | 133,879 | |
6.00%, 12/15/32 | | | 60,591 | | | | | | 67,269 | |
6.50%, 12/15/32 | | | 21,714 | | | | | | 24,371 | |
5.50%, 01/15/33 | | | 38,288 | | | | | | 42,387 | |
6.00%, 01/15/33 | | | 85,406 | | | | | | 94,820 | |
5.50%, 02/15/33 | | | 35,271 | | | | | | 39,048 | |
6.00%, 02/15/33 | | | 63,033 | | | | | | 69,980 | |
| | | | |
| 122 | | See Notes to Financial Statements. | | |
| | | | | | | | | | |
| | | Par | | | Value | |
5.50%, 03/15/33 | | $ | 38,105 | | | | | $ | 42,184 | |
6.50%, 04/15/33 | | | 425,008 | | | | | | 477,015 | |
6.00%, 05/15/33 | | | 356,314 | | | | | | 395,586 | |
6.00%, 06/15/33 | | | 22,046 | | | | | | 24,476 | |
5.50%, 07/15/33 | | | 43,719 | | | | | | 48,494 | |
5.50%, 08/15/33 | | | 24,576 | | | | | | 27,207 | |
5.50%, 09/15/33 | | | 21,793 | | | | | | 24,207 | |
6.00%, 10/15/33 | | | 179,760 | | | | | | 199,573 | |
6.50%, 10/15/33 | | | 163,737 | | | | | | 183,773 | |
6.00%, 12/15/33 | | | 375,940 | | | | | | 417,375 | |
5.50%, 04/15/34 | | | 23,294 | | | | | | 25,828 | |
5.50%, 05/15/34 | | | 26,465 | | | | | | 29,343 | |
6.50%, 08/15/34 | | | 391,560 | | | | | | 444,317 | |
5.50%, 09/15/34 | | | 218,445 | | | | | | 242,202 | |
5.50%, 12/15/34 | | | 166,939 | | | | | | 185,096 | |
5.50%, 01/15/35 | | | 192,814 | | | | | | 214,148 | |
2.25%, 03/16/35 | | | 378,989 | | | | | | 379,255 | |
5.86%, 02/16/36 IOW† | | | 543,709 | | | | | | 72,234 | |
0.47%, 03/20/37† | | | 960,944 | | | | | | 963,562 | |
0.47%, 05/20/37† | | | 423,873 | | | | | | 424,227 | |
6.82%, 02/20/38 IOW† | | | 437,288 | | | | | | 74,159 | |
6.00%, 09/20/38 | | | 641,837 | | | | | | 722,702 | |
7.63%, 03/20/39 IOW† | | | 140,777 | | | | | | 22,838 | |
11.06%, 01/20/40 IOW† | | | 173,954 | | | | | | 30,053 | |
4.50%, 03/15/40 | | | 322,687 | | | | | | 344,768 | |
5.00%, 07/20/40 | | | 47,109 | | | | | | 51,594 | |
5.00%, 09/20/40 | | | 187,448 | | | | | | 205,288 | |
6.00%, 10/20/40 | | | 78,216 | | | | | | 87,183 | |
3.50%, 01/15/41 TBA | | | 1,900,000 | | | | | | 1,914,918 | |
4.00%, 01/20/41 TBA | | | 3,200,000 | | | | | | 3,327,125 | |
6.00%, 01/20/41 | | | 98,256 | | | | | | 109,827 | |
4.50%, 04/20/41 | | | 935,570 | | | | | | 1,004,275 | |
3.50%, 01/20/42 TBA | | | 2,100,000 | | | | | | 2,118,457 | |
2.50%, 12/20/42 | | | 48,032 | | | | | | 44,216 | |
3.00%, 01/15/43 TBA | | | 30,000,000 | | | | | | 28,971,093 | |
0.00%, 08/16/43 IOW†@ | | | 482,697 | | | | | | 72,530 | |
2.90%, 02/16/44W† | | | 1,075,896 | | | | | | 1,103,965 | |
2.90%, 06/16/44 | | | 358,421 | | | | | | 367,598 | |
2.00%, 12/16/49 | | | 450,000 | | | | | | 448,268 | |
10.12%, 08/16/52 IOW† | | | 878,296 | | | | | | 57,673 | |
10.70%, 06/16/55 IOW† | | | 921,028 | | | | | | 60,780 | |
0.57%, 12/20/60† | | | 449,661 | | | | | | 445,054 | |
0.65%, 03/20/61† | | | 530,725 | | | | | | 527,959 | |
0.67%, 03/20/61† | | | 349,659 | | | | | | 348,123 | |
0.52%, 12/20/62† | | | 1,716,156 | | | | | | 1,693,952 | |
Granite Master Issuer PLC | | | | | | | | | | |
0.25%, 12/20/54† | | | 1,726,313 | | | | | | 1,707,614 | |
0.31%, 12/20/54† | | | 412,254 | | | | | | 407,788 | |
0.45%, 12/20/54(E)† | | | 206,127 | | | | | | 281,302 | |
0.47%, 12/20/54(E)† | | | 25,766 | | | | | | 35,180 | |
0.71%, 12/20/54(U)† | | | 51,532 | | | | | | 84,558 | |
0.73%, 12/20/54(U)† | | | 489,552 | | | | | | 803,625 | |
0.81%, 12/20/54(U)† | | | 51,532 | | | | | | 84,694 | |
Granite Mortgages 03-3 PLC | | | | | | | | | | |
0.60%, 01/20/44(E)† | | | 146,878 | | | | | | 201,222 | |
0.90%, 01/20/44(U)† | | | 44,590 | | | | | | 73,393 | |
GreenPoint Mortgage Funding Trust | | | | | | | | | | |
0.34%, 01/25/37† | | | 964,310 | | | | | | 673,106 | |
GS Mortgage Securities Corporation II | | | | | | | | | | |
4.27%, 11/10/46 | | | 670,000 | | | | | | 686,830 | |
4.65%, 11/10/46 | | | 190,000 | | | | | | 195,554 | |
5.16%, 11/10/46† | | | 150,000 | | | | | | 154,037 | |
| | | | | | | | | | |
| | | Par | | | Value | |
GS Mortgage Securities Corporation Trust | | | | | | | | | | |
3.55%, 04/10/34 144A | | $ | 116,000 | | | | | $ | 114,053 | |
GS Mortgage Securities Trust | | | | | | | | | | |
4.82%, 08/10/44 IO 144AW† | | | 465,697 | | | | | | 33,092 | |
4.04%, 07/10/46† | | | 80,000 | | | | | | 81,947 | |
GSMPS Mortgage Loan Trust | | | | | | | | | | |
0.62%, 02/25/35 144A† | | | 99,486 | | | | | | 91,578 | |
GSR Mortgage Loan Trust | | | | | | | | | | |
2.65%, 09/25/35† | | | 461,778 | | | | | | 458,659 | |
Impac CMB Trust | | | | | | | | | | |
0.88%, 10/25/34† | | | 77,340 | | | | | | 65,546 | |
0.42%, 11/25/35† | | | 812,977 | | | | | | 618,676 | |
IndyMac ARM Trust | | | | | | | | | | |
1.72%, 01/25/32† | | | 7,518 | | | | | | 7,153 | |
IndyMac INDX Mortgage Loan Trust | | | | | | | | | | |
0.35%, 09/25/46† | | | 1,048,373 | | | | | | 868,824 | |
JP Morgan Alternative Loan Trust | | | | | | | | | | |
0.42%, 01/25/36† | | | 416,956 | | | | | | 377,922 | |
JP Morgan Chase Commercial Mortgage Securities Trust | | | | | | | | | | |
5.87%, 02/12/51† | | | 10,000 | | | | | | 11,315 | |
5.93%, 02/12/51† | | | 300,000 | | | | | | 337,554 | |
JP Morgan Mortgage Trust | | | | | | | | | | |
3.55%, 02/25/35† | | | 160,024 | | | | | | 160,639 | |
JPMBB Commercial Mortgage Securities Trust | | | | | | | | | | |
4.42%, 11/15/45 | | | 220,000 | | | | | | 224,965 | |
5.08%, 11/15/45 144A† | | | 100,000 | | | | | | 89,660 | |
5.08%, 11/15/45† | | | 90,000 | | | | | | 90,413 | |
4.89%, 01/15/47† | | | 50,000 | | | | | | 50,576 | |
LB Commercial Mortgage Trust | | | | | | | | | | |
5.84%, 07/15/44† | | | 1,950,806 | | | | | | 2,164,895 | |
5.88%, 07/15/44† | | | 130,000 | | | | | | 144,312 | |
LB-UBS Commercial Mortgage Trust 0.00%, | | | | | | | | | | |
06/15/36 IO 144AW†@ | | | 450,044 | | | | | | 1,086 | |
6.16%, 09/15/45† | | | 70,000 | | | | | | 80,010 | |
Leek Finance Number Seventeen PLC | | | | | | | | | | |
0.53%, 12/21/37 144A† | | | 173,760 | | | | | | 178,993 | |
0.57%, 12/21/37(E)† | | | 69,504 | | | | | | 99,464 | |
0.81%, 12/21/37(U)† | | | 34,752 | | | | | | 59,736 | |
Leek Finance Number Eighteen PLC | | | | | | | | | | |
0.51%, 09/21/38† | | | 417,880 | | | | | | 429,092 | |
0.55%, 09/21/38(E)† | | | 52,235 | | | | | | 74,056 | |
Lehman XS Trust | | | | | | | | | | |
0.46%, 11/25/35† | | | 588,887 | | | | | | 514,229 | |
Luminent Mortgage Trust | | | | | | | | | | |
0.33%, 12/25/36† | | | 2,424,824 | | | | | | 1,791,229 | |
0.36%, 02/25/46† | | | 703,596 | | | | | | 495,004 | |
MASTR Adjustable Rate Mortgages Trust | | | | | | | | | | |
2.40%, 05/25/34† | | | 220,226 | | | | | | 215,898 | |
0.80%, 11/25/34† | | | 378,325 | | | | | | 366,074 | |
2.53%, 11/25/35 144A† | | | 880,213 | | | | | | 589,761 | |
Merrill Lynch Mortgage Investors Trust | | | | | | | | | | |
1.09%, 11/25/29† | | | 290,037 | | | | | | 282,989 | |
1.60%, 10/25/35† | | | 66,243 | | | | | | 64,052 | |
| | | | |
| | See Notes to Financial Statements. | | 123 |
MEDIUM-DURATION BOND FUND
SCHEDULE OF INVESTMENTS (Continued)
| | | | | | | | | | |
| | | Par | | | Value | |
MLCC Mortgage Investors, Inc. | | | | | | | | | | |
0.84%, 04/25/28† | | $ | 279,434 | | | | | $ | 274,533 | |
Morgan Stanley Bank of America Merrill Lynch Trust | | | | | | | | | | |
5.30%, 08/15/45 IO 144AW† | | | 1,002,075 | | | | | | 94,904 | |
2.92%, 02/15/46 | | | 120,000 | | | | | | 112,797 | |
3.21%, 02/15/46 | | | 121,000 | | | | | | 113,253 | |
3.10%, 05/15/46 | | | 300,000 | | | | | | 284,185 | |
3.46%, 05/15/46 | | | 140,000 | | | | | | 132,339 | |
Morgan Stanley Capital I Trust | | | | | | | | | | |
5.48%, 02/12/44† | | | 50,000 | | | | | | 55,123 | |
Permanent Master Issuer PLC | | | | | | | | | | |
1.64%, 07/15/42 144A†@ | | | 1,000,000 | | | | | | 1,004,820 | |
Prime Mortgage Trust | | | | | | | | | | |
5.50%, 05/25/35 144A | | | 3,159,241 | | | | | | 3,024,822 | |
6.00%, 05/25/35 144A | | | 2,726,241 | | | | | | 2,756,652 | |
RBSCF Trust | | | | | | | | | | |
3.83%, 01/13/32 144A† | | | 800,000 | | | | | | 787,632 | |
Reperforming Loan REMIC Trust | | | | | | | | | | |
0.58%, 11/25/34 144A† | | | 14,517 | | | | | | 12,572 | |
0.52%, 03/25/35 144A† | | | 57,996 | | | | | | 50,534 | |
Sequoia Mortgage Trust | | | | | | | | | | |
1.06%, 07/20/33† | | | 144,247 | | | | | | 132,046 | |
Structured Adjustable Rate Mortgage Loan Trust | | | | | | | | | | |
0.50%, 08/25/35† | | | 296,099 | | | | | | 278,540 | |
Structured Asset Mortgage Investments II Trust | | | | | | | | | | |
0.42%, 07/19/35† | | | 178,618 | | | | | | 164,885 | |
Structured Asset Securities Corporation | | | | | | | | | | |
0.51%, 06/25/35 144A† | | | 176,010 | | | | | | 141,895 | |
Thrones 2013-1 PLC | | | | | | | | | | |
2.02%, 07/20/44(U)† | | | 98,504 | | | | | | 164,568 | |
UBS-Barclays Commercial Mortgage Trust | | | | | | | | | | |
3.32%, 12/10/45 144A | | | 110,000 | | | | | | 103,222 | |
VNDO 2012-6AVE Mortgage Trust | | | | | | | | | | |
3.00%, 11/15/30 144A | | | 100,000 | | | | | | 93,246 | |
Wachovia Bank Commercial Mortgage Trust | | | | | | | | | | |
5.38%, 12/15/43 | | | 140,000 | | | | | | 150,639 | |
Washington Mutual Mortgage Pass-Through Certificates | | | | | | | | | | |
2.49%, 02/25/33† | | | 11,635 | | | | | | 11,446 | |
2.41%, 02/25/37† | | | 618,505 | | | | | | 497,205 | |
4.56%, 02/25/37† | | | 402,808 | | | | | | 330,860 | |
1.54%, 06/25/42† | | | 27,243 | | | | | | 24,927 | |
0.45%, 07/25/45† | | | 284,105 | | | | | | 265,564 | |
0.90%, 04/25/47† | | | 1,063,494 | | | | | | 936,504 | |
Wells Fargo Alternative Loan 2007-PA6 Trust | | | | | | | | | | |
2.67%, 12/28/37† | | | 1,267,788 | | | | | | 1,029,943 | |
Wells Fargo Commercial Mortgage Trust | | | | | | | | | | |
4.22%, 07/15/46† | | | 60,000 | | | | | | 61,764 | |
Wells Fargo Mortgage-Backed Securities 2005-AR16 Trust | | | | | | | | | | |
2.66%, 08/25/33† | | | 312,489 | | | | | | 317,114 | |
| | | | | | | | | | |
| | | Par | | | Value | |
WF-RBS Commercial Mortgage Trust 5.54%, | | | | | | | | | | |
02/15/44 IO 144AW† | | $ | 1,534,249 | | | | | $ | 60,076 | |
4.83%, 06/15/45 IO 144AW† | | | 322,932 | | | | | | 30,944 | |
| | | | | | | | | | |
Total Mortgage-Backed Securities
(Cost $260,354,869) | | | | | | 258,303,242 | |
| | | | | | | | | | |
MUNICIPAL BONDS — 3.0% | |
Alameda County Joint Powers Authority, Revenue Bond, Series Z | | | | | | | | | | |
7.05%, 12/01/44 | | | 3,300,000 | | | | | | 3,648,480 | |
American Municipal Power, Inc., Hydroelectric Projects, Revenue Bond, Series B | | | | | | | | | | |
8.08%, 02/15/50 | | | 300,000 | | | | | | 396,030 | |
American Municipal Power, Inc., Revenue Bond, Series E | | | | | | | | | | |
6.27%, 02/15/50 | | | 250,000 | | | | | | 263,243 | |
Arizona State University, Revenue Bond, Series A | | | | | | | | | | |
5.00%, 07/01/43 | | | 40,000 | | | | | | 41,142 | |
California State University, Revenue Bond, Series A | | | | | | | | | | |
5.00%, 11/01/37 | | | 290,000 | | | | | | 303,018 | |
Chicago Transit Authority, Revenue Bond, Series A | | | | | | | | | | |
6.90%, 12/01/40 | | | 1,800,000 | | | | | | 2,005,848 | |
City of Richmond, General Obligation, Series A | | | | | | | | | | |
5.00%, 03/01/27 | | | 40,000 | | | | | | 45,067 | |
5.00%, 03/01/28 | | | 40,000 | | | | | | 44,666 | |
5.00%, 03/01/29 | | | 50,000 | | | | | | 55,378 | |
City Public Service Board of San Antonio, Revenue Bond | | | | | | | | | | |
5.00%, 02/01/43 | | | 150,000 | | | | | | 152,731 | |
Commonwealth of Massachusetts, General Obligation, Series E | | | | | | | | | | |
5.00%, 08/01/40 | | | 255,000 | | | | | | 264,927 | |
Illinois Finance Authority, University of Chicago, Revenue Bond, Series B | | | | | | | | | | |
5.75%, 07/01/33 | | | 1,800,000 | | | | | | 1,969,920 | |
Los Angeles Community College District, General Obligation | | | | | | | | | | |
6.75%, 08/01/49 | | | 300,000 | | | | | | 376,389 | |
Los Angeles Community College District, General Obligation, Series D | | | | | | | | | | |
6.68%, 08/01/36 | | | 300,000 | | | | | | 354,708 | |
Metropolitan Pier & Exposition Authority, McCormick Place Expansion Project, Revenue Bond, Series A | | | | | | | | | | |
5.50%, 06/15/50 | | | 250,000 | | | | | | 249,990 | |
New Jersey Economic Development Authority, Rutgers University, Revenue Bond | | | | | | | | | | |
5.00%, 06/15/46 | | | 50,000 | | | | | | 51,439 | |
| | | | |
| 124 | | See Notes to Financial Statements. | | |
| | | | | | | | | | |
| | | Par | | | Value | |
New Jersey State Turnpike Authority, Revenue Bond, Series A | | | | | | | | | | |
5.00%, 01/01/43 | | $ | 60,000 | | | | | $ | 60,953 | |
New Jersey State Turnpike Authority, Revenue Bond, Series B | | | | | | | | | | |
5.00%, 01/01/25 | | | 200,000 | | | | | | 221,658 | |
5.00%, 01/01/26 | | | 400,000 | | | | | | 438,804 | |
5.00%, 01/01/27 | | | 400,000 | | | | | | 432,136 | |
New Jersey Transportation Trust Fund Authority, Transportation Program, Revenue Bond, Series AA | | | | | | | | | | |
5.00%, 06/15/36 | | | 265,000 | | | | | | 270,591 | |
5.00%, 06/15/38 | | | 150,000 | | | | | | 152,059 | |
New Jersey Transportation Trust Fund Authority, Transportation System, Revenue Bond, Series A | | | | | | | | | | |
5.00%, 06/15/42 | | | 90,000 | | | | | | 90,688 | |
New York City Transitional Finance Authority, Revenue Bond, Sub-Series A-1 | | | | | | | | | | |
5.00%, 11/01/42 | | | 90,000 | | | | | | 93,319 | |
New York City Water & Sewer System, Revenue Bond, Series BB | | | | | | | | | | |
5.00%, 06/15/47 | | | 40,000 | | | | | | 40,780 | |
New York City Water & Sewer System, Revenue Bond, Series CC | | | | | | | | | | |
5.00%, 06/15/45 | | | 250,000 | | | | | | 254,755 | |
5.00%, 06/15/47 | | | 250,000 | | | | | | 255,090 | |
New York City Water & Sewer System, Revenue Bond, Series EE | | | | | | | | | | |
5.00%, 06/15/47 | | | 300,000 | | | | | | 306,108 | |
New York City, General Obligation, Series E | | | | | | | | | | |
5.00%, 08/01/25 | | | 250,000 | | | | | | 278,325 | |
New York City, General Obligation, Series I | | | | | | | | | | |
5.00%, 08/01/24 | | | 250,000 | | | | | | 282,022 | |
New York City, General Obligation, Series J | | | | | | | | | | |
5.00%, 08/01/25 | | | 50,000 | | | | | | 55,928 | |
New York Liberty Development Corporation, Revenue Bond | | | | | | | | | | |
5.00%, 12/15/41 | | | 80,000 | | | | | | 81,203 | |
New York State Dormitory Authority, Revenue Bond, Series A | | | | | | | | | | |
5.00%, 12/15/26 | | | 30,000 | | | | | | 33,307 | |
5.00%, 12/15/27 | | | 100,000 | | | | | | 109,978 | |
New York State Urban Development Corporation, Revenue Bond, Series C | | | | | | | | | | |
5.00%, 03/15/27 | | | 180,000 | | | | | | 198,378 | |
5.00%, 03/15/30 | | | 260,000 | | | | | | 279,820 | |
5.00%, 03/15/31 | | | 260,000 | | | | | | 277,961 | |
5.00%, 03/15/32 | | | 260,000 | | | | | | 276,323 | |
Northeast Ohio Regional Sewer District, Revenue Bond | | | | | | | | | | |
5.00%, 11/15/43 | | | 90,000 | | | | | | 93,123 | |
| | | | | | | | | | |
| | | Par | | | Value | |
Ohio State Turnpike Commission, Infrastructure Project, Revenue Bond | | | | | | | | | | |
5.25%, 02/15/39 | | $ | 250,000 | | | | | $ | 258,955 | |
5.00%, 02/15/48 | | | 455,000 | | | | | | 448,380 | |
Ohio State Turnpike Commission, Revenue Bond, Series A | | | | | | | | | | |
5.00%, 02/15/48 | | | 80,000 | | | | | | 80,930 | |
Pennsylvania Turnpike Commission, Revenue Bond, Series C | | | | | | | | | | |
5.00%, 12/01/43 | | | 70,000 | | | | | | 69,567 | |
Port Authority of New York & New Jersey, Revenue Bond | | | | | | | | | | |
4.46%, 10/01/62 | | | 2,800,000 | | | | | | 2,388,064 | |
Private Colleges & Universities Authority, Emory University, Revenue Bond, Series A | | | | | | | | | | |
5.00%, 10/01/43 | | | 340,000 | | | | | | 355,171 | |
State of California, General Obligation | | | | | | | | | | |
5.00%, 09/01/25 | | | 120,000 | | | | | | 133,393 | |
5.00%, 09/01/27 | | | 250,000 | | | | | | 272,368 | |
5.00%, 09/01/28 | | | 250,000 | | | | | | 269,857 | |
5.00%, 09/01/32 | | | 255,000 | | | | | | 267,125 | |
5.00%, 09/01/33 | | | 250,000 | | | | | | 260,687 | |
7.95%, 03/01/36 | | | 165,000 | | | | | | 190,908 | |
7.55%, 04/01/39 | | | 385,000 | | | | | | 498,371 | |
5.00%, 04/01/42 | | | 110,000 | | | | | | 111,251 | |
5.00%, 04/01/43 | | | 415,000 | | | | | | 419,872 | |
5.00%, 11/01/43 | | | 105,000 | | | | | | 106,295 | |
State of California, General Obligation, Series B | | | | | | | | | | |
5.00%, 09/01/23 | | | 160,000 | | | | | | 183,765 | |
State of Connecticut, General Obligation, Series C | | | | | | | | | | |
5.00%, 07/15/24 | | | 50,000 | | | | | | 57,035 | |
State of Illinois, General Obligation | | | | | | | | | | |
7.35%, 07/01/35 | | | 375,000 | | | | | | 413,224 | |
Tarrant County Cultural Education Facilities Finance Corporation, Revenue Bond, Series 2007A | | | | | | | | | | |
5.00%, 02/15/26 | | | 1,500,000 | | | | | | 1,566,570 | |
Utah Transit Authority, Revenue Bond | | | | | | | | | | |
5.00%, 06/15/42 | | | 160,000 | | | | | | 160,213 | |
Washington State, General Obligation, Series A | | | | | | | | | | |
5.00%, 08/01/33 | | | 250,000 | | | | | | 266,645 | |
5.00%, 08/01/34 | | | 270,000 | | | | | | 285,571 | |
5.00%, 08/01/35 | | | 250,000 | | | | | | 264,215 | |
Washington State, Motor Vehicle Fuel Tax, General Obligation, Series B | | | | | | | | | | |
5.00%, 08/01/33 | | | 250,000 | | | | | | 266,645 | |
| | | | | | | | | | |
Total Municipal Bonds
(Cost $24,697,441) | | | | | | 24,401,362 | |
| | | | | | | | | | |
| | | | |
| | See Notes to Financial Statements. | | 125 |
MEDIUM-DURATION BOND FUND
SCHEDULE OF INVESTMENTS (Continued)
| | | | | | | | | | |
| | | Notional
Amount | | | Value | |
PURCHASED OPTIONS — 0.1% | |
Call Options — 0.0% | |
U.S. Dollar vs. Euro, Strike Price $1.35, Expires 01/06/14 (CITI) | | $ | 3,520,000 | | | | | $ | 1,859 | |
U.S. Dollar vs. Euro, Strike Price $1.36, Expires 02/16/14 (CITI) | | | 4,190,000 | | | | | | 29,309 | |
| | | | | | | | | | |
| | | | | | | | | 31,168 | |
| | | | | | | | | | |
| | | |
| | | Number of
Contracts | | | | | | |
Put Options — 0.0% | | | | | | | | | | |
10-Year U.S. Treasury Note Futures, Strike Price $125.00, Expires 01/24/14 (MLCS) | | | 17 | | | | | | 34,265 | |
15-Year U.S. Treasury Long Bond Futures, Strike Price $131.00, Expires 01/24/14 (MLCS) | | | 14 | | | | | | 40,469 | |
| | | | | | | | | | |
| | | | | | | | | 74,734 | |
| | | | | | | | | | |
| | | |
| | | Notional
Amount | | | | | | |
Put Swaptions — 0.1% | |
3-Month LIBOR, Strike Price 3.45%, Expires 09/21/15 (RBS) | | $ | 2,300,000 | | | | | | 371,596 | |
| | | | | | | | | | |
Total Purchased Options
(Cost $293,299) | | | | | | 477,498 | |
| | | | | | | | | | |
| | | |
| | | Par | | | | | | |
U.S. TREASURY OBLIGATIONS — 28.0% | |
U.S. Treasury Bills | | | | | | | | | | |
0.04%, 01/02/14 | | $ | 79,000 | | | | | | 79,000 | |
0.14%, 05/29/14‡‡ | | | 281,000 | | | | | | 280,938 | |
0.10%, 06/05/14 | | | 1,200,000 | | | | | | 1,199,724 | |
| | | | | | | | | | |
| | | | | | | | | 1,559,662 | |
| | | | | | | | | | |
U.S. Treasury Bonds | | | | | | | | | | |
2.75%, 08/15/42D | | | 2,948,000 | | | | | | 2,336,750 | |
2.88%, 05/15/43 | | | 8,498,000 | | | | | | 6,889,354 | |
3.63%, 08/15/43D | | | 2,190,000 | | | | | | 2,068,694 | |
3.75%, 11/15/43 | | | 2,810,000 | | | | | | 2,716,480 | |
| | | | | | | | | | |
| | | | | | | | | 14,011,278 | |
| | | | | | | | | | |
U.S. Treasury Inflationary Index Bonds | | | | | | | | | | |
1.25%, 04/15/14 | | | 1,600,000 | | | | | | 1,778,292 | |
2.00%, 07/15/14D | | | 1,780,000 | | | | | | 2,255,568 | |
0.13%, 04/15/18 | | | 4,200,000 | | | | | | 4,330,256 | |
1.13%, 01/15/21D‡‡ | | | 4,700,000 | | | | | | 5,279,195 | |
0.13%, 01/15/22 | | | 6,600,000 | | | | | | 6,552,799 | |
0.13%, 07/15/22 | | | 2,600,000 | | | | | | 2,532,017 | |
0.13%, 01/15/23 | | | 2,000,000 | | | | | | 1,913,104 | |
0.38%, 07/15/23D | | | 4,700,000 | | | | | | 4,552,929 | |
2.13%, 02/15/40D | | | 1,280,000 | | | | | | 1,556,741 | |
2.13%, 02/15/41 | | | 600,000 | | | | | | 720,421 | |
| | | | | | | | | | |
| | | | | | | | | 31,471,322 | |
| | | | | | | | | | |
U.S. Treasury Notes | | | | | | | | | | |
0.25%, 05/31/14D | | | 900,000 | | | | | | 900,580 | |
0.63%, 07/15/14 | | | 8,006,000 | | | | | | 8,028,833 | |
0.13%, 07/31/14‡‡ | | | 4,767,000 | | | | | | 4,767,839 | |
| | | | | | | | | | |
| | | Par | | | Value | |
0.50%, 08/15/14D | | $ | 300,000 | | | | | $ | 300,727 | |
0.25%, 08/31/14D | | | 100,000 | | | | | | 100,092 | |
0.25%, 09/30/14D | | | 1,100,000 | | | | | | 1,100,967 | |
0.50%, 10/15/14 | | | 8,900,000 | | | | | | 8,925,730 | |
0.38%, 11/15/14D | | | 300,000 | | | | | | 300,592 | |
0.25%, 11/30/14D | | | 3,600,000 | | | | | | 3,603,445 | |
0.25%, 09/30/15D | | | 7,000,000 | | | | | | 6,994,120 | |
0.25%, 10/31/15 | | | 10,000 | | | | | | 9,987 | |
0.38%, 02/15/16 | | | 6,400,000 | | | | | | 6,395,002 | |
2.13%, 02/29/16 | | | 3,900,000 | | | | | | 4,042,900 | |
0.38%, 03/15/16D | | | 3,300,000 | | | | | | 3,295,232 | |
1.50%, 06/30/16D | | | 2,300,000 | | | | | | 2,353,277 | |
1.00%, 08/31/16D | | | 11,200,000 | | | | | | 11,306,310 | |
0.63%, 12/15/16D | | | 3,700,000 | | | | | | 3,685,115 | |
1.00%, 03/31/17 | | | 24,500,000 | | | | | | 24,557,428 | |
2.75%, 04/15/17D | | | 2,130,000 | | | | | | 2,083,905 | |
0.75%, 10/31/17D | | | 3,120,000 | | | | | | 3,063,937 | |
2.88%, 03/31/18D | | | 900,000 | | | | | | 954,105 | |
0.63%, 04/30/18 | | | 23,200,000 | | | | | | 22,376,214 | |
1.38%, 06/30/18 | | | 10,730,000 | | | | | | 10,649,107 | |
1.38%, 07/31/18D | | | 7,190,000 | | | | | | 7,126,246 | |
1.38%, 09/30/18D | | | 5,810,000 | | | | | | 5,739,420 | |
1.25%, 11/30/18D | | | 3,490,000 | | | | | | 3,415,565 | |
3.63%, 08/15/19 | | | 1,050,000 | | | | | | 1,144,336 | |
2.63%, 08/15/20D | | | 500,000 | | | | | | 510,312 | |
2.00%, 09/30/20 | | | 6,360,000 | | | | | | 6,217,644 | |
1.75%, 10/31/20 | | | 2,700,000 | | | | | | 2,590,628 | |
2.00%, 11/30/20 | | | 14,780,000 | | | | | | 14,389,719 | |
2.00%, 11/15/21 | | | 4,200,000 | | | | | | 4,009,522 | |
1.75%, 05/15/23D | | | 900,000 | | | | | | 811,301 | |
2.50%, 08/15/23 | | | 2,500,000 | | | | | | 2,401,075 | |
2.75%, 11/15/23D | | | 1,400,000 | | | | | | 1,369,703 | |
| | | | | | | | | | |
| | | | | | | | | 179,520,915 | |
| | | | | | | | | | |
Total U.S. Treasury Obligations
(Cost $230,003,022) | | | | | | 226,563,177 | |
| | | | | | | | | | |
| | |
| | | Shares | | | | |
PREFERRED STOCKS — 0.4% | |
GMAC Capital Trust I, | | | | | | | | | | |
8.125%, 02/15/40 | | | 23,879 | | | | | | 638,524 | |
Wells Fargo & Co., | | | | | | | | | | |
7.50%, 12/31/49D | | | 2,400 | | | | | | 2,652,000 | |
| | | | | | | | | | |
Total Preferred Stocks
(Cost $2,012,980) | | | | | | | | | 3,290,524 | |
| | | | | | | | | | |
| | |
| | | Par | | | | |
REPURCHASE AGREEMENTS — 1.4% | |
Citigroup Global Markets, Inc. 0.05% (dated 12/31/13, due 01/02/14, repurchase price $4,000,011, collateralized by U.S. Treasury Note, 0.875%, due 07/31/19, total market value $4,075,845) | | $ | 4,000,000 | | | | | | 4,000,000 | |
0.03% (dated 01/02/14, due 01/03/14, repurchase price $7,400,006, collateralized by U.S. Treasury Note, 0.875%, due 07/31/19, total market value $7,551,884) | | | 7,400,000 | | | | | | 7,400,000 | |
| | | | | | | | | | |
Total Repurchase Agreements
(Cost $11,400,000) | | | | | | 11,400,000 | |
| | | | | | | | | | |
| | | | |
| 126 | | See Notes to Financial Statements. | | |
| | | | | | | | | | | | |
| | | Shares | | | Value | |
MONEY MARKET FUNDS — 15.7% | |
GuideStone Money Market Fund (GS4 Class)¥ | | | | | 38,647,829 | | | | | $ | 38,647,829 | |
Northern Institutional Liquid Assets Portfolio§ | | | | | 88,599,222 | | | | | | 88,599,222 | |
| | | | | | | | | | | | |
Total Money Market Funds
(Cost $127,247,051) | | | | | | 127,247,051 | |
| | | | | | | | | | | | |
TOTAL INVESTMENTS — 118.3%
(Cost $955,223,703) | | | | | | 957,423,449 | |
| | | | | | | | | | | | |
| | | |
| | | Number of
Contracts | | | | | | |
WRITTEN OPTIONS — (0.1)% | |
Call Options — 0.0% | |
10-Year U.S. Treasury Note Futures, Strike Price $127.50, Expires 03/20/14 (CITIG) | | | | | (141 | ) | | | | | (4,406 | ) |
| | | | | | | | | | | | |
Put Options — 0.0% | |
10-Year U.S. Treasury Note Futures, Strike Price $122.50, Expires 01/24/14 (MLCS) | | | | | (34 | ) | | | | | (12,750 | ) |
10-Year U.S. Treasury Note Futures, Strike Price $123.00, Expires 03/20/14 (BAR) | | | | | (141 | ) | | | | | (129,985 | ) |
15-Year U.S. Treasury Long Bond Futures, Strike Price $127.00, Expires 01/24/14 (GSC) | | | | | (29 | ) | | | | | (15,406 | ) |
90-Day Euro, Strike Price $97.38, Expires 03/14/14 (BAR) | | | | | (67 | ) | | | | | (33,500 | ) |
| | | | | | | | | | | | |
| | | | | | | | | | | (191,641 | ) |
| | | | | | | | | | | | |
| | |
| | | Notional
Amount | | | | |
Put Swaptions — (0.1)% | |
3-Month LIBOR, Strike Price 2.00%, Expires 03/31/14 (GSC) | | | | $ | (97,800,000 | ) | | | | | (180,686 | ) |
3-Month LIBOR, Strike Price 2.50%, Expires 09/21/15 (RBS) | | | | | (9,700,000 | ) | | | | | (385,856 | ) |
| | | | | | | | | | | | |
| | | | | | | | | | | (566,542 | ) |
| | | | | | | | | | | | |
Total Written Options
(Premiums received $(456,971)) | | | | | | (762,589 | ) |
| | | | | | | | | | | | |
| | | | | | | | | | | | |
| | | Par | | | | | Value | |
SECURITY SOLD SHORT — (0.9)% | |
U.S. Treasury Note 1.63%, 08/15/22
(Cost $(7,412,651)) | | | | $ | (8,100,000 | ) | | | | $ | (7,360,243 | ) |
| | | | | | | | | | | | |
TBA SALE COMMITMENTS — (0.3)% | |
Federal Home Loan Mortgage Corporation | | | | | | | | | | | | |
5.00%, 01/01/40 TBA | | | | | (1,000,000 | ) | | | | | (1,078,438 | ) |
Federal National Mortgage Association | | | | | | | | | | | | |
4.50%, 01/01/42 TBA | | | | | (1,000,000 | ) | | | | | (1,059,570 | ) |
| | | | | | | | | | | | |
Total TBA Sale Commitments
(Cost $(2,145,781)) | | | | | | (2,138,008 | ) |
| | | | | | | | | | | | |
Liabilities in Excess of Other
Assets — (17.0)% | | | (137,539,621 | ) |
| | | | | | | | | | | | |
NET ASSETS — 100.0% | | | | | | | | | | $ | 809,622,988 | |
| | | | | | | | | | | | |
| | | | |
| | See Notes to Financial Statements. | | 127 |
MEDIUM-DURATION BOND FUND
SCHEDULE OF INVESTMENTS (Continued)
Swap agreements outstanding at December 31, 2013:
| | | | | | | | | | | | | | | | | | | | | | | | | | |
Reference Obligation | | Fixed
Deal
(Pay) Rate | | | Maturity
Date | | Counterparty | | Currency | | Notional
Amount | | | Market Value | | | Upfront
Premiums
Paid/
(Received) | | | Unrealized
Appreciation
(Depreciation) | |
Credit Default Swaps on Corporate Issues — Buy Protection | |
CitiFinancial, | | | | | | | | | | | | | | | | | | | | | | | | | | |
6.63% due 06/01/15 | | | (0.15 | )% | | 06/20/15 | | UBS | | USD | | $ | 300,000 | | | $ | 467 | | | $ | — | | | $ | 467 | |
Credit Suisse, Inc., | | | | | | | | | | | | | | | | | | | | | | | | | | |
6.50%, due 01/15/12 | | | (1.00 | )% | | 09/20/20 | | GSC | | USD | | | 300,000 | | | | (640 | ) | | | 5,196 | | | | (5,836 | ) |
| | | | | | | | | | | | | | | | | | | | | | | | | | |
| | | | | | | | | | | | $ | 600,000 | | | $ | (173 | ) | | $ | 5,196 | | | $ | (5,369 | ) |
| | | | | | | | | | | | | | | | | | | | | | | | | | |
| | | | | | | | | | | | | | | | | | | | | | | | | | | | | | | | | | | | |
Reference Obligation | | Implied
Credit
Spread | | | Fixed
Deal
(Pay) Rate | | | Maturity
Date | | | Counterparty | | | Currency | | | Notional
Amount | | | Market Value | | | Upfront
Premiums
Paid/
(Received) | | | Unrealized
Appreciation
(Depreciation) | |
Credit Default Swaps on Corporate Issues — Sell Protection | |
Federated Republic of Brazil, | | | | | | | | | | | | | | | | | | | | | | | | | | | | | | | | | | | | |
12.50% due 03/06/30 | | | 1.45 | % | | | (1.04 | )% | | | 05/20/17 | | | | DEUT | | | | USD | | | $ | 1,000,000 | | | $ | (12,387 | ) | | $ | — | | | $ | (12,387 | ) |
GMAC LLC, | | | | | | | | | | | | | | | | | | | | | | | | | | | | | | | | | | | | |
6.88% due 08/28/12 | | | 1.10 | % | | | (3.53 | )% | | | 09/20/17 | | | | DEUT | | | | USD | | | | 4,100,000 | | | | 364,059 | | | | — | | | | 364,059 | |
| | | | | | | | | | | | | | | | | | | | | | | | | | | | | | | | | | | | |
| | | | | | | | | | | | | | | | | | | | | | $ | 5,100,000 | | | $ | 351,672 | | | $ | — | | | $ | 351,672 | |
| | | | | | | | | | | | | | | | | | | | | | | | | | | | | | | | | | | | |
| | | | | | | | | | | | | | | | | | | | | | | | | | | | | | | | |
Reference Obligation | | Fixed
Deal
(Pay) Rate | | | Maturity
Date | | | Counterparty | | | Currency | | | Notional
Amount | | | Market Value | | | Upfront
Premiums
Paid/
(Received) | | | Unrealized
Appreciation
(Depreciation) | |
Credit Default Swaps on Credit Indices — Buy Protection | | | | | | | | | | | | | | | | | | | | | |
Dow Jones CDX.NA.IG16
Index | | | 1.00 | % | | | 06/20/14 | | | | JPM | | | | USD | | | $ | 5,600,000 | | | $ | (27,507 | ) | | $ | (10,737 | ) | | $ | (16,770 | ) |
Dow Jones CDX.NA.IG16
Index | | | 1.00 | % | | | 06/20/14 | | | | JPM | | | | USD | | | | 5,300,000 | | | | (26,034 | ) | | | (10,874 | ) | | | (15,160 | ) |
Dow Jones CDX.NA.IG16
Index | | | 1.00 | % | | | 06/20/14 | | | | DEUT | | | | USD | | | | 4,100,000 | | | | (20,139 | ) | | | (8,128 | ) | | | (12,011 | ) |
Dow Jones CDX.NA.HY15
Index | | | (5.00 | )% | | | 12/20/15 | | | | CME | | | | USD | | | | 2,112,000 | | | | (165,430 | ) | | | 43,560 | | | | (208,990 | ) |
Dow Jones CDX.NA.IG16
Index | | | 1.00 | % | | | 12/20/16 | | | | BOA | | | | USD | | | | 900,000 | | | | (4,421 | ) | | | (1,662 | ) | | | (2,759 | ) |
Dow Jones CDX.NA.IG21
Index | | | (1.00 | )% | | | 12/20/18 | | | | CME | | | | USD | | | | 9,600,000 | | | | (176,208 | ) | | | (138,396 | ) | | | (37,812 | ) |
| | | | | | | | | | | | | | | | | | | | | | | | | | | | | | | | |
| | | | | | | | | | | | | | | | | | $ | 27,612,000 | | | $ | (419,739 | ) | | $ | (126,237 | ) | | $ | (293,502 | ) |
| | | | | | | | | | | | | | | | | | | | | | | | | | | | | | | | |
| | | | | | | | | | | | | | | | | | | | | | | | | | | | | | | | | | | | |
Reference Obligation | | Implied
Credit
Spread | | | Fixed
Deal
(Pay) Rate | | | Maturity
Date | | | Counterparty | | | Currency | | | Notional
Amount | | | Market Value | | | Upfront
Premiums
Paid/
(Received) | | | Unrealized
Appreciation
(Depreciation) | |
Credit Default Swaps on Credit Indices — Sell Protection | |
Dow Jones CDX.NA.IG16
Index | | | 0.94 | % | | | 1.00 | % | | | 06/20/16 | | | | JPM | | | | USD | | | $ | 4,825,000 | | | $ | 95,475 | | | $ | 9,997 | | | $ | 85,478 | |
Dow Jones CDX.NA.IG16
Index | | | 0.94 | % | | | (1.00 | )% | | | 06/20/16 | | | | DEUT | | | | USD | | | | 2,125,000 | | | | 42,049 | | | | 4,304 | | | | 37,745 | |
Dow Jones CDX.NA.IG16
Index | | | 0.97 | % | | | 1.00 | % | | | 12/20/16 | | | | BOA | | | | USD | | | | 3,000,000 | | | | 59,363 | | | | 3,366 | | | | 55,997 | |
Dow Jones CMBX.NA.AAA.4
Index | | | 0.97 | % | | | 0.35 | % | | | 02/17/51 | | | | CITI | | | | USD | | | | 1,200,000 | | | | (18,652 | ) | | | (32,811 | ) | | | 14,159 | |
| | | | | | | | | | | | | | | | | | | | | | | | | | | | | | | | | | | | |
| | | | | | | | | | | | | | | | | | | | | | $ | 11,150,000 | | | $ | 178,235 | | | $ | (15,144 | ) | | $ | 193,379 | |
| | | | | | | | | | | | | | | | | | | | | | | | | | | | | | | | | | | | |
| | | | |
| 128 | | See Notes to Financial Statements. | | |
| | | | | | | | | | | | | | | | | | | | | | | | | | | | | | | | |
Reference Obligation | | Fixed
Deal
(Pay) Rate | | | Maturity
Date | | | Counterparty | | | Currency | | | Notional Amount | | | Market Value | | | Upfront
Premiums
Paid/
(Received) | | | Unrealized
Appreciation
(Depreciation) | |
Interest Rate Swaps | | | | | | | | | | | | | | | | | | | | | | | | | | | | | | | | |
Brazil CETIP Interbank Deposit | | | 8.15 | % | | | 01/02/15 | | | | DEUT | | | | BRL | | | $ | 8,830,000 | | | $ | (84,027 | ) | | $ | — | | | $ | (84,027 | ) |
Brazil CETIP Interbank Deposit | | | 10.14 | % | | | 01/02/15 | | | | HKSB | | | | BRL | | | | 5,300,000 | | | | 63,480 | | | | 21,159 | | | | 42,321 | |
Brazil CETIP Interbank Deposit | | | 8.56 | % | | | 01/02/15 | | | | UBS | | | | BRL | | | | 5,300,000 | | | | (34,072 | ) | | | 136 | | | | (34,208 | ) |
Brazil CETIP Interbank Deposit | | | 8.08 | % | | | 01/02/15 | | | | HSBC | | | | BRL | | | | 3,700,000 | | | | (29,401 | ) | | | 3,421 | | | | (32,822 | ) |
Brazil CETIP Interbank Deposit | | | 9.94 | % | | | 01/02/15 | | | | DEUT | | | | BRL | | | | 2,570,000 | | | | (2,804 | ) | | | — | | | | (2,804 | ) |
Brazil CETIP Interbank Deposit | | | 7.62 | % | | | 01/02/15 | | | | DEUT | | | | BRL | | | | 1,800,000 | | | | (21,824 | ) | | | (2,156 | ) | | | (19,668 | ) |
Brazil CETIP Interbank Deposit | | | 8.43 | % | | | 01/02/15 | | | | DEUT | | | | BRL | | | | 1,000,000 | | | | (4,378 | ) | | | 3,045 | | | | (7,423 | ) |
Brazil CETIP Interbank Deposit | | | 8.27 | % | | | 01/02/15 | | | | MSCS | | | | BRL | | | | 900,000 | | | | (7,360 | ) | | | (1,120 | ) | | | (6,240 | ) |
Brazil CETIP Interbank Deposit | | | 7.92 | % | | | 01/02/15 | | | | BAR | | | | BRL | | | | 700,000 | | | | (7,176 | ) | | | (37 | ) | | | (7,139 | ) |
Brazil CETIP Interbank Deposit | | | 10.39 | % | | | 01/04/16 | | | | BOA | | | | BRL | | | | 9,130,000 | | | | (48,850 | ) | | | — | | | | (48,850 | ) |
Brazil CETIP Interbank Deposit | | | 7.77 | % | | | 01/04/16 | | | | CITI | | | | BRL | | | | 2,700,000 | | | | (21,279 | ) | | | — | | | | (21,279 | ) |
Brazil CETIP Interbank Deposit | | | 8.94 | % | | | 01/02/17 | | | | CS | | | | BRL | | | | 5,800,000 | | | | (156,338 | ) | | | (2,535 | ) | | | (153,803 | ) |
Brazil CETIP Interbank Deposit | | | 8.60 | % | | | 01/02/17 | | | | DEUT | | | | BRL | | | | 5,300,000 | | | | (163,765 | ) | | | 2,385 | | | | (166,150 | ) |
Brazil CETIP Interbank Deposit | | | 8.90 | % | | | 01/02/17 | | | | UBS | | | | BRL | | | | 5,200,000 | | | | (142,257 | ) | | | (4,206 | ) | | | (138,051 | ) |
Brazil CETIP Interbank Deposit | | | 8.50 | % | | | 01/02/17 | | | | CS | | | | BRL | | | | 5,200,000 | | | | (166,665 | ) | | | (3,313 | ) | | | (163,352 | ) |
Brazil CETIP Interbank Deposit | | | 8.59 | % | | | 01/02/17 | | | | UBS | | | | BRL | | | | 2,900,000 | | | | (93,325 | ) | | | (2,657 | ) | | | (90,668 | ) |
Brazil CETIP Interbank Deposit | | | 8.49 | % | | | 01/02/17 | | | | BNP | | | | BRL | | | | 1,100,000 | | | | (34,174 | ) | | | — | | | | (34,174 | ) |
3-Month LIBOR | | | (0.70 | )% | | | 05/31/17 | | | | JPM | | | | USD | | | | 42,000,000 | | | | 491,180 | | | | (36,895 | ) | | | 528,075 | |
3-Month LIBOR | | | (1.68 | )% | | | 11/25/17 | | | | CME | | | | USD | | | | 20,400,000 | | | | 170,697 | | | | 43,842 | | | | 126,855 | |
3-Month KLIBOR | | | (3.88 | )% | | | 11/14/18 | | | | DEUT | | | | MYR | | | | 860,000 | | | | (148 | ) | | | — | | | | (148 | ) |
3-Month KLIBOR | | | (3.92 | )% | | | 11/19/18 | | | | CITI | | | | MYR | | | | 960,000 | | | | 597 | | | | — | | | | 597 | |
3-Month KLIBOR | | | (3.97 | )% | | | 12/11/18 | | | | JPM | | | | MYR | | | | 1,570,000 | | | | 1,271 | | | | — | | | | 1,271 | |
3-Month LIBOR | | | 2.00 | % | | | 03/19/19 | | | | CME | | | | USD | | | | 8,300,000 | | | | 25,797 | | | | 108,481 | | | | (82,684 | ) |
3-Month LIBOR | | | 2.56 | % | | | 10/20/20 | | | | DEUT | | | | USD | | | | 2,800,000 | | | | 40,099 | | | | — | | | | 40,099 | |
3-Month LIBOR | | | 2.92 | % | | | 11/25/20 | | | | CME | | | | USD | | | | 24,400,000 | | | | (368,570 | ) | | | (81,882 | ) | | | (286,688 | ) |
3-Month LIBOR | | | 2.75 | % | | | 03/19/21 | | | | CME | | | | USD | | | | 4,700,000 | | | | 47,932 | | | | — | | | | 47,932 | |
3-Month LIBOR | | | 2.65 | % | | | 07/31/23 | | | | CME | | | | USD | | | | 6,200,000 | | | | (123,384 | ) | | | — | | | | (123,384 | ) |
3-Month KRW-CD-KDSA | | | (3.45 | )% | | | 08/08/23 | | | | CITI | | | | KRW | | | | 1,328,210,000 | | | | (4,832 | ) | | | — | | | | (4,832 | ) |
3-Month KLIBOR | | | (4.49 | )% | | | 08/14/23 | | | | DEUT | | | | MYR | | | | 220,000 | | | | 302 | | | | — | | | | 302 | |
3-Month KRW-CD-KDSA | | | (3.42 | )% | | | 08/14/23 | | | | JPM | | | | KRW | | | | 391,340,000 | | | | (315 | ) | | | — | | | | (315 | ) |
3-Month KRW-CD-KDSA | | | (3.49 | )% | | | 08/16/23 | | | | CITI | | | | KRW | | | | 185,320,000 | | | | (989 | ) | | | — | | | | (989 | ) |
3-Month KRW-CD-KDSA | | | (3.56 | )% | | | 08/21/23 | | | | JPM | | | | KRW | | | | 228,920,000 | | | | (2,825 | ) | | | 5 | | | | (2,830 | ) |
3-Month KLIBOR | | | (4.33 | )% | | | 09/26/23 | | | | JPM | | | | MYR | | | | 370,000 | | | | 2,249 | | | | — | | | | 2,249 | |
3-Month KLIBOR | | | (4.45 | )% | | | 11/15/23 | | | | CITI | | | | MYR | | | | 600,000 | | | | 1,072 | | | | — | | | | 1,072 | |
3-Month LIBOR | | | (3.51 | )% | | | 11/25/23 | | | | CME | | | | USD | | | | 10,800,000 | | | | 193,935 | | | | 37,876 | | | | 156,059 | |
6-Month WIBOR | | | (4.16 | )% | | | 11/28/23 | | | | FCM | | | | PLN | | | | 970,000 | | | | 1,013 | | | | — | | | | 1,013 | |
3-Month KORIBOR | | | (3.47 | )% | | | 12/23/23 | | | | CITI | | | | KRW | | | | 239,520,000 | | | | (697 | ) | | | — | | | | (697 | ) |
3-Month KORIBOR | | | (3.47 | )% | | | 12/26/23 | | | | JPM | | | | KRW | | | | 114,310,000 | | | | (379 | ) | | | — | | | | (379 | ) |
3-Month LIBOR | | | (3.50 | )% | | | 03/19/29 | | | | CME | | | | USD | | | | 5,100,000 | | | | 94,127 | | | | — | | | | 94,127 | |
3-Month LIBOR | | | (3.00 | )% | | | 12/18/43 | | | | CITI | | | | USD | | | | 2,700,000 | | | | 437,905 | | | | 179,146 | | | | 258,759 | |
| | | | | | | | | | | | | | | | | | | | | | | | | | | | | | | | |
| | | | | | | | | | | | | | | | | | $ | 2,688,000,000 | | | $ | 51,822 | | | $ | 264,695 | | | $ | (212,873 | ) |
| | | | | | | | | | | | | | | | | | | | | | | | | | | | | | | | |
Total Swap agreements outstanding at December 31, 2013 | | | | | | | $ | 2,732,462,000 | | | $ | 161,817 | | | $ | 128,510 | | | $ | 33,307 | |
| | | | | | | | | | | | | | | | | | | | | | | | | | | | | | | | |
| | | | |
| | See Notes to Financial Statements. | | 129 |
MEDIUM-DURATION BOND FUND
SCHEDULE OF INVESTMENTS (Continued)
VALUATION HIERARCHY
The following is a summary of the inputs used, as of December 31, 2013, in valuing the Fund’s investments carried at fair value:
| | | | | | | | | | | | | | | | | | | | |
| | | Total
Value | | Level 1
Quoted Prices | | Level 2
Other Significant
Observable Inputs | | Level 3
Significant
Unobservable Inputs |
Assets: | | | | | | | | | | | | | | | | | | | | |
Investments in Securities: | | | | | | | | | | | | | | | | | | | | |
Agency Obligations | | | $ | 15,306,422 | | | | $ | — | | | | $ | 15,306,422 | | | | $ | — | |
Asset-Backed Securities | | | | 19,734,775 | | | | | — | | | | | 17,849,074 | | | | | 1,885,701 | |
Corporate Bonds | | | | 152,770,691 | | | | | — | | | | | 151,264,394 | | | | | 1,506,297 | |
Foreign Bonds: | | | | | | | | | | | | | | | | | | | | |
Australia | | | | 5,004,368 | | | | | — | | | | | 5,004,368 | | | | | — | |
Bermuda | | | | 725,087 | | | | | — | | | | | 725,087 | | | | | — | |
Canada | | | | 3,889,165 | | | | | — | | | | | 3,889,165 | | | | | — | |
Cayman Islands | | | | 4,542,961 | | | | | — | | | | | 4,542,961 | | | | | — | |
Chile | | | | 814,775 | | | | | — | | | | | 814,775 | | | | | — | |
Colombia | | | | 531,858 | | | | | — | | | | | 531,858 | | | | | — | |
Dominican Republic | | | | 204,126 | | | | | — | | | | | 204,126 | | | | | — | |
France | | | | 5,733,822 | | | | | — | | | | | 5,733,822 | | | | | — | |
Germany | | | | 2,522,763 | | | | | — | | | | | 2,522,763 | | | | | — | |
Honduras | | | | 201,626 | | | | | — | | | | | 201,626 | | | | | — | |
Iceland | | | | 14 | | | | | — | | | | | — | | | | | 14 | |
India | | | | 3,401,091 | | | | | — | | | | | 3,401,091 | | | | | — | |
Indonesia | | | | 1,409,238 | | | | | — | | | | | 1,409,238 | | | | | — | |
Ireland | | | | 758,825 | | | | | — | | | | | 758,825 | | | | | — | |
Israel | | | | 2,197,856 | | | | | — | | | | | 2,197,856 | | | | | — | |
Italy | | | | 10,909,535 | | | | | — | | | | | 10,909,535 | | | | | — | |
Japan | | | | 1,597,427 | | | | | — | | | | | 1,597,427 | | | | | — | |
Jersey | | | | 239,448 | | | | | — | | | | | 239,448 | | | | | — | |
Jordan | | | | 1,176,567 | | | | | — | | | | | 1,176,567 | | | | | — | |
Luxembourg | | | | 4,471,200 | | | | | — | | | | | 4,471,200 | | | | | — | |
Mexico | | | | 23,881,746 | | | | | — | | | | | 23,881,746 | | | | | — | |
Netherlands | | | | 5,746,489 | | | | | — | | | | | 5,746,489 | | | | | — | |
New Zealand | | | | 223,457 | | | | | — | | | | | 223,457 | | | | | — | |
Norway | | | | 492,511 | | | | | — | | | | | 492,511 | | | | | — | |
Russia | | | | 2,505,995 | | | | | — | | | | | 2,505,995 | | | | | — | |
Singapore | | | | 297,774 | | | | | — | | | | | 297,774 | | | | | — | |
South Africa | | | | 688,380 | | | | | — | | | | | 688,380 | | | | | — | |
South Korea | | | | 3,855,693 | | | | | — | | | | | 3,855,693 | | | | | — | |
Spain | | | | 2,376,247 | | | | | — | | | | | 2,376,247 | | | | | — | |
Supranational | | | | 391,845 | | | | | — | | | | | 391,845 | | | | | — | |
Sweden | | | | 5,137,871 | | | | | — | | | | | 5,137,871 | | | | | — | |
Switzerland | | | | 944,340 | | | | | — | | | | | 944,340 | | | | | — | |
Turkey | | | | 1,267,772 | | | | | — | | | | | 1,267,772 | | | | | — | |
United Kingdom | | | | 16,476,089 | | | | | — | | | | | 16,476,089 | | | | | — | |
Virgin Islands (British) | | | | 3,310,746 | | | | | — | | | | | 3,310,746 | | | | | — | |
Money Market Funds | | | | 127,247,051 | | | | | 127,247,051 | | | | | — | | | | | — | |
Mortgage-Backed Securities | | | | 258,303,242 | | | | | — | | | | | 253,586,840 | | | | | 4,716,402 | |
Municipal Bonds | | | | 24,401,362 | | | | | — | | | | | 24,401,362 | | | | | — | |
Preferred Stocks | | | | 3,290,524 | | | | | 638,524 | | | | | — | | | | | 2,652,000 | |
Purchased Options | | | | 477,498 | | | | | 74,734 | | | | | 402,764 | | | | | — | |
Repurchase Agreements | | | | 11,400,000 | | | | | — | | | | | 11,400,000 | | | | | — | |
U.S. Treasury Obligations | | | | 226,563,177 | | | | | — | | | | | 226,563,177 | | | | | — | |
| | | | | | | | | | | | | | | | | | | | |
Total Assets - Investments in Securities | | | $ | 957,423,449 | | | | $ | 127,960,309 | | | | $ | 818,702,726 | | | | $ | 10,760,414 | |
| | | | | | | | | | | | | | | | | | | | |
| | | | |
Other Financial Instruments*** | | | | | | | | | | | | | | | | | | | | |
Forward Foreign Currency Contracts | | | $ | 8,461 | | | | $ | — | | | | $ | 8,461 | | | | $ | — | |
Swap Agreements | | | | 161,817 | | | | | — | | | | | 161,817 | | | | | — | |
| | | | | | | | | | | | | | | | | | | | |
Total Assets - Other Financial Instruments | | | $ | 170,278 | | | | $ | — | | | | $ | 170,278 | | | | $ | — | |
| | | | | | | | | | | | | | | | | | | | |
| | | | |
| 130 | | See Notes to Financial Statements. | | |
| | | | | | | | | | | | | | | | |
| | | Total
Value | | | Level 1
Quoted Prices | | | Level 2
Other Significant
Observable Inputs | | | Level 3
Significant
Unobservable Inputs | |
Liabilities: | | | | | | | | | | | | | | | | |
Investments in Securities: | | | | | | | | | | | | | | | | |
Security Sold Short | | $ | (7,360,243 | ) | | $ | — | | | $ | (7,360,243 | ) | | $ | — | |
TBA Sale Commitments | | | (2,138,008 | ) | | | — | | | | (2,138,008 | ) | | | — | |
Written Options | | | (762,589 | ) | | | (196,047 | ) | | | (385,856 | ) | | | (180,686 | ) |
| | | | | | | | | | | | | | | | |
Total Liabilities - Investments in Securities | | $ | (10,260,840 | ) | | $ | (196,047 | ) | | $ | (9,884,107 | ) | | $ | (180,686 | ) |
| | | | | | | | | | | | | | | | |
Other Financial Instruments*** | | | | | | | | | | | | | | | | |
Futures Contracts | | $ | (168,299 | ) | | $ | (168,299 | ) | | $ | — | | | $ | — | |
| | | | | | | | | | | | | | | | |
Total Liabilities - Other Financial Instruments | | $ | (168,299 | ) | | $ | (168,299 | ) | | $ | — | | | $ | — | |
| | | | | | | | | | | | | | | | |
***Other financial instruments are derivative instruments not reflected in the Schedule of Investments, such as futures, forwards and swap contracts, which are valued at the unrealized appreciation (depreciation) on the investment. Details of these investments can be found in the Notes to Financial Statements.
There were no transfers between Level 1 and Level 2 during the year ended December 31, 2013.
The unobservable inputs used in the fair value measurement of the reporting entity’s asset-backed securities, corporate bonds, foreign bonds, loan agreements, mortgage-backed securities, preferred stock and written option are values based on evaluated quotations received from dealers who make markets in such securities. Significant increases (decreases) in those evaluated quotations would result in a significantly higher (lower) fair value measurement.
The following is a reconciliation of assets in which significant unobservable inputs (Level 3) were used in determining fair value:
| | | | | | | | | | | | | | | | | | | | | | | | | | | | |
| | | Total
Value | | | Asset-Backed
Securities | | | Corporate
Bonds | | | Foreign
Bonds | | | Mortgage-Backed
Securities | | | Preferred
Stock | | | Written
Option | |
Balance, 12/31/12 | | $ | 14,016,404 | | | $ | 1,782,083 | | | $ | 2,846,064 | | | $ | 157,695 | | | $ | 6,290,562 | | | $ | 2,940,000 | | | $ | — | |
Accrued discounts/premiums | | | (7,218 | ) | | | 5,804 | | | | (5,064 | ) | | | — | | | | (7,958 | ) | | | — | | | | — | |
Realized gain (loss)(1) | | | (73,888 | ) | | | (4,492 | ) | | | (71,251 | ) | | | (657 | ) | | | 2,512 | | | | — | | | | — | |
Change in unrealized appreciation (depreciation)(2) | | | (8,540 | ) | | | 3,325 | | | | 271,340 | | | | 2,421 | | | | 91,148 | | | | (288,000 | ) | | | (88,774 | ) |
Purchases | | | 865,115 | | | | 504,488 | | | | (248,394 | ) | | | — | | | | 700,933 | | | | — | | | | (91,912 | ) |
Sales | | | (1,771,534 | ) | | | (403,472 | ) | | | (1,208,617 | ) | | | (159,445 | ) | | | — | | | | — | | | | — | |
Transfers in to Level 3 | | | — | | | | — | | | | — | | | | — | | | | — | | | | — | | | | — | |
Transfers out of Level 3(3) | | | (2,235,128 | ) | | | — | | | | — | | | | — | | | | (2,235,128 | ) | | | — | | | | — | |
Maturities | | | — | | | | — | | | | — | | | | — | | | | — | | | | — | | | | — | |
Paydowns | | | (205,483 | ) | | | (2,035 | ) | | | (77,781 | ) | | | — | | | | (125,667 | ) | | | — | | | | — | |
| | | | | | | | | | | | | | | | | | | | | | | | | | | | |
Balance, 12/31/13 | | $ | 10,579,728 | | | $ | 1,885,701 | | | $ | 1,506,297 | | | $ | 14 | | | $ | 4,716,402 | | | $ | 2,652,000 | | | $ | (180,686 | ) |
| | | | | | | | | | | | | | | | | | | | | | | | | | | | |
| (1) | Realized gain (loss) from the sale of Level 3 securities can be found on the Statement of Operations in Net realized gain (loss) from: Investment securities. |
| (2) | Change in unrealized appreciation (depreciation) can be found on the Statement of Operations in Net change in unrealized appreciation (depreciation) on: Investment securities and Net change in unrealized appreciation (depreciation) on: Option contracts written. |
| (3) | Transfers out of Level 3 represent the value of securities at December 31, 2013 that were transferred from Level 3 to Level 2 of the fair value hierarchy as a result of the ability of the Fund to obtain a price which was determined using observable inputs. |
| | | | |
| | See Notes to Financial Statements. | | 131 |
Extended-Duration Bond Fund (Unaudited)
The Fund invested in a diversified portfolio composed primarily of investment grade fixed income securities with an average dollar-weighted duration (a measure of bond prices’ sensitivity to changes in interest rates) normally greater than or equal to seven years. The GS4 Class of the Fund outperformed its composite benchmark index, 50% Barclays U.S. Long-Term Credit Index and 50% Barclays U.S. Long-Term Government Index, for the one-year period ended December 31, 2013 (-5.24% versus -9.57%). The Fund’s benchmark-relative performance was positively impacted by the Fund’s significant underweight to the U.S. Treasury sector. Throughout the year, the Fund underweighted lower yielding U.S. Treasury securities in favor of higher yielding corporate bonds, non-U.S. bonds and high yield bonds. These sectors, which traded at a yield premium to U.S. Treasuries, benefitted as spreads compressed, or decreased, during the year. A by-product of underweighting U.S. Treasuries was the Fund’s higher than benchmark yield, which provided incremental interest income. The Fund’s lower-than-benchmark duration position also benefited relative returns as longer-term yields increased from the beginning to the end of the year.
During the year, the Fund remained focused on its objective of seeking maximum total return consistent with preservation of capital.
This Fund may be suitable for investors who are seeking higher returns without investing in stocks, can accept short-term fluctuations in account value and want to diversify their portfolio with a fixed income investment option. This Fund is subject to interest rate risk. Meaning, when interest rates rise, the value of the existing bonds decrease and vice versa. Changes in interest rates have a bigger impact on long duration holdings than on short duration holdings. To the extent that the investment adviser misjudges current market conditions, the Fund’s volatility may be amplified by its use of derivatives and by its ability to select sub-advisers to allocate assets. Leverage may increase the risk of loss and cause fluctuations in the market value of the Fund’s portfolio to have disproportionately large effects or cause the net asset value of the Fund generally to decline faster than it would otherwise.
At December 31, 2013, the portfolio holdings of the Fund, as a percentage of net assets, is shown in the following table. Portfolio holdings are subject to risk and may change at any time.
| | | | |
| | | % | |
Corporate Bonds | | | 48.4 | |
Foreign Bonds | | | 20.9 | |
Municipal Bonds | | | 17.8 | |
Money Market Funds | | | 14.9 | |
U.S. Treasury Obligations | | | 6.4 | |
Asset-Backed Security | | | 0.9 | |
Mortgage-Backed Security | | | 0.5 | |
Preferred Stocks | | | 0.2 | |
| | | | |
| | | 110.0 | |
| | | | |
132
Extended-Duration Bond Fund (Unaudited)
| | | | | | |
| Average Annual Total Returns as of 12/31/13 |
| | GS2 Class* | | GS4 Class* | | Benchmark** |
One Year | | -5.10% | | -5.24% | | -9.57% |
Five Year | | 11.78% | | 11.56% | | 6.18% |
Ten Year | | 7.64% | | 7.45% | | 6.29% |
Inception Date | | 08/27/01 | | 08/27/01 | | |
Total Fund Operating Expenses (May 1, 2013 Prospectus, as amended on October 31, 2013)(1) | | 0.56% | | 0.80% | | |
(1) Current information regarding the Fund’s Operating Expenses can be found in the Financial Highlights.
The performance data quoted represents past performance and does not guarantee future results. Current performance may be lower or higher. Performance data current to the most recent month-end may be obtained at www.GuideStoneFunds.org. The investment return and principal value of an investment will fluctuate so that shares, when redeemed, may be worth more or less than their original cost.
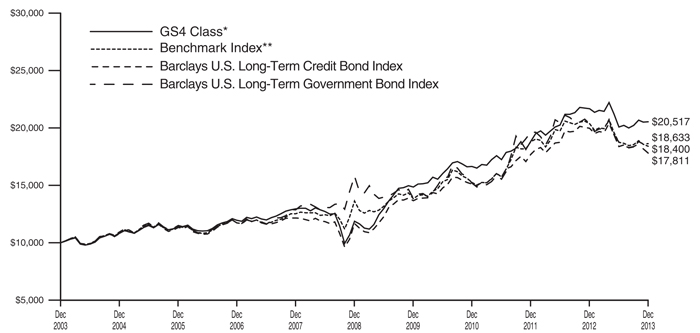
The graph compares the results of a hypothetical $10,000 investment in the GS4 Class of the Fund for the 10-year period from December 31, 2003 to December 31, 2013, with all dividends and capital gains reinvested, with the weighted composite benchmark index.
*These returns reflect expense waivers by the Fund’s investment adviser. Without these waivers, returns would have been lower. Returns shown do not reflect the deduction of taxes that a shareholder would pay on Fund distributions or the redemption of Fund shares.
**Represents a weighted composite benchmark index consisting of 50% Barclays U.S. Long-Term Credit Bond Index and 50% Barclays U.S. Long-Term Government Bond Index.
Unlike a mutual fund, the performance of an index assumes no taxes, transaction costs, management fees or other expenses.
133
| | |
EXTENDED-DURATION BOND FUND SCHEDULE OF INVESTMENTS | | December 31, 2013 |
| | | | | | | | | | |
| | | Par | | | Value | |
ASSET-BACKED SECURITY — 0.9% | |
Citibank Credit Card Issuance Trust | | | | | | | | | | |
6.15%, 06/15/39
(Cost $3,102,185) | | $ | 2,300,000 | | | | | $ | 2,574,921 | |
| | | | | | | | | | |
|
CORPORATE BONDS — 48.4% | |
AES Corporation | | | | | | | | | | |
4.88%, 05/15/23 | | | 60,000 | | | | | | 56,400 | |
Aflac, Inc. | | | | | | | | | | |
6.45%, 08/15/40D | | | 4,705,000 | | | | | | 5,554,935 | |
Alcatel-Lucent USA, Inc. | | | | | | | | | | |
6.45%, 03/15/29 | | | 105,000 | | | | | | 93,450 | |
Alcoa, Inc. | | | | | | | | | | |
5.87%, 02/23/22D | | | 10,000 | | | | | | 10,338 | |
6.75%, 01/15/28 | | | 235,000 | | | | | | 247,198 | |
5.95%, 02/01/37D | | | 85,000 | | | | | | 78,779 | |
Ally Financial, Inc. | | | | | | | | | | |
8.00%, 11/01/31 | | | 177,000 | | | | | | 212,621 | |
Alta Wind Holdings LLC | | | | | | | | | | |
7.00%, 06/30/35 144A | | | 510,531 | | | | | | 542,638 | |
Andarko Holding Co. | | | | | | | | | | |
7.15%, 05/15/28D | | | 250,000 | | | | | | 290,558 | |
Apple, Inc. | | | | | | | | | | |
3.85%, 05/04/43D | | | 2,537,000 | | | | | | 2,128,122 | |
AT&T, Inc. | | | | | | | | | | |
4.30%, 12/15/42D | | | 1,242,000 | | | | | | 1,057,564 | |
Bank of America NA | | | | | | | | | | |
6.00%, 10/15/36 | | | 5,000,000 | | | | | | 5,757,080 | |
Barrick North America Finance LLC | | | | | | | | | | |
5.70%, 05/30/41 | | | 3,634,000 | | | | | | 3,131,967 | |
Bruce Mansfield Unit | | | | | | | | | | |
6.85%, 06/01/34 | | | 1,092,943 | | | | | | 1,134,440 | |
California Institute of Technology | | | | | | | | | | |
4.70%, 11/01/11 | | | 4,030,000 | | | | | | 3,418,564 | |
CenturyLink, Inc. | | | | | | | | | | |
6.45%, 06/15/21D | | | 260,000 | | | | | | 271,700 | |
6.88%, 01/15/28 | | | 65,000 | | | | | | 60,288 | |
7.65%, 03/15/42 | | | 295,000 | | | | | | 264,762 | |
Chesapeake Energy Corporation | | | | | | | | | | |
6.63%, 08/15/20 | | | 10,000 | | | | | | 11,225 | |
6.88%, 11/15/20 | | | 15,000 | | | | | | 17,025 | |
2.75%, 11/15/35 CONV | | | 75,000 | | | | | | 78,797 | |
2.50%, 05/15/37 CONV | | | 200,000 | | | | | | 204,000 | |
2.25%, 12/15/38 CONV | | | 50,000 | | | | | | 46,875 | |
Ciena Corporation | | | | | | | | | | |
3.75%, 10/15/18 CONV 144A | | | 155,000 | | | | | | 224,072 | |
Citigroup, Inc. | | | | | | | | | | |
8.13%, 07/15/39 | | | 3,584,000 | | | | | | 5,043,419 | |
Comcast Corporation | | | | | | | | | | |
4.50%, 01/15/43D | | | 1,950,000 | | | | | | 1,768,278 | |
Continental Airlines 1999-2 Class B Pass Through Trust | | | | | | | | | | |
7.57%, 09/15/21 | | | 60,012 | | | | | | 62,262 | |
Continental Airlines 2000-2 Class B Pass Through Trust | | | | | | | | | | |
8.31%, 10/02/19 | | | 113,155 | | | | | | 119,520 | |
Corning, Inc. | | | | | | | | | | |
7.25%, 08/15/36 | | | 850,000 | | | | | | 981,397 | |
| | | | | | | | | | |
| | | Par | | | Value | |
Cummins, Inc. | | | | | | | | | | |
5.65%, 03/01/98 | | $ | 2,520,000 | | | | | $ | 2,426,102 | |
Darden Restaurants, Inc. | | | | | | | | | | |
6.00%, 08/15/35 | | | 990,000 | | | | | | 891,612 | |
DCP Midstream LLC | | | | | | | | | | |
6.45%, 11/03/36 144A | | | 490,000 | | | | | | 500,584 | |
Dillard’s, Inc. | | | | | | | | | | |
7.00%, 12/01/28D | | | 500,000 | | | | | | 512,500 | |
Dow Chemical Co. | | | | | | | | | | |
9.40%, 05/15/39 | | | 920,000 | | | | | | 1,378,580 | |
Foot Locker, Inc. | | | | | | | | | | |
8.50%, 01/15/22 | | | 1,000,000 | | | | | | 1,147,500 | |
Ford Motor Co. | | | | | | | | | | |
4.25%, 11/15/16 CONVD | | | 175,000 | | | | | | 323,750 | |
6.63%, 10/01/28 | | | 680,000 | | | | | | 765,294 | |
6.38%, 02/01/29 | | | 1,255,000 | | | | | | 1,384,180 | |
General Electric Capital Corporation | | | | | | | | | | |
6.75%, 03/15/32 | | | 2,000,000 | | | | | | 2,483,598 | |
6.15%, 08/07/37 | | | 3,000,000 | | | | | | 3,511,644 | |
5.88%, 01/14/38 | | | 150,000 | | | | | | 171,446 | |
Goldman Sachs Group, Inc. | | | | | | | | | | |
6.75%, 10/01/37 | | | 500,000 | | | | | | 557,997 | |
HCA, Inc. | | | | | | | | | | |
7.58%, 09/15/25 | | | 1,000,000 | | | | | | 1,047,500 | |
7.05%, 12/01/27 | | | 500,000 | | | | | | 497,500 | |
Hewlett-Packard Co. | | | | | | | | | | |
6.00%, 09/15/41D | | | 1,167,000 | | | | | | 1,173,189 | |
HSBC Bank USA NA | | | | | | | | | | |
7.00%, 01/15/39 | | | 4,748,000 | | | | | | 5,960,274 | |
Intel Corporation | | | | | | | | | | |
3.25%, 08/01/39 CONVD | | | 1,155,000 | | | | | | 1,572,250 | |
International Lease Finance Corporation | | | | | | | | | | |
5.88%, 08/15/22 | | | 5,000 | | | | | | 5,012 | |
International Paper Co. | | | | | | | | | | |
8.70%, 06/15/38 | | | 2,643,000 | | | | | | 3,650,998 | |
iStar Financial, Inc. | | | | | | | | | | |
3.00%, 11/15/16 CONV | | | 100,000 | | | | | | 136,750 | |
7.13%, 02/15/18D | | | 180,000 | | | | | | 199,350 | |
4.88%, 07/01/18 | | | 100,000 | | | | | | 100,125 | |
Jefferies Group LLC | | | | | | | | | | |
6.45%, 06/08/27 | | | 50,000 | | | | | | 52,204 | |
3.88%, 11/01/29 CONV | | | 65,000 | | | | | | 69,022 | |
6.25%, 01/15/36 | | | 185,000 | | | | | | 179,450 | |
6.50%, 01/20/43 | | | 1,990,000 | | | | | | 1,979,648 | |
JPMorgan Chase & Co. | | | | | | | | | | |
4.25%, 11/02/18(Z) | | | 385,000 | | | | | | 299,725 | |
5.60%, 07/15/41 | | | 5,000,000 | | | | | | 5,445,950 | |
KB Home | | | | | | | | | | |
1.38%, 02/01/19 CONV | | | 30,000 | | | | | | 29,944 | |
Kinder Morgan Energy Partners LP | | | | | | | | | | |
5.80%, 03/15/35 | | | 280,000 | | | | | | 287,932 | |
Kraft Foods Group, Inc. | | | | | | | | | | |
6.88%, 01/26/39 | | | 2,268,000 | | | | | | 2,771,120 | |
6.50%, 02/09/40 | | | 1,000,000 | | | | | | 1,170,138 | |
Liberty Mutual Group, Inc. | | | | | | | | | | |
6.50%, 03/15/35 144AD | | | 1,400,000 | | | | | | 1,537,586 | |
Macy’s Retail Holdings, Inc. | | | | | | | | | | |
6.38%, 03/15/37 | | | 240,000 | | | | | | 268,673 | |
Masco Corporation | | | | | | | | | | |
7.75%, 08/01/29 | | | 275,000 | | | | | | 303,362 | |
6.50%, 08/15/32 | | | 55,000 | | | | | | 54,312 | |
| | | | |
| 134 | | See Notes to Financial Statements. | | |
| | | | | | | | | | |
| | | Par | | | Value | |
Massachusetts Institute of Technology | | | | | | | | | | |
5.60%, 07/01/11 | | $ | 1,000,000 | | | | | $ | 1,140,886 | |
Mead Corporation | | | | | | | | | | |
7.55%, 03/01/47@D | | | 515,000 | | | | | | 523,148 | |
Merrill Lynch & Co., Inc. | | | | | | | | | | |
6.11%, 01/29/37 | | | 900,000 | | | | | | 973,714 | |
MetLife, Inc. | | | | | | | | | | |
5.88%, 02/06/41 | | | 2,675,000 | | | | | | 2,998,750 | |
6.40%, 12/15/66 | | | 310,000 | | | | | | 320,075 | |
Morgan Stanley | | | | | | | | | | |
4.75%, 11/16/18(A) | | | 295,000 | | | | | | 260,836 | |
3.75%, 02/25/23 | | | 300,000 | | | | | | 292,478 | |
6.25%, 08/09/26 | | | 600,000 | | | | | | 695,042 | |
Motorola Solutions, Inc. | | | | | | | | | | |
6.63%, 11/15/37 | | | 46,000 | | | | | | 45,696 | |
Mutual of Omaha Insurance Co. | | | | | | | | | | |
6.80%, 06/15/36 144A | | | 100,000 | | | | | | 112,870 | |
Nationwide Mutual Insurance Co. | | | | | | | | | | |
6.60%, 04/15/34 144A | | | 150,000 | | | | | | 153,562 | |
New Albertsons, Inc. | | | | | | | | | | |
7.45%, 08/01/29 | | | 55,000 | | | | | | 45,375 | |
8.70%, 05/01/30 | | | 25,000 | | | | | | 21,750 | |
8.00%, 05/01/31 | | | 295,000 | | | | | | 244,850 | |
Old Republic International Corporation | | | | | | | | | | |
3.75%, 03/15/18 CONVD | | | 2,255,000 | | | | | | 2,815,931 | |
Owens Corning | | | | | | | | | | |
7.00%, 12/01/36 | | | 2,360,000 | | | | | | 2,549,732 | |
Penn Mutual Life Insurance Co. | | | | | | | | | | |
7.63%, 06/15/40 144A | | | 1,750,000 | | | | | | 2,201,645 | |
Prudential Financial, Inc. | | | | | | | | | | |
6.63%, 06/21/40D | | | 3,912,000 | | | | | | 4,760,200 | |
5.63%, 05/12/41 | | | 987,000 | | | | | | 1,067,531 | |
PulteGroup, Inc. | | | | | | | | | | |
6.38%, 05/15/33 | | | 1,000,000 | | | | | | 910,000 | |
Qwest Corporation | | | | | | | | | | |
7.25%, 09/15/25D | | | 490,000 | | | | | | 522,872 | |
6.88%, 09/15/33D | | | 2,250,000 | | | | | | 2,171,250 | |
RPM International, Inc. | | | | | | | | | | |
2.25%, 12/15/20 CONVD | | | 22,000 | | | | | | 24,461 | |
RR Donnelley & Sons Co. | | | | | | | | | | |
8.25%, 03/15/19D | | | 250,000 | | | | | | 287,500 | |
7.00%, 02/15/22D | | | 285,000 | | | | | | 307,800 | |
SandRidge Energy, Inc. | | | | | | | | | | |
7.50%, 02/15/23 | | | 350,000 | | | | | | 357,000 | |
Sempra Energy | | | | | | | | | | |
6.00%, 10/15/39 | | | 991,000 | | | | | | 1,092,294 | |
SLM Corporation | | | | | | | | | | |
5.00%, 06/15/18 | | | 335,000 | | | | | | 329,893 | |
5.63%, 08/01/33 | | | 1,460,000 | | | | | | 1,209,975 | |
Sprint Capital Corporation | | | | | | | | | | |
6.90%, 05/01/19 | | | 55,000 | | | | | | 60,362 | |
6.88%, 11/15/28 | | | 1,025,000 | | | | | | 971,188 | |
8.75%, 03/15/32 | | | 20,000 | | | | | | 21,550 | |
Textron, Inc. | | | | | | | | | | |
6.63%, 04/07/20(U) | | | 160,000 | | | | | | 296,679 | |
Toro Co. | | | | | | | | | | |
6.63%, 05/01/37@ | | | 300,000 | | | | | | 305,528 | |
UnitedHealth Group, Inc. | | | | | | | | | | |
6.50%, 06/15/37 | | | 767,000 | | | | | | 912,900 | |
6.63%, 11/15/37 | | | 1,026,000 | | | | | | 1,245,358 | |
3.95%, 10/15/42 | | | 181,000 | | | | | | 154,116 | |
| | | | | | | | | | |
| | | Par | | | Value | |
University of Pennsylvania | | | | | | | | | | |
4.67%, 09/01/12 | | $ | 3,370,000 | | | | | $ | 3,000,692 | |
University of Southern California | | | | | | | | | | |
5.25%, 10/01/11 | | | 2,779,000 | | | | | | 2,945,857 | |
US Airways 2012-1 Class A Pass Through Trust | | | | | | | | | | |
5.90%, 04/01/26D | | | 441,814 | | | | | | 481,577 | |
US Airways 2012-2 Class A Pass Through Trust | | | | | | | | | | |
4.63%, 12/03/26 | | | 303,953 | | | | | | 310,222 | |
Valeant Pharmaceuticals International | | | | | | | | | | |
6.38%, 10/15/20 144A | | | 490,000 | | | | | | 518,787 | |
Verizon Communications, Inc. | | | | | | | | | | |
6.40%, 02/15/38 | | | 968,000 | | | | | | 1,090,542 | |
6.00%, 04/01/41 | | | 2,770,000 | | | | | | 3,051,917 | |
6.55%, 09/15/43 | | | 1,878,000 | | | | | | 2,204,999 | |
Verizon Maryland, Inc. | | | | | | | | | | |
5.13%, 06/15/33 | | | 150,000 | | | | | | 142,643 | |
WellPoint, Inc. | | | | | | | | | | |
6.38%, 06/15/37D | | | 182,000 | | | | | | 208,353 | |
Wells Fargo & Co. | | | | | | | | | | |
5.61%, 01/15/44 144A | | | 4,912,000 | | | | | | 5,120,878 | |
Western Union Co. | | | | | | | | | | |
6.20%, 11/17/36D | | | 1,265,000 | | | | | | 1,189,996 | |
Weyerhaeuser Co. | | | | | | | | | | |
6.88%, 12/15/33 | | | 580,000 | | | | | | 686,062 | |
| | | | | | | | | | |
Total Corporate Bonds
(Cost $121,931,230) | | | | | | 131,072,397 | |
| | | | | | | | | | |
|
FOREIGN BONDS — 20.9% | |
Australia — 2.7% | |
Barrick PD Australia Finance Propriety, Ltd. | | | | | | | | | | |
5.95%, 10/15/39 | | | 2,870,000 | | | | | | 2,490,821 | |
BHP Billiton Finance (USA), Ltd. | | | | | | | | | | |
5.00%, 09/30/43 | | | 854,000 | | | | | | 871,675 | |
New South Wales Treasury Corporation | | | | | | | | | | |
6.00%, 02/01/18(A) | | | 730,000 | | | | | | 713,803 | |
Queensland Treasury Corporation | | | | | | | | | | |
5.75%, 11/21/14(A) | | | 60,000 | | | | | | 55,061 | |
Rio Tinto Finance USA, Ltd. | | | | | | | | | | |
5.20%, 11/02/40 | | | 2,946,000 | | | | | | 3,045,654 | |
| | | | | | | | | | |
| | | | | | | | | 7,177,014 | |
| | | | | | | | | | |
Brazil — 0.4% | | | | | | | | | | |
Brazilian Government International Bond | | | | | | | | | | |
10.25%, 01/10/28(B)D | | | 2,525,000 | | | | | | 1,040,823 | |
| | | | | | | | | | |
Canada — 4.7% | | | | | | | | | | |
Canada Generic Residual STRIP | | | | | | | | | | |
2.95%, 06/01/25(C)W† | | | 3,685,000 | | | | | | 2,484,604 | |
Ontario Generic Residual STRIP | | | | | | | | | | |
4.37%, 03/08/29(C)W† | | | 4,600,000 | | | | | | 2,288,546 | |
Saskatchewan Residual STRIP | | | | | | | | | | |
3.22%, 02/04/22(C)W† | | | 3,000,000 | | | | | | 2,111,803 | |
Talisman Energy, Inc. | | | | | | | | | | |
6.25%, 02/01/38 | | | 450,000 | | | | | | 459,013 | |
| | | | |
| | See Notes to Financial Statements. | | 135 |
EXTENDED-DURATION BOND FUND
SCHEDULE OF INVESTMENTS (Continued)
| | | | | | | | | | |
| | | Par | | | Value | |
TransCanada PipeLines, Ltd. | | | | | | | | | | |
6.20%, 10/15/37 | | $ | 1,541,000 | | | | | $ | 1,761,312 | |
Xstrata Finance Canada, Ltd. | | | | | | | | | | |
6.00%, 11/15/41 144A | | | 3,591,000 | | | | | | 3,486,764 | |
| | | | | | | | | | |
| | | | | | | | | 12,592,042 | |
| | | | | | | | | | |
Ireland — 0.7% | |
Eircom Finance, Ltd. | | | | | | | | | | |
9.25%, 05/15/20 144A(E) | | | 200,000 | | | | | | 292,021 | |
XL Group PLC | | | | | | | | | | |
6.25%, 05/15/27D | | | 1,530,000 | | | | | | 1,717,775 | |
| | | | | | | | | | |
| | | | | | | | | 2,009,796 | |
| | | | | | | | | | |
|
Italy — 0.6% | |
Telecom Italia Capital SA | | | | | | | | | | |
6.38%, 11/15/33 | | | 755,000 | | | | | | 687,050 | |
6.00%, 09/30/34 | | | 1,010,000 | | | | | | 879,963 | |
| | | | | | | | | | |
| | | | | | | | | 1,567,013 | |
| | | | | | | | | | |
|
Luxembourg — 0.4% | |
ArcelorMittal | | | | | | | | | | |
6.00%, 03/01/21D | | | 45,000 | | | | | | 47,925 | |
7.50%, 10/15/39 | | | 215,000 | | | | | | 212,313 | |
7.25%, 03/01/41D | | | 975,000 | | | | | | 936,000 | |
| | | | | | | | | | |
| | | | | | | | | 1,196,238 | |
| | | | | | | | | | |
|
Malaysia — 0.1% | |
Telekom Malaysia Bhd | | | | | | | | | | |
7.88%, 08/01/25 144A | | | 225,000 | | | | | | 280,081 | |
| | | | | | | | | | |
Mexico — 0.7% | |
America Movil SAB de CV | | | | | | | | | | |
6.45%, 12/05/22(M) | | | 2,600,000 | | | | | | 184,502 | |
Mexican Bonos | | | | | | | | | | |
8.00%, 12/07/23(M) | | | 19,800,000 | | | | | | 1,689,745 | |
| | | | | | | | | | |
| | | | | | | | | 1,874,247 | |
| | | | | | | | | | |
|
Netherlands — 4.5% | |
Cooperatieve Centrale Raiffeisen-Boerenleenbank BA | | | | | | | | | | |
5.25%, 05/24/41D | | | 1,023,000 | | | | | | 1,059,333 | |
5.75%, 12/01/43 | | | 1,500,000 | | | | | | 1,595,964 | |
Deutsche Telekom International Finance BV | | | | | | | | | | |
4.88%, 03/06/42 144A | | | 2,050,000 | | | | | | 1,963,613 | |
EDP Finance BV | | | | | | | | | | |
4.90%, 10/01/19 144A | | | 500,000 | | | | | | 510,000 | |
Enel Finance International NV | | | | | | | | | | |
6.80%, 09/15/37 144AD | | | 100,000 | | | | | | 103,961 | |
6.00%, 10/07/39 144AD | | | 2,210,000 | | | | | | 2,126,471 | |
Koninklijke Philips Electronics NV | | | | | | | | | | |
6.88%, 03/11/38D | | | 3,250,000 | | | | | | 3,962,150 | |
5.00%, 03/15/42D | | | 1,000,000 | | | | | | 996,685 | |
| | | | | | | | | | |
| | | | | | | | | 12,318,177 | |
| | | | | | | | | | |
Norway — 0.5% | |
Norway Government Bond | | | | | | | | | | |
5.00%, 05/15/15(K) | | | 540,000 | | | | | | 93,301 | |
4.25%, 05/19/17(K) | | | 7,670,000 | | | | | | 1,363,767 | |
| | | | | | | | | | |
| | | | | | | | | 1,457,068 | |
| | | | | | | | | | |
|
Portugal — 0.3% | |
Portugal Obrigacoesdo Tesouro OT | | | | | | | | | | |
4.80%, 06/15/20(E) | | | 75,000 | | | | | | 98,695 | |
| | | | | | | | | | |
| | | Par | | | Value | |
3.85%, 04/15/21(E) | | $ | 255,000 | | | | | $ | 311,709 | |
4.95%, 10/25/23(E) | | | 355,000 | | | | | | 451,755 | |
| | | | | | | | | | |
| | | | | | | | | 862,159 | |
| | | | | | | | | | |
|
Spain — 1.1% | |
Autonomous Community of Madrid Spain | | | | | | | | | | |
4.30%, 09/15/26(E) | | | 665,000 | | | | | | 862,836 | |
Telefonica Emisiones SA Unipersonal | | | | | | | | | | |
5.13%, 04/27/20 | | | 75,000 | | | | | | 79,864 | |
7.05%, 06/20/36 | | | 1,720,000 | | | | | | 1,904,625 | |
| | | | | | | | | | |
| | | | | | | | | 2,847,325 | |
| | | | | | | | | | |
|
Supranational — 1.7% | |
Inter-American Development Bank | | | | | | | | | | |
6.00%, 12/15/17(Z) | | | 3,115,000 | | | | | | 2,665,798 | |
International Bank For Reconstruction & Development | | | | | | | | | | |
1.43%, 03/05/14(G) | | | 2,470,000 | | | | | | 1,959,097 | |
| | | | | | | | | | |
| | | | | | | | | 4,624,895 | |
| | | | | | | | | | |
United Kingdom — 2.5% | |
Barclays Bank PLC | | | | | | | | | | |
3.68%, 08/20/15(W) | | | 740,000,000 | | | | | | 716,980 | |
BG Energy Capital PLC | | | | | | | | | | |
5.13%, 10/15/41 144A | | | 585,000 | | | | | | 602,125 | |
Centrica PLC | | | | | | | | | | |
5.38%, 10/16/43 144A | | | 1,097,000 | | | | | | 1,108,841 | |
HBOS PLC | | | | | | | | | | |
6.00%, 11/01/33 144A | | | 925,000 | | | | | | 896,784 | |
Rio Tinto Finance USA PLC | | | | | | | | | | |
4.13%, 08/21/42D | | | 392,000 | | | | | | 346,039 | |
Standard Chartered PLC | | | | | | | | | | |
5.30%, 01/09/43 144AD | | | 3,201,000 | | | | | | 3,102,105 | |
| | | | | | | | | | |
| | | | | | | | | 6,772,874 | |
| | | | | | | | | | |
Total Foreign Bonds
(Cost $52,811,460) | | | | | | 56,619,752 | |
| | | | | | | | | | |
MORTGAGE-BACKED SECURITY — 0.5% | |
Community Program Loan Trust | | | | | | | | | | |
4.50%, 04/01/29
(Cost $1,164,506) | | | 1,296,843 | | | | | | 1,309,328 | |
| | | | | | | | | | |
MUNICIPAL BONDS — 17.8% | |
Austin Water & Wastewater System, Revenue Bond, Series A | | | | | | | | | | |
5.00%, 11/15/43 | | | 1,250,000 | | | | | | 1,287,600 | |
Bay Area Toll Authority, Revenue Bond, Series S-4 | | | | | | | | | | |
5.00%, 04/01/43 | | | 1,395,000 | | | | | | 1,395,921 | |
5.13%, 04/01/48 | | | 510,000 | | | | | | 512,754 | |
California Educational Facilities Authority, Stanford University, Revenue Bond | | | | | | | | | | |
5.25%, 04/01/40 | | | 3,690,000 | | | | | | 4,295,750 | |
Cook County Community College District No. 508, General Obligation | | | | | | | | | | |
5.25%, 12/01/43 | | | 325,000 | | | | | | 322,559 | |
| | | | |
| 136 | | See Notes to Financial Statements. | | |
| | | | | | | | | | |
| | | Par | | | Value | |
District of Columbia Water & Sewer Authority, Revenue Bond, Series A | | | | | | | | | | |
5.00%, 10/01/44 | | $ | 2,005,000 | | | | | $ | 2,041,992 | |
Grand Parkway Transportation Corporation, Revenue Bond, Series B | | | | | | | | | | |
5.25%, 10/01/51 | | | 6,415,000 | | | | | | 6,482,678 | |
Los Angeles Department of Water & Power, Revenue Bond, Series B | | | | | | | | | | |
5.00%, 07/01/43 | | | 2,405,000 | | | | | | 2,478,555 | |
Metropolitan Pier & Exposition Authority, McCormick Place Expansion Project, Revenue Bond, Series B (AGM Insured) | | | | | | | | | | |
0.00%, 06/15/45W† | | | 9,800,000 | | | | | | 1,560,454 | |
0.00%, 06/15/46W† | | | 1,240,000 | | | | | | 186,236 | |
0.00%, 06/15/47W† | | | 400,000 | | | | | | 56,300 | |
Miami-Dade County Water & Sewer System, Revenue Bond, Series A | | | | | | | | | | |
5.00%, 10/01/42 | | | 2,030,000 | | | | | | 2,058,542 | |
New York City Transitional Finance Authority, Revenue Bond, Sub-Series A-1 | | | | | | | | | | |
5.00%, 11/01/38 | | | 2,080,000 | | | | | | 2,165,093 | |
New York City Water & Sewer System, Revenue Bond, Series FF | | | | | | | | | | |
5.00%, 06/15/45 | | | 1,190,000 | | | | | | 1,213,800 | |
New York State Dormitory Authority, Revenue Bond, Series A | | | | | | | | | | |
5.00%, 03/15/43 | | | 2,210,000 | | | | | | 2,294,046 | |
New York State Dormitory Authority, Revenue Bond, Series C | | | | | | | | | | |
5.00%, 03/15/41 | | | 745,000 | | | | | | 764,415 | |
Ohio State Turnpike Commission, Revenue Bond, Series A-2 | | | | | | | | | | |
0.00%, 02/15/36W† | | | 925,000 | | | | | | 257,973 | |
0.00%, 02/15/37W† | | | 1,635,000 | | | | | | 425,590 | |
0.00%, 02/15/38W† | | | 1,995,000 | | | | | | 485,344 | |
0.00%, 02/15/40W† | | | 1,670,000 | | | | | | 355,877 | |
0.00%, 02/15/41W† | | | 1,585,000 | | | | | | 315,843 | |
0.00%, 02/15/42W† | | | 1,200,000 | | | | | | 224,688 | |
0.00%, 02/15/43W† | | | 830,000 | | | | | | 146,005 | |
Omaha Public Power District, Revenue Bond, Series A | | | | | | | | | | |
5.00%, 02/01/42 | | | 1,475,000 | | | | | | 1,528,439 | |
Pennsylvania Turnpike Commission, Revenue Bond, Series C | | | | | | | | | | |
5.00%, 12/01/43 | | | 390,000 | | | | | | 387,586 | |
Philadelphia Water & Wastewater, Revenue Bond, Series A | | | | | | | | | | |
5.13%, 01/01/43 | | | 380,000 | | | | | | 382,097 | |
San Bernardino Community College District, General Obligation, Series B | | | | | | | | | | |
0.00%, 08/01/48W† | | | 2,845,000 | | | | | | 373,378 | |
| | | | | | | | | | |
| | | Par | | | Value | |
Southwestern Community College District, General Obligation, Series C | | | | | | | | | | |
0.00%, 08/01/46W† | | $ | 3,975,000 | | | | | $ | 596,051 | |
State of California, General Obligation | | | | | | | | | | |
5.00%, 02/01/43 | | | 1,775,000 | | | | | | 1,795,590 | |
5.00%, 04/01/43 | | | 3,850,000 | | | | | | 3,895,199 | |
State of Illinois, General Obligation | | | | | | | | | | |
5.10%, 06/01/33 | | | 635,000 | | | | | | 590,512 | |
State of Illinois, General Obligation, Series B | | | | | | | | | | |
5.52%, 04/01/38 | | | 425,000 | | | | | | 382,921 | |
University of California, Revenue Bond, Series AD | | | | | | | | | | |
4.86%, 05/15/12 | | | 4,912,000 | | | | | | 4,256,101 | |
University of California, Revenue Bond, Series AI | | | | | | | | | | |
5.00%, 05/15/38 | | | 405,000 | | | | | | 422,508 | |
University of Utah, Revenue Bond, Series A | | | | | | | | | | |
5.00%, 08/01/43 | | | 1,545,000 | | | | | | 1,599,616 | |
Westside Union School District, General Obligation, Series B | | | | | | | | | | |
0.00%, 08/01/40W† | | | 1,600,000 | | | | | | 339,408 | |
0.00%, 08/01/45W† | | | 2,170,000 | | | | | | 337,587 | |
| | | | | | | | | | |
Total Municipal Bonds
(Cost $47,937,095) | | | | | | 48,215,008 | |
| | | | | | | | | | |
U.S. TREASURY OBLIGATIONS — 6.4% | |
U.S. Treasury Bonds | | | | | | | | | | |
2.75%, 11/15/42D | | | 1,200,000 | | | | | | 949,126 | |
2.88%, 05/15/43 | | | 5,020,000 | | | | | | 4,069,729 | |
3.63%, 08/15/43 | | | 2,511,000 | | | | | | 2,371,913 | |
| | | | | | | | | | |
| | | | | | | | | 7,390,768 | |
| | | | | | | | | | |
U.S. Treasury STRIP | | | | | | | | | | |
0.00%, 08/15/42W† | | | 32,225,000 | | | | | | 9,840,742 | |
| | | | | | | | | | |
| | |
Total U.S. Treasury Obligations
(Cost $18,365,892) | | | | | | 17,231,510 | |
| | | | | | | | | | |
| | | |
| | | Shares | | | | | | |
PREFERRED STOCKS — 0.2% | |
Ally Financial, Inc., | | | | | | | | | | |
7.00% 144A | | | 82 | | | | | | 78,318 | |
Chesapeake Energy Corporation, | | | | | | | | | | |
5.00% CONV | | | 620 | | | | | | 60,450 | |
Chesapeake Energy Corporation, | | | | | | | | | | |
5.75% CONV 144A | | | 80 | | | | | | 92,700 | |
El Paso Energy Capital Trust I, | | | | | | | | | | |
4.75%, 03/31/28 CONV | | | 5,350 | | | | | | 300,295 | |
| | | | | | | | | | |
Total Preferred Stocks
(Cost $373,592) | | | | | | 531,763 | |
| | | | | | | | | | |
| | | | |
| | See Notes to Financial Statements. | | 137 |
EXTENDED-DURATION BOND FUND
SCHEDULE OF INVESTMENTS (Continued)
| | | | | | | | | | |
| | | Shares | | | Value | |
MONEY MARKET FUNDS — 14.9% | |
GuideStone Money Market
Fund (GS4 Class)¥ | | | 10,096,703 | | | | | $ | 10,096,703 | |
Northern Institutional Liquid
Assets Portfolio§ | | | 30,220,442 | | | | | | 30,220,442 | |
| | | | | | | | | | |
Total Money Market Funds
(Cost $40,317,145) | | | | | | | | | 40,317,145 | |
| | | | | | | | | | |
| | |
TOTAL INVESTMENTS — 110.0%
(Cost $286,003,105) | | | | | | 297,871,824 | |
| | | |
Liabilities in Excess of Other
Assets — (10.0)% | | | | | | | | | (27,090,443 | ) |
| | | | | | | | | | |
NET ASSETS — 100.0% | | | | | | | | $ | 270,781,381 | |
| | | | | | | | | | |
VALUATION HIERARCHY
The following is a summary of the inputs used, as of December 31, 2013, in valuing the Fund’s investments carried at fair value:
| | | | | | | | | | | | | | | | |
| | | Total
Value | | | Level 1
Quoted Prices | | | Level 2
Other Significant
Observable Inputs | | | Level 3
Significant
Unobservable Inputs | |
Assets: | | | | | | | | | | | | | | | | |
Investments in Securities: | | | | | | | | | | | | | | | | |
Asset-Backed Security | | $ | 2,574,921 | | | $ | — | | | $ | 2,574,921 | | | $ | — | |
Corporate Bonds | | | 131,072,397 | | | | — | | | | 128,964,375 | | | | 2,108,022 | |
Foreign Bonds | | | 56,619,752 | | | | — | | | | 56,619,752 | | | | — | |
Money Market Funds | | | 40,317,145 | | | | 40,317,145 | | | | — | | | | — | |
Mortgage-Backed Security | | | 1,309,328 | | | | — | | | | 1,309,328 | | | | — | |
Municipal Bonds | | | 48,215,008 | | | | — | | | | 48,215,008 | | | | — | |
Preferred Stocks | | | 531,763 | | | | 453,445 | | | | — | | | | 78,318 | |
U.S. Treasury Obligations | | | 17,231,510 | | | | — | | | | 17,231,510 | | | | — | |
| | | | | | | | | | | | | | | | |
| | | | |
Total Assets - Investments in Securities | | $ | 297,871,824 | | | $ | 40,770,590 | | | $ | 254,914,894 | | | $ | 2,186,340 | |
| | | | | | | | | | | | | | | | |
There were no transfers between Level 1 and Level 2 during the year ended December 31, 2013.
Management has determined that the amount of Level 3 securities compared to total net assets is not material; therefore, the reconciliation of Level 3 securities and assumptions is not shown for the period ending December 31, 2013.
| | | | |
| 138 | | See Notes to Financial Statements. | | |
Global Bond Fund (Unaudited)
The headwinds of deleveraging, financial crisis and austerity have been powerful forces in the developed markets over the past few years, but the major central banks across the globe have been determined through aggressive accommodative monetary policy to support economic growth and their financial markets. Focus remained on improvements in the U.S. economy, stabilization in the peripheral European countries, potential impact of stimulus policies in Japan and the level of economic growth in China. Related to currency, the euro and Great Britain pound appreciated relative to the U.S. dollar, while the Japanese yen depreciated relative to the U.S. dollar during the year. Similar to the domestic bond market, the environment was difficult for global bonds with rates at historically low levels. The global bond market, as measured by the Barclays Global Aggregate Index, posted an annual return of -2.60% for the year. Emerging markets debt, as measured by the JPMorgan Emerging Markets Bond Index Plus, suffered much worse, posting an annual return of -8.31%
The Fund is actively managed and invests in a diversified portfolio composed primarily of global fixed income securities with an average dollar-weighted duration (a measure of bond prices’ sensitivity to changes in interest rates) normally between three to 10 years. The Fund maintained its global focus, seeking investment opportunities across a wide array of economies, credits, yield curves and currencies. For the one-year period ended December 31, 2013, the Fund outperformed its composite benchmark, 50% Barclays Global Aggregate Bond Index – Unhedged, 25% JPMorgan Emerging Markets Bond Index Plus and 25% Barclays U.S. Corporate High Yield Index – 2% Issuer Capped (0.30% versus -1.62%). The outperformance was primarily generated during the first and fourth quarters. The Fund’s benchmark-relative outperformance was attributable to several factors including exposure to and security selection within the corporate bond and high yield bond sectors. Also, strong returns from select convertible bonds allowed this sector to contribute moderately to excess returns. During the year, the Fund utilized U.S. and non-U.S. government futures and options to manage yield curve strategies. These strategies, in aggregate, detracted modest value from the Fund’s performance. Additionally, the Fund used currency forward contracts and currency options for hedging purposes which slightly detracted from performance.
This Fund may be suitable for investors who have a medium to long-term investment horizon, seek higher returns than those offered by a shorter maturity bond fund, can accept short-term fluctuations in account value and want to diversify their portfolio with a globally diversified fixed-income investment option. This Fund may invest, to a large extent, in high yield securities, commonly known as junk bonds. While offering higher current yields, these securities may be considered speculative and are subject to greater risks than higher-rated bonds. Securities of emerging countries may involve additional risks including price volatility, reduced liquidity, currency fluctuation and financial reporting requirements as well as political and economic instability. This Fund is subject to interest rate risk. Meaning, when interest rates rise, the value of the existing bonds decrease and vice versa. Changes in interest rates have a bigger impact on long duration holdings than on short duration holdings. To the extent that the investment adviser misjudges current market conditions, the Fund’s volatility may be amplified by its use of derivatives and by its ability to select sub-advisers to allocate assets. Leverage may increase the risk of loss and cause fluctuations in the market value of the Fund’s portfolio to have disproportionately large effects or cause the net asset value of the Fund generally to decline faster than it would otherwise.
At December 31, 2013, the portfolio holdings of the Fund, as a percentage of net assets, is shown in the following table. Portfolio holdings are subject to risk and may change at any time.
| | | | |
| | | % | |
Foreign Bonds | | | 39.4 | |
Corporate Bonds | | | 35.6 | |
Money Market Funds | | | 32.0 | |
U.S. Treasury Obligations | | | 7.7 | |
Mortgage-Backed Securities | | | 3.9 | |
Preferred Stocks | | | 1.2 | |
Common Stocks | | | 0.9 | |
Foreign Common Stocks | | | 0.4 | |
Municipal Bond | | | 0.1 | |
Purchased Option | | | — | ** |
| | | | |
| | | 121.2 | |
| | | | |
| ** | Rounds to less than 0.005%. |
139
Global Bond Fund (Unaudited)
| | | | |
| Average Annual Total Returns as of 12/31/13 |
| | | GS4 Class* | | Benchmark** |
One Year | | 0.30% | | -1.62% |
Five Year | | 12.47% | | 9.31% |
Since Inception | | 6.32% | | 6.48% |
Inception Date | | 12/29/06 | | |
Total Fund Operating Expenses (May 1, 2013 Prospectus, as amended on October 31, 2013)(1) | | 0.88% | | |
(1) Current information regarding the Fund’s Operating Expenses can be found in the Financial Highlights.
The performance data quoted represents past performance and does not guarantee future results. Current performance may be lower or higher. Performance data current to the most recent month-end may be obtained at www.GuideStoneFunds.org. The investment return and principal value of an investment will fluctuate so that shares, when redeemed, may be worth more or less than their original cost.
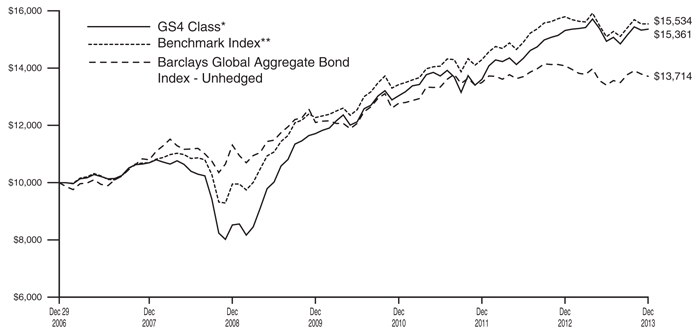
The graph compares the results of a hypothetical $10,000 investment in the GS4 Class of the Fund since December 29, 2006 (commencement of operations), with all dividends and capital gains reinvested, with the weighted composite index.
*These returns reflect expense waivers by the Fund’s investment adviser. Without these waivers, returns would have been lower. Returns shown do not reflect the deduction of taxes that a shareholder would pay on Fund distributions or the redemption of Fund shares.
**Represents a weighted composite benchmark index consisting of 25% JPMorgan Emerging Markets Bond Index Plus, 50% Barclays Global Aggregate Bond Index — Unhedged and 25% Barclays U.S. Corporate High Yield – 2% Issuer Capped Index. Unlike a mutual fund, the performance of an index assumes no taxes, transaction costs, management fees or other expenses.
140
| | |
GLOBAL BOND FUND SCHEDULE OF INVESTMENTS | | December 31, 2013 |
| | | | | | | | | | | | |
| | | Par | | | Value | |
CORPORATE BONDS — 35.6% | | | | |
Acadia Healthcare Co., Inc. | | | | | | | | | | | | |
12.88%, 11/01/18 | | | | $ | 106,000 | | | | | $ | 128,790 | |
Access Midstream Partners LP | | | | | | | | | | | | |
6.13%, 07/15/22 | | | | | 150,000 | | | | | | 161,250 | |
4.88%, 05/15/23 | | | | | 360,000 | | | | | | 349,200 | |
Activision Blizzard, Inc. | | | | | | | | | | | | |
5.63%, 09/15/21 144A | | | | | 70,000 | | | | | | 72,625 | |
6.13%, 09/15/23 144A | | | | | 60,000 | | | | | | 62,700 | |
AES Corporation | | | | | | | | | | | | |
8.00%, 06/01/20 | | | | | 350,000 | | | | | | 411,250 | |
7.38%, 07/01/21 | | | | | 170,000 | | | | | | 192,525 | |
4.88%, 05/15/23 | | | | | 1,710,000 | | | | | | 1,607,400 | |
Alcatel-Lucent USA, Inc. | | | | | | | | | | | | |
6.45%, 03/15/29 | | | | | 275,000 | | | | | | 244,750 | |
Alcoa, Inc. | | | | | | | | | | | | |
5.87%, 02/23/22 | | | | | 5,000 | | | | | | 5,169 | |
5.90%, 02/01/27 | | | | | 825,000 | | | | | | 810,175 | |
6.75%, 01/15/28 | | | | | 1,380,000 | | | | | | 1,451,633 | |
5.95%, 02/01/37D | | | | | 65,000 | | | | | | 60,242 | |
Ally Financial, Inc. | | | | | | | | | | | | |
6.75%, 12/01/14 | | | | | 399,000 | | | | | | 418,202 | |
5.50%, 02/15/17 | | | | | 70,000 | | | | | | 76,125 | |
8.00%, 12/31/18 | | | | | 104,000 | | | | | | 122,785 | |
8.00%, 03/15/20 | | | | | 200,000 | | | | | | 240,750 | |
7.50%, 09/15/20D | | | | | 415,000 | | | | | | 485,031 | |
8.00%, 11/01/31 | | | | | 345,000 | | | | | | 414,431 | |
American Axle & Manufacturing, Inc. | | | | | | | | | | | | |
7.75%, 11/15/19 | | | | | 70,000 | | | | | | 79,975 | |
6.25%, 03/15/21D | | | | | 30,000 | | | | | | 32,025 | |
6.63%, 10/15/22D | | | | | 150,000 | | | | | | 158,625 | |
American International Group, Inc. | | | | | | | | | | | | |
5.45%, 05/18/17 | | | | | 25,000 | | | | | | 27,965 | |
Anadarko Petroleum Corporation | | | | | | | | | | | | |
5.95%, 09/15/16 | | | | | 10,000 | | | | | | 11,148 | |
6.38%, 09/15/17 | | | | | 110,000 | | | | | | 126,393 | |
Appvion, Inc. | | | | | | | | | | | | |
9.00%, 06/01/20 144A | | | | | 210,000 | | | | | | 212,887 | |
Arch Coal, Inc. | | | | | | | | | | | | |
9.88%, 06/15/19D | | | | | 400,000 | | | | | | 358,000 | |
AT&T, Inc. | | | | | | | | | | | | |
3.88%, 08/15/21 | | | | | 60,000 | | | | | | 60,886 | |
Atlas Pipeline Partners LP | | | | | | | | | | | | |
4.75%, 11/15/21 144A | | | | | 110,000 | | | | | | 101,200 | |
Ball Corporation | | | | | | | | | | | | |
5.75%, 05/15/21 | | | | | 380,000 | | | | | | 401,850 | |
5.00%, 03/15/22 | | | | | 500,000 | | | | | | 497,500 | |
Bank of America Corporation | | | | | | | | | | | | |
5.49%, 03/15/19 | | | | | 100,000 | | | | | | 110,829 | |
5.00%, 05/13/21 | | | | | 100,000 | | | | | | 109,447 | |
5.20%, 12/29/49† | | | | | 550,000 | | | | | | 486,750 | |
Barrick North America Finance LLC | | | | | | | | | | | | |
5.75%, 05/01/43D | | | | | 1,000,000 | | | | | | 902,204 | |
Beazer Homes USA, Inc. | | | | | | | | | | | | |
7.25%, 02/01/23 | | | | | 50,000 | | | | | | 50,250 | |
Best Buy Co., Inc. | | | | | | | | | | | | |
5.00%, 08/01/18D | | | | | 3,455,000 | | | | | | 3,636,388 | |
Calpine Corporation | | | | | | | | | | | | |
7.88%, 01/15/23 144A | | | | | 348,000 | | | | | | 381,930 | |
| | | | | | | | | | | | |
| | | Par | | | Value | |
Calumet Specialty Products Partners LP | | | | | | | | | | | | |
9.38%, 05/01/19 | | | | $ | 520,000 | | | | | $ | 579,800 | |
CCO Holdings LLC | | | | | | | | | | | | |
7.00%, 01/15/19D | | | | | 230,000 | | | | | | 242,937 | |
6.50%, 04/30/21 | | | | | 190,000 | | | | | | 196,175 | |
Cemex Finance LLC | | | | | | | | | | | | |
9.38%, 10/12/22D | | | | | 550,000 | | | | | | 622,875 | |
CenturyLink, Inc. | | | | | | | | | | | | |
7.60%, 09/15/39 | | | | | 755,000 | | | | | | 677,612 | |
Chesapeake Energy Corporation | | | | | | | | | | | | |
6.63%, 08/15/20 | | | | | 5,000 | | | | | | 5,612 | |
6.88%, 11/15/20D | | | | | 75,000 | | | | | | 85,125 | |
6.13%, 02/15/21 | | | | | 140,000 | | | | | | 150,850 | |
2.75%, 11/15/35 CONVD | | | | | 110,000 | | | | | | 115,569 | |
2.50%, 05/15/37 CONV | | | | | 290,000 | | | | | | 295,800 | |
2.25%, 12/15/38 CONV | | | | | 910,000 | | | | | | 853,125 | |
Ciena Corporation | | | | | | | | | | | | |
0.88%, 06/15/17 CONVD | | | | | 1,695,000 | | | | | | 1,741,612 | |
3.75%, | | | | | | | | | | | | |
10/15/18 CONV 144A | | | | | 415,000 | | | | | | 599,934 | |
Cincinnati Bell Telephone Co. LLC | | | | | | | | | | | | |
6.30%, 12/01/28 | | | | | 155,000 | | | | | | 139,112 | |
CIT Group, Inc. | | | | | | | | | | | | |
5.00%, 08/15/22 | | | | | 500,000 | | | | | | 489,582 | |
5.00%, 08/01/23D | | | | | 100,000 | | | | | | 96,750 | |
Citigroup, Inc. | | | | | | | | | | | | |
3.50%, 05/15/23 | | | | | 1,305,000 | | | | | | 1,218,373 | |
5.35%, 04/29/49†D | | | | | 360,000 | | | | | | 317,434 | |
Cleaver-Brooks, Inc. | | | | | | | | | | | | |
8.75%, 12/15/19 144AD | | | | | 110,000 | | | | | | 119,900 | |
Cliffs Natural Resources, Inc. | | | | | | | | | | | | |
3.95%, 01/15/18D | | | | | 200,000 | | | | | | 202,146 | |
6.25%, 10/01/40D | | | | | 1,920,000 | | | | | | 1,640,517 | |
Cogent Communications Group, Inc. | | | | | | | | | | | | |
8.38%, 02/15/18 144A | | | | | 410,000 | | | | | | 446,900 | |
Colorado Interstate Gas Co. LLC | | | | | | | | | | | | |
5.95%, 03/15/15 | | | | | 20,000 | | | | | | 21,220 | |
6.80%, 11/15/15 | | | | | 125,000 | | | | | | 139,037 | |
Comcast Corporation | | | | | | | | | | | | |
5.15%, 03/01/20 | | | | | 170,000 | | | | | | 189,900 | |
Compiler Finance Sub, Inc. | | | | | | | | | | | | |
7.00%, 05/01/21 144A | | | | | 10,000 | | | | | | 9,975 | |
Concho Resources, Inc. | | | | | | | | | | | | |
5.50%, 10/01/22 | | | | | 520,000 | | | | | | 539,500 | |
ConocoPhillips | | | | | | | | | | | | |
6.50%, 02/01/39 | | | | | 20,000 | | | | | | 25,166 | |
CONSOL Energy, Inc. | | | | | | | | | | | | |
8.25%, 04/01/20 | | | | | 621,000 | | | | | | 675,338 | |
Continental Airlines 2007-1 Class A Pass Through Trust | | | | | | | | | | | | |
5.98%, 10/19/23 | | | | | 468,681 | | | | | | 512,034 | |
Continental Airlines 2009-1 Pass Through Trust | | | | | | | | | | | | |
9.00%, 01/08/18 | | | | | 1,003,515 | | | | | | 1,144,007 | |
Continental Resources, Inc. | | | | | | | | | | | | |
5.00%, 09/15/22 | | | | | 260,000 | | | | | | 270,400 | |
Continental Rubber of America Corporation | | | | | | | | | | | | |
4.50%, 09/15/19 144AD | | | | | 350,000 | | | | | | 372,680 | |
| | | | |
| | See Notes to Financial Statements. | | 141 |
GLOBAL BOND FUND
SCHEDULE OF INVESTMENTS (Continued)
| | | | | | | | | | |
| | | Par | | | | | Value | |
Cooper-Standard Automotive, Inc. | | | | | | | | | | |
8.50%, 05/01/18 | | $ | 160,000 | | | | | $ | 170,200 | |
Countrywide Financial Corporation | | | | | | | | | | |
6.25%, 05/15/16 | | | 280,000 | | | | | | 309,151 | |
Crestview DS Merger Sub II, Inc. | | | | | | | | | | |
10.00%, 09/01/21 144A | | | 265,000 | | | | | | 285,538 | |
CSC Holdings LLC | | | | | | | | | | |
6.75%, 11/15/21 | | | 250,000 | | | | | | 270,625 | |
CST Brands, Inc. | | | | | | | | | | |
5.00%, 05/01/23D | | | 170,000 | | | | | | 164,900 | |
Cummins, Inc. | | | | | | | | | | |
5.65%, 03/01/98 | | | 1,340,000 | | | | | | 1,290,070 | |
Curtis Palmer LLC | | | | | | | | | | |
5.90%, 07/15/14 144A | | | 360,000 | | | | | | 361,751 | |
D.R. Horton, Inc. | | | | | | | | | | |
4.38%, 09/15/22 | | | 1,405,000 | | | | | | 1,317,187 | |
DAE Aviation Holdings, Inc. | | | | | | | | | | |
11.25%, 08/01/15 144A | | | 120,000 | | | | | | 120,525 | |
Delta Air Lines 2007-1 Class B Pass Through Trust | | | | | | | | | | |
8.02%, 02/10/24 | | | 70,348 | | | | | | 79,142 | |
Denbury Resources, Inc. | | | | | | | | | | |
4.63%, 07/15/23D | | | 590,000 | | | | | | 535,425 | |
Dillard’s, Inc. | | | | | | | | | | |
7.75%, 07/15/26 | | | 890,000 | | | | | | 947,850 | |
DISH DBS Corporation | | | | | | | | | | |
5.88%, 07/15/22 144A | | | 600,000 | | | | | | 603,000 | |
DJO Finance LLC | | | | | | | | | | |
8.75%, 03/15/18 | | | 400,000 | | | | | | 441,000 | |
Dynegy Holdings Escrow | | | | | | | | | | |
5.81%, 06/01/19+W†# | | | 893,000 | | | | | | — | |
Eagle Spinco, Inc. | | | | | | | | | | |
4.63%, 02/15/21 144A | | | 520,000 | | | | | | 511,550 | |
El Paso LLC | | | | | | | | | | |
7.75%, 01/15/32 | | | 50,000 | | | | | | 51,003 | |
El Paso Natural Gas Co. LLC | | | | | | | | | | |
8.63%, 01/15/22 | | | 90,000 | | | | | | 113,474 | |
8.38%, 06/15/32D | | | 75,000 | | | | | | 96,622 | |
Embarq Corporation | | | | | | | | | | |
8.00%, 06/01/36 | | | 995,000 | | | | | | 1,010,008 | |
Energy Future Intermediate Holding Co. LLC | | | | | | | | | | |
10.00%, 12/01/20D | | | 210,000 | | | | | | 224,175 | |
Enterprise Products Operating LLC | | | | | | | | | | |
9.75%, 01/31/14 | | | 100,000 | | | | | | 100,702 | |
8.38%, 08/01/66† | | | 60,000 | | | | | | 66,519 | |
ERAC USA Finance LLC | | | | | | | | | | |
7.00%, 10/15/37 144A | | | 1,065,000 | | | | | | 1,264,289 | |
Erickson Air-Crane, Inc. | | | | | | | | | | |
8.25%, 05/01/20 144AD | | | 250,000 | | | | | | 260,000 | |
ExamWorks Group, Inc. | | | | | | | | | | |
9.00%, 07/15/19 | | | 60,000 | | | | | | 65,250 | |
First Data Corporation | | | | | | | | | | |
12.63%, 01/15/21 | | | 320,000 | | | | | | 377,200 | |
First Quality Finance Co., Inc. | | | | | | | | | | |
4.63%, 05/15/21 144A | | | 30,000 | | | | | | 28,650 | |
FirstEnergy Corporation | | | | | | | | | | |
7.38%, 11/15/31 | | | 185,000 | | | | | | 201,531 | |
Ford Motor Co. | | | | | | | | | | |
4.25%, 11/15/16 CONVD | | | 830,000 | | | | | | 1,535,500 | |
6.63%, 10/01/28 | | | 850,000 | | | | | | 956,617 | |
| | | | | | | | | | |
| | | Par | | | | | Value | |
Freescale Semiconductor, Inc. | | | | | | | | | | |
10.13%, 12/15/16 | | $ | 56,000 | | | | | $ | 57,260 | |
Fresenius Medical Care US Finance, Inc. | | | | | | | | | | |
5.75%, 02/15/21 144AD | | | 750,000 | | | | | | 798,750 | |
Fresenius US Finance II, Inc. | | | | | | | | | | |
8.75%, 07/15/15
144A(E) | | | 30,000 | | | | | | 46,383 | |
Frontier Communications Corporation | | | | | | | | | | |
7.88%, 01/15/27 | | | 405,000 | | | | | | 390,825 | |
Gannett Co., Inc. | | | | | | | | | | |
6.38%, 10/15/23 144A | | | 90,000 | | | | | | 93,375 | |
General Electric Capital Corporation | | | | | | | | | | |
7.63%, 12/10/14(Z) | | | 1,025,000 | | | | | | 871,903 | |
4.88%, 03/04/15 | | | 370,000 | | | | | | 388,765 | |
6.50%, 09/28/15(Z) | | | 255,000 | | | | | | 217,115 | |
6.75%, 09/26/16(Z) | | | 150,000 | | | | | | 128,837 | |
3.15%, 09/07/22 | | | 330,000 | | | | | | 319,947 | |
6.75%, 03/15/32 | | | 30,000 | | | | | | 37,254 | |
6.88%, 01/10/39 | | | 200,000 | | | | | | 257,982 | |
General Motors Financial Co., Inc. | | | | | | | | | | |
2.75%, 05/15/16 144A | | | 10,000 | | | | | | 10,150 | |
GenOn REMA LLC | | | | | | | | | | |
9.68%, 07/02/26 | | | 400,000 | | | | | | 412,000 | |
Georgia-Pacific LLC | | | | | | | | | | |
8.88%, 05/15/31 | | | 605,000 | | | | | | 842,501 | |
Gerdau Holdings, Inc. | | | | | | | | | | |
7.00%, 01/20/20D | | | 640,000 | | | | | | 700,800 | |
Goldman Sachs Group, Inc. | | | | | | | | | | |
2.90%, 07/19/18 | | | 130,000 | | | | | | 132,438 | |
4.75%, 10/12/21(E) | | | 150,000 | | | | | | 220,859 | |
6.75%, 10/01/37 | | | 355,000 | | | | | | 396,178 | |
Goodyear Tire & Rubber Co. | | | | | | | | | | |
7.00%, 03/15/28 | | | 690,000 | | | | | | 693,450 | |
Graphic Packaging International, Inc. | | | | | | | | | | |
4.75%, 04/15/21D | | | 600,000 | | | | | | 595,500 | |
Gulfmark Offshore, Inc. | | | | | | | | | | |
6.38%, 03/15/22D | | | 220,000 | | | | | | 222,750 | |
Halcon Resources Corporation | | | | | | | | | | |
9.25%, 02/15/22 144A | | | 1,440,000 | | | | | | 1,472,400 | |
Hawk Acquisition Sub, Inc. | | | | | | | | | | |
4.25%, 10/15/20 144AD | | | 70,000 | | | | | | 67,900 | |
HCA, Inc. | | | | | | | | | | |
6.38%, 01/15/15 | | | 150,000 | | | | | | 157,875 | |
7.19%, 11/15/15 | | | 205,000 | | | | | | 224,475 | |
7.50%, 12/15/23 | | | 770,000 | | | | | | 837,375 | |
8.36%, 04/15/24 | | | 90,000 | | | | | | 99,450 | |
7.69%, 06/15/25 | | | 815,000 | | | | | | 855,750 | |
7.58%, 09/15/25 | | | 715,000 | | | | | | 748,962 | |
7.05%, 12/01/27 | | | 20,000 | | | | | | 19,900 | |
7.50%, 11/06/33 | | | 205,000 | | | | | | 207,050 | |
7.75%, 07/15/36D | | | 120,000 | | | | | | 120,600 | |
Hercules Offshore, Inc. | | | | | | | | | | |
8.75%, 07/15/21 144A | | | 785,000 | | | | | | 879,200 | |
7.50%, 10/01/21 144A | | | 1,875,000 | | | | | | 1,996,875 | |
Hercules, Inc. | | | | | | | | | | |
6.50%, 06/30/29 | | | 250,000 | | | | | | 220,000 | |
Hexion US Finance Corporation | | | | | | | | | | |
6.63%, 04/15/20 | | | 160,000 | | | | | | 164,800 | |
9.00%, 11/15/20D | | | 185,000 | | | | | | 185,462 | |
Hiland Partners LP | | | | | | | | | | |
7.25%, 10/01/20 144A | | | 100,000 | | | | | | 107,750 | |
| | | | |
| 142 | | See Notes to Financial Statements. | | |
| | | | | | | | | | |
| | | Par | | | | | Value | |
Hilton Worldwide Finance LLC | | | | | | | | | | |
5.63%, 10/15/21 144A | | $ | 180,000 | | | | | $ | 187,088 | |
Howard Hughes Corporation | | | | | | | | | | |
6.88%, 10/01/21 144A | | | 140,000 | | | | | | 146,300 | |
IASIS Healthcare LLC | | | | | | | | | | |
8.38%, 05/15/19D | | | 520,000 | | | | | | 553,800 | |
Idearc, Inc. Escrow | | | | | | | | | | |
0.00%, 11/15/16+W# | | | 185,000 | | | | | | — | |
ING Capital Funding Trust III | | | | | | | | | | |
3.85%, 12/29/49† | | | 160,000 | | | | | | 160,200 | |
Intel Corporation | | | | | | | | | | |
2.95%, 12/15/35 CONV | | | 580,000 | | | | | | 651,050 | |
3.25%, 08/01/39 CONVD | | | 460,000 | | | | | | 626,177 | |
International Lease Finance Corporation | | | | | | | | | | |
5.65%, 06/01/14 | | | 80,000 | | | | | | 81,600 | |
8.88%, 09/01/17D | | | 20,000 | | | | | | 23,900 | |
3.88%, 04/15/18 | | | 10,000 | | | | | | 10,044 | |
5.88%, 04/01/19 | | | 210,000 | | | | | | 224,700 | |
6.25%, 05/15/19D | | | 155,000 | | | | | | 168,562 | |
5.88%, 08/15/22 | | | 215,000 | | | | | | 215,538 | |
iStar Financial, Inc. | | | | | | | | | | |
6.05%, 04/15/15 | | | 20,000 | | | | | | 21,125 | |
3.88%, 07/01/16 | | | 30,000 | | | | | | 30,825 | |
3.00%, 11/15/16 CONV | | | 80,000 | | | | | | 109,400 | |
7.13%, 02/15/18 | | | 150,000 | | | | | | 166,125 | |
4.88%, 07/01/18 | | | 95,000 | | | | | | 95,119 | |
JC Penney Corporation, Inc. | | | | | | | | | | |
6.38%, 10/15/36D | | | 510,000 | | | | | | 383,775 | |
7.63%, 03/01/97D | | | 910,000 | | | | | | 659,750 | |
Jefferies Group LLC | | | | | | | | | | |
5.13%, 04/13/18 | | | 55,000 | | | | | | 59,699 | |
6.88%, 04/15/21 | | | 270,000 | | | | | | 308,888 | |
5.13%, 01/20/23 | | | 305,000 | | | | | | 309,052 | |
6.45%, 06/08/27 | | | 35,000 | | | | | | 36,542 | |
3.88%, 11/01/29 CONV | | | 55,000 | | | | | | 58,403 | |
6.25%, 01/15/36 | | | 135,000 | | | | | | 130,950 | |
6.50%, 01/20/43 | | | 1,510,000 | | | | | | 1,502,145 | |
Jones Group, Inc. | | | | | | | | | | |
6.13%, 11/15/34 | | | 135,000 | | | | | | 115,256 | |
JPMorgan Chase & Co. | | | | | | | | | | |
4.25%, 11/02/18(Z) | | | 360,000 | | | | | | 280,263 | |
3.38%, 05/01/23D | | | 400,000 | | | | | | 373,533 | |
JPMorgan Chase Bank NA | | | | | | | | | | |
4.38%, 11/30/21(E)† | | | 350,000 | | | | | | 503,769 | |
K Hovnanian Enterprises, Inc. | | | | | | | | | | |
5.00%, 11/01/21 | | | 795,000 | | | | | | 716,494 | |
KB Home | | | | | | | | | | |
1.38%, 02/01/19 CONV | | | 115,000 | | | | | | 114,784 | |
Key Energy Services, Inc. | | | | | | | | | | |
6.75%, 03/01/21D | | | 170,000 | | | | | | 175,100 | |
Kinder Morgan Energy Partners LP | | | | | | | | | | |
6.50%, 02/01/37 | | | 75,000 | | | | | | 82,441 | |
6.95%, 01/15/38 | | | 90,000 | | | | | | 103,714 | |
Kinder Morgan, Inc. | | | | | | | | | | |
5.63%, 11/15/23 144A | | | 120,000 | | | | | | 116,788 | |
Lantheus Medical Imaging, Inc. | | | | | | | | | | |
9.75%, 05/15/17D | | | 300,000 | | | | | | 270,000 | |
Lennar Corporation | | | | | | | | | | |
5.60%, 05/31/15 | | | 1,400,000 | | | | | | 1,477,000 | |
4.75%, 11/15/22 | | | 215,000 | | | | | | 200,488 | |
Level 3 Financing, Inc. | | | | | | | | | | |
9.38%, 04/01/19 | | | 20,000 | | | | | | 22,475 | |
| | | | | | | | | | |
| | | Par | | | | | Value | |
7.00%, 06/01/20 | | $ | 930,000 | | | | | $ | 990,450 | |
8.63%, 07/15/20 | | | 220,000 | | | | | | 247,500 | |
Magnachip Semiconductor Corporation | | | | | | | | | | |
6.63%, 07/15/21 | | | 40,000 | | | | | | 40,900 | |
Magnum Hunter Resources Corporation | | | | | | | | | | |
9.75%, 05/15/20 | | | 120,000 | | | | | | 130,200 | |
MarkWest Energy Partners LP | | | | | | | | | | |
6.25%, 06/15/22 | | | 288,000 | | | | | | 306,000 | |
5.50%, 02/15/23 | | | 240,000 | | | | | | 243,000 | |
Masco Corporation | | | | | | | | | | |
5.85%, 03/15/17D | | | 90,000 | | | | | | 99,225 | |
7.75%, 08/01/29 | | | 250,000 | | | | | | 275,783 | |
6.50%, 08/15/32 | | | 175,000 | | | | | | 172,812 | |
MBIA Insurance Corporation | | | | | | | | | | |
11.50%, 01/15/33 144A | | | 435,000 | | | | | | 331,688 | |
Meccanica Holdings USA, Inc. | | | | | | | | | | |
6.25%, 01/15/40 144A | | | 335,000 | | | | | | 284,342 | |
Merrill Lynch & Co., Inc. | | | | | | | | | | |
6.05%, 06/01/34 | | | 700,000 | | | | | | 731,895 | |
6.11%, 01/29/37 | | | 1,300,000 | | | | | | 1,406,475 | |
Mirant Mid Atlantic Pass Through Trust | | | | | | | | | | |
10.06%, 12/30/28 | | | 165,630 | | | | | | 180,330 | |
Molycorp, Inc. | | | | | | | | | | |
10.00%, 06/01/20D | | | 150,000 | | | | | | 149,625 | |
Morgan Stanley | | | | | | | | | | |
4.75%, 04/01/14D | | | 40,000 | | | | | | 40,320 | |
4.75%, 11/16/18(A) | | | 275,000 | | | | | | 243,152 | |
5.75%, 01/25/21 | | | 330,000 | | | | | | 373,866 | |
4.10%, 05/22/23 | | | 370,000 | | | | | | 358,756 | |
6.25%, 08/09/26 | | | 400,000 | | | | | | 463,362 | |
Motorola Solutions, Inc. | | | | | | | | | | |
6.63%, 11/15/37 | | | 105,000 | | | | | | 104,306 | |
Murphy Oil USA, Inc. | | | | | | | | | | |
6.00%, 08/15/23 144A | | | 80,000 | | | | | | 80,800 | |
Mutual of Omaha Insurance Co. | | | | | | | | | | |
6.80%, 06/15/36 144A | | | 1,200,000 | | | | | | 1,354,444 | |
Nationstar Mortgage LLC | | | | | | | | | | |
7.88%, 10/01/20 | | | 450,000 | | | | | | 469,125 | |
Natural Resource Partners LP | | | | | | | | | | |
9.13%, 10/01/18 144A | | | 70,000 | | | | | | 71,925 | |
NBCUniversal Enterprise, Inc. | | | | | | | | | | |
1.97%, 04/15/19 144A | | | 410,000 | | | | | | 401,553 | |
Neiman Marcus Group LTD, Inc. | | | | | | | | | | |
8.00%, 10/15/21 144A | | | 50,000 | | | | | | 52,500 | |
Cash coupon 8.75% or PIK | | | | | | | | | | |
9.50%, 10/15/21 144AD | | | 130,000 | | | | | | 136,825 | |
NES Rentals Holdings, Inc. | | | | | | | | | | |
7.88%, 05/01/18 144A | | | 60,000 | | | | | | 63,750 | |
Newfield Exploration Co. | | | | | | | | | | |
5.63%, 07/01/24 | | | 955,000 | | | | | | 955,000 | |
Newmont Mining Corporation | | | | | | | | | | |
4.88%, 03/15/42 | | | 575,000 | | | | | | 427,153 | |
Old Republic International Corporation | | | | | | | | | | |
3.75%, 03/15/18 CONVD | | | 1,600,000 | | | | | | 1,998,000 | |
Owens Corning | | | | | | | | | | |
7.00%, 12/01/36 | | | 1,800,000 | | | | | | 1,944,711 | |
Owens-Brockway Glass Container, Inc. | | | | | | | | | | |
3.00%, | | | | | | | | | | |
06/01/15 CONV 144A | | | 840,000 | | | | | | 879,375 | |
| | | | |
| | See Notes to Financial Statements. | | 143 |
GLOBAL BOND FUND
SCHEDULE OF INVESTMENTS (Continued)
| | | | | | | | | | |
| | | Par | | | Value | |
Pacific Gas & Electric Co. | | | | | | | | | | |
4.60%, 06/15/43D | | $ | 50,000 | | | | | $ | 47,900 | |
Pactiv LLC | | | | | | | | | | |
8.38%, 04/15/27D | | | 200,000 | | | | | | 188,000 | |
Parker Drilling Co. | | | | | | | | | | |
9.13%, 04/01/18 | | | 400,000 | | | | | | 426,000 | |
Peabody Energy Corporation | | | | | | | | | | |
6.50%, 09/15/20D | | | 490,000 | | | | | | 518,175 | |
6.25%, 11/15/21D | | | 140,000 | | | | | | 142,100 | |
Pemex Project Funding Master Trust | | | | | | | | | | |
6.63%, 06/15/35 | | | 516,000 | | | | | | 545,670 | |
Penn Mutual Life Insurance Co. | | | | | | | | | | |
7.63%, 06/15/40 144A | | | 685,000 | | | | | | 861,787 | |
Pioneer Natural Resources Co. | | | | | | | | | | |
5.88%, 07/15/16 | | | 900,000 | | | | | | 998,952 | |
Plains Exploration & Production Co. | | | | | | | | | | |
8.63%, 10/15/19 | | | 55,000 | | | | | | 60,361 | |
Post Holdings, Inc. | | | | | | | | | | |
7.38%, 02/15/22 144A | | | 150,000 | | | | | | 161,250 | |
ProLogis LP | | | | | | | | | | |
6.63%, 05/15/18 | | | 14,000 | | | | | | 16,367 | |
PulteGroup, Inc. | | | | | | | | | | |
7.88%, 06/15/32 | | | 1,500,000 | | | | | | 1,548,750 | |
6.38%, 05/15/33 | | | 470,000 | | | | | | 427,700 | |
6.00%, 02/15/35 | | | 180,000 | | | | | | 153,450 | |
QEP Resources, Inc. | | | | | | | | | | |
6.88%, 03/01/21D | | | 290,000 | | | | | | 312,475 | |
5.25%, 05/01/23 | | | 1,900,000 | | | | | | 1,790,750 | |
Quicksilver Resources, Inc. | | | | | | | | | | |
11.00%, 07/01/21 144A | | | 90,000 | | | | | | 98,100 | |
Qwest Capital Funding, Inc. | | | | | | | | | | |
6.50%, 11/15/18 | | | 225,000 | | | | | | 245,250 | |
Qwest Corporation | | | | | | | | | | |
7.25%, 09/15/25D | | | 615,000 | | | | | | 656,257 | |
6.88%, 09/15/33D | | | 2,500,000 | | | | | | 2,412,500 | |
7.25%, 10/15/35 | | | 110,000 | | | | | | 107,089 | |
Radnet Management, Inc. | | | | | | | | | | |
10.38%, 04/01/18D | | | 320,000 | | | | | | 320,800 | |
Rain CII Carbon LLC | | | | | | | | | | |
8.25%, 01/15/21 144A | | | 200,000 | | | | | | 205,000 | |
8.50%, 01/15/21(E) | | | 100,000 | | | | | | 140,322 | |
Range Resources Corporation | | | | | | | | | | |
6.75%, 08/01/20 | | | 510,000 | | | | | | 554,625 | |
Regency Energy Partners LP | | | | | | | | | | |
5.50%, 04/15/23 | | | 450,000 | | | | | | 441,000 | |
Reliance Holdings USA, Inc. | | | | | | | | | | |
4.50%, 10/19/20 144A | | | 290,000 | | | | | | 286,961 | |
Republic Services, Inc. | | | | | | | | | | |
4.75%, 05/15/23D | | | 400,000 | | | | | | 415,906 | |
Resolute Forest Products, Inc. | | | | | | | | | | |
5.88%, 05/15/23 144A | | | 70,000 | | | | | | 65,100 | |
Reynolds Group Issuer, Inc. | | | | | | | | | | |
9.00%, 04/15/19D | | | 330,000 | | | | | | 355,575 | |
5.75%, 10/15/20 | | | 60,000 | | | | | | 61,500 | |
Rock Tenn Co. | | | | | | | | | | |
4.00%, 03/01/23 | | | 600,000 | | | | | | 574,137 | |
RPM International, Inc. | | | | | | | | | | |
2.25%, 12/15/20 CONVD | | | 47,000 | | | | | | 52,258 | |
RR Donnelley & Sons Co. | | | | | | | | | | |
7.00%, 02/15/22D | | | 495,000 | | | | | | 534,600 | |
Ryerson, Inc. | | | | | | | | | | |
9.00%, 10/15/17D | | | 440,000 | | | | | | 466,950 | |
| | | | | | | | | | |
| | | Par | | | Value | |
Samson Investment Co. | | | | | | | | | | |
10.50%, 02/15/20 144AD | | $ | 100,000 | | | | | $ | 109,500 | |
Sanchez Energy Corporation | | | | | | | | | | |
7.75%, 06/15/21 144A | | | 160,000 | | | | | | 164,400 | |
SandRidge Energy, Inc. | | | | | | | | | | |
7.50%, 02/15/23D | | | 250,000 | | | | | | 255,000 | |
Service Corporation International | | | | | | | | | | |
7.50%, 04/01/27 | | | 75,000 | | | | | | 79,500 | |
ServiceMaster Co. | | | | | | | | | | |
7.00%, 08/15/20D | | | 520,000 | | | | | | 518,050 | |
7.45%, 08/15/27 | | | 900,000 | | | | | | 765,000 | |
Shea Homes LP | | | | | | | | | | |
8.63%, 05/15/19 | | | 150,000 | | | | | | 166,875 | |
Sidewinder Drilling, Inc. | | | | | | | | | | |
9.75%, 11/15/19 144A | | | 820,000 | | | | | | 729,800 | |
Simon Property Group LP | | | | | | | | | | |
5.75%, 12/01/15D | | | 25,000 | | | | | | 27,090 | |
SLM Corporation | | | | | | | | | | |
5.00%, 06/15/18 | | | 700,000 | | | | | | 689,328 | |
8.45%, 06/15/18 | | | 604,000 | | | | | | 705,925 | |
5.50%, 01/15/19 | | | 75,000 | | | | | | 77,917 | |
4.88%, 06/17/19 | | | 88,000 | | | | | | 87,792 | |
8.00%, 03/25/20 | | | 10,000 | | | | | | 11,362 | |
5.50%, 01/25/23 | | | 1,720,000 | | | | | | 1,633,513 | |
Southern Copper Corporation | | | | | | | | | | |
5.38%, 04/16/20D | | | 70,000 | | | | | | 75,144 | |
6.75%, 04/16/40 | | | 450,000 | | | | | | 440,218 | |
5.25%, 11/08/42 | | | 550,000 | | | | | | 448,787 | |
Springleaf Finance Corporation | | | | | | | | | | |
5.75%, 09/15/16D | | | 700,000 | | | | | | 743,750 | |
6.50%, 09/15/17D | | | 400,000 | | | | | | 430,000 | |
7.75%, 10/01/21D | | | 145,000 | | | | | | 157,325 | |
8.25%, 10/01/23D | | | 55,000 | | | | | | 59,538 | |
Sprint Capital Corporation | | | | | | | | | | |
6.88%, 11/15/28 | | | 2,915,000 | | | | | | 2,761,962 | |
8.75%, 03/15/32 | | | 745,000 | | | | | | 802,738 | |
Steel Dynamics, Inc. | | | | | | | | | | |
7.63%, 03/15/20 | | | 100,000 | | | | | | 108,875 | |
6.38%, 08/15/22D | | | 400,000 | | | | | | 434,000 | |
Suburban Propane Partners LP | | | | | | | | | | |
7.38%, 08/01/21 | | | 225,000 | | | | | | 246,375 | |
Targa Resources Partners LP | | | | | | | | | | |
4.25%, 11/15/23 144AD | | | 110,000 | | | | | | 99,000 | |
Taylor Morrison Communities, Inc. | | | | | | | | | | |
5.25%, 04/15/21 144A | | | 130,000 | | | | | | 126,750 | |
Teachers Insurance & Annuity Association of America | | | | | | | | | | |
6.85%, 12/16/39 144A | | | 100,000 | | | | | | 123,854 | |
Tenet Healthcare Corporation | | | | | | | | | | |
6.88%, 11/15/31 | | | 85,000 | | | | | | 74,375 | |
Textron Financial Corporation | | | | | | | | | | |
5.13%, 08/15/14 | | | 30,000 | | | | | | 30,805 | |
Textron, Inc. | | | | | | | | | | |
6.63%, 04/07/20(U) | | | 130,000 | | | | | | 241,052 | |
Time Warner Cable, Inc. | | | | | | | | | | |
8.75%, 02/14/19 | | | 190,000 | | | | | | 226,880 | |
8.25%, 04/01/19 | | | 40,000 | | | | | | 46,911 | |
Time Warner, Inc. | | | | | | | | | | |
4.00%, 01/15/22D | | | 100,000 | | | | | | 101,436 | |
TMX Finance LLC | | | | | | | | | | |
8.50%, 09/15/18 144AD | | | 30,000 | | | | | | 32,100 | |
| | | | |
| 144 | | See Notes to Financial Statements. | | |
| | | | | | | | | | |
| | | Par | | | Value | |
Toys “R” Us, Inc. | | | | | | | | | | |
7.38%, 10/15/18D | | $ | 335,000 | | | | | $ | 249,575 | |
TransDigm, Inc. | | | | | | | | | | |
7.50%, 07/15/21D | | | 970,000 | | | | | | 1,047,600 | |
tw telecom holdings, Inc. | | | | | | | | | | |
5.38%, 10/01/22 | | | 380,000 | | | | | | 374,300 | |
United Air Lines 2007-1 Pass-Through Trust | | | | | | | | | | |
6.64%, 01/02/24 | | | 225,605 | | | | | | 239,141 | |
United Air Lines 2009-1 Pass-Through Trust | | | | | | | | | | |
10.40%, 05/01/18D | | | 45,329 | | | | | | 51,449 | |
United Rentals North America, Inc. | | | | | | | | | | |
8.38%, 09/15/20D | | | 270,000 | | | | | | 302,400 | |
United States Steel Corporation | | | | | | | | | | |
2.75%, 04/01/19 CONV | | | 400,000 | | | | | | 531,500 | |
Univision Communications, Inc. | | | | | | | | | | |
7.88%, 11/01/20 144A | | | 267,000 | | | | | | 294,701 | |
US Airways 2012-1 Class A Pass Through Trust | | | | | | | | | | |
5.90%, 04/01/26D | | | 321,756 | | | | | | 350,714 | |
US Airways 2012-1 Class B Pass Through Trust | | | | | | | | | | |
8.00%, 04/01/21D | | | 560,616 | | | | | | 625,087 | |
US Airways 2012-1 Class C Pass Through Trust | | | | | | | | | | |
9.13%, 10/01/15 | | | 433,610 | | | | | | 457,459 | |
US Airways 2012-2 Class A Pass Through Trust | | | | | | | | | | |
4.63%, 12/03/26 | | | 269,073 | | | | | | 274,623 | |
Valeant Pharmaceuticals International | | | | | | | | | | |
6.38%, 10/15/20 144A | | | 360,000 | | | | | | 381,150 | |
Verizon Communications, Inc. | | | | | | | | | | |
6.00%, 04/01/41 | | | 70,000 | | | | | | 77,124 | |
6.55%, 09/15/43 | | | 1,201,000 | | | | | | 1,410,119 | |
Verizon Pennsylvania LLC | | | | | | | | | | |
6.00%, 12/01/28 | | | 35,000 | | | | | | 34,555 | |
Watco Cos., LLC | | | | | | | | | | |
6.38%, 04/01/23 144A | | | 100,000 | | | | | | 99,500 | |
WellCare Health Plans, Inc. | | | | | | | | | | |
5.75%, 11/15/20 | | | 140,000 | | | | | | 143,850 | |
WellPoint, Inc. | | | | | | | | | | |
7.00%, 02/15/19 | | | 80,000 | | | | | | 95,024 | |
6.38%, 06/15/37 | | | 221,000 | | | | | | 253,000 | |
Wells Fargo & Co. | | | | | | | | | | |
4.48%, 01/16/24 144A | | | 124,000 | | | | | | 123,682 | |
Westvaco Corporation | | | | | | | | | | |
8.20%, 01/15/30 | | | 145,000 | | | | | | 172,224 | |
7.95%, 02/15/31 | | | 45,000 | | | | | | 52,341 | |
WEX, Inc. | | | | | | | | | | |
4.75%, 02/01/23 144A | | | 440,000 | | | | | | 407,000 | |
Weyerhaeuser Co. | | | | | | | | | | |
8.50%, 01/15/25 | | | 405,000 | | | | | | 516,889 | |
6.95%, 10/01/27D | | | 55,000 | | | | | | 63,593 | |
7.38%, 03/15/32 | | | 370,000 | | | | | | 453,975 | |
6.88%, 12/15/33 | | | 490,000 | | | | | | 579,604 | |
Williams Cos., Inc. | | | | | | | | | | |
7.50%, 01/15/31 | | | 60,000 | | | | | | 63,573 | |
Windstream Corporation | | | | | | | | | | |
7.75%, 10/01/21 144A | | | 220,000 | | | | | | 234,300 | |
| | | | | | | | | | |
| | | Par | | | Value | |
Zayo Group LLC | | | | | | | | | | |
8.13%, 01/01/20 | | $ | 310,000 | | | | | $ | 341,000 | |
| | | | | | | | | | |
Total Corporate Bonds
(Cost $117,617,465) | | | | | | | | | 127,568,188 | |
| | | | | | | | | | |
FOREIGN BONDS — 39.4% | | | | | | | |
Argentina — 0.3% | | | | | | | | | | |
Argentina Boden Bonds | | | | | | | | | | |
7.00%, 10/03/15D | | | 952,000 | | | | | | 951,048 | |
Pan American Energy LLC | | | | | | | | | | |
7.88%, 05/07/21 | | | 156,000 | | | | | | 162,240 | |
7.88%, 05/07/21 144AD | | | 61,000 | | | | | | 63,440 | |
| | | | | | | | | | |
| | | | | | | | | 1,176,728 | |
| | | | | | | | | | |
| | | |
Australia — 1.0% | | | | | | | | | | |
Barminco Finance Property, Ltd. | | | | | | | | | | |
9.00%, 06/01/18 144AD | | | 60,000 | | | | | | 55,500 | |
FMG Resources August 2006 Proprietary, Ltd. | | | | | | | | | | |
7.00%, 11/01/15 144A | | | 10,000 | | | | | | 10,394 | |
6.88%, 04/01/22 144AD | | | 380,000 | | | | | | 416,100 | |
New South Wales Treasury Corporation | | | | | | | | | | |
6.00%, 02/01/18(A) | | | 2,620,000 | | | | | | 2,561,866 | |
Queensland Treasury Corporation | | | | | | | | | | |
7.13%, 09/18/17 144A(Z) | | | 275,000 | | | | | | 244,465 | |
St. Barbara, Ltd. | | | | | | | | | | |
8.88%, 04/15/18 144AD | | | 200,000 | | | | | | 167,500 | |
| | | | | | | | | | |
| | | | | | | | | 3,455,825 | |
| | | | | | | | | | |
| | | |
Bermuda — 0.7% | | | | | | | | | | |
Alliance Oil Co., Ltd. | | | | | | | | | | |
7.00%, 05/04/20 144A | | | 320,000 | | | | | | 310,400 | |
Digicel Group, Ltd. | | | | | | | | | | |
8.25%, 09/30/20 | | | 550,000 | | | | | | 572,688 | |
Qtel International Finance, Ltd. | | | | | | | | | | |
4.75%, 02/16/21 144A | | | 200,000 | | | | | | 210,500 | |
Sirius International Group, Ltd. | | | | | | | | | | |
6.38%, 03/20/17 144A | | | 1,250,000 | | | | | | 1,355,841 | |
| | | | | | | | | | |
| | | | | | | | | 2,449,429 | |
| | | | | | | | | | |
| | | |
Brazil — 2.5% | | | | | | | | | | |
Brazil Notas do Tesouro Nacional | | | | | | | | | | |
10.00%, 01/01/14(B) | | | 131,000 | | | | | | 55,526 | |
10.00%, 01/01/17(B) | | | 4,207,000 | | | | | | 1,690,145 | |
10.00%, 01/01/21(B) | | | 6,727,000 | | | | | | 2,485,556 | |
Centrais Eletricas Brasileiras SA | | | | | | | | | | |
5.75%, 10/27/21D | | | 200,000 | | | | | | 195,250 | |
Federal Republic of Brazil | | | | | | | | | | |
10.25%, 01/10/28(B) | | | 5,250,000 | | | | | | 2,164,088 | |
Hypermarcas SA | | | | | | | | | | |
6.50%, 04/20/21 144AD | | | 150,000 | | | | | | 159,000 | |
Oi SA | | | | | | | | | | |
5.75%, 02/10/22 144A | | | 933,000 | | | | | | 867,690 | |
Samarco Mineracao SA | | | | | | | | | | |
4.13%, 11/01/22 144A | | | 775,000 | | | | | | 699,438 | |
Telemar Norte Leste SA | | | | | | | | | | |
5.50%, 10/23/20D | | | 200,000 | | | | | | 191,000 | |
Vale SA | | | | | | | | | | |
5.63%, 09/11/42D | | | 395,000 | | | | | | 360,549 | |
| | | | | | | | | | |
| | | | | | | | | 8,868,242 | |
| | | | | | | | | | |
| | | | |
| | See Notes to Financial Statements. | | 145 |
GLOBAL BOND FUND
SCHEDULE OF INVESTMENTS (Continued)
| | | | | | | | | | |
| | | Par | | | Value | |
Canada — 5.8% | | | | | | | | | | |
Air Canada | | | | | | | | | | |
7.63%, 10/01/19
144A(C) | | $ | 1,520,000 | | | | | $ | 1,498,894 | |
Atlantic Power Corporation | | | | | | | | | | |
9.00%, 11/15/18 | | | 310,000 | | | | | | 324,725 | |
Canadian Government Bond | | | | | | | | | | |
2.50%, 06/01/15(C) | | | 4,720,000 | | | | | | 4,535,205 | |
1.25%, 02/01/16(C) | | | 3,545,000 | | | | | | 3,345,098 | |
Kodiak Oil & Gas Corporation | | | | | | | | | | |
8.13%, 12/01/19D | | | 90,000 | | | | | | 100,350 | |
5.50%, 02/01/22 | | | 410,000 | | | | | | 410,000 | |
Methanex Corporation | | | | | | | | | | |
5.25%, 03/01/22 | | | 75,000 | | | | | | 79,534 | |
Ontario Generic Residual STRIP | | | | | | | | | | |
3.58%, 07/13/22(C)W† | | | 2,600,000 | | | | | | 1,786,553 | |
4.37%, 03/08/29(C)W† | | | 2,400,000 | | | | | | 1,194,024 | |
Pacific Rubiales Energy Corporation | | | | | | | | | | |
5.38%, 01/26/19 144A | | | 540,000 | | | | | | 545,400 | |
Province of Manitoba | | | | | | | | | | |
6.38%, 09/01/15(Z) | | | 815,000 | | | | | | 694,000 | |
Province of Quebec | | | | | | | | | | |
6.75%, 11/09/15(Z) | | | 2,650,000 | | | | | | 2,274,438 | |
Saskatchewan Residual STRIP | | | | | | | | | | |
1.24%, 04/10/14(C)W† | | | 3,535,000 | | | | | | 3,322,458 | |
Stone Container Finance Company of Canada II Escrow | | | | | | | | | | |
5.73%, 07/15/14+W† | | | 330,000 | | | | | | 6,600 | |
Thompson Creek Metals Co., Inc. | | | | | | | | | | |
12.50%, 05/01/19D | | | 120,000 | | | | | | 117,600 | |
Valeant Pharmaceuticals International, Inc. | | | | | | | | | | |
7.50%, 07/15/21 144A | | | 390,000 | | | | | | 429,975 | |
5.63%, 12/01/21 144A | | | 100,000 | | | | | | 100,750 | |
| | | | | | | | | | |
| | | | | | | | | 20,765,604 | |
| | | | | | | | | | |
| | | |
Cayman Islands — 1.3% | | | | | | | | | | |
Braskem Finance, Ltd. | | | | | | | | | | |
7.00%, 05/07/20 | | | 350,000 | | | | | | 375,025 | |
5.75%, 04/15/21D | | | 400,000 | | | | | | 394,000 | |
Odebrecht Finance, Ltd. | | | | | | | | | | |
4.38%, 04/25/25 144A | | | 1,070,000 | | | | | | 936,250 | |
Odebrecht Offshore Drilling Finance, Ltd. | | | | | | | | | | |
6.75%, 10/01/22 144A | | | 492,300 | | | | | | 505,100 | |
Petrobras International Finance Co. | | | | | | | | | | |
6.88%, 01/20/40 | | | 390,000 | | | | | | 372,741 | |
6.75%, 01/27/41 | | | 270,000 | | | | | | 252,567 | |
Suzano Trading, Ltd. | | | | | | | | | | |
5.88%, 01/23/21 144AD | | | 250,000 | | | | | | 246,875 | |
Vale Overseas, Ltd. | | | | | | | | | | |
4.38%, 01/11/22 | | | 800,000 | | | | | | 781,274 | |
6.88%, 11/21/36 | | | 592,000 | | | | | | 614,350 | |
| | | | | | | | | | |
| | | | | | | | | 4,478,182 | |
| | | | | | | | | | |
| | | |
Chile — 0.5% | | | | | | | | | | |
AES Gener SA | | | | | | | | | | |
5.25%, 08/15/21 144A | | | 420,000 | | | | | | 427,180 | |
Celulosa Arauco y Constitucion SA | | | | | | | | | | |
4.75%, 01/11/22 | | | 255,000 | | | | | | 249,707 | |
| | | | | | | | | | |
| | | Par | | | Value | |
Colbun SA | | | | | | | | | | |
6.00%, 01/21/20D | | $ | 100,000 | | | | | $ | 107,786 | |
6.00%, 01/21/20 144A | | | 110,000 | | | | | | 118,565 | |
Corporation Nacional del Cobre de Chile | | | | | | | | | | |
3.88%, 11/03/21 144A | | | 420,000 | | | | | | 412,892 | |
ENTEL Chile SA | | | | | | | | | | |
4.88%, 10/30/24 144A | | | 220,000 | | | | | | 215,459 | |
Inversiones CMPC SA | | | | | | | | | | |
4.38%, 05/15/23 144AD | | | 400,000 | | | | | | 374,774 | |
| | | | | | | | | | |
| | | | | | | | | 1,906,363 | |
| | | | | | | | | | |
| | | |
Colombia — 0.2% | | | | | | | | | | |
Ecopetrol SA | | | | | | | | | | |
5.88%, 09/18/23 | | | 181,000 | | | | | | 191,408 | |
Empresa de Energia de Bogota SA ESP | | | | | | | | | | |
6.13%, 11/10/21 144AD | | | 250,000 | | | | | | 267,500 | |
Empresas Publicas de Medellin ESP | | | | | | | | | | |
7.63%, 07/29/19 144AD | | | 120,000 | | | | | | 142,200 | |
Transportadora de Gas Internacional SA ESP | | | | | | | | | | |
5.70%, 03/20/22 | | | 260,000 | | | | | | 276,575 | |
| | | | | | | | | | |
| | | | | | | | | 877,683 | |
| | | | | | | | | | |
| | |
Croatia (Hrvatska) — 0.1% | | | | | | | |
Croatia Government International Bond | | | | | | | | | | |
5.50%, 04/04/23 144AD | | | 500,000 | | | | | | 488,750 | |
| | | | | | | | | | |
| | | |
France — 0.4% | | | | | | | | | | |
AXA SA | | | | | | | | | | |
6.21%, 10/29/49(E)† | | | 210,000 | | | | | | 310,313 | |
CGG SA | | | | | | | | | | |
9.50%, 05/15/16D | | | 420,000 | | | | | | 444,150 | |
Electricite de France SA | | | | | | | | | | |
5.25%, 01/29/49 144A† | | | 380,000 | | | | | | 378,585 | |
Europcar Groupe SA | | | | | | | | | | |
11.50%, 05/15/17(E) | | | 123,000 | | | | | | 197,800 | |
Rexel SA | | | | | | | | | | |
5.25%, 06/15/20 144A | | | 210,000 | | | | | | 212,100 | |
| | | | | | | | | | |
| | | | | | | | | 1,542,948 | |
| | | | | | | | | | |
| | | |
Germany — 4.9% | | | | | | | | | | |
Bundesrepublik Deutschland | | | | | | | | | | |
4.00%, 07/04/16(E) | | | 2,000 | | | | | | 3,005 | |
3.75%, 01/04/19(E) | | | 4,570,000 | | | | | | 7,150,595 | |
3.25%, 01/04/20(E) | | | 4,240,000 | | | | | | 6,531,496 | |
3.25%, 07/04/21(E) | | | 1,300,000 | | | | | | 2,010,105 | |
Kabel Deutschland Holding AG | | | | | | | | | | |
6.50%, 07/31/17
144A(E) | | | 100,000 | | | | | | 148,246 | |
Kabel Deutschland Vertrieb und Service GmbH | | | | | | | | | | |
6.50%, 06/29/18
144A(E) | | | 160,000 | | | | | | 232,979 | |
KP Germany Erste GmbH | | | | | | | | | | |
11.63%, 07/15/17(E) | | | 180,000 | | | | | | 286,752 | |
KraussMaffei Group GmbH | | | | | | | | | | |
8.75%, 12/15/20(E)D | | | 160,000 | | | | | | 246,526 | |
8.75%, 12/15/20
144A(E) | | | 100,000 | | | | | | 154,079 | |
Rearden G Holdings EINS GmbH | | | | | | | | | | |
7.88%, 03/30/20 144AD | | | 400,000 | | | | | | 418,000 | |
Unitymedia KabelBW GmbH | | | | | | | | | | |
9.50%, 03/15/21(E) | | | 180,000 | | | | | | 288,711 | |
| | | | | | | | | | |
| | | | | | | | | 17,470,494 | |
| | | | | | | | | | |
| | | | |
| 146 | | See Notes to Financial Statements. | | |
| | | | | | | | | | |
| | | Par | | | Value | |
Hungary — 0.7% | | | | | | | | | | |
Hungary Government International Bond | | | | | | | | | | |
5.75%, 11/22/23D | | $ | 2,654,000 | | | | | $ | 2,620,764 | |
| | | | | | | | | | |
| | | |
Iceland — 0.0% | | | | | | | | | | |
Kaupthing Bank HF | | | | | | | | | | |
7.13%, 05/19/16+ 144A# | | | 150,000 | | | | | | 2 | |
| | | | | | | | | | |
| | | |
Indonesia — 0.4% | | | | | | | | | | |
Indonesia Government International Bond | | | | | | | | | | |
6.63%, 02/17/37 | | | 225,000 | | | | | | 228,713 | |
5.25%, 01/17/42 144AD | | | 770,000 | | | | | | 667,975 | |
Pertamina Persero PT | | | | | | | | | | |
5.25%, 05/23/21 144A | | | 400,000 | | | | | | 387,000 | |
| | | | | | | | | | |
| | | | | | | | | 1,283,688 | |
| | | | | | | | | | |
| | | |
Ireland — 1.3% | | | | | | | | | | |
Ardagh Glass Finance PLC | | | | | | | | | | |
7.13%, 06/15/17
144A(E) | | | 112,000 | | | | | | 158,509 | |
Ardagh Packaging Finance PLC | | | | | | | | | | |
9.13%, 10/15/20 144AD | | | 200,000 | | | | | | 219,000 | |
7.00%, 11/15/20 144A | | | 200,000 | | | | | | 203,000 | |
EDC Finance, Ltd. | | | | | | | | | | |
4.88%, 04/17/20 144A | | | 500,000 | | | | | | 486,875 | |
Eircom Finance, Ltd. | | | | | | | | | | |
9.25%, 05/15/20
144A(E) | | | 200,000 | | | | | | 292,021 | |
Nara Cable Funding, Ltd. | | | | | | | | | | |
8.88%, 12/01/18 144AD | | | 360,000 | | | | | | 388,800 | |
Novatek OAO via Novatek Finance, Ltd. | | | | | | | | | | |
6.60%, 02/03/21 144AD | | | 400,000 | | | | | | 440,000 | |
Ono Finance II PLC | | | | | | | | | | |
11.13%, 07/15/19(E) | | | 110,000 | | | | | | 167,595 | |
Rosneft Oil Co via Rosneft International Finance, Ltd. | | | | | | | | | | |
4.20%, 03/06/22 | | | 870,000 | | | | | | 798,225 | |
XL Group PLC | | | | | | | | | | |
6.38%, 11/15/24D | | | 585,000 | | | | | | 671,860 | |
6.25%, 05/15/27D | | | 640,000 | | | | | | 718,547 | |
| | | | | | | | | | |
| | | | | | | | | 4,544,432 | |
| | | | | | | | | | |
| | | |
Isle of Man (U.K.) — 0.1% | | | | | | | | | | |
AngloGold Ashanti Holdings PLC | | | | | | | | | | |
8.50%, 07/30/20D | | | 300,000 | | | | | | 311,280 | |
| | | | | | | | | | |
| | | |
Italy — 0.4% | | | | | | | | | | |
Astaldi SpA | | | | | | | | | | |
7.13%, 12/01/20
144A(E) | | | 210,000 | | | | | | 308,760 | |
Telecom Italia Capital SA | | | | | | | | | | |
6.38%, 11/15/33 | | | 995,000 | | | | | | 905,450 | |
6.00%, 09/30/34 | | | 250,000 | | | | | | 217,812 | |
| | | | | | | | | | |
| | | | | | | | | 1,432,022 | |
| | | | | | | | | | |
| | | |
Japan — 0.1% | | | | | | | | | | |
Softbank Corporation | | | | | | | | | | |
4.50%, 04/15/20 144AD | | | 250,000 | | | | | | 245,000 | |
| | | | | | | | | | |
| | | |
Jersey — 0.0% | | | | | | | | | | |
AA Bond Co., Ltd. | | | | | | | | | | |
9.50%, 07/31/19 144A(U) | | | 100,000 | | | | | | 182,569 | |
| | | | | | | | | | |
| | | |
Luxembourg — 3.0% | | | | | | | | | | |
Altice Finco SA | | | | | | | | | | |
9.00%, 06/15/23 144A(E) | | | 100,000 | | | | | | 150,812 | |
| | | | | | | | | | |
| | | Par | | | Value | |
Andrade Gutierrez International SA | | | | | | | | | | |
4.00%, 04/30/18 144A | | $ | 780,000 | | | | | $ | 739,050 | |
ArcelorMittal | | | | | | | | | | |
6.13%, 06/01/18D | | | 740,000 | | | | | | 814,925 | |
6.00%, 03/01/21D | | | 60,000 | | | | | | 63,900 | |
7.50%, 10/15/39 | | | 510,000 | | | | | | 503,625 | |
7.25%, 03/01/41D | | | 690,000 | | | | | | 662,400 | |
ConvaTec Healthcare E SA | | | | | | | | | | |
10.88%, 12/15/18(E)D | | | 200,000 | | | | | | 310,909 | |
CSN Resources SA | | | | | | | | | | |
6.50%, 07/21/20D | | | 400,000 | | | | | | 406,500 | |
6.50%, 07/21/20 144AD | | | 150,000 | | | | | | 152,438 | |
Evraz Group SA | | | | | | | | | | |
9.50%, 04/24/18D | | | 270,000 | | | | | | 295,987 | |
6.75%, 04/27/18 144A | | | 440,000 | | | | | | 439,120 | |
6.50%, 04/22/20 144A | | | 480,000 | | | | | | 448,200 | |
gategroup Finance Luxembourg SA | | | | | | | | | | |
6.75%, 03/01/19(E)D | | | 370,000 | | | | | | 541,842 | |
Hannover Finance Luxembourg SA | | | | | | | | | | |
5.75%, 09/14/40(E)† | | | 50,000 | | | | | | 77,015 | |
INEOS Group Holdings SA | | | | | | | | | | |
7.88%, 02/15/16(E) | | | 195,361 | | | | | | 271,446 | |
6.13%, 08/15/18 144AD | | | 600,000 | | | | | | 604,500 | |
Intelsat Jackson Holdings SA | | | | | | | | | | |
7.25%, 10/15/20D | | | 170,000 | | | | | | 186,787 | |
7.50%, 04/01/21D | | | 30,000 | | | | | | 33,225 | |
5.50%, 08/01/23 144A | | | 2,490,000 | | | | | | 2,377,950 | |
Ontex IV SA | | | | | | | | | | |
9.00%, 04/15/19(E) | | | 100,000 | | | | | | 149,952 | |
Pacific Drilling SA | | | | | | | | | | |
5.38%, 06/01/20 144A | | | 100,000 | | | | | | 101,000 | |
Spie BondCo 3 SCA | | | | | | | | | | |
11.00%, 08/15/19(E) | | | 200,000 | | | | | | 314,772 | |
TMK OAO Via TMK Capital SA | | | | | | | | | | |
6.75%, 04/03/20 | | | 200,000 | | | | | | 193,000 | |
Vimpel Communications OJSC Via UBS Luxembourg SA | | | | | | | | | | |
8.25%, 05/23/16 | | | 275,000 | | | | | | 305,250 | |
Wind Acquisition Finance SA | | | | | | | | | | |
7.25%, 02/15/18 144A | | | 420,000 | | | | | | 443,050 | |
Wind Acquisition Holdings Finance SA | | | | | | | | | | |
PIK 12.25%, 07/15/17 (E)D | | | 9,890 | | | | | | 14,354 | |
| | | | | | | | | | |
| | | | | | | | | 10,602,009 | |
| | | | | | | | | | |
| | | |
Mexico — 3.2% | | | | | | | | | | |
America Movil SAB de CV | | | | | | | | | | |
5.63%, 11/15/17 | | | 98,000 | | | | | | 110,879 | |
Axtel SAB de CV | | | | | | | | | | |
7.00%, | | | | | | | | | | |
01/31/20 STEP 144AD | | | 124,000 | | | | | | 116,250 | |
7.00%, | | | | | | | | | | |
01/31/20 STEP CONV 144A(M) | | | 141,300 | | | | | | 15,313 | |
Cemex SAB de CV | | | | | | | | | | |
6.50%, 12/10/19 144A | | | 1,100,000 | | | | | | 1,139,050 | |
Grupo Televisa SAB | | | | | | | | | | |
6.63%, 01/15/40 | | | 270,000 | | | | | | 289,423 | |
Mexican Bonos | | | | | | | | | | |
8.00%, 06/11/20(M) | | | 19,619,000 | | | | | | 1,686,370 | |
6.50%, 06/09/22(M) | | | 45,803,100 | | | | | | 3,555,130 | |
8.00%, 12/07/23(M) | | | 38,500,000 | | | | | | 3,285,614 | |
| | | | |
| | See Notes to Financial Statements. | | 147 |
GLOBAL BOND FUND
SCHEDULE OF INVESTMENTS (Continued)
| | | | | | | | | | |
| | | Par | | | Value | |
Petroleos Mexicanos | | | | | | | | | | |
5.50%, 01/21/21 | | $ | 750,000 | | | | | $ | 810,000 | |
6.50%, 06/02/41 | | | 135,000 | | | | | | 141,750 | |
5.50%, 06/27/44D | | | 200,000 | | | | | | 183,500 | |
| | | | | | | | | | |
| | | | | | | | | 11,333,279 | |
| | | | | | | | | | |
| | | |
Netherlands — 1.6% | | | | | | | | | | |
EDP Finance BV | | | | | | | | | | |
4.75%, 09/26/16(E) | | | 300,000 | | | | | | 437,276 | |
6.00%, 02/02/18 144A | | | 600,000 | | | | | | 645,600 | |
4.90%, 10/01/19 144A | | | 1,600,000 | | | | | | 1,632,000 | |
Indosat Palapa Co. BV | | | | | | | | | | |
7.38%, 07/29/20 | | | 100,000 | | | | | | 108,875 | |
7.38%, 07/29/20 144A | | | 100,000 | | | | | | 108,875 | |
Lukoil International Finance BV | | | | | | | | | | |
6.36%, 06/07/17D | | | 200,000 | | | | | | 224,500 | |
6.66%, 06/07/22 | | | 570,000 | | | | | | 626,288 | |
LyondellBasell Industries NV | | | | | | | | | | |
5.75%, 04/15/24 | | | 260,000 | | | | | | 291,950 | |
New World Resources NV | | | | | | | | | | |
7.88%, 01/15/21
144A(E) | | | 150,000 | | | | | | 82,542 | |
Petrobras Global Finance BV | | | | | | | | | | |
4.38%, 05/20/23 | | | 250,000 | | | | | | 225,223 | |
Polish Television Holding BV | | | | | | | | | | |
Cash coupon 11.00%, | | | | | | | | | | |
01/15/21 PIK
144A(E) | | | 100,000 | | | | | | 148,329 | |
Schaeffler Holding Finance BV | | | | | | | | | | |
Cash coupon 6.88%, | | | | | | | | | | |
08/15/18 PIK
144A(E) | | | 100,000 | | | | | | 147,716 | |
Swiss Reinsurance Co. Via ELM BV | | | | | | | | | | |
5.25%, 05/29/49(E)† | | | 400,000 | | | | | | 577,710 | |
VimpelCom Holdings BV | | | | | | | | | | |
7.50%, 03/01/22 | | | 400,000 | | | | | | 418,848 | |
7.50%, 03/01/22 144AD | | | 200,000 | | | | | | 209,424 | |
| | | | | | | | | | |
| | | | | | | | | 5,885,156 | |
| | | | | | | | | | |
| | | |
Norway — 0.7% | | | | | | | | | | |
Norway Government Bond | | | | | | | | | | |
5.00%, 05/15/15(K) | | | 355,000 | | | | | | 61,337 | |
4.25%, 05/19/17(K) | | | 12,330,000 | | | | | | 2,192,340 | |
Petroleum Geo-Services ASA | | | | | | | | | | |
7.38%, 12/15/18 144A | | | 200,000 | | | | | | 214,000 | |
| | | | | | | | | | |
| | | | | | | | | 2,467,677 | |
| | | | | | | | | | |
| | | |
Panama — 0.0% | | | | | | | | | | |
Panama Government International Bond | | | | | | | | | | |
6.70%, 01/26/36 | | | 3,000 | | | | | | 3,368 | |
| | | | | | | | | | |
| | | |
Peru — 0.1% | | | | | | | | | | |
Transportadora de Gasdel Peru SA | | | | | | | | | | |
4.25%, 04/30/28 144A | | | 550,000 | | | | | | 484,000 | |
| | | | | | | | | | |
| | | |
Philippines — 0.1% | | | | | | | | | | |
Philippine Government International Bond | | | | | | | | | | |
4.00%, 01/15/21D | | | 200,000 | | | | | | 208,000 | |
| | | | | | | | | | |
| | | |
Poland — 0.9% | | | | | | | | | | |
Poland Government Bond | | | | | | | | | | |
5.25%, 10/25/17(P) | | | 8,880,000 | | | | | | 3,127,789 | |
| | | | | | | | | | |
| | | | | | | | | | |
| | | Par | | | Value | |
| | | |
Portugal — 0.4% | | | | | | | | | | |
Portugal Obrigacoesdo Tesouro OT | | | | | | | | | | |
4.80%, 06/15/20(E) | | $ | 50,000 | | | | | $ | 65,797 | |
3.85%, 04/15/21(E) | | | 200,000 | | | | | | 244,478 | |
4.95%, 10/25/23(E) | | | 900,000 | | | | | | 1,145,294 | |
| | | | | | | | | | |
| | | | | | | | | 1,455,569 | |
| | | | | | | | | | |
| | | |
Russia — 0.8% | | | | | | | | | | |
Russian Foreign Bond | | | | | | | | | | |
4.88%, 09/16/23 144AD | | | 1,600,000 | | | | | | 1,620,000 | |
7.50%, 03/31/30 STEP | | | 1,189,045 | | | | | | 1,387,853 | |
| | | | | | | | | | |
| | | | | | | | | 3,007,853 | |
| | | | | | | | | | |
| | | |
South Africa — 1.2% | | | | | | | | | | |
Edcon Proprietary, Ltd. | | | | | | | | | | |
9.50%, 03/01/18 144A(E) | | | 210,000 | | | | | | 297,565 | |
South Africa Government Bond | | | | | | | | | | |
10.50%, 12/21/26(S)D | | | 8,229,811 | | | | | | 925,859 | |
South Africa Government International Bond | | | | | | | | | | |
5.88%, 09/16/25D | | | 2,824,000 | | | | | | 2,945,432 | |
| | | | | | | | | | |
| | | | | | | | | 4,168,856 | |
| | | | | | | | | | |
| | | |
Spain — 0.3% | | | | | | | | | | |
Autonomous Community of Madrid Spain | | | | | | | | | | |
4.30%, 09/15/26(E) | | | 560,000 | | | | | | 726,599 | |
Santander Issuances SA Unipersonal | | | | | | | | | | |
5.91%, 06/20/16 144A | | | 100,000 | | | | | | 106,337 | |
Telefonica Emisiones SA Unipersonal | | | | | | | | | | |
5.13%, 04/27/20 | | | 75,000 | | | | | | 79,864 | |
| | | | | | | | | | |
| | | | | | | | | 912,800 | |
| | | | | | | | | | |
| | | |
Supranational — 0.8% | | | | | | | | | | |
Inter-American Development Bank | | | | | | | | | | |
6.00%, 12/15/17(Z) | | | 3,250,000 | | | | | | 2,781,330 | |
| | | | | | | | | | |
| | | |
Sweden — 0.1% | | | | | | | | | | |
Corral Petroleum Holdings AB | | | | | | | | | | |
Cash coupon 2.00% and PIK | | | | | | | | | | |
13.00%, | | | | | | | | | | |
12/31/17 144A(E) | | | 186,035 | | | | | | 267,446 | |
TVN Finance Corporation III AB | | | | | | | | | | |
7.38%, 12/15/20 144A(E) | | | 125,000 | | | | | | 186,150 | |
| | | | | | | | | | |
| | | | | | | | | 453,596 | |
| | | | | | | | | | |
| | | |
Trinidad and Tobago — 0.1% | | | | | | | | | | |
Petroleum Co. of Trinidad & Tobago, Ltd. | | | | | | | | | | |
9.75%, 08/14/19 144A | | | 340,000 | | | | | | 428,400 | |
| | | | | | | | | | |
| | | |
Turkey — 0.6% | | | | | | | | | | |
Mersin Uluslararasi Liman Isletmeciligi AS | | | | | | | | | | |
5.88%, 08/12/20 144A | | | 400,000 | | | | | | 394,000 | |
Turkey Government Bond | | | | | | | | | | |
9.50%, 01/12/22(T) | | | 900,000 | | | | | | 404,224 | |
7.10%, 03/08/23(T) | | | 510,000 | | | | | | 194,934 | |
Turkey Government International Bond | | | | | | | | | | |
7.50%, 07/14/17 | | | 100,000 | | | | | | 112,025 | |
7.00%, 03/11/19 | | | 100,000 | | | | | | 109,875 | |
6.25%, 09/26/22 | | | 545,000 | | | | | | 567,345 | |
| | | | |
| 148 | | See Notes to Financial Statements. | | |
| | | | | | | | | | |
| | | Par | | | Value | |
6.88%, 03/17/36 | | $ | 73,000 | | | | | $ | 71,887 | |
4.88%, 04/16/43 | | | 500,000 | | | | | | 385,250 | |
| | | | | | | | | | |
| | | | | | | | | 2,239,540 | |
| | | | | | | | | | |
|
United Arab Emirates — 0.4% | |
DP World, Ltd. | | | | | | | | | | |
6.85%, 07/02/37 144AD | | | 1,500,000 | | | | | | 1,481,250 | |
| | | | | | | | | | |
| | | |
United Kingdom — 3.3% | | | | | | | | | | |
Anglian Water Osprey Financing PLC | | | | | | | | | | |
7.00%, 01/31/18(U) | | | 310,000 | | | | | | 557,110 | |
Barclays Bank PLC | | | | | | | | | | |
6.00%, 01/23/18(E) | | | 450,000 | | | | | | 699,346 | |
HBOS PLC | | | | | | | | | | |
6.75%, 05/21/18 144A | | | 500,000 | | | | | | 568,063 | |
6.00%, 11/01/33 144A | | | 1,385,000 | | | | | | 1,342,752 | |
HSBC Holdings PLC | | | | | | | | | | |
6.00%, 06/10/19(E) | | | 270,000 | | | | | | 432,383 | |
Lloyds TSB Bank PLC | | | | | | | | | | |
6.50%, 03/24/20(E)D | | | 326,000 | | | | | | 520,803 | |
Priory Group No. 3 PLC | | | | | | | | | | |
8.88%, 02/15/19(U) | | | 100,000 | | | | | | 171,806 | |
Royal Bank of Scotland PLC | | | | | | | | | | |
6.13%, 01/11/21 | | | 350,000 | | | | | | 396,725 | |
13.13%,
03/19/22(A)† | | | 160,000 | | | | | | 168,509 | |
Royal Bank of Scotland Group PLC | | | | | | | | | | |
6.10%, 06/10/23D | | | 1,880,000 | | | | | | 1,898,593 | |
6.00%, 12/19/23 | | | 275,000 | | | | | | 277,302 | |
Southern Gas Networks PLC | | | | | | | | | | |
4.88%, 12/21/20(U) | | | 270,000 | | | | | | 484,859 | |
Tesco Property Finance 3 PLC | | | | | | | | | | |
5.74%, 04/13/40(U) | | | 278,359 | | | | | | 497,468 | |
United Kingdom Gilt | | | | | | | | | | |
1.00%, 09/07/17(U) | | | 1,420,000 | | | | | | 2,309,209 | |
Vedanta Resources PLC | | | | | | | | | | |
6.75%, 06/07/16 144AD | | | 200,000 | | | | | | 208,250 | |
6.00%, 01/31/19 144A | | | 350,000 | | | | | | 340,375 | |
7.13%, 05/31/23 144A | �� | | 200,000 | | | | | | 183,750 | |
7.13%, 05/31/23 144AD | | | 400,000 | | | | | | 367,500 | |
Virgin Media Finance PLC | | | | | | | | | | |
7.00%, 04/15/23
144A(U) | | | 130,000 | | | | | | 224,962 | |
Virgin Media Secured Finance PLC | | | | | | | | | | |
6.50%, 01/15/18 | | | 100,000 | | | | | | 103,875 | |
5.50%, 01/15/21(U)D | | | 100,000 | | | | | | 167,210 | |
| | | | | | | | | | |
| | | | | | | | | 11,920,850 | |
| | | | | | | | | | |
| | | |
Venezuela — 1.0% | | | | | | | | | | |
Petroleos de Venezuela SA | | | | | | | | | | |
8.50%, 11/02/17 | | | 1,180,000 | | | | | | 985,300 | |
Venezuela Government International Bond | | | | | | | | | | |
8.50%, 10/08/14D | | | 26,000 | | | | | | 25,454 | |
5.75%, 02/26/16D | | | 1,153,000 | | | | | | 982,356 | |
7.75%, 10/13/19 | | | 860,000 | | | | | | 645,000 | |
9.25%, 09/15/27D | | | 1,154,000 | | | | | | 898,389 | |
9.38%, 01/13/34 | | | 207,000 | | | | | | 154,526 | |
| | | | | | | | | | |
| | | | | | | | | 3,691,025 | |
| | | | | | | | | | |
|
Virgin Islands (British) — 0.1% | |
GTL Trade Finance, Inc. | | | | | | | | | | |
7.25%, 10/20/17
144A | | | 189,000 | | | | | | 213,334 | |
| | | | | | | | | | |
Total Foreign Bonds
(Cost $140,561,840) | | | | | | | | | 140,965,686 | |
| | | | | | | | | | |
| | | | | | | | | | | | |
| | | | | Par | | | Value | |
MORTGAGE-BACKED SECURITIES — 3.9% | |
Credit Suisse Commercial Mortgage Trust | | | | | | | | | | | | |
5.70%, 09/15/40† | | | | $ | 220,000 | | | | | $ | 242,963 | |
Federal Home Loan Mortgage Corporation | | | | | | | | | | | | |
3.50%, 01/01/42 TBA | | | | | 200,000 | | | | | | 198,438 | |
Federal National Mortgage Association | | | | | | | | | | | | |
3.00%, 01/01/26 TBA | | | | | 1,100,000 | | | | | | 1,122,559 | |
4.50%, 01/01/40 TBA | | | | | 4,600,000 | | | | | | 4,874,023 | |
5.00%, 01/01/40 TBA | | | | | 1,200,000 | | | | | | 1,303,219 | |
3.50%, 01/01/41 TBA | | | | | 500,000 | | | | | | 496,680 | |
4.00%, 01/01/41 TBA | | | | | 4,800,000 | | | | | | 4,941,000 | |
3.00%, 01/01/43 TBA | | | | | 200,000 | | | | | | 189,859 | |
Government National Mortgage Association | | | | | | | | | | | | |
3.50%, 01/15/41 TBA | | | | | 100,000 | | | | | | 100,785 | |
4.50%, 01/20/41 TBA | | | | | 400,000 | | | | | | 427,656 | |
| | | | | | | | | | | | |
| | |
Total Mortgage-Backed Securities
(Cost $13,827,739) | | | | | | 13,897,182 | |
| | | | | | | | | | | | |
| | |
MUNICIPAL BOND — 0.1% | | | | | | | |
State of Illinois, General Obligation | | | | | | | | | | | | |
5.10%, 06/01/33 | | | | | | | | | | | | |
(Cost $333,614) | | | | | 435,000 | | | | | | 404,524 | |
| | | | | | | | | | | | |
| | | | |
| | | | | Number of
Contracts | | | | | | |
|
PURCHASED OPTION — 0.0% | |
Call Option — 0.0% | | | | | | | | | | | | |
U.S. Dollar vs. Euro, Strike Price $1.36, Expires | | | | | | | | | | | | |
02/11/14 (HSBC) | | | | | | | | | | | | |
(Cost $86,984) | | | | | 10,380,000 | | | | | | 20,812 | |
| | | | | | | | | | | | |
| | | | |
| | | | | Par | | | | | | |
|
U.S. TREASURY OBLIGATIONS — 7.7% | |
U.S. Treasury Bonds | | | | | | | | | | | | |
3.50%, 02/15/39 | | | | $ | 860,000 | | | | | | 810,147 | |
4.25%, 05/15/39D | | | | | 40,000 | | | | | | 42,669 | |
3.88%, 08/15/40D | | | | | 30,000 | | | | | | 30,019 | |
2.75%, 08/15/42 | | | | | 120,000 | | | | | | 95,119 | |
2.75%, 11/15/42D | | | | | 2,275,000 | | | | | | 1,799,384 | |
3.13%, 02/15/43D | | | | | 3,980,000 | | | | | | 3,408,806 | |
2.88%, 05/15/43 | | | | | 2,665,000 | | | | | | 2,160,523 | |
| | | | | | | | | | | | |
| | | | | | | | | | | 8,346,667 | |
| | | | | | | | | | | | |
U.S. Treasury Notes | | | | | | | | | | | | |
1.00%, 05/15/14 | | | | | 10,000 | | | | | | 10,034 | |
2.63%, 07/31/14D | | | | | 50,000 | | | | | | 50,730 | |
0.25%, 09/30/14D | | | | | 5,100,000 | | | | | | 5,104,483 | |
2.38%, 09/30/14 | | | | | 110,000 | | | | | | 111,832 | |
0.25%, 10/31/14D | | | | | 2,860,000 | | | | | | 2,862,683 | |
1.25%, 08/31/15 | | | | | 90,000 | | | | | | 91,441 | |
0.25%, 09/30/15D | | | | | 3,505,000 | | | | | | 3,502,056 | |
0.38%, 11/15/15D | | | | | 2,855,000 | | | | | | 2,856,953 | |
0.25%, 12/15/15 | | | | | 620,000 | | | | | | 618,668 | |
0.75%, 10/31/17D | | | | | 20,000 | | | | | | 19,641 | |
0.63%, 04/30/18D | | | | | 530,000 | | | | | | 511,181 | |
| | | | |
| | See Notes to Financial Statements. | | 149 |
GLOBAL BOND FUND
SCHEDULE OF INVESTMENTS (Continued)
| | | | | | | | | | |
| | | Par | | | Value | |
1.38%, 07/31/18D | | $ | 10,000 | | | | | $ | 9,911 | |
1.38%, 09/30/18D | | | 250,000 | | | | | | 246,963 | |
1.25%, 10/31/19D | | | 110,000 | | | | | | 105,235 | |
2.00%, 02/15/22D | | | 120,000 | | | | | | 113,897 | |
1.63%, 08/15/22D | | | 3,380,000 | | | | | | 3,071,311 | |
| | | | | | | | | | |
| | | | | | | | | 19,287,019 | |
| | | | | | | | | | |
Total U.S. Treasury Obligations
(Cost $29,014,936) | | | | | | 27,633,686 | |
| | | | | | | | | | |
| | | |
| | | Shares | | | | | | |
COMMON STOCKS — 0.9% | | | | |
Healthcare — 0.2% | | | | | | | | | | |
Bristol-Myers Squibb Co. | | | 15,400 | | | | | | 818,510 | |
| | | | | | | | | | |
Materials & Processing — 0.3% | | | | |
Nortek, Inc.* | | | 33 | | | | | | 2,462 | |
PPG Industries, Inc. | | | 5,751 | | | | | | 1,090,734 | |
Rock-Tenn Co. Class A | | | 188 | | | | | | 19,742 | |
| | | | | | | | | | |
| | | | | | | | | 1,112,938 | |
| | | | | | | | | | |
Technology — 0.4% | | | | | | | | | | |
Corning, Inc. | | | 70,534 | | | | | | 1,256,916 | |
| | | | | | | | | | |
Total Common Stocks
(Cost $1,696,589) | | | | | | | | | 3,188,364 | |
| | | | | | | | | | |
| |
FOREIGN COMMON STOCKS — 0.4% | | | | |
Norway — 0.1% | | | | | | | | | | |
Deep Ocean Group Holding+@* | | | 8,860 | | | | | | 291,986 | |
| | | | | | | | | | |
| | | |
Spain — 0.2% | | | | | | | | | | |
Repsol SA ADR | | | 15,820 | | | | | | 400,087 | |
Telefonica SA ADRD | | | 22,180 | | | | | | 362,421 | |
| | | | | | | | | | |
| | | | | | | | | 762,508 | |
| | | | | | | | | | |
| |
United Kingdom — 0.1% | | | | |
Royal Dutch Shell PLC ADRD | | | 6,443 | | | | | | 459,193 | |
| | | | | | | | | | |
Total Foreign Common Stocks
(Cost $1,283,346) | | | 1,513,687 | |
| | | | | | | | | | |
| |
PREFERRED STOCKS — 1.2% | | | | |
Ally Financial, Inc., | | | | | | | | | | |
7.00% 144A | | | 400 | | | | | | 382,037 | |
Bank of America Corporation, | | | | | | | | | | |
7.25%, 11/30/14 CONV | | | 602 | | | | | | 638,722 | |
Chesapeake Energy Corporation, | | | | | | | | | | |
5.00% CONV | | | 3,950 | | | | | | 385,125 | |
Chesapeake Energy Corporation, | | | | | | | | | | |
5.75% CONV 144A | | | 50 | | | | | | 57,938 | |
El Paso Energy Capital Trust I, | | | | | | | | | | |
4.75%, 03/31/28 CONV | | | 500 | | | | | | 28,065 | |
iStar Financial, Inc.* | | | 578 | | | | | | 36,558 | |
Lucent Technologies Capital Trust I, | | | | | | | | | | |
7.75%, 03/15/17 CONV | | | 1,891 | | | | | | 1,900,455 | |
Stanley Black & Decker, Inc., | | | | | | | | | | |
6.25%,11/17/16D* | | | 2,900 | | | | | | 299,280 | |
Weyerhaeuser Co., | | | | | | | | | | |
6.38%, 07/01/16D* | | | 7,252 | | | | | | 406,402 | |
| | | | | | | | | | |
Total Preferred Stocks
(Cost $3,174,947) | | | 4,134,582 | |
| | | | | | | | | | |
| | | | | | | | | | |
| | |
| | | Shares | | | Value | |
MONEY MARKET FUNDS — 32.0% | | | | |
GuideStone Money Market Fund (GS4 Class)D | | | 46,360,552 | | | | | $ | 46,360,552 | |
Northern Institutional Liquid Assets Portfolio§ | | | 68,161,728 | | | | | | 68,161,728 | |
| | | | | | | | | | |
| |
Total Money Market Funds
(Cost $114,522,280) | | | 114,522,280 | |
| | | | | | | | | | |
| |
TOTAL INVESTMENTS — 121.2%
(Cost $422,119,740) | | | 433,848,991 | |
| |
Liabilities in Excess of Other
Assets — (21.2)% | | | (76,007,004 | ) |
| | | | | | | | | | |
| |
NET ASSETS — 100.0% | | $ | 357,841,987 | |
| | | | | | | | | | |
| | | | |
| 150 | | See Notes to Financial Statements. | | |
VALUATION HIERARCHY
The following is a summary of the inputs used, as of December 31, 2013, in valuing the Fund’s investments carried at fair value:
| | | | | | | | | | | | | | | | | | | | |
| | | Total
Value | | Level 1
Quoted Prices | | Level 2
Other Significant
Observable Inputs | | Level 3
Significant
Unobservable Inputs |
Assets: | | | | | | | | | | | | | | | | | | | | |
Investments in Securities: | | | | | | | | | | | | | | | | | | | | |
Common Stocks | | | $ | 3,188,364 | | | | $ | 3,185,902 | | | | $ | — | | | | $ | 2,462 | |
Corporate Bonds | | | | 127,568,188 | | | | | — | | | | | 123,242,204 | | | | | 4,325,984 | |
Foreign Bonds: | | | | | | | | | | | | | | | | | | | | |
Argentina | | | | 1,176,728 | | | | | — | | | | | 1,176,728 | | | | | — | |
Australia | | | | 3,455,825 | | | | | — | | | | | 3,455,825 | | | | | — | |
Bermuda | | | | 2,449,429 | | | | | — | | | | | 2,449,429 | | | | | — | |
Brazil | | | | 8,868,242 | | | | | — | | | | | 8,868,242 | | | | | — | |
Canada | | | | 20,765,604 | | | | | — | | | | | 20,759,004 | | | | | 6,600 | |
Cayman Islands | | | | 4,478,182 | | | | | — | | | | | 4,478,182 | | | | | — | |
Chile | | | | 1,906,363 | | | | | — | | | | | 1,906,363 | | | | | — | |
Colombia | | | | 877,683 | | | | | — | | | | | 877,683 | | | | | — | |
Croatia (Hrvatska) | | | | 488,750 | | | | | — | | | | | 488,750 | | | | | — | |
France | | | | 1,542,948 | | | | | — | | | | | 1,542,948 | | | | | — | |
Germany | | | | 17,470,494 | | | | | — | | | | | 17,470,494 | | | | | — | |
Hungary | | | | 2,620,764 | | | | | — | | | | | 2,620,764 | | | | | — | |
Iceland | | | | 2 | | | | | — | | | | | — | | | | | 2 | |
Indonesia | | | | 1,283,688 | | | | | — | | | | | 1,283,688 | | | | | — | |
Ireland | | | | 4,544,432 | | | | | — | | | | | 4,544,432 | | | | | — | |
Isle of Man (U.K.) | | | | 311,280 | | | | | — | | | | | 311,280 | | | | | — | |
Italy | | | | 1,432,022 | | | | | — | | | | | 1,432,022 | | | | | — | |
Japan | | | | 245,000 | | | | | — | | | | | 245,000 | | | | | — | |
Jersey | | | | 182,569 | | | | | — | | | | | 182,569 | | | | | — | |
Luxembourg | | | | 10,602,009 | | | | | — | | | | | 10,602,009 | | | | | — | |
Mexico | | | | 11,333,279 | | | | | — | | | | | 11,333,279 | | | | | — | |
Netherlands | | | | 5,885,156 | | | | | — | | | | | 5,885,156 | | | | | — | |
Norway | | | | 2,467,677 | | | | | — | | | | | 2,467,677 | | | | | — | |
Panama | | | | 3,368 | | | | | — | | | | | 3,368 | | | | | — | |
Peru | | | | 484,000 | | | | | — | | | | | 484,000 | | | | | — | |
Philippines | | | | 208,000 | | | | | — | | | | | 208,000 | | | | | — | |
Poland | | | | 3,127,789 | | | | | — | | | | | 3,127,789 | | | | | — | |
Portugal | | | | 1,455,569 | | | | | — | | | | | 1,455,569 | | | | | — | |
Russia | | | | 3,007,853 | | | | | — | | | | | 3,007,853 | | | | | — | |
South Africa | | | | 4,168,856 | | | | | — | | | | | 4,168,856 | | | | | — | |
Spain | | | | 912,800 | | | | | — | | | | | 912,800 | | | | | — | |
Supranational | | | | 2,781,330 | | | | | — | | | | | 2,781,330 | | | | | — | |
Sweden | | | | 453,596 | | | | | — | | | | | 453,596 | | | | | — | |
Trinidad and Tobago | | | | 428,400 | | | | | 428,400 | | | | | — | | | | | — | |
Turkey | | | | 2,239,540 | | | | | — | | | | | 2,239,540 | | | | | — | |
United Arab Emirates | | | | 1,481,250 | | | | | — | | | | | 1,481,250 | | | | | — | |
United Kingdom | | | | 11,920,850 | | | | | — | | | | | 11,920,850 | | | | | — | |
Venezuela | | | | 3,691,025 | | | | | — | | | | | 3,691,025 | | | | | — | |
Virgin Islands (British) | | | | 213,334 | | | | | — | | | | | 213,334 | | | | | — | |
Foreign Common Stocks | | | | 1,513,687 | | | | | 1,221,701 | | | | | — | | | | | 291,986 | |
Money Market Funds | | | | 114,522,280 | | | | | 114,522,280 | | | | | — | | | | | — | |
Mortgage-Backed Securities | | | | 13,897,182 | | | | | — | | | | | 13,897,182 | | | | | — | |
Municipal Bond | | | | 404,524 | | | | | — | | | | | 404,524 | | | | | — | |
Preferred Stocks | | | | 4,134,582 | | | | | 3,752,545 | | | | | — | | | | | 382,037 | |
Purchased Option | | | | 20,812 | | | | | 20,812 | | | | | — | | | | | — | |
U.S. Treasury Obligations | | | | 27,633,686 | | | | | — | | | | | 27,633,686 | | | | | — | |
| | | | | | | | | | | | | | | | | | | | |
Total Assets - Investments in Securities | | | $ | 433,848,991 | | | | $ | 123,131,640 | | | | $ | 305,708,280 | | | | $ | 5,009,071 | |
| | | | | | | | | | | | | | | | | | | | |
| | | | |
| | See Notes to Financial Statements. | | 151 |
GLOBAL BOND FUND
SCHEDULE OF INVESTMENTS (Continued)
| | | | | | | | | | | | | | | | | | | | |
| | | Total
Value | | Level 1
Quoted Prices | | Level 2
Other Significant
Observable Inputs | | Level 3
Significant
Unobservable Inputs |
| | | | |
Other Financial Instruments*** | | | | | | | | | | | | | | | | | | | | |
Futures Contracts | | | $ | 9,149 | | | | $ | 9,149 | | | | $ | — | | | | $ | — | |
| | | | | | | | | | | | | | | | | | | | |
Total Assets - Other Financial Instruments | | | $ | 9,149 | | | | $ | 9,149 | | | | $ | — | | | | $ | — | |
| | | | | | | | | | | | | | | | | | | | |
Liabilities: | | | | | | | | | | | | | | | | | | | | |
Other Financial Instruments*** | | | | | | | | | | | | | | | | | | | | |
Forward Foreign Currency Contracts | | | $ | (225,188 | ) | | | $ | — | | | | $ | (225,188 | ) | | | $ | — | |
| | | | | | | | | | | | | | | | | | | | |
Total Liabilities - Other Financial Instruments | | | $ | (225,188 | ) | | | $ | — | | | | $ | (225,188 | ) | | | $ | — | |
| | | | | | | | | | | | | | | | | | | | |
***Other financial instruments are derivative instruments not reflected in the Schedule of Investments, such as futures, forwards and swap contracts, which are valued at the unrealized appreciation (depreciation) on the investment. Details of these investments can be found in the Notes to Financial Statements.
There were no transfers between Level 1 and Level 2 during the year ended December 31, 2013.
The unobservable inputs used in the fair value measurement of the reporting entity’s common stock, corporate bonds, foreign bonds, foreign common stock, loan agreement and preferred stock are values based on evaluated quotations received from dealers who make markets in such securities. Significant increases (decreases) in those evaluated quotations would result in a significantly higher (lower) fair value measurement.
The following is a reconciliation of assets in which significant unobservable inputs (Level 3) were used in determining fair value:
| | | | | | | | | | | | | | | | | | | | | | | | | | | | |
| | | Total
Value | | | Common
Stock | | | Corporate
Bonds | | | Foreign
Bonds | | | Foreign
Common
Stock | | | Loan
Agreement | | | Preferred
Stock | |
Balance, 12/31/12 | | $ | 7,168,943 | | | $ | 2,385 | | | $ | 4,691,264 | | | $ | 1,872,450 | | | $ | 179,619 | | | $ | 30,363 | | | $ | 392,862 | |
Accrued discounts/premiums | | | 114,044 | | | | — | | | | 6,624 | | | | 107,304 | | | | — | | | | 116 | | | | — | |
Realized gain (loss)(1) | | | (208,574 | ) | | | 27 | | | | 75,068 | | | | (284,813 | ) | | | — | | | | 1,144 | | | | — | |
Change in unrealized appreciation (depreciation)(2) | | | 5,284 | | | | 319 | | | | (131,396 | ) | | | 36,305 | | | | 112,367 | | | | (1,486 | ) | | | (10,825 | ) |
Purchases | | | 453,801 | | | | — | | | | 424,000 | | | | 29,801 | | | | — | | | | — | | | | — | |
Sales | | | (864,507 | ) | | | (269 | ) | | | (747,983 | ) | | | (86,118 | ) | | | — | | | | (30,137 | ) | | | — | |
Transfers in to Level 3 | | | — | | | | — | | | | — | | | | — | | | | — | | | | — | | | | — | |
Transfers out of Level 3(3) | | | (267,446 | ) | | | — | | | | — | | | | (267,446 | ) | | | — | | | | — | | | | — | |
Maturities | | | (1,400,881 | ) | | | — | | | | — | | | | (1,400,881 | ) | | | — | | | | — | | | | — | |
Paydowns | | | 8,407 | | | | — | | | | 8,407 | | | | — | | | | — | | | | — | | | | — | |
| | | | | | | | | | | | | | | | | | | | | | | | | | | | |
Balance, 12/31/13 | | $ | 5,009,071 | | | $ | 2,462 | | | $ | 4,325,984 | | | $ | 6,602 | | | $ | 291,986 | | | $ | — | | | $ | 382,037 | |
| | | | | | | | | | | | | | | | | | | | | | | | | | | | |
| (1) | Realized gain (loss) from the sale of Level 3 securities can be found on the Statement of Operations in Net realized gain (loss) from: Investment securities. |
| (2) | Change in unrealized appreciation (depreciation) can be found on the Statement of Operations in Net change in unrealized appreciation (depreciation) on: Investment securities. |
| (3) | Transfers out of Level 3 represent the value of securities at December 31, 2013 that were transferred from Level 3 to Level 2 of the fair value hierarchy as a result of the ability of the Fund to obtain a price which was determined using observable inputs. |
| | | | |
| 152 | | See Notes to Financial Statements. | | |
(This page intentionally left blank)
153
| | |
| STATEMENTS OF ASSETS AND LIABILITIES | | December 31, 2013 |
| | | | | | | | |
| | | Money
Market Fund | | | Low-Duration
Bond Fund | |
Assets | | | | | | | | |
Investments in securities of unaffiliated issuers, at value | | $ | 1,338,480,770 | | | $ | 880,471,496 | |
Investments in repurchase agreements, at value | | | 30,361,000 | | | | 39,100,000 | |
Investments in securities of affiliated issuers, at value | | | — | | | | 35,793,992 | |
| | | | | | | | |
Total investments (1)(2) | | | 1,368,841,770 | | | | 955,365,488 | |
Cash | | | 414 | | | | 1,825,901 | |
Cash collateral for derivatives | | | — | | | | 2,538,012 | |
Foreign currency(3) | | | — | | | | 1,229,423 | |
Swap premiums paid | | | — | | | | 2,764,185 | |
Receivables: | | | | | | | | |
Dividends and reclaims | | | — | | | | 316 | |
Interest | | | 445,787 | | | | 3,292,530 | |
Securities lending | | | 36,613 | | | | 204,535 | |
Investment securities sold | | | — | | | | 27,082,188 | |
Maturities | | | — | | | | 59,464 | |
Fund shares sold | | | 8,313,963 | | | | 79,222 | |
Variation margin on exchange traded swaps | | | — | | | | — | |
Variation margin on financial futures contracts | | | — | | | | 69,731 | |
Unrealized appreciation on foreign currency exchange contracts | | | — | | | | 809,848 | |
Unrealized appreciation on swap agreements | | | — | | | | 1,190,111 | |
Prepaid expenses and other assets | | | 39,207 | | | | 26,597 | |
| | | | | | | | |
Total Assets | | | 1,377,677,754 | | | | 996,537,551 | |
| | | | | | | | |
Liabilities | | | | | | | | |
Securities sold short, at value (4) | | | — | | | | 3,084,500 | |
TBA sale commitments, at value (5) | | | — | | | | 17,838,008 | |
Options written at value (6) | | | — | | | | 662,660 | |
Swap premiums received | | | — | | | | 392,384 | |
Unrealized depreciation on foreign currency exchange contracts | | | — | | | | 676,173 | |
Unrealized depreciation on swap agreements | | | — | | | | 2,145,810 | |
Collateral held for securities on loan at value | | | — | | | | 79,891,920 | |
Collateral held for derivatives | | | — | | | | 520,000 | |
Payables: | | | | | | | | |
Investment securities purchased | | | — | | | | 50,775,783 | |
Fund shares redeemed | | | 8,438,410 | | | | 146,825 | |
Variation margin on exchange traded swaps | | | — | | | | 1,606,147 | |
Variation margin on financial futures contracts | | | — | | | | 54,955 | |
Distributions | | | 6,597 | | | | — | |
Securities lending | | | — | | | | 1,152 | |
Accrued expenses: | | | | | | | | |
Investment advisory fees | | | 169,296 | | | | 174,157 | |
Shareholder servicing fees | | | — | | | | 143,021 | |
Other expenses | | | 65,462 | | | | 159,815 | |
| | | | | | | | |
Total Liabilities | | | 8,679,765 | | | | 158,273,310 | |
| | | | | | | | |
Net Assets | | $ | 1,368,997,989 | | | $ | 838,264,241 | |
| | | | | | | | |
Net Assets Consist of: | | | | | | | | |
Paid-in-capital | | $ | 1,368,950,159 | | | $ | 842,706,281 | |
Accumulated (distributions in excess of) net investment income | | | 36,613 | | | | (619,939 | ) |
Undistributed (accumulated) net realized gain (loss) on investments, foreign currency translations and derivative transactions | | | 11,217 | | | | (387,746 | ) |
Net unrealized appreciation (depreciation) on investments, foreign currency translations and derivative transactions | | | — | | | | (3,434,355 | ) |
| | | | | | | | |
Net Assets | | $ | 1,368,997,989 | | | $ | 838,264,241 | |
| | | | | | | | |
Net Asset Value: | | | | | | | | |
$0.001 par value, unlimited shares authorized | | | | | | | | |
Net assets applicable to the GS2 Class | | $ | 106,059,602 | | | $ | 136,965,674 | |
| | | | | | | | |
GS2 shares outstanding | | | 106,051,286 | | | | 16,037,259 | |
| | | | | | | | |
Net asset value, offering and redemption price per GS2 share | | $ | 1.00 | | | $ | 8.54 | |
| | | | | | | | |
Net assets applicable to the GS4 Class | | $ | 1,262,938,387 | | | $ | 701,298,567 | |
| | | | | | | | |
GS4 shares outstanding | | | 1,262,864,226 | | | | 52,522,345 | |
| | | | | | | | |
Net asset value, offering and redemption price per GS4 share | | $ | 1.00 | | | $ | 13.35 | |
| | | | | | | | |
| | | | | | | | |
(1) Investments in securities of unaffiliated issuers, at cost | | $ | 1,338,480,770 | | | $ | 883,187,139 | |
Investmentsin repurchase agreements, at cost | | | 30,361,000 | | | | 39,100,000 | |
Investmentsin securities of affiliated issuers, at cost | | | — | | | | 35,793,992 | |
| | | | | | | | |
Total investments at cost | | $ | 1,368,841,770 | | | $ | 958,081,131 | |
| | | | | | | | |
(2) Includes securities loaned of: | | $ | — | | | $ | 122,959,189 | |
| | | | | | | | |
(3) Foreign currency at cost | | $ | — | | | $ | 1,233,714 | |
| | | | | | | | |
(4) Proceeds from securities sold short | | $ | — | | | $ | 3,091,420 | |
| | | | | | | | |
(5) TBA sale commitments at cost | | $ | — | | | $ | 17,806,133 | |
| | | | | | | | |
(6) Premiums received on options written | | $ | — | | | $ | 404,812 | |
| | | | | | | | |
| | | | |
| 154 | | See Notes to Financial Statements. | | |
| | | | | | | | | | |
Medium-Duration
Bond Fund | | | Extended-Duration
Bond Fund | | | Global
Bond Fund | |
| | |
| $ | 907,375,620 | | | $ | 287,775,121 | | | $ | 387,488,439 | |
| | 11,400,000 | | | | — | | | | — | |
| | 38,647,829 | | | | 10,096,703 | | | | 46,360,552 | |
| | | | | | | | | | |
| | 957,423,449 | | | | 297,871,824 | | | | 433,848,991 | |
| | 2,956,935 | | | | 11,417 | | | | 356 | |
| | 2,023,398 | | | | — | | | | 506,518 | |
| | 1,958,153 | | | | — | | | | 1,140,943 | |
| | 465,919 | | | | — | | | | — | |
| | |
| | 294 | | | | 64 | | | | 31,333 | |
| | 4,380,710 | | | | 3,237,014 | | | | 4,534,038 | |
| | 358,677 | | | | 159,892 | | | | 64,066 | |
| | 37,703,040 | | | | — | | | | 9,094,447 | |
| | 348 | | | | — | | | | — | |
| | 90,748 | | | | 16,978 | | | | 58,188 | |
| | 458,794 | | | | — | | | | — | |
| | 66,655 | | | | — | | | | 6,837 | |
| | 648,260 | | | | — | | | | 308,131 | |
| | 1,858,636 | | | | — | | | | — | |
| | 26,847 | | | | 20,291 | | | | 21,251 | |
| | | | | | | | | | |
| | 1,010,420,863 | | | | 301,317,480 | | | | 449,615,099 | |
| | | | | | | | | | |
| | |
| | 7,360,243 | | | | — | | | | — | |
| | 2,138,008 | | | | — | | | | — | |
| | 762,589 | | | | — | | | | — | |
| | 337,409 | | | | — | | | | — | |
| | 639,799 | | | | — | | | | 533,319 | |
| | 1,825,329 | | | | — | | | | — | |
| | 88,599,222 | | | | 30,220,442 | | | | 68,161,728 | |
| | 935,539 | | | | — | | | | 358 | |
| | 97,377,134 | | | | — | | | | 22,765,297 | |
| | 148,789 | | | | 103,989 | | | | 2,939 | |
| | — | | | | — | | | | — | |
| | 130,330 | | | | — | | | | — | |
| | — | | | | — | | | | — | |
| | 2,258 | | | | 662 | | | | 2,474 | |
| | |
| | 209,331 | | | | 93,960 | | | | 130,044 | |
| | |
| | 118,379 | | | | 44,461 | | | | 72,563 | |
| | |
| | 213,516 | | | | 72,585 | | | | 104,390 | |
| | | | | | | | | | |
| | 200,797,875 | | | | 30,536,099 | | | | 91,773,112 | |
| | | | | | | | | | |
| $ | 809,622,988 | | | $ | 270,781,381 | | | $ | 357,841,987 | |
| | | | | | | | | | |
| | |
| $ | 819,075,038 | | | $ | 258,423,083 | | | $ | 355,757,792 | |
| | 541,345 | | | | 154,263 | | | | (1,116,395 | ) |
| | (11,825,658 | ) | | | 336,707 | | | | (8,321,707 | ) |
| | 1,832,263 | | | | 11,867,328 | | | | 11,522,297 | |
| | | | | | | | | | |
| $ | 809,622,988 | | | $ | 270,781,381 | | | $ | 357,841,987 | |
| | | | | | | | | | |
| | |
| $ | 227,172,395 | | | $ | 51,959,363 | | | | N/A | |
| | | | | | | | | | |
| | 32,875,147 | | | | 10,865,195 | | | | N/A | |
| | | | | | | | | | |
| $ | 6.91 | | | $ | 4.78 | | | | N/A | |
| | | | | | | | | | |
| | |
| $ | 582,450,593 | | | $ | 218,822,018 | | | $ | 357,841,987 | |
| | | | | | | | | | |
| | 41,198,834 | | | | 13,347,396 | | | | 35,479,315 | |
| | | | | | | | | | |
| $ | 14.14 | | | $ | 16.39 | | | $ | 10.09 | |
| | | | | | | | | | |
| | |
| $ | 905,175,874 | | | $ | 275,906,402 | | | $ | 375,759,188 | |
| | 11,400,000 | | | | — | | | | — | |
| | 38,647,829 | | | | 10,096,703 | | | | 46,360,552 | |
| | | | | | | | | | |
| $ | 955,223,703 | | | $ | 286,003,105 | | | $ | 422,119,740 | |
| | | | | | | | | | |
| $ | 94,097,595 | | | $ | 29,495,862 | | | $ | 71,220,818 | |
| | | | | | | | | | |
| $ | 1,954,347 | | | $ | — | | | $ | 1,138,427 | |
| | | | | | | | | | |
| $ | 7,412,651 | | | $ | — | | | $ | — | |
| | | | | | | | | | |
| $ | 2,145,781 | | | $ | — | | | $ | — | |
| | | | | | | | | | |
| $ | 456,971 | | | $ | — | | | $ | — | |
| | | | | | | | | | |
| | | | |
| | See Notes to Financial Statements. | | 155 |
| | |
| STATEMENTS OF OPERATIONS | | For the Year Ended December 31, 2013 |
| | | | | | | | |
| | | Money
Market Fund | | | Low-Duration
Bond Fund | |
Investment Income | | | | | | | | |
Dividends | | $ | — | | | $ | — | |
Income distributions received from affiliated funds | | | — | | | | 3,520 | |
Interest | | | 2,923,502 | | | | 13,100,015 | |
Securities lending | | | 65,499 | | | | 278,726 | |
Less foreign taxes withheld | | | — | | | | — | |
| | | | | | | | |
Total Investment Income | | | 2,989,001 | | | | 13,382,261 | |
| | | | | | | | |
Expenses | | | | | | | | |
Investment advisory fees | | | 2,074,787 | | | | 2,777,457 | |
Transfer agent fees: | | | | | | | | |
GS2 shares | | | 3,925 | | | | 3,941 | |
GS4 shares | | | 36,585 | | | | 26,154 | |
Custodian fees | | | 28,052 | | | | 120,336 | |
Shareholder servicing fees: | | | | | | | | |
GS4 shares | | | 2,957,228 | | | | 1,656,955 | |
Accounting and administration fees | | | 281,226 | | | | 323,819 | |
Professional fees | | | 52,952 | | | | 95,065 | |
Blue sky fees: | | | | | | | | |
GS2 shares | | | 4,145 | | | | 4,148 | |
GS4 shares | | | 34,865 | | | | 21,753 | |
Shareholder reporting fees: | | | | | | | | |
GS2 shares | | | 667 | | | | 668 | |
GS4 shares | | | 37,478 | | | | 16,972 | |
Trustee expenses | | | 13,438 | | | | 8,402 | |
Line of credit facility fees | | | 12,857 | | | | 8,146 | |
Other expenses | | | 37,687 | | | | 55,497 | |
| | | | | | | | |
Total expenses | | | 5,575,892 | | | | 5,119,313 | |
Expenses waived/reimbursed net of amount recaptured(1) | | | (2,786,413 | ) | | | (685,289 | ) |
| | | | | | | | |
Net expenses | | | 2,789,479 | | | | 4,434,024 | |
| | | | | | | | |
| | |
Net Investment Income | | | 199,522 | | | | 8,948,237 | |
| | | | | | | | |
| | |
Realized and Unrealized Gain (Loss) | | | | | | | | |
Net realized gain (loss) from: | | | | | | | | |
Investment securities | | | 64,118 | | | | 483,240 | |
Investment securities sold short | | | — | | | | (39,491 | ) |
Futures transactions | | | — | | | | 1,242,454 | |
Swap agreements | | | — | | | | (566,541 | ) |
Option contracts written | | | — | | | | 639,967 | |
Option contracts purchased | | | — | | | | — | |
Foreign currency transactions | | | — | | | | (1,959,379 | ) |
| | | | | | | | |
| | |
Net realized gain (loss) | | | 64,118 | | | | (199,750 | ) |
| | | | | | | | |
| | |
Net change in unrealized appreciation (depreciation) on: | | | | | | | | |
Investment securities | | | — | | | | (9,846,722 | ) |
Investment securities sold short | | | — | | | | (8,236 | ) |
Futures | | | — | | | | 277,383 | |
Swap agreements | | | — | | | | (1,638,978 | ) |
Option contracts written | | | — | | | | (370,182 | ) |
Option contracts purchased | | | — | | | | 163,214 | |
Foreign currency translation | | | — | | | | 1,685,481 | |
| | | | | | | | |
| | |
Net change in unrealized appreciation (depreciation) | | | — | | | | (9,738,040 | ) |
| | | | | | | | |
Net Realized and Unrealized Gain | | | 64,118 | | | | (9,937,790 | ) |
| | | | | | | | |
Net Increase (Decrease) in Net Assets Resulting from Operations | | $ | 263,640 | | | $ | (989,553 | ) |
| | | | | | | | |
| (1) | See Note 3a and 3c in Notes to Financial Statements. |
| | | | |
| 156 | | See Notes to Financial Statements. | | |
| | | | | | | | | | |
Medium-Duration
Bond Fund | | | Extended-Duration
Bond Fund | | | Global Bond
Fund | |
| | | | | | | | | | |
| $ | 229,813 | | | $ | 25,352 | | | $ | 364,611 | |
| | 6,827 | | | | 1,003 | | | | 3,588 | |
| | 22,010,221 | | | | 18,541,509 | | | | 12,656,881 | |
| | 461,002 | | | | 198,954 | | | | 141,919 | |
| | — | | | | — | | | | (7,152 | ) |
| | | | | | | | | | |
| | 22,707,863 | | | | 18,766,818 | | | | 13,159,847 | |
| | | | | | | | | | |
| | | | | | | | | | |
| | 3,550,511 | | | | 1,731,135 | | | | 1,332,705 | |
| | | | | | | | | | |
| | 3,930 | | | | 3,798 | | | | — | |
| | 26,894 | | | | 26,215 | | | | 19,645 | |
| | 181,238 | | | | 25,817 | | | | 64,733 | |
| | | | | | | | | | |
| | 1,445,691 | | | | 710,370 | | | | 690,823 | |
| | 387,693 | | | | 113,969 | | | | 153,612 | |
| | 95,065 | | | | 71,834 | | | | 75,065 | |
| | | | | | | | | | |
| | 4,148 | | | | 4,148 | | | | — | |
| | 16,898 | | | | 17,217 | | | | 17,841 | |
| | | | | | | | | | |
| | 657 | | | | 402 | | | | — | |
| | 17,581 | | | | 15,782 | | | | 5,236 | |
| | 8,505 | | | | 3,725 | | | | 2,996 | |
| | 8,232 | | | | 5,179 | | | | 2,889 | |
| | 124,461 | | | | 16,682 | | | | 27,301 | |
| | | | | | | | | | |
| | 5,871,504 | | | | 2,746,273 | | | | 2,392,846 | |
| | (913,007 | ) | | | (152,852 | ) | | | (85,036 | ) |
| | | | | | | | | | |
| | 4,958,497 | | | | 2,593,421 | | | | 2,307,810 | |
| | | | | | | | | | |
| | |
| | 17,749,366 | | | | 16,173,397 | | | | 10,852,037 | |
| | | | | | | | | | |
| | | | | | | | | | |
| | | | | | | | | | |
| | | | | | | | | | |
| | (11,759,383 | ) | | | 12,593,030 | | | | 2,646,852 | |
| | 1,030,754 | | | | — | | | | — | |
| | 1,353,193 | | | | — | | | | 364,330 | |
| | (705,709 | ) | | | — | | | | — | |
| | 1,078,503 | | | | — | | | | 16,883 | |
| | (76,645 | ) | | | — | | | | (370,694 | ) |
| | (453,236 | ) | | | 943,668 | | | | (2,438,398 | ) |
| | | | | | | | | | |
| | |
| | (9,532,523 | ) | | | 13,536,698 | | | | 218,973 | |
| | | | | | | | | | |
| | | | | | | | | | |
| | | | | | | | | | |
| | (24,717,305 | ) | | | (55,242,377 | ) | | | (8,377,808 | ) |
| | 99,400 | | | | — | | | | — | |
| | (214,642 | ) | | | — | | | | (65,342 | ) |
| | (2,346,447 | ) | | | — | | | | — | |
| | (440,032 | ) | | | — | | | | — | |
| | 224,445 | | | | — | | | | (229,283 | ) |
| | 1,553,681 | | | | (7,531 | ) | | | 977,585 | |
| | | | | | | | | | |
| | |
| | (25,840,900 | ) | | | (55,249,908 | ) | | | (7,694,848 | ) |
| | | | | | | | | | |
| | (35,373,423 | ) | | | (41,713,210 | ) | | | (7,475,875 | ) |
| | | | | | | | | | |
| $ | (17,624,057 | ) | | $ | (25,539,813 | ) | | $ | 3,376,162 | |
| | | | | | | | | | |
| | | | |
| | See Notes to Financial Statements. | | 157 |
STATEMENTS OF CHANGES IN NET ASSETS
| | | | | | | | |
| | | Money Market Fund | |
| |
| | | For the Year Ended | |
| | |
| | | 12/31/13 | | | 12/31/12 | |
Operations: | | | | | | | | |
Net investment income | | $ | 199,522 | | | $ | 226,226 | |
Net realized gain (loss) on investment securities, foreign currency transactions and derivative transactions | | | 64,118 | | | | 43,215 | |
Net change in unrealized appreciation (depreciation) on investment securities, foreign currency translations and derivative transactions | | | — | | | | — | |
| | | | | | | | |
Net increase (decrease) in net assets resulting from operations | | | 263,640 | | | | 269,441 | |
| | | | | | | | |
Dividends and Distributions to Shareholders: | | | | | | | | |
Dividends from net investment income | | | | | | | | |
GS2 shares | | | (39,682 | ) | | | (107,325 | ) |
GS4 shares | | | (123,227 | ) | | | (118,901 | ) |
Distributions from net realized capital gains | | | | | | | | |
GS2 shares | | | (5,110 | ) | | | (2,502 | ) |
GS4 shares | | | (60,366 | ) | | | (28,176 | ) |
| | | | | | | | |
Total dividends and distributions | | | (228,385 | ) | | | (256,904 | ) |
| | | | | | | | |
Capital Share Transactions: | | | | | | | | |
Proceeds from shares sold | | | | | | | | |
GS2 shares | | | 105,460,546 | | | | 83,682,824 | |
GS4 shares | | | 4,335,936,657 | | | | 3,411,426,687 | |
Reinvestment of dividends and distributions | | | | | | | | |
GS2 shares | | | 38,908 | | | | 96,490 | |
GS4 shares | | | 105,203 | | | | 73,574 | |
| | | | | | | | |
Total proceeds from shares sold and reinvested | | | 4,441,541,314 | | | | 3,495,279,575 | |
| | | | | | | | |
Value of shares redeemed | | | | | | | | |
GS2 shares | | | (106,106,557 | ) | | | (93,414,476 | ) |
GS4 shares | | | (4,204,891,545 | ) | | | (3,441,385,826 | ) |
| | | | | | | | |
Total value of shares redeemed | | | (4,310,998,102 | ) | | | (3,534,800,302 | ) |
| | | | | | | | |
Net increase (decrease) from capital share transactions(1) | | | 130,543,212 | | | | (39,520,727 | ) |
| | | | | | | | |
Total increase (decrease) in net assets | | | 130,578,467 | | | | (39,508,190 | ) |
| | | | | | | | |
Net Assets: | | | | | | | | |
Beginning of Year | | | 1,238,419,522 | | | | 1,277,927,712 | |
| | | | | | | | |
End of Year* | | $ | 1,368,997,989 | | | $ | 1,238,419,522 | |
| | | | | | | | |
*Including undistributed (distributions in excess of) net investment income | | $ | 36,613 | | | $ | — | |
| | | | | | | | |
| (1) | See Note 6 in Notes to Financial Statements. |
| | | | |
| 158 | | See Notes to Financial Statements. | | |
| | | | | | | | | | | | | | |
Low-Duration
Bond Fund | | | Medium-Duration
Bond Fund | |
| |
| For the Year Ended | | | For the Year Ended | |
| | | |
| 12/31/13 | | | 12/31/12 | | | 12/31/13 | | | 12/31/12 | |
| | | | | | | | | | | | | | |
| $ | 8,948,237 | | | $ | 11,830,873 | | | $ | 17,749,366 | | | $ | 20,131,144 | |
| | | |
| | (199,750 | ) | | | 1,261,804 | | | | (9,532,523 | ) | | | 17,426,589 | |
| | | |
| | (9,738,040 | ) | | | 18,559,772 | | | | (25,840,900 | ) | | | 30,180,403 | |
| | | | | | | | | | | | | | |
| | (989,553 | ) | | | 31,652,449 | | | | (17,624,057 | ) | | | 67,738,136 | |
| | | | | | | | | | | | | | |
| | | | | | | | | | | | | | |
| | | | | | | | | | | | | | |
| | (2,638,146 | ) | | | (3,309,118 | ) | | | (8,960,565 | ) | | | (9,108,772 | ) |
| | (6,980,736 | ) | | | (9,695,948 | ) | | | (10,135,398 | ) | | | (11,859,266 | ) |
| | | | | | | | | | | | | | |
| | (130,184 | ) | | | (380,466 | ) | | | (238,953 | ) | | | (6,691,198 | ) |
| | (404,740 | ) | | | (1,245,870 | ) | | | (290,430 | ) | | | (8,571,353 | ) |
| | | | | | | | | | | | | | |
| | (10,153,806 | ) | | | (14,631,402 | ) | | | (19,625,346 | ) | | | (36,230,589 | ) |
| | | | | | | | | | | | | | |
| | | | | | | | | | | | | | |
| | | | | | | | | | | | | | |
| | 20,817,542 | | | | 15,089,463 | | | | 26,720,145 | | | | 25,136,437 | |
| | 96,538,640 | | | | 136,297,000 | | | | 73,101,056 | | | | 67,278,339 | |
| | | | | | | | | | | | | | |
| | 2,761,563 | | | | 3,678,833 | | | | 9,193,242 | | | | 15,787,476 | |
| | 7,383,801 | | | | 10,939,056 | | | | 10,422,967 | | | | 20,426,709 | |
| | | | | | | | | | | | | | |
| | 127,501,546 | | | | 166,004,352 | | | | 119,437,410 | | | | 128,628,961 | |
| | | | | | | | | | | | | | |
| | | | | | | | | | | | | | |
| | (19,428,445 | ) | | | (7,405,946 | ) | | | (46,258,722 | ) | | | (19,481,717 | ) |
| | (72,290,918 | ) | | | (106,169,179 | ) | | | (98,816,806 | ) | | | (132,385,936 | ) |
| | | | | | | | | | | | | | |
| | (91,719,363 | ) | | | (113,575,125 | ) | | | (145,075,528 | ) | | | (151,867,653 | ) |
| | | | | | | | | | | | | | |
| | 35,782,183 | | | | 52,429,227 | | | | (25,638,118 | ) | | | (23,238,692 | ) |
| | | | | | | | | | | | | | |
| | 24,638,824 | | | | 69,450,274 | | | | (62,887,521 | ) | | | 8,268,855 | |
| | | | | | | | | | | | | | |
| | | | | | | | | | | | | | |
| | 813,625,417 | | | | 744,175,143 | | | | 872,510,509 | | | | 864,241,654 | |
| | | | | | | | | | | | | | |
| $ | 838,264,241 | | | $ | 813,625,417 | | | $ | 809,622,988 | | | $ | 872,510,509 | |
| | | | | | | | | | | | | | |
| $ | (619,939 | ) | | $ | 281,687 | | | $ | 541,345 | | | $ | 785,897 | |
| | | | | | | | | | | | | | |
| | | | |
| | See Notes to Financial Statements. | | 159 |
STATEMENTS OF CHANGES IN NET ASSETS
| | | | | | | | |
| | | Extended-Duration
Bond Fund | |
| |
| | | For the Year Ended | |
| | |
| | | 12/31/13 | | | 12/31/12 | |
Operations: | | | | | | | | |
Net investment income | | $ | 16,173,397 | | | $ | 19,941,659 | |
Net realized gain on investment securities, foreign currency transactions and derivative transactions | | | 13,536,698 | | | | 15,624,979 | |
Net change in unrealized appreciation (depreciation) on investment securities, foreign currency translations and derivative transactions | | | (55,249,908 | ) | | | 26,234,587 | |
| | | | | | | | |
Net increase (decrease) in net assets resulting from operations | | | (25,539,813 | ) | | | 61,801,225 | |
| | | | | | | | |
Dividends and Distributions to Shareholders: | | | | | | | | |
Dividends from net investment income | | | | | | | | |
GS2 shares | | | (7,171,639 | ) | | | (7,919,753 | ) |
GS4 shares | | | (9,578,417 | ) | | | (12,163,609 | ) |
Distributions from net realized capital gains | | | | | | | | |
GS2 shares | | | (6,448,885 | ) | | | (5,298,065 | ) |
GS4 shares | | | (8,820,661 | ) | | | (8,532,365 | ) |
| | | | | | | | |
Total dividends and distributions | | | (32,019,602 | ) | | | (33,913,792 | ) |
| | | | | | | | |
Capital Share Transactions: | | | | | | | | |
Proceeds from shares sold | | | | | | | | |
GS2 shares | | | 8,686,398 | | | | 11,430,897 | |
GS4 shares | | | 32,327,945 | | | | 63,160,350 | |
Reinvestment of dividends and distributions | | | | | | | | |
GS2 shares | | | 13,606,468 | | | | 13,205,389 | |
GS4 shares | | | 18,389,399 | | | | 20,684,630 | |
| | | | | | | | |
Total proceeds from shares sold and reinvested | | | 73,010,210 | | | | 108,481,266 | |
| | | | | | | | |
Value of shares redeemed | | | | | | | | |
GS2 shares | | | (38,446,492 | ) | | | (11,242,800 | ) |
GS4 shares | | | (177,196,077 | ) | | | (59,622,352 | ) |
| | | | | | | | |
Total value of shares redeemed | | | (215,642,569 | ) | | | (70,865,152 | ) |
| | | | | | | | |
Net increase (decrease) from capital share transactions(1) | | | (142,632,359 | ) | | | 37,616,114 | |
| | | | | | | | |
Total increase (decrease) in net assets | | | (200,191,774 | ) | | | 65,503,547 | |
| | | | | | | | |
Net Assets: | | | | | | | | |
Beginning of Year | | | 470,973,155 | | | | 405,469,608 | |
| | | | | | | | |
End of Year* | | $ | 270,781,381 | | | $ | 470,973,155 | |
| | | | | | | | |
*Including undistributed (distributions in excess of) net investment income | | $ | 154,263 | | | $ | (661 | ) |
| | | | | | | | |
| (1) | See Note 6 in Notes to Financial Statements. |
| | | | |
| 160 | | See Notes to Financial Statements. | | |
| | | | | | |
Global
Bond Fund | |
|
| For the Year Ended | |
| |
| 12/31/13 | | | 12/31/12 | |
| | | | | | |
| $ | 10,852,037 | | | $ | 8,683,748 | |
| |
| | 218,973 | | | | 3,144,085 | |
| |
| | (7,694,848 | ) | | | 10,899,264 | |
| | | | | | |
| | 3,376,162 | | | | 22,727,097 | |
| | | | | | |
| | | | | | |
| | | | | | |
| | — | | | | — | |
| | (9,497,750 | ) | | | (10,523,011 | ) |
| | | | | | |
| | — | | | | — | |
| | — | | | | — | |
| | | | | | |
| | (9,497,750 | ) | | | (10,523,011 | ) |
| | | | | | |
| | | | | | |
| | | | | | |
| | — | | | | — | |
| | 140,576,281 | | | | 51,652,945 | |
| | | | | | |
| | — | | | | — | |
| | 9,497,746 | | | | 10,522,963 | |
| | | | | | |
| | 150,074,027 | | | | 62,175,908 | |
| | | | | | |
| | | | | | |
| | — | | | | — | |
| | (18,966,067 | ) | | | (11,691,609 | ) |
| | | | | | |
| | (18,966,067 | ) | | | (11,691,609 | ) |
| | | | | | |
| | 131,107,960 | | | | 50,484,299 | |
| | | | | | |
| | 124,986,372 | | | | 62,688,385 | |
| | | | | | |
| | | | | | |
| | 232,855,615 | | | | 170,167,230 | |
| | | | | | |
| $ | 357,841,987 | | | $ | 232,855,615 | |
| | | | | | |
| $ | (1,116,395 | ) | | $ | (192,456 | ) |
| | | | | | |
| | | | |
| | See Notes to Financial Statements. | | 161 |
FINANCIAL HIGHLIGHTS
| | | | | | | | | | | | | | | | | | | | | | | | | | | | | | | | | | | | | | | | | | | | | | | | |
| For a Share Outstanding For the Years Ending December 31, unless otherwise indicated | | | | | | Ratios to Average Net Assets | | | | |
| | | Net Asset
Value,
Beginning
of Year | | | Net
Investment
Income | | | Realized and
Unrealized
Gain
(Loss) on
Investments | | | Dividends
from Net
Investment
Income | | | Distribu- tions
from Net
Realized
Capital
Gains | | | Net
Asset
Value,
End of
Year | | | Total
Return | | | Net
Assets,
End of
Year (000) | | | Expenses,
Net(1) | | | Expenses,
Gross(2) | | | Invest- ment
Income,
Net(1) | | | Portfolio
Turnover
Rate | |
Money Market Fund | |
| | | | | | | | | | |
GS2 Class | | | | | | | | | | | | | | | | | | | | | | | | | | | | | | | | | | | | | | | | | |
| 2013(3) | | $ | 1.00 | | | $ | — | †# | | $ | — | † | | $ | — | † | | $ | — | † | | $ | 1.00 | | | | 0.04 | % | | $ | 106,060 | | | | 0.18 | % | | | 0.20 | % | | | 0.04 | % | | | N/A | |
| 2012 | | | 1.00 | | | | — | †# | | | — | † | | | — | † | | | — | † | | | 1.00 | | | | 0.10 | | | | 106,664 | | | | 0.18 | | | | 0.20 | | | | 0.10 | | | | N/A | |
| 2011 | | | 1.00 | | | | — | †# | | | — | † | | | — | † | | | — | † | | | 1.00 | | | | 0.10 | | | | 116,298 | | | | 0.18 | | | | 0.19 | | | | 0.09 | | | | N/A | |
| 2010 | | | 1.00 | | | | — | † | | | — | † | | | — | † | | | — | † | | | 1.00 | | | | 0.18 | | | | 119,311 | | | | 0.17 | | | | 0.18 | | | | 0.17 | | | | N/A | |
| 2009 | | | 1.00 | | | | — | † | | | — | † | | | — | † | | | — | † | | | 1.00 | | | | 0.47 | | | | 133,323 | | | | 0.23(4 | ) | | | 0.23(4 | ) | | | 0.49 | | | | N/A | |
GS4 Class | | | | | | | | | | | | | | | | | | | | | | | | | | | | | | | | | | | | | | | | | |
| 2013(3) | | $ | 1.00 | | | $ | — | †# | | $ | — | † | | $ | — | † | | $ | — | † | | $ | 1.00 | | | | 0.02 | % | | $ | 1,262,938 | | | | 0.21 | % | | | 0.44 | % | | | 0.01 | % | | | N/A | |
| 2012 | | | 1.00 | | | | — | †# | | | — | † | | | — | † | | | — | † | | | 1.00 | | | | 0.01 | | | | 1,131,756 | | | | 0.27 | | | | 0.44 | | | | 0.01 | | | | N/A | |
| 2011 | | | 1.00 | | | | — | †# | | | — | † | | | — | † | | | — | † | | | 1.00 | | | | 0.01 | | | | 1,161,630 | | | | 0.27 | | | | 0.42 | | | | 0.01 | | | | N/A | |
| 2010 | | | 1.00 | | | | — | † | | | — | † | | | — | † | | | — | † | | | 1.00 | | | | 0.02 | | | | 1,180,141 | | | | 0.33 | | | | 0.37 | | | | 0.01 | | | | N/A | |
| 2009 | | | 1.00 | | | | — | † | | | — | † | | | — | † | | | — | † | | | 1.00 | | | | 0.29 | | | | 1,064,934 | | | | 0.41(4 | ) | | | 0.43(4 | ) | | | 0.28 | | | | N/A | |
| | | | | | | | | | | | | | | | | | | | | | | | | | | | | | | | | | | | | | | | | | | | | | | | |
Low-Duration Bond Fund | |
| | | | | | | | | | |
GS2 Class | | | | | | | | | | | | | | | | | | | | | | | | | | | | | | | | | | | | | | | | | |
| 2013(5) | | $ | 8.71 | | | $ | 0.11 | # | | $ | (0.11 | )(6) | | $ | (0.16 | ) | | $ | (0.01 | ) | | $ | 8.54 | | | | 0.02 | % | | $ | 136,966 | | | | 0.36 | % | | | 0.42 | % | | | 1.26 | % | | | 202 | % |
| 2012 | | | 8.59 | | | | 0.15 | # | | | 0.22(6 | ) | | | (0.22 | ) | | | (0.03 | ) | | | 8.71 | | | | 4.35 | | | | 135,526 | | | | 0.36 | | | | 0.41 | | | | 1.68 | | | | 228 | |
| 2011 | | | 8.70 | | | | 0.16 | # | | | (0.01 | )(6) | | | (0.23 | ) | | | (0.03 | ) | | | 8.59 | | | | 1.77 | | | | 122,462 | | | | 0.36 | | | | 0.42 | | | | 1.84 | | | | 221 | |
| 2010 | | | 8.70 | | | | 0.20 | # | | | 0.17 | | | | (0.28 | ) | | | (0.09 | ) | | | 8.70 | | | | 4.35 | | | | 128,143 | | | | 0.36 | | | | 0.41 | | | | 2.27 | | | | 257 | |
| 2009 | | | 8.11 | | | | 0.29 | # | | | 0.69 | | | | (0.39 | ) | | | — | | | | 8.70 | | | | 12.29 | | | | 115,741 | | | | 0.36 | | | | 0.42 | | | | 3.47 | | | | 322 | |
GS4 Class | | | | | | | | | | | | | | | | | | | | | | | | | | | | | | | | | | | | | | | | | |
| 2013(5) | | $ | 13.52 | | | $ | 0.14 | # | | $ | (0.16 | )(6) | | $ | (0.14 | ) | | $ | (0.01 | ) | | $ | 13.35 | | | | (0.20 | )% | | $ | 701,299 | | | | 0.57 | % | | | 0.66 | % | | | 1.04 | % | | | 202 | % |
| 2012 | | | 13.20 | | | | 0.20 | # | | | 0.35(6 | ) | | | (0.20 | ) | | | (0.03 | ) | | | 13.52 | | | | 4.15 | | | | 678,099 | | | | 0.57 | | | | 0.65 | | | | 1.47 | | | | 228 | |
| 2011 | | | 13.23 | | | | 0.22 | # | | | (0.01 | )(6) | | | (0.21 | ) | | | (0.03 | ) | | | 13.20 | | | | 1.58 | | | | 621,713 | | | | 0.55 | | | | 0.65 | | | | 1.64 | | | | 221 | |
| 2010 | | | 13.04 | | | | 0.28 | # | | | 0.26 | | | | (0.26 | ) | | | (0.09 | ) | | | 13.23 | | | | 4.20 | | | | 580,452 | | | | 0.52 | | | | 0.61 | | | | 2.11 | | | | 257 | |
| 2009 | | | 11.99 | | | | 0.42 | # | | | 1.00 | | | | (0.37 | ) | | | — | | | | 13.04 | | | | 11.97 | | | | 569,316 | | | | 0.52 | | | | 0.62 | | | | 3.30 | | | | 322 | |
| | | | | | | | | | | | | | | | | | | | | | | | | | | | | | | | | | | | | | | | | | | | | | | | |
Medium-Duration Bond Fund | |
| | | | | | | | | | |
GS2 Class | | | | | | | | | | | | | | | | | | | | | | | | | | | | | | | | | | | | | | | | | |
| 2013(7) | | $ | 7.32 | | | $ | 0.16 | # | | $ | (0.29 | )(6) | | $ | (0.27 | ) | | $ | (0.01 | ) | | $ | 6.91 | | | | (1.90 | )% | | $ | 227,172 | | | | 0.48 | % | | | 0.52 | % | | | 2.21 | % | | | 409 | % |
| 2012 | | | 7.24 | | | | 0.17 | # | | | 0.39(6 | ) | | | (0.28 | ) | | | (0.20 | ) | | | 7.32 | | | | 7.93 | | | | 251,565 | | | | 0.48 | | | | 0.51 | | | | 2.32 | | | | 570 | |
| 2011 | | | 7.25 | | | | 0.20 | # | | | 0.27(6 | ) | | | (0.35 | ) | | | (0.13 | ) | | | 7.24 | | | | 6.56 | | | | 228,024 | | | | 0.48 | | | | 0.52 | | | | 2.76 | | | | 609 | |
| 2010 | | | 7.47 | | | | 0.25 | # | | | 0.40 | | | | (0.41 | ) | | | (0.46 | ) | | | 7.25 | | | | 8.86 | | | | 236,369 | | | | 0.48 | | | | 0.49 | | | | 3.21 | | | | 487 | |
| 2009 | | | 7.13 | | | | 0.31 | # | | | 0.85 | | | | (0.51 | ) | | | (0.31 | ) | | | 7.47 | | | | 17.07 | | | | 139,917 | | | | 0.48 | | | | 0.51 | | | | 4.17 | | | | 427 | |
GS4 Class | | | | | | | | | | | | | | | | | | | | | | | | | | | | | | | | | | | | | | | | | |
| 2013(7) | | $ | 14.68 | | | $ | 0.30 | # | | $ | (0.59 | )(6) | | $ | (0.24 | ) | | $ | (0.01 | ) | | $ | 14.14 | | | | (1.98 | )% | | $ | 582,451 | | | | 0.63 | % | | | 0.77 | % | | | 2.06 | % | | | 409 | % |
| 2012 | | | 14.07 | | | | 0.32 | # | | | 0.75(6 | ) | | | (0.26 | ) | | | (0.20 | ) | | | 14.68 | | | | 7.68 | | | | 620,945 | | | | 0.63 | | | | 0.75 | | | | 2.18 | | | | 570 | |
| 2011 | | | 13.65 | | | | 0.37 | # | | | 0.51(6 | ) | | | (0.33 | ) | | | (0.13 | ) | | | 14.07 | | | | 6.49 | | | | 636,218 | | | | 0.61 | | | | 0.75 | | | | 2.62 | | | | 609 | |
| 2010 | | | 13.36 | | | | 0.43 | # | | | 0.71 | | | | (0.39 | ) | | | (0.46 | ) | | | 13.65 | | | | 8.65 | | | | 614,082 | | | | 0.58 | | | | 0.68 | | | | 3.11 | | | | 487 | |
| 2009 | | | 12.16 | | | | 0.53 | # | | | 1.48 | | | | (0.50 | ) | | | (0.31 | ) | | | 13.36 | | | | 16.97 | | | | 868,800 | | | | 0.58 | | | | 0.70 | | | | 4.08 | | | | 427 | |
| † | Amount represents less than $0.005 per share. |
| # | Calculated using the average shares outstanding method. |
| (1) | The ratio includes expenses waived/reimbursed net of amount recaptured and fees paid indirectly, where applicable; if expenses waived/reimbursed net of amount recaptured and fees paid indirectly were excluded, the ratio would have been higher (lower) than the ratio shown. |
| (2) | The ratio excludes expenses waived/reimbursed net of amount recaptured and fees paid indirectly, where applicable; if expenses waived/reimbursed net of amount recaptured and fees paid indirectly were included, the ratio would have been lower than the ratio shown. |
| (3) | An out of period adjustment to Investment Income had no impact on Net Investment Income per Share, Total Return or the Ratio of Net Investment Income to Average Net Assets for GS2 Class and GS4 Class. See Note 10 in Notes to Financial Statements. |
| (4) | The Money Market Fund participated in the U.S. Department of the Treasury (the “Treasury”) Temporary Guarantee Program for Money Market Funds (the “Program”). The Fund bore the expense of its participation in the Program without regard to any expense limitation in effect. The Program expired on September 18, 2009. |
| (5) | An out of period adjustment to Investment Income had no impact on Net Investment Income per Share or Total Return; however, the Ratio of Net Investment Income to Average Net Assets increased by 0.02% and 0.02% for GS2 Class and GS4 Class, respectively. See Note 10 in Notes to Financial Statements. |
| (6) | Amount includes Capital Gains distributions received by the Fund from the GuideStone Money Market Fund. The amount of these distributions represents less than $0.005 per share. |
| (7) | An out of period adjustment to Investment Income increased Net Investment Income per Share by $0.00 and $0.01, Total Return by 0.00% and 0.07%, and the Ratio of Net Investment Income to Average Net Assets by 0.04% and 0.04% for GS2 Class and GS4 Class, respectively. See Note 10 in Notes to Financial Statements. |
| | | | |
| 162 | | See Notes to Financial Statements. | | |
| | | | | | | | | | | | | | | | | | | | | | | | | | | | | | | | | | | | | | | | | | | | | | | | |
| For a Share Outstanding For the Years Ending December 31, unless otherwise indicated | | | | | | Ratios to Average Net Assets | | | | |
| | | Net Asset
Value,
Beginning
of Period | | | Net
Investment
Income | | | Realized and
Unrealized
Gain
(Loss) on
Investments | | | Dividends
from Net
Investment
Income | | | Distribu-
tions
from Net
Realized
Capital
Gains | | | Net
Asset
Value,
End of
Period | | | Total
Return | | | Net Assets,
End of
Period
(000) | | | Expenses,
Net(1) | | | Expenses,
Gross(2) | | | Invest- ment
Income,
Net(1) | | | Portfolio
Turnover
Rate | |
Extended-Duration Bond Fund | |
| | | | | | | | | |
GS2 Class | | | | | | | | | | | | | | | | | | | | | | | | | | | | | | | | | | | | | |
| 2013(3) | | $ | 6.36 | | | $ | 0.27 | # | | $ | (0.58 | )(4) | | $ | (0.63 | ) | | $ | (0.64 | ) | | $ | 4.78 | | | | (5.10 | )% | | $ | 51,959 | | | | 0.55 | % | | | 0.55 | % | | | 4.61 | % | | | 37 | % |
| 2012 | | | 6.48 | | | | 0.31 | # | | | 0.64(4 | ) | | | (0.65 | ) | | | (0.42 | ) | | | 6.36 | | | | 15.41 | | | | 86,268 | | | | 0.52 | | | | 0.53 | | | | 4.68 | | | | 27 | |
| 2011 | | | 6.93 | | | | 0.37 | # | | | 0.49(4 | ) | | | (0.74 | ) | | | (0.57 | ) | | | 6.48 | | | | 13.33 | | | | 74,591 | | | | 0.54 | | | | 0.55 | | | | 5.32 | | | | 41 | |
| 2010 | | | 7.01 | | | | 0.40 | # | | | 0.43 | | | | (0.80 | ) | | | (0.11 | ) | | | 6.93 | | | | 12.25 | | | | 72,741 | | | | 0.53 | | | | 0.53 | | | | 5.60 | | | | 39 | |
| 2009 | | | 6.31 | | | | 0.44 | # | | | 1.04 | | | | (0.76 | ) | | | (0.02 | ) | | | 7.01 | | | | 25.27 | | | | 67,699 | | | | 0.53 | | | | 0.53 | | | | 6.78 | | | | 41 | |
GS4 Class | | | | | | | | | | | | | | | | | | | | | | | | | | | | | | | | | | | | | | | | | |
| 2013(3) | | $ | 18.58 | | | $ | 0.78 | # | | $ | (1.74 | )(4) | | $ | (0.59 | ) | | $ | (0.64 | ) | | $ | 16.39 | | | | (5.24 | )% | | $ | 218,822 | | | | 0.75 | % | | | 0.80 | % | | | 4.40 | % | | | 37 | % |
| 2012 | | | 17.08 | | | | 0.81 | # | | | 1.72(4 | ) | | | (0.61 | ) | | | (0.42 | ) | | | 18.58 | | | | 15.06 | | | | 384,705 | | | | 0.75 | | | | 0.78 | | | | 4.45 | | | | 27 | |
| 2011 | | | 16.28 | | | | 0.86 | # | | | 1.22(4 | ) | | | (0.71 | ) | | | (0.57 | ) | | | 17.08 | | | | 13.14 | | | | 330,879 | | | | 0.73 | | | | 0.78 | | | | 5.13 | | | | 41 | |
| 2010 | | | 15.34 | | | | 0.88 | # | | | 0.94 | | | | (0.77 | ) | | | (0.11 | ) | | | 16.28 | | | | 12.05 | | | | 337,760 | | | | 0.69 | | | | 0.72 | | | | 5.43 | | | | 39 | |
| 2009 | | | 12.97 | | | | 0.91 | # | | | 2.22 | | | | (0.74 | ) | | | (0.02 | ) | | | 15.34 | | | | 24.97 | | | | 392,962 | | | | 0.69 | | | | 0.73 | | | | 6.60 | | | | 41 | |
| | | | | | | | | | | | | | | | | | | | | | | | | | | | | | | | | | | | | | | | | | | | | | | | |
Global Bond Fund | |
| | | | | | | | | | |
GS4 Class | | | | | | | | | | | | | | | | | | | | | | | | | | | | | | | | | | | | | | | | | |
| 2013(5) | | $ | 10.38 | | | $ | 0.39 | # | | $ | (0.36 | )(4) | | $ | (0.32 | ) | | $ | — | | | $ | 10.09 | | | | 0.30 | % | | $ | 357,842 | | | | 0.80 | % | | | 0.83 | % | | | 3.77 | % | | | 101 | % |
| 2012 | | | 9.73 | | | | 0.45 | # | | | 0.74(4 | ) | | | (0.54 | ) | | | — | | | | 10.38 | | | | 12.52 | | | | 232,856 | | | | 0.83 | | | | 0.86 | | | | 4.41 | | | | 64 | |
| 2011 | | | 9.83 | | | | 0.51 | # | | | (0.09 | )(4) | | | (0.52 | ) | | | — | | | | 9.73 | | | | 4.35 | | | | 170,167 | | | | 0.86 | | | | 0.88 | | | | 5.09 | | | | 68 | |
| 2010 | | | 9.36 | | | | 0.52 | # | | | 0.51 | | | | (0.56 | ) | | | — | | | | 9.83 | | | | 11.29 | | | | 161,070 | | | | 0.79 | | | | 0.81 | | | | 5.40 | | | | 40 | |
| 2009 | | | 7.34 | | | | 0.56 | # | | | 2.07 | | | | (0.61 | ) | | | — | | | | 9.36 | | | | 37.35 | | | | 221,555 | | | | 0.79 | | | | 0.81 | | | | 6.81 | | | | 96 | |
| # | Calculated using the average shares outstanding method. |
| (1) | The ratio includes expenses waived/reimbursed net of amount recaptured and fees paid indirectly, where applicable; if expenses waived/reimbursed net of amount recaptured and fees paid indirectly were excluded, the ratio would have been higher (lower) than the ratio shown. |
| (2) | The ratio excludes expenses waived/reimbursed net of amount recaptured and fees paid indirectly, where applicable; if expenses waived/reimbursed net of amount recaptured and fees paid indirectly were included, the ratio would have been lower than the ratio shown. |
| (3) | An out of period adjustment to Investment Income increased Net Investment Income per Share by $0.00 and $0.01, Total Return by 0.00% and 0.05%, and the Ratio of Net Investment Income to Average Net Assets by 0.04% and 0.04% for GS2 Class and GS4 Class, respectively. See Note 10 in Notes to Financial Statements. |
| (4) | Amount includes Capital Gains distributions received by the Fund from the GuideStone Money Market Fund. The amount of these distributions represents less than $0.005 per share. |
| (5) | An out of period adjustment to Investment Income increased Net Investment Income per Share by $0.01, Total Return by 0.10%, and the Ratio of Net Investment Income to Average Net Assets by 0.02%. See Note 10 in Notes to Financial Statements. |
| | | | |
| | See Notes to Financial Statements. | | 163 |
EQUITY SELECT FUNDS (Unaudited)
Equity markets continued to advance as investors responded favorably to generally improving economic conditions and became comfortable with QE tapering which commences in early 2014. Towards the end of the year, a federal budget deal was reached making a repeat of the extended government shutdown unlikely in future periods. In the U.S., stocks surged to new all-time highs as the S&P 500® Index posted a stellar fourth quarter return of 10.51%, bringing the return to 32.39% for the full year of 2013, its strongest annual gain since 1997. The broader U.S. equity market, as measured by the Russell 3000® Index, posted similar returns of 10.10% for the quarter and 33.55% for calendar year 2013.
From a sector perspective, performance was unanimously in positive territory as all sectors within the Russell 3000® Index experienced double-digit gains for the year. The consumer discretionary, healthcare and producer durables sectors were the best performers and advanced over 40%, while the utilities and materials & processing sectors lagged the overall market for the one-year period.
Companies with high beta and earnings growth characteristics generally outperformed during the year. In terms of equity market capitalization, small-cap companies outperformed their large-cap counterparts as the Russell 2000® Index posted a one-year return of 38.82%, while the Russell 1000® Index advanced 33.11%. Style differentiation was evident as growth-oriented stocks outperformed value-oriented stocks across all market capitalization segments for the year. In the large capitalization segment, the Russell 1000® Growth Index outpaced the Russell 1000® Value Index, posting one-year returns of 33.48% and 32.53%, respectively. In the small capitalization segment, the Russell 2000® Growth Index outperformed the Russell 2000® Value Index by a wider margin, posting one-year returns of 43.30% and 34.52%, respectively.
Developed non-U.S. markets also experienced strong gains as the MSCI EAFE Index (Net), a measure of international developed country returns, posted a one-year return of 22.78%. All regions ended the period in positive territory as Japan and Europe advanced the most as a result of the region’s improved outlook. From a sector perspective, all groups generated positive results during the period. The telecommunications and consumer discretionary sectors were the best performers, while the materials and energy sectors were the worst performers and lagged the overall market during the one-year period.
Emerging markets significantly underperformed developed markets during the year as the MSCI Emerging Markets Index (Net) posted a return of -2.60%. The worst performing markets were primarily in the Latin American region, while Europe was the only positive performing region for the year. From a sector perspective, seven of the ten groups posted negative returns for calendar year 2013. The materials and energy sectors were the worst performers and experienced double-digit declines, while the technology, healthcare and consumer discretionary sectors were the only positive performing sectors for the one-year period.
164
Defensive Market Strategies Fund (Unaudited)
The Defensive Market Strategies Fund combines multiple strategies that in aggregate seek to provide long-term capital appreciation with reduced volatility compared to the equity markets.
The Fund achieved its investment objective during 2013, during a banner year for stocks that saw U.S. equity markets end the year at all-time highs. The Fund’s benchmark index, the S&P 500® Index, posted a return of 32.39% for the year compared to the Fund’s 18.22% return net of fees. The lower capital appreciation of the Fund, relative to that of the S&P 500® Index, was mostly a reflection of the materially lower market sensitivity and volatility of the Fund compared to the S&P 500® Index.
The Fund participated in equity gains during the year, and helped provide protection during negative months. The S&P 500® index gained in all but two months of the year, and the Fund outperformed the S&P 500® Index during its down months in June and August. As anticipated for a lower risk strategy, the Fund underperformed the S&P 500® Index most in very strong up markets, and the S&P 500® Index gained over 3% for 6 out of 12 months last year.
All of the underlying investment strategies had positive investment returns for the year. The lowest performing strategy was equity long/short, whose conservative positioning, and low net exposure level, led to only single digit returns for the year. The strategic exposure to convertible bonds within the Fund delivered double digit returns, as prices benefited from increasing exposure to equity price rallies through the optionality to stocks embedded in the bonds. However, convertible bonds failed to keep up with the strong equity market rally. Long-only equities within the portfolio also trailed the S&P 500® Index, but delivered the strongest performance of all of the underlying strategies.
The Fund underperformed the S&P 500® Index for the year, which should generally characterize performance of the portfolio in very strong up years for equities like the one experienced in 2013. Fund performance is also compared against the Fund’s reference benchmark, 50% S&P 500® Index / 50% Citigroup 3 Month T-Bill, which more accurately reflects the Fund’s risk level and equity market beta. Versus this benchmark index, the Fund delivered excess returns (18.22% versus 15.28%) for the one year period ending December 31, 2013.
In terms of the underlying dynamics of equity market performance, companies with high beta and earnings growth characteristics generally outperformed during the year. This factor contributed negatively to the relative performance of the Fund versus the S&P 500® Index, which generally emphasized quality and stability themes for most of its long-only equity exposure. From a sector perspective, overweight positioning in more defensive sectors, such as utilities, detracted from performance. In addition, security selection that emphasized quality in the more cyclical sectors, such as healthcare, also detracted.
Some underlying strategies may utilize derivative instruments within the Fund. During 2013, equity options were used in the Fund in order to hedge (reduce) exposure. The use of options for hedging equity holdings detracted from performance during 2013.
This Fund may be suitable for investors who have a medium - to long-term investment horizon, possess a moderate tolerance for risk and seek to participate in the return potential of stocks at a slightly lower risk level than an all stock portfolio. Convertible securities valuations generally are more closely aligned with a company’s bonds than common stock. This Fund is subject to interest rate risk. Meaning, when interest rates rise, the value of the existing bonds decrease and vice versa. Foreign securities may be subject to greater risk than domestic securities due to currency volatility, reduced market liquidity and political and economic instability. To the extent that the investment adviser misjudges current market conditions, the Fund’s volatility may be amplified by its use of short sales and derivatives and by its ability to select sub-advisers to allocate assets. Short sales by a fund theoretically involve unlimited loss potential since the market price of securities sold short may continuously increase. Leverage may increase the risk of loss and cause fluctuations in the market value of the Fund’s portfolio to have disproportionately large effects or cause the net asset value of the Fund to generally decline faster than it would otherwise.
165
Defensive Market Strategies Fund (Unaudited)
Please see page xx for information regarding specific portfolio allocations. Portfolio holdings are subject to change and risk at any time.
| | | | |
| | | % | |
Money Market Funds | | | 30.7 | |
Corporate Bonds | | | 22.8 | |
Healthcare | | | 10.1 | |
Financial Services | | | 10.0 | |
Consumer Discretionary | | | 6.9 | |
Utilities | | | 6.9 | |
Producer Durables | | | 6.0 | |
Technology | | | 5.8 | |
Preferred Stocks | | | 5.6 | |
Consumer Staples | | | 5.5 | |
Foreign Common Stocks | | | 4.7 | |
Energy | | | 4.4 | |
Foreign Bonds | | | 0.9 | |
Materials & Processing | | | 0.8 | |
Synthetic Convertible Instruments | | | 0.4 | |
Master Limited Partnerships | | | 0.3 | |
Purchased Options | | | — | ** |
Foreign Preferred Stocks Sold Short | | | — | ** |
Written Options | | | — | ** |
Foreign Common Stocks Sold Short | | | (1.3 | ) |
Exchange Traded Funds Sold Short | | | (2.3 | ) |
Common Stocks Sold Short | | | (6.1 | ) |
| | | | |
| | | 112.1 | |
| | | | |
| ** | Rounds to less than 0.005%. |
166
Defensive Market Strategies Fund (Unaudited)
| | | | | | | | |
| Average Annual Total Returns as of 12/31/13 |
| | | GS2 Class* | | GS4 Class* | | Benchmark** | | Benchmark*** |
One Year | | 18.47% | | 18.22% | | 15.28% | | 32.39% |
Since Inception | | 12.73% | | 12.43% | | 10.82% | | 22.20% |
Inception Date | | 09/01/11 | | 09/01/11 | | | | |
Total Fund Operating Expenses (May 1, 2013 Prospectus, as amended on October 31, 2013)(1) | | 1.13% | | 1.37% | | | | |
(1) Current information regarding the Fund’s Operating Expenses can be found in the Financial Highlights.
The performance data quoted represents past performance and does not guarantee future results. Current performance may be lower or higher. Performance data current to the most recent month-end may be obtained at www.GuideStoneFunds.org. The investment return and principal value of an investment will fluctuate so that shares, when redeemed, may be worth more or less than their original cost.
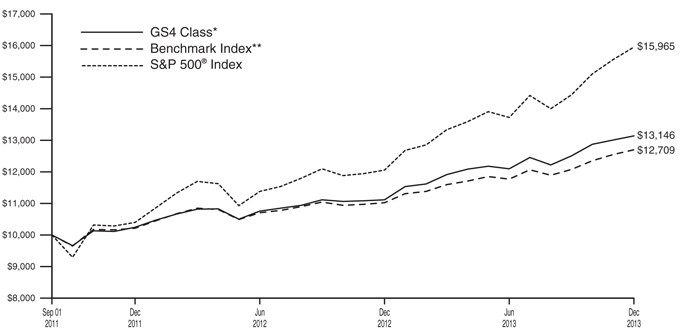
The graph compares the results of a hypothetical $10,000 investment in the GS4 Class of the Fund since September 1, 2011 (commencement of operations), with all dividends and capital gains reinvested, with the weighted composite index.
*These returns reflect expense waivers by the Fund’s investment adviser. Without these waivers, returns would have been lower. Returns shown do not reflect the deduction of taxes that a shareholder would pay on Fund distributions or the redemption of Fund shares.
**Represents a weighted composite benchmark index as a reference benchmark consisting of 50% S&P 500® Index and 50% Citigroup 3-Month Treasury Bill Index.
***The Fund’s benchmark was changed from the S&P 500® Index due to a change in the Fund’s investment strategy. Unlike a mutual fund, the performance of an index assumes no taxes, transaction costs, management fees or other expenses.
167
| | |
DEFENSIVE MARKET STRATEGIES FUND SCHEDULE OF INVESTMENTS | | December 31, 2013 |
| | | | | | | | | | |
| | | Shares | | | Value | |
COMMON STOCKS — 56.4% | |
Consumer Discretionary — 6.9% | |
Advance Auto Parts, Inc. | | | 1,000 | | | | | $ | 110,680 | |
Amazon.com, Inc.* | | | 4,100 | | | | | | 1,635,039 | |
American Axle & Manufacturing Holdings, Inc.*‡‡ | | | 9,450 | | | | | | 193,252 | |
Apollo Group, Inc. Class AD* | | | 4,000 | | | | | | 109,280 | |
Ascena Retail Group, Inc.D* | | | 9,510 | | | | | | 201,232 | |
AutoZone, Inc.D* | | | 1,900 | | | | | | 908,086 | |
Bed Bath & Beyond, Inc.* | | | 5,200 | | | | | | 417,560 | |
Big Lots, Inc.D* | | | 4,600 | | | | | | 148,534 | |
Bloomin’ Brands, Inc.D*‡‡ | | | 9,010 | | | | | | 216,330 | |
Buckle, Inc. (The)D | | | 2,100 | | | | | | 110,376 | |
Burlington Stores, Inc.*‡‡ | | | 11,590 | | | | | | 370,880 | |
Chipotle Mexican Grill, Inc.* | | | 1,000 | | | | | | 532,780 | |
Costco Wholesale Corporation | | | 12,800 | | | | | | 1,523,328 | |
Cracker Barrel Old Country Store, Inc.‡‡ | | | 4,460 | | | | | | 490,912 | |
Dollar General Corporation*‡‡ | | | 7,860 | | | | | | 474,115 | |
Dollar Tree, Inc.* | | | 9,500 | | | | | | 535,990 | |
Estee Lauder Cos., Inc. (The) Class A | | | 2,700 | | | | | | 203,364 | |
Family Dollar Stores, Inc.D | | | 6,000 | | | | | | 389,820 | |
Fifth & Pacific Cos, Inc.*‡‡ | | | 10,150 | | | | | | 325,511 | |
Fortune Brands Home & Security, Inc.‡‡ | | | 10,030 | | | | | | 458,371 | |
General Motors Co.D*‡‡ | | | 22,150 | | | | | | 905,270 | |
Genuine Parts Co.D | | | 1,000 | | | | | | 83,190 | |
Harman International Industries, Inc.‡‡ | | | 3,920 | | | | | | 320,852 | |
Hasbro, Inc.D | | | 7,500 | | | | | | 412,575 | |
Hertz Global Holdings, Inc.* | | | 12,270 | | | | | | 351,167 | |
Hilton Worldwide Holdings, Inc.*‡‡ | | | 40,130 | | | | | | 892,893 | |
Home Depot, Inc. (The)‡‡ | | | 18,730 | | | | | | 1,542,228 | |
HomeAway, Inc.D*‡‡ | | | 18,720 | | | | | | 765,274 | |
Jarden Corporation*‡‡ | | | 8,220 | | | | | | 504,297 | |
Kohl’s CorporationD‡‡ | | | 7,300 | | | | | | 414,275 | |
Lennar Corporation Class AD‡‡ | | | 16,470 | | | | | | 651,553 | |
LifeLock, Inc.D*‡‡ | | | 16,700 | | | | | | 274,047 | |
LIN Media LLC Class A*‡‡ | | | 13,180 | | | | | | 378,398 | |
Lithia Motors, Inc. Class A‡‡ | | | 7,300 | | | | | | 506,766 | |
Lowe’s Cos., Inc. | | | 2,300 | | | | | | 113,965 | |
Macy’s, Inc.D | | | 10,130 | | | | | | 540,942 | |
McDonald’s Corporation | | | 13,900 | | | | | | 1,348,717 | |
NIKE, Inc. Class B | | | 1,600 | | | | | | 125,824 | |
O’Reilly Automotive, Inc.* | | | 3,200 | | | | | | 411,872 | |
Panera Bread Co. Class A* | | | 2,900 | | | | | | 512,401 | |
PetSmart, Inc.D | | | 11,400 | | | | | | 829,350 | |
priceline.com, Inc.* | | | 700 | | | | | | 813,680 | |
Red Robin Gourmet Burgers, Inc.*‡‡ | | | 6,080 | | | | | | 447,123 | |
Ross Stores, Inc. | | | 1,900 | | | | | | 142,367 | |
Scripps Networks | | | | | | | | | | |
Interactive, Inc. Class A | | | 900 | | | | | | 77,769 | |
Shutterfly, Inc.*‡‡ | | | 3,250 | | | | | | 165,522 | |
Starbucks Corporation | | | 4,900 | | | | | | 384,111 | |
Starwood Hotels & Resorts Worldwide, Inc.‡‡ | | | 6,510 | | | | | | 517,220 | |
Target Corporation | | | 14,700 | | | | | | 930,069 | |
Tenneco, Inc.*‡‡ | | | 5,470 | | | | | | 309,438 | |
Tiffany & Co.‡‡ | | | 6,830 | | | | | | 633,687 | |
Time Warner, Inc. | | | 1,300 | | | | | | 90,636 | |
TJX Cos., Inc. | | | 10,100 | | | | | | 643,673 | |
Tractor Supply Co. | | | 6,800 | | | | | | 527,544 | |
| | | | | | | | | | |
| | | Shares | | | Value | |
Tupperware Brands CorporationD | | | 1,700 | | | | | $ | 160,701 | |
Urban Outfitters, Inc.*‡‡ | | | 8,790 | | | | | | 326,109 | |
Vail Resorts, Inc.‡‡ | | | 4,790 | | | | | | 360,352 | |
Vitamin Shoppe, Inc.*‡‡ | | | 18,650 | | | | | | 969,987 | |
Wal-Mart Stores, Inc. | | | 38,600 | | | | | | 3,037,434 | |
Walt Disney Co. (The)‡‡ | | | 12,730 | | | | | | 972,572 | |
Yum! Brands, Inc.‡‡ | | | 11,270 | | | | | | 852,125 | |
| | | | | | | | | | |
| | | | | | | | | 33,603,415 | |
| | | | | | | | | | |
Consumer Staples — 5.5% | |
Archer-Daniels-Midland Co. | | | 2,300 | | | | | | 99,820 | |
Campbell Soup Co.D | | | 5,700 | | | | | | 246,696 | |
Church & Dwight Co., Inc. | | | 17,600 | | | | | | 1,166,528 | |
Clorox Co. (The)D | | | 6,900 | | | | | | 640,044 | |
Coca-Cola Co. (The)D | | | 19,000 | | | | | | 784,890 | |
Coca-Cola Enterprises, Inc. | | | 9,090 | | | | | | 401,142 | |
Colgate-Palmolive Co.‡‡ | | | 31,540 | | | | | | 2,056,723 | |
CVS Caremark Corporation | | | 6,700 | | | | | | 479,519 | |
Dr. Pepper Snapple Group, Inc. | | | 16,100 | | | | | | 784,392 | |
General Mills, Inc. | | | 12,300 | | | | | | 613,893 | |
Hershey Co. (The)‡‡ | | | 14,820 | | | | | | 1,440,948 | |
Hillshire Brands Co. | | | 46,400 | | | | | | 1,551,616 | |
Hormel Foods CorporationD | | | 10,200 | | | | | | 460,734 | |
Kellogg Co. | | | 10,000 | | | | | | 610,700 | |
Kimberly-Clark Corporation | | | 14,200 | | | | | | 1,483,332 | |
Kroger Co. (The) | | | 10,700 | | | | | | 422,971 | |
McCormick & Co., Inc. (Non-Voting Shares)D | | | 12,500 | | | | | | 861,500 | |
Monster Beverage Corporation*‡‡ | | | 14,400 | | | | | | 975,888 | |
PepsiCo, Inc. | | | 49,704 | | | | | | 4,122,450 | |
Procter & Gamble Co. (The) | | | 51,000 | | | | | | 4,151,910 | |
Rite Aid Corporation* | | | 20,950 | | | | | | 106,007 | |
Safeway, Inc.‡‡ | | | 11,610 | | | | | | 378,138 | |
Sysco CorporationD | | | 35,300 | | | | | | 1,274,330 | |
Walgreen Co. | | | 14,800 | | | | | | 850,112 | |
Whole Foods Market, Inc. | | | 10,500 | | | | | | 607,215 | |
| | | | | | | | | | |
| | | | | | | | | 26,571,498 | |
| | | | | | | | | | |
Energy — 4.4% | |
Bill Barrett Corporation* | | | 16,920 | | | | | | 453,118 | |
Cabot Oil & Gas Corporation‡‡ | | | 7,450 | | | | | | 288,762 | |
CARBO Ceramics, Inc. | | | 1,700 | | | | | | 198,101 | |
Chevron Corporation | | | 34,100 | | | | | | 4,259,431 | |
Cimarex Energy Co. | | | 4,560 | | | | | | 478,390 | |
Cobalt International Energy, Inc.*‡‡ | | | 28,790 | | | | | | 473,596 | |
Concho Resources, Inc.*‡‡ | | | 2,150 | | | | | | 232,200 | |
Dril-Quip, Inc.* | | | 1,760 | | | | | | 193,477 | |
EOG Resources, Inc.‡‡ | | | 5,880 | | | | | | 986,899 | |
Exxon Mobil CorporationD | | | 62,900 | | | | | | 6,365,480 | |
Gulfport Energy Corporation*‡‡ | | | 9,840 | | | | | | 621,396 | |
Halliburton Co.‡‡ | | | 15,690 | | | | | | 796,267 | |
Occidental Petroleum Corporation | | | 50,100 | | | | | | 4,764,510 | |
Penn Virginia CorporationD* | | | 41,750 | | | | | | 393,702 | |
SemGroup Corporation Class A‡‡ | | | 5,310 | | | | | | 346,371 | |
Spectra Energy Corporation | | | 7,900 | | | | | | 281,398 | |
SunPower Corporation*‡‡ | | | 10,480 | | | | | | 312,409 | |
| | | | | | | | | | |
| | | | | | | | | 21,445,507 | |
| | | | | | | | | | |
| | | | |
| 168 | | See Notes to Financial Statements. | | |
| | | | | | | | | | |
| | | Shares | | | Value | |
Financial Services — 10.0% | |
Affiliated Managers Group, Inc.*‡‡ | | | 2,710 | | | | | $ | 587,745 | |
Alliance Data Systems Corporation*‡‡ | | | 1,500 | | | | | | 394,395 | |
Allstate Corporation (The) | | | 6,100 | | | | | | 332,694 | |
American Tower Corporation REIT | | | 300 | | | | | | 23,946 | |
Annaly Capital Management, Inc. REITD | | | 117,600 | | | | | | 1,172,472 | |
Bank of Hawaii Corporation | | | 13,300 | | | | | | 786,562 | |
Bank of the Ozarks, Inc.‡‡ | | | 6,440 | | | | | | 364,440 | |
Brixmor Property Group, Inc.‡‡ | | | 12,050 | | | | | | 244,976 | |
Bryn Mawr Bank Corporation‡‡ | | | 9,520 | | | | | | 287,313 | |
Capitol Federal Financial, Inc. | | | 110,300 | | | | | | 1,335,733 | |
Cardtronics, Inc.*‡‡ | | | 5,610 | | | | | | 243,754 | |
Chubb Corporation (The)D | | | 32,700 | | | | | | 3,159,801 | |
City National Corporation | | | 4,400 | | | | | | 348,568 | |
Commerce Bancshares, Inc.D | | | 26,000 | | | | | | 1,167,649 | |
Cullen/Frost Bankers, Inc.D | | | 19,500 | | | | | | 1,451,385 | |
Discover Financial Services‡‡ | | | 11,770 | | | | | | 658,531 | |
Dun & Bradstreet Corporation (The)D | | | 3,600 | | | | | | 441,900 | |
East West Bancorp, Inc.D‡‡ | | | 26,660 | | | | | | 932,300 | |
Evercore Partners, Inc. Class A‡‡ | | | 5,570 | | | | | | 332,975 | |
FactSet Research Systems, Inc.D | | | 5,400 | | | | | | 586,332 | |
Financial Engines, Inc.‡‡ | | | 5,190 | | | | | | 360,601 | |
First Niagara Financial Group, Inc. | | | 1,300 | | | | | | 13,806 | |
Fiserv, Inc.D* | | | 600 | | | | | | 35,430 | |
Fortegra Financial CorporationD* | | | 21,510 | | | | | | 177,888 | |
Genworth Financial, Inc. Class A*‡‡ | | | 32,700 | | | | | | 507,831 | |
Goldman Sachs Group, Inc. (The) | | | 3,800 | | | | | | 673,588 | |
Hersha Hospitality Trust REIT‡‡ | | | 46,940 | | | | | | 261,456 | |
IntercontinentalExchange Group, Inc.D*‡‡ | | | 2,460 | | | | | | 553,303 | |
JPMorgan Chase & Co. | | | 21,456 | | | | | | 1,254,747 | |
KeyCorp | | | 175,600 | | | | | | 2,356,552 | |
M&T Bank CorporationD | | | 7,400 | | | | | | 861,508 | |
Marsh & McLennan Cos., Inc. | | | 68,000 | | | | | | 3,288,480 | |
Mastercard, Inc. Class A | | | 900 | | | | | | 751,914 | |
Nelnet, Inc. Class A‡‡ | | | 11,220 | | | | | | 472,811 | |
New York Community Bancorp, Inc.D | | | 34,400 | | | | | | 579,640 | |
Northern Trust Corporation | | | 79,300 | | | | | | 4,907,877 | |
Ocwen Financial Corporation*‡‡ | | | 16,860 | | | | | | 934,887 | |
OmniAmerican Bancorp, Inc.*‡‡ | | | 10,730 | | | | | | 229,407 | |
PacWest Bancorp‡‡ | | | 10,110 | | | | | | 426,844 | |
People’s United Financial, Inc.D | | | 97,300 | | | | | | 1,471,176 | |
PNC Financial Services Group, Inc. (The) | | | 55,500 | | | | | | 4,305,690 | |
Portfolio Recovery Associates, Inc.*‡‡ | | | 19,860 | | | | | | 1,049,402 | |
ProAssurance Corporation‡‡ | | | 8,520 | | | | | | 413,050 | |
Progressive Corporation (The) | | | 4,800 | | | | | | 130,896 | |
Qunar Cayman Islands, Ltd. ADR*‡‡ | | | 9,110 | | | | | | 241,688 | |
Rayonier, Inc. REIT | | | 9,457 | | | | | | 398,140 | |
| | | | | | | | | | |
| | | Shares | | | Value | |
Reinsurance Group of America, Inc. | | | 20,500 | | | | | $ | 1,586,905 | |
Signature BankD*‡‡ | | | 3,680 | | | | | | 395,306 | |
SunTrust Banks, Inc. | | | 10,600 | | | | | | 390,186 | |
Total System Services, Inc. | | | 14,800 | | | | | | 492,544 | |
Travelers Cos., Inc. (The) | | | 9,900 | | | | | | 896,346 | |
US BancorpD | | | 16,200 | | | | | | 654,480 | |
Visa, Inc. Class AD‡‡ | | | 8,320 | | | | | | 1,852,698 | |
W.R. Berkley Corporation | | | 12,500 | | | | | | 542,375 | |
| | | | | | | | | | |
| | | | | | | | | 48,322,923 | |
| | | | | | | | | | |
Healthcare — 10.1% | |
Abbott Laboratories | | | 14,200 | | | | | | 544,286 | |
Aegerion Pharmaceuticals, Inc.D*‡‡ | | | 8,070 | | | | | | 572,647 | |
Aetna, Inc. | | | 3,200 | | | | | | 219,488 | |
Agios Pharmaceuticals, Inc.D* | | | 2,500 | | | | | | 59,875 | |
Air Methods Corporation*‡‡ | | | 4,200 | | | | | | 244,986 | |
Akorn, Inc.D* | | | 6,990 | | | | | | 172,164 | |
Alexion Pharmaceuticals, Inc.*‡‡ | | | 3,540 | | | | | | 471,032 | |
Align Technology, Inc.*‡‡ | | | 9,340 | | | | | | 533,781 | |
Allergan, Inc.D‡‡ | | | 9,530 | | | | | | 1,058,592 | |
AmerisourceBergen Corporation | | | 15,000 | | | | | �� | 1,054,650 | |
Amgen, Inc. | | | 3,600 | | | | | | 410,976 | |
ArthroCare Corporation*‡‡ | | | 13,890 | | | | | | 558,934 | |
Baxter International, Inc. | | | 7,400 | | | | | | 514,670 | |
Becton, Dickinson and Co.D | | | 34,400 | | | | | | 3,800,856 | |
Biogen Idec, Inc.*‡‡ | | | 4,540 | | | | | | 1,270,065 | |
BioMarin Pharmaceutical, Inc.D* | | | 1,290 | | | | | | 90,648 | |
Bristol-Myers Squibb Co.D‡‡ | | | 29,900 | | | | | | 1,589,185 | |
C.R. Bard, Inc.D | | | 6,700 | | | | | | 897,398 | |
Cardinal Health, Inc. | | | 5,700 | | | | | | 380,817 | |
Celgene Corporation* | | | 1,100 | | | | | | 185,856 | |
Cepheid, Inc.D* | | | 2,180 | | | | | | 101,850 | |
Cerner Corporation*‡‡ | | | 7,400 | | | | | | 412,476 | |
Cooper Cos., Inc. (The)D‡‡ | | | 3,020 | | | | | | 373,997 | |
Covance, Inc.* | | | 200 | | | | | | 17,612 | |
Cubist Pharmaceuticals, Inc.D*‡‡ | | | 7,070 | | | | | | 486,911 | |
Cyberonics, Inc.* | | | 1,860 | | | | | | 121,849 | |
Depomed, Inc.D* | | | 30,440 | | | | | | 322,055 | |
Dynavax Technologies CorporationD* | | | 31,030 | | | | | | 60,819 | |
Edwards Lifesciences CorporationD* | | | 1,500 | | | | | | 98,640 | |
Eli Lilly & Co.D | | | 52,000 | | | | | | 2,652,000 | |
Enanta Pharmaceuticals, Inc.* | | | 1,120 | | | | | | 30,554 | |
Express Scripts Holding Co.*‡‡ | | | 8,180 | | | | | | 574,563 | |
Forest Laboratories, Inc.* | | | 10,900 | | | | | | 654,327 | |
Furiex Pharmaceuticals, Inc.D* | | | 4,440 | | | | | | 186,524 | |
Gilead Sciences, Inc.*‡‡ | | | 8,110 | | | | | | 609,466 | |
Henry Schein, Inc.D* | | | 2,100 | | | | | | 239,946 | |
Horizon Pharma, Inc.D* | | | 19,770 | | | | | | 150,647 | |
Idera Pharmaceuticals, Inc.D* | | | 19,620 | | | | | | 90,841 | |
IDEXX Laboratories, Inc.D* | | | 6,200 | | | | | | 659,494 | |
Impax Laboratories, Inc.*‡‡ | | | 14,110 | | | | | | 354,725 | |
Ironwood Pharmaceuticals, Inc.D* | | | 8,230 | | | | | | 95,550 | |
Johnson & JohnsonD‡‡ | | | 101,750 | | | | | | 9,319,282 | |
Keryx Biopharmaceuticals, Inc.D* | | | 9,440 | | | | | | 122,248 | |
Laboratory Corporation of America HoldingsD* | | | 8,400 | | | | | | 767,508 | |
| | | | |
| | See Notes to Financial Statements. | | 169 |
DEFENSIVE MARKET STRATEGIES FUND
SCHEDULE OF INVESTMENTS (Continued)
| | | | | | | | | | |
| | | Shares | | | Value | |
Lannett Co., Inc.*‡‡ | | | 12,360 | | | | | $ | 409,116 | |
MacroGenics, Inc.D*‡‡ | | | 1,990 | | | | | | 54,586 | |
McKesson Corporation‡‡ | | | 10,050 | | | | | | 1,622,070 | |
MEDNAX, Inc.* | | | 2,800 | | | | | | 149,464 | |
Medtronic, Inc. | | | 3,500 | | | | | | 200,865 | |
Merck & Co., Inc. | | | 69,100 | | | | | | 3,458,455 | |
Myriad Genetics, Inc.D* | | | 800 | | | | | | 16,784 | |
Natus Medical, Inc.D* | | | 4,170 | | | | | | 93,825 | |
Neurocrine Biosciences, Inc.D* | | | 21,220 | | | | | | 198,195 | |
NPS Pharmaceuticals, Inc.D*‡‡ | | | 6,360 | | | | | | 193,090 | |
NxStage Medical, Inc.* | | | 5,910 | | | | | | 59,100 | |
PAREXEL International CorporationD*‡‡ | | | 11,020 | | | | | | 497,884 | |
Patterson Cos., Inc.D | | | 13,400 | | | | | | 552,080 | |
Pfizer, Inc. | | | 46,644 | | | | | | 1,428,706 | |
Prestige Brands Holdings, Inc.D* | | | 2,620 | | | | | | 93,796 | |
Puma Biotechnology, Inc.* | | | 1,190 | | | | | | 123,201 | |
Quest Diagnostics, Inc.D | | | 56,000 | | | | | | 2,998,240 | |
Receptos, Inc.*‡‡ | | | 6,970 | | | | | | 202,060 | |
Rigel Pharmaceuticals IncD* | | | 16,400 | | | | | | 46,740 | |
Salix Pharmaceuticals, Ltd.D* | | | 1,100 | | | | | | 98,934 | |
Stryker Corporation | | | 13,680 | | | | | | 1,027,915 | |
Targacept, Inc.* | | | 6,630 | | | | | | 27,515 | |
Team Health Holdings, Inc.*‡‡ | | | 11,300 | | | | | | 514,715 | |
Teleflex, Inc.D | | | 2,880 | | | | | | 270,317 | |
Theravance, Inc.D* | | | 3,140 | | | | | | 111,941 | |
UnitedHealth Group, Inc. | | | 8,400 | | | | | | 632,520 | |
Universal Health Services, Inc. Class B‡‡ | | | 3,340 | | | | | | 271,408 | |
Zimmer Holdings, Inc. | | | 3,000 | | | | | | 279,570 | |
Zoetis, Inc.‡‡ | | | 14,500 | | | | | | 474,005 | |
| | | | | | | | | | |
| | | | | | | | | 49,241,887 | |
| | | | | | | | | | |
Materials & Processing — 0.8% | |
Fastenal Co.D | | | 8,000 | | | | | | 380,080 | |
Graphic Packaging Holding, Co.*‡‡ | | | 49,090 | | | | | | 471,264 | |
International Flavors & Fragrances, Inc. | | | 600 | | | | | | 51,588 | |
Louisiana-Pacific Corporation*‡‡ | | | 26,200 | | | | | | 484,962 | |
MRC Global, Inc.*‡‡ | | | 11,320 | | | | | | 365,183 | |
Newmont Mining Corporation | | | 17,200 | | | | | | 396,116 | |
Precision Castparts Corporation‡‡ | | | 1,560 | | | | | | 420,108 | |
Rockwood Holdings, Inc.‡‡ | | | 7,490 | | | | | | 538,681 | |
Sherwin-Williams Co. (The) | | | 2,100 | | | | | | 385,350 | |
Sigma-Aldrich CorporationD | | | 800 | | | | | | 75,208 | |
Westlake Chemical Corporation‡‡ | | | 3,070 | | | | | | 374,755 | |
| | | | | | | | | | |
| | | | | | | | | 3,943,295 | |
| | | | | | | | | | |
Producer Durables — 6.0% | |
3M Co. | | | 6,000 | | | | | | 841,500 | |
ADT Corporation (The)D* | | | 52,700 | | | | | | 2,132,769 | |
Agilent Technologies, Inc. | | | 18,708 | | | | | | 1,069,911 | |
AMETEK, Inc.‡‡ | | | 9,750 | | | | | | 513,532 | |
Automatic Data Processing, Inc. | | | 19,800 | | | | | | 1,600,038 | |
Bristow Group, Inc. | | | 4,135 | | | | | | 310,373 | |
CAI International, Inc.*‡‡ | | | 11,920 | | | | | | 280,954 | |
CH Robinson Worldwide, Inc.D | | | 4,800 | | | | | | 280,032 | |
Cintas CorporationD | | | 3,300 | | | | | | 196,647 | |
Clean Harbors, Inc.D* | | | 1,800 | | | | | | 107,928 | |
Danaher Corporation | | | 1,400 | | | | | | 108,080 | |
| | | | | | | | | | |
| | | Shares | | | Value | |
Delta Air Lines, Inc.‡‡ | | | 12,450 | | | | | $ | 342,002 | |
Electronics For Imaging, Inc.*‡‡ | | | 13,950 | | | | | | 540,284 | |
FLIR Systems, Inc. | | | 8,000 | | | | | | 240,800 | |
General Dynamics Corporation | | | 3,700 | | | | | | 353,535 | |
General Electric Co. | | | 15,200 | | | | | | 426,056 | |
Genesee & Wyoming, Inc. Class A*‡‡ | | | 6,170 | | | | | | 592,629 | |
Honeywell International, Inc.‡‡ | | | 4,640 | | | | | | 423,957 | |
Huron Consulting Group, Inc.*‡‡ | | | 11,520 | | | | | | 722,534 | |
Kirby CorporationD*‡‡ | | | 2,300 | | | | | | 228,275 | |
Knight Transportation, Inc.D | | | 1,900 | | | | | | 34,846 | |
Landstar System, Inc.D* | | | 500 | | | | | | 28,725 | |
Lockheed Martin Corporation | | | 700 | | | | | | 104,062 | |
Macquarie Infrastructure Co. LLC‡‡ | | | 11,800 | | | | | | 642,274 | |
Mettler Toledo International, Inc.D* | | | 1,500 | | | | | | 363,885 | |
Middleby Corporation (The)*‡‡ | | | 1,550 | | | | | | 371,954 | |
MSC Industrial Direct Co., Inc. Class AD | | | 3,700 | | | | | | 299,219 | |
Northrop Grumman Corporation | | | 2,800 | | | | | | 320,908 | |
On Assignment, Inc.*‡‡ | | | 7,170 | | | | | | 250,376 | |
Paychex, Inc.D | | | 20,800 | | | | | | 947,024 | |
Quanta Services, Inc.*‡‡ | | | 13,450 | | | | | | 424,482 | |
Raytheon Co. | | | 7,600 | | | | | | 689,320 | |
Republic Services, Inc. | | | 47,033 | | | | | | 1,561,496 | |
Roadrunner Transportation Systems, Inc.*‡‡ | | | 10,550 | | | | | | 284,322 | |
Rockwell Automation, Inc.D‡‡ | | | 2,830 | | | | | | 334,393 | |
Rockwell Collins, Inc.D | | | 6,974 | | | | | | 515,518 | |
Saia, Inc.*‡‡ | | | 12,810 | | | | | | 410,560 | |
Stericycle, Inc.* | | | 9,400 | | | | | | 1,091,998 | |
Towers Watson & Co. Class A‡‡ | | | 12,530 | | | | | | 1,598,953 | |
Union Pacific Corporation‡‡ | | | 4,700 | | | | | | 789,600 | |
United Parcel Service, Inc. Class B | | | 35,000 | | | | | | 3,677,800 | |
United Rentals, Inc.*‡‡ | | | 6,040 | | | | | | 470,818 | |
United Technologies Corporation | | | 800 | | | | | | 91,040 | |
Verisk Analytics, Inc. Class AD*‡‡ | | | 6,590 | | | | | | 433,095 | |
Waste Management, Inc.D | | | 43,300 | | | | | | 1,942,871 | |
Werner Enterprises, Inc.D | | | 4,700 | | | | | | 116,231 | |
| | | | | | | | | | |
| | | | | | | | | 29,107,606 | |
| | | | | | | | | | |
Technology — 5.8% | |
Adobe Systems, Inc.*‡‡ | | | 3,550 | | | | | | 212,574 | |
ADTRAN, Inc. | | | 7,600 | | | | | | 205,276 | |
Altera CorporationD | | | 3,700 | | | | | | 120,361 | |
Analog Devices, Inc. | | | 14,500 | | | | | | 738,485 | |
Apple, Inc.‡‡ | | | 1,810 | | | | | | 1,015,609 | |
Applied Materials, Inc. | | | 224,000 | | | | | | 3,962,560 | |
Autodesk, Inc.* | | | 2,300 | | | | | | 115,759 | |
Broadcom Corporation Class A | | | 2,600 | | | | | | 77,090 | |
Cisco Systems, Inc. | | | 73,500 | | | | | | 1,650,075 | |
Citrix Systems, Inc.* | | | 800 | | | | | | 50,600 | |
Cognizant Technology Solutions Corporation Class A* | | | 1,400 | | | | | | 141,372 | |
Cree, Inc.D* | | | 8,730 | | | | | | 546,236 | |
Dealertrack Holdings, Inc.D* | | | 3,630 | | | | | | 174,530 | |
Digimarc Corporation‡‡ | | | 20,590 | | | | | | 396,563 | |
Discovery Laboratories, Inc.D* | | | 16,350 | | | | | | 36,788 | |
| | | | |
| 170 | | See Notes to Financial Statements. | | |
| | | | | | | | | | |
| | | Shares | | | Value | |
Ellie Mae, Inc.*‡‡ | | | 7,200 | | | | | $ | 193,464 | |
EMC CorporationD | | | 8,780 | | | | | | 220,817 | |
F5 Networks, Inc.D* | | | 3,600 | | | | | | 327,096 | |
Facebook, Inc. Class A*‡‡ | | | 21,240 | | | | | | 1,160,978 | |
Google, Inc. Class A*‡‡ | | | 2,580 | | | | | | 2,891,432 | |
Groupon, Inc.*‡‡ | | | 34,320 | | | | | | 403,946 | |
IAC/InterActiveCorp | | | 5,000 | | | | | | 343,450 | |
Intel CorporationD‡‡ | | | 142,570 | | | | | | 3,701,117 | |
International Business Machines Corporation | | | 6,400 | | | | | | 1,200,448 | |
Intuit, Inc. | | | 13,500 | | | | | | 1,030,320 | |
KLA-Tencor CorporationD | | | 3,000 | | | | | | 193,380 | |
Linear Technology CorporationD | | | 19,300 | | | | | | 879,115 | |
Manhattan Associates, Inc.*‡‡ | | | 5,170 | | | | | | 607,372 | |
Maxim Integrated Products, Inc.D | | | 8,900 | | | | | | 248,399 | |
Microchip Technology, Inc.D | | | 2,800 | | | | | | 125,300 | |
Microsoft Corporation | | | 22,200 | | | | | | 830,946 | |
NetApp, Inc. | | | 3,200 | | | | | | 131,648 | |
QUALCOMM, Inc. | | | 2,200 | | | | | | 163,350 | |
Red Hat, Inc.* | | | 4,750 | | | | | | 266,190 | |
Remark Media, Inc.* | | | 21,680 | | | | | | 101,029 | |
Riverbed Technology, Inc.*‡‡ | | | 10,870 | | | | | | 196,530 | |
Salesforce.com, Inc.D*‡‡ | | | 8,810 | | | | | | 486,224 | |
ServiceNow, Inc.*‡‡ | | | 6,380 | | | | | | 357,344 | |
Silicon Laboratories, Inc.* | | | 600 | | | | | | 25,986 | |
Sohu.com, Inc.D* | | | 1,700 | | | | | | 123,981 | |
Synopsys, Inc.* | | | 8,600 | | | | | | 348,902 | |
Teradata CorporationD* | | | 4,000 | | | | | | 181,960 | |
Texas Instruments, Inc. | | | 2,300 | | | | | | 100,993 | |
Tyler Technologies, Inc.*‡‡ | | | 6,270 | | | | | | 640,355 | |
VeriSign, Inc.D* | | | 1,200 | | | | | | 71,736 | |
VMware, Inc. Class AD* | | | 6,740 | | | | | | 604,645 | |
Xilinx, Inc. | | | 8,200 | | | | | | 376,544 | |
| | | | | | | | | | |
| | | | | | | | | 27,978,875 | |
| | | | | | | | | | |
Utilities — 6.9% | |
Alliant Energy Corporation | | | 1,900 | | | | | | 98,039 | |
American Electric Power Co., Inc. | | | 11,600 | | | | | | 542,184 | |
American Water Works Co., Inc. | | | 23,000 | | | | | | 971,980 | |
AT&T, Inc. | | | 86,600 | | | | | | 3,044,856 | |
CenterPoint Energy, Inc.D | | | 10,800 | | | | | | 250,344 | |
CenturyLink, Inc.D | | | 83,200 | | | | | | 2,649,920 | |
Consolidated Edison, Inc.D | | | 66,700 | | | | | | 3,687,176 | |
Dominion Resources, Inc. | | | 23,200 | | | | | | 1,500,808 | |
DTE Energy Co. | | | 8,400 | | | | | | 557,676 | |
Duke Energy Corporation | | | 9,700 | | | | | | 669,397 | |
Entergy Corporation | | | 2,300 | | | | | | 145,521 | |
Laclede Group, Inc. (The)D | | | 46,500 | | | | | | 2,117,610 | |
National Fuel Gas Co.D | | | 1,600 | | | | | | 114,240 | |
NextEra Energy, Inc. | | | 4,100 | | | | | | 351,042 | |
NiSource, Inc.D | | | 8,900 | | | | | | 292,632 | |
OGE Energy Corporation | | | 5,400 | | | | | | 183,060 | |
PG&E Corporation | | | 55,400 | | | | | | 2,231,512 | |
Piedmont Natural Gas Co., Inc.D | | | 61,600 | | | | | | 2,042,656 | |
Pinnacle West Capital CorporationD | | | 6,100 | | | | | | 322,812 | |
Public Service Enterprise Group, Inc. | | | 13,200 | | | | | | 422,928 | |
Questar Corporation | | | 23,500 | | | | | | 540,265 | |
Sempra EnergyD | | | 16,700 | | | | | | 1,498,992 | |
Southern Co. (The)D | | | 23,900 | | | | | | 982,529 | |
| | | | | | | | | | |
| | | Shares | | | Value | |
tw telecom, Inc.* | | | 9,300 | | | | | $ | 283,371 | |
UGI Corporation | | | 12,000 | | | | | | 497,520 | |
Verizon Communications, Inc. | | | 26,300 | | | | | | 1,292,382 | |
Westar Energy, Inc.D | | | 33,300 | | | | | | 1,071,261 | |
WGL Holdings, Inc. | | | 110,400 | | | | | | 4,422,624 | |
Wisconsin Energy CorporationD | | | 8,100 | | | | | | 334,854 | |
Xcel Energy, Inc.D | | | 8,500 | | | | | | 237,490 | |
| | | | | | | | | | |
| | | | | | | | | 33,357,681 | |
| | | | | | | | | | |
Total Common Stocks
(Cost $229,877,810) | | | 273,572,687 | |
| | | | | | | | | | |
FOREIGN COMMON STOCKS — 4.7% | |
Australia — 0.1% | |
BHP Billiton, Ltd. ADRD‡‡ | | | 10,030 | | | | | | 684,046 | |
| | | | | | | | | | |
Austria — 0.1% | |
Erste Group Bank AG | | | 7,711 | | | | | | 268,702 | |
| | | | | | | | | | |
Bermuda — 0.4% | |
Essent Group Ltd*‡‡ | | | 7,500 | | | | | | 180,450 | |
Everest Re Group, Ltd. | | | 9,300 | | | | | | 1,449,591 | |
Marvell Technology Group, Ltd. | | | 23,900 | | | | | | 343,682 | |
| | | | | | | | | | |
| | | | | | | | | 1,973,723 | |
| | | | | | | | | | |
Brazil — 0.1% | |
Linx SA* | | | 23,923 | | | | | | 485,812 | |
| | | | | | | | | | |
British Virgin Islands — 0.1% | |
Arcos Dorados Holdings, Inc.D | | | 26,450 | | | | | | 320,574 | |
Michael Kors Holdings, Ltd.*‡‡ | | | 2,180 | | | | | | 176,994 | |
| | | | | | | | | | |
| | | | | | | | | 497,568 | |
| | | | | | | | | | |
Canada — 0.8% | |
Augusta Resource CorporationD* | | | 48,590 | | | | | | 69,484 | |
Canadian Pacific Railway, Ltd.D‡‡ | | | 4,810 | | | | | | 727,849 | |
Caracal Energy, Inc.* | | | 34,251 | | | | | | 250,694 | |
Catamaran Corporation*‡‡ | | | 7,920 | | | | | | 376,042 | |
Intact Financial CorporationD | | | 5,590 | | | | | | 365,054 | |
Kodiak Oil & Gas Corporation* | | | 48,550 | | | | | | 544,245 | |
Potash Corporation of Saskatchewan, Inc.D | | | 46,600 | | | | | | 1,535,936 | |
Silvercrest Mines, Inc.D* | | | 17,767 | | | | | | 30,274 | |
| | | | | | | | | | |
| | | | | | | | | 3,899,578 | |
| | | | | | | | | | |
Cayman Islands — 0.2% | |
Lekoil, Ltd.* | | | 791,221 | | | | | | 818,893 | |
| | | | | | | | | | |
China — 0.1% | |
PetroChina Co., Ltd. Class H | | | 278,320 | | | | | | 305,085 | |
| | | | | | | | | | |
France — 0.6% | |
Total SA | | | 51,000 | | | | | | 3,130,364 | |
| | | | | | | | | | |
Germany — 0.0% | |
Bayer AG | | | 1,401 | | | | | | 196,495 | |
| | | | | | | | | | |
Hong Kong — 0.1% | |
AIA Group, Ltd. | | | 80,711 | | | | | | 404,892 | |
| | | | | | | | | | |
Ireland — 0.5% | |
Accenture PLC Class A | | | 9,000 | | | | | | 739,980 | |
Alkermes PLC* | | | 5,910 | | | | | | 240,300 | |
Covidien PLC‡‡ | | | 9,950 | | | | | | 677,595 | |
Eaton Corporation PLCD‡‡ | | | 6,940 | | | | | | 528,273 | |
Providence Resources PLC* | | | 17,050 | | | | | | 62,821 | |
| | | | | | | | | | |
| | | | | | | | | 2,248,969 | |
| | | | | | | | | | |
| | | | |
| | See Notes to Financial Statements. | | 171 |
DEFENSIVE MARKET STRATEGIES FUND
SCHEDULE OF INVESTMENTS (Continued)
| | | | | | | | | | |
| | | Shares | | | Value | |
Japan — 0.1% | |
Honda Motor Co., Ltd. | | | 8,000 | | | | | $ | 330,217 | |
| | | | | | | | | | |
Mexico — 0.1% | |
Credito Real SAB de CV | | | 170,509 | | | | | | 262,754 | |
| | | | | | | | | | |
Netherlands — 0.1% | |
Koninklijke Philips NV | | | 8,815 | | | | | | 324,580 | |
NXP Semiconductor NV*‡‡ | | | 5,250 | | | | | | 241,133 | |
| | | | | | | | | | |
| | | | | | | | | 565,713 | |
| | | | | | | | | | |
Philippines — 0.1% | |
Metropolitan Bank & Trust | | | 212,970 | | | | | | 364,027 | |
| | | | | | | | | | |
Singapore — 0.0% | |
Avago Technologies, Ltd.‡‡ | | | 3,760 | | | | | | 198,866 | |
| | | | | | | | | | |
Sweden — 0.0% | |
Swedish Orphan Biovitrum AB* | | | 16,690 | | | | | | 173,154 | |
| | | | | | | | | | |
Switzerland — 0.8% | |
ABB, Ltd.* | | | 19,200 | | | | | | 507,648 | |
ACE, Ltd. | | | 7,000 | | | | | | 724,710 | |
Basilea Pharmaceutica* | | | 1,580 | | | | | | 187,465 | |
Roche Holding AG ADR‡‡ | | | 13,810 | | | | | | 969,462 | |
TE Connectivity, Ltd.‡‡ | | | 3,230 | | | | | | 178,006 | |
Tyco International, Ltd. | | | 30,188 | | | | | | 1,238,915 | |
| | | | | | | | | | |
| | | | | | | | | 3,806,206 | |
| | | | | | | | | | |
United Kingdom — 0.4% | |
Aon PLC‡‡ | | | 14,720 | | | | | | 1,234,861 | |
AstraZeneca PLC ADR‡‡ | | | 3,260 | | | | | | 193,546 | |
Countrywide PLC* | | | 31,892 | | | | | | 314,231 | |
Ophir Energy PLC* | | | 78,755 | | | | | | 427,500 | |
| | | | | | | | | | |
| | | | | | | | | 2,170,138 | |
| | | | | | | | | | |
Total Foreign Common Stocks
(Cost $19,653,113) | | | | | | 22,785,202 | |
| | | | | | | | | | |
PREFERRED STOCKS — 5.6% | |
Bank of America Corporation, | | | | | | | | | | |
7.25%, 11/30/14 | | | 7,415 | | | | | | 7,867,315 | |
Health Care REIT, Inc., | | | | | | | | | | |
6.25%* | | | 36,600 | | | | | | 1,876,116 | |
MetLife, Inc., | | | | | | | | | | |
5.00%, 03/26/14* | | | 13,300 | | | | | | 419,482 | |
NextEra Energy, Inc., | | | | | | | | | | |
5.80%, 3/2/14* | | | 27,743 | | | | | | 1,391,866 | |
Post Holdings, Inc., | | | | | | | | | | |
3.75% 144A@* | | | 1,273 | | | | | | 150,621 | |
Stanley Black & Decker, Inc., | | | | | | | | | | |
4.75%, 2/19/14* | | | 24,500 | | | | | | 3,041,185 | |
Stanley Black & Decker, Inc., | | | | | | | | | | |
6.25%,11/17/16* | | | 3,213 | | | | | | 331,582 | |
US Bancorp, | | | | | | | | | | |
6.00%, 3/26/14D* | | | 144,600 | | | | | | 3,957,702 | |
Wells Fargo & Co., | | | | | | | | | | |
7.50%, 12/31/49 | | | 7,120 | | | | | | 7,867,600 | |
| | | | | | | | | | |
Total Preferred Stocks
(Cost $27,475,295) | | | | | | 26,903,469 | |
| | | | | | | | | | |
MASTER LIMITED PARTNERSHIP — 0.3% | |
Spectra Energy Partners LP
(Cost $1,204,085) | | | 27,925 | | | | | | 1,266,399 | |
| | | | | | | | | | |
| | | | | | | | | | |
| | | Shares | | | Value | |
MONEY MARKET FUNDS — 30.7% | |
GuideStone Money Market Fund (GS4 Class)¥ | | | 64,725,574 | | | | | $ | 64,725,574 | |
Northern Institutional Liquid Assets Portfolio§ | | | 84,172,289 | | | | | | 84,172,289 | |
| | | | | | | | | | |
Total Money Market Funds
(Cost $148,897,863) | | | | | | 148,897,863 | |
| | | | | | | | | | |
SYNTHETIC CONVERTIBLE
INSTRUMENTS — 0.4% | |
Citigroup, Inc.+ | | | 15,900 | | | | | | 1,016,169 | |
Credit Suisse+ | | | 4,800 | | | | | | 378,672 | |
Deutsche Bank AG+ | | | 12,700 | | | | | | 708,851 | |
| | | | | | | | | | |
Total Synthetic Convertible Instruments
(Cost $2,147,993) | | | | | | 2,103,692 | |
| | | | | | | | | | |
| | | |
| | | Par | | | | | | |
CORPORATE BONDS — 22.8% | |
Alere, Inc. | | | | | | | | | | |
3.00%, 05/15/16 CONV | | $ | 1,400,000 | | | | | | 1,580,250 | |
Alliant Techsystems, Inc. | | | | | | | | | | |
3.00%, 08/15/24 CONVD | | | 350,000 | | | | | | 561,094 | |
American Realty Capital Properties, Inc. | | | | | | | | | | |
3.00%, 08/01/18 CONV | | | 1,005,000 | | | | | | 1,005,628 | |
3.75%, 12/15/20 CONV | | | 1,295,000 | | | | | | 1,314,431 | |
Archer-Daniels-Midland Co. | | | | | | | | | | |
0.88%, 02/15/14 CONV | | | 665,000 | | | | | | 704,484 | |
Biomet, Inc. | | | | | | | | | | |
6.50%, 10/01/20 | | | 495,000 | | | | | | 512,325 | |
Boston Properties LP | | | | | | | | | | |
3.63%, 02/15/14 CONV 144A | | | 1,545,000 | | | | | | 1,551,759 | |
Bristow Group, Inc. | | | | | | | | | | |
3.00%, 06/15/38 CONV | | | 925,000 | | | | | | 1,138,906 | |
CCO Holdings LLC | | | | | | | | | | |
5.25%, 09/30/22 | | | 310,000 | | | | | | 291,013 | |
Chesapeake Energy Corporation | | | | | | | | | | |
2.50%, 05/15/37 CONVD | | | 2,515,000 | | | | | | 2,565,300 | |
Ciena Corporation | | | | | | | | | | |
0.88%, 06/15/17 CONVD | | | 2,105,000 | | | | | | 2,162,888 | |
Citigroup, Inc. | | | | | | | | | | |
5.95%, 07/29/49† | | | 3,120,000 | | | | | | 2,890,992 | |
Covanta Holding Corporation | | | | | | | | | | |
3.25%, 06/01/14 CONV | | | 555,000 | | | | | | 651,778 | |
DaVita HealthCare Partners, Inc. | | | | | | | | | | |
6.63%, 11/01/20D | | | 500,000 | | | | | | 538,750 | |
Dealertrack Technologies, Inc. | | | | | | | | | | |
1.50%, 03/15/17 CONVD | | | 370,000 | | | | | | 513,375 | |
Electronic Arts, Inc. | | | | | | | | | | |
0.75%, 07/15/16 CONVD | | | 2,390,000 | | | | | | 2,554,312 | |
Exterran Holdings, Inc. | | | | | | | | | | |
4.25%, 06/15/14 CONV | | | 630,000 | | | | | | 941,456 | |
Extra Space Storage LP | | | | | | | | | | |
2.38%, 07/01/33 CONV 144A | | | 2,390,000 | | | | | | 2,400,456 | |
Forest City Enterprises, Inc. | | | | | | | | | | |
3.63%, 08/15/20 CONV 144A | | | 350,000 | | | | | | 358,312 | |
Frontier
Communications Corporation | | | | | | | | | | |
8.50%, 04/15/20D | | | 465,000 | | | | | | 523,125 | |
General Electric Capital Corporation | | | | | | | | | | |
6.25%, 12/29/49† | | | 2,600,000 | | | | | | 2,695,625 | |
| | | | |
| 172 | | See Notes to Financial Statements. | | |
| | | | | | | | | | |
| | | Par | | | Value | |
Goodyear Tire & Rubber Co. | | | | | | | | | | |
7.00%, 05/15/22D | | $ | 340,000 | | | | | $ | 367,625 | |
Greenbrier Cos., Inc. | | | | | | | | | | |
3.50%, 04/01/18 CONVD | | | 1,300,000 | | | | | | 1,543,750 | |
Griffon Corporation | | | | | | | | | | |
4.00%, 01/15/17 CONV 144A | | | 670,000 | | | | | | 789,344 | |
Group 1 Automotive, Inc. | | | | | | | | | | |
2.25%, 06/15/36 STEP | | | 1,740,000 | | | | | | 2,206,538 | |
Health Care REIT, Inc. | | | | | | | | | | |
3.00%, 12/01/29 CONV | | | 1,180,000 | | | | | | 1,317,912 | |
Hologic, Inc. | | | | | | | | | | |
0.00%, 12/15/43 STEP | | | 190,000 | | | | | | 199,975 | |
2.00%, 03/01/42 STEPD | | | 2,280,000 | | | | | | 2,334,150 | |
Iconix Brand Group, Inc. | | | | | | | | | | |
2.50%, 06/01/16 CONV | | | 1,945,000 | | | | | | 2,680,453 | |
Illumina, Inc. | | | | | | | | | | |
0.25%, 03/15/16 CONV 144A | | | 2,105,000 | | | | | | 2,929,897 | |
Integra LifeSciences
Holdings Corporation | | | | | | | | | | |
1.63%, 12/15/16 CONVD | | | 2,010,000 | | | | | | 2,168,288 | |
Intel Corporation | | | | | | | | | | |
2.95%, 12/15/35 CONVD | | | 2,810,000 | | | | | | 3,154,225 | |
Janus Capital Group, Inc. | | | | | | | | | | |
3.25%, 07/15/14 CONVD | | | 1,219,000 | | | | | | 1,267,760 | |
0.75%, 07/15/18 CONV | | | 208,000 | | | | | | 265,460 | |
Jarden Corporation | | | | | | | | | | |
1.88%, 09/15/18 CONVD | | | 885,000 | | | | | | 1,254,488 | |
L-3 Communications
Holdings, Inc. | | | | | | | | | | |
3.00%, 08/01/35 CONV | | | 468,000 | | | | | | 565,988 | |
Lam Research Corporation | | | | | | | | | | |
0.50%, 05/15/16 CONVD | | | 2,095,000 | | | | | | 2,396,156 | |
Leap Wireless
International, Inc. | | | | | | | | | | |
4.50%, 07/15/14 CONV | | | 2,310,000 | | | | | | 2,350,425 | |
Liberty Interactive LLC | | | | | | | | | | |
1.00%, 09/30/43 CONV 144AD | | | 2,250,000 | | | | | | 2,379,375 | |
LifePoint Hospitals, Inc. | | | | | | | | | | |
3.50%, 05/15/14 CONV | | | 2,770,000 | | | | | | 3,024,494 | |
Linear Technology Corporation | | | | | | | | | | |
3.00%, 05/01/27 CONV | | | 1,270,000 | | | | | | 1,450,975 | |
Live Nation Entertainment, Inc. | | | | | | | | | | |
2.88%, 07/15/27 CONV | | | 2,110,000 | | | | | | 2,149,562 | |
Mediacom LLC | | | | | | | | | | |
7.25%, 02/15/22D | | | 350,000 | | | | | | 372,750 | |
Meritor, Inc. | | | | | | | | | | |
7.88%, 03/01/26 CONV 144A | | | 1,275,000 | | | | | | 1,836,797 | |
Microchip Technology, Inc. | | | | | | | | | | |
2.13%, 12/15/37 CONV | | | 729,000 | | | | | | 1,268,916 | |
Navistar International Corporation | | | | | | | | | | |
3.00%, 10/15/14 CONV | | | 2,285,000 | | | | | | 2,347,838 | |
Nuance Communications, Inc. | | | | | | | | | | |
2.75%, 11/01/31 CONV | | | 2,165,000 | | | | | | 2,125,759 | |
NuVasive, Inc. | | | | | | | | | | |
2.75%, 07/01/17 CONV | | | 2,535,000 | | | | | | 2,758,397 | |
NVIDIA Corporation | | | | | | | | | | |
1.00%, 12/01/18 CONV 144A | | | 750,000 | | | | | | 771,562 | |
Omnicare, Inc. | | | | | | | | | | |
3.25%, 12/15/35 CONV | | | 2,400,000 | | | | | | 2,577,000 | |
| | | | | | | | | | |
| | | Par | | | Value | |
Owens-Brockway Glass
Container, Inc. | | | | | | | | | | |
3.00%, 06/01/15 CONV 144A | | $ | 2,245,000 | | | | | $ | 2,350,234 | |
Prologis LP | | | | | | | | | | |
3.25%, 03/15/15 CONVD | | | 1,720,000 | | | | | | 1,924,250 | |
Reynolds Group Issuer, Inc. | | | | | | | | | | |
9.88%, 08/15/19 | | | 250,000 | | | | | | 279,375 | |
Rovi Corporation | | | | | | | | | | |
2.63%, 02/15/40 CONV | | | 1,480,000 | | | | | | 1,498,500 | |
Royal Gold, Inc. | | | | | | | | | | |
2.88%, 06/15/19 CONV | | | 1,895,000 | | | | | | 1,831,044 | |
RTI International Metals, Inc. | | | | | | | | | | |
3.00%, 12/01/15 CONV | | | 435,000 | | | | | | 495,084 | |
Ryland Group, Inc. | | | | | | | | | | |
0.25%, 06/01/19 CONVD | | | 2,230,000 | | | | | | 2,092,019 | |
Salesforce.com, Inc. | | | | | | | | | | |
0.25%, 04/01/18 CONV 144AD | | | 1,960,000 | | | | | | 2,132,725 | |
Salix Pharmaceuticals, Ltd. | | | | | | | | | | |
1.50%, 03/15/19 CONV | | | 570,000 | | | | | | 852,506 | |
SEACOR Holdings, Inc. | | | | | | | | | | |
2.50%, 12/15/27 CONVD | | | 960,000 | | | | | | 1,181,400 | |
Sinclair Television Group, Inc. | | | | | | | | | | |
6.38%, 11/01/21 144AD | | | 410,000 | | | | | | 425,375 | |
Sirius XM Radio, Inc. | | | | | | | | | | |
5.88%, 10/01/20 144AD | | | 200,000 | | | | | | 204,500 | |
Sprint Corporation | | | | | | | | | | |
7.88%, 09/15/23 144A | | | 435,000 | | | | | | 468,712 | |
7.13%, 06/15/24 144A | | | 100,000 | | | | | | 101,750 | |
Steel Dynamics, Inc. | | | | | | | | | | |
5.13%, 06/15/14 CONVD | | | 1,075,000 | | | | | | 1,269,172 | |
TIBCO Software, Inc. | | | | | | | | | | |
2.25%, 05/01/32 CONVD | | | 2,120,000 | | | | | | 2,134,575 | |
Titan Machinery, Inc. | | | | | | | | | | |
3.75%, 05/01/19 CONVD | | | 1,250,000 | | | | | | 1,068,750 | |
T-Mobile USA, Inc. | | | | | | | | | | |
6.63%, 04/28/21D | | | 310,000 | | | | | | 327,438 | |
6.13%, 01/15/22 | | | 300,000 | | | | | | 306,000 | |
Toll Brothers Finance Corporation | | | | | | | | | | |
0.50%, 09/15/32 CONVD | | | 2,115,000 | | | | | | 2,210,175 | |
Trinity Industries, Inc. | | | | | | | | | | |
3.88%, 06/01/36 CONV | | | 1,615,000 | | | | | | 2,134,828 | |
Volcano Corporation | | | | | | | | | | |
1.75%, 12/01/17 CONV | | | 1,875,000 | | | | | | 1,849,219 | |
Walter Investment
Management Corporation | | | | | | | | | | |
4.50%, 11/01/19 CONVD | | | 2,290,000 | | | | | | 2,298,588 | |
WebMD Health Corporation | | | | | | | | | | |
2.50%, 01/31/18 CONV | | | 2,225,000 | | | | | | 2,197,188 | |
WellPoint, Inc. | | | | | | | | | | |
2.75%, 10/15/42 CONVD | | | 172,000 | | | | | | 233,705 | |
XM Satellite Radio, Inc. | | | | | | | | | | |
7.00%, 12/01/14 CONV 144A | | | 120,000 | | | | | | 233,700 | |
| | | | | | | | | | |
Total Corporate Bonds
(Cost $102,149,539) | | | | | | 110,412,930 | |
| | | | | | | | | | |
FOREIGN BONDS — 0.9% | |
Canada — 0.1% | |
Valeant Pharmaceuticals
International, Inc. | | | | | | | | | | |
7.50%, 07/15/21 144A | | | 400,000 | | | | | | 441,000 | |
| | | | | | | | | | |
| | | | |
| | See Notes to Financial Statements. | | 173 |
DEFENSIVE MARKET STRATEGIES FUND
SCHEDULE OF INVESTMENTS (Continued)
| | | | | | | | | | |
| | | Par | | | Value | |
Luxembourg — 0.3% | |
ArcelorMittal | | | | | | | | | | |
5.00%, 05/15/14 CONVD | | $ | 1,790,000 | | | | | $ | 1,815,731 | |
| | | | | | | | | | |
Netherlands — 0.5% | |
Siemens Financierings-maatschappij NV | | | | | | | | | | |
1.05%, 08/16/17 CONVD | | | 2,000,000 | | | | | | 2,311,920 | |
| | | | | | | | | | |
Total Foreign Bonds
(Cost $4,218,208) | | | | | | 4,568,651 | |
| | | | | | | | | | |
| | | |
| | | Number of
Contracts | | | | | | |
PURCHASED OPTIONS — 0.0% | |
Call Options — 0.0% | |
Cliffs Natural Resources, Inc., | | | | | | | | | | |
Strike Price $26.00, Expires | | | | | | | | | | |
01/18/14 (RJ) | | | 140 | | | | | | 14,840 | |
Cobalt International Energy, Inc., | | | | | | | | | | |
Strike Price $25.00, Expires | | | | | | | | | | |
01/18/14 (KS) | | | 316 | | | | | | 1,580 | |
Cobalt International Energy, Inc., | | | | | | | | | | |
Strike Price $27.50, Expires | | | | | | | | | | |
01/18/14 (KS) | | | 307 | | | | | | 1,535 | |
| | | | | | | | | | |
Total Purchased Options
(Cost $162,351) | | | | | | 17,955 | |
| | | | | | | | | | |
TOTAL INVESTMENTS — 121.8%
(Cost $535,786,257) | | | | | | 590,528,848 | |
| | | | | | | | | | |
| | | |
| | | Shares | | | | | | |
COMMON STOCKS SOLD SHORT — (6.1)% | |
Consumer Discretionary — (1.4)% | |
Autoliv, Inc. | | | (1,920 | ) | | | | | (176,256 | ) |
AutoZone, Inc.* | | | (420 | ) | | | | | (200,735 | ) |
Bed Bath & Beyond, Inc.* | | | (2,580 | ) | | | | | (207,174 | ) |
Buckle, Inc. (The) | | | (6,770 | ) | | | | | (355,831 | ) |
CarMax, Inc.* | | | (3,350 | ) | | | | | (157,517 | ) |
Coach, Inc. | | | (6,730 | ) | | | | | (377,755 | ) |
Costco Wholesale Corporation | | | (3,310 | ) | | | | | (393,923 | ) |
Dollar Tree, Inc.* | | | (4,340 | ) | | | | | (244,863 | ) |
DSW, Inc. Class A | | | (4,580 | ) | | | | | (195,703 | ) |
Ford Motor Co. | | | (29,420 | ) | | | | | (453,951 | ) |
L Brands, Inc. | | | (3,930 | ) | | | | | (243,070 | ) |
Lowe’s Cos., Inc. | | | (9,340 | ) | | | | | (462,797 | ) |
Lumber Liquidators Holdings, Inc.* | | | (2,340 | ) | | | | | (240,763 | ) |
McDonald’s Corporation | | | (2,520 | ) | | | | | (244,516 | ) |
Nordstrom, Inc. | | | (2,650 | ) | | | | | (163,770 | ) |
NVR, Inc.* | | | (430 | ) | | | | | (441,184 | ) |
Panera Bread Co. Class A* | | | (1,380 | ) | | | | | (243,832 | ) |
PetSmart, Inc. | | | (4,370 | ) | | | | | (317,918 | ) |
Sally Beauty Holdings, Inc.* | | | (5,710 | ) | | | | | (172,613 | ) |
Steven Madden, Ltd.* | | | (4,420 | ) | | | | | (161,728 | ) |
TJX Cos., Inc. | | | (3,080 | ) | | | | | (196,288 | ) |
Twenty-First Century Fox, Inc. | | | (11,980 | ) | | | | | (421,456 | ) |
Under Armour, Inc. Class A* | | | (2,670 | ) | | | | | (233,091 | ) |
Wal-Mart Stores, Inc. | | | (4,140 | ) | | | | | (325,777 | ) |
zulily, Inc. | | | (2,590 | ) | | | | | (107,304 | ) |
| | | | | | | | | | |
| | | | | | | | | (6,739,815 | ) |
| | | | | | | | | | |
| | | | | | | | | | |
| | | Shares | | | Value | |
Consumer Staples — (0.3)% | |
Clorox Co. (The) | | | (6,610 | ) | | | | $ | (613,144 | ) |
ConAgra Foods, Inc. | | | (9,030 | ) | | | | | (304,311 | ) |
General Mills, Inc. | | | (5,630 | ) | | | | | (280,993 | ) |
McCormick & Co., Inc. (Non-Voting Shares) | | | (2,550 | ) | | | | | (175,746 | ) |
Procter & Gamble Co. (The) | | | (3,430 | ) | | | | | (279,236 | ) |
| | | | | | | | | | |
| | | | | | | | | (1,653,430 | ) |
| | | | | | | | | | |
Energy — (0.6)% | |
Chesapeake Energy Corporation | | | (18,300 | ) | | | | | (496,662 | ) |
Continental Resources, Inc.* | | | (1,570 | ) | | | | | (176,656 | ) |
Dresser-Rand Group, Inc.* | | | (3,300 | ) | | | | | (196,779 | ) |
Exxon Mobil Corporation | | | (7,930 | ) | | | | | (802,516 | ) |
Southwestern Energy Co.* | | | (21,480 | ) | | | | | (844,809 | ) |
Swift Energy Co.* | | | (22,930 | ) | | | | | (309,555 | ) |
| | | | | | | | | | |
| | | | | | | | | (2,826,977 | ) |
| | | | | | | | | | |
Financial Services — (1.1)% | |
Amtrust Financial Services, Inc. | | | (4,170 | ) | | | | | (136,317 | ) |
BankUnited, Inc. | | | (11,880 | ) | | | | | (391,090 | ) |
Capital One Financial Corporation | | | (7,360 | ) | | | | | (563,850 | ) |
CBRE Group, Inc. Class A* | | | (21,060 | ) | | | | | (553,878 | ) |
Cohen & Steers Inc | | | (16,010 | ) | | | | | (641,361 | ) |
DiamondRock Hospitality Co. REIT | | | (31,080 | ) | | | | | (358,974 | ) |
FactSet Research Systems, Inc. | | | (1,200 | ) | | | | | (130,296 | ) |
First Republic Bank | | | (12,500 | ) | | | | | (654,375 | ) |
Global Payments, Inc. | | | (5,160 | ) | | | | | (335,348 | ) |
Health Care REIT, Inc. | | | (6,290 | ) | | | | | (336,955 | ) |
People’s United Financial, Inc. | | | (24,620 | ) | | | | | (372,254 | ) |
Sovran Self Storage, Inc. REIT | | | (4,960 | ) | | | | | (323,243 | ) |
Western Union Co. (The) | | | (41,040 | ) | | | | | (707,940 | ) |
| | | | | | | | | | |
| | | | | | | | | (5,505,881 | ) |
| | | | | | | | | | |
Healthcare — (0.8)% | |
AbbVie, Inc. | | | (6,730 | ) | | | | | (355,411 | ) |
Amgen, Inc. | | | (2,060 | ) | | | | | (235,170 | ) |
Arena Pharmaceuticals, Inc.* | | | (26,540 | ) | | | | | (155,259 | ) |
Boston Scientific Corporation* | | | (8,000 | ) | | | | | (96,160 | ) |
Celgene Corporation* | | | (570 | ) | | | | | (96,307 | ) |
Cynosure, Inc.* | | | (5,660 | ) | | | | | (151,009 | ) |
Endologix, Inc.* | | | (3,250 | ) | | | | | (56,680 | ) |
Halozyme Therapeutics, Inc.* | | | (5,260 | ) | | | | | (78,847 | ) |
HMS Holdings Corporation* | | | (8,170 | ) | | | | | (185,704 | ) |
Hologic, Inc.* | | | (6,230 | ) | | | | | (139,241 | ) |
IDEXX Laboratories, Inc.* | | | (1,810 | ) | | | | | (192,530 | ) |
LifePoint Hospitals, Inc.* | | | (2,910 | ) | | | | | (153,764 | ) |
Medtronic, Inc. | | | (4,800 | ) | | | | | (275,472 | ) |
Merck & Co., Inc. | | | (3,780 | ) | | | | | (189,189 | ) |
Neogen Corporation* | | | (1,205 | ) | | | | | (55,068 | ) |
Organovo Holdings, Inc.* | | | (4,180 | ) | | | | | (46,273 | ) |
Pfizer, Inc. | | | (14,680 | ) | | | | | (449,648 | ) |
Quest Diagnostics, Inc. | | | (1,390 | ) | | | | | (74,421 | ) |
Sirona Dental Systems, Inc.* | | | (6,260 | ) | | | | | (439,452 | ) |
UnitedHealth Group, Inc. | | | (1,280 | ) | | | | | (96,384 | ) |
WellPoint, Inc. | | | (3,430 | ) | | | | | (316,898 | ) |
| | | | | | | | | | |
| | | | | | | | | (3,838,887 | ) |
| | | | | | | | | | |
| | | | |
| 174 | | See Notes to Financial Statements. | | |
| | | | | | | | | | |
| | | Shares | | | Value | |
Materials & Processing — (0.3)% | |
Albemarle Corporation | | | (2,080 | ) | | | | $ | (131,851 | ) |
Alcoa, Inc. | | | (21,270 | ) | | | | | (226,100 | ) |
Fastenal Co. | | | (12,780 | ) | | | | | (607,178 | ) |
Reliance Steel & Aluminum Co. | | | (4,210 | ) | | | | | (319,286 | ) |
Schnitzer Steel Industries, Inc. | | | (4,840 | ) | | | | | (158,123 | ) |
| | | | | | | | | | |
| | | | | | | | | (1,442,538 | ) |
| | | | | | | | | | |
Producer Durables — (1.1)% | |
Boeing Co. (The) | | | (950 | ) | | | | | (129,666 | ) |
CH Robinson Worldwide, Inc. | | | (7,740 | ) | | | | | (451,552 | ) |
Control4 Corporation* | | | (6,860 | ) | | | | | (121,422 | ) |
Con-Way, Inc. | | | (7,240 | ) | | | | | (287,500 | ) |
CSX Corporation | | | (17,730 | ) | | | | | (510,092 | ) |
Deere & Co. | | | (1,930 | ) | | | | | (176,267 | ) |
Emerson Electric Co. | | | (6,830 | ) | | | | | (479,329 | ) |
Hub Group, Inc. Class A* | | | (6,770 | ) | | | | | (269,988 | ) |
JB Hunt Transport Services, Inc. | | | (6,330 | ) | | | | | (489,309 | ) |
Kansas City Southern | | | (5,230 | ) | | | | | (647,631 | ) |
Manitowoc Co., Inc. | | | (32,320 | ) | | | | | (753,702 | ) |
Stericycle, Inc.* | | | (1,520 | ) | | | | | (176,578 | ) |
Werner Enterprises, Inc. | | | (29,090 | ) | | | | | (719,396 | ) |
| | | | | | | | | | |
| | | | | | | | | (5,212,432 | ) |
| | | | | | | | | | |
Technology — (0.5)% | |
Informatica Corporation* | | | (3,240 | ) | | | | | (134,460 | ) |
Linear Technology Corporation | | | (2,890 | ) | | | | | (131,640 | ) |
OpenTable, Inc.* | | | (2,200 | ) | | | | | (174,614 | ) |
SanDisk Corporation | | | (3,110 | ) | | | | | (219,379 | ) |
Symantec Corporation | | | (9,570 | ) | | | | | (225,661 | ) |
Tech Data Corporation* | | | (2,620 | ) | | | | | (135,192 | ) |
Texas Instruments, Inc. | | | (3,030 | ) | | | | | (133,047 | ) |
Textura Corporation* | | | (3,660 | ) | | | | | (109,580 | ) |
Twitter, Inc.* | | | (1,370 | ) | | | | | (87,200 | ) |
VeriFone Systems, Inc.* | | | (28,130 | ) | | | | | (754,447 | ) |
Vocera Communications, Inc.* | | | (2,950 | ) | | | | | (46,050 | ) |
| | | | | | | | | | |
| | | | | | | | | (2,151,270 | ) |
| | | | | | | | | | |
Total Common Stocks Sold Short
(Cost $(28,296,842)) | | | | | | (29,371,230 | ) |
| | | | | | | | | | |
FOREIGN COMMON STOCKS SOLD
SHORT — (1.3)% | |
Bermuda — 0.0% | |
Textainer Group Holdings, Ltd. | | | (3,760 | ) | | | | | (151,227 | ) |
| | | | | | | | | | |
Canada — (0.1)% | |
Ultra Petroleum Corporation* | | | (18,230 | ) | | | | | (394,680 | ) |
| | | | | | | | | | |
Cayman Islands — 0.0% | |
Ctrip.com International, Ltd. ADR* | | | (1,740 | ) | | | | | (86,339 | ) |
Herbalife, Ltd. | | | (1,600 | ) | | | | | (125,920 | ) |
| | | | | | | | | | |
| | | | | | | | | (212,259 | ) |
| | | | | | | | | | |
China — (0.1)% | |
China Petroleum & Chemical | | | | | | | | | | |
Corporation Series H | | | (395,690 | ) | | | | | (323,010 | ) |
| | | | | | | | | | |
France — 0.0% | |
Ingenico | | | (2,160 | ) | | | | | (173,392 | ) |
| | | | | | | | | | |
Germany — (0.1)% | |
Fresenius Medical Care AG & Co. KGaA ADR | | | (3,390 | ) | | | | | (120,616 | ) |
Merck KGaA | | | (1,080 | ) | | | | | (193,521 | ) |
| | | | | | | | | | |
| | | | | | | | | (314,137 | ) |
| | | | | | | | | | |
| | | | | | | | | | |
| | | Shares | | | Value | |
Hong Kong — (0.1)% | |
Hong Kong & China Gas Co., Ltd. | | | (149,320 | ) | | | | $ | (342,379 | ) |
Yue Yuen Industrial Holdings, Ltd. | | | (44,380 | ) | | | | | (148,233 | ) |
| | | | | | | | | | |
| | | | | | | | | (490,612 | ) |
| | | | | | | | | | |
Hungary — (0.1)% | |
OTP Bank PLC | | | (20,320 | ) | | | | | (385,563 | ) |
| | | | | | | | | | |
Ireland — (0.1)% | |
Accenture PLC Class A | | | (3,890 | ) | | | | | (319,836 | ) |
Willis Group Holdings PLC | | | (8,040 | ) | | | | | (360,272 | ) |
| | | | | | | | | | |
| | | | | | | | | (680,108 | ) |
| | | | | | | | | | |
Israel — 0.0% | |
Mazor Robotics, Ltd. ADR* | | | (3,790 | ) | | | | | (73,981 | ) |
SodaStream International, Ltd.* | | | (2,910 | ) | | | | | (144,452 | ) |
| | | | | | | | | | |
| | | | | | | | | (218,433 | ) |
| | | | | | | | | | |
Japan — 0.0% | |
Eisai Co., Ltd. | | | (4,840 | ) | | | | | (187,584 | ) |
| | | | | | | | | | |
Mexico — (0.1)% | |
Banregio Grupo Financiero SAB de CV | | | (57,807 | ) | | | | | (343,570 | ) |
| | | | | | | | | | |
Netherlands — (0.2)% | |
Chicago Bridge & Iron Co. NV | | | (4,030 | ) | | | | | (335,054 | ) |
Frank’s International NV | | | (16,150 | ) | | | | | (436,050 | ) |
| | | | | | | | | | |
| | | | | | | | | (771,104 | ) |
| | | | | | | | | | |
Panama — 0.0% | |
Carnival Corporation | | | (2,630 | ) | | | | | (105,647 | ) |
| | | | | | | | | | |
South Africa — (0.1)% | |
Nedbank Group, Ltd. | | | (20,750 | ) | | | | | (415,396 | ) |
| | | | | | | | | | |
Sweden — (0.1)% | |
Volvo AB, B Shares | | | (19,390 | ) | | | | | (255,141 | ) |
| | | | | | | | | | |
Switzerland — (0.1)% | |
Novartis AG ADR | | | (2,950 | ) | | | | | (237,121 | ) |
| | | | | | | | | | |
United Kingdom — (0.1)% | |
Amlin PLC | | | (19,230 | ) | | | | | (146,132 | ) |
Rio Tinto PLC ADR | | | (8,950 | ) | | | | | (505,049 | ) |
| | | | | | | | | | |
| | | | | | | | | (651,181 | ) |
| | | | | | | | | | |
Total Foreign Common Stocks Sold Short
(Cost $(6,158,706)) | | | (6,310,165 | ) |
| | | | | | | | | | |
FOREIGN PREFERRED STOCKS SOLD
SHORT — 0.0% | |
Volkswagen AG
1.76%, 03/13/14
(Cost $(156,946)) | | | (650 | ) | | | | | (182,553 | ) |
| | | | | | | | | | |
EXCHANGE TRADED FUNDS SOLD
SHORT — (2.3)% | |
Consumer Staples Select Sector SPDR Fund | | | (15,980 | ) | | | | | (686,820 | ) |
CurrencyShares Euro Trust* | | | (1,020 | ) | | | | | (138,710 | ) |
Health Care Select Sector SPDR Fund | | | (8,410 | ) | | | | | (466,250 | ) |
iShares Core S&P Small-Cap ETF | | | (11,090 | ) | | | | | (1,211,139 | ) |
iShares Nasdaq Biotechnology ETF | | | (4,250 | ) | | | | | (965,005 | ) |
iShares Russell 2000 Growth ETF | | | (12,980 | ) | | | | | (1,758,920 | ) |
iShares Russell 2000 ETF | | | (15,250 | ) | | | | | (1,758,478 | ) |
Market Vectors Biotech ETF | | | (4,090 | ) | | | | | (362,047 | ) |
| | | | |
| | See Notes to Financial Statements. | | 175 |
DEFENSIVE MARKET STRATEGIES FUND
SCHEDULE OF INVESTMENTS (Continued)
| | | | | | | | | | |
| | | Shares | | | Value | |
Market Vectors Oil Service ETF | | | (5,860 | ) | | | | $ | (281,690 | ) |
Market Vectors Pharmaceutical ETF | | | (10,090 | ) | | | | | (535,880 | ) |
SPDR S&P 500 ETF Trust | | | (14,120 | ) | | | | | (2,607,540 | ) |
SPDR S&P Retail ETF | | | (4,160 | ) | | | | | (366,496 | ) |
| | | | | | | | | | |
Total Exchange Traded Funds Sold Short
(Cost $(10,384,879)) | | | (11,138,975 | ) |
| | | | | | | | | | |
TOTAL SECURITIES SOLD
SHORT — (9.7)%
(Cost $(44,997,373)) | | | (47,002,923 | ) |
| | | | | | | | | | |
| | | |
| | | Number of
Contracts | | | | | | |
WRITTEN OPTIONS — 0.0% | |
Cobalt International Energy, Inc., | | | | | | | | | | |
Strike Price $35.00, | | | | | | | | | | |
Expires 01/18/14 (RJ) | | | (55 | ) | | | | | (275 | ) |
Cobalt International Energy, Inc., | | | | | | | | | | |
Strike Price $35.00, | | | | | | | | | | |
Expires 01/18/14 (KS) | | | (326 | ) | | | | | (1,630 | ) |
Cobalt International Energy, Inc., | | | | | | | | | | |
Strike Price $37.50, | | | | | | | | | | |
Expires 01/18/14 (KS) | | | (307 | ) | | | | | (1,535 | ) |
| | | | | | | | | | |
Total Written Options
(Premiums received $(32,881)) | | | (3,440 | ) |
| | | | | | | | | | |
Other Assets in Excess of
Liabilities — (12.1)% | | | (58,815,475 | ) |
| | | | | | | | | | |
NET ASSETS — 100.0% | | | | | | | | $ | 484,707,010 | |
| | | | | | | | | | |
| | | | |
| 176 | | See Notes to Financial Statements. | | |
VALUATION HIERARCHY
The following is a summary of the inputs used, as of December 31, 2013, in valuing the Fund’s investments carried at fair value:
| | | | | | | | | | | | | | | | | | | | |
| | | Total
Value | | Level 1
Quoted Prices | | Level 2
Other Significant
Observable Inputs | | Level 3
Significant
Unobservable Inputs |
Assets: | | | | | | | | | | | | | | | | | | | | |
Investments in Securities: | | | | | | | | | | | | | | | | | | | | |
Common Stocks | | | $ | 273,572,687 | | | | $ | 273,572,687 | | | | $ | — | | | | $ | — | |
Corporate Bonds | | | | 110,412,930 | | | | | — | | | | | 107,388,436 | | | | | 3,024,494 | |
Foreign Bonds | | | | 4,568,651 | | | | | — | | | | | 4,568,651 | | | | | — | |
Foreign Common Stocks: | | | | | | | | | | | | | | | | | | | | |
Australia | | | | 684,046 | | | | | 684,046 | | | | | — | | | | | — | |
Austria | | | | 268,702 | | | | | 268,702 | | | | | — | | | | | — | |
Bermuda | | | | 1,973,723 | | | | | 1,973,723 | | | | | — | | | | | — | |
Brazil | | | | 485,812 | | | | | 485,812 | | | | | — | | | | | — | |
British Virgin Islands | | | | 497,568 | | | | | 497,568 | | | | | — | | | | | — | |
Canada | | | | 3,899,578 | | | | | 3,899,578 | | | | | — | | | | | — | |
Cayman Islands | | | | 818,893 | | | | | 818,893 | | | | | — | | | | | — | |
China | | | | 305,085 | | | | | 305,085 | | | | | — | | | | | — | |
France | | | | 3,130,364 | | | | | — | | | | | 3,130,364 | | | | | — | |
Germany | | | | 196,495 | | | | | 196,495 | | | | | — | | | | | — | |
Hong Kong | | | | 404,892 | | | | | 404,892 | | | | | — | | | | | — | |
Ireland | | | | 2,248,969 | | | | | 2,248,969 | | | | | — | | | | | — | |
Japan | | | | 330,217 | | | | | — | | | | | 330,217 | | | | | — | |
Mexico | | | | 262,754 | | | | | 262,754 | | | | | — | | | | | — | |
Netherlands | | | | 565,713 | | | | | 241,133 | | | | | 324,580 | | | | | — | |
Philippines | | | | 364,027 | | | | | — | | | | | 364,027 | | | | | — | |
Singapore | | | | 198,866 | | | | | 198,866 | | | | | — | | | | | — | |
Sweden | | | | 173,154 | | | | | — | | | | | 173,154 | | | | | — | |
Switzerland | | | | 3,806,206 | | | | | 3,111,092 | | | | | 695,114 | | | | | — | |
United Kingdom | | | | 2,170,138 | | | | | 2,170,138 | | | | | — | | | | | — | |
Master Limited Partnership | | | | 1,266,399 | | | | | 1,266,399 | | | | | — | | | | | — | |
Money Market Funds | | | | 148,897,863 | | | | | 148,897,863 | | | | | — | | | | | — | |
Preferred Stocks | | | | 26,903,469 | | | | | 19,035,869 | | | | | — | | | | | 7,867,600 | |
Purchased Options | | | | 17,955 | | | | | 17,955 | | | | | — | | | | | — | |
Synthetic Convertible Instruments | | | | 2,103,692 | | | | | — | | | | | — | | | | | 2,103,692 | |
| | | | | | | | | | | | | | | | | | | | |
Total Assets - Investments in Securities | | | $ | 590,528,848 | | | | $ | 460,558,519 | | | | $ | 116,974,543 | | | | $ | 12,995,786 | |
| | | | | | | | | | | | | | | | | | | | |
| | | | |
Other Financial Instruments*** | | | | | | | | | | | | | | | | | | | | |
Futures Contracts | | | $ | 840,099 | | | | $ | 840,099 | | | | $ | — | | | | $ | — | |
| | | | | | | | | | | | | | | | | | | | |
Total Assets - Other Financial Instruments | | | $ | 840,099 | | | | $ | 840,099 | | | | $ | — | | | | $ | — | |
| | | | | | | | | | | | | | | | | | | | |
| | | | |
| | See Notes to Financial Statements. | | 177 |
DEFENSIVE MARKET STRATEGIES FUND
SCHEDULE OF INVESTMENTS (Continued)
| | | | | | | | | | | | | | | | | | | | |
| | | Total
Value | | Level 1
Quoted Prices | | Level 2
Other Significant
Observable Inputs | | Level 3
Significant
Unobservable Inputs |
Liabilities: | | | | | | | | | | | | | | | | | | | | |
Investments in Securities: | | | | | | | | | | | | | | | | | | | | |
Common Stocks Sold Short | | | $ | (29,371,230 | ) | | | $ | (29,371,230 | ) | | | $ | — | | | | $ | — | |
Exchange Traded Funds Sold Short | | | | (11,138,975 | ) | | | | (11,138,975 | ) | | | | — | | | | | — | |
Foreign Common Stocks Sold Short: | | | | | | | | | | | | | | | | | | | | |
Bermuda | | | | (151,227 | ) | | | | (151,227 | ) | | | | — | | | | | — | |
Canada | | | | (394,680 | ) | | | | (394,680 | ) | | | | — | | | | | — | |
Cayman Islands | | | | (212,259 | ) | | | | (212,259 | ) | | | | — | | | | | — | |
China | | | | (323,010 | ) | | | | (323,010 | ) | | | | — | | | | | — | |
France | | | | (173,392 | ) | | | | — | | | | | (173,392 | ) | | | | — | |
Germany | | | | (314,137 | ) | | | | (314,137 | ) | | | | — | | | | | — | |
Hong Kong | | | | (490,612 | ) | | | | (490,612 | ) | | | | — | | | | | — | |
Hungary | | | | (385,563 | ) | | | | (385,563 | ) | | | | — | | | | | — | |
Ireland | | | | (680,108 | ) | | | | (680,108 | ) | | | | — | | | | | — | |
Israel | | | | (218,433 | ) | | | | (218,433 | ) | | | | — | | | | | — | |
Japan | | | | (187,584 | ) | | | | — | | | | | (187,584 | ) | | | | — | |
Mexico | | | | (343,570 | ) | | | | (343,570 | ) | | | | — | | | | | — | |
Netherlands | | | | (771,104 | ) | | | | (771,104 | ) | | | | — | | | | | — | |
Panama | | | | (105,647 | ) | | | | (105,647 | ) | | | | — | | | | | — | |
South Africa | | | | (415,396 | ) | | | | (415,396 | ) | | | | — | | | | | — | |
Sweden | | | | (255,141 | ) | | | | — | | | | | (255,141 | ) | | | | — | |
Switzerland | | | | (237,121 | ) | | | | (237,121 | ) | | | | — | | | | | — | |
United Kingdom | | | | (651,181 | ) | | | | (651,181 | ) | | | | — | | | | | — | |
Foreign Preferred Stocks Sold Short | | | | (182,553 | ) | | | | (182,553 | ) | | | | — | | | | | — | |
Written Options | | | | (3,440 | ) | | | | (3,440 | ) | | | | — | | | | | — | |
| | | | | | | | | | | | | | | | | | | | |
Total Liabilities - Investments in Securities | | | $ | (47,006,363 | ) | | | $ | (46,390,246 | ) | | | $ | (616,117 | ) | | | $ | — | |
| | | | | | | | | | | | | | | | | | | | |
| | | | |
Other Financial Instruments*** | | | | | | | | | | | | | | | | | | | | |
Forward Foreign Currency Contracts | | | $ | (31,629 | ) | | | $ | — | | | | $ | (31,629 | ) | | | $ | — | |
| | | | | | | | | | | | | | | | | | | | |
Total Liabilities - Other Financial Instruments | | | $ | (31,629 | ) | | | $ | — | | | | $ | (31,629 | ) | | | $ | — | |
| | | | | | | | | | | | | | | | | | | | |
***Other financial instruments are derivative instruments not reflected in the Schedule of Investments, such as futures, forwards and swap contracts, which are valued at the unrealized appreciation (depreciation) on the investment. Details of these investments can be found in the Notes to Financial Statements.
Management has determined that the amount of transfers between Level 1 and Level 2 compared to total net assets of the Funds is not material, therefore, the transfers between Level 1 and Level 2 are not shown for the the year ended December 31, 2013.
The unobservable inputs used in the fair value measurement of the reporting entity’s corporate bonds, preferred stock and synthetic convertible instruments are values based on evaluated quotations received from dealers who make markets in such securities. Significant increases (decreases) in those evaluated quotations would result in a significantly higher (lower) fair value measurement.
| | | | |
| 178 | | See Notes to Financial Statements. | | |
The following is a reconciliation of assets in which significant unobservable inputs (Level 3) were used in determining fair value:
| | | | | | | | | | | | | | | | |
| | | Total
Value | | | Corporate
Bonds | | | Preferred
Stock | | | Synthetic
Convertible
Instruments | |
Balance, 12/31/12 | | $ | 17,105,649 | | | $ | 9,279,529 | | | $ | 6,358,975 | | | $ | 1,467,145 | |
Accrued discounts/premiums | | | 33,590 | | | | 33,590 | | | | — | | | | — | |
Realized gain (loss)(1) | | | 925,088 | | | | 450,835 | | | | 435,997 | | | | 38,256 | |
Change in unrealized appreciation (depreciation)(2) | | | (1,301,122 | ) | | | (249,904 | ) | | | (998,636 | ) | | | (52,582 | ) |
Purchases | | | 8,089,072 | | | | 1,525,842 | | | | 4,415,237 | | | | 2,147,993 | |
Sales | | | (11,162,721 | ) | | | (8,015,398 | ) | | | (2,343,973 | ) | | | (803,350 | ) |
Transfers in to Level 3 | | | — | | | | — | | | | — | | | | — | |
Transfers out of Level 3(3) | | | (693,770 | ) | | | — | | | | — | | | | (693,770 | ) |
Maturities | | | — | | | | — | | | | — | | | | — | |
Paydowns | | | — | | | | — | | | | — | | | | — | |
| | | | | | | | | | | | | | | | |
Balance, 12/31/13 | | $ | 12,995,786 | | | $ | 3,024,494 | | | $ | 7,867,600 | | | $ | 2,103,692 | |
| | | | | | | | | | | | | | | | |
| (1) | Realized gain (loss) from the sale of Level 3 securities can be found on the Statement of Operations in Net realized gain (loss) from: Investment securities. |
| (2) | Change in unrealized appreciation (depreciation) can be found on the Statement of Operations in Net change in unrealized appreciation (depreciation) on: Investment securities. |
| (3) | Transfers out of Level 3 represent the value of securities at December 31, 2013 that were transferred from Level 3 to Level 2 of the fair value hierarchy as a result of the ability of the Fund to obtain a price which was determined using observable inputs. |
| | | | |
| | See Notes to Financial Statements. | | 179 |
Equity Index Fund (Unaudited)
The Fund was passively managed and benchmarked against the S&P 500® Index. The Fund was comprised of domestic, large-cap equity stocks with both value- and growth-style orientations. The objective of the Fund was to provide investment results approximating the aggregate price and dividend performance of the securities included in the S&P 500® Index. The GS4 Class of the Fund returned 31.95% for the one-year period ended December 31, 2013, as compared to a 32.39% return for the S&P 500® Index. The return differential was primarily a result of expenses of the Fund.
This Fund may be suitable for investors who seek higher, long-term rates of return, can accept significant short-term fluctuations in account value and want to diversify their portfolio by adding a potentially higher return, higher risk option of stocks.
At December 31, 2013, the portfolio holdings of the Fund, as a percentage of net assets, is shown in the following table. Portfolio holdings are subject to risk and may change at any time.
| | | | |
| | | % | |
Financial Services | | | 16.9 | |
Technology | | | 15.6 | |
Consumer Discretionary | | | 13.4 | |
Healthcare | | | 12.1 | |
Money Market Funds | | | 10.5 | |
Producer Durables | | | 10.4 | |
Energy | | | 9.2 | |
Consumer Staples | | | 6.6 | |
Utilities | | | 5.0 | |
Materials & Processing | | | 3.6 | |
Foreign Common Stocks | | | 3.4 | |
U.S. Treasury Obligation | | | 0.2 | |
Rights/Warrants | | | — | ** |
| | | | |
| | | 106.9 | |
| | | | |
| ** | Rounds to less than 0.005%. |
180
Equity Index Fund (Unaudited)
| | | | | | | | | | |
| Average Annual Total Returns as of 12/31/13 |
| | | GS2 Class* | | | | GS4 Class* | | | | Benchmark** |
One Year | | 32.04% | | | | 31.95% | | | | 32.39% |
Five Year | | 17.98% | | | | 17.81% | | | | 17.94% |
Ten Year | | 7.26% | | | | 7.10% | | | | 7.41% |
Inception Date | | 08/27/01 | | | | 08/27/01 | | | | |
Total Fund Operating Expenses (May 1, 2013 Prospectus, as amended on October 31, 2013)(1) | | 0.25% | | | | 0.50% | | | | |
(1)Current information regarding the Fund’s Operating Expenses can be found in the Financial Highlights.
The performance data quoted represents past performance and does not guarantee future results. Current performance may be lower or higher. Performance data current to the most recent month-end may be obtained at www.GuideStoneFunds.org. The investment return and principal value of an investment will fluctuate so that shares, when redeemed, may be worth more or less than their original cost.
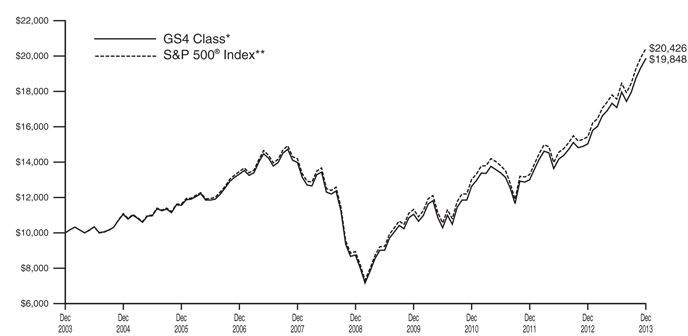
The graph compares the results of a hypothetical $10,000 investment in the GS4 Class of the Fund for the 10-year period from December 31, 2003 to December 31, 2013, with all dividends and capital gains reinvested, with the S&P 500® Index.
*These returns reflect expense waivers by the Fund’s investment adviser. Without these waivers, returns would have been lower. Returns shown do not reflect the deduction of taxes that a shareholder would pay on Fund distributions or the redemption of Fund shares.
Unlike a mutual fund, the performance of an index assumes no taxes, transaction costs, management fees or other expenses.
181
| | |
EQUITY INDEX FUND SCHEDULE OF INVESTMENTS | | December 31, 2013 |
| | | | | | | | | | |
| | | Shares | | | Value | |
COMMON STOCKS — 92.8% | |
Consumer Discretionary — 13.4% | |
Amazon.com, Inc.* | | | 7,900 | | | | | $ | 3,150,441 | |
AutoNation, Inc.* | | | 1,371 | | | | | | 68,125 | |
AutoZone, Inc.D* | | | 725 | | | | | | 346,506 | |
Avon Products, Inc. | | | 9,006 | | | | | | 155,083 | |
Bed Bath & Beyond, Inc.* | | | 4,510 | | | | | | 362,153 | |
Best Buy Co., Inc. | | | 5,859 | | | | | | 233,657 | |
BorgWarner, Inc.D | | | 4,800 | | | | | | 268,368 | |
Cablevision Systems Corporation Class AD | | | 4,693 | | | | | | 84,145 | |
CarMax, Inc.D* | | | 4,833 | | | | | | 227,248 | |
CBS Corporation Class B | | | 11,814 | | | | | | 753,024 | |
Chipotle Mexican Grill, Inc.* | | | 660 | | | | | | 351,635 | |
Coach, Inc.D | | | 5,881 | | | | | | 330,101 | |
Comcast Corporation Class A | | | 55,499 | | | | | | 2,884,006 | |
Costco Wholesale Corporation | | | 9,324 | | | | | | 1,109,649 | |
D.R. Horton, Inc.D | | | 5,917 | | | | | | 132,067 | |
Darden Restaurants, Inc.D | | | 2,708 | | | | | | 147,234 | |
DIRECTV* | | | 10,403 | | | | | | 718,743 | |
Discovery Communications, Inc. Class A* | | | 4,752 | | | | | | 429,676 | |
Dollar General Corporation* | | | 6,184 | | | | | | 373,019 | |
Dollar Tree, Inc.* | | | 4,518 | | | | | | 254,906 | |
eBay, Inc.* | | | 24,881 | | | | | | 1,365,718 | |
Estee Lauder Cos., Inc. (The) Class A | | | 5,401 | | | | | | 406,803 | |
Expedia, Inc.D | | | 2,121 | | | | | | 147,749 | |
Family Dollar Stores, Inc.D | | | 2,045 | | | | | | 132,864 | |
Ford Motor Co. | | | 84,125 | | | | | | 1,298,049 | |
Fossil Group, Inc.* | | | 1,078 | | | | | | 129,295 | |
GameStop Corporation Class AD | | | 2,459 | | | | | | 121,130 | |
Gannett Co., Inc. | | | 4,845 | | | | | | 143,315 | |
Gap, Inc. (The) | | | 5,603 | | | | | | 218,965 | |
General Motors Co.* | | | 24,202 | | | | | | 989,136 | |
Genuine Parts Co.D | | | 3,300 | | | | | | 274,527 | |
Goodyear Tire & Rubber Co. (The) | | | 5,261 | | | | | | 125,475 | |
Graham Holdings, Co. Class B* | | | 100 | | | | | | 66,332 | |
H&R Block, Inc. | | | 5,973 | | | | | | 173,456 | |
Harley-Davidson, Inc. | | | 4,769 | | | | | | 330,206 | |
Harman International | | | | | | | | | | |
Industries, Inc. | | | 1,495 | | | | | | 122,366 | |
Hasbro, Inc.D | | | 2,508 | | | | | | 137,965 | |
Home Depot, Inc. (The) | | | 29,993 | | | | | | 2,469,624 | |
Interpublic Group of Cos., Inc. (The) | | | 8,747 | | | | | | 154,822 | |
Johnson Controls, Inc. | | | 14,611 | | | | | | 749,544 | |
Kohl’s CorporationD | | | 4,336 | | | | | | 246,068 | |
L Brands, Inc. | | | 5,256 | | | | | | 325,084 | |
Leggett & Platt, Inc.D | | | 3,123 | | | | | | 96,626 | |
Lennar Corporation Class AD | | | 3,691 | | | | | | 146,016 | |
Lowe’s Cos., Inc. | | | 22,230 | | | | | | 1,101,496 | |
Macy’s, Inc. | | | 7,838 | | | | | | 418,549 | |
Marriott International, Inc. Class A | | | 4,701 | | | | | | 232,041 | |
Mattel, Inc.D | | | 7,116 | | | | | | 338,579 | |
McDonald’s Corporation | | | 21,216 | | | | | | 2,058,588 | |
McGraw Hill Financial, Inc. | | | 5,745 | | | | | | 449,259 | |
Mohawk Industries, Inc.* | | | 1,284 | | | | | | 191,188 | |
Netflix, Inc.* | | | 1,270 | | | | | | 467,576 | |
Newell Rubbermaid, Inc. | | | 5,983 | | | | | | 193,909 | |
| | | | | | | | | | |
| | | Shares | | | Value | |
News Corporation Class A* | | | 10,703 | | | | | $ | 192,868 | |
NIKE, Inc. Class B | | | 15,942 | | | | | | 1,253,679 | |
Nordstrom, Inc.D | | | 3,020 | | | | | | 186,636 | |
Omnicom Group, Inc. | | | 5,489 | | | | | | 408,217 | |
O’Reilly Automotive, Inc.* | | | 2,282 | | | | | | 293,716 | |
PetSmart, Inc.D | | | 2,271 | | | | | | 165,215 | |
priceline.com, Inc.* | | | 1,098 | | | | | | 1,276,315 | |
PulteGroup, Inc.D | | | 7,550 | | | | | | 153,793 | |
PVH Corporation | | | 1,723 | | | | | | 234,362 | |
Ralph Lauren Corporation | | | 1,259 | | | | | | 222,302 | |
Ross Stores, Inc. | | | 4,613 | | | | | | 345,652 | |
Scripps Networks Interactive, Inc. Class AD | | | 2,307 | | | | | | 199,348 | |
Staples, Inc.D | | | 14,101 | | | | | | 224,065 | |
Starbucks Corporation | | | 16,035 | | | | | | 1,256,984 | |
Starwood Hotels & Resorts Worldwide, Inc. | | | 4,024 | | | | | | 319,707 | |
Target Corporation | | | 13,480 | | | | | | 852,880 | |
Tiffany & Co. | | | 2,342 | | | | | | 217,291 | |
Time Warner Cable, Inc. | | | 6,002 | | | | | | 813,271 | |
Time Warner, Inc. | | | 19,261 | | | | | | 1,342,877 | |
TJX Cos., Inc. | | | 15,091 | | | | | | 961,749 | |
TripAdvisor, Inc.D* | | | 2,314 | | | | | | 191,669 | |
Twenty-First Century Fox, Inc. Class A | | | 41,761 | | | | | | 1,469,152 | |
Urban Outfitters, Inc.* | | | 2,209 | | | | | | 81,954 | |
VF CorporationD | | | 7,540 | | | | | | 470,044 | |
Wal-Mart Stores, Inc. | | | 34,492 | | | | | | 2,714,175 | |
Walt Disney Co. (The) | | | 34,810 | | | | | | 2,659,484 | |
Whirlpool Corporation | | | 1,681 | | | | | | 263,682 | |
Wyndham Worldwide Corporation | | | 2,789 | | | | | | 205,521 | |
Yum! Brands, Inc. | | | 9,529 | | | | | | 720,488 | |
| | | | | | | | | | |
| | | | | | | | | 47,899,202 | |
| | | | | | | | | | |
Consumer Staples — 6.6% | |
Archer-Daniels-Midland Co. | | | 14,075 | | | | | | 610,855 | |
Campbell Soup Co. | | | 3,715 | | | | | | 160,785 | |
Clorox Co. (The)D | | | 2,785 | | | | | | 258,337 | |
Coca-Cola Co. (The) | | | 80,919 | | | | | | 3,342,764 | |
Coca-Cola Enterprises, Inc. | | | 5,260 | | | | | | 232,124 | |
Colgate-Palmolive Co. | | | 18,694 | | | | | | 1,219,036 | |
ConAgra Foods, Inc. | | | 9,053 | | | | | | 305,086 | |
CVS Caremark Corporation | | | 25,349 | | | | | | 1,814,228 | |
Dr. Pepper Snapple Group, Inc. | | | 4,366 | | | | | | 212,711 | |
General Mills, Inc. | | | 13,493 | | | | | | 673,436 | |
Hershey Co. (The) | | | 3,179 | | | | | | 309,094 | |
Hormel Foods CorporationD | | | 2,830 | | | | | | 127,831 | |
J.M. Smucker Co. (The) | | | 2,202 | | | | | | 228,171 | |
Kellogg Co.D | | | 5,549 | | | | | | 338,877 | |
Kimberly-Clark Corporation | | | 8,090 | | | | | | 845,081 | |
Kraft Foods Group, Inc. | | | 12,743 | | | | | | 687,103 | |
Kroger Co. (The) | | | 11,119 | | | | | | 439,534 | |
McCormick & Co., Inc. (Non-Voting Shares)D | | | 2,754 | | | | | | 189,806 | |
Mead Johnson Nutrition Co. | | | 4,276 | | | | | | 358,158 | |
Mondelez International, Inc. Class A | | | 37,334 | | | | | | 1,317,890 | |
Monster Beverage Corporation* | | | 2,821 | | | | | | 191,179 | |
PepsiCo, Inc. | | | 32,650 | | | | | | 2,707,991 | |
Procter & Gamble Co. (The) | | | 57,899 | | | | | | 4,713,558 | |
Safeway, Inc. | | | 5,326 | | | | | | 173,468 | |
Sysco CorporationD | | | 12,289 | | | | | | 443,633 | |
Tyson Foods, Inc. Class AD | | | 5,766 | | | | | | 192,930 | |
Walgreen Co. | | | 18,552 | | | | | | 1,065,627 | |
| | | | |
| 182 | | See Notes to Financial Statements. | | |
| | | | | | | | | | |
| | | Shares | | | Value | |
Whole Foods Market, Inc. | | | 7,859 | | | | | $ | 454,486 | |
| | | | | | | | | | |
| | | | | | | | | 23,613,779 | |
| | | | | | | | | | |
Energy — 9.2% | | | | | | | | | | |
Anadarko Petroleum Corporation | | | 10,722 | | | | | | 850,469 | |
Apache Corporation | | | 8,494 | | | | | | 729,974 | |
Baker Hughes, Inc. | | | 9,436 | | | | | | 521,433 | |
Cabot Oil & Gas Corporation | | | 8,963 | | | | | | 347,406 | |
Cameron International Corporation* | | | 5,058 | | | | | | 301,103 | |
Chesapeake Energy CorporationD | | | 10,676 | | | | | | 289,747 | |
Chevron Corporation | | | 40,958 | | | | | | 5,116,064 | |
ConocoPhillips | | | 26,085 | | | | | | 1,842,905 | |
CONSOL Energy, Inc. | | | 5,000 | | | | | | 190,200 | |
Denbury Resources, Inc.* | | | 7,628 | | | | | | 125,328 | |
Devon Energy Corporation | | | 8,137 | | | | | | 503,436 | |
Diamond Offshore Drilling, Inc.D | | | 1,404 | | | | | | 79,916 | |
EOG Resources, Inc. | | | 5,806 | | | | | | 974,479 | |
EQT Corporation | | | 3,201 | | | | | | 287,386 | |
Exterran Holdings, Inc.* | | | 13 | | | | | | 445 | |
Exxon Mobil Corporation | | | 93,038 | | | | | | 9,415,446 | |
First Solar, Inc.* | | | 1,556 | | | | | | 85,020 | |
FMC Technologies, Inc.* | | | 5,099 | | | | | | 266,219 | |
Halliburton Co. | | | 17,998 | | | | | | 913,398 | |
Helmerich & Payne, Inc. | | | 2,333 | | | | | | 196,159 | |
Hess Corporation | | | 6,024 | | | | | | 499,992 | |
Kinder Morgan, Inc.D | | | 14,488 | | | | | | 521,568 | |
Marathon Oil Corporation | | | 14,810 | | | | | | 522,793 | |
Marathon Petroleum Corporation | | | 6,405 | | | | | | 587,531 | |
Murphy Oil Corporation | | | 3,685 | | | | | | 239,083 | |
National Oilwell Varco, Inc. | | | 9,107 | | | | | | 724,280 | |
Newfield Exploration Co.* | | | 2,688 | | | | | | 66,205 | |
Noble Energy, Inc. | | | 7,714 | | | | | | 525,400 | |
Occidental Petroleum Corporation | | | 17,181 | | | | | | 1,633,913 | |
Peabody Energy Corporation | | | 5,661 | | | | | | 110,559 | |
Phillips 66 | | | 12,760 | | | | | | 984,179 | |
Pioneer Natural Resources Co. | | | 3,032 | | | | | | 558,100 | |
QEP Resources, Inc.D | | | 3,912 | | | | | | 119,903 | |
Range Resources Corporation | | | 3,446 | | | | | | 290,532 | |
Southwestern Energy Co.* | | | 7,482 | | | | | | 294,267 | |
Spectra Energy Corporation | | | 14,350 | | | | | | 511,147 | |
Tesoro Corporation | | | 2,764 | | | | | | 161,694 | |
Valero Energy Corporation | | | 11,567 | | | | | | 582,977 | |
Williams Cos., Inc. (The)D | | | 14,574 | | | | | | 562,119 | |
WPX Energy, Inc.* | | | 4,056 | | | | | | 82,661 | |
| | | | | | | | | | |
| | | | | | | | | 32,615,436 | |
| | | | | | | | | | |
Financial Services — 16.9% | |
Aflac, Inc. | | | 9,939 | | | | | | 663,925 | |
Alliance Data Systems Corporation* | | | 1,029 | | | | | | 270,555 | |
Allstate Corporation (The) | | | 9,640 | | | | | | 525,766 | |
American Express Co. | | | 19,612 | | | | | | 1,779,397 | |
American International Group, Inc. | | | 31,317 | | | | | | 1,598,733 | |
American Tower Corporation REIT | | | 8,416 | | | | | | 671,765 | |
Ameriprise Financial, Inc. | | | 4,111 | | | | | | 472,971 | |
| | | | | | | | | | |
| | | Shares | | | Value | |
Apartment Investment & Management Co. Class A REITD | | | 3,208 | | | | | $ | 83,119 | |
Assurant, Inc. | | | 1,564 | | | | | | 103,803 | |
AvalonBay Communities, Inc. REIT | | | 2,565 | | | | | | 303,260 | |
Bank of America Corporation | | | 227,141 | | | | | | 3,536,585 | |
Bank of New York Mellon Corporation (The) | | | 24,612 | | | | | | 859,943 | |
BB&T Corporation | | | 15,085 | | | | | | 562,972 | |
Berkshire Hathaway, Inc. Class B* | | | 38,347 | | | | | | 4,546,420 | |
BlackRock, Inc. | | | 2,690 | | | | | | 851,304 | |
Boston Properties, Inc. REIT | | | 3,296 | | | | | | 330,820 | |
Capital One Financial Corporation | | | 12,284 | | | | | | 941,077 | |
CBRE Group, Inc. Class A* | | | 5,812 | | | | | | 152,856 | |
Charles Schwab Corporation (The) | | | 24,816 | | | | | | 645,216 | |
Chubb Corporation (The) | | | 5,348 | | | | | | 516,777 | |
Cincinnati Financial CorporationD | | | 3,098 | | | | | | 162,242 | |
Citigroup, Inc. | | | 64,584 | | | | | | 3,365,472 | |
CME Group, Inc. | | | 6,749 | | | | | | 529,527 | |
Comerica, Inc. | | | 3,797 | | | | | | 180,509 | |
Discover Financial Services | | | 10,116 | | | | | | 565,990 | |
Dun & Bradstreet Corporation (The)D | | | 779 | | | | | | 95,622 | |
E*TRADE Financial Corporation* | | | 5,845 | | | | | | 114,796 | |
Equifax, Inc. | | | 2,524 | | | | | | 174,383 | |
Equity Residential REIT | | | 7,231 | | | | | | 375,072 | |
Fidelity National Information Services, Inc. | | | 6,242 | | | | | | 335,071 | |
Fifth Third BancorpD | | | 19,043 | | | | | | 400,474 | |
Fiserv, Inc.* | | | 5,482 | | | | | | 323,712 | |
Franklin Resources, Inc. | | | 8,696 | | | | | | 502,020 | |
General Growth Properties, Inc. REIT | | | 11,348 | | | | | | 227,754 | |
Genworth Financial, Inc. Class A* | | | 10,589 | | | | | | 164,447 | |
Goldman Sachs Group, Inc. (The) | | | 8,983 | | | | | | 1,592,327 | |
Hartford Financial Services Group, Inc. | | | 9,600 | | | | | | 347,808 | |
HCP, Inc. REIT | | | 9,684 | | | | | | 351,723 | |
Health Care REIT, Inc. | | | 6,199 | | | | | | 332,080 | |
Host Hotels & Resorts, Inc. REIT | | | 15,936 | | | | | | 309,796 | |
Hudson City Bancorp, Inc. | | | 10,419 | | | | | | 98,251 | |
Huntington Bancshares, Inc.D | | | 18,206 | | | | | | 175,688 | |
IntercontinentalExchange Group, Inc.* | | | 2,435 | | | | | | 547,680 | |
JPMorgan Chase & Co. | | | 80,050 | | | | | | 4,681,324 | |
KeyCorp | | | 19,129 | | | | | | 256,711 | |
Kimco Realty Corporation REIT | | | 8,531 | | | | | | 168,487 | |
Legg Mason, Inc.D | | | 2,303 | | | | | | 100,135 | |
Leucadia National Corporation | | | 6,709 | | | | | | 190,133 | |
Lincoln National Corporation | | | 5,649 | | | | | | 291,601 | |
Loews Corporation | | | 6,485 | | | | | | 312,836 | |
M&T Bank CorporationD | | | 2,759 | | | | | | 321,203 | |
Macerich Co. (The) REIT | | | 2,946 | | | | | | 173,490 | |
Marsh & McLennan Cos., Inc. | | | 11,598 | | | | | | 560,879 | |
Mastercard, Inc. Class A | | | 2,201 | | | | | | 1,838,848 | |
MetLife, Inc. | | | 23,890 | | | | | | 1,288,149 | |
| | | | |
| | See Notes to Financial Statements. | | 183 |
EQUITY INDEX FUND
SCHEDULE OF INVESTMENTS (Continued)
| | | | | | | | | | |
| | | Shares | | | Value | |
Moody’s Corporation | | | 3,997 | | | | | $ | 313,645 | |
Morgan Stanley | | | 29,361 | | | | | | 920,761 | |
NASDAQ OMX Group, Inc. (The) | | | 2,549 | | | | | | 101,450 | |
Northern Trust Corporation | | | 4,750 | | | | | | 293,978 | |
People’s United Financial, Inc.D | | | 7,109 | | | | | | 107,488 | |
Plum Creek Timber Co., Inc. REITD | | | 3,689 | | | | | | 171,575 | |
PNC Financial Services Group, Inc. (The) | | | 11,311 | | | | | | 877,507 | |
Principal Financial Group, Inc. | | | 5,931 | | | | | | 292,458 | |
Progressive Corporation (The) | | | 11,815 | | | | | | 322,195 | |
Prologis, Inc. REIT | | | 10,494 | | | | | | 387,753 | |
Prudential Financial, Inc. | | | 9,912 | | | | | | 914,085 | |
Public Storage REIT | | | 3,103 | | | | | | 467,064 | |
Regions Financial Corporation | | | 29,089 | | | | | | 287,690 | |
Simon Property Group, Inc. REIT | | | 6,602 | | | | | | 1,004,560 | |
SLM Corporation | | | 9,451 | | | | | | 248,372 | |
State Street Corporation | | | 9,328 | | | | | | 684,582 | |
SunTrust Banks, Inc. | | | 11,348 | | | | | | 417,720 | |
T Rowe Price Group, Inc. | | | 5,570 | | | | | | 466,599 | |
Torchmark CorporationD | | | 1,902 | | | | | | 148,641 | |
Total System Services, Inc. | | | 3,427 | | | | | | 114,051 | |
Travelers Cos., Inc. (The) | | | 7,745 | | | | | | 701,232 | |
Unum Group | | | 5,433 | | | | | | 190,590 | |
US BancorpD | | | 38,879 | | | | | | 1,570,712 | |
Ventas, Inc. REIT | | | 6,327 | | | | | | 362,411 | |
Visa, Inc. Class A | | | 10,844 | | | | | | 2,414,742 | |
Vornado Realty Trust REIT | | | 3,729 | | | | | | 331,098 | |
Wells Fargo & Co. | | | 102,067 | | | | | | 4,633,842 | |
Western Union Co. (The)D | | | 11,769 | | | | | | 203,015 | |
Weyerhaeuser Co. REIT | | | 12,418 | | | | | | 392,036 | |
Zions BancorporationD | | | 4,106 | | | | | | 123,016 | |
| | | | | | | | | | |
| | | | | | | | | 60,338,372 | |
| | | | | | | | | | |
Healthcare — 12.1% | |
Abbott Laboratories | | | 32,894 | | | | | | 1,260,827 | |
AbbVie, Inc. | | | 33,845 | | | | | | 1,787,354 | |
Aetna, Inc. | | | 7,798 | | | | | | 534,865 | |
Alexion Pharmaceuticals, Inc.* | | | 4,186 | | | | | | 556,989 | |
Allergan, Inc. | | | 6,341 | | | | | | 704,358 | |
AmerisourceBergen Corporation | | | 4,903 | | | | | | 344,730 | |
Amgen, Inc. | | | 16,086 | | | | | | 1,836,378 | |
Baxter International, Inc. | | | 11,595 | | | | | | 806,432 | |
Becton, Dickinson and Co. | | | 4,164 | | | | | | 460,080 | |
Biogen Idec, Inc.* | | | 5,027 | | | | | | 1,406,303 | |
Boston Scientific Corporation* | | | 28,614 | | | | | | 343,940 | |
Bristol-Myers Squibb Co.D | | | 35,142 | | | | | | 1,867,797 | |
C.R. Bard, Inc. | | | 1,662 | | | | | | 222,608 | |
Cardinal Health, Inc. | | | 7,250 | | | | | | 484,372 | |
CareFusion Corporation* | | | 4,580 | | | | | | 182,376 | |
Celgene Corporation* | | | 8,776 | | | | | | 1,482,793 | |
Cerner Corporation* | | | 6,328 | | | | | | 352,723 | |
Cigna Corporation | | | 5,885 | | | | | | 514,820 | |
DaVita HealthCare Partners, Inc.* | | | 3,735 | | | | | | 236,687 | |
DENTSPLY International, Inc. | | | 3,058 | | | | | | 148,252 | |
Edwards Lifesciences Corporation* | | | 2,256 | | | | | | 148,355 | |
Eli Lilly & Co. | | | 21,179 | | | | | | 1,080,129 | |
Express Scripts Holding Co.* | | | 17,173 | | | | | | 1,206,232 | |
Forest Laboratories, Inc.* | | | 5,049 | | | | | | 303,091 | |
Gilead Sciences, Inc.* | | | 32,668 | | | | | | 2,455,000 | |
| | | | | | | | | | |
| | | Shares | | | Value | |
Hospira, Inc.D* | | | 3,500 | | | | | $ | 144,480 | |
Humana, Inc. | | | 3,357 | | | | | | 346,510 | |
Intuitive Surgical, Inc.* | | | 809 | | | | | | 310,721 | |
Johnson & Johnson | | | 60,059 | | | | | | 5,500,804 | |
Laboratory Corporation of America HoldingsD* | | | 1,887 | | | | | | 172,415 | |
Life Technologies Corporation* | | | 3,724 | | | | | | 282,279 | |
McKesson Corporation | | | 4,882 | | | | | | 787,955 | |
Medtronic, Inc. | | | 21,287 | | | | | | 1,221,661 | |
Merck & Co., Inc. | | | 62,258 | | | | | | 3,116,013 | |
Mylan, Inc.* | | | 8,142 | | | | | | 353,363 | |
Patterson Cos., Inc.D | | | 1,684 | | | | | | 69,381 | |
PerkinElmer, Inc. | | | 2,326 | | | | | | 95,901 | |
Pfizer, Inc. | | | 138,000 | | | | | | 4,226,940 | |
Quest Diagnostics, Inc.D | | | 3,071 | | | | | | 164,421 | |
Regeneron Pharmaceuticals, Inc.* | | | 1,683 | | | | | | 463,229 | |
St. Jude Medical, Inc. | | | 6,279 | | | | | | 388,984 | |
Stryker Corporation | | | 6,340 | | | | | | 476,388 | |
Tenet Healthcare CorporationD* | | | 2,046 | | | | | | 86,177 | |
Thermo Fisher Scientific, Inc. | | | 7,688 | | | | | | 856,059 | |
UnitedHealth Group, Inc. | | | 21,446 | | | | | | 1,614,884 | |
Varian Medical Systems, Inc.D* | | | 2,304 | | | | | | 178,998 | |
Vertex Pharmaceuticals, Inc.* | | | 4,909 | | | | | | 364,739 | |
WellPoint, Inc. | | | 6,273 | | | | | | 579,562 | |
Zimmer Holdings, Inc. | | | 3,618 | | | | | | 337,161 | |
Zoetis, Inc. | | | 10,680 | | | | | | 349,129 | |
| | | | | | | | | | |
| | | | | | | | | 43,215,645 | |
| | | | | | | | | | |
Materials & Processing — 3.6% | |
Air Products & Chemicals, Inc.D | | | 4,476 | | | | | | 500,327 | |
Airgas, Inc. | | | 1,439 | | | | | | 160,952 | |
Alcoa, Inc.D | | | 22,296 | | | | | | 237,006 | |
Allegheny Technologies, Inc.D | | | 2,381 | | | | | | 84,835 | |
Ball Corporation | | | 3,080 | | | | | | 159,113 | |
Bemis Co., Inc. | | | 2,220 | | | | | | 90,931 | |
CF Industries Holdings, Inc. | | | 1,202 | | | | | | 280,114 | |
Cliffs Natural Resources, Inc.D | | | 3,462 | | | | | | 90,739 | |
Dow Chemical Co. (The) | | | 25,835 | | | | | | 1,147,074 | |
E.I. du Pont de Nemours & Co. | | | 19,713 | | | | | | 1,280,754 | |
Eastman Chemical Co. | | | 3,278 | | | | | | 264,535 | |
Ecolab, Inc. | | | 5,784 | | | | | | 603,098 | |
Fastenal Co.D | | | 5,913 | | | | | | 280,927 | |
FMC Corporation | | | 2,824 | | | | | | 213,099 | |
Freeport-McMoRan Copper & Gold, Inc. | | | 22,118 | | | | | | 834,733 | |
International Flavors & Fragrances, Inc. | | | 1,742 | | | | | | 149,777 | |
International Paper Co. | | | 9,377 | | | | | | 459,754 | |
Masco Corporation | | | 7,467 | | | | | | 170,024 | |
MeadWestvaco Corporation | | | 3,690 | | | | | | 136,272 | |
Monsanto Co. | | | 11,197 | | | | | | 1,305,010 | |
Mosaic Co. (The) | | | 7,188 | | | | | | 339,777 | |
Newmont Mining Corporation | | | 10,530 | | | | | | 242,506 | |
Nucor CorporationD | | | 6,736 | | | | | | 359,568 | |
Owens-Illinois, Inc.* | | | 3,629 | | | | | | 129,846 | |
PPG Industries, Inc. | | | 3,049 | | | | | | 578,273 | |
Praxair, Inc. | | | 6,234 | | | | | | 810,607 | |
Precision Castparts Corporation | | | 3,108 | | | | | | 836,984 | |
Sealed Air Corporation | | | 4,329 | | | | | | 147,402 | |
Sherwin-Williams Co. (The) | | | 1,851 | | | | | | 339,658 | |
Sigma-Aldrich CorporationD | | | 2,586 | | | | | | 243,110 | |
United States Steel CorporationD | | | 3,237 | | | | | | 95,491 | |
| | | | |
| 184 | | See Notes to Financial Statements. | | |
| | | | | | | | | | |
| | | Shares | | | Value | |
Vulcan Materials Co. | | | 2,787 | | | | | $ | 165,604 | |
| | | | | | | | | | |
| | | | | | | | | 12,737,900 | |
| | | | | | | | | | |
Producer Durables — 10.4% | |
3M Co. | | | 13,618 | | | | | | 1,909,925 | |
ADT Corporation (The)D* | | | 4,222 | | | | | | 170,864 | |
Agilent Technologies, Inc. | | | 6,966 | | | | | | 398,386 | |
AMETEK, Inc. | | | 5,182 | | | | | | 272,936 | |
Automatic Data Processing, Inc. | | | 10,319 | | | | | | 833,878 | |
Avery Dennison Corporation | | | 1,980 | | | | | | 99,376 | |
Boeing Co. (The) | | | 14,715 | | | | | | 2,008,450 | |
Caterpillar, Inc. | | | 13,490 | | | | | | 1,225,027 | |
CH Robinson Worldwide, Inc.D | | | 3,229 | | | | | | 188,380 | |
Cintas CorporationD | | | 2,141 | | | | | | 127,582 | |
CSX Corporation | | | 21,470 | | | | | | 617,692 | |
Cummins, Inc. | | | 3,720 | | | | | | 524,408 | |
Danaher Corporation | | | 12,790 | | | | | | 987,388 | |
Deere & Co.D | | | 8,196 | | | | | | 748,541 | |
Delta Air Lines, Inc. | | | 18,142 | | | | | | 498,361 | |
Dover Corporation | | | 3,646 | | | | | | 351,985 | |
Emerson Electric Co. | | | 14,968 | | | | | | 1,050,454 | |
Expeditors International of Washington, Inc.D | | | 4,422 | | | | | | 195,674 | |
FedEx Corporation | | | 6,335 | | | | | | 910,783 | |
FLIR Systems, Inc. | | | 3,049 | | | | | | 91,775 | |
Flowserve Corporation | | | 2,945 | | | | | | 232,154 | |
Fluor Corporation | | | 3,451 | | | | | | 277,081 | |
General Dynamics Corporation | | | 7,114 | | | | | | 679,743 | |
General Electric Co. | | | 215,452 | | | | | | 6,039,120 | |
Honeywell International, Inc. | | | 16,647 | | | | | | 1,521,036 | |
Illinois Tool Works, Inc. | | | 8,669 | | | | | | 728,890 | |
Iron Mountain, Inc.D | | | 3,511 | | | | | | 106,559 | |
Jacobs Engineering Group, Inc.* | | | 2,735 | | | | | | 172,278 | |
Joy Global, Inc.D | | | 2,274 | | | | | | 133,006 | |
Kansas City Southern | | | 2,341 | | | | | | 289,886 | |
L-3 Communications Holdings, Inc. | | | 1,873 | | | | | | 200,149 | |
Lockheed Martin Corporation | | | 5,753 | | | | | | 855,241 | |
Norfolk Southern Corporation | | | 6,542 | | | | | | 607,294 | |
Northrop Grumman Corporation | | | 4,717 | | | | | | 540,615 | |
PACCAR, Inc.D | | | 7,579 | | | | | | 448,449 | |
Pall Corporation | | | 2,398 | | | | | | 204,669 | |
Parker Hannifin Corporation | | | 3,184 | | | | | | 409,590 | |
Paychex, Inc.D | | | 6,886 | | | | | | 313,520 | |
Pitney Bowes, Inc.D | | | 4,372 | | | | | | 101,868 | |
Quanta Services, Inc.* | | | 4,504 | | | | | | 142,146 | |
Raytheon Co. | | | 6,770 | | | | | | 614,039 | |
Republic Services, Inc. | | | 5,735 | | | | | | 190,402 | |
Robert Half International, Inc. | | | 2,978 | | | | | | 125,046 | |
Rockwell Automation, Inc. | | | 2,970 | | | | | | 350,935 | |
Rockwell Collins, Inc.D | | | 2,927 | | | | | | 216,364 | |
Roper Industries, Inc. | | | 2,122 | | | | | | 294,279 | |
Ryder System, Inc. | | | 1,151 | | | | | | 84,921 | |
Snap-on, Inc. | | | 1,258 | | | | | | 137,776 | |
Southwest Airlines Co. | | | 14,685 | | | | | | 276,665 | |
Stanley Black & Decker, Inc. | | | 3,357 | | | | | | 270,876 | |
Stericycle, Inc.* | | | 1,791 | | | | | | 208,061 | |
Textron, Inc. | | | 6,066 | | | | | | 222,986 | |
Union Pacific Corporation | | | 9,819 | | | | | | 1,649,592 | |
United Parcel Service, Inc. Class B | | | 15,237 | | | | | | 1,601,104 | |
United Technologies Corporation | | | 17,938 | | | | | | 2,041,344 | |
| | | | | | | | | | |
| | | Shares | | | Value | |
W.W. Grainger, Inc. | | | 1,301 | | | | | $ | 332,301 | |
Waste Management, Inc. | | | 9,205 | | | | | | 413,028 | |
Waters Corporation* | | | 1,817 | | | | | | 181,700 | |
Xerox Corporation | | | 24,453 | | | | | | 297,593 | |
Xylem, Inc. | | | 3,939 | | | | | | 136,289 | |
| | | | | | | | | | |
| | | | | | | | | 36,860,460 | |
| | | | | | | | | | |
Technology — 15.6% | |
Adobe Systems, Inc.* | | | 9,863 | | | | | | 590,596 | |
Akamai Technologies, Inc.D* | | | 3,726 | | | | | | 175,793 | |
Altera CorporationD | | | 6,949 | | | | | | 226,051 | |
Amphenol Corporation Class A | | | 3,402 | | | | | | 303,390 | |
Analog Devices, Inc. | | | 6,697 | | | | | | 341,078 | |
Apple, Inc. | | | 19,160 | | | | | | 10,750,868 | |
Applied Materials, Inc. | | | 25,751 | | | | | | 455,535 | |
Autodesk, Inc.* | | | 4,871 | | | | | | 245,157 | |
Broadcom Corporation Class A | | | 11,294 | | | | | | 334,867 | |
CA, Inc. | | | 6,776 | | | | | | 228,012 | |
Cisco Systems, Inc. | | | 113,842 | | | | | | 2,555,753 | |
Citrix Systems, Inc.* | | | 3,960 | | | | | | 250,470 | |
Cognizant Technology Solutions Corporation Class A* | | | 6,437 | | | | | | 650,008 | |
Computer Sciences CorporationD | | | 3,120 | | | | | | 174,346 | |
Corning, Inc. | | | 30,603 | | | | | | 545,345 | |
Crown Castle International Corporation* | | | 7,177 | | | | | | 527,007 | |
Electronic Arts, Inc.D* | | | 6,737 | | | | | | 154,547 | |
EMC Corporation | | | 43,771 | | | | | | 1,100,841 | |
F5 Networks, Inc.D* | | | 1,645 | | | | | | 149,465 | |
Facebook, Inc. Class A* | | | 35,024 | | | | | | 1,914,412 | |
Google, Inc. Class A* | | | 5,973 | | | | | | 6,694,001 | |
Harris Corporation | | | 2,245 | | | | | | 156,723 | |
Hewlett-Packard Co. | | | 41,018 | | | | | | 1,147,684 | |
Intel Corporation | | | 105,776 | | | | | | 2,745,945 | |
International Business Machines Corporation | | | 21,739 | | | | | | 4,077,584 | |
Intuit, Inc. | | | 6,056 | | | | | | 462,194 | |
Jabil Circuit, Inc. | | | 3,722 | | | | | | 64,912 | |
Juniper Networks, Inc.D* | | | 10,710 | | | | | | 241,725 | |
KLA-Tencor CorporationD | | | 3,535 | | | | | | 227,866 | |
Lam Research Corporation* | | | 3,498 | | | | | | 190,466 | |
Linear Technology CorporationD | | | 5,045 | | | | | | 229,800 | |
LSI Corporation | | | 11,256 | | | | | | 124,041 | |
Microchip Technology, Inc.D | | | 4,339 | | | | | | 194,170 | |
Micron Technology, Inc.* | | | 22,579 | | | | | | 491,319 | |
Microsoft Corporation | | | 161,848 | | | | | | 6,057,971 | |
Motorola Solutions, Inc.D | | | 4,862 | | | | | | 328,185 | |
NetApp, Inc. | | | 7,331 | | | | | | 301,597 | |
NVIDIA CorporationD | | | 12,596 | | | | | | 201,788 | |
Oracle Corporation | | | 74,724 | | | | | | 2,858,940 | |
QUALCOMM, Inc. | | | 35,971 | | | | | | 2,670,847 | |
Red Hat, Inc.* | | | 4,052 | | | | | | 227,074 | |
Salesforce.com, Inc.* | | | 11,899 | | | | | | 656,706 | |
SanDisk Corporation | | | 4,858 | | | | | | 342,683 | |
Symantec Corporation | | | 14,705 | | | | | | 346,744 | |
Teradata CorporationD* | | | 3,489 | | | | | | 158,715 | |
Texas Instruments, Inc. | | | 23,171 | | | | | | 1,017,439 | |
VeriSign, Inc.D* | | | 2,712 | | | | | | 162,123 | |
Western Digital Corporation | | | 4,483 | | | | | | 376,124 | |
Xilinx, Inc. | | | 5,801 | | | | | | 266,382 | |
| | | | |
| | See Notes to Financial Statements. | | 185 |
EQUITY INDEX FUND
SCHEDULE OF INVESTMENTS (Continued)
| | | | | | | | | | |
| | | Shares | | | Value | |
Yahoo!, Inc.* | | | 19,996 | | | | | $ | 808,638 | |
| | | | | | | | | | |
| | | | | | | | | 55,503,927 | |
| | | | | | | | | | |
Utilities — 5.0% | |
AES Corporation | | | 14,057 | | | | | | 203,967 | |
AGL Resources, Inc.D | | | 2,585 | | | | | | 122,090 | |
Ameren Corporation | | | 5,215 | | | | | | 188,574 | |
American Electric Power Co., Inc. | | | 10,408 | | | | | | 486,470 | |
AT&T, Inc. | | | 112,202 | | | | | | 3,945,022 | |
CenterPoint Energy, Inc. | | | 9,214 | | | | | | 213,581 | |
CenturyLink, Inc.D | | | 12,510 | | | | | | 398,444 | |
CMS Energy Corporation | | | 5,581 | | | | | | 149,403 | |
Consolidated Edison, Inc.D | | | 6,328 | | | | | | 349,812 | |
Dominion Resources, Inc. | | | 12,334 | | | | | | 797,887 | |
DTE Energy Co. | | | 3,840 | | | | | | 254,938 | |
Duke Energy Corporation | | | 14,931 | | | | | | 1,030,388 | |
Edison International | | | 6,966 | | | | | | 322,526 | |
Entergy CorporationD | | | 3,824 | | | | | | 241,945 | |
Exelon CorporationD | | | 18,308 | | | | | | 501,456 | |
FirstEnergy Corporation | | | 8,948 | | | | | | 295,105 | |
Frontier Communications CorporationD | | | 21,639 | | | | | | 100,621 | |
Integrys Energy Group, Inc.D | | | 1,743 | | | | | | 94,837 | |
NextEra Energy, Inc. | | | 9,176 | | | | | | 785,649 | |
NiSource, Inc. | | | 6,780 | | | | | | 222,926 | |
Northeast Utilities | | | 6,645 | | | | | | 281,682 | |
NRG Energy, Inc.D | | | 6,727 | | | | | | 193,199 | |
ONEOK, Inc. | | | 4,398 | | | | | | 273,468 | |
Pepco Holdings, Inc.D | | | 5,087 | | | | | | 97,314 | |
PG&E Corporation | | | 9,519 | | | | | | 383,425 | |
Pinnacle West Capital CorporationD | | | 2,369 | | | | | | 125,368 | |
PPL Corporation | | | 13,337 | | | | | | 401,310 | |
Public Service Enterprise Group, Inc.D | | | 10,702 | | | | | | 342,892 | |
SCANA CorporationD | | | 3,051 | | | | | | 143,183 | |
Sempra Energy | | | 4,853 | | | | | | 435,605 | |
Southern Co. (The)D | | | 18,719 | | | | | | 769,538 | |
TECO Energy, Inc.D | | | 4,578 | | | | | | 78,925 | |
Verizon Communications, Inc. | | | 60,880 | | | | | | 2,991,643 | |
Windstream Holdings, Inc.D | | | 12,759 | | | | | | 101,817 | |
Wisconsin Energy CorporationD | | | 4,798 | | | | | | 198,349 | |
Xcel Energy, Inc.D | | | 10,636 | | | | | | 297,170 | |
| | | | | | | | | | |
| | | | | | | | | 17,820,529 | |
| | | | | | | | | | |
Total Common Stocks
(Cost $201,784,073) | | | | | | | | | 330,605,250 | |
| | | | | | | | | | |
FOREIGN COMMON STOCKS — 3.4% | |
Bermuda — 0.1% | |
Invesco, Ltd. | | | 9,400 | | | | | | 342,160 | |
Nabors Industries, Ltd. | | | 5,483 | | | | | | 93,156 | |
| | | | | | | | | | |
| | | | | | | | | 435,316 | |
| | | | | | | | | | |
British Virgin Islands — 0.1% | |
Michael Kors Holdings, Ltd.D* | | | 3,844 | | | | | | 312,094 | |
| | | | | | | | | | |
Curacao — 0.7% | |
Schlumberger, Ltd. | | | 28,013 | | | | | | 2,524,252 | |
| | | | | | | | | | |
Ireland — 1.0% | |
Accenture PLC Class A | | | 13,537 | | | | | | 1,113,012 | |
Allegion PLC* | | | 1,902 | | | | | | 84,050 | |
Covidien PLC | | | 9,827 | | | | | | 669,219 | |
Eaton Corporation PLC | | | 10,114 | | | | | | 769,878 | |
Ingersoll-Rand PLC | | | 5,707 | | | | | | 351,551 | |
| | | | | | | | | | |
| | | Shares | | | Value | |
Seagate Technology PLC | | | 6,946 | | | | | $ | 390,087 | |
XL Group PLC | | | 5,999 | | | | | | 191,008 | |
| | | | | | | | | | |
| | | | | | | | | 3,568,805 | |
| | | | | | | | | | |
Netherlands — 0.3% | |
LyondellBasell Industries NV Class A | | | 9,289 | | | | | | 745,721 | |
Nielsen Holdings NV | | | 5,489 | | | | | | 251,890 | |
| | | | | | | | | | |
| | | | | | | | | 997,611 | |
| | | | | | | | | | |
Panama — 0.1% | |
Carnival CorporationD | | | 9,383 | | | | | | 376,915 | |
| | | | | | | | | | |
Switzerland — 0.7% | |
ACE, Ltd. | | | 7,273 | | | | | | 752,974 | |
Garmin, Ltd.D | | | 2,607 | | | | | | 120,495 | |
Pentair, Ltd. | | | 4,196 | | | | | | 325,903 | |
TE Connectivity, Ltd. | | | 8,825 | | | | | | 486,346 | |
Transocean, Ltd.D | | | 7,281 | | | | | | 359,827 | |
Tyco International, Ltd. | | | 9,873 | | | | | | 405,188 | |
| | | | | | | | | | |
| | | | | | | | | 2,450,733 | |
| | | | | | | | | | |
United Kingdom — 0.4% | |
Aon PLC | | | 6,399 | | | | | | 536,812 | |
Delphi Automotive PLC | | | 5,975 | | | | | | 359,277 | |
Ensco PLC Class A | | | 4,968 | | | | | | 284,070 | |
Noble Corporation PLC | | | 5,519 | | | | | | 206,797 | |
Rowan Cos. PLC Class A* | | | 2,707 | | | | | | 95,720 | |
| | | | | | | | | | |
| | | | | | | | | 1,482,676 | |
| | | | | | | | | | |
Total Foreign Common Stocks
(Cost $8,187,777) | | | 12,148,402 | |
| | | | | | | | | | |
RIGHTS/WARRANTS — 0.0% | |
American International Group, Inc. Fractional Warrants+*
(Cost $0) | | | 65,600 | | | | | | — | |
| | | | | | | | | | |
MONEY MARKET FUNDS — 10.5% | |
GuideStone Money Market Fund (GS4 Class)¥ | | | 12,116,847 | | | | | | 12,116,847 | |
Northern Institutional Liquid Assets Portfolio§ | | | 25,398,730 | | | | | | 25,398,730 | |
| | | | | | | | | | |
Total Money Market Funds
(Cost $37,515,577) | | | 37,515,577 | |
| | | | | | | | | | |
| | | |
| | | Par | | | | | | |
U.S. TREASURY OBLIGATION — 0.2% | |
U.S. Treasury Bill
0.05%, 04/10/14‡
(Cost $534,927) | | $ | 535,000 | | | | | | 534,938 | |
| | | | | | | | | | |
TOTAL INVESTMENTS — 106.9%
(Cost $248,022,354) | | | 380,804,167 | |
Liabilities in Excess of Other
Assets — (6.9)% | | | (24,489,209 | ) |
| | | | | | | | | | |
NET ASSETS — 100.0% | | $ | 356,314,958 | |
| | | | | | | | | | |
| | | | |
| 186 | | See Notes to Financial Statements. | | |
VALUATION HIERARCHY
The following is a summary of the inputs used, as of December 31, 2013, in valuing the Fund’s investments carried at fair value:
| | | | | | | | | | | | | | | | | | | | |
| | | Total
Value | | Level 1
Quoted Prices | | Level 2
Other Significant
Observable Inputs | | Level 3
Significant
Unobservable Inputs |
Assets: | | | | | | | | | | | | | | | | | | | | |
Investments in Securities: | | | | | | | | | | | | | | | | | | | | |
Common Stocks | | | $ | 330,605,250 | | | | $ | 330,605,250 | | | | $ | — | | | | $ | — | |
Foreign Common Stocks | | | | 12,148,402 | | | | | 12,148,402 | | | | | — | | | | | — | |
Money Market Funds | | | | 37,515,577 | | | | | 37,515,577 | | | | | — | | | | | — | |
Rights/Warrants | | | | — | | | | | — | | | | | — | | | | | — | |
U.S. Treasury Obligation | | | | 534,938 | | | | | — | | | | | 534,938 | | | | | — | |
| | | | | | | | | | | | | | | | | | | | |
Total Assets - Investments in Securities | | | $ | 380,804,167 | | | | $ | 380,269,229 | | | | $ | 534,938 | | | | $ | — | |
| | | | | | | | | | | | | | | | | | | | |
| | | | |
Other Financial Instruments*** | | | | | | | | | | | | | | | | | | | | |
Futures Contracts | | | $ | 428,001 | | | | $ | 428,001 | | | | $ | — | | | | $ | — | |
| | | | | | | | | | | | | | | | | | | | |
Total Assets - Other Financial Instruments | | | $ | 428,001 | | | | $ | 428,001 | | | | $ | — | | | | $ | — | |
| | | | | | | | | | | | | | | | | | | | |
***Other financial instruments are derivative instruments not reflected in the Schedule of Investments, such as futures, forwards and swap contracts, which are valued at the unrealized appreciation (depreciation) on the investment. Details of these investments can be found in the Notes to Financial Statements.
There were no transfers between Level 1 and Level 2 during the year ended December 31, 2013.
| | | | |
| | See Notes to Financial Statements. | | 187 |
Value Equity Fund (Unaudited)
The Fund invested in a diversified portfolio of large - and medium-sized U.S. companies whose stocks were considered to be attractive from a valuation perspective. The GS4 Class of the Fund posted double-digit positive performance and outperformed its benchmark, the Russell 1000® Value Index, for the one-year period ended December 31, 2013 (35.22% versus 32.53%). Security selection to the financials and healthcare sectors contributed to benchmark-relative returns, while security selection to the consumer discretionary and technology sectors detracted from benchmark-relative performance for the year.
This Fund may be suitable for investors who seek higher, long-term rates of return, can accept significant short-term fluctuations in account value and want to diversify their portfolio by adding a potentially higher return, higher risk option of value stocks. This Fund is subject to value investing risk. This involves the risk that an investment in companies whose securities are believed to be undervalued, relative to their underlying profitability, will not appreciate in value as anticipated.
At December 31, 2013, the portfolio holdings of the Fund, as a percentage of net assets, is shown in the following table. Portfolio holdings are subject to risk and may change at any time.
| | | | |
| | | % | |
Financial Services | | | 23.9 | |
Healthcare | | | 14.2 | |
Money Market Funds | | | 11.7 | |
Energy | | | 10.9 | |
Producer Durables | | | 10.3 | |
Foreign Common Stocks | | | 10.0 | |
Technology | | | 8.5 | |
Consumer Discretionary | | | 7.3 | |
Utilities | | | 5.7 | |
Consumer Staples | | | 3.2 | |
Materials & Processing | | | 2.2 | |
U.S. Treasury Obligation | | | — | ** |
| | | | |
| | | 107.9 | |
| | | | |
| ** | Rounds to less than 0.005%. |
188
Value Equity Fund (Unaudited)
| | | | | | | | | | |
| Average Annual Total Returns as of 12/31/13 |
| | | GS2 Class* | | | | GS4 Class* | | | | Benchmark** |
One Year | | 35.52% | | | | 35.22% | | | | 32.53% |
Five Year | | 17.28% | | | | 17.04% | | | | 16.67% |
Ten Year | | 7.59% | | | | 7.39% | | | | 7.58% |
Inception Date | | 08/27/01 | | | | 08/27/01 | | | | |
Total Fund Operating Expenses (May 1, 2013 Prospectus, as amended on October 31, 2013)(1) | | 0.68% | | | | 0.92% | | | | |
(1)Current information regarding the Fund’s Operating Expenses can be found in the Financial Highlights.
The performance data quoted represents past performance and does not guarantee future results. Current performance may be lower or higher. Performance data current to the most recent month-end may be obtained at www.GuideStoneFunds.org. The investment return and principal value of an investment will fluctuate so that shares, when redeemed, may be worth more or less than their original cost.
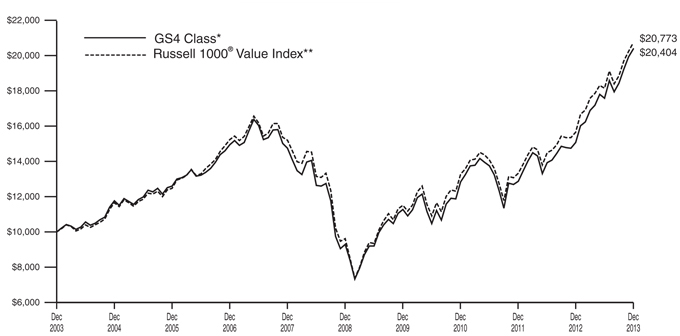
The graph compares the results of a hypothetical $10,000 investment in the GS4 Class of the Fund for the 10-year period from December 31, 2003 to December 31, 2013, with all dividends and capital gains reinvested, with the Russell 1000® Value Index.
*These returns reflect expense waivers by the Fund’s investment adviser. Without these waivers, returns would have been lower. Returns shown do not reflect the deduction of taxes that a shareholder would pay on Fund distributions or the redemption of Fund shares.
Unlike a mutual fund, the performance of an index assumes no taxes, transaction costs, management fees or other expenses.
189
| | |
VALUE EQUITY FUND SCHEDULE OF INVESTMENTS | | December 31, 2013 |
| | | | | | | | | | |
| | | Shares | | | Value | |
COMMON STOCKS — 86.2% | |
Consumer Discretionary — 7.3% | |
Best Buy Co., Inc. | | | 113,800 | | | | | $ | 4,538,344 | |
CBS Corporation Class B | | | 1,902 | | | | | | 121,233 | |
Comcast Corporation
Class A | | | 218,126 | | | | | | 11,334,918 | |
Dana Holding CorporationD | | | 299,040 | | | | | | 5,867,165 | |
Ford Motor Co. | | | 317,487 | | | | | | 4,898,824 | |
GameStop Corporation
Class AD | | | 70,700 | | | | | | 3,482,682 | |
Gap, Inc. (The) | | | 158,700 | | | | | | 6,201,996 | |
General Motors Co.* | | | 27,981 | | | | | | 1,143,583 | |
Goodyear Tire & Rubber Co. (The) | | | 130,500 | | | | | | 3,112,425 | |
Home Depot, Inc. (The) | | | 103,608 | | | | | | 8,531,083 | |
Johnson Controls, Inc. | | | 23,043 | | | | | | 1,182,106 | |
Lear Corporation | | | 58,600 | | | | | | 4,744,842 | |
Lennar Corporation
Class AD | | | 155,451 | | | | | | 6,149,641 | |
McGraw Hill Financial, Inc. | | | 13,600 | | | | | | 1,063,520 | |
News Corporation Class A* | | | 4,799 | | | | | | 86,478 | |
Nu Skin Enterprises, Inc.
Class A | | | 34,100 | | | | | | 4,713,302 | |
Sirius XM Holdings, Inc.D* | | | 55,021 | | | | | | 192,023 | |
Target Corporation | | | 182,103 | | | | | | 11,521,657 | |
Time Warner, Inc.D | | | 94,879 | | | | | | 6,614,964 | |
Twenty-First Century Fox,
Inc. Class A | | | 17,256 | | | | | | 607,066 | |
Wal-Mart Stores, Inc. | | | 82,172 | | | | | | 6,466,115 | |
Walt Disney Co. (The) | | | 46,969 | | | | | | 3,588,432 | |
Whirlpool Corporation | | | 8,400 | | | | | | 1,317,624 | |
| | | | | | | | | | |
| | | | | | | | | 97,480,023 | |
| | | | | | | | | | |
Consumer Staples — 3.2% | |
Archer-Daniels-Midland Co. | | | 54,715 | | | | | | 2,374,631 | |
Coca-Cola Enterprises, Inc. | | | 65,300 | | | | | | 2,881,689 | |
CVS Caremark Corporation | | | 36,127 | | | | | | 2,585,609 | |
Green Mountain Coffee
Roasters, Inc.D* | | | 1,900 | | | | | | 143,602 | |
Hershey Co. (The) | | | 40,600 | | | | | | 3,947,538 | |
Hillshire Brands Co. | | | 22,600 | | | | | | 755,744 | |
Kellogg Co. | | | 769 | | | | | | 46,963 | |
Kimberly-Clark Corporation | | | 2,135 | | | | | | 223,022 | |
Kroger Co. (The) | | | 102,600 | | | | | | 4,055,778 | |
Mondelez International,
Inc. Class A | | | 271,337 | | | | | | 9,578,196 | |
PepsiCo, Inc. | | | 83,700 | | | | | | 6,942,078 | |
Procter & Gamble Co. (The) | | | 91,501 | | | | | | 7,449,097 | |
Sysco CorporationD | | | 12,804 | | | | | | 462,224 | |
Tyson Foods, Inc. Class AD | | | 38,500 | | | | | | 1,288,210 | |
Walgreen Co. | | | 7,690 | | | | | | 441,714 | |
| | | | | | | | | | |
| | | | | | | | | 43,176,095 | |
| | | | | | | | | | |
Energy — 10.9% | |
Anadarko Petroleum Corporation | | | 15,854 | | | | | | 1,257,539 | |
Apache Corporation | | | 13,153 | | | | | | 1,130,369 | |
Baker Hughes, Inc. | | | 175,062 | | | | | | 9,673,926 | |
Chevron Corporation | | | 214,020 | | | | | | 26,733,238 | |
ConocoPhillipsD | | | 238,536 | | | | | | 16,852,568 | |
Devon Energy Corporation | | | 13,726 | | | | | | 849,228 | |
Diamond Offshore Drilling, Inc.D | | | 51,800 | | | | | | 2,948,456 | |
EOG Resources, Inc. | | | 523 | | | | | | 87,780 | |
Exxon Mobil CorporationD | | | 296,356 | | | | | | 29,991,227 | |
Halliburton Co. | | | 84,500 | | | | | | 4,288,375 | |
| | | | | | | | | | |
| | | Shares | | | Value | |
Hess Corporation | | | 10,374 | | | | | $ | 861,042 | |
Kinder Morgan, Inc.D | | | 2,079 | | | | | | 74,844 | |
Marathon Oil Corporation | | | 354,573 | | | | | | 12,516,427 | |
Marathon Petroleum Corporation | | | 10,051 | | | | | | 921,978 | |
Murphy Oil Corporation | | | 76,700 | | | | | | 4,976,296 | |
National Oilwell Varco, Inc.D | | | 14,355 | | | | | | 1,141,653 | |
Occidental Petroleum Corporation | | | 173,894 | | | | | | 16,537,320 | |
Phillips 66 | | | 20,744 | | | | | | 1,599,985 | |
SM Energy Co.D | | | 48,600 | | | | | | 4,039,146 | |
Spectra Energy Corporation | | | 22,081 | | | | | | 786,525 | |
Valero Energy Corporation | | | 164,279 | | | | | | 8,279,662 | |
Williams Cos., Inc. (The)D | | | 10,595 | | | | | | 408,649 | |
| | | | | | | | | | |
| | | | | | | | | 145,956,233 | |
| | | | | | | | | | |
Financial Services — 23.9% | |
Aflac, Inc. | | | 15,688 | | | | | | 1,047,958 | |
Allstate Corporation (The) | | | 119,153 | | | | | | 6,498,605 | |
American Express Co. | | | 253,445 | | | | | | 22,995,065 | |
American Financial
Group, Inc. | | | 57,800 | | | | | | 3,336,216 | |
American International
Group, Inc. | | | 345,245 | | | | | | 17,624,757 | |
Ameriprise Financial, Inc. | | | 86,185 | | | | | | 9,915,584 | |
Assurant, Inc.D | | | 71,700 | | | | | | 4,758,729 | |
Bank of America Corporation | | | 1,064,895 | | | | | | 16,580,415 | |
Bank of New York Mellon Corporation (The) | | | 38,905 | | | | | | 1,359,341 | |
BB&T Corporation | | | 23,672 | | | | | | 883,439 | |
Berkshire Hathaway, Inc. Class B* | | | 60,129 | | | | | | 7,128,894 | |
BlackRock, Inc. | | | 2,790 | | | | | | 882,951 | |
Capital One Financial Corporation | | | 277,760 | | | | | | 21,279,194 | |
CBOE Holdings, Inc. | | | 55,500 | | | | | | 2,883,780 | |
CBRE Group, Inc. Class A* | | | 51,500 | | | | | | 1,354,450 | |
Charles Schwab Corporation (The) | | | 32,070 | | | | | | 833,820 | |
Chubb Corporation (The) | | | 65,215 | | | | | | 6,301,725 | |
CIT Group, Inc. | | | 77,500 | | | | | | 4,040,075 | |
Citigroup, Inc. | | | 474,157 | | | | | | 24,708,321 | |
CME Group, Inc. | | | 10,451 | | | | | | 819,986 | |
Comerica, Inc. | | | 43,900 | | | | | | 2,087,006 | |
Discover Financial Services | | | 123,985 | | | | | | 6,936,961 | |
Equity Residential REIT | | | 11,877 | | | | | | 616,060 | |
Fifth Third BancorpD | | | 259,800 | | | | | | 5,463,594 | |
First Niagara Financial Group, Inc. | | | 43,900 | | | | | | 466,218 | |
Goldman Sachs Group, Inc. (The) | | | 15,281 | | | | | | 2,708,710 | |
Hartford Financial Services Group, Inc. | | | 128,415 | | | | | | 4,652,475 | |
Huntington Bancshares, Inc.D | | | 514,400 | | | | | | 4,963,960 | |
JPMorgan Chase & Co. | | | 563,310 | | | | | | 32,942,369 | |
KeyCorp | | | 379,500 | | | | | | 5,092,890 | |
Lincoln National CorporationD | | | 26,400 | | | | | | 1,362,768 | |
Loews Corporation | | | 9,266 | | | | | | 446,992 | |
Marsh & McLennan Cos., Inc. | | | 6,277 | | | | | | 303,556 | |
MetLife, Inc. | | | 29,907 | | | | | | 1,612,585 | |
Morgan Stanley | | | 50,938 | | | | | | 1,597,416 | |
PNC Financial Services Group, Inc. (The) | | | 59,032 | | | | | | 4,579,703 | |
Prudential Financial, Inc. | | | 9,426 | | | | | | 869,266 | |
Public Storage REIT | | | 320 | | | | | | 48,166 | |
| | | | |
| 190 | | See Notes to Financial Statements. | | |
| | | | | | | | | | |
| | | Shares | | | Value | |
Reinsurance Group of America, Inc. | | | 30,400 | | | | | $ | 2,353,264 | |
RLJ Lodging Trust REIT | | | 34,300 | | | | | | 834,176 | |
Simon Property Group, Inc. REIT | | | 2,588 | | | | | | 393,790 | |
SLM Corporation | | | 536,245 | | | | | | 14,092,519 | |
State Street Corporation | | | 289,534 | | | | | | 21,248,900 | |
Travelers Cos., Inc. (The) | | | 156,227 | | | | | | 14,144,793 | |
Unum Group | | | 51,300 | | | | | | 1,799,604 | |
US BancorpD | | | 61,665 | | | | | | 2,491,266 | |
Waddell & Reed Financial, Inc. Class A | | | 65,300 | | | | | | 4,252,336 | |
Wells Fargo & Co. | | | 603,011 | | | | | | 27,376,699 | |
| | | | | | | | | | |
| | | | | | | | | 320,971,347 | |
| | | | | | | | | | |
Healthcare — 14.2% | |
Abbott Laboratories | | | 51,959 | | | | | | 1,991,588 | |
Aetna, Inc. | | | 9,145 | | | | | | 627,256 | |
Align Technology, Inc.* | | | 18,100 | | | | | | 1,034,415 | |
AmerisourceBergen CorporationD | | | 64,300 | | | | | | 4,520,933 | |
Amgen, Inc. | | | 39,700 | | | | | | 4,532,152 | |
Biogen Idec, Inc.* | | | 15,200 | | | | | | 4,252,200 | |
Bristol-Myers Squibb Co.D | | | 7,510 | | | | | | 399,157 | |
Cardinal Health, Inc. | | | 196,100 | | | | | | 13,101,441 | |
Celgene Corporation* | | | 26,800 | | | | | | 4,528,128 | |
Cigna Corporation | | | 111,645 | | | | | | 9,766,705 | |
Cubist Pharmaceuticals, Inc.D* | | | 21,300 | | | | | | 1,466,931 | |
Eli Lilly & Co.D | | | 25,913 | | | | | | 1,321,563 | |
Express Scripts Holding Co.* | | | 3,548 | | | | | | 249,212 | |
Hologic, Inc.D* | | | 122,506 | | | | | | 2,738,009 | |
Humana, Inc. | | | 31,800 | | | | | | 3,282,396 | |
Johnson & Johnson | | | 253,085 | | | | | | 23,180,055 | |
McKesson Corporation | | | 28,500 | | | | | | 4,599,900 | |
Medtronic, Inc. | | | 345,368 | | | | | | 19,820,670 | |
Merck & Co., Inc. | | | 336,421 | | | | | | 16,837,871 | |
Mylan, Inc.* | | | 124,790 | | | | | | 5,415,886 | |
Omnicare, Inc.D | | | 80,600 | | | | | | 4,865,016 | |
Pfizer, Inc. | | | 912,896 | | | | | | 27,962,004 | |
Questcor Pharmaceuticals, Inc.D | | | 26,500 | | | | | | 1,442,925 | |
Stryker Corporation | | | 4,528 | | | | | | 340,234 | |
Thermo Fisher Scientific, Inc.D | | | 32,701 | | | | | | 3,641,256 | |
United Therapeutics CorporationD* | | | 47,300 | | | | | | 5,348,684 | |
UnitedHealth Group, Inc. | | | 114,891 | | | | | | 8,651,292 | |
WellPoint, Inc. | | | 163,721 | | | | | | 15,126,183 | |
| | | | | | | | | | |
| | | | | | | | | 191,044,062 | |
| | | | | | | | | | |
Materials & Processing — 2.2% | |
Air Products & Chemicals, Inc. | | | 6,877 | | | | | | 768,711 | |
Allegheny Technologies, Inc.D | | | 38,600 | | | | | | 1,375,318 | |
CF Industries Holdings, Inc. | | | 6,400 | | | | | | 1,491,456 | |
Cliffs Natural Resources, Inc.D | | | 55,600 | | | | | | 1,457,276 | |
Dow Chemical Co. (The) | | | 35,225 | | | | | | 1,563,990 | |
E.I. du Pont de Nemours & Co. | | | 125,800 | | | | | | 8,173,226 | |
Freeport-McMoRan Copper & Gold, Inc. | | | 34,658 | | | | | | 1,307,993 | |
Mosaic Co. (The) | | | 9,903 | | | | | | 468,115 | |
Packaging Corporation of America | | | 48,400 | | | | | | 3,062,752 | |
PPG Industries, Inc. | | | 477 | | | | | | 90,468 | |
Rock-Tenn Co. Class A | | | 18,200 | | | | | | 1,911,182 | |
Sealed Air Corporation | | | 179,855 | | | | | | 6,124,062 | |
| | | | | | | | | | |
| | | Shares | | | Value | |
Westlake Chemical Corporation | | | 9,900 | | | | | $ | 1,208,493 | |
| | | | | | | | | | |
| | | | | | | | | 29,003,042 | |
| | | | | | | | | | |
Producer Durables — 10.3% | |
3M Co. | | | 3,515 | | | | | | 492,979 | |
ADT Corporation
(The)D* | | | 73,437 | | | | | | 2,971,995 | |
AECOM Technology Corporation* | | | 28,500 | | | | | | 838,755 | |
Alliant Techsystems, Inc.D | | | 40,500 | | | | | | 4,928,040 | |
Caterpillar, Inc. | | | 18,020 | | | | | | 1,636,396 | |
CSX Corporation | | | 16,913 | | | | | | 486,587 | |
Cummins, Inc.D | | | 1,118 | | | | | | 157,604 | |
Danaher Corporation | | | 16,017 | | | | | | 1,236,512 | |
Delta Air Lines, Inc. | | | 70,000 | | | | | | 1,922,900 | |
Emerson Electric Co. | | | 61,575 | | | | | | 4,321,334 | |
Exelis, Inc. | | | 248,300 | | | | | | 4,732,598 | |
FedEx Corporation | | | 10,604 | | | | | | 1,524,537 | |
General Dynamics Corporation | | | 58,845 | | | | | | 5,622,640 | |
General Electric Co. | | | 763,319 | | | | | | 21,395,832 | |
Honeywell International, Inc. | | | 70,500 | | | | | | 6,441,585 | |
Huntington Ingalls Industries, Inc. | | | 55,400 | | | | | | 4,986,554 | |
Illinois Tool Works, Inc. | | | 80,545 | | | | | | 6,772,224 | |
L-3 Communications Holdings, Inc.D | | | 50,700 | | | | | | 5,417,802 | |
Lockheed Martin Corporation | | | 11,500 | | | | | | 1,709,590 | |
Norfolk Southern CorporationD | | | 56,818 | | | | | | 5,274,415 | |
Northrop Grumman CorporationD | | | 60,426 | | | | | | 6,925,424 | |
Oshkosh Corporation | | | 57,800 | | | | | | 2,911,964 | |
Raytheon Co.D | | | 169,418 | | | | | | 15,366,213 | |
Southwest Airlines Co. | | | 117,200 | | | | | | 2,208,048 | |
Stanley Black & Decker, Inc. | | | 120,100 | | | | | | 9,690,869 | |
Terex CorporationD | | | 187,960 | | | | | | 7,892,440 | |
Textron, Inc. | | | 275,095 | | | | | | 10,112,492 | |
United Technologies Corporation | | | 2,004 | | | | | | 228,055 | |
Waste Management, Inc. | | | 14,168 | | | | | | 635,718 | |
| | | | | | | | | | |
| | | | | | | | | 138,842,102 | |
| | | | | | | | | | |
Technology — 8.5% | |
Adobe Systems, Inc.* | | | 10,328 | | | | | | 618,441 | |
Apple, Inc. | | | 13,236 | | | | | | 7,426,852 | |
Applied Materials, Inc. | | | 214,000 | | | | | | 3,785,660 | |
Arrow Electronics, Inc.* | | | 49,000 | | | | | | 2,658,250 | |
Avnet, Inc. | | | 57,400 | | | | | | 2,531,914 | |
Broadcom Corporation Class A | | | 10,498 | | | | | | 311,266 | |
CA, Inc. | | | 76,700 | | | | | | 2,580,955 | |
Cisco Systems, Inc. | | | 479,612 | | | | | | 10,767,289 | |
Corning, Inc. | | | 256,758 | | | | | | 4,575,428 | |
EMC CorporationD | | | 35,508 | | | | | | 893,026 | |
Hewlett-Packard Co. | | | 64,927 | | | | | | 1,816,657 | |
Ingram Micro, Inc. Class A* | | | 184,600 | | | | | | 4,330,716 | |
Intel Corporation | | | 662,833 | | | | | | 17,207,145 | |
International Business Machines Corporation | | | 36,975 | | | | | | 6,935,401 | |
Lam Research Corporation* | | | 65,900 | | | | | | 3,588,255 | |
Microsoft Corporation | | | 410,255 | | | | | | 15,355,845 | |
SanDisk Corporation | | | 64,900 | | | | | | 4,578,046 | |
Texas Instruments, Inc. | | | 242,200 | | | | | | 10,635,002 | |
Twitter, Inc.D* | | | 659 | | | | | | 41,945 | |
Western Digital Corporation | | | 147,360 | | | | | | 12,363,504 | |
Yahoo!, Inc.* | | | 30,017 | | | | | | 1,213,887 | |
| | | | | | | | | | |
| | | | | | | | | 114,215,484 | |
| | | | | | | | | | |
| | | | |
| | See Notes to Financial Statements. | | 191 |
VALUE EQUITY FUND
SCHEDULE OF INVESTMENTS (Continued)
| | | | | | | | | | |
| | | Shares | | | Value | |
Utilities — 5.7% | |
AES CorporationD | | | 654,100 | | | | | $ | 9,490,991 | |
American Electric Power Co., Inc. | | | 225,357 | | | | | | 10,533,186 | |
AT&T, Inc. | | | 635,580 | | | | | | 22,346,993 | |
CenturyLink, Inc.D | | | 20,074 | | | | | | 639,357 | |
Dominion Resources, Inc. | | | 19,365 | | | | | | 1,252,722 | |
Duke Energy CorporationD | | | 23,556 | | | | | | 1,625,600 | |
Edison International | | | 104,900 | | | | | | 4,856,870 | |
Entergy CorporationD | | | 130,300 | | | | | | 8,244,081 | |
Exelon CorporationD | | | 28,947 | | | | | | 792,858 | |
Frontier Communications CorporationD | | | 276,900 | | | | | | 1,287,585 | |
NextEra Energy, Inc. | | | 14,235 | | | | | | 1,218,801 | |
PG&E Corporation | | | 14,572 | | | | | | 586,960 | |
PPL Corporation | | | 40,100 | | | | | | 1,206,609 | |
Public Service Enterprise Group, Inc.D | | | 49,500 | | | | | | 1,585,980 | |
Southern Co. (The)D | | | 29,221 | | | | | | 1,201,275 | |
Sprint CorporationD* | | | 24,126 | | | | | | 259,355 | |
Verizon Communications, Inc. | | | 188,924 | | | | | | 9,283,725 | |
| | | | | | | | | | |
| | | | | | | | | 76,412,948 | |
| | | | | | | | | | |
Total Common Stocks
(Cost $849,547,895) | | | | | | 1,157,101,336 | |
| | | | | | | | | | |
FOREIGN COMMON STOCKS — 10.0% | |
Bermuda — 1.6% | |
AXIS Capital Holdings, Ltd. | | | 90,100 | | | | | | 4,286,057 | |
Everest Re Group, Ltd.D | | | 31,200 | | | | | | 4,863,144 | |
Marvell Technology Group, Ltd. | | | 339,300 | | | | | | 4,879,134 | |
Nabors Industries, Ltd. | | | 185,455 | | | | | | 3,150,880 | |
PartnerRe, Ltd. | | | 26,200 | | | | | | 2,762,266 | |
RenaissanceRe Holdings, Ltd. | | | 11,500 | | | | | | 1,119,410 | |
| | | | | | | | | | |
| | | | | | | | | 21,060,891 | |
| | | | | | | | | | |
Canada — 0.4% | |
Magna International, Inc. | | | 56,000 | | | | | | 4,595,360 | |
Thomson Reuters Corporation | | | 12,314 | | | | | | 465,715 | |
| | | | | | | | | | |
| | | | | | | | | 5,061,075 | |
| | | | | | | | | | |
Cayman Islands — 0.2% | |
Herbalife, Ltd.D | | | 35,700 | | | | | | 2,809,590 | |
| | | | | | | | | | |
France — 0.8% | |
Sanofi ADRD | | | 212,600 | | | | | | 11,401,738 | |
| | | | | | | | | | |
Guernsey — 0.4% | |
Amdocs, Ltd. | | | 117,700 | | | | | | 4,853,948 | |
| | | | | | | | | | |
Ireland — 0.8% | |
Covidien PLC | | | 15,829 | | | | | | 1,077,955 | |
CRH PLC ADRD | | | 328,300 | | | | | | 8,388,065 | |
Eaton Corporation PLC | | | 15,897 | | | | | | 1,210,080 | |
Mallinckrodt PLCD* | | | 2,152 | | | | | | 112,463 | |
| | | | | | | | | | |
| | | | | | | | | 10,788,563 | |
| | | | | | | | | | |
Netherlands — 0.3% | |
LyondellBasell Industries NV Class A | | | 46,800 | | | | | | 3,757,104 | |
| | | | | | | | | | |
Panama — 0.8% | |
Carnival CorporationD | | | 282,381 | | | | | | 11,343,245 | |
| | | | | | | |
Singapore — 0.1% | |
Flextronics International, Ltd.* | | | 127,000 | | | | | | 986,790 | |
| | | | | | | |
Switzerland — 1.8% | |
ACE, Ltd. | | | 19,325 | | | | | | 2,000,717 | |
| | | | | | | | | | |
| | | Shares | | | Value | |
Allied World Assurance Company Holdings AG | | | 34,800 | | | | | $ | 3,925,788 | |
Pentair, Ltd. | | | 53,564 | | | | | | 4,160,316 | |
TE Connectivity, Ltd. | | | 133,175 | | | | | | 7,339,274 | |
Tyco International, Ltd. | | | 163,870 | | | | | | 6,725,225 | |
| | | | | | | | | | |
| | | | | | | | | 24,151,320 | |
| | | | | | | | | | |
United Kingdom — 2.8% | |
BP PLC ADR | | | 219,300 | | | | | | 10,660,173 | |
Delphi Automotive PLC | | | 231,800 | | | | | | 13,938,134 | |
Ensco PLC Class A | | | 103,100 | | | | | | 5,895,258 | |
Liberty Global PLC Class A* | | | 1,939 | | | | | | 172,552 | |
Noble Corporation PLC | | | 188,600 | | | | | | 7,066,842 | |
| | | | | | | | | | |
| | | | | | | | | 37,732,959 | |
| | | | | | | | | | |
Total Foreign Common Stocks
(Cost $107,232,807) | | | | | | 133,947,223 | |
| | | | | | | | | | |
MONEY MARKET FUNDS — 11.7% | |
GuideStone Money Market Fund (GS4 Class)¥ | | | 48,058,108 | | | | | | 48,058,108 | |
Northern Institutional Liquid Assets Portfolio§ | | | 109,412,405 | | | | | | 109,412,405 | |
| | | | | | | | | | |
Total Money Market Funds
(Cost $157,470,513) | | | | | | 157,470,513 | |
| | | | | | | |
| | | |
| | | Par | | | | | | |
U.S. TREASURY OBLIGATION — 0.0% | |
U.S. Treasury Bill
0.05%, 04/10/14‡‡
| | | | | | | | | | |
(Cost $649,910) | | $ | 650,000 | | | | | | 649,925 | |
| | | | | | | |
TOTAL INVESTMENTS — 107.9%
(Cost $1,114,901,125) | | | | | | 1,449,168,997 | |
Liabilities in Excess of
Other Assets — (7.9)% | | | | | | (106,154,366 | ) |
| | | | | | | | | | |
Net Assets — 100.0% | | | | | | | | $ | 1,343,014,631 | |
| | | | | | | | | | |
| | | | |
| 192 | | See Notes to Financial Statements. | | |
VALUATION HIERARCHY
The following is a summary of the inputs used, as of December 31, 2013, in valuing the Fund’s investments carried at fair value:
| | | | | | | | | | | | | | | | | | | | |
| | | Total Value | | Level 1
Quoted Prices | | Level 2
Other Significant
Observable Inputs | | Level 3
Significant
Unobservable Inputs |
Assets: | | | | | | | | | | | | | | | | | | | | |
Investments in Securities: | | | | | | | | | | | | | | | | | | | | |
Common Stocks | | | $ | 1,157,101,336 | | | | $ | 1,157,101,336 | | | | $ | — | | | | $ | — | |
Foreign Common Stocks | | | | 133,947,223 | | | | | 133,947,223 | | | | | — | | | | | — | |
Money Market Funds | | | | 157,470,513 | | | | | 157,470,513 | | | | | — | | | | | — | |
U.S. Treasury Obligation | | | | 649,925 | | | | | — | | | | | 649,925 | | | | | — | |
| | | | | | | | | | | | | | | | | | | | |
Total Assets - Investments in Securities | | | $ | 1,449,168,997 | | | | $ | 1,448,519,072 | | | | $ | 649,925 | | | | $ | — | |
| | | | | | | | | | | | | | | | | | | | |
| | | | |
Other Financial Instruments*** | | | | | | | | | | | | | | | | | | | | |
Futures Contracts | | | $ | 1,791,093 | | | | $ | 1,791,093 | | | | $ | — | | | | $ | — | |
| | | | | | | | | | | | | | | | | | | | |
Total Assets - Other Financial Instruments | | | $ | 1,791,093 | | | | $ | 1,791,093 | | | | $ | — | | | | $ | — | |
| | | | | | | | | | | | | | | | | | | | |
***Other financial instruments are derivative instruments not reflected in the Schedule of Investments, such as futures, forwards and swap contracts, which are valued at the unrealized appreciation (depreciation) on the investment. Details of these investments can be found in the Notes to Financial Statements.
There were no transfers between Level 1 and Level 2 during the year ended December 31, 2013.
| | | | |
| | See Notes to Financial Statements. | | 193 |
Growth Equity Fund (Unaudited)
The Fund invested in a diversified portfolio of large- and medium-sized U.S. companies whose stocks were considered to have above average potential for growth in revenue and earnings. The GS4 Class of the Fund outperformed its benchmark, the Russell 1000® Growth Index, for the one-year period ended December 31, 2013 (34.52% versus 33.48%). Underweight exposure and security selection within the technology sector contributed to benchmark-relative returns, while underweight exposure and security selection within the producer durables sector detracted from benchmark-relative performance during the year.
This Fund may be suitable for investors who seek high, long-term rates of return, can accept significant short-term fluctuations in account value, want to invest in growth-oriented stocks and would like to diversify their portfolio by adding a potentially higher return, higher risk option of stocks. The Fund will not concentrate in any particular industry, but at times, it may be heavily invested in a particular economic sector. This may result in greater short-term price volatility.
At December 31, 2013, the portfolio holdings of the Fund, as a percentage of net assets, is shown in the following table. Portfolio holdings are subject to risk and may change at any time.
| | | | |
| | | % | |
Consumer Discretionary | | | 21.2 | |
Technology | | | 18.0 | |
Money Market Funds | | | 15.3 | |
Healthcare | | | 14.7 | |
Financial Services | | | 13.2 | |
Foreign Common Stocks | | | 10.8 | |
Energy | | | 5.6 | |
Producer Durables | | | 5.5 | |
Materials & Processing | | | 4.0 | |
Consumer Staples | | | 2.5 | |
Foreign Preferred Stocks | | | — | ** |
| | | | |
| | | 110.8 | |
| | | | |
** Rounds to less than 0.005%.
194
Growth Equity Fund (Unaudited)
| | | | | | | | | | | | |
| Average Annual Total Returns as of 12/31/13 | | |
| | | GS2 Class* | | | | GS4 Class* | | | | Benchmark** | | |
One Year | | 34.83% | | | | 34.52% | | | | 33.48% | | |
Five Year | | 20.80% | | | | 20.64% | | | | 20.39% | | |
Ten Year | | 7.47% | | | | 7.32% | | | | 7.83% | | |
Inception Date | | 08/27/01 | | | | 08/27/01 | | | | | | |
Total Fund Operating Expenses (May 1, 2013 Prospectus, as amended on October 31, 2013)(1) | | 0.90% | | | | 1.14% | | | | | | |
(1)Current information regarding the Fund’s Operating Expenses can be found in the Financial Highlights.
The performance data quoted represents past performance and does not guarantee future results. Current performance may be lower or higher. Performance data current to the most recent month-end may be obtained at www.GuideStoneFunds.org. The investment return and principal value of an investment will fluctuate so that shares, when redeemed, may be worth more or less than their original cost.
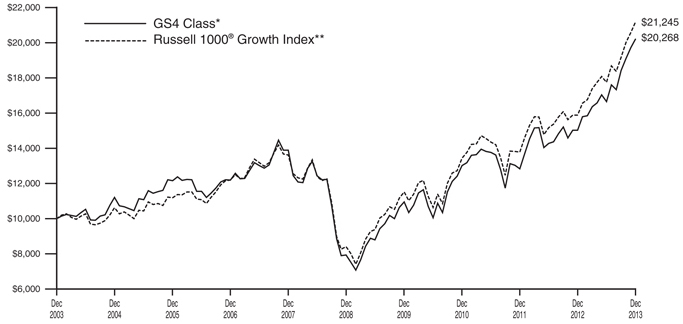
The graph compares the results of a hypothetical $10,000 investment in the GS4 Class of the Fund for the 10-year period from December 31, 2003 to December 31, 2013, with all dividends and capital gains reinvested, with the Russell 1000® Growth Index.
*These returns reflect expense waivers by the Fund’s investment adviser. Without these waivers, returns would have been lower. Returns shown do not reflect the deduction of taxes that a shareholder would pay on Fund distributions or the redemption of Fund shares.
Unlike a mutual fund, the performance of an index assumes no taxes, transaction costs, management fees or other expenses.
195
| | |
GROWTH EQUITY FUND SCHEDULE OF INVESTMENTS | | December 31, 2013 |
| | | | | | | | | | |
| | | Shares | | | Value | |
COMMON STOCKS — 84.7% | |
Consumer Discretionary — 21.2% | |
Amazon.com, Inc.* | | | 98,965 | | | | | $ | 39,466,252 | |
CBS Corporation Class B | | | 102,271 | | | | | | 6,518,754 | |
Chipotle Mexican Grill, Inc.* | | | 25,700 | | | | | | 13,692,446 | |
Comcast Corporation Class A | | | 194,530 | | | | | | 10,108,752 | |
Costco Wholesale Corporation | | | 89,144 | | | | | | 10,609,027 | |
Discovery Communications, Inc. Class A* | | | 39,160 | | | | | | 3,540,847 | |
eBay, Inc.* | | | 68,220 | | | | | | 3,744,596 | |
Estee Lauder Cos., Inc. (The) Class A | | | 247,872 | | | | | | 18,669,719 | |
Expedia, Inc.D | | | 91,030 | | | | | | 6,341,150 | |
Fortune Brands Home & Security, Inc. | | | 99,370 | | | | | | 4,541,209 | |
Fossil Group, Inc.* | | | 37,037 | | | | | | 4,442,218 | |
Gap, Inc. (The) | | | 88,417 | | | | | | 3,455,336 | |
General Motors Co.* | | | 138,866 | | | | | | 5,675,453 | |
Hertz Global Holdings, Inc.* | | | 134,905 | | | | | | 3,860,981 | |
Home Depot, Inc. (The) | | | 68,130 | | | | | | 5,609,824 | |
Jarden Corporation* | | | 110,970 | | | | | | 6,808,010 | |
Johnson Controls, Inc. | | | 148,918 | | | | | | 7,639,493 | |
Lennar Corporation Class AD | | | 120,280 | | | | | | 4,758,277 | |
Liberty Media Corporation Class A* | | | 20,643 | | | | | | 3,023,167 | |
Lululemon Athletica, Inc.D* | | | 43,652 | | | | | | 2,576,778 | |
NIKE, Inc. Class B | | | 312,091 | | | | | | 24,542,836 | |
Panera Bread Co. Class A* | | | 6,096 | | | | | | 1,077,102 | |
priceline.com, Inc.* | | | 27,330 | | | | | | 31,768,392 | |
Ralph Lauren Corporation | | | 29,840 | | | | | | 5,268,849 | |
Sirius XM Holdings, Inc.D* | | | 2,140,722 | | | | | | 7,471,120 | |
Starbucks Corporation | | | 294,052 | | | | | | 23,050,736 | |
Starwood Hotels & Resorts Worldwide, Inc. | | | 159,538 | | | | | | 12,675,294 | |
TJX Cos., Inc. | | | 74,353 | | | | | | 4,738,517 | |
Ulta Salon Cosmetics & Fragrance, Inc.* | | | 81,200 | | | | | | 7,837,424 | |
Walt Disney Co. (The) | | | 195,920 | | | | | | 14,968,288 | |
Whirlpool Corporation | | | 18,345 | | | | | | 2,877,597 | |
| | | | | | | | | | |
| | | | | | | | | 301,358,444 | |
| | | | | | | | | | |
Consumer Staples — 2.5% | |
Church & Dwight Co., Inc. | | | 75,280 | | | | | | 4,989,558 | |
Green Mountain Coffee Roasters, Inc.D* | | | 40,870 | | | | | | 3,088,955 | |
Mead Johnson Nutrition Co. | | | 84,745 | | | | | | 7,098,241 | |
Monster Beverage Corporation* | | | 90,300 | | | | | | 6,119,631 | |
Procter & Gamble Co. (The) | | | 61,279 | | | | | | 4,988,723 | |
Safeway, Inc. | | | 78,500 | | | | | | 2,556,745 | |
Whole Foods Market, Inc. | | | 108,820 | | | | | | 6,293,061 | |
| | | | | | | | | | |
| | | | | | | | | 35,134,914 | |
| | | | | | | | | | |
Energy — 5.6% | |
Anadarko Petroleum Corporation | | | 41,390 | | | | | | 3,283,055 | |
Antero Resources Corporation* | | | 34,947 | | | | | | 2,217,038 | |
Continental Resources, Inc.D* | | | 82,446 | | | | | | 9,276,824 | |
EOG Resources, Inc. | | | 37,210 | | | | | | 6,245,326 | |
FMC Technologies, Inc.D* | | | 336,099 | | | | | | 17,547,729 | |
Halliburton Co. | | | 106,172 | | | | | | 5,388,229 | |
National Oilwell Varco, Inc.D | | | 119,500 | | | | | | 9,503,835 | |
Noble Energy, Inc. | | | 77,433 | | | | | | 5,273,962 | |
| | | | | | | | | | |
| | | Shares | | | Value | |
Occidental Petroleum Corporation | | | 38,665 | | | | | $ | 3,677,041 | |
Pioneer Natural Resources Co. | | | 37,011 | | | | | | 6,812,615 | |
Southwestern Energy Co.* | | | 241,000 | | | | | | 9,478,530 | |
| | | | | | | | | | |
| | | | | | | | | 78,704,184 | |
| | | | | | | | | | |
Financial Services — 13.2% | |
American Express Co. | | | 32,900 | | | | | | 2,985,017 | |
American International Group, Inc. | | | 74,050 | | | | | | 3,780,253 | |
BlackRock, Inc. | | | 16,150 | | | | | | 5,110,991 | |
Charles Schwab Corporation (The)D | | | 618,015 | | | | | | 16,068,390 | |
Citigroup, Inc. | | | 370,598 | | | | | | 19,311,862 | |
CME Group, Inc. | | | 34,700 | | | | | | 2,722,562 | |
Discover Financial Services | | | 228,073 | | | | | | 12,760,684 | |
FleetCor Technologies, Inc.* | | | 67,054 | | | | | | 7,856,717 | |
Goldman Sachs Group, Inc. (The) | | | 19,390 | | | | | | 3,437,071 | |
Hartford Financial Services Group, Inc.D | | | 140,550 | | | | | | 5,092,126 | |
IntercontinentalExchange Group, Inc.* | | | 33,699 | | | | | | 7,579,579 | |
JPMorgan Chase & Co. | | | 147,300 | | | | | | 8,614,104 | |
Mastercard, Inc. Class A | | | 18,719 | | | | | | 15,638,976 | |
Morgan Stanley | | | 406,940 | | | | | | 12,761,638 | |
Ocwen Financial Corporation* | | | 29,700 | | | | | | 1,646,865 | |
SLM Corporation | | | 151,650 | | | | | | 3,985,362 | |
Visa, Inc. Class AD | | | 262,414 | | | | | | 58,434,350 | |
| | | | | | | | | | |
| | | | | | | | | 187,786,547 | |
| | | | | | | | | | |
Healthcare — 14.7% | |
Alexion Pharmaceuticals, Inc.* | | | 81,400 | | | | | | 10,831,084 | |
Allergan, Inc. | | | 64,350 | | | | | | 7,147,998 | |
athenahealth, Inc.D* | | | 35,900 | | | | | | 4,828,550 | |
Biogen Idec, Inc.* | | | 124,788 | | | | | | 34,909,443 | |
BioMarin Pharmaceutical, Inc.* | | | 73,400 | | | | | | 5,157,818 | |
Boston Scientific Corporation* | | | 277,871 | | | | | | 3,340,010 | |
Bristol-Myers Squibb Co.D | | | 53,500 | | | | | | 2,843,525 | |
Celgene Corporation* | | | 68,880 | | | | | | 11,637,965 | |
Cerner Corporation* | | | 154,000 | | | | | | 8,583,960 | |
Cooper Cos., Inc. (The)D | | | 25,560 | | | | | | 3,165,350 | |
Covance, Inc.D* | | | 53,586 | | | | | | 4,718,783 | |
DaVita HealthCare Partners, Inc.* | | | 85,884 | | | | | | 5,442,469 | |
Express Scripts Holding Co.* | | | 210,209 | | | | | | 14,765,080 | |
Gilead Sciences, Inc.D* | | | 503,536 | | | | | | 37,840,730 | |
Intuitive Surgical, Inc.D* | | | 37,259 | | | | | | 14,310,437 | |
McKesson Corporation | | | 21,200 | | | | | | 3,421,680 | |
Pfizer, Inc. | | | 169,926 | | | | | | 5,204,833 | |
Pharmacyclics, Inc.* | | | 21,506 | | | | | | 2,274,905 | |
Regeneron Pharmaceuticals, Inc.D* | | | 59,593 | | | | | | 16,402,377 | |
St. Jude Medical, Inc. | | | 58,700 | | | | | | 3,636,465 | |
Thermo Fisher Scientific, Inc. | | | 53,400 | | | | | | 5,946,090 | |
Zoetis, Inc. | | | 71,420 | | | | | | 2,334,720 | |
| | | | | | | | | | |
| | | | | | | | | 208,744,272 | |
| | | | | | | | | | |
Materials & Processing — 4.0% | |
Ecolab, Inc. | | | 78,328 | | | | | | 8,167,261 | |
Masco Corporation | | | 180,178 | | | | | | 4,102,653 | |
Monsanto Co. | | | 160,655 | | | | | | 18,724,340 | |
PPG Industries, Inc. | | | 29,838 | | | | | | 5,659,075 | |
Precision Castparts Corporation | | | 26,800 | | | | | | 7,217,240 | |
| | | | |
| 196 | | See Notes to Financial Statements. | | |
| | | | | | | | | | |
| | | Shares | | | Value | |
Sherwin-Williams Co. (The) | | | 71,182 | | | | | $ | 13,061,897 | |
| | | | | | | | | | |
| | | | | | | | | 56,932,466 | |
| | | | | | | | | | |
Producer Durables — 5.5% | |
B/E Aerospace, Inc.* | | | 77,366 | | | | | | 6,733,163 | |
Boeing Co. (The) | | | 80,751 | | | | | | 11,021,704 | |
Cummins, Inc. | | | 34,860 | | | | | | 4,914,214 | |
Danaher Corporation | | | 94,138 | | | | | | 7,267,453 | |
Delta Air Lines, Inc. | | | 193,257 | | | | | | 5,308,770 | |
Fluor CorporationD | | | 104,230 | | | | | | 8,368,627 | |
Honeywell International, Inc. | | | 46,980 | | | | | | 4,292,563 | |
National Instruments CorporationD | | | 111,704 | | | | | | 3,576,762 | |
Roper Industries, Inc.D | | | 42,672 | | | | | | 5,917,753 | |
Stericycle, Inc.* | | | 52,234 | | | | | | 6,068,024 | |
Union Pacific Corporation | | | 63,953 | | | | | | 10,744,104 | |
Verisk Analytics, Inc. Class A* | | | 52,260 | | | | | | 3,434,527 | |
| | | | | | | | | | |
| | | | | | | | | 77,647,664 | |
| | | | | | | | | | |
Technology — 18.0% | |
Amphenol Corporation Class AD | | | 69,404 | | | | | | 6,189,449 | |
ANSYS, Inc.* | | | 41,270 | | | | | | 3,598,744 | |
Apple, Inc. | | | 39,566 | | | | | | 22,200,878 | |
Citrix Systems, Inc.* | | | 38,520 | | | | | | 2,436,390 | |
Cognizant Technology Solutions Corporation Class A* | | | 39,427 | | | | | | 3,981,338 | |
Cree, Inc.D* | | | 44,048 | | | | | | 2,756,083 | |
Crown Castle International Corporation* | | | 50,442 | | | | | | 3,703,956 | |
Equinix, Inc.D* | | | 18,470 | | | | | | 3,277,502 | |
F5 Networks, Inc.D* | | | 43,130 | | | | | | 3,918,792 | |
Facebook, Inc. Class AD* | | | 547,638 | | | | | | 29,933,893 | |
Google, Inc. Class A* | | | 61,292 | | | | | | 68,690,557 | |
Lam Research Corporation* | | | 37,050 | | | | | | 2,017,372 | |
LinkedIn Corporation, Class AD* | | | 85,065 | | | | | | 18,444,644 | |
NetApp, Inc. | | | 110,947 | | | | | | 4,564,360 | |
QUALCOMM, Inc. | | | 169,571 | | | | | | 12,590,647 | |
Rovi Corporation* | | | 7 | | | | | | 138 | |
Salesforce.com, Inc.D* | | | 667,972 | | | | | | 36,865,375 | |
ServiceNow, Inc.* | | | 32,492 | | | | | | 1,819,877 | |
Splunk, Inc.D* | | | 139,617 | | | | | | 9,587,499 | |
Texas Instruments, Inc. | | | 115,837 | | | | | | 5,086,403 | |
Twitter, Inc.D* | | | 17,868 | | | | | | 1,137,298 | |
Workday, Inc. Class AD* | | | 24,050 | | | | | | 1,999,998 | |
Yahoo!, Inc.* | | | 206,300 | | | | | | 8,342,772 | |
Yelp, Inc.* | | | 30,474 | | | | | | 2,101,182 | |
| | | | | | | | | | |
| | | | | | | | | 255,245,147 | |
| | | | | | | | | | |
Total Common Stocks
(Cost $850,644,898) | | | | | | | | | 1,201,553,638 | |
| | | | | | | | | | |
| | | | | | | | | | |
| | | Shares | | | Value | |
FOREIGN COMMON STOCKS — 10.8% | |
Bermuda — 0.3% | |
Genpact, Ltd.* | | | 207,595 | | | | | $ | 3,813,520 | |
| | | | | | | |
British Virgin Islands — 0.3% | |
Michael Kors Holdings, Ltd.D* | | | 55,705 | | | | | | 4,522,689 | |
| | | | | | | | | | |
Canada — 1.1% | |
Canadian Pacific Railway, Ltd. | | | 65,885 | | | | | | 9,969,718 | |
Valeant Pharmaceuticals International, Inc.* | | | 50,626 | | | | | | 5,943,493 | |
| | | | | | | | | | |
| | | | | | | | | 15,913,211 | |
| | | | | | | | | | |
Cayman Islands — 1.5% | |
Baidu, Inc. ADR* | | | 116,500 | | | | | | 20,723,020 | |
| | | | | | | | | | |
Curacao — 2.3% | |
Schlumberger, Ltd. | | | 355,436 | | | | | | 32,028,338 | |
| | | | | | | | | | |
Ireland — 0.8% | |
Accenture PLC Class A | | | 62,445 | | | | | | 5,134,228 | |
Eaton Corporation PLC | | | 84,150 | | | | | | 6,405,498 | |
| | | | | | | | | | |
| | | | | | | | | 11,539,726 | |
| | | | | | | | | | |
Jersey — 0.3% | |
Shire PLC ADRD | | | 35,170 | | | | | | 4,969,169 | |
| | | | | | | | | | |
Netherlands — 2.1% | |
ASML Holding NVD | | | 183,458 | | | | | | 17,190,014 | |
Core Laboratories NV | | | 33,596 | | | | | | 6,415,156 | |
LyondellBasell Industries NV Class A | | | 35,463 | | | | | | 2,846,970 | |
Yandex NV, Class A | | | 78,340 | | | | | | 3,380,371 | |
| | | | | | | | | | |
| | | | | | | | | 29,832,511 | |
| | | | | | | | | | |
United Kingdom — 2.1% | |
ARM Holdings PLC ADRD | | | 211,700 | | | | | | 11,588,458 | |
Liberty Global PLC Class A* | | | 137,181 | | | | | | 12,207,737 | |
Rolls-Royce Holdings PLC* | | | 253,865 | | | | | | 5,359,970 | |
| | | | | | | | | | |
| | | | | | | | | 29,156,165 | |
| | | | | | | | | | |
Total Foreign Common Stocks
(Cost $110,730,767) | | | | | | 152,498,349 | |
| | | | | | | | | | |
FOREIGN PREFERRED STOCKS — 0.0% | |
Rolls-Royce Holdings PLC
Class C, 3.00%+*
| | | | | | | | | | |
(Cost $21,833) | | | 21,832,390 | | | | | | 36,154 | |
| | | | | | | | | | |
MONEY MARKET FUNDS — 15.3% | |
GuideStone Money Market Fund (GS4 Class)¥ | | | 60,581,823 | | | | | | 60,581,823 | |
Northern Institutional Liquid Assets Portfolio§ | | | 156,992,176 | | | | | | 156,992,176 | |
| | | | | | | | | | |
Total Money Market Funds
(Cost $217,573,999) | | | | | | | | | 217,573,999 | |
| | | | | | | | | | |
| |
TOTAL INVESTMENTS — 110.8%
(Cost $1,178,971,497) | | | 1,571,662,140 | |
Liabilities in Excess of
Other Assets — (10.8)% | | | | | | (153,018,295 | ) |
| | | | | | | | | | |
NET ASSETS — 100.0% | | | | | $ | 1,418,643,845 | |
| | | | | | | | | | |
| | | | |
| | See Notes to Financial Statements. | | 197 |
GROWTH EQUITY FUND
SCHEDULE OF INVESTMENTS (Continued)
VALUATION HIERARCHY
The following is a summary of the inputs used, as of December 31, 2013, in valuing the Fund’s investments carried at fair value:
| | | | | | | | | | | | | | | | | | | | |
| | | Total
Value | | Level 1
Quoted Prices | | Level 2
Other Significant
Observable Inputs | | Level 3
Significant
Unobservable Inputs |
Assets: | | | | | | | | | | | | | | | | | | | | |
Investments in Securities: | | | | | | | | | | | | | | | | | | | | |
Common Stocks | | | $ | 1,201,553,638 | | | | $ | 1,201,553,638 | | | | $ | — | | | | $ | — | |
Foreign Common Stocks | | | | 152,498,349 | | | | | 152,498,349 | | | | | — | | | | | — | |
Foreign Preferred Stocks | | | | 36,154 | | | | | — | | | | | — | | | | | 36,154 | |
Money Market Funds | | | | 217,573,999 | | | | | 217,573,999 | | | | | — | | | | | — | |
| | | | | | | | | | | | | | | | | | | | |
Total Assets - Investments in Securities | | | $ | 1,571,662,140 | | | | $ | 1,571,625,986 | | | | $ | — | | | | $ | 36,154 | |
| | | | | | | | | | | | | | | | | | | | |
| | | | |
Other Financial Instruments*** | | | | | | | | | | | | | | | | | | | | |
Futures Contracts | | | $ | 2,352,173 | | | | $ | 2,352,173 | | | | $ | — | | | | $ | — | |
| | | | | | | | | | | | | | | | | | | | |
Total Assets - Other Financial Instruments | | | $ | 2,352,173 | | | | $ | 2,352,173 | | | | $ | — | | | | $ | — | |
| | | | | | | | | | | | | | | | | | | | |
***Other financial instruments are derivative instruments not reflected in the Schedule of Investments, such as futures, forwards and swap contracts, which are valued at the unrealized appreciation (depreciation) on the investment. Details of these investments can be found in the Notes to Financial Statements.
Management has determined that the amount of transfers between Level 1 and Level 2 compared to total net assets of the Funds is not material, therefore, the transfers between Level 1 and Level 2 are not shown for the year ended December 31, 2013.
Management has determined that the amount of Level 3 securities compared to total net assets is not material; therefore, the reconciliation of Level 3 securities and assumptions is not shown for the period ending December 31, 2013.
| | | | |
| 198 | | See Notes to Financial Statements. | | |
Small Cap Equity Fund (Unaudited)
The Fund was comprised of domestic, small-cap stocks with both value- and growth-style orientations. The GS4 Class of the Fund generated exceptionally strong performance for the year with a return of 38.09%, slightly underperforming its benchmark, the Russell 2000® Index, for the one-year period ended December 31, 2013 (38.09% versus 38.82%). Security selection within the healthcare and technology sectors detracted from benchmark-relative returns, while security selection within the financial services and producer durables sectors contributed to benchmark-relative performance during the year. The Fund’s relative performance further benefited from a portable alpha strategy, where stock index futures contracts were used to gain small cap equity beta exposure and the underlying cash was invested in fixed income securities. Within this portion of the Fund, the fixed income securities’ performance outpaced the futures contracts’ financing costs which generated excess return for the Fund. Within the fixed income portion of the portfolio, certain derivative contracts were used to manage duration and adjust exposure along the yield curve, including U.S. Treasuries futures and options, Eurodollar futures and options and Euro-Bund futures. The Fund also used currency forwards to manage foreign currency exposure. At the Fund level, overall derivative exposure had a very slight negative impact on performance over the course of the year.
This Fund may be suitable for investors who seek higher, long-term rates of return, can accept significant short-term fluctuations in account value, want to invest in stocks of small- to medium-sized U.S. companies and would like to diversify their portfolio by adding a potentially higher return, higher risk option of stocks. Small company stocks are subject to greater risk than large company stocks due to more volatility and less liquidity. To the extent that the investment adviser misjudges current market conditions, the Fund’s volatility may be amplified by its use of derivatives and by its ability to select sub-advisers to allocate assets. Leverage may increase the risk of loss and cause fluctuations in the market value of the Fund’s portfolio to have disproportionately large effects or cause the net asset value of the Fund generally to decline faster than it would otherwise.
At December 31, 2013, the portfolio holdings of the Fund, as a percentage of net assets, is shown in the following table. Portfolio holdings are subject to risk and may change at any time.
| | | | |
| | | % | |
Money Market Funds | | | 31.6 | |
Producer Durables | | | 16.3 | |
Financial Services | | | 15.2 | |
Consumer Discretionary | | | 12.8 | |
Technology | | | 12.7 | |
Foreign Common Stocks | | | 7.3 | |
Healthcare | | | 7.1 | |
Materials & Processing | | | 5.0 | |
Energy | | | 4.3 | |
Mortgage-Backed Securities | | | 3.4 | |
Utilities | | | 3.2 | |
Corporate Bonds | | | 2.3 | |
Consumer Staples | | | 1.8 | |
Foreign Bonds | | | 1.5 | |
U.S. Treasury Obligations | | | 1.5 | |
Agency Obligations | | | 0.7 | |
Asset-Backed Securities | | | 0.4 | |
Municipal Bonds | | | 0.1 | |
Purchased Options | | | — | ** |
Rights/Warrants | | | — | ** |
Written Option | | | — | ** |
| | | | |
| | | 127.2 | |
| | | | |
** Rounds to less than 0.005%.
199
Small Cap Equity Fund (Unaudited)
| | | | | | | | | | |
| Average Annual Total Returns as of 12/31/13 |
| | GS2 Class* | | | | GS4 Class* | | | | Benchmark** |
One Year | | 38.39% | | | | 38.09% | | | | 38.82% |
Five Year | | 21.51% | | | | 21.29% | | | | 20.08% |
Ten Year | | 8.67% | | | | 8.50% | | | | 9.07% |
Inception Date | | 08/27/01 | | | | 08/27/01 | | | | |
Total Fund Operating Expenses (May 1, 2013 Prospectus, as amended on October 31, 2013)(1) | | 1.05% | | | | 1.29% | | | | |
(1)Current information regarding the Fund’s Operating Expenses can be found in the Financial Highlights.
The performance data quoted represents past performance and does not guarantee future results. Current performance may be lower or higher. Performance data current to the most recent month-end may be obtained at www.GuideStoneFunds.org. The investment return and principal value of an investment will fluctuate so that shares, when redeemed, may be worth more or less than their original cost.
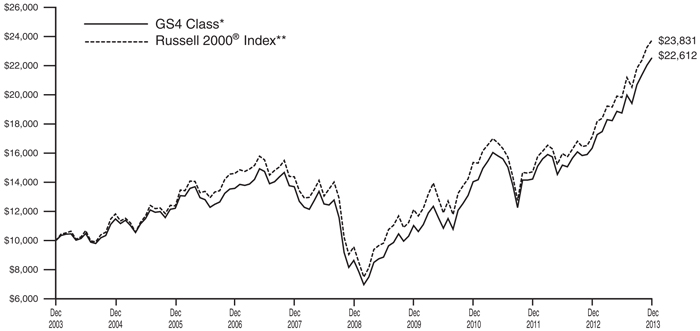
The graph compares the results of a hypothetical $10,000 investment in the GS4 Class of the Fund for the 10-year period from December 31, 2003 to December 31, 2013, with all dividends and capital gains reinvested, with the Russell 2000® Index.
*These returns reflect expense waivers by the Fund’s investment adviser. Without these waivers, returns would have been lower. Returns shown do not reflect the deduction of taxes that a shareholder would pay on Fund distributions or the redemption of Fund shares.
Unlike a mutual fund, the performance of an index assumes no taxes, transaction costs, management fees or other expenses.
200
| | |
SMALL CAP EQUITY FUND SCHEDULE OF INVESTMENTS | | December 31, 2013 |
| | | | | | | | | | |
| | | Shares | | | Value | |
COMMON STOCKS — 78.4% | |
Consumer Discretionary — 12.8% | |
ANN, Inc.* | | | 15,200 | | | | | $ | 555,712 | |
Arctic Cat, Inc. | | | 12,000 | | | | | | 683,760 | |
Ascena Retail Group, Inc.* | | | 51,300 | | | | | | 1,085,508 | |
Blue Nile, Inc.D* | | | 13,200 | | | | | | 621,588 | |
Bright Horizons Family Solutions, Inc.D* | | | 33,600 | | | | | | 1,234,464 | |
Buffalo Wild Wings, Inc.* | | | 8,390 | | | | | | 1,235,008 | |
Burlington Stores, Inc.* | | | 10,600 | | | | | | 339,200 | |
Cato Corporation (The) Class A | | | 35,500 | | | | | | 1,128,900 | |
CEC Entertainment, Inc.D | | | 8,200 | | | | | | 363,096 | |
Chegg, Inc.* | | | 9,800 | | | | | | 83,398 | |
Children’s Place Retail Stores, Inc. (The)D* | | | 6,300 | | | | | | 358,911 | |
Chuy’s Holdings, Inc.D* | | | 5,642 | | | | | | 203,225 | |
Deckers Outdoor CorporationD* | | | 20,500 | | | | | | 1,731,430 | |
Destination Maternity Corporation | | | 32,000 | | | | | | 956,160 | |
Destination XL Group, Inc.D* | | | 323,288 | | | | | | 2,124,002 | |
Drew Industries, Inc.* | | | 36,400 | | | | | | 1,863,680 | |
DSW, Inc. Class A | | | 17,400 | | | | | | 743,502 | |
Fiesta Restaurant Group, Inc.* | | | 5,800 | | | | | | 302,992 | |
Finish Line, Inc. (The) Class A | | | 6,800 | | | | | | 191,556 | |
Five Below, Inc.D* | | | 16,600 | | | | | | 717,120 | |
Fox Factory Holding Corporation* | | | 38,700 | | | | | | 681,894 | |
FTD Cos., Inc.D* | | | 15,520 | | | | | | 505,642 | |
GameStop Corporation Class AD | | | 29,000 | | | | | | 1,428,540 | |
Gentex CorporationD | | | 32,400 | | | | | | 1,068,876 | |
G-III Apparel Group, Ltd.* | | | 14,700 | | | | | | 1,084,713 | |
Goodyear Tire & Rubber Co. (The) | | | 37,200 | | | | | | 887,220 | |
Grand Canyon Education, Inc.* | | | 47,600 | | | | | | 2,075,360 | |
Harman International Industries, Inc. | | | 22,878 | | | | | | 1,872,564 | |
Hibbett Sports, Inc.D* | | | 22,700 | | | | | | 1,525,667 | |
Inter Parfums, Inc. | | | 24,700 | | | | | | 884,507 | |
ITT Educational Services, Inc.D* | | | 29,500 | | | | | | 990,610 | |
Jarden Corporation* | | | 8,000 | | | | | | 490,800 | |
Kirkland’s, Inc.* | | | 75,300 | | | | | | 1,782,351 | |
Krispy Kreme Doughnuts, Inc.D* | | | 27,000 | | | | | | 520,830 | |
Lear Corporation | | | 33,900 | | | | | | 2,744,883 | |
Libbey, Inc.* | | | 75,800 | | | | | | 1,591,800 | |
Lions Gate Entertainment CorporationD | | | 31,038 | | | | | | 982,663 | |
Lithia Motors, Inc. Class AD | | | 19,000 | | | | | | 1,318,980 | |
Mattress Firm Holding CorporationD* | | | 20,100 | | | | | | 865,104 | |
Monro Muffler Brake, Inc.D | | | 31,250 | | | | | | 1,761,250 | |
National CineMedia, Inc. | | | 70,000 | | | | | | 1,397,200 | |
Nu Skin Enterprises, Inc. Class A | | | 16,200 | | | | | | 2,239,164 | |
Nutrisystem, Inc. | | | 66,500 | | | | | | 1,093,260 | |
Oxford Industries, Inc. | | | 16,550 | | | | | | 1,335,088 | |
Pandora Media, Inc.D* | | | 63,700 | | | | | | 1,694,420 | |
Red Robin Gourmet Burgers, Inc.D* | | | 5,600 | | | | | | 411,824 | |
RG Barry Corporation | | | 76,740 | | | | | | 1,481,082 | |
Ryland Group, Inc. (The)D | | | 24,400 | | | | | | 1,059,204 | |
Sally Beauty Holdings, Inc.* | | | 45,300 | | | | | | 1,369,419 | |
SFX Entertainment, Inc.D* | | | 19,200 | | | | | | 230,400 | |
| | | | | | | | | | |
| | | Shares | | | Value | |
Shutterfly, Inc.D* | | | 25,600 | | | | | $ | 1,303,808 | |
Shutterstock, Inc.D* | | | 12,600 | | | | | | 1,053,738 | |
Smith & Wesson Holding CorporationD* | | | 304,400 | | | | | | 4,106,356 | |
Sotheby’s | | | 37,500 | | | | | | 1,995,000 | |
Steven Madden, Ltd.* | | | 35,850 | | | | | | 1,311,752 | |
Sturm Ruger & Co., Inc.D | | | 30,300 | | | | | | 2,214,627 | |
Tower International, Inc.* | | | 98,700 | | | | | | 2,112,180 | |
Universal Electronics, Inc.* | | | 103,654 | | | | | | 3,950,254 | |
Vera Bradley, Inc.D* | | | 34,100 | | | | | | 819,764 | |
Vince Holding Corporation* | | | 7,900 | | | | | | 242,293 | |
Zagg, Inc.D* | | | 178,100 | | | | | | 774,735 | |
| | | | | | | | | | |
| | | | | | | | | 73,783,034 | |
| | | | | | | | | | |
Consumer Staples — 1.8% | |
Andersons, Inc. (The) | | | 10,200 | | | | | | 909,534 | |
Annie’s, Inc.D* | | | 18,250 | | | | | | 785,480 | |
Boulder Brands, Inc.D* | | | 25,638 | | | | | | 406,618 | |
Cal-Maine Foods, Inc. | | | 1,400 | | | | | | 84,322 | |
Chef’s Warehouse, Inc. (The)D* | | | 35,900 | | | | | | 1,046,844 | |
Diamond Foods, Inc.D* | | | 20,200 | | | | | | 521,968 | |
Hain Celestial Group, Inc.
(The)* | | | 13,901 | | | | | | 1,261,933 | |
Natural Grocers by Vitamin Cottage, Inc.D* | | | 5,555 | | | | | | 235,810 | |
Omega Protein CorporationD* | | | 40,700 | | | | | | 500,203 | |
PetMed Express, Inc.D | | | 10,300 | | | | | | 171,289 | |
United Natural Foods, Inc.* | | | 44,600 | | | | | | 3,362,394 | |
WhiteWave Foods Co. Class A* | | | 41,834 | | | | | | 959,672 | |
| | | | | | | | | | |
| | | | | | | | | 10,246,067 | |
| | | | | | | | | | |
Energy — 4.3% | |
American Standard Energy Corporation@* | | | 8,702 | | | | | | 1,925 | |
Athlon Energy, Inc.* | | | 23,000 | | | | | | 695,750 | |
Bonanza Creek Energy, Inc.* | | | 18,725 | | | | | | 813,976 | |
CARBO Ceramics, Inc.D | | | 4,900 | | | | | | 570,997 | |
Dawson Geophysical Co.D* | | | 10,500 | | | | | | 355,110 | |
Delek US Holdings, Inc. | | | 13,500 | | | | | | 464,535 | |
Diamondback Energy, Inc.D* | | | 22,836 | | | | | | 1,207,111 | |
Geospace Technologies CorporationD* | | | 23,000 | | | | | | 2,181,090 | |
Green Plains Renewable Energy, Inc.D | | | 26,000 | | | | | | 504,140 | |
Gulfport Energy Corporation* | | | 46,900 | | | | | | 2,961,735 | |
Hornbeck Offshore Services, Inc.D* | | | 22,550 | | | | | | 1,110,137 | |
Laredo Petroleum Holdings, Inc.D* | | | 26,600 | | | | | | 736,554 | |
Matador Resources Co.D* | | | 44,150 | | | | | | 822,956 | |
Parker Drilling Co.* | | | 118,000 | | | | | | 959,340 | |
PDC Energy, Inc.* | | | 14,500 | | | | | | 771,690 | |
Renewable Energy Group, Inc.D* | | | 148,900 | | | | | | 1,706,394 | |
RPC, Inc.D | | | 64,300 | | | | | | 1,147,755 | |
Sanchez Energy CorporationD* | | | 31,200 | | | | | | 764,712 | |
SEACOR Holdings, Inc.D* | | | 7,400 | | | | | | 674,880 | |
SM Energy Co. | | | 24,700 | | | | | | 2,052,817 | |
Stone Energy Corporation* | | | 40,300 | | | | | | 1,393,977 | |
SunPower CorporationD* | | | 17,082 | | | | | | 509,214 | |
Vaalco Energy, Inc.D* | | | 336,500 | | | | | | 2,318,485 | |
| | | | | | | | | | |
| | | | | | | | | 24,725,280 | |
| | | | | | | | | | |
Financial Services — 15.2% | |
American Equity Investment Life Holding Co.D | | | 65,700 | | | | | | 1,733,166 | |
| | | | |
| | See Notes to Financial Statements. | | 201 |
SMALL CAP EQUITY FUND
SCHEDULE OF INVESTMENTS (Continued)
| | | | | | | | | | |
| | | Shares | | | Value | |
American Financial Group, Inc. | | | 42,900 | | | | | $ | 2,476,188 | |
AMERISAFE, Inc. | | | 43,665 | | | | | | 1,844,410 | |
Apartment Investment & Management Co. Class A REIT | | | 30,700 | | | | | | 795,437 | |
Ashford Hospitality Prime, Inc. | | | 19,680 | | | | | | 358,176 | |
Ashford Hospitality Trust, Inc.
REITD | | | 98,400 | | | | | | 814,752 | |
Assurant, Inc. | | | 41,400 | | | | | | 2,747,718 | |
Banner Corporation | | | 50,800 | | | | | | 2,276,856 | |
Brandywine Realty Trust REIT | | | 80,000 | | | | | | 1,127,200 | |
Cardtronics, Inc.* | | | 39,200 | | | | | | 1,703,240 | |
CBL & Associates Properties,
Inc. REITD | | | 76,400 | | | | | | 1,372,144 | |
CBRE Group, Inc. Class A* | | | 88,000 | | | | | | 2,314,400 | |
Cedar Realty Trust, Inc. REIT | | | 139,300 | | | | | | 872,018 | |
Central Pacific Financial
Corporation | | | 23,400 | | | | | | 469,872 | |
Chemical Financial Corporation | | | 16,091 | | | | | | 509,602 | |
Columbia Banking System, Inc. | | | 16,600 | | | | | | 456,666 | |
Comerica, Inc. | | | 14,100 | | | | | | 670,314 | |
Community Bank System, Inc.D | | | 34,300 | | | | | | 1,361,024 | |
Compass Diversified Holdings LLC | | | 139,275 | | | | | | 2,733,968 | |
CoreSite Realty Corporation REITD | | | 10,400 | | | | | | 334,776 | |
CubeSmart REIT | | | 123,000 | | | | | | 1,960,620 | |
DiamondRock Hospitality Co.
REIT | | | 56,000 | | | | | | 646,800 | |
DuPont Fabros Technology,
Inc. REITD | | | 79,700 | | | | | | 1,969,387 | |
E*TRADE Financial
Corporation* | | | 74,400 | | | | | | 1,461,216 | |
Equity Lifestyle Properties,
Inc. REIT | | | 32,700 | | | | | | 1,184,721 | |
Euronet Worldwide, Inc.* | | | 17,100 | | | | | | 818,235 | |
EverBank Financial CorporationD | | | 61,600 | | | | | | 1,129,744 | |
FBL Financial Group, Inc.
Class A | | | 14,500 | | | | | | 649,455 | |
First Interstate Bancsystem, Inc. | | | 82,600 | | | | | | 2,343,362 | |
First Midwest Bancorp, Inc. | | | 22,400 | | | | | | 392,672 | |
First Niagara Financial
Group, Inc. | | | 42,500 | | | | | | 451,350 | |
Genworth Financial, Inc.
Class AD* | | | 25,200 | | | | | | 391,356 | |
Global Payments, Inc.D | | | 41,700 | | | | | | 2,710,083 | |
Hanmi Financial CorporationD | | | 20,100 | | | | | | 439,989 | |
Hanover Insurance
Group, Inc. (The) | | | 25,900 | | | | | | 1,546,489 | |
HCI Group, Inc.D | | | 11,600 | | | | | | 620,600 | |
Heartland Payment Systems,
Inc.D | | | 45,700 | | | | | | 2,277,688 | |
Huntington Bancshares, Inc.D | | | 305,900 | | | | | | 2,951,935 | |
Investment Technology
Group, Inc.* | | | 24,400 | | | | | | 501,664 | |
Jack Henry & Associates, Inc. | | | 36,300 | | | | | | 2,149,323 | |
Kennedy-Wilson Holdings, Inc. | | | 29,325 | | | | | | 652,481 | |
KKR Financial Holdings LLC | | | 124,900 | | | | | | 1,522,531 | |
Lakeland Financial CorporationD | | | 33,400 | | | | | | 1,302,600 | |
LaSalle Hotel Properties REITD | | | 44,500 | | | | | | 1,373,270 | |
Manning & Napier, Inc. | | | 93,300 | | | | | | 1,646,745 | |
MarketAxess Holdings, Inc. | | | 19,400 | | | | | | 1,297,278 | |
MoneyGram International, Inc.* | | | 27,000 | | | | | | 561,060 | |
| | | | | | | | | | |
| | | Shares | | | Value | |
National Bank Holdings Corporation Class AD | | | 22,300 | | | | | $ | 477,220 | |
Portfolio Recovery Associates,
Inc.D* | | | 21,400 | | | | | | 1,130,776 | |
PrivateBancorp, Inc. | | | 24,250 | | | | | | 701,553 | |
ProAssurance Corporation | | | 34,700 | | | | | | 1,682,256 | |
RLJ Lodging Trust REIT | | | 96,800 | | | | | | 2,354,176 | |
Rockville Financial, Inc.D | | | 1,200 | | | | | | 17,052 | |
Sabra Health Care REIT, Inc.D | | | 29,700 | | | | | | 776,358 | |
Safeguard Scientifics, Inc.D* | | | 42,400 | | | | | | 851,816 | |
Safety Insurance Group, Inc. | | | 17,800 | | | | | | 1,002,140 | |
Signature Bank* | | | 4,100 | | | | | | 440,422 | |
Simmons First National Corporation Class AD | | | 16,900 | | | | | | 627,835 | |
Sunstone Hotel Investors, Inc.REIT | | | 76,300 | | | | | | 1,022,420 | |
SVB Financial Group* | | | 1,200 | | | | | | 125,832 | |
United Community Banks, Inc.* | | | 92,700 | | | | | | 1,645,425 | |
Unum Group | | | 50,600 | | | | | | 1,775,048 | |
Waddell & Reed Financial,
Inc. Class A | | | 32,500 | | | | | | 2,116,400 | |
WEX, Inc.* | | | 22,900 | | | | | | 2,267,787 | |
Wilshire Bancorp, Inc. | | | 75,500 | | | | | | 825,215 | |
Wintrust Financial CorporationD | | | 52,300 | | | | | | 2,412,076 | |
WisdomTree Investments,
Inc.D* | | | 49,300 | | | | | | 873,103 | |
World Acceptance
CorporationD* | | | 23,500 | | | | | | 2,056,955 | |
Zillow, Inc. Class AD* | | | 5,291 | | | | | | 432,433 | |
| | | | | | | | | | |
| | | | | | | | | 87,538,879 | |
| | | | | | | | | | |
Healthcare — 7.1% | | | | | | | | | | |
Acadia Healthcare Co., Inc.D* | | | 17,800 | | | | | | 842,474 | |
Air Methods CorporationD* | | | 40,500 | | | | | | 2,362,365 | |
Align Technology, Inc.* | | | 21,200 | | | | | | 1,211,580 | |
Alnylam Pharmaceuticals, Inc.* | | | 11,180 | | | | | | 719,210 | |
Array BioPharma, Inc.D* | | | 96,100 | | | | | | 481,461 | |
AVANIR Pharmaceuticals,
Inc. Class AD* | | | 135,300 | | | | | | 454,608 | |
Bio-Reference Labs, Inc.D* | | | 31,800 | | | | | | 812,172 | |
BioScrip, Inc.* | | | 235,100 | | | | | | 1,739,740 | |
Brookdale Senior Living, Inc.D* | | | 25,700 | | | | | | 698,526 | |
Celldex Therapeutics, Inc.D* | | | 41,100 | | | | | | 995,031 | |
Clovis Oncology, Inc.* | | | 10,800 | | | | | | 650,916 | |
Covance, Inc.* | | | 7,200 | | | | | | 634,032 | |
Five Star Quality Care, Inc.+* | | | 2,086 | | | | | | — | |
Globus Medical, Inc.
Class A* | | | 31,300 | | | | | | 631,634 | |
Haemonetics CorporationD* | | | 24,500 | | | | | | 1,032,185 | |
Hanger, Inc.* | | | 10,700 | | | | | | 420,938 | |
Hill-Rom Holdings, Inc. | | | 33,100 | | | | | | 1,368,354 | |
IPC The Hospitalist Co., Inc.D* | | | 15,900 | | | | | | 944,301 | |
Isis Pharmaceuticals, Inc.D* | | | 10,200 | | | | | | 406,368 | |
Magellan Health Services, Inc.* | | | 13,800 | | | | | | 826,758 | |
Masimo CorporationD* | | | 48,900 | | | | | | 1,429,347 | |
Medidata Solutions, Inc.* | | | 8,342 | | | | | | 505,275 | |
Meridian Bioscience, Inc.D | | | 6,600 | | | | | | 175,098 | |
MWI Veterinary Supply, Inc.D* | | | 2,400 | | | | | | 409,416 | |
Myriad Genetics, Inc.D* | | | 89,700 | | | | | | 1,881,906 | |
Omnicare, Inc.D | | | 31,456 | | | | | | 1,898,684 | |
Pacira Pharmaceuticals, Inc.D* | | | 8,300 | | | | | | 477,167 | |
PDL BioPharma, Inc.D | | | 257,400 | | | | | | 2,172,456 | |
| | | | |
| 202 | | See Notes to Financial Statements. | | |
| | | | | | | | | | |
| | | Shares | | | Value | |
Providence Service
Corporation (The)* | | | 20,600 | | | | | $ | 529,832 | |
Puma Biotechnology, Inc.* | | | 4,500 | | | | | | 465,885 | |
Questcor Pharmaceuticals, Inc.D | | | 8,900 | | | | | | 484,605 | |
Sirona Dental Systems, Inc.* | | | 8,200 | | | | | | 575,640 | |
Surgical Care Affiliates, Inc.* | | | 32,300 | | | | | | 1,125,332 | |
Team Health Holdings, Inc.* | | | 33,700 | | | | | | 1,535,035 | |
TESARO, Inc.* | | | 5,300 | | | | | | 149,672 | |
United Therapeutics
CorporationD* | | | 36,200 | | | | | | 4,093,496 | |
US Physical Therapy, Inc. | | | 32,600 | | | | | | 1,149,476 | |
Volcano CorporationD* | | | 35,700 | | | | | | 780,045 | |
WebMD Health CorporationD* | | | 25,200 | | | | | | 995,400 | |
West Pharmaceutical
Services, Inc. | | | 60,000 | | | | | | 2,943,600 | |
| | | | | | | | | | |
| | | | | | | | | 41,010,020 | |
| | | | | | | | | | |
Materials & Processing — 5.0% | | | | | | | | | | |
Acuity Brands, Inc.D | | | 8,726 | | | | | | 953,926 | |
Cliffs Natural Resources, Inc.D | | | 46,300 | | | | | | 1,213,523 | |
Comfort Systems USA, Inc. | | | 102,800 | | | | | | 1,993,292 | |
Eagle Materials, Inc. | | | 11,249 | | | | | | 871,010 | |
Ferro Corporation* | | | 151,300 | | | | | | 1,941,179 | |
FutureFuel Corporation | | | 72,327 | | | | | | 1,142,767 | |
Insteel Industries, Inc.D | | | 54,800 | | | | | | 1,245,604 | |
Interface, Inc. | | | 95,500 | | | | | | 2,097,180 | |
Kaiser Aluminum CorporationD | | | 9,600 | | | | | | 674,304 | |
Koppers Holdings, Inc. | | | 38,500 | | | | | | 1,761,375 | |
Landec Corporation* | | | 49,500 | | | | | | 599,940 | |
Lennox International, Inc. | | | 14,100 | | | | | | 1,199,346 | |
Martin Marietta Materials, Inc. | | | 8,134 | | | | | | 812,912 | |
OMNOVA Solutions, Inc.* | | | 162,310 | | | | | | 1,478,644 | |
P.H. Glatfelter Co. | | | 6,100 | | | | | | 168,604 | |
Packaging Corporation
of America | | | 21,400 | | | | | | 1,354,192 | |
Patrick Industries, Inc.* | | | 27,100 | | | | | | 784,003 | |
PolyOne Corporation | | | 54,075 | | | | | | 1,911,551 | |
RBC Bearings, Inc.D* | | | 12,700 | | | | | | 898,525 | |
Rexnord Corporation* | | | 41,500 | | | | | | 1,120,915 | |
Rock-Tenn Co. Class A | | | 10,400 | | | | | | 1,092,104 | |
Rockwood Holdings, Inc. | | | 5,600 | | | | | | 402,752 | |
Universal Stainless & Alloy Products, Inc.D* | | | 61,049 | | | | | | 2,201,427 | |
Westlake Chemical Corporation | | | 8,700 | | | | | | 1,062,009 | |
| | | | | | | | | | |
| | | | | | | | | 28,981,084 | |
| | | | | | | | | | |
Producer Durables — 16.3% | | | | | | | | | | |
A.O. Smith CorporationD | | | 22,900 | | | | | | 1,235,226 | |
AAR Corporation | | | 78,000 | | | | | | 2,184,780 | |
ACCO Brands CorporationD* | | | 243,900 | | | | | | 1,639,008 | |
Advisory Board Co. (The)D* | | | 24,500 | | | | | | 1,559,915 | |
AECOM Technology
Corporation* | | | 59,800 | | | | | | 1,759,914 | |
Albany International Corporation
Class A | | | 46,075 | | | | | | 1,655,475 | |
Allegiant Travel Co.* | | | 9,800 | | | | | | 1,033,312 | |
Alliant Techsystems, Inc.D | | | 21,100 | | | | | | 2,567,448 | |
Astronics Corporation* | | | 48,360 | | | | | | 2,466,360 | |
Atlas Air Worldwide
Holdings, Inc.* | | | 14,400 | | | | | | 592,560 | |
AZZ, Inc.D | | | 71,501 | | | | | | 3,493,539 | |
Brink’s Co. (The) | | | 43,400 | | | | | | 1,481,676 | |
Chart Industries, Inc.D* | | | 8,500 | | | | | | 812,940 | |
Clean Harbors, Inc.D* | | | 30,800 | | | | | | 1,846,768 | |
Coleman Cable, Inc. | | | 33,300 | | | | | | 873,126 | |
| | | | | | | | | | |
| | | Shares | | | Value | |
Columbus McKinnon Corporation* | | | 101,035 | | | | | $ | 2,742,090 | |
Consolidated Graphics, Inc.* | | | 24,300 | | | | | | 1,638,792 | |
Corporate Executive
Board Co. (The) | | | 26,000 | | | | | | 2,013,180 | |
CoStar Group, Inc.* | | | 23,557 | | | | | | 4,348,151 | |
Curtiss-Wright CorporationD | | | 5,500 | | | | | | 342,265 | |
Ducommun, Inc.* | | | 45,997 | | | | | | 1,371,170 | |
Dycom Industries, Inc.* | | | 78,800 | | | | | | 2,189,852 | |
Electronics For Imaging, Inc.* | | | 13,300 | | | | | | 515,109 | |
EMCOR Group, Inc. | | | 39,800 | | | | | | 1,689,112 | |
EnerSys, Inc.D | | | 40,700 | | | | | | 2,852,663 | |
Exelis, Inc. | | | 139,900 | | | | | | 2,666,494 | |
ExlService Holdings, Inc.* | | | 53,250 | | | | | | 1,470,765 | |
GP Strategies CorporationD* | | | 51,100 | | | | | | 1,522,269 | |
Greenbrier Cos., Inc. (The)D* | | | 66,100 | | | | | | 2,170,724 | |
Gulfmark Offshore, Inc.
Class A | | | 18,900 | | | | | | 890,757 | |
Healthcare Services
Group, Inc.D | | | 23,850 | | | | | | 676,624 | |
HEICO Corporation
Class AD* | | | 5,875 | | | | | | 340,456 | |
Huntington Ingalls
Industries, Inc. | | | 25,700 | | | | | | 2,313,257 | |
Huron Consulting Group, Inc.* | | | 12,872 | | | | | | 807,332 | |
JetBlue Airways CorporationD* | | | 70,900 | | | | | | 606,195 | |
Lexmark International, Inc.
Class AD | | | 29,800 | | | | | | 1,058,496 | |
Liquidity Services, Inc.D* | | | 42,600 | | | | | | 965,316 | |
MAXIMUS, Inc. | | | 25,900 | | | | | | 1,139,341 | |
McGrath RentCorpD | | | 21,800 | | | | | | 867,640 | |
Measurement Specialties, Inc.* | | | 36,100 | | | | | | 2,190,909 | |
Mobile Mini, Inc.D | | | 15,500 | | | | | | 638,290 | |
Old Dominion Freight
Line, Inc.* | | | 53,400 | | | | | | 2,831,268 | |
On Assignment, Inc.* | | | 78,000 | | | | | | 2,723,760 | |
Orbital Sciences Corporation* | | | 41,800 | | | | | | 973,940 | |
Oshkosh CorporationD | | | 28,500 | | | | | | 1,435,830 | |
Park-Ohio Holdings
Corporation* | | | 7,700 | | | | | | 403,480 | |
Pitney Bowes, Inc.D | | | 76,600 | | | | | | 1,784,780 | |
Powell Industries, Inc. | | | 10,300 | | | | | | 689,997 | |
Primoris Services Corporation | | | 61,300 | | | | | | 1,908,269 | |
Roadrunner Transportation
Systems, Inc.* | | | 19,900 | | | | | | 536,305 | |
Rush Enterprises, Inc.
Class AD* | | | 30,800 | | | | | | 913,220 | |
SP Plus CorporationD* | | | 27,000 | | | | | | 703,080 | |
Spirit Airlines, Inc.* | | | 22,500 | | | | | | 1,021,725 | |
Sun Hydraulics CorporationD | | | 42,600 | | | | | | 1,739,358 | |
Taser International, Inc.* | | | 23,544 | | | | | | 373,879 | |
Terex Corporation | | | 7,800 | | | | | | 327,522 | |
Trimas Corporation* | | | 24,500 | | | | | | 977,305 | |
Tutor Perini Corporation* | | | 27,700 | | | | | | 728,510 | |
URS CorporationD | | | 27,900 | | | | | | 1,478,421 | |
Wabtec CorporationD | | | 31,600 | | | | | | 2,346,932 | |
WageWorks, Inc.D* | | | 45,150 | | | | | | 2,683,716 | |
WESCO International, Inc.D* | | | 17,700 | | | | | | 1,611,939 | |
| | | | | | | | | | |
| | | | | | | | | 93,422,532 | |
| | | | | | | | | | |
Technology — 12.7% | | | | | | | | | | |
Acacia Research CorporationD | | | 55,200 | | | | | | 802,608 | |
Acxiom CorporationD* | | | 15,027 | | | | | | 555,698 | |
Applied Micro Circuits CorporationD* | | | 55,712 | | | | | | 745,427 | |
| | | | |
| | See Notes to Financial Statements. | | 203 |
SMALL CAP EQUITY FUND
SCHEDULE OF INVESTMENTS (Continued)
| | | | | | | | | | |
| | | Shares | | | Value | |
Arrow Electronics, Inc.* | | | 23,300 | | | | | $ | 1,264,025 | |
Aspen Technology, Inc.* | | | 41,300 | | | | | | 1,726,340 | |
Avnet, Inc. | | | 11,000 | | | | | | 485,210 | |
Bankrate, Inc.D* | | | 35,400 | | | | | | 635,076 | |
Benefitfocus, Inc.D* | | | 13,800 | | | | | | 796,812 | |
Bottomline
Technologies, Inc.D* | | | 49,800 | | | | | | 1,800,768 | |
BroadSoft, Inc.* | | | 24,500 | | | | | | 669,830 | |
Cavium, Inc.D* | | | 19,800 | | | | | | 683,298 | |
ChannelAdvisor Corporation* | | | 12,300 | | | | | | 513,033 | |
Cirrus Logic, Inc.D* | | | 33,200 | | | | | | 678,276 | |
Cognex Corporation | | | 16,100 | | | | | | 614,698 | |
CommVault Systems, Inc.D* | | | 21,100 | | | | | | 1,579,968 | |
Computer Task Group, Inc.D | | | 76,200 | | | | | | 1,440,180 | |
comScore, Inc.* | | | 16,913 | | | | | | 483,881 | |
Cornerstone OnDemand, Inc.* | | | 13,000 | | | | | | 693,420 | |
Dealertrack Holdings, Inc.D* | | | 47,300 | | | | | | 2,274,184 | |
Demandware, Inc.* | | | 18,300 | | | | | | 1,173,396 | |
DigitalGlobe, Inc.* | | | 46,600 | | | | | | 1,917,590 | |
Envestnet, Inc.* | | | 14,500 | | | | | | 584,350 | |
FEI Co. | | | 3,100 | | | | | | 277,016 | |
Global Eagle
Entertainment, Inc.D* | | | 37,200 | | | | | | 553,164 | |
Hittite Microwave Corporation* | | | 14,200 | | | | | | 876,566 | |
Imperva, Inc.* | | | 10,100 | | | | | | 486,113 | |
Infoblox, Inc.* | | | 54,100 | | | | | | 1,786,382 | |
Informatica Corporation* | | | 19,000 | | | | | | 788,500 | |
Ingram Micro, Inc. Class A* | | | 105,300 | | | | | | 2,470,338 | |
Interactive Intelligence
Group, Inc.* | | | 44,300 | | | | | | 2,984,048 | |
InterDigital, Inc.D | | | 23,400 | | | | | | 690,066 | |
IPG Photonics CorporationD* | | | 6,200 | | | | | | 481,182 | |
Manhattan Associates, Inc.* | | | 17,500 | | | | | | 2,055,900 | |
Marketo, Inc.* | | | 24,600 | | | | | | 911,922 | |
Methode Electronics, Inc. | | | 9,500 | | | | | | 324,805 | |
Monotype Imaging
Holdings, Inc. | | | 32,000 | | | | | | 1,019,520 | |
NIC, Inc.* | | | 107,950 | | | | | | 2,684,716 | |
OpenTable, Inc.D* | | | 7,700 | | | | | | 611,149 | |
PDF Solutions, Inc.D* | | | 30,200 | | | | | | 773,724 | |
Proofpoint, Inc.* | | | 24,700 | | | | | | 819,299 | |
PROS Holdings, Inc.* | | | 18,750 | | | | | | 748,125 | |
Qlik Technologies, Inc.* | | | 44,000 | | | | | | 1,171,720 | |
QLogic Corporation* | | | 193,700 | | | | | | 2,291,471 | |
RealPage, Inc.D* | | | 40,500 | | | | | | 946,890 | |
Sapient Corporation* | | | 34,400 | | | | | | 597,184 | |
Semtech CorporationD* | | | 28,050 | | | | | | 709,104 | |
Skyworks Solutions, Inc.* | | | 68,200 | | | | | | 1,947,792 | |
Solera Holdings, Inc. | | | 43,250 | | | | | | 3,060,370 | |
Sonus Networks, Inc.* | | | 137,625 | | | | | | 433,519 | |
Synchronoss Technologies,
Inc.D* | | | 55,800 | | | | | | 1,733,706 | |
Take-Two Interactive
Software, Inc.D* | | | 107,300 | | | | | | 1,863,801 | |
Tessco Technologies, Inc.D | | | 56,799 | | | | | | 2,290,136 | |
Textura CorporationD* | | | 25,000 | | | | | | 748,500 | |
Trulia, Inc.D* | | | 7,737 | | | | | | 272,884 | |
Tyler Technologies, Inc.D* | | | 58,500 | | | | | | 5,974,605 | |
Ultimate Software
Group, Inc. (The)* | | | 20,400 | | | | | | 3,125,688 | |
United Online, Inc.D* | | | 11,085 | | | | | | 152,530 | |
Verint Systems, Inc.* | | | 6,800 | | | | | | 291,992 | |
ViaSat, Inc.D* | | | 8,713 | | | | | | 545,869 | |
Vocera Communications, Inc.D* | | | 29,800 | | | | | | 465,178 | |
| | | | | | | | | | |
| | | Shares | | | Value | |
Yelp, Inc.* | | | 13,189 | | | | | $ | 909,381 | |
| | | | | | | | | | |
| | | | | | | | | 72,992,923 | |
| | | | | | | | | | |
Utilities — 3.2% | | | | | | | | | | |
Atmos Energy Corporation | | | 39,700 | | | | | | 1,803,174 | |
CMS Energy Corporation | | | 54,200 | | | | | | 1,450,934 | |
El Paso Electric Co. | | | 64,400 | | | | | | 2,261,084 | |
Great Plains Energy, Inc.D | | | 55,600 | | | | | | 1,347,744 | |
Inteliquent, Inc. | | | 143,000 | | | | | | 1,633,060 | |
j2 Global, Inc.D | | | 37,700 | | | | | | 1,885,377 | |
New Jersey Resources
CorporationD | | | 42,000 | | | | | | 1,942,080 | |
Pinnacle West Capital
CorporationD | | | 42,800 | | | | | | 2,264,976 | |
PNM Resources, Inc. | | | 14,700 | | | | | | 354,564 | |
Vectren CorporationD | | | 66,900 | | | | | | 2,374,950 | |
West Corporation | | | 29,950 | | | | | | 770,015 | |
| | | | | | | | | | |
| | | | | | | | | 18,087,958 | |
| | | | | | | | | | |
Total Common Stocks
(Cost $354,117,814) | | | | | | | | | 450,787,777 | |
| | | | | | | | | | |
FOREIGN COMMON STOCKS — 7.3% | |
Bermuda — 3.1% | | | | | | | | | | |
Aspen Insurance
Holdings, Ltd. | | | 59,800 | | | | | | 2,470,338 | |
AXIS Capital Holdings, Ltd. | | | 53,100 | | | | | | 2,525,967 | |
Everest Re Group, Ltd. | | | 18,700 | | | | | | 2,914,769 | |
Helen of Troy, Ltd.* | | | 30,100 | | | | | | 1,490,251 | |
Marvell Technology
Group, Ltd. | | | 152,100 | | | | | | 2,187,198 | |
Montpelier Re
Holdings, Ltd.D | | | 59,200 | | | | | | 1,722,720 | |
PartnerRe, Ltd. | | | 16,700 | | | | | | 1,760,681 | |
Platinum Underwriters
Holdings, Ltd. | | | 36,100 | | | | | | 2,212,208 | |
RenaissanceRe
Holdings, Ltd.D | | | 3,800 | | | | | | 369,892 | |
| | | | | | | | | | |
| | | | | | | | | 17,654,024 | |
| | | | | | | | | | |
British Virgin Islands — 0.1% | | | | | | | | | | |
UTi Worldwide, Inc.D | | | 50,300 | | | | | | 883,268 | |
| | | | | | | | | | |
Canada — 1.5% | | | | | | | | | | |
Celestica, Inc.* | | | 180,400 | | | | | | 1,876,160 | |
Domtar Corporation | | | 27,400 | | | | | | 2,584,916 | |
Gran Tierra Energy, Inc.* | | | 255,000 | | | | | | 1,864,050 | |
Resolute Forest Products* | | | 143,600 | | | | | | 2,300,472 | |
| | | | | | | | | | |
| | | | | | | | | 8,625,598 | |
| | | | | | | | | | |
Cayman Islands — 0.4% | | | | | | | | | | |
Greenlight Capital Re, Ltd.
Class A* | | | 65,300 | | | | | | 2,201,263 | |
Herbalife, Ltd.D | | | 1,800 | | | | | | 141,660 | |
| | | | | | | | | | |
| | | | | | | | | 2,342,923 | |
| | | | | | | | | | |
Guernsey — 0.4% | | | | | | | | | | |
Amdocs, Ltd. | | | 50,500 | | | | | | 2,082,620 | |
| | | | | | | | | | |
Ireland — 0.2% | | | | | | | | | | |
Icon PLC ADR* | | | 24,008 | | | | | | 970,163 | |
| | | | | | | | | | |
Israel — 0.2% | | | | | | | | | | |
SodaStream International, Ltd.D* | | | 27,500 | | | | | | 1,365,100 | |
| | | | | | | | | | |
Netherlands — 0.3% | | | | | | | | | | |
AerCap Holdings NV* | | | 34,800 | | | | | | 1,334,580 | |
VistaPrint NVD* | | | 2,700 | | | | | | 153,495 | |
| | | | | | | | | | |
| | | | | | | | | 1,488,075 | |
| | | | | | | | | | |
Puerto Rico — 0.2% | | | | | | | | | | |
EVERTEC, Inc. | | | 51,050 | | | | | | 1,258,893 | |
| | | | | | | | | | |
| | | | |
| 204 | | See Notes to Financial Statements. | | |
| | | | | | | | | | |
| | | Shares | | | Value | |
Switzerland — 0.5% | | | | | | | | | | |
Allied World Assurance Company Holdings AG | | | 22,000 | | | | | $ | 2,481,820 | |
Foster Wheeler AG* | | | 20,300 | | | | | | 670,306 | |
| | | | | | | | | | |
| | | | | | | | | 3,152,126 | |
| | | | | | | | | | |
United Kingdom — 0.4% | | | | | | | |
Xyratex, Ltd. | | | 176,881 | | | | | | 2,350,749 | |
| | | | | | | | | | |
Total Foreign Common Stocks
(Cost $35,596,025) | | | | | | 42,173,539 | |
| | | | | | | | | | |
RIGHTS/WARRANTS — 0.0% | | | | | | | |
Asen Warrants A+@ | | | 25,000 | | | | | | 127 | |
Asen Warrants B+@ | | | 25,000 | | | | | | 68 | |
Asen Warrants C+@ | | | 25,000 | | | | | | 92 | |
| | | | | | | | | | |
Total Rights/Warrants
(Cost $0) | | | | | | | | | 287 | |
| | | | | | | | | | |
MONEY MARKET FUNDS — 31.6% | |
GuideStone Money Market Fund (GS4 Class)¥ | | | 27,331,387 | | | | | | 27,331,387 | |
Northern Institutional Liquid Assets Portfolio§ | | | 154,309,256 | | | | | | 154,309,256 | |
| | | | | | | | | | |
Total Money Market Funds
(Cost $181,640,643) | | | | | | 181,640,643 | |
| | | | | | | | | | |
| | | |
| | | Par | | | | | | |
AGENCY OBLIGATIONS — 0.7% | |
Farmer Mac Guaranteed
Notes Trust | | | | | | | | | | |
5.13%, 04/19/17 144A | | $ | 250,000 | | | | | | 282,899 | |
Federal Home Loan Bank | | | | | | | | | | |
5.50%, 07/15/36 | | | 120,000 | | | | | | 139,293 | |
Federal National Mortgage Association | | | | | | | | | | |
0.01%, 02/24/14W‡‡ | | | 2,330,000 | | | | | | 2,329,862 | |
3.03%, 10/09/19W† | | | 430,000 | | | | | | 366,146 | |
6.25%, 05/15/29 | | | 110,000 | | | | | | 138,263 | |
6.63%, 11/15/30D | | | 390,000 | | | | | | 508,704 | |
Tennessee Valley Authority | | | | | | | | | | |
5.25%, 09/15/39 | | | 50,000 | | | | | | 53,558 | |
| | | | | | | | | | |
Total Agency Obligations
(Cost $3,807,946) | | | 3,818,725 | |
| | | | | | | | | | |
ASSET-BACKED SECURITIES — 0.4% | |
Access Group, Inc. | | | | | | | | | | |
0.64%, 07/25/34† | | | 280,000 | | | | | | 256,453 | |
Ameriquest Mortgage Securities Asset-Backed Pass-Through Certificates | | | | | | | | | | |
0.93%, 09/25/33† | | | 65,826 | | | | | | 63,106 | |
Asset Backed Securities Corporation Home Equity Loan Trust | | | | | | | | | | |
1.14%, 12/15/33† | | | 24,665 | | | | | | 23,102 | |
Asset-Backed Pass-Through Certificates | | | | | | | | | | |
0.85%, 04/25/34† | | | 32,422 | | | | | | 31,186 | |
Avis Budget Rental Car Funding AESOP LLC | | | | | | | | | | |
2.80%, 05/20/18 144A | | | 125,000 | | | | | | 128,913 | |
2.10%, 03/20/19 144A | | | 100,000 | | | | | | 99,852 | |
Bayview Financial Acquisition Trust | | | | | | | | | | |
1.22%, 08/28/44† | | | 91,146 | | | | | | 85,762 | |
| | | | | | | | | | | | |
| | | Par | | | Value | |
Bear Stearns Asset-Backed
Securities Trust | | | | | | | | | | | | |
1.07%, 10/27/32† | | | | $ | 10,235 | | | | | $ | 9,641 | |
1.07%, 12/25/33† | | | | | 91,898 | | | | | | 90,156 | |
Countrywide Asset-Backed Certificates | | | | | | | | | | | | |
1.42%, 10/25/47† | | | | | 133,680 | | | | | | 116,299 | |
Education Funding Capital Trust IV | | | | | | | | | | | | |
3.18%, 06/15/43W† | | | | | 100,000 | | | | | | 84,887 | |
Educational Funding of the South, Inc. | | | | | | | | | | | | |
0.89%, 04/25/35† | | | | | 180,000 | | | | | | 179,713 | |
EFS Volunteer No. 2 LLC | | | | | | | | | | | | |
1.52%, 03/25/36 144A† | | | | | 100,000 | | | | | | 101,305 | |
EMC Mortgage Loan Trust | | | | | | | | | | | | |
0.82%, 02/25/41 144A† | | | | | 40,814 | | | | | | 37,040 | |
Greenpoint Manufactured Housing | | | | | | | | | | | | |
2.93%, 03/18/29† | | | | | 50,000 | | | | | | 43,550 | |
3.56%, 06/19/29† | | | | | 50,000 | | | | | | 42,367 | |
3.67%, 02/20/30† | | | | | 75,000 | | | | | | 63,401 | |
GSAA Home Equity Trust | | | | | | | | | | | | |
0.43%, 07/25/37† | | | | | 151,452 | | | | | | 128,588 | |
MASTR Specialized Loan Trust | | | | | | | | | | | | |
0.52%, 05/25/37 144A† | | | | | 161,721 | | | | | | 109,626 | |
New Century Home Equity Loan Trust | | | | | | | | | | | | |
0.88%, 10/25/33 144A† | | | | | 230,156 | | | | | | 214,861 | |
Option One Mortgage Acceptance Corporation Asset Backed Certificate | | | | | | | | | | | | |
0.97%, 11/25/32† | | | | | 13,146 | | | | | | 12,125 | |
Renaissance Home Equity Loan Trust | | | | | | | | | | | | |
1.03%, 06/25/33† | | | | | 14,779 | | | | | | 13,920 | |
SASCO Mortgage Loan Trust | | | | | | | | | | | | |
0.72%, 12/25/34† | | | | | 116,518 | | | | | | 113,408 | |
SLM Student Loan Trust | | | | | | | | | | | | |
0.67%, 09/16/24† | | | | | 100,000 | | | | | | 95,727 | |
0.82%, 06/26/28† | | | | | 280,000 | | | | | | 280,007 | |
SunTrust Student Loan Trust | | | | | | | | | | | | |
0.36%, 01/30/23 144A† | | | | | 79,524 | | | | | | 79,019 | |
| | | | | | | | | | | | |
Total Asset-Backed Securities
(Cost $2,514,134) | | | | | | 2,504,014 | |
| | | | | | | | | | | | |
CORPORATE BONDS — 2.3% | | | | | | | |
21st Century Fox
America, Inc. | | | | | | | | | | | | |
6.75%, 01/09/38 | | | | | 20,000 | | | | | | 22,786 | |
AbbVie, Inc. | | | | | | | | | | | | |
1.75%, 11/06/17D | | | | | 150,000 | | | | | | 149,882 | |
2.90%, 11/06/22 | | | | | 100,000 | | | | | | 93,645 | |
Access Midstream
Partners LP | | | | | | | | | | | | |
4.88%, 05/15/23 | | | | | 40,000 | | | | | | 38,800 | |
AES Corporation | | | | | | | | | | | | |
7.75%, 10/15/15D | | | | | 17,000 | | | | | | 18,870 | |
8.00%, 06/01/20 | | | | | 40,000 | | | | | | 47,000 | |
7.38%, 07/01/21 | | | | | 10,000 | | | | | | 11,325 | |
4.88%, 05/15/23 | | | | | 20,000 | | | | | | 18,800 | |
Ally Financial, Inc. | | | | | | | | | | | | |
7.50%, 09/15/20 | | | | | 90,000 | | | | | | 105,188 | |
American Express Co. | | | | | | | | | | | | |
6.80%, 09/01/66† | | | | | 140,000 | | | | | | 149,695 | |
| | | | |
| | See Notes to Financial Statements. | | 205 |
SMALL CAP EQUITY FUND
SCHEDULE OF INVESTMENTS (Continued)
| | | | | | | | | | | | |
| | | Par | | | Value | |
American International
Group, Inc. | | | | | | | | | | | | |
5.85%, 01/16/18 | | | | $ | 180,000 | | | | | $ | 206,846 | |
Amgen, Inc. | | | | | | | | | | | | |
3.88%, 11/15/21D | | | | | 150,000 | | | | | | 154,332 | |
Apache Corporation | | | | | | | | | | | | |
5.63%, 01/15/17 | | | | | 110,000 | | | | | | 123,716 | |
Arch Coal, Inc. | | | | | | | | | | | | |
7.00%, 06/15/19D | | | | | 70,000 | | | | | | 56,000 | |
AT&T, Inc. | | | | | | | | | | | | |
3.88%, 08/15/21 | | | | | 30,000 | | | | | | 30,443 | |
Atwood Oceanics, Inc. | | | | | | | | | | | | |
6.50%, 02/01/20D | | | | | 20,000 | | | | | | 21,450 | |
BAC Capital Trust XIV | | | | | | | | | | | | |
4.00%, 09/29/49†D | | | | | 10,000 | | | | | | 7,455 | |
Baker Hughes, Inc. | | | | | | | | | | | | |
7.50%, 11/15/18 | | | | | 60,000 | | | | | | 74,001 | |
Ball Corporation | | | | | | | | | | | | |
5.00%, 03/15/22 | | | | | 120,000 | | | | | | 119,400 | |
4.00%, 11/15/23D | | | | | 10,000 | | | | | | 9,000 | |
Bank of America Corporation | | | | | | | | | | | | |
5.42%, 03/15/17D | | | | | 60,000 | | | | | | 66,012 | |
3.88%, 03/22/17 | | | | | 20,000 | | | | | | 21,363 | |
5.75%, 12/01/17 | | | | | 200,000 | | | | | | 227,825 | |
2.60%, 01/15/19 | | | | | 90,000 | | | | | | 90,503 | |
3.30%, 01/11/23 | | | | | 100,000 | | | | | | 94,809 | |
Boeing Capital Corporation | | | | | | | | | | | | |
4.70%, 10/27/19 | | | | | 40,000 | | | | | | 44,940 | |
Boeing Co. | | | | | | | | | | | | |
4.88%, 02/15/20 | | | | | 40,000 | | | | | | 44,657 | |
Calpine Corporation | | | | | | | | | | | | |
7.88%, 01/15/23 144AD | | | | | 72,000 | | | | | | 79,020 | |
CCO Holdings LLC | | | | | | | | | | | | |
7.00%, 01/15/19D | | | | | 70,000 | | | | | | 73,937 | |
6.50%, 04/30/21 | | | | | 10,000 | | | | | | 10,325 | |
6.63%, 01/31/22 | | | | | 10,000 | | | | | | 10,350 | |
Cellco Partnership | | | | | | | | | | | | |
8.50%, 11/15/18D | | | | | 10,000 | | | | | | 12,674 | |
Chesapeake Energy Corporation | | | | | | | | | | | | |
6.13%, 02/15/21D | | | | | 60,000 | | | | | | 64,650 | |
CIT Group, Inc. | | | | | | | | | | | | |
4.25%, 08/15/17D | | | | | 20,000 | | | | | | 20,900 | |
5.00%, 08/01/23D | | | | | 40,000 | | | | | | 38,700 | |
Citigroup, Inc. | | | | | | | | | | | | |
6.38%, 08/12/14 | | | | | 11,000 | | | | | | 11,372 | |
5.50%, 10/15/14 | | | | | 23,000 | | | | | | 23,859 | |
3.95%, 06/15/16D | | | | | 70,000 | | | | | | 74,517 | |
6.00%, 08/15/17 | | | | | 30,000 | | | | | | 34,221 | |
4.50%, 01/14/22 | | | | | 90,000 | | | | | | 95,535 | |
3.38%, 03/01/23 | | | | | 40,000 | | | | | | 38,094 | |
3.50%, 05/15/23 | | | | | 110,000 | | | | | | 102,698 | |
5.50%, 09/13/25 | | | | | 50,000 | | | | | | 52,776 | |
5.35%, 04/29/49†D | | | | | 30,000 | | | | | | 26,453 | |
5.95%, 07/29/49† | | | | | 30,000 | | | | | | 27,798 | |
Cliffs Natural Resources, Inc. | | | | | | | | | | | | |
3.95%, 01/15/18D | | | | | 120,000 | | | | | | 121,288 | |
4.80%, 10/01/20D | | | | | 30,000 | | | | | | 29,860 | |
Comcast Cable Communications Holdings, Inc. | | | | | | | | | | | | |
9.46%, 11/15/22 | | | | | 30,000 | | | | | | 41,620 | |
Comcast Corporation | | | | | | | | | | | | |
6.50%, 01/15/17D | | | | | 120,000 | | | | | | 137,568 | |
| | | | | | | | | | | | |
| | | Par | | | Value | |
5.15%, 03/01/20D | | | | $ | 20,000 | | | | | $ | 22,341 | |
3.13%, 07/15/22 | | | | | 50,000 | | | | | | 47,803 | |
Concho Resources, Inc. | | | | | | | | | | | | |
6.50%, 01/15/22D | | | | | 33,000 | | | | | | 35,887 | |
5.50%, 04/01/23 | | | | | 20,000 | | | | | | 20,700 | |
CONSOL Energy, Inc. | | | | | | | | | | | | |
6.38%, 03/01/21 | | | | | 50,000 | | | | | | 51,875 | |
Continental Resources, Inc. | | | | | | | | | | | | |
5.00%, 09/15/22 | | | | | 90,000 | | | | | | 93,600 | |
4.50%, 04/15/23D | | | | | 20,000 | | | | | | 20,300 | |
Countrywide Financial Corporation | | | | | | | | | | | | |
6.25%, 05/15/16 | | | | | 50,000 | | | | | | 55,206 | |
CSC Holdings LLC | | | | | | | | | | | | |
6.75%, 11/15/21 | | | | | 20,000 | | | | | | 21,650 | |
CVS Caremark Corporation | | | | | | | | | | | | |
2.75%, 12/01/22D | | | | | 160,000 | | | | | | 147,963 | |
CVS Pass-Through Trust | | | | | | | | | | | | |
6.94%, 01/10/30 | | | | | 60,134 | | | | | | 69,044 | |
Daimler Finance North
America LLC | | | | | | | | | | | | |
1.88%, 01/11/18 144A | | | | | 150,000 | | | | | | 147,899 | |
Denbury Resources, Inc. | | | | | | | | | | | | |
4.63%, 07/15/23D | | | | | 170,000 | | | | | | 154,275 | |
Devon Energy Corporation | | | | | | | | | | | | |
3.25%, 05/15/22D | | | | | 40,000 | | | | | | 38,211 | |
5.60%, 07/15/41 | | | | | 30,000 | | | | | | 31,374 | |
Devon Financing Corporation LLC | | | | | | | | | | | | |
7.88%, 09/30/31 | | | | | 10,000 | | | | | | 12,896 | |
DISH DBS Corporation | | | | | | | | | | | | |
6.75%, 06/01/21D | | | | | 40,000 | | | | | | 42,600 | |
Duke Energy Carolinas LLC | | | | | | | | | | | | |
5.30%, 02/15/40D | | | | | 50,000 | | | | | | 54,484 | |
Eagle Spinco, Inc. | | | | | | | | | | | | |
4.63%, 02/15/21 144A | | | | | 40,000 | | | | | | 39,350 | |
Eaton Corporation | | | | | | | | | | | | |
1.50%, 11/02/17 | | | | | 30,000 | | | | | | 29,437 | |
2.75%, 11/02/22 | | | | | 100,000 | | | | | | 93,466 | |
4.15%, 11/02/42D | | | | | 60,000 | | | | | | 53,513 | |
Ecolab, Inc. | | | | | | | | | | | | |
4.35%, 12/08/21 | | | | | 20,000 | | | | | | 20,773 | |
Energy Future Intermediate Holding Co. LLC | | | | | | | | | | | | |
10.00%, 12/01/20D | | | | | 70,000 | | | | | | 74,725 | |
Energy Transfer Equity LP | | | | | | | | | | | | |
7.50%, 10/15/20D | | | | | 20,000 | | | | | | 22,550 | |
Enterprise Products Operating LLC | | | | | | | | | | | | |
6.30%, 09/15/17 | | | | | 80,000 | | | | | | 92,172 | |
Express Scripts Holding, Co. | | | | | | | | | | | | |
3.50%, 11/15/16 | | | | | 150,000 | | | | | | 158,691 | |
First Data Corporation | | | | | | | | | | | | |
7.38%, 06/15/19 144AD | | | | | 70,000 | | | | | | 74,900 | |
FirstEnergy Corporation | | | | | | | | | | | | |
2.75%, 03/15/18 | | | | | 20,000 | | | | | | 19,671 | |
4.25%, 03/15/23 | | | | | 140,000 | | | | | | 130,745 | |
7.38%, 11/15/31D | | | | | 160,000 | | | | | | 174,297 | |
Ford Motor Co. | | | | | | | | | | | | |
4.75%, 01/15/43 | | | | | 70,000 | | | | | | 63,368 | |
Ford Motor Credit Co., LLC | | | | | | | | | | | | |
12.00%, 05/15/15 | | | | | 140,000 | | | | | | 160,777 | |
Freeport-McMoRan Copper & Gold, Inc. | | | | | | | | | | | | |
3.10%, 03/15/20 | | | | | 20,000 | | | | | | 19,458 | |
| | | | |
| 206 | | See Notes to Financial Statements. | | |
| | | | | | | | | | | | |
| | | Par | | | Value | |
Freeport-McMoRan Copper & Gold, Inc. | | | | | | | | | | | | |
3.55%, 03/01/22 | | | | $ | 75,000 | | | | | $ | 71,404 | |
Fresenius Medical Care US Finance, Inc. | | | | | | | | | | | | |
6.88%, 07/15/17D | | | | | 40,000 | | | | | | 45,400 | |
5.75%, 02/15/21 144AD | | | | | 10,000 | | | | | | 10,650 | |
General Electric Capital Corporation | | | | | | | | | | | | |
1.63%, 07/02/15 | | | | | 30,000 | | | | | | 30,499 | |
6.00%, 08/07/19 | | | | | 260,000 | | | | | | 305,431 | |
4.63%, 01/07/21D | | | | | 30,000 | | | | | | 32,763 | |
6.38%, 11/15/67† | | | | | 180,000 | | | | | | 195,975 | |
General Electric Co. | | | | | | | | | | | | |
0.85%, 10/09/15 | | | | | 30,000 | | | | | | 30,153 | |
General Motors Financial Co., Inc. | | | | | | | | | | | | |
2.75%, 05/15/16 144A | | | | | 20,000 | | | | | | 20,300 | |
3.25%, 05/15/18 144A | | | | | 20,000 | | | | | | 20,050 | |
4.25%, 05/15/23 144A | | | | | 20,000 | | | | | | 19,075 | |
Goldman Sachs Capital II | | | | | | | | | | | | |
4.00%, 12/01/49† | | | | | 10,000 | | | | | | 7,080 | |
Goldman Sachs Group, Inc. | | | | | | | | | | | | |
6.00%, 05/01/14 | | | | | 10,000 | | | | | | 10,179 | |
3.30%, 05/03/15 | | | | | 100,000 | | | | | | 103,066 | |
5.95%, 01/18/18 | | | | | 100,000 | | | | | | 113,797 | |
6.00%, 06/15/20 | | | | | 40,000 | | | | | | 45,925 | |
5.25%, 07/27/21 | | | | | 10,000 | | | | | | 10,966 | |
3.63%, 01/22/23D | | | | | 90,000 | | | | | | 87,318 | |
6.25%, 02/01/41 | | | | | 130,000 | | | | | | 150,335 | |
Hawk Acquisition Sub, Inc. | | | | | | | | | | | | |
4.25%, 10/15/20 144AD | | | | | 40,000 | | | | | | 38,800 | |
Hess Corporation | | | | | | | | | | | | |
8.13%, 02/15/19 | | | | | 80,000 | | | | | | 99,477 | |
HSBC Finance Corporation | | | | | | | | | | | | |
6.68%, 01/15/21 | | | | | 20,000 | | | | | | 23,014 | |
Humana, Inc. | | | | | | | | | | | | |
7.20%, 06/15/18 | | | | | 60,000 | | | | | | 71,052 | |
3.15%, 12/01/22 | | | | | 70,000 | | | | | | 64,923 | |
Hyundai Capital America | | | | | | | | | | | | |
2.13%, 10/02/17 144A | | | | | 20,000 | | | | | | 19,881 | |
ING US, Inc. | | | | | | | | | | | | |
2.90%, 02/15/18 | | | | | 10,000 | | | | | | 10,238 | |
International Lease Finance Corporation | | | | | | | | | | | | |
6.50%, 09/01/14 144A | | | | | 30,000 | | | | | | 31,125 | |
6.75%, 09/01/16 144A | | | | | 140,000 | | | | | | 156,800 | |
JPMorgan Chase & Co. | | | | | | | | | | | | |
1.10%, 10/15/15 | | | | | 110,000 | | | | | | 110,468 | |
6.13%, 06/27/17D | | | | | 200,000 | | | | | | 227,344 | |
4.40%, 07/22/20 | | | | | 60,000 | | | | | | 64,590 | |
4.25%, 10/15/20 | | | | | 40,000 | | | | | | 42,464 | |
4.35%, 08/15/21 | | | | | 10,000 | | | | | | 10,556 | |
4.50%, 01/24/22 | | | | | 100,000 | | | | | | 105,952 | |
3.38%, 05/01/23D | | | | | 80,000 | | | | | | 74,707 | |
Kerr-McGee Corporation | | | | | | | | | | | | |
6.95%, 07/01/24 | | | | | 120,000 | | | | | | 139,667 | |
Key Energy Services, Inc. | | | | | | | | | | | | |
6.75%, 03/01/21D | | | | | 60,000 | | | | | | 61,800 | |
Kinder Morgan Finance
Co. LLC | | | | | | | | | | | | |
6.00%, 01/15/18 144AD | | | | | 140,000 | | | | | | 154,110 | |
Kraft Foods Group, Inc. | | | | | | | | | | | | |
5.38%, 02/10/20 | | | | | 22,000 | | | | | | 24,853 | |
3.50%, 06/06/22 | | | | | 50,000 | | | | | | 48,818 | |
| | | | | | | | | | | | |
| | | Par | | | Value | |
Lehman Escrow Bonds | | | | | | | | | | | | |
0.00%, 07/19/17+W†# | | | | $ | 160,000 | | | | | $ | — | |
0.00%, 12/28/17+W†# | | | | | 120,000 | | | | | | — | |
0.00%, 08/19/45+W†# | | | | | 50,000 | | | | | | — | |
0.00%, 11/30/49+W†# | | | | | 10,000 | | | | | | — | |
M&T Bank Corporation | | | | | | | | | | | | |
6.88%, 12/29/49 144A | | | | | 120,000 | | | | | | 115,861 | |
MarkWest Energy Partners LP | | | | | | | | | | | | |
6.25%, 06/15/22 | | | | | 8,000 | | | | | | 8,500 | |
5.50%, 02/15/23D | | | | | 20,000 | | | | | | 20,250 | |
4.50%, 07/15/23D | | | | | 20,000 | | | | | | 18,850 | |
Medtronic, Inc. | | | | | | | | | | | | |
4.45%, 03/15/20 | | | | | 40,000 | | | | | | 43,896 | |
MetLife, Inc. | | | | | | | | | | | | |
6.75%, 06/01/16 | | | | | 50,000 | | | | | | 56,884 | |
6.40%, 12/15/66 | | | | | 160,000 | | | | | | 165,200 | |
Michaels Stores, Inc. | | | | | | | | | | | | |
7.75%, 11/01/18 | | | | | 20,000 | | | | | | 21,800 | |
Mondelez International, Inc. | | | | | | | | | | | | |
5.38%, 02/10/20D | | | | | 58,000 | | | | | | 65,591 | |
Morgan Stanley | | | | | | | | | | | | |
4.75%, 03/22/17 | | | | | 10,000 | | | | | | 10,921 | |
Nationstar Mortgage LLC | | | | | | | | | | | | |
6.50%, 07/01/21 | | | | | 20,000 | | | | | | 19,150 | |
Noble Energy, Inc. | | | | | | | | | | | | |
4.15%, 12/15/21 | | | | | 90,000 | | | | | | 92,699 | |
NVR, Inc. | | | | | | | | | | | | |
3.95%, 09/15/22 | | | | | 10,000 | | | | | | 9,468 | �� |
Occidental Petroleum Corporation | | | | | | | | | | | | |
3.13%, 02/15/22 | | | | | 40,000 | | | | | | 39,028 | |
2.70%, 02/15/23D | | | | | 20,000 | | | | | | 18,346 | |
Oracle Corporation | | | | | | | | | | | | |
1.20%, 10/15/17 | | | | | 20,000 | | | | | | 19,699 | |
Pacific Gas & Electric Co. | | | | | | | | | | | | |
5.63%, 11/30/17D | | | | | 30,000 | | | | | | 34,019 | |
6.05%, 03/01/34 | | | | | 80,000 | | | | | | 91,919 | |
Peabody Energy Corporation | | | | | | | | | | | | |
6.25%, 11/15/21D | | | | | 60,000 | | | | | | 60,900 | |
Pemex Project Funding Master Trust | | | | | | | | | | | | |
6.63%, 06/15/35 | | | | | 90,000 | | | | | | 95,175 | |
PepsiCo, Inc. | | | | | | | | | | | | |
0.70%, 08/13/15 | | | | | 70,000 | | | | | | 70,102 | |
7.90%, 11/01/18 | | | | | 13,000 | | | | | | 16,267 | |
Pfizer, Inc. | | | | | | | | | | | | |
6.20%, 03/15/19D | | | | | 20,000 | | | | | | 23,736 | |
Plains Exploration &
Production Co. | | | | | | | | | | | | |
6.50%, 11/15/20 | | | | | 10,000 | | | | | | 11,049 | |
Progress Energy, Inc. | | | | | | | | | | | | |
3.15%, 04/01/22D | | | | | 40,000 | | | | | | 38,584 | |
QEP Resources, Inc. | | | | | | | | | | | | |
5.25%, 05/01/23D | | | | | 30,000 | | | | | | 28,275 | |
Range Resources Corporation | | | | | | | | | | | | |
5.75%, 06/01/21D | | | | | 60,000 | | | | | | 63,900 | |
Raytheon Co. | | | | | | | | | | | | |
3.13%, 10/15/20 | | | | | 30,000 | | | | | | 30,080 | |
Regency Energy Partners LP | | | | | | | | | | | | |
6.50%, 07/15/21 | | | | | 42,000 | | | | | | 44,730 | |
4.50%, 11/01/23D | | | | | 10,000 | | | | | | 9,150 | |
Reynolds Group Issuer, Inc. | | | | | | | | | | | | |
5.75%, 10/15/20D | | | | | 70,000 | | | | | | 71,750 | |
| | | | |
| | See Notes to Financial Statements. | | 207 |
SMALL CAP EQUITY FUND
SCHEDULE OF INVESTMENTS (Continued)
| | | | | | | | | | | | |
| | | Par | | | Value | |
Roche Holdings, Inc. | | | | | | | | | | | | |
6.00%, 03/01/19 144A | | | | $ | 46,000 | | | | | $ | 53,892 | |
Rock Tenn Co. | | | | | | | | | | | | |
3.50%, 03/01/20 | | | | | 30,000 | | | | | | 29,548 | |
4.00%, 03/01/23 | | | | | 20,000 | | | | | | 19,138 | |
SESI LLC | | | | | | | | | | | | |
7.13%, 12/15/21 | | | | | 10,000 | | | | | | 11,200 | |
SLM Corporation | | | | | | | | | | | | |
3.88%, 09/10/15 | | | | | 70,000 | | | | | | 72,712 | |
8.00%, 03/25/20D | | | | | 40,000 | | | | | | 45,450 | |
Southern Copper Corporation | | | | | | | | | | | | |
5.25%, 11/08/42 | | | | | 100,000 | | | | | | 81,598 | |
Sprint Communications, Inc. | | | | | | | | | | | | |
7.00%, 08/15/20D | | | | | 120,000 | | | | | | 130,500 | |
State Street Corporation | | | | | | | | | | | | |
4.96%, 03/15/18 | | | | | 110,000 | | | | | | 119,453 | |
3.10%, 05/15/23 | | | | | 70,000 | | | | | | 65,217 | |
Taylor Morrison
Communities, Inc. | | | | | | | | | | | | |
7.75%, 04/15/20 144A | | | | | 24,000 | | | | | | 26,520 | |
5.25%, 04/15/21 144AD | | | | | 20,000 | | | | | | 19,500 | |
Teachers Insurance & Annuity Association of America | | | | | | | | | | | | |
6.85%, 12/16/39 144AD | | | | | 60,000 | | | | | | 74,312 | |
Thermo Fisher Scientific, Inc. | | | | | | | | | | | | |
3.60%, 08/15/21D | | | | | 20,000 | | | | | | 19,854 | |
Time Warner Cable, Inc. | | | | | | | | | | | | |
8.25%, 04/01/19D | | | | | 40,000 | | | | | | 46,911 | |
5.00%, 02/01/20 | | | | | 110,000 | | | | | | 111,835 | |
4.13%, 02/15/21D | | | | | 50,000 | | | | | | 47,460 | |
5.88%, 11/15/40 | | | | | 30,000 | | | | | | 26,032 | |
Time Warner, Inc. | | | | | | | | | | | | |
4.70%, 01/15/21 | | | | | 30,000 | | | | | | 31,898 | |
6.25%, 03/29/41 | | | | | 10,000 | | | | | | 11,143 | |
Toyota Motor Credit Corporation | | | | | | | | | | | | |
1.25%, 10/05/17 | | | | | 40,000 | | | | | | 39,303 | |
tw telecom holdings, Inc. | | | | | | | | | | | | |
5.38%, 10/01/22 | | | | | 20,000 | | | | | | 19,700 | |
United Airline 2009-2A Pass Through Trust | | | | | | | | | | | | |
9.75%, 07/15/18 | | | | | 32,944 | | | | | | 37,885 | |
UnitedHealth Group, Inc. | | | | | | | | | | | | |
1.63%, 03/15/19D | | | | | 50,000 | | | | | | 48,208 | |
Univision Communications, Inc. | | | | | | | | | | | | |
6.75%, 09/15/22 144A | | | | | 40,000 | | | | | | 44,000 | |
5.13%, 05/15/23 144AD | | | | | 20,000 | | | | | | 20,075 | |
Verizon Communications, Inc. | | | | | | | | | | | | |
6.35%, 04/01/19 | | | | | 10,000 | | | | | | 11,767 | |
4.50%, 09/15/20D | | | | | 120,000 | | | | | | 128,654 | |
5.15%, 09/15/23 | | | | | 290,000 | | | | | | 311,969 | |
6.40%, 09/15/33 | | | | | 60,000 | | | | | | 69,210 | |
6.55%, 09/15/43 | | | | | 50,000 | | | | | | 58,706 | |
Virginia Electric and Power Co. | | | | | | | | | | | | |
2.95%, 01/15/22D | | | | | 40,000 | | | | | | 38,714 | |
Wachovia Capital Trust III | | | | | | | | | | | | |
5.57%, 03/29/49† | | | | | 80,000 | | | | | | 73,600 | |
Wal-Mart Stores, Inc. | | | | | | | | | | | | |
6.50%, 08/15/37D | | | | | 140,000 | | | | | | 175,712 | |
Waste Management, Inc. | | | | | | | | | | | | |
7.38%, 05/15/29 | | | | | 20,000 | | | | | | 24,395 | |
WellPoint, Inc. | | | | | | | | | | | | |
1.25%, 09/10/15 | | | | | 20,000 | | | | | | 20,147 | |
5.88%, 06/15/17 | | | | | 110,000 | | | | | | 124,169 | |
| | | | | | | | | | | | |
| | | Par | | | Value | |
Wells Fargo & Co. | | | | | | | | | | | | |
3.68%, 06/15/16 STEP | | | | $ | 50,000 | | | | | $ | 53,269 | |
2.10%, 05/08/17 | | | | | 20,000 | | | | | | 20,389 | |
1.50%, 01/16/18D | | | | | 170,000 | | | | | | 169,066 | |
4.60%, 04/01/21 | | | | | 10,000 | | | | | | 10,979 | |
3.45%, 02/13/23 | | | | | 80,000 | | | | | | 75,780 | |
4.48%, 01/16/24 144A | | | | | 306,000 | | | | | | 305,216 | |
5.38%, 11/02/43D | | | | | 40,000 | | | | | | 41,114 | |
Williams Cos., Inc. | | | | | | | | | | | | |
7.88%, 09/01/21 | | | | | 24,000 | | | | | | 27,715 | |
7.50%, 01/15/31 | | | | | 15,000 | | | | | | 15,893 | |
7.75%, 06/15/31 | | | | | 24,000 | | | | | | 25,796 | |
8.75%, 03/15/32D | | | | | 5,000 | | | | | | 5,852 | |
Williams Partners LP | | | | | | | | | | | | |
5.25%, 03/15/20 | | | | | 20,000 | | | | | | 21,899 | |
WM Wrigley Jr Co. | | | | | | | | | | | | |
2.40%, 10/21/18 144A | | | | | 10,000 | | | | | | 9,950 | |
2.90%, 10/21/19 144A | | | | | 50,000 | | | | | | 49,652 | |
3.38%, 10/21/20 144A | | | | | 10,000 | | | | | | 9,900 | |
| | | | | | | | | | | | |
Total Corporate Bonds
(Cost $12,555,937) | | | | | | | | | | | 12,912,600 | |
| | | | | | | | | | | | |
FOREIGN BONDS — 1.5% | | | | |
Australia — 0.1% | | | | | | | | | | | | |
BHP Billiton Finance (USA), Ltd. | | | | | | | | | | | | |
6.50%, 04/01/19 | | | | | 110,000 | | | | | | 132,028 | |
3.25%, 11/21/21D | | | | | 10,000 | | | | | | 9,958 | |
5.00%, 09/30/43 | | | | | 40,000 | | | | | | 40,828 | |
Commonwealth Bank of Australia | | | | | | | | | | | | |
3.75%, 10/15/14 144A | | | | | 60,000 | | | | | | 61,541 | |
5.00%, 10/15/19 144A | | | | | 20,000 | | | | | | 22,321 | |
FMG Resources August 2006 Proprietary, Ltd. | | | | | | | | | | | | |
7.00%, 11/01/15 144A | | | | | 10,000 | | | | | | 10,394 | |
Rio Tinto Finance (USA), Ltd. | | | | | | | | | | | | |
9.00%, 05/01/19 | | | | | 90,000 | | | | | | 117,636 | |
| | | | | | | | | | | | |
| | | | | | | | | | | 394,706 | |
| | | | | | | | | | | | |
Canada — 0.3% | | | | | | | | | | | | |
Anadarko Finance Co. | | | | | | | | | | | | |
7.50%, 05/01/31 | | | | | 60,000 | | | | | | 73,138 | |
Barrick Gold Corporation | | | | | | | | | | | | |
6.95%, 04/01/19 | | | | | 100,000 | | | | | | 115,557 | |
3.85%, 04/01/22D | | | | | 70,000 | | | | | | 63,153 | |
4.10%, 05/01/23 144AD | | | | | 80,000 | | | | | | 72,448 | |
Hydro-Quebec | | | | | | | | | | | | |
1.38%, 06/19/17 | | | | | 240,000 | | | | | | 241,017 | |
Potash Corporation of Saskatchewan, Inc. | | | | | | | | | | | | |
4.88%, 03/30/20D | | | | | 20,000 | | | | | | 21,668 | |
Province of British Columbia | | | | | | | | | | | | |
2.00%, 10/23/22D | | | | | 120,000 | | | | | | 107,926 | |
Province of Ontario | | | | | | | | | | | | |
1.10%, 10/25/17 | | | | | 220,000 | | | | | | 217,716 | |
1.20%, 02/14/18 | | | | | 210,000 | | | | | | 206,153 | |
4.40%, 04/14/20 | | | | | 160,000 | | | | | | 175,794 | |
Province of Quebec | | | | | | | | | | | | |
2.63%, 02/13/23 | | | | | 150,000 | | | | | | 138,056 | |
Xstrata Finance Canada, Ltd. | | | | | | | | | | | | |
2.05%, 10/23/15 144A | | | | | 60,000 | | | | | | 60,790 | |
2.70%, 10/25/17 144A | | | | | 120,000 | | | | | | 121,472 | |
| | | | | | | | | | | | |
| | | | | | | | | | | 1,614,888 | |
| | | | | | | | | | | | |
| | | | |
| 208 | | See Notes to Financial Statements. | | |
| | | | | | | | | | | | |
| | | Par | | | Value | |
Cayman Islands — 0.1% | | | | | | | |
Petrobras International Finance Co. | | | | | | | | | | | | |
3.88%, 01/27/16D | | | | $ | 50,000 | | | | | $ | 51,723 | |
6.13%, 10/06/16 | | | | | 40,000 | | | | | | 43,523 | |
5.75%, 01/20/20 | | | | | 32,000 | | | | | | 33,086 | |
5.38%, 01/27/21 | | | | | 150,000 | | | | | | 149,608 | |
Transocean, Inc. | | | | | | | | | | | | |
5.05%, 12/15/16D | | | | | 10,000 | | | | | | 11,054 | |
6.38%, 12/15/21D | | | | | 10,000 | | | | | | 11,255 | |
Vale Overseas, Ltd. | | | | | | | | | | | | |
4.38%, 01/11/22 | | | | | 195,000 | | | | | | 190,436 | |
6.88%, 11/21/36 | | | | | 60,000 | | | | | | 62,265 | |
| | | | | | | | | | | | |
| | | | | | | | | | | 552,950 | |
| | | | | | | | | | | | |
Chile — 0.0% | | | | | | | | | | | | |
Celulosa Arauco y Constitucion SA | | | | | | | | | | | | |
4.75%, 01/11/22 | | | | | 40,000 | | | | | | 39,170 | |
| | | | | | | | | | | | |
France — 0.0% | | | | | | | | | | | | |
BNP Paribas SA | | | | | | | | | | | | |
2.38%, 09/14/17 | | | | | 130,000 | | | | | | 132,843 | |
Credit Agricole SA | | | | | | | | | | | | |
8.38%, 10/29/49 144A† | | | | | 120,000 | | | | | | 136,800 | |
| | | | | | | | | | | | |
| | | | | | | | | | | 269,643 | |
| | | | | | | | | | | | |
Hungary — 0.0% | | | | | | | | | | | | |
Hungary Government International Bond | | | | | | | | | | | | |
5.75%, 11/22/23 | | | | | 100,000 | | | | | | 101,000 | |
| | | | | | | | | | | | |
Iceland — 0.0% | | | | | | | | | | | | |
Glitnir HF | | | | | | | | | | | | |
6.69%, 06/15/16+ 144A# | | | | | 130,000 | | | | | | 1 | |
| | | | | | | | | | | | |
Indonesia — 0.1% | | | | | | | | | | | | |
Indonesia Government International Bond | | | | | | | | | | | | |
4.88%, 05/05/21 144A | | | | | 400,000 | | | | | | 398,000 | |
| | | | | | | | | | | | |
Italy — 0.3% | | | | | | | | | | | | |
Italy Buoni Poliennali Del Tesoro | | | | | | | | | | | | |
3.50%, 12/01/18(E) | | | | | 1,000,000 | | | | | | 1,427,156 | |
| | | | | | | | | | | | |
Japan — 0.1% | | | | | | | | | | | | |
Softbank Corporation | | | | | | | | | | | | |
4.50%, 04/15/20 144AD | | | | | 200,000 | | | | | | 196,000 | |
Sumitomo Mitsui Banking Corporation | | | | | | | | | | | | |
3.15%, 07/22/15 144A | | | | | 100,000 | | | | | | 103,446 | |
| | | | | | | | | | | | |
| | | | | | | | | | | 299,446 | |
| | | | | | | | | | | | |
Jersey — 0.0% | | | | | | | | | | | | |
UBM PLC | | | | | | | | | | | | |
5.75%, 11/03/20 144A | | | | | 30,000 | | | | | | 31,232 | |
| | | | | | | | | | | | |
Luxembourg — 0.0% | | | | | | | | | | | | |
ArcelorMittal | | | | | | | | | | | | |
5.00%, 02/25/17D | | | | | 10,000 | | | | | | 10,775 | |
Intelsat Jackson Holdings SA | | | | | | | | | | | | |
7.50%, 04/01/21D | | | | | 10,000 | | | | | | 11,075 | |
5.50%, 08/01/23 144A | | | | | 100,000 | | | | | | 95,500 | |
| | | | | | | | | | | | |
| | | | | | | | | | | 117,350 | |
| | | | | | | | | | | | |
Mexico — 0.2% | | | | | | | | | | | | |
America Movil SAB de CV | | | | | | | | | | | | |
5.63%, 11/15/17 | | | | | 30,000 | | | | | | 33,942 | |
| | | | | | | | | | | | |
| | | Par | | | Value | |
Mexican Bonos | | | | | | | | | | | | |
6.50%, 06/09/22(M) | | | | $ | 9,931,000 | | | | | $ | 770,821 | |
Mexico Government International Bond | | | | | | | | | | | | |
6.05%, 01/11/40D | | | | | 10,000 | | | | | | 10,925 | |
4.75%, 03/08/44D | | | | | 50,000 | | | | | | 45,313 | |
Petroleos Mexicanos | | | | | | | | | | | | |
3.50%, 01/30/23D | | | | | 156,000 | | | | | | 143,325 | |
| | | | | | | | | | | | |
| | | | | | | | | | | 1,004,326 | |
| | | | | | | | | | | | |
Netherlands — 0.2% | | | | | | | | | | | | |
Achmea Hypotheekbank NV | | | | | | | | | | | | |
3.20%, 11/03/14 144A | | | | | 370,000 | | | | | | 378,744 | |
Cooperatieve Centrale Raiffeisen-Boerenleenbank BA | | | | | | | | | | | | |
3.38%, 01/19/17 | | | | | 250,000 | | | | | | 263,413 | |
Deutsche Telekom International Finance BV | | | | | | | | | | | | |
5.75%, 03/23/16 | | | | | 75,000 | | | | | | 82,391 | |
Petrobras Global Finance BV | | | | | | | | | | | | |
4.38%, 05/20/23D | | | | | 60,000 | | | | | | 54,054 | |
Shell International Finance BV | | | | | | | | | | | | |
4.38%, 03/25/20 | | | | | 90,000 | | | | | | 98,797 | |
| | | | | | | | | | | | |
| | | | | | | | | | | 877,399 | |
| | | | | | | | | | | | |
Russia — 0.0% | | | | | | | | | | | | |
Russian Foreign Bond | | | | | | | | | | | | |
7.50%, 03/31/30 STEP | | | | | 120,120 | | | | | | 140,204 | |
| | | | | | | | | | | | |
South Africa — 0.0% | | | | | | | | | | | | |
South Africa Government International Bond | | | | | | | | | | | | |
5.88%, 09/16/25 | | | | | 200,000 | | | | | | 208,600 | |
| | | | | | | | | | | | |
Spain — 0.0% | | | | | | | | | | | | |
BBVA US Senior SA Unipersonal | | | | | | | | | | | | |
3.25%, 05/16/14 | | | | | 100,000 | | | | | | 100,812 | |
Santander US Debt SA Unipersonal | | | | | | | | | | | | |
3.72%, 01/20/15 144A | | | | | 100,000 | | | | | | 102,019 | |
Telefonica Emisiones SA Unipersonal | | | | | | | | | | | | |
5.88%, 07/15/19 | | | | | 30,000 | | | | | | 33,528 | |
| | | | | | | | | | | | |
| | | | | | | | | | | 236,359 | |
| | | | | | | | | | | | |
Switzerland — 0.0% | | | | | | | | | | | | |
UBS AG | | | | | | | | | | | | |
5.75%, 04/25/18 | | | | | 120,000 | | | | | | 137,900 | |
| | | | | | | | | | | | |
Turkey — 0.0% | | | | | | | | | | | | |
Turkey Government International Bond | | | | | | | | | | | | |
7.38%, 02/05/25 | | | | | 200,000 | | | | | | 216,400 | |
| | | | | | | | | | | | |
United Kingdom — 0.1% | | | | | | | | | | | | |
BP Capital Markets PLC | | | | | | | | | | | | |
3.88%, 03/10/15 | | | | | 30,000 | | | | | | 31,218 | |
3.56%, 11/01/21 | | | | | 10,000 | | | | | | 10,049 | |
3.25%, 05/06/22 | | | | | 30,000 | | | | | | 29,130 | |
GlaxoSmithKline Capital PLC | | | | | | | | | | | | |
2.85%, 05/08/22 | | | | | 50,000 | | | | | | 47,244 | |
Lloyds Bank PLC | | | | | | | | | | | | |
6.50%, 09/14/20 144AD | | | | | 100,000 | | | | | | 113,831 | |
Royal Bank of Scotland Group PLC | | | | | | | | | | | | |
2.55%, 09/18/15D | | | | | 10,000 | | | | | | 10,232 | |
| | | | |
| | See Notes to Financial Statements. | | 209 |
SMALL CAP EQUITY FUND
SCHEDULE OF INVESTMENTS (Continued)
| | | | | | | | | | | | |
| | | Par | | | Value | |
4.70%, 07/03/18 | | | | $ | 10,000 | | | | | $ | 10,170 | |
6.10%, 06/10/23D | | | | | 60,000 | | | | | | 60,593 | |
6.00%, 12/19/23D | | | | | 40,000 | | | | | | 40,335 | |
7.65%, 08/29/49†D | | | | | 10,000 | | | | | | 10,550 | |
WPP Finance UK | | | | | | | | | | | | |
8.00%, 09/15/14 | | | | | 100,000 | | | | | | 104,994 | |
| | | | | | | | | | | | |
| | | | | | | | | | | 468,346 | |
| | | | | | | | | | | | |
Total Foreign Bonds
(Cost $8,619,206) | | | | | | | | | | | 8,535,076 | |
| | | | | | | | | | | | |
MORTGAGE-BACKED SECURITIES — 3.4% | |
Alternative Loan Trust | | | | | | | | | | | | |
0.41%, 07/25/35† | | | | | 147,278 | | | | | | 119,585 | |
0.43%, 07/25/35† | | | | | 186,850 | | | | | | 160,410 | |
American Home Mortgage Investment Trust | | | | | | | | | | | | |
0.87%, 04/25/44† | | | | | 30,605 | | | | | | 29,094 | |
0.46%, 11/25/45† | | | | | 150,177 | | | | | | 129,378 | |
Banc of America Commercial Mortgage Trust | | | | | | | | | | | | |
5.42%, 09/10/45† | | | | | 17,000 | | | | | | 18,331 | |
5.45%, 09/10/47 | | | | | 10,000 | | | | | | 10,702 | |
Bear Stearns Adjustable Rate Mortgage Trust | | | | | | | | | | | | |
2.70%, 02/25/35† | | | | | 55,782 | | | | | | 48,260 | |
Bear Stearns ALT-A Trust | | | | | | | | | | | | |
2.59%, 08/25/34† | | | | | 98,409 | | | | | | 99,503 | |
0.87%, 01/25/35† | | | | | 115,571 | | | | | | 108,851 | |
Bear Stearns Mortgage Funding Trust | | | | | | | | | | | | |
0.37%, 12/25/46† | | | | | 55,257 | | | | | | 15,256 | |
CD 2006-CD2 Mortgage Trust | | | | | | | | | | | | |
5.35%, 01/15/46† | | | | | 30,000 | | | | | | 32,216 | |
CD 2007-CD5 Mortgage Trust | | | | | | | | | | | | |
6.12%, 11/15/44† | | | | | 10,000 | | | | | | 11,140 | |
COBALT CMBS Commercial Mortgage Trust | | | | | | | | | | | | |
5.53%, 04/15/47† | | | | | 25,000 | | | | | | 27,637 | |
COMM 2013-CCRE12 Mortgage Trust | | | | | | | | | | | | |
4.05%, 10/10/46 | | | | | 70,000 | | | | | | 70,648 | |
4.30%, 10/10/46 | | | | | 20,000 | | | | | | 20,093 | |
4.76%, 10/10/46† | | | | | 10,000 | | | | | | 9,997 | |
Commercial Mortgage Lease-Backed Certificates | | | | | | | | | | | | |
6.75%, 06/20/31 144A | | | | | 101,039 | | | | | | 105,870 | |
Commercial Mortgage Pass-Through Certificates | | | | | | | | | | | | |
2.82%, 10/15/45 | | | | | 20,000 | | | | | | 18,800 | |
Credit Suisse Commercial Mortgage Trust | | | | | | | | | | | | |
5.61%, 01/15/49† | | | | | 60,000 | | | | | | 63,695 | |
Credit Suisse First Boston Mortgage Securities Corporation | | | | | | | | | | | | |
6.00%, 10/25/35 | | | | | 83,648 | | | | | | 55,703 | |
Federal Home Loan Mortgage Corporation | | | | | | | | | | | | |
4.00%, 10/01/25 | | | | | 281,354 | | | | | | 297,137 | |
2.73%, 05/01/37† | | | | | 7,257 | | | | | | 7,728 | |
5.50%, 12/01/38 | | | | | 93,796 | | | | | | 102,245 | |
6.00%, 11/01/39 | | | | | 153,020 | | | | | | 168,783 | |
4.00%, 10/01/42 | | | | | 95,177 | | | | | | 97,013 | |
3.50%, 11/01/42 | | | | | 96,048 | | | | | | 94,364 | |
3.50%, 01/01/43 | | | | | 97,512 | | | | | | 95,803 | |
| | | | | | | | | | | | |
| | | Par | | | Value | |
3.50%, 05/01/43 | | | | $ | 97,041 | | | | | $ | 96,447 | |
4.00%, 05/01/43 | | | | | 98,672 | | | | | | 101,969 | |
Federal Home Loan Mortgage Corporation REMIC | | | | | | | | | | | | |
2.99%, 06/15/27 IOW† | | | | | 378,781 | | | | | | 55,227 | |
0.48%, 09/15/31 IOW† | | | | | 672,255 | | | | | | 106,005 | |
6.00%, 05/15/36 | | | | | 122,502 | | | | | | 135,522 | |
13.18%, 01/15/40 IOW† | | | | | 62,261 | | | | | | 8,292 | |
4.53%, 10/15/41 IOW† | | | | | 256,860 | | | | | | 51,497 | |
3.00%, 05/15/43 | | | | | 99,653 | | | | | | 77,677 | |
3.00%, 07/15/43 | | | | | 101,256 | | | | | | 75,621 | |
Federal National Mortgage Association | | | | | | | | | | | | |
3.00%, 01/01/26 TBA | | | | | 1,300,000 | | | | | | 1,326,660 | |
4.50%, 05/01/31 | | | | | 54,035 | | | | | | 58,087 | |
6.00%, 04/01/33 | | | | | 17,175 | | | | | | 19,276 | |
5.00%, 07/01/33 | | | | | 16,592 | | | | | | 18,070 | |
5.00%, 09/01/33 | | | | | 18,112 | | | | | | 19,735 | |
6.00%, 02/01/34 | | | | | 6,274 | | | | | | 7,040 | |
2.37%, 09/01/35† | | | | | 50,789 | | | | | | 53,785 | |
5.00%, 10/01/35 | | | | | 35,809 | | | | | | 39,002 | |
6.00%, 11/01/35 | | | | | 38,807 | | | | | | 43,562 | |
7.00%, 04/01/37 | | | | | 47,689 | | | | | | 54,411 | |
6.00%, 08/01/37 | | | | | 65,380 | | | | | | 73,381 | |
6.50%, 11/01/37 | | | | | 47,248 | | | | | | 53,043 | |
5.50%, 08/01/38 | | | | | 39,227 | | | | | | 43,218 | |
7.00%, 02/01/39 | | | | | 204,073 | | | | | | 228,952 | |
4.50%, 01/01/40 TBA | | | | | 500,000 | | | | | | 529,785 | |
5.00%, 01/01/40 TBA | | | | | 800,000 | | | | | | 868,813 | |
6.50%, 05/01/40 | | | | | 191,369 | | | | | | 212,571 | |
4.00%, 01/01/41 TBA | | | | | 1,200,000 | | | | | | 1,235,250 | |
4.50%, 06/01/41 | | | | | 158,710 | | | | | | 168,196 | |
4.50%, 09/01/41 | | | | | 82,433 | | | | | | 87,356 | |
4.00%, 04/01/42 | | | | | 183,148 | | | | | | 188,852 | |
3.00%, 09/01/42 | | | | | 462,315 | | | | | | 439,557 | |
4.00%, 09/01/42 | | | | | 94,805 | | | | | | 97,739 | |
3.50%, 10/01/42 | | | | | 287,197 | | | | | | 281,901 | |
4.00%, 12/01/42 | | | | | 181,308 | | | | | | 188,565 | |
4.00%, 01/01/43 | | | | | 97,984 | | | | | | 101,115 | |
3.50%, 03/01/43 | | | | | 388,671 | | | | | | 382,879 | |
3.50%, 04/01/43 | | | | | 195,064 | | | | | | 192,158 | |
3.50%, 05/01/43 | | | | | 196,145 | | | | | | 195,053 | |
4.00%, 05/01/43 | | | | | 97,169 | | | | | | 100,242 | |
3.50%, 06/01/43 | | | | | 296,871 | | | | | | 295,219 | |
4.00%, 06/01/43 | | | | | 195,069 | | | | | | 201,199 | |
3.50%, 07/01/43 | | | | | 296,243 | | | | | | 294,594 | |
4.00%, 07/01/43 | | | | | 196,331 | | | | | | 202,627 | |
4.00%, 08/01/43 | | | | | 99,283 | | | | | | 101,285 | |
Federal National Mortgage Association Interest STRIP | | | | | | | | | | | | |
6.50%, 04/25/27 IOW† | | | | | 143,879 | | | | | | 16,320 | |
10.43%, 11/25/39 IOW† | | | | | 51,970 | | | | | | 9,578 | |
3.79%, 11/25/41 IOW† | | | | | 64,253 | | | | | | 13,919 | |
5.18%, 04/25/42 IOW† | | | | | 131,507 | | | | | | 32,034 | |
Federal National Mortgage Association REMIC | | | | | | | | | | | | |
2.55%, 06/25/27 IOW† | | | | | 336,364 | | | | | | 43,327 | |
6.50%, 06/25/39 | | | | | 68,178 | | | | | | 76,012 | |
1.81%, 04/25/40 IOW† | | | | | 239,602 | | | | | | 47,970 | |
13.42%, 12/25/40 IOW† | | | | | 58,295 | | | | | | 6,610 | |
14.87%, 01/25/41 IOW† | | | | | 41,745 | | | | | | 6,241 | |
5.50%, 07/25/41 | | | | | 114,704 | | | | | | 125,421 | |
15.06%, 07/25/41 IOW† | | | | | 151,943 | | | | | | 20,315 | |
| | | | |
| 210 | | See Notes to Financial Statements. | | |
| | | | | | | | | | | | |
| | | Par | | | Value | |
7.61%, 09/25/41 IOW† | | | | $ | 143,132 | | | | | $ | 22,264 | |
13.33%, 10/25/41 IOW† | | | | | 171,920 | | | | | | 25,147 | |
9.78%, 03/25/42 IOW† | | | | | 80,667 | | | | | | 12,575 | |
5.50%, 04/25/42 | | | | | 296,158 | | | | | | 322,806 | |
6.00%, 05/25/42 | | | | | 127,673 | | | | | | 139,603 | |
7.00%, 05/25/42 | | | | | 121,843 | | | | | | 135,311 | |
6.50%, 07/25/42 | | | | | 257,534 | | | | | | 282,078 | |
2.50%, 04/25/43 | | | | | 101,257 | | | | | | 68,659 | |
FHLMC Multifamily Structured Pass Through Certificates | | | | | | | | | | | | |
4.63%, 01/25/20 IOW† | | | | | 210,512 | | | | | | 10,660 | |
3.85%, 04/25/20 IOW† | | | | | 690,633 | | | | | | 39,237 | |
4.84%, 06/25/20 IOW† | | | | | 413,848 | | | | | | 33,184 | |
4.57%, 08/25/20 IOW† | | | | | 193,693 | | | | | | 14,125 | |
4.58%, 06/25/21 IOW† | | | | | 268,284 | | | | | | 19,924 | |
4.64%, 07/25/21 IOW† | | | | | 206,178 | | | | | | 20,204 | |
4.55%, 10/25/21 IOW† | | | | | 182,105 | | | | | | 17,426 | |
4.75%, 12/25/21 IOW† | | | | | 108,025 | | | | | | 9,404 | |
4.55%, 09/25/22 IOW† | | | | | 109,428 | | | | | | 6,554 | |
First Horizon Alternative Mortgage Securities Trust | | | | | | | | | | | | |
2.22%, 02/25/36† | | | | | 133,519 | | | | | | 97,314 | |
0.53%, 02/25/37† | | | | | 53,330 | | | | | | 35,681 | |
Government National Mortgage Association | | | | | | | | | | | | |
2.25%, 03/16/35 | | | | | 69,814 | | | | | | 69,863 | |
6.50%, 10/20/37 | | | | | 40,482 | | | | | | 45,909 | |
6.82%, 02/20/38 IOW† | | | | | 437,288 | | | | | | 74,159 | |
6.00%, 07/20/38 | | | | | 49,171 | | | | | | 54,463 | |
6.00%, 09/20/38 | | | | | 314,864 | | | | | | 354,533 | |
5.00%, 01/15/40 | | | | | 291,085 | | | | | | 320,888 | |
4.50%, 01/20/40 | | | | | 52,006 | | | | | | 55,778 | |
11.06%, 01/20/40 IOW† | | | | | 51,618 | | | | | | 8,918 | |
4.50%, 05/20/40 | | | | | 53,877 | | | | | | 57,760 | |
6.00%, 10/20/40 | | | | | 39,108 | | | | | | 43,592 | |
3.50%, 01/15/41 TBA | | | | | 300,000 | | | | | | 302,356 | |
4.00%, 01/20/41 TBA | | | | | 500,000 | | | | | | 519,863 | |
4.50%, 01/20/41 | | | | | 58,052 | | | | | | 62,321 | |
4.50%, 03/20/41 | | | | | 317,966 | | | | | | 341,357 | |
4.50%, 07/20/41 | | | | | 55,670 | | | | | | 59,583 | |
3.50%, 01/20/42 TBA | | | | | 300,000 | | | | | | 302,637 | |
2.90%, 02/16/44W† | | | | | 209,202 | | | | | | 214,660 | |
2.90%, 06/16/44 | | | | | 69,693 | | | | | | 71,477 | |
2.00%, 12/16/49 | | | | | 100,000 | | | | | | 99,615 | |
10.12%, 08/16/52 IOW† | | | | | 169,993 | | | | | | 11,163 | |
10.70%, 06/16/55† | | | | | 169,821 | | | | | | 11,207 | |
1.32%, 11/20/59† | | | | | 269,057 | | | | | | 274,121 | |
1.16%, 05/20/60† | | | | | 150,080 | | | | | | 152,130 | |
0.67%, 01/20/61† | | | | | 201,590 | | | | | | 200,733 | |
0.62%, 02/20/61† | | | | | 211,850 | | | | | | 209,235 | |
0.67%, 03/20/61† | | | | | 87,415 | | | | | | 87,031 | |
Granite Mortgages 03-2 PLC | | | | | | | | | | | | |
0.74%, 07/20/43† | | | | | 16,945 | | | | | | 16,873 | |
GreenPoint Mortgage Funding Trust | | | | | | | | | | | | |
0.42%, 10/25/45† | | | | | 39,606 | | | | | | 34,910 | |
GS Mortgage Securities Corporation II | | | | | | | | | | | | |
4.27%, 11/10/46 | | | | | 130,000 | | | | | | 133,265 | |
4.65%, 11/10/46 | | | | | 40,000 | | | | | | 41,169 | |
5.16%, 11/10/46† | | | | | 30,000 | | | | | | 30,807 | |
GS Mortgage Securities Corporation Trust | | | | | | | | | | | | |
3.55%, 04/10/34 144A | | | | | 26,000 | | | | | | 25,564 | |
| | | | | | | | | | | | |
| | | Par | | | Value | |
GS Mortgage Securities Trust | | | | | | | | | | | | |
5.80%, 08/10/45† | | | | $ | 40,000 | | | | | $ | 43,923 | |
4.04%, 07/10/46† | | | | | 20,000 | | | | | | 20,487 | |
GSMPS Mortgage Loan Trust | | | | | | | | | | | | |
0.51%, 03/25/35 144A† | | | | | 24,417 | | | | | | 20,698 | |
0.51%, 09/25/35 144A† | | | | | 74,605 | | | | | | 61,907 | |
HarborView Mortgage Loan Trust | | | | | | | | | | | | |
0.41%, 06/19/35† | | | | | 178,114 | | | | | | 155,277 | |
Homestar Mortgage Acceptance Corporation | | | | | | | | | | | | |
0.62%, 07/25/34† | | | | | 65,557 | | | | | | 63,790 | |
Impac CMB Trust | | | | | | | | | | | | |
0.97%, 03/25/33† | | | | | 12,824 | | | | | | 12,584 | |
JP Morgan Chase Commercial Mortgage Securities Trust | | | | | | | | | | | | |
1.57%, 10/15/30 144A† | | | | | 100,000 | | | | | | 100,288 | |
5.87%, 02/12/51† | | | | | 10,000 | | | | | | 11,315 | |
JPMBB Commercial Mortgage Securities Trust | | | | | | | | | | | | |
4.42%, 11/15/45 | | | | | 40,000 | | | | | | 40,903 | |
5.08%, 11/15/45† | | | | | 20,000 | | | | | | 20,092 | |
4.89%, 01/15/47† | | | | | 10,000 | | | | | | 10,056 | |
LB-UBS Commercial Mortgage Trust | | | | | | | | | | | | |
6.16%, 09/15/45† | | | | | 40,000 | | | | | | 45,720 | |
Lehman XS Trust | | | | | | | | | | | | |
0.47%, 11/25/35† | | | | | 154,092 | | | | | | 136,940 | |
0.47%, 12/25/35† | | | | | 62,226 | | | | | | 33,491 | |
MASTR Adjustable Rate Mortgages Trust | | | | | | | | | | | | |
0.94%, 12/25/46† | | | | | 185,550 | | | | | | 101,779 | |
Merrill Lynch Mortgage Investors Trust | | | | | | | | | | | | |
5.05%, 05/25/34† | | | | | 11,085 | | | | | | 10,867 | |
Merrill Lynch-Countrywide Financial Corporation Commercial Mortgage Trust | | | | | | | | | | | | |
5.49%, 03/12/51† | | | | | 160,000 | | | | | | 175,997 | |
Morgan Stanley Bank of America Merrill Lynch Trust | | | | | | | | | | | | |
5.30%, 08/15/45 IO 144AW† | | | | | 137,540 | | | | | | 13,026 | |
3.46%, 05/15/46 | | | | | 50,000 | | | | | | 47,264 | |
Morgan Stanley Capital I Trust | | | | | | | | | | | | |
5.69%, 04/15/49† | | | | | 60,000 | | | | | | 66,449 | |
Nomura Asset Acceptance Corporation Alternative Loan Trust | | | | | | | | | | | | |
5.96%, 03/25/47 STEP | | | | | 67,594 | | | | | | 67,524 | |
6.14%, 03/25/47 STEP | | | | | 55,304 | | | | | | 55,239 | |
RBSCF Trust | | | | | | | | | | | | |
3.83%, 01/13/32+ 144A† | | | | | 160,000 | | | | | | 157,526 | |
RBSSP Resecuritization Trust | | | | | | | | | | | | |
3.14%, 12/26/35 144A† | | | | | 19,185 | | | | | | 19,750 | |
Residential Accredit Loans, Inc. | | | | | | | | | | | | |
3.13%, 12/26/34† | | | | | 193,110 | | | | | | 160,994 | |
Structured Adjustable Rate Mortgage Loan Trust | | | | | | | | | | | | |
2.53%, 11/25/34† | | | | | 60,020 | | | | | | 55,606 | |
Structured Asset Securities Corporation Mortgage Loan Trust | | | | | | | | | | | | |
0.77%, 10/25/27† | | | | | 16,104 | | | | | | 15,916 | |
| | | | |
| | See Notes to Financial Statements. | | 211 |
SMALL CAP EQUITY FUND
SCHEDULE OF INVESTMENTS (Continued)
| | | | | | | | | | | | |
| | | Par | | | Value | |
UBS-Barclays Commercial Mortgage Trust | | | | | | | | | | | | |
3.32%, 12/10/45 144A | | | | $ | 25,000 | | | | | $ | 23,460 | |
Wachovia Bank Commercial Mortgage Trust | | | | | | | | | | | | |
5.38%, 12/15/43 | | | | | 10,000 | | | | | | 10,760 | |
Washington Mutual Mortgage Pass-Through Certificates | | | | | | | | | | | | |
2.49%, 02/25/33† | | | | | 21,244 | | | | | | 20,898 | |
2.43%, 10/25/33† | | | | | 58,798 | | | | | | 59,761 | |
2.41%, 01/25/35† | | | | | 71,538 | | | | | | 71,143 | |
2.07%, 11/25/36† | | | | | 139,217 | | | | | | 117,042 | |
0.48%, 08/25/45† | | | | | 95,893 | | | | | | 92,475 | |
Wells Fargo Commercial Mortgage Trust | | | | | | | | | | | | |
4.22%, 07/15/46† | | | | | 10,000 | | | | | | 10,294 | |
Wells Fargo Mortgage Loan Trust | | | | | | | | | | | | |
2.76%, 08/27/35 144A† | | | | | 56,244 | | | | | | 57,095 | |
Wells Fargo Mortgage-Backed Securities Trust | | | | | | | | | | | | |
2.63%, 04/25/36† | | | | | 45,627 | | | | | | 41,821 | |
WF-RBS Commercial Mortgage Trust | | | | | | | | | | | | |
4.83%, 06/15/45 IO 144AW† | | | | | 78,287 | | | | | | 7,502 | |
| | | | | | | | | | | | |
Total Mortgage-Backed Securities
(Cost $20,062,481) | | | | | | 19,365,179 | |
| | | | | | | | | | | | |
MUNICIPAL BONDS — 0.1% | | | | |
Arizona State University, Revenue Bond, Series A | | | | | | | | | | | | |
5.00%, 07/01/43 | | | | | 10,000 | | | | | | 10,285 | |
City of Richmond, General Obligation, Series A | | | | | | | | | | | | |
5.00%, 03/01/27 | | | | | 10,000 | | | | | | 11,267 | |
5.00%, 03/01/28 | | | | | 10,000 | | | | | | 11,166 | |
5.00%, 03/01/29 | | | | | 10,000 | | | | | | 11,075 | |
City Public Service Board of San Antonio, Revenue Bond | | | | | | | | | | | | |
5.00%, 02/01/43 | | | | | 30,000 | | | | | | 30,546 | |
New Jersey Economic Development Authority, Rutgers University, Revenue Bond | | | | | | | | | | | | |
5.00%, 06/15/46 | | | | | 10,000 | | | | | | 10,288 | |
New Jersey State Turnpike Authority, Revenue Bond, Series A | | | | | | | | | | | | |
5.00%, 01/01/43 | | | | | 10,000 | | | | | | 10,159 | |
New Jersey Transportation Trust Fund Authority, Transportation Program, Revenue Bond, Series AA | | | | | | | | | | | | |
5.00%, 06/15/38 | | | | | 20,000 | | | | | | 20,275 | |
New Jersey Transportation Trust Fund Authority, Transportation System, Revenue Bond, Series A | | | | | | | | | | | | |
5.00%, 06/15/42 | | | | | 20,000 | | | | | | 20,153 | |
New York City Transitional Finance Authority, Revenue Bond, Sub-Series A-1 | | | | | | | | | | | | |
5.00%, 11/01/42 | | | | | 20,000 | | | | | | 20,738 | |
| | | | | | | | | | | | |
| | | Par | | | Value | |
New York City Water & Sewer System, Revenue Bond, Series BB | | | | | | | | | | | | |
5.00%, 06/15/47 | | | | $ | 10,000 | | | | | $ | 10,195 | |
New York City Water & Sewer System, Revenue Bond, Series EE | | | | | | | | | | | | |
5.00%, 06/15/47 | | | | | 10,000 | | | | | | 10,204 | |
New York City, General Obligation, Series J | | | | | | | | | | | | |
5.00%, 08/01/25 | | | | | 10,000 | | | | | | 11,185 | |
New York Liberty Development Corporation, Revenue Bond | | | | | | | | | | | | |
5.00%, 12/15/41 | | | | | 20,000 | | | | | | 20,301 | |
New York State Dormitory Authority, Revenue Bond, Series A | | | | | | | | | | | | |
5.00%, 12/15/27 | | | | | 10,000 | | | | | | 10,998 | |
New York State Urban Development Corporation, Revenue Bond, Series C | | | | | | | | | | | | |
5.00%, 03/15/27 | | | | | 30,000 | | | | | | 33,063 | |
Northeast Ohio Regional Sewer District, Revenue Bond | | | | | | | | | | | | |
5.00%, 11/15/43 | | | | | 20,000 | | | | | | 20,694 | |
Northstar Education Finance, Inc., Revenue Bond | | | | | | | | | | | | |
1.67%, 01/29/46† | | | | | 75,000 | | | | | | 68,773 | |
Ohio State Turnpike Commission, Infrastructure Project, Revenue Bond | | | | | | | | | | | | |
5.00%, 02/15/48 | | | | | 40,000 | | | | | | 39,418 | |
Ohio State Turnpike Commission, Revenue Bond, Series A | | | | | | | | | | | | |
5.00%, 02/15/48 | | | | | 20,000 | | | | | | 20,232 | |
Pennsylvania Turnpike Commission, Revenue Bond, Series C | | | | | | | | | | | | |
5.00%, 12/01/43 | | | | | 10,000 | | | | | | 9,938 | |
Private Colleges & Universities Authority, Emory University, Revenue Bond, Series A | | | | | | | | | | | | |
5.00%, 10/01/43 | | | | | 20,000 | | | | | | 20,892 | |
State of California, General Obligation | | | | | | | | | | | | |
5.00%, 09/01/25 | | | | | 20,000 | | | | | | 22,232 | |
5.00%, 04/01/42 | | | | | 20,000 | | | | | | 20,227 | |
5.00%, 11/01/43 | | | | | 20,000 | | | | | | 20,247 | |
State of California, General Obligation, Series B | | | | | | | | | | | | |
5.00%, 09/01/23 | | | | | 30,000 | | | | | | 34,456 | |
State of Connecticut, General Obligation, Series C | | | | | | | | | | | | |
5.00%, 07/15/24 | | | | | 10,000 | | | | | | 11,407 | |
Utah Transit Authority, Revenue Bond | | | | | | | | | | | | |
5.00%, 06/15/42 | | | | | 30,000 | | | | | | 30,040 | |
| | | | | | | | | | | | |
Total Municipal Bonds
(Cost $560,622) | | | | | | 570,454 | |
| | | | | | | | | | | | |
| | | | |
| 212 | | See Notes to Financial Statements. | | |
| | | | | | | | | | | | |
| | | Number of
Contracts | | | Value | |
|
PURCHASED OPTIONS — 0.0% | |
Call Options — 0.0% | | | | | | | | | | | | |
U.S. Dollar vs. Euro, Strike Price $1.35, Expires 01/06/14 (CITI) | | | | | 700,000 | | | | | $ | 370 | |
U.S. Dollar vs. Euro, Strike Price $1.36, Expires 02/16/14 (CITI) | | | | | 860,000 | | | | | | 6,016 | |
Put Options — 0.0% | | | | | | | | | | | | |
10-Year U.S. Treasury Note Futures, Strike Price $125.00, Expires 01/24/14 (MLCS) | | | | | 3 | | | | | | 6,047 | |
15-Year U.S. Treasury Long Bond Futures, Strike Price $131.00, Expires 01/24/14 (MLCS) | | | | | 3 | | | | | | 8,672 | |
| | | | | | | | | | | | |
Total Purchased Options
(Cost $22,058) | | | | | | | | | | | 21,105 | |
| | | | | | | | | | | | |
| | | |
| | | Par | | | | | | |
U.S. TREASURY OBLIGATIONS — 1.5% | |
U.S. Treasury Bonds | | | | | | | | | | | | |
2.75%, 08/15/42D | | | | $ | 1,230,000 | | | | | | 974,967 | |
2.88%, 05/15/43 | | | | | 1,549,000 | | | | | | 1,255,779 | |
3.63%, 08/15/43 | | | | | 530,000 | | | | | | 500,642 | |
3.75%, 11/15/43D | | | | | 620,000 | | | | | | 599,366 | |
| | | | | | | | | | | | |
| | | | | | | | | | | 3,330,754 | |
| | | | | | | | | | | | |
U.S. Treasury Inflationary Index Bonds | | | | | | | | | | | | |
0.38%, 07/15/23D | | | | | 570,000 | | | | | | 552,164 | |
0.75%, 02/15/42 | | | | | 310,000 | | | | | | 258,288 | |
| | | | | | | | | | | | |
| | | | | | | | | | | 810,452 | |
| | | | | | | | | | | | |
U.S. Treasury Notes | | | | | | | | | | | | |
0.25%, 10/31/15 | | | | | 30,000 | | | | | | 29,959 | |
0.75%, 10/31/17D | | | | | 600,000 | | | | | | 589,219 | |
1.38%, 06/30/18D | | | | | 2,030,000 | | | | | | 2,014,696 | |
1.38%, 09/30/18D | | | | | 90,000 | | | | | | 88,907 | |
3.63%, 08/15/19 | | | | | 880,000 | | | | | | 959,063 | |
2.00%, 09/30/20D | | | | | 30,000 | | | | | | 29,328 | |
2.00%, 11/30/20D | | | | | 810,000 | | | | | | 788,611 | |
2.75%, 11/15/23D | | | | | 180,000 | | | | | | 176,105 | |
| | | | | | | | | | | | |
| | | | | | | | | | | 4,675,888 | |
| | | | | | | | | | | | |
Total U.S. Treasury Obligations
(Cost $9,297,700) | | | | | | 8,817,094 | |
| | | | | | | | | | | | |
TOTAL INVESTMENTS — 127.2%
(Cost $628,794,566) | | | | | | 731,146,493 | |
| | | | | | | | | | | | |
| | | | | | | | | | | | |
| | | Number of
Contracts | | | Value | |
WRITTEN OPTIONS — 0.0% | | | | | | | | | | | | |
Put Options — 0.0% | | | | | | | | | | | | |
10-Year U.S. Treasury Note Futures, Strike Price $122.50, Expires 01/24/14 (MLCS) | | | | | (7 | ) | | | | $ | (2,625 | ) |
15-Year U.S. Treasury Long Bond Futures, Strike Price $127.00, Expires 01/24/14 (GSC) | | | | | (6 | ) | | | | | (3,188 | ) |
| | | | | | | | | | | | |
| | | | | | | | | | | (5,813 | ) |
| | | | | | | | | | | | |
Total Written Options
(Premiums received $(3,974)) | | | | | | (5,813 | ) |
| | | | | | | | | | | | |
Liabilities in Excess of
Other Assets — (27.2)% | | | | | | (156,295,849 | ) |
| | | | | | | | | | | | |
| | | |
NET ASSETS — 100.0% | | | | | | | | $ | 574,844,831 | |
| | | | | | | | | | | | |
| | | | |
| | See Notes to Financial Statements. | | 213 |
SMALL CAP EQUITY FUND
SCHEDULE OF INVESTMENTS (Continued)
VALUATION HIERARCHY
The following is a summary of the inputs used, as of December 31, 2013, in valuing the Fund’s investments carried at fair value:
| | | | | | | | | | | | | | | | | | | | |
| | | Total
Value | | Level 1
Quoted Prices | | Level 2
Other Significant
Observable Inputs | | Level 3
Significant
Unobservable Inputs |
Assets: | | | | | | | | | | | | | | | | | | | | |
Investments in Securities: | | | | | | | | | | | | | | | | | | | | |
Agency Obligations | | | $ | 3,818,725 | | | | $ | — | | | | $ | 3,818,725 | | | | $ | — | |
Asset-Backed Securities | | | | 2,504,014 | | | | | — | | | | | 2,419,126 | | | | | 84,888 | |
Common Stocks: | | | | | | | | | | | | | | | | | | | | |
Consumer Discretionary | | | | 73,783,034 | | | | | 73,783,034 | | | | | — | | | | | — | |
Consumer Staples | | | | 10,246,067 | | | | | 10,246,067 | | | | | — | | | | | — | |
Energy | | | | 24,725,280 | | | | | 24,725,280 | | | | | — | | | | | — | |
Financial Services | | | | 87,538,879 | | | | | 87,538,879 | | | | | — | | | | | — | |
Healthcare | | | | 41,010,020 | | | | | 41,010,020 | | | | | — | | | | | — | |
Materials & Processing | | | | 28,981,084 | | | | | 28,981,084 | | | | | — | | | | | — | |
Producer Durables | | | | 93,422,532 | | | | | 93,422,532 | | | | | — | | | | | — | |
Technology | | | | 72,992,923 | | | | | 72,992,923 | | | | | — | | | | | — | |
Utilities | | | | 18,087,958 | | | | | 18,087,958 | | | | | — | | | | | — | |
Corporate Bonds | | | | 12,912,600 | | | | | — | | | | | 12,874,715 | | | | | 37,885 | |
Foreign Bonds: | | | | | | | | | | | | | | | | | | | | |
Australia | | | | 394,706 | | | | | — | | | | | 394,706 | | | | | — | |
Canada | | | | 1,614,888 | | | | | — | | | | | 1,614,888 | | | | | — | |
Cayman Islands | | | | 552,950 | | | | | — | | | | | 552,950 | | | | | — | |
Chile | | | | 39,170 | | | | | — | | | | | 39,170 | | | | | — | |
France | | | | 269,643 | | | | | — | | | | | 269,643 | | | | | — | |
Hungary | | | | 101,000 | | | �� | | — | | | | | 101,000 | | | | | — | |
Iceland | | | | 1 | | | | | — | | | | | — | | | | | 1 | |
Indonesia | | | | 398,000 | | | | | — | | | | | 398,000 | | | | | — | |
Italy | | | | 1,427,156 | | | | | — | | | | | 1,427,156 | | | | | — | |
Japan | | | | 299,446 | | | | | — | | | | | 299,446 | | | | | — | |
Jersey | | | | 31,232 | | | | | — | | | | | 31,232 | | | | | — | |
Luxembourg | | | | 117,350 | | | | | — | | | | | 117,350 | | | | | — | |
Mexico | | | | 1,004,326 | | | | | — | | | | | 1,004,326 | | | | | — | |
Netherlands | | | | 877,399 | | | | | — | | | | | 877,399 | | | | | — | |
Russia | | | | 140,204 | | | | | — | | | | | 140,204 | | | | | — | |
South Africa | | | | 208,600 | | | | | — | | | | | 208,600 | | | | | — | |
Spain | | | | 236,359 | | | | | — | | | | | 236,359 | | | | | — | |
Switzerland | | | | 137,900 | | | | | — | | | | | 137,900 | | | | | — | |
Turkey | | | | 216,400 | | | | | — | | | | | 216,400 | | | | | — | |
United Kingdom | | | | 468,346 | | | | | — | | | | | 468,346 | | | | | — | |
Foreign Common Stocks | | | | 42,173,539 | | | | | 42,173,539 | | | | | — | | | | | — | |
Money Market Funds | | | | 181,640,643 | | | | | 181,640,643 | | | | | — | | | | | — | |
Mortgage-Backed Securities | | | | 19,365,179 | | | | | — | | | | | 19,207,652 | | | | | 157,527 | |
Municipal Bonds | | | | 570,454 | | | | | — | | | | | 570,454 | | | | | — | |
Purchased Options | | | | 21,105 | | | | | 14,718 | | | | | 6,387 | | | | | — | |
Rights/Warrants | | | | 287 | | | | | — | | | | | — | | | | | 287 | |
U.S. Treasury Obligations | | | | 8,817,094 | | | | | — | | | | | 8,817,094 | | | | | — | |
| | | | | | | | | | | | | | | | | | | | |
Total Assets - Investments in Securities | | | $ | 731,146,493 | | | | $ | 674,616,677 | | | | $ | 56,249,228 | | | | $ | 280,588 | |
| | | | | | | | | | | | | | | | | | | | |
| | | | |
Other Financial Instruments*** | | | | | | | | | | | | | | | | | | | | |
Forward Foreign Currency Contracts | | | $ | 2,961 | | | | $ | — | | | | $ | 2,961 | | | | $ | — | |
Futures Contracts | | | | 4,361,787 | | | | | 4,361,787 | | | | | — | | | | | — | |
| | | | | | | | | | | | | | | | | | | | |
Total Assets - Other Financial Instruments | | | $ | 4,364,748 | | | | $ | 4,361,787 | | | | $ | 2,961 | | | | $ | — | |
| | | | | | | | | | | | | | | | | | | | |
| | | | |
| 214 | | See Notes to Financial Statements. | | |
| | | | | | | | | | | | | | | | | | | | |
| | | Total
Value | | Level 1
Quoted Prices | | Level 2
Other Significant
Observable Inputs | | Level 3
Significant
Unobservable Inputs |
Liabilities: | | | | | | | | | | | | | | | | | | | | |
Investments in Securities: | | | | | | | | | | | | | | | | | | | | |
Written Options | | | $ | (5,813 | ) | | | $ | (5,813 | ) | | | $ | — | | | | $ | — | |
| | | | | | | | | | | | | | | | | | | | |
Total Liabilities - Investments in Securities | | | $ | (5,813 | ) | | | $ | (5,813 | ) | | | $ | — | | | | $ | — | |
| | | | | | | | | | | | | | | | | | | | |
***Other financial instruments are derivative instruments not reflected in the Schedule of Investments, such as futures, forwards and swap contracts, which are valued at the unrealized appreciation (depreciation) on the investment. Details of these investments can be found in the Notes to Financial Statements.
There were no transfers between Level 1 and Level 2 during the year ended December 31, 2013.
Management has determined that the amount of Level 3 securities compared to total net assets is not material; therefore, the reconciliation of Level 3 securities and assumptions is not shown for the period ending December 31, 2013.
| | | | |
| | See Notes to Financial Statements. | | 215 |
International Equity Fund (Unaudited)
Developed non-U.S. markets experienced strong gains as the MSCI EAFE Index (Net), a measure of international developed country returns, posted a one-year return of 22.78%. All regions ended the period in positive territory as Japan and Europe advanced the most as a result of the regions’ improved outlook. From a sector perspective all groups generated positive results during the period. The telecommunications and consumer discretionary sectors were the best performers, while the materials and energy sectors were the worst performers and lagged the overall market during the one-year period.
During the fourth quarter of 2013, the International Equity Fund’s benchmark index transitioned from the MSCI ACWI Ex-U.S. (Net) to the MSCI EAFE Index (Net) primarily as a result of the Fund’s change in objective to focus primarily on developed, non-U.S. equity markets. The International Equity Fund continued to be invested in markets deemed to be developed and, to a much lesser extent, in markets deemed to be emerging or non-developed. The Fund was primarily comprised of equities of foreign companies and was diversified among a large number of companies across different industries and economic sectors.
The GS4 Class of the Fund performed in line with its former benchmark, the MSCI ACWI Ex-U.S. (Net), for the year-to-date period through October (14.08% versus 14.08%). The GS4 Class of the Fund outperformed its new benchmark, the MSCI EAFE Index (Net), for the remaining two month period (3.63% versus 2.28%). For the entire calendar year ending December 31, 2013, the Fund underperformed its new benchmark index (18.23% versus 22.78%). On a country basis, security selection to the Netherlands and the U.K. contributed positively to benchmark relative performance, while underweight exposure and security selection to Japan negatively impacted performance. On a sector basis, security selection to the consumer staples and materials sectors added value, while security selection to the financial services sector detracted from benchmark-relative returns during the year. Within the Fund, certain derivatives were utilized to express active views in currency and country selection and to hedge foreign currency exposure back to the U.S. dollar. These derivative positions primarily included currency forward contracts and stock index futures. Overall, derivative exposure had a slight positive impact on Fund performance over the course of the year.
This Fund may be suitable to investors who seek higher, long-term rates of return, can accept significant short-term fluctuations in account value and want to diversify their portfolio with international stocks. The Fund invests in foreign and emerging market securities which involve certain risks such as currency volatility, political and social instability and reduced market liquidity. To the extent that the investment adviser misjudges current market conditions, the Fund’s volatility may be amplified by its use of short sales and derivatives and by its ability to select sub-advisers to allocate assets. Short sales by a fund theoretically involve unlimited loss potential since the market price of securities sold short may continuously increase. Leverage may increase the risk of loss and cause fluctuations in the market value of the Fund’s portfolio to have disproportionately large effects or cause the net asset value of the Fund generally to decline faster than it would otherwise.
At December 31, 2013, the portfolio holdings of the Fund, as a percentage of net assets, is shown in the following table. Portfolio holdings are subject to risk and may change at any time.
| | | | |
| | | % | |
Financial Services | | | 22.5 | |
Consumer Discretionary | | | 16.2 | |
Technology | | | 12.1 | |
Producer Durables | | | 11.7 | |
Money Market Funds | | | 10.6 | |
Materials & Processing | | | 9.6 | |
Healthcare | | | 9.1 | |
Utilities | | | 6.1 | |
Consumer Staples | | | 5.7 | |
Energy | | | 5.5 | |
Foreign Preferred Stocks | | | 0.7 | |
Securities Sold Short | | | (6.4 | ) |
| | | | |
| | | 103.4 | |
| | | | |
| ** | Rounds to less than 0.005%. |
International Equity Fund (Unaudited)
| | | | | | | | | | | | | | |
| Average Annual Total Returns as of 12/31/13 |
| | | GS2 Class* | | | | GS4 Class* | | | | Benchmark** | | | | Benchmark*** |
One Year | | 18.49% | | | | 18.23% | | | | 22.78% | | | | 15.29% |
Five Year | | 12.45% | | | | 12.19% | | | | 12.44% | | | | 12.81% |
Ten Year | | 6.90% | | | | 6.68% | | | | 6.91% | | | | 7.57% |
Inception Date | | 08/27/01 | | | | 08/27/01 | | | | | | | | |
Total Fund Operating Expenses (May 1, 2013 Prospectus, as amended on October 31, 2013)(1) | | 1.33% | | | | 1.58% | | | | | | | | |
(1)Current information regarding the Fund’s Operating Expenses can be found in the Financial Highlights.
The performance data quoted represents past performance and does not guarantee future results. Current performance may be lower or higher. Performance data current to the most recent month-end may be obtained at www.GuideStoneFunds.org. The investment return and principal value of an investment will fluctuate so that shares, when redeemed, may be worth more or less than their original cost.
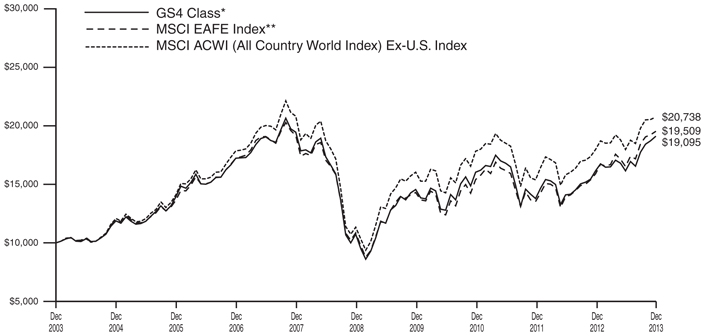
The graph compares the results of a hypothetical $10,000 investment in the GS4 Class of the Fund for the 10-year period from December 31, 2003 to December 31, 2013, with all dividends and capital gains reinvested, with the MSCI EAFE Index.
*These returns reflect expense waivers by the Fund’s investment adviser. Without these waivers, returns would have been lower. Returns shown do not reflect the deduction of taxes that a shareholder would pay on Fund distributions or the redemption of Fund shares.
***The Fund’s benchmark was changed from the MSCI ACWI (All Country World Index) Ex-U.S. Index to MSCI EAFE Index due to a change in the Fund’s investment strategy.
Unlike a mutual fund, the performance of an index assumes no taxes, transaction costs, management fees or other expenses.
| | |
INTERNATIONAL EQUITY FUND SCHEDULE OF INVESTMENTS | | December 31, 2013 |
| | | | | | | | |
| | | Shares | | | Value | |
FOREIGN COMMON STOCKS — 98.5% | | | | | |
Argentina — 0.1% | | | | | | | | |
MercadoLibre, Inc.D | | | 18,600 | | | $ | 2,004,894 | |
| | | | | | | | |
Australia — 3.1% | | | | | | | | |
AGL Energy, Ltd. | | | 10,423 | | | | 139,879 | |
Amcor, Ltd.‡‡ | | | 42,125 | | | | 396,820 | |
AMP, Ltd.‡‡ | | | 944,418 | | | | 3,701,946 | |
APA Group | | | 15,545 | | | | 83,280 | |
Asciano, Ltd. | | | 105,850 | | | | 544,396 | |
ASX, Ltd.‡‡ | | | 2,537 | | | | 83,272 | |
Aurizon Holdings, Ltd. | | | 86,208 | | | | 375,637 | |
Australia & New Zealand
Banking Group, Ltd.‡‡ | | | 48,458 | | | | 1,394,528 | |
Bendigo and Adelaide
Bank, Ltd.‡‡ | | | 60,135 | | | | 630,909 | |
BHP Billiton, Ltd.‡‡ | | | 67,304 | | | | 2,283,029 | |
BlueScope Steel, Ltd.*‡‡ | | | 118,568 | | | | 616,158 | |
Brambles, Ltd. | | | 215,887 | | | | 1,763,798 | |
Caltex Australia, Ltd.‡‡ | | | 16,309 | | | | 291,973 | |
CFS Retail Property Trust
Group REIT‡‡ | | | 37,629 | | | | 65,350 | |
Cochlear, Ltd.D | | | 23,994 | | | | 1,262,312 | |
Commonwealth Bank of
Australia‡‡ | | | 27,405 | | | | 1,903,754 | |
Computershare, Ltd.‡‡ | | | 6,176 | | | | 62,755 | |
CSL, Ltd.‡‡ | | | 11,742 | | | | 723,004 | |
Dexus Property Group REIT‡‡ | | | 84,924 | | | | 76,208 | |
Downer EDI, Ltd. | | | 387,457 | | | | 1,681,362 | |
Federation Centres, Ltd. REIT | | | 27,212 | | | | 56,856 | |
Flight Centre Travel Group, Ltd. | | | 8,441 | | | | 358,382 | |
Fortescue Metals Group, Ltd.D | | | 893,219 | | | | 4,641,756 | |
Goodman Group REIT‡‡ | | | 33,286 | | | | 140,580 | |
GPT Group+* | | | 63,198 | | | | — | |
GPT Group REIT | | | 26,294 | | | | 79,825 | |
Incitec Pivot, Ltd.‡‡ | | | 165,542 | | | | 396,136 | |
Insurance Australia Group,
Ltd.‡‡ | | | 51,029 | | | | 265,180 | |
Lend Lease Group‡‡ | | | 55,348 | | | | 550,539 | |
Macquarie Group, Ltd.‡‡ | | | 8,291 | | | | 406,943 | |
Mirvac Group REIT‡‡ | | | 47,808 | | | | 71,715 | |
National Australia Bank, Ltd.‡‡ | | | 98,501 | | | | 3,063,342 | |
Newcrest Mining, Ltd.*‡‡ | | | 13,780 | | | | 95,972 | |
Origin Energy, Ltd. | | | 18,277 | | | | 229,615 | |
Orora, Ltd.*‡‡ | | | 42,125 | | | | 43,631 | |
Qantas Airways, Ltd.*‡‡ | | | 320,253 | | | | 313,118 | |
QBE Insurance Group, Ltd. | | | 250,255 | | | | 2,571,932 | |
Ramsay Health Care, Ltd.‡‡ | | | 8,739 | | | | 337,559 | |
Rio Tinto, Ltd. | | | 13,987 | | | | 851,497 | |
Seek, Ltd. | | | 21,190 | | | | 253,724 | |
Sims Metal
Management, Ltd.*‡‡ | | | 49,945 | | | | 485,648 | |
Sonic Healthcare, Ltd.‡‡ | | | 43,407 | | | | 642,607 | |
SP AusNet | | | 31,687 | | | | 35,225 | |
Stockland REIT‡‡ | | | 46,149 | | | | 148,755 | |
Suncorp Group, Ltd.*‡‡ | | | 54,921 | | | | 642,408 | |
Sydney Airport‡‡ | | | 8,786 | | | | 29,811 | |
Telstra Corporation, Ltd.‡‡ | | | 294,634 | | | | 1,381,159 | |
Toll Holdings, Ltd.D | | | 278,224 | | | | 1,411,056 | |
Transfield Services, Ltd.‡‡ | | | 129,357 | | | | 103,375 | |
Wesfarmers, Ltd.*‡‡ | | | 34,758 | | | | 1,366,795 | |
Westfield Group REIT‡‡ | | | 40,245 | | | | 362,581 | |
Westfield Retail Trust REIT‡‡ | | | 59,197 | | | | 156,985 | |
Westpac Banking
Corporation‡‡ | | | 47,626 | | | | 1,376,963 | |
Woodside Petroleum, Ltd.‡‡ | | | 69,109 | | | | 2,400,411 | |
| | | | | | | | |
| | | Shares | | | Value | |
WorleyParsons, Ltd.‡‡ | | | 26,193 | | | $ | 388,235 | |
| | | | | | | | |
| | | | | | | 43,740,686 | |
| | | | | | | | |
Austria — 0.3% | | | | | | | | |
Erste Group Bank AG | | | 112,106 | | | | 3,906,514 | |
| | | | | | | | |
Belgium — 0.2% | | | | | | | | |
Ageas STRIP VVPR* | | | 5,306 | | | | 7 | |
Delhaize Group SA | | | 36,419 | | | | 2,164,398 | |
Groupe Bruxelles
Lambert SA‡‡ | | | 457 | | | | 41,953 | |
| | | | | | | | |
| | | | | | | 2,206,358 | |
| | | | | | | | |
Bermuda — 0.1% | | | | | | | | |
Catlin Group, Ltd.‡‡ | | | 731 | | | | 7,027 | |
Seadrill, Ltd.D | | | 42,079 | | | | 1,727,374 | |
| | | | | | | | |
| | | | | | | 1,734,401 | |
| | | | | | | | |
Brazil — 0.8% | | | | | | | | |
BM&FBovespa SA | | | 459,200 | | | | 2,152,697 | |
Brookfield Incorporacoes SA* | | | 852,600 | | | | 415,594 | |
Cia de Saneamento Basico do Estado de Sao Paulo ADRD* | | | 43,268 | | | | 490,659 | |
Embraer SA ADRD* | | | 104,000 | | | | 3,346,720 | |
Itau Unibanco
Holding SA ADR | | | 147,670 | | | | 2,003,882 | |
Petroleo Brasileiro SA ADRD* | | | 74,510 | | | | 1,026,748 | |
Vale SA ADRD | | | 170,400 | | | | 2,387,304 | |
| | | | | | | | |
| | | | | | | 11,823,604 | |
| | | | | | | | |
Canada — 0.6% | | | | | | | | |
Canadian National
Railway Co.D | | | 149,840 | | | | 8,543,877 | |
| | | | | | | | |
Chile — 0.1% | | | | | | | | |
Sociedad Quimica y Minera de Chile SA ADRD | | | 50,100 | | | | 1,296,588 | |
| | | | | | | | |
China — 2.4% | | | | | | | | |
Agricultural Bank of
China, Ltd. | | | 1,311,000 | | | | 644,147 | |
Baidu, Inc. ADR* | | | 80,297 | | | | 14,283,231 | |
Dongyue Group, Ltd. | | | 2,415,000 | | | | 956,121 | |
New Oriental Education &
Technology Group ADR* | | | 76,400 | | | | 2,406,600 | |
Tencent Holdings, Ltd. | | | 224,300 | | | | 14,306,743 | |
Yangzijiang Shipbuilding
Holdings, Ltd. | | | 285,800 | | | | 268,373 | |
Youku Tudou, Inc. ADRD* | | | 52,804 | | | | 1,599,961 | |
| | | | | | | | |
| | | | | | | 34,465,176 | |
| | | | | | | | |
Denmark — 1.7% | | | | | | | | |
AP Moller - Maersk A/S
Class B | | | 57 | | | | 616,851 | |
Chr. Hansen Holding A/SD | | | 31,344 | | | | 1,242,492 | |
Coloplast A/S Class B | | | 1,352 | | | | 89,632 | |
Danske Bank A/S* | | | 174,701 | | | | 4,013,176 | |
GN Store Nord A/S | | | 58,451 | | | | 1,436,490 | |
Novo Nordisk A/S Class B | | | 25,393 | | | | 4,654,583 | |
Novozymes A/S Class B | | | 36,890 | | | | 1,558,243 | |
TDC A/S | | | 560,401 | | | | 5,435,820 | |
Vestas Wind Systems A/S* | | | 146,952 | | | | 4,351,463 | |
| | | | | | | | |
| | | | | | | 23,398,750 | |
| | | | | | | | |
Finland — 0.2% | | | | | | | | |
Metso OYJ | | | 5,047 | | | | 215,820 | |
Nokia OYJ*‡‡ | | | 125,211 | | | | 1,011,709 | |
Sampo‡‡ | | | 12,161 | | | | 597,748 | |
| | | | |
| 218 | | See Notes to Financial Statements. | | |
| | | | | | | | | | |
| | | Shares | | | Value | |
UPM-Kymmene OYJ | | | 78,017 | | | | | $ | 1,323,181 | |
| | | | | | | | | | |
| | | | | | | | | 3,148,458 | |
| | | | | | | | | | |
France — 9.1% | | | | | | | | | | |
Alcatel-Lucent* | | | 118,354 | | | | | | 525,224 | |
Arkema SA‡‡ | | | 6,678 | | | | | | 779,714 | |
AtoS | | | 7,344 | | | | | | 665,396 | |
AXA SA‡‡ | | | 100,310 | | | | | | 2,793,406 | |
BNP Paribas SA‡‡ | | | 65,917 | | | | | | 5,142,027 | |
Cap Gemini SA‡‡ | | | 9,201 | | | | | | 622,776 | |
Carrefour SA | | | 32,797 | | | | | | 1,301,827 | |
Casino Guichard
Perrachon SA | | | 57,873 | | | | | | 6,677,761 | |
Christian Dior SA | | | 38,734 | | | | | | 7,331,641 | |
Cie de St-GobainD | | | 145,937 | | | | | | 8,039,274 | |
Cie Generale des Etablissements Michelin Class B‡‡ | | | 20,791 | | | | | | 2,212,186 | |
Credit Agricole SA*‡‡ | | | 29,800 | | | | | | 382,006 | |
Danone‡‡ | | | 95,373 | | | | | | 6,880,418 | |
Electricite de France | | | 19,964 | | | | | | 706,272 | |
Essilor International SA | | | 14,175 | | | | | | 1,508,331 | |
European Aeronautic Defence and Space Co. NV | | | 55,742 | | | | | | 4,279,342 | |
Kering | | | 26,677 | | | | | | 5,639,021 | |
Klepierre REIT‡‡ | | | 623 | | | | | | 28,878 | |
Lagardere SCA*‡‡ | | | 65,772 | | | | | | 2,444,992 | |
L’Oreal SA | | | 32,650 | | | | | | 5,733,785 | |
Natixis*‡‡ | | | 44,299 | | | | | | 260,622 | |
Orange SA | | | 443,175 | | | | | | 5,502,097 | |
Publicis Groupe SA* | | | 7,064 | | | | | | 647,244 | |
Renault SA‡‡ | | | 32,993 | | | | | | 2,655,168 | |
Sanofi‡‡ | | | 162,556 | | | | | | 17,360,221 | |
Schneider Electric SA | | | 83,158 | | | | | | 7,254,860 | |
Societe BIC SA‡‡ | | | 12,202 | | | | | | 1,495,410 | |
Societe Generale SA‡‡ | | | 125,097 | | | | | | 7,274,481 | |
Suez Environnement Co.‡‡ | | | 20,562 | | | | | | 368,741 | |
Total SA‡‡ | | | 178,010 | | | | | | 10,926,199 | |
Unibail-Rodamco SE REIT‡‡ | | | 1,611 | | | | | | 412,835 | |
Valeo SA‡‡ | | | 25,703 | | | | | | 2,848,452 | |
Vallourec SA | | | 36,050 | | | | | | 1,966,758 | |
Vinci SA | | | 66,873 | | | | | | 4,395,664 | |
Vivendi SA‡‡ | | | 83,635 | | | | | | 2,206,083 | |
| | | | | | | | | | |
| | | | | | | | | 129,269,112 | |
| | | | | | | | | | |
Germany — 10.3% | | | | | | | | | | |
Aixtron SE* | | | 76,439 | | | | | | 1,105,731 | |
Allianz SED | | | 16,902 | | | | | | 3,030,920 | |
Aurubis AG‡‡ | | | 26,506 | | | | | | 1,615,375 | |
BASF SE | | | 24,449 | | | | | | 2,606,346 | |
Bayer AG‡‡ | | | 162,077 | | | | | | 22,731,806 | |
Beiersdorf AG | | | 76,609 | | | | | | 7,761,022 | |
Bilfinger SE‡‡ | | | 10,002 | | | | | | 1,121,837 | |
Continental AG‡‡ | | | 10,872 | | | | | | 2,384,092 | |
Daimler AG | | | 107,538 | | | | | | 9,305,462 | |
Deutsche Bank AG‡‡ | | | 11,432 | | | | | | 545,336 | |
Deutsche Boerse AG | | | 52,045 | | | | | | 4,310,234 | |
Deutsche Lufthansa AG*‡‡ | | | 245,500 | | | | | | 5,207,883 | |
Deutsche Post AG‡‡ | | | 94,688 | | | | | | 3,451,963 | |
Deutsche Telekom AG | | | 661,626 | | | | | | 11,313,814 | |
Freenet AG*‡‡ | | | 82,325 | | | | | | 2,466,692 | |
Fresenius Medical Care AG & Co. KGaA | | | 100,831 | | | | | | 7,175,660 | |
Fresenius SE & Co. KGaA‡‡ | | | 1,995 | | | | | | 306,290 | |
GEA Group AG | | | 57,889 | | | | | | 2,755,481 | |
Hannover Rueck SE‡‡ | | | 14,316 | | | | | | 1,228,549 | |
| | | | | | | | | | |
| | | Shares | | | Value | |
HeidelbergCement AG | | | 23,160 | | | | | $ | 1,757,152 | |
Hochtief AG | | | 4,603 | | | | | | 392,987 | |
Kloeckner & Co. SE*‡‡ | | | 29,827 | | | | | | 408,362 | |
Leoni AG‡‡ | | | 27,381 | | | | | | 2,046,512 | |
Linde AGD | | | 50,143 | | | | | | 10,488,710 | |
Merck KGaA‡‡ | | | 25,050 | | | | | | 4,488,599 | |
Metro AGD | | | 27,702 | | | | | | 1,341,464 | |
Muenchener Rueckversicherungs AG‡‡ | | | 12,020 | | | | | | 2,648,236 | |
Rheinmetall AG‡‡ | | | 28,974 | | | | | | 1,787,507 | |
RWE AGD | | | 68,341 | | | | | | 2,501,324 | |
Salzgitter AG‡‡ | | | 20,817 | | | | | | 887,780 | |
SAP AG | | | 187,568 | | | | | | 16,078,363 | |
Siemens AG | | | 16,787 | | | | | | 2,292,999 | |
SMA Solar Technology AGD | | | 20,776 | | | | | | 656,235 | |
Stada Arzneimittel AG‡‡ | | | 15,790 | | | | | | 780,377 | |
TUI AG*‡‡ | | | 103,095 | | | | | | 1,698,394 | |
Volkswagen AG | | | 21,913 | | | | | | 5,935,713 | |
| | | | | | | | | | |
| | | | | | | | | 146,615,207 | |
| | | | | | | | | | |
Guernsey — 0.0% | | | | | | | | | | |
Resolution, Ltd.‡‡ | | | 112,958 | | | | | | 662,170 | |
| | | | | | | | | | |
Hong Kong — 2.3% | | | | | | | | | | |
AIA Group, Ltd.‡‡ | | | 1,806,600 | | | | | | 9,062,938 | |
ASM Pacific Technology, Ltd.‡‡ | | | 3,400 | | | | | | 28,456 | |
Bank of East Asia, Ltd. | | | 9,400 | | | | | | 39,822 | |
Belle International Holdings, Ltd.D | | | 569,000 | | | | | | 658,206 | |
Cathay Pacific Airways, Ltd.‡‡ | | | 208,000 | | | | | | 439,911 | |
Cheung Kong Holdings, Ltd.‡‡ | | | 28,000 | | | | | | 441,974 | |
Cheung Kong Infrastructure Holdings, Ltd.‡‡ | | | 12,000 | | | | | | 75,751 | |
China Mobile, Ltd. | | | 321,000 | | | | | | 3,328,269 | |
CLP Holdings, Ltd. | | | 19,500 | | | | | | 154,153 | |
CNOOC, Ltd. | | | 474,500 | | | | | | 882,387 | |
Esprit Holdings, Ltd.* | | | 77 | | | | | | 148 | |
First Pacific Co., Ltd.‡‡ | | | 38,000 | | | | | | 43,222 | |
Guangdong Investment, Ltd. | | | 442,900 | | | | | | 432,945 | |
Hang Seng Bank, Ltd.‡‡ | | | 24,800 | | | | | | 402,017 | |
HKT Trust | | | 954 | | | | | | 942 | |
Hong Kong & China Gas Co., Ltd.‡‡ | | | 220 | | | | | | 504 | |
Hong Kong Exchanges and Clearing, Ltd.‡‡ | | | 146,107 | | | | | | 2,436,279 | |
Hopewell Holdings, Ltd.‡‡ | | | 10,500 | | | | | | 35,545 | |
Hutchison Whampoa, Ltd.‡‡ | | | 14,000 | | | | | | 190,294 | |
Hysan Development Co., Ltd.‡‡ | | | 99,000 | | | | | | 426,421 | |
Jardine Matheson Holdings, Ltd.D | | | 43,600 | | | | | | 2,280,716 | |
Kerry Logistics Network, Ltd.* | | | 16,550 | | | | | | 23,520 | |
Kerry Properties, Ltd. | | | 33,100 | | | | | | 114,825 | |
Li & Fung, Ltd.D | | | 4,478,924 | | | | | | 5,776,052 | |
Link REIT (The)‡‡ | | | 45,000 | | | | | | 218,202 | |
MTR Corporation, Ltd. | | | 20,500 | | | | | | 77,592 | |
New World Development Co., Ltd.‡‡ | | | 64,000 | | | | | | 80,802 | |
NWS Holdings, Ltd.‡‡ | | | 21,000 | | | | | | 32,011 | |
PCCW, Ltd.‡‡ | | | 68,000 | | | | | | 30,430 | |
Power Assets Holdings, Ltd.‡‡ | | | 43,500 | | | | | | 345,844 | |
Shangri-La Asia, Ltd. | | | 1,000 | | | | | | 1,950 | |
Sino Land Co., Ltd.‡‡ | | | 306,000 | | | | | | 418,297 | |
Skyworth Digital Holdings, Ltd.* | | | 620,000 | | | | | | 341,411 | |
Sun Hung Kai Properties, Ltd.‡‡ | | | 13,000 | | | | | | 164,883 | |
| | | | |
| | See Notes to Financial Statements. | | 219 |
INTERNATIONAL EQUITY FUND
SCHEDULE OF INVESTMENTS (Continued)
| | | | | | | | | | |
| | | Shares | | | Value | |
Swire Pacific, Ltd. Class A‡‡ | | | 13,000 | | | | | $ | 152,393 | |
Swire Properties, Ltd. | | | 100 | | | | | | 253 | |
Wharf Holdings, Ltd.‡‡ | | | 70,000 | | | | | | 535,316 | |
Wheelock & Co., Ltd. | | | 21,000 | | | | | | 96,546 | |
Yue Yuen Industrial Holdings, Ltd. ADR‡‡ | | | 717,500 | | | | | | 2,396,509 | |
| | | | | | | | | | |
| | | | | | | | | 32,167,736 | |
| | | | | | | | | | |
India — 0.5% | | | | | | | | | | |
Container Corporation of India | | | — | | | | | | 6 | |
Housing Development Finance Corporation | | | 175,616 | | | | | | 2,256,135 | |
ICICI Bank, Ltd. ADRD | | | 88,580 | | | | | | 3,292,519 | �� |
Tata Motors, Ltd. ADR | | | 50,000 | | | | | | 1,540,000 | |
| | | | | | | | | | |
| | | | | | | | | 7,088,660 | |
| | | | | | | | | | |
Indonesia — 0.0% | | | | | | | | | | |
Telekomunikasi Indonesia Persero Tbk PT | | | 2,997,700 | | | | | | 530,560 | |
| | | | | | | | | | |
Ireland — 0.4% | | | | | | | | | | |
CRH PLC | | | 157,481 | | | | | | 3,971,708 | |
James Hardie Industries PLCD | | | 150,698 | | | | | | 1,741,178 | |
| | | | | | | | | | |
| | | | | | | | | 5,712,886 | |
| | | | | | | | | | |
Italy — 2.3% | | | | | | | | | | |
Assicurazioni Generali SpA | | | 20,976 | | | | | | 492,818 | |
Banca Popolare dell’Emilia Romagna SC* | | | 206,862 | | | | | | 1,973,818 | |
Enel SpA‡‡ | | | 537,409 | | | | | | 2,344,938 | |
Eni SpA | | | 377,440 | | | | | | 9,120,367 | |
Fiat SpAD* | | | 693,467 | | | | | | 5,676,001 | |
Intesa Sanpaolo SpA‡‡ | | | 180,175 | | | | | | 443,178 | |
Mediolanum SpA‡‡ | | | 44,851 | | | | | | 388,657 | |
Prysmian SpA | | | 39,610 | | | | | | 1,019,845 | |
Snam SpA | | | 673,037 | | | | | | 3,761,860 | |
UniCredit SpA‡‡ | | | 924,364 | | | | | | 6,818,735 | |
Unione di Banche Italiane SCPA‡‡ | | | 14,202 | | | | | | 96,280 | |
| | | | | | | | | | |
| | | | | | | | | 32,136,497 | |
| | | | | | | | | | |
Japan — 15.2% | | | | | | | | | | |
Amada Co., Ltd. | | | 474,000 | | | | | | 4,186,050 | |
Aozora Bank, Ltd. | | | 64,600 | | | | | | 183,069 | |
Asahi Kasei Corporation | | | 44,200 | | | | | | 346,697 | |
Astellas Pharma, Inc.‡‡ | | | 93,700 | | | | | | 5,555,177 | |
Azbil Corporation‡‡ | | | 10,000 | | | | | | 233,079 | |
Bridgestone Corporation | | | 18,800 | | | | | | 712,273 | |
Calsonic Kansei Corporation‡‡ | | | 127,000 | | | | | | 656,250 | |
Canon, Inc. | | | 335,050 | | | | | | 10,690,907 | |
Central Japan Railway Co.‡‡ | | | 11,100 | | | | | | 1,308,158 | |
Chubu Electric Power Co., Inc.‡‡ | | | 68,800 | | | | | | 889,434 | |
Chugai Pharmaceutical Co., Ltd. | | | 43,200 | | | | | | 956,235 | |
COMSYS Holdings Corporation‡‡ | | | 42,300 | | | | | | 665,070 | |
Daicel Corporation‡‡ | | | 31,000 | | | | | | 252,644 | |
Daihatsu Motor Co., Ltd.‡‡ | | | 27,000 | | | | | | 457,994 | |
Daiichi Sankyo Co., Ltd. | | | 22,100 | | | | | | 404,098 | |
Daito Trust Construction Co., Ltd.‡‡ | | | 1,100 | | | | | | 102,837 | |
Daiwa House Industry Co., Ltd.‡‡ | | | 10,000 | | | | | | 193,752 | |
Daiwa Securities Group, Inc.‡‡ | | | 31,000 | | | | | | 310,482 | |
Dena Co., Ltd. | | | 26,400 | | | | | | 556,524 | |
Denso Corporation | | | 202,100 | | | | | | 10,676,679 | |
| | | | | | | | | | |
| | | Shares | | | Value | |
East Japan Railway Co.‡‡ | | | 18,000 | | | | | $ | 1,433,841 | |
Electric Power Development Co., Ltd. | | | 25,500 | | | | | | 743,498 | |
Fuji Electric Co., Ltd.‡‡ | | | 356,000 | | | | | | 1,668,012 | |
Fuji Heavy Industries, Ltd.‡‡ | | | 80,400 | | | | | | 2,310,612 | |
Fuji Oil Co., Ltd. | | | 32,800 | | | | | | 488,442 | |
Fujikura, Ltd. | | | 4,000 | | | | | | 18,776 | |
Fujitsu, Ltd.*‡‡ | | | 92,000 | | | | | | 476,806 | |
Fukuoka Financial Group, Inc.‡‡ | | | 128,000 | | | | | | 561,850 | |
Gree, Inc.D | | | 86,700 | | | | | | 855,392 | |
GungHo Online Entertainment, Inc.* | | | 116,600 | | | | | | 839,864 | |
Hino Motors, Ltd.‡‡ | | | 139,000 | | | | | | 2,189,632 | |
Hitachi, Ltd. | | | 377,000 | | | | | | 2,858,471 | |
Honda Motor Co., Ltd. | | | 223,900 | | | | | | 9,241,949 | |
Hoya Corporation | | | 117,100 | | | | | | 3,256,773 | |
Inpex Corporation | | | 446,800 | | | | | | 5,730,733 | |
Isuzu Motors, Ltd.‡‡ | | | 96,100 | | | | | | 599,370 | |
ITOCHU Corporation‡‡ | | | 381,200 | | | | | | 4,712,637 | |
J Front Retailing Co., Ltd.‡‡ | | | 169,000 | | | | | | 1,282,080 | |
Japan Airlines Co., Ltd. | | | 52,500 | | | | | | 2,589,893 | |
Japan Real Estate Investment Corporation REIT | | | 14 | | | | | | 74,901 | |
Japan Retail Fund Investment Corporation REIT | | | 20 | | | | | | 40,694 | |
Japan Steel Works, Ltd. (The) | | | 39,000 | | | | | | 218,538 | |
JFE Holdings, Inc. | | | 28,800 | | | | | | 686,306 | |
JGC Corporation‡‡ | | | 43,000 | | | | | | 1,687,485 | |
JSR Corporation | | | 85,500 | | | | | | 1,657,239 | |
JX Holdings, Inc. | | | 70 | | | | | | 360 | |
Kajima Corporation | | | 188,000 | | | | | | 707,069 | |
Kansai Electric Power Co., Inc. (The)* | | | 40,000 | | | | | | 460,373 | |
Kao Corporation‡‡ | | | 184,800 | | | | | | 5,817,842 | |
KDDI Corporation‡‡ | | | 30,300 | | | | | | 1,866,943 | |
Keisei Electric Railway Co., Ltd.‡‡ | | | 1,000 | | | | | | 9,201 | |
Konica Minolta, Inc.‡‡ | | | 163,000 | | | | | | 1,628,907 | |
Kyocera Corporation | | | 26,400 | | | | | | 1,319,777 | |
Mabuchi Motor Co., Ltd.D | | | 64,200 | | | | | | 3,820,338 | |
Marubeni Corporation‡‡ | | | 240,800 | | | | | | 1,733,537 | |
Marui Group Co., Ltd. | | | 38,800 | | | | | | 394,647 | |
Mazda Motor Corporation* | | | 54,000 | | | | | | 279,832 | |
Miraca Holdings, Inc.‡‡ | | | 8,700 | | | | | | 410,434 | |
Mitsubishi Corporation | | | 72,100 | | | | | | 1,384,170 | |
Mitsubishi Electric Corporation‡‡ | | | 800 | | | | | | 10,060 | |
Mitsubishi Estate Co., Ltd.‡‡ | | | 24,000 | | | | | | 718,225 | |
Mitsubishi Heavy Industries, Ltd.‡‡ | | | 138,000 | | | | | | 854,713 | |
Mitsubishi UFJ Financial Group, Inc.‡‡ | | | 797,200 | | | | | | 5,292,927 | |
Mitsui & Co., Ltd.‡‡ | | | 57,700 | | | | | | 804,404 | |
Mitsui Engineering & Shipbuilding Co., Ltd. | | | 218,000 | | | | | | 450,265 | |
Mitsui Fudosan Co., Ltd.‡‡ | | | 18,000 | | | | | | 649,272 | |
Mizuho Financial Group, Inc. | | | 97,440 | | | | | | 211,545 | |
MS&AD Insurance Group Holdings | | | 104,100 | | | | | | 2,798,101 | |
Mutoh Holdings Co., Ltd. | | | 22,000 | | | | | | 110,502 | |
Namco Bandai Holdings, Inc. | | | 20,100 | | | | | | 446,270 | |
NHK Spring Co., Ltd.‡‡ | | | 12,400 | | | | | | 140,103 | |
Nippon Building Fund, Inc. REIT | | | 16 | | | | | | 92,963 | |
Nippon Meat Packers, Inc.‡‡ | | | 11,000 | | | | | | 189,063 | |
| | | | |
| 220 | | See Notes to Financial Statements. | | |
| | | | | | | | | | |
| | | Shares | | | Value | |
Nippon Steel & Sumitomo Metal Corporation | | | 230 | | | | | $ | 771 | |
Nippon Telegraph & Telephone Corporation‡‡ | | | 6,900 | | | | | | 371,637 | |
Nippon Yusen KK | | | 33,800 | | | | | | 108,073 | |
Nishi-Nippon City Bank, Ltd. (The) | | | 200 | | | | | | 539 | |
Nissan Chemical Industries, Ltd. | | | 14,800 | | | | | | 235,193 | |
NKSJ Holdings, Inc.‡‡ | | | 64,550 | | | | | | 1,796,660 | |
Nomura Holdings, Inc.‡‡ | | | 68,200 | | | | | | 527,037 | |
NTT DOCOMO, Inc. | | | 60,800 | | | | | | 1,001,150 | |
Obayashi Corporation‡‡ | | | 69,000 | | | | | | 393,560 | |
Omron Corporation | | | 3,800 | | | | | | 167,935 | |
Oriental Land Co., Ltd. | | | 4,600 | | | | | | 663,385 | |
ORIX Corporation‡‡ | | | 15,900 | | | | | | 279,393 | |
Osaka Gas Co., Ltd.‡‡ | | | 195,000 | | | | | | 765,886 | |
Panasonic Corporation | | | 900 | | | | | | 10,492 | |
Rakuten, Inc. | | | 464,400 | | | | | | 6,930,442 | |
Resona Holdings, Inc.‡‡ | | | 407,800 | | | | | | 2,080,787 | |
Ryohin Keikaku Co., Ltd. | | | 500 | | | | | | 54,081 | |
Sanrio Co., Ltd.D | | | 43,200 | | | | | | 1,819,034 | |
SCSK Corporation | | | 27,700 | | | | | | 727,058 | |
Secom Co., Ltd. | | | 2,100 | | | | | | 126,703 | |
Seiko Epson Corporation | | | 87,600 | | | | | | 2,358,589 | |
Sekisui Chemical Co., Ltd.‡‡ | | | 74,000 | | | | | | 908,092 | |
Sekisui House, Ltd.‡‡ | | | 8,000 | | | | | | 111,946 | |
Seven & I Holdings Co., Ltd.‡‡ | | | 152,800 | | | | | | 6,083,950 | |
Shimamura Co., Ltd. | | | 2,300 | | | | | | 215,594 | |
Shin-Etsu Chemical Co., Ltd. | | | 120,400 | | | | | | 7,042,110 | |
Shinsei Bank, Ltd.‡‡ | | | 847,000 | | | | | | 2,073,375 | |
Shionogi & Co., Ltd. | | | 130,700 | | | | | | 2,837,455 | |
SMC CorporationD* | | | 19,300 | | | | | | 4,871,099 | |
Softbank Corporation‡‡ | | | 183,300 | | | | | | 16,084,715 | |
Sony Corporation | | | 13,800 | | | | | | 237,889 | |
Sumitomo Corporation‡‡ | | | 292,900 | | | | | | 3,681,206 | |
Sumitomo Mitsui Financial Group, Inc.‡‡ | | | 90,700 | | | | | | 4,716,707 | |
Sumitomo Mitsui Trust Holdings, Inc.‡‡ | | | 256,000 | | | | | | 1,354,551 | |
Sumitomo Realty & Development Co., Ltd.‡‡ | | | 7,000 | | | | | | 348,792 | |
T&D Holdings, Inc. | | | 44,100 | | | | | | 617,250 | |
Taisei Corporation | | | 121,000 | | | | | | 550,660 | |
Takashimaya Co., Ltd.‡‡ | | | 134,000 | | | | | | 1,337,010 | |
Takeda Pharmaceutical Co., Ltd. | | | 113,300 | | | | | | 5,196,510 | |
Toho Co., Ltd.* | | | 21,900 | | | | | | 481,794 | |
Tokio Marine Holdings, Inc. | | | 128,700 | | | | | | 4,307,549 | |
Tokyo Electric Power Co., Inc.* | | | 177,900 | | | | | | 876,529 | |
Tokyo Electron, Ltd. | | | 48,600 | | | | | | 2,677,992 | |
Tokyo Gas Co., Ltd. | | | 30,000 | | | | | | 147,861 | |
Toshiba Corporation | | | 579,300 | | | | | | 2,438,745 | |
Toyo Seikan Group Holdings, Ltd. | | | 29,400 | | | | | | 632,929 | |
Toyo Suisan Kaisha, Ltd. | | | 5,000 | | | | | | 150,204 | |
Toyo Tire & Rubber Co., Ltd. | | | 58,000 | | | | | | 331,136 | |
Toyota Boshoku Corporation | | | 9,000 | | | | | | 112,530 | |
Toyota Motor Corporation‡‡ | | | 57,160 | | | | | | 3,485,336 | |
Tsumura & Co.D | | | 21,300 | | | | | | 564,448 | |
USS Co., Ltd. | | | 10,000 | | | | | | 137,165 | |
West Japan Railway Co.‡‡ | | | 18,100 | | | | | | 784,245 | |
Yamaha Corporation | | | 7,900 | | | | | | 125,598 | |
Yamato Holdings Co., Ltd.‡‡ | | | 5,200 | | | | | | 105,161 | |
| | | | | | | | | | |
| | | Shares | | | Value | |
Yokogawa Electric Corporation | | | 42,000 | | | | | $ | 645,742 | |
Yokohama Rubber Co., Ltd. (The) | | | 16,000 | | | | | | 157,336 | |
| | | | | | | | | | |
| | | | | | | | | 215,012,662 | |
| | | | | | | | | | |
Jersey — 0.0% | | | | | | | | | | |
Randgold Resources, Ltd.‡‡ | | | 1,533 | | | | | | 96,212 | |
| | | | | | | | | | |
Luxembourg — 0.3% | | | | | | | | | | |
APERAM*‡‡ | | | 72,975 | | | | | | 1,347,764 | |
ArcelorMittal | | | 132,172 | | | | | | 2,358,331 | |
| | | | | | | | | | |
| | | | | | | | | 3,706,095 | |
| | | | | | | | | | |
Malaysia — 0.1% | | | | | | | | | | |
Tenaga Nasional Bhd | | | 251,300 | | | | | | 873,086 | |
| | | | | | | | | | |
Netherlands — 6.2% | | | | | | | | | | |
Aegon NV‡‡ | | | 1,059,741 | | | | | | 10,042,704 | |
Corio NV REIT | | | 368 | | | | | | 16,515 | |
Delta Lloyd NV | | | 260,631 | | | | | | 6,472,493 | |
ING Groep NVD*‡‡ | | | 1,556,078 | | | | | | 21,736,213 | |
Koninklijke Ahold NV‡‡ | | | 534,307 | | | | | | 9,602,143 | |
Koninklijke KPN NV* | | | 57,023 | | | | | | 184,247 | |
Koninklijke Philips NV‡‡ | | | 132,093 | | | | | | 4,863,841 | |
PostNL NV*‡‡ | | | 171,205 | | | | | | 978,772 | |
QIAGEN NV* | | | 4,199 | | | | | | 98,031 | |
Randstad Holding NV | | | 185,139 | | | | | | 12,014,296 | |
Reed Elsevier NV | | | 370,329 | | | | | | 7,870,917 | |
Royal Dutch Shell PLC Class AD‡‡ | | | 384,162 | | | | | | 13,724,553 | |
Unilever NV | | | 8,391 | | | | | | 337,364 | |
| | | | | | | | | | |
| | | | | | | | | 87,942,089 | |
| | | | | | | | | | |
New Zealand — 0.1% | | | | | | | | | | |
Fletcher Building, Ltd.‡‡ | | | 65,050 | | | | | | 448,981 | |
Telecom Corporation of New Zealand, Ltd.‡‡ | | | 320,079 | | | | | | 625,897 | |
| | | | | | | | | | |
| | | | | | | | | 1,074,878 | |
| | | | | | | | | | |
Nigeria — 0.0% | | | | | | | | | | |
Afriland Properties PLC REIT+* | | | 331,249 | | | | | | — | |
| | | | | | | | | | |
Norway — 1.4% | | | | | | | | | | |
DNB ASA‡‡ | | | 325,575 | | | | | | 5,824,096 | |
Marine Harvest ASA* | | | 3,801,954 | | | | | | 4,629,191 | |
Orkla ASAD | | | 323,784 | | | | | | 2,526,084 | |
Schibsted ASAD | | | 42,822 | | | | | | 2,832,537 | |
Telenor ASA | | | 61,343 | | | | | | 1,462,450 | |
TGS Nopec Geophysical Co. ASA‡‡ | | | 23,328 | | | | | | 618,459 | |
Yara International ASA‡‡ | | | 51,785 | | | | | | 2,228,395 | |
| | | | | | | | | | |
| | | | | | | | | 20,121,212 | |
| | | | | | | | | | |
Peru — 0.2% | | | | | | | | | | |
Credicorp, Ltd.D | | | 25,593 | | | | | | 3,396,959 | |
| | | | | | | | | | |
Portugal — 0.1% | | | | | | | | | | |
Jeronimo Martins SGPS SA | | | 83,398 | | | | | | 1,630,902 | |
| | | | | | | | | | |
Russia — 0.2% | | | | | | | | | | |
Magnit OJSC GDR | | | 20,600 | | | | | | 1,363,720 | |
Mail.ru Group, Ltd. GDR* | | | 30,241 | | | | | | 1,348,749 | |
| | | | | | | | | | |
| | | | | | | | | 2,712,469 | |
| | | | | | | | | | |
Singapore — 1.7% | | | | | | | | | | |
Ascendas Real Estate Investment Trust REIT‡‡ | | | 30,000 | | | | | | 52,300 | |
CapitaCommercial Trust REIT | | | 38,000 | | | | | | 43,663 | |
CapitaMall Trust REIT‡‡ | | | 51,000 | | | | | | 76,988 | |
| | | | |
| | See Notes to Financial Statements. | | 221 |
INTERNATIONAL EQUITY FUND
SCHEDULE OF INVESTMENTS (Continued)
| | | | | | | | | | |
| | | Shares | | | Value | |
CapitaMalls Asia, Ltd. | | | 227,000 | | | | | $ | 352,566 | |
ComfortDelGro Corporation, Ltd.‡‡ | | | 263,000 | | | | | | 418,899 | |
DBS Group Holdings, Ltd.‡‡ | | | 161,000 | | | | | | 2,181,624 | |
Golden Agri-Resources, Ltd. | | | 300 | | | | | | 130 | |
Jardine Cycle & Carriage, Ltd. | | | 142,000 | | | | | | 4,045,247 | |
Keppel Corporation, Ltd.‡‡ | | | 5,700 | | | | | | 50,543 | |
Keppel REIT‡‡ | | | 596 | | | | | | 560 | |
Oversea-Chinese Banking Corporation, Ltd.‡‡ | | | 32,000 | | | | | | 258,647 | |
Sembcorp Industries, Ltd.‡‡ | | | 993,300 | | | | | | 4,321,262 | |
Sembcorp Marine, Ltd. | | | 23,000 | | | | | | 81,105 | |
Singapore Airlines, Ltd. | | | 6,000 | | | | | | 49,495 | |
Singapore Exchange, Ltd.‡‡ | | | 173,000 | | | | | | 995,269 | |
Singapore Press Holdings, Ltd. | | | 9,000 | | | | | | 29,383 | |
Singapore Technologies Engineering, Ltd.‡‡ | | | 26,000 | | | | | | 81,588 | |
Singapore Telecommunications, Ltd.‡‡ | | | 1,288,700 | | | | | | 3,737,582 | |
StarHub, Ltd.‡‡ | | | 11,000 | | | | | | 37,395 | |
United Overseas Bank, Ltd.‡‡ | | | 449,417 | | | | | | 7,564,180 | |
UOL Group, Ltd.‡‡ | | | 9,186 | | | | | | 45,058 | |
Wilmar International, Ltd. | | | 44,000 | | | | | | 119,244 | |
| | | | | | | | | | |
| | | | | | | | | 24,542,728 | |
| | | | | | | | | | |
South Korea — 1.4% | | | | | | | | | | |
Celltrion, Inc. | | | 40,983 | | | | | | 1,489,255 | |
Hankook Tire Co., Ltd. | | | 38,500 | | | | | | 2,218,409 | |
Kia Motors Corporation | | | 23,870 | | | | | | 1,271,115 | |
LG Corporation | | | 8,135 | | | | | | 494,122 | |
NAVER Corporation | | | 6,353 | | | | | | 4,378,028 | |
POSCO ADRD | | | 5,054 | | | | | | 394,212 | |
Samsung Electronics Co., Ltd. | | | 3,343 | | | | | | 4,356,087 | |
Samsung Heavy Industries Co., Ltd. | | | 36,700 | | | | | | 1,326,388 | |
Shinhan Financial Group Co., Ltd. | | | 75,120 | | | | | | 3,372,500 | |
| | | | | | | | | | |
| | | | | | | | | 19,300,116 | |
| | | | | | | | | | |
Spain — 5.1% | | | | | | | | | | |
ACS Actividades de Construccion y Servicios SA | | | 29,619 | | | | | | 1,019,490 | |
Amadeus IT Holding SA‡‡ | | | 276,043 | | | | | | 11,812,240 | |
Banco Bilbao Vizcaya Argentaria SA‡‡ | | | 104,075 | | | | | | 1,281,143 | |
Banco Popular Espanol SA* | | | 865,198 | | | | | | 5,219,278 | |
Banco Santander SA‡‡ | | | 1,567,410 | | | | | | 14,028,848 | |
Distribuidora Internacional de Alimentacion SA | | | 248,468 | | | | | | 2,221,821 | |
Ebro Foods SA | | | 158,764 | | | | | | 3,720,656 | |
Endesa SA‡‡ | | | 57,879 | | | | | | 1,855,249 | |
Gas Natural SDG SA‡‡ | | | 135,236 | | | | | | 3,478,108 | |
Grifols SA | | | 2,523 | | | | | | 120,666 | |
Iberdrola SA‡‡ | | | 1,574,420 | | | | | | 10,039,121 | |
Inditex SA | | | 61,923 | | | | | | 10,205,497 | |
Telefonica SA | | | 443,163 | | | | | | 7,215,345 | |
| | | | | | | | | | |
| | | | | | | | | 72,217,462 | |
| | | | | | | | | | |
Sweden — 3.0% | | | | | | | | | | |
Alfa Laval AB | | | 115,897 | | | | | | 2,977,765 | |
Atlas Copco AB Class A | | | 311,207 | | | | | | 8,640,991 | |
Elekta ABD | | | 93,460 | | | | | | 1,430,231 | |
Hennes & Mauritz AB Class B | | | 143,371 | | | | | | 6,603,163 | |
| | | | | | | | | | |
| | | Shares | | | Value | |
Investment AB Kinnevik Class B | | | 117,328 | | | | | $ | 5,439,459 | |
Investor AB Class B‡‡ | | | 3,383 | | | | | | 116,590 | |
Meda AB | | | 134,524 | | | | | | 1,708,401 | |
NCC AB Class B‡‡ | | | 1,499 | | | | | | 48,958 | |
Nordea Bank AB‡‡ | | | 125,373 | | | | | | 1,690,379 | |
Sandvik ABD | | | 182,589 | | | | | | 2,577,005 | |
Skandinaviska Enskilda Banken AB | | | 42,548 | | | | | | 562,113 | |
Svenska Cellulosa AB SCA Class B‡‡ | | | 103,291 | | | | | | 3,182,175 | |
Svenska Handelsbanken AB Class A | | | 88,488 | | | | | | 4,350,674 | |
TeliaSonera AB‡‡ | | | 37,643 | | | | | | 313,958 | |
Trelleborg AB Class B‡‡ | | | 118,595 | | | | | | 2,361,740 | |
| | | | | | | | | | |
| | | | | | | | | 42,003,602 | |
| | | | | | | | | | |
Switzerland — 9.4% | | | | | | | | | | |
ABB, Ltd.* | | | 444,666 | | | | | | 11,756,975 | |
ABB, Ltd. ADRD* | | | 48,400 | | | | | | 1,285,504 | |
Actelion, Ltd.*‡‡ | | | 2,037 | | | | | | 172,780 | |
Adecco SA*‡‡ | | | 5,621 | | | | | | 446,233 | |
Baloise Holding AG‡‡ | | | 4,229 | | | | | | 539,257 | |
Cie Financiere Richemont SA | | | 63,203 | | | | | | 6,313,820 | |
Credit Suisse Group AG* | | | 222,776 | | | | | | 6,875,620 | |
Galenica AG | | | 671 | | | | | | 675,495 | |
Geberit AG* | | | 12,036 | | | | | | 3,651,495 | |
Georg Fischer AG*‡‡ | | | 952 | | | | | | 670,240 | |
Givaudan SA*‡‡ | | | 537 | | | | | | 768,213 | |
Glencore Xstrata PLC*‡‡ | | | 189,409 | | | | | | 980,794 | |
Helvetia Holding AG | | | 2,401 | | | | | | 1,205,346 | |
Julius Baer Group, Ltd.* | | | 91,746 | | | | | | 4,408,948 | |
Logitech International SA‡‡ | | | 232,360 | | | | | | 3,190,864 | |
Lonza Group AG* | | | 58,060 | | | | | | 5,517,627 | |
Nestle SA‡‡ | | | 200,186 | | | | | | 14,671,644 | |
Novartis AG‡‡ | | | 263,825 | | | | | | 21,145,410 | |
OC Oerlikon Corporation AG*‡‡ | | | 265,236 | | | | | | 3,973,370 | |
Roche Holding AG‡‡ | | | 40,618 | | | | | | 11,378,169 | |
Swatch Group AG (The) | | | 2,139 | | | | | | 1,417,737 | |
Swiss Life Holding AGD*‡‡ | | | 25,337 | | | | | | 5,267,557 | |
Swiss Re AG* | | | 21,484 | | | | | | 1,980,577 | |
Syngenta AG | | | 11,315 | | | | | | 4,511,258 | |
Transocean, Ltd.‡‡ | | | 4,575 | | | | | | 223,899 | |
UBS AG* | | | 288,924 | | | | | | 5,532,130 | |
Wolseley PLC*‡‡ | | | 57,960 | | | | | | 3,287,292 | |
Zurich Insurance Group AG* | | | 40,183 | | | | | | 11,655,647 | |
| | | | | | | | | | |
| | | | | | | | | 133,503,901 | |
| | | | | | | | | | |
Taiwan — 1.1% | | | | | | | | | | |
Taiwan Semiconductor Manufacturing Co., Ltd. | | | 538,000 | | | | | | 1,904,441 | |
Taiwan Semiconductor Manufacturing Co., Ltd. ADRD | | | 599,109 | | | | | | 10,448,461 | |
Teco Electric and Machinery Co., Ltd. | | | 2,234,700 | | | | | | 2,560,605 | |
| | | | | | | | | | |
| | | | | | | | | 14,913,507 | |
| | | | | | | | | | |
Turkey — 0.3% | | | | | | | | | | |
BIM Birlesik Magazalar AS | | | 44,748 | | | | | | 903,705 | |
Türkiye Garanti Bankasi AS | | | 915,382 | | | | | | 2,964,663 | |
Yapi ve Kredi Bankasi AS | | | 1 | | | | | | 2 | |
| | | | | | | | | | |
| | | | | | | | | 3,868,370 | |
| | | | | | | | | | |
United Kingdom — 17.7% | | | | | | | | | | |
3i Group PLC*‡‡ | | | 37,796 | | | | | | 241,028 | |
| | | | |
| 222 | | See Notes to Financial Statements. | | |
| | | | | | | | | | |
| | | Shares | | | Value | |
Aggreko PLC | | | 119,555 | | | | | $ | 3,383,445 | |
Alent PLC‡‡ | | | 23,998 | | | | | | 141,076 | |
AMEC PLC‡‡ | | | 213,193 | | | | | | 3,841,060 | |
Anglo American PLC | | | 88,854 | | | | | | 1,942,228 | |
ARM Holdings PLC‡‡ | | | 714,366 | | | | | | 13,000,731 | |
Associated British Foods PLC‡‡ | | | 16,970 | | | | | | 687,084 | |
Aviva PLC‡‡ | | | 267,695 | | | | | | 1,993,483 | |
Babcock International Group PLC‡‡ | | | 46,176 | | | | | | 1,036,108 | |
BAE Systems PLC‡‡ | | | 162,980 | | | | | | 1,174,013 | |
Barclays PLC‡‡ | | | 1,896,340 | | | | | | 8,539,935 | |
Barratt Developments PLC‡‡ | | | 706,521 | | | | | | 4,083,192 | |
BG Group PLC | | | 380,999 | | | | | | 8,186,165 | |
BHP Billiton PLC‡‡ | | | 139,098 | | | | | | 4,305,063 | |
BP PLC‡‡ | | | 2,066,865 | | | | | | 16,704,202 | |
British Land Co. PLC REIT‡‡ | | | 11,811 | | | | | | 123,023 | |
Britvic PLC | | | 150,579 | | | | | | 1,726,766 | |
BT Group PLC‡‡ | | | 386,964 | | | | | | 2,431,180 | |
Cairn Energy PLC* | | | 7,744 | | | | | | 34,598 | |
Centrica PLC‡‡ | | | 123,555 | | | | | | 711,401 | |
Cobham PLC‡‡ | | | 11,978 | | | | | | 54,447 | |
Compass Group PLC‡‡ | | | 1,121,714 | | | | | | 17,980,709 | |
Daily Mail & General Trust PLC‡‡ | | | 23,864 | | | | | | 379,568 | |
Dairy Crest Group PLC | | | 405,005 | | | | | | 3,621,625 | |
Drax Group PLC‡‡ | | | 6,189 | | | | | | 82,041 | |
DS Smith PLC | | | 891,019 | | | | | | 4,898,627 | |
easyJet PLC*‡‡ | | | 6,564 | | | | | | 166,959 | |
Ferrexpo PLC‡‡ | | | 62,007 | | | | | | 196,121 | |
G4S PLC | | | 833,132 | | | | | | 3,621,533 | |
GKN PLC‡‡ | | | 416,817 | | | | | | 2,576,634 | |
GlaxoSmithKline PLC | | | 416,485 | | | | | | 11,114,220 | |
Hammerson PLC REIT‡‡ | | | 6,134 | | | | | | 50,991 | |
Home Retail Group PLC | | | 205,704 | | | | | | 653,683 | |
HSBC Holdings PLC‡‡ | | | 1,655,458 | | | | | | 18,158,828 | |
IMI PLC‡‡ | | | 13,025 | | | | | | 328,925 | |
Inchcape PLC‡‡ | | | 125,597 | | | | | | 1,278,058 | |
InterContinental Hotels Group PLC‡‡ | | | 17,487 | | | | | | 582,919 | |
Intu Properties PLC REIT | | | 3,152 | | | | | | 16,175 | |
Invensys PLC* | | | 6,284 | | | | | | 52,915 | |
ITV PLC‡‡ | | | 772,579 | | | | | | 2,481,955 | |
J Sainsbury PLC‡‡ | | | 64,745 | | | | | | 391,335 | |
John Wood Group PLC‡‡ | | | 36,211 | | | | | | 411,352 | |
Kazakhmys PLC‡‡ | | | 69,101 | | | | | | 250,140 | |
Land Securities Group PLC REIT‡‡ | | | 10,536 | | | | | | 168,104 | |
Legal & General Group PLC‡‡ | | | 648,959 | | | | | | 2,393,243 | |
Lloyds Banking Group PLC* | | | 358,114 | | | | | | 467,776 | |
Man Strategic Holdings PLC*‡‡ | | | 616,185 | | | | | | 867,320 | |
Marks & Spencer Group PLC | | | 56,121 | | | | | | 402,033 | |
Meggitt PLC | | | 400,968 | | | | | | 3,502,527 | |
Mondi PLC‡‡ | | | 87,827 | | | | | | 1,521,280 | |
National Grid PLC | | | 855,584 | | | | | | 11,164,472 | |
Next PLC‡‡ | | | 40,341 | | | | | | 3,640,764 | |
Persimmon PLC*‡‡ | | | 39,907 | | | | | | 818,785 | |
Premier Oil PLC | | | 245,313 | | | | | | 1,273,931 | |
Provident Financial PLC‡‡ | | | 1,710 | | | | | | 45,987 | |
Prudential PLC | | | 430,543 | | | | | | 9,553,679 | |
Reckitt Benckiser Group PLC‡‡ | | | 18,477 | | | | | | 1,466,521 | |
Reed Elsevier PLC‡‡ | | | 17,027 | | | | | | 253,482 | |
Rexam PLC‡‡ | | | 15,190 | | | | | | 133,442 | |
Rio Tinto PLC‡‡ | | | 77,821 | | | | | | 4,393,765 | |
| | | | | | | | | | |
| | | Shares | | | Value | |
Rolls-Royce Holdings PLC*‡‡ | | | 458,137 | | | | | $ | 9,672,859 | |
Rotork PLC | | | 59,458 | | | | | | 2,825,801 | |
RSA Insurance Group PLC‡‡ | | | 262,850 | | | | | | 397,835 | |
Sage Group PLC (The)‡‡ | | | 24,529 | | | | | | 163,979 | |
Segro PLC REIT | | | 12,232 | | | | | | 67,654 | |
Smith & Nephew PLC | | | 105,900 | | | | | | 1,509,901 | |
Spirax-Sarco Engineering PLC | | | 47,585 | | | | | | 2,356,083 | |
SSE PLC | | | 54,463 | | | | | | 1,235,582 | |
Standard Chartered PLCD | | | 700,817 | | | | | | 15,770,826 | |
Standard Life PLC‡‡ | | | 92,309 | | | | | | 549,684 | |
Tate & Lyle PLC‡‡ | | | 72,178 | | | | | | 966,947 | |
Tesco PLC | | | 1,262,626 | | | | | | 6,990,776 | |
Thomas Cook Group PLC*‡‡ | | | 40,467 | | | | | | 112,043 | |
Travis Perkins PLC‡‡ | | | 72,290 | | | | | | 2,240,956 | |
TUI Travel PLC‡‡ | | | 67,031 | | | | | | 458,543 | |
Tullow Oil PLC‡‡ | | | 12,519 | | | | | | 177,250 | |
Unilever PLC‡‡ | | | 209,441 | | | | | | 8,608,209 | |
Vesuvius PLC‡‡ | | | 102,909 | | | | | | 869,106 | |
Vodafone Group PLC*‡‡ | | | 2,512,815 | | | | | | 9,861,845 | |
WPP PLC‡‡ | | | 20,193 | | | | | | 461,455 | |
| | | | | | | | | | |
| | | | | | | | | 250,999,986 | |
| | | | | | | | | | |
United States of America — 0.5% | | | | |
Joy Global, Inc.D | | | 24,900 | | | | | | 1,456,401 | |
Yum! Brands, Inc.D | | | 77,780 | | | | | | 5,880,946 | |
| | | | | | | | | | |
| | | | | | | | | 7,337,347 | |
| | | | | | | | | | |
Total Foreign Common Stocks
(Cost $1,133,661,325) | | | | | | 1,395,705,717 | |
| | | | | | | | | | |
FOREIGN PREFERRED STOCKS — 0.7% | |
Germany — 0.7% | | | | | | | | | | |
Henkel AG & Co. KGaA, 0.95%‡‡ | | | 12,849 | | | | | | 1,490,300 | |
Porsche Automobil Holding SE 2.01%‡‡ | | | 47,603 | | | | | | 4,954,799 | |
ProSiebenSat.1 Media AG 5.65%‡‡ | | | 84,838 | | | | | | 4,201,634 | |
| | | | | | | | | | |
| | | | | | | | | 10,646,733 | |
| | | | | | | | | | |
United Kingdom — 0.0% | | | | | | | |
Rolls-Royce Holdings PLC Class C,
3.00%+*‡‡ | | | 39,399,782 | | | | | | 65,244 | |
| | | | | | | | | | |
Total Foreign Preferred Stocks
(Cost $7,795,886) | | | | | | 10,711,977 | |
| | | | | | | | | | |
MONEY MARKET FUNDS — 10.6% | | | | | | | |
GuideStone Money Market Fund (GS4 Class)¥ | | | 81,447,283 | | | | | | 81,447,283 | |
Northern Institutional Liquid Assets Portfolio§ | | | 68,447,083 | | | | | | 68,447,083 | |
| | | | | | | | | | |
Total Money Market Funds
(Cost $149,894,366) | | | | | | 149,894,366 | |
| | | | | | | | | | |
TOTAL INVESTMENTS — 109.8%
(Cost $1,291,351,577) | | | 1,556,312,060 | |
| | | | | | | | | | |
FOREIGN COMMON STOCKS SOLD
SHORT — (6.4)% | |
Australia — (0.5)% | | | | | | | | | | |
ALS, Ltd. | | | (81,799 | ) | | | | | (643,465 | ) |
Alumina, Ltd.* | | | (422,500 | ) | | | | | (420,633 | ) |
Boart Longyear Ltd. | | | (190,767 | ) | | | | | (65,579 | ) |
Boral, Ltd. | | | (130,357 | ) | | | | | (555,206 | ) |
Brambles, Ltd. | | | (18,000 | ) | | | | | (147,060 | ) |
Coca-Cola Amatil, Ltd.* | | | (38,628 | ) | | | | | (414,925 | ) |
Cochlear, Ltd. | | | (5,846 | ) | | | | | (307,555 | ) |
| | | | |
| | See Notes to Financial Statements. | | 223 |
INTERNATIONAL EQUITY FUND
SCHEDULE OF INVESTMENTS (Continued)
| | | | | | | | | | |
| | | Shares | | | Value | |
Fortescue Metals Group, Ltd. | | | (106,025 | ) | | | | $ | (550,976 | ) |
Harvey Norman Holdings, Ltd. | | | (133,167 | ) | | | | | (375,738 | ) |
Iluka Resources, Ltd. | | | (31,802 | ) | | | | | (245,057 | ) |
Leighton Holdings, Ltd. | | | (21,954 | ) | | | | | (315,799 | ) |
Mount Gibson Iron, Ltd. | | | (153,244 | ) | | | | | (138,883 | ) |
Orica, Ltd. | | | (12,263 | ) | | | | | (261,257 | ) |
QBE Insurance Group, Ltd. | | | (23,333 | ) | | | | | (239,799 | ) |
Recall Holdings, Ltd.* | | | (3,600 | ) | | | | | (13,051 | ) |
Santos, Ltd | | | (33,443 | ) | | | | | (436,869 | ) |
Sydney Airport | | | (209,162 | ) | | | | | (709,688 | ) |
Transurban Group | | | (110,337 | ) | | | | | (673,874 | ) |
UGL, Ltd. | | | (5,290 | ) | | | | | (34,528 | ) |
Whitehaven Coal, Ltd.* | | | (270,877 | ) | | | | | (461,963 | ) |
| | | | | | | | | | |
| | | | | | | | | (7,011,905 | ) |
| | | | | | | | | | |
Belgium — 0.0% | | | | | | | | | | |
Mobistar SA | | | (10,079 | ) | | | | | (191,347 | ) |
| | | | | | | | | | |
Bermuda — 0.0% | | | | | | | | | | |
Seadrill, Ltd. | | | (9,431 | ) | | | | | (384,996 | ) |
| | | | | | | | | | |
Denmark — (0.2)% | | | | | | | | | | |
FLSmidth & Co. A/S | | | (35,453 | ) | | | | | (1,938,801 | ) |
Novozymes A/S Class B | | | (3,293 | ) | | | | | (139,097 | ) |
| | | | | | | | | | |
| | | | | | | | | (2,077,898 | ) |
| | | | | | | | | | |
Finland — (0.2)% | | | | | | | | | | |
Elisa OYJ | | | (10,624 | ) | | | | | (281,494 | ) |
Nokian Renkaat OYJ | | | (47,682 | ) | | | | | (2,286,571 | ) |
| | | | | | | | | | |
| | | | | | | | | (2,568,065 | ) |
| | | | | | | | | | |
France — (0.8)% | | | | | | | | | | |
Air France-KLM* | | | (55,394 | ) | | | | | (578,921 | ) |
Alstom SA | | | (61,461 | ) | | | | | (2,241,279 | ) |
Carrefour SA | | | (21,436 | ) | | | | | (850,869 | ) |
CGG SA* | | | (20,570 | ) | | | | | (356,991 | ) |
Cie de St-Gobain | | | (508 | ) | | | | | (27,984 | ) |
Etablissements Maurel et Prom | | | (6,247 | ) | | | | | (104,497 | ) |
Faurecia* | | | (41,148 | ) | | | | | (1,569,896 | ) |
Hermes International | | | (1,769 | ) | | | | | (641,522 | ) |
Nexans SA | | | (37,824 | ) | | | | | (1,919,576 | ) |
Veolia Environnement SA | | | (190,246 | ) | | | | | (3,107,184 | ) |
| | | | | | | | | | |
| | | | | | | | | (11,398,719 | ) |
| | | | | | | | | | |
Germany — (1.3)% | | | | | | | | | | |
Aixtron SE* | | | (181,185 | ) | | | | | (2,620,939 | ) |
Commerzbank AG* | | | (268,878 | ) | | | | | (4,331,492 | ) |
Dialog Semiconductor PLC* | | | (123,316 | ) | | | | | (2,652,422 | ) |
Fraport AG Frankfurt Airport Services Worldwide | | | (3,448 | ) | | | | | (257,995 | ) |
Infineon Technologies AG | | | (191,110 | ) | | | | | (2,040,189 | ) |
LANXESS AG | | | (42,167 | ) | | | | | (2,812,004 | ) |
Sky Deutschland AG* | | | (388,246 | ) | | | | | (4,272,895 | ) |
| | | | | | | | | | |
| | | | | | | | | (18,987,936 | ) |
| | | | | | | | | | |
Italy — (0.2)% | | | | | | | | | | |
A2A SpA | | | (765,150 | ) | | | | | (895,505 | ) |
Enel Green Power SpA | | | (76,780 | ) | | | | | (193,166 | ) |
Fiat SpA* | | | (151,855 | ) | | | | | (1,242,927 | ) |
Pirelli & C. SpA | | | (42,464 | ) | | | | | (734,636 | ) |
| | | | | | | | | | |
| | | | | | | | | (3,066,234 | ) |
| | | | | | | | | | |
Japan — (1.4)% | | | | | | | | | | |
ABC-Mart, Inc. | | | (1,200 | ) | | | | | (52,426 | ) |
Acom Co., Ltd.* | | | (416,300 | ) | | | | | (1,418,432 | ) |
Advantest Corporation | | | (88,000 | ) | | | | | (1,096,521 | ) |
AEON Financial Service Co., Ltd. | | | (28,800 | ) | | | | | (772,283 | ) |
| | | | | | | | | | |
| | | Shares | | | Value | |
Asahi Glass Co., Ltd. | | | (22,000 | ) | | | | $ | (136,989 | ) |
Asics Corporation | | | (5,700 | ) | | | | | (97,426 | ) |
Credit Saison Co., Ltd. | | | (44,300 | ) | | | | | (1,167,836 | ) |
Disco Corporation | | | (15,400 | ) | | | | | (1,022,145 | ) |
GS Yuasa Corporation | | | (130,000 | ) | | | | | (747,990 | ) |
Hamamatsu Photonics KK | | | (14,100 | ) | | | | | (564,214 | ) |
Hitachi Metals, Ltd. | | | (32,000 | ) | | | | | (452,777 | ) |
Hokkaido Electric Power Co., Inc.* | | | (78,800 | ) | | | | | (906,803 | ) |
Kansai Paint Co., Ltd. | | | (20,000 | ) | | | | | (295,759 | ) |
Komatsu, Ltd. | | | (5,900 | ) | | | | | (121,135 | ) |
Kyushu Electric Power Co., Inc.* | | | (6,700 | ) | | | | | (85,571 | ) |
Mitsubishi Motors Corporation* | | | (10,700 | ) | | | | | (115,114 | ) |
Mitsubishi UFJ Lease & Finance Co., Ltd. | | | (56,200 | ) | | | | | (345,509 | ) |
Nabtesco Corporation | | | (47,900 | ) | | | | | (1,105,474 | ) |
Nachi-Fujikoshi Corporation | | | (97,000 | ) | | | | | (547,930 | ) |
NGK Insulators, Ltd. | | | (25,000 | ) | | | | | (475,772 | ) |
Nidec Corporation | | | (20,400 | ) | | | | | (2,009,699 | ) |
Nikon Corporation | | | (47,500 | ) | | | | | (907,760 | ) |
Nippon Electric Glass Co., Ltd. | | | (74,000 | ) | | | | | (388,733 | ) |
NOK Corporation | | | (10,100 | ) | | | | | (165,428 | ) |
NTN Corporation* | | | (99,000 | ) | | | | | (450,268 | ) |
OSAKA Titanium Technologies Co., Ltd. | | | (15,700 | ) | | | | | (273,428 | ) |
Rakuten, Inc. | | | (103,100 | ) | | | | | (1,538,606 | ) |
Sharp Corporation Japan* | | | (88,000 | ) | | | | | (280,183 | ) |
Shikoku Electric Power Co., Inc.* | | | (15,700 | ) | | | | | (235,444 | ) |
SMC Corporation* | | | (1,000 | ) | | | | | (252,389 | ) |
Taiheiyo Cement Corporation | | | (153,000 | ) | | | | | (588,400 | ) |
Terumo Corporation | | | (8,700 | ) | | | | | (420,033 | ) |
Yamada Denki Co., Ltd. | | | (118,700 | ) | | | | | (388,265 | ) |
Yamaha Motor Co., Ltd. | | | (16,400 | ) | | | | | (246,564 | ) |
Yaskawa Electric Corporation | | | (13,000 | ) | | | | | (205,993 | ) |
| | | | | | | | | | |
| | | | | | | | | (19,879,299 | ) |
| | | | | | | | | | |
Liberia — 0.0% | | | | | | | | | | |
Royal Caribbean Cruises, Ltd. | | | (8,768 | ) | | | | | (415,321 | ) |
| | | | | | | | | | |
Luxembourg — (0.1)% | | | | | | | | | | |
Millicom International Cellular SA | | | (15,606 | ) | | | | | (1,555,072 | ) |
| | | | | | | | | | |
Netherlands — (0.5)% | | | | | | | | | | |
ASML Holding NV | | | (29,000 | ) | | | | | (2,716,200 | ) |
Fugro NV* | | | (36,929 | ) | | | | | (2,202,881 | ) |
Royal Imtech NV* | | | (187,216 | ) | | | | | (549,787 | ) |
TNT Express NV | | | (121,458 | ) | | | | | (1,129,739 | ) |
| | | | | | | | | | |
| | | | | | | | | (6,598,607 | ) |
| | | | | | | | | | |
Norway — (0.2)% | | | | | | | | | | |
Aker Solutions ASA | | | (24,251 | ) | | | | | (433,418 | ) |
Norsk Hydro ASA | | | (76,633 | ) | | | | | (342,020 | ) |
Schibsted ASA | | | (4,189 | ) | | | | | (277,089 | ) |
Storebrand ASA* | | | (271,351 | ) | | | | | (1,695,580 | ) |
| | | | | | | | | | |
| | | | | | | | | (2,748,107 | ) |
| | | | | | | | | | |
Sweden — 0.0% | | | | | | | | | | |
SSAB AB | | | (63,289 | ) | | | | | (486,190 | ) |
| | | | | | | | | | |
Switzerland — (0.1)% | | | | | | | | | | |
Dufry AG* | | | (3,348 | ) | | | | | (588,175 | ) |
Kuehne + Nagel International AG | | | (7,907 | ) | | | | | (1,039,291 | ) |
| | | | | | | | | | |
| | | | | | | | | (1,627,466 | ) |
| | | | | | | | | | |
| | | | |
| 224 | | See Notes to Financial Statements. | | |
| | | | | | | | | | |
| | | Shares | | | Value | |
United Kingdom — (0.9)% | | | | | | | | | | |
Admiral Group PLC | | | (64,001 | ) | | | | $ | (1,388,377 | ) |
Aggreko PLC | | | (109,356 | ) | | | | | (3,094,810 | ) |
Anglo American PLC | | | (86,000 | ) | | | | | (1,879,844 | ) |
Capita PLC | | | (21,735 | ) | | | | | (373,599 | ) |
FirstGroup PLC* | | | (183,936 | ) | | | | | (376,474 | ) |
Inmarsat PLC | | | (16,925 | ) | | | | | (211,885 | ) |
Kazakhmys PLC | | | (113,240 | ) | | | | | (409,920 | ) |
Lonmin PLC* | | | (181,187 | ) | | | | | (925,617 | ) |
Michael Page International PLC | | | (61,047 | ) | | | | | (493,325 | ) |
Vedanta Resources PLC | | | (74,130 | ) | | | | | (1,145,929 | ) |
Weir Group PLC (The) | | | (52,176 | ) | | | | | (1,842,075 | ) |
| | | | | | | | | | |
| | | | | | | | | (12,141,855 | ) |
| | | | | | | | | | |
Total Foreign Common Stocks
Sold Short
(Cost $(79,825,201)) | | | (91,139,017 | ) |
| | | | | | | | | | |
Liabilities in Excess of
Other Assets — (3.4)% | | | | | | (48,492,166 | ) |
| | | | | | | | | | |
NET ASSETS — 100.0% | | | | | | | | $ | 1,416,680,877 | |
| | | | | | | | | | |
| | | | |
| | See Notes to Financial Statements. | | 225 |
INTERNATIONAL EQUITY FUND
SCHEDULE OF INVESTMENTS (Continued)
VALUATION HIERARCHY
The following is a summary of the inputs used, as of December 31, 2013, in valuing the Fund’s investments carried at fair value:
| | | | | | | | | | | | | | | | | | | | |
| | | Total
Value | | Level 1
Quoted Prices | | Level 2
Other Significant
Observable Inputs | | Level 3
Significant
Unobservable Inputs |
Assets: | | | | | | | | | | | | | | | | | | | | |
Investments in Securities: | | | | | | | | | | | | | | | | | | | | |
Foreign Common Stocks: | | | | | | | | | | | | | | | | | | | | |
Argentina | | | $ | 2,004,894 | | | | $ | 2,004,894 | | | | $ | — | | | | $ | — | |
Australia | | | | 43,740,686 | | | | | 43,740,686 | | | | | — | | | | | — | |
Austria | | | | 3,906,514 | | | | | 3,906,514 | | | | | — | | | | | — | |
Belgium | | | | 2,206,358 | | | | | 2,206,358 | | | | | — | | | | | — | |
Bermuda | | | | 1,734,401 | | | | | 1,734,401 | | | | | — | | | | | — | |
Brazil | | | | 11,823,604 | | | | | 11,823,604 | | | | | — | | | | | — | |
Canada | | | | 8,543,877 | | | | | 8,543,877 | | | | | — | | | | | — | |
Chile | | | | 1,296,588 | | | | | 1,296,588 | | | | | — | | | | | — | |
China | | | | 34,465,176 | | | | | 34,465,176 | | | | | — | | | | | — | |
Denmark | | | | 23,398,750 | | | | | 10,090,403 | | | | | 13,308,347 | | | | | — | |
Finland | | | | 3,148,458 | | | | | — | | | | | 3,148,458 | | | | | — | |
France | | | | 129,269,112 | | | | | — | | | | | 129,269,112 | | | | | — | |
Germany | | | | 146,615,207 | | | | | 146,615,207 | | | | | — | | | | | — | |
Guernsey | | | | 662,170 | | | | | 662,170 | | | | | — | | | | | — | |
Hong Kong | | | | 32,167,736 | | | | | 32,167,736 | | | | | — | | | | | — | |
India | | | | 7,088,660 | | | | | 7,088,660 | | | | | — | | | | | — | |
Indonesia | | | | 530,560 | | | | | — | | | | | 530,560 | | | | | — | |
Ireland | | | | 5,712,886 | | | | | 5,712,886 | | | | | — | | | | | — | |
Italy | | | | 32,136,497 | | | | | — | | | | | 32,136,497 | | | | | — | |
Japan | | | | 215,012,662 | | | | | 855,392 | | | | | 214,157,270 | | | | | — | |
Jersey | | | | 96,212 | | | | | 96,212 | | | | | — | | | | | — | |
Luxembourg | | | | 3,706,095 | | | | | 3,706,095 | | | | | — | | | | | — | |
Malaysia | | | | 873,086 | | | | | 873,086 | | | | | — | | | | | — | |
Netherlands | | | | 87,942,089 | | | | | 2,746,015 | | | | | 85,196,074 | | | | | — | |
New Zealand | | | | 1,074,878 | | | | | 1,074,878 | | | | | — | | | | | — | |
Nigeria | | | | — | | | | | — | | | | | — | | | | | — | |
Norway | | | | 20,121,212 | | | | | 20,121,212 | | | | | — | | | | | — | |
Peru | | | | 3,396,959 | | | | | 3,396,959 | | | | | — | | | | | — | |
Portugal | | | | 1,630,902 | | | | | 1,630,902 | | | | | — | | | | | — | |
Russia | | | | 2,712,469 | | | | | 2,712,469 | | | | | — | | | | | — | |
Singapore | | | | 24,542,728 | | | | | 24,542,728 | | | | | — | | | | | — | |
South Korea | | | | 19,300,116 | | | | | 1,883,467 | | | | | 17,416,649 | | | | | — | |
Spain | | | | 72,217,462 | | | | | 72,217,462 | | | | | — | | | | | — | |
Sweden | | | | 42,003,602 | | | | | — | | | | | 42,003,602 | | | | | — | |
Switzerland | | | | 133,503,901 | | | | | 8,744,454 | | | | | 124,759,447 | | | | | — | |
Taiwan | | | | 14,913,507 | | | | | 14,913,507 | | | | | — | | | | | — | |
Turkey | | | | 3,868,370 | | | | | 3,868,370 | | | | | — | | | | | — | |
United Kingdom | | | | 250,999,986 | | | | | 250,999,986 | | | | | — | | | | | — | |
United States of America | | | | 7,337,347 | | | | | 7,337,347 | | | | | — | | | | | — | |
Foreign Preferred Stocks: | | | | | | | | | | | | | | | | | | | | |
Germany | | | | 10,646,733 | | | | | 10,646,733 | | | | | — | | | | | — | |
United Kingdom | | | | 65,244 | | | | | — | | | | | — | | | | | 65,244 | |
Money Market Funds | | | | 149,894,366 | | | | | 149,894,366 | | | | | — | | | | | — | |
| | | | | | | | | | | | | | | | | | | | |
Total Assets - Investments in Securities | | | $ | 1,556,312,060 | | | | $ | 894,320,800 | | | | $ | 661,926,016 | | | | $ | 65,244 | |
| | | | | | | | | | | | | | | | | | | | |
| | | | |
Other Financial Instruments*** | | | | | | | | | | | | | | | | | | | | |
Futures Contracts | | | $ | 3,623,644 | | | | $ | 3,623,644 | | | | $ | — | | | | $ | — | |
| | | | | | | | | | | | | | | | | | | | |
Total Assets - Other Financial Instruments | | | $ | 3,623,644 | | | | $ | 3,623,644 | | | | $ | — | | | | $ | — | |
| | | | | | | | | | | | | | | | | | | | |
| | | | |
| 226 | | See Notes to Financial Statements. | | |
| | | | | | | | | | | | | | | | | | | | |
| | | Total
Value | | Level 1
Quoted Prices | | Level 2
Other Significant
Observable Inputs | | Level 3
Significant
Unobservable Inputs |
Liabilities: | | | | | | | | | | | | | | | | | | | | |
Investments in Securities: | | | | | | | | | | | | | | | | | | | | |
Foreign Common Stocks Sold Short: | | | | | | | | | | | | | | | | | | | | |
Australia | | | $ | (7,011,905 | ) | | | $ | (7,011,905 | ) | | | $ | — | | | | $ | — | |
Belgium | | | | (191,347 | ) | | | | (191,347 | ) | | | | — | | | | | — | |
Bermuda | | | | (384,996 | ) | | | | (384,996 | ) | | | | — | | | | | — | |
Denmark | | | | (2,077,898 | ) | | | | — | | | | | (2,077,898 | ) | | | | — | |
Finland | | | | (2,568,065 | ) | | | | (281,494 | ) | | | | (2,286,571 | ) | | | | — | |
France | | | | (11,398,719 | ) | | | | — | | | | | (11,398,719 | ) | | | | — | |
Germany | | | | (18,987,936 | ) | | | | (18,987,936 | ) | | | | — | | | | | — | |
Italy | | | | (3,066,234 | ) | | | | — | | | | | (3,066,234 | ) | | | | — | |
Japan | | | | (19,879,299 | ) | | | | — | | | | | (19,879,299 | ) | | | | — | |
Liberia | | | | (415,321 | ) | | | | (415,321 | ) | | | | — | | | | | — | |
Luxembourg | | | | (1,555,072 | ) | | | | — | | | | | (1,555,072 | ) | | | | — | |
Netherlands | | | | (6,598,607 | ) | | | | — | | | | | (6,598,607 | ) | | | | — | |
Norway | | | | (2,748,107 | ) | | | | (2,748,107 | ) | | | | — | | | | | — | |
Sweden | | | | (486,190 | ) | | | | — | | | | | (486,190 | ) | | | | — | |
Switzerland | | | | (1,627,466 | ) | | | | — | | | | | (1,627,466 | ) | | | | — | |
United Kingdom | | | | (12,141,855 | ) | | | | (12,141,855 | ) | | | | — | | | | | — | |
| | | | | | | | | | | | | | | | | | | | |
Total Liabilities - Investments in Securities | | | $ | (91,139,017 | ) | | | $ | (42,162,961 | ) | | | $ | (48,976,056 | ) | | | $ | — | |
| | | | | | | | | | | | | | | | | | | | |
| | | | |
Other Financial Instruments*** | | | | | | | | | | | | | | | | | | | | |
Forward Foreign Currency Contracts | | | $ | (620,375 | ) | | | $ | — | | | | $ | (620,375 | ) | | | $ | — | |
| | | | | | | | | | | | | | | | | | | | |
Total Liabilities - Other Financial Instruments | | | $ | (620,375 | ) | | | $ | — | | | | $ | (620,375 | ) | | | $ | — | |
| | | | | | | | | | | | | | | | | | | | |
***Other financial instruments are derivative instruments not reflected in the Schedule of Investments, such as futures, forwards and swap contracts, which are valued at the unrealized appreciation (depreciation) on the investment. Details of these investments can be found in the Notes to Financial Statements.
LEVEL 1 - 2 TRANSFERS
The Fund had securities that transferred from Level 2 to Level 1 of the fair value hierarchy as a result of foreign equities that were fair valued at December 31, 2012 that are now being valued based on quoted prices. The value of the securities that were transferred to Level 1 as of December 31, 2013 is $589,265,140.
Management has determined that the amount of Level 3 securities compared to total net assets is not material; therefore, the reconciliation of Level 3 securities and assumptions is not shown for the period ending December 31, 2013.
| | | | |
| | See Notes to Financial Statements. | | 227 |
Emerging Markets Equity Fund (Unaudited)
Emerging market equities significantly lagged the performance of equities in developed markets during the year as the MSCI Emerging Markets Index (Net) posted an annual return of -2.60%. The worst performing markets were primarily in the Latin American region, while Europe was the only positive performing region for the year. From a sector perspective, seven of the ten groups posted negative returns for calendar year 2013. The materials and energy sectors were the worst performers and experienced double-digit declines, while the technology, healthcare and consumer discretionary sectors were the only positive performing sectors for the one-year period.
The Emerging Markets Equity Fund is actively managed and invests mainly in a diversified portfolio of stocks of foreign companies of any market capitalization located in emerging markets. The inception date of the Fund was 10/31/13. The GS4 Class of the Fund outperformed its benchmark, the MSCI Emerging Markets Index (Net), for the remaining two month period (-2.50% versus -2.89%). On a country basis, security selection in China and Brazil contributed positively to benchmark-relative performance, while security selection to South Africa negatively impacted performance. On a sector basis, overweight exposure and security selection to the technology sector added value, while overweight exposure and security selection to the materials sector detracted from benchmark-relative returns during the two month period. Within the Fund, certain derivatives were utilized to express active views in currency and country selection. These derivative positions primarily included currency forward contracts and stock index futures. Overall, derivative exposure had a slight positive impact on Fund performance.
This fund may be suitable to investors who seek higher, long-term rates of return, can accept significant short-term fluctuations in account value and want to diversify their portfolio with emerging market stocks. The fund invests in emerging market securities which involves certain risks such as currency volatility, political and social instability and reduced market liquidity. Medium and small companies have limited product lines, markets and financial resources, and their stocks historically have been more volatile and less liquid than large company stocks. To the extent that the investment advisor misjudges current market conditions, the fund’s volatility may be amplified by its use derivatives, and by its ability to select sub-advisers to allocate assets. Some derivatives may increase the risk of loss and cause fluctuations in the market value of the fund’s portfolio to have disproportionately large effects or cause the NAV of the fund generally to decline faster than it would otherwise.
At December 31, 2013, the portfolio holdings of the Fund, as a percentage of net assets, is shown in the following table. Portfolio holdings are subject to risk and may change at any time.
| | | | |
| | | % | |
Financial Services | | | 28.0 | |
Technology | | | 16.5 | |
Materials & Processing | | | 14.6 | |
Money Market Funds | | | 13.1 | |
Consumer Discretionary | | | 8.5 | |
Energy | | | 7.6 | |
Utilities | | | 4.7 | |
Consumer Staples | | | 4.0 | |
Producer Durables | | | 3.3 | |
Foreign Preferred Stocks | | | 2.2 | |
Healthcare | | | 2.2 | |
Rights | | | — | ** |
| | | | |
| | | 104.7 | |
| | | | |
** Rounds to less than 0.005%.
228
| | | | |
EMERGING MARKETS EQUITY FUND SCHEDULE OF INVESTMENTS | | | December 31, 2013 | |
| | | | | | | | |
| | | Shares | | | Value | |
FOREIGN COMMON STOCKS — 89.4% | |
Argentina — 0.1% | | | | | | | | |
Banco Macro SA ADRD* | | | 16,263 | | | $ | 394,703 | |
| | | | | | | | |
Bermuda — 0.1% | | | | | | | | |
Kosmos Energy, Ltd.* | | | 34,700 | | | | 387,946 | |
| | | | | | | | |
Brazil — 5.8% | | | | | | | | |
All - America Latina Logistica SA | | | 333,700 | | | | 927,868 | |
Arteris SA | | | 900 | | | | 7,267 | |
Banco Bradesco SA ADR | | | 42,400 | | | | 531,272 | |
Banco do Brasil SA | | | 61,200 | | | | 632,947 | |
Banco Santander Brasil SA | | | 247,400 | | | | 1,465,996 | |
Banco Santander Brasil SA ADRD | | | 478,089 | | | | 2,916,343 | |
BR Malls Participacoes SA | | | 11,200 | | | | 80,941 | |
BR Properties SA | | | 5,500 | | | | 43,361 | |
CCR SA | | | 140,300 | | | | 1,056,747 | |
Cia Brasileira de Distribuicao Grupo Pao de Acucar ADR | | | 7,200 | | | | 321,624 | |
Cia Energetica de Minas Gerais ADR* | | | 51,300 | | | | 399,627 | |
Fibria Celulose SA* | | | 17,800 | | | | 208,613 | |
Grupo BTG Pactual* | | | 84,000 | | | | 973,428 | |
Itau Unibanco Holding SA ADR | | | 95,369 | | | | 1,294,157 | |
JBS SA | | | 261,900 | | | | 973,556 | |
Lojas Renner SA* | | | 33,800 | | | | 873,922 | |
Magnesita Refratarios SA | | | 56,700 | | | | 141,795 | |
Multiplan Empreendimentos Imobiliarios SA* | | | 2,300 | | | | 48,647 | |
Petroleo Brasileiro SA ADRD* | | | 44,600 | | | | 655,174 | |
Porto Seguro SA* | | | 55,600 | | | | 701,113 | |
Telefonica Brasil SA ADRD | | | 34,300 | | | | 659,246 | |
Tim Participacoes SA ADRD* | | | 1,300 | | | | 34,112 | |
Totvs SA* | | | 27,700 | | | | 433,948 | |
Tractebel Energia SA* | | | 33,600 | | | | 511,851 | |
Ultrapar Participacoes SA | | | 27,900 | | | | 661,653 | |
Vale SA ADR | | | 23,800 | | | | 333,438 | |
| | | | | | | | |
| | | | | | | 16,888,646 | |
| | | | | | | | |
Canada — 2.2% | | | | | | | | |
First Quantum Minerals, Ltd.D | | | 336,100 | | | | 6,055,970 | |
Torex Gold Resources, Inc.* | | | 254,100 | | | | 224,857 | |
| | | | | | | | |
| | | | | | | 6,280,827 | |
| | | | | | | | |
Chile — 0.8% | | | | | | | | |
Banco Santander Chile ADRD | | | 13,700 | | | | 322,909 | |
Embotelladora Andina SA ADR Class BD | | | 35,696 | | | | 1,008,055 | |
Enersis SA ADRD | | | 52,900 | | | | 792,971 | |
Latam Airlines Group SA ADRD | | | 12,600 | | | | 205,506 | |
| | | | | | | | |
| | | | | | | 2,329,441 | |
| | | | | | | | |
China — 9.6% | | | | | | | | |
AAC Technologies Holdings, Inc.D | | | 278,500 | | | | 1,352,221 | |
Agile Property Holdings, Ltd. | | | 36,000 | | | | 38,580 | |
Agricultural Bank of China, Ltd. | | | 983,000 | | | | 482,988 | |
Anhui Conch Cement Co., Ltd. Class H | | | 799,500 | | | | 2,964,242 | |
Baidu, Inc. ADR* | | | 7,557 | | | | 1,344,239 | |
Bank of China, Ltd. Class H | | | 2,245,000 | | | | 1,033,575 | |
| | | | | | | | |
| | | Shares | | | Value | |
Bank of Communications Co., Ltd. Class A | | | 389,000 | | | $ | 274,406 | |
Beijing Capital International Airport Co., Ltd. Class H | | | 178,000 | | | | 139,337 | |
China CITIC Bank Corporation, Ltd. Class H | | | 350,000 | | | | 190,024 | |
China Communications Construction Co., Ltd. Class H | | | 126,000 | | | | 101,557 | |
China Construction Bank Corporation Class H | | | 1,826,000 | | | | 1,377,571 | |
China Life Insurance Co., Ltd. Class H | | | 334,000 | | | | 1,044,517 | |
China Merchants Bank Co., Ltd. Class H | | | 1,736,500 | | | | 3,699,493 | |
China Minsheng Banking Corporation, Ltd. Class H | | | 78,000 | | | | 86,607 | |
China Oilfield Services, Ltd. Class H | | | 130,000 | | | | 403,196 | |
China Petroleum & Chemical Corporation Class H | | | 254,000 | | | | 207,346 | |
China Railway Construction Corporation, Ltd. Class HD | | | 317,000 | | | | 315,598 | |
China Telecom Corporation, Ltd. Class H | | | 380,000 | | | | 192,100 | |
Chongqing Rural Commercial Bank Class H | | | 767,000 | | | | 371,912 | |
Country Garden Holdings Co., Ltd. | | | 121,000 | | | | 73,028 | |
Dongfeng Motor Group Co., Ltd. Class H | | | 234,000 | | | | 366,346 | |
Evergrande Real Estate Group, Ltd. | | | 173,000 | | | | 66,038 | |
Guangzhou R&F Properties Co., Ltd. Class H | | | 23,600 | | | | 34,513 | |
Huaneng Power International, Inc. Class H | | | 322,000 | | | | 291,093 | |
Industrial & Commercial Bank of China, Ltd. Class H | | | 1,953,000 | | | | 1,319,748 | |
Li Ning Co., Ltd.* | | | 921,500 | | | | 727,284 | |
Longfor Properties Co., Ltd. | | | 848,000 | | | | 1,185,448 | |
Mindray Medical International, Ltd. ADRD | | | 20,002 | | | | 727,273 | |
Parkson Retail Group, Ltd.D | | | 1,259,500 | | | | 388,198 | |
PICC Property & Casualty Co., Ltd. Class H | | | 64,000 | | | | 94,915 | |
Sihuan Pharmaceutical Holdings Group, Ltd. | | | 993,000 | | | | 906,651 | |
Sino-Ocean Land Holdings, Ltd. | | | 78,000 | | | | 51,200 | |
Sinopec Shanghai Petrochemical Co., Ltd. Class H | | | 1,968,000 | | | | 565,962 | |
SOHO China, Ltd. | | | 53,000 | | | | 45,657 | |
Tencent Holdings, Ltd. | | | 43,200 | | | | 2,755,467 | |
Tingyi Cayman Islands Holding Corporation | | | 530,000 | | | | 1,531,021 | |
West China Cement, Ltd.* | | | 2,000,000 | | | | 296,610 | |
Wumart Stores, Inc. Class H | | | 401,000 | | | | 651,587 | |
Zhejiang Expressway Co., Ltd. Class H | | | 172,000 | | | | 162,588 | |
| | | | | | | | |
| | | | | | | 27,860,136 | |
| | | | | | | | |
Colombia — 0.4% | | | | | | | | |
BanColombia SA | | | 85,799 | | | | 1,058,929 | |
| | | | | | | | |
Cyprus — 0.7% | | | | | | | | |
Eurasia Drilling Co., Ltd. GDR | | | 27,325 | | | | 1,229,625 | |
| | | | |
| | See Notes to Financial Statements. | | 229 |
EMERGING MARKETS EQUITY FUND
SCHEDULE OF INVESTMENTS (Continued)
| | | | | | | | | | | | |
| | | Shares | | | Value | |
Global Ports Investments PLC GDR | | | | | 44,166 | | | | | $ | 617,441 | |
QIWI PLC ADR | | | | | 4,600 | | | | | | 257,600 | |
| | | | | | | | | | | | |
| | | | | | | | | | | 2,104,666 | |
| | | | | | | | | | | | |
Egypt — 0.1% | | | | | | | | | | | | |
ElSwedy Electric Co. | | | | | 82,700 | | | | | | 380,737 | |
| | | | | | | | | | | | |
Estonia — 0.2% | | | | | | | | | | | | |
Tallink Group AS@ | | | | | 486,725 | | | | | | 595,935 | |
| | | | | | | | | | | | |
Hong Kong — 5.6% | | | | | | | | | | | | |
ASM Pacific Technology, Ltd.D | | | | | 171,900 | | | | | | 1,438,726 | |
Belle International Holdings, Ltd. | | | | | 909,000 | | | | | | 1,051,511 | |
China Gas Holdings, Ltd. | | | | | 126,000 | | | | | | 185,239 | |
China Mengniu Dairy Co., Ltd. | | | | | 531,000 | | | | | | 2,519,995 | |
China Mobile, Ltd. | | | | | 327,500 | | | | | | 3,395,664 | |
China Overseas Land & Investment, Ltd. | | | | | 942,000 | | | | | | 2,648,285 | |
China Resources Cement Holdings, Ltd. | | | | | 274,000 | | | | | | 184,097 | |
China Resources Land, Ltd. | | | | | 54,000 | | | | | | 133,846 | |
China Resources Power Holdings Co., Ltd. | | | | | 144,000 | | | | | | 341,323 | |
CNOOC, Ltd. | | | | | 262,000 | | | | | | 487,219 | |
COSCO Pacific, Ltd. | | | | | 62,000 | | | | | | 85,073 | |
Geely Automobile Holdings, Ltd. | | | | | 1,645,000 | | | | | | 795,526 | |
GOME Electrical Appliances Holdings, Ltd. | | | | | 4,899,000 | | | | | | 903,443 | |
Kingboard Chemical Holdings, Ltd. | | | | | 123,500 | | | | | | 322,515 | |
Lee & Man Paper Manufacturing, Ltd. | | | | | 258,000 | | | | | | 170,019 | |
New World Department Store China, Ltd. | | | | | 491,000 | | | | | | 276,074 | |
Shimao Property Holdings, Ltd.* | | | | | 36,000 | | | | | | 82,731 | |
Sino Biopharmaceutical, Ltd. | | | | | 1,452,000 | | | | | | 1,151,593 | |
Yuexiu Property Co., Ltd. | | | | | 138,000 | | | | | | 33,991 | |
| | | | | | | | | | | | |
| | | | | | | | | | | 16,206,870 | |
| | | | | | | | | | | | |
Hungary — 0.0% | | | | | | | | | | | | |
OTP Bank PLC | | | | | 5,313 | | | | | | 100,812 | |
| | | | | | | | | | | | |
India — 8.9% | | | | | | | | | | | | |
Aditya Birla Nuvo, Ltd. | | | | | 6,363 | | | | | | 127,836 | |
Ambuja Cements, Ltd. | | | | | 529,600 | | | | | | 1,563,842 | |
Axis Bank, Ltd. | | | | | 126,800 | | | | | | 2,664,020 | |
Cairn India, Ltd.* | | | | | 58,265 | | | | | | 304,960 | |
Canara Bank | | | | | 22,833 | | | | | | 104,189 | |
Dabur India, Ltd.@ | | | | | 489,319 | | | | | | 1,347,595 | |
GAIL India, Ltd.* | | | | | 15,616 | | | | | | 86,417 | |
HCL Technologies, Ltd. | | | | | 28,181 | | | | | | 575,215 | |
Hero MotoCorp, Ltd. | | | | | 28,411 | | | | | | 953,219 | |
Infosys, Ltd. | | | | | 27,048 | | | | | | 1,524,207 | |
Infosys, Ltd. ADRD | | | | | 49,758 | | | | | | 2,816,303 | |
Kotak Mahindra Bank, Ltd.@ | | | | | 265,448 | | | | | | 3,125,253 | |
Lupin, Ltd. | | | | | 179,354 | | | | | | 2,633,261 | |
Maruti Suzuki India, Ltd. | | | | | 68,120 | | | | | | 1,942,557 | |
Power Finance Corporation, Ltd. | | | | | 140,715 | | | | | | 379,797 | |
Reliance Industries, Ltd. | | | | | 17,270 | | | | | | 249,941 | |
Shriram Transport Finance Co., Ltd.@ | | | | | 120,097 | | | | | | 1,305,913 | |
Tata Consultancy Services, Ltd. | | | | | 57,961 | | | | | | 2,035,311 | |
| | | | | | | | | | | | |
| | | Shares | | | Value | |
Tata Motors, Ltd. ADR | | | | | 17,800 | | | | | $ | 548,240 | |
Wipro, Ltd. | | | | | 104,841 | | | | | | 947,815 | |
Wockhardt, Ltd. | | | | | 74,786 | | | | | | 547,278 | |
| | | | | | | | | | | | |
| | | | | | | | | | | 25,783,169 | |
| | | | | | | | | | | | |
Indonesia — 1.9% | | | | | | | | | | | | |
PT Bank Negara Indonesia Persero Tbk | | | | | 953,500 | | | | | | 310,578 | |
PT Bank Rakyat Indonesia Persero Tbk | | | | | 132,000 | | | | | | 78,899 | |
PT Bank Tabungan Pensiunan Nasional Tbk* | | | | | 64,500 | | | | | | 22,814 | |
PT Global Mediacom Tbk | | | | | 1,928,500 | | | | | | 301,396 | |
PT Indocement Tunggal Prakarsa Tbk | | | | | 1,315,000 | | | | | | 2,166,148 | |
PT Lippo Karawaci Tbk | | | | | 541,000 | | | | | | 40,503 | |
PT Media Nusantara Citra Tbk | | | | | 1,036,000 | | | | | | 224,425 | |
PT Perusahaan Gas Negara Persero Tbk | | | | | 479,500 | | | | | | 176,750 | |
PT Ramayana Lestari Sentosa Tbk | | | | | 2,635,000 | | | | | | 229,707 | |
PT Semen Indonesia Persero Tbk | | | | | 1,249,500 | | | | | | 1,457,048 | |
PT Telekomunikasi Indonesia Tbk ADRD* | | | | | 4,700 | | | | | | 168,495 | |
PT Unilever Indonesia Tbk | | | | | 61,500 | | | | | | 131,754 | |
PT United Tractors Tbk | | | | | 152,500 | | | | | | 238,705 | |
| | | | | | | | | | | | |
| | | | | | | | | | | 5,547,222 | |
| | | | | | | | | | | | |
Luxembourg — 0.4% | | | | | | | | | | | | |
O’Key Group SA GDR | | | | | 10,400 | | | | | | 123,760 | |
Ternium SA ADRD | | | | | 34,878 | | | | | | 1,091,681 | |
| | | | | | | | | | | | |
| | | | | | | | | | | 1,215,441 | |
| | | | | | | | | | | | |
Malaysia — 1.8% | | | | | | | | | | | | |
AMMB Holdings Bhd | | | | | 119,200 | | | | | | 263,474 | |
CIMB Group Holdings Bhd | | | | | 555,900 | | | | | | 1,293,225 | |
IOI Corporation Bhd | | | | | 188,200 | | | | | | 270,622 | |
IOI Properties Group Bhd+* | | | | | 62,733 | | | | | | 33,708 | |
Lafarge Malaysia Bhd | | | | | 154,300 | | | | | | 403,710 | |
Malayan Banking Bhd | | | | | 135,800 | | | | | | 412,106 | |
MISC Bhd* | | | | | 55,200 | | | | | | 96,058 | |
Petronas Chemicals Group Bhd | | | | | 201,300 | | | | | | 425,277 | |
Public Bank Bhd | | | | | 71,400 | | | | | | 425,937 | |
RHB Capital Bhd | | | | | 35,700 | | | | | | 86,103 | |
Sime Darby Bhd | | | | | 33,300 | | | | | | 96,784 | |
Tenaga Nasional Bhd | | | | | 363,900 | | | | | | 1,264,290 | |
Westports Holdings Bhd* | | | | | 355,900 | | | | | | 274,897 | |
| | | | | | | | | | | | |
| | | | | | | | | | | 5,346,191 | |
| | | | | | | | | | | | |
Mexico — 5.3% | | | | | | | | | | | | |
Alfa SAB de CV | | | | | 295,700 | | | | | | 829,360 | |
America Movil SAB de CV ADRD | | | | | 200,478 | | | | | | 4,685,171 | |
Arca Continental SAB de CV* | | | | | 108,700 | | | | | | 679,765 | |
Cemex SAB de CV ADRD* | | | | | 26,700 | | | | | | 315,861 | |
Coca-Cola Femsa SAB de CV ADR | | | | | 900 | | | | | | 109,593 | |
Compartamos SAB de CV | | | | | 309,300 | | | | | | 578,494 | |
Corporacion Moctezuma SAB de CV@ | | | | | 190,009 | | | | | | 581,385 | |
Fibra Uno Administracion SA de CV REIT | | | | | 36,600 | | | | | | 117,230 | |
Genomma Lab Internacional SAB de CV Class B* | | | | | 520,000 | | | | | | 1,458,461 | |
| | | | |
| 230 | | See Notes to Financial Statements. | | |
| | | | | | | | | | | | |
| | | Shares | | | Value | |
Grupo Aeroportuario del Pacifico SAB de CV Class B | | | | | 68,800 | | | | | $ | 367,804 | |
Grupo Financiero Banorte SAB de CV | | | | | 381,200 | | | | | | 2,667,363 | |
Grupo Financiero Inbursa SAB de CV | | | | | 527,900 | | | | | | 1,493,153 | |
Grupo Mexico SAB de CV Series B | | | | | 120,500 | | | | | | 398,975 | |
Kimberly-Clark de Mexico SAB de CV Class A | | | | | 40,800 | | | | | | 115,871 | |
Megacable Holdings SAB de CV | | | | | 267,400 | | | | | | 904,407 | |
| | | | | | | | | | | | |
| | | | | | | | | | | 15,302,893 | |
| | | | | | | | | | | | |
Mongolia — 0.1% | | | | | | | | | | | | |
Mongolian Mining CorporationD* | | | | | 1,524,500 | | | | | | 202,499 | |
| | | | | | | | | | | | |
Netherlands — 0.9% | | | | | | | | | | | | |
OCID* | | | | | 57,305 | | | | | | 2,580,656 | |
| | | | | | | | | | | | |
Nigeria — 1.3% | | | | | | | | | | | | |
FBN Holdings PLC | | | | | 2,210,200 | | | | | | 225,234 | |
FCMB Group PLC* | | | | | 12,000,000 | | | | | | 276,836 | |
Guaranty Trust Bank PLC | | | | | 14,259,274 | | | | | | 2,408,788 | |
United Bank for Africa PLC | | | | | 15,258,631 | | | | | | 849,027 | |
| | | | | | | | | | | | |
| | | | | | | | | | | 3,759,885 | |
| | | | | | | | | | | | |
Peru — 0.1% | | | | | | | | | | | | |
Credicorp, Ltd.D | | | | | 3,200 | | | | | | 424,736 | |
| | | | | | | | | | | | |
Philippines — 0.4% | | | | | | | | | | | | |
International Container Terminal Services, Inc. | | | | | 519,950 | | | | | | 1,196,962 | |
| | | | | | | | | | | | |
Poland — 0.8% | | | | | | | | | | | | |
Alior Bank SA* | | | | | 20,073 | | | | | | 540,964 | |
Bank Zachodni WBK SA | | | | | 1,994 | | | | | | 255,830 | |
Eurocash SA | | | | | 11,499 | | | | | | 181,522 | |
Grupa Lotos SA* | | | | | 5,550 | | | | | | 65,126 | |
PGE SA | | | | | 82,818 | | | | | | 446,294 | |
Polskie Gornictwo Naftowe i Gazownictwo SA | | | | | 261,173 | | | | | | 445,223 | |
Synthos SA | | | | | 74,449 | �� | | | | | 134,799 | |
Tauron Polska Energia SA | | | | | 100,309 | | | | | | 145,099 | |
| | | | | | | | | | | | |
| | | | | | | | | | | 2,214,857 | |
| | | | | | | | | | | | |
Russia — 6.9% | | | | | | | | | | | | |
Gazprom OAO ADR | | | | | 283,539 | | | | | | 2,424,258 | |
LSR Group GDR | | | | | 137,600 | | | | | | 575,994 | |
Lukoil OAO ADR | | | | | 10,216 | | | | | | 644,834 | |
NovaTek OAO GDR | | | | | 36,282 | | | | | | 4,967,006 | |
Novolipetsk Steel OJSC GDR | | | | | 79,198 | | | | | | 1,329,932 | |
Rosneft OAO GDR* | | | | | 42,657 | | | | | | 326,612 | |
Sberbank of Russia ADR | | | | | 405,109 | | | | | | 5,092,220 | |
Sistema JSFC GDR | | | | | 55,643 | | | | | | 1,787,253 | |
Surgutneftegas OAO ADRD | | | | | 61,695 | | | | | | 534,896 | |
Tatneft OAO ADR | | | | | 15,225 | | | | | | 581,138 | |
VTB Bank OJSC GDR | | | | | 7,603 | | | | | | 22,980 | |
X5 Retail Group NV GDR* | | | | | 100,827 | | | | | | 1,690,869 | |
| | | | | | | | | | | | |
| | | | | | | | | | | 19,977,992 | |
| | | | | | | | | | | | |
South Africa — 3.4% | | | | | | | | | | | | |
African Bank Investments, Ltd.D | | | | | 582,728 | | | | | | 669,387 | |
African Rainbow Minerals, Ltd. | | | | | 6,681 | | | | | | 120,373 | |
Bidvest Group, Ltd. | | | | | 111,062 | | | | | | 2,841,133 | |
Capitec Bank Holdings, Ltd.D | | | | | 17,600 | | | | | | 349,433 | |
Discovery, Ltd. | | | | | 29,150 | | | | | | 234,812 | |
| | | | | | | | | | | | |
| | | Shares | | | Value | |
Growthpoint Properties, Ltd. | | | | | 48,957 | | | | | $ | 113,315 | |
Imperial Holdings, Ltd. | | | | | 28,497 | | | | | | 550,408 | |
Investec. Ltd. | | | | | 36,321 | | | | | | 257,952 | |
Liberty Holdings, Ltd. | | | | | 35,539 | | | | | | 411,968 | |
Mediclinic International, Ltd. | | | | | 19,872 | | | | | | 143,973 | |
MMI Holdings, Ltd. | | | | | 55,918 | | | | | | 134,864 | |
Netcare, Ltd. | | | | | 23,976 | | | | | | 59,471 | |
Northam Platinum, Ltd.* | | | | | 50,227 | | | | | | 201,100 | |
Pick n Pay Stores, Ltd. | | | | | 193,900 | | | | | | 961,182 | |
Redefine Properties, Ltd.* | | | | | 79,691 | | | | | | 73,993 | |
Remgro, Ltd. | | | | | 11,242 | | | | | | 222,718 | |
RMB Holdings, Ltd. | | | | | 10,184 | | | | | | 46,940 | |
Standard Bank Group, Ltd. | | | | | 195,800 | | | | | | 2,415,675 | |
| | | | | | | | | | | | |
| | | | | | | | | | | 9,808,697 | |
| | | | | | | | | | | | |
South Korea — 10.8% | | | | | | | | | | | | |
AMOREPACIFIC Corporation | | | | | 459 | | | | | | 435,157 | |
AMOREPACIFIC Group | | | | | 533 | | | | | | 235,147 | |
Coway Co., Ltd. | | | | | 2,091 | | | | | | 131,728 | |
Daelim Industrial Co., Ltd. | | | | | 6,016 | | | | | | 537,492 | |
DGB Financial Group, Inc. | | | | | 5,610 | | | | | | 87,889 | |
E-Mart Co., Ltd. | | | | | 1,212 | | | | | | 306,523 | |
Hanwha Life Insurance Co., Ltd. | | | | | 35,490 | | | | | | 255,744 | |
Hyosung Corporation | | | | | 10,788 | | | | | | 719,809 | |
Hyundai Department Store Co., Ltd. | | | | | 564 | | | | | | 86,242 | |
Hyundai Mobis Co., Ltd. | | | | | 3,532 | | | | | | 983,323 | |
Hyundai Motor Co. | | | | | 2,728 | | | | | | 612,345 | |
Hyundai Wia Corporation | | | | | 1,696 | | | | | | 306,072 | |
KB Financial Group, Inc. | | | | | 5,610 | | | | | | 226,756 | |
KCC Corporation | | | | | 1,073 | | | | | | 477,126 | |
Kia Motors Corporation | | | | | 6,259 | | | | | | 333,302 | |
KIWOOM Securities Co., Ltd. | | | | | 7,205 | | | | | | 345,593 | |
Korea Zinc Co., Ltd. | | | | | 477 | | | | | | 143,891 | |
KT Corporation ADR | | | | | 1,100 | | | | | | 16,357 | |
LG Chem, Ltd. | | | | | 1,407 | | | | | | 400,209 | |
LG Display Co., Ltd.* | | | | | 19,430 | | | | | | 469,202 | |
Mirae Asset Securities Co., Ltd. | | | | | 9,400 | | | | | | 342,854 | |
NAVER Corporation | | | | | 233 | | | | | | 160,567 | |
POSCO | | | | | 1,489 | | | | | | 463,321 | |
Samsung Electronics Co., Ltd. | | | | | 8,414 | | | | | | 10,963,840 | |
Samsung Fire & Marine Insurance Co., Ltd. | | | | | 21,046 | | | | | | 5,171,687 | |
Shinhan Financial Group Co., Ltd. | | | | | 100,110 | | | | | | 4,494,423 | |
Shinsegae Co., Ltd. | | | | | 860 | | | | | | 205,984 | |
SK Holdings Co., Ltd. | | | | | 3,959 | | | | | | 717,784 | |
SK Hynix, Inc.* | | | | | 15,240 | | | | | | 533,058 | |
SK Telecom Co., Ltd. | | | | | 5,049 | | | | | | 1,104,919 | |
Woori Finance Holdings Co., Ltd. | | | | | 21,810 | | | | | | 275,521 | |
| | | | | | | | | | | | |
| | | | | | | | | | | 31,543,865 | |
| | | | | | | | | | | | |
Switzerland — 0.6% | | | | | | | | | | | | |
Coca-Cola HBC AG* | | | | | 62,438 | | | | | | 1,821,815 | |
| | | | | | | | | | | | |
Taiwan — 8.2% | | | | | | | | | | | | |
Cheng Uei Precision Industry Co., Ltd. | | | | | 76,000 | | | | | | 152,492 | |
Chicony Electronics Co., Ltd. | | | | | 36,000 | | | | | | 90,473 | |
China Life Insurance Co., Ltd. | | | | | 221,000 | | | | | | 223,940 | |
Chroma ATE, Inc. | | | | | 138,000 | | | | | | 289,396 | |
CTBC Financial Holding Co., Ltd. | | | | | 411,000 | | | | | | 280,633 | |
Far Eastern Department Stores, Ltd. | | | | | 211,000 | | | | | | 208,851 | |
| | | | |
| | See Notes to Financial Statements. | | 231 |
EMERGING MARKETS EQUITY FUND
SCHEDULE OF INVESTMENTS (Continued)
| | | | | | | | | | |
| | | Shares | | | Value | |
Far EasTone Telecommunications Co., Ltd. | | | 302,000 | | | | | $ | 663,714 | |
Fubon Financial Holding Co., Ltd. | | | 448,000 | | | | | | 655,386 | |
Hon Hai Precision Industry Co., Ltd. | | | 366,000 | | | | | | 983,663 | |
Inventec Corporation | | | 1,041,000 | | | | | | 920,373 | |
Kinsus Interconnect Technology Corporation | | | 139,000 | | | | | | 461,258 | |
MediaTek, Inc. | | | 197,000 | | | | | | 2,931,518 | |
Pegatron Corporation | | | 256,000 | | | | | | 329,840 | |
Pou Chen Corporation | | | 211,000 | | | | | | 315,401 | |
Powertech Technology, Inc.* | | | 60,000 | | | | | | 91,701 | |
President Chain Store Corporation | | | 109,000 | | | | | | 755,230 | |
Realtek Semiconductor Corporation | | | 216,000 | | | | | | 579,798 | |
Richtek Technology Corporation | | | 64,000 | | | | | | 298,488 | |
Ruentex Development Co., Ltd. | | | 17,000 | | | | | | 32,969 | |
Siliconware Precision Industries Co. | | | 116,000 | | | | | | 138,561 | |
SinoPac Financial Holdings Co., Ltd. | | | 674,000 | | | | | | 335,830 | |
Taishin Financial Holding Co., Ltd. | | | 760,000 | | | | | | 373,580 | |
Taiwan Cooperative Financial Holding Co., Ltd. | | | 212,000 | | | | | | 115,946 | |
Taiwan Semiconductor Manufacturing Co., Ltd. | | | 3,178,000 | | | | | | 11,249,652 | |
Taiwan Semiconductor Manufacturing Co., Ltd. ADR | | | 28,400 | | | | | | 495,296 | |
Teco Electric and Machinery Co., Ltd. | | | 145,000 | | | | | | 166,147 | |
Uni-President Enterprises Corporation | | | 279,000 | | | | | | 502,703 | |
Walsin Lihwa Corporation* | | | 289,000 | | | | | | 92,702 | |
| | | | | | | | | | |
| | | | | | | | | 23,735,541 | |
| | | | | | | | | | |
Thailand — 3.1% | | | | | | | | | | |
Airports of Thailand PCL NVDR | | | 64,600 | | | | | | 312,694 | |
Bangkok Bank PCL NVDR | | | 46,600 | | | | | | 253,834 | |
BEC World PCL NVDR | | | 334,800 | | | | | | 516,112 | |
Big C Supercenter PCL NVDR | | | 222,100 | | | | | | 1,247,282 | |
Central Pattana PCL | | | 2,235,700 | | | | | | 2,789,522 | |
Krung Thai Bank PCL NVDR | | | 191,200 | | | | | | 96,631 | |
PTT Exploration & Production PCL NVDR | | | 82,600 | | | | | | 419,559 | |
PTT Global Chemical PCL NVDR | | | 229,900 | | | | | | 555,220 | |
Robinson Department Store PCL | | | 308,800 | | | | | | 451,077 | |
Siam Commercial Bank PCL (The) | | | 419,400 | | | | | | 1,831,525 | |
TMB Bank PCL | | | 6,687,100 | | | | | | 419,216 | |
| | | | | | | | | | |
| | | | | | | | | 8,892,672 | |
| | | | | | | | | | |
Turkey — 2.0% | | | | | | | | | | |
Akfen Holding AS | | | 106,500 | | | | | | 210,621 | |
Coca-Cola Icecek AS | | | 21,836 | | | | | | 525,832 | |
Eregli Demir ve Celik Fabrikalari TAS | | | 329,561 | | | | | | 395,657 | |
TAV Havalimanlari Holding AS | | | 83,690 | | | | | | 601,680 | |
Turk Hava Yollari | | | 204,722 | | | | | | 613,499 | |
Türkiye Garanti Bankasi AS | | | 536,995 | | | | | | 1,739,174 | |
| | | | | | | | | | |
| | | Shares | | | Value | |
Ulker Biskuvi Sanayi AS | | | 91,700 | | | | | $ | 648,600 | |
Yapi ve Kredi Bankasi AS | | | 577,100 | | | | | | 998,982 | |
| | | | | | | | | | |
| | | | | | | | | 5,734,045 | |
| | | | | | | | | | |
United Kingdom — 5.9% | | | | | | | | | | |
Anglo American PLC | | | 481,852 | | | | | | 10,522,049 | |
Hikma Pharmaceuticals PLC | | | 15,579 | | | | | | 309,836 | |
Tullow Oil PLC | | | 446,917 | | | | | | 6,327,648 | |
| | | | | | | | | | |
| | | | | | | | | 17,159,533 | |
| | | | | | | | | | |
United States of America — 1.0% | | | | | | | |
Cognizant Technology Solutions Corporation Class A* | | | 28,200 | | | | | | 2,847,636 | |
Southern Copper Corporation | | | 3,900 | | | | | | 111,969 | |
| | | | | | | | | | |
| | | | | | | | | 2,959,605 | |
| | | | | | | | | | |
Total Foreign Common Stocks
(Cost $265,439,770) | | | | | | 259,797,924 | |
| | | | | | | | | | |
FOREIGN PREFERRED STOCKS — 2.2% | |
Brazil — 1.0% | | | | | | | | | | |
Banco do Estado do Rio Grande do Sul SA Class B 0.78% | | | 14,400 | | | | | | 76,906 | |
Cia Brasileira de Distribuicao Grupo Pao de Acucar 1.04% | | | 13,800 | | | | | | 613,651 | |
Cia Energetica de Sao Paulo, Class B 1.42% | | | 73,200 | | | | | | 695,621 | |
Itau Unibanco Holding SA 1.00% | | | 4,800 | | | | | | 63,783 | |
Itausa Investimentos Itau SA 0.33% | | | 308,500 | | | | | | 1,163,781 | |
Metalurgica Gerdau SA 0.31% | | | 29,500 | | | | | | 292,593 | |
| | | | | | | | | | |
| | | | | | | | | 2,906,335 | |
| | | | | | | | | | |
South Korea — 1.2% | | | | | | | | | | |
Samsung Electronics Co., Ltd. 1.50% | | | 3,727 | | | | | | 3,584,288 | |
| | | | | | | | | | |
Total Foreign Preferred Stocks
(Cost $6,833,153) | | | | | | 6,490,623 | |
| | | | | | | | | | |
RIGHTS — 0.0% | | | | | | | | | | |
IOI Properties Group Bhd+* | | | | | | | | | | |
(Cost $7,182) | | | 31,367 | | | | | | — | |
| | | | | | | | | | |
MONEY MARKET FUNDS — 13.1% | |
GuideStone Money Market Fund (GS4 Class)¥ | | | 13,828,315 | | | | | | 13,828,315 | |
Northern Institutional Liquid Assets Portfolio§ | | | 24,260,022 | | | | | | 24,260,022 | |
| | | | | | | | | | |
Total Money Market Funds
(Cost $38,088,337) | | | | | | 38,088,337 | |
| | | | | | | | | | |
TOTAL INVESTMENTS — 104.7%
(Cost $310,368,442) | | | | | | 304,376,884 | |
| | | | | | | | | | |
Liabilities in Excess of
Other Assets — (4.7)% | | | | | | (13,775,796 | ) |
| | | | | | | | | | |
NET ASSETS — 100.0% | | | | | | | | $ | 290,601,088 | |
| | | | | | | | | | |
| | | | |
| 232 | | See Notes to Financial Statements. | | |
VALUATION HIERARCHY
The following is a summary of the inputs used, as of December 31, 2013, in valuing the Fund’s investments carried at fair value:
| | | | | | | | | | | | | | | | | | | | |
| | | Total
Value | | Level 1
Quoted Prices | | Level 2
Other Significant
Observable Inputs | | Level 3
Significant
Unobservable Inputs |
Assets: | | | | | | | | | | | | | | | | | | | | |
Investments in Securities: | | | | | | | | | | | | | | | | | | | | |
Foreign Common Stocks: | | | | | | | | | | | | | | | | | | | | |
Argentina | | | $ | 394,703 | | | | $ | 394,703 | | | | $ | — | | | | $ | — | |
Bermuda | | | | 387,946 | | | | | 387,946 | | | | | — | | | | | — | |
Brazil | | | | 16,888,646 | | | | | 16,888,646 | | | | | — | | | | | — | |
Canada | | | | 6,280,827 | | | | | 6,280,827 | | | | | — | | | | | — | |
Chile | | | | 2,329,441 | | | | | 2,329,441 | | | | | — | | | | | — | |
China | | | | 27,860,136 | | | | | 27,860,136 | | | | | — | | | | | — | |
Colombia | | | | 1,058,929 | | | | | 1,058,929 | | | | | — | | | | | — | |
Cyprus | | | | 2,104,666 | | | | | 2,104,666 | | | | | — | | | | | — | |
Egypt | | | | 380,737 | | | | | 380,737 | | | | | — | | | | | — | |
Estonia | | | | 595,935 | | | | | 595,935 | | | | | — | | | | | — | |
Hong Kong | | | | 16,206,870 | | | | | 16,206,870 | | | | | — | | | | | — | |
Hungary | | | | 100,812 | | | | | 100,812 | | | | | — | | | | | — | |
India | | | | 25,783,169 | | | | | 25,783,169 | | | | | — | | | | | — | |
Indonesia | | | | 5,547,222 | | | | | 168,495 | | | | | 5,378,727 | | | | | — | |
Luxembourg | | | | 1,215,441 | | | | | 1,215,441 | | | | | — | | | | | — | |
Malaysia | | | | 5,346,191 | | | | | 5,312,483 | | | | | — | | | | | 33,708 | |
Mexico | | | | 15,302,893 | | | | | 15,302,893 | | | | | — | | | | | — | |
Mongolia | | | | 202,499 | | | | | 202,499 | | | | | — | | | | | — | |
Netherlands | | | | 2,580,656 | | | | | 2,580,656 | | | | | — | | | | | — | |
Nigeria | | | | 3,759,885 | | | | | 3,759,885 | | | | | — | | | | | — | |
Peru | | | | 424,736 | | | | | 424,736 | | | | | — | | | | | — | |
Philippines | | | | 1,196,962 | | | | | — | | | | | 1,196,962 | | | | | — | |
Poland | | | | 2,214,857 | | | | | 2,214,857 | | | | | — | | | | | — | |
Russia | | | | 19,977,992 | | | | | 19,977,992 | | | | | — | | | | | — | |
South Africa | | | | 9,808,697 | | | | | 9,808,697 | | | | | — | | | | | — | |
South Korea | | | | 31,543,865 | | | | | 16,357 | | | | | 31,527,508 | | | | | — | |
Switzerland | | | | 1,821,815 | | | | | 1,821,815 | | | | | — | | | | | — | |
Taiwan | | | | 23,735,541 | | | | | 23,735,541 | | | | | — | | | | | — | |
Thailand | | | | 8,892,672 | | | | | 5,491,340 | | | | | 3,401,332 | | | | | — | |
Turkey | | | | 5,734,045 | | | | | 5,734,045 | | | | | — | | | | | — | |
United Kingdom | | | | 17,159,533 | | | | | 17,159,533 | | | | | — | | | | | — | |
United States of America | | | | 2,959,605 | | | | | 2,959,605 | | | | | — | | | | | — | |
Foreign Preferred Stocks: | | | | | | | | | | | | | | | | | | | | |
Brazil | | | | 2,906,335 | | | | | 2,906,335 | | | | | — | | | | | — | |
South Korea | | | | 3,584,288 | | | | | — | | | | | 3,584,288 | | | | | — | |
Money Market Funds | | | | 38,088,337 | | | | | 38,088,337 | | | | | — | | | | | — | |
Rights | | | | — | | | | | — | | | | | — | | | | | — | |
| | | | | | | | | | | | | | | | | | | | |
Total Assets - Investments in Securities | | | $ | 304,376,884 | | | | $ | 259,254,359 | | | | $ | 45,088,817 | | | | $ | 33,708 | |
| | | | | | | | | | | | | | | | | | | | |
| | | | |
Other Financial Instruments*** | | | | | | | | | | | | | | | | | | | | |
Forward Foreign Currency Contracts | | | $ | 40,328 | | | | $ | — | | | | $ | 40,328 | | | | $ | — | |
Futures Contracts | | | | 934,639 | | | | | 934,639 | | | | | — | | | | | — | |
| | | | | | | | | | | | | | | | | | | | |
Total Assets - Other Financial Instruments | | | $ | 974,967 | | | | $ | 934,639 | | | | $ | 40,328 | | | | $ | — | |
| | | | | | | | | | | | | | | | | | | | |
***Other financial instruments are derivative instruments not reflected in the Schedule of Investments, such as futures, forwards and swap contracts, which are valued at the unrealized appreciation (depreciation) on the investment. Details of these investments can be found in the Notes to Financial Statements.
There were no transfers between Level 1 and Level 2 during the period ending December 31, 2013.
Management has determined that the amount of Level 3 securities compared to total net assets is not material; therefore, the reconciliation of Level 3 securities and assumptions is not shown for the period ending December 31, 2013.
| | | | |
| | See Notes to Financial Statements. | | 233 |
| | | | |
| STATEMENTS OF ASSETS AND LIABILITIES | | | December 31, 2013 | |
| | | | | | | | | | |
| | | Defensive Market
Strategies Fund | | | Equity Index
Fund | |
Assets | | | | | | | | | | |
Investments in securities of unaffiliated issuers, at value | | | | $ | 525,803,274 | | | $ | 368,687,320 | |
Investments in securities of affiliated issuers, at value | | | | | 64,725,574 | | | | 12,116,847 | |
| | | | | | | | | | |
Total investments (1)(2) | | | | | 590,528,848 | | | | 380,804,167 | |
Cash | | | | | 60,320 | | | | — | |
Cash collateral for derivatives | | | | | 1,024,000 | | | | 435,000 | |
Deposits with broker for securities sold short | | | | | 23,455,465 | | | | — | |
Foreign currency(3) | | | | | 42,412 | | | | — | |
Receivables: | | | | | | | | | | |
Dividends and reclaims | | | | | 638,992 | | | | 411,524 | |
Interest | | | | | 678,630 | | | | — | |
Securities lending | | | | | 46,487 | | | | 70,172 | |
Investment securities sold | | | | | 6,989,459 | | | | — | |
Fund shares sold | | | | | 138,208 | | | | 153,818 | |
Variation margin on financial futures contracts | | | | | 77,120 | | | | 44,800 | |
Unrealized appreciation on foreign currency exchange contracts | | | | | 2,329 | | | | — | |
Prepaid expenses and other assets | | | | | 21,605 | | | | 18,089 | |
| | | | | | | | | | |
Total Assets | | | | | 623,703,875 | | | | 381,937,570 | |
| | | | | | | | | | |
Liabilities | | | | | | | | | | |
Securities sold short, at value (4) | | | | | 47,002,923 | | | | — | |
Options written at value (5) | | | | | 3,440 | | | | — | |
Unrealized depreciation on foreign currency exchange contracts | | | | | 33,958 | | | | — | |
Collateral held for securities on loan at value | | | | | 84,172,289 | | | | 25,398,730 | |
Collateral held for derivatives | | | | | — | | | | — | |
Payables: | | | | | | | | | | |
Investment securities purchased | | | | | 7,165,631 | | | | — | |
Dividends on short sales | | | | | 12,387 | | | | — | |
Fund shares redeemed | | | | | 30,786 | | | | 8,812 | |
Variation margin on financial futures contracts | | | | | — | | | | — | |
Securities lending | | | | | 3,392 | | | | 486 | |
Deferred foreign capital gains taxes | | | | | — | | | | — | |
Accrued expenses: | | | | | | | | | | |
Investment advisory fees | | | | | 352,902 | | | | 14,146 | |
Shareholder servicing fees | | | | | 78,618 | | | | 57,320 | |
Other expenses | | | | | 140,539 | | | | 143,118 | |
| | | | | | | | | | |
Total Liabilities | | | | | 138,996,865 | | | | 25,622,612 | |
| | | | | | | | | | |
Net Assets | | | | $ | 484,707,010 | | | $ | 356,314,958 | |
| | | | | | | | | | |
Net Assets Consist of: | | | | | | | | | | |
Paid-in-capital | | | | $ | 435,439,990 | | | $ | 228,801,247 | |
Accumulated (distributions in excess of) net investment income (loss) | | | | | (228,862 | ) | | | 64,888 | |
Undistributed (accumulated) net realized gain (loss) on investments, foreign currency translations and derivative transactions | | | | | (4,079,862 | ) | | | (5,760,991 | ) |
Net unrealized appreciation (depreciation) on investments, foreign currency translations and derivative transactions | | | | | 53,575,744 | | | | 133,209,814 | |
| | | | | | | | | | |
Net Assets | | | | $ | 484,707,010 | | | $ | 356,314,958 | |
| | | | | | | | | | |
Net Asset Value: | | | | | | | | | | |
$0.001 par value, unlimited shares authorized | | | | | | | | | | |
Net assets applicable to the GS2 Class | | | | $ | 89,429,797 | | | $ | 66,377,857 | |
| | | | | | | | | | |
GS2 shares outstanding | | | | | 7,821,868 | | | | 7,804,989 | |
| | | | | | | | | | |
Net asset value, offering and redemption price per GS2 share | | | | $ | 11.43 | | | $ | 8.50 | |
| | | | | | | | | | |
Net assets applicable to the GS4 Class | | | | $ | 395,277,213 | | | $ | 289,937,101 | |
| | | | | | | | | | |
GS4 shares outstanding | | | | | 34,599,098 | | | | 14,011,133 | |
| | | | | | | | | | |
Net asset value, offering and redemption price per GS4 share | | | | $ | 11.42 | | | $ | 20.69 | |
| | | | | | | | | | |
___________ | | | | | | | | | | |
| | | |
| (1) Investments in securities of unaffiliated issuers, at cost | | | | $471,060,683 | | | $235,905,507 | |
Investments in securities of affiliated issuers, at cost | | | | | 64,725,574 | | | | 12,116,847 | |
| | | | | | | | | | |
Total investments at cost | | | | $ | 535,786,257 | | | $ | 248,022,354 | |
| | | | | | | | | | |
(2) Includes securities loaned of: | | | | $ | 82,427,706 | | | $ | 25,034,522 | |
| | | | | | | | | | |
(3) Foreign currency at cost | | | | $ | 42,261 | | | $ | — | |
| | | | | | | | | | |
(4) Proceeds from securities sold short | | | | $ | 44,997,373 | | | $ | — | |
| | | | | | | | | | |
(5) Premiums received on options written | | | | $ | 32,881 | | | $ | — | |
| | | | | | | | | | |
(6) Net of $(111,602) accrued foreign capital gains taxes on appreciated securities | | | | | | | | | | |
| | | | |
| 234 | | See Notes to Financial Statements. | | |
| | | | | | | | | | | | | | | | | | |
Value Equity
Fund | | | Growth Equity
Fund | | | Small Cap
Equity Fund | | | International
Equity Fund | | | Emerging Markets
Equity Fund | |
| | | | | | | | | | | | | | | | | | |
| $ | 1,401,110,889 | | | $ | 1,511,080,317 | | | $ | 703,815,106 | | | $ | 1,474,864,777 | | | $ | 290,548,569 | |
| | 48,058,108 | | | | 60,581,823 | | | | 27,331,387 | | | | 81,447,283 | | | | 13,828,315 | |
| | | | | | | | | | | | | | | | | | |
| | 1,449,168,997 | | | | 1,571,662,140 | | | | 731,146,493 | | | | 1,556,312,060 | | | | 304,376,884 | |
| | 28,000 | | | | — | | | | 109,262 | | | | 922,017 | | | | 7,694,600 | |
| | 2,109,000 | | | | 2,667,000 | | | | 1,472,003 | | | | 8,334,779 | | | | 2,056,000 | |
| | — | | | | — | | | | — | | | | 704,194 | | | | — | |
| | — | | | | — | | | | 210,423 | | | | 9,186,887 | | | | 139,893 | |
| | | | | | | | | | | | | | | | | | |
| | 1,501,437 | | | | 812,745 | | | | 458,689 | | | | 3,186,157 | | | | 103,148 | |
| | — | | | | — | | | | 355,931 | | | | — | | | | — | |
| | 285,370 | | | | 347,398 | | | | 515,418 | | | | 418,987 | | | | 10,174 | |
| | 1,895,941 | | | | 2,694,313 | | | | 2,323,306 | | | | 368,634 | | | | 474,232 | |
| | 131,547 | | | | 387,799 | | | | 390,449 | | | | 193,554 | | | | 28,913 | |
| | 173,120 | | | | 206,765 | | | | 360,242 | | | | 256,452 | | | | 430,074 | |
| | — | | | | — | | | | 71,271 | | | | 1,288,413 | | | | 661,456 | |
| | 33,099 | | | | 33,670 | | | | 23,447 | | | | 34,855 | | | | 35,807 | |
| | | | | | | | | | | | | | | | | | |
| | 1,455,326,511 | | | | 1,578,811,830 | | | | 737,436,934 | | | | 1,581,206,989 | | | | 316,011,181 | |
| | | | | | | | | | | | | | | | | | |
| | | | | | | | | | | | | | | | | | |
| | — | | | | — | | | | — | | | | 91,139,017 | | | | — | |
| | — | | | | — | | | | 5,813 | | | | — | | | | — | |
| | — | | | | — | | | | 68,310 | | | | 1,908,788 | | | | 621,128 | |
| | 109,412,405 | | | | 156,992,176 | | | | 154,309,256 | | | | 68,447,083 | | | | 24,260,022 | |
| | — | | | | — | | | | — | | | | 349,547 | | | | — | |
| | | | | | | | | | | | | | | | | | |
| | 1,869,794 | | | | 1,915,498 | | | | 7,521,303 | | | | 447,501 | | | | — | |
| | — | | | | — | | | | — | | | | 53,831 | | | | — | |
| | 17,114 | | | | 14,645 | | | | 3,724 | | | | 9,263 | | | | — | |
| | — | | | | — | | | | 2,078 | | | | 354,814 | | | | 50,955 | |
| | 3,578 | | | | 3,026 | | | | 26,743 | | | | 6,840 | | | | 1,976 | |
| | — | | | | — | | | | — | | | | 4,091 | | | | 112,450 | |
| | | | | | | | | | | | | | | | | | |
| | 686,618 | | | | 901,100 | | | | 405,952 | | | | 926,110 | | | | 208,054 | |
| | 215,935 | | | | 233,728 | | | | 95,425 | | | | 226,231 | | | | 48,853 | |
| | 106,436 | | | | 107,812 | | | | 153,499 | | | | 652,996 | | | | 106,655 | |
| | | | | | | | | | | | | | | | | | |
| | 112,311,880 | | | | 160,167,985 | | | | 162,592,103 | | | | 164,526,112 | | | | 25,410,093 | |
| | | | | | | | | | | | | | | | | | |
| $ | 1,343,014,631 | | | $ | 1,418,643,845 | | | $ | 574,844,831 | | | $ | 1,416,680,877 | | | $ | 290,601,088 | |
| | | | | | | | | | | | | | | | | | |
| | | | | | | | | | | | | | | | | | |
| $ | 1,024,684,168 | | | $ | 1,012,967,656 | | | $ | 461,981,447 | | | $ | 1,235,244,047 | | | $ | 297,546,167 | |
| | 246,220 | | | | — | | | | 238,176 | | | | (3,519,110 | ) | | | (1,244,447 | ) |
|
(17,974,722 |
) | | | 10,633,373 | | | | 5,907,778 | | | | (71,930,152 | ) | | | (571,040 | ) |
|
336,058,965 |
| | | 395,042,816 | | | | 106,717,430 | | | | 256,886,092 | | | | (5,129,592 | )(6) |
| | | | | | | | | | | | | | | | | | |
| $ | 1,343,014,631 | | | $ | 1,418,643,845 | | | $ | 574,844,831 | | | $ | 1,416,680,877 | | | $ | 290,601,088 | |
| | | | | | | | | | | | | | | | | | |
| | | | | | | | | | | | | | | | | | |
| | | | | | | | | | | | | | | | | | |
| $ | 253,988,275 | | | $ | 227,933,797 | | | $ | 84,139,143 | | | $ | 269,499,468 | | | $ | 46,420,031 | |
| | | | | | | | | | | | | | | | | | |
| | 25,645,461 | | | | 18,685,378 | | | | 8,128,586 | | | | 23,336,082 | | | | 4,759,526 | |
| | | | | | | | | | | | | | | | | | |
| $ | 9.90 | | | $ | 12.20 | | | $ | 10.35 | | | $ | 11.55 | | | $ | 9.75 | |
| | | | | | | | | | | | | | | | | | |
| $ | 1,089,026,356 | | | $ | 1,190,710,048 | | | $ | 490,705,688 | | | $ | 1,147,181,409 | | | $ | 244,181,057 | |
| | | | | | | | | | | | | | | | | | |
| | 51,850,876 | | | | 51,730,929 | | | | 26,970,705 | | | | 75,251,195 | | | | 25,047,066 | |
| | | | | | | | | | | | | | | | | | |
| $ | 21.00 | | | $ | 23.02 | | | $ | 18.19 | | | $ | 15.24 | | | $ | 9.75 | |
| | | | | | | | | | | | | | | | | | |
| | | | |
| $ | 1,066,843,017 | | | $ | 1,118,389,674 | | | $ | 601,463,179 | | | $ | 1,209,904,294 | | | $ | 296,540,127 | |
| | 48,058,108 | | | | 60,581,823 | | | | 27,331,387 | | | | 81,447,283 | | | | 13,828,315 | |
| | | | | | | | | | | | | | | | | | |
| $ | 1,114,901,125 | | | $ | 1,178,971,497 | | | $ | 628,794,566 | | | $ | 1,291,351,577 | | | $ | 310,368,442 | |
| | | | | | | | | | | | | | | | | | |
| $ | 107,204,960 | | | $ | 154,845,403 | | | $ | 152,100,244 | | | $ | 66,487,987 | | | $ | 24,687,797 | |
| | | | | | | | | | | | | | | | | | |
| $ | — | | | $ | — | | | $ | 207,841 | | | $ | 9,096,323 | | | $ | 140,875 | |
| | | | | | | | | | | | | | | | | | |
| $ | — | | | $ | — | | | $ | — | | | $ | 79,825,201 | | | $ | — | |
| | | | | | | | | | | | | | | | | | |
| $ | — | | | $ | — | | | $ | 3,974 | | | $ | — | | | $ | — | |
| | | | | | | | | | | | | | | | | | |
| | | | |
| | See Notes to Financial Statements. | | 235 |
| | |
| STATEMENTS OF OPERATIONS | | For the Year Ended December 31, 2013 |
| | | | | | | | | | |
| | | Defensive Market
Strategies Fund | | | Equity Index
Fund | |
Investment Income | | | | | | | | | | |
Dividends | | | | $ | 7,635,976 | | | $ | 6,111,564 | |
Income distributions received from affiliated funds | | | | | 3,171 | | | | 1,201 | |
Interest | | | | | 2,752,484 | | | | 202 | |
Securities lending | | | | | 219,828 | | | | 104,066 | |
Less foreign taxes withheld | | | | | (33,042 | ) | | | (1,296 | ) |
| | | | | | | | | | |
Total Investment Income | | | | | 10,578,417 | | | | 6,215,737 | |
| | | | | | | | | | |
Expenses | | | | | | | | | | |
Investment advisory fees | | | | | 3,831,391 | | | | 468,175 | |
Transfer agent fees: | | | | | | | | | | |
GS2 shares | | | | | 3,778 | | | | 3,755 | |
GS4 shares | | | | | 19,269 | | | | 24,821 | |
Custodian fees | | | | | 143,777 | | | | 28,795 | |
Shareholder servicing fees: | | | | | | | | | | |
GS4 shares | | | | | 864,062 | | | | 596,448 | |
Accounting and administration fees | | | | | 157,935 | | | | 87,105 | |
Professional fees | | | | | 67,671 | | | | 68,594 | |
Blue sky fees: | | | | | | | | | | |
GS2 shares | | | | | 1,883 | | | | 4,148 | |
GS4 shares | | | | | 18,914 | | | | 15,806 | |
Shareholder reporting fees: | | | | | | | | | | |
GS2 shares | | | | | 381 | | | | 311 | |
GS4 shares | | | | | 5,257 | | | | 15,605 | |
Trustee expenses | | | | | 4,672 | | | | 3,136 | |
Line of credit facility fees | | | | | 4,500 | | | | 3,015 | |
Other expenses | | | | | 356,529 | | | | 15,315 | |
| | | | | | | | | | |
Total expenses before dividends and interest on securities sold short | | | | | 5,480,019 | | | | 1,335,029 | |
Dividends and interest on securities sold short | | | | | 497,710 | | | | — | |
Expenses waived/reimbursed net of amount recaptured(2) | | | | | (87,229 | ) | | | (260,266 | ) |
Fees paid indirectly | | | | | (17,950 | ) | | | — | |
| | | | | | | | | | |
Net expenses | | | | | 5,872,550 | | | | 1,074,763 | |
| | | | | | | | | | |
Net Investment Income (Loss) | | | | | 4,705,867 | | | | 5,140,974 | |
| | | | | | | | | | |
| | | |
Realized and Unrealized Gain (Loss) | | | | | | | | | | |
| | | |
Net realized gain (loss) from: | | | | | | | | | | |
Investment securities | | | | | 46,639,367 | | | | 3,449,958 | |
Investment securities sold short | | | | | (13,855,311 | ) | | | — | |
Futures transactions | | | | | 5,824,421 | | | | 2,798,542 | |
Swap agreements | | | | | — | | | | | |
Option contracts written | | | | | 14,073 | | | | — | |
Option contracts purchased | | | | | (605,569 | ) | | | — | |
Foreign currency transactions | | | | | 146,255 | | | | — | |
| | | | | | | | | | |
Net realized gain (loss) | | | | | 38,163,236 | | | | 6,248,500 | |
| | | | | | | | | | |
| | | |
Net change in unrealized appreciation (depreciation) on: | | | | | | | | | | |
Investment securities | | | | | | | | | | |
(net of estimated capital gains taxes of $(111,602) for Emerging Markets Equity) | | | | | 32,405,880 | | | | 71,983,294 | |
Investment securities sold short | | | | | (1,277,045 | ) | | | — | |
Futures | | | | | 733,249 | | | | 391,506 | |
Option contracts written | | | | | 29,441 | | | | — | |
Option contracts purchased | | | | | (117,849 | ) | | | — | |
Foreign currency translation | | | | | (46,848 | ) | | | — | |
| | | | | | | | | | |
Net change in unrealized appreciation (depreciation) | | | | | 31,726,828 | | | | 72,374,800 | |
| | | | | | | | | | |
Net Realized and Unrealized Gain (Loss) | | | | | 69,890,064 | | | | 78,623,300 | |
| | | | | | | | | | |
Net Increase (Decrease) in Net Assets Resulting from Operations | | | | $ | 74,595,931 | | | $ | 83,764,274 | |
| | | | | | | | | | |
| | | | | | | | | | |
| (1) | Inception Date for the Emerging Markets Equity Fund was October 31, 2013. |
| (2) | See Note 3a and 3c in Notes to Financial Statements. |
| | | | |
| 236 | | See Notes to Financial Statements. | | |
| | | | | | | | | | | | | | | | | | |
Value Equity
Fund | | | Growth Equity
Fund | | | Small Cap
Equity Fund | | | International
Equity Fund | | | Emerging Markets
Equity Fund(1) | |
| | | | | | | | | | | | | | | | | | |
| $ | 28,520,609 | | | $ | 10,560,097 | | | $ | 4,640,676 | | | $ | 43,552,338 | | | $ | 437,111 | |
| | 3,447 | | | | 5,859 | | | | 2,398 | | | | 10,126 | | | | 149 | |
| | 677 | | | | — | | | | 1,349,224 | | | | — | | | | — | |
| | 441,853 | | | | 590,561 | | | | 1,094,357 | | | | 1,255,526 | | | | 13,702 | |
| | (80,092 | ) | | | (95,000 | ) | | | (406 | ) | | | (3,422,485 | ) | | | (22,190 | ) |
| | | | | | | | | | | | | | | | | | |
| | 28,886,494 | | | | 11,061,517 | | | | 7,086,249 | | | | 41,395,505 | | | | 428,772 | |
| | | | | | | | | | | | | | | | | | |
| | | | | | | | | | | | | | | | | | |
| | 8,048,298 | | | | 11,095,613 | | | | 4,332,272 | | | | 13,585,138 | | | | 548,343 | |
| | | | | | | | | | | | | | | | | | |
| | 3,916 | | | | 3,860 | | | | 3,941 | | | | 3,978 | | | | 617 | |
| | 27,219 | | | | 26,480 | | | | 27,826 | | | | 27,228 | | | | 3,327 | |
| | 68,315 | | | | 95,718 | | | | 141,358 | | | | 1,148,214 | | | | 47,318 | |
| | | | | | | | | | | | | | | | | | |
| | 2,481,161 | | | | 2,664,600 | | | | 1,045,543 | | | | 2,882,252 | | | | 94,428 | |
| | 279,848 | | | | 293,354 | | | | 207,059 | | | | 652,029 | | | | 21,978 | |
| | 64,959 | | | | 64,959 | | | | 70,459 | | | | 93,290 | | | | 89,421 | |
| | | | | | | | | | | | | | | | | | |
| | 4,148 | | | | 4,148 | | | | 4,148 | | | | 4,148 | | | | 1,142 | |
| | 16,625 | | | | 16,727 | | | | 17,399 | | | | 16,514 | | | | 1,686 | |
| | | | | | | | | | | | | | | | | | |
| | 661 | | | | 548 | | | | 703 | | | | 674 | | | | 111 | |
| | 20,917 | | | | 18,616 | | | | 22,009 | | | | 18,617 | | | | 1,694 | |
| | 13,106 | | | | 13,633 | | | | 5,240 | | | | 14,817 | | | | 740 | |
| | 12,553 | | | | 13,035 | | | | 5,004 | | | | 14,454 | | | | 664 | |
| | 32,161 | | | | 35,654 | | | | 24,271 | | | | 748,955 | | | | 6,661 | |
| | | | | | | | | | | | | | | | | | |
| | 11,073,887 | | | | 14,346,945 | | | | 5,907,232 | | | | 19,210,308 | | | | 818,130 | |
| | — | | | | — | | | | — | | | | 2,288,233 | | | | — | |
| | (81,634 | ) | | | (737,777 | ) | | | (56,514 | ) | | | (2,065,865 | ) | | | (133,958 | ) |
| | (86,296 | ) | | | (81,045 | ) | | | (68,008 | ) | | | (71,257 | ) | | | — | |
| | | | | | | | | | | | | | | | | | |
| | 10,905,957 | | | | 13,528,123 | | | | 5,782,710 | | | | 19,361,419 | | | | 684,172 | |
| | | | | | | | | | | | | | | | | | |
| | 17,980,537 | | | | (2,466,606 | ) | | | 1,303,539 | | | | 22,034,086 | | | | (255,400 | ) |
| | | | | | | | | | | | | | | | | | |
| | | | | | | | | | | | | | | | | | |
| | | | |
| | | | | | | | | | | | | | | | | | |
| | 137,310,798 | | | | 235,251,924 | | | | 78,734,837 | | | | 83,529,063 | | | | (139,725 | ) |
| | — | | | | — | | | | — | | | | (11,116,143 | ) | | | — | |
| | 8,569,444 | | | | 15,573,869 | | | | 29,142,977 | | | | 20,062,582 | | | | (430,714 | ) |
| | — | | | | — | | | | — | | | | (108,215 | ) | | | — | |
| | — | | | | — | | | | 34,180 | | | | — | | | | — | |
| | — | | | | — | | | | (30,452 | ) | | | — | | | | — | |
| | — | | | | (9,086 | ) | | | 60,061 | | | | 2,444,190 | | | | (1,244,448 | ) |
| | | | | | | | | | | | | | | | | | |
| | 145,880,242 | | | | 250,816,707 | | | | 107,941,603 | | | | 94,811,477 | | | | (1,814,887 | ) |
| | | | | | | | | | | | | | | | | | |
| | | | |
| | | | | | | | | | | | | | | | | | |
| | | | | | | | | | | | | | | | | | |
| | 217,997,259 | | | | 141,075,986 | | | | 52,215,641 | | | | 149,314,676 | | | | (6,103,160 | ) |
| | — | | | | — | | | | — | | | | (9,000,213 | ) | | | — | |
| | 1,685,630 | | | | 2,186,149 | | | | 3,178,527 | | | | 2,190,495 | | | | 934,639 | |
| | — | | | | — | | | | (9,282 | ) | | | — | | | | — | |
| | — | | | | — | | | | 9,915 | | | | — | | | | — | |
| | — | | | | 1,610 | | | | 25,744 | | | | (4,435,144 | ) | | | 38,929 | |
| | | | | | | | | | | | | | | | | | |
| | 219,682,889 | | | | 143,263,745 | | | | 55,420,545 | | | | 138,069,814 | | | | (5,129,592 | ) |
| | | | | | | | | | | | | | | | | | |
| | 365,563,131 | | | | 394,080,452 | | | | 163,362,148 | | | | 232,881,291 | | | | (6,944,479 | ) |
| | | | | | | | | | | | | | | | | | |
| $ | 383,543,668 | | | $ | 391,613,846 | | | $ | 164,665,687 | | | $ | 254,915,377 | | | $ | (7,199,879 | ) |
| | | | | | | | | | | | | | | | | | |
| | | | |
| | See Notes to Financial Statements. | | 237 |
STATEMENTS OF CHANGES IN NET ASSETS
| | | | | | | | |
| | | Defensive Market
Strategies Fund | |
| | | For the Year Ended | |
| | |
| | | 12/31/13 | | | 12/31/12 | |
Operations: | | | | | | | | |
Net investment income | | $ | 4,705,867 | | | $ | 5,323,718 | |
Net realized gain on investment securities, foreign currency transactions and derivative transactions | | | 38,163,236 | | | | 10,591,923 | |
Net change in unrealized appreciation (depreciation) on investment securities, foreign currency translations and derivative transactions | | | 31,726,828 | | | | 12,885,168 | |
| | | | | | | | |
Net increase in net assets resulting from operations | | | 74,595,931 | | | | 28,800,809 | |
| | | | | | | | |
Dividends and Distributions to Shareholders: | | | | | | | | |
Dividends from net investment income | | | | | | | | |
GS2 shares | | | (1,173,699 | ) | | | (1,340,492 | ) |
GS4 shares | | | (4,069,569 | ) | | | (4,192,927 | ) |
Distributions from net realized capital gains | | | | | | | | |
GS2 shares | | | (7,059,195 | ) | | | (2,470,784 | ) |
GS4 shares | | | (30,890,202 | ) | | | (9,083,204 | ) |
| | | | | | | | |
Total dividends and distributions | | | (43,192,665 | ) | | | (17,087,407 | ) |
| | | | | | | | |
Capital Share Transactions: | | | | | | | | |
Proceeds from shares sold | | | | | | | | |
GS2 shares | | | 7,592,070 | | | | 15,153,959 | |
GS4 shares | | | 74,050,825 | | | | 57,511,353 | |
Reinvestment of dividends and distributions | | | | | | | | |
GS2 shares | | | 8,223,321 | | | | 3,807,041 | |
GS4 shares | | | 34,959,748 | | | | 13,276,131 | |
| | | | | | | | |
Total proceeds from shares sold and reinvested | | | 124,825,964 | | | | 89,748,484 | |
| | | | | | | | |
Value of shares redeemed | | | | | | | | |
GS2 shares | | | (18,746,972 | ) | | | (10,919,229 | ) |
GS4 shares | | | (52,760,180 | ) | | | (5,602,873 | ) |
| | | | | | | | |
Total value of shares redeemed | | | (71,507,152 | ) | | | (16,522,102 | ) |
| | | | | | | | |
Net increase (decrease) from capital share transactions(1) | | | 53,318,812 | | | | 73,226,382 | |
| | | | | | | | |
Total increase in net assets | | | 84,722,078 | | | | 84,939,784 | |
| | | | | | | | |
Net Assets: | | | | | | | | |
Beginning of Year | | | 399,984,932 | | | | 315,045,148 | |
| | | | | | | | |
End of Year* | | $ | 484,707,010 | | | $ | 399,984,932 | |
| | | | | | | | |
* Including undistributed net investment income | | $ | (228,862 | ) | | $ | (2,176 | ) |
| | | | | | | | |
(1)See Note 6 in Notes to Financial Statements.
| | | | |
| 238 | | See Notes to Financial Statements. | | |
| | | | | | | | | | | | | | |
| Equity Index Fund | | | Value Equity Fund | |
| For the Year Ended | | | For the Year Ended | |
| | | |
| 12/31/13 | | | 12/31/12 | | | 12/31/13 | | | 12/31/12 | |
| | | | | | | | | | | | | | |
| $ | 5,140,974 | | | $ | 4,459,095 | | | $ | 17,980,537 | | | $ | 19,356,667 | |
| | 6,248,500 | | | | 3,524,631 | | | | 145,880,242 | | | | 28,714,675 | |
| | 72,374,800 | | | | 26,719,460 | | | | 219,682,889 | | | | 128,975,407 | |
| | | | | | | | | | | | | | |
| | 83,764,274 | | | | 34,703,186 | | | | 383,543,668 | | | | 177,046,749 | |
| | | | | | | | | | | | | | |
| | | | | | | | | | | | | | |
| | | | | | | | | | | | | | |
| | (1,910,992 | ) | | | (1,571,769 | ) | | | (9,104,181 | ) | | | (6,831,856 | ) |
| | (3,169,798 | ) | | | (2,883,760 | ) | | | (16,327,168 | ) | | | (12,514,527 | ) |
| | | | | | | | | | | | | | |
| | (1,874,438 | ) | | | (1,164,145 | ) | | | (12,958,074 | ) | | | — | |
| | (3,460,464 | ) | | | (2,337,106 | ) | | | (27,109,606 | ) | | | — | |
| | | | | | | | | | | | | | |
| | (10,415,692 | ) | | | (7,956,780 | ) | | | (65,499,029 | ) | | | (19,346,383 | ) |
| | | | | | | | | | | | | | |
| | | | | | | | | | | | | | |
| | | | | | | | | | | | | | |
| | 8,865,349 | | | | 9,096,280 | | | | 23,449,413 | | | | 9,537,724 | |
| | 42,055,015 | | | | 23,839,386 | | | | 82,826,039 | | | | 45,285,927 | |
| | | | | | | | | | | | | | |
| | 3,781,445 | | | | 2,732,297 | | | | 22,042,894 | | | | 6,825,833 | |
| | 6,630,100 | | | | 5,219,194 | | | | 43,431,117 | | | | 12,513,223 | |
| | | | | | | | | | | | | | |
| | 61,331,909 | | | | 40,887,157 | | | | 171,749,463 | | | | 74,162,707 | |
| | | | | | | | | | | | | | |
| | | | | | | | | | | | | | |
| | (5,225,280 | ) | | | (4,607,900 | ) | | | (58,523,134 | ) | | | (28,255,572 | ) |
| | (28,402,934 | ) | | | (27,559,476 | ) | | | (236,877,855 | ) | | | (108,252,456 | ) |
| | | | | | | | | | | | | | |
| | (33,628,214 | ) | | | (32,167,376 | ) | | | (295,400,989 | ) | | | (136,508,028 | ) |
| | | | | | | | | | | | | | |
| | 27,703,695 | | | | 8,719,781 | | | | (123,651,526 | ) | | | (62,345,321 | ) |
| | | | | | | | | | | | | | |
| | 101,052,277 | | | | 35,466,187 | | | | 194,393,113 | | | | 95,355,045 | |
| | | | | | | | | | | | | | |
| | | | | | | | | | | | | | |
| | 255,262,681 | | | | 219,796,494 | | | | 1,148,621,518 | | | | 1,053,266,473 | |
| | | | | | | | | | | | | | |
| $ | 356,314,958 | | | $ | 255,262,681 | | | $ | 1,343,014,631 | | | $ | 1,148,621,518 | |
| | | | | | | | | | | | | | |
| $ | 64,888 | | | $ | 3,817 | | | $ | 246,220 | | | $ | 7,694,927 | |
| | | | | | | | | | | | | | |
| | | | |
| | See Notes to Financial Statements. | | 239 |
| | | | | | | | |
| | | Growth Equity Fund | |
| | | For the Year Ended | |
| | |
| | | 12/31/13 | | | 12/31/12 | |
Operations: | | | | | | | | |
Net investment income (loss) | | $ | (2,466,606 | ) | | $ | 2,147,545 | |
Net realized gain (loss) on investment securities, foreign currency transactions and derivative transactions | | | 250,816,707 | | | | 124,715,096 | |
Net change in unrealized appreciation (depreciation) on investment securities, foreign currency translations and derivative transactions | | | 143,263,745 | | | | 61,890,168 | |
| | | | | | | | |
Net increase (decrease) in net assets resulting from operations | | | 391,613,846 | | | | 188,752,809 | |
| | | | | | | | |
Dividends and Distributions to Shareholders: | | | | | | | | |
Dividends from net investment income | | | | | | | | |
GS2 shares | | | — | | | | (997,169 | ) |
GS4 shares | | | — | | | | (1,161,213 | ) |
Distributions from net realized capital gains | | | | | | | | |
GS2 shares | | | (59,354,927 | ) | | | (22,360,470 | ) |
GS4 shares | | | (184,064,261 | ) | | | (72,908,150 | ) |
| | | | | | | | |
Total dividends and distributions | | | (243,419,188 | ) | | | (97,427,002 | ) |
| | | | | | | | |
Capital Share Transactions: | | | | | | | | |
Proceeds from shares sold | | | | | | | | |
GS2 shares | | | 16,158,120 | | | | 8,038,745 | |
GS4 shares | | | 57,212,428 | | | | 62,823,460 | |
Reinvestment of dividends and distributions | | | | | | | | |
GS2 shares | | | 59,313,648 | | | | 23,338,265 | |
GS4 shares | | | 184,053,788 | | | | 74,068,713 | |
| | | | | | | | |
Total proceeds from shares sold and reinvested | | | 316,737,984 | | | | 168,269,183 | |
| | | | | | | | |
Value of shares redeemed | | | | | | | | |
GS2 shares | | | (51,027,934 | ) | | | (25,997,419 | ) |
GS4 shares | | | (216,524,263 | ) | | | (112,712,284 | ) |
| | | | | | | | |
Total value of shares redeemed | | | (267,552,197 | ) | | | (138,709,703 | ) |
| | | | | | | | |
Net increase (decrease) from capital share transactions(2) | | | 49,185,787 | | | | 29,559,480 | |
| | | | | | | | |
Total increase (decrease) in net assets | | | 197,380,445 | | | | 120,885,287 | |
| | | | | | | | |
Net Assets: | | | | | | | | |
Beginning of Year | | | 1,221,263,400 | | | | 1,100,378,113 | |
| | | | | | | | |
End of Year* | | $ | 1,418,643,845 | | | $ | 1,221,263,400 | |
| | | | | | | | |
* Including undistributed (distributions in excess of) net investment income | | $ | — | | | $ | (865 | ) |
| | | | | | | | |
(1)Inception Date for the Emerging Markets Equity Fund was October 31, 2013.
(2)See Note 6 in Notes to Financial Statements.
| | | | |
| 240 | | See Notes to Financial Statements. | | |
| | | | | | | | | | | | | | | | | | |
| Small Cap Equity Fund | | | International Equity Fund | | | Emerging Markets Equity Fund | |
| For the Year Ended | | | For the Year Ended | | | For the Period | |
| | | | |
| 12/31/13 | | | 12/31/12 | | | 12/31/13 | | | 12/31/12 | | | 10/31/13(1)-12/31/13 | |
| | | | | | | | | | | | | | | | | | |
| $ | 1,303,539 | | | $ | 2,734,679 | | | $ | 22,034,086 | | | $ | 21,715,795 | | | $ | (255,400 | ) |
| | 107,941,603 | | | | 42,096,483 | | | | 94,811,477 | | | | (7,086,651 | ) | | | (1,814,887 | ) |
| | 55,420,545 | | | | 16,481,702 | | | | 138,069,814 | | | | 193,119,661 | | | | (5,129,592 | ) |
| | | | | | | | | | | | | | | | | | |
| | | | |
| | 164,665,687 | | | | 61,312,864 | | | | 254,915,377 | | | | 207,748,805 | | | | (7,199,879 | ) |
| | | | | | | | | | | | | | | | | | |
| | | | | | | | | | | | | | | | | | |
| | | | | | | | | | | | | | | | | | |
| | (680,686 | ) | | | (824,580 | ) | | | (5,710,188 | ) | | | (5,831,914 | ) | | | — | |
| | (1,183,448 | ) | | | (2,228,182 | ) | | | (15,633,737 | ) | | | (16,637,904 | ) | | | — | |
| | | | | | | | | | | | | | | | | | |
| | (21,979,674 | ) | | | (4,730,877 | ) | | | — | | | | — | | | | — | |
| | (82,693,531 | ) | | | (17,549,897 | ) | | | — | | | | — | | | | — | |
| | | | | | | | | | | | | | | | | | |
| | (106,537,339 | ) | | | (25,333,536 | ) | | | (21,343,925 | ) | | | (22,469,818 | ) | | | — | |
| | | | | | | | | | | | | | | | | | |
| | | | | | | | | | | | | | | | | | |
| | | | | | | | | | | | | | | | | | |
| | 8,015,941 | | | | 3,532,639 | | | | 26,480,523 | | | | 22,643,677 | | | | 47,632,875 | |
| | 58,431,827 | | | | 26,607,000 | | | | 116,146,641 | | | | 98,709,445 | | | | 250,401,654 | |
| | | | | | | | | | | | | | | | | | |
| | 22,649,010 | | | | 5,551,218 | | | | 5,708,234 | | | | 5,830,084 | | | | — | |
| | 83,870,624 | | | | 19,776,480 | | | | 15,631,209 | | | | 16,637,209 | | | | — | |
| | | | | | | | | | | | | | | | | | |
| | 172,967,402 | | | | 55,467,337 | | | | 163,966,607 | | | | 143,820,415 | | | | 298,034,529 | |
| | | | | | | | | | | | | | | | | | |
| | | | | | | | | | | | | | | | | | |
| | (16,576,386 | ) | | | (9,202,703 | ) | | | (75,614,406 | ) | | | (15,820,816 | ) | | | (64,000 | ) |
| | (84,498,033 | ) | | | (55,335,902 | ) | | | (331,679,243 | ) | | | (65,824,409 | ) | | | (169,562 | ) |
| | | | | | | | | | | | | | | | | | |
| | (101,074,419 | ) | | | (64,538,605 | ) | | | (407,293,649 | ) | | | (81,645,225 | ) | | | (233,562 | ) |
| | | | | | | | | | | | | | | | | | |
| | 71,892,983 | | | | (9,071,268 | ) | | | (243,327,042 | ) | | | 62,175,190 | | | | 297,800,967 | |
| | | | | | | | | | | | | | | | | | |
| | 130,021,331 | | | | 26,908,060 | | | | (9,755,590 | ) | | | 247,454,177 | | | | 290,601,088 | |
| | | | | | | | | | | | | | | | | | |
| | | | | | | | | | | | | | | | | | |
| | 444,823,500 | | | | 417,915,440 | | | | 1,426,436,467 | | | | 1,178,982,290 | | | | — | |
| | | | | | | | | | | | | | | | | | |
| $ | 574,844,831 | | | $ | 444,823,500 | | | $ | 1,416,680,877 | | | $ | 1,426,436,467 | | | $ | 290,601,088 | |
| | | | | | | | | | | | | | | | | | |
| $ | 238,176 | | | $ | 51,833 | | | $ | (3,519,110 | ) | | $ | (1,019,310 | ) | | $ | (1,244,447 | ) |
| | | | | | | | | | | | | | | | | | |
| | | | |
| | See Notes to Financial Statements. | | 241 |
FINANCIAL HIGHLIGHTS
| | | | | | | | | | | | | | | | | | | | | | | | | | | | | | | | | | | | | | | | | | | | | | | | |
| For a Share Outstanding For the Years Ending December 31, unless otherwise indicated | | | | | | Ratios to Average Net Assets | | | | |
| | | Net Asset
Value,
Beginning
of Year | | | Net
Invest- ment
Income | | | Realized and Unrealized Gain (Loss) on
Investments | | | Dividends from Net Investment
Income | | | Distribu- tions from Net Realized Capital
Gains | | | Net Asset Value, End of
Year | | | Total Return | | | Net Assets, End of Year (000) | | | Expenses,
Net(1) | | | Expenses,
Gross(2) | | | Invest- ment
Income/ (Loss),
Net(1) | | | Portfolio
Turnover
Rate | |
Defensive Market Strategies Fund | |
| | | | | | | | | | |
GS2 Class | | | | | | | | | | | | | | | | | | | | | | | | | | | | | | | | | | | | | | | | | |
| 2013(3) | | $ | 10.61 | | | $ | 0.14 | # | | $ | 1.80(4 | ) | | $ | (0.15 | ) | | $ | (0.97 | ) | | $ | 11.43 | | | | 18.47 | % | | $ | 89,430 | | | | 1.10 | %(5) | | | 1.13 | %(5) | | | 1.25 | % | | | 208 | % |
| 2012 | | | 10.20 | | | | 0.18 | # | | | 0.73(4 | ) | | | (0.18 | ) | | | (0.32 | ) | | | 10.61 | | | | 8.93 | | | | 85,347 | | | | 1.04 | (5) | | | 1.12 | (5) | | | 1.67 | | | | 304 | |
| 2011(6) | | | 10.00 | | | | 0.04 | # | | | 0.21(4 | ) | | | (0.04 | ) | | | (0.01 | ) | | | 10.20 | | | | 2.51 | | | | 74,516 | | | | 1.03 | (5) | | | 1.10 | (5) | | | 1.11 | | | | 120 | |
GS4 Class | | | | | | | | | | | | | | | | | | | | | | | | | | | | | | | | | | | | | | | | | |
| 2013(3) | | $ | 10.60 | | | $ | 0.12 | # | | $ | 1.79(4 | ) | | $ | (0.12 | ) | | $ | (0.97 | ) | | $ | 11.42 | | | | 18.22 | % | | $ | 395,277 | | | | 1.36 | %(5) | | | 1.38 | %(5) | | | 0.99 | % | | | 208 | % |
| 2012 | | | 10.20 | | | | 0.15 | # | | | 0.72(4 | ) | | | (0.15 | ) | | | (0.32 | ) | | | 10.60 | | | | 8.57 | | | | 314,638 | | | | 1.30 | (5) | | | 1.37 | (5) | | | 1.42 | | | | 304 | |
| 2011(6) | | | 10.00 | | | | 0.03 | # | | | 0.21(4 | ) | | | (0.03 | ) | | | (0.01 | ) | | | 10.20 | | | | 2.43 | | | | 240,529 | | | | 1.29 | (5) | | | 1.35 | (5) | | | 0.86 | | | | 120 | |
| | | | | | | | | | | | | | | | | | | | | | | | | | | | | | | | | | | | | | | | | | | | | | | | |
Equity Index Fund | |
| | | | | | | | | | |
GS2 Class | | | | | | | | | | | | | | | | | | | | | | | | | | | | | | | | | | | | | | | | | |
| 2013(7) | | $ | 6.85 | | | $ | 0.14 | # | | $ | 2.02(4 | ) | | $ | (0.26 | ) | | $ | (0.25 | ) | | $ | 8.50 | | | | 32.04 | % | | $ | 66,378 | | | | 0.23 | % | | | 0.24 | % | | | 1.81 | % | | | 4 | % |
| 2012 | | | 6.29 | | | | 0.13 | # | | | 0.86(4 | ) | | | (0.25 | ) | | | (0.18 | ) | | | 6.85 | | | | 15.92 | | | | 47,071 | | | | 0.23 | | | | 0.24 | | | | 1.95 | | | | 3 | |
| 2011 | | | 8.63 | | | | 0.15 | # | | | 0.04(4 | ) | | | (0.31 | ) | | | (2.22 | ) | | | 6.29 | | | | 3.00 | | | | 36,721 | | | | 0.23 | | | | 0.24 | | | | 1.71 | | | | 4 | |
| 2010 | | | 7.77 | | | | 0.14 | # | | | 0.97 | | | | (0.25 | ) | | | — | | | | 8.63 | | | | 14.57 | | | | 71,093 | | | | 0.22 | | | | 0.22 | | | | 1.77 | | | | 5 | |
| 2009 | | | 6.36 | | | | 0.14 | # | | | 1.49 | | | | (0.22 | ) | | | — | | | | 7.77 | | | | 26.38 | | | | 65,217 | | | | 0.22 | | | | 0.24 | | | | 2.05 | | | | 4 | |
GS4 Class | | | | | | | | | | | | | | | | | | | | | | | | | | | | | | | | | | | | | | | | | |
| 2013(7) | | $ | 16.07 | | | $ | 0.31 | # | | $ | 4.79(4 | ) | | $ | (0.23 | ) | | $ | (0.25 | ) | | $ | 20.69 | | | | 31.95 | % | | $ | 289,937 | | | | 0.38 | % | | | 0.48 | % | | | 1.66 | % | | | 4 | % |
| 2012 | | | 14.24 | | | | 0.28 | # | | | 1.95(4 | ) | | | (0.22 | ) | | | (0.18 | ) | | | 16.07 | | | | 15.76 | | | | 208,192 | | | | 0.38 | | | | 0.49 | | | | 1.79 | | | | 3 | |
| 2011 | | | 16.36 | | | | 0.26 | # | | | 0.12(4 | ) | | | (0.28 | ) | | | (2.22 | ) | | | 14.24 | | | | 2.75 | | | | 183,076 | | | | 0.38 | | | | 0.47 | | | | 1.57 | | | | 4 | |
| 2010 | | | 14.51 | | | | 0.24 | # | | | 1.84 | | | | (0.23 | ) | | | — | | | | 16.36 | | | | 14.45 | | | | 335,859 | | | | 0.37 | | | | 0.41 | | | | 1.60 | | | | 5 | |
| 2009 | | | 11.70 | | | | 0.24 | # | | | 2.77 | | | | (0.20 | ) | | | — | | | | 14.51 | | | | 26.14 | | | | 321,486 | | | | 0.37 | | | | 0.43 | | | | 1.90 | | | | 4 | |
| # | Calculated using the average shares outstanding method. |
| (1) | The ratio includes expenses waived/reimbursed net of amount recaptured and fees paid indirectly, where applicable; if expenses waived/reimbursed net of amount recaptured and fees paid indirectly were excluded, the ratio would have been higher (lower) than the ratio shown. |
| (2) | The ratio excludes expenses waived/reimbursed net of amount recaptured and fees paid indirectly, where applicable; if expenses waived/reimbursed net of amount recaptured and fees paid indirectly were included, the ratio would have been lower than the ratio shown. |
| (3) | An out of period adjustment to Investment Income increased Net Investment Income per Share by $0.00 and $0.01, the Total Return did not change, and the Ratio of Net Investment Income to Average Net Assets increased by 0.01% and 0.00% for GS2 Class and GS4 Class, respectively. See Note 10 in Notes to Financial Statements. |
| (4) | Amount includes Capital Gains distributions received by the Fund from the GuideStone Money Market Fund. The amount of these distributions represents less than $0.005 per share. |
| (5) | The ratio for the Defensive Market Strategies Fund includes the effect of dividend expense on securities sold short which increased the ratio by 0.04%, 0.05% and 0.11% for the years 2011, 2012 and 2013, respectively. |
| (6) | Inception date was September 1, 2011. All ratios for the period have been annualized. Total return and portfolio turnover for the period have not been annualized. |
| (7) | An out of period adjustment to Investment Income increased Net Investment Income per Share by $0.00 and $0.01, the Total Return did not change, and the Ratio of Net Investment Income to Average Net Assets increased by 0.03% and 0.03% for GS2 Class and GS4 Class, respectively. See Note 10 in Notes to Financial Statements. |
| | | | |
| 242 | | See Notes to Financial Statements. | | |
| | | | | | | | | | | | | | | | | | | | | | | | | | | | | | | | | | | | | | | | | | | | | | | | |
| For a Share Outstanding For the Years Ending December 31, unless otherwise indicated | | | | | | Ratios to Average Net Assets | | | | |
| | | Net Asset
Value,
Beginning
of Year | | | Net
Invest- ment
Income | | | Realized and Unrealized Gain (Loss) on
Investments | | | Dividends from Net Investment
Income | | | Distribu- tions from Net Realized Capital
Gains | | | Net
Asset Value, End of
Year | | | Total Return | | | Net Assets, End of Year (000) | | | Expenses,
Net(1) | | | Expenses,
Gross(2) | | | Invest- ment
Income/ (Loss),
Net(1) | | | Portfolio
Turnover
Rate | |
Value Equity Fund | |
| | | | | | | | | | |
GS2 Class | | | | | | | | | | | | | | | | | | | | | | | | | | | | | | | | | | | | | | | | | |
| 2013(3) | | $ | 7.99 | | | $ | 0.15 | # | | $ | 2.64 | (4) | | $ | (0.34 | ) | | $ | (0.54 | ) | | $ | 9.90 | | | | 35.52 | % | | $ | 253,988 | | | | 0.66 | % | | | 0.67 | % | | | 1.61 | % | | | 45 | % |
| 2012 | | | 7.03 | | | | 0.15 | # | | | 1.06 | (4) | | | (0.25 | ) | | | — | | | | 7.99 | | | | 17.47 | | | | 215,512 | | | | 0.67 | | | | 0.68 | | | | 1.90 | | | | 27 | |
| 2011 | | | 7.18 | | | | 0.12 | # | | | (0.07 | )(4) | | | (0.20 | ) | | | — | | | | 7.03 | | | | 0.57 | | | | 200,308 | | | | 0.67 | | | | 0.68 | | | | 1.62 | | | | 35 | |
| 2010 | | | 6.46 | | | | 0.10 | # | | | 0.78 | | | | (0.16 | ) | | | — | | | | 7.18 | | | | 14.01 | | | | 231,079 | | | | 0.67 | | | | 0.68 | | | | 1.52 | | | | 36 | |
| 2009 | | | 5.52 | | | | 0.11 | # | | | 1.02 | | | | (0.19 | ) | | | — | | | | 6.46 | | | | 21.35 | | | | 181,123 | | | | 0.68 | | | | 0.69 | | | | 2.06 | | | | 32 | |
GS4 Class | | | | | | | | | | | | | | | | | | | | | | | | | | | | | | | | | | | | | | | | | |
| 2013(3) | | $ | 16.18 | | | $ | 0.26 | # | | $ | 5.39 | (4) | | $ | (0.29 | ) | | | (0.54 | ) | | $ | 21.00 | | | | 35.22 | % | | $ | 1,089,026 | | | | 0.90 | % | | | 0.91 | % | | | 1.36 | % | | | 45 | % |
| 2012 | | | 14.00 | | | | 0.25 | # | | | 2.14 | (4) | | | (0.21 | ) | | | — | | | | 16.18 | | | | 17.20 | | | | 933,110 | | | | 0.92 | | | | 0.92 | | | | 1.66 | | | | 27 | |
| 2011 | | | 14.12 | | | | 0.20 | # | | | (0.16 | )(4) | | | (0.16 | ) | | | — | | | | 14.00 | | | | 0.27 | | | | 852,958 | | | | 0.89 | | | | 0.91 | | | | 1.39 | | | | 35 | |
| 2010 | | | 12.54 | | | | 0.17 | # | | | 1.56 | | | | (0.15 | ) | | | — | | | | 14.12 | | | | 13.96 | | | | 958,211 | | | | 0.85 | | | | 0.87 | | | | 1.35 | | | | 36 | |
| 2009 | | | 10.53 | | | | 0.20 | # | | | 1.98 | | | | (0.17 | ) | | | — | | | | 12.54 | | | | 21.16 | | | | 1,001,814 | | | | 0.84 | | | | 0.88 | | | | 1.89 | | | | 32 | |
| | | | | | | | | | | | | | | | | | | | | | | | | | | | | | | | | | | | | | | | | | | | | | | | |
Growth Equity Fund | |
| | | | | | | | | | |
GS2 Class | | | | | | | | | | | | | | | | | | | | | | | | | | | | | | | | | | | | | | | | | |
| 2013(5) | | $ | 12.19 | | | $ | — | †# | | $ | 4.12 | (4) | | $ | — | | | $ | (4.11 | ) | | $ | 12.20 | | | | 34.83 | % | | $ | 227,934 | | | | 0.84 | % | | | 0.88 | % | | | 0.00 | % | | | 83 | % |
| 2012 | | | 11.76 | | | | 0.04 | # | | | 2.00 | (4) | | | (0.06 | ) | | | (1.55 | ) | | | 12.19 | | | | 17.39 | | | | 198,329 | | | | 0.87 | | | | 0.89 | | | | 0.33 | | | | 67 | |
| 2011 | | | 11.91 | | | | — | †# | | | (0.15 | )(4) | | | — | | | | — | | | | 11.76 | | | | (1.26 | ) | | | 184,418 | | | | 0.87 | | | | 0.89 | | | | 0.02 | | | | 60 | |
| 2010 | | | 10.00 | | | | — | † | | | 1.91 | | | | — | † | | | — | | | | 11.91 | | | | 19.13 | | | | 215,863 | | | | 0.87 | | | | 0.89 | | | | 0.06 | | | | 63 | |
| 2009 | | | 7.26 | | | | 0.02 | | | | 2.74 | | | | (0.02 | ) | | | — | | | | 10.00 | | | | 38.14 | | | | 196,026 | | | | 0.87 | | | | 0.89 | | | | 0.22 | | | | 78 | |
GS4 Class | | | | | | | | | | | | | | | | | | | | | | | | | | | | | | | | | | | | | | | | | |
| 2013(5) | | $ | 20.26 | | | $ | (0.05 | )# | | $ | 6.92 | (4) | | $ | — | | | $ | (4.11 | ) | | $ | 23.02 | | | | 34.52 | % | | $ | 1,190,710 | | | | 1.05 | % | | | 1.12 | % | | | (0.22 | )% | | | 83 | % |
| 2012 | | | 18.63 | | | | 0.03 | # | | | 3.17 | (4) | | | (0.02 | ) | | | (1.55 | ) | | | 20.26 | | | | 17.21 | | | | 1,022,934 | | | | 1.05 | | | | 1.13 | | | | 0.15 | | | | 67 | |
| 2011 | | | 18.90 | | | | (0.02 | )# | | | (0.25 | )(4) | | | — | | | | — | | | | 18.63 | | | | (1.43 | ) | | | 915,960 | | | | 1.02 | | | | 1.11 | | | | (0.13 | ) | | | 60 | |
| 2010 | | | 15.88 | | | | (0.01 | ) | | | 3.03 | | | | — | † | | | — | | | | 18.90 | | | | 19.03 | | | | 1,044,060 | | | | 0.97 | | | | 1.08 | | | | (0.04 | ) | | | 63 | |
| 2009 | | | 11.52 | | | | 0.01 | | | | 4.36 | | | | (0.01 | ) | | | — | | | | 15.88 | | | | 37.99 | | | | 1,067,654 | | | | 0.96 | | | | 1.09 | | | | 0.13 | | | | 78 | |
| | | | | | | | | | | | | | | | | | | | | | | | | | | | | | | | | | | | | | | | | | | | | | | | |
Small Cap Equity Fund | |
| | | | | | | | | | |
GS2 Class | | | | | | | | | | | | | | | | | | | | | | | | | | | | | | | | | | | | | | | | | |
| 2013(6) | | $ | 10.27 | | | $ | 0.06 | # | | $ | 3.82 | (4) | | $ | (0.08 | ) | | $ | (3.72 | ) | | $ | 10.35 | | | | 38.39 | % | | $ | 84,139 | | | | 0.92 | % | | | 0.94 | % | | | 0.45 | % | | | 161 | % |
| 2012 | | | 9.70 | | | | 0.08 | # | | | 1.40 | (4) | | | (0.13 | ) | | | (0.78 | ) | | | 10.27 | | | | 15.25 | | | | 67,723 | | | | 0.99 | | | | 1.02 | | | | 0.79 | | | | 128 | |
| 2011 | | | 9.61 | | | | 0.03 | # | | | 0.11 | (4) | | | (0.05 | ) | | | — | | | | 9.70 | | | | 1.40 | | | | 63,903 | | | | 1.00 | | | | 1.03 | | | | 0.27 | | | | 165 | |
| 2010 | | | 7.57 | | | | 0.03 | # | | | 2.06 | | | | (0.05 | ) | | | — | | | | 9.61 | | | | 27.64 | | | | 74,424 | | | | 1.00 | | | | 1.02 | | | | 0.42 | | | | 177 | |
| 2009 | | | 5.94 | | | | 0.03 | # | | | 1.64 | | | | (0.04 | ) | | | — | | | | 7.57 | | | | 28.12 | | | | 64,033 | | | | 1.03 | | | | 1.05 | | | | 0.44 | | | | 130 | |
GS4 Class | | | | | | | | | | | | | | | | | | | | | | | | | | | | | | | | | | | | | | | | | |
| 2013(6) | | $ | 15.94 | | | $ | 0.04 | # | | $ | 5.97 | (4) | | $ | (0.04 | ) | | $ | (3.72 | ) | | $ | 18.19 | | | | 38.09 | % | | $ | 490,706 | | | | 1.16 | % | | | 1.19 | % | | | 0.22 | % | | | 161 | % |
| 2012 | | | 14.62 | | | | 0.09 | # | | | 2.10 | (4) | | | (0.09 | ) | | | (0.78 | ) | | | 15.94 | | | | 15.02 | | | | 377,101 | | | | 1.19 | | | | 1.27 | | | | 0.59 | | | | 128 | |
| 2011 | | | 14.46 | | | | 0.01 | # | | | 0.17 | (4) | | | (0.02 | ) | | | — | | | | 14.62 | | | | 1.22 | | | | 354,013 | | | | 1.17 | | | | 1.26 | | | | 0.10 | | | | 165 | |
| 2010 | | | 11.37 | | | | 0.03 | # | | | 3.09 | | | | (0.03 | ) | | | — | | | | 14.46 | | | | 27.47 | | | | 400,072 | | | | 1.15 | | | | 1.21 | | | | 0.27 | | | | 177 | |
| 2009 | | | 8.91 | | | | 0.03 | # | | | 2.46 | | | | (0.03 | ) | | | — | | | | 11.37 | | | | 27.93 | | | | 356,043 | | | | 1.14 | | | | 1.25 | | | | 0.33 | | | | 130 | |
| † | Amount represents less than $0.005 per share. |
| # | Calculated using the average shares outstanding method. |
| (1) | The ratio includes expenses waived/reimbursed net of amount recaptured and fees paid indirectly, where applicable; if expenses waived/reimbursed net of amount recaptured and fees paid indirectly were excluded, the ratio would have been higher (lower) than the ratio shown. |
| (2) | The ratio excludes expenses waived/reimbursed net of amount recaptured and fees paid indirectly, where applicable; if expenses waived/reimbursed net of amount recaptured and fees paid indirectly were included, the ratio would have been lower than the ratio shown. |
| (3) | An out of period adjustment to Investment Income increased Net Investment Income per Share by $0.00 and $0.01, the Total Return did not change, and the Ratio of Net Investment Income to Average Net Assets increased by 0.02% and 0.02% for GS2 Class and GS4 Class, respectively. See Note 10 in Notes to Financial Statements. |
| (4) | Amount includes Capital Gains distributions received by the Fund from the GuideStone Money Market Fund. The amount of these distributions represents less than $0.005 per share. |
| (5) | An out of period adjustment to Investment Income increased Net Investment Income per Share by $0.00 and $0.01, Total Return by 0.00% and 0.05%, and the Ratio of Net Investment Income to Average Net Assets by 0.03% and 0.03% for GS2 Class and GS4 Class, respectively. See Note 10 in Notes to Financial Statements. |
| (6) | An out of period adjustment to Investment Income increased Net Investment Income per Share by $0.01 and $0.01, Total Return by 0.14% and 0.08%, and the Ratio of Net Investment Income to Average Net Assets by 0.07% and 0.08% for GS2 Class and GS4 Class, respectively. See Note 10 in Notes to Financial Statements. |
| | | | |
| | See Notes to Financial Statements. | | 243 |
FINANCIAL HIGHLIGHTS (Continued)
| | | | | | | | | | | | | | | | | | | | | | | | | | | | | | | | | | | | | | | | | | | | | | | | |
| For a Share Outstanding For the Years Ending December 31, unless otherwise indicated | | | | | | Ratios to Average Net Assets | | | | |
| | | Net Asset
Value,
Beginning
of Year | | | Net
Invest- ment
Income | | | Realized and Unrealized Gain (Loss) on
Investm- ents | | | Dividends from Net Investment
Income | | | Distribu- tions from Net Realized Capital
Gains | | | Net Asset Value, End of
Year | | | Total Return | | | Net Assets, End of Year (000) | | | Expenses,
Net(1) | | | Expenses,
Gross(2) | | | Invest- ment
Income/ (Loss),
Net(1) | | | Portfolio
Turnover
Rate | |
International Equity Fund | |
| | | | | | | | | | | |
GS2 Class | | | | | | | | | | | | | | | | | | | | | | | | | | | | | | | | | | | | | | | | | | | | | |
| 2013(3) | | $ | 9.96 | | | $ | 0.18 | # | | $ | 1.66 | (4) | | $ | (0.25 | ) | | $ | — | | | $ | 11.55 | | | | 18.49 | % | | $ | 269,499 | | | | 1.11 | %(5) | | | 1.25 | %(5) | | | 1.69 | % | | | 51 | % |
| 2012 | | | 8.67 | | | | 0.18 | # | | | 1.33 | (4) | | | (0.22 | ) | | | — | | | | 9.96 | | | | 17.43 | | | | 270,130 | | | | 1.15 | (5) | | | 1.32 | (5) | | | 1.89 | | | | 53 | |
| 2011 | | | 10.35 | | | | 0.22 | # | | | (1.66) | (4) | | | (0.24 | ) | | | — | | | | 8.67 | | | | (13.86 | ) | | | 223,677 | | | | 1.02 | (5) | | | 1.22 | (5) | | | 2.17 | | | | 82 | |
| 2010 | | | 9.64 | | | | 0.17 | # | | | 0.83 | | | | (0.29 | ) | | | — | | | | 10.35 | | | | 10.45 | | | | 262,103 | | | | 0.97 | (5) | | | 1.19 | (5) | | | 1.81 | | | | 56 | |
| 2009 | | | 7.32 | | | | 0.17 | # | | | 2.42 | | | | (0.27 | ) | | | — | † | | | 9.64 | | | | 35.81 | | | | 240,483 | | | | 0.98 | (5) | | | 1.21 | (5) | | | 2.12 | | | | 59 | |
| | | | | | | | | | | |
GS4 Class | | | | | | | | | | | | | | | | | | | | | | | | | | | | | | | | | | | | | | | | | | | | | |
| 2013(3) | | $ | 13.07 | | | $ | 0.20 | # | | $ | 2.18 | (4) | | $ | (0.21 | ) | | $ | — | | | $ | 15.24 | | | | 18.23 | % | | $ | 1,147,181 | | | | 1.35 | %(5) | | | 1.49 | %(5) | | | 1.44 | % | | | 51 | % |
| 2012 | | | 11.33 | | | | 0.20 | # | | | 1.73 | (4) | | | (0.19 | ) | | | — | | | | 13.07 | | | | 17.05 | | | | 1,156,306 | | | | 1.39 | (5) | | | 1.57 | (5) | | | 1.65 | | | | 53 | |
| 2011 | | | 13.43 | | | | 0.25 | # | | | (2.13) | (4) | | | (0.22 | ) | | | — | | | | 11.33 | | | | (14.01 | ) | | | 955,305 | | | | 1.24 | (5) | | | 1.45 | (5) | | | 1.95 | | | | 82 | |
| 2010 | | | 12.44 | | | | 0.21 | # | | | 1.05 | | | | (0.27 | ) | | | — | | | | 13.43 | | | | 10.14 | | | | 1,029,317 | | | | 1.15 | (5) | | | 1.38 | (5) | | | 1.67 | | | | 56 | |
| 2009 | | | 9.38 | | | | 0.20 | # | | | 3.11 | | | | (0.25 | ) | | | — | † | | | 12.44 | | | | 35.61 | | | | 1,101,628 | | | | 1.16 | (5) | | | 1.40 | (5) | | | 1.98 | | | | 59 | |
Emerging Markets Equity Fund | |
| | | | | | | | | | | |
GS2 Class | | | | | | | | | | | | | | | | | | | | | | | | | | | | | | | | | | | | | | | | | | | | | |
| 2013(6)(7) | | $ | 10.00 | | | $ | (0.01 | )# | | $ | (0.24) | (4) | | $ | — | | | $ | — | | | $ | 9.75 | | | | (2.50 | )% | | $ | 46,420 | | | | 1.25 | % | | | 1.55 | % | | | (0.34 | )% | | | 6 | % |
| | | | | | | | | | | |
GS4 Class | | | | | | | | | | | | | | | | | | | | | | | | | | | | | | | | | | | | | | | | | | | | | |
| 2013(6)(7) | | $ | 10.00 | | | $ | (0.01 | )# | | $ | (0.24) | (4) | | $ | — | | | $ | — | | | $ | 9.75 | | | | (2.50 | )% | | $ | 244,181 | | | | 1.50 | % | | | 1.78 | % | | | (0.58 | )% | | | 6 | % |
| † | Amount represents less than $0.005 per share. |
| # | Calculated using the average shares outstanding method. |
| (1) | The ratio includes expenses waived/reimbursed net of amount recaptured and fees paid indirectly, where applicable; if expenses waived/reimbursed net of amount recaptured and fees paid indirectly were excluded, the ratio would have been higher (lower) than the ratio shown. |
| (2) | The ratio excludes expenses waived/reimbursed net of amount recaptured and fees paid indirectly, where applicable; if expenses waived/reimbursed net of amount recaptured and fees paid indirectly were included, the ratio would have been lower than the ratio shown. |
| (3) | An out of period adjustment to Investment Income had no impact on Net Investment Income per Share or Total Return; however, the Ratio of Net Investment Income to Average Net Assets increased by 0.02% and 0.03% for GS2 Class and GS4 Class, respectively. See Note 10 in Notes to Financial Statements. |
| (4) | Amount includes Capital Gains distributions received by the Fund from the GuideStone Money Market Fund. The amount of these distributions represents less than $0.005 per share. |
| (5) | The ratio for the International Equity Fund includes the effect of dividend expense on securities sold short which increased the ratio by 0.04% for the years 2009 and 2010, and 0.08%, 0.20% and 0.15% for the years 2011, 2012 and 2013, respectively. |
| (6) | An out of period adjustment to Investment Income had no impact on Net Investment Income per Share or Total Return; however, the Ratio of Net Investment Income to Average Net Assets increased by 0.00% and 0.01% for GS2 Class and GS4 Class, respectively. See Note 10 in Notes to Financial Statements. |
| (7) | Inception Date was October 31, 2013. All ratios for the period have been annualized. Total return and portfolio turnover for the period have not been annualized. |
| | | | |
| 244 | | See Notes to Financial Statements. | | |
REAL RETURN SELECT FUNDS (Unaudited)
Real assets performance was mixed in 2013. The Real Return Select Funds include funds that invest in various real asset strategies that are commonly used as a strategic diversifier to traditional equity and fixed income investments and as inflation hedges within a broader investment portfolio. Real assets represent a broadly diverse set of investments that can be classified into several sub-categories including inflation-linked bonds, commodities, global natural resource equities, real estate and floating-rate bank loans.
U.S. Treasury Inflation Protected Securities (“TIPS”) historically have been the least volatile of the real asset categories. However, TIPS, as measured by the Barclays U.S. TIPS Index, fell 8.61% in 2013. This compares to the nominal U.S. Treasury sector declining 2.75% within the Barclays U.S. Aggregate Bond Index.
The S&P Dow-Jones UBS Commodity Index posted a -9.52% return for 2013. This Index represents diversified exposure to a basket of commodities futures across energy, agriculture, livestock and industrial and precious metals. While the energy sector was up 5.2% for the year, metals and agriculture sectors posted double digit declines. In particular, gold made headlines with prices falling 28% during 2013.
Global natural resource equities were the best performing real asset category, with the MSCI World Commodity Producers Index up 8.12% for the year. Energy producers, which make up the majority of the index, drove returns as they posted double digit returns in 2013. The worst performing segment for the year were gold and silver mining stocks, which in aggregate lost approximately half or more of their value during the year.
The global REIT market, as measured by the FTSE/EPRA NAREIT Developed Index (Gross), returned 4.4% for the year. While Asian markets led gains with an advance of over 16%, currency depreciation versus the U.S. dollar hampered returns so that the U.S. dollar investor realized a return of only 4.4%. European markets posted the highest U.S. dollar return with an advance of over 16.3%, partially boosted from currency gains. U.S. REITs were the significant laggard, posting a modest 1.3% return for the year. Rising yields put pressure on real estate categories with long-term tenants given their bond-like features – therefore, the health care sector was the worst performer in the U.S. with a 7.4% decline. On the other hand, hotels, which benefit from a stronger economy and are less sensitive to rising rates, were the best performing segment with a 7.7% gain.
Bank loans, predominately senior-secured, were up 5.29% for the year based on the S&P Leveraged Loan Index. During a risk-on environment, investor demand was high for these below-investment grade investments that provided a combination of higher yields and lower duration (a measure of bond prices’ sensitivity to changes in interest rates) than in traditional fixed income instruments. Bank loans provided investors seeking higher yields with a spread over LIBOR that at December 31, 2013 was 438 basis points for the index. Bank loans benefited from a low default rate environment, and while they underperformed the broader high yield market (below-investment grade fixed income securities), they meaningfully outperformed the broader fixed income marketplace as investors were compensated for holding additional credit risk.
Inflation Protected Bond Fund (Unaudited)
The Fund was actively managed and was primarily comprised of inflation-indexed debt securities with an average dollar-weighted duration (a measure of bond prices’ sensitivity to changes in interest rates) normally between four and 10 years. The Fund underperformed the benchmark index, the Barclays U.S. TIPS Index, for the one year period ended December 31, 2013 (-8.64% versus -8.61%).
The Fund was invested predominately in U.S. Treasury Inflation Protected Securities (“TIPS”) throughout the year. Negative performance for U.S. TIPS was concentrated in May and June of 2013, as the benchmark index fell 7.78% over these two months. This was the worst period of the year for all fixed income assets, as the Federal Reserve rattled the markets with suggestions that tapering of its quantitative easing program could come as early as September 2013. This was much sooner than markets had been expecting, especially with economic indicators well short of Federal Reserve targets. The change in expectations led to a sharp rise in yields across fixed income instruments, negatively impacting all fixed income sectors including U.S. TIPS.
The Fund was consistently managed to provide inflation protection and income consistent with investment in inflation-indexed securities.
Certain strategies involving derivatives were utilized during the year. Interest rate futures and options were utilized to manage duration and yield curve exposure and to express active views on valuations of securities. The portfolio’s overall duration and yield curve posture contributed positively to relative performance for the year. The Fund also utilized currency forwards and options to hedge non-dollar positions and to express active views in foreign currencies. The use of currency forwards and futures detracted marginally from performance over the year.
This Fund may be suitable for investors who have a long-term investment horizon, want protection from inflation, can accept short-term fluctuations in account value and want to diversify their portfolio with a fixed income investment option. This Fund is subject to interest rate risk. Meaning, when interest rates rise, the value of the existing bonds decrease and vice versa. Changes in interest rates have a bigger impact on long duration holdings than on short duration holdings. To the extent that the investment adviser misjudges current market conditions, the Fund’s volatility may be amplified by its use of derivatives and by its ability to select sub-advisers to allocate assets. Leverage may increase the risk of loss and cause fluctuations in the market value of the Fund’s portfolio to have disproportionately large effects or cause the net asset value of the Fund generally to decline faster than it would otherwise.
At December 31, 2013, the portfolio holdings of the Fund, as a percentage of net assets, is shown in the following table. Portfolio holdings are subject to risk and may change at any time.
| | | | |
| | | % | |
U.S. Treasury Obligations | | | 86.9 | |
Foreign Government Inflation-Linked Bond | | | 8.4 | |
Money Market Fund | | | 5.0 | |
Purchased Options | | | — | ** |
Written Options | | | — | ** |
| | | | |
| | | 100.3 | |
| | | | |
** Rounds to less than 0.005%.
Inflation Protected Bond Fund (Unaudited)
| | | | |
Average Annual Total Returns as of 12/31/13 |
| | | GS4 Class* | | Benchmark** |
One Year | | -8.64% | | -8.61% |
Since Inception | | 4.26% | | 5.04% |
Inception Date | | 06/25/09 | | |
Total Fund Operating Expenses (May 1, 2013 Prospectus, as amended on October 31, 2013)(1) | | 0.67% | | |
(1)Current information regarding the Fund’s Operating Expenses can be found in the Financial Highlights.
The performance data quoted represents past performance and does not guarantee future results. Current performance may be lower or higher. Performance data current to the most recent month-end may be obtained at www.GuideStoneFunds.org. The investment return and principal value of an investment will fluctuate so that shares, when redeemed, may be worth more or less than their original cost.
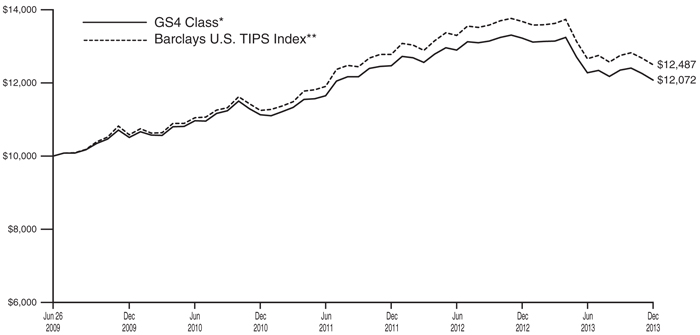
The graph compares the results of a hypothetical $10,000 investment in the GS4 Class of the Fund since June 25, 2009 (commencement of operations), with all dividends and capital gains reinvested, with the Barclays U.S. TIPS Index.
*These returns reflect expense waivers by the Fund’s investment adviser. Without these waivers, returns would have been lower. Returns shown do not reflect the deduction of taxes that a shareholder would pay on Fund distributions or the redemption of Fund shares.
Unlike a mutual fund, the performance of an index assumes no taxes, transaction costs, management fees or other expenses.
| | |
INFLATION PROTECTED BOND FUND SCHEDULE OF INVESTMENTS | | December 31, 2013 |
| | | | | | | | | | | | |
| | | Par | | | Value | |
U.S. TREASURY OBLIGATIONS — 86.9% | |
U.S. Treasury Inflationary Index Bonds | | | | | | | | | | | | |
2.00%, 01/15/16 | | | | $ | 4,735,000 | | | | | $ | 5,942,339 | |
0.13%, 04/15/16 | | | | | 19,970,600 | | | | | | 21,713,017 | |
2.50%, 07/15/16 | | | | | 6,167,200 | | | | | | 7,831,110 | |
2.38%, 01/15/17 | | | | | 1,750,000 | | | | | | 2,231,891 | |
0.13%, 04/15/17 | | | | | 8,173,300 | | | | | | 8,643,867 | |
0.13%, 04/15/18 | | | | | 30,750,000 | | | | | | 31,703,658 | |
1.38%, 07/15/18 | | | | | 3,300,000 | | | | | | 3,877,311 | |
2.13%, 01/15/19 | | | | | 475,900 | | | | | | 578,549 | |
1.88%, 07/15/19 | | | | | 2,240,000 | | | | | | 2,725,016 | |
1.38%, 01/15/20 | | | | | 3,370,000 | | | | | | 3,912,044 | |
1.25%, 07/15/20 | | | | | 5,480,000 | | | | | | 6,284,840 | |
1.13%, 01/15/21 | | | | | 9,875,000 | | | | | | 11,091,925 | |
0.63%, 07/15/21 | | | | | 1,080,000 | | | | | | 1,137,173 | |
0.13%, 01/15/22 | | | | | 11,059,200 | | | | | | 10,980,109 | |
0.13%, 07/15/22 | | | | | 4,945,000 | | | | | | 4,815,702 | |
0.13%, 01/15/23 | | | | | 15,729,000 | | | | | | 15,045,603 | |
0.38%, 07/15/23 | | | | | 20,510,000 | | | | | | 19,868,207 | |
2.38%, 01/15/25‡‡ | | | | | 9,575,200 | | | | | | 13,656,379 | |
2.00%, 01/15/26 | | | | | 3,775,000 | | | | | | 4,924,798 | |
2.38%, 01/15/27 | | | | | 3,870,000 | | | | | | 5,172,032 | |
1.75%, 01/15/28 | | | | | 7,330,000 | | | | | | 8,764,943 | |
3.63%, 04/15/28 | | | | | 3,880,000 | | | | | | 7,422,267 | |
2.50%, 01/15/29 | | | | | 5,350,000 | | | | | | 6,848,628 | |
3.88%, 04/15/29 | | | | | 4,875,000 | | | | | | 9,507,094 | |
3.38%, 04/15/32 | | | | | 627,100 | | | | | | 1,099,804 | |
2.13%, 02/15/40 | | | | | 2,787,600 | | | | | | 3,390,291 | |
2.13%, 02/15/41 | | | | | 4,138,900 | | | | | | 4,969,584 | |
0.75%, 02/15/42 | | | | | 7,294,400 | | | | | | 6,077,598 | |
0.63%, 02/15/43 | | | | | 10,275,000 | | | | | | 8,047,338 | |
| | | | | | | | | | | | |
Total U.S. Treasury Obligations
(Cost $245,898,143) | | | 238,263,117 | |
| | | | | | | | | | | | |
FOREIGN GOVERNMENT INFLATION-LINKED BOND — 8.4% | |
Canada — 0.2% | | | | | | | | | | | | |
Canadian Government Bond
1.50%,12/01/44(C) | | | | | 350,000 | | | | | | 369,636 | |
| | | | | | | | | | | | |
Germany — 5.6% | | | | | | | | | | | | |
Bundesrepublik Deutschland Bundesobligation Inflation Linked Bond 0.75%, 04/15/18(E) | | | | | 1,045,000 | | | | | | 1,586,638 | |
Deutsche Bundesrepublik Inflation Linked Bond 1.50%, 04/15/16(E) | | | | | 8,245,000 | | | | | | 13,712,846 | |
| | | | | | | | | | | | |
| | | | | | | | | | | 15,299,484 | |
| | | | | | | | | | | | |
Italy — 2.3% | | | | | | | | | | | | |
Italy Buoni Poliennali Del Tesoro
2.10%, 09/15/16(E) | | | | | 4,200,000 | | | | | | 6,367,421 | |
| | | | | | | | | | | | |
New Zealand — 0.3% | | | | | | | | | | | | |
New Zealand Government Bond
3.00%, 09/20/30(Z) | | | | | 1,096,000 | | | | | | 912,347 | |
| | | | | | | | | | | | |
Total Foreign Government Inflation-Linked Bond
(Cost $23,016,011) | | | 22,948,888 | |
| | | | | | | | | | | | |
| | | | | | | | | | | | |
| | | Number of
Contracts | | | Value | |
PURCHASED OPTIONS — 0.0% | |
Put Options — 0.0% | | | | | | | | | | | | |
2-Year Eurodollar Mid-Curve Option, Strike Price $98.75, Expires 01/11/14 (JPM) | | | | | 200 | | | | | $ | 97,500 | |
| | |
| | | Notional
Amount | | | | |
Euro vs. U.S. Dollar, Strike Price $1.32, Expires 01/24/14 (DEUT) | | | | $ | 1,955,000 | | | | | | 1,565 | |
Euro vs. U.S. Dollar, Strike Price $1.35, Expires 01/24/14 (DEUT) | | | | | 1,930,000 | | | | | | 6,513 | |
| | | | | | | | | | | | |
Total Purchased Options
(Cost $75,527) | | | | | | | | | | | 105,578 | |
| | | | | | | | | | | | |
| | |
| | | Shares | | | | |
MONEY MARKET FUND — 5.0% | |
GuideStone Money Market Fund (GS4 Class)¥
(Cost $13,562,904) | | | | | 13,562,904 | | | | | | 13,562,904 | |
| | | | | | | | | | | | |
TOTAL INVESTMENTS — 100.3%
(Cost $282,552,585) | | | | | | 274,880,487 | |
| | | | | | | | | | | | |
| | |
| | | Notional
Amount | | | | |
WRITTEN OPTIONS — 0.0% | |
Call Options — 0.0% | | | | | | | | | | | | |
Euro vs. U.S. Dollar, Strike Price $1.41, Expires 01/24/14 (DEUT) | | | | $ | (1,930,000 | ) | | | | | (3,555 | ) |
U.S. Dollar vs. Japanese Yen, Strike Price $105.25, Expires 03/18/14 (DEUT) | | | | | (1,015,000 | ) | | | | | (17,799 | ) |
| | | | | | | | | | | | |
| | | | | | | | | | | (21,354 | ) |
| | | | | | | | | | | | |
| | |
| | | Number of
Contracts | | | | |
Put Options — 0.0% | | | | | | | | | | | | |
2-Year Eurodollar Mid-Curve Option, Strike Price $98.50, Expires 01/11/14 (JPM) | | | | | (200 | ) | | | | | (22,500 | ) |
| | |
| | | Notional
Amount | | | | |
Euro vs. U.S. Dollar, Strike Price $1.35, Expires 01/24/14 (DEUT) | | | | $ | (1,945,000 | ) | | | | | (5,349 | ) |
| | | | | | | | | | | | |
| | | | | | | | | | | (27,849 | ) |
| | | | | | | | | | | | |
Total Written Options
(Premiums received $(81,583)) | | | (49,203 | ) |
| | | | | | | | | | | | |
Liabilities in Excess of
Other Assets — (0.3)% | | | | | | (720,770 | ) |
| | | | | | | | | | | | |
NET ASSETS — 100.0% | | | | | | | | | | $ | 274,110,514 | |
| | | | | | | | | | | | |
| | | | |
| 248 | | See Notes to Financial Statements. | | |
VALUATION HIERARCHY
The following is a summary of the inputs used, as of December 31, 2013, in valuing the Fund’s investments carried at fair value:
| | | | | | | | | | | | | | | | | | | | |
| | | Total
Value | | Level 1
Quoted Prices | | Level 2
Other Significant
Observable Inputs | | Level 3
Significant
Unobservable Inputs |
Assets: | | | | | | | | | | | | | | | | | | | | |
Investments in Securities: | | | | | | | | | | | | | | | | | | | | |
Foreign Government Inflation-Linked Bond | | | $ | 22,948,888 | | | | $ | — | | | | $ | 22,948,888 | | | | $ | — | |
Money Market Fund | | | | 13,562,904 | | | | | 13,562,904 | | | | | — | | | | | — | |
Purchased Options | | | | 105,578 | | | | | 105,578 | | | | | — | | | | | — | |
U.S. Treasury Obligations | | | | 238,263,117 | | | | | — | | | | | 238,263,117 | | | | | — | |
| | | | |
| | | | | | | | | | | | | | | | | | | | |
| | | | |
Total Assets - Investments in Securities | | | $ | 274,880,487 | | | | $ | 13,668,482 | | | | $ | 261,212,005 | | | | $ | — | |
| | | | | | | | | | | | | | | | | | | | |
| | | | |
Other Financial Instruments*** | | | | | | | | | | | | | | | | | | | | |
Futures Contracts | | | $ | 68,822 | | | | $ | 68,822 | | | | $ | — | | | | $ | — | |
| | | | |
| | | | | | | | | | | | | | | | | | | | |
| | | | |
Total Assets - Other Financial Instruments | | | $ | 68,822 | | | | $ | 68,822 | | | | $ | — | | | | $ | — | |
| | | | | | | | | | | | | | | | | | | | |
| | | | |
Liabilities: | | | | | | | | | | | | | | | | | | | | |
Investments in Securities: | | | | | | | | | | | | | | | | | | | | |
Written Options | | | $ | (49,203 | ) | | | $ | (49,203 | ) | | | $ | — | | | | $ | — | |
| | | | |
| | | | | | | | | | | | | | | | | | | | |
| | | | |
Total Liabilities - Investments in Securities | | | $ | (49,203 | ) | | | $ | (49,203 | ) | | | $ | — | | | | $ | — | |
| | | | | | | | | | | | | | | | | | | | |
| | | | |
Other Financial Instruments*** | | | | | | | | | | | | | | | | | | | | |
Forward Foreign Currency Contracts | | | $ | (419,123 | ) | | | $ | — | | | | $ | (419,123 | ) | | | $ | — | |
| | | | |
| | | | | | | | | | | | | | | | | | | | |
| | | | |
Total Liabilities - Other Financial Instruments | | | $ | (419,123 | ) | | | $ | — | | | | $ | (419,123 | ) | | | $ | — | |
| | | | | | | | | | | | | | | | | | | | |
***Other financial instruments are derivative instruments not reflected in the Schedule of Investments, such as futures, forwards and swap contracts, which are valued at the unrealized appreciation (depreciation) on the investment. Details of these investments can be found in the Notes to Financial Statements.
There were no transfers between Level 1 and Level 2 during the year ended December 31, 2013.
| | | | |
| | See Notes to Financial Statements. | | 249 |
Flexible Income Fund (Unaudited)
The Flexible Income Fund was launched on July 1, 2013, as part of an expanded GuideStone Real Return Select Fund suite of offerings. The Fund primarily invests in below-investment grade, senior secured floating rate loans issued by U.S. banks or other financial institutions, otherwise referred to as “bank loans” or “leveraged loans”. To a lesser extent, the Fund may also invest in other below investment grade corporate fixed income securities or unsecured floating rate loans and may include non-U.S. securities. The Fund underperformed its benchmark, the S&P LSTA U.S. B- & Above Leveraged Loan Index, for the since inception period ending December 31, 2013 (1.57% versus 2.86%).
The bank loan market ended the year on a high note with positive investment returns for all months in the fourth quarter. The Fund returned 1.84% in the fourth quarter compared to 1.61% for the benchmark. Strong market demand for bank loans helped to push prices higher during 2013, particularly in the fourth quarter when new issuance volume declined.
The Fund’s benchmark relative underperformance for the year occurred entirely during the third quarter and was largely due to cash exposure that is not included in the benchmark. In addition, the Fund’s underweight exposure to and negative selection within the lowest rated bonds, those rated CCC or lower by Standard and Poor’s, also hurt benchmark relative returns. Lastly, underweight exposure and negative selection in the printing and publishing sector along with underweight exposure in the utilities sector detracted from benchmark relative performance for the Fund. Positive security selection in BB-rated and B-rated loans, which comprised over 90% of the Fund’s market value at year-end, contributed positively to benchmark-relative results.
During the year, the Fund remained focused on its objective of seeking a high level of current income. At year-end, the current yield of the Fund was 4.34%.
The Fund did not invest in derivative instruments during the year.
This Fund may be suitable for investors who have a medium- to long-term investment horizon, possess a moderate tolerance for risk and are seeking income which may be more sensitive to interest rates than traditional bonds.
There is a risk that the issuer of a fixed-income investment owned by the Fund may fail to pay interest or principal due in a timely manner or at all. If the Fund acquires a participation interest in a senior secured or unsecured floating rate loan (“Senior Loans”), the Fund may not be able to control the exercise of any remedies that the lender would have under the loan and likely would not have any rights against the borrower directly. Senior Loans made to finance highly leveraged corporate acquisitions may be especially vulnerable to adverse changes in economic or market conditions. The Fund is subject to collateral risk in that the value of collateral securing a Senior Loan may decline after investment and that the collateral may not be sufficient to cover the amount owed. The Fund might not be able to sell a security promptly and at an acceptable price, which could have the effect of decreasing the overall level of the fund’s liquidity. High yield securities (“junk bonds”) involve greater risks of default and are more volatile than securities rated investment grade.
At December 31, 2013, the portfolio holdings of the Fund, as a percentage of net assets, is shown in the following table. Portfolio holdings are subject to risk and may change at any time.
| | | | |
| | | % | |
Loan Agreements | | | 93.8 | |
Money Market Fund | | | 4.7 | |
| | | | |
| | | 98.5 | |
| | | | |
250
| | |
FLEXIBLE INCOME FUND SCHEDULE OF INVESTMENTS | | December 31, 2013 |
| | | | | | | | | | | | |
| | | Par | | | Value | |
LOAN AGREEMENTS — 93.8% | |
Accudyne Industries Borrower SCA Term Loan | | | | | | | | | | | | |
4.00%, 12/13/19 | | | | $ | 1,959,949 | | | | | $ | 1,961,987 | |
ADS Waste Holdings, Inc. Term B Loan | | | | | | | | | | | | |
4.25%, 10/09/19 | | | | | 1,243,719 | | | | | | 1,249,241 | |
Affinia Group, Inc.
Term B-2 Loan | | | | | | | | | | | | |
4.75%, 04/25/20 | | | | | 1,044,750 | | | | | | 1,057,809 | |
Akorn, Inc. Term B Loan | | | | | | | | | | | | |
0.00%, 11/13/20S | | | | | 650,000 | | | | | | 653,250 | |
AlixPartners LLP Term B-2 Loan | | | | | | | | | | | | |
5.00%, 07/02/20 | | | | | 987,500 | | | | | | 993,366 | |
Allflex Holdings III, Inc. Term B Loan | | | | | | | | | | | | |
4.25%, 07/17/20 | | | | | 936,652 | | | | | | 939,697 | |
Ancestry.com, Inc. Term B-1 Loan | | | | | | | | | | | | |
5.25%, 12/28/18 | | | | | 748,125 | | | | | | 749,838 | |
Apex Tool Group LLC Term B Loan | | | | | | | | | | | | |
4.50%, 02/01/20 | | | | | 994,987 | | | | | | 998,470 | |
ARRIS Group, Inc.
Term B Loan | | | | | | | | | | | | |
3.50%, 03/27/20 | | | | | 632,319 | | | | | | 629,556 | |
Asurion LLC Term B-1 Loan | | | | | | | | | | | | |
4.50%, 05/24/19 | | | | | 1,492,462 | | | | | | 1,491,343 | |
Berry Plastics Group, Inc. Term D Loan | | | | | | | | | | | | |
3.50%, 02/08/20 | | | | | 746,241 | | | | | | 743,129 | |
Biomet, Inc. Term B-2 Loan | | | | | | | | | | | | |
3.66%-3.75%, 07/25/17 | | | | | 746,250 | | | | | | 750,451 | |
BJ’s Wholesale Club, Inc. Term B Loan | | | | | | | | | | | | |
4.50%, 09/26/19 | | | | | 994,987 | | | | | | 1,000,092 | |
BJ’s Wholesale Club, Inc. Term Loan | | | | | | | | | | | | |
8.50%, 03/31/20 | | | | | 500,000 | | | | | | 509,375 | |
BMC Software Finance, Inc. Term B Loan | | | | | | | | | | | | |
5.00%, 09/10/20 | | | | | 1,750,000 | | | | | | 1,758,207 | |
Bombardier Recreational Products, Inc. Term B Loan | | | | | | | | | | | | |
4.00%, 01/29/19 | | | | | 750,000 | | | | | | 751,875 | |
Brand Energy & Infrastructure Services, Inc. Term B Loan | | | | | | | | | | | | |
4.75%, 11/26/20 | | | | | 980,000 | | | | | | 984,596 | |
Bright Horizons Family Solutions, Inc. Term Loan | | | | | | | | | | | | |
4.00%, 01/30/20 | | | | | 1,243,719 | | | | | | 1,250,248 | |
BSN Medical International Holding GmbH & Co. Term B1A Loan | | | | | | | | | | | | |
4.00%, 06/01/19 | | | | | 1,000,000 | | | | | | 1,005,310 | |
Capsugel Holdings US, Inc. Term B Loan | | | | | | | | | | | | |
3.50%, 08/01/18 | | | | | 455,298 | | | | | | 455,016 | |
| | | | | | | | | | | | |
| | | Par | | | Value | |
Catalina Marketing Corporation Term B Loan | | | | | | | | | | | | |
5.25%, 10/11/20 | | | | $ | 748,125 | | | | | $ | 757,477 | |
CDW LLC Term B-1 Loan | | | | | | | | | | | | |
3.25%, 04/29/20 | | | | | 994,989 | | | | | | 990,900 | |
Chesapeake Energy Corporation Term B Loan | | | | | | | | | | | | |
5.75%, 12/02/17 | | | | | 1,000,000 | | | | | | 1,020,000 | |
Chromaflo Technologies Corporation Term B Loan | | | | | | | | | | | | |
4.50%, 12/02/19 | | | | | 500,000 | | | | | | 499,690 | |
Cincinnati Bell, Inc. Term B Loan | | | | | | | | | | | | |
4.00%, 09/10/20 | | | | | 1,496,250 | | | | | | 1,498,120 | |
CompuCom Systems, Inc. Term B Loan | | | | | | | | | | | | |
4.25%, 05/09/20 | | | | | 1,936,425 | | | | | | 1,931,584 | |
CPG International, Inc. Term B Loan | | | | | | | | | | | | |
4.75% ,09/30/20 | | | | | 997,500 | | | | | | 999,994 | |
CWGS Group LLC Term B Loan | | | | | | | | | | | | |
5.75%, 02/20/20 | | | | | 500,000 | | | | | | 503,750 | |
Del Monte Corporation Term B-New Loan | | | | | | | | | | | | |
4.00%, 03/08/18 | | | | | 500,000 | | | | | | 501,155 | |
Del Monte Foods, Inc. Term Loan | | | | | | | | | | | | |
0.00%, 11/26/20S | | | | | 500,000 | | | | | | 502,500 | |
Dell International LLC Term B Loan | | | | | | | | | | | | |
4.50%, 04/29/20 | | | | | 1,280,000 | | | | | | 1,282,291 | |
Delta 2 Lux S.à r.l. Term B Loan | | | | | | | | | | | | |
4.50%, 04/30/19 | | | | | 1,492,481 | | | | | | 1,507,197 | |
Dole Food Co., Inc. Term B Loan | | | | | | | | | | | | |
4.50%, 11/01/18 | | | | | 500,000 | | | | | | 501,665 | |
DS Waters of America, Inc. Term Loan | | | | | | | | | | | | |
5.25%, 09/03/20 | | | | | 1,246,875 | | | | | | 1,264,020 | |
E.W. Scripps Co. Term B Loan | | | | | | | | | | | | |
3.25%, 11/26/20 | | | | | 700,000 | | | | | | 699,125 | |
Equipower Resources Holdings LLC Term B Loan | | | | | | | | | | | | |
4.25%, 12/21/18 | | | | | 1,245,133 | | | | | | 1,248,632 | |
Exopack Holdngs SA Term B Loan | | | | | | | | | | | | |
5.25%, 11/08/19 | | | | | 700,000 | | | | | | 710,500 | |
Fairmount Minerals, Ltd. Term B-2 Loan | | | | | | | | | | | | |
5.00%, 09/05/19 | | | | | 1,246,875 | | | | | | 1,265,890 | |
Fieldwood Energy LLC Term Loan | | | | | | | | | | | | |
3.88%, 09/25/18 | | | | | 438,900 | | | | | | 441,582 | |
8.38%, 09/30/20 | | | | | 400,000 | | | | | | 408,000 | |
Filtration Group, Inc. Term B Loan | | | | | | | | | | | | |
4.50%, 11/21/20 | | | | | 500,000 | | | | | | 504,690 | |
Foresight Energy LLC Term B Loan | | | | | | | | | | | | |
5.50%, 08/23/20 | | | | | 1,072,312 | | | | | | 1,081,695 | |
| | | | |
| | See Notes to Financial Statements. | | 251 |
FLEXIBLE INCOME FUND
SCHEDULE OF INVESTMENTS (Continued)
| | | | | | | | | | | | |
| | | Par | | | Value | |
Garda World Security Corporation Delayed Draw Term B-DD Loan | | | | | | | | | | | | |
0.00%, 11/08/20S | | | | $ | 101,852 | | | | | $ | 101,948 | |
Garda World Security Corporation Term B Loan | | | | | | | | | | | | |
4.00%, 11/08/20 | | | | | 398,148 | | | | | | 398,522 | |
Gardner Denver, Inc. Term Loan | | | | | | | | | | | | |
4.25%, 07/30/20 | | | | | 1,745,625 | | | | | | 1,745,416 | |
Genesys Telecommunications Laboratories, Inc. Term B Loan | | | | | | | | | | | | |
4.00%, 02/08/20 | | | | | 994,987 | | | | | | 987,525 | |
Getty Images, Inc. Term B Loan | | | | | | | | | | | | |
4.75%, 10/18/19 | | | | | 994,975 | | | | | | 927,018 | |
Great Wolf Resorts, Inc. Term B Loan | | | | | | | | | | | | |
4.50%, 08/06/20 | | | | | 995,000 | | | | | | 998,423 | |
HGIM Corporation Term B Loan | | | | | | | | | | | | |
5.50%, 06/18/20 | | | | | 997,500 | | | | | | 1,006,228 | |
Hilton Worldwide Finance LLC
Term B Loan | | | | | | | | | | | | |
4.00%, 10/25/20 | | | | | 888,158 | | | | | | 894,819 | |
Hub International, Ltd. Term B Loan | | | | | | | | | | | | |
4.75%, 10/02/20 | | | | | 1,745,625 | | | | | | 1,765,263 | |
Hudson’s Bay Co. Term B Loan | | | | | | | | | | | | |
4.75%, 11/04/20 | | | | | 850,000 | | | | | | 863,073 | |
Infor US, Inc.
Term B-3 Loan | | | | | | | | | | | | |
3.75%, 06/03/20 | | | | | 986,222 | | | | | | 983,756 | |
Integra Telecom Holdings, Inc. Term Loan | | | | | | | | | | | | |
5.25%, 02/22/19 | | | | | 994,987 | | | | | | 1,007,007 | |
Interactive Data Corporation
Term B Loan | | | | | | | | | | | | |
3.75%, 02/11/18 | | | | | 1,244,104 | | | | | | 1,243,843 | |
ION Media Networks, Inc. Term B Loan | | | | | | | | | | | | |
0.00%, 12/18/20S | | | | | 800,000 | | | | | | 803,336 | |
J. Crew Group, Inc. Term B-1 Loan | | | | | | | | | | | | |
4.00%, 03/07/18 | | | | | 1,272,843 | | | | | | 1,279,831 | |
Jo-Ann Stores, Inc. Term Loan | | | | | | | | | | | | |
4.00%, 03/18/18 | | | | | 746,241 | | | | | | 747,173 | |
Kronos, Inc. Term Loan | | | | | | | | | | | | |
9.75%, 04/30/20 | | | | | 750,000 | | | | | | 774,375 | |
Level 3 Financing, Inc.
Term B-III Loan | | | | | | | | | | | | |
4.00%, 08/01/19 | | | | | 1,250,000 | | | | | | 1,255,725 | |
Live Nation Entertainment, Inc. Term B-1 Loan | | | | | | | | | | | | |
3.50%, 08/16/20 | | | | | 1,995,000 | | | | | | 2,000,825 | |
LTS Buyer LLC
Term B Loan | | | | | | | | | | | | |
4.50%, 04/01/20 | | | | | 1,243,750 | | | | | | 1,248,029 | |
MacDermid, Inc. Term Loan | | | | | | | | | | | | |
4.00%, 06/07/20 | | | | | 995,000 | | | | | | 1,001,527 | |
| | | | | | | | | | | | |
| | | Par | | | Value | |
McJunkin Red Man Corporation
Term B Loan | | | | | | | | | | | | |
5.00%, 11/09/19 | | | | $ | 498,750 | | | | | $ | 504,984 | |
Michaels Stores, Inc. Term B Loan | | | | | | | | | | | | |
3.75%, 01/28/20 | | | | | 997,494 | | | | | | 1,000,606 | |
Mission Broadcasting, Inc. Term B-2 Loan | | | | | | | | | | | | |
3.75%, 10/01/20 | | | | | 1,039,063 | | | | | | 1,040,039 | |
MoneyGram International, Inc. Term B Loan | | | | | | | | | | | | |
4.25%, 03/28/20 | | | | | 994,987 | | | | | | 1,003,385 | |
Monitronics International, Inc. Term B Loan | | | | | | | | | | | | |
4.25%, 03/23/18 | | | | | 497,487 | | | | | | 501,219 | |
MultiPlan, Inc.
Term B-1 Loan | | | | | | | | | | | | |
4.00%, 08/18/17 | | | | | 885,321 | | | | | | 890,376 | |
Murray Energy Corporation
Term B Loan | | | | | | | | | | | | |
5.25%, 12/05/19 | | | | | 850,000 | | | | | | 857,973 | |
Neiman Marcus Group Ltd., Inc.
Term Loan | | | | | | | | | | | | |
5.00%, 10/25/20 | | | | | 1,000,000 | | | | | | 1,011,530 | |
Nexstar Broadcasting, Inc. Term B-2 Loan | | | | | | | | | | | | |
3.75%, 10/01/20 | | | | | 207,812 | | | | | | 208,008 | |
Nuveen Investments, Inc. Term B Loan | | | | | | | | | | | | |
4.17%, 05/13/17 | | | | | 500,000 | | | | | | 497,605 | |
OXEA S.à r.l. Term Loan | | | | | | | | | | | | |
8.25%, 06/06/20 | | | | | 750,000 | | | | | | 762,660 | |
Pacific Drilling SA Term B Loan | | | | | | | | | | | | |
4.50%, 06/03/18 | | | | | 796,000 | | | | | | 804,461 | |
Pacific Industrial Services BidCo Property, Ltd.
Term B Loan | | | | | | | | | | | | |
5.00%, 10/02/18 | | | | | 1,496,250 | | | | | | 1,515,582 | |
Par Pharmaceutical Cos., Inc.
Term B Loan | | | | | | | | | | | | |
4.25%, 09/28/19 | | | | | 1,989,950 | | | | | | 1,999,900 | |
Party City Holdings, Inc. Term B Loan | | | | | | | | | | | | |
4.25%, 07/27/19 | | | | | 1,243,719 | | | | | | 1,247,997 | |
Performance Food Group, Inc.
Term Loan | | | | | | | | | | | | |
6.25%, 11/14/19 | | | | | 995,000 | | | | | | 999,557 | |
Quebecor Media, Inc. Term B Loan | | | | | | | | | | | | |
3.25%, 08/17/20 | | | | | 997,500 | | | | | | 989,400 | |
Quikrete Co., Inc. Term B Loan | | | | | | | | | | | | |
4.00%, 09/30/20 | | | | | 1,496,250 | | | | | | 1,501,577 | |
Ravago Holdings America, Inc. Term B Loan | | | | | | | | | | | | |
0.00%, 12/20/20S | | | | | 500,000 | | | | | | 500,000 | |
Rexnord LLC
Term B Loan | | | | | | | | | | | | |
4.00%, 08/21/20 | | | | | 1,995,000 | | | | | | 1,999,150 | |
Sabre, Inc. Term B-2 Loan | | | | | | | | | | | | |
4.50%, 02/19/19 | | | | | 997,500 | | | | | | 998,747 | |
| | | | |
| 252 | | See Notes to Financial Statements. | | |
| | | | | | | | | | | | |
| | | Par | | | Value | |
SAM Finance Lux S.à r.l. Term B Loan | | | | | | | | | | | | |
4.25%, 11/26/20 | | | | $ | 500,000 | | | | | $ | 500,625 | |
Sandy Creek Energy Associates LP Term B Loan | | | | | | | | | | | | |
5.00%, 11/08/20 | | | | | 300,000 | | | | | | 299,667 | |
Sedgwick Claims Management Services, Inc.
Term B Loan | | | | | | | | | | | | |
4.25%, 06/12/18 | | | | | 746,250 | | | | | | 749,966 | |
Sequa Corporation Term B Loan | | | | | | | | | | | | |
5.25%, 06/19/17 | | | | | 1,493,715 | | | | | | 1,455,566 | |
Spin Holdco, Inc. Term B Loan | | | | | | | | | | | | |
5.50%, 11/08/19 | | | | | 997,500 | | | | | | 1,001,869 | |
Springer Science + Business Media GmbH Term B-2 Loan | | | | | | | | | | | | |
5.00%, 08/15/20 | | | | | 1,496,250 | | | | | | 1,501,233 | |
Springleaf Financial Funding Co. Term B-2 Loan | | | | | | | | | | | | |
4.75%, 09/30/19 | | | | | 500,000 | | | | | | 505,250 | |
Syncreon Group BV Term B Loan | | | | | | | | | | | | |
5.25%, 10/28/20 | | | | | 500,000 | | | | | | 497,190 | |
Syniverse Holdings, Inc. Term B Loan | | | | | | | | | | | | |
4.00%, 04/23/19 | | | | | 1,211,902 | | | | | | 1,215,937 | |
Templar Energy LLC Term Loan | | | | | | | | | | | | |
8.00%, 11/25/20 | | | | | 500,000 | | | | | | 501,250 | |
TGGT Holdings LLC Term B Loan | | | | | | | | | | | | |
6.50%, 11/15/18 | | | | | 600,000 | | | | | | 603,000 | |
TMS International Corporation Term B Loan | | | | | | | | | | | | |
4.50%, 10/16/20 | | | | | 500,000 | | | | | | 503,540 | |
TNT Crane & Rigging, Inc.
Term Loan | | | | | | | | | | | | |
5.50%, 11/27/20 | | | | | 500,000 | | | | | | 495,000 | |
10.00%, 11/27/21 | | | | | 250,000 | | | | | | 238,750 | |
Toys “R” Us Property Co. Term B Loan | | | | | | | | | | | | |
6.00%, 08/21/19 | | | | | 500,000 | | | | | | 480,470 | |
Tribune Co. Term B Loan | | | | | | | | | | | | |
0.00%, 12/27/20S | | | | | 1,250,000 | | | | | | 1,242,187 | |
Univision Communications, Inc. Term C-3 Loan | | | | | | | | | | | | |
4.00%, 03/01/20 | | | | | 1,243,734 | | | | | | 1,248,398 | |
UPC Financing Partnership Term AH Loan | | | | | | | | | | | | |
3.25%, 06/30/21 | | | | | 1,000,000 | | | | | | 998,000 | |
US Foods, Inc. Term B Loan | | | | | | | | | | | | |
4.50%, 03/31/19 | | | | | 1,492,500 | | | | | | 1,505,246 | |
Walter Investment Management Corporation
Term Loan | | | | | | | | | | | | |
0.00%, 12/19/20S | | | | | 500,000 | | | | | | 500,375 | |
WaveDivision Holdings LLC Term Loan | | | | | | | | | | | | |
4.00%,10/15/19 | | | | | 1,243,719 | | | | | | 1,248,383 | |
| | | | | | | | | | | | |
| | | Par | | | Value | |
West Corporation Term B-8 Loan | | | | | | | | | | | | |
3.75%, 06/30/18 | | | | $ | 728,015 | | | | | $ | 730,738 | |
WideOpenWest Finance LLC Term B Loan | | | | | | | | | | | | |
4.75%, 04/01/19 | | | | | 994,987 | | | | | | 998,967 | |
Zayo Group LLC Term B Loan | | | | | | | | | | | | |
4.00%, 07/02/19 | | | | | 497,476 | | | | | | 497,591 | |
| | | | | | | | | | | | |
Total Loan Agreements
(Cost $101,923,854) | | | | | | 102,440,929 | |
| | | | | | | | | | | | |
| | | Shares | | | | |
MONEY MARKET FUND — 4.7% | |
GuideStone Money Market Fund (GS4 Class)¥
(Cost $5,129,568) | | | | | 5,129,568 | | | | | | 5,129,568 | |
| | | | | | | | | | | | |
TOTAL INVESTMENTS — 98.5%
(Cost $107,053,422) | | | | | | 107,570,497 | |
| | | | | | | | | | | | |
Other Assets in Excess of
Liabilities — 1.5% | | | | | | 1,592,158 | |
| | | | | | | | | | | | |
NET ASSETS — 100.0% | | | | | $ | 109,162,655 | |
| | | | | | | | | | | | |
| | | | |
| | See Notes to Financial Statements. | | 253 |
FLEXIBLE INCOME FUND
SCHEDULE OF INVESTMENTS (Continued)
VALUATION HIERARCHY
The following is a summary of the inputs used, as of December 31, 2013, in valuing the Fund’s investments carried at fair value:
| | | | | | | | | | | | | | | | |
| | | Total
Value | | | Level 1
Quoted Prices | | | Level 2
Other Significant
Observable Inputs | | | Level 3
Significant
Unobservable Inputs | |
Assets: | | | | | | | | | | | | | | | | |
Investments in Securities: | | | | | | | | | | | | | | | | |
Loan Agreements | | $ | 102,440,929 | | | $ | — | | | $ | 95,340,787 | | | $ | 7,100,142 | |
Money Market Fund | | | 5,129,568 | | | | 5,129,568 | | | | — | | | | — | |
| | | | | | | | | | | | | | | | |
Total Assets - Investments in Securities | | $ | 107,570,497 | | | $ | 5,129,568 | | | $ | 95,340,787 | | | $ | 7,100,142 | |
| | | | | | | | | | | | | | | | |
There were no transfers between Level 1 and Level 2 during the year ended December 31, 2013.
The unobservable inputs used in the fair value measurement of the reporting entity’s loan agreements are values based on evaluated quotations received from dealers who make markets in such securities. Significant increases (decreases) in those evaluated quotations would result in a significantly higher (lower) fair value measurement.
The following is a reconciliation of assets in which significant unobservable inputs (Level 3) were used in determining fair value:
| | | | | | | | |
| | | Total
Value | | | Loan
Agreements | |
Balance, 12/31/12 | | $ | — | | | $ | — | |
Accrued discounts/premiums | | | 383 | | | | 383 | |
Realized gain (loss)(1) | | | 13 | | | | 13 | |
Change in unrealized appreciation (depreciation)(2) | | | 80,231 | | | | 80,231 | |
Purchases | | | 7,040,121 | | | | 7,040,121 | |
Sales | | | (20,606 | ) | | | (20,606 | ) |
Transfers in to Level 3 | | | — | | | | — | |
Transfers out of Level 3 | | | — | | | | — | |
Maturities | | | — | | | | — | |
Paydowns | | | — | | | | — | |
| | | | | | | | |
Balance, 12/31/13 | | $ | 7,100,142 | | | $ | 7,100,142 | |
| | | | | | | | |
| (1) | Realized gain (loss) from the sale of Level 3 securities can be found on the Statement of Operations in Net realized gain (loss) from: Investment securities. |
| (2) | Change in unrealized appreciation (depreciation) can be found on the Statement of Operations in Net change in unrealized appreciation (depreciation) on: Investment securities. |
| | | | |
| 254 | | See Notes to Financial Statements. | | |
Real Assets Fund (Unaudited)
The Real Assets Fund was launched on July 1, 2013, as part of an expanded GuideStone Real Return Select Fund suite of offerings. The Fund, through investments in other funds, invests mainly in securities or physical assets with real return characteristics.
The Fund had a target asset allocation to Real Return Select Funds and another real return fund including 33% Inflation Protected Bond Fund, 15% Real Estate Securities Fund, 17.5% Credit Suisse Commodity Return Strategy Fund (a third party mutual fund), 17.5% Global Natural Resources Equity Fund and 17% Flexible Income Fund.
As a fund of funds, its performance was based on the performance of the underlying funds. The Fund underperformed its composite benchmark index (33% Barclays U.S. TIPS Index, 17% S&P/LSTA Leveraged Loan Index, 15% FTSE EPRA / NAREIT Developed Index, 14% MSCI World Commodity Producers Index, 4% NYSE Arca Gold Miners Index and 17% S&P Dow Jones-UBS Commodity Index) for the since inception period ending December 31, 2013 ( -0.87% versus 1.01%).
On an absolute basis, the only underlying Real Asset Select Fund with a positive contribution to performance was the Flexible Income Fund, which gained 1.57% since its July 1, 2013 inception.
Only the Real Estate Securities Fund contributed positively to benchmark-relative performance, with all other underlying Real Asset Select Funds underperforming their respective benchmarks. The dominant driver of benchmark-relative underperformance was the Fund’s allocation to the Global Natural Resources Equity Fund, which trailed its benchmark by 8.72% in 2013.
This Fund may be suitable for investors who have a medium- to long-term investment horizon, possess a moderate tolerance for risk and seek to participate in the return potential of real return related securities. The Fund attempts to achieve its objective by investing in selected GuideStone Select Funds and other investments. By investing in the Fund you will also incur the expenses and risks of underlying fund investments. The principal risks of the Fund will change depending on the asset mix of the Select Funds and other investments in which it invests. You may directly invest only in those Select Funds which are eligible for direct investment. The Fund’s value will go up and down in response to changes in the share prices of the investments that it owns. It is possible to lose money by investing in the Fund.
At December 31, 2013, the portfolio holdings of the Fund, as a percentage of net assets, is shown in the following table. Portfolio holdings are subject to risk and may change at any time.
| | | | |
| | | % | |
Real Return Select Funds | | | 81.4 | |
Credit Suisse Commodity Return Strategy Fund | | | 16.9 | |
Fixed Income Select Fund | | | 1.4 | |
| | | | |
| | | 99.7 | |
| | | | |
255
| | |
REAL ASSETS FUND SCHEDULE OF INVESTMENTS | | December 31, 2013 |
| | | | | | | | | | | | |
| | | Shares | | | Value | |
MUTUAL FUNDS — 99.7% | |
GuideStone Money Market Fund (GS4 Class)¥ | | | | | 377,614 | | | | | $ | 377,614 | |
GuideStone Inflation Protected Bond Fund (GS4 Class)¥ | | | | | 883,204 | | | | | | 8,964,518 | |
GuideStone Flexible Income Fund (GS4 Class)¥ | | | | | 459,180 | | | | | | 4,619,355 | |
GuideStone Real Estate Securities Fund (GS4 Class)¥ | | | | | 443,588 | | | | | | 4,151,983 | |
GuideStone Global Natural Resources Equity Fund (GS4 Class)¥ | | | | | 493,110 | | | | | | 4,788,101 | |
Credit Suisse Commodity Return Strategy Fund | | | | | 646,734 | | | | | | 4,675,884 | |
| | | | | | | | | | | | |
| | | | |
Total Mutual Funds
(Cost $28,509,605) | | | | | | | | | | | 27,577,455 | |
| | | | | | | | | | | | |
| | |
TOTAL INVESTMENTS — 99.7%
(Cost $28,509,605) | | | | | | 27,577,455 | |
| | | | |
Other Assets in Excess of
Liabilities — 0.3% | | | | | | | | | | | 73,157 | |
| | | | | | | | | | | | |
NET ASSETS — 100.0% | | | | | | | | | | $ | 27,650,612 | |
| | | | | | | | | | | | |
VALUATION HIERARCHY
The following is a summary of the inputs used, as of December 31, 2013, in valuing the Fund’s investments carried at fair value:
| | | | | | | | | | | | | | | | |
| | | Total
Value | | | Level 1
Quoted Prices | | | Level 2
Other Significant
Observable Inputs | | | Level 3
Significant
Unobservable Inputs | |
Assets: | | | | | | | | | | | | | | | | |
Investments in Securities: | | | | | | | | | | | | | | | | |
Mutual Funds | | $ | 27,577,455 | | | $ | 27,577,455 | | | $ | — | | | $ | — | |
| | | | | | | | | | | | | | | | |
Total Assets - Investments in Securities | | $ | 27,577,455 | | | $ | 27,577,455 | | | $ | — | | | $ | — | |
| | | | | | | | | | | | | | | | |
| | | | |
| 256 | | See Notes to Financial Statements. | | |
Real Estate Securities Fund (Unaudited)
Since the Fund’s inception in December 2006, the Fund has had a domestic-only focus to investing in real estate securities. However, the investment landscape for investing in real estate securities has changed considerably since the Fund was launched. Since that time, the global real estate securities market has increased substantially and many global real estate markets have matured significantly with the adoption of more investor-friendly structures for accessing real estate being launched in many countries. Today, institutional demand for real estate is concentrated in global mandates versus U.S. only focused strategies. Compared to just five or ten years ago, investment managers now have much stronger and more established global capabilities with proven track records.
With that background in mind, GuideStone Capital Management broadened the investment mandate to a global focus for the Fund in 2013. The Fund’s name, principal investment strategy and historical performance track record remained unchanged; however, the transition involved a number of modifications in the Fund. The benchmark index became the FTSE EPRA / NAREIT Developed Index - Net. The benchmark index is global in nature with roughly half of its exposure outside of the United States.
The Fund provided exposure to real estate by investing in public real estate securities with strong cash flow growth potential that provided the capacity for sustained dividend increases. The Fund was diversified among property sectors and geographical locations. The Fund transitioned to a global portfolio at the end of the third quarter. For the year-to-date period through the end of the third quarter, the Fund underperformed its former benchmark, the Dow Jones U.S. Select Real Estate Securities Index (1.98% versus 2.41%) as security selection within the regional mall, office, apartment and retail sectors and underweight exposure to stocks with the highest yields and above average leverage detracted from benchmark relative performance. During the fourth quarter, the Fund slightly outperformed its new global-oriented benchmark, the FTSE EPRA / NAREIT Developed Index - Net (-0.47% versus -0.66%). For the calendar year ending December 31, 2013, the Fund modestly underperformed its new global benchmark (1.49% versus 3.67%).
This Fund may be suitable for investors who seek the potential for current income and long-term capital appreciation. Investors should be willing to accept significant short-term fluctuations in account value and want to diversify their portfolio through exposure to publicly traded real estate securities.
This Fund invests substantial assets in REITs that involve equity market risks as well as risks linked directly to the real estate market. Risks include declines in the value of real estate, general and economic conditions, changes in the value of the underlying property and defaults by borrowers. The value of assets in the real estate industry may go through cycles of relative underperformance and outperformance in comparison to equity securities markets in general.
At December 31, 2013, the portfolio holdings of the Fund, as a percentage of net assets, is shown in the following table. Portfolio holdings are subject to risk and may change at any time.
| | | | |
| | | % | |
Foreign Common Stocks | | | 52.4 | |
Financial Services | | | 44.8 | |
Money Market Funds | | | 12.5 | |
| | | | |
| | | 109.7 | |
| | | | |
257
Real Estate Securities Fund (Unaudited)
| | | | | | |
| Average Annual Total Returns as of 12/31/13 |
| | | GS4 Class* | | Benchmark** | | Benchmark*** |
One Year | | 1.49% | | 3.67% | | 1.31% |
Five Year | | 16.86% | | 15.24% | | 16.44% |
Since Inception | | 1.28% | | -0.29% | | 0.88% |
Inception Date | | 12/29/06 | | | | |
Total Fund Operating Expenses (May 1, 2013 Prospectus, as amended on October 31, 2013)(1) | | 1.07% | | | | |
(1) Current information regarding the Fund’s Operating Expenses can be found in the Financial Highlights.
The performance data quoted represents past performance and does not guarantee future results. Current performance may be lower or higher. Performance data current to the most recent month-end may be obtained at www.GuideStoneFunds.org. The investment return and principal value of an investment will fluctuate so that shares, when redeemed, may be worth more or less than their original cost.
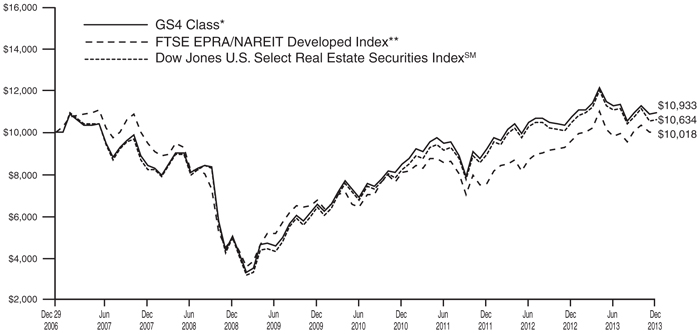
The graph compares the results of a hypothetical $10,000 investment in the GS4 Class of the Fund since December 29, 2006 (commencement of operations), with all dividends and capital gains reinvested, with the FTSE EPRA/NAREIT Developed Index.
*These returns reflect expense waivers by the Fund’s investment adviser. Without these waivers, returns would have been lower. Returns shown do not reflect the deduction of taxes that a shareholder would pay on Fund distributions or the redemption of Fund shares.
***The Fund’s benchmark was changed from the Dow Jones U.S. Select Real Estate Securities IndexSM due to a change in the Fund’s investment strategy.
Unlike a mutual fund, the performance of an index assumes no taxes, transaction costs, management fees or other expenses.
258
| | |
REAL ESTATE SECURITIES FUND SCHEDULE OF INVESTMENTS | | December 31, 2013 |
| | | | | | | | | | |
| | | Shares | | | Value | |
COMMON STOCKS — 44.8% | |
Financial Services — 44.8% | |
Acadia Realty Trust REIT | | | 24,922 | | | | | $ | 618,813 | |
Alexandria Real Estate Equities, Inc. REIT | | | 12,654 | | | | | | 805,047 | |
American Campus Communities, Inc. REITD | | | 60,999 | | | | | | 1,964,778 | |
AvalonBay Communities, Inc. REITD | | | 29,128 | | | | | | 3,443,803 | |
Boston Properties, Inc. REIT | | | 57,313 | | | | | | 5,752,506 | |
BRE Properties, Inc. REIT | | | 17,815 | | | | | | 974,659 | |
Camden Property Trust REITD | | | 23,271 | | | | | | 1,323,655 | |
CBL & Associates Properties, Inc. REITD | | | 49,529 | | | | | | 889,541 | |
Chesapeake Lodging Trust REIT | | | 35,212 | | | | | | 890,511 | |
CoreSite Realty Corporation REITD | | | 45,838 | | | | | | 1,475,525 | |
CubeSmart REIT | | | 53,516 | | | | | | 853,045 | |
DCT Industrial Trust, Inc. REIT | | | 391,961 | | | | | | 2,794,682 | |
DiamondRock Hospitality Co. REITD | | | 56,794 | | | | | | 655,971 | |
Douglas Emmett, Inc. REIT | | | 84,789 | | | | | | 1,974,736 | |
Duke Realty Corporation REIT | | | 213,525 | | | | | | 3,211,416 | |
DuPont Fabros Technology, Inc. REITD | | | 33,011 | | | | | | 815,702 | |
Education Realty Trust, Inc. REITD | | | 1,059 | | | | | | 9,340 | |
Equity Lifestyle Properties, Inc. REIT | | | 12,838 | | | | | | 465,121 | |
Equity One, Inc. REIT | | | 57,757 | | | | | | 1,296,067 | |
Equity Residential REIT | | | 116,949 | | | | | | 6,066,145 | |
Essex Property Trust, Inc. REITD | | | 7,101 | | | | | | 1,019,065 | |
Extra Space Storage, Inc. REIT | | | 36,714 | | | | | | 1,546,761 | |
Federal Realty Investment Trust REITD | | | 16,350 | | | | | | 1,658,054 | |
General Growth Properties, Inc. REIT | | | 129,547 | | | | | | 2,600,008 | |
Glimcher Realty Trust REITD | | | 88,684 | | | | | | 830,082 | |
HCP, Inc. REIT | | | 76,911 | | | | | | 2,793,408 | |
Health Care REIT, Inc. | | | 20,535 | | | | | | 1,100,060 | |
Healthcare Realty Trust, Inc. REIT | | | 42,038 | | | | | | 895,830 | |
Highwoods Properties, Inc. REITD | | | 24,075 | | | | | | 870,793 | |
Host Hotels & Resorts, Inc. REIT | | | 87,167 | | | | | | 1,694,526 | |
Kilroy Realty Corporation REITD | | | 22,124 | | | | | | 1,110,182 | |
Kimco Realty Corporation REITD | | | 82,625 | | | | | | 1,631,844 | |
Kite Realty Group Trust REIT | | | 87,608 | | | | | | 575,585 | |
LaSalle Hotel Properties REITD | | | 41,716 | | | | | | 1,287,356 | |
LTC Properties, Inc. REIT | | | 16,909 | | | | | | 598,410 | |
Macerich Co. (The) REITD | | | 22,625 | | | | | | 1,332,386 | |
Mack-Cali Realty Corporation REITD | | | 18,525 | | | | | | 397,917 | |
Mid-America Apartment Communities, Inc. REIT | | | 19,100 | | | | | | 1,160,134 | |
National Health Investors, Inc. REITD | | | 14,204 | | | | | | 796,844 | |
National Retail Properties, Inc. REITD | | | 78,105 | | | | | | 2,368,925 | |
Pennsylvania Real Estate Investment Trust REIT | | | 28,194 | | | | | | 535,122 | |
| | | | | | | | | | |
| | | Shares | | | Value | |
Piedmont Office Realty Trust, Inc.
Class A REITD | | | 48,954 | | | | | $ | 808,720 | |
Post Properties, Inc. REIT | | | 3,514 | | | | | | 158,938 | |
Prologis, Inc. REIT | | | 60,860 | | | | | | 2,248,777 | |
Public Storage REIT | | | 22,308 | | | | | | 3,357,800 | |
Realty Income Corporation REITD | | | 27,049 | | | | | | 1,009,739 | |
Regency Centers Corporation REIT | | | 25,997 | | | | | | 1,203,661 | |
Retail Properties of America, Inc. Class A REITD | | | 76,719 | | | | | | 975,866 | |
Rexford Industrial Realty, Inc. | | | 30,397 | | | | | | 401,240 | |
RLJ Lodging Trust REIT | | | 51,454 | | | | | | 1,251,361 | |
Sabra Health Care REIT, Inc.D | | | 19,780 | | | | | | 517,049 | |
Select Income REIT | | | 39,902 | | | | | | 1,066,979 | |
Simon Property Group, Inc. REIT | | | 72,145 | | | | | | 10,977,583 | |
SL Green Realty Corporation REITD | | | 18,528 | | | | | | 1,711,617 | |
Spirit Realty Capital, Inc. REITD | | | 220,182 | | | | | | 2,164,389 | |
Sunstone Hotel Investors, Inc. REIT | | | 176,338 | | | | | | 2,362,929 | |
Taubman Centers, Inc. REIT | | | 12,565 | | | | | | 803,155 | |
Ventas, Inc. REIT | | | 110,036 | | | | | | 6,302,862 | |
Vornado Realty Trust REITD | | | 47,566 | | | | | | 4,223,385 | |
Weingarten Realty Investors REIT | | | 25,890 | | | | | | 709,904 | |
| | | | | | | | | | |
| | | |
Total Common Stocks
(Cost $110,167,749) | | | | | | | | | 105,340,309 | |
| | | | | | | | | | |
FOREIGN COMMON STOCKS — 52.4% | |
Australia — 6.3% | |
CFS Retail Property Trust Group REIT | | | 386,331 | | | | | | 670,935 | |
Dexus Property Group REIT | | | 1,090,494 | | | | | | 978,567 | |
Federation Centres, Ltd. REIT | | | 521,925 | | | | | | 1,090,499 | |
GDI Property Group* | | | 112,403 | | | | | | 89,324 | |
Goodman Group REIT | | | 337,878 | | | | | | 1,426,995 | |
GPT Group REIT | | | 256,331 | | | | | | 778,182 | |
Investa Office Fund REIT | | | 25,760 | | | | | | 71,993 | |
Mirvac Group REIT | | | 1,422,429 | | | | | | 2,133,739 | |
Stockland REIT | | | 329,397 | | | | | | 1,061,765 | |
Westfield Group REIT | | | 534,224 | | | | | | 4,813,001 | |
Westfield Retail Trust REIT | | | 621,309 | | | | | | 1,647,652 | |
| | | | | | | | | | |
| | | | | | | | | 14,762,652 | |
| | | | | | | | | | |
Austria — 0.1% | |
CA Immobilien Anlagen AG* | | | 19,412 | | | | | | 343,963 | |
| | | | | | | | | | |
Belgium — 0.2% | |
Warehouses De Pauw SCA REIT | | | 5,428 | | | | | | 393,528 | |
| | | | | | | | | | |
Canada — 3.7% | |
Allied Properties Real Estate Investment Trust REIT | | | 72,553 | | | | | | 2,237,549 | |
Boardwalk Real Estate Investment Trust REIT | | | 30,259 | | | | | | 1,704,873 | |
Canadian Real Estate Investment Trust REIT | | | 15,400 | | | | | | 628,758 | |
Chartwell Retirement Residences REITD | | | 121,674 | | | | | | 1,144,291 | |
First Capital Realty, Inc. D | | | 40,168 | | | | | | 669,687 | |
RioCan Real Estate Investment Trust REITD | | | 94,713 | | | | | | 2,208,558 | |
| | | | | | | | | | |
| | | | | | | | | 8,593,716 | |
| | | | | | | | | | |
| | | | |
| | See Notes to Financial Statements. | | 259 |
REAL ESTATE SECURITIES FUND
SCHEDULE OF INVESTMENTS (Continued)
| | | | | | | | | | |
| | | Shares | | | Value | |
China — 0.5% | |
Agile Property Holdings, Ltd. | | | 412,000 | | | | | $ | 441,525 | |
Country Garden Holdings Co., Ltd. | | | 1,118,000 | | | | | | 674,754 | |
| | | | | | | | | | |
| | | | | | | | | 1,116,279 | |
| | | | | | | | | | |
France — 3.5% | |
Gecina SA REIT | | | 6,894 | | | | | | 912,818 | |
ICADE REIT | | | 2,683 | | | | | | 249,763 | |
Klepierre REIT | | | 34,895 | | | | | | 1,617,470 | |
Societe Fonciere Lyonnaise SA | | | 4,500 | | | | | | 235,803 | |
Unibail-Rodamco SE REIT | | | 20,404 | | | | | | 5,228,736 | |
| | | | | | | | | | |
| | | | | | | | | 8,244,590 | |
| | | | | | | | | | |
Germany — 1.7% | |
Alstria Office REIT AG* | | | 48,566 | | | | | | 611,468 | |
Deutsche Euroshop AG | | | 16,500 | | | | | | 722,400 | |
Deutsche Wohnen AG | | | 50,982 | | | | | | 984,361 | |
DIC Asset AG | | | 74,316 | | | | | | 683,965 | |
LEG Immobilien AG* | | | 18,000 | | | | | | 1,063,558 | |
| | | | | | | | | | |
| | | | | | | | | 4,065,752 | |
| | | | | | | | | | |
Hong Kong — 7.7% | |
Cheung Kong Holdings, Ltd. | | | 32,000 | | | | | | 505,113 | |
Hang Lung Properties, Ltd. | | | 233,000 | | | | | | 736,172 | |
Henderson Land Development Co., Ltd. | | | 165,000 | | | | | | 941,574 | |
Hongkong Land Holdings, Ltd. | | | 396,000 | | | | | | 2,383,920 | |
Link REIT (The) | | | 349,000 | | | | | | 1,692,274 | |
New World Development Co., Ltd. | | | 839,000 | | | | | | 1,059,259 | |
Shimao Property Holdings, Ltd.D* | | | 625,500 | | | | | | 1,437,449 | |
Sino Land Co., Ltd.D | | | 151,948 | | | | | | 207,710 | |
Sun Hung Kai Properties, Ltd. | | | 395,000 | | | | | | 5,009,898 | |
Swire Properties, Ltd. | | | 449,800 | | | | | | 1,136,928 | |
Wharf Holdings, Ltd. | | | 256,000 | | | | | | 1,957,727 | |
Wheelock & Co., Ltd. | | | 243,000 | | | | | | 1,117,180 | |
| | | | | | | | | | |
| | | | | | | | | 18,185,204 | |
| | | | | | | | | | |
Ireland — 0.1% | |
Hibernia REIT PLC* | | | 203,747 | | | | | | 327,946 | |
| | | | | | | | | | |
Japan — 15.4% | |
Advance Residence Investment Corporation REIT | | | 300 | | | | | | 647,170 | |
AEON REIT Investment Corporation | | | 162 | | | | | | 198,751 | |
Frontier Real Estate Investment Corporation REIT | | | 122 | | | | | | 602,378 | |
Global One Real Estate Investment Corporation REIT | | | 59 | | | | | | 400,634 | |
GLP J-REIT* | | | 235 | | | | | | 229,531 | |
Japan Hotel REIT Investment Corporation | | | 733 | | | | | | 351,407 | |
Japan Prime Realty Investment Corporation REIT | | | 165 | | | | | | 528,059 | |
Japan Real Estate Investment Corporation REIT | | | 160 | | | | | | 856,011 | |
Japan Retail Fund Investment Corporation REIT | | | 426 | | | | | | 866,780 | |
Mitsubishi Estate Co., Ltd. | | | 317,500 | | | | | | 9,501,519 | |
Mitsui Fudosan Co., Ltd. | | | 209,313 | | | | | | 7,550,061 | |
Nippon Accommodations Fund, Inc. REIT | | | 142 | | | | | | 955,360 | |
Nippon Building Fund, Inc. REIT | | | 412 | | | | | | 2,393,807 | |
| | | | | | | | | | |
| | | Shares | | | Value | |
Nippon Prologis REIT, Inc. | | | 112 | | | | | $ | 1,072,844 | |
Nomura Real Estate Master Fund, Inc. REIT | | | 822 | | | | | | 846,924 | |
Nomura Real Estate Office Fund, Inc. REIT | | | 101 | | | | | | 469,409 | |
NTT Urban Development Corporation | | | 86,200 | | | | | | 993,635 | |
Sumitomo Realty & Development Co., Ltd. | | | 91,000 | | | | | | 4,534,298 | |
Tokyo Tatemono Co., Ltd. | | | 217,000 | | | | | | 2,413,033 | |
Tokyu REIT, Inc. | | | 122 | | | | | | 752,512 | |
| | | | | | | | | | |
| | | | | | | | | 36,164,123 | |
| | | | | | | | | | |
Jersey — 0.4% | |
LXB Retail Properties PLC* | | | 380,000 | | | | | | 804,671 | |
Max Property Group PLC* | | | 54,329 | | | | | | 137,649 | |
| | | | | | | | | | |
| | | | | | | | | 942,320 | |
| | | | | | | | | | |
Luxembourg — 0.2% | |
GAGFAH SA* | | | 24,607 | | | | | | 362,216 | |
| | | | | | | | | | |
Netherlands — 0.6% | |
Corio NV REITD | | | 24,827 | | | | | | 1,114,170 | |
Wereldhave NV REIT | | | 2,582 | | | | | | 203,161 | |
| | | | | | | | | | |
| | | | | | | | | 1,317,331 | |
| | | | | | | | | | |
Norway — 0.3% | |
Norwegian Property ASA | | | 615,000 | | | | | | 737,152 | |
| | | | | | | | | | |
Singapore — 4.1% | |
Ascendas Real Estate Investment Trust REIT | | | 334,000 | | | | | | 582,274 | |
CapitaCommercial Trust REIT | | | 945,137 | | | | | | 1,085,977 | |
CapitaLand, Ltd. | | | 936,000 | | | | | | 2,247,379 | |
CapitaMall Trust REIT | | | 484,000 | | | | | | 730,631 | |
CapitaMalls Asia, Ltd. | | | 452,000 | | | | | | 702,024 | |
City Developments, Ltd. | | | 69,000 | | | | | | 524,902 | |
Global Logistic Properties, Ltd. | | | 1,109,000 | | | | | | 2,539,728 | |
Soilbuild Business Space REITD | | | 862,000 | | | | | | 525,964 | |
Suntec Real Estate Investment Trust REIT | | | 651,000 | | | | | | 794,437 | |
| | | | | | | | | | |
| | | | | | | | | 9,733,316 | |
| | | | | | | | | | |
Sweden — 1.1% | |
Castellum AB | | | 45,000 | | | | | | 700,662 | |
Fabege AB | | | 87,055 | | | | | | 1,039,918 | |
Fastighets AB Balder Class B* | | | 46,191 | | | | | | 474,500 | |
Wihlborgs Fastigheter AB | | | 25,720 | | | | | | 461,282 | |
| | | | | | | | | | |
| | | | | | | | | 2,676,362 | |
| | | | | | | | | | |
Switzerland — 0.7% | |
PSP Swiss Property AG* | | | 19,219 | | | | | | 1,628,623 | |
| | | | | | | | | | |
United Kingdom — 5.8% | |
Big Yellow Group PLC REIT | | | 43,264 | | | | | | 342,455 | |
British Land Co. PLC REIT | | | 290,706 | | | | | | 3,027,987 | |
Capital & Counties Properties PLC | | | 202,455 | | | | | | 1,103,666 | |
Derwent London PLC REIT | | | 38,096 | | | | | | 1,573,980 | |
Great Portland Estates PLC REIT | | | 91,500 | | | | | | 907,606 | |
Hammerson PLC REIT | | | 233,475 | | | | | | 1,940,856 | |
Helical Bar PLC | | | 40,500 | | | | | | 218,971 | |
Land Securities Group PLC REIT | | | 154,823 | | | | | | 2,470,225 | |
Quintain Estates & Development PLC* | | | 230,000 | | | | | | 359,923 | |
Safestore Holdings PLC REIT | | | 131,070 | | | | | | 349,445 | |
| | | | |
| 260 | | See Notes to Financial Statements. | | |
| | | | | | | | | | |
| | | Shares | | | Value | |
ST Modwen Properties PLC | | | 64,000 | | | | | $ | 389,269 | |
Unite Group PLC | | | 126,577 | | | | | | 843,874 | |
| | | | | | | | | | |
| | | | | | | | | 13,528,257 | |
| | | | | | | | | | |
Total Foreign Common Stocks
(Cost $124,698,601) | | | | | | 123,123,330 | |
| | | | | | | | | | |
MONEY MARKET FUNDS — 12.5% | | | | | | | |
GuideStone Money Market Fund (GS4 Class)¥ | | | 4,512,863 | | | | | | 4,512,863 | |
Northern Institutional Liquid Assets Portfolio§ | | | 24,822,432 | | | | | | 24,822,432 | |
| | | | | | | | | | |
Total Money Market Funds
(Cost $29,335,295) | | | | | | 29,335,295 | |
| | | | | | | | | | |
TOTAL INVESTMENTS — 109.7%
(Cost $264,201,645) | | | | | | 257,798,934 | |
| | |
Liabilities in Excess of
Other Assets — (9.7)% | | | | | | (22,896,221 | ) |
| | | | | | | | | | |
NET ASSETS — 100.0% | | | | | | | | $ | 234,902,713 | |
| | | | | | | | | | |
VALUATION HIERARCHY
The following is a summary of the inputs used, as of December 31, 2013, in valuing the Fund’s investments carried at fair value:
| | | | | | | | | | | | | | | | |
| | | Total
Value | | | Level 1
Quoted Prices | | | Level 2
Other Significant
Observable Inputs | | | Level 3
Significant
Unobservable Inputs | |
Assets: | | | | | | | | | | | | | | | | |
Investments in Securities: | | | | | | | | | | | | | | | | |
Common Stocks | | $ | 105,340,309 | | | $ | 105,340,309 | | | $ | — | | | $ | — | |
Foreign Common Stocks: | | | | | | | | | | | | | | | | |
Australia | | | 14,762,652 | | | | 14,762,652 | | | | — | | | | — | |
Austria | | | 343,963 | | | | 343,963 | | | | — | | | | — | |
Belgium | | | 393,528 | | | | 393,528 | | | | — | | | | — | |
Canada | | | 8,593,716 | | | | 8,593,716 | | | | — | | | | — | |
China | | | 1,116,279 | | | | 1,116,279 | | | | — | | | | — | |
France | | | 8,244,590 | | | | 235,803 | | | | 8,008,787 | | | | — | |
Germany | | | 4,065,752 | | | | 4,065,752 | | | | — | | | | — | |
Hong Kong | | | 18,185,204 | | | | 18,185,204 | | | | — | | | | — | |
Ireland | | | 327,946 | | | | 327,946 | | | | — | | | | — | |
Japan | | | 36,164,123 | | | | 198,751 | | | | 35,965,372 | | | | — | |
Jersey | | | 942,320 | | | | 942,320 | | | | — | | | | — | |
Luxembourg | | | 362,216 | | | | 362,216 | | | | — | | | | — | |
Netherlands | | | 1,317,331 | | | | — | | | | 1,317,331 | | | | — | |
Norway | | | 737,152 | | | | 737,152 | | | | — | | | | — | |
Singapore | | | 9,733,316 | | | | 9,733,316 | | | | — | | | | — | |
Sweden | | | 2,676,362 | | | | — | | | | 2,676,362 | | | | — | |
Switzerland | | | 1,628,623 | | | | — | | | | 1,628,623 | | | | — | |
United Kingdom | | | 13,528,257 | | | | 13,528,257 | | | | — | | | | — | |
Money Market Funds | | | 29,335,295 | | | | 29,335,295 | | | | — | | | | — | |
| | | | | | | | | | | | | | | | |
Total Assets - Investments in Securities | | $ | 257,798,934 | | | $ | 208,202,459 | | | $ | 49,596,475 | | | $ | — | |
| | | | | | | | | | | | | | | | |
| | | | |
Other Financial Instruments*** | | | | | | | | | | | | | | | | |
Futures Contracts | | $ | 157,537 | | | $ | 157,537 | | | $ | — | | | $ | — | |
| | | | | | | | | | | | | | | | |
Total Assets - Other Financial Instruments | | $ | 157,537 | | | $ | 157,537 | | | $ | — | | | $ | — | |
| | | | | | | | | | | | | | | | |
***Other financial instruments are derivative instruments not reflected in the Schedule of Investments, such as futures, forwards and swap contracts, which are valued at the unrealized appreciation (depreciation) on the investment. Details of these investments can be found in the Notes to Financial Statements.
There were no transfers between Level 1 and Level 2 during the the year ended December 31, 2013.
| | | | |
| | See Notes to Financial Statements. | | 261 |
Global Natural Resources Equity Fund (Unaudited)
The Global Natural Resources Equity Fund was launched on July 1, 2013, as part of an expanded GuideStone Real Return Select Fund suite of offerings. The Fund primarily invests in equity securities of companies considered to be principally engaged in natural resources industries and related sectors or that supply goods, technology and services to such companies. The Fund underperformed its benchmark, 75% MSCI World Commodity Producers Index / 25% NYSE Gold Miners Arca Index, for the since inception period ending December 31, 2013 (-1.69% versus 7.03%).
From an absolute performance perspective, the Fund’s exposure to gold miners detracted from returns, as the NYSE Arca Gold Miners Index fell 13.9% since the 2013 inception of the Fund while the MSCI World Commodity Producers Index gained 14.46%. Benchmark-relative results were benefited from stock selection within the gold miners sector.
The Fund’s benchmark relative underperformance for the year was partially attributable to cash positions within the portfolio that are not held in the benchmark. In addition, a material underweight to the energy sector versus other commodity sectors detracted from results, as energy commodities and related companies tended to outperform other sectors. Negative security selection across sectors also detracted from benchmark-relative results.
During the year, the Fund remained focused on achieving its objective of seeking long-term capital appreciation.
The Fund did not invest in derivative instruments during the year.
This Fund may be suitable for investors who have a medium- to long-term investment horizon, possess a high tolerance for risk and seek to participate in the return potential of natural resources related equity securities. An investment in medium-, small- and micro-cap companies may involve greater risk and be more volatile and less liquid than an investment in a larger company. Investment in companies in natural resources industries may be significantly affected by (often rapid) changes in supply of, or demand for various natural resources. Concentrating investments in the natural resources sector increases the risk of loss because the securities of many or all of the companies in the sector may decline in value due to developments adversely affecting the sector, including market, economic, political or regulatory developments. Prices of precious metals and of precious metal-related securities have historically been very volatile due to various economic, financial, social and political factors and may adversely affect the financial condition of companies involved with precious metals.
At December 31, 2013, the portfolio holdings of the Fund, as a percentage of net assets, is shown in the following table. Portfolio holdings are subject to risk and may change at any time.
| | | | |
| | | % | |
Foreign Common Stocks | | | 59.4 | |
Money Market Funds | | | 30.9 | |
Energy | | | 20.1 | |
Materials & Processing | | | 7.7 | |
Utilities | | | 2.7 | |
Rights/Warrants | | | 0.6 | |
| | | | |
| | | 121.4 | |
| | | | |
262
| | |
GLOBAL NATURAL RESOURCES EQUITY FUND SCHEDULE OF INVESTMENTS | | December 31, 2013 |
| | | | | | | | | | |
| | | Shares | | | Value | |
COMMON STOCKS — 30.5% | |
Energy — 20.1% | | | | | | | | | | |
Cabot Oil & Gas Corporation | | | 152,272 | | | | | $ | 5,902,063 | |
Concho Resources, Inc.* | | | 66,200 | | | | | | 7,149,600 | |
Denbury Resources, Inc.D* | | | 459,000 | | | | | | 7,541,370 | |
EOG Resources, Inc. | | | 11,705 | | | | | | 1,964,567 | |
Laredo Petroleum Holdings, Inc.D* | | | 218,262 | | | | | | 6,043,675 | |
Noble Energy, Inc. | | | 82,249 | | | | | | 5,601,979 | |
Range Resources Corporation | | | 71,400 | | | | | | 6,019,734 | |
Rosetta Resources, Inc.D* | | | 133,800 | | | | | | 6,427,752 | |
Southwestern Energy Co.* | | | 146,500 | | | | | | 5,761,845 | |
| | | | | | | | | | |
| | | | | | | | | 52,412,585 | |
| | | | | | | | | | |
Materials & Processing — 7.7% | |
Compass Minerals International, Inc.D | | | 79,400 | | | | | | 6,355,970 | |
Mosaic Co. (The) | | | 210,570 | | | | | | 9,953,644 | |
Newmont Mining CorporationD | | | 36,000 | | | | | | 829,080 | |
Royal Gold, Inc.D | | �� | 63,000 | | | | | | 2,902,410 | |
| | | | | | | | | | |
| | | | | | | | | 20,041,104 | |
| | | | | | | | | | |
Utilities — 2.7% | | | | | | | | | | |
Calpine Corporation* | | | 365,470 | | | | | | 7,130,320 | |
| | | | | | | | | | |
Total Common Stocks
(Cost $77,568,897) | | | | | | 79,584,009 | |
| | | | | | | | | | |
FOREIGN COMMON STOCKS — 59.4% | |
Australia — 5.9% | | | | | | | | | | |
Evolution Mining, Ltd. | | | 989,000 | | | | | | 543,091 | |
Gryphon Minerals, Ltd.* | | | 1,077,000 | | | | | | 163,480 | |
Iluka Resources, Ltd. | | | 923,753 | | | | | | 7,118,165 | |
Mineral Resources, Ltd. | | | 554,486 | | | | | | 5,876,824 | |
Newcrest Mining, Ltd.* | | | 163,000 | | | | | | 1,135,229 | |
Papillon Resources, Ltd.* | | | 482,000 | | | | | | 421,769 | |
| | | | | | | | | | |
| | | | | | | | | 15,258,558 | |
| | | | | | | | | | |
Bermuda — 1.5% | | | | | | | | | | |
Continental Gold, Ltd.* | | | 245,000 | | | | | | 779,572 | |
Kosmos Energy, Ltd.* | | | 291,300 | | | | | | 3,256,734 | |
| | | | | | | | | | |
| | | | | | | | | 4,036,306 | |
| | | | | | | | | | |
Canada — 34.9% | | | | | | | | | | |
Alamos Gold, Inc. | | | 181,000 | | | | | | 2,192,958 | |
ARC Resources, Ltd.D | | | 176,900 | | | | | | 4,924,390 | |
Argonaut Gold, Inc.D* | | | 375,000 | | | | | | 1,878,089 | |
Asanko Gold, Inc.D* | | | 331,000 | | | | | | 538,611 | |
AuRico Gold, Inc.D | | | 536,000 | | | | | | 1,961,760 | |
B2Gold CorporationD* | | | 754,000 | | | | | | 1,542,074 | |
Bear Creek Mining Corporation* | | | 128,000 | | | | | | 175,928 | |
Belo Sun Mining CorporationD* | | | 319,000 | | | | | | 100,602 | |
Eastmain Resources, Inc.D* | | | 237,000 | | | | | | 60,240 | |
Eldorado Gold CorporationD | | | 754,000 | | | | | | 4,290,260 | |
First Quantum Minerals, Ltd.D | | | 569,300 | | | | | | 10,257,851 | |
Fortuna Silver Mines, Inc.D* | | | 124,000 | | | | | | 355,880 | |
Franco-Nevada CorporationD | | | 71,000 | | | | | | 2,892,540 | |
Gold Canyon Resources, Inc.* | | | 230,000 | | | | | | 49,800 | |
Goldcorp, Inc. | | | 562,839 | | | | | | 12,196,721 | |
Guyana Goldfields, Inc.D* | | | 184,000 | | | | | | 284,076 | |
Hudbay Minerals, Inc.D | | | 421,800 | | | | | | 3,454,542 | |
Kinross Gold CorporationD | | | 285,000 | | | | | | 1,248,300 | |
Klondex Mines, Ltd.D* | | | 269,000 | | | | | | 407,710 | |
Midway Gold CorporationD* | | | 339,000 | | | | | | 274,590 | |
New Gold, Inc.D* | | | 1,837,262 | | | | | | 9,627,038 | |
| | | | | | | | | | |
| | | Shares | | | Value | |
Orezone Gold CorporationD* | | | 383,000 | | | | | $ | 194,700 | |
Osisko Mining Corporation* | | | 891,000 | | | | | | 3,950,680 | |
Painted Pony Petroleum, Ltd.* | | | 264,300 | | | | | | 1,726,752 | |
Peyto Exploration & Development CorporationD | | | 247,300 | | | | | | 7,568,579 | |
Premier Gold Mines, Ltd.* | | | 58,000 | | | | | | 81,902 | |
Pretium Resources, Inc.D* | | | 73,000 | | | | | | 376,597 | |
Primero Mining CorporationD* | | | 159,000 | | | | | | 705,960 | |
Romarco Minerals, Inc.* | | | 419,000 | | | | | | 147,917 | |
Roxgold, Inc.* | | | 219,000 | | | | | | 91,744 | |
Rubicon Minerals CorporationD* | | | 278,000 | | | | | | 239,358 | |
Sabina Gold & Silver CorporationD* | | | 332,000 | | | | | | 228,157 | |
SEMAFO, Inc.D* | | | 190,000 | | | | | | 499,035 | |
Silver Wheaton CorporationD | | | 162,000 | | | | | | 3,270,780 | |
Silvercorp Metals, Inc. | | | 331,000 | | | | | | 757,990 | |
Sulliden Gold Corp, Ltd.* | | | 271,000 | | | | | | 183,686 | |
Tahoe Resources, Inc.* | | | 160,600 | | | | | | 2,671,501 | |
Timmins Gold Corporation* | | | 372,000 | | | | | | 395,726 | |
Torex Gold Resources, Inc.* | | | 859,000 | | | | | | 760,141 | |
Tourmaline Oil Corporation* | | | 4,600 | | | | | | 193,570 | |
Turquoise Hill Resources Ltd.D* | | | 1,613,340 | | | | | | 5,324,022 | |
Yamana Gold, Inc.D | | | 332,000 | | | | | | 2,861,840 | |
| | | | | | | | | | |
| | | | | | | | | 90,944,597 | |
| | | | | | | | | | |
Chile — 3.9% | | | | | | | | | | |
Sociedad Quimica y Minera de Chile SA ADRD | | | 394,632 | | | | | | 10,213,076 | |
| | | | | | | | | | |
Jersey — 1.9% | | | | | | | | | | |
Lydian International, Ltd.D* | | | 370,000 | | | | | | 254,272 | |
Randgold Resources, Ltd. ADRD | | | 75,000 | | | | | | 4,710,750 | |
| | | | | | | | | | |
| | | | | | | | | 4,965,022 | |
| | | | | | | | | | |
Papua New Guinea — 2.9% | |
Oil Search, Ltd. | | | 1,040,774 | | | | | | 7,536,655 | |
| | | | | | | | | | |
United Kingdom — 8.4% | | | | | | | | | | |
Antofagasta PLC | | | 622,872 | | | | | | 8,499,147 | |
Fresnillo PLC* | | | 101,000 | | | | | | 1,246,862 | |
Ophir Energy PLC* | | | 1,089,832 | | | | | | 5,915,859 | |
Salamander Energy PLC* | | | 1,010,153 | | | | | | 1,869,322 | |
Tullow Oil PLC | | | 307,818 | | | | | | 4,358,223 | |
| | | | | | | | | | |
| | | | | | | | | 21,889,413 | |
| | | | | | | | | | |
Total Foreign Common Stocks
(Cost $168,968,163) | | | | | | 154,843,627 | |
| | | | | | | | | | |
RIGHTS/WARRANTS — 0.6% | |
Turquoise Hill Resources, Ltd. RightsD*
(Cost $1,905,824) | | | 1,613,340 | | | | | | 1,548,806 | |
| | | | | | | | | | |
MONEY MARKET FUNDS — 30.9% | |
GuideStone Money Market Fund (GS4 Class)¥ | | | 24,983,443 | | | | | | 24,983,443 | |
Northern Institutional Liquid Assets Portfolio§ | | | 55,648,353 | | | | | | 55,648,353 | |
| | | | | | | | | | |
Total Money Market Funds
(Cost $80,631,796) | | | | | | 80,631,796 | |
| | | | | | | | | | |
TOTAL INVESTMENTS — 121.4%
(Cost $329,074,680) | | | | | | 316,608,238 | |
| | | | | | | | | | |
Liabilities in Excess of
Other Assets — (21.4)% | | | | | | (55,886,385 | ) |
| | | | | | | | | | |
NET ASSETS — 100.0% | | | | | | | | $ | 260,721,853 | |
| | | | | | | | | | |
| | | | |
| | See Notes to Financial Statements. | | 263 |
GLOBAL NATURAL RESOURCES EQUITY FUND
SCHEDULE OF INVESTMENTS (Continued)
VALUATION HIERARCHY
The following is a summary of the inputs used, as of December 31, 2013, in valuing the Fund’s investments carried at fair value:
| | | | | | | | | | | | | | | | |
| | | Total
Value | | | Level 1
Quoted Prices | | | Level 2
Other Significant
Observable Inputs | | | Level 3
Significant
Unobservable Inputs | |
Assets: | | | | | | | | | | | | | | | | |
Investments in Securities: | | | | | | | | | | | | | | | | |
Common Stocks | | $ | 79,584,009 | | | $ | 79,584,009 | | | $ | — | | | $ | — | |
Foreign Common Stocks: | | | | | | | | | | | | | | | | |
Australia | | | 15,258,558 | | | | 15,258,558 | | | | — | | | | — | |
Bermuda | | | 4,036,306 | | | | 4,036,306 | | | | — | | | | — | |
Canada | | | 90,944,597 | | | | 90,944,597 | | | | — | | | | — | |
Chile | | | 10,213,076 | | | | 10,213,076 | | | | — | | | | — | |
Jersey | | | 4,965,022 | | | | 4,965,022 | | | | — | | | | — | |
Papua New Guinea | | | 7,536,655 | | | | 7,536,655 | | | | — | | | | — | |
United Kingdom | | | 21,889,413 | | | | 21,889,413 | | | | — | | | | — | |
Money Market Funds | | | 80,631,796 | | | | 80,631,796 | | | | — | | | | — | |
Rights/Warrants | | | 1,548,806 | | | | 1,548,806 | | | | — | | | | — | |
| | | | | | | | | | | | | | | | |
Total Assets - Investments in Securities | | $ | 316,608,238 | | | $ | 316,608,238 | | | $ | — | | | $ | — | |
| | | | | | | | | | | | | | | | |
| | | | |
| 264 | | See Notes to Financial Statements. | | |
(This page intentionally left blank)
| | |
| STATEMENTS OF ASSETS AND LIABILITIES | | December 31, 2013 |
| | | | | | | | |
| | | Inflation Protected
Bond Fund | | | Flexible Income
Fund | |
Assets | | | | | | | | |
Investments in securities of unaffiliated issuers, at value | | $ | 261,317,583 | | | $ | 102,440,929 | |
Investments in securities of affiliated issuers, at value | | | 13,562,904 | | | | 5,129,568 | |
| | | | | | | | |
Total investments (1)(2) | | | 274,880,487 | | | | 107,570,497 | |
Cash | | | — | | | | 751,649 | |
Cash collateral for derivatives | | | — | | | | — | |
Foreign currency (3) | | | 519,375 | | | | — | |
Receivables: | | | | | | | | |
Dividends and reclaims | | | 59 | | | | 45 | |
Interest | | | 1,158,271 | | | | 323,850 | |
Securities lending | | | 31,810 | | | | — | |
Receivable from advisor | | | — | | | | — | |
Investment securities sold | | | 2,508,545 | | | | 4,995,313 | |
Fund shares sold | | | 6,717 | | | | — | |
Variation margin on financial futures contracts | | | 91,777 | | | | — | |
Unrealized appreciation on foreign currency exchange contracts | | | 166,502 | | | | — | |
Prepaid expenses and other assets | | | 14,036 | | | | 4,614 | |
| | | | | | | | |
Total Assets | | | 279,377,579 | | | | 113,645,968 | |
| | | | | | | | |
Liabilities | | | | | | | | |
Cash overdraft | | | 15,974 | | | | — | |
Foreign currency overdraft (3) | | | — | | | | — | |
Options written at value (4) | | | 49,203 | | | | — | |
Unrealized depreciation on foreign currency exchange contracts | | | 585,625 | | | | — | |
Collateral held for securities on loan at value | | | — | | | | — | |
Payables: | | | | | | | | |
Investment securities purchased | | | 4,391,932 | | | | 4,273,467 | |
Fund shares redeemed | | | 15,342 | | | | — | |
Variation margin on financial futures contracts | | | 26,528 | | | | — | |
Securities lending | | | — | | | | — | |
Accrued expenses: | | | | | | | | |
Investment advisory fees | | | 70,080 | | | | 114,177 | |
Shareholder servicing fees | | | 55,588 | | | | 22,130 | |
Other expenses | | | 56,793 | | | | 73,539 | |
| | | | | | | | |
Total Liabilities | | | 5,267,065 | | | | 4,483,313 | |
| | | | | | | | |
Net Assets | | $ | 274,110,514 | | | $ | 109,162,655 | |
| | | | | | | | |
Net Assets Consist of: | | | | | | | | |
Paid-in-capital | | $ | 282,939,318 | | | $ | 108,554,393 | |
Undistributed (distributions in excess of) net investment income | | | 400,620 | | | | — | |
Undistributed (accumulated) net realized gain (loss) on investments, foreign currency translations and derivative transactions | | | (1,254,211 | ) | | | 91,187 | |
Net unrealized appreciation (depreciation) on investments, foreign currency translations and derivative transactions | | | (7,975,213 | ) | | | 517,075 | |
| | | | | | | | |
Net Assets | | $ | 274,110,514 | | | $ | 109,162,655 | |
| | | | | | | | |
Net Asset Value: | | | | | | | | |
$0.001 par value, unlimited shares authorized | | | | | | | | |
Net assets applicable to the GS2 Class | | | N/A | | | | N/A | |
| | | | | | | | |
GS2 shares outstanding | | | N/A | | | | N/A | |
| | | | | | | | |
Net asset value, offering and redemption price per GS2 share | | | N/A | | | | N/A | |
| | | | | | | | |
Net assets applicable to the GS4 Class | | $ | 274,110,514 | | | $ | 109,162,655 | |
| | | | | | | | |
GS4 shares outstanding | | | 26,995,903 | | | | 10,856,249 | |
| | | | | | | | |
Net asset value, offering and redemption price per GS4 share | | $ | 10.15 | | | $ | 10.06 | |
| | | | | | | | |
| | | | | | | | |
(1) Investments in securities of unaffiliated issuers, at cost | | $ | 268,989,681 | | | $ | 101,923,854 | |
Investments in securities of affiliated issuers, at cost | | | 13,562,904 | | | | 5,129,568 | |
| | | | | | | | |
Total investments at cost | | $ | 282,552,585 | | | $ | 107,053,422 | |
| | | | | | | | |
(2) Includes securities loaned of: | | $ | — | | | $ | — | |
| | | | | | | | |
(3) Foreign currency at cost | | $ | 508,432 | | | $ | — | |
| | | | | | | | |
(4) Premiums received on options written | | $ | 81,583 | | | $ | — | |
| | | | | | | | |
| | | | |
| 266 | | See Notes to Financial Statements. | | |
| | | | | | | | | | |
Real Assets
Fund | | | Real Estate
Securities Fund | | | Global Natural
Resources
Equity Fund | |
| | | | | | | | | | |
| $ | 4,675,884 | | | $ | 253,286,071 | | | $ | 291,624,795 | |
| | 22,901,571 | | | | 4,512,863 | | | | 24,983,443 | |
| | | | | | | | | | |
| | 27,577,455 | | | | 257,798,934 | | | | 316,608,238 | |
| | — | | | | — | | | | — | |
| | — | | | | 226,250 | | | | — | |
| | — | | | | 1,097,395 | | | | — | |
| | | | | | | | | | |
| | 4 | | | | 980,806 | | | | 102,240 | |
| | — | | | | — | | | | — | |
| | — | | | | 67,039 | | | | 17,382 | |
| | 10,543 | | | | — | | | | | |
| | — | | | | 856,848 | | | | — | |
| | 73,331 | | | | 11,209 | | | | — | |
| | — | | | | 12,950 | | | | — | |
| | — | | | | — | | | | — | |
| | 17,758 | | | | 21,036 | | | | 4,614 | |
| | | | | | | | | | |
| | 27,679,091 | | | | 261,072,467 | | | | 316,732,474 | |
| | | | | | | | | | |
| | |
| | — | | | | — | | | | — | |
| | — | | | | — | | | | 43 | |
| | — | | | | — | | | | — | |
| | — | | | | — | | | | — | |
| | — | | | | 24,822,432 | | | | 55,648,353 | |
| | | | | | | | | | |
| | — | | | | 980,026 | | | | 1,029 | |
| | — | | | | 113,142 | | | | — | |
| | — | | | | — | | | | — | |
| | — | | | | 1,059 | | | | 2,300 | |
| | | | | | | | | | |
| | — | | | | 138,568 | | | | 222,243 | |
| | — | | | | 46,644 | | | | 50,930 | |
| | 28,479 | | | | 67,883 | | | | 85,723 | |
| | | | | | | | | | |
| | 28,479 | | | | 26,169,754 | | | | 56,010,621 | |
| | | | | | | | | | |
| $ | 27,650,612 | | | $ | 234,902,713 | | | $ | 260,721,853 | |
| | | | | | | | | | |
| | |
| $ | 28,268,319 | | | $ | 243,574,026 | | | $ | 273,640,124 | |
| | 310 | | | | (367,712 | ) | | | (490,104 | ) |
| | 314,133 | | | | (2,054,663 | ) | | | 38,075 | |
| | (932,150) | | | | (6,248,938 | ) | | | (12,466,242 | ) |
| | | | | | | | | | |
| $ | 27,650,612 | | | $ | 234,902,713 | | | $ | 260,721,853 | |
| | | | | | | | | | |
| | |
| | N/A | | | | N/A | | | | N/A | |
| | | | | | | | | | |
| | N/A | | | | N/A | | | | N/A | |
| | | | | | | | | | |
| | |
| | N/A | | | | N/A | | | | N/A | |
| | | | | | | | | | |
| | |
| $ | 27,650,612 | | | $ | 234,902,713 | | | $ | 260,721,853 | |
| | | | | | | | | | |
| | 2,816,029 | | | | 25,088,476 | | | | 26,860,089 | |
| | | | | | | | | | |
| | $9.82 | | | $ | 9.36 | | | $ | 9.71 | |
| | | | | | | | | | |
| | |
| $ | 4,704,100 | | | $ | 259,688,782 | | | $ | 304,091,237 | |
| | 23,805,505 | | | | 4,512,863 | | | | 24,983,443 | |
| | | | | | | | | | |
| $ | 28,509,605 | | | $ | 264,201,645 | | | $ | 329,074,680 | |
| | | | | | | | | | |
| $ | — | | | $ | 25,313,133 | | | $ | 68,203,448 | |
| | | | | | | | | | |
| $ | — | | | $ | 1,100,585 | | | $ | (43 | ) |
| | | | | | | | | | |
| $ | — | | | $ | — | | | $ | — | |
| | | | | | | | | | |
| | | | |
| | See Notes to Financial Statements. | | 267 |
| | |
| STATEMENTS OF OPERATIONS | | For the Year Ended December 31, 2013 |
| | | | | | | | |
| | | Inflation Protected
Bond Fund | | | Flexible Income
Fund(1) | |
Investment Income | | | | | | | | |
Dividends | | $ | — | | | $ | — | |
Income distributions received from affiliated funds | | | 881 | | | | 243 | |
Interest | | | 3,681,273 | | | | 1,555,516 | |
Securities lending | | | 36,134 | | | | — | |
Less foreign taxes withheld | | | — | | | | — | |
| | | | | | | | |
Total Investment Income | | | 3,718,288 | | | | 1,555,759 | |
| | | | | | | | |
Expenses | | | | | | | | |
Investment advisory fees | | | 716,980 | | | | 342,874 | |
Transfer agent fees: | | | | | | | | |
GS4 shares | | | 21,564 | | | | 8,543 | |
Custodian fees | | | 35,583 | | | | 23,598 | |
Shareholder servicing fees: | | | | | | | | |
GS4 shares | | | 552,213 | | | | 109,320 | |
Accounting and administration fees | | | 54,249 | | | | 19,090 | |
Professional fees | | | 57,569 | | | | 57,234 | |
Blue sky fees: | | | | | | | | |
GS4 shares | | | 18,974 | | | | 1,000 | |
Shareholder reporting fees: | | | | | | | | |
GS4 shares | | | 8,084 | | | | 952 | |
Trustee expenses | | | 2,365 | | | | 476 | |
Line of credit facility fees | | | 2,284 | | | | 5,902 | |
Other expenses | | | 16,737 | | | | 5,867 | |
| | | | | | | | |
Total Expenses | | | 1,486,602 | | | | 574,856 | |
Expenses waived/reimbursed net of amount recaptured(2) | | | (20,971 | ) | | | (28,255 | ) |
| | | | | | | | |
Net expenses | | | 1,465,631 | | | | 546,601 | |
| | | | | | | | |
| | |
Net Investment Income (Loss) | | | 2,252,657 | | | | 1,009,158 | |
| | | | | | | | |
| | |
Realized and Unrealized Gain (Loss) | | | | | | | | |
Net realized gain (loss) from: | | | | | | | | |
Capital gain distributions received from affiliated funds | | | 321 | | | | 223 | |
Investment securities | | | (2,192,130 | ) | | | 109,330 | |
Investment securities of affiliated issuers | | | — | | | | — | |
Futures transactions | | | 1,108,298 | | | | — | |
Option contracts written | | | 374,024 | | | | — | |
Option contracts purchased | | | (379,205 | ) | | | — | |
Foreign currency transactions | | | (27,545 | ) | | | — | |
| | | | | | | | |
| | |
Net realized gain (loss) | | | (1,116,237 | ) | | | 109,553 | |
| | | | | | | | |
| | |
Net change in unrealized appreciation (depreciation) on: | | | | | | | | |
Investment securities | | | (19,879,965 | ) | | | 517,075 | |
Investment securities of unaffiliated issuers | | | — | | | | — | |
Futures | | | (53,424 | ) | | | — | |
Option contracts written | | | 32,380 | | | | — | |
Option contracts purchased | | | 30,051 | | | | — | |
Foreign currency translation | | | (408,656 | ) | | | — | |
| | | | | | | | |
| | |
Net change in unrealized appreciation (depreciation) | | | (20,279,614 | ) | | | 517,075 | |
| | | | | | | | |
Net Realized and Unrealized Gain (Loss) | | | (21,395,851 | ) | | | 626,628 | |
| | | | | | | | |
Net Increase (Decrease) in Net Assets Resulting from Operations | | $ | (19,143,194 | ) | | $ | 1,635,786 | |
| | | | | | | | |
| (1) | Inception Date was July 1, 2013. |
| (2) | See Note 3a and 3c in Notes to Financial Statements. |
| | | | |
| 268 | | See Notes to Financial Statements. | | |
| | | | | | | | | | |
Real Assets
Fund(1) | | | Real Estate
Securities Fund | | | Global Natural
Resources
Equity Fund(1) | |
| | | | | | | | | | |
| $ | — | | | $ | 5,443,208 | | | $ | 1,474,189 | |
| | 117,940 | | | | 735 | | | | 1,075 | |
| | — | | | | 375,005 | | | | — | |
| | — | | | | 114,766 | | | | 44,163 | |
| | — | | | | (45,718 | ) | | | (159,769 | ) |
| | | | | | | | | | |
| | 117,940 | | | | 5,887,996 | | | | 1,359,658 | |
| | | | | | | | | | |
| | | | | | | | | | |
| | 9,002 | | | | 1,583,792 | | | | 1,219,811 | |
| | | | | | | | | | |
| | 8,711 | | | | 24,747 | | | | 8,510 | |
| | 4,025 | | | | 45,816 | | | | 38,258 | |
| | | | | | | | | | |
| | — | | | | 541,450 | | | | 277,012 | |
| | 5,979 | | | | 58,769 | | | | 38,736 | |
| | 33,326 | | | | 66,573 | | | | 49,165 | |
| | | | | | | | | | |
| | 8,426 | | | | 19,240 | | | | 1,000 | |
| | | | | | | | | | |
| | 2,136 | | | | 14,693 | | | | 781 | |
| | 92 | | | | 2,353 | | | | 1,173 | |
| | 87 | | | | 2,220 | | | | 1,068 | |
| | 5,867 | | | | 18,217 | | | | 5,867 | |
| | | | | | | | | | |
| | 77,651 | | | | 2,377,870 | | | | 1,641,381 | |
| | (67,124 | ) | | | (16,967 | ) | | | — | |
| | | | | | | | | | |
| | 10,527 | | | | 2,360,903 | | | | 1,641,381 | |
| | | | | | | | | | |
| | 107,413 | | | | 3,527,093 | | | | (281,723 | ) |
| | | | | | | | | | |
| | |
| | | | | | | | | | |
| | |
| | | | | | | | | | |
| | 465,335 | | | | 156 | | | | 1,156 | |
| | (2,248 | ) | | | 23,498,549 | | | | 3,095,029 | |
| | 1,124 | | | | — | | | | — | |
| | — | | | | 1,706,784 | | | | — | |
| | — | | | | — | | | | — | |
| | — | | | | — | | | | — | |
| | — | | | | (63,094 | ) | | | (140,467 | ) |
| | | | | | | | | | |
| | |
| | 464,211 | | | | 25,142,395 | | | | 2,955,718 | |
| | | | | | | | | | |
| | |
| | | | | | | | | | |
| | (903,935 | ) | | | (26,861,166 | ) | | | (12,466,442 | ) |
| | (28,215 | ) | | | — | | | | — | |
| | — | | | | 66,776 | | | | — | |
| | — | | | | — | | | | — | |
| | — | | | | — | | | | — | |
| | — | | | | (3,764 | ) | | | 200 | |
| | | | | | | | | | |
| | |
| | (932,150 | ) | | | (26,798,154 | ) | | | (12,466,242 | ) |
| | | | | | | | | | |
| | (467,939 | ) | | | (1,655,759 | ) | | | (9,510,524 | ) |
| | | | | | | | | | |
| $ | (360,526 | ) | | $ | 1,871,334 | | | $ | (9,792,247 | ) |
| | | | | | | | | | |
| | | | |
| | See Notes to Financial Statements. | | 269 |
STATEMENTS OF CHANGES IN NET ASSETS
| | | | | | | | |
| | | Inflation Protected Bond Fund | |
| | | For the Year Ended | |
| | |
| | | 12/31/13 | | | 12/31/12 | |
Operations: | | | | | | | | |
Net investment income (loss) | | $ | 2,252,657 | | | $ | 3,231,235 | |
Net realized gain (loss) on investment securities, foreign currency transactions and derivative transactions | | | (1,116,237 | ) | | | 5,069,301 | |
Net change in unrealized appreciation (depreciation) on investment securities, foreign currency translations and derivative transactions | | | (20,279,614 | ) | | | 1,959,361 | |
| | | | | | | | |
Net increase (decrease) in net assets resulting from operations | | | (19,143,194 | ) | | | 10,259,897 | |
| | | | | | | | |
Dividends and Distributions to Shareholders: | | | | | | | | |
Dividends from net investment income(2) | | | (1,868,128 | ) | | | (3,186,492 | ) |
Distributions from net realized capital gains | | | (882,675 | ) | | | (6,129,916 | ) |
| | | | | | | | |
Total dividends and distributions | | | (2,750,803 | ) | | | (9,316,408 | ) |
| | | | | | | | |
Capital Share Transactions: | | | | | | | | |
Proceeds from GS4 shares sold | | | 151,311,796 | | | | 52,030,483 | |
Reinvestment of dividends and distributions into GS4 shares | | | 2,749,825 | | | | 9,312,059 | |
| | | | | | | | |
Total proceeds from shares sold and reinvested | | | 154,061,621 | | | | 61,342,542 | |
| | | | | | | | |
Value of GS4 shares redeemed | | | (55,819,406 | ) | | | (27,679,464 | ) |
| | | | | | | | |
Total value of shares redeemed | | | (55,819,406 | ) | | | (27,679,464 | ) |
| | | | | | | | |
Net increase (decrease) from capital share transactions(3) | | | 98,242,215 | | | | 33,663,078 | |
| | | | | | | | |
Total increase (decrease) in net assets | | | 76,348,218 | | | | 34,606,567 | |
| | | | | | | | |
Net Assets: | | | | | | | | |
Beginning of Period | | | 197,762,296 | | | | 163,155,729 | |
| | | | | | | | |
End of Year* | | $ | 274,110,514 | | | $ | 197,762,296 | |
| | | | | | | | |
* Including undistributed (distributions in excess of) net investment income | | $ | 400,620 | | | $ | 11,998 | |
| | | | | | | | |
| (1) | Inception date was July 1, 2013. |
| (2) | Includes dividends paid from the short-term portion of capital gain distributions received from affiliated funds for the Real Assets Fund. |
| (3) | See Note 6 in Notes to Financial Statements. |
| | | | |
| 270 | | See Notes to Financial Statements. | | |
| | | | | | | | | | | | | | | | | | |
Flexible Income Fund | | | Real Assets Fund | | | Real Estate Securities Fund | | | Global Natural Resources Equity Fund | |
| | | | | | | For the Year Ended | | | | |
For the Period
07/01/13(1) - 12/31/13 | | | For the Period
07/01/13(1) - 12/31/13 | | | 12/31/13 | | | 12/31/12 | | | For the Period
07/01/13(1) - 12/31/13 | |
| | | | | | | | | | | | | | | | | | |
| $ | 1,009,158 | | | $ | 107,413 | | | $ | 3,527,093 | | | $ | 2,837,011 | | | $ | (281,723 | ) |
| | 109,553 | | | | 464,211 | | | | 25,142,395 | | | | 21,121,145 | | | | 2,955,718 | |
| | 517,075 | | | | (932,150 | ) | | | (26,798,154 | ) | | | 2,192,568 | | | | (12,466,242 | ) |
| | | | | | | | | | | | | | | | | | |
| | 1,635,786 | | | | (360,526 | ) | | | 1,871,334 | | | | 26,150,724 | | | | (9,792,247 | ) |
| | | | | | | | | | | | | | | | | | |
| | | | | | | | | | | | | | | | | | |
| | (1,014,482) | | | | (258,438 | ) | | | (4,569,650 | ) | | | (2,553,245 | ) | | | (747,193 | ) |
| | (14,042) | | | | — | | | | (25,908,952 | ) | | | — | | | | (2,379,831 | ) |
| | | | | | | | | | | | | | | | | | |
| | (1,028,524) | | | | (258,438 | ) | | | (30,478,602 | ) | | | (2,553,245 | ) | | | (3,127,024 | ) |
| | | | | | | | | | | | | | | | | | |
| | | | | | | | | | | | | | | | | | |
| | 109,825,782 | | | | 29,147,087 | | | | 142,160,856 | | | | 48,804,620 | | | | 274,513,313 | |
| | 1,028,524 | | | | 258,438 | | | | 30,476,790 | | | | 2,553,036 | | | | 3,127,024 | |
| | | | | | | | | | | | | | | | | | |
| | 110,854,306 | | | | 29,405,525 | | | | 172,637,646 | | | | 51,357,656 | | | | 277,640,337 | |
| | | | | | | | | | | | | | | | | | |
| | (2,298,913) | | | | (1,135,949 | ) | | | (100,275,836 | ) | | | (34,033,826 | ) | | | (3,999,213 | ) |
| | | | | | | | | | | | | | | | | | |
| | (2,298,913) | | | | (1,135,949 | ) | | | (100,275,836 | ) | | | (34,033,826 | ) | | | (3,999,213 | ) |
| | | | | | | | | | | | | | | | | | |
| | 108,555,393 | | | | 28,269,576 | | | | 72,361,810 | | | | 17,323,830 | | | | 273,641,124 | |
| | | | | | | | | | | | | | | | | | |
| | 109,162,655 | | | | 27,650,612 | | | | 43,754,542 | | | | 40,921,309 | | | | 260,721,853 | |
| | | | | | | | | | | | | | | | | | |
| | | | | | | | | | | | | | | | | | |
| | — | | | | — | | | | 191,148,171 | | | | 150,226,862 | | | | — | |
| | | | | | | | | | | | | | | | | | |
| $ | 109,162,655 | | | $ | 27,650,612 | | | $ | 234,902,713 | | | $ | 191,148,171 | | | $ | 260,721,853 | |
| | | | | | | | | | | | | | | | | | |
| $ | — | | | $ | 310 | | | $ | (367,712 | ) | | $ | 468,376 | | | $ | (490,104 | ) |
| | | | | | | | | | | | | | | | | | |
| | | | |
| | See Notes to Financial Statements. | | 271 |
FINANCIAL HIGHLIGHTS
| | | | | | | | | | | | | | | | | | | | | | | | | | | | | | | | | | | | | | | | | | | | | | | | | | | | | | | | |
| For a Share Outstanding For the Years Ending December 31, unless otherwise indicated | | | | | | | | | Ratios to Average Net Assets | | | | |
| | | Net Asset
Value,
Beginning
of Period | | | Net
Investment
Income (1) | | | Capital Gain
Distributions
Received
from
Affiliated
Funds | | | Realized
and
Unrealized
Gain (Loss) on
Investments | | | Dividends
from Net
Investment
Income | | | Distribu- tions
from Net
Realized
Capital
Gains(2) | | | Excess
Distribution/
Return of
Capital | | | Net
Asset
Value,
End of
Period | | | Total
Return | | | Net Assets, End
of Period
(000) | | | Expenses,
Net(3)(4) | | | Expenses,
Gross(3)(5) | | | Invest- ment
Income,
Net
(1)(4) | | | Portfolio
Turnover
Rate | |
Inflation Protected Bond Fund | |
| | | | | | | | | | | | |
GS4 Class | | | | | | | | | | | | | | | | | | | | | | | | | | | | | | | | | | | | | | | | | | | | | | | | | |
| 2013(6) | | $ | 11.25 | | | $ | 0.10 | # | | $ | — | † | | $ | (1.06 | ) | | $ | (0.09 | ) | | $ | (0.05 | ) | | $ | — | | | $ | 10.15 | | | | (8.64 | )% | | $ | 274,111 | | | | 0.64 | % | | | 0.65 | % | | | 0.98 | % | | | 75 | % |
| 2012 | | | 11.16 | | | | 0.21 | # | | | — | † | | | 0.46 | | | | (0.20 | ) | | | (0.38 | ) | | | — | | | | 11.25 | | | | 6.06 | | | | 197,762 | | | | 0.65 | | | | 0.66 | | | | 1.80 | | | | 94 | |
| 2011 | | | 10.43 | | | | 0.29 | # | | | — | † | | | 0.94 | | | | (0.31 | ) | | | (0.19 | ) | | | — | | | | 11.16 | | | | 12.00 | | | | 163,156 | | | | 0.66 | | | | 0.68 | | | | 2.65 | | | | 114 | |
| 2010 | | | 10.32 | | | | 0.20 | # | | | — | | | | 0.40 | | | | (0.21 | ) | | | (0.28 | ) | | | — | | | | 10.43 | | | | 5.82 | | | | 107,825 | | | | 0.65 | | | | 0.66 | | | | 1.90 | | | | 113 | |
| 2009(7) | | | 10.00 | | | | 0.19 | # | | | — | | | | 0.32 | | | | (0.18 | ) | | | (0.01 | ) | | | — | | | | 10.32 | | | | 5.12 | | | | 87,994 | | | | 0.67 | | | | 0.70 | | | | 3.53 | | | | 55 | |
| | | | | | | | | | | | | | | | | | | | | | | | | | | | | | | | | | | | | | | | | | | | | | | | | | | | | | | | |
Flexible Income Fund | |
| | | | | | | | | | | | |
GS4 Class | | | | | | | | | | | | | | | | | | | | | | | | | | | | | | | | | | | | | | | | | | | | | | | | | |
| 2013(8) | | $ | 10.00 | | | $ | 0.11 | # | | $ | — | † | | $ | 0.05 | | | $ | (0.10 | ) | | $ | — | † | | $ | — | | | $ | 10.06 | | | | 1.57 | % | | $ | 109,163 | | | | 1.20 | % | | | 1.26 | % | | | 2.22 | % | | | 25 | % |
| | | | | | | | | | | | | | | | | | | | | | | | | | | | | | | | | | | | | | | | | | | | | | | | | | | | | | | | |
Real Assets Fund | |
| | | | | | | | | | | | |
GS4 Class | | | | | | | | | | | | | | | | | | | | | | | | | | | | | | | | | | | | | | | | | | | | | | | | | |
| 2013(8) | | $ | 10.00 | | | $ | 0.06 | # | | $ | 0.27 | | | $ | (0.42 | ) | | $ | (0.09 | ) | | $ | — | | | $ | — | | | $ | 9.82 | | | | (0.87 | )% | | $ | 27,651 | | | | 0.12 | % | | | 0.89 | % | | | 1.22 | % | | | 1 | % |
| | | | | | | | | | | | | | | | | | | | | | | | | | | | | | | | | | | | | | | | | | | | | | | | | | | | | | | | |
Real Estate Securities Fund | |
| | | | | | | | | | | | |
GS4 Class | | | | | | | | | | | | | | | | | | | | | | | | | | | | | | | | | | | | | | | | | | | | | | | | | |
| 2013(9) | | $ | 10.60 | | | $ | 0.17 | # | | $ | — | † | | $ | (0.02 | ) | | $ | (0.21 | ) | | $ | (1.18 | ) | | $ | — | | | $ | 9.36 | | | | 1.49 | % | | $ | 234,903 | | | | 1.05 | % | | | 1.05 | % | | | 1.56 | % | | | 168 | % |
| 2012 | | | 9.18 | | | | 0.17 | # | | | — | † | | | 1.40 | | | | (0.15 | ) | | | — | | | | — | | | | 10.60 | | | | 17.09 | | | | 191,148 | | | | 1.05 | | | | 1.06 | | | | 1.62 | | | | 95 | |
| 2011 | | | 8.52 | | | | 0.08 | # | | | — | † | | | 0.65 | | | | (0.07 | ) | | | — | | | | — | | | | 9.18 | | | | 8.51 | | | | 150,227 | | | | 1.14 | | | | 1.14 | | | | 0.85 | | | | 90 | |
| 2010 | | | 6.74 | | | | 0.11 | # | | | — | | | | 1.82 | | | | (0.15 | ) | | | — | | | | — | | | | 8.52 | | | | 28.80 | | | | 141,900 | | | | 1.19 | | | | 1.19 | | | | 1.41 | | | | 105 | |
| 2009 | | | 5.25 | | | | 0.12 | # | | | — | | | | 1.49 | | | | (0.12 | ) | | | — | | | | — | † | | | 6.74 | | | | 31.21 | | | | 121,533 | | | | 1.27 | | | | 1.28 | | | | 2.29 | | | | 128 | |
| | | | | | | | | | | | | | | | | | | | | | | | | | | | | | | | | | | | | | | | | | | | | | | | | | | | | | | | |
Global Natural Resources Equity Fund | |
| | | | | | | | | | | | |
GS4 Class | | | | | | | | | | | | | | | | | | | | | | | | | | | | | | | | | | | | | | | | | | | | | | | | | |
| 2013(8)(10) | | $ | 10.00 | | | $ | (0.01 | )# | | $ | — | † | | $ | (0.16 | ) | | $ | (0.03 | ) | | $ | (0.09 | ) | | $ | — | | | $ | 9.71 | | | | (1.69 | )% | | $ | 260,722 | | | | 1.42 | % | | | 1.42 | % | | | (0.24 | )% | | | 18 | % |
| † | Amount represents less than $0.005 per share. |
| # | Calculated using the average shares outstanding method. |
| (1) | Recognition of net investment income by the Fund is affected by the timing of the declaration of dividends by the underlying investment companies in which the Fund invests. |
| (2) | Includes dividends paid from the short-term portion of capital gain distributions received from affiliated Funds. |
| (3) | Does not include expenses of the investment companies in which the Fund invests. |
| (4) | The ratio includes expenses waived/reimbursed net of amount recaptured and fees paid indirectly, where applicable; if expenses waived/reimbursed net of amount recaptured and fees paid indirectly were excluded, the ratio would have been higher (lower) than the ratio shown. |
| (5) | The ratio excludes expenses waived/reimbursed net of amount recaptured and fees paid indirectly, where applicable; if expenses waived/reimbursed net of amount recaptured and fees paid indirectly were included, the ratio would have been lower than the ratio shown. |
| (6) | An out of period adjustment to Investment Income had no impact on Net Investment Income per Share or Total Return; however, the Ratio of Net Investment Income to Average Net Assets increased by 0.01%. See Note 10 in Notes to Financial Statements. |
| (7) | Inception date was June 25, 2009. All ratios for the period have been annualized. Total return and portfolio turnover for the period have not been annualized. |
| (8) | Inception date was July 1, 2013. All ratios for the period have been annualized. Total return and portfolio turnover for the period have not been annualized. |
| (9) | An out of period adjustment to Investment Income had no impact on Net Investment Income per Share or Total Return; however, the Ratio of Net Investment Income to Average Net Assets increased by 0.03%. See Note 10 in Notes to Financial Statements. |
| (10) | An out of period adjustment to Investment Income had no impact on Net Investment Income per Share or Total Return; however, the Ratio of Net Investment Income to Average Net Assets increased by 0.01%. See Note 10 in Notes to Financial Statements. |
| | | | |
| 272 | | See Notes to Financial Statements. | | |
NOTES TO FINANCIAL STATEMENTS
1. DESCRIPTION OF THE FUNDS
GuideStone Funds (the “Trust”) was organized as a Delaware statutory trust on March 2, 2000. The Trust has established thirty-one series (each, a “Fund” and together, the “Funds”). Each Fund is a diversified, open-end management investment company, registered under the Investment Company Act of 1940, as amended (the “1940 Act”).
The MyDestination 2005, MyDestination 2015, MyDestination 2025, MyDestination 2035, MyDestination 2045 and MyDestination 2055 Fund are each referred to as a “Date Target Fund” and together as the “Date Target Funds.”
The Conservative Allocation Fund, Balanced Allocation Fund, Growth Allocation Fund, Aggressive Allocation Fund, Conservative Allocation Fund I, Balanced Allocation Fund I, Growth Allocation Fund I and Aggressive Allocation Fund I are each referred to as an “Asset Allocation Fund” and together as the “Asset Allocation Funds.”
The remaining Funds are each referred to as a “Select Fund” and are together referred to as the “Select Funds.” The Money Market Fund is referred to as the “Money Market Fund.” The Low-Duration Bond Fund, Medium-Duration Bond Fund, Extended-Duration Bond Fund and Global Bond Fund are together referred to as the “Fixed Income Funds.”
The Defensive Market Strategies Fund, Equity Index Fund, Value Equity Fund, Growth Equity Fund, Small Cap Equity Fund, International Equity Fund and Emerging Markets Equity Fund are together referred to as the “Equity Funds.”
The Inflation Protected Bond Fund, Flexible Income Fund, Real Assets Fund, Real Estate Securities Fund and the Global Natural Resources Equity Fund are together referred to as the “Real Return Select Funds.”
The Flexible Income Fund, Real Assets Fund and Global Natural Resources Equity Fund commenced operations as registered investment companies on July 1, 2013.
The Emerging Markets Equity Fund commenced operations as a registered investment company on October 31, 2013. There are two classes of shares issued by the Funds — the GS2 Class and the GS4 Class (each, a “Class” and together the “Classes”), except the Conservative Allocation Fund I, Balanced Allocation Fund I, Growth Allocation Fund I and Aggressive Allocation Fund I which issued the GS2 Class only. The Date Target Funds, Global Bond Fund, Inflation Protected Bond Fund, Flexible Income Fund, Real Assets Fund, Real Estate Securities Fund and the Global Natural Resources Equity Fund issued the GS4 Class only. All Classes of shares have identical voting, dividend and liquidation rights. Income, expenses (other than class specific expenses) and realized and unrealized gains or losses on investments are allocated to each Class of shares based upon its relative net assets.
Each Fund is a separate mutual fund with its own investment objective, strategies and risks. The Select Funds invest directly in particular types of fixed-income obligations, stocks and other investments. The Date Target, Asset Allocation and Real Assets Funds primarily invest in a different mix of the Select Funds to meet a specified investment strategy. The Date Target Funds, Asset Allocation Funds and Real Assets Fund are commonly referred to as “Fund of Funds.”
2. SIGNIFICANT ACCOUNTING POLICIES
The following significant accounting policies are in conformity with generally accepted accounting principles (“GAAP”) in the United States of America which require management to make estimates and assumptions that affect the reported amounts of assets, liabilities, disclosures of contingent assets and liabilities at the date of the financial statements and the reported amounts of income and expenses during the reporting period. Actual results could differ from those estimates and those differences could be significant.
273
a. Valuation of Securities
The Funds (except the Money Market Fund) each value securities traded on national securities exchanges or included in national market systems at the last quoted sale price, or official close price, on the principal exchange on which they were traded, or, in the absence of any sale or official close price, at the closing bid price. Securities which are primarily traded on foreign exchanges are generally valued at the closing values of such securities on their respective exchanges, except that when an occurrence subsequent to the time when the foreign security is valued is likely to have changed such value, then the fair value of those securities will be determined through procedures established by the Board of Trustees of the Trust (the “Board of Trustees”) and under the direction of a valuation committee appointed by the Board of Trustees. The valuation committee is comprised of individuals from the Adviser and BNY Mellon Investment Servicing (US) Inc. who previously have been identified to the Board. Non-exchange traded securities for which an over-the-counter quotation is readily available are valued at the last quoted bid price.
Debt securities, excluding asset-backed and mortgage-backed securities, are valued at the mean of the last bid and ask prices available. Asset-backed and mortgage-backed securities are generally valued at the last bid price, if available. Certain debt securities may be valued on the basis of broker quotations, valuations provided by a pricing service which may use a matrix, formula or other objective methods that take into consideration market indices, matrices, yield curves and other specific adjustments or by a sub-adviser using various methodologies approved by the Board of Trustees.
Short-term securities maturing in more than 60 days from the valuation date are valued at the mean of the last bid and ask prices; those maturing in 60 days or less are generally valued at amortized cost which approximates current market value in accordance with Rule 2a-7 of the 1940 Act.
Forward foreign exchange contracts are valued based upon closing exchange rates from each respective foreign market. Futures contracts are valued at the closing settlement price on the exchange on which they are primarily traded.
Options, rights and warrants for which the primary market is a national securities exchange are valued at the last sale price on the exchange on which they are traded, or, in the absence of any sale, at the closing bid price. Options, rights and warrants not traded on a national securities exchange are valued at the last quoted bid price.
Swap agreements are valued daily based upon the terms specific to each agreement with its counterparty. (Please see Note i, “Derivative Financial Instruments” for additional information regarding the valuation of swap agreements).
To the extent available, valuations of portfolio securities are provided by independent pricing services approved by the Board of Trustees. Securities for which market quotations are not readily available are valued at fair value according to methods established in good faith by the Board of Trustees. Due to the potential excessive volatility at the time valuations are developed, pricing techniques may materially vary from the actual amounts realized upon sale of the securities.
For securities that principally trade on a foreign market or exchange, a significant gap in time can exist between the time of a particular security’s last trade and the time at which a Fund calculates its NAV. The closing prices of such securities may no longer reflect their market value at the time the Fund calculates its NAV if an event that could materially affect the value of those securities (a “Significant Event”) has occurred between the time of the security’s last close and the time that the Fund calculates its NAV. A Significant Event may relate to a single issuer or to an entire market sector. If a Fund becomes aware of a Significant Event that has occurred with respect to a security or group of securities after the closing of the exchange or market on which the security or securities principally trade, but before the time at which the Fund calculates its NAV, a Valuation Committee meeting may be called. The Trust uses Interactive Data Corporation (“IDC”) as a third party fair valuation vendor. IDC provides a fair value for foreign equity securities held by the Trust based on certain factors and methodologies applied by IDC in the event that there is movement in the U.S. market that exceeds a specific threshold established by the Valuation Committee in consultation
274
with, and approved by, the Board of Trustees. Such methodologies generally involve tracking valuation correlations between the U.S. market and each non-U.S. security. As part of the valuation procedures, a “confidence interval” is used, when the threshold is exceeded, to determine the level of correlation between the value of a foreign equity security and movements in the U.S. market before a particular security will be fair valued. In the event that the threshold established by the Valuation Committee is exceeded on a specific day, the Trust will typically value non-U.S. equity securities in its portfolio that exceed the applicable confidence interval based upon the fair values provided by IDC.
The Asset Allocation, Date Target and Real Assets Funds value their investments in the underlying Select Funds daily at the closing NAV of each respective Select Fund.
The Financial Accounting Standards Board’s (“FASB”) “Fair Value Measurements and Disclosures” defines fair value as the price that a fund would receive to sell an asset or pay to transfer a liability in an orderly transaction between market participants at the measurement date. It establishes and requires disclosure of a fair value hierarchy, separately for each major category of assets and liabilities, that segregates fair value measurements into levels (Levels 1, 2, and 3). Categorizations of fair value measurements, and the criteria used to determine each categorization, are as follows:
| | | | |
Level 1 | | – | | quoted prices in active markets for identical securities which include: |
Equity securities, including restricted securities, for which market quotations are readily available, that are valued at the last reported sale price or official closing price as reported by an independent pricing service on the primary market or exchange on which they are traded; and
Investments in open-end mutual funds, including the GuideStone Funds, Credit Suisse Commodity Return Strategy Fund and the Northern Institutional Liquid Assets Portfolio, which are valued at their closing net asset value each business day.
| | | | |
Level 2 | | – | | prices determined using other significant observable inputs (including quoted prices for similar securities, interest rates, prepayment speeds, credit risk, etc.) which include: |
Equity securities for which there were no sales or closing prices for that day, that are valued at the last quoted bid price or that may be valued using the last available price;
Foreign equity securities for which a Significant Event has occurred and a fair value price is provided by IDC;
Debt securities, including restricted securities that are valued based on evaluated quotations received from independent pricing. For corporate bonds, pricing services that utilize matrix pricing which considers yield or price of bonds of comparable quality, coupon, maturity and type as well as dealer supplied prices; and
Short-term securities with remaining maturities of sixty days or less for which quotations are not readily available and are valued at amortized cost.
| | | | |
Level 3 | | – | | prices determined using significant unobservable inputs (including the valuation committee’s own assumptions in determining the fair value of investments) which include: |
Restricted equity securities and private placements where observable inputs are limited, assumptions about market activity and risk are used; and
Debt securities, including restricted securities that are valued based on evaluated quotations received from dealers who make markets in such securities.
275
Valuation levels are not necessarily an indication of the risk associated with investing in those securities. Changes in valuation techniques may result in transfers into or out of an assigned level within the disclosure hierarchy. Transfers between different levels of the fair value disclosure hierarchy are deemed to have occurred as of the end of the reporting period.
In accordance with FASB “Amendments to Achieve Common Fair Value Measurement and Disclosure Requirements in U.S. GAAP and International Financial Reporting Standards (“IFRSs”),” management has not presented quantitative disclosures as the securities which are advisor priced or valued by the valuation committee are immaterial. Additionally, there have been no adjustments to prices received from third parties as of December 31, 2013.
A valuation hierarchy including information regarding transfers between levels and Level 3 securities, where applicable, is shown at the end of each Fund’s Schedule of Investments.
b. Fixed Income Securities
The Bond Funds, Defensive Market Strategies Fund and the Small Cap Equity Fund may invest in mortgage-related and other asset-backed securities. These securities include mortgage pass-through securities, collateralized mortgage obligations, commercial mortgage-backed securities, stripped mortgage-backed securities, asset-backed securities, collateralized debt obligations and other securities that directly or indirectly represent a participation in, or are secured by and payable from, mortgage loans on real property. Mortgage-related and other asset-backed securities are interests in pools of loans or other receivables. Mortgage-related securities are created from pools of residential or commercial mortgage loans, including mortgage loans made by savings and loan institutions, mortgage bankers, commercial banks and others. Asset-backed securities are created from many types of assets, including auto loans, credit card receivables, home equity loans and student loans. These securities provide a monthly payment which consists of both interest and principal payments. Interest payments may be determined by fixed or adjustable rates. The rate of pre-payments on underlying mortgages will affect the price and volatility of a mortgage-related security and may have the effect of shortening or extending the effective duration of the security relative to what was anticipated at the time of purchase. The timely payment of principal and interest of certain mortgage-related securities is guaranteed with the full faith and credit of the United States Government. Pools created and guaranteed by non-governmental issuers, including government-sponsored corporations, may be supported by various forms of insurance or guarantees, but there can be no assurance that the private insurers or guarantors can meet their obligations under the insurance policies or guarantee arrangements.
Collateralized Mortgage Obligations (“CMOs”) are debt obligations of a legal entity that are collateralized by mortgages and divided into classes. CMOs are structured into multiple classes, often referred to as “tranches,” with each class bearing a different stated maturity and entitled to a different schedule for payments of principal and interest, including pre-payments. Commercial Mortgage-Backed Securities (“CMBS”) include securities that reflect an interest in, and are secured by, mortgage loans on commercial real property. Many of the risks of investing in CMBS reflect the risks of investing in the real estate securing the underlying mortgage loans. These risks reflect the effects of local and other economic conditions on real estate markets, the ability of tenants to make loan payments, and the ability of a property to attract and retain tenants. CMOs and CMBS may be less liquid and may exhibit greater price volatility than other types of mortgage- or asset-backed securities. Stripped Mortgage-Backed Securities (“SMBS”) are derivative multi-class mortgage securities. SMBS are usually structured with two classes that receive different proportions of the interest and principal distributions on a pool of mortgage assets. A common type of SMBS will have one class receiving some of the interest and most of the principal from the mortgage assets, while the other class will receive most of the interest and the remainder of the principal. In the most extreme case, one class will receive all of the interest (the interest-only or “IO” class), while the other class will receive the entire principal (the principal-only or “PO” class). Payments received for IOs are included in interest income on the Statements of Operations. Because little to
276
no principal will be received at the maturity of an IO, adjustments are made to the book value of the security on a monthly basis until maturity. These adjustments are included in interest income on the Statements of Operations. Payments received for POs are treated as reductions to the cost and par value of the securities.
Inflation-indexed bonds are fixed-income securities whose principal value is periodically adjusted to the rate of inflation. The interest rate on these bonds is generally fixed at issuance at a rate lower than typical bonds. Over the life of an inflation-indexed bond, however, interest will be paid based on a principal value, which is adjusted for inflation. Any increase or decrease in the principal amount of an inflation-indexed bond will be included as interest income on the Statements of Operations, even though investors do not receive their principal until maturity.
“TBA” (to be announced) purchase commitments are commitments to purchase securities for a fixed price at a future date, typically not exceeding 45 days. TBAs may be considered securities in themselves and involve a risk of loss if the value of the security to be purchased declines prior to settlement date. This risk is in addition to the risk of decline in each Fund’s other assets. Unsettled TBAs are valued at the current market value of the underlying securities, according to the procedures described in the section entitled “Valuation of Securities”.
During the year ended December 31, 2013, the Low-Duration Bond Fund and Medium-Duration Bond Fund entered into dollar roll transactions, pursuant to which they sell a mortgage-backed TBA or security and simultaneously purchase a similar, but not identical, TBA with the same issuer, rate and terms. The Funds may execute a “roll” to obtain better underlying mortgage securities or to increase yield. The Funds account for dollar roll transactions as purchases and sales, which has the effect of increasing their portfolio turnover rates. Risks associated with dollar rolls are that actual mortgages received by the Funds may be less favorable than those anticipated or that counterparties may fail to perform under the terms of the contracts.
TBA sale commitments are commitments to sell mortgage-backed securities for a fixed price at a future date. TBAs may be considered securities in themselves and involve a risk of loss if the value of the security to be sold increases prior to settlement date of the Fund’s other assets.
U.S. Government securities are obligations of and, in certain cases, guaranteed by, the U.S. Government, its agencies or instrumentalities. The U.S. Government does not guarantee the NAV of the Funds’ shares. Some U.S. Government securities, such as Treasury bills, notes and bonds, and securities guaranteed by the Government National Mortgage Association (“GNMA” or “Ginnie Mae”), are supported by the full faith and credit of the United States Government; others, such as those of the Federal Home Loan Bank, are supported by the right of the issuer to borrow from the U.S. Department of the Treasury (the “U.S. Treasury”); others, such as those of the Federal National Mortgage Association (“FNMA” or “Fannie Mae”), are supported by the discretionary authority of the U.S. Government to purchase the agency’s obligations; and still others, such as those of the Student Loan Marketing Association, are supported only by the credit of the instrumentality. U.S. Government securities may include zero coupon securities, which do not distribute interest on a current basis and tend to be subject to greater risk than interest-paying securities of similar maturities.
Government-related guarantors (i.e., not backed by the full faith and credit of the United States Government) include FNMA and the Federal Home Loan Mortgage Corporation (“FHLMC” or “Freddie Mac”). FNMA is a government-sponsored corporation, the common stock of which is owned entirely by private stockholders. FNMA purchases conventional (i.e., not insured or guaranteed by any government agency) residential mortgages from a list of approved seller/servicers which include state and federally chartered savings and loan associations, mutual savings banks, commercial banks and credit unions and mortgage bankers. Pass-through securities issued by FNMA are guaranteed as to timely payment of principal and interest by FNMA, but are not backed by the full faith and credit of the United States Government. FHLMC issues Participation Certificates (“PCs”), which are pass-through securities, each representing an undivided interest in a pool of residential mortgages. FHLMC guarantees the timely payment of interest and ultimate collection of principal, but PCs are not backed by the full faith and credit of the United States Government.
277
The U.S. Treasury has historically had the authority to purchase obligations of Fannie Mae and Freddie Mac (collectively, the “GSEs”). However, in 2008, due to capitalization concerns, Congress provided the U.S. Treasury with additional authority to lend the GSEs emergency funds and to purchase their stock. In September 2008, those capital concerns led the U.S. Treasury and the Federal Housing Finance Authority (“FHFA”) to announce that the GSEs had been placed in conservatorship.
Since that time, the GSEs have received significant capital support through U.S. Treasury preferred stock purchases, as well as Treasury and Federal Reserve purchases, of their mortgage backed securities (“MBS”). The FHFA and the U.S. Treasury (through its agreement to purchase GSE preferred stock) have imposed strict limits on the size of their mortgage portfolios. While the MBS purchase programs ended in 2010, the U.S. Treasury announced in December 2009 that it would continue its support for the entities’ capital as necessary to prevent a negative net worth through at least 2012. While the U.S. Treasury is committed to offset negative equity at the GSEs through its preferred stock purchases through 2012, no assurance can be given that the Federal Reserve, U.S. Treasury, or FHFA initiatives will ensure that the GSEs will remain successful in meeting their obligations with respect to the debt and MBS they issue beyond that date.
The problems faced by the GSEs, resulting in their being placed into federal conservatorship and receiving significant U.S. Government support, have sparked serious debate among federal policy makers regarding the continued role of the U.S. Government in providing liquidity for mortgage loans. The Obama Administration produced a report to Congress on February 11, 2011, outlining a proposal to wind down the GSEs by increasing their guarantee fees, reducing their conforming loan limits (the maximum amount of each loan they are authorized to purchase) and continuing progressive limits on the size of their investment portfolio. Congress is currently considering several pieces of legislation that would reform the GSEs and possibly wind down their existence, addressing portfolio limits and guarantee fees, among other issues.
Based on quarterly loss figures, in August 2011, both GSEs requested additional support from the U.S. Treasury (Fannie Mae requested $2.8 billion and Freddie Mac requested $1.5 billion, net of dividend payments to the U.S. Treasury). In August 2012, the U.S. Treasury announced a set of modifications to the Preferred Stock Purchase Agreements between the U.S. Treasury and the FHFA. Instead of receiving 10% dividends from the GSEs, the U.S. Treasury is taking a quarterly sweep of all profits earned by the firms.
Serious discussions among policymakers continue, however, as to what role the U.S. Government should play in the U.S. housing market. Fannie Mae and Freddie Mac are also the subject to several continuing legal actions and investigations over certain accounting, disclosure or corporate governance matters, which (along with any resulting financial restatements) may continue to have an adverse effect on the guaranteeing entities. Importantly, the future of the GSEs is in serious question as the U.S. Government considers multiple options.
c. Foreign Currency Translations
Investment securities and other assets and liabilities denominated in foreign currencies are translated into U.S. dollar amounts at the date of valuation. Purchases and sales of investment securities and income and expense items denominated in foreign currencies are translated into U.S. dollar amounts on the respective dates of such transactions.
The Funds isolate that portion of the results of operations resulting from changes in foreign exchange rates on investments from the fluctuations arising from changes in market prices of securities held.
Reported net realized foreign exchange gains or losses arise from sales of portfolio securities, sales and maturities of short-term securities, sales of foreign currencies, currency gains or losses realized between the trade and settlement dates on securities transactions, and the difference between the amounts of dividends, interest, and foreign withholding taxes recorded on the
278
Fund’s books and the U.S. dollar equivalent of the amounts actually received or paid. Net unrealized foreign exchange gains and losses arise from changes in the values of assets and liabilities, including investments in securities at fiscal period end, resulting from changes in the exchange rate.
d. Loan Participations
The Bond Funds, Small Cap Equity Fund and the Flexible Income Fund may invest in direct debt instruments which are interests in amounts owed to lenders or lending syndicates by corporate borrowers. A Fund’s investments in loans may be in the form of participations in loans. A loan is often administered by a bank or other financial institution (the “lender”) that acts as agent for all holders. The agent administers the terms of the loan, as specified in the loan agreement. A Fund may invest in multiple series or tranches of a loan, which may have varying terms and carry different associated risks. A Fund generally has no right to enforce compliance with the terms of the loan agreement with the borrower. As a result, a Fund may be subject to the credit risk of both the borrower and the lender that is selling the loan agreement. When investing in a loan participation, a Fund has the right to receive payments of principal, interest and any fees to which it is entitled only from the lender selling the loan agreement and only upon receipt of payments by the lender from the borrower. A Fund may receive a commitment fee based on the undrawn portion of the underlying line of credit portion of a floating rate loan. In certain circumstances, a Fund may receive a prepayment penalty fee upon the prepayment of a floating rate loan by a borrower. Fees earned or paid are recorded as a component of interest income or interest expense on the Statements of Operations.
e. REITs
The Real Estate Securities Fund invests substantial assets in real estate investment trusts (“REITs”) that involve risks not associated with investing in stocks. Risks include declines in the value of real estate, general and economic conditions, changes in the value of the underlying property and defaults by borrowers. The value of assets in the real estate industry may go through cycles of relative underperformance and outperformance in comparison to equity securities markets in general.
Dividend income is recorded using management’s estimate of the income included in distributions received from REIT investments. The actual amounts of income, return of capital and capital gains are only determined by each REIT after its fiscal year-end and may differ from the estimated amount. Estimates of income are adjusted in the Funds to the actual amounts when the amounts are determined.
f. Repurchase Agreements
Each Fund may agree to purchase securities from financial institutions subject to the seller’s agreement to repurchase them at a mutually agreed upon date and price. It is the Fund’s policy that repurchase agreements are fully collateralized by U.S. Treasury and Government Agency securities. All collateral is held by the Fund’s custodian bank or a bank with which the custodian bank has entered into a subcustodian agreement, or is segregated in the Federal Reserve Book Entry System. In connection with transactions in repurchase agreements, if the seller defaults and the value of the collateral declines, or if the seller enters an insolvency proceeding, realization of the collateral by the Fund may be delayed or limited.
Repurchase transactions are entered into by the Funds under Master Repurchase Agreements (“MRA”) which permit the Funds, under certain circumstances including an event of default (such as bankruptcy or insolvency), to offset payables and/or receivables under the MRA with collateral held and/or posted to the counterparty and create one single net payment due to or from the Fund.
279
At December 31, 2013, the open repurchase agreements by counterparty which are subject to an MRA on a net payment basis are as follows:
| | | | | | | | | | | | | | | | |
| Fund/Counterparty | | Repurchase
Agreements | | | Fair Value of
Non-cash
Collateral
Received | | | Cash
Collateral
Received | | | Net Amount(1) | |
Money Market | | | | | | | | | | | | | | | | |
Goldman Sachs & Co. | | $ | 30,361,000 | | | $ | (30,361,000 | ) | | $ | — | | | $ | — | |
| | | | | | | | | | | | | | | | |
Low-Duration Bond | | | | | | | | | | | | | | | | |
Barclays Capital, Inc. | | $ | 12,200,000 | | | $ | (12,200,000 | ) | | $ | — | | | $ | — | |
Citigroup Global Markets, Inc. | | | 26,900,000 | | | | (26,900,000 | ) | | | — | | | | — | |
| | | | | | | | | | | | | | | | |
Total Repurchase Agreements | | $ | 39,100,000 | | | $ | (39,100,000 | ) | | $ | — | | | $ | — | |
| | | | | | | | | | | | | | | | |
Medium-Duration Bond | | | | | | | | | | | | | | | | |
Citigroup Global Markets, Inc. | | $ | 11,400,000 | | | $ | (11,400,000 | ) | | $ | — | | | $ | — | |
| | | | | | | | | | | | | | | | |
| (1) | Net amount represents the net amount receivable due from (payable to) the counterparty in the event of default. |
Additional information about master netting arrangements can be found in the Derivative Financial Instruments and Securities Lending sections of the Notes to Financial Statements.
g. Short Sales
A short sale is a transaction in which a Fund sells a security it does not own. The Fund’s obligation to replace the security borrowed and sold short will be fully collateralized at all times by cash equivalents deposited in an account with the Fund’s custodian. If the price of the security sold short increases between the time of the short sale and the time the Fund replaces the borrowed security, the Fund will realize a loss; and if the price declines during the period, the Fund will realize a gain. Any realized gain will be decreased, and any realized loss increased, by the amount of transaction costs.
The Equity Funds may sell short exchange-listed equity futures contracts to reduce market exposure. The Date Target Funds, Asset Allocation Funds, Bond Funds and Small Cap Equity Fund may sell short U.S. Treasury securities and exchange-listed U.S. Treasury futures contracts to reduce market exposure. The Low-Duration Bond and Medium-Duration Bond Funds will occasionally enter into a short sale to initiate a dollar roll transaction. The Defensive Market Strategies Fund may establish short positions in stocks of companies with a market value of up to 30% of the Fund’s assets. The International Equity Fund may establish short positions in stocks of foreign companies with a market value of up to 7% of the Fund’s assets.
At December 31, 2013, the value of securities sold short in the Low-Duration Bond, Medium-Duration Bond, Defensive Market Strategies and International Equity Funds amounted to $3,084,500, $7,360,243, $47,002,923 and $91,139,017, respectively.
h. Synthetic Convertible Instruments
The Defensive Market Strategies Fund invests in synthetic convertible instruments. Synthetic convertible instruments are hybrid financial instruments that generally combine both debt and equity characteristics into a single note form. Income received from synthetic convertible instruments will be recorded as realized gains in the Statement of Operations and may be based on the performance of an underlying equity security, an equity index, or an option position. The risks of investing in synthetic convertible instruments include unfavorable price movements in the underlying security and the credit risk of the issuing financial institution. There may be no guarantee of a return of principal with synthetic convertible instruments and the appreciation potential may be limited. Synthetic convertible instruments may be more volatile and less liquid than other investments held by the Fund.
280
i. Derivative Financial Instruments
The Funds may engage in various portfolio strategies to seek to increase their return by hedging their portfolios against adverse movements in the equity, debt and currency markets. Losses may arise due to changes in the value of the contract if the counterparty does not perform under the contract. The Funds, in their normal course of business, may enter into contracts that contain a variety of representations and warranties and which provide general indemnifications. The Funds’ exposure may include future claims that may be made against the Funds that have not yet occurred.
Financial Futures Contracts — The Funds (except the Money Market Fund) may purchase or sell financial futures contracts and the options on such futures contracts for the purpose of hedging risk on existing securities, demonstrating purchase of securities or gaining market exposure on cash balances. Financial futures contracts are contracts for the delivery of securities at a specified future date at an agreed upon price or yield. Upon entering into a contract, the Funds deposit and maintain as collateral such initial margin as required by the exchange on which the transaction is effected.
Pursuant to the contract, the Funds agree to pay to or receive from the broker an amount of cash equal to the daily fluctuation in the value of the contract. Such payments or receipts are known as variation margin and are recorded by the Funds as unrealized gains or losses until the contract is closed or settled.
Risks of entering into futures contracts include the possibility that there will be an imperfect price correlation between the futures and the underlying securities. Second, it is possible that a lack of liquidity for futures contracts could exist in the secondary market, resulting in an inability to close a futures position prior to its maturity date. Third, the purchase of a futures contract involves the risk that a Fund could lose more than the original margin deposit required to initiate a futures transaction. Futures contracts involve, to varying degrees, risk of loss in excess of the variation margin disclosed on the Statements of Assets and Liabilities.
Foreign Currency Options and Futures — The Bond Funds, Defensive Market Strategies Fund, Small Cap Equity Fund and International Equity Fund may also enter into futures contracts on foreign currencies and related options on transactions as a short or long hedge against possible variations in foreign exchange rates.
Forward Foreign Exchange Contracts — Certain Funds may enter into forward foreign currency exchange contracts to hedge against adverse exchange rate fluctuation to the U.S. dollar or between different foreign currencies in connection with either specific security transactions or portfolio positions. Each contract is valued daily and the change in value is recorded as an unrealized gain or loss. When the contract is closed, a realized gain or loss is recorded equal to the difference between the opening value and the closing value of the contract. These contracts may involve market risk in excess of the unrealized gain or loss reflected on the Statements of Assets and Liabilities. The Funds could be exposed to risk if the counterparties to the contracts are unable to meet the terms of the contract and from unanticipated movements in the value of a foreign currency relative to the U.S. dollar.
Options — Certain Funds are authorized to write and purchase put and call options. The risk in writing a call option is that the Funds give up the opportunity for profit if the market price of the security increases. The risk in writing a put option is that the Funds may incur a loss if the market price of the security decreases and the option is exercised. The risk in purchasing an option is that the Funds pay a premium whether or not the option is exercised. The Funds also have the additional risk of being unable to enter into a closing transaction at an acceptable price if a liquid secondary market does not exist. The Funds also may write over-the-counter options where completing the obligation depends upon the credit standing of the other party and that party’s ability to perform. Option contracts also involve the risk that they may not work as intended due to unanticipated developments in market conditions or other causes.
Options purchased are recorded as an asset, and written options are recorded as liabilities to the extent of premiums paid or received. Each Fund will realize a gain or loss when the option transaction expires or closes. When an option is exercised, the proceeds on sales for a written call option, the purchase cost for a written put option or the cost of a security for a purchased put or call option is adjusted by the amount of the premium received or paid.
281
When a Fund writes a call or put option, an amount equal to the premium received is recorded as a liability and subsequently marked to market to reflect the current value of the option written. These liabilities are reflected as written options outstanding on the Statements of Assets and Liabilities.
Certain Funds may write swaption contracts to manage exposure to fluctuations in interest rates and to enhance portfolio yield. Swaption contracts written by the Funds represent an option that gives the purchaser the right, but not the obligation, to enter into a previously agreed upon swap contract on a future date. If a written call swaption is exercised, the writer will enter a swap and is obligated to pay the fixed-rate and receive a floating rate in exchange. If a written put swaption is exercised, the writer will enter a swap and is obligated to pay the floating rate and receive a fixed rate in exchange. Swaptions are marked-to-market daily based upon quotations from market makers. When a Fund writes a swaption, the premium received is recorded as a liability and is subsequently adjusted to the current market value of the swaption. Entering into a swaption contract involves, to varying degrees, the elements of credit, market and interest rate risk in excess of the associated option and swap contract amounts reported in the Statement of Assets and Liabilities. The Funds bear the market risk arising from any change in index values or interest rates.
Swap Agreements — Each Select Fund, except the Money Market Fund, may enter into swap agreements. The Equity Funds may enter into equity swap contracts and the Bond Funds and the Small Cap Equity Fund may enter into interest rate and credit default swaps. The Bond Funds and International Equity Fund may enter into cross-currency swaps, and each Select Fund may enter into total return swaps.
Swap agreements are privately negotiated agreements between a Fund and a counterparty to exchange or swap investment cash flows, assets, foreign currencies or market-linked returns at specified, future intervals. A swap may be entered into in order to, among other things, change the maturity of a Fund’s portfolio, to protect a Fund’s value from changes in interest rates, to expose a Fund to a different security or market, or to help a Fund achieve a strategy relative to an index or other benchmark. By entering into a swap agreement, a Fund is exposed to the risk of unanticipated movements in interest rates or in the value of an underlying security or index (or the risk that the counterparty will not fulfill its obligation under the agreement). Credit default swaps involve the payment of amounts based on a specified rate multiplied by a notional amount as well as upon an event of default. In connection with these agreements, securities are set aside as collateral by the Fund’s custodian.
Swaps are marked-to-market daily based upon values from third party vendors or quotations from market makers to the extent available and the change in value, if any, is recorded as an unrealized gain or loss on the Statements of Assets and Liabilities. In the event that market quotations are not readily available or deemed reliable, certain swap agreements may be valued pursuant to guidelines established by the Board of Trustees. In the event that market quotes are not readily available and the swap cannot be valued pursuant to one of the valuation methods, the value of the swap will be determined in good faith by the Valuation Committee, generally based upon recommendations provided by the Fund’s sub-adviser. Payments received or made at the beginning of the measurement period are reflected as such on the Statements of Assets and Liabilities and represent payments made or received upon entering into the swap agreement to compensate for differences between the stated terms of the swap agreement and prevailing market conditions (credit spreads, currency exchange rates, interest rates, and other relevant factors). These up-front payments are recorded as realized gains or losses on the Statements of Operations upon termination or maturity of the swap. A liquidation payment received or made at the termination of the swap is recorded as realized gain or loss on the Statements of Operations. Net periodic payments received or paid by a Fund are included as part of realized gains or losses on the Statements of Operations.
282
Certain of the Fund’s derivative agreements contain provisions that require the Fund to maintain a predetermined level of net assets, and/or provide limits regarding the decline of the Fund’s NAV over one-month, three-month and 12-month periods. If a Fund were to violate such provisions, the counterparties to the derivative instruments could request immediate payment or demand immediate collateralization on derivative instruments in net liability positions. For the year ended December 31, 2013, all of the Funds maintained the required level of net assets and/or the NAVs of the Funds did not decline below the limits set forth in the derivative agreements.
Entering into these agreements involves, to varying degrees, elements of credit, market and documentation risk in excess of the amounts recognized on the Statements of Assets and Liabilities. Such risks involve the possibility that there will be no liquid market for these agreements, that the counterparty to the agreements may default on its obligation to perform or disagree as to the meaning of contractual terms in the agreements and that there may be unfavorable changes in interest rates.
Credit Default Swaps — Credit default swap agreements involve one party making a stream of payments (referred to as the buyer of protection) to another party (the seller of protection) in exchange for the right to receive a specified return in the event of a default or other credit event for the referenced entity, obligation or index. As a seller of protection on credit default swap agreements, a Fund will generally receive from the buyer of protection a fixed rate of income throughout the term of the swap provided that there is no credit event. As the seller, a Fund would effectively add leverage to its portfolio because, in addition to its total net assets, a Fund would be subject to investment exposure on the notional amount of the swap.
Any up-front payments made or received upon entering a credit default swap contract are treated as part of the cost and are reflected as part of the unrealized gain (loss) on valuation. Upon termination of the swap contract, the amount included in the cost is reversed and becomes part of the swap’s realized gain (loss).
The sub-advisers monitor a variety of factors including cash flow assumptions, market activity, market sentiment and valuation as part of their ongoing process of assessing payment and performance risk. As payment and performance risk increases, the value of a credit default swap increases, resulting in recognition of unrealized gains for long positions and unrealized losses for short positions. Conversely, as payment and performance risk decreases, unrealized gains are recognized for short positions and unrealized losses are recognized for long positions. Any current or future declines in the fair value of the swap may be partially offset by up-front payments received by the Fund as a seller of protection if applicable. The change in value is recorded within unrealized appreciation (depreciation) until the occurrence of a credit event or the termination of the swap, at which time a realized gain (loss) is recorded.
If a Fund is a seller of protection and a credit event occurs, as defined under the terms of that particular swap agreement, a Fund will either (i) pay to the buyer of protection an amount equal to the notional amount of the swap and take delivery of the referenced obligation, other deliverable obligations or underlying securities comprising the referenced index or (ii) pay a net settlement amount in the form of cash or securities equal to the notional amount of the swap less the recovery value of the referenced obligation or underlying securities comprising the referenced index. If a Fund is a buyer of protection and a credit event occurs, as defined under the terms of that particular swap agreement, a Fund will either (i) receive from the seller of protection an amount equal to the notional amount of the swap and deliver the referenced obligation, other deliverable obligations or underlying securities comprising the referenced index or (ii) receive a net settlement amount in the form of cash or securities equal to the notional amount of the swap less the recovery value of the referenced obligation or underlying securities comprising the referenced index. Recovery values are assumed by market makers considering either industry standard recovery rates or entity specific factors and considerations until a credit event occurs. If a credit event has occurred, the recovery value is determined by a facilitated auction whereby a minimum number of allowable broker bids, together with a specified valuation method, are used to calculate the settlement value.
283
Credit default swap agreements on corporate issues or sovereign issues of an emerging country involve one party making a stream of payments to another party in exchange for the right to receive a specified return in the event of a default or other credit event. If a credit event occurs and cash settlement is not elected, a variety of other deliverable obligations may be delivered in lieu of the specific referenced obligation. The ability to deliver other obligations may result in a cheapest-to-deliver option (the buyer of protection’s right to choose the deliverable obligation with the lowest value following a credit event). A Fund may use credit default swaps on corporate issues or sovereign issues of an emerging country to provide a measure of protection against defaults of the issuers (i.e., to reduce risk where a Fund owns or has exposure to the referenced obligation) or to take an active long or short position with respect to the likelihood of a particular issuer’s default.
Credit default swap agreements on asset-backed securities involve one party making a stream of payments to another party in exchange for the right to receive a specified return in the event of a default or other credit event. Unlike credit default swaps on corporate issues or sovereign issues of an emerging country, deliverable obligations in most instances would be limited to the specific referenced obligation as performance for asset-backed securities can vary across deals. Prepayments, principal paydowns, and other write down or loss events on the underlying mortgage loans will reduce the outstanding principal balance of the referenced obligation. These reductions may be temporary or permanent as defined under the terms of the swap agreement and the notional amount for the swap agreement will be adjusted by corresponding amounts. A Fund may use credit default swaps on asset-backed securities to provide a measure of protection against defaults of the referenced obligation or to take an active long or short position with respect to the likelihood of a particular referenced obligation’s default.
Credit default swap agreements on credit indices involve one party making a stream of payments to another party in exchange for the right to receive a specified return in the event of a write-down, principal shortfall, interest shortfall or default of all or part of the referenced entities comprising the credit index. A credit index is a list of a basket of credit instruments or exposures designed to be representative of some part of the credit market as a whole. These indices are made up of reference credits that are judged by a poll of dealers to be the most liquid entities in the credit default swap market based on the sector of the index. Components of the indices may include, but are not limited to, investment grade securities, high yield securities, asset-backed securities, emerging markets, and/or various credit ratings within each sector. Credit indices are traded using credit default swaps with standardized terms including a fixed spread and standard maturity dates. An index credit default swap references all the names in the index, and if there is a default, the credit event is settled based on that name’s weight in the index. The composition of the indices changes periodically, usually every six months, and for most indices, each name has an equal weight in the index. A Fund may use credit default swaps on credit indices to hedge a portfolio of credit default swaps or bonds with a credit default swap on indices which is less expensive than it would be to buy many credit default swaps to achieve a similar effect. Credit-default swaps on indices are benchmarks for protecting investors owning bonds against default, and traders use them to speculate on changes in credit quality.
Implied credit spreads, represented in absolute terms, utilized in determining the market value of credit default swap agreements on corporate issues or sovereign issues of an emerging country as of period end are disclosed in the footnotes to the Schedules of Investments and serve as an indicator of the current status of the payment/performance risk and represent the likelihood or risk of default for the credit derivative. The implied credit spread of a particular referenced entity reflects the cost of buying/selling protection and may include up-front payments required to be made to enter into the agreement. For credit default swap agreements on asset-backed securities and credit indices, the quoted market prices
284
and resulting values serve as the indicator of the current status of the payment/performance risk. Wider credit spreads and increasing market values, in absolute terms when compared to the notional amount of the swap, represent a deterioration of the referenced entity’s credit soundness and a greater likelihood or risk of default or other credit event occurring as defined under the terms of the agreement.
The maximum potential amount of future payments (undiscounted) that a Fund as a seller of protection could be required to make under a credit default swap agreement would be an amount equal to the notional amount of the agreement. These potential amounts would be partially offset by any recovery values of the respective referenced obligations, up-front payments received upon entering into the agreement, or net amounts received from the settlement of buy protection credit default swap agreements entered into by a Fund for the same referenced entity or entities.
Credit default swaps involve greater risks than if the Funds had invested in the referenced obligation directly. In addition to general market risks, credit default swaps are subject to liquidity risk and counterparty credit risk. The Funds enter into credit default swaps with counterparties meeting defined criteria for financial strength. A buyer also may lose its investment and recover nothing should a credit event not occur. If a credit event did occur, the value of the referenced obligation received by the seller, coupled with the periodic payments previously received, may be less than the full notional value it pays to the buyer, resulting in a loss of value.
Exchange Traded Swap Agreements — Exchange traded swaps are either interest rate or credit default swap agreements brokered by the Chicago Mercantile Exchange (the “CME”) where the CME is the counterparty to both the buyer and seller of protection. Exchange traded swaps involve a lesser degree of risk because the CME, as counterparty, monitors risk factors for the involved parties. Exchange traded swaps are subject to general market risks and to liquidity risk. Pursuant to the agreement, the Funds agree to pay to or receive from the broker an amount of cash equal to the daily fluctuation in the value of the contract (the “Margin”) and daily interest on the margin. In the case of exchange traded interest rate swaps, the daily settlement also includes the daily portion of interest. Such payments are recorded by the Funds as unrealized gains or losses until the contract is closed or settled.
Exchange traded swaps require no payments at the beginning of the measurement period nor are there liquidation payments at the termination of the swap.
Cross-Currency Swap Agreements — Cross-currency swap agreements involve two parties exchanging two different currencies with an agreement to reverse the exchange at a later date at specified exchange rates. The exchange of currencies at the inception date of the contract takes place at the current spot rate. The re-exchange at maturity may take place at the same exchange rate, a specified rate, or the then current spot rate. Interest payments, if applicable, are made between the parties based on interest rates available in the two currencies at the inception of the contract. The terms of cross-currency swap contracts may extend for many years. Cross-currency swaps are usually negotiated with commercial and investment banks. Some cross-currency swaps may not provide for exchanging principal cash flows but only for exchanging interest cash flows.
Interest Rate Swap Agreements — Interest rate swap agreements involve the exchange by a Fund with another party of their respective commitments to pay or receive interest with respect to the notional amount of principal. Certain forms of interest rate swap agreements may include: (i) interest rate caps, under which, in return for a premium, one party agrees to make payments to the other to the extent that interest rates exceed a specified rate, or “cap”, (ii) interest rate floors, under which, in return for a premium, one party agrees to make payments to the other to the extent that interest rates fall below a specified rate, or “floor”, (iii) interest rate collars, under which a party sells a cap and purchases a floor or vice versa in an attempt to protect itself against interest rate movements exceeding given minimum or maximum levels, (iv) callable interest rate swaps, under which the counterparty may terminate the swap transaction in whole at zero cost by a
285
predetermined date and time prior to the maturity date, (v) spread locks, which allow the interest rate swap users to lock in the forward differential (or spread) between the interest rate swap rate and a specified benchmark, or (vi) basis swap, under which two parties can exchange variable interest rates based on different money markets.
Total Return Swap Agreements — Total return swap agreements on commodities involve commitments where exchanged cash flows are based on the price of a commodity and in return a Fund receives either fixed or determined by floating price or rate. One party would receive payments based on the market value of the commodity involved and pay a fixed amount. Total return swap agreements on indices involve commitments to pay interest in exchange for a market-linked return. One counterparty pays out the total return of a specific reference asset, which may be an equity, index, or bond, and in return receives a regular stream of payments. To the extent the total return of the security or index underlying the transaction exceeds or falls short of the offsetting interest rate obligation, a Fund will receive a payment from or make a payment to the counterparty.
FASB “Derivatives and Hedging” includes required disclosure for (i) the nature and terms of the derivative, reasons for entering into the derivative, the events or circumstances that would require the seller to perform under the derivative, and the current status of the payment/performance risk of the derivative, (ii) the maximum potential amount of future payments (undiscounted) the seller could be required to make under the derivative, (iii) the fair value of the derivative, and (iv) the nature of any recourse provisions and assets held either as collateral or by third parties. FASB “Guarantees” require additional disclosures about the current status of the payment/performance risk of a guarantee. All of this information has been incorporated for the current period as part of the Schedules of Investments within the Swap agreements outstanding disclosure and in the Notes to Financial Statements.
As of December 31, 2013, the Low-Duration Bond Fund and the Medium-Duration Bond Fund are the buyers (“receiving protection”) on a total notional amount of $28,628,025 and $28,212,000, respectively, and the sellers (“providing protection”) on a total notional amount of $1,200,000 and $16,250,000, respectively. The notional amounts of the swaps are not recorded in the financial statements; however, the notional amount does approximate the maximum potential amount of future payments that the Funds could be required to make if the Funds were the seller of protection and a credit event was to occur. Those credit default swaps for which the Funds are providing protection at balance sheet date are summarized as follows:
| | | | | | | | | | | | | | | | | | | | |
| Written Credit Derivative Contracts | | Single Name
Credit Default Swaps | | | Credit Default
Swap Index | | | | |
| | | Corporate | | | Sovereign | | | Asset-Backed | | | Corporate | | | | |
| Reference Asset | | Debt | | | Debt | | | Securities | | | Debt | | | Total | |
| Low-Duration Bond Fund | | | | | | | | | | | | | | | | | | | | |
Fair value of written credit derivatives | | $ | 20,560 | | | $ | — | | | $ | — | | | $ | — | | | $ | 20,560 | |
Maximum potential amount of future payments | | | 1,200,000 | | | | — | | | | — | | | | — | | | | 1,200,000 | |
| Medium-Duration Bond Fund | | | | | | | | | | | | | | | | | | | | |
Fair value of written credit derivatives | | $ | 364,059 | | | $ | (12,387 | ) | | $ | 178,235 | | | $ | — | | | $ | 529,907 | |
Maximum potential amount of future payments | | | 4,100,000 | | | | 1,000,000 | | | | 11,150,000 | | | | — | | | | 16,250,000 | |
At December 31, 2013, there were no recourse provisions with third parties to recover any amounts paid under the credit derivative agreement (including any purchased credit protection) nor was any collateral held by the Funds or other third parties which the Funds can obtain upon occurrence of a triggering event.
286
The credit spread disclosed below for each referenced obligation where the Funds are the seller of protection is a representation of the current payment/performance risk of the swap.
| | | | | | | | | | | | | | | | | | | | | | | | |
| | | Maximum Potential Amount of Future Payments by Contract Term | | | | |
Current credit spread on underlying (in basis points) | | 0-6
Months | | | 6-12
Months | | | 1-5
Years | | | 5-10
Years | | | More
Than
10 Years | | | Total | |
Low-Duration Bond Fund | | | | | | | | | | | | | | | | | | | | | | | | |
0 - 100 | | $ | — | | | $ | — | | | $ | 1,200,000 | | | $ | — | | | $ | — | | | $ | 1,200,000 | |
101 - 250 | | | — | | | | — | | | | — | | | | — | | | | — | | | | — | |
251 - 500 | | | — | | | | — | | | | — | | | | — | | | | — | | | | — | |
501 - 1,000 | | | — | | | | — | | | | — | | | | — | | | | — | | | | — | |
Greater than 1,000 | | | — | | | | — | | | | — | | | | — | | | | — | | | | — | |
| | | | | | | | | | | | | | | | | | | | | | | | |
Total | | $ | — | | | $ | — | | | $ | 1,200,000 | | | $ | — | | | $ | — | | | $ | 1,200,000 | |
| | | | | | | | | | | | | | | | | | | | | | | | |
| | | | | | |
Medium-Duration Bond Fund | | | | | | | | | | | | | | | | | | | | | | | | |
| | | | | | |
0 - 100 | | $ | — | | | $ | — | | | $ | 9,950,000 | | | $ | 1,200,000 | | | $ | — | | | $ | 11,150,000 | |
101 - 250 | | | — | | | | — | | | | 5,100,000 | | | | — | | | | — | | | | 5,100,000 | |
251 - 500 | | | — | | | | — | | | | — | | | | — | | | | — | | | | — | |
501 - 1,000 | | | — | | | | — | | | | — | | | | — | | | | — | | | | — | |
Greater than 1,000 | | | — | | | | — | | | | — | | | | — | | | | — | | | | — | |
| | | | | | | | | | | | | | | | | | | | | | | | |
Total | | $ | — | | | $ | — | | | $ | 15,050,000 | | | $ | 1,200,000 | | | $ | — | | | $ | 16,250,000 | |
| | | | | | | | | | | | | | | | | | | | | | | | |
Offsetting of Financial and Derivative Assets and Liabilities
Certain Funds are parties to International Swap and Derivatives Association, Inc. (“ISDA”) Master Agreements (“MA”) with various counterparties that govern over-the-counter derivative and foreign exchange contracts entered into from time to time. The ISDA MA may contain provisions regarding, among other things, the parties’ general obligations, representations, agreements, collateral requirements, events of default and early termination. With respect to certain counterparties, in accordance with the terms of the ISDA MA, collateral posted to the Fund is held in a segregated account by the Fund’s custodian and with respect to those amounts which can be sold or repledged, are presented in the Fund’s portfolio or Statements of Assets and Liabilities.
For financial reporting purposes, the Funds do not offset derivative assets and derivative liabilities that are subject to an ISDA MA in the Statements of Assets and Liabilities.
287
At December 31, 2013, derivative assets and liabilities (by type) held by the Funds are as follows:
| | | | | | | | |
| Fund | | Assets | | | Liabilities | |
MyDestination 2005 | | | | | | | | |
Derivative Financial Instruments: | | | | | | | | |
Financial futures contracts | | $ | 1,600 | | | $ | — | |
| | | | | | | | |
Total derivative assets and liabilities in the Statements of Assets and Liabilities | | | 1,600 | | | | — | |
Derivatives not subject to an MA or similar agreement | | | 1,600 | | | | — | |
| | | | | | | | |
Total assets and liabilities subject to an MA | | $ | — | | | $ | — | |
| | | | | | | | |
MyDestination 2015 | | | | | | | | |
Derivative Financial Instruments: | | | | | | | | |
Financial futures contracts | | $ | 13,255 | | | $ | 2,750 | |
| | | | | | | | |
Total derivative assets and liabilities in the Statements of Assets and Liabilities | | | 13,255 | | | | 2,750 | |
Derivatives not subject to an MA or similar agreement | | | 13,255 | | | | 2,750 | |
| | | | | | | | |
Total assets and liabilities subject to an MA | | $ | — | | | $ | — | |
| | | | | | | | |
MyDestination 2025 | | | | | | | | |
Derivative Financial Instruments: | | | | | | | | |
Financial futures contracts | | $ | 20,755 | | | $ | 2,750 | |
| | | | | | | | |
Total derivative assets and liabilities in the Statements of Assets and Liabilities | | | 20,755 | | | | 2,750 | |
Derivatives not subject to an MA or similar agreement | | | 20,755 | | | | 2,750 | |
| | | | | | | | |
Total assets and liabilities subject to an MA | | $ | — | | | $ | — | |
| | | | | | | | |
MyDestination 2035 | | | | | | | | |
Derivative Financial Instruments: | | | | | | | | |
Financial futures contracts | | $ | 17,600 | | | $ | 1,375 | |
| | | | | | | | |
Total derivative assets and liabilities in the Statements of Assets and Liabilities | | | 17,600 | | | | 1,375 | |
Derivatives not subject to an MA or similar agreement | | | 17,600 | | | | 1,375 | |
| | | | | | | | |
Total assets and liabilities subject to an MA | | $ | — | | | $ | — | |
| | | | | | | | |
MyDestination 2045 | | | | | | | | |
Derivative Financial Instruments: | | | | | | | | |
Financial futures contracts | | $ | 14,445 | | | $ | 344 | |
| | | | | | | | |
Total derivative assets and liabilities in the Statements of Assets and Liabilities | | | 14,445 | | | | 344 | |
Derivatives not subject to an MA or similar agreement | | | 14,445 | | | | 344 | |
| | | | | | | | |
Total assets and liabilities subject to an MA | | $ | — | | | $ | — | |
| | | | | | | | |
MyDestination 2055 | | | | | | | | |
Derivative Financial Instruments: | | | | | | | | |
Financial futures contracts | | $ | 960 | | | $ | — | |
| | | | | | | | |
Total derivative assets and liabilities in the Statements of Assets and Liabilities | | | 960 | | | | — | |
Derivatives not subject to an MA or similar agreement | | | 960 | | | | — | |
| | | | | | | | |
Total assets and liabilities subject to an MA | | $ | — | | | $ | — | |
| | | | | | | | |
Conservative Allocation | | | | | | | | |
Derivative Financial Instruments: | | | | | | | | |
Financial futures contracts | | $ | 3,430 | | | $ | — | |
| | | | | | | | |
Total derivative assets and liabilities in the Statements of Assets and Liabilities | | | 3,430 | | | | — | |
Derivatives not subject to an MA or similar agreement | | | 3,430 | | | | — | |
| | | | | | | | |
Total assets and liabilities subject to an MA | | $ | — | | | $ | — | |
| | | | | | | | |
288
| | | | | | | | |
| Fund | | Assets | | | Liabilities | |
Balanced Allocation | | | | | | | | |
Derivative Financial Instruments: | | | | | | | | |
Financial futures contracts | | $ | 50,470 | | | $ | 18,891 | |
| | | | | | | | |
Total derivative assets and liabilities in the Statements of Assets and Liabilities | | | 50,470 | | | | 18,891 | |
Derivatives not subject to an MA or similar agreement | | | 50,470 | | | | 18,891 | |
| | | | | | | | |
Total assets and liabilities subject to an MA | | $ | — | | | $ | — | |
| | | | | | | | |
Growth Allocation | | | | | | | | |
Derivative Financial Instruments: | | | | | | | | |
Financial futures contracts | | $ | 54,265 | | | $ | 6,687 | |
| | | | | | | | |
Total derivative assets and liabilities in the Statements of Assets and Liabilities | | | 54,265 | | | | 6,687 | |
Derivatives not subject to an MA or similar agreement | | | 54,265 | | | | 6,687 | |
| | | | | | | | |
Total assets and liabilities subject to an MA | | $ | — | | | $ | — | |
| | | | | | | | |
Aggressive Allocation | | | | | | | | |
Derivative Financial Instruments: | | | | | | | | |
Financial futures contracts | | $ | 66,700 | | | $ | — | |
| | | | | | | | |
Total derivative assets and liabilities in the Statements of Assets and Liabilities | | | 66,700 | | | | — | |
Derivatives not subject to an MA or similar agreement | | | 66,700 | | | | — | |
| | | | | | | | |
Total assets and liabilities subject to an MA | | $ | — | | | $ | — | |
| | | | | | | | |
Conservative Allocation I | | | | | | | | |
Derivative Financial Instruments: | | | | | | | | |
Financial futures contracts | | $ | 640 | | | $ | — | |
| | | | | | | | |
Total derivative assets and liabilities in the Statements of Assets and Liabilities | | | 640 | | | | — | |
Derivatives not subject to an MA or similar agreement | | | 640 | | | | — | |
| | | | | | | | |
Total assets and liabilities subject to an MA | | $ | — | | | $ | — | |
| | | | | | | | |
Balanced Allocation I | | | | | | | | |
Derivative Financial Instruments: | | | | | | | | |
Financial futures contracts | | $ | 12,755 | | | $ | 4,781 | |
| | | | | | | | |
Total derivative assets and liabilities in the Statements of Assets and Liabilities | | | 12,755 | | | | 4,781 | |
Derivatives not subject to an MA or similar agreement | | | 12,755 | | | | 4,781 | |
| | | | | | | | |
Total assets and liabilities subject to an MA | | $ | — | | | $ | — | |
| | | | | | | | |
Growth Allocation I | | | | | | | | |
Derivative Financial Instruments: | | | | | | | | |
Financial futures contracts | | $ | 13,215 | | | $ | 1,750 | |
| | | | | | | | |
Total derivative assets and liabilities in the Statements of Assets and Liabilities | | | 13,215 | | | | 1,750 | |
Derivatives not subject to an MA or similar agreement | | | 13,215 | | | | 1,750 | |
| | | | | | | | |
Total assets and liabilities subject to an MA | | $ | — | | | $ | — | |
| | | | | | | | |
Aggressive Allocation I | | | | | | | | |
Derivative Financial Instruments: | | | | | | | | |
Financial futures contracts | | $ | 13,895 | | | $ | — | |
| | | | | | | | |
Total derivative assets and liabilities in the Statements of Assets and Liabilities | | | 13,895 | | | | — | |
Derivatives not subject to an MA or similar agreement | | | 13,895 | | | | — | |
| | | | | | | | |
Total assets and liabilities subject to an MA | | $ | — | | | $ | — | |
| | | | | | | | |
289
| | | | | | | | |
| Fund | | Assets | | | Liabilities | |
Low-Duration Bond | | | | | | | | |
Derivative Financial Instruments: | | | | | | | | |
Financial futures contracts | | $ | 69,731 | | | $ | 54,955 | |
Forward foreign exchange contracts | | | 809,848 | | | | 676,173 | |
Options | | | 306,971 | | | | 662,660 | |
Swaps | | | 1,190,111 | | | | 2,145,810 | |
| | | | | | | | |
Total derivative assets and liabilities in the Statements of Assets and Liabilities | | | 2,376,661 | | | | 3,539,598 | |
Derivatives not subject to an MA or similar agreement | | | 687,053 | | | | 744,397 | |
| | | | | | | | |
Total assets and liabilities subject to an MA | | $ | 1,689,608 | | | $ | 2,795,201 | |
| | | | | | | | |
Medium-Duration Bond | | | | | | | | |
Derivative Financial Instruments: | | | | | | | | |
Financial futures contracts | | $ | 66,655 | | | $ | 130,330 | |
Forward foreign exchange contracts | | | 648,260 | | | | 639,799 | |
Options | | | 477,498 | | | | 762,589 | |
Swaps | | | 1,858,636 | | | | 1,825,329 | |
| | | | | | | | |
Total derivative assets and liabilities in the Statements of Assets and Liabilities | | | 3,051,049 | | | | 3,358,047 | |
Derivatives not subject to an MA or similar agreement | | | 597,831 | | | | 1,066,632 | |
| | | | | | | | |
Total assets and liabilities subject to an MA | | $ | 2,453,218 | | | $ | 2,291,415 | |
| | | | | | | | |
Global Bond | | | | | | | | |
Derivative Financial Instruments: | | | | | | | | |
Financial futures contracts | | $ | 6,837 | | | $ | — | |
Forward foreign exchange contracts | | | 308,131 | | | | 533,319 | |
Options | | | 20,812 | | | | — | |
| | | | | | | | |
Total derivative assets and liabilities in the Statements of Assets and Liabilities | | | 335,780 | | | | 533,319 | |
Derivatives not subject to an MA or similar agreement | | | 27,649 | | | | — | |
| | | | | | | | |
Total assets and liabilities subject to an MA | | $ | 308,131 | | | $ | 533,319 | |
| | | | | | | | |
Defensive Market Strategies | | | | | | | | |
Derivative Financial Instruments: | | | | | | | | |
Financial futures contracts | | $ | 77,120 | | | $ | — | |
Forward foreign exchange contracts | | | 2,329 | | | | 33,958 | |
Options | | | 17,955 | | | | 3,440 | |
| | | | | | | | |
Total derivative assets and liabilities in the Statements of Assets and Liabilities | | | 97,404 | | | | 37,398 | |
Derivatives not subject to an MA or similar agreement | | | 97,404 | | | | 37,398 | |
| | | | | | | | |
Total assets and liabilities subject to an MA | | $ | — | | | $ | — | |
| | | | | | | | |
Equity Index | | | | | | | | |
Derivative Financial Instruments: | | | | | | | | |
Financial futures contracts | | $ | 44,800 | | | $ | — | |
| | | | | | | | |
Total derivative assets and liabilities in the Statements of Assets and Liabilities | | | 44,800 | | | | — | |
Derivatives not subject to an MA or similar agreement | | | 44,800 | | | | — | |
| | | | | | | | |
Total assets and liabilities subject to an MA | | $ | — | | | $ | — | |
| | | | | | | | |
Value Equity | | | | | | | | |
Derivative Financial Instruments: | | | | | | | | |
Financial futures contracts | | $ | 173,120 | | | $ | — | |
| | | | | | | | |
Total derivative assets and liabilities in the Statements of Assets and Liabilities | | | 173,120 | | | | — | |
Derivatives not subject to an MA or similar agreement | | | 173,120 | | | | — | |
| | | | | | | | |
Total assets and liabilities subject to an MA | | $ | — | | | $ | — | |
| | | | | | | | |
290
| | | | | | | | |
| Fund | | Assets | | | Liabilities | |
Growth Equity | | | | | | | | |
Derivative Financial Instruments: | | | | | | | | |
Financial futures contracts | | $ | 206,765 | | | $ | — | |
| | | | | | | | |
Total derivative assets and liabilities in the Statements of Assets and Liabilities | | | 206,765 | | | | — | |
Derivatives not subject to an MA or similar agreement | | | 206,765 | | | | — | |
| | | | | | | | |
Total assets and liabilities subject to an MA | | $ | — | | | $ | — | |
| | | | | | | | |
Small Cap Equity | | | | | | | | |
Derivative Financial Instruments: | | | | | | | | |
Financial futures contracts | | $ | 360,242 | | | $ | 2,078 | |
Forward foreign exchange contracts | | | 71,271 | | | | 68,310 | |
Options | | | 21,105 | | | | 5,813 | |
| | | | | | | | |
Total derivative assets and liabilities in the Statements of Assets and Liabilities | | | 452,618 | | | | 76,201 | |
Derivatives not subject to an MA or similar agreement | | | 381,346 | | | | 7,891 | |
| | | | | | | | |
Total assets and liabilities subject to an MA | | $ | 71,272 | | | $ | 68,310 | |
| | | | | | | | |
International Equity | | | | | | | | |
Derivative Financial Instruments: | | | | | | | | |
Financial futures contracts | | $ | 256,452 | | | $ | 354,814 | |
Forward foreign exchange contracts | | | 1,288,413 | | | | 1,908,788 | |
| | | | | | | | |
Total derivative assets and liabilities in the Statements of Assets and Liabilities | | | 1,544,865 | | | | 2,263,602 | |
Derivatives not subject to an MA or similar agreement | | | 256,452 | | | | 354,814 | |
| | | | | | | | |
Total assets and liabilities subject to an MA | | $ | 1,288,413 | | | $ | 1,908,788 | |
| | | | | | | | |
Emerging Markets Equity | | | | | | | | |
Derivative Financial Instruments: | | | | | | | | |
Financial futures contracts | | $ | 430,074 | | | $ | 50,955 | |
Forward foreign exchange contracts | | | 661,456 | | | | 621,128 | |
| | | | | | | | |
Total derivative assets and liabilities in the Statements of Assets and Liabilities | | | 1,091,530 | | | | 672,083 | |
Derivatives not subject to an MA or similar agreement | | | 430,074 | | | | 50,955 | |
| | | | | | | | |
Total assets and liabilities subject to an MA | | $ | 661,456 | | | $ | 621,128 | |
| | | | | | | | |
Inflation Protected Bond | | | | | | | | |
Derivative Financial Instruments: | | | | | | | | |
Financial futures contracts | | $ | 91,777 | | | $ | 26,528 | |
Forward foreign exchange contracts | | | 166,502 | | | | 585,625 | |
Options | | | 105,578 | | | | 49,203 | |
| | | | | | | | |
Total derivative assets and liabilities in the Statements of Assets and Liabilities | | | 363,857 | | | | 661,356 | |
Derivatives not subject to an MA or similar agreement | | | 197,355 | | | | 75,731 | |
| | | | | | | | |
Total assets and liabilities subject to an MA | | $ | 166,502 | | | $ | 585,625 | |
| | | | | | | | |
Real Estate Securities | | | | | | | | |
Derivative Financial Instruments: | | | | | | | | |
Financial futures contracts | | $ | 12,950 | | | $ | — | |
| | | | | | | | |
Total derivative assets and liabilities in the Statements of Assets and Liabilities | | | 12,950 | | | | — | |
Derivatives not subject to an MA or similar agreement | | | 12,950 | | | | — | |
| | | | | | | | |
Total assets and liabilities subject to an MA | | $ | — | | | $ | — | |
| | | | | | | | |
291
At December 31, 2013, derivative assets and liabilities by counterparty net of amounts available for offset under an MA and net of the related collateral (received)/pledged by the Trust are as follows:
| | | | | | | | | | | | | | | | | | | | | | | | | |
| Fund/Sub-adviser/Counterparty | | Derivative Assets
Subject to
an MA | | Derivative Liabilities
Subject to
an MA | | Value of
Derivatives Subject to
an MA | | Collateral
(Received)/
Pledged | | Net Exposure |
Low-Duration Bond | | | | | | | | | | | | | | | | | | | | | | | | | |
Sub-adviser A | | | | | | | | | | | | | | | | | | | | | | | | | |
WEST | | | $ | 398,745 | | | | $ | — | | | | $ | 398,745 | | | | $ | — | | | | $ | 398,745 | |
Other Counterparties* | | | | 293,709 | | | | | (415,333 | ) | | | | (121,624 | ) | | | | — | | | | | (121,624 | ) |
| | | | | | | | | | | | | | | | | | | | | | | | | |
| | | | 692,454 | | | | | (415,333 | ) | | | | 277,121 | | | | | — | | | | | 277,121 | |
| | | | | | | | | | | | | | | | | | | | | | | | | |
Sub-adviser B | | | | | | | | | | | | | | | | | | | | | | | | | |
GSC | | | | 12,676 | | | | | (890,825 | ) | | | | (878,149 | ) | | | | — | | | | | (878,149 | ) |
Other Counterparties* | | | | 926,072 | | | | | (1,350,055 | ) | | | | (423,983 | ) | | | | — | | | | | (423,983 | ) |
| | | | | | | | | | | | | | | | | | | | | | | | | |
| | | | 938,748 | | | | | (2,240,880 | ) | | | | (1,302,132 | ) | | | | — | | | | | (1,302,132 | ) |
| | | | | | | | | | | | | | | | | | | | | | | | | |
Sub-adviser C | | | | | | | | | | | | | | | | | | | | | | | | | |
Other Counterparties* | | | | 58,406 | | | | | (138,988 | ) | | | | (80,582 | ) | | | | — | | | | | (80,582 | ) |
| | | | | | | | | | | | | | | | | | | | | | | | | |
Total Derivatives | | | $ | 1,689,608 | | | | $ | (2,795,201 | ) | | | $ | (1,105,593 | ) | | | $ | — | | | | $ | (1,105,593 | ) |
| | | | | | | | | | | | | | | | | | | | | | | | | |
Medium-Duration Bond | | | | | | | | | | | | | | | | | | | | | | | | | |
Sub-adviser A | | | | | | | | | | | | | | | | | | | | | | | | | |
Other Counterparties* | | | $ | 1,131,885 | | | | $ | (259,856 | ) | | | $ | 872,029 | | | | $ | (566,963 | ) | | | $ | 305,066 | |
| | | | | | | | | | | | | | | | | | | | | | | | | |
Sub-adviser B | | | | | | | | | | | | | | | | | | | | | | | | | |
Other Counterparties* | | | | 910,950 | | | | | (1,661,655 | ) | | | | (750,705 | ) | | | | — | | | | | (750,705 | ) |
| | | | | | | | | | | | | | | | | | | | | | | | | |
Sub-adviser C | | | | | | | | | | | | | | | | | | | | | | | | | |
Other Counterparties* | | | | 410,383 | | | | | (369,904 | ) | | | | 40,479 | | | | | — | | | | | 40,479 | |
| | | | | | | | | | | | | | | | | | | | | | | | | |
Total Derivatives | | | $ | 2,453,218 | | | | $ | (2,291,415 | ) | | | $ | 161,803 | | | | $ | (566,963 | ) | | | $ | (405,160 | ) |
| | | | | | | | | | | | | | | | | | | | | | | | | |
Global Bond | | | | | | | | | | | | | | | | | | | | | | | | | |
Sub-adviser A | | | | | | | | | | | | | | | | | | | | | | | | | |
BAR | | | $ | 198,819 | | | | $ | (22,081 | ) | | | $ | 176,738 | | | | $ | — | | | | $ | 176,738 | |
CITIC | | | | 23,212 | | | | | (186,307 | ) | | | | (163,095 | ) | | | | — | | | | | (163,095 | ) |
Other Counterparties* | | | | 86,100 | | | | | (324,931 | ) | | | | (238,831 | ) | | | | — | | | | | (238,831 | ) |
| | | | | | | | | | | | | | | | | | | | | | | | | |
Total Derivatives | | | $ | 308,131 | | | | $ | (533,319 | ) | | | $ | (225,188 | ) | | | $ | — | | | | $ | (225,188 | ) |
| | | | | | | | | | | | | | | | | | | | | | | | | |
Small Cap Equity | | | | | | | | | | | | | | | | | | | | | | | | | |
Sub-adviser A | | | | | | | | | | | | | | | | | | | | | | | | | |
Other Counterparties* | | | $ | 71,272 | | | | $ | (68,310 | ) | | | $ | 2,962 | | | | $ | — | | | | $ | 2,962 | |
| | | | | | | | | | | | | | | | | | | | | | | | | |
292
| | | | | | | | | | | | | | | | | | | | | | | | | |
| Fund/Sub-adviser/Counterparty | | Derivative Assets
Subject to
an MA | | Derivative Liabilities
Subject to
an MA | | Value of
Derivatives Subject to
an MA | | Collateral
(Received)/
Pledged | | Net Exposure |
International Equity | | | | | | | | | | | | | | | | | | | | | | | | | |
Sub-adviser A | | | | | | | | | | | | | | | | | | | | | | | | | |
Other Counterparties* | | | $ | 855,079 | | | | $ | (1,864,322 | ) | | | $ | (1,009,243 | ) | | | $ | 590,000 | | | | $ | (419,243 | ) |
| | | | | | | | | | | | | | | | | | | | | | | | | |
Sub-adviser B | | | | | | | | | | | | | | | | | | | | | | | | | |
Other Counterparties* | | | | 433,334 | | | | | (44,466 | ) | | | | 388,868 | | | | | — | | | | | 388,868 | |
| | | | | | | | | | | | | | | | | | | | | | | | | |
Total Derivatives | | | $ | 1,288,413 | | | | $ | (1,908,788 | ) | | | $ | (620,375 | ) | | | $ | 590,000 | | | | $ | (30,375 | ) |
| | | | | | | | | | | | | | | | | | | | | | | | | |
Emerging Markets Equity | | | | | | | | | | | | | | | | | | | | | | | | | |
Sub-adviser A | | | | | | | | | | | | | | | | | | | | | | | | | |
Other Counterparties* | | | $ | 661,456 | | | | $ | (621,128 | ) | | | $ | 40,328 | | | | $ | (40,328 | ) | | | $ | — | |
| | | | | | | | | | | | | | | | | | | | | | | | | |
Inflation Protected Bond | | | | | | | | | | | | | | | | | | | | | | | | | |
Sub-adviser A | | | | | | | | | | | | | | | | | | | | | | | | | |
BAR | | | $ | 9,563 | | | | $ | (384,159 | ) | | | $ | (374,596 | ) | | | $ | — | | | | $ | (374,596 | ) |
Other Counterparties* | | | | 156,939 | | | | | (201,466 | ) | | | | (44,527 | ) | | | | — | | | | | (44,527 | ) |
| | | | | | | | | | | | | | | | | | | | | | | | | |
Total Derivatives | | | $ | 166,502 | | | | $ | (585,625 | ) | | | $ | (419,123 | ) | | | $ | — | | | | $ | (419,123 | ) |
| | | | | | | | | | | | | | | | | | | | | | | | | |
*Other Counterparties represent amounts that are held with counterparties where the absolute value of the total is less than 0.05% of the net assets of the respective Fund. Those holdings are deemed immaterial to the respective Fund and are listed collectively.
Additional information about master netting arrangements can be found in the Repurchase Agreements and Securities Lending sections of the Notes to Financial Statements.
Derivative Holdings Categorized by Risk Exposure
FASB “Derivatives and Hedging” also requires all companies to disclose information intended to enable financial statement users to understand how and why the entity uses derivative instruments, how derivatives are accounted for, and how derivative instruments affect the entity’s financial position, results of operations, and cash flows.
| | | | |
| | | Location on the Statements of Assets and Liabilities |
Derivative Type | | Asset Derivatives | | Liability Derivatives |
| Interest rate contracts | | Investments in securities of unaffiliated issuers, at value | | Options written at value |
| | Receivables: Variation margin* | | Payables: Variation margin* |
| | Unrealized appreciation on swap agreements | | Unrealized depreciation on swap agreements |
| Foreign exchange contracts | | Investments in securities of unaffiliated issuers, at value | | Options written at value |
| | Unrealized appreciation on foreign currency exchange contracts | | Unrealized depreciation on foreign currency exchange contracts |
| Credit contracts | | Unrealized appreciation on swap agreements | | Unrealized depreciation on swap agreements |
| Equity contracts | | Investments in securities of unaffiliated issuers, at value | | Options written at value |
| | Receivables: Variation margin* | | Payables: Variation margin* |
*The variation margin shown on the Statements of Assets and Liabilities is the daily change in the unrealized appreciation (depreciation) for open futures and exchange traded swap contracts. The variation margin presented below is the cumulative change in unrealized appreciation (depreciation) from the date the contract was opened until December 31, 2013.
| | | | | | | | | | | | | | | | | | | | | | | | | |
| | | Asset Derivative Value |
| Fund | | Total Value
at
12/31/13 | | Interest Rate
Contracts | | Foreign Exchange
Contracts | | Credit
Contracts | | Equity
Contracts |
MyDestination 2005 | | | | | | | | | | | | | | | | | | | | | | | | | |
Futures | | | $ | 18,103 | | | | $ | — | | | | $ | — | | | | $ | — | | | | $ | 18,103 | |
| | | | | | | | | | | | | | | | | | | | | | | | | |
293
| | | | | | | | | | | | | | | | | | | | | | | | | |
| | | Asset Derivative Value |
| Fund | | Total Value
at
12/31/13 | | Interest Rate
Contracts | | Foreign Exchange
Contracts | | Credit
Contracts | | Equity
Contracts |
MyDestination 2015 | | | | | | | | | | | | | | | | | | | | | | | | | |
Futures | | | $ | 100,500 | | | | $ | (27,773 | ) | | | $ | — | | | | $ | — | | | | $ | 128,273 | |
| | | | | | | | | | | | | | | | | | | | | | | | | |
MyDestination 2025 | | | | | | | | | | | | | | | | | | | | | | | | | |
Futures | | | $ | 182,494 | | | | $ | (25,960 | ) | | | $ | — | | | | $ | — | | | | $ | 208,454 | |
| | | | | | | | | | | | | | | | | | | | | | | | | |
MyDestination 2035 | | | | | | | | | | | | | | | | | | | | | | | | | |
Futures | | | $ | 160,230 | | | | $ | (16,609 | ) | | | $ | — | | | | $ | — | | | | $ | 176,839 | |
| | | | | | | | | | | | | | | | | | | | | | | | | |
MyDestination 2045 | | | | | | | | | | | | | | | | | | | | | | | | | |
Futures | | | $ | 129,522 | | | | $ | (4,547 | ) | | | $ | — | | | | $ | — | | | | $ | 134,069 | |
| | | | | | | | | | | | | | | | | | | | | | | | | |
MyDestination 2055 | | | | | | | | | | | | | | | | | | | | | | | | | |
Futures | | | $ | 10,862 | | | | $ | — | | | | $ | — | | | | $ | — | | | | $ | 10,862 | |
| | | | | | | | | | | | | | | | | | | | | | | | | |
Conservative Allocation | | | | | | | | | | | | | | | | | | | | | | | | | |
Futures | | | $ | 38,191 | | | | $ | (3,780 | ) | | | $ | — | | | | $ | — | | | | $ | 41,971 | |
| | | | | | | | | | | | | | | | | | | | | | | | | |
Balanced Allocation | | | | | | | | | | | | | | | | | | | | | | | | | |
Futures | | | $ | 393,143 | | | | $ | (177,567 | ) | | | $ | — | | | | $ | — | | | | $ | 570,710 | |
| | | | | | | | | | | | | | | | | | | | | | | | | |
Growth Allocation | | | | | | | | | | | | | | | | | | | | | | | | | |
Futures | | | $ | 555,401 | | | | $ | (59,562 | ) | | | $ | — | | | | $ | — | | | | $ | 614,963 | |
| | | | | | | | | | | | | | | | | | | | | | | | | |
Aggressive Allocation | | | | | | | | | | | | | | | | | | | | | | | | | |
Futures | | | $ | 756,054 | | | | $ | — | | | | $ | — | | | | $ | — | | | | $ | 756,054 | |
| | | | | | | | | | | | | | | | | | | | | | | | | |
Conservative Allocation I | | | | | | | | | | | | | | | | | | | | | | | | | |
Futures | | | $ | 7,241 | | | | $ | — | | | | $ | — | | | | $ | — | | | | $ | 7,241 | |
| | | | | | | | | | | | | | | | | | | | | | | | | |
Balanced Allocation I | | | | | | | | | | | | | | | | | | | | | | | | | |
Futures | | | $ | 92,697 | | | | $ | (38,921 | ) | | | $ | — | | | | $ | — | | | | $ | 131,618 | |
| | | | | | | | | | | | | | | | | | | | | | | | | |
Growth Allocation I | | | | | | | | | | | | | | | | | | | | | | | | | |
Futures | | | $ | 140,579 | | | | $ | (16,406 | ) | | | $ | — | | | | $ | — | | | | $ | 156,985 | |
| | | | | | | | | | | | | | | | | | | | | | | | | |
Aggressive Allocation I | | | | | | | | | | | | | | | | | | | | | | | | | |
Futures | | | $ | 139,848 | | | | $ | — | | | | $ | — | | | | $ | — | | | | $ | 139,848 | |
| | | | | | | | | | | | | | | | | | | | | | | | | |
Low-Duration Bond | | | | | | | | | | | | | | | | | | | | | | | | | |
Forwards | | | $ | 809,848 | | | | $ | — | | | | $ | 809,848 | | | | $ | — | | | | $ | — | |
Futures | | | | (626,132 | ) | | | | (626,132 | ) | | | | — | | | | | — | | | | | — | |
Purchased Options | | | | 306,971 | | | | | 306,971 | | | | | — | | | | | — | | | | | — | |
Swaps | | | | 1,190,111 | | | | | 777,495 | | | | | — | | | | | 412,616 | | | | | — | |
| | | | | | | | | | | | | | | | | | | | | | | | | |
Totals | | | $ | 1,680,798 | | | | $ | 458,334 | | | | $ | 809,848 | | | | $ | 412,616 | | | | $ | — | |
| | | | | | | | | | | | | | | | | | | | | | | | | |
Medium-Duration Bond | | | | | | | | | | | | | | | | | | | | | | | | | |
Forwards | | | $ | 648,260 | | | | $ | — | | | | $ | 648,260 | | | | $ | — | | | | $ | — | |
Futures | | | | (735,121 | ) | | | | (735,121 | ) | | | | — | | | | | — | | | | | — | |
Purchased Options | | | | 477,498 | | | | | 446,330 | | | | | 31,168 | | | | | — | | | | | — | |
Swaps | | | | 1,858,636 | | | | | 1,300,731 | | | | | — | | | | | 557,905 | | | | | — | |
| | | | | | | | | | | | | | | | | | | | | | | | | |
Totals | | | $ | 2,249,273 | | | | $ | 1,011,940 | | | | $ | 679,428 | | | | $ | 557,905 | | | | $ | — | |
| | | | | | | | | | | | | | | | | | | | | | | | | |
294
| | | | | | | | | | | | | | | | | | | | |
| | | Asset Derivative Value | |
| Fund | | Total Value
at
12/31/13 | | | Interest Rate
Contracts | | | Foreign Exchange
Contracts | | | Credit
Contracts | | | Equity
Contracts | |
Global Bond Fund | | | | | | | | | | | | | | | | | | | | |
Forwards | | $ | 308,131 | | | $ | — | | | $ | 308,131 | | | $ | — | | | $ | — | |
Futures | | | (62,381 | ) | | | (62,381 | ) | | | — | | | | — | | | | — | |
Purchased Options | | | 20,812 | | | | — | | | | 20,812 | | | | — | | | | — | |
| | | | | | | | | | | | | | | | | | | | |
Totals | | $ | 266,562 | | | $ | (62,381 | ) | | $ | 328,943 | | | $ | — | | | $ | — | |
| | | | | | | | | | | | | | | | | | | | |
| Defensive Market Strategies | | | | | | | | | | | | | | | | | | | | |
Forwards | | $ | 2,329 | | | $ | — | | | $ | 2,329 | | | $ | — | | | $ | — | |
Futures | | | 840,099 | | | | — | | | | — | | | | — | | | | 840,099 | |
Purchased Options | | | 17,955 | | | | — | | | | — | | | | — | | | | 17,955 | |
| | | | | | | | | | | | | | | | | | | | |
Totals | | $ | 860,383 | | | $ | — | | | $ | 2,329 | | | $ | — | | | $ | 858,054 | |
| | | | | | | | | | | | | | | | | | | | |
Equity Index | | | | | | | | | | | | | | | | | | | | |
Futures | | $ | 428,001 | | | $ | — | | | $ | — | | | $ | — | | | $ | 428,001 | |
| | | | | | | | | | | | | | | | | | | | |
Value Equity | | | | | | | | | | | | | | | | | | | | |
Futures | | $ | 1,791,093 | | | $ | — | | | $ | — | | | $ | — | | | $ | 1,791,093 | |
| | | | | | | | | | | | | | | | | | | | |
Growth Equity Fund | | | | | | | | | | | | | | | | | | | | |
Futures | | $ | 2,352,173 | | | $ | — | | | $ | — | | | $ | — | | | $ | 2,352,173 | |
| | | | | | | | | | | | | | | | | | | | |
Small Cap Equity | | | | | | | | | | | | | | | | | | | | |
Forwards | | $ | 71,271 | | | $ | — | | | $ | 71,271 | | | $ | — | | | $ | — | |
Futures | | | 4,146,969 | | | | (8,143 | ) | | | — | | | | — | | | | 4,155,112 | |
Purchased Options | | | 21,105 | | | | 14,719 | | | | 6,386 | | | | — | | | | — | |
| | | | | | | | | | | | | | | | | | | | |
Totals | | $ | 4,239,345 | | | $ | 6,576 | | | $ | 77,657 | | | $ | — | | | $ | 4,155,112 | |
| | | | | | | | | | | | | | | | | | | | |
International Equity | | | | | | | | | | | | | | | | | | | | |
Forwards | | $ | 1,288,413 | | | $ | — | | | $ | 1,288,413 | | | $ | — | | | $ | — | |
Futures | | | 5,232,594 | | | | — | | | | — | | | | — | | | | 5,232,594 | |
| | | | | | | | | | | | | | | | | | | | |
Totals | | $ | 6,521,007 | | | $ | — | | | $ | 1,288,413 | | | $ | — | | | $ | 5,232,594 | |
| | | | | | | | | | | | | | | | | | | | |
Emerging Markets Equity | | | | | | | | | | | | | | | | | | | | |
Forwards | | $ | 661,456 | | | $ | — | | | $ | 661,456 | | | $ | — | | | $ | — | |
Futures | | | 1,047,815 | | | | — | | | | — | | | | — | | | | 1,047,815 | |
| | | | | | | | | | | | | | | | | | | | |
Totals | | $ | 1,709,271 | | | $ | — | | | $ | 661,456 | | | $ | — | | | $ | 1,047,815 | |
| | | | | | | | | | | | | | | | | | | | |
Inflation Protected Bond | | | | | | | | | | | | | | | | | | | | |
Forwards | | $ | 166,502 | | | $ | — | | | $ | 166,502 | | | $ | — | | | $ | — | �� |
Futures | | | (191,148 | ) | | | (191,148 | ) | | | — | | | | — | | | | — | |
Purchased Options | | | 105,578 | | | | 97,500 | | | | 8,078 | | | | — | | | | — | |
| | | | | | | | | | | | | | | | | | | | |
Totals | | $ | 80,932 | | | $ | (93,648 | ) | | $ | 174,580 | | | $ | — | | | $ | — | |
| | | | | | | | | | | | | | | | | | | | |
Real Estate Securities | | | | | | | | | | | | | | | | | | | | |
Futures | | $ | 157,537 | | | $ | — | | | $ | — | | | $ | — | | | $ | 157,537 | |
| | | | | | | | | | | | | | | | | | | | |
| |
| | | Liability Derivative Value | |
| Fund | | Total Value
at
12/31/13 | | | Interest Rate
Contracts | | | Foreign Exchange
Contracts | | | Credit
Contracts | | | Equity
Contracts | |
Low-Duration Bond | | | | | | | | | | | | | | | | | | | | |
Forwards | | $ | 676,173 | | | $ | — | | | $ | 676,173 | | | $ | — | | | $ | — | |
Futures | | | (1,015,479 | ) | | | (1,015,479 | ) | | | — | | | | — | | | | — | |
Written Options | | | 662,660 | | | | 662,660 | | | | — | | | | — | | | | — | |
Swaps | | | 2,145,810 | | | | 1,353,621 | | | | — | | | | 792,189 | | | | — | |
| | | | | | | | | | | | | | | | | | | | |
Totals | | $ | 2,469,164 | | | $ | 1,000,802 | | | $ | 676,173 | | | $ | 792,189 | | | $ | — | |
| | | | | | | | | | | | | | | | | | | | |
295
| | | | | | | | | | | | | | | | | | | | |
| | | Liability Derivative Value | |
| Fund | | Total Value
at
12/31/13 | | | Interest Rate
Contracts | | | Foreign Exchange
Contracts | | | Credit
Contracts | | | Equity
Contracts | |
Medium-Duration Bond | | | | | | | | | | | | | | | | | | | | |
Forwards | | $ | 639,799 | | | $ | — | | | $ | 639,799 | | | $ | — | | | $ | — | |
Futures | | | (566,822 | ) | | | (566,822 | ) | | | — | | | | — | | | | — | |
Written Options | | | 762,589 | | | | 762,589 | | | | — | | | | — | | | | — | |
Swaps | | | 1,825,329 | | | | 1,513,604 | | | | — | | | | 311,725 | | | | — | |
| | | | | | | | | | | | | | | | | | | | |
Totals | | $ | 2,660,895 | | | $ | 1,709,371 | | | $ | 639,799 | | | $ | 311,725 | | | $ | — | |
| | | | | | | | | | | | | | | | | | | | |
Global Bond | | | | | | | | | | | | | | | | | | | | |
Forwards | | $ | 533,319 | | | $ | — | | | $ | 533,319 | | | $ | — | | | $ | — | |
Futures | | | (71,530 | ) | | | (71,530 | ) | | | — | | | | — | | | | — | |
| | | | | | | | | | | | | | | | | | | | |
Totals | | $ | 461,789 | | | $ | (71,530 | ) | | $ | 533,319 | | | $ | — | | | $ | — | |
| | | | | | | | | | | | | | | | | | | | |
Defensive Market Strategies | | | | | | | | | | | | | | | | | | | | |
Forwards | | $ | 33,958 | | | $ | — | | | $ | 33,958 | | | $ | — | | | $ | — | |
Written Options | | | 3,440 | | | | — | | | | — | | | | — | | | | 3,440 | |
| | | | | | | | | | | | | | | | | | | | |
Totals | | $ | 37,398 | | | $ | — | | | $ | 33,958 | | | $ | — | | | $ | 3,440 | |
| | | | | | | | | | | | | | | | | | | | |
Small Cap Equity | | | | | | | | | | | | | | | | | | | | |
Forwards | | $ | 68,310 | | | $ | — | | | $ | 68,310 | | | $ | — | | | $ | — | |
Futures | | | (214,818 | ) | | | (214,818 | ) | | | — | | | | — | | | | — | |
Written Options | | | 5,813 | | | | 5,813 | | | | — | | | | — | | | | — | |
| | | | | | | | | | | | | | | | | | | | |
Totals | | $ | (140,695 | ) | | $ | (209,005 | ) | | $ | 68,310 | | | $ | — | | | $ | — | |
| | | | | | | | | | | | | | | | | | | | |
International Equity | | | | | | | | | | | | | | | | | | | | |
Forwards | | $ | 1,908,788 | | | $ | — | | | $ | 1,908,788 | | | $ | — | | | $ | — | |
Futures | | | 1,608,950 | | | | — | | | | — | | | | — | | | | 1,608,950 | |
| | | | | | | | | | | | | | | | | | | | |
Totals | | $ | 3,517,738 | | | $ | — | | | $ | 1,908,788 | | | $ | — | | | $ | 1,608,950 | |
| | | | | | | | | | | | | | | | | | | | |
Emerging Markets | | | | | | | | | | | | | | | | | | | | |
Equity | | | | | | | | | | | | | | | | | | | | |
Forwards | | $ | 621,128 | | | $ | — | | | $ | 621,128 | | | $ | — | | | $ | — | |
Futures | | | 113,176 | | | | — | | | | — | | | | — | | | | 113,176 | |
| | | | | | | | | | | | | | | | | | | | |
Totals | | $ | 734,304 | | | $ | — | | | $ | 621,128 | | | $ | — | | | $ | 113,176 | |
| | | | | | | | | | | | | | | | | | | | |
Inflation Protected Bond | | | | | | | | | | | | | | | | | | | | |
Forwards | | $ | 585,625 | | | $ | — | | | $ | 585,625 | | | $ | — | | | $ | — | |
Futures | | | (259,970 | ) | | | (259,970 | ) | | | — | | | | — | | | | — | |
Written Options | | | 49,203 | | | | 22,500 | | | | 26,703 | | | | — | | | | — | |
| | | | | | | | | | | | | | | | | | | | |
Totals | | $ | 374,858 | | | $ | (237,470 | ) | | $ | 612,328 | | | $ | — | | | $ | — | |
| | | | | | | | | | | | | | | | | | | | |
296
| | |
Derivative Type | | Location on the Statements of Operations |
| Interest rate contracts | | Net realized gain (loss) from: Futures transactions |
| | Net realized gain (loss) from: Swap agreements |
| | Net realized gain (loss) from: Option contracts written |
| | Net realized gain (loss) from: Option contracts purchased |
| | Net change in unrealized appreciation (depreciation) on: Futures |
| | Net change in unrealized appreciation (depreciation) on: Swap agreements |
| | Net change in unrealized appreciation (depreciation) on: Option contracts written |
| | Net change in unrealized appreciation (depreciation) on: Option contracts purchased |
| Foreign exchange contracts | | Net realized gain (loss) from: Foreign currency transactions |
| | Net realized gain (loss) from: Option contracts written |
| | Net realized gain (loss) from: Option contracts purchased |
| | Net change in unrealized appreciation (depreciation) on: Foreign currency translations |
| | Net change in unrealized appreciation (depreciation) on: Option contracts purchased |
| | Net change in unrealized appreciation (depreciation) on: Option contracts written |
| Credit contracts | | Net realized gain (loss) from: Swap agreements |
| | Net change in unrealized appreciation (depreciation) on: Swap agreements |
| Equity contracts | | Net realized gain (loss) from: Futures transactions |
| | Net realized gain (loss) from: Option contracts written |
| | Net realized gain (loss) from: Option contracts purchased |
| | Net change in unrealized appreciation (depreciation) on: Futures |
| | Net change in unrealized appreciation (depreciation) on: Option contracts written |
| | Net change in unrealized appreciation (depreciation) on: Option contracts purchased |
| | | | | | | | | | | | | | | | | | | | |
| | | Realized Gain (Loss) on Derivatives Recognized in Income | |
| | | Total Value
at
12/31/13 | | | Interest Rate
Contracts | | | Foreign Exchange
Contracts | | | Credit
Contracts | | | Equity
Contracts | |
MyDestination 2005 | | | | | | | | | | | | | | | | | | | | |
Futures | | $ | 110,903 | | | $ | (18,330 | ) | | $ | — | | | $ | — | | | $ | 129,233 | |
| | | | | | | | | | | | | | | | | | | | |
MyDestination 2015 | | | | | | | | | | | | | | | | | | | | |
Futures | | $ | 608,511 | | | $ | (95,555 | ) | | $ | — | | | $ | — | | | $ | 704,066 | |
| | | | | | | | | | | | | | | | | | | | |
MyDestination 2025 | | | | | | | | | | | | | | | | | | | | |
Futures | | $ | 948,591 | | | $ | (67,139 | ) | | $ | — | | | $ | — | | | $ | 1,015,730 | |
| | | | | | | | | | | | | | | | | | | | |
MyDestination 2035 | | | | | | | | | | | | | | | | | | | | |
Futures | | $ | 770,941 | | | $ | (14,821 | ) | | $ | — | | | $ | — | | | $ | 785,762 | |
| | | | | | | | | | | | | | | | | | | | |
MyDestination 2045 | | | | | | | | | | | | | | | | | | | | |
Futures | | $ | 653,358 | | | $ | (6,226 | ) | | $ | — | | | $ | — | | | $ | 659,584 | |
| | | | | | | | | | | | | | | | | | | | |
MyDestination 2055 | | | | | | | | | | | | | | | | | | | | |
Futures | | $ | 19,936 | | | $ | — | | | $ | — | | | $ | — | | | $ | 19,936 | |
| | | | | | | | | | | | | | | | | | | | |
Conservative Allocation | | | | | | | | | | | | | | | | | | | | |
Futures | | $ | 254,012 | | | $ | 6,186 | | | $ | — | | | $ | — | | | $ | 247,826 | |
| | | | | | | | | | | | | | | | | | | | |
Balanced Allocation | | | | | | | | | | | | | | | | | | | | |
Futures | | $ | 2,239,119 | | | $ | (476,577 | ) | | $ | — | | | $ | — | | | $ | 2,715,696 | |
| | | | | | | | | | | | | | | | | | | | |
Growth Allocation | | | | | | | | | | | | | | | | | | | | |
Futures | | $ | 2,683,817 | | | $ | (142,720 | ) | | $ | — | | | $ | — | | | $ | 2,826,537 | |
| | | | | | | | | | | | | | | | | | | | |
Aggressive Allocation | | | | | | | | | | | | | | | | | | | | |
Futures | | $ | 2,654,901 | | | $ | — | | | $ | — | | | $ | — | | | $ | 2,654,901 | |
| | | | | | | | | | | | | | | | | | | | |
297
| | | | | | | | | | | | | | | | | | | | |
| | | Realized Gain (Loss) on Derivatives Recognized in Income | |
| | | Total Value
at
12/31/13 | | | Interest Rate
Contracts | | | Foreign Exchange
Contracts | | | Credit
Contracts | | | Equity
Contracts | |
Conservative Allocation I | | | | | | | | | | | | | | | | | | | | |
Futures | | $ | 39,184 | | | $ | (1,630 | ) | | $ | — | | | $ | — | | | $ | 40,814 | |
| | | | | | | | | | | | | | | | | | | | |
Balanced Allocation I | | | | | | | | | | | | | | | | | | | | |
Futures | | $ | 577,566 | | | $ | (103,524 | ) | | $ | — | | | $ | — | | | $ | 681,090 | |
| | | | | | | | | | | | | | | | | | | | |
Growth Allocation I | | | | | | | | | | | | | | | | | | | | |
Futures | | $ | 637,020 | | | $ | (15,111 | ) | | $ | — | | | $ | — | | | $ | 652,131 | |
| | | | | | | | | | | | | | | | | | | | |
Aggressive Allocation I | | | | | | | | | | | | | | | | | | | | |
Futures | | $ | 494,098 | | | $ | — | | | $ | — | | | $ | — | | | $ | 494,098 | |
| | | | | | | | | | | | | | | | | | | | |
Low-Duration Bond | | | | | | | | | | | | | | | | | | | | |
Forwards | | $ | (1,036,757 | ) | | $ | — | | | $ | (1,036,757 | ) | | $ | — | | | $ | — | |
Futures | | | 1,242,454 | | | | 1,242,454 | | | | — | | | | — | | | | — | |
Swaps | | | (566,541 | ) | | | 626,722 | | | | — | | | | (1,193,263 | ) | | | — | |
Written Options | | | 639,967 | | | | 639,967 | | | | — | | | | — | | | | — | |
| | | | | | | | | | | | | | | | | | | | |
Totals | | $ | 279,123 | | | $ | 2,509,143 | | | $ | (1,036,757 | ) | | $ | (1,193,263 | ) | | $ | — | |
| | | | | | | | | | | | | | | | | | | | |
Medium-Duration Bond | | | | | | | | | | | | | | | | | | | | |
Forwards | | $ | (1,217,577 | ) | | $ | — | | | $ | (1,217,577 | ) | | $ | — | | | $ | — | |
Futures | | | 1,353,193 | | | | 1,353,193 | | | | — | | | | — | | | | — | |
Purchased Options | | | (76,645 | ) | | | (62,354 | ) | | | (14,291 | ) | | | — | | | | — | |
Swaps | | | (705,709 | ) | | | 415,435 | | | | — | | | | (1,121,144 | ) | | | — | |
Written Options | | | 1,078,503 | | | | 1,078,503 | | | | — | | | | — | | | | — | |
| | | | | | | | | | | | | | | | | | | | |
Totals | | $ | 431,765 | | | $ | 2,784,777 | | | $ | (1,231,868 | ) | | $ | (1,121,144 | ) | | $ | — | |
| | | | | | | | | | | | | | | | | | | | |
Global Bond | | | | | | | | | | | | | | | | | | | | |
Forwards | | $ | (1,978,780 | ) | | $ | — | | | $ | (1,978,780 | ) | | $ | — | | | $ | — | |
Futures | | | 364,330 | | | | 364,330 | | | | — | | | | — | | | | — | |
Purchased Options | | | (370,694 | ) | | | (131,848 | ) | | | (238,846 | ) | | | — | | | | — | |
Written Options | | | 16,883 | | | | 16,883 | | | | — | | | | — | | | | — | |
| | | | | | | | | | | | | | | | | | | | |
Totals | | $ | (1,968,261 | ) | | $ | 249,365 | | | $ | (2,217,626 | ) | | $ | — | | | $ | — | |
| | | | | | | | | | | | | | | | | | | | |
Defensive Market Strategies | | | | | | | | | | | | | | | | | | | | |
Forwards | | $ | 184,765 | | | $ | — | | | $ | 184,765 | | | $ | — | | | $ | — | |
Futures | | | 5,824,421 | | | | — | | | | — | | | | — | | | | 5,824,421 | |
Purchased Options | | | (605,569 | ) | | | — | | | | — | | | | — | | | | (605,569 | ) |
Written Options | | | 14,073 | | | | — | | | | — | | | | — | | | | 14,073 | |
| | | | | | | | | | | | | | | | | | | | |
Totals | | $ | 5,417,690 | | | $ | — | | | $ | 184,765 | | | $ | — | | | $ | 5,232,925 | |
| | | | | | | | | | | | | | | | | | | | |
Equity Index | | | | | | | | | | | | | | | | | | | | |
Futures | | $ | 2,798,542 | | | $ | — | | | $ | — | | | $ | — | | | $ | 2,798,542 | |
| | | | | | | | | | | | | | | | | | | | |
Value Equity | | | | | | | | | | | | | | | | | | | | |
Futures | | $ | 8,569,444 | | | $ | — | | | $ | — | | | $ | — | | | $ | 8,569,444 | |
| | | | | | | | | | | | | | | | | | | | |
Growth Equity | | | | | | | | | | | | | | | | | | | | |
Futures | | $ | 15,573,869 | | | $ | — | | �� | $ | — | | | $ | — | | | $ | 15,573,869 | |
| | | | | | | | | | | | | | | | | | | | |
Small Cap Equity | | | | | | | | | | | | | | | | | | | | |
Forwards | | $ | 63,128 | | | $ | — | | | $ | 63,128 | | | $ | — | | | $ | — | |
Futures | | | 29,142,977 | | | | 887,128 | | | | — | | | | — | | | | 28,255,849 | |
Purchased Options | | | (30,452 | ) | | | (27,946 | ) | | | (2,506 | ) | | | — | | | | — | |
Written Options | | | 34,180 | | | | 34,180 | | | | — | | | | — | | | | — | |
| | | | | | | | | | | | | | | | | | | | |
Totals | | $ | 29,209,833 | | | $ | 893,362 | | | $ | 60,622 | | | $ | — | | | $ | 28,255,849 | |
| | | | | | | | | | | | | | | | | | | | |
298
| | | | | | | | | | | | | | | | | | | | |
| | | Realized Gain (Loss) on Derivatives Recognized in Income | |
| | | Total Value
at
12/31/13 | | | Interest Rate
Contracts | | | Foreign Exchange
Contracts | | | Credit
Contracts | | | Equity
Contracts | |
International Equity | | | | | | | | | | | | | | | | | | | | |
Forwards | | $ | 4,719,042 | | | $ | — | | | $ | 4,719,042 | | | $ | — | | | $ | — | |
Futures | | | 20,062,582 | | | | — | | | | — | | | | — | | | | 20,062,582 | |
Swaps | | | (108,215 | ) | | | — | | | | — | | | | — | | | | (108,215 | ) |
| | | | | | | | | | | | | | | | | | | | |
Totals | | $ | 24,673,409 | | | $ | — | | | $ | 4,719,042 | | | $ | — | | | $ | 19,954,367 | |
| | | | | | | | | | | | | | | | | | | | |
Emerging Markets Equity | | | | | | | | | | | | | | | | | | | | |
Futures | | $ | (430,714 | ) | | $ | — | | | $ | — | | | $ | (430,714 | ) | | $ | — | |
| | | | | | | | | | | | | | | | | | | | |
Inflation Protected Bond | | | | | | | | | | | | | | | | | | | | |
Forwards | | $ | (77,858 | ) | | $ | — | | | $ | (77,858 | ) | | $ | — | | | $ | — | |
Futures | | | 1,108,298 | | | | 1,108,298 | | | | — | | | | — | | | | — | |
Purchased Options | | | (379,205 | ) | | | (261,317 | ) | | | (117,888 | ) | | | — | | | | — | |
Written Options | | | 374,024 | | | | 222,585 | | | | 151,439 | | | | — | | | | — | |
| | | | | | | | | | | | | | | | | | | | |
Totals | | $ | 1,025,259 | | | $ | 1,069,566 | | | $ | (44,307 | ) | | $ | — | | | $ | — | |
| | | | | | | | | | | | | | | | | | | | |
Real Estate Securities | | | | | | | | | | | | | | | | | | | | |
Futures | | $ | 1,706,784 | | | $ | — | | | $ | — | | | $ | — | | | $ | 1,706,784 | |
| | | | | | | | | | | | | | | | | | | | |
| |
| | | Change in Unrealized Appreciation (Depreciation) on Derivatives Recognized in Income | |
| | | Total Value
at
12/31/13 | | | Interest Rate
Contracts | | | Foreign Exchange
Contracts | | | Credit
Contracts | | | Equity
Contracts | |
MyDestination 2005 | | | | | | | | | | | | | | | | | | | | |
Futures | | $ | 11,191 | | | $ | (687 | ) | | $ | — | | | $ | — | | | $ | 11,878 | |
| | | | | | | | | | | | | | | | | | | | |
MyDestination 2015 | | | | | | | | | | | | | | | | | | | | |
Futures | | $ | 84,121 | | | $ | (20,499 | ) | | $ | — | | | $ | — | | | $ | 104,620 | |
| | | | | | | | | | | | | | | | | | | | |
MyDestination 2025 | | | | | | | | | | | | | | | | | | | | |
Futures | | $ | 155,142 | | | $ | (21,851 | ) | | $ | — | | | $ | — | | | $ | 176,993 | |
| | | | | | | | | | | | | | | | | | | | |
MyDestination 2035 | | | | | | | | | | | | | | | | | | | | |
Futures | | $ | 140,792 | | | $ | (14,445 | ) | | $ | — | | | $ | — | | | $ | 155,237 | |
| | | | | | | | | | | | | | | | | | | | |
MyDestination 2045 | | | | | | | | | | | | | | | | | | | | |
Futures | | $ | 114,984 | | | $ | (3,969 | ) | | $ | — | | | $ | — | | | $ | 118,953 | |
| | | | | | | | | | | | | | | | | | | | |
MyDestination 2055 | | | | | | | | | | | | | | | | | | | | |
Futures | | $ | 10,862 | | | $ | — | | | $ | — | | | $ | — | | | $ | 10,862 | |
| | | | | | | | | | | | | | | | | | | | |
Conservative Allocation
| | | | | | | | | | | | | | | | | | | | |
Futures | | $ | 26,458 | | | $ | (4,061 | ) | | $ | — | | | $ | — | | | $ | 30,519 | |
| | | | | | | | | | | | | | | | | | | | |
Balanced Allocation
| | | | | | | | | | | | | | | | | | | | |
Futures | | $ | 322,838 | | | $ | (140,257 | ) | | $ | — | | | $ | — | | | $ | 463,095 | |
| | | | | | | | | | | | | | | | | | | | |
Growth Allocation
| | | | | | | | | | | | | | | | | | | | |
Futures | | $ | 452,871 | | | $ | (43,120 | ) | | $ | — | | | $ | — | | | $ | 495,991 | |
| | | | | | | | | | | | | | | | | | | | |
Aggressive Allocation
| | | | | | | | | | | | | | | | | | | | |
Futures | | $ | 653,729 | | | $ | — | | | $ | — | | | $ | — | | | $ | 653,729 | |
| | | | | | | | | | | | | | | | | | | | |
Conservative Allocation I
| | | | | | | | | | | | | | | | | | | | |
Futures | | $ | 5,786 | | | $ | (65 | ) | | $ | — | | | $ | — | | | $ | 5,851 | |
| | | | | | | | | | | | | | | | | | | | |
Balanced Allocation I
| | | | | | | | | | | | | | | | | | | | |
Futures | | $ | 79,027 | | | $ | (34,618 | ) | | $ | — | | | $ | — | | | $ | 113,645 | |
| | | | | | | | | | | | | | | | | | | | |
299
| | | | | | | | | | | | | | | | | | | | |
| | | Change in Unrealized Appreciation (Depreciation) on Derivatives Recognized in Income | |
| | | Total Value
at
12/31/13 | | | Interest Rate
Contracts | | | Foreign Exchange
Contracts | | | Credit
Contracts | | | Equity
Contracts | |
Growth Allocation I
| | | | | | | | | | | | | | | | | | | | |
Futures | | $ | 119,943 | | | $ | (13,633 | ) | | $ | — | | | $ | — | | | $ | 133,576 | |
| | | | | | | | | | | | | | | | | | | | |
Aggressive Allocation I
| | | | | | | | | | | | | | | | | | | | |
Futures | | $ | 122,117 | | | $ | — | | | $ | — | | | $ | — | | | $ | 122,117 | |
| | | | | | | | | | | | | | | | | | | | |
Low-Duration Bond
| | | | | | | | | | | | | | | | | | | | |
Forwards | | $ | 1,690,721 | | | $ | — | | | $ | 1,690,721 | | | $ | — | | | $ | — | |
Futures | | | 277,383 | | | | 277,383 | | | | — | | | | — | | | | — | |
Purchased Options | | | 163,214 | | | | 163,214 | | | | — | | | | — | | | | — | |
Swaps | | | (1,638,978 | ) | | | (1,772,404 | ) | | | — | | | | 133,426 | | | | — | |
Written Options | | | (370,182 | ) | | | (370,182 | ) | | | — | | | | — | | | | — | |
| | | | | | | | | | | | | | | | | | | | |
Totals | | $ | 122,158 | | | $ | (1,701,989 | ) | | $ | 1,690,721 | | | $ | 133,426 | | | $ | — | |
| | | | | | | | | | | | | | | | | | | | |
Medium-Duration Bond
| | | | | | | | | | | | | | | | | | | | |
Forwards | | $ | 1,554,270 | | | $ | — | | | $ | 1,554,270 | | | $ | — | | | $ | — | |
Futures | | | (214,642 | ) | | | (214,642 | ) | | | — | | | | — | | | | — | |
Purchased Options | | | 224,445 | | | | 270,880 | | | | (46,435 | ) | | | — | | | | — | |
Swaps | | | (2,346,447 | ) | | | (3,021,666 | ) | | | — | | | | 675,219 | | | | — | |
Written Options | | | (440,032 | ) | | | (440,032 | ) | | | — | | | | — | | | | — | |
| | | | | | | | | | | | | | | | | | | | |
Totals | | $ | (1,222,406 | ) | | $ | (3,405,460 | ) | | $ | 1,507,835 | | | $ | 675,219 | | | $ | — | |
| | | | | | | | | | | | | | | | | | | | |
Global Bond | | | | | | | | | | | | | | | | | | | | |
Forwards | | $ | 980,924 | | | $ | — | | | $ | 980,924 | | | $ | — | | | $ | — | |
Futures | | | (65,342 | ) | | | (65,342 | ) | | | — | | | | — | | | | — | |
Purchased Options | | | (229,283 | ) | | | — | | | | (229,283 | ) | | | — | | | | — | |
| | | | | | | | | | | | | | | | | | | | |
Totals | | $ | 686,299 | | | $ | (65,342 | ) | | $ | 751,641 | | | $ | — | | | $ | — | |
| | | | | | | | | | | | | | | | | | | | |
Defensive Market Strategies
| | | | | | | | | | | | | | | | | | | | |
Forwards | | $ | (47,649 | ) | | $ | — | | | $ | (47,649 | ) | | $ | — | | | $ | — | |
Futures | | | 733,249 | | | | — | | | | — | | | | — | | | | 733,249 | |
Purchased Options | | | (117,849 | ) | | | — | | | | — | | | | — | | | | (117,849 | ) |
Written Options | | | 29,441 | | | | — | | | | — | | | | — | | | | 29,441 | |
| | | | | | | | | | | | | | | | | | | | |
Totals | | $ | 597,192 | | | $ | — | | | $ | (47,649 | ) | | $ | — | | | $ | 644,841 | |
| | | | | | | | | | | | | | | | | | | | |
Equity Index
| | | | | | | | | | | | | | | | | | | | |
Futures | | $ | 391,506 | | | $ | — | | | $ | — | | | $ | — | | | $ | 391,506 | |
| | | | | | | | | | | | | | | | | | | | |
Value Equity
| | | | | | | | | | | | | | | | | | | | |
Futures | | $ | 1,685,630 | | | $ | — | | | $ | — | | | $ | — | | | $ | 1,685,630 | |
| | | | | | | | | | | | | | | | | | | | |
Growth Equity
| | | | | | | | | | | | | | | | | | | | |
Futures | | $ | 2,186,149 | | | $ | — | | | $ | — | | | $ | — | | | $ | 2,186,149 | |
| | | | | | | | | | | | | | | | | | | | |
Small Cap Equity
| | | | | | | | | | | | | | | | | | | | |
Forwards | | $ | 24,657 | | | $ | — | | | $ | 24,657 | | | $ | — | | | $ | — | |
Futures | | | 3,178,527 | | | | 107,682 | | | | — | | | | — | | | | 3,070,845 | |
Purchased Options | | | 9,915 | | | | 19,194 | | | | (9,279 | ) | | | — | | | | — | |
Written Options | | | (9,282 | ) | | | (9,282 | ) | | | — | | | | — | | | | — | |
| | | | | | | | | | | | | | | | | | | | |
Totals | | $ | 3,203,817 | | | $ | 117,594 | | | $ | 15,378 | | | $ | — | | | $ | 3,070,845 | |
| | | | | | | | | | | | | | | | | | | | |
International Equity
| | | | | | | | | | | | | | | | | | | | |
Forwards | | $ | (4,517,197 | ) | | $ | — | | | $ | (4,517,197 | ) | | $ | — | | | $ | — | |
Futures | | | 2,190,495 | | | | — | | | | 233,840 | | | | — | | | | 1,956,655 | |
| | | | | | | | | | | | | | | | | | | | |
Totals | | $ | (2,326,702 | ) | | $ | — | | | $ | (4,283,357 | ) | | $ | — | | | $ | 1,956,655 | |
| | | | | | | | | | | | | | | | | | | | |
300
| | | | | | | | | | | | | | | | | | | | |
| | | Change in Unrealized Appreciation (Depreciation) on Derivatives Recognized in Income | |
| | | Total Value
at
12/31/13 | | | Interest Rate
Contracts | | | Foreign Exchange
Contracts | | | Credit
Contracts | | | Equity
Contracts | |
Emerging Markets Equity
| | | | | | | | | | | | | | | | | | | | |
Forwards | | $ | (3,856,494 | ) | | $ | — | | | $ | (3,856,494 | ) | | $ | — | | | $ | — | |
Futures | | | 934,639 | | | | — | | | | — | | | | — | | | | 934,639 | |
| | | | | | | | | | | | | | | | | | | | |
Totals | | $ | (2,921,855 | ) | | $ | — | | | $ | (3,856,494 | ) | | $ | — | | | $ | 934,639 | |
| | | | | | | | | | | | | | | | | | | | |
Inflation Protected Bond
| | | | | | | | | | | | | | | | | | | | |
Forwards | | $ | (419,123 | ) | | $ | — | | | $ | (419,123 | ) | | $ | — | | | $ | — | |
Futures | | | (53,424 | ) | | | (53,424 | ) | | | — | | | | — | | | | — | |
Purchased Options | | | 30,051 | | | | 52,160 | | | | (22,109 | ) | | | — | | | | — | |
Written Options | | | 32,380 | | | | (7,840 | ) | | | 40,220 | | | | — | | | | — | |
| | | | | | | | | | | | | | | | | | | | |
Totals | | $ | (410,116 | ) | | $ | (9,104 | ) | | $ | (401,012 | ) | | $ | — | | | $ | — | |
| | | | | | | | | | | | | | | | | | | | |
Real Estate Securities
| | | | | | | | | | | | | | | | | | | | |
Futures | | $ | 66,776 | | | $ | — | | | $ | — | | | $ | — | | | $ | 66,776 | |
| | | | | | | | | | | | | | | | | | | | |
Volume of Derivative Transactions
The table below summarizes the average balance of derivative holdings by fund during the year ended December 31, 2013. The average balance of derivatives held is indicative of the trading volume of each Fund.
| | | | | | | | | | | | | | | | |
| | | Long Derivative Volume | |
| | | Forward Foreign
Currency
Contracts
(Average Cost) | | | Futures
Contracts
(Average Notional Value) | | | Purchased
Option
Contracts
(Average Notional Cost) | | | Swap
Contracts
(Average Notional Amount) | |
MyDestination 2005 | | $ | — | | | $ | 1,079,633 | | | $ | — | | | $ | — | |
MyDestination 2015 | | | — | | | | 6,002,100 | | | | — | | | | — | |
MyDestination 2025 | | | — | | | | 7,419,651 | | | | — | | | | — | |
MyDestination 2035 | | | — | | | | 5,085,787 | | | | — | | | | — | |
MyDestination 2045 | | | — | | | | 3,603,083 | | | | — | | | | — | |
MyDestination 2055 | | | — | | | | 239,436 | | | | — | | | | — | |
Conservative Allocation | | | — | | | | 4,180,104 | | | | — | | | | — | |
Balanced Allocation | | | — | | | | 26,491,669 | | | | — | | | | — | |
Growth Allocation | | | — | | | | 19,055,733 | | | | — | | | | — | |
Aggressive Allocation | | | — | | | | 16,240,131 | | | | — | | | | — | |
Conservative Allocation I | | | — | | | | 649,333 | | | | — | | | | — | |
Balanced Allocation I | | | — | | | | 6,108,330 | | | | — | | | | — | |
Growth Allocation I | | | — | | | | 4,423,373 | | | | — | | | | — | |
Aggressive Allocation I | | | — | | | | 2,996,498 | | | | — | | | | — | |
Low-Duration Bond | | | 38,719,657 | | | | 119,997,400 | | | | 151,445 | | | | 48,981,345 | |
Medium-Duration Bond | | | 34,301,932 | | | | 137,287,389 | | | | 228,950 | | | | 112,141,600 | |
Global Bond | | | 23,427,906 | | | | 6,523,075 | | | | 105,847 | | | | — | |
Defensive Market Strategies | | | 927,521 | | | | 25,035,194 | | | | 199,698 | | | | — | |
Equity Index | | | — | | | | 12,195,093 | | | | — | | | | — | |
Value Equity | | | — | | | | 36,036,802 | | | | — | | | | — | |
Growth Equity | | | — | | | | 59,068,435 | | | | — | | | | — | |
Small Cap Equity | | | 690,944 | | | | 102,254,357 | | | | 13,136 | | | | — | |
International Equity | | | 344,775,417 | | | | 210,932,217 | | | | — | | | | — | |
Emerging Markets Equity | | | 42,962,836 | | | | 26,126,465 | | | | — | | | | — | |
Inflation Protected Bond | | | 5,506,770 | | | | 34,955,932 | | | | 179,811 | | | | — | |
Real Estate Securities | | | — | | | | 7,066,991 | | | | — | | | | — | |
301
| | | | | | | | | | | | | | | | | | | | |
| | | Short Derivative Volume |
| | Forward Foreign
Currency
Contracts
(Average Cost) | | Futures
Contracts
(Average Notional Value) | | Written
Option
Contracts
(Average Notional Cost) | | Swap
Contracts
(Average Notional Amount) |
Low-Duration Bond | | | $ | 96,337,656 | | | | | $92,208,655 | | | | $ | 402,433 | | | | $ | 65,463,200 | |
Medium-Duration Bond | | | | 76,676,569 | | | | | 87,691,257 | | | | | 522,326 | | | | | 1,342,992,150 | |
Global Bond | | | | 37,520,429 | | | | | 12,390,106 | | | | | 18,660 | | | | | — | |
Defensive Market Strategies | | | | 5,029,780 | | | | | — | | | | | 21,201 | | | | | — | |
Small Cap Equity | | | | 2,967,868 | | | | | 31,268,884 | | | | | 9,370 | | | | | — | |
International Equity | | | | 325,640,034 | | | | | 39,569,951 | | | | | — | | | | | 618,276 | |
Emerging Markets Equity | | | | 33,999,740 | | | | | 3,396,754 | | | | | — | | | | | — | |
Inflation Protected Bond | | | | 23,825,046 | | | | | 37,635,174 | | | | | 179,812 | | | | | — | |
j. Dividends and Distributions to Shareholders
The Low-Duration Bond Fund, Medium-Duration Bond Fund, Extended-Duration Bond Fund, Inflation Protected Bond Fund, Global Bond Fund and Flexible Income Fund declare and pay dividends from net investment income monthly. The Money Market Fund declares income dividends daily and pays them monthly. Each of the Defensive Market Strategies Fund, Equity Index Fund, Real Estate Securities Fund, Value Equity Fund and Growth Equity Fund declares and pays dividends from net investment income semi-annually. Each of the other Funds (including all the Date Target Funds and Asset Allocation Funds) declares and pays dividends from net investment income annually. Each Fund also distributes to its shareholders at least annually any realized net capital gains and net gains, if any, from certain foreign currency transactions. Dividends and distributions to shareholders are recorded on the ex-dividend date.
k. Expenses
Expenses arising in connection with a Fund are charged directly to that Fund. Expenses common to all Funds are generally allocated to each Fund in proportion to their relative net assets. Each Class of shares bears its pro-rata portion of expenses attributable to its Class, except that each Class separately bears expenses related specifically to that Class, such as shareholder reporting, registration, transfer agent, shareholder servicing and distribution fees.
l. Security Transactions, Income and Realized Gains and Losses
Security transactions are accounted for on the date securities are purchased or sold (the trade date). Dividend income is recognized on the ex-dividend date, except certain dividends from foreign securities where the ex-date may have passed, which are recorded as soon as the Fund is informed of the ex-dividend date. Interest income is accrued daily, including the amortization of market premium and the accretion of market discount. Realized gains and losses from security transactions are on an identified cost basis.
3. FEES AND OTHER TRANSACTIONS WITH AFFILIATES
a. Investment Advisory Fees
Pursuant to a separate investment advisory agreement, GuideStone Capital Management (“GSCM” or “Adviser”) acts as the Adviser to the Funds. As Adviser, it supervises the investments of the Funds and for such services is paid a fee. GSCM and the Trust have entered into sub-advisory agreements with various sub-advisers to manage each Select Fund’s investments. Under the general supervision of GSCM, the sub-advisers make the day-to-day investment decisions for the Select Funds, and for such services, each sub-adviser receives a fee from the Funds.
302
The advisory fees paid to GSCM and aggregate sub-advisory fees paid to the sub-advisers are computed daily based upon the net assets of each Fund. The actual advisory fees accrued and the sub-advisory fees accrued during the year ended December 31, 2013, based upon average daily net assets, were as follows:
| | | | |
Fund | | Advisory Fees | | Sub-Adviser Fees |
MyDestination 2005 | | 0.10% | | 0.00% |
MyDestination 2015 | | 0.10% | | 0.00% |
MyDestination 2025 | | 0.10% | | 0.00% |
MyDestination 2035 | | 0.10% | | 0.00% |
MyDestination 2045 | | 0.10% | | 0.00% |
MyDestination 2055 | | 0.10% | | 0.00% |
Conservative Allocation | | 0.10% | | 0.00% |
Balanced Allocation | | 0.10% | | 0.00% |
Growth Allocation | | 0.10% | | 0.00% |
Aggressive Allocation | | 0.10% | | 0.00% |
Conservative Allocation I | | 0.10% | | 0.00% |
Balanced Allocation I | | 0.10% | | 0.00% |
Growth Allocation I | | 0.10% | | 0.00% |
Aggressive Allocation I | | 0.10% | | 0.00% |
Money Market | | 0.09% | | 0.07% |
Low-Duration Bond | | 0.13% | | 0.21% |
Medium-Duration Bond | | 0.21% | | 0.21% |
Extended-Duration Bond | | 0.25% | | 0.23% |
Global Bond | | 0.21% | | 0.25% |
Defensive Market Strategies | | 0.37% | | 0.48% |
Equity Index | | 0.13% | | 0.02% |
Value Equity | | 0.40% | | 0.23% |
Growth Equity | | 0.45% | | 0.38% |
Small Cap Equity | | 0.27% | | 0.57% |
International Equity | | 0.47% | | 0.44% |
Emerging Markets Equity | | 0.47% | | 0.70% |
Inflation Protected Bond | | 0.20% | | 0.11% |
Flexible Income | | 0.25% | | 0.50% |
Real Assets | | 0.10% | | 0.00% |
Real Estate Securities | | 0.28% | | 0.42% |
Global Natural Resources Equity | | 0.39% | | 0.67% |
For the year ended December 31, 2013, advisory fees and waivers for each Fund were as follows:
| | | | | | | | | | | | | | | |
| | | Gross
Advisory Fee | | Waiver/
Reimbursements | | Net Advisory Fee
(Reimbursement) |
MyDestination 2005 | | | $ | 84,357 | | | | $ | (40,223 | ) | | | $ | 44,134 | |
MyDestination 2015 | | | | 398,346 | | | | | — | | | | | 398,346 | |
MyDestination 2025 | | | | 456,263 | | | | | — | | | | | 456,263 | |
MyDestination 2035 | | | | 237,696 | | | | | 70,071 | | | | | 307,767 | |
MyDestination 2045 | | | | 171,312 | | | | | 28,663 | | | | | 199,975 | |
MyDestination 2055 | | | | 10,787 | | | | | (87,450 | ) | | | | (76,663 | ) |
Conservative Allocation | | | | 323,150 | | | | | (122,093 | ) | | | | 201,057 | |
Balanced Allocation | | | | 1,256,272 | | | | | (98,366 | ) | | | | 1,157,906 | |
Growth Allocation | | | | 904,810 | | | | | (87,577 | ) | | | | 817,233 | |
Aggressive Allocation | | | | 796,206 | | | | | (79,432 | ) | | | | 716,774 | |
Conservative Allocation I | | | | 84,979 | | | | | (43,252 | ) | | | | 41,727 | |
Balanced Allocation I | | | | 374,190 | | | | | — | | | | | 374,190 | |
Growth Allocation I | | | | 251,752 | | | | | — | | | | | 251,752 | |
Aggressive Allocation I | | | | 168,337 | | | | | (9,637 | ) | | | | 158,700 | |
Money Market(1) | | | | 1,204,715 | | | | | — | | | | | 1,204,715 | |
303
| | | | | | | | | | | | | | | |
| | | Gross
Advisory Fee | | Waiver/
Reimbursements | | Net Advisory Fee
(Reimbursement) |
Low-Duration Bond | | | $ | 1,077,624 | | | | $ | (685,289 | ) | | | $ | 392,335 | |
Medium-Duration Bond | | | | 1,774,036 | | | | | (913,007 | ) | | | | 861,029 | |
Extended-Duration Bond | | | | 910,660 | | | | | (152,852 | ) | | | | 757,808 | |
Global Bond | | | | 604,470 | | | | | (85,036 | ) | | | | 519,434 | |
Defensive Market Strategies | | | | 1,665,318 | | | | | (87,229 | ) | | | | 1,578,089 | |
Equity Index | | | | 396,773 | | | | | (260,266 | ) | | | | 136,507 | |
Value Equity | | | | 5,112,646 | | | | | (81,634 | ) | | | | 5,031,012 | |
Growth Equity(1) | | | | 5,979,794 | | | | | (392,517 | ) | | | | 5,587,277 | |
Small Cap Equity | | | | 1,385,522 | | | | | (56,514 | ) | | | | 1,329,008 | |
International Equity | | | | 6,981,940 | | | | | (2,065,865 | ) | | | | 4,916,075 | |
Emerging Markets Equity | | | | 220,265 | | | | | (133,958 | ) | | | | 86,307 | |
Inflation Protected Bond | | | | 460,177 | | | | | (20,971 | ) | | | | 439,206 | |
Flexible Income | | | | 113,875 | | | | | (28,255 | ) | | | | 85,620 | |
Real Assets | | | | 8,772 | | | | | (67,124 | ) | | | | (58,352 | ) |
Real Estate Securities | | | | 631,692 | | | | | (16,967 | ) | | | | 614,725 | |
Global Natural Resources Equity | | | | 450,144 | | | | | — | | | | | 450,144 | |
| (1) | The Statement of Operations “Expenses waived/reimbursed net of amount recaptured” for the Money Market Fund and the Growth Equity Fund include shareholder servicing fee waiver and other waivers, respectively, in addition to the advisory fee waiver. |
b. Shareholder Servicing Fees
The Board of Trustees has adopted a Shareholder Service Plan for the GS4 Class of each Select Fund. Under this Plan, the GS4 Class of each Select Fund, with the exception of the Real Assets Fund, is authorized to pay fees of 0.24% of average daily net assets to parties that provide services for and maintain shareholder accounts.
The Board of Trustees voluntarily agreed to waive shareholder servicing fees and/or reimburse expenses for the GS4 Class of the Money Market Fund to the extent necessary to maintain a minimum daily net yield of at least 0.01%. This voluntary shareholder servicing fee waiver and expense reimbursement may be changed or terminated by the Board of Trustees at any time.
c. Expense Limitation
GSCM has agreed, through April 30, 2014, to waive fees and reimburse expenses of the GS2 Class and GS4 Class of each Fund (excluding interest, taxes, brokerage commissions, dividend expense on securities sold short and extraordinary expenses) which exceed, in the aggregate, the annual percentage rate of each Class’s average daily net assets as follows:
| | | | |
Fund | | GS2 Class | | GS4 Class |
MyDestination 2005 | | N/A | | 0.20% |
MyDestination 2015 | | N/A | | 0.20% |
MyDestination 2025 | | N/A | | 0.20% |
MyDestination 2035 | | N/A | | 0.20% |
MyDestination 2045 | | N/A | | 0.20% |
MyDestination 2055 | | N/A | | 0.20% |
Conservative Allocation | | N/A | | 0.12% |
Balanced Allocation | | N/A | | 0.12% |
Growth Allocation | | N/A | | 0.12% |
Aggressive Allocation | | N/A | | 0.12% |
Conservative Allocation I | | 0.15% | | N/A |
Balanced Allocation I | | 0.15% | | N/A |
Growth Allocation I | | 0.15% | | N/A |
Aggressive Allocation I | | 0.15% | | N/A |
Money Market | | 0.20% | | 0.39% |
Low-Duration Bond | | 0.36% | | 0.57% |
304
| | | | |
Fund | | GS2 Class | | GS4 Class |
Medium-Duration Bond | | 0.48% | | 0.63% |
Extended-Duration Bond | | 0.63% | | 0.75% |
Global Bond | | N/A | | 1.02% |
Defensive Market Strategies | | 0.99% | | 1.25% |
Equity Index | | 0.23% | | 0.38% |
Value Equity | | 0.74% | | 0.94% |
Growth Equity | | 0.88% | | 1.06% |
Small Cap Equity | | 1.12% | | 1.21% |
International Equity | | 0.96% | | 1.20% |
Emerging Markets Equity | | 1.25% | | 1.50% |
Inflation Protected Bond | | N/A | | 0.67% |
Flexible Income | | N/A | | 1.20% |
Real Assets | | N/A | | 0.12% |
Real Estate Securities | | N/A | | 1.29% |
Global Natural Resources Equity | | N/A | | 1.50% |
Each Fund in turn agrees to reimburse GSCM for any operating expenses in excess of the expense limitation paid, waived or assumed by GSCM for that Fund during the limitation period, provided GSCM would not be entitled to reimbursement for any amount that would cause operating expenses to exceed the expense limitation during the year in which the reimbursement would be made, and provided further that no amount will be reimbursed by the Fund more than three years after the year in which it was incurred or waived by GSCM.
At December 31, 2013, the amounts subject to possible future reimbursement under the expense limitation agreement are as follows:
| | | | | | | | | | | | | | | | | | | | | | | | | | | | | | | | | | |
| | | GS2 Class | | | | | GS4 Class | |
| | | 2011 | | | | | 2012 | | | | | 2013 | | | | | 2011 | | | | | 2012 | | | | | 2013 | |
MyDestination 2005 | | | N/A | | | | | | N/A | | | | | | N/A | | | | | $ | 91,223 | | | | | $ | 48,296 | | | | | $ | 40,223 | |
MyDestination 2015 | | | N/A | | | | | | N/A | | | | | | N/A | | | | | | N/A | | | | | | N/A | | | | | | N/A | |
MyDestination 2025 | | | N/A | | | | | | N/A | | | | | | N/A | | | | | | N/A | | | | | | N/A | | | | | | N/A | |
MyDestination 2035 | | | N/A | | | | | | N/A | | | | | | N/A | | | | | | N/A | | | | | | N/A | | | | | | N/A | |
MyDestination 2045 | | | N/A | | | | | | N/A | | | | | | N/A | | | | | | 74,220 | | | | | | 15,118 | | | | | | N/A | |
MyDestination 2055 | | | N/A | | | | | | N/A | | | | | | N/A | | | | | | N/A | | | | | | 95,601 | | | | | | 87,450 | |
Conservative Allocation | | | N/A | | | | | | N/A | | | | | | N/A | | | | | | 148,927 | | | | | | 119,266 | | | | | | 122,093 | |
Balanced Allocation | | | N/A | | | | | | N/A | | | | | | N/A | | | | | | 157,363 | | | | | | 117,270 | | | | | | 98,366 | |
Growth Allocation | | | N/A | | | | | | N/A | | | | | | N/A | | | | | | 133,967 | | | | | | 104,633 | | | | | | 87,577 | |
Aggressive Allocation | | | N/A | | | | | | N/A | | | | | | N/A | | | | | | 129,580 | | | | | | 97,258 | | | | | | 79,432 | |
Conservative Allocation I | | $ | 66,248 | | | | | $ | 42,753 | | | | | $ | 43,252 | | | | | | N/A | | | | | | N/A | | | | | | N/A | |
Balanced Allocation I | | | N/A | | | | | | N/A | | | | | | N/A | | | | | | N/A | | | | | | N/A | | | | | | N/A | |
Growth Allocation I | | | N/A | | | | | | N/A | | | | | | N/A | | | | | | N/A | | | | | | N/A | | | | | | N/A | |
Aggressive Allocation I | | | 38,072 | | | | | | 17,895 | | | | | | 9,637 | | | | | | N/A | | | | | | N/A | | | | | | N/A | |
Money Market | | | N/A | | | | | | N/A | | | | | | N/A | | | | | | N/A | | | | | | N/A | | | | | | N/A | |
Low-Duration Bond | | | 59,610 | | | | | | 53,538 | | | | | | 62,386 | | | | | | 501,417 | | | | | | 493,263 | | | | | | 539,623 | |
Medium-Duration Bond | | | 34,814 | | | | | | 12,070 | | | | | | 48,408 | | | | | | 701,423 | | | | | | 679,378 | | | | | | 703,036 | |
Extended-Duration Bond | | | N/A | | | | | | N/A | | | | | | N/A | | | | | | 141,631 | | | | | | 82,647 | | | | | | 129,150 | |
Global Bond | | | N/A | | | | | | N/A | | | | | | N/A | | | | | | N/A | | | | | | N/A | | | | | | N/A | |
Defensive Market Strategies | | | 8,654 | | | | | | 46,439 | | | | | | 13,140 | | | | | | 19,443 | | | | | | 133,940 | | | | | | N/A | |
Equity Index | | | N/A | | | | | | 220 | | | | | | N/A | | | | | | 240,739 | | | | | | 210,543 | | | | | | 234,035 | |
Value Equity | | | N/A | | | | | | N/A | | | | | | N/A | | | | | | 28,595 | | | | | | N/A | | | | | | N/A | |
Growth Equity | | | N/A | | | | | | N/A | | | | | | N/A | | | | | | 775,619 | | | | | | 544,115 | | | | | | 254,800 | |
Small Cap Equity | | | N/A | | | | | | N/A | | | | | | N/A | | | | | | 232,755 | | | | | | 186,783 | | | | | | N/A | |
International Equity | | | 494,427 | | | | | | 388,370 | | | | | | 345,716 | | | | | | 2,083,992 | | | | | | 1,703,913 | | | | | | 1,480,579 | |
Emerging Markets Equity | | | N/A | | | | | | N/A | | | | | | 22,538 | | | | | | N/A | | | | | | N/A | | | | | | 111,351 | |
305
| | | | | | | | | | | | | | | | | | | | | | | | | | | | | | | | | | |
| | | GS2 Class | | | | | GS4 Class | |
| | 2011 | | | | | 2012 | | | | | 2013 | | | | | 2011 | | | | | 2012 | | | | | 2013 | |
Inflation Protected Bond | | | N/A | | | | | | N/A | | | | | | N/A | | | | | | N/A | | | | | | N/A | | | | | | N/A | |
Flexible Income | | | N/A | | | | | | N/A | | | | | | N/A | | | | | | N/A | | | | | | N/A | | | | | $ | 28,255 | |
Real Assets | | | N/A | | | | | | N/A | | | | | | N/A | | | | | | N/A | | | | | | N/A | | | | | | 67,124 | |
Real Estate Securities | | | N/A | | | | | | N/A | | | | | | N/A | | | | | | N/A | | | | | | N/A | | | | | | N/A | |
Global Natural Resources Equity | | | N/A | | | | | | N/A | | | | | | N/A | | | | | | N/A | | | | | | N/A | | | | | | N/A | |
During the year ended December 31, 2013, GSCM recaptured the following amounts:
| | | | | | | | |
| | | GS2
Class | | | GS4
Class | |
MyDestination 2035 | | | N/A | | | $ | 70,071 | |
MyDestination 2045 | | | N/A | | | | 28,663 | |
Defensive Market Strategies | | | N/A | | | | 846 | |
Equity Index | | $ | 2,152 | | | | N/A | |
d. Brokerage Service Arrangements
The Adviser directs the sub-advisers to place a certain percentage of security trades (if feasible) with designated brokers who have agreed to pay certain custody, transfer agency or other operating expenses through the use of Brokerage Service Arrangements on behalf of the Funds shown below.
| | | | | |
Fund | | Expenses Paid
Through Brokerage
Service Arrangements |
Defensive Market Strategies | | | $ | 17,950 | |
Value Equity | | | | 86,296 | |
Growth Equity | | | | 81,045 | |
Small Cap Equity | | | | 68,008 | |
International Equity | | | | 71,257 | |
e. Administrator, Transfer Agent and Distributor
For its services as Administrator, BNY Mellon Investment Servicing (US) Inc. (“BNY Mellon”) is entitled to receive fees, computed daily and paid monthly, based upon the average daily net assets of each Fund. The fees, excluding out of pocket expenses, currently range between 0.004% and 0.02% of average daily net assets. For its services as Transfer Agent, BNY Mellon receives a fee based mainly upon the number of accounts serviced. Certain minimum fees and transaction charges may apply. For the year ended December 31, 2013, BNY Mellon received $2,848,233 in aggregate fees and expenses for services rendered under the various agreements described above.
Certain employees of BNY Mellon are officers of the Funds. BNY Mellon serves as Administrator and Transfer Agent of the Funds.
Foreside Funds Distributors LLC serves as the Underwriter and does not receive any fees in its capacity as Underwriter from GuideStone Funds. The fees are paid by GSCM.
306
f. Investments in Affiliates
The Date Target and Asset Allocation Funds and the Real Asset Fund do not invest in the underlying Select Funds for the purpose of exercising management or control; however, investments made by each Date Target and Asset Allocation Fund and the Real Asset Fund within each of its principal investment strategies may represent a significant portion of an underlying Select Fund’s net assets. At December 31, 2013, the Date Target and Asset Allocation Funds and the Real Asset Fund were the owner of record of the following approximate percentages of the total outstanding shares of the underlying Select Funds as detailed below:
| | | | | | | | | | | | | | | | | | | | | | | | | | | | | | | | | | | | | | | | | | | | | | | | | | | | | | | | |
Fund | | Low-
Duration
Bond | | | Medium-
Duration
Bond | | | Extended-
Duration
Bond | | | Global
Bond | | | Defen-
sive
Market
Strategies | | | Value
Equity | | | Growth
Equity | | | Small
Cap
Equity | | | Inter-
national
Equity | | | Emer-
ging
Markets
Equity | | | Inflation
Protected
Bond | | | Flexible
Income | | | Real
Estate
Securities | | | Global
Natural
Resources
Equity | |
MyDestination 2005 | | | 2.91 | % | | | 0.89 | % | | | — | | | | 0.64 | % | | | 1.98 | % | | | 0.28 | % | | | 0.28 | % | | | 0.17 | % | | | 0.35 | % | | | 0.51 | % | | | 3.61 | % | | | 3.78 | % | | | 0.35 | % | | | 0.63 | % |
MyDestination 2015 | | | 5.46 | | | | 4.90 | | | | 1.80 | % | | | 5.50 | | | | 16.34 | | | | 2.26 | | | | 2.31 | | | | 1.55 | | | | 2.90 | | | | 4.01 | | | | 15.49 | | | | 15.63 | | | | 3.71 | | | | 3.78 | |
MyDestination 2025 | | | 3.13 | | | | 4.98 | | | | 3.28 | | | | 10.21 | | | | 18.67 | | | | 3.96 | | | | 4.00 | | | | 2.96 | | | | 5.13 | | | | 7.28 | | | | 5.79 | | | | 4.77 | | | | 6.84 | | | | 6.24 | |
MyDestination 2035 | | | — | | | | 0.83 | | | | 2.10 | | | | 6.30 | | | | — | | | | 3.43 | | | | 3.44 | | | | 2.97 | | | | 4.55 | | | | 6.56 | | | | — | | | | — | | | | 4.06 | | | | 3.65 | |
MyDestination 2045 | | | — | | | | — | | | | 0.52 | | | | 3.16 | | | | — | | | | 2.69 | | | | 2.70 | | | | 2.53 | | | | 3.63 | | | | 5.23 | | | | — | | | | — | | | | 2.97 | | | | 2.65 | |
MyDestination 2055 | | | — | | | | — | | | | — | | | | 0.22 | | | | — | | | | 0.21 | | | | 0.21 | | | | 0.20 | | | | 0.28 | | | | 0.41 | | | | — | | | | — | | | | 0.23 | | | | 0.20 | |
Conservative Allocation | | | 19.81 | | | | — | | | | — | | | | — | | | | 4.98 | | | | 0.71 | | | | 0.72 | | | | 0.40 | | | | 0.87 | | | | 1.20 | | | | 13.53 | | | | 12.83 | | | | 1.46 | | | | 4.93 | |
Balanced Allocation | | | 16.53 | | | | 19.46 | | | | 12.87 | | | | 28.38 | | | | 21.41 | | | | 7.09 | | | | 7.26 | | | | 4.06 | | | | 8.84 | | | | 12.37 | | | | 26.39 | | | | 35.14 | | | | 14.34 | | | | 29.13 | |
Growth Allocation | | | 7.38 | | | | 8.69 | | | | 5.88 | | | | 12.79 | | | | — | | | | 10.48 | | | | 10.53 | | | | 5.88 | | | | 13.01 | | | | 18.18 | | | | — | | | | — | | | | 13.71 | | | | 21.76 | |
Aggressive Allocation | | | — | | | | — | | | | — | | | | — | | | | — | | | | 14.29 | | | | 14.58 | | | | 8.12 | | | | 17.82 | | | | 24.89 | | | | — | | | | — | | | | — | | | | — | |
Conservative Allocation I | | | 8.11 | | | | — | | | | — | | | | — | | | | 1.30 | | | | 0.40 | | | | 0.35 | | | | 0.18 | | | | 0.30 | | | | 0.31 | | | | 3.54 | | | | 3.36 | | | | 0.38 | | | | 1.29 | |
Balanced Allocation I | | | 7.79 | | | | 12.01 | | | | 13.32 | | | | 8.56 | | | | 6.45 | | | | 4.54 | | | | 4.13 | | | | 2.15 | | | | 3.52 | | | | 3.73 | | | | 7.96 | | | | 10.60 | | | | 4.32 | | | | 8.79 | |
Growth Allocation I | | | 3.24 | | | | 5.01 | | | | 5.67 | | | | 3.60 | | | | — | | | | 6.25 | | | | 5.59 | | | | 2.91 | | | | 4.83 | | | | 5.12 | | | | — | | | | — | | | | 3.86 | | | | 6.12 | |
Aggressive Allocation I | | | — | | | | — | | | | — | | | | — | | | | — | | | | 6.51 | | | | 5.91 | | | | 3.07 | | | | 5.06 | | | | 5.35 | | | | — | | | | — | | | | — | | | | — | |
Real Assets Fund | | | — | | | | — | | | | — | �� | | | — | | | | — | | | | — | | | | — | | | | — | | | | — | | | | — | | | | 3.27 | | | | 4.23 | | | | 1.77 | | | | 1.84 | |
A summary of the Fund of Fund’s total long-term and short-term purchases and sales of the shares of the underlying Select Funds during the year ended December 31, 2013 is as follows:
| | | | | | | | | | | | | | | | | | | | | | | | |
| | | Total Value
at
12/31/12 | | | Total Value
at
12/31/13 | | | Purchases | | | Sales Proceeds | | | Dividend
Income | | | Distributions
of Realized
Gains | |
MyDestination 2005 | | | | | | | | | | | | | | | | | | | | | | | | |
Money Market | | $ | 1,736,846 | | | $ | 1,750,776 | | | $ | 30,694,786 | | | $ | 30,680,856 | | | $ | 158 | | | $ | 68 | |
Low-Duration Bond | | | 23,178,698 | | | | 26,643,303 | | | | 5,624,702 | | | | 1,832,150 | | | | 260,352 | | | | 14,600 | |
Medium-Duration Bond | | | 12,957,406 | | | | 9,314,107 | | | | 996,436 | | | | 4,160,200 | | | | 186,734 | | | | 6,202 | |
Global Bond | | | — | | | | 2,303,743 | | | | 2,480,241 | | | | 196,500 | | | | 43,291 | | | | — | |
Defensive Market Strategies | | | 10,365,666 | | | | 9,615,183 | | | | 1,297,970 | | | | 2,915,800 | | | | 106,044 | | | | 774,276 | |
Value Equity | | | 5,379,933 | | | | 4,530,323 | | | | 491,478 | | | | 2,724,750 | | | | 76,911 | | | | 115,567 | |
Growth Equity | | | 5,320,915 | | | | 4,515,306 | | | | 994,719 | | | | 2,564,900 | | | | — | | | | 732,218 | |
Small Cap Equity | | | 1,348,977 | | | | 1,089,610 | | | | 292,627 | | | | 762,700 | | | | 2,637 | | | | 187,490 | |
International Equity | | | 6,685,711 | | | | 5,319,158 | | | | 921,415 | | | | 3,340,998 | | | | 72,565 | | | | — | |
Emerging Markets Equity | | | — | | | | 1,475,630 | | | | 1,515,748 | | | | 3,000 | | | | — | | | | — | |
Inflation Protected Bond | | | 11,644,573 | | | | 9,885,972 | | | | 2,429,174 | | | | 2,999,500 | | | | 91,064 | | | | 53,460 | |
Flexible Income | | | — | | | | 4,132,693 | | | | 4,352,306 | | | | 243,500 | | | | 39,271 | | | | 536 | |
Real Estate Securities | | | 1,696,755 | | | | 830,902 | | | | 174,360 | | | | 990,250 | | | | 22,176 | | | | 95,184 | |
Global Natural Resources Equity | | | — | | | | 1,650,400 | | | | 1,773,021 | | | | 44,500 | | | | 4,728 | | | | 15,093 | |
| | | | | | | | | | | | | | | | | | | | | | | | |
| | $ | 80,315,480 | | | $ | 83,057,106 | | | $ | 54,038,983 | | | $ | 53,459,604 | | | $ | 905,931 | | | $ | 1,994,694 | |
| | | | | | | | | | | | | | | | | | | | | | | | |
MyDestination 2015 | | | | | | | | | | | | | | | | | | | | | | | | |
Money Market | | $ | 4,696,654 | | | $ | 6,090,835 | | | $ | 69,511,229 | | | $ | 68,117,048 | | | $ | 667 | | | $ | 373 | |
Low-Duration Bond | | | 31,307,086 | | | | 49,961,846 | | | | 19,134,236 | | | | — | | | | 422,263 | | | | 20,474 | |
Medium-Duration Bond | | | 42,710,156 | | | | 51,248,345 | | | | 11,437,999 | | | | 1,048,850 | | | | 821,167 | | | | 21,582 | |
Extended-Duration Bond | | | 12,871,681 | | | | 7,125,395 | | | | 818,102 | | | | 5,142,250 | | | | 327,129 | | | | 290,972 | |
Global Bond | | | 14,129,910 | | | | 19,687,399 | | | | 5,961,932 | | | | — | | | | 538,782 | | | | — | |
Defensive Market Strategies | | | 67,882,208 | | | | 79,140,133 | | | | 9,265,625 | | | | 3,291,700 | | | | 820,953 | | | | 6,194,673 | |
Value Equity | | | 33,221,896 | | | | 36,830,884 | | | | 2,090,028 | | | | 7,868,050 | | | | 572,378 | | | | 917,651 | |
Growth Equity | | | 32,049,744 | | | | 37,360,474 | | | | 5,787,384 | | | | 5,026,850 | | | | — | | | | 5,787,384 | |
Small Cap Equity | | | 8,829,041 | | | | 9,878,392 | | | | 1,693,355 | | | | 2,010,800 | | | | 23,904 | | | | 1,669,450 | |
307
| | | | | | | | | | | | | | | | | | | | | | | | |
| | | Total Value
at
12/31/12 | | | Total Value
at
12/31/13 | | | Purchases | | | Sales Proceeds | | | Dividend
Income | | | Distributions
of Realized
Gains | |
International Equity | | $ | 42,074,716 | | | $ | 43,575,438 | | | $ | 6,051,365 | | | $ | 11,951,295 | | | $ | 594,465 | | | $ | — | |
Emerging Markets Equity | | | — | | | | 11,652,513 | | | | 11,951,295 | | | | — | | | | — | | | | — | |
Inflation Protected Bond | | | 43,670,168 | | | | 42,435,631 | | | | 15,958,278 | | | | 12,244,200 | | | | 371,111 | | | | 213,292 | |
Flexible Income | | | — | | | | 17,072,258 | | | | 16,973,418 | | | | — | | | | 151,085 | | | | 2,132 | |
Real Estate Securities | | | 18,965,722 | | | | 8,723,360 | | | | 1,600,150 | | | | 11,188,700 | | | | 262,665 | | | | 1,017,485 | |
Global Natural Resources Equity | | | — | | | | 9,862,035 | | | | 10,372,286 | | | | — | | | | 28,255 | | | | 85,481 | |
| | | | | | | | | | | | | | | | | | | | | | | | |
| | $ | 352,408,982 | | | $ | 430,644,938 | | | $ | 188,606,682 | | | $ | 127,889,743 | | | $ | 4,934,824 | | | $ | 16,220,949 | |
| | | | | | | | | | | | | | | | | | | | | | | | |
MyDestination 2025 | | | | | | | | | | | | | | | | | | | | | | | | |
Money Market | | $ | 5,298,470 | | | $ | 8,386,521 | | | $ | 101,627,650 | | | $ | 98,539,599 | | | $ | 787 | | | $ | 504 | |
Low-Duration Bond | | | 8,894,556 | | | | 28,603,451 | | | | 19,868,721 | | | | — | | | | 190,035 | | | | 6,236 | |
Medium-Duration Bond | | | 32,007,365 | | | | 52,073,121 | | | | 21,608,676 | | | | — | | | | 741,983 | | | | 16,543 | |
Extended-Duration Bond | | | 23,160,943 | | | | 13,006,251 | | | | 7,351,160 | | | | 14,634,450 | | | | 622,536 | | | | 533,124 | |
Global Bond | | | 23,945,093 | | | | 36,500,550 | | | | 13,382,490 | | | | — | | | | 986,340 | | | | — | |
Defensive Market Strategies | | | 61,891,535 | | | | 90,438,214 | | | | 26,550,681 | | | | 2,632,800 | | | | 893,627 | | | | 7,031,724 | |
Value Equity | | | 51,673,128 | | | | 64,490,884 | | | | 4,532,207 | | | | 6,772,250 | | | | 925,401 | | | | 1,606,806 | |
Growth Equity | | | 51,546,186 | | | | 64,816,050 | | | | 12,505,209 | | | | 6,548,350 | | | | — | | | | 9,996,209 | |
Small Cap Equity | | | 15,649,935 | | | | 18,870,550 | | | | 3,654,791 | | | | 2,785,200 | | | | 45,664 | | | | 3,189,127 | |
International Equity | | | 66,113,612 | | | | 77,069,778 | | | | 19,062,301 | | | | 20,872,019 | | | | 1,051,401 | | | | — | |
Emerging Markets Equity | | | — | | | | 21,153,075 | | | | 21,662,019 | | | | — | | | | — | | | | — | |
Inflation Protected Bond | | | 10,683,899 | | | | 15,858,641 | | | | 9,632,439 | | | | 3,027,250 | | | | 109,825 | | | | 55,664 | |
Flexible Income | | | — | | | | 5,209,362 | | | | 5,178,840 | | | | — | | | | 47,919 | | | | 670 | |
Real Estate Securities | | | 24,153,755 | | | | 16,051,144 | | | | 7,463,423 | | | | 14,110,900 | | | | 422,981 | | | | 1,835,442 | |
Global Natural Resources Equity | | | — | | | | 16,286,154 | | | | 17,090,796 | | | | — | | | | 46,661 | | | | 148,936 | |
| | | | | | | | | | | | | | | | | | | | | | | | |
| | $ | 375,018,477 | | | $ | 528,813,746 | | | $ | 291,171,403 | | | $ | 169,922,818 | | | $ | 6,085,160 | | | $ | 24,420,985 | |
| | | | | | | | | | | | | | | | | | | | | | | | |
MyDestination 2035 | | | | | | | | | | | | | | | | | | | | | | | | |
Money Market | | $ | 3,762,803 | | | $ | 5,601,401 | | | $ | 53,212,006 | | | $ | 51,373,408 | | | $ | 521 | | | $ | 323 | |
Medium-Duration Bond | | | 4,998,964 | | | | 8,713,362 | | | | 4,321,980 | | | | 337,500 | | | | 121,203 | | | | 2,777 | |
Extended-Duration Bond | | | 5,012,252 | | | | 8,332,236 | | | | 4,524,945 | | | | 340,850 | | | | 235,989 | | | | 289,205 | |
Global Bond | | | 12,856,753 | | | | 22,546,037 | | | | 10,162,797 | | | | — | | | | 574,547 | | | | — | |
Value Equity | | | 40,888,978 | | | | 55,746,522 | | | | 7,524,076 | | | | 5,104,750 | | | | 779,138 | | | | 1,388,938 | |
Growth Equity | | | 40,865,787 | | | | 55,765,221 | | | | 13,805,304 | | | | 4,788,850 | | | | — | | | | 8,577,024 | |
Small Cap Equity | | | 14,154,286 | | | | 18,951,646 | | | | 4,921,192 | | | | 2,226,800 | | | | 45,860 | | | | 3,202,832 | |
International Equity | | | 52,506,416 | | | | 68,380,341 | | | | 22,953,095 | | | | 17,957,922 | | | | 928,761 | | | | — | |
Emerging Markets Equity | | | — | | | | 19,050,818 | | | | 19,487,922 | | | | — | | | | — | | | | — | |
Real Estate Securities | | | 12,984,905 | | | | 9,539,390 | | | | 5,223,214 | | | | 7,743,850 | | | | 242,292 | | | | 1,066,922 | |
Global Natural Resources Equity | | | — | | | | 9,529,671 | | | | 9,991,601 | | | | — | | | | 27,303 | | | | 87,148 | |
| | | | | | | | | | | | | | | | | | | | | | | | |
| | $ | 188,031,144 | | | $ | 282,156,645 | | | $ | 156,128,132 | | | $ | 89,873,930 | | | $ | 2,955,614 | | | $ | 14,615,169 | |
| | | | | | | | | | | | | | | | | | | | | | | | |
MyDestination 2045 | | | | | | | | | | | | | | | | | | | | | | | | |
Money Market | | $ | 3,135,660 | | | $ | 4,335,152 | | | $ | 35,909,696 | | | $ | 34,710,204 | | | $ | 378 | | | $ | 227 | |
Extended-Duration Bond | | | 1,326,683 | | | | 2,049,390 | | | | 932,846 | | | | 1,650 | | | | 58,854 | | | | 71,742 | |
Global Bond | | | 6,632,689 | | | | 11,296,170 | | | | 4,931,793 | | | | — | | | | 293,192 | | | | — | |
Value Equity | | | 30,426,322 | | | | 43,786,511 | | | | 6,938,190 | | | | 3,032,850 | | | | 596,139 | | | | 1,084,050 | |
Growth Equity | | | 30,523,562 | | | | 43,675,710 | | | | 11,754,574 | | | | 2,978,850 | | | | — | | | | 6,703,224 | |
308
| | | | | | | | | | | | | | | | | | | | | | | | |
| | | Total Value
at
12/31/12 | | | Total Value
at
12/31/13 | | | Purchases | | | Sales Proceeds | | | Dividend
Income | | | Distributions
of Realized
Gains | |
Small Cap Equity | | $ | 11,391,795 | | | $ | 16,131,917 | | | $ | 4,369,834 | | | $ | 1,312,200 | | | $ | 39,037 | | | $ | 2,726,297 | |
International Equity | | | 39,397,456 | | | | 54,502,717 | | | | 21,002,956 | | | | 14,368,340 | | | | 738,756 | | | | — | |
Emerging Markets Equity | | | — | | | | 15,188,913 | | | | 15,528,340 | | | | — | | | | — | | | | — | |
Real Estate Securities | | | 11,954,159 | | | | 6,964,203 | | | | 4,503,900 | | | | 8,891,950 | | | | 199,750 | | | | 784,151 | |
Global Natural Resources Equity | | | — | | | | 6,900,755 | | | | 7,226,737 | | | | — | | | | 19,771 | | | | 62,166 | |
| | | | | | | | | | | | | | | | | | | | | | | | |
| | $ | 134,788,326 | | | $ | 204,831,438 | | | $ | 113,098,866 | | | $ | 65,296,044 | | | $ | 1,945,877 | | | $ | 11,431,857 | |
| | | | | | | | | | | | | | | | | | | | | | | | |
MyDestination 2055 | | | | | | | | | | | | | | | | | | | | | | | | |
Money Market | | $ | 140,843 | | | $ | 415,075 | | | $ | 7,620,872 | | | $ | 7,346,640 | | | $ | 26 | | | $ | 20 | |
Global Bond | | | 307,765 | | | | 789,543 | | | | 576,962 | | | | 79,000 | | | | 18,562 | | | | — | |
Value Equity | | | 1,424,338 | | | | 3,407,487 | | | | 1,793,223 | | | | 358,250 | | | | 39,745 | | | | 83,979 | |
Growth Equity | | | 1,423,806 | | | | 3,393,408 | | | | 2,138,417 | | | | 355,250 | | | | — | | | | 506,166 | |
Small Cap Equity | | | 540,926 | | | | 1,280,757 | | | | 830,497 | | | | 151,750 | | | | 3,085 | | | | 215,662 | |
International Equity | | | 1,840,197 | | | | 4,243,038 | | | | 3,237,384 | | | | 1,395,188 | | | | 57,884 | | | | — | |
Emerging Markets Equity | | | — | | | | 1,191,035 | | | | 1,215,188 | | | | — | | | | — | | | | — | |
Real Estate Securities | | | 619,147 | | | | 528,778 | | | | 663,723 | | | | 697,700 | | | | 14,522 | | | | 59,651 | |
Global Natural Resources Equity | | | — | | | | 532,392 | | | | 594,788 | | | | 37,500 | | | | 1,524 | | | | 4,864 | |
| | | | | | | | | | | | | | | | | | | | | | | | |
| | $ | 6,297,022 | | | $ | 15,781,513 | | | $ | 18,671,054 | | | $ | 10,421,278 | | | $ | 135,348 | | | $ | 870,342 | |
| | | | | | | | | | | | | | | | | | | | | | | | |
Conservative Allocation | | | | | | | | | | | | | | | | | | | | | | | | |
Money Market | | $ | 5,925,474 | | | $ | 4,124,830 | | | $ | 49,493,593 | | | $ | 51,294,237 | | | $ | 449 | | | $ | 207 | |
Low-Duration Bond | | | 191,140,214 | | | | 181,357,631 | | | | 4,439,518 | | | | 11,798,793 | | | | 1,876,973 | | | | 112,545 | |
Defensive Market Strategies | | | 24,043,313 | | | | 24,101,563 | | | | 2,152,190 | | | | 4,018,323 | | | | 257,594 | | | | 1,894,595 | |
Value Equity | | | 16,962,524 | | | | 11,615,696 | | | | 629,299 | | | | 9,978,549 | | | | 243,891 | | | | 289,408 | |
Growth Equity | | | 16,930,172 | | | | 11,586,568 | | | | 1,947,137 | | | | 9,551,129 | | | | — | | | | 1,897,137 | |
Small Cap Equity | | | 3,856,292 | | | | 2,552,633 | | | | 442,573 | | | | 2,401,484 | | | | 6,177 | | | | 431,396 | |
International Equity | | | 20,907,918 | | | | 12,999,842 | | | | 177,346 | | | | 10,661,652 | | | | 177,346 | | | | — | |
Emerging Markets Equity | | | — | | | | 3,476,288 | | | | 3,565,424 | | | | — | | | | — | | | | — | |
Inflation Protected Bond | | | 46,875,888 | | | | 37,061,722 | | | | 1,590,657 | | | | 6,852,494 | | | | 347,848 | | | | 202,809 | |
Flexible Income | | | | | | | 14,017,375 | | | | 14,072,592 | | | | 140,000 | | | | 131,689 | | | | 1,804 | |
Real Estate Securities | | | — | | | | 3,435,007 | | | | 4,018,714 | | | | — | | | | 41,365 | | | | 362,848 | |
Global Natural Resources Equity | | | — | | | | 12,847,970 | | | | 13,864,903 | | | | 332,000 | | | | 36,810 | | | | 117,494 | |
| | | | | | | | | | | | | | | | | | | | | | | | |
| | $ | 326,641,795 | | | $ | 319,177,125 | | | $ | 96,393,946 | | | $ | 107,028,661 | | | $ | 3,120,142 | | | $ | 5,310,243 | |
| | | | | | | | | | | | | | | | | | | | | | | | |
Balanced Allocation | | | | | | | | | | | | | | | | | | | | | | | | |
Money Market | | $ | 25,212,869 | | | $ | 28,394,843 | | | $ | 134,660,286 | | | $ | 131,478,312 | | | $ | 2,921 | | | $ | 1,339 | |
Low-Duration Bond | | | 171,847,392 | | | | 151,286,470 | | | | 4,131,424 | | | | 22,502,192 | | | | 1,631,368 | | | | 102,057 | |
Medium-Duration Bond | | | 248,047,517 | | | | 203,632,561 | | | | 9,984,863 | | | | 45,086,532 | | | | 3,769,108 | | | | 115,754 | |
Extended-Duration Bond | | | 100,515,605 | | | | 51,050,418 | | | | 11,918,316 | | | | 50,045,627 | | | | 2,534,789 | | | | 2,138,527 | |
Global Bond | | | 58,885,101 | | | | 101,512,097 | | | | 46,894,986 | | | | 2,931,866 | | | | 2,574,185 | | | | — | |
Defensive Market Strategies | | | 115,930,568 | | | | 103,700,222 | | | | 9,401,144 | | | | 31,250,639 | | | | 1,176,730 | | | | 8,224,413 | |
Value Equity | | | 141,390,538 | | | | 115,385,816 | | | | 5,033,188 | | | | 67,117,015 | | | | 2,158,322 | | | | 2,874,866 | |
Growth Equity | | | 139,533,578 | | | | 117,555,854 | | | | 20,162,778 | | | | 61,759,596 | | | | — | | | | 18,837,779 | |
Small Cap Equity | | | 32,695,791 | | | | 25,883,218 | | | | 4,436,903 | | | | 16,809,935 | | | | 62,634 | | | | 4,374,269 | |
International Equity | | | 169,629,188 | | | | 132,825,976 | | | | 1,812,039 | | | | 63,333,417 | | | | 1,812,039 | | | | — | |
Emerging Markets Equity | | | — | | | | 35,939,786 | | | | 36,861,319 | | | | — | | | | — | | | | — | |
Inflation Protected Bond | | | — | | | | 72,324,031 | | | | 74,610,176 | | | | 900,000 | | | | 250,176 | | | | — | |
309
| | | | | | | | | | | | | | | | | | | | | | | | |
| | | Total Value
at
12/31/12 | | | Total Value
at
12/31/13 | | | Purchases | | | Sales Proceeds | | | Dividend
Income | | | Distributions
of Realized
Gains | |
Flexible Income | | $ | — | | | $ | 38,381,452 | | | $ | 38,398,625 | | | $ | 250,000 | | | $ | 360,486 | | | $ | 4,939 | |
Real Estate Securities | | | — | | | | 33,665,678 | | | | 40,413,001 | | | | 1,900,000 | | | | 405,411 | | | | 3,556,190 | |
Global Natural Resources Equity | | | — | | | | 75,969,866 | | | | 80,229,296 | | | | 350,000 | | | | 217,658 | | | | 694,739 | |
| | | | | | | | | | | | | | | | | | | | | | | | |
| | $ | 1,203,688,147 | | | $ | 1,287,508,288 | | | $ | 518,948,344 | | | $ | 495,715,131 | | | $ | 16,955,827 | | | $ | 40,924,872 | |
| | | | | | | | | | | | | | | | | | | | | | | | |
Growth Allocation | | | | | | | | | | | | | | | | | | | | | | | | |
Money Market | | $ | 18,606,768 | | | $ | 19,336,501 | | | $ | 76,200,082 | | | $ | 75,470,349 | | | $ | 1,990 | | | $ | 933 | |
Low-Duration Bond | | | 59,249,861 | | | | 67,509,057 | | | | 10,162,921 | | | | 1,175,555 | | | | 632,157 | | | | 34,363 | |
Medium-Duration Bond | | | 86,256,786 | | | | 91,002,174 | | | | 9,642,556 | | | | 1,705,161 | | | | 1,494,767 | | | | 39,189 | |
Extended-Duration Bond | | | 35,063,972 | | | | 23,302,975 | | | | 7,263,483 | | | | 14,885,128 | | | | 985,209 | | | | 923,274 | |
Global Bond | | | 20,678,872 | | | | 45,723,874 | | | | 25,833,233 | | | | 411,863 | | | | 1,069,433 | | | | — | |
Value Equity | | | 184,200,559 | | | | 170,602,934 | | | | 7,462,242 | | | | 69,589,917 | | | | 2,911,628 | | | | 4,250,615 | |
Growth Equity | | | 181,742,369 | | | | 170,653,044 | | | | 26,989,581 | | | | 63,641,143 | | | | — | | | | 26,989,582 | |
Small Cap Equity | | | 42,282,215 | | | | 37,525,434 | | | | 6,432,612 | | | | 17,906,535 | | | | 90,806 | | | | 6,341,806 | |
International Equity | | | 224,959,845 | | | | 195,545,699 | | | | 4,429,774 | | | | 68,761,032 | | | | 2,667,674 | | | | — | |
Emerging Markets Equity | | | — | | | | 52,827,873 | | | | 54,182,434 | | | | — | | | | — | | | | — | |
Real Estate Securities | | | — | | | | 32,195,539 | | | | 36,918,103 | | | | — | | | | 387,707 | | | | 3,400,895 | |
Global Natural Resources Equity | | | — | | | | 56,743,574 | | | | 59,701,689 | | | | — | | | | 162,573 | | | | 518,916 | |
| | | | | | | | | | | | | | | | | | | | | | | | |
| | $ | 853,041,247 | | | $ | 962,968,678 | | | $ | 325,218,710 | | | $ | 313,546,683 | | | $ | 10,403,944 | | | $ | 42,499,573 | |
| | | | | | | | | | | | | | | | | | | | | | | | |
Aggressive Allocation | | | | | | | | | | | | | | | | | | | | | | | | |
Money Market | | $ | 14,287,922 | | | $ | 17,878,395 | | | $ | 46,839,870 | | | $ | 43,249,397 | | | $ | 1,607 | | | $ | 898 | |
Value Equity | | | 190,846,412 | | | | 232,579,031 | | | | 9,385,097 | | | | 22,509,390 | | | | 3,290,333 | | | | 5,794,764 | |
Growth Equity | | | 189,842,940 | | | | 236,169,182 | | | | 36,307,837 | | | | 16,713,262 | | | | — | | | | 36,307,837 | |
Small Cap Equity | | | 42,824,378 | | | | 51,819,192 | | | | 8,882,850 | | | | 6,290,108 | | | | 125,395 | | | | 8,757,456 | |
International Equity | | | 288,345,749 | | | | 267,705,065 | | | | 19,048,786 | | | | 86,653,015 | | | | 3,652,086 | | | | — | |
Emerging Markets Equity | | | — | | | | 72,347,121 | | | | 74,202,175 | | | | — | | | | — | | | | — | |
| | | | | | | | | | | | | | | | | | | | | | | | |
| | $ | 726,147,401 | | | $ | 878,497,986 | | | $ | 194,666,615 | | | $ | 175,415,172 | | | $ | 7,069,421 | | | $ | 50,860,955 | |
| | | | | | | | | | | | | | | | | | | | | | | | |
Conservative Allocation I | | | | | | | | | | | | | | | | | | | | | | | | |
Money Market | | $ | 1,257,792 | | | $ | 1,003,363 | | | $ | 12,773,381 | | | $ | 13,027,810 | | | $ | 478 | | | $ | 48 | |
Low-Duration Bond | | | 48,270,806 | | | | 47,501,174 | | | | 6,336,465 | | | | 6,130,000 | | | | 934,454 | | | | 47,118 | |
Defensive Market Strategies | | | 6,076,033 | | | | 6,313,658 | | | | 1,236,503 | | | | 1,503,000 | | | | 81,950 | | | | 495,030 | |
Value Equity | | | 4,287,962 | | | | 3,040,580 | | | | 604,245 | | | | 2,748,000 | | | | 147,950 | | | | 155,046 | |
Growth Equity | | | 4,277,949 | | | | 3,038,462 | | | | 1,115,616 | | | | 2,624,000 | | | | — | | | | 831,187 | |
Small Cap Equity | | | 974,717 | | | | 668,463 | | | | 255,036 | | | | 668,000 | | | | 5,418 | | | | 175,034 | |
International Equity | | | 5,286,140 | | | | 3,405,600 | | | | 504,699 | | | | 3,041,000 | | | | 72,171 | | | | — | |
Emerging Markets Equity | | | — | | | | 912,549 | | | | 940,000 | | | | 4,000 | | | | — | | | | — | |
Inflation Protected Bond | | | 11,841,975 | | | | 9,704,788 | | | | 1,545,089 | | | | 2,496,000 | | | | 91,063 | | | | 54,732 | |
Flexible Income | | | — | | | | 3,673,259 | | | | 3,735,028 | | | | 84,000 | | | | 34,555 | | | | 473 | |
Real Estate Securities | | | — | | | | 900,449 | | | | 1,057,960 | | | | 8,000 | | | | 10,843 | | | | 95,117 | |
Global Natural Resources Equity | | | — | | | | 3,364,729 | | | | 3,849,947 | | | | 304,000 | | | | 9,640 | | | | 30,807 | |
| | | | | | | | | | | | | | | | | | | | | | | | |
| | $ | 82,273,374 | | | $ | 83,527,074 | | | $ | 33,953,969 | | | $ | 32,637,810 | | | $ | 1,388,522 | | | $ | 1,884,592 | |
| | | | | | | | | | | | | | | | | | | | | | | | |
310
| | | | | | | | | | | | | | | | | | | | | | | | |
| | | Total Value
at
12/31/12 | | | Total Value
at
12/31/13 | | | Purchases | | | Sales Proceeds | | | Dividend
Income | | | Distributions
of Realized
Gains | |
Balanced Allocation I | | | | | | | | | | | | | | | | | | | | | | | | |
Money Market | | $ | 6,348,888 | | | $ | 7,009,585 | | | $ | 34,906,715 | | | $ | 34,246,017 | | | $ | 2,544 | | | $ | 285 | |
Low-Duration Bond | | | 49,353,157 | | | | 45,601,127 | | | | 4,466,200 | | | | 7,216,000 | | | | 923,849 | | | | 47,459 | |
Medium-Duration Bond | | | 71,271,324 | | | | 61,464,073 | | | | 8,492,141 | | | | 14,216,000 | | | | 2,502,215 | | | | 69,694 | |
Extended-Duration Bond | | | 28,885,176 | | | | 15,414,850 | | | | 8,199,588 | | | | 15,290,000 | | | | 2,452,370 | | | | 1,992,391 | |
Global Bond | | | 16,910,122 | | | | 30,621,300 | | | | 15,796,131 | | | | 1,680,000 | | | | 775,265 | | | | — | |
Defensive Market Strategies | | | 33,335,730 | | | | 31,292,866 | | | | 4,767,888 | | | | 9,624,000 | | | | 432,380 | | | | 2,482,169 | |
Value Equity | | | 40,609,639 | | | | 34,815,915 | | | | 5,630,957 | | | | 20,450,000 | | | | 1,519,925 | | | | 1,778,316 | |
Growth Equity | | | 40,072,993 | | | | 35,474,776 | | | | 12,205,732 | | | | 18,842,000 | | | | — | | | | 9,527,236 | |
Small Cap Equity | | | 9,389,671 | | | | 7,810,599 | | | | 2,592,068 | | | | 5,052,000 | | | | 63,311 | | | | 2,049,422 | |
International Equity | | | 48,756,549 | | | | 40,093,098 | | | | 3,936,951 | | | | 19,758,000 | | | | 849,653 | | | | — | |
Emerging Markets Equity | | | — | | | | 10,840,765 | | | | 11,148,000 | | | | 28,000 | | | | — | | | | — | |
Inflation Protected Bond | | | — | | | | 21,817,397 | | | | 22,811,116 | | | | 572,000 | | | | 75,116 | | | | — | |
Flexible Income | | | — | | | | 11,576,680 | | | | 11,666,327 | | | | 160,000 | | | | 108,834 | | | | 1,494 | |
Real Estate Securities | | | — | | | | 10,155,515 | | | | 12,297,614 | | | | 680,000 | | | | 122,295 | | | | 1,075,319 | |
Global Natural Resources Equity | | | — | | | | 22,917,798 | | | | 24,367,769 | | | | 260,000 | | | | 65,661 | | | | 210,109 | |
| | | | | | | | | | | | | | | | | | | | | | | | |
| | $ | 344,933,249 | | | $ | 386,906,344 | | | $ | 183,285,197 | | | $ | 148,074,017 | | | $ | 9,893,418 | | | $ | 19,233,894 | |
| | | | | | | | | | | | | | | | | | | | | | | | |
Growth Allocation I | | | | | | | | | | | | | | | | | | | | | | | | |
Money Market | | $ | 3,753,596 | | | $ | 5,114,024 | | | $ | 19,678,512 | | | $ | 18,318,084 | | | $ | 1,714 | �� | | $ | 236 | |
Low-Duration Bond | | | 15,083,811 | | | | 18,996,085 | | | | 4,985,398 | | | | 744,000 | | | | 334,887 | | | | 14,956 | |
Medium-Duration Bond | | | 21,982,444 | | | | 25,627,848 | | | | 6,075,566 | | | | 1,064,000 | | | | 925,337 | | | | 22,069 | |
Extended-Duration Bond | | | 8,929,444 | | | | 6,560,575 | | | | 3,983,236 | | | | 4,061,000 | | | | 889,990 | | | | 803,518 | |
Global Bond | | | 5,267,041 | | | | 12,867,895 | | | | 8,045,715 | | | | 336,000 | | | | 300,852 | | | | — | |
Value Equity | | | 46,889,255 | | | | 47,984,403 | | | | 9,259,894 | | | | 19,224,000 | | | | 1,924,856 | | | | 2,446,921 | |
Growth Equity | | | 46,283,021 | | | | 48,042,442 | | | | 17,300,332 | | | | 17,472,000 | | | | — | | | | 12,713,889 | |
Small Cap Equity | | | 10,770,610 | | | | 10,554,319 | | | | 3,872,686 | | | | 4,886,000 | | | | 85,551 | | | | 2,763,600 | |
International Equity | | | 57,287,210 | | | | 55,049,827 | | | | 8,533,214 | | | | 20,092,000 | | | | 1,166,615 | | | | — | |
Emerging Markets Equity | | | — | | | | 14,866,752 | | | | 15,272,000 | | | | 24,000 | | | | — | | | | — | |
Real Estate Securities | | | — | | | | 9,059,241 | | | | 10,502,044 | | | | 112,000 | | | | 109,094 | | | | 956,950 | |
Global Natural Resources Equity | | | — | | | | 15,970,817 | | | | 17,011,809 | | | | 208,000 | | | | 45,757 | | | | 146,052 | |
| | | | | | | | | | | | | | | | | | | | | | | | |
| | $ | 216,246,432 | | | $ | 270,694,228 | | | $ | 124,520,406 | | | $ | 86,541,084 | | | $ | 5,784,653 | | | $ | 19,868,191 | |
| | | | | | | | | | | | | | | | | | | | | | | | |
Aggressive Allocation I | | | | | | | | | | | | | | | | | | | | | | | | |
Money Market | | $ | 2,213,460 | | | $ | 3,618,856 | | | $ | 12,339,381 | | | $ | 10,933,985 | | | $ | 1,124 | | | $ | 164 | |
Value Equity | | | 37,636,761 | | | | 49,964,167 | | | | 7,393,834 | | | | 4,374,000 | | | | 1,668,667 | | | | 2,547,877 | |
Growth Equity | | | 37,455,347 | | | | 50,784,861 | | | | 16,258,605 | | | | 3,281,000 | | | | — | | | | 13,056,943 | |
Small Cap Equity | | | 8,456,203 | | | | 11,136,469 | | | | 3,746,511 | | | | 1,292,000 | | | | 90,270 | | | | 2,916,034 | |
International Equity | | | 56,916,582 | | | | 57,574,864 | | | | 9,839,966 | | | | 18,752,000 | | | | 1,220,126 | | | | — | |
Emerging Markets Equity | | | — | | | | 15,535,488 | | | | 15,940,000 | | | | 8,000 | | | | — | | | | — | |
| | | | | | | | | | | | | | | | | | | | | | | | |
| | $ | 142,678,353 | | | $ | 188,614,705 | | | $ | 65,518,297 | | | $ | 38,640,985 | | | $ | 2,980,187 | | | $ | 18,521,018 | |
| | | | | | | | | | | | | | | | | | | | | | | | |
311
| | | | | | | | | | | | | | | | | | | | | | | | |
| | | Total Value
at
12/31/12 | | | Total Value
at
12/31/13 | | | Purchases | | | Sales Proceeds | | | Dividend
Income | | | Distributions
of Realized
Gains | |
Real Assets | | | | | | | | | | | | | | | | | | | | | | | | |
Money Market | | $ | — | | | $ | 377,614 | | | $ | 10,952,049 | | | $ | 10,574,435 | | | $ | 23 | | | $ | 49 | |
Inflation Protected Bond | | | — | | | | 8,964,518 | | | | 9,118,549 | | | | — | | | | 18,549 | | | | — | |
Flexible Income | | | — | | | | 4,619,355 | | | | 4,596,325 | | | | — | | | | 37,050 | | | | 575 | |
Real Estate Securities | | | — | | | | 4,151,983 | | | | 4,693,262 | | | | — | | | | 49,156 | | | | 421,106 | |
Global Natural Resources Equity | | | — | | | | 4,788,101 | | | | 5,051,880 | | | | 31,000 | | | | 13,675 | | | | 43,605 | |
| | | | | | | | | | | | | | | | | | | | | | | | |
| | $ | — | | | $ | 22,901,571 | | | $ | 34,412,065 | | | $ | 10,605,435 | | | $ | 118,453 | | | $ | 465,335 | |
| | | | | | | | | | | | | | | | | | | | | | | | |
g. Transactions with Affiliates
Advisers to Investment Companies, including GuideStone Funds, are permitted under Rule 17a-7 of the 1940 Act to purchase or sell securities directly between affiliated clients. When affecting these “cross” transactions, Rule 17a-7 imposes restrictions on how the trades are processed and reported. The specified conditions within Rule 17a-7 are outlined in procedures established by or under the direction of the Board of Trustees. The procedures have been designed to provide assurance that any purchase or sale of securities by the Fund from or to another Fund complies with Rule 17a-7 under the 1940 act.
For the year ended December 31, 2013, the Funds engaged in the following security transactions with affiliates:
| | | | | | | | | | | | |
| | | Purchases | | | Sales
Proceeds | | | Net Realized
Loss
from Sales | |
Low-Duration Bond | | $ | 6,294,742 | | | $ | 15,882,115 | | | $ | (580,884 | ) |
Medium-Duration Bond | | | 66,487,806 | | | | 11,285,140 | | | | 805,490 | |
Extended-Duration Bond | | | — | | | | 25,977,424 | | | | 2,024,661 | |
Global Bond | | | 25,734,473 | | | | — | | | | — | |
International Equity | | | 117,817 | | | | 609,748 | | | | 105,733 | |
4. SECURITIES LENDING
Through an agreement with The Northern Trust Company (“Northern Trust”) (the Funds’ custodian) the Select Funds may lend portfolio securities to certain brokers, dealers and other financial institutions that pay the Select Funds a negotiated fee. The Select Funds receive cash or U.S. government securities as collateral against the loaned securities in an amount at least equal to the market value of the loaned securities. The Funds continue to own the loaned securities and the securities remain in the investment portfolio. However, in the event of default or bankruptcy by the other party to the agreement, realization and/or retention of the collateral may be subject to legal proceedings. Cash collateral has been invested in a short-term money market fund of Northern Trust, an affiliate of the Funds, which invests in securities that satisfy the quality requirements of Rule 2a-7 and have short maturities. At December 31, 2013, the market values of loaned securities and collateral received were as follows:
| | | | | | | | | | | | | | | | |
Fund | | Value of
Securities Loaned | | | Value of
Non-cash
Collateral | | | Value of
Cash
Collateral | | | Total
Value of
Collateral | |
Low-Duration Bond | | $ | 122,959,189 | | | $ | 45,588,420 | | | $ | 79,891,920 | | | $ | 125,480,340 | |
Medium-Duration Bond | | | 94,097,595 | | | | 7,577,754 | | | | 88,599,222 | | | | 96,176,976 | |
Extended-Duration Bond | | | 29,495,862 | | | | — | | | | 30,220,442 | | | | 30,220,442 | |
Global Bond | | | 71,220,818 | | �� | | 4,874,707 | | | | 68,161,728 | | | | 73,036,435 | |
Defensive Market Strategies | | | 82,427,706 | | | | 70,564 | | | | 84,172,289 | | | | 84,242,853 | |
Equity Index | | | 25,034,522 | | | | 220,952 | | | | 25,398,730 | | | | 25,619,682 | |
Value Equity | | | 107,204,960 | | | | 3,713 | | | | 109,412,405 | | | | 109,416,118 | |
Growth Equity | | | 154,845,403 | | | | 451,158 | | | | 156,992,176 | | | | 157,443,334 | |
Small Cap Equity | | | 152,100,244 | | | | 1,140,436 | | | | 154,309,256 | | | | 155,449,692 | |
International Equity | | | 66,487,987 | | | | 880,275 | | | | 68,447,083 | | | | 69,327,358 | |
Emerging Markets Equity | | | 24,687,797 | | | | 1,227,690 | | | | 24,260,022 | | | | 25,487,712 | |
312
| | | | | | | | | | | | | | | | |
Fund | | Value of
Securities Loaned | | | Value of
Non-cash
Collateral | | | Value of
Cash
Collateral | | | Total
Value of
Collateral | |
Real Estate Securities | | $ | 25,313,133 | | | $ | 1,273,935 | | | $ | 24,822,432 | | | $ | 26,096,367 | |
Global Natural Resources Equity | | | 68,203,448 | | | | 14,409,706 | | | | 55,648,353 | | | | 70,058,059 | |
Securities lending transactions are entered into by the Funds under a Securities Lending Authorization Agreement which permit the Funds, under certain circumstances including an event of default (such as bankruptcy or insolvency), to offset amounts payable by the Fund to the same counterparty against amounts to be received and create one single net payment due to or from the Fund.
At December 31, 2013, the securities loaned which are subject to an MA on a net payment basis are as follows:
| | | | | | | | | | | | | | | | |
Fund | | Value of
Securities Loaned | | | Fair Value of
Non-cash
Collateral | | | Cash
Collateral
(Pledged) | | | Net Amount(1) | |
Low-Duration Bond | | $ | 122,959,189 | | | $ | (45,588,420 | ) | | $ | (77,370,769 | ) | | $ | — | |
Medium-Duration Bond | | | 94,097,595 | | | | (7,577,754 | ) | | | (86,519,841 | ) | | | — | |
Extended-Duration Bond | | | 29,495,862 | | | | — | | | | (29,495,862 | ) | | | — | |
Global Bond | | | 71,220,818 | | | | (4,874,707 | ) | | | (66,346,111 | ) | | | — | |
Defensive Market Strategies | | | 82,427,706 | | | | (70,564 | ) | | | (82,357,142 | ) | | | — | |
Equity Index | | | 25,034,522 | | | | (220,952 | ) | | | (24,813,570 | ) | | | — | |
Value Equity | | | 107,204,960 | | | | (3,713 | ) | | | (107,201,247 | ) | | | — | |
Growth Equity | | | 154,845,403 | | | | (451,158 | ) | | | (154,394,245 | ) | | | — | |
Small Cap Equity | | | 152,100,244 | | | | (1,140,436 | ) | | | (150,959,808 | ) | | | — | |
International Equity | | | 66,487,987 | | | | (880,275 | ) | | | (65,607,712 | ) | | | — | |
Emerging Markets Equity | | | 24,687,797 | | | | (1,227,690 | ) | | | (23,460,107 | ) | | | — | |
Real Estate Securities | | | 25,313,133 | | | | (1,273,935 | ) | | | (24,039,198 | ) | | | — | |
Global Natural Resources Equity | | | 68,203,448 | | | | (14,409,706 | ) | | | (53,793,742 | ) | | | — | |
| (1) | Net amount represents the net amount receivable due from (payable to) the counterparty in the event of default. |
Additional information about master netting arrangements can be found in the Repurchase Agreements and Derivative Financial Instruments sections of the Notes to Financial Statements.
5. INVESTMENT TRANSACTIONS
For the year ended December 31, 2013, the cost of purchases and proceeds from sales and maturities for each Fund were as follows:
| | | | | | | | | | | | | | | | |
| | | Cost of Purchases and
Proceeds from Sales and Maturities
of Long-Term Securities
(other than U.S. Government Obligations) | | | Cost of Purchases and
Proceeds from Sales and Maturities
of Long-Term U.S. Government Obligations | |
| | | Purchases | | | Sale and Maturity
Proceeds | | | Purchases | | | Sale and Maturity
Proceeds | |
MyDestination 2005 | | $ | 22,166,098 | | | $ | 22,807,748 | | | $ | — | | | $ | — | |
MyDestination 2015 | | | 107,537,120 | | | | 59,772,695 | | | | — | | | | — | |
MyDestination 2025 | | | 174,997,599 | | | | 71,383,219 | | | | — | | | | — | |
MyDestination 2035 | | | 94,685,137 | | | | 38,500,522 | | | | — | | | | — | |
MyDestination 2045 | | | 70,635,940 | | | | 30,585,840 | | | | — | | | | — | |
MyDestination 2055 | | | 10,605,338 | | | | 3,113,638 | | | | — | | | | — | |
Conservative Allocation | | | 38,470,624 | | | | 55,734,424 | | | | — | | | | — | |
Balanced Allocation | | | 326,411,619 | | | | 364,236,819 | | | | — | | | | — | |
Growth Allocation | | | 196,118,034 | | | | 238,076,334 | | | | — | | | | — | |
Aggressive Allocation | | | 89,898,875 | | | | 132,165,775 | | | | — | | | | — | |
Conservative Allocation I | | | 17,908,000 | | | | 19,610,000 | | | | — | | | | — | |
Balanced Allocation I | | | 119,254,000 | | | | 113,828,000 | | | | — | | | | — | |
Growth Allocation I | | | 79,191,000 | | | | 68,223,000 | | | | — | | | | — | |
313
| | | | | | | | | | | | | | | | | | | | |
| | | Cost of Purchases and
Proceeds from Sales and Maturities
of Long-Term Securities
(other than U.S. Government Obligations) | | Cost of Purchases and
Proceeds from Sales and Maturities
of Long-Term U.S. Government Obligations |
| | Purchases | | Sale and Maturity
Proceeds | | Purchases | | Sale and Maturity
Proceeds |
Aggressive Allocation I | | | $ | 31,679,000 | | | | $ | 27,707,000 | | | | $ | — | | | | $ | — | |
Low-Duration Bond | | | | 1,077,735,671 | | | | | 1,107,524,826 | | | | | 493,268,186 | | | | | 445,197,317 | |
Medium-Duration Bond | | | | 2,613,155,380 | | | | | 2,698,250,501 | | | | | 751,611,824 | | | | | 677,954,311 | |
Extended-Duration Bond | | | | 83,042,657 | | | | | 215,883,160 | | | | | 46,798,956 | | | | | 63,968,007 | |
Global Bond | | | | 355,907,604 | | | | | 250,887,487 | | | | | 16,420,654 | | | | | 9,569,922 | |
Defensive Market Strategies | | | | 954,512,223 | | | | | 941,871,707 | | | | | — | | | | | — | |
Equity Index | | | | 34,547,326 | | | | | 12,896,133 | | | | | — | | | | | — | |
Value Equity | | | | 549,498,299 | | | | | 741,901,754 | | | | | — | | | | | — | |
Growth Equity | | | | 1,050,618,396 | | | | | 1,246,671,070 | | | | | — | | | | | — | |
Small Cap Equity | | | | 709,207,250 | | | | | 724,559,925 | | | | | 30,453,569 | | | | | 26,130,125 | |
International Equity | | | | 762,864,507 | | | | | 957,827,180 | | | | | — | | | | | — | |
Emerging Markets Equity | | | | 289,557,791 | | | | | 17,045,489 | | | | | — | | | | | — | |
Inflation Protected Bond | | | | 28,302,896 | | | | | 5,776,743 | | | | | 245,891,700 | | | | | 160,268,047 | |
Flexible Income | | | | 123,691,237 | | | | | 21,876,854 | | | | | — | | | | | — | |
Real Assets | | | | 27,647,900 | | | | | 98,500 | | | | | — | | | | | — | |
Real Estate Securities | | | | 408,745,662 | | | | | 360,826,460 | | | | | — | | | | | — | |
Global Natural Resources Equity | | | | 286,463,471 | | | | | 41,372,313 | | | | | — | | | | | — | |
Financial Futures Contracts
Investments as of December 31, 2013, included cash and securities that were valued and pledged as collateral to cover initial margin deposits. The market value of the open futures contracts is as follows:
| | | | | | | | | | | | | | | | |
Fund/Future Type | | Expiration Date | | Open Long
(Short) Contracts | | Notional
Market Value
of Contracts | | Counter-
party | | Net Unrealized Appreciation
(Depreciation) on Futures |
MyDestination 2005 Fund | | | | | | | | | | | | | | | | |
S&P 500® E-Mini | | 03/2014 | | 5 | | | $ | 460,275 | | | GSC | | | $ | 18,103 | |
| | | | | | | | | | | | | | | | |
MyDestination 2015 Fund | | | | | | | | | | | | | | | | |
10-Year U.S. Treasury Note | | 03/2014 | | 16 | | | $ | 1,968,750 | | | GSC | | | $ | (27,773 | ) |
MSCI EAFE Index E-Mini | | 03/2014 | | 11 | | | | 1,054,790 | | | GSC | | | | 51,109 | |
MSCI Emerging Markets E-Mini | | 03/2014 | | 7 | | | | 355,880 | | | GSC | | | | 8,330 | |
S&P 500® E-Mini | | 03/2014 | | 23 | | | | 2,117,265 | | | GSC | | | | 68,834 | |
| | | | | | | | | | | | | | | | |
| | | | | | | $ | 5,496,685 | | | | | | $ | 100,500 | |
| | | | | | | | | | | | | | | | |
MyDestination 2025 Fund | | | | | | | | | | | | | | | | |
10-Year U.S. Treasury Note | | 03/2014 | | 16 | | | $ | 1,968,750 | | | GSC | | | $ | (25,960 | ) |
MSCI EAFE Index E-Mini | | 03/2014 | | 19 | | | | 1,821,910 | | | GSC | | | | 81,654 | |
MSCI Emerging Markets E-Mini | | 03/2014 | | 9 | | | | 457,560 | | | GSC | | | | 10,105 | |
S&P 500® E-Mini | | 03/2014 | | 37 | | | | 3,406,035 | | | GSC | | | | 116,695 | |
| | | | | | | | | | | | | | | | |
| | | | | | | $ | 7,654,255 | | | | | | $ | 182,494 | |
| | | | | | | | | | | | | | | | |
MyDestination 2035 Fund | | | | | | | | | | | | | | | | |
10-Year U.S. Treasury Note | | 03/2014 | | 8 | | | $ | 984,375 | | | GSC | | | $ | (16,609 | ) |
MSCI EAFE Index E-Mini | | 03/2014 | | 16 | | | | 1,534,240 | | | GSC | | | | 67,858 | |
MSCI Emerging Markets E-Mini | | 03/2014 | | 8 | | | | 406,720 | | | GSC | | | | 9,520 | |
S&P 500® E-Mini | | 03/2014 | | 31 | | | | 2,853,705 | | | GSC | | | | 99,461 | |
| | | | | | | | | | | | | | | | |
| | | | | | | $ | 5,779,040 | | | | | | $ | 160,230 | |
| | | | | | | | | | | | | | | | |
314
| | | | | | | | | | | | | | | | |
Fund/Future Type | | Expiration Date | | Open Long
(Short) Contracts | | Notional
Market Value
of Contracts | | Counter-
party | | Net Unrealized Appreciation
(Depreciation) on Futures |
MyDestination 2045 Fund | | | | | | | | | | | | | | | | |
10-Year U.S. Treasury Note | | 03/2014 | | 2 | | | $ | 246,094 | | | GSC | | | $ | (4,547 | ) |
MSCI EAFE Index E-Mini | | 03/2014 | | 13 | | | | 1,246,570 | | | GSC | | | | 61,351 | |
MSCI Emerging Markets E-Mini | | 03/2014 | | 7 | | | | 355,880 | | | GSC | | | | 8,330 | |
S&P 500® E-Mini | | 03/2014 | | 25 | | | | 2,301,375 | | | GSC | | | | 64,388 | |
| | | | | | | | | | | | | | | | |
| | | | | | | $ | 4,149,919 | | | | | | $ | 129,522 | |
| | | | | | | | | | | | | | | | |
MyDestination 2055 Fund | | | | | | | | | | | | | | | | |
S&P 500® E-Mini | | 03/2014 | | 3 | | | $ | 276,165 | | | GSC | | | $ | 10,862 | |
| | | | | | | | | | | | | | | | |
Conservative Allocation Fund | | | | | | | | | | | | | | | | |
2-Year U.S. Treasury Note | | 03/2014 | | 10 | | | $ | 2,198,125 | | | GSC | | | $ | (3,780 | ) |
MSCI EAFE Index E-Mini | | 03/2014 | | 4 | | | | 383,560 | | | GSC | | | | 19,057 | |
MSCI Emerging Markets E-Mini | | 03/2014 | | 1 | | | | 50,840 | | | GSC | | | | 1,190 | |
S&P 500® E-Mini | | 03/2014 | | 6 | | | | 552,330 | | | GSC | | | | 21,724 | |
| | | | | | | | | | | | | | | | |
| | | | | | | $ | 3,184,855 | | | | | | $ | 38,191 | |
| | | | | | | | | | | | | | | | |
Balanced Allocation Fund | | | | | | | | | | | | | | | | |
10-Year U.S. Treasury Note | | 03/2014 | | 27 | | | $ | 3,322,266 | | | GSC | | | $ | (61,381 | ) |
5-Year U.S. Treasury Note | | 03/2014 | | 47 | | | | 5,607,688 | | | GSC | | | | (71,233 | ) |
Long U.S. Treasury Bond | | 03/2014 | | 21 | | | | 2,694,562 | | | GSC | | | | (44,953 | ) |
MSCI EAFE Index E-Mini | | 03/2014 | | 46 | | | | 4,410,940 | | | GSC | | | | 218,674 | |
MSCI Emerging Markets E-Mini | | 03/2014 | | 22 | | | | 1,118,480 | | | GSC | | | | 26,180 | |
S&P 500® E-Mini | | 03/2014 | | 90 | | | | 8,284,950 | | | GSC | | | | 325,856 | |
| | | | | | | | | | | | | | | | |
| | | | | | | $ | 25,438,886 | | | | | | $ | 393,143 | |
| | | | | | | | | | | | | | | | |
Growth Allocation Fund | | | | | | | | | | | | | | | | |
10-Year U.S. Treasury Note | | 03/2014 | | 10 | | | $ | 1,230,469 | | | GSC | | | $ | (22,734 | ) |
5-Year U.S. Treasury Note | | 03/2014 | | 13 | | | | 1,551,062 | | | GSC | | | | (19,703 | ) |
Long U.S. Treasury Bond | | 03/2014 | | 8 | | | | 1,026,500 | | | GSC | | | | (17,125 | ) |
MSCI EAFE Index E-Mini | | 03/2014 | | 51 | | | | 4,890,390 | | | GSC | | | | 242,443 | |
MSCI Emerging Markets E-Mini | | 03/2014 | | 24 | | | | 1,220,160 | | | GSC | | | | 28,560 | |
S&P 500® E-Mini | | 03/2014 | | 95 | | | | 8,745,225 | | | GSC | | | | 343,960 | |
| | | | | | | | | | | | | | | | |
| | | | | | | $ | 18,663,806 | | | | | | $ | 555,401 | |
| | | | | | | | | | | | | | | | |
Aggressive Allocation Fund | | | | | | | | | | | | | | | | |
MSCI EAFE Index E-Mini | | 03/2014 | | 62 | | | $ | 5,945,180 | | | GSC | | | $ | 294,735 | |
MSCI Emerging Markets E-Mini | | 03/2014 | | 29 | | | | 1,474,360 | | | GSC | | | | 34,510 | |
S&P 500® E-Mini | | 03/2014 | | 118 | | | | 10,862,490 | | | GSC | | | | 426,809 | |
| | | | | | | | | | | | | | | | |
| | | | | | | $ | 18,282,030 | | | | | | $ | 756,054 | |
| | | | | | | | | | | | | | | | |
Conservative Allocation Fund I | | | | | | | | | | | | | | | | |
S&P 500® E-Mini | | 03/2014 | | 2 | | | $ | 184,110 | | | GSC | | | $ | 7,241 | |
| | | | | | | | | | | | | | | | |
Balanced Allocation Fund I | | | | | | | | | | | | | | | | |
10-Year U.S. Treasury Note | | 03/2014 | | 6 | | | $ | 738,281 | | | GSC | | | $ | (13,640 | ) |
5-Year U.S. Treasury Note | | 03/2014 | | 10 | | | | 1,193,125 | | | GSC | | | | (12,734 | ) |
Long U.S. Treasury Bond | | 03/2014 | | 6 | | | | 769,875 | | | GSC | | | | (12,547 | ) |
MSCI EAFE Index E-Mini | | 03/2014 | | 11 | | | | 1,054,790 | | | GSC | | | | 52,292 | |
MSCI Emerging Markets E-Mini | | 03/2014 | | 5 | | | | 254,200 | | | GSC | | | | 5,950 | |
S&P 500® E-Mini | | 03/2014 | | 24 | | | | 2,209,320 | | | GSC | | | | 73,376 | |
| | | | | | | | | | | | | | | | |
| | | | | | | $ | 6,219,591 | | | | | | $ | 92,697 | |
| | | | | | | | | | | | | | | | |
315
| | | | | | | | | | | | | | | | | | | | | | |
Fund/Future Type | | Expiration Date | | Open Long
(Short) Contracts | | Notional
Market Value
of Contracts | | Counter-
party | | Net Unrealized Appreciation
(Depreciation) on Futures |
Growth Allocation Fund I | | | | | | | | | | | | | | | | | | | | | | |
10-Year U.S. Treasury Note | | 03/2014 | | | | 2 | | | | $ | 246,094 | | | | | GSC | | | | $ | (4,547 | ) |
5-Year U.S. Treasury Note | | 03/2014 | | | | 5 | | | | | 596,562 | | | | | GSC | | | | | (7,578 | ) |
Long U.S. Treasury Bond | | 03/2014 | | | | 2 | | | | | 256,625 | | | | | GSC | | | | | (4,281 | ) |
MSCI EAFE Index E-Mini | | 03/2014 | | | | 13 | | | | | 1,246,570 | | | | | GSC | | | | | 61,799 | |
MSCI Emerging Markets E-Mini | | 03/2014 | | | | 4 | | | | | 203,360 | | | | | GSC | | | | | 4,760 | |
S&P 500® E-Mini | | 03/2014 | | | | 25 | | | | | 2,301,375 | | | | | GSC | | | | | 90,426 | |
| | | | | | | | | | | | | | | | | | | | | | |
| | | | | | | | | | $ | 4,850,586 | | | | | | | | | $ | 140,579 | |
| | | | | | | | | | | | | | | | | | | | | | |
Aggressive Allocation Fund I | | | | | | | | | | | | | | | | | | | | | | |
MSCI EAFE Index E-Mini | | 03/2014 | | | | 11 | | | | $ | 1,054,790 | | | | | GSC | | | | $ | 52,292 | |
MSCI Emerging Markets E-Mini | | 03/2014 | | | | 7 | | | | | 355,880 | | | | | GSC | | | | | 7,175 | |
S&P 500® E-Mini | | 03/2014 | | | | 25 | | | | | 2,301,375 | | | | | GSC | | | | | 80,381 | |
| | | | | | | | | | | | | | | | | | | | | | |
| | | | | | | | | | $ | 3,712,045 | | | | | | | | | $ | 139,848 | |
| | | | | | | | | | | | | | | | | | | | | | |
Low-Duration Bond Fund | | | | | | | | | | | | | | | | | | | | | | |
90-Day Euro | | 03/2014 | | | | 45 | | | | $ | 11,089,125 | | | | | CITI | | | | $ | (16,952 | ) |
5-Year U.S. Treasury Note | | 03/2014 | | | | 290 | | | | | 29,099,688 | | | | | CITI | | | | | (337,553 | ) |
10-Year U.S. Treasury Note | | 03/2014 | | | | (5 | ) | | | | (615,234 | ) | | | | CITI | | | | | 11,323 | |
10-Year U.S. Treasury Note | | 03/2014 | | | | (6 | ) | | | | (738,281 | ) | | | | GSC | | | | | 8,820 | |
10-Year U.S. Treasury Note | | 03/2014 | | | | (149 | ) | | | | (18,333,984 | ) | | | | UBS | | | | | 335,118 | |
2-Year U.S. Treasury Note | | 03/2014 | | | | 281 | | | | | 61,767,312 | | | | | CITI | | | | | (107,106 | ) |
2-Year U.S. Treasury Note | | 03/2014 | | | | 85 | | | | | 18,684,062 | | | | | JPM | | | | | (34,830 | ) |
2-Year U.S. Treasury Note | | 03/2014 | | | | 20 | | | | | 4,396,250 | | | | | UBS | | | | | (22 | ) |
2-Year U.S. Treasury Note | | 03/2014 | | | | 19 | | | | | 4,176,437 | | | | | CS | | | | | (7,630 | ) |
5-Year U.S. Treasury Note | | 03/2014 | | | | 9 | | | | | 1,073,812 | | | | | CITI | | | | | (13,653 | ) |
5-Year U.S. Treasury Note | | 03/2014 | | | | (57 | ) | | | | (6,800,812 | ) | | | | CITI | | | | | 85,726 | |
5-Year U.S. Treasury Note | | 03/2014 | | | | (109 | ) | | | | (5,369,062 | ) | | | | GSC | | | | | 45,842 | |
5-Year U.S. Treasury Note | | 03/2014 | | | | (142 | ) | | | | (16,942,375 | ) | | | | JPM | | | | | 196,252 | |
5-Year U.S. Treasury Note | | 03/2014 | | | | (210 | ) | | | | (25,055,625 | ) | | | | UBS | | | | | 315,466 | |
90-Day Euro | | 06/2014 | | | | 45 | | | | | 11,053,688 | | | | | CITI | | | | | (45,545 | ) |
90-Day Euro | | 06/2014 | | | | (1 | ) | | | | (249,213 | ) | | | | CITI | | | | | (2,540 | ) |
90-Day Euro | | 09/2014 | | | | (1 | ) | | | | (249,088 | ) | | | | CITI | | | | | (2,928 | ) |
Euro-OAT | | 12/2014 | | | | (9 | ) | | | | (1,627,404 | ) | | | | CITI | | | | | 22,400 | |
90-Day Euro | | 12/2014 | | | | 1 | | | | | 248,925 | | | | | CITI | | | | | 1,610 | |
90-Day Euro | | 03/2015 | | | | 109 | | | | | 27,105,575 | | | | | CITI | | | | | (24,027 | ) |
90-Day Euro | | 06/2015 | | | | 159 | | | | | 39,481,687 | | | | | CITI | | | | | (40,424 | ) |
| | | | | | | | | | | | | | | | | | | | | | |
| | | | | | | | | | $ | 132,195,483 | | | | | | | | | $ | 389,347 | |
| | | | | | | | | | | | | | | | | | | | | | |
Medium-Duration Bond Fund | | | | | | | | | | | | | | | | | | | | | | |
90-Day Euro | | 03/2014 | | | | 45 | | | | $ | 11,089,125 | | | | | BAR | | | | $ | (16,952 | ) |
90-Day Euro | | 03/2014 | | | | 224 | | | | | 55,703,200 | | | | | DEUT | | | | | (53,564 | ) |
10-Year U.S. Treasury Note | | 03/2014 | | | | (4 | ) | | | | (492,188 | ) | | | | BAR | | | | | 9,393 | |
10-Year U.S. Treasury Note | | 03/2014 | | | | (16 | ) | | | | (738,281 | ) | | | | GSC | | | | | 2,449 | |
10-Year U.S. Treasury Note | | 03/2014 | | | | (18 | ) | | | | (2,214,844 | ) | | | | JPM | | | | | 30,486 | |
10-Year U.S. Treasury Note | | 03/2014 | | | | (194 | ) | | | | (23,871,094 | ) | | | | CITI | | | | | 280,270 | |
2-Year U.S. Treasury Note | | 03/2014 | | | | 110 | | | | | 24,179,375 | | | | | CITI | | | | | (49,243 | ) |
2-Year U.S. Treasury Note | | 03/2014 | | | | (7 | ) | | | | (1,538,688 | ) | | | | GSC | | | | | 3,100 | |
5-Year U.S. Treasury Note | | 03/2014 | | | | 147 | | | | | 17,538,938 | | | | | CITI | | | | | (220,916 | ) |
5-Year U.S. Treasury Note | | 03/2014 | | | | (18) | | | | | (2,147,625 | ) | | | | GSC | | | | | 27,035 | |
Long U.S. Treasury Bond | | 03/2014 | | | | 8 | | | | | 1,026,500 | | | | | GSC | | | | | (6,838 | ) |
Long U.S. Treasury Bond | | 03/2014 | | | | (36 | ) | | | | (4,619,250 | ) | | | | CITI | | | | | 79,928 | |
316
| | | | | | | | | | | | | | | | | | | | | | | | | |
Fund/Future Type | | Expiration Date | | Open Long
(Short) Contracts | | Notional
Market Value
of Contracts | | Counter-
party | | Net Unrealized Appreciation
(Depreciation) on Futures |
Ultra Long U.S. Treasury Bond | | | | 03/2014 | | | | | 113 | | | | $ | 15,396,250 | | | | | CITI | | | | $ | (275,739 | ) |
Ultra Long U.S. Treasury Bond | | | | 03/2014 | | | | | 3 | | | | | 408,750 | | | | | GSC | | | | | (5,447 | ) |
90-Day Euro | | | | 06/2014 | | | | | 45 | | | | | 11,053,688 | | | | | CITI | | | | | (45,545 | ) |
90-Day Euro | | | | 06/2014 | | | | | 191 | | | | | 47,427,688 | | | | | DEUT | | | | | (54,899 | ) |
90-Day Euro | | | | 06/2014 | | | | | (40 | ) | | | | (9,825,500 | ) | | | | CITI | | | | | 24,415 | |
Euro-OAT | | | | 12/2014 | | | | | (11 | ) | | | | (1,989,049 | ) | | | | DEUT | | | | | 27,377 | |
90-Day Euro | | | | 03/2015 | | | | | 51 | | | | | 12,682,425 | | | | | GSC | | | | | (5,978 | ) |
90-Day Euro | | | | 12/2015 | | | | | (51 | ) | | | | (12,606,563 | ) | | | | GSC | | | | | 13,547 | |
90-Day Euro | | | | 12/2015 | | | | | (80 | ) | | | | (19,775,000 | ) | | | | CITI | | | | | 49,820 | |
90-Day Euro | | | | 03/2016 | | | | | (40 | ) | | | | (9,857,000 | ) | | | | CITI | | | | | 19,002 | |
| | | | | | | | | | | | | | | | | | | | | | | | | |
| | | | | | | | | | | | | $ | 106,830,857 | | | | | | | | | $ | (168,299 | ) |
| | | | | | | | | | | | | | | | | | | | | | | | | |
Global Bond Fund | | | | | | | | | | | | | | | | | | | | | | | | | |
10-Year U.S. Treasury Note | | | | 03/2014 | | | | | (34 | ) | | | $ | (4,183,594 | ) | | | | GSC | | | | $ | 71,530 | |
Long Gilt | | | | 03/2014 | | | | | 15 | | | | | 2,646,884 | | | | | GSC | | | | | (62,381 | ) |
| | | | | | | | | | | | | | | | | | | | | | | | | |
| | | | | | | | | | | | | $ | (1,536,710 | ) | | | | | | | | $ | 9,149 | |
| | | | | | | | | | | | | | | | | | | | | | | | | |
Defensive Market Strategies Fund | | | | | | | | | | | | | | | | | | | | | | | | | |
S&P 500® E-Mini | | | | 03/2014 | | | | | 241 | | | | $ | 22,185,255 | | | | | GSC | | | | $ | 840,099 | |
| | | | | | | | | | | | | | | | | | | | | | | | | |
Equity Index Fund | | | | | | | | | | | | | | | | | | | | | | | | | |
S&P 500® E-Mini | | | | 03/2014 | | | | | 140 | | | | $ | 12,887,700 | | | | | GSC | | | | $ | 428,001 | |
| | | | | | | | | | | | | | | | | | | | | | | | | |
Value Equity Fund | | | | | | | | | | | | | | | | | | | | | | | | | |
S&P 500® E-Mini | | | | 03/2014 | | | | | 541 | | | | $ | 49,801,755 | | | | | GSC | | | | $ | 1,791,093 | |
| | | | | | | | | | | | | | | | | | | | | | | | | |
Growth Equity Fund | | | | | | | | | | | | | | | | | | | | | | | | | |
S&P 500® E-Mini | | | | 03/2014 | | | | | 688 | | | | $ | 63,333,840 | | | | | GSC | | | | $ | 2,352,173 | |
| | | | | | | | | | | | | | | | | | | | | | | | | |
| | | | | |
Small Cap Equity Fund | | | | | | | | | | | | | | | | | | | | | | | | | |
10-Year U.S. Treasury Note | | | | 03/2014 | | | | | (68 | ) | | | $ | (8,367,187 | ) | | | | GSC | | | | $ | 125,373 | |
2-Year U.S. Treasury Note | | | | 03/2014 | | | | | (47 | ) | | | | (10,331,188 | ) | | | | GSC | | | | | 17,785 | |
5-Year U.S. Treasury Note | | | | 03/2014 | | | | | 24 | | | | | 2,863,500 | | | | | GSC | | | | | (8,305 | ) |
90-Day Euro | | | | 03/2014 | | | | | (3 | ) | | | | (747,938 | ) | | | | GSC | | | | | 140 | |
Long U.S. Treasury Bond | | | | 03/2014 | | | | | (16 | ) | | | | (2,053,000 | ) | | | | GSC | | | | | 22,237 | |
Russell 2000® IMM-Mini | | | | 03/2014 | | | | | 678 | | | | | 78,742,920 | | | | | GSC | | | | | 4,155,112 | |
Ultra Long U.S. Treasury Bond | | | | 03/2014 | | | | | (19 | ) | | | | (2,588,750 | ) | | | | GSC | | | | | 48,126 | |
90-Day Euro | | | | 09/2014 | | | | | (3 | ) | | | | (747,262 | ) | | | | GSC | | | | | (1,435 | ) |
90-Day Euro | | | | 12/2014 | | | | | 8 | | | | | 1,991,400 | | | | | GSC | | | | | 162 | |
90-Day Euro | | | | 12/2015 | | | | | (10 | ) | | | | (2,471,875 | ) | | | | GSC | | | | | 2,592 | |
| | | | | | | | | | | | | | | | | | | | | | | | | |
| | | | | | | | | | | | | $ | 56,290,620 | | | | | | | | | $ | 4,361,787 | |
| | | | | | | | | | | | | | | | | | | | | | | | | |
| | | | | |
International Equity Fund | | | | | | | | | | | | | | | | | | | | | | | | | |
AEX Index | | | | 01/2014 | | | | | (7 | ) | | | $ | (774,921 | ) | | | | BAR | | | | $ | (41,302 | ) |
Hang Seng Index | | | | 01/2014 | | | | | 66 | | | | | 9,929,833 | | | | | BAR | | | | | 179,991 | |
IBEX 35 | | | | 01/2014 | | | | | 12 | | | | | 1,629,286 | | | | | BAR | | | | | 91,208 | |
MSCI Singapore Index | | | | 01/2014 | | | | | 4 | | | | | 231,515 | | | | | BAR | | | | | 5,467 | |
OMX 30 Index | | | | 01/2014 | | | | | (279 | ) | | | | (5,790,947 | ) | | | | BAR | | | | | (290,818 | ) |
DAX Index | | | | 03/2014 | | | | | 24 | | | | | 7,928,601 | | | | | BAR | | | | | 369,930 | |
FTSE 100 Index® | | | | 03/2014 | | | | | 73 | | | | | 8,096,268 | | | | | BAR | | | | | 309,669 | |
MSCI EAFE Index E-Mini | | | | 03/2014 | | | | | 638 | | | | | 61,177,820 | | | | | GSC | | | | | 2,937,570 | |
S&P/TSE 60 Index | | | | 03/2014 | | | | | (87 | ) | | | | (12,791,396 | ) | | | | BAR | | | | | (501,470 | ) |
SPI 200 Index | | | | 03/2014 | | | | | (82 | ) | | | | (9,734,274 | ) | | | | BAR | | | | | (446,788 | ) |
TOPIX Index® | | | | 03/2014 | | | | | 229 | | | | | 28,323,284 | | | | | BAR | | | | | 1,052,805 | |
CAC40 Index | | | | 01/2020 | | | | | 99 | | | | | 5,854,334 | | | | | BAR | | | | | 285,954 | |
317
| | | | | | | | | | | | | | | | | | | | | | | | | |
Fund/Future Type | | Expiration Date | | Open Long
(Short) Contracts | | Notional
Market Value
of Contracts | | Counter-
party | | Net Unrealized Appreciation
(Depreciation) on Futures |
Swiss Market Index Future | | | | 03/2014 | | | | | (99 | ) | | | $ | (8,717,149 | ) | | | | JPM | | | | $ | (328,572 | ) |
| | | | | | | | | | | | | | | | | | | | | | | | | |
| | | | | | | | | | | | | $ | 85,362,254 | | | | | | | | | $ | 3,623,644 | |
| | | | | | | | | | | | | | | | | | | | | | | | | |
Emerging Markets Equity Fund | | | | | | | | | | | | | | | | | | | | | | | | | |
MSCI Taiwan Index | | | | 01/2014 | | | | | 36 | | | | $ | 1,091,520 | | | | | BAR | | | | $ | 22,653 | |
HSCEI Index | | | | 01/2014 | | | | | 16 | | | | | 1,117,625 | | | | | BAR | | | | | 20,285 | |
FBM KLCI Index | | | | 01/2014 | | | | | (22 | ) | | | | (626,988 | ) | | | | BAR | | | | | (9,218 | ) |
MSCI Singapore Index | | | | 01/2014 | | | | | 10 | | | | | 578,787 | | | | | BAR | | | | | 13,868 | |
BIST 30 Index | | | | 02/2014 | | | | | 11 | | | | | 42,306 | | | | | JPM | | | | | 2,629 | |
KOSPI 200 Index | | | | 03/2014 | | | | | (45 | ) | | | | (5,663,642 | ) | | | | BAR | | | | | (85,983 | ) |
FTSE/JSE Africa Top40 Tradeable Index | | | | 03/2014 | | | | | 117 | | | | | 4,651,001 | | | | | BAR | | | | | 260,972 | |
MEXBOL Index | | | | 03/2014 | | | | | (36 | ) | | | | (1,184,072 | ) | | | | JPM | | | | | (23,603 | ) |
MSCI Emerging Markets E-Mini | | | | 03/2014 | | | | | 463 | | | | | 23,538,920 | | | | | GSC | | | | | 548,090 | |
SET50 Index | | | | 03/2014 | | | | | (32 | ) | | | | (849,471 | ) | | | | BAR | | | | | 30,386 | |
MSCI Taiwan Index | | | | 01/2014 | | | | | 14 | | | | | 424,480 | | | | | GSC | | | | | 9,916 | |
HSCEI Index | | | | 01/2014 | | | | | 39 | | | | | 2,724,211 | | | | | GSC | | | | | 56,572 | |
TA-25 Index | | | | 01/2014 | | | | | 31 | | | | | 1,186,955 | | | | | GSC | | | | | 2,258 | |
Bovespa Index | | | | 02/2014 | | | | | 250 | | | | | 5,488,078 | | | | | GSC | | | | | 110,572 | |
RTS Index | | | | 03/2014 | | | | | (334 | ) | | | | (964,792 | ) | | | | GSC | | | | | (35,270 | ) |
WIG20 Index | | | | 03/2014 | | | | | (106 | ) | | | | (849,109 | ) | | | | GSC | | | | | 10,512 | |
| | | | | | | | | | | | | | | | | | | | | | | | | |
| | | | | | | | | | | | | $ | 30,705,809 | | | | | | | | | $ | 934,639 | |
| | | | | | | | | | | | | | | | | | | | | | | | | |
Inflation Protected Bond Fund | | | | | | | | | | | | | | | | | | | | | | | | | |
10-Year Canadian Bond | | | | 03/2014 | | | | | (9 | ) | | | $ | (1,073,815 | ) | | | | UBS | | | | $ | 14,218 | |
10-Year U.S. Treasury Note | | | | 03/2014 | | | | | 24 | | | | | 2,953,125 | | | | | UBS | | | | | 1,863 | |
2-Year U.S. Treasury Note | | | | 03/2014 | | | | | (10 | ) | | | | (2,198,125 | ) | | | | UBS | | | | | 4,362 | |
5-Year U.S. Treasury Note | | | | 03/2014 | | | | | 81 | | | | | 9,664,312 | | | | | UBS | | | | | (30,975 | ) |
Long U.S. Treasury Bond | | | | 03/2014 | | | | | (61 | ) | | | | (7,827,062 | ) | | | | UBS | | | | | 77,930 | |
Ultra Long U.S. Treasury Bond | | | | 03/2014 | | | | | (63 | ) | | | | (8,583,750 | ) | | | | UBS | | | | | 130,897 | |
90-Day Euro | | | | 09/2015 | | | | | (167 | ) | | | | (41,386,775 | ) | | | | UBS | | | | | 32,563 | |
90-Day Euro | | | | 09/2020 | | | | | 167 | | | | | 40,430,700 | | | | | UBS | | | | | (162,036 | ) |
| | | | | | | | | | | | | | | | | | | | | | | | | |
| | | | | | | | | | | | | $ | (8,021,390 | ) | | | | | | | | $ | 68,822 | |
| | | | | | | | | | | | | | | | | | | | | | | | | |
Real Estate Securities Fund | | | | | | | | | | | | | | | | | | | | | | | | | |
S&P 500® MidCap 400 E-Mini | | | | 03/2014 | | | | | 37 | | | | $ | 4,955,780 | | | | | GSC | | | | $ | 157,537 | |
| | | | | | | | | | | | | | | | | | | | | | | | | |
Forward Foreign Currency Contracts
As of December 31, 2013, the following Funds have forward foreign currency exchange contracts that obligate them to deliver currencies at specified future dates. The unrealized appreciation and/or depreciation on these contracts is included in the accompanying financial statements. The terms of the open contracts are as follows:
| | | | | | | | | | | | | | | | | | | | |
Fund/Expiration Date | | Currency Purchased | | Amount
of Currency
Purchased | | | Currency Sold | | Amount
of Currency
Sold | | | Counter-
party | | | Net Unrealized
Appreciation
(Depreciation) | |
Low-Duration Bond Fund | | | | | | | | | | | | | | | | | | | | |
01/02/14 | | U.S. Dollars | | | 313,529 | | | Euro | | | 233,000 | | | | JPM | | | $ | (7,010 | ) |
01/02/14 | | Euro | | | 233,000 | | | U.S. Dollars | | | 320,771 | | | | CITI | | | | (232 | ) |
01/03/14 | | Brazilian Reals | | | 1,298,196 | | | U.S. Dollars | | | 550,456 | | | | MSCS | | | | (631 | ) |
01/03/14 | | U.S. Dollars | | | 555,734 | | | Brazilian Reals | | | 1,298,196 | | | | MSCS | | | | 5,909 | |
01/06/14 | | Euro | | | 1,400,000 | | | Switzerland Francs | | | 1,725,290 | | | | UBS | | | | (8,173 | ) |
01/06/14 | | New Zealand Dollars | | | 1,348,181 | | | Australian Dollars | | | 1,200,000 | | | | BAR | | | | 37,205 | |
01/06/14 | | New Zealand Dollars | | | 775,535 | | | Australian Dollars | | | 690,000 | | | | UBS | | | | 21,666 | |
318
| | | | | | | | | | | | | | | | | | | | |
Fund/Expiration Date | | Currency Purchased | | Amount
of Currency
Purchased | | | Currency Sold | | Amount
of Currency
Sold | | | Counter-
party | | | Net Unrealized
Appreciation
(Depreciation) | |
01/06/14 | | Australian Dollars | | | 538,000 | | | U.S. Dollars | | | 476,956 | | | | BAR | | | $ | 3,228 | |
01/06/14 | | U.S. Dollars | | | 490,988 | | | Australian Dollars | | | 538,000 | | | | CITI | | | | 10,804 | |
01/07/14 | | Japanese Yen | | | 29,924,040 | | | U.S. Dollars | | | 300,000 | | | | DEUT | | | | (15,838 | ) |
01/07/14 | | Swedish Kronor | | | 4,040,874 | | | Norwegian Krone | | | 3,800,000 | | | | BNP | | | | 1,835 | |
01/07/14 | | Swedish Kronor | | | 4,022,110 | | | U.S. Dollars | | | 617,334 | | | | GSC | | | | 7,930 | |
01/07/14 | | Norwegian Krone | | | 3,800,000 | | | Swedish Kronor | | | 4,086,026 | | | | GSC | | | | (8,853 | ) |
01/07/14 | | Norwegian Krone | | | 3,800,000 | | | Swedish Kronor | | | 4,135,654 | | | | BNP | | | | (16,570 | ) |
01/07/14 | | New Zealand Dollars | | | 1,661,415 | | | Euro | | | 1,000,000 | | | | BAR | | | | (10,063 | ) |
01/07/14 | | Euro | | | 1,000,000 | | | New Zealand Dollars | | | 1,697,760 | | | | UBS | | | | (19,811 | ) |
01/07/14 | | British Pounds | | | 829,150 | | | Euro | | | 1,000,000 | | | | BAR | | | | (2,727 | ) |
01/07/14 | | New Zealand Dollars | | | 800,000 | | | Canadian Dollars | | | 687,976 | | | | UBS | | | | 10,032 | |
01/07/14 | | Canadian Dollars | | | 698,704 | | | New Zealand Dollars | | | 800,000 | | | | UBS | | | | 66 | |
01/07/14 | | U.S. Dollars | | | 617,334 | | | Norwegian Krone | | | 3,800,000 | | | | GSC | | | | (9,012 | ) |
01/07/14 | | U.S. Dollars | | | 300,000 | | | Japanese Yen | | | 29,970,450 | | | | DEUT | | | | 15,398 | |
01/08/14 | | U.S. Dollars | | | 300,000 | | | Switzerland Francs | | | 273,390 | | | | DEUT | | | | (6,491 | ) |
01/08/14 | | Switzerland Francs | | | 272,535 | | | U.S. Dollars | | | 300,000 | | | | DEUT | | | | 5,532 | |
01/09/14 | | U.S. Dollars | | | 3,304,106 | | | Euro | | | 2,431,000 | | | | CITIG | | | | (40,212 | ) |
01/09/14 | | U.S. Dollars | | | 1,704,591 | | | British Pounds | | | 1,041,000 | | | | HKSB | | | | (19,155 | ) |
01/10/14 | | Euro | | | 1,000,000 | | | Switzerland Francs | | | 1,228,007 | | | | UBS | | | | (1,011 | ) |
01/10/14 | | Euro | | | 1,000,000 | | | Switzerland Francs | | | 1,232,858 | | | | DEUT | | | | (6,450 | ) |
01/22/14 | | U.S. Dollars | | | 3,188,233 | | | Euro | | | 2,361,000 | | | | BAR | | | | (59,757 | ) |
01/23/14 | | U.S. Dollars | | | 5,738,013 | | | Australian Dollars | | | 5,989,000 | | | | WEST | | | | 398,743 | |
01/23/14 | | U.S. Dollars | | | 3,031,064 | | | British Pounds | | | 1,878,000 | | | | BAR | | | | (78,333 | ) |
01/23/14 | | U.S. Dollars | | | 380,770 | | | Australian Dollars | | | 400,000 | | | | BNP | | | | 24,165 | |
01/30/14 | | U.S. Dollars | | | 921,712 | | | Brazilian Reals | | | 2,171,000 | | | | HKSB | | | | 8,683 | |
02/04/14 | | Brazilian Reals | | | 1,298,196 | | | U.S. Dollars | | | 551,391 | | | | MSCS | | | | (6,066 | ) |
02/04/14 | | U.S. Dollars | | | 476,045 | | | Australian Dollars | | | 538,000 | | | | BAR | | | | (3,214 | ) |
02/04/14 | | U.S. Dollars | | | 320,764 | | | Euro | | | 233,000 | | | | CITI | | | | 232 | |
02/06/14 | | U.S. Dollars | | | 1,437,030 | | | Mexican Pesos | | | 18,991,790 | | | | GSC | | | | (13,050 | ) |
02/06/14 | | U.S. Dollars | | | 1,293,836 | | | Mexican Pesos | | | 17,092,611 | | | | MSCS | | | | (11,235 | ) |
02/10/14 | | New Zealand Dollars | | | 1,522,260 | | | Euro | | | 900,000 | | | | DEUT | | | | 10,089 | |
02/13/14 | | Norwegian Krone | | | 3,585,000 | | | U.S. Dollars | | | 580,163 | | | | UBS | | | | 9,937 | |
02/20/14 | | U.S. Dollars | | | 1,654,357 | | | Mexican Pesos | | | 21,477,196 | | | | BNP | | | | 16,202 | |
02/20/14 | | U.S. Dollars | | | 1,323,200 | | | Mexican Pesos | | | 17,181,757 | | | | GSC | | | | 12,676 | |
03/04/14 | | British Pounds | | | 2,287,000 | | | U.S. Dollars | | | 3,742,024 | | | | JPM | | | | 43,497 | |
03/04/14 | | U.S. Dollars | | | 3,705,901 | | | British Pounds | | | 2,287,000 | | | | JPM | | | | (79,621 | ) |
03/10/14 | | U.S. Dollars | | | 601,165 | | | Switzerland Francs | | | 536,940 | | | | DEUT | | | | (1,062 | ) |
03/12/14 | | U.S. Dollars | | | 6,947,275 | | | British Pounds | | | 4,246,000 | | | | BAR | | | | (80,415 | ) |
03/12/14 | | New Zealand Dollars | | | 759,822 | | | Australian Dollars | | | 700,000 | | | | DEUT | | | | (466 | ) |
03/12/14 | | New Zealand Dollars | | | 666,236 | | | Euro | | | 400,000 | | | | BAR | | | | (5,162 | ) |
03/12/14 | | U.S. Dollars | | | 600,000 | | | Switzerland Francs | | | 532,988 | | | | DEUT | | | | 2,195 | |
03/12/14 | | Euro | | | 400,000 | | | New Zealand Dollars | | | 682,268 | | | | UBS | | | | (7,955 | ) |
03/25/14 | | U.S. Dollars | | | 1,800,137 | | | Mexican Pesos | | | 23,580,000 | | | | RBS | | | | 6,226 | |
| | | | | | | | | | | | | | | | | | | | |
| | | | | | | | | | | | | | | | | | $ | 133,675 | |
| | | | | | | | | | | | | | | | | | | | |
| | | | | |
Medium-Duration Bond Fund | | | | | | | | | | | | | | | | | | |
01/02/14 | | U.S. Dollars | | | 2,427,493 | | | Euro | | | 1,804,000 | | | | JPM | | | $ | (54,275 | ) |
01/02/14 | | Euro | | | 1,804,000 | | | U.S. Dollars | | | 2,483,567 | | | | CITI | | | | (1,798 | ) |
01/02/14 | | U.S. Dollars | | | 1,052,832 | | | Mexican Pesos | | | 13,963,075 | | | | BNP | | | | (16,419 | ) |
01/03/14 | | Brazilian Reals | | | 1,814,147 | | | U.S. Dollars | | | 769,228 | | | | MSCS | | | | (881 | ) |
01/03/14 | | U.S. Dollars | | | 776,604 | | | Brazilian Reals | | | 1,814,147 | | | | MSCS | | | | 8,257 | |
01/06/14 | | Australian Dollars | | | 2,133,000 | | | U.S. Dollars | | | 1,890,979 | | | | BAR | | | | 12,800 | |
319
| | | | | | | | | | | | | | | | | | | | |
Fund/Expiration Date | | Currency Purchased | | Amount
of Currency
Purchased | | | Currency Sold | | Amount
of Currency
Sold | | | Counter-
party | | | Net Unrealized
Appreciation
(Depreciation) | |
01/06/14 | | U.S. Dollars | | | 1,946,614 | | | Australian Dollars | | | 2,133,000 | | | | CITI | | | $ | 42,835 | |
01/15/14 | | Brazilian Reals | | | 1,622,476 | | | U.S. Dollars | | | 706,192 | | | | JPM | | | | (21,176 | ) |
01/24/14 | | U.S. Dollars | | | 1,262,809 | | | British Pounds | | | 773,643 | | | | JPM | | | | (18,099 | ) |
01/29/14 | | U.S. Dollars | | | 1,108,125 | | | Euro | | | 805,031 | | | | JPM | | | | 662 | |
01/30/14 | | U.S. Dollars | | | 1,745,751 | | | Mexican Pesos | | | 22,494,004 | | | | UBS | | | | 27,379 | |
02/04/14 | | U.S. Dollars | | | 2,483,511 | | | Euro | | | 1,804,000 | | | | CITI | | | | 1,794 | |
02/04/14 | | U.S. Dollars | | | 1,887,368 | | | Australian Dollars | | | 2,133,000 | | | | BAR | | | | (12,741 | ) |
02/04/14 | | Brazilian Reals | | | 1,814,147 | | | U.S. Dollars | | | 770,535 | | | | MSCS | | | | (8,478 | ) |
02/06/14 | | U.S. Dollars | | | 1,401,499 | | | Mexican Pesos | | | 18,522,213 | | | | GSC | | | | (12,727 | ) |
02/06/14 | | U.S. Dollars | | | 1,261,846 | | | Mexican Pesos | | | 16,669,992 | | | | MSCS | | | | (10,958 | ) |
02/13/14 | | Norwegian Krone | | | 1,133,000 | | | U.S. Dollars | | | 183,354 | | | | UBS | | | | 3,140 | |
02/18/14 | | U.S. Dollars | | | 6,392,967 | | | Euro | | | 4,781,701 | | | | CITIC | | | | (185,073 | ) |
02/18/14 | | U.S. Dollars | | | 4,198,811 | | | Euro | | | 3,100,000 | | | | CITIC | | | | (65,765 | ) |
02/18/14 | | U.S. Dollars | | | 3,513,227 | | | Euro | | | 2,600,000 | | | | CITIC | | | | (63,514 | ) |
02/18/14 | | U.S. Dollars | | | 3,059,791 | | | Japanese Yen | | | 303,288,000 | | | | CITIC | | | | 179,151 | |
02/18/14 | | U.S. Dollars | | | 1,556,565 | | | Japanese Yen | | | 153,366,000 | | | | BAR | | | | 99,889 | |
02/18/14 | | Australian Dollars | | | 1,550,000 | | | U.S. Dollars | | | 1,390,858 | | | | CITIC | | | | (11,290 | ) |
02/18/14 | | U.S. Dollars | | | 1,459,697 | | | Australian Dollars | | | 1,550,000 | | | | CITIC | | | | 80,129 | |
02/18/14 | | Euro | | | 1,408,585 | | | U.S. Dollars | | | 1,886,532 | | | | MLCS | | | | 51,215 | |
02/18/14 | | U.S. Dollars | | | 1,111,172 | | | Euro | | | 824,514 | | | | UBS | | | | (23,086 | ) |
02/20/14 | | U.S. Dollars | | | 3,648,070 | | | Mexican Pesos | | | 47,359,971 | | | | BNP | | | | 35,728 | |
02/20/14 | | U.S. Dollars | | | 2,917,826 | | | Mexican Pesos | | | 37,887,977 | | | | GSC | | | | 27,953 | |
03/06/14 | | U.S. Dollars | | | 1,971,322 | | | Mexican Pesos | | | 26,266,288 | | | | MSCS | | | | (29,989 | ) |
03/06/14 | | U.S. Dollars | | | 1,970,834 | | | Mexican Pesos | | | 26,266,288 | | | | DEUT | | | | (30,477 | ) |
03/12/14 | | U.S. Dollars | | | 3,840,145 | | | British Pounds | | | 2,347,000 | | | | BAR | | | | (44,450 | ) |
03/19/14 | | Japanese Yen | | | 20,732,580 | | | U.S. Dollars | | | 200,000 | | | | DEUT | | | | (3,050 | ) |
03/19/14 | | Japanese Yen | | | 20,711,000 | | | U.S. Dollars | | | 200,000 | | | | BNP | | | | (3,255 | ) |
03/19/14 | | Japanese Yen | | | 13,985,216 | | | U.S. Dollars | | | 133,000 | | | | SS | | | | (147 | ) |
03/19/14 | | Japanese Yen | | | 13,968,192 | | | U.S. Dollars | | | 133,000 | | | | MLCS | | | | (309 | ) |
03/19/14 | | Japanese Yen | | | 13,692,084 | | | U.S. Dollars | | | 133,000 | | | | MLCS | | | | (2,931 | ) |
03/19/14 | | Japanese Yen | | | 7,056,507 | | | U.S. Dollars | | | 67,000 | | | | SS | | | | 34 | |
03/19/14 | | Japanese Yen | | | 7,041,566 | | | U.S. Dollars | | | 67,000 | | | | MLCS | | | | (108 | ) |
03/19/14 | | Japanese Yen | | | 7,005,647 | | | U.S. Dollars | | | 67,000 | | | | DEUT | | | | (450 | ) |
03/19/14 | | Japanese Yen | | | 6,992,153 | | | U.S. Dollars | | | 67,000 | | | | DEUT | | | | (578 | ) |
03/19/14 | | Japanese Yen | | | 6,978,146 | | | U.S. Dollars | | | 67,000 | | | | DEUT | | | | (711 | ) |
03/19/14 | | Norwegian Krone | | | 2,978,374 | | | Euro | | | 352,193 | | | | DEUT | | | | 5,126 | |
03/19/14 | | U.S. Dollars | | | 1,079,202 | | | Switzerland Francs | | | 956,000 | | | | BAR | | | | 6,873 | |
03/19/14 | | U.S. Dollars | | | 777,041 | | | Japanese Yen | | | 80,131,561 | | | | UBS | | | | 15,827 | |
03/19/14 | | U.S. Dollars | | | 465,046 | | | Canadian Dollars | | | 496,755 | | | | RBC | | | | (1,708 | ) |
03/19/14 | | Australian Dollars | | | 449,000 | | | U.S. Dollars | | | 397,697 | | | | WEST | | | | 1,175 | |
03/19/14 | | U.S. Dollars | | | 399,033 | | | Euro | | | 291,000 | | | | MLCS | | | | (1,288 | ) |
03/19/14 | | U.S. Dollars | | | 386,990 | | | New Zealand Dollars | | | 469,762 | | | | WEST | | | | 2,860 | |
03/19/14 | | U.S. Dollars | | | 332,000 | | | Japanese Yen | | | 34,075,816 | | | | MLCS | | | | 8,295 | |
03/19/14 | | British Pounds | | | 326,689 | | | U.S. Dollars | | | 534,012 | | | | SC | | | | 6,672 | |
03/19/14 | | Australian Dollars | | | 292,428 | | | Euro | | | 193,000 | | | | WEST | | | | (5,725 | ) |
03/19/14 | | U.S. Dollars | | | 264,359 | | | Australian Dollars | | | 298,000 | | | | WEST | | | | (371 | ) |
03/19/14 | | U.S. Dollars | | | 200,000 | | | Japanese Yen | | | 20,522,560 | | | | HKSB | | | | 5,045 | |
03/19/14 | | U.S. Dollars | | | 199,000 | | | Japanese Yen | | | 20,527,049 | | | | SS | | | | 4,002 | |
03/19/14 | | Euro | | | 194,000 | | | Switzerland Francs | | | 236,836 | | | | MLCS | | | | 1,226 | |
03/19/14 | | British Pounds | | | 163,289 | | | Euro | | | 194,000 | | | | HKSB | | | | 3,369 | |
03/19/14 | | Australian Dollars | | | 142,000 | | | U.S. Dollars | | | 127,392 | | | | BAR | | | | (1,245 | ) |
03/19/14 | | U.S. Dollars | | | 141,844 | | | Swedish Kronor | | | 926,306 | | | | JPM | | | | (1,982 | ) |
320
| | | | | | | | | | | | | | | | | | | | |
Fund/Expiration Date | | Currency Purchased | | Amount
of Currency
Purchased | | | Currency Sold | | Amount
of Currency
Sold | | | Counter-
party | | | Net Unrealized
Appreciation
(Depreciation) | |
03/19/14 | | U.S. Dollars | | | 133,000 | | | Japanese Yen | | | 13,527,829 | | | | SS | | | $ | 4,492 | |
03/19/14 | | U.S. Dollars | | | 133,000 | | | Canadian Dollars | | | 142,503 | | | | RBC | | | | (896 | ) |
03/19/14 | | Euro | | | 98,000 | | | U.S. Dollars | | | 133,585 | | | | MLCS | | | | 1,231 | |
03/19/14 | | New Zealand Dollars | | | 82,000 | | | U.S. Dollars | | | 66,615 | | | | MLCS | | | | 437 | |
03/19/14 | | British Pounds | | | 81,721 | | | Euro | | | 97,000 | | | | HKSB | | | | 1,811 | |
03/19/14 | | New Zealand Dollars | | | 81,000 | | | U.S. Dollars | | | 66,141 | | | | MLCS | | | | 94 | |
03/19/14 | | British Pounds | | | 80,925 | | | Euro | | | 97,000 | | | | MLCS | | | | 494 | |
03/19/14 | | New Zealand Dollars | | | 80,000 | | | U.S. Dollars | | | 65,784 | | | | WEST | | | | (367 | ) |
03/19/14 | | Canadian Dollars | | | 71,977 | | | U.S. Dollars | | | 67,000 | | | | RBC | | | | 630 | |
03/19/14 | | Canadian Dollars | | | 71,806 | | | U.S. Dollars | | | 67,000 | | | | DEUT | | | | 469 | |
03/19/14 | | Canadian Dollars | | | 71,542 | | | U.S. Dollars | | | 67,000 | | | | DEUT | | | | 221 | |
03/19/14 | | U.S. Dollars | | | 67,000 | | | Japanese Yen | | | 6,873,798 | | | | SC | | | | 1,702 | |
03/19/14 | | U.S. Dollars | | | 66,500 | | | Canadian Dollars | | | 70,554 | | | | RBC | | | | 207 | |
03/19/14 | | U.S. Dollars | | | 66,408 | | | Euro | | | 48,000 | | | | JPM | | | | 375 | |
03/19/14 | | U.S. Dollars | | | 66,194 | | | Euro | | | 48,000 | | | | MLCS | | | | 162 | |
03/19/14 | | U.S. Dollars | | | 65,718 | | | New Zealand Dollars | | | 80,000 | | | | WEST | | | | 302 | |
03/19/14 | | Switzerland Francs | | | 60,015 | | | U.S. Dollars | | | 67,000 | | | | UBS | | | | 318 | |
03/19/14 | | Euro | | | 49,000 | | | U.S. Dollars | | | 67,012 | | | | BNP | | | | 396 | |
03/19/14 | | U.S. Dollars | | | 4,637 | | | Euro | | | 3,370 | | | | CS | | | | 1 | |
| | | | | | | | | | | | | | | | | | | | |
| | | | | | | | | | | | | | | | | | $ | 8,461 | |
| | | | | | | | | | | | | | | | | | | | |
| | | | | |
Global Bond Fund | | | | | | | | | | | | | | | | | | |
01/16/14 | | Chinese Yuan Renminbi | | | 21,064,000 | | | U.S. Dollars | | | 3,434,674 | | | | HSBC | | | $ | 41,229 | |
01/24/14 | | Indian Rupees | | | 64,920,000 | | | U.S. Dollars | | | 1,029,332 | | | | CITIC | | | | 13,911 | |
01/24/14 | | Indian Rupees | | | 51,960,000 | | | U.S. Dollars | | | 824,762 | | | | JPM | | | | 10,219 | |
01/24/14 | | Brazilian Reals | | | 4,003,000 | | | U.S. Dollars | | | 1,695,899 | | | | BAR | | | | (9,779 | ) |
01/24/14 | | U.S. Dollars | | | 3,067,598 | | | Brazilian Reals | | | 6,832,000 | | | | BAR | | | | 189,863 | |
02/18/14 | | Norwegian Krone | | | 21,560,000 | | | U.S. Dollars | | | 3,596,332 | | | | DEUT | | | | (48,115 | ) |
02/18/14 | | Swedish Kronor | | | 5,133,306 | | | U.S. Dollars | | | 788,471 | | | | BAR | | | | 8,957 | |
02/18/14 | | U.S. Dollars | | | 3,130,054 | | | Polish Zloty | | | 9,810,683 | | | | JPM | | | | (107,543 | ) |
02/18/14 | | U.S. Dollars | | | 2,410,061 | | | Euro | | | 1,808,255 | | | | MSCS | | | | (77,501 | ) |
02/18/14 | | U.S. Dollars | | | 2,176,408 | | | Euro | | | 1,614,942 | | | | UBS | | | | (45,218 | ) |
02/18/14 | | U.S. Dollars | | | 1,491,175 | | | British Pounds | | | 931,041 | | | | JPM | | | | (50,069 | ) |
02/18/14 | | U.S. Dollars | | | 1,280,694 | | | Euro | | | 947,399 | | | | GSC | | | | (22,614 | ) |
02/18/14 | | U.S. Dollars | | | 1,276,166 | | | Euro | | | 954,524 | | | | CITIC | | | | (36,944 | ) |
02/18/14 | | U.S. Dollars | | | 1,269,679 | | | British Pounds | | | 790,000 | | | | RBC | | | | (38,086 | ) |
02/18/14 | | U.S. Dollars | | | 1,041,723 | | | British Pounds | | | 650,000 | | | | CS | | | | (34,287 | ) |
02/18/14 | | U.S. Dollars | | | 929,912 | | | Euro | | | 696,830 | | | | JPM | | | | (28,695 | ) |
02/18/14 | | U.S. Dollars | | | 796,149 | | | South African Rand | | | 8,273,340 | | | | JPM | | | | 12,994 | |
02/18/14 | | U.S. Dollars | | | 784,500 | | | Swedish Kronor | | | 5,130,000 | | | | UBS | | | | (12,415 | ) |
02/18/14 | | U.S. Dollars | | | 619,362 | | | Turkish Lira | | | 1,280,270 | | | | RBC | | | | 29,752 | |
02/18/14 | | U.S. Dollars | | | 434,175 | | | British Pounds | | | 269,710 | | | | BAR | | | | (12,302 | ) |
02/18/14 | | U.S. Dollars | | | 321,328 | | | British Pounds | | | 200,000 | | | | GSC | | | | (9,752 | ) |
02/18/14 | | U.S. Dollars | | | 172,740 | | | Australian Dollars | | | 192,725 | | | | HSBC | | | | 1,207 | |
| | | | | | | | | | | | | | | | | | | | |
| | | | | | | | | | | | | | | | | | $ | (225,188 | ) |
| | | | | | | | | | | | | | | | | | | | |
| | | | | |
Defensive Market Strategies Fund | | | | | | | | | | | | | | | | | | |
01/30/14 | | U.S. Dollars | | | 2,942,452 | | | Euro | | | 2,154,261 | | | | UBS | | | $ | (21,115 | ) |
01/31/14 | | U.S. Dollars | | | 1,313,577 | | | Canadian Dollars | | | 1,407,018 | | | | JPM | | | | (9,953 | ) |
01/31/14 | | U.S. Dollars | | | 441,097 | | | Switzerland Francs | | | 395,366 | | | | CS | | | | (2,209 | ) |
01/31/14 | | U.S. Dollars | | | 290,481 | | | Japanese Yen | | | 30,348,000 | | | | CS | | | | 2,260 | |
01/31/14 | | U.S. Dollars | | | 87,103 | | | Euro | | | 63,625 | | | | UBS | | | | (425 | ) |
321
| | | | | | | | | | | | | | | | | | | | |
Fund/Expiration Date | | Currency Purchased | | Amount
of Currency
Purchased | | | Currency Sold | | Amount
of Currency
Sold | | | Counter-
party | | | Net Unrealized
Appreciation
(Depreciation) | |
01/31/14 | | U.S. Dollars | | | 36,142 | | | Canadian Dollars | | | 38,693 | | | | JPM | | | $ | (256 | ) |
01/31/14 | | U.S. Dollars | | | 34,600 | | | Canadian Dollars | | | 36,780 | | | | JPM | | | | 2 | |
01/31/14 | | U.S. Dollars | | | 12,661 | | | Switzerland Francs | | | 11,232 | | | | CS | | | | 67 | |
| | | | | | | | | | | | | | | | | | | | |
| | | | | | | | | | | | | | | | | | $ | (31,629 | ) |
| | | | | | | | | | | | | | | | | | | | |
| | | | | |
Small Cap Equity Fund | | | | | | | | | | | | | | | | | | |
01/27/14 | | U.S. Dollars | | | 45,146 | | | Euro | | | 33,000 | | | | CS | | | $ | (252 | ) |
02/18/14 | | U.S. Dollars | | | 581,151 | | | Japanese Yen | | | 57,604,000 | | | | CITIG | | | | 34,027 | |
02/18/14 | | U.S. Dollars | | | 478,933 | | | Euro | | | 359,341 | | | | MSCS | | | | (15,401 | ) |
02/18/14 | | Euro | | | 126,550 | | | U.S. Dollars | | | 169,490 | | | | CITIG | | | | 4,601 | |
02/18/14 | | U.S. Dollars | | | 837,769 | | | Euro | | | 620,000 | | | | MLCS | | | | (15,146 | ) |
02/18/14 | | U.S. Dollars | | | 761,000 | | | Euro | | | 569,200 | | | | CITIG | | | | (22,031 | ) |
02/18/14 | | U.S. Dollars | | | 677,228 | | | Euro | | | 500,000 | | | | CITIG | | | | (10,607 | ) |
02/18/14 | | Australian Dollars | | | 300,000 | | | U.S. Dollars | | | 271,887 | | | | CITIG | | | | (4,874 | ) |
02/18/14 | | U.S. Dollars | | | 282,522 | | | Australian Dollars | | | 300,000 | | | | CITIG | | | | 15,509 | |
02/18/14 | | U.S. Dollars | | | 267,009 | | | Japanese Yen | | | 26,308,000 | | | | BAR | | | | 17,135 | |
| | | | | | | | | | | | | | | | | | | | |
| | | | | | | | | | | | | | | | | | $ | 2,961 | |
| | | | | | | | | | | | | | | | | | | | |
| | | | | |
International Equity Fund | | | | | | | | | | | | | | | | | | |
01/31/14 | | U.S. Dollars | | | 7,554,045 | | | Australian Dollars | | | 7,991,500 | | | | NT | | | $ | 433,334 | |
01/31/14 | | Australian Dollars | | | 1,618,000 | | | U.S. Dollars | | | 1,476,344 | | | | NT | | | | (34,648 | ) |
01/31/14 | | Australian Dollars | | | 384,000 | | | U.S. Dollars | | | 347,016 | | | | NT | | | | (4,858 | ) |
01/31/14 | | Australian Dollars | | | 284,000 | | | U.S. Dollars | | | 258,013 | | | | NT | | | | (4,959 | ) |
03/19/14 | | Japanese Yen | | | 1,398,319,000 | | | U.S. Dollars | | | 13,630,420 | | | | RBS | | | | (347,026 | ) |
03/19/14 | | Japanese Yen | | | 968,008,899 | | | U.S. Dollars | | | 9,405,082 | | | | RBS | | | | (209,438 | ) |
03/19/14 | | Japanese Yen | | | 908,579,000 | | | U.S. Dollars | | | 8,869,213 | | | | RBS | | | | (238,126 | ) |
03/19/14 | | Japanese Yen | | | 168,655,101 | | | U.S. Dollars | | | 1,646,246 | | | | RBS | | | | (44,099 | ) |
03/19/14 | | Norwegian Krone | | | 40,206,654 | | | U.S. Dollars | | | 6,529,651 | | | | RBS | | | | 80,102 | |
03/19/14 | | Norwegian Krone | | | 31,983,000 | | | U.S. Dollars | | | 5,215,590 | | | | RBS | | | | 42,240 | |
03/19/14 | | Euro | | | 25,735,681 | | | U.S. Dollars | | | 35,375,438 | | | | RBS | | | | 28,470 | |
03/19/14 | | U.S. Dollars | | | 24,235,275 | | | Canadian Dollars | | | 25,828,657 | | | | RBS | | | | (33,461 | ) |
03/19/14 | | U.S. Dollars | | | 18,794,441 | | | British Pounds | | | 11,547,000 | | | | RBS | | | | (316,335 | ) |
03/19/14 | | Norwegian Krone | | | 15,873,346 | | | U.S. Dollars | | | 2,573,249 | | | | RBS | | | | 36,242 | |
03/19/14 | | U.S. Dollars | | | 11,526,451 | | | British Pounds | | | 7,030,000 | | | | RBS | | | | (108,496 | ) |
03/19/14 | | U.S. Dollars | | | 11,079,101 | | | Canadian Dollars | | | 11,833,532 | | | | RBS | | | | (39,745 | ) |
03/19/14 | | Canadian Dollars | | | 10,952,000 | | | U.S. Dollars | | | 10,302,240 | | | | RBS | | | | (11,685 | ) |
03/19/14 | | Euro | | | 9,311,000 | | | U.S. Dollars | | | 12,816,927 | | | | RBS | | | | (8,026 | ) |
03/19/14 | | Hong Kong Dollars | | | 8,810,000 | | | U.S. Dollars | | | 1,136,569 | | | | RBS | | | | (325 | ) |
03/19/14 | | U.S. Dollars | | | 8,598,467 | | | Australian Dollars | | | 9,516,000 | | | | RBS | | | | 144,867 | |
03/19/14 | | Euro | | | 8,299,393 | | | U.S. Dollars | | | 11,311,866 | | | | RBS | | | | 105,394 | |
03/19/14 | | U.S. Dollars | | | 7,946,498 | | | Canadian Dollars | | | 8,497,905 | | | | RBS | | | | (38,177 | ) |
03/19/14 | | U.S. Dollars | | | 7,928,778 | | | Canadian Dollars | | | 8,497,906 | | | | RBS | | | | (55,897 | ) |
03/19/14 | | New Zealand Dollars | | | 6,783,729 | | | U.S. Dollars | | | 5,581,470 | | | | RBS | | | | (34,340 | ) |
03/19/14 | | U.S. Dollars | | | 6,316,126 | | | Swedish Kronor | | | 41,521,000 | | | | RBS | | | | (130,755 | ) |
03/19/14 | | U.S. Dollars | | | 4,399,931 | | | Japanese Yen | | | 452,694,000 | | | | RBS | | | | 99,544 | |
03/19/14 | | U.S. Dollars | | | 4,318,371 | | | Euro | | | 3,156,000 | | | | RBS | | | | (23,257 | ) |
03/19/14 | | Euro | | | 4,177,926 | | | U.S. Dollars | | | 5,674,919 | | | | RBS | | | | 72,546 | |
03/19/14 | | U.S. Dollars | | | 3,812,176 | | | Swedish Kronor | | | 24,980,438 | | | | RBS | | | | (66,486 | ) |
03/19/14 | | Israeli Shekels | | | 3,456,056 | | | U.S. Dollars | | | 986,509 | | | | RBS | | | | 7,660 | |
03/19/14 | | New Zealand Dollars | | | 3,314,000 | | | U.S. Dollars | | | 2,701,613 | | | | RBS | | | | 8,281 | |
03/19/14 | | British Pounds | | | 3,218,000 | | | U.S. Dollars | | | 5,260,388 | | | | RBS | | | | 65,539 | |
03/19/14 | | Switzerland Francs | | | 3,100,000 | | | U.S. Dollars | | | 3,423,355 | | | | RBS | | | | 53,863 | |
322
| | | | | | | | | | | | | | | | | | | | |
Fund/Expiration Date | | Currency Purchased | | Amount
of Currency
Purchased | | | Currency Sold | | Amount
of Currency
Sold | | | Counter-
party | | | Net Unrealized
Appreciation
(Depreciation) | |
03/19/14 | | U.S. Dollars | | | 3,068,793 | | | Australian Dollars | | | 3,459,000 | | | | RBS | | | $ | (4,032 | ) |
03/19/14 | | U.S. Dollars | | | 2,724,585 | | | British Pounds | | | 1,662,000 | | | | RBS | | | | (26,095 | ) |
03/19/14 | | New Zealand Dollars | | | 2,681,271 | | | U.S. Dollars | | | 2,184,375 | | | | RBS | | | | 8,130 | |
03/19/14 | | New Zealand Dollars | | | 2,476,000 | | | U.S. Dollars | | | 2,015,955 | | | | RBS | | | | 8,697 | |
03/19/14 | | U.S. Dollars | | | 1,743,321 | | | Swedish Kronor | | | 11,425,000 | | | | RBS | | | | (30,615 | ) |
03/19/14 | | U.S. Dollars | | | 1,717,617 | | | Swedish Kronor | | | 11,192,227 | | | | RBS | | | | (20,177 | ) |
03/19/14 | | U.S. Dollars | | | 1,637,082 | | | New Zealand Dollars | | | 1,998,000 | | | | RBS | | | | 3,296 | |
03/19/14 | | U.S. Dollars | | | 1,573,509 | | | Swedish Kronor | | | 10,277,765 | | | | RBS | | | | (22,299 | ) |
03/19/14 | | Hong Kong Dollars | | | 1,503,000 | | | U.S. Dollars | | | 193,869 | | | | RBS | | | | (24 | ) |
03/19/14 | | U.S. Dollars | | | 1,463,221 | | | Danish Kroner | | | 7,933,000 | | | | RBS | | | | (579 | ) |
03/19/14 | | U.S. Dollars | | | 1,330,962 | | | Swedish Kronor | | | 8,696,570 | | | | RBS | | | | (19,337 | ) |
03/19/14 | | Hong Kong Dollars | | | 1,322,000 | | | U.S. Dollars | | | 170,543 | | | | RBS | | | | (42 | ) |
03/19/14 | | British Pounds | | | 1,286,967 | | | U.S. Dollars | | | 2,108,877 | | | | RBS | | | | 21,108 | |
03/19/14 | | Switzerland Francs | | | 1,125,000 | | | U.S. Dollars | | | 1,246,434 | | | | RBS | | | | 15,460 | |
03/19/14 | | U.S. Dollars | | | 1,121,741 | | | Japanese Yen | | | 116,590,000 | | | | RBS | | | | 14,189 | |
03/19/14 | | New Zealand Dollars | | | 1,048,000 | | | U.S. Dollars | | | 861,445 | | | | RBS | | | | (4,484 | ) |
03/19/14 | | Israeli Shekels | | | 894,944 | | | U.S. Dollars | | | 253,479 | | | | RBS | | | | 3,961 | |
03/19/14 | | U.S. Dollars | | | 818,279 | | | Norwegian Krone | | | 5,025,000 | | | | RBS | | | | (7,804 | ) |
03/19/14 | | U.S. Dollars | | | 667,144 | | | Euro | | | 492,000 | | | | RBS | | | | (9,688 | ) |
03/19/14 | | U.S. Dollars | | | 652,974 | | | Australian Dollars | | | 735,000 | | | | RBS | | | | 32 | |
03/19/14 | | U.S. Dollars | | | 539,487 | | | Norwegian Krone | | | 3,337,000 | | | | RBS | | | | (9,098 | ) |
03/19/14 | | Danish Kroner | | | 532,000 | | | U.S. Dollars | | | 98,351 | | | | RBS | | | | (187 | ) |
03/19/14 | | British Pounds | | | 492,293 | | | U.S. Dollars | | | 806,672 | | | | RBS | | | | 8,093 | |
03/19/14 | | British Pounds | | | 492,292 | | | U.S. Dollars | | | 804,550 | | | | RBS | | | | 10,214 | |
03/19/14 | | British Pounds | | | 395,448 | | | U.S. Dollars | | | 645,727 | | | | RBS | | | | 8,756 | |
03/19/14 | | U.S. Dollars | | | 383,987 | | | Australian Dollars | | | 424,000 | | | | RBS | | | | 7,324 | |
03/19/14 | | Danish Kroner | | | 280,000 | | | U.S. Dollars | | | 50,916 | | | | RBS | | | | 750 | |
03/19/14 | | Singapore Dollars | | | 278,000 | | | U.S. Dollars | | | 222,519 | | | | RBS | | | | (2,220 | ) |
03/19/14 | | Hong Kong Dollars | | | 246,000 | | | U.S. Dollars | | | 31,738 | | | | RBS | | | | (10 | ) |
03/19/14 | | Danish Kroner | | | 223,000 | | | U.S. Dollars | | | 41,181 | | | | RBS | | | | (33 | ) |
03/19/14 | | Hong Kong Dollars | | | 220,000 | | | U.S. Dollars | | | 28,378 | | | | RBS | | | | (4 | ) |
03/19/14 | | U.S. Dollars | | | 162,944 | | | Hong Kong Dollars | | | 1,263,000 | | | | RBS | | | | 53 | |
03/19/14 | | U.S. Dollars | | | 150,858 | | | Danish Kroner | | | 822,000 | | | | RBS | | | | (818 | ) |
03/19/14 | | Hong Kong Dollars | | | 140,000 | | | U.S. Dollars | | | 18,060 | | | | RBS | | | | (4 | ) |
03/19/14 | | U.S. Dollars | | | 68,667 | | | Singapore Dollars | | | 87,000 | | | | RBS | | | | (276 | ) |
03/19/14 | | U.S. Dollars | | | 67,326 | | | Hong Kong Dollars | | | 522,000 | | | | RBS | | | | 3 | |
03/19/14 | | Singapore Dollars | | | 63,000 | | | U.S. Dollars | | | 50,433 | | | | RBS | | | | (510 | ) |
03/19/14 | | Israeli Shekels | | | 36,000 | | | U.S. Dollars | | | 10,249 | | | | RBS | | | | 107 | |
03/19/14 | | U.S. Dollars | | | 35,027 | | | Singapore Dollars | | | 44,000 | | | | RBS | | | | 160 | |
03/19/14 | | Euro | | | 21,000 | | | U.S. Dollars | | | 28,928 | | | | RBS | | | | (39 | ) |
03/19/14 | | Singapore Dollars | | | 19,000 | | | U.S. Dollars | | | 15,141 | | | | RBS | | | | (85 | ) |
03/19/14 | | U.S. Dollars | | | 17,118 | | | Israeli Shekels | | | 60,000 | | | | RBS | | | | (141 | ) |
03/19/14 | | U.S. Dollars | | | 5,703 | | | Israeli Shekels | | | 20,000 | | | | RBS | | | | (50 | ) |
| | | | | | | | | | | | | | | | | | | | |
| | | | | | | | | | | | | | | | | | $ | (620,375 | ) |
| | | | | | | | | | | | | | | | | | | | |
| | | | | |
Emerging Markets Equity Fund | | | | | | | | | | | | | | | | | | |
03/19/14 | | South Korean Won | | | 10,600,000,000 | | | U.S. Dollars | | | 9,931,802 | | | | RBS | | | $ | 63,389 | |
03/19/14 | | Indonesian Rupiahs | | | 3,800,000,000 | | | U.S. Dollars | | | 307,319 | | | | RBS | | | | 525 | |
03/19/14 | | Indonesian Rupiahs | | | 2,226,402,913 | | | U.S. Dollars | | | 180,659 | | | | RBS | | | | (294 | ) |
03/19/14 | | Hungarian Forint | | | 739,000,000 | | | U.S. Dollars | | | 3,306,019 | | | | RBS | | | | 99,274 | |
03/19/14 | | Columbian Peso | | | 510,000,000 | | | U.S. Dollars | | | 261,070 | | | | RBS | | | | 2,085 | |
03/19/14 | | Indian Rupees | | | 207,000,000 | | | U.S. Dollars | | | 3,276,373 | | | | RBS | | | | 8,820 | |
323
| | | | | | | | | | | | | | | | | | | | |
Fund/Expiration Date | | Currency Purchased | | Amount
of Currency
Purchased | | | Currency Sold | | Amount
of Currency
Sold | | | Counter-
party | | | Net Unrealized
Appreciation
(Depreciation) | |
03/19/14 | | Taiwan Dollars | | | 176,700,000 | | | U.S. Dollars | | | 6,005,218 | | | | RBS | | | $ | (62,985 | ) |
03/19/14 | | South Korean Won | | | 170,000,000 | | | U.S. Dollars | | | 159,887 | | | | RBS | | | | 413 | |
03/19/14 | | Hungarian Forint | | | 98,000,000 | | | U.S. Dollars | | | 449,932 | | | | RBS | | | | 1,649 | |
03/19/14 | | Hungarian Forint | | | 76,000,000 | | | U.S. Dollars | | | 348,048 | | | | RBS | | | | 2,159 | |
03/19/14 | | South Korean Won | | | 70,000,000 | | | U.S. Dollars | | | 66,211 | | | | RBS | | | | (205 | ) |
03/19/14 | | Russian Rubles | | | 39,900,000 | | | U.S. Dollars | | | 1,191,604 | | | | RBS | | | | 6,055 | |
03/19/14 | | Russian Rubles | | | 38,600,000 | | | U.S. Dollars | | | 1,155,775 | | | | RBS | | | | 2,863 | |
03/19/14 | | South African Rand | | | 31,872,619 | | | U.S. Dollars | | | 3,038,175 | | | | RBS | | | | (34,050 | ) |
03/19/14 | | Czech Republic Koruna | | | 30,100,000 | | | U.S. Dollars | | | 1,492,813 | | | | RBS | | | | 23,847 | |
03/19/14 | | Polish Zloty | | | 29,570,000 | | | U.S. Dollars | | | 9,524,492 | | | | RBS | | | | 216,560 | |
03/19/14 | | Taiwan Dollars | | | 24,196,497 | | | U.S. Dollars | | | 823,302 | | | | RBS | | | | (9,600 | ) |
03/19/14 | | Russian Rubles | | | 22,300,000 | | | U.S. Dollars | | | 668,328 | | | | RBS | | | | 1,041 | |
03/19/14 | | Indian Rupees | | | 12,955,000 | | | U.S. Dollars | | | 206,734 | | | | RBS | | | | (1,132 | ) |
03/19/14 | | South African Rand | | | 9,412,381 | | | U.S. Dollars | | | 887,810 | | | | RBS | | | | (654 | ) |
03/19/14 | | Mexican Pesos | | | 9,200,000 | | | U.S. Dollars | | | 705,538 | | | | RBS | | | | (5,288 | ) |
03/19/14 | | U.S. Dollars | | | 8,473,553 | | | Singapore Dollars | | | 10,630,000 | | | | RBS | | | | 49,887 | |
03/19/14 | | Taiwan Dollars | | | 7,465,503 | | | U.S. Dollars | | | 253,756 | | | | RBS | | | | (2,699 | ) |
03/19/14 | | Mexican Pesos | | | 6,800,000 | | | U.S. Dollars | | | 520,689 | | | | RBS | | | | (3,113 | ) |
03/19/14 | | Mexican Pesos | | | 6,000,000 | | | U.S. Dollars | | | 460,977 | | | | RBS | | | | (4,292 | ) |
03/19/14 | | Brazilian Reals | | | 5,722,000 | | | U.S. Dollars | | | 2,365,734 | | | | RBS | | | | 13,990 | |
03/19/14 | | Hong Kong Dollars | | | 5,700,000 | | | U.S. Dollars | | | 735,328 | | | | RBS | | | | (188 | ) |
03/19/14 | | U.S. Dollars | | | 5,410,583 | | | Chilean Peso | | | 2,905,000,000 | | | | RBS | | | | (69,877 | ) |
03/19/14 | | U.S. Dollars | | | 4,924,955 | | | Brazilian Reals | | | 11,960,000 | | | | RBS | | | | (49,092 | ) |
03/19/14 | | U.S. Dollars | | | 4,590,619 | | | South African Rand | | | 48,900,000 | | | | RBS | | | | (18,406 | ) |
03/19/14 | | U.S. Dollars | | | 4,553,359 | | | Mexican Pesos | | | 59,900,000 | | | | RBS | | | | (5,876 | ) |
03/19/14 | | Brazilian Reals | | | 4,400,000 | | | U.S. Dollars | | | 1,848,859 | | | | RBS | | | | (18,942 | ) |
03/19/14 | | U.S. Dollars | | | 3,236,440 | | | Philippine Peso | | | 141,500,000 | | | | RBS | | | | 44,723 | |
03/19/14 | | Turkish Lira | | | 2,640,000 | | | U.S. Dollars | | | 1,270,187 | | | | RBS | | | | (61,922 | ) |
03/19/14 | | Turkish Lira | | | 2,270,000 | | | U.S. Dollars | | | 1,092,489 | | | | RBS | | | | (53,564 | ) |
03/19/14 | | Turkish Lira | | | 2,250,000 | | | U.S. Dollars | | | 1,076,394 | | | | RBS | | | | (46,623 | ) |
03/19/14 | | Turkish Lira | | | 2,250,000 | | | U.S. Dollars | | | 1,088,089 | | | | RBS | | | | (58,318 | ) |
03/19/14 | | U.S. Dollars | | | 2,130,923 | | | Israeli Shekels | | | 7,520,000 | | | | RBS | | | | (32,281 | ) |
03/19/14 | | Hong Kong Dollars | | | 2,000,000 | | | U.S. Dollars | | | 257,952 | | | | RBS | | | | (8 | ) |
03/19/14 | | U.S. Dollars | | | 1,745,080 | | | Singapore Dollars | | | 2,190,000 | | | | RBS | | | | 9,630 | |
03/19/14 | | Hong Kong Dollars | | | 1,600,000 | | | U.S. Dollars | | | 206,378 | | | | RBS | | | | (23 | ) |
03/19/14 | | Malaysian Ringgits | | | 1,575,000 | | | U.S. Dollars | | | 487,088 | | | | RBS | | | | (8,502 | ) |
03/19/14 | | Malaysian Ringgits | | | 1,410,000 | | | U.S. Dollars | | | 435,589 | | | | RBS | | | | (7,140 | ) |
03/19/14 | | Turkish Lira | | | 1,210,000 | | | U.S. Dollars | | | 582,987 | | | | RBS | | | | (29,199 | ) |
03/19/14 | | Hong Kong Dollars | | | 1,200,000 | | | U.S. Dollars | | | 154,805 | | | | RBS | | | | (38 | ) |
03/19/14 | | U.S. Dollars | | | 1,170,036 | | | Turkish Lira | | | 2,490,000 | | | | RBS | | | | 30,422 | |
03/19/14 | | U.S. Dollars | | | 1,146,186 | | | Turkish Lira | | | 2,420,000 | | | | RBS | | | | 38,610 | |
03/19/14 | | U.S. Dollars | | | 1,132,400 | | | Brazilian Reals | | | 2,740,000 | | | | RBS | | | | (7,139 | ) |
03/19/14 | | U.S. Dollars | | | 1,111,948 | | | Russian Rubles | | | 37,400,000 | | | | RBS | | | | (10,670 | ) |
03/19/14 | | Thailand Baht | | | 1,100,000 | | | U.S. Dollars | | | 33,962 | | | | RBS | | | | (605 | ) |
03/19/14 | | U.S. Dollars | | | 1,096,645 | | | Mexican Pesos | | | 14,300,000 | | | | RBS | | | | 8,213 | |
03/19/14 | | U.S. Dollars | | | 1,072,633 | | | Singapore Dollars | | | 1,340,000 | | | | RBS | | | | 10,760 | |
03/19/14 | | Thailand Baht | | | 1,000,000 | | | U.S. Dollars | | | 30,317 | | | | RBS | | | | 7 | |
03/19/14 | | Czech Republic Koruna | | | 900,000 | | | U.S. Dollars | | | 44,904 | | | | RBS | | | | 445 | |
03/19/14 | | Thailand Baht | | | 900,000 | | | U.S. Dollars | | | 27,871 | | | | RBS | | | | (579 | ) |
03/19/14 | | U.S. Dollars | | | 834,209 | | | Mexican Pesos | | | 10,900,000 | | | | RBS | | | | 4,565 | |
03/19/14 | | U.S. Dollars | | | 817,829 | | | Brazilian Reals | | | 1,950,000 | | | | RBS | | | | 6,843 | |
03/19/14 | | U.S. Dollars | | | 785,019 | | | Hong Kong Dollars | | | 6,085,000 | | | | RBS | | | | 225 | |
324
| | | | | | | | | | | | | | | | | | | | |
Fund/Expiration Date | | Currency Purchased | | Amount
of Currency
Purchased | | | Currency Sold | | Amount
of Currency
Sold | | | Counter-
party | | | Net Unrealized
Appreciation
(Depreciation) | |
03/19/14 | | U.S. Dollars | | | 709,117 | | | Singapore Dollars | | | 890,000 | | | | RBS | | | $ | 3,843 | |
03/19/14 | | Thailand Baht | | | 700,000 | | | U.S. Dollars | | | 21,301 | | | | RBS | | | | (74 | ) |
03/19/14 | | Mexican Pesos | | | 698,000 | | | U.S. Dollars | | | 52,367 | | | | RBS | | | | 761 | |
03/19/14 | | U.S. Dollars | | | 516,710 | | | Brazilian Reals | | | 1,240,000 | | | | RBS | | | | 1,006 | |
03/19/14 | | Polish Zloty | | | 447,178 | | | U.S. Dollars | | | 146,223 | | | | RBS | | | | 1,088 | |
03/19/14 | | U.S. Dollars | | | 428,391 | | | Brazilian Reals | | | 1,040,000 | | | | RBS | | | | (4,135 | ) |
03/19/14 | | Czech Republic Koruna | | | 400,000 | | | U.S. Dollars | | | 20,009 | | | | RBS | | | | 146 | |
03/19/14 | | Hong Kong Dollars | | | 400,000 | | | U.S. Dollars | | | 51,595 | | | | RBS | | | | (6 | ) |
03/19/14 | | U.S. Dollars | | | 296,671 | | | Hong Kong Dollars | | | 2,300,000 | | | | RBS | | | | 35 | |
03/19/14 | | Turkish Lira | | | 264,000 | | | U.S. Dollars | | | 127,518 | | | | RBS | | | | (6,691 | ) |
03/19/14 | | U.S. Dollars | | | 242,627 | | | South Korean Won | | | 256,865,313 | | | | RBS | | | | 417 | |
03/19/14 | | U.S. Dollars | | | 206,368 | | | Hong Kong Dollars | | | 1,600,000 | | | | RBS | | | | 13 | |
03/19/14 | | Polish Zloty | | | 200,000 | | | U.S. Dollars | | | 65,414 | | | | RBS | | | | 470 | |
03/19/14 | | U.S. Dollars | | | 190,218 | | | Chilean Peso | | | 102,756,000 | | | | RBS | | | | (3,637 | ) |
03/19/14 | | U.S. Dollars | | | 170,001 | | | South Korean Won | | | 180,000,000 | | | | RBS | | | | 271 | |
03/19/14 | | Peruvian Nuevos Soles | | | 140,000 | | | U.S. Dollars | | | 49,192 | | | | RBS | | | | 292 | |
03/19/14 | | U.S. Dollars | | | 131,700 | | | Thailand Baht | | | 4,300,000 | | | | RBS | | | | 1,306 | |
03/19/14 | | U.S. Dollars | | | 131,283 | | | South Korean Won | | | 140,000,000 | | | | RBS | | | | (729 | ) |
03/19/14 | | U.S. Dollars | | | 124,750 | | | Brazilian Reals | | | 300,000 | | | | RBS | | | | (17 | ) |
03/19/14 | | Polish Zloty | | | 120,000 | | | U.S. Dollars | | | 39,163 | | | | RBS | | | | 368 | |
03/19/14 | | Polish Zloty | | | 118,102 | | | U.S. Dollars | | | 37,888 | | | | RBS | | | | 1,018 | |
03/19/14 | | U.S. Dollars | | | 114,449 | | | Polish Zloty | | | 350,000 | | | | RBS | | | | (849 | ) |
03/19/14 | | U.S. Dollars | | | 103,189 | | | Hong Kong Dollars | | | 800,000 | | | | RBS | | | | 12 | |
03/19/14 | | South African Rand | | | 100,000 | | | U.S. Dollars | | | 9,491 | | | | RBS | | | | (65 | ) |
03/19/14 | | Polish Zloty | | | 93,720 | | | U.S. Dollars | | | 30,288 | | | | RBS | | | | 586 | |
03/19/14 | | U.S. Dollars | | | 90,302 | | | Hong Kong Dollars | | | 700,000 | | | | RBS | | | | 21 | |
03/19/14 | | U.S. Dollars | | | 88,443 | | | Polish Zloty | | | 270,000 | | | | RBS | | | | (501 | ) |
03/19/14 | | U.S. Dollars | | | 81,766 | | | Polish Zloty | | | 250,000 | | | | RBS | | | | (590 | ) |
03/19/14 | | U.S. Dollars | | | 68,816 | | | Mexican Pesos | | | 900,000 | | | | RBS | | | | 314 | |
03/19/14 | | U.S. Dollars | | | 66,208 | | | South Korean Won | | | 70,000,000 | | | | RBS | | | | 202 | |
03/19/14 | | U.S. Dollars | | | 63,889 | | | Singapore Dollars | | | 80,000 | | | | RBS | | | | 493 | |
03/19/14 | | Polish Zloty | | | 60,000 | | | U.S. Dollars | | | 19,641 | | | | RBS | | | | 125 | |
03/19/14 | | U.S. Dollars | | | 49,883 | | | South Korean Won | | | 53,248,687 | | | | RBS | | | | (327 | ) |
03/19/14 | | U.S. Dollars | | | 43,063 | | | Thailand Baht | | | 1,400,000 | | | | RBS | | | | 609 | |
03/19/14 | | Polish Zloty | | | 30,000 | | | U.S. Dollars | | | 9,802 | | | | RBS | | | | 80 | |
03/19/14 | | U.S. Dollars | | | 28,342 | | | South Korean Won | | | 30,000,000 | | | | RBS | | | | 54 | |
03/19/14 | | U.S. Dollars | | | 25,795 | | | Hong Kong Dollars | | | 200,000 | | | | RBS | | | | 1 | |
03/19/14 | | U.S. Dollars | | | 24,676 | | | Thailand Baht | | | 800,000 | | | | RBS | | | | 416 | |
03/19/14 | | U.S. Dollars | | | 12,231 | | | Thailand Baht | | | 400,000 | | | | RBS | | | | 101 | |
03/19/14 | | U.S. Dollars | | | 10,667 | | | Peruvian Nuevos Soles | | | 30,000 | | | | RBS | | | | 63 | |
03/19/14 | | Polish Zloty | | | 10,000 | | | U.S. Dollars | | | 3,279 | | | | RBS | | | | 15 | |
03/19/14 | | Peruvian Nuevos Soles | | | 10,000 | | | U.S. Dollars | | | 3,546 | | | | RBS | | | | (12 | ) |
03/19/14 | | Peruvian Nuevos Soles | | | 10,000 | | | U.S. Dollars | | | 3,551 | | | | RBS | | | | (16 | ) |
03/19/14 | | Peruvian Nuevos Soles | | | 10,000 | | | U.S. Dollars | | | 3,580 | | | | RBS | | | | (46 | ) |
03/19/14 | | Peruvian Nuevos Soles | | | 10,000 | | | U.S. Dollars | | | 3,586 | | | | RBS | | | | (51 | ) |
03/19/14 | | U.S. Dollars | | | 9,299 | | | Thailand Baht | | | 300,000 | | | | RBS | | | | 202 | |
03/19/14 | | U.S. Dollars | | | 6,513 | | | Polish Zloty | | | 20,000 | | | | RBS | | | | (76 | ) |
03/19/14 | | U.S. Dollars | | | 6,173 | | | Thailand Baht | | | 200,000 | | | | RBS | | | | 108 | |
03/19/14 | | U.S. Dollars | | | 3,552 | | | Peruvian Nuevos Soles | | | 10,000 | | | | RBS | | | | 18 | |
| | | | | | | | | | | | | | | | | | | | |
| | | | | | | | | | | | | | | | | | $ | 40,328 | |
| | | | | | | | | | | | | | | | | | | | |
325
| | | | | | | | | | | | | | | | | | | | |
Fund/Expiration Date | | Currency
Purchased | | Amount
of Currency
Purchased | | | Currency
Sold | | Amount
of Currency
Sold | | | Counter-
party | | | Net Unrealized
Appreciation
(Depreciation) | |
Inflation Protected Bond Fund | | | | | | | | | | | | | | | | | | | | |
01/15/14 | | Norwegian Krone | | | 7,883,130 | | | Australian Dollars | | | 1,420,000 | | | | UBS | | | $ | 32,327 | |
01/15/14 | | Norwegian Krone | | | 4,458,646 | | | Australian Dollars | | | 794,000 | | | | CS | | | | 26,439 | |
01/15/14 | | U.S. Dollars | | | 4,424,938 | | | Euro | | | 3,285,000 | | | | DEUT | | | | (94,206) | |
01/15/14 | | Euro | | | 1,501,615 | | | Switzerland Francs | | | 1,848,282 | | | | CS | | | | (6,406) | |
01/22/14 | | U.S. Dollars | | | 20,495,979 | | | Euro | | | 15,178,000 | | | | BAR | | | | (384,158) | |
01/22/14 | | U.S. Dollars | | | 1,580,578 | | | Euro | | | 1,169,000 | | | | BNP | | | | (27,597) | |
01/23/14 | | New Zealand Dollars | | | 1,200,000 | | | U.S. Dollars | | | 985,734 | | | | DEUT | | | | (552) | |
01/23/14 | | U.S. Dollars | | | 1,023,516 | | | Japanese Yen | | | 105,326,000 | | | | UBS | | | | 23,252 | |
01/23/14 | | Australian Dollars | | | 594,855 | | | British Pounds | | | 330,000 | | | | DEUT | | | | (16,059) | |
01/23/14 | | U.S. Dollars | | | 587,951 | | | New Zealand Dollars | | | 725,000 | | | | DEUT | | | | (7,263) | |
01/23/14 | | U.S. Dollars | | | 555,868 | | | Australian Dollars | | | 615,000 | | | | BNP | | | | 7,588 | |
01/23/14 | | Euro | | | 490,000 | | | U.S. Dollars | | | 662,289 | | | | DEUT | | | | 11,796 | |
01/23/14 | | U.S. Dollars | | | 373,673 | | | Canadian Dollars | | | 387,000 | | | | BAR | | | | 9,563 | |
01/23/14 | | U.S. Dollars | | | 322,233 | | | New Zealand Dollars | | | 385,000 | | | | BNP | | | | 6,153 | |
| | | | | | | | | | | | | | | | | | | | |
| | | | | | | | | | | | | | | | | | $ | (419,123) | |
| | | | | | | | | | | | | | | | | | | | |
Options Written
Transactions in options written during the year ended December 31, 2013 were as follows:
| | | | | | | | | | | | | | | | | | | | |
| Fund | | Number of
Contracts | | | Premiums
Received | | | Notional
Amount | | | Premiums
Received | | | Total
Premiums
Received | |
Low-Duration Bond | | | | | | | | | | | | | | | | | | | | |
Options written, 12/31/12 | | | — | | | $ | — | | | $ | 36,000,000 | | | $ | 586,250 | | | $ | 586,250 | |
| | | | | | | | | | | | | | | | | | | | |
Options written | | | 396 | | | | 173,943 | | | | 204,100,000 | | | | 404,553 | | | | 578,496 | |
Options expired | | | — | | | | — | | | | (92,700,000 | ) | | | (191,438 | ) | | | (191,438 | ) |
Options closed | | | — | | | | — | | | | (57,200,000 | ) | | | (568,496 | ) | | | (568,496 | ) |
| | | | | | | | | | | | | | | | | | | | |
Options written, 12/31/13 | | | 396 | | | $ | 173,943 | | | $ | 90,200,000 | | | $ | 230,869 | | | $ | 404,812 | |
| | | | | | | | | | | | | | | | | | | | |
Medium-Duration Bond | | | | | | | | | | | | | | | | | | | | |
Options written, 12/31/12 | | | — | | | $ | — | | | $ | 43,100,000 | | | $ | 702,140 | | | $ | 702,140 | |
| | | | | | | | | | | | | | | | | | | | |
Options written | | | 31,764 | | | | 584,062 | | | | 246,400,000 | | | | 553,154 | | | | 1,137,216 | |
Options expired | | | (261 | ) | | | (104,199 | ) | | | (106,400,000 | ) | | | (673,632 | ) | | | (777,831 | ) |
Options closed | | | (31,091 | ) | | | (299,104 | ) | | | (75,600,000 | ) | | | (305,450 | ) | | | (604,554 | ) |
| | | | | | | | | | | | | | | | | | | | |
Options written, 12/31/13 | | | 412 | | | $ | 180,759 | | | $ | 107,500,000 | | | $ | 276,212 | | | $ | 456,971 | |
| | | | | | | | | | | | | | | | | | | | |
Global Bond | | | | | | | | | | | | | | | | | | | | |
Options written, 12/31/12 | | | — | | | $ | — | | | $ | — | | | $ | — | | | $ | — | |
| | | | | | | | | | | | | | | | | | | | |
Options written | | | 18 | | | | 18,660 | | | | — | | | | — | | | | 18,660 | |
Options expired | | | — | | | | — | | | | — | | | | — | | | | — | |
Options closed | | | (18 | ) | | | (18,660 | ) | | | — | | | | — | | | | (18,660 | ) |
| | | | | | | | | | | | | | | | | | | | |
Options written, 12/31/13 | | | — | | | $ | — | | | $ | — | | | $ | — | | | $ | — | |
| | | | | | | | | | | | | | | | | | | | |
Defensive Market Strategies | | | | | | | | | | | | | | | | | | | | |
Options written, 12/31/12 | | | — | | | $ | — | | | $ | — | | | $ | — | | | $ | — | |
| | | | | | | | | | | | | | | | | | | | |
Options written | | | 2,337 | | | | 135,556 | | | | — | | | | — | | | | 135,556 | |
Options expired | | | (185 | ) | | | (7,229 | ) | | | — | | | | — | | | | (7,229 | ) |
Options closed | | | (1,464 | ) | | | (95,446 | ) | | | — | | | | — | | | | (95,446 | ) |
| | | | | | | | | | | | | | | | | | | | |
Options written, 12/31/13 | | | 688 | | | $ | 32,881 | | | $ | — | | | $ | — | | | $ | 32,881 | |
| | | | | | | | | | | | | | | | | | | | |
326
| | | | | | | | | | | | | | | | | | | | |
| Fund | | Number of
Contracts | | | Premiums
Received | | | Notional
Amount | | | Premiums
Received | | | Total
Premiums
Received | |
Small Cap Equity | | | | | | | | | | | | | | | | | | | | |
Options written, 12/31/12 | | | 18 | | | $ | 11,848 | | | $ | — | | | $ | — | | | $ | 11,848 | |
| | | | | | | | | | | | | | | | | | | | |
Options written | | | 5,353 | | | | 49,951 | | | | — | | | | — | | | | 49,951 | |
Options expired | | | (75 | ) | | | (27,163 | ) | | | — | | | | — | | | | (27,163 | ) |
Options closed | | | (5,283 | ) | | | (30,662 | ) | | | — | | | | — | | | | (30,662 | ) |
| | | | | | | | | | | | | | | | | | | | |
Options written, 12/31/13 | | | 13 | | | $ | 3,974 | | | $ | — | | | $ | — | | | $ | 3,974 | |
| | | | | | | | | | | | | | | | | | | | |
Inflation Protected Bond | | | | | | | | | | | | | | | | | | | | |
Options written, 12/31/12 | | | — | | | $ | — | | | $ | — | | | $ | — | | | $ | — | |
| | | | | | | | | | | | | | | | | | | | |
Options written | | | 1,391 | | | | 248,363 | | | | 19,690,000 | | | | 218,362 | | | | 466,725 | |
Options expired | | | (1,127 | ) | | | (216,976 | ) | | | (14,800,000 | ) | | | (151,439 | ) | | | (368,415 | ) |
Options closed | | | (64 | ) | | | (16,727 | ) | | | — | | | | — | | | | (16,727 | ) |
| | | | | | | | | | | | | | | | | | | | |
Options written, 12/31/13 | | | 200 | | | $ | 14,660 | | | $ | 4,890,000 | | | $ | 66,923 | | | $ | 81,583 | |
| | | | | | | | | | | | | | | | | | | | |
6. CAPITAL SHARE TRANSACTIONS
Transactions in shares of capital stock were as follows:
| | | | | | | | | | | | |
| | | Year Ended 12/31/13 | | | Year Ended 12/31/12 | |
| | | | |
| | | GS2 | | GS4 | | | GS2 | | GS4 | |
MyDestination 2005 | | | | | | | | | | | | |
Shares sold | | | | | 2,390,141 | | | | | | 2,186,065 | |
Shares reinvested | | | | | 133,788 | | | | | | 154,580 | |
Shares redeemed | | | | | (2,453,997 | ) | | | | | (1,213,387 | ) |
| | | | | | | | | | | | |
Net increase | | | | | 69,932 | | | | | | 1,127,258 | |
| | | | | | | | | | | | |
MyDestination 2015 | | | | | | | | | | | | |
Shares sold | | | | | 7,823,039 | | | | | | 7,180,208 | |
Shares reinvested | | | | | 1,056,637 | | | | | | 772,986 | |
Shares redeemed | | | | | (3,249,231 | ) | | | | | (2,677,229 | ) |
| | | | | | | | | | | | |
Net increase | | | | | 5,630,445 | | | | | | 5,275,965 | |
| | | | | | | | | | | | |
MyDestination 2025 | | | | | | | | | | | | |
Shares sold | | | | | 11,525,044 | | | | | | 7,889,241 | |
Shares reinvested | | | | | 2,356,280 | | | | | | 740,061 | |
Shares redeemed | | | | | (1,456,827 | ) | | | | | (2,077,575 | ) |
| | | | | | | | | | | | |
Net increase | | | | | 12,424,497 | | | | | | 6,551,727 | |
| | | | | | | | | | | | |
MyDestination 2035 | | | | | | | | | | | | |
Shares sold | | | | | 6,160,978 | | | | | | 4,505,585 | |
Shares reinvested | | | | | 1,469,835 | | | | | | 334,266 | |
Shares redeemed | | | | | (599,267 | ) | | | | | (801,820 | ) |
| | | | | | | | | | | | |
Net increase | | | | | 7,031,546 | | | | | | 4,038,031 | |
| | | | | | | | | | | | |
MyDestination 2045 | | | | | | | | | | | | |
Shares sold | | | | | 4,414,752 | | | | | | 3,601,217 | |
Shares reinvested | | | | | 1,643,081 | | | | | | 224,875 | |
Shares redeemed | | | | | (400,028 | ) | | | | | (336,308 | ) |
| | | | | | | | | | | | |
Net increase | | | | | 5,657,805 | | | | | | 3,489,784 | |
| | | | | | | | | | | | |
327
| | | | | | | | | | | | | | | | |
| | | Year Ended 12/31/13 | | | Year Ended 12/31/12 | |
| | | | |
| | | GS2 | | | GS4 | | | GS2 | | | GS4 | |
MyDestination 2055 | | | | | | | | | | | | | | | | |
Shares sold | | | | | | | 779,633 | | | | | | | | 1,228,311 | |
Shares reinvested | | | | | | | 79,228 | | | | | | | | 10,652 | |
Shares redeemed | | | | | | | (158,031 | ) | | | | | | | (675,062 | ) |
| | | | | | | | | | | | | | | | |
Net increase (decrease) | | | | | | | 700,830 | | | | | | | | 563,901 | |
| | | | | | | | | | | | | | | | |
Conservative Allocation | | | | | | | | | | | | | | | | |
Shares sold | | | | | | | 3,550,322 | | | | | | | | 3,749,359 | |
Shares reinvested | | | | | | | 1,864,374 | | | | | | | | 532,286 | |
Shares redeemed | | | | | | | (5,118,767 | ) | | | | | | | (2,659,967 | ) |
| | | | | | | | | | | | | | | | |
Net increase | | | | | | | 295,929 | | | | | | | | 1,621,678 | |
| | | | | | | | | | | | | | | | |
Balanced Allocation | | | | | | | | | | | | | | | | |
Shares sold | | | | | | | 6,124,611 | | | | | | | | 4,803,801 | |
Shares reinvested | | | | | | | 6,104,594 | | | | | | | | 3,071,332 | |
Shares redeemed | | | | | | | (8,788,484 | ) | | | | | | | (6,451,079 | ) |
| | | | | | | | | | | | | | | | |
Net increase | | | | | | | 3,440,721 | | | | | | | | 1,424,054 | |
| | | | | | | | | | | | | | | | |
Growth Allocation | | | | | | | | | | | | | | | | |
Shares sold | | | | | | | 3,092,779 | | | | | | | | 2,499,289 | |
Shares reinvested | | | | | | | 6,462,903 | | | | | | | | 1,385,054 | |
Shares redeemed | | | | | | | (6,124,482 | ) | | | | | | | (5,983,566 | ) |
| | | | | | | | | | | | | | | | |
Net increase (decrease) | | | | | | | 3,431,200 | | | | | | | | (2,099,223 | ) |
| | | | | | | | | | | | | | | | |
Aggressive Allocation | | | | | | | | | | | | | | | | |
Shares sold | | | | | | | 2,138,220 | | | | | | | | 6,233,287 | |
Shares reinvested | | | | | | | 3,947,279 | | | | | | | | 1,382,510 | |
Shares redeemed | | | | | | | (5,065,859 | ) | | | | | | | (11,235,355 | ) |
| | | | | | | | | | | | | | | | |
Net increase (decrease) | | | | | | | 1,019,640 | | | | | | | | (3,619,558 | ) |
| | | | | | | | | | | | | | | | |
Conservative Allocation I | | | | | | | | | | | | | | | | |
Shares sold | | | 1,051,991 | | | | | | | | 1,302,574 | | | | | |
Shares reinvested | | | 307,930 | | | | | | | | 218,686 | | | | | |
Shares redeemed | | | (1,268,188 | ) | | | | | | | (971,386 | ) | | | | |
| | | | | | | | | | | | | | | | |
Net increase | | | 91,733 | | | | | | | | 549,874 | | | | | |
| | | | | | | | | | | | | | | | |
Balanced Allocation I | | | | | | | | | | | | | | | | |
Shares sold | | | 2,931,254 | | | | | | | | 2,004,250 | | | | | |
Shares reinvested | | | 1,297,121 | | | | | | | | 1,359,355 | | | | | |
Shares redeemed | | | (2,315,029 | ) | | | | | | | (2,221,689 | ) | | | | |
| | | | | | | | | | | | | | | | |
Net increase | | | 1,913,346 | | | | | | | | 1,141,916 | | | | | |
| | | | | | | | | | | | | | | | |
328
| | | | | | | | | | | | | | | | |
| | | Year Ended 12/31/13 | | | Year Ended 12/31/12 | |
| | | | |
| | | GS2 | | | GS4 | | | GS2 | | | GS4 | |
Growth Allocation I | | | | | | | | | | | | | | | | |
Shares sold | | | 2,619,702 | | | | | | | | 968,767 | | | | | |
Shares reinvested | | | 769,800 | | | | | | | | 556,094 | | | | | |
Shares redeemed | | | (1,488,489 | ) | | | | | | | (2,009,594 | ) | | | | |
| | | | | | | | | | | | | | | | |
Net increase (decrease) | | | 1,901,013 | | | | | | | | (484,733 | ) | | | | |
| | | | | | | | | | | | | | | | |
Aggressive Allocation I | | | | | | | | | | | | | | | | |
Shares sold | | | 1,441,037 | | | | | | | | 563,200 | | | | | |
Shares reinvested | | | 335,244 | | | | | | | | 206,778 | | | | | |
Shares redeemed | | | (988,775 | ) | | | | | | | (1,360,178 | ) | | | | |
| | | | | | | | | | | | | | | | |
Net increase (decrease) | | | 787,506 | | | | | | | | (590,200 | ) | | | | |
| | | | | | | | | | | | | | | | |
Money Market | | | | | | | | | | | | | | | | |
Shares sold | | | 105,460,546 | | | | 4,335,936,657 | | | | 83,682,824 | | | | 3,411,426,687 | |
Shares reinvested | | | 38,908 | | | | 105,203 | | | | 96,490 | | | | 73,574 | |
Shares redeemed | | | (106,106,557 | ) | | | (4,204,891,545 | ) | | | (93,414,476 | ) | | | (3,441,385,827 | ) |
| | | | | | | | | | | | | | | | |
Net increase (decrease) | | | (607,103 | ) | | | 131,150,315 | | | | (9,635,162 | ) | | | (29,885,566 | ) |
| | | | | | | | | | | | | | | | |
Low-Duration Bond | | | | | | | | | | | | | | | | |
Shares sold | | | 2,410,812 | | | | 7,197,509 | | | | 1,736,358 | | | | 10,131,882 | |
Shares reinvested | | | 320,329 | | | | 549,518 | | | | 425,569 | | | | 818,950 | |
Shares redeemed | | | (2,259,882 | ) | | | (5,397,894 | ) | | | (853,542 | ) | | | (7,872,202 | ) |
| | | | | | | | | | | | | | | | |
Net increase | | | 471,259 | | | | 2,349,133 | | | | 1,308,385 | | | | 3,078,630 | |
| | | | | | | | | | | | | | | | |
Medium-Duration Bond | | | | | | | | | | | | | | | | |
Shares sold | | | 3,728,890 | | | | 5,082,508 | | | | 3,397,961 | | | | 4,647,929 | |
Shares reinvested | | | 1,297,479 | | | | 725,378 | | | | 2,151,022 | | | | 1,406,047 | |
Shares redeemed | | | (6,539,868 | ) | | | (6,915,624 | ) | | | (2,638,135 | ) | | | (8,957,431 | ) |
| | | | | | | | | | | | | | | | |
Net increase (decrease) | | | (1,513,499 | ) | | | (1,107,738 | ) | | | 2,910,848 | | | | (2,903,455 | ) |
| | | | | | | | | | | | | | | | |
Extended-Duration Bond | | | | | | | | | | | | | | | | |
Shares sold | | | 1,450,978 | | | | 1,802,684 | | | | 1,716,122 | | | | 3,486,474 | |
Shares reinvested | | | 2,566,909 | | | | 1,075,013 | | | | 2,028,140 | | | | 1,132,113 | |
Shares redeemed | | | (6,720,701 | ) | | | (10,234,291 | ) | | | (1,682,883 | ) | | | (3,286,612 | ) |
| | | | | | | | | | | | | | | | |
Net increase (decrease) | | | (2,702,814 | ) | | | (7,356,594 | ) | | | 2,061,379 | | | | 1,331,975 | |
| | | | | | | | | | | | | | | | |
Global Bond | | | | | | | | | | | | | | | | |
Shares sold | | | | | | | 13,971,357 | | | | | | | | 5,063,867 | |
Shares reinvested | | | | | | | 931,764 | | | | | | | | 1,042,050 | |
Shares redeemed | | | | | | | (1,865,216 | ) | | | | | | | (1,155,096 | ) |
| | | | | | | | | | | | | | | | |
Net increase | | | | | | | 13,037,905 | | | | | | | | 4,950,821 | |
| | | | | | | | | | | | | | | | |
Defensive Market Strategies | | | | | | | | | | | | | | | | |
Shares sold | | | 661,878 | | | | 6,381,892 | | | | 1,394,675 | | | | 5,372,393 | |
Shares reinvested | | | 721,331 | | | | 3,070,861 | | | | 357,500 | | | | 1,246,865 | |
Shares redeemed | | | (1,607,751 | ) | | | (4,528,408 | ) | | | (1,010,990 | ) | | | (527,398 | ) |
| | | | | | | | | | | | | | | | |
Net increase (decrease) | | | (224,542 | ) | | | 4,924,345 | | | | 741,185 | | | | 6,091,860 | |
| | | | | | | | | | | | | | | | |
329
| | | | | | | | | | | | | | | | |
| | | Year Ended 12/31/13 | | | Year Ended 12/31/12 | |
| | | | |
| | | GS2 | | | GS4 | | | GS2 | | | GS4 | |
Equity Index | | | | | | | | | | | | | | | | |
Shares sold | | | 1,131,793 | | | | 2,256,224 | | | | 1,309,015 | | | | 1,535,150 | |
Shares reinvested | | | 460,083 | | | | 335,582 | | | | 400,508 | | | | 330,280 | |
Shares redeemed | | | (662,076 | ) | | | (1,537,196 | ) | | | (674,532 | ) | | | (1,761,582 | ) |
| | | | | | | | | | | | | | | | |
Net increase | | | 929,800 | | | | 1,054,610 | | | | 1,034,991 | | | | 103,848 | |
| | | | | | | | | | | | | | | | |
Value Equity | | | | | | | | | | | | | | | | |
Shares sold | | | 2,595,246 | | | | 4,377,712 | | | | 1,248,320 | | | | 2,949,920 | |
Shares reinvested | | | 2,293,663 | | | | 2,159,615 | | | | 919,754 | | | | 839,556 | |
Shares redeemed | | | (6,218,683 | ) | | | (12,367,991 | ) | | | (3,682,506 | ) | | | (7,027,650 | ) |
| | | | | | | | | | | | | | | | |
Net decrease | | | (1,329,774 | ) | | | (5,830,664 | ) | | | (1,514,432 | ) | | | (3,238,174 | ) |
| | | | | | | | | | | | | | | | |
Growth Equity | | | | | | | | | | | | | | | | |
Shares sold | | | 1,209,794 | | | | 2,482,933 | | | | 608,864 | | | | 2,980,715 | |
Shares reinvested | | | 4,889,718 | | | | 8,132,474 | | | | 1,904,890 | | | | 3,649,389 | |
Shares redeemed | | | (3,679,257 | ) | | | (9,363,004 | ) | | | (1,935,265 | ) | | | (5,320,301 | ) |
| | | | | | | | | | | | | | | | |
Net increase | | | 2,420,255 | | | | 1,252,403 | | | | 578,489 | | | | 1,309,803 | |
| | | | | | | | | | | | | | | | |
Small Cap Equity | | | | | | | | | | | | | | | | |
Shares sold | | | 674,645 | | | | 3,097,274 | | | | 335,769 | | | | 1,682,203 | |
Shares reinvested | | | 2,205,035 | | | | 4,671,768 | | | | 537,278 | | | | 1,237,825 | |
Shares redeemed | | | (1,346,815 | ) | | | (4,452,164 | ) | | | (866,465 | ) | | | (3,478,641 | ) |
| | | | | | | | | | | | | | | | |
Net increase (decrease) | | | 1,532,865 | | | | 3,316,878 | | | | 6,582 | | | | (558,613 | ) |
| | | | | | | | | | | | | | | | |
International Equity | | | | | | | | | | | | | | | | |
Shares sold | | | 2,527,358 | | | | 8,472,335 | | | | 2,421,769 | | | | 8,188,523 | |
Shares reinvested | | | 497,233 | | | | 1,031,763 | | | | 589,493 | | | | 1,281,757 | |
Shares redeemed | | | (6,818,923 | ) | | | (22,701,043 | ) | | | (1,678,205 | ) | | | (5,351,027 | ) |
| | | | | | | | | | | | | | | | |
Net increase (decrease) | | | (3,794,332 | ) | | | (13,196,945 | ) | | | 1,333,057 | | | | 4,119,253 | |
| | | | | | | | | | | | | | | | |
Emerging Markets Equity(1) | | | | | | | | | | | | | | | | |
Shares sold | | | 4,766,135 | | | | 25,064,445 | | | | | | | | | |
Shares redeemed | | | (6,609 | ) | | | (17,379 | ) | | | | | | | | |
| | | | | | | | | | | | | | | | |
Net increase | | | 4,759,526 | | | | 25,047,066 | | | | | | | | | |
| | | | | | | | | | | | | | | | |
Inflation Protected Bond | | | | | | | | | | | | | | | | |
Shares sold | | | | | | | 14,472,849 | | | | | | | | 4,566,757 | |
Shares reinvested | | | | | | | 256,571 | | | | | | | | 824,710 | |
Shares redeemed | | | | | | | (5,308,242 | ) | | | | | | | (2,437,517 | ) |
| | | | | | | | | | | | | | | | |
Net increase | | | | | | | 9,421,178 | | | | | | | | 2,953,950 | |
| | | | | | | | | | | | | | | | |
Flexible Income(2) | | | | | | | | | | | | | | | | |
Shares sold | | | | | | | 10,983,177 | | | | | | | | | |
Shares reinvested | | | | | | | 102,640 | | | | | | | | | |
Shares redeemed | | | | | | | (229,568 | ) | | | | | | | | |
| | | | | | | | | | | | | | | | |
Net increase | | | | | | | 10,856,249 | | | | | | | | | |
| | | | | | | | | | | | | | | | |
330
| | | | | | | | | | | | |
| | | Year Ended 12/31/13 | | | Year Ended 12/31/12 | |
| | | | |
| | | GS2 | | GS4 | | | GS2 | | GS4 | |
Real Assets(2) | | | | | | | | | | | | |
Shares sold | | | | | 2,902,856 | | | | | | | |
Shares reinvested | | | | | 26,318 | | | | | | | |
Shares redeemed | | | | | (113,145 | ) | | | | | | |
| | | | | | | | | | | | |
Net increase | | | | | 2,816,029 | | | | | | | |
| | | | | | | | | | | | |
Real Estate Securities | | | | | | | | | | | | |
Shares sold | | | | | 12,984,775 | | | | | | 4,786,237 | |
Shares reinvested | | | | | 3,225,459 | | | | | | 246,062 | |
Shares redeemed | | | | | (9,162,135 | ) | | | | | (3,358,942 | ) |
| | | | | | | | | | | | |
Net increase | | | | | 7,048,099 | | | | | | 1,673,357 | |
| | | | | | | | | | | | |
Global Natural Resources Equity(2) | | | | | | | | | | | | |
Shares sold | | | | | 26,918,280 | | | | | | | |
Shares reinvested | | | | | 328,917 | | | | | | | |
Shares redeemed | | | | | (387,108 | ) | | | | | | |
| | | | | | | | | | | | |
Net increase | | | | | 26,860,089 | | | | | | | |
| | | | | | | | | | | | |
(1)Inception date was October 31, 2013
(2)Inception date was July 1, 2013
7. BANK BORROWINGS
The Board of Trustees approved the renewal of a credit agreement with Bank of America, N.A. dated November 29, 2013 through November 28, 2014. The agreement permits up to $50 million, collectively. Interest is charged to each Fund based on its borrowings at a rate equal to the Bank Prime plus 0.60% or the Wall Street Journal LIBOR One Month Floating Rate plus 1.00%. Each Fund also pays a facility fee equal to its pro rata share of the amount of the credit facility at a rate of 0.23% per annum.
The following Funds borrowed for the year ended December 31, 2013. The repayment amount represents principal and accrued interest.
| | | | | | | | | | | | | | | | |
| Fund | | Loan
Date | | Loan
Amount | | | Loan
Rate | | | Repayment
Date | | Repayment
Amount | |
MyDestination 2055 | | 01/18/13 | | $ | 250,000 | | | | 1.021 | % | | 01/22/13 | | $ | 250,034 | |
| | 10/09/13 | | | 250,000 | | | | 1.174 | % | | 10/10/13 | | | 250,008 | |
Extended-Duration Bond | | 06/04/13 | | | 1,000,000 | | | | 1.194 | % | | 06/05/13 | | | 1,000,033 | |
| | 08/09/13 | | | 15,000,000 | | | | 1.185 | % | | 08/12/13 | | | 15,001,481 | |
No other Funds borrowed for the year ended December 31, 2013, and there were no outstanding loans at December 31, 2013.
8. FEDERAL INCOME TAXES
Each Fund’s policy is to comply with all sections of the Internal Revenue Code of 1986, as amended, that apply to regulated investment companies and to distribute substantially all of its taxable income and capital gains to shareholders. No provision for income or excise taxes is thus required. Each Fund is treated as a separate entity for federal income tax purposes.
The Funds may be subject to taxes imposed by countries in which they invest in issuers existing or operating in such countries. Such taxes are generally based on income earned. The Funds accrue such taxes when the related income is earned. Dividend and interest income is recorded net of non-U.S. taxes paid. Gains realized by the Funds on the sale of securities in certain countries
331
are subject to non-U.S. taxes. The Funds record a liability based on unrealized gains to provide for potential non-U.S. taxes payable upon the sale of these securities. For year ended December 31, 2013, the Emerging Markets Equity Fund accrued non-U.S. taxes on unrealized gains of $111,602.
Management has analyzed the Funds’ tax positions and has concluded that no provision for income tax is required in the Funds’ financial statements. The Funds are not aware of any tax positions for which it is reasonably possible that the total amounts of unrecognized tax benefits will significantly change in the next twelve months. However, management’s conclusions may be subject to review and adjustment at a later date based on factors including, but not limited to new tax laws, regulations and administrative interpretations (including court decisions). Each of the Funds’ federal tax returns for the prior three fiscal years (years ended December 31, 2010 through December 31, 2012) remains subject to examination by the Internal Revenue Service.
The character of distributions made during the year from net investment income or net realized gains may differ from their ultimate characterization for federal income tax purposes. Also, due to the timing of dividend distributions, the fiscal year in which amounts are distributed may differ from the year that the income or realized gains (losses) were recorded by the Funds. Income dividends and capital gain distributions are determined in accordance with federal income tax regulations, which may differ from GAAP. These differences are primarily due to differing treatments for futures and options transactions, foreign currency transactions, paydowns, losses deferred due to wash sales, straddles and investments in Passive Foreign Investment Companies (“PFIC’s”). Distributions during the year ended December 31, 2013, were characterized as follows for tax purposes:
| | | | | | | | | | | | | | | | |
Fund | | | | | Ordinary
Income | | | Long-Term
Capital Gain | | | Total
Distribution | |
MyDestination 2005 | | | 2013 | | | $ | 1,430,800 | | | $ | — | | | $ | 1,430,800 | |
| | | 2012 | | | | 1,578,267 | | | | — | | | | 1,578,267 | |
MyDestination 2015 | | | 2013 | | | | 11,082,375 | | | | 507,649 | | | | 11,590,024 | |
| | | 2012 | | | | 7,838,073 | | | | — | | | | 7,838,073 | |
MyDestination 2025 | | | 2013 | | | | 13,816,231 | | | | 11,772,816 | | | | 25,589,047 | |
| | | 2012 | | | | 7,215,597 | | | | — | | | | 7,215,597 | |
MyDestination 2035 | | | 2013 | | | | 6,111,194 | | | | 9,769,547 | | | | 15,880,741 | |
| | | 2012 | | | | 2,242,099 | | | | 879,202 | | | | 3,121,301 | |
MyDestination 2045 | | | 2013 | | | | 4,505,425 | | | | 12,558,112 | | | | 17,063,537 | |
| | | 2012 | | | | 1,379,906 | | | | 660,432 | | | | 2,040,338 | |
MyDestination 2055 | | | 2013 | | | | 337,035 | | | | 689,617 | | | | 1,026,652 | |
| | | 2012 | | | | 118,877 | | | | — | | | | 118,877 | |
Conservative Allocation | | | 2013 | | | | 4,707,701 | | | | 17,556,365 | | | | 22,264,066 | |
| | | 2012 | | | | 5,840,997 | | | | 688,186 | | | | 6,529,183 | |
Balanced Allocation | | | 2013 | | | | 27,828,660 | | | | 53,077,462 | | | | 80,906,122 | |
| | | 2012 | | | | 25,943,077 | | | | 13,284,081 | | | | 39,227,158 | |
Growth Allocation | | | 2013 | | | | 19,778,720 | | | | 71,013,455 | | | | 90,792,175 | |
| | | 2012 | | | | 12,093,852 | | | | 5,913,471 | | | | 18,007,323 | |
Aggressive Allocation | | | 2013 | | | | 18,059,402 | | | | 40,374,215 | | | | 58,433,617 | |
| | | 2012 | | | | 7,350,220 | | | | 9,829,880 | | | | 17,180,100 | |
Conservative Allocation I | | | 2013 | | | | 2,555,600 | | | | 476,930 | | | | 3,032,530 | |
| | | 2012 | | | | 2,141,071 | | | | — | | | | 2,141,071 | |
Balanced Allocation I | | | 2013 | | | | 13,881,599 | | | | — | | | | 13,881,599 | |
| | | 2012 | | | | 13,614,253 | | | | — | | | | 13,614,253 | |
Growth Allocation I | | | 2013 | | | | 9,414,953 | | | | — | | | | 9,414,953 | |
| | | 2012 | | | | 5,883,636 | | | | — | | | | 5,883,636 | |
Aggressive Allocation I | | | 2013 | | | | 4,675,371 | | | | — | | | | 4,675,371 | |
| | | 2012 | | | | 2,288,303 | | | | — | | | | 2,288,303 | |
Money Market | | | 2013 | | | | 228,385 | | | | — | | | | 228,385 | |
| | | 2012 | | | | 256,904 | | | | — | | | | 256,904 | |
332
| | | | | | | | | | | | | | | | |
Fund | | | | | Ordinary
Income | | | Long-Term
Capital Gain | | | Total
Distribution | |
Low-Duration Bond | | | 2013 | | | $ | 10,153,806.00 | | | $ | — | | | $ | 10,153,806.00 | |
| | | 2012 | | | | 14,200,533 | | | | 430,869 | | | | 14,631,402 | |
Medium-Duration Bond | | | 2013 | | | | 19,625,346 | | | | — | | | | 19,625,346 | |
| | | 2012 | | | | 36,230,589 | | | | — | | | | 36,230,589 | |
Extended-Duration Bond | | | 2013 | | | | 16,784,004 | | | | 15,235,598 | | | | 32,019,602 | |
| | | 2012 | | | | 25,350,803 | | | | 8,562,989 | | | | 33,913,792 | |
Global Bond | | | 2013 | | | | 9,497,750 | | | | — | | | | 9,497,750 | |
| | | 2012 | | | | 10,523,011 | | | | — | | | | 10,523,011 | |
Defensive Market Strategies | | | 2013 | | | | 24,435,473 | | | | 18,757,192 | | | | 43,192,665 | |
| | | 2012 | | | | 14,722,792 | | | | 2,364,615 | | | | 17,087,407 | |
Equity Index | | | 2013 | | | | 6,219,243 | | | | 4,196,449 | | | | 10,415,692 | |
| | | 2012 | | | | 5,289,625 | | | | 2,667,155 | | | | 7,956,780 | |
Value Equity | | | 2013 | | | | 25,431,349 | | | | 40,067,680 | | | | 65,499,029 | |
| | | 2012 | | | | 19,346,383 | | | | — | | | | 19,346,383 | |
Growth Equity | | | 2013 | | | | 50,068,100 | | | | 193,351,088 | | | | 243,419,188 | |
| | | 2012 | | | | 2,148,451 | | | | 95,278,551 | | | | 97,427,002 | |
Small Cap Equity | | | 2013 | | | | 39,689,845 | | | | 66,847,494 | | �� | | 106,537,339 | |
| | | 2012 | | | | 3,052,762 | | | | 22,280,774 | | | | 25,333,536 | |
International Equity | | | 2013 | | | | 21,343,925 | | | | — | | | | 21,343,925 | |
| | | 2012 | | | | 22,469,818 | | | | — | | | | 22,469,818 | |
Inflation Protected Bond | | | 2013 | | | | 2,068,697 | | | | 682,106 | | | | 2,750,803 | |
| | | 2012 | | | | 7,052,735 | | | | 2,263,673 | | | | 9,316,408 | |
Flexible Income | | | 2013 | | | | 1,028,524 | | | | — | | | | 1,028,524 | |
Real Assets | | | 2013 | | | | 258,438 | | | | — | | | | 258,438 | |
Real Estate Securities | | | 2013 | | | | 10,582,340 | | | | 19,896,262 | | | | 30,478,602 | |
| | | 2012 | | | | 2,553,245 | | | | — | | | | 2,553,245 | |
Global Natural Resources Equity | | | 2013 | | | | 3,127,024 | | | | — | | | | 3,127,024 | |
At December 31, 2013, the components of distributable earnings on a tax basis were as follows:
| | | | | | | | | | | | | | | | |
Fund | | Undistributed
Ordinary
Income | | | Undistributed
Long-Term
Capital
Gain/ (Capital
Loss
Carryforward) | | | Late Year
Loss
Deferrals | | | Net Unrealized
Appreciation
(Depreciation)
on Investments | |
MyDestination 2005 | | $ | 83,785 | | | $ | 1,356,949 | | | $ | — | | | $ | 2,202,178 | |
MyDestination 2015 | | | — | | | | 10,218,241 | | | | — | | | | 35,242,944 | |
MyDestination 2025 | | | 78,978 | | | | 15,609,679 | | | | — | | | | 53,589,787 | |
MyDestination 2035 | | | 68,660 | | | | 10,599,160 | | | | — | | | | 38,394,452 | |
MyDestination 2045 | | | 60,829 | | | | 8,242,663 | | | | — | | | | 28,023,688 | |
MyDestination 2055 | | | 5,263 | | | | 636,071 | | | | — | | | | 1,036,090 | |
Conservative Allocation | | | 13,257 | | | | 3,058,599 | | | | — | | | | 14,498,618 | |
Balanced Allocation | | | 107,105 | | | | 27,634,774 | | | | — | | | | 129,598,801 | |
Growth Allocation | | | 197,890 | | | | 31,187,159 | | | | — | | | | 113,718,347 | |
Aggressive Allocation | | | 291,461 | | | | 37,793,564 | | | | — | | | | 151,067,455 | |
Conservative Allocation I | | | — | | | | 1,154,011 | | | | — | | | | (2,728,184 | ) |
Balanced Allocation I | | | 5,275,083 | | | | (2,089,258 | ) | | | — | | | | (4,171,921 | ) |
Growth Allocation I | | | 1,464,856 | | | | 7,330,894 | | | | — | | | | 6,995,407 | |
Aggressive Allocation I | | | 4,390,854 | | | | 3,534,218 | | | | — | | | | 6,771,111 | |
Money Market | | | 47,830 | | | | — | | | | — | | | | — | |
Low-Duration Bond | | | 190,509 | | | | 462,630 | | | | — | | | | (5,095,179 | ) |
Medium-Duration Bond | | | 1,121,489 | | | | (10,419,386 | ) | | | — | | | | (154,153 | ) |
Extended-Duration Bond | | | 154,959 | | | | 486,133 | | | | — | | | | 11,717,206 | |
Global Bond | | | 639,097 | | | | (7,751,153 | ) | | | (69,959 | ) | | | 9,266,210 | |
333
| | | | | | | | | | | | | | | | |
Fund | | Undistributed
Ordinary
Income | | | Undistributed
Long-Term
Capital
Gain/ (Capital
Loss
Carryforward) | | | Late Year
Loss
Deferrals | | | Net Unrealized
Appreciation
(Depreciation)
on Investments | |
Defensive Market Strategies | | $ | 1,418,808 | | | $ | 3,727,575 | | | $ | — | | | $ | 44,120,637 | |
Equity Index | | | 344,212 | | | | 1,163,051 | | | | — | | | | 126,006,448 | |
Value Equity | | | 246,220 | | | | 14,943,180 | | | | — | | | | 303,141,063 | |
Growth Equity | | | 4,112,762 | | | | 18,877,835 | | | | — | | | | 382,685,592 | |
Small Cap Equity | | | 6,278,462 | | | | 5,659,213 | | | | — | | | | 100,925,709 | |
International Equity | | | 1,717,147 | | | | (45,022,506 | ) | | | — | | | | 224,742,189 | |
Emerging Markets Equity | | | — | | | | 42,811 | | | | (1,088,983 | ) | | | (5,898,907 | ) |
Inflation Protected Bond | | | 30,727 | | | | (1,141,069 | ) | | | — | | | | (7,718,462 | ) |
Flexible Income | | | 91,204 | | | | — | | | | — | | | | 517,058 | |
Real Assets | | | 310 | | | | 315,257 | | | | — | | | | (933,274 | ) |
Real Estate Securities | | | — | | | | 258,324 | | | | (902,246 | ) | | | (8,027,391 | ) |
Global Natural Resources Equity | | | 152,400 | | | | — | | | | — | | | | (13,070,671 | ) |
For Federal income tax purposes, realized capital losses may be carried forward and applied against future realized capital gains. Capital loss carryovers and their expiration dates, were as follows as of December 31, 2013:
| | | | | | | | | | | | | | | | |
| | | | | | | | | | | | | | | | |
| | | | | | | | | | | | | | | | |
| Expiring December 31, | | 2017 | | | 2018 | | | Unlimited | | | Total | |
Balanced Allocation I | | $ | — | | | $ | 2,089,258 | | | $ | — | | | $ | 2,089,258 | |
Medium-Duration Bond | | | — | | | | — | | | | 10,419,386 | | | | 10,419,386 | |
Global Bond | | | 7,751,153 | | | | — | | | | — | | | | 7,751,153 | |
International Equity | | | 45,022,506 | | | | — | | | | — | | | | 45,022,506 | |
Inflation Protected Bond | | | — | | | | — | | | | 1,141,069 | | | | 1,141,069 | |
Under the Regulated Investment Company Modernization Act of 2010, Funds will be permitted to carry forward capital losses incurred in taxable years beginning after December 22, 2010, for an unlimited period. Such losses are presented in the table above under the column heading “Unlimited.” However, any losses incurred during those future taxable years will be required to be utilized prior to the losses incurred in pre-enactment taxable years. As a result of this ordering rule, pre-enactment capital loss carryforwards may be more likely to expire unused. Additionally, post-enactment capital losses that are carried forward will retain their character as either short-term or long-term capital losses rather than being considered all short-term losses as under previous law.
During the year ended December 31, 2013, the following Funds utilized capital loss carryforwards to offset capital gains:
| | | | |
| | | Carryforward
Utilized | |
MyDestination 2005 | | $ | 1,881,232 | |
MyDestination 2015 | | | 9,086,079 | |
Conservative Allocation I | | | 2,058,253 | |
Balanced Allocation I | | | 15,326,290 | |
Growth Allocation I | | | 7,761,554 | |
Aggressive Allocation I | | | 7,608,540 | |
Global Bond | | | 2,653,072 | |
Value Equity | | | 91,152,620 | |
International Equity | | | 90,064,756 | |
334
For federal income tax purposes, late year loss deferrals, which will reverse in 2014, were as follows as of December 31, 2013:
| | | | | | | | | | | | |
| | | Capital | | | Ordinary
Income | | | Total | |
Global Bond | | $ | 69,959 | | | $ | — | | | $ | 69,959 | |
Emerging Markets Equity | | | — | | | | 1,088,983 | | | | 1,088,983 | |
Real Estate Securities | | | 902,246 | | | | — | | | | 902,246 | |
At December 31, 2013, the aggregate cost of investment securities for federal income tax purposes (excluding foreign currency, securities sold short and derivative related items) and the net unrealized appreciation from investments for those securities having an excess of value over cost and net unrealized depreciation from investments for those securities having an excess of cost over value (based on cost for federal income tax purposes) were as follows:
| | | | | | | | | | | | | | | | |
Fund | | Federal Tax Cost | | | Net Unrealized
Appreciation
(Depreciation) | | | Appreciated
Securities | | | Depreciated
Securities | |
MyDestination 2005 | | $ | 82,536,368 | | | $ | 2,202,178 | | | $ | 4,246,908 | | | $ | (2,044,730 | ) |
MyDestination 2015 | | | 404,850,373 | | | | 35,242,944 | | | | 46,791,497 | | | | (11,548,553 | ) |
MyDestination 2025 | | | 491,092,361 | | | | 53,589,787 | | | | 65,955,731 | | | | (12,365,944 | ) |
MyDestination 2035 | | | 253,051,178 | | | | 38,394,452 | | | | 43,100,470 | | | | (4,706,018 | ) |
MyDestination 2045 | | | 183,540,135 | | | | 28,023,688 | | | | 32,591,732 | | | | (4,568,044 | ) |
MyDestination 2055 | | | 15,264,377 | | | | 1,036,090 | | | | 1,182,185 | | | | (146,095 | ) |
Conservative Allocation | | | 304,678,507 | | | | 14,498,618 | | | | 19,066,213 | | | | (4,567,595 | ) |
Balanced Allocation | | | 1,157,909,487 | | | | 129,598,801 | | | | 148,640,164 | | | | (19,041,363 | ) |
Growth Allocation | | | 849,250,331 | | | | 113,718,347 | | | | 126,378,074 | | | | (12,659,727 | ) |
Aggressive Allocation | | | 727,430,531 | | | | 151,067,455 | | | | 153,248,924 | | | | (2,181,469 | ) |
Conservative Allocation I | | | 86,255,258 | | | | (2,728,184 | ) | | | 1,981,011 | | | | (4,709,195 | ) |
Balanced Allocation I | | | 391,078,265 | | | | (4,171,921 | ) | | | 33,956,989 | | | | (38,128,910 | ) |
Growth Allocation I | | | 263,698,821 | | | | 6,995,407 | | | | 29,745,586 | | | | (22,750,179 | ) |
Aggressive Allocation I | | | 181,843,594 | | | | 6,771,111 | | | | 19,764,817 | | | | (12,993,706 | ) |
Money Market | | | 1,368,841,770 | | | | — | | | | — | | | | — | |
Low-Duration Bond | | | 958,827,095 | | | | (3,461,607 | ) | | | 4,693,553 | | | | (8,155,160 | ) |
Medium-Duration Bond | | | 957,317,733 | | | | 105,716 | | | | 19,392,718 | | | | (19,287,002 | ) |
Extended-Duration Bond | | | 286,152,531 | | | | 11,719,293 | | | | 18,858,019 | | | | (7,138,726 | ) |
Global Bond | | | 424,643,921 | | | | 9,205,070 | | | | 14,491,005 | | | | (5,285,935 | ) |
Defensive Market Strategies | | | 544,304,079 | | | | 46,224,769 | | | | 53,746,210 | | | | (7,521,441 | ) |
Equity Index | | | 254,797,719 | | | | 126,006,448 | | | | 136,148,274 | | | | (10,141,826 | ) |
Value Equity | | | 1,146,027,934 | | | | 303,141,063 | | | | 349,488,855 | | | | (46,347,792 | ) |
Growth Equity | | | 1,188,976,548 | | | | 382,685,592 | | | | 397,071,101 | | | | (14,385,509 | ) |
Small Cap Equity | | | 630,223,255 | | | | 100,923,238 | | | | 112,365,530 | | | | (11,442,292 | ) |
International Equity | | | 1,320,249,884 | | | | 236,062,176 | | | | 299,051,161 | | | | (62,988,985 | ) |
Emerging Markets Equity | | | 310,508,335 | | | | (6,131,451 | ) | | | 7,006,095 | | | | (13,137,546 | ) |
Inflation Protected Bond | | | 282,552,585 | | | | (7,672,098 | ) | | | 571,457 | | | | (8,243,555 | ) |
Flexible Income | | | 107,053,439 | | | | 517,058 | | | | 747,683 | | | | (230,625 | ) |
Real Assets | | | 28,510,729 | | | | (933,274 | ) | | | 23,030 | | | | (956,304 | ) |
Real Estate Securities | | | 265,822,561 | | | | (8,023,627 | ) | | | 3,985,185 | | | | (12,008,812 | )�� |
Global Natural Resources Equity | | | 329,679,109 | | | | (13,070,871 | ) | | | 7,919,500 | | | | (20,990,371 | ) |
The differences between book basis and tax-basis unrealized appreciation (depreciation) is attributable primarily to the tax deferral of losses on wash sales and investments in PFIC’s.
At December 31, 2013, capital contributions, accumulated undistributed net investment income and accumulated net realized gain (loss) from investments have been adjusted for current period permanent book/tax differences which arose principally from differing book/tax treatments of PFICs, paydown losses, net operating losses, swaps, foreign currency transactions, distributions received from regulated investment companies, defaulted bonds, reclassifications of dividends paid and non-deductible expenses.
335
The following amounts were reclassified within the capital accounts:
| | | | | | | | | | | | | | | | |
Fund | | Paid in
Capital | | | | | Undistributed
Net Investment
Income | | | | | Accumulated
Net Realized
Gain (Loss) on
Investments,
Currency Translations
and Derivative
Transactions | |
MyDestination 2005 | | $ | — | | | | | $ | 675,232 | | | | | $ | (675,232) | |
MyDestination 2015 | | | — | | | | | | 5,343,266 | | | | | | (5,343,266) | |
MyDestination 2025 | | | — | | | | | | 7,410,221 | | | | | | (7,410,221) | |
MyDestination 2035 | | | — | | | | | | 3,276,328 | | | | | | (3,276,328) | |
MyDestination 2045 | | | — | | | | | | 2,620,682 | | | | | | (2,620,682) | |
MyDestination 2055 | | | (364) | | | | | | 204,135 | | | | | | (203,771) | |
Conservative Allocation | | | — | | | | | | 1,853,778 | | | | | | (1,853,778) | |
Balanced Allocation | | | — | | | | | | 11,269,401 | | | | | | (11,269,401) | |
Growth Allocation | | | — | | | | | | 9,189,205 | | | | | | (9,189,205) | |
Aggressive Allocation | | | — | | | | | | 10,702,757 | | | | | | (10,702,757) | |
Conservative Allocation I | | | — | | | | | | 590,161 | | | | | | (590,161) | |
Balanced Allocation I | | | — | | | | | | 4,488,148 | | | | | | (4,488,148) | |
Growth Allocation I | | | — | | | | | | 3,990,638 | | | | | | (3,990,638) | |
Aggressive Allocation I | | | — | | | | | | 3,766,916 | | | | | | (3,766,916) | |
Low-Duration Bond | | | — | | | | | | (230,981) | | | | | | 230,981 | |
Medium-Duration Bond | | | — | | | | | | 1,102,045 | | | | | | (1,102,045) | |
Extended-Duration Bond | | | — | | | | | | 731,583 | | | | | | (731,583) | |
Global Bond | | | — | | | | | | (2,278,226) | | | | | | 2,278,226 | |
Defensive Market Strategies | | | (252) | | | | | | 310,715 | | | | | | (310,463) | |
Equity Index | | | — | | | | | | 887 | | | | | | (887) | |
Value Equity | | | — | | | | | | 2,105 | | | | | | (2,105) | |
Growth Equity | | | — | | | | | | 2,467,471 | | | | | | (2,467,471) | |
Small Cap Equity | | | — | | | | | | 746,938 | | | | | | (746,938) | |
International Equity | | | — | | | | | | (3,189,961) | | | | | | 3,189,961 | |
Emerging Markets Equity | | | (254,800) | | | | | | (989,047) | | | | | | 1,243,847 | |
Inflation Protected Bond | | | — | | | | | | 4,093 | | | | | | (4,093) | |
Flexible Income | | | (1,000) | | | | | | 5,324 | | | | | | (4,324) | |
Real Assets | | | (1,257) | | | | | | 151,335 | | | | | | (150,078) | |
Real Estate Securities | | | — | | | | | | 206,469 | | | | | | (206,469) | |
Global Natural Resources Equity | | | (1,000) | | | | | | 538,812 | | | | | | (537,812) | |
Net investment income, net realized gain (loss) on investments and net assets were not affected by these reclassifications.
9. MARKET AND CREDIT RISK
In the normal course of business, the Funds trade financial instruments and enter into financial transactions where the risk of potential loss exists due to changes in the market (market risk) or due to the failure of the other party to a transaction to perform (credit and counterparty risks).
Market Risks — A Fund’s investments in derivatives and other financial instruments expose the Fund to various risks such as, but not limited to, interest rate, foreign currency, equity and commodity risks.
Interest rate risk is the risk that fixed income securities will decline in value because of changes in interest rates. As nominal interest rates rise, the value of certain fixed income securities held by a Fund is likely to decrease. A nominal interest rate can be described as the sum of a real interest rate and an expected inflation rate. Fixed income securities with longer durations tend to be more sensitive to changes in interest rates, usually making them more volatile than securities with shorter durations. Duration is useful primarily as a measure of the sensitivity of a fixed income’s market price to interest rate (i.e. yield) movements.
336
If a Fund invests directly in foreign currencies or in securities that trade in, and receive revenues in, foreign currencies, or in derivatives that provide exposure to foreign currencies, it will be subject to the risk that those currencies will decline in value relative to the base currency of the Fund, or, in the case of hedging positions, that the Fund’s base currency will decline in value relative to the currency being hedged. Currency rates in foreign countries may fluctuate significantly over short periods of time for a number of reasons, including changes in interest rates, intervention (or the failure to intervene) by U.S. or foreign governments, central banks or supranational entities such as the International Monetary Fund, or by the imposition of currency controls or other political developments in the United States or abroad. As a result, a Fund’s investments in foreign currency denominated securities may reduce the returns of the Fund.
The market values of equities, such as common stocks and preferred stocks, or equity related investments such as futures and options, may decline due to general market conditions which are not specifically related to a particular company, such as real or perceived adverse economic conditions, changes in the general outlook for corporate earnings, changes in interest or currency rates or adverse investor sentiment. Market values may also decline due to factors which affect a particular industry or industries, such as labor shortages or increased production costs and competitive conditions within an industry. Equity securities and equity related investments generally have greater market price volatility than fixed income securities.
A Fund’s investments in commodity-linked derivative instruments may subject the Fund to greater market price volatility than investments in traditional securities. The value of commodity-linked derivative instruments may be affected by changes in overall market movements, commodity index volatility, changes in interest rates, or factors affecting a particular industry or commodity, such as drought, floods, weather, livestock disease, embargoes, tariffs and international economic, political and regulatory developments.
Credit and Counterparty Risks — A Fund will be exposed to credit risk on parties with whom it trades and will also bear the risk of settlement default. A Fund minimizes concentrations of credit risk by undertaking transactions with a large number of customers and counterparties on recognized and reputable exchanges. A Fund could lose money if the issuer or guarantor of a fixed income security, or the counterparty to a derivatives contract, repurchase agreement or a loan of portfolio securities, is unable or unwilling to make timely principal and/or interest payments, or to otherwise honor its obligations. Securities are subject to varying degrees of credit risk, which are often reflected in credit ratings.
Similar to credit risk, a Fund may be exposed to counterparty risk, or the risk that an institution or other entity with which the Fund has unsettled or open transactions will default. Financial assets, which potentially expose a Fund to counterparty risk, consist principally of cash due from counterparties and investments. The investment advisers minimize counterparty risks to the Funds by performing extensive reviews of each counterparty and obtaining approval from the Counterparty Risk Committee prior to entering into transactions with a third party. All transactions in listed securities are settled/paid for upon delivery using approved counterparties. The risk of default is considered minimal, as delivery of securities sold is only made once a Fund has received payment. Payment is made on a purchase once the securities have been delivered by the counterparty. The trade will fail if either party fails to meet its obligation.
10. OUT OF PERIOD ADJUSTMENT
The Statement of Operations contains an out of period adjustment to Investment Income. GuideStone Capital Management was notified of a clerical error by a third party service provider in certain Select Funds that are identified in the table below. The
337
adjustment includes amounts due to the Funds from the years 2004 to 2013. This resulted in an understatement of Total Investment Income on the Statement of Operations for each year. As management believes that this error was not material to prior years’ financial statements and that the impact of recording the error in the current year is not material to the Funds’ financial statements, the Funds recorded the cumulative adjustment in the current year.
| | | | |
| | | Payment
Amount | |
Money Market | | $ | 36,613 | |
Low-Duration Bond | | | 199,296 | |
Medium-Duration Bond | | | 348,413 | |
Extended-Duration Bond | | | 156,881 | |
Global Bond | | | 52,815 | |
Defensive Market Strategies | | | 31,058 | |
Equity Index | | | 67,963 | |
Value Equity | | | 269,107 | |
Growth Equity | | | 333,638 | |
Small Cap Equity | | | 393,800 | |
International Equity | | | 387,891 | |
Emerging Markets Equity | | | 1,189 | |
Inflation Protected Bond | | | 31,810 | |
Real Estate Securities | | | 62,221 | |
Global Natural Resources Equity | | | 6,927 | |
11. SUBSEQUENT EVENTS
Subsequent events have been evaluated through the date that the financial statements were available to be issued. Except as described in Note 10, above, all subsequent events determined to be relevant and material to the financial statements have been appropriately recorded or disclosed.
338
REPORT OF INDEPENDENT REGISTERED PUBLIC ACCOUNTING FIRM
To the Board of Trustees and
Shareholders of GuideStone Funds:
In our opinion, the accompanying statements of assets and liabilities, including the schedules of investments, and the related statements of operations and of changes in net assets and the financial highlights present fairly, in all material respects, the financial position of MyDestination 2005 Fund, MyDestination 2015 Fund, MyDestination 2025 Fund, MyDestination 2035 Fund, MyDestination 2045 Fund, MyDestination 2055 Fund, Conservative Allocation Fund, Balanced Allocation Fund, Growth Allocation Fund, Aggressive Allocation Fund, Conservative Allocation Fund I, Balanced Allocation Fund I, Growth Allocation Fund I, Aggressive Allocation Fund I, Money Market Fund, Low-Duration Bond Fund, Medium-Duration Bond Fund, Extended-Duration Bond Fund, Inflation Protected Bond Fund, Global Bond Fund, Defensive Market Strategies Fund, Equity Index Fund, Real Estate Securities Fund, Value Equity Fund, Growth Equity Fund, Small Cap Equity Fund, International Equity Fund, Emerging Markets Equity Fund, Real Assets Fund, Flexible Income Fund, and Global Natural Resources Equity Fund (constituting GuideStone Funds, hereafter referred to as the “Trust”) at December 31, 2013, the results of each of their operations, the changes in each of their net assets and the financial highlights for each of the periods indicated, in conformity with accounting principles generally accepted in the United States of America. These financial statements and financial highlights (hereafter referred to as “financial statements”) are the responsibility of the Trust’s management; our responsibility is to express an opinion on these financial statements based on our audits. We conducted our audits of these financial statements in accordance with the standards of the Public Company Accounting Oversight Board (United States). Those standards require that we plan and perform the audit to obtain reasonable assurance about whether the financial statements are free of material misstatement. An audit includes examining, on a test basis, evidence supporting the amounts and disclosures in the financial statements, assessing the accounting principles used and significant estimates made by management, and evaluating the overall financial statement presentation. We believe that our audits, which included confirmation of securities at December 31, 2013 by correspondence with the custodian, brokers and transfer agent of the investee funds, provide a reasonable basis for our opinion.

PricewaterhouseCoopers LLP
Philadelphia, Pennsylvania
March 1, 2014
339
NOTICE TO SHAREHOLDERS (Unaudited)
Each Fund is required by Subchapter M of the Internal Revenue Code of 1986, as amended, to advise its shareholders of the federal tax status of distributions received by each Fund’s shareholders. During the year ended December 31, 2013, the Funds hereby designate the following dividends and distributions paid by each of the Funds:
| | | | | | | | | | | | |
Fund | | Ordinary
Income | | | Long-Term
Capital Gain | | | Return
of Capital | |
MyDestination 2005 | | $ | 1,430,800 | | | $ | — | | | $ | — | |
MyDestination 2015 | | | 11,082,375 | | | | 507,649 | | | | — | |
MyDestination 2025 | | | 13,816,231 | | | | 11,772,816 | | | | — | |
MyDestination 2035 | | | 6,111,194 | | | | 9,769,547 | | | | — | |
MyDestination 2045 | | | 4,505,425 | | | | 12,558,112 | | | | — | |
MyDestination 2055 | | | 337,035 | | | | 689,617 | | | | — | |
Conservative Allocation | | | 4,707,701 | | | | 17,556,365 | | | | — | |
Balanced Allocation | | | 27,828,660 | | | | 53,077,462 | | | | — | |
Growth Allocation | | | 19,778,720 | | | | 71,013,455 | | | | — | |
Aggressive Allocation | | | 18,059,402 | | | | 40,374,215 | | | | — | |
Conservative Allocation I | | | 2,555,600 | | | | 476,930 | | | | — | |
Balanced Allocation I | | | 13,881,599 | | | | — | | | | — | |
Growth Allocation I | | | 9,414,953 | | | | — | | | | — | |
Aggressive Allocation I | | | 4,675,371 | | | | — | | | | — | |
Money Market | | | 228,385 | | | | — | | | | — | |
Low-Duration Bond | | | 10,153,806 | | | | — | | | | — | |
Medium-Duration Bond | | | 19,625,346 | | | | — | | | | — | |
Extended-Duration Bond | | | 16,784,004 | | | | 15,235,598 | | | | — | |
Global Bond | | | 9,497,750 | | | | — | | | | — | |
Defensive Market Strategies | | | 24,435,473 | | | | 18,757,192 | | | | — | |
Equity Index | | | 6,219,243 | | | | 4,196,449 | | | | — | |
Value Equity | | | 25,431,349 | | | | 40,067,680 | | | | — | |
Growth Equity | | | 50,068,100 | | | | 193,351,088 | | | | — | |
Small Cap Equity | | | 39,689,845 | | | | 66,847,494 | | | | — | |
International Equity | | | 21,343,925 | | | | — | | | | — | |
Inflation Protected Bond | | | 2,068,697 | | | | 682,106 | | | | — | |
Flexible Income | | | 1,028,524 | | | | — | | | | — | |
Real Assets | | | 258,438 | | | | — | | | | — | |
Real Estate Securities | | | 10,582,340 | | | | 19,896,262 | | | | — | |
Global Natural Resources Equity | | | 3,127,024 | | | | — | | | | — | |
Dividends from net investment income and short-term capital gains are treated as ordinary income dividends for federal income tax purposes. Long-term capital gain distributions are taxable as capital gain dividends.
340
NOTICE TO SHAREHOLDERS (Continued)
The following percentages of ordinary income dividends paid for the year ended December 31, 2013, have been designated as qualified for the reduced tax rate under The Job and Growth Tax Relief Reconciliation Act of 2003.
| | | | |
Fund | | | |
MyDestination 2005 | | | 21.16 | % |
MyDestination 2015 | | | 21.52 | % |
MyDestination 2025 | | | 25.03 | % |
MyDestination 2035 | | | 32.94 | % |
MyDestination 2045 | | | 34.74 | % |
MyDestination 2055 | | | 32.78 | % |
Conservative Allocation | | | 17.60 | % |
Balanced Allocation | | | 22.05 | % |
Growth Allocation | | | 33.18 | % |
Aggressive Allocation | | | 44.36 | % |
Conservative Allocation I | | | 12.96 | % |
Balanced Allocation I | | | 22.14 | % |
Growth Allocation I | | | 36.29 | % |
Aggressive Allocation I | | | 68.25 | % |
Defensive Market Strategies | | | 25.60 | % |
Equity Index | | | 77.94 | % |
Value Equity | | | 88.35 | % |
Growth Equity | | | 17.22 | % |
Small Cap Equity | | | 5.55 | % |
International Equity | | | 100.00 | % |
Real Assets | | | 7.89 | % |
Real Estate Securities | | | 4.81 | % |
Global Natural Resources Equity | | | 32.93 | % |
All above designations are based on financial information available as of the date of this annual report, and accordingly, are subject to change. It is the intention of the Funds to designate the maximum amount permitted under the Internal Revenue Code and the regulations thereunder. Shareholders are advised to consult their own tax advisers with respect to the tax consequences of their investment in the Funds.
341
FUND MANAGEMENT (Unaudited)
Information pertaining to the Trustees and officers of the Trust is set forth below. The statement of additional information (SAI) includes additional information about the Trustees and is available without charge, upon request, by calling 1-888-98-GUIDE (1-888-984-8433).
| | | | | | | | | | |
| | | | | | | | | | | |
Name, (DOB), Address and Position(s) with Trust | | Term of Office
and Length of
Time Served1 | | | | Principal Occupation(s) During Past 5 Years | | Number of
Portfolios in Fund
Complex
Overseen
by Trustee | | Other Trusteeships/ Directorships Held by Trusteee |
INDEPENDENT TRUSTEES |
Michael R. Buster (1957) 2401 Cedar Springs Road Dallas, TX 75201-1407 Trustee | | Since 2002 | | | | Executive Pastor, Prestonwood Baptist Church, 1989 - present. | | 31 | | Ouachita Baptist University - Board of Trustees Member |
Carson L. Eddy (1943) 2401 Cedar Springs Road Dallas, TX 75201-1407 Trustee | | Since 2011 | | | | Partner in Charge (Orlando office), Carr, Riggs & Ingram, LLC, 2007 - 2014 – Certified Public Accountants; President, Quantum Consulting Group LLC, 2000 - 2013. | | 31 | | N/A |
William Craig George (1958) 2401 Cedar Springs Road Dallas, TX 75201-1407 Trustee | | Since 2004 | | | | Chief Credit Officer, CapStone Bank, 2011 - present; Executive Vice President/ Regional Credit Officer, SunTrust Bank, 1995 - 2011. | | 31 | | N/A |
Grady R. Hazel (1947) 2401 Cedar Springs Road Dallas, TX 75201-1407 Trustee | | Since 2011 | | | | G400 Field Representative, American Institute of Certified Public Accountants, 2012 - present; Executive Director, Society of Louisiana CPAs, 1995 - 2012. | | 31 | | Neighbors Federal Credit Union — Board of Directors Member and Chairman of Audit Committee; Stonetrust Commercial Insurance Company — Board of Directors Member and Member of Audit Committee |
Joseph A. Mack (1939) 2401 Cedar Springs Road Dallas, TX 75201-1407 Trustee | | Since 2002 | | | | Retired - Director, Office of Public Policy, South Carolina Baptist Convention, 1999 - 2011. | | 31 | | N/A |
Franklin R. Morgan (1943) 2401 Cedar Springs Road Dallas, TX 75201-1407 Trustee | | Since 2005 | | | | Retired - Senior Vice President, Director of International Administration, Prudential Securities, Inc., January 1962 - May 2003. | | 31 | | N/A |
Kyle Tucker (1981) 2401 Cedar Springs Road Dallas, TX 75201-1407 Trustee | | Since 2013 | | | | Vice President and Financial Advisor - CAPTRUST Financial Advisors, 2006 - Present. | | 31 | | N/A |
INTERESTED TRUSTEES2,3 |
Thomas G. Evans (1961) 2401 Cedar Springs Road Dallas, TX 75201-1407 Trustee | | Since 2012 | | | | Appraiser, Manager and Owner, Encompass Financial Services, Inc., 1985 – present, President and Owner, Custom Land Management, LLC, 1984 – present; Manager, Private Partners Opportunity Fund, LLC, 2011 – present. | | 31 | | GuideStone Financial Resources – Board of Trustees Member, June 2010 – present; Baptist Foundation of Oklahoma, Board of Directors Member and Chairman, 2004 – present; Pioneer Spirit Foundation – Board of Trustees Member, 1993 – present; GuideStone Capital Management, LLC, Board of Directors Member, July 2011 – July 2012 |
James W. Hixson (1931) 2401 Cedar Springs Road Dallas, TX 75201-1407 Trustee | | Since 2010 | | | | Retired | | 31 | | GuideStone Financial Resources – Board of Trustees Member, June 2008 – present; GuideStone Advisors – Board of Directors Member, July 2008 – present; GuideStone Financial Services – Board of Directors Member, July 2008 – present |
342
FUND MANAGEMENT (Continued)
| | | | | | | | | | |
| | | | | | | | | | | |
Name, (DOB), Address and Position(s) with Trust | | Term of Office and Length of Time Served1 | | | | Principal Occupation(s) During Past 5 Years | | Number of Portfolios in Fund
Complex
Overseen by Trustee | | Other Trusteeships/ Directorships Held by Trusteee |
| OFFICERS WHO ARE NOT TRUSTEES4 |
Ron W. Bass (1966) 2401 Cedar Springs Road Dallas, TX 75201-1407 Chief Compliance Officer and AML Officer. | | Since 2009 | | | | Director of Broker/Dealer and RIA Compliance, GuideStone Financial Resources, June 2009 – present; Manager of Broker/Dealer and RIA Compliance, GuideStone Financial Resources, 2008 – May 2009. | | N/A | | N/A |
Jeffrey P. Billinger (1946) 2401 Cedar Springs Road Dallas, TX 75201-1407 Vice President and Treasurer | | Since 2000 | | | | Vice President, Treasurer and Chief Financial Officer, GuideStone Financial Resources, 1995 - present. | | N/A | | N/A |
Rodric E. Cummins (1957) 2401 Cedar Springs Road Dallas, TX 75201-1407 Vice President and Investment Officer | | Since 2000 | | | | Vice President and Chief Investment Officer, GuideStone Financial Resources, 1998 - present. | | N/A | | N/A |
Ronald C. Dugan, Jr. (1962) 2401 Cedar Springs Road Dallas, TX 75201-1407 Vice President and Investment Officer | | Since 2010 | | | | Vice President and Chief Strategic Investment Officer, GuideStone Financial Resources, 2013 - present; Director of Global Investment Strategies, GuideStone Financial Resources, 2010 - 2013; Managing Director, Equities, Russell Investments, 2000 - 2010. | | N/A | | N/A |
John R. Jones (1953) 2401 Cedar Springs Road Dallas, TX 75201-1407 President | | Since 2000 | | | | Executive Vice President and Chief Operating Officer, GuideStone Financial Resources, 1997 - present. | | N/A | | N/A |
Cherika N. Latham(1982) 2401 Cedar Springs Road Dallas, TX 75201-1407 Chief Legal Officer and Secretary | | Since 2013 | | | | Assistant Secretary, GuideStone Financial Resources, 2008 - present. | | N/A | | N/A |
Patricia A. Weiland (1959) 2401 Cedar Springs Road Dallas, TX 75201-1407 Vice President - Fund Operations and Sales | | Since 2000 | | | | Officer, Financial Solutions and Services, GuideStone Financial Resources, 2006 - January 2014; Director, Mutual Funds, GuideStone Financial Resources, 2000 - 2006. | | N/A | | N/A |
| 1 | Each Independent Trustee serves until his or her resignation, removal or mandatory retirement. Each Interested Trustee serves until his or her resignation, removal or mandatory retirement or until he or she ceases to be a member of the board of trustees of GuideStone Financial Resources. All Trustees must retire after reaching the age of seventy-seven years or after achieving ten years of service, whichever occurs last. Officers serve at the pleasure of the Board of Trustees. |
| 2 | The Trust pays no compensation to the Trustees. The Trust reimburses the Trustees for any expenses incurred in attending meetings. The Trust does not compensate the officers for the services they provide to the Funds. |
| 3 | Messrs. Evans and Hixson are “interested persons” of the Trust as the term is defined in the Investment Company Act of 1940, due to their positions on the Board of Trustees of GuideStone Financial Resources. |
| 4 | The officers of the Trust may be deemed to be affiliates of the Adviser due to their positions with the Adviser and/or GuideStone Financial Resources. |
343
PROXY VOTING
A description of the policies and procedures that GuideStone Funds uses to determine how to vote proxies relating to their portfolio securities as well as information regarding how GuideStone Funds voted proxies during the most recent 12-month period ended June 30 is available without charge by calling 1-888-98-GUIDE (1-888-984-8433), by visiting our website at www.GuideStoneFunds.org or by visiting the SEC’s website at www.sec.gov.
FORM N-MFP
Beginning December 2009, the GuideStone Money Market Fund began filing Form N-MFP with the SEC. Form N-MFP is filed on a monthly basis by money market mutual funds and includes detailed information about a money market fund’s investments and the market-based price of its portfolio known as its “shadow NAV” or mark-to-market valuation. The portfolio holdings information is posted on our website, www.GuideStoneFunds.org within five business days after the end of the month. Form N-MFP is made available online with a 60-day delay at www.sec.gov.
QUARTERLY SCHEDULES OF INVESTMENTS
In addition to the semi-annual and annual reports that GuideStone Funds delivers to shareholders and makes available through its website, GuideStone Funds files a complete schedule of portfolio holdings with the SEC for each Fund’s first and third fiscal quarters on Form N-Q. GuideStone Funds does not deliver the schedule for the first and third fiscal quarters to shareholders; however, the schedule is posted to our website, www.GuideStoneFunds.org. You may also obtain the Form N-Q filings by accessing the SEC’s website at www.sec.gov or copy them at the SEC’s Public Reference Room in Washington, DC. Information on the operation of the SEC’s Public Reference Room may be obtained by calling the SEC at (800) 732-0330. You can also request copies of this information, upon payment of a fee for duplication, at the SEC’s email address (publicinfo@sec.gov) or by writing the Public Reference section of the SEC, Washington, DC 20549-0102.
344
BOARD REVIEW OF THE CONTINUATION OF THE ADVISORY AGREEMENT AND SUB-ADVISORY AGREEMENTS (Unaudited)
As required by the Investment Company Act of 1940, as amended (the “1940 Act”), the Board of Trustees (the “Board”) of GuideStone Funds (the “Trust”), including all of the Trustees who are not “interested persons” of the Trust, as that term is defined in Section 2(a)(19) of the 1940 Act (the “Independent Trustees”), recently considered the renewal of (i) the investment advisory agreement between GuideStone Capital Management (the “Adviser” or “GSCM”) and the Trust on behalf of the Date Target, Asset Allocation and Select Funds (each a “Fund” and together, the “Funds”) (the “Advisory Agreement”); (ii) the sub-advisory agreements among the Adviser, each sub-adviser and the Trust on behalf of each Select Fund; (iii) the sub-advisory agreement among the Adviser, Parametric Portfolio Associates LLC, d/b/a The Clifton Group (“The Clifton Group”) and the Trust on behalf of each Fund participating in the cash overlay program (“Cash Overlay Program”); (iv) the sub-advisory agreements for AQR Capital Management, LLC (“AQR”) (emerging markets mandate), Genesis Asset Managers, LLP (“GAM”) and The Clifton Group (Canadian mandate) on behalf of the International Equity Fund for a period not to exceed December 1, 2013; and (v) the amended sub-advisory fee schedule for RS Investment Management Co. LLC (“RS Investments”) on behalf of the Global Natural Resources Equity Fund (Items ii, iii, iv and v referred to collectively as the “Sub-Advisory Agreements”). The Advisory Agreement and the Sub-Advisory Agreements presented for renewal (collectively, the “Agreements”) were approved for an additional one-year term, except as noted, at a meeting of the Board held on September 12-13, 2013. The Board’s decision to approve the Agreements reflects the exercise of its business judgment to continue each existing arrangement. In approving the Agreements, the Board considered information provided by the Adviser, each applicable sub-adviser and a consulting firm engaged by the Adviser with the assistance and advice of counsel to the Independent Trustees and counsel to the Trust. Because each was approved for an initial two-year term at a meeting of the Board held on February 28-March 1, 2013 (as discussed below), the following agreements were not subject to annual renewal at the September 12-13, 2013 Board meeting: (i) the advisory or any sub-advisory agreements for the Real Assets Fund, Flexible Income Fund, Global Natural Resources Equity Fund or Emerging Markets Equity Fund; and (ii) the sub-advisory agreements for the Growth Equity Fund with Brown Advisory, LLC and the Small Cap Equity Fund with RBC Global Asset Management (U.S.) Inc.
The Board’s consideration of various factors and its conclusions with respect to such factors formed the basis for the Board’s determination to continue the Agreements. The factors considered by the Board included, but were not limited to: (i) the resources of the Adviser or sub-adviser; (ii) the experience and expertise of the Adviser or sub-adviser; (iii) the financial capabilities of the Adviser or sub-adviser; (iv) the compliance procedures and history of the Adviser or sub-adviser; (v) the performance of the Fund or portfolio account in comparison to relevant benchmarks, similarly managed funds and the Adviser’s or sub-adviser’s other clients; (vi) the costs of the services to be provided by the Adviser or sub-adviser; (vii) the amount of the contractual advisory fee in comparison to similarly managed funds and the Adviser’s or sub-adviser’s other clients and the effect of any fee waiver and expense reimbursement arrangements; (viii) the total expenses of the Fund in comparison to similarly managed funds and the use of past and anticipated expense caps; (ix) the profitability of the Adviser or sub-adviser with respect to the Fund or portfolio account and its overall business as well as the effect of fee waivers and expense caps on profitability; (x) the extent of any economies of scale and whether the fee structure reflects such economies of scale through breakpoints; (xi) the existence of any collateral benefits realized by the Adviser and sub-advisers, such as affiliated brokerage arrangements or the use of soft dollars; and (xii) the existence of any collateral benefits realized by the Fund resulting from its relationship with the Adviser and sub-advisers. In its decision to renew the Agreements, the Board was also mindful of the potential disruptions of the Trust’s operations and various risks, uncertainties and other effects that could occur as a result of a decision to terminate or not renew an Agreement. The Board also evaluated whether the approval of an Agreement is in the best interests of each Fund and its shareholders. No one factor was determinative in the Board’s consideration of the Agreements.
The Board undertook a review of the terms of the Agreements and the nature, extent and quality of the services provided by the Adviser and each applicable sub-adviser. The Board conducted its analysis on a Fund-by-Fund basis with respect to the Adviser and each applicable sub-adviser. The Adviser provided the Board with substantial detailed information in the form of reports about each Date Target Fund, Asset Allocation Fund, Select Fund, applicable sub-advisory firm and the Adviser prior to and during the meeting, which addressed the factors listed previously. The Adviser also provided additional information about the
345
Adviser and each sub-adviser in presentations made during the meeting and responded to questions from the Trustees. In addition, the Independent Trustees met separately in executive session with counsel to the Independent Trustees to discuss and consider information presented in connection with the continuation of the Agreements as well as the Trustees’ responsibilities and duties in approving the Agreements.
BOARD APPROVAL OF CONTINUATION OF ADVISORY AGREEMENT WITH GSCM
In considering the renewal of the existing Advisory Agreement with GSCM, the Board took into account all the materials provided prior to and during the meeting, the presentations made during the meeting and the comprehensive discussions during the meeting, including the discussions between the Independent Trustees and their independent legal counsel during the executive session. More specifically, the Board examined the nature, extent and quality of the services to be provided by the Adviser to the Funds. The Board evaluated the Adviser’s experience in serving as an investment adviser, including overseeing and managing the allocation of each Fund’s assets among the sub-advisers and continually reviewing the investment performance of each Fund, the nature and quality of the services provided by each sub-adviser for that Fund, and recommending changes to the sub-advisers as and when appropriate. The Board considered the experience of key personnel at the Adviser in providing investment management and administrative services and the systems used by such persons and the ability of the Adviser to attract and retain capable personnel. The Board considered the reputation, compliance history, compliance program and financial condition of the Adviser. The Board also considered the terms of the advisory and sub-advisory agreements and the responsibilities that the Adviser has as investment adviser to the Funds, including oversight of sub-adviser compliance with each Fund’s policies and objectives, oversight of general Fund compliance, including compliance with social restrictions and the implementation of Board directives as they relate to the Funds. The Board concluded that each Fund is likely to benefit from the nature, extent and quality of these services as a result of the Adviser’s experience, personnel, operations and resources. In their deliberations, the Board members did not identify any particular information that was all-important or controlling, and each Trustee may have attributed different weights to the various factors deliberated upon, among others.
The Board also reviewed a memorandum prepared by a consulting firm engaged by the Adviser for, among other things, supplying research on expense comparisons and investment performance of other similar funds. The memorandum compared each Date Target, Asset Allocation and Select Fund with other funds having the same investment style or objective, and compared the share class of each Fund with other funds in the same distribution channel. The Board analyzed the comparative expense information for each Fund and the performance information for each Select Fund in the memorandum, including comparative expense information for each Fund based on a sampling of funds similar in asset size. The Board considered the comparative fee and expense information that had been provided in its evaluation of the management fees charged to each Fund.
The Board examined fee and expense information for the Select Funds, as compared to other funds in the Funds’ asset-stratified peer groups for the GS4 Class as of June 30, 2013. The Board determined that the management fees (combined advisory and sub-advisory fees) net of any fee waiver or expense reimbursement, for each Select Fund were the same as, or lower, than the median management fees for other mutual funds in the Fund’s asset-stratified peer group, except for the Medium-Duration Bond, Defensive Market Strategies, Equity Index, Value Equity, Growth Equity, Small Cap Equity and International Equity Funds. The Board took into account that the management fees, net of any fee waiver or expense reimbursement, for the Low-Duration Bond, Extended-Duration Bond, Global Bond and Real Estate Securities Funds ranked in the second quartile, and the Money Market and Inflation Protected Bond Funds ranked in the first quartile among similar funds at similar asset levels. The Board also considered that the management fees, net of any fee waiver or expense reimbursement, for the Medium-Duration Bond, Defensive Market Strategies, Equity Index and Value Equity Funds ranked in the third quartile; and the Growth Equity, Small Cap Equity and International Equity Funds ranked in the fourth quartile, among similar funds at similar asset levels. The Board also evaluated the total expense ratios for other funds in the Funds’ asset-stratified peer groups and determined that each Fund’s total expense ratio, with the exception of the Money Market, Defensive Market Strategies and International Equity Funds, was lower than the median total expense ratio for such other funds. The Board took into account that the total expense ratio for the International Equity Fund ranked in the third quartile; and the Money Market and Defensive Market Strategies Funds ranked in the fourth quartile, among similar funds at similar asset levels.
The Board also examined fee and expense information for the Select Funds, as compared to other funds in the peer groups for the GS2 Class as of June 30, 2013. The Board determined that the management fees, net of any fee waiver or expense
346
reimbursement, for each Select Fund were the same as, or lower than, the median management fees for other mutual funds in each Fund’s broad peer group, except for the Money Market, Defensive Market Strategies, Equity Index, Growth Equity, Small Cap Equity and International Equity Funds. The Board noted that the management fees, net of any fee waiver or expense reimbursement, for the Low-Duration Bond, Extended-Duration Bond and Value Equity Funds ranked in the second quartile; the Money Market, Medium-Duration Bond and Equity Index Funds ranked in the third quartile; and the Defensive Market Strategies, Growth Equity, Small Cap Equity and International Equity Funds ranked in the fourth quartile. The Board also evaluated the total expense ratios for other funds in each Fund’s broad peer group and determined that each Fund’s total expense ratio was the same as, or lower than, the median total expense ratio for such other funds, except for the Money Market, Defensive Market Strategies, Equity Index, Growth Equity, Small Cap Equity and International Equity Funds. The Board took into account that the total expense ratios for the Money Market, Equity Index, Growth Equity, Small Cap Equity and International Equity Funds ranked in the third quartile and the Defensive Market Strategies Fund ranked in the fourth quartile.
The Board also examined fee and expense information for the Date Target Funds and the Asset Allocation Funds, as compared to other funds in the Funds’ asset-stratified peer groups for the GS4 Class of the Date Target Funds and the GS2 and GS4 Classes of the Asset Allocation Funds as of June 30, 2013. The Board determined that the management fees, net of any fee waiver or expense reimbursement, for each Date Target Fund were lower than the median management fees for other mutual funds in each Fund’s asset-stratified peer group and that the total expense ratios for each Date Target Fund were lower than the median total expense ratio (top quartile) for such other funds. For the Asset Allocation Funds, the Board determined that the management fees, net of any fee waiver or expense reimbursement, for each Asset Allocation Fund for both the GS2 and GS4 Classes were higher than the median management fees for other mutual funds in each Fund’s asset-stratified peer group but that the total expense ratios for each Asset Allocation Fund for both the GS2 and GS4 Classes were lower than the median total expense ratio for such other funds.
The Board examined the performance information for the GS4 Class of the Select Funds compared to the relevant benchmark and to Morningstar peer rankings, specifically for the three-, five- and 10-year average annual total returns for the period ended June 30, 2013. Among Morningstar peers, the Board noted that the average annual total returns for the three-, five- and 10-year periods ended June 30, 2013, for the Money Market Fund ranked in the first quartile. For the period ended June 30, 2013, the Board noted that for the three-year average annual total returns the Global Bond, Real Estate Securities, Value Equity, Growth Equity and Small Cap Equity Funds ranked in the first quartile; the Low-Duration Bond, Medium-Duration Bond and Extended-Duration Bond Funds ranked in the second quartile; the Inflation Protected Bond Fund ranked in the third quartile; and the International Equity Fund ranked in the fourth quartile. For the five-year average annual total return for the period ended June 30, 2013, the Board noted that the Medium-Duration Bond, Extended-Duration Bond and Global Bond Funds ranked in the first quartile; the Low-Duration Bond, Real Estate Securities, Value Equity, Growth Equity and Small Cap Equity Funds ranked in the second quartile; and the International Equity Fund ranked in the third quartile. For the 10-year average annual total return period ended June 30, 2013, the Board noted that the Medium-Duration Bond and Extended-Duration Bond Funds ranked in the first quartile; the Low-Duration Bond, Value Equity and International Equity Funds ranked in the second quartile; and the Growth Equity and Small Cap Equity Funds ranked in the third quartile. The Board recognized the inception dates of the Inflation Protected Bond Fund (2009), Global Bond Fund (2006), Defensive Market Strategies Fund (2011) and Real Estate Securities Fund (2006), and noted that the 10-year average annual total return information for the Global Bond and Real Estate Securities Funds and the five- and 10-year average annual total return information for the Inflation Protected Bond and Defensive Market Strategies Funds was not available.
The Board then examined the performance information presented in the relevant meeting materials for the GS4 Class of each Asset Allocation Fund compared to the relevant benchmark and to Lipper peer rankings for the three-, five- and 10-year periods ended June 30, 2013, and for the Date Target Funds for the three- and five-year periods ended June 30, 2013. Among Lipper peers, the Board noted that the Conservative Allocation Fund ranked in the fourth quartile for the three- and 10-year periods and the third quartile for the five-year period ended June 30, 2013; the Balanced Allocation Fund ranked in the second quartile for the five- and 10-year periods and the third quartile for the three-year period ended June 30, 2013; the Growth Allocation Fund ranked in the second quartile for the three-, five- and 10-year periods ended June 30, 2013; and the Aggressive Allocation Fund ranked in the first quartile for the three-year period, and the third quartile for the five- and ten-year periods ended June 30, 2013.
347
The Board also noted that the MyDestination 2015, 2025, 2035 and 2045 Funds each ranked in the first quartile among Lipper peers for the three-year period ended June 30, 2013; and the MyDestination 2005 Fund ranked in the third quartile among Lipper peers for the same period. Among Lipper peers for the five-year period ended June 30, 2013, the Board noted that the MyDestination 2015 and 2025 Funds each ranked in the first quartile among Lipper peers for the five-year period ended June 30, 2013; and the MyDestination 2005, 2035 and 2045 Funds each ranked in the second quartile among Lipper peers for the same period.
The Board considered the costs to GSCM of serving as the Adviser to the Funds, including the costs associated with the personnel, systems and equipment necessary to manage the Funds in accordance with the existing Advisory Agreement. The Board considered the anticipated revenues that GSCM expected to receive for serving as the Adviser to the Funds, the fact that any profit realized by the Adviser is forwarded to its affiliate, GuideStone Financial Resources, which for many years had operated at a deficit with respect to the Trust. The Board also considered the profitability estimates for the Adviser, first without taking into account sub-advisory fees, and second, taking into account sub-advisory fees. The Board then considered whether any direct or indirect collateral benefits inured to either the Adviser or the Trust as a result of their affiliation with one another. In light of these considerations, the Board concluded that any profits realized in connection with the Adviser’s services appeared reasonable.
The Board considered the extent to which the advisory fee to be paid to the Adviser reflected economies of scale. The Board noted that all of the Funds are subject to an expense cap and considered the amount of any fees waived by the Adviser for each Fund and the total amount of fees waived for the Trust as a whole during the past year. The Board also noted that the total expense ratios net of any fee waiver and expense reimbursement were below the median total expense ratio for other similar funds at the same asset levels for the GS4 Class, except for the Money Market, Defensive Market Strategies and International Equity Funds. Based on their review, the Board concluded that each Fund’s advisory fee was reasonable.
Based on all of the information presented to the Board and its consideration of relevant factors, the Board concluded that the fee paid to the Adviser by each Fund was reasonable, and in the exercise of its business judgment, determined to approve the continuation of the Advisory Agreement for each Fund. The Board also determined that approval of the continuation of each Advisory Agreement is in the best interests of each Fund and its shareholders.
BOARD APPROVAL OF CONTINUATION OF SUB-ADVISORY AGREEMENTS FOR THE SELECT FUNDS AND THE FUNDS PARTICIPATING IN THE CASH OVERLAY PROGRAM
In considering the existing Sub-Advisory Agreements with each of the applicable sub-advisers, the Board took into account the materials provided prior to and during the meeting, the presentations made during the meeting and the extensive discussions during the meeting, including the discussions the Independent Trustees had during their executive sessions with their independent legal counsel. The Board also took into account the Investment Management Committee’s (the “Committee”) review of information related to the Trust’s sub-advisers, questions submitted by the Committee to Trust management regarding various sub-advisers, Trust management’s responses to those questions and recommendations made by the Committee. More specifically, the Board examined the nature, extent and quality of the services to be provided by the sub-advisers. The Board evaluated each sub-adviser’s experience in serving as a sub-adviser to a Fund. The Board noted that each sub-adviser currently provides investment advice to various clients, including, in some cases, other pooled investment vehicles. The Board noted the experience of key personnel at each sub-adviser in providing investment management services and the systems used by such persons and the ability of each sub-adviser to attract and retain capable personnel. The Board noted the reputation, compliance history, compliance program and financial condition of each sub-adviser. The Board also noted the terms of the existing Sub-Advisory Agreements and the responsibilities that each sub-adviser has towards a Fund, including the responsibility of the day-to-day management of the investment portfolio of each Fund, compliance with each Fund’s policies and objectives and the implementation of Board directives as they relate to the Funds. The Board also took into account the overall structure of each Fund and the particular role each sub-adviser plays in that structure and in achieving each Fund’s overall investment objective. The Board also noted that market conditions presented challenges for certain active management strategies during recent periods. The Board concluded that each Fund is likely to benefit from the nature, extent and quality of these services as a result of each sub-adviser’s experience, personnel, operations and resources. In their deliberations, the Board members did not identify any particular information that was all-important or controlling, and each Trustee may have attributed different weights to the various factors deliberated upon, among others.
348
The Board examined performance information for each segment of a Fund managed by a sub-adviser. The Board noted that, for many of the sub-advisers, the performance record of the segment of the Fund managed by the sub-adviser compared favorably to the relevant benchmark, the composite performance for the sub-adviser’s clients (on a gross fee basis) and the peer universe of similarly managed funds for the period of time the sub-adviser performed advisory services on behalf of the Fund. In cases where the sub-adviser’s performance lagged behind the relevant benchmark, the Board also considered more recent investment performance, performance measured against other relevant benchmarks or how the sub-adviser’s strategy deviated from the composition of the benchmark, any recent reductions in the sub-advisory fee, and the role each sub-adviser plays in that structure and in achieving each Fund’s overall investment objective.
The Board also noted that, in certain cases, market trends due to the economic downturn have contributed to the underperformance of certain sub-advisers. The Board concluded that, although past performance is no guarantee of future performance, the performance of each Fund was satisfactory and the Funds were likely to benefit from each sub-adviser continuing to serve as a sub-adviser to the Trust’s Funds.
The Board also examined the fee schedule for each sub-adviser, noting how the fee levels charged to the Trust compared with available information about fees charged by the sub-advisers to their other similarly situated clients, which in many cases include separately managed accounts, as well as how the sub-adviser fee levels for each Select Fund compared to the median sub-advisory fee for the peer universe of similarly managed funds.
The Board also took into account the profitability and the financial capability of each sub-adviser in light of information presented at the meeting. In light of these considerations, the Board concluded that the profits realized by each sub-adviser who completed a profitability questionnaire appeared reasonable. For those sub-advisers that did not provide profitability information, the Board relied upon other relevant information, particularly the independent negotiation of the fee schedules, the level of the fees and the sub-adviser’s performance history. The Board noted that, based on the Adviser’s representations, the financial statements of the sub-advisers did not appear to raise any significant concerns regarding the financial capability of those sub-advisers. The Board also considered the Adviser’s representations in the materials prepared for the meeting that to its knowledge no sub-adviser experienced any material change in its financial condition since the date of its most recent audited financial statements, and took into account the Adviser’s representation that it would continue to monitor the financial condition of each sub-adviser.
The Board considered the extent to which sub-adviser fees to be paid to each sub-adviser reflected economies of scale. The Board noted that each sub-adviser’s fee schedule either reflected economies of scale by reducing the fee on assets in excess of certain stated breakpoints or the fee level negotiated was below or on par with the standard fee level for the sub-adviser.
In evaluating the benefits that are expected to accrue to each sub-adviser through its relationship as sub-adviser to a Select Fund, the Board noted that certain sub-advisers allocate portfolio brokerage to affiliated broker-dealers that receive commissions from the execution of Fund trades. The Board also noted that certain sub-advisers expect to benefit from “soft dollar” arrangements by which brokers will provide research and other services to the sub-adviser in exchange for commissions on trades of the portfolio securities of the Select Fund. The Board considered whether any direct or indirect collateral benefits inured to the Trust as a result of its affiliation with each sub-adviser.
With respect to the conditional sub-advisory agreement extensions for AQR, GAM and The Clifton Group, the Board noted that the terminations of these sub-advisers were necessary in order to effectuate the restructuring of the International Equity Fund and the launch of the Emerging Markets Equity Fund. The Board noted that because the restructuring of the International Equity Fund was not scheduled to occur until after the expiration of the current sub-advisory agreements with AQR, GAM and The Clifton Group, the Board approved the continuance of the sub-advisory agreements for AQR (with respect to the emerging markets mandate only), GAM and The Clifton Group (with respect to the Canadian mandate only) for a limited period not to exceed December 1, 2013 in order to effectuate an orderly transition of assets for those accounts.
With respect to the amended sub-advisory fee schedule for RS Investments on behalf of the Global Natural Resources Equity Fund, the Board noted that the new fee schedule would not change the total fees the Fund would pay to the firm at current and anticipated asset levels, but rather would modify the tier levels previously approved by the Board and provide for a fourth tier level. The Board noted that RS Investments would likely not offer the Fund enough additional capacity to reach these higher tier breakpoints and therefore, the Fund will likely not be able to take advantage of these fee reductions in the future.
349
Based on all of the information presented to the Board and its consideration of relevant factors, the Board, in the exercise of its reasonable business judgment, determined to approve the continuation of each Sub-Advisory Agreement. The Board also determined that approval of the continuation of each Sub-Advisory Agreement is in the best interest of each Select Fund and each Fund participating in the Cash Overlay Program and their respective shareholders.
BOARD REVIEW OF NEW INVESTMENT ADVISORY AND SUB-ADVISORY AGREEMENTS FOR THE EMERGING MARKETS EQUITY FUND, FLEXIBLE INCOME FUND, GLOBAL NATURAL RESOURCES EQUITY FUND AND REAL ASSETS FUND AND THE FUNDS PARTICIPATING IN THE CASH OVERLAY
As required by the 1940 Act, the Board, including all of the Independent Trustees, considered the approval of four new Advisory Agreements between the Adviser and the Trust on behalf of the Emerging Markets Equity Fund, Flexible Income Fund, Global Natural Resources Equity Fund and Real Assets Fund (“New Advisory Agreements”), each a new series of the Trust (together, “New Funds”). The Board also considered the approval of the following new sub-advisory agreements related to the four New Funds among: (i) AQR, the Adviser and the Trust on behalf of the Emerging Markets Equity Fund; (ii) GAM, the Adviser and the Trust on behalf of the Emerging Markets Equity Fund; (iii) Shenkman Capital Management, Inc. (“Shenkman”), the Adviser and Trust on behalf of the Flexible Income Fund; (iv) RS Investments, the Adviser and the Trust on behalf of the Global Natural Resources Equity Fund; (v) Van Eck Associates Corporation (“Van Eck”), the Adviser and the Trust on behalf of the Global Natural Resources Equity Fund; and (vi) The Clifton Group, the Adviser and the Trust on behalf of each participating series of the Trust for the purpose of investing in the Cash Overlay Program (collectively referred to hereinafter as the “New Sub-Advisory Agreements”). Each sub-adviser was selected to manage all or a portion of each New Fund’s assets. The Board noted that the investment mandates currently utilized by AQR (emerging markets mandate) and GAM on behalf of the International Equity Fund, another series of the Trust, would be transitioned to the Emerging Markets Equity Fund through the termination and rehiring of each sub-adviser. The Board noted that the Real Assets Fund is a fund-of-funds that achieves its investment objective by allocating a diversified set of real assets strategies among multiple registered investment companies and, therefore, does not participate in sub-advisory engagements under its investment mandate. The Board noted that RS Investments and Van Eck are new sub-advisers to the Trust, while AQR, Genesis and Shenkman are existing sub-advisers to other series of the Trust.
The Board approved each New Advisory and Sub-Advisory Agreement for a two-year term at an in-person meeting of the Board held on February 28-March 1, 2013. The Flexible Income Fund, Global Natural Resources Equity Fund and Real Assets Fund each commenced operations effective July 1, 2013; and the Emerging Markets Equity Fund commenced operations effective October 31, 2013. The Board’s decision to approve the New Advisory Agreements and New Sub-Advisory Agreements on behalf of the New Funds reflects the exercise of its business judgment to enter into such agreements. In approving each New Advisory Agreement and New Sub-Advisory Agreement, the Board considered information provided by the Adviser and each sub-adviser, as applicable, to the New Funds with the assistance and advice of counsel to the Independent Trustees and counsel to the Trust.
The Board’s consideration of various factors and its conclusions with respect to such factors formed the basis for the Board’s determination to approve each New Advisory and Sub-Advisory Agreement. The factors considered by the Board included, but were not limited to: (i) the resources of the Adviser and each sub-adviser; (ii) the experience and expertise of the Adviser and each sub-adviser; (iii) the financial capability of the Adviser and each sub-adviser; (iv) the compliance procedures and history of the Adviser and each sub-adviser; (v) the performance of similarly managed funds and accounts in comparison to relevant benchmarks for the New Funds; (vi) the amount of the contractual advisory and sub-advisory fees in comparison to similarly managed funds and the Adviser’s and each sub-adviser’s other clients and the effect of any fee waiver and expense reimbursement arrangements; (vii) the total expenses for each of the New Funds in comparison to similarly managed funds and the use of any anticipated expense caps; (viii) to the extent available, the anticipated profitability of each sub-adviser with respect to the News Funds and their overall business; (ix) the extent of any economies of scale and whether the fee structure reflects such economies of scale; (x) the existence of any collateral benefits to be realized by the Adviser or each sub-adviser; and (xi) the existence of any collateral benefits to be realized by the New Funds. The Board also evaluated whether the approval of the New Advisory Agreements and New Sub-Advisory Agreements were in the best interest of the New Funds and their shareholders. No one factor was determinative in the Board’s consideration of the New Advisory Agreements, and each Board member may have attributed different weights to the factors considered.
350
The Board undertook a review of the terms of the New Advisory Agreements and New Sub-Advisory Agreements, the nature and quality of the services to be provided by the Adviser and each sub-adviser. The Adviser provided the Board with substantial detailed information in the form of reports about each of the New Funds, the Adviser and each sub-adviser prior to the meeting which addressed the factors listed previously. The Adviser also provided additional information about the Adviser and each sub-adviser in a presentation made during the meeting, discussed the comprehensive screening process used to recommend each sub-adviser and responded to questions from the Board. In addition, the Independent Trustees met separately in executive session with counsel to the Independent Trustees to discuss and consider information presented in connection with the approval of the New Advisory Agreements and New Sub-Advisory Agreements, as well as the Board’s responsibilities and duties in approving the New Agreements.
BOARD APPROVAL OF NEW INVESTMENT ADVISORY AND SUB-ADVISORY AGREEMENTS FOR THE EMERGING MARKETS EQUITY FUND, FLEXIBLE INCOME FUND, GLOBAL NATURAL RESOURCES EQUITY FUND AND REAL ASSETS FUND AND THE FUNDS PARTICIPATING IN THE CASH OVERLAY PROGRAM
In considering the approval of each New Advisory Agreement with the Adviser on behalf of the New Funds, the Board took into account all the materials provided prior to and during the meeting, the presentations made during the meeting and the extensive discussions during the meeting, including the discussion the Independent Trustees had during their executive session with their independent legal counsel. More specifically, the Board examined the nature, extent and quality of the services to be provided by the Adviser to the New Funds. The Board evaluated the Adviser’s experience in serving as an investment adviser, including overseeing and managing the allocation of existing Fund assets among the underlying Select Funds as well as the Asset Allocation Funds (with respect to the Real Assets Fund). The Board noted the experience of key personnel in providing investment management and administrative services, the systems used by such persons and the Adviser’s ability to attract and retain capable personnel.
The Board noted the reputation, compliance history, compliance program and financial condition of the Adviser. The Board noted the terms of each New Advisory Agreement and the responsibilities that the Adviser has as an investment adviser to the New Funds, including oversight of general Fund compliance, compliance with social restrictions and the implementation of Board directives as they relate to the New Funds. The Board also noted that, except for the identity of the New Funds and their respective management fees, each New Advisory Agreement is identical in all material respects to other advisory agreements entered into by the other series of the Trust. The Board concluded that the New Funds are likely to benefit from the extent and quality of these services as a result of the Adviser’s experience, personnel, operations and resources.
The Board also reviewed a memorandum prepared by a third-party independent consulting firm engaged by the Adviser for, among other things, supplying research on expense comparisons. The Board noted that the aggregate management fees of the New Funds, taking into account the proposed fee cap for each New Fund, were competitive relative to other comparable funds with similar investment objectives and policies. With respect to the Real Assets Fund, the Board also noted that the proposed advisory fee was the same as the fee the Adviser assessed for the Asset Allocation Funds.
Based on all of the information presented to the Board and its consideration of relevant factors, the Board, in the exercise of its reasonable business judgment, determined to approve each New Advisory Agreement.
In considering the approval of the New Sub-Advisory Agreements for the Emerging Markets Equity Fund, Flexible Income Fund and Global Natural Resources Equity Fund and the Funds participating in the Cash Overlay Program, the Board took into account all the materials provided prior to and during the meeting, the presentations made during the meeting and the extensive discussions during the meeting, including the discussions the Independent Trustees had during their executive session with their independent legal counsel. The Board also took into account the Committee’s review of information related to each new sub-advisory arrangement, questions submitted by the Committee to Trust management regarding those sub-advisers, Trust management’s responses to those questions and recommendations made by the Committee. The Board considered its responsibilities with respect to reviewing and approving the terms of the New Sub-Advisory Agreements, the investment management teams at each sub-adviser, the reasonableness of the sub-advisory fees and whether the appointment of each sub-adviser would be in the best interests of the shareholders of the Emerging Markets Equity Fund, Flexible Income Fund and Global Natural Resources Equity Fund and the Funds participating in the Cash Overlay Program. The Board reviewed the above factors in evaluating whether to approve each New Sub-Advisory Agreement and the materials provided to support each factor.
351
The Board considered the reputation, compliance history, compliance program and financial condition of each sub-adviser. The Board also considered the experience of key personnel at each sub-adviser in providing investment management services to the Emerging Markets Equity Fund, Flexible Income Fund and Global Natural Resources Equity Fund and the Funds participating in the Cash Overlay Program; the systems and resources used by such persons to implement and manage the applicable strategy; and the ability of each sub-adviser to attract and retain capable personnel. The Board also noted the terms of the New Sub-Advisory Agreements and the responsibilities that each sub-adviser has to each Fund, as applicable, including the responsibility of day-to-day management and compliance with each Fund’s investment objectives and policies and the implementation of Board directives as they relate to the New Funds. The Board concluded that the Emerging Markets Equity Fund, Flexible Income Fund and Global Natural Resources Equity Fund were likely to benefit from the nature, extent and quality of the services with respect to each sub-adviser’s experience, personnel, operations and resources.
With respect to the Emerging Markets Equity Fund, the Board examined the nature, extent and quality of services to be provided by AQR. The Board noted that AQR was currently being utilized in the International Equity Fund, another series of the Trust. The Board noted that the existing International Equity Fund fee schedule for AQR (emerging markets mandate) would apply to the Emerging Markets Equity Fund. The Board also considered the level of the proposed fee as compared to peer universe fee information that was provided.
With respect to the Emerging Markets Equity Fund, the Board examined the nature, extent and quality of services to be provided by GAM. The Board noted that GAM was currently being utilized in the International Equity Fund, another series of the Trust. The Board noted that the existing International Equity Fund fee schedule for GAM would also apply to the Emerging Markets Equity Fund. The Board also considered the level of the proposed fee as compared to peer universe information that was provided and took into account both the performance history of GAM as sub-adviser to the International Equity Fund and the favorable results generated from the back-tested performance, expense and peer information for the Emerging Market Equity Fund’s sub-adviser composite (post restructure) versus the benchmark index (MSCI Emerging Markets Index).
With respect to the Flexible Income Fund, the Board examined the nature, extent and quality of services to be provided by Shenkman. The Board noted Shenkman’s expertise in managing high yield securities. The Board noted that the Shenkman High Yield Bank Loan Investment Strategy is one of the lower risk strategies compared to its peer universe, and took into account Shenkman’s risk adjusted returns in evaluating Shenkman’s performance record for this strategy. The Board acknowledged that the estimated tracking error on the High Yield Bank Loan Investment Strategy would be approximately 200 to 400 basis points, with superior performance expected in stressed markets. The Board noted that while attempts to negotiate fees below the standard fee schedule during the due diligence period were unsuccessful and while the fee schedule does not contain breakpoints, the Adviser indicated to the Board that it believes Shenkman’s fee is reasonable given the quality of the product, the ongoing labor-intensive nature of the strategy and its competitiveness versus peers.
With respect to the Global Natural Resources Equity Fund, the Board examined the nature, extent and quality of the services to be provided by RS Investments. The Board noted that RS Investments Global Natural Resources Strategy would consist of a concentrated portfolio of publicly traded natural resource companies, and would exhibit a high tracking error range of approximately 600 to 1200 basis points. The Board noted that the performance of the strategy since inception has been strong and they specifically noted that the strategy outperformed its benchmark in seven of the past ten years. The Board noted that while attempts to negotiate fees below the standard fee schedule during the due diligence period were unsuccessful, the fee schedule does include several breakpoints. Moreover, the Adviser indicated to the Board that it believes RS Investments’ fee is reasonable given the quality of the product, the labor-intensive nature of this strategy and its competitiveness versus peers.
With respect to the Global Natural Resources Equity Fund, the Board examined the nature, extent and quality of the services to be provided by Van Eck. The Board noted Van Eck’s experience in managing portfolios investing in securities of gold mining companies, and they emphasized that the firm’s leading International Investors Gold Fund has been in operation since 1968. The Board noted that the Van Eck Gold Strategy would exhibit a high tracking error range of 500 to 1500 basis points. The Board noted that Van Eck’s performance history has been strong on an absolute and benchmark-relative basis, emphasized that the strategy has outperformed its benchmark in 10 of the previous 15 years and exceeded the benchmark by nearly 4% on an annualized basis in that same timeframe. The Board noted that the Adviser succeeded in negotiating a fee schedule that resulted
352
in nearly a 23% annual savings from the initial fee schedule proposed by Van Eck. The Board highlighted that the Trust will follow a tiered fee schedule, based on the total assets managed by Van Eck, and that fees charged could decline as assets under management grow.
With respect to the New Funds’ participation in the Cash Overlay Program, the Board examined the nature, extent and quality of the services to be provided The Clifton Group in providing cash overlay services. The Board also noted the ability of The Clifton Group to attract and retain capable personnel as well as The Clifton Group’s reputation, compliance history and financial condition. The Board also noted that the contractual arrangements established with The Clifton Group were established at the Trust level and the fees would remain the same as the fees for the other series participating in the Cash Overlay Program.
The Board noted the terms of each New Sub-Advisory Agreement and the responsibilities of each sub-adviser, including oversight of general Fund compliance and compliance with the Trust’s social restrictions. The Board considered the Adviser’s assessment of each sub-adviser’s financial condition. The Board noted that the Adviser, after reviewing certain financial information provided by each sub-adviser, felt comfortable that each sub-adviser was financially sound.
Based on all the information presented to the Board and its consideration of relevant factors, the Board, in the exercise of its reasonable business judgment, concluded that the Emerging Markets Equity Fund, Flexible Income Fund and Global Natural Resources Equity Fund were likely to benefit from the nature, extent, and quality of each sub-adviser’s services, as applicable, and the Board determined to approve the New Sub-Advisory Agreements. The Board also determined that approval of the New Sub-Advisory Agreements was in the best interest of the Emerging Markets Equity Fund, Flexible Income Fund and Global Natural Resources Equity Fund and their respective shareholders.
BOARD REVIEW OF NEW SUB-ADVISORY AGREEMENT FOR THE EXTENDED-DURATION BOND FUND
As required by the 1940 Act, the Board of the Trust, including all of the Independent Trustees, considered the approval of a new sub-advisory agreement among the Adviser, Schroder Investment Management North America Inc. (“SIMNA”) and the Trust on behalf of the Extended-Duration Bond Fund due to a corporate reorganization of STW Fixed Income Management LLC. The Board approved a new sub-advisory agreement with SIMNA (the “SIMNA Sub-Advisory Agreement”) at an in-person meeting of the Board held on September 12-13, 2013, to be effective upon the completion of the corporate reorganization.
The Board’s consideration of various factors and its conclusions with respect to such factors formed the basis for the Board’s determination to approve the SIMNA Sub-Advisory Agreement. The factors considered by the Board included, but were not limited to: (i) the changes, if any, in fees, services or other terms of the SIMNA Sub-Advisory Agreement; (ii) SIMNA’s corporate structure after the transaction causing the transfer of the sub-advisory agreement and any potential effects on the ability of SIMNA to provide services to the Extended-Duration Bond Fund; (iii) any changes to SIMNA’s personnel, systems or policies arising from the transaction; and (iv) any other possible effects of the transaction on the operations of SIMNA or the services it provides to the Extended-Duration Bond Fund.
The Independent Trustees consulted with counsel to the Independent Trustees and Trust counsel to discuss and consider the information presented in connection with the change of control and the approval of the SIMNA Sub-Advisory Agreement, including the Board’s responsibilities and duties in approving the agreement. The Board’s decision to approve the SIMNA Sub-Advisory Agreement reflects the exercise of its business judgment to enter into new or amended sub-advisory arrangements. In approving the SIMNA Sub-Advisory Agreement, the Board considered information provided by the Adviser and the relevant parties to the change of control with the assistance and advice of counsel to the Independent Trustees and counsel to the Trust.
The Board’s consideration of various factors and its conclusions with respect to such factors formed the basis for the Board’s determination to approve the SIMNA Sub-Advisory Agreement. The factors considered by the Board included, but were not limited to: (i) the resources of the sub-adviser; (ii) the experience and expertise of the sub-adviser; (iii) the financial capability of the sub-adviser; (iv) the compliance procedures and history of the sub-adviser; (v) the performance of similarly managed funds and accounts in comparison to relevant benchmarks for the Extended-Duration Bond Fund; (vi) the costs of the services to be provided by the sub-adviser; (vii) the amount of the contractual sub-advisory fee in comparison to similarly managed funds and any available information for the sub-adviser’s other similarly situated clients and the effect of any fee waiver and expense reimbursement arrangements; (viii) the total expenses of the Extended-Duration Bond Fund in comparison to similarly managed funds and the use of any anticipated expense caps; (ix) to the extent available, the anticipated profitability of the sub-adviser with
353
respect to the Extended-Duration Bond Fund and its overall business; (x) the extent of any economies of scale and whether the fee structure reflects such economies of scale; (xi) the existence of any collateral benefits to be realized by the sub-adviser; and (xii) the existence of any collateral benefits to be realized by the Extended-Duration Bond Fund. The Board evaluated the material aspects of the change of control and considered whether the approval of the SIMNA Sub-Advisory Agreement is in the best interests of the Extended-Duration Bond Fund and its shareholders. No one factor was determinative in the Board’s consideration of the SIMNA Sub-Advisory Agreement.
The Independent Trustees met separately in executive session with counsel to the Independent Trustees to discuss and consider the information presented in connection with the change of control and the approval of the SIMNA Sub-Advisory Agreement, including the Board’s responsibilities and duties in approving the new agreement.
BOARD APPROVAL OF SIMNA SUB-ADVISORY AGREEMENT FOR THE EXTENDED-DURATION BOND FUND
In considering the approval of the SIMNA Sub-Advisory Agreement, the Board took into account the materials provided prior to (including the materials that the Board had considered at the February 2013 meeting) and during the meeting, the presentations made during the meeting and the extensive discussions during the meeting, including the discussions the Independent Trustees had during their executive session with independent legal counsel. The Board also took into account the Committee’s review of information related to the Trust’s new sub-adviser and any recommendations made by the Committee. The Board considered its responsibilities with respect to reviewing and approving the terms of the SIMNA Sub-Advisory Agreement, the investment management team at SIMNA, the reasonableness of the sub-advisory fees, the material aspects of the change of control and whether the appointment of SIMNA would be in the best interests of the shareholders of the Extended-Duration Bond Fund. The Board reviewed the above factors in evaluating whether to approve the SIMNA Sub-Advisory Agreement and the materials provided to support each factor.
The Board considered the reputation, compliance history, compliance program and financial condition of SIMNA. The Board also considered the experience of key personnel at SIMNA in providing investment management services to the Extended-Duration Bond Fund, the systems and resources used by such persons to implement and manage the strategy and the ability of the sub-adviser to attract and retain capable personnel. The Board also noted the terms of the SIMNA Sub-Advisory Agreement and the responsibilities that SIMNA has to the Extended-Duration Bond Fund, including the responsibility of day-to-day management and compliance with the Extended-Duration Bond Fund’s investment objective and policies. The Board concluded that the Extended-Duration Bond Fund is likely to benefit from the nature, extent and quality of the services with respect to SIMNA’s experience, personnel, operations and resources.
In considering the approval of the SIMNA Sub-Advisory Agreement, the Board examined the nature, extent and quality of the services to be provided by SIMNA on behalf of the Extended-Duration Bond Fund. The Board noted the terms of the SIMNA Sub-Advisory Agreement and the responsibilities of SIMNA, including oversight of general Fund compliance and compliance with the Trust’s social restrictions. The Board noted that SIMNA has been a sub-adviser to the Extended-Duration Bond Fund since June 2006, and took into account that the SIMNA Sub-Advisory Agreement was identical in all material respects to the prior agreement, including compensation. The Board considered the Adviser’s assessment of SIMNA’s financial condition. The Board noted that the Adviser, after reviewing certain financial information provided by SIMNA, felt comfortable that SIMNA was financially sound.
Based on all the information presented to the Board and its consideration of relevant factors, the Board, in the exercise of its reasonable business judgment, concluded that the Extended-Duration Bond Fund is likely to benefit from the extent and quality of SIMNA’s services, and the Board determined to approve the SIMNA Sub-Advisory Agreement effective upon the change of control of SIMNA. The Board also determined that approval of the SIMNA Sub-Advisory Agreement is in the best interests of the Extended-Duration Bond Fund and its shareholders.
BOARD REVIEW OF NEW SUB-ADVISORY AGREEMENTS FOR THE REAL ESTATE SECURITIES FUND AND EMERGING MARKETS EQUITY FUND
As required by the 1940 Act, the Board, including all of the Independent Trustees, considered the approval of the following new sub-advisory agreements among: (i) RREEF America L.L.C. (“RREEF America”), Deutsche Investment Australia Limited (“DIAL”), Deutsche Alternative Asset Management (Global) Limited (“DeAAM Global”), the Adviser and the Trust on behalf of
354
the Real Estate Securities Fund; (ii) Heitman International Real Estate Securities GmbH (“HIRES GmbH”), the Adviser and the Trust on behalf of the Real Estate Securities Fund; (iii) Heitman International Real Estate Securities HK Limited (“HIRES HK”), the Adviser and the Trust on behalf of the Real Estate Securities Fund; and (iv) GAM and Genesis Investment Management, LLP (“GIM”), the Adviser and the Trust on behalf of the Emerging Markets Equity Fund.
The Board noted the following: (i) RREEF America is an existing sub-adviser to the Trust, while DIAL and DeAAM Global are each new sub-advisers to the Trust and affiliates of RREEF America (together, “RREEF”); (ii) HIRES GmbH and HIRES HK are each new sub-advisers to the Trust and affiliates of Heitman Real Estate Securities, LLC (“HRES”), a previously approved sub-adviser to the Trust; and (iii) GAM is an existing sub-adviser to the Trust, while GIM is a new sub-adviser to the Trust and an affiliate of GAM (together, “Genesis”).
The Board approved the new sub-advisory agreements with RREEF, HIRES GmbH and HIRES HK each for a two-year term at an in-person meeting of the Board held on September 12-13, 2013. The Board approved the new sub-advisory agreement with Genesis for a two-year term at an in-person meeting of the Board held on November 7, 2013 (the new sub-advisory agreements for RREEF, HIRES GmbH, HIRES HK and Genesis are collectively referred to as the “New Sub-Advisory Agreements”).
The Board’s decision to approve the New Sub-Advisory Agreements reflects the exercise of its business judgment to enter into new sub-advisory arrangements. In approving the New Sub-Advisory Agreements, the Board considered information provided by the Adviser and each sub-adviser with the assistance and advice of counsel to the Independent Trustees and counsel to the Trust.
The Board’s consideration of various factors and its conclusions with respect to such factors formed the basis for the Board’s determination to approve the New Sub-Advisory Agreements for each sub-adviser. The factors considered by the Board included, but were not limited to: (i) the resources of each sub-adviser; (ii) the experience and expertise of each sub-adviser; (iii) the financial capability of each sub-adviser; (iv) the compliance procedures and history of each sub-adviser; (v) the performance of similarly managed funds and accounts in comparison to the relevant benchmarks for each Fund; (vi) the costs of the services to be provided by each sub-adviser; (vii) the amount of the contractual advisory fee in comparison to similarly managed funds and any available information for each sub-adviser’s other similarly situated clients and the effect of any fee waiver and expense reimbursement arrangements; (viii) the total expenses of each Fund in comparison to similarly managed funds and the use of past and anticipated expense caps; (ix) to the extent available, the anticipated profitability of each sub-adviser with respect to each Fund and its overall business; (x) the extent of any economies of scale and whether the fee structure reflects such economies of scale; (xi) the existence of any collateral benefits realized by each sub-adviser; and (xii) the existence of any collateral benefits realized by the Funds. The Board also evaluated whether the approval of the New Sub-Advisory Agreements was in the best interest of each Fund and its shareholders. No one factor was determinative in the Board’s consideration of the New Sub-Advisory agreements, and each Board member may have attributed different weights to the factors considered.
The Board undertook a review of the terms of the New Sub-Advisory Agreements, and the nature, extent and quality of the services to be provided by each sub-adviser. The Adviser provided the Board with information in the form of reports about each sub-adviser prior to the relevant meeting, which addressed the factors listed previously. The Adviser also provided additional information about each sub-adviser in a presentation made during the relevant meeting, discussed the comprehensive screening process used to recommend each sub-adviser and responded to questions from the Board.
The Independent Trustees met separately in executive sessions with counsel to the Independent Trustees to discuss and consider information presented in connection with the approval of the New Sub-Advisory Agreements, including the Board’s responsibilities and duties in approving the New Sub-Advisory Agreements.
BOARD APPROVAL OF NEW SUB-ADVISORY AGREEMENTS FOR THE EMERGING MARKETS EQUITY FUND AND REAL ESTATE SECURITIES FUND
In considering the approval of the New Sub-Advisory Agreements for the Real Estate Securities Fund and the Emerging Markets Equity Fund, the Board took into account the materials provided prior to and during the relevant meeting, the presentations made during the relevant meeting and the extensive discussions during the relevant meeting, including the discussions the Independent Trustees had during their executive sessions with independent legal counsel. The Board also took into account the Committee’s review of information related to each new sub-advisory arrangement and any recommendations made by the Committee. The
355
Board considered its responsibilities with respect to reviewing and approving the terms of the New Sub-Advisory Agreements, the investment management teams at each sub-adviser, the reasonableness of the sub-advisory fees and whether the appointment of each sub-adviser would be in the best interests of the shareholders of the Real Estate Securities Fund and Emerging Markets Equity Fund. The Board reviewed the above factors in evaluating whether to approve the New Sub-Advisory Agreements and the materials provided to support each factor.
The Board considered the reputation, compliance history, compliance program and financial condition of each sub-adviser. The Board also considered the experience of key personnel at each sub-adviser in providing investment management services to each Fund; the systems and resources used by such persons to implement and manage the applicable strategies; and the ability of each sub-adviser to attract and retain capable personnel. The Board also noted the terms of the New Sub-Advisory Agreements and the responsibilities that each sub-adviser has to Real Estate Securities Fund and Emerging Markets Equity Fund, including the responsibility of day-to-day management and compliance with each Fund’s objectives and policies. The Board concluded that the Real Estate Securities Fund and Emerging Markets Equity Fund are likely to benefit from the nature, extent and quality of services with respect to each sub-adviser’s experience, personnel, operations and resources.
With respect to the Real Estate Securities Fund, the Board examined the nature, extent and quality of the services to be provided by RREEF America, DIAL and DeAAM Global. The Board noted that the current RREEF America strategy has outperformed its benchmark, net of fees, for the three-, five- and seven-year and since inception periods ended June 30, 2013. With respect to DIAL and DeAAM Global, related to the RREEF Global Real Estate Securities Strategy, the Board noted that the strategy has outperformed its benchmark, net of fees, for the one-, three- and five-year and since inception periods ended June 30, 2013. The Board further noted that the existing RREEF America fee schedule would also apply to each RREEF America affiliate sub-advising the Real Estate Securities Fund.
With respect to the Real Estate Securities Fund, the Board examined the nature, extent and quality of services to be provided by HIRES GmbH and HIRES HK. The Board noted that the HIRES GmbH and HIRES HK strategy has outperformed its benchmark, net of fees, for the three- and five-year and since inception periods ended June 30, 2013. The Board noted that the approved HRES fee schedule would also apply to each HRES affiliate sub-advising the Real Estate Securities Fund.
With respect to the Emerging Markets Equity Fund, the Board examined the nature, extent and quality of the services to be provided by Genesis. The Board noted that there was no historical performance for GIM. However, with respect to GAM, the Board noted that the strategy has outperformed its benchmark, net of fees, for the one-, three-, five- and seven-year and since inception periods ended June 30, 2013. The Board further noted that the existing GAM fee schedule would be extended to GIM, and there would be no changes to the current portfolio management team.
The Board considered the Adviser’s assessment of each sub-adviser’s financial condition. The Board noted that the Adviser, after reviewing certain financial information provided by each sub-adviser, felt comfortable that each sub-adviser was financially sound.
The Board considered the Adviser’s assessment of each sub-adviser’s financial condition. The Board noted that the Adviser, after reviewing certain financial information provided by each sub-adviser, felt comfortable that each sub-adviser was financially sound.
Based on all of the information presented to the Board and its consideration of relevant factors, the Board, in the exercise of its reasonable business judgment, concluded that the Real Estate Securities Fund and Emerging Markets Equity Fund are likely to benefit from the extent and quality of these services as a result of each sub-adviser’s experience, personnel, operations and resources and determined to approve the New Sub-Advisory Agreements. The Board also determined that approval of the New Sub-Advisory Agreements was in the best interests of the Real Estate Securities Fund and Emerging Markets Equity Fund and their respective shareholders.
356
INVESTMENT SUB-ADVISERS (Assets under management as of December 31, 2013) (Unaudited)
GuideStone Funds employs a broad array of proven investment managers for the benefit of their investors. Each manager is distinctive in its investment management process and business approach.
| | | | | | | | | | | | |
Fund | | Sub-Adviser | | Firm
Established | | Total Assets
Managed |
Money Market | | BlackRock Advisors, LLC | | 1994 | | | $ | 4.3Tr | |
Low-Duration Bond | | BlackRock Financial Management, Inc. | | 1988 | | | $ | 4.3Tr | |
| | Pacific Investment Management Company LLC (PIMCO) | | 1971 | | | $ | 1.9Tr | |
| | Payden & Rygel | | 1983 | | | $ | 82.8B | |
Medium-Duration Bond | | Goldman Sachs Asset Management, L.P. | | 1984 | | | $ | 807.6B | |
| | Pacific Investment Management Company LLC (PIMCO) | | 1971 | | | $ | 1.9Tr | |
| | Western Asset Management Company | | 1971 | | | $ | 364.7B | |
| | Western Asset Management Company Limited | | 1971 | | | $ | 38.6B | |
Extended-Duration Bond | | Loomis, Sayles & Company, L.P. | | 1926 | | | $ | 200.0B | |
| | Schroder Investment Management North America Inc.(1) | | 1804 | | | $ | 415.8B | |
Global Bond | | Loomis, Sayles & Company, L.P. | | 1926 | | | $ | 200.0B | |
| | Western Asset Management Company | | 1971 | | | $ | 364.7B | |
| | Western Asset Management Company Limited | | 1971 | | | $ | 38.6B | |
Defensive Market Strategies | | American Century Investment Management, Inc. | | 1958 | | | $ | 139B | |
| | AQR Capital Management, LLC | | 1998 | | | $ | 98.8B | |
| | Shenkman Capital Management, Inc. | | 1985 | | | $ | 24.1B | |
| | Turner Investments, L.P. | | 1990 | | | $ | 8.4B | |
Equity Index | | Northern Trust Investments, Inc. | | 1889 | | | $ | 751.4B | |
Value Equity | | AJO, LP | | 1984 | | | $ | 24.0B | |
| | Barrow, Hanley, Mewhinney & Straus, LLC | | 1979 | | | $ | 91.0B | |
| | Northern Trust Investments, Inc. | | 1889 | | | $ | 751.4B | |
| | TCW Investment Management Company | | 1971 | | | $ | 131.9B | |
Growth Equity | | Brown Advisory, LLC | | 1993 | | | $ | 40.3B | |
| | Columbus Circle Investors | | 1975 | | | $ | 17.0B | |
| | Marsico Capital Management, LLC | | 1997 | | | $ | 17.1B | |
| | Rainier Investment Management, Inc.® | | 1991 | | | $ | 10.4B | |
| | Sands Capital Management, LLC | | 1992 | | | $ | 42.1B | |
Small Cap Equity | | AJO, LP | | 1984 | | | $ | 24.0B | |
| | Columbus Circle Investors | | 1975 | | | $ | 17.0B | |
| | RBC Global Asset Management (U.S.) Inc. | | 1983 | | | $ | 46.3B | |
| | TimesSquare Capital Management, LLC | | 2000 | | | $ | 20.4B | |
| | Western Asset Management Company | | 1971 | | | $ | 364.7B | |
| | Western Asset Management Company Limited | | 1971 | | | $ | 38.6B | |
International Equity | | AQR Capital Management, LLC | | 1998 | | | $ | 98.8B | |
| | Baillie Gifford Overseas Limited | | 1983 | | | $ | 174.4B | |
| | Barrow, Hanley, Mewhinney & Strauss | | 1979 | | | $ | 91.0B | |
| | MFS Institutional Advisors, Inc. | | 1970 | | | $ | 412.2B | |
| | Mondrian Investment Partners Ltd. | | 1990 | | | $ | 70.0B | |
| | Philadelphia International Advisors, L.P. | | 1956 | | | $ | 2.8B | |
Emerging Markets Equity | | AQR Capital Management, LLC | | 1998 | | | $ | 98.8B | |
| | Genesis Asset Managers, LLP and Genesis Investment Management, LLP | | 1989 | | | $ | 37.0B | |
Inflation Protected Bond | | BlackRock Financial Management, Inc. | | 1988 | | | $ | 4.3Tr | |
Flexible Income | | Shenkman Capital Management, Inc. | | 1985 | | | $ | 24.1B | |
Real Estate Securities | | Heitman Real Estate Securities, LLC | | 1966 | | | $ | 2.1B | |
| | Heitman International Real Estate Securities GmbH | | 1966 | | | $ | 219.4M | |
| | Heitman International Real Estate Securities HK Limited | | 1966 | | | $ | 113.6M | |
| | RREEF America L.L.C. | | 1975 | | | $ | 32.7B | |
Global Natural Resources Equity | | RS Investment Management Co. LLC | | 1986 | | | $ | 27.5B | |
| | Van Eck Associates Corporation | | 1955 | | | $ | 31.0B | |
Custodian for GuideStone Funds Assets | | The Northern Trust Company | | 1889 | | | $ | 5.6Tr | |
CashOverlayforDateTarget,AssetAllocation, Fixed Income, Equity and Real Return Funds | | Parametric Portfolio Associates LLC | | 1992 | | | $ | 115.7B | |
(1)Assets as of September 30, 2013.
357
| | | | |
 | | | | |
| | 2401 Cedar Springs Road, Dallas, TX 75201-1498 | | Funds distributed by Foreside Funds Distributors LLC |
| | 1-888-98-GUIDE • www.GuideStoneFunds.org | | 400 Berwyn Park, 899 Cassatt Road, Berwyn, PA 19312 |
| | |
| | | | © 2014 GuideStone Funds 23834 02/14 2233 |
Item 2. Code of Ethics.
| | (a) | The registrant, as of the end of the period covered by this report, has adopted a code of ethics that applies to the registrant’s principal executive officer, principal financial officer, principal accounting officer or controller, or persons performing similar functions, regardless of whether these individuals are employed by the registrant or a third party. |
| | (c) | There have been no amendments, during the period covered by this report, to a provision of the code of ethics that applies to the registrant’s principal executive officer, principal financial officer, principal accounting officer or controller, or persons performing similar functions, regardless of whether these individuals are employed by the registrant or a third party, and that relates to any element of the code of ethics description. |
| | (d) | The registrant has not granted any waivers, including an implicit waiver, from a provision of the code of ethics that applies to the registrant’s principal executive officer, principal financial officer, principal accounting officer or controller, or persons performing similar functions, regardless of whether these individuals are employed by the registrant or a third party, that relates to one or more of the items set forth in paragraph (b) of this item’s instructions. |
Item 3. Audit Committee Financial Expert.
As of the end of the period covered by the report, the registrant’s board of directors has determined that Carson L. Eddy is qualified to serve as an audit committee financial expert serving on its audit committee and that he is “independent,” as defined by Item 3 of Form N-CSR.
Item 4. Principal Accountant Fees and Services.
Audit Fees
| | (a) | The aggregate fees billed for each of the last two fiscal years for professional services rendered by the principal accountant for the audit of the registrant’s annual financial statements or services that are normally provided by the accountant in connection with statutory and regulatory filings or engagements for those fiscal years are $601,323 and $731,746 for 2012 and 2013, respectively. |
Audit-Related Fees
| | (b) | The aggregate fees billed in each of the last two fiscal years for assurance and related services by the principal accountant that are reasonably related to the performance of the audit of the registrant’s financial statements and are not reported under paragraph (a) of this Item are $38,977 and $40,146 for 2012 and 2013, respectively. Audit-related fees are related to procedures performed and the issuance of the auditors’ reports in connection with the Funds’ 17F-2 security counts. |
Tax Fees
| | |
| (c) | | The aggregate fees billed in each of the last two fiscal years for professional services rendered by the principal accountant for tax compliance, tax advice, and tax planning are $102,900 and $126,360 for 2012 and 2013, respectively. Tax fees are related to tax services in connection with Funds’ excise tax calculations and review of the Funds’ applicable tax returns. |
All Other Fees
| | |
| (d) | | The aggregate fees billed in each of the last two fiscal years for products and services provided by the principal accountant, other than the services reported in paragraphs (a) through (c) of this Item are $0 and $0 for 2012 and 2013, respectively. |
| |
| (e)(1) | | Disclose the audit committee’s pre-approval policies and procedures described in paragraph (c)(7) of Rule 2-01 of Regulation S-X. |
GuideStone
Non-Audit Services Provided to the Company, Advisor, and Others
The Audit Committee shall pre-approve all permissible non-audit services (e.g., tax services) to be provided to the Company by the Auditors, including the fees therefor;
provided, that if the Committee chooses to delegate the authority to grant pre-approvals to one or more Committee members, each acting on behalf of the Committee, then the Committee shall adopt policies and procedures detailed as to the particular service and designed to safeguard the continued independence of the auditors, consistent with the requirements of the Sarbanes-Oxley Act of 2002 (the “S-O Act”) and related SEC regulations, which shall then be used in making such pre-approvals; and,
further provided, that each delegated pre-approval shall be reported to the Committee during its next regularly scheduled meeting.
The pre-approval requirement for a permitted non-audit service may be waived if:
| | (1) | the aggregate amount of all such non-audit services provided constitutes not more than 5% of the total revenues paid by the Company to the Auditors in the fiscal year in which the non-audit services are provided; |
| | (2) | such services were not recognized by the Company at the time of the engagement to be non-audit services; and |
| | (3) | such services are promptly brought to the attention of, and approved by, the Audit Committee or by a member of the Audit Committee to whom the Committee has delegated the authority to grant such approvals, if any, prior to the Auditors’ completion of the Company’s audit. |
Additionally, if the Auditors’ engagement relates directly to the operations and financial reporting of the Company, to the extent required by Rule 2-01 of Regulation S-X, the Audit Committee shall pre-approve their engagements for non-audit services with:
| | (1) | the Advisor (excluding any subadviser whose role is primarily portfolio management and is sub-contracted or overseen by the Advisor), and |
| | (2) | any entity controlling, controlled by, or under common control with such Advisor that provides ongoing services to the Company (each, a “Control Entity”) |
in accordance with the foregoing paragraph, unless the aggregate amount of all services provided constitutes no more than 5% of the total amount of revenues paid to the Auditors by the Company, the Advisor and any such Control Entity during the fiscal year in which the services are provided that would have to be pre-approved by the Audit Committee pursuant to this paragraph (in the absence of this exception). The Auditors may not perform contemporaneously any prohibited non-audit services for the Company, which currently include the following:
| | 1. | bookkeeping or other services related to the accounting records or financial statements of the Company; |
| | 2. | financial information systems design and implementation; |
| | 3. | appraisal or valuation services, fairness opinions, or contribution-in-kind reports; |
| | 5. | internal audit outsourcing services; |
| | 6. | management functions or human resources; |
| | 7. | broker or dealer, investment adviser, or investment banking services; |
| | 8. | legal services and expert services unrelated to the audit; and |
| | 9. | any other service that the Public Company Accounting Oversight Board determines, by regulation, is impermissible. |
| | |
| (e)(2) | | The percentage of services described in each of paragraphs (b) through (d) of this Item that were approved by the audit committee pursuant to paragraph (c)(7)(i)(C) of Rule 2-01 of Regulation S-X are as follows: |
| | (f) | The percentage of hours expended on the principal accountant’s engagement to audit the registrant’s financial statements for the most recent fiscal year that were attributed to work performed by persons other than the principal accountant’s full-time, permanent employees was less than fifty percent. |
| | (g) | The aggregate non-audit fees billed by the registrant’s accountant for services rendered to the registrant, and rendered to the registrant’s investment adviser (not including any sub-adviser whose role is primarily portfolio management and is subcontracted with or overseen by another investment adviser), and any entity controlling, controlled by, or under common control with the adviser that provides ongoing services to the registrant for each of the last two fiscal years of the registrant was $0 and $0 for 2012 and 2013, respectively. |
| | (h) | The registrant’s audit committee of the board of directors has considered whether the provision of non-audit services that were rendered to the registrant’s investment adviser (not including any sub-adviser whose role is primarily portfolio management and is subcontracted with or overseen by another investment adviser), and any entity controlling, controlled by, or under common control with the investment adviser that provides ongoing services to the registrant that were not pre-approved pursuant to paragraph (c)(7)(ii) of Rule 2-01 of Regulation S-X is compatible with maintaining the principal accountant’s independence. |
Item 5. Audit Committee of Listed Registrants.
Not applicable.
| (a) | Schedule of Investments in securities of unaffiliated issuers as of the close of the reporting period is included as part of the report to shareholders filed under Item 1 of this form. |
| Item 7. | Disclosure of Proxy Voting Policies and Procedures for Closed-End Management Investment Companies. |
Not applicable.
| Item 8. | Portfolio Managers of Closed-End Management Investment Companies. |
Not applicable.
| Item 9. | Purchases of Equity Securities by Closed-End Management Investment Company and Affiliated Purchasers. |
Not applicable.
| Item 10. | Submission of Matters to a Vote of Security Holders. |
There have been no material changes to the procedures by which the shareholders may recommend nominees to the registrant’s board of directors, where those changes were implemented after the
registrant last provided disclosure in response to the requirements of Item 407(c)(2)(iv) of Regulation S-K (17 CFR 229.407) (as required by Item 22(b)(15) of Schedule 14A (17 CFR 240.14a-101)), or this Item.
| Item 11. | Controls and Procedures. |
| | (a) | The registrant’s principal executive and principal financial officers, or persons performing similar functions, have concluded that the registrant’s disclosure controls and procedures (as defined in Rule 30a-3(c) under the Investment Company Act of 1940, as amended (the “1940 Act”) (17 CFR 270.30a-3(c))) are effective, as of a date within 90 days of the filing date of the report that includes the disclosure required by this paragraph, based on their evaluation of these controls and procedures required by Rule 30a-3(b) under the 1940 Act (17 CFR 270.30a-3(b)) and Rules 13a-15(b) or 15d-15(b) under the Securities Exchange Act of 1934, as amended (17 CFR 240.13a-15(b) or 240.15d-15(b)). |
| | (b) | There were no changes in the registrant’s internal control over financial reporting (as defined in Rule 30a-3(d) under the 1940 Act (17 CFR 270.30a-3(d)) that occurred during the registrant’s second fiscal quarter of the period covered by this report that has materially affected, or is reasonably likely to materially affect, the registrant’s internal control over financial reporting. |
| | |
| (a)(1) | | Code of ethics, or any amendment thereto, that is the subject of disclosure required by Item 2 is attached hereto. |
| |
| (a)(2) | | Certifications pursuant to Rule 30a-2(a) under the 1940 Act and Section 302 of the Sarbanes-Oxley Act of 2002 are attached hereto. |
| |
| (a)(3) | | Not applicable. |
| |
| (b) | | Certifications pursuant to Rule 30a-2(b) under the 1940 Act and Section 906 of the Sarbanes-Oxley Act of 2002 are attached hereto. |
| |
| (12.other) | | Not applicable. |
SIGNATURES
Pursuant to the requirements of the Securities Exchange Act of 1934 and the Investment Company Act of 1940, the registrant has duly caused this report to be signed on its behalf by the undersigned, thereunto duly authorized.
| | | | |
| (Registrant) | | GuideStone Funds | | |
| | | | |
| | |
| By (Signature and Title)* | | /s/ John R. Jones | | |
| | John R. Jones, President | | |
| | (principal executive officer) | | |
Pursuant to the requirements of the Securities Exchange Act of 1934 and the Investment Company Act of 1940, this report has been signed below by the following persons on behalf of the registrant and in the capacities and on the dates indicated.
| | | | |
| | |
| By (Signature and Title)* | | /s/ John R. Jones | | |
| | John R. Jones, President | | |
| | (principal executive officer) | | |
| | | | |
| | |
| By (Signature and Title)* | | /s/ Jeffrey P. Billinger | | |
| | Jeffrey P. Billinger, Vice President and Treasurer | | |
| | (principal financial officer) | | |
* Print the name and title of each signing officer under his or her signature.