UNITED STATES
SECURITIES AND EXCHANGE COMMISSION
Washington, D.C. 20549
FORM N-CSR
CERTIFIED SHAREHOLDER REPORT OF REGISTERED
MANAGEMENT INVESTMENT COMPANIES
Investment Company Act file number 811-10263
(Exact name of registrant as specified in charter)
|
2401 Cedar Springs Road Dallas, TX 75201-1407 |
(Address of principal executive offices) (Zip code)
|
Rodney R. Miller, Esq. GuideStone Financial Resources of the Southern Baptist Convention 2401 Cedar Springs Road Dallas, TX 75201-1407 |
(Name and address of agent for service)
Registrant’s telephone number, including area code: 214-720-2142
Date of fiscal year end: December 31
Date of reporting period: December 31, 2010
Form N-CSR is to be used by management investment companies to file reports with the Commission not later than 10 days after the transmission to stockholders of any report that is required to be transmitted to stockholders under Rule 30e-1 under the Investment Company Act of 1940 (17 CFR 270.30e-1). The Commission may use the information provided on Form N-CSR in its regulatory, disclosure review, inspection, and policymaking roles.
A registrant is required to disclose the information specified by Form N-CSR, and the Commission will make this information public. A registrant is not required to respond to the collection of information contained in Form N-CSR unless the Form displays a currently valid Office of Management and Budget (“OMB”) control number. Please direct comments concerning the accuracy of the information collection burden estimate and any suggestions for reducing the burden to Secretary, Securities and Exchange Commission, 100 F Street, NE, Washington, DC 20549. The OMB has reviewed this collection of information under the clearance requirements of 44 U.S.C. § 3507.
Item 1. Reports to Stockholders.
The Report to Shareholders is attached herewith.
Annual Report
December 31, 2010
Gs 2 Gs 4
DATE TARGET FunD s
MyDestination 2005 Fund GMIZX MyDestination 2015 Fund GMTZX MyDestination 2025 Fund GMWZX MyDestination 2035 Fund GMHZX MyDestination 2045 Fund GMFZX
AssET Alloc ATion FunDs
Conservative Allocation Fund GFIZX Balanced Allocation Fund GGIZX Growth Allocation Fund GCOZX Aggressive Allocation Fund GGBZX Conservative Allocation Fund I GFIYX
Balanced Allocation Fund I GGIYX Growth Allocation Fund I GCOYX Aggressive Allocation Fund I GGBYX
sElEcT Fun Ds
Money Market Fund GMYXX GMZXX Low-Duration Bond Fund GLDYX GLDZX Medium-Duration Bond Fund GMDYX GMDZX Extended-Duration Bond Fund GEDYX GEDZX Inflation Protected Bond Fund GIPZX Global Bond Fund GGBFX Equity Index Fund GEQYX GEQZX Real Estate Securities Fund GREZX Value Equity Fund GVEYX GVEZX Growth Equity Fund GGEYX GGEZX Small Cap Equity Fund GSCYX GSCZX International Equity Fund GIEYX GIEZX
Well Donegood and faithful servant. MATTHEW 25:21
GuideStone Funds
Privacy Notice
NOTICE CONCERNING YOUR PRIVACY RIGHTS
This notice will provide you with information concerning our policies with respect to nonpublic personal information thatwe collect about you in connection with the following financial products and services provided and/or serviced by the entities listed below: individual retirement accounts ( “IRAs”) and/or personal mutual fund accounts.
The confidentiality of your information is important to us as we recognize that you depend on us to keep your informationconfidential, as described in this notice.
We collect nonpublic personal information about you with regard to your IRA and/or personal mutual fund accounts from the following sources:
| | • | | Information we receive from you on applications or other forms; |
| | • | | Information about your transactions with us, our affiliates or others (including our third party service providers); |
| | • | | Information we receive from others such as service providers, broker-dealers and your personal agents or representatives; and |
| | • | | Information you and others provide to us in correspondence sent to us, whether written, electronic or by telephone. |
We may disclose such nonpublic personal financial information about you to one or more of our affiliates as permitted bylaw. An affiliate of an organization means any entity that controls, is controlled by or is under common control with thatorganization. GuideStone Funds, GuideStone Financial Resources of the Southern Baptist Convention (“GuideStone FinancialResources”), GuideStone Capital Management (“GSCM”), GuideStone Trust Services (“GSTS”), GuideStone Financial Services(“GFS”) and GuideStone Advisors (“GA”) are affiliates of one another. GuideStone Funds, GuideStone Financial Resources, GSCM, GSTS, GFS, GA and BNY Mellon Distributors Inc. do not sell your personal information to nonaffiliated third parties.
We may also disclose any of the personal information that we collect about you to nonaffiliated third parties as permitted bylaw. For example, we may provide your information to nonaffiliated companies that provide account services or that performmarketing services on our behalf and to other financial institutions with whom we have joint marketing agreements. We restrictaccess to nonpublic personal information about you to those of our employees who need to know that information in order for usto provide and/or service products or services to you.We also maintain physical, electronic and procedural safeguards to guard your personal information.
These procedures will continue to remain in effect after you cease to receive financial products and services from us.
If you have any questions concerning our customer information policy, please contact a customer relations specialist at
1-888-98-GUIDE (1-888-984-8433).
TABLE OF CONTENTS
This report has been prepared for shareholders of GuideStone Funds. It is not authorized for distribution to prospective investors unless accompanied or preceded by a current prospectus, which contains more complete information about the Funds. Investors are reminded to read the prospectus carefully before investing. Past performance is no guarantee of future results. Share prices will fluctuate and there may be a gain or loss when shares are redeemed. Fund shares are distributed by BNY Mellon Distributors Inc., 760 Moore Rd., King of Prussia, PA 19406.
LETTER FROM THE PRESIDENT

Dear Shareholder:
We are pleased to present you with the 2010 GuideStone Funds Annual Report. Although the equity and fixed income markets continued to experience some volatility throughout 2010, all 25 GuideStone Funds ended the year with positive performance with a majority of the Funds earning double-digit returns.
Two recent regulatory events impacting GuideStone Funds’ investors were:
| | • | | Money Market Fund. In October, we began disclosing the monthly portfolio holdings of the GuideStone Funds Money Market Fund on our website. Additionally, investors may now locate detailed information about the Fund’s risk characteristics and market valuations on the U.S. Securities and Exchange Commission’s website at www.sec.gov. These enhanced disclosures equip investors with supplemental information useful for ascertaining the Fund’s risk profile. |
| | • | | Risk/Return Summaries Tagged Using XBRL. Effective with the annual registration statement update, GuideStone Funds will tag certain sections of the prospectus using eXtensible Business Reporting Language (“XBRL”). XBRL is designed to facilitate the ease of mutual fund data compilation and comparative analysis for investors and government regulators. |
This report reflects our commitment to keep you fully informed on the results of your investments. We hope you will find the information valuable. If you have questions regarding its content, please call us at 1-888-98-GUIDE (1-888-984-8433) or visit our website at www.GuideStoneFunds.org. Thank you for choosing to invest in GuideStone Funds.
Sincerely,

John R. Jones, President
FROM THE CHIEF INVESTMENT OFFICER
| | |

Rodric E. Cummins, CFA | | The course of economic growth took center stage in 2010 as investors kept a nervous eye on the progress of economic recovery. While bumpy at times and noticeably slower than past economic recoveries, the latter half of 2010 marked the beginning of an important transition from a recovery phase to an expansion phase in the U.S. and in many economies around the world. Along with the improved fortunes of economic growth came continued advancement of asset values for investors in financial markets. U.S. stocks, as represented by the S&P 500® Index, rallied over 24% from their mid-summer low to post a return of 15.06% for the year, well above historical norms. While not fully recovered from its peak |
| level in 2007, the S&P 500® Index is up over 93% from the market trough less than two years ago. For non-U.S. equity investors, stock markets in developed international countries posted sub-par performance in 2010, but were boosted by depreciation in the U.S. dollar and strong returns in emerging markets. The MSCI All Country World Ex-U.S. Index returned 11.15% for the year. The bond markets posted solid performance in 2010 on the strength of narrowing credit spreads, as the Barclays U.S. Capital Aggregate Bond Index returned 6.54%. |
The past 18 month period has been a strong and critical period of wealth rebuilding for investors, and we are very pleased with the manner in which our funds have performed. While investment returns for GuideStone Funds customers have been systematically fueled by improving economic growth, strong contributions to returns have also come from our positioning portfolios to take advantage of the market dislocations that existed as a result of the 2008 financial crisis and the opportunities presented in the ensuing economic rebound. The market turmoil during the financial crisis created valuation anomalies, asset mispricing and unique investment opportunities across many global assets classes that have played profitably into the hands of patient and disciplined investors with an appropriate perspective on risk and time horizons. We are pleased that our strong fundamentally-based approach, implemented by the Funds’ 29 world class investment sub-advisers, has been able to effectively take advantage of many opportunities on behalf of our investors.
As we enter 2011, economic data is consistently posting positive indications of improving growth and providing good support to corporate earnings and equity valuations. However, the prospects for further acceleration in economic growth will hold the key to the direction and magnitude of capital market returns in the periods ahead. As we look beyond the short-term cyclical dynamics of an economic recovery, significant impediments exist that may hinder a robust long-term economic expansion. Central to this issue will be the economy’s ability to generate enough organic growth, independent of temporary boosts from the inventory rebuilding phase and government stimulus programs, to form the positive feedback loop between business/consumer demand, employment and income needed to sustain a naturally functioning economic cycle. We expect this uncertainty to translate into periods of high volatility in the capital markets and a divergence of performance among asset classes, which we believe can be successfully navigated by investors whose risk tolerance and market expectations are realistic and properly aligned with a well-diversified, global portfolio.
Asset Class Performance Comparison
The following graph illustrates the performance of the major assets classes during 2010.

| 1 | The S&P 500® Index includes 500 of the largest stocks (in terms of market value) in the United States. |
| 2 | The Russell 2000® Index is a small-cap index consisting of the smallest 2,000 companies in the Russell 3000® Index, representing approximately 10% of the Russell 3000® Index total market capitalization. |
| 3 | The MSCI ACWI (All Country World Index) Ex-U.S. Index is a free float-adjusted market capitalization index that is designed to measure equity market performance in the global developed and emerging markets excluding the United States. |
| 4 | The Barclays Capital U.S. Aggregate Bond Index represents securities that are SEC-registered, taxable and dollar denominated. The index covers the U.S. investment grade bond market, with index components for government and corporate securities, mortgage pass-through securities and asset-backed securities. |
4
U.S. Economy — Real Gross Domestic Product
Over the past four quarters of reporting this figure, the U.S. economy has begun to make positive steps towards generating growth on a current quarter over prior quarter basis (annualized) which was not the case in the latter half of 2008 through the first half of 2009. Fourth quarter 2009 reported GDP growth of 5.0%; however, the first two quarters of 2010 were on a declining trend, up 3.7% in the first quarter and up 1.7% in the second quarter. Albeit positive economic growth, the downward trend was quite concerning to the White House, Federal Reserve, Wall Street, and Main Street USA. Therefore, additional stimulus was deployed by the Federal Reserve through its quantitative easing program (widely known as QE 2). This monetary policy was used to increase the money supply by buying U. S. Treasury securities in the market. Quantitative easing increases the money supply by flooding financial institutions with capital in an effort to promote increased lending and liquidity, which hopefully will encourage large companies and small businesses to make capital expenditures and create jobs.
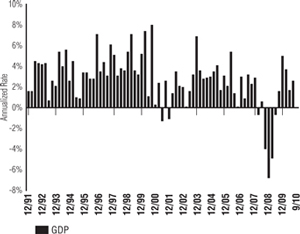
Real Gross Domestic Product (“GDP”) is one of the most widely used economic measures for the overall U.S. economy. GDP measures the output of all goods and services produced by labor and property within the United States during a specific period. The output is usually expressed as an annualized rate for a quarter. Generally, it is viewed as positive for the equity markets when GDP expands reflecting an environment of economic growth and profitability. The converse is true when GDP is contracting.
Data Source: Bloomberg, Bureau of Economic Analysis
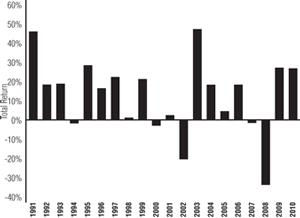
S&P 500® Index Returns
The U.S. large cap equity market, as represented by the S&P 500® Index, posted a positive annual return of 15.06%. This is the second positive year in a row after a very disappointing year for stocks in 2008. This index has generated positive results in seven of the last eight years. The low point in the first quarter was in early February when the index was down 5.07% since the beginning of the year. From this level, the index rose significantly from early February until late April, only to retreat again to its lowest point of the year on July 2, down 7.38% year-to-date. From this point, the index rallied until mid-August then settled back. However, since the end of August, this index was up 20.64%. The best performing sectors this year in this index were Producer Durables, Consumer Discretionary and Materials & Processing. The sectors in the index that lagged the most this year were Health Care, Technology and Utilities.

The S&P 500® Index includes 500 leading companies in major industries of the U.S. economy. The index represents about 75% of U.S. equity market capitalization. It is a capitalization-weighted index calculated on a total return basis with dividends reinvested. Constituents are selected by a team of Standard & Poor’s economists and analysts.
Data Source: Standard & Poor’s®
Russell 2000® Index Return
The U.S. small cap equity market, as represented by the Russell 2000® Index, posted a positive annual return of 26.85%. This is the second consecutive year that results have been this strong following an abysmal 2008. The low point for the year was in early February when the index was down 6.15% since the beginning of the year. From this level, the index rose significantly from early February until late April, only to retreat once again to near February lows by early July. However, since the end of August, this index was up 30.74%. The best performing sectors this year in this index were Technology, Energy, Materials & Processing and Consumer Discretionary. The sectors in the index that lagged the most this year were Utilities, Health Care and Consumer Staples.
The Russell 2000® Index measures the performance of the small-cap segment of the U.S. equity universe. The Russell 2000® Index is a subset of the Russell 3000® Index and represents approximately 10% of the total market capitalization of that index. It includes approximately 2,000 of the smallest securities based on a combination of their market capitalization and current index membership. The Russell 2000® is constructed to provide a comprehensive and unbiased small-cap barometer and is completely reconstituted annually to ensure larger stocks do not distort the performance and characteristics of the true small-cap opportunity set.
Data Source: Russell Investments
5
The Conference Board Consumer Confidence Index
U.S. consumer confidence, as measured by the Conference Board’s index, reflects current appraisals and expectations of business and employment conditions as well as expectations related to future family income. In 2010, this measure of consumer confidence was in a fairly tight range throughout the year. This index finished 2009 at 52.9 and moved up in January to 56.5. A pullback was observed in February back to 46.4 but sentiment turned more positive at this juncture and moved upward to its peak level for the year in May at 62.7. At this point, confidence levels began to wane once again as unemployment levels continued to remain quite high and job growth was tepid at best. Confidence levels trended downward to 48.6 in September. From this month to the end of the year, this measure of consumer confidence was much steadier through this period and finished 2010 at a level of 53.3.
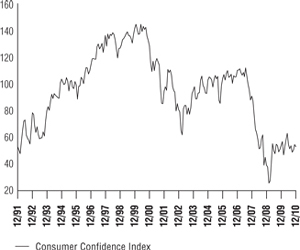
The Conference Board Consumer Confidence Index is based on a monthly survey of a sample of 5000 U.S. households for the purpose of measuring consumer sentiment. The trend in this economic measure is closely monitored, given consumers comprise approximately two-thirds of the U.S. Economy. Generally, it is viewed as positive to the economy and equity markets when the index increases. This reflects the fact that consumers are positive regarding their economic outlook and that they are more willing to spend money providing further economic stimulus.
Data Source: Bloomberg, The Conference Board
Federal Reserve
The Federal Reserve (“Fed”) maintained the same targeted Fed Funds level of 0% - 0.25% throughout 2010. Although the Fed formally met to review this rate level on nine separate occasions during the year, no meaningful action was taken. The last time an action was taken was December 2008 when the Fed cut rates to their current levels. At this level, the Fed has been compelled this year to implement other measures such as quantitative easing in order to contribute additional liquidity to the markets in an effort to spark an economic recovery. The Fed continues to carefully monitor the risks of these additional U.S. Treasury security purchases and the related impact that this continued high level of monetary accommodation may have on the future.
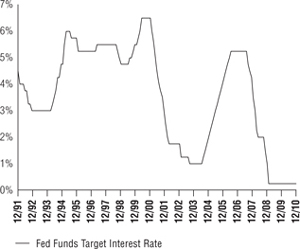
The Federal Reserve (“Fed”) is the central bank of the United States. It was created by Congress to provide the nation with a safer, more flexible, and more stable monetary and financial system. The Federal Funds Rate is the interest rate at which depository institutions lend balances at the Fed to other depository institutions overnight. The rate is one tool the Fed can use in their efforts of controlling the supply of money. Changes in the Federal Funds Rate trigger a chain of events that affect other short-term interest rates, foreign exchange rates, long-term interest rates, the amount of money and credit, and, ultimately, a range of economic variables, including employment, output, and prices of goods and services.
Data Source: Bloomberg
6
U.S. Unemployment
We entered this year from a level of 10% unemployment. Although many measures were discussed at the White House and Congress, few were implemented and require time to take effect in reducing this rate. Job growth remained tepid throughout this year. Initial jobless claims are reported by the U. S. Department of Labor on a weekly basis. The employment situation is extremely important for macroeconomic analysis, so the financial markets track this as one of their employment indicators. This report tracks how many people have filed for unemployment benefits in the previous week. It is a good gauge of the U.S. job market. Initial jobless claims started the year at a level of 456,000 and were consistently being reported each week within a range of 440,000–490,000 until mid-August when the level peaked at 504,000. Since that time, initial jobless claims have been trending downward to 411,000 by year-end. As a result, unemployment levels ranged between 9.5% - 10% all year long until year-end, when the last report came in at 9.4%.
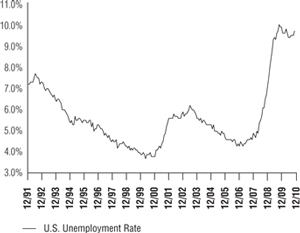
The U.S. unemployment rate measures the numbers of persons unemployed as a percentage of the labor force. Typically, unemployment tends to increase during difficult economic periods and declines during expansionary economic times. Additionally, very low unemployment can place inflationary pressure on the economy as labor markets become very competitive and expensive.
Data Source: Bloomberg, Bureau of Labor Statistics
U.S. Treasury Yield Curve
Over the last two years, the U. S. Treasury yield curve has not changed much relative to preceding years. Short-term rates remained at historically low levels as the Federal Reserve (the “Fed”), through its aggressive monetary policy, maintained the target federal funds rate at 0% - 0.25% in an effort to stimulate economic growth all year long. The very short end of the curve where the maturity is less than two years stayed basically the same. Starting at the 2-year maturity level and longer, there was some reduction in yield levels compared to the yield curve at the end of 2009. The mid-to-long end of the yield curve, which is much more heavily influenced by market forces and inflation expectations, experienced a decline in yields primarily due to concerns related to economic growth and the European debt crisis. This trend through the first three quarters of the year reversed course in the fourth quarter as the Fed’s quantitative easing measures (widely known as “QE 2”) were taking effect. Overall for the year, there was a larger drop in yields in the 2-year to 10-year area of the yield curve than there was observed in the longest part of the curve, which is the 30-year maturity. At year-end, yields on the 2-year, 10-year and 30-year U. S. Treasury securities were 0.59%, 3.29% and 4.33%, respectively.
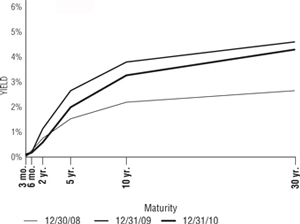
The Treasury yield curve illustrates the relationship between yields on short-term, intermediate-term and long-term Treasury securities. Normally, the shape of the yield curve is upward sloping with rates increasing from the short end of the curve moving higher to the long end. The short end of the curve is impacted more by monetary policy (demand for money) while inflationary expectations and market forces impact the long end of the curve.
Data Source: Bloomberg
7
About Your Expenses (Unaudited)
As a shareholder of the Funds, you incur ongoing costs, including advisory fees and to the extent applicable, distribution (12b-1) fees and/or shareholder services fees, as well as other Fund expenses. This example is intended to help you to understand your ongoing costs (in dollars) of investing in the Funds and to compare these costs with the ongoing costs of investing in other mutual funds. It is based on an investment of $1,000 invested at the beginning of the period and held for the entire period from July 1, 2010 to December 31, 2010.
Actual Expenses
The first section of the table below provides information about actual account values and actual expenses. You may use the information in this section, together with the amount you invested, to estimate the expenses that you incurred over the period. Simply divide your account value by $1,000 (for example, an $8,600 account value divided by $1,000 = 8.6), then multiply the result by the number in the first section under the heading entitled “Expenses Paid During Period” to estimate the expenses attributable to your investment during this period.
Hypothetical Example for Comparison Purposes
The second section of the table below provides information about hypothetical account values and hypothetical expenses based on the Fund’s actual expense ratio and an assumed rate of return of 5% per year before expenses, which is not the Fund’s actual return. Thus, you should not use the hypothetical account values and expenses to estimate the actual ending account balance or your expenses for the period. Rather, these figures are provided to enable you to compare the ongoing costs of investing in the Fund and other funds. To do so, compare this 5% hypothetical example with the 5% hypothetical examples that appear in the shareholder reports of the other funds. Please note that the expenses shown in the table are meant to highlight your ongoing costs only. Therefore, the second section of the table is useful in comparing ongoing costs only and will not help you determine the relative total costs of owning different funds.
| | | | | | | | | | | | | | | | | | | | |
ACTUAL | |
Fund | | Class | | | Beginning
Account Value
07/01/10 | | | Ending
Account Value
12/31/10 | | | Annualized
Expense
Ratio (1) | | | Expenses
Paid During
Period (2) | |
MyDestination 2005 | | | GS4 | | | $ | 1,000.00 | | | $ | 1,115.72 | | | | 0.20 | % | | $ | 1.07 | |
MyDestination 2015 | | | GS4 | | | | 1,000.00 | | | | 1,165.86 | | | | 0.16 | | | | 0.88 | |
MyDestination 2025 | | | GS4 | | | | 1,000.00 | | | | 1,203.58 | | | | 0.19 | | | | 1.07 | |
MyDestination 2035 | | | GS4 | | | | 1,000.00 | | | | 1,237.55 | | | | 0.20 | | | | 1.13 | |
MyDestination 2045 | | | GS4 | | | | 1,000.00 | | | | 1,256.55 | | | | 0.20 | | | | 1.14 | |
Conservative Allocation | | | GS4 | | | | 1,000.00 | | | | 1,070.00 | | | | 0.12 | | | | 0.63 | |
Balanced Allocation | | | GS4 | | | | 1,000.00 | | | | 1,138.09 | | | | 0.12 | | | | 0.65 | |
Growth Allocation | | | GS4 | | | | 1,000.00 | | | | 1,197.96 | | | | 0.12 | | | | 0.66 | |
Aggressive Allocation | | | GS4 | | | | 1,000.00 | | | | 1,259.04 | | | | 0.12 | | | | 0.68 | |
Conservative Allocation I | | | GS2 | | | | 1,000.00 | | | | 1,070.14 | | | | 0.15 | | | | 0.77 | |
Balanced Allocation I | | | GS2 | | | | 1,000.00 | | | | 1,138.08 | | | | 0.13 | | | | 0.71 | |
Growth Allocation I | | | GS2 | | | | 1,000.00 | | | | 1,197.05 | | | | 0.14 | | | | 0.80 | |
Aggressive Allocation I | | | GS2 | | | | 1,000.00 | | | | 1,258.86 | | | | 0.15 | | | | 0.87 | |
Money Market | |
| GS2
GS4 |
| |
| 1,000.00
1,000.00 |
| |
| 1,001.19
1,000.12 |
| |
| 0.16
0.37 |
| |
| 0.80
1.88 |
|
Low-Duration Bond | |
| GS2
GS4 |
| |
| 1,000.00
1,000.00 |
| |
| 1,013.09
1,012.41 |
| |
| 0.36
0.52 |
| |
| 1.83
2.64 |
|
Medium-Duration Bond | |
| GS2
GS4 |
| |
| 1,000.00
1,000.00 |
| |
| 1,023.13
1,021.47 |
| |
| 0.48
0.58 |
| |
| 2.45
2.96 |
|
8
| | | | | | | | | | | | | | | | | | |
ACTUAL | |
Fund | | Class | | Beginning
Account Value
07/01/10 | | | Ending
Account Value
12/31/10 | | | Annualized
Expense
Ratio (1) | | | Expenses
Paid During
Period (2) | |
Extended-Duration Bond | | GS2
GS4 | | $
| 1,000.00
1,000.00 |
| | $
| 1,038.66
1,037.80 |
| |
| 0.53
0.69 | %
| | $
| 2.71
3.54 |
|
Inflation Protected Bond | | GS4 | | | 1,000.00 | | | | 1,014.81 | | | | 0.63 | | | | 3.19 | |
Global Bond | | GS4 | | | 1,000.00 | | | | 1,075.49 | | | | 0.81 | | | | 4.22 | |
Equity Index | | GS2
GS4 | |
| 1,000.00
1,000.00 |
| |
| 1,228.79
1,228.75 |
| |
| 0.21
0.37 |
| |
| 1.20
2.08 |
|
Real Estate Securities | | GS4 | | | 1,000.00 | | | | 1,231.97 | | | | 1.19 | | | | 6.68 | |
Value Equity | | GS2
GS4 | |
| 1,000.00
1,000.00 |
| |
| 1,225.48
1,226.76 |
| |
| 0.67
0.84 |
| |
| 3.74
4.71 |
|
Growth Equity | | GS2
GS4 | |
| 1,000.00
1,000.00 |
| |
| 1,297.38
1,297.18 |
| |
| 0.87
0.96 |
| |
| 5.04
5.56 |
|
Small Cap Equity | | GS2
GS4 | |
| 1,000.00
1,000.00 |
| |
| 1,297.00
1,296.34 |
| |
| 1.00
1.14 |
| |
| 5.79
6.60 |
|
International Equity (3) | | GS2
GS4 | |
| 1,000.00
1,000.00 |
| |
| 1,254.09
1,252.41 |
| |
| 0.96
1.14 |
| |
| 5.44
6.46 |
|
| | | | | | | | | | | | | | | | | | | | |
HYPOTHETICAL (assuming a 5% return before expenses) | |
Fund | | Class | | | Beginning
Account Value
07/01/10 | | | Ending
Account Value
12/31/10 | | | Annualized
Expense
Ratio (1) | | | Expenses
Paid During
Period (2) | |
MyDestination 2005 | | | GS4 | | | $ | 1,000.00 | | | $ | 1,024.20 | | | | 0.20 | % | | $ | 1.02 | |
MyDestination 2015 | | | GS4 | | | | 1,000.00 | | | | 1,024.39 | | | | 0.16 | | | | 0.83 | |
MyDestination 2025 | | | GS4 | | | | 1,000.00 | | | | 1,024.24 | | | | 0.19 | | | | 0.98 | |
MyDestination 2035 | | | GS4 | | | | 1,000.00 | | | | 1,024.20 | | | | 0.20 | | | | 1.02 | |
MyDestination 2045 | | | GS4 | | | | 1,000.00 | | | | 1,024.20 | | | | 0.20 | | | | 1.02 | |
Conservative Allocation | | | GS4 | | | | 1,000.00 | | | | 1,024.60 | | | | 0.12 | | | | 0.61 | |
Balanced Allocation | | | GS4 | | | | 1,000.00 | | | | 1,024.60 | | | | 0.12 | | | | 0.61 | |
Growth Allocation | | | GS4 | | | | 1,000.00 | | | | 1,024.60 | | | | 0.12 | | | | 0.61 | |
Aggressive Allocation | | | GS4 | | | | 1,000.00 | | | | 1,024.60 | | | | 0.12 | | | | 0.61 | |
Conservative Allocation I | | | GS2 | | | | 1,000.00 | | | | 1,024.46 | | | | 0.15 | | | | 0.75 | |
Balanced Allocation I | | | GS2 | | | | 1,000.00 | | | | 1,024.54 | | | | 0.13 | | | | 0.67 | |
Growth Allocation I | | | GS2 | | | | 1,000.00 | | | | 1,024.48 | | | | 0.14 | | | | 0.73 | |
Aggressive Allocation I | | | GS2 | | | | 1,000.00 | | | | 1,024.44 | | | | 0.15 | | | | 0.78 | |
Money Market | |
| GS2
GS4 |
| |
| 1,000.00
1,000.00 |
| |
| 1,023.60
1,021.44 |
| |
| 0.16
0.37 |
| |
| 0.81
1.90 |
|
Low-Duration Bond | |
| GS2
GS4 |
| |
| 1,000.00
1,000.00 |
| |
| 1,021.58
1,019.96 |
| |
| 0.36
0.52 |
| |
| 1.84
2.65 |
|
Medium-Duration Bond | |
| GS2
GS4 |
| |
| 1,000.00
1,000.00 |
| |
| 1,020.37
1,019.36 |
| |
| 0.48
0.58 |
| |
| 2.45
2.96 |
|
Extended-Duration Bond | |
| GS2
GS4 |
| |
| 1,000.00
1,000.00 |
| |
| 1,019.88
1,018.25 |
| |
| 0.53
0.69 |
| |
| 2.69
3.52 |
|
Inflation Protected Bond | | | GS4 | | | | 1,000.00 | | | | 1,022.03 | | | | 0.63 | | | | 3.21 | |
Global Bond | | | GS4 | | | | 1,000.00 | | | | 1,021.14 | | | | 0.81 | | | | 4.11 | |
Equity Index | |
| GS2
GS4 |
| |
| 1,000.00
1,000.00 |
| |
| 1,023.05
1,021.48 |
| |
| 0.21
0.37 |
| |
| 1.09
1.89 |
|
9
| | |
About Your Expenses (Unaudited) (Continued) | | |
| | |
| | | | | | | | | | | | | | | | | | | | |
HYPOTHETICAL (assuming a 5% return before expenses) | |
Fund | | Class | | | Beginning
Account Value
07/01/10 | | | Ending
Account Value
12/31/10 | | | Annualized
Expense
Ratio (1) | | | Expenses
Paid During
Period (2) | |
Real Estate Securities | | | GS4 | | | $ | 1,000.00 | | | $ | 1,019.22 | | | | 1.19 | % | | $ | 6.04 | |
Value Equity | |
| GS2
GS4 |
| |
| 1,000.00
1,000.00 |
| |
| 1,018.49
1,016.74 |
| |
| 0.67
0.84 |
| |
| 3.39
4.28 |
|
Growth Equity | |
| GS2
GS4 |
| |
| 1,000.00
1,000.00 |
| |
| 1,016.43
1,015.53 |
| |
| 0.87
0.96 |
| |
| 4.43
4.89 |
|
Small Cap Equity | |
| GS2
GS4 |
| |
| 1,000.00
1,000.00 |
| |
| 1,015.12
1,013.71 |
| |
| 1.00
1.14 |
| |
| 5.09
5.80 |
|
International Equity (3) | |
| GS2
GS4 |
| |
| 1,000.00
1,000.00 |
| |
| 1,015.83
1,014.01 |
| |
| 0.96
1.14 |
| |
| 4.87
5.79 |
|
| (1) | Expenses include the effect of contractual waivers by GuideStone Capital Management. The Date Target Funds’ and Asset Allocation Funds’ proportionate share of the operating expenses of the Select Funds is not reflected in the tables above. |
| (2) | Expenses are equal to the Fund’s annualized expense ratios for the period July 1, 2010, through December 31, 2010, multiplied by the average account value over the period, multiplied by 184/365 (to reflect the one-half year period). |
| (3) | The expense ratios for the International Equity Fund include the impact of dividend expense on securities sold short. |
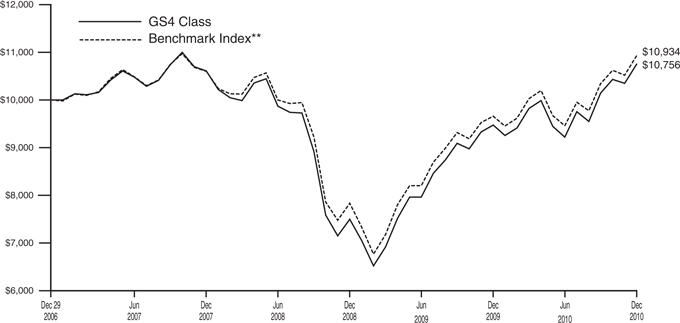
The Fund, through investments in the underlying Select Funds, combines a slightly greater percentage of exposure to fixed income securities with a smaller percentage to equity securities. While the Fund follows an allocation glide path which becomes more conservative over time, the year-end targeted allocations were approximately 57% Fixed Income Select Funds, 12% Non-U.S. Equity Select Fund and 31% U.S. Equity Select Funds.
The Fund is a fund of funds, and its performance is based on the performance of the underlying Select Funds. The Fund generated a strong return of 10.56% during 2010, benefiting from positive absolute performance from all of the underlying Select Funds including both equities and fixed income. The Fund’s absolute returns were most positively influenced by its exposure to the Growth Equity Fund, Value Equity Fund and Medium-Duration Bond Fund.
Equities were the largest contributor to overall performance, as equities outpaced bonds and posted strong double-digit returns for the year. While equities started the first quarter with positive results thanks to stronger economic growth, the second quarter resulted in double-digit declines for equities as investors shunned the asset class due to fears of a faltering and jobless economic recovery coupled with international concerns over European economic strength and a slowing Chinese economy. After a dismal second quarter correction, global equity markets experienced a strong, albeit still volatile, rally throughout the remainder of the year as investors responded favorably to additional stimulus measures and improving economic conditions.
While lagging equities, the Fund’s fixed income holdings contributed positively to overall absolute performance with all major bond sectors producing positive returns. Fixed income assets produced virtually all of their positive performance during the first nine months of the year, as declining interest rates provided the backdrop for a rally in bond prices. During the second quarter, the Fund benefited from diversification into fixed income securities that helped mitigate the effect of strong negative equity returns during this quarter. Market sentiment shifted in the fourth quarter, however, as an improved economic outlook fueled a rise in interest rates which was a strong enough headwind to send fixed income returns generally into negative territory for the quarter.
The Fund modestly outpaced its composite benchmark during the year by 0.20%, benefitting most notably from its exposure to the Fixed Income Select Funds. The majority of the outperformance came from the two largest Fixed Income Select Funds holdings, the Low-Duration Bond Fund and the Medium-Duration Bond Fund, which represented over two-thirds of the fixed income allocation. Both of these funds outpaced their respective benchmarks, and were positively impacted by taking advantage of more attractive yield opportunities outside of Treasuries. The Fund’s relative performance was positively impacted by exposure to certain U.S. Equity Select Funds, most notably the Growth Equity Fund which benefited primarily from strong security selection leading to outperformance of its respective benchmark. The largest detractor to the Fund’s relative performance was attributed to exposure to the Value Equity Fund, which trailed its respective benchmark.
The Fund attempts to achieve its objective by investing in the Select Funds. The Fund is managed to a retirement date (“target date”) by adjusting the percentage of fixed income securities and equity securities to become more conservative each year until reaching the retirement year and then approximately 15 years thereafter. The target date in the name of the Fund is the approximate date when an investor plans to start withdrawing money. By investing in the Fund, you will also incur the expenses and risks of the underlying Select Funds. The principal risks of the Fund will change depending on the asset mix of the Select Funds in which it invests. You may directly invest in the Select Funds. The Fund’s value will go up and down in response to changes in the share prices of the investments that it owns. The amount invested in the Fund is not guaranteed to increase, is not guaranteed against loss, nor is the amount of the original investment guaranteed at the target date. It is possible to lose money by investing in the Fund.
Please see page 13 for information regarding specific portfolio allocations. Portfolio holdings are subject to change at any time.
Average Annual Total Returns as of 12/31/10
| | | | | | | | |
| | | GS4 Class* | | | Benchmark** | |
One Year | | | 10.56 | % | | | 10.36 | % |
Since Inception | | | 2.57 | % | | | 3.01 | % |
Inception Date | | | 12/29/06 | | | | | |
Total Fund Operating Expenses (April 30, 2010 Prospectus, as supplemented on August 5, 2010)(1) | | | 1.00 | % | | | | |
| (1) | The Fund’s shareholders indirectly bear the expenses of the GS4 Class shares of the Select Funds in which the Fund invests. Current information regarding the Fund’s Operating Expenses can be found in the Financial Highlights. |
The performance data quoted represents past performance and does not guarantee future results. Current performance may be lower or higher. Performance data current to the most recent month-end may be obtained at www.GuideStoneFunds.org. The investment return and principal value of an investment will fluctuate so that shares, when redeemed, may be worth more or less than their original cost.
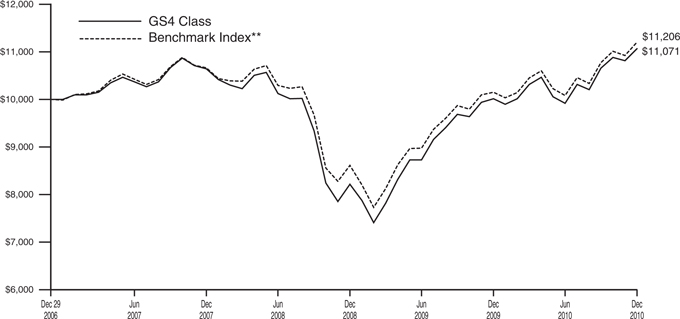
The graph illustrates the results of a hypothetical $10,000 investment in the GS4 Class of the Fund since December 29, 2006 (commencement of operations), with all dividends and capital gains reinvested, with the Fund’s composite benchmark index.
| * | These returns reflect expense waivers by the Fund’s investment adviser. Without these waivers, returns would have been lower. Returns shown do not reflect the deduction of taxes that a shareholder would pay on Fund distributions or the redemption of Fund shares. |
| ** | Represents a composite index as of December 2010, consisting of 22.50% of the Merrill Lynch 1-3 Year Treasury Index, 18.25% of the Barclays Capital U.S. Aggregate Bond Index, 15.00% of the Barclays Capital U.S. TIPS Index, 0.50% of the Barclays Capital Global Aggregate Bond Index — Unhedged, 0.25% of the Barclays U.S. Corporate High Yield — 2% Issuer Capped Index, 0.25% of the JPMorgan Emerging Markets Bond Index Plus, 2.25% of the S&P 500® Index, 3.00% of the Dow Jones U.S. Select Real Estate Securities IndexSM, 11.50% of the Russell 1000® Value Index, 11.50% of the Russell 1000® Growth Index, 3.00% of the Russell 2000® Index and 12.00% of the MSCI ACWI (All Country World Index) Ex-U.S. Index. |
The construction of the composite index corresponds to the target percentage allocations to the underlying asset classes as represented by the Fund’s investment in the Select Funds. As the target percentage allocations to the underlying investments change according to the MyDestination Funds® glide path, the target percentage allocations to the composite index also change.
Unlike a mutual fund, the performance of an index assumes no taxes, transaction costs, management fees or other expenses.
| | |
| MYDESTINATION 2005 FUND | | |
| SCHEDULE OF INVESTMENTS | | December 31, 2010 |
| | | | | | | | |
| | | Shares | | | Value | |
MUTUAL FUNDS — 100.6% | | | | | | | | |
GuideStone Money Market Fund (GS4 Class)¥ | | | 1,446,944 | | | $ | 1,446,944 | |
GuideStone Low-Duration Bond Fund (GS4 Class)¥ | | | 906,553 | | | | 11,993,701 | |
GuideStone Medium-Duration Bond Fund (GS4 Class)¥ | | | 718,629 | | | | 9,809,284 | |
GuideStone Extended-Duration Bond Fund (GS4 Class)¥ | | | 2,547 | | | | 41,460 | |
GuideStone Inflation Protected Bond Fund (GS4 Class)¥ | | | 775,477 | | | | 8,088,222 | |
GuideStone Global Bond Fund (GS4 Class)¥ | | | 54,888 | | | | 539,551 | |
GuideStone Equity Index Fund (GS4 Class)¥ | | | 72,993 | | | | 1,194,173 | |
GuideStone Real Estate Securities Fund (GS4 Class)¥ | | | 189,301 | | | | 1,612,846 | |
GuideStone Value Equity Fund (GS4 Class)¥ | | | 433,538 | | | | 6,121,558 | |
GuideStone Growth Equity Fund (GS4 Class)¥ | | | 323,024 | | | | 6,105,156 | |
GuideStone Small Cap Equity Fund (GS4 Class)¥ | | | 111,526 | | | | 1,612,667 | |
GuideStone International Equity Fund (GS4 Class)¥ | | | 480,735 | | | | 6,456,267 | |
| | | | | | | | |
Total Mutual Funds
(Cost $49,335,512) | | | | | | | 55,021,829 | |
| | | | | | | | |
TOTAL INVESTMENTS — 100.6%
(Cost $49,335,512) | | | | 55,021,829 | |
Liabilities in Excess of Other Assets — (0.6)% | | | | | | | (338,920 | ) |
| | | | | | | | |
NET ASSETS — 100.0% | | | | | | $ | 54,682,909 | |
| | | | | | | | |
Please see abbreviation and footnote definitions beginning on page 180.
PORTFOLIO SUMMARY (based on net assets)
| | | | |
| | | % | |
Bond Funds | | | 55.8 | |
Domestic Equity Funds | | | 30.4 | |
International Equity Fund | | | 11.8 | |
Money Market Fund | | | 2.6 | |
| | | | |
| | | 100.6 | |
| | | | |
VALUATION HIERARCHY
The following is a summary of the inputs used, as of December 31, 2010, in valuing the Fund’s investments carried at fair value:
| | | | | | | | |
Valuation Inputs | | Investments
in
Securities | | | Other
Financial
Instruments*** | |
Level 1 — Quoted Prices | | | | | | | | |
Mutual Funds | | $ | 55,021,829 | | | $ | — | |
Level 2 — Other Significant Observable Inputs | | | — | | | | — | |
Level 3 — Significant Unobservable Inputs | | | — | | | | — | |
| | | | | | | | |
Total | | $ | 55,021,829 | | | $ | — | |
| | | | | | | | |
| *** | Other financial instruments are derivative instruments not reflected in the Schedule of Investments, such as futures, forwards and swap contracts, which are valued at the unrealized appreciation (depreciation) on the investment. Details of these investments can be found in the Notes to Financial Statements. |
| | | | |
| | See Notes to Financial Statements. | | 13 |
MyDestination 2015 Fund
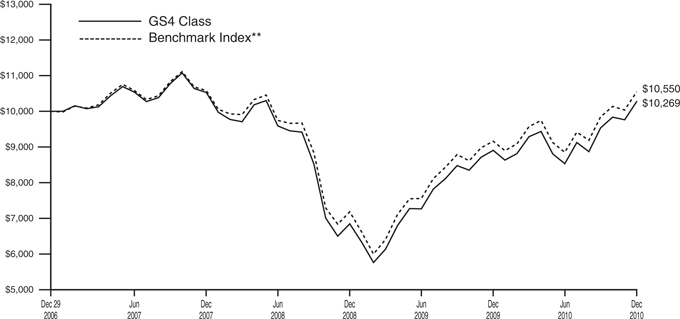
The Fund, through investments in the underlying Select Funds, combines a greater percentage of exposure to equity securities with a smaller percentage to fixed income securities. While the Fund follows an allocation glide path which becomes more conservative over time, the year-end targeted allocations were approximately 45% U.S. Equity Select Funds, 38% Fixed Income Select Funds and 17% Non-U.S. Equity Select Fund.
The Fund is a fund of funds, and its performance is based on the performance of the underlying Select Funds. The Fund generated a strong return of 13.54% during 2010, benefiting from positive absolute performance from all of the underlying Select Funds including both equities and fixed income. The Fund’s absolute returns were most positively influenced by its exposure to the Growth Equity Fund and Value Equity Fund, which represented just over half of the total equity allocation.
Equities were by far the largest contributor to overall performance, as equities outpaced bonds and posted strong double-digit returns for the year. While equities started the first quarter with positive results thanks to stronger economic growth, the second quarter resulted in double-digit declines for equities as investors shunned the asset class due to fears of a faltering and jobless economic recovery coupled with international concerns over European economic strength and a slowing Chinese economy. After a dismal second quarter correction, global equity markets experienced a strong, albeit still volatile, rally throughout the remainder of the year as investors responded favorably to additional stimulus measures and improving economic conditions.
While lagging equities, the Fund’s fixed income holdings contributed positively to overall absolute performance with all major bond sectors producing positive returns. Fixed income assets produced virtually all of their positive performance during the first nine months of the year, as declining interest rates provided the backdrop for a rally in bond prices. Particularly during the second quarter, the Fund benefited from diversification into fixed income securities that helped mitigate the effect of strong negative equity returns during this quarter. Market sentiment shifted in the fourth quarter, however, as an improved economic outlook fueled a rise in interest rates which was a strong enough headwind to send fixed income returns generally into negative territory for the quarter.
The Fund modestly outpaced its composite benchmark during the year by 0.35%, benefitting most overall from its exposure to the Fixed Income Select Funds. The majority of the outperformance from fixed income came from the two largest Fixed Income Select Funds holdings, the Low-Duration Bond Fund and the Medium-Duration Bond Fund, which represented nearly one-half of the fixed income allocation. Both of these funds outpaced their respective benchmarks, and were positively impacted by taking advantage of more attractive yield opportunities outside of Treasuries. The Fund’s relative performance was positively impacted by exposure to certain U.S. Equity Select Funds, with the Growth Equity Fund contributing the most of any Select Fund to relative outperformance. The Growth Equity Fund benefited primarily from strong security selection leading to outperformance of its respective benchmark. The largest detractor to the Fund’s relative performance was attributed to exposure to the Value Equity Fund, which trailed its respective benchmark.
The Fund attempts to achieve its objective by investing in the Select Funds. The Fund is managed to a retirement date (“target date”) by adjusting the percentage of fixed income securities and equity securities to become more conservative each year until reaching the retirement year and then approximately 15 years thereafter. The target date in the name of the Fund is the approximate date when an investor plans to start withdrawing money. By investing in the Fund, you will also incur the expenses and risks of the underlying Select Funds. The principal risks of the Fund will change depending on the asset mix of the Select Funds in which it invests. You may directly invest in the Select Funds. The Fund’s value will go up and down in response to changes in the share prices of the investments that it owns. The amount invested in the Fund is not guaranteed to increase, is not guaranteed against loss, nor is the amount of the original investment guaranteed at the target date. It is possible to lose money by investing in the Fund.
Please see page 16 for information regarding specific portfolio allocations. Portfolio holdings are subject to change at any time.
MyDestination 2015 Fund
| | | | | | | | |
| Average Annual Total Returns as of 12/31/10 | |
| | |
| | | GS4 Class* | | | Benchmark** | |
One Year | | | 13.54 | % | | | 13.19 | % |
Since Inception | | | 1.84 | % | | | 2.34 | % |
Inception Date | | | 12/29/06 | | | | | |
Total Fund Operating Expenses (April 30, 2010 Prospectus, as supplemented on August 5, 2010)(1) | | | 1.00 | % | | | | |
| (1) | The Fund’s shareholders indirectly bear the expenses of the GS4 Class shares of the Select Funds in which the Fund invests. Current information regarding the Fund’s Operating Expenses can be found in the Financial Highlights. |
The performance data quoted represents past performance and does not guarantee future results. Current performance may be lower or higher. Performance data current to the most recent month-end may be obtained at www.GuideStoneFunds.org. The investment return and principal value of an investment will fluctuate so that shares, when redeemed, may be worth more or less than their original cost.
The graph illustrates the results of a hypothetical $10,000 investment in the GS4 Class of the Fund since December 29, 2006 (commencement of operations), with all dividends and capital gains reinvested, with the Fund’s composite benchmark index.
| * | These returns reflect expense waivers by the Fund’s investment adviser. Without these waivers, returns would have been lower. Returns shown do not reflect the deduction of taxes that a shareholder would pay on Fund distributions or the redemption of Fund shares. |
| ** | Represents a composite index as of December 2010, consisting of 7.25% of the Merrill Lynch 1-3 Year Treasury Index, 11.50% of the Barclays Capital U.S. Aggregate Bond Index, 2.13% of the Barclays Capital U.S. Long-Term Government Bond Index, 2.13% of the Barclays Capital U.S. Long-Term Credit Bond Index, 11.00% of the Barclays Capital U.S. TIPS Index, 2.25% of the Barclays Capital Global Aggregate Bond Index — Unhedged, 1.13% of the Barclays U.S. Corporate High Yield — 2% Issuer Capped Index, 1.13 % of the JPMorgan Emerging Markets Bond Index Plus, 2.75% of the S&P 500® Index, 5.75% of the Dow Jones U.S. Select Real Estate Securities IndexSM, 16.00% of the Russell 1000® Value Index, 16.00% of the Russell 1000® Growth Index, 4.50% of the Russell 2000® Index and 16.50% of the MSCI ACWI (All Country World Index) Ex-U.S. Index. |
The construction of the composite index corresponds to the target percentage allocations to the underlying asset classes as represented by the Fund’s investment in the Select Funds. As the target percentage allocations to the underlying investments change according to the MyDestination Funds® glide path, the target percentage allocations to the composite index also change.
Unlike a mutual fund, the performance of an index assumes no taxes, transaction costs, management fees or other expenses.
| | |
| MYDESTINATION 2015 FUND | | |
| SCHEDULE OF INVESTMENTS | | December 31, 2010 |
| | | | | | | | |
| | | Shares | | | Value | |
MUTUAL FUNDS — 98.7% | |
GuideStone Money Market Fund (GS4 Class)¥ | | | 4,387,484 | | | $ | 4,387,484 | |
GuideStone Low-Duration Bond Fund (GS4 Class)¥ | | | 1,297,414 | | | | 17,164,782 | |
GuideStone Medium-Duration Bond Fund (GS4 Class)¥ | | | 2,000,821 | | | | 27,311,201 | |
GuideStone Extended-Duration Bond Fund (GS4 Class)¥ | | | 625,929 | | | | 10,190,119 | |
GuideStone Inflation Protected Bond Fund (GS4 Class)¥ | | | 2,507,783 | | | | 26,156,179 | |
GuideStone Global Bond Fund (GS4 Class)¥ | | | 1,088,799 | | | | 10,702,898 | |
GuideStone Equity Index Fund (GS4 Class)¥ | | | 405,291 | | | | 6,630,569 | |
GuideStone Real Estate Securities Fund (GS4 Class)¥ | | | 1,608,713 | | | | 13,706,233 | |
GuideStone Value Equity Fund (GS4 Class)¥ | | | 2,713,537 | | | | 38,315,149 | |
GuideStone Growth Equity Fund (GS4 Class)¥ | | | 2,002,909 | | | | 37,854,982 | |
GuideStone Small Cap Equity Fund (GS4 Class)¥ | | | 747,740 | | | | 10,812,318 | |
GuideStone International Equity Fund (GS4 Class)¥ | | | 2,916,644 | | | | 39,170,524 | |
| | | | | | | | |
Total Mutual Funds
(Cost $231,552,298) | | | | | | | 242,402,438 | |
| | | | | | | | |
| | |
| | | Par | | | | |
U.S. TREASURY OBLIGATIONS — 1.3% | |
U.S. Treasury Bills | | | | | | | | |
0.17%, 05/05/11‡‡ | | $ | 400,000 | | | | 399,815 | |
0.18%, 05/05/11‡‡ | | | 95,000 | | | | 94,956 | |
0.19%, 05/05/11‡‡ | | | 10,000 | | | | 9,995 | |
| | | | | | | | |
| | | | | | | 504,766 | |
| | | | | | | | |
U.S. Treasury Note | | | | | | | | |
4.63%, 02/15/17 | | | 2,530,000 | | | | 2,848,820 | |
| | | | | | | | |
Total U.S. Treasury Obligations
(Cost $3,376,041) | | | | 3,353,586 | |
| | | | | | | | |
TOTAL INVESTMENTS — 100.0%
(Cost $234,928,339) | | | | 245,756,024 | |
Liabilities in Excess of Other Assets — 0.0% | | | | (84,433 | ) |
| | | | | | | | |
NET ASSETS — 100.0% | | | | | | $ | 245,671,591 | |
| | | | | | | | |
Please see abbreviation and footnote definitions beginning on page 180.
PORTFOLIO SUMMARY (based on net assets)
| | | | |
| | | % | |
Domestic Equity Funds | | | 43.7 | |
Bond Funds | | | 37.3 | |
International Equity Fund | | | 15.9 | |
Futures Contracts | | | 2.0 | |
Money Market Fund | | | 1.8 | |
U.S. Treasury Obligations | | | 1.3 | |
| | | | |
| | | 102.0 | |
| | | | |
VALUATION HIERARCHY
The following is a summary of the inputs used, as of December 31, 2010, in valuing the Fund’s investments carried at fair value:
| | | | | | | | |
Valuation Inputs | | Investments
in
Securities | | | Other
Financial
Instruments*** | |
| | |
Level 1 — Quoted Prices | | | | |
Futures Contracts | | $ | — | | | $ | 102,722 | |
Mutual Funds | | | 242,402,438 | | | | — | |
Level 2 — Other Significant Observable Inputs | | | | | | | | |
U.S. Treasury Obligations | | | 3,353,586 | | | | — | |
Level 3 — Significant Unobservable Inputs | | | — | | | | — | |
| | | | | | | | |
Total | | $ | 245,756,024 | | | $ | 102,722 | |
| | | | | | | | |
| *** | Other financial instruments are derivative instruments not reflected in the Schedule of Investments, such as futures, forwards and swap contracts, which are valued at the unrealized appreciation (depreciation) on the investment. Details of these investments can be found in the Notes to Financial Statements. |
| | | | |
| 16 | | See Notes to Financial Statements. | | |
MyDestination 2025 Fund
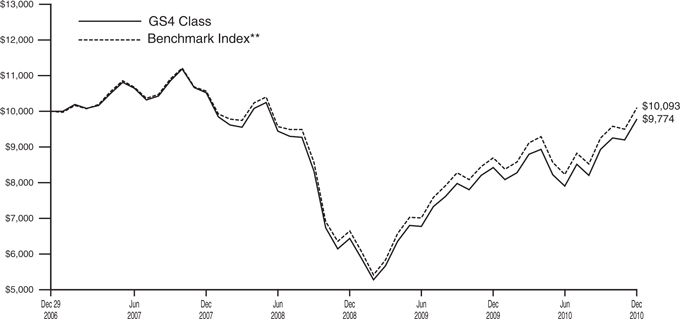
The Fund, through investments in the underlying Select Funds, combines a greater percentage of exposure to equity securities with a much smaller percentage to fixed income securities. While the Fund follows an allocation glide path which becomes more conservative over time, the year-end targeted allocations were approximately 55% U.S. Equity Select Funds, 24% Fixed Income Select Funds and 21% Non-U.S. Equity Select Fund.
The Fund is a fund of funds, and its performance is based on the performance of the underlying Select Funds. The Fund generated a strong return of 15.32% during 2010, benefiting from positive absolute performance from all of the underlying Select Funds including both equities and fixed income. The Fund’s absolute returns were most positively influenced by its exposure to the Growth Equity Fund and Value Equity Fund, which represented just over half of the total equity allocation.
Equities were by far the largest contributor to overall performance, as equities outpaced bonds and posted strong double-digit returns for the year. While equities started the first quarter with positive results thanks to stronger economic growth, the second quarter resulted in double-digit declines for equities as investors shunned the asset class due to fears of a faltering and jobless economic recovery coupled with international concerns over European economic strength and a slowing Chinese economy. After a dismal second quarter correction, global equity markets experienced a strong, albeit still volatile, rally throughout the remainder of the year as investors responded favorably to additional stimulus measures and improving economic conditions.
While lagging equities, the Fund’s fixed income holdings contributed positively to overall absolute performance with all major bond sectors producing positive returns. Fixed income assets produced virtually all of their positive performance during the first nine months of the year, as declining interest rates provided the backdrop for a rally in bond prices. Particularly during the second quarter, the Fund benefited from diversification into fixed income securities that helped mitigate the effect of strong negative equity returns during this quarter. Market sentiment shifted in the fourth quarter, however, as an improved economic outlook fueled a rise in interest rates which was a strong enough headwind to send fixed income returns generally into negative territory for the quarter.
The Fund modestly outpaced its composite benchmark during the year by 0.19%, benefitting from its exposure to the Fixed Income Select Funds. The majority of the outperformance from fixed income came from the two largest Fixed Income Select Funds holdings, the Medium-Duration Bond Fund and the Extended-Duration Bond Fund, which represented nearly two-thirds of the fixed income allocation. Both of these funds outpaced their respective benchmarks, and were positively impacted by taking advantage of more attractive yield opportunities outside of Treasuries. The Fund’s relative performance was positively impacted by exposure to certain U.S. Equity Select Funds, with the majority of relative outperformance coming from the Growth Equity Fund. The Growth Equity Fund benefited primarily from strong security selection leading to outperformance of its respective benchmark. The largest detractor to the Fund’s relative performance was attributed to exposure to the Value Equity Fund, which trailed its respective benchmark.
The Fund attempts to achieve its objective by investing in the Select Funds. The Fund is managed to a retirement date (“target date”) by adjusting the percentage of fixed income securities and equity securities to become more conservative each year until reaching the retirement year and then approximately 15 years thereafter. The target date in the name of the Fund is the approximate date when an investor plans to start withdrawing money. By investing in the Fund, you will also incur the expenses and risks of the underlying Select Funds. The principal risks of the Fund will change depending on the asset mix of the Select Funds in which it invests. You may directly invest in the Select Funds. The Fund’s value will go up and down in response to changes in the share prices of the investments that it owns. The amount invested in the Fund is not guaranteed to increase, is not guaranteed against loss, nor is the amount of the original investment guaranteed at the target date. It is possible to lose money by investing in the Fund.
Please see page 19 for information regarding specific portfolio allocations. Portfolio holdings are subject to change at any time.
MyDestination 2025 Fund
| | | | | | | | |
| Average Annual Total Returns as of 12/31/10 | |
| | |
| | | GS4 Class* | | | Benchmark** | |
One Year | | | 15.32 | % | | | 15.13 | % |
Since Inception | | | 0.66 | % | | | 1.40 | % |
Inception Date | | | 12/29/06 | | | | | |
Total Fund Operating Expenses (April 30, 2010 Prospectus, as supplemented on August 5, 2010)(1) | | | 1.11 | % | | | | |
| (1) | The Fund’s shareholders indirectly bear the expenses of the GS4 Class shares of the Select Funds in which the Fund invests. Current information regarding the Fund’s Operating Expenses can be found in the Financial Highlights. |
The performance data quoted represents past performance and does not guarantee future results. Current performance may be lower or higher. Performance data current to the most recent month-end may be obtained at www.GuideStoneFunds.org. The investment return and principal value of an investment will fluctuate so that shares, when redeemed, may be worth more or less than their original cost.
The graph illustrates the results of a hypothetical $10,000 investment in the GS4 Class of the Fund since December 29, 2006 (commencement of operations), with all dividends and capital gains reinvested, with the Fund’s composite benchmark index.
| * | These returns reflect expense waivers by the Fund’s investment adviser. Without these waivers, returns would have been lower. Returns shown do not reflect the deduction of taxes that a shareholder would pay on Fund distributions or the redemption of Fund shares. |
| ** | Represents a composite benchmark index as of December 2010, consisting of 1.00% of the Merrill Lynch 1-3 Year Treasury Index, 7.75% of the Barclays Capital U.S. Aggregate Bond Index, 3.63% of the Barclays Capital U.S. Long-Term Government Bond Index, 3.63% of the Barclays Capital U.S. Long-Term Credit Bond Index, 1.00% of the Barclays Capital U.S. TIPS Index, 3.50% of the Barclays Capital Global Aggregate Bond Index — Unhedged, 1.75% of the Barclays U.S. Corporate High Yield — 2% Issuer Capped Index, 1.75% of the JPMorgan Emerging Markets Bond Index Plus, 3.25% of the S&P 500® Index, 6.50% of the Dow Jones U.S. Select Real Estate Securities IndexSM, 19.50% of the Russell 1000® Value Index, 19.50% of the Russell 1000® Growth Index, 6.50% of the Russell 2000® Index and 20.75% of the MSCI ACWI (All Country World Index) Ex-U.S. Index. |
The construction of the composite index corresponds to the target percentage allocations to the underlying asset classes as represented by the Fund’s investment in the Select Funds. As the target percentage allocations to the underlying investments change according to the MyDestination Funds® glide path, the target percentage allocations to the composite index also change.
Unlike a mutual fund, the performance of an index assumes no taxes, transaction costs, management fees or other expenses.
| | |
| MYDESTINATION 2005 FUND | | |
| SCHEDULE OF INVESTMENTS | | December 31, 2010 |
| | | | | | | | |
| | | Shares | | | Value | |
MUTUAL FUNDS — 99.0% | |
GuideStone Money Market Fund (GS4 Class)¥ | | | 3,800,041 | | | $ | 3,800,041 | |
GuideStone Low-Duration Bond Fund (GS4 Class)¥ | | | 172,840 | | | | 2,286,679 | |
GuideStone Medium-Duration Bond Fund (GS4 Class)¥ | | | 1,306,351 | | | | 17,831,697 | |
GuideStone Extended-Duration Bond Fund (GS4 Class)¥ | | | 1,037,275 | | | | 16,886,834 | |
GuideStone Inflation Protected Bond Fund (GS4 Class)¥ | | | 220,170 | | | | 2,296,373 | |
GuideStone Global Bond Fund (GS4 Class)¥ | | | 1,648,522 | | | | 16,204,972 | |
GuideStone Equity Index Fund (GS4 Class)¥ | | | 456,978 | | | | 7,476,167 | |
GuideStone Real Estate Securities Fund (GS4 Class)¥ | | | 1,817,735 | | | | 15,487,104 | |
GuideStone Value Equity Fund (GS4 Class)¥ | | | 3,181,681 | | | | 44,925,330 | |
GuideStone Growth Equity Fund (GS4 Class)¥ | | | 2,345,092 | | | | 44,322,232 | |
GuideStone Small Cap Equity Fund (GS4 Class)¥ | | | 1,049,154 | | | | 15,170,770 | |
GuideStone International Equity Fund (GS4 Class)¥ | | | 3,540,421 | | | | 47,547,848 | |
| | | | | | | | |
Total Mutual Funds
(Cost $225,234,998) | | | | | | | 234,236,047 | |
| | | | | | | | |
| | |
| | | Par | | | | |
U.S. TREASURY OBLIGATIONS — 0.8% | |
U.S. Treasury Bills | | | | | | | | |
0.16%, 05/05/11‡‡ | | $ | 50,000 | | | | 49,977 | |
0.17%, 05/05/11‡‡ | | | 5,000 | | | | 4,998 | |
0.17%, 05/05/11‡‡ | | | 470,000 | | | | 469,782 | |
0.18%, 05/05/11‡‡ | | | 100,000 | | | | 99,953 | |
0.19%, 05/05/11‡‡ | | | 20,000 | | | | 19,991 | |
| | | | | | | | |
| | | | | | | 644,701 | |
| | | | | | | | |
U.S. Treasury Note | | | | | | | | |
2.75%, 12/31/17 | | | 1,220,000 | | | | 1,222,859 | |
| | | | | | | | |
Total U.S. Treasury Obligations
(Cost $1,862,110) | | | | 1,867,560 | |
| | | | | | | | |
TOTAL INVESTMENTS — 99.8%
(Cost $227,097,108) | | | | 236,103,607 | |
Other Assets in Excess of Liabilities — 0.2% | | | | | | | 398,278 | |
| | | | | | | | |
NET ASSETS — 100.0% | | | | | | $ | 236,501,885 | |
| | | | | | | | |
Please see abbreviation and footnote definitions beginning on page 180.
PORTFOLIO SUMMARY (based on net assets)
| | | | |
| | | % | |
Domestic Equity Funds | | | 53.8 | |
Bond Funds | | | 23.5 | |
International Equity Fund | | | 20.1 | |
Futures Contracts | | | 1.8 | |
Money Market Fund | | | 1.6 | |
U.S. Treasury Obligations | | | 0.8 | |
| | | | |
| | | 101.6 | |
| | | | |
VALUATION HIERARCHY
The following is a summary of the inputs used, as of December 31, 2010, in valuing the Fund’s investments carried at fair value:
| | | | | | | | |
| Valuation Inputs | | Investments in
Securities | | | Other
Financial
Instruments*** | |
Level 1 — Quoted Prices | | | | | | | | |
Futures Contracts | | $ | — | | | $ | 63,147 | |
Mutual Funds | | | 234,236,047 | | | | — | |
Level 2 — Other Significant Observable Inputs U.S. Treasury Obligations | | | 1,867,560 | | | | — | |
Level 3 — Significant Unobservable Inputs | | | — | | | | — | |
| | | | | | | | |
Total | | $ | 236,103,607 | | | $ | 63,147 | |
| | | | | | | | |
| *** | Other financial instruments are derivative instruments not reflected in the Schedule of Investments, such as futures, forwards and swap contracts, which are valued at the unrealized appreciation (depreciation) on the investment. Details of these investments can be found in the Notes to Financial Statements. |
| | | | |
| | See Notes to Financial Statements. | | 19 |
MyDestination 2035 Fund
The Fund, through investments in the underlying Select Funds, combines a high percentage of exposure to equity securities with only a modest percentage to fixed income securities. While the Fund follows an allocation glide path which becomes more conservative over time, the year-end targeted allocations were approximately 65% U.S. Equity Select Funds, 25% Non-U.S. Equity Select Fund and 10% Fixed Income Select Funds.
The Fund is a fund of funds, and its performance is based on the performance of the underlying Select Funds. The Fund generated a strong return of 16.02% during 2010, benefiting from positive absolute performance from all of the underlying Select Funds including both equities and fixed income. The Fund’s absolute returns were most positively influenced by its exposure to the Growth Equity Fund and Value Equity Fund, which represented just over half of the total equity allocation.
Equities represented approximately 90% of the fund and therefore contributed most all of the performance of the Fund, as equities outpaced bonds and posted strong double-digit returns for the year. While equities started the first quarter with positive results thanks to stronger economic growth, the second quarter resulted in double-digit declines for equities as investors shunned the asset class due to fears of a faltering and jobless economic recovery coupled with international concerns over European economic strength and a slowing Chinese economy. After a dismal second quarter correction, global equity markets experienced a strong, albeit still volatile, rally throughout the remainder of the year as investors responded favorably to additional stimulus measures and improving economic conditions.
The Fund’s fixed income holdings contributed modestly to overall absolute performance with all major bond sectors producing positive returns. Fixed income assets generally produced all of the positive performance during the first nine months of the year, as declining interest rates provided the backdrop for a rally in bond prices. Particularly during the second quarter, the Fund benefited most from its modest diversification into fixed income securities that helped mitigate the effect of strong negative equity returns during this quarter. Market sentiment shifted in the fourth quarter, however, as an improved economic outlook fueled a rise in interest rates which was a strong enough headwind to send fixed income returns generally into negative territory for the quarter.
The Fund modestly underperformed its composite benchmark during the year by -0.11%, with all of the relative underperformance coming from the Equity Select Funds. The Value Equity Fund and International Equity Fund were large contributors to the Fund’s absolute return, but also served as the key drivers in the Fund’s relative underperformance during the year. The Value Equity Fund, the largest detractor to relative performance, suffered the most underperformance due to under-exposure to more economically sensitive and higher beta securities that outperformed in the rapidly rising market. The Fund’s relative performance was positively impacted primarily from its exposure to the Growth Equity Fund. The Growth Equity Fund benefited primarily from strong security selection leading to outperformance of its respective benchmark.
The Fund attempts to achieve its objective by investing in the Select Funds. The Fund is managed to a retirement date (“target date”) by adjusting the percentage of fixed income securities and equity securities to become more conservative each year until reaching the retirement year and then approximately 15 years thereafter. The target date in the name of the Fund is the approximate date when an investor plans to start withdrawing money. By investing in the Fund, you will also incur the expenses and risks of the underlying Select Funds. The principal risks of the Fund will change depending on the asset mix of the Select Funds in which it invests. You may directly invest in the Select Funds. The Fund’s value will go up and down in response to changes in the share prices of the investments that it owns. The amount invested in the Fund is not guaranteed to increase, is not guaranteed against loss, nor is the amount of the original investment guaranteed at the target date. It is possible to lose money by investing in the Fund.
Please see page 22 for information regarding specific portfolio allocations. Portfolio holdings are subject to change at any time.
MyDestination 2035 Fund
| | | | | | | | |
| Average Annual Total Returns as of 12/31/10 | |
| | |
| | | GS4 Class* | | | Benchmark** | |
One Year | | | 16.02 | % | | | 16.13 | % |
Since Inception | | | -0.57 | % | | | 0.30 | % |
Inception Date | | | 12/29/06 | | | | | |
Total Fund Operating Expenses (April 30, 2010 Prospectus,as supplemented on August 5, 2010)(1) | | | 1.24 | % | | | | |
| (1) | The Fund’s shareholders indirectly bear the expenses of the GS4 Class shares of the Select Funds in which the Fund invests. Current information regarding the Fund’s Operating Expenses can be found in the Financial Highlights. |
The performance data quoted represents past performance and does not guarantee future results. Current performance may be lower or higher. Performance data current to the most recent month-end may be obtained at www.GuideStoneFunds.org. The investment return and principal value of an investment will fluctuate so that shares, when redeemed, may be worth more or less than their original cost.
The graph illustrates the results of a hypothetical $10,000 investment in the GS4 Class of the Fund since December 29, 2006 (commencement of operations), with all dividends and capital gains reinvested, with the Fund’s composite benchmark index.
| * | These returns reflect expense waivers by the Fund’s investment adviser. Without these waivers, returns would have been lower. Returns shown do not reflect the deduction of taxes that a shareholder would pay on Fund distributions or the redemption of Fund shares. |
| ** | Represents a composite benchmark index as of December 2010, consisting of 2.50% of the Barclays Capital U.S. Aggregate Bond Index, 1.25% of the Barclays Capital U.S. Long-Term Government Bond Index, 1.25% of the Barclays Capital U.S. Long-Term Credit Bond Index, 2.25% of the Barclays Capital Global Aggregate Bond Index — Unhedged, 1.13% of the Barclays U.S. Corporate High Yield — 2% Issuer Capped Index, 1.13% of the JPMorgan Emerging Markets Bond Index Plus, 3.75% of the S&P 500® Index, 7.00% of the Dow Jones U.S. Select Real Estate Securities IndexSM, 23.00% of the Russell 1000® Value Index, 23.00% of the Russell 1000® Growth Index, 8.75% of the Russell 2000® Index and 25.00% of the MSCI ACWI (All Country World Index) Ex-U.S. Index. |
The construction of the composite index corresponds to the target percentage allocations to the underlying asset classes as represented by the Fund’s investment in the Select Funds. As the target percentage allocations to the underlying investments change according to the MyDestination Funds® glide path, the target percentage allocations to the composite index also change.
Unlike a mutual fund, the performance of an index assumes no taxes, transaction costs, management fees or other expenses.
| | |
| MYDESTINATION 2035 FUND | | |
| SCHEDULE OF INVESTMENTS | | December 31, 2010 |
| | | | | | | | |
| | | Shares | | | Value | |
MUTUAL FUNDS — 99.5% | |
GuideStone Money Market Fund (GS4 Class)¥ | | | 2,254,225 | | | $ | 2,254,225 | |
GuideStone Medium-Duration Bond Fund (GS4 Class)¥ | | | 196,775 | | | | 2,685,978 | |
GuideStone Extended-Duration Bond Fund (GS4 Class)¥ | | | 166,867 | | | | 2,716,597 | |
GuideStone Global Bond Fund (GS4 Class)¥ | | | 494,326 | | | | 4,859,225 | |
GuideStone Equity Index Fund (GS4 Class)¥ | | | 244,696 | | | | 4,003,220 | |
GuideStone Real Estate Securities Fund (GS4 Class)¥ | | | 916,439 | | | | 7,808,060 | |
GuideStone Value Equity Fund (GS4 Class)¥ | | | 1,730,815 | | | | 24,439,112 | |
GuideStone Growth Equity Fund (GS4 Class)¥ | | | 1,294,855 | | | | 24,472,766 | |
GuideStone Small Cap Equity Fund (GS4 Class)¥ | | | 662,841 | | | | 9,584,676 | |
GuideStone International Equity Fund (GS4 Class)¥ | | | 1,998,549 | | | | 26,840,516 | |
| | | | | | | | |
Total Mutual Funds
(Cost $102,074,357) | | | | | | | 109,664,375 | |
| | | | | | | | |
| | |
| | | Par | | | | |
U.S. TREASURY OBLIGATIONS — 0.4% | |
U.S. Treasury Bills | | | | | | | | |
0.17%, 05/05/11‡‡ | | $ | 190,000 | | | | 189,912 | |
0.18%, 05/05/11‡‡ | | | 5,000 | | | | 4,998 | |
0.18%, 05/05/11‡‡ | | | 5,000 | | | | 4,997 | |
| | | | | | | | |
| | | | | | | 199,907 | |
| | | | | | | | |
U.S. Treasury Note | | | | | | | | |
2.75%, 12/31/17 | | | 210,000 | | | | 210,492 | |
| | | | | | | | |
Total U.S. Treasury Obligations
(Cost $409,458) | | | | 410,399 | |
| | | | | | | | |
TOTAL INVESTMENTS — 99.9%
(Cost $102,483,815) | | | | 110,074,774 | |
Other Assets in Excess of Liabilities — 0.1% | | | | 131,441 | |
| | | | | | | | |
NET ASSETS — 100.0% | | | | | | $ | 110,206,215 | |
| | | | | | | | |
Please see abbreviation and footnote definitions beginning on page 180.
PORTFOLIO SUMMARY (based on net assets)
| | | | |
| | | % | |
Domestic Equity Funds | | | 63.8 | |
International Equity Fund | | | 24.4 | |
Bond Funds | | | 9.3 | |
Futures Contracts | | | 2.2 | |
Money Market Fund | | | 2.0 | |
U.S. Treasury Obligations | | | 0.4 | |
| | | | |
| | | 102.1 | |
| | | | |
VALUATION HIERARCHY
The following is a summary of the inputs used, as of December 31, 2010, in valuing the Fund’s investments carried at fair value:
| | | | | | | | |
Valuation Inputs | | Investments in
Securities | | | Other
Financial
Instruments*** | |
Level 1 — Quoted Prices | | | | | | | | |
Futures Contracts | | $ | — | | | $ | 31,946 | |
Mutual Funds | | | 109,664,375 | | | | — | |
Level 2 — Other Significant Observable Inputs | | | | | | | | |
U.S. Treasury Obligations | | | 410,399 | | | | — | |
Level 3 — Significant Unobservable Inputs | | | — | | | | — | |
| | | | | | | | |
Total | | $ | 110,074,774 | | | $ | 31,946 | |
| | | | | | | | |
| *** | Other financial instruments are derivative instruments not reflected in the Schedule of Investments, such as futures, forwards and swap contracts, which are valued at the unrealized appreciation (depreciation) on the investment. Details of these investments can be found in the Notes to Financial Statements. |
| | | | |
| 22 | | See Notes to Financial Statements. | | |
MyDestination 2045 Fund
The Fund, through investments in the underlying Select Funds, combines a greater percentage of exposure to U.S. equity securities with a smaller percentage to non-U.S. equity securities. While the Fund follows an allocation glide path which becomes more conservative over time, the year-end targeted allocations were approximately 73% U.S. Equity Select Funds and 27% Non-U.S. Equity Select Fund.
The Fund is a fund of funds, and its performance is based on the performance of the underlying Select Funds. The Fund generated a strong return of 16.80% during 2010, benefiting from double-digit returns across all the Equity Select Funds for the year. While equities started the first quarter with positive results thanks to stronger economic growth, the second quarter resulted in double digit-declines for equities as investors shunned the asset class due to fears of a faltering and jobless economic recovery coupled with international concerns over European economic strength and a slowing Chinese economy. After a dismal second quarter correction, global equity markets experienced a strong, albeit still volatile, rally throughout the remainder of the year as investors responded favorably to additional stimulus measures and improving economic conditions.
The Fund underperformed its composite benchmark during the year by -0.29%. The Value Equity Fund and International Equity Fund were large contributors to the Fund’s absolute return, but also served as the key drivers in the Fund’s relative underperformance during the year. The Value Equity Fund, the largest detractor to relative performance, suffered the most underperformance due to under-exposure to more economically sensitive and higher beta securities that outperformed in the rapidly rising market. The Fund’s relative performance was positively impacted by exposure to the Growth Equity Fund. The Growth Equity Fund benefited primarily from strong security selection leading to outperformance of its respective benchmark.
The Fund attempts to achieve its objective by investing in the Select Funds. The Fund is managed to a retirement date (“target date”) by adjusting the percentage of fixed income securities and equity securities to become more conservative each year until reaching the retirement year and then approximately 15 years thereafter. The target date in the name of the Fund is the approximate date when an investor plans to start withdrawing money. By investing in the Fund, you will also incur the expenses and risks of the underlying Select Funds. The principal risks of the Fund will change depending on the asset mix of the Select Funds in which it invests. You may directly invest in the Select Funds. The Fund’s value will go up and down in response to changes in the share prices of the investments that it owns. The amount invested in the Fund is not guaranteed to increase, is not guaranteed against loss, nor is the amount of the original investment guaranteed at the target date. It is possible to lose money by investing in the Fund.
Please see page 25 for information regarding specific portfolio allocations. Portfolio holdings are subject to change at any time.
MyDestination 2045 Fund
| | | | | | | | |
Average Annual Total Returns as of 12/31/10 | |
| | | GS4 Class* | | | Benchmark** | |
One Year | | | 16.80 | % | | | 17.09 | % |
Since Inception | | | -1.21 | % | | | -0.22 | % |
Inception Date | | | 12/29/06 | | | | | |
Total Fund Operating Expenses (April 30, 2010 Prospectus, as supplemented on August 5, 2010)(1) | | | 1.39 | % | | | | |
| (1) | The Fund’s shareholders indirectly bear the expenses of the GS4 Class shares of the Select Funds in which the Fund invests. Current information regarding the Fund’s Operating Expenses can be found in the Financial Highlights. |
The performance data quoted represents past performance and does not guarantee future results. Current performance may be lower or higher. Performance data current to the most recent month-end may be obtained at www.GuideStoneFunds.org. The investment return and principal value of an investment will fluctuate so that shares, when redeemed, may be worth more or less than their original cost.
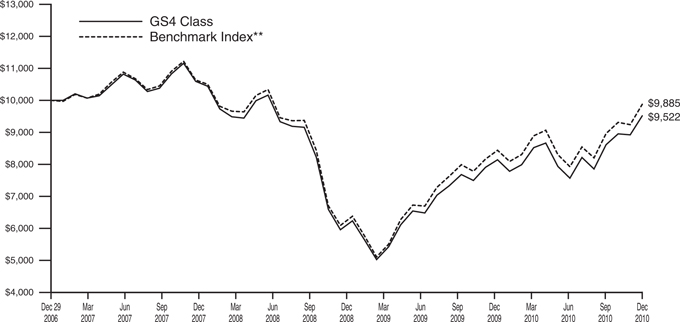
The graph illustrates the results of a hypothetical $10,000 investment in the GS4 Class of the Fund since December 29, 2006 (commencement of operations), with all dividends and capital gains reinvested, with the Fund’s composite benchmark index.
| * | These returns reflect expense waivers by the Fund’s investment adviser. Without these waivers, returns would have been lower. Returns shown do not reflect the deduction of taxes that a shareholder would pay on Fund distributions or the redemption of Fund shares. |
| ** | Represents a composite benchmark index as of December 2010, consisting of 5.00% of the S&P 500® Index, 10.00% of the Dow Jones U.S. Select Real Estate Securities IndexSM, 24.00% of the Russell 1000® Value Index, 24.00% of the Russell 1000® Growth Index, 10.00% of the Russell 2000® Index and 27.00% of the MSCI ACWI (All Country World Index) Ex-U.S. Index. |
The construction of the composite index corresponds to the target percentage allocations to the underlying asset classes as represented by the Fund’s investment in the Select Funds. As the target percentage allocations to the underlying investments change according to the MyDestination Funds® glide path, the target percentage allocations to the composite index also change. Unlike a mutual fund, the performance of an index assumes no taxes, transaction costs, management fees or other expenses.
| | |
| MYDESTINATION 2045 FUND | | |
| SCHEDULE OF INVESTMENTS | | December 31, 2010 |
| | | | | | | | |
| | | Shares | | | Value | |
MUTUAL FUNDS — 98.9% | | | | | |
GuideStone Money Market Fund (GS4 Class)¥ | | | 2,192,973 | | | $ | 2,192,973 | |
GuideStone Equity Index Fund (GS4 Class)¥ | | | 219,922 | | | | 3,597,917 | |
GuideStone Real Estate Securities Fund (GS4 Class)¥ | | | 878,036 | | | | 7,480,868 | |
GuideStone Value Equity Fund (GS4 Class)¥ | | | 1,230,274 | | | | 17,371,474 | |
GuideStone Growth Equity Fund (GS4 Class)¥ | | | 912,906 | | | | 17,253,914 | |
GuideStone Small Cap Equity Fund (GS4 Class)¥ | | | 501,952 | | | | 7,258,225 | |
GuideStone International Equity Fund (GS4 Class)¥ | | | 1,472,411 | | | | 19,774,485 | |
| | | | | | | | |
Total Mutual Funds
(Cost $64,613,100) | | | | | | | 74,929,856 | |
| | | | | | | | |
| | |
| | | Par | | | | |
U.S. TREASURY OBLIGATION — 0.2% | |
U.S. Treasury Bill | | | | | | | | |
0.17%, 05/05/11‡‡ | | | | | | | | |
(Cost $179,895) | | $ | 180,000 | | | | 179,917 | |
| | | | | | | | |
TOTAL INVESTMENTS — 99.1%
(Cost $64,792,995) | | | | 75,109,773 | |
Other Assets in Excess of Liabilities — 0.9% | | | | | | | 692,793 | |
| | | | | | | | |
NET ASSETS — 100.0% | | | | | | $ | 75,802,566 | |
| | | | | | | | |
Please see abbreviation and footnote definitions beginning on page 180.
PORTFOLIO SUMMARY (based on net assets)
| | | | |
| | | % | |
Domestic Equity Funds | | | 69.9 | |
International Equity Fund | | | 26.1 | |
Futures Contracts | | | 3.1 | |
Money Market Fund | | | 2.9 | |
U.S. Treasury Obligation | | | 0.2 | |
| | | | |
| | | 102.2 | |
| | | | |
VALUATION HIERARCHY
The following is a summary of the inputs used, as of December 31, 2010, in valuing the Fund’s investments carried at fair value:
| | | | | | | | |
Valuation Inputs | | Investments
in
Securities | | | Other
Financial
Instruments*** | |
Level 1 — Quoted Prices | | | | | | | | |
Futures Contracts | | $ | — | | | $ | 36,336 | |
Mutual Funds | | | 74,929,856 | | | | — | |
Level 2 — Other Significant Observable Inputs | | | | | | | | |
U.S. Treasury Obligations | | | 179,917 | | | | — | |
Level 3 — Significant Unobservable Inputs | | | — | | | | — | |
| | | | | | | | |
Total | | $ | 75,109,773 | | | $ | 36,336 | |
| | | | | | | | |
| *** | Other financial instruments are derivative instruments not reflected in the Schedule of Investments, such as futures, forwards and swap contracts, which are valued at the unrealized appreciation (depreciation) on the investment. Details of these investments can be found in the Notes to Financial Statements. |
| | | | |
| | See Notes to Financial Statements. | | 25 |
| | |
| STATEMENTS OF ASSETS AND LIABILITIES | | December 31, 2010 |
| | |
| | | | | | | | | | | | | | | | | | | | |
| | | MyDestination
2005 Fund | | | MyDestination
2015 Fund | | | MyDestination
2025 Fund | | | MyDestination
2035 Fund | | | MyDestination
2045 Fund | |
Assets | | | | | | | | | | | | | | | | | | | | |
Investments in securities of affiliated issuers, at value | | $ | 55,021,829 | | | $ | 242,402,438 | | | $ | 234,236,047 | | | $ | 109,664,375 | | | $ | 74,929,856 | |
Investments in securities of unaffiliated issuers, at value | | | — | | | | 3,353,586 | | | | 1,867,560 | | | | 410,399 | | | | 179,917 | |
| | | | | | | | | | | | | | | | | | | | |
Total investments (1) | | | 55,021,829 | | | | 245,756,024 | | | | 236,103,607 | | | | 110,074,774 | | | | 75,109,773 | |
Receivables: | | | | | | | | | | | | | | | | | | | | |
Dividends | | | 27 | | | | 39 | | | | 40 | | | | 18 | | | | 18 | |
Interest | | | — | | | | 44,193 | | | | 99 | | | | 17 | | | | — | |
Fund shares sold | | | 11,974 | | | | 44,189 | | | | 447,288 | | | | 118,965 | | | | 672,777 | |
Receivable from advisor | | | 10,940 | | | | — | | | | — | | | | 4,776 | | | | 10,080 | |
Prepaid expenses and other assets | | | 35,017 | | | | 36,729 | | | | 37,297 | | | | 36,018 | | | | 34,866 | |
| | | | | | | | | | | | | | | | | | | | |
Total Assets | | | 55,079,787 | | | | 245,881,174 | | | | 236,588,331 | | | | 110,234,568 | | | | 75,827,514 | |
| | | | | | | | | | | | | | | | | | | | |
Liabilities | | | | | | | | | | | | | | | | | | | | |
Payables: | | | | | | | | | | | | | | | | | | | | |
Investment securities purchased | | | — | | | | 34,282 | | | | 45,067 | | | | 10,015 | | | | — | |
Fund shares redeemed | | | 385,236 | | | | 131,711 | | | | — | | | | — | | | | 8,488 | |
Variation margin | | | — | | | | 5,627 | | | | 4,879 | | | | 2,850 | | | | 2,775 | |
Accrued expenses: | | | | | | | | | | | | | | | | | | | | |
Investment advisory fees | | | — | | | | 21,162 | | | | 19,985 | | | | — | | | | — | |
Distribution (12b-1) fees | | | 11 | | | | 1 | | | | 2 | | | | 4 | | | | 9 | |
Other expenses | | | 11,631 | | | | 16,800 | | | | 16,513 | | | | 15,484 | | | | 13,676 | |
| | | | | | | | | | | | | | | | | | | | |
Total Liabilities | | | 396,878 | | | | 209,583 | | | | 86,446 | | | | 28,353 | | | | 24,948 | |
| | | | | | | | | | | | | | | | | | | | |
Net Assets | | $ | 54,682,909 | | | $ | 245,671,591 | | | $ | 236,501,885 | | | $ | 110,206,215 | | | $ | 75,802,566 | |
| | | | | | | | | | | | | | | | | | | | |
Net Assets Consist of: | | | | | | | | | | | | | | | | | | | | |
Paid-in capital | | $ | 59,355,287 | | | $ | 252,803,665 | | | $ | 234,413,086 | | | $ | 105,058,228 | | | $ | 66,854,053 | |
Undistributed net investment income | | | 149,327 | | | | 1,490,826 | | | | 642,853 | | | | 4,948 | | | | 1,491 | |
Accumulated net realized loss on investments and futures transactions | | | (10,508,022 | ) | | | (19,553,307 | ) | | | (7,623,700 | ) | | | (2,479,866 | ) | | | (1,406,092 | ) |
Net unrealized appreciation (depreciation) on investments and futures | | | 5,686,317 | | | | 10,930,407 | | | | 9,069,646 | | | | 7,622,905 | | | | 10,353,114 | |
| | | | | | | | | | | | | | | | | | | | |
Net Assets | | $ | 54,682,909 | | | $ | 245,671,591 | | | $ | 236,501,885 | | | $ | 110,206,215 | | | $ | 75,802,566 | |
| | | | | | | | | | | | | | | | | | | | |
Net Asset Value: | | | | | | | | | | | | | | | | | | | | |
$0.001 par value, unlimited shares authorized | | | | | | | | | | | | | | | | | | | | |
Net assets applicable to the GS4 Class | | $ | 54,682,909 | | | $ | 245,671,591 | | | $ | 236,501,885 | | | $ | 110,206,215 | | | $ | 75,802,566 | |
| | | | | | | | | | | | | | | | | | | | |
GS4 shares outstanding | | | 5,736,489 | | | | 26,253,540 | | | | 26,453,593 | | | | 12,791,562 | | | | 8,896,468 | |
| | | | | | | | | | | | | | | | | | | | |
Net asset value, offering and redemption price per GS4 share | | $ | 9.53 | | | $ | 9.36 | | | $ | 8.94 | | | $ | 8.62 | | | $ | 8.52 | |
| | | | | | | | | | | | | | | | | | | | |
| | | | | |
(1) Investments in securities of affiliated issuers, at cost | | $ | 49,335,512 | | | $ | 231,552,298 | | | $ | 225,234,998 | | | $ | 102,074,357 | | | $ | 64,613,100 | |
Investments in securities of unaffiliated issuers, at cost | | | — | | | | 3,376,041 | | | | 1,862,110 | | | | 409,458 | | | | 179,895 | |
| | | | | | | | | | | | | | | | | | | | |
Total investments at cost | | $ | 49,335,512 | | | $ | 234,928,339 | | | $ | 227,097,108 | | | $ | 102,483,815 | | | $ | 64,792,995 | |
| | | | | | | | | | | | | | | | | | | | |
| | | | |
| 26 | | See Notes to Financial Statements. | | |
| | |
| STATEMENTS OF OPERATIONS | | For the Year Ended December 31, 2010 |
| | |
| | | | | | | | | | | | | | | | | | | | |
| | | MyDestination
2005 Fund | | | MyDestination
2015 Fund | | | MyDestination
2025 Fund | | | MyDestination
2035 Fund | | | MyDestination
2045 Fund | |
Investment Income | | | | | | | | | | | | | | | | | | | | |
Income dividends received from affiliated funds | | $ | 1,085,321 | | | $ | 4,249,632 | | | $ | 3,685,785 | | | $ | 1,320,088 | | | $ | 717,108 | |
Interest | | | — | | | | 36,070 | | | | 20,282 | | | | 3,686 | | | | 220 | |
| | | | | | | | | | | | | | | | | | | | |
Total Investment Income | | | 1,085,321 | | | | 4,285,702 | | | | 3,706,067 | | | | 1,323,774 | | | | 717,328 | |
| | | | | | | | | | | | | | | | | | | | |
Expenses | | | | | | | | | | | | | | | | | | | | |
Investment advisory fees | | | 63,831 | | | | 240,600 | | | | 197,113 | | | | 89,194 | | | | 57,915 | |
Transfer agent fees: | | | | | | | | | | | | | | | | | | | | |
GS4 Shares | | | 18,882 | | | | 20,619 | | | | 21,608 | | | | 19,743 | | | | 19,451 | |
Custodian fees | | | 7,221 | | | | 18,273 | | | | 17,298 | | | | 15,747 | | | | 12,460 | |
Accounting and administration fees | | | 7,078 | | | | 16,273 | | | | 13,538 | | | | 8,102 | | | | 5,931 | |
Professional fees | | | 41,818 | | | | 41,819 | | | | 41,818 | | | | 41,818 | | | | 41,818 | |
Blue sky fees: | | | | | | | | | | | | | | | | | | | | |
GS4 Shares | | | 13,221 | | | | 14,148 | | | | 13,440 | | | | 13,211 | | | | 13,266 | |
Shareholder reporting fees: | | | | | | | | | | | | | | | | | | | | |
GS4 Shares | | | 2,815 | | | | 5,074 | | | | 6,237 | | | | 4,721 | | | | 4,321 | |
Trustee expenses | | | 623 | | | | 2,431 | | | | 1,674 | | | | 778 | | | | 519 | |
Line of credit facility fees | | | 766 | | | | 2,747 | | | | 2,162 | | | | 958 | | | | 601 | |
Other expenses | | | 9,388 | | | | 9,388 | | | | 9,389 | | | | 9,388 | | | | 9,388 | |
| | | | | | | | | | | | | | | | | | | | |
Total Expenses | | | 165,643 | | | | 371,372 | | | | 324,277 | | | | 203,660 | | | | 165,670 | |
Expenses waived/reimbursed net of amount recaptured(1) | | | (37,982 | ) | | | — | | | | 54,962 | | | | (29,344 | ) | | | (53,661 | ) |
| | | | | | | | | | | | | | | | | | | | |
Net Expenses | | | 127,661 | | | | 371,372 | | | | 379,239 | | | | 174,316 | | | | 112,009 | |
| | | | | | | | | | | | | | | | | | | | |
Net investment income | | | 957,660 | | | | 3,914,330 | | | | 3,326,828 | | | | 1,149,458 | | | | 605,319 | |
| | | | | | | | | | | | | | | | | | | | |
Realized and Unrealized Gain (Loss) | | | | | | | | | | | | | | | | | | | | |
Capital gain distributions received from affiliated funds | | | 595,922 | | | | 1,698,100 | | | | 740,000 | | | | 98,189 | | | | 119 | |
Net realized gain (loss) on investment securities of affiliated issuers | | | (3,187,537 | ) | | | (8,115,398 | ) | | | (1,922,983 | ) | | | (1,326,498 | ) | | | 245,353 | |
Net realized gain (loss) on investment securities of unaffiliated issuers | | | — | | | | 19,645 | | | | (5,148 | ) | | | 3,931 | | | | — | |
Net realized gain on futures transactions | | | — | | | | 296,162 | | | | 482,246 | | | | 298,900 | | | | 198,146 | |
| | | | | | | | | | | | | | | | | | | | |
Net realized gain (loss) | | | (2,591,615 | ) | | | (6,101,491 | ) | | | (705,885 | ) | | | (925,478 | ) | | | 443,618 | |
| | | | | | | | | | | | | | | | | | | | |
Change in unrealized appreciation on investment securities of affiliated issuers | | | 7,862,555 | | | | 32,413,576 | | | | 26,522,247 | | | | 13,906,491 | | | | 8,913,113 | |
Change in unrealized appreciation on investment securities of unaffiliated issuers | | | — | | | | 8,702 | | | | 5,528 | | | | 3,823 | | | | 19 | |
Change in unrealized appreciation on futures | | | — | | | | 75,044 | | | | 45,178 | | | | 18,086 | | | | 30,829 | |
| | | | | | | | | | | | | | | | | | | | |
Net change in unrealized appreciation | | | 7,862,555 | | | | 32,497,322 | | | | 26,572,953 | | | | 13,928,400 | | | | 8,943,961 | |
| | | | | | | | | | | | | | | | | | | | |
Net Realized and Unrealized Gain | | | 5,270,940 | | | | 26,395,831 | | | | 25,867,068 | | | | 13,002,922 | | | | 9,387,579 | |
| | | | | | | | | | | | | | | | | | | | |
Net Increase in Net Assets Resulting from Operations | | $ | 6,228,600 | | | $ | 30,310,161 | | | $ | 29,193,896 | | | $ | 14,152,380 | | | $ | 9,992,898 | |
| | | | | | | | | | | | | | | | | | | | |
| (1) | See Note 3a and 3c in Notes to Financial Statements. |
| | | | |
| | See Notes to Financial Statements. | | 27 |
| | |
| STATEMENTS OF CHANGES IN NET ASSETS | | |
| | |
| | | | | | | | |
| | | MyDestination 2005 Fund | |
| | | For the Year Ended | |
| | | 12/31/10 | | | 12/31/09 | |
Operations: | | | | | | | | |
Net investment income | | $ | 957,660 | | | $ | 1,309,987 | |
Net realized gain (loss) on investment securities and futures transactions | | | (2,591,615 | ) | | | (5,992,388 | ) |
Net change in unrealized appreciation (depreciation) on investment securities and futures | | | 7,862,555 | | | | 15,916,131 | |
| | | | | | | | |
Net increase in net assets resulting from operations | | | 6,228,600 | | | | 11,233,730 | |
| | | | | | | | |
Dividends and Distributions to Shareholders: | | | | | | | | |
Dividends from net investment income(1) | | | | | | | | |
GS4 shares | | | (1,382,009 | ) | | | (1,558,574 | ) |
GS6 shares | | | — | | | | (5,830 | ) |
Distributions from net realized capital gains | | | | | | | | |
GS4 shares | | | — | | | | — | |
GS6 shares | | | — | | | | — | |
| | | | | | | | |
Return of Capital | | | | | | | | |
Total dividends and distributions | | | (1,382,009 | ) | | | (1,564,404 | ) |
| | | | | | | | |
Capital Share Transactions: | | | | | | | | |
Proceeds from shares sold | | | | | | | | |
GS4 shares | | | 16,345,475 | | | | 17,780,517 | |
GS6 shares | | | — | | | | 355,124 | |
Proceeds from exchange of GS6 shares for GS4 shares(2) | | | | | | | | |
GS4 shares | | | — | | | | 1,382,278 | |
GS6 shares | | | — | | | | (1,382,278 | ) |
Reinvestment of dividends and distributions | | | | | | | | |
GS4 shares | | | 1,381,875 | | | | 1,558,574 | |
GS6 shares | | | — | | | | 5,830 | |
| | | | | | | | |
Total proceeds from shares sold and reinvested | | | 17,727,350 | | | | 19,700,045 | |
| | | | | | | | |
Value of shares redeemed | | | | | | | | |
GS4 shares | | | (34,721,138 | ) | | | (14,217,632 | ) |
GS6 shares | | | — | | | | (133,418 | ) |
| | | | | | | | |
Total value of shares redeemed | | | (34,721,138 | ) | | | (14,351,050 | ) |
| | | | | | | | |
Net increase (decrease) from capital share transactions(3) | | | (16,993,788 | ) | | | 5,348,995 | |
| | | | | | | | |
Total increase (decrease) in net assets | | | (12,147,197 | ) | | | 15,018,321 | |
| | | | | | | | |
Net Assets: | | | | | | | | |
Beginning of Year | | | 66,830,106 | | | | 51,811,785 | |
| | | | | | | | |
End of Year* | | $ | 54,682,909 | | | $ | 66,830,106 | |
| | | | | | | | |
* Including undistributed net investment income | | $ | 149,327 | | | $ | 102,070 | |
| | | | | | | | |
| (1) | Includes dividends paid from the short-term portion of capital gain distributions received from affiliated funds. |
| (2) | See Note 1 in Notes to Financial Statements. |
| (3) | See Note 7 in Notes to Financial Statements. |
| | | | |
| 28 | | See Notes to Financial Statements. | | |
| | | | | | | | | | | | | | | | | | | | | | | | | | | | | | |
MyDestination 2015 Fund | | | MyDestination 2025 Fund | | | MyDestination 2035 Fund | | | MyDestination 2045 Fund | |
| For the Year Ended | | | For the Year Ended | | | For the Year Ended | | | For the Year Ended | |
12/31/10 | | | 12/31/09 | | | 12/31/10 | | | 12/31/09 | | | 12/31/10 | | | 12/31/09 | | | 12/31/10 | | | 12/31/09 | |
| | | | | | | | | | | | | | | | | | | | | | | | | | | | | | | |
| | $3,914,330 | | | $ | 3,890,672 | | | $ | 3,326,828 | | | $ | 2,638,898 | | | $ | 1,149,458 | | | $ | 835,373 | | | $ | 605,319 | | | $ | 371,193 | |
| | (6,101,491 | ) | | | (7,653,972 | ) | | | (705,885 | ) | | | (5,439,659 | ) | | | (925,478 | ) | | | (627,218 | ) | | | 443,618 | | | | (609,798 | ) |
| | 32,497,322 | | | | 45,802,599 | | | | 26,572,953 | | | | 38,700,374 | | | | 13,928,400 | | | | 16,099,543 | | | | 8,943,961 | | | | 10,106,218 | |
| | | | | | | | | | | | | | | | | | | | | | | | | | | | | | | |
| | 30,310,161 | | | | 42,039,299 | | | | 29,193,896 | | | | 35,899,613 | | | | 14,152,380 | | | | 16,307,698 | | | | 9,992,898 | | | | 9,867,613 | |
| | | | | | | | | | | | | | | | | | | | | | | | | | | | | | | |
| | | | | | | | | | | | | | | | | | | | | | | | | | | | | | | |
| | | | | | | | | | | | | | | | | | | | | | | | | | | | | | | |
| | (5,104,591 | ) | | | (4,379,876 | ) | | | (3,787,639 | ) | | | (2,861,067 | ) | | | (1,213,587 | ) | | | (1,036,881 | ) | | | (603,947 | ) | | | (496,078 | ) |
| | — | | | | (32,689 | ) | | | — | | | | (23,117 | ) | | | — | | | | (6,754 | ) | | | — | | | | (3,261 | ) |
| | | | | | | | | | | | | | | | | | | | | | | | | | | | | | | |
| | — | | | | — | | | | — | | | | — | | | | (98,451 | ) | | | (118,981 | ) | | | (257,097 | ) | | | (188,497 | ) |
| | — | | | | — | | | | — | | | | — | | | | — | | | | (5,779 | ) | | | — | | | | (221 | ) |
| | | | | | | | | | | | | | | | | | | | | | | | | | | | | | | |
| | | | | | | | | | | | | | | | | | | | | | | | | | | | | | | |
| | (5,104,591) | | | | (4,412,565 | ) | | | (3,787,639 | ) | | | (2,884,184 | ) | | | (1,312,038 | ) | | | (1,168,395 | ) | | | (861,044 | ) | | | (688,057 | ) |
| | | | | | | | | | | | | | | | | | | | | | | | | | | | | | | |
| | | | | | | | | | | | | | | | | | | | | | | | | | | | | | | |
| | | | | | | | | | | | | | | | | | | | | | | | | | | | | | | |
| | 47,065,643 | | | | 45,112,706 | | | | 50,705,586 | | | | 43,639,781 | | | | 28,363,630 | | | | 23,054,369 | | | | 25,499,963 | | | | 18,858,620 | |
| | — | | | | 1,621,277 | | | | — | | | | 1,038,155 | | | | — | | | | 842,870 | | | | — | | | | 357,765 | |
| | | | | | | | | | | | | | | | | | | | | | | | | | | | | | | |
| | — | | | | 2,917,331 | | | | — | | | | 3,159,998 | | | | — | | | | 2,109,355 | | | | — | | | | 1,269,575 | |
| | — | | | | (2,917,331 | ) | | | — | | | | (3,159,998 | ) | | | — | | | | (2,109,355 | ) | | | — | | | | (1,269,575 | ) |
| | | | | | | | | | | | | | | | | | | | | | | | | | | | | | | |
| | 5,104,589 | | | | 4,379,876 | | | | 3,787,605 | | | | 2,861,067 | | | | 1,312,038 | | | | 1,155,862 | | | | 861,044 | | | | 684,575 | |
| | — | | | | 32,689 | | | | — | | | | 23,117 | | | | — | | | | 12,533 | | | | — | | | | 3,482 | |
| | | | | | | | | | | | | | | | | | | | | | | | | | | | | | | |
| | 52,170,232 | | | | 51,146,548 | | | | 54,493,191 | | | | 47,562,120 | | | | 29,675,668 | | | | 25,065,634 | | | | 26,361,007 | | | | 19,904,442 | |
| | | | | | | | | | | | | | | | | | | | | | | | | | | | | | | |
| | | | | | | | | | | | | | | | | | | | | | | | | | | | | | | |
| | (50,968,664 | ) | | | (16,856,207 | ) | | | (12,960,593 | ) | | | (9,916,293 | ) | | | (7,729,184 | ) | | | (3,639,614 | ) | | | (3,849,382 | ) | | | (3,831,202 | ) |
| | — | | | | (44,365 | ) | | | — | | | | (9,820 | ) | | | — | | | | (7,283 | ) | | | — | | | | (21,937 | ) |
| | | | | | | | | | | | | | | | | | | | | | | | | | | | | | | |
| | (50,968,664 | ) | | | (16,900,572 | ) | | | (12,960,593 | ) | | | (9,926,113 | ) | | | (7,729,184 | ) | | | (3,646,897 | ) | | | (3,849,382 | ) | | | (3,853,139 | ) |
| | | | | | | | | | | | | | | | | | | | | | | | | | | | | | | |
| | 1,201,568 | | | | 34,245,976 | | | | 41,532,598 | | | | 37,636,007 | | | | 21,946,484 | | | | 21,418,737 | | | | 22,511,625 | | | | 16,051,303 | |
| | | | | | | | | | | | | | | | | | | | | | | | | | | | | | | |
| | 26,407,138 | | | | 71,872,710 | | | | 66,938,855 | | | | 70,651,436 | | | | 34,786,826 | | | | 36,558,040 | | | | 31,643,479 | | | | 25,230,859 | |
| | | | | | | | | | | | | | | | | | | | | | | | | | | | | | | |
| | | | | | | | | | | | | | | | | | | | | | | | | | | | | | | |
| | 219,264,453 | | | | 147,391,743 | | | | 169,563,030 | | | | 98,911,594 | | | | 75,419,389 | | | | 38,861,349 | | | | 44,159,087 | | | | 18,928,228 | |
| | | | | | | | | | | | | | | | | | | | | | | | | | | | | | | |
| | $245,671,591 | | | $ | 219,264,453 | | | $ | 236,501,885 | | | $ | 169,563,030 | | | $ | 110,206,215 | | | $ | 75,419,389 | | | $ | 75,802,566 | | | $ | 44,159,087 | |
| | | | | | | | | | | | | | | | | | | | | | | | | | | | | | | |
| | $1,490,826 | | | $ | 1,381,114 | | | $ | 642,853 | | | $ | 607,942 | | | $ | 4,948 | | | $ | 5,301 | | | $ | 1,491 | | | $ | — | |
| | | | | | | | | | | | | | | | | | | | | | | | | | | | | | | |
| | | | |
| | See Notes to Financial Statements. | | 29 |
| | | | | | | | | | | | | | | | | | | | | | | | | | | | | | | | | | | | | | | | | | | | | | | | | | | | |
| For a Share Outstanding For the Years Ending December 31, unless otherwise indicated | | | | | | Ratios to Average Net Assets | | | | |
| | | Net Asset
Value,
Beginning
of Year | | | Net Investment
Income (1) | | | Capital Gain
Distributions
Received
from
Affiliated
Funds | | | Realized
and
Unrealized
Gain
(Loss) on
Investments | | | Dividends
from Net
Investment
Income (2) | | | Distributions
from Net
Realized
Capital
Gains | | | Net Asset
Value,
End of
Year | | | Total
Return | | | Net Assets,
End of Year
(000) | | | Expenses,
Net(3) | | | Expenses,
Gross(3)(4) | | | Investment
Income,
Net
(1)(5) | | | Portfolio
Turnover
Rate | |
MyDestination 2005 Fund* | | | | | | | | | | | | | | | | | | | | | | | | | | | | | | | | | | | | | | | | | |
GS4 Class | | | | | | | | | | | | | | | | | | | | | | | | | | | | | | | | | | | | | | | | | | | | | | | | | |
2010 | | $ | 8.84 | | | $ | 0.14 | # | | $ | 0.09 | | | $ | 0.70 | | | $ | (0.24 | ) | | $ | — | | | $ | 9.53 | | | | 10.56 | % | | $ | 54,683 | | | | 0.20 | % | | | 0.26 | % | | | 1.50 | % | | | 19 | % |
2009 | | | 7.44 | | | | 0.18 | # | | | 0.04 | | | | 1.40 | | | | (0.22 | ) | | | — | | | | 8.84 | | | | 21.84 | | | | 66,830 | | | | 0.20 | | | | 0.26 | | | | 2.31 | | | | 57 | |
2008 | | | 10.35 | | | | 0.30 | # | | | 0.08 | | | | (2.75 | ) | | | (0.31 | ) | | | (0.23 | ) | | | 7.44 | | | | (22.78 | ) | | | 50,678 | | | | 0.20 | | | | 0.29 | | | | 3.25 | | | | 40 | |
2007 | | | 10.00 | | | | 0.33 | # | | | 0.62 | | | | (0.31 | ) | | | (0.28 | ) | | | (0.01 | ) | | | 10.35 | | | | 6.42 | | | | 57,667 | | | | 0.20 | | | | 0.43 | | | | 3.16 | | | | 21 | |
MyDestination 2015 Fund* | | | | | | | | | | | | | | | | | | | | | | | | | | | | | | | | | | | | | |
GS4 Class | | | | | | | | | | | | | | | | | | | | | | | | | | | | | | | | | | | | | | | | | | | | | | | | | |
2010 | | $ | 8.42 | | | $ | 0.14 | # | | $ | 0.06 | | | $ | 0.94 | | | $ | (0.20 | ) | | $ | — | | | $ | 9.36 | | | | 13.54 | % | | $ | 245,672 | | | | 0.16 | % | | | 0.16 | % | | | 1.65 | % | | | 28 | % |
2009 | | | 6.83 | | | | 0.17 | # | | | 0.02 | | | | 1.58 | | | | (0.18 | ) | | | — | | | | 8.42 | | | | 26.27 | | | | 219,264 | | | | 0.16 | | | | 0.16 | | | | 2.25 | | | | 25 | |
2008 | | | 10.33 | | | | 0.26 | # | | | 0.09 | | | | (3.39 | ) | | | (0.19 | ) | | | (0.27 | ) | | | 6.83 | | | | (29.31 | ) | | | 146,140 | | | | 0.20 | | | | 0.18 | | | | 2.87 | | | | 22 | |
2007 | | | 10.00 | | | | 0.29 | # | | | 0.83 | | | | (0.50 | ) | | | (0.28 | ) | | | (0.01 | ) | | | 10.33 | | | | 6.12 | | | | 169,953 | | | | 0.20 | | | | 0.24 | | | | 2.74 | | | | 7 | |
MyDestination 2025 Fund* | | | | | | | | | | | | | | | | | | | | | | | | | | | | | | | | | | | | | |
GS4 Class | | | | | | | | | | | | | | | | | | | | | | | | | | | | | | | | | | | | | | | | | | | | | |
2010 | | $ | 7.88 | | | $ | 0.14 | # | | $ | 0.03 | | | $ | 1.04 | | | $ | (0.15 | ) | | $ | — | | | $ | 8.94 | | | | 15.32 | % | | $ | 236,502 | | | | 0.20 | % | | | 0.17 | % | | | 1.72 | % | | | 15 | % |
2009 | | | 6.18 | | | | 0.14 | # | | | 0.01 | | | | 1.69 | | | | (0.14 | ) | | | — | | | | 7.88 | | | | 30.12 | | | | 169,563 | | | | 0.20 | | | | 0.19 | | | | 2.11 | | | | 13 | |
2008 | | | 10.24 | | | | 0.21 | # | | | 0.09 | | | | (3.89 | ) | | | (0.15 | ) | | | (0.32 | ) | | | 6.18 | | | | (35.00 | ) | | | 96,826 | | | | 0.20 | | | | 0.21 | | | | 2.47 | | | | 10 | |
2007 | | | 10.00 | | | | 0.25 | # | | | 1.13 | | | | (0.85 | ) | | | (0.28 | ) | | | (0.01 | ) | | | 10.24 | | | | 5.29 | | | | 105,102 | | | | 0.20 | | | | 0.30 | | | | 2.37 | | | | 5 | |
MyDestination 2035 Fund* | | | | | | | | | | | | | | | | | | | | | | | | | | | | | | | | | | | | | | | | | |
GS4 Class | | | | | | | | | | | | | | | | | | | | | | | | | | | | | | | | | | | | | | | | | |
2010 | | $ | 7.52 | | | $ | 0.10 | # | | $ | 0.01 | | | $ | 1.10 | | | $ | (0.10 | ) | | $ | (0.01 | ) | | $ | 8.62 | | | | 16.02 | % | | $ | 110,206 | | | | 0.20 | % | | | 0.23 | % | | | 1.32 | % | | | 9 | % |
2009 | | | 5.85 | | | | 0.10 | # | | | — | † | | | 1.70 | | | | (0.11 | ) | | | (0.02 | ) | | | 7.52 | | | | 30.99 | | | | 75,419 | | | | 0.20 | | | | 0.28 | | | | 1.57 | | | | 4 | |
2008 | | | 10.24 | | | | 0.17 | # | | | 0.09 | | | | (4.25 | ) | | | (0.10 | ) | | | (0.30 | ) | | | 5.85 | | | | (38.86 | ) | | | 37,637 | | | | 0.20 | | | | 0.40 | | | | 2.02 | | | | 5 | |
2007 | | | 10.00 | | | | 0.19 | # | | | 1.31 | | | | (0.98 | ) | | | (0.28 | ) | | | — | † | | | 10.24 | | | | 5.20 | | | | 35,117 | | | | 0.20 | | | | 0.64 | | | | 1.83 | | | | 2 | |
MyDestination 2045 Fund* | | | | | | | | | | | | | | | | | | | | | | | | | | | | | | | | | | | | | | | | | |
GS4 Class | | | | | | | | | | | | | | | | | | | | | | | | | | | | | | | | | | | | | | | | | |
2010 | | $ | 7.38 | | | $ | 0.08 | # | | $ | — | † | | $ | 1.16 | | | $ | (0.07 | ) | | $ | (0.03 | ) | | $ | 8.52 | | | | 16.80 | % | | $ | 75,803 | | | | 0.20 | % | | | 0.30 | % | | | 1.08 | % | | | 1 | % |
2009 | | | 5.75 | | | | 0.08 | # | | | — | † | | | 1.67 | | | | (0.09 | ) | | | (0.03 | ) | | | 7.38 | | | | 30.71 | | | | 44,159 | | | | 0.20 | | | | 0.41 | | | | 1.23 | | | | 7 | |
2008 | | | 10.12 | | | | 0.16 | # | | | 0.10 | | | | (4.34 | ) | | | (0.06 | ) | | | (0.23 | ) | | | 5.75 | | | | (40.29 | ) | | | 17,998 | | | | 0.20 | | | | 0.79 | | | | 1.97 | | | | 5 | |
2007 | | | 10.00 | | | | 0.17 | # | | | 1.37 | | | | (1.09 | ) | | | (0.28 | ) | | | (0.05 | ) | | | 10.12 | | | | 4.46 | | | | 11,659 | | | | 0.19 | | | | 1.48 | | | | 1.60 | | | | 9 | |
| † | Amount represents less than $0.005 per share. |
| # | Calculated using the average shares outstanding method. |
| * | Inception date was December 29, 2006. |
| (1) | Recognition of net investment income by the Fund is affected by the timing of the declaration of dividends by the underlying investment companies in which the Fund invests. |
| (2) | Includes dividends paid from the short-term portion of capital gain distributions received from affiliated Funds. |
| (3) | Does not include expenses of the investment companies in which the Fund invests. |
| (4) | The ratio excludes expenses waived/reimbursed net of amount recaptured. |
| (5) | The ratio includes expenses waived/reimbursed net of amount recaptured and fees paid indirectly, where applicable; if expenses waived/reimbursed net of amount recaptured and fees paid indirectly were excluded, the ratio would have been lower than the ratio shown. |
| | | | |
| 30 | | See Notes to Financial Statements. | | |
| | |
Conservative Allocation Fund | | |
The Fund, through investments in the underlying Select Funds, combines a greater percentage of exposure to fixed income securities with a smaller percentage to equity securities. The Fund has a target of, but is not limited to, an asset allocation of 75% Fixed Income Select Funds, 18% U.S. Equity Select Funds and 7% Non-U.S. Equity Select Fund.
The Fund is a fund of funds, and its performance is based on the performance of the underlying Select Funds. The Fund generated a positive return of 7.19% during 2010, benefiting from positive absolute performance from all of the underlying Select Funds including both equities and fixed income. The Fund’s absolute returns were most positively influenced by its exposure to the Low-Duration Bond Fund, followed by exposure to the Value Equity Fund and Growth Equity Fund.
Equities were the largest contributor to absolute performance, as equities outpaced bonds and posted strong double-digit returns for the year. While equities started the first quarter with positive results thanks to stronger economic growth, the second quarter resulted in double-digit declines for equities as investors shunned the asset class due to fears of a faltering and jobless economic recovery coupled with international concerns over European economic strength and a slowing Chinese economy. After a dismal second quarter correction, global equity markets experienced a strong, albeit still volatile, rally throughout the remainder of the year as investors responded favorably to additional stimulus measures and improving economic conditions.
While lagging equities, the Fund’s fixed income holdings contributed positively to overall absolute performance with all major bond sectors producing positive returns. The underlying Fixed Income Select Funds produced all of their positive performance during the first nine months of the year, as declining interest rates provided the backdrop for a rally in bond prices. During the second quarter, the Fund benefited from diversification into fixed income securities that helped mitigate the effect of strong negative equity returns during this quarter. Market sentiment shifted in the fourth quarter, however, as an improved economic outlook fueled a rise in interest rates which was a strong enough headwind to send fixed income returns into negative territory for the quarter.
The Fund outpaced its composite benchmark during the year by 0.74%, benefitting primarily from its exposure to the Low-Duration Bond Fund. At a target weighting of 60%, the Low-Duration Bond Fund contributed the most to the Fund’s relative excess return. The Low-Duration Bond Fund benefited from tactical utilization of higher yielding securities relative to Treasuries, across a broad spectrum of spread sectors including corporate bonds, mortgaged-backed securities, Yankee bonds and non-U.S. bonds. The contribution to relative performance was mixed for the Equity Select Funds, with the Value Equity Fund’s being the largest single detractor to relative performance, offset by the Growth Equity Fund’s contributing positively to relative outperformance.
The Fund attempts to achieve its objective by investing in the Select Funds. By investing in the Fund you will also incur the expenses and risks of the underlying Select Funds. The principal risks of the Fund will change depending on the asset mix of the Select Funds in which it invests. You may directly invest in the Select Funds. The Fund’s value will go up and down in response to changes in the share prices of the investments that it owns. It is possible to lose money by investing in the Fund.
Please see page 33 for information regarding specific portfolio allocations. Portfolio holdings are subject to change at any time.
| | |
| Conservative Allocation Fund | | |
Average Annual Total Returns as of 12/31/10
| | | | | | | | |
| | | GS4 Class* | | | Benchmark** | |
One Year | | | 7.19 | % | | | 6.45 | % |
Five Year | | | 4.15 | % | | | 4.62 | % |
Since Inception | | | 4.02 | % | | | 4.29 | % |
Inception Date | | | 08/27/01 | | | | | |
Total Fund Operating Expenses (April 30, 2010 Prospectus, as supplemented on August 5, 2010)(1) | | | 0.79 | % | | | | |
| (1) | The Fund’s shareholders indirectly bear the expenses of the GS4 Class shares of the Select Funds in which the Fund invests. Current information regarding the Fund’s Operating Expenses can be found in the Financial Highlights. |
The performance data quoted represents past performance and does not guarantee future results. Current performance may be lower or higher. Performance data current to the most recent month-end may be obtained at www.GuideStoneFunds.org. The investment return and principal value of an investment will fluctuate so that shares, when redeemed, may be worth more or less than their original cost.
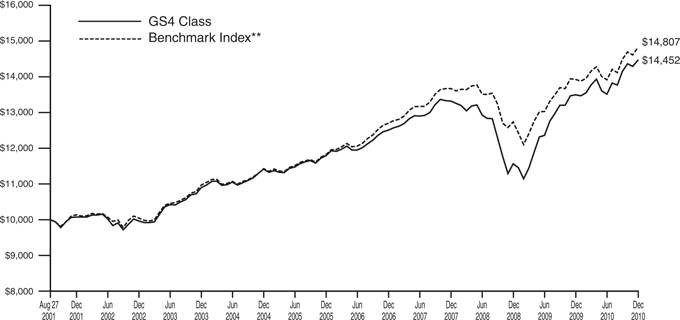
The graph compares the results of a hypothetical $10,000 investment in the GS4 Class of the Fund since August 27, 2001 (commencement of operations), with all dividends and capital gains reinvested, with the Fund’s weighted composite benchmark index.
| * | These returns reflect expense waivers by the Fund’s investment adviser. Without these waivers, returns would have been lower. Returns shown do not reflect the deduction of taxes that a shareholder would pay on Fund distributions or the redemption of Fund shares. |
| ** | Represents a composite index consisting of the Russell 3000® Index, the MSCI ACWI (All Country World Index) Ex-U.S. Index, the Merrill Lynch 1-3 Year Treasury Index and Barclays Capital U.S. TIPS Index, weighted 17.5%, 7.5%, 60% and 15%, respectively. |
The Russell 3000® Index measures the performance of the 3,000 largest U.S. companies based on total market capitalization, which represents approximately 98% of the investable U.S. equity market.
The MSCI ACWI (All Country World Index) Ex-U.S. Index is a free float-adjusted market capitalization index that is designed to measure equity market performance in the global developed (Ex-U.S.) and emerging markets.
The Merrill Lynch 1-3 Year Treasury Index is composed of all U.S. Treasury notes and bonds with maturities greater than or equal to one year and less than three years.
The Barclays Capital U.S. TIPS Index measures the performance of the U.S. Treasury Inflation Protected Securities (“TIPS”) market and includes TIPS with one or more years remaining until maturity with total outstanding issue size of $500 million or more.
Unlike a mutual fund, the performance of an index assumes no taxes, transaction costs, management fees or other expenses.
| | |
| CONSERVATIVE ALLOCATION FUND | | |
| SCHEDULE OF INVESTMENTS | | December 31, 2010 |
| | | | | | | | |
| | | Shares | | | Value | |
MUTUAL FUNDS — 100.3% | |
GuideStone Money Market Fund (GS4 Class)¥ | | | 9,896,880 | | | $ | 9,896,880 | |
GuideStone Low-Duration Bond Fund (GS4 Class)¥ | | | 11,445,231 | | | | 151,420,411 | |
GuideStone Inflation Protected Bond Fund (GS4 Class)¥ | | | 3,638,390 | | | | 37,948,411 | |
GuideStone Equity Index Fund (GS4 Class)¥ | | | 243,219 | | | | 3,979,058 | |
GuideStone Value Equity Fund (GS4 Class)¥ | | | 1,264,203 | | | | 17,850,550 | |
GuideStone Growth Equity Fund (GS4 Class)¥ | | | 940,924 | | | | 17,783,462 | |
GuideStone Small Cap Equity Fund (GS4 Class)¥ | | | 302,343 | | | | 4,371,878 | |
GuideStone International Equity Fund (GS4 Class)¥ | | | 1,443,016 | | | | 19,379,706 | |
| | | | | | | | |
Total Mutual Funds
(Cost $246,142,838) | | | | | | | 262,630,356 | |
| | | | | | | | |
| | |
| | | Par | | | | |
U.S. TREASURY OBLIGATIONS — 0.1% | |
U.S. Treasury Bills | | | | | | | | |
0.16%, 05/05/11‡‡ | | $ | 245,000 | | | | 244,886 | |
0.17%, 05/05/11‡‡ | | | 115,000 | | | | 114,947 | |
| | | | | | | | |
Total U.S. Treasury Obligations | |
(Cost $359,795) | | | | | | | 359,833 | |
| | | | | | | | |
TOTAL INVESTMENTS — 100.4%
(Cost $246,502,633) | | | | 262,990,189 | |
Liabilities in Excess of Other Assets —(0.4)% | | | | (997,535 | ) |
| | | | | | | | |
NET ASSETS — 100.0% | | | $ | 261,992,654 | |
| | | | | | | | |
Please see abbreviation and footnote definitions beginning on page 180.
| | | | |
| PORTFOLIO SUMMARY (based on net assets) | | | | |
| | | % | |
Bond Funds | | | 72.3 | |
Domestic Equity Funds | | | 16.8 | |
International Equity Fund | | | 7.4 | |
Money Market Fund | | | 3.8 | |
Futures Contracts | | | 1.0 | |
U.S. Treasury Obligations | | | 0.1 | |
| | | | |
| | | 101.4 | |
| | | | |
VALUATION HIERARCHY
The following is a summary of the inputs used, as of December 31, 2010, in valuing the Fund’s investments carried at fair value:
| | | | | | | | |
Valuation Inputs | | Investments in
Securities | | | Other
Financial
Instruments*** | |
Level 1 — Quoted Prices | | | | | | | | |
Futures Contracts | | $ | — | | | $ | 58,571 | |
Mutual Funds | | | 262,630,356 | | | | — | |
Level 2 — Other Significant Observable Inputs | | | | | | | | |
U.S. Treasury Obligations | | | 359,833 | | | | — | |
Level 3 — Significant Unobservable Inputs | | | — | | | | — | |
| | | | | | | | |
Total | | $ | 262,990,189 | | | $ | 58,571 | |
| | | | | | | | |
| *** | Other financial instruments are derivative instruments not reflected in the Schedule of Investments, such as futures, forwards and swap contracts, which are valued at the unrealized appreciation (depreciation) on the investment. Details of these investments can be found in the Notes to Financial Statements. |
| | | | |
| | See Notes to Financial Statements. | | 33 |
The Fund, through investments in the underlying Select Funds, combines approximately equal percentages to equity securities and fixed income securities. The Fund has a target of, but is not limited to, an asset allocation of 50% Fixed Income Select Funds, 35% U.S. Equity Select Funds and 15% Non-U.S. Equity Select Fund.
The Fund is a fund of funds, and its performance is based on the performance of the underlying Select Funds. The Fund generated a strong return of 11.87% during 2010, benefiting from positive absolute performance from all of the underlying Select Funds including both equities and fixed income. The Fund’s absolute returns were most positively influenced by its exposure to the Value Equity Fund and Growth Equity Fund, which represented over half of the overall equity allocation.
Equities contributed the majority of absolute performance, as equities outpaced bonds and posted strong double-digit returns for the year. While equities started the first quarter with positive results thanks to stronger economic growth, the second quarter resulted in double-digit declines for equities as investors shunned the asset class due to fears of a faltering and jobless economic recovery coupled with international concerns over European economic strength and a slowing Chinese economy. After a dismal second quarter correction, global equity markets experienced a strong, albeit still volatile, rally throughout the remainder of the year as investors responded favorably to additional stimulus measures and improving economic conditions.
While lagging equities, the Fund’s fixed income holdings contributed positively to overall absolute performance with all major bond sectors producing positive returns. Fixed income assets produced virtually all of their positive performance during the first nine months of the year, as declining interest rates provided the backdrop for a rally in bond prices. Particularly during the second quarter, the Fund benefited from diversification into fixed income securities that helped mitigate the effect of strong negative equity returns during this quarter. Market sentiment shifted in the fourth quarter, however, as an improved economic outlook fueled a rise in interest rates which was a strong enough headwind to send fixed income returns generally into negative territory for the quarter.
The Fund outpaced its composite benchmark during the year by 0.45%, benefitting primarily from its exposure to the Fixed Income Select Funds. The majority of the outperformance from fixed income came from the two largest Fixed Income Select holdings, the Low-Duration Bond Fund and Medium-Duration Bond Fund, which represented nearly three-fourths of the fixed income allocation. Both of these funds outpaced their respective benchmarks, and were positively impacted by taking advantage of more attractive yield opportunities outside of the Treasuries. The Fund’s relative performance was positively impacted by exposure to certain U.S. Equity Select Funds, with the Growth Equity Fund’s contributing the most of any Select Fund to relative outperformance. The Growth Equity Fund benefited mostly from strong security selection leading to outperformance of its respective benchmark. The largest detractor to the Fund’s relative performance was attributed to exposure to the Value Equity Fund, which trailed its respective benchmark.
The Fund attempts to achieve its objective by investing in the Select Funds. By investing in the Fund you will also incur the expenses and risks of the underlying Select Funds. The principal risks of the Fund will change depending on the asset mix of the Select Funds in which it invests. You may directly invest in the Select Funds. The Fund’s value will go up and down in response to changes in the share prices of the investments that it owns. It is possible to lose money by investing in the Fund.
Please see page 36 for information regarding specific portfolio allocations. Portfolio holdings are subject to change at any time.
Average Annual Total Returns as of 12/31/10
| | | | | | | | |
| | | GS4 Class* | | | Benchmark** | |
One Year | | | 11.87 | % | | | 11.42 | % |
Five Year | | | 4.27 | % | | | 5.02 | % |
Since Inception | | | 5.13 | % | | | 5.47 | % |
Inception Date | | | 08/27/01 | | | | | |
Total Fund Operating Expenses (April 30, 2010 Prospectus,as supplemented on August 5, 2010)(1) | | | 0.90 | % | | | | |
| (1) | The Fund’s shareholders indirectly bear the expenses of the GS4 Class shares of the Select Funds in which the Fund invests. Current information regarding the Fund’s Operating Expenses can be found in the Financial Highlights. |
The performance data quoted represents past performance and does not guarantee future results. Current performance may be lower or higher. Performance data current to the most recent month-end may be obtained at www.GuideStoneFunds.org. The investment return and principal value of an investment will fluctuate so that shares, when redeemed, may be worth more or less than their original cost.
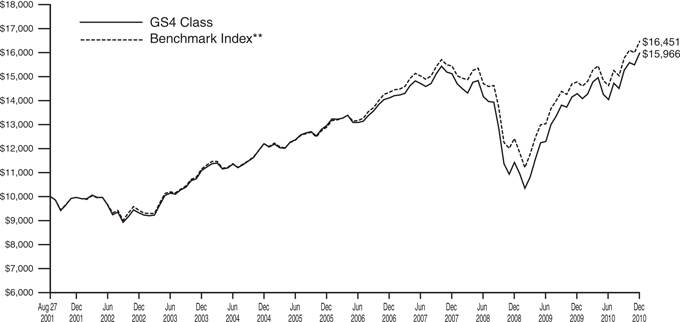
The graph compares the results of a hypothetical $10,000 investment in the GS4 Class of the Fund since August 27, 2001 (commencement of operations), with all dividends and capital gains reinvested, with the Fund’s weighted composite benchmark index.
| * | These returns reflect expense waivers by the Fund’s investment adviser. Without these waivers, returns would have been lower. Returns shown do not reflect the deduction of taxes that a shareholder would pay on Fund distributions or the redemption of Fund shares. |
| ** | Represents a composite index consisting of the Russell 3000® Index, the MSCI ACWI (All Country World Index) Ex-U.S. Index and the Barclays Capital U.S. Aggregate Bond Index, weighted 35%, 15% and 50%, respectively. |
The Russell 3000® Index measures the performance of the 3,000 largest U.S. companies based on total market capitalization, which represents approximately 98% of the investable U.S. equity market.
The MSCI ACWI (All Country World Index) Ex-U.S. Index is a free float-adjusted market capitalization index that is designed to measure equity market performance in the global developed (Ex-U.S.) and emerging markets.
The Barclays Capital U.S. Aggregate Bond Index represents securities that are SEC-registered, taxable and dollar denominated. The index covers the U.S. investment grade bond market, with index components for government and corporate securities, mortgage pass-through securities, and asset-backed securities.
Unlike a mutual fund, the performance of an index assumes no taxes, transaction costs, management fees or other expenses.
| | |
BALANCED ALLOCATION FUND SCHEDULE OF INVESTMENTS | | December 31, 2010 |
| | |
| | | | | | | | |
| | | Shares | | | Value | |
MUTUAL FUNDS — 98.3% | |
GuideStone Money Market Fund (GS4 Class)¥ | | | 15,760,681 | | | $ | 15,760,681 | |
GuideStone Low-Duration Bond Fund (GS4 Class)¥ | | | 12,063,491 | | | | 159,599,982 | |
GuideStone Medium-Duration Bond Fund (GS4 Class)¥ | | | 16,903,551 | | | | 230,733,468 | |
GuideStone Extended-Duration Bond Fund (GS4 Class)¥ | | | 5,591,111 | | | | 91,023,291 | |
GuideStone Global Bond Fund (GS4 Class)¥ | | | 5,407,950 | | | | 53,160,144 | |
GuideStone Equity Index Fund (GS4 Class)¥ | | | 2,094,594 | | | | 34,267,563 | |
GuideStone Value Equity Fund (GS4 Class)¥ | | | 11,250,968 | | | | 158,863,675 | |
GuideStone Growth Equity Fund (GS4 Class)¥ | | | 8,238,586 | | | | 155,709,280 | |
GuideStone Small Cap Equity Fund (GS4 Class)¥ | | | 2,620,890 | | | | 37,898,076 | |
GuideStone International Equity Fund (GS4 Class)¥ | | | 12,296,569 | | | | 165,142,915 | |
| | | | | | | | |
Total Mutual Funds
(Cost $1,041,429,840) | | | | | | | 1,102,159,075 | |
| | | | | | | | |
| | |
| | | Par | | | | |
U.S. TREASURY OBLIGATIONS — 1.8% | |
U.S. Treasury Bills | | | | | | | | |
0.16%, 05/05/11‡‡ | | $ | 910,000 | | | | 909,578 | |
0.17%, 05/05/11‡‡ | | | 1,020,000 | | | | 1,019,527 | |
| | | | | | | | |
| | | | | | | 1,929,105 | |
| | | | | | | | |
U.S. Treasury Note | | | | | | | | |
2.38%, 03/31/16 | | | 17,725,000 | | | | 17,952,110 | |
| | | | | | | | |
Total U.S. Treasury Obligations
(Cost $19,815,212) | | | | | | | 19,881,215 | |
| | | | | | | | |
TOTAL INVESTMENTS — 100.1%
(Cost $1,061,245,052) | | | | 1,122,040,290 | |
Liabilities in Excess of Other Assets — (0.1)% | | | | (1,059,427 | ) |
| | | | | | | | |
NET ASSETS — 100.0% | | | | | | $ | 1,120,980,863 | |
| | | | | | | | |
Please see abbreviation and footnote definitions beginning on page 180.
PORTFOLIO SUMMARY (based on net assets)
| | | | |
| | | % | |
Bond Funds | | | 47.7 | |
Domestic Equity Funds | | | 34.5 | |
International Equity Fund | | | 14.7 | |
U.S. Treasury Obligations | | | 1.8 | |
Futures Contracts | | | 1.6 | |
Money Market Fund | | | 1.4 | |
| | | | |
| | | 101.7 | |
| | | | |
VALUATION HIERARCHY
The following is a summary of the inputs used, as of December 31, 2010, in valuing the Fund’s investments carried at fair value:
| | | | | | | | |
Valuation Inputs | | Investments
in
Securities | | | Other
Financial
Instruments*** | |
Level 1 — Quoted Prices | | | | | | | | |
Futures Contracts | | $ | — | | | $ | 455,513 | |
Mutual Funds | | | 1,102,159,075 | | | | — | |
Level 2 — Other Significant Observable Inputs | | | | | | | | |
U.S. Treasury Obligations | | | 19,881,215 | | | | — | |
Level 3 — Significant Unobservable Inputs | | | — | | | | — | |
| | | | | | | | |
Total | | $ | 1,122,040,290 | | | $ | 455,513 | |
| | | | | | | | |
| *** | Other financial instruments are derivative instruments not reflected in the Schedule of Investments, such as futures, forwards and swap contracts, which are valued at the unrealized appreciation (depreciation) on the investment. Details of these investments can be found in the Notes to Financial Statements. |
| | | | |
| 36 | | See Notes to Financial Statements. | | |
Growth Allocation Fund
The Fund, through investments in the underlying Select Funds, combines a greater percentage of exposure to equity securities with a smaller percentage to fixed income securities. The Fund has a target of, but is not limited to, an asset allocation of 53% U.S. Equity Select Funds, 24% Fixed Income Select Fund, and 23% Non-U.S. Equity Select Fund.
The Fund is a fund of funds, and its performance is based on the performance of the underlying Select Funds. The Fund generated a strong return of 13.65% during 2010, benefiting from positive absolute performance from all of the underlying Select Funds including both equities and fixed income. The Fund’s absolute returns were most positively influenced by its exposure to the Value Equity Fund and Growth Equity Fund, which represented over half of the overall equity allocation.
Equities contributed the majority of absolute performance, as equities outpaced bonds and posted strong double-digit returns for the year. While equities started the first quarter with positive results thanks to stronger economic growth, the second quarter resulted in double-digit declines for equities as investors shunned the asset class due to fears of a faltering and jobless economic recovery coupled with international concerns over European economic strength and a slowing Chinese economy. After a dismal second quarter correction, global equity markets experienced a strong, albeit still volatile, rally throughout the remainder of the year as investors responded favorably to additional stimulus measures and improving economic conditions.
While lagging equities, the Fund’s fixed income holdings contributed positively to overall absolute performance with all major bond sectors producing positive returns. Fixed income assets produced virtually all of their positive performance during the first nine months of the year, as declining interest rates provided the backdrop for a rally in bond prices. Particularly during the second quarter, the Fund benefited from diversification into fixed income securities that helped mitigate the effect of strong negative equity returns during this quarter. Market sentiment shifted in the fourth quarter, however, as an improved economic outlook fueled a rise in interest rates which was a strong enough headwind to send fixed income returns generally into negative territory for the quarter.
The Fund outpaced its composite benchmark during the year by 0.17%, benefitting primarily from the relative outperformance of all of the underlying Fixed Income Select Funds. The largest single contributor to relative outperformance, however, was the Growth Equity Fund. The Growth Equity Fund benefited mostly from strong security selection, which led to outperformance of its respective benchmark. The largest detractor to the Fund’s relative performance was attributed to its exposure to the Value Equity Fund, which trailed its respective benchmark.
The Fund attempts to achieve its objective by investing in the Select Funds. By investing in the Fund you will also incur the expenses and risks of the underlying Select Funds. The principal risks of the Fund will change depending on the asset mix of the Select Funds in which it invests. You may directly invest in the Select Funds. The Fund’s value will go up and down in response to changes in the share prices of the investments that it owns. It is possible to lose money by investing in the Fund.
Please see page 39 for information regarding specific portfolio allocations. Portfolio holdings are subject to change at any time.
37
Growth Allocation Fund
| | | | | | | | |
| Average Annual Total Returns as of 12/31/10 | |
| | |
| | | GS4 Class* | | | Benchmark** | |
One Year | | | 13.65 | % | | | 13.48 | % |
Five Year | | | 3.00 | % | | | 4.25 | % |
Since Inception | | | 4.51 | % | | | 5.09 | % |
Inception Date | | | 08/27/01 | | | | | |
Total Fund Operating Expenses (April 30, 2010 Prospectus,as supplemented on August 5, 2010)(1) | | | 0.99 | % | | | | |
| (1) | The Fund’s shareholders indirectly bear the expenses of the GS4 Class shares of the Select Funds in which the Fund invests. Current information regarding the Fund’s Operating Expenses can be found in the Financial Highlights. |
The performance data quoted represents past performance and does not guarantee future results. Current performance may be lower or higher. Performance data current to the most recent month-end may be obtained at www.GuideStoneFunds.org. The investment return and principal value of an investment will fluctuate so that shares, when redeemed, may be worth more or less than their original cost.
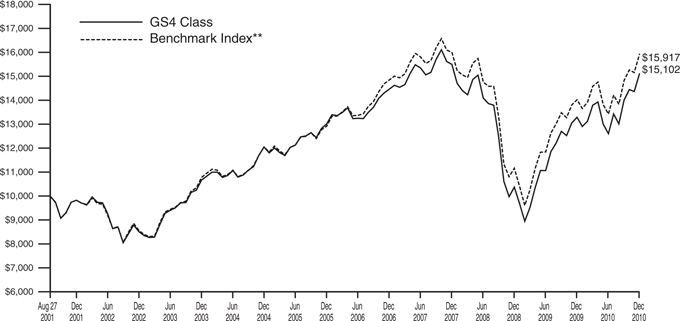
The graph compares the results of a hypothetical $10,000 investment in the GS4 Class of the Fund since August 27, 2001 (commencement of operations), with all dividends and capital gains reinvested, with the Fund’s weighted composite benchmark index.
| * | These returns reflect expense waivers by the Fund’s investment adviser. Without these waivers, returns would have been lower. Returns shown do not reflect the deduction of taxes that a shareholder would pay on Fund distributions or the redemption of Fund shares. |
| ** | Represents a composite index consisting of the Russell 3000® Index, the MSCI ACWI (All Country World Index) Ex-U.S. Index and the Barclays Capital U.S. Aggregate Bond Index, weighted 52.5%, 22.5% and 25%, respectively. |
The Russell 3000® Index measures the performance of the 3,000 largest U.S. companies based on total market capitalization, which represents approximately 98% of the investable U.S. equity market.
The MSCI ACWI (All Country World Index) Ex-U.S. Index is a free float-adjusted market capitalization index that is designed to measure equity market performance in the global developed (Ex-U.S.) and emerging markets.
The Barclays U.S. Capital Aggregate Bond Index represents securities that are SEC-registered, taxable and dollar denominated. The index covers the U.S. investment grade bond market, with index components for government and corporate securities, mortgage pass-through securities and asset-backed securities.
Unlike a mutual fund, the performance of an index assumes no taxes, transaction costs, management fees or other expenses.
38
| | |
GROWTH ALLOCATION FUND SCHEDULE OF INVESTMENTS | | December 31, 2010 |
| | |
| | | | | | | | |
| | | Shares | | | Value | |
MUTUAL FUNDS — 99.2% | | | | | |
GuideStone Money Market Fund (GS4 Class)¥ | | | 15,088,874 | | | $ | 15,088,874 | |
GuideStone Low-Duration Bond Fund (GS4 Class)¥ | | | 4,428,903 | | | | 58,594,392 | |
GuideStone Medium-Duration Bond Fund (GS4 Class)¥ | | | 6,298,824 | | | | 85,978,945 | |
GuideStone Extended-Duration Bond Fund (GS4 Class)¥ | | | 2,069,935 | | | | 33,698,549 | |
GuideStone Global Bond Fund (GS4 Class)¥ | | | 2,027,494 | | | | 19,930,270 | |
GuideStone Equity Index Fund (GS4 Class)¥ | | | 2,375,508 | | | | 38,863,303 | |
GuideStone Value Equity Fund (GS4 Class)¥ | | | 12,716,894 | | | | 179,562,544 | |
GuideStone Growth Equity Fund (GS4 Class)¥ | | | 9,317,083 | | | | 176,092,878 | |
GuideStone Small Cap Equity Fund (GS4 Class)¥ | | | 2,961,390 | | | | 42,821,695 | |
GuideStone International Equity Fund (GS4 Class)¥ | | | 13,774,723 | | | | 184,994,524 | |
| | | | | | | | |
Total Mutual Funds
(Cost $808,279,103) | | | | | | | 835,625,974 | |
| | | | | | | | |
| | |
| | | Par | | | | |
U.S. TREASURY OBLIGATIONS — 0.9% | |
U.S. Treasury Bills | | | | | | | | |
0.16%, 05/05/11‡‡ | | $ | 310,000 | | | | 309,856 | |
0.17%, 05/05/11‡‡ | | | 1,495,000 | | | | 1,494,307 | |
| | | | | | | | |
| | | | | | | 1,804,163 | |
| | | | | | | | |
U.S. Treasury Note | | | | | | | | |
2.38%, 03/31/16 | | | 5,475,000 | | | | 5,545,151 | |
| | | | | | | | |
Total U.S. Treasury Obligations
(Cost $7,329,253) | | | | 7,349,314 | |
| | | | | | | | |
TOTAL INVESTMENTS — 100.1%
(Cost $815,608,356) | | | | 842,975,288 | |
Liabilities in Excess of Other Assets — (0.1)% | | | | (1,049,204 | ) |
| | | | | | | | |
NET ASSETS — 100.0% | | | | | | $ | 841,926,084 | |
| | | | | | | | |
Please see abbreviation and footnote definitions beginning on page 180.
PORTFOLIO SUMMARY (based on net assets)
| | | | |
| | | % | |
Domestic Equity Funds | | | 51.9 | |
Bond Funds | | | 23.5 | |
International Equity Fund | | | 22.0 | |
Futures Contracts | | | 1.9 | |
Money Market Fund | | | 1.8 | |
U.S. Treasury Obligations | | | 0.9 | |
| | | | |
| | | 102.0 | |
| | | | |
VALUATION HIERARCHY
The following is a summary of the inputs used, as of December 31, 2010, in valuing the Fund’s investments carried at fair value:
| | | | | | | | |
Valuation Inputs | | Investments
in
Securities | | | Other
Financial
Instruments*** | |
Level 1 — Quoted Prices | | | | | | | | |
Futures Contracts | | $ | — | | | $ | 408,243 | |
Mutual Funds | | | 835,625,974 | | | | — | |
Level 2 — Other Significant Observable Inputs | | | | | | | | |
U.S. Treasury Obligations | | | 7,349,314 | | | | — | |
Level 3 — Significant Unobservable Inputs | | | — | | | | — | |
| | | | | | | | |
Total | | $ | 842,975,288 | | | $ | 408,243 | |
| | | | | | | | |
| *** | Other financial instruments are derivative instruments not reflected in the Schedule of Investments, such as futures, forwards and swap contracts, which are valued at the unrealized appreciation (depreciation) on the investment. Details of these investments can be found in the Notes to Financial Statements. |
| | | | |
| | See Notes to Financial Statements. | | 39 |
Aggressive Allocation Fund
The Fund, through investments in the underlying Select Funds, combines a greater percentage of exposure to U.S. equity securities with a smaller percentage to non-U.S. equity securities. The Fund has a target of, but is not limited to, an asset allocation of 70% U.S. Equity Select Funds and 30% Non-U.S. Select Fund.
The Fund is a fund of funds, and its performance is based on the performance of the underlying Select Funds. The Fund generated a strong return of 15.16% during 2010, benefiting from double-digit returns across all the Equity Select Funds for the year. While equities started the first quarter with positive results thanks to stronger economic growth, the second quarter resulted in double-digit declines for equities as investors shunned the asset class due to fears of a faltering and jobless economic recovery coupled with international concerns over European economic strength and a slowing Chinese economy. After a dismal second quarter correction, global equity markets experienced a strong, albeit still volatile, rally throughout the remainder of the year as investors responded favorably to additional stimulus measures and improving economic conditions.
The Fund underperformed its composite benchmark during the year by -0.10%. The Value Equity Fund and International Equity Fund were large contributors to the Fund’s absolute return but also served as the key drivers in the Fund’s relative underperformance during the year. The Value Equity Fund, the largest detractor to relative performance, suffered the most underperformance due to under-exposure to more economically sensitive and higher beta securities that outperformed in the rapidly rising market. The Fund’s relative performance was positively impacted by exposure to the Growth Equity Fund. The Growth Equity Fund benefited primarily from strong security selection leading the Fund to outperform its respective benchmark.
The Fund attempts to achieve its objective by investing in the Select Funds. By investing in the Fund you will also incur the expenses and risks of the underlying Select Funds. The principal risks of the Fund will change depending on the asset mix of the Select Funds in which it invests. You may directly invest in the Select Funds. The Fund’s value will go up and down in response to changes in the share prices of the investments that it owns. It is possible to lose money by investing in the Fund.
Please see page 42 for information regarding specific portfolio allocations. Portfolio holdings are subject to change at any time.
40
Aggressive Allocation Fund
| | | | | | | | |
| Average Annual Total Returns as of 12/31/10 | |
| | |
| | | GS4 Class* | | | Benchmark** | |
One Year | | | 15.16 | % | | | 15.26 | % |
Five Year | | | 1.50 | % | | | 3.25 | % |
Since Inception | | | 3.65 | % | | | 4.51 | % |
Inception Date | | | 08/27/01 | | | | | |
Total Fund Operating Expenses (April 30, 2010 Prospectus, as supplemented on August 5, 2010)(1) | | | 1.08 | % | | | | |
| (1) | The Fund’s shareholders indirectly bear the expenses of the GS4 Class shares of the Select Funds in which the Fund invests. Current information regarding the Fund’s Operating Expenses can be found in the Financial Highlights. |
The performance data quoted represents past performance and does not guarantee future results. Current performance may be lower or higher. Performance data current to the most recent month-end may be obtained at www.GuideStoneFunds.org. The investment return and principal value of an investment will fluctuate so that shares, when redeemed, may be worth more or less than their original cost.
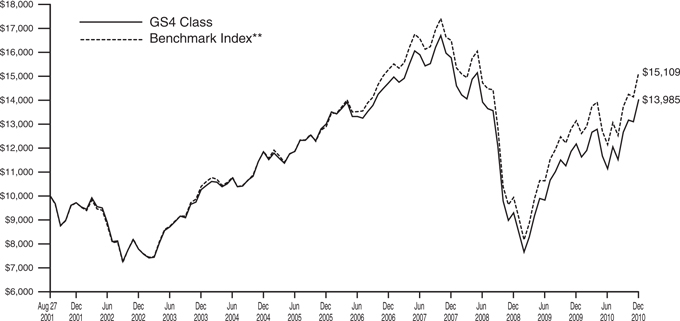
The graph compares the results of a hypothetical $10,000 investment in the GS4 Class of the Fund since August 27, 2001 (commencement of operations), with all dividends and capital gains reinvested, with the Fund’s weighted composite benchmark index.
| * | These returns reflect expense waivers by the Fund’s investment adviser. Without these waivers, returns would have been lower. Returns shown do not reflect the deduction of taxes that a shareholder would pay on Fund distributions or the redemption of Fund shares. |
| ** | Represents a composite index consisting of the Russell 3000® Index and the MSCI ACWI (All Country World Index) Ex-U.S. Index, weighted 70% and 30%, respectively. |
The Russell 3000® Index measures the performance of the 3,000 largest U.S. companies based on total market capitalization, which represents approximately 98% of the investable U.S. equity market.
The MSCI ACWI (All Country World Index) Ex-U.S. Index is a free float-adjusted market capitalization index that is designed to measure equity market performance in the global developed (Ex-U.S.) and emerging markets.
Unlike a mutual fund, the performance of an index assumes no taxes, transaction costs, management fees or other expenses.
41
| | |
AGGRESSIVE ALLOCATION FUND SCHEDULE OF INVESTMENTS | | December 31, 2010 |
| | |
| | | | | | | | |
| | | Shares | | | Value | |
MUTUAL FUNDS — 99.7% | |
GuideStone Money Market Fund (GS4 Class)¥ | | | 17,614,735 | | | $ | 17,614,735 | |
GuideStone Equity Index Fund (GS4 Class)¥ | | | 2,782,687 | | | | 45,524,758 | |
GuideStone Value Equity Fund (GS4 Class)¥ | | | 14,703,050 | | | | 207,607,061 | |
GuideStone Growth Equity Fund (GS4 Class)¥ | | | 10,688,210 | | | | 202,007,163 | |
GuideStone Small Cap Equity Fund (GS4 Class)¥ | | | 3,537,800 | | | | 51,156,592 | |
GuideStone International Equity Fund (GS4 Class)¥ | | | 16,314,091 | | | | 219,098,245 | |
| | | | | | | | |
Total Mutual Funds
(Cost $736,011,482) | | | | | | | 743,008,554 | |
| | | | | | | | |
| | |
| | | Par | | | | |
U.S. TREASURY OBLIGATIONS — 0.5% | |
U.S. Treasury Bills | | | | | | | | |
0.16%, 05/05/11‡‡ | | $ | 1,625,000 | | | | 1,624,246 | |
0.17%, 05/05/11‡‡ | | | 2,000,000 | | | | 1,999,072 | |
| | | | | | | | |
Total U.S. Treasury Obligations
(Cost $3,622,915) | | | | 3,623,318 | |
| | | | | | | | |
TOTAL INVESTMENTS — 100.2%
(Cost $739,634,397) | | | | 746,631,872 | |
Liabilities in Excess of Other Assets — (0.2)% | | | | | | | (1,138,878 | ) |
| | | | | | | | |
NET ASSETS — 100.0% | | | | | | $ | 745,492,994 | |
| | | | | | | | |
Please see abbreviation and footnote definitions beginning on page 180.
PORTFOLIO SUMMARY (based on net assets)
| | | | |
| | | % | |
Domestic Equity Funds | | | 67.9 | |
International Equity Fund | | | 29.4 | |
Futures Contracts | | | 2.8 | |
Money Market Fund | | | 2.4 | |
U.S. Treasury Obligations | | | 0.5 | |
| | | | |
| | | 103.0 | |
| | | | |
VALUATION HIERARCHY
The following is a summary of the inputs used, as of December 31, 2010, in valuing the Fund’s investments carried at fair value:
| | | | | | | | |
Valuation Inputs | | Investments
in
Securities | | | Other
Financial
Instruments*** | |
Level 1 — Quoted Prices | | | | | | | | |
Futures Contracts | | $ | — | | | $ | 485,675 | |
Mutual Funds | | | 743,008,554 | | | | — | |
Level 2 — Other Significant Observable Inputs | | | | | | | | |
U.S. Treasury Obligations | | | 3,623,318 | | | | — | |
Level 3 — Significant Unobservable Inputs | | | — | | | | — | |
| | | | | | | | |
Total | | $ | 746,631,872 | | | $ | 485,675 | |
| | | | | | | | |
| *** | Other financial instruments are derivative instruments not reflected in the Schedule of Investments, such as futures, forwards and swap contracts, which are valued at the unrealized appreciation (depreciation) on the investment. Details of these investments can be found in the Notes to Financial Statements. |
| | | | |
| 42 | | See Notes to Financial Statements. | | |
| | |
| STATEMENTS OF ASSETS AND LIABILITIES | | |
| | December 31, 2010 |
| | | | | | | | | | | | | | | | |
| | | Conservative
Allocation Fund | | | Balanced
Allocation Fund | | | Growth
Allocation Fund | | | Aggressive
Allocation Fund | |
Assets | | | | | | | | | | | | | | | | |
Investments in securities of affiliated issuers, at value | | $ | 262,630,356 | | | $ | 1,102,159,075 | | | $ | 835,625,974 | | | $ | 743,008,554 | |
Investments in securities of unaffiliated issuers, at value | | | 359,833 | | | | 19,881,215 | | | | 7,349,314 | | | | 3,623,318 | |
| | | | | | | | | | | | | | | | |
Total investments (1) | | | 262,990,189 | | | | 1,122,040,290 | | | | 842,975,288 | | | | 746,631,872 | |
Receivables: | | | | | | | | | | | | | | | | |
Dividends | | | 101 | | | | 142 | | | | 143 | | | | 299 | |
Interest | | | — | | | | 107,516 | | | | 33,245 | | | | — | |
Investment securities sold | | | — | | | | 330,909 | | | | — | | | | — | |
Fund shares sold | | | 531 | | | | 15,912 | | | | 33,585 | | | | 11,522 | |
Prepaid expenses and other assets | | | 23,969 | | | | 35,350 | | | | 26,428 | | | | 25,173 | |
| | | | | | | | | | | | | | | | |
Total Assets | | | 263,014,790 | | | | 1,122,530,119 | | | | 843,068,689 | | | | 746,668,866 | |
| | | | | | | | | | | | | | | | |
Liabilities | | | | | | | | | | | | | | | | |
Payables: | | | | | | | | | | | | | | | | |
Investment securities purchased | | | — | | | | 754 | | | | 178,150 | | | | — | |
Fund shares redeemed | | | 984,632 | | | | 1,382,665 | | | | 839,206 | | | | 1,053,417 | |
Variation margin | | | 3,000 | | | | 21,375 | | | | 18,754 | | | | 25,125 | |
Accrued expenses: | | | | | | | | | | | | | | | | |
Investment advisory fees | | | 15,075 | | | | 99,500 | | | | 71,572 | | | | 68,962 | |
Distribution (12b-1) fees | | | 83 | | | | 87 | | | | 71 | | | | 112 | |
Other expenses | | | 19,346 | | | | 44,875 | | | | 34,852 | | | | 28,256 | |
| | | | | | | | | | | | | | | | |
Total Liabilities | | | 1,022,136 | | | | 1,549,256 | | | | 1,142,605 | | | | 1,175,872 | |
| | | | | | | | | | | | | | | | |
Net Assets | | $ | 261,992,654 | | | $ | 1,120,980,863 | | | $ | 841,926,084 | | | $ | 745,492,994 | |
| | | | | | | | | | | | | | | | |
Net Assets Consist of: | | | | | | | | | | | | | | | | |
Paid-in-capital | | $ | 243,063,599 | | | $ | 1,060,566,709 | | | $ | 811,176,547 | | | $ | 733,436,597 | |
Undistributed net investment income | | | 83,018 | | | | 2,195,907 | | | | 218,423 | | | | 2,220 | |
Undistributed (accumulated) net realized gain (loss) on investments and futures transactions | | | 2,299,910 | | | | (3,032,504 | ) | | | 2,755,939 | | | | 4,571,027 | |
Net unrealized appreciation (depreciation) on investments and futures | | | 16,546,127 | | | | 61,250,751 | | | | 27,775,175 | | | | 7,483,150 | |
| | | | | | | | | | | | | | | | |
Net Assets | | $ | 261,992,654 | | | $ | 1,120,980,863 | | | $ | 841,926,084 | | | $ | 745,492,994 | |
| | | | | | | | | | | | | | | | |
Net Asset Value: | | | | | | | | | | | | | | | | |
$0.001 par value, unlimited shares authorized Net assets applicable to the GS4 Class | | $ | 261,992,654 | | | $ | 1,120,980,863 | | | $ | 841,926,084 | | | $ | 745,492,994 | |
| | | | | | | | | | | | | | | | |
GS4 shares outstanding | | | 22,064,961 | | | | 92,470,076 | | | | 68,582,400 | | | | 63,256,250 | |
| | | | | | | | | | | | | | | | |
Net asset value, offering and redemption price per GS4 share | | $ | 11.87 | | | $ | 12.12 | | | $ | 12.28 | | | $ | 11.79 | |
| | | | | | | | | | | | | | | | |
(1) Investments in securities of affiliated issuers, at cost | | $ | 246,142,838 | | | $ | 1,041,429,840 | | | $ | 808,279,103 | | | $ | 736,011,482 | |
| Investments in securities of unaffiliated issuers, at cost | | | 359,795 | | | | 19,815,212 | | | | 7,329,253 | | | | 3,622,915 | |
| | | | | | | | | | | | | | | | |
Total investments at cost | | $ | 246,502,633 | | | $ | 1,061,245,052 | | | $ | 815,608,356 | | | $ | 739,634,397 | |
| | | | | | | | | | | | | | | | |
| | | | |
| 43 | | See Notes to Financial Statements. | | |
| | |
| STATEMENTS OF OPERATIONS | | |
| | For the Year Ended December 31, 2010 |
| | | | | | | | | | | | | | | | |
| | | Conservative
Allocation Fund | | | Balanced
Allocation Fund | | | Growth
Allocation Fund | | | Aggressive
Allocation Fund | |
Investment Income | | | | | | | | | | | | | | | | |
Income dividends received from affiliated funds | | $ | 4,819,378 | | | $ | 23,294,054 | | | $ | 12,787,841 | | | $ | 7,470,604 | |
Interest | | | 25,647 | | | | 251,667 | | | | 85,858 | | | | 2,318 | |
| | | | | | | | | | | | | | | | |
Total Investment Income | | | 4,845,025 | | | | 23,545,721 | | | | 12,873,699 | | | | 7,472,922 | |
| | | | | | | | | | | | | | | | |
Expenses | | | | | | | | | | | | | | | | |
Investment advisory fees | | | 288,529 | | | | 1,151,398 | | | | 846,966 | | | | 741,449 | |
Transfer agent fees: | | | | | | | | | | | | | | | | |
GS4 shares | | | 27,437 | | | | 51,264 | | | | 38,737 | | | | 36,118 | |
Custodian fees | | | 11,533 | | | | 28,347 | | | | 24,041 | | | | 6,993 | |
Accounting and administration fees | | | 19,289 | | | | 64,987 | | | | 48,436 | | | | 42,408 | |
Professional fees | | | 42,374 | | | | 42,350 | | | | 42,350 | | | | 42,350 | |
Blue sky fees: | | | | | | | | | | | | | | | | |
GS4 shares | | | 12,940 | | | | 8,961 | | | | 14,261 | | | | 12,910 | |
Shareholder reporting fees: | | | | | | | | | | | | | | | | |
GS4 shares | | | 12,636 | | | | 28,229 | | | | 22,026 | | | | 19,872 | |
Trustee expenses | | | 2,067 | | | | 8,602 | | | | 6,345 | | | | 5,646 | |
Line of credit facility fees | | | 3,397 | | | | 13,385 | | | | 9,805 | | | | 8,459 | |
Other expenses | | | 9,788 | | | | 10,888 | | | | 10,532 | | | | 10,288 | |
| | | | | | | | | | | | | | | | |
Total Expenses | | | 429,990 | | | | 1,408,411 | | | | 1,063,499 | | | | 926,493 | |
Expenses waived/reimbursed(1) | | | (85,986 | ) | | | (44,858 | ) | | | (65,662 | ) | | | (59,666 | ) |
| | | | | | | | | | | | | | | | |
Net Expenses | | | 344,004 | | | | 1,363,553 | | | | 997,837 | | | | 866,827 | |
| | | | | | | | | | | | | | | | |
Net investment income | | | 4,501,021 | | | | 22,182,168 | | | | 11,875,862 | | | | 6,606,095 | |
| | | | | | | | | | | | | | | | |
Realized and Unrealized Gain (Loss) | | | | | | | | | | | | | | | | |
Capital gain distributions received from affiliated funds | | | 1,971,618 | | | | 9,159,736 | | | | 3,368,709 | | | | 2,708 | |
Net realized gain (loss) on investment securities of affiliated issuers | | | 4,160,417 | | | | (519,412 | ) | | | 9,457,593 | | | | 8,224,217 | |
Net realized gain on investment securities of unaffiliated issuers | | | 61,204 | | | | 466,211 | | | | 154,048 | | | | 73 | |
Net realized gain on futures transactions | | | 210,779 | | | | 1,519,314 | | | | 1,723,932 | | | | 2,588,246 | |
| | | | | | | | | | | | | | | | |
Net realized gain | | | 6,404,018 | | | | 10,625,849 | | | | 14,704,282 | | | | 10,815,244 | |
| | | | | | | | | | | | | | | | |
Change in unrealized appreciation on investment securities of affiliated issuers | | | 9,159,409 | | | | 93,611,494 | | | | 78,606,733 | | | | 85,269,465 | |
Change in unrealized appreciation on investment securities of unaffiliated issuers | | | 15,486 | | | | 65,464 | | | | 19,867 | | | | 350 | |
Change in unrealized appreciation on futures | | | 38,442 | | | | 386,013 | | | | 285,809 | | | | 293,546 | |
| | | | | | | | | | | | | | | | |
Net change in unrealized appreciation | | | 9,213,337 | | | | 94,062,971 | | | | 78,912,409 | | | | 85,563,361 | |
| | | | | | | | | | | | | | | | |
Net Realized and Unrealized Gain | | | 15,617,355 | | | | 104,688,820 | | | | 93,616,691 | | | | 96,378,605 | |
| | | | | | | | | | | | | | | | |
Net Increase in Net Assets Resulting from Operations | | $ | 20,118,376 | | | $ | 126,870,988 | | | $ | 105,492,553 | | | $ | 102,984,700 | |
| | | | | | | | | | | | | | | | |
| (1) | See Note 3a and 3c in Notes to Financial Statements. |
| | | | |
| | See Notes to Financial Statements. | | 44 |
| | |
| STATEMENTS OF CHANGES IN NET ASSETS | | |
| | |
| | | | | | | | | | | | | | | | |
| | | Conservative Allocation Fund | | | Balanced Allocation Fund | |
| | | For the Year Ended | | | For the Year Ended | |
| | | 12/31/10 | | | 12/31/09 | | | 12/31/10 | | | 12/31/09 | |
Operations: | | | | | | | | | | | | | | | | |
Net investment income | | $ | 4,501,021 | | | $ | 6,251,933 | | | $ | 22,182,168 | | | $ | 25,426,085 | |
Net realized gain (loss) on investment securities and futures transactions | | | 6,404,018 | | | | 7,542,733 | | | | 10,625,849 | | | | 539,153 | |
Net change in unrealized appreciation (depreciation) on investment securities and futures | | | 9,213,337 | | | | 26,348,218 | | | | 94,062,971 | | | | 196,693,079 | |
| | | | | | | | | | | | | | | | |
Net increase in net assets resulting from operations | | | 20,118,376 | | | | 40,142,884 | | | | 126,870,988 | | | | 222,658,317 | |
| | | | | | | | | | | | | | | | |
Dividends and Distributions to Shareholders: | | | | | | | | | | | | | | | | |
Dividends from net investment income(1) | | | | | | | | | | | | | | | | |
GS4 shares | | | (5,905,990 | ) | | | (6,154,064 | ) | | | (30,794,116 | ) | | | (26,203,247 | ) |
GS6 shares | | | — | | | | (129,157 | ) | | | — | | | | (188,348 | ) |
Distributions from net realized capital gains | | | | | | | | | | | | | | | | |
GS4 shares | | | (1,420,226 | ) | | | (9,032,931 | ) | | | — | | | | (6,561,722 | ) |
GS6 shares | | | — | | | | (78,277 | ) | | | — | | | | (235,775 | ) |
| | | | | | | | | | | | | | | | |
Total dividends and distributions | | | (7,326,216 | ) | | | (15,394,429 | ) | | | (30,794,116 | ) | | | (33,189,092 | ) |
| | | | | | | | | | | | | | | | |
Capital Share Transactions: | | | | | | | | | | | | | | | | |
Proceeds from shares sold | | | | | | | | | | | | | | | | |
GS4 shares | | | 37,177,857 | | | | 37,517,620 | | | | 44,223,390 | | | | 66,019,986 | |
GS6 shares | | | — | | | | 1,736,060 | | | | — | | | | 712,549 | |
Proceeds from exchange of GS6 shares for GS4 shares(2) | | | | | | | | | | | | | | | | |
GS4 shares | | | — | | | | 11,903,681 | | | | — | | | | 16,986,754 | |
GS6 shares | | | — | | | | (11,903,681 | ) | | | — | | | | (16,986,754 | ) |
Reinvestment of dividends and distributions | | | | | | | | | | | | | | | | |
GS4 shares | | | 7,320,019 | | | | 15,174,582 | | | | 30,789,666 | | | | 32,760,925 | |
GS6 shares | | | — | | | | 207,434 | | | | — | | | | 424,123 | |
| | | | | | | | | | | | | | | | |
Total proceeds from shares sold and reinvested | | | 44,497,876 | | | | 54,635,696 | | | | 75,013,056 | | | | 99,917,583 | |
| | | | | | | | | | | | | | | | |
Value of shares redeemed | | | | | | | | | | | | | | | | |
GS4 shares | | | (80,047,873 | ) | | | (51,093,327 | ) | | | (183,100,371 | ) | | | (78,208,293 | ) |
GS6 shares | | | — | | | | (196,593 | ) | | | — | | | | (95,773 | ) |
| | | | | | | | | | | | | | | | |
Total value of shares redeemed | | | (80,047,873 | ) | | | (51,289,920 | ) | | | (183,100,371 | ) | | | (78,304,066 | ) |
| | | | | | | | | | | | | | | | |
Net increase (decrease) from capital share transactions(3) | | | (35,549,997 | ) | | | 3,345,776 | | | | (108,087,315 | ) | | | 21,613,517 | |
| | | | | | | | | | | | | | | | |
Total increase (decrease) in net assets | | | (22,757,837 | ) | | | 28,094,231 | | | | (12,010,443 | ) | | | 211,082,742 | |
| | | | | | | | | | | | | | | | |
Net Assets: | | | | | | | | | | | | | | | | |
Beginning of Year | | | 284,750,491 | | | | 256,656,260 | | | | 1,132,991,306 | | | | 921,908,564 | |
| | | | | | | | | | | | | | | | |
End of Year* | | $ | 261,992,654 | | | $ | 284,750,491 | | | $ | 1,120,980,863 | | | $ | 1,132,991,306 | |
| | | | | | | | | | | | | | | | |
*Including undistributed net investment income | | $ | 83,018 | | | $ | — | | | $ | 2,195,907 | | | $ | 4,110,528 | |
| | | | | | | | | | | | | | | | |
| (1) | Includes dividends paid from the short-term portion of capital gain distributions received from affiliated funds. |
| (2) | See Note 1 in Notes to Financial Statements. |
| (3) | See Note 7 in Notes to Financial Statements. |
| | | | |
| 45 | | See Notes to Financial Statements. | | |
| | | | | | | | | | | | | | |
| Growth Allocation Fund | | | Aggressive Allocation Fund | |
| For the Year Ended | | | For the Year Ended | |
| 12/31/10 | | | 12/31/09 | | | 12/31/10 | | | 12/31/09 | |
| | | | | | | | | | | | | | | |
| $ | 11,875,862 | | | $ | 13,511,935 | | | $ | 6,606,095 | | | $ | 7,158,492 | |
| 14,704,282 | | | | (1,658,657 | ) | | | 10,815,244 | | | | 2,380,837 | |
| 78,912,409 | | | | 169,696,601 | | | | 85,563,361 | | | | 161,719,617 | |
| | | | | | | | | | | | | | | |
| | 105,492,553 | | | | 181,549,879 | | | | 102,984,700 | | | | 171,258,946 | |
| | | | | | | | | | | | | | | |
| | | | | | | | | | | | | | | |
| | | | | | | | | | | | | | | |
| | (17,932,584) | | | | (11,476,397 | ) | | | (6,611,145 | ) | | | (7,153,930 | ) |
| | — | | | | (48,836 | ) | | | — | | | | — | |
| | | | | | | | | | | | | | | |
| | (5,229,092) | | | | (3,758,322 | ) | | | (7,518,944 | ) | | | (5,357,679 | ) |
| | — | | | | (114,025 | ) | | | — | | | | (175,394 | ) |
| | | | | | | | | | | | | | | |
| | (23,161,676) | | | | (15,397,580 | ) | | | (14,130,089 | ) | | | (12,687,003 | ) |
| | | | | | | | | | | | | | | |
| | | | | | | | | | | | | | | |
| | | | | | | | | | | | | | | |
| | 28,291,186 | | | | 38,935,556 | | | | 34,506,419 | | | | 41,717,915 | |
| | — | | | | 1,111,513 | | | | — | | | | 495,847 | |
| | | | | | | | | | | | | | | |
| | — | | | | 11,004,801 | | | | — | | | | 12,055,110 | |
| | — | | | | (11,004,801 | ) | | | — | | | | (12,055,110 | ) |
| | | | | | | | | | | | | | | |
| | 23,159,991 | | | | 15,233,766 | | | | 14,129,316 | | | | 12,511,448 | |
| | — | | | | 162,861 | | | | — | | | | 175,394 | |
| | | | | | | | | | | | | | | |
| | 51,451,177 | | | | 55,443,696 | | | | 48,635,735 | | | | 54,900,604 | |
| | | | | | | | | | | | | | | |
| | | | | | | | | | | | | | | |
| | (132,666,304) | | | | (58,417,111 | ) | | | (121,731,738 | ) | | | (42,757,835 | ) |
| | — | | | | (245,720 | ) | | | — | | | | (156,279 | ) |
| | | | | | | | | | | | | | | |
| | (132,666,304) | | | | (58,662,831 | ) | | | (121,731,738 | ) | | | (42,914,114 | ) |
| | | | | | | | | | | | | | | |
| | (81,215,127) | | | | (3,219,135 | ) | | | (73,096,003 | ) | | | 11,986,490 | |
| | | | | | | | | | | | | | | |
| | 1,115,750 | | | | 162,933,164 | | | | 15,758,608 | | | | 170,558,433 | |
| | | | | | | | | | | | | | | |
| | | | | | | | | | | | | | | |
| | 840,810,334 | | | | 677,877,170 | | | | 729,734,386 | | | | 559,175,953 | |
| | | | | | | | | | | | | | | |
| $ | 841,926,084 | | | $ | 840,810,334 | | | $ | 745,492,994 | | | $ | 729,734,386 | |
| | | | | | | | | | | | | | | |
| $ | 218,423 | | | $ | 3,813,544 | | | $ | 2,220 | | | $ | 4,562 | |
| | | | | | | | | | | | | | | |
| | | | |
| | See Notes to Financial Statements. | | 46 |
| | | | | | | | | | | | | | | | | | | | | | | | | | | | | | | | | | | | | | | | | | | | | | | | | | | | |
| For a Share Outstanding For the Years Ending December 31, unless otherwise indicated | | | Ratios to Average Net Assets | | | | |
| | | Net Asset
Value,
Beginning
of Year | | | Net Investment
Income (1) | | | Capital Gain
Distributions
Received
from
Affiliated
Funds | | | Realized
and
Unrealized
Gain
(Loss) on
Investments | | | Dividends
from Net
Investment
Income (2) | | | Distributions
from Net
Realized
Capital
Gains | | | Net Asset
Value,
End of
Year | | | Total
Return | | | Net Assets,
End of Year
(000) | | | Expenses,
Net(3) | | | Expenses,
Gross(3)(4) | | | Investment
Income,
Net (1)(5) | | | Portfolio
Turnover
Rate | |
Conservative Allocation Fund | |
|
GS4 Class | |
2010 | | $ | 11.39 | | | $ | 0.18 | # | | $ | 0.08 | | | $ | 0.56 | | | $ | (0.27 | ) | | $ | (0.07 | ) | | $ | 11.87 | | | | 7.19 | % | | $ | 261,993 | | | | 0.12 | % | | | 0.15 | % | | | 1.57 | % | | | 19 | % |
2009 | | | 10.33 | | | | 0.26 | # | | | — | † | | | 1.44 | | | | (0.26 | ) | | | (0.38 | ) | | | 11.39 | | | | 16.58 | | | | 284,750 | | | | 0.12 | | | | 0.16 | | | | 2.37 | | | | 32 | |
2008 | | | 13.02 | | | | 0.42 | # | | | 0.03 | | | | (2.17 | ) | | | (0.42 | ) | | | (0.55 | ) | | | 10.33 | | | | (13.11 | ) | | | 246,617 | | | | 0.12 | | | | 0.15 | | | | 3.36 | | | | 17 | |
2007 | | | 13.15 | | | | 0.43 | # | | | 0.21 | | | | 0.21 | | | | (0.44 | ) | | | (0.54 | ) | | | 13.02 | | | | 6.48 | | | | 313,829 | | | | 0.13 | | | | 0.16 | | | | 3.13 | | | | 13 | |
2006 | | | 12.94 | | | | 0.40 | # | | | 0.17 | | | | 0.20 | | | | (0.41 | ) | | | (0.15 | ) | | | 13.15 | | | | 5.99 | | | | 308,802 | | | | 0.13 | | | | 0.18 | | | | 3.08 | | | | 9 | |
|
Balanced Allocation Fund | |
|
GS4 Class | |
2010 | | $ | 11.14 | | | $ | 0.23 | # | | $ | 0.09 | | | $ | 1.00 | | | $ | (0.34 | ) | | $ | — | | | $ | 12.12 | | | | 11.87 | % | | $ | 1,120,981 | | | | 0.12 | % | | | 0.12 | % | | | 1.95 | % | | | 17 | % |
2009 | | | 9.20 | | | | 0.26 | # | | | 0.05 | | | | 1.97 | | | | (0.27 | ) | | | (0.07 | ) | | | 11.14 | | | | 25.05 | | | | 1,132,991 | | | | 0.12 | | | | 0.13 | | | | 2.58 | | | | 19 | |
2008 | | | 14.13 | | | | 0.39 | # | | | 0.13 | | | | (3.99 | ) | | | (0.43 | ) | | | (1.03 | ) | | | 9.20 | | | | (24.41 | ) | | | 905,743 | | | | 0.12 | | | | 0.13 | | | | 3.05 | | | | 19 | |
2007 | | | 14.61 | | | | 0.41 | # | | | 0.48 | | | | 0.16 | | | | (0.48 | ) | | | (1.05 | ) | | | 14.13 | | | | 7.16 | | | | 1,348,204 | | | | 0.13 | | | | 0.13 | | | | 2.68 | | | | 7 | |
2006 | | | 14.20 | | | | 0.36 | # | | | 0.39 | | | | 0.50 | | | | (0.40 | ) | | | (0.44 | ) | | | 14.61 | | | | 8.78 | | | | 1,400,001 | | | | 0.13 | | | | 0.14 | | | | 2.44 | | | | 7 | |
|
Growth Allocation Fund | |
|
GS4 Class | |
2010 | | $ | 11.11 | | | $ | 0.16 | # | | $ | 0.05 | | | $ | 1.31 | | | $ | (0.27 | ) | | $ | (0.08 | ) | | $ | 12.28 | | | | 13.65 | % | | $ | 841,926 | | | | 0.12 | % | | | 0.13 | % | | | 1.43 | % | | | 8 | % |
2009 | | | 8.86 | | | | 0.18 | # | | | 0.02 | | | | 2.25 | | | | (0.15 | ) | | | (0.05 | ) | | | 11.11 | | | | 27.96 | | | | 840,810 | | | | 0.12 | | | | 0.13 | | | | 1.88 | | | | 11 | |
2008 | | | 15.34 | | | | 0.28 | # | | | 0.13 | | | | (5.50 | ) | | | (0.29 | ) | | | (1.10 | ) | | | 8.86 | | | | (32.98 | ) | | | 667,769 | | | | 0.12 | | | | 0.13 | | | | 2.15 | | | | 13 | |
2007 | | | 16.05 | | | | 0.30 | # | | | 0.78 | | | | 0.07 | | | | (0.43 | ) | | | (1.43 | ) | | | 15.34 | | | | 7.16 | | | | 1,095,092 | | | | 0.13 | | | | 0.13 | | | | 1.80 | | | | 5 | |
2006 | | | 15.45 | | | | 0.27 | #�� | | | 0.63 | | | | 0.81 | | | | (0.35 | ) | | | (0.76 | ) | | | 16.05 | | | | 11.03 | | | | 1,137,039 | | | | 0.13 | | | | 0.14 | | | | 1.66 | | | | 7 | |
|
Aggressive Allocation Fund | |
|
GS4 Class | |
2010 | | $ | 10.43 | | | $ | 0.10 | # | | $ | — | † | | $ | 1.48 | | | $ | (0.10 | ) | | $ | (0.12 | ) | | $ | 11.79 | | | | 15.16 | % | | $ | 745,493 | | | | 0.12 | % | | | 0.13 | % | | | 0.91 | % | | | 1 | % |
2009 | | | 8.13 | | | | 0.10 | # | | | — | † | | | 2.38 | | | | (0.10 | ) | | | (0.08 | ) | | | 10.43 | | | | 30.82 | | | | 729,734 | | | | 0.12 | | | | 0.14 | | | | 1.17 | | | | 3 | |
2008 | | | 16.31 | | | | 0.16 | # | | | 0.12 | | | | (7.01 | ) | | | (0.14 | ) | | | (1.31 | ) | | | 8.13 | | | | (41.05 | ) | | | 547,313 | | | | 0.12 | | | | 0.13 | | | | 1.21 | | | | 7 | |
2007 | | | 17.23 | | | | 0.17 | # | | | 1.11 | | | | (0.04 | ) | | | (0.36 | ) | | | (1.80 | ) | | | 16.31 | | | | 7.17 | | | | 1,000,850 | | | | 0.13 | | | | 0.13 | | | | 0.94 | | | | 2 | |
2006 | | | 16.28 | | | | 0.15 | # | | | 0.88 | | | | 1.13 | | | | (0.28 | ) | | | (0.93 | ) | | | 17.23 | | | | 13.20 | | | | 1,031,999 | | | | 0.13 | | | | 0.14 | | | | 0.90 | | | | 4 | |
| † | Amount represents less than $0.005 per share. |
| # | Calculated using the average shares outstanding method. |
| (1) | Recognition of net investment income by the Fund is affected by the timing of the declaration of dividends by the underlying investment companies in which the Fund invests. |
| (2) | Includes dividends paid from the short-term portion of capital gain distributions received from affiliated Funds. |
| (3) | Does not include expenses of the investment companies in which the Fund invests. |
| (4) | The ratio excludes expenses waived/reimbursed net of amount recaptured. |
| (5) | The ratio includes expenses waived/reimbursed net of amount recaptured and fees paid indirectly, where applicable; if expenses waived/reimbursed net of amount recaptured and fees paid indirectly were excluded, the ratio would have been lower than the ratio shown. |
| | | | |
| 47 | | See Notes to Financial Statements. | | |
Conservative Allocation Fund I
The Fund, through investments in the underlying Select Funds, combines a greater percentage of exposure to fixed income securities with a smaller percentage to equity securities. The Fund has a target of, but is not limited to, an asset allocation of 75% Fixed Income Select Funds, 18% U.S. Equity Select Funds and 7% Non-U.S. Equity Select Fund.
The Fund is a fund of funds, and its performance is based on the performance of the underlying Select Funds. The Fund generated a positive return of 7.25% during 2010, benefiting from positive absolute performance from all of the underlying Select Funds including both equities and fixed income. The Fund’s absolute returns were most positively influenced by its exposure to the Low-Duration Bond Fund, followed by exposure to the Value Equity Fund and Growth Equity Fund.
Equities were the largest contributor to absolute performance, as equities outpaced bonds and posted strong double-digit returns for the year. While equities started the first quarter with positive results thanks to stronger economic growth, the second quarter resulted in double-digit declines for equities as investors shunned the asset class due to fears of a faltering and jobless economic recovery coupled with international concerns over European economic strength and a slowing Chinese economy. After a dismal second quarter correction, global equity markets experienced a strong, albeit still volatile, rally throughout the remainder of the year as investors responded favorably to additional stimulus measures and improving economic conditions.
While lagging equities, the Fund’s fixed income holdings contributed positively to overall absolute performance with all major bond sectors producing positive returns. The underlying Fixed Income Select Funds produced all of their positive performance during the first nine months of the year, as declining interest rates provided the backdrop for a rally in bond prices. During the second quarter, the Fund benefited from diversification into fixed income securities that helped mitigate the effect of strong negative equity returns during this quarter. Market sentiment shifted in the fourth quarter, however, as an improved economic outlook fueled a rise in interest rates which was a strong enough headwind to send fixed income returns into negative territory for the quarter.
The Fund outpaced its composite benchmark during the year by 0.80%, benefitting primarily from its exposure to the Low-Duration Bond Fund. At a target weighting of 60%, the Low-Duration Bond Fund contributed the most to the Fund’s relative excess return. The Low-Duration Bond Fund benefited from tactical utilization of higher yielding securities relative to Treasuries, across a broad spectrum of spread sectors including corporate bonds, mortgaged-backed securities, Yankee bonds and non-U.S. bonds. The contribution to relative performance was mixed for the Equity Select Funds, with the Value Equity Fund’s being the largest single detractor to relative performance, offset by the Growth Equity Fund’s contributing positively to relative outperformance.
The Fund attempts to achieve its objective by investing in the Select Funds. By investing in the Fund you will also incur the expenses and risks of the underlying Select Funds. The principal risks of the Fund will change depending on the asset mix of the Select Funds in which it invests. You may directly invest in the Select Funds. The Fund’s value will go up and down in response to changes in the share prices of the investments that it owns. It is possible to lose money by investing in the Fund.
Please see page 51 for information regarding specific portfolio allocations. Portfolio holdings are subject to change at any time.
48
Conservative Allocation Fund I
Average Annual Total Returns as of 12/31/10
| | | | | | | | |
| | |
| | | GS2 Class* | | | Benchmark** | |
One Year | | | 7.25 | % | | | 6.45 | % |
Five Year | | | 4.35 | % | | | 4.62 | % |
Since Inception | | | 4.59 | % | | | 4.75 | % |
Inception Date | | | 07/01/03 | | | | | |
Total Fund Operating Expenses (April 30, 2010 Prospectus, as supplemented on August 5, 2010)(1) | | | 0.72 | % | | | | |
| (1) | The Fund’s shareholders indirectly bear the expenses of the shares of the Select Funds in which the Fund invests. Current information regarding the Fund’s Operating Expenses can be found in the Financial Highlights. |
The performance data quoted represents past performance and does not guarantee future results. Current performance may be lower or higher. Performance data current to the most recent month-end may be obtained at www.GuideStoneFunds.org. The investment return and principal value of an investment will fluctuate so that shares, when redeemed, may be worth more or less than their original cost.
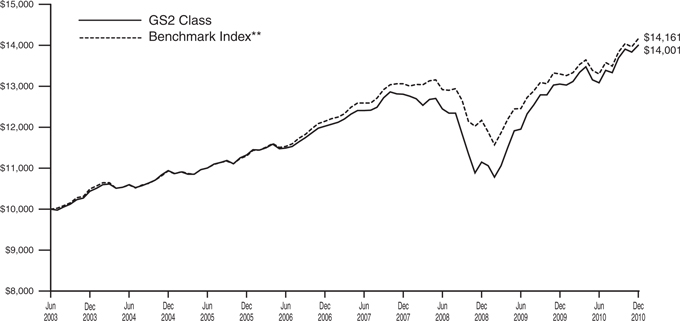
The graph compares the results of a hypothetical $10,000 investment in the GS2 Class of the Fund since July 1, 2003 (commencement of operations), with all dividends and capital gains reinvested, with the Fund’s weighted composite benchmark index.
| * | These returns reflect expense waivers by the Fund’s investment adviser. Without these waivers, returns would have been lower. Returns shown do not reflect the deduction of taxes that a shareholder would pay on Fund distributions or the redemption of Fund shares. |
| ** | Represents a composite index consisting of the Russell 3000® Index, the MSCI ACWI (All Country World Index) Ex-U.S. Index, the Merrill Lynch 1-3 Year Treasury Index and Barclays Capital U.S. TIPS Index, weighted 17.5%, 7.5%, 60% and 15%, respectively. |
The Russell 3000® Index measures the performance of the 3,000 largest U.S. companies based on total market capitalization, which represents approximately 98% of the investable U.S. equity market.
The MSCI ACWI (All Country World Index) Ex-U.S. Index is a free float-adjusted market capitalization index that is designed to measure equity market performance in the global developed (Ex-U.S.) and emerging markets.
The Merrill Lynch 1-3 Year Treasury Index is composed of all U.S. Treasury notes and bonds with maturities greater than or equal to one year and less than three years.
The Barclays Capital U.S. TIPS Index measures the performance of the U.S. Treasury Inflation Protected Securities (“TIPS”) market and includes TIPS with one or more years remaining until maturity with total outstanding issue size of $500 million or more.
Unlike a mutual fund, the performance of an index assumes no taxes, transaction costs, management fees or other expenses.
49
| | |
| CONSERVATIVE ALLOCATION FUND I | | |
| SCHEDULE OF INVESTMENTS | | December 31, 2010 |
| | | | | | | | |
| | | Shares | | | Value | |
MUTUAL FUNDS — 99.9% | | | | | | | | |
GuideStone Money Market Fund (GS2 Class)¥ | | | 1,137,030 | | | $ | 1,137,030 | |
GuideStone Low-Duration Bond Fund (GS2 Class)¥ | | | 4,867,660 | | | | 42,348,640 | |
GuideStone Inflation Protected Bond Fund (GS4 Class)¥ | | | 1,017,280 | | | | 10,610,228 | |
GuideStone Equity Index Fund (GS2 Class)¥ | | | 128,971 | | | | 1,113,015 | |
GuideStone Value Equity Fund (GS2 Class)¥ | | | 695,385 | | | | 4,992,861 | |
GuideStone Growth Equity Fund (GS2 Class)¥ | | | 417,426 | | | | 4,971,544 | |
GuideStone Small Cap Equity Fund (GS2 Class)¥ | | | 127,507 | | | | 1,225,339 | |
GuideStone International Equity Fund (GS2 Class)¥ | | | 524,018 | | | | 5,423,583 | |
| | | | | | | | |
Total Mutual Funds
(Cost $69,656,909) | | | | | | | 71,822,240 | |
| | | | | | | | |
TOTAL INVESTMENTS — 99.9%
(Cost $69,656,909) | | | | 71,822,240 | |
Other Assets in Excess of Liabilities — 0.1% | | | | | | | 103,276 | |
| | | | | | | | |
NET ASSETS — 100.0% | | | | | | $ | 71,925,516 | |
| | | | | | | | |
Please see abbreviation and footnote definitions beginning on page 180.
PORTFOLIO SUMMARY (based on net assets)
| | | | |
| | | % | |
Bond Funds | | | 73.6 | |
Domestic Equity Funds | | | 17.1 | |
International Equity Fund | | | 7.5 | |
Money Market Fund | | | 1.7 | |
| | | | |
| | | 99.9 | |
| | | | |
VALUATION HIERARCHY
The following is a summary of the inputs used, as of December 31, 2010, in valuing the Fund’s investments carried at fair value:
| | | | | | | | |
Valuation Inputs | | Investments
in
Securities | | | Other
Financial
Instruments*** | |
Level 1 — Quoted Prices | | | | | | | | |
Mutual Funds | | $ | 71,822,240 | | | $ | — | |
Level 2 — Other Significant Observable Inputs | | | — | | | | — | |
Level 3 — Significant Unobservable Inputs | | | — | | | | — | |
| | | | | | | | |
Total | | $ | 71,822,240 | | | $ | — | |
| | | | | | | | |
| *** | Other financial instruments are derivative instruments not reflected in the Schedule of Investments, such as futures, forwards and swap contracts, which are valued at the unrealized appreciation (depreciation) on the investment. Details of these investments can be found in the Notes to Financial Statements. |
| | | | |
| | See Notes to Financial Statements. | | 50 |
Balanced Allocation Fund I
The Fund, through investments in the underlying Select Funds, combines approximately equal percentages to equity securities and fixed income securities. The Fund has a target of, but is not limited to, an asset allocation of 50% Fixed Income Select Funds, 35% U.S. Equity Select Funds and 15% Non-U.S. Equity Select Fund.
The Fund is a fund of funds, and its performance is based on the performance of the underlying Select Funds. The Fund generated a strong return of 12.04% during 2010, benefiting from positive absolute performance from all of the underlying Select Funds including both equities and fixed income. The Fund’s absolute returns were most positively influenced by its exposure to the Value Equity Fund and Growth Equity Fund, which represented over half of the overall equity allocation.
Equities contributed the majority of absolute performance, as equities outpaced bonds and posted strong double-digit returns for the year. While equities started the first quarter with positive results thanks to stronger economic growth, the second quarter resulted in double-digit declines for equities as investors shunned the asset class due to fears of a faltering and jobless economic recovery coupled with international concerns over European economic strength and a slowing Chinese economy. After a dismal second quarter correction, global equity markets experienced a strong, albeit still volatile, rally throughout the remainder of the year as investors responded favorably to additional stimulus measures and improving economic conditions.
While lagging equities, the Fund’s fixed income holdings contributed positively to overall absolute performance with all major bond sectors producing positive returns. Fixed income assets produced virtually all of their positive performance during the first nine months of the year, as declining interest rates provided the backdrop for a rally in bond prices. Particularly during the second quarter, the Fund benefited from diversification into fixed income securities that helped mitigate the effect of strong negative equity returns during this quarter. Market sentiment shifted in the fourth quarter, however, as an improved economic outlook fueled a rise in interest rates which was a strong enough headwind to send fixed income returns generally into negative territory for the quarter.
The Fund outpaced its composite benchmark during the year by 0.62%, benefitting primarily from its exposure to the Fixed Income Select Funds. The majority of the outperformance from fixed income came from the two largest Fixed Income Select holdings, the Low-Duration Bond Fund and Medium-Duration Bond Fund, which represented nearly three-fourths of the fixed income allocation. Both of these funds outpaced their respective benchmarks, and were positively impacted by taking advantage of more attractive yield opportunities outside of the Treasuries. The Fund’s relative performance was positively impacted by exposure to certain U.S. Equity Select Funds, with the Growth Equity Fund’s contributing the most of any Select Fund to relative outperformance. The Growth Equity Fund benefited mostly from strong security selection leading to outperformance of its respective benchmark. The largest detractor to the Fund’s relative performance was attributed to exposure to the Value Equity Fund, which trailed its respective benchmark.
The Fund attempts to achieve its objective by investing in the Select Funds. By investing in the Fund you will also incur the expenses and risks of the underlying Select Funds. The principal risks of the Fund will change depending on the asset mix of the Select Funds in which it invests. You may directly invest in the Select Funds. The Fund’s value will go up and down in response to changes in the share prices of the investments that it owns. It is possible to lose money by investing in the Fund.
Please see page 54 for information regarding specific portfolio allocations. Portfolio holdings are subject to change at any time.
51
Balanced Allocation Fund I
| | | | | | | | |
| Average Annual Total Returns as of 12/31/10 | |
| | |
| | | GS2 Class* | | | Benchmark** | |
One Year | | | 12.04 | % | | | 11.42 | % |
Five Year | | | 4.43 | % | | | 5.02 | % |
Since Inception | | | 6.35 | % | | | 6.59 | % |
Inception Date | | | 07/01/03 | | | | | |
Total Fund Operating Expenses (April 30, 2010 Prospectus, as supplemented on August 5, 2010)(1) | | | 0.78 | % | | | | |
| (1) | The Fund’s shareholders indirectly bear the expenses of the shares of the Select Funds in which the Fund invests. Current information regarding the Fund’s Operating Expenses can be found in the Financial Highlights. |
The performance data quoted represents past performance and does not guarantee future results. Current performance may be lower or higher. Performance data current to the most recent month-end may be obtained at www.GuideStoneFunds.org. The investment return and principal value of an investment will fluctuate so that shares, when redeemed, may be worth more or less than their original cost.
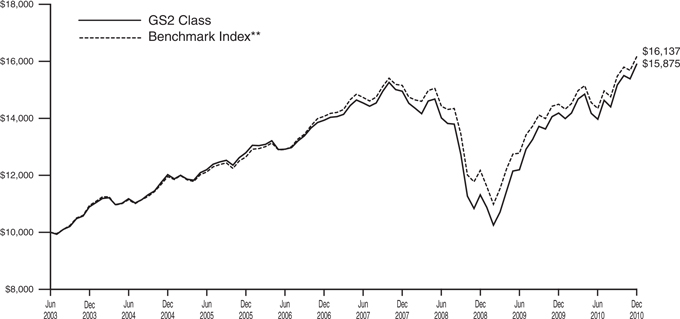
The graph compares the results of a hypothetical $10,000 investment in the GS2 Class of the Fund since July 1, 2003 (commencement of operations), with all dividends and capital gains reinvested, with the Fund’s weighted composite benchmark index.
| * | These returns reflect expense waivers by the Fund’s investment adviser. Without these waivers, returns would have been lower. Returns shown do not reflect the deduction of taxes that a shareholder would pay on Fund distributions or the redemption of Fund shares. |
| ** | Represents a composite index consisting of the Russell 3000® Index, the MSCI ACWI (All Country World Index) Ex-U.S. Index and the Barclays Capital U.S. Aggregate Bond Index, weighted 35%, 15% and 50%, respectively. |
The Russell 3000® Index measures the performance of the 3,000 largest U.S. companies based on total market capitalization, which represents approximately 98% of the investable U.S. equity market.
The MSCI ACWI (All Country World Index) Ex-U.S. Index is a free float-adjusted market capitalization index that is designed to measure equity market performance in the global developed (Ex-U.S.) and emerging markets.
The Barclays Capital U.S. Aggregate Bond Index represents securities that are SEC-registered, taxable and dollar denominated. The index covers the U.S. investment grade fixed rate bond market, with index components for government and corporate securities, mortgage pass-through securities and asset-backed securities.
Unlike a mutual fund, the performance of an index assumes no taxes, transaction costs, management fees or other expenses.
52
| | |
| BALANCED ALLOCATION FUND I | | |
| SCHEDULE OF INVESTMENTS | | December 31, 2010 |
| | | | | | | | |
| | | Shares | | | Value | |
MUTUAL FUNDS — 99.0% | | | | | |
GuideStone Money Market Fund (GS2 Class)¥ | | | 2,747,513 | | | $ | 2,747,513 | |
GuideStone Low-Duration Bond Fund (GS2 Class)¥ | | | 5,761,219 | | | | 50,122,605 | |
GuideStone Medium-Duration Bond Fund (GS2 Class)¥ | | | 10,002,556 | | | | 72,518,533 | |
GuideStone Extended-Duration Bond Fund (GS2 Class)¥ | | | 4,120,930 | | | | 28,558,045 | |
GuideStone Global Bond Fund (GS4 Class)¥ | | | 1,697,363 | | | | 16,685,078 | |
GuideStone Equity Index Fund (GS2 Class)¥ | | | 1,246,033 | | | | 10,753,267 | |
GuideStone Value Equity Fund (GS2 Class)¥ | | | 6,945,585 | | | | 49,869,304 | |
GuideStone Growth Equity Fund (GS2 Class)¥ | | | 4,103,470 | | | | 48,872,324 | |
GuideStone Small Cap Equity Fund (GS2 Class)¥ | | | 1,238,130 | | | | 11,898,428 | |
GuideStone International Equity Fund (GS2 Class)¥ | | | 5,012,974 | | | | 51,884,281 | |
| | | | | | | | |
Total Mutual Funds (Cost $355,780,750) | | | | | | | 343,909,378 | |
| | | | | | | | |
| | |
| | | Par | | | | |
U.S. TREASURY OBLIGATIONS — 1.0% | |
U.S. Treasury Bills | | | | | | | | |
0.16%, 05/05/11‡‡ | | $ | 95,000 | | | | 94,956 | |
0.17%, 05/05/11‡‡ | | | 385,000 | | | | 384,821 | |
0.17%, 05/05/11‡‡ | | | 15,000 | | | | 14,993 | |
| | | | | | | | |
| | | | | | | 494,770 | |
| | | | | | | | |
U.S. Treasury Note | | | | | | | | |
2.38%, 03/31/16 | | | 3,135,000 | | | | 3,175,169 | |
| | | | | | | | |
Total U.S. Treasury Obligations
(Cost $3,658,340) | | | | | | | 3,669,939 | |
| | | | | | | | |
TOTAL INVESTMENTS — 100.0%
(Cost $359,439,090) | | | | 347,579,317 | |
Liabilities in Excess of Other Assets — 0.0% | | | | (90,288 | ) |
| | | | | | | | |
NET ASSETS — 100.0% | | | $ | 347,489,029 | |
| | | | | | | | |
Please see abbreviation and footnote definitions beginning on page 180.
PORTFOLIO SUMMARY (based on net assets)
| | | | |
| | | % | |
Bond Funds | | | 48.3 | |
Domestic Equity Funds | | | 34.9 | |
International Equity Fund | | | 14.9 | |
U.S. Treasury Obligations | | | 1.1 | |
Futures Contracts | | | 0.9 | |
Money Market Fund | | | 0.8 | |
| | | | |
| | | 100.9 | |
| | | | |
VALUATION HIERARCHY
The following is a summary of the inputs used, as of December 31, 2010, in valuing the Fund’s investments carried at fair value:
| | | | | | | | |
Valuation Inputs | | Investments
in
Securities | | | Other
Financial
Instruments*** | |
Level 1 — Quoted Prices | | | | | | | | |
Futures Contracts | | $ | — | | | $ | 57,988 | |
Mutual Funds | | | 343,909,378 | | | | — | |
Level 2 — Other Significant Observable Inputs | | | | | | | | |
U.S. Treasury Obligations | | | 3,669,939 | | | | — | |
Level 3 — Significant Unobservable Inputs | | | — | | | | — | |
| | | | | | | | |
Total | | $ | 347,579,317 | | | $ | 57,988 | |
| | | | | | | | |
| *** | Other financial instruments are derivative instruments not reflected in the Schedule of Investments, such as futures, forwards and swap contracts, which are valued at the unrealized appreciation (depreciation) on the investment. Details of these investments can be found in the Notes to Financial Statements. |
| | | | |
| 53 | | See Notes to Financial Statements. | | |
The Fund, through investments in the underlying Select Funds, combines a greater percentage of exposure to equity securities with a smaller percentage to fixed income securities. The Fund has a target of, but is not limited to, an asset allocation of 53% U.S. Equity Select Funds, 24% Fixed Income Select Funds and 23% Non-U.S. Equity Select Fund.
The Fund is a fund of funds, and its performance is based on the performance of the underlying Select Funds. The Fund generated a strong return of 13.68% during 2010, benefiting from positive absolute performance from all of the underlying Select Funds including both equities and fixed income. The Fund’s absolute returns were most positively influenced by its exposure to the Value Equity Fund and Growth Equity Fund, which represented over half of the overall equity allocation.
Equities contributed the majority of absolute performance, as equities outpaced bonds and posted strong double-digit returns for the year. While equities started the first quarter with positive results thanks to stronger economic growth, the second quarter resulted in double-digit declines for equities as investors shunned the asset class due to fears of a faltering and jobless economic recovery coupled with international concerns over European economic strength and a slowing Chinese economy. After a dismal second quarter correction, global equity markets experienced a strong, albeit still volatile, rally throughout the remainder of the year as investors responded favorably to additional stimulus measures and improving economic conditions.
While lagging equities, the Fund’s fixed income holdings contributed positively to overall absolute performance with all major bond sectors producing positive returns. Fixed income assets produced virtually all of their positive performance during the first nine months of the year, as declining interest rates provided the backdrop for a rally in bond prices. Particularly during the second quarter, the Fund benefited from diversification into fixed income securities that helped mitigate the effect of strong negative equity returns during this quarter. Market sentiment shifted in the fourth quarter, however, as an improved economic outlook fueled a rise in interest rates which was a strong enough headwind to send fixed income returns generally into negative territory for the quarter.
The Fund outpaced its composite benchmark during the year by 0.20%, benefitting primarily from the relative outperformance of all of the underlying Fixed Income Select Funds. The largest single contributor to relative outperformance, however, was the Growth Equity Fund. The Growth Equity Fund benefited mostly from strong security selection, which led to outperformance of its respective benchmark. The largest detractor to the Fund’s relative performance was attributed to exposure to the Value Equity Fund, which trailed its respective benchmark.
The Fund attempts to achieve its objective by investing in the Select Funds. By investing in the Fund you will also incur the expenses and risks of the underlying Select Funds. The principal risks of the Fund will change depending on the asset mix of the Select Funds in which it invests. You may directly invest in the Select Funds. The Fund’s value will go up and down in response to changes in the share prices of the investments that it owns. It is possible to lose money by investing in the Fund.
Please see page 57 for information regarding specific portfolio allocations. Portfolio holdings are subject to change at any time.
| | | | | | | | |
| Average Annual Total Returns as of 12/31/10 | |
| | |
| | | GS2 Class* | | | Benchmark** | |
One Year | | | 13.68 | % | | | 13.48 | % |
Five Year | | | 3.18 | % | | | 4.25 | % |
Since Inception | | | 6.59 | % | | | 7.19 | % |
Inception Date | | | 07/01/03 | | | | | |
Total Fund Operating Expenses (April 30, 2010 Prospectus, as supplemented on August 5, 2010)(1) | | | 0.87 | % | | | | |
| (1) | The Fund’s shareholders indirectly bear the expenses of the shares of the Select Funds in which the Fund invests. Current information regarding the Fund’s Operating Expenses can be found in the Financial Highlights. |
The performance data quoted represents past performance and does not guarantee future results. Current performance may be lower or higher. Performance data current to the most recent month-end may be obtained at www.GuideStoneFunds.org. The investment return and principal value of an investment will fluctuate so that shares, when redeemed, may be worth more or less than their original cost.
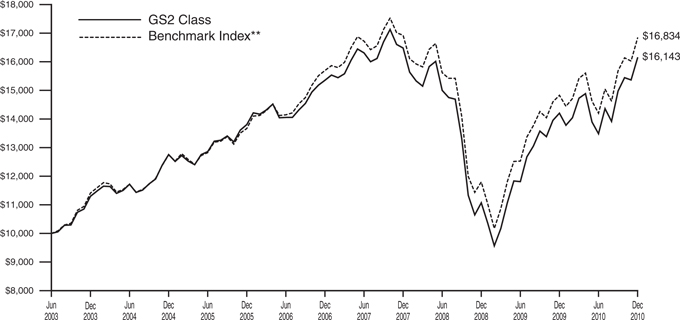
The graph compares the results of a hypothetical $10,000 investment in the GS2 Class of the Fund since July 1, 2003 (commencement of operations), with all dividends and capital gains reinvested, with the Fund’s weighted composite benchmark index.
| * | These returns reflect expense waivers by the Fund’s investment adviser. Without these waivers, returns would have been lower. Returns shown do not reflect the deduction of taxes that a shareholder would pay on Fund distributions or the redemption of Fund shares. |
| ** | Represents a composite index consisting of the Russell 3000® Index, the MSCI ACWI (All Country World Index) Ex-U.S. Index and the Barclays U.S. Capital Aggregate Bond Index, weighted 52.5%, 22.5% and 25%, respectively. |
The Russell 3000® Index measures the performance of the 3,000 largest U.S. companies based on total market capitalization, which represents approximately 98% of the investable U.S. equity market.
The MSCI ACWI (All Country World Index) Ex-U.S. Index is a free float-adjusted market capitalization index that is designed to measure equity market performance in the global developed (Ex-U.S.) and emerging markets.
The Barclays U.S. Capital Aggregate Bond Index represents securities that are SEC-registered, taxable and dollar denominated. The index covers the U.S. investment grade fixed rate bond market, with index components for government and corporate securities, mortgage pass-through securities and asset-backed securities.
Unlike a mutual fund, the performance of an index assumes no taxes, transaction costs, management fees or other expenses.
| | |
| GROWTH ALLOCATION FUND I | | |
| SCHEDULE OF INVESTMENTS | | December 31, 2010 |
| | | | | | | | |
| | | Shares | | | Value | |
MUTUAL FUNDS — 99.3% | | | | | |
GuideStone Money Market Fund (GS2 Class)¥ | | | 2,983,368 | | | $ | 2,983,368 | |
GuideStone Low-Duration Bond Fund (GS2 Class)¥ | | | 1,878,878 | | | | 16,346,241 | |
GuideStone Medium-Duration Bond Fund (GS2 Class)¥ | | | 3,311,350 | | | | 24,007,290 | |
GuideStone Extended-Duration Bond Fund (GS2 Class)¥ | | | 1,355,485 | | | | 9,393,510 | |
GuideStone Global Bond Fund (GS4 Class)¥ | | | 565,181 | | | | 5,555,730 | |
GuideStone Equity Index Fund (GS2 Class)¥ | | | 1,255,740 | | | | 10,837,035 | |
GuideStone Value Equity Fund (GS2 Class)¥ | | | 6,975,483 | | | | 50,083,969 | |
GuideStone Growth Equity Fund (GS2 Class)¥ | | | 4,123,059 | | | | 49,105,636 | |
GuideStone Small Cap Equity Fund (GS2 Class)¥ | | | 1,243,079 | | | | 11,945,987 | |
GuideStone International Equity Fund (GS2 Class)¥ | | | 4,989,230 | | | | 51,638,527 | |
| | | | | | | | |
Total Mutual Funds (Cost $250,970,486) | | | | | | | 231,897,293 | |
| | | | | | | | |
| | |
| | | Par | | | | |
U.S. TREASURY OBLIGATIONS — 0.6% | |
U.S. Treasury Bill | | | | | | | | |
0.17%, 05/05/11‡‡ | | $ | 340,000 | | | | 339,842 | |
U.S. Treasury Note | | | | | | | | |
2.38%, 03/31/16 | | | 1,065,000 | | | | 1,078,646 | |
| | | | | | | | |
Total U.S. Treasury Obligations
(Cost $1,414,602) | | | | 1,418,488 | |
| | | | | | | | |
TOTAL INVESTMENTS — 99.9%
(Cost $252,385,088) | | | | 233,315,781 | |
Other Assets in Excess of
Liabilities — 0.1% | | | | 241,336 | |
| | | | | | | | |
NET ASSETS — 100.0% | | | $ | 233,557,117 | |
| | | | | | | | |
Please see abbreviation and footnote definitions beginning on page 180.
PORTFOLIO SUMMARY (based on net assets)
| | | | |
| | | % | |
Domestic Equity Funds | | | 52.2 | |
Bond Funds | | | 23.7 | |
International Equity Fund | | | 22.1 | |
Futures Contracts | | | 1.4 | |
Money Market Fund | | | 1.3 | |
U.S. Treasury Obligations | | | 0.6 | |
| | | | |
| | | 101.3 | |
| | | | |
VALUATION HIERARCHY
The following is a summary of the inputs used, as of December 31, 2010, in valuing the Fund’s investments carried at fair value:
| | | | | | | | |
Valuation Inputs | | Investments
In
Securities | | | Other
Financial
Instruments*** | |
Level 1 — Quoted Prices | | | | | | | | |
Futures Contracts | | $ | — | | | $ | 50,688 | |
Mutual Funds | | | 231,897,293 | | | | | |
Level 2 — Other Significant Observable Inputs | | | | | | | | |
U.S. Treasury Obligations | | | 1,418,488 | | | | — | |
Level 3 — Significant Unobservable Inputs | | | — | | | | — | |
| | | | | | | | |
Total | | $ | 233,315,781 | | | $ | 50,688 | |
| | | | | | | | |
| *** | Other financial instruments are derivative instruments not reflected in the Schedule of Investments, such as futures, forwards and swap contracts, which are valued at the unrealized appreciation (depreciation) on the investment. Details of these investments can be found in the Notes to Financial Statements. |
| | | | |
| | See Notes to Financial Statements. | | 56 |
Aggressive Allocation Fund I
The Fund, through investments in the underlying Select Funds, combines a greater percentage of exposure to U.S. equity securities with a smaller percentage to non-U.S. equity securities. The Fund has a target of, but is not limited to, an asset allocation of 70% U.S. Equity Select Funds and 30% Non-U.S. Select Fund.
The Fund is a fund of funds, and its performance is based on the performance of the underlying Select Funds. The Fund generated a strong return of 15.23% during 2010, benefiting from double-digit returns across all the Equity Select Funds for the year. While equities started the first quarter with positive results thanks to stronger economic growth, the second quarter resulted in double-digit declines for equities as investors shunned the asset class due to fears of a faltering and jobless economic recovery coupled with international concerns over European economic strength and a slowing Chinese economy. After a dismal second quarter correction, global equity markets experienced a strong, albeit still volatile, rally throughout the remainder of the year as investors responded favorably to additional stimulus measures and improving economic conditions.
The Fund underperformed its composite benchmark during the year by -0.03%. The Value Equity Fund and International Equity Funds were large contributors to the Fund’s absolute return, but also served as the key drivers in the Fund’s relative underperformance during the year. The Value Equity Fund, the largest detractor to relative performance, suffered the most underperformance due to under-exposure to more economically sensitive and higher beta securities that outperformed in the rapidly rising market. The Fund’s relative performance was positively impacted by exposure to the Growth Equity Fund. The Growth Equity Fund benefited primarily from strong security selection leading the Fund to outperform its respective benchmark.
The Fund attempts to achieve its objective by investing in the Select Funds. By investing in the Fund you will also incur the expenses and risks of the underlying Select Funds. The principal risks of the Fund will change depending on the asset mix of the Select Funds in which it invests. You may directly invest in the Select Funds. The Fund’s value will go up and down in response to changes in the share prices of the investments that it owns. It is possible to lose money by investing in the Fund.
Please see page 60 for information regarding specific portfolio allocations. Portfolio holdings are subject to change at any time.
Aggressive Allocation Fund I
Average Annual Total Returns as of 12/31/10
| | | | | | | | |
| | | GS2 Class* | | | Benchmark** | |
One year | | | 15.23 | % | | | 15.26 | % |
Five year | | | 1.65 | % | | | 3.25 | % |
Since Inception | | | 6.60 | % | | | 7.60 | % |
Inception Date | | | 07/01/03 | | | | | |
Total Fund Operating Expenses (April 30, 2010 Prospectus, as supplemented on August 5, 2010)(1) | | | 0.96 | % | | | | |
| (1) | The Fund’s shareholders indirectly bear the expenses of the GS2 Class shares of the Select Funds in which the Fund invests. Current information regarding the Fund’s Operating Expenses can be found in the Financial Highlights. |
The performance data quoted represents past performance and does not guarantee future results. Current performance may be lower or higher. Performance data current to the most recent month-end may be obtained at www.GuideStoneFunds.org. The investment return and principal value of an investment will fluctuate so that shares, when redeemed, may be worth more or less than their original cost.
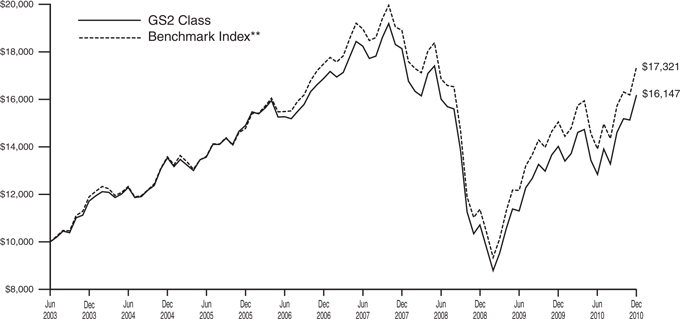
The graph compares the results of a hypothetical $10,000 investment in the GS2 Class of the Fund since July 1, 2003 (commencement of operations), with all dividends and capital gains reinvested, with the Fund’s weighted composite benchmark index.
| * | These returns reflect expense waivers by the Fund’s investment adviser. Without these waivers, returns would have been lower. Returns shown do not reflect the deduction of taxes that a shareholder would pay on Fund distributions or the redemption of Fund shares. |
| ** | Represents a composite index consisting of the Russell 3000® Index and the MSCI ACWI (All Country World Index) Ex-U.S. Index, weighted 70% and 30%, respectively. |
The Russell 3000® Index measures the performance of the 3,000 largest U.S. companies based on total market capitalization, which represents approximately 98% of the investable U.S. equity market.
The MSCI ACWI (All Country World Index) Ex-U.S. Index is a free float-adjusted market capitalization index that is designed to measure equity market performance in the global developed (Ex-U.S.) and emerging markets.
Unlike a mutual fund, the performance of an index assumes no taxes, transaction costs, management fees or other expenses.
| | |
| AGGRESSIVE ALLOCATION FUND I | | |
| SCHEDULE OF INVESTMENTS | | December 31, 2010 |
| | | | | | | | |
| | | Shares | | | Value | |
MUTUAL FUNDS — 99.8% | | | | | |
GuideStone Money Market Fund (GS2 Class)¥ | | | 2,697,371 | | | $ | 2,697,371 | |
GuideStone Equity Index Fund (GS2 Class)¥ | | | 1,121,144 | | | | 9,675,471 | |
GuideStone Value Equity Fund (GS2 Class)¥ | | | 6,147,232 | | | | 44,137,128 | |
GuideStone Growth Equity Fund (GS2 Class)¥ | | | 3,605,399 | | | | 42,940,300 | |
GuideStone Small Cap Equity Fund (GS2 Class)¥ | | | 1,132,151 | | | | 10,879,974 | |
GuideStone International Equity Fund (GS2 Class)¥ | | | 4,504,303 | | | | 46,619,540 | |
| | | | | | | | |
Total Mutual Funds
(Cost $178,568,261) | | | | | | | 156,949,784 | |
| | | | | | | | |
| | |
| | | Par | | | | |
U.S. TREASURY OBLIGATION — 0.2% | |
U.S. Treasury Bill | | | | | | | | |
0.17%, 05/05/11‡‡ | | | | | | | | |
(Cost $284,833) | | $ | 285,000 | | | | 284,868 | |
| | | | | | | | |
TOTAL INVESTMENTS — 100.0%
(Cost $178,853,094) | | | | 157,234,652 | |
Other Assets in Excess of
Liabilities — 0.0% | | | | 75,419 | |
| | | | | | | | |
NET ASSETS — 100.0% | | | $ | 157,310,071 | |
| | | | | | | | |
Please see abbreviation and footnote definitions beginning on page 180.
PORTFOLIO SUMMARY (based on net assets)
| | | | |
| | | % | |
Domestic Equity Funds | | | 68.4 | |
International Equity Fund | | | 29.7 | |
Futures Contracts | | | 1.9 | |
Money Market Fund | | | 1.7 | |
U.S. Treasury Obligation | | | 0.2 | |
| | | | |
| | | 101.9 | |
| | | | |
VALUATION HIERARCHY
The following is a summary of the inputs used, as of December 31, 2010, in valuing the Fund’s investments carried at fair value:
| | | | | | | | |
Valuation Inputs | | Investments
in
Securities | | | Other
Financial
Instruments*** | |
Level 1 — Quoted Prices | | | | | | | | |
Futures Contracts | | $ | — | | | $ | 61,344 | |
Mutual Funds | | | 156,949,784 | | | | — | |
Level 2 — Other Significant Observable Inputs | | | | | | | | |
U.S. Treasury Obligation | | | 284,868 | | | | — | |
Level 3 — Significant Unobservable Inputs | | | — | | | | — | |
| | | | | | | | |
Total | | $ | 157,234,652 | | | $ | 61,344 | |
| | | | | | | | |
| *** | Other financial instruments are derivative instruments not reflected in the Schedule of Investments, such as futures, forwards and swap contracts, which are valued at the unrealized appreciation (depreciation) on the investment. Details of these investments can be found in the Notes to Financial Statements. |
| | | | |
| 59 | | See Notes to Financial Statements. | | |
| | |
| STATEMENTS OF ASSETS AND LIABILITIES | | |
| | December 31, 2010 |
| | | | | | | | | | | | | | | | |
| | | Conservative
Allocation
Fund I | | | Balanced
Allocation
Fund I | | | Growth
Allocation
Fund I | | | Aggressive
Allocation
Fund I | |
Assets | | | | | | | | | | | | | | | | |
Investments in securities of affiliated issuers, at value | | $ | 71,822,240 | | | $ | 343,909,378 | | | $ | 231,897,293 | | | $ | 156,949,784 | |
Investments in securities of unaffiliated issuers, at value | | | — | | | | 3,669,939 | | | | 1,418,488 | | | | 284,868 | |
| | | | | | | | | | | | | | | | |
Total investments (1) | | | 71,822,240 | | | | 347,579,317 | | | | 233,315,781 | | | | 157,234,652 | |
Receivables: | | | | | | | | | | | | | | | | |
Dividends | | | 162 | | | | 441 | | | | 481 | | | | 403 | |
Interest | | | — | | | | 19,028 | | | | 6,468 | | | | — | |
Fund shares sold | | | 101,586 | | | | 2,127 | | | | 300,158 | | | | 87,254 | |
Prepaid expenses and other assets | | | 10,504 | | | | 10,503 | | | | 10,503 | | | | 10,503 | |
| | | | | | | | | | | | | | | | |
Total Assets | | | 71,934,492 | | | | 347,611,416 | | | | 233,633,391 | | | | 157,332,812 | |
| | | | | | | | | | | | | | | | |
Liabilities | | | | | | | | | | | | | | | | |
Payables: | | | | | | | | | | | | | | | | |
Investment securities purchased | | | — | | | | 35,630 | | | | 40,720 | | | | — | |
Fund shares redeemed | | | — | | | | 40,355 | | | | — | | | | — | |
Variation margin | | | — | | | | 3,750 | | | | 3,825 | | | | 3,377 | |
Accrued expenses: | | | | | | | | | | | | | | | | |
Investment advisory fees | | | 1,371 | | | | 29,701 | | | | 19,864 | | | | 9,648 | |
Other expenses | | | 7,605 | | | | 12,951 | | | | 11,865 | | | | 9,716 | |
| | | | | | | | | | | | | | | | |
Total Liabilities | | | 8,976 | | | | 122,387 | | | | 76,274 | | | | 22,741 | |
| | | | | | | | | | | | | | | | |
Net Assets | | $ | 71,925,516 | | | $ | 347,489,029 | | | $ | 233,557,117 | | | $ | 157,310,071 | |
| | | | | | | | | | | | | | | | |
Net Assets Consist of: | | | | | | | | | | | | | | | | |
Paid-in-capital | | $ | 76,200,875 | | | $ | 385,086,514 | | | $ | 262,771,245 | | | $ | 188,419,871 | |
Undistributed net investment income | | | 724,828 | | | | 5,589,325 | | | | 1,563,564 | | | | 2,389,297 | |
Accumulated net realized loss on investments and futures transactions | | | (7,165,518 | ) | | | (31,385,025 | ) | | | (11,759,073 | ) | | | (11,941,999 | ) |
Net unrealized appreciation (depreciation) on investments and futures | | | 2,165,331 | | | | (11,801,785 | ) | | | (19,018,619 | ) | | | (21,557,098 | ) |
| | | | | | | | | | | | | | | | |
Net Assets | | $ | 71,925,516 | | | $ | 347,489,029 | | | $ | 233,557,117 | | | $ | 157,310,071 | |
| | | | | | | | | | | | | | | | |
Net Asset Value: | | | | | | | | | | | | | | | | |
$0.001 par value, unlimited shares authorized | | | | | | | | | | | | | | | | |
Net assets applicable to the GS2 Class | | $ | 71,925,516 | | | $ | 347,489,029 | | | $ | 233,557,117 | | | $ | 157,310,071 | |
| | | | | | | | | | | | | | | | |
GS2 shares outstanding | | | 7,634,307 | | | | 36,040,260 | | | | 23,164,973 | | | | 15,070,102 | |
| | | | | | | | | | | | | | | | |
Net asset value, offering and redemption price per GS2 share | | $ | 9.42 | | | $ | 9.64 | | | $ | 10.08 | | | $ | 10.44 | |
| | | | | | | | | | | | | | | | |
| | | | | | | | | | | | | | | | |
(1) Investments in securities of affiliated issuers, at cost | | $ | 69,656,909 | | | $ | 355,780,750 | | | $ | 250,970,486 | | | $ | 178,568,261 | |
Investments in securities of unaffiliated issuers, at cost | | | — | | | | 3,658,340 | | | | 1,414,602 | | | | 284,833 | |
| | | | | | | | | | | | | | | | |
Total investments at cost | | $ | 69,656,909 | | | $ | 359,439,090 | | | $ | 252,385,088 | | | $ | 178,853,094 | |
| | | | | | | | | | | | | | | | |
| | | | |
| 60 | | See Notes to Financial Statements. | | |
| | |
| | |
| STATEMENTS OF OPERATIONS | | For the Year Ended December 31, 2010 |
| | | | | | | | | | | | | | | | |
| | | Conservative
Allocation Fund I | | | Balanced
Allocation Fund I | | | Growth
Allocation Fund I | | | Aggressive
Allocation Fund I | |
Investment Income | | | | | | | | | | | | | | | | |
Income dividends received from affiliated funds | | $ | 1,806,951 | | | $ | 12,286,994 | | | $ | 5,880,656 | | | $ | 2,609,443 | |
Interest | | | — | | | | 58,321 | | | | 21,497 | | | | 162 | |
| | | | | | | | | | | | | | | | |
Total Investment Income | | | 1,806,951 | | | | 12,345,315 | | | | 5,902,153 | | | | 2,609,605 | |
| | | | | | | | | | | | | | | | |
Expenses | | | | | | | | | | | | | | | | |
Investment advisory fees | | | 68,151 | | | | 338,043 | | | | 218,632 | | | | 146,228 | |
Transfer agent fees: | | | | | | | | | | | | | | | | |
GS2 Shares | | | 3,882 | | | | 3,978 | | | | 3,917 | | | | 3,918 | |
Custodian fees | | | 4,212 | | | | 16,504 | | | | 14,054 | | | | 9,970 | |
Accounting and administration fees | | | 6,998 | | | | 21,362 | | | | 14,695 | | | | 10,662 | |
Professional fees | | | 42,351 | | | | 42,351 | | | | 42,351 | | | | 42,351 | |
Blue sky fees: | | | | | | | | | | | | | | | | |
GS2 Shares | | | 267 | | | | 267 | | | | 267 | | | | 267 | |
Shareholder reporting fees | | | 291 | | | | 394 | | | | 260 | | | | 204 | |
Trustee expenses | | | 663 | | | | 3,316 | | | | 2,159 | | | | 1,449 | |
Line of credit facility fees | | | 787 | | | | 3,892 | | | | 2,484 | | | | 1,659 | |
Other expenses | | | 9,388 | | | | 9,888 | | | | 9,388 | | | | 9,388 | |
| | | | | | | | | | | | | | | | |
Total Expenses | | | 136,990 | | | | 439,995 | | | | 308,207 | | | | 226,096 | |
Expenses waived/reimbursed net of amount recaptured(1) | | | (33,009 | ) | | | — | | | | 1,095 | | | | (7,100 | ) |
| | | | | | | | | | | | | | | | |
Net expenses | | | 103,981 | | | | 439,995 | | | | 309,302 | | | | 218,996 | |
| | | | | | | | | | | | | | | | |
Net Investment Income | | | 1,702,970 | | | | 11,905,320 | | | | 5,592,851 | | | | 2,390,609 | |
| | | | | | | | | | | | | | | | |
Realized and Unrealized Gain (Loss) | | | | | | | | | | | | | | | | |
Capital gain distributions received from affiliated funds | | | 697,289 | | | | 5,220,716 | | | | 1,692,131 | | | | 154 | |
Net realized loss on investment securities of affiliated issuers | | | (1,373,644 | ) | | | (9,468,867 | ) | | | (4,244,725 | ) | | | (4,191,770 | ) |
Net realized gain on investment securities of unaffiliated issuers | | | — | | | | 98,961 | | | | 53,424 | | | | — | |
Net realized gain on futures transactions | | | — | | | | 600,895 | | | | 392,068 | | | | 348,562 | |
| | | | | | | | | | | | | | | | |
Net realized loss | | | (676,355 | ) | | | (3,548,295 | ) | | | (2,107,102 | ) | | | (3,843,054 | ) |
| | | | | | | | | | | | | | | | |
Change in unrealized appreciation on investment securities of affiliated issuers | | | 3,826,228 | | | | 30,002,988 | | | | 24,880,797 | | | | 22,235,454 | |
Change in unrealized appreciation on investment securities of unaffiliated issuers | | | — | | | | 11,478 | | | | 3,838 | | | | 24 | |
Change in unrealized appreciation on futures | | | — | | | | 8,206 | | | | 10,147 | | | | 20,055 | |
| | | | | | | | | | | | | | | | |
Net change in unrealized appreciation | | | 3,826,228 | | | | 30,022,672 | | | | 24,894,782 | | | | 22,255,533 | |
| | | | | | | | | | | | | | | | |
Net Realized and Unrealized Gain | | | 3,149,873 | | | | 26,474,377 | | | | 22,787,680 | | | | 18,412,479 | |
| | | | | | | | | | | | | | | | |
Net Increase in Net Assets Resulting from Operations | | $ | 4,852,843 | | | $ | 38,379,697 | | | $ | 28,380,531 | | | $ | 20,803,088 | |
| | | | | | | | | | | | | | | | |
(1) See Note 3a and 3c in Notes to Financial Statements.
| | | | |
| | See Notes to Financial Statements. | | 61 |
| | |
| STATEMENTS OF CHANGES IN NET ASSETS | | |
| | | | | | | | | | | | | | | | |
| | | Conservative Allocation Fund I | | | Balanced Allocation Fund I | |
| | | For the Year Ended | | | For the Year Ended | |
| | | 12/31/10 | | | 12/31/09 | | | 12/31/10 | | | 12/31/09 | |
Operations: | | | | | | | | | | | | | | | | |
Net investment income | | $ | 1,702,970 | | | $ | 2,122,877 | | | $ | 11,905,320 | | | $ | 12,511,014 | |
Net realized loss on investment securities and futures transactions | | | (676,355 | ) | | | (3,478,084 | ) | | | (3,548,295 | ) | | | (9,521,918 | ) |
Net change in unrealized appreciation (depreciation) on investment securities and futures | | | 3,826,228 | | | | 10,426,841 | | | | 30,022,672 | | | | 61,035,909 | |
| | | | | | | | | | | | | | | | |
Net increase in net assets resulting from operations | | | 4,852,843 | | | | 9,071,634 | | | | 38,379,697 | | | | 64,025,005 | |
| | | | | | | | | | | | | | | | |
Dividends to Shareholders: | | | | | | | | | | | | | | | | |
Dividends from net investment income(1) | | | (2,200,764 | ) | | | (2,128,240 | ) | | | (15,332,084 | ) | | | (15,067,834 | ) |
| | | | | | | | | | | | | | | | |
Total dividends | | | (2,200,764 | ) | | | (2,128,240 | ) | | | (15,332,084 | ) | | | (15,067,834 | ) |
| | | | | | | | | | | | | | | | |
Capital Share Transactions: | | | | | | | | | | | | | | | | |
Proceeds from GS2 shares sold | | | 11,578,089 | | | | 8,391,907 | | | | 20,143,207 | | | | 22,306,268 | |
Reinvestment of dividends and distributions into GS2 shares | | | 2,196,344 | | | | 2,122,742 | | | | 15,298,336 | | | | 15,033,265 | |
Value of GS2 shares redeemed | | | (8,731,188 | ) | | | (7,544,466 | ) | | | (37,676,116 | ) | | | (19,743,274 | ) |
| | | | | | | | | | | | | | | | |
Net increase (decrease) from capital share transactions(2) | | | 5,043,245 | | | | 2,970,183 | | | | (2,234,573 | ) | | | 17,596,259 | |
| | | | | | | | | | | | | | | | |
Total increase in net assets | | | 7,695,324 | | | | 9,913,577 | | | | 20,813,040 | | | | 66,553,430 | |
| | | | | | | | | | | | | | | | |
Net Assets: | | | | | | | | | | | | | | | | |
Beginning of Year | | | 64,230,192 | | | | 54,316,615 | | | | 326,675,989 | | | | 260,122,559 | |
| | | | | | | | | | | | | | | | |
End of Year* | | $ | 71,925,516 | | | $ | 64,230,192 | | | $ | 347,489,029 | | | $ | 326,675,989 | |
| | | | | | | | | | | | | | | | |
* Including undistributed net investment income | | $ | 724,828 | | | $ | 705,488 | | | $ | 5,589,325 | | | $ | 5,272,196 | |
| | | | | | | | | | | | | | | | |
| (1) | Includes dividends paid from the short-term portion of capital gain distributions received from affiliated funds. |
| (2) | See Note 7 in Notes to Financial Statements. |
| | | | |
| 62 | | See Notes to Financial Statements. | | |
| | | | | | | | | | | | | | |
| Growth Allocation Fund I | | | Aggressive Allocation Fund I | |
| For the Year Ended | | | For the Year Ended | |
| 12/31/10 | | | 12/31/09 | | | 12/31/10 | | | 12/31/09 | |
| | | | | | | | | | | | | | |
| | $5,592,851 | | | $ | 5,769,241 | | | $ | 2,390,609 | | | $ | 2,510,787 | |
| (2,107,102) | | | | (3,897,122 | ) | | | (3,843,054 | ) | | | (3,226,596 | ) |
| | 24,894,782 | | | | 43,329,239 | | | | 22,255,533 | | | | 34,619,327 | |
| | | | | | | | | | | | | | | |
| | 28,380,531 | | | | 45,201,358 | | | | 20,803,088 | | | | 33,903,518 | |
| | | | | | | | | | | | | | | |
| | | | | | | | | | | | | | |
| | (6,706,135) | | | | (6,560,814 | ) | | | (2,510,802 | ) | | | (3,254,796 | ) |
| | | | | | | | | | | | | | | |
| | (6,706,135) | | | | (6,560,814 | ) | | | (2,510,802 | ) | | | (3,254,796 | ) |
| | | | | | | | | | | | | | | |
| | | | | | | | | | | | | | |
| | 12,756,146 | | | | 15,197,050 | | | | 8,533,321 | | | | 13,301,477 | |
| | 6,685,451 | | | | 6,539,648 | | | | 2,509,149 | | | | 3,251,584 | |
| | (16,618,041) | | | | (13,133,053 | ) | | | (15,288,566 | ) | | | (13,493,549 | ) |
| | | | | | | | | | | | | | | |
| | 2,823,556 | | | | 8,603,645 | | | | (4,246,096 | ) | | | 3,059,512 | |
| | | | | | | | | | | | | | | |
| | 24,497,952 | | | | 47,244,189 | | | | 14,046,190 | | | | 33,708,234 | |
| | | | | | | | | | | | | | | |
| | | | | | | | | | | | | | |
| | 209,059,165 | | | | 161,814,976 | | | | 143,263,881 | | | | 109,555,647 | |
| | | | | | | | | | | | | | | |
| | $233,557,117 | | | $ | 209,059,165 | | | $ | 157,310,071 | | | $ | 143,263,881 | |
| | | | | | | | | | | | | | | |
| | $1,563,564 | | | $ | 1,464,983 | | | $ | 2,389,297 | | | $ | 2,509,336 | |
| | | | | | | | | | | | | | | |
| | | | |
| | See Notes to Financial Statements. | | 63 |
FINANCIAL HIGHLIGHTS
| | | | | | | | | | | | | | | | | | | | | | | | | | | | | | | | | | | | | | | | | | | | | | | | | | | | |
For a Share Outstanding For the Years Ending December 31, unless otherwise indicated | | | Ratios to Average Net Assets | |
| | | Net Asset
Value,
Beginning
of Year | | | Net
Investment
Income (1) | | | Capital Gain
Distributions
Received
from
Affiliated
Funds | | | Realized
and
Unrealized
Gain
(Loss) on
Investments | | | Dividends
from Net
Investment
Income (2) | | | Distributions
from Net
Realized
Capital
Gains | | | Net
Asset
Value,
End
of
Year | | | Total
Return | | | Net
Assets,
End of
Year
(000) | | | Expenses,
Net(3) | | | Expenses,
Gross(3)(4) | | | Investment
Income,
Net (1)(5) | | | Portfolio
Turnover
Rate | |
Conservative Allocation Fund I | | | | | | | | | | | | | | | | | | | | | | | | | | | | | | | | | | | | | | | | | | | | | | | | | | | | |
GS2 Class | | | | | | | | | | | | | | | | | | | | | | | | | | | | | | | | | | | | | | | | | | | | | | | | | | | | |
2010 | | $ | 9.06 | | | $ | 0.23 | # | | $ | 0.10 | | | $ | 0.33 | | | $ | (0.30 | ) | | $ | — | | | $ | 9.42 | | | | 7.25 | % | | $ | 71,926 | | | | 0.15 | % | | | 0.20 | % | | | 2.50 | % | | | 12 | % |
2009 | | | 8.00 | | | | 0.32 | # | | | — | † | | | 1.05 | | | | (0.31 | ) | | | — | | | | 9.06 | | | | 17.13 | | | | 64,230 | | | | 0.15 | | | | 0.23 | | | | 3.70 | | | | 35 | |
2008 | | | 9.86 | | | | 0.49 | | | | 0.03 | | | | (1.81 | ) | | | (0.39 | ) | | | (0.18 | ) | | | 8.00 | | | | (12.98 | ) | | | 54,317 | | | | 0.15 | | | | 0.22 | | | | 5.21 | | | | 25 | |
2007 | | | 10.05 | | | | 0.50 | | | | 0.23 | | | | (0.07 | ) | | | (0.54 | ) | | | (0.31 | ) | | | 9.86 | | | | 6.55 | | | | 67,231 | | | | 0.16 | | | | 0.22 | | | | 4.77 | | | | 25 | |
2006 | | | 10.15 | | | | 0.46 | | | | 0.19 | | | | (0.02 | ) | | | (0.49 | ) | | | (0.24 | ) | | | 10.05 | | | | 6.21 | | | | 57,188 | | | | 0.17 | | | | 0.30 | | | | 4.53 | | | | 16 | |
Balanced Allocation Fund I | | | | | | | | | | | | | | | | | | | | | | | | | | | | | | | | | | | | | | | | | | | | | | | | | | | | |
GS2 Class | |
2010 | | $ | 9.00 | | | $ | 0.33 | # | | $ | 0.15 | | | $ | 0.60 | | | $ | (0.44 | ) | | $ | — | | | $ | 9.64 | | | | 12.04 | % | | $ | 347,489 | | | | 0.13 | % | | | 0.13 | % | | | 3.56 | % | | | 19 | % |
2009 | | | 7.53 | | | | 0.37 | # | | | 0.08 | | | | 1.46 | | | | (0.44 | ) | | | — | | | | 9.00 | | | | 25.28 | | | | 326,676 | | | | 0.14 | | | | 0.14 | | | | 4.46 | | | | 20 | |
2008 | | | 11.07 | | | | 0.51 | # | | | 0.17 | | | | (3.38 | ) | | | (0.42 | ) | | | (0.42 | ) | | | 7.53 | | | | (24.26 | ) | | | 260,123 | | | | 0.14 | | | | 0.14 | | | | 5.16 | | | | 23 | |
2007 | | | 11.35 | | | | 0.55 | # | | | 0.66 | | | | (0.38 | ) | | | (0.62 | ) | | | (0.49 | ) | | | 11.07 | | | | 7.32 | | | | 353,793 | | | | 0.16 | | | | 0.14 | | | | 4.62 | | | | 12 | |
2006 | | | 11.32 | | | | 0.46 | # | | | 0.45 | | | | 0.09 | | | | (0.50 | ) | | | (0.47 | ) | | | 11.35 | | | | 8.85 | | | | 262,451 | | | | 0.17 | | | | 0.18 | | | | 3.93 | | | | 13 | |
Growth Allocation Fund I | | | | | | | | | | | | | | | | | | | | | | | | | | | | | | | | | | | | | | | | | | | | | | | | | | | | |
GS2 Class | | | | | | | | | | | | | | | | | | | | | | | | | | | | | | | | | | | | | | | | | | | | | | | | | | | | |
2010 | | $ | 9.13 | | | $ | 0.24 | # | | $ | 0.07 | | | $ | 0.94 | | | $ | (0.30 | ) | | $ | — | | | $ | 10.08 | | | | 13.68 | % | | $ | 233,557 | | | | 0.14 | % | | | 0.14 | % | | | 2.60 | % | | | 13 | % |
2009 | | | 7.35 | | | | 0.26 | # | | | 0.04 | | | | 1.78 | | | | (0.30 | ) | | | — | | | | 9.13 | | | | 28.22 | | | | 209,059 | | | | 0.15 | | | | 0.15 | | | | 3.28 | | | | 13 | |
2008 | | | 12.53 | | | | 0.39 | # | | | 0.16 | | | | (4.69 | ) | | | (0.34 | ) | | | (0.70 | ) | | | 7.35 | | | | (32.82 | ) | | | 161,815 | | | | 0.15 | | | | 0.14 | | | | 3.65 | | | | 18 | |
2007 | | | 12.96 | | | | 0.41 | | | | 0.92 | | | | (0.37 | ) | | | (0.58 | ) | | | (0.81 | ) | | | 12.53 | | | | 7.40 | | | | 251,579 | | | | 0.16 | | | | 0.15 | | | | 3.20 | | | | 9 | |
2006 | | | 12.62 | | | | 0.34 | | | | 0.73 | | | | 0.35 | | | | (0.44 | ) | | | (0.64 | ) | | | 12.96 | | | | 11.21 | | | | 187,536 | | | | 0.17 | | | | 0.20 | | | | 2.73 | | | | 9 | |
Aggressive Allocation Fund I | | | | | | | | | | | | | | | | | | | | | | | | | | | | | | | | | | | | | | | | | | | | | | | | | | | | |
GS2 Class | | | | | | | | | | | | | | | | | | | | | | | | | | | | | | | | | | | | | | | | | | | | | | | | | | | | |
2010 | | $ | 9.21 | | | $ | 0.16 | # | | $ | — | † | | $ | 1.24 | | | $ | (0.17 | ) | | $ | — | | | $ | 10.44 | | | | 15.23 | % | | $ | 157,310 | | | | 0.15 | % | | | 0.16 | % | | | 1.67 | % | | | 5 | % |
2009 | | | 7.20 | | | | 0.16 | # | | | — | † | | | 2.06 | | | | (0.21 | ) | | | — | | | | 9.21 | | | | 30.87 | | | | 143,264 | | | | 0.15 | | | | 0.17 | | | | 2.10 | | | | 5 | |
2008 | | | 14.07 | | | | 0.24 | # | | | 0.14 | | | | (6.15 | ) | | | — | | | | (1.10 | ) | | | 7.20 | | | | (40.87 | ) | | | 109,556 | | | | 0.15 | | | | 0.16 | | | | 2.08 | | | | 10 | |
2007 | | | 14.56 | | | | 0.27 | | | | 1.37 | | | | (0.56 | ) | | | (0.52 | ) | | | (1.05 | ) | | | 14.07 | | | | 7.38 | | | | 198,847 | | | | 0.16 | | | | 0.15 | | | | 1.81 | | | | 7 | |
2006 | | | 14.01 | | | | 0.21 | | | | 1.09 | | | | 0.57 | | | | (0.36 | ) | | | (0.96 | ) | | | 14.56 | | | | 13.33 | | | | 142,218 | | | | 0.17 | | | | 0.21 | | | | 1.47 | | | | 8 | |
| † | Amount represents less than $0.005 per share. |
| # | Calculated using the average shares outstanding method. |
| (1) | Recognition of net investment income by the Fund is affected by the timing of the declaration of dividends by the underlying investment companies in which the Fund invests. |
| (2) | Includes dividends paid from the short-term portion of capital gain distributions received from affiliated Funds. |
| (3) | Does not include expenses of the investment companies in which the Fund invests. |
| (4) | The ratio excludes expenses waived/reimbursed net of amount recaptured. |
| (5) | The ratio includes expenses waived/reimbursed net of amount recaptured and fees paid indirectly, where applicable; if expenses waived/reimbursed net of amount recaptured and fees paid indirectly were excluded, the ratio would have been lower than the ratio shown. |
| | | | |
| 64 | | See Notes to Financial Statements. | | |
Money Market Fund
During 2010, short-term rates remained at historically low levels as the Federal Reserve was persistent in maintaining its near zero percent interest rate policy to keep borrowing costs low in a concerted effort to stimulate economic growth. Given the environment of historically low interest rates and a limited investment universe per Rule 2a-7 under the Investment Company Act of 1940, as amended, it is not surprising that money market funds (which are lenders to borrowers at short-term interest rates) experienced a year of historically low returns. At year-end, 90-day U.S. Treasury-bills were yielding a modest 0.12%, compared to 0.05% one year ago.
It should be noted that the U.S. Securities and Exchange Commission approved amendments to Rule 2a-7 during 2010 for the purpose of strengthening the money market industry. After severe problems in the money market industry surfaced (including certain funds breaking the $1.00 Net Asset Value) during and after the financial crisis of 2008, the SEC found it necessary to institute changes to reform money market funds, making them more resilient to credit, liquidity and short-term volatility risks. In summary, the primary reforms were focused on improving quality and liquidity, reducing the allowable portfolio maturity and enhancing disclosure reporting on behalf of investors. GuideStone Capital Management, as the advisor to the Fund, was well prepared for the money market reform and ensured all aspects of the amendment were implemented successfully on a timely basis.
The Money Market Fund is actively managed and invests in a broad range of high quality, short-term money market instruments denominated exclusively in U.S. dollars. The Fund seeks to maintain, but does not guarantee, a stable per share price of $1.00, while paying monthly dividends based on the daily account value. The Fund returned 0.02% for the one-year period ended December 31, 2010, as compared to a 0.13% return for the Citigroup 3-Month Treasury Bill Index (benchmark index). The Fund’s underperformance was primarily due to Fund expenses as the low-rate environment provided little opportunity to generate returns sufficient to cover expenses and outpace the benchmark index. Despite the difficult interest rate environment, the management of the Fund remained true to its primary objectives of preservation of capital and liquidity versus sacrificing quality in an effort to “stretch for incremental yield”. Throughout the year, the Fund remained well diversified among many sectors including floating rate notes, certificates of deposits, time deposits, commercial paper, U.S. Treasuries and agency obligations.
An investment in the Fund is not insured or guaranteed by the Federal Deposit Insurance Corporation or any other governmental agency. Although the Fund seeks to maintain a value of $1.00 per share, it is possible to lose money.
Please see page 71 for information regarding specific portfolio allocations. Portfolio holdings are subject to change at any time.
65
Money Market Fund
| | | | | | | | | | | | |
| Average Annual Total Returns as of 12/31/10 | |
| | | |
| | | GS2 Class* | | | GS4 Class* | | | Benchmark** | |
One Year | | | 0.18 | % | | | 0.02 | % | | | 0.13 | % |
Five Year | | | 2.73 | % | | | 2.54 | % | | | 2.30 | % |
Since Inception | | | 2.28 | % | | | 2.13 | % | | | 2.09 | % |
Inception Date | | | 08/27/01 | | | | 08/27/01 | | | | | |
Total Fund Operating Expenses (April 30, 2010 Prospectus, as supplemented on August 5, 2010)(1) | | | 0.23 | % | | | 0.43 | % | | | | |
| | | | | | | | |
| Yield as of 12/31/10(2) | |
| | |
| | | GS2 Class* | | | GS4 Class* | |
7-Day Annualized Yield (Net) | | | 0.19 | % | | | 0.01 | % |
7-Day Annualized Yield (Gross) | | | 0.33 | % | | | 0.33 | % |
| (1) | Current information regarding the Fund’s Operating Expenses can be found in the Financial Highlights. |
| (2) | Yield for the Money Market Fund represents the annualization of the Fund’s declared dividends over the period indicated, excluding capital gains distributions. The yield more closely reflects the current earnings of the Fund than the total return. Gross Yield reflects the yield without fee waivers in effect. |
The performance data quoted represents past performance and does not guarantee future results. Current performance may be lower or higher. Performance data current to the most recent month-end may be obtained at www.GuideStoneFunds.org. Investment return will fluctuate so that shares, when redeemed, may be worth more or less than their original cost. The yield for the Money Market Fund represents annualization of the Fund’s declared dividends over the period indicated, excluding capital gains distributions. The 7-day annualized yield more closely reflects the current earnings of the Fund than the total return.
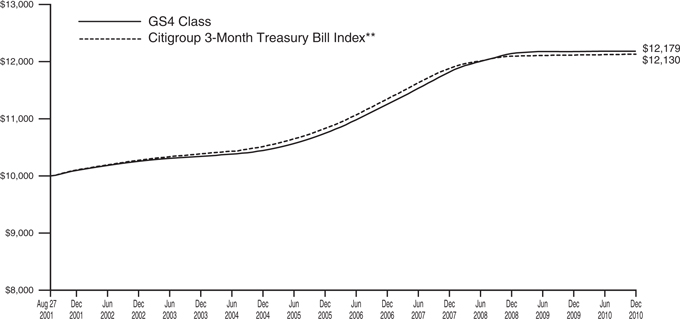
The graph compares the results of a hypothetical $10,000 investment in the GS4 Class of the Fund since August 27, 2001 (commencement of operations), with all dividends and capital gains reinvested, with the Citigroup 3-Month Treasury Bill Index.
| * | These performance figures reflect expense waivers by the Fund’s investment adviser. Without these waivers, performance would have been lower. Performance figures shown do not reflect the deduction of taxes that a shareholder would pay on Fund distributions or the redemption of Fund shares. |
| ** | The Citigroup 3-Month Treasury Bill Index is an unmanaged index that is generally representative of 3-month U.S. Treasury bills, consisting of an average of the last 3-month U.S. Treasury bill issues. |
Unlike a mutual fund, the performance of an index assumes no taxes, transaction costs, management fees or other expenses.
66
| | |
| MONEY MARKET FUND | | |
| SCHEDULE OF INVESTMENTS | | December 31, 2010 |
| | | | | | | | |
| | | Par | | | Value | |
AGENCY OBLIGATIONS — 11.8% | | | | | |
Federal Home Loan Bank | | | | | | | | |
0.21%, 06/15/11 | | $ | 14,825,000 | | | $ | 14,810,527 | |
0.18%, 09/15/11† | | | 10,000,000 | | | | 9,995,735 | |
Federal Home Loan Mortgage Corporation | | | | | | | | |
0.20%, 04/25/11 | | | 20,000,000 | | | | 19,987,333 | |
0.17%, 05/05/11† | | | 17,000,000 | | | | 16,998,257 | |
0.22%, 02/16/12† | | | 6,000,000 | | | | 5,997,277 | |
0.24%, 04/03/12† | | | 10,000,000 | | | | 9,994,909 | |
Federal National Mortgage Association | | | | | | | | |
0.17%, 05/13/11† | | | 15,000,000 | | | | 15,001,031 | |
0.20%, 06/08/11 | | | 20,000,000 | | | | 19,982,444 | |
0.21%, 06/08/11 | | | 10,000,000 | | | | 9,990,783 | |
0.17%, 08/11/11† | | | 12,697,000 | | | | 12,695,550 | |
0.25%, 07/26/12† | | | 11,000,000 | | | | 10,996,557 | |
0.29%, 12/20/12† | | | 7,000,000 | | | | 6,997,209 | |
| | | | | | | | |
Total Agency Obligations
(Cost $153,447,612) | | | | 153,447,612 | |
| | | | | | | | |
CERTIFICATES OF DEPOSIT — 22.9% | |
Bank of Montreal CHI | | | | | | | | |
0.31%, 08/29/11† | | | 6,000,000 | | | | 6,000,000 | |
Bank of Tokyo-Mitsubishi UFJ, Ltd. | | | | | | | | |
0.30%, 03/14/11 | | | 20,000,000 | | | | 20,000,000 | |
0.38%, 04/11/11 | | | 10,000,000 | | | | 10,000,000 | |
Barclays Bank PLC NY | | | | | | | | |
0.42%, 02/18/11 | | | 10,000,000 | | | | 10,000,000 | |
Canadian Imperial Bank of Commerce NY | | | | | | | | |
0.42%, 01/31/11† | | | 10,000,000 | | | | 10,000,000 | |
Commonwealth Bank of Australia | | | | | | | | |
0.49%, 01/14/11 | | | 27,000,000 | | | | 27,001,989 | |
Credit Agricole CIB NY | | | | | | | | |
0.32%, 02/14/11 | | | 15,000,000 | | | | 15,000,000 | |
Credit Industriel Et Commercial NY | | | | | | | | |
0.54%, 03/04/11 | | | 20,000,000 | | | | 20,000,000 | |
Dexia Credit Local NY | | | | | | | | |
1.69%, 04/18/11† | | | 14,000,000 | | | | 14,000,000 | |
Fortis Bank SA NV NY | | | | | | | | |
0.33%, 02/15/11 | | | 15,000,000 | | | | 14,999,907 | |
National Australia Bank NY | | | | | | | | |
0.34%, 11/09/11† | | | 10,000,000 | | | | 10,000,000 | |
Rabobank Nederland NV NY | | | | | | | | |
0.27%, 01/10/11† | | | 6,000,000 | | | | 6,000,000 | |
0.26%, 01/13/11† | | | 12,000,000 | | | | 12,000,000 | |
0.57%, 01/18/11 | | | 7,000,000 | | | | 7,000,000 | |
0.35%, 09/15/11† | | | 12,000,000 | | | | 12,000,000 | |
Royal Bank of Canada NY | | | | | | | | |
0.37%, 10/14/11 | | | 10,000,000 | | | | 10,000,000 | |
Royal Bank of Scotland PLC CT | | | | | | | | |
0.67%, 02/09/11† | | | 10,000,000 | | | | 10,000,000 | |
0.49%, 04/19/11† | | | 25,000,000 | | | | 25,000,000 | |
Societe Generale NY | | | | | | | | |
0.41%, 04/21/11† | | | 10,000,000 | | | | 10,000,000 | |
State Street Bank & Trust Co. | | | | | | | | |
0.25%, 01/12/11 | | | 10,000,000 | | | | 10,000,000 | |
Toronto Dominion Bank NY | | | | | | | | |
0.26%, 02/04/11† | | | 3,500,000 | | | | 3,500,000 | |
0.28%, 03/18/11 | | | 20,000,000 | | | | 20,000,000 | |
Westpac Banking Corporation NY | | | | | | | | |
0.34%, 11/04/11† | | | 15,000,000 | | | | 15,000,000 | |
| | | | | | | | |
Total Certificates of Deposit
(Cost $297,501,896) | | | | 297,501,896 | |
| | | | | | | | |
COMMERCIAL PAPER — 35.3% | |
Antalis US Funding Corporation | | | | | | | | |
0.33%, 01/10/11 | | | 11,000,000 | | | | 10,999,093 | |
Atlantis One Funding Corporation | | | | | | | | |
0.30%, 04/01/11 | | | 10,000,000 | | | | 9,992,500 | |
Bank of Nova Scotia | | | | | | | | |
0.24%, 02/07/11 | | | 10,100,000 | | | | 10,097,509 | |
BNP Paribas Finance, Inc. | | | | | | | | |
0.49%, 02/11/11 | | | 15,000,000 | | | | 14,991,629 | |
0.42%, 03/01/11 | | | 15,000,000 | | | | 14,989,675 | |
BNZ International Funding, Ltd. | | | | | | | | |
0.35%, 02/04/11 | | | 9,000,000 | | | | 9,000,085 | |
BPCE SA | | | | | | | | |
0.35%, 03/10/11 | | | 36,000,000 | | | | 35,976,200 | |
0.42%, 03/10/11 | | | 15,000,000 | | | | 14,988,100 | |
Cancara Asset Securitisation LLC | | | | | | | | |
0.30%, 02/14/11 | | | 10,000,000 | | | | 9,996,333 | |
0.46%, 04/26/11 | | | 15,000,000 | | | | 14,977,958 | |
Clipper Receivables Co., LLC | | | | | | | | |
0.52%, 01/18/11 | | | 15,000,000 | | | | 14,996,317 | |
0.44%, 02/15/11 | | | 12,000,000 | | | | 11,993,400 | |
Commonwealth Bank of Australia | | | | | |
0.31%, 10/06/11 | | | 15,000,000 | | | | 14,998,690 | |
CRC Funding LLC | | | | | | | | |
0.35%, 02/03/11 | | | 10,000,000 | | | | 9,996,792 | |
Credit Agricole CIB NY | | | | | | | | |
0.40%, 02/08/11 | | | 10,000,000 | | | | 9,995,778 | |
Credit Agricole North America, Inc. | | | | | | | | |
0.41%, 04/08/11 | | | 12,000,000 | | | | 11,986,743 | |
Fairway Finance Co., LLC | | | | | | | | |
0.31%, 05/04/11 | | | 20,000,000 | | | | 20,000,000 | |
ING Funding LLC | | | | | | | | |
0.43%, 04/05/11 | | | 10,000,000 | | | | 9,988,772 | |
KBC Bank NV NY | | | | | | | | |
1.72%, 07/01/11† | | | 6,690,000 | | | | 6,690,000 | |
Manhattan Asset Funding Co. LLC | | | | | | | | |
0.28%, 01/18/11 | | | 15,000,000 | | | | 14,998,017 | |
Metlife Short Term Fund | | | | | | | | |
0.29%, 01/12/11 | | | 5,000,000 | | | | 4,999,557 | |
Nieuw Amsterdam Receivables Corporation | | | | | | | | |
0.37%, 01/07/11 | | | 10,000,000 | | | | 9,999,383 | |
0.30%, 01/21/11 | | | 10,000,000 | | | | 9,998,333 | |
0.30%, 01/28/11 | | | 506,000 | | | | 505,886 | |
NRW.Bank | | | | | | | | |
0.40%, 02/03/11 | | | 10,000,000 | | | | 9,996,379 | |
Old Line Funding LLC | | | | | | | | |
0.58%, 01/20/11 | | | 12,000,000 | | | | 11,996,327 | |
Romulus Funding Corporation | | | | | | | | |
0.43%, 01/10/11 | | | 12,000,000 | | | | 11,998,710 | |
0.43%, 01/12/11 | | | 16,000,000 | | | | 15,997,898 | |
| | | | |
| | See Notes to Financial Statements. | | 67 |
| | |
MONEY MARKET FUND SCHEDULE OF INVESTMENTS (Continued) | | |
| | |
| | | | | | | | |
| | | Par | | | Value | |
Royal Park Investments Funding Corporation | | | | | | | | |
0.32%, 01/07/11 | | $ | 10,000,000 | | | $ | 9,999,475 | |
Scaldis Capital LLC | | | | | | | | |
0.32%, 01/14/11 | | | 3,554,000 | | | | 3,553,589 | |
Societe Generale North America, Inc. | | | | | | | | |
0.11%, 01/03/11 | | | 32,243,000 | | | | 32,242,803 | |
Solitaire Funding LLC | | | | | | | | |
0.30%, 01/14/11 | | | 9,000,000 | | | | 8,999,025 | |
0.28%, 01/24/11 | | | 1,743,000 | | | | 1,742,688 | |
Starbird Funding Corporation | | | | | | | | |
0.25%, 01/13/11 | | | 15,000,000 | | | | 14,998,750 | |
State Street Corporation | | | | | | | | |
0.31%, 02/22/11 | | | 15,000,000 | | | | 14,993,283 | |
Thunder Bay Funding LLC | | | | | | | | |
0.28%, 03/03/11 | | | 15,000,000 | | | | 14,992,882 | |
Windmill Funding Corporation | | | | | | | | |
0.40%, 03/01/11 | | | 10,000,000 | | | | 9,993,445 | |
| | | | | | | | |
Total Commercial Paper
(Cost $458,662,004) | | | | | | | 458,662,004 | |
| | | | | | | | |
MUNICIPAL BONDS — 18.8% | | | | | |
California Housing Finance Agency, Multi-Family III, Series E Revenue Bond (LOC-Fannie Mae, Freddie Mac) | | | | | | | | |
0.30%, 01/05/11† | | | 11,000,000 | | | | 11,000,000 | |
California Housing Finance Agency, Series D Revenue Bond | | | | | | | | |
0.33%, 01/05/11† | | | 15,000,000 | | | | 15,000,000 | |
California Pollution Control Financing Authority, Series E Pollution Control Revenue Bonds (LOC-Bank One N.A.) | | | | | | | | |
0.26%, 01/03/11† | | | 5,800,000 | | | | 5,800,000 | |
California Statewide Communities Development Authority, Kimberly Woods Apartments, Series B Revenue Bond | | | | | | | | |
0.32%, 01/05/11† | | | 17,100,000 | | | | 17,100,000 | |
City of Chicago Wastewater Transmission, Series C-1 Revenue Bond | | | | | | | | |
0.28%, 01/03/11† | | | 4,000,000 | | | | 4,000,000 | |
City of Houston, Series 2008D-1 Revenue Bond | | | | | | | | |
0.33%, 01/06/11† | | | 5,000,000 | | | | 5,000,000 | |
City of Philadelphia, Series 2009B General Obligation Bond (LOC-Wachovia Bank N.A.) | | | | | | | | |
0.31%, 01/06/11† | | | 10,000,000 | | | | 10,000,000 | |
Connecticut State Health & Educational Facilities Authority, Series K2 Yale-New Haven Hospital Revenue Bond (LOC-JPMorgan Chase Bank) | | | | | | | | |
0.30%, 01/05/11† | | | 12,805,000 | | | | 12,805,000 | |
Cook County, Series 2002A General Obligation Bond | | | | | | | | |
0.27%, 01/05/11† | | $ | 26,700,000 | | | $ | 26,700,000 | |
Los Angeles Community Redevelopment Agency, Hollywood & Vine Apartments, Series A Revenue Bonds | | | | | | | | |
0.31%, 01/06/11† | | | 10,000,000 | | | | 10,000,000 | |
New York City Housing Development Corporation, Series A Multi-Family Housing (155 West 21st Street) Revenue Bond | | | | | | | | |
0.30%, 01/05/11† | | | 3,100,000 | | | | 3,100,000 | |
New York City Housing Development Corporation, Series A Multi-Family Housing (90 West Street) Revenue Bond | | | | | | | | |
0.30%, 01/05/11† | | | 6,000,000 | | | | 6,000,000 | |
New York City Housing Development Corporation, Series A Multi-Family Housing Revenue Bond | | | | | | | | |
0.30%, 01/05/11† | | | 3,000,000 | | | | 3,000,000 | |
New York City Housing Development Corporation, Series J-2-B Multi-Family Housing Revenue Bond | | | | | | | | |
0.34%, 01/05/11† | | | 10,100,000 | | | | 10,100,000 | |
New York City Industrial Development Agency, New York Law School Project, Series A Revenue Bond (LOC-JPMorgan Chase Bank) | | | | | | | | |
0.30%, 01/06/11† | | | 8,000,000 | | | | 8,000,000 | |
New York City Municipal Water Finance Authority, Series B-1 Water and Sewer System Revenue Bond | | | | | | | | |
0.32%, 01/06/11† | | | 6,800,000 | | | | 6,800,000 | |
New York Housing Finance Agency, Biltmore Tower Housing Project, Series A Revenue Bond | | | | | | | | |
0.30%, 01/05/11† | | | 4,000,000 | | | | 4,000,000 | |
New York Mortgage Agency, Series 125 Homeowner Mortgage Revenue Bond | | | | | | | | |
0.41%, 01/05/11† | | | 6,600,000 | | | | 6,600,000 | |
New York State Housing Finance Agency, Series 2001-A The Victory Housing Revenue Bond | | | | | | | | |
0.30%, 01/05/11† | | | 2,700,000 | | | | 2,700,000 | |
New York State Housing Finance Agency, Series A 10 Barclay Street Housing Revenue Bond | | | | | | | | |
0.30%, 01/05/11† | | | 10,000,000 | | | | 10,000,000 | |
Pennsylvania Higher Educational Facilities Authority, Thomas Jefferson University, Series B Revenue Bond | | | | | | | | |
0.31%, 01/06/11† | | | 5,000,000 | | | | 5,000,000 | |
| | | | |
| 68 | | See Notes to Financial Statements. | | |
| | | | | | | | |
| | | Par | | | Value | |
Sacramento Housing Authority, Multifamily Housing The Lofts at Natomas Apartments Revenue Bond Series F | | | | | | | | |
0.32%, 01/06/11† | | $ | 10,190,000 | | | $ | 10,190,000 | |
South Carolina Transportation Infrastructure Bank Revenue Bond (LOC- WellsFargo Bank) 0.32%, | | | | | | | | |
01/05/11† | | | 19,700,000 | | | | 19,700,000 | |
State of Texas, Veterans’ Housing Assistance Program, Series A-2 General Obligation Bond | | | | | | | | |
0.25%, 01/05/11† | | | 7,700,000 | | | | 7,700,000 | |
Triborough Bridge & Tunnel Authority Series 2003B Revenue Bond | | | | | | | | |
0.33%, 01/05/11† | | | 8,700,000 | | | | 8,700,000 | |
Wisconsin Housing & Economic Development Authority, Series B Home Ownership Revenue Bond 0.33%, | | | | | | | | |
01/05/11† | | | 9,300,000 | | | | 9,300,000 | |
Wisconsin Housing & Economic Development Authority, Series D Home Ownership Revenue Bond 0.34%, | | | | | | | | |
01/05/11† | | | 5,350,000 | | | | 5,350,000 | |
| | | | | | | | |
Total Municipal Bonds
(Cost $243,645,000) | | | | 243,645,000 | |
| | | | | | | | |
U.S. TREASURY OBLIGATIONS — 9.3% | |
U.S. Treasury Bills | | | | | | | | |
0.20%, 01/27/11WD | | | 12,000,000 | | | | 11,998,288 | |
0.18%, 02/17/11W | | | 20,000,000 | | | | 19,995,300 | |
0.19%, 05/26/11W | | | 6,000,000 | | | | 5,995,409 | |
| | | | | | | | |
| | | | | | | 37,988,997 | |
| | | | | | | | |
U.S. Treasury Notes | | | | | | | | |
0.88%, 01/31/11 | | | 10,000,000 | | | | 10,005,118 | |
0.88%, 03/31/11D | | | 55,000,000 | | | | 55,088,513 | |
0.88%, 05/31/11 | | | 13,000,000 | | | | 13,035,410 | |
1.13%, 06/30/11 | | | 5,000,000 | | | | 5,022,716 | |
| | | | | | | | |
| | | | | | | 83,151,757 | |
| | | | | | | | |
Total U.S. Treasury Obligations
(Cost $121,140,754) | | | | 121,140,754 | |
| | | | | | | | |
VARIABLE RATE OBLIGATION — 0.9% | |
Rabobank Nederland 1.79%, 01/07/11 144A†
(Cost $11,800,000) | | | 11,800,000 | | | | 11,800,000 | |
| | | | | | | | |
| | |
| | | Shares | | | | |
MONEY MARKET FUND — 0.8% | |
Northern Institutional Liquid Assets Portfolio§
(Cost $10,967,813) | | | 10,967,813 | | | | 10,967,813 | |
| | | | | | | | |
TOTAL INVESTMENTS — 99.8%
(Cost $1,297,165,079) | | | | 1,297,165,079 | |
Other Assets in Excess of Liabilities — 0.2% | | | | 2,286,442 | |
| | | | | | | | |
NET ASSETS — 100.0% | | | $ | 1,299,451,520 | |
| | | | | | | | |
Please see abbreviation and footnote definitions beginning on page 180.
PORTFOLIO SUMMARY (based on net assets)
| | | | |
| | | % | |
Commercial Paper | | | 35.3 | |
Certificates of Deposit | | | 22.9 | |
Municipal Bonds | | | 18.8 | |
Agency Obligations | | | 11.8 | |
U.S. Treasury Obligations | | | 9.3 | |
Variable Rate Obligation | | | 0.9 | |
Money Market Fund | | | 0.8 | |
| | | | |
| | | 99.8 | |
| | | | |
VALUATION HIERARCHY
The following is a summary of the inputs used, as of December 31, 2010, in valuing the Fund’s investments carried at fair value:
| | | | | | | | |
Valuation Inputs | | Investments
in
Securities | | | Other
Financial
Instruments*** | |
Level 1 — Quoted Prices | | | | | | | | |
Money Market Fund | | $ | 10,967,813 | | | $ | — | |
Level 2 — Other Significant Observable Inputs | | | | | | | | |
Agency Obligations | | | 153,447,612 | | | | — | |
Certificates of Deposit | | | 297,501,896 | | | | — | |
Commercial Paper | | | 458,662,004 | | | | — | |
Municipal Bonds | | | 243,645,000 | | | | — | |
U.S. Treasury Obligations | | | 121,140,754 | | | | — | |
Variable Rate Obligation | | | 11,800,000 | | | | — | |
Level 3 — Significant Unobservable Inputs | | | — | | | | — | |
| | | | | | | | |
Total | | $ | 1,297,165,079 | | | $ | — | |
| | | | | | | | |
| *** | Other financial instruments are derivative instruments not reflected in the Schedule of Investments, such as futures, forwards and swap contracts, which are valued at the unrealized appreciation (depreciation) on the investment. Details of these investments can be found in the Notes to Financial Statements. |
| | | | |
| | See Notes to Financial Statements. | | 69 |
Low-Duration Bond Fund
During the first nine months of the year, the environment for bonds was positive as interest rates declined amidst concerns of economic uncertainty while investor demand for fixed income securities remained strong. This backdrop provided a nice rally in bond prices. However, the fourth quarter was characterized by a positive change in sentiment related to the domestic economy, partially due to the announcement of further quantitative easing measures by the Federal Reserve as well as indications that the economy was gaining traction. The brightened economic picture fueled a rise in interest rates which proved to be a headwind for bonds during the year’s final quarter. The broad U.S. investment grade bond market, as measured by the Barclays Capital U.S Aggregate Bond Index, posted an annual return of 6.54%. All major bond sectors produced positive returns, led by investment grade corporate bonds and commercial mortgage-backed securities. In general, investor appetite for bonds that traded at a risk premium (yield spread above U.S. Treasuries) was strong, causing yield spreads to narrow which boosted returns. U.S. Treasuries lagged the overall broad index, posting an annual return of 5.87%. Shorter-term U.S. Treasuries, as measured by the Merrill Lynch 1-3 Year Treasury Index, generated a one-year return of 2.35%.
The Low-Duration Bond Fund invests in a diversified portfolio composed primarily of investment grade fixed income securities with an average dollar-weighted duration normally between one to three years. The Fund outpaced its all-U.S. Treasury benchmark index, the Merrill Lynch 1-3 Year Treasury Index, for the one-year period ended December 31, 2010 (4.20% versus 2.35%). In an effort to outperform the all-U.S. Treasury benchmark index during the low-interest rate environment, the Fund tactically utilized bond sectors that traded at a yield premium relative to their U.S. Treasury counterparts. During the year, the Fund maintained diversified exposure to multiple spread sectors (outside the U.S. Treasury sector) including, but not limited to, corporate bonds, mortgaged-backed securities, Yankee bonds and non-U.S. bonds.
Certain securities within these sectors remained attractively valued and greatly benefited from improving fundamentals and strong investor demand which caused yield spreads to tighten and bond prices to increase. Also, the additional incremental yield of these securities provided a “cushion” against rising interest rates during the fourth quarter. U.S. Government futures contracts were used for portfolio construction purposes, including duration management and the replication of government bond positions. Government futures contracts were also used to take advantage of perceived mispricings between government bond futures and physical securities.
Along with government futures contracts, interest rate swaps were also used to manage interest rate exposures. Additionally, interest rate options were written and purchased to generate income and take advantage of perceived interest rate scenarios. Credit default swaps (“CDS”) were used to manage credit risk within the Fund. Written CDS positions (selling protection) increased credit exposure while purchased CDS positions (buying protection) decreased credit exposure. Forward currency contracts were utilized to hedge foreign currency risk while money market derivatives, such as Eurodollar futures, were utilized to manage exposure on the front-end of the yield curve. These strategies, when aggregated, provided the sources for the excess return relative to the benchmark index. During the year, the Fund remained true to its overall objective of seeking current income consistent with conservation of capital.
This fund is subject to interest rate risk. Meaning, when interest rates rise, the value of the existing bonds decrease and vice versa. Changes in interest rates have a bigger impact on long duration holdings than on short duration holdings.
Please see page 85 for information regarding specific portfolio allocations. Portfolio holdings are subject to change at any time.
Low-Duration Bond Fund
| | | | | | | | | | | | |
Average Annual Total Returns as of 12/31/10 | |
| | | GS2 Class* | | | GS4 Class* | | | Benchmark** | |
One Year | | | 4.35 | % | | | 4.20 | % | | | 2.35 | % |
Five Year | | | 4.70 | % | | | 4.53 | % | | | 4.17 | % |
Since Inception | | | 3.91 | % | | | 3.79 | % | | | 3.60 | % |
Inception Date | | | 08/27/01 | | | | 08/27/01 | | | | | |
Total Fund Operating Expenses (April 30, 2010 Prospectus, as supplemented on August 5, 2010)(1) | | | 0.43 | % | | | 0.63 | % | | | | |
| (1) | Current information regarding the Fund’s Operating Expenses can be found in the Financial Highlights. |
The performance data quoted represents past performance and does not guarantee future results. Current performance may be lower or higher. Performance data current to the most recent month-end may be obtained at www.GuideStoneFunds.org. The investment return and principal value of an investment will fluctuate so that shares, when redeemed, may be worth more or less than their original cost.
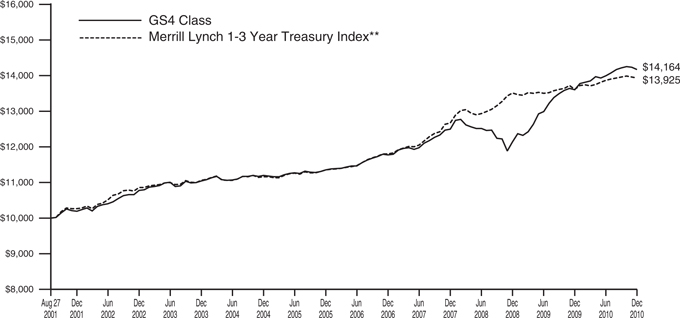
The graph compares the results of a hypothetical $10,000 investment in the GS4 Class of the Fund since August 27, 2001 (commencement of operations), with all dividends and capital gains reinvested, with the Merrill Lynch 1-3 Year Treasury Index.
| * | These returns reflect expense waivers by the Fund’s investment adviser. Without these waivers, returns would have been lower. Returns shown do not reflect the deduction of taxes that a shareholder would pay on Fund distributions or the redemption of Fund shares. |
| ** | The Merrill Lynch 1-3 Year Treasury Index is composed of all U.S. Treasury Notes and Bonds with maturities greater than or equal to one year and less than three years. |
Unlike a mutual fund, the performance of an index assumes no taxes, transaction costs, management fees or other expenses.
| | |
| LOW-DURATION BOND FUND | | |
| SCHEDULE OF INVESTMENTS | | December 31, 2010 |
| | | | | | | | |
| | | Par | | | Value | |
AGENCY OBLIGATIONS — 1.3% | | | | | |
Federal Farm Credit Bank | | | | | | | | |
1.38%, 06/25/13 | | $ | 2,150,000 | | | $ | 2,179,337 | |
Federal Home Loan Bank | | | | | | | | |
5.38%, 06/13/14 | | | 895,000 | | | | 1,015,615 | |
Federal National Mortgage Association | | | | | | | | |
6.25%, 02/01/11 | | | 2,355,000 | | | | 2,365,027 | |
0.88%, 01/12/12D | | | 1,500,000 | | | | 1,506,892 | |
5.25%, 08/01/12 | | | 1,580,000 | | | | 1,688,559 | |
Small Business Administration | | | | | | | | |
6.95%, 11/01/16 | | | 368,363 | | | | 395,327 | |
| | | | | | | | |
Total Agency Obligations
(Cost $8,908,160) | | | | | | | 9,150,757 | |
| | | | | | | | |
ASSET-BACKED SECURITIES — 6.5% | | | | | |
Accredited Mortgage Loan Trust | | | | | | | | |
0.31%, 02/25/37† | | | 43,959 | | | | 43,914 | |
Ally Auto Receivables Trust | | | | | | | | |
1.32%, 03/15/12 144A | | | 254,147 | | | | 254,463 | |
Americredit Automobile Receivables Trust | | | | | | | | |
4.27%, 08/06/12† | | | 184,457 | | | | 185,003 | |
Asset-Backed Securities Corporation Home Equity | | | | | | | | |
0.54%, 09/25/34† | | | 100,868 | | | | 91,723 | |
Bank of America Auto Trust | | | | | | | | |
2.67%, 07/15/13 144A | | | 1,115,007 | | | | 1,126,914 | |
Bear Stearns Asset-Backed Securities Trust | | | | | | | | |
0.31%, 11/25/36† | | | 161,353 | | | | 157,906 | |
1.26%, 10/25/37† | | | 1,085,096 | | | | 716,758 | |
0.45%, 01/25/47† | | | 1,077,100 | | | | 1,012,724 | |
BNC Mortgage Loan Trust | | | | | | | | |
0.38%, 11/25/36† | | | 1,030,000 | | | | 969,410 | |
0.32%, 03/25/37† | | | 956,962 | | | | 907,304 | |
Capital One Auto Finance Trust | | | | | | | | |
0.29%, 05/15/13† | | | 750,341 | | | | 746,178 | |
Capital One Multi-Asset Execution Trust | | | | | | | | |
0.39%, 08/15/14† | | | 2,000,000 | | | | 1,996,314 | |
Cars Alliance Funding PLC | | | | | | | | |
1.08%, 10/08/23(E)† | | | 500,000 | | | | 660,745 | |
Chase Issuance Trust | | | | | | | | |
0.28%, 03/15/13† | | | 1,100,000 | | | | 1,099,901 | |
Chester Asset Receivables Dealings | | | | | | | | |
0.83%, 05/15/13(U)† | | | 850,000 | | | | 1,322,856 | |
Citibank Omni Master Trust | | | | | | | | |
2.36%, 05/16/16 144A† | | | 2,875,000 | | | | 2,910,630 | |
Conseco Financial Corporation | | | | | | | | |
6.04%, 11/01/29 | | | 18,088 | | | | 18,201 | |
CSAB Mortgage Backed Trust | | | | | | | | |
5.72%, 09/25/36 STEP | | | 835,958 | | | | 598,745 | |
Daimler Chrysler Auto Trust | | | | | | | | |
5.28%, 03/08/13 | | | 2,348,761 | | | | 2,406,030 | |
FHLMC Structured Pass-Through Securities | | | | | | | | |
0.52%, 08/25/31† | | | 881,683 | | | | 856,545 | |
Ford Credit Auto Owner Trust | | | | | | | | |
1.21%, 01/15/12 | | | 76,288 | | | | 76,301 | |
0.30%, 02/15/12† | | | 510,275 | | | | 510,096 | |
7.12%, 02/15/13 144A | | | 925,000 | | | | 935,163 | |
2.17%, 10/15/13 | | | 2,525,000 | | | | 2,553,560 | |
2.98%, 08/15/14 | | | 1,255,000 | | | | 1,300,262 | |
Ford Credit Floorplan Master Owner Trust | | | | | | | | |
0.51%, 06/15/13† | | | 1,870,000 | | | | 1,864,584 | |
Globaldrive BV | | | | | | | | |
4.00%, 10/20/16(E) | | | 1,453,415 | | | | 1,959,324 | |
GSAA Trust | | | | | | | | |
0.58%, 12/25/34† | | | 363,653 | | | | 319,603 | |
Hyundai Auto Receivables Trust | | | | | | | | |
1.11%, 02/15/12 | | | 159,250 | | | | 159,354 | |
Hyundai Capital Auto Funding, Ltd. | | | | | | | | |
1.26%, 09/20/16 144A† | | | 1,460,000 | | | | 1,441,166 | |
IFC SBA Loan-Backed Adjustable Rate Certificate | | | | | | | | |
0.00%, 01/15/24 144AW† | | | 176,783 | | | | 131,292 | |
MBNA Credit Card Master Note Trust | | | | | | | | |
0.92%, 02/20/14(E)† | | | 715,000 | | | | 941,912 | |
Morgan Stanley ABS Capital I | | | | | | | | |
0.31%, 11/25/36† | | | 45,199 | | | | 45,133 | |
Nissan Auto Lease Trust | | | | | | | | |
1.22%, 09/15/11 | | | 133,910 | | | | 133,959 | |
Ocwen Advance Receivables Backed Notes | | | | | | | | |
3.59%, 09/15/23 144A | | | 930,000 | | | | 931,162 | |
PG&E Energy Recovery Funding LLC | | | | | | | | |
4.37%, 06/25/14 | | | 274,289 | | | | 282,627 | |
Residential Asset Mortgage Products, Inc. | | | | | | | | |
0.38%, 12/25/36† | | | 695,095 | | | | 666,470 | |
Santander Drive Auto Receivables Trust | | | | | | | | |
1.37%, 08/15/13 144A | | | 1,930,000 | | | | 1,937,249 | |
SLC Student Loan Trust | | | | | | | | |
0.41%, 01/15/19† | | | 890,000 | | | | 855,996 | |
SLM Student Loan Trust | | | | | | | | |
0.29%, 07/25/17† | | | 1,208,753 | | | | 1,198,994 | |
1.91%, 12/15/17 144A† | | | 1,088,878 | | | | 1,089,148 | |
1.59%, 01/25/18† | | | 3,975,000 | | | | 4,085,365 | |
Soundview Home Equity Loan Trust | | | | | | | | |
1.11%, 08/25/31† | | | 776,486 | | | | 772,011 | |
0.32%, 08/25/37† | | | 100,695 | | | | 100,360 | |
Structured Asset Investment Loan Trust | | | | | | | | |
0.31%, 07/25/36† | | | 17,454 | | | | 17,396 | |
Structured Asset Securities Corporation | | | | | | | | |
1.75%, 04/25/35† | | | 1,021,390 | | | | 770,378 | |
0.31%, 10/25/36† | | | 68,017 | | | | 67,716 | |
Structured Asset Receivables Trust | | | | | | | | |
0.79%, 04/21/11 144A† | | | 520,549 | | | | 494,521 | |
TXU Electric Delivery Transition Bond Co. LLC | | | | | | | | |
4.81%, 11/17/14 | | | 1,406,920 | | | | 1,467,711 | |
Wells Fargo Home Equity Trust | | | | | | | | |
0.35%, 04/25/37† | | | 638,310 | | | | 621,779 | |
| | | | | | | | |
Total Asset-Backed Securities
(Cost $46,543,180) | | | | | | | 45,812,856 | |
| | | | | | | | |
| | | | |
| 72 | | See Notes to Financial Statements. | | |
| | | | | | | | |
| | | Par | | | Value | |
CORPORATE BONDS — 18.6% | |
3M Co. | | | | | | | | |
4.50%, 11/01/11D | | $ | 590,000 | | | $ | 611,031 | |
Abbott Laboratories | | | | | | | | |
5.60%, 05/15/11 | | | 750,000 | | | | 764,838 | |
AEP Texas Central Transition Funding LLC | | | | | | | | |
4.98%, 07/01/13 | | | 2,406,747 | | | | 2,518,246 | |
Aflac, Inc. | | | | | | | | |
3.45%, 08/15/15D | | | 250,000 | | | | 254,253 | |
Agilent Technologies, Inc. | | | | | | | | |
4.45%, 09/14/12 | | | 610,000 | | | | 637,477 | |
2.50%, 07/15/13 | | | 810,000 | | | | 819,996 | |
5.50%, 09/14/15 | | | 310,000 | | | | 337,069 | |
Airgas, Inc. | | | | | | | | |
2.85%, 10/01/13 | | | 1,440,000 | | | | 1,452,233 | |
Allstate Corporation | | | | | | | | |
6.20%, 05/16/14 | | | 300,000 | | | | 339,533 | |
American Express Bank FSB | | | | | | | | |
5.50%, 04/16/13 | | | 1,015,000 | | | | 1,094,550 | |
American Express Credit Corporation | | | | | | | | |
0.42%, 06/16/11† | | | 100,000 | | | | 99,993 | |
American Honda Finance Corporation | | | | | | | | |
2.65%, 06/29/11 144A† | | | 600,000 | | | | 606,575 | |
2.38%, 03/18/13 144A | | | 300,000 | | | | 305,206 | |
American International Group, Inc. | | | | | | | | |
1.17%, 07/19/13(E)† | | | 400,000 | | | | 500,743 | |
3.65%, 01/15/14D | | | 1,610,000 | | | | 1,639,829 | |
8.25%, 08/15/18 144A | | | 1,350,000 | | | | 1,559,790 | |
AvalonBay Communities, Inc. | | | | | | | | |
6.13%, 11/01/12D | | | 317,000 | | | | 342,198 | |
BAE Systems Holdings, Inc. | | | | | | | | |
6.40%, 12/15/11 144A | | | 1,420,000 | | | | 1,494,604 | |
Bank of America Corporation | | | | | | | | |
5.38%, 09/11/12D | | | 2,800,000 | | | | 2,942,013 | |
4.90%, 05/01/13 | | | 400,000 | | | | 417,272 | |
5.88%, 01/05/21 | | | 1,200,000 | | | | 1,243,874 | |
Bank of New York Mellon Corporation | | | | | | | | |
4.30%, 05/15/14D | | | 790,000 | | | | 843,587 | |
BB&T Corporation | | | | | | | | |
3.38%, 09/25/13D | | | 400,000 | | | | 419,172 | |
Bear Stearns Cos. LLC | | | | | | | | |
6.95%, 08/10/12 | | | 1,165,000 | | | | 1,271,497 | |
Berkshire Hathaway Finance Corporation | | | | | | | | |
4.00%, 04/15/12 | | | 500,000 | | | | 520,157 | |
Berkshire Hathaway, Inc. | | | | | | | | |
0.72%, 02/11/13† | | | 1,340,000 | | | | 1,347,487 | |
Bottling Group LLC | | | | | | | | |
6.95%, 03/15/14D | | | 770,000 | | | | 892,937 | |
Broadcom Corporation | | | | | | | | |
1.50%, 11/01/13 144AD | | | 520,000 | | | | 516,812 | |
Burlington Northern Santa Fe Corporation | | | | | | | | |
6.75%, 07/15/11 | | | 600,000 | | | | 620,393 | |
7.00%, 02/01/14 | | | 365,000 | | | | 417,409 | |
Capital One Financial Corporation | | | | | | | | |
6.25%, 11/15/13 | | | 1,210,000 | | | | 1,328,931 | |
CareFusion Corporation | | | | | | | | |
4.13%, 08/01/12 | | | 1,720,000 | | | | 1,792,704 | |
Caterpillar Financial Services Corporation | | | | | | | | |
5.75%, 02/15/12 | | | 575,000 | | | | 607,048 | |
2.00%, 04/05/13D | | | 540,000 | | | | 549,642 | |
Celgene Corporation | | | | | | | | |
3.95%, 10/15/20 | | | 365,000 | | | | 347,711 | |
Cellco Partnership/Verizon Wireless Capital LLC | | | | | | | | |
3.75%, 05/20/11 | | | 600,000 | | | | 607,412 | |
5.25%, 02/01/12 | | | 2,585,000 | | | | 2,706,327 | |
5.55%, 02/01/14 | | | 400,000 | | | | 441,396 | |
CenterPoint Energy Transition Bond Co., LLC | | | | | | | | |
4.97%, 08/01/14 | | | 1,617,608 | | | | 1,662,950 | |
CenterPoint Energy, Inc. | | | | | | | | |
6.85%, 06/01/15 | | | 710,000 | | | | 812,345 | |
Cisco Systems, Inc. | | | | | | | | |
5.25%, 02/22/11 | | | 750,000 | | | | 754,724 | |
Citigroup Funding, Inc. | | | | | | | | |
1.38%, 05/05/11 | | | 610,000 | | | | 612,406 | |
Citigroup, Inc. | | | | | | | | |
5.30%, 10/17/12 | | | 275,000 | | | | 291,361 | |
2.29%, 08/13/13† | | | 700,000 | | | | 712,373 | |
6.00%, 12/13/13 | | | 300,000 | | | | 328,043 | |
Coca-Cola Enterprises, Inc. | | | | | | | | |
1.13%, 11/12/13D | | | 780,000 | | | | 772,939 | |
Comcast Cable Communications LLC | | | | | | | | |
6.75%, 01/30/11D | | | 2,060,000 | | | | 2,068,514 | |
ConocoPhillips | | | | | | | | |
4.75%, 10/15/12 | | | 1,000,000 | | | | 1,071,346 | |
4.75%, 02/01/14 | | | 400,000 | | | | 434,817 | |
Consumers Energy Co. | | | | | | | | |
5.38%, 04/15/13 | | | 475,000 | | | | 513,049 | |
Corn Products International, Inc. | | | | | | | | |
3.20%, 11/01/15D | | | 200,000 | | | | 200,831 | |
COX Communications, Inc. | | | | | | | | |
7.13%, 10/01/12 | | | 420,000 | | | | 460,814 | |
Crown Castle Towers LLC | | | | | | | | |
4.52%, 01/15/15 144A | | | 1,300,000 | | | | 1,352,083 | |
CSX Corporation | | | | | | | | |
5.75%, 03/15/13 | | | 1,225,000 | | | | 1,336,355 | |
CVS Caremark Corporation | | | | | | | | |
5.75%, 08/15/11 | | | 975,000 | | | | 1,005,390 | |
Daimler Finance NA LLC | | | | | | | | |
7.30%, 01/15/12 | | | 350,000 | | | | 371,962 | |
DIRECTV Holdings LLC | | | | | | | | |
4.75%, 10/01/14 | | | 680,000 | | | | 725,337 | |
Dow Chemical Co. | | | | | | | | |
4.85%, 08/15/12 | | | 1,500,000 | | | | 1,581,885 | |
Dr Pepper Snapple Group, Inc. | | | | | | | | |
1.70%, 12/21/11 | | | 620,000 | | | | 625,684 | |
Duke Energy Carolinas LLC | | | | | | | | |
6.25%, 01/15/12 | | | 1,300,000 | | | | 1,372,745 | |
eBay, Inc. | | | | | | | | |
0.88%, 10/15/13 | | | 330,000 | | | | 326,926 | |
Eli Lilly & Co. | | | | | | | | |
3.55%, 03/06/12 | | | 200,000 | | | | 206,408 | |
Enterprise Products Operating LLC | | | | | | | | |
7.50%, 02/01/11D | | | 600,000 | | | | 602,661 | |
4.60%, 08/01/12 | | | 675,000 | | | | 708,708 | |
6.13%, 02/01/13 | | | 1,005,000 | | | | 1,083,258 | |
6.38%, 02/01/13 | | | 750,000 | | | | 818,072 | |
| | | | |
| | See Notes to Financial Statements. | | 73 |
| | |
| LOW-DURATION BOND FUND | | |
| SCHEDULE OF INVESTMENTS (Continued) | | |
| | | | | | | | |
| | | Par | | | Value | |
EOG Resources, Inc. | | | | | | | | |
1.03%, 02/03/14† | | $ | 2,900,000 | | | $ | 2,905,182 | |
Equifax, Inc. | | | | | | | | |
4.45%, 12/01/14 | | | 140,000 | | | | 147,490 | |
ERAC USA Finance LLC | | | | | | | | |
2.75%, 07/01/13 144A | | | 370,000 | | | | 376,833 | |
Exelon Generation Co. LLC | | | | | | | | |
5.35%, 01/15/14 | | | 808,000 | | | | 875,332 | |
Express Scripts, Inc. | | | | | | | | |
5.25%, 06/15/12 | | | 550,000 | | | | 580,703 | |
Florida Power Corporation | | | | | | | | |
6.65%, 07/15/11 | | | 600,000 | | | | 618,896 | |
Freeport-McMoRan Copper & Gold, Inc. | | | | | | | | |
8.38%, 04/01/17 | | | 1,512,000 | | | | 1,674,702 | |
General Electric Capital Corporation | | | | | | | | |
1.14%, 01/15/13†D | | | 700,000 | | | | 702,659 | |
1.88%, 09/16/13 | | | 200,000 | | | | 200,238 | |
5.90%, 05/13/14 | | | 460,000 | | | | 508,534 | |
3.75%, 11/14/14D | | | 660,000 | | | | 682,866 | |
6.50%, 09/15/67 144A(U)† | | | 300,000 | | | | 434,518 | |
Genzyme Corporation | | | | | | | | |
3.63%, 06/15/15 144A | | | 395,000 | | | | 405,935 | |
Georgia Power Co. | | | | | | | | |
1.30%, 09/15/13 | | | 720,000 | | | | 721,519 | |
Goldman Sachs Group, Inc. | | | | | | | | |
1.63%, 07/15/11 | | | 400,000 | | | | 402,911 | |
4.75%, 07/15/13 | | | 950,000 | | | | 1,012,615 | |
6.00%, 05/01/14 | | | 560,000 | | | | 617,385 | |
Hartford Financial Services Group, Inc. | | | | | | | | |
4.00%, 03/30/15 | | | 320,000 | | | | 321,179 | |
Health Care REIT, Inc. | | | | | | | | |
6.00%, 11/15/13 | | | 540,000 | | | | 591,614 | |
Hewlett-Packard Co. | | | | | | | | |
4.25%, 02/24/12 | | | 486,000 | | | | 505,190 | |
Hyundai Capital America | | | | | | | | |
3.75%, 04/06/16 144A | | | 190,000 | | | | 186,824 | |
International Business Machines Corporation | | | | | | | | |
2.10%, 05/06/13 | | | 1,250,000 | | | | 1,281,075 | |
1.00%, 08/05/13D | | | 700,000 | | | | 697,887 | |
JB Hunt Transport Services, Inc. | | | | | | | | |
3.38%, 09/15/15 | | | 550,000 | | | | 543,865 | |
John Deere Capital Corporation | | | | | | | | |
0.99%, 01/18/11† | | | 760,000 | | | | 760,269 | |
JPMorgan Chase & Co. | | | | | | | | |
5.38%, 10/01/12D | | | 300,000 | | | | 322,038 | |
4.75%, 05/01/13 | | | 390,000 | | | | 417,779 | |
KeyCorp | | | | | | | | |
3.75%, 08/13/15 | | | 360,000 | | | | 361,566 | |
Kraft Foods, Inc. | | | | | | | | |
6.00%, 02/11/13 | | | 950,000 | | | | 1,040,822 | |
2.63%, 05/08/13D | | | 230,000 | | | | 236,671 | |
5.25%, 10/01/13 | | | 230,000 | | | | 251,598 | |
Lehman Brothers Holdings, Inc. | | | | | | | | |
6.63%, 01/18/12# | | | 600,000 | | | | 141,750 | |
6.75%, 12/28/17# | | | 2,600,000 | | | | 1,430 | |
6.88%, 05/02/18# | | | 2,400,000 | | | | 606,000 | |
Life Technologies Corporation | | | | | | | | |
3.38%, 03/01/13 | | | 1,140,000 | | | | 1,166,426 | |
3.50%, 01/15/16 | | | 800,000 | | | | 798,474 | |
Merrill Lynch & Co., Inc. | | | | | | | | |
6.05%, 08/15/12D | | | 400,000 | | | | 423,723 | |
5.00%, 01/15/15 | | | 2,700,000 | | | | 2,814,048 | |
MetLife, Inc. | | | | | | | | |
2.38%, 02/06/14 | | | 290,000 | | | | 291,592 | |
Metropolitan Life Global Funding I | | | | | | | | |
0.69%, 07/13/11 144A† | | | 980,000 | | | | 981,266 | |
2.88%, 09/17/12 144A | | | 2,225,000 | | | | 2,281,424 | |
Microsoft Corporation | | | | | | | | |
0.88%, 09/27/13D | | | 720,000 | | | | 716,435 | |
2.95%, 06/01/14 | | | 900,000 | | | | 937,639 | |
MidAmerican Energy Co. | | | | | | | | |
5.13%, 01/15/13 | | | 515,000 | | | | 554,079 | |
MidAmerican Energy Holdings Co. | | | | | | | | |
5.88%, 10/01/12 | | | 550,000 | | | | 593,678 | |
MidAmerican Funding LLC | | | | | | | | |
6.75%, 03/01/11 | | | 600,000 | | | | 605,890 | |
Morgan Stanley | | | | | | | | |
6.60%, 04/01/12 | | | 885,000 | | | | 943,222 | |
6.00%, 05/13/14D | | | 755,000 | | | | 816,384 | |
6.00%, 04/28/15 | | | 400,000 | | | | 433,614 | |
Nabors Industries, Inc. | | | | | | | | |
6.15%, 02/15/18 | | | 1,650,000 | | | | 1,763,677 | |
9.25%, 01/15/19 | | | 2,300,000 | | | | 2,854,351 | |
National Rural Utilities Cooperative Finance Corporation | | | | | | | | |
1.13%, 11/01/13 | | | 330,000 | | | | 326,411 | |
NBC Universal, Inc. | | | | | | | | |
2.10%, 04/01/14 144A | | | 1,560,000 | | | | 1,556,588 | |
3.65%, 04/30/15 144AD | | | 550,000 | | | | 564,693 | |
NextEra Energy Capital Holdings, Inc. | | | | | | | | |
5.63%, 09/01/11 | | | 475,000 | | | | 489,653 | |
2.55%, 11/15/13 | | | 750,000 | | | | 767,299 | |
Nissan Motor Acceptance Corporation | | | | | | | | |
3.25%, 01/30/13 144A | | | 580,000 | | | | 592,130 | |
Novartis Capital Corporation | | | | | | | | |
1.90%, 04/24/13D | | | 560,000 | | | | 569,258 | |
4.13%, 02/10/14 | | | 210,000 | | | | 224,274 | |
Novus USA Trust 2010-1 | | | | | | | | |
1.53%, 11/28/11 144A† | | | 840,000 | | | | 840,000 | |
Oracle Corporation | | | | | | | | |
3.75%, 07/08/14 | | | 970,000 | | | | 1,031,839 | |
Overseas Private Investment Corporation | | | | | | | | |
0.00%, 07/12/12W † | | | 2,100,000 | | | | 2,401,229 | |
5.75%, 04/15/14W | | | 1,600,000 | | | | 1,894,736 | |
PACCAR Financial Corporation | | | | | | | | |
0.72%, 04/05/13† | | | 550,000 | | | | 550,245 | |
Pfizer, Inc. | | | | | | | | |
3.63%, 06/03/13(E) | | | 100,000 | | | | 139,190 | |
Praxair, Inc. | | | | | | | | |
1.75%, 11/15/12 | | | 330,000 | | | | 334,466 | |
Procter & Gamble Co. | | | | | | | | |
3.50%, 02/15/15D | | | 200,000 | | | | 210,186 | |
Progress Energy, Inc. | | | | | | | | |
7.10%, 03/01/11 | | | 1,120,000 | | | | 1,131,437 | |
Prudential Financial, Inc. | | | | | | | | |
3.63%, 09/17/12 | | | 945,000 | | | | 981,141 | |
2.75%, 01/14/13 | | | 650,000 | | | | 662,189 | |
| | | | |
| 74 | | See Notes to Financial Statements. | | |
| | | | | | | | |
| | | Par | | | Value | |
Regions Financial Corporation | | | | | | | | |
4.88%, 04/26/13D | | $ | 735,000 | | | $ | 717,010 | |
SBA Tower Trust | | | | | | | | |
4.25%, 04/15/15 144A | | | 510,000 | | | | 528,315 | |
Simon Property Group LP REIT | | | | | | | | |
4.20%, 02/01/15D | | | 140,000 | | | | 146,525 | |
Southeast Supply Header LLC | | | | | | | | |
4.85%, 08/15/14 144A | | | 945,000 | | | | 991,682 | |
Sprint Capital Corporation | | | | | | | | |
8.38%, 03/15/12D | | | 1,000,000 | | | | 1,062,500 | |
SteelRiver Transmission Co., LLC | | | | | | | | |
4.71%, 06/30/17 144A | | | 645,000 | | | | 635,044 | |
Stryker Corporation | | | | | | | | |
3.00%, 01/15/15D | | | 450,000 | | | | 460,211 | |
TD Ameritrade Holding Corporation | | | | | | | | |
4.15%, 12/01/14 | | | 660,000 | | | | 683,115 | |
Teva Pharmaceutical Finance III LLC | | | | | | | | |
1.50%, 06/15/12D | | | 800,000 | | | | 807,644 | |
Thermo Fisher Scientific, Inc. | | | | | | | | |
2.15%, 12/28/12 | | | 370,000 | | | | 376,545 | |
Time Warner Cable, Inc. | | | | | | | | |
5.40%, 07/02/12 | | | 1,325,000 | | | | 1,407,170 | |
6.20%, 07/01/13 | | | 685,000 | | | | 761,227 | |
Time Warner, Inc. | | | | | | | | |
3.15%, 07/15/15 | | | 290,000 | | | | 294,955 | |
Toyota Motor Credit Corporation | | | | | | | | |
1.38%, 08/12/13 | | | 750,000 | | | | 753,555 | |
Union Bank NA | | | | | | | | |
2.13%, 12/16/13 | | | 790,000 | | | | 789,187 | |
Union Pacific Corporation | | | | | | | | |
6.13%, 01/15/12 | | | 365,000 | | | | 384,200 | |
US Bancorp | | | | | | | | |
1.38%, 09/13/13 | | | 720,000 | | | | 720,124 | |
Verizon Global Funding Corporation | | | | | | | | |
6.88%, 06/15/12D | | | 445,000 | | | | 482,442 | |
Vornado Realty LP REIT | | | | | | | | |
4.25%, 04/01/15 | | | 700,000 | | | | 707,333 | |
Wachovia Corporation | | | | | | | | |
5.30%, 10/15/11 | | | 394,000 | | | | 408,456 | |
Wells Fargo & Co. | | | | | | | | |
3.75%, 10/01/14 | | | 360,000 | | | | 376,126 | |
Western Corporate Federal Credit Union | | | | | | | | |
1.75%, 11/02/12 | | | 1,875,000 | | | | 1,909,764 | |
WM Wrigley Jr Co. | | | | | | | | |
1.68%, 06/28/11 144A† | | | 700,000 | | | | 700,423 | |
3.70%, 06/30/14 144A | | | 1,420,000 | | | | 1,463,872 | |
XTO Energy, Inc. | | | | | | | | |
6.25%, 04/15/13 | | | 600,000 | | | | 668,769 | |
Yum! Brands, Inc. | | | | | | | | |
3.88%, 11/01/20D | | | 240,000 | | | | 229,730 | |
| | | | | | | | |
Total Corporate Bonds
(Cost $133,630,600) | | | | | | | 131,870,616 | |
| | | | | | | | |
FOREIGN BONDS — 16.9% | | | | | |
Australia — 1.6% | | | | | | | | |
Australia & New Zealand Banking Group, Ltd. | | | | | | | | |
0.58%, 06/18/12 144A† | | | 1,575,000 | | | | 1,577,928 | |
Australia Government Bond | | | | | | | | |
4.75%, 06/15/16(A) | | | 5,600,000 | | | | 5,553,593 | |
Commonwealth Bank of Australia | | | | | | | | |
2.40%, 01/12/12 144AD | | | 1,004,000 | | | | 1,021,142 | |
National Australia Bank, Ltd. | | | | | | | | |
0.77%, 01/08/13 144A† | | | 930,000 | | | | 931,108 | |
Rio Tinto Finance USA, Ltd. | | | | | | | | |
1.88%, 11/02/15 | | | 1,500,000 | | | | 1,445,270 | |
Westpac Banking Corporation | | | | | | | | |
2.25%, 11/19/12D | | | 620,000 | | | | 634,651 | |
Woodside Finance, Ltd. | | | | | | | | |
4.50%, 11/10/14 144A | | | 490,000 | | | | 515,481 | |
| | | | | | | | |
| | | | | | | 11,679,173 | |
| | | | | | | | |
Bermuda — 0.3% | | | | | | | | |
Ingersoll-Rand Global Holding Co., Ltd. | | | | | | | | |
9.50%, 04/15/14 | | | 880,000 | | | | 1,060,913 | |
Qtel International Finance, Ltd. | | | | | | | | |
6.50%, 06/10/14 144A | | | 660,000 | | | | 724,559 | |
| | | | | | | | |
| | | | | | | 1,785,472 | |
| | | | | | | | |
Brazil — 0.2% | | | | | | | | |
Banco do Brasil SA | | | | | | | | |
4.50%, 01/22/15 144A | | | 680,000 | | | | 708,976 | |
Banco do Nordeste do Brasil SA | | | | | | | | |
3.63%, 11/09/15 144A | | | 710,000 | | | | 696,980 | |
Brazilian Government International Bond | | | | | | | | |
10.25%, 06/17/13D | | | 280,000 | | | | 337,400 | |
| | | | | | | | |
| | | | | | | 1,743,356 | |
| | | | | | | | |
Canada — 4.8% | | | | | | | | |
Caisse Centrale Desjardins du Quebec | | | | | | | | |
1.70%, 09/16/13 144A | | | 720,000 | | | | 719,616 | |
Canadian Government Bond | | | | | | | | |
1.50%, 03/01/12(C) | | | 20,700,000 | | | | 20,827,618 | |
Canadian Imperial Bank of Commerce | | | | | | | | |
2.00%, 02/04/13 144A | | | 6,560,000 | | | | 6,680,678 | |
CDP Financial, Inc. | | | | | | | | |
3.00%, 11/25/14 144A | | | 735,000 | | | | 747,816 | |
Devon Financing Corporation ULC | | | | | | | | |
6.88%, 09/30/11 | | | 1,570,000 | | | | 1,640,490 | |
Export Development Canada | | | | | | | | |
2.25%, 05/28/15 | | | 330,000 | | | | 334,484 | |
Province of Ontario | | | | | | | | |
1.88%, 11/19/12D | | | 775,000 | | | | 790,259 | |
Rogers Communications, Inc. | | | | | | | | |
6.25%, 06/15/13 | | | 1,300,000 | | | | 1,445,991 | |
6.38%, 03/01/14 | | | 320,000 | | | | 359,813 | |
TELUS Corporation | | | | | | | | |
8.00%, 06/01/11 | | | 400,000 | | | | 410,950 | |
TransCanada PipeLines, Ltd. | | | | | | | | |
3.40%, 06/01/15 | | | 360,000 | | | | 374,409 | |
| | | | | | | | |
| | | | | | | 34,332,124 | |
| | | | | | | | |
Cayman Islands — 0.0% | | | | | | | | |
IPIC GMTN, Ltd. | | | | | | | | |
3.13%, 11/15/15 144A | | | 330,000 | | | | 323,332 | |
| | | | | | | | |
| | | | |
| | See Notes to Financial Statements. | | 75 |
| | |
| LOW-DURATION BOND FUND | | |
| SCHEDULE OF INVESTMENTS (Continued) | | |
| | | | | | | | |
| | | Par | | | Value | |
Chile — 0.2% | | | | | | | | |
Celulosa Arauco y Constitucion SA | | | | | | | | |
5.63%, 04/20/15D | | $ | 1,260,000 | | | $ | 1,340,898 | |
Chile Government International Bond | | | | | | | | |
5.50%, 01/15/13 | | | 300,000 | | | | 325,818 | |
| | | | | | | | |
| | | | | | | 1,666,716 | |
| | | | | | | | |
Denmark — 0.1% | | | | | | | | |
FIH Erhvervsbank A/S | | | | | | | | |
2.45%, 08/17/12 144AD | | | 450,000 | | | | 461,439 | |
| | | | | | | | |
France — 1.3% | | | | | | | | |
Banque PSA Finance | | | | | | | | |
3.50%, 01/17/14(E)D | | | 550,000 | | | | 734,151 | |
BPCE SA | | | | | | | | |
2.38%, 10/04/13 144A@ | | | 1,500,000 | | | | 1,487,384 | |
Dexia Credit Local | | | | | | | | |
0.77%, 04/29/14 144A† | | | 2,300,000 | | | | 2,293,266 | |
2.75%, 04/29/14 144A | | | 1,400,000 | | | | 1,421,327 | |
Total Capital SA | | | | | | | | |
3.00%, 06/24/15D | | | 2,800,000 | | | | 2,861,704 | |
Veolia Environnement SA | | | | | | | | |
5.25%, 06/03/13D | | | 520,000 | | | | 562,064 | |
| | | | | | | | |
| | | | | | | 9,359,896 | |
| | | | | | | | |
Germany — 0.4% | | | | | | | | |
Deutsche Bank AG | | | | | | | | |
5.38%, 10/12/12 | | | 2,600,000 | | | | 2,795,484 | |
| | | | | | | | |
India — 0.2% | | | | | | | | |
Axis Bank, Ltd. | | | | | | | | |
4.75%, 05/02/16 144A | | | 740,000 | | | | 715,039 | |
| | | | | | | | |
ICICI Bank, Ltd. | | | | | | | | |
5.50%, 03/25/15 144A | | | 790,000 | | | | 822,910 | |
| | | | | | | | |
| | | | | | | 1,537,949 | |
| | | | | | | | |
Ireland — 0.5% | | | | | | | | |
DanFin Funding, Ltd. | | | | | | | | |
0.99%, 07/16/13 144A† | | | 2,800,000 | | | | 2,798,785 | |
| | | | | | | | |
Depfa ACS Bank | | | | | | | | |
5.50%, 06/28/11 144A | | | 800,000 | | | | 812,692 | |
| | | | | | | | |
| | | | | | | 3,611,477 | |
| | | | | | | | |
Italy — 0.3% | | | | | | | | |
Atlantia SpA | | | | | | | | |
1.48%, 06/09/11(E)† | | | 900,000 | | | | 1,202,665 | |
| | | | | | | | |
Telecom Italia SpA | | | | | | | | |
1.56%, 12/06/12(E)† | | | 900,000 | | | | 1,178,723 | |
| | | | | | | | |
| | | | | | | 2,381,388 | |
| | | | | | | | |
Jersey — 0.2% | | | | | | | | |
Magnolia Funding, Ltd. | | | | | | | | |
3.00%, 04/20/17 144A(E) | | | 834,259 | | | | 1,110,837 | |
| | | | | | | | |
Luxembourg — 0.7% | | | | | | | | |
Covidien International Finance SA | | | | | | | | |
5.45%, 10/15/12 | | | 1,165,000 | | | | 1,256,256 | |
1.88%, 06/15/13 | | | 570,000 | | | | 577,170 | |
Gazprom Via Gaz Capital SA | | | | | | | | |
9.25%, 04/23/19 | | | 2,300,000 | | | | 2,837,740 | |
| | | | | | | | |
| | | | | | | 4,671,166 | |
| | | | | | | | |
Malaysia — 0.1% | | | | | | | | |
Malaysia Government International Bond | | | | | | | | |
7.50%, 07/15/11D | | | 680,000 | | | | 702,364 | |
| | | | | | | | |
Mexico — 0.7% | | | | | | | | |
America Movil SAB de CV | | | | | | | | |
5.50%, 03/01/14 | | | 852,000 | | | | 925,500 | |
3.63%, 03/30/15 144AD | | | 200,000 | | | | 206,646 | |
Mexico Government International Bond | | | | | | | | |
6.38%, 01/16/13D | | | 760,000 | | | | 834,100 | |
Petroleos Mexicanos | | | | | | | | |
4.88%, 03/15/15 144AD | | | 1,250,000 | | | | 1,321,940 | |
5.50%, 01/21/21D | | | 1,400,000 | | | | 1,424,500 | |
| | | | | | | | |
| | | | | | | 4,712,686 | |
| | | | | | | | |
Netherlands — 0.7% | | | | | | | | |
Achmea Hypotheekbank NV | | | | | | | | |
3.20%, 11/03/14 144A | | | 1,500,000 | | | | 1,562,041 | |
Fortis Bank Nederland NV | | | | | | | | |
1.51%, 06/10/11(E)† | | | 600,000 | | | | 802,391 | |
LeasePlan Corporation NV | | | | | | | | |
3.00%, 05/07/12 144A | | | 300,000 | | | | 308,183 | |
Nederlandse Waterschapsbank NV | | | | | | | | |
4.63%, 07/25/11(E) | | | 1,000,000 | | | | 1,364,518 | |
Shell International Finance BV | | | | | | | | |
1.88%, 03/25/13 | | | 400,000 | | | | 406,254 | |
4.00%, 03/21/14 | | | 520,000 | | | | 553,749 | |
| | | | | | | | |
| | | | | | | 4,997,136 | |
| | | | | | | | |
New Zealand — 0.3% | | | | | | | | |
Westpac Securities NZ, Ltd. | | | | | | | | |
2.50%, 05/25/12 144AD | | | 1,800,000 | | | | 1,842,552 | |
| | | | | | | | |
Norway — 0.3% | | | | | | | | |
Eksportfinans ASA | | | | | | | | |
5.00%, 02/14/12D | | | 1,125,000 | | | | 1,178,269 | |
Sparebanken 1 Boligkreditt | | | | | | | | |
1.25%, 10/25/13 144AD | | | 370,000 | | | | 367,769 | |
Statoil ASA | | | | | | | | |
2.90%, 10/15/14D | | | 650,000 | | | | 672,709 | |
| | | | | | | | |
| | | | | | | 2,218,747 | |
| | | | | | | | |
Portugal — 0.5% | | | | | | | | |
Obrigacoes do Tesouro | | | | | | | | |
2.21%, 05/16/47(E)W | | | 2,400,000 | | | | 3,207,632 | |
| | | | | | | | |
Qatar — 0.1% | | | | | | | | |
Qatar Government International Bond | | | | | | | | |
4.00%, 01/20/15 | | | 350,000 | | | | 364,000 | |
| | | | | | | | |
South Africa — 0.1% | | | | | | | | |
South Africa Government International Bond | | | | | | | | |
7.38%, 04/25/12D | | | 600,000 | | | | 648,000 | |
| | | | | | | | |
South Korea — 0.1% | | | | | | | | |
Korea National Oil Corporation | | | | | | | | |
2.88%, 11/09/15 144A | | | 770,000 | | | | 742,721 | |
| | | | | | | | |
Spain — 0.3% | | | | | | | | |
Telefonica Emisiones SAU | | | | | | | | |
2.58%, 04/26/13 | | | 2,210,000 | | | | 2,213,012 | |
| | | | | | | | |
Supranational — 0.3% | | | | | | | | |
European Investment Bank | | | | | | | | |
4.75%, 04/15/11(E) | | | 1,500,000 | | | | 2,027,033 | |
| | | | | | | | |
| | | | |
| 76 | | See Notes to Financial Statements. | | |
| | | | | | | | |
| | | Par | | | Value | |
Sweden — 0.4% | | | | | |
Stadshypotek AB | | | | | | | | |
1.45%, 09/30/13 144A | | $ | 2,900,000 | | | $ | 2,898,431 | |
| | | | | | | | |
United Kingdom — 2.2% | | | | | |
Anglo American Capital PLC | | | | | | | | |
2.15%, 09/27/13 144A | | | 1,460,000 | | | | 1,473,525 | |
Barclays Bank PLC | | | | | | | | |
4.25%, 10/27/11(E) | | | 1,000,000 | | | | 1,370,677 | |
2.70%, 03/05/12 144AD | | | 740,000 | | | | 754,395 | |
2.50%, 01/23/13 | | | 495,000 | | | | 503,287 | |
5.93%, 12/15/49 144A† | | | 3,800,000 | | | | 3,420,000 | |
BP Capital Markets PLC | | | | | | | | |
5.25%, 11/07/13D | | | 1,900,000 | | | | 2,059,089 | |
Lloyds TSB Bank PLC | | | | | | | | |
1.18%, 06/09/11(E)† | | | 400,000 | | | | 534,925 | |
National Grid PLC | | | | | | | | |
1.34%, 01/18/12(E)† | | | 850,000 | | | | 1,133,189 | |
Royal Bank of Scotland PLC | | | | | | | | |
2.63%, 05/11/12 144A | | | 500,000 | | | | 510,155 | |
Standard Chartered Bank | | | | | | | | |
0.68%, 11/16/11† | | | 1,340,000 | | | | 1,340,646 | |
Standard Chartered PLC | | | | | | | | |
3.85%, 04/27/15 144AD | | | 1,425,000 | | | | 1,468,584 | |
Vodafone Group PLC | | | | | | | | |
0.57%, 02/27/12† | | | 950,000 | | | | 951,775 | |
| | | | | | | | |
| | | | | | | 15,520,247 | |
| | | | | | | | |
Total Foreign Bonds
(Cost $117,141,870) | | | | | | | 119,554,370 | |
| | | | | | | | |
MORTGAGE-BACKED SECURITIES — 27.5% | |
Adjustable Rate Mortgage Trust | | | | | | | | |
5.17%, 03/25/37† | | | 3,030,715 | | | | 1,768,498 | |
American Home Mortgage Investment Trust | | | | | | | | |
2.26%, 10/25/34† | | | 834,802 | | | | 736,654 | |
American Home Mortgage Assets | | | | | | | | |
1.25%, 11/25/46† | | | 1,210,864 | | | | 596,733 | |
Arkle Master Issuer PLC | | | | | | | | |
1.43%, 05/17/60 144A† | | | 2,780,000 | | | | 2,767,083 | |
Arran Residential Mortgages Funding PLC | | | | | | | | |
1.58%, 05/16/47 144A† | | | 1,640,000 | | | | 1,639,744 | |
0.36%, 09/16/56 144A† | | | 1,031,966 | | | | 1,013,608 | |
0.81%, 09/16/56(U)† | | | 1,093,507 | | | | 1,681,733 | |
1.08%, 09/20/56(E)† | | | 332,629 | | | | 441,831 | |
Banc of America Commercial Mortgage, Inc. | | | | | | | | |
3.88%, 09/11/36 | | | 598,613 | | | | 606,620 | |
5.66%, 06/10/49† | | | 1,455,000 | | | | 1,512,034 | |
Banc of America Funding Corporation | | | | | | | | |
5.89%, 01/20/47† | | | 1,019,449 | | | | 733,467 | |
Banc of America Mortgage Securities, Inc. | | | | | | | | |
6.50%, 10/25/31 | | | 215,933 | | | | 217,527 | |
Bear Stearns Adjustable Rate Mortgage Trust | | | | | | | | |
3.11%, 01/25/34† | | | 406,989 | | | | 388,964 | |
3.27%, 07/25/34† | | | 756,800 | | | | 696,373 | |
3.05%, 10/25/34† | | | 351,708 | | | | 317,038 | |
2.73%, 03/25/35† | | | 1,373,870 | | | | 1,305,178 | |
Bear Stearns Alt-A Trust | | | | | | | | |
1.00%, 11/25/34† | | | 408,467 | | | | 339,426 | |
2.96%, 09/25/35† | | | 636,245 | | | | 483,510 | |
Bear Stearns Commercial Mortgage Securities | | | | | | | | |
0.37%, 03/15/19 144A† | | | 1,265,357 | | | | 1,244,958 | |
Commercial Mortgage Pass-Through Certificates | | | | | | | | |
6.10%, 07/16/34 144A | | | 2,630,000 | | | | 2,648,672 | |
Countrywide Alternative Loan Trust | | | | | | | | |
6.00%, 10/25/32 | | | 73,437 | | | | 73,069 | |
Countrywide Home Loan Mortgage Pass-Through Trust | | | | | | | | |
0.80%, 02/25/35† | | | 218,723 | | | | 183,728 | |
Credit Suisse First Boston Mortgage Securities Corporation | | | | | | | | |
5.44%, 09/15/34 | | | 1,502,939 | | | | 1,527,134 | |
Deutsche ALT-A Securities, Inc. | | | | | | | | |
5.87%, 10/25/36 STEP | | | 726,664 | | | | 452,300 | |
5.89%, 10/25/36 STEP | | | 726,664 | | | | 435,961 | |
Extended Stay America Trust | | | | | | | | |
2.95%, 11/05/27 144A | | | 3,609,208 | | | | 3,549,632 | |
Fannie Mae Grantor Trust | | | | | | | | |
3.31%, 03/25/32 | | | 226,134 | | | | 226,982 | |
FDIC Structured Sale Guaranteed Notes | | | | | | | | |
1.03%, 10/25/12 144A | | | 1,700,000 | | | | 1,655,487 | |
1.53%, 10/25/13 144A | | | 2,300,000 | | | | 2,183,896 | |
3.00%, 09/30/19 144A | | | 1,399,824 | | | | 1,413,672 | |
0.98%, 12/06/20 144A† | | | 2,600,000 | | | | 2,600,000 | |
3.25%, 04/25/38 144A | | | 854,882 | | | | 864,958 | |
0.81%, 02/25/48 144A† | | | 780,756 | | | | 781,982 | |
FDIC Trust | | | | | | | | |
2.18%, 05/25/50 144A | | | 1,617,014 | | | | 1,614,807 | |
Federal Home Loan Mortgage Corporation | | | | | | | | |
15.25%, 08/01/11 | | | 160 | | | | 168 | |
3.50%, 12/01/18 | | | 1,612,605 | | | | 1,664,007 | |
10.75%, 02/01/19 | | | 53,407 | | | | 53,744 | |
6.00%, 11/01/22 | | | 853,167 | | | | 931,685 | |
5.50%, 01/01/26 | | | 3,860,000 | | | | 4,159,711 | |
2.78%, 07/01/27† | | | 17,695 | | | | 18,557 | |
2.41%, 06/01/33† | | | 1,558,506 | | | | 1,613,750 | |
2.52%, 04/01/34† | | | 1,260,534 | | | | 1,313,884 | |
2.50%, 10/01/34† | | | 416,175 | | | | 431,850 | |
2.67%, 08/01/35† | | | 1,312,158 | | | | 1,377,904 | |
2.74%, 10/01/35† | | | 1,023,652 | | | | 1,072,961 | |
5.51%, 04/01/36† | | | 1,064,523 | | | | 1,116,449 | |
5.50%, 12/01/37 | | | 1,871,871 | | | | 1,997,128 | |
5.50%, 05/01/38 | | | 3,418,925 | | | | 3,646,635 | |
5.50%, 02/01/40 | | | 1,043,789 | | | | 1,113,308 | |
Federal Home Loan Mortgage Corporation REMIC | | | | | | | | |
5.38%, 09/15/11 | | | 871,496 | | | | 886,577 | |
5.00%, 11/15/16 | | | 18,446 | | | | 18,442 | |
0.61%, 12/15/30† | | | 297,340 | | | | 297,433 | |
Federal Housing Authority | | | | | | | | |
7.43%, 09/01/22 | | | 1,390 | | | | 1,390 | |
Federal National Mortgage Association | | | | | | | | |
5.00%, 01/01/18 | | | 1,716,170 | | | | 1,835,498 | |
5.50%, 12/01/18 | | | 606,189 | | | | 652,885 | |
2.47%, 12/01/24† | | | 53,622 | | | | 55,944 | |
9.00%, 05/01/25 | | | 66,977 | | | | 77,575 | |
9.00%, 07/01/25 | | | 72,559 | | | | 85,133 | |
| | | | |
| | See Notes to Financial Statements. | | 77 |
| | |
| LOW-DURATION BOND FUND | | |
| SCHEDULE OF INVESTMENTS (Continued) | | |
| | | | | | | | |
| | | Par | | | Value | |
3.50%, 01/01/26 TBA | | $ | 7,000,000 | | | $ | 7,048,125 | |
2.57%, 09/01/31† | | | 58,487 | | | | 61,129 | |
5.50%, 10/01/32 | | | 1,026,823 | | | | 1,105,528 | |
2.24%, 04/01/33† | | | 253,231 | | | | 263,685 | |
2.40%, 06/01/33† | | | 257,023 | | | | 265,508 | |
2.81%, 10/01/33† | | | 572,415 | | | | 599,387 | |
2.64%, 12/01/33† | | | 173,344 | | | | 180,652 | |
2.64%, 09/01/34† | | | 344,464 | | | | 356,396 | |
2.65%, 09/01/34† | | | 423,796 | | | | 438,100 | |
2.43%, 10/01/34† | | | 454,089 | | | | 471,978 | |
2.63%, 10/01/34† | | | 559,198 | | | | 582,851 | |
2.94%, 08/01/35† | | | 2,717,781 | | | | 2,846,042 | |
2.98%, 09/01/35† | | | 1,040,514 | | | | 1,092,342 | |
5.36%, 10/01/35† | | | 1,213,320 | | | | 1,294,947 | |
3.06%, 12/01/35† | | | 67,741 | | | | 70,749 | |
4.00%, 01/13/39 TBA | | | 5,000,000 | | | | 4,973,440 | |
4.50%, 01/01/40 TBA | | | 10,500,000 | | | | 10,777,263 | |
5.50%, 01/01/40 TBA | | | 5,900,000 | | | | 6,312,080 | |
4.00%, 01/01/41 TBA | | | 7,500,000 | | | | 7,460,160 | |
1.54%, 07/01/44† | | | 196,282 | | | | 196,672 | |
Federal National Mortgage Association REMIC | | | | | | | | |
4.00%, 11/25/19 | | | 536,880 | | | | 561,404 | |
5.50%, 11/25/27 | | | 741,576 | | | | 752,072 | |
0.86%, 05/25/30† | | | 1,261,313 | | | | 1,262,570 | |
0.91%, 05/25/30† | | | 997,318 | | | | 995,896 | |
FHLMC Multifamily Structured Pass-Through Certificates | | | | | | | | |
2.23%, 07/25/13 | | | 988,752 | | | | 1,001,210 | |
3.61%, 06/25/14 | | | 1,095,000 | | | | 1,143,177 | |
FHLMC Structured Pass-Through Securities | | | | | | | | |
1.26%, 05/25/43† | | | 1,157,212 | | | | 1,189,351 | |
1.74%, 07/25/44† | | | 1,889,523 | | | | 1,846,614 | |
First Horizon Alternative Mortgage Securities | | | | | | | | |
2.38%, 06/25/34† | | | 651,988 | | | | 586,508 | |
Fosse Master Issuer PLC | | | | | | | | |
0.37%, 10/18/54† | | | 525,455 | | | | 523,773 | |
GE Capital Commercial Mortgage Corporation | | | | | | | | |
6.53%, 05/15/33 | | | 2,108,116 | | | | 2,112,002 | |
5.56%, 06/10/38 | | | 70,910 | | | | 71,184 | |
6.07%, 06/10/38 | | | 2,075,000 | | | | 2,130,672 | |
GMAC Commercial Mortgage Securities, Inc. | | | | | | | | |
6.70%, 04/15/34 | | | 1,910,689 | | | | 1,923,027 | |
GMAC Mortgage Servicer Advance Funding Co., Ltd. | | | | | | | | |
4.25%, 01/15/22 144A | | | 1,000,000 | | | | 1,005,162 | |
Government National Mortgage Association | | | | | | | | |
6.00%, 02/15/11 | | | 139 | | | | 140 | |
3.38%, 06/20/17† | | | 11,262 | | | | 11,615 | |
3.38%, 06/20/21† | | | 6,177 | | | | 6,371 | |
3.13%, 10/20/27† | | | 46,870 | | | | 48,239 | |
8.50%, 10/15/29 | | | 27,095 | | | | 32,662 | |
0.86%, 02/16/30† | | | 185,971 | | | | 187,482 | |
8.50%, 03/15/30 | | | 3,695 | | | | 4,460 | |
8.50%, 04/15/30 | | | 12,138 | | | | 13,392 | |
8.50%, 05/15/30 | | | 133,857 | | | | 161,508 | |
8.50%, 06/15/30 | | | 12,960 | | | | 15,639 | |
8.50%, 07/15/30 | | | 63,200 | | | | 76,265 | |
8.50%, 08/15/30 | | | 17,530 | | | | 21,156 | |
8.50%, 09/15/30 | | | 2,206 | | | | 2,663 | |
8.50%, 11/15/30 | | | 50,682 | | | | 61,164 | |
8.50%, 12/15/30 | | | 32,353 | | | | 39,045 | |
8.50%, 02/15/31 | | | 18,808 | | | | 22,720 | |
0.56%, 03/20/37† | | | 2,639,249 | | | | 2,626,792 | |
0.00%, 04/20/37 IOW† | | | 2,574,163 | | | | 269,677 | |
0.56%, 05/20/37† | | | 1,095,751 | | | | 1,091,214 | |
0.00%, 07/20/37 IOW† | | | 2,979,874 | | | | 403,768 | |
Gracechurch Mortgage Financing PLC | | | | | | | | |
0.36%, 11/20/56 144A† | | | 4,036,718 | | | | 3,970,557 | |
1.14%, 11/20/56(E)† | | | 964,087 | | | | 1,277,386 | |
Greenpoint Mortgage Funding Trust | | | | | | | | |
0.44%, 01/25/37† | | | 990,957 | | | | 621,595 | |
0.53%, 11/25/45† | | | 282,272 | | | | 188,083 | |
GS Mortgage Securities Corporation II | | | | | | | | |
6.45%, 08/05/18 144A† | | | 2,105,000 | | | | 2,156,703 | |
6.04%, 08/15/18 144A | | | 76,564 | | | | 77,933 | |
GSR Mortgage Loan Trust | | | | | | | | |
2.86%, 08/25/34† | | | 507,143 | | | | 460,871 | |
2.99%, 09/25/34† | | | 649,839 | | | | 578,890 | |
2.83%, 09/25/35† | | | 2,617,610 | | | | 2,496,926 | |
HarborView Mortgage Loan Trust | | | | | | | | |
3.19%, 12/19/35† | | | 1,756,723 | | | | 1,301,368 | |
0.47%, 11/19/36† | | | 2,103,787 | | | | 1,388,918 | |
Holmes Master Issuer PLC | | | | | | | | |
0.37%, 07/15/21† | | | 1,030,000 | | | | 1,023,305 | |
0.83%, 07/15/21(U)† | | | 625,000 | | | | 968,033 | |
1.08%, 07/15/21(E)† | | | 730,000 | | | | 969,019 | |
Indymac Index Mortgage Loan Trust | | | | | | | | |
0.53%, 06/25/37† | | | 762,198 | | | | 170,257 | |
0.45%, 09/25/46† | | | 1,123,984 | | | | 667,082 | |
JP Morgan Mortgage Trust | | | | | | | | |
5.04%, 02/25/35† | | | 477,854 | | | | 477,087 | |
LB-UBS Commercial Mortgage Trust | | | | | | | | |
6.16%, 07/14/16 144A | | | 623,449 | | | | 624,274 | |
6.37%, 12/15/28 | | | 1,401,739 | | | | 1,419,008 | |
Luminent Mortgage Trust | | | | | | | | |
0.43%, 12/25/36† | | | 1,201,165 | | | | 780,244 | |
MASTR Adjustable Rate Mortgages Trust | | | | | | | | |
2.84%, 12/25/33† | | | 697,878 | | | | 619,211 | |
MLCC Mortgage Investors, Inc. | | | | | | | | |
2.33%, 12/25/34† | | | 987,463 | | | | 940,589 | |
4.12%, 02/25/36† | | | 1,082,911 | | | | 985,967 | |
Morgan Stanley Capital I | | | | | | | | |
5.36%, 12/15/44 | | | 1,241,605 | | | | 1,289,588 | |
Morgan Stanley Resecuritization Trust | | | | | | | | |
0.51%, 06/17/13 144A† | | | 1,065,000 | | | | 1,062,505 | |
NCUA Guaranteed Notes | | | | | | | | |
0.64%, 11/06/17† | | | 1,541,957 | | | | 1,541,479 | |
1.84%, 10/07/20 | | | 435,925 | | | | 431,499 | |
2.90%, 10/29/20 | | | 730,000 | | | | 709,762 | |
0.83%, 12/08/20† | | | 4,300,000 | | | | 4,294,625 | |
Opteum Mortgage Acceptance Corporation | | | | | | | | |
0.54%, 11/25/35† | | | 703,719 | | | | 619,429 | |
Permanent Financing PLC | | | | | | | | |
0.39%, 06/10/33 | | | 972,500 | | | | 970,118 | |
| | | | |
| 78 | | See Notes to Financial Statements. | | |
| | | | | | | | |
| | | Par | | | Value | |
Permanent Master Issuer PLC | | | | | | | | |
1.59%, 04/15/14(U)† | | $ | 695,000 | | | $ | 1,078,028 | |
Provident Funding Mortgage Loan Trust | | | | | | | | |
2.78%, 04/25/34† | | | 1,157,705 | | | | 1,127,563 | |
Residential Accredit Loans, Inc. | | | | | | | | |
0.66%, 01/25/33† | | | 323,212 | | | | 290,980 | |
Residential Asset Securitization Trust | | | | | | | | |
0.56%, 05/25/35† | | | 739,477 | | | | 641,951 | |
Residential Funding Mortgage Securities I | | | | | | | | |
6.50%, 03/25/32 | | | 38,514 | | | | 39,569 | |
Salomon Brothers Mortgage Securities VII, Inc. | | | | | | | | |
6.50%, 11/13/36 | | | 1,800,989 | | | | 1,843,343 | |
Structured Adjustable Rate Mortgage Loan Trust | | | | | | | | |
2.74%, 08/25/34† | | | 1,023,084 | | | | 896,390 | |
0.56%, 09/25/34† | | | 183,857 | | | | 147,058 | |
Structured Asset Mortgage Investments, Inc. | | | | | | | | |
2.17%, 10/19/34† | | | 569,583 | | | | 459,669 | |
0.51%, 07/19/35† | | | 157,586 | | | | 112,093 | |
0.54%, 02/25/36† | | | 929,426 | | | | 558,916 | |
Structured Asset Securities Corporation | | | | | | | | |
0.31%, 05/25/36† | | | 67,432 | | | | 66,271 | |
Superannuation Members Home Loans Global Fund | | | | | | | | |
1.11%, 06/12/40(E)† | | | 1,128,199 | | | | 1,471,239 | |
TBW Mortgage Backed Pass-Through Certificates | | | | | | | | |
6.02%, 07/25/37 STEP | | | 651,560 | | | | 415,753 | |
Thornburg Mortgage Securities Trust | | | | | | | | |
0.37%, 07/25/36† | | | 600,800 | | | | 595,702 | |
0.35%, 03/25/37† | | | 775,034 | | | | 756,110 | |
0.36%, 03/25/37† | | | 1,019,780 | | | | 994,838 | |
0.39%, 06/25/37† | | | 995,507 | | | | 967,099 | |
0.38%, 10/25/46† | | | 1,384,439 | | | | 1,371,639 | |
0.37%, 11/25/46† | | | 1,908,217 | | | | 1,881,905 | |
TIAA Seasoned Commercial Mortgage Trust | | | | | | | | |
5.65%, 08/15/39† | | | 1,404,703 | | | | 1,430,535 | |
Wachovia Bank Commercial Mortgage Trust | | | | | | | | |
4.04%, 02/15/35 | | | 552,610 | | | | 557,719 | |
Washington Mutual Alternative Mortgage Pass-Through Certificates | | | | | | | | |
1.17%, 05/25/47† | | | 970,740 | | | | 290,581 | |
Washington Mutual Mortgage Pass-Through Certificates | | | | | | | | |
0.80%, 12/25/27† | | | 1,983,402 | | | | 1,749,996 | |
12.40%, 12/25/27+ 144AW† | | | 2,016,419 | | | | 110,903 | |
5.49%, 02/25/37† | | | 1,043,159 | | | | 760,701 | |
5.53%, 05/25/37† | | | 1,186,278 | | | | 957,013 | |
5.63%, 07/25/37† | | | 2,806,571 | | | | 1,957,982 | |
1.73%, 06/25/42† | | | 31,910 | | | | 26,706 | |
0.57%, 01/25/45† | | | 1,112,070 | | | | 952,388 | |
0.58%, 08/25/45† | | | 449,516 | | | | 379,937 | |
0.55%, 10/25/45† | | | 468,918 | | | | 395,662 | |
1.31%, 06/25/46† | | | 1,724,046 | | | | 1,307,346 | |
1.07%, 01/25/47† | | | 985,221 | | | | 598,952 | |
Washington Mutual MSC Mortgage Pass-Through Certificates | | | | | | | | |
2.80%, 11/25/30† | | | 90,748 | | | | 80,256 | |
Wells Fargo Mortgage-Backed Securities Trust | | | | | | | | |
2.86%, 12/25/34† | | | 1,150,632 | | | | 1,111,878 | |
| | | | | | | | |
Total Mortgage-Backed Securities
(Cost $201,012,116) | | | | 195,190,487 | |
| | | | | | | | |
MUNICIPAL BONDS — 3.4% | | | | | |
California State Public Works Board, California State University Projects, Series B-2 Revenue Bond | | | | | | | | |
7.80%, 03/01/35 | | | 800,000 | | | | 789,824 | |
Chicago Transit Authority, Revenue Bond | | | | | | | | |
6.90%, 12/01/40 | | | 1,300,000 | | | | 1,289,366 | |
Citizens Property Insurance Corporation High Risk Account, Series A-1 Revenue Bond | | | | | | | | |
5.00%, 06/01/12 | | | 1,100,000 | | | | 1,148,620 | |
Dallas County Hospital District, Series B General Obligation Bond | | | | | | | | |
6.17%, 08/15/34 | | | 1,300,000 | | | | 1,312,935 | |
Irvine Ranch Water District Joint Powers Agency, Revenue Bond, Escrowed to Maturity | | | | | | | | |
2.61%, 03/15/14 | | | 2,800,000 | | | | 2,851,268 | |
Kentucky Asset/Liability Commission, Revenue Bond | | | | | | | | |
3.17%, 04/01/18 | | | 700,000 | | | | 672,854 | |
State of California General Obligation Bond | | | | | | | | |
5.10%, 08/01/14 | | | 170,000 | | | | 175,569 | |
5.00%, 11/01/32 | | | 1,300,000 | | | | 1,184,157 | |
7.50%, 04/01/34 | | | 1,600,000 | | | | 1,657,200 | |
5.65%, 04/01/39† | | | 1,850,000 | | | | 1,957,781 | |
7.55%, 04/01/39 | | | 3,400,000 | | | | 3,529,676 | |
State of Illinois General Obligation Bond | | | | | | | | |
2.77%, 01/01/12 | | | 1,820,000 | | | | 1,826,297 | |
3.32%, 01/01/13 | | | 5,500,000 | | | | 5,504,290 | |
| | | | | | | | |
Total Municipal Bonds
(Cost $23,759,675) | | | | | | | 23,899,837 | |
| | | | | | | | |
U.S. TREASURY OBLIGATIONS — 13.3% | |
U.S. Treasury Bills | | | | | | | | |
0.19%, 06/16/11 | | | 29,100,000 | | | | 29,078,524 | |
0.22%, 09/22/11WD | | | 4,500,000 | | | | 4,493,124 | |
| | | | | | | | |
| | | | | | | 33,571,648 | |
| | | | | | | | |
U.S. Treasury Bonds | | | | | | | | |
8.13%, 05/15/21‡‡ | | | 41,000 | | | | 58,207 | |
8.00%, 11/15/21 | | | 400,000 | | | | 565,812 | |
7.25%, 08/15/22D | | | 51,000 | | | | 68,954 | |
7.63%, 11/15/22‡‡ | | | 117,000 | | | | 162,831 | |
| | | | | | | | |
| | | | | | | 855,804 | |
| | | | | | | | |
U.S. Treasury Inflationary Index Bond | | | | | | | | |
1.25%, 07/15/20‡‡ | | | 6,600,000 | | | | 6,786,217 | |
| | | | | | | | |
| | | | |
| | See Notes to Financial Statements. | | 79 |
| | |
LOW-DURATION BOND FUND SCHEDULE OF INVESTMENTS (Continued) | | |
| | |
| | | | | | | | |
| | | Par | | | Value | |
U.S. Treasury Notes | | | | | | | | |
1.75%, 11/15/11 | | $ | 500,000 | | | $ | 506,289 | |
1.00%, 04/30/12D | | | 2,219,000 | | | | 2,237,298 | |
0.50%, 11/30/12D | | | 4,345,000 | | | | 4,340,077 | |
0.63%, 12/31/12 | | | 5,000,000 | | | | 5,003,515 | |
1.38%, 05/15/13 | | | 2,255,000 | | | | 2,287,781 | |
1.00%, 07/15/13D | | | 3,600,000 | | | | 3,618,277 | |
0.75%, 08/15/13D | | | 555,000 | | | | 553,959 | |
0.50%, 11/15/13D | | | 1,700,000 | | | | 1,678,352 | |
0.75%, 12/15/13D | | | 16,420,000 | | | | 16,305,832 | |
2.50%, 04/30/15D | | | 347,000 | | | | 358,793 | |
1.88%, 06/30/15D | | | 270,000 | | | | 271,118 | |
1.38%, 11/30/15D‡‡ | | | 12,645,000 | | | | 12,290,346 | |
2.75%, 05/31/17 | | | 2,200,000 | | | | 2,228,360 | |
1.88%, 08/31/17 | | | 1,100,000 | | | | 1,050,243 | |
3.38%, 11/15/19D | | | 200,000 | | | | 204,203 | |
| | | | | | | | |
| | | | | | | 52,934,443 | |
| | | | | | | | |
Total U.S. Treasury Obligations
(Cost $94,409,526) | | | | | | | 94,148,112 | |
| | | | | | | | |
| | |
| | | Shares | | | | |
MONEY MARKET FUNDS — 14.1% | | | | | | | | |
GuideStone Money Market Fund (GS4 Class)¥ | | | 31,818,398 | | | | 31,818,398 | |
Northern Institutional Liquid Assets Portfolio§ | | | 68,285,101 | | | | 68,285,101 | |
| | | | | | | | |
Total Money Market Funds
(Cost $100,103,499) | | | | | | | 100,103,499 | |
| | | | | | | | |
| | |
| | | Par | | | | |
REPURCHASE AGREEMENTS — 20.8% | |
Barclays Capital, Inc. 0.17% (dated 12/23/10, due 01/13/11, repurchase price $20,001,983, collateralized by U.S. Treasury Inflationary Index Bond, 3.500%, due 01/15/11, total market value $20,386,242) | | $ | 20,000,000 | | | | 20,000,000 | |
Citigroup Global Markets, Inc. 0.21% (dated 01/03/11, due 01/04/11, repurchase price $49,425,841, collateralized by U.S. Treasury Note, 1.000%, due 07/15/13, total market value $50,475,620) | | | 49,425,553 | | | | 49,425,553 | |
Citigroup Global Markets, Inc. 0.21% (dated 01/03/11, due 01/04/11, repurchase price $14,674,533, collateralized by U.S. Treasury Note, 1.000%, due 07/15/13, total market value $14,986,211) | | | 14,674,447 | | | | 14,674,447 | |
Merrill Lynch & Co., Inc. 0.22% (dated 12/31/10, due 01/03/11, repurchase price $49,117,900, collateralized by U.S. Treasury Note, 0.625%, due 07/31/12, total market value $50,266,425) | | | 49,117,000 | | | | 49,117,000 | |
| | | | | | | | |
| | | Par | | | Value | |
Merrill Lynch & Co., Inc. 0.22% (dated 12/31/10, due 01/03/11, repurchase price $14,283,262, collateralized by U.S. Treasury Note, 0.625%, due 07/31/12, total market value $14,617,476) | | $ | 14,283,000 | | | $ | 14,283,000 | |
| | | | | | | | |
Total Repurchase Agreements
(Cost $147,500,000) | | | | 147,500,000 | |
| | | | | | | | |
TOTAL INVESTMENTS — 122.4%
(Cost $873,008,626) | | | | 867,230,534 | |
| | | | | | | | |
| | |
| | | Number of
Contracts | | | | |
WRITTEN OPTIONS — (0.1)% | |
Call Options — 0.0% | | | | | | | | |
10-Year U.S. Treasury Note Fututes, Strike Price $129.00, Expires 01/21/11 (CITIG) | | | (15 | ) | | | (234 | ) |
September 2011 90-Day Eurodollar Futures, Strike Price $99.375, Expires 09/19/11 (JPM) | | | (15 | ) | | | (8,813 | ) |
| | | | | | | | |
| | | | | | | (9,047 | ) |
| | | | | | | | |
| | |
| | | Notional
Amount | | | | |
Call Swaptions — 0.0% | | | | | | | | |
3-Month LIBOR, Strike Price $3.25, Expires 01/24/11 (DEUT) | | $ | (21,100,000 | ) | | | (73,162 | ) |
| | | | | | | | |
| | |
| | | Number of
Contracts | | | | |
Put Options — 0.0% | | | | | | | | |
10-Year U.S. Treasury Note Fututes, Strike Price $124.00, Expires 01/21/11 (CITIG) | | | (15 | ) | | | (54,375 | ) |
September 2011 90-Day Eurodollar Futures, Strike Price $99.375, Expires 09/19/11 (JPM) | | | (15 | ) | | | (6,188 | ) |
| | | | | | | | |
| | | | | | | (60,563 | ) |
| | | | | | | | |
| | |
| | | Notional
Amount | | | | |
Put Swaptions — (0.1)% | | | | | |
3-Month LIBOR, Strike Price $10.00, Expires 07/10/12 (BAR) | | $ | (200,000 | ) | | | (143 | ) |
3-Month LIBOR, Strike Price $10.00, Expires 07/10/12 (CS) | | | (100,000 | ) | | | (71 | ) |
3-Month LIBOR, Strike Price $10.00, Expires 07/10/12 (MSCS) | | | (3,800,000 | ) | | | (2,712 | ) |
3-Month LIBOR, Strike Price $10.00, Expires 07/10/12 (RBS) | | | (300,000 | ) | | | (214 | ) |
3-Month LIBOR, Strike Price $2.25, Expires 06/18/12 (RBS) | | | (2,700,000 | ) | | | (42,725 | ) |
| | | | |
| 80 | | See Notes to Financial Statements. | | |
| | | | | | | | |
| | | Notional
Amount | | | Value | |
3-Month LIBOR, Strike Price $2.25, Expires 09/24/12 (CITI) | | $ | (600,000 | ) | | $ | (8,498 | ) |
3-Month LIBOR, Strike Price $2.25, Expires 09/24/12 (MSCS) | | | (900,000 | ) | | | (12,748 | ) |
3-Month LIBOR, Strike Price $2.25, Expires 09/24/12 (RBS) | | | (11,700,000 | ) | | | (165,721 | ) |
3-Month LIBOR, Strike Price $2.25, Expires 09/24/12 (UBS) | | | (2,100,000 | ) | | | (29,745 | ) |
3-Month LIBOR, Strike Price $2.75, Expires 06/18/12 (DEUT) | | | (2,800,000 | ) | | | (44,308 | ) |
3-Month LIBOR, Strike Price $3.00, Expires 06/18/12 (BAR) | | | (3,900,000 | ) | | | (51,517 | ) |
3-Month LIBOR, Strike Price $3.00, Expires 06/18/12 (CITI) | | | (4,000,000 | ) | | | (52,838 | ) |
3-Month LIBOR, Strike Price $3.00, Expires 06/18/12 (DEUT) | | | (500,000 | ) | | | (6,605 | ) |
3-Month LIBOR, Strike Price $5.00, Expires 01/24/11 (DEUT) | | | (21,100,000 | ) | | | (15 | ) |
CDX IG15 Index, Strike Price $1.70, Expiration Date 03/16/11 (MSCS) | | | (11,600,000 | ) | | | (3,525 | ) |
iTraxx Crossover Index, Strike Price $1.80, Expiration Date 03/16/11 (MSCS) | | | (2,100,000 | ) | | | (2,125 | ) |
| | | | | | | | |
| | | | | | | (423,510 | ) |
| | | | | | | | |
Total Written Options
(Premiums received $(728,747)) | | | | | | | (566,282 | ) |
| | | | | | | | |
| | |
| | | Par | | | | |
TBA SALE COMMITMENTS — (1.1)% | |
Federal National Mortgage Association (JPM)
5.50%, 01/01/40 TBA | | $ | (1,000,000 | ) | | | (1,069,844 | ) |
Federal National Mortgage Association (CS)
5.50%, 01/01/40 TBA | | | (6,000,000 | ) | | | (6,419,064 | ) |
| | | | | | | | |
Total TBA Sale Commitments
(Cost $(7,509,688)) | | | | (7,488,908 | ) |
| | | | | | | | |
Liabilities in Excess of Other Assets — (21.3)% | | | | (150,580,985 | ) |
| | | | | | | | |
NET ASSETS — 100.0% | | | $ | 708,594,359 | |
| | | | | | | | |
Please see abbreviation and footnote definitions beginning on page 180.
| | | | |
| | See Notes to Financial Statements. | | 81 |
| | |
| LOW-DURATION BOND FUND | | |
| SCHEDULE OF INVESTMENTS (Continued) | | |
Swap agreements outstanding at December 31, 2010:
| | | | | | | | | | | | | | | | | | | | | | | | | | | | | | | | |
Reference Obligation | | Fixed
Deal
(Pay) Rate | | | Maturity
Date | | | Counterparty | | | Currency | | | Notional
Amount | | | Market
Value | | | Upfront
Premiums
Paid/
(Received) | | | Unrealized
Appreciation
(Depreciation) | |
Credit Default Swaps on Corporate Issues — Buy Protection | | | | | | | | | | | | | | | | | |
Nabors Industries, 6.15% due 02/15/18 | | | (0.63 | )% | | | 03/20/18 | | | | CITI | | | | USD | | | $ | 3,300,000 | | | $ | 167,782 | | | $ | — | | | $ | 167,782 | |
Nabors Industries, 5.375% due 08/15/12 | | | (1.00 | )% | | | 03/20/19 | | | | BNP | | | | USD | | | | 2,700,000 | | | | 87,177 | �� | | | 8,660 | | | | 78,517 | |
Morgan Stanley ABS Capital I, 7.02% due 12/27/33 | | | (0.54 | )% | | | 12/27/33 | | | | MSCS | | | | USD | | | | 431,036 | | | | 191,044 | | | | — | | | | 191,044 | |
Long Beach Mortgage Trust, 6.72%, due 02/25/34 | | | (0.49 | )% | | | 02/25/34 | | | | BAR | | | | USD | | | | 431,701 | | | | 210,853 | | | | — | | | | 210,853 | |
Specialty Underwriting & Residential Finance, 6.62% due 02/25/35 | | | (0.59 | )% | | | 02/25/35 | | | | BAR | | | | USD | | | | 437,951 | | | | 321,095 | | | | — | | | | 321,095 | |
| | | | | | | | | | | | | | | | | | | | | | | | | | | | | | | | |
| | | | | | | | | | | | | | | | | | $ | 7,300,688 | | | $ | 977,951 | | | $ | 8,660 | | | $ | 969,291 | |
| | | | | | | | | | | | | | | | | | | | | | | | | | | | | | | | |
| | | | | | | | |
Reference Obligation | | Fixed
Deal (Pay)
Rate | | | Maturity
Date | | | Counterparty | | | Currency | | | Notional
Amount | | | Market
Value | | | Upfront
Premiums
Paid/
(Received) | | | Unrealized
Appreciation
(Depreciation) | |
Credit Default Swaps on Credit Indices — Buy Protection | |
Dow Jones CDX HY-8 Index | | | (1.63 | )% | | | 06/20/12 | | | | CITI | | | | USD | | | $ | 4,900,000 | | | $ | (67,750 | ) | | $ | — | | | $ | (67,750 | ) |
Dow Jones CDX IG14 5Y Index | | | (0.10 | )% | | | 06/20/15 | | | | GSC | | | | USD | | | | 7,900,000 | | | | (151,329 | ) | | | 115,963 | | | | (267,292 | ) |
Dow Jones CDX IG9 10Y Index | | | (0.80 | )% | | | 12/20/17 | | | | BAR | | | | USD | | | | 2,420,000 | | | | 61,970 | | | | 23,696 | | | | 38,274 | |
Dow Jones CDX IG9 10Y Index | | | (0.80 | )% | | | 12/20/17 | | | | GSC | | | | USD | | | | 6,872,800 | | | | 175,996 | | | | 83,786 | | | | 92,210 | |
Dow Jones CDX IG9 10Y Index | | | (0.80 | )% | | | 12/20/17 | | | | MSCS | | | | USD | | | | 5,227,200 | | | | 133,856 | | | | 61,667 | | | | 72,189 | |
Dow Jones CDX IG9 10Y Index | | | (0.80 | )% | | | 12/20/17 | | | | RBS | | | | USD | | | | 2,032,800 | | | | 52,055 | | | | 21,534 | | | | 30,521 | |
CMBX.NA.AAA.4 Index | | | (0.35 | )% | | | 02/17/51 | | | | GSC | | | | USD | | | | 5,700,000 | | | | 236,701 | | | | 876,439 | | | | (639,738 | ) |
| | | | | | | | | | | | | | | | | | | | | | | | | | | | | | | | |
| | | | | | | | | | | | | | | | | | $ | 35,052,800 | | | $ | 441,499 | | | $ | 1,183,085 | | | $ | (741,586 | ) |
| | | | | | | | | | | | | | | | | | | | | | | | | | | | | | | | |
| | | | | | | | |
Reference Obligation | | Fixed
Deal
(Pay) Rate | | | Maturity
Date | | | Counterparty | | | Currency | | | Notional
Amount | | | Market
Value | | | Upfront
Premiums
Paid/
(Received) | | | Unrealized
Appreciation
(Depreciation) | |
Interest Rate Swaps | | | | | | | | | | | | | | | | | | | | | |
Brazil Cetip Interbank Deposit | | | 11.65 | % | | | 01/02/12 | | | | MSCS | | | | BRL | | | $ | 1,800,000 | | | $ | 29,100 | | | $ | 7,029 | | | $ | 22,071 | |
Brazil Cetip Interbank Deposit | | | 11.95 | % | | | 01/02/13 | | | | BAR | | | | BRL | | | | 5,000,000 | | | | 17,747 | | | | 22,580 | | | | (4,833 | ) |
Brazil Cetip Interbank Deposit | | | 11.96 | % | | | 01/02/14 | | | | GSC | | | | BRL | | | | 5,900,000 | | | | 21,308 | | | | (8,571 | ) | | | 29,879 | |
Brazil Cetip Interbank Deposit | | | 11.94 | % | | | 01/02/14 | | | | HSBC | | | | BRL | | | | 10,400,000 | | | | (2,974 | ) | | | 18,682 | | | | (21,656 | ) |
6-Month BBR BBSW Index | | | (5.50 | )% | | | 12/15/17 | | | | BAR | | | | AUD | | | | 1,500,000 | | | | (31,956 | ) | | | (7,234 | ) | | | (24,722 | ) |
6-Month BBR BBSW Index | | | (5.50 | )% | | | 12/15/17 | | | | DEUT | | | | AUD | | | | 1,000,000 | | | | (21,304 | ) | | | (4,250 | ) | | | (17,054 | ) |
| | | | | | | | | | | | | | | | | | | | | | | | | | | | | | | | |
| | | | | | | | | | | | | | | | | | $ | 25,600,000 | | | $ | 11,921 | | | $ | 28,236 | | | $ | (16,315 | ) |
| | | | | | | | | | | | | | | | | | | | | | | | | | | | | | | | |
Total Swap agreements outstanding at December 31, 2010 | | | | | | | | | | | $ | 1,431,371 | | | $ | 1,219,981 | | | $ | 211,390 | |
| | | | | | | | | | | | | | | | | | | | | | | | | | | | | | | | |
Please see abbreviation and footnote definitions beginning on page 180.
| | | | |
| 82 | | See Notes to Financial Statements. | | |
PORTFOLIO SUMMARY (based on net assets)
| | | | |
| | | % | |
Mortgage-Backed Securities | | | 27.5 | |
Repurchase Agreements | | | 20.8 | |
Corporate Bonds | | | 18.6 | |
Foreign Bonds | | | 16.9 | |
Futures Contracts | | | 14.8 | |
Money Market Funds | | | 14.1 | |
U.S. Treasury Obligations | | | 13.3 | |
Forward Foreign Currency Contracts | | | 6.6 | |
Asset-Backed Securities | | | 6.5 | |
Municipal Bonds | | | 3.4 | |
Agency Obligations | | | 1.3 | |
Swap Agreements | | | 0.2 | |
Written Options | | | (0.1 | ) |
TBA Sale Commitments | | | (1.1 | ) |
| | | | |
| | | 142.8 | |
| | | | |
VALUATION HIERARCHY
The following is a summary of the inputs used, as of December 31, 2010, in valuing the Fund’s investments carried at fair value:
| | | | | | | | |
Valuation Inputs | | Investments
in
Securities | | | Other
Financial
Instruments*** | |
Assets: | | | | | | | | |
Level 1 — Quoted Prices | | | | | | | | |
Futures Contracts | | $ | — | | | $ | 199,212 | |
Money Market Funds | | | 100,103,499 | | | | — | |
Level 2 — Other Significant Observable Inputs | | | | | | | | |
Agency Obligations | | | 9,150,757 | | | | — | |
Asset-Backed Securities | | | 45,812,856 | | | | — | |
Corporate Bonds | | | 131,870,616 | | | | — | |
Foreign Bonds | | | 119,554,370 | | | | — | |
Mortgage-Backed Securities | | | 195,079,584 | | | | — | |
Municipal Bonds | | | 23,899,837 | | | | | |
Repurchase Agreements | | | 147,500,000 | | | | — | |
Swap Agreements | | | — | | | | 1,431,371 | |
U.S. Treasury Obligations | | | 94,148,112 | | | | — | |
Level 3 — Significant Unobservable Inputs | | | | | | | | |
Mortgage-Backed Securities | | | 110,903 | | | | — | |
| | | | | | | | |
Total Assets | | $ | 867,230,534 | | | $ | 1,630,583 | |
| | | | | | | | |
| | |
Liabilities: | | | | | | | | |
Level 1 — Quoted Prices | | | | | | | | |
Written Options | | $ | (69,609 | ) | | $ | — | |
Level 2 — Other Significant Observable Inputs | | | | | | | | |
Forward Foreign Currency Contracts | | | — | | | | (272,766 | ) |
TBA Sale Commitment | | | (7,488,908 | ) | | | — | |
Written Options | | | (496,673 | ) | | | — | |
Level 3 — Significant Unobservable Inputs | | | — | | | | — | |
| | | | | | | | |
Total Liabilities | | $ | (8,055,190 | ) | | $ | (272,766 | ) |
| | | | | | | | |
| *** | Other financial instruments are derivative instruments not reflected in the Schedule of Investments, such as futures, forwards and swap contracts, which are valued at the unrealized appreciation (depreciation) on the investment. Details of these investments can be found in the Notes to Financial Statements. |
| | | | |
| | See Notes to Financial Statements. | | 83 |
| | |
| LOW-DURATION BOND FUND | | |
| SCHEDULE OF INVESTMENTS (Continued) | | |
The following is a reconciliation of assets in which significant unobservable inputs (Level 3) were used in determining fair value:
| | | | | | | | |
| | | Investments
in
Securities | | | Other
Financial
Instruments*** | |
Balance, 12/31/09 | | | | | | | | |
Corporate Bonds | | $ | 1,818,415 | | | $ | — | |
Accrued discounts/premiums | | | | | | | | |
Corporate Bonds | | | 76,699 | | | | — | |
Realized gain (loss)(1) | | | | | | | | |
Corporate Bonds | | | — | | | | — | |
Change in unrealized appreciation (depreciation)(2) | | | | | | | | |
Corporate Bonds | | | (378 | ) | | | — | |
Purchases | | | | | | | | |
Corporate Bonds | | | — | | | | — | |
Sales | | | | | | | | |
Corporate Bonds | | | — | | | | — | |
Transfers in and/or out of Level 3 | | | | | | | | |
Corporate Bonds | | | (1,783,833 | ) | | | — | |
| | | | | | | | |
Balance, 12/31/10 | | $ | 110,903 | | | $ | — | |
| | | | | | | | |
| *** | Other financial instruments are derivative instruments not reflected in the Schedule of Investments, such as futures, forwards and swap contracts, which are valued at the unrealized appreciation (depreciation) on the investment. Details of these investments can be found in the Notes to Financial Statements. |
| (1) | Realized gain (loss) from the sale of Level 3 securities can be found on the Statement of Operations in Net Realized Gain (loss) from Investment securities and securities sold short. |
| (2) | Change in unrealized appreciation (depreciation) can be found on the Statement of Operations in Net change in unrealized appreciation (depreciation) on Investment securities and securities sold short. |
| | | | |
| 84 | | See Notes to Financial Statements. | | |
Medium-Duration Bond Fund
During the first nine months of the year, the environment for bonds was positive as interest rates declined amidst concerns of economic uncertainty while investor demand for fixed income securities remained strong. This backdrop provided a nice rally in bond prices. However, the fourth quarter was characterized by a positive change in sentiment related to the domestic economy, partially due to the announcement of further quantitative easing measures by the Federal Reserve as well as indications that the economy was gaining traction. The brightened economic picture fueled a rise in interest rates which proved to be a headwind for bonds during the year’s final quarter. The broad U.S. investment grade bond market, as measured by the Barclays Capital U.S Aggregate Bond Index, posted an annual return of 6.54%. All major bond sectors produced positive returns, led by investment grade corporate bonds and commercial mortgage-backed securities. In general, investor appetite for bonds that traded at a risk premium (yield spread above U.S. Treasuries) was strong, causing yield spreads to narrow which boosted returns. Overall, lower quality bonds outpaced higher quality bonds while longer-dated bonds outperformed shorter-maturity bonds. U.S. Treasuries lagged the overall broad index, posting an annual return of 5.87%. Non-benchmark sectors were also strong during the year, as high yield (below investment grade corporate bonds) and emerging market bonds generated annual returns of 15.24% and 11.83%, respectively.
The Medium-Duration Bond Fund invests in a diversified portfolio composed of investment grade fixed income securities with an average dollar-weighted duration normally between three to seven years. The Fund outperformed its benchmark index, the Barclays Capital U.S. Aggregate Bond Index, for the one-year period ended December 31, 2010 (8.65% versus 6.54%). The Fund’s benchmark relative performance was positively impacted by security selection and sector rotation between non-U.S. Treasury sectors. The Fund took advantage of bond sectors that traded at a yield premium relative to U.S. Treasuries.
Certain securities within these sectors remained attractively valued and greatly benefited from improving corporate fundamentals and investor demand which caused yield spreads to compress and bond prices to elevate. These securities maintained higher coupons which provided a “cushion” against rising interest rates during the fourth quarter. In an effort to find attractively valued securities across the fixed income universe, the Fund further benefitted from modest exposure to high yield and emerging market securities. High yield bonds performed well as corporate balance sheets were strengthened, refinancing activity for the purpose of lowering debt service was prevalent and credit downgrades became fewer. Demand for high yield bonds remained strong, providing a strong technical tailwind, which when combined with the improving fundamental story, provided a very positive environment for the sector. The Fund’s emerging market exposure was rewarded as strong fundamentals and growth characteristics of the sector continued to fuel strong investor demand and price appreciation.
U.S. Government futures contracts were used for portfolio construction purposes, including duration management, and the replication of government bond positions. Government futures contracts were also used to take advantage of perceived mispricings between government bond futures and physical securities. Along with government futures contracts, interest rate swaps were also used to manage interest rate exposures. Additionally, interest rate options were written and purchased to generate income and take advantage of perceived interest rate scenarios. Credit default swaps (“CDS”) were used to manage credit risk within the Fund. Written CDS positions (selling protection) increased credit exposure while purchased CDS positions (buying protection) decreased credit exposure. Forward currency contracts were utilized to manage currency risk while money market derivatives, such as Eurodollar futures, were utilized to manage exposure on the front-end of the yield curve. During the year, the Fund remained focused on its objective of maximum total return consistent with preservation of capital.
This fund is subject to interest rate risk. Meaning, when interest rates rise, the value of the existing bonds decrease and vice versa. Changes in interest rates have a bigger impact on long duration holdings than on short duration holdings.
Please see page 106 for information regarding specific portfolio allocations. Portfolio holdings are subject to change at any time.
Medium-Duration Bond Fund
Average Annual Total Returns as of 12/31/10
| | | | | | | | | | | | |
| | | GS2 Class* | | | GS4 Class* | | | Benchmark** | |
One Year | | | 8.86 | % | | | 8.65 | % | | | 6.54 | % |
Five Year | | | 6.43 | % | | | 6.30 | % | | | 5.80 | % |
Since Inception | | | 6.09 | % | | | 6.03 | % | | | 5.53 | % |
Inception Date | | | 08/27/01 | | | | 08/27/01 | | | | | |
Total Fund Operating Expenses (April 30, 2010 Prospectus, as supplemented on August 5, 2010)(1) | | | 0.52 | % | | | 0.71 | % | | | | |
| (1) | Current information regarding the Fund’s Operating Expenses can be found in the Financial Highlights. |
The performance data quoted represents past performance and does not guarantee future results. Current performance may be lower or higher. Performance data current to the most recent month-end may be obtained at www.GuideStoneFunds.org. The investment return and principal value of an investment will fluctuate so that shares, when redeemed, may be worth more or less than their original cost.
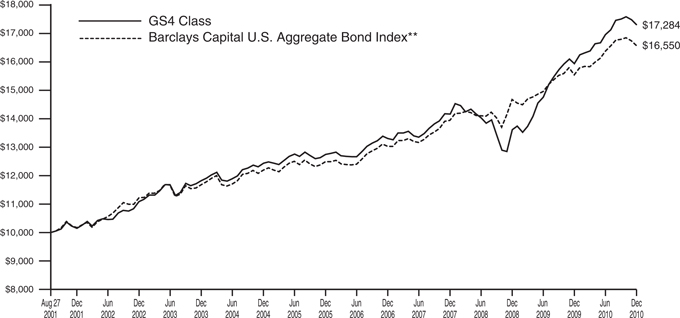
The graph compares the results of a hypothetical $10,000 investment in the GS4 Class of the Fund since August 27, 2001 (commencement of operations), with all dividends and capital gains reinvested, with the Barclays Capital U.S. Aggregate Bond Index.
| * | These returns reflect expense waivers by the Fund’s investment adviser. Without these waivers, returns would have been lower. Returns shown do not reflect the deduction of taxes that a shareholder would pay on Fund distributions or the redemption of Fund shares. |
| ** | The Barclays Capital U.S. Aggregate Bond Index represents securities that are SEC-registered, taxable and dollar denominated. The index covers the U.S. investment grade bond market, with index components for government and corporate securities, mortgage pass-through securities and asset-backed securities. |
Unlike a mutual fund, the performance of an index assumes no taxes, transaction costs, management fees or other expenses.
| | |
MEDIUM-DURATION BOND FUND SCHEDULE OF INVESTMENTS | | December 31, 2010 |
| | |
| | | | | | | | |
| | | Par | | | Value | |
AGENCY OBLIGATIONS — 0.9% | | | | | |
Federal Farm Credit Bank | | | | | | | | |
5.05%, 11/06/17 | | $ | 400,000 | | | $ | 450,067 | |
Federal National Mortgage Association | | | | | | | | |
5.25%, 08/01/12 | | | 2,400,000 | | | | 2,564,899 | |
3.88%, 07/12/13D | | | 1,070,000 | | | | 1,149,832 | |
4.38%, 10/15/15 | | | 510,000 | | | | 561,990 | |
5.38%, 06/12/17 | | | 700,000 | | | | 807,081 | |
5.31%, 10/09/19WD | | | 150,000 | | | | 94,916 | |
6.63%, 11/15/30D | | | 820,000 | | | | 1,037,765 | |
Tennessee Valley Authority | | | | | | | | |
5.25%, 09/15/39 | | | 350,000 | | | | 371,429 | |
4.63%, 09/15/60D | | | 200,000 | | | | 187,941 | |
| | | | | | | | |
Total Agency Obligations
(Cost $7,056,077) | | | | | | | 7,225,920 | |
| | | | | | | | |
ASSET-BACKED SECURITIES — 4.2% | |
Access Group, Inc. | | | | | | | | |
1.59%, 10/27/25† | | | 1,597,361 | | | | 1,628,364 | |
Amortizing Residential Collateral Trust | | | | | | | | |
0.54%, 01/01/32† | | | 37,476 | | | | 27,922 | |
Asset-Backed Securities Corporation Home Equity | | | | | | | | |
0.54%, 09/25/34† | | | 168,112 | | | | 152,870 | |
Avis Budget Rental Car Funding AESOP LLC | | | | | | | | |
4.64%, 05/20/16 144A | | | 200,000 | | | | 210,671 | |
Bayview Financial Acquisition Trust | | | | | | | | |
0.94%, 02/28/44† | | | 486,431 | | | | 454,136 | |
Bear Stearns Asset-Backed Securities, Inc. | | | | | | | | |
6.00%, 10/25/36 | | | 2,784,184 | | | | 2,199,625 | |
6.50%, 10/25/36 | | | 3,127,483 | | | | 2,148,906 | |
Brazos Higher Education Authority | | | | | | | | |
0.41%, 09/25/23† | | | 821,060 | | | | 816,232 | |
1.20%, 05/25/29† | | | 500,000 | | | | 498,789 | |
CIT Mortgage Loan Trust | | | | | | | | |
1.26%, 10/25/37 144A† | | | 325,637 | | | | 312,518 | |
1.51%, 10/25/37 144A† | | | 430,000 | | | | 308,840 | |
1.71%, 10/25/37 144A† | | | 800,000 | | | | 435,652 | |
College Loan Corporation Trust | | | | | | | | |
0.38%, 10/25/25† | | | 1,000,000 | | | | 991,197 | |
Countrywide Home Equity Loan Trust | | | | | | | | |
0.55%, 02/15/34† | | | 364,907 | | | | 224,488 | |
0.50%, 12/15/35† | | | 985,007 | | | | 431,685 | |
0.40%, 07/15/36† | | | 1,075,540 | | | | 597,639 | |
Daimler Chrysler Auto Trust | | | | | | | | |
1.75%, 09/10/12† | | | 1,935,151 | | | | 1,940,607 | |
Education Funding Capital Trust I | | | | | | | | |
1.45%, 06/15/43† | | | 200,000 | | | | 186,122 | |
EFS Volunteer LLC | | | | | | | | |
1.39%, 10/25/35 144A† | | | 450,000 | | | | 420,771 | |
EMC Mortgage Loan Trust | | | | | | | | |
0.81%, 11/25/41 144A† | | | 146,010 | | | | 126,166 | |
Ford Credit Auto Owner Trust | | | | | | | | |
1.68%, 06/15/12† | | | 872,866 | | | | 875,523 | |
Franklin Auto Trust | | | | | | | | |
1.84%, 06/20/12† | | | 162,127 | | | | 162,361 | |
GMAC Mortgage Corporation Loan Trust | | | | | | | | |
7.00%, 09/25/37 | | | 402,648 | | | | 286,913 | |
Goal Capital Funding Trust | | | | | | | | |
0.98%, 08/25/48 144A†@ | | | 435,189 | | | | 426,642 | |
GSAMP Trust | | | | | | | | |
0.37%, 05/25/46 144A† | | | 196,343 | | | | 192,719 | |
Hertz Vehicle Financing LLC | | | | | | | | |
5.29%, 03/25/16 144A | | | 400,000 | | | | 430,757 | |
HSBC Home Equity Loan Trust | | | | | | | | |
1.46%, 11/20/36† | | | 916,530 | | | | 846,020 | |
Illinois Student Assistance Commission | | | | | | | | |
1.19%, 07/25/45† | | | 1,400,000 | | | | 1,329,524 | |
Knowledgeworks Foundation | | | | | | | | |
1.24%, 02/25/42† | | | 292,239 | | | | 289,585 | |
Lehman XS Trust | | | | | | | | |
0.56%, 11/25/35† | | | 1,703,372 | | | | 1,276,798 | |
0.53%, 02/25/36† | | | 1,024,047 | | | | 634,232 | |
Madison Avenue Manufactured Housing Contract | | | | | | | | |
0.61%, 03/25/32† | | | 119,181 | | | | 118,995 | |
Missouri Higher Education Loan Authority | | | | | | | | |
1.23%, 11/26/32† | | | 909,550 | | | | 912,744 | |
Morgan Stanley Dean Witter Credit Corporation HELOC Trust | | | | | | | | |
0.45%, 07/25/17† | | | 106,944 | | | | 82,787 | |
Nelnet Education Loan Funding, Inc. | | | | | | | | |
1.09%, 02/25/39† | | | 800,000 | | | | 733,032 | |
Nelnet Student Loan Trust | | | | | | | | |
1.77%, 04/25/24† | | | 780,000 | | | | 798,334 | |
1.07%, 07/27/48 144A† | | | 394,262 | | | | 393,475 | |
Panhandle-Plains Higher Education Authority, Inc. | | | | | | | | |
1.49%, 10/01/35† | | | 1,000,000 | | | | 1,007,566 | |
Provident Bank Home Equity Loan Trust | | | | | | | | |
0.80%, 08/25/31† | | | 114,757 | | | | 51,872 | |
Residential Asset Mortgage Products, Inc. | | | | | | | | |
0.74%, 03/25/34† | | | 361,366 | | | | 241,766 | |
Residential Funding Securities LLC | | | | | | | | |
0.71%, 06/25/33 144A† | | | 364,018 | | | | 312,871 | |
Salomon Brothers Mortgage Securities VII, Inc. | | | | | | | | |
0.74%, 03/25/28† | | | 49,633 | | | | 46,723 | |
Securitized Asset-Backed Receivables LLC Trust | | | | | | | | |
0.49%, 02/25/37† | | | 2,738,893 | | | | 1,313,532 | |
SLM Student Loan Trust | | | | | | | | |
1.79%, 04/25/23† | | | 6,303,384 | | | | 6,506,622 | |
0.59%, 12/15/25 144A† | | | 400,000 | | | | 382,000 | |
Structured Asset Securities Corporation | | | | | | | | |
0.56%, 04/25/31 144A† | | | 2,905,337 | | | | 2,221,823 | |
| | | | | | | | |
Total Asset-Backed Securities
(Cost $42,281,255) | | | | | | | 35,988,416 | |
| | | | | | | | |
CORPORATE BONDS — 20.8% | |
AES Corporation | | | | | | | | |
7.75%, 10/15/15 | | | 270,000 | | | | 289,575 | |
| | | | |
| | See Notes to Financial Statements. | | 87 |
| | |
MEDIUM-DURATION BOND FUND SCHEDULE OF INVESTMENTS (Continued) | | |
| | |
| | | | | | | | |
| | | Par | | | Value | |
Allied Waste North America, Inc. | | | | | | | | |
7.13%, 05/15/16 | | $ | 125,000 | | | $ | 132,491 | |
Ally Financial, Inc. | | | | | | | | |
6.88%, 09/15/11D | | | 1,101,000 | | | | 1,136,782 | |
7.50%, 12/31/13 | | | 177,000 | | | | 191,602 | |
6.25%, 12/01/17 144A | | | 606,000 | | | | 606,758 | |
8.00%, 12/31/18D | | | 62,000 | | | | 66,185 | |
8.00%, 03/15/20 144AD | | | 200,000 | | | | 219,000 | |
American Express Bank FSB | | | | | | | | |
6.00%, 09/13/17 | | | 1,100,000 | | | | 1,227,548 | |
American Express Co. | | | | | | | | |
6.80%, 09/01/66† | | | 1,340,000 | | | | 1,336,650 | |
American Express Credit Corporation | | | | | | | | |
5.88%, 05/02/13D | | | 2,600,000 | | | | 2,829,146 | |
5.13%, 08/25/14 | | | 160,000 | | | | 172,653 | |
American General Finance Corporation | | | | | | | | |
6.90%, 12/15/17 | | | 580,000 | | | | 471,250 | |
American International Group, Inc. | | | | | | | | |
5.60%, 10/18/16 | | | 600,000 | | | | 621,164 | |
5.85%, 01/16/18D | | | 180,000 | | | | 186,139 | |
8.25%, 08/15/18 144A | | | 3,200,000 | | | | 3,697,280 | |
6.25%, 03/15/37 | | | 680,000 | | | | 604,759 | |
Anadarko Petroleum Corporation | | | | | | | | |
6.38%, 09/15/17 | | | 525,000 | | | | 572,670 | |
ANZ Capital Trust II | | | | | | | | |
5.36%, 12/29/49 144A@ | | | 800,000 | | | | 827,000 | |
Apache Corporation | | | | | | | | |
6.00%, 09/15/13 | | | 680,000 | | | | 764,050 | |
Arizona Public Service Co. | | | | | | | | |
8.75%, 03/01/19D | | | 525,000 | | | | 658,366 | |
ASIF Global Financing XIX | | | | | | | | |
4.90%, 01/17/13 144A | | | 100,000 | | | | 103,500 | |
Astoria Financial Corporation | | | | | | | | |
5.75%, 10/15/12 | | | 450,000 | | | | 462,267 | |
AT&T, Inc. | | | | | | | | |
5.10%, 09/15/14 | | | 550,000 | | | | 602,263 | |
6.55%, 02/15/39D | | | 430,000 | | | | 469,604 | |
BAC Capital Trust XIV | | | | | | | | |
5.63%, 09/20/49†D | | | 40,000 | | | | 28,708 | |
Baker Hughes, Inc. | | | | | | | | |
7.50%, 11/15/18 | | | 710,000 | | | | 891,678 | |
Bank of America Corporation | | | | | | | | |
0.55%, 10/14/16†D | | | 1,700,000 | | | | 1,509,658 | |
5.75%, 12/01/17 | | | 2,290,000 | | | | 2,386,420 | |
5.65%, 05/01/18 | | | 2,700,000 | | | | 2,762,894 | |
7.63%, 06/01/19 | | | 670,000 | | | | 772,687 | |
5.88%, 01/05/21 | | | 400,000 | | | | 414,625 | |
Bear Stearns Cos. LLC | | | | | | | | |
5.70%, 11/15/14D | | | 1,000,000 | | | | 1,099,707 | |
6.40%, 10/02/17 | | | 1,200,000 | | | | 1,369,948 | |
7.25%, 02/01/18D | | | 2,005,000 | | | | 2,379,420 | |
BellSouth Capital Funding Corporation | | | | | | | | |
7.88%, 02/15/30D | | | 210,000 | | | | 253,696 | |
BellSouth Corporation | | | | | | | | |
4.75%, 11/15/12D | | | 40,000 | | | | 42,687 | |
6.88%, 10/15/31 | | | 10,000 | | | | 10,872 | |
Berkshire Hathaway, Inc. | | | | | | | | |
3.20%, 02/11/15 | | | 560,000 | | | | 578,407 | |
Boeing Capital Corporation | | | | | | | | |
4.70%, 10/27/19 | | | 230,000 | | | | 244,286 | |
Boeing Co. | | | | | | | | |
4.88%, 02/15/20 | | | 300,000 | | | | 323,544 | |
6.63%, 02/15/38 | | | 210,000 | | | | 246,554 | |
Boston Scientific Corporation | | | | | | | | |
4.50%, 01/15/15D | | | 500,000 | | | | 510,977 | |
Capital One Capital III | | | | | | | | |
7.69%, 08/15/36 | | | 250,000 | | | | 252,500 | |
Caterpillar Financial Services Corporation | | | | | | | | |
6.20%, 09/30/13 | | | 450,000 | | | | 505,530 | |
Cellco Partnership/Verizon Wireless Capital LLC | | | | | | | | |
8.50%, 11/15/18 | | | 710,000 | | | | 930,478 | |
CenterPoint Energy Resources Corporation | | | | | | | | |
5.95%, 01/15/14 | | | 525,000 | | | | 571,790 | |
Chesapeake Energy Corporation | | | | | | | | |
7.25%, 12/15/18 | | | 205,000 | | | | 213,200 | |
Chubb Corporation | | | | | | | | |
6.38%, 03/29/67† | | | 375,000 | | | | 392,812 | |
CitiFinancial, Inc. | | | | | | | | |
6.63%, 06/01/15 | | | 300,000 | | | | 326,378 | |
Citigroup, Inc. | | | | | | | | |
6.50%, 08/19/13 | | | 110,000 | | | | 120,860 | |
6.00%, 12/13/13 | | | 980,000 | | | | 1,071,606 | |
5.00%, 09/15/14 | | | 1,720,000 | | | | 1,780,795 | |
6.01%, 01/15/15D | | | 520,000 | | | | 570,967 | |
5.50%, 02/15/17D | | | 1,160,000 | | | | 1,202,198 | |
6.13%, 11/21/17 | | | 1,000,000 | | | | 1,097,435 | |
6.13%, 05/15/18D | | | 4,800,000 | | | | 5,266,382 | |
5.38%, 08/09/20D | | | 425,000 | | | | 442,405 | |
6.88%, 03/05/38 | | | 1,140,000 | | | | 1,268,633 | |
Comcast Cable Communications LLC | | | | | | | | |
6.75%, 01/30/11 | | | 230,000 | | | | 230,951 | |
Comcast Cable Communications Holdings, Inc. | | | | | | | | |
8.38%, 03/15/13 | | | 83,000 | | | | 94,494 | |
9.46%, 11/15/22 | | | 200,000 | | | | 277,263 | |
Comcast Corporation | | | | | | | | |
5.70%, 05/15/18 | | | 1,250,000 | | | | 1,377,742 | |
6.95%, 08/15/37 | | | 40,000 | | | | 45,389 | |
6.40%, 03/01/40D | | | 140,000 | | | | 150,575 | |
Comcast Holdings Corporation | | | | | | | | |
10.63%, 07/15/12 | | | 550,000 | | | | 623,327 | |
Community Health Systems, Inc. | | | | | | | | |
8.88%, 07/15/15 | | | 250,000 | | | | 263,125 | |
Complete Production Services, Inc. | | | | | | | | |
8.00%, 12/15/16 | | | 280,000 | | | | 291,200 | |
ConocoPhillips Holding Co. | | | | | | | | |
6.95%, 04/15/29 | | | 940,000 | | | | 1,158,471 | |
COX Communications, Inc. | | | | | | | | |
5.45%, 12/15/14 | | | 210,000 | | | | 231,390 | |
CSC Holdings, Inc. | | | | | | | | |
7.63%, 04/01/11 | | | 500,000 | | | | 507,500 | |
6.75%, 04/15/12 | | | 60,000 | | | | 62,475 | |
CVS Caremark Corporation | | | | | | | | |
6.60%, 03/15/19D | | | 780,000 | | | | 914,758 | |
CVS Pass-Through Trust | | | | | | | | |
6.94%, 01/10/30 144A | | | 937,926 | | | | 1,022,404 | |
| | | | |
| 88 | | See Notes to Financial Statements. | | |
| | | | | | | | |
| | | Par | | | Value | |
Daimler Finance NA LLC | | | | | | | | |
5.88%, 03/15/11 | | $ | 590,000 | | | $ | 596,012 | |
5.75%, 09/08/11D | | | 1,900,000 | | | | 1,963,561 | |
7.30%, 01/15/12 | | | 550,000 | | | | 584,512 | |
6.50%, 11/15/13 | | | 100,000 | | | | 113,282 | |
DCP Midstream LLC | | | | | | | | |
9.75%, 03/15/19 144A@ | | | 200,000 | | | | 258,850 | |
Dean Foods Co. | | | | | | | | |
7.00%, 06/01/16D | | | 375,000 | | | | 345,937 | |
Delta Air Lines 2007-1 A | | | | | | | | |
6.82%, 08/10/22 | | | 406,279 | | | | 436,750 | |
Developers Diversified Realty Corporation | | | | | | | | |
7.50%, 04/01/17 | | | 375,000 | | | | 419,437 | |
Discover Bank | | | | | | | | |
8.70%, 11/18/19 | | | 425,000 | | | | 501,073 | |
DISH DBS Corporation | | | | | | | | |
7.00%, 10/01/13 | | | 10,000 | | | | 10,725 | |
6.63%, 10/01/14 | | | 30,000 | | | | 31,200 | |
7.75%, 05/31/15D | | | 200,000 | | | | 213,500 | |
Dominion Resources, Inc. | | | | | | | | |
5.70%, 09/17/12 | | | 1,230,000 | | | | 1,324,077 | |
Dow Chemical Co. | | | | | | | | |
7.60%, 05/15/14 | | | 550,000 | | | | 634,841 | |
Duke Energy Carolinas LLC | | | | | | | | |
5.63%, 11/30/12 | | | 580,000 | | | | 628,785 | |
Eastman Kodak Co. | | | | | | | | |
7.25%, 11/15/13D | | | 390,000 | | | | 385,125 | |
El Paso Corporation | | | | | | | | |
7.00%, 06/15/17D | | | 710,000 | | | | 752,824 | |
7.80%, 08/01/31 | | | 750,000 | | | | 749,807 | |
El Paso Natural Gas Co. | | | | | | | | |
7.50%, 11/15/26 | | | 300,000 | | | | 332,427 | |
El Paso Performance-Linked Trust | | | | | | | | |
7.75%, 07/15/11 144A | | | 1,460,000 | | | | 1,501,870 | |
El Paso Pipeline Partners Operating Co., LLC | | | | | | | | |
6.50%, 04/01/20 | | | 175,000 | | | | 184,483 | |
Energy Future Holdings Corporation | | | | | | | | |
5.55%, 11/15/14D | | | 120,000 | | | | 73,500 | |
6.55%, 11/15/34 | | | 865,000 | | | | 311,400 | |
Energy Transfer Partners LP | | | | | | | | |
5.95%, 02/01/15 | | | 650,000 | | | | 713,645 | |
6.70%, 07/01/18D | | | 570,000 | | | | 647,615 | |
Enterprise Products Operating LLC | | | | | | | | |
7.03%, 01/15/68†D | | | 350,000 | | | | 363,626 | |
EOG Resources, Inc. | | | | | | | | |
1.03%, 02/03/14† | | | 3,500,000 | | | | 3,506,254 | |
Exelon Corporation | | | | | | | | |
5.63%, 06/15/35D | | | 655,000 | | | | 625,623 | |
Fifth Third Bank Ohio | | | | | | | | |
0.39%, 05/17/13† | | | 400,000 | | | | 384,717 | |
First Niagara Financial Group, Inc. | | | | | | | | |
6.75%, 03/19/20 | | | 250,000 | | | | 260,787 | |
FirstEnergy Corporation | | | | | | | | |
6.45%, 11/15/11 | | | 3,000 | | | | 3,123 | |
7.38%, 11/15/31 | | | 1,180,000 | | | | 1,247,289 | |
Ford Motor Credit Co., LLC | | | | | | | | |
5.55%, 06/15/11† | | | 607,000 | | | | 616,864 | |
12.00%, 05/15/15 | | | 1,320,000 | | | | 1,661,946 | |
5.63%, 09/15/15D | | | 4,100,000 | | | | 4,249,830 | |
8.00%, 12/15/16D | | | 1,300,000 | | | | 1,454,433 | |
Freeport-McMoRan Copper & Gold, Inc. | | | | | | | | |
8.38%, 04/01/17 | | | 1,995,000 | | | | 2,209,676 | |
General Electric Capital Corporation | | | | | | | | |
5.45%, 01/15/13D | | | 150,000 | | | | 161,388 | |
6.00%, 08/07/19D | | | 1,850,000 | | | | 2,061,792 | |
4.38%, 09/16/20 | | | 400,000 | | | | 394,432 | |
General Electric Co. | | | | | | | | |
5.00%, 02/01/13 | | | 840,000 | | | | 898,382 | |
5.25%, 12/06/17 | | | 200,000 | | | | 216,334 | |
Georgia-Pacific LLC | | | | | | | | |
8.13%, 05/15/11 | | | 4,000 | | | | 4,150 | |
GlaxoSmithKline Capital, Inc. | | | | | | | | |
5.65%, 05/15/18 | | | 490,000 | | | | 561,137 | |
Goldman Sachs Capital II | | | | | | | | |
5.79%, 06/01/43† | | | 60,000 | | | | 51,150 | |
Goldman Sachs Group, Inc. | | | | | | | | |
6.60%, 01/15/12 | | | 70,000 | | | | 74,041 | |
5.30%, 02/14/12D | | | 30,000 | | | | 31,400 | |
3.63%, 08/01/12 | | | 110,000 | | | | 113,564 | |
5.45%, 11/01/12 | | | 190,000 | | | | 203,299 | |
4.75%, 07/15/13 | | | 60,000 | | | | 63,955 | |
5.25%, 10/15/13D | | | 160,000 | | | | 173,267 | |
5.75%, 10/01/16 | | | 1,900,000 | | | | 2,071,460 | |
6.25%, 09/01/17D | | | 1,700,000 | | | | 1,878,612 | |
5.95%, 01/18/18D | | | 2,300,000 | | | | 2,498,835 | |
5.38%, 03/15/20 | | | 310,000 | | | | 320,922 | |
6.00%, 06/15/20D | | | 460,000 | | | | 498,008 | |
HCA, Inc. | | | | | | | | |
6.30%, 10/01/12D | | | 32,000 | | | | 32,880 | |
9.13%, 11/15/14 | | | 60,000 | | | | 63,075 | |
6.50%, 02/15/16D | | | 686,000 | | | | 673,995 | |
9.25%, 11/15/16 | | | 480,000 | | | | 513,300 | |
9.63%, 11/15/16 PIK | | | 95,720 | | | | 102,779 | |
7.88%, 02/15/20 | | | 125,000 | | | | 134,375 | |
7.69%, 06/15/25 | | | 250,000 | | | | 241,250 | |
Hess Corporation | | | | | | | | |
8.13%, 02/15/19 | | | 410,000 | | | | 518,787 | |
7.88%, 10/01/29 | | | 260,000 | | | | 327,182 | |
7.30%, 08/15/31 | | | 430,000 | | | | 517,187 | |
Hospira, Inc. | | | | | | | | |
5.60%, 09/15/40 | | | 275,000 | | | | 271,253 | |
HSBC Finance Corporation | | | | | | | | |
7.00%, 05/15/12 | | | 390,000 | | | | 418,586 | |
6.38%, 11/27/12D | | | 70,000 | | | | 75,926 | |
6.68%, 01/15/21 144A | | | 100,000 | | | | 101,211 | |
Humana, Inc. | | | | | | | | |
7.20%, 06/15/18D | | | 480,000 | | | | 543,024 | |
ILFC E-Capital Trust II | | | | | | | | |
6.25%, 12/21/65 144A†D | | | 280,000 | | | | 219,800 | |
International Lease Finance Corporation | | | | | | | | |
6.50%, 09/01/14 144AD | | | 240,000 | | | | 255,600 | |
6.75%, 09/01/16 144A | | | 880,000 | | | | 943,800 | |
JPMorgan Chase & Co. | | | | | | | | |
5.75%, 01/02/13 | | | 320,000 | | | | 346,903 | |
5.15%, 10/01/15D | | | 1,890,000 | | | | 2,001,000 | |
6.30%, 04/23/19 | | | 800,000 | | | | 912,102 | |
4.95%, 03/25/20D | | | 800,000 | | | | 822,771 | |
4.40%, 07/22/20 | | | 230,000 | | | | 226,813 | |
| | | | |
| | See Notes to Financial Statements. | | 89 |
| | |
MEDIUM-DURATION BOND FUND SCHEDULE OF INVESTMENTS (Continued) | | |
| | |
| | | | | | | | |
| | | Par | | | Value | |
4.25%, 10/15/20 | | $ | 300,000 | | | $ | 293,574 | |
JPMorgan Chase Capital XXV | | | | | | | | |
6.80%, 10/01/37 | | | 375,000 | | | | 387,866 | |
Kerr-McGee Corporation | | | | | | | | |
6.95%, 07/01/24 | | | 450,000 | | | | 490,231 | |
7.88%, 09/15/31 | | | 1,010,000 | | | | 1,160,948 | |
Kinder Morgan Energy Partners LP | | | | | | | | |
6.75%, 03/15/11 | | | 110,000 | | | | 111,226 | |
7.13%, 03/15/12 | | | 500,000 | | | | 533,551 | |
5.85%, 09/15/12 | | | 40,000 | | | | 42,908 | |
5.00%, 12/15/13 | | | 200,000 | | | | 217,443 | |
6.00%, 02/01/17 | | | 250,000 | | | | 276,368 | |
Kraft Foods, Inc. | | | | | | | | |
6.13%, 08/23/18 | | | 350,000 | | | | 400,810 | |
5.38%, 02/10/20 | | | 830,000 | | | | 894,920 | |
6.50%, 02/09/40 | | | 300,000 | | | | 337,354 | |
Kroger Co. | | | | | | | | |
6.15%, 01/15/20 | | | 500,000 | | | | 567,579 | |
L-3 Communications Corporation | | | | | | | | |
6.38%, 10/15/15 | | | 120,000 | | | | 124,200 | |
Lehman Brothers Holdings Capital Trust VII | | | | | | | | |
5.86%, 11/29/49# | | | 2,330,000 | | | | 699 | |
Lehman Brothers Holdings, Inc. | | | | | | | | |
6.63%, 01/18/12# | | | 200,000 | | | | 47,250 | |
5.63%, 01/24/13# | | | 2,300,000 | | | | 575,000 | |
6.50%, 07/19/17# | | | 150,000 | | | | 82 | |
6.75%, 12/28/17# | | | 3,340,000 | | | | 1,837 | |
Liberty Property LP | | | | | | | | |
4.75%, 10/01/20D | | | 575,000 | | | | 570,089 | |
Life Technologies Corporation | | | | | | | | |
5.00%, 01/15/21 | | | 700,000 | | | | 694,763 | |
Medtronic, Inc. | | | | | | | | |
4.45%, 03/15/20 | | | 300,000 | | | | 312,040 | |
Merrill Lynch & Co., Inc. | | | | | | | | |
5.45%, 02/05/13 | | | 1,550,000 | | | | 1,635,737 | |
6.05%, 05/16/16 | | | 375,000 | | | | 386,806 | |
5.70%, 05/02/17 | | | 400,000 | | | | 401,872 | |
6.40%, 08/28/17D | | | 2,300,000 | | | | 2,435,015 | |
MetLife Capital Trust IV | | | | | | | | |
7.88%, 12/15/37 144AD | | | 300,000 | | | | 318,750 | |
MetLife Capital Trust X | | | | | | | | |
9.25%, 04/08/38 144A@D | | | 300,000 | | | | 354,000 | |
MetLife, Inc. | | | | | | | | |
7.72%, 02/15/19D | | | 100,000 | | | | 122,965 | |
4.75%, 02/08/21D | | | 620,000 | | | | 634,298 | |
6.40%, 12/15/36 | | | 150,000 | | | | 141,750 | |
5.88%, 02/06/41 | | | 190,000 | | | | 201,048 | |
Morgan Stanley | | | | | | | | |
5.63%, 01/09/12D | | | 310,000 | | | | 323,765 | |
5.75%, 08/31/12 | | | 2,055,000 | | | | 2,198,342 | |
1.36%, 03/01/13(E) | | | 500,000 | | | | 639,579 | |
0.74%, 10/18/16† | | | 340,000 | | | | 314,459 | |
6.63%, 04/01/18 | | | 1,350,000 | | | | 1,466,556 | |
Motors Liquidation Co. | | | | | | | | |
8.25%, 07/15/23# | | | 210,000 | | | | 74,025 | |
8.38%, 07/05/33(E)# | | | 170,000 | | | | 76,103 | |
Nabors Industries, Inc. | | | | | | | | |
9.25%, 01/15/19 | | | 3,300,000 | | | | 4,095,373 | |
NBC Universal, Inc. | | | | | | | | |
4.38%, 04/01/21 144A@D | | | 150,000 | | | | 145,887 | |
New Cingular Wireless Services, Inc. | | | | | | | | |
8.13%, 05/01/12 | | | 135,000 | | | | 147,519 | |
Northwestern Mutual Life Insurance | | | | | | | | |
6.06%, 03/30/40 144A@D | | | 600,000 | | | | 665,110 | |
NRG Energy, Inc. | | | | | | | | |
7.38%, 02/01/16 | | | 80,000 | | | | 82,200 | |
7.38%, 01/15/17D | | | 35,000 | | | | 36,137 | |
Occidental Petroleum Corporation | | | | | | | | |
7.00%, 11/01/13D | | | 1,120,000 | | | | 1,295,814 | |
Overseas Private Investment Corporation | | | | | | | | |
0.00%, 07/12/12W† | | | 3,000,000 | | | | 3,430,327 | |
Pacific Gas & Electric Co. | | | | | | | | |
8.25%, 10/15/18D | | | 40,000 | | | | 52,049 | |
6.05%, 03/01/34 | | | 390,000 | | | | 428,388 | |
5.80%, 03/01/37 | | | 250,000 | | | | 265,868 | |
Patrons’ Legacy | | | | | | | | |
5.65%, 04/17/18 144A | | | 1,290,357 | | | | 1,233,130 | |
Peabody Energy Corporation | | | | | | | | |
7.88%, 11/01/26D | | | 1,100,000 | | | | 1,199,000 | |
Pemex Project Funding Master Trust | | | | | | | | |
6.63%, 06/15/35 | | | 159,000 | | | | 162,577 | |
PepsiCo, Inc. | | | | | | | | |
7.90%, 11/01/18 | | | 140,000 | | | | 180,402 | |
Pfizer, Inc. | | | | | | | | |
7.20%, 03/15/39 | | | 760,000 | | | | 986,874 | |
Pricoa Global Funding I | | | | | | | | |
0.50%, 09/27/13 144A† | | | 1,700,000 | | | | 1,675,518 | |
Private Export Funding Corporation | | | | | | | | |
5.45%, 09/15/17 | | | 1,600,000 | | | | 1,829,094 | |
Progress Energy, Inc. | | | | | | | | |
7.75%, 03/01/31 | | | 350,000 | | | | 438,909 | |
ProLogis | | | | | | | | |
1.88%, 11/15/37 | | | 350,000 | | | | 347,812 | |
Prudential Financial, Inc. | | | | | | | | |
4.50%, 11/15/20D | | | 900,000 | | | | 881,887 | |
PVNGS II Funding Corporation, Inc. | | | | | | | | |
8.00%, 12/30/15D | | | 929,000 | | | | 970,997 | |
Qwest Corporation | | | | | | | | |
8.88%, 03/15/12 | | | 200,000 | | | | 216,750 | |
Raytheon Co. | | | | | | | | |
3.13%, 10/15/20 | | | 200,000 | | | | 184,799 | |
Reed Elsevier Capital, Inc. | | | | | | | | |
8.63%, 01/15/19 | | | 410,000 | | | | 522,064 | |
Reinsurance Group of America, Inc. | | | | | | | | |
6.75%, 12/15/65† | | | 250,000 | | | | 231,706 | |
Rensselaer Polytechnic Institute | | | | | | | | |
5.60%, 09/01/20 | | | 675,000 | | | | 697,198 | |
Roche Holdings, Inc. | | | | | | | | |
6.00%, 03/01/19 144A | | | 430,000 | | | | 500,844 | |
Service Corporation International | | | | | | | | |
7.63%, 10/01/18D | | | 90,000 | | | | 94,950 | |
7.50%, 04/01/27 | | | 200,000 | | | | 192,500 | |
Simon Property Group LP | | | | | | | | |
10.35%, 04/01/19D | | | 750,000 | | | | 1,026,936 | |
Southern Natural Gas Co. | | | | | | | | |
8.00%, 03/01/32D | | | 400,000 | | | | 460,256 | |
| | | | |
| 90 | | See Notes to Financial Statements. | | |
| | | | | | | | |
| | | Par | | | Value | |
Sovereign Bank | | | | | | | | |
2.00%, 08/01/13† | | $ | 250,000 | | | $ | 250,164 | |
Sprint Capital Corporation | | | | | | | | |
7.63%, 01/30/11D | | | 1,100,000 | | | | 1,104,125 | |
8.38%, 03/15/12D | | | 465,000 | | | | 494,062 | |
6.90%, 05/01/19D | | | 30,000 | | | | 29,775 | |
8.75%, 03/15/32 | | | 170,000 | | | | 172,550 | |
Steel Dynamics, Inc. | | | | | | | | |
6.75%, 04/01/15D | | | 225,000 | | | | 228,937 | |
SunTrust Preferred Capital I | | | | | | | | |
5.85%, 12/31/49† | | | 357,000 | | | | 276,675 | |
Teachers Insurance & Annuity Association of America | | | | | | | | |
6.85%, 12/16/39 144A | | | 540,000 | | | | 633,965 | |
Tenet Healthcare Corporation | | | | | | | | |
9.25%, 02/01/15D | | | 1,262,000 | | | | 1,350,340 | |
Tennessee Gas Pipeline Co. | | | | | | | | |
7.50%, 04/01/17 | | | 250,000 | | | | 288,654 | |
7.63%, 04/01/37D | | | 50,000 | | | | 55,914 | |
Time Warner Cable, Inc. | | | | | | | | |
8.75%, 02/14/19D | | | 650,000 | | | | 828,367 | |
4.13%, 02/15/21D | | | 100,000 | | | | 95,348 | |
5.88%, 11/15/40 | | | 520,000 | | | | 516,263 | |
Time Warner, Inc. | | | | | | | | |
4.70%, 01/15/21D | | | 10,000 | | | | 10,202 | |
7.70%, 05/01/32 | | | 70,000 | | | | 85,693 | |
6.10%, 07/15/40 | | | 140,000 | | | | 147,415 | |
Time Warner Entertainment Co. LP | | | | | | | | |
8.38%, 07/15/33 | | | 590,000 | | | | 746,686 | |
Transatlantic Holdings, Inc. | | | | | | | | |
8.00%, 11/30/39 | | | 300,000 | | | | 308,004 | |
TransDigm, Inc. | | | | | | | | |
7.75%, 12/15/18 144A | | | 375,000 | | | | 390,000 | |
UAL 1993 Pass Through Trust A | | | | | | | | |
9.21%, 01/21/17+ | | | 81,116 | | | | — | |
UAL 1995 Pass Through Trust A | | | | | | | | |
9.56%, 10/19/18@ | | | 139,156 | | | | 58,619 | |
United Parcel Service, Inc. | | | | | | | | |
4.50%, 01/15/13D | | | 770,000 | | | | 824,087 | |
UnitedHealth Group, Inc. | | | | | | | | |
4.88%, 02/15/13 | | | 370,000 | | | | 394,117 | |
4.88%, 04/01/13 | | | 410,000 | | | | 438,338 | |
Verizon Communications, Inc. | | | | | | | | |
6.10%, 04/15/18 | | | 290,000 | | | | 329,909 | |
Verizon Global Funding Corporation | | | | | | | | |
7.38%, 09/01/12 | | | 290,000 | | | | 320,310 | |
4.38%, 06/01/13 | | | 140,000 | | | | 149,748 | |
Wachovia Bank NA | | | | | | | | |
6.60%, 01/15/38D | | | 275,000 | | | | 303,796 | |
Wachovia Capital Trust III | | | | | | | | |
5.80%, 03/15/42† | | | 500,000 | | | | 435,625 | |
Wachovia Corporation | | | | | | | | |
5.25%, 08/01/14D | | | 1,850,000 | | | | 1,974,622 | |
5.63%, 10/15/16 | | | 250,000 | | | | 272,298 | |
WEA Finance LLC | | | | | | | | |
7.13%, 04/15/18 144A@ | | | 400,000 | | | | 460,816 | |
WellPoint, Inc. | | | | | | | | |
5.88%, 06/15/17 | | | 720,000 | | | | 805,908 | |
Wells Fargo & Co. | | | | | | | | |
4.38%, 01/31/13 | | | 600,000 | | | | 635,266 | |
7.98%, 03/15/49†D | | | 2,600,000 | | | | 2,756,000 | |
Wells Fargo Capital X | | | | | | | | |
5.95%, 12/15/36 | | | 200,000 | | | | 194,053 | |
Wells Fargo Capital XV | | | | | | | | |
9.75%, 09/26/44† | | | 990,000 | | | | 1,106,325 | |
Westlake Chemical Corporation | | | | | | | | |
6.63%, 01/15/16 | | | 54,000 | | | | 56,092 | |
Whirlpool Corporation | | | | | | | | |
8.00%, 05/01/12 | | | 125,000 | | | | 134,745 | |
8.60%, 05/01/14 | | | 150,000 | | | | 173,091 | |
Williams Cos., Inc. | | | | | | | | |
7.50%, 01/15/31 | | | 15,000 | | | | 16,892 | |
7.75%, 06/15/31 | | | 149,000 | | | | 168,505 | |
8.75%, 03/15/32D | | | 1,053,000 | | | | 1,291,713 | |
Windstream Corporation | | | | | | | | |
8.63%, 08/01/16 | | | 630,000 | | | | 666,225 | |
| | | | | | | | |
Total Corporate Bonds
(Cost $174,351,584) | | | | 176,604,558 | |
| | | | | | | | |
FOREIGN BONDS — 14.0% | | | | | |
Argentina — 0.1% | | | | | | | | |
Argentina Government International Bond | | | | | | | | |
0.00%, 12/15/35(E)W† | | | 3,060,000 | | | | 519,316 | |
| | | | | | | | |
Australia — 1.7% | | | | | | | | |
Australia Government Bond | | | | | | | | |
4.75%, 06/15/16(A) | | | 7,800,000 | | | | 7,735,363 | |
6.00%, 02/15/17(A) | | | 2,400,000 | | | | 2,527,900 | |
Commonwealth Bank of Australia | | | | | | | | |
3.75%, 10/15/14 144A | | | 440,000 | | | | 456,859 | |
5.00%, 10/15/19 144A | | | 190,000 | | | | 199,230 | |
QBE Insurance Group, Ltd. | | | | | | | | |
5.65%, 07/01/23 144A† | | | 525,000 | | | | 498,787 | |
Rio Tinto Finance USA, Ltd. | | | | | | | | |
3.50%, 11/02/20 | | | 1,180,000 | | | | 1,122,431 | |
Westpac Banking Corporation | | | | | | | | |
1.90%, 12/14/12 144A@ | | | 1,500,000 | | | | 1,526,096 | |
| | | | | | | | |
| | | | | | | 14,066,666 | |
| | | | | | | | |
Bermuda — 0.1% | | | | | | | | |
Arch Capital Group, Ltd. | | | | | | | | |
7.35%, 05/01/34 | | | 250,000 | | | | 259,776 | |
Endurance Specialty Holdings, Ltd. | | | | | | | | |
6.15%, 10/15/15 | | | 200,000 | | | | 210,112 | |
| | | | | | | | |
| | | | | | | 469,888 | |
| | | | | | | | |
Brazil — 0.1% | | | | | | | | |
Brazilian Government International Bond | | | | | | | | |
8.25%, 01/20/34 | | | 600,000 | | | | 802,500 | |
Telemar Norte Leste SA | | | | | | | | |
5.50%, 10/23/20 144A@D | | | 225,000 | | | | 217,688 | |
| | | | | | | | |
| | | | | | | 1,020,188 | |
| | | | | | | | |
Canada — 1.7% | | | | | | | | |
Canadian Government Bond | | | | | | | | |
1.50%, 03/01/12(C) | | | 12,700,000 | | | | 12,778,296 | |
Hydro Quebec | | | | | | | | |
6.30%, 05/11/11 | | | 305,000 | | | | 311,310 | |
Nexen, Inc. | | | | | | | | |
7.50%, 07/30/39 | | | 175,000 | | | | 190,899 | |
Potash Corporation of Saskatchewan, Inc. | | | | | | | | |
4.88%, 03/30/20 | | | 110,000 | | | | 115,131 | |
| | | | |
| | See Notes to Financial Statements. | | 91 |
| | |
MEDIUM-DURATION BOND FUND SCHEDULE OF INVESTMENTS (Continued) | | |
| | |
| | | | | | | | |
| | | Par | | | Value | |
Rogers Communications, Inc. | | | | | | | | |
6.38%, 03/01/14 | | $ | 90,000 | | | $ | 101,198 | |
6.75%, 03/15/15 | | | 10,000 | | | | 11,619 | |
Teck Resources, Ltd. | | | | | | | | |
10.75%, 05/15/19 | | | 400,000 | | | | 520,767 | |
TransCanada PipeLines, Ltd. | | | | | | | | |
6.35%, 05/15/67†D | | | 400,000 | | | | 395,484 | |
| | | | | | | | |
| | | | | | | 14,424,704 | |
| | | | | | | | |
Cayman Islands — 0.5% | | | | | |
MUFG Capital Finance 1, Ltd. | | | | | | | | |
6.35%, 07/25/25† | | | 450,000 | | | | 456,480 | |
Petrobras International Finance Co. | | | | | | | | |
6.13%, 10/06/16 | | | 271,000 | | | | 299,461 | |
5.75%, 01/20/20 | | | 235,000 | | | | 245,003 | |
Resona Preferred Global Securities Cayman, Ltd. | | | | | | | | |
7.19%, 12/29/49 144A†@ | | | 1,015,000 | | | | 1,008,347 | |
Systems 2001 Asset Trust LLC | | | | | | | | |
6.66%, 09/15/13 144A | | | 516,490 | | | | 558,622 | |
Transocean, Inc. | | | | | | | | |
6.50%, 11/15/20D | | | 600,000 | | | | 638,196 | |
Vale Overseas, Ltd. | | | | | | | | |
8.25%, 01/17/34 | | | 80,000 | | | | 99,897 | |
6.88%, 11/21/36 | | | 511,000 | | | | 563,368 | |
| | | | | | | | |
| | | | | | | 3,869,374 | |
| | | | | | | | |
Chile — 0.0% | | | | | | | | |
Corp Nacional del Cobre de Chile | | | | | | | | |
4.75%, 10/15/14 144AD | | | 210,000 | | | | 224,723 | |
| | | | | | | | |
| Denmark — 0.5% | | | | | | | | |
BRFkredit AS | | | | | | | | |
2.05%, 04/15/13 144A@ | | | 2,500,000 | | | | 2,543,625 | |
Danske Bank AS | | | | | | | | |
2.50%, 05/10/12 144A@ | | | 600,000 | | | | 614,831 | |
FIH Erhvervsbank A/S | | | | | | | | |
2.00%, 06/12/13 144A@ | | | 1,000,000 | | | | 1,017,212 | |
| | | | | | | | |
| | | | | | | 4,175,668 | |
| | | | | | | | |
France — 1.1% | | | | | | | | |
AXA SA | | | | | | | | |
6.46%, 12/14/18 144A†@ | | | 150,000 | | | | 135,375 | |
Cie de Financement Foncier | | | | | | | | |
1.63%, 07/23/12 144A@ | | | 900,000 | | | | 904,568 | |
2.13%, 04/22/13 144A@D | | | 300,000 | | | | 302,722 | |
Compagnie Generale de Geophysique - Veritas | | | | | | | | |
7.50%, 05/15/15D | | | 200,000 | | | | 204,500 | |
7.75%, 05/15/17 | | | 155,000 | | | | 159,650 | |
Credit Agricole SA | | | | | | | | |
8.38%, 10/13/19 144A†@D | | | 1,180,000 | | | | 1,218,350 | |
Dexia Credit Local | | | | | | | | |
2.75%, 01/10/14 144A | | | 5,900,000 | | | | 5,994,589 | |
Legrand France SA | | | | | | | | |
8.50%, 02/15/25 | | | 250,000 | | | | 293,254 | |
| | | | | | | | |
| | | | | | | 9,213,008 | |
| | | | | | | | |
Iceland — 0.1% | | | | | | | | |
Glitnir Banki HF | | | | | | | | |
6.33%, 07/28/11 144A#@ | | | 600,000 | | | | 181,500 | |
6.38%, 09/25/12 144A#@ | | | 580,000 | | | | 175,450 | |
6.69%, 06/15/16 144A#@D | | | 1,000,000 | | | | 10 | |
7.45%, 09/14/16 144A#@ | | | 100,000 | | | | 1 | |
Kaupthing Bank HF | | | | | | | | |
5.75%, 10/04/11 144A#@ | | | 250,000 | | | | 68,125 | |
7.63%, 02/28/15 144A#@ | | | 2,490,000 | | | | 678,525 | |
7.13%, 05/19/16 144A#@ | | | 350,000 | | | | 3 | |
Landsbanki Islands HF | | | | | | | | |
6.10%, 08/25/11 144A#@ | | | 1,500,000 | | | | 172,500 | |
| | | | | | | | |
| | | | | | | 1,276,114 | |
| | | | | | | | |
India — 0.1% | | | | | | | | |
ICICI Bank, Ltd. | | | | | | | | |
6.38%, 04/30/22† | | | 110,000 | | | | 104,971 | |
ICICI Bank, Ltd. | | | | | | | | |
6.38%, 04/30/22 144A† | | | 418,000 | | | | 420,149 | |
| | | | | | | | |
| | | | | | | 525,120 | |
| | | | | | | | |
Ireland — 0.0% | | | | | | | | |
DEPFA ACS Bank | | | | | | | | |
5.13%, 03/16/37 144A | | | 280,000 | | | | 189,440 | |
VIP Finance Ireland Ltd. for OJSC Vimpel Communications | | | | | | | | |
8.38%, 04/30/13 144AD | | | 120,000 | | | | 130,200 | |
| | | | | | | | |
| | | | | | | 319,640 | |
| | | | | | | | |
Italy — 0.1% | | | | | | | | |
Intesa Sanpaolo SpA | | | | | | | | |
3.63%, 08/12/15 144A | | | 290,000 | | | | 280,648 | |
Telecom Italia Capital SA | | | | | | | | |
6.20%, 07/18/11D | | | 150,000 | | | | 153,960 | |
5.25%, 11/15/13 | | | 165,000 | | | | 172,012 | |
4.95%, 09/30/14 | | | 260,000 | | | | 266,607 | |
5.25%, 10/01/15 | | | 130,000 | | | | 133,240 | |
| | | | | | | | |
| | | | | | | 1,006,467 | |
| | | | | | | | |
Japan — 0.2% | | | | | | | | |
Bank of Tokyo-Mitsubishi UFJ, Ltd. | | | | | | | | |
3.85%, 01/22/15 144A | | | 440,000 | | | | 459,169 | |
Resona Bank, Ltd. | | | | | | | | |
5.85%, 07/15/49 144A† | | | 250,000 | | | | 250,050 | |
Sumitomo Mitsui Banking Corporation | | | | | | | | |
3.15%, 07/22/15 144AD | | | 640,000 | | | | 652,075 | |
| | | | | | | | |
| | | | | | | 1,361,294 | |
| | | | | | | | |
Jersey — 0.5% | | | | | | | | |
HSBC Capital Funding LP | | | | | | | | |
4.61%, 12/29/49 144A†@ | | | 960,000 | | | | 908,935 | |
Magnolia Funding, Ltd. | | | | | | | | |
3.00%, 04/20/17 144A(E) | | | 2,275,253 | | | | 3,029,556 | |
United Business Media, Ltd. | | | | | | | | |
5.75%, 11/03/20 144A | | | 260,000 | | | | 250,075 | |
| | | | | | | | |
| | | | | | | 4,188,566 | |
| | | | | | | | |
Luxembourg — 0.7% | | | | | | | | |
Fiat Finance & Trade, Ltd. SA | | | | | | | | |
9.00%, 07/30/12(E) | | | 700,000 | | | | 1,007,771 | |
FMC Finance III SA | | | | | | | | |
6.88%, 07/15/17D | | | 250,000 | | | | 266,250 | |
Gazprom Via Gaz Capital SA | | | | | | | | |
6.51%, 03/07/22 144AD | | | 3,200,000 | | | | 3,280,000 | |
Gazprom Via Gaz Capital SA | | | | | | | | |
9.25%, 04/23/19 | | | 290,000 | | | | 357,802 | |
Russian Capital SA for OJSC Russian Agricultural Bank | | | | | | | | |
6.30%, 05/15/17 144A | | | 300,000 | | | | 303,000 | |
| | | | |
| 92 | | See Notes to Financial Statements. | | |
| | | | | | | | |
| | | Par | | | Value | |
TNK-BP Finance SA | | | | | | | | |
7.50%, 07/18/16 144A | | $ | 110,000 | | | $ | 122,512 | |
Tyco International Group SA | | | | | | | | |
6.00%, 11/15/13 | | | 710,000 | | | | 788,153 | |
| | | | | | | | |
| | | | | | | 6,125,488 | |
| | | | | | | | |
Mexico — 0.5% | | | | | | | | |
America Movil SAB de CV | | | | | | | | |
5.63%, 11/15/17 | | | 270,000 | | | | 295,693 | |
5.00%, 03/30/20 144AD | | | 240,000 | | | | 250,667 | |
BBVA Bancomer SA Texas | | | | | | | | |
7.25%, 04/22/20 144A@D | | | 625,000 | | | | 662,689 | |
Mexican Bonos | | | | | | | | |
10.00%, 12/05/24(M) | | | 6,657,600 | | | | 673,361 | |
8.50%, 11/18/38(M) | | | 2,886,800 | | | | 249,987 | |
Mexico Government International Bond | | | | | | | | |
6.75%, 09/27/34 | | | 601,000 | | | | 679,130 | |
6.05%, 01/11/40 | | | 134,000 | | | | 137,685 | |
Petroleos Mexicanos | | | | | | | | |
8.00%, 05/03/19 | | | 720,000 | | | | 871,200 | |
5.50%, 01/21/21 144A | | | 370,000 | | | | 376,475 | |
| | | | | | | | |
| | | | | | | 4,196,887 | |
| | | | | | | | |
Netherlands — 0.8% | | | | | | | | |
Achmea Hypotheekbank NV | | | | | | | | |
3.20%, 11/03/14 144A@ | | | 2,000,000 | | | | 2,082,722 | |
Deutsche Telekom International Finance BV | | | | | | | | |
5.75%, 03/23/16D | | | 510,000 | | | | 571,843 | |
Fortis Bank Nederland NV | | | | | | | | |
1.51%, 06/10/11(E)† | | | 700,000 | | | | 936,122 | |
ING Bank NV | | | | | | | | |
3.90%, 03/19/14 144A | | | 500,000 | | | | 537,624 | |
LeasePlan Corporation NV | | | | | | | | |
3.00%, 05/07/12 144A@ | | | 1,200,000 | | | | 1,232,730 | |
Rabobank Nederland | | | | | | | | |
11.00%, 06/30/19 144A† | | | 687,000 | | | | 888,786 | |
Shell International Finance BV | | | | | | | | |
4.38%, 03/25/20 | | | 700,000 | | | | 735,594 | |
| | | | | | | | |
| | | | | | | 6,985,421 | |
| | | | | | | | |
New Zealand — 0.2% | | | | | | | | |
ANZ National International, Ltd. | | | | | | | | |
3.25%, 04/02/12 144A@ | | | 1,900,000 | | | | 1,955,415 | |
Westpac Securities NZ, Ltd. | | | | | | | | |
2.50%, 05/25/12 144A@ | | | 200,000 | | | | 204,728 | |
| | | | | | | | |
| | | | | | | 2,160,143 | |
| | | | | | | | |
Norway — 0.3% | | | | | | | | |
DnB NOR Boligkreditt | | | | | | | | |
2.10%, 10/14/15 144A@D | | | 1,100,000 | | | | 1,047,504 | |
Sparebanken 1 Boligkreditt | | | | | | | | |
1.25%, 10/25/13 144A@D | | | 1,900,000 | | | | 1,888,543 | |
| | | | | | | | |
| | | | | | | 2,936,047 | |
| | | | | | | | |
Peru — 0.0% | | | | | | | | |
Peruvian Government International Bond | | | | | | | | |
5.63%, 11/18/50 | | | 70,000 | | | | 65,100 | |
| | | | | | | | |
Portugal — 0.5% | | | | | | | | |
Obrigacoes do Tesouro | | | | | | | | |
2.21%, 05/16/47(E)W | | | 3,000,000 | | | | 4,009,540 | |
| | | | | | | | |
| Qatar — 0.2% | | | | | | | | |
Qatar Government International Bond | | | | | | | | |
5.15%, 04/09/14 | | | 510,000 | | | | 550,443 | |
5.25%, 01/20/20@D | | | 580,000 | | | | 614,800 | |
Ras Laffan Liquefied Natural Gas Co., Ltd. III | | | | | | | | |
6.75%, 09/30/19 144A@ | | | 250,000 | | | | 291,235 | |
| | | | | | | | |
| | | | | | | 1,456,478 | |
| | | | | | | | |
Russia — 0.0% | | | | | | | | |
Russian Federation | | | | | | | | |
7.50%, 03/31/30 | | | 214,800 | | | | 248,953 | |
| | | | | | | | |
South Africa — 0.2% | | | | | | | | |
South Africa Government Bond | | | | | | | | |
8.00%, 12/21/18(S) | | | 3,180,000 | | | | 482,010 | |
6.75%, 03/31/21(S) | | | 7,200,000 | | | | 989,737 | |
| | | | | | | | |
| | | | | | | 1,471,747 | |
| | | | | | | | |
South Korea — 0.0% | | | | | | | | |
Export-Import Bank of Korea | | | | | | | | |
5.25%, 02/10/14 | | | 235,000 | | | | 249,940 | |
| | | | | | | | |
Spain — 0.1% | | | | | | | | |
Santander US Debt SA Unipersonal | | | | | | | | |
3.72%, 01/20/15 144A | | | 700,000 | | | | 663,834 | |
3.78%, 10/07/15 144A | | | 100,000 | | | | 94,059 | |
Telefonica Emisiones SAU | | | | | | | | |
5.13%, 04/27/20 | | | 435,000 | | | | 419,554 | |
| | | | | | | | |
| | | | | | | 1,177,447 | |
| | | | | | | | |
Sweden — 0.8% | | | | | | | | |
Nordea Bank AB | | | | | | | | |
3.70%, 11/13/14 144A | | | 390,000 | | | | 402,358 | |
4.88%, 01/27/20 144A | | | 110,000 | | | | 113,055 | |
Stadshypotek AB | | | | | | | | |
1.45%, 09/30/13 144A@ | | | 5,800,000 | | | | 5,796,862 | |
Swedish Housing Finance Corporation | | | | | | | | |
3.13%, 03/23/12@ | | | 300,000 | | | | 307,793 | |
| | | | | | | | |
| | | | | | | 6,620,068 | |
| | | | | | | | |
Switzerland — 0.2% | | | | | | | | |
Credit Suisse AG | | | | | | | | |
5.40%, 01/14/20D | | | 200,000 | | | | 204,617 | |
UBS AG | | | | | | | | |
1.38%, 02/23/12† | | | 400,000 | | | | 403,511 | |
3.88%, 01/15/15D | | | 530,000 | | | | 546,737 | |
4.88%, 08/04/20D | | | 180,000 | | | | 183,470 | |
| | | | | | | | |
| | | | | | | 1,338,335 | |
| | | | | | | | |
United Arab Emirates — 0.0% | | | | | |
Dolphin Energy, Ltd. | | | | | | | | |
5.89%, 06/15/19 144A@ | | | 258,412 | | | | 276,963 | |
| | | | | | | | |
United Kingdom — 2.2% | | | | | | | | |
Abbey National Treasury Services PLC | | | | | | | | |
3.88%, 11/10/14 144A | | | 3,800,000 | | | | 3,768,893 | |
Anglo American Capital PLC | | | | | | | | |
9.38%, 04/08/14 144A@D | | | 100,000 | | | | 120,484 | |
9.38%, 04/08/19 144AD | | | 275,000 | | | | 370,482 | |
Barclays Bank PLC | | | | | | | | |
5.20%, 07/10/14 | | | 460,000 | | | | 497,238 | |
6.05%, 12/04/17 144AD | | | 230,000 | | | | 236,266 | |
| | | | |
| | See Notes to Financial Statements. | | 93 |
| | |
MEDIUM-DURATION BOND FUND SCHEDULE OF INVESTMENTS (Continued) | | |
| | |
| | | | | | | | |
| | | Par | | | Value | |
BP Capital Markets PLC | | | | | | | | |
5.25%, 11/07/13D | | $ | 1,190,000 | | | $ | 1,289,640 | |
3.88%, 03/10/15D | | | 635,000 | | | | 655,626 | |
4.50%, 10/01/20 | | | 375,000 | | | | 374,828 | |
HSBC Holdings PLC | | | | | | | | |
6.80%, 06/01/38D | | | 250,000 | | | | 271,203 | |
Lloyds TSB Bank PLC | | | | | | | | |
1.18%, 06/09/11(E)† | | | 500,000 | | | | 668,657 | |
6.50%, 09/14/20 144A@D | | | 350,000 | | | | 322,572 | |
12.00%, 12/16/39 144A† | | | 3,200,000 | | | | 3,493,045 | |
Royal Bank of Scotland PLC | | | | | | | | |
1.50%, 03/30/12 144A@ | | | 2,400,000 | | | | 2,421,415 | |
4.88%, 08/25/14 144A@ | | | 425,000 | | | | 435,633 | |
4.88%, 03/16/15 | | | 200,000 | | | | 204,778 | |
3.95%, 09/21/15D | | | 970,000 | | | | 954,555 | |
Royal Bank of Scotland Group PLC | | | | | | | | |
6.40%, 10/21/19D | | | 880,000 | | | | 887,066 | |
7.64%, 03/31/45 | | | 300,000 | | | | 201,000 | |
Silverstone Master Issuer PLC | | | | | | | | |
1.68%, 01/21/55 144A†@ | | | 1,200,000 | | | | 1,201,211 | |
WPP Finance UK | | | | | | | | |
8.00%, 09/15/14 | | | 226,000 | | | | 260,212 | |
| | | | | | | | |
| | | | | | | 18,634,804 | |
| | | | | | | | |
Venezuela — 0.0% | | | | | | | | |
Venezuela Government International Bond | | | | | | | | |
5.75%, 02/26/16D | | | 260,000 | | | | 183,612 | |
7.75%, 10/13/19 | | | 160,000 | | | | 109,200 | |
8.25%, 10/13/24 | | | 50,000 | | | | 32,750 | |
| | | | | | | | |
| | | | | | | 325,562 | |
| | | | | | | | |
Virgin Islands (British) — 0.5% | |
Gerdau Trade, Inc. | | | | | | | | |
5.75%, 01/30/21 144A | | | 4,000,000 | | | | 4,030,000 | |
| | | | | | | | |
Total Foreign Bonds
(Cost $120,434,623) | | | | | | | 118,969,659 | |
| | | | | | | | |
LOAN AGREEMENT — 0.0% | | | | | |
Ford Motor Co. Tranche B | | | | | | | | |
3.74%, 12/15/13 | | | | | | | | |
(Cost $40,349) | | | 40,349 | | | | 40,258 | |
| | | | | | | | |
MORTGAGE-BACKED SECURITIES — 52.1% | |
ABN Amro Mortgage Corporation | | | | | | | | |
0.00%, 06/25/33 IOW | | | 56,670 | | | | 2,794 | |
American Home Mortgage Assets | | | | | | | | |
1.25%, 11/25/46† | | | 1,393,065 | | | | 686,525 | |
Arkle Master Issuer PLC | | | | | | | | |
1.68%, 05/17/60 144A†@ | | | 1,100,000 | | | | 1,098,545 | |
Avis Budget Rental Car Funding AESOP LLC | | | | | | | | |
3.15%, 03/20/17 144A | | | 160,000 | | | | 156,253 | |
Banc of America Large Loan, Inc., Sereis 2010-UB5, Cl A4 | | | | | | | | |
5.64%, 02/17/51 144A† | | | 100,000 | | | | 106,547 | |
Bank of America Funding Corporation | | | | | | | | |
0.34%, 07/20/36† | | | 234,141 | | | | 233,498 | |
Bank of America Mortgage Securities, Inc. | | | | | | | | |
2.77%, 07/25/34† | | | 344,565 | | | | 316,570 | |
Bear Stearns Adjustable Rate Mortgage Trust | | | | | | | | |
5.67%, 02/25/33† | | | 96,892 | | | | 96,538 | |
5.28%, 05/25/34† | | | 656,960 | | | | 643,652 | |
2.73%, 03/25/35† | | | 1,345,248 | | | | 1,277,987 | |
Bear Stearns Alt-A Trust | | | | | | | | |
0.90%, 04/25/34† | | | 99,520 | | | | 84,686 | |
2.88%, 05/25/35† | | | 558,404 | | | | 466,916 | |
2.96%, 09/25/35† | | | 835,071 | | | | 634,606 | |
Bear Stearns Structured Products, Inc. | | | | | | | | |
2.36%, 01/26/36† | | | 1,417,788 | | | | 925,244 | |
Chase Mortgage Finance Corporation | | | | | | | | |
3.07%, 02/25/37† | | | 275,904 | | | | 258,277 | |
Citigroup Mortgage Loan Trust, Inc. | | | | | | | | |
4.90%, 12/25/35† | | | 1,673,594 | | | | 1,576,796 | |
Commercial Mortgage Pass-Through Certificates | | | | | | | | |
5.76%, 06/10/46† | | | 1,250,000 | | | | 1,366,717 | |
Countrywide Alternative Loan Trust | | | | | | | | |
5.50%, 10/25/33 | | | 146,526 | | | | 153,473 | |
0.61%, 09/25/35† | | | 2,000,120 | | | | 1,254,855 | |
1.83%, 09/25/35† | | | 281,707 | | | | 183,457 | |
0.59%, 10/25/35† | | | 1,325,861 | | | | 804,646 | |
0.58%, 11/20/35† | | | 1,618,335 | | | | 983,763 | |
0.59%, 11/20/35† | | | 1,972,929 | | | | 1,203,660 | |
0.53%, 01/25/36† | | | 666,003 | | | | 452,518 | |
0.53%, 02/25/36† | | | 1,518,663 | | | | 828,995 | |
6.00%, 08/25/37 | | | 1,242,988 | | | | 947,905 | |
0.47%, 06/25/46† | | | 1,029,802 | | | | 460,689 | |
0.45%, 09/25/46† | | | 1,452,348 | | | | 873,112 | |
Countrywide Home Loan Mortgage Pass-Through Trust | | | | | | | | |
3.03%, 02/19/34† | | | 1,256,791 | | | | 1,184,346 | |
3.09%, 11/20/34† | | | 258,107 | | | | 221,496 | |
0.68%, 11/25/34 144A† | | | 25,692 | | | | 22,462 | |
0.62%, 03/25/35 144A† | | | 99,253 | | | | 81,822 | |
0.50%, 03/25/36† | | | 463,277 | | | | 315,826 | |
Credit Suisse Mortgage Capital Certificates | | | | | | | | |
5.38%, 02/15/40 | | | 1,800,000 | | | | 1,828,188 | |
CS First Boston Mortgage Securities Corporation | | | | | | | | |
0.00%, 07/25/33 IOW† | | | 292,630 | | | | 7,819 | |
0.00%, 08/25/33 IOW† | | | 213,921 | | | | — | |
6.53%, 06/15/34 | | | 635,656 | | | | 638,808 | |
Federal Home Loan Mortgage Corporation | | | | | | | | |
7.00%, 11/01/14 | | | 19,634 | | | | 21,283 | |
7.00%, 04/01/15 | | | 10,001 | | | | 10,841 | |
7.00%, 12/01/15 | | | 17,271 | | | | 18,461 | |
8.50%, 06/01/16 | | | 10,820 | | | | 12,095 | |
8.50%, 06/01/18 | | | 4,809 | | | | 5,375 | |
4.50%, 09/01/18 | | | 17,851 | | | | 18,844 | |
8.00%, 08/01/24 | | | 3,022 | | | | 3,529 | |
7.50%, 11/01/29 | | | 10,772 | | | | 12,349 | |
7.50%, 12/01/29 | | | 18,511 | | | | 21,221 | |
7.50%, 02/01/31 | | | 29,070 | | | | 33,355 | |
2.66%, 07/01/31† | | | 28,542 | | | | 29,823 | |
2.61%, 08/01/31† | | | 3,634 | | | | 3,790 | |
7.50%, 11/01/31 | | | 10,058 | | | | 11,544 | |
| | | | |
| 94 | | See Notes to Financial Statements. | | |
| | | | | | | | |
| | | Par | | | Value | |
2.85%, 04/01/32† | | $ | 6,920 | | | $ | 7,240 | |
2.72%, 03/01/34† | | | 7,062 | | | | 7,353 | |
5.00%, 12/01/34 | | | 82,256 | | | | 86,732 | |
5.50%, 05/01/35 | | | 1,186,785 | | | | 1,272,597 | |
5.00%, 11/01/35 | | | 1,078,586 | | | | 1,136,604 | |
5.50%, 11/01/35 | | | 452,928 | | | | 485,500 | |
5.00%, 12/01/35 | | | 83,058 | | | | 88,097 | |
5.50%, 01/01/36 | | | 213,041 | | | | 228,695 | |
6.00%, 02/01/36 | | | 1,305,151 | | | | 1,421,162 | |
5.98%, 01/01/37† | | | 920,994 | | | | 974,026 | |
5.64%, 04/01/37† | | | 1,586,461 | | | | 1,674,277 | |
6.00%, 04/01/37 | | | 8,862 | | | | 9,798 | |
0.00%, 04/15/37W† | | | 5,107 | | | | 5,116 | |
5.50%, 07/01/37 | | | 369,355 | | | | 396,495 | |
6.00%, 07/01/37 | | | 2,507 | | | | 2,771 | |
5.57%, 09/01/37† | | | 856,700 | | | | 908,924 | |
6.00%, 09/01/37 | | | 110,820 | | | | 122,501 | |
5.50%, 02/01/38 | | | 212,080 | | | | 226,272 | |
5.50%, 04/01/38 | | | 142,790 | | | | 152,345 | |
6.00%, 07/01/38 | | | 42,457 | | | | 46,938 | |
5.50%, 12/01/38 | | | 673,296 | | | | 718,139 | |
6.00%, 12/01/38 | | | 116,345 | | | | 128,625 | |
5.50%, 01/01/39 TBA | | | 5,000,000 | | | | 5,328,125 | |
6.00%, 01/01/39 | | | 58,744 | | | | 64,945 | |
5.50%, 02/01/39 | | | 153,337 | | | | 163,550 | |
4.50%, 09/01/39 | | | 914,192 | | | | 944,816 | |
4.50%, 11/01/39 | | | 967,095 | | | | 991,935 | |
4.50%, 01/01/40 TBA | | | 2,000,000 | | | | 2,049,376 | |
5.00%, 01/01/40 TBA | | | 3,000,000 | | | | 3,146,250 | |
5.50%, 01/01/40 | | | 928,199 | | | | 990,310 | |
4.50%, 05/01/40 | | | 476,921 | | | | 489,171 | |
4.00%, 01/01/41 TBA | | | 6,100,000 | | | | 6,055,202 | |
4.50%, 01/13/41 TBA | | | 25,500,000 | | | | 26,129,544 | |
Federal Home Loan Mortgage Corporation REMIC | | | | | | | | |
3.95%, 04/15/22 POW† | | | 17,413 | | | | 15,679 | |
0.76%, 06/15/37† | | | 1,450,434 | | | | 1,455,475 | |
4.00%, 12/15/38 | | | 400,000 | | | | 391,258 | |
Federal Housing Administration | | | | | | | | |
7.43%, 10/01/18@ | | | 151,690 | | | | 161,717 | |
Federal National Mortgage Association | | | | | | | | |
8.00%, 06/01/15 | | | 25,455 | | | | 27,320 | |
8.00%, 07/01/15 | | | 14,049 | | | | 14,263 | |
8.00%, 09/01/15 | | | 26,018 | | | | 28,222 | |
5.00%, 12/01/17 | | | 55,403 | | | | 58,806 | |
5.00%, 05/01/18 | | | 122,389 | | | | 130,780 | |
4.00%, 09/01/18 | | | 2,109,459 | | | | 2,202,078 | |
5.00%, 04/01/19 | | | 326,111 | | | | 349,154 | |
5.00%, 08/01/19 | | | 172,009 | | | | 184,038 | |
6.00%, 09/01/19 | | | 435,994 | | | | 474,620 | |
5.00%, 10/01/19 | | | 142,529 | | | | 152,510 | |
6.00%, 12/01/20 | | | 805,964 | | | | 877,367 | |
9.50%, 05/01/22 | | | 2,816 | | | | 3,173 | |
3.00%, 07/01/22† | | | 9,690 | | | | 9,701 | |
5.50%, 09/01/23 | | | 426,242 | | | | 461,984 | |
5.50%, 10/01/23 | | | 66,807 | | | | 72,705 | |
9.50%, 07/01/24 | | | 5,486 | | | | 6,147 | |
3.00%, 01/01/26 TBA | | | 7,000,000 | | | | 6,852,342 | |
3.50%, 01/01/26 TBA | | | 10,900,000 | | | | 10,974,938 | |
4.00%, 01/19/26 TBA | | | 5,000,000 | | | | 5,149,220 | |
4.50%, 01/19/26 TBA | | | 17,000,000 | | | | 17,820,777 | |
3.00%, 02/01/26 TBA | | | 4,000,000 | | | | 3,904,376 | |
3.50%, 02/01/26 TBA | | | 4,000,000 | | | | 4,016,248 | |
3.50%, 09/18/26 TBA | | | 16,000,000 | | | | 16,110,000 | |
2.91%, 07/01/27† | | | 24,551 | | | | 24,831 | |
2.50%, 08/01/27† | | | 59,855 | | | | 62,569 | |
2.91%, 11/01/27† | | | 49,202 | | | | 49,761 | |
5.50%, 04/01/29 | | | 435 | | | | 470 | |
3.01%, 02/01/30† | | | 155,566 | | | | 163,725 | |
2.76%, 06/01/30† | | | 20,975 | | | | 21,187 | |
8.00%, 10/01/30 | | | 43,175 | | | | 48,286 | |
2.76%, 12/01/30† | | | 7,452 | | | | 7,855 | |
2.91%, 01/01/31† | | | 8,192 | | | | 8,352 | |
2.57%, 05/01/31† | | | 17,440 | | | | 18,230 | |
6.00%, 11/01/31 | | | 17,158 | | | | 18,902 | |
6.00%, 01/01/32 | | | 71,846 | | | | 79,146 | |
6.00%, 03/01/32 | | | 96,003 | | | | 105,757 | |
6.00%, 04/01/32 | | | 540,179 | | | | 595,063 | |
2.91%, 06/01/32† | | | 9,575 | | | | 9,693 | |
3.00%, 08/01/32† | | | 32,884 | | | | 33,794 | |
2.50%, 02/01/33† | | | 3,174 | | | | 3,290 | |
3.00%, 05/01/33† | | | 77,391 | | | | 79,003 | |
6.00%, 05/01/33 | | | 10,071 | | | | 11,094 | |
5.00%, 08/01/33 | | | 25,113 | | | | 26,561 | |
5.50%, 09/01/33 | | | 6,813 | | | | 7,343 | |
6.00%, 12/01/33 | | | 4,246 | | | | 4,678 | |
5.50%, 02/01/34 | | | 8,574 | | | | 9,239 | |
5.50%, 04/01/34 | | | 1,422 | | | | 1,541 | |
5.50%, 08/01/34 | | | 13,276 | | | | 14,394 | |
5.50%, 10/01/34 | | | 804 | | | | 871 | |
6.00%, 10/01/34 | | | 70,696 | | | | 77,709 | |
2.56%, 12/01/34† | | | 533,902 | | | | 547,992 | |
5.50%, 12/01/34 | | | 84,798 | | | | 91,377 | |
6.00%, 12/01/34 | | | 2,099 | | | | 2,302 | |
6.00%, 01/01/35 | | | 741,236 | | | | 811,278 | |
6.00%, 05/01/35 | | | 2,589,412 | | | | 2,825,800 | |
5.50%, 07/01/35 | | | 560 | | | | 607 | |
6.00%, 07/01/35 | | | 636,092 | | | | 694,161 | |
5.50%, 08/01/35 | | | 1,401 | | | | 1,519 | |
6.00%, 08/01/35 | | | 572 | | | | 625 | |
5.50%, 09/01/35 | | | 440,331 | | | | 473,966 | |
6.00%, 10/01/35 | | | 147,910 | | | | 161,903 | |
2.27%, 11/01/35† | | | 209,699 | | | | 215,109 | |
2.27%, 11/01/35† | | | 241,021 | | | | 247,002 | |
2.29%, 11/01/35† | | | 204,642 | | | | 209,875 | |
2.30%, 11/01/35† | | | 183,005 | | | | 187,754 | |
2.33%, 11/01/35† | | | 185,503 | | | | 190,558 | |
2.91%, 11/01/35† | | | 20,951 | | | | 21,453 | |
6.00%, 11/01/35 | | | 1,397,229 | | | | 1,533,547 | |
5.50%, 12/01/35 | | | 6,560 | | | | 7,112 | |
6.00%, 12/01/35 | | | 29,027 | | | | 31,822 | |
4.50%, 01/01/36 TBA | | | 5,800,000 | | | | 5,953,155 | |
5.50%, 01/01/36 TBA | | | 5,800,000 | | | | 6,205,095 | |
6.00%, 02/01/36 | | | 18,878 | | | | 20,696 | |
6.00%, 03/01/36 | | | 26,031 | | | | 28,538 | |
5.50%, 04/01/36 | | | 376,211 | | | | 399,404 | |
6.00%, 04/01/36 | | | 25,870 | | | | 28,361 | |
4.09%, 05/01/36† | | | 303,998 | | | | 309,263 | |
6.00%, 09/01/36 | | | 244,413 | | | | 270,239 | |
6.00%, 10/01/36 | | | 3,776 | | | | 4,116 | |
6.50%, 10/01/36 | | | 273,760 | | | | 305,254 | |
5.50%, 11/01/36 | | �� | 1,024,189 | | | | 1,098,211 | |
6.00%, 11/01/36 | | | 101,694 | | | | 110,851 | |
6.50%, 11/01/36 | | | 132,920 | | | | 148,294 | |
6.00%, 12/01/36 | | | 340,970 | | | | 376,994 | |
6.00%, 01/01/37 | | | 262,911 | | | | 289,091 | |
| | | | |
| | See Notes to Financial Statements. | | 95 |
| | |
MEDIUM-DURATION BOND FUND SCHEDULE OF INVESTMENTS (Continued) | | |
| | |
| | | | | | | | |
| | | Par | | | Value | |
5.50%, 02/01/37 | | $ | 1,203 | | | $ | 1,296 | |
5.53%, 02/01/37† | | | 1,238,643 | | | | 1,311,188 | |
5.50%, 03/01/37 | | | 51,001 | | | | 54,847 | |
5.50%, 04/01/37 | | | 1,908 | | | | 2,056 | |
6.00%, 04/01/37 | | | 12,733 | | | | 13,855 | |
5.50%, 05/01/37 | | | 2,511 | | | | 2,705 | |
6.00%, 05/01/37 | | | 45,107 | | | | 49,084 | |
5.50%, 06/01/37 | | | 911 | | | | 981 | |
6.00%, 06/01/37 | | | 36,643 | | | | 39,873 | |
6.00%, 07/01/37 | | | 5,434,371 | | | | 5,957,577 | |
5.63%, 07/15/37 | | | 300,000 | | | | 338,353 | |
6.00%, 08/01/37 | | | 123,366 | | | | 134,243 | |
6.00%, 09/01/37 | | | 85,510 | | | | 93,049 | |
6.00%, 10/01/37 | | | 254,397 | | | | 276,826 | |
6.50%, 10/01/37 | | | 349,411 | | | | 391,261 | |
6.00%, 11/01/37 | | | 250,952 | | | | 273,077 | |
2.91%, 12/01/37† | | | 117,079 | | | | 116,868 | |
5.50%, 12/01/37 | | | 381,551 | | | | 408,531 | |
6.00%, 12/01/37 | | | 732,784 | | | | 797,390 | |
2.91%, 01/01/38† | | | 51,775 | | | | 53,056 | |
5.50%, 01/01/38 | | | 824,358 | | | | 882,649 | |
6.00%, 01/01/38 | | | 325,902 | | | | 354,704 | |
5.50%, 02/01/38 | | | 939 | | | | 1,012 | |
6.00%, 02/01/38 | | | 39,617 | | | | 43,098 | |
4.50%, 03/01/38 | | | 49,892 | | | | 51,259 | |
5.50%, 03/01/38 | | | 2,750 | | | | 2,964 | |
6.00%, 03/01/38 | | | 268,717 | | | | 292,336 | |
4.50%, 04/01/38 | | | 1,517,921 | | | | 1,559,518 | |
6.00%, 04/01/38 | | | 3,905 | | | | 4,249 | |
5.50%, 05/01/38 | | | 501,235 | | | | 536,606 | |
6.00%, 05/01/38 | | | 790 | | | | 859 | |
5.50%, 06/01/38 | | | 501,967 | | | | 537,405 | |
5.50%, 07/01/38 | | | 672,671 | | | | 722,717 | |
6.00%, 07/01/38 | | | 549,661 | | | | 597,950 | |
5.50%, 08/01/38 | | | 4,203 | | | | 4,530 | |
5.50%, 09/01/38 | | | 1,947 | | | | 2,098 | |
6.00%, 10/01/38 | | | 34,946 | | | | 38,115 | |
5.50%, 12/01/38 | | | 678,070 | | | | 730,889 | |
6.00%, 01/01/39 TBA | | | 2,000,000 | | | | 2,173,750 | |
5.00%, 01/13/39 TBA | | | 300,000 | | | | 315,375 | |
4.50%, 08/01/39 | | | 237,834 | | | | 246,210 | |
5.50%, 08/01/39 | | | 192,109 | | | | 205,633 | |
4.50%, 09/01/39 | | | 187,923 | | | | 194,541 | |
4.50%, 10/01/39 | | | 91,952 | | | | 95,190 | |
5.50%, 10/01/39 | | | 900,204 | | | | 964,191 | |
4.50%, 12/01/39 | | | 185,488 | | | | 192,020 | |
6.00%, 12/01/39 | | | 4,320,052 | | | | 4,700,931 | |
4.00%, 01/01/40 TBA | | | 1,000,000 | | | | 1,029,844 | |
4.50%, 01/01/40 TBA | | | 17,000,000 | | | | 17,448,902 | |
5.00%, 01/01/40 TBA | | | 1,000,000 | | | | 1,051,250 | |
5.50%, 01/01/40 TBA | | | 8,000,000 | | | | 8,558,752 | |
5.50%, 02/01/40 TBA | | | 2,200,000 | | | | 2,349,532 | |
1.74%, 06/01/40† | | | 90,453 | | | | 91,891 | |
1.74%, 10/01/40† | | | 273,625 | | | | 277,859 | |
2.91%, 11/01/40† | | | 48,110 | | | | 49,998 | |
3.50%, 01/01/41 TBA | | | 700,000 | | | | 668,500 | |
4.00%, 01/01/41 TBA | | | 47,300,000 | | | | 47,048,743 | |
4.50%, 01/13/41 TBA | | | 31,900,000 | | | | 32,742,351 | |
4.00%, 02/01/41 TBA | | | 3,000,000 | | | | 2,975,625 | |
4.00%, 02/10/41 TBA | | | 23,000,000 | | | | 22,813,125 | |
Federal National Mortgage Association REMIC | | | | | | | | |
11.97%, 08/25/21 IOW† | | | 157 | | | | 3,633 | |
8.68%, 10/25/21 IOW† | | | 258 | | | | 4,924 | |
0.86%, 05/25/30† | | | 1,041,317 | | | | 1,042,355 | |
0.71%, 10/18/30† | | | 41,757 | | | | 41,914 | |
0.00%, 07/25/33 IOW† | | | 202,629 | | | | 1,962 | |
0.00%, 04/25/34 IOW† | | | 351,217 | | | | 7,583 | |
0.00%, 06/25/34 IOW† | | | 463,268 | | | | 3,451 | |
FFCA Secured Lending Corporation | | | | | | | | |
17.23%, 09/18/27 IO 144AW†@ | | | 796,405 | | | | 30,295 | |
FHLMC MultiFamily Structured Pass Through Certificates | | | | | | | | |
1.52%, 08/25/20 IOW† | | | 1,308,877 | | | | 121,074 | |
FHLMC Structured Pass-Through Securities | | | | | | | | |
1.74%, 07/25/44† | | | 1,906,394 | | | | 1,863,101 | |
First Horizon Alternative Mortgage Securities | | | | | | | | |
2.38%, 06/25/34† | | | 869,317 | | | | 782,011 | |
GMAC Commercial Mortgage Securities, Inc. | | | | | | | | |
6.28%, 11/15/39 | | | 1,939,271 | | | | 1,990,941 | |
GMAC Mortgage Corporation Loan Trust | | | | | | | | |
3.39%, 06/25/34† | | | 348,136 | | | | 354,387 | |
Government National Mortgage Association | | | | | | | | |
3.95%, 07/15/25 | | | 200,000 | | | | 200,954 | |
7.00%, 10/15/25 | | | 55,957 | | | | 63,979 | |
7.00%, 01/15/26 | | | 13,922 | | | | 15,931 | |
7.00%, 07/15/27 | | | 121,669 | | | | 139,164 | |
7.00%, 12/15/27 | | | 1,462 | | | | 1,675 | |
7.00%, 01/15/28 | | | 30,179 | | | | 34,577 | |
7.00%, 03/15/28 | | | 153,352 | | | | 175,590 | |
7.00%, 07/15/28 | | | 22,377 | | | | 25,637 | |
7.50%, 07/15/28 | | | 14,494 | | | | 16,742 | |
6.50%, 08/15/28 | | | 13,912 | | | | 15,794 | |
7.00%, 08/15/28 | | | 32,806 | | | | 37,586 | |
7.50%, 08/15/28 | | | 11,957 | | | | 13,812 | |
6.50%, 09/15/28 | | | 54,279 | | | | 61,625 | |
7.00%, 10/15/28 | | | 63,840 | | | | 73,142 | |
7.50%, 03/15/29 | | | 40,320 | | | | 46,532 | |
7.50%, 11/15/29 | | | 23,478 | | | | 27,141 | |
3.13%, 11/20/29† | | | 68,841 | | | | 70,853 | |
8.50%, 08/15/30 | | | 2,341 | | | | 2,826 | |
8.50%, 11/20/30 | | | 18,204 | | | | 21,896 | |
6.50%, 08/15/31 | | | 122,768 | | | | 138,462 | |
7.50%, 08/15/31 | | | 31,510 | | | | 36,523 | |
6.50%, 10/15/31 | | | 211,760 | | | | 239,198 | |
6.00%, 11/15/31 | | | 625,287 | | | | 688,431 | |
6.50%, 11/15/31 | | | 225,484 | | | | 254,308 | |
6.00%, 12/15/31 | | | 145,112 | | | | 159,766 | |
6.00%, 01/15/32 | | | 217,630 | | | | 240,287 | |
6.00%, 02/15/32 | | | 353,391 | | | | 389,078 | |
6.50%, 02/15/32 | | | 391,822 | | | | 444,096 | |
6.00%, 04/15/32 | | | 176,293 | | | | 194,646 | |
7.50%, 04/15/32 | | | 86,039 | | | | 99,963 | |
6.50%, 06/15/32 | | | 204,049 | | | | 230,133 | |
6.50%, 07/15/32 | | | 3,877 | | | | 4,373 | |
6.50%, 08/15/32 | | | 353,220 | | | | 398,373 | |
6.50%, 09/15/32 | | | 364,821 | | | | 411,457 | |
6.00%, 10/15/32 | | | 356,022 | | | | 391,975 | |
6.00%, 11/15/32 | | | 321,346 | | | | 354,033 | |
6.00%, 12/15/32 | | | 128,769 | | | | 141,772 | |
| | | | |
| 96 | | See Notes to Financial Statements. | | |
| | | | | | | | |
| | | Par | | | Value | |
6.50%, 12/15/32 | | $ | 24,955 | | | $ | 28,145 | |
22.28%, 12/20/32 IOW† | | | 343,162 | | | | 49,018 | |
6.00%, 01/15/33 | | | 152,059 | | | | 167,415 | |
6.00%, 02/15/33 | | | 116,774 | | | | 128,566 | |
6.50%, 03/15/33 | | | 47,307 | | | | 53,355 | |
6.50%, 04/15/33 | | | 874,609 | | | | 986,413 | |
6.00%, 05/15/33 | | | 579,056 | | | | 637,531 | |
6.00%, 06/15/33 | | | 97,923 | | | | 107,811 | |
6.00%, 10/15/33 | | | 412,693 | | | | 454,368 | |
6.50%, 10/15/33 | | | 199,974 | | | | 225,537 | |
6.00%, 12/15/33 | | | 401,296 | | | | 441,820 | |
23.99%, 07/20/34 IOW† | | | 273,337 | | | | 36,013 | |
6.50%, 08/15/34 | | | 761,802 | | | | 897,994 | |
19.69%, 02/20/35 IOW† | | | 239,498 | | | | 37,258 | |
20.99%, 02/20/35 IOW† | | | 305,432 | | | | 45,366 | |
20.48%, 07/20/35 IOW† | | | 575,173 | | | | 77,266 | |
30.72%, 08/20/35 IOW† | | | 599,974 | | | | 80,106 | |
25.75%, 11/16/35 IOW† | | | 674,713 | | | | 97,469 | |
14.94%, 08/16/36 IOW† | | | 726,380 | | | | 135,296 | |
0.56%, 03/20/37† | | | 2,673,976 | | | | 2,661,355 | |
16.13%, 05/16/37 IOW† | | | 695,032 | | | | 91,037 | |
0.56%, 05/20/37† | | | 1,131,098 | | | | 1,126,415 | |
23.36%, 11/16/37 IOW† | | | 459,397 | | | | 60,070 | |
6.00%, 01/01/39 TBA | | | 600,000 | | | | 656,911 | |
5.50%, 01/15/39 | | | 162,282 | | | | 175,543 | |
4.00%, 01/01/40 TBA | | | 200,000 | | | | 201,344 | |
4.50%, 02/01/40 TBA | | | 3,000,000 | | | | 3,105,936 | |
17.76%, 02/16/40 IOW† | | | 338,649 | | | | 51,610 | |
4.50%, 03/15/40 | | | 939,173 | | | | 976,342 | |
25.19%, 07/16/40 IOW† | | | 907,594 | | | | 124,996 | |
5.00%, 07/20/40 | | | 97,136 | | | | 103,324 | |
5.00%, 08/20/40 | | | 1,374,969 | | | | 1,462,556 | |
5.00%, 09/20/40 | | | 396,550 | | | | 421,811 | |
4.50%, 10/20/40 | | | 2,699 | | | | 2,806 | |
3.50%, 01/01/41 TBA | | | 3,000,000 | | | | 2,888,436 | |
4.00%, 01/01/41 TBA | | | 7,900,000 | | | | 7,945,733 | |
4.50%, 01/01/41 TBA | | | 4,700,000 | | | | 4,879,187 | |
5.50%, 01/01/41 TBA | | | 800,000 | | | | 860,756 | |
Greenpoint Mortgage Funding Trust | | | | | | | | |
0.44%, 01/25/37† | | | 1,255,212 | | | | 787,353 | |
0.34%, 02/25/47† | | | 2,207,947 | | | | 1,667,931 | |
Greenwich Capital Commercial Funding Corporation | | | | | | | | |
5.44%, 03/10/39 | | | 1,500,000 | | | | 1,580,368 | |
GS Mortgage Securities Corporation II | | | | | | | | |
4.68%, 07/10/39 | | | 1,079,158 | | | | 1,124,483 | |
5.81%, 08/01/45† | | | 700,000 | | | | 731,788 | |
GSMPS Mortgage Loan Trust | | | | | | | | |
0.49%, 02/25/35 144A† | | | 194,881 | | | | 171,678 | |
0.61%, 09/25/35 144A† | | | 1,981,162 | | | | 1,643,546 | |
GSR Mortgage Loan Trust | | | | | | | | |
2.83%, 09/25/35† | | | 785,283 | | | | 749,078 | |
HarborView Mortgage Loan Trust | | | | | | | | |
0.50%, 01/19/36† | | | 212,353 | | | | 126,958 | |
Holmes Master Issuer PLC | | | | | | | | |
1.67%, 10/15/54 144A†@ | | | 500,000 | | | | 499,994 | |
Impac CMB Trust | | | | | | | | |
0.98%, 10/25/34† | | | 109,166 | | | | 69,632 | |
0.52%, 11/25/35† | | | 1,067,810 | | | | 657,599 | |
Impac Secured Assets CMN Owner Trust | | | | | | | | |
0.51%, 03/25/36† | | | 767,262 | | | | 360,505 | |
Indymac ARM Trust | | | | | | | | |
1.93%, 01/25/32† | | | 15,258 | | | | 11,333 | |
Indymac INDA Mortgage Loan Trust | | | | | | | | |
5.87%, 11/25/37† | | | 548,491 | | | | 440,762 | |
Indymac Index Mortgage Loan Trust | | | | | | | | |
0.56%, 07/25/35† | | | 1,961,850 | | | | 1,327,511 | |
5.05%, 09/25/35† | | | 476,533 | | | | 396,243 | |
0.48%, 04/25/46† | | | 825,106 | | | | 483,998 | |
0.45%, 09/25/46† | | | 1,406,265 | | | | 834,616 | |
JP Morgan Alternative Loan Trust | | | | | | | | |
0.52%, 01/25/36† | | | 626,972 | | | | 454,167 | |
JP Morgan Chase Commercial Mortgage Securities Corporation | | | | | | | | |
4.90%, 09/12/37 | | | 1,700,000 | | | | 1,800,502 | |
JP Morgan Mortgage Trust | | | | | | | | |
5.04%, 02/25/35† | | | 627,183 | | | | 626,176 | |
2.91%, 07/25/35† | | | 401,668 | | | | 354,494 | |
3.01%, 07/25/35† | | | 463,061 | | | | 441,665 | |
3.11%, 07/25/35† | | | 440,815 | | | | 414,266 | |
LB-UBS Commercial Mortgage Trust | | | | | | | | |
4.66%, 07/15/30 | | | 872,336 | | | | 907,302 | |
4.95%, 09/15/30 | | | 400,000 | | | | 426,644 | |
8.00%, | | | | | | | | |
06/15/36 IO 144AW†@ | | | 3,778,789 | | | | 8,167 | |
5.37%, 09/15/39 | | | 1,650,000 | | | | 1,765,318 | |
Luminent Mortgage Trust | | | | | | | | |
0.43%, 12/25/36† | | | 3,290,862 | | | | 2,137,655 | |
0.46%, 02/25/46† | | | 961,718 | | | | 571,107 | |
MASTR Adjustable Rate Mortgages Trust | | | | | | | | |
2.85%, 05/25/34† | | | 293,715 | | | | 230,644 | |
2.84%, 11/25/35 144A† | | | 1,087,414 | | | | 675,707 | |
0.46%, 05/25/47† | | | 3,025,102 | | | | 1,703,601 | |
MASTR Reperforming Loan Trust | | | | | | | | |
7.00%, 08/25/34 144A | | | 724,075 | | | | 737,908 | |
Merrill Lynch/Countrywide Commercial Mortgage Trust | | | | | | | | |
5.97%, 08/12/49 | | | 300,000 | | | | 322,869 | |
MLCC Mortgage Investors, Inc. | | | | | | | | |
0.82%, 11/25/29† | | | 402,420 | | | | 349,052 | |
NCUA Guaranteed Notes | | | | | | | | |
2.65%, 10/29/20 | | | 995,069 | | | | 968,922 | |
2.90%, 10/29/20 | | | 1,180,000 | | | | 1,147,287 | |
Nomura Asset Acceptance Corporation | | | | | | | | |
6.50%, 03/25/34 144A | | | 115,957 | | | | 116,454 | |
6.50%, 10/25/34 144A† | | | 127,358 | | | | 130,162 | |
Prime Mortgage Trust | | | | | | | | |
5.50%, 05/25/35 144A | | | 5,635,044 | | | | 5,068,940 | |
6.00%, 05/25/35 144A | | | 3,728,082 | | | | 3,436,576 | |
RBSGC Mortgage Pass-Through Certificates | | | | | | | | |
0.71%, 01/25/37† | | | 1,159,602 | | | | 683,572 | |
Residential Accredit Loans, Inc. | | | | | | | | |
1.33%, 01/25/46† | | | 853,881 | | | | 479,061 | |
Sequoia Mortgage Trust | | | | | | | | |
1.06%, 07/20/33† | | | 229,979 | | | | 222,186 | |
0.82%, 10/20/34† | | | 212,795 | | | | 180,231 | |
| | | | |
| | See Notes to Financial Statements. | | 97 |
| | |
| MEDIUM-DURATION BOND FUND | | |
| SCHEDULE OF INVESTMENTS (Continued) | | |
| | | | | | | | |
| | | Par | | | Value | |
Structured Adjustable Rate Mortgage Loan Trust | | | | | | | | |
2.74%, 11/25/34† | | $ | 717,526 | | | $ | 616,624 | |
0.60%, 08/25/35† | | | 512,310 | | | | 433,225 | |
Structured Asset Mortgage Investments, Inc. | | | | | | | | |
0.51%, 07/19/35† | | | 206,831 | | | | 147,121 | |
0.57%, 12/25/35† | | | 851,325 | | | | 520,621 | |
0.49%, 02/25/36† | | | 891,660 | | | | 570,116 | |
Structured Asset Securities Corporation | | | | | | | | |
0.61%, 06/25/35 144A† | | | 248,647 | | | | 206,403 | |
Thornburg Mortgage Securities Trust | | | | | | | | |
6.18%, 09/25/37† | | | 1,066,080 | | | | 1,035,042 | |
6.20%, 09/25/37† | | | 1,020,163 | | | | 949,943 | |
Wachovia Bank Commercial Mortgage Trust | | | | | | | | |
5.20%, 10/15/44† | | | 1,000,000 | | | | 1,080,786 | |
Washington Mutual Mortgage Pass-Through Certificates | | | | | | | | |
0.80%, 12/25/27† | | | 1,809,037 | | | | 1,596,150 | |
12.40%, | | | | | | | | |
12/25/27+ IO 144AW † | | | 1,839,152 | | | | 101,153 | |
2.66%, 02/25/33† | | | 17,902 | | | | 16,200 | |
5.30%, 12/25/36† | | | 636,430 | | | | 485,433 | |
5.49%, 02/25/37† | | | 1,044,369 | | | | 761,583 | |
5.72%, 02/25/37† | | | 670,295 | | | | 518,841 | |
1.73%, 06/25/42† | | | 37,893 | | | | 31,714 | |
0.55%, 07/25/45† | | | 1,193,237 | | | | 1,031,738 | |
0.58%, 07/25/45† | | | 751,749 | | | | 637,423 | |
0.58%, 08/25/45† | | | 2,652,145 | | | | 2,241,630 | |
0.55%, 10/25/45† | | | 2,413,549 | | | | 2,036,497 | |
0.55%, 12/25/45† | | | 1,382,730 | | | | 1,068,238 | |
1.09%, 04/25/47† | | | 1,464,716 | | | | 937,906 | |
Wells Fargo Alternative Loan Trust | | | | | | | | |
6.20%, 12/28/37† | | | 1,919,992 | | | | 1,457,553 | |
Wells Fargo Mortgage-Backed Securities Trust | | | | | | | | |
2.90%, 10/25/35† | | | 575,840 | | | | 571,253 | |
| | | | | | | | |
Total Mortgage-Backed Securities
(Cost $452,443,130) | | | | | | | 442,772,865 | |
| | | | | | | | |
| |
MUNICIPAL BONDS — 2.6% | | | | | |
Chicago Transit Authority, Series A Revenue Bond | | | | | | | | |
6.90%, 12/01/40 | | | 1,800,000 | | | | 1,785,276 | |
Connecticut State Health & Educational Facilities Authority, Yale University, Series Z-1 Revenue Bonds | | | | | | | | |
5.00%, 07/01/42 | | | 200,000 | | | | 202,582 | |
Illinois Finance Authority, Series B Revenue Bond | | | | | | | | |
5.75%, 07/01/33 | | | 1,800,000 | | | | 1,892,628 | |
Kentucky Higher Education Student Loan Corporation, Series 1 Revenue Bond | | | | | | | | |
1.49%, 05/01/34† | | | 350,000 | | | | 344,333 | |
Los Angeles Department of Water & Power, Build America Revenue Bonds | | | | | | | | |
6.57%, 07/01/45 | | | 200,000 | | | | 204,180 | |
Municipal Electric Authority of Georgia, Series B Revenue Bond | | | | | | | | |
6.64%, 04/01/57 | | | 230,000 | | | | 225,055 | |
6.66%, 04/01/57 | | | 130,000 | | | | 125,869 | |
North Texas Higher Education Authority, Series 1 Revenue Bond | | | | | | | | |
1.19%, 07/01/30† | | | 765,000 | | | | 742,035 | |
Pennsylvania Higher Education Assistance Agency, Student Loan, Sub-Series HH-10 Revenue Bond | | | | | | | | |
2.16%, 05/01/46† | | | 2,500,000 | | | | 2,214,350 | |
South Carolina Transportation Infrastructure Bank, Series A Revenue Bond (AMBAC Insured) | | | | | | | | |
5.00%, 10/01/23 | | | 2,700,000 | | | | 2,736,477 | |
State of California General Obligation Bond | | | | | | | | |
7.50%, 04/01/34 | | | 525,000 | | | | 543,769 | |
7.95%, 03/01/36 | | | 165,000 | | | | 169,391 | |
7.55%, 04/01/39 | | | 475,000 | | | | 493,116 | |
7.30%, 10/01/39 | | | 360,000 | | | | 362,916 | |
7.63%, 03/01/40 | | | 775,000 | | | | 809,418 | |
State of Illinois General Obligation Bond | | | | | | | | |
3.32%, 01/01/13 | | | 6,500,000 | | | | 6,505,070 | |
4.42%, 01/01/15 | | | 1,400,000 | | | | 1,407,168 | |
7.35%, 07/01/35 | | | 400,000 | | | | 392,192 | |
Virginia State Housing Development Authority, Commonwealth Mortgage, Series H-1 Revenue Bond (NATL-RE Insured) | | | | | | | | |
5.38%, 07/01/36 | | | 1,000,000 | | | | 1,006,430 | |
| | | | | | | | |
Total Municipal Bonds
(Cost $21,946,885) | | | | | | | 22,162,255 | |
| | | | | | | | |
| | |
| | | Notional
Amount | | | | |
PURCHASED OPTIONS — 0.0% | | | | | |
Put Options — 0.0% | | | | | |
30-Year Federal Home Loan Mortgage Corporation, Strike Price $96.00, Expires 01/06/11 | | $ | 27,000,000 | | | | — | |
30-Year Federal National Mortgage Association, Strike Price $92.00, Expires 01/06/11 | | | 22,500,000 | | | | — | |
30-Year Federal National Mortgage Association, Strike Price $96.00, Expires 01/06/11 | | | 2,000,000 | | | | — | |
| | | | | | | | |
Total Purchased Options
(Cost $6,035) | | | | | | | — | |
| | | | | | | | |
| | | | |
| 98 | | See Notes to Financial Statements. | | |
| | | | | | | | |
| | | Par | | | Value | |
U.S. TREASURY OBLIGATIONS — 13.3% | |
U.S. Treasury Bills | | | | | | | | |
0.19%, 06/16/11 | | $ | 33,100,000 | | | $ | 33,074,367 | |
| | | | | | | | |
U.S. Treasury Bonds | | | | | | | | |
8.13%, 08/15/19 | | | 300,000 | | | | 418,008 | |
8.50%, 02/15/20D | | | 2,300,000 | | | | 3,291,157 | |
6.25%, 08/15/23 | | | 2,800,000 | | | | 3,519,687 | |
7.50%, 11/15/24 | | | 800,000 | | | | 1,121,000 | |
4.38%, 02/15/38D | | | 400,000 | | | | 404,312 | |
4.25%, 05/15/39 | | | 2,600,000 | | | | 2,561,814 | |
4.38%, 11/15/39D | | | 9,850,000 | | | | 9,903,870 | |
4.63%, 02/15/40D | | | 1,800,000 | | | | 1,885,781 | |
4.38%, 05/15/40D | | | 5,280,000 | | | | 5,306,379 | |
| | | | | | | | |
| | | | | | | 28,412,008 | |
| | | | | | | | |
U.S. Treasury Inflationary Index Bonds | | | | | | | | |
2.38%, 04/15/11‡‡ | | | 1,300,000 | | | | 1,446,058 | |
1.25%, 07/15/20‡‡ | | | 15,700,000 | | | | 16,142,970 | |
2.38%, 01/15/25‡‡ | | | 2,090,000 | | | | 2,704,524 | |
2.38%, 01/15/27‡‡ | | | 1,880,000 | | | | 2,270,918 | |
1.75%, 01/15/28‡‡ | | | 3,000 | | | | 3,196 | |
3.88%, 04/15/29‡‡ | | | 3,068,000 | | | | 5,486,808 | |
2.13%, 02/15/40 | | | 950,000 | | | | 1,021,196 | |
| | | | | | | | |
| | | | | | | 29,075,670 | |
| | | | | | | | |
U.S. Treasury Notes | | | | | | | | |
1.00%, 09/30/11 | | | 9,600,000 | | | | 9,653,251 | |
1.38%, 02/15/13 | | | 70,000 | | | | 71,066 | |
0.50%, 11/15/13D | | | 40,000 | | | | 39,491 | |
2.75%, 02/15/19‡‡ | | | 6,700,000 | | | | 6,614,682 | |
3.13%, 05/15/19 | | | 1,700,000 | | | | 1,718,195 | |
3.38%, 11/15/19D | | | 3,000,000 | | | | 3,063,048 | |
2.63%, 11/15/20D | | | 765,000 | | | | 721,730 | |
6.13%, 11/15/27 | | | 600,000 | | | | 753,844 | |
3.88%, 08/15/40D | | | 180,000 | | | | 165,825 | |
| | | | | | | | |
| | | | | | | 22,801,132 | |
| | | | | | | | |
Total U.S. Treasury Obligations
(Cost $112,837,952) | | | | | | | 113,363,177 | |
| | | | | | | | |
| | |
| | | Shares | | | | |
COMMON STOCKS — 0.0% | | | | | |
Financial Services — 0.0% | | | | | |
Holdco, Cl A+ | | | 14,317 | | | | 26,785 | |
Holdco, Cl B+ | | | 128,860 | | | | 241,075 | |
| | | | | | | | |
| | | | | | | 267,860 | |
| | | | | | | | |
Producer Durables — 0.0% | | | | | |
Nortek, Inc. | | | 1,362 | | | | 49,032 | |
| | | | | | | | |
Total Common Stocks
(Cost $775,897) | | | | | | | 316,892 | |
| | | | | | | | |
PREFERRED STOCKS — 0.3% | |
Federal Home Loan Mortgage Corporation | | | 55,675 | | | | 33,962 | |
Federal National Mortgage Association | | | 42,050 | | | | 23,526 | |
Motors Liquidation Co.D | | | 40,650 | | | | 333,330 | |
Wells Fargo & Co.D | | | 2,400 | | | | 2,401,320 | |
| | | | | | | | |
Total Preferred Stocks
(Cost $4,635,857) | | | | | | | 2,792,138 | |
| | | | | | | | |
| | |
| | | Par | | | Value | |
REPURCHASE AGREEMENTS — 18.2% | |
Barclays Capital, Inc. | | | | | | | | |
0.17% (dated 12/23/10, due 01/13/11, repurchase price $19,001,884, collateralized by U.S. Treasury Inflationary Index Bond, 3.500%, due 01/15/11, total market value $24,329,039) | | $ | 19,000,000 | | | $ | 19,000,000 | |
Citigroup Global Markets, Inc. | | | | | | | | |
0.21% (dated 01/03/11, due 01/04/11, repurchase price $18,673,487, collateralized by U.S. Treasury Note, 1.000%, due 07/15/13, total market value $19,069,689) | | | 18,673,378 | | | | 18,673,378 | |
Citigroup Global Markets, Inc. | | | | | | | | |
0.21% (dated 01/03/11, due 01/04/11, repurchase price $49,426,910, collateralized by U.S. Treasury Note, 1.000%, due 07/15/13, total market value $50,475,620) | | | 49,426,622 | | | | 49,426,622 | |
Merrill Lynch & Co., Inc. | | | | | | | | |
0.22% (dated 12/31/10, due 01/03/11, repurchase price $49,816,913, collateralized by U.S. Treasury Note, 3.375%, due 11/15/19, total market value $51,257,384) | | | 49,816,000 | | | | 49,816,000 | |
Merrill Lynch & Co., Inc. | | | | | | | | |
0.22% (dated 12/31/10, due 01/03/11, repurchase price $9,300,171, collateralized by U.S. Treasury Note, 3.375%, due 11/15/19, total market value $9,569,754) | | | 9,300,000 | | | | 9,300,000 | |
Merrill Lynch & Co., Inc. | | | | | | | | |
0.22% (dated 12/31/10, due 01/03/11, repurchase price $8,784,161, collateralized by U.S. Treasury Note, 0.625%, due 07/31/12, total market value $8,989,648) | | | 8,784,000 | | | | 8,784,000 | |
| | | | | | | | |
Total Repurchase Agreements
(Cost $155,000,000) | | | | | | | 155,000,000 | |
| | | | | | | | |
| | |
| | | Shares | | | | |
MONEY MARKET FUNDS — 18.2% | | | | | | | | |
GuideStone Money Market Fund (GS4 Class)¥ | | | 100,976,120 | | | | 100,976,120 | |
Northern Institutional Liquid Assets Portfolio§ | | | 53,322,138 | | | | 53,322,138 | |
| | | | | | | | |
Total Money Market Funds
(Cost $154,298,258) | | | | | | | 154,298,258 | |
| | | | | | | | |
TOTAL INVESTMENTS — 144.6%
(Cost $1,246,107,902) | | | | 1,229,534,396 | |
| | | | | | | | |
| | | | |
| | See Notes to Financial Statements. | | 99 |
| | |
| MEDIUM-DURATION BOND FUND | | |
| SCHEDULE OF INVESTMENTS (Continued) | | |
| | | | | | | | |
| | | Number of
Contracts | | | Value | |
WRITTEN OPTIONS — (0.1)% | | | | | |
Call Options — 0.0% | | | | | | | | |
September 2011
90-Day Eurodollar Futures, Strike Price $99.375, Expires 09/19/11 (JPM) | | | (18 | ) | | $ | (10,575 | ) |
| | | | | | | | |
| | |
| | | Notional
Amount | | | | |
Call Swaptions — 0.0% | | | | | | | | |
3-Month LIBOR, Strike Price $3.25, Expires 01/24/11 (CITI) | | $ | (1,800,000 | ) | | | (6,242 | ) |
3-Month LIBOR, Strike Price $3.25, Expires 01/24/11 (DEUT) | | | (10,500,000 | ) | | | (36,408 | ) |
3-Month LIBOR, Strike Price $3.25, Expires 01/24/11 (RBS) | | | (5,700,000 | ) | | | (19,764 | ) |
CDX IG15 Index, Strike Price $0.90, Expiration Date 03/16/11 (MSCS) | | | (1,200,000 | ) | | | (5,147 | ) |
| | | | | | | | |
| | | | | | | (67,561 | ) |
| | | | | | | | |
| | |
| | | Number of
Contracts | | | | |
Put Options — 0.0% | | | | | | | | |
September 2011
90-Day Eurodollar Futures, Strike Price $99.375, Expires 09/19/11 (JPM) | | | (18 | ) | | | (7,425 | ) |
| | | | | | | | |
| | |
| | | Notional
Amount | | | | |
Put Swaptions — (0.1)% | | | | | | | | |
3-Month LIBOR, Strike Price $10.00, Expires 07/10/12 (BAR) | | $ | (300,000 | ) | | | (214 | ) |
3-Month LIBOR, Strike Price $10.00, Expires 07/10/12 (CS) | | | (100,000 | ) | | | (71 | ) |
3-Month LIBOR, Strike Price $10.00, Expires 07/10/12 (DEUT) | | | (500,000 | ) | | | (357 | ) |
3-Month LIBOR, Strike Price $10.00, Expires 07/10/12 (MSCS) | | | (5,600,000 | ) | | | (3,996 | ) |
3-Month LIBOR, Strike Price $2.25, Expires 06/19/12 (RBS) | | | (3,700,000 | ) | | | (58,550 | ) |
3-Month LIBOR, Strike Price $2.25, Expires 09/24/12 (CITI) | | | (900,000 | ) | | | (12,748 | ) |
3-Month LIBOR, Strike Price $2.25, Expires 09/24/12 (MSCS) | | | (1,500,000 | ) | | | (21,246 | ) |
3-Month LIBOR, Strike Price $2.25, Expires 09/24/12 (RBS) | | | (16,000,000 | ) | | | (226,627 | ) |
3-Month LIBOR, Strike Price $2.25, Expires 09/24/12 (UBS) | | | (2,800,000 | ) | | | (39,660 | ) |
| | | | | | | | |
| | | Notional
Amount | | | Value | |
3-Month LIBOR, Strike Price $2.75, Expires 06/18/12 (DEUT) | | $ | (3,900,000 | ) | | $ | (61,714 | ) |
3-Month LIBOR, Strike Price $3.00, Expires 06/18/12 (BAR) | | | (5,800,000 | ) | | | (76,615 | ) |
3-Month LIBOR, Strike Price $3.00, Expires 06/18/12 (CITI) | | | (5,600,000 | ) | | | (73,973 | ) |
3-Month LIBOR, Strike Price $3.00, Expires 06/18/12 (DEUT) | | | (700,000 | ) | | | (9,247 | ) |
3-Month LIBOR, Strike Price $5.00, Expires 01/24/11 (CITI) | | | (1,800,000 | ) | | | (1 | ) |
3-Month LIBOR, Strike Price $5.00, Expires 01/24/11 (DEUT) | | | (10,500,000 | ) | | | (7 | ) |
CDX IG15 Index, Strike Price $1.50, Expiration Date 12/20/15 (MSCS) | | | (1,200,000 | ) | | | (771 | ) |
| | | | | | | | |
| | | | | | | (585,797 | ) |
| | | | | | | | |
Total Written Options
(Premiums received $(652,009)) | | | | (671,358 | ) |
| | | | | | | | |
Liabilities in Excess of Other
Assets — (44.5)% | | | | (378,412,003 | ) |
| | | | | | | | |
NET ASSETS — 100.0% | | | $ | 850,451,035 | |
| | | | | | | | |
Please see abbreviation and footnote definitions beginning on page 180.
| | | | |
| 100 | | See Notes to Financial Statements. | | |
Swap agreements outstanding at December 31, 2010:
| | | | | | | | | | | | | | | | | | | | | | | | | | | | | | | | |
Reference Obligation | | Fixed
Deal
(Pay) Rate | | | Maturity
Date | | | Counter-
party | | | Currency | | | Notional
Amount | | | Market
Value | | | Upfront
Premiums
Paid/
Received | | | Unrealized
Appreciation
(Depreciation) | |
Credit Default Swaps on Corporate Issues — Buy Protection | |
Target Corporation, 5.88% due 03/01/12 | | | (0.11 | )% | | | 06/20/12 | | | | MSCS | | | | USD | | | $ | 1,200,000 | | | $ | 509 | | | $ | — | | | $ | 509 | |
CitiFinancial, 6.63% due 06/01/15 | | | (0.15 | )% | | | 06/20/15 | | | | BAR | | | | USD | | | | 300,000 | | | | 15,509 | | | | — | | | | 15,509 | |
Nabors Industries, 5.375% due 05/15/12 | | | (1.00 | )% | | | 03/20/19 | | | | BNP | | | | USD | | | | 3,900,000 | | | | 125,828 | | | | 11,024 | | | | 114,804 | |
| | | | | | | | | | | | | | | | | | | | | | | | | | | | | | | | |
| | | | | | | | | | | | | | | | | | $ | 5,400,000 | | | $ | 141,846 | | | $ | 11,024 | | | $ | 130,822 | |
| | | | | | | | | | | | | | | | | | | | | | | | | | | | | | | | |
| | | | | | | | | | | | | | | | | | | | | | | | | | | | | | | | | | | | |
Reference Obligation | | Implied
Credit
Spread | | | Fixed
Deal
(Pay) Rate | | | Maturity
Date | | | Counter-
party | | | Currency | | | Notional
Amount | | | Market
Value | | | Upfront
Premiums
Paid/
(Received) | | | Unrealized
Appreciation
(Depreciation) | |
Credit Default Swaps on Corporate Issues — Sell Protection | |
Federated Republic of Brazil, 12.25% due 03/06/30 | | | 2.65 | % | | | (1.04 | )% | | | 05/20/17 | | | | DEUT | | | | USD | | | $ | 1,000,000 | | | $ | (8,958 | ) | | $ | — | | | $ | (8,958 | ) |
GMAC LLC, 6.88% due 08/28/12 | | | 1.21 | % | | | (3.53 | )% | | | 09/20/17 | | | | DEUT | | | | USD | | | | 4,100,000 | | | | 199,766 | | | | — | | | | 199,766 | |
| | | | | | | | | | | | | | | | | | | | | | | | | | | | | | | | | | | | |
| | | | | | | | | | | | | | | | | | | | | | $ | 5,100,000 | | | $ | 190,808 | | | $ | — | | | $ | 190,808 | |
| | | | | | | | | | | | | | | | | | | | | | | | | | | | | | | | | | | | |
| | | | | | | | | | | | | | | | | | | | | | | | | | | | | | | | |
Reference Obligation | | Fixed
Deal
(Pay) Rate | | | Maturity
Date | | | Counter-
party | | | Currency | | | Notional
Amount | | | Market
Value | | | Upfront
Premiums
Paid/
(Received) | | | Unrealized
Appreciation
(Depreciation) | |
Credit Default Swaps on Credit Indices — Buy Protection | |
Dow Jones CDX HY-8 Index | | | (1.60 | )% | | | 06/20/12 | | | | MLCS | | | | USD | | | $ | 1,200,000 | | | $ | (16,047 | ) | | $ | — | | | $ | (16,047 | ) |
Dow Jones CDX IG14 Index | | | (1.00 | )% | | | 06/20/15 | | | | UBS | | | | USD | | | | 3,900,000 | | | | (36,628 | ) | | | (25,931 | ) | | | (10,697 | ) |
Dow Jones CDX IG10 Index | | | (0.80 | )% | | | 12/20/17 | | | | RBS | | | | USD | | | | 7,163,200 | | | | 183,432 | | | | 75,881 | | | | 107,551 | |
Dow Jones CDX IG10 Index | | | (1.50 | )% | | | 06/20/18 | | | | MSCS | | | | USD | | | | 7,356,800 | | | | (151,940 | ) | | | (222,833 | ) | | | 70,893 | |
| | | | | | | | | | | | | | | | | | | | | | | | | | | | | | | | |
| | | | | | | | | | | | | | | | | | $ | 19,620,000 | | | $ | (21,183 | ) | | $ | (172,883 | ) | | $ | 151,700 | |
| | | | | | | | | | | | | | | | | | | | | | | | | | | | | | | | |
| | | | | | | | | | | | | | | | | | | | | | | | | | | | | | | | | | | | |
Reference Obligation | | Implied
Credit
Spread | | | Fixed
Deal
(Pay) Rate | | | Maturity
Date | | | Counter-
party | | | Currency | | | Notional
Amount | | | Market
Value | | | Upfront
Premiums
Paid/
(Received) | | | Unrealized
Appreciation
(Depreciation) | |
Credit Default Swaps on Credit Indices — Sell Protection | |
CDPHY 515 Index | | | 1.03 | % | | | (5.00 | )% | | | 12/20/15 | | | | DEUT | | | | USD | | | $ | 2,000,000 | | | $ | 108,516 | | | $ | 35,088 | | | $ | 73,428 | |
CDPHY 515 Index | | | 1.03 | % | | | (5.00 | )% | | | 12/20/15 | | | | JPM | | | | USD | | | | 2,000,000 | | | | 62,080 | | | | 58,237 | | | | 3,843 | |
| | | | | | | | | | | | | | | | | | | | | | | | | | | | | | | | | | | | |
| | | | | | | | | | | | | | | | | | | | | | $ | 4,000,000 | | | $ | 170,596 | | | $ | 93,325 | | | $ | 77,271 | |
| | | | | | | | | | | | | | | | | | | | | | | | | | | | | | | | | | | | |
| | | | |
| | See Notes to Financial Statements. | | 101 |
| | |
| MEDIUM-DURATION BOND FUND | | |
| SCHEDULE OF INVESTMENTS (Continued) | | |
| | | | | | | | | | | | | | | | | | | | | | | | | | | | |
Reference Obligation | | Fixed
Deal
(Pay)
Rate | | | Maturity
Date | | | Counter-
party | | Currency | | Notional
Amount | | | Market
Value | | | Upfront
Premiums
Paid/
(Received) | | | Unrealized
Appreciation
(Depreciation) | |
Interest Rate Swaps | |
KWCDC Index | | | 2.82 | % | | | 01/28/11 | | | DEUT | | KRW | | $ | 927,000,000 | | | $ | 190 | | | $ | — | | | $ | 190 | |
KWCDC Index | | | 2.83 | % | | | 01/28/11 | | | JPM | | KRW | | | 901,000,000 | | | | 538 | | | | — | | | | 538 | |
KWCDC Index | | | 3.87 | % | | | 06/12/11 | | | DEUT | | KRW | | | 400,000,000 | | | | 234 | | | | (10 | ) | | | 244 | |
KWCDC Index | | | 3.90 | % | | | 06/15/11 | | | JPM | | KRW | | | 720,000,000 | | | | 3,524 | | | | (6 | ) | | | 3,530 | |
KWCDC Index | | | 3.72 | % | | | 06/22/11 | | | JPM | | KRW | | | 2,300,000,000 | | | | 8,652 | | | | (14 | ) | | | 8,666 | |
KWCDC Index | | | 3.69 | % | | | 06/26/11 | | | DEUT | | KRW | | | 2,280,000,000 | | | | 289 | | | | (34 | ) | | | 323 | |
KWCDC Index | | | 3.62 | % | | | 07/06/11 | | | DEUT | | KRW | | | 964,630,000 | | | | 2,295 | | | | — | | | | 2,295 | |
KWCDC Index | | | 3.63 | % | | | 07/07/11 | | | DEUT | | KRW | | | 1,611,662,000 | | | | 3,810 | | | | — | | | | 3,810 | |
KWCDC Index | | | 3.66 | % | | | 07/08/11 | | | JPM | | KRW | | | 766,531,000 | | | | 5,741 | | | | — | | | | 5,741 | |
3-Month BRR CDI Index | | | (10.12 | )% | | | 01/02/12 | | | MSCS | | BRL | | | 8,000,000 | | | | (175,698 | ) | | | (35,671 | ) | | | (140,027 | ) |
Brazil CETIP Interbank Deposit | | | 11.02 | % | | | 01/02/12 | | | UBS | | BRL | | | 1,600,000 | | | | 9,502 | | | | — | | | | 9,502 | |
Brazil CETIP Interbank Deposit | | | 11.67 | % | | | 02/02/12 | | | MSCS | | BRL | | | 2,300,000 | | | | 37,183 | | | | 8,906 | | | | 28,277 | |
BZDIOVRA Index | | | 12.26 | % | | | 01/02/12 | | | DEUT | | BRL | | | 4,950,000 | | | | (3,853 | ) | | | — | | | | (3,853 | ) |
BZDIOVRA Index | | | 11.51 | % | | | 01/02/12 | | | DEUT | | BRL | | | 10,920,000 | | | | (6,344 | ) | | | — | | | | (6,344 | ) |
Brazil CETIP Interbank Deposit | | | 12.59 | % | | | 01/02/13 | | | MSCS | | BRL | | | 6,000,000 | | | | 52,156 | | | | 6,401 | | | | 45,755 | |
Brazil CETIP Interbank Deposit | | | 11.91 | % | | | 01/02/13 | | | BAR | | BRL | | | 15,400,000 | | | | 54,663 | | | | 60,776 | | | | (6,113 | ) |
Brazil CETIP Interbank Deposit | | | 12.48 | % | | | 01/02/13 | | | CS | | BRL | | | 20,500,000 | | | | 152,246 | | | | (3,481 | ) | | | 155,727 | |
BZDIOVRA Index | | | 12.19 | % | | | 01/02/13 | | | JPM | | BRL | | | 2,490,000 | | | | 1,617 | | | | — | | | | 1,617 | |
BZDIOVRA Index | | | 11.45 | % | | | 10/02/13 | | | JPM | | BRL | | | 14,880,000 | | | | 14,263 | | | | — | | | | 14,263 | |
Brazil CETIP Interbank Deposit | | | 11.99 | % | | | 01/02/14 | | | BAR | | BRL | | | 1,700,000 | | | | 6,788 | | | | 437 | | | | 6,351 | |
Brazil CETIP Interbank Deposit | | | 11.94 | % | | | 01/02/14 | | | HSBC | | BRL | | | 14,400,000 | | | | (4,118 | ) | | | 37,055 | | | | (41,173 | ) |
Brazil CETIP Interbank Deposit | | | 12.12 | % | | | 01/02/14 | | | HSBC | | BRL | | | 15,600,000 | | | | 99,653 | | | | 27,939 | | | | 71,714 | |
3-Month LIBOR | | | (1.65 | )% | | | 11/02/14 | | | DEUT | | USD | | | 18,400,000 | | | | 352,992 | | | | — | | | | 352,992 | |
3-Month LIBOR | | | (1.63 | )% | | | 11/05/14 | | | BOA | | USD | | | 9,300,000 | | | | 181,863 | | | | — | | | | 181,863 | |
3-Month LIBOR | | | (2.12 | )% | | | 11/23/14 | | | BOA | | USD | | | 6,800,000 | | | | 76,019 | | | | — | | | | 76,019 | |
3-Month LIBOR | | | (1.75 | )% | | | 06/15/16 | | | DEUT | | USD | | | 26,200,000 | | | | 1,074,458 | | | | 525,562 | | | | 548,896 | |
3-Month LIBOR | | | 1.75 | % | | | 06/15/16 | | | DEUT | | USD | | | 14,200,000 | | | | (582,340 | ) | | | (306,362 | ) | | | (275,978 | ) |
3-Month LIBOR | | | 1.75 | % | | | 06/15/16 | | | DEUT | | USD | | | 14,100,000 | | | | (578,239 | ) | | | (492,684 | ) | | | (85,555 | ) |
3-Month LIBOR | | | (1.75 | )% | | | 06/15/16 | | | DEUT | | USD | | | 4,600,000 | | | | 186,745 | | | | 161,564 | | | | 25,181 | |
3-Month LIBOR | | | (2.11 | )% | | | 08/15/17 | | | DEUT | | USD | | | 300,000 | | | | 12,549 | | | | — | | | | 12,549 | |
3-Month LIBOR | | | (2.08 | )% | | | 08/15/17 | | | BOA | | USD | | | 2,600,000 | | | | 112,724 | | | | — | | | | 112,724 | |
3-Month LIBOR | | | 2.75 | % | | | 11/02/17 | | | DEUT | | USD | | | 15,400,000 | | | | (655,053 | ) | | | — | | | | (655,053 | ) |
| | | | |
| 102 | | See Notes to Financial Statements. | | |
| | | | | | | | | | | | | | | | | | | | | | | | | | | | | | | | |
Reference Obligation | | Fixed
Deal
(Pay)
Rate | | | Maturity
Date | | | Counter-
party | | | Currency | | | Notional
Amount | | | Market
Value | | | Upfront
Premiums
Paid/
(Received) | | | Unrealized
Appreciation
(Depreciation) | |
3-Month LIBOR | | | 2.75 | % | | | 11/05/17 | | | | BOA | | | | USD | | | $ | 7,800,000 | | | $ | (327,578 | ) | | $ | — | | | $ | (327,578 | ) |
6-Month BBR BBSW Index | | | 5.50 | % | | | 12/15/17 | | | | BAR | | | | AUD | | | | 2,200,000 | | | | (74,708 | ) | | | (10,609 | ) | | | (64,099 | ) |
6-Month BBR BBSW Index | | | 5.50 | % | | | 12/15/17 | | | | DEUT | | | | AUD | | | | 1,300,000 | | | | (44,146 | ) | | | (5,600 | ) | | | (38,546 | ) |
3-Month LIBOR | | | (2.25 | )% | | | 06/15/18 | | | | DEUT | | | | USD | | | | 1,900,000 | | | | 114,668 | | | | 121,102 | | | | (6,434 | ) |
3-Month LIBOR | | | 3.59 | % | | | 11/23/19 | | | | BOA | | | | USD | | | | 6,100,000 | | | | (170,836 | ) | | | — | | | | (170,836 | ) |
3-Month LIBOR | | | 2.56 | % | | | 10/20/20 | | | | DEUT | | | | USD | | | | 2,800,000 | | | | (198,253 | ) | | | — | | | | (198,253 | ) |
3-Month LIBOR | | | (2.75 | )% | | | 06/15/21 | | | | DEUT | | | | USD | | | | 4,000,000 | | | | 322,306 | | | | 322,284 | | | | 22 | |
3-Month LIBOR | | | (2.75 | )% | | | 06/15/21 | | | | JPM | | | | USD | | | | 800,000 | | | | 63,516 | | | | 66,891 | | | | (3,375 | ) |
3-Month LIBOR | | | (3.54 | )% | | | 11/02/22 | | | | DEUT | | | | USD | | | | 4,200,000 | | | | 267,983 | | | | — | | | | 267,983 | |
3-Month LIBOR | | | (3.57 | )% | | | 11/05/22 | | | | BOA | | | | USD | | | | 2,100,000 | | | | 126,930 | | | | — | | | | 126,930 | |
3-Month LIBOR | | | (3.09 | )% | | | 02/15/26 | | | | DEUT | | | | USD | | | | 1,900,000 | | | | 190,323 | | | | — | | | | 190,323 | |
3-Month LIBOR | | | 3.25 | % | | | 06/15/26 | | | | DEUT | | | | USD | | | | 3,000,000 | | | | 288,791 | | | | 263,987 | | | | 24,804 | |
3-Month LIBOR | | | (3.25 | )% | | | 06/15/26 | | | | JPM | | | | USD | | | | 2,400,000 | | | | 227,467 | | | | 225,559 | | | | 1,908 | |
3-Month LIBOR | | | (4.21 | )% | | | 11/23/27 | | | | BOA | | | | USD | | | | 2,200,000 | | | | 82,602 | | | | — | | | | 82,602 | |
3-Month LIBOR | | | (3.75 | )% | | | 06/15/41 | | | | BOA | | | | USD | | | | 1,100,000 | | | | 102,130 | | | | 1,126 | | | | 101,004 | |
3-Month LIBOR | | | (3.75 | )% | | | 06/15/41 | | | | DEUT | | | | USD | | | | 2,200,000 | | | | 207,407 | | | | 21,720 | | | | 185,687 | |
3-Month LIBOR | | | 3.75 | % | | | 06/15/41 | | | | JPM | | | | USD | | | | 1,200,000 | | | | (111,115 | ) | | | (67,960 | ) | | | (43,155 | ) |
3-Month LIBOR | | | 3.75 | % | | | 06/15/41 | | | | DEUT | | | | USD | | | | 1,000,000 | | | | (94,276 | ) | | | (57,629 | ) | | | (36,647 | ) |
| | | | | | | | | | | | | | | | | | | | | | | | | | | | | | | | |
| | | | | | | | | | | | | | | | | | $ | 11,149,663,000 | | | $ | 1,418,260 | | | $ | 871,249 | | | $ | 547,011 | |
| | | | | | | | | | | | | | | | | | | | | | | | | | | | | | | | |
Total Swap agreements outstanding at December 31, 2010 | | | $ | 1,900,327 | | | $ | 802,715 | | | $ | 1,097,612 | |
| | | | | | | | | | | | | | | | | | | | | | | | | | | | | | | | |
Please see abbreviation and footnote definitions beginning on page 180.
| | | | |
| | See Notes to Financial Statements. | | 103 |
| | |
| MEDIUM-DURATION BOND FUND | | |
| SCHEDULE OF INVESTMENTS (Continued) | | |
| | | | |
| PORTFOLIO SUMMARY (based on net assets) | |
| | | % | |
Mortgage-Backed Securities | | | 52.1 | |
Futures Contracts | | | 15.1 | |
Corporate Bonds | | | 20.8 | |
Money Market Funds | | | 18.2 | |
Repurchase Agreements | | | 18.2 | |
Foreign Bonds | | | 14.0 | |
U.S. Treasury Obligations | | | 13.3 | |
Asset-Backed Securities | | | 4.2 | |
Forward Foreign Currency Contracts | | | 2.9 | |
Municipal Bonds | | | 2.6 | |
Agency Obligations | | | 0.9 | |
Preferred Stocks | | | 0.3 | |
Swap Agreements | | | 0.2 | |
Common Stock | | | — | ** |
Loan Agreements | | | — | ** |
Purchased Options | | | — | ** |
Written Options | | | (0.1 | ) |
| | | | |
| | | 162.7 | |
| | | | |
| ** | Rounds to less than 0.005%. |
VALUATION HIERARCHY
The following is a summary of the inputs used, as of December 31, 2010, in valuing the Fund’s investments carried at fair value:
| | | | | | | | |
Valuation Inputs | | Investments
in
Securities | | | Other
Financial
Instruments*** | |
Assets: | | | | | | | | |
Level 1 — Quoted Prices | | | | | | | | |
Common Stock | | $ | 49,032 | | | $ | — | |
Money Market Funds | | | 154,298,258 | | | | — | |
Preferred Stocks | | | 2,792,138 | | | | — | |
Level 2 — Other Significant Observable Inputs | | | | | | | | |
Agency Obligations | | | 7,225,920 | | | | — | |
Asset-Backed Securities | | | 35,988,416 | | | | — | |
Corporate Bonds | | | 176,604,558 | | | | — | |
Foreign Bonds | | | 118,969,659 | | | | — | |
Loan Agreement | | | 40,258 | | | | — | |
Mortgage-Backed Securities | | | 442,671,712 | | | | — | |
Municipal Bonds | | | 22,162,255 | | | | — | |
Repurchase Agreements | | | 155,000,000 | | | | — | |
Swap Agreements | | | — | | | | 1,900,327 | |
U.S. Treasury Obligations | | | 113,363,177 | | | | — | |
Level 3 — Significant Unobservable Inputs | | | | | | | | |
Common Stocks | | | 267,860 | | | | — | |
Mortgage-Backed Securities | | | 101,153 | | | | — | |
| | | | | | | | |
Total Assets | | $ | 1,229,534,396 | | | $ | 1,900,327 | |
| | | | | | | | |
Liabilities: | | | | | | | | |
Level 1 — Quoted Prices Futures Contracts | | $ | — | | | $ | (263,281 | ) |
Written Options | | | (18,000 | ) | | | — | |
Level 2 — Other Significant Observable Inputs | | | | | | | | |
Forward Foreign Currency
Contracts | | | — | | | | (827,280 | ) |
Written Options | | | (653,358 | ) | | | — | |
Level 3 — Significant Unobservable Inputs | | | — | | | | — | |
| | | | | | | | |
Total Liabilities | | $ | (671,358 | ) | | $ | (1,090,561 | ) |
| | | | | | | | |
| *** | Other financial instruments are derivative instruments not reflected in the Schedule of Investments, such as futures, forwards and swap contracts, which are valued at the unrealized appreciation (depreciation) on the investment. Details of these investments can be found in the Notes to Financial Statements. |
| | | | |
| 104 | | See Notes to Financial Statements. | | |
The following is a reconciliation of assets in which significant unobservable inputs (Level 3) were used in determining fair value:
| | | | | | | | |
| | | Investments
in
Securities | | | Other
Financial
Instruments*** | |
Balance, 12/31/09 | | | | | | | | |
Common Stock | | $ | 47,670 | | | $ | — | |
Accrued discounts/premiums | | | | | | | | |
| Realized gain (loss)(1) | | | | | | | | |
Common Stock | | | — | | | | — | |
Change in unrealized appreciation (depreciation)(2) | | | | | | | | |
Common Stock | | | 1,362 | | | | — | |
Purchases | | | | | | | | |
Common Stock | | | — | | | | — | |
Sales | | | | | | | | |
Common Stock | | | — | | | | — | |
Transfers in and/or out of Level 3 | | | | | | | | |
Common Stock | | | 319,981 | | | | — | |
| | | | | | | | |
Balance, 12/31/10 | | $ | 369,013 | | | $ | — | |
| | | | | | | | |
| *** | Other financial instruments are derivative instruments not reflected in the Schedule of Investments, such as futures, forwards and swap contracts, which are valued at the unrealized appreciation (depreciation) on the investment. Details of these investments can be found in the Notes to Financial Statements. |
| (1) | Realized gain (loss) from the sale of Level 3 securities can be found on the Statement of Operations in Net Realized Gain (loss) from Investment securities and securities sold short. |
| (2) | Change in unrealized appreciation (depreciation) can be found on the Statement of Operations in Net change in unrealized appreciation (depreciation) on Investment securities and securities sold short. |
| | | | |
| | See Notes to Financial Statements. | | 105 |
Extended-Duration Bond Fund
During the first nine months of the year, the environment for bonds was positive as interest rates declined amidst economic uncertainty while investor demand for fixed income securities remained strong. This backdrop provided a nice rally in bond prices. However, the fourth quarter was characterized by a positive change in sentiment related to the domestic economy, partially due to the announcement of further quantitative easing measures by the Federal Reserve as well as indications that the economy was gaining traction. The brightened economic picture fueled a rise in interest rates which proved to be a headwind for bonds during the year’s final quarter. The broad U.S. investment grade bond market, as measured by the Barclays Capital U.S Aggregate Bond Index, posted an annual return of 6.54%. All major bond sectors produced positive returns, led by investment grade corporate bonds and commercial mortgage-backed securities. In general, investor appetite for bonds that traded at a risk premium (yield spread above U.S. Treasuries) was strong, causing yield spreads to narrow which boosted returns. Overall, lower quality outpaced higher quality bonds and longer-dated bonds outperformed shorter-maturity bonds given their prices are more interest rate sensitivity. Within the longer-maturity space, long-term credit bonds posted an annual return of 10.69% (as measured by the Barclays Capital U.S. Long-term Credit Index) compared to long-term government bonds which generated an annual return of 9.43% (as measured by the Barclays Capital U.S. Long-term Government Index) for the same period. Non-benchmark sectors were also strong during the year, as high yield (below investment grade corporate bonds) and emerging market bonds generated annual returns of 15.24% and 11.83%, respectively.
The Extended-Duration Bond Fund invests in a diversified portfolio composed primarily of investment grade fixed income securities with an average dollar-weighted duration normally greater than or equal to seven years. The Fund outperformed its composite benchmark index, 50% Barclays Capital U.S. Long-Term Government Index / 50% Barclays Capital U.S. Long-Term Credit Index, for the one-year period ended December 31, 2010 (12.05% versus 10.13%). The Fund’s benchmark-relative performance was positively impacted by the Fund’s tactical underweight to the U.S. Treasury sector. Throughout the year, the Fund underweighted lower yielding U.S. Treasury securities in favor of higher yielding corporate bonds, non-U.S. bonds and high yield bonds. These sectors, which traded at a yield premium to U.S. Treasuries, benefited as spreads contracted which boosted returns on a relative basis. A byproduct of underweighting U.S. Treasuries was the Fund’s higher-than-benchmark yield, which provided incremental interest income and a nice performance cushion in the fourth quarter, when interest rates rose. During the year, the Fund remained focused on its objective of maximum total return consistent with preservation of capital.
This fund is subject to interest rate risk. Meaning, when interest rates rise, the value of the existing bonds decrease and vice versa. Changes in interest rates have a bigger impact on long duration holdings than on short duration holdings.
Please see page 113 for information regarding specific portfolio allocations. Portfolio holdings are subject to change at any time.
| | |
| Extended-Duration Bond Fund | | |
| | |
| | | | | | | | | | | | |
Average Annual Total Returns as of 12/31/10 | |
| | | GS2 Class* | | | GS4 Class* | | | Benchmark** | |
One Year | | | 12.25 | % | | | 12.05 | % | | | 10.13 | % |
Five Year | | | 7.98 | % | | | 7.77 | % | | | 5.94 | % |
Since Inception | | | 8.31 | % | | | 8.18 | % | | | 6.93 | % |
Inception Date | | | 08/27/01 | | | | 08/27/01 | | | | | |
Total Fund Operating Expenses (April 30, 2010 Prospectus, as supplemented on August 5, 2010)(1) | | | 0.54 | % | | | 0.74 | % | | | | |
| (1) | Current information regarding the Fund’s Operating Expenses can be found in the Financial Highlights. |
The performance data quoted represents past performance and does not guarantee future results. Current performance may be lower or higher. Performance data current to the most recent month-end may be obtained at www.GuideStoneFunds.org. The investment return and principal value of an investment will fluctuate so that shares, when redeemed, may be worth more or less than their original cost.
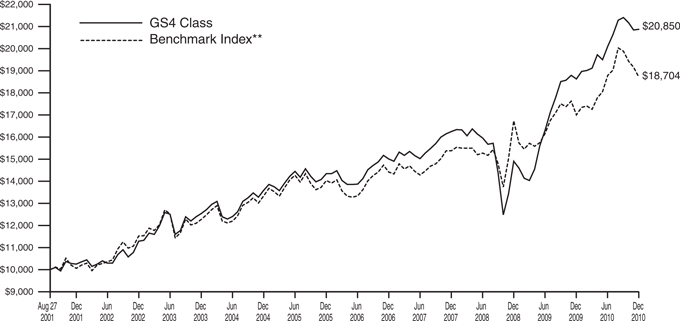
The graph compares the results of a hypothetical $10,000 investment in the GS4 Class of the Fund since August 27, 2001 (commencement of operations), with all dividends and capital gains reinvested, with the weighted composite benchmark index.
| * | These returns reflect expense waivers by the Fund’s investment adviser. Without these waivers, returns would have been lower. Returns shown do not reflect the deduction of taxes that a shareholder would pay on Fund distributions or the redemption of Fund shares. |
| ** | Represents a weighted composite benchmark index consisting of 50% Barclays Capital U.S. Long-Term Government Bond Index and 50% Barclays Capital U.S. Long-Term Credit Bond Index. |
The Barclays Capital U.S. Long-Term Government Bond Index is composed of all bonds covered by the Barclays Capital U.S. Government Bond Index with maturities of 10 years or greater.
The Barclays Capital U.S. Long-Term Credit Bond Index is composed of a subset of the Barclays Capital U.S. Credit Bond Index covering all corporate, publicly issued, fixed-rate, nonconvertible U.S. debt issues rated at least Baa with at least $50 million principal outstanding and maturity greater than 10 years.
Unlike a mutual fund, the performance of an index assumes no taxes, transaction costs, management fees or other expenses.
| | |
| EXTENDED-DURATION BOND FUND | | |
| SCHEDULE OF INVESTMENTS | | December 31, 2010 |
| | | | | | | | |
| | | Par | | | Value | |
ASSET-BACKED SECURITIES — 4.3% | |
Capital One Multi-Asset Execution Trust | | | | | | | | |
5.75%, 07/15/20 | | $ | 3,500,000 | | | $ | 3,977,183 | |
Citibank Credit Card Issuance Trust | | | | | | | | |
6.15%, 06/15/39 | | | 7,650,000 | | | | 9,270,276 | |
Community Program Loan Trust | | | | | | | | |
4.50%, 04/01/29 | | | 1,950,000 | | | | 1,836,959 | |
Discover Card Master Trust | | | | | | | | |
5.65%, 03/16/20 | | | 2,400,000 | | | | 2,722,907 | |
| | | | | | | | |
Total Asset-Backed Securities
(Cost $15,392,497) | | | | | | | 17,807,325 | |
| | | | | | | | |
CORPORATE BONDS — 59.1% | | | | | |
Aflac, Inc. | | | | | | | | |
8.50%, 05/15/19 | | | 244,000 | | | | 302,176 | |
6.90%, 12/17/39 | | | 2,669,000 | | | | 2,875,815 | |
6.45%, 08/15/40D | | | 5,416,000 | | | | 5,565,465 | |
Alcoa, Inc. | | | | | | | | |
5.87%, 02/23/22 | | | 10,000 | | | | 9,955 | |
6.75%, 01/15/28 | | | 235,000 | | | | 240,382 | |
5.95%, 02/01/37D | | | 5,326,000 | | | | 5,007,670 | |
Allegheny Technologies, Inc. | | | | | | | | |
9.38%, 06/01/19 | | | 3,613,000 | | | | 4,227,210 | |
Ally Financial, Inc. | | | | | | | | |
8.00%, 11/01/31 | | | 199,000 | | | | 215,418 | |
Alta Wind Holdings LLC | | | | | | | | |
7.00%, 06/30/35 144A | | | 600,000 | | | | 641,865 | |
American Express Co. | | | | | | | | |
8.15%, 03/19/38 | | | 6,202,000 | | | | 8,427,799 | |
American International Group, Inc. | | | | | | | | |
5.45%, 05/18/17 | | | 30,000 | | | | 30,460 | |
Anadarko Petroleum Corporation | | | | | | | | |
6.45%, 09/15/36 | | | 1,840,000 | | | | 1,840,926 | |
AT&T Corporation | | | | | | | | |
6.50%, 03/15/29 | | | 125,000 | | | | 130,773 | |
6.50%, 09/01/37 | | | 9,530,000 | | | | 10,311,374 | |
Bank of America Corporation | | | | | | | | |
7.63%, 06/01/19 | | | 7,000,000 | | | | 8,072,848 | |
Bell South Tele- communications, Inc. | | | | | | | | |
7.00%, 12/01/95 | | | 1,000,000 | | | | 1,025,316 | |
Bruce Mansfield Unit | | | | | | | | |
6.85%, 06/01/34@ | | | 1,231,288 | | | | 1,309,956 | |
Camden Property Trust | | | | | | | | |
5.70%, 05/15/17D | | | 25,000 | | | | 26,417 | |
Chesapeake Energy Corporation | | | | | | | | |
6.88%, 11/15/20 | | | 320,000 | | | | 325,600 | |
CIT Group, Inc. | | | | | | | | |
7.00%, 05/01/13 | | | 102,626 | | | | 104,935 | |
7.00%, 05/01/14D | | | 153,940 | | | | 155,864 | |
7.00%, 05/01/15D | | | 153,940 | | | | 154,710 | |
7.00%, 05/01/16D | | | 256,570 | | | | 258,174 | |
7.00%, 05/01/17 | | | 359,197 | | | | 360,993 | |
Citigroup, Inc. | | | | | | | | |
6.88%, 06/01/25 | | | 2,441,000 | | | | 2,496,201 | |
5.88%, 05/29/37 | | | 1,141,000 | | | | 1,119,919 | |
8.13%, 07/15/39 | | | 4,174,000 | | | | 5,326,896 | |
Comcast Corporation | | | | | | | | |
5.65%, 06/15/35 | | | 660,000 | | | | 643,256 | |
6.50%, 11/15/35 | | | 555,000 | | | | 598,394 | |
6.45%, 03/15/37D | | | 2,415,000 | | | | 2,588,750 | |
6.95%, 08/15/37 | | | 625,000 | | | | 709,199 | |
Commonwealth Edison Co. | | | | | | | | |
4.75%, 12/01/11@ | | | 135,000 | | | | 134,953 | |
Continental Airlines, Inc. | | | | | | | | |
9.00%, 07/08/16D | | | 1,919,157 | | | | 2,197,434 | |
8.31%, 10/02/19 | | | 191,084 | | | | 192,040 | |
7.57%, 09/15/21 | | | 243,334 | | | | 244,551 | |
Corning, Inc. | | | | | | | | |
7.25%, 08/15/36 | | | 850,000 | | | | 970,325 | |
Cummins, Inc. | | | | | | | | |
6.75%, 02/15/27 | | | 1,000,000 | | | | 1,045,558 | |
7.13%, 03/01/28 | | | 425,000 | | | | 464,926 | |
5.65%, 03/01/98 | | | 2,520,000 | | | | 1,976,998 | |
Darden Restaurants, Inc. | | | | | | | | |
6.00%, 08/15/35 | | | 990,000 | | | | 938,247 | |
DCP Midstream LP | | | | | | | | |
6.45%, 11/03/36 144A | | | 490,000 | | | | 510,408 | |
Dillard’s, Inc. | | | | | | | | |
7.75%, 07/15/26 | | | 890,000 | | | | 832,150 | |
7.00%, 12/01/28D | | | 500,000 | | | | 435,000 | |
Dow Chemical Co. | | | | | | | | |
9.40%, 05/15/39 | | | 4,331,000 | | | | 6,305,823 | |
Duke Realty LP | | | | | | | | |
5.95%, 02/15/17 | | | 70,000 | | | | 72,996 | |
First Industrial LP | | | | | | | | |
7.60%, 07/15/28 | | | 1,000,000 | | | | 892,021 | |
Foot Locker, Inc. | | | | | | | | |
8.50%, 01/15/22 | | | 1,000,000 | | | | 962,500 | |
Ford Motor Co. | | | | | | | | |
6.63%, 10/01/28D | | | 680,000 | | | | 661,300 | |
6.38%, 02/01/29 | | | 1,255,000 | | | | 1,201,662 | |
General Electric Capital Corporation | | | | | | | | |
4.88%, 03/04/15 | | | 510,000 | | | | 544,728 | |
6.75%, 03/15/32D | | | 3,000,000 | | | | 3,406,410 | |
6.15%, 08/07/37D | | | 6,114,000 | | | | 6,466,295 | |
5.88%, 01/14/38 | | | 150,000 | | | | 156,243 | |
Goldman Sachs Group, Inc. | | | | | | | | |
5.38%, 03/15/20 | | | 415,000 | | | | 429,621 | |
Halliburton Co. | | | | | | | | |
7.45%, 09/15/39D | | | 3,070,000 | | | | 3,958,080 | |
HCA, Inc. | | | | | | | | |
7.58%, 09/15/25 | | | 1,000,000 | | | | 922,500 | |
7.05%, 12/01/27 | | | 500,000 | | | | 438,750 | |
Home Depot, Inc. | | | | | | | | |
5.88%, 12/16/36 | | | 875,000 | | | | 913,206 | |
HSBC Bank USA NA | | | | | | | | |
7.00%, 01/15/39 | | | 5,948,000 | | | | 6,799,004 | |
Intel Corporation | | | | | | | | |
3.25%, 08/01/39D | | | 1,155,000 | | | | 1,390,331 | |
International Lease Finance Corporation | | | | | | | | |
5.65%, 06/01/14 | | | 105,000 | | | | 104,738 | |
8.63%, 09/15/15 144AD | | | 5,000 | | | | 5,388 | |
International Paper Co. | | | | | | | | |
8.70%, 06/15/38 | | | 2,643,000 | | | | 3,344,225 | |
iStar Financial, Inc. | | | | | | | | |
8.63%, 06/01/13 | | | 635,000 | | | | 596,900 | |
5.95%, 10/15/13D | | | 305,000 | | | | 282,887 | |
5.70%, 03/01/14D | | | 1,171,000 | | | | 1,068,537 | |
JC Penney Corporation, Inc. | | | | | | | | |
6.38%, 10/15/36 | | | 414,000 | | | | 378,810 | |
| | | | |
| 108 | | See Notes to Financial Statements. | | |
| | | | | | | | |
| | | Par | | | Value | |
Kinder Morgan Energy Partners LP | | | | | | | | |
5.80%, 03/15/35 | | $ | 280,000 | | | $ | 267,548 | |
Kraft Foods, Inc. | | | | | | | | |
6.50%, 11/01/31D | | | 1,700,000 | | | | 1,896,603 | |
7.00%, 08/11/37 | | | 525,000 | | | | 616,631 | |
6.88%, 02/01/38 | | | 3,243,000 | | | | 3,777,793 | |
6.50%, 02/09/40 | | | 3,928,000 | | | | 4,417,087 | |
Lennar Corporation | | | | | | | | |
5.60%, 05/31/15D | | | 935,000 | | | | 906,950 | |
6.50%, 04/15/16D | | | 625,000 | | | | 612,500 | |
Liberty Mutual Group, Inc. | | | | | | | | |
6.50%, 03/15/35 144A | | | 1,400,000 | | | | 1,243,868 | |
Lowe’s Cos., Inc. | | | | | | | | |
6.65%, 09/15/37 | | | 357,000 | | | | 419,954 | |
Macy’s Retail Holdings, Inc. | | | | | | | | |
6.38%, 03/15/37 | | | 240,000 | | | | 236,400 | |
Manufacturers & Traders Trust Co. | | | | | | | | |
6.63%, 12/04/17 | | | 1,320,000 | | | | 1,483,978 | |
Mead Corporation | | | | | | | | |
7.55%, 03/01/47 | | | 515,000 | | | | 477,717 | |
MetLife, Inc. | | | | | | | | |
7.72%, 02/15/19D | | | 3,510,000 | | | | 4,316,082 | |
6.40%, 12/15/36 | | | 310,000 | | | | 292,950 | |
5.88%, 02/06/41 | | | 2,238,000 | | | | 2,368,129 | |
Morgan Stanley | | | | | | | | |
5.45%, 01/09/17 | | | 5,000 | | | | 5,192 | |
5.55%, 04/27/17D | | | 185,000 | | | | 192,989 | |
6.63%, 04/01/18 | | | 70,000 | | | | 76,044 | |
5.63%, 09/23/19 | | | 195,000 | | | | 199,179 | |
6.25%, 08/09/26 | | | 100,000 | | | | 103,415 | |
Motorola, Inc. | | | | | | | | |
6.50%, 09/01/25 | | | 265,000 | | | | 273,173 | |
6.50%, 11/15/28D | | | 725,000 | | | | 715,440 | |
6.63%, 11/15/37 | | | 275,000 | | | | 273,229 | |
Mutual of Omaha Insurance Co. | | | | | | | | |
6.80%, 06/15/36 144A | | | 100,000 | | | | 94,856 | |
Nextel Communications, Inc. | | | | | | | | |
7.38%, 08/01/15 | | | 550,000 | | | | 553,438 | |
NGPL PipeCo LLC | | | | | | | | |
7.12%, 12/15/17 144AD | | | 640,000 | | | | 701,625 | |
Nortel Networks Capital Corporation | | | | | | | | |
7.88%, 06/15/26# | | | 450,000 | | | | 308,250 | |
Owens Corning, Inc. | | | | | | | | |
6.50%, 12/01/16 | | | 240,000 | | | | 254,501 | |
7.00%, 12/01/36 | | | 3,940,000 | | | | 4,071,714 | |
Penn Mutual Life Insurance Co. | | | | | | | | |
7.63%, 06/15/40 144A | | | 1,750,000 | | | | 1,729,649 | |
PepsiCo, Inc. | | | | | | | | |
4.88%, 11/01/40 | | | 3,496,000 | | | | 3,405,436 | |
Pioneer Natural Resources Co. | | | | | | | | |
7.20%, 01/15/28 | | | 2,500,000 | | | | 2,625,012 | |
Prologis | | | | | | | | |
5.63%, 11/15/15 | | | 35,000 | | | | 36,770 | |
Prudential Financial, Inc. | | | | | | | | |
6.63%, 06/21/40 | | | 5,000,000 | | | | 5,598,195 | |
Pulte Homes, Inc. | | | | | | | | |
5.20%, 02/15/15D | | | 38,000 | | | | 37,145 | |
7.88%, 06/15/32D | | | 1,500,000 | | | | 1,350,000 | |
6.38%, 05/15/33 | | | 1,000,000 | | | | 760,000 | |
Qwest Corporation | | | | | | | | |
7.25%, 09/15/25 | | | 1,000,000 | | | | 1,055,000 | |
6.88%, 09/15/33 | | | 2,250,000 | | | | 2,221,875 | |
Sempra Energy | | | | | | | | |
6.00%, 10/15/39 | | | 8,268,000 | | | | 8,766,709 | |
SLM Corporation | | | | | | | | |
5.00%, 10/01/13 | | | 250,000 | | | | 250,805 | |
5.38%, 05/15/14 | | | 200,000 | | | | 201,139 | |
Southern Natural Gas Co. | | | | | | | | |
7.35%, 02/15/31 | | | 1,750,000 | | | | 1,872,988 | |
Sprint Capital Corporation | | | | | | | | |
6.90%, 05/01/19D | | | 55,000 | | | | 54,588 | |
6.88%, 11/15/28 | | | 2,350,000 | | | | 2,068,000 | |
8.75%, 03/15/32 | | | 20,000 | | | | 20,300 | |
Target Corporation | | | | | | | | |
6.50%, 10/15/37D | | | 5,400,000 | | | | 6,318,254 | |
7.00%, 01/15/38D | | | 2,330,000 | | | | 2,866,047 | |
Tennessee Gas Pipeline Co. | | | | | | | | |
7.00%, 10/15/28 | | | 750,000 | | | | 796,830 | |
Textron, Inc. | | | | | | | | |
6.63%, 04/07/20(U) | | | 160,000 | | | | 249,164 | |
Time Warner Cable, Inc. | | | | | | | | |
6.55%, 05/01/37D | | | 1,049,000 | | | | 1,126,796 | |
6.75%, 06/15/39D | | | 2,995,000 | | | | 3,318,915 | |
5.88%, 11/15/40 | | | 1,700,000 | | | | 1,687,782 | |
Time Warner Entertainment Co. LP | | | | | | | | |
8.38%, 07/15/33 | | | 1,049,000 | | | | 1,327,583 | |
Toll Brothers Finance Corporation | | | | | | | | |
5.15%, 05/15/15 | | | 1,245,000 | | | | 1,273,913 | |
Toro Co. | | | | | | | | |
6.63%, 05/01/37@ | | | 300,000 | | | | 275,606 | |
Travelers Cos., Inc. | | | | | | | | |
6.25%, 06/15/37 | | | 4,825,000 | | | | 5,380,362 | |
Union Pacific Resources Group | | | | | | | | |
7.15%, 05/15/28 | | | 250,000 | | | | 259,714 | |
United Parcel Service, Inc. | | | | | | | | |
4.88%, 11/15/40 | | | 808,000 | | | | 785,653 | |
UnitedHealth Group, Inc. | | | | | | | | |
5.80%, 03/15/36 | | | 920,000 | | | | 936,469 | |
6.50%, 06/15/37 | | | 767,000 | | | | 849,695 | |
6.63%, 11/15/37 | | | 2,526,000 | | | | 2,843,195 | |
5.70%, 10/15/40D | | | 1,210,000 | | | | 1,209,048 | |
Verizon Communications, Inc. | | | | | | | | |
5.85%, 09/15/35 | | | 2,420,000 | | | | 2,511,418 | |
6.40%, 02/15/38 | | | 968,000 | | | | 1,074,404 | |
6.90%, 04/15/38 | | | 1,000,000 | | | | 1,170,232 | |
8.95%, 03/01/39 | | | 105,000 | | | | 150,111 | |
7.35%, 04/01/39 | | | 979,000 | | | | 1,208,166 | |
Verizon Maryland, Inc. | | | | | | | | |
5.13%, 06/15/33 | | | 175,000 | | | | 154,555 | |
Verizon New York, Inc. | | | | | | | | |
7.38%, 04/01/32 | | | 385,000 | | | | 433,240 | |
Wachovia Bank NA | | | | | | | | |
5.85%, 02/01/37 | | | 4,577,000 | | | | 4,621,639 | |
6.60%, 01/15/38 | | | 3,757,000 | | | | 4,150,403 | |
Wal-Mart Stores, Inc. | | | | | | | | |
6.50%, 08/15/37 | | | 4,359,000 | | | | 5,138,668 | |
WellPoint, Inc. | | | | | | | | |
5.95%, 12/15/34 | | | 846,000 | | | | 872,846 | |
6.38%, 06/15/37 | | | 2,766,000 | | | | 3,029,362 | |
Western Union Co. | | | | | | | | |
6.20%, 11/17/36D | | | 3,240,000 | | | | 3,212,897 | |
6.20%, 06/21/40D | | | 20,000 | | | | 19,852 | |
| | | | |
| | See Notes to Financial Statements. | | 109 |
| | |
| EXTENDED-DURATION BOND FUND | | |
| SCHEDULE OF INVESTMENTS (Continued) | | |
| | | | | | | | |
| | | Par | | | Value | |
Weyerhaeuser Co. | | | | | | | | |
8.50%, 01/15/25D | | $ | 520,000 | | | $ | 565,729 | |
6.88%, 12/15/33D | | | 580,000 | | | | 545,699 | |
Williams Cos., Inc. | | | | | | | | |
7.50%, 01/15/31 | | | 926,000 | | | | 1,042,771 | |
Wyndham Worldwide Corporation | | | | | | | | |
5.75%, 02/01/18 | | | 50,000 | | | | 50,915 | |
Xerox Capital Trust I | | | | | | | | |
8.00%, 02/01/27 | | | 1,500,000 | | | | 1,529,700 | |
| | | | | | | | |
Total Corporate Bonds
(Cost $223,609,304) | | | | | | | 242,548,740 | |
| | | | | | | | |
FOREIGN BONDS — 24.6% | | | | | |
Australia — 2.1% | | | | | | | | |
Barrick Gold Mining Finance, Ltd. | | | | | | | | |
5.95%, 10/15/39D | | | 2,870,000 | | | | 3,049,688 | |
General Electric Capital Australia Funding, Ltd. | | | | | | | | |
8.00%, 02/13/12(A) | | | 60,000 | | | | 62,688 | |
New South Wales Treasury Corporation | | | | | | | | |
6.00%, 05/01/12(A) | | | 60,000 | | | | 61,990 | |
Qantas Airways, Ltd. | | | | | | | | |
6.05%, 04/15/16 144A | | | 345,000 | | | | 367,537 | |
Queensland Treasury Corporation | | | | | | | | |
6.00%, 06/14/11(A) | | | 785,000 | | | | 805,620 | |
Rio Tinto Finance USA, Ltd. | | | | | | | | |
5.20%, 11/02/40 | | | 4,186,000 | | | | 4,119,589 | |
| | | | | | | | |
| | | | | | | 8,467,112 | |
| | | | | | | | |
Brazil — 0.4% | | | | | | | | |
Federative Republic of Brazil | | | | | | | | |
10.25%, 01/10/28(B) | | | 2,525,000 | | | | 1,587,252 | |
| | | | | | | | |
Canada — 5.5% | | | | | | | | |
British Columbia Generic Residual STRIP | | | | | | | | |
2.46%, 06/09/14(C)W† | | | 4,335,000 | | | | 3,998,986 | |
Canada Generic Residual STRIP | | | | | | | | |
3.65%, 06/01/25(C)W† | | | 3,685,000 | | | | 2,210,740 | |
Methanex Corporation | | | | | | | | |
6.00%, 08/15/15 | | | 25,000 | | | | 24,078 | |
Ontario Generic Residual STRIP | | | | | | | | |
4.43%, 07/13/22(C)W† | | | 3,900,000 | | | | 2,335,215 | |
4.67%, 03/08/29(C)W† | | | 7,000,000 | | | | 3,032,043 | |
Saskatchewan Residual STRIP | | | | | | | | |
3.19%, 04/10/14(C) | | | 4,235,000 | | | | 3,912,147 | |
4.22%, 02/04/22(C) | | | 3,000,000 | | | | 1,826,672 | |
Talisman Energy, Inc. | | | | | | | | |
6.25%, 02/01/38 | | | 450,000 | | | | 482,224 | |
TransCanada Pipelines, Ltd. | | | | | | | | |
6.20%, 10/15/37 | | | 4,291,000 | | | | 4,724,357 | |
| | | | | | | | |
| | | | | | | 22,546,462 | |
| | | | | | | | |
Cayman Islands — 0.2% | | | | | | | | |
Enersis SA | | | | | | | | |
7.40%, 12/01/16D | | | 625,000 | | | | 706,261 | |
| | | | | | | | |
Finland — 1.1% | | | | | | | | |
Nokia OYJ | | | | | | | | |
6.63%, 05/15/39 | | | 4,410,000 | | | | 4,673,643 | |
| | | | | | | | |
Ireland — 0.9% | | | | | | | | |
Ireland Government Bond | | | | | | | | |
4.50%, 10/18/18(E) | | | 1,150,000 | | | | 1,174,311 | |
5.00%, 10/18/20(E) | | | 75,000 | | | | 73,572 | |
5.40%, 03/13/25(E) | | | 300,000 | | | | 287,103 | |
XL Capital, Ltd. | | | | | | | | |
6.38%, 11/15/24 | | | 585,000 | | | | 590,305 | |
6.25%, 05/15/27 | | | 1,530,000 | | | | 1,510,595 | |
| | | | | | | | |
| | | | | | | 3,635,886 | |
| | | | | | | | |
Italy — 1.0% | | | | | | | | |
Telecom Italia Capital SA | | | | | | | | |
6.38%, 11/15/33D | | | 410,000 | | | | 352,879 | |
6.00%, 09/30/34D | | | 415,000 | | | | 345,366 | |
7.72%, 06/04/38 | | | 3,354,000 | | | | 3,332,856 | |
| | | | | | | | |
| | | | | | | 4,031,101 | |
| | | | | | | | |
Luxembourg — 1.7% | | | | | | | | |
ArcelorMittal | | | | | | | | |
7.00%, 10/15/39D | | | 5,195,000 | | | | 5,408,291 | |
Enel Finance International SA | | | | | | | | |
6.00%, 10/07/39 144A | | | 1,710,000 | | | | 1,538,810 | |
| | | | | | | | |
| | | | | | | 6,947,101 | |
| | | | | | | | |
Malaysia — 0.1% | | | | | | | | |
Telekom Malaysia BHD | | | | | | | | |
7.88%, 08/01/25 144A | | | 225,000 | | | | 284,539 | |
| | | | | | | | |
Mexico — 1.0% | | | | | | | | |
Mexican Bonos | | | | | | | | |
7.25%, 12/15/16(M) | | | 13,150,000 | | | | 1,107,794 | |
8.00%, 12/07/23(M) | | | 34,000,000 | | | | 2,952,907 | |
| | | | | | | | |
| | | | | | | 4,060,701 | |
| | | | | | | | |
Netherlands — 0.9% | | | | | | | | |
Koninklijke Philips Electronics NV | | | | | | | | |
6.88%, 03/11/38 | | | 3,250,000 | | | | 3,888,768 | |
| | | | | | | | |
Norway — 0.5% | | | | | | | | |
Norway Government Bond | | | | | | | | |
5.00%, 05/15/15(K) | | | 540,000 | | | | 100,287 | |
4.25%, 05/19/17(K) | | | 11,940,000 | | | | 2,154,328 | |
| | | | | | | | |
| | | | | | | 2,254,615 | |
| | | | | | | | |
Philippines — 0.1% | | | | | | | | |
Quezon Power (Philippines), Ltd. | | | | | | | | |
8.86%, 06/15/17 | | | 310,000 | | | | 324,725 | |
| | | | | | | | |
Portugal — 0.1% | | | | | | | | |
Obrigacoes do Tesouro | | | | | | | | |
4.80%, 06/15/20(E) | | | 75,000 | | | | 87,854 | |
3.85%, 04/15/21(E) | | | 250,000 | | | | 262,384 | |
| | | | | | | | |
| | | | | | | 350,238 | |
| | | | | | | | |
Spain — 0.4% | | | | | | | | |
Telefonica Emisiones SAU | | | | | | | | |
5.13%, 04/27/20 | | | 1,650,000 | | | | 1,591,414 | |
| | | | | | | | |
Supranational — 1.7% | | | | | | | | |
Inter-American Development Bank | | | | | | | | |
6.00%, 12/15/17(Z) | | | 6,365,000 | | | | 5,117,694 | |
International Bank For Reconstruction & Development | | | | | | | | |
1.43%, 03/05/14(G) | | | 2,470,000 | | | | 1,932,788 | |
| | | | | | | | |
| | | | | | | 7,050,482 | |
| | | | | | | | |
| | | | |
| 110 | | See Notes to Financial Statements. | | |
| | | | | | | | |
| | | Par | | | Value | |
United Kingdom — 6.9% | |
Barclays Bank PLC | | | | | | | | |
3.68%, 08/20/15(W) | | $ | 740,000,000 | | | $ | 642,485 | |
10.18%, 06/12/21 144A | | | 7,312,000 | | | | 9,120,945 | |
HBOS PLC | | | | | | | | |
6.00%, 11/01/33 144A | | | 590,000 | | | | 441,118 | |
HSBC Holdings PLC | | | | | | | | |
6.80%, 06/01/38 | | | 2,000,000 | | | | 2,169,622 | |
Lloyds TSB Bank PLC | | | | | | | | |
5.80%, 01/13/20 144A | | | 9,000,000 | | | | 8,901,693 | |
Royal Bank of Scotland PLC | | | | | | | | |
5.63%, 08/24/20 | | | 904,000 | | | | 900,411 | |
Royal Bank of Scotland Group PLC | | | | | | | | |
6.40%, 10/21/19D | | | 1,084,000 | | | | 1,092,704 | |
Standard Chartered Bank | | | | | | | | |
6.40%, 09/26/17 144A | | | 1,000,000 | | | | 1,071,485 | |
Tesco PLC | | | | | | | | |
6.15%, 11/15/37 144A | | | 3,720,000 | | | | 4,201,230 | |
| | | | | | | | |
| | | | | | | 28,541,693 | |
| | | | | | | | |
Total Foreign Bonds (Cost $92,276,528) | | | | | | | 100,941,993 | |
| | | | | | | | |
MORTGAGE-BACKED SECURITY — 0.0% | |
Federal Home Loan Mortgage Corporation | | | | | | | | |
5.00%, 12/01/31 | | | | | | | | |
(Cost $109,825) | | | 115,890 | | | | 122,217 | |
| | | | | | | | |
MUNICIPAL BONDS — 5.7% | |
Los Angeles Unified School District, Series KRY General Obligation Bond | | | | | | | | |
5.76%, 07/01/29 | | | 2,280,000 | | | | 2,164,153 | |
5.75%, 07/01/34 | | | 3,415,000 | | | | 3,193,128 | |
Metropolitan Transportation Authority, Build America Series E Revenue Bond | | | | | | | | |
6.81%, 11/15/40 | | | 1,020,000 | | | | 1,050,916 | |
New Jersey State Turnpike Authority Series F Revenue Bond | | | | | | | | |
7.41%, 01/01/40 | | | 2,342,000 | | | | 2,572,921 | |
New Jersey State Turnpike Authority, Build America Series A Revenue Bond | | | | | | | | |
7.10%, 01/01/41 | | | 1,945,000 | | | | 2,109,994 | |
New York City Municipal Water Finance Authority | | | | | | | | |
6.01%, 06/15/42 | | | 3,295,000 | | | | 3,295,297 | |
North Texas Tollway Authority Revenue Bond | | | | | | | | |
6.72%, 01/01/49 | | | 3,620,000 | | | | 3,547,600 | �� |
State of California General Obligation Bond | | | | | | | | |
7.50%, 04/01/34 | | | 2,135,000 | | | | 2,211,326 | |
7.55%, 04/01/39 | | | 1,190,000 | | | | 1,235,387 | |
7.30%, 10/01/39 | | | 2,000,000 | | | | 2,016,200 | |
| | | | | | | | |
Total Municipal Bonds
(Cost $23,578,511) | | | | | | | 23,396,922 | |
| | | | | | | | |
U.S. TREASURY OBLIGATIONS — 3.1% | |
U.S. Treasury STRIPS | | | | | | | | |
4.70%, 05/15/38 | | | 26,240,000 | | | | 7,595,011 | |
4.70%, 02/15/40 | | | 3,000,000 | | | | 790,140 | |
4.70%, 05/15/40D | | | 16,000,000 | | | | 4,174,464 | |
| | | | | | | | |
| | | | | | | 12,559,615 | |
| | | | | | | | |
Total U.S. Treasury Obligations
(Cost $13,556,724) | | | | | | | 12,559,615 | |
| | | | | | | | |
| | |
| | | Shares | | | | |
PREFERRED STOCKS — 0.1% | |
Chesapeake Energy Corporation | | | 330 | | | | 30,525 | |
El Paso Energy Capital Trust I | | | 5,350 | | | | 207,954 | |
Preferred Blocker (GMAC), Inc.D | | | 82 | | | | 77,498 | |
| | | | | | | | |
Total Preferred Stocks
(Cost $278,115) | | | | | | | 315,977 | |
| | | | | | | | |
MONEY MARKET FUNDS — 11.6% | |
GuideStone Money Market Fund (GS4 Class)¥ | | | 7,743,334 | | | | 7,743,334 | |
Northern Institutional Liquid Assets Portfolio§ | | | 39,862,497 | | | | 39,862,497 | |
| | | | | | | | |
Total Money Market Funds
(Cost $47,605,831) | | | | | | | 47,605,831 | |
| | | | | | | | |
TOTAL INVESTMENTS — 108.5% | |
(Cost $416,407,335) | | | | | | | 445,298,620 | |
Liabilities in Excess of Other Assets —(8.5)% | | | | (34,798,313 | ) |
| | | | | | | | |
NET ASSETS — 100.0% | | | $ | 410,500,307 | |
| | | | | | | | |
Please see abbreviation and footnote definitions beginning on page 180.
PORTFOLIO SUMMARY (based on net assets)
| | | | |
| | | % | |
Corporate Bonds | | | 59.1 | |
Foreign Bonds | | | 24.6 | |
Money Market Funds | | | 11.6 | |
Municipal Bonds | | | 5.7 | |
Asset-Backed Securities | | | 4.3 | |
U.S. Treasury Obligations | | | 3.1 | |
Preferred Stocks | | | 0.1 | |
Mortgage-Backed Security | | | — | ** |
| | | | |
| | | 108.5 | |
| | | | |
| ** | Rounds to less than 0.005%. |
| | | | |
| | See Notes to Financial Statements. | | 111 |
| | |
| EXTENDED-DURATION BOND FUND | | |
SCHEDULE OF INVESTMENTS (Continued) | | |
VALUATION HIERARCHY
The following is a summary of the inputs used, as of December 31, 2010, in valuing the Fund’s assets carried at fair value:
| | | | | | | | |
Valuation Inputs | | Investments
in
Securities | | | Other
Financial
Instruments*** | |
Level 1 — Quoted Prices | | | | | |
Money Market Funds | | $ | 47,605,831 | | | $ | — | |
Preferred Stocks | | | 315,977 | | | | — | |
Level 2 — Other Significant | | | | | | | | |
Observable Inputs | | | | | | | | |
Asset-Backed Securities | | | 17,807,325 | | | | — | |
Corporate Bonds | | | 242,548,740 | | | | — | |
Foreign Bonds | | | 100,941,993 | | | | — | |
Mortgage-Backed Security | | | 122,217 | | | | — | |
Municipal Bonds | | | 23,396,922 | | | | — | |
U.S. Treasury Obligations | | | 12,559,615 | | | | — | |
Level 3 — Significant Unobservable Inputs | | | — | | | | — | |
| | | | | | | | |
Total | | $ | 445,298,620 | | | $ | — | |
| | | | | | | | |
| *** | Other financial instruments are derivative instruments not reflected in the Schedule of Investments, such as futures, forwards and swap contracts, which are valued at the unrealized appreciation (depreciation) on the investment. Details of these investments can be found in the Notes to Financial Statements. |
| | | | |
| 112 | | See Notes to Financial Statements. | | |
Inflation Protected Bond Fund
During the first nine months of the year, the environment for bonds was positive as interest rates declined amidst concerns of economic uncertainty while investor demand for fixed income securities remained strong. This backdrop provided a nice rally in bond prices. However, the fourth quarter was characterized by a positive change in sentiment related to the domestic economy, partially due to the announcement of further quantitative easing measures by the Federal Reserve as well as indications that the economy was gaining traction. The brightened economic picture fueled a rise in interest rates which proved to be a headwind for bonds during the year’s final quarter. The broad U.S. investment grade bond market, as measured by the Barclays Capital U.S Aggregate Bond Index, posted an annual return of 6.54%. All major bond sectors produced positive returns, led by investment grade corporate bonds and commercial mortgage-backed securities. In general, investor appetite for bonds that traded at a risk premium (yield spread above U.S. Treasuries) was strong, causing yield spreads to narrow which boosted returns. Overall, lower quality bonds outpaced higher quality bonds while longer-dated bonds outperformed shorter-maturity bonds. U.S. Treasuries posted an annual return of 5.87%. Outperforming their nominal counterparts, U.S. Treasury Inflation Protected Securities (“TIPS”) generated an annual return of 6.31%, as measured by the Barclays Capital U.S. TIPS Index.
The Fund is actively managed and is primarily comprised of inflation-indexed debt securities with an average dollar-weighted duration normally between four and ten years. The Fund slightly underperformed its benchmark index, the Barclays Capital U.S. TIPS Index, for the period ended December 31, 2010 (5.82% versus 6.31%). The Fund’s investment strategy generally added value during the year, but it was not quite sufficient to overcome the hurdle of Fund-related expenses. During the first quarter of the year, the Fund benefitted from tactical duration positioning as well as a real curve flattening bias given relatively high levels of inflation priced into the front end of the curve. During the second and third quarters, the Fund benefitted from its allocation to short and intermediate nominal U.S. Treasuries as breakevens narrowed on decreased inflation expectations.
However, as was the case for most of the year, the Fund’s short duration position detracted from performance as real yields moved lower all the way up to the Federal Reserve’s quantitative easing announcement. The Fund’s real curve flattening bias partially offset the underperformance during the fourth quarter. During 2010, interest rate futures were utilized in order to manage the duration and yield curve exposures relative to the Fund’s benchmark index. The Fund was consistently managed to provide an inflation protection and income consistent with investment in inflation-indexed securities. The Fund’s average modified duration ranged between 6.5 and 8.5 years.
This fund is subject to interest rate risk. Meaning, when interest rates rise, the value of the existing bonds decrease and vice versa. Changes in interest rates have a bigger impact on long duration holdings than on short duration holdings.
Please see page 117 for information regarding specific portfolio allocations. Portfolio holdings are subject to change at any time.
| | |
| Inflation Protected Bond Fund | | |
| | |
| | | | | | | | |
Average Annual Total Returns as of 12/31/10 | |
| | | GS4 Class* | | | Benchmark** | |
One Year | | | 5.82 | % | | | 6.31 | % |
Since Inception | | | 7.26 | % | | | 7.70 | % |
Inception Date | | | 06/25/09 | | | | | |
Total Fund Operating Expenses (April 30, 2010 Prospectus, as supplemented on August 5, 2010)(1) | | | 0.72 | % | | | | |
| (1) | The Fund’s shareholders indirectly bear the expenses of the GS4 Class shares of the Select Fund in which the Fund invests. Current information regarding the Fund’s Operating Expenses can be found in the Financial Highlights. |
The performance data quoted represents past performance and does not guarantee future results. Current performance may be lower or higher. Performance data current to the most recent month-end may be obtained at www.GuideStoneFunds.org. The investment return and principal value of an investment will fluctuate so that shares, when redeemed, may be worth more or less than their original cost.
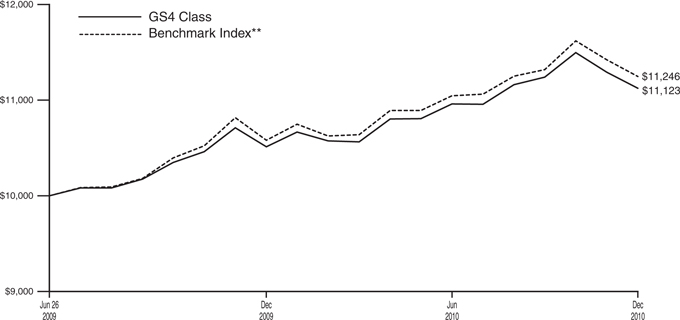
The graph compares the results of a hypothetical $10,000 investment in the GS4 Class of the Fund since June 25, 2009 (commencement of operations), with all dividends and capital gains reinvested, with the Barclays Capital U.S. TIPS index.
| * | These returns reflect expense waivers by the Fund’s investment adviser. Without these waivers, returns would have been lower. Returns shown do not reflect the deduction of taxes that a shareholder would pay on Fund distributions or the redemption of Fund shares. |
| ** | The Barclays Capital U.S. TIPS Index measures the performance of the U.S. Treasury Inflation Protected Securities (“TIPS”) market and includes TIPS with one or more years remaining maturity with total outstanding issue size of $500 million or more. |
Unlike a mutual fund, the performance of an index assumes no taxes, transaction costs, management fees or other expenses.
| | |
| INFLATION PROTECTED BOND FUND | | |
SCHEDULE OF INVESTMENTS | | December 31, 2010 |
| | | | | | | | |
| | | Par | | | Value | |
U.S. TREASURY OBLIGATIONS — 94.8% | |
U.S. Treasury Bonds | | | | | | | | |
5.25%, 02/15/29 | | $ | 1,865,000 | | | $ | 2,139,213 | |
4.38%, 05/15/40D | | | 240,000 | | | | 241,199 | |
3.88%, 08/15/40D | | | 160,000 | | | | 147,400 | |
U.S. Treasury Inflationary Index Bonds | | | | | | | 2,527,812 | |
3.38%, 01/15/12 | | | 2,970,000 | | | | 3,826,420 | |
2.00%, 04/15/12 | | | 1,947,300 | | | | 2,176,624 | |
3.00%, 07/15/12 | | | 4,348,700 | | | | 5,622,665 | |
0.63%, 04/15/13 | | | 600,000 | | | | 640,082 | |
1.88%, 07/15/13D | | | 1,885,000 | | | | 2,395,234 | |
2.00%, 01/15/14 | | | 2,290,000 | | | | 2,912,505 | |
1.25%, 04/15/14 | | | 1,255,000 | | | | 1,365,106 | |
2.00%, 07/15/14D‡‡ | | | 3,908,200 | | | | 4,906,062 | |
1.63%, 01/15/15 | | | 735,000 | | | | 898,737 | |
0.50%, 04/15/15D | | | 10,801,900 | | | | 11,156,561 | |
1.88%, 07/15/15 | | | 3,390,000 | | | | 4,133,851 | |
2.00%, 01/15/16 | | | 3,415,000 | | | | 4,102,245 | |
2.50%, 07/15/16D | | | 3,755,000 | | | | 4,569,027 | |
2.38%, 01/15/17 | | | 1,965,000 | | | | 2,377,422 | |
2.63%, 07/15/17 | | | 2,125,000 | | | | 2,554,718 | |
1.63%, 01/15/18D | | | 3,220,000 | | | | 3,601,255 | |
1.38%, 07/15/18 | | | 3,765,000 | | | | 4,029,372 | |
2.13%, 01/15/19D | | | 785,900 | | | | 886,984 | |
1.88%, 07/15/19 | | | 935,000 | | | | 1,042,623 | |
1.38%, 01/15/20 | | | 2,753,900 | | | | 2,898,332 | |
1.25%, 07/15/20 | | | 648,900 | | | | 667,209 | |
2.38%, 01/15/25D | | | 3,620,200 | | | | 4,684,650 | |
2.00%, 01/15/26 | | | 1,475,000 | | | | 1,729,805 | |
2.38%, 01/15/27D | | | 1,345,000 | | | | 1,624,673 | |
1.75%, 01/15/28D | | | 4,965,000 | | | | 5,289,256 | |
3.63%, 04/15/28 | | | 1,200,000 | | | | 2,099,639 | |
2.50%, 01/15/29D | | | 3,900,000 | | | | 4,520,185 | |
3.88%, 04/15/29 | | | 2,880,000 | | | | 5,150,589 | |
3.38%, 04/15/32 | | | 307,100 | | | | 490,218 | |
2.13%, 02/15/40 | | | 6,831,600 | | | | 7,343,583 | |
| | | | | | | | |
| | | | | | | 99,695,632 | |
| | | | | | | | |
Total U.S. Treasury Obligations
(Cost $99,705,539) | | | | | | | 102,223,444 | |
| | | | | | | | |
| | |
| | | Shares | | | | |
MONEY MARKET FUNDS — 6.7% | |
GuideStone Money Market Fund (GS4 Class)¥ | | | 4,857,515 | | | | 4,857,515 | |
Northern Institutional Liquid Assets Portfolio§ | | | 2,321,463 | | | | 2,321,463 | |
| | | | | | | | |
Total Money Market Funds
(Cost $7,178,978) | | | | | | | 7,178,978 | |
| | | | | | | | |
TOTAL INVESTMENTS — 101.5%
(Cost $106,884,517) | | | | 109,402,422 | |
Liabilities in Excess of Other Assets — (1.5)% | | | | (1,577,470 | ) |
| | | | | | | | |
NET ASSETS — 100.0% | | | $ | 107,824,952 | |
| | | | | | | | |
Please see abbreviation and footnote definitions beginning on page 180. | |
| | | | |
PORTFOLIO SUMMARY (based on net assets) | |
| | | % | |
U.S. Treasury Obligations | | | 94.8 | |
Money Market Funds | | | 6.7 | |
Futures Contracts | | | (0.3 | ) |
| | | | |
| | | 101.2 | |
| | | | |
| | | | | | | | |
VALUATION HIERARCHY | |
The following is a summary of the inputs used, as of December 31, 2010, in valuing the Fund’s assets carried at fair value: | |
Valuation Inputs | | Investments
in
Securities | | | Other
Financial
Instruments*** | |
Assets: | | | | | | | | |
Level 1 — Quoted Prices | | | | | | | | |
Money Market Funds | | $ | 7,178,978 | | | $ | — | |
Level 2 — Other Significant Observable Inputs | | | | | | | | |
U.S. Treasury Obligations | | | 102,223,444 | | | | — | |
Level 3 — Significant Unobservable Inputs | | | — | | | | — | |
| | | | | | | | |
Total | | $ | 109,402,422 | | | $
|
— |
|
| | | | | | | | |
| | |
Liabilities: | | | | | | | | |
Level 1 — Quoted Prices | | | | | | | | |
Futures Contracts | | $ | — | | | $ | (4,433 | ) |
Level 2 — Other Significant Observable Inputs | | | — | | | | — | |
Level 3 — Significant Unobservable Inputs | | | — | | | | — | |
| | | | | | | | |
Total Liabilities | | $ | — | | | $ | (4,433 | ) |
| | | | | | | | |
| *** | Other financial instruments are derivative instruments not reflected in the Schedule of Investments, such as futures, forwards and swap contracts, which are valued at the unrealized appreciation (depreciation) on the investment. Details of these investments can be found in the Notes to Financial Statements. |
| | | | |
| | See Notes to Financial Statements. | | 115 |
Global Bond Fund
The backdrop for global bond markets was volatile and uncertain during the year, struggling to absorb the divergence in economic news between the debt-burdened developed markets and vastly improving emerging markets economies. Concerns were widespread in developed countries with fears focused on a double dip recession in the U.S. and the sovereign debt crisis in Europe. The U.S. and U.K. implemented quantitative easing in an effort to stimulate economic activity while eurozone policymakers took steps to assist the peripheral continental European markets of Greece, Spain, Ireland and Portugal. In contrast, emerging market economies experienced much stronger economic growth and maintained lower debt to GDP levels compared to their developed market counterparts. In the U.S., the broad investment grade bond market, as measured by the Barclays Capital U.S. Aggregate Bond Index, posted an annual return of 6.54%. All major bond sectors produced positive returns, led by investment grade corporate bonds and commercial mortgage-backed securities. In general, investor appetite for bonds that traded at a risk premium (yield spread above U.S. Treasuries) was strong, causing yield spreads to narrow which boosted returns. Overall, lower quality bonds outpaced higher quality while longer-dated bonds outperformed shorter-maturity bonds. U.S. Treasuries posted an annual return of 5.87%. High yield bonds (defined as below investment grade corporate bonds) posted a robust return of 15.24% for the year. High yield bonds benefitted from a decline in overall default rates, improved corporate profits and balance sheets, lower debt service coverage due to refinancing activity and strong investor demand. The CitigroupWorld Government Bond Index posted an annual return of 3.4%. Within the global bond markets, emerging market debt was one of the top performing sectors, generating an annual return of 11.83%. Emerging market debt experienced further spread compression as credit quality improved and investor demand remained strong given the securities’ higher yield orientation.
The Fund is actively managed and invests in a diversified portfolio composed primarily of global fixed income securities with an average dollar-weighted duration normally between three to ten years. For the one-year period ended December 31, 2010, the Fund outpaced its composite benchmark, 50% Barclays Capital Global Aggregate Bond Index – Unhedged, 25% JPMorgan Emerging Markets Index Plus and 25% Barclays Capital U.S. Corporate High Yield Index – 2% Issuer Capped (11.29% versus 9.44%). The Fund maintained its global focus, seeking investment opportunities across a wide array of economies, credits, yield curves and currencies. The Fund’s investment strategies focused on spread sectors during the year. Security selection and exposure to certain segments of the global bond market, including investment grade corporate bonds, high yield bonds and emerging markets securities, added value relative to the composite benchmark. During the year, the Fund utilized government futures and options to manage risk and adjust exposure along the yield curve. Additionally, the Fund used currency forwards to manage foreign currency exposure. The outperformance was generated primarily in the first and fourth quarter, taking advantage of spread compression and attractive yields.
The Fund invests in high yield securities, commonly known as “junk bonds”. While offering higher currency yields, these securities generally are considered speculative and are subject to greater risks than higher-rated bonds. Securities of emerging countries may involve additional risks, including price volatility, reduced liquidity, currency fluctuation and financial reporting requirements as well as political and economic instability.
This fund is subject to interest rate risk. Meaning, when interest rates rise, the value of the existing bonds decrease and vice versa. Changes in interest rates have a bigger impact on long duration holdings than on short duration holdings.
Please see page 127 for information regarding specific portfolio allocations. Portfolio holdings are subject to change at any time.
116
| | | | | | | | |
Average Annual Total Returns as of 12/31/10 | |
| | | GS4 Class* | | | Benchmark** | |
One Year | | | 11.29% | | | | 9.44% | |
Since Inception | | | 6.86% | | | | 7.64% | |
Inception Date | | | 12/29/06 | | | | | |
Total Fund Operating Expenses (April 30, 2010 Prospectus, as supplemented on August 5, 2010)(1) | | | 0.82% | | | | | |
| (1)The | Fund’s shareholders indirectly bear the expenses of the GS4 Class shares of the Select Fund in which the Fund invests. Current information regarding the Fund’s Operating Expenses can be found in the Financial Highlights. |
The performance data quoted represents past performance and does not guarantee future results. Current performance may be lower or higher. Performance data current to the most recent month-end may be obtained at www.GuideStoneFunds.org. The investment return and principal value of an investment will fluctuate so that shares, when redeemed, may be worth more or less than their original cost.
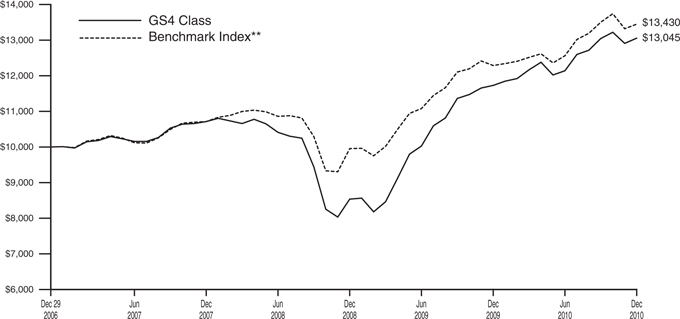
The graph compares the results of a hypothetical $10,000 investment in the GS4 Class of the Fund since December 29, 2006 (commencement of operations), with all dividends and capital gains reinvested, with the weighted composite index.
*These returns reflect expense waivers by the Fund’s investment adviser. Without these waivers, returns would have been lower. Returns shown do not reflect the deduction of taxes that a shareholder would pay on Fund distributions or the redemption of Fund shares.
**Represents a weighted composite benchmark index consisting of 25% JPMorgan Emerging Markets Bond Index Plus, 50% Barclays Capital Global Aggregate Bond Index — Unhedged and 25% Barclays Capital U.S. Corporate High Yield – 2% Issuer Capped Index. The JPMorgan Emerging Markets Bond Index Plus is a traditional, market-capitalization weighted index comprised of U.S. dollar denominated Brady bonds, Eurobonds and traded loans issued by sovereign entities.
The Barclays Capital Global Aggregate Bond Index — Unhedged provides a broad-based measure of the global investment grade fixed-rate debt markets.
The Barclays Capital U.S. Corporate High Yield – 2% Issuer Capped Index is an issuer-constrained version of the Barclays Capital U.S. Corporate High Yield Index that covers the U.S.-denominated, non-investment grade, fixed-rate and taxable corporate bond market.
Unlike a mutual fund, the performance of an index assumes no taxes, transaction costs, management fees or other expenses.
| | |
| GLOBAL BOND FUND | | |
| SCHEDULE OF INVESTMENTS | | December 31, 2010 |
| | | | | | | | |
| | | Par | | | Value | |
AGENCY OBLIGATION — 0.1% | |
Federal National Mortgage Association | | | | | | | | |
0.13%, 05/09/11W | | | | | | | | |
(Cost $169,855) | | $ | 170,000 | | | $ | 169,929 | |
| | | | | | | | |
CORPORATE BONDS — 43.4% | |
ACCO Brands Corporation | | | | | | | | |
10.63%, 03/15/15D | | | 105,000 | | | | 118,650 | |
AES Corporation | | | | | | | | |
8.38%, 03/01/11(U) | | | 50,000 | | | | 78,485 | |
Alcoa, Inc. | | | | | | | | |
5.87%, 02/23/22 | | | 5,000 | | | | 4,977 | |
6.75%, 01/15/28 | | | 185,000 | | | | 189,236 | |
5.95%, 02/01/37D | | | 65,000 | | | | 61,115 | |
Allied Waste North America, Inc. | | | | | | | | |
7.13%, 05/15/16 | | | 225,000 | | | | 238,484 | |
Ally Financial, Inc. | | | | | | | | |
7.50%, 09/15/20 144A | | | 415,000 | | | | 437,306 | |
8.00%, 11/01/31 | | | 389,000 | | | | 421,092 | |
Altegrity, Inc. | | | | | | | | |
10.50%, 11/01/15 144A | | | 150,000 | | | | 154,688 | |
American Express Credit Corporation | | | | | | | | |
5.13%, 08/25/14 | | | 100,000 | | | | 107,908 | |
American General Finance Corporation | | | | | | | | |
5.75%, 09/15/16 | | | 700,000 | | | | 546,000 | |
6.50%, 09/15/17D | | | 400,000 | | | | 317,000 | |
6.90%, 12/15/17 | | | 200,000 | | | | 162,500 | |
American Greetings Corporation | | | | | | | | |
7.38%, 06/01/16 | | | 30,000 | | | | 31,237 | |
American International Group, Inc. | | | | | | | | |
5.45%, 05/18/17 | | | 25,000 | | | | 25,384 | |
Anadarko Petroleum Corporation | | | | | | | | |
5.95%, 09/15/16 | | | 130,000 | | | | 139,827 | |
Appleton Papers, Inc. | | | | | | | | |
11.25%, 12/15/15 144AD | | | 102,000 | | | | 82,110 | |
Ashtead Capital, Inc. | | | | | | | | |
9.00%, 08/15/16 144A | | | 140,000 | | | | 146,650 | |
Ashton Woods USA LLC | | | | | | | | |
23.53%, | | | | | | | | |
06/30/15 STEP 144AW@ | | | 20,800 | | | | 11,648 | |
Astoria Depositor Corporation | | | | | | | | |
8.14%, 05/01/21 144A | | | 130,000 | | | | 130,000 | |
AT&T, Inc. | | | | | | | | |
6.55%, 02/15/39D | | | 220,000 | | | | 240,263 | |
Baltimore Gas & Electric Co. | | | | | | | | |
5.20%, 06/15/33D | | | 1,125,000 | | | | 1,057,479 | |
Bank of America Corporation | | | | | | | | |
4.63%, 08/07/17(E)D | | | 300,000 | | | | 382,676 | |
Belden & Blake Corporation | | | | | | | | |
8.75%, 07/15/12 | | | 165,000 | | | | 158,400 | |
Berry Petroleum Co. | | | | | | | | |
10.25%, 06/01/14D | | | 80,000 | | | | 92,200 | |
Biomet, Inc. | | | | | | | | |
10.00%, 10/15/17 | | | 20,000 | | | | 21,950 | |
10.38%, 10/15/17 PIK | | | 535,000 | | | | 587,162 | |
Boston Scientific Corporation | | | | | | | | |
7.00%, 11/15/35 | | | 215,000 | | | | 216,111 | |
Buffets Restaurants Holdings, Inc. | | | | | | | | |
12.50%, 11/01/14@ | | | 105,000 | | | | 10 | |
Cellco Partnership/Verizon Wireless Capital LLC | | | | | | | | |
8.50%, 11/15/18 | | | 260,000 | | | | 340,738 | |
Cengage Learning Acquisitions, Inc. | | | | | | | | |
10.50%, 01/15/15 144A | | | 100,000 | | | | 103,750 | |
Ceridian Corporation | | | | | | | | |
12.25%, 11/15/15 144AD | | | 63,900 | | | | 64,699 | |
Charter Communications Operating LLC | | | | | | | | |
10.88%, 09/15/14 144AD | | | 140,000 | | | | 157,150 | |
Chesapeake Energy Corporation | | | | | | | | |
7.25%, 12/15/18 | | | 110,000 | | | | 114,400 | |
Chiquita Brands International, Inc. | | | | | | | | |
7.50%, 11/01/14D | | | 450,000 | | | | 453,938 | |
Cincinnati Bell Telephone Co. LLC | | | | | | | | |
6.30%, 12/01/28 | | | 155,000 | | | | 123,225 | |
CIT Group, Inc. | | | | | | | | |
7.00%, 05/01/13 | | | 61,634 | | | | 63,021 | |
7.00%, 05/01/14D | | | 92,453 | | | | 93,609 | |
7.00%, 05/01/15D | | | 92,453 | | | | 92,915 | |
7.00%, 05/01/16D | | | 154,090 | | | | 155,053 | |
7.00%, 05/01/17D | | | 215,726 | | | | 216,805 | |
Citigroup, Inc. | | | | | | | | |
6.38%, 08/12/14 | | | 300,000 | | | | 331,831 | |
7.38%, 09/04/19(E) | | | 380,000 | | | | 568,089 | |
CMP Susquehanna Radio Holdings Corporation | | | | | | | | |
9.88%, 05/15/14 | | | 6,000 | | | | 4,174 | |
Colorado Interstate Gas Co. | | | | | | | | |
5.95%, 03/15/15 | | | 20,000 | | | | 21,888 | |
6.80%, 11/15/15 | | | 125,000 | | | | 144,628 | |
Comcast Corporation | | | | | | | | |
6.50%, 01/15/17D | | | 40,000 | | | | 46,169 | |
5.15%, 03/01/20D | | | 170,000 | | | | 178,885 | |
Community Health | | | | | | | | |
Systems, Inc. | | | | | | | | |
8.88%, 07/15/15 | | | 100,000 | | | | 105,250 | |
Complete Production Services, Inc. | | | | | | | | |
8.00%, 12/15/16 | | | 80,000 | | | | 83,200 | |
ConocoPhillips | | | | | | | | |
6.50%, 02/01/39 | | | 60,000 | | | | 71,597 | |
Consol Energy, Inc. | | | | | | | | |
8.25%, 04/01/20 144A | | | 210,000 | | | | 227,850 | |
Continental Airlines, Inc. | | | | | | | | |
9.00%, 07/08/16D | | | 1,199,473 | | | | 1,373,397 | |
5.98%, 04/19/22D | | | 525,719 | | | | 554,633 | |
Countrywide Financial Corporation | | | | | | | | |
5.80%, 06/07/12D | | | 90,000 | | | | 94,721 | |
6.25%, 05/15/16 | | | 280,000 | | | | 287,461 | |
Cricket Communications, Inc. | | | | | | | | |
7.75%, 05/15/16D | | | 150,000 | | | | 156,375 | |
Cummins, Inc. | | | | | | | | |
5.65%, 03/01/98 | | | 1,500,000 | | | | 1,176,784 | |
DAE Aviation Holdings, Inc. | | | | | | | | |
11.25%, 08/01/15 144AD | | | 230,000 | | | | 239,200 | |
Delta Air Lines, Inc. | | | | | | | | |
9.50%, 09/15/14 144A | | | 36,000 | | | | 39,375 | |
| | | | |
| 118 | | See Notes to Financial Statements. | | |
| | | | | | | | |
| | | Par | | | Value | |
8.02%, 08/10/22 | | $ | 97,706 | | | $ | 99,660 | |
Deutsche Postbank Funding Trust IV | | | | | | | | |
5.98%, 06/29/49(E)† | | | 300,000 | | | | 300,669 | |
DISH DBS Corporation | | | | | | | | |
7.00%, 10/01/13D | | | 600,000 | | | | 643,500 | |
Dynegy Holdings, Inc. | | | | | | | | |
7.75%, 06/01/19 | | | 893,000 | | | | 600,542 | |
Edison Mission Energy | | | | | | | | |
7.63%, 05/15/27 | | | 180,000 | | | | 130,950 | |
El Paso Natural Gas Co. | | | | | | | | |
8.63%, 01/15/22 | | | 90,000 | | | | 110,099 | |
8.38%, 06/15/32 | | | 75,000 | | | | 88,591 | |
El Pollo Loco, Inc. | | | | | | | | |
11.75%, 12/01/12 | | | 20,000 | | | | 20,500 | |
11.75%, 11/15/13D | | | 165,000 | | | | 134,475 | |
Embarq Corporation | | | | | | | | |
8.00%, 06/01/36 | | | 1,245,000 | | | | 1,363,263 | |
Energy Future Holdings Corporation | | | | | | | | |
6.50%, 11/15/24 | | | 350,000 | | | | 131,250 | |
6.55%, 11/15/34 | | | 300,000 | | | | 108,000 | |
Enterprise Products Operating LLC | | | | | | | | |
9.75%, 01/31/14D | | | 100,000 | | | | 120,877 | |
8.38%, 08/01/66† | | | 60,000 | | | | 64,497 | |
ERAC USA Finance Co. | | | | | | | | |
7.00%, 10/15/37 144A | | | 1,065,000 | | | | 1,150,419 | |
FirstEnergy Corporation | | | | | | | | |
7.38%, 11/15/31 | | | 325,000 | | | | 343,533 | |
Ford Motor Co. | | | | | | | | |
4.25%, 11/15/16D | | | 830,000 | | | | 1,663,112 | |
6.63%, 10/01/28 | | | 850,000 | | | | 826,625 | |
Ford Motor Credit Co., LLC | | | | | | | | |
3.04%, 01/13/12† | | | 37,500 | | | | 37,877 | |
7.50%, 08/01/12D | | | 500,000 | | | | 531,802 | |
12.00%, 05/15/15 | | | 250,000 | | | | 314,762 | |
Freeport-McMoRan Copper & Gold, Inc. | | | | | | | | |
8.38%, 04/01/17 | | | 250,000 | | | | 276,902 | |
Freescale Semiconductor, Inc. | | | | | | | | |
10.13%, 12/15/16D | | | 130,000 | | | | 137,475 | |
Fresenius US Finance II, Inc. | | | | | | | | |
8.75%, 07/15/15 144A(E) | | | 30,000 | | | | 46,504 | |
Frontier Communications Corporation | | | | | | | | |
7.88%, 01/15/27 | | | 405,000 | | | | 390,825 | |
General Electric Capital Corporation | | | | | | | | |
3.49%, 03/08/12(G) | | | 200,000 | | | | 158,748 | |
7.63%, 12/10/14(Z) | | | 1,025,000 | | | | 857,187 | |
4.88%, 03/04/15 | | | 370,000 | | | | 395,195 | |
6.50%, 09/28/15(Z) | | | 255,000 | | | | 204,328 | |
6.75%, 09/26/16(Z) | | | 150,000 | | | | 119,751 | |
6.00%, 08/07/19 | | | 330,000 | | | | 367,779 | |
6.75%, 03/15/32D | | | 30,000 | | | | 34,064 | |
Georgia-Pacific LLC | | | | | | | | |
8.88%, 05/15/31D | | | 785,000 | | | | 969,475 | |
GMAC, Inc. | | | | | | | | |
7.50%, 12/31/13 | | | 87,000 | | | | 94,178 | |
6.75%, 12/01/14D | | | 399,000 | | | | 421,942 | |
8.00%, 12/31/18 | | | 104,000 | | | | 111,020 | |
Goldman Sachs Group, Inc. | | | | | | | | |
5.13%, 10/23/19(E) | | | 500,000 | | | | 654,626 | |
4.75%, 10/12/21(E) | | | 300,000 | | | | 353,618 | |
Goodyear Tire & Rubber Co. | | | | | | | | |
7.00%, 03/15/28 | | | 690,000 | | | | 655,500 | |
GXS Worldwide, Inc. | | | | | | | | |
9.75%, 06/15/15D | | | 570,000 | | | | 565,725 | |
H&E Equipment Services, Inc. | | | | | | | | |
8.38%, 07/15/16D | | | 120,000 | | | | 123,000 | |
Hanover Insurance Group, Inc. | | | | | | | | |
7.50%, 03/01/20D | | | 385,000 | | | | 406,368 | |
Hawaiian Telcom Communications, Inc. | | | | | | | | |
12.50%, 05/01/15#@ | | | 65,000 | | | | 6 | |
HCA, Inc. | | | | | | | | |
7.88%, 02/01/11 | | | 240,000 | | | | 241,800 | |
6.38%, 01/15/15 | | | 150,000 | | | | 148,125 | |
7.19%, 11/15/15 | | | 205,000 | | | | 201,412 | |
9.25%, 11/15/16 | | | 60,000 | | | | 64,162 | |
9.63%, 11/15/16 PIK | | | 596 | | | | 640 | |
7.50%, 12/15/23 | | | 555,000 | | | | 511,988 | |
8.36%, 04/15/24 | | | 90,000 | | | | 88,875 | |
7.69%, 06/15/25 | | | 775,000 | | | | 747,875 | |
7.58%, 09/15/25 | | | 570,000 | | | | 525,825 | |
Hercules Offshore, Inc. | | | | | | | | |
10.50%, 10/15/17 144A | | | 80,000 | | | | 66,600 | |
Hertz Corporation | | | | | | | | |
8.88%, 01/01/14 | | | 250,000 | | | | 256,875 | |
Idearc, Inc. | | | | | | | | |
0.00%, 11/15/16W@ | | | 185,000 | | | | — | |
Intel Corporation | | | | | | | | |
2.95%, 12/15/35 | | | 580,000 | | | | 580,725 | |
3.25%, 08/01/39D | | | 460,000 | | | | 553,725 | |
International Lease Finance Corporation | | | | | | | | |
5.65%, 06/01/14 | | | 90,000 | | | | 89,775 | |
8.63%, 09/15/15 144AD | | | 215,000 | | | | 231,662 | |
8.25%, 12/15/20 | | | 100,000 | | | | 103,125 | |
iStar Financial, Inc. | | | | | | | | |
5.70%, 03/01/14D | | | 62,000 | | | | 56,575 | |
6.05%, 04/15/15 | | | 20,000 | | | | 17,575 | |
5.88%, 03/15/16 | | | 22,000 | | | | 19,168 | |
JC Penney Corporation, Inc. | | | | | | | | |
6.38%, 10/15/36 | | | 650,000 | | | | 594,750 | |
7.63%, 03/01/97 | | | 1,300,000 | | | | 1,160,250 | |
Jones Apparel Group, Inc. | | | | | | | | |
6.13%, 11/15/34 | | | 135,000 | | | | 108,675 | |
JPMorgan Chase Bank NA | | | | | | | | |
4.38%, 11/30/21(E)† | | | 350,000 | | | | 439,025 | |
K Hovnanian Enterprises, Inc. | | | | | | | | |
6.38%, 12/15/14D | | | 795,000 | | | | 659,850 | |
Kerr-McGee Corporation | | | | | | | | |
6.95%, 07/01/24 | | | 30,000 | | | | 32,682 | |
Kinder Morgan Energy Partners LP | | | | | | | | |
6.50%, 02/01/37 | | | 75,000 | | | | 77,639 | |
6.95%, 01/15/38 | | | 90,000 | | | | 98,105 | |
L-3 Communications Corporation | | | | | | | | |
6.38%, 10/15/15 | | | 450,000 | | | | 465,750 | |
Lennar Corporation | | | | | | | | |
5.60%, 05/31/15D | | | 1,400,000 | | | | 1,358,000 | |
Level 3 Communications, Inc. | | | | | | | | |
3.50%, 06/15/12D | | | 195,000 | | | | 186,225 | |
Level 3 Financing, Inc. | | | | | | | | |
8.75%, 02/15/17D | | | 1,185,000 | | | | 1,096,125 | |
| | | | |
| | See Notes to Financial Statements. | | 119 |
| | |
| GLOBAL BOND FUND | | |
| SCHEDULE OF INVESTMENTS (Continued) | | |
| | | | | | | | |
| | | Par | | | Value | |
Marsh & McLennan Cos., Inc. | | | | | | | | |
5.88%, 08/01/33D | | $ | 1,000,000 | | | $ | 917,106 | |
Masco Corporation | | | | | | | | |
5.85%, 03/15/17 | | | 90,000 | | | | 89,805 | |
6.50%, 08/15/32D | | | 145,000 | | | | 127,942 | |
MBIA Insurance Corporation | | | | | | | | |
14.00%, 01/15/33 144A† | | | 435,000 | | | | 240,338 | |
Merrill Lynch & Co., Inc. | | | | | | | | |
6.05%, 06/01/34 | | | 700,000 | | | | 655,231 | |
6.11%, 01/29/37 | | | 1,300,000 | | | | 1,177,093 | |
Mirant Mid Atlantic Pass Through Trust | | | | | | | | |
10.06%, 12/30/28 | | | 165,630 | | | | 183,849 | |
Morgan Stanley | | | | | | | | |
4.75%, 04/01/14D | | | 50,000 | | | | 51,240 | |
Motorola, Inc. | | | | | | | | |
6.50%, 11/15/28D | | | 155,000 | | | | 152,956 | |
6.63%, 11/15/37 | | | 625,000 | | | | 620,976 | |
Motors Liquidation Co. | | | | | | | | |
8.38%, 07/05/33(E)# | | | 250,000 | | | | 111,916 | |
Mutual of Omaha Insurance Co. | | | | | | | | |
6.80%, 06/15/36 144A | | | 1,200,000 | | | | 1,138,274 | |
Nalco Co. | | | | | | | | |
6.88%, 01/15/19 144A(E) | | | 100,000 | | | | 138,649 | |
Neiman-Marcus Group, Inc. | | | | | | | | |
7.13%, 06/01/28 | | | 30,000 | | | | 28,950 | |
NetFlix, Inc. | | | | | | | | |
8.50%, 11/15/17 | | | 150,000 | | | | 169,500 | |
NewPage Corporation | | | | | | | | |
11.38%, 12/31/14 144AD | | | 285,000 | | | | 269,325 | |
Nextel Communications, Inc. | | | | | | | | |
5.95%, 03/15/14 | | | 970,000 | | | | 957,875 | |
7.38%, 08/01/15 | | | 1,615,000 | | | | 1,625,094 | |
Owens Corning, Inc. | | | | | | | | |
7.00%, 12/01/36 | | | 220,000 | | | | 227,355 | |
Owens-Brockway Glass Container, Inc. | | | | | | | | |
3.00%, 06/01/15 144AD | | | 840,000 | | | | 849,450 | |
Oxford Industries, Inc. | | | | | | | | |
11.38%, 07/15/15 144A | | | 135,000 | | | | 152,212 | |
Pemex Project Funding Master Trust | | | | | | | | |
6.63%, 06/15/35 | | | 900,000 | | | | 920,245 | |
Penn Mutual Life Insurance Co. | | | | | | | | |
7.63%, 06/15/40 144A | | | 685,000 | | | | 677,034 | |
Pioneer Natural Resources Co. | | | | | | | | |
5.88%, 07/15/16D | | | 900,000 | | | | 929,824 | |
7.20%, 01/15/28 | | | 315,000 | | | | 330,752 | |
Plains Exploration & Production Co. | | | | | | | | |
10.00%, 03/01/16 | | | 75,000 | | | | 84,188 | |
8.63%, 10/15/19 | | | 55,000 | | | | 60,500 | |
ProLogis | | | | | | | | |
6.63%, 05/15/18 | | | 15,000 | | | | 15,950 | |
Quicksilver Resources, Inc. | | | | | | | | |
11.75%, 01/01/16 | | | 95,000 | | | | 111,150 | |
Qwest Capital Funding, Inc. | | | | | | | | |
6.50%, 11/15/18 | | | 225,000 | | | | 224,438 | |
Qwest Corporation | | | | | | | | |
3.55%, 06/15/13† | | | 100,000 | | | | 105,000 | |
7.63%, 06/15/15 | | | 300,000 | | | | 339,750 | |
7.50%, 06/15/23 | | | 110,000 | | | | 109,725 | |
7.25%, 09/15/25 | | | 105,000 | | | | 110,775 | |
6.88%, 09/15/33 | | | 2,500,000 | | | | 2,468,750 | |
7.25%, 10/15/35D | | | 110,000 | | | | 108,350 | |
RailAmerica, Inc. | | | | | | | | |
9.25%, 07/01/17 | | | 652,000 | | | | 719,645 | |
Reliance Holdings USA, Inc. | | | | | | | | |
4.50%, 10/19/20 144AD | | | 290,000 | | | | 277,243 | |
Republic Services, Inc. | | | | | | | | |
5.00%, 03/01/20 | | | 90,000 | | | | 94,875 | |
RSC Equipment Rental, Inc. | | | | | | | | |
10.00%, 07/15/17 144A | | | 80,000 | | | | 90,400 | |
SandRidge Energy, Inc. | | | | | | | | |
9.88%, 05/15/16 144AD | | | 185,000 | | | | 196,562 | |
Service Corporation International | | | | | | | | |
7.50%, 04/01/27 | | | 75,000 | | | | 72,188 | |
Simon Property Group LP | | | | | | | | |
5.75%, 12/01/15 | | | 25,000 | | | | 27,805 | |
SLM Corporation | | | | | | | | |
5.38%, 01/15/13D | | | 650,000 | | | | 663,295 | |
5.38%, 05/15/14 | | | 1,000,000 | | | | 1,005,693 | |
8.45%, 06/15/18 | | | 769,000 | | | | 800,369 | |
8.00%, 03/25/20 | | | 60,000 | | | | 60,933 | |
Southern Copper Corporation | | | | | | | | |
5.38%, 04/16/20D | | | 70,000 | | | | 71,119 | |
6.75%, 04/16/40D | | | 90,000 | | | | 93,645 | |
Sprint Capital Corporation | | | | | | | | |
8.38%, 03/15/12 | | | 60,000 | | | | 63,750 | |
6.88%, 11/15/28 | | | 200,000 | | | | 176,000 | |
8.75%, 03/15/32 | | | 755,000 | | | | 766,325 | |
Steel Dynamics, Inc. | | | | | | | | |
7.38%, 11/01/12 | | | 45,000 | | | | 47,700 | |
Teachers Insurance & Annuity Association of America | | | | | | | | |
6.85%, 12/16/39 144A | | | 100,000 | | | | 117,401 | |
Tenet Healthcare Corporation | | | | | | | | |
9.00%, 05/01/15D | | | 85,000 | | | | 94,775 | |
10.00%, 05/01/18D | | | 55,000 | | | | 64,350 | |
8.88%, 07/01/19 | | | 377,000 | | | | 427,895 | |
6.88%, 11/15/31 | | | 85,000 | | | | 68,425 | |
Textron Financial Corporation | | | | | | | | |
5.13%, 08/15/14 | | | 30,000 | | | | 30,823 | |
Textron, Inc. | | | | | | | | |
6.63%, 04/07/20(U) | | | 130,000 | | | | 202,446 | |
Time Warner Cable, Inc. | | | | | | | | |
8.75%, 02/14/19D | | | 190,000 | | | | 242,138 | |
8.25%, 04/01/19 | | | 40,000 | | | | 49,765 | |
Toys “R” Us, Inc. | | | | | | | | |
7.38%, 10/15/18D | | | 335,000 | | | | 329,975 | |
United Air Lines, Inc. | | | | | | | | |
10.40%, 11/01/16D | | | 750,724 | | | | 867,086 | |
6.64%, 07/02/22 | | | 273,686 | | | | 274,370 | |
Universal Hospital Services, Inc. | | | | | | | | |
3.83%, 06/01/15† | | | 20,000 | | | | 18,400 | |
8.50%, 06/01/15 PIK | | | 20,000 | | | | 20,650 | |
Univision Communications, Inc. | | | | | | | | |
12.00%, 07/01/14 144AD | | | 125,000 | | | | 137,500 | |
US Oncology Holdings, Inc. | | | | | | | | |
6.74%, 03/15/12 PIK | | | 24 | | | | 24 | |
US Oncology, Inc. | | | | | | | | |
9.13%, 08/15/17 | | | 155,000 | | | | 191,812 | |
USG Corporation | | | | | | | | |
6.30%, 11/15/16 | | | 1,250,000 | | | | 1,100,000 | |
| | | | |
| 120 | | See Notes to Financial Statements. | | |
| | | | | | | | |
| | | Par | | | Value | |
Valor Telecommunications Enterprises Finance Corporation | | | | | | | | |
7.75%, 02/15/15 | | $ | 125,000 | | | $ | 128,969 | |
Vanguard Health Holding Co. II LLC | | | | | | | | |
8.00%, 02/01/18 | | | 105,000 | | | | 108,150 | |
Verizon Maryland, Inc. | | | | | | | | |
5.13%, 06/15/33 | | | 100,000 | | | | 88,317 | |
Verizon New York, Inc. | | | | | | | | |
7.38%, 04/01/32D | | | 115,000 | | | | 129,409 | |
Verizon Pennsylvania, Inc. | | | | | | | | |
6.00%, 12/01/28 | | | 90,000 | | | | 84,316 | |
Wachovia Corporation | | | | | | | | |
5.25%, 08/01/14 | | | 120,000 | | | | 128,084 | |
WellPoint, Inc. | | | | | | | | |
7.00%, 02/15/19 | | | 80,000 | | | | 94,320 | |
Western Union Co. | | | | | | | | |
6.20%, 11/17/36 | | | 70,000 | | | | 69,414 | |
6.20%, 06/21/40D | | | 5,000 | | | | 4,963 | |
Westvaco Corporation | | | | | | | | |
8.20%, 01/15/30 | | | 150,000 | | | | 158,569 | |
7.95%, 02/15/31 | | | 135,000 | | | | 136,507 | |
Weyerhaeuser Co. | | | | | | | | |
8.50%, 01/15/25 | | | 405,000 | | | | 440,616 | |
6.95%, 10/01/27 | | | 55,000 | | | | 54,138 | |
7.38%, 03/15/32 | | | 370,000 | | | | 375,030 | |
6.88%, 12/15/33D | | | 490,000 | | | | 461,021 | |
Whiting Petroleum Corporation | | | | | | | | |
7.00%, 02/01/14 | | | 130,000 | | | | 137,150 | |
Williams Cos., Inc. | | | | | | | | |
7.50%, 01/15/31 | | | 97,000 | | | | 109,232 | |
Wyndham Worldwide Corporation | | | | | | | | |
7.38%, 03/01/20 | | | 380,000 | | | | 418,456 | |
| | | | | | | | |
Total Corporate Bonds
(Cost $63,162,923) | | | | | | | 69,831,770 | |
| | | | | | | | |
FOREIGN BONDS — 39.9% | |
Argentina — 0.2% | | | | | | | | |
Pan American Energy LLC | | | | | | | | |
7.88%, 05/07/21 144A | | | 100,000 | | | | 106,750 | |
Pan American Energy LLC | | | | | | | | |
7.88%, 05/07/21 | | | 20,000 | | | | 21,350 | |
Republic of Argentina | | | | | | | | |
7.00%, 10/03/15D | | | 102,000 | | | | 97,410 | |
8.75%, 06/02/17D | | | 93,000 | | | | 94,507 | |
| | | | | | | | |
| | | | | | | 320,017 | |
| | | | | | | | |
Australia — 2.2% | | | | | | | | |
New South Wales Treasury Corporation | | | | | | | | |
6.00%, 05/01/12(A) | | | 2,825,000 | | | | 2,918,425 | |
Queensland Treasury Corporation | | | | | | | | |
7.13%, 09/18/17(Z) | | | 275,000 | | | | 229,732 | |
Rio Tinto Finance USA, Ltd. | | | | | | | | |
9.00%, 05/01/19 | | | 260,000 | | | | 349,739 | |
| | | | | | | | |
| | | | | | | 3,497,896 | |
| | | | | | | | |
Austria — 0.2% | | | | | | | | |
PE Paper Escrow GmbH | | | | | | | | |
11.75%, 08/01/14 144A(E) | | | 192,000 | | | | 296,340 | |
| | | | | | | | |
Bermuda — 0.9% | | | | | | | | |
Qtel International Finance, Ltd. | | | | | | | | |
4.75%, 02/06/21 144A | | | 200,000 | | | | 191,568 | |
White Mountains Re Group, Ltd. | | | | | | | | |
6.38%, 03/20/17 144A | | | 1,250,000 | | | | 1,215,431 | |
| | | | | | | | |
| | | | | | | 1,406,999 | |
| | | | | | | | |
Brazil — 4.6% | | | | | | | | |
Brazil Notas do Tesouro Nacional, Series F | | | | | | | | |
10.00%, 01/01/12(B) | | | 2,966,000 | | | | 1,755,102 | |
10.00%, 01/01/17(B) | | | 1,117,000 | | | | 616,990 | |
Centrais Eletricas Brasileiras SA | | | | | | | | |
6.88%, 07/30/19 | | | 100,000 | | | | 113,500 | |
Centrais Eletricas Brasileiras SA | | | | | | | | |
6.88%, 07/30/19 144A | | | 130,000 | | | | 147,550 | |
Federative Republic of Brazil | | | | | | | | |
4.88%, 01/22/21D | | | 220,000 | | | | 225,500 | |
10.25%, 01/10/28 | | | 6,000,000 | | | | 3,771,687 | |
7.13%, 01/20/37 | | | 130,000 | | | | 155,675 | |
11.00%, 08/17/40D | | | 275,000 | | | | 371,113 | |
NET Servicos de Comunicacao SA | | | | | | | | |
7.50%, 01/27/20 144AD | | | 130,000 | | | | 149,825 | |
Telemar Norte Leste SA | | | | | | | | |
5.50%, 10/23/20 144AD | | | 110,000 | | | | 106,425 | |
| | | | | | | | |
| | | | | | | 7,413,367 | |
| | | | | | | | |
Canada — 5.0% | | | | | | | | |
Canadian Government Bond | | | | | | | | |
5.25%, 06/01/12(C) | | | 4,720,000 | | | | 4,991,199 | |
Nortel Networks, Ltd. | | | | | | | | |
6.88%, 09/01/23# | | | 380,000 | | | | 85,500 | |
OPTI Canada, Inc. | | | | | | | | |
7.88%, 12/15/14 | | | 50,000 | | | | 35,563 | |
Province of Manitoba | | | | | | | | |
6.38%, 09/01/15(Z) | | | 815,000 | | | | 665,911 | |
Province of Quebec | | | | | | | | |
6.75%, 11/09/15(Z) | | | 2,650,000 | | | | 2,191,746 | |
Stone Container Finance Company of Canada II | | | | | | | | |
0.00%, 07/15/25+W | | | 330,000 | | | | 11,550 | |
Teck Resources, Ltd. | | | | | | | | |
9.75%, 05/15/14 144A | | | 21,000 | | | | 26,298 | |
10.25%, 05/15/16 144A | | | 29,000 | | | | 35,926 | |
| | | | | | | | |
| | | | | | | 8,043,693 | |
| | | | | | | | |
Cayman Islands — 0.9% | | | | | | | | |
Odebrecht Finance, Ltd. | | | | | | | | |
7.50%, 10/18/17 | | | 130,000 | | | | 141,700 | |
7.00%, 04/21/20 144A | | | 150,000 | | | | 162,000 | |
Petrobras International Finance Co. | | | | | | | | |
6.88%, 01/20/40 | | | 160,000 | | | | 167,104 | |
Suzano Trading, Ltd. | | | | | | | | |
5.88%, 01/23/21 144AD | | | 250,000 | | | | 246,250 | |
TGI International, Ltd. | | | | | | | | |
9.50%, 10/03/17D | | | 130,000 | | | | 146,575 | |
Vale Overseas, Ltd. | | | | | | | | |
6.88%, 11/21/36 | | | 511,000 | | | | 563,368 | |
| | | | | | | | |
| | | | | | | 1,426,997 | |
| | | | | | | | |
| | | | |
| | See Notes to Financial Statements. | | 121 |
| | |
| GLOBAL BOND FUND | | |
| SCHEDULE OF INVESTMENTS (Continued) | | |
| | | | | | | | |
| | | Par | | | Value | |
Chile — 0.4% | | | | | | | | |
Banco del Estado | | | | | | | | |
4.13%, 10/07/20 144A | | $ | 200,000 | | | $ | 190,725 | |
Celulosa Arauco y Constitucion SA | | | | | | | | |
7.25%, 07/29/19 | | | 120,000 | | | | 138,324 | |
Colbun SA | | | | | | | | |
6.00%, 01/21/20 144A | | | 110,000 | | | | 114,806 | |
E.CL SA | | | | | | | | |
5.63%, 01/15/21 144A | | | 150,000 | | | | 149,349 | |
| | | | | | | | |
| | | | | | | 593,204 | |
| | | | | | | | |
Colombia — 0.5% | | | | | | | | |
Ecopetrol SA | | | | | | | | |
7.63%, 07/23/19 144AD | | | 260,000 | | | | 301,600 | |
Empresas Publicas de Medellin ESP | | | | | | | | |
7.63%, 07/29/19 144A | | | 120,000 | | | | 138,000 | |
Republic of Colombia | | | | | | | | |
7.38%, 03/18/19 | | | 200,000 | | | | 241,000 | |
7.38%, 09/18/37 | | | 160,000 | | | | 190,400 | |
| | | | | | | | |
| | | | | | | 871,000 | |
| | | | | | | | |
Egypt — 0.5% | | | | | | | | |
Egypt Treasury Bills | | | | | | | | |
2.20%, 01/04/11W(Y) | | | 1,475,000 | | | | 253,969 | |
7.99%, 01/25/11W(Y) | | | 1,275,000 | | | | 218,463 | |
8.82%, 02/15/11W(Y) | | | 250,000 | | | | 42,635 | |
9.21%, 02/22/11W(Y) | | | 375,000 | | | | 63,841 | |
8.81%, 03/08/11W(Y) | | | 1,175,000 | | | | 199,234 | |
| | | | | | | | |
| | | | | | | 778,142 | |
| | | | | | | | |
France — 1.1% | | | | | | | | |
AXA SA | | | | | | | | |
6.21%, 10/05/49(E)† | | | 210,000 | | | | 240,846 | |
Compagnie Generale de Geophysique - Veritas | | | | | | | | |
7.50%, 05/15/15 | | | 90,000 | | | | 92,025 | |
9.50%, 05/15/16 | | | 650,000 | | | | 711,750 | |
Credit Agricole SA | | | | | | | | |
8.38%, 10/13/19 144A†D | | | 250,000 | | | | 258,125 | |
Dexia Credit Local | | | | | | | | |
4.30%, 11/18/49(E)† | | | 500,000 | | | | 287,240 | |
Europcar Groupe SA | | | | | | | | |
9.38%, 04/15/18 144A(E) | | | 145,000 | | | | 195,218 | |
Korreden SA | | | | | | | | |
11.00%, 08/01/14(E) | | | 69,333 | | | | 30,111 | |
| | | | | | | | |
| | | | | | | 1,815,315 | |
| | | | | | | | |
Germany — 3.1% | | | | | | | | |
Bundesrepublik Deutschland | | | | | | | | |
4.00%, 07/04/16(E) | | | 2,000 | | | | 2,932 | |
3.75%, 01/04/19(E) | | | 770,000 | | | | 1,102,137 | |
3.25%, 01/04/20(E)D | | | 2,340,000 | | | | 3,217,679 | |
HT1 Funding GmbH | | | | | | | | |
6.35%, 07/29/49(E) | | | 433,000 | | | | 393,463 | |
Rearden G Holdings EINS GmbH | | | | | | | | |
7.88%, 03/30/20 144AD | | | 100,000 | | | | 106,000 | |
Unitymedia Hessen NRW GmbH | | | | | | | | |
8.13%, 12/01/17 144A | | | 100,000 | | | | 105,000 | |
| | | | | | | | |
| | | | | | | 4,927,211 | |
| | | | | | | | |
Greece — 0.6% | | | | | | | | |
Hellenic Republic Government Bond | | | | | | | | |
2.30%, 07/25/30 | | | 1,440,000 | | | | 960,243 | |
| | | | | | | | |
Iceland — 0.0% | | | | | | | | |
Kaupthing Bank HF | | | | | | | | |
7.13%, 05/19/16 144A#@ | | | 150,000 | | | | 2 | |
| | | | | | | | |
Indonesia — 0.2% | | | | | | | | |
Indonesia Government International Bond | | | | | | | | |
6.88%, 01/17/18 | | | 100,000 | | | | 116,500 | |
6.63%, 02/17/37 | | | 240,000 | | | | 264,650 | |
| | | | | | | | |
| | | | | | | 381,150 | |
| | | | | | | | |
Ireland — 1.4% | | | | | | | | |
Ardagh Glass Finance PLC | | | | | | | | |
7.13%, 06/15/17 144A(E) | | | 112,000 | | | | 142,183 | |
Ardagh Glass Group PLC | | | | | | | | |
10.75%, 03/01/15 PIK(E) | | | 199,182 | | | | 269,496 | |
Ireland Government Bond | | | | | | | | |
4.50%, 10/18/18(E) | | | 900,000 | | | | 919,026 | |
5.00%, 10/18/20(E) | | | 50,000 | | | | 49,048 | |
5.40%, 03/13/25(E) | | | 250,000 | | | | 239,253 | |
XL Capital, Ltd. | | | | | | | | |
6.25%, 05/15/27 | | | 640,000 | | | | 631,883 | |
| | | | | | | | |
| | | | | | | 2,250,889 | |
| | | | | | | | |
Italy — 0.2% | | | | | | | | |
Seat Pagine Gialle SpA | | | | | | | | |
10.50%, 01/31/17(E) | | | 233,000 | | | | 262,321 | |
| | | | | | | | |
Japan — 0.1% | | | | | | | | |
Resona Bank, Ltd. | | | | | | | | |
5.99%, 08/10/49(U)† | | | 100,000 | | | | 156,127 | |
| | | | | | | | |
Kyrgyzstan — 0.1% | | | | | | | | |
KazMunaiGaz Finance Sub BV | | | | | | | | |
8.38%, 07/02/13 144A | | | 230,000 | | | | 253,874 | |
| | | | | | | | |
Luxembourg — 1.5% | | | | | | | | |
CSN Resources SA | | | | | | | | |
6.50%, 07/21/20 | | | 100,000 | | | | 105,075 | |
CSN Resources SA | | | | | | | | |
6.50%, 07/21/20 144AD | | | 150,000 | | | | 159,000 | |
Evraz Group SA | | | | | | | | |
8.88%, 04/24/13 144AD | | | 160,000 | | | | 173,200 | |
FMC Finance III SA | | | | | | | | |
6.88%, 07/15/17 | | | 75,000 | | | | 79,875 | |
Hannover Finance Luxembourg SA | | | | | | | | |
5.75%, 09/14/40(E)† | | | 50,000 | | | | 63,214 | |
Intelsat Jackson Holdings SA | | | | | | | | |
11.50%, 06/15/16D | | | 250,000 | | | | 270,625 | |
RSHB Capital SA for OJSC Russian Agricultural Bank | | | | | | | | |
9.00%, 06/11/14D | | | 200,000 | | | | 226,000 | |
6.97%, 09/21/16†D | | | 100,000 | | | | 99,910 | |
Russian Capital SA for OJSC Russian Agricultural Bank | | | | | | | | |
6.30%, 05/15/17 144A | | | 286,000 | | | | 288,860 | |
TNK-BP Finance SA | | | | | | | | |
7.88%, 03/13/18D | | | 510,000 | | | | 580,788 | |
UBS Luxembourg SA for OJSC Vimpel Communications | | | | | | | | |
8.25%, 05/23/16 | | | 255,000 | | | | 279,556 | |
| | | | |
| 122 | | See Notes to Financial Statements. | | |
| | | | | | | | |
| | | Par | | | Value | |
Wind Acquisition Holdings Finance SA | | | | | | | | |
12.25%, 07/15/17 PIK(E)D | | $ | 120,000 | | | $ | 180,402 | |
| | | | | | | 2,506,505 | |
| | | | | | | | |
Malaysia — 0.6% | | | | | | | | |
Malaysia Government Bond | | | | | | | | |
3.84%, 08/12/15(R) | | | 1,960,000 | | | | 646,563 | |
Petronas Capital, Ltd. | | | | | | | | |
5.25%, 08/12/19 | | | 200,000 | | | | 214,887 | |
Petronas Capital, Ltd. | | | | | | | | |
5.25%, 08/12/19 144A | | | 100,000 | | | | 107,863 | |
| | | | | | | | |
| | | | | | | 969,313 | |
| | | | | | | | |
Marshall Islands — 0.1% | | | | | |
Teekay Corporation | | | | | | | | |
8.50%, 01/15/20D | | | 150,000 | | | | 164,063 | |
| | | | | | | | |
Mexico — 2.2% | | | | | | | | |
America Movil Sab de CV | | | | | | | | |
5.63%, 11/15/17 | | | 98,000 | | | | 107,326 | |
Axtel SAB de CV | | | | | | | | |
7.63%, 02/01/17 144A | | | 170,000 | | | | 158,100 | |
9.00%, 09/22/19D | | | 58,000 | | | | 55,390 | |
Axtel SAB de CV | | | | | | | | |
7.63%, 02/01/17 | | | 20,000 | | | | 18,600 | |
Grupo Televisa SA | | | | | | | | |
6.63%, 03/18/25D | | | 100,000 | | | | 112,669 | |
6.63%, 01/15/40 144AD | | | 100,000 | | | | 108,794 | |
Kansas City Southern de Mexico SA de CV | | | | | | | | |
12.50%, 04/01/16 | | | 60,000 | | | | 73,500 | |
8.00%, 02/01/18D | | | 500,000 | | | | 543,750 | |
Mexican Bonos | | | | | | | | |
8.00%, 12/07/23(M) | | | 26,500,000 | | | | 2,301,530 | |
| | | | | | | | |
| | | | | | | 3,479,659 | |
| | | | | | | | |
Netherlands — 1.5% | | | | | | | | |
Clondalkin Acquisition BV | | | | | | | | |
3.03%, 12/15/13 144A(E)† | | | 66,000 | | | | 83,566 | |
Clondalkin Industries BV | | | | | | | | |
8.00%, 03/15/14 144A(E) | | | 150,000 | | | | 196,437 | |
ELM BV for Swiss Reinsurance Co. | | | | | | | | |
5.25%, 05/25/49(E)† | | | 400,000 | | | | 470,381 | |
Hollandwide Parent BV | | | | | | | | |
0.00%, 08/01/14(E)W | | | 191,000 | | | | 1,914 | |
Indosat Palapa Co. BV | | | | | | | | |
7.38%, 07/29/20 144A | | | 100,000 | | | | 111,000 | |
ING Verzekeringen NV | | | | | | | | |
6.25%, 06/21/21(E)† | | | 250,000 | | | | 302,340 | |
Lukoil International Finance BV | | | | | | | | |
6.36%, 06/07/17 | | | 300,000 | | | | 315,000 | |
OI European Group BV | | | | | | | | |
6.88%, 03/31/17 144A(E) | | | 100,000 | | | | 139,644 | |
Polish Television Holding BV 11.25%, | | | | | | | | |
05/15/17 STEP 144A(E) | | | 125,000 | | | | 173,612 | |
UPC Holding BV | | | | | | | | |
8.00%, 11/01/16(E) | | | 154,000 | | | | 215,052 | |
Ziggo Bond Co. BV | | | | | | | | |
8.00%, 05/15/18 144A(E) | | | 250,000 | | | | 345,770 | |
| | | | | | | | |
| | | | | | | 2,354,716 | |
| | | | | | | | |
Norway — 1.0% | | | | | | | | |
Norway Government Bond | | | | | | | | |
5.00%, 05/15/15(K) | | | 355,000 | | | | 65,930 | |
4.25%, 05/19/17(K) | | | 8,060,000 | | | | 1,454,261 | |
Trico Shipping AS | | | | | | | | |
13.88%, 11/01/14 144AD | | | 200,000 | | | | 163,000 | |
| | | | | | | | |
| | | | | | | 1,683,191 | |
| | | | | | | | |
Panama — 0.3% | | | | | | | | |
AES El Salvador Trust | | | | | | | | |
6.75%, 02/01/16 | | | 100,000 | | | | 97,241 | |
Panama Government International Bond | | | | | | | | |
7.25%, 03/15/15 | | | 1,000 | | | | 1,160 | |
6.70%, 01/26/36D | | | 296,000 | | | | 331,520 | |
| | | | | | | | |
| | | | | | | 429,921 | |
| | | | | | | | |
Peru — 0.4% | | | | | | | | |
Peru Government Bond | | | | | | | | |
7.84%, 08/12/20(P) | | | 1,270,000 | | | | 517,323 | |
Republic of Peru | | | | | | | | |
7.35%, 07/21/25 | | | 40,000 | | | | 48,860 | |
8.75%, 11/21/33 | | | 9,000 | | | | 12,397 | |
6.55%, 03/14/37 | | | 8,000 | | | | 8,800 | |
| | | | | | | | |
| | | | | | | 587,380 | |
| | | | | | | | |
Poland — 1.5% | | | | | |
Poland Government Bond | | | | | | | | |
5.75%, 09/23/22(V) | | | 7,340,000 | | | | 2,416,644 | |
| | | | | | | | |
Portugal — 0.2% | | | | | | | | |
Obrigacoes do Tesouro | | | | | | | | |
4.80%, 06/15/20(E) | | | 50,000 | | | | 58,569 | |
3.85%, 04/15/21(E) | | | 200,000 | | | | 209,907 | |
| | | | | | | | |
| | | | | | | 268,476 | |
| | | | | | | | |
Qatar — 0.2% | | | | | |
Ras Laffan Liquefied Natural Gas Co., Ltd. III | | | | | | | | |
5.50%, 09/30/14D | | | 250,000 | | | | 269,480 | |
| | | | | | | | |
Russia — 0.5% | | | | | |
Russian Federation | | | | | | | | |
7.50%, 03/31/30 STEP | | | 736,585 | | | | 853,702 | |
| | | | | | | | |
South Africa — 0.2% | | | | | |
Edcon Proprietary, Ltd. | | | | | | | | |
4.28%, 06/15/14(E)† | | | 320,000 | | | | 363,476 | |
| | | | | | | | |
Supranational — 0.9% | | | | | |
Inter-American Development Bank | | | | | | | | |
7.17%, 09/23/13(N)W | | | 15,900,000,000 | | | | 1,451,647 | |
| | | | | | | | |
Sweden — 0.2% | | | | | |
Corral Petroleum Holdings AB 2.00%, | | | | | | | | |
09/18/11 PIK 144A(E) | | | 119,466 | | | | 151,313 | |
Nordea Bank AB | | | | | | | | |
4.88%, 01/27/20 144A | | | 160,000 | | | | 164,444 | |
| | | | | | | | |
| | | | | | | 315,757 | |
| | | | | | | | |
Thailand — 0.2% | |
True Move Co., Ltd. | | | | | | | | |
10.75%, 12/16/13 144A | | | 361,000 | | | | 389,880 | |
| | | | | | | | |
Trinidad And Tobago — 0.2% | |
Petroleum Co. of Trinidad & Tobago, Ltd. | | | | | | | | |
9.75%, 08/14/19 144A | | | 240,000 | | | | 289,200 | |
| | | | | | | | |
| | | | |
| | See Notes to Financial Statements. | | 123 |
| | |
| GLOBAL BOND FUND | | |
| SCHEDULE OF INVESTMENTS (Continued) | | |
| | | | | | | | |
| | | Par | | | Value | |
Turkey — 0.9% | | | | | | | | |
Republic of Turkey | | | | | | | | |
7.50%, 07/14/17 | | $ | 100,000 | | | $ | 118,735 | |
7.00%, 03/11/19 | | | 100,000 | | | | 116,080 | |
6.88%, 03/17/36 | | | 995,000 | | | | 1,114,400 | |
6.75%, 05/30/40D | | | 110,000 | | | | 121,550 | |
| | | | | | | | |
| | | | | | | 1,470,765 | |
| | | | | | | | |
United Arab Emirates — 0.9% | | | | | |
DP World, Ltd. | | | | | | | | |
6.85%, 07/02/37 144A | | | 1,500,000 | | | | 1,387,341 | |
| | | | | | | | |
United Kingdom — 3.4% | | | | | | | | |
Ashtead Holdings PLC | | | | | | | | |
8.63%, 08/01/15 144AD | | | 160,000 | | | | 166,600 | |
Barclays Bank PLC | | | | | | | | |
6.00%, 01/23/18(E) | | | 450,000 | | | | 609,757 | |
6.37%, 12/15/49(U)† | | | 180,000 | | | | 242,750 | |
DFS Furniture Holdings PLC | | | | | | | | |
9.75%, 07/15/17 144A(U) | | | 154,000 | | | | 240,100 | |
HBOS PLC | | | | | | | | |
1.33%, 09/01/16(E)† | | | 200,000 | | | | 226,114 | |
HSBC Holdings PLC | | | | | | | | |
6.00%, 06/10/19(E)D | | | 270,000 | | | | 383,187 | |
Ineos Finance PLC | | | | | | | | |
9.25%, 05/15/15 144A(E) | | | 236,000 | | | | 336,656 | |
Infinis PLC | | | | | | | | |
9.13%, 12/15/14 144A(U) | | | 190,000 | | | | 314,000 | |
Inmarsat Finance PLC | | | | | | | | |
7.38%, 12/01/17 144AD | | | 290,000 | | | | 305,950 | |
ISS Financing PLC | | | | | | | | |
11.00%, 06/15/14(E) | | | 50,000 | | | | 73,664 | |
ISS Financing PLC | | | | | | | | |
11.00%, 06/15/14 144A(E) | | | 62,000 | | | | 91,343 | |
Lloyds TSB Bank PLC | | | | | | | | |
6.50%, 03/24/20(E) | | | 706,000 | | | | 869,506 | |
Royal Bank of Scotland Group PLC | | | | | | | | |
4.88%, 01/20/17(E)D | | | 580,000 | | | | 746,091 | |
7.09%, 10/29/49(E) | | | 500,000 | | | | 443,922 | |
Vedanta Resources PLC | | | | | | | | |
8.75%, 01/15/14 | | | 210,000 | | | | 224,700 | |
Virgin Media Finance PLC | | | | | | | | |
9.13%, 08/15/16 | | | 175,000 | | | | 187,250 | |
| | | | | | | | |
| | | | | | | 5,461,590 | |
| | | | | | | | |
Venezuela — 0.6% | | | | | | | | |
Venezuela Government International Bond | | | | | | | | |
1.29%, 04/20/11†D | | | 75,000 | | | | 72,881 | |
8.50%, 10/08/14 | | | 26,000 | | | | 22,100 | |
5.75%, 02/26/16 | | | 1,153,000 | | | | 814,249 | |
9.38%, 01/13/34D | | | 207,000 | | | | 141,277 | |
| | | | | | | | |
| | | | | | | 1,050,507 | |
| | | | | | | | |
Virgin Islands (British) — 0.2% | | | | | |
GTL Trade Finance, Inc. | | | | | | | | |
7.25%, 10/20/17 144AD | | | 189,000 | | | | 208,845 | |
Sinochem Overseas Capital Co., Ltd. | | | | | | | | |
4.50%, 11/12/20 144AD | | | 170,000 | | | | 168,219 | |
| | | | | | | | |
| | | | | | | 377,064 | |
| | | | | | | | |
Total Foreign Bonds
(Cost $64,015,770) | | | | | | | 64,195,064 | |
| | | | | | | | |
MORTGAGE-BACKED SECURITIES — 2.4% | |
Bayview Commercial Asset Trust | | | | | | | | |
0.49%, 07/25/36 144A† | | | 222,601 | | | | 173,472 | |
Credit Suisse Mortgage Capital Certificates | | | | | | | | |
5.70%, 09/15/40† | | | 220,000 | | | | 225,877 | |
Federal National Mortgage Association | | | | | | | | |
3.50%, 01/01/26 TBA | | | 300,000 | | | | 302,062 | |
4.50%, 01/01/40 TBA | | | 2,700,000 | | | | 2,771,296 | |
Government National Mortgage Association | | | | | | | | |
4.00%, 01/01/41 TBA | | | 100,000 | | | | 100,579 | |
4.50%, 01/01/41 TBA | | | 300,000 | | | | 311,438 | |
| | | | | | | | |
Total Mortgage-Backed Securities
(Cost $3,768,815) | | | | 3,884,724 | |
| | | | | | | | |
U.S. TREASURY OBLIGATIONS — 5.2% | |
U.S. Treasury Bonds | | | | | | | | |
3.50%, 02/15/39D‡‡ | | | 3,500,000 | | | | 3,016,562 | |
4.25%, 05/15/39 | | | 40,000 | | | | 39,413 | |
4.63%, 02/15/40D | | | 1,090,000 | | | | 1,141,945 | |
| | | | | | | | |
| | | | | | | 4,197,920 | |
| | | | | | | | |
U.S. Treasury Notes | | | | | | | | |
4.50%, 04/30/12D | | | 30,000 | | | | 31,656 | |
2.63%, 07/31/14 | | | 50,000 | | | | 52,301 | |
2.38%, 09/30/14 | | | 110,000 | | | | 113,953 | |
1.75%, 07/31/15 | | | 90,000 | | | | 89,726 | |
1.25%, 08/31/15D | | | 90,000 | | | | 87,546 | |
1.25%, 09/30/15D | | | 90,000 | | | | 87,335 | |
1.88%, 10/31/17D | | | 10,000 | | | | 9,508 | |
3.38%, 11/15/19D | | | 40,000 | | | | 40,841 | |
3.63%, 02/15/20 | | | 20,000 | | | | 20,759 | |
2.63%, 08/15/20 | | | 340,000 | | | | 322,389 | |
2.63%, 11/15/20D | | | 3,600,000 | | | | 3,396,377 | |
| | | | | | | | |
| | | | | | | 4,252,391 | |
| | | | | | | | |
Total U.S. Treasury Obligations
(Cost $8,699,146) | | | | 8,450,311 | |
| | | | | | | | |
| | |
| | | Shares | | | | |
COMMON STOCKS — 0.6% | | | | | |
Consumer Discretionary — 0.0% | | | | | |
Dex One CorporationD | | | 1,433 | | | | 10,690 | |
| | | | | | | | |
Financial Services — 0.2% | | | | | | | | |
Charter Communications, Inc.D | | | 2,769 | | | | 107,825 | |
Georgia Gulf CorporationD | | | 6,177 | | | | 148,619 | |
| | | | | | | | |
| | | | | | | 256,444 | |
| | | | | | | | |
Healthcare — 0.2% | | | | | | | | |
Bristol-Myers Squibb Co. | | | 15,400 | | | | 407,792 | |
| | | | | | | | |
Producer Durables — 0.2% | |
Nortek, Inc. | | | 179 | | | | 6,444 | |
Smurfit-Stone Container Corporation | | | 10,194 | | | | 260,966 | |
| | | | | | | | |
| | | | | | | 267,410 | |
| | | | | | | | |
Total Common Stocks
(Cost $1,260,160) | | | | | | | 942,336 | |
| | | | | | | | |
| | | | |
| 124 | | See Notes to Financial Statements. | | |
| | | | | | | | |
| | | Shares | | | Value | |
FOREIGN COMMON STOCK — 0.0% | | | | | |
Spain — 0.0% | | | | | | | | |
Repsol YPF SA ADRD
(Cost $35,304) | | | 1,848 | | | $ | 51,633 | |
| | | | | | | | |
PREFERRED STOCKS — 1.9% | | | | | |
Bank of America Corporation CONV | | | 602 | | | | 576,096 | |
Citigroup Capital XII | | | 13,800 | | | | 365,148 | |
Citigroup, Inc. | | | 826 | | | | 112,906 | |
CMP Susquehanna Radio Holdings Corporation@ | | | 1,493 | | | | — | |
El Paso Energy Capital Trust I CONV | | | 500 | | | | 19,435 | |
Lucent Technologies Capital Trust I CONV | | | 1,891 | | | | 1,675,426 | |
Preferred Blocker (GMAC), Inc. | | | 400 | | | | 378,037 | |
| | | | | | | | |
Total Preferred Stocks
(Cost $2,558,418) | | | | | | | 3,127,048 | |
| | | | | | | | |
RIGHTS/WARRANTS — 0.0% | | | | | |
Buffets Restaurants Holdings, Inc.@ | | | 89 | | | | 1 | |
Charter Communications, Inc. | | | 110 | | | | 11 | |
CMP Susquehanna Radio Holdings Corporation@ | | | 1,706 | | | | — | |
Nortek, Inc.@ | | | 184 | | | | 1,288 | |
| | | | | | | | |
Total Rights/Warrants
(Cost $50,348) | | | | | | | 1,300 | |
| | | | | | | | |
MONEY MARKET FUNDS — 27.1% | | | | | |
GuideStone Money Market Fund (GS4 Class)¥ | | | 9,510,886 | | | | 9,510,886 | |
Northern Institutional Liquid Assets Portfolio§ | | | 34,081,461 | | | | 34,081,461 | |
| | | | | | | | |
Total Money Market Funds
(Cost $43,592,347) | | | | | | | 43,592,347 | |
| | | | | | | | |
TOTAL INVESTMENTS — 120.6%
(Cost $187,313,086) | | | | 194,246,462 | |
Liabilities in Excess of Other Assets — (20.6)% | | | | | | | (33,176,809 | ) |
| | | | | | | | |
NET ASSETS — 100.0% | | | | | | $ | 161,069,653 | |
| | | | | | | | |
Please see abbreviation and footnote definitions beginning on page 180.
PORTFOLIO SUMMARY (based on net assets)
| | | | |
| | | % | |
Corporate Bonds | | | 43.4 | |
Foreign Bonds | | | 39.9 | |
Money Market Funds | | | 27.1 | |
U.S. Treasury Obligations | | | 5.2 | |
Mortgage-Backed Securities | | | 2.4 | |
Preferred Stocks | | | 1.9 | |
Forward Foreign Currency Contracts | | | 1.6 | |
Common Stocks | | | 0.6 | |
Agency Obligation | | | 0.1 | |
Foreign Common Stock | | | — | ** |
Rights/Warrants | | | — | ** |
Futures Contracts | | | (6.4 | ) |
| | | | |
| | | 115.8 | |
| | | | |
| ** | Rounds to less than 0.005%. |
| | | | |
| | See Notes to Financial Statements. | | 125 |
| | |
| GLOBAL BOND FUND | | |
| SCHEDULE OF INVESTMENTS (Continued) | | |
VALUATION HIERARCHY
The following is a summary of the inputs used, as of December 31, 2010, in valuing the Fund’s assets carried at fair value:
| | | | | | | | |
Valuation Inputs | | Investments
in
Securities | | | Other
Financial
Instruments*** | |
Assets: | | | | | | | | |
Level 1 — Quoted Prices | | | | | | | | |
Common Stocks | | $ | 942,336 | | | $ | — | |
Foreign Common Stock | | | 51,633 | | | | — | |
Futures Contracts | | | — | | | | 50,590 | |
Money Market Funds | | | 43,592,347 | | | | — | |
Preferred Stocks | | | 3,127,048 | | | | — | |
Rights/Warrants | | | 1,300 | | | | — | |
Level 2 — Other Significant Observable Inputs | | | | | | | | |
Agency Obligation | | | 169,929 | | | | — | |
Corporate Bonds | | | 69,831,770 | | | | — | |
Foreign Bonds | | | 64,183,514 | | | | — | |
Forward Foreign Currency Contracts | | | — | | | | 322,201 | |
Mortgage-Backed Securities | | | 3,884,724 | | | | — | |
U.S. Treasury Obligations | | | 8,450,311 | | | | — | |
Level 3 — Significant Unobservable Inputs | | | | | | | | |
Foreign Bonds | | | 11,550 | | | | — | |
| | | | | | | | |
Total | | $ | 194,246,462 | | | $ | 372,791 | |
| | | | | | | | |
| *** | Other financial instruments are derivative instruments not reflected in the Schedule of Investments, such as futures, forwards and swap contracts, which are valued at the unrealized appreciation (depreciation) on the investment. Details of these investments can be found in the Notes to Financial Statements. |
The following is a reconciliation of assets in which significant unobservable inputs (Level 3) were used in determining fair value:
| | | | | | | | |
| | | Investments
in
Securities | | | Other
Financial
Instruments*** | |
Balance, 12/31/09 | | | | | | | | |
Common Stock | | $ | 6,265 | | | $ | — | |
Realized gain (loss)(1) | | | | | | | | |
Common Stocks | | | — | | | | — | |
Change in unrealizedappreciation (depreciation)(2) | | | | | | | | |
Common Stocks | | | 179 | | | | — | |
Purchases | | | | | | | | |
Common Stocks | | | — | | | | — | |
Sales | | | | | | | | |
Common Stocks | | | — | | | | — | |
Transfers in and/or out of Level 3 Common Stocks | | | 5,106 | | | | — | |
| | | | | | | | |
Balance, 12/31/10 | | $ | 11,550 | | | $ | — | |
| | | | | | | | |
| (1) | Realized gain (loss) from the sale of Level 3 securities can be found on the Statement of Operations in Net Realized Gain (loss) from Investment securities and securities sold short. |
| (2) | Change in unrealized appreciation (depreciation) can be found on the Statement of Operations in Net change in unrealized appreciation (depreciation) on Investment securities and securities sold short. |
| | | | |
| 126 | | See Notes to Financial Statements. | | |
Equity Index Fund
Equity markets continued to appreciate during the year as investors responded favorably to additional fiscal stimulus and generally improving economic conditions. The S&P 500® Index posted a performance return of 15.06% for the full year of 2010. As of year-end, the S&P 500® Index had soared over 90% off the March 2009 lows. The broader U.S. market, as measured by the Russell 3000® Index, posted an impressive return of 16.93% for the one-year period.
From a sector perspective, performance was unanimously in positive territory as all sectors within the Russell 3000® Index advanced during the year. In general, economically-sensitive sectors benefitted from an increasingly more optimistic outlook, while the more defensive sectors tended to lag. Eight of the nine sectors within the Russell 3000® Index posted double-digit gains with the best performance coming from the consumer discretionary and producer durables sectors. The weakest performer was the healthcare sector which still posted a solid single-digit gain for the year.
Higher beta, lower quality stocks generally outperformed lower beta, higher quality stocks during the year. In terms of equity market capitalization and style, everything (small, mid, large; growth, core, value) advanced over the course of the year. Small-cap companies significantly outperformed their large-cap counterparts as the Russell 2000® Index posted a one-year return of 26.85%, while the Russell1000® Index advanced 16.10%. Style differentiation was evident as growth oriented stocks outperformed value oriented stocks across all market capitalization segments. In the large capitalization segment, the Russell 1000® Growth Index and Russell 1000® Value Index posted one-year returns of 16.71% and 15.51%, respectively.
The Equity Index Fund is a passively managed Fund benchmarked against the S&P 500® Index. The Fund is comprised of domestic, large-cap equity stocks with both value- and growth-style orientations. The objective of the Fund is to closely replicate the performance of the S&P 500® Index within the investment guidelines. The Fund slightly underperformed its benchmark index, the S&P 500® Index, for the one-year period ended December 31, 2010 (14.45% versus 15.06%). The return differential was primarily a result of social restrictions and expenses within the Fund.
Please see page 135 for information regarding specific portfolio allocations. Portfolio holdings are subject to change at any time.
Equity Index Fund
Average Annual Total Returns as of 12/31/10
| | | | | | | | | | | | |
| | | GS2 Class* | | | GS4 Class* | | | Benchmark** | |
One Year | | | 14.57 | % | | | 14.45 | % | | | 15.06 | % |
Five Year | | | 1.95 | % | | | 1.79 | % | | | 2.29 | % |
Since Inception | | | 2.23 | % | | | 2.16 | % | | | 2.60 | % |
Inception Date | | | 08/27/01 | | | | 08/27/01 | | | | | |
Total Fund Operating Expenses (April 30, 2010 Prospectus, as supplemented on August 5, 2010)(1) | | | 0.25 | % | | | 0.44 | % | | | | |
| (1) | Current information regarding the Fund’s Operating Expenses can be found in the Financial Highlights. |
The performance data quoted represents past performance and does not guarantee future results. Current performance may be lower or higher. Performance data current to the most recent month-end may be obtained at www.GuideStoneFunds.org. The investment return and principal value of an investment will fluctuate so that shares, when redeemed, may be worth more or less than their original cost.
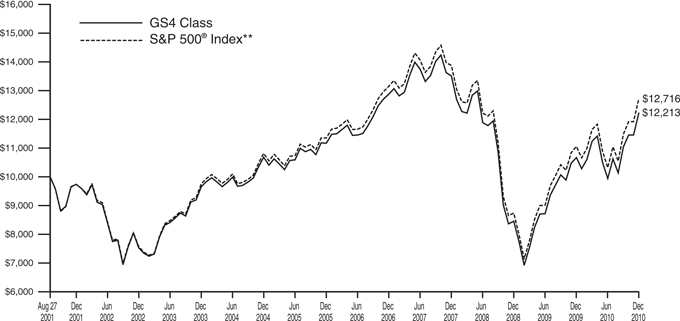
The graph compares the results of a hypothetical $10,000 investment in the GS4 Class of the Fund since August 27, 2001 (commencement of operations), with all dividends and capital gains reinvested, with the S&P 500® Index.
| * | These returns reflect expense waivers by the Fund’s investment adviser. Without these waivers, returns would have been lower. Returns shown do not reflect the deduction of taxes that a shareholder would pay on Fund distributions or the redemption of Fund shares. |
| ** | The S&P 500® Index is an unmanaged index (with no defined investment objective) of common stocks, includes reinvestment of dividends, and is a registered trademark of McGraw-Hill Co., Inc. The S&P 500® Index includes 500 of the largest stocks (in terms of market value) in the United States. |
Unlike a mutual fund, the performance of an index assumes no taxes, transaction costs, management fees or other expenses.
| | |
| EQUITY INDEX FUND | | |
| SCHEDULE OF INVESTMENTS | | December 31, 2010 |
| | | | | | | | |
| | | Shares | | | Value | |
COMMON STOCKS — 97.2% | | | | | |
Consumer Discretionary — 11.9% | | | | | |
Amazon.com, Inc.* | | | 12,620 | | | $ | 2,271,600 | |
Apollo Group, Inc. Class A* | | | 4,677 | | | | 184,695 | |
AutoNation, Inc.D* | | | 2,371 | | | | 66,862 | |
AutoZone, Inc.* | | | 986 | | | | 268,774 | |
Avon Products, Inc. | | | 15,411 | | | | 447,844 | |
Bed Bath & Beyond, Inc.* | | | 9,240 | | | | 454,146 | |
Best Buy Co., Inc. | | | 11,764 | | | | 403,387 | |
Big Lots, Inc.* | | | 2,803 | | | | 85,379 | |
Cablevision Systems CorporationD | | | 8,538 | | | | 288,926 | |
CarMax, Inc.D* | | | 7,884 | | | | 251,342 | |
Carnival Corporation | | | 15,421 | | | | 711,062 | |
CBS Corporation Class B | | | 23,927 | | | | 455,809 | |
Coach, Inc. | | | 10,542 | | | | 583,078 | |
Comcast Corporation Class A | | | 99,211 | | | | 2,179,666 | |
Costco Wholesale Corporation | | | 15,394 | | | | 1,111,601 | |
Darden Restaurants, Inc. | | | 4,890 | | | | 227,092 | |
DeVry, Inc. | | | 2,091 | | | | 100,326 | |
DIRECTV Group, Inc. Class A* | | | 29,775 | | | | 1,188,916 | |
Discovery Communications, Inc.D* | | | 10,009 | | | | 417,375 | |
DR Horton, Inc.D | | | 10,006 | | | | 119,372 | |
eBay, Inc.* | | | 40,699 | | | | 1,132,653 | |
Estee Lauder Cos., Inc. (The) Class A | | | 3,983 | | | | 321,428 | |
Expedia, Inc. | | | 7,331 | | | | 183,935 | |
Family Dollar Stores, Inc. | | | 4,385 | | | | 217,978 | |
Ford Motor Co.D* | | | 133,239 | | | | 2,237,083 | |
GameStop Corporation Class AD* | | | 5,182 | | | | 118,564 | |
Gannett Co., Inc. | | | 8,785 | | | | 132,566 | |
Gap, Inc. (The) | | | 15,854 | | | | 351,008 | |
Genuine Parts Co. | | | 5,638 | | | | 289,455 | |
Goodyear Tire & Rubber Co. (The)* | | | 8,224 | | | | 97,454 | |
H&R Block, Inc.D | | | 10,582 | | | | 126,032 | |
Harley-Davidson, Inc. | | | 8,346 | | | | 289,356 | |
Harman International Industries, Inc.* | | | 2,542 | | | | 117,695 | |
Hasbro, Inc. | | | 4,785 | | | | 225,756 | |
Home Depot, Inc. | | | 58,364 | | | | 2,046,242 | |
Interpublic Group of Companies, Inc.* | | | 17,836 | | | | 189,418 | |
Johnson Controls, Inc. | | | 23,911 | | | | 913,400 | |
Kohl’s Corporation* | | | 10,397 | | | | 564,973 | |
Leggett & Platt, Inc. | | | 5,360 | | | | 121,994 | |
Lennar Corporation Class AD | | | 5,764 | | | | 108,075 | |
Limited Brands, Inc. | | | 9,323 | | | | 286,496 | |
Lowe’s Cos., Inc. | | | 49,120 | | | | 1,231,930 | |
Macy’s, Inc. | | | 15,219 | | | | 385,041 | |
Marriott International, Inc. Class AD | | | 10,217 | | | | 424,414 | |
Marriott International, Ltd. Placeholder Shares+ | | | 82,125 | | | | — | |
Mattel, Inc.D | | | 12,898 | | | | 327,996 | |
McDonald’s Corporation | | | 37,655 | | | | 2,890,398 | |
McGraw-Hill Co., Inc. (The) | | | 10,842 | | | | 394,757 | |
Meredith CorporationD | | | 1,400 | | | | 48,510 | |
Netflix, Inc.D* | | | 1,542 | | | | 270,929 | |
Newell Rubbermaid, Inc. | | | 10,244 | | | | 186,236 | |
News Corporation | | | 81,018 | | | | 1,179,622 | |
NIKE, Inc. Class BD | | | 13,592 | | | | 1,161,029 | |
Nordstrom, Inc.D | | | 6,023 | | | | 255,255 | |
Omnicom Group, Inc. | | | 10,646 | | | | 487,587 | |
O’Reilly Automotive, Inc.* | | | 4,953 | | | | 299,260 | |
Penney (J.C.) Co., Inc. | | | 8,285 | | | | 267,688 | |
Polo Ralph Lauren Corporation | | | 2,320 | | | | 257,334 | |
Priceline.com, Inc.* | | | 1,740 | | | | 695,217 | |
Pulte Homes, Inc.D* | | | 12,040 | | | | 90,541 | |
RadioShack CorporationD | | | 3,788 | | | | 70,040 | |
Ross Stores, Inc.D | | | 4,224 | | | | 267,168 | |
Scripps Networks Interactive, Inc. Class A | | | 3,114 | | | | 161,149 | |
Sears Holdings CorporationD* | | | 1,614 | | | | 119,032 | |
Snap-On, Inc. | | | 2,020 | | | | 114,292 | |
Stanley Black & Decker, Inc. | | | 5,833 | | | | 390,053 | |
Staples, Inc. | | | 25,718 | | | | 585,599 | |
Starbucks Corporation | | | 26,255 | | | | 843,573 | |
Starwood Hotels & Resorts Worldwide, Inc. | | | 6,712 | | | | 407,955 | |
Target Corporation | | | 25,221 | | | | 1,516,539 | |
Tiffany & Co. | | | 4,481 | | | | 279,032 | |
Time Warner Cable, Inc. | | | 12,604 | | | | 832,242 | |
Time Warner, Inc. | | | 39,519 | | | | 1,271,326 | |
TJX Cos., Inc. | | | 14,213 | | | | 630,915 | |
Urban Outfitters, Inc.* | | | 4,482 | | | | 160,500 | |
VF CorporationD | | | 3,067 | | | | 264,314 | |
Wal-Mart Stores, Inc.D | | | 69,786 | | | | 3,763,559 | |
Walt Disney Co. (The) | | | 67,374 | | | | 2,527,199 | |
Washington Post Co. (The)D | | | 191 | | | | 83,944 | |
Whirlpool Corporation | | | 2,694 | | | | 239,308 | |
Wyndham Worldwide Corporation | | | 6,175 | | | | 185,003 | |
Yum! Brands, Inc. | | | 16,582 | | | | 813,347 | |
| | | | | | | | |
| | | | | | | 48,268,646 | |
| | | | | | | | |
Consumer Staples — 7.5% | | | | | | | | |
Archer-Daniels-Midland Co. | | | 22,605 | | | | 679,958 | |
Campbell Soup Co.D | | | 6,812 | | | | 236,717 | |
Clorox Co. | | | 4,942 | | | | 312,730 | |
Coca-Cola Co. (The) | | | 82,607 | | | | 5,433,062 | |
Coca-Cola Enterprises, Inc. | | | 12,065 | | | | 301,987 | |
Colgate-Palmolive Co. | | | 17,129 | | | | 1,376,658 | |
ConAgra Foods, Inc. | | | 15,775 | | | | 356,199 | |
CVS Caremark Corporation | | | 48,229 | | | | 1,676,922 | |
Dean Foods Co.* | | | 5,903 | | | | 52,183 | |
Dr Pepper Snapple Group, Inc. | | | 8,068 | | | | 283,671 | |
General Mills, Inc. | | | 22,804 | | | | 811,594 | |
Heinz (H.J.) Co. | | | 11,480 | | | | 567,801 | |
Hershey Co. (The) | | | 5,508 | | | | 259,702 | |
Hormel Foods CorporationD | | | 2,399 | | | | 122,973 | |
J.M. Smucker Co. (The) | | | 4,339 | | | | 284,855 | |
Kellogg Co. | | | 9,142 | | | | 466,973 | |
Kimberly-Clark Corporation | | | 14,542 | | | | 916,728 | |
Kraft Foods, Inc. Class A | | | 62,253 | | | | 1,961,592 | |
Kroger Co. (The) | | | 22,587 | | | | 505,045 | |
McCormick & Co., Inc. | | | 4,854 | | | | 225,857 | |
Mead Johnson Nutrition Co. | | | 7,199 | | | | 448,138 | |
PepsiCo, Inc. | | | 56,326 | | | | 3,679,778 | |
Procter & Gamble Co. (The) | | | 99,606 | | | | 6,407,654 | |
Safeway, Inc. | | | 13,200 | | | | 296,868 | |
Sara Lee Corporation | | | 22,666 | | | | 396,882 | |
SUPERVALU, Inc.D | | | 6,880 | | | | 66,254 | |
Sysco Corporation | | | 20,765 | | | | 610,491 | |
Tyson Foods, Inc. Class A | | | 10,535 | | | | 181,413 | |
Walgreen Co. | | | 32,951 | | | | 1,283,771 | |
| | | | |
| | See Notes to Financial Statements. | | 129 |
| | |
| EQUITY INDEX FUND | | |
SCHEDULE OF INVESTMENTS (Continued) | | |
| | | | | | | | |
| | | Shares | | | Value | |
Whole Foods Market, Inc.D* | | | 5,227 | | | $ | 264,434 | |
| | | | | | | | |
| | | | | | | 30,468,890 | |
| | | | | | | | |
Energy — 12.1% | | | | | | | | |
Anadarko Petroleum Corporation | | | 17,586 | | | | 1,339,350 | |
Apache Corporation | | | 13,577 | | | | 1,618,786 | |
Baker Hughes, Inc. | | | 15,327 | | | | 876,245 | |
Cabot Oil & Gas Corporation | | | 3,627 | | | | 137,282 | |
Cameron International Corporation* | | | 8,693 | | | | 440,996 | |
Chesapeake Energy Corporation | | | 23,473 | | | | 608,185 | |
Chevron Corporation | | | 71,608 | | | | 6,534,230 | |
ConocoPhillips | | | 52,258 | | | | 3,558,770 | |
Consol Energy, Inc. | | | 8,063 | | | | 392,991 | |
Denbury Resources, Inc.* | | | 14,332 | | | | 273,598 | |
Devon Energy Corporation | | | 15,325 | | | | 1,203,166 | |
Diamond Offshore Drilling, Inc.D | | | 2,439 | | | | 163,096 | |
El Paso Corporation | | | 24,569 | | | | 338,069 | |
EOG Resources, Inc. | | | 9,011 | | | | 823,695 | |
EQT Corporation | | | 5,251 | | | | 235,455 | |
Exterran Holdings, Inc.* | | | 13 | | | | 311 | |
Exxon Mobil Corporation | | | 179,381 | | | | 13,116,339 | |
First Solar, Inc.D* | | | 1,900 | | | | 247,266 | |
FMC Technologies, Inc.* | | | 4,271 | | | | 379,735 | |
Halliburton Co. | | | 32,372 | | | | 1,321,749 | |
Helmerich & Payne, Inc. | | | 3,717 | | | | 180,200 | |
Hess Corporation | | | 10,641 | | | | 814,462 | |
Marathon Oil Corporation | | | 25,211 | | | | 933,563 | |
Massey Energy Co. | | | 3,562 | | | | 191,101 | |
Murphy Oil Corporation | | | 6,881 | | | | 512,979 | |
Nabors Industries, Ltd.* | | | 10,143 | | | | 237,955 | |
National Oilwell Varco, Inc. | | | 14,894 | | | | 1,001,621 | |
Newfield Exploration Co.* | | | 4,762 | | | | 343,388 | |
Noble Energy, Inc. | | | 6,183 | | | | 532,233 | |
Occidental Petroleum Corporation | | | 28,962 | | | | 2,841,172 | |
Peabody Energy Corporation | | | 9,633 | | | | 616,319 | |
Pioneer Natural Resouces Co. | | | 4,140 | | | | 359,435 | |
QEP Resources, Inc. | | | 6,356 | | | | 230,786 | |
Range Resources Corporation | | | 5,724 | | | | 257,465 | |
Rowan Cos., Inc. | | | 4,512 | | | | 157,514 | |
Schlumberger, Ltd. | | | 48,530 | | | | 4,052,255 | |
Southwestern Energy Co.* | | | 12,473 | | | | 466,864 | |
Spectra Energy Corporation | | | 23,248 | | | | 580,968 | |
Sunoco, Inc. | | | 4,350 | | | | 175,348 | |
Tesoro CorporationD* | | | 4,921 | | | | 91,235 | |
Valero Energy Corporation | | | 20,292 | | | | 469,151 | |
Williams Cos., Inc. (The) | | | 20,616 | | | | 509,628 | |
| | | | | | | | |
| | | | | | | 49,164,956 | |
| | | | | | | | |
Financial Services — 16.6% | | | | | |
Aflac, Inc. | | | 16,705 | | | | 942,663 | |
Allstate Corporation (The) | | | 19,281 | | | | 614,678 | |
American Express Co. | | | 37,185 | | | | 1,595,980 | |
American International Group, Inc.D* | | | 4,985 | | | | 287,236 | |
Ameriprise Financial, Inc. | | | 8,821 | | | | 507,649 | |
AON Corporation | | | 11,796 | | | | 542,734 | |
Apartment Investment & Management Co. Class A REIT | | | 4,040 | | | | 104,394 | |
Assurant, Inc. | | | 3,727 | | | | 143,564 | |
AvalonBay Communities, Inc. REIT | | | 3,051 | | | | 343,390 | |
Bank of America Corporation | | | 358,600 | | | | 4,783,724 | |
Bank of New York Mellon Corporation (The) | | | 44,073 | | | | 1,331,005 | |
BB&T Corporation | | | 24,807 | | | | 652,176 | |
Berkshire Hathaway, Inc.* | | | 61,557 | | | | 4,931,331 | |
Boston Properties, Inc. REITD | | | 5,020 | | | | 432,222 | |
Capital One Financial Corporation | | | 16,377 | | | | 697,005 | |
CB Richard Ellis Group, Inc. Class A* | | | 10,124 | | | | 207,340 | |
Chubb Corporation | | | 10,851 | | | | 647,154 | |
Cincinnati Financial CorporationD | | | 5,996 | | | | 190,013 | |
Citigroup, Inc.* | | | 1,032,862 | | | | 4,885,437 | |
CME Group, Inc. | | | 2,380 | | | | 765,765 | |
Comerica, Inc. | | | 6,260 | | | | 264,422 | |
Discover Financial Services | | | 19,443 | | | | 360,279 | |
Dun & Bradstreet Corporation | | | 1,739 | | | | 142,754 | |
E*TRADE Financial CorporationD* | | | 6,947 | | | | 111,152 | |
Equifax, Inc. | | | 4,371 | | | | 155,608 | |
Equity Residential REIT | | | 10,052 | | | | 522,201 | |
Federated Investors, Inc. Class BD | | | 3,300 | | | | 86,361 | |
Fidelity National Information Services, Inc. | | | 9,608 | | | | 263,163 | |
Fifth Third Bancorp | | | 28,467 | | | | 417,896 | |
First Horizon National CorporationD* | | | 8,307 | | | | 97,856 | |
First Horizon National Corporation Placeholder Shares+ | | | 189,413 | | | | — | |
Fiserv, Inc.* | | | 5,257 | | | | 307,850 | |
Franklin Resources, Inc. | | | 5,178 | | | | 575,845 | |
Genworth Financial, Inc. Class A* | | | 17,063 | | | | 224,208 | |
Goldman Sachs Group, Inc. (The) | | | 18,202 | | | | 3,060,848 | |
Hartford Financial Services Group, Inc. | | | 15,894 | | | | 421,032 | |
HCP, Inc. REIT | | | 12,957 | | | | 476,688 | |
Health Care REIT, Inc. | | | 5,194 | | | | 247,442 | |
Host Hotels & Resorts, Inc. REIT | | | 23,225 | | | | 415,031 | |
Hudson City Bancorp, Inc. | | | 18,520 | | | | 235,945 | |
Huntington Bancshares, Inc.D | | | 30,700 | | | | 210,909 | |
IntercontinentalExchange, Inc.* | | | 2,581 | | | | 307,526 | |
Invesco, Ltd. | | | 16,361 | | | | 393,646 | |
Janus Capital Group, Inc. | | | 6,708 | | | | 87,003 | |
JPMorgan Chase & Co. | | | 139,034 | | | | 5,897,822 | |
KeyCorp | | | 31,349 | | | | 277,439 | |
Kimco Realty Corporation REIT | | | 14,165 | | | | 255,537 | |
Legg Mason, Inc.D | | | 5,388 | | | | 195,423 | |
Leucadia National Corporation | | | 6,852 | | | | 199,941 | |
Lincoln National CorporationD | | | 11,299 | | | | 314,225 | |
Loews Corporation | | | 11,447 | | | | 445,403 | |
M&T Bank Corporation | | | 4,248 | | | | 369,788 | |
Marsh & McLennan Cos., Inc. | | | 19,512 | | | | 533,458 | |
Marshall & Ilsley Corporation | | | 19,212 | | | | 132,947 | |
Mastercard, Inc. Class A | | | 3,439 | | | | 770,714 | |
MetLife, Inc. | | | 32,201 | | | | 1,431,012 | |
Moody’s Corporation | | | 7,127 | | | | 189,151 | |
Morgan Stanley | | | 53,784 | | | | 1,463,463 | |
NASDAQ OMX Group, Inc. (The)* | | | 5,070 | | | | 120,210 | |
| | | | |
| 130 | | See Notes to Financial Statements. | | |
| | | | | | | | |
| | | Shares | | | Value | |
Northern Trust Corporation | | | 8,799 | | | $ | 487,553 | |
NYSE Euronext | | | 9,340 | | | | 280,013 | |
People’s United Financial, Inc. | | | 13,442 | | | | 188,322 | |
Plum Creek Timber Co., Inc. REITD | | | 5,932 | | | | 222,153 | |
PNC Financial Services Group, Inc. | | | 18,667 | | | | 1,133,460 | |
Principal Financial Group, Inc. | | | 11,317 | | | | 368,482 | |
Progressive Corporation (The) | | | 23,473 | | | | 466,409 | |
ProLogis REIT | | | 20,391 | | | | 294,446 | |
Prudential Financial, Inc. | | | 17,293 | | | | 1,015,272 | |
Public Storage REIT | | | 4,961 | | | | 503,145 | |
Regions Financial CorporationD | | | 44,332 | | | | 310,324 | |
Schwab (Charles) Corporation (The) | | | 35,567 | | | | 608,551 | |
Simon Property Group, Inc. REIT | | | 10,428 | | | | 1,037,482 | |
SLM Corporation* | | | 17,253 | | | | 217,215 | |
State Street Corporation | | | 17,798 | | | | 824,759 | |
SunTrust Banks, Inc. | | | 17,922 | | | | 528,878 | |
T. Rowe Price Group, Inc.D | | | 9,040 | | | | 583,442 | |
Torchmark Corporation | | | 2,850 | | | | 170,259 | |
Total System Services, Inc.D | | | 5,618 | | | | 86,405 | |
Travelers Cos., Inc. (The) | | | 16,341 | | | | 910,357 | |
Unum Group | | | 11,200 | | | | 271,264 | |
US Bancorp | | | 68,088 | | | | 1,836,333 | |
Ventas, Inc. REITD | | | 5,680 | | | | 298,086 | |
Visa, Inc. | | | 17,317 | | | | 1,218,770 | |
Vornado Realty Trust REIT | | | 5,838 | | | | 486,481 | |
Wells Fargo & Co. | | | 186,594 | | | | 5,782,548 | |
Western Union Co. (The) | | | 23,175 | | | | 430,360 | |
Xl Group PLCD | | | 11,605 | | | | 253,221 | |
Zions BancorporationD | | | 6,256 | | | | 151,583 | |
| | | | | | | | |
| | | | | | | 67,553,231 | |
| | | | | | | | |
Healthcare — 10.7% | | | | | | | | |
Abbott Laboratories | | | 55,020 | | | | 2,636,008 | |
Aetna, Inc. | | | 14,209 | | | | 433,517 | |
Allergan, Inc. | | | 10,913 | | | | 749,396 | |
AmerisourceBergen Corporation | | | 9,538 | | | | 325,437 | |
Amgen, Inc.* | | | 33,608 | | | | 1,845,079 | |
Bard (C.R.), Inc.D | | | 3,287 | | | | 301,648 | |
Baxter International, Inc. | | | 20,751 | | | | 1,050,416 | |
Becton Dickinson & Co. | | | 8,220 | | | | 694,754 | |
Biogen Idec, Inc.* | | | 8,392 | | | | 562,684 | |
Boston Scientific Corporation* | | | 54,324 | | | | 411,233 | |
Bristol-Myers Squibb Co. | | | 60,499 | | | | 1,602,014 | |
Cardinal Health, Inc. | | | 12,219 | | | | 468,110 | |
CareFusion Corporation* | | | 7,860 | | | | 202,002 | |
Celgene Corporation* | | | 16,698 | | | | 987,520 | |
Cephalon, Inc.D* | | | 2,614 | | | | 161,336 | |
Cerner CorporationD* | | | 2,496 | | | | 236,471 | |
CIGNA Corporation | | | 9,723 | | | | 356,445 | |
Conventry Health Care, Inc.* | | | 5,201 | | | | 137,306 | |
DaVita, Inc.* | | | 3,504 | | | | 243,493 | |
DENTSPLY International, Inc. | | | 4,977 | | | | 170,064 | |
Eli Lilly & Co. | | | 35,729 | | | | 1,251,944 | |
Express Scripts, Inc.* | | | 18,731 | | | | 1,012,411 | |
Forest Laboratories, Inc.* | | | 9,905 | | | | 316,762 | |
Genzyme Corporation* | | | 9,172 | | | | 653,046 | |
Gilead Sciences, Inc.* | | | 28,872 | | | | 1,046,321 | |
Hospira, Inc.* | | | 5,914 | | | | 329,351 | |
Humana, Inc.* | | | 5,902 | | | | 323,075 | |
Intuitive Surgical, Inc.* | | | 1,403 | | | | 361,623 | |
Johnson & Johnson | | | 97,623 | | | | 6,037,983 | |
King Pharmaceuticals, Inc.* | | | 3,409 | | | | 47,896 | |
Laboratory Corporation of America Holdings* | | | 3,690 | | | | 324,425 | |
Life Technologies Corporation* | | | 6,716 | | | | 372,738 | |
McKesson Corporation | | | 8,856 | | | | 623,285 | |
Medco Health Solutions, Inc.* | | | 15,069 | | | | 923,278 | |
Medtronic, Inc. | | | 38,360 | | | | 1,422,772 | |
Merck & Co., Inc. | | | 109,258 | | | | 3,937,658 | |
Mylan, Inc.* | | | 15,019 | | | | 317,351 | |
Patterson Cos., Inc. | | | 3,566 | | | | 109,227 | |
PerkinElmer, Inc. | | | 4,010 | | | | 103,538 | |
Pfizer, Inc. | | | 284,241 | | | | 4,977,060 | |
Quest Diagnostics, Inc. | | | 5,049 | | | | 272,495 | |
St. Jude Medical, Inc.* | | | 12,182 | | | | 520,781 | |
Stryker Corporation | | | 12,066 | | | | 647,944 | |
Tenet Healthcare Corporation* | | | 17,431 | | | | 116,613 | |
Thermo Fisher Scientific, Inc.* | | | 14,130 | | | | 782,237 | |
UnitedHealth Group, Inc. | | | 39,112 | | | | 1,412,334 | |
Varian Medical Systems, Inc.* | | | 4,168 | | | | 288,759 | |
Watson Pharmaceuticals, Inc.* | | | 4,359 | | | | 225,142 | |
WellPoint, Inc.* | | | 14,006 | | | | 796,381 | |
Zimmer Holdings, Inc.* | | | 7,024 | | | | 377,048 | |
| | | | | | | | |
| | | | | | | 43,506,411 | |
| | | | | | | | |
Materials & Processing — 4.1% | | | | | | | | |
Air Products & Chemicals, Inc. | | | 7,610 | | | | 692,130 | |
Airgas, Inc. | | | 2,639 | | | | 164,832 | |
AK Steel Holding CorporationD | | | 3,577 | | | | 58,556 | |
Alcoa, Inc. | | | 36,508 | | | | 561,858 | |
Allegheny Technologies, Inc.D | | | 3,419 | | | | 188,660 | |
Ball Corporation | | | 3,232 | | | | 219,938 | |
Bemis Co., Inc. | | | 3,721 | | | | 121,528 | |
CF Industries Holdings, Inc. | | | 2,534 | | | | 342,470 | |
Cliffs Natural Resources, Inc. | | | 4,846 | | | | 378,036 | |
Dow Chemical Co. (The) | | | 41,203 | | | | 1,406,670 | |
Du Pont (E.I.) de Nemours & Co. | | | 32,519 | | | | 1,622,048 | |
Eastman Chemical Co. | | | 2,518 | | | | 211,713 | |
Ecolab, Inc. | | | 8,335 | | | | 420,251 | |
Fastenal Co.D | | | 5,281 | | | | 316,385 | |
FMC Corporation | | | 2,528 | | | | 201,962 | |
Freeport-McMoRan Copper & Gold, Inc. | | | 16,795 | | | | 2,016,912 | |
International Flavors & Fragrances, Inc. | | | 2,922 | | | | 162,434 | |
International Paper Co. | | | 15,565 | | | | 423,991 | |
Masco CorporationD | | | 12,796 | | | | 161,997 | |
MeadWestvaco Corporation | | | 5,954 | | | | 155,757 | |
Monsanto Co. | | | 19,030 | | | | 1,325,249 | |
Newmont Mining Corporation | | | 17,496 | | | | 1,074,779 | |
Nucor CorporationD | | | 11,264 | | | | 493,588 | |
Owens-Illinois, Inc.* | | | 5,701 | | | | 175,021 | |
PPG Industries, Inc. | | | 5,793 | | | | 487,018 | |
Praxair, Inc. | | | 10,969 | | | | 1,047,210 | |
Precision Castparts Corporation | | | 5,057 | | | | 703,985 | |
Sealed Air Corporation | | | 5,583 | | | | 142,087 | |
Sherwin-Williams Co. (The) | | | 3,188 | | | | 266,995 | |
Sigma-Aldrich Corporation | | | 4,300 | | | | 286,208 | |
Titanium Metals Corporation | | | 2,990 | | | | 51,368 | |
United States Steel CorporationD | | | 5,050 | | | | 295,021 | |
Vulcan Materials Co.D | | | 4,441 | | | | 197,003 | |
Weyerhaeuser Co. | | | 18,741 | | | | 354,767 | |
| | | | | | | | |
| | | | | | | 16,728,427 | |
| | | | | | | | |
| | | | |
| | See Notes to Financial Statements. | | 131 |
| | |
| EQUITY INDEX FUND | | |
| SCHEDULE OF INVESTMENTS (Continued) | | |
| | | | | | | | |
| | | Shares | | | Value | |
Producer Durables — 10.9% | | | | | | | | |
3M Co. | | | 25,499 | | | $ | 2,200,564 | |
Agilent Technologies, Inc.* | | | 12,428 | | | | 514,892 | |
Automatic Data Processing, Inc. | | | 17,709 | | | | 819,572 | |
Avery Dennison Corporation | | | 3,809 | | | | 161,273 | |
Boeing Co. (The) | | | 26,131 | | | | 1,705,309 | |
C.H. Robinson Worldwide, Inc. | | | 5,928 | | | | 475,366 | |
Caterpillar, Inc. | | | 22,597 | | | | 2,116,435 | |
Cintas Corporation | | | 4,648 | | | | 129,958 | |
CSX Corporation | | | 13,302 | | | | 859,442 | |
Cummins, Inc. | | | 7,053 | | | | 775,901 | |
Danaher Corporation | | | 18,982 | | | | 895,381 | |
Deere & Co. | | | 15,079 | | | | 1,252,311 | |
Dover Corporation | | | 6,708 | | | | 392,083 | |
Eaton Corporation | | | 6,035 | | | | 612,613 | |
Emerson Electric Co. | | | 26,760 | | | | 1,529,869 | |
Expeditors International of Washington, Inc. | | | 7,611 | | | | 415,561 | |
FedEx Corporation | | | 11,160 | | | | 1,037,992 | |
FLIR Systems, Inc.D* | | | 5,510 | | | | 163,922 | |
Flowserve Corporation | | | 1,991 | | | | 237,367 | |
Fluor Corporation | | | 6,290 | | | | 416,775 | |
General Dynamics Corporation | | | 13,508 | | | | 958,528 | |
General Electric Co. | | | 379,104 | | | | 6,933,812 | |
Goodrich Corporation | | | 4,406 | | | | 388,036 | |
Honeywell International, Inc.D | | | 27,717 | | | | 1,473,436 | |
Illinois Tool Works, Inc. | | | 17,680 | | | | 944,112 | |
Iron Mountain, Inc. | | | 6,912 | | | | 172,869 | |
ITT Corporation | | | 6,471 | | | | 337,204 | |
Jacobs Engineering Group, Inc.* | | | 4,553 | | | | 208,755 | |
L-3 Communications Holdings, Inc. | | | 4,059 | | | | 286,119 | |
Lexmark International, Inc. Class A* | | | 2,856 | | | | 99,446 | |
Lockheed Martin Corporation | | | 10,567 | | | | 738,739 | |
Monster Worldwide, Inc.D* | | | 4,609 | | | | 108,911 | |
Norfolk Southern Corporation | | | 12,931 | | | | 812,325 | |
Northrop Grumman Corporation | | | 10,437 | | | | 676,109 | |
PACCAR, Inc.D | | | 13,051 | | | | 749,388 | |
Pall Corporation | | | 4,081 | | | | 202,336 | |
Parker Hannifin Corporation | | | 5,687 | | | | 490,788 | |
Paychex, Inc. | | | 11,470 | | | | 354,538 | |
Pitney Bowes, Inc.D | | | 7,526 | | | | 181,979 | |
Quanta Services, Inc.D* | | | 7,756 | | | | 154,499 | |
Raytheon Co. | | | 12,976 | | | | 601,308 | |
Republic Services, Inc. | | | 10,957 | | | | 327,176 | |
Robert Half International, Inc.D | | | 5,054 | | | | 154,652 | |
Rockwell Automation, Inc. | | | 5,073 | | | | 363,785 | |
Rockwell Collins, Inc. | | | 5,574 | | | | 324,741 | |
Roper Industries, Inc.D | | | 3,358 | | | | 256,652 | |
RR Donnelley & Sons Co. | | | 7,507 | | | | 131,147 | |
Ryder System, Inc. | | | 1,869 | | | | 98,384 | |
Southwest Airlines Co. | | | 26,647 | | | | 345,878 | |
Stericycle, Inc.D* | | | 3,017 | | | | 244,136 | |
Textron, Inc.D | | | 9,716 | | | | 229,686 | |
Union Pacific Corporation | | | 17,543 | | | | 1,625,534 | |
United Parcel Service, Inc. Class B | | | 35,148 | | | | 2,551,042 | |
United Technologies Corporation | | | 32,889 | | | | 2,589,022 | |
W.W. Grainger, Inc.D | | | 2,087 | | | | 288,236 | |
Waste Management, Inc. | | | 16,839 | | | | 620,854 | |
Waters Corporation* | | | 3,266 | | | | 253,801 | |
Xerox Corporation | | | 49,676 | | | | 572,268 | |
| | | | | | | | |
| | | | | | | 44,562,817 | |
| | | | | | | | |
Technology — 17.2% | | | | | | | | |
Adobe Systems, Inc.* | | | 18,029 | | | | 554,933 | |
Advanced Micro Devices, Inc.D* | | | 20,017 | | | | 163,739 | |
Akamai Technologies, Inc.* | | | 6,528 | | | | 307,142 | |
Altera Corporation | | | 11,053 | | | | 393,266 | |
American Tower Corporation Class A* | | | 14,278 | | | | 737,316 | |
Amphenol Corporation Class A | | | 6,289 | | | | 331,933 | |
Analog Devices, Inc. | | | 10,536 | | | | 396,891 | |
Apple, Inc.* | | | 32,624 | | | | 10,523,197 | |
Applied Materials, Inc. | | | 47,802 | | | | 671,618 | |
Autodesk, Inc.* | | | 8,110 | | | | 309,802 | |
BMC Software, Inc.* | | | 6,250 | | | | 294,625 | |
Broadcom Corporation Class AD | | | 16,195 | | | | 705,292 | |
CA, Inc. | | | 13,499 | | | | 329,916 | |
Cisco Systems, Inc.* | | | 197,093 | | | | 3,987,191 | |
Citrix Systems, Inc.* | | | 6,740 | | | | 461,083 | |
Cognizant Technology Solutions Corporation Class A* | | | 10,831 | | | | 793,804 | |
Computer Sciences Corporation | | | 5,455 | | | | 270,568 | |
Compuware Corporation* | | | 7,551 | | | | 88,120 | |
Corning, Inc. | | | 55,523 | | | | 1,072,704 | |
Dell, Inc.* | | | 59,950 | | | | 812,323 | |
Electronic Arts, Inc.* | | | 11,501 | | | | 188,386 | |
EMC Corporation* | | | 73,429 | | | | 1,681,524 | |
F5 Networks, Inc.* | | | 2,876 | | | | 374,340 | |
Google, Inc. Class A* | | | 8,869 | | | | 5,267,920 | |
Harris Corporation | | | 4,552 | | | | 206,206 | |
Hewlett-Packard Co. | | | 80,573 | | | | 3,392,123 | |
Intel Corporation | | | 198,686 | | | | 4,178,367 | |
International Business Machines Corporation | | | 44,209 | | | | 6,488,113 | |
Intuit, Inc.* | | | 9,936 | | | | 489,845 | |
Jabil Circuit, Inc. | | | 7,203 | | | | 144,708 | |
JDS Uniphase Corporation* | | | 7,684 | | | | 111,264 | |
Juniper Networks, Inc.* | | | 18,668 | | | | 689,223 | |
KLA-Tencor Corporation | | | 6,060 | | | | 234,158 | |
Linear Technology CorporationD | | | 7,981 | | | | 276,063 | |
LSI Corporation* | | | 21,819 | | | | 130,696 | |
McAfee, Inc.* | | | 5,417 | | | | 250,861 | |
MEMC Electronic Materials, Inc.* | | | 7,606 | | | | 85,644 | |
Microchip Technology, Inc.D | | | 6,607 | | | | 226,025 | |
Micron Technology, Inc.* | | | 29,994 | | | | 240,552 | |
Microsoft Corporation | | | 267,746 | | | | 7,475,468 | |
Molex, Inc.D | | | 4,798 | | | | 109,011 | |
Motorola, Inc.* | | | 83,716 | | | | 759,304 | |
National Semiconductor Corporation | | | 8,311 | | | | 114,359 | |
NetApp, Inc.* | | | 12,840 | | | | 705,686 | |
Novell, Inc.* | | | 11,731 | | | | 69,448 | |
Novellus Systems, Inc.* | | | 3,127 | | | | 101,065 | |
NVIDIA Corporation* | | | 20,794 | | | | 320,228 | |
Oracle Corporation | | | 137,812 | | | | 4,313,516 | |
QLogic Corporation* | | | 3,639 | | | | 61,936 | |
QUALCOMM, Inc. | | | 57,491 | | | | 2,845,230 | |
Red Hat, Inc.* | | | 6,879 | | | | 314,026 | |
SAIC, Inc.* | | | 10,348 | | | | 164,119 | |
Salesforce.com, Inc.* | | | 4,220 | | | | 557,040 | |
| | | | |
| 132 | | See Notes to Financial Statements. | | |
| | | | | | | | |
| | | Shares | | | Value | |
SanDisk Corporation* | | | 8,283 | | | $ | 412,990 | |
Symantec Corporation* | | | 27,782 | | | | 465,071 | |
Tellabs, Inc. | | | 13,674 | | | | 92,710 | |
Teradata Corporation* | | | 5,989 | | | | 246,507 | |
Teradyne, Inc.D* | | | 6,164 | | | | 86,543 | |
Texas Instruments, Inc.D | | | 41,872 | | | | 1,360,840 | |
VeriSign, Inc.D* | | | 6,147 | | | | 200,823 | |
Western Digital Corporation* | | | 8,126 | | | | 275,471 | |
Xilinx, Inc.D | | | 9,277 | | | | 268,847 | |
Yahoo!, Inc.* | | | 46,217 | | | | 768,589 | |
| | | | | | | | |
| | | | | | | 69,950,308 | |
| | | | | | | | |
Utilities — 6.2% | | | | | | | | |
AES Corporation (The)* | | | 23,499 | | | | 286,218 | |
Allegheny Energy, Inc. | | | 5,835 | | | | 141,440 | |
Ameren Corporation | | | 8,452 | | | | 238,262 | |
American Electric Power Co., Inc. | | | 17,275 | | | | 621,555 | |
AT&T, Inc. | | | 210,262 | | | | 6,177,498 | |
Centerpoint Energy, Inc. | | | 15,114 | | | | 237,592 | |
CenturyTel, Inc.D | | | 10,783 | | | | 497,851 | |
CMS Energy CorporationD | | | 8,600 | | | | 159,960 | |
Consolidated Edison, Inc. | | | 10,315 | | | | 511,315 | |
Constellation Energy Group, Inc. | | | 7,068 | | | | 216,493 | |
Dominion Resources, Inc. | | | 20,613 | | | | 880,587 | |
DTE Energy Co. | | | 6,042 | | | | 273,823 | |
Duke Energy Corporation | | | 46,928 | | | | 835,788 | |
Edison International | | | 11,711 | | | | 452,045 | |
Entergy Corporation | | | 6,439 | | | | 456,074 | |
Exelon Corporation | | | 23,488 | | | | 978,040 | |
FirstEnergy CorporationD | | | 10,968 | | | | 406,035 | |
Frontier Communications CorporationD | | | 35,099 | | | | 341,513 | |
Integrys Energy Group, Inc.D | | | 2,650 | | | | 128,552 | |
MetroPCS Communications, Inc.D* | | | 8,869 | | | | 112,015 | |
NextEra Energy, Inc. | | | 14,767 | | | | 767,736 | |
Nicor, Inc.D | | | 1,498 | | | | 74,780 | |
NiSource, Inc. | | | 9,848 | | | | 173,522 | |
Northeast Utilities | | | 6,153 | | | | 196,158 | |
NRG Energy, Inc.D* | | | 8,879 | | | | 173,496 | |
Oneok, Inc. | | | 3,753 | | | | 208,179 | |
Pepco Holdings, Inc.D | | | 7,712 | | | | 140,744 | |
PG&E Corporation | | | 14,098 | | | | 674,448 | |
Pinnacle West Capital Corporation | | | 3,778 | | | | 156,598 | |
PPL Corporation | | | 17,314 | | | | 455,704 | |
Progress Energy, Inc. | | | 10,527 | | | | 457,714 | |
Public Service Enterprise Group, Inc. | | | 18,180 | | | | 578,306 | |
Qwest Communications International, Inc. | | | 62,588 | | | | 476,295 | |
SCANA Corporation | | | 4,153 | | | | 168,612 | |
Sempra Energy | | | 8,504 | | | | 446,290 | |
Southern Co. | | | 29,793 | | | | 1,138,986 | |
Sprint Nextel Corporation* | | | 106,648 | | | | 451,121 | |
TECO Energy, Inc. | | | 7,410 | | | | 131,898 | |
Verizon Communications, Inc. | | | 100,696 | | | | 3,602,903 | |
Windstream CorporationD | | | 16,996 | | | | 236,924 | |
Wisconsin Energy Corporation | | | 4,094 | | | | 240,973 | |
Xcel Energy Inc. | | | 16,510 | | | | 388,811 | |
| | | | | | | | |
| | | | | | | 25,292,854 | |
| | | | | | | | |
Total Common Stocks
(Cost $329,070,256) | | | | | | | 395,496,540 | |
| | | | | | | | |
FOREIGN COMMON STOCKS — 0.5% | | | | | |
Ireland — 0.1% | | | | | | | | |
Ingersoll-Rand PLCD | | | 11,586 | | | | 545,585 | |
| | | | | | | | |
Switzerland — 0.4% | | | | | | | | |
Ace, Ltd. | | | 12,004 | | | | 747,249 | |
Tyco International, Ltd.* | | | 17,388 | | | | 720,558 | |
| | | | | | | | |
Total Foreign Common Stocks
(Cost $1,809,668) | | | | 2,013,392 | |
| | | | | | | | |
MONEY MARKET FUNDS — 7.5% | | | | | |
GuideStone Money Market Fund (GS4 Class)¥ | | | 7,740,278 | | | | 7,740,278 | |
Northern Institutional Liquid Assets Portfolio§ | | | 22,662,484 | | | | 22,662,484 | |
| | | | | | | | |
Total Money Market Funds
(Cost $30,402,762) | | | | 30,402,762 | |
| | | | | | | | |
| | |
| | | Par | | | | |
U.S. TREASURY OBLIGATIONS — 0.3% | |
U.S. Treasury Bills | | | | | | | | |
0.16%, 05/05/11‡‡ | | $ | 95,000 | | | | 94,956 | |
0.17%, 05/05/11‡‡ | | | 1,350,000 | | | | 1,349,374 | |
| | | | | | | | |
Total U.S. Treasury Obligations
(Cost $1,444,156) | | | | 1,444,330 | |
| | | | | | | | |
TOTAL INVESTMENTS — 105.5%
(Cost $362,726,842) | | | | 429,357,024 | |
Liabilities in Excess of Other Assets — (5.5)% | | | | | | | (22,404,869 | ) |
| | | | | | | | |
NET ASSETS — 100.0% | | | | | | $ | 406,952,155 | |
| | | | | | | | |
Please see abbreviation and footnote definitions beginning on page 180.
PORTFOLIO SUMMARY (based on net assets)
| | | | |
| | | % | |
Technology | | | 17.2 | |
Financial Services | | | 16.6 | |
Energy | | | 12.1 | |
Consumer Discretionary | | | 11.9 | |
Producer Durables | | | 10.9 | |
Healthcare | | | 10.7 | |
Consumer Staples | | | 7.5 | |
Money Market Funds | | | 7.5 | |
Utilities | | | 6.2 | |
Materials & Processing | | | 4.1 | |
Futures | | | 2.2 | |
Foreign Common Stocks | | | 0.5 | |
U.S. Treasury Obligations | | | 0.3 | |
| | | | |
| | | 107.7 | |
| | | | |
| | | | |
| | See Notes to Financial Statements. | | 133 |
| | |
| EQUITY INDEX FUND | | |
| SCHEDULE OF INVESTMENTS (Continued) | | |
VALUATION HIERARCHY
The following is a summary of the inputs used, as of December 31, 2010, in valuing the Fund’s assets carried at fair value:
| | | | | | | | |
Valuation Inputs | | Investments
in
Securities | | | Other
Financial
Instruments*** | |
Level 1 — Quoted Prices | | | | | | | | |
Common Stocks | | $ | 395,496,540 | | | $ | — | |
Foreign Common Stocks | | | 2,013,392 | | | | — | |
Futures Contracts | | | — | | | | 230,370 | |
Money Market Funds | | | 30,402,762 | | | | — | |
Level 2 — Other Significant Observable Inputs | | | | | | | | |
U.S. Treasury Obligation | | | 1,444,330 | | | | — | |
Level 3 — Significant Unobservable Inputs | | | — | | | | — | |
| | | | | | | | |
Total | | $ | 429,357,024 | | | $ | 230,370 | |
| | | | | | | | |
| *** | Other financial instruments are derivative instruments not reflected in the Schedule of Investments, such as futures, forwards and swap contracts, which are valued at the unrealized appreciation (depreciation) on the investment. Details of these investments can be found in the Notes to Financial Statements. |
| | | | |
| 134 | | See Notes to Financial Statements. | | |
Real Estate Securities Fund
The Real Estate Securities Fund provides exposure to real estate by investing in public real estate securities with strong cash flow growth potential that provides the capacity for sustained dividend increases. The Fund is diversified among property sectors and geographical locations. The Fund became a registered mutual fund on December 29, 2006, but prior to that, it was offered as a private fund that operated from 2000 to 2006.
The US REIT market finished off 2010 with a solid fourth quarter and outperformed broader equity indices by roughly 10% for the year. Following the soft patch during the summer, economic data trended positively through the fourth quarter. The improvement accelerated in December as nearly all of the data released suggested improvement in demand as well as signs of hope for the job market. The Fund outperformed its benchmark, the Dow Jones U.S. Select Real Estate Securities Index, by .33% (28.80% versus 28.47%) in 2010. The outperformance was driven by a combination of strong stock selection and solid sector allocation. Stock selection was particularly strong in the apartments and hotels and in retail sectors. This was only somewhat offset by poor selection in the regional malls, self storage and office sectors. Sector allocation benefitted from the Fund’s underweight exposure to the underperforming office, industrial and healthcare sectors and by the overweight exposure to the outperforming apartments sector.
This Fund invests substantial assets in Real Estate Investment Trusts (“REITs”) that involve risks not associated with investing in stocks. Risks include declines in the value of real estate, general and economic conditions, changes in the value of the underlying property and defaults by borrowers. The value of assets in the real estate industry may go through cycles of relative underperformance and outperformance in comparison to equity securities markets in general.
Please see page 139 for information regarding specific portfolio allocations. Portfolio holdings are subject to change at any time.
135
Real Estate Securities Fund
Average Annual Total Returns as of 12/31/10
| | | | | | | | |
| | | GS4 Class* | | | Benchmark** | |
One Year | | | 28.80 | % | | | 28.47 | % |
Since Inception | | | -4.04 | % | | | -4.73 | % |
Inception Date | | | 12/29/06 | | | | | |
Total Fund Operating Expenses (April 30, 2010 Prospectus, as supplemented on August 5, 2010)(1) | | | 1.29 | % | | | | |
| (1) | Current information regarding the Fund’s Operating Expenses can be found in the Financial Highlights. |
The performance data quoted represents past performance and does not guarantee future results. Current performance may be lower or higher. Performance data current to the most recent month-end may be obtained at www.GuideStoneFunds.org. The investment return and principal value of an investment will fluctuate so that shares, when redeemed, may be worth more or less than their original cost.
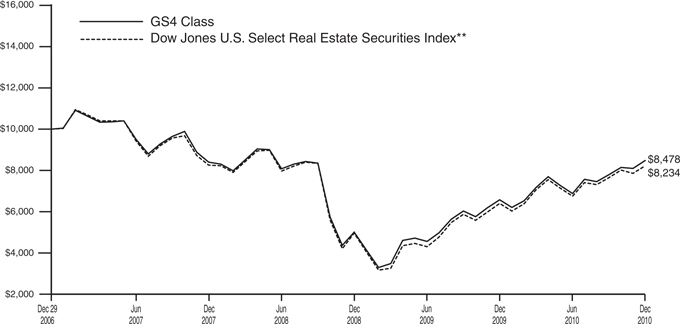
The graph compares the results of a hypothetical $10,000 investment in the GS4 Class of the Fund since December 29, 2006 (commencement of operations), with all dividends and capital gains reinvested, with the Dow Jones Wilshire Real Estate Securities Index.
| * | These returns reflect expense waivers by the Fund’s investment adviser. Without these waivers, returns would have been lower. Returns shown do not reflect the deduction of taxes that a shareholder would pay on Fund distributions or the redemption of Fund shares. |
| ** | The Dow Jones U.S. Select Real Estate Securities Index is an unmanaged, broad-based, market capitalization-weighted index comprised of publicly traded REITs and real estate operating companies, not including special purpose or healthcare REITs. It is comprised of major companies engaged in the equity ownership and operation of commercial real estate. |
Unlike a mutual fund, the performance of an index assumes no taxes, transaction costs, management fees or other expenses.
136
| | |
| REAL ESTATE SECURITIES FUND | | |
| SCHEDULE OF INVESTMENTS | | December 31, 2010 |
| | | | | | | | |
| | | Shares | | | Value | |
COMMON STOCKS — 97.4% | | | | | |
Financial Services — 95.4% | | | | | | | | |
AMB Property Corporation REIT | | | 11,400 | | | $ | 361,494 | |
Apartment Investment & Management Co. Class A REITD | | | 91,900 | | | | 2,374,696 | |
AvalonBay Communities, Inc. REITD | | | 60,585 | | | | 6,818,842 | |
Boston Properties, Inc. REITD | | | 70,542 | | | | 6,073,666 | |
Brandywine Realty Trust REITD | | | 250,450 | | | | 2,917,742 | |
BRE Properties, Inc. REITD | | | 101,000 | | | | 4,393,500 | |
Brookfield Properties Corporation | | | 260,750 | | | | 4,570,948 | |
Campus Crest Communities, Inc. | | | 62,950 | | | | 882,559 | |
Cogdell Spencer, Inc. REITD | | | 135,200 | | | | 784,160 | |
Colonial Properties Trust REITD | | | 123,950 | | | | 2,237,298 | |
CommonWealth REITD | | | 85,750 | | | | 2,187,482 | |
DCT Industrial Trust, Inc. REITD | | | 276,300 | | | | 1,467,153 | |
Developers Diversified Realty Corporation REITD | | | 301,250 | | | | 4,244,612 | |
Digital Realty Trust, Inc. REITD | | | 89,150 | | | | 4,594,791 | |
Douglas Emmett, Inc. REITD | | | 122,750 | | | | 2,037,650 | |
Equity Lifestyle Properties, Inc. REITD | | | 17,200 | | | | 961,996 | |
Equity Residential REIT | | | 105,750 | | | | 5,493,713 | |
Extra Space Storage, Inc. REITD | | | 156,100 | | | | 2,716,140 | |
General Growth Properties, Inc. REITD | | | 98,250 | | | | 1,520,910 | |
Glimcher Realty Trust REITD | | | 133,750 | | | | 1,123,500 | |
HCP, Inc. REITD | | | 134,350 | | | | 4,942,736 | |
Host Hotels & Resorts, Inc. REITD | | | 421,640 | | | | 7,534,707 | |
Hudson Pacific Properties, Inc. REITD | | | 21,800 | | | | 328,090 | |
Kimco Realty Corporation REITD | | | 142,900 | | | | 2,577,916 | |
LTC Properties, Inc. REITD | | | 49,450 | | | | 1,388,556 | |
Nationwide Health Properties, Inc. REITD | | | 23,160 | | | | 842,561 | |
Pebblebrook Hotel Trust REITD | | | 99,700 | | | | 2,025,904 | |
Post Properties, Inc. REITD | | | 84,350 | | | | 3,061,905 | |
ProLogis REITD | | | 454,300 | | | | 6,560,092 | |
PS Business Parks, Inc. REITD | | | 14,100 | | | | 785,652 | |
Public Storage REITD | | | 67,080 | | | | 6,803,254 | |
Ramco-Gershenson Properties Trust REITD | | | 89,800 | | | | 1,118,010 | |
Regency Centers Corporation REITD | | | 106,300 | | | | 4,490,112 | |
Sabra Healthcare, Inc. REIT | | | 30,750 | | | | 565,800 | |
Senior Housing Properties Trust REITD | | | 180,535 | | | | 3,960,938 | |
Simon Property Group, Inc. REITD | | | 150,550 | | | | 14,978,220 | |
SL Green Realty Corporation REITD | | | 97,950 | | | | 6,612,604 | |
Strategic Hotels & Resorts, Inc. REITD* | | | 268,650 | | | | 1,421,158 | |
Tanger Factory Outlet Centers REITD | | | 26,950 | | | | 1,379,571 | |
Taubman Centers, Inc. REITD | | | 63,450 | | | | 3,202,956 | |
Vornado Realty Trust REITD | | | 35,456 | | | | 2,954,548 | |
| | | | | | | | |
| | | | | | | 135,298,142 | |
| | | | | | | | |
| | |
Healthcare — 2.0% | | | | | | | | |
Brookdale Senior Living, Inc.* | | | 133,150 | | | | 2,850,742 | |
| | | | | | | | |
Total Common Stocks
(Cost $112,725,335) | | | | | | | 138,148,884 | |
| | | | | | | | |
MONEY MARKET FUNDS — 26.4% | |
GuideStone Money Market Fund (GS4 Class)¥ | | | 2,975,979 | | | | 2,975,979 | |
Northern Institutional Liquid Assets Portfolio§ | | | 34,429,336 | | | | 34,429,336 | |
| | | | | | | | |
Total Money Market Funds
(Cost $37,405,315) | | | | | | | 37,405,315 | |
| | | | | | | | |
| | |
| | | Par | | | | |
U.S. TREASURY OBLIGATION — 0.5% | |
U.S. Treasury Bill | | | | | | | | |
0.17%, 05/05/11‡‡
(Cost $774,546) | | $ | 775,000 | | | | 774,640 | |
| | | | | | | | |
TOTAL INVESTMENTS — 124.3%
(Cost $150,905,196) | | | | 176,328,839 | |
Liabilities in Excess of Other Assets — (24.3)% | | | | (34,428,641 | ) |
| | | | | | | | |
NET ASSETS — 100.0% | | | $ | 141,900,198 | |
| | | | | | | | |
| | |
Please see abbreviation and footnote definitions beginning on page 180. |
|
PORTFOLIO SUMMARY (based on net assets) |
| | | % |
Financial Services | | 95.4 |
Money Market Funds | | 26.4 |
Futures Contracts | | 2.8 |
Healthcare | | 2.0 |
U.S. Treasury Obligation | | 0.5 |
| | |
| | 127.1 |
| | |
| | | | |
| | See Notes to Financial Statements. | | 137 |
| | |
| REAL ESTATE SECURITIES FUND | | |
| SCHEDULE OF INVESTMENTS (Continued) | | |
VALUATION HIERARCHY
The following is a summary of the inputs used, as of December 31, 2010, in valuing the Fund’s assets carried at fair value:
| | | | | | | | |
Valuation Inputs | | Investments
in
Securities | | | Other
Financial
Instruments*** | |
Level 1 — Quoted Prices | | | | | | | | |
Common Stocks | | $ | 138,148,884 | | | $ | — | |
Futures Contracts | | | — | | | | 33,902 | |
Money Market Funds | | | 37,405,315 | | | | — | |
U.S. Treasury Obligations | | | | | | | | |
Level 2 — Other Significant | | | | | | | | |
Observable Inputs | | | | | | | | |
U.S. Treasury Obligation | | | 774,640 | | | | — | |
Level 3 — Significant | | | | | | | | |
Unobservable Inputs | | | — | | | | — | |
| | | | | | | | |
Total | | $ | 176,328,839 | | | $ | 33,902 | |
| | | | | | | | |
| *** | Other financial instruments are derivative instruments not reflected in the Schedule of Investments, such as futures, forwards and swap contracts, which are valued at the unrealized appreciation (depreciation) on the investment. Details of these investments can be found in the Notes to Financial Statements. |
| | | | |
| 138 | | See Notes to Financial Statements. | | |
Value Equity Fund
Equity markets continued to appreciate during the year as investors responded favorably to additional fiscal stimulus and generally improving economic conditions. The S&P 500® Index posted a return of 15.06% for the full year of 2010. As of year-end, the S&P 500® Index had soared over 90% off the March 2009 lows. The broader U.S. market, as measured by the Russell 3000® Index, posted an impressive return of 16.93% for the one-year period.
From a sector perspective, performance was unanimously in positive territory as all sectors within the Russell 3000® Index advanced during the year. In general, economically-sensitive sectors benefitted from an increasingly optimistic outlook, while the more defensive sectors tended to lag. Eight of the nine sectors within the Russell 3000® Index posted double-digit gains with the best performance coming from the consumer discretionary and producer durables sectors. The weakest performer was the healthcare sector which still posted a solid single-digit gain for the year.
Higher beta, lower quality stocks generally outperformed lower beta, higher quality stocks during the year. In terms of equity market capitalization and style, everything (small, mid, large; growth, core, value) advanced over the course of the year. Small-cap companies significantly outperformed their large-cap counterparts as the Russell 2000® Index posted a one-year return of 26.85%, while the Russell 1000® Index advanced 16.10%. Style differentiation was evident as growth oriented stocks outperformed value oriented stocks across all market capitalization segments. In the large capitalization segment, the Russell 1000® Growth Index and Russell 1000® Value Index posted one-year returns of 16.71% and 15.51%, respectively.
The Value Equity Fund invests in a diversified portfolio of large and medium-size U.S. companies whose stocks are considered to be attractive from a valuation perspective. The Fund posted a double-digit performance return but still underperformed its benchmark, the Russell 1000® Value Index, for the one-year period ended December 31, 2010 (13.96% versus 15.51%). All economic sectors within the Russell 1000® Value Index ended the year in positive territory. Overweight exposure and security selection to the technology sector detracted from benchmark-relative returns, while security selection to the healthcare sector contributed to benchmark-relative performance over the course of the year.
This fund is subject to value investing risk. This involves the risk that an investment in companies whose securities are believed to be undervalued, relative to their underlying profitability, will not appreciate in value as anticipated.
Please see page 145 for information regarding specific portfolio allocations. Portfolio holdings are subject to change at any time.
| | | | | | | | | | | | |
Average Annual Total Returns as of 12/31/10 | |
| | | GS2 Class* | | | GS4 Class* | | | Benchmark** | |
One Year | | | 14.01 | % | | | 13.96 | % | | | 15.51 | % |
Five Year | | | 0.51 | % | | | 0.37 | % | | | 1.28 | % |
Since Inception | | | 3.41 | % | | | 3.15 | % | | | 3.77 | % |
Inception Date | | | 08/27/01 | | | | 08/27/01 | | | | | |
Total Fund Operating Expenses (April 30, 2010 Prospectus, as supplemented on August 5, 2010)(1) | | | 0.70 | % | | | 0.89 | % | | | | |
| (1) | Current information regarding the Fund’s Operating Expenses can be found in the Financial Highlights. |
The performance data quoted represents past performance and does not guarantee future results. Current performance may be lower or higher. Performance data current to the most recent month-end may be obtained at www.GuideStoneFunds.org. The investment return and principal value of an investment will fluctuate so that shares, when redeemed, may be worth more or less than their original cost.
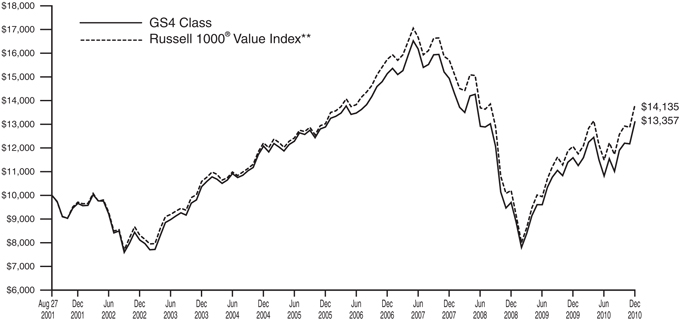
The graph compares the results of a hypothetical $10,000 investment in the GS4 Class of the Fund since August 27, 2001 (commencement of operations), with all dividends and capital gains reinvested, with the Russell 1000® Value Index.
| * | These returns reflect expense waivers by the Fund’s investment adviser. Without these waivers, returns would have been lower. Returns shown do not reflect the deduction of taxes that a shareholder would pay on Fund distributions or the redemption of Fund shares. |
| ** | The Russell 1000® Value Index is a large-cap index consisting of those Russell 1000® Index securities with a less-than-average growth orientation. Companies in this index tend to exhibit lower price-to-book and price-to-earnings ratios, higher dividend yields and lower forecasted growth values than the growth universe. |
Unlike a mutual fund, the performance of an index assumes no taxes, transaction costs, management fees or other expenses.
| | |
| VALUE EQUITY FUND | | |
| SCHEDULE OF INVESTMENTS | | December 31, 2010 |
| | | | | | | | |
| | | Shares | | | Value | |
COMMON STOCKS — 94.4% | | | | | |
Consumer Discretionary — 10.6% | |
Apollo Group, Inc. Class AD* | | | 62,500 | | | $ | 2,468,125 | |
AutoZone, Inc.* | | | 9,300 | | | | 2,535,087 | |
Carnival Corporation | | | 244,996 | | | | 11,296,766 | |
CBS Corporation Class B | | | 293,000 | | | | 5,581,650 | |
Coach, Inc. | | | 62,100 | | | | 3,434,751 | |
Comcast Corporation Class A | | | 601,415 | | | | 13,213,088 | |
Dana Holding Corporation* | | | 57,100 | | | | 982,691 | |
DIRECTV Group, Inc. Class A* | | | 91,600 | | | | 3,657,588 | |
eBay, Inc.* | | | 32,216 | | | | 896,571 | |
Family Dollar Stores, Inc. | | | 29,700 | | | | 1,476,387 | |
Ford Motor Co.D* | | | 104,000 | | | | 1,746,160 | |
Fossil, Inc.* | | | 34,900 | | | | 2,459,752 | |
Gannett Co., Inc.D | | | 152,600 | | | | 2,302,734 | |
Gap, Inc. (The) | | | 230,750 | | | | 5,108,805 | |
Home Depot, Inc. | | | 464,700 | | | | 16,292,382 | |
IAC/InterActiveCorpD* | | | 98,600 | | | | 2,829,820 | |
ITT Educational Services, Inc.D* | | | 32,300 | | | | 2,057,187 | |
Johnson Controls, Inc. | | | 1,730 | | | | 66,086 | |
Kohl’s Corporation* | | | 3,684 | | | | 200,188 | |
Lennar Corporation Class AD | | | 292,751 | | | | 5,489,081 | |
Lowe’s Cos., Inc. | | | 15,387 | | | | 385,906 | |
McDonald’s Corporation | | | 105,500 | | | | 8,098,180 | |
McGraw-Hill Co., Inc. (The) | | | 38,300 | | | | 1,394,503 | |
News Corporation | | | 81,844 | | | | 1,191,649 | |
Omnicom Group, Inc. | | | 2,725 | | | | 124,805 | |
Stanley Black & Decker, Inc. | | | 152,100 | | | | 10,170,927 | |
Thomson Reuters CorporationD | | | 11,520 | | | | 429,350 | |
Time Warner Cable, Inc. | | | 16,055 | | | | 1,060,112 | |
Time Warner, Inc. | | | 380,384 | | | | 12,236,953 | |
Wal-Mart Stores, Inc.D | | | 76,781 | | | | 4,140,799 | |
Walt Disney Co. (The) | | | 88,607 | | | | 3,323,649 | |
| | | | | | | | |
| | | | | | | 126,651,732 | |
| | | | | | | | |
Consumer Staples — 5.6% | | | | | | | | |
Archer-Daniels-Midland Co. | | | 70,095 | | | | 2,108,458 | |
Coca-Cola Co. (The) | | | 24,158 | | | | 1,588,872 | |
Colgate-Palmolive Co. | | | 3,542 | | | | 284,671 | |
CVS Caremark Corporation | | | 240,304 | | | | 8,355,370 | |
General Mills, Inc. | | | 12,233 | | | | 435,373 | |
Herbalife, Ltd. | | | 39,000 | | | | 2,666,430 | |
Kellogg Co. | | | 1,292 | | | | 65,995 | |
Kimberly-Clark Corporation | | | 104,383 | | | | 6,580,304 | |
Kraft Foods, Inc. Class A | | | 323,848 | | | | 10,204,450 | |
Kroger Co. (The) | | | 212,824 | | | | 4,758,745 | |
PepsiCo, Inc. | | | 30,968 | | | | 2,023,139 | |
Procter & Gamble Co. (The) | | | 280,673 | | | | 18,055,694 | |
Safeway, Inc.D | | | 168,300 | | | | 3,785,067 | |
Sysco Corporation | | | 45,400 | | | | 1,334,760 | |
Tyson Foods, Inc. Class A | | | 154,900 | | | | 2,667,378 | |
Walgreen Co. | | | 43,265 | | | | 1,685,604 | |
| | | | | | | | |
| | | | | | | 66,600,310 | |
| | | | | | | | |
Energy — 12.2% | | | | | | | | |
Anadarko Petroleum CorporationD | | | 69,698 | | | | 5,308,200 | |
Apache Corporation | | | 17,277 | | | | 2,059,937 | |
Baker Hughes, Inc. | | | 144,183 | | | | 8,242,942 | |
BP PLC ADR | | | 103,600 | | | | 4,576,012 | |
Chesapeake Energy Corporation | | | 29,306 | | | | 759,318 | |
Chevron Corporation | | | 343,575 | | | | 31,351,219 | |
ConocoPhillipsD | | | 331,178 | | | | 22,553,223 | |
Devon Energy Corporation | | | 118,449 | | | | 9,299,431 | |
Exxon Mobil Corporation | | | 43,380 | | | | 3,171,946 | |
Hess Corporation | | | 74,333 | | | | 5,689,448 | |
Marathon Oil Corporation | | | 358,825 | | | | 13,287,290 | |
Murphy Oil Corporation | | | 52,300 | | | | 3,898,965 | |
National Oilwell Varco, Inc. | | | 18,955 | | | | 1,274,724 | |
Occidental Petroleum CorporationD | | | 157,178 | | | | 15,419,162 | |
Patterson-UTI Energy, Inc. | | | 69,300 | | | | 1,493,415 | |
Schlumberger, Ltd. | | | 7,899 | | | | 659,566 | |
Spectra Energy Corporation | | | 262,350 | | | | 6,556,127 | |
Sunoco, Inc. | | | 38,200 | | | | 1,539,842 | |
Valero Energy Corporation | | | 308,400 | | | | 7,130,208 | |
Williams Cos., Inc. (The) | | | 15,514 | | | | 383,506 | |
| | | | | | | | |
| | | | | | | 144,654,481 | |
| | | | | | | | |
Financial Services — 22.4% | |
Aflac, Inc. | | | 1,162 | | | | 65,572 | |
Allied World Assurance Co. Holdings, Ltd. | | | 23,200 | | | | 1,379,008 | |
Allstate Corporation (The) | | | 291,561 | | | | 9,294,965 | |
American Express Co. | | | 290,600 | | | | 12,472,552 | |
American Financial Group, Inc. | | | 106,700 | | | | 3,445,343 | |
Ameriprise Financial, Inc. | | | 172,100 | | | | 9,904,355 | |
Arch Capital Group, Ltd.* | | | 34,900 | | | | 3,072,945 | |
Assurant, Inc. | | | 65,100 | | | | 2,507,652 | �� |
AXIS Capital Holdings, Ltd. | | | 93,400 | | | | 3,351,192 | |
Bank of America Corporation | | | 1,407,976 | | | | 18,782,400 | |
Bank of New York Mellon Corporation (The) | | | 54,814 | | | | 1,655,383 | |
BB&T Corporation | | | 31,069 | | | | 816,804 | |
Berkshire Hathaway, Inc.* | | | 78,250 | | | | 6,268,607 | |
BlackRock, Inc. | | | 2,835 | | | | 540,294 | |
BOK Financial CorporationD | | | 26,700 | | | | 1,425,780 | |
Capital One Financial Corporation | | | 382,923 | | | | 16,297,203 | |
Chubb Corporation | | | 85,666 | | | | 5,109,120 | |
Citigroup, Inc.* | | | 3,306,282 | | | | 15,638,714 | |
CME Group, Inc. | | | 2,972 | | | | 956,241 | |
Endurance Specialty Holdings, Ltd.D | | | 12,400 | | | | 571,268 | |
Everest Re Group, Ltd. | | | 16,800 | | | | 1,424,976 | |
Fifth Third Bancorp | | | 278,700 | | | | 4,091,316 | |
Franklin Resources, Inc. | | | 31,800 | | | | 3,536,478 | |
Goldman Sachs Group, Inc. (The) | | | 23,303 | | | | 3,918,632 | |
Hudson City Bancorp, Inc. | | | 116,700 | | | | 1,486,758 | |
Jones Lang LaSalle, Inc. | | | 38,700 | | | | 3,247,704 | |
JPMorgan Chase & Co. | | | 945,541 | | | | 40,109,849 | |
Loews Corporation | | | 14,151 | | | | 550,615 | |
MBIA, Inc.D* | | | 259,500 | | | | 3,111,405 | |
MetLife, Inc. | | | 20,225 | | | | 898,799 | |
Morgan StanleyD | | | 252,553 | | | | 6,871,967 | |
NASDAQ OMX Group, Inc. (The)* | | | 63,400 | | | | 1,503,214 | |
Northern Trust CorporationD | | | 6,577 | | | | 364,432 | |
PNC Financial Services Group, Inc. | | | 23,770 | | | | 1,443,314 | |
Prudential Financial, Inc. | | | 21,036 | | | | 1,235,024 | |
Public Storage REITD | | | 630 | | | | 63,895 | |
RenaissanceRe Holdings, Ltd. | | | 51,600 | | | | 3,286,404 | |
SEI Investments Co. | | | 53,400 | | | | 1,270,386 | |
Simon Property Group, Inc. REIT | | | 4,089 | | | | 406,815 | |
SLM Corporation* | | | 477,800 | | | | 6,015,502 | |
| | | | |
| | See Notes to Financial Statements. | | 141 |
| | |
| VALUE EQUITY FUND | | |
| SCHEDULE OF INVESTMENTS (Continued) | | |
| | | | | | | | |
| | | Shares | | | Value | |
State Street Corporation | | | 274,513 | | | $ | 12,720,932 | |
T. Rowe Price Group, Inc.D | | | 57,700 | | | | 3,723,958 | |
Taubman Centers, Inc. REITD | | | 28,300 | | | | 1,428,584 | |
Torchmark CorporationD | | | 27,000 | | | | 1,612,980 | |
Travelers Cos., Inc. (The) | | | 259,516 | | | | 14,457,636 | |
US Bancorp | | | 86,607 | | | | 2,335,791 | |
Validus Holdings, Ltd. | | | 8,900 | | | | 272,429 | |
Wells Fargo & Co. | | | 902,427 | | | | 27,966,213 | |
XL Group PLC | | | 145,600 | | | | 3,176,992 | |
| | | | | | | | |
| | | | | | | 266,088,398 | |
| | | | | | | | |
Healthcare — 13.0% | |
Abbott Laboratories | | | 6,817 | | | | 326,603 | |
Aetna, Inc. | | | 135,473 | | | | 4,133,281 | |
AmerisourceBergen Corporation | | | 90,500 | | | | 3,087,860 | |
Amgen, Inc.* | | | 119,625 | | | | 6,567,412 | |
Baxter International, Inc. | | | 4,594 | | | | 232,548 | |
Biogen Idec, Inc.* | | | 78,215 | | | | 5,244,316 | |
Bristol-Myers Squibb Co. | | | 566,303 | | | | 14,995,703 | |
Cardinal Health, Inc. | | | 209,988 | | | | 8,044,640 | |
Eli Lilly & Co. | | | 35,446 | | | | 1,242,028 | |
Forest Laboratories, Inc.* | | | 52,500 | | | | 1,678,950 | |
Genzyme Corporation* | | | 2,920 | | | | 207,904 | |
Gilead Sciences, Inc.* | | | 40,800 | | | | 1,478,592 | |
Health Net, Inc.* | | | 105,800 | | | | 2,887,282 | |
Hologic, Inc.* | | | 256,550 | | | | 4,828,271 | |
Humana, Inc.* | | | 31,200 | | | | 1,707,888 | |
Johnson & Johnson | | | 348,747 | | | | 21,570,002 | |
McKesson Corporation | | | 6,551 | | | | 461,059 | |
Medtronic, Inc. | | | 102,855 | | | | 3,814,892 | |
Merck & Co., Inc. | | | 141,088 | | | | 5,084,812 | |
Pfizer, Inc. | | | 1,542,634 | | | | 27,011,521 | |
Tenet Healthcare CorporationD* | | | 613,300 | | | | 4,102,977 | |
Thermo Fisher Scientific, Inc.* | | | 18,570 | | | | 1,028,035 | |
UnitedHealth Group, Inc. | | | 402,364 | | | | 14,529,364 | |
Watson Pharmaceuticals, Inc.* | | | 117,600 | | | | 6,074,040 | |
WellPoint, Inc.* | | | 245,228 | | | | 13,943,664 | |
Zimmer Holdings, Inc.* | | | 9,110 | | | | 489,025 | |
| | | | | | | | |
| | | | | | | 154,772,669 | |
| | | | | | | | |
Materials & Processing — 3.3% | |
Alcoa, Inc. | | | 431,389 | | | | 6,639,077 | |
Cabot Corporation | | | 51,800 | | | | 1,950,270 | |
Domtar CorporationD | | | 16,400 | | | | 1,245,088 | |
Dow Chemical Co. (The) | | | 52,289 | | | | 1,785,146 | |
Du Pont (E.I.) de Nemours & Co. | | | 240,236 | | | | 11,982,972 | |
Eastman Chemical Co. | | | 42,600 | | | | 3,581,808 | |
Lubrizol Corporation | | | 13,900 | | | | 1,485,632 | |
MeadWestvaco Corporation | | | 177,100 | | | | 4,632,936 | |
Nucor CorporationD | | | 8,239 | | | | 361,033 | |
United States Steel CorporationD | | | 87,300 | | | | 5,100,066 | |
| | | | | | | | |
| | | | | | | 38,764,028 | |
| | | | | | | | |
Producer Durables — 10.2% | |
3M Co. | | | 36,200 | | | | 3,124,060 | |
Boeing Co. (The) | | | 6,582 | | | | 429,541 | |
CSX Corporation | | | 42,709 | | | | 2,759,428 | |
Danaher Corporation | | | 1,807 | | | | 85,236 | |
Deere & Co. | | | 1,075 | | | | 89,279 | |
Emerson Electric Co. | | | 151,700 | | | | 8,672,689 | |
FedEx Corporation | | | 5,062 | | | | 470,817 | |
Gardner Denver, Inc. | | | 28,700 | | | | 1,975,134 | |
General Dynamics Corporation | | | 41,726 | | | | 2,960,877 | |
General Electric Co. | | | 1,290,176 | | | | 23,597,319 | |
Honeywell International, Inc.D | | | 348,600 | | | | 18,531,576 | |
Illinois Tool Works, Inc. | | | 199,900 | | | | 10,674,660 | |
KBR, Inc. | | | 98,000 | | | | 2,986,060 | |
L-3 Communications Holdings, Inc. | | | 18,000 | | | | 1,268,820 | |
Lockheed Martin CorporationD | | | 35,558 | | | | 2,485,860 | |
Norfolk Southern Corporation | | | 16,742 | | | | 1,051,733 | |
Northrop Grumman CorporationD | | | 85,919 | | | | 5,565,833 | |
Oshkosh CorporationD* | | | 79,800 | | | | 2,812,152 | |
Raytheon Co. | | | 196,433 | | | | 9,102,705 | |
Ryder System, Inc. | | | 60,700 | | | | 3,195,248 | |
Terex CorporationD | | | 176,000 | | | | 5,463,040 | |
Textron, Inc.D | | | 269,600 | | | | 6,373,344 | |
Union Pacific Corporation | | | 37,915 | | | | 3,513,204 | |
United Technologies Corporation | | | 3,574 | | | | 281,345 | |
Waste Management, Inc.D | | | 104,101 | | | | 3,838,204 | |
| | | | | | | | |
| | | | | | | 121,308,164 | |
| | | | | | | | |
Technology — 7.8% | |
Activision Blizzard, Inc. | | | 17,307 | | | | 215,299 | |
Applied Materials, Inc. | | | 498,400 | | | | 7,002,520 | |
CA, Inc. | | | 125,700 | | | | 3,072,108 | |
Corning, Inc. | | | 61,848 | | | | 1,194,903 | |
Dell, Inc.* | | | 319,100 | | | | 4,323,805 | |
Hewlett-Packard Co. | | | 123,000 | | | | 5,178,300 | |
Ingram Micro, Inc. Class A* | | | 81,400 | | | | 1,553,926 | |
Intel Corporation | | | 629,615 | | | | 13,240,803 | |
International Business Machines Corporation | | | 123,200 | | | | 18,080,832 | |
Microsoft Corporation | | | 584,973 | | | | 16,332,446 | |
Motorola, Inc.* | | | 826,122 | | | | 7,492,927 | |
Nokia Corporation ADRD | | | 322,500 | | | | 3,328,200 | |
Symantec Corporation* | | | 209,723 | | | | 3,510,763 | |
Texas Instruments, Inc.D | | | 116,826 | | | | 3,796,845 | |
Yahoo!, Inc.* | | | 296,210 | | | | 4,925,972 | |
| | | | | | | | |
| | | | | | | 93,249,649 | |
| | | | | | | | |
Utilities — 9.3% | | | | | | | | |
Alliant Energy Corporation | | | 50,700 | | | | 1,864,239 | |
American Electric Power Co., Inc. | | | 186,821 | | | | 6,721,820 | |
AT&T, Inc. | | | 1,200,818 | | | | 35,280,033 | |
Constellation Energy Group, Inc. | | | 42,700 | | | | 1,307,901 | |
Dominion Resources, Inc.D | | | 124,167 | | | | 5,304,414 | |
Duke Energy Corporation | | | 59,458 | | | | 1,058,947 | |
Edison InternationalD | | | 111,500 | | | | 4,303,900 | |
Energen Corporation | | | 29,300 | | | | 1,414,018 | |
Entergy Corporation | | | 118,822 | | | | 8,416,162 | |
Exelon Corporation | | | 114,863 | | | | 4,782,895 | |
MetroPCS Communications, Inc.D* | | | 248,900 | | | | 3,143,607 | |
NextEra Energy, Inc. | | | 18,762 | | | | 975,436 | |
NRG Energy, Inc.* | | | 58,800 | | | | 1,148,952 | |
NV Energy, Inc. | | | 208,000 | | | | 2,922,400 | |
PG&E Corporation | | | 17,718 | | | | 847,629 | |
Progress Energy, Inc. Contingent Value Obligation+* | | | 3,100 | | | | 1,209 | |
Public Service Enterprise Group, Inc. | | | 135,295 | | | | 4,303,734 | |
Southern Co. | | | 37,285 | | | | 1,425,406 | |
Sprint Nextel Corporation* | | | 919,826 | | | | 3,890,864 | |
| | | | |
| 142 | | See Notes to Financial Statements. | | |
| | | | | | | | |
| | | Shares | | | Value | |
Verizon Communications, Inc. | | | 591,631 | | | $ | 21,168,557 | |
| | | | | | | | |
| | | | | | | 110,282,123 | |
| | | | | | | | |
Total Common Stocks
(Cost $1,098,939,220) | | | | | | | 1,122,371,554 | |
| | | | | | | | |
FOREIGN COMMON STOCKS — 2.7% | |
Canada — 0.3% | | | | | | | | |
Research In Motion, Ltd.* | | | 58,600 | | | | 3,406,418 | |
| | | | | | | | |
Peru — 0.1% | | | | | | | | |
Credicorp, Ltd. | | | 11,400 | | | | 1,355,574 | |
| | | | | | | | |
Singapore — 0.4% | | | | | | | | |
Flextronics International, Ltd.* | | | 639,238 | | | | 5,018,018 | |
| | | | | | | | |
Switzerland — 1.4% | | | | | | | | |
Ace, Ltd. | | | 12,968 | | | | 807,258 | |
Tyco Electronics, Ltd. | | | 233,775 | | | | 8,275,635 | |
Tyco International, Ltd.* | | | 172,114 | | | | 7,132,404 | |
| | | | | | | | |
| | | | | | | 16,215,297 | |
| | | | | | | | |
United Kingdom — 0.5% | | | | | |
Ensco International PLCD | | | 124,800 | | | | 6,661,824 | |
| | | | | | | | |
Total Foreign Common Stocks
(Cost $29,244,265) | | | | 32,657,131 | |
| | | | | | | | |
MONEY MARKET FUNDS — 9.7% | |
GuideStone Money Market Fund (GS4 Class)¥ | | | 29,448,901 | | | | 29,448,901 | |
Northern Institutional Liquid Assets Portfolio§ | | | 85,564,732 | | | | 85,564,732 | |
| | | | | | | | |
Total Money Market Funds
(Cost $115,013,633) | | | | 115,013,633 | |
| | | | | | | | |
| | |
| | | Par | | | | |
U.S. TREASURY OBLIGATIONS — 0.3% | |
U.S. Treasury Bills | | | | | | | | |
0.17%, 05/05/11‡‡ | | $ | 2,590,000 | | | | 2,588,798 | |
0.18%, 05/05/11‡‡ | | | 875,000 | | | | 874,594 | |
0.19%, 05/05/11‡‡ | | | 20,000 | | | | 19,991 | |
| | | | | | | | |
Total U.S. Treasury Obligations
(Cost $3,482,921) | | | | 3,483,383 | |
| | | | | | | | |
TOTAL INVESTMENTS — 107.1% | |
(Cost $1,246,680,039) | | | | | | | 1,273,525,701 | |
Liabilities in Excess of Other Assets — (7.1)% | | | | (84,235,762 | ) |
| | | | | | | | |
Net Assets — 100.0% | | | | | | $ | 1,189,289,939 | |
| | | | | | | | |
Please see abbreviation and footnote definitions beginning on page 180.
PORTFOLIO SUMMARY (based on net assets)
| | | | |
| | | % | |
Financial Services | | | 22.4 | |
Healthcare | | | 13.0 | |
Energy | | | 12.2 | |
Consumer Discretionary | | | 10.6 | |
Producer Durables | | | 10.2 | |
Money Market Funds | | | 9.7 | |
Utilities | | | 9.3 | |
Technology | | | 7.8 | |
Consumer Staples | | | 5.6 | |
Materials & Processing | | | 3.3 | |
Futures Contracts | | | 2.8 | |
Foreign Common Stocks | | | 2.7 | |
U.S. Treasury Obligations | | | 0.3 | |
| | | | |
| | | 109.9 | |
| | | | |
VALUATION HIERARCHY
The following is a summary of the inputs used, as of December 31, 2010, in valuing the Fund’s assets carried at fair value:
| | | | | | | | |
Valuation Inputs | | Investments
in
Securities | | | Other
Financial
Instruments*** | |
Level 1 — Quoted Prices | | | | | | | | |
Common Stocks | | $ | 1,122,370,345 | | | $ | — | |
Foreign Common Stocks | | | 32,657,131 | | | | — | |
Futures Contracts | | | | | | | 688,859 | |
Money Market Funds | | | 115,013,633 | | | | — | |
Level 2 — Other Significant Observable Inputs | | | | | | | | |
U.S. Treasury Obligations | | | 3,483,383 | | | | — | |
Level 3 — Significant Unobservable Inputs | | | | | | | | |
Common Stocks | | | 1,209 | | | | — | |
| | | | | | | | |
Total | | $ | 1,273,525,701 | | | $ | 688,859 | |
| | | | | | | | |
| *** | Other financial instruments are derivative instruments not reflected in the Schedule of Investments, such as futures, forwards and swap contracts, which are valued at the unrealized appreciation (depreciation) on the investment. Details of these investments can be found in the Notes to Financial Statements. |
| | | | |
| | See Notes to Financial Statements. | | 143 |
| | |
| VALUE EQUITY FUND | | |
| SCHEDULE OF INVESTMENTS (Continued) | | |
The following is a reconciliation of assets in which significant unobservable inputs (Level 3) were used in determining fair value:
| | | | | | | | |
Valuation Inputs | | Investments
in
Securities | | | Other
Financial
Instruments*** | |
Balance, 12/31/09 | | | | | | | | |
Common Stocks | | $ | 1,209 | | | $ | — | |
Accrued discounts/premiums | | | | | | | | |
Common Stocks | | | — | | | | — | |
Realized gain (loss)(1) | | | | | | | | |
Common Stocks | | | — | | | | — | |
Changed in unrealizedappreciation (depreciation)(2) | | | | | | | | |
Common Stocks | | | — | | | | — | |
Net purchases (sales) | | | | | | | | |
Common Stocks | | | — | | | | — | |
Transfers in and/orout of Level 3 | | | | | | | | |
Common Stocks | | | — | | | | — | |
| | | | | | | | |
Balance, 12/31/10 | | $ | 1,209 | | | $ | — | |
| | | | | | | | |
| *** | Other financial instruments are derivative instruments not reflected in the Schedule of Investments, such as futures, forwards and swap contracts, which are valued at the unrealized appreciation (depreciation) on the investment. Details of these investments can be found in the Notes to Financial Statements. |
| (1) | Realized gain (loss) from the sale of Level 3 securities can be found on the Statement of Operations in Net Realized Gain (loss) from Investment securities and securities sold short. |
| (2) | Change in unrealized appreciation (depreciation) can be found on the Statement of Operations in Net change in unrealized appreciation (depreciation) on Investment securities and securities sold short. |
| | | | |
| 144 | | See Notes to Financial Statements. | | |
Growth Equity Fund
Equity markets continued to appreciate during the year as investors responded favorably to additional fiscal stimulus and generally improving economic conditions. The S&P 500® Index posted a return of 15.06% for the full year of 2010. As of year-end, the S&P 500® Index had soared over 90% off the March 2009 lows. The broader U.S. market, as measured by the Russell 3000® Index, posted an impressive return of 16.93% for the one-year period.
From a sector perspective, performance was unanimously in positive territory as all sectors within the Russell 3000® Index advanced during the year. In general, economically-sensitive sectors benefitted from an increasingly optimistic outlook, while the more defensive sectors tended to lag. Eight of the nine sectors within the Russell 3000® Index posted double-digit gains with the best performance coming from the consumer discretionary and producer durables sectors. The weakest performer was the healthcare sector which still posted a solid single-digit gain for the year.
Higher beta, lower quality stocks generally outperformed lower beta, higher quality stocks during the year. In terms of equity market capitalization and style, everything (small, mid, large; growth, core, value) advanced over the course of the year. Small-cap companies significantly outperformed their large-cap counterparts as the Russell 2000® Index posted a one-year return of 26.85%, while the Russell 1000® Index advanced 16.10%. Style differentiation was evident as growth oriented stocks outperformed value oriented stocks across all market capitalization segments. In the large capitalization segment, the Russell 1000® Growth Index and Russell 1000® Value Index posted one-year returns of 16.71% and 15.51%, respectively.
The Growth Equity Fund invests in a diversified portfolio of large and medium-size U.S. companies whose stocks are considered to have above average potential for growth in revenue and earnings. Across the market capitalization spectrum, Russell’s style indices indicated that growth stocks outperformed value stocks in 2010. The Fund outperformed its benchmark, the Russell 1000® Growth Index, for the one-year period ended December 31, 2010 (19.03% versus 16.71%). Strong security selection within the technology and healthcare sectors contributed to benchmark-relative returns, while security selection within the financial services sector detracted from benchmark-relative performance during the year.
Please see page 151 for information regarding specific portfolio allocations. Portfolio holdings are subject to change at any time.
145
| | | | | | | | | | | | |
Average Annual Total Returns as of 12/31/10 | |
| | | GS2 Class* | | | GS4 Class* | | | Benchmark** | |
One Year | | | 19.13 | % | | | 19.03 | % | | | 16.71 | % |
Five Year | | | 1.50 | % | | | 1.39 | % | | | 3.75 | % |
Since Inception | | | 2.01 | % | | | 1.89 | % | | | 2.30 | % |
Inception Date | | | 08/27/01 | | | | 08/27/01 | | | | | |
Total Fund Operating Expenses | | | | | | | | | | | | |
(April 30, 2010 Prospectus,as supplemented on August 5, 2010)(1) | | | 0.90 | % | | | 1.10 | % | | | | |
| (1) | Current information regarding the Fund’s Operating Expenses can be found in the Financial Highlights. |
The performance data quoted represents past performance and does not guarantee future results. Current performance may be lower or higher. Performance data current to the most recent month-end may be obtained at www.GuideStoneFunds.org. The investment return and principal value of an investment will fluctuate so that shares, when redeemed, may be worth more or less than their original cost.
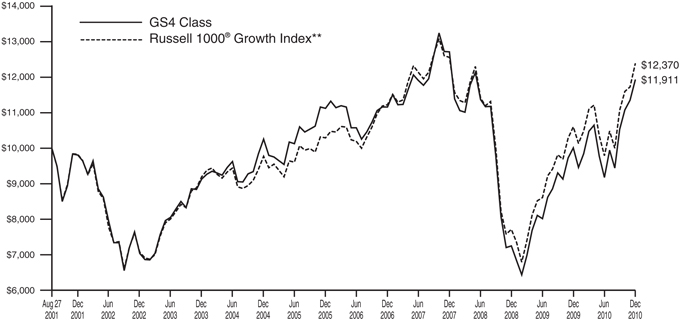
The graph compares the results of a hypothetical $10,000 investment in the GS4 Class of the Fund since August 27, 2001 (commencement of operations), with all dividends and capital gains reinvested, with the Russell 1000® Growth Index.
| * | These returns reflect expense waivers by the Fund’s investment adviser. Without these waivers, returns would have been lower. Returns shown do not reflect the deduction of taxes that a shareholder would pay on Fund distributions or the redemption of Fund shares. |
| ** | The Russell 1000® Growth Index is a large-cap index consisting of those Russell 1000® Index securities with greater-than-average growth orientation. Companies in this index tend to exhibit higher price-to-book and price-to-earnings-ratios, lower dividend yields and higher forecasted growth values than the value universe. |
Unlike a mutual fund, the performance of an index assumes no taxes, transaction costs, management fees or other expenses.
| | |
| GROWTH EQUITY FUND | | |
| SCHEDULE OF INVESTMENTS | | December 31, 2010 |
| | | | | | | | |
| | | Shares | | | Value | |
COMMON STOCKS — 92.3% | | | | | |
Consumer Discretionary — 19.6% | | | | | |
Amazon.com, Inc.D* | | | 290,096 | | | $ | 52,217,280 | |
Bed Bath & Beyond, Inc.* | | | 99,300 | | | | 4,880,595 | |
CBS Corporation Class B | | | 96,240 | | | | 1,833,372 | |
Costco Wholesale Corporation | | | 68,440 | | | | 4,942,052 | |
Darden Restaurants, Inc. | | | 38,040 | | | | 1,766,577 | |
Estee Lauder Cos., Inc. (The) Class A | | | 108,256 | | | | 8,736,259 | |
Ford Motor Co.D* | | | 938,265 | | | | 15,753,469 | |
General Motors Co.* | | | 59,300 | | | | 2,185,798 | |
Home Depot, Inc.D | | | 150,700 | | | | 5,283,542 | |
Kohl’s Corporation* | | | 82,240 | | | | 4,468,922 | |
Limited Brands, Inc. | | | 123,110 | | | | 3,783,170 | |
Marriott International, Inc. Class AD | | | 180,390 | | | | 7,493,401 | |
McDonald’s Corporation | | | 174,831 | | | | 13,420,028 | |
Netflix, Inc.D* | | | 32,600 | | | | 5,727,820 | |
NIKE, Inc. Class BD | | | 304,871 | | | | 26,042,081 | |
Nordstrom, Inc.D | | | 85,128 | | | | 3,607,725 | |
Priceline.com, Inc.* | | | 36,696 | | | | 14,661,887 | |
Scripps Networks Interactive, Inc. Class A | | | 53,230 | | | | 2,754,652 | |
Staples, Inc. | | | 360,000 | | | | 8,197,200 | |
Starbucks Corporation | | | 434,223 | | | | 13,951,585 | |
Starwood Hotels & Resorts Worldwide, Inc. | | | 124,100 | | | | 7,542,798 | |
Target Corporation | | | 98,220 | | | | 5,905,969 | |
Tiffany & Co.D | | | 146,659 | | | | 9,132,456 | |
TJX Cos., Inc. | | | 108,897 | | | | 4,833,938 | |
TRW Automotive Holdings Corporation* | | | 66,970 | | | | 3,529,319 | |
Wal-Mart Stores, Inc. | | | 32,190 | | | | 1,736,007 | |
Walt Disney Co. (The) | | | 165,690 | | | | 6,215,032 | |
Whirlpool CorporationD | | | 17,530 | | | | 1,557,190 | |
Yum! Brands, Inc. | | | 103,100 | | | | 5,057,055 | |
| | | | | | | | |
| | | | | | | 247,217,179 | |
| | | | | | | | |
Consumer Staples — 3.3% | | | | | |
Church & Dwight Co., Inc.D | | | 32,150 | | | | 2,218,993 | |
Coca-Cola Co. (The) | | | 247,260 | | | | 16,262,290 | |
Coca-Cola Enterprises, Inc. | | | 171,870 | | | | 4,301,906 | |
Hansen Natural Corporation* | | | 16,000 | | | | 836,480 | |
J.M. Smucker Co. (The) | | | 16,060 | | | | 1,054,339 | |
Mead Johnson Nutrition Co. | | | 37,255 | | | | 2,319,124 | |
PepsiCo, Inc. | | | 36,680 | | | | 2,396,304 | |
Procter & Gamble Co. (The)D | | | 95,300 | | | | 6,130,649 | |
Whole Foods Market, Inc.D* | | | 110,400 | | | | 5,585,136 | |
| | | | | | | | |
| | | | | | | 41,105,221 | |
| | | | | | | | |
Energy — 8.6% | | | | | | | | |
Anadarko Petroleum Corporation | | | 97,526 | | | | 7,427,580 | |
Chevron Corporation | | | 77,780 | | | | 7,097,425 | |
Concho Resources, Inc.* | | | 33,470 | | | | 2,934,315 | |
Continental Resources, Inc.D* | | | 34,740 | | | | 2,044,449 | |
Devon Energy Corporation | | | 33,390 | | | | 2,621,449 | |
EOG Resources, Inc. | | | 38,659 | | | | 3,533,819 | |
FMC Technologies, Inc.* | | | 155,900 | | | | 13,861,069 | |
Halliburton Co. | | | 271,488 | | | | 11,084,855 | |
National Oilwell Varco, Inc. | | | 239,200 | | | | 16,086,200 | |
Noble Energy, Inc. | | | 17,180 | | | | 1,478,855 | |
Occidental Petroleum Corporation | | | 64,960 | | | | 6,372,576 | |
Schlumberger, Ltd. | | | 260,860 | | | | 21,781,810 | |
Southwestern Energy Co.* | | | 147,400 | | | | 5,517,182 | |
Walter Energy, Inc. | | | 32,620 | | | | 4,170,141 | |
Whiting Petroleum Corporation* | | | 23,550 | | | | 2,759,824 | |
| | | | | | | | |
| | | | | | | 108,771,549 | |
| | | | | | | | |
Financial Services — 11.1% | | | | | |
American Express Co. | | | 286,840 | | | | 12,311,173 | |
Ameriprise Financial, Inc. | | | 77,540 | | | | 4,462,427 | |
Bank of America Corporation | | | 139,600 | | | | 1,862,264 | |
CB Richard Ellis Group, Inc. Class A* | | | 116,750 | | | | 2,391,040 | |
Citigroup, Inc.* | | | 1,148,832 | | | | 5,433,975 | |
Comerica, Inc. | | | 32,560 | | | | 1,375,334 | |
Discover Financial Services | | | 93,300 | | | | 1,728,849 | |
Fifth Third Bancorp | | | 266,100 | | | | 3,906,348 | |
Franklin Resources, Inc. | | | 36,190 | | | | 4,024,690 | |
Goldman Sachs Group, Inc. (The) | | | 75,348 | | | | 12,670,520 | |
Host Hotels & Resorts, Inc. REIT | | | 104,430 | | | | 1,866,164 | |
IntercontinentalExchange, Inc.* | | | 124,670 | | | | 14,854,430 | |
JPMorgan Chase & Co. | | | 115,670 | | | | 4,906,721 | |
Lincoln National CorporationD | | | 15,000 | | | | 417,150 | |
Mastercard, Inc. Class A | | | 20,400 | | | | 4,571,844 | |
MetLife, Inc. | | | 44,010 | | | | 1,955,804 | |
Schwab (Charles) Corporation (The) | | | 612,870 | | | | 10,486,206 | |
SEI Investments Co. | | | 41,000 | | | | 975,390 | |
T. Rowe Price Group, Inc.D | | | 71,970 | | | | 4,644,944 | |
US Bancorp | | | 339,471 | | | | 9,155,533 | |
Visa, Inc.D | | | 329,780 | | | | 23,209,916 | |
Wells Fargo & Co. | | | 392,236 | | | | 12,155,394 | |
| | | | | | | | |
| | | | | | | 139,366,116 | |
| | | | | | | | |
Healthcare — 8.4% | | | | | | | | |
Abbott Laboratories | | | 21,170 | | | | 1,014,255 | |
Alexion Pharmaceuticals, Inc.D* | | | 107,550 | | | | 8,663,152 | |
Allergan, Inc. | | | 275,240 | | | | 18,900,731 | |
AmerisourceBergen Corporation | | | 88,330 | | | | 3,013,820 | |
Amgen, Inc.* | | | 80,660 | | | | 4,428,234 | |
Bristol-Myers Squibb Co. | | | 103,000 | | | | 2,727,440 | |
Celgene Corporation* | | | 187,580 | | | | 11,093,481 | |
Express Scripts, Inc.* | | | 78,790 | | | | 4,258,600 | |
Illumina, Inc.D* | | | 248,318 | | | | 15,728,462 | |
Intuitive Surgical, Inc.* | | | 38,700 | | | | 9,974,925 | |
McKesson Corporation | | | 18,310 | | | | 1,288,658 | |
Merck & Co., Inc. | | | 44,120 | | | | 1,590,085 | |
Perrigo Co. | | | 18,580 | | | | 1,176,671 | |
ResMed, Inc.D* | | | 36,580 | | | | 1,267,131 | |
Thermo Fisher Scientific, Inc.* | | | 87,893 | | | | 4,865,756 | |
Varian Medical Systems, Inc.* | | | 168,270 | | | | 11,657,746 | |
Watson Pharmaceuticals, Inc.* | | | 73,000 | | | | 3,770,450 | |
| | | | | | | | |
| | | | | | | 105,419,597 | |
| | | | | | | | |
Materials & Processing — 6.8% | | | | | |
Albemarle Corporation | | | 50,460 | | | | 2,814,659 | |
Dow Chemical Co. (The) | | | 329,149 | | | | 11,237,147 | |
Du Pont (E.I.) de Nemours & Co. | | | 44,500 | | | | 2,219,660 | |
FMC Corporation | | | 23,810 | | | | 1,902,181 | |
Freeport-McMoRan Copper & Gold, Inc. | | | 70,096 | | | | 8,417,829 | |
Monsanto Co. | | | 201,215 | | | | 14,012,613 | |
Newmont Mining Corporation | | | 67,000 | | | | 4,115,810 | |
| | | | |
| | See Notes to Financial Statements. | | 147 |
| | |
| GROWTH EQUITY FUND | | |
| SCHEDULE OF INVESTMENTS (Continued) | | |
| | | | | | | | |
| | | Shares | | | Value | |
Packaging Corporation of America | | | 71,120 | | | $ | 1,837,741 | |
PPG Industries, Inc.D | | | 80,095 | | | | 6,733,586 | |
Praxair, Inc. | | | 222,964 | | | | 21,286,373 | |
Precision Castparts Corporation | | | 82,888 | | | | 11,538,838 | |
| | | | | | | | |
| | | | | | | 86,116,437 | |
| | | | | | | | |
Producer Durables — 10.6% | | | | | |
3M Co. | | | 18,500 | | | | 1,596,550 | |
Agilent Technologies, Inc.* | | | 169,600 | | | | 7,026,528 | |
AMETEK, Inc. | | | 61,740 | | | | 2,423,295 | |
C.H. Robinson Worldwide, Inc. | | | 80,400 | | | | 6,447,276 | |
Caterpillar, Inc. | | | 79,900 | | | | 7,483,434 | |
CSX Corporation | | | 58,110 | | | | 3,754,487 | |
Cummins, Inc. | | | 104,242 | | | | 11,467,662 | |
Danaher Corporation | | | 78,594 | | | | 3,707,279 | |
Deere & Co. | | | 196,033 | | | | 16,280,541 | |
Eaton Corporation | | | 44,081 | | | | 4,474,662 | |
Emerson Electric Co. | | | 103,560 | | | | 5,920,525 | |
Expeditors International of Washington, Inc. | | | 73,300 | | | | 4,002,180 | |
FedEx Corporation | | | 163,710 | | | | 15,226,667 | |
Flowserve Corporation | | | 38,280 | | | | 4,563,742 | |
General Dynamics Corporation | | | 97,334 | | | | 6,906,821 | |
Manpower, Inc. | | | 33,520 | | | | 2,103,715 | |
PACCAR, Inc.D | | | 107,700 | | | | 6,184,134 | |
Rockwell Automation, Inc. | | | 32,650 | | | | 2,341,331 | |
Trimble Navigation, Ltd.* | | | 22,190 | | | | 886,047 | |
Union Pacific Corporation | | | 127,882 | | | | 11,849,546 | |
United Continental Holdings, Inc.D* | | | 77,940 | | | | 1,856,531 | |
W.W. Grainger, Inc.D | | | 55,900 | | | | 7,720,349 | |
| | | | | | | | |
| | | | | | | 134,223,302 | |
| | | | | | | | |
Technology — 23.7% | | | | | |
American Tower Corporation Class A* | | | 193,801 | | | | 10,007,884 | |
Amphenol Corporation Class A | | | 20,050 | | | | 1,058,239 | |
Apple, Inc.* | | | 202,924 | | | | 65,455,165 | |
Autodesk, Inc.* | | | 138,140 | | | | 5,276,948 | |
Broadcom Corporation Class AD | | | 432,530 | | | | 18,836,682 | |
Cisco Systems, Inc.* | | | 276,110 | | | | 5,585,705 | |
Citrix Systems, Inc.* | | | 33,710 | | | | 2,306,101 | |
Cognizant Technology Solutions Corporation Class A* | | | 110,661 | | | | 8,110,345 | |
Cree, Inc.D* | | | 132,000 | | | | 8,697,480 | |
EMC Corporation* | | | 324,310 | | | | 7,426,699 | |
F5 Networks, Inc.D* | | | 102,993 | | | | 13,405,569 | |
Google, Inc. Class A* | | | 55,460 | | | | 32,941,576 | |
Hewlett-Packard Co. | | | 137,740 | | | | 5,798,854 | |
Intuit, Inc.* | | | 90,570 | | | | 4,465,101 | |
Juniper Networks, Inc.* | | | 252,020 | | | | 9,304,578 | |
Microsoft Corporation | | | 64,200 | | | | 1,792,464 | |
NetApp, Inc.* | | | 143,334 | | | | 7,877,637 | |
Oracle Corporation | | | 793,620 | | | | 24,840,306 | |
QUALCOMM, Inc. | | | 545,100 | | | | 26,976,999 | |
Red Hat, Inc.* | | | 67,200 | | | | 3,067,680 | |
Rovi Corporation* | | | 7 | | | | 434 | |
Salesforce.com, Inc.D* | | | 230,808 | | | | 30,466,656 | |
SanDisk CorporationD* | | | 69,100 | | | | 3,445,326 | |
Teradata Corporation* | | | 34,310 | | | | 1,412,200 | |
| | | | | | | | |
| | | | | | | 298,556,628 | |
| | | | | | | | |
Utilities — 0.2% | | | | | |
AES Corporation (The)* | | | 226,850 | | | | 2,763,033 | |
| | | | | | | | |
Total Common Stocks
(Cost $858,979,648) | | | | 1,163,539,062 | |
| | | | | | | | |
FOREIGN COMMON STOCKS — 4.1% | |
Bermuda — 0.3% | | | | | |
Marvell Technology Group, Ltd.* | | | 245,420 | | | | 4,552,541 | |
| | | | | | | | |
Canada — 0.7% | | | | | | | | |
Goldcorp, Inc. | | | 46,260 | | | | 2,127,035 | |
Potash Corporation of Saskatchewan, Inc. | | | 23,500 | | | | 3,638,505 | |
Yamana Gold, Inc. | | | 201,790 | | | | 2,582,912 | |
| | | | | | | | |
| | | | | | | 8,348,452 | |
| | | | | | | | |
China — 0.6% | | | | | |
Baidu, Inc. ADR* | | | 73,656 | | | | 7,110,014 | |
| | | | | | | | |
Ireland — 0.5% | | | | | | | | |
Accenture, Ltd. Class A | | | 49,700 | | | | 2,409,953 | |
Shire PLC ADR | | | 51,370 | | | | 3,718,161 | |
| | | | | | | | |
| | | | | | | 6,128,114 | |
| | | | | | | | |
Israel — 0.7% | | | | | | | | |
Check Point Software Technologies, Ltd.D* | | | 117,200 | | | | 5,421,672 | |
Teva Pharmaceutical Industries, Ltd. ADR | | | 73,200 | | | | 3,815,916 | |
| | | | | | | | |
| | | | | | | 9,237,588 | |
| | | | | | | | |
Netherlands — 0.5% | | | | | |
ASML Holding N.V.D | | | 168,800 | | | | 6,471,792 | |
| | | | | | | | |
United Kingdom — 0.8% | | | | | | | | |
BHP Billiton PLC ADRD | | | 126,797 | | | | 10,207,158 | |
| | | | | | | | |
Total Foreign Common Stocks
(Cost $38,596,460) | | | | 52,055,659 | |
| | | | | | | | |
PREFERRED STOCK — 0.1% | | | | | |
Wells Fargo & Co.*
(Cost $678,134) | | | 35,400 | | | | 962,526 | |
| | | | | | | | |
RIGHT/WARRANT — 0.0% | | | | | |
Krispy Kreme Doughnuts, Inc.
(Cost $74) | | | 7,410 | | | | 2,297 | |
| | | | | | | | |
MONEY MARKET FUNDS — 12.8% | | | | | |
GuideStone Money Market Fund (GS4 Class)¥ | | | 35,564,268 | | | | 35,564,268 | |
Northern Institutional Liquid Assets Portfolio§ | | | 126,132,616 | | | | 126,132,616 | |
| | | | | | | | |
Total Money Market Funds
(Cost $161,696,884) | | | | 161,696,884 | |
| | | | | | | | |
| | |
| | | Par | | | | |
U.S. TREASURY OBLIGATIONS — 0.6% | |
U.S. Treasury Bills | | | | | | | | |
0.17%, 05/05/11‡‡ | | $ | 3,500,000 | | | | 3,498,376 | |
0.18%, 05/05/11‡‡ | | | 1,975,000 | | | | 1,974,083 | |
0.19%, 05/05/11‡‡ | | | 25,000 | | | | 24,984 | |
0.19%, 05/05/11‡‡ | | | 15,000 | | | | 14,993 | |
0.19%, 05/05/11‡‡ | | | 1,500,000 | | | | 1,499,304 | |
| | | | | | | | |
Total U.S. Treasury Obligations
(Cost $7,010,706) | | | | 7,011,740 | |
| | | | | | | | |
| | | | |
| 148 | | See Notes to Financial Statements. | | |
| | | | |
| | | Value | |
TOTAL INVESTMENTS — 109.9%
(Cost $1,066,961,906) | | $ | 1,385,268,168 | |
Liabilities in Excess of Other Assets — (9.9)% | | | (125,344,962 | ) |
| | | | |
NET ASSETS — 100.0% | | $ | 1,259,923,206 | |
| | | | |
Please see abbreviation and footnote definitions beginning on page 180.
| | | | |
PORTFOLIO SUMMARY (based on net assets) | |
| | | % | |
Technology | | | 23.7 | |
Consumer Discretionary | | | 19.6 | |
Money Market Funds | | | 12.8 | |
Financial Services | | | 11.1 | |
Producer Durables | | | 10.6 | |
Energy | | | 8.6 | |
Healthcare | | | 8.4 | |
Materials & Processing | | | 6.8 | |
Foreign Common Stocks | | | 4.1 | |
Consumer Staples | | | 3.3 | |
Futures Contracts | | | 3.3 | |
U.S. Treasury Obligations | | | 0.6 | |
Utilities | | | 0.2 | |
Preferred Stock | | | 0.1 | |
Right/Warrant | | | — | ** |
| | | | |
| | | 113.2 | |
| | | | |
| ** | Rounds to less than 0.005%. |
VALUATION HIERARCHY
The following is a summary of the inputs used, as of December 31, 2010, in valuing the Fund’s assets carried at fair value:
| | | | | | | | |
Valuation Inputs | | Investments
in
Securities | | | Other
Financial
Instruments*** | |
Level 1 — Quoted Prices | | | | | | | | |
Common Stocks | | $ | 1,163,539,062 | | | $ | — | |
Foreign Common Stocks | | | 52,055,659 | | | | — | |
Futures Contracts | | | — | | | | 984,190 | |
Money Market Funds | | | 161,696,884 | | | | — | |
Preferred Stock | | | 962,526 | | | | — | |
Right/Warrant | | | 2,297 | | | | — | |
Level 2 — Other Significant Observable Inputs | | | | | | | | |
U.S. Treasury Obligations | | | 7,011,740 | | | | — | |
Level 3 — Significant Unobservable Inputs | | | — | | | | — | |
| | | | | | | | |
Total | | $ | 1,385,268,168 | | | $ | 984,190 | |
| | | | | | | | |
| *** | Other financial instruments are derivative instruments not reflected in the Schedule of Investments, such as futures, forwards and swap contracts, which are valued at the unrealized appreciation (depreciation) on the investment. Details of these investments can be found in the Notes to Financial Statements. |
| | | | |
| | See Notes to Financial Statements. | | 149 |
Small Cap Equity Fund
Equity markets continued to appreciate during the year as investors responded favorably to additional fiscal stimulus and generally improving economic conditions. The S&P 500® Index posted a return of 15.06% for the full year of 2010. As of year-end, the S&P 500® Index had soared over 90% off the March 2009 lows. The broader U.S. market, as measured by the Russell 3000® Index, posted an impressive return of 16.93% for the one-year period.
From a sector perspective, performance was unanimously in positive territory as all sectors within the Russell 3000® Index advanced during the year. In general, economically-sensitive sectors benefitted from an increasingly optimistic outlook, while the more defensive sectors tended to lag. Eight of the nine sectors within the Russell 3000® Index posted double-digit gains with the best performance coming from the consumer discretionary and producer durables sectors. The weakest performer was the healthcare sector which still posted a solid single-digit gain for the year.
Higher beta, lower quality stocks generally outperformed lower beta, higher quality stocks during the year. In terms of equity market capitalization and style, everything (small, mid, large; growth, core, value) advanced over the course of the year. Small-cap companies significantly outperformed their large-cap counterparts as the Russell 2000® Index posted a one-year return of 26.85%, while the Russell 1000® Index advanced 16.10%. Style differentiation was evident as growth oriented stocks outperformed value oriented stocks across all market capitalization segments. In the large capitalization segment, the Russell 1000® Growth Index and Russell 1000® Value Index posted one-year returns of 16.71% and 15.51%, respectively.
The Small Cap Equity Fund is comprised of domestic, small-cap stocks with both value and growth style orientations. Small-cap companies outperformed the broader market in 2010. The Fund outperformed its benchmark, the Russell 2000® Index, for the one-year period ended December 31, 2010 (27.47% versus 26.85%). Security selection within the financial services and consumer staples sectors contributed to benchmark-relative returns, while security selection within the technology sector detracted from benchmark-relative performance during the year. The Fund’s relative performance was further benefitted from a portable alpha strategy whereby stock index futures contracts are used to gain small cap equity beta exposure and the underlying cash is invested in fixed income securities. Within this portion of the Fund, the fixed income securities’ performance outpaced the futures contracts’ financing costs which generated excess return at the Fund level. Within the fixed income portion of the portfolio, certain derivative contracts were used to manage risk and adjust exposure along the yield curve including U.S. Treasuries futures and options, Eurodollar futures and options and Euro-Bund futures. The Fund also used currency forwards to manage foreign currency exposure.
Small company stocks are generally riskier than large company stocks due to greater volatility and less liquidity.
Please see page 163 for information regarding specific portfolio allocations. Portfolio holdings are subject to change at any time.
| | | | | | | | | | | | |
| Average Annual Total Returns as of 12/31/10 | |
| | | |
| | | GS2 Class* | | | GS4 Class* | | | Benchmark** | |
One Year | | | 27.64 | % | | | 27.47 | % | | | 26.85 | % |
Five Year | | | 2.99 | % | | | 2.85 | % | | | 4.47 | % |
Since Inception | | | 5.40 | % | | | 5.25 | % | | | 6.75 | % |
Inception Date | | | 08/27/01 | | | | 08/27/01 | | | | | |
Total Fund Operating Expenses (April 30, 2010 Prospectus, as supplemented on August 5, 2010)(1) | | | 1.07 | % | | | 1.27 | % | | | | |
| (1) | The Fund’s shareholders indirectly bear the expenses of the GS4 Class shares of the Select Fund in which the Fund invests. Current information regarding the Fund’s Operating Expenses can be found in the Financial Highlights. |
The performance data quoted represents past performance and does not guarantee future results. Current performance may be lower or higher. Performance data current to the most recent month-end may be obtained at www.GuideStoneFunds.org. The investment return and principal value of an investment will fluctuate so that shares, when redeemed, may be worth more or less than their original cost.
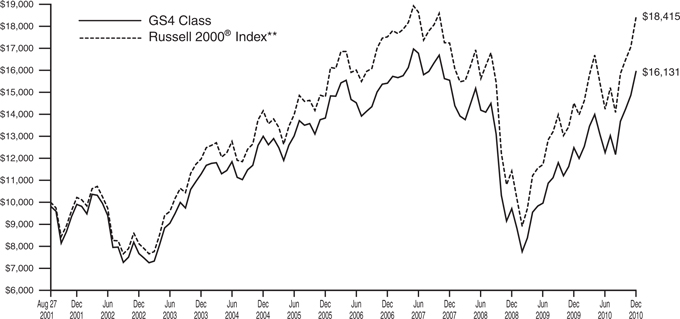
The graph compares the results of a hypothetical $10,000 investment in the GS4 Class of the Fund since August 27, 2001 (commencement of operations), with all dividends and capital gains reinvested, with the Russell 2000® Index.
| * | These returns reflect expense waivers by the Fund’s investment adviser. Without these waivers, returns would have been lower. Returns shown do not reflect the deduction of taxes that a shareholder would pay on Fund distributions or the redemption of Fund shares. |
| ** | The Russell 2000® Index is a small-cap equity index comprised of the 2,000 smallest companies in the Russell 3000® Index, which represents approximately 10% of the total market capitalization of the Russell 3000® Index. |
Unlike a mutual fund, the performance of an index assumes no taxes, transaction costs, management fees or other expenses.
| | |
SMALL CAP EQUITY FUND SCHEDULE OF INVESTMENTS | | December 31, 2010 |
| | | | | | | | |
| | | Shares | | | Value | |
COMMON STOCKS — 83.8% | | | | | | | | |
Consumer Discretionary — 12.4% | |
Aaron’s, Inc.D | | | 93,000 | | | $ | 1,896,270 | |
Advance Auto Parts, Inc. | | | 9,300 | | | | 615,195 | |
American Eagle Outfitters | | | 35,500 | | | | 519,365 | |
American Public Education, Inc.D* | | | 30,200 | | | | 1,124,648 | |
AnnTaylor Stores CorporationD* | | | 76,700 | | | | 2,100,813 | |
Apollo Group, Inc. Class A* | | | 16,900 | | | | 667,381 | |
Arbitron, Inc. | | | 32,500 | | | | 1,349,400 | |
Bravo Brio Restaurant Group, Inc.* | | | 18,800 | | | | 360,396 | |
Brightpoint, Inc.* | | | 84,100 | | | | 734,193 | |
Buffalo Wild Wings, Inc.D* | | | 14,300 | | | | 627,055 | |
Cabela’s, Inc.D* | | | 18,850 | | | | 409,988 | |
Capella Education Co.D* | | | 7,800 | | | | 519,324 | |
Career Education CorporationD* | | | 44,700 | | | | 926,631 | |
CEC Entertainment, Inc.* | | | 16,100 | | | | 625,163 | |
Cheesecake Factory, Inc. (The)D* | | | 34,150 | | | | 1,047,039 | |
Citi Trends, Inc.D* | | | 34,500 | | | | 846,975 | |
comScore, Inc.* | | | 13,200 | | | | 294,492 | |
CROCS, Inc.* | | | 34,000 | | | | 582,080 | |
Deckers Outdoor Corporation* | | | 29,400 | | | | 2,344,356 | |
DG Fastchannel, Inc.D* | | | 28,200 | | | | 814,416 | |
Domino’s Pizza, Inc.D | | | 46,600 | | | | 743,270 | |
DSW, Inc.D* | | | 12,600 | | | | 492,660 | |
Elizabeth Arden, Inc.D* | | | 55,450 | | | | 1,275,904 | |
Federal-Mogul CorporationD* | | | 30,900 | | | | 638,085 | |
Fossil, Inc.D* | | | 9,900 | | | | 697,752 | |
Genesco, Inc.* | | | 16,600 | | | | 622,334 | |
Great Lakes Dredge & Dock Corporation | | | 86,000 | | | | 633,820 | |
Guess ?, Inc. | | | 35,200 | | | | 1,665,664 | |
Hibbett Sports, Inc.D* | | | 8,800 | | | | 324,720 | |
Hot Topic, Inc. | | | 95,300 | | | | 597,531 | |
IAC/InterActiveCorp* | | | 41,700 | | | | 1,196,790 | |
Iconix Brand Group, Inc.* | | | 28,400 | | | | 548,404 | |
Inter Parfums, Inc.D | | | 30,600 | | | | 576,810 | |
ITT Educational Services, Inc.D* | | | 19,600 | | | | 1,248,324 | |
John Wiley & Sons, Inc. | | | 28,500 | | | | 1,289,340 | |
Jos. A. Bank Clothiers, Inc.D* | | | 21,500 | | | | 866,880 | |
Lincoln Educational Services Corporation | | | 88,500 | | | | 1,372,635 | |
Lithia Motors, Inc.D | | | 52,900 | | | | 755,941 | |
Monro Muffler Brake, Inc.D | | | 47,325 | | | | 1,636,972 | |
Nu Skin Enterprises, Inc. Class A | | | 9,250 | | | | 279,905 | |
PetSmart, Inc. | | | 15,800 | | | | 629,156 | |
Polaris Industries, Inc. | | | 13,560 | | | | 1,057,951 | |
RC2 Corporation* | | | 46,500 | | | | 1,012,305 | |
Rent-A-Center, Inc.D | | | 23,900 | | | | 771,492 | |
Select Comfort Corporation* | | | 105,400 | | | | 962,302 | |
SodaStream International, Ltd.D* | | | 27,700 | | | | 874,766 | |
Sotheby’s Holdings Class AD | | | 24,800 | | | | 1,116,000 | |
Steven Madden, Ltd.D* | | | 17,656 | | | | 736,608 | |
Superior Industries International, Inc. | | | 55,300 | | | | 1,173,466 | |
Tempur-Pedic International, Inc.D* | | | 12,274 | | | | 491,696 | |
Tenneco Automotive, Inc.* | | | 24,400 | | | | 1,004,304 | |
Timberland Co. (The)D* | | | 54,500 | | | | 1,340,155 | |
Travelzoo, Inc.D* | | | 8,600 | | | | 354,492 | |
Ulta Salon Cosmetics & Fragrance, Inc.* | | | 27,418 | | | | 932,212 | |
United Online, Inc. | | | 159,700 | | | | 1,054,020 | |
ValueClick, Inc.D* | | | 57,700 | | | | 924,931 | |
Vera Bradley, Inc.D* | | | 6,900 | | | | 227,700 | |
Vitamin Shoppe, Inc.D* | | | 54,100 | | | | 1,819,924 | |
WABCO Holdings, Inc.* | | | 55,200 | | | | 3,363,336 | |
Warnaco Group, Inc. (The)D* | | | 11,700 | | | | 644,319 | |
WESCO International, Inc.D* | | | 12,400 | | | | 654,720 | |
Wolverine World Wide, Inc. | | | 11,800 | | | | 376,184 | |
World Fuel Services Corporation | | | 23,500 | | | | 849,760 | |
Zumiez, Inc.D* | | | 18,287 | | | | 491,372 | |
| | | | | | | | |
| | | | | | | 58,732,092 | |
| | | | | | | | |
Consumer Staples — 1.9% | | | | | | | | |
Biglari Holdings, Inc.* | | | 1,400 | | | | 574,294 | |
Diamond Foods, Inc.D | | | 16,200 | | | | 861,516 | |
Hansen Natural Corporation* | | | 19,200 | | | | 1,003,776 | |
Herbalife, Ltd. | | | 25,200 | | | | 1,722,924 | |
J & J Snack Foods CorporationD | | | 21,052 | | | | 1,015,548 | |
Nash Finch Co.D | | | 16,900 | | | | 718,419 | |
Pantry, Inc.D* | | | 44,050 | | | | 874,833 | |
Ruddick Corporation | | | 21,100 | | | | 777,324 | |
United Natural Foods, Inc.* | | | 33,500 | | | | 1,228,780 | |
| | | | | | | | |
| | | | | | | 8,777,414 | |
| | | | | | | | |
Energy — 6.2% | | | | | | | | |
Alpha Natural Resources, Inc.* | | | 11,200 | | | | 672,336 | |
Brigham Exploration Co.D* | | | 25,526 | | | | 695,328 | |
Carrizo Oil & Gas, Inc.D* | | | 34,400 | | | | 1,186,456 | |
Clayton Williams Energy, Inc.D* | | | 15,500 | | | | 1,301,535 | |
Complete Production Services, Inc.* | | | 44,850 | | | | 1,325,318 | |
Dril-Quip, Inc.* | | | 12,400 | | | | 963,728 | |
EXCO Resources, Inc.D | | | 76,800 | | | | 1,491,456 | |
Exterran Holdings, Inc.D* | | | 23,500 | | | | 562,825 | |
Franklin Electric Co., Inc.D | | | 3,500 | | | | 136,220 | |
Frontier Oil Corporation* | | | 48,000 | | | | 864,480 | |
GT Solar International, Inc.D* | | | 67,200 | | | | 612,864 | |
Gulf Island Fabrication, Inc. | | | 10,100 | | | | 284,618 | |
Hercules Offshore, Inc.D* | | | 274,600 | | | | 950,116 | |
Holly CorporationD | | | 36,200 | | | | 1,475,874 | |
Key Energy Services, Inc.* | | | 77,700 | | | | 1,008,546 | |
Kodiak Oil & Gas CorporationD* | | | 159,170 | | | | 1,050,522 | |
Newpark Resources, Inc.D* | | | 57,600 | | | | 354,816 | |
Oasis Petroleum, Inc.D* | | | 58,296 | | | | 1,580,988 | |
Patterson-UTI Energy, Inc. | | | 98,900 | | | | 2,131,295 | |
Petroleum Development Corporation* | | | 13,900 | | | | 586,719 | |
Pioneer Drilling Co.D* | | | 83,600 | | | | 736,516 | |
Rosetta Resources, Inc.D* | | | 32,650 | | | | 1,228,946 | |
SEACOR Holdings, Inc.* | | | 10,000 | | | | 1,010,900 | |
Sunoco, Inc. | | | 14,600 | | | | 588,526 | |
Superior Energy Services, Inc.* | | | 41,800 | | | | 1,462,582 | |
Swift Energy Co.* | | | 26,100 | | | | 1,021,815 | |
Tesoro CorporationD* | | | 45,300 | | | | 839,862 | |
TPC Group, Inc.* | | | 9,803 | | | | 297,227 | |
Vaalco Energy, Inc.D* | | | 114,400 | | | | 819,104 | |
W&T Offshore, Inc.D | | | 60,600 | | | | 1,082,922 | |
Western Refining, Inc.D* | | | 104,400 | | | | 1,104,552 | |
| | | | | | | | |
| | | | | | | 29,428,992 | |
| | | | | | | | |
| | | | |
| 152 | | See Notes to Financial Statements. | | |
| | | | | | | | |
| | | Shares | | | Value | |
Financial Services — 16.8% | | | | | | | | |
Allied World Assurance Co. Holdings, Ltd. | | | 20,000 | | | $ | 1,188,800 | |
American Equity Investment Life Holding Co.D | | | 75,900 | | | | 952,545 | |
American Financial Group, Inc. | | | 50,500 | | | | 1,630,645 | |
AMERISAFE, Inc.* | | | 18,418 | | | | 322,315 | |
Amtrust Financial Services, Inc.D | | | 48,700 | | | | 852,250 | |
Apartment Investment & Management Co. Class A REITD | | | 64,800 | | | | 1,674,432 | |
Argo Group International Holdings, Ltd. | | | 9,252 | | | | 346,488 | |
Ashford Hospitality Trust, Inc. REITD* | | | 110,300 | | | | 1,064,395 | |
Assurant, Inc. | | | 35,100 | | | | 1,352,052 | |
AXIS Capital Holdings, Ltd. | | | 49,000 | | | | 1,758,120 | |
BOK Financial CorporationD | | | 25,900 | | | | 1,383,060 | |
Calamos Asset Management, Inc.D | | | 45,700 | | | | 639,800 | |
Cash America International, Inc.D | | | 29,400 | | | | 1,085,742 | |
CBL & Associates Properties, Inc. REITD | | | 82,300 | | | | 1,440,250 | |
Columbia Banking System, Inc.D | | | 43,300 | | | | 911,898 | |
Community Bank System, Inc.D | | | 31,300 | | | | 869,201 | |
Compass Diversified Holdings | | | 56,600 | | | | 1,001,254 | |
CVB Financial CorporationD | | | 61,500 | | | | 533,205 | |
Deluxe Corporation | | | 28,600 | | | | 658,372 | |
DiamondRock Hospitality Co. REIT* | | | 58,300 | | | | 699,600 | |
Dime Community BancsharesD | | | 67,000 | | | | 977,530 | |
Duff & Phelps Corporation | | | 48,900 | | | | 824,454 | |
Endurance Specialty Holdings, Ltd.D | | | 14,800 | | | | 681,836 | |
Euronet Worldwide, Inc.D* | | | 46,700 | | | | 814,448 | |
Evercore Partners, Inc. Class AD | | | 30,000 | | | | 1,020,000 | |
ExlService Holdings, Inc.* | | | 29,500 | | | | 633,660 | |
EZCORP, Inc. Class A* | | | 42,400 | | | | 1,150,312 | |
Federal Realty Investors Trust REITD | | | 6,900 | | | | 537,717 | |
First Cash Financial Services, Inc.* | | | 25,000 | | | | 774,750 | |
First Citizens BancShares, Inc. Cl A | | | 6,600 | | | | 1,247,730 | |
First Commonwealth Financial CorporationD | | | 116,900 | | | | 827,652 | |
First Financial BancorpD | | | 37,400 | | | | 691,152 | |
FleetCor Technologies, Inc.* | | | 10,600 | | | | 327,752 | |
FPIC Insurance Group, Inc.D* | | | 17,250 | | | | 637,560 | |
Global Payments, Inc. | | | 50,000 | | | | 2,310,500 | |
Higher One Holdings, Inc.D* | | | 23,100 | | | | 467,313 | |
Home Bancshares, Inc.D | | | 34,140 | | | | 752,104 | |
Hospitality Properties Trust REIT | | | 48,000 | | | | 1,105,920 | |
Huntington Bancshares, Inc.D | | | 251,800 | | | | 1,729,866 | |
IBERIABANK CorporationD | | | 39,900 | | | | 2,359,287 | |
Infinity Property & Casualty CorporationD | | | 19,400 | | | | 1,198,920 | |
International Bancshares CorporationD | | | 70,200 | | | | 1,406,106 | |
Jack Henry & Associates, Inc. | | | 40,700 | | | | 1,186,405 | |
Jones Lang LaSalle, Inc. | | | 31,900 | | | | 2,677,048 | |
LaSalle Hotel Properties REIT | | | 26,300 | | | | 694,320 | |
Life Partners Holdings, Inc.D | | | 26,900 | | | | 514,597 | |
NASDAQ OMX Group, Inc. (The)* | | | 43,900 | | | | 1,040,869 | |
National American University Holdings, Inc. | | | 54,600 | | | | 400,764 | |
National Health Investors, Inc. REITD | | | 24,300 | | | | 1,093,986 | |
NBH Holdings Corporation PIPE+@ | | | 30,300 | | | | 560,550 | |
Nelnet, Inc. Class A | | | 25,200 | | | | 596,988 | |
Net 1 UEPS Technologies, Inc.* | | | 72,100 | | | | 883,946 | |
Netspend Holdings, Inc.D* | | | 70,300 | | | | 901,246 | |
Ocwen Financial CorporationD* | | | 110,700 | | | | 1,056,078 | |
optionsXpress Holdings, Inc.D | | | 50,590 | | | | 792,745 | |
Pacwest BancorpD | | | 47,100 | | | | 1,006,998 | |
Platinum Underwriters Holdings, Ltd. | | | 13,600 | | | | 611,592 | |
Protective Life Corporation | | | 26,400 | | | | 703,296 | |
Provident Financial Services, Inc.D | | | 47,400 | | | | 717,162 | |
PS Business Parks, Inc. REITD | | | 11,400 | | | | 635,208 | |
Raymond James Financial, Inc. | | | 22,700 | | | | 742,290 | |
RenaissanceRe Holdings, Ltd. | | | 26,300 | | | | 1,675,047 | |
Republic Bancorp, Inc. Class AD | | | 27,600 | | | | 655,500 | |
RLI CorporationD | | | 13,700 | | | | 720,209 | |
Safety Insurance Group, Inc.D | | | 39,500 | | | | 1,879,015 | |
SCBT Financial CorporationD | | | 19,100 | | | | 625,525 | |
Senior Housing Properties Trust REIT | | | 27,300 | | | | 598,962 | |
Signature Bank* | | | 17,900 | | | | 895,000 | |
StanCorp Financial Group, Inc.D | | | 67,500 | | | | 3,046,950 | |
Taubman Centers, Inc. REITD | | | 35,300 | | | | 1,781,944 | |
Tower Group, Inc.D | | | 48,600 | | | | 1,243,188 | |
Transatlantic Holdings, Inc. | | | 18,700 | | | | 965,294 | |
Unitrin, Inc. | | | 21,800 | | | | 534,972 | |
Washington Banking Co. | | | 17,700 | | | | 242,667 | |
Webster Financial CorporationD | | | 66,900 | | | | 1,317,930 | |
Wintrust Financial CorporationD | | | 28,100 | | | | 928,143 | |
World Acceptance CorporationD* | | | 25,400 | | | | 1,341,120 | |
Wright Express Corporation* | | | 38,300 | | | | 1,761,800 | |
| | | | | | | | |
| | | | | | | 79,870,347 | |
| | | | | | | | |
Healthcare — 9.5% | | | | | | | | |
Align Technology, Inc.D* | | | 42,100 | | | | 822,634 | |
Alimera Sciences, Inc.D* | | | 29,600 | | | | 307,248 | |
AMERIGROUP CorporationD* | | | 36,100 | | | | 1,585,512 | |
Avanir Pharmaceuticals, Inc.D* | | | 101,400 | | | | 413,712 | |
BioMarin Pharmaceuticals, Inc.* | | | 28,000 | | | | 754,040 | |
Bio-Rad Laboratories, Inc. Class A* | | | 14,800 | | | | 1,536,980 | |
Brookdale Senior Living, Inc.* | | | 53,500 | | | | 1,145,435 | |
Catalyst Health Solutions, Inc.D* | | | 48,800 | | | | 2,268,712 | |
Centene Corporation* | | | 52,400 | | | | 1,327,816 | |
Cephalon, Inc.D* | | | 10,400 | | | | 641,888 | |
Conventry Health Care, Inc.* | | | 26,600 | | | | 702,240 | |
Cooper Cos., Inc.D | | | 51,700 | | | | 2,912,777 | |
Cyberonics, Inc.* | | | 9,100 | | | | 282,282 | |
Dionex CorporationD* | | | 8,000 | | | | 944,080 | |
Emergency Medical Services Corporation Class A* | | | 19,600 | | | | 1,266,356 | |
| | | | |
| | See Notes to Financial Statements. | | 153 |
| | |
SMALL CAP EQUITY FUND SCHEDULE OF INVESTMENTS (Continued) | | |
| | | | | | | | |
| | | Shares | | | Value | |
Five Star Quality Care, Inc.+ | | | 2,086 | | | $ | — | |
Gen-Probe, Inc.* | | | 4,800 | | | | 280,080 | |
Haemonetics Corporation* | | | 17,200 | | | | 1,086,696 | |
Health Net, Inc.* | | | 62,900 | | | | 1,716,541 | |
Healthspring, Inc.* | | | 15,031 | | | | 398,772 | |
Hill-Rom Holdings, Inc.D | | | 29,300 | | | | 1,153,541 | |
ICON PLC ADR* | | | 50,400 | | | | 1,103,760 | |
ICU Medical, Inc.* | | | 27,200 | | | | 992,800 | |
Incyte Corporation, Ltd.D* | | | 30,700 | | | | 508,392 | |
IPC The Hospitalist Co., Inc.* | | | 25,200 | | | | 983,052 | |
Kindred Healthcare, Inc.* | | | 23,700 | | | | 435,369 | |
LifePoint Hospitals, Inc.D* | | | 25,300 | | | | 929,775 | |
Magellan Health Services, Inc.* | | | 40,900 | | | | 1,933,752 | |
Map Pharmaceuticals, Inc.* | | | 18,712 | | | | 313,239 | |
Masimo CorporationD | | | 15,600 | | | | 453,492 | |
MedAssets, Inc.D* | | | 51,400 | | | | 1,037,766 | |
Mednax, Inc.* | | | 17,500 | | | | 1,177,575 | |
Myriad Genetics, Inc.* | | | 23,072 | | | | 526,965 | |
NetSuite, Inc.D* | | | 20,450 | | | | 511,250 | |
PDL BioPharma, Inc.D | | | 106,200 | | | | 661,626 | |
PerkinElmer, Inc. | | | 56,200 | | | | 1,451,084 | |
PSS World Medical, Inc.D* | | | 49,900 | | | | 1,127,740 | |
Salix Pharmaceuticals, Ltd.D* | | | 19,050 | | | | 894,588 | |
Sirona Dental Systems, Inc.* | | | 25,400 | | | | 1,061,212 | |
SXC Health Solutions Corporation* | | | 14,350 | | | | 615,041 | |
Techne CorporationD | | | 13,400 | | | | 879,978 | |
Thoratec Corporation* | | | 39,400 | | | | 1,115,808 | |
United Therapeutics CorporationD* | | | 16,500 | | | | 1,043,130 | |
Universal American CorporationD | | | 72,500 | | | | 1,482,625 | |
Volcano CorporationD* | | | 48,650 | | | | 1,328,632 | |
WebMD Health Corporation* | | | 8,700 | | | | 444,222 | |
WellCare Health Plans, Inc.D* | | | 21,500 | | | | 649,730 | |
| | | | | | | | |
| | | | | | | 45,209,945 | |
| | | | | | | | |
Materials & Processing — 7.7% | |
Albany International Corporation Class A | | | 42,000 | | | | 994,980 | |
Allied Nevada Gold CorporationD* | | | 20,050 | | | | 527,515 | |
Beacon Roofing Supply, Inc.D* | | | 40,400 | | | | 721,948 | |
Belden, Inc. | | | 22,600 | | | | 832,132 | |
Boise, Inc.D* | | | 141,900 | | | | 1,125,267 | |
Buckeye Technologies, Inc. | | | 75,600 | | | | 1,588,356 | |
Cabot Corporation | | | 45,900 | | | | 1,728,135 | |
Chicago Bridge & Iron Co. NV* | | | 41,600 | | | | 1,368,640 | |
CLARCOR, Inc.D | | | 42,400 | | | | 1,818,536 | |
Commercial Metals Co. | | | 34,500 | | | | 572,355 | |
Domtar CorporationD | | | 9,500 | | | | 721,240 | |
DryShips, Inc.D* | | | 128,400 | | | | 706,200 | |
DXP Enterprises, Inc.* | | | 20,400 | | | | 489,600 | |
Eastman Chemical Co. | | | 12,300 | | | | 1,034,184 | |
Ferro CorporationD* | | | 184,500 | | | | 2,701,080 | |
Forest City Enterprises, Inc. Class A* | | | 38,100 | | | | 635,889 | |
Huntsman Corporation | | | 41,400 | | | | 646,254 | |
Interline Brands, Inc.D* | | | 50,500 | | | | 1,149,885 | |
Kraton Performance Polymers, Inc.D* | | | 57,600 | | | | 1,782,720 | |
Kronos Worldwide, Inc. | | | 31,700 | | | | 1,346,933 | |
Layne Christensen Co.* | | | 21,300 | | | | 733,146 | |
Minerals Technologies, Inc. | | | 14,000 | | | | 915,740 | |
Noranda Aluminium Holding Corporation* | | | 51,800 | | | | 756,280 | |
OM Group, Inc.* | | | 15,400 | | | | 593,054 | |
PolyOne Corporation* | | | 37,200 | | | | 464,628 | |
RBC Bearings, Inc.D* | | | 12,900 | | | | 504,132 | |
Reliance Steel & Aluminum Co. | | | 31,500 | | | | 1,609,650 | |
Rock-Tenn Co. Class A | | | 21,800 | | | | 1,176,110 | |
Schnitzer Steel Industries, Inc. Class A | | | 15,900 | | | | 1,055,601 | |
Steel Dynamics, Inc.D | | | 47,500 | | | | 869,250 | |
Temple-Inland, Inc. | | | 18,600 | | | | 395,064 | |
Under Armour, Inc. Class AD* | | | 12,950 | | | | 710,178 | |
Watsco, Inc.D | | | 29,700 | | | | 1,873,476 | |
Westlake Chemical Corporation | | | 29,850 | | | | 1,297,580 | |
Worthington Industries, Inc.D | | | 67,700 | | | | 1,245,680 | |
| | | | | | | | |
| | | | | | | 36,691,418 | |
| | | | | | | | |
Producer Durables — 12.4% | |
A.O. Smith Corporation | | | 28,447 | | | | 1,083,262 | |
Advisory Board Co. (The)D* | | | 21,400 | | | | 1,019,282 | |
Allegiant Travel Co.D | | | 19,900 | | | | 979,876 | |
Applied Industrial Technologies, Inc.D | | | 33,500 | | | | 1,088,080 | |
Astec Industries, Inc.* | | | 2,400 | | | | 77,784 | |
B/E Aerospace* | | | 26,500 | | | | 981,295 | |
Clean Harbors, Inc.* | | | 13,800 | | | | 1,160,304 | |
Cognex Corporation | | | 14,900 | | | | 438,358 | |
Columbus McKinnon CorporationD* | | | 43,000 | | | | 873,760 | |
CoStar Group, Inc.D* | | | 22,500 | | | | 1,295,100 | |
Curtiss-Wright CorporationD | | | 22,400 | | | | 743,680 | |
Darling International, Inc.* | | | 40,900 | | | | 543,152 | |
Douglas Dynamics, Inc.D | | | 27,600 | | | | 418,140 | |
Dycom Industries, Inc.* | | | 43,700 | | | | 644,575 | |
EMCOR Group, Inc.* | | | 38,400 | | | | 1,112,832 | |
EnPro Industries, Inc.D* | | | 33,300 | | | | 1,383,948 | |
FARO Technologies, Inc.* | | | 51,900 | | | | 1,704,396 | |
Genco Shipping & Trading, Ltd.D* | | | 34,900 | | | | 502,560 | |
Generac Holdings, Inc.D* | | | 56,000 | | | | 905,520 | |
General Cable CorporationD* | | | 21,300 | | | | 747,417 | |
Genesee & Wyoming, Inc. Class AD* | | | 53,850 | | | | 2,851,358 | |
Healthcare Services Group, Inc.D | | | 50,050 | | | | 814,314 | |
HEICO Corporation Class AD | | | 32,550 | | | | 1,502,333 | |
Herman Miller, Inc. | | | 64,300 | | | | 1,626,790 | |
HUB Group, Inc.* | | | 18,850 | | | | 662,389 | |
IDEX Corporation | | | 28,911 | | | | 1,130,998 | |
Innospec, Inc.* | | | 16,500 | | | | 336,600 | |
KBR, Inc. | | | 66,200 | | | | 2,017,114 | |
Kennametal, Inc. | | | 19,400 | | | | 765,524 | |
Kforce, Inc.D* | | | 135,883 | | | | 2,198,587 | |
Knight Transportation, Inc.D | | | 49,300 | | | | 936,700 | |
McGrath RentCorpD | | | 27,000 | | | | 707,940 | |
Middleby CorporationD* | | | 12,400 | | | | 1,046,808 | |
Monster Worldwide, Inc.D* | | | 48,600 | | | | 1,148,418 | |
Moog, Inc. Class AD* | | | 24,100 | | | | 959,180 | |
NACCO Industries, Inc. Class A | | | 6,800 | | | | 736,916 | |
Navistar International Corporation* | | | 11,300 | | | | 654,383 | |
Old Dominion Freight Line, Inc.* | | | 41,150 | | | | 1,316,388 | |
On Assignment, Inc.* | | | 104,000 | | | | 847,600 | |
Orbital Sciences Corporation* | | | 63,000 | | | | 1,079,190 | |
| | | | |
| 154 | | See Notes to Financial Statements. | | |
| | | | | | | | |
| | | Shares | | | Value | |
Oshkosh Corporation* | | | 34,200 | | | $ | 1,205,208 | |
Polypore International, Inc.D* | | | 12,200 | | | | 496,906 | |
Regal-Beloit Corporation | | | 22,900 | | | | 1,528,804 | |
Resources Connection, Inc. | | | 56,300 | | | | 1,046,617 | |
Robert Half International, Inc.D | | | 55,700 | | | | 1,704,420 | |
Ryder System, Inc. | | | 27,800 | | | | 1,463,392 | |
Standard Parking CorporationD* | | | 37,500 | | | | 708,375 | |
Steelcase, Inc. Class AD | | | 186,900 | | | | 1,975,533 | |
SYKES Enterprises, Inc.* | | | 58,900 | | | | 1,193,314 | |
Thomas & Betts Corporation | | | 29,800 | | | | 1,439,340 | |
Toro Co. | | | 19,300 | | | | 1,189,652 | |
TransDigm Group, Inc.D* | | | 30,150 | | | | 2,171,102 | |
Tutor Perini CorporationD* | | | 27,400 | | | | 586,634 | |
Zebra Technologies Corporation Class A* | | | 21,900 | | | | 831,981 | |
| | | | | | | | |
| | | | | | | 58,584,129 | |
| | | | | | | | |
Technology — 12.7% | | | | | | | | |
Acme Packet, Inc.* | | | 17,891 | | | | 951,086 | |
Acxiom CorporationD* | | | 79,800 | | | | 1,368,570 | |
Ancestry.com, Inc.* | | | 10,300 | | | | 291,696 | |
Arrow Electronics, Inc.* | | | 48,300 | | | | 1,654,275 | |
Aruba Networks, Inc.D* | | | 40,050 | | | | 836,244 | |
Atheros Communications, Inc.D* | | | 52,800 | | | | 1,896,576 | |
Blackboard, Inc.D* | | | 50,000 | | | | 2,065,000 | |
Bottomline Technologies, Inc.D* | | | 73,800 | | | | 1,602,198 | |
BroadSoft, Inc.D* | | | 24,900 | | | | 594,612 | |
Cadence Design Systems, Inc.* | | | 78,300 | | | | 646,758 | |
Cardtronics, Inc.* | | | 89,500 | | | | 1,584,150 | |
Cavium Networks, Inc.D* | | | 26,000 | | | | 979,680 | |
Ciena CorporationD* | | | 15,200 | | | | 319,960 | |
CommVault Systems, Inc.* | | | 25,600 | | | | 732,672 | |
Compuware Corporation* | | | 48,800 | | | | 569,496 | |
CSG Systems International, Inc.* | | | 36,800 | | | | 696,992 | |
Cymer, Inc.* | | | 27,500 | | | | 1,239,425 | |
DigitalGlobe, Inc.* | | | 19,400 | | | | 615,174 | |
Ebix, Inc.D* | | | 32,200 | | | | 762,174 | |
Entropic Communications, Inc.D* | | | 47,631 | | | | 575,382 | |
GeoEye, Inc.* | | | 9,250 | | | | 392,107 | |
Hittite Microwave Corporation* | | | 15,500 | | | | 946,120 | |
iGate CorporationD | | | 15,889 | | | | 313,172 | |
Informatica CorporationD* | | | 16,700 | | | | 735,301 | |
Ingram Micro, Inc. Class A* | | | 75,600 | | | | 1,443,204 | |
Inphi Corporation* | | | 14,100 | | | | 283,269 | |
Insight Enterprises, Inc.* | | | 46,400 | | | | 610,624 | |
ION Geophysical CorporationD* | | | 36,100 | | | | 306,128 | |
iSoftstone Holdings, Ltd. ADR* | | | 19,277 | | | | 350,263 | |
LivePerson, Inc.D* | | | 21,100 | | | | 238,430 | |
LogMeIn, Inc.D* | | | 18,150 | | | | 804,771 | |
Mantech International Corporation Class A* | | | 14,200 | | | | 586,886 | |
Monotype Imaging Holdings, Inc.D* | | | 71,200 | | | | 790,320 | |
Netlogic Microsystems, Inc.D* | | | 28,500 | | | | 895,185 | |
Omnivision Technologies, Inc.D* | | | 29,550 | | | | 874,976 | |
OpenTable, Inc.D* | | | 3,900 | | | | 274,872 | |
OSI Systems, Inc.* | | | 10,550 | | | | 383,598 | |
Plantronics, Inc. | | | 19,400 | | | | 722,068 | |
Plexus Corporation* | | | 24,400 | | | | 754,936 | |
PMC-Sierra, Inc.* | | | 2,500 | | | | 21,475 | |
Power Intergrations, Inc.D | | | 48,700 | | | | 1,954,818 | |
Progress Software Corporation* | | | 12,300 | | | | 520,536 | |
Radiant Systems, Inc.* | | | 26,450 | | | | 517,626 | |
RealD, Inc.D* | | | 50,400 | | | | 1,306,368 | |
Riverbed Technology, Inc.* | | | 23,450 | | | | 824,736 | |
Rovi Corporation* | | | 14,750 | | | | 914,648 | |
SBA Communications | | | | | | | | |
Corporation Class AD* | | | 18,600 | | | | 761,484 | |
Scansource, Inc.* | | | 45,100 | | | | 1,438,690 | |
Semtech CorporationD* | | | 75,867 | | | | 1,717,629 | |
Shutterfly, Inc.D* | | | 10,650 | | | | 373,070 | |
Silicon Laboratories, Inc.D* | | | 14,600 | | | | 671,892 | |
Solera Holdings, Inc.D | | | 57,000 | | | | 2,925,240 | |
SRA International, Inc. Class AD* | | | 81,300 | | | | 1,662,585 | |
SS&C Technologies Holdings, Inc.* | | | 32,700 | | | | 670,677 | |
STEC, Inc.D* | | | 35,000 | | | | 617,750 | |
Stoneridge, Inc.* | | | 35,500 | | | | 560,545 | |
Stratasys, Inc.D* | | | 41,192 | | | | 1,344,507 | |
SuccessFactors, Inc.D* | | | 39,600 | | | | 1,146,816 | |
Synchronoss Technologies, Inc.* | | | 14,499 | | | | 387,268 | |
Tech Data Corporation* | | | 30,600 | | | | 1,347,012 | |
Ultimate Software Group, Inc.D* | | | 36,000 | | | | 1,750,680 | |
Universal Display CorporationD* | | | 17,315 | | | | 530,705 | |
Varian Semiconductor Equipment Associates, Inc.* | | | 32,425 | | | | 1,198,752 | |
VeriFone Holdings, Inc.* | | | 45,601 | | | | 1,758,375 | |
Viasat, Inc.D* | | | 18,200 | | | | 808,262 | |
Vishay Intertechnology, Inc.D* | | | 62,200 | | | | 913,096 | |
| | | | | | | | |
| | | | | | | 60,333,592 | |
| | | | | | | | |
Utilities — 4.2% | | | | | | | | |
Alliant Energy Corporation | | | 50,300 | | | | 1,849,531 | |
American Water Works Co., Inc. | | | 42,500 | | | | 1,074,825 | |
El Paso Electric Co.* | | | 44,400 | | | | 1,222,332 | |
Energen Corporation | | | 28,900 | | | | 1,394,714 | |
General Communication, Inc. Class AD* | | | 69,400 | | | | 878,604 | |
GenOn Energy, Inc.* | | | 111,415 | | | | 424,491 | |
Great Plains Energy, Inc.D | | | 71,700 | | | | 1,390,263 | |
IDACORP, Inc. | | | 22,300 | | �� | | 824,654 | |
j2 Global Communications, Inc.D* | | | 34,500 | | | | 998,775 | |
Laclede Group, Inc. (The) | | | 6,300 | | | | 230,202 | |
MetroPCS Communications, Inc.D* | | | 57,700 | | | | 728,751 | |
NorthWestern Corporation | | | 18,500 | | | | 533,355 | |
NTELOS Holdings CorporationD | | | 46,300 | | | | 882,015 | |
NV Energy, Inc. | | | 117,000 | | | | 1,643,850 | |
OGE Energy Corporation | | | 38,600 | | | | 1,757,844 | |
PNM Resources, Inc.D | | | 96,300 | | | | 1,253,826 | |
Portland General Electric Co. | | | 51,600 | | | | 1,119,720 | |
Telephone & Data Systems, Inc. | | | 32,000 | | | | 1,169,600 | |
USA Mobility, Inc. | | | 37,300 | | | | 662,821 | |
| | | | | | | | |
| | | | | | | 20,040,173 | |
| | | | | | | | |
Total Common Stocks
(Cost $313,385,737) | | | | | | | 397,668,102 | |
| | | | | | | | |
| | | | |
| | See Notes to Financial Statements. | | 155 |
| | |
SMALL CAP EQUITY FUND SCHEDULE OF INVESTMENTS (Continued) | | |
| | |
| | | | | | | | |
| | | Shares | | | Value | |
FOREIGN COMMON STOCKS — 0.9% | |
Bermuda — 0.3% | |
Montpelier Re Holdings, Ltd. | | | 70,000 | | | $ | 1,395,800 | |
| | | | | | | | |
British Virgin Islands — 0.2% | |
UTi Worldwide, Inc. | | | 50,900 | | | | 1,079,080 | |
| | | | | | | | |
Greece — 0.1% | | | | | | | | |
Diana Shipping, Inc.D* | | | 46,500 | | | | 558,930 | |
| | | | | | | | |
Netherlands — 0.3% | | | | | |
AerCap Holdings NV* | | | 89,745 | | | | 1,267,199 | |
| | | | | | | | |
Total Foreign Common Stocks
(Cost $4,093,200) | | | | 4,301,009 | |
| | | | | | | | |
PREFERRED STOCKS — 0.0% | |
Federal Home Loan Mortgage Corporation | | | 5,125 | | | | 3,126 | |
Federal National Mortgage Association | | | 3,750 | | | | 2,105 | |
| | | | | | | | |
Total Preferred Stocks
(Cost $227,515) | | | | | | | 5,231 | |
| | | | | | | | |
MONEY MARKET FUNDS — 35.8% | |
GuideStone Money Market Fund (GS4 Class)¥ | | | 26,410,953 | | | | 26,410,953 | |
Northern Institutional Liquid Assets Portfolio§ | | | 143,555,699 | | | | 143,555,699 | |
| | | | | | | | |
Total Money Market Funds
(Cost $169,966,652) | | | | | | | 169,966,652 | |
| | | | | | | | |
| | |
| | | Par | | | | |
AGENCY OBLIGATIONS — 2.3% | |
Farmer Mac Guaranteed Trust | | | | | | | | |
5.13%, 04/19/17 144A | | $ | 250,000 | | | | 272,346 | |
Federal Home Loan Bank | | | | | | | | |
1.50%, 01/16/13D | | | 50,000 | | | | 50,819 | |
Federal Home Loan Mortgage Corporation | | | | | | | | |
0.05%, 01/24/11W | | | 4,434,000 | | | | 4,433,694 | |
0.21%, 07/06/11W | | | 480,000 | | | | 479,583 | |
Federal National Mortgage Association | | | | | | | | |
0.11%, 04/26/11W | | | 1,500,000 | | | | 1,499,529 | |
0.13%, 05/09/11W | | | 2,860,000 | | | | 2,858,799 | |
5.25%, 08/01/12 | | | 110,000 | | | | 117,558 | |
0.38%, 12/28/12D | | | 150,000 | | | | 149,121 | |
5.00%, 02/13/17D | | | 230,000 | | | | 259,871 | |
5.31%, 10/09/19 | | | 90,000 | | | | 56,950 | |
6.25%, 05/15/29D | | | 110,000 | | | | 135,349 | |
7.13%, 01/15/30D | | | 100,000 | | | | 132,782 | |
Tennessee Valley Authority | | | | | | | | |
5.25%, 09/15/39 | | | 50,000 | | | | 53,061 | |
4.63%, 09/15/60D | | | 80,000 | | | | 75,176 | |
World Bank | | | | | | | | |
0.20%, 04/19/11W | | | 480,000 | | | | 479,859 | |
| | | | | | | | |
Total Agency Obligations
(Cost $11,002,941) | | | | | | | 11,054,497 | |
| | | | | | | | |
ASSET-BACKED SECURITIES — 0.4% | |
Ameriquest Mortgage Securities, Inc. | | | | | | | | |
0.61%, 04/25/34† | | | 46,923 | | | | 40,630 | |
Asset Backed Securities Corporation Home Equity | | | | | | | | |
1.24%, 12/15/33† | | | 28,312 | | | | 25,711 | |
| | |
| | | Par | | | Value | |
Bear Stearns Asset-Backed Securities Trust | | | | | | | | |
0.71%, 10/27/32† | | $ | 15,670 | | | $ | 14,023 | |
0.71%, 12/25/33† | | | 207,940 | | | | 185,913 | |
Education Funding Capital Trust I | | | | | | | | |
2.43%, 12/15/42† | | | 100,000 | | | | 94,623 | |
EMC Mortgage Loan Trust | | | | | | | | |
0.91%, 02/25/41 144A† | | | 62,144 | | | | 52,144 | |
GSAA Trust | | | | | | | | |
0.53%, 07/25/37† | | | 200,000 | | | | 130,398 | |
Hertz Vehicle Financing LLC | | | | | | | | |
5.29%, 03/25/16 144A | | | 90,000 | | | | 96,920 | |
Illinois Student Assistance Commission | | | | | | | | |
1.19%, 07/25/45† | | | 200,000 | | | | 189,932 | |
KeyCorporation Student Loan Trust | | | | | | | | |
0.55%, 10/25/32† | | | 64,239 | | | | 62,538 | |
Lehman XS Trust | | | | | | | | |
0.56%, 11/25/35† | | | 220,120 | | | | 169,142 | |
0.56%, 12/25/35† | | | 111,663 | | | | 46,551 | |
0.38%, 06/25/37† | | | 142,373 | | | | 89,858 | |
0.52%, 02/25/46† | | | 240,124 | | | | 146,894 | |
0.33%, 08/25/46† | | | 11,962 | | | | 11,855 | |
MASTR Specialized Loan Trust | | | | | | | | |
0.61%, 05/25/37 144A† | | | 218,513 | | | | 109,558 | |
Nelnet Student Loan Trust | | | | | | | | |
1.77%, 04/25/24† | | | 80,000 | | | | 81,881 | |
Northstar Education Finance, Inc. | | | | | | | | |
1.76%, 01/29/46† | | | 100,000 | | | | 83,906 | |
Option One Mortgage Loan Trust | | | | | | | | |
1.06%, 11/25/32† | | | 21,210 | | | | 17,452 | |
Renaissance Home Equity Loan Trust | | | | | | | | |
1.12%, 06/25/33† | | | 23,453 | | | | 20,827 | |
Securitized Asset-Backed Receivables LLC Trust | | | | | | | | |
0.49%, 02/25/37† | | | 223,583 | | | | 107,227 | |
SLM Student Loan Trust | | | | | | | | |
0.73%, 09/16/24† | | | 100,000 | | | | 92,678 | |
1.05%, 03/15/33 144A† | | | 99,792 | | | | 97,338 | |
Student Loan Consolidation Center | | | | | | | | |
1.80%, 07/01/42 144AW† | | | 100,000 | | | | 90,723 | |
| | | | | | | | |
Total Asset-Backed Securities
(Cost $2,563,878) | | | | 2,058,722 | |
| | | | |
CORPORATE BONDS — 2.2% | |
AES Corporation | | | | | | | | |
7.75%, 10/15/15 | | | 30,000 | | | | 32,175 | |
8.00%, 06/01/20D | | | 190,000 | | | | 202,350 | |
Ally Financial, Inc. | | | | | | | | |
6.63%, 05/15/12D | | | 348,000 | | | | 362,790 | |
1.75%, 10/30/12D | | | 100,000 | | | | 101,817 | |
American Express Co. | | | | | | | | |
8.13%, 05/20/19 | | | 60,000 | | | | 74,771 | |
6.80%, 09/01/66† | | | 140,000 | | | | 139,650 | |
American International Group, Inc. | | | | | | | | |
5.85%, 01/16/18D | | | 180,000 | | | | 186,139 | |
| | | | |
| 156 | | See Notes to Financial Statements. | | |
| | | | | | | | |
| | | Par | | | Value | |
Anadarko Petroleum Corporation | | | | | | | | |
6.45%, 09/15/36 | | $ | 100,000 | | | $ | 100,050 | |
Apache Corporation | | | | | | | | |
5.63%, 01/15/17D | | | 110,000 | | | | 125,620 | |
AT&T, Inc. | | | | | | | | |
5.50%, 02/01/18 | | | 90,000 | | | | 100,127 | |
6.30%, 01/15/38 | | | 90,000 | | | | 95,261 | |
BAC Capital Trust XIV | | | | | | | | |
5.63%, 09/20/49†D | | | 10,000 | | | | 7,177 | |
Baker Hughes, Inc. | | | | | | | | |
7.50%, 11/15/18 | | | 60,000 | | | | 75,353 | |
Bank of America Corporation | | | | | | | | |
7.40%, 01/15/11 | | | 60,000 | | | | 60,099 | |
5.42%, 03/15/17 | | | 60,000 | | | | 59,534 | |
5.75%, 12/01/17 | | | 190,000 | | | | 198,000 | |
7.63%, 06/01/19 | | | 20,000 | | | | 23,065 | |
8.00%, 12/29/49†D | | | 60,000 | | | | 60,549 | |
Bear Stearns Cos. LLC | | | | | | | | |
7.25%, 02/01/18 | | | 30,000 | | | | 35,602 | |
Boeing Capital Corporation | | | | | | | | |
4.70%, 10/27/19 | | | 40,000 | | | | 42,485 | |
Boeing Co. | | | | | | | | |
4.88%, 02/15/20 | | | 60,000 | | | | 64,709 | |
Caterpillar Financial Services Corporation | | | | | | | | |
6.20%, 09/30/13 | | | 110,000 | | | | 123,574 | |
Cellco Partnership/Verizon Wireless Capital LLC | | | | | | | | |
8.50%, 11/15/18 | | | 60,000 | | | | 78,632 | |
Citigroup, Inc. | | | | | | | | |
6.50%, 08/19/13 | | | 60,000 | | | | 65,924 | |
6.00%, 12/13/13 | | | 110,000 | | | | 120,282 | |
6.38%, 08/12/14 | | | 30,000 | | | | 33,183 | |
5.00%, 09/15/14 | | | 160,000 | | | | 165,655 | |
5.50%, 10/15/14 | | | 60,000 | | | | 64,702 | |
6.88%, 03/05/38 | | | 120,000 | | | | 133,540 | |
Comcast Corporation | | | | | | | | |
6.50%, 01/15/17D | | | 120,000 | | | | 138,508 | |
5.15%, 03/01/20D | | | 100,000 | | | | 105,226 | |
5.65%, 06/15/35 | | | 10,000 | | | | 9,746 | |
Community Health Systems, Inc. | | | | | | | | |
8.88%, 07/15/15 | | | 30,000 | | | | 31,575 | |
ConocoPhillips Holding Co. | | | | | | | | |
6.95%, 04/15/29 | | | 120,000 | | | | 147,890 | |
Countrywide Financial Corporation | | | | | | | | |
6.25%, 05/15/16 | | | 50,000 | | | | 51,332 | |
COX Communications, Inc. | | | | | | | | |
5.45%, 12/15/14 | | | 30,000 | | | | 33,056 | |
CVS Caremark Corporation | | | | | | | | |
6.60%, 03/15/19 | | | 80,000 | | | | 93,821 | |
CVS Pass-Through Trust | | | | | | | | |
6.94%, 01/10/30 | | | 84,413 | | | | 92,016 | |
Dominion Resources, Inc. | | | | | | | | |
5.70%, 09/17/12 | | | 120,000 | | | | 129,178 | |
Duke Energy Carolinas LLC | | | | | | | | |
5.63%, 11/30/12 | | | 130,000 | | | | 140,935 | |
Energy Future Holdings Corporation | | | | | | | | |
11.25%, 11/01/17 PIKD | | | 120,318 | | | | 72,792 | |
Energy Future Intermediate Holding Co., LLC | | | | | | | | |
10.00%, 12/01/20D | | | 270,000 | | | | 279,794 | |
Energy Transfer Partners LP | | | | | | | | |
9.00%, 04/15/19D | | | 70,000 | | | | 87,829 | |
Enterprise Products Operating LLC | | | | | | | | |
6.30%, 09/15/17 | | | 170,000 | | | | 192,090 | |
FirstEnergy Corporation | | | | | | | | |
7.38%, 11/15/31 | | | 150,000 | | | | 158,554 | |
Ford Motor Credit Co., LLC | | | | | | | | |
12.00%, 05/15/15 | | | 140,000 | | | | 176,267 | |
Freeport-McMoRan Copper & Gold, Inc. | | | | | | | | |
8.38%, 04/01/17 | | | 145,000 | | | | 160,603 | |
General Electric Capital Corporation | | | | | | | | |
6.00%, 08/07/19 | | | 260,000 | | | | 289,765 | |
5.50%, 01/08/20 | | | 100,000 | | | | 107,140 | |
6.38%, 11/15/67†D | | | 130,000 | | | | 129,188 | |
Goldman Sachs Capital II | | | | | | | | |
5.79%, 06/01/43†D | | | 10,000 | | | | 8,525 | |
Goldman Sachs Group, Inc. | | | | | | | | |
6.60%, 01/15/12 | | | 10,000 | | | | 10,577 | |
5.30%, 02/14/12D | | | 10,000 | | | | 10,467 | |
3.63%, 08/01/12 | | | 20,000 | | | | 20,648 | |
5.45%, 11/01/12 | | | 20,000 | | | | 21,400 | |
4.75%, 07/15/13 | | | 10,000 | | | | 10,659 | |
5.25%, 10/15/13 | | | 20,000 | | | | 21,658 | |
5.95%, 01/18/18 | | | 100,000 | | | | 108,645 | |
5.38%, 03/15/20 | | | 60,000 | | | | 62,114 | |
6.00%, 06/15/20D | | | 40,000 | | | | 43,305 | |
HCA, Inc. | | | | | | | | |
9.63%, 11/15/16 PIK | | | 52,593 | | | | 56,472 | |
Hess Corporation | | | | | | | | |
8.13%, 02/15/19 | | | 100,000 | | | | 126,533 | |
7.30%, 08/15/31 | | | 120,000 | | | | 144,331 | |
HSBC Finance Corporation | | | | | | | | |
6.68%, 01/15/21 144A | | | 120,000 | | | | 121,454 | |
Humana, Inc. | | | | | | | | |
7.20%, 06/15/18D | | | 60,000 | | | | 67,878 | |
International Lease Finance Corporation | | | | | | | | |
6.50%, 09/01/14 144AD | | | 30,000 | | | | 31,950 | |
6.75%, 09/01/16 144A | | | 150,000 | | | | 160,875 | |
JPMorgan Chase & Co. | | | | | | | | |
6.13%, 06/27/17 | | | 200,000 | | | | 219,722 | |
4.40%, 07/22/20 | | | 60,000 | | | | 59,169 | |
4.25%, 10/15/20D | | | 60,000 | | | | 58,715 | |
Kerr-McGee Corporation | | | | | | | | |
7.88%, 09/15/31 | | | 30,000 | | | | 34,484 | |
Kinder Morgan Energy Partners LP | | | | | | | | |
6.00%, 02/01/17 | | | 70,000 | | | | 77,383 | |
6.95%, 01/15/38 | | | 40,000 | | | | 43,602 | |
Kraft Foods, Inc. | | | | | | | | |
5.38%, 02/10/20D | | | 110,000 | | | | 118,604 | |
Kroger Co. | | | | | | | | |
6.15%, 01/15/20 | | | 70,000 | | | | 79,461 | |
L-3 Communications Corporation | | | | | | | | |
6.38%, 10/15/15 | | | 85,000 | | | | 87,975 | |
Lehman Brothers Holdings Capital Trust VII | | | | | | | | |
5.86%, 11/29/49# | | | 10,000 | | | | 3 | |
| | | | |
| | See Notes to Financial Statements. | | 157 |
| | |
| SMALL CAP EQUITY FUND | | |
| SCHEDULE OF INVESTMENTS (Continued) | | |
| | | | | | | | |
| | | Par | | | Value | |
Lehman Brothers Holdings E-Capital Trust I | | | | | | | | |
3.59%, 08/19/65# | | $ | 50,000 | | | $ | 15 | |
Lehman Brothers Holdings, Inc. | | | | | | | | |
6.50%, 07/19/17# | | | 160,000 | | | | 88 | |
6.75%, 12/28/17# | | | 120,000 | | | | 66 | |
Medtronic, Inc. | | | | | | | | |
4.45%, 03/15/20 | | | 40,000 | | | | 41,605 | |
Merrill Lynch & Co., Inc. | | | | | | | | |
5.45%, 02/05/13 | | | 220,000 | | | | 232,169 | |
MetLife, Inc. | | | | | | | | |
6.75%, 06/01/16D | | | 50,000 | | | | 58,065 | |
6.40%, 12/15/36 | | | 120,000 | | | | 113,400 | |
Morgan Stanley | | | | | | | | |
5.63%, 01/09/12D | | | 160,000 | | | | 167,104 | |
NRG Energy, Inc. | | | | | | | | |
7.38%, 02/01/16 | | | 30,000 | | | | 30,825 | |
Occidental Petroleum Corporation | | | | | | | | |
7.00%, 11/01/13 | | | 100,000 | | | | 115,698 | |
Pacific Gas & Electric Co. | | | | | | | | |
5.63%, 11/30/17 | | | 30,000 | | | | 33,823 | |
6.05%, 03/01/34 | | | 70,000 | | | | 76,890 | |
Pemex Project Funding Master Trust | | | | | | | | |
6.63%, 06/15/35 | | | 90,000 | | | | 92,024 | |
PepsiCo, Inc. | | | | | | | | |
7.90%, 11/01/18 | | | 13,000 | | | | 16,752 | |
Pfizer, Inc. | | | | | | | | |
6.20%, 03/15/19 | | | 100,000 | | | | 117,329 | |
Qwest Communications International, Inc. | | | | | | | | |
7.50%, 02/15/14 | | | 50,000 | | | | 50,875 | |
Raytheon Co. | | | | | | | | |
3.13%, 10/15/20 | | | 30,000 | | | | 27,720 | |
Reed Elsevier Capital, Inc. | | | | | | | | |
8.63%, 01/15/19 | | | 80,000 | | | | 101,866 | |
Roche Holdings, Inc. | | | | | | | | |
6.00%, 03/01/19 144A | | | 90,000 | | | | 104,828 | |
SLM Corporation | | | | | | | | |
2.76%, 04/01/14† | | | 30,000 | | | | 27,064 | |
Sprint Capital Corporation | | | | | | | | |
6.90%, 05/01/19D | | | 100,000 | | | | 99,250 | |
Steel Dynamics, Inc. | | | | | | | | |
7.38%, 11/01/12 | | | 25,000 | | | | 26,500 | |
SunTrust Capital VIII | | | | | | | | |
6.10%, 12/15/36†D | | | 100,000 | | | | 91,783 | |
Teachers Insurance & Annuity Association of America | | | | | | | | |
6.85%, 12/16/39 144A | | | 60,000 | | | | 70,441 | |
Time Warner Cable, Inc. | | | | | | | | |
6.75%, 07/01/18D | | | 110,000 | | | | 128,417 | |
4.13%, 02/15/21 | | | 20,000 | | | | 19,070 | |
7.30%, 07/01/38D | | | 90,000 | | | | 105,578 | |
5.88%, 11/15/40 | | | 90,000 | | | | 89,353 | |
Time Warner, Inc. | | | | | | | | |
4.70%, 01/15/21 | | | 30,000 | | | | 30,606 | |
United Parcel Service, Inc. | | | | | | | | |
4.50%, 01/15/13 | | | 50,000 | | | | 53,512 | |
UnitedHealth Group, Inc. | | | | | | | | |
4.88%, 02/15/13 | | | 100,000 | | | | 106,518 | |
Verizon Global Funding Corporation | | | | | | | | |
7.38%, 09/01/12 | | | 100,000 | | | | 110,452 | |
Wachovia Corporation | | | | | | | | |
5.63%, 10/15/16 | | | 270,000 | | | | 294,082 | |
WellPoint, Inc. | | | | | | | | |
5.88%, 06/15/17D | | | 110,000 | | | | 123,125 | |
Williams Cos., Inc. | | | | | | | | |
7.88%, 09/01/21 | | | 38,000 | | | | 44,937 | |
7.50%, 01/15/31 | | | 23,000 | | | | 25,900 | |
7.75%, 06/15/31 | | | 38,000 | | | | 42,974 | |
8.75%, 03/15/32D | | | 8,000 | | | | 9,814 | |
Williams Partners LP | | | | | | | | |
5.25%, 03/15/20 | | | 110,000 | | | | 114,234 | |
Windstream Corporation | | | | | | | | |
8.63%, 08/01/16 | | | 20,000 | | | | 21,150 | |
Wyeth | | | | | | | | |
5.95%, 04/01/37 | | | 60,000 | | | | 66,628 | |
| | | | | | | | |
Total Corporate Bonds
(Cost $10,084,129) | | | | | | | 10,449,259 | |
| | | | | | | | |
FOREIGN BONDS — 0.7% | |
Australia — 0.1% | | | | | | | | |
BHP Billiton Finance (USA) Ltd. | | | | | | | | |
6.50%, 04/01/19D | | | 130,000 | | | | 154,842 | |
Commonwealth Bank of Australia | | | | | | | | |
3.75%, 10/15/14 144A | | | 60,000 | | | | 62,299 | |
5.00%, 10/15/19 144A | | | 20,000 | | | | 20,971 | |
Rio Tinto Finance USA, Ltd. | | | | | | | | |
9.00%, 05/01/19 | | | 180,000 | | | | 242,127 | |
| | | | | | | | |
| | | | | | | 480,239 | |
| | | | | | | | |
Canada — 0.1% | | | | | | | | |
Anadarko Finance Co. | | | | | | | | |
7.50%, 05/01/31 | | | 60,000 | | | | 66,525 | |
Barrick Gold Corporation | | | | | | | | |
6.95%, 04/01/19D | | | 100,000 | | | | 122,907 | |
Devon Financing Corporation ULC | | | | | | | | |
6.88%, 09/30/11 | | | 150,000 | | | | 156,735 | |
Potash Corporation of Saskatchewan, Inc. | | | | | | | | |
4.88%, 03/30/20 | | | 20,000 | | | | 20,933 | |
| | | | | | | | |
| | | | | | | 367,100 | |
| | | | | | | | |
Cayman Islands — 0.1% | | | | | | | | |
Petrobras International Finance Co. | | | | | | | | |
6.13%, 10/06/16 | | | 40,000 | | | | 44,201 | |
5.75%, 01/20/20 | | | 32,000 | | | | 33,362 | |
Resona Preferred Global Securities Cayman, Ltd. | | | | | | | | |
7.19%, 12/29/49† | | | 60,000 | | | | 59,607 | |
Vale Overseas, Ltd. | | | | | | | | |
6.88%, 11/21/36 | | | 60,000 | | | | 66,149 | |
| | | | | | | | |
| | | | | | | 203,319 | |
| | | | | | | | |
France — 0.1% | | | | | | | | |
Compagnie Generale de Geophysique - Veritas | | | | | | | | |
7.50%, 05/15/15 | | | 50,000 | | | | 51,125 | |
Credit Agricole SA | | | | | | | | |
8.38%, 10/13/19 144A†D | | | 120,000 | | | | 123,900 | |
Total Capital SA | | | | | | | | |
4.45%, 06/24/20D | | | 10,000 | | | | 10,385 | |
| | | | | | | | |
| | | | | | | 185,410 | |
| | | | | | | | |
| | | | |
| 158 | | See Notes to Financial Statements. | | |
| | | | | | | | |
| | | Par | | | Value | |
Germany — 0.1% | | | | | | | | |
Kreditanstalt fuer Wiederaufbau | | | | | | | | |
4.63%, 01/20/11 | | $ | 290,000 | | | $ | 290,447 | |
| | | | | | | | |
Iceland — 0.0% | | | | | | | | |
Glitnir Banki HF | | | | | | | | |
6.69%, 06/15/16 144A#@ | | | 130,000 | | | | 1 | |
Kaupthing Bank HF | | | | | | | | |
7.63%, 02/28/15 144A#@ | | | 310,000 | | | | 84,475 | |
| | | | | | | | |
| | | | | | | 84,476 | |
| | | | | | | | |
India — 0.0% | | | | | | | | |
ICICI Bank, Ltd. | | | | | | | | |
6.38%, 04/30/22 144A† | | | 110,000 | | | | 110,566 | |
| | | | | | | | |
Italy — 0.0% | | | | | | | | |
Telecom Italia Capital SA | | | | | | | | |
5.25%, 10/01/15 | | | 60,000 | | | | 61,496 | |
| | | | | | | | |
Japan — 0.1% | | | | | | | | |
Bank of Tokyo-Mitsubishi UFJ, Ltd. | | | | | | | | |
3.85%, 01/22/15 144A | | | 100,000 | | | | 104,356 | |
Japan Finance Cooperation | | | | | | | | |
2.88%, 02/02/15D | | | 200,000 | | | | 204,797 | |
Sumitomo Mitsui Banking Corporation | | | | | | | | |
3.15%, 07/22/15 144A | | | 100,000 | | | | 101,887 | |
| | | | | | | | |
| | | | | | | 411,040 | |
| | | | | | | | |
Jersey — 0.0% | | | | | | | | |
United Business Media, Ltd. | | | | | | | | |
5.75%, 11/03/20 144A | | | 30,000 | | | | 28,855 | |
| | | | | | | | |
Luxembourg — 0.0% | | | | | | | | |
FMC Finance III SA | | | | | | | | |
6.88%, 07/15/17 | | | 40,000 | | | | 42,600 | |
| | | | | | | | |
Mexico — 0.0% | | | | | | | | |
America Movil SAB de CV | | | | | | | | |
5.63%, 11/15/17D | | | 30,000 | | | | 32,855 | |
Mexico Government International Bond | | | | | | | | |
6.75%, 09/27/34 | | | 40,000 | | | | 45,200 | |
6.05%, 01/11/40 | | | 10,000 | | | | 10,275 | |
| | | | | | | | |
| | | | | | | 88,330 | |
| | | | | | | | |
Netherlands — 0.0% | | | | | | | | |
Deutsche Telekom International Finance BV | | | | | | | | |
5.75%, 03/23/16 | | | 75,000 | | | | 84,095 | |
Shell International Finance BV | | | | | | | | |
4.38%, 03/25/20 | | | 90,000 | | | | 94,576 | |
| | | | | | | | |
| | | | | | | 178,671 | |
| | | | | | | | |
Russia — 0.0% | | | | | | | | |
Russian Federation | | | | | | | | |
7.50%, 03/31/30 STEP | | | 11,635 | | | | 13,485 | |
| | | | | | | | |
Spain — 0.0% | | | | | | | | |
Santander US Debt SA Unipersonal | | | | | | | | |
3.72%, 01/20/15 144AD | | | 100,000 | | | | 94,833 | |
Telefonica Emisiones SAU | | | | | | | | |
5.13%, 04/27/20 | | | 80,000 | | | | 77,160 | |
| | | | | | | | |
| | | | | | | 171,993 | |
| | | | | | | | |
Switzerland — 0.0% | | | | | | | | |
UBS AG | | | | | | | | |
4.88%, 08/04/20D | | | 80,000 | | | | 81,542 | |
| | | | | | | | |
United Kingdom — 0.1% | | | | | | | | |
BP Capital Markets PLC | | | | | | | | |
5.25%, 11/07/13 | | | 90,000 | | | | 97,536 | |
3.88%, 03/10/15D | | | 30,000 | | | | 30,974 | |
Lloyds TSB Bank PLC | | | | | | | | |
4.38%, 01/12/15 144AD | | | 100,000 | | | | 100,069 | |
Royal Bank of Scotland PLC | | | | | | | | |
4.88%, 03/16/15D | | | 100,000 | | | | 102,389 | |
3.95%, 09/21/15 | | | 80,000 | | | | 78,726 | |
Royal Bank of Scotland Group PLC | | | | | | | | |
6.40%, 10/21/19 | | | 100,000 | | | | 101,385 | |
WPP Finance UK | | | | | | | | |
8.00%, 09/15/14 | | | 100,000 | | | | 115,138 | |
| | | | | | | | |
| | | | | | | 626,217 | |
| | | | | | | | |
Total Foreign Bonds
(Cost $3,529,933) | | | | | | | 3,425,786 | |
| | | | | | | | |
MORTGAGE-BACKED SECURITIES — 4.4% | |
American Home Mortgage Investment Trust | | | | | | | | |
0.96%, 04/25/44† | | | 33,668 | | | | 28,509 | |
0.55%, 11/25/45† | | | 205,215 | | | | 137,639 | |
Bear Stearns Adjustable Rate Mortgage Trust | | | | | | | | |
3.31%, 02/25/35† | | | 76,689 | | | | 62,664 | |
2.94%, 08/25/35† | | | 213,742 | | | | 154,439 | |
Bear Stearns Mortgage Funding Trust | | | | | | | | |
0.47%, 12/25/36† | | | 214,958 | | | | 59,111 | |
Commercial Mortgage Lease-Backed Certificates | | | | | | | | |
6.75%, 06/20/31 144A | | | 237,175 | | | | 259,925 | |
Countrywide Alternative Loan Trust | | | | | | | | |
0.50%, 07/25/35† | | | 198,395 | | | | 120,302 | |
0.52%, 07/25/35† | | | 257,834 | | | | 162,615 | |
Credit Suisse Mortgage Capital Certificates | | | | | | | | |
5.54%, 02/15/39† | | | 110,000 | | | | 118,367 | |
CS First Boston Mortgage Securities Corporation | | | | | | | | |
6.00%, 10/25/35 | | | 114,315 | | | | 76,936 | |
Federal Home Loan Mortgage Corporation | | | | | | | | |
5.83%, 05/01/37† | | | 17,803 | | | | 18,828 | |
5.50%, 01/01/39 TBA | | | 1,500,000 | | | | 1,598,438 | |
Federal Home Loan Mortgage Corporation REMIC | | | | | | | | |
4.00%, 12/15/38 | | | 100,000 | | | | 97,815 | |
Federal National Mortgage Association | | | | | | | | |
3.50%, 01/01/26 TBA | | | 1,700,000 | | | | 1,711,687 | |
6.50%, 01/14/28 TBA | | | 400,000 | | | | 444,500 | |
2.78%, 09/01/35† | | | 82,852 | | | | 86,804 | |
6.00%, 01/01/39 TBA | | | 1,500,000 | | | | 1,630,312 | |
6.00%, 02/01/39 TBA | | | 1,000,000 | | | | 1,085,000 | |
4.50%, 01/01/40 TBA | | | 400,000 | | | | 410,562 | |
5.50%, 01/01/40 TBA | | | 1,000,000 | | | | 1,069,844 | |
5.50%, 02/01/40 TBA | | | 500,000 | | | | 533,984 | |
3.50%, 01/01/41 TBA | | | 100,000 | | | | 95,500 | |
4.00%, 01/01/41 TBA | | | 2,100,000 | | | | 2,088,845 | |
| | | | |
| | See Notes to Financial Statements. | | 159 |
| | |
SMALL CAP EQUITY FUND SCHEDULE OF INVESTMENTS (Continued) | | |
| | |
| | | | | | | | |
| | | Par | | | Value | |
FHLMC Multifamily Structured Pass Through Certificates | | | | | | | | |
1.24%, 04/25/20 IOW† | | $ | 179,290 | | | $ | 13,551 | |
1.69%, 06/25/20 IOW† | | | 249,467 | | | | 25,893 | |
FHLMC MultiFamily Structured Pass Through Certificates | | | | | | | | |
1.52%, 08/25/20 IOW† | | | 209,820 | | | | 19,409 | |
First Horizon Alternative Mortgage Securities | | | | | | | | |
2.36%, 02/25/36† | | | 155,290 | | | | 106,525 | |
0.63%, 02/25/37† | | | 85,291 | | | | 44,002 | |
General Electric Capital Commercial Mortgage Corporation | | | | | | | | |
5.34%, 03/10/44† | | | 300,000 | | | | 322,974 | |
GMAC Commercial Mortgage Securities, Inc. | | | | | | | | |
5.24%, 11/10/45† | | | 100,000 | | | | 106,116 | |
Government National Mortgage Association | | | | | | | | |
10.20%, 10/20/33 IOW† | | | 1,020,454 | | | | 112,351 | |
25.17%, 03/20/35 IOW† | | | 465,144 | | | | 46,500 | |
25.18%, 03/20/35 IOW† | | | 542,668 | | | | 54,242 | |
6.00%, 01/01/38 TBA | | | 200,000 | | | | 219,906 | |
6.00%, 01/01/39 TBA | | | 300,000 | | | | 328,455 | |
5.00%, 01/15/40 | | | 483,079 | | | | 517,293 | |
5.00%, 08/20/40 | | | 196,424 | | | | 208,937 | |
3.50%, 01/01/41 TBA | | | 400,000 | | | | 385,125 | |
4.00%, 01/01/41 TBA | | | 1,500,000 | | | | 1,508,684 | |
4.50%, 01/01/41 TBA | | | 900,000 | | | | 934,312 | |
5.50%, 01/01/41 TBA | | | 500,000 | | | | 540,312 | |
1.40%, 11/20/59† | | | 298,240 | | | | 311,010 | |
1.25%, 05/20/60† | | | 168,624 | | | | 169,985 | |
Greenpoint Mortgage Funding Trust | | | | | | | | |
0.52%, 10/25/45† | | | 55,579 | | | | 37,037 | |
GS Mortgage Securities Corporation II | | | | | | | | |
6.71%, 08/15/18 144A | | | 110,000 | | | | 112,526 | |
GSMPS Mortgage Loan Trust | | | | | | | | |
0.61%, 03/25/35 144A† | | | 34,244 | | | | 28,775 | |
0.61%, 09/25/35 144A† | | | 101,259 | | | | 84,003 | |
Harborview Mortgage Loan Trust | | | | | | | | |
0.50%, 06/19/35† | | | 252,692 | | | | 171,217 | |
Homestar Mortgage Acceptance Corporation | | | | | | | | |
0.71%, 07/25/34† | | | 87,211 | | | | 76,037 | |
Impac CMB Trust | | | | | | | | |
1.06%, 03/25/33† | | | 18,596 | | | | 14,209 | |
Indymac INDA Mortgage Loan Trust | | | | | | | | |
5.87%, 11/25/37† | | | 120,146 | | | | 96,548 | |
MASTR Adjustable Rate Mortgages Trust | | | | | | | | |
2.90%, 11/21/34† | | | 200,000 | | | | 185,620 | |
1.13%, 12/25/46† | | | 278,511 | | | | 78,256 | |
Merrill Lynch Mortgage Investors, Inc. | | | | | | | | |
5.02%, 05/25/34† | | | 33,069 | | | | 33,288 | |
Morgan Stanley Capital I | | | | | | | | |
5.69%, 04/15/49† | | | 200,000 | | | | 207,279 | |
NCUA Guaranteed Notes | | | | | | | | |
2.65%, 10/29/20 | | | 49,753 | | | | 48,446 | |
2.90%, 10/29/20 | | | 10,000 | | | | 9,723 | |
RBSSP Resecuritization Trust | | | | | | | | |
3.44%, 12/26/35 144A† | | | 40,246 | | | | 40,820 | |
Residential Accredit Loans, Inc. | | | | | | | | |
3.22%, 12/26/34† | | | 252,132 | | | | 183,926 | |
0.66%, 10/25/45† | | | 153,134 | | | | 85,459 | |
Structured Adjustable Rate Mortgage Loan Trust | | | | | | | | |
2.72%, 11/25/34† | | | 72,829 | | | | 57,687 | |
Structured Asset Mortgage Investments, Inc. | | | | | | | | |
0.47%, 08/25/36† | | | 247,176 | | | | 154,371 | |
0.44%, 09/25/47† | | | 299,148 | | | | 174,181 | |
Structured Asset Securities Corporation | | | | | | | | |
0.56%, 10/25/27† | | | 25,972 | | | | 22,946 | |
Washington Mutual Alternative Mortgage Pass-Through Certificates | | | | | | | | |
1.17%, 05/25/47† | | | 298,689 | | | | 89,410 | |
Washington Mutual Mortgage Pass Through Certificates | | | | | | | | |
2.66%, 02/25/33† | | | 32,687 | | | | 31,865 | |
Washington Mutual Mortgage Pass-Through Certificates | | | | | | | | |
5.49%, 11/25/36† | | | 209,442 | | | | 161,757 | |
0.58%, 08/25/45† | | | 134,855 | | | | 113,981 | |
Wells Fargo Mortgage Loan Trust | | | | | | | | |
3.15%, 08/27/35 144A† | | | 101,436 | | | | 97,748 | |
Wells Fargo Mortgage-Backed Securities Trust | | | | | | | | |
0.66%, 05/25/33† | | | 47,310 | | | | 47,453 | |
2.90%, 04/25/36† | | | 114,684 | | | | 104,468 | |
| | | | | | | | |
Total Mortgage-Backed Securities
(Cost $21,947,828) | | | | 20,577,244 | |
| | | | | | | | |
MUNICIPAL BONDS — 0.1% | |
Los Angeles Department of Water & Power, Build America Revenue Bond | | | | | | | | |
6.57%, 07/01/45 | | | 30,000 | | | | 30,627 | |
Municipal Electric Authority of Georgia, Series B Revenue Bond | | | | | | | | |
6.64%, 04/01/57 | | | 30,000 | | | | 29,355 | |
6.66%, 04/01/57 | | | 10,000 | | | | 9,682 | |
North Carolina State Education Assistance Authority, Student Loan Backed Notes Revenue Bond Series 2010-1, Cl A1 | | | | | | | | |
1.20%, 07/25/41 | | | 100,000 | | | | 97,215 | |
North Texas Higher Education Authority, Series 1 Revenue Bond | | | | | | | | |
1.19%, 07/01/30† | | | 95,000 | | | | 92,148 | |
State of California General Obligation Bond | | | | | | | | |
7.30%, 10/01/39 | | | 50,000 | | | | 50,405 | |
| | | | | | | | |
Total Municipal Bonds
(Cost $312,806) | | | | | | | 309,432 | |
| | | | | | | | |
| | | | |
| 160 | | See Notes to Financial Statements. | | |
| | | | | | | | |
| | | Par | | | Value | |
U.S. TREASURY OBLIGATIONS — 2.7% | |
U.S. Treasury Bills | | | | | | | | |
0.63%, 01/13/11D | | $ | 1,000,000 | | | $ | 999,971 | |
0.17%, 05/05/11‡‡ | | | 1,500,000 | | | | 1,499,304 | |
0.18%, 05/05/11‡‡ | | | 500,000 | | | | 499,768 | |
| | | | | | | | |
| | | | | | | 2,999,043 | |
| | | | | | | | |
U.S. Treasury Bonds | | | | | | | | |
8.00%, 11/15/21 | | | 90,000 | | | | 127,308 | |
4.50%, 08/15/39 | | | 10,000 | | | | 10,270 | |
4.38%, 11/15/39D | | | 620,000 | | | | 623,391 | |
| | | | | | | | |
| | | | | | | 760,969 | |
| | | | | | | | |
U.S. Treasury Inflationary Index Bonds | | | | | | | | |
2.38%, 01/15/27D | | | 55,000 | | | | 66,436 | |
1.75%, 01/15/28D | | | 100,000 | | | | 106,531 | |
2.50%, 01/15/29D | | | 40,000 | | | | 46,361 | |
3.88%, 04/15/29 | | | 10,000 | | | | 17,884 | |
2.13%, 02/15/40 | | | 160,000 | | | | 171,991 | |
| | | | | | | | |
| | | | | | | 409,203 | |
| | | | | | | | |
U.S. Treasury Notes | | | | | | | | |
1.38%, 02/15/13 | | | 250,000 | | | | 253,809 | |
0.75%, 12/15/13D | | | 140,000 | | | | 139,027 | |
2.13%, 12/31/15 | | | 190,000 | | | | 191,039 | |
2.75%, 05/31/17D | | | 880,000 | | | | 891,344 | |
2.25%, 11/30/17D | | | 3,490,000 | | | | 3,394,297 | |
3.50%, 05/15/20 | | | 1,530,000 | | | | 1,567,542 | |
2.63%, 08/15/20 | | | 460,000 | | | | 436,173 | |
2.63%, 11/15/20D | | | 740,000 | | | | 698,144 | |
4.25%, 11/15/40D | | | 900,000 | | | | 885,515 | |
| | | | | | | | |
| | | | | | | 8,456,890 | |
| | | | | | | | |
Total U.S. Treasury Obligations
(Cost $12,799,927) | | | | 12,626,105 | |
| | | | | | | | |
TOTAL INVESTMENTS — 133.3%
(Cost $549,914,546) | | | | 632,442,039 | |
| | | | | | | | |
Liabilities in Excess of Other Assets — (33.3)% | | | | (157,946,805 | ) |
| | | | | | | | |
NET ASSETS — 100.0% | | | | | | $ | 474,495,234 | |
| | | | | | | | |
Please see abbreviation and footnote definitions beginning on page 180.
PORTFOLIO SUMMARY (based on net assets)
| | | | |
| | | % | |
Money Market Funds | | | 35.8 | |
Financial Services | | | 16.8 | |
Technology | | | 12.7 | |
Consumer Discretionary | | | 12.4 | |
Producer Durables | | | 12.4 | |
Healthcare | | | 9.5 | |
Materials & Processing | | | 7.7 | |
Energy | | | 6.2 | |
Mortgage-Backed Securities | | | 4.4 | |
Utilities | | | 4.2 | |
U.S. Treasury Obligations | | | 2.7 | |
Agency Obligations | | | 2.3 | |
Corporate Bonds | | | 2.2 | |
Consumer Staples | | | 1.9 | |
Foreign Common Stocks | | | 0.9 | |
Foreign Bonds | | | 0.7 | |
Asset-Backed Securities | | | 0.4 | |
Forward Foreign Currency Contracts | | | 0.2 | |
Futures Contracts | | | 0.2 | |
Municipal Bonds | | | 0.1 | |
Preferred Stocks | | | — | ** |
| | | | |
| | | 133.7 | |
| | | | |
| ** | Rounds to less than 0.005%. |
| | | | |
| | See Notes to Financial Statements. | | 161 |
| | |
| SMALL CAP EQUITY FUND | | |
| SCHEDULE OF INVESTMENTS (Continued) | | |
VALUATION HIERARCHY
The following is a summary of the inputs used, as of December 31, 2010, in valuing the Fund’s assets carried at fair value:
| | | | | | | | |
Valuation Inputs | | Investments
in
Securities | | | Other
Financial
Instruments*** | |
Assets: | | | | | | | | |
Level 1 — Quoted Prices | | | | | | | | |
Common Stocks | | $ | 397,107,552 | | | $ | — | |
Foreign Common Stocks | | | 4,301,009 | | | | — | |
Futures Contracts | | | — | | | | 1,159,627 | |
Money Market Funds | | | 169,966,652 | | | | — | |
Preferred Stocks | | | 5,231 | | | | — | |
Level 2 — Other Significant | | | | | | | | |
Observable Inputs | | | | | | | | |
Agency Obligations | | | 11,054,497 | | | | — | |
Asset-Backed Securities | | | 2,058,722 | | | | — | |
Corporate Bonds | | | 10,449,259 | | | | — | |
Foreign Bonds | | | 3,425,786 | | | | — | |
Mortgage-Backed Securities | | | 20,577,244 | | | | — | |
Municipal Bonds | | | 309,432 | | | | — | |
U.S. Treasury Obligations | | | 12,626,105 | | | | — | |
Level 3 — Significant Unobservable Inputs | | | | | | | | |
Common Stocks | | | 560,550 | | | | — | |
| | | | | | | | |
Total Assets | | $ | 632,442,039 | | | $ | 1,159,627 | |
| | | | | | | | |
| | |
Liabilities: | | | | | | | | |
Level 1 — Quoted Prices | | $ | — | | | $ | — | |
Level 2 — Other Significant Observable Inputs | | | — | | | | — | |
Forward Foreign Currency Contracts | | | — | | | | (7,564 | ) |
Level 3 — Significant Unobservable Inputs | | | — | | | | — | |
| | | | | | | | |
Total Liabilities | | $ | — | | | $ | (7,564 | ) |
| | | | | | | | |
| *** | Other financial instruments are derivative instruments not reflected in the Schedule of Investments, such as futures, forwards and swap contracts, which are valued at the unrealized appreciation (depreciation) on the investment. Details of these investments can be found in the Notes to Financial Statements. |
The following is a reconciliation of assets in which significant unobservable inputs (Level 3) were used in determining fair value:
| | | | | | | | |
| | | Investments
in
Securities | | | Other
Financial
Instruments*** | |
Balance, 12/31/09 | | | | | | | | |
Common Stocks | | $ | 613,575 | | | $ | — | |
Realized gain (loss)(1) | | | | | | | | |
Common Stocks | | | — | | | | — | |
Changed in unrealized appreciation (depreciation)(2) | | | | | | | | |
Common Stocks | | | (53,025 | ) | | | — | |
Purchases | | | | | | | | |
Common Stocks | | | — | | | | — | |
Sales | | | | | | | | |
Common Stocks | | | — | | | | — | |
Transfers in and/or out of Level 3 | | | | | | | | |
Common Stocks | | | — | | | | — | |
| | | | | | | | |
Balance, 12/31/10 | | $ | 560,550 | | | $ | — | |
| | | | | | | | |
| (1) | Realized gain (loss) from the sale of Level 3 securities can be found on the Statement of Operations in Net Realized Gain (loss) from Investment securities and securities sold short. |
| (2) | Change in unrealized appreciation (depreciation) can be found on the Statement of Operations in Net change in unrealized appreciation (depreciation) on Investment securities and securities sold short. |
| | | | |
| 162 | | See Notes to Financial Statements. | | |
| | |
| International Equity Fund | | |
During 2010, global equity markets advanced despite ongoing concerns of slower growth in China, the unresolved sovereign debt crisis in Europe and fears of a double dip recession in the U.S. The MSCI-EAFE Index (Net), a measure of international developed market returns, posted a one-year return of 7.75%. Emerging markets equities continued to experience solid gains as the MSCI Emerging Market Index (Net) returned 18.88% for the year.
From a country perspective, most of the markets within the MSCI All Country World ex-U.S. Index (representing both developed and emerging international markets) ended the year in positive territory. The best performing markets were primarily in emerging markets countries and included Peru, Chile, Columbia and Thailand. Negative performing markets included Greece, Spain and Ireland. From a sector perspective, all groups with the exception of the utilities sector generated positive results. Economically sensitive sectors tended to experience higher returns than defensive stocks. The consumer discretionary, industrials and materials sectors were among the best performers, while the utilities, healthcare and financials sectors lagged. The International Equity Fund is primarily comprised of international stocks located in developed countries, and to a lesser extent, in international stocks located in emerging markets. During 2010, global financial markets continued to stage a remarkable recovery from their lows in March 2009. The Fund posted a solid double-digit return but underperformed its benchmark, the MSCI ACWI (All Country World Index) Ex-U.S., for the one-year period ended December 31, 2010 (10.14% versus 11.15%). On a country basis, underweight exposure to Canada and a slight overweight exposure to Spain negatively impacted the Fund, while security selection to Denmark, India and the U.K. contributed positively to performance. On a sector basis, security selection to the telecommunication services sector detracted from benchmark-relative returns, while an underweight exposure and security selection to the financials sector added value over the course of the year.
Foreign securities may involve additional risks, social and political instability, reduced market liquidity and currency volatility.
Please see page 178 for information regarding specific portfolio allocations. Portfolio holdings are subject to change at any time.
| | |
| International Equity Fund | | |
Average Annual Total Returns as of 12/31/10
| | | | | | | | | | | | |
| | | GS2 Class* | | | GS4 Class* | | | Benchmark** | |
One Year | | | 10.45 | % | | | 10.14 | % | | | 11.15 | % |
Five Year | | | 3.05 | % | | | 2.85 | % | | | 4.82 | % |
Since Inception | | | 6.87 | % | | | 6.68 | % | | | 7.78 | % |
Inception Date | | | 08/27/01 | | | | 08/27/01 | | | | | |
Total Fund Operating Expenses (April 30, 2010 Prospectus, as supplemented on August 5, 2010)(1) | | | 1.18 | % | | | 1.37 | % | | | | |
| (1) | Current information regarding the Fund’s Operating Expenses can be found in the Financial Highlights. |
The performance data quoted represents past performance and does not guarantee future results. Current performance may be lower or higher. Performance data current to the most recent month-end may be obtained at www.GuideStoneFunds.org. The investment return and principal value of an investment will fluctuate so that shares, when redeemed, may be worth more or less than their original cost.
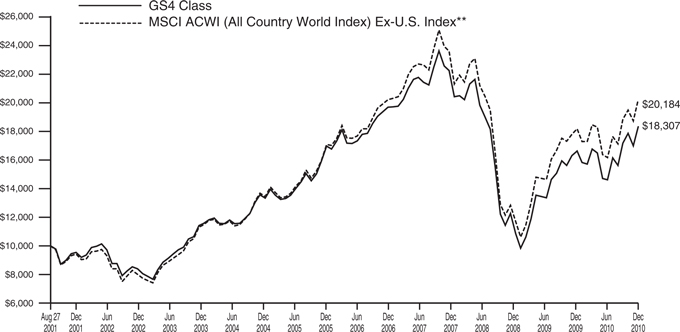
The graph compares the results of a hypothetical $10,000 investment in the GS4 Class of the Fund since August 27, 2001 (commencement of operations), with all dividends and capital gains reinvested, with the MSCI ACWI (All Country World Index) Ex-U.S. Index.
| * | These returns reflect expense waivers by the Fund’s investment adviser. Without these waivers, returns would have been lower. Returns shown do not reflect the deduction of taxes that a shareholder would pay on Fund distributions or the redemption of Fund shares. |
| ** | The MSCI ACWI (All Country World Index) Ex-U.S. Index is a free float-adjusted market capitalization index that is designed to measure equity market performance in the global developed (Ex-U.S.) and emerging markets. |
Unlike a mutual fund, the performance of an index assumes no taxes, transaction costs, management fees or other expenses.
| | |
| INTERNATIONAL EQUITY FUND | | |
| SCHEDULE OF INVESTMENTS | | December 31, 2010 |
| | | | | | | | |
| | | Shares | | | Value | |
FOREIGN COMMON STOCKS — 96.8% | |
Argentina — 0.1% | | | | | | | | |
Banco Macro SA ADRD | | | 14,500 | | | $ | 727,900 | |
| | | | | | | | |
Australia — 5.3% | | | | | | | | |
Ageas+ | | | 1,330 | | | | 490 | |
AGL Energy, Ltd. | | | 6,084 | | | | 94,772 | |
Alumina, Ltd. | | | 235,963 | | | | 598,529 | |
Amcor, Ltd.‡‡ | | | 799,244 | | | | 5,517,890 | |
AMP, Ltd.‡‡ | | | 8,518 | | | | 46,087 | |
Ansell, Ltd.‡‡ | | | 19,528 | | | | 253,260 | |
ASX, Ltd.‡‡ | | | 1,237 | | | | 47,673 | |
Australia & New Zealand Banking Group, Ltd.‡‡ | | | 95,632 | | | | 2,283,915 | |
AXA Asia Pacific Holdings, Ltd.‡‡ | | | 6,597 | | | | 42,576 | |
Bank of Queensland, Ltd. | | | 7,468 | | | | 79,361 | |
Bendigo and Adelaide Bank, Ltd. | | | 11,209 | | | | 114,072 | |
BGP Group REIT Entitlement Shares+*‡‡ | | | 63,198 | | | | — | |
BHP Billiton, Ltd.‡‡ | | | 282,153 | | | | 13,058,495 | |
BlueScope Steel, Ltd. | | | 877,556 | | | | 2,019,516 | |
Boral, Ltd. | | | 3,449 | | | | 17,038 | |
Brambles, Ltd.‡‡ | | | 7,446 | | | | 54,224 | |
Caltex Australia, Ltd.‡‡ | | | 12,451 | | | | 183,000 | |
Centamin Egypt, Ltd.* | | | 83,586 | | | | 229,881 | |
CFS Retail Property Trust REIT‡‡ | | | 12,495 | | | | 22,493 | |
Challenger, Ltd.‡‡ | | | 225,018 | | | | 1,081,695 | |
Coca-Cola Amatil, Ltd. | | | 152,975 | | | | 1,699,183 | |
Commonwealth Bank of Australia‡‡ | | | 8,631 | | | | 448,186 | |
Computershare, Ltd.‡‡ | | | 2,076 | | | | 22,889 | |
Consolidated Media Holdings, Ltd. | | | 15,786 | | | | 50,375 | |
CSL, Ltd. | | | 17,826 | | | | 661,654 | |
CSR, Ltd. | | | 38,462 | | | | 66,089 | |
Dexus Property Group REIT‡‡ | | | 21,504 | | | | 17,485 | |
DUET Group‡‡ | | | 116,008 | | | | 199,930 | |
DuluxGroup, Ltd.‡‡ | | | 5,036 | | | | 14,165 | |
Fairfax Media, Ltd.‡‡ | | | 95,727 | | | | 137,073 | |
Flight Centre, Ltd.‡‡ | | | 4,001 | | | | 101,405 | |
Fortescue Metals Group, Ltd.* | | | 7,413 | | | | 49,586 | |
Goodman Fielder, Ltd.‡‡ | | | 47,803 | | | | 65,761 | |
Goodman Group REIT‡‡ | | | 39,279 | | | | 26,113 | |
GPT Group REIT‡‡ | | | 12,640 | | | | 38,009 | |
Harvey Norman Holdings, Ltd. | | | 3,987 | | | | 11,989 | |
Iluka Resources, Ltd.* | | | 247,581 | | | | 2,314,480 | |
Incitec Pivot, Ltd. | | | 419,649 | | | | 1,699,696 | |
Leighton Holdings, Ltd. | | | 278 | | | | 8,752 | |
Lend Lease Group‡‡ | | | 3,453 | | | | 30,479 | |
Macquarie Atlas Roads Group*‡‡ | | | 4,871 | | | | 7,573 | |
Mineral Resources, Ltd. | | | 44,728 | | | | 564,069 | |
Mirvac Group REIT‡‡ | | | 18,008 | | | | 22,563 | |
Mount Gibson Iron, Ltd.* | | | 1,219,862 | | | | 2,645,066 | |
Myer Holdings, Ltd. | | | 432,688 | | | | 1,571,061 | |
National Australia Bank, Ltd.‡‡ | | | 152,798 | | | | 3,703,871 | |
Newcrest Mining, Ltd.‡‡ | | | 37,432 | | | | 1,548,261 | |
OneSteel, Ltd.‡‡ | | | 65,630 | | | | 173,857 | |
Orica, Ltd.‡‡ | | | 3,935 | | | | 100,215 | |
Origin Energy, Ltd.‡‡ | | | 5,102 | | | | 86,937 | |
OZ Minerals, Ltd.‡‡ | | | 1,544,136 | | | | 2,716,463 | |
Pacific Brands, Ltd.* | | | 28,484 | | | | 28,551 | |
Paladin Energy, Ltd.*‡‡ | | | 4,238 | | | | 21,370 | |
Primary Health Care, Ltd. | | | 995 | | | | 3,837 | |
Qantas Airways, Ltd.*‡‡ | | | 15,633 | | | | 40,613 | |
QBE Insurance Group, Ltd.‡‡ | | | 291,231 | | | | 5,406,349 | |
Ramsay Health Care, Ltd.‡‡ | | | 482 | | | | 8,775 | |
Rio Tinto, Ltd.‡‡ | | | 21,725 | | | | 1,899,168 | |
Santos, Ltd. | | | 4,871 | | | | 65,514 | |
Sonic Healthcare, Ltd.‡‡ | | | 467 | | | | 5,541 | |
SP AusNet | | | 20,551 | | | | 18,287 | |
Stockland REIT‡‡ | | | 15,786 | | | | 58,125 | |
Suncorp Group, Ltd.‡‡ | | | 21,162 | | | | 186,359 | |
Telstra Corporation, Ltd.‡‡ | | | 2,535,204 | | | | 7,234,474 | |
Toll Holdings, Ltd. | | | 285,145 | | | | 1,671,130 | |
Transfield Services, Ltd. | | | 5,987 | | | | 20,575 | |
Transurban Group‡‡ | | | 8,164 | | | | 42,753 | |
UGL, Ltd.‡‡ | | | 3,325 | | | | 49,074 | |
Wesfarmers, Ltd.‡‡ | | | 149,145 | | | | 4,881,447 | |
Wesfarmers, Ltd. Price Protected Shares‡‡ | | | 974 | | | | 32,177 | |
Westfield Group REIT‡‡ | | | 13,458 | | | | 131,867 | |
Westfield Retail Trust REIT*‡‡ | | | 13,458 | | | | 35,376 | |
Westpac Banking Corporation‡‡ | | | 14,107 | | | | 320,459 | |
| | | | | | | | |
| | | | | | | 68,710,023 | |
| | | | | | | | |
Austria — 0.2% | | | | | | | | |
Erste Group Bank AG | | | 34,171 | | | | 1,612,767 | |
Raiffeisen Bank International AG | | | 9,737 | | | | 536,362 | |
Vienna Insurance Group | | | 15,475 | | | | 806,561 | |
| | | | | | | | |
| | | | | | | 2,955,690 | |
| | | | | | | | |
Belgium — 0.0% | | | | | | | | |
Groupe Bruxelles Lambert SA‡‡ | | | 457 | | | | 38,431 | |
KBC Groep NVD‡‡ | | | 14,916 | | | | 508,276 | |
| | | | | | | | |
| | | | | | | 546,707 | |
| | | | | | | | |
Bermuda — 0.1% | | | | | | | | |
Catlin Group, Ltd.‡‡ | | | 32,870 | | | | 189,615 | |
Hiscox, Ltd.‡‡ | | | 28,185 | | | | 167,598 | |
Seadrill, Ltd.D | | | 35,239 | | | | 1,202,115 | |
| | | | | | | | |
| | | | | | | 1,559,328 | |
| | | | | | | | |
Brazil — 2.3% | | | | | | | | |
Amil Participacoes SA | | | 87,319 | | | | 936,312 | |
Banco do Brasil SA | | | 59,266 | | | | 1,121,770 | |
Banco Santander Brasil SA ADR | | | 397,701 | | | | 5,408,734 | |
BM&FBovespa SA | | | 237,400 | | | | 1,877,748 | |
BR Malls Participacoes SA | | | 17,810 | | | | 183,464 | |
Cia Brasileira de Distribuicao Grupo Pao de Acucar ADRD | | | 13,460 | | | | 565,051 | |
Cia Paranaense de Energia ADRD | | | 94,671 | | | | 2,382,869 | |
Cia Siderurgica Nacional SA | | | 80,927 | | | | 1,300,195 | |
Cosan, Ltd.D | | | 13,400 | | | | 182,508 | |
Diagnosticos da America SA | | | 54,600 | | | | 740,060 | |
Eletropaulo Metropolitana Eletricidade de Sao Paulo SA | | | 18,151 | | | | 351,102 | |
Estacio Participacoes SA | | | 3,100 | | | | 50,422 | |
Fibria Celulose SA* | | | 6,162 | | | | 98,332 | |
Fibria Celulose SA ADRD* | | | 5,626 | | | | 90,016 | |
Gafisa SA | | | 9,500 | | | | 68,904 | |
Gafisa SA ADRD | | | 7,900 | | | | 114,787 | |
Gerdau SA ADRD | | | 1,700 | | | | 23,783 | |
Hypermarcas SA* | | | 10,440 | | | | 141,695 | |
| | | | |
| | See Notes to Financial Statements. | | 165 |
| | |
| INTERNATIONAL EQUITY FUND | | |
| SCHEDULE OF INVESTMENTS (Continued) | | |
| | | | | | | | |
| | | Shares | | | Value | |
Itau Unibanco Holding SA ADR 144A | | | 7,000 | | | $ | 167,789 | |
Localiza Rent A Car SA | | | 23,116 | | | | 374,591 | |
Lojas Renner SA | | | 64,868 | | | | 2,203,949 | |
Marfrig Alimentos SA | | | 69,781 | | | | 651,569 | |
Multiplan Empreendimentos Imobiliarios SA | | | 2,000 | | | | 44,458 | |
OGX Petroleo e Gas Participacoes SA* | | | 166,100 | | | | 2,001,205 | |
PDG Realty SA Empreendimentos e Participacoes | | | 53,870 | | | | 329,710 | |
Petroleo Brasileiro SA ADRD | | | 87,462 | | | | 3,138,643 | |
Redecard SA | | | 3,400 | | | | 43,114 | |
Tele Norte Leste Participacoes SA ADRD | | | 11,400 | | | | 167,580 | |
Totvs SA | | | 10,473 | | | | 1,066,227 | |
Tractebel Energia SA | | | 61,757 | | | | 1,021,223 | |
Usinas Siderurgicas de Minas Gerais SA | | | 25,116 | | | | 323,028 | |
Usinas Siderurgicas de Minas Gerais SA ADRD | | | 67,600 | | | | 814,580 | |
Vale SA ADRD | | | 50,700 | | | | 1,532,154 | |
| | | | | | | | |
| | | | | | | 29,517,572 | |
| | | | | | | | |
Canada — 2.0% | | | | | | | | |
Barrick Gold CorporationD | | | 41,930 | | | | 2,229,837 | |
Canadian National Railway Co. | | | 21,048 | | | | 1,404,541 | |
Enbridge, Inc.D | | | 42,100 | | | | 2,382,547 | |
Falcon Oil & Gas, Ltd.D* | | | 433,398 | | | | 67,562 | |
First Quantum Minerals, Ltd.D | | | 36,467 | | | | 3,961,014 | |
Gran Tierra Energy, Inc.* | | | 96,560 | | | | 785,649 | |
Lundin Mining CorporationD* | | | 98,200 | | | | 717,019 | |
Magna International, Inc. Class AD | | | 54,440 | | | | 2,830,880 | |
Pacific Rubiales Energy Corporation | | | 48,860 | | | | 1,658,478 | |
Suncor Energy, Inc. | | | 47,715 | | | | 1,837,001 | |
Talisman Energy, Inc. | | | 80,600 | | | | 1,793,093 | |
Teck Resources, Ltd. Class B | | | 90,044 | | | | 5,595,714 | |
| | | | | | | | |
| | | | | | | 25,263,335 | |
| | | | | | | | |
Chile — 0.2% | | | | | | | | |
Banco Santander Chile ADRD | | | 2,726 | | | | 254,799 | |
Centros Comerciales Sudamericanos SA | | | 18,200 | | | | 143,084 | |
Embotelladora Andina SA ADR Class AD | | | 12,808 | | | | 304,831 | |
Embotelladora Andina SA ADR Class BD | | | 14,770 | | | | 447,088 | |
Empresas La Polar SA | | | 25,400 | | | | 184,595 | |
Enersis SA ADRD | | | 24,500 | | | | 568,890 | |
| | | | | | | | |
| | | | | | | 1,903,287 | |
| | | | | | | | |
China — 2.9% | | | | | | | | |
Air China, Ltd. Class HD | | | 182,000 | | | | 204,413 | |
Anhui Conch Cement Co., Ltd. Class HD | | | 621,060 | | | | 2,912,417 | |
Baidu, Inc. ADRD* | | | 8,400 | | | | 810,852 | |
Bank of China, Ltd. Class H | | | 4,792,700 | | | | 2,528,056 | |
Bank of Communications Co., Ltd.D | | | 329,250 | | | | 331,673 | |
Besunyen Holdings Co.* | | | 345,000 | | | | 143,809 | |
China Coal Energy Co. Class H | | | 223,000 | | | | 348,294 | |
China Construction Bank Corporation Class H | | | 3,028,776 | | | | 2,715,954 | |
China Life Insurance Co., Ltd. Class H | | | 363,000 | | | | 1,482,767 | |
China Merchants Bank Co., Ltd. Class HD | | | 911,504 | | | | 2,300,806 | |
China National Building Material Co., Ltd. | | | 298,000 | | | | 683,198 | |
China Rongsheng Heavy Industry Group Co., Ltd.* | | | 424,000 | | | | 365,480 | |
China Shenhua Energy Co., Ltd. Class H | | | 344,656 | | | | 1,445,526 | |
China Shipping Development Co., Ltd. Class H | | | 242,000 | | | | 322,550 | |
China Yurun Food Group, Ltd. | | | 526,500 | | | | 1,730,660 | |
Chongqing Rural Commercial Bank* | | | 498,000 | | | | 335,084 | |
Dongfeng Motor Group Co., Ltd. Class H | | | 288,000 | | | | 496,501 | |
ENN Energy Holdings, Ltd. | | | 290,433 | | | | 870,612 | |
Focus Media Holding, Ltd. ADR* | | | 19,500 | | | | 427,635 | |
Foxconn International Holdings, Ltd.*‡‡ | | | 16,000 | | | | 11,177 | |
Industrial & Commercial Bank of China Class HD | | | 4,131,399 | | | | 3,077,501 | |
Li Ning Co, Ltd. | | | 617,842 | | | | 1,309,957 | |
Longfor Properties Co., Ltd.D | | | 518,458 | | | | 721,711 | |
Netease.com ADRD* | | | 65,600 | | | | 2,371,440 | |
Parkson Retail Group, Ltd.D | | | 587,267 | | | | 905,138 | |
Ping An Insurance Group Co. of China, Ltd. | | | 196,000 | | | | 2,191,282 | |
Sina CorporationD* | | | 14,120 | | | | 971,738 | |
SITC International Holdings Co., Ltd.* | | | 196,000 | | | | 116,499 | |
Tencent Holdings, Ltd.D | | | 19,400 | | | | 421,555 | |
Want Want China Holdings, Ltd.@ | | | 978,283 | | | | 857,105 | |
Yangzijiang Shipbuilding Holdings, Ltd.D‡‡ | | | 2,129,000 | | | | 3,168,574 | |
Zhongsheng Group Holdings, Ltd.* | | | 193,500 | | | | 420,717 | |
ZTE Corporation Class HD | | | 155,800 | | | | 619,368 | |
| | | | | | | | |
| | | | | | | 37,620,049 | |
| | | | | | | | |
Colombia — 0.1% | | | | | | | | |
BanColombia SA | | | 64,300 | | | | 987,943 | |
BanColombia SA ADRD | | | 9,394 | | | | 581,582 | |
| | | | | | | | |
| | | | | | | 1,569,525 | |
| | | | | | | | |
Czech Republic — 0.0% | | | | | | | | |
Komercni Banka AS | | | 800 | | | | 189,286 | |
| | | | | | | | |
Denmark — 1.1% | | | | | | | | |
A P Moller—Maersk A/S Class B‡‡ | | | 28 | | | | 253,503 | |
Coloplast A/S Class B‡‡ | | | 4,683 | | | | 636,387 | |
Danisco A/S‡‡ | | | 10,619 | | | | 973,874 | |
FLSmidth & Co. A/SD‡‡ | | | 12,325 | | | | 1,179,256 | |
Novo-Nordisk A/S Class B‡‡ | | | 100,696 | | | | 11,344,867 | |
| | | | | | | | |
| | | | | | | 14,387,887 | |
| | | | | | | | |
Egypt — 0.3% | | | | | | | | |
Commercial International Bank of Egypt SAE* | | | 106,805 | | | | 872,103 | |
ElSwedy Electric Co.* | | | 62,055 | | | | 575,973 | |
Orascom Construction Industries | | | 50,794 | | | | 2,512,225 | |
| | | | |
| 166 | | See Notes to Financial Statements. | | |
| | | | | | | | |
| | | Shares | | | Value | |
Orascom Construction Industries GDR | | | 2,338 | | | $ | 116,021 | |
| | | | | | | | |
| | | | | | | 4,076,322 | |
| | | | | | | | |
Estonia — 0.1% | | | | | | | | |
Tallink Group, Ltd.* | | | 546,960 | | | | 576,408 | |
Finland — 0.6% | | | | | | | | |
Cargotec Oyj Class B | | | 1,835 | | | | 95,696 | |
Kesko OYJ‡‡ | | | 5,568 | | | | 260,195 | |
Kone OYJ‡‡ | | | 29,862 | | | | 1,658,608 | |
Nokia OYJ‡‡ | | | 15,841 | | | | 164,094 | |
Sampo OYJ | | | 65,740 | | | | 1,757,862 | |
Stora Enso OYJ Class RD‡‡ | | | 296,781 | | | | 3,054,208 | |
UPM-Kymmene OYJ‡‡ | | | 25,336 | | | | 449,153 | |
Wartsila OYJ‡‡ | | | 4,626 | | | | 352,521 | |
| | | | | | | | |
| | | | | | | 7,792,337 | |
| | | | | | | | |
France — 7.6% | | | | | | | | |
Accor SA | | | 3,525 | | | | 156,859 | |
Air Liquide SA | | | 15,408 | | | | 1,948,623 | |
Arkema SA | | | 3,037 | | | | 218,624 | |
Atos Origin SA‡‡ | | | 4,277 | | | | 227,701 | |
AXA SA | | | 166,486 | | | | 2,769,835 | |
BNP Paribas‡‡ | | | 110,889 | | | | 7,054,943 | |
Bouygues SA‡‡ | | | 11,509 | | | | 496,068 | |
Cap Gemini SA‡‡ | | | 3,522 | | | | 164,397 | |
Carrefour SA | | | 155,335 | | | | 6,403,705 | |
Casino Guichard Perrachon SA | | | 24,754 | | | | 2,413,112 | |
Christian Dior SA‡‡ | | | 24,666 | | | | 3,523,573 | |
Cie de St-Gobain‡‡ | | | 123,729 | | | | 6,365,596 | |
Cie Generale d’Optique Essilor International SA | | | 20,653 | | | | 1,329,572 | |
CNP Assurances‡‡ | | | 13,433 | | | | 242,423 | |
Danone | | | 49,249 | | | | 3,094,474 | |
Dassault Systemes SA | | | 27,321 | | | | 2,059,854 | |
France Telecom SA | | | 316,899 | | | | 6,604,092 | |
Gecina SA REIT | | | 5,235 | | | | 575,806 | |
Imerys SA‡‡ | | | 52 | | | | 3,466 | |
Klepierre REIT‡‡ | | | 623 | | | | 22,474 | |
Lafarge SA | | | 37,161 | | | | 2,329,980 | |
Lagardere SCA‡‡ | | | 3,356 | | | | 138,262 | |
Legrand SA‡‡ | | | 11,810 | | | | 480,951 | |
L’Oreal SA | | | 5,543 | | | | 615,387 | |
Natixis‡‡ | | | 94,291 | | | | 441,007 | |
PPR‡‡ | | | 1,216 | | | | 193,369 | |
Publicis Groupe SA | | | 30,026 | | | | 1,564,836 | |
Rhodia SA | | | 10,043 | | | | 332,159 | |
Safran SA‡‡ | | | 6,719 | | | | 237,935 | |
Sanofi-Aventis SA‡‡ | | | 162,526 | | | | 10,392,299 | |
Schneider Electric SA‡‡ | | | 44,153 | | | | 6,608,229 | |
SEB SA | | | 842 | | | | 87,460 | |
Societe BIC SA‡‡ | | | 6,764 | | | | 581,375 | |
Societe Generale | | | 152,553 | | | | 8,199,166 | |
Societe Television Francaise | | | 6,408 | | | | 111,320 | |
Thales SA‡‡ | | | 6,660 | | | | 233,042 | |
Total SA‡‡ | | | 226,520 | | | | 12,002,082 | |
Unibail-Rodamco SE REIT‡‡ | | | 611 | | | | 120,840 | |
Valeo SA | | | 22,213 | | | | 1,260,507 | |
Vinci SA | | | 81,294 | | | | 4,419,227 | |
Vivendi SA‡‡ | | | 17,050 | | | | 460,238 | |
WendelD | | | 19,400 | | | | 1,786,450 | |
Zodiac Aerospace | | | 3,285 | | | | 246,705 | |
| | | | | | | | |
| | | | | | | 98,518,023 | |
| | | | | | | | |
Germany — 6.1% | | | | | | | | |
Aareal Bank AG* | | | 16,399 | | | | 498,740 | |
Adidas AG‡‡ | | | 6,331 | | | | 411,826 | |
Aixtron SED | | | 54,492 | | | | 2,030,683 | |
Allianz SE‡‡ | | | 24,857 | | | | 2,953,402 | |
Aurubis AG | | | 2,977 | | | | 174,579 | |
BASF SE‡‡ | | | 103,864 | | | | 8,288,657 | |
Bayer AG‡‡ | | | 32,768 | | | | 2,429,005 | |
Bayerische Motoren Werke AG | | | 42,719 | | | | 3,365,703 | |
Beiersdorf AG | | | 26,370 | | | | 1,463,277 | |
Commerzbank AGD | | | 76,277 | | | | 567,868 | |
Daimler AG‡‡ | | | 6,107 | | | | 413,230 | |
Deutsche Bank AG‡‡ | | | 47,651 | | | | 2,491,956 | |
Deutsche Boerse AG‡‡ | | | 24,254 | | | | 1,675,735 | |
Deutsche Lufthansa AG | | | 116,530 | | | | 2,534,845 | |
Deutsche Post AG‡‡ | | | 19,517 | | | | 331,110 | |
Deutsche Telekom AG | | | 483,435 | | | | 6,232,063 | |
Dialog Semiconductor PLC* | | | 20,450 | | | | 465,109 | |
E.ON AG‡‡ | | | 10,502 | | | | 320,719 | |
Fresenius Medical Care AG & Co. KGaA | | | 26,546 | | | | 1,526,210 | |
GEA Group AG | | | 101,339 | | | | 2,928,536 | |
Hannover Rueckversicherung AG‡‡ | | | 105,604 | | | | 5,665,102 | |
Infineon Technologies AG‡‡ | | | 154,334 | | | | 1,438,592 | |
Lanxess AG | | | 30,885 | | | | 2,428,410 | |
Linde AG | | | 19,905 | | | | 3,011,216 | |
MAN SE‡‡ | | | 4,102 | | | | 488,572 | |
Merck KGaA | | | 12,094 | | | | 968,249 | |
Metro AG | | | 31,510 | | | | 2,274,290 | |
Muenchener Rueckversicherungs AG | | | 22,914 | | | | 3,470,434 | |
RWE AG‡‡ | | | 109,825 | | | | 7,335,195 | |
Salzgitter AG‡‡ | | | 225 | | | | 17,396 | |
SAP AG | | | 33,232 | | | | 1,694,921 | |
Siemens AG‡‡ | | | 24,845 | | | | 3,077,665 | |
SMA Solar Technology AG | | | 803 | | | | 74,238 | |
Software AG | | | 613 | | | | 89,853 | |
Suedzucker AG‡‡ | | | 19,465 | | | | 519,842 | |
Symrise AG | | | 60,670 | | | | 1,662,375 | |
ThyssenKrupp AG‡‡ | | | 21,632 | | | | 898,698 | |
Volkswagen AG | | | 6,800 | | | | 964,518 | |
Wacker Chemie AG | | | 9,982 | | | | 1,740,321 | |
| | | | | | | | |
| | | | | | | 78,923,140 | |
| | | | | | | | |
Greece — 0.3% | | | | | | | | |
Coca Cola Hellenic Bottling Co. SA | | | 78,620 | | | | 2,033,973 | |
Public Power Corporation SA | | | 138,686 | | | | 1,990,416 | |
| | | | | | | | |
| | | | | | | 4,024,389 | |
| | | | | | | | |
Hong Kong — 3.0% | | | | | | | | |
AIA Group, Ltd.* | | | 363,600 | | | | 1,022,110 | |
ASM Pacific Technology, Ltd.‡‡ | | | 1,400 | | | | 17,696 | |
Belle International Holdings, Ltd. | | | 110,000 | | | | 185,956 | |
BOC Hong Kong Holdings, Ltd. | | | 2,000 | | | | 6,806 | |
Cathay Pacific Airways, Ltd. | | | 363,000 | | | | 1,001,743 | |
Cheung Kong Holdings, Ltd.‡‡ | | | 9,000 | | | | 138,830 | |
Cheung Kong Infrastructure Holdings, Ltd.‡‡ | | | 2,000 | | | | 9,160 | |
China Everbright, Ltd. | | | 378,000 | | | | 853,963 | |
China Mengniu Dairy Co., Ltd.D | | | 120,000 | | | | 318,032 | |
| | | | |
| | See Notes to Financial Statements. | | 167 |
| | |
| INTERNATIONAL EQUITY FUND | | |
| SCHEDULE OF INVESTMENTS (Continued) | | |
| | | | | | | | |
| | | Shares | | | Value | |
China Mobile, Ltd. | | | 410,618 | | | $ | 4,078,287 | |
China Overseas Land & Investment, Ltd. | | | 656,372 | | | | 1,214,315 | |
China Unicom Hong Kong, Ltd. | | | 1,324,000 | | | | 1,894,154 | |
Chinese Estates Holdings, Ltd. | | | 8,500 | | | | 14,041 | |
CLP Holdings, Ltd. | | | 12,000 | | | | 97,417 | |
CNOOC, Ltd. | | | 2,882,000 | | | | 6,837,186 | |
Dairy Farm International Holdings, Ltd. | | | 146,700 | | | | 1,362,843 | |
Esprit Holdings, Ltd.‡‡ | | | 290,971 | | | | 1,385,077 | |
Fushan International Energy Group, Ltd. | | | 756,000 | | | | 518,408 | |
Hang Lung Group, Ltd.‡‡ | | | 5,000 | | | | 32,871 | |
Hang Lung Properties, Ltd. | | | 12,000 | | | | 56,119 | |
Hang Seng Bank, Ltd. | | | 6,500 | | | | 106,873 | |
Hong Kong Electric Holdings, Ltd. | | | 300,500 | | | | 1,894,362 | |
Hong Kong Exchanges and Clearing, Ltd.‡‡ | | | 80,800 | | | | 1,832,678 | |
Hopewell Holdings, Ltd. | | | 24,000 | | | | 75,340 | |
Hutchison Whampoa, Ltd. | | | 149,600 | | | | 1,539,728 | |
Hysan Development Co., Ltd.‡‡ | | | 241,000 | | | | 1,134,803 | |
Jardine Matheson Holdings, Ltd. | | | 107,600 | | | | 4,734,400 | |
Kerry Properties, Ltd. | | | 4,500 | | | | 23,447 | |
Li & Fung, Ltd. | | | 362,000 | | | | 2,100,427 | |
Lifestyle International Holdings, Ltd.‡‡ | | | 4,000 | | | | 9,850 | |
Link (The) REIT‡‡ | | | 12,000 | | | | 37,284 | |
Mongolia Energy Corporation Ltd.*‡‡ | | | 15,000 | | | | 4,477 | |
New World Department Store China, Ltd. | | | 439,337 | | | | 361,743 | |
New World Development, Ltd.‡‡ | | | 13,000 | | | | 24,418 | |
NWS Holdings, Ltd.‡‡ | | | 9,000 | | | | 13,663 | |
Orient Overseas International, Ltd.‡‡ | | | 65,000 | | | | 630,532 | |
PCCW, Ltd.‡‡ | | | 14,000 | | | | 6,196 | |
Shangri-La Asia, Ltd. | | | 244,000 | | | | 662,361 | |
Sun Hung Kai Properties, Ltd.‡‡ | | | 31,000 | | | | 514,885 | |
Swire Pacific, Ltd. Class A‡‡ | | | 92,500 | | | | 1,520,880 | |
Television Broadcasts, Ltd.‡‡ | | | 13,000 | | | | 70,245 | |
Wharf Holdings, Ltd.‡‡ | | | 14,000 | | | | 107,709 | |
Wheelock & Co., Ltd.‡‡ | | | 24,000 | | | | 97,108 | |
Wing Hang Bank, Ltd. | | | 2,500 | | | | 34,576 | |
Yue Yuen Industrial Holdings, Ltd.‡‡ | | | 171,500 | | | | 616,692 | |
| | | | | | | | |
| | | | | | | 39,199,691 | |
| | | | | | | | |
Hungary — 0.2% | | | | | | | | |
MOL Hungarian Oil and Gas PLC | | | 21,330 | | | | 2,131,403 | |
MOL Hungarian Oil and Gas PLC ADR | | | 4,960 | | | | 248,347 | |
| | | | | | | | |
| | | | | | | 2,379,750 | |
| | | | | | | | |
India — 1.6% | | | | | | | | |
Ambuja Cements, Ltd. | | | 520,521 | | | | 1,666,971 | |
Andhra Bank | | | 246,868 | | | | 830,623 | |
Asian Paints, Ltd. | | | 21,527 | | | | 1,385,883 | |
Axis Bank, Ltd. | | | 74,493 | | | | 2,249,200 | |
Bajaj Auto, Ltd. | | | 24,231 | | | | 835,066 | |
Container Corporation of India, Ltd. | | | 23,263 | | | | 659,209 | |
Dabur India, Ltd. | | | 363,997 | | | | 816,073 | |
Engineers India, Ltd. | | | 33,568 | | | | 250,324 | |
HDFC Bank, Ltd. | | | 34,197 | | | | 1,794,434 | |
Housing Development Finance Corporation | | | 30,305 | | | | 493,630 | |
ICICI Bank, Ltd. ADR | | | 24,500 | | | | 1,240,680 | |
Infosys Technologies, Ltd. | | | 8,241 | | | | 634,501 | |
Infosys Technologies, Ltd. ADRD | | | 16,530 | | | | 1,257,602 | |
Jindal Steel & Power, Ltd. | | | 37,000 | | | | 589,195 | |
Larsen & Toubro, Ltd. | | | 7,700 | | | | 340,830 | |
Lupin, Ltd. | | | 105,646 | | | | 1,139,862 | |
Maruti Suzuki India, Ltd. | | | 6,470 | | | | 205,697 | |
Oberoi Realty, Ltd.* | | | 2,118 | | | | 12,109 | |
Opto Circuits India, Ltd. | | | 92,158 | | | | 553,175 | |
Prestige Estates Projects, Ltd.* | | | 67,159 | | | | 258,333 | |
Shriram Transport Finance Co., Ltd. | | | 103,294 | | | | 1,804,267 | |
SKS Microfinance, Ltd.* | | | 15,678 | | | | 226,045 | |
Tata Motors, Ltd. ADRD | | | 30,800 | | | | 903,672 | |
Welspun Corporation Ltd. | | | 75,572 | | | | 286,553 | |
| | | | | | | | |
| | | | | | | 20,433,934 | |
| | | | | | | | |
Indonesia — 0.9% | | | | | | | | |
PT Astra International Tbk | | | 240,500 | | | | 1,453,444 | |
PT Bank Danamon Indonesia Tbk | | | 1,385,180 | | | | 873,989 | |
PT Bank Rakyat Indonesia Tbk | | | 2,953,817 | | | | 3,435,981 | |
PT Indocement Tunggal Prakarsa Tbk | | | 985,627 | | | | 1,740,673 | |
PT Indofood CBP Sukses Makmur Tbk* | | | 111,000 | | | | 57,594 | |
PT Panin Life Tbk | | | 16,633,500 | | | | 387,132 | |
PT Ramayana Lestari Sentosa Tbk | | | 2,790,000 | | | | 262,511 | |
PT Semen Gresik Persero Tbk | | | 754,572 | | | | 790,182 | |
PT Telekomunikasi Indonesia Tbk | | | 2,699,199 | | | | 2,381,646 | |
| | | | | | | | |
| | | | | | | 11,383,152 | |
| | | | | | | | |
| | | | | | | | |
Ireland — 0.6% | | | | | | | | |
Experian PLC‡‡ | | | 323,063 | | | | 4,019,398 | |
Shire PLC | | | 52,196 | | | | 1,255,666 | |
WPP PLC‡‡ | | | 191,592 | | | | 2,358,307 | |
| | | | | | | | |
| | | | | | | 7,633,371 | |
| | | | | | | | |
Israel — 0.4% | | | | | | | | |
Check Point Software | | | | | | | | |
Technologies, Ltd.D* | | | 31,400 | | | | 1,452,564 | |
NICE Systems, Ltd. ADR* | | | 37,350 | | | | 1,303,515 | |
Teva Pharmaceutical Industries, Ltd. ADR | | | 50,570 | | | | 2,636,214 | |
| | | | | | | | |
| | | | | | | 5,392,293 | |
| | | | | | | | |
Italy — 2.2% | | | | | | | | |
ACEA SpAD | | | 165,331 | | | | 1,901,539 | |
Banco Popolare SC‡‡ | | | 31,358 | | | | 142,337 | |
Enel SpA | | | 22,364 | | | | 112,067 | |
ENI SpA‡‡ | | | 528,926 | | | | 11,592,690 | |
Exor SpA | | | 66,615 | | | | 2,198,690 | |
Fiat SpA‡‡ | | | 94,479 | | | | 1,521,091 | |
Intesa Sanpaolo SpA | | | 1,721,204 | | | | 4,679,334 | |
Mediaset SpA‡‡ | | | 212,785 | | | | 1,288,669 | |
Pirelli & C SpA‡‡ | | | 44,098 | | | | 356,854 | |
Saipem SpA | | | 80,408 | | | | 3,970,001 | |
Telecom Italia SpA | | | 179,220 | | | | 232,530 | |
Terna Rete Elettrica Nazionale SpA‡‡ | | | 6,035 | | | | 25,506 | |
| | | | |
| 168 | | See Notes to Financial Statements. | | |
| | | | | | | | |
| | | Shares | | | Value | |
Tod’s SpA | | | 601 | | | $ | 59,457 | |
| | | | | | | | |
| | | | | | | 28,080,765 | |
| | | | | | | | |
Japan — 14.8% | | | | | | | | |
77 Bank, Ltd. (The) | | | 78,000 | | | | 412,057 | |
Aisin Seiki Co., Ltd. | | | 44,500 | | | | 1,568,024 | |
Alfresa Holdings Corporation | | | 100 | | | | 4,431 | |
Aozora Bank, Ltd. | | | 246,000 | | | | 507,396 | |
Asahi Glass Co., Ltd.‡‡ | | | 335,000 | | | | 3,895,995 | |
Asahi Kasei Corporation | | | 74,000 | | | | 481,344 | |
Astellas Pharma, Inc. | | | 222,800 | | | | 8,467,610 | |
Bridgestone Corporation | | | 8,200 | | | | 157,842 | |
Brother Industries, Ltd. | | | 2,600 | | | | 38,373 | |
Canon, Inc.D‡‡ | | | 236,150 | | | | 12,129,910 | |
Central Japan Railway Co.‡‡ | | | 243 | | | | 2,031,341 | |
Chubu Electric Power Co., Inc.‡‡ | | | 3,400 | | | | 83,464 | |
Chuo Mitsui Trust Holdings, Inc. | | | 569,300 | | | | 2,351,739 | |
Citizen Holdings Co., Ltd. | | | 1,900 | | | | 13,037 | |
Coca-Cola West Co., Ltd. | | | 2,000 | | | | 36,203 | |
Cosmo Oil Co., Ltd. | | | 19,000 | | | | 62,050 | |
Credit Saison Co., Ltd.‡‡ | | | 12,900 | | | | 210,524 | |
Daicel Chemical Industries, Ltd.‡‡ | | | 31,000 | | | | 225,585 | |
Daido Steel Co., Ltd. | | | 30,000 | | | | 175,647 | |
Daito Trust Construction Co., Ltd.‡‡ | | | 28,900 | | | | 1,975,098 | |
Daiwa House Industry Co., Ltd.‡‡ | | | 146,000 | | | | 1,788,451 | |
Dena Co., Ltd.D | | | 41,400 | | | | 1,483,231 | |
Denso Corporation | | | 3,300 | | | | 113,450 | |
DIC Corporation | | | 264,000 | | | | 588,427 | |
Disco CorporationD | | | 14,300 | | | | 863,144 | |
Dr Ci: Labo Co., Ltd.D | | | 99 | | | | 384,936 | |
East Japan Railway Co.‡‡ | | | 1,000 | | | | 64,889 | |
Elpida Memory, Inc.* | | | 7,100 | | | | 82,118 | |
FANUC Corporation | | | 23,200 | | | | 3,546,267 | |
Fuji Heavy Industries, Ltd.D‡‡ | | | 468,000 | | | | 3,609,118 | |
FUJIFILM Holdings CorporationD‡‡ | | | 16,700 | | | | 601,512 | |
Fujitsu, Ltd.‡‡ | | | 508,000 | | | | 3,519,602 | |
Fukuoka Financial Group, Inc.‡‡ | | | 22,000 | | | | 95,228 | |
Hakuhodo DY Holdings, Inc.‡‡ | | | 260 | | | | 14,848 | |
Hino Motors, Ltd. | | | 17,000 | | | | 91,647 | |
Hitachi Chemical Co., Ltd.‡‡ | | | 2,200 | | | | 45,341 | |
Hitachi High-Technologies Corporation | | | 8,000 | | | | 186,406 | |
Hitachi, Ltd.D | | | 547,000 | | | | 2,904,116 | |
Hokkaido Electric Power Co., Inc. | | | 30,800 | | | | 628,959 | |
Hokuhoku Financial Group, Inc.‡‡ | | | 87,000 | | | | 176,373 | |
Honda Motor Co., Ltd.D‡‡ | | | 20,100 | | | | 793,323 | |
Hoya Corporation | | | 56,300 | | | | 1,361,289 | |
Ibiden Co., Ltd.‡‡ | | | 22,000 | | | | 690,104 | |
IHI Corporation | | | 60,000 | | | | 133,210 | |
Inpex Corporation | | | 215 | | | | 1,255,469 | |
Isuzu Motors, Ltd.D | | | 657,000 | | | | 2,968,796 | |
ITOCHU Corporation‡‡ | | | 172,500 | | | | 1,738,065 | |
Itochu Techno-Solutions Corporation‡‡ | | | 5,000 | | | | 187,055 | |
Japan Petroleum Exploration Co.‡‡ | | | 1,800 | | | | 68,260 | |
Japan Real Estate Investment Corporation REIT | | | 3 | | | | 31,079 | |
JFE Holdings, Inc.‡‡ | | | 3,000 | | | | 104,017 | |
JGC Corporation | | | 145,000 | | | | 3,142,675 | |
JTEKT Corporation‡‡ | | | 12,000 | | | | 140,803 | |
JX Holdings, Inc.‡‡ | | | 16,270 | | | | 110,100 | |
Kaken Pharmaceutical Co., Ltd. | | | 31,000 | | | | 375,998 | |
Kaneka Corporation‡‡ | | | 25,000 | | | | 172,728 | |
Kao Corporation‡‡ | | | 296,000 | | | | 7,955,025 | |
KDDI Corporation‡‡ | | | 1,200 | | | | 6,920,087 | |
Keisei Electric Railway Co., Ltd. | | | 4,000 | | | | 26,624 | |
Keyence Corporation | | | 2,900 | | | | 836,752 | |
Kinden Corporation‡‡ | | | 39,000 | | | | 359,387 | |
Kobe Steel, Ltd. | | | 88,000 | | | | 222,353 | |
Koito Manufacturing Co., Ltd. | | | 1,000 | | | | 15,546 | |
Komatsu, Ltd. | | | 152,400 | | | | 4,586,762 | |
Konica Minolta Holdings, Inc.‡‡ | | | 359,000 | | | | 3,710,395 | |
Kuraray Co., Ltd.‡‡ | | | 16,600 | | | | 236,964 | |
Lawson, Inc. | | | 18,100 | | | | 893,538 | |
Leopalace21 Corporation*‡‡ | | | 4,600 | | | | 8,837 | |
Makino Milling Machine Co., Ltd.D* | | | 102,000 | | | | 836,139 | |
Makita Corporation‡‡ | | | 6,400 | | | | 260,428 | |
Marubeni Corporation | | | 212,000 | | | | 1,484,167 | |
Maruichi Steel Tube, Ltd.‡‡ | | | 17,100 | | | | 362,593 | |
Mazda Motor Corporation | | | 24,000 | | | | 68,459 | |
Miraca Holdings, Inc.‡‡ | | | 9,900 | | | | 397,411 | |
Mitsubishi Corporation | | | 133,400 | | | | 3,595,362 | |
Mitsubishi Electric Corporation | | | 196,000 | | | | 2,048,057 | |
Mitsubishi Estate Co., Ltd.‡‡ | | | 8,000 | | | | 147,850 | |
Mitsubishi Motors Corporation* | | | 25,000 | | | | 36,223 | |
Mitsubishi UFJ Financial Group, Inc.‡‡ | | | 225,500 | | | | 1,215,923 | |
Mitsubishi UFJ Lease & Finance Co., Ltd.‡‡ | | | 2,020 | | | | 79,731 | |
Mitsui & Co., Ltd.‡‡ | | | 71,300 | | | | 1,173,164 | |
Mitsui Engineering & Shipbuilding Co., Ltd. | | | 58,000 | | | | 152,930 | |
Mitsui Fudosan Co., Ltd.‡‡ | | | 6,000 | | | | 119,241 | |
Mitsui OSK Lines, Ltd. | | | 78,000 | | | | 528,539 | |
Mitsumi Electric Co., Ltd.‡‡ | | | 6,500 | | | | 118,787 | |
Mizuho Financial Group, Inc.‡‡ | | | 23,300 | | | | 43,708 | |
Mizuho Securities Co., Ltd.‡‡ | | | 42,000 | | | | 119,764 | |
Mizuho Trust & Banking Co., Ltd. | | | 10,000 | | | | 10,301 | |
MS&AD Insurance Group Holdings, Inc. | | | 71 | | | | 1,772 | |
Nihon Yamamura Glass Co., Ltd. | | | 103,000 | | | | 282,214 | |
Nippon Building Fund, Inc. REIT | | | 3 | | | | 30,745 | |
Nippon Electric Glass Co., Ltd.‡‡ | | | 209,000 | | | | 2,999,967 | |
Nippon Kayaku Co., Ltd.‡‡ | | | 14,000 | | | | 147,593 | |
Nippon Meat Packers, Inc.‡‡ | | | 11,000 | | | | 143,331 | |
Nippon Sheet Glass Co., Ltd. | | | 179,000 | | | | 480,123 | |
Nippon Shokubai Co., Ltd.‡‡ | | | 25,000 | | | | 257,785 | |
Nippon Steel Corporation | | | 8,000 | | | | 28,660 | |
Nippon Telegraph & Telephone Corporation‡‡ | | | 12,400 | | | | 564,669 | |
Nippon Television Network Corporation | | | 160 | | | | 25,093 | |
Nippon Yusen Kabushiki Kaisha | | | 255,000 | | | | 1,122,654 | |
| | | | |
| | See Notes to Financial Statements. | | 169 |
| | |
| INTERNATIONAL EQUITY FUND | | |
| SCHEDULE OF INVESTMENTS (Continued) | | |
| | | | | | | | |
| | | Shares | | | Value | |
Nishi-Nippon City Bank, Ltd. (The)‡‡ | | | 171,000 | | | $ | 517,209 | |
Nissan Motor Co., Ltd. | | | 117,300 | | | | 1,109,641 | |
Nisshin Seifun Group, Inc.‡‡ | | | 19,500 | | | | 246,848 | |
Nisshin Steel Co., Ltd. | | | 17,000 | | | | 37,732 | |
Nitto Denko Corporation‡‡ | | | 3,200 | | | | 150,083 | |
NKSJ Holdings, Inc. | | | 300,000 | | | | 2,200,716 | |
Nomura Holdings, Inc. | | | 173,800 | | | | 1,102,774 | |
Nomura Research Institute, Ltd. | | | 49,800 | | | | 1,106,318 | |
NTN Corporation | | | 3,000 | | | | 15,832 | |
NTT Data Corporation‡‡ | | | 56 | | | | 193,122 | |
NTT DoCoMo, Inc. | | | 428 | | | | 745,407 | |
OJI Paper Co., Ltd.‡‡ | | | 37,000 | | | | 178,563 | |
Okinawa Electric Power Co., Inc. (The) | | | 13,200 | | | | 657,446 | |
Omron Corporation‡‡ | | | 2,000 | | | | 52,707 | |
Oriental Land Co., Ltd. | | | 18,600 | | | | 1,720,355 | |
ORIX Corporation‡‡ | | | 10,050 | | | | 984,650 | |
Osaka Gas Co., Ltd.‡‡ | | | 317,000 | | | | 1,228,830 | |
Otsuka Corporation | | | 200 | | | | 13,608 | |
Promise Co., Ltd. | | | 19,600 | | | | 111,911 | |
Rengo Co., Ltd.‡‡ | | | 4,000 | | | | 27,074 | |
Resona Holdings, Inc. | | | 4,700 | | | | 28,015 | |
Ryobi, Ltd. | | | 103,000 | | | | 469,594 | |
Sakai Chemical Industry Co., Ltd. | | | 81,000 | | | | 400,299 | |
Sanrio Co., Ltd.D | | | 48,700 | | | | 1,137,974 | |
Santen Pharmaceutical Co., Ltd. | | | 35,600 | | | | 1,234,260 | |
Sapporo Hokuyo Holdings, Inc.D | | | 175,900 | | | | 821,932 | |
SBI Holdings, Inc. | | | 176 | | | | 26,541 | |
Secom Co., Ltd.‡‡ | | | 600 | | | | 28,351 | |
Seino Holdings Corporation‡‡ | | | 26,000 | | | | 178,155 | |
Sekisui Chemical Co., Ltd.‡‡ | | | 22,000 | | | | 157,395 | |
Sekisui House, Ltd.‡‡ | | | 186,000 | | | | 1,874,232 | |
Seven & I Holdings Co., Ltd.‡‡ | | | 322,200 | | | | 8,571,855 | |
Shimamura Co., Ltd.‡‡ | | | 16,600 | | | | 1,536,487 | |
Shimano, Inc.D | | | 30,100 | | | | 1,525,900 | |
Shin-Etsu Chemical Co., Ltd. | | | 42,600 | | | | 2,295,994 | |
Showa Shell Sekiyu KK | | | 21,300 | | | | 194,611 | |
SMC Corporation | | | 12,700 | | | | 2,167,208 | |
Softbank Corporation‡‡ | | | 1,800 | | | | 62,065 | |
Sojitz Corporation‡‡ | | | 109,000 | | | | 238,340 | |
Sony Corporation‡‡ | | | 52,700 | | | | 1,884,797 | |
Square Enix Co., Ltd. | | | 43,200 | | | | 764,114 | |
Sumitomo Corporation | | | 19,900 | | | | 280,138 | |
Sumitomo Heavy Industries, Ltd.‡‡ | | | 43,000 | | | | 275,042 | |
Sumitomo Mitsui Financial Group, Inc. | | | 4,900 | | | | 173,495 | |
Sumitomo Realty & Development Co., Ltd.‡‡ | | | 3,000 | | | | 71,369 | |
Sumitomo Trust & Banking Co., Ltd. (The)‡‡ | | | 6,000 | | | | 37,588 | |
Suzuken Co., Ltd.‡‡ | | | 2,700 | | | | 82,324 | |
Takeda Pharmaceutical Co., Ltd.‡‡ | | | 174,400 | | | | 8,567,545 | |
TDK Corporation‡‡ | | | 300 | | | | 20,771 | |
THK Co., Ltd. | | | 58,500 | | | | 1,338,060 | |
Toho Gas Co., Ltd. | | | 8,000 | | | | 39,936 | |
Tokai Rika Co., Ltd.‡‡ | | | 9,400 | | | | 177,126 | |
Tokio Marine Holdings, Inc.‡‡ | | | 196,100 | | | | 5,825,632 | |
Tokyo Electron, Ltd. | | | 54,200 | | | | 3,412,497 | |
Tokyo Gas Co., Ltd. | | | 384,000 | | | | 1,700,453 | |
Tokyu Land Corporation | | | 5,000 | | | | 25,021 | |
Toshiba Corporation | | | 124,000 | | | | 672,983 | |
Tosoh Corporation | | | 36,000 | | | | 116,581 | |
Toyo Ink Manu- facturing Co., Ltd. | | | 169,000 | | | | 827,715 | |
Toyo Suisan Kaisha, Ltd. | | | 24,000 | | | | 532,867 | |
Toyota Auto Body Co., Ltd. | | | 8,400 | | | | 156,407 | |
Toyota Motor Corporation‡‡ | | | 141,040 | | | | 5,552,525 | |
Unicharm CorporationD | | | 153,400 | | | | 6,091,422 | |
USS Co., Ltd.‡‡ | | | 4,040 | | | | 329,683 | |
West Japan Railway Co.D‡‡ | | | 291 | | | | 1,086,158 | |
Yahoo! Japan Corporation | | | 2,671 | | | | 1,032,415 | |
Yamada Denki Co., Ltd.‡‡ | | | 5,190 | | | | 353,082 | |
Yamaguchi Financial Group, Inc. | | | 2,000 | | | | 20,142 | |
Yamaha Corporation | | | 10,700 | | | | 132,100 | |
Yamaha Motor Co., Ltd.* | | | 11,100 | | | | 180,128 | |
Yamatake Corporation | | | 2,100 | | | | 49,571 | |
Yamato Holdings Co., Ltd.‡‡ | | | 5,200 | | | | 73,765 | |
| | | | | | | | |
| | | | | | | 190,777,843 | |
| | | | | | | | |
Kazakhstan — 0.0% | | | | | | | | |
KazakhGold Group, Ltd. GDR* | | | 28,367 | | | | 110,631 | |
| | | | | | | | |
Luxembourg — 0.0% | | | | | | | | |
Evraz Group SA GDRD* | | | 5,012 | | | | 179,780 | |
Millicom International Cellular SA ADR‡‡ | | | 858 | | | | 82,356 | |
SES SA ADR | | | 3,114 | | | | 74,133 | |
| | | | | | | | |
| | | | | | | 336,269 | |
| | | | | | | | |
Malaysia — 0.8% | | | | | | | | |
AirAsia Bhd* | | | 1,063,265 | | | | 872,092 | |
AMMB Holdings Bhd | | | 380,481 | | | | 866,882 | |
Axiata Group Bhd* | | | 758,600 | | | | 1,167,155 | |
CIMB Group Holdings Bhd | | | 1,746,096 | | | | 4,814,091 | |
Lafarge Malayan Cement Bhd | | | 140,680 | | | | 349,637 | |
Malayan Banking Bhd | | | 53,800 | | | | 148,267 | |
Petronas Chemicals Group Bhd@* | | | 96,400 | | | | 172,573 | |
RHB Capital Bhd | | | 206,000 | | | | 582,780 | |
Sime Darby Bhd | | | 649,000 | | | | 1,851,760 | |
| | | | | | | | |
| | | | | | | 10,825,237 | |
| | | | | | | | |
Mexico — 0.8% | | | | | | | | |
America Movil SAB de CV ADR Series LD | | | 88,577 | | | | 5,079,005 | |
Corporacion Moctezuma SAB de CV@ | | | 157,607 | | | | 392,422 | |
Genomma Lab Internacional SAB de CVD* | | | 403,014 | | | | 978,329 | |
Grupo Financiero Banorte SAB de CV | | | 104,989 | | | | 499,017 | |
Grupo Financiero Inbursa SA | | | 359,401 | | | | 1,578,454 | |
Grupo Televisa SA ADRD* | | | 40,466 | | | | 1,049,283 | |
Megacable Holdings SAB de CVD* | | | 166,695 | | | | 431,247 | |
OHL Mexico SAB de CV* | | | 39,500 | | | | 75,770 | |
Urbi Desarrollos Urbanos SAB de CV* | | | 176,400 | | | | 414,362 | |
| | | | | | | | |
| | | | | | | 10,497,889 | |
| | | | | | | | |
Mongolia — 0.0% | | | | | | | | |
Mongolian Mining Corporation* | | | 173,500 | | | | 202,455 | |
| | | | | | | | |
Netherlands — 4.3% | | | | | | | | |
Akzo Nobel NV | | | 39,451 | | | | 2,450,630 | |
| | | | |
| 170 | | See Notes to Financial Statements. | | |
| | | | | | | | |
| | | Shares | | | Value | |
ASML Holding NV | | | 22,419 | | | $ | 865,807 | |
Corio NV REIT | | | 363 | | | | 23,291 | |
Fugro NV | | | 7,713 | | | | 633,877 | |
Gemalto NV | | | 8,368 | | | | 356,098 | |
ING Groep NV*‡‡ | | | 610,943 | | | | 5,943,454 | |
Koninklijke Ahold NV‡‡ | | | 533,658 | | | | 7,042,891 | |
Koninklijke Boskalis Westminster NV‡‡ | | | 396 | | | | 18,892 | |
Koninklijke DSM NV‡‡ | | | 23,108 | | | | 1,315,618 | |
Koninklijke Philips Electronics NVD | | | 22,998 | | | | 705,155 | |
Reed Elsevier NV | | | 568,105 | | | | 7,027,579 | |
Royal Dutch Shell PLC Class A‡‡ | | | 395,062 | | | | 13,074,484 | |
Royal Dutch Shell PLC Class B‡‡ | | | 256,285 | | | | 8,450,929 | |
SBM Offshore NV | | | 127,600 | | | | 2,858,651 | |
TNT NV | | | 53,660 | | | | 1,416,200 | |
Unilever NV‡‡ | | | 86,099 | | | | 2,680,778 | |
VimpelCom, Ltd. ADRD | | | 7,300 | | | | 109,792 | |
| | | | | | | | |
| | | | | | | 54,974,126 | |
| | | | | | | | |
New Zealand — 0.1% | | | | | | | | |
Telecom Corporation of New Zealand, Ltd. | | | 969,663 | | | | 1,639,566 | |
Nigeria — 0.1% | | | | | | | | |
First City Monument Bank PLC | | | 8,506,891 | | | | 419,748 | |
Guaranty Trust Bank PLC | | | 1,890,054 | | | | 220,838 | |
Guaranty Trust Bank PLC ADR | | | 80,743 | | | | 476,384 | |
United Bank for Africa PLC | | | 9,088,229 | | | | 547,087 | |
| | | | | | | | |
| | | | | | | 1,664,057 | |
| | | | | | | | |
Norway — 0.9% | | | | | | | | |
DnB NOR ASA | | | 272,033 | | | | 3,826,974 | |
Statoil ASA | | | 76,837 | | | | 1,830,107 | |
Telenor ASA | | | 172,500 | | | | 2,810,946 | |
TGS Nopec Geophysical Co ASA | | | 71,622 | | | | 1,620,806 | |
Yara International ASA | | | 16,535 | | | | 962,483 | |
| | | | | | | | |
| | | | | | | 11,051,316 | |
| | | | | | | | |
Panama — 0.2% | | | | | | | | |
Copa Holdings SA Class A | | | 45,130 | | | | 2,655,449 | |
| | | | | | | | |
Peru — 0.2% | | | | | | | | |
Cia de Minas Buenaventura SA ADR | | | 2,500 | | | | 122,400 | |
Credicorp, Ltd.D | | | 19,915 | | | | 2,368,093 | |
| | | | | | | | |
| | | | | | | 2,490,493 | |
| | | | | | | | |
Philippines — 0.2% | | | | | | | | |
International Container Terminal Services, Inc. | | | 1,178,750 | | | | 1,208,335 | |
Philippine Long Distance Telephone Co. | | | 32,820 | | | | 1,910,243 | |
| | | | | | | | |
| | | | | | | 3,118,578 | |
| | | | | | | | |
Poland — 0.2% | | | | | | | | |
KGHM Polska Miedz SA | | | 40,960 | | | | 2,393,622 | |
Powszechna Kasa Oszczednosci Bank Polski SA | | | 15,369 | | | | 225,053 | |
| | | | | | | | |
| | | | | | | 2,618,675 | |
| | | | | | | | |
Russia — 1.8% | | | | | | | | |
Alliance Oil Co., Ltd. GDRD* | | | 9,000 | | | | 142,285 | |
CTC Media, Inc. | | | 4,700 | | | | 110,121 | |
Gazprom OAO ADRD | | | 93,107 | | | | 2,368,642 | |
Globaltrans Investment PLC GDR | | | 10,357 | | | | 176,069 | |
Kalina ADR@ | | | 5,200 | | | | 140,400 | |
LSR Group GDR* | | | 77,288 | | | | 711,822 | |
Lukoil OAO ADR | | | 21,420 | | | | 1,225,652 | |
Magnit@ | | | 15,379 | | | | 2,054,081 | |
Mail.ru Group, Ltd. GDR* | | | 7,464 | | | | 268,704 | |
Mechel ADRD | | | 27,300 | | | | 797,979 | |
NovaTek OAO GDR | | | 24,673 | | | | 2,948,424 | |
Novorossiysk Commercial Sea Port GDR | | | 79,236 | | | | 774,332 | |
Pharmstandard GDR* | | | 9,073 | | | | 258,581 | |
Raspadskaya@ | | | 204,472 | | | | 1,435,393 | |
Rosneft Oil Co. GDR | | | 85,846 | | | | 583,753 | |
Sberbank of Russia | | | 1,593,737 | | | | 5,429,862 | |
TransContainer OAO, GDR* | | | 12,500 | | | | 118,750 | |
Uralkali ADRD | | | 4,800 | | | | 176,256 | |
VTB Bank OJSC GDRD | | | 220,328 | | | | 1,451,962 | |
X5 Retail Group NV GDR* | | | 47,302 | | | | 2,187,718 | |
| | | | | | | | |
| | | | | | | 23,360,786 | |
| | | | | | | | |
Singapore — 1.2% | | | | | | | | |
Ascendas Real Estate Investment Trust REIT‡‡ | | | 6,000 | | | | 9,678 | |
Biosensors International Group, Ltd.* | | | 710,000 | | | | 625,161 | |
CapitaMall Trust REIT‡‡ | | | 12,000 | | | | 18,234 | |
Cosco Corporation Singapore, Ltd. | | | 21,000 | | | | 35,018 | |
DBS Group Holdings, Ltd.‡‡ | | | 1,000 | | | | 11,158 | |
Golden Agri-Resources, Ltd. | | | 1,672,000 | | | | 1,042,272 | |
Jardine Cycle & Carriage, Ltd.‡‡ | | | 2,000 | | | | 57,038 | |
Keppel Corporation, Ltd. | | | 6,000 | | | | 52,924 | |
Neptune Orient Lines, Ltd.*‡‡ | | | 49,000 | | | | 83,235 | |
Oversea-Chinese Banking Corporation, Ltd.D‡‡ | | | 116,000 | | | | 893,038 | |
SembCorp Industries, Ltd.‡‡ | | | 569,000 | | | | 2,278,926 | |
SembCorp Marine, Ltd. | | | 28,000 | | | | 117,162 | |
Singapore Airlines, Ltd. | | | 63,000 | | | | 751,081 | |
Singapore Exchange, Ltd.D‡‡ | | | 114,000 | | | | 747,949 | |
Singapore Technologies Engineering, Ltd.‡‡ | | | 10,000 | | | | 26,649 | |
Singapore Telecom- munications, Ltd.‡‡ | | | 1,686,000 | | | | 4,006,935 | |
StarHub, Ltd.‡‡ | | | 3,000 | | | | 6,148 | |
United Overseas Bank, Ltd.‡‡ | | | 326,594 | | | | 4,631,637 | |
UOL Group, Ltd.‡‡ | | | 3,186 | | | | 11,792 | |
| | | | | | | | |
| | | | | | | 15,406,035 | |
| | | | | | | | |
South Africa — 1.2% | | | | | | | | |
African Rainbow Minerals, Ltd. | | | 5,887 | | | | 187,758 | |
Aspen Pharmacare Holdings, Ltd. | | | 18,087 | | | | 252,628 | |
Bidvest Group, Ltd. | | | 94,360 | | | | 2,245,302 | |
FirstRand, Ltd. | | | 237,518 | | | | 703,450 | |
Impala Platinum Holdings, Ltd. | | | 6,900 | | | | 244,011 | |
Imperial Holdings, Ltd. | | | 13,518 | | | | 261,598 | |
Massmart Holdings, Ltd. | | | 7,210 | | | | 160,563 | |
MMI Holdings, Ltd. | | | 7,991 | | | | 20,161 | |
MTN Group, Ltd. | | | 161,001 | | | | 3,285,276 | |
Naspers, Ltd. | | | 11,603 | | | | 683,322 | |
Pick’n Pay Stores, Ltd. | | | 101,331 | | | | 744,504 | |
Royal Bafokeng Platinum, Ltd.@* | | | 14,696 | | | | 148,912 | |
Sasol, Ltd. | | | 72,897 | | | | 3,831,920 | |
| | | | |
| | See Notes to Financial Statements. | | 171 |
INTERNATIONAL EQUITY FUND
SCHEDULE OF INVESTMENTS (Continued)
| | | | | | | | |
| | | Shares | | | Value | |
Standard Bank Group, Ltd. | | | 142,340 | | | $ | 2,323,896 | |
| | | | | | | | |
| | | | | | | 15,093,301 | |
| | | | | | | | |
South Korea — 2.6% | | | | | | | | |
Amorepacific Corporation | | | 1,406 | | | | 1,412,052 | |
Celltrion, Inc.* | | | 27,700 | | | | 816,529 | |
Hyundai Heavy Industries Co., Ltd. | | | 2,488 | | | | 969,739 | |
Hyundai Mobis | | | 3,103 | | | | 776,917 | |
Hyundai Motor Co. | | | 2,815 | | | | 429,793 | |
Hyundai Steel Co. | | | 15,626 | | | | 1,711,701 | |
Kia Motors Corporation | | | 80,930 | | | | 3,604,951 | |
KIWOOM Securities Co., Ltd. | | | 4,448 | | | | 226,942 | |
Korea Electric Power Corporation* | | | 95,336 | | | | 2,536,558 | |
KTB Securities Co., Ltd.* | | | 35,429 | | | | 166,420 | |
LG Chem, Ltd. | | | 7,590 | | | | 2,613,321 | |
LG Household & Health Care, Ltd. | | | 1,720 | | | | 591,407 | |
MegaStudy Co., Ltd. | | | 2,907 | | | | 450,054 | |
POSCO | | | 1,160 | | | | 495,541 | |
Samsung Electro-Mechanics Co., Ltd. | | | 2,512 | | | | 273,842 | |
Samsung Electronics Co., Ltd. | | | 9,711 | | | | 8,110,008 | |
Samsung Electronics Co., Ltd. | | | | | | | | |
(Non-Voting Shares) GDR 144A | | | 5,207 | | | | 1,488,829 | |
Samsung Engineering Co., Ltd. | | | 6,055 | | | | 1,023,390 | |
Samsung Fire & Marine Insurance Co., Ltd. | | | 9,720 | | | | 1,923,295 | |
Shinhan Financial Group Co., Ltd. | | | 68,792 | | | | 3,198,760 | |
STX Engine Co., Ltd. | | | 25,950 | | | | 791,470 | |
| | | | | | | | |
| | | | | | | 33,611,519 | |
| | | | | | | | |
Spain — 3.4% | | | | | | | | |
Amadeus IT Holding SA* | | | 56,997 | | | | 1,197,810 | |
Banco Bilbao Vizcaya Argentaria SAD‡‡ | | | 513,111 | | | | 5,229,257 | |
Banco Espanol de Credito SA‡‡ | | | 8,518 | | | | 70,605 | |
Banco Santander SA‡‡ | | | 853,172 | | | | 9,091,252 | |
Bolsas y Mercados Espanoles SA‡‡ | | | 1,314 | | | | 31,337 | |
Corporacion Financiera Alba SA | | | 7,249 | | | | 372,795 | |
Enagas | | | 120,783 | | | | 2,415,710 | |
Endesa SA‡‡ | | | 20,832 | | | | 539,791 | |
Iberdrola SA | | | 965,400 | | | | 7,485,338 | |
Inditex SA‡‡ | | | 43,577 | | | | 3,261,893 | |
Red Electrica Corporacion SAD | | | 14,390 | | | | 678,368 | |
Repsol YPF SA‡‡ | | | 15,666 | | | | 438,705 | |
Telefonica SA‡‡ | | | 551,424 | | | | 12,589,034 | |
Viscofan SA | | | 15,665 | | | | 594,092 | |
| | | | | | | | |
| | | | | | | 43,995,987 | |
| | | | | | | | |
Sri Lanka — 0.0% | | | | | | | | |
Dialog Axiata, Ltd.* | | | 2,452,710 | | | | 260,868 | |
| | | | | | | | |
Sweden — 1.4% | | | | | | | | |
Assa Abloy AB Class B | | | 117,720 | | | | 3,320,726 | |
Atlas Copco AB Class A | | | 113,455 | | | | 2,863,998 | |
Autoliv, Inc.D | | | 7,500 | | | | 592,050 | |
Boliden AB‡‡ | | | 19,332 | | | | 393,868 | |
Electrolux ABD‡‡ | | | 41,997 | | | | 1,191,781 | |
Getinge AB | | | 6,236 | | | | 130,549 | |
Hennes & Mauritz AB Class B | | | 13,076 | | | | 435,497 | |
Holmen AB‡‡ | | | 2,621 | | | | 86,281 | |
Investor AB‡‡ | | | 3,383 | | | | 72,390 | |
NCC AB | | | 3,258 | | | | 71,771 | |
Sandvik AB‡‡ | | | 3,271 | | | | 63,824 | |
Scania AB‡‡ | | | 20,772 | | | | 478,152 | |
Skandinaviska Enskilda Banken AB | | | 93,774 | | | | 782,940 | |
SKF AB | | | 58,779 | | | | 1,677,359 | |
Swedbank AB*‡‡ | | | 11,890 | | | | 166,262 | |
Tele2 AB‡‡ | | | 49,119 | | | | 1,019,101 | |
Volvo AB Class B*‡‡ | | | 287,717 | | | | 5,068,364 | |
| | | | | | | | |
| | | | | | | 18,414,913 | |
| | | | | | | | |
Switzerland — 6.4% | | | | | | | | |
ABB, Ltd.*‡‡ | | | 24,837 | | | | 554,558 | |
Cie Financiere Richemont SA‡‡ | | | 86,811 | | | | 5,104,819 | |
Clariant AG*‡‡ | | | 58,220 | | | | 1,179,677 | |
Credit Suisse Group AG | | | 108,779 | | | | 4,381,068 | |
GAM Holding AG* | | | 52,307 | | | | 864,620 | |
Julius Baer Group, Ltd. | | | 89,714 | | | | 2,372,687 | |
Nestle SAD‡‡ | | | 249,901 | | | | 14,640,118 | |
Novartis AG‡‡ | | | 253,255 | | | | 14,908,009 | |
Roche Holding AGD‡‡ | | | 39,332 | | | | 5,765,790 | |
Schindler Holding AG‡‡ | | | 14,641 | | | | 1,731,964 | |
Sonova Holding AG | | | 17,742 | | | | 2,287,059 | |
STMicroelectronics NV‡‡ | | | 7,032 | | | | 73,129 | |
Sulzer AG‡‡ | | | 3,552 | | | | 541,897 | |
Swatch Group AG (The) | | | 30,407 | | | | 6,570,197 | |
Swiss Reinsurance Co., Ltd. | | | 1,550 | | | | 83,153 | |
Synthes, Inc.D | | | 12,246 | | | | 1,652,930 | |
Temenos Group AGD* | | | 11,567 | | | | 480,875 | |
UBS AG* | | | 209,383 | | | | 3,437,789 | |
Xstrata PLC | | | 269,490 | | | | 6,385,874 | |
Zurich Financial Services AG‡‡ | | | 37,496 | | | | 9,710,216 | |
| | | | | | | | |
| | | | | | | 82,726,429 | |
| | | | | | | | |
Taiwan — 2.1% | | | | | | | | |
Acer, Inc. | | | 759,674 | | | | 2,347,560 | |
Advanced Semiconductor Engineering, Inc. | | | 361,000 | | | | 417,874 | |
Cathay Financial Holding Co., Ltd. | | | 136,200 | | | | 241,508 | |
Chimei Innolux Corporation* | | | 395,000 | | | | 545,968 | |
Chroma ATE, Inc. | | | 13,000 | | | | 38,835 | |
Delta Electronics, Inc. | | | 141,000 | | | | 689,126 | |
Formosa Plastics Corporation | | | 545,000 | | | | 1,822,492 | |
Hon Hai Precision Industry Co., Ltd. | | | 94,304 | | | | 380,043 | |
HTC Corporation | | | 79,250 | | | | 2,446,281 | |
MediaTek, Inc. | | | 95,719 | | | | 1,370,627 | |
Richtek Technology Corporation | | | 27,000 | | | | 225,027 | |
Taiwan Semiconductor Manufacturing Co., Ltd. | | | 4,037,348 | | | | 9,831,486 | |
Taiwan Semiconductor Manufacturing Co., Ltd. ADRD | | | 340,524 | | | | 4,270,171 | |
Unimicron Technology Corporation | | | 271,000 | | | | 527,937 | |
Wintek Corporation* | | | 814,000 | | | | 1,398,707 | |
| | | | | | | | |
| | | | | | | 26,553,642 | |
| | | | | | | | |
Thailand — 0.6% | | | | | | | | |
Bangkok Bank PCL | | | 35,500 | | | | 179,576 | |
Banpu PCL ADR | | | 90,160 | | | | 2,366,720 | |
Central Pattana PCL@ | | | 507,292 | | | | 450,160 | |
| | | | |
| 172 | | See Notes to Financial Statements. | | |
| | | | | | | | |
| | | Shares | | | Value | |
Central Pattana PCL ADR | | | 374,200 | | | $ | 331,275 | |
CP ALL PCL | | | 1,539,999 | | | | 2,002,483 | |
Italian-Thai Development PCLD* | | | 2,201,100 | | | | 338,799 | |
Siam Commercial Bank PCL | | | 391,926 | | | | 1,345,641 | |
| | | | | | | | |
| | | | | | | 7,014,654 | |
| | | | | | | | |
Turkey — 0.6% | | | | | | | | |
Akbank TAS | | | 301,100 | | | | 1,673,211 | |
Akfen Holding AS* | | | 43,000 | | | | 348,122 | |
Coca-Cola Icecek AS | | | 74,153 | | | | 979,742 | |
KOC Holding AS | | | 475,590 | | | | 2,316,345 | |
Türkiye Garanti Bankasi AS | | | 213,099 | | | | 1,079,298 | |
Türkiye Halk Bankasi AS* | | | 14,600 | | | | 123,873 | |
Yapi ve Kredi Bankasi AS* | | | 220,231 | | | | 693,214 | |
| | | | | | | | |
| | | | | | | 7,213,805 | |
| | | | | | | | |
Ukraine — 0.0% | | | | | | | | |
MHP SA, GDR* | | | 7,000 | | | | 119,700 | |
| | | | | | | | |
United Arab Emirates — 0.0% | | | | | |
DP World, Ltd. | | | 408,600 | | | | 257,418 | |
| | | | | | | | |
United Kingdom — 14.7% | | | | | | | | |
Aberdeen Asset Management PLC | | | 484,670 | | | | 1,533,201 | |
Acergy SAD | | | 36,706 | | | | 902,724 | |
Admiral Group PLC | | | 38,725 | | | | 914,692 | |
Afren PLC* | | | 132,800 | | | | 305,601 | |
Aggreko PLC | | | 126,699 | | | | 2,927,469 | |
Amlin PLC‡‡ | | | 30,518 | | | | 194,556 | |
Anglo American PLC‡‡ | | | 227,459 | | | | 11,840,936 | |
Antofagasta PLC | | | 7,200 | | | | 180,954 | |
Associated British Foods PLC | | | 9,521 | | | | 175,309 | |
AstraZeneca PLC‡‡ | | | 126,348 | | | | 5,755,983 | |
Aviva PLC‡‡ | | | 426,331 | | | | 2,612,224 | |
BAE Systems PLC | | | 484,345 | | | | 2,491,952 | |
Barclays PLC‡‡ | | | 66,703 | | | | 272,105 | |
BG Group PLC | | | 471,002 | | | | 9,516,969 | |
BHP Billiton PLC‡‡ | | | 258,629 | | | | 10,286,286 | |
BP PLC‡‡ | | | 1,164,865 | | | | 8,454,985 | |
British Airways PLC* | | | 7,891 | | | | 33,525 | |
British Land Co. PLC‡‡ | | | 4,511 | | | | 36,888 | |
British Sky Broadcasting Group PLC | | | 7,380 | | | | 84,685 | |
Britvic PLC | | | 571,987 | | | | 4,220,788 | |
BT Group PLC‡‡ | | | 1,287,203 | | | | 3,628,410 | |
Burberry Group PLC‡‡ | | | 16,567 | | | | 290,323 | |
Capita Group PLC (The) | | | 123,000 | | | | 1,335,664 | |
Capital Shopping Centres Group PLC REIT | | | 3,152 | | | | 20,522 | |
Centrica PLC‡‡ | | | 831,992 | | | | 4,301,348 | |
Compass Group PLC | | | 738,811 | | | | 6,692,377 | |
easyJet PLC* | | | 6,449 | | | | 44,240 | |
Firstgroup PLC | | | 318,754 | | | | 1,979,415 | |
GlaxoSmithKline PLC‡‡ | | | 730,555 | | | | 14,123,603 | |
Gulf Keystone Petroleum, Ltd.* | | | 24,440 | | | | 64,205 | |
Hammerson PLC REIT‡‡ | | | 6,134 | | | | 39,899 | |
Hays PLC | | | 697,837 | | | | 1,402,419 | |
HSBC Holdings PLC‡‡ | | | 529,106 | | | | 5,371,076 | |
ICAP PLC | | | 105,192 | | | | 877,420 | |
IMI PLC‡‡ | | | 24,229 | | | | 356,975 | |
International Power PLC‡‡ | | | 25,479 | | | | 173,832 | |
Intertek Group PLC | | | 49,446 | | | | 1,368,360 | |
Investec PLC‡‡ | | | 58,652 | | | | 481,908 | |
ITV PLC* | | | 285,280 | | | | 311,566 | |
J Sainsbury PLC | | | 229,872 | | | | 1,348,625 | |
Kesa Electricals PLC‡‡ | | | 79,242 | | | | 196,808 | |
Kingfisher PLC‡‡ | | | 66,957 | | | | 274,968 | |
Land Securities Group PLC REIT‡‡ | | | 3,636 | | | | 38,208 | |
Legal & General Group PLC | | | 180,838 | | | | 272,779 | |
Lloyds Banking Group PLC*‡‡ | | | 1,349,914 | | | | 1,382,746 | |
Marks & Spencer Group PLC | | | 9,779 | | | | 56,259 | |
Michael Page International PLC | | | 206,624 | | | | 1,787,906 | |
Mondi PLC‡‡ | | | 66,984 | | | | 536,269 | |
Next PLC | | | 55,826 | | | | 1,718,995 | |
Old Mutual PLC | | | 96,574 | | | | 185,349 | |
Pearson PLC‡‡ | | | 46,189 | | | | 725,889 | |
Persimmon PLC‡‡ | | | 774 | | | | 5,030 | |
Petrofac, Ltd. | | | 174,835 | | | | 4,325,897 | |
Prudential PLC | | | 349,888 | | | | 3,643,984 | |
Reckitt Benckiser Group PLC | | | 129,311 | | | | 7,106,659 | |
Rentokil Initial PLC* | | | 61,858 | | | | 93,452 | |
Rexam PLC | | | 297,209 | | | | 1,541,650 | |
Rio Tinto PLC | | | 130,374 | | | | 9,119,469 | |
Rolls-Royce Group PLC‡‡ | | | 244,139 | | | | 2,371,352 | |
Rolls-Royce Group PLC +*‡‡ | | | 28,325,696 | | | | 44,162 | |
Royal Bank of Scotland Group PLC* | | | 421,218 | | | | 256,579 | |
Sage Group PLC (The) | | | 50,357 | | | | 214,649 | |
Scottish & Southern Energy PLC | | | 97,181 | | | | 1,856,044 | |
Severn Trent PLC | | | 2,552 | | | | 58,807 | |
Smith & Nephew PLC | | | 243,575 | | | | 2,569,043 | |
Stagecoach Group PLC‡‡ | | | 38,256 | | | | 126,566 | |
Standard Chartered PLC‡‡ | | | 244,257 | | | | 6,571,022 | |
Tate & Lyle PLC‡‡ | | | 52,371 | | | | 422,952 | |
Tesco PLC‡‡ | | | 1,022,794 | | | | 6,777,164 | |
TUI Travel PLC | | | 710,564 | | | | 2,727,484 | |
Tullow Oil PLC | | | 178,062 | | | | 3,500,719 | |
Unilever PLC‡‡ | | | 284,485 | | | | 8,706,640 | |
Vedanta Resources PLC | | | 1,221 | | | | 47,915 | |
Vodafone Group PLC‡‡ | | | 3,366,356 | | | | 8,701,928 | |
Weir Group PLC (The)‡‡ | | | 76,276 | | | | 2,116,795 | |
WH Smith PLC‡‡ | | | 27,380 | | | | 207,890 | |
WM Morrison Supermarkets PLC | | | 532,822 | | | | 2,222,999 | |
Wolseley PLC*‡‡ | | | 11,884 | | | | 379,087 | |
| | | | | | | | |
| | | | | | | 189,846,133 | |
| | | | | | | | |
Total Foreign Common Stocks
(Cost $1,060,900,489) | | | | 1,250,201,938 | |
| | | | | | | | |
FOREIGN PREFERRED STOCKS — 0.9% | |
Belgium — 0.0% | | | | | | | | |
Fortis* | | | 106,120 | | | | 142 | |
| | | | | | | | |
Brazil — 0.4% | | | | | | | | |
Banco Bradesco SA | | | 94,799 | | | | 1,864,571 | |
Gerdau SA | | | 8,500 | | | | 116,081 | |
Investimentos Itau SA | | | 133,306 | | | | 1,060,024 | |
Tele Norte Leste Participacoes SA | | | 600 | | | | 8,779 | |
Ultrapar Participacoes SA | | | 31,921 | | | | 2,021,022 | |
| | | | | | | | |
| | | | | | | 5,070,477 | |
| | | | | | | | |
Chile — 0.0% | | | | | | | | |
Embotelladora Andina SA Class A | | | 38,000 | | | | 155,898 | |
Embotelladora Andina SA Class B | | | 28,700 | | | | 145,278 | |
| | | | | | | | |
| | | | | | | 301,176 | |
| | | | | | | | |
| | | | |
| | See Notes to Financial Statements. | | 173 |
INTERNATIONAL EQUITY FUND
SCHEDULE OF INVESTMENTS (Continued)
| | | | | | | | |
| | | Shares | | | Value | |
Germany — 0.3% | | | | | | | | |
Henkel AG & Co. KGaA | | | 21,471 | | | $ | 1,331,239 | |
ProSiebenSat.1 Media AGD | | | 47,891 | | | | 1,437,467 | |
Volkswagen AG‡‡ | | | 6,290 | | | | 1,022,683 | |
| | | | | | | | |
| | | | | | | 3,791,389 | |
| | | | | | | | |
Russia — 0.0% | | | | | |
MDM Bank@ | | | 656,800 | | | | 308,696 | |
| | | | | | | | |
South Korea — 0.2% | | | | | |
Samsung Electronics Co., Ltd. | | | 3,019 | | | | 1,723,278 | |
| | | | | | | | |
Total Foreign Preferred Stocks
(Cost $7,937,321) | | | | 11,195,158 | |
| | | | | | | | |
RIGHTS — 0.0% | | | | | | | | |
Henderson Land Development Co., Ltd.*‡‡
(Cost $0) | | | 71 | | | | 16 | |
| | | | | | | | |
MONEY MARKET FUNDS — 10.7% | |
GuideStone Money Market Fund (GS4 Class)¥ | | | 36,786,025 | | | | 36,786,025 | |
Northern Institutional Liquid Assets Portfolio§ | | | 101,923,046 | | | | 101,923,046 | |
| | | | | | | | |
Total Money Market Funds
(Cost $138,709,071) | | | | | | | 138,709,071 | |
| | | | | | | | |
| | |
| | | Par | | | | |
U.S. TREASURY OBLIGATIONS — 0.6% | |
U.S. Treasury Bills | | | | | | | | |
0.17%, 05/05/11‡‡ | | $ | 5,000,000 | | | | 4,997,680 | |
0.18%, 05/05/11‡‡ | | | 1,825,000 | | | | 1,824,153 | |
0.19%, 05/05/11‡‡ | | | 615,000 | | | | 614,603 | |
| | | | | | | | |
Total U.S. Treasury Obligations
(Cost $7,435,530) | | | | 7,436,436 | |
| | | | | | | | |
TOTAL INVESTMENTS — 109.0%
(Cost $1,214,982,411) | | | | 1,407,542,619 | |
| | | | | | | | |
| | |
| | | Shares | | | | |
SECURITIES SOLD SHORT — (1.7)% | |
Australia — (0.1)% | | | | | |
Adelaide Brighton, Ltd. | | | (3,339 | ) | | | (11,270 | ) |
Amcor, Ltd. | | | (18,166 | ) | | | (125,416 | ) |
Asciano, Ltd.* | | | (16,445 | ) | | | (26,828 | ) |
Billabong International, Ltd. | | | (3,551 | ) | | | (29,600 | ) |
Bluescope Steel, Ltd. | | | (38,063 | ) | | | (87,594 | ) |
Boart Longyear Group | | | (16,352 | ) | | | (76,265 | ) |
Cochlear, Ltd. | | | (1,231 | ) | | | (101,241 | ) |
ConnectEast Group | | | (111,654 | ) | | | (48,535 | ) |
David Jones, Ltd. | | | (8,124 | ) | | | (37,059 | ) |
Downer EDI, Ltd. | | | (1,442 | ) | | | (6,770 | ) |
Energy Resources of Australia, Ltd. | | | (3,374 | ) | | | (38,409 | ) |
Iluka Resources, Ltd.* | | | (2,833 | ) | | | (26,484 | ) |
Insurance Australia Group, Ltd. | | | (24,369 | ) | | | (96,707 | ) |
JB Hi-Fi, Ltd. | | | (454 | ) | | | (8,312 | ) |
Macquarie Group, Ltd. | | | (1,242 | ) | | | (47,014 | ) |
Nufarm, Ltd. | | | (7,073 | ) | | | (37,184 | ) |
Perpetual, Ltd. | | | (5,743 | ) | | | (183,325 | ) |
Primary Health Care, Ltd. | | | (85 | ) | | | (328 | ) |
Seek, Ltd. | | | (17,616 | ) | | | (119,457 | ) |
Sims Metal Management, Ltd. | | | (6,480 | ) | | | (142,960 | ) |
| | |
| | | Shares | | | Value | |
Spark Infrastructure Group 144A | | | (14,972 | ) | | $ | (17,381 | ) |
Toll Holdings, Ltd. | | | (20,115 | ) | | | (117,886 | ) |
WorleyParsons, Ltd. | | | (7,088 | ) | | | (193,854 | ) |
| | | | | | | | |
| | | | | | | (1,579,879 | ) |
| | | | | | | | |
Belgium — 0.0% | | | | | |
Dexia SA | | | (15,239 | ) | | | (52,946 | ) |
| | | | | | | | |
Denmark — (0.1)% | | | | | |
D/S Norden A/S | | | (2,851 | ) | | | (103,633 | ) |
Topdanmark A/S* | | | (266 | ) | | | (35,164 | ) |
Tryg A/S | | | (9,696 | ) | | | (447,139 | ) |
Vestas Wind Systems A/S* | | | (12,439 | ) | | | (393,947 | ) |
William Demant Holding A/S* | | | (2,412 | ) | | | (178,307 | ) |
| | | | | | | | |
| | | | | | | (1,158,190 | ) |
| | | | | | | | |
Finland — (0.1)% | | | | | |
Konecranes OYJ | | | (1,661 | ) | | | (68,630 | ) |
Nokian Renkaat OYJ | | | (6,185 | ) | | | (227,255 | ) |
Outokumpu OYJ | | | (22,866 | ) | | | (423,862 | ) |
Rautaruukki OYJ | | | (14,249 | ) | | | (334,589 | ) |
| | | | | | | | |
| | | | | | | (1,054,336 | ) |
| | | | | | | | |
France — (0.1)% | | | | | |
Air France-KLM | | | (10,104 | ) | | | (184,033 | ) |
Alcatel-Lucent/France* | | | (46,063 | ) | | | (134,189 | ) |
EDF SA | | | (3,525 | ) | | | (144,588 | ) |
Eiffage SA | | | (6,455 | ) | | | (284,697 | ) |
Iliad SA | | | (2,059 | ) | | | (223,969 | ) |
Neopost SA | | | (3,786 | ) | | | (329,864 | ) |
PagesJaunes Groupe | | | (8,076 | ) | | | (73,386 | ) |
Vallourec | | | (3,614 | ) | | | (379,592 | ) |
| | | | | | | | |
| | | | | | | (1,754,318 | ) |
| | | | | | | | |
Germany — (0.1)% | | | | | |
Bilfinger Berger SE | | | (1,160 | ) | | | (98,193 | ) |
Fraport AG | | | (2,297 | ) | | | (145,024 | ) |
Hamburger Hafen Und Logistik AG | | | (15,437 | ) | | | (712,248 | ) |
HeidelbergCement AG | | | (1,162 | ) | | | (72,930 | ) |
Puma AG Rudolf Dassler Sport | | | (209 | ) | | | (69,264 | ) |
SGL Carbon SE* | | | (6,976 | ) | | | (251,844 | ) |
| | | | | | | | |
| | | | | | | (1,349,503 | ) |
| | | | | | | | |
Ireland — (0.1)% | | | | | |
Charter International PLC | | | (16,074 | ) | | | (211,638 | ) |
James Hardie Industries SE ADR* | | | (30,130 | ) | | | (208,939 | ) |
Shire PLC | | | (9,158 | ) | | | (220,312 | ) |
United Business Media, Ltd. | | | (7,082 | ) | | | (76,186 | ) |
| | | | | | | | |
| | | | | | | (717,075 | ) |
| | | | | | | | |
Italy — (0.1)% | | | | | |
A2A SpA | | | (324,083 | ) | | | (446,061 | ) |
Banca Carige SpA | | | (25,954 | ) | | | (54,439 | ) |
Buzzi Unicem SpA | | | (30,270 | ) | | | (346,335 | ) |
Mediobanca SpA | | | (17,618 | ) | | | (157,147 | ) |
Mediolanum SpA | | | (17,201 | ) | | | (71,055 | ) |
| | | | | | | | |
| | | | | | | (1,075,037 | ) |
| | | | | | | | |
Japan — (0.4)% | | | | | |
ABC-Mart, Inc. | | | (4,100 | ) | | | (146,036 | ) |
Advantest Corporation | | | (5,000 | ) | | | (112,416 | ) |
Aeon Credit Service Co., Ltd. | | | (4,500 | ) | | | (63,319 | ) |
Bank of Kyoto, Ltd. | | | (9,000 | ) | | | (85,072 | ) |
Casio Computer Co., Ltd. | | | (15,500 | ) | | | (124,407 | ) |
| | | | | | | | |
| | | Shares | | | Value | |
Disco Corporation | | | (2,600 | ) | | $ | (156,935 | ) |
Don Quijote Co., Ltd. | | | (2,400 | ) | | | (73,027 | ) |
Fast Retailing Co., Ltd. | | | (300 | ) | | | (47,587 | ) |
Furukawa Electric Co., Ltd. | | | (30,000 | ) | | | (134,256 | ) |
GS Yuasa Corporation | | | (17,000 | ) | | | (117,214 | ) |
Hamamatsu Photonics KK | | | (2,400 | ) | | | (87,488 | ) |
Hirose Electric Co., Ltd. | | | (1,000 | ) | | | (112,372 | ) |
Hiroshima Bank, Ltd. | | | (5,000 | ) | | | (21,028 | ) |
Hisamitsu Pharmaceutical Co., Inc. | | | (1,300 | ) | | | (54,638 | ) |
Hitachi Construction Machinery Co., Ltd. | | | (1,400 | ) | | | (33,414 | ) |
Isetan Mitsukoshi Holdings, Ltd. | | | (3,500 | ) | | | (40,565 | ) |
Jafco Co., Ltd. | | | (3,400 | ) | | | (98,300 | ) |
Japan Steel Works, Ltd. | | | (12,000 | ) | | | (124,982 | ) |
Joyo Bank, Ltd. | | | (24,000 | ) | | | (105,200 | ) |
Kintetsu Corporation | | | (53,000 | ) | | | (165,609 | ) |
Matsui Securities Co., Ltd. | | | (27,600 | ) | | | (195,495 | ) |
Mitsubishi Materials Corporation | | | (7,000 | ) | | | (22,245 | ) |
MS&AD Insurance Group Holdings, Inc. | | | (4,500 | ) | | | (112,332 | ) |
NGK Insulators, Ltd. | | | (7,000 | ) | | | (113,708 | ) |
Nidec Corporation | | | (300 | ) | | | (30,250 | ) |
Nippon Sheet Glass Co., Ltd. | | | (30,000 | ) | | | (80,468 | ) |
Nitori Holdings Co., Ltd. | | | (550 | ) | | | (48,061 | ) |
NOK Corporation | | | (5,900 | ) | | | (122,297 | ) |
NSK, Ltd. | | | (16,000 | ) | | | (143,894 | ) |
Olympus Corporation | | | (2,900 | ) | | | (87,319 | ) |
OSAKA Titanium Technologies Co. | | | (2,600 | ) | | | (122,228 | ) |
Rakuten, Inc. | | | (402 | ) | | | (336,414 | ) |
Seiko Epson Corporation | | | (3,800 | ) | | | (68,987 | ) |
Seven Bank, Ltd. | | | (18 | ) | | | (38,062 | ) |
Shimadzu Corporation | | | (22,000 | ) | | | (170,405 | ) |
Shiseido Co., Ltd. | | | (1,800 | ) | | | (39,197 | ) |
Sumco Corporation* | | | (5,900 | ) | | | (84,013 | ) |
Sumitomo Chemical Co., Ltd. | | | (30,000 | ) | | | (147,270 | ) |
Suruga Bank, Ltd. | | | (8,000 | ) | | | (74,234 | ) |
Taiheiyo Cement Corporation | | | (25,000 | ) | | | (31,904 | ) |
Taiyo Nippon Sanso Corporation | | | (21,000 | ) | | | (184,860 | ) |
Takashimaya Co., Ltd. | | | (1,000 | ) | | | (8,541 | ) |
THK Co., Ltd. | | | (1,600 | ) | �� | | (36,597 | ) |
Tokyo Broadcasting System, Inc. | | | (10,800 | ) | | | (152,913 | ) |
Toyota Boshoku Corporation | | | (4,300 | ) | | | (75,600 | ) |
Trend Micro, Inc. | | | (1,100 | ) | | | (36,137 | ) |
Tsumura & Co. | | | (5,900 | ) | | | (190,620 | ) |
Ushio, Inc. | | | (3,600 | ) | | | (68,357 | ) |
Yakult Honsha Co., Ltd. | | | (5,000 | ) | | | (143,754 | ) |
Yaskawa Electric Corporation | | | (17,000 | ) | | | (160,071 | ) |
| | | | | | | | |
| | | | | | | (5,030,098 | ) |
| | | | | | | | |
Luxembourg — 0.0% | |
Oriflame Cosmetics SA ADR | | | (8,190 | ) | | | (431,228 | ) |
| | | | | | | | |
Netherlands — (0.1)% | |
Fugro NV | | | (3,687 | ) | | | (303,009 | ) |
Koninklijke Boskalis Westminster NV | | | (9 | ) | | | (429 | ) |
SBM Offshore NV | | | (15,151 | ) | | | (339,431 | ) |
| | | | | | | | |
| | | | | | | (642,869 | ) |
| | | | | | | | |
Papua New Guinea — 0.0% | | | | | | | | |
Oil Search, Ltd. | | | (28,813 | ) | | | (207,468 | ) |
| | | | | | | | |
Russia — 0.0% | | | | | | | | |
Alliance Oil Co., Ltd. GDR* | | | (16,060 | ) | | | (253,900 | ) |
Spain — (0.1)% | | | | | | | | |
Acciona SA | | | (5,032 | ) | | | (357,180 | ) |
Ferrovial SA | | | (6,436 | ) | | | (64,273 | ) |
Gestevision Telecinco SA | | | (31,740 | ) | | | (349,625 | ) |
Grifols SA | | | (2,193 | ) | | | (29,974 | ) |
Iberdrola Renovables SA | | | (32,308 | ) | | | (114,822 | ) |
| | | | | | | | |
| | | | | | | (915,874 | ) |
| | | | | | | | |
Sweden — 0.0% | | | | | | | | |
Meda AB | | | (23,081 | ) | | | (175,951 | ) |
| | | | | | | | |
Switzerland — (0.1)% | | | | | | | | |
Adecco SA | | | (1,790 | ) | | | (117,387 | ) |
Baloise Holding AG | | | (871 | ) | | | (84,727 | ) |
Julius Baer Group, Ltd. | | | (3,419 | ) | | | (160,088 | ) |
Lonza Group AG | | | (3,328 | ) | | | (266,756 | ) |
Nobel Biocare Holding AG | | | (6,440 | ) | | | (121,467 | ) |
Sonova Holding AG | | | (1,077 | ) | | | (138,832 | ) |
| | | | | | | | |
| | | | | | | (889,257 | ) |
| | | | | | | | |
United Kingdom — (0.3)% | | | | | | | | |
Aegis Group PLC | | | (133,080 | ) | | | (291,514 | ) |
Berkeley Group Holdings PLC* | | | (14,472 | ) | | | (200,812 | ) |
Bunzl PLC | | | (20,573 | ) | | | (230,620 | ) |
Capita Group PLC (The) | | | (37,105 | ) | | | (402,925 | ) |
Chemring Group PLC | | | (922 | ) | | | (41,745 | ) |
Cobham PLC | | | (94,680 | ) | | | (300,396 | ) |
Cookson Group PLC* | | | (20,065 | ) | | | (205,999 | ) |
Dixons Retail PLC* | | | (10,002 | ) | | | (3,574 | ) |
Drax Group PLC | | | (27,747 | ) | | | (159,327 | ) |
Firstgroup PLC | | | (13,350 | ) | | | (82,902 | ) |
Hays PLC | | | (29,940 | ) | | | (60,169 | ) |
ICAP PLC | | | (6,788 | ) | | | (56,620 | ) |
Invensys PLC | | | (63,978 | ) | | | (353,305 | ) |
Lonmin PLC* | | | (12,111 | ) | | | (371,223 | ) |
Man Group PLC | | | (94,293 | ) | | | (435,153 | ) |
Misys PLC* | | | (14,592 | ) | | | (78,033 | ) |
Pennon Group PLC | | | (25,179 | ) | | | (251,240 | ) |
Provident Financial PLC | | | (13,123 | ) | | | (178,820 | ) |
Prudential PLC | | | (16,690 | ) | | | (173,821 | ) |
Standard Life PLC | | | (126,888 | ) | | | (427,312 | ) |
Thomas Cook Group PLC | | | (21,109 | ) | | | (62,432 | ) |
TUI Travel PLC | | | (27,644 | ) | | | (106,111 | ) |
| | | | | | | | |
| | | | | | | (4,474,053 | ) |
| | | | | | | | |
Total Securities Sold Short
(Proceeds $(20,027,787)) | | | | | | | (21,761,982 | ) |
| | | | | | | | |
Liabilities in Excess of Other Assets — (7.3)% | | | | | | | (94,360,824 | ) |
| | | | | | | | |
NET ASSETS — 100.0% | | | | | | $ | 1,291,419,813 | |
| | | | | | | | |
Please see abbreviation and footnote definitions beginning on page 180.
| | | | |
| | See Notes to Financial Statements. | | 175 |
| | |
| INTERNATIONAL EQUITY FUND | | |
| SCHEDULE OF INVESTMENTS (Continued) | | |
| | | | |
| PORTFOLIO SUMMARY (based on net assets) | | % | |
Foreign Common Stocks | | | | |
Japan | | | 14.8 | |
United Kingdom | | | 14.7 | |
France | | | 7.6 | |
Switzerland | | | 6.4 | |
Germany | | | 6.1 | |
Australia | | | 5.3 | |
Netherlands | | | 4.3 | |
Spain | | | 3.4 | |
Hong Kong | | | 3.0 | |
China | | | 2.9 | |
South Korea | | | 2.6 | |
Brazil | | | 2.3 | |
Italy | | | 2.2 | |
Taiwan | | | 2.1 | |
Canada | | | 2.0 | |
Russia | | | 1.8 | |
India | | | 1.6 | |
Sweden | | | 1.4 | |
Singapore | | | 1.2 | |
South Africa | | | 1.2 | |
Denmark | | | 1.1 | |
Indonesia | | | 0.9 | |
Norway | | | 0.9 | |
Malaysia | | | 0.8 | |
Mexico | | | 0.8 | |
Finland | | | 0.6 | |
Ireland | | | 0.6 | |
Thailand | | | 0.6 | |
Turkey | | | 0.6 | |
Israel | | | 0.4 | |
Egypt | | | 0.3 | |
Greece | | | 0.3 | |
Austria | | | 0.2 | |
Chile | | | 0.2 | |
Hungary | | | 0.2 | |
Panama | | | 0.2 | |
Peru | | | 0.2 | |
Philippines | | | 0.2 | |
Poland | | | 0.2 | |
Argentina | | | 0.1 | |
Bermuda | | | 0.1 | |
Colombia | | | 0.1 | |
Estonia | | | 0.1 | |
New Zealand | | | 0.1 | |
Nigeria | | | 0.1 | |
Belgium | | | — | ** |
Czech Republic | | | — | ** |
Kazakhstan | | | — | ** |
Luxembourg | | | — | ** |
Mongolia | | | — | ** |
Sri Lanka | | | — | ** |
Ukraine | | | — | ** |
United Arab Emirates | | | — | ** |
| | | | |
Total Foreign Common Stocks | | | 96.8 | |
| | | | |
Total Money Market Funds | | | 10.7 | |
| | | | |
Total Futures Contracts | | | 3.7 | |
| | | | |
Total Foreign Preferred Stocks | | | 0.9 | |
| | | | |
Total U.S. Treasury Obligations | | | 0.6 | |
| | | | |
Total Rights | | | — | ** |
| | | | |
Total Forward Foreign Currency Contracts | | | (0.2 | ) |
| | | | |
Total Securities Sold Short | | | (1.7 | ) |
| | | | |
Total Investments | | | 110.8 | |
| | | | |
| ** | Rounds to less than 0.005%. |
| | | | |
| 176 | | See Notes to Financial Statements. | | |
VALUATION HIERARCHY
The following is a summary of the inputs used, as of December 31, 2010, in valuing the Fund’s assets carried at fair value:
| | | | | | | | |
Valuation Inputs | | Investments
in
Securities | | | Other
Financial
Instruments*** | |
Assets: | | | | | | | | |
Level 1 — Quoted Prices | | | | | | | | |
Foreign Common Stocks | | $ | 711,489,044 | | | $ | — | |
Foreign Preferred Stocks | | | 5,680,490 | | | | — | |
Futures Contracts | | | — | | | | 690,262 | |
Money Market Funds | | | 138,709,071 | | | | — | |
Rights | | | 16 | | | | — | |
Level 2 — Other Significant Observable Inputs | | | | | | | | |
Foreign Common Stocks | | | 538,500,453 | | | | — | |
Foreign Preferred Stocks | | | 5,514,668 | | | | — | |
Forward Foreign Currency Contracts | | | — | | | | 519,842 | |
U.S. Treasury Obligations | | | 7,436,436 | | | | — | |
Level 3 — Significant Unobservable Inputs | | | | | | | | |
Foreign Common Stocks | | | 212,441 | | | | — | |
Rights | | | — | | | | — | |
| | | | | | | | |
Total Assets | | $ | 1,407,542,619 | | | $ | 1,210,104 | |
| | | | | | | | |
Liabilities: | | | | | | | | |
Level 1 — Quoted Prices | | | | | | | | |
Securities Sold Short | | $ | (9,497,872 | ) | | $ | — | |
Level 2 — Other Significant Observable Inputs | | | | | | | | |
Securities Sold Short | | | (12,264,110 | ) | | | — | |
Level 3 — Significant Unobservable Inputs | | | — | | | | — | |
| | | | | | | | |
Total Liabilities | | $ | (21,761,982 | ) | | $ | — | |
| | | | | | | | |
| *** | Other financial instruments are derivative instruments not reflected in the Schedule of Investments, such as futures, forwards and swap contracts, which are valued at the unrealized appreciation (depreciation) on the investment. Details of these investments can be found in the Notes to Financial Statements. |
The following is a reconciliation of assets in which significant unobservable inputs (Level 3) were used in determining fair value:
| | | | | | | | |
| | | Investments
in
Securities | | | Other
Financial
Instruments*** | |
Balance, 12/31/09 | | | | | | | | |
Rights | | $ | 1,251 | | | $ | — | |
Accrued discounts/premiums | | | | | | | | |
Rights | | | — | | | | — | |
Realized gain (loss)(1) | | | | | | | | |
Rights | | | 620 | | | | — | |
Changed in unrealized appreciation (depreciation)(1) | | | | | | | | |
Rights | | | (1,251 | ) | | | — | |
Purchases | | | | | | | | |
Rights | | | — | | | | — | |
Sales | | | | | | | | |
Rights | | | (620 | ) | | | — | |
Transfers in and/or out of Level 3 | | | | | | | | |
Foreign Common Stocks | | | 212,441 | | | | — | |
| | | | | | | | |
Balance, 12/31/10 | | $ | 212,441 | | | $ | — | |
| | | | | | | | |
| (1) | Realized gain (loss) from the sale of Level 3 securities can be found on the Statement of Operations in Net Realized Gain (loss) from Investment securities and securities sold short. |
| (2) | Change in unrealized appreciation (depreciation) can be found on the Statement of Operations in Net change in unrealized appreciation (depreciation) on Investment securities and securities sold short. |
Level 1-2 Transfers
The Fund had common stocks valued at $553,461,167 as of December 31, 2009 that were either sold or transferred from Level 2 to Level 1 of the fair value hierarchy. The common stocks that transferred from Level 2 to Level 1 did so as a result of foreign equities that were fair valued at December 31, 2009 that are now being valued based on quoted prices. The value of the securities that were transferred to Level 1 as of December 31, 2010 is $511,892,106.
The Fund had common stocks valued at $6,479,563 as of December 31, 2009 that were either sold or transferred from Level 1 to Level 2 of the fair value hierarchy. The common stocks that transferred from Level 1 to Level 2 did so as a result of foreign equities that were being valued based on quoted prices December 31, 2009 that are now being fair valued. The value of the securities that were transferred to Level 1 as of December 31, 2010 is $4,690,585.
ABBREVIATIONS AND FOOTNOTES
| | | | |
| INVESTMENT ABBREVIATIONS: |
| | |
| ADR | | — | | American Depository Receipt |
| CONV | | — | | Convertible |
| GDR | | — | | Global Depository Receipt |
| IO | | — | | Interest Only (Principal amount shown is notional) |
| LLC | | — | | Limited Liability Company |
| LOC | | — | | Letter of Credit |
| LP | | — | | Limited Partnership |
| PIK | | — | | Payment-in-Kind Bonds |
| PIPE | | — | | Private Investment in Public Equity |
| PLC | | — | | Public Limited Company |
| PO | | — | | Principal Only |
| REIT | | — | | Real Estate Investment Trust |
| STEP | | — | | Stepped Coupon Bonds (1) |
| STRIP | | — | | Stripped Security |
| TBA | | — | | To be announced. |
| 144A | | — | | Security was purchased pursuant to Rule 144A under the Securities Act of 1933 and may not be resold subject to that rule except to qualified institutional buyers. As of December 31, 2010, the total market values and percentages of net assets for 144A securities by fund were as follows: |
| | | | | | | | |
Fund | | Value of
144A Securities | | | Percentage of
Net Assets | |
Money Market | | $ | 11,800,000 | | | | 0.91 | % |
Low-Duration Bond | | | 106,061,098 | | | | 14.97 | |
Medium-Duration Bond | | | 100,742,406 | | | | 11.84 | |
Extended-Duration Bond | | | 30,855,016 | | | | 7.52 | |
Global Bond | | | 18,809,453 | | | | 11.68 | |
Small Cap Equity | | | 2,664,586 | | | | 0.56 | |
International Equity | | | 1,639,237 | | | | 0.13 | |
INVESTMENT FOOTNOTES:
| | | | |
| ‡‡ | | — | | All or a portion of the security was held as collateral |
| | | | for open futures, options, securities sold short and/or |
| | | | swap contracts. |
| @ | | — | | Illiquid. |
| * | | — | | Non-income producing security. |
| # | | — | | Security in default. |
| + | | — | | Security is valued at fair value (2) . |
| § | | — | | Security purchased with the cash proceeds from |
| | | | securities loaned. |
| † | | — | | Variable rate security (1) . |
| W | | — | | Interest rates shown reflect the effective yields |
| | | | as of December 31, 2010. |
| ¥ | | — | | Affiliated fund. |
| D | | — | | Security either partially or fully on loan. |
| (1) | | Interest rates shown reflect the rates currently in effect. Maturity date for money market instruments is the date of the next interest rate reset. |
| (2) | | Fair valued securities were held at December 31, 2010 in the Low-Duration Bond Fund, Medium-Duration Bond Fund, Global Bond Fund, Equity Index Fund, Value Equity Fund, Small Cap Equity Fund and International Equity Fund at an aggregate market value of $110,903, $369,013, $11,550, $0, $1,209, $560,550 and $44,652, respec- tively, which amounted to 0.02%, 0.04%, 0.01%, 0.00%, 0.00%, 0.12% and 0.00% of each of those funds, repectively. |
ABBREVIATIONS AND FOOTNOTES
| | | | |
| FOREIGN BOND FOOTNOTES: |
| | |
| (A) | | — | | Par is denominated in Australian Dollars (AUD). |
| (B) | | — | | Par is denominated in Brazilian Real (BRL). |
| (C) | | — | | Par is denominated in Canadian Dollars (CAD). |
| (E) | | — | | Par is denominated in Euro (EUR). |
| (G) | | — | | Par is denominated in Singapore Dollars (SGD). |
| (K) | | — | | Par is denominated in Norweigan Krone (NOK). |
| (M) | | — | | Par is denominated in Mexican Pesos (MXN). |
| (N) | | — | | Par is denominated in Indonesian Rupiahs (IDR). |
| (P) | | — | | Par is denominated in Peruvian Nuevos Soles (PEN). |
| (R) | | — | | Par is denominated in Malaysian Ringgits (MYR). |
| (S) | | — | | Par is denominated in South African Rand (ZAR). |
| (U) | | — | | Par is denominated in British Pounds (GBP). |
| (V) | | — | | Par is denominated in Polish Zloty (PLN). |
| (W) | | — | | Par is denominated in South Korean Won (KRW). |
| (Y) | | — | | Par is denominated in Egyptian Pounds (EGP). |
| (Z) | | — | | Par is denominated in New Zealand Dollars (NZD). |
| | | | |
| COUNTERPARTY ABBREVIATIONS: |
| | |
| BAR | | — | | Counterparty to contract is Barclays Capital. |
| BNP | | — | | Counterparty to contract is BNP Paribas. |
| BOA | | — | | Counterparty to contract is Bank of America. |
| CITI | | — | | Counterparty to contract is Citibank NA London. |
| CITIC | | — | | Counterparty to contract is Citicorp. |
| CITIG | | — | | Counterparty to contract is Citigroup Global Markets, Inc. |
| CS | | — | | Counterparty to contract is Credit Suisse International. |
| DEUT | | — | | Counterparty to contract is Deutsche Bank AG. |
| GSC | | — | | Counterparty to contract is Goldman Sachs Capital Markets, LP. |
| HKSB | | — | | Counterparty to contract is Hong Kong&Shanghai Bank. |
| HSBC | | — | | Counterparty to contract is HSBC Securities. |
| JPM | | — | | Counterparty to contract is JPMorgan Chase Bank. |
| MLCS | | — | | Counterparty to contract is Merrill Lynch Capital Services, Inc. |
| MSCS | | — | | Counterparty to contract is Morgan Stanley Capital Services. |
| RBS | | — | | Counterparty to contract is Royal Bank of Scotland. |
| SG | | — | | Counterparty to contract is Societe Generale. |
| UBS | | — | | Counterparty to contract is UBS AG. |
| WEST | | — | | Counterparty to contract is Westpac Pollock. |
| | |
| STATEMENTS OF ASSETS AND LIABILITIES | | |
| | December 31, 2010 |
| | | | | | | | | | | | |
| | | Money
Market Fund | | | Low-Duration
Bond Fund | | | Medium-Duration
Bond Fund | |
Assets | | | | | | | | | | | | |
Investments in securities of unaffiliated issuers, at value | | $ | 1,297,165,079 | | | $ | 687,912,136 | | | $ | 973,558,276 | |
Investments in repurchase agreements, at value | | | — | | | | 147,500,000 | | | | 155,000,000 | |
Investments in securities of affiliated issuers, at value | | | — | | | | 31,818,398 | | | | 100,976,120 | |
| | | | | | | | | | | | |
Total investments (1)(2) | | | 1,297,165,079 | | | | 867,230,534 | | | | 1,229,534,396 | |
Cash | | | 565,330 | | | | 607,684 | | | | 2,454,184 | |
Foreign currency (3) | | | — | | | | 3,340,142 | | | | 872,056 | |
Receivables: | | | | | | | | | | | | |
Dividends and reclaims | | | — | | | | 256 | | | | 611 | |
Interest | | | 635,191 | | | | 3,718,830 | | | | 5,413,588 | |
Securities lending | | | 1,779 | | | | 4,472 | | | | 6,476 | |
Investment securities sold | | | — | | | | 64,415,143 | | | | 242,559,420 | |
Maturities | | | — | | | | 136,251 | | | | 133,718 | |
Fund shares sold | | | 20,670,274 | | | | 21,784 | | | | 95,672,311 | |
Variation margin | | | — | | | | 35,203 | | | | 361,770 | |
Unrealized appreciation on foreign currency exchange contracts | | | — | | | | 733,734 | | | | 669,600 | |
Unrealized appreciation on swap agreements | | | — | | | | 1,706,684 | | | | 5,140,457 | |
Prepaid expenses and other assets | | | 55,769 | | | | 31,973 | | | | 34,767 | |
| | | | | | | | | | | | |
Total Assets | | | 1,319,093,422 | | | | 941,982,690 | | | | 1,582,853,354 | |
| | | | | | | | | | | | |
Liabilities | | | | | | | | | | | | |
TBA sale commitments, at value (4) | | | — | | | | 7,488,908 | | | | — | |
Options written at value (5) | | | — | | | | 566,282 | | | | 671,358 | |
Unrealized depreciation on foreign currency exchange contracts | | | — | | | | 1,006,500 | | | | 1,496,880 | |
Unrealized depreciation on swap agreements | | | — | | | | 275,313 | | | | 3,240,130 | |
Collateral held for securities on loan at value | | | 10,967,813 | | | | 68,285,101 | | | | 53,322,138 | |
Collateral held for derivatives | | | — | | | | 1,700,000 | | | | 980,000 | |
Payables: | | | | | | | | | | | | |
Investment securities purchased | | | — | | | | 153,521,843 | | | | 576,166,078 | |
Fund shares redeemed | | | 8,263,466 | | | | 213,727 | | | | 95,962,833 | |
Variation margin | | | — | | | | — | | | | 75,775 | |
Distributions | | | 7,700 | | | | — | | | | — | |
Securities lending | | | 356 | | | | 895 | | | | 1,295 | |
Accrued expenses: | | | | | | | | | | | | |
Investment advisory fees | | | 156,566 | | | | 148,404 | | | | 226,445 | |
Distribution (12b-1) fees | | | 151 | | | | 42 | | | | 47 | |
Shareholder servicing fees | | | 203,248 | | | | 93,771 | | | | 113,742 | |
Other expenses | | | 42,602 | | | | 87,545 | | | | 145,598 | |
| | | | | | | | | | | | |
Total Liabilities | | | 19,641,902 | | | | 233,388,331 | | | | 732,402,319 | |
| | | | | | | | | | | | |
Net Assets | | $ | 1,299,451,520 | | | $ | 708,594,359 | | | $ | 850,451,035 | |
| | | | | | | | | | | | |
Net Assets Consist of: | | | | | | | | | | | | |
Paid-in-capital | | $ | 1,299,444,261 | | | $ | 715,506,013 | | | $ | 873,624,661 | |
Undistributed (distributions in excess of) net investment income | | | 7,259 | | | | (82,912 | ) | | | 281,806 | |
Accumulated net realized loss on investments, foreign currency transactions and derivative transactions | | | — | | | | (1,362,659 | ) | | | (6,905,040 | ) |
Net unrealized appreciation (depreciation) on investments, foreign currency translations and derivative transactions | | | — | | | | (5,466,083 | ) | | | (16,550,392 | ) |
| | | | | | | | | | | | |
Net Assets | | $ | 1,299,451,520 | | | $ | 708,594,359 | | | $ | 850,451,035 | |
| | | | | | | | | | | | |
Net Asset Value: | | | | | | | | | | | | |
$0.001 par value, unlimited shares authorized | | | | | | | | | | | | |
Net assets applicable to the GS2 Class | | $ | 119,310,978 | | | $ | 128,142,505 | | | $ | 236,369,310 | |
| | | | | | | | | | | | |
GS2 shares outstanding | | | 119,306,235 | | | | 14,727,394 | | | | 32,606,396 | |
| | | | | | | | | | | | |
Net asset value, offering and redemption price per GS2 share | | $ | 1.00 | | | $ | 8.70 | | | $ | 7.25 | |
| | | | | | | | | | | | |
Net assets applicable to the GS4 Class | | $ | 1,180,140,542 | | | $ | 580,451,854 | | | $ | 614,081,725 | |
| | | | | | | | | | | | |
GS4 shares outstanding | | | 1,180,103,380 | | | | 43,859,633 | | | | 44,973,885 | |
| | | | | | | | | | | | |
Net asset value, offering and redemption price per GS4 share | | $ | 1.00 | | | $ | 13.23 | | | $ | 13.65 | |
| | | | | | | | | | | | |
| | | | | | | | | | | | |
(1) Investments in securities of unaffiliated issuers, at cost | | $ | 1,297,165,079 | | | $ | 693,690,228 | | | $ | 990,131,782 | |
| Investments in repurchase agreements, at cost | | | — | | | | 147,500,000 | | | | 155,000,000 | |
| Investments in securities of affiliated issuers, at cost | | | — | | | | 31,818,398 | | | | 100,976,120 | |
| | | | | | | | | | | | |
Total investments at cost | | $ | 1,297,165,079 | | | $ | 873,008,626 | | | $ | 1,246,107,902 | |
| | | | | | | | | | | | |
(2) Includes securities loaned of: | | $ | 10,752,569 | | | $ | 71,040,963 | | | $ | 52,410,097 | |
| | | | | | | | | | | | |
(3) Foreign currency at cost | | $ | — | | | $ | 3,345,204 | | | $ | 861,617 | |
| | | | | | | | | | | | |
(4) TBA sale commitments at cost | | $ | — | | | $ | 7,509,688 | | | $ | — | |
| | | | | | | | | | | | |
(5) Premiums received on options written | | $ | — | | | $ | 728,747 | | | $ | 652,009 | |
| | | | | | | | | | | | |
| | | | |
| | See Notes to Financial Statements. | | 180 |
| | |
| STATEMENTS OF ASSETS AND LIABILITIES | | |
| | December 31, 2010 |
| | | | | | | | | | | | |
| | | Extended-Duration
Bond fund | | | Inflation Protected
Bond Fund | | | Global
Bond Fund | |
Assets | | | | | | | | | | | | |
Investments in securities of unaffiliated issuers, at value | | $ | 437,555,286 | | | $ | 104,544,907 | | | $ | 184,735,576 | |
Investments in securities of affiliated issuers, at value | | | 7,743,334 | | | | 4,857,515 | | | | 9,510,886 | |
| | | | | | | | | | | | |
Total investments (1)(2) | | | 445,298,620 | | | | 109,402,422 | | | | 194,246,462 | |
Cash | | | — | | | | — | | | | — | |
Cash collateral for derivatives | | | — | | | | — | | | | — | |
Foreign currency (3) | | | — | | | | — | | | | 1,257,697 | |
Receivables: | | | | | | | | | | | | |
Dividends and reclaims | | | 58 | | | | 35 | | | | 11,269 | |
Interest | | | 5,486,892 | | | | 819,907 | | | | 2,670,865 | |
Securities lending | | | 3,611 | | | | 612 | | | | 5,596 | |
Investment securities sold | | | — | | | | — | | | | 2,860,661 | |
Fund shares sold | | | 326 | | | | 1,149 | | | | 1,138 | |
Variation margin | | | — | | | | — | | | | 44 | |
Unrealized appreciation on foreign currency exchange contracts | | | — | | | | — | | | | 941,301 | |
Prepaid expenses and other assets | | | 27,807 | | | | 7,884 | | | | 26,203 | |
| | | | | | | | | | | | |
Total Assets | | | 450,817,314 | | | | 110,232,009 | | | | 202,021,236 | |
| | | | | | | | | | | | |
Liabilities | | | | | | | | | | | | |
Cash overdraft | | | 117 | | | | — | | | | — | |
Securities sold short, at value (4) | | | — | | | | — | | | | — | |
Unrealized depreciation on foreign currency exchange contracts | | | — | | | | — | | | | 619,100 | |
Collateral held for securities on loan at value | | | 39,862,497 | | | | 2,321,463 | | | | 34,081,461 | |
Payables: | | | | | | | | | | | | |
Investment securities purchased | | | — | | | | — | | | | 6,032,352 | |
Dividends on short sales | | | — | | | | — | | | | — | |
Fund shares redeemed | | | 210,496 | | | | 11,853 | | | | 65,088 | |
Variation margin | | | — | | | | 14,969 | | | | 9,203 | |
Securities lending | | | 722 | | | | 122 | | | | 1,119 | |
Accrued expenses: | | | | | | | | | | | | |
Investment advisory fees | | | 144,641 | | | | 28,271 | | | | 62,350 | |
Distribution (12b-1) fees | | | 55 | | | | — | | | | — | |
Shareholder servicing fees | | | 53,849 | | | | 17,229 | | | | 25,757 | |
Other expenses | | | 44,630 | | | | 13,150 | | | | 55,153 | |
| | | | | | | | | | | | |
Total Liabilities | | | 40,317,007 | | | | 2,407,057 | | | | 40,951,583 | |
| | | | | | | | | | | | |
Net Assets | | $ | 410,500,307 | | | $ | 107,824,952 | | | $ | 161,069,653 | |
| | | | | | | | | | | | |
Net Assets Consist of: | | | | | | | | | | | | |
Paid-in-capital | | $ | 379,307,197 | | | $ | 104,484,139 | | | $ | 163,178,167 | |
Undistributed (distributions in excess of) net investment income | | | 494,619 | | | | — | | | | 665,096 | |
Undistributed (accumulated) net realized gain (loss) on investments, foreign currency transactions and derivative transactions | | | 1,800,799 | | | | 825,555 | | | | (10,092,257 | ) |
Net unrealized appreciation (depreciation) on investments, foreign currency translations and derivative transactions | | | 28,897,692 | | | | 2,515,258 | | | | 7,318,647 | |
| | | | | | | | | | | | |
Net Assets | | $ | 410,500,307 | | | $ | 107,824,952 | | | $ | 161,069,653 | |
| | | | | | | | | | | | |
Net Asset Value: | | | | | | | | | | | | |
$0.001 par value, unlimited shares authorized | | | | | | | | | | | | |
Net assets applicable to the GS2 Class | | $ | 72,740,661 | | | | N/A | | | | N/A | |
| | | | | | | | | | | | |
GS2 shares outstanding | | | 10,493,777 | | | | N/A | | | | N/A | |
| | | | | | | | | | | | |
Net asset value, offering and redemption price per GS2 share | | $ | 6.93 | | | | N/A | | | | N/A | |
| | | | | | | | | | | | |
Net assets applicable to the GS4 Class | | $ | 337,759,646 | | | $ | 107,824,952 | | | $ | 161,069,653 | |
| | | | | | | | | | | | |
GS4 shares outstanding | | | 20,744,929 | | | | 10,342,865 | | | | 16,386,584 | |
| | | | | | | | | | | | |
Net asset value, offering and redemption price per GS4 share | | $ | 16.28 | | | $ | 10.43 | | | $ | 9.83 | |
| | | | | | | | | | | | |
| | | | | | | | | | | | |
(1) Investments in securities of unaffiliated issuers, at cost | | $ | 408,664,001 | | | $ | 102,027,002 | | | $ | 177,802,200 | |
Investments in securities of affiliated issuers, at cost | | | 7,743,334 | | | | 4,857,515 | | | | 9,510,886 | |
| | | | | | | | | | | | |
Total investments at cost | | $ | 416,407,335 | | | $ | 106,884,517 | | | $ | 187,313,086 | |
| | | | | | | | | | | | |
(2) Includes securities loaned of: | | $ | 39,284,128 | | | $ | 21,941,093 | | | $ | 36,119,838 | |
| | | | | | | | | | | | |
(3) Foreign currency at cost | | $ | — | | | $ | — | | | $ | 1,258,466 | |
| | | | | | | | | | | | |
(4) Securities Sold Short at proceeds | | $ | — | | | $ | — | | | $ | — | |
| | | | | | | | | | | | |
(5) Net of ($174,779) accrued foreign capital gains taxes on appreciated securities | | | | | | | | | | | | |
| | | | |
| 181 | | See Notes to Financial Statements. | | |
| | | | | | | | | | | | | | | | | | | | | | |
Equity
Index Fund | | | Real Estate
Securities Fund | | | Value
Equity Fund | | | Growth
Equity Fund | | | Small Cap
Equity Fund | | | International
Equity Fund | |
| | | | | | | | | | | | | | | | | | | | | | |
| $ | 421,616,746 | | | $ | 173,352,860 | | | $ | 1,244,076,800 | | | $ | 1,349,703,900 | | | $ | 606,031,086 | | | $ | 1,370,756,594 | |
| | 7,740,278 | | | | 2,975,979 | | | | 29,448,901 | | | | 35,564,268 | | | | 26,410,953 | | | | 36,786,025 | |
| | | | | | | | | | | | | | | | | | | | | | | |
| | 429,357,024 | | | | 176,328,839 | | | | 1,273,525,701 | | | | 1,385,268,168 | | | | 632,442,039 | | | | 1,407,542,619 | |
| | — | | | | — | | | | — | | | | — | | | | 14 | | | | — | |
| | — | | | | — | | | | — | | | | — | | | | 686,462 | | | | 5,200,000 | |
| | — | | | | — | | | | — | | | | — | | | | 3,247 | | | | 1,340,705 | |
| | | | | | | | | | | | | | | | | | | | | | |
| | 402,556 | | | | 406,226 | | | | 957,638 | | | | 584,171 | | | | 208,493 | | | | 2,158,324 | |
| | — | | | | — | | | | — | | | | — | | | | 281,452 | | | | — | |
| | 3,752 | | | | 3,873 | | | | 7,176 | | | | 8,816 | | | | 26,300 | | | | 49,231 | |
| | 67,449 | | | | 878,756 | | | | 1,749,994 | | | | 2,621,533 | | | | 15,123,103 | | | | 1,301,575 | |
| | 132,749 | | | | 25,022 | | | | 28,369,396 | | | | 15,690 | | | | 118,952 | | | | 239 | |
| | — | | | | — | | | | — | | | | — | | | | 2,266 | | | | 571,793 | |
| | — | | | | — | | | | — | | | | — | | | | — | | | | 1,554,249 | |
| | 28,002 | | | | 44,866 | | | | 39,097 | | | | 41,776 | | | | 29,581 | | | | 40,798 | |
| | | | | | | | | | | | | | | | | | | | | | | |
| | 429,991,532 | | | | 177,687,582 | | | | 1,304,649,002 | | | | 1,388,540,154 | | | | 648,921,909 | | | | 1,419,759,533 | |
| | | | | | | | | | | | | | | | | | | | | | | |
| | | | | | | | | | | | | | | | | | | | | | |
| | — | | | | — | | | | — | | | | — | | | | — | | | | 25,037 | |
| | — | | | | — | | | | — | | | | — | | | | — | | | | 21,761,982 | |
| | — | | | | — | | | | — | | | | — | | | | 7,564 | | | | 1,034,407 | |
| | 22,662,484 | | | | 34,429,336 | | | | 85,564,732 | | | | 126,132,616 | | | | 143,555,699 | | | | 101,923,046 | |
| | | | | | | | | | | | | | | | | | | | | | |
| | 754 | | | | 1,073,734 | | | | 181,144 | | | | 1,000,380 | | | | 29,722,003 | | | | 1,446,484 | |
| | — | | | | — | | | | — | | | | — | | | | — | | | | 12,638 | |
| | 159,468 | | | | 108,467 | | | | 28,743,456 | | | | 385,691 | | | | 198,506 | | | | 535,226 | |
| | 10,875 | | | | 26,010 | | | | 37,733 | | | | 49,500 | | | | 458,663 | | | | 113,830 | |
| | 750 | | | | 772 | | | | 1,435 | | | | 1,763 | | | | 5,250 | | | | 9,846 | |
| | | | | | | | | | | | | | | | | | | | | | |
| | 34,036 | | | | 102,553 | | | | 610,974 | | | | 805,027 | | | | 345,140 | | | | 806,141 | |
| | 48 | | | | — | | | | 109 | | | | 93 | | | | 118 | | | | 178 | |
| | 53,872 | | | | 22,497 | | | | 156,703 | | | | 168,986 | | | | 64,106 | | | | 163,633 | |
| | 117,090 | | | | 24,015 | | | | 62,777 | | | | 72,892 | | | | 69,626 | | | | 507,272 | |
| | | | | | | | | | | | | | | | | | | | | | | |
| | 23,039,377 | | | | 35,787,384 | | | | 115,359,063 | | | | 128,616,948 | | | | 174,426,675 | | | | 128,339,720 | |
| | | | | | | | | | | | | | | | | | | | | | | |
| $ | 406,952,155 | | | $ | 141,900,198 | | | $ | 1,189,289,939 | | | $ | 1,259,923,206 | | | $ | 474,495,234 | | | $ | 1,291,419,813 | |
| | | | | | | | | | | | | | | | | | | | | | | |
| | | | | | | | | | | | | | | | | | | | | | |
| $ | 343,375,920 | | | $ | 155,711,794 | | | $ | 1,332,809,719 | | | $ | 1,076,416,487 | | | $ | 462,152,842 | | | $ | 1,319,300,704 | |
| | 1,075,513 | | | | — | | | | 7,719,446 | | | | — | | | | 4,903 | | | | (3,491,275 | ) |
| (4,359,830) | | | | (39,269,141 | ) | | | (178,773,747 | ) | | | (135,783,733 | ) | | | (71,342,114 | ) | | | (216,424,520 | ) |
| 66,860,552 | | | | 25,457,545 | | | | 27,534,521 | | | | 319,290,452 | | | | 83,679,603 | | | | 192,034,904 | (5) |
| | | | | | | | | | | | | | | | | | | | | | | |
| $ | 406,952,155 | | | $ | 141,900,198 | | | $ | 1,189,289,939 | | | $ | 1,259,923,206 | | | $ | 474,495,234 | | | $ | 1,291,419,813 | |
| | | | | | | | | | | | | | | | | | | | | | | |
| | | | | | | | | | | | | | | | | | | | | | |
| | | | | | | | | | | | | | | | | | | | | | |
| $ | 71,093,085 | | | | N/A | | | $ | 231,078,676 | | | $ | 215,863,187 | | | $ | 74,423,733 | | | $ | 262,102,742 | |
| | | | | | | | | | | | | | | | | | | | | | | |
| | 8,235,929 | | | | N/A | | | | 32,165,065 | | | | 18,126,912 | | | | 7,744,518 | | | | 25,335,868 | |
| | | | | | | | | | | | | | | | | | | | | | | |
| | $8.63 | | | | N/A | | | $ | 7.18 | | | $ | 11.91 | | | $ | 9.61 | | | $ | 10.35 | |
| | | | | | | | | | | | | | | | | | | | | | | |
| $ | 335,859,070 | | | $ | 141,900,198 | | | $ | 958,211,263 | | | $ | 1,044,060,019 | | | $ | 400,071,501 | | | $ | 1,029,317,071 | |
| | | | | | | | | | | | | | | | | | | | | | | |
| | 20,528,418 | | | | 16,653,781 | | | | 67,877,919 | | | | 55,244,706 | | | | 27,664,346 | | | | 76,649,237 | |
| | | | | | | | | | | | | | | | | | | | | | | |
| $ | 16.36 | | | $ | 8.52 | | | $ | 14.12 | | | $ | 18.90 | | | $ | 14.46 | | | $ | 13.43 | |
| | | | | | | | | | | | | | | | | | | | | | | |
| | | | | | | | | | | | | | | | | | | | | | |
| $ | 354,986,564 | | | $ | 147,929,217 | | | $ | 1,217,231,138 | | | $ | 1,031,397,638 | | | $ | 523,503,593 | | | $ | 1,178,196,386 | |
| | 7,740,278 | | | | 2,975,979 | | | | 29,448,901 | | | | 35,564,268 | | | | 26,410,953 | | | | 36,786,025 | |
| | | | | | | | | | | | | | | | | | | | | | | |
| $ | 362,726,842 | | | $ | 150,905,196 | | | $ | 1,246,680,039 | | | $ | 1,066,961,906 | | | $ | 549,914,546 | | | $ | 1,214,982,411 | |
| | | | | | | | | | | | | | | | | | | | | | | |
| $ | 22,318,677 | | | $ | 33,683,329 | | | $ | 83,703,402 | | | $ | 124,170,621 | | | $ | 141,753,872 | | | $ | 100,150,956 | |
| | | | | | | | | | | | | | | | | | | | | | | |
| $ | — | | | $ | — | | | $ | — | | | $ | — | | | $ | 3,210 | | | $ | 1,284,930 | |
| | | | | | | | | | | | | | | | | | | | | | | |
| $ | — | | | $ | — | | | $ | — | | | $ | — | | | $ | — | | | $ | 20,027,787 | |
| | | | | | | | | | | | | | | | | | | | | | | |
| | | | | | | | | | | | | | | | | | | | | | |
| | | | |
| | See Notes to Financial Statements. | | 182 |
| | |
| STATEMENTS OF OPERATIONS | | |
| | For the Year Ended December 31, 2010 |
| | | | | | | | | | | | |
| | | Money
Market Fund | | | Low-Duration
Bond Fund | | | Medium-Duration
Bond Fund | |
Investment Income | | | | | | | | | | | | |
Dividends | | $ | — | | | $ | — | | | $ | 200,284 | |
Income distributions received from affiliated funds | | | — | | | | 4,531 | | | | 9,756 | |
Interest | | | 4,073,657 | | | | 18,798,478 | | | | 36,966,858 | |
Securities lending | | | 40,380 | | | | 56,869 | | | | 107,689 | |
Less foreign taxes withheld | | | — | | | | — | | | | — | |
| | | | | | | | | | | | |
Total Investment Income | | | 4,114,037 | | | | 18,859,878 | | | | 37,284,587 | |
| | | | | | | | | | | | |
Expenses | | | | | | | | | | | | |
Investment advisory fees | | | 1,879,320 | | | | 2,461,401 | | | | 4,207,369 | |
Transfer agent fees: | | | | | | | | | | | | |
GS2 shares | | | 2,762 | | | | 3,342 | | | | 4,235 | |
GS4 shares | | | 39,099 | | | | 21,880 | | | | 24,785 | |
Custodian fees | | | 22,776 | | | | 98,123 | | | | 159,518 | |
Shareholder servicing fees: | | | | | | | | | | | | |
GS4 shares | | | 2,065,103 | | | | 1,131,488 | | | | 1,647,207 | |
Accounting and administration fees | | | 254,589 | | | | 255,214 | | | | 415,814 | |
Professional fees | | | 53,531 | | | | 64,512 | | | | 65,356 | |
Blue sky fees: | | | | | | | | | | | | |
GS2 shares | | | 1,977 | | | | 1,599 | | | | 1,599 | |
GS4 shares | | | 35,845 | | | | 15,760 | | | | 18,202 | |
Shareholder reporting fees: | | | | | | | | | | | | |
GS2 shares | | | 812 | | | | 516 | | | | 539 | |
GS4 shares | | | 38,964 | | | | 9,562 | | | | 10,276 | |
Trustee expenses | | | 11,016 | | | | 5,242 | | | | 7,109 | |
Line of credit facility fees | | | 14,070 | | | | 8,417 | | | | 12,316 | |
Dividend expense on securities sold short | | | — | | | | — | | | | — | |
Other expenses | | | (134,597 | ) | | | 40,943 | | | | 62,239 | |
| | | | | | | | | | | | |
Total expenses | | | 4,285,267 | | | | 4,117,999 | | | | 6,636,564 | |
Expenses waived/reimbursed net of amount recaptured(1) | | | (492,104 | ) | | | (579,527 | ) | | | (913,726 | ) |
Fees paid indirectly | | | — | | | | — | | | | — | |
| | | | | | | | | | | | |
Net expenses | | | 3,793,163 | | | | 3,538,472 | | | | 5,722,838 | |
| | | | | | | | | | | | |
Net Investment Income (Loss) | | | 320,874 | | | | 15,321,406 | | | | 31,561,749 | |
| | | | | | | | | | | | |
Realized and Unrealized Gain (Loss) | | | | | | | | | | | | |
Net realized gain (loss) from: | | | | | | | | | | | | |
Investment securities and securities sold short | | | 20,216 | | | | 5,404,075 | | | | 22,498,438 | |
Futures transactions | | | — | | | | 1,376,766 | | | | 3,760,748 | |
Swap agreements | | | — | | | | (761,992 | ) | | | (1,921,766 | ) |
Option contracts written | | | — | | | | 535,324 | | | | 921,916 | |
Option contracts purchased | | | — | | | | (107,375 | ) | | | 42,723 | |
Foreign currency transactions | | | — | | | | (407,033 | ) | | | (1,535,949 | ) |
| | | | | | | | | | | | |
Net realized gain (loss) | | | 20,216 | | | | 6,039,765 | | | | 23,766,110 | |
| | | | | | | | | | | | |
Net change in unrealized appreciation (depreciation) on: | | | | | | | | | | | | |
Investment securities and securities sold short (net of estimated capital gains taxes of ($420,621) for International Equity) | | | — | | | | 10,151,359 | | | | 33,115,038 | |
Futures | | | — | | | | 169,952 | | | | (517,888 | ) |
Swap agreements | | | — | | | | (1,430,419 | ) | | | 1,342,907 | |
Option contracts written | | | — | | | | 238,291 | | | | 82,810 | |
Option contracts purchased | | | — | | | | 53,802 | | | | (6,035 | ) |
Foreign currency translation | | | — | | | | (901,924 | ) | | | (1,278,523 | ) |
| | | | | | | | | | | | |
Net change in unrealized appreciation (depreciation) | | | — | | | | 8,281,061 | | | | 32,738,309 | |
| | | | | | | | | | | | |
Net Realized and Unrealized Gain (Loss) | | | 20,216 | | | | 14,320,826 | | | | 56,504,419 | |
| | | | | | | | | | | | |
Net Increase (Decrease) in Net Assets Resulting from Operations | | $ | 341,090 | | | $ | 29,642,232 | | | $ | 88,066,168 | |
| | | | | | | | | | | | |
| (1) | See Note 3a and 3c in Notes to Financial Statements. |
| | | | |
| 183 | | See Notes to Financial Statements. | | |
| | | | | | | | | | | | | | | | | | | | | | | | | | | | | | | | | | |
Extended-
Duration
Bond Fund | | | Inflation
Protected
Bond Fund | | | Global
Bond Fund | | | Equity Index
Fund | | | Real Estate
Securities
Fund | | | Value Equity
Fund | | | Growth Equity
Fund | | | Small Cap
Equity Fund | | | International
Equity Fund | |
| | | | | | | | | | | | | | | | | | | | | | | | | | | | | | | | | | |
| $ | 20,081 | | | $ | — | | | $ | 263,500 | | | $ | 7,684,481 | | | $ | 3,458,506 | | | $ | 25,427,083 | | | $ | 11,338,957 | | | $ | 4,271,761 | | | $ | 38,403,039 | |
| | 1,502 | | | | 1,123 | | | | 2,128 | | | | 1,398 | | | | 620 | | | | 4,313 | | | | 7,304 | | | | 3,701 | | | | 5,785 | |
| | 28,296,505 | | | | 2,633,950 | | | | 13,038,793 | | | | 2,178 | | | | 1,046 | | | | 6,196 | | | | 11,109 | | | | 1,488,227 | | | | 10,738 | |
| | 51,761 | | | | 4,123 | | | | 72,543 | | | | 51,428 | | | | 47,017 | | | | 145,940 | | | | 147,736 | | | | 415,746 | | | | 1,082,352 | |
| | — | | | | — | | | | (171 | ) | | | — | | | | — | | | | (63,812 | ) | | | (31,325 | ) | | | (713 | ) | | | (3,346,362 | ) |
| | | | | | | | | | | | | | | | | | | | | | | | | | | | | | | | | | | |
| | 28,369,849 | | | | 2,639,196 | | | | 13,376,793 | | | | 7,739,485 | | | | 3,507,189 | | | | 25,519,720 | | | | 11,473,781 | | | | 6,178,722 | | | | 36,155,552 | |
| | | | | | | | | | | | | | | | | | | | | | | | | | | | | | | | | | | |
| | | | | | | | | | | | | | | | | | | | | | | | | | | | | | | | | | |
| | 2,157,068 | | | | 330,393 | | | | 1,009,576 | | | | 591,117 | | | | 1,174,945 | | | | 7,422,419 | | | | 10,445,366 | | | | 4,047,992 | | | | 12,463,334 | |
| | | | | | | | | | | | | | | | | | | | | | | | | | | | | | | | | | |
| | 4,024 | | | | — | | | | — | | | | 4,017 | | | | — | | | | 3,998 | | | | 3,901 | | | | 4,059 | | | | 4,188 | |
| | 23,796 | | | | 18,768 | | | | 22,400 | | | | 24,455 | | | | 22,638 | | | | 27,297 | | | | 26,409 | | | | 27,658 | | | | 33,314 | |
| | 28,381 | | | | 19,480 | | | | 59,493 | | | | 24,028 | | | | 30,604 | | | | 45,440 | | | | 79,244 | | | | 118,241 | | | | 1,166,794 | |
| | | | | | | | | | | | | | | | | | | | | | | | | | | | | | | | | | |
| | 744,047 | | | | 197,082 | | | | 410,215 | | | | 616,247 | | | | 256,424 | | | | 1,856,200 | | | | 1,967,900 | | | | 703,920 | | | | 1,987,784 | |
| | 137,468 | | | | 27,829 | | | | 134,983 | | | | 103,709 | | | | 36,122 | | | | 258,027 | | | | 264,301 | | | | 156,318 | | | | 637,188 | |
| | 57,149 | | | | 52,703 | | | | 55,629 | | | | 73,149 | | | | 63,117 | | | | 73,149 | | | | 54,910 | | | | 54,864 | | | | 56,282 | |
| | | | | | | | | | | | | | | | | | | | | | | | | | | | | | | | | | |
| | 1,599 | | | | — | | | | — | | | | 1,599 | | | | — | | | | 1,599 | | | | 1,599 | | | | 1,599 | | | | 1,599 | |
| | 15,417 | | | | 17,702 | | | | 17,966 | | | | 12,914 | | | | 6,052 | | | | 12,859 | | | | 13,465 | | | | 12,742 | | | | 13,071 | |
| | | | | | | | | | | | | | | | | | | | | | | | | | | | | | | | | | |
| | 376 | | | | — | | | | — | | | | 375 | | | | — | | | | 361 | | | | 417 | | | | 462 | | | | 434 | |
| | 8,306 | | | | 1,742 | | | | 944 | | | | 8,846 | | | | 6,817 | | | | 10,359 | | | | 15,920 | | | | 11,352 | | | | 14,054 | |
| | 4,311 | | | | 1,225 | | | | 2,056 | | | | 3,928 | | | | 1,119 | | | | 11,342 | | | | 9,398 | | | | 4,364 | | | | 9,675 | |
| | 5,578 | | | | 1,171 | | | | 2,652 | | | | 4,583 | | | | 1,557 | | | | 13,819 | | | | 14,561 | | | | 5,102 | | | | 15,119 | |
| | — | | | | — | | | | — | | | | — | | | | — | | | | — | | | | — | | | | — | | | | 496,085 | |
| | 18,516 | | | | 12,544 | | | | 28,541 | | | | 17,308 | | | | 10,843 | | | | 32,273 | | | | 43,179 | | | | 17,419 | | | | 357,756 | |
| | | | | | | | | | | | | | | | | | | | | | | | | | | | | | | | | | | |
| | 3,206,036 | | | | 680,639 | | | | 1,744,455 | | | | 1,486,275 | | | | 1,610,238 | | | | 9,769,142 | | | | 12,940,570 | | | | 5,166,092 | | | | 17,256,677 | |
| | (128,194) | | | | (10,847 | ) | | | (31,190 | ) | | | (143,289 | ) | | | (8,081 | ) | | | (212,779 | ) | | | (1,139,996 | ) | | | (229,910 | ) | | | (2,810,432 | ) |
| | — | | | | — | | | | — | | | | — | | | | — | | | | (57,240 | ) | | | (60,973 | ) | | | (22,103 | ) | | | (61,967 | ) |
| | | | | | | | | | | | | | | | | | | | | | | | | | | | | | | | | | | |
| | 3,077,842 | | | | 669,792 | | | | 1,713,265 | | | | 1,342,986 | | | | 1,602,157 | | | | 9,499,123 | | | | 11,739,601 | | | | 4,914,079 | | | | 14,384,278 | |
| | | | | | | | | | | | | | | | | | | | | | | | | | | | | | | | | | | |
| | 25,292,007 | | | | 1,969,404 | | | | 11,663,528 | | | | 6,396,499 | | | | 1,905,032 | | | | 16,020,597 | | | | (265,820 | ) | | | 1,264,643 | | | | 21,771,274 | |
| | | | | | | | | | | | | | | | | | | | | | | | | | | | | | | | | | | |
| | | | | | | | | | | | | | | | | | | | | | | | | | | | | | | | | | |
| | | | | | | | | | | | | | | | | | | | | | | | | | | | | | | | | | |
| | 19,225,821 | | | | 2,695,897 | | | | 2,713,432 | | | | 4,165,956 | | | | 26,135,966 | | | | 19,162,000 | | | | 110,465,842 | | | | 46,961,061 | | | | 67,806,752 | |
| | — | | | | 542,552 | | | | (619,751 | ) | | | 1,108,176 | | | | 768,594 | | | | 2,355,725 | | | | 5,979,991 | | | | 16,302,730 | | | | 1,197,819 | |
| | — | | | | — | | | | — | | | | — | | | | — | | | | — | | | | — | | | | — | | | | — | |
| | — | | | | — | | | | — | | | | — | | | | — | | | | — | | | | — | | | | 61,632 | | | | — | |
| | — | | | | — | | | | (61,674 | ) | | | — | | | | — | | | | — | | | | — | | | | (21,979 | ) | | | — | |
| | 821,979 | | | | — | | | | 1,289,137 | | | | — | | | | — | | | | — | | | | (2,321 | ) | | | (68,572 | ) | | | 373,683 | |
| | | | | | | | | | | | | | | | | | | | | | | | | | | | | | | | | | | |
| | 20,047,800 | | | | 3,238,449 | | | | 3,321,144 | | | | 5,274,132 | | | | 26,904,560 | | | | 21,517,725 | | | | 116,443,512 | | | | 63,234,872 | | | | 69,378,254 | |
| | | | | | | | | | | | | | | | | | | | | | | | | | | | | | | | | | | |
| | | | | | | | | | | | | | | | | | | | | | | | | | | | | | | | | | |
| 7,971,998 | | | | 470,811 | | | | 8,769,818 | | | | 41,392,757 | | | | 4,571,558 | | | | 112,571,499 | | | | 99,101,641 | | | | 44,572,649 | | | | 29,608,211 | |
| | — | | | | (7,611 | ) | | | (52,895 | ) | | | 84,979 | | | | (133,183 | ) | | | 220,239 | | | | 358,729 | | | | (1,469,605 | ) | | | 867,489 | |
| | — | | | | — | | | | — | | | | — | | | | — | | | | — | | | | — | | | | — | | | | — | |
| | — | | | | — | | | | — | | | | — | | | | — | | | | — | | | | — | | | | (3,322 | ) | | | — | |
| | — | | | | — | | | | — | | | | — | | | | — | | | | — | | | | — | | | | 2,320 | | | | — | |
| | 259 | | | | (300 | ) | | | (75,017 | ) | | | — | | | | — | | | | — | | | | — | | | | (7,558 | ) | | | 844,263 | |
| | | | | | | | | | | | | | | | | | | | | | | | | | | | | | | | | | | |
| | 7,972,257 | | | | 462,900 | | | | 8,641,906 | | | | 41,477,736 | | | | 4,438,375 | | | | 112,791,738 | | | | 99,460,370 | | | | 43,094,484 | | | | 31,319,963 | |
| | | | | | | | | | | | | | | | | | | | | | | | | | | | | | | | | | | |
| | 28,020,057 | | | | 3,701,349 | | | | 11,963,050 | | | | 46,751,868 | | | | 31,342,935 | | | | 134,309,463 | | | | 215,903,882 | | | | 106,329,356 | | | | 100,698,217 | |
| | | | | | | | | | | | | | | | | | | | | | | | | | | | | | | | | | | |
| $ | 53,312,064 | | | $ | 5,670,753 | | | $ | 23,626,578 | | | $ | 53,148,367 | | | $ | 33,247,967 | | | $ | 150,330,060 | | | $ | 215,638,062 | | | $ | 107,593,999 | | | $ | 122,469,491 | |
| | | | | | | | | | | | | | | | | | | | | | | | | | | | | | | | | | | |
| | | | |
| | See Notes to Financial Statements. | | 184 |
| | |
| STATEMENTS OF CHANGES IN NET ASSETS | | |
| | | | | | | | |
| | | Money Market Fund | |
| | | For the Year Ended | |
| | | 12/31/10 | | | 12/31/09 | |
Operations: | | | | | | | | |
Net investment income | | $ | 320,874 | | | $ | 3,601,028 | |
Net realized gain (loss) on investment securities, foreign currency transactions and derivative transactions | | | 20,216 | | | | 60,542 | |
Net change in unrealized appreciation on investment securities, foreign currency translations and derivative transactions | | | — | | | | — | |
| | | | | | | | |
Net increase in net assets resulting from operations | | | 341,090 | | | | 3,661,570 | |
| | | | | | | | |
Dividends and Distributions to Shareholders: | | | | | | | | |
Dividends from net investment income | | | | | | | | |
GS2 shares | | | (212,193 | ) | | | (769,065 | ) |
GS4 shares | | | (108,681 | ) | | | (2,824,065 | ) |
GS6 shares | | | — | | | | (7,898 | ) |
Distributions from net realized capital gains | | | | | | | | |
GS2 shares | | | (7,509 | ) | | | (7,898 | ) |
GS4 shares | | | (80,492 | ) | | | (62,102 | ) |
GS6 shares | | | — | | | | — | |
| | | | | | | | |
Total dividends and distributions | | | (408,875 | ) | | | (3,671,028 | ) |
| | | | | | | | |
Capital Share Transactions: | | | | | | | | |
Proceeds from shares sold | | | | | | | | |
GS2 shares | | | 94,494,393 | | | | 102,344,425 | |
GS4 shares | | | 4,496,591,499 | | | | 2,886,053,282 | |
GS6 shares | | | — | | | | 1,367,352 | |
Proceeds from exchange of GS6 shares for GS4 shares(1) | | | | | | | | |
GS4 shares | | | — | | | | 9,761,236 | |
GS6 shares | | | — | | | | (9,761,236 | ) |
Reinvestment of dividends and distributions | | | | | | | | |
GS2 shares | | | 203,577 | | | | 644,744 | |
GS4 shares | | | 136,473 | | | | 2,050,152 | |
GS6 shares | | | — | | | | 7,898 | |
| | | | | | | | |
Total proceeds from shares sold and reinvested | | | 4,591,425,942 | | | | 2,992,467,853 | |
| | | | | | | | |
Value of shares redeemed | | | | | | | | |
GS2 shares | | | (108,704,940 | ) | | | (141,405,488 | ) |
GS4 shares | | | (4,381,459,310 | ) | | | (2,803,066,431 | ) |
GS6 shares | | | — | | | | (421,134 | ) |
| | | | | | | | |
Total value of shares redeemed | | | (4,490,164,250 | ) | | | (2,944,893,053 | ) |
| | | | | | | | |
Net increase (decrease) from capital share transactions(2) | | | 101,261,692 | | | | 47,574,800 | |
| | | | | | | | |
Total increase (decrease) in net assets | | | 101,193,907 | | | | 47,565,342 | |
| | | | | | | | |
Net Assets: | | | | | | | | |
Beginning of Year | | | 1,198,257,613 | | | | 1,150,692,271 | |
| | | | | | | | |
End of Year* | | $ | 1,299,451,520 | | | $ | 1,198,257,613 | |
| | | | | | | | |
* Including undistributed (distributions in excess of) net investment income | | $ | 7,259 | | | $ | 75,044 | |
| | | | | | | | |
| (1) | See Note 1 in Notes to Financial Statements. |
| (2) | See Note 7 in Notes to Financial Statements. |
| | | | |
| 185 | | See Notes to Financial Statements. | | |
| | | | | | | | | | | | | | | | | | | | | | | | | | | | | | | | | | | | | | |
Low-Duration
Bond Fund | | | Medium-Duration
Bond Fund | | | Extended-Duration
Bond Fund | | | Inflation Protected
Bond Fund | | | Global
Bond Fund | |
| For the Year Ended | | | For the Year Ended | | | For the Year Ended | | | For the Year
Ended | | | For the Period | | | For the Year Ended | |
| 12/31/10 | | | 12/31/09 | | | 12/31/10 | | | 12/31/09 | | | 12/31/10 | | | 12/31/09 | | | 12/31/10 | | | 06/25/09 -
12/31/09 | | | 12/31/10 | | | 12/31/09 | |
| | | | | | | | | | | | | | | | | | | | | | | | | | | | | | | | | | | | | | |
| $ | 15,321,406 | | | $ | 20,944,974 | | | $ | 31,561,749 | | | $ | 36,356,649 | | | $ | 25,292,007 | | | $ | 27,763,523 | | | $ | 1,969,404 | | | $ | 1,424,136 | | | $ | 11,663,528 | | | $ | 12,862,766 | |
| 6,039,765 | | | | 8,473,015 | | | | 23,766,110 | | | | 25,495,374 | | | | 20,047,800 | | | | (13,712,692 | ) | | | 3,238,449 | | | | 400,251 | | | | 3,321,144 | | | | (8,252,760 | ) |
| 8,281,061 | | | | 40,666,842 | | | | 32,738,309 | | | | 74,039,703 | | | | 7,972,257 | | | | 78,067,569 | | | | 462,900 | | | | 2,052,358 | | | | 8,641,906 | | | | 54,764,000 | |
| | | | | | | | | | | | | | | | | | | | | | | | | | | | | | | | | | | | | | | |
| | 29,642,232 | | | | 70,084,831 | | | | 88,066,168 | | | | 135,891,726 | | | | 53,312,064 | | | | 92,118,400 | | | | 5,670,753 | | | | 3,876,745 | | | | 23,626,578 | | | | 59,374,006 | |
| | | | | | | | | | | | | | | | | | | | | | | | | | | | | | | | | | | | | | | |
| | | | | | | | | | | | | | | | | | | | | | | | | | | | | | | | | | | | | | |
| | | | | | | | | | | | | | | | | | | | | | | | | | | | | | | | | | | | | | |
| | (3,973,347) | | | | (4,819,001 | ) | | | (7,594,121 | ) | | | (8,289,189 | ) | | | (7,921,317 | ) | | | (7,203,294 | ) | | | — | | | | — | | | | — | | | | — | |
| | (11,817,267) | | | | (15,263,843 | ) | | | (23,828,942 | ) | | | (29,716,113 | ) | | | (18,424,763 | ) | | | (18,714,067 | ) | | | (2,038,102 | ) | | | (1,359,644 | ) | | | (12,273,443 | ) | | | (13,789,431 | ) |
| | — | | | | (101,664 | ) | | | — | | | | (303,734 | ) | | | — | | | | (571,919 | ) | | | — | | | | — | | | | — | | | | — | |
| | | | | | | | | | | | | | | | | | | | | | | | | | | | | | | | | | | | | | |
| | (1,301,794) | | | | — | | | | (8,335,060 | ) | | | (5,307,160 | ) | | | (1,150,059 | ) | | | (162,568 | ) | | | — | | | | — | | | | — | | | | — | |
| | (3,870,062) | | | | — | | | | (23,494,123 | ) | | | (19,148,776 | ) | | | (2,305,386 | ) | | | (426,577 | ) | | | (2,718,888 | ) | | | (91,394 | ) | | | — | | | | — | |
| | — | | | | — | | | | — | | | | (168,322 | ) | | | — | | | | (44,540 | ) | | | — | | | | — | | | | — | | | | — | |
| | | | | | | | | | | | | | | | | | | | | | | | | | | | | | | | | | | | | | | |
| | (20,962,470) | | | | (20,184,508 | ) | | | (63,252,246 | ) | | | (62,933,294 | ) | | | (29,801,525 | ) | | | (27,122,965 | ) | | | (4,756,990 | ) | | | (1,451,038 | ) | | | (12,273,443 | ) | | | (13,789,431 | ) |
| | | | | | | | | | | | | | | | | | | | | | | | | | | | | | | | | | | | | | | |
| | | | | | | | | | | | | | | | | | | | | | | | | | | | | | | | | | | | | | |
| | | | | | | | | | | | | | | | | | | | | | | | | | | | | | | | | | | | | | |
| | 19,547,765 | | | | 21,205,424 | | | | 112,777,863 | | | | 23,176,665 | | | | 11,995,759 | | | | 5,901,308 | | | | — | | | | | | | | — | | | | — | |
| | 81,552,147 | | | | 100,049,225 | | | | 142,085,311 | | | | 116,757,280 | | | | 80,583,836 | | | | 33,154,694 | | | | 42,423,880 | | | | 85,910,487 | | | | 27,722,929 | | | | 33,309,227 | |
| | — | | | | 254,107 | | | | — | | | | 144,295 | | | | — | | | | 49,106 | | | | — | | | | | | | | — | | | | — | |
| | | | | | | | | | | | | | | | | | | | | | | | | | | | | | | | | | | | | | |
| | — | | | | 6,028,341 | | | | — | | | | 14,963,529 | | | | — | | | | 15,327,294 | | | | — | | | | — | | | | — | | | | — | |
| | — | | | | (6,028,341 | ) | | | — | | | | (14,963,529 | ) | | | — | | | | (15,327,294 | ) | | | — | | | | — | | | | — | | | | — | |
| | | | | | | | | | | | | | | | | | | | | | | | | | | | | | | | | | | | | | |
| | 5,270,201 | | | | 4,814,646 | | | | 15,918,518 | | | | 13,585,942 | | | | 9,060,622 | | | | 7,356,577 | | | | — | | | | — | | | | — | | | | — | |
| | 15,682,171 | | | | 15,261,292 | | | | 47,316,666 | | | | 48,861,482 | | | | 20,727,992 | | | | 19,139,457 | | | | 4,756,950 | | | | 1,451,038 | | | | 12,273,386 | | | | 13,789,383 | |
| | — | | | | 101,664 | | | | — | | | | 472,056 | | | | — | | | | 616,459 | | | | — | | | | — | | | | — | | | | — | |
| | | | | | | | | | | | | | | | | | | | | | | | | | | | | | | | | | | | | | | |
| | 122,052,284 | | | | 141,686,358 | | | | 318,098,358 | | | | 202,997,720 | | | | 122,368,209 | | | | 66,217,601 | | | | 47,180,830 | | | | 87,361,525 | | | | 39,996,315 | | | | 47,098,610 | |
| | | | | | | | | | | | | | | | | | | | | | | | | | | | | | | | | | | | | | | |
| | | | | | | | | | | | | | | | | | | | | | | | | | | | | | | | | | | | | | |
| | (12,320,194) | | | | (22,503,752 | ) | | | (28,532,320 | ) | | | (13,815,713 | ) | | | (15,032,006 | ) | | | (16,838,462 | ) | | | — | | | | — | | | | — | | | | — | |
| | (94,873,974) | | | | (110,793,220 | ) | | | (472,646,775 | ) | | | (118,612,655 | ) | | | (181,007,812 | ) | | | (91,273,123 | ) | | | (28,263,358 | ) | | | (1,793,515 | ) | | | (111,834,370 | ) | | | (38,593,388 | ) |
| | — | | | | (74,922 | ) | | | — | | | | (176,672 | ) | | | — | | | | (44,729 | ) | | | — | | | | | | | | — | | | | — | |
| | | | | | | | | | | | | | | | | | | | | | | | | | | | | | | | | | | | | | | |
| | (107,194,168) | | | | (133,371,894 | ) | | | (501,179,095 | ) | | | (132,605,040 | ) | | | (196,039,818 | ) | | | (108,156,314 | ) | | | (28,263,358 | ) | | | (1,793,515 | ) | | | (111,834,370 | ) | | | (38,593,388 | ) |
| | | | | | | | | | | | | | | | | | | | | | | | | | | | | | | | | | | | | | | |
| | 14,858,116 | | | | 8,314,464 | | | | (183,080,737 | ) | | | 70,392,680 | | | | (73,671,609 | ) | | | (41,938,713 | ) | | | 18,917,472 | | | | 85,568,010 | | | | (71,838,055 | ) | | | 8,505,222 | |
| | | | | | | | | | | | | | | | | | | | | | | | | | | | | | | | | | | | | | | |
| | 23,537,878 | | | | 58,214,787 | | | | (158,266,815 | ) | | | 143,351,112 | | | | (50,161,070 | ) | | | 23,056,722 | | | | 19,831,235 | | | | 87,993,717 | | | | (60,484,920 | ) | | | 54,089,797 | |
| | | | | | | | | | | | | | | | | | | | | | | | | | | | | | | | | | | | | | | |
| | | | | | | | | | | | | | | | | | | | | | | | | | | | | | | | | | | | | | |
| | 685,056,481 | | | | 626,841,694 | | | | 1,008,717,850 | | | | 865,366,738 | | | | 460,661,377 | | | | 437,604,655 | | | | 87,993,717 | | | | — | | | | 221,554,573 | | | | 167,464,776 | |
| | | | | | | | | | | | | | | | | | | | | | | | | | | | | | | | | | | | | | | |
| $ | 708,594,359 | | | $ | 685,056,481 | | | $ | 850,451,035 | | | $ | 1,008,717,850 | | | $ | 410,500,307 | | | $ | 460,661,377 | | | $ | 107,824,952 | | | $ | 87,993,717 | | | $ | 161,069,653 | | | $ | 221,554,573 | |
| | | | | | | | | | | | | | | | | | | | | | | | | | | | | | | | | | | | | | | |
| $ | (82,912) | | | $ | (152,642 | ) | | $ | 281,806 | | | $ | (59,115 | ) | | $ | 494,619 | | | $ | 692,095 | | | $ | — | | | $ | 64,492 | | | $ | 665,096 | | | $ | (651,947 | ) |
| | | | | | | | | | | | | | | | | | | | | | | | | | | | | | | | | | | | | | | |
| | | | |
| | See Notes to Financial Statements. | | 186 |
| | |
| STATEMENTS OF CHANGES IN NET ASSETS | | |
| | | | | | | | | | | | | | | | |
| | | Equity Index Fund | | | Real Estate
Securities Fund | |
| | | For the Year Ended | | | For the Year Ended | |
| | | 12/31/10 | | | 12/31/09 | | | 12/31/10 | | | 12/31/09 | |
Operations: | | | | | | | | | | | | | | | | |
Net investment income (loss) | | $ | 6,396,499 | | | $ | 6,218,448 | | | $ | 1,905,032 | | | $ | 2,070,541 | |
Net realized gain (loss) on investment securities, foreign currency transactions and derivative transactions | | | 5,274,132 | | | | (2,578,884 | ) | | | 26,904,560 | | | | (19,042,691 | ) |
Net change in unrealized appreciation (depreciation) on investment securities, foreign currency translations and derivative transactions | | | 41,477,736 | | | | 75,763,601 | | | | 4,438,375 | | | | 49,297,450 | |
| | | | | | | | | | | | | | | | |
Net increase in net assets resulting from operations | | | 53,148,367 | | | | 79,403,165 | | | | 33,247,967 | | | | 32,325,300 | |
| | | | | | | | | | | | | | | | |
Dividends and Distributions to Shareholders: | | | | | | | | | | | | | | | | |
Dividends from net investment income | | | | | | | | | | | | | | | | |
GS2 shares | | | (2,079,604 | ) | | | (1,801,063 | ) | | | — | | | | — | |
GS4 shares | | | (4,864,924 | ) | | | (4,402,101 | ) | | | (2,634,670 | ) | | | (2,070,541 | ) |
GS6 shares | | | — | | | | (14,301 | ) | | | — | | | | — | |
Distributions from net realized capital gains | | | | | | | | | | | | | | | | |
GS2 shares | | | — | | | | — | | | | — | | | | — | |
GS4 shares | | | — | | | | — | | | | — | | | | — | |
GS6 shares | | | — | | | | — | | | | — | | | | — | |
Return of Capital | | | | | | | | | | | | | | | | |
GS4 shares | | | — | | | | — | | | | | | | | (45,334 | ) |
| | | | | | | | | | | | | | | | |
Total dividends and distributions | | | (6,944,528 | ) | | | (6,217,465 | ) | | | (2,634,670 | ) | | | (2,115,875 | ) |
| | | | | | | | | | | | | | | | |
Capital Share Transactions: | | | | | | | | | | | | | | | | |
Proceeds from shares sold | | | | | | | | | | | | | | | | |
GS2 shares | | | 4,602,259 | | | | 5,404,027 | | | | — | | | | — | |
GS4 shares | | | 20,345,130 | | | | 26,274,116 | | | | 59,543,641 | | | | 40,121,237 | |
GS6 shares | | | — | | | | 169,604 | | | | — | | | | — | |
Proceeds from exchange of GS6 shares for GS4 shares(1) | | | | | | | | | | | | | | | | |
GS4shares | | | — | | | | 752,012 | | | | — | | | | — | |
GS6 shares | | | — | | | | (752,012 | ) | | | — | | | | — | |
Reinvestment of dividends and distributions | | | | | | | | | | | | | | | | |
GS2 shares | | | 2,076,955 | | | | 1,798,674 | | | | — | | | | — | |
GS4 shares | | | 4,864,576 | | | | 4,401,738 | | | | 2,634,446 | | | | 2,115,821 | |
GS6 shares | | | — | | | | 14,301 | | | | — | | | | — | |
| | | | | | | | | | | | | | | | |
Total proceeds from shares sold and reinvested | | | 31,888,920 | | | | 38,062,460 | | | | 62,178,087 | | | | 42,237,058 | |
| | | | | | | | | | | | | | | | |
Value of shares redeemed | | | | | | | | | | | | | | | | |
GS2 shares | | | (8,023,576 | ) | | | (3,267,371 | ) | | | — | | | | — | |
GS4 shares | | | (49,820,804 | ) | | | (18,417,132 | ) | | | (72,424,383 | ) | | | (31,492,535 | ) |
GS6 shares | | | — | | | | (53,435 | ) | | | — | | | | — | |
| | | | | | | | | | | | | | | | |
Total value of shares redeemed | | | (57,844,380 | ) | | | (21,737,938 | ) | | | (72,424,383 | ) | | | (31,492,535 | ) |
| | | | | | | | | | | | | | | | |
Net increase (decrease) from capital share transactions(2) | | | (25,955,460 | ) | | | 16,324,522 | | | | (10,246,296 | ) | | | 10,744,523 | |
| | | | | | | | | | | | | | | | |
Total increase (decrease) in net assets | | | 20,248,379 | | | | 89,510,222 | | | | 20,367,001 | | | | 40,953,948 | |
| | | | | | | | | | | | | | | | |
Net Assets: | | | | | | | | | | | | | | | | |
Beginning of Year | | | 386,703,776 | | | | 297,193,554 | | | | 121,533,197 | | | | 80,579,249 | |
| | | | | | | | | | | | | | | | |
End of Year* | | $ | 406,952,155 | | | $ | 386,703,776 | | | $ | 141,900,198 | | | $ | 121,533,197 | |
| | | | | | | | | | | | | | | | |
* Including undistributed (distributions in excess of) net investment income | | $ | 1,075,513 | | | $ | 1,623,542 | | | $ | — | | | $ | — | |
| | | | | | | | | | | | | | | | |
| (1) | See Note 1 in Notes to Financial Statements. |
| (2) | See Note 7 in Notes to Financial Statements. |
| | | | |
| 187 | | See Notes to Financial Statements. | | |
| | | | | | | | | | | | | | | | | | | | | | | | | | | | | | |
Value Equity Fund | | | Growth Equity Fund | | | Small Cap Equity Fund | | | International Equity Fund | |
| For the Year Ended | | | For the Year Ended | | | For the Year Ended | | | For the Year Ended | |
| 12/31/10 | | | 12/31/09 | | | 12/31/10 | | | 12/31/09 | | | 12/31/10 | | | 12/31/09 | | | 12/31/10 | | | 12/31/09 | |
| | | | | | | | | | | | | | | | | | | | | | | | | | | | | | |
| $ | 16,020,597 | | | $ | 19,779,510 | | | $ | (265,820 | ) | | $ | 1,505,015 | | | $ | 1,264,643 | | | $ | 1,203,503 | | | $ | 21,771,274 | | | $ | 23,826,445 | |
| 21,517,725 | | | | (64,175,066 | ) | | | 116,443,512 | | | | (109,204,568 | ) | | | 63,234,872 | | | | (41,870,403 | ) | | | 69,378,254 | | | | (165,177,080 | ) |
| 112,791,738 | | | | 257,263,641 | | | | 99,460,370 | | | | 464,623,213 | | | | 43,094,484 | | | | 132,900,348 | | | | 31,319,963 | | | | 523,658,601 | |
| | | | | | | | | | | | | | | | | | | | | | | | | | | | | | | |
| | 150,330,060 | | | | 212,868,085 | | | | 215,638,062 | | | | 356,923,660 | | | | 107,593,999 | | | | 92,233,448 | | | | 122,469,491 | | | | 382,307,966 | |
| | | | | | | | | | | | | | | | | | | | | | | | | | | | | | | |
| | | | | | | | | | | | | | | | | | | | | | | | | | | | | | |
| | | | | | | | | | | | | | | | | | | | | | | | | | | | | | |
| | (4,566,483 | ) | | | (5,200,697 | ) | | | (40,561 | ) | | | (483,098 | ) | | | (415,040 | ) | | | (308,721 | ) | | | (7,250,286 | ) | | | (6,734,271 | ) |
| | (11,523,832 | ) | | | (14,265,973 | ) | | | (133,534 | ) | | | (889,232 | ) | | | (925,891 | ) | | | (799,277 | ) | | | (20,213,303 | ) | | | (22,872,522 | ) |
| | — | | | | (275,945 | ) | | | — | | | | (1,914 | ) | | | — | | | | (13,179 | ) | | | — | | | | (134,700 | ) |
| | | | | | | | | | | | | | | | | | | | | | | | | | | | | | |
| | — | | | | — | | | | — | | | | — | | | | — | | | | — | | | | — | | | | (2,529 | ) |
| | — | | | | — | | | | — | | | | — | | | | — | | | | — | | | | — | | | | (9,714 | ) |
| | — | | | | — | | | | — | | | | — | | | | — | | | | — | | | | — | | | | (219 | ) |
| | | | | | | | | | | | | | | | | | | | | | | | | | | | | | |
| | — | | | | — | | | | — | | | | — | | | | — | | | | — | | | | — | | | | — | |
| | | | | | | | | | | | | | | | | | | | | | | | | | | | | | | |
| | (16,090,315 | ) | | | (19,742,615 | ) | | | (174,095 | ) | | | (1,374,244 | ) | | | (1,340,931 | ) | | | (1,121,177 | ) | | | (27,463,589 | ) | | | (29,753,955 | ) |
| | | | | | | | | | | | | | | | | | | | | | | | | | | | | | | |
| | | | | | | | | | | | | | | | | | | | | | | | | | | | | | |
| | | | | | | | | | | | | | | | | | | | | | | | | | | | | | |
| | 39,754,658 | | | | 12,902,236 | | | | 11,089,301 | | | | 12,713,753 | | | | 6,136,286 | | | | 5,492,162 | | | | 21,416,243 | | | | 20,280,057 | |
| | 102,300,386 | | | | 72,329,322 | | | | 97,600,498 | | | | 71,786,841 | | | | 50,387,278 | | | | 30,796,225 | | | | 72,024,528 | | | | 93,746,559 | |
| | — | | | | 202,991 | | | | — | | | | 130,568 | | | | — | | | | 121,495 | | | | — | | | | 203,417 | |
| | | | | | | | | | | | | | | | | | | | | | | | | | | | | | |
| | — | | | | 10,999,393 | | | | — | | | | 8,465,100 | | | | — | | | | 11,250,269 | | | | — | | | | 15,254,145 | |
| | — | | | | (10,999,393 | ) | | | — | | | | (8,465,100 | ) | | | — | | | | (11,250,269 | ) | | | — | | | | (15,254,145 | ) |
| | | | | | | | | | | | | | | | | | | | | | | | | | | | | | |
| | 4,561,533 | | | | 5,194,371 | | | | 40,520 | | | | 482,587 | | | | 414,619 | | | | 308,317 | | | | 7,247,462 | | | | 6,729,926 | |
| | 11,522,839 | | | | 14,264,827 | | | | 133,532 | | | | 889,208 | | | | 925,723 | | | | 799,160 | | | | 20,212,073 | | | | 22,880,793 | |
| | — | | | | 275,945 | | | | — | | | | 1,914 | | | | — | | | | 13,179 | | | | — | | | | 134,919 | |
| | | | | | | | | | | | | | | | | | | | | | | | | | | | | | | |
| | 158,139,416 | | | | 105,169,692 | | | | 108,863,851 | | | | 86,004,871 | | | | 57,863,906 | | | | 37,530,538 | | | | 120,900,306 | | | | 143,975,671 | |
| | | | | | | | | | | | | | | | | | | | | | | | | | | | | | | |
| | | | | | | | | | | | | | | | | | | | | | | | | | | | | | |
| | (15,449,564 | ) | | | (7,838,330 | ) | | | (27,914,876 | ) | | | (12,252,310 | ) | | | (12,770,867 | ) | | | (3,541,206 | ) | | | (24,804,983 | ) | | | (36,708,492 | ) |
| | (270,576,572 | ) | | | (107,020,416 | ) | | | (300,169,249 | ) | | | (131,924,307 | ) | | | (96,926,506 | ) | | | (37,084,961 | ) | | | (241,791,703 | ) | | | (200,124,972 | ) |
| | — | | | | (12,384 | ) | | | — | | | | (41,306 | ) | | | — | | | | (22,607 | ) | | | — | | | | (67,761 | ) |
| | | | | | | | | | | | | | | | | | | | | | | | | | | | | | | |
| | (286,026,136 | ) | | | (114,871,130 | ) | | | (328,084,125 | ) | | | (144,217,923 | ) | | | (109,697,373 | ) | | | (40,648,774 | ) | | | (266,596,686 | ) | | | (236,901,225 | ) |
| | | | | | | | | | | | | | | | | | | | | | | | | | | | | | | |
| | (127,886,720 | ) | | | (9,701,438 | ) | | | (219,220,274 | ) | | | (58,213,052 | ) | | | (51,833,467 | ) | | | (3,118,236 | ) | | | (145,696,380 | ) | | | (92,925,554 | ) |
| | | | | | | | | | | | | | | | | | | | | | | | | | | | | | | |
| | 6,353,025 | | | | 183,424,032 | | | | (3,756,307 | ) | | | 297,336,364 | | | | 54,419,601 | | | | 87,994,035 | | | | (50,690,478 | ) | | | 259,628,457 | |
| | | | | | | | | | | | | | | | | | | | | | | | | | | | | | | |
| | | | | | | | | | | | | | | | | | | | | | | | | | | | | | |
| | 1,182,936,914 | | | | 999,512,882 | | | | 1,263,679,513 | | | | 966,343,149 | | | | 420,075,633 | | | | 332,081,598 | | | | 1,342,110,291 | | | | 1,082,481,834 | |
| | | | | | | | | | | | | | | | | | | | | | | | | | | | | | | |
| $ | 1,189,289,939 | | | $ | 1,182,936,914 | | | $ | 1,259,923,206 | | | $ | 1,263,679,513 | | | $ | 474,495,234 | | | $ | 420,075,633 | | | $ | 1,291,419,813 | | | $ | 1,342,110,291 | |
| | | | | | | | | | | | | | | | | | | | | | | | | | | | | | | |
$ | 7,719,446 | | | $ | 7,789,164 | | | $ | — | | | $ | 169,198 | | | $ | 4,903 | | | $ | 47,515 | | | $ | (3,491,275 | ) | | $ | (3,162,445 | ) |
| | | | | | | | | | | | | | | | | | | | | | | | | | | | | | | |
| | | | |
| | See Notes to Financial Statements. | | 188 |
For a Share Outstanding For the Years Ending December 31, unless otherwise indicated
| | | | | | | | | | | | | | | | | | | | | | | | | | | | | | | | | | | | | | | | | | | | | | | | |
| | | | | | | | | | | | | Ratios to Average Net Assets | |
| | | Net Asset
Value,
Beginning
of Year | | | Net Investment
Income | | | Realized
and
Unrealized
Gain
(Loss) on
Investments | | | Dividends
from Net
Investment
Income | | | Distributions
from Net
Realized
Capital
Gains | | | Net Asset
Value,
End of
Year | | | Total
Return | | | Net Assets,
End of Year
(000) | | | Expenses,
Net | | | Expenses,
Gross(1) | | | Investment
Income,
Net(2) | | | Portfolio
Turnover
Rate | |
Money Market Fund | | | | | | | | | | | | | | | | | | | | | | | | | | | | | | | | | | | | | | | | | |
| | | | | | | | | | | |
GS2 Class | | | | | | | | | | | | | | | | | | | | | | | | | | | | | | | | | | | | | | | | | | | | | |
2010 | | $ | 1.00 | | | $ | — | † | | $ | — | † | | $ | — | † | | $ | — | † | | $ | 1.00 | | | | 0.18 | % | | $ | 119,311 | | | | 0.17 | % | | | 0.18 | % | | | 0.17 | % | | | N/A | |
2009 | | | 1.00 | | | | — | † | | | — | † | | | — | † | | | — | † | | | 1.00 | | | | 0.47 | | | | 133,323 | | | | 0.23 | (3) | | | 0.23 | (3) | | | 0.49 | | | | N/A | |
2008 | | | 1.00 | | | | 0.03 | | | | — | † | | | (0.03 | ) | | | — | | | | 1.00 | | | | 2.95 | | | | 171,739 | | | | 0.20 | | | | 0.20 | | | | 2.86 | | | | N/A | |
2007 | | | 1.00 | | | | 0.05 | | | | — | † | | | (0.05 | ) | | | — | | | | 1.00 | | | | 5.23 | | | | 112,581 | | | | 0.23 | | | | 0.23 | | | | 5.11 | | | | N/A | |
2006 | | | 1.00 | | | | 0.05 | | | | — | † | | | (0.05 | ) | | | — | | | | 1.00 | | | | 4.92 | | | | 100,559 | | | | 0.26 | | | | 0.26 | | | | 4.82 | | | | N/A | |
GS4 Class | | | | | | | | | | | | | | | | | | | | | | | | | | | | | | | | | | | | | | | | | | | | | |
2010 | | $ | 1.00 | | | $ | — | † | | $ | — | † | | $ | — | † | | $ | — | † | | $ | 1.00 | | | | 0.02 | % | | $ | 1,180,141 | | | | 0.33 | % | | | 0.37 | % | | | 0.01 | % | | | N/A | |
2009 | | | 1.00 | | | | — | † | | | — | † | | | — | † | | | — | † | | | 1.00 | | | | 0.29 | | | | 1,064,934 | | | | 0.41 | (3) | | | 0.43 | (3) | | | 0.28 | | | | N/A | |
2008 | | | 1.00 | | | | 0.03 | | | | — | † | | | (0.03 | ) | | | — | | | | 1.00 | | | | 2.75 | | | | 970,146 | | | | 0.40 | (3) | | | 0.40 | (3) | | | 2.72 | | | | N/A | |
2007 | | | 1.00 | | | | 0.05 | | | | — | † | | | (0.05 | ) | | | — | | | | 1.00 | | | | 5.03 | | | | 939,596 | | | | 0.43 | | | | 0.43 | | | | 4.92 | | | | N/A | |
2006 | | | 1.00 | | | | 0.05 | | | | — | † | | | (0.05 | ) | | | — | | | | 1.00 | | | | 4.72 | | | | 930,582 | | | | 0.46 | | | | 0.46 | | | | 4.64 | | | | N/A | |
| | | | | | | | | | |
Low-Duration Bond Fund | | | | | | | | | | | | | | | | | | | | | | | | | | | | | | | | | | | | | | | | | |
| | | | | | | | | | | |
GS2 Class | | | | | | | | | | | | | | | | | | | | | | | | | | | | | | | | | | | | | | | | | | | | | |
2010 | | $ | 8.70 | | | $ | 0.20 | # | | $ | 0.17 | | | $ | (0.28 | ) | | $ | (0.09 | ) | | $ | 8.70 | | | | 4.35 | % | | $ | 128,143 | | | | 0.36 | % | | | 0.41 | % | | | 2.27 | % | | | 257 | % |
2009 | | | 8.11 | | | | 0.29 | # | | | 0.69 | | | | (0.39 | ) | | | — | | | | 8.70 | | | | 12.29 | | | | 115,741 | | | | 0.36 | | | | 0.42 | | | | 3.47 | | | | 322 | |
2008 | | | 8.90 | | | | 0.36 | # | | | (0.60 | ) | | | (0.55 | ) | | | — | | | | 8.11 | | | | (2.76 | ) | | | 105,223 | | | | 0.36 | | | | 0.41 | | | | 4.19 | | | | 427 | |
2007 | | | 8.89 | | | | 0.42 | # | | | 0.12 | | | | (0.53 | ) | | | — | | | | 8.90 | | | | 6.22 | | | | 133,374 | | | | 0.42 | | | | 0.45 | | | | 4.71 | | | | 248 | |
2006 | | | 9.06 | | | | 0.38 | # | | | (0.03 | ) | | | (0.52 | ) | | | — | | | | 8.89 | | | | 3.94 | | | | 105,991 | | | | 0.45 | | | | 0.47 | | | | 4.22 | | | | 168 | |
GS4 Class | | | | | | | | | | | | | | | | | | | | | | | | | | | | | | | | | | | | | | | | | | | | | |
2010 | | $ | 13.04 | | | $ | 0.28 | # | | $ | 0.26 | | | $ | (0.26 | ) | | $ | (0.09 | ) | | $ | 13.23 | | | | 4.20 | % | | $ | 580,452 | | | | 0.52 | % | | | 0.61 | % | | | 2.11 | % | | | 257 | % |
2009 | | | 11.99 | | | | 0.42 | # | | | 1.00 | | | | (0.37 | ) | | | — | | | | 13.04 | | | | 11.97 | | | | 569,316 | | | | 0.52 | | | | 0.62 | | | | 3.30 | | | | 322 | |
2008 | | | 12.88 | | | | 0.51 | # | | | (0.87 | ) | | | (0.53 | ) | | | — | | | | 11.99 | | | | (2.84 | ) | | | 515,996 | | | | 0.52 | | | | 0.61 | | | | 4.03 | | | | 427 | |
2007 | | | 12.63 | | | | 0.58 | # | | | 0.17 | | | | (0.50 | ) | | | — | | | | 12.88 | | | | 6.11 | | | | 665,292 | | | | 0.58 | | | | 0.64 | | | | 4.54 | | | | 248 | |
2006 | | | 12.66 | | | | 0.58 | # | | | (0.11 | ) | | | (0.50 | ) | | | — | | | | 12.63 | | | | 3.75 | | | | 697,687 | | | | 0.61 | | | | 0.66 | | | | 4.05 | | | | 168 | |
| † | Amount represents less than $0.005 per share. |
| # | Calculated using the average shares outstanding method. |
| (1) | The ratio excludes expenses waived/reimbursed net of amount recaptured. |
| (2) | The ratio includes expenses waived/reimbursed net of amount recaptured and fees paid indirectly, where applicable; if expenses waived/reimbursed net of amount recaptured and fees paid indirectly were excluded, the ratio would have been lower than the ratio shown. |
| (3) | The Money Market Fund participated in the U.S. Department of the Treasury (the “Treasury”) Temporary Guarantee Program for Money Market Funds (the “Program”). The Fund bore the expense of its participation in the Program without regard to any expense limitation in effect. The Program expired on September 18, 2009. |
| | | | |
| 189 | | See Notes to Financial Statements. | | |
| | | | | | | | | | | | | | | | | | | | | | | | | | | | | | | | | | | | | | | | | | | | | | | | | | | | |
| | | | | | | | | | | | | | | | | | | | | | | | | | | | | | Ratios to Average Net Assets | |
| | | Net Asset
Value,
Beginning
of Year | | | Net Investment
Income | | | Realized
and
Unrealized
Gain
(Loss) on
Investments | | | Dividends
from Net
Investment
Income | | | Distributions
from Net
Realized
Capital
Gains | | | Return
of
Capital | | | Net Asset
Value,
End of
Year | | | Total
Return | | | Net Assets,
End of Year
(000) | | | Expenses,
Net | | | Expenses,
Gross(1) | | | Investment
Income,
Net(2) | | | Portfolio
Turnover
Rate | |
Medium-Duration Bond Fund | | | | | | | | | | | | | | | | | | | | | | | | | | | | | | | | | | | | | | | | | | | | | |
| | | | | | | | | | | | |
GS2 Class | | | | | | | | | | | | | | | | | | | | | | | | | | | | | | | | | | | | | | | | | | | | | | | | | |
2010 | | $ | 7.47 | | | $ | 0.25 | # | | $ | 0.40 | | | $ | (0.41 | ) | | $ | (0.46 | ) | | $ | — | | | $ | 7.25 | | | | 8.86 | % | | $ | 236,369 | | | | 0.48 | % | | | 0.49 | % | | | 3.21 | % | | | 487 | % |
2009 | | | 7.13 | | | | 0.31 | # | | | 0.85 | | | | (0.51 | ) | | | (0.31 | ) | | | — | | | | 7.47 | | | | 17.07 | | | | 139,917 | | | | 0.48 | | | | 0.51 | | | | 4.17 | | | | 427 | |
2008 | | | 8.42 | | | | 0.40 | # | | | (0.72 | ) | | | (0.65 | ) | | | (0.32 | ) | | | — | | | | 7.13 | | | | (3.88 | ) | | | 112,240 | | | | 0.47 | | | | 0.48 | | | | 5.07 | | | | 566 | |
2007 | | | 8.52 | | | | 0.42 | # | | | 0.12 | | | | (0.64 | ) | | | — | † | | | — | | | | 8.42 | | | | 6.65 | | | | 151,466 | | | | 0.48 | | | | 0.49 | | | | 5.02 | | | | 428 | |
2006 | | | 8.71 | | | | 0.39 | # | | | (0.01 | ) | | | (0.57 | ) | | | — | | | | — | | | | 8.52 | | | | 4.50 | | | | 113,051 | | | | 0.50 | | | | 0.50 | | | | 4.60 | | | | 440 | |
GS4 Class | | | | | | | | | | | | | | | | | | | | | | | | | | | | | | | | | | | | | | | | | | | | | | | | | | | | |
2010 | | $ | 13.36 | | | $ | 0.43 | # | | $ | 0.71 | | | $ | (0.39 | ) | | $ | (0.46 | ) | | $ | — | | | $ | 13.65 | | | | 8.65 | % | | $ | 614,082 | | | | 0.58 | % | | | 0.68 | % | | | 3.11 | % | | | 487 | % |
2009 | | | 12.16 | | | | 0.53 | # | | | 1.48 | | | | (0.50 | ) | | | (0.31 | ) | | | — | | | | 13.36 | | | | 16.97 | | | | 868,800 | | | | 0.58 | | | | 0.70 | | | | 4.08 | | | | 427 | |
2008 | | | 13.64 | | | | 0.65 | # | | | (1.18 | ) | | | (0.63 | ) | | | (0.32 | ) | | | — | | | | 12.16 | | | | (3.89 | ) | | | 738,610 | | | | 0.58 | | | | 0.67 | | | | 4.96 | | | | 566 | |
2007 | | | 13.42 | | | | 0.66 | # | | | 0.18 | | | | (0.62 | ) | | | — | † | | | — | | | | 13.64 | | | | 6.46 | | | | 1,079,034 | | | | 0.61 | | | | 0.68 | | | | 4.88 | | | | 428 | |
2006 | | | 13.40 | | | | 0.60 | # | | | (0.03 | ) | | | (0.55 | ) | | | — | | | | — | | | | 13.42 | | | | 4.37 | | | | 1,108,958 | | | | 0.62 | | | | 0.69 | | | | 4.48 | | | | 440 | |
| | | | | | | | | | | |
Extended-Duration Bond Fund | | | | | | | | | | | | | | | | | | | | | | | | | | | | | | | | | | | | | | | | | | | | | |
| | | | | | | | | | | | |
GS2 Class | | | | | | | | | | | | | | | | | | | | | | | | | | | | | | | | | | | | | | | | | | | | | | | | | |
2010 | | $ | 7.01 | | | $ | 0.40 | # | | $ | 0.43 | | | $ | (0.80 | ) | | $ | (0.11 | ) | | $ | — | | | $ | 6.93 | | | | 12.25 | % | | $ | 72,741 | | | | 0.53 | % | | | 0.53 | % | | | 5.60 | % | | | 39 | % |
2009 | | | 6.31 | | | | 0.44 | # | | | 1.04 | | | | (0.76 | ) | | | (0.02 | ) | | | — | | | | 7.01 | | | | 25.27 | | | | 67,699 | | | | 0.53 | | | | 0.53 | | | | 6.78 | | | | 41 | |
2008 | | | 7.95 | | | | 0.47 | # | | | (1.11 | ) | | | (0.85 | ) | | | (0.15 | ) | | | — | | | | 6.31 | | | | (8.12 | ) | | | 64,834 | | | | 0.52 | | | | 0.52 | | | | 6.66 | | | | 40 | |
2007 | | | 8.13 | | | | 0.41 | # | | | 0.23 | | | | (0.69 | ) | | | (0.13 | ) | | | — | | | | 7.95 | | | | 8.45 | | | | 75,841 | | | | 0.53 | | | | 0.53 | | | | 5.21 | | | | 101 | |
2006 | | | 8.44 | | | | 0.40 | # | | | (0.03 | ) | | | (0.65 | ) | | | (0.03 | ) | | | — | | | | 8.13 | | | | 4.75 | | | | 59,916 | | | | 0.57 | | | | 0.57 | | | | 4.91 | | | | 100 | |
GS4 Class | | | | | | | | | | | | | | | | | | | | | | | | | | | | | | | | | | | | | | | | | | | | | | | | | |
2010 | | $ | 15.34 | | | $ | 0.88 | # | | $ | 0.94 | | | $ | (0.77 | ) | | $ | (0.11 | ) | | $ | — | | | $ | 16.28 | | | | 12.05 | % | | $ | 337,760 | | | | 0.69 | % | | | 0.72 | % | | | 5.43 | % | | | 39 | % |
2009 | | | 12.97 | | | | 0.91 | # | | | 2.22 | | | | (0.74 | ) | | | (0.02 | ) | | | — | | | | 15.34 | | | | 24.97 | | | | 392,962 | | | | 0.69 | | | | 0.73 | | | | 6.60 | | | | 41 | |
2008 | | | 15.20 | | | | 0.90 | # | | | (2.15 | ) | | | (0.83 | ) | | | (0.15 | ) | | | — | | | | 12.97 | | | | (8.28 | ) | | | 357,073 | | | | 0.69 | | | | 0.71 | | | | 6.45 | | | | 40 | |
2007 | | | 14.81 | | | | 0.74 | # | | | 0.44 | | | | (0.66 | ) | | | (0.13 | ) | | | — | | | | 15.20 | | | | 8.29 | | | | 500,252 | | | | 0.72 | | | | 0.72 | | | | 5.02 | | | | 101 | |
2006 | | | 14.82 | | | | 0.69 | # | | | (0.04 | ) | | | (0.63 | ) | | | (0.03 | ) | | | — | | | | 14.81 | | | | 4.56 | | | | 467,877 | | | | 0.73 | | | | 0.76 | | | | 4.75 | | | | 100 | |
| | | | | | | | | | | |
Inflation Protected Bond Fund | | | | | | | | | | | | | | | | | | | | | | | | | | | | | | | | | | | | | | | | | | | | | |
| | | | | | | | | | | | |
GS4 Class | | | | | | | | | | | | | | | | | | | | | | | | | | | | | | | | | | | | | | | | | | | | | | | | | |
2010 | | $ | 10.32 | | | $ | 0.20 | # | | $ | 0.40 | | | $ | (0.21 | ) | | $ | (0.28 | ) | | $ | — | | | $ | 10.43 | | | | 5.82 | % | | $ | 107,825 | | | | 0.65 | % | | | 0.66 | % | | | 1.90 | % | | | 113 | % |
2009(3)(4)(5) | | $ | 10.00 | | | $ | 0.19 | # | | $ | 0.32 | | | $ | (0.18 | ) | | $ | (0.01 | ) | | $ | — | | | | 10.32 | | | | 5.12 | | | | 87,994 | | | | 0.67 | | | | 0.70 | | | | 3.53 | | | | 55 | |
| | | | | | | | | | | | |
Global Bond Fund | | | | | | | | | | | | | | | | | | | | | | | | | | | | | | | | | | | | | | | | | | | | | | | | | |
| | | | | | | | | | | | | |
GS4 Class | | | | | | | | | | | | | | | | | | | | | | | | | | | | | | | | | | | | | | | | | | | | | | | | | | | | |
2010 | | $ | 9.36 | | | $ | 0.52 | # | | $ | 0.51 | | | $ | (0.56 | ) | | $ | — | | | $ | — | | | $ | 9.83 | | | | 11.29 | % | | $ | 161,070 | | | | 0.79 | % | | | 0.81 | % | | | 5.40 | % | | | 40 | % |
2009 | | | 7.34 | | | | 0.56 | # | | | 2.07 | | | | (0.61 | ) | | | — | | | | — | | | | 9.36 | | | | 37.35 | | | | 221,555 | | | | 0.79 | | | | 0.81 | | | | 6.81 | | | | 96 | |
2008 | | | 10.14 | | | | 0.64 | # | | | (2.59 | ) | | | (0.75 | ) | | | (0.10 | ) | | | — | | | | 7.34 | | | | (20.28 | ) | | | 167,465 | | | | 0.78 | | | | 0.80 | | | | 7.20 | | | | 176 | |
2007 | | | 10.12 | | | | 0.61 | | | | 0.08 | | | | (0.64 | ) | | | (0.03 | ) | | | — | | | | 10.14 | | | | 7.00 | | | | 125,333 | | | | 0.79 | | | | 0.80 | | | | 6.07 | | | | 255 | |
2006(5)(6) | | | 10.12 | | | | — | † | | | — | † | | | — | † | | | — | | | | — | † | | | 10.12 | | | | 0.04 | | | | 104,635 | | | | 1.04 | | | | 1.42 | | | | 4.32 | | | | — | |
| † | Amount represents less than $0.005 per share. |
| # | Calculated using the average shares outstanding method. |
| (1) | The ratio excludes expenses waived/reimbursed net of amount recaptured. |
| (2) | The ratio includes expenses waived/reimbursed net of amount recaptured and fees paid indirectly, where applicable; if expenses waived/reimbursed net of amount recaptured and fees paid indirectly were excluded, the ratio would have been lower than the ratio shown. |
| (3) | Inception date was June 26, 2009. |
| (4) | Due to a procedural error, the Ratios to Average Net Assets were incorrectly reported in the 2009 financial highlights as 0.35% (Expenses, Net), 0.36% (Expenses, Gross) and 1.83% (Investment Income, Net). Such amounts have been revised in the financial highlights for the year ended December 31, 2009. |
| (5) | Total return is not annualized. Ratios are annualized. |
| (6) | Inception date was December 29, 2006. |
| | | | |
| | See Notes to Financial Statements. | | 190 |
FINANCIAL HIGHLIGHTS (Continued)
| | | | | | | | | | | | | | | | | | | | | | | | | | | | | | | | | | | | | | | | | | | | | | | | | | | | |
| For a Share Outstanding For the Years Ending December 31, unless otherwise indicated | | | Ratios to Average Net Assets | | | | |
| | | Net Asset
Value,
Beginning
of Year | | | Net Investment
Income | | | Realized
and
Unrealized
Gain
(Loss) on
Investments | | | Dividends
from Net
Investment
Income | | | Distributions
from Net
Realized
Capital
Gains | | | Excess
Distribution/
Return of
Capital | | | Net Asset
Value,
End of
Year | | | Total
Return | | | Net Assets,
End of Year
(000) | | | Expenses,
Net | | | Expenses,
Gross(1) | | | Investment
Income/
(Loss),
Net(2) | | | Portfolio
Turnover
Rate | |
Equity Index Fund | | | | | | | | | | | | | | | | | | | | | | | | | | | | | | | | | | | | | | | | | | | | | | | | | |
| | | | | | | | | | | |
GS2 Class | | | | | | | | | | | | | | | | | | | | | | | | | | | | | | | | | | | | | | | | | | | | | |
2010 | | $ | 7.77 | | | $ | 0.14 | # | | $ | 0.97 | | | $ | (0.25 | ) | | $ | — | | | $ | — | | | $ | 8.63 | | | | 14.57 | % | | $ | 71,093 | | | | 0.22 | % | | | 0.22 | % | | | 1.77 | % | | | 5 | % |
2009 | | | 6.36 | | | | 0.14 | # | | | 1.49 | | | | (0.22 | ) | | | — | | | | — | | | | 7.77 | | | | 26.38 | | | | 65,217 | | | | 0.22 | | | | 0.24 | | | | 2.05 | | | | 4 | |
2008 | | | 10.57 | | | | 0.18 | # | | | (4.06 | ) | | | (0.24 | ) | | | (0.09 | ) | | | — | | | | 6.36 | | | | (37.32 | ) | | | 49,472 | | | | 0.21 | | | | 0.22 | | | | 2.11 | | | | 5 | |
2007 | | | 11.08 | | | | 0.20 | # | | | 0.39 | | | | (0.32 | ) | | | (0.78 | ) | | | — | | | | 10.57 | | | | 5.19 | | | | 81,104 | | | | 0.22 | | | | 0.22 | | | | 1.77 | | | | 5 | |
2006 | | | 9.96 | | | | 0.18 | # | | | 1.33 | | | | (0.28 | ) | | | (0.11 | ) | | | — | | | | 11.08 | | | | 15.37 | | | | 74,634 | | | | 0.23 | | | | 0.23 | | | | 1.74 | | | | 5 | |
GS4 Class | | | | | | | | | | | | | | | | | | | | | | | | | | | | | | | | | | | | | | | | | | | | | | | | | |
2010 | | $ | 14.51 | | | $ | 0.24 | # | | $ | 1.84 | | | $ | (0.23 | ) | | $ | — | | | $ | — | | | $ | 16.36 | | | | 14.45 | % | | $ | 335,859 | | | | 0.37 | % | | | 0.41 | % | | | 1.60 | % | | | 5 | % |
2009 | | | 11.70 | | | | 0.24 | # | | | 2.77 | | | | (0.20 | ) | | | — | | | | — | | | | 14.51 | | | | 26.14 | | | | 321,486 | | | | 0.37 | | | | 0.43 | | | | 1.90 | | | | 4 | |
2008 | | | 19.07 | | | | 0.31 | # | | | (7.37 | ) | | | (0.22 | ) | | | (0.09 | ) | | | — | | | | 11.70 | | | | (37.37 | ) | | | 247,077 | | | | 0.37 | | | | 0.42 | | | | 1.95 | | | | 5 | |
2007 | | | 19.17 | | | | 0.32 | # | | | 0.64 | | | | (0.28 | ) | | | (0.78 | ) | | | — | | | | 19.07 | | | | 4.95 | | | | 429,423 | | | | 0.39 | | | | 0.42 | | | | 1.59 | | | | 5 | |
2006 | | | 16.97 | | | | 0.28 | # | | | 2.28 | | | | (0.25 | ) | | | (0.11 | ) | | | — | | | | 19.17 | | | | 15.19 | | | | 466,429 | | | | 0.40 | | | | 0.43 | | | | 1.57 | | | | 5 | |
| | | | | | | |
Real Estate Securities Fund | | | | | | | | | | | | | | | | | | | | | | | | | | | | | |
| | | | | | | | | | | |
GS4 Class | | | | | | | | | | | | | | | | | | | | | | | | | | | | | | | | | | | | | | | | | | | | | |
2010 | | $ | 6.74 | | | $ | 0.11 | # | | $ | 1.82 | | | $ | (0.15 | ) | | $ | — | | | $ | — | | | $ | 8.52 | | | | 28.80 | % | | $ | 141,900 | | | | 1.19 | % | | | 1.19 | % | | | 1.41 | % | | | 105 | % |
2009 | | | 5.25 | | | | 0.12 | # | | | 1.49 | | | | (0.12 | ) | | | — | | | | — | † | | | 6.74 | | | | 31.21 | | | | 121,533 | | | | 1.27 | | | | 1.28 | | | | 2.29 | | | | 128 | |
2008 | | | 9.04 | | | | 0.18 | # | | | (3.80 | ) | | | (0.16 | ) | | | — | | | | (0.01 | ) | | | 5.25 | | | | (40.35 | ) | | | 80,579 | | | | 1.26 | | | | 1.25 | | | | 2.21 | | | | 94 | |
2007 | | | 12.55 | | | | 0.11 | # | | | (2.12 | ) | | | (0.11 | ) | | | (1.39 | ) | | | — | | | | 9.04 | | | | (16.23 | ) | | | 96,775 | | | | 1.20 | | | | 1.22 | | | | 0.94 | | | | 119 | |
2006(3)(4) | | | 12.50 | | | | — | † | | | 0.05 | | | | — | | | | — | | | | — | | | | 12.55 | | | | 0.40 | | | | 107,035 | | | | 1.33 | | | | 1.88 | | | | (1.16 | ) | | | — | |
| | | | | | | | |
Value Equity Fund | | | | | | | | | | | | | | | | | | | | | | | | | | | | | | | | | |
| | | | | | | | | | | |
GS2 Class | | | | | | | | | | | | | | | | | | | | | | | | | | | | | | | | | | | | | | | | | | | | | |
2010 | | $ | 6.46 | | | $ | 0.10 | # | | $ | 0.78 | | | $ | (0.16 | ) | | $ | — | | | $ | — | | | $ | 7.18 | | | | 14.01 | % | | $ | 231,079 | | | | 0.67 | % | | | 0.68 | % | | | 1.52 | % | | | 36 | % |
2009 | | | 5.52 | | | | 0.11 | # | | | 1.02 | | | | (0.19 | ) | | | — | | | | — | | | | 6.46 | | | | 21.35 | | | | 181,123 | | | | 0.68 | | | | 0.69 | | | | 2.06 | | | | 32 | |
2008 | | | 9.10 | | | | 0.17 | # | | | (3.46 | ) | | | (0.22 | ) | | | (0.07 | ) | | | — | | | | 5.52 | | | | (36.81 | ) | | | 143,506 | | | | 0.66 | (5) | | | 0.67 | | | | 2.29 | | | | 52 | |
2007 | | | 10.62 | | | | 0.18 | # | | | (0.27 | ) | | | (0.28 | ) | | | (1.15 | ) | | | — | | | | 9.10 | | | | (1.18 | ) | | | 230,436 | | | | 0.69 | | | | 0.69 | | | | 1.70 | | | | 45 | |
2006 | | | 10.75 | | | | 0.18 | # | | | 1.78 | | | | (0.28 | ) | | | (1.81 | ) | | | — | | | | 10.62 | | | | 18.76 | | | | 181,940 | | | | 0.72 | (5) | | | 0.72 | | | | 1.70 | | | | 76 | |
GS4 Class | | | | | | | | | | | | | | | | | | | | | | | | | | | | | | | | | | | | | | | | | | | | | | | | | |
2010 | | $ | 12.54 | | | $ | 0.17 | # | | $ | 1.56 | | | $ | (0.15 | ) | | $ | — | | | $ | — | | | $ | 14.12 | | | | 13.96 | % | | $ | 958,211 | | | | 0.85 | %(5) | | | 0.87 | % | | | 1.35 | % | | | 36 | % |
2009 | | | 10.53 | | | | 0.20 | # | | | 1.98 | | | | (0.17 | ) | | | — | | | | — | | | | 12.54 | | | | 21.16 | | | | 1,001,814 | | | | 0.85 | (5) | | | 0.88 | | | | 1.89 | | | | 32 | |
2008 | | | 17.03 | | | | 0.30 | # | | | (6.54 | ) | | | (0.19 | ) | | | (0.07 | ) | | | — | | | | 10.53 | | | | (36.95 | ) | | | 844,459 | | | | 0.85 | (5) | | | 0.86 | | | | 2.09 | | | | 52 | |
2007 | | | 18.65 | | | | 0.29 | # | | | (0.52 | ) | | | (0.24 | ) | | | (1.15 | ) | | | — | | | | 17.03 | | | | (1.39 | ) | | | 1,407,534 | | | | 0.88 | | | | 0.88 | | | | 1.50 | | | | 45 | |
2006 | | | 17.50 | | | | 0.28 | # | | | 2.93 | | | | (0.25 | ) | | | (1.81 | ) | | | — | | | | 18.65 | | | | 18.64 | | | | 1,434,773 | | | | 0.90 | (5) | | | 0.91 | | | | 1.52 | | | | 76 | |
| † | Amount represents less than $0.005 per share. |
| # | Calculated using the average shares outstanding method. |
| (1) | The ratio excludes expenses waived/reimbursed net of amount recaptured. |
| (2) | The ratio includes expenses waived/reimbursed net of amount recaptured and fees paid indirectly, where applicable; if expenses waived/reimbursed net of amount recaptured and fees paid indirectly were excluded, the ratio would have been lower than the ratio shown. (3) Inception date was December 29, 2006. |
| (4) | Total return is not annualized. Ratios are annualized. |
| (5) | The ratio excludes the effect of expense offsets for fees paid indirectly; if expense offsets were included, the ratio would have been lower than the ratio shown. |
| | | | |
| 191 | | See Notes to Financial Statements. | | |
| | | | | | | | | | | | | | | | | | | | | | | | | | | | | | | | | | | | | | | | | | | | | | | | | | | | |
| | | | | | | | | | | | | | | | | | | | | | | | | | | | | | Ratios to Average Net Assets | | | | |
| | | Net Asset
Value,
Beginning
of Year | | | Net Investment
Income/ (Loss) | | | Realized
and
Unrealized
Gain
(Loss) on
Investments | | | Dividends
from Net
Investment
Income | | | Distributions
from Net
Realized
Capital
Gains | | | Excess
Distribution/
Return of
Capital | | | Net Asset
Value,
End of
Year | | | Total
Return | | | Net Assets,
End of Year
(000) | | | Expenses,
Net | | | Expenses,
Gross(1) | | | Investment
Income/
(Loss),
Net(2) | | | Portfolio
Turnover
Rate | |
Growth Equity Fund | | | | | | | | | | | | | | | | | | | | | | | | | |
| | | | | | | | | | |
GS2 Class | | | | | | | | | | | | | | | | | | | | | | | | | | | | | | | | | | | | | | | | | |
2010 | | $ | 10.00 | | | $ | — | † | | $ | 1.91 | | | $ | — | † | | $ | — | | | $ | — | | | $ | 11.91 | | | | 19.13 | % | | $ | 215,863 | | | | 0.88 | %(3) | | | 0.89 | % | | | 0.06 | % | | | 63 | % |
2009 | | | 7.26 | | | | 0.02 | | | | 2.74 | | | | (0.02 | ) | | | — | | | | — | | | | 10.00 | | | | 38.14 | | | | 196,026 | | | | 0.88 | (3) | | | 0.89 | | | | 0.22 | | | | 78 | |
2008 | | | 12.76 | | | | 0.03 | | | | (5.49 | ) | | | (0.04 | ) | | | — | | | | — | | | | 7.26 | | | | (42.84 | ) | | | 141,138 | | | | 0.87 | (3) | | | 0.87 | | | | 0.26 | | | | 99 | |
2007 | | | 11.23 | | | | 0.02 | | | | 1.55 | | | | (0.04 | ) | | | — | | | | — | | | | 12.76 | | | | 13.99 | | | | 242,557 | | | | 0.89 | | | | 0.88 | | | | 0.24 | | | | 51 | |
2006 | | | 11.18 | | | | — | † | | | 0.05 | | | | — | | | | — | | | | — | | | | 11.23 | | | | 0.45 | | | | 179,852 | | | | 0.89 | (3) | | | 0.90 | | | | 0.00 | | | | 48 | |
GS4 Class | | | | | | | | | | | | | | | | | | | | | | | | | | | | | | | | | | | | | | | | | |
2010 | | $ | 15.88 | | | $ | (0.01 | ) | | $ | 3.03 | | | $ | — | † | | $ | — | | | $ | — | | | $ | 18.90 | | | | 19.03 | % | | $ | 1,044,060 | | | | 0.97 | %(3) | | | 1.08 | % | | | (0.04 | )% | | | 63 | % |
2009 | | | 11.52 | | | | 0.01 | | | | 4.36 | | | | (0.01 | ) | | | — | | | | — | | | | 15.88 | | | | 37.99 | | | | 1,067,654 | | | | 0.97 | (3) | | | 1.09 | | | | 0.13 | | | | 78 | |
2008 | | | 20.22 | | | | 0.02 | | | | (8.70 | ) | | | (0.02 | ) | | | — | | | | — | | | | 11.52 | | | | (42.92 | ) | | | 817,315 | | | | 0.97 | (3) | | | 1.06 | | | | 0.16 | | | | 99 | |
2007 | | | 17.77 | | | | 0.02 | | | | 2.45 | | | | (0.02 | ) | | | — | | | | — | | | | 20.22 | | | | 13.90 | | | | 1,488,091 | | | | 1.00 | | | | 1.07 | | | | 0.13 | | | | 51 | |
2006 | | | 17.71 | | | | (0.02 | ) | | | 0.08 | | | | — | | | | — | | | | — | | | | 17.77 | | | | 0.34 | | | | 1,343,147 | | | | 1.01 | (3) | | | 1.09 | | | | (0.12 | ) | | | 48 | |
| | | | | | | | |
Small Cap Equity Fund | | | | | | | | | | | | | | | | | | | | | | | | | | | | | | | | | |
| | | | | | | | | | |
GS2 Class | | | | | | | | | | | | | | | | | | | | | | | | | | | | | | | | | | | | | | | | | |
2010 | | $ | 7.57 | | | $ | 0.03 | # | | $ | 2.06 | | | $ | (0.05 | ) | | $ | — | | | $ | — | | | $ | 9.61 | | | | 27.64 | % | | $ | 74,424 | | | | 1.00 | %(3) | | | 1.02 | % | | | 0.42 | % | | | 177 | % |
2009 | | | 5.94 | | | | 0.03 | # | | | 1.64 | | | | (0.04 | ) | | | — | | | | — | | | | 7.57 | | | | 28.12 | | | | 64,033 | | | | 1.04 | (3) | | | 1.05 | | | | 0.44 | | | | 130 | |
2008 | | | 9.60 | | | | 0.05 | # | | | (3.61 | ) | | | (0.08 | ) | | | — | | | | (0.02 | ) | | | 5.94 | | | | (37.05 | ) | | | 48,159 | | | | 1.03 | (3) | | | 1.04 | | | | 0.66 | | | | 147 | |
2007 | | | 11.33 | | | | 0.06 | # | | | 0.09 | | | | (0.07 | ) | | | (1.81 | ) | | | — | | | | 9.60 | | | | 1.05 | | | | 76,792 | | | | 1.05 | | | | 1.05 | | | | 0.48 | | | | 119 | |
2006 | | | 11.40 | | | | (0.01 | )# | | | 1.32 | | | | — | | | | (1.38 | ) | | | — | | | | 11.33 | | | | 11.40 | | | | 66,695 | | | | 1.06 | (3) | | | 1.06 | | | | (0.05 | ) | | | 86 | |
GS4 Class | | | | | | | | | | | | | | | | | | | | | | | | | | | | | | | | | | | | | | | | | |
2010 | | $ | 11.37 | | | $ | 0.03 | # | | $ | 3.09 | | | $ | (0.03 | ) | | $ | — | | | $ | — | | | $ | 14.46 | | | | 27.47 | % | | $ | 400,072 | | | | 1.15 | %(3) | | | 1.21 | % | | | 0.27 | % | | | 177 | % |
2009 | | | 8.91 | | | | 0.03 | # | | | 2.46 | | | | (0.03 | ) | | | — | | | | — | | | | 11.37 | | | | 27.93 | | | | 356,043 | | | | 1.15 | (3) | | | 1.25 | | | | 0.33 | | | | 130 | |
2008 | | | 14.31 | | | | 0.07 | # | | | (5.39 | ) | | | (0.06 | ) | | | — | | | | (0.02 | ) | | | 8.91 | | | | (37.19 | ) | | | 272,588 | | | | 1.15 | (3) | | | 1.24 | | | | 0.55 | | | | 147 | |
2007 | | | 16.00 | | | | 0.06 | # | | | 0.11 | | | | (0.05 | ) | | | (1.81 | ) | | | — | | | | 14.31 | | | | 0.87 | | | | 466,522 | | | | 1.18 | | | | 1.25 | | | | 0.34 | | | | 119 | |
2006 | | | 15.61 | | | | (0.03 | )# | | | 1.80 | | | | — | | | | (1.38 | ) | | | — | | | | 16.00 | | | | 11.27 | | | | 486,358 | | | | 1.21 | (3) | | | 1.25 | | | | (0.20 | ) | | | 86 | |
| † | Amount represents less than $0.005 per share. |
| # | Calculated using the average shares outstanding method. |
| (1) | The ratio excludes expenses waived/reimbursed net of amount recaptured. |
| (2) | The ratio includes expenses waived/reimbursed net of amount recaptured and fees paid indirectly, where applicable; if expenses waived/reimbursed net of amount recaptured and fees paid indirectly were excluded, the ratio would have been lower than the ratio shown. |
| (3) | The ratio excludes the effect of expense offsets for fees paid indirectly; if expense offsets were included, the ratio would have been lower than the ratio shown. |
| | | | |
| | See Notes to Financial Statements. | | 192 |
FINANCIAL HIGHLIGHTS (Continued)
| | | | | | | | | | | | | | | | | | | | | | | | | | | | | | | | | | | | | | | | | | | | | | | | | | | | |
| For a Share Outstanding For the Years Ended December 31, unless otherwise indicated | | | Ratios to Average Net Assets | | | | |
| | | Net
Asset
Value,
Beginning
of Period | | | Net
Investment
Income | | | Realized
and
Unrealized
Gain
(Loss) on
Investments | | | Dividends
from Net
Investment
Income | | | Distributions
from
Net
Realized
Capital
Gains | | | Return
of
Capital | | | Net
Asset
Value,
End
of
Period | | | Total
Return | | | Net
Assets,
End of
Period
(000) | | | Expenses,
Net | | | Expenses,
Gross(1) | | | Investment
Income/
(Loss),
Net(2) | | | Portfolio
Turnover
Rate | |
International Equity Fund | | | | | | | | | | | | | | | | | |
| | | | | | | | | | |
GS2 Class | | | | | | | | | | | | | | | | | | | | | | | | | | | | | | | | | | | | | | | | | |
2010 | | $ | 9.64 | | | $ | 0.17 | # | | $ | 0.83 | | | $ | (0.29 | ) | | $ | — | | | $ | — | | | $ | 10.35 | | | | 10.45 | % | | $ | 262,103 | | | | 0.94 | %(3) | | | 1.19 | % | | | 1.81 | % | | | 56 | % |
2009 | | | 7.32 | | | | 0.17 | # | | | 2.42 | | | | (0.27 | ) | | | — | † | | | — | | | | 9.64 | | | | 35.81 | | | | 240,483 | | | | 0.94 | (3) | | | 1.21 | | | | 2.12 | | | | 59 | |
2008 | | | 14.61 | | | | 0.34 | # | | | (6.89 | ) | | | (0.39 | ) | | | (0.35 | ) | | | — | | | | 7.32 | | | | (44.72 | ) | | | 193,281 | | | | 0.94 | (3) | | | 1.08 | | | | 2.92 | | | | 88 | |
2007 | | | 15.80 | | | | 0.26 | # | | | 1.79 | | | | (0.27 | ) | | | (2.97 | ) | | | — | | | | 14.61 | | | | 13.21 | | | | 279,652 | | | | 0.96 | | | | 1.07 | | | | 1.55 | | | | 66 | |
2006 | | | 14.71 | | | | 0.25 | | | | 3.23 | | | | (0.35 | ) | | | (2.04 | ) | | | — | | | | 15.80 | | | | 23.78 | | | | 199,989 | | | | 0.97 | (3) | | | 1.10 | | | | 1.60 | | | | 26 | |
| | | | | | | | | | | |
GS4 Class | | | | | | | | | | | | | | | | | | | | | | | | | | | | | | | | | | | | | | | | | | | | | |
2010 | | $ | 12.44 | | | $ | 0.21 | # | | $ | 1.05 | | | $ | (0.27 | ) | | $ | — | | | $ | — | | | $ | 13.43 | | | | 10.14 | % | | $ | 1,029,317 | | | | 1.12 | %(3) | | | 1.38 | % | | | 1.67 | % | | | 56 | % |
2009 | | | 9.38 | | | | 0.20 | # | | | 3.11 | | | | (0.25 | ) | | | — | † | | | — | | | | 12.44 | | | | 35.61 | | | | 1,101,628 | | | | 1.12 | (3) | | | 1.40 | | | | 1.98 | | | | 59 | |
2008 | | | 18.32 | | | | 0.40 | # | | | (8.63 | ) | | | (0.36 | ) | | | (0.35 | ) | | | — | | | | 9.38 | | | | (44.81 | ) | | | 873,618 | | | | 1.12 | (3) | | | 1.28 | | | | 2.46 | | | | 88 | |
2007 | | | 19.09 | | | | 0.28 | # | | | 2.16 | | | | (0.24 | ) | | | (2.97 | ) | | | — | | | | 18.32 | | | | 12.96 | | | | 1,400,548 | | | | 1.14 | | | | 1.27 | | | | 1.11 | | | | 66 | |
2006 | | | 17.37 | | | | 0.26 | | | | 3.82 | | | | (0.32 | ) | | | (2.04 | ) | | | — | | | | 19.09 | | | | 23.58 | | | | 1,254,839 | | | | 1.15 | (3) | | | 1.29 | | | | 1.10 | | | | 26 | |
| † | Amount represents less than $0.005 per share. |
| # | Calculated using the average shares outstanding method. |
| (1) | The ratio excludes expense offsets for fees paid indirectly; if expense offsets were included, the ratio would have been lower than the ratio shown. The ratio has been revised to include the effect of dividend expense on securities sold short which increased the ratio by 0.04% for the year 2009. The effect of dividend expense on securities sold short increased the ratio by 0.04% for the year 2010. |
| (2) | The ratio has been revised to include expenses waived/reimbursed net of amount recaptured and fees paid indirectly, where applicable; if expenses waived/reimbursed net of amount recaptured and fees paid indirectly were excluded, the ratio would have been lower than the ratio shown. |
| (3) | The ratio excludes expense offsets for fees paid indirectly; if expense offsets were included, the ratio would have been lower than the ratio shown. The ratio excludes the effect of dividend expense on securities sold short. |
| | | | |
| 193 | | See Notes to Financial Statements. | | |
NOTES TO FINANCIAL STATEMENTS
1. DESCRIPTION OF THE FUNDS
GuideStone Funds (the “Trust”) was organized as a Delaware statutory trust on March 2, 2000. The Trust has established twenty-five series (each, a “Fund” and together, the “Funds”). Each Fund is a diversified, open-end management investment company, registered under the Investment Company Act of 1940, as amended (the “1940 Act”). The MyDestination 2005, MyDestination 2015, MyDestination 2025, MyDestination 2035 and MyDestination 2045 Funds, each referred to as a “Date Target Fund” and together as the “Date Target Funds.” The Conservative Allocation Fund, Balanced Allocation Fund, Growth Allocation Fund, Aggressive Allocation Fund, Conservative Allocation Fund I, Balanced Allocation Fund I, Growth Allocation Fund I and Aggressive Allocation Fund I are each referred to as an “Asset Allocation Fund” and together as the “Asset Allocation Funds.” The remaining Funds are each referred to as a “Select Fund” and are together referred to as the “Select Funds.” The Low-Duration Bond Fund, Medium-Duration Bond Fund, Extended-Duration Bond Fund, Inflation Protected Bond Fund and Global Bond Fund are together referred to as the “Bond Funds.” The Equity Index Fund, Real Estate Securities Fund, Value Equity Fund, Growth Equity Fund, Small Cap Equity Fund and International Equity Fund are together referred to as the “Equity Funds.” The Money Market Fund is referred to as the “Money Market Fund.” The Inflation Protected Bond Fund commenced operations as a registered investment company on June 25, 2009.
There are two classes of shares issued by the Funds — the GS2 Class and the GS4 Class (each, a “Class” and together the “Classes”), except for the Date Target Funds, the Inflation Protected Bond Fund, the Global Bond Fund, and the Real Estate Securities Fund, which issued the GS4 Class only. The Conservative Allocation Fund I, Balanced Allocation Fund I, Growth Allocation Fund I and Aggressive Allocation Fund I issued the GS2 Class only. All Classes of shares have identical voting, dividend and liquidation rights. Income, expenses (other than class specific expenses) and realized and unrealized gains or losses on investments are allocated to each Class of shares based upon its relative net assets. The distribution fee (expense specific to the GS6 Class) ceased with the elimination of the GS6 Class.
Prior to May 1, 2009, GS6 Class shares of the Funds were also available. On April 30, 2009, shares of the GS6 Class of each Fund were exchanged at each Fund’s applicable net asset value (“NAV”) for equivalent shares of the GS4 Class of the same Fund, and the GS6 Class was terminated effective May 1, 2009.
Each Fund is a separate mutual fund with its own investment objective, strategies and risks. The Select Funds invest directly in particular types of fixed-income obligations, stocks and other investments. The Asset Allocation and Date Target Funds primarily invest in a different mix of the Select Funds to meet a specified investment strategy. The Asset Allocation and Date Target Funds are commonly referred to as “Fund of Funds”.
2. SIGNIFICANT ACCOUNTING POLICIES
The following significant accounting policies are in conformity with generally accepted accounting principles (“GAAP”) in the United States of America which require management to make estimates and assumptions that affect the reported amounts of assets, liabilities, disclosures of contingent assets and liabilities at the date of the financial statements and the reported amounts of income and expenses during the reporting period. Actual results could differ from those estimates and those differences could be significant.
a. Valuation of Securities
The Funds (except the Money Market Fund) each value securities traded on national securities exchanges or included in national market systems at the last quoted sale price, or official close price, on the principal exchange on which they were traded, or, in the absence of any sale or official close price, at the closing bid price. Securities which are primarily traded on foreign exchanges are generally valued at the closing values of such securities on their respective exchanges, except that when an occurrence
subsequent to the time when the foreign security is valued is likely to have changed such value, then the fair value of those securities will be determined through procedures established by or under the direction of the Board of Trustees of the Trust (the “Board of Trustees”). Non-exchange traded securities for which an over-the-counter quotation is readily available are valued at the last quoted bid price.
Debt securities, excluding asset-backed and mortgage-backed securities, are valued at the mean of the last bid and ask prices available. Asset-backed and mortgage-backed securities are valued at the last bid price. Certain debt securities may be valued on the basis of broker quotations, valuations provided by a pricing service which may use a matrix, formula or other objective method that takes into consideration market indices, matrices, yield curves and other specific adjustments or by a sub-adviser using various methodologies approved by the Board of Trustees.
Short-term securities maturing in more than 60 days from the valuation date are valued at the mean of the last bid and ask prices; those maturing in 60 days or less are generally valued at amortized cost which approximates current market value in accordance with Rule 2a-7 of the 1940 Act.
Forward foreign exchange contracts are valued based upon closing exchange rates from each respective foreign market.
Futures contracts are valued at the closing settlement price on the exchange on which they are primarily traded.
Options, Rights and warrants for which the primary market is a national securities exchange are valued at the last sale price on the exchange on which they are traded, or, in the absence of any sale, at the closing bid price. Options, Rights and warrants not traded on a national securities exchange are valued at the last quoted bid price.
Swap agreements are valued daily based upon the terms specific to each agreement with its counterparty.
To the extent available, valuations of portfolio securities are provided by independent pricing services approved by the Board of Trustees. Securities for which market quotations are not readily available are valued at fair value according to methods established in good faith by the Board of Trustees. Due to the potential excessive volatility at the time valuations are developed, pricing techniques may materially vary from the actual amounts realized upon sale of the securities.
For securities that principally trade on a foreign market or exchange, a significant gap in time can exist between the time of a particular security’s last trade and the time at which a Fund calculates its NAV. The closing prices of such securities may no longer reflect their market value at the time the Fund calculates its NAV if an event that could materially affect the value of those securities (a “Significant Event”) has occurred between the time of the security’s last close and the time that the Fund calculates its NAV. A Significant Event may relate to a single issuer or to an entire market sector. If a Fund becomes aware of a Significant Event that has occurred with respect to a security or group of securities after the closing of the exchange or market on which the security or securities principally trade, but before the time at which the Fund calculates its NAV, a Valuation Committee meeting may be called. The Trust uses Interactive Data Corporation (“IDC”) as a third party fair valuation vendor. IDC provides a fair value for foreign equity securities held by the Trust based on certain factors and methodologies applied by IDC in the event that there is movement in the U.S. market that exceeds a specific threshold established by the Valuation Committee in consultation with, and approved by, the Trustees. Such methodologies generally involve tracking valuation correlations between the U.S. market and each non-U.S. security. As part of the valuation procedures, a “confidence interval” is used, when the threshold is exceeded, to determine the level of correlation between the value of a foreign equity security and movements in the U.S. market before a particular security will be fair valued. In the event that the threshold established by the Valuation Committee is exceeded on a specific day, the Trust will typically value non-U.S. equity securities in its portfolio that exceed the applicable confidence interval based upon the fair values provided by IDC.
The Asset Allocation and Date Target Funds value their investments in the underlying Select Funds daily at the closing NAV of each respective Select Fund.
The Financial Accounting Standards Board’s (“FASB”) “Fair Value Measurements and Disclosures” defines fair value as the price that a fund would receive to sell an asset or pay to transfer a liability in an orderly transaction between market participants at the measurement date. It establishes and requires disclosure of a fair value hierarchy, separately for each major category of assets and liabilities, that segregates fair value measurements into levels (Levels 1, 2, and 3). Categorizations of fair value measurements, and the criteria used to determine each categorization, are as follows:
| | Level 1 – | quoted prices in active markets for identical securities which include: |
Equity securities, including restricted securities, for which market quotations are readily available, that are valued at the last reported sale price or official closing price as reported by an independent pricing service on the primary market or exchange on which they are traded; and
Investments in open-end mutual funds, including the GuideStone Funds and the Northern Institutional Liquid Assets Portfolio, which are valued at their closing net asset value each business day.
| | Level 2 – | prices determined using other significant observable inputs (including quoted prices for similar securities, interest rates, prepayment speeds, credit risk, etc.) which include: |
Equity securities for which there were no sales or closing prices for that day, that are valued at the last quoted bid price or
that may be valued using the last available price;
Foreign equity securities for which a Significant Event has occurred and a fair value price is provided by IDC;
Debt securities, including restricted securities that are valued based on evaluated quotations received from independent pricing services or from dealers who make markets in such securities. For corporate bonds, pricing services that utilize matrix pricing which considers yield or price of bonds of comparable quality, coupon, maturity and type as well as dealer supplied prices; and
Short-term securities with remaining maturities of sixty days or less for which quotations are not readily available and are valued at amortized cost.
| | Level 3 – | prices determined using significant unobservable inputs (including the Fund’s own assumptions in determining the fair value of investments) which include: |
Restricted equity securities and private placements where observable inputs are limited, assumptions about market activity and risk are used.
Valuation levels are not necessarily an indication of the risk associated with investing in those securities and changes in valuation techniques may result in transfers in or out of an assigned level within the disclosure hierarchy. For fair valuations using significant unobservable inputs, a reconciliation of the beginning to ending balances for reported market values that presents changes attributable to total realized and unrealized gains or losses, purchases and sales, and transfers in/out of the Level 3 category during the period is required. A fair value hierarchy and Level 3 reconciliation have been included in the Schedules of Investments.
b. Fixed Income Securities
The Bond Funds and the Small Cap Equity Fund may invest in mortgage-related and other asset-backed securities. These securities include mortgage pass-through securities, collateralized mortgage obligations, commercial mortgage-backed securities, stripped mortgage-backed securities, asset-backed securities, collateralized debt obligations and other securities that
directly or indirectly represent a participation in, or are secured by and payable from, mortgage loans on real property. Mortgage-related and other asset-backed securities are interests in pools of loans or other receivables. Mortgage-related securities are created from pools of residential or commercial mortgage loans, including mortgage loans made by savings and loan institutions, mortgage bankers, commercial banks and others. Asset-backed securities are created from many types of assets, including auto loans, credit card receivables, home equity loans, and student loans. These securities provide a monthly payment which consists of both interest and principal payments. Interest payments may be determined by fixed or adjustable rates. The rate of prepayments on underlying mortgages will affect the price and volatility of a mortgage-related security and may have the effect of shortening or extending the effective duration of the security relative to what was anticipated at the time of purchase. The timely payment of principal and interest of certain mortgage-related securities is guaranteed with the full faith and credit of the United States Government. Pools created and guaranteed by non-governmental issuers, including government-sponsored corporations, may be supported by various forms of insurance or guarantees, but there can be no assurance that the private insurers or guarantors can meet their obligations under the insurance policies or guarantee arrangements.
Collateralized Mortgage Obligations (“CMOs”) are debt obligations of a legal entity that are collateralized by mortgages and divided into classes. CMOs are structured into multiple classes, often referred to as “tranches,” with each class bearing a different stated maturity and entitled to a different schedule for payments of principal and interest, including pre-payments. Commercial Mortgage-Backed Securities (“CMBS”) include securities that reflect an interest in, and are secured by, mortgage loans on commercial real property. Many of the risks of investing in CMBS reflect the risks of investing in the real estate securing the underlying mortgage loans. These risks reflect the effects of local and other economic conditions on real estate markets, the ability of tenants to make loan payments, and the ability of a property to attract and retain tenants. CMOs and CMBS may be less liquid and may exhibit greater price volatility than other types of mortgage- or asset-backed securities. Stripped Mortgage-Backed Securities (“SMBS”) are derivative multi-class mortgage securities. SMBS are usually structured with two classes that receive different proportions of the interest and principal distributions on a pool of mortgage assets. A common type of SMBS will have one class receiving some of the interest and most of the principal from the mortgage assets, while the other class will receive most of the interest and the remainder of the principal. In the most extreme case, one class will receive all of the interest (the interest-only or “IO” class), while the other class will receive the entire principal (the principal-only or “PO” class). Payments received for IOs are included in interest income on the Statements of Operations. Because little to no principal will be received at the maturity of an IO, adjustments are made to the book value of the security on a monthly basis until maturity. These adjustments are included in interest income on the Statements of Operations. Payments received for POs are treated as reductions to the cost and par value of the securities.
Inflation-indexed bonds are fixed-income securities whose principal value is periodically adjusted to the rate of inflation. The interest rate on these bonds is generally fixed at issuance at a rate lower than typical bonds. Over the life of an inflation-indexed bond, however, interest will be paid based on a principal value, which is adjusted for inflation. Any increase or decrease in the principal amount of an inflation-indexed bond will be included as interest income on the Statements of Operations, even though investors do not receive their principal until maturity.
“TBA” (to be announced) purchase commitments are commitments to purchase securities for a fixed price at a future date, typically not exceeding 45 days. TBAs may be considered securities in themselves and involve a risk of loss if the value of the security to be purchased declines prior to settlement date. This risk is in addition to the risk of decline in each Fund’s other assets. Unsettled TBAs are valued at the current market value of the underlying securities, according to the procedures described in the section entitled “Valuation of Securities”.
During the year ended December 31, 2010, the Low-Duration Bond Fund and Medium-Duration Bond Fund entered into dollar roll transactions, pursuant to which they sell a mortgage-backed TBA or security and simultaneously purchase a similar, but not
identical, TBA with the same issuer, rate and terms. The Funds may execute a “roll” to obtain better underlying mortgage securities or to increase yield. The Funds account for dollar roll transactions as purchases and sales, which has the effect of increasing their portfolio turnover rates. Risks associated with dollar rolls are that actual mortgages received by the Funds may be less favorable than those anticipated or that counterparties may fail to perform under the terms of the contracts.
TBA sale commitments are commitments to sell mortgage-backed securities for a fixed price at a future date. TBA sales commitments are considered securities in themselves and involve a risk of loss if the value of the security to be purchased or sold declines or increases prior to settlement date, which is in addition to the risk of decline in the value of the Fund’s other assets. U.S. Government securities are obligations of and, in certain cases, guaranteed by, the U.S. Government, its agencies or instrumentalities. The U.S. Government does not guarantee the NAV of the Funds’ shares. Some U.S. Government securities, such as Treasury bills, notes and bonds, and securities guaranteed by the Government National Mortgage Association (“GNMA” or “Ginnie Mae”), are supported by the full faith and credit of the United States Government; others, such as those of the Federal Home Loan Bank, are supported by the right of the issuer to borrow from the U.S. Department of the Treasury (the “U.S. Treasury”); others, such as those of the Federal National Mortgage Association (“FNMA” or “Fannie Mae”), are supported by the discretionary authority of the U.S. Government to purchase the agency’s obligations; and still others, such as those of the Student Loan Marketing Association, are supported only by the credit of the instrumentality. U.S. Government securities may include zero coupon securities, which do not distribute interest on a current basis and tend to be subject to greater risk than interest-paying securities of similar maturities.
Government-related guarantors (i.e., not backed by the full faith and credit of the United States Government) include FNMA and the Federal Home Loan Mortgage Corporation (“FHLMC” or “Freddie Mac”). FNMA is a government-sponsored corporation, the common stock of which is owned entirely by private stockholders. FNMA purchases conventional (i.e., not insured or guaranteed by any government agency) residential mortgages from a list of approved seller/servicers which include state and federally chartered savings and loan associations, mutual savings banks, commercial banks and credit unions and mortgage bankers. Pass-through securities issued by FNMA are guaranteed as to timely payment of principal and interest by FNMA, but are not backed by the full faith and credit of the United States Government. FHLMC issues Participation Certificates (“PCs”), which are pass-through securities, each representing an undivided interest in a pool of residential mortgages. FHLMC guarantees the timely payment of interest and ultimate collection of principal, but PCs are not backed by the full faith and credit of the United States Government.
On September 6, 2008, the Federal Housing Finance Agency (“FHFA”) placed FNMA and FHMLC into conservatorship. As the conservator, FHFA succeeded to all rights, titles, powers and privileges of FNMA and FHLMC and of any stockholder, officer or director of FNMA and FHLMC with respect to FNMA and FHLMC and the assets of FNMA and FHLMC. FHFA selected a new chief executive officer and chairman of the board of directors for each of FNMA and FHLMC. On September 7, 2008, the U.S. Treasury announced three additional steps taken by it in connection with the conservatorship. First, the U.S. Treasury entered into a Senior Preferred Stock Purchase Agreement with each of FNMA and FHLMC pursuant to which the U.S. Treasury would purchase up to an aggregate of $100 billion of each of FNMA and FHLMC to maintain a positive net worth in each enterprise. This agreement contained various covenants that limit each enterprise’s operations. In exchange for entering into these agreements, the U.S. Treasury received $1 billion of each enterprise’s senior preferred stock and warrants to purchase 79.9% of each enterprise’s common stock. Second, the U.S. Treasury announced the creation of a new secured lending facility which is available to each of FNMA and FHLMC as a liquidity backstop. Third, the U.S. Treasury announced the creation of a temporary program to purchase mortgage-backed securities issued by each of FNMA and FHLMC. Both the liquidity backstop and the mortgage-backed securities purchase program expired in December 2009. FNMA and FHLMC are continuing to operate as going concerns while in conservatorship and each remain liable for all of its obligations, including its guaranty
obligations, associated with its mortgage-backed securities. The liquidity backstop and the Senior Preferred Stock Purchase Agreements are both intended to enhance each of FNMA’s and FHLMC’s ability to meet its obligations. On December 24, 2009, the U.S. Treasury amended the Senior Preferred Stock Purchase Agreements to allow the cap on its funding commitment to increase as necessary to accommodate any cumulative reduction in the net worth of FNMA and FHMLC over the next three years.
c. Foreign Currency Translations
Investment securities and other assets and liabilities denominated in foreign currencies are translated into U.S. dollar amounts at the date of valuation. Purchases and sales of investment securities and income and expense items denominated in foreign currencies are translated into U.S. dollar amounts on the respective dates of such transactions.
The Funds isolate that portion of the results of operations resulting from changes in foreign exchange rates on investments from
the fluctuations arising from changes in market prices of securities held.
Reported net realized foreign exchange gains or losses arise from sales of portfolio securities, sales and maturities of short-term securities, sales of foreign currencies, currency gains or losses realized between the trade and settlement dates on securities transactions, and the difference between the amounts of dividends, interest, and foreign withholding taxes recorded on the Fund’s books and the U.S. dollar equivalent of the amounts actually received or paid. Net unrealized foreign exchange gains and losses arise from changes in the values of assets and liabilities, including investments in securities at fiscal period end, resulting from changes in the exchange rate.
d. Loan Participations
The Bond Funds and the Small Cap Equity Fund may invest in direct debt instruments which are interests in amounts owed to lenders or lending syndicates by corporate borrowers. A Fund’s investments in loans may be in the form of participations in loans. A loan is often administered by a bank or other financial institution (the “lender”) that acts as agent for all holders. The agent administers the terms of the loan, as specified in the loan agreement. A Fund may invest in multiple series or tranches of a loan, which may have varying terms and carry different associated risks. A Fund generally has no right to enforce compliance with the terms of the loan agreement with the borrower. As a result, a Fund may be subject to the credit risk of both the borrower and the lender that is selling the loan agreement. When investing in a loan participation, a Fund has the right to receive payments of principal, interest and any fees to which it is entitled only from the lender selling the loan agreement and only upon receipt of payments by the lender from the borrower. A Fund may receive a commitment fee based on the undrawn portion of the underlying line of credit portion of a floating rate loan. In certain circumstances, a Fund may receive a prepayment penalty fee upon the prepayment of a floating rate loan by a borrower. Fees earned or paid are recorded as a component of interest income or interest expense on the Statements of Operations.
The Medium-Duration Bond Fund invests in loan participations with credit quality comparable to that of issuers of its securities investments. Indebtedness of companies whose creditworthiness is poor involves substantially greater risks and may be highly speculative.
e. PIPEs
The Small Cap Equity Fund invests in Private Investment in Public Equity (“PIPE”) securities. PIPES involve the purchase of securities directly from a publicly traded company by a Fund. PIPES are restricted securities and cannot be immediately resold into the public markets. These investments are valued at fair value as determined in accordance with the procedures approved by the Board of Trustees. Risks include the potential decline in the value of the publicly traded company, the potential dilution of shareholder equity and the inability of the Fund to liquidate the position quickly.
f. REITs
The Real Estate Securities Fund invests substantial assets in real estate investment trusts (“REITs”) that involve risks not associated with investing in stocks. Risks include declines in the value of real estate, general and economic conditions, changes in the value of the underlying property and defaults by borrowers. The value of assets in the real estate industry may go through cycles of relative underperformance and outperformance in comparison to equity securities markets in general.
Dividend income is recorded using management’s estimate of the income included in distributions received from REIT investments. The actual amounts of income, return of capital and capital gains are only determined by each REIT after its fiscal year-end and may differ from the estimated amount. Estimates of income are adjusted in the Funds to the actual amounts when the amounts are determined.
g. Repurchase Agreements
Each Fund may agree to purchase securities from financial institutions subject to the seller’s agreement to repurchase them at a mutually agreed upon date and price. It is the Fund’s policy that repurchase agreements are fully collateralized by U.S. Treasury and Government Agency securities. All collateral is held by the Fund’s custodian bank or a bank with which the custodian bank has entered into a subcustodian agreement, or is segregated in the Federal Reserve Book Entry System. In connection with transactions in repurchase agreements, if the seller defaults and the value of the collateral declines, or if the seller enters an insolvency proceeding, realization of the collateral by the Fund may be delayed or limited.
h. Short Sales
A short sale is a transaction in which a Fund sells a security it does not own. The Fund’s obligation to replace the security borrowed and sold short will be fully collateralized at all times by cash equivalents deposited in an account with the Fund’s custodian. If the price of the security sold short increases between the time of the short sale and the time the Fund replaces the borrowed security, the Fund will realize a loss; and if the price declines during the period, the Fund will realize a gain. Any realized gain will be decreased, and any realized loss increased, by the amount of transaction costs.
The Equity Funds may sell short exchange-listed equity futures contracts to reduce market exposure. The Date Target Funds, Asset Allocation Funds, Bond Funds and Small Cap Equity Fund may sell short U.S. Treasury securities and exchange-listed U.S. Treasury futures contracts to reduce market exposure. The Low-Duration Bond and Medium-Duration Bond Funds will occasionally enter into a short sale to initiate a dollar roll transaction. The International Equity Fund may establish short positions in stocks of foreign companies with a market value of up to 5% of the Fund’s assets.
At December 31, 2010, the value of securities sold short in the International Equity Fund amounted to $21,761,982.
i. Derivative Financial Instruments
The Funds may engage in various portfolio strategies to seek to increase its return by hedging its portfolio against adverse movements in the equity, debt and currency markets. Losses may arise due to changes in the value of the contract if the counterparty does not perform under the contract. The Funds, in their normal course of business, may enter into contracts that contain a variety of representations and warranties and which provide general indemnifications. The Funds’ exposure may include future claims that may be made against the Funds that have not yet occurred.
Financial Futures Contracts — The Funds (except the Money Market Fund) may purchase or sell financial futures contracts and the options on such futures contracts for the purpose of hedging risk on existing securities, demonstrating purchase of securities or gaining market exposure on cash balances. Financial futures contracts are contracts for the delivery of securities at a specified future date at an agreed upon price or yield. Upon entering into a contract, the Funds deposit and maintain as collateral such initial margin as required by the exchange on which the transaction is effected.
Pursuant to the contract, the Funds agree to pay to or receive from the broker an amount of cash equal to the daily fluctuation in the value of the contract. Such payments or receipts are known as variation margin and are recorded by the Funds as unrealized gains or losses until the contract is closed or settled.
Risks of entering into futures contracts include the possibility that there will be an imperfect price correlation between the futures and the underlying securities. Second, it is possible that a lack of liquidity for futures contracts could exist in the secondary market, resulting in an inability to close a futures position prior to its maturity date. Third, the purchase of a futures contract involves the risk that a Fund could lose more than the original margin deposit required to initiate a futures transaction. Futures contracts involve, to varying degrees, risk of loss in excess of the variation margin disclosed on the Statements of Assets and Liabilities.
Foreign Currency Options and Futures — The International Equity Fund, Small Cap Equity Fund and the Bond Funds may also enter into futures contracts on foreign currencies and related options on transactions as a short or long hedge against possible variations in foreign exchange rates.
Forward Foreign Exchange Contracts — Certain Funds may enter into forward foreign currency exchange contracts to hedge against adverse exchange rate fluctuation to the U.S. dollar or between different foreign currencies in connection with either specific security transactions or portfolio positions. Each contract is valued daily and the change in value is recorded as an unrealized gain or loss. When the contract is closed, a realized gain or loss is recorded equal to the difference between the opening value and the closing value of the contract. These contracts may involve market risk in excess of the unrealized gain or loss reflected on the Statements of Assets and Liabilities. The Funds could be exposed to risk if the counterparties to the contracts are unable to meet the terms of the contract and from unanticipated movements in the value of a foreign currency relative to the U.S. dollar.
Options — Certain Funds are authorized to write and purchase put and call options. The risk in writing a call option is that the Funds give up the opportunity for profit if the market price of the security increases. The risk in writing a put option is that the Funds may incur a loss if the market price of the security decreases and the option is exercised. The risk in purchasing an option is that the Funds pay a premium whether or not the option is exercised. The Funds also have the additional risk of being unable to enter into a closing transaction at an acceptable price if a liquid secondary market does not exist. The Funds also may write over-the-counter options where completing the obligation depends upon the credit standing of the other party and that party’s ability to perform. Option contracts also involve the risk that they may not work as intended due to unanticipated developments in market conditions or other causes.
Options purchased are recorded as an asset, and written options are recorded as liabilities to the extent of premiums paid or received. Each Fund will realize a gain or loss when the option transaction expires or closes. When an option is exercised, the proceeds on sales for a written call option, the purchase cost for a written put option or the cost of a security for a purchased put or call option is adjusted by the amount of the premium received or paid.
When a Fund writes a call or put option, an amount equal to the premium received is recorded as a liability and subsequently marked to market to reflect the current value of the option written. These liabilities are reflected as written options outstanding on the Statements of Assets and Liabilities.
Certain Funds may write swaption contracts to manage exposure to fluctuations in interest rates and to enhance portfolio yield. Swaption contracts written by the Funds represent an option that gives the purchaser the right, but not the obligation, to enter into a previously agreed upon swap contract on a future date. If a written call swaption is exercised, the writer will enter a swap and is obligated to pay the fixed-rate and receive a floating rate in exchange. If a written put swaption is exercised, the writer will enter a swap and is obligated to pay the floating rate and receive a fixed rate in exchange.
Swaptions are marked-to-market daily based upon quotations from market makers. When a Fund writes a swaption, the premium received is recorded as a liability and is subsequently adjusted to the current market value of the swaption. Entering into a swaption contract involves, to varying degrees, the elements of credit, market and interest rate risk in excess of the associated option and swap contract amounts reported in the Statement of Assets and Liabilities. The Funds bear the market risk arising from any change in index values or interest rates.
Swap Agreements — Each Select Fund, except the Money Market Fund, may enter into swap agreements. The Equity Funds may enter into equity swap contracts and the Bond Funds and the Small Cap Equity Fund may enter into interest rate and credit default swaps. The Bond Funds and International Equity Fund may enter into cross-currency swaps, and each Select Fund may enter into total return swaps.
Swap agreements are privately negotiated agreements between a Fund and a counterparty to exchange or swap investment cash flows, assets, foreign currencies or market-linked returns at specified, future intervals. A swap may be entered into in order to, among other things, change the maturity of a Fund’s portfolio, to protect a Fund’s value from changes in interest rates, to expose a Fund to a different security or market, or to help a Fund achieve a strategy relative to an index or other benchmark. By entering into a swap agreement, a Fund is exposed to the risk of unanticipated movements in interest rates or in the value of an underlying security or index (or the risk that the counterparty will not fulfill its obligation under the agreement). Credit default swaps involve the payment of amounts based on a specified rate multiplied by a notional amount as well as upon an event of default. In connection with these agreements, securities are set aside as collateral by the Fund’s custodian.
Swaps are marked-to-market daily based upon values from third party vendors or quotations from market makers to the extent available and the change in value, if any, is recorded as an unrealized gain or loss on the Statements of Assets and Liabilities. In the event that market quotations are not readily available or deemed reliable, certain swap agreements may be valued pursuant to guidelines established by the Board of Trustees. In the event that market quotes are not readily available and the swap cannot be valued pursuant to one of the valuation methods, the value of the swap will be determined in good faith by the Valuation Committee of the Board of Trustees, generally based upon recommendations provided by the Fund’s sub-adviser.
Payments received or made at the beginning of the measurement period are reflected as such on the Statements of Assets and Liabilities and represent payments made or received upon entering into the swap agreement to compensate for differences between the stated terms of the swap agreement and prevailing market conditions (credit spreads, currency exchange rates, interest rates, and other relevant factors). These upfront payments are recorded as realized gains or losses on the Statements of Operations upon termination or maturity of the swap. A liquidation payment received or made at the termination of the swap is recorded as realized gain or loss on the Statements of Operations. Net periodic payments received or paid by a Fund are included as part of realized gains or losses on the Statements of Operations.
Certain of the Fund’s derivative agreements contain provisions that require the Fund to maintain a predetermined level of net assets, and/or provide limits regarding the decline of the Fund’s NAV over one-month, three-month and 12-month periods. If the Fund were to violate such provisions, the counterparties to the derivative instruments could request immediate payment or demand immediate collateralization on derivative instruments in net liability positions. For the year ended December 31, 2010, the Fund did maintain the required level of net assets and/or the NAV of the Fund did not decline below the limits set forth in the derivative agreements.
Entering into these agreements involves, to varying degrees, elements of credit, market and documentation risk in excess of the amounts recognized on the Statements of Assets and Liabilities. Such risks involve the possibility that there will be
no liquid market for these agreements, that the counterparty to the agreements may default on its obligation to perform or disagree as to the meaning of contractual terms in the agreements and that there may be unfavorable changes in interest rates.
Credit Default Swaps — Credit default swap agreements involve one party making a stream of payments (referred to as the buyer of protection) to another party (the seller of protection) in exchange for the right to receive a specified return in the event of a default or other credit event for the referenced entity, obligation or index. As a seller of protection on credit default swap agreements, a Fund will generally receive from the buyer of protection a fixed rate of income throughout the term of the swap provided that there is no credit event. As the seller, a Fund would effectively add leverage to its portfolio because, in addition to its total net assets, a Fund would be subject to investment exposure on the notional amount of the swap.
Any upfront payments made or received upon entering a credit default swap contract are treated as part of the cost and are reflected as part of the unrealized gain (loss) on valuation. Upon termination of the swap contract, the amount included in the cost is reversed and becomes part of the swap’s realized gain (loss).
The sub-advisers monitor a variety of factors including cash flow assumptions, market activity, market sentiment and valuation as part of its ongoing process of assessing payment and performance risk. As payment and performance risk increases, the value of a credit default swap increases, resulting in recognition of unrealized gains for long positions and unrealized losses for short positions. Conversely, as payment and performance risk decreases, unrealized gains are recognized for short positions and unrealized losses are recognized for long positions. Any current or future declines in the fair value of the swap may be partially offset by upfront payments received by the Fund as a seller of protection if applicable. The change in value is recorded within unrealized appreciation (depreciation) until the occurrence of a credit event or the termination of the swap, at which time a realized gain (loss) is recorded.
If a Fund is a seller of protection and a credit event occurs, as defined under the terms of that particular swap agreement, a Fund will either (i) pay to the buyer of protection an amount equal to the notional amount of the swap and take delivery of the referenced obligation, other deliverable obligations or underlying securities comprising the referenced index or (ii) pay a net settlement amount in the form of cash or securities equal to the notional amount of the swap less the recovery value of the referenced obligation or underlying securities comprising the referenced index. If a Fund is a buyer of protection and a credit event occurs, as defined under the terms of that particular swap agreement, a Fund will either (i) receive from the seller of protection an amount equal to the notional amount of the swap and deliver the referenced obligation, other deliverable obligations or underlying securities comprising the referenced index or (ii) receive a net settlement amount in the form of cash or securities equal to the notional amount of the swap less the recovery value of the referenced obligation or underlying securities comprising the referenced index. Recovery values are assumed by market makers considering either industry standard recovery rates or entity specific factors and considerations until a credit event occurs. If a credit event has occurred, the recovery value is determined by a facilitated auction whereby a minimum number of allowable broker bids, together with a specified valuation method, are used to calculate the settlement value.
Credit default swap agreements on corporate issues or sovereign issues of an emerging country involve one party making a stream of payments to another party in exchange for the right to receive a specified return in the event of a default or other credit event. If a credit event occurs and cash settlement is not elected, a variety of other deliverable obligations may be delivered in lieu of the specific referenced obligation. The ability to deliver other obligations may result in a cheapest-to-deliver option (the buyer of protection’s right to choose the deliverable obligation with the lowest value following a credit event). A Fund may use credit default swaps on corporate issues or sovereign issues of an emerging country to provide a
measure of protection against defaults of the issuers (i.e., to reduce risk where a Fund owns or has exposure to the referenced obligation) or to take an active long or short position with respect to the likelihood of a particular issuer’s default.
Credit default swap agreements on asset-backed securities involve one party making a stream of payments to another party in exchange for the right to receive a specified return in the event of a default or other credit event. Unlike credit default swaps on corporate issues or sovereign issues of an emerging country, deliverable obligations in most instances would be limited to the specific referenced obligation as performance for asset-backed securities can vary across deals. Prepayments, principal paydowns, and other write down or loss events on the underlying mortgage loans will reduce the outstanding principal balance of the referenced obligation. These reductions may be temporary or permanent as defined under the terms of the swap agreement and the notional amount for the swap agreement will be adjusted by corresponding amounts. A Fund may use credit default swaps on asset-backed securities to provide a measure of protection against defaults of the referenced obligation or to take an active long or short position with respect to the likelihood of a particular referenced obligation’s default.
Credit default swap agreements on credit indices involve one party making a stream of payments to another party in exchange for the right to receive a specified return in the event of a write-down, principal shortfall, interest shortfall or default of all or part of the referenced entities comprising the credit index. A credit index is a list of a basket of credit instruments or exposures designed to be representative of some part of the credit market as a whole. These indices are made up of reference credits that are judged by a poll of dealers to be the most liquid entities in the credit default swap market based on the sector of the index. Components of the indices may include, but are not limited to, investment grade securities, high yield securities, asset-backed securities, emerging markets, and/or various credit ratings within each sector. Credit indices are traded using credit default swaps with standardized terms including a fixed spread and standard maturity dates. An index credit default swap references all the names in the index, and if there is a default, the credit event is settled based on that name’s weight in the index. The composition of the indices changes periodically, usually every six months, and for most indices, each name has an equal weight in the index. A Fund may use credit default swaps on credit indices to hedge a portfolio of credit default swaps or bonds with a credit default swap on indices which is less expensive than it would be to buy many credit default swaps to achieve a similar effect. Credit-default swaps on indices are benchmarks for protecting investors owning bonds against default, and traders use them to speculate on changes in credit quality.
Implied credit spreads, represented in absolute terms, utilized in determining the market value of credit default swap agreements on corporate issues or sovereign issues of an emerging country as of period end are disclosed in the footnotes to the Schedules of Investments and serve as an indicator of the current status of the payment/performance risk and represent the likelihood or risk of default for the credit derivative. The implied credit spread of a particular referenced entity reflects the cost of buying/selling protection and may include upfront payments required to be made to enter into the agreement. For credit default swap agreements on asset-backed securities and credit indices, the quoted market prices and resulting values serve as the indicator of the current status of the payment/performance risk. Wider credit spreads and increasing market values, in absolute terms when compared to the notional amount of the swap, represent a deterioration of the referenced entity’s credit soundness and a greater likelihood or risk of default or other credit event occurring as defined under the terms of the agreement.
The maximum potential amount of future payments (undiscounted) that a Fund as a seller of protection could be required to make under a credit default swap agreement would be an amount equal to the notional amount of the agreement. These potential amounts would be partially offset by any recovery values of the respective referenced obligations, upfront
payments received upon entering into the agreement, or net amounts received from the settlement of buy protection credit
default swap agreements entered into by a Fund for the same referenced entity or entities.
Credit default swaps involve greater risks than if the Funds had invested in the referenced obligation directly. In addition to general market risks, credit default swaps are subject to liquidity risk and counterparty credit risk. The Funds enter into credit default swaps with counterparties meeting defined criteria for financial strength. A buyer also may lose its investment and recover nothing should a credit event not occur. If a credit event did occur, the value of the referenced obligation received by the seller, coupled with the periodic payments previously received, may be less than the full notional value it pays to the buyer, resulting in a loss of value.
Cross-Currency Swap Agreements — Cross-currency swap agreements involve two parties exchanging two different currencies with an agreement to reverse the exchange at a later date at specified exchange rates. The exchange of currencies at the inception date of the contract takes place at the current spot rate. The re-exchange at maturity may take place at the same exchange rate, a specified rate, or the then current spot rate. Interest payments, if applicable, are made between the parties based on interest rates available in the two currencies at the inception of the contract. The terms of cross-currency swap contracts may extend for many years. Cross-currency swaps are usually negotiated with commercial and investment banks. Some cross-currency swaps may not provide for exchanging principal cash flows but only for exchanging interest cash flows.
Interest Rate Swap Agreements — Interest rate swap agreements involve the exchange by a Fund with another party of their respective commitments to pay or receive interest with respect to the notional amount of principal. Certain forms of interest rate swap agreements may include: (i) interest rate caps, under which, in return for a premium, one party agrees to make payments to the other to the extent that interest rates exceed a specified rate, or “cap”, (ii) interest rate floors, under which, in return for a premium, one party agrees to make payments to the other to the extent that interest rates fall below a specified rate, or “floor”, (iii) interest rate collars, under which a party sells a cap and purchases a floor or vice versa in an attempt to protect itself against interest rate movements exceeding given minimum or maximum levels, (iv) callable interest rate swaps, under which the counterparty may terminate the swap transaction in whole at zero cost by a predetermined date and time prior to the maturity date, (v) spread locks, which allow the interest rate swap users to lock in the forward differential (or spread) between the interest rate swap rate and a specified benchmark, or (vi) basis swap, under which two parties can exchange variable interest rates based on different money markets.
Total Return Swap Agreements — Total return swap agreements on commodities involve commitments where exchanged cash flows based on the price of a commodity and in return receives either fixed or determined by floating price or rate. One party would receive payments based on the market value of the commodity involved and pay a fixed amount. Total return swap agreements on indices involve commitments to pay interest in exchange for a market-linked return. One counterparty pays out the total return of a specific reference asset, which may be an equity, index, or bond, and in return receives a regular stream of payments. To the extent the total return of the security or index underlying the transaction exceeds or falls short of the offsetting interest rate obligation, a Fund will receive a payment from or make a payment to the counterparty.
FASB “Derivatives and Hedging” includes required disclosure for (i) the nature and terms of the derivative, reasons for entering into the derivative, the events or circumstances that would require the seller to perform under the derivative, and the current status of the payment/performance risk of the derivative, (ii) the maximum potential amount of future payments (undiscounted) the seller could be required to make under the derivative, (iii) the fair value of the derivative, and (iv) the nature of any recourse provisions and assets held either as collateral or by third parties. FASB “Guarantees” require additional disclosures about the current status of the payment/performance risk of a guarantee. All of this information has
been incorporated for the current period as part of the Schedules of Investments within the Swap agreements outstanding
disclosure and in the Notes to Financial Statements.
As of December 31, 2010, the Low-Duration Bond Fund and the Medium-Duration Bond Fund are the buyers (“receiving protection”) on a total notional amount of $42,353,488 and $25,020,000, respectively, and Medium-Duration Bond Fund is the seller (“providing protection”) on a total notional amount of $9,100,000. The notional amounts of the swaps are not recorded in the financial statements; however, the notional amount does approximate the maximum potential amount of future payments that the Funds could be required to make if the Funds were the seller of protection and a credit event were to occur. Those credit default swaps for which the Funds are providing protection at balance sheet date are summarized as follows:
| | | | | | | | | | | | | | | | | | | | |
| | | Single Name
Credit Default Swaps | | | Credit Default
Swap Index | | | | |
| Reference Asset | | Corporate
Debt | | | Sovereign
Debt | | | Asset-Backed
Securities | | | Corporate
Debt | | | Total | |
Medium-Duration Bond Fund | | | | | | | | | | | | | | | | | | | | |
Fair value of written credit derivatives | | $ | 199,766 | | | $ | (8,958 | ) | | $ | 170,596 | | | $ | — | | | $ | 361,404 | |
Maximum potential amount of future payments | | | 4,100,000 | | | | 1,000,000 | | | | 4,000,000 | | | | — | | | | 9,100,000 | |
Recourse provisions with third parties to recover any amounts paid under the credit derivative (including any purchased credit protection) | | | — | | | | — | | | | — | | | | — | | | | — | |
Collateral held by the Funds or other third parties which the Funds can obtain upon occurrence of triggering event | | | — | | | | — | | | | — | | | | — | | | | — | |
The credit spread disclosed below for each referenced obligation where the Funds are the seller of protection is a representation
of the current payment/performance risk of the swap.
| | | | | | | | | | | | | | | | | | | | | | | | |
| | | Maximum Potential Amount of Futures Payments by Contract Term | | | | |
Current credit spread on underlying (in basis points) | | 0-6
Months | | | 6-12
Months | | | 1-5
Years | | | 5-10
Years | | | More
Than
10 Years | | | Total | |
Medium-Duration Bond Fund | | | | | | | | | | | | | | | | | | | | | | | | |
0 - 100 | | $ | — | | | $ | — | | | $ | — | | | $ | — | | | $ | — | | | $ | — | |
101 - 250 | | | — | | | | — | | | | 4,000,000 | | | | 4,100,000 | | | | — | | | | 8,100,000 | |
251 - 500 | | | — | | | | — | | | | — | | | | 1,000,000 | | | | — | | | | 1,000,000 | |
501 - 1,000 | | | — | | | | — | | | | — | | | | — | | | | — | | | | — | |
Greater than 1,000 | | | — | | | | — | | | | — | | | | — | | | | — | | | | — | |
| | | | | | | | | | | | | | | | | | | | | | | | |
Total | | $ | — | | | $ | — | | | $ | 4,000,000 | | | $ | 5,100,000 | | | $ | — | | | $ | 9,100,000 | |
| | | | | | | | | | | | | | | | | | | | | | | | |
Derivative Holdings Categorized by Risk Exposure
FASB “Derivatives and Hedging” also requires all companies to disclose information intended to enable financial statement users to understand how and why the entity uses derivative instruments, how derivatives are accounted for, and how derivative instruments affect the entity’s financial position, results of operations, and cash flows.
| | | | |
| | | Location on the Statements of Assets and Liabilities |
Derivative Type | | Asset Derivatives | | Liability Derivatives |
Interest rate contracts | | Investments in securities of unaffiliated issuers, at value | | Options written at value |
| | Receivables: Variation margin* | | Payables: Variation margin* |
| | Unrealized appreciation on swap agreements | | Unrealized depreciation on swap agreements |
| | |
Foreign exchange contracts | | Unrealized appreciation on foreign currency exchange contracts | | Unrealized depreciation on foreign currency exchange contracts |
| | |
Credit contracts | | Unrealized appreciation on swap agreements | | Unrealized depreciation on swap agreements |
| | |
Equity contracts | | Receivables: Variation margin* | | Payables: Variation margin* |
| * | The variation margin shown on the Statements of Assets and Liabilities is the daily change in the unrealized appreciation (depreciation) for open futures contracts. The variation margin presented below is the cumulative change in unrealized appreciation (depreciation) from the date the contract was opened until December 31, 2010. |
| | | | | | | | | | | | | | | | | | | | | | | | |
| | | Asset Derivative Value | |
| Fund | | Total Value at
December 31, 2010 | | | Interest Rate
Contracts | | | Foreign Exchange
Contracts | | | Credit
Contracts | | | Equity
Contracts | |
MyDestination 2015 Fund | | $ | 102,722 | | | $ | — | | | | $— | | | $ | — | | | $ | 102,722 | |
MyDestination 2025 Fund | | | 63,147 | | | | — | | | | — | | | | — | | | | 63,147 | |
MyDestination 2035 Fund | | | 31,946 | | | | — | | | | — | | | | — | | | | 31,946 | |
MyDestination 2045 Fund | | | 36,336 | | | | — | | | | — | | | | — | | | | 36,336 | |
Conservative Allocation Fund | | | 58,571 | | | | — | | | | — | | | | — | | | | 58,571 | |
Balanced Allocation Fund | | | 455,513 | | | | — | | | | — | | | | — | | | | 455,513 | |
Growth Allocation Fund | | | 408,243 | | | | — | | | | — | | | | — | | | | 408,243 | |
Aggressive Allocation Fund | | | 485,675 | | | | — | | | | — | | | | — | | | | 485,675 | |
Balanced Allocation Fund I | | | 57,988 | | | | — | | | | — | | | | — | | | | 57,988 | |
Growth Allocation Fund I | | | 50,688 | | | | — | | | | — | | | | — | | | | 50,688 | |
Aggressive Allocation Fund I | | | 61,344 | | | | — | | | | — | | | | — | | | | 61,344 | |
Low-Duration Bond Fund | | | 2,329,841 | | | | (42,422 | ) | | | 733,734 | | | | 1,638,529 | | | | — | |
Medium-Duration Bond Fund | | | 4,924,668 | | | | 3,559,428 | | | | 669,600 | | | | 695,640 | | | | — | |
Inflation Protected Bond Fund | | | (15,363 | ) | | | (15,363 | ) | | | — | | | | — | | | | — | |
Global Bond Fund | | | 927,869 | | | | (13,432 | ) | | | 941,301 | | | | — | | | | — | |
Equity Index Fund | | | 230,370 | | | | — | | | | — | | | | — | | | | 230,370 | |
Real Estate Securities Fund | | | 33,902 | | | | — | | | | — | | | | — | | | | 33,902 | |
Value Equity Fund | | | 688,859 | | | | — | | | | — | | | | — | | | | 688,859 | |
Growth Equity Fund | | | 984,190 | | | | — | | | | — | | | | — | | | | 984,190 | |
Small Cap Equity Fund | | | 1,113,299 | | | | 12,241 | | | | — | | | | — | | | | 1,101,058 | |
International Equity Fund | | | 2,113,437 | | | | — | | | | 1,554,249 | | | | — | | | | 559,188 | |
| |
| | | Liability Derivative Value | |
Low-Duration Bond Fund | | $ | 1,538,306 | | | $ | 307,077 | | | | $1,006,500 | | | $ | 224,729 | | | $ | — | |
Medium-Duration Bond Fund | | | 4,786,260 | | | | 3,069,889 | | | | 1,496,880 | | | | 219,491 | | | | — | |
Inflation Protected Bond Fund | | | (10,930 | ) | | | (10,930 | ) | | | | | | | — | | | | — | | | | — | |
Global Bond Fund | | | 555,078 | | | | (64,022 | ) | | | | | | | 619,100 | | | | — | | | | — | |
Small Cap Equity Fund | | | (38,764 | ) | | | (46,328 | ) | | | | | | | 7,564 | | | | — | | | | — | |
International Equity Fund | | | 903,333 | | | | — | | | | | | | | 1,034,407 | | | | — | | | | (131,074 | ) |
| | |
Derivative Type | | Location on the Statements of Operations |
Interest rate contracts | | Net realized gain (loss) from: Futures transactions |
| | Net realized gain (loss) from: Swap agreements |
| | Net realized gain (loss) from: Option contracts written |
| | Net realized gain (loss) from: Option contracts purchased |
| | Net change in unrealized appreciation (depreciation) on: Futures |
| | Net change in unrealized appreciation (depreciation) on: Swap agreements |
| | Net change in unrealized appreciation (depreciation) on: Option contracts written |
| | Net change in unrealized appreciation (depreciation) on: Option contracts purchased |
| |
Foreign exchange contracts | | Net realized gain (loss) from: Foreign currency transactions |
| | Net realized gain (loss) from: Option contracts written |
| | Net change in unrealized appreciation (depreciation) on: Foreign currency translations |
| |
Credit contracts | | Net realized gain (loss) from: Swap agreements |
| | Net realized gain (loss) from: Option contracts written |
| | Net change in unrealized appreciation (depreciation) on: Swap agreements |
| | Net change in unrealized appreciation (depreciation) on: Option contracts written |
| |
Equity contracts | | Net realized gain (loss) from: Futures transactions |
| | | | | | | | | | | | | | | | | | | | |
| | | Realized Gain (Loss) on Derivatives Recognized in Income | |
| Fund | | Total Value
at
December 31, 2010 | | | Interest Rate
Contracts | | | Foreign Exchange
Contracts | | | Credit
Contracts | | | Equity
Contracts | |
MyDestination 2015 Fund | | $ | 296,162 | | | $ | — | | | $ | — | | | $ | — | | | $ | 296,162 | |
MyDestination 2025 Fund | | | 482,246 | | | | — | | | | — | | | | — | | | | 482,246 | |
MyDestination 2035 Fund | | | 298,900 | | | | — | | | | — | | | | — | | | | 298,900 | |
MyDestination 2045 Fund | | | 198,146 | | | | — | | | | — | | | | — | | | | 198,146 | |
Conservative Allocation Fund | | | 210,779 | | | | — | | | | — | | | | — | | | | 210,779 | |
Balanced Allocation Fund | | | 1,519,314 | | | | — | | | | — | | | | — | | | | 1,519,314 | |
Growth Allocation Fund | | | 1,723,932 | | | | — | | | | — | | | | — | | | | 1,723,932 | |
Aggressive Allocation Fund | | | 2,588,246 | | | | — | | | | — | | | | — | | | | 2,588,246 | |
Balanced Allocation Fund I | | | 600,895 | | | | — | | | | — | | | | — | | | | 600,895 | |
Growth Allocation Fund I | | | 392,068 | | | | — | | | | — | | | | — | | | | 392,068 | |
Aggressive Allocation Fund I | | | 348,562 | | | | — | | | | — | | | | — | | | | 348,562 | |
Low-Duration Bond Fund | | | 3,998,152 | | | | 1,221,743 | | | | 2,955,429 | | | | (179,020 | ) | | | — | |
Medium-Duration Bond Fund | | | 3,017,284 | | | | 2,792,729 | | | | 266,583 | | | | (42,028 | ) | | | — | |
Inflation Protected Bond Fund | | | 542,552 | | | | 542,552 | | | | — | | | | — | | | | — | |
Global Bond Fund | | | 2,218,805 | | | | (681,425 | ) | | | 2,900,230 | | | | — | | | | — | |
Equity Index Fund | | | 1,108,176 | | | | — | | | | — | | | | — | | | | 1,108,176 | |
Real Estate Securities Fund | | | 768,594 | | | | — | | | | — | | | | — | | | | 768,594 | |
Value Equity Fund | | | 2,355,725 | | | | — | | | | — | | | | — | | | | 2,355,725 | |
Growth Equity Fund | | | 5,979,991 | | | | — | | | | — | | | | — | | | | 5,979,991 | |
Small Cap Equity Fund | | | 16,273,714 | | | | (141,209 | ) | | | (68,669 | ) | | | — | | | | 16,483,592 | |
International Equity Fund | | | 2,669,114 | | | | — | | | | 1,471,295 | | | | — | | | | 1,197,819 | |
| |
| | | Change in Unrealized Appreciation (Depreciation) on Derivatives Recognized in Income | |
| Fund | | Total Value
at
December 31, 2010 | | | Interest Rate
Contracts | | | Foreign Exchange
Contracts | | | Credit
Contracts | | | Equity
Contracts | |
MyDestination 2015 Fund | | $ | 75,044 | | | $ | — | | | $ | — | | | $ | — | | | $ | 75,044 | |
MyDestination 2025 Fund | | | 45,178 | | | | — | | | | — | | | | — | | | | 45,178 | |
MyDestination 2035 Fund | | | 18,086 | | | | — | | | | — | | | | — | | | | 18,086 | |
MyDestination 2045 Fund | | | 30,829 | | | | — | | | | — | | | | — | | | | 30,829 | |
Conservative Allocation Fund | | | 38,442 | | | | — | | | | — | | | | — | | | | 38,442 | |
Balanced Allocation Fund | | | 386,013 | | | | — | | | | — | | | | — | | | | 386,013 | |
Growth Allocation Fund | | | 285,809 | | | | — | | | | — | | | | — | | | | 285,809 | |
| | | | | | | | | | | | | | | | | | | | |
| | | Change in Unrealized Appreciation (Depreciation) on Derivatives Recognized in Income | |
| Fund | | Total Value
at
December 31, 2010 | | | Interest Rate
Contracts | | | Foreign Exchange
Contracts | | | Credit
Contracts | | | Equity
Contracts | |
Aggressive Allocation Fund | | $ | 293,546 | | | $ | — | | | $ | — | | | $ | — | | | $ | 293,546 | |
Balanced Allocation Fund I | | | 8,206 | | | | — | | | | — | | | | — | | | | 8,206 | |
Growth Allocation Fund I | | | 10,147 | | | | — | | | | — | | | | — | | | | 10,147 | |
Aggressive Allocation Fund I | | | 20,055 | | | | — | | | | — | | | | — | | | | 20,055 | |
Low-Duration Bond Fund | | | (1,895,281 | ) | | | 386,500 | | | | (926,907 | ) | | | (1,354,874 | ) | | | — | |
Medium-Duration Bond Fund | | | (385,964 | ) | | | (143,705 | ) | | | (1,287,758 | ) | | | 1,045,499 | | | | — | |
Inflation Protected Bond Fund | | | (7,611 | ) | | | (7,611 | ) | | | — | | | | — | | | | — | |
Global Bond Fund | | | (84,549 | ) | | | (52,895 | ) | | | (31,654 | ) | | | — | | | | — | |
Equity Index Fund | | | 84,979 | | | | — | | | | — | | | | — | | | | 84,979 | |
Real Estate Securities Fund | | | (133,183 | ) | | | — | | | | — | | | | — | | | | (133,183 | ) |
Value Equity Fund | | | 220,239 | | | | — | | | | — | | | | — | | | | 220,239 | |
Growth Equity Fund | | | 358,729 | | | | — | | | | — | | | | — | | | | 358,729 | |
Small Cap Equity Fund | | | (1,478,171 | ) | | | 34,165 | | | | (7,564 | ) | | | — | | | | (1,504,772 | ) |
International Equity Fund | | | 1,581,977 | | | | — | | | | 714,488 | | | | — | | | | 867,489 | |
Volume of Derivative Transactions
The table below summarizes the average balance of derivative holdings by fund during the year ended December 31, 2010. The average balance of derivatives held is indicative of the trading volume of each Fund.
| | | | | | | | | | | | | | | | | | | | |
| | | Asset Derivative Volume | |
| Fund | | Average Volume
for the Period Ended
December 31, 2010 | | | Forward Foreign
Currency
Contracts
(Average Cost) | | | Futures
Contracts
(Average
Notional Value) | | | Purchased
Option
Contracts
(Average
Notional Cost) | | | Swap
Contracts
(Average
Notional Amount) | |
MyDestination 2015 Fund | | $ | 2,703,034 | | | $ | — | | | $ | 2,703,034 | | | $ | — | | | $ | — | |
MyDestination 2025 Fund | | | 2,765,415 | | | | — | | | | 2,765,415 | | | | — | | | | — | |
MyDestination 2035 Fund | | | 1,715,093 | | | | — | | | | 1,715,093 | | | | — | | | | — | |
MyDestination 2045 Fund | | | 1,612,903 | | | | — | | | | 1,612,903 | | | | — | | | | — | |
Conservative Allocation Fund | | | 1,574,633 | | | | — | | | | 1,574,633 | | | | — | | | | — | |
Balanced Allocation Fund | | | 12,717,302 | | | | — | | | | 12,717,302 | | | | — | | | | — | |
Growth Allocation Fund | | | 12,980,954 | | | | — | | | | 12,980,954 | | | | — | | | | — | |
Aggressive Allocation Fund | | | 16,121,703 | | | | — | | | | 16,121,703 | | | | — | | | | — | |
Balanced Allocation Fund I | | | 3,160,435 | | | | — | | | | 3,160,435 | | | | — | | | | — | |
Growth Allocation Fund I | | | 3,246,984 | | | | — | | | | 3,246,984 | | | | — | | | | — | |
Aggressive Allocation Fund I | | | 2,669,637 | | | | — | | | | 2,669,637 | | | | — | | | | — | |
Low-Duration Bond Fund | | | 177,701,184 | | | | (35,330,221 | ) | | | 162,167,868 | | | | 93,375 | | | | 50,770,162 | |
Medium-Duration Bond Fund | | | 341,944,942 | | | | (22,384,164 | ) | | | 216,261,510 | | | | 46,013 | | | | 148,021,583 | |
Inflation Protected Bond Fund | | | 4,258,402 | | | | — | | | | 4,258,402 | | | | — | | | | — | |
Global Bond Fund | | | (3,898,083 | ) | | | (5,175,592 | ) | | | 1,227,338 | | | | 50,171 | | | | — | |
Equity Index Fund | | | 9,303,697 | | | | — | | | | 9,303,697 | | | | — | | | | — | |
Real Estate Securities Fund | | | 4,936,400 | | | | — | | | | 4,936,400 | | | | — | | | | — | |
Value Equity Fund | | | 33,364,272 | | | | — | | | | 33,364,272 | | | | — | | | | — | |
Growth Equity Fund | | | 55,743,553 | | | | — | | | | 55,743,553 | | | | — | | | | — | |
Small Cap Equity Fund | | | 68,403,991 | | | | (445,343 | ) | | | 68,841,351 | | | | 7,983 | | | | — | |
International Equity Fund | | | 84,584,503 | | | | 19,907,219 | | | | 64,677,284 | | | | — | | | | — | |
| | | | | | | | | | | | | | | | | | | | |
| | | Liability Derivative Volume | |
| Fund | | Average Volume
for the Period Ended
December 31, 2010 | | | Forward Foreign
Currency
Contracts
(Average Cost) | | | Futures
Contracts
(Average
Notional Value) | | | Written
Option
Contracts
(Average
Notional Cost) | | | Swap
Contracts
(Average
Notional Amount) | |
Low-Duration Bond Fund | | $ | (39,002,316 | ) | | $ | (8,319,720 | ) | | $ | (30,000,030 | ) | | $ | (682,566 | ) | | $ | — | |
Medium-Duration Bond Fund | | | (43,684,969 | ) | | | (2,070,322 | ) | | | (40,530,521 | ) | | | (1,084,126 | ) | | | — | |
Inflation Protected Bond Fund | | | (5,421,653 | ) | | | — | | | | (5,421,653 | ) | | | — | | | | — | |
Global Bond Fund | | | (15,427,554 | ) | | | 2,984,792 | | | | (18,412,346 | ) | | | — | | | | — | |
Small Cap Equity Fund | | | (6,145,189 | ) | | | (765,356 | ) | | | (5,379,833 | ) | | | — | | | | — | |
International Equity Fund | | | (22,768,654 | ) | | | (13,271,688 | ) | | | (9,496,966 | ) | | | — | | | | — | |
j. Dividends and Distributions to Shareholders
Dividends from net investment income for the Money Market Fund are declared daily and paid monthly. Dividends from net investment income for the Bond Funds are declared and paid monthly. Dividends from net investment income, if any, for the Equity Index Fund, Real Estate Securities Fund, Value Equity Fund and Growth Equity Fund are declared and paid semi-annually. Dividends from net investment income, if any, for the Small Cap Equity Fund, International Equity Fund, the Asset Allocation Funds and the Date Target Funds are declared and paid annually. Net realized capital gains, if any, will be distributed at least annually by each of the Funds. Dividends and distributions to shareholders are recorded on the ex-dividend date.
k. Expenses
Expenses arising in connection with a Fund are charged directly to that Fund. Expenses common to all Funds are generally allocated to each Fund in proportion to their relative net assets. Each Class of shares bears its pro-rata portion of expenses attributable to its Class, except that each Class separately bears expenses related specifically to that Class, such as shareholder reporting, registration, transfer agent, shareholder servicing and distribution fees.
l. Security Transactions, Income and Realized Gains and Losses
Security transactions are accounted for on the date securities are purchased or sold (the trade date). Dividend income is recognized on the ex-dividend date, except certain dividends from foreign securities where the ex-date may have passed, which are recorded as soon as the Fund is informed of the ex-dividend date. Interest income is accrued daily, including the amortization of market premium and the accretion of market discount. Realized gains and losses from security transactions are on an identified cost basis.
3. FEES AND OTHER TRANSACTIONS WITH AFFILIATES
a. Investment Advisory Fees
Pursuant to a separate investment advisory agreement, GuideStone Capital Management (“GSCM” or “Adviser”) acts as the Adviser to the Funds. As Adviser, it supervises the investments of the Funds and for such services is paid a fee. GSCM and the Trust have entered into sub-advisory agreements with various sub-advisers to manage each Select Fund’s investments. Under the general supervision of GSCM, the sub-advisers make the day-to-day investment decisions for the Select Funds, and for such services, each sub-adviser receives a fee from the Funds.
The advisory fees paid to GSCM and aggregate sub-advisory fees paid to the sub-advisers, listed at the end of this report, are computed daily based upon the net assets of each Fund. The actual advisory fees accrued and the sub-advisory fees accrued during the year ended December 31, 2010, based upon average daily net assets, were as follows:
| | | | | | | | |
Fund | | Advisory Fees | | | Sub-Adviser Fees | |
MyDestination 2005 | | | 0.10 | % | | | — | |
MyDestination 2015 | | | 0.10 | % | | | — | |
MyDestination 2025 | | | 0.10 | % | | | — | |
MyDestination 2035 | | | 0.10 | % | | | — | |
MyDestination 2045 | | | 0.10 | % | | | — | |
Conservative Allocation | | | 0.10 | % | | | — | |
Balanced Allocation | | | 0.10 | % | | | — | |
Growth Allocation | | | 0.10 | % | | | — | |
Aggressive Allocation | | | 0.10 | % | | | — | |
Conservative Allocation I | | | 0.10 | % | | | — | |
Balanced Allocation I | | | 0.10 | % | | | — | |
Growth Allocation I | | | 0.10 | % | | | — | |
Aggressive Allocation I | | | 0.10 | % | | | — | |
Money Market | | | 0.09 | % | | | 0.07 | % |
Low-Duration Bond | | | 0.13 | % | | | 0.21 | % |
Medium-Duration Bond | | | 0.21 | % | | | 0.21 | % |
Extended-Duration Bond | | | 0.25 | % | | | 0.22 | % |
Inflation Protected Bond | | | 0.20 | % | | | 0.12 | % |
Global Bond | | | 0.21 | % | | | 0.26 | % |
Equity Index | | | 0.13 | % | | | 0.02 | % |
Real Estate Securities | | | 0.28 | % | | | 0.59 | % |
Value Equity | | | 0.40 | % | | | 0.24 | % |
Growth Equity | | | 0.45 | % | | | 0.40 | % |
Small Cap Equity | | | 0.27 | % | | | 0.66 | % |
International Equity | | | 0.47 | % | | | 0.50 | % |
For the year ended December 31, 2010, advisory fees (excluding sub-advisory fees) and waivers for each Fund were as follows:
| | | | | | | | | | | | |
| | | Gross
Advisory Fee | | | Waiver/
Reimbursements | | | Net Advisory Fee
(Reimbursement) | |
MyDestination 2005 | | $ | 63,831 | | | $ | (37,982 | ) | | $ | 25,849 | |
MyDestination 2015 | | | 237,416 | | | | — | | | | 237,416 | |
MyDestination 2025 | | | 193,847 | | | | 54,962 | | | | 248,809 | |
MyDestination 2035 | | | 87,158 | | | | (29,344 | ) | | | 57,814 | |
MyDestination 2045 | | | 56,005 | | | | (53,661 | ) | | | 2,344 | |
Conservative Allocation | | | 286,669 | | | | (85,986 | ) | | | 200,683 | |
Balanced Allocation | | | 1,136,293 | | | | (44,858 | ) | | | 1,091,435 | |
Growth Allocation | | | 831,531 | | | | (65,662 | ) | | | 765,869 | |
Aggressive Allocation | | | 722,355 | | | | (59,666 | ) | | | 662,689 | |
Conservative Allocation I | | | 68,151 | | | | (33,009 | ) | | | 35,142 | |
Balanced Allocation I | | | 334,288 | | | | — | | | | 334,288 | |
Growth Allocation I | | | 214,761 | | | | 1,095 | | | | 215,856 | |
Aggressive Allocation I | | | 143,047 | | | | (7,100 | ) | | | 135,947 | |
Money Market | | | 1,091,218 | | | | (392,103 | ) | | | 699,115 | |
Low-Duration Bond | | | 933,700 | | | | (579,527 | ) | | | 354,173 | |
Medium-Duration Bond | | | 2,124,451 | | | | (913,726 | ) | | | 1,210,725 | |
Extended-Duration Bond | | | 1,157,778 | | | | (128,194 | ) | | | 1,029,584 | |
Inflation Protected Bond | | | 207,455 | | | | (10,847 | ) | | | 196,608 | |
Global Bond | | | 453,395 | | | | (31,190 | ) | | | 422,205 | |
Equity Index | | | 508,070 | | | | (143,289 | ) | | | 364,781 | |
Real Estate Securities | | | 377,887 | | | | (8,081 | ) | | | 369,806 | |
Value Equity | | | 4,650,086 | | | | (212,779 | ) | | | 4,437,307 | |
Growth Equity | | | 5,557,710 | | | | (1,139,996 | ) | | | 4,417,714 | |
Small Cap Equity | | | 1,181,593 | | | | (229,910 | ) | | | 951,683 | |
International Equity | | | 6,033,498 | | | | (2,810,432 | ) | | | 3,223,066 | |
b. Distribution and Shareholder Servicing Fees
The Board of Trustees has adopted a Shareholder Service Plan for the GS4 Class of each Select Fund. Under this Plan, the GS4 Class of each Select Fund is authorized to pay fees to parties that provide services for and maintain shareholder accounts. The GS4 Class of each Select Fund is authorized to pay service fees of 0.19% of average daily net assets.
c. Expense Limitation
GSCM has agreed, through April 30, 2011, to waive fees and reimburse expenses of the GS2 Class and GS4 Class of each Fund (excluding interest, taxes, brokerage commissions, dividend expense on securities sold short and extraordinary expenses) which exceed, in the aggregate, the annual percentage rate of each Class’s average daily net assets as follows:
| | | | | | | | |
Fund | | GS2
Class | | | GS4
Class | |
MyDestination 2005 | | | NA | | | | 0.20 | % |
MyDestination 2015 | | | NA | | | | 0.20 | % |
MyDestination 2025 | | | NA | | | | 0.20 | % |
MyDestination 2035 | | | NA | | | | 0.20 | % |
MyDestination 2045 | | | NA | | | | 0.20 | % |
Conservative Allocation | | | NA | | | | 0.12 | % |
Balanced Allocation | | | NA | | | | 0.12 | % |
Growth Allocation | | | NA | | | | 0.12 | % |
Aggressive Allocation | | | NA | | | | 0.12 | % |
Conservative Allocation I | | | 0.15 | % | | | NA | |
Balanced Allocation I | | | 0.15 | % | | | NA | |
Growth Allocation I | | | 0.15 | % | | | NA | |
Aggressive Allocation I | | | 0.15 | % | | | NA | |
Money Market | | | 0.20 | % | | | 0.39 | % |
Low-Duration Bond | | | 0.36 | % | | | 0.52 | % |
Medium-Duration Bond | | | 0.48 | % | | | 0.58 | % |
Extended-Duration Bond | | | 0.63 | % | | | 0.69 | % |
Inflation Protected Bond | | | NA | | | | 0.67 | % |
Global Bond | | | NA | | | | 1.02 | % |
Equity Index | | | 0.23 | % | | | 0.37 | % |
Real Estate Securities | | | NA | | | | 1.29 | % |
Value Equity | | | 0.74 | % | | | 0.85 | % |
Growth Equity | | | 0.88 | % | | | 0.97 | % |
Small Cap Equity | | | 1.12 | % | | | 1.15 | % |
International Equity | | | 0.94 | % | | | 1.12 | % |
Each Fund in turn agrees to reimburse GSCM for any operating expenses in excess of the expense limitation paid, waived or assumed by GSCM for that Fund during the limitation period, provided GSCM would not be entitled to reimbursement for any amount that would cause operating expenses to exceed the expense limitation during the year in which the reimbursement would be made, and provided further that no amount will be reimbursed by the Fund more than three years after the year in which it was incurred or waived by GSCM.
At December 31, 2010, the amounts subject to possible future reimbursement under the expense limitation agreement are as follows:
| | | | | | | | | | | | | | | | | | | | | | | | |
| | | GS2 Class | | | GS4 Class | |
| | | 2008 | | | 2009 | | | 2010 | | | 2008 | | | 2009 | | | 2010 | |
MyDestination 2005 | | | NA | | | | NA | | | | NA | | | $ | 51,833 | | | $ | 34,663 | | | $ | 37,982 | |
MyDestination 2035 | | | NA | | | | NA | | | | NA | | | | 74,281 | | | | 42,923 | | | | 29,344 | |
MyDestination 2045 | | | NA | | | | NA | | | | NA | | | | 87,558 | | | | 60,981 | | | | 53,661 | |
Conservative Allocation | | | NA | | | | NA | | | | NA | | | | 100,571 | | | | 94,137 | | | | 85,986 | |
Balanced Allocation | | | NA | | | | NA | | | | NA | | | | 91,086 | | | | 97,716 | | | | 44,858 | |
Growth Allocation | | | NA | | | | NA | | | | NA | | | | 94,991 | | | | 102,990 | | | | 65,662 | |
Aggressive Allocation | | | NA | | | | NA | | | | NA | | | | 98,613 | | | | 116,674 | | | | 59,666 | |
Conservative Allocation I | | $ | 43,693 | | | $ | 41,261 | | | $ | 33,009 | | | | NA | | | | NA | | | | NA | |
Aggressive Allocation I | | | 7,921 | | | | 14,709 | | | | 7,100 | | | | NA | | | | NA | | | | NA | |
Low-Duration Bond | | | 59,618 | | | | 62,697 | | | | 55,742 | | | | 502,736 | | | | 480,368 | | | | 468,377 | |
Medium-Duration Bond | | | NA | | | | 21,118 | | | | 962 | | | | 811,087 | | | | 829,796 | | | | 799,436 | |
Extended-Duration Bond | | | NA | | | | NA | | | | NA | | | | 83,138 | | | | 112,701 | | | | 108,124 | |
Equity Index | | | NA | | | | NA | | | | NA | | | | 155,209 | | | | 152,180 | | | | 128,840 | |
Value Equity | | | NA | | | | NA | | | | NA | | | | 71,410 | | | | 233,562 | | | | 159,664 | |
Growth Equity | | | NA | | | | 8,395 | | | | NA | | | | 1,003,684 | | | | 990,164 | | | | 1,049,330 | |
Small Cap Equity | | | NA | | | | NA | | | | NA | | | | 310,319 | | | | 244,965 | | | | 188,066 | |
International Equity | | | 376,091 | | | | 451,372 | | | | 483,790 | | | | 1,844,484 | | | | 2,302,219 | | | | 2,260,849 | |
During the year ended December 31, 2010, GSCM recaptured the following amounts:
| | | | | | | | |
| | | GS2
Class | | | GS4
Class | |
MyDestination 2025 | | | NA | | | $ | 54,962 | |
Growth Allocation I | | $ | 1,095 | | | | NA | |
Inflation Protected Bond | | | NA | | | | 3,859 | |
Equity Index | | | 282 | | | | NA | |
Growth Equity | | | 1,417 | | | | NA | |
d. Brokerage Service Arrangements
The Adviser directs the sub-advisers to place security trades with designated brokers who have agreed to pay certain custody, transfer agency or other operating expenses through the use of Brokerage Service Arrangements on behalf of the Funds shown below.
| | | | |
Fund | | Expenses Paid
Through Brokerage
Service Arrangements | |
Value Equity | | $ | 57,240 | |
Growth Equity | | | 60,973 | |
Small Cap Equity | | | 22,103 | |
International Equity | | | 61,967 | |
e. Administrator, Transfer Agent and Distributor
On July 1, 2010, The PNC Financial Services Group, Inc. sold the outstanding stock of PNC Global Investment Servicing Inc. to The Bank of New York Mellon Corporation. At the closing of the sale, PNC Global Investment Servicing (U.S.) Inc. and PFPC Distributors, Inc. changed their names to BNY Mellon Investment Servicing (US) Inc. (“BNY Mellon”) and BNY Mellon Distributors Inc. (the “Distributor”), respectively.
Certain employees of BNY Mellon are officers of the Funds. BNY Mellon serves as Administrator and Transfer Agent of the Funds.
For its services as Administrator, BNY Mellon is entitled to receive fees, computed daily and paid monthly, based upon the average daily net assets of each Fund. The fees, excluding out of pocket expenses, currently range between 0.004% and 0.02% of average daily net assets. For its services as Transfer Agent, BNY Mellon receives a fee based mainly upon the number of accounts serviced. Certain minimum fees and transaction charges may apply. For the year ended December 31, 2010, BNY Mellon received $2,919,236 in aggregate fees and expenses for services rendered under the various agreements described above.
The Distributor serves as the Underwriter for the Funds. The Funds do not pay any fees to the Distributor in its capacity as
Underwriter. The fees are paid by GSCM.
f. Investments in Affiliates
A summary of the Fund of Fund’s total long-term and short-term purchases and sales of the shares of the underlying Select
Funds during the year ended December 31, 2010 is as follows:
| | | | | | | | | | | | | | | | | | | | | | | | |
| | | Balance
at
12/31/09 | | | Balance
at
12/31/10 | | | Purchases | | | Sales Proceeds | | | Dividend
Income | | | Distributions
of Realized
Gains | |
MyDestination 2005 Fund | | | | | | | | | | | | | | | | | | | | | | | | |
Money Market Fund | | $ | 957,089 | | | $ | 1,446,944 | | | $ | 26,438,934 | | | $ | 25,949,430 | | | $ | 116 | | | $ | 236 | |
Low-Duration Bond Fund | | | 12,405,231 | | | | 11,993,701 | | | | 3,551,443 | | | | 4,496,830 | | | | 254,203 | | | | 76,383 | |
Medium-Duration Bond Fund | | | 11,477,216 | | | | 9,809,284 | | | | 2,404,065 | | | | 5,036,030 | | | | 310,558 | | | | 311,516 | |
Extended-Duration Bond Fund | | | 658,407 | | | | 41,460 | | | | 20,000 | | | | 686,481 | | | | 15,849 | | | | 282 | |
Inflation Protected Bond Fund | | | 9,750,494 | | | | 8,088,222 | | | | 2,158,373 | | | | 4,399,000 | | | | 182,959 | | | | 207,505 | |
Global Bond Fund | | | 1,017,045 | | | | 539,551 | | | | 24,000 | | | | 588,000 | | | | 45,595 | | | | — | |
Equity Index Fund | | | 1,490,646 | | | | 1,194,173 | | | | 154,200 | | | | 636,500 | | | | 20,384 | | | | — | |
Real Estate Securities Fund | | | 2,418,192 | | | | 1,612,846 | | | | 285,650 | | | | 1,625,890 | | | | 34,846 | | | | — | |
Value Equity Fund | | | 7,915,297 | | | | 6,121,558 | | | | 808,000 | | | | 3,530,200 | | | | 90,957 | | | | — | |
Growth Equity Fund | | | 8,028,765 | | | | 6,105,156 | | | | 1,102,060 | | | | 4,318,500 | | | | 1,004 | | | | — | |
Small Cap Equity Fund | | | 2,222,434 | | | | 1,612,667 | | | | 242,500 | | | | 1,327,500 | | | | 3,717 | | | | — | |
International Equity Fund | | | 8,341,021 | | | | 6,456,267 | | | | 1,356,680 | | | | 3,968,140 | | | | 125,133 | | | | — | |
| | | | | | | | | | | | | | | | | | | | | | | | |
| | $ | 66,681,837 | | | $ | 55,021,829 | | | $ | 38,545,905 | | | $ | 56,562,501 | | | $ | 1,085,321 | | | $ | 595,922 | |
| | | | | | | | | | | | | | | | | | | | | | | | |
MyDestination 2015 Fund | | | | | | | | | | | | | | | | | | | | | | | | |
Money Market Fund | | $ | 2,405,941 | | | $ | 4,387,484 | | | $ | 45,633,389 | | | $ | 43,652,384 | | | $ | 251 | | | $ | 287 | |
Low-Duration Bond Fund | | | 14,476,706 | | | | 17,164,782 | | | | 4,781,000 | | | | 2,734,500 | | | | 322,546 | | | | 111,417 | |
Medium-Duration Bond Fund | | | 23,987,621 | | | | 27,311,201 | | | | 7,327,130 | | | | 6,178,500 | | | | 746,699 | | | | 866,545 | |
Extended-Duration Bond Fund | | | 9,097,860 | | | | 10,190,119 | | | | 2,997,200 | | | | 3,020,000 | | | | 471,577 | | | | 67,534 | |
Inflation Protected Bond Fund | | | 21,186,757 | | | | 26,156,179 | | | | 10,063,628 | | | | 6,462,500 | | | | 481,494 | | | | 652,317 | |
Global Bond Fund | | | 10,259,585 | | | | 10,702,898 | | | | 1,449,500 | | | | 2,132,500 | | | | 621,414 | | | | — | |
Equity Index Fund | | | 6,426,975 | | | | 6,630,569 | | | | 341,500 | | | | 1,063,000 | | | | 100,785 | | | | — | |
Real Estate Securities Fund | | | 13,833,310 | | | | 13,706,233 | | | | 1,850,000 | | | | 5,708,000 | | | | 259,891 | | | | — | |
Value Equity Fund | | | 34,756,701 | | | | 38,315,149 | | | | 3,467,490 | | | | 5,061,000 | | | | 446,225 | | | | — | |
Growth Equity Fund | | | 35,254,089 | | | | 37,854,982 | | | | 3,361,000 | | | | 7,820,699 | | | | 4,946 | | | | — | |
Small Cap Equity Fund | | | 9,986,530 | | | | 10,812,318 | | | | 917,000 | | | | 2,826,000 | | | | 24,920 | | | | — | |
International Equity Fund | | | 36,038,870 | | | | 39,170,524 | | | | 7,080,130 | | | | 8,164,300 | | | | 768,884 | | | | — | |
| | | | | | | | | | | | | | | | | | | | | | | | |
| | $ | 217,710,945 | | | $ | 242,402,438 | | | $ | 89,268,967 | | | $ | 94,823,383 | | | $ | 4,249,632 | | | $ | 1,698,100 | |
| | | | | | | | | | | | | | | | | | | | | | | | |
| | | | | | | | | | | | | | | | | | | | | | | | |
| | | Balance
at
12/31/09 | | | Balance
at
12/31/10 | | | Purchases | | | Sales Proceeds | | | Dividend
Income | | | Distributions
of Realized
Gains | |
MyDestination 2025 Fund | | | | | | | | | | | | | | | | | | | | | | | | |
Money Market Fund | | $ | 2,448,001 | | | $ | 3,800,041 | | | $ | 34,610,944 | | | $ | 33,259,438 | | | $ | 265 | | | $ | 268 | |
Low-Duration Bond Fund | | | — | | | | 2,286,679 | | | | 3,470,975 | | | | 1,203,500 | | | | 20,407 | | | | 13,878 | |
Medium-Duration Bond Fund | | | 12,298,666 | | | | 17,831,697 | | | | 6,611,100 | | | | 2,217,500 | | | | 419,746 | | | | 564,130 | |
Extended-Duration Bond Fund | | | 11,971,332 | | | | 16,886,834 | | | | 6,985,540 | | | | 3,584,000 | | | | 664,804 | | | | 114,551 | |
Inflation Protected Bond Fund | | | — | | | | 2,296,373 | | | | 2,262,669 | | | | — | | | | 16,319 | | | | 47,173 | |
Global Bond Fund | | | 12,028,616 | | | | 16,204,972 | | | | 4,520,790 | | | | 1,739,000 | | | | 799,752 | | | | — | |
Equity Index Fund | | | 5,723,198 | | | | 7,476,167 | | | | 982,830 | | | | 160,500 | | | | 99,276 | | | | — | |
Real Estate Securities Fund | | | 11,848,278 | | | | 15,487,104 | | | | 3,473,582 | | | | 3,351,500 | | | | 263,388 | | | | — | |
Value Equity Fund | | | 32,419,512 | | | | 44,925,330 | | | | 7,911,990 | | | | 806,000 | | | | 429,260 | | | | — | |
Growth Equity Fund | | | 32,812,129 | | | | 44,322,232 | | | | 5,392,800 | | | | 1,110,000 | | | | 4,730 | | | | — | |
Small Cap Equity Fund | | | 11,470,194 | | | | 15,170,770 | | | | 1,135,500 | | | | 799,000 | | | | 34,965 | | | | — | |
International Equity Fund | | | 35,477,449 | | | | 47,547,848 | | | | 8,614,340 | | | | 1,029,000 | | | | 932,873 | | | | — | |
| | | | | | | | | | | | | | | | | | | | | | | | |
| | $ | 168,497,375 | | | $ | 234,236,047 | | | $ | 85,973,060 | | | $ | 49,259,438 | | | $ | 3,685,785 | | | $ | 740,000 | |
| | | | | | | | | | | | | | | | | | | | | | | | |
MyDestination 2035 Fund | | | | | | | | | | | | | | | | | | | | | | | | |
Money Market Fund | | $ | 1,881,218 | | | $ | 2,254,225 | | | $ | 20,760,842 | | | $ | 20,388,134 | | | $ | 167 | | | $ | 131 | |
Medium-Duration Bond Fund | | | 1,433,593 | | | | 2,685,978 | | | | 1,501,500 | | | | 390,000 | | | | 55,874 | | | | 80,523 | |
Extended-Duration Bond Fund | | | 1,403,008 | | | | 2,716,597 | | | | 1,365,000 | | | | 254,000 | | | | 93,371 | | | | 17,535 | |
Global Bond Fund | | | 3,071,057 | | | | 4,859,225 | | | | 2,078,800 | | | | 661,500 | | | | 219,758 | | | | — | |
Equity Index Fund | | | 2,903,993 | | | | 4,003,220 | | | | 734,000 | | | | 121,500 | | | | 51,253 | | | | — | |
Real Estate Securities Fund | | | 5,451,948 | | | | 7,808,060 | | | | 2,147,160 | | | | 1,443,000 | | | | 126,542 | | | | — | |
Value Equity Fund | | | 16,685,977 | | | | 24,439,112 | | | | 5,585,772 | | | | 712,000 | | | | 223,323 | | | | — | |
Growth Equity Fund | | | 16,858,729 | | | | 24,472,766 | | | | 4,663,767 | | | | 882,400 | | | | 2,466 | | | | — | |
Small Cap Equity Fund | | | 6,743,574 | | | | 9,584,676 | | | | 1,255,980 | | | | 465,000 | | | | 22,090 | | | | — | |
International Equity Fund | | | 18,656,191 | | | | 26,840,516 | | | | 6,292,028 | | | | 490,500 | | | | 525,244 | | | | — | |
| | | | | | | | | | | | | | | | | | | | | | | | |
| | $ | 75,089,288 | | | $ | 109,664,375 | | | $ | 46,384,849 | | | $ | 25,808,034 | | | $ | 1,320,088 | | | $ | 98,189 | |
| | | | | | | | | | | | | | | | | | | | | | | | |
MyDestination 2045 Fund | | | | | | | | | | | | | | | | | | | | | | | | |
Money Market Fund | | $ | 1,286,027 | | | $ | 2,192,973 | | | $ | 17,362,443 | | | $ | 16,455,774 | | | $ | 157 | | | $ | 119 | |
Equity Index Fund | | | 2,125,408 | | | | 3,597,917 | | | | 1,045,830 | | | | — | | | | 43,513 | | | | — | |
Real Estate Securities Fund | | | 4,214,731 | | | | 7,480,868 | | | | 2,424,600 | | | | 661,000 | | | | 118,556 | | | | — | |
Value Equity Fund | | | 10,172,536 | | | | 17,371,474 | | | | 5,190,976 | | | | — | | | | 149,515 | | | | — | |
Growth Equity Fund | | | 10,319,039 | | | | 17,253,914 | | | | 4,287,997 | | | | — | | | | 1,654 | | | | — | |
Small Cap Equity Fund | | | 4,295,182 | | | | 7,258,225 | | | | 1,446,390 | | | | — | | | | 16,728 | | | | — | |
International Equity Fund | | | 11,623,278 | | | | 19,774,485 | | | | 6,376,500 | | | | — | | | | 386,985 | | | | — | |
| | | | | | | | | | | | | | | | | | | | | | | | |
| | $ | 44,036,201 | | | $ | 74,929,856 | | | $ | 38,134,736 | | | $ | 17,116,774 | | | $ | 717,108 | | | $ | 119 | |
| | | | | | | | | | | | | | | | | | | | | | | | |
| | | | | | | | | | | | | | | | | | | | | | | | |
| | | Balance
at
12/31/09 | | | Balance
at
12/31/10 | | | Purchases | | | Sales Proceeds | | | Dividend
Income | | | Distributions
of Realized
Gains | |
Conservative Allocation Fund | | | | | | | | | | | | | | | | | | | | | | | | |
Money Market Fund | | $ | 1,458,350 | | | $ | 9,896,880 | | | $ | 62,977,661 | | | $ | 54,540,203 | | | $ | 277 | | | $ | 916 | |
Low-Duration Bond Fund | | | 165,193,885 | | | | 151,420,411 | | | | 9,435,000 | | | | 30,134,000 | | | | 3,304,612 | | | | 997,566 | |
Inflation Protected Bond Fund | | | 40,951,653 | | | | 37,948,411 | | | | 2,521,000 | | | | 7,950,155 | | | | 813,536 | | | | 973,136 | |
Equity Index Fund | | | 4,864,696 | | | | 3,979,058 | | | | 210,000 | | | | 1,725,000 | | | | 67,183 | | | | — | |
Value Equity Fund | | | 19,858,640 | | | | 17,850,550 | | | | 2,100,000 | | | | 6,843,000 | | | | 234,206 | | | | — | |
Growth Equity Fund | | | 20,383,118 | | | | 17,783,462 | | | | 2,401,000 | | | | 8,766,000 | | | | 2,697 | | | | — | |
Small Cap Equity Fund | | | 5,040,729 | | | | 4,371,878 | | | | 585,000 | | | | 2,544,000 | | | | 10,379 | | | | — | |
International Equity Fund | | | 21,562,280 | | | | 19,379,706 | | | | 2,045,000 | | | | 6,566,000 | | | | 386,488 | | | | — | |
| | | | | | | | | | | | | | | | | | | | | | | | |
| | $ | 279,313,351 | | | $ | 262,630,356 | | | $ | 82,274,661 | | | $ | 119,068,358 | | | $ | 4,819,378 | | | $ | 1,971,618 | |
| | | | | | | | | | | | | | | | | | | | | | | | |
Balanced Allocation Fund | | | | | | | | | | | | | | | | | | | | | | | | |
Money Market Fund | | $ | 13,056,266 | | | $ | 15,760,681 | | | $ | 112,108,708 | | | $ | 109,406,622 | | | $ | 1,126 | | | $ | 1,203 | |
Low-Duration Bond Fund | | | 160,935,757 | | | | 159,599,982 | | | | 10,000,000 | | | | 18,059,096 | | | | 3,246,518 | | | | 1,071,911 | |
Medium-Duration Bond Fund | | | 233,149,295 | | | | 230,733,468 | | | | 11,000,000 | | | | 33,100,000 | | | | 6,630,753 | | | | 7,468,052 | |
Extended-Duration Bond Fund | | | 92,773,652 | | | | 91,023,291 | | | | 8,900,000 | | | | 21,170,000 | | | | 4,437,675 | | | | 618,570 | |
Global Bond Fund | | | 55,530,347 | | | | 53,160,144 | | | | — | | | | 8,270,000 | | | | 3,205,359 | | | | — | |
Equity Index Fund | | | 35,102,654 | | | | 34,267,563 | | | | 1,275,000 | | | | 7,000,000 | | | | 526,639 | | | | — | |
Value Equity Fund | | | 158,399,932 | | | | 158,863,675 | | | | 5,275,000 | | | | 26,100,000 | | | | 1,892,642 | | | | — | |
Growth Equity Fund | | | 161,122,326 | | | | 155,709,280 | | | | 7,130,000 | | | | 41,750,000 | | | | 20,933 | | | | — | |
Small Cap Equity Fund | | | 39,018,057 | | | | 37,898,076 | | | | 1,490,000 | | | | 12,650,000 | | | | 90,789 | | | | — | |
International Equity Fund | | | 168,451,926 | | | | 165,142,915 | | | | 7,000,000 | | | | 27,600,000 | | | | 3,241,620 | | | | — | |
| | | | | | | | | | | | | | | | | | | | | | | | |
| | $ | 1,117,540,212 | | | $ | 1,102,159,075 | | | $ | 164,178,708 | | | $ | 305,105,718 | | | $ | 23,294,054 | | | $ | 9,159,736 | |
| | | | | | | | | | | | | | | | | | | | | | | | |
Growth Allocation Fund | | | | | | | | | | | | | | | | | | | | | | | | |
Money Market Fund | | $ | 11,482,976 | | | $ | 15,088,874 | | | $ | 95,661,779 | | | $ | 92,058,118 | | | $ | 1,156 | | | $ | 1,081 | |
Low-Duration Bond Fund | | | 58,844,612 | | | | 58,594,392 | | | | 3,749,754 | | | | 6,449,000 | | | | 1,182,772 | | | | 393,534 | |
Medium-Duration Bond Fund | | | 85,463,209 | | | | 85,978,945 | | | | 5,636,000 | | | | 12,300,000 | | | | 2,408,359 | | | | 2,745,088 | |
Extended-Duration Bond Fund | | | 34,467,339 | | | | 33,698,549 | | | | 3,725,000 | | | | 8,376,000 | | | | 1,614,290 | | | | 229,006 | |
Global Bond Fund | | | 20,744,816 | | | | 19,930,270 | | | | 224,000 | | | | 3,184,000 | | | | 1,169,762 | | | | — | |
Equity Index Fund | | | 38,614,305 | | | | 38,863,303 | | | | 350,000 | | | | 5,451,000 | | | | 579,942 | | | | — | |
Value Equity Fund | | | 175,692,447 | | | | 179,562,544 | | | | 590,000 | | | | 19,742,000 | | | | 2,076,321 | | | | — | |
Growth Equity Fund | | | 177,494,545 | | | | 176,092,878 | | | | 340,000 | | | | 33,040,000 | | | | 22,959 | | | | — | |
Small Cap Equity Fund | | | 43,893,701 | | | | 42,821,695 | | | | 470,000 | | | | 12,406,000 | | | | 100,989 | | | | — | |
International Equity Fund | | | 188,693,735 | | | | 184,994,524 | | | | 2,000,000 | | | | 23,727,000 | | | | 3,631,291 | | | | — | |
| | | | | | | | | | | | | | | | | | | | | | | | |
| | $ | 835,391,685 | | | $ | 835,625,974 | | | $ | 112,746,533 | | | $ | 216,733,118 | | | $ | 12,787,841 | | | $ | 3,368,709 | |
| | | | | | | | | | | | | | | | | | | | | | | | |
Aggressive Allocation Fund | | | | | | | | | | | | | | | | | | | | | | | | |
Money Market Fund | | $ | 12,186,651 | | | $ | 17,614,735 | | | $ | 101,460,241 | | | $ | 96,036,324 | | | $ | 1,458 | | | $ | 2,708 | |
Equity Index Fund | | | 44,783,229 | | | | 45,524,758 | | | | — | | | | 5,271,000 | | | | 664,535 | | | | — | |
Value Equity Fund | | | 200,559,218 | | | | 207,607,061 | | | | 1,775,000 | | | | 21,094,500 | | | | 2,359,950 | | | | — | |
Growth Equity Fund | | | 204,055,846 | | | | 202,007,163 | | | | 75,000 | | | | 37,515,000 | | | | 26,039 | | | | — | |
Small Cap Equity Fund | | | 50,748,839 | | | | 51,156,592 | | | | — | | | | 12,098,000 | | | | 117,903 | | | | — | |
International Equity Fund | | | 216,329,360 | | | | 219,098,245 | | | | 7,250,000 | | | | 25,167,000 | | | | 4,300,719 | | | | — | |
| | | | | | | | | | | | | | | | | | | | | | | | |
| | $ | 728,663,143 | | | $ | 743,008,554 | | | $ | 110,560,241 | | | $ | 197,181,824 | | | $ | 7,470,604 | | | $ | 2,708 | |
| | | | | | | | | | | | | | | | | | | | | | | | |
| | | | | | | | | | | | | | | | | | | | | | | | |
| | | Balance
at
12/31/09 | | | Balance
at
12/31/10 | | | Purchases | | | Sales Proceeds | | | Dividend
Income | | | Distributions
of Realized
Gains | |
Conservative Allocation Fund I | | | | | | | | | | | | | | | | | | | | | | | | |
Money Market Fund | | $ | 1,122,056 | | | $ | 1,137,030 | | | $ | 12,125,911 | | | $ | 12,112,949 | | | $ | 1,947 | | | $ | 64 | |
Low-Duration Bond Fund | | | 37,508,525 | | | | 42,348,640 | | | | 5,933,000 | | | | 2,750,000 | | | | 1,298,389 | | | | 428,402 | |
Inflation Protected Bond Fund | | | 9,295,960 | | | | 10,610,228 | | | | 1,416,000 | | | | 653,000 | | | | 195,414 | | | | 268,823 | |
Equity Index Fund | | | 1,105,994 | | | | 1,113,015 | | | | 124,000 | | | | 278,000 | | | | 34,508 | | | | — | |
Value Equity Fund | | | 4,515,451 | | | | 4,992,861 | | | | 952,000 | | | | 1,178,000 | | | | 114,593 | | | | — | |
Growth Equity Fund | | | 4,629,943 | | | | 4,971,544 | | | | 809,000 | | | | 1,409,000 | | | | 999 | | | | — | |
Small Cap Equity Fund | | | 1,144,652 | | | | 1,225,339 | | | | 200,000 | | | | 439,000 | | | | 7,020 | | | | — | |
International Equity Fund | | | 4,917,439 | | | | 5,423,583 | | | | 1,148,000 | | | | 1,263,000 | | | | 154,081 | | | | — | |
| | | | | | | | | | | | | | | | | | | | | | | | |
| | $ | 64,240,020 | | | $ | 71,822,240 | | | $ | 22,707,911 | | | $ | 20,082,949 | | | $ | 1,806,951 | | | $ | 697,289 | |
| | | | | | | | | | | | | | | | | | | | | | | | |
Balanced Allocation Fund I | | | | | | | | | | | | | | | | | | | | | | | | |
Money Market Fund | | $ | 2,741,213 | | | $ | 2,747,513 | | | $ | 34,135,843 | | | $ | 34,134,586 | | | $ | 4,859 | | | $ | 183 | |
Low-Duration Bond Fund | | | 46,645,414 | | | | 50,122,605 | | | | 5,124,000 | | | | 3,671,814 | | | | 1,561,564 | | | | 510,362 | |
Medium-Duration Bond Fund | | | 67,529,409 | | | | 72,518,533 | | | | 8,175,000 | | | | 9,040,000 | | | | 3,698,404 | | | | 4,260,931 | |
Extended-Duration Bond Fund | | | 26,857,858 | | | | 28,558,045 | | | | 3,880,000 | | | | 5,308,000 | | | | 3,065,619 | | | | 449,240 | |
Global Bond Fund | | | 16,088,976 | | | | 16,685,078 | | | | 808,000 | | | | 1,948,000 | | | | 950,075 | | | | — | |
Equity Index Fund | | | 10,211,786 | | | | 10,753,267 | | | | 756,000 | | | | 1,708,000 | | | | 328,083 | | | | — | |
Value Equity Fund | | | 45,994,391 | | | | 49,869,304 | | | | 2,660,000 | | | | 5,280,000 | | | | 1,166,094 | | | | — | |
Growth Equity Fund | | | 46,719,156 | | | | 48,872,324 | | | | 3,182,000 | | | | 9,852,000 | | | | 9,763 | | | | — | |
Small Cap Equity Fund | | | 11,326,329 | | | | 11,898,428 | | | | 796,000 | | | | 3,256,000 | | | | 68,047 | | | | — | |
International Equity Fund | | | 49,058,573 | | | | 51,884,281 | | | | 4,112,000 | | | | 6,736,000 | | | | 1,434,486 | | | | — | |
| | | | | | | | | | | | | | | | | | | | | | | | |
| | $ | 323,173,105 | | | $ | 343,909,378 | | | $ | 63,628,843 | | | $ | 80,934,400 | | | $ | 12,286,994 | | | $ | 5,220,716 | |
| | | | | | | | | | | | | | | | | | | | | | | | |
Growth Allocation Fund I | | | | | | | | | | | | | | | | | | | | | | | | |
Money Market Fund | | $ | 2,782,247 | | | $ | 2,983,368 | | | $ | 17,243,215 | | | $ | 17,047,437 | | | $ | 5,132 | | | $ | 210 | |
Low-Duration Bond Fund | | | 14,605,734 | | | | 16,346,241 | | | | 2,352,136 | | | | 1,252,000 | | | | 497,571 | | | | 165,351 | |
Medium-Duration Bond Fund | | | 21,206,796 | | | | 24,007,290 | | | | 3,448,000 | | | | 2,500,000 | | | | 1,175,095 | | | | 1,379,776 | |
Extended-Duration Bond Fund | | | 8,549,204 | | | | 9,393,510 | | | | 1,752,000 | | | | 1,908,000 | | | | 975,672 | | | | 146,794 | |
Global Bond Fund | | | 5,146,284 | | | | 5,555,730 | | | | 460,000 | | | | 604,143 | | | | 303,859 | | | | — | |
Equity Index Fund | | | 9,620,692 | | | | 10,837,035 | | | | 700,000 | | | | 936,000 | | | | 316,081 | | | | — | |
Value Equity Fund | | | 43,694,274 | | | | 50,083,969 | | | | 2,884,000 | | | | 2,744,000 | | | | 1,110,512 | | | | — | |
Growth Equity Fund | | | 44,082,873 | | | | 49,105,636 | | | | 2,128,000 | | | | 5,532,000 | | | | 9,294 | | | | — | |
Small Cap Equity Fund | | | 10,908,264 | | | | 11,945,987 | | | | 612,000 | | | | 2,476,000 | | | | 66,883 | | | | — | |
International Equity Fund | | | 47,066,296 | | | | 51,638,527 | | | | 3,798,000 | | | | 4,352,000 | | | | 1,420,557 | | | | — | |
| | | | | | | | | | | | | | | | | | | | | | | | |
| | $ | 207,662,664 | | | $ | 231,897,293 | | | $ | 35,377,351 | | | $ | 39,351,580 | | | $ | 5,880,656 | | | $ | 1,692,131 | |
| | | | | | | | | | | | | | | | | | | | | | | | |
Aggressive Allocation Fund I | | | | | | | | | | | | | | | | | | | | | | | | |
Money Market Fund | | $ | 2,391,427 | | | $ | 2,697,371 | | | $ | 13,316,556 | | | $ | 13,014,935 | | | $ | 4,168 | | | $ | 154 | |
Equity Index Fund | | | 8,798,088 | | | | 9,675,471 | | | | 363,000 | | | | 716,000 | | | | 278,217 | | | | — | |
Value Equity Fund | | | 39,338,327 | | | | 44,137,128 | | | | 2,100,000 | | | | 2,698,000 | | | | 969,868 | | | | — | |
Growth Equity Fund | | | 39,969,950 | | | | 42,940,300 | | | | 808,000 | | | | 4,997,000 | | | | 8,108 | | | | — | |
Small Cap Equity Fund | | | 9,950,718 | | | | 10,879,974 | | | | 296,000 | | | | 1,904,000 | | | | 59,842 | | | | — | |
International Equity Fund | | | 42,547,374 | | | | 46,619,540 | | | | 3,628,000 | | | | 3,881,000 | | | | 1,289,240 | | | | — | |
| | | | | | | | | | | | | | | | | | | | | | | | |
| | $ | 142,995,884 | | | $ | 156,949,784 | | | $ | 20,511,556 | | | $ | 27,210,935 | | | $ | 2,609,443 | | | $ | 154 | |
| | | | | | | | | | | | | | | | | | | | | | | | |
4. SECURITIES LENDING
Through an agreement with The Northern Trust Company (“Northern Trust”) (the Funds’ custodian) the Select Funds may lend portfolio securities to certain brokers, dealers and other financial institutions that pay the Select Funds a negotiated fee. The Select Funds receive cash or U.S. government securities as collateral against the loaned securities in an amount at least equal to the market value of the loaned securities. The Funds continue to own the loaned securities and the securities remain in the investment portfolio. However, in the event of default or bankruptcy by the other party to the agreement, realization and/or retention of the collateral may be subject to legal proceedings. Cash collateral has been invested in a short-term money market fund of Northern Trust, an affiliate of the Funds, that invests in securities that satisfy the quality requirements of Rule 2a-7 and have short maturities. At December 31, 2010, the market values of loaned securities and collateral received were as follows:
| | | | | | | | | | | | | | | | |
Fund | | Value of
Securities Loaned | | | Value of
Cash
Collateral | | | Value of
Non-cash
Collateral | | | Total
Value of
Collateral | |
Money Market | | $ | 10,752,569 | | | $ | 10,967,813 | | | $ | — | | | $ | 10,967,813 | |
Low-Duration Bond | | | 71,040,963 | | | | 68,285,101 | | | | 4,105,913 | | | | 72,391,014 | |
Medium-Duration Bond | | | 52,410,097 | | | | 53,322,138 | | | | — | | | | 53,322,138 | |
Extended-Duration Bond | | | 39,284,128 | | | | 39,862,497 | | | | — | | | | 39,862,497 | |
Inflation Protected Bond | | | 21,941,093 | | | | 2,321,463 | | | | 19,949,944 | | | | 22,271,407 | |
Global Bond | | | 36,119,838 | | | | 34,081,461 | | | | 2,929,241 | | | | 37,010,702 | |
Equity Index | | | 22,318,677 | | | | 22,662,484 | | | | 261,497 | | | | 22,923,981 | |
Real Estate Securities | | | 33,683,329 | | | | 34,429,336 | | | | 130,586 | | | | 34,559,922 | |
Value Equity | | | 83,703,402 | | | | 85,564,732 | | | | 77,795 | | | | 85,642,527 | |
Growth Equity | | | 124,170,621 | | | | 126,132,616 | | | | 1,356,663 | | | | 127,489,279 | |
Small Cap Equity | | | 141,753,872 | | | | 143,555,699 | | | | 2,655,292 | | | | 146,210,991 | |
International Equity | | | 100,150,956 | | | | 101,923,046 | | | | 2,162,334 | | | | 104,085,380 | |
5. 10% SHAREHOLDERS
The Date Target and Asset Allocation Funds do not invest in the underlying Select Funds for the purpose of exercising management or control; however, investments made by each Date Target and Asset Allocation Fund within each of its principal investment strategies may represent a significant portion of an underlying Select Fund’s net assets. At December 31, 2010, the Date Target and Asset Allocation Funds were the owner of record of the following approximate percentages of the total outstanding shares of the underlying Select Funds as detailed below:
| | | | | | | | | | | | | | | | | | | | | | | | | | | | | | | | | | | | | | | | | | | | |
Fund | | Low-
Duration
Bond | | | Medium-
Duration
Bond | | | Extended-
Duration
Bond | | | Inflation
Protected
Bond | | | Global
Bond | | | Equity
Index | | | Real
Estate
Securities | | | Value
Equity | | | Growth
Equity | | | Small
Cap
Equity | | | International
Equity | |
MyDestination 2005 | | | 1.55 | % | | | 0.93 | % | | | 0.01 | % | | | 7.50 | % | | | 0.33 | % | | | 0.25 | % | | | 1.14 | % | | | 0.43 | % | | | 0.44 | % | | | 0.31 | % | | | 0.47 | % |
MyDestination 2015 | | | 2.21 | | | | 2.58 | | | | 2.00 | | | | 24.25 | | | | 6.64 | | | | 1.41 | | | | 9.66 | | | | 2.71 | | | | 2.73 | | | | 2.11 | | | | 2.86 | |
MyDestination 2025 | | | 0.30 | | | | 1.68 | | | | 3.32 | | | | 2.13 | | | | 10.06 | | | | 1.59 | | | | 10.91 | | | | 3.18 | | | | 3.20 | | | | 2.96 | | | | 3.47 | |
MyDestination 2035 | | | — | | | | 0.34 | | | | 0.53 | | | | — | | | | 3.02 | | | | 0.85 | | | | 5.50 | | | | 1.73 | | | | 1.76 | | | | 1.87 | | | | 1.96 | |
MyDestination 2045 | | | — | | | | — | | | | — | | | | — | | | | — | | | | 0.76 | | | | 5.27 | | | | 1.23 | | | | 1.24 | | | | 1.42 | | | | 1.44 | |
Conservative Allocation | | | 19.54 | | | | — | | | | — | | | | 35.18 | | | | — | | | | 0.85 | | | | — | | | | 1.26 | | | | 1.28 | | | | 0.85 | | | | 1.41 | |
Balanced Allocation | | | 20.59 | | | | 21.79 | | | | 17.90 | | | | — | | | | 33.00 | | | | 7.28 | | | | — | | | | 11.25 | | | | 11.23 | | | | 7.40 | | | | 12.06 | |
Growth Allocation | | | 7.56 | | | | 8.12 | | | | 6.63 | | | | — | | | | 12.37 | | | | 8.26 | | | | — | | | | 12.71 | | | | 12.70 | | | | 8.36 | | | | 13.51 | |
Aggressive Allocation | | | — | | | | — | | | | — | | | | — | | | | — | | | | 9.67 | | | | — | | | | 14.70 | | | | 14.57 | | | | 9.99 | | | | 16.00 | |
Conservative Allocation I | | | 8.31 | | | | — | | | | — | | | | 9.84 | | | | — | | | | 0.45 | | | | — | | | | 0.70 | | | | 0.57 | | | | 0.36 | | | | 0.51 | |
Balanced Allocation I | | | 9.83 | | | | 12.89 | | | | 13.19 | | | | — | | | | 10.36 | | | | 4.33 | | | | — | | | | 6.94 | | | | 5.59 | | | | 3.50 | | | | 4.92 | |
Growth Allocation I | | | 3.21 | | | | 4.27 | | | | 4.34 | | | | — | | | | 3.45 | | | | 4.37 | | | | — | | | | 6.97 | | | | 5.62 | | | | 3.51 | | | | 4.89 | |
Aggressive Allocation I | | | — | | | | — | | | | — | | | | — | | | | — | | | | 3.90 | | | | — | | | | 6.14 | | | | 4.91 | | | | 3.20 | | | | 4.42 | |
6. INVESTMENT TRANSACTIONS
For the year ended December 31, 2010, the cost of purchases and proceeds from sales and maturities for each Fund were as follows:
| | | | | | | | | | | | | | | | |
| | | Cost of Purchases and
Proceeds from Sales and Maturities
of Long-Term Securities
(other than U.S. Government Obligations) | | | Cost of Purchases and
Proceeds from Sales and Maturities
of Long-Term U.S. Government Obligations | |
| | | Purchases | | | Sale and Maturity
Proceeds | | | Purchases | | | Sale and Maturity
Proceeds | |
MyDestination 2005 | | $ | 12,106,971 | | | $ | 30,613,071 | | | $ | — | | | $ | — | |
MyDestination 2015 | | | 43,635,578 | | | | 51,170,999 | | | | 21,908,583 | | | | 20,586,223 | |
MyDestination 2025 | | | 51,362,116 | | | | 16,000,000 | | | | 12,080,754 | | | | 11,585,532 | |
MyDestination 2035 | | | 25,624,007 | | | | 5,419,900 | | | | 2,513,115 | | | | 2,480,917 | |
MyDestination 2045 | | | 20,772,293 | | | | 661,000 | | | | — | | | | — | |
Conservative Allocation | | | 19,297,000 | | | | 64,528,155 | | | | 33,935,380 | | | | 38,898,063 | |
Balanced Allocation | | | 52,070,000 | | | | 195,699,095 | | | | 136,027,244 | | | | 132,841,091 | |
Growth Allocation | | | 17,084,753 | | | | 124,675,000 | | | | 49,647,880 | | | | 48,474,901 | |
Aggressive Allocation | | | 9,100,000 | | | | 101,145,500 | | | | — | | | | — | |
Conservative Allocation I | | | 10,582,000 | | | | 7,970,000 | | | | — | | | | — | |
Balanced Allocation I | | | 29,493,000 | | | | 46,799,814 | | | | 31,677,036 | | | | 31,693,604 | |
Growth Allocation I | | | 18,134,137 | | | | 22,304,144 | | | | 9,495,891 | | | | 9,498,299 | |
Aggressive Allocation I | | | 7,195,000 | | | | 14,196,000 | | | | — | | | | — | |
Low-Duration Bond | | | 925,794,543 | | | | 1,026,528,784 | | | | 612,197,353 | | | | 564,457,775 | |
Medium-Duration Bond | | | 4,176,280,681 | | | | 4,230,532,217 | | | | 575,753,257 | | | | 676,122,989 | |
Extended-Duration Bond | | | 132,861,283 | | | | 207,804,493 | | | | 42,536,100 | | | | 43,455,381 | |
Inflation Protected Bond | | | — | | | | — | | | | 117,489,681 | | | | 99,736,259 | |
Global Bond | | | 67,177,547 | | | | 129,717,426 | | | | 9,234,942 | | | | 9,724,721 | |
Equity Index | | | 19,233,939 | | | | 47,163,705 | | | | — | | | | — | |
Real Estate Securities | | | 135,347,653 | | | | 143,699,448 | | | | — | | | | — | |
Value Equity | | | 400,301,072 | | | | 525,244,759 | | | | — | | | | — | |
Growth Equity | | | 738,325,367 | | | | 940,164,467 | | | | — | | | | — | |
Small Cap Equity | | | 693,521,495 | | | | 735,761,001 | | | | 35,846,086 | | | | 36,755,768 | |
International Equity | | | 706,451,155 | | | | 848,311,697 | | | | — | | | | — | |
Futures Contracts
Investments as of December 31, 2010, included cash and securities that were valued and pledged as collateral to cover initial
margin deposits. The market value of the open futures contracts is as follows:
| | | | | | | | | | | | |
| | | Open Long
(Short) Contracts | | | Market Value
of Contracts | | | Net Unrealized Appreciation
(Depreciation) on Futures | |
MyDestination 2015 Fund | | | | | | | | | | | | |
March 2011 S&P 500® E-Mini | | | 77 | | | $ | 4,824,050 | | | $ | 102,722 | |
| | | | | | | | | | | | |
MyDestination 2025 Fund | | | | | | | | | | | | |
March 2011 S&P 500® E-Mini | | | 69 | | | $ | 4,322,850 | | | $ | 63,147 | |
| | | | | | | | | | | | |
MyDestination 2035 Fund | | | | | | | | | | | | |
March 2011 S&P 500® E-Mini | | | 38 | | | $ | 2,380,700 | | | $ | 31,946 | |
| | | | | | | | | | | | |
MyDestination 2045 Fund | | | | | | | | | | | | |
March 2011 S&P 500® E-Mini | | | 37 | | | $ | 2,318,050 | | | $ | 36,336 | |
| | | | | | | | | | | | |
Conservative Allocation Fund | | | | | | | | | | | | |
March 2011 S&P 500® | | | 8 | | | $ | 2,506,000 | | | $ | 58,571 | |
| | | | | | | | | | | | |
Balanced Allocation Fund | | | | | | | | | | | | |
March 2011 S&P 500® | | | 57 | | | $ | 17,855,250 | | | $ | 455,513 | |
| | | | | | | | | | | | |
Growth Allocation Fund | | | | | | | | | | | | |
March 2011 S&P 500® | | | 52 | | | $ | 16,289,000 | | | $ | 408,243 | |
| | | | | | | | | | | | |
| | | | | | | | | | | | |
| | | Open Long
(Short) Contracts | | | Market Value
of Contracts | | | Net Unrealized Appreciation
(Depreciation) on Futures | |
Aggressive Allocation Fund | | | | | | | | | | | | |
March 2011 S&P 500® | | | 67 | | | $ | 20,987,750 | | | $ | 485,675 | |
| | | | | | | | | | | | |
Balanced Allocation Fund I | | | | | | | | | | | | |
March 2011 S&P 500® E-Mini | | | 50 | | | $ | 3,132,500 | | | $ | 57,988 | |
| | | | | | | | | | | | |
Growth Allocation Fund I | | | | | | | | | | | | |
March 2011 S&P 500® E-Mini | | | 51 | | | $ | 3,195,150 | | | $ | 50,688 | |
| | | | | | | | | | | | |
Aggressive Allocation Fund I | | | | | | | | | | | | |
March 2011 S&P 500® E-Mini | | | 47 | | | $ | 2,944,550 | | | $ | 61,344 | |
| | | | | | | | | | | | |
Low-Duration Bond Fund | | | | | | | | | | | | |
March 2011 90-Day Euro | | | 9 | | | $ | 2,241,788 | | | $ | — | |
March 2011 90-Day Euro | | | (6 | ) | | | (1,494,525 | ) | | | (5,267 | ) |
March 2011 2-Year U.S.Treasury Note | | | 479 | | | | 104,856,094 | | | | (6,264 | ) |
March 2011 5-Year U.S.Treasury Note | | | (354 | ) | | | (41,672,438 | ) | | | 357,390 | |
March 2011 10-Year U.S. Treasury Note | | | (11 | ) | | | (1,324,813 | ) | | | (11,671 | ) |
June 2011 90-Day EURIBOR | | | 57 | | | | 18,904,797 | | | | 19,844 | |
June 2011 90-Day Euro | | | (4 | ) | | | (995,600 | ) | | | (2,349 | ) |
September 2011 90-Day Euro | | | (5 | ) | | | (1,243,063 | ) | | | (5,964 | ) |
December 2011 90-Day Euro | | | (5 | ) | | | (1,240,875 | ) | | | (10,302 | ) |
March 2012 90-Day Euro | | | (6 | ) | | | (1,485,750 | ) | | | (14,380 | ) |
June 2012 90-Day Euro | | | (1 | ) | | | (246,950 | ) | | | 985 | |
December 2012 90-Day Euro | | | 116 | | | | 28,482,350 | | | | (122,814 | ) |
September 2012 90-Day Euro | | | (1 | ) | | | (246,263 | ) | | | 1,347 | |
June 2013 90-Day Euro | | | 2 | | | | 488,250 | | | | (1,343 | ) |
| | | | | | | | | | | | |
| | | | | | | | | | $ | 199,212 | |
| | | | | | | | | | | | |
Medium-Duration Bond Fund | | | | | | | | | | | | |
March 2011 90-Day Euro | | | 107 | | | $ | 26,652,363 | | | $ | 1,663 | |
March 2011 2-Year U.S.Treasury Note | | | 74 | | | | 16,199,063 | | | | (34,665 | ) |
March 2011 2-Year U.S.Treasury Note | | | (9 | ) | | | (1,970,156 | ) | | | (1,857 | ) |
March 2011 5-Year U.S.Treasury Note | | | 249 | | | | 29,311,969 | | | | (341,385 | ) |
March 2011 5-Year U.S.Treasury Note | | | (150 | ) | | | (17,657,813 | ) | | | 270,888 | |
March 2011 10-Year U.S. Treasury Note | | | 434 | | | | 52,269,875 | | | | (458,894 | ) |
March 2011 Euro-Bund | | | (31 | ) | | | (5,211,374 | ) | | | (31,823 | ) |
March 2011 Long U.S.Treasury Bond | | | 73 | | | | 8,915,125 | | | | (124,819 | ) |
March 2011 Long U.S.Treasury Bond | | | (100 | ) | | | (12,212,500 | ) | | | 384,777 | |
March 2011 Ultra Long U.S. Treasury Bond | | | 37 | | | | 4,702,469 | | | | 41,140 | |
June 2011 90-Day EURIBOR | | | 82 | | | | 27,196,375 | | | | 31,694 | |
| | | | | | | | | | | | |
| | | | | | | | | | $ | (263,281 | ) |
| | | | | | | | | | | | |
Inflation Protected Bond Fund | | | | | | | | | | | | |
March 2011 2-Year U.S.Treasury Note | | | 12 | | | $ | 2,626,875 | | | $ | (2,805 | ) |
March 2011 5-Year U.S.Treasury Note | | | (57 | ) | | | (6,709,969 | ) | | | (2,469 | ) |
| | | | | | | | | | | | |
| | | Open Long
(Short) Contracts | | | Market Value
of Contracts | | | Net Unrealized Appreciation
(Depreciation) on Futures | |
March 2011 10-Year U.S. Treasury Note | | | 42 | | | $ | 5,058,375 | | | $ | (16,490 | ) |
March 2011 Long U.S. Treasury Bond | | | 3 | | | | 366,375 | | | | 3,932 | |
March 2011 Ultra Long U.S. Treasury Bond | | | (13 | ) | | | (1,652,219 | ) | | | 13,399 | |
| | | | | | | | | | | | |
| | | | | | | | | | $ | (4,433 | ) |
| | | | | | | | | | | | |
Global Bond Fund | | | | | | | | | | | | |
March 2011 5-Year U.S. Treasury Note | | | (33 | ) | | $ | (3,884,719 | ) | | $ | 64,479 | |
March 2011 10-Year U.S. Treasury Note | | | (5 | ) | | | (602,188 | ) | | | (8,188 | ) |
March 2011 Euro-BOBL | | | (39 | ) | | | (6,214,593 | ) | | | 7,731 | |
March 2011 Long U.S. Treasury Bond | | | 3 | | | | 366,375 | | | | (13,432 | ) |
| | | | | | | | | | | | |
| | | | | | | | | | $ | 50,590 | |
| | | | | | | | | | | | |
Equity Index Fund | | | | | | | | | | | | |
March 2011 S&P 500® | | | 29 | | | $ | 9,084,250 | | | $ | 230,370 | |
| | | | | | | | | | | | |
Real Estate Securities Fund | | | | | | | | | | | | |
March 2011 Russell 2000® | | | | | | | | | | | | |
IMM-Mini | | | 51 | | | $ | 3,989,730 | | | $ | 33,902 | |
| | | | | | | | | | | | |
Value Equity Fund | | | | | | | | | | | | |
March 2011 S&P 500® | | | 23 | | | $ | 1,440,950 | | | $ | 34,178 | |
March 2011 S&P 500® E-Mini | | | 100 | | | | 31,325,000 | | | | 654,681 | |
| | | | | | | | | | | | |
| | | | | | | | | | $ | 688,859 | |
| | | | | | | | | | | | |
Growth Equity Fund | | | | | | | | | | | | |
March 2011 S&P 500® | | | 132 | | | $ | 41,349,000 | | | $ | 984,190 | |
| | | | | | | | | | | | |
Small Cap Equity Fund | | | | | | | | | | | | |
March 2011 2-Year U.S. Treasury Note | | | (5 | ) | | $ | (1,094,531 | ) | | $ | 328 | |
March 2011 5-Year U.S. Treasury Note | | | (22 | ) | | | (2,589,813 | ) | | | 21,889 | |
March 2011 10-Year U.S. Treasury Note | | | 45 | | | | 5,419,688 | | | | 31,854 | |
March 2011 Euro-Bund | | | (5 | ) | | | (840,544 | ) | | | (4,773 | ) |
March 2011 Russell 2000® | | | | | | | | | | | | |
IMM-Mini | | | 924 | | | | 72,284,520 | | | | 1,101,058 | |
March 2011 Long U.S. Treasury Bond | | | (7 | ) | | | (854,875 | ) | | | 28,884 | |
March 2011 Ultra Long U.S. Treasury Bond | | | 6 | | | | 762,563 | | | | (19,613 | ) |
| | | | | | | | | | | | |
| | | | | | | | | | $ | 1,159,627 | |
| | | | | | | | | | | | |
International Equity Fund | | | | | | | | | | | | |
January 2011 AEX Index | | | 75 | | | $ | 7,111,836 | | | $ | 78,149 | |
January 2011 CAC40 Index | | | 79 | | | | 4,021,628 | | | | (80,801 | ) |
January 2011 Hang Seng Index | | | (14 | ) | | | (2,073,127 | ) | | | (34,781 | ) |
January 2011 IBEX 35 | | | 9 | | | | 1,177,542 | | | | (32,267 | ) |
January 2011 MSCI Singapore Index | | | 1 | | | | 58,971 | | | | 1,049 | |
January 2011 OMX 30 Index | | | (82 | ) | | | (1,410,629 | ) | | | (7,430 | ) |
March 2011 ASXSPI 200 Index® | | | (77 | ) | | | (9,312,831 | ) | | | 83,899 | |
March 2011 DAX Index | | | 22 | | | | 5,091,136 | | | | (78,299 | ) |
March 2011 FTSE 100 Index® | | | 44 | | | | 4,042,593 | | | | 42,218 | |
| | | | | | | | | | | | |
| | | Open Long
(Short) Contracts | | | Market Value
of Contracts | | | Net Unrealized Appreciation
(Depreciation) on Futures | |
March 2011 FTSE MIB Index | | | 35 | | | $ | 4,725,021 | | | $ | (86,330 | ) |
March 2011 MSCI EAFE Index | | | | | | | | | | | | |
E-Mini | | | 382 | | | | 31,725,100 | | | | 377,554 | |
March 2011 MSCI Emerging | | | | | | | | | | | | |
Markets E-Mini | | | 183 | | | | 10,576,485 | | | | 347,322 | |
March 2011 S&P/TSE 60 Index | | | (11 | ) | | | (1,697,295 | ) | | | (23,110 | ) |
March 2011 Swiss Market Index | | | | | | | | | | | | |
Future | | | (111 | ) | | | (7,548,000 | ) | | | 112,496 | |
March 2011 TOPIX Index® | | | 11 | | | | 1,213,943 | | | | (9,407 | ) |
| | | | | | | | | | | | |
| | | | | | | | | | $ | 690,262 | |
| | | | | | | | | | | | |
Forward Foreign Currency Contracts
As of December 31, 2010, the following Funds have forward foreign currency exchange contracts that obligate them to deliver currencies at specified future dates. The unrealized appreciation and/or depreciation on these contracts is included in the accompanying financial statements. The terms of the open contracts are as follows:
| | | | | | | | | | | | | | | | | | | | |
Fund/ Expiration Date | | Currency to be Delivered | | Counter-
party | | | Amount
of Currency
to be
Delivered | | | Currency to be Received | | Amount
of Currency
to be
Received | | | Net Unrealized
Appreciation
(Depreciation) | |
Low-Duration Bond Fund | |
01/06/11 | | Euro | | | CITI | | | | 6,432,000 | | | U.S. Dollars | | | 8,711,906 | | | $ | 116,838 | |
01/10/11 | | Chinese Yuan Renminbi | | | DEUT | | | | 567,800 | | | U.S. Dollars | | | 85,294 | | | | (854 | ) |
01/10/11 | | U.S. Dollars | | | JPM | | | | 85,000 | | | Chinese Yuan Renminbi | | | 567,800 | | | | 1,147 | |
01/11/11 | | Euro | | | CITIG | | | | 7,480,000 | | | U.S. Dollars | | | 10,006,669 | | | | 11,270 | |
01/14/11 | | Taiwan Dollars | | | DEUT | | | | 21,600,000 | | | U.S. Dollars | | | 720,480 | | | | (20,670 | ) |
01/14/11 | | Taiwan Dollars | | | DEUT | | | | 15,126,480 | | | U.S. Dollars | | | 506,326 | | | | (12,702 | ) |
01/14/11 | | U.S. Dollars | | | DEUT | | | | 88,834 | | | Taiwan Dollars | | | 2,796,480 | | | | 7,121 | |
01/14/11 | | U.S. Dollars | | | UBS | | | | 192,964 | | | Taiwan Dollars | | | 6,116,000 | | | | 16,891 | |
01/14/11 | | U.S. Dollars | | | DEUT | | | | 296,913 | | | Taiwan Dollars | | | 9,185,000 | | | | 18,247 | |
01/14/11 | | U.S. Dollars | | | JPM | | | | 232,299 | | | Taiwan Dollars | | | 7,336,000 | | | | 19,418 | |
01/14/11 | | U.S. Dollars | | | MSCS | | | | 359,364 | | | Taiwan Dollars | | | 11,293,000 | | | | 28,127 | |
01/19/11 | | South Korean Won | | | JPM | | | | 148,733,900 | | | U.S. Dollars | | | 128,807 | | | | (2,097 | ) |
01/19/11 | | U.S. Dollars | | | CITI | | | | 4,531,396 | | | United Kingdom Pounds | | | 2,819,000 | | | | (136,974 | ) |
01/19/11 | | U.S. Dollars | | | RBS | | | | 2,431,926 | | | United Kingdom Pounds | | | 1,510,000 | | | | (78,050 | ) |
01/19/11 | | U.S. Dollars | | | MSCS | | | | 133,000 | | | South Korean Won | | | 148,733,900 | | | | (2,095 | ) |
01/19/11 | | U.S. Dollars | | | CITI | | | | 1,440,078 | | | United Kingdom Pounds | | | 934,000 | | | | 15,896 | |
01/19/11 | | United Kingdom Pounds | | | CITI | | | | 160,000 | | | U.S. Dollars | | | 252,276 | | | | 2,859 | |
01/19/11 | | United Kingdom Pounds | | | UBS | | | | 1,001,000 | | | U.S. Dollars | | | 1,596,085 | | | | 35,668 | |
01/19/11 | | United Kingdom Pounds | | | CITI | | | | 7,308,000 | | | U.S. Dollars | | | 11,608,283 | | | | 216,147 | |
01/28/11 | | Australian Dollars | | | RBS | | | | 5,616,000 | | | U.S. Dollars | | | 5,345,949 | | | | (376,242 | ) |
01/28/11 | | Euro | | | UBS | | | | 274,500 | | | U.S. Dollars | | | 373,402 | | | | 6,603 | |
01/28/11 | | Euro | | | UBS | | | | 1,183,000 | | | U.S. Dollars | | | 1,617,138 | | | | 36,362 | |
01/28/11 | | Euro | | | DEUT | | | | 4,092,500 | | | U.S. Dollars | | | 5,603,328 | | | | 134,750 | |
01/28/11 | | U.S. Dollars | | | CITI | | | | 594,454 | | | Euro | | | 447,000 | | | | 2,847 | |
02/17/11 | | Canadian Dollars | | | DEUT | | | | 21,420,000 | | | U.S. Dollars | | | 21,267,301 | | | | (254,554 | ) |
02/17/11 | | U.S. Dollars | | | MSCS | | | | 601,948 | | | Canadian Dollars | | | 603,000 | | | | 3,919 | |
02/24/11 | | U.S. Dollars | | | JPM | | | | 60,000 | | | Singapore Dollars | | | 78,330 | | | | 1,039 | |
02/24/11 | | U.S. Dollars | | | BAR | | | | 60,000 | | | Singapore Dollars | | | 78,349 | | | | 1,053 | |
02/24/11 | | U.S. Dollars | | | HKSB | | | | 60,000 | | | Singapore Dollars | | | 78,366 | | | | 1,067 | |
03/02/11 | | U.S. Dollars | | | CITI | | | | 460,876 | | | Brazilian Reals | | | 785,978 | | | | 6,298 | |
03/21/11 | | U.S. Dollars | | | MSCS | | | | 700,430 | | | United Kingdom Pounds | | | 456,000 | | | | 10,066 | |
03/21/11 | | United Kingdom Pounds | | | RBS | | | | 1,264,000 | | | U.S. Dollars | | | 1,975,954 | | | | 6,510 | |
| | | | | | | | | | | | | | | | | | | | | | | | |
Fund/ Expiration Date | | Currency to be
Delivered | | | Counter-
party | | | Amount
of Currency
to be
Delivered | | | Currency to be
Received | | | Amount
of Currency
to be
Received | | | Net Unrealized
Appreciation
(Depreciation) | |
04/06/11 | | | U.S. Dollars | | | | DEUT | | | | 510,254 | | | | Taiwan Dollars | | | | 15,126,480 | | | $ | 9,963 | |
04/06/11 | | | U.S. Dollars | | | | DEUT | | | | 726,050 | | | | Taiwan Dollars | | | | 21,600,000 | | | | 16,799 | |
04/07/11 | | | U.S. Dollars | | | | JPM | | | | 499,000 | | | | Chinese Yuan Renminbi | | | | 3,309,368 | | | | 3,154 | |
04/28/11 | | | U.S. Dollars | | | | MLCS | | | | 144,000 | | | | Chinese Yuan Renminbi | | | | 952,416 | | | | 573 | |
04/28/11 | | | U.S. Dollars | | | | JPM | | | | 172,000 | | | | Chinese Yuan Renminbi | | | | 1,137,780 | | | | 711 | |
05/09/11 | | | U.S. Dollars | | | | CITI | | | | 291,496 | | | | South Korean Won | | | | 327,000,000 | | | | (4,990 | ) |
05/09/11 | | | U.S. Dollars | | | | CITI | | | | 200,000 | | | | South Korean Won | | | | 224,000,000 | | | | (3,739 | ) |
05/09/11 | | | U.S. Dollars | | | | CITI | | | | 321,558 | | | | South Korean Won | | | | 363,200,000 | | | | (3,336 | ) |
05/09/11 | | | U.S. Dollars | | | | RBS | | | | 313,784 | | | | South Korean Won | | | | 355,000,000 | | | | (2,747 | ) |
05/09/11 | | | U.S. Dollars | | | | HSBC | | | | 157,670 | | | | South Korean Won | | | | 177,000,000 | | | | (2,589 | ) |
05/09/11 | | | U.S. Dollars | | | | JPM | | | | 359,778 | | | | South Korean Won | | | | 408,000,000 | | | | (2,304 | ) |
05/09/11 | | | U.S. Dollars | | | | BAR | | | | 83,504 | | | | South Korean Won | | | | 93,800,000 | | | | (1,320 | ) |
05/09/11 | | | U.S. Dollars | | | | GSC | | | | 66,575 | | | | South Korean Won | | | | 75,549,400 | | | | (381 | ) |
05/09/11 | | | U.S. Dollars | | | | JPM | | | | 128,418 | | | | South Korean Won | | | | 148,733,900 | | | | 1,897 | |
06/15/11 | | | U.S. Dollars | | | | HSBC | | | | 48,000 | | | | Chinese Yuan Renminbi | | | | 319,176 | | | | 493 | |
11/04/11 | | | U.S. Dollars | | | | DEUT | | | | 390,000 | | | | Chinese Yuan Renminbi | | | | 2,490,150 | | | | (10,297 | ) |
02/13/12 | | | U.S. Dollars | | | | BAR | | | | 1,367,801 | | | | Chinese Yuan Renminbi | | | | 8,799,062 | | | | (21,204 | ) |
02/13/12 | | | U.S. Dollars | | | | CITI | | | | 1,124,074 | | | | Chinese Yuan Renminbi | | | | 7,223,298 | | | | (18,630 | ) |
02/13/12 | | | U.S. Dollars | | | | CITI | | | | 789,747 | | | | Chinese Yuan Renminbi | | | | 5,083,996 | | | | (11,699 | ) |
02/13/12 | | | U.S. Dollars | | | | JPM | | | | 471,000 | | | | Chinese Yuan Renminbi | | | | 3,029,001 | | | | (7,446 | ) |
02/13/12 | | | U.S. Dollars | | | | JPM | | | | 392,076 | | | | Chinese Yuan Renminbi | | | | 2,526,343 | | | | (5,448 | ) |
02/13/12 | | | U.S. Dollars | | | | DEUT | | | | 385,347 | | | | Chinese Yuan Renminbi | | | | 2,482,791 | | | | (5,384 | ) |
02/13/12 | | | U.S. Dollars | | | | BAR | | | | 406,300 | | | | Chinese Yuan Renminbi | | | | 2,619,822 | | | | (5,366 | ) |
02/13/12 | | | U.S. Dollars | | | | CITI | | | | 387,172 | | | | Chinese Yuan Renminbi | | | | 2,496,098 | | | | (5,172 | ) |
02/13/12 | | | U.S. Dollars | | | | DEUT | | | | 370,654 | | | | Chinese Yuan Renminbi | | | | 2,388,307 | | | | (5,150 | ) |
02/13/12 | | | U.S. Dollars | | | | UBS | | | | 309,696 | | | | Chinese Yuan Renminbi | | | | 1,994,287 | | | | (4,493 | ) |
02/13/12 | | | U.S. Dollars | | | | DEUT | | | | 87,461 | | | | Chinese Yuan Renminbi | | | | 567,800 | | | | (566 | ) |
| | | | | | | | | | | | | | | | | | | | | | | | |
| | | | | | | | | | | | | | | | | | | | | | $ | (272,766 | ) |
| | | | | | | | | | | | | | | | | | | | | | | | |
Medium-Duration Bond Fund | |
01/06/11 | | | Euro | | | | CITI | | | | 10,374,000 | | | | U.S. Dollars | | | | 14,051,168 | | | $ | 188,445 | |
01/10/11 | | | Chinese Yuan Renminbi | | | | DEUT | | | | 821,640 | | | | U.S. Dollars | | | | 123,425 | | | | (1,234 | ) |
01/10/11 | | | U.S. Dollars | | | | DEUT | | | | 123,000 | | | | Chinese Yuan Renminbi | | | | 821,640 | | | | 1,660 | |
01/11/11 | | | Euro | | | | BAR | | | | 376,380 | | | | U.S. Dollars | | | | 497,601 | | | | (5,349 | ) |
01/11/11 | | | Euro | | | | CITIG | | | | 713,175 | | | | U.S. Dollars | | | | 960,373 | | | | 7,368 | |
01/11/11 | | | U.S. Dollars | | | | WEST | | | | 620,036 | | | | Euro | | | | 471,650 | | | | 10,222 | |
01/12/11 | | | Indian Rupees | | | | BAR | | | | 56,916,480 | | | | U.S. Dollars | | | | 1,251,462 | | | | (18,598 | ) |
01/12/11 | | | U.S. Dollars | | | | BAR | | | | 151,000 | | | | Indian Rupees | | | | 7,093,980 | | | | 7,298 | |
01/12/11 | | | U.S. Dollars | | | | MSCS | | | | 270,000 | | | | Indian Rupees | | | | 12,684,600 | | | | 13,050 | |
01/12/11 | | | U.S. Dollars | | | | HSBC | | | | 790,000 | | | | Indian Rupees | | | | 37,137,900 | | | | 38,712 | |
01/14/11 | | | Japanese Yen | | | | RBS | | | | 50,326,000 | | | | U.S. Dollars | | | | 598,756 | | | | (21,201 | ) |
01/14/11 | | | Japanese Yen | | | | GSC | | | | 42,274,000 | | | | U.S. Dollars | | | | 502,239 | | | | (18,525 | ) |
01/14/11 | | | Japanese Yen | | | | RBS | | | | 25,163,000 | | | | U.S. Dollars | | | | 298,844 | | | | (11,134 | ) |
01/14/11 | | | Taiwan Dollars | | | | DEUT | | | | 28,300,000 | | | | U.S. Dollars | | | | 943,963 | | | | (27,080 | ) |
01/14/11 | | | Taiwan Dollars | | | | DEUT | | | | 19,762,980 | | | | U.S. Dollars | | | | 661,522 | | | | (16,595 | ) |
01/14/11 | | | U.S. Dollars | | | | DEUT | | | | 116,264 | | | | Taiwan Dollars | | | | 3,659,980 | | | | 9,319 | |
01/14/11 | | | U.S. Dollars | | | | UBS | | | | 252,500 | | | | Taiwan Dollars | | | | 8,003,000 | | | | 22,103 | |
01/14/11 | | | U.S. Dollars | | | | DEUT | | | | 388,557 | | | | Taiwan Dollars | | | | 12,020,000 | | | | 23,880 | |
01/14/11 | | | U.S. Dollars | | | | JPM | | | | 304,022 | | | | Taiwan Dollars | | | | 9,601,000 | | | | 25,413 | |
01/14/11 | | | U.S. Dollars | | | | MSCS | | | | 470,294 | | | | Taiwan Dollars | | | | 14,779,000 | | | | 36,810 | |
01/19/11 | | | South Korean Won | | | | JPM | | | | 2,763,997,700 | | | | U.S. Dollars | | | | 2,393,693 | | | | (38,979 | ) |
01/19/11 | | | U.S. Dollars | | | | MSCS | | | | 1,240,000 | | | | South Korean Won | | | | 1,386,568,000 | | | | (19,643 | ) |
| | | | | | | | | | | | | | | | | | | | |
Fund/ Expiration Date | | Currency to be
Delivered | | Counter-
party | | | Amount
of Currency
to be
Delivered | | | Currency to be
Received | | Amount
of Currency
to be
Received | | | Net Unrealized
Appreciation
(Depreciation) | |
01/19/11 | | U.S. Dollars | | | HSBC | | | | 1,053,000 | | | South Korean Won | | | 1,177,254,000 | | | $ | (16,866 | ) |
01/19/11 | | U.S. Dollars | | | MSCS | | | | 179,000 | | | South Korean Won | | | 200,175,700 | | | | (2,820 | ) |
01/21/11 | | Mexican Pesos | | | DEUT | | | | 3,211,875 | | | U.S. Dollars | | | 257,527 | | | | (2,172 | ) |
01/21/11 | | Mexican Pesos | | | DEUT | | | | 1,705,294 | | | U.S. Dollars | | | 137,441 | | | | (443 | ) |
01/21/11 | | Mexican Pesos | | | CITI | | | | 23,546,731 | | | U.S. Dollars | | | 1,903,458 | | | | (435 | ) |
01/21/11 | | U.S. Dollars | | | DEUT | | | | 900,245 | | | Mexican Pesos | | | 11,205,081 | | | | 5,752 | |
01/21/11 | | U.S. Dollars | | | DEUT | | | | 378,672 | | | Mexican Pesos | | | 4,754,611 | | | | 5,766 | |
01/28/11 | | Australian Dollars | | | RBS | | | | 10,482,000 | | | U.S. Dollars | | | 9,977,963 | | | | (702,241 | ) |
01/31/11 | | South African Rand | | | DEUT | | | | 9,717,539 | | | U.S. Dollars | | | 1,413,512 | | | | (54,656 | ) |
02/07/11 | | U.S. Dollars | | | DEUT | | | | 2,734 | | | Malaysian Ringgits | | | 8,484 | | | | 10 | |
02/14/11 | | Canadian Dollars | | | CS | | | | 1,842,980 | | | U.S. Dollars | | | 1,818,772 | | | | (33,111 | ) |
02/14/11 | | Euro | | | CITIC | | | | 2,290,678 | | | U.S. Dollars | | | 3,028,635 | | | | (32,055 | ) |
02/14/11 | | Euro | | | UBS | | | | 824,514 | | | U.S. Dollars | | | 1,131,765 | | | | 30,092 | |
02/14/11 | | Japanese Yen | | | CITIC | | | | 156,230,000 | | | U.S. Dollars | | | 1,902,159 | | | | (23,037 | ) |
02/14/11 | | U.S. Dollars | | | CITIC | | | | 1,049,585 | | | Euro | | | 765,977 | | | | (26,121 | ) |
02/14/11 | | U.S. Dollars | | | JPM | | | | 1,158,898 | | | Canadian Dollars | | | 1,175,203 | | | | 21,983 | |
02/17/11 | | Canadian Dollars | | | DEUT | | | | 11,121,000 | | | U.S. Dollars | | | 11,041,720 | | | | (132,161 | ) |
02/22/11 | | Mexican Pesos | | | MSCS | | | | 1,127,655 | | | U.S. Dollars | | | 90,000 | | | | (960 | ) |
02/22/11 | | U.S. Dollars | | | BAR | | | | 93,641 | | | Mexican Pesos | | | 1,202,254 | | | | 3,336 | |
02/24/11 | | U.S. Dollars | | | BAR | | | | 287,000 | | | Singapore Dollars | | | 374,615 | | | | 4,919 | |
02/24/11 | | U.S. Dollars | | | JPM | | | | 287,000 | | | Singapore Dollars | | | 374,679 | | | | 4,968 | |
02/24/11 | | U.S. Dollars | | | BAR | | | | 287,000 | | | Singapore Dollars | | | 374,767 | | | | 5,038 | |
02/24/11 | | U.S. Dollars | | | HKSB | | | | 287,000 | | | Singapore Dollars | | | 374,851 | | | | 5,102 | |
03/02/11 | | U.S. Dollars | | | CITI | | | | 738,498 | | | Brazilian Reals | | | 1,259,435 | | | | 10,092 | |
03/16/11 | | Euro | | | JPM | | | | 1,230,699 | | | U.S. Dollars | | | 1,610,000 | | | | (34,166 | ) |
03/16/11 | | Euro | | | DEUT | | | | 1,209,000 | | | U.S. Dollars | | | 1,598,987 | | | | (16,190 | ) |
03/16/11 | | Japanese Yen | | | JPM | | | | 156,096,380 | | | U.S. Dollars | | | 1,870,000 | | | | (54,142 | ) |
03/16/11 | | U.S. Dollars | | | CS | | | | 1,902,598 | | | Japanese Yen | | | 156,096,380 | | | | 21,544 | |
03/21/11 | | U.S. Dollars | | | MSCS | | | | 944,658 | | | United Kingdom Pounds | | | 615,000 | | | | 13,576 | |
03/21/11 | | United Kingdom Pounds | | | RBS | | | | 1,779,000 | | | U.S. Dollars | | | 2,781,031 | | | | 9,162 | |
04/06/11 | | U.S. Dollars | | | DEUT | | | | 666,655 | | | Taiwan Dollars | | | 19,762,980 | | | | 13,017 | |
04/06/11 | | U.S. Dollars | | | DEUT | | | | 951,261 | | | Taiwan Dollars | | | 28,300,000 | | | | 22,010 | |
04/07/11 | | U.S. Dollars | | | JPM | | | | 597,000 | | | Chinese Yuan Renminbi | | | 3,959,304 | | | | 3,773 | |
04/28/11 | | U.S. Dollars | | | MLCS | | | | 283,000 | | | Chinese Yuan Renminbi | | | 1,871,762 | | | | 1,126 | |
04/28/11 | | U.S. Dollars | | | JPM | | | | 341,000 | | | Chinese Yuan Renminbi | | | 2,255,715 | | | | 1,409 | |
05/09/11 | | U.S. Dollars | | | CITI | | | | 697,094 | | | South Korean Won | | | 782,000,000 | | | | (11,934 | ) |
05/09/11 | | U.S. Dollars | | | CITI | | | | 478,571 | | | South Korean Won | | | 536,000,000 | | | | (8,948 | ) |
05/09/11 | | U.S. Dollars | | | CITI | | | | 768,924 | | | South Korean Won | | | 868,500,000 | | | | (7,977 | ) |
05/09/11 | | U.S. Dollars | | | RBS | | | | 749,547 | | | South Korean Won | | | 848,000,000 | | | | (6,561 | ) |
05/09/11 | | U.S. Dollars | | | HSBC | | | | 376,804 | | | South Korean Won | | | 423,000,000 | | | | (6,187 | ) |
05/09/11 | | U.S. Dollars | | | JPM | | | | 860,470 | | | South Korean Won | | | 975,800,000 | | | | (5,510 | ) |
05/09/11 | | U.S. Dollars | | | BAR | | | | 199,501 | | | South Korean Won | | | 224,100,000 | | | | (3,153 | ) |
05/09/11 | | U.S. Dollars | | | GSC | | | | 159,074 | | | South Korean Won | | | 180,516,800 | | | | (912 | ) |
05/09/11 | | U.S. Dollars | | | BAR | | | | 1,228,502 | | | Indian Rupees | | | 56,916,480 | | | | 14,239 | |
05/09/11 | | U.S. Dollars | | | JPM | | | | 2,386,460 | | | South Korean Won | | | 2,763,997,700 | | | | 35,253 | |
06/09/11 | | U.S. Dollars | | | DEUT | | | | 728,296 | | | Singapore Dollars | | | 947,586 | | | | 10,083 | |
06/09/11 | | U.S. Dollars | | | DEUT | | | | 1,318,392 | | | Singapore Dollars | | | 1,720,000 | | | | 21,870 | |
06/15/11 | | U.S. Dollars | | | HKSB | | | | 990,000 | | | Chinese Yuan Renminbi | | | 6,583,005 | | | | 10,166 | |
09/14/11 | | U.S. Dollars | | | UBS | | | | 315,000 | | | Chinese Yuan Renminbi | | | 2,088,450 | | | | 3,025 | |
09/14/11 | | U.S. Dollars | | | CITI | | | | 211,000 | | | Chinese Yuan Renminbi | | | 1,401,040 | | | | 2,347 | |
09/14/11 | | U.S. Dollars | | | RBS | | | | 132,000 | | | Chinese Yuan Renminbi | | | 875,160 | | | | 1,268 | |
11/04/11 | | U.S. Dollars | | | DEUT | | | | 805,000 | | | Chinese Yuan Renminbi | | | 5,139,925 | | | | (21,255 | ) |
| | | | | | | | | | | | | | | | | | | | |
Fund/ Expiration Date | | Currency to be
Delivered | | Counter-
party | | | Amount
of Currency
to be
Delivered | | | Currency to be
Received | | Amount
of Currency
to be
Received | | | Net Unrealized
Appreciation
(Depreciation) | |
11/15/11 | | U.S. Dollars | | | DEUT | | | | 438,000 | | | Chinese Yuan Renminbi | | | 2,900,436 | | | $ | 4,392 | |
02/13/12 | | U.S. Dollars | | | CITI | | | | 994,631 | | | Chinese Yuan Renminbi | | | 6,402,937 | | | | (14,734 | ) |
02/13/12 | | U.S. Dollars | | | DEUT | | | | 515,636 | | | Chinese Yuan Renminbi | | | 3,324,821 | | | | (6,810 | ) |
02/13/12 | | U.S. Dollars | | | BAR | | | | 491,360 | | | Chinese Yuan Renminbi | | | 3,167,798 | | | | (6,564 | ) |
02/13/12 | | U.S. Dollars | | | CITI | | | | 489,045 | | | Chinese Yuan Renminbi | | | 3,150,917 | | | | (6,833 | ) |
02/13/12 | | U.S. Dollars | | | BAR | | | | 1,415,691 | | | Chinese Yuan Renminbi | | | 9,097,230 | | | | (23,463 | ) |
02/13/12 | | U.S. Dollars | | | JPM | | | | 1,722,648 | | | Chinese Yuan Renminbi | | | 11,081,793 | | | | (26,704 | ) |
02/13/12 | | U.S. Dollars | | | CITI | | | | 597,000 | | | Chinese Yuan Renminbi | | | 3,839,307 | | | | (9,437 | ) |
02/13/12 | | U.S. Dollars | | | JPM | | | | 470,658 | | | Chinese Yuan Renminbi | | | 3,032,686 | | | | (6,540 | ) |
02/13/12 | | U.S. Dollars | | | DEUT | | | | 497,861 | | | Chinese Yuan Renminbi | | | 3,207,965 | | | | (6,918 | ) |
02/13/12 | | U.S. Dollars | | | UBS | | | | 393,254 | | | Chinese Yuan Renminbi | | | 2,532,357 | | | | (5,705 | ) |
02/13/12 | | U.S. Dollars | | | DEUT | | | | 126,562 | | | Chinese Yuan Renminbi | | | 821,640 | | | | (819 | ) |
| | | | | | | | | | | | | | | | | | | | |
| | | | | | | | | | | | | | | | | | $ | (827,280 | ) |
| | | | | | | | | | | | | | | | | | | | |
Global Bond Fund | |
02/14/11 | | Australian Dollars | | | JPM | | | | 760,000 | | | U.S. Dollars | | | 740,164 | | | $ | (32,635 | ) |
02/14/11 | | Australian Dollars | | | CITIC | | | | 631,336 | | | U.S. Dollars | | | 624,133 | | | | (17,836 | ) |
02/14/11 | | Australian Dollars | | | BAR | | | | 567,400 | | | U.S. Dollars | | | 564,137 | | | | (12,818 | ) |
02/14/11 | | Canadian Dollars | | | JPM | | | | 514,539 | | | U.S. Dollars | | | 510,000 | | | | (7,020 | ) |
02/14/11 | | Euro | | | DEUT | | | | 845,289 | | | U.S. Dollars | | | 1,100,000 | | | | (29,428 | ) |
02/14/11 | | Euro | | | SG | | | | 550,000 | | | U.S. Dollars | | | 745,375 | | | | 10,496 | |
02/14/11 | | Euro | | | JPM | | | | 1,735,952 | | | U.S. Dollars | | | 2,363,916 | | | | 44,434 | |
02/14/11 | | Euro | | | GSC | | | | 1,947,319 | | | U.S. Dollars | | | 2,648,587 | | | | 46,690 | |
02/14/11 | | Euro | | | MSCS | | | | 1,808,255 | | | U.S. Dollars | | | 2,481,141 | | | | 65,045 | |
02/14/11 | | Euro | | | BAR | | | | 1,500,000 | | | U.S. Dollars | | | 2,069,295 | | | | 65,079 | |
02/14/11 | | Euro | | | CITIC | | | | 3,087,722 | | | U.S. Dollars | | | 4,230,936 | | | | 105,295 | |
02/14/11 | | Euro | | | SG | | | | 4,119,322 | | | U.S. Dollars | | | 5,679,957 | | | | 175,951 | |
02/14/11 | | Japanese Yen | | | JPM | | | | 531,533,148 | | | U.S. Dollars | | | 6,463,509 | | | | (86,485 | ) |
02/14/11 | | Japanese Yen | | | DEUT | | | | 133,892,800 | | | U.S. Dollars | | | 1,600,000 | | | | (49,939 | ) |
02/14/11 | | Japanese Yen | | | CITIC | | | | 128,025,470 | | | U.S. Dollars | | | 1,558,758 | | | | (18,878 | ) |
02/14/11 | | Japanese Yen | | | SG | | | | 121,041,680 | | | U.S. Dollars | | | 1,481,283 | | | | (10,294 | ) |
02/14/11 | | Norwegian Krone | | | SG | | | | 9,594,323 | | | U.S. Dollars | | | 1,597,554 | | | | (43,044 | ) |
02/14/11 | | Norwegian Krone | | | SG | | | | 3,276,677 | | | U.S. Dollars | | | 551,562 | | | | (8,739 | ) |
02/14/11 | | Polish Zloty | | | CITIC | | | | 1,201,054 | | | U.S. Dollars | | | 390,016 | | | | (14,527 | ) |
02/14/11 | | Polish Zloty | | | CITIC | | | | 1,191,800 | | | U.S. Dollars | | | 394,929 | | | | (6,497 | ) |
02/14/11 | | U.S. Dollars | | | MSCS | | | | 582,946 | | | Australian Dollars | | | 587,221 | | | | 14,159 | |
02/14/11 | | U.S. Dollars | | | DEUT | | | | 739,293 | | | Australian Dollars | | | 745,608 | | | | 18,872 | |
02/14/11 | | U.S. Dollars | | | CS | | | | 614,250 | | | Australian Dollars | | | 630,000 | | | | 26,360 | |
02/14/11 | | U.S. Dollars | | | JPM | | | | 1,498,970 | | | Canadian Dollars | | | 1,520,075 | | | | 28,434 | |
02/14/11 | | U.S. Dollars | | | UBS | | | | 2,155,054 | | | Euro | | | 1,570,000 | | | | (57,299 | ) |
02/14/11 | | U.S. Dollars | | | CS | | | | 2,133,241 | | | Euro | | | 1,566,003 | | | | (40,836 | ) |
02/14/11 | | U.S. Dollars | | | DEUT | | | | 948,432 | | | Euro | | | 688,767 | | | | (28,140 | ) |
02/14/11 | | U.S. Dollars | | | SG | | | | 551,562 | | | Euro | | | 412,000 | | | | (1,070 | ) |
02/14/11 | | U.S. Dollars | | | CITIC | | | | 394,929 | | | Euro | | | 295,000 | | | | (766 | ) |
02/14/11 | | U.S. Dollars | | | JPM | | | | 1,187,685 | | | Euro | | | 900,000 | | | | 14,844 | |
02/14/11 | | U.S. Dollars | | | SG | | | | 1,597,554 | | | Euro | | | 1,210,770 | | | | 20,209 | |
02/14/11 | | U.S. Dollars | | | JPM | | | | 1,582,008 | | | Euro | | | 1,200,000 | | | | 21,364 | |
02/14/11 | | U.S. Dollars | | | SG | | | | 745,375 | | | Japanese Yen | | | 61,396,500 | | | | 11,204 | |
02/14/11 | | U.S. Dollars | | | CS | | | | 712,638 | | | Japanese Yen | | | 59,000,000 | | | | 14,409 | |
02/14/11 | | U.S. Dollars | | | GSC | | | | 10,253,414 | | | Japanese Yen | | | 837,478,320 | | | | 66,691 | |
02/14/11 | | U.S. Dollars | | | DEUT | | | | 6,740,601 | | | Japanese Yen | | | 554,566,060 | | | | 93,224 | |
02/14/11 | | U.S. Dollars | | | GSC | | | | 374,832 | | | Mexican Pesos | | | 4,650,275 | | | | 504 | |
| | | | | | | | | | | | | | | | | | | | |
Fund/ Expiration Date | | Currency to be
Delivered | | Counter-
party | | | Amount
of Currency
to be
Delivered | | | Currency to be
Received | | Amount
of Currency
to be
Received | | | Net Unrealized
Appreciation
(Depreciation) | |
02/14/11 | | U.S. Dollars | | | SG | | | | 2,191,424 | | | Norwegian Krone | | | 12,871,000 | | | $ | 9,475 | |
02/14/11 | | U.S. Dollars | | | GSC | | | | 138,986 | | | South African Rand | | | 988,065 | | | | 10,020 | |
02/14/11 | | U.S. Dollars | | | SG | | | | 2,041,822 | | | United Kingdom Pounds | | | 1,277,800 | | | | (50,308 | ) |
02/14/11 | | U.S. Dollars | | | JPM | | | | 1,181,545 | | | United Kingdom Pounds | | | 738,000 | | | | (31,336 | ) |
02/14/11 | | U.S. Dollars | | | DEUT | | | | 482,595 | | | United Kingdom Pounds | | | 300,000 | | | | (15,030 | ) |
02/14/11 | | U.S. Dollars | | | JPM | | | | 545,117 | | | United Kingdom Pounds | | | 350,000 | | | | 375 | |
02/14/11 | | United Kingdom Pounds | | | DEUT | | | | 321,217 | | | U.S. Dollars | | | 500,000 | | | | (633 | ) |
02/14/11 | | United Kingdom Pounds | | | GSC | | | | 200,000 | | | U.S. Dollars | | | 320,970 | | | | 9,260 | |
02/14/11 | | United Kingdom Pounds | | | BAR | | | | 787,510 | | | U.S. Dollars | | | 1,258,882 | | | | 31,509 | |
02/14/11 | | United Kingdom Pounds | | | CS | | | | 650,000 | | | U.S. Dollars | | | 1,045,850 | | | | 32,793 | |
02/22/11 | | Brazilian Reals | | | JPM | | | | 2,175,000 | | | U.S. Dollars | | | 1,239,316 | | | | (55,542 | ) |
02/22/11 | | U.S. Dollars | | | DEUT | | | | 514,345 | | | South Korean Won | | | 590,596,400 | | | | 4,605 | |
| | | | | | | | | | | | | | | | | | | | |
| | | | | | | | | | | | | | | | | | $ | 322,201 | |
| | | | | | | | | | | | | | | | | | | | |
Small Cap Equity Fund | |
02/14/11 | | Euro | | | CITIG | | | | 361,200 | | | U.S. Dollars | | | 477,560 | | | $ | (5,055 | ) |
02/14/11 | | Japanese Yen | | | CITIG | | | | 14,380,000 | | | U.S. Dollars | | | 175,082 | | | | (2,120 | ) |
02/14/11 | | Japanese Yen | | | GSC | | | | 4,882,084 | | | U.S. Dollars | | | 59,772 | | | | (389 | ) |
| | | | | | | | | | | | | | | | | | | | |
| | | | | | | | | | | | | | | | | | $ | (7,564 | ) |
| | | | | | | | | | | | | | | | | | | | |
International Equity Fund | |
03/16/11 | | Australian Dollars | | | RBS | | | | 482,000 | | | U.S. Dollars | | | 480,767 | | | $ | (7,578 | ) |
03/16/11 | | Australian Dollars | | | RBS | | | | 60,000 | | | U.S. Dollars | | | 59,025 | | | | (1,765 | ) |
03/16/11 | | Canadian Dollars | | | RBS | | | | 2,907,000 | | | U.S. Dollars | | | 2,835,351 | | | | (83,514 | ) |
03/16/11 | | Canadian Dollars | | | RBS | | | | 684,000 | | | U.S. Dollars | | | 677,451 | | | | (9,341 | ) |
03/16/11 | | Danish Kroner | | | RBS | | | | 1,714,000 | | | U.S. Dollars | | | 302,538 | | | | (4,655 | ) |
03/16/11 | | Danish Kroner | | | RBS | | | | 249,000 | | | U.S. Dollars | | | 43,638 | | | | (989 | ) |
03/16/11 | | Danish Kroner | | | RBS | | | | 232,000 | | | U.S. Dollars | | | 40,648 | | | | (933 | ) |
03/16/11 | | Danish Kroner | | | RBS | | | | 68,000 | | | U.S. Dollars | | | 12,060 | | | | (127 | ) |
03/16/11 | | Danish Kroner | | | RBS | | | | 10,000 | | | U.S. Dollars | | | 1,769 | | | | (23 | ) |
03/16/11 | | Danish Kroner | | | RBS | | | | 49,000 | | | U.S. Dollars | | | 8,774 | | | | (8 | ) |
03/16/11 | | Danish Kroner | | | RBS | | | | 120,000 | | | U.S. Dollars | | | 21,667 | | | | 160 | |
03/16/11 | | Euro | | | RBS | | | | 5,215,000 | | | U.S. Dollars | | | 6,847,153 | | | | (119,887 | ) |
03/16/11 | | Euro | | | RBS | | | | 1,641,000 | | | U.S. Dollars | | | 2,136,588 | | | | (55,725 | ) |
03/16/11 | | Euro | | | RBS | | | | 1,099,000 | | | U.S. Dollars | | | 1,434,745 | | | | (33,477 | ) |
03/16/11 | | Euro | | | RBS | | | | 472,000 | | | U.S. Dollars | | | 620,645 | | | | (9,929 | ) |
03/16/11 | | Euro | | | RBS | | | | 144,000 | | | U.S. Dollars | | | 190,318 | | | | (2,061 | ) |
03/16/11 | | Euro | | | RBS | | | | 6,000 | | | U.S. Dollars | | | 7,939 | | | | (76 | ) |
03/16/11 | | Euro | | | RBS | | | | 690,000 | | | U.S. Dollars | | | 927,263 | | | | 5,450 | |
03/16/11 | | Hong Kong Dollars | | | RBS | | | | 101,000 | | | U.S. Dollars | | | 12,993 | | | | (9 | ) |
03/16/11 | | Hong Kong Dollars | | | RBS | | | | 12,000 | | | U.S. Dollars | | | 1,543 | | | | (2 | ) |
03/16/11 | | Hong Kong Dollars | | | RBS | | | | 139,000 | | | U.S. Dollars | | | 17,913 | | | | 18 | |
03/16/11 | | Hong Kong Dollars | | | RBS | | | | 333,000 | | | U.S. Dollars | | | 42,896 | | | | 25 | |
03/16/11 | | Israeli Shekels | | | RBS | | | | 52,000 | | | U.S. Dollars | | | 14,170 | | | | (469 | ) |
03/16/11 | | Israeli Shekels | | | RBS | | | | 50,000 | | | U.S. Dollars | | | 13,854 | | | | (223 | ) |
03/16/11 | | Israeli Shekels | | | RBS | | | | 6,000 | | | U.S. Dollars | | | 1,627 | | | | (62 | ) |
03/16/11 | | Israeli Shekels | | | RBS | | | | 10,000 | | | U.S. Dollars | | | 2,756 | | | | (60 | ) |
03/16/11 | | Japanese Yen | | | RBS | | | | 338,856,000 | | | U.S. Dollars | | | 4,051,993 | | | | (124,958 | ) |
03/16/11 | | Japanese Yen | | | RBS | | | | 7,119,000 | | | U.S. Dollars | | | 84,702 | | | | (3,051 | ) |
03/16/11 | | New Zealand Dollars | | | RBS | | | | 3,800,000 | | | U.S. Dollars | | | 2,794,976 | | | | (148,232 | ) |
| | | | | | | | | | | | | | | | | | |
Fund/ Expiration Date | | Currency to be
Delivered | | Counter-
party | | Amount
of Currency
to be
Delivered | | | Currency to be Received | | Amount
of Currency
to be
Received | | | Net Unrealized
Appreciation
(Depreciation) | |
03/16/11 | | New Zealand Dollars | | RBS | | | 1,038,000 | | | U.S. Dollars | | | 773,614 | | | $ | (30,346 | ) |
03/16/11 | | New Zealand Dollars | | RBS | | | 758,000 | | | U.S. Dollars | | | 560,917 | | | | (26,176 | ) |
03/16/11 | | New Zealand Dollars | | RBS | | | 568,000 | | | U.S. Dollars | | | 423,640 | | | | (16,292 | ) |
03/16/11 | | New Zealand Dollars | | RBS | | | 670,000 | | | U.S. Dollars | | | 504,607 | | | | (14,327 | ) |
03/16/11 | | New Zealand Dollars | | RBS | | | 69,000 | | | U.S. Dollars | | | 51,055 | | | | (2,387 | ) |
03/16/11 | | Norwegian Krone | | RBS | | | 5,659,000 | | | U.S. Dollars | | | 907,990 | | | | (58,208 | ) |
03/16/11 | | Norwegian Krone | | RBS | | | 1,647,000 | | | U.S. Dollars | | | 264,593 | | | | (16,610 | ) |
03/16/11 | | Singapore Dollars | | RBS | | | 41,000 | | | U.S. Dollars | | | 31,255 | | | | (695 | ) |
03/16/11 | | Singapore Dollars | | RBS | | | 8,000 | | | U.S. Dollars | | | 6,065 | | | | (169 | ) |
03/16/11 | | Switzerland Francs | | RBS | | | 2,140,000 | | | U.S. Dollars | | | 2,138,225 | | | | (152,690 | ) |
03/16/11 | | Switzerland Francs | | RBS | | | 719,000 | | | U.S. Dollars | | | 721,410 | | | | (48,295 | ) |
03/16/11 | | Switzerland Francs | | RBS | | | 1,165,000 | | | U.S. Dollars | | | 1,226,155 | | | | (21,002 | ) |
03/16/11 | | Switzerland Francs | | RBS | | | 518,000 | | | U.S. Dollars | | | 538,949 | | | | (15,581 | ) |
03/16/11 | | Switzerland Francs | | RBS | | | 87,000 | | | U.S. Dollars | | | 89,066 | | | | (4,070 | ) |
03/16/11 | | U.S. Dollars | | RBS | | | 10,809 | | | Australian Dollars | | | 11,000 | | | | 336 | |
03/16/11 | | U.S. Dollars | | RBS | | | 133,717 | | | Australian Dollars | | | 137,000 | | | | 5,087 | |
03/16/11 | | U.S. Dollars | | RBS | | | 1,350,590 | | | Australian Dollars | | | 1,420,000 | | | | 88,103 | |
03/16/11 | | U.S. Dollars | | RBS | | | 8,215,674 | | | Australian Dollars | | | 8,630,000 | | | | 527,937 | |
03/16/11 | | U.S. Dollars | | RBS | | | 158,786 | | | Canadian Dollars | | | 160,000 | | | | 1,867 | |
03/16/11 | | U.S. Dollars | | RBS | | | 1,497,838 | | | Canadian Dollars | | | 1,532,000 | | | | 40,415 | |
03/16/11 | | U.S. Dollars | | RBS | | | 196,255 | | | Euro | | | 147,000 | | | | 132 | |
03/16/11 | | U.S. Dollars | | RBS | | | 398,815 | | | Hong Kong Dollars | | | 3,095,000 | | | | (366 | ) |
03/16/11 | | U.S. Dollars | | RBS | | | 12,375 | | | Hong Kong Dollars | | | 96,000 | | | | (16 | ) |
03/16/11 | | U.S. Dollars | | RBS | | | 16,470 | | | Hong Kong Dollars | | | 128,000 | | | | 9 | |
03/16/11 | | U.S. Dollars | | RBS | | | 2,794 | | | Israeli Shekels | | | 10,000 | | | | 21 | |
03/16/11 | | U.S. Dollars | | RBS | | | 31,435 | | | Israeli Shekels | | | 113,000 | | | | 379 | |
03/16/11 | | U.S. Dollars | | RBS | | | 492,784 | | | Israeli Shekels | | | 1,813,000 | | | | 17,643 | |
03/16/11 | | U.S. Dollars | | RBS | | | 90,630 | | | Japanese Yen | | | 7,558,000 | | | | 2,535 | |
03/16/11 | | U.S. Dollars | | RBS | | | 159,042 | | | Japanese Yen | | | 13,377,000 | | | | 5,852 | |
03/16/11 | | U.S. Dollars | | RBS | | | 712,953 | | | Japanese Yen | | | 58,700,000 | | | | 10,620 | |
03/16/11 | | U.S. Dollars | | RBS | | | 1,892,136 | | | Japanese Yen | | | 156,127,000 | | | | 32,383 | |
03/16/11 | | U.S. Dollars | | RBS | | | 216,816 | | | Norwegian Krone | | | 1,299,000 | | | | 4,971 | |
03/16/11 | | U.S. Dollars | | RBS | | | 883,453 | | | Norwegian Krone | | | 5,242,000 | | | | 11,548 | |
03/16/11 | | U.S. Dollars | | RBS | | | 2,187,971 | | | Norwegian Krone | | | 12,945,000 | | | | 22,214 | |
03/16/11 | | U.S. Dollars | | RBS | | | 5,824,106 | | | Norwegian Krone | | | 36,192,000 | | | | 355,189 | |
03/16/11 | | U.S. Dollars | | RBS | | | 2,311 | | | Singapore Dollars | | | 3,000 | | | | 27 | |
03/16/11 | | U.S. Dollars | | RBS | | | 8,437 | | | Singapore Dollars | | | 11,000 | | | | 135 | |
03/16/11 | | U.S. Dollars | | RBS | | | 13,779 | | | Singapore Dollars | | | 18,000 | | | | 248 | |
03/16/11 | | U.S. Dollars | | RBS | | | 66,365 | | | Singapore Dollars | | | 87,000 | | | | 1,430 | |
03/16/11 | | U.S. Dollars | | RBS | | | 16,462 | | | Swedish Kronor | | | 112,000 | | | | 145 | |
03/16/11 | | U.S. Dollars | | RBS | | | 123,682 | | | Swedish Kronor | | | 846,000 | | | | 1,763 | |
03/16/11 | | U.S. Dollars | | RBS | | | 111,011 | | | Swedish Kronor | | | 781,000 | | | | 4,796 | |
03/16/11 | | U.S. Dollars | | RBS | | | 662,144 | | | Swedish Kronor | | | 4,533,000 | | | | 10,009 | |
03/16/11 | | U.S. Dollars | | RBS | | | 877,385 | | | Swedish Kronor | | | 5,989,000 | | | | 10,664 | |
03/16/11 | | U.S. Dollars | | RBS | | | 9,283,844 | | | Swedish Kronor | | | 65,003,000 | | | | 354,799 | |
03/16/11 | | U.S. Dollars | | RBS | | | 1,048,666 | | | Switzerland Francs | | | 1,011,000 | | | | 33,631 | |
03/16/11 | | U.S. Dollars | | RBS | | | 715,710 | | | United Kingdom Pounds | | | 454,000 | | | | (8,300 | ) |
227
| | | | | | | | | | | | | | | | | | |
Fund/ Expiration Date | | Currency to be Delivered | | Counter-
party | | Amount
of Currency
to be
Delivered | | | Currency to be Received | | Amount
of Currency
to be
Received | | | Net Unrealized
Appreciation
(Depreciation) | |
03/16/11 | | U.S. Dollars | | RBS | | | 429,803 | | | United Kingdom Pounds | | | 271,000 | | | $ | (7,539 | ) |
03/16/11 | | U.S. Dollars | | RBS | | | 1,915,116 | | | United Kingdom Pounds | | | 1,230,000 | | | | 1,435 | |
03/16/11 | | U.S. Dollars | | RBS | | | 237,686 | | | United Kingdom Pounds | | | 154,000 | | | | 2,272 | |
03/16/11 | | United Kingdom Pounds | | RBS | | | 575,000 | | | U.S. Dollars | | | 891,984 | | | | (3,965 | ) |
03/16/11 | | United Kingdom Pounds | | RBS | | | 96,000 | | | U.S. Dollars | | | 149,366 | | | | (218 | ) |
| | | | | | | | | | | | | | | | | | |
| | | | | | | | | | | | | | | | $ | 519,842 | |
| | | | | | | | | | | | | | | | | | |
Please see abbreviation and footnote definitions beginning on page 180.
Options Written
Transactions in options written during the year ended December 31, 2010 were as follows:
| | | | | | | | | | | | |
Low-Duration Bond Fund | | Number of
Contracts | | | Notional
Amount | | | Premiums
Received | |
Options written, 12/31/09 | | | 152 | | | $ | 51,000,000 | | | $ | 561,299 | |
| | | | | | | | | | | | |
Options written | | | 332 | | | | 126,100,000 | | | | 1,034,991 | |
Options expired | | | (348 | ) | | | (75,600,000 | ) | | | (745,238 | ) |
Options closed | | | (76 | ) | | | (12,000,000 | ) | | | (122,305 | ) |
| | | | | | | | | | | | |
Options written, 12/31/10 | | | 60 | | | $ | 89,500,000 | | | $ | 728,747 | |
| | | | | | | | | | | | |
| | | |
Medium-Duration Bond Fund | | Number of
Contracts | | | Notional
Amount | | | Premiums
Received | |
Options written, 12/31/09 | | | 470 | | | $ | 74,000,000 | | | $ | 937,881 | |
| | | | | | | | | | | | |
Options written | | | 621 | | | | 9,077,500,000 | | | | 2,538,339 | |
Options expired | | | (877 | ) | | | (9,031,300,000 | ) | | | (1,859,034 | ) |
Options closed | | | (178 | ) | | | (40,100,000 | ) | | | (965,177 | ) |
| | | | | | | | | | | | |
Options written, 12/31/10 | | | 36 | | | $ | 80,100,000 | | | $ | 652,009 | |
| | | | | | | | | | | | |
| | | |
Small Cap Equity Fund | | Number of
Contracts | | | Notional
Amount | | | Premiums
Received | |
Options written, 12/31/09 | | | 45 | | | $ | — | | | $ | 19,934 | |
| | | | | | | | | | | | |
Options written | | | 136 | | | | — | | | | 63,099 | |
Options expired | | | (42 | ) | | | — | | | | (18,431 | ) |
Options closed | | | (139 | ) | | | — | | | | (64,602 | ) |
| | | | | | | | | | | | |
Options written, 12/31/10 | | | — | | | $ | — | | | $ | — | |
| | | | | | | | | | | | |
228
7. CAPITAL SHARE TRANSACTIONS
Transactions in shares of capital stock were as follows:
| | | | | | | | | | | | |
| | | Year Ended December 31, 2010 | | | Year Ended December 31, 2009 | |
| | | GS4 | | | GS4 | | | GS6 | |
MyDestination 2005 | | | | | | | | | | | | |
Shares sold | | | 1,782,281 | | | | 2,213,197 | | | | 50,038 | |
Shares exchanged | | | — | | | | 184,772 | | | | (183,044 | ) |
Shares reinvested | | | 145,545 | | | | 182,815 | | | | 773 | |
Shares redeemed | | | (3,748,045 | ) | | | (1,839,744 | ) | | | (19,104 | ) |
| | | | | | | | | | | | |
Net increase (decrease) | | | (1,820,219 | ) | | | 741,040 | | | | (151,337 | ) |
| | | | | | | | | | | | |
MyDestination 2015 | | | | | | | | | | | | |
Shares sold | | | 5,359,331 | | | | 6,079,553 | | | | 247,957 | |
Shares exchanged | | | — | | | | 431,494 | | | | (427,887 | ) |
Shares reinvested | | | 547,026 | | | | 575,590 | | | | 4,807 | |
Shares redeemed | | | (5,686,881 | ) | | | (2,440,561 | ) | | | (6,551 | ) |
| | | | | | | | | | | | |
Net increase (decrease) | | | 219,476 | | | | 4,646,076 | | | | (181,674 | ) |
| | | | | | | | | | | | |
MyDestination 2025 | | | | | | | | | | | | |
Shares sold | | | 6,117,622 | | | | 6,514,115 | | | | 178,840 | |
Shares exchanged | | | — | | | | 519,224 | | | | (517,312 | ) |
Shares reinvested | | | 425,744 | | | | 396,790 | | | | 3,796 | |
Shares redeemed | | | (1,598,263 | ) | | | (1,600,886 | ) | | | (1,813 | ) |
| | | | | | | | | | | | |
Net increase (decrease) | | | 4,945,103 | | | | 5,829,243 | | | | (336,489 | ) |
| | | | | | | | | | | | |
MyDestination 2035 | | | | | | | | | | | | |
Shares sold | | | 3,628,903 | | | | 3,674,311 | | | | 156,527 | |
Shares exchanged | | | — | | | | 367,932 | | | | (364,947 | ) |
Shares reinvested | | | 152,793 | | | | 167,185 | | | | 2,176 | |
Shares redeemed | | | (1,024,122 | ) | | | (603,775 | ) | | | (1,335 | ) |
| | | | | | | | | | | | |
Net increase (decrease) | | | 2,757,574 | | | | 3,605,653 | | | | (207,579 | ) |
| | | | | | | | | | | | |
MyDestination 2045 | | | | | | | | | | | | |
Shares sold | | | 3,312,450 | | | | 3,146,539 | | | | 67,736 | |
Shares exchanged | | | — | | | | 226,386 | | | | (224,243 | ) |
Shares reinvested | | | 101,676 | | | | 98,130 | | | | 616 | |
Shares redeemed | | | (501,015 | ) | | | (617,369 | ) | | | (4,681 | ) |
| | | | | | | | | | | | |
Net increase (decrease) | | | 2,913,111 | | | | 2,853,686 | | | | (160,572 | ) |
| | | | | | | | | | | | |
229
| | | | | | | | | | | | |
| | | Year Ended December 31, 2010 | | | Year Ended December 31, 2009 | |
| | | GS4 | | | GS4 | | | GS6 | |
Conservative Allocation Fund | | | | | | | | | | | | |
Shares sold | | | 3,187,360 | | | | 3,409,502 | | | | 269,055 | |
Shares exchanged | | | — | | | | 1,134,656 | | | | (1,811,024 | ) |
Shares reinvested | | | 615,888 | | | | 1,343,985 | | | | 31,621 | |
Shares redeemed | | | (6,746,128 | ) | | | (4,764,021 | ) | | | (30,545 | ) |
| | | | | | | | | | | | |
Net increase (decrease) | | | (2,942,880 | ) | | | 1,124,122 | | | | (1,540,893 | ) |
| | | | | | | | | | | | |
Balanced Allocation Fund | | | | | | | | | | | | |
Shares sold | | | 3,835,756 | | | | 6,475,848 | | | | 152,629 | |
Shares exchanged | | | — | | | | 1,936,474 | | | | (3,506,545 | ) |
Shares reinvested | | | 2,548,485 | | | | 3,173,514 | | | | 87,810 | |
Shares redeemed | | | (15,601,452 | ) | | | (8,328,776 | ) | | | (20,612 | ) |
| | | | | | | | | | | | |
Net increase (decrease) | | | (9,217,211 | ) | | | 3,257,060 | | | | (3,286,718 | ) |
| | | | | | | | | | | | |
Growth Allocation Fund | | | | | | | | | | | | |
Shares sold | | | 2,474,913 | | | | 4,090,589 | | | | 237,995 | |
Shares exchanged | | | — | | | | 1,254,537 | | | | (2,246,107 | ) |
Shares reinvested | | | 1,888,651 | | | | 1,504,652 | | | | 33,305 | |
Shares redeemed | | | (11,457,649 | ) | | | (6,540,396 | ) | | | (53,186 | ) |
| | | | | | | | | | | | |
Net increase (decrease) | | | (7,094,085 | ) | | | 309,382 | | | | (2,027,993 | ) |
| | | | | | | | | | | | |
Aggressive Allocation Fund | | | | | | | | | | | | |
Shares sold | | | 3,255,212 | | | | 4,873,795 | | | | 111,653 | |
Shares exchanged | | | — | | | | 1,515,794 | | | | (2,573,184 | ) |
Shares reinvested | | | 1,206,218 | | | | 1,335,155 | | | | 37,558 | |
Shares redeemed | | | (11,200,914 | ) | | | (5,033,707 | ) | | | (35,096 | ) |
| | | | | | | | | | | | |
Net increase (decrease) | | | (6,739,484 | ) | | | 2,691,037 | | | | (2,459,069 | ) |
| | | | | | | | | | | | |
| | | |
| | | GS2 | | | GS2 | | | | |
Conservative Allocation Fund I | | | | | | | | | | | | |
Shares sold | | | 1,241,966 | | | | 968,454 | | | | | |
Shares reinvested | | | 232,413 | | | | 234,040 | | | | | |
Shares redeemed | | | (930,456 | ) | | | (899,677 | ) | | | | |
| | | | | | | | | | | | |
Net increase | | | 543,923 | | | | 302,817 | | | | | |
| | | | | | | | | | | | |
Balanced Allocation Fund I | | | | | | | | | | | | |
Shares sold | | | 2,147,224 | | | | 2,654,936 | | | | | |
Shares reinvested | | | 1,582,934 | | | | 1,664,813 | | | | | |
Shares redeemed | | | (3,979,021 | ) | | | (2,553,059 | ) | | | | |
| | | | | | | | | | | | |
Net increase (decrease) | | | (248,863 | ) | | | 1,766,690 | | | | | |
| | | | | | | | | | | | |
Growth Allocation Fund I | | | | | | | | | | | | |
Shares sold | | | 1,349,275 | | | | 1,910,217 | | | | | |
Shares reinvested | | | 663,740 | | | | 713,157 | | | | | |
Shares redeemed | | | (1,755,410 | ) | | | (1,732,764 | ) | | | | |
| | | | | | | | | | | | |
Net increase | | | 257,605 | | | | 890,610 | | | | | |
| | | | | | | | | | | | |
Aggressive Allocation Fund I | | | | | | | | | | | | |
Shares sold | | | 906,542 | | | | 1,699,702 | | | | | |
Shares reinvested | | | 243,843 | | | | 350,764 | | | | | |
Shares redeemed | | | (1,640,107 | ) | | | (1,712,562 | ) | | | | |
| | | | | | | | | | | | |
Net increase (decrease) | | | (489,722 | ) | | | 337,904 | | | | | |
| | | | | | | | | | | | |
230
| | | | | | | | | | | | | | | | | | | | |
| | | Year Ended December 31, 2010 | | | Year Ended December 31, 2009 | |
| | | GS2 | | | GS4 | | | GS2 | | | GS4 | | | GS6 | |
Money Market Fund | | | | | | | | | | | | | | | | | | | | |
Shares sold | | | 94,494,393 | | | | 4,496,591,499 | | | | 102,344,425 | | | | 2,886,054,721 | | | | 1,365,914 | |
Shares exchanged | | | — | | | | — | | | | — | | | | 9,761,236 | | | | (9,761,137 | ) |
Shares reinvested | | | 203,577 | | | | 136,473 | | | | 644,744 | | | | 2,050,152 | | | | 7,898 | |
Shares redeemed | | | (108,704,940 | ) | | | (4,381,459,309 | ) | | | (141,405,488 | ) | | | (2,803,066,431 | ) | | | (421,233 | ) |
| | | | | | | | | | | | | | | | | | | | |
Net increase (decrease) | | | (14,006,970 | ) | | | 115,268,663 | | | | (38,416,319 | ) | | | 94,799,678 | | | | (8,808,558 | ) |
| | | | | | | | | | | | | | | | | | | | |
Low-Duration Bond Fund | | | | | | | | | | | | | | | | | | | | |
Shares sold | | | 2,213,591 | | | | 6,135,841 | | | | 2,468,591 | | | | 7,846,621 | | | | 30,894 | |
Shares exchanged | | | — | | | | — | | | | — | | | | 489,313 | | | | (723,673 | ) |
Shares reinvested | | | 600,976 | | | | 1,182,586 | | | | 567,258 | | | | 1,207,547 | | | | 12,328 | |
Shares redeemed | | | (1,397,531 | ) | | | (7,123,322 | ) | | | (2,692,163 | ) | | | (8,924,341 | ) | | | (9,054 | ) |
| | | | | | | | | | | | | | | | | | | | |
Net increase (decrease) | | | 1,417,036 | | | | 195,105 | | | | 343,686 | | | | 619,140 | | | | (689,505 | ) |
| | | | | | | | | | | | | | | | | | | | |
Medium-Duration Bond Fund | | | | | | | | | | | | | | | | | | | | |
Shares sold | | | 15,423,343 | | | | 10,208,086 | | | | 3,074,949 | | | | 8,917,482 | | | | 20,156 | |
Shares exchanged | | | — | | | | — | | | | — | | | | 1,213,587 | | | | (2,078,297 | ) |
Shares reinvested | | | 2,148,938 | | | | 3,449,151 | | | | 1,837,631 | | | | 3,766,018 | | | | 66,716 | |
Shares redeemed | | | (3,689,932 | ) | | | (33,721,553 | ) | | | (1,927,699 | ) | | | (9,609,788 | ) | | | (24,765 | ) |
| | | | | | | | | | | | | | | | | | | | |
Net increase (decrease) | | | 13,882,349 | | | | (20,064,316 | ) | | | 2,984,881 | | | | 4,287,299 | | | | (2,016,190 | ) |
| | | | | | | | | | | | | | | | | | | | |
Extended-Duration Bond Fund | | | | | | | | | | | | | | | | | | | | |
Shares sold | | | 1,659,903 | | | | 4,938,166 | | | | 906,347 | | | | 2,390,121 | | | | 8,130 | |
Shares exchanged | | | — | | | | — | | | | — | | | | 1,233,982 | | | | (2,593,714 | ) |
Shares reinvested | | | 1,280,612 | | | | 1,288,882 | | | | 1,135,939 | | | | 1,388,639 | | | | 104,274 | |
Shares redeemed | | | (2,100,789 | ) | | | (11,095,823 | ) | | | (2,659,695 | ) | | | (6,932,227 | ) | | | (7,292 | ) |
| | | | | | | | | | | | | | | | | | | | |
Net increase (decrease) | | | 839,726 | | | | (4,868,775 | ) | | | (617,409 | ) | | | (1,919,485 | ) | | | (2,488,602 | ) |
| | | | | | | | | | | | | | | | | | | | |
Inflation Protected Bond Fund(1) | | | | | | | | | | | | | | | | | | | | |
Shares sold | | | | | | | 4,018,816 | | | | | | | | 8,555,948 | | | | | |
Shares reinvested | | | | | | | 454,380 | | | | | | | | 141,953 | | | | | |
Shares redeemed | | | | | | | (2,653,937 | ) | | | | | | | (174,295 | ) | | | | |
| | | | | | | | | | | | | | | | | | | | |
Net increase | | | | | | | 1,819,259 | | | | | | | | 8,523,606 | | | | | |
| | | | | | | | | | | | | | | | | | | | |
(1) Inception date was June 25, 2009. | | | | | | | | | | | | | | | | | | | | |
Global Bond Fund | | | | | | | | | | | | | | | | | | | | |
Shares sold | | | | | | | 2,860,387 | | | | | | | | 3,948,026 | | | | | |
Shares reinvested | | | | | | | 1,274,719 | | | | | | | | 1,687,037 | | | | | |
Shares redeemed | | | | | | | (11,423,859 | ) | | | | | | | (4,785,608 | ) | | | | |
| | | | | | | | | | | | | | | | | | | | |
Net increase (decrease) | | | | | | | (7,288,753 | ) | | | | | | | 849,455 | | | | | |
| | | | | | | | | | | | | | | | | | | | |
231
| | | | | | | | | | | | | | | | | | | | |
| | | Year Ended December 31, 2010 | | | Year Ended December 31, 2009 | |
| | | GS2 | | | GS4 | | | GS2 | | | GS4 | | | GS6 | |
Equity Index Fund | | | | | | | | | | | | | | | | | | | | |
Shares sold | | | 585,990 | | | | 1,370,881 | | | | 841,105 | | | | 2,160,596 | | | | 28,455 | |
Shares exchanged | | | — | | | | — | | | | — | | | | 66,567 | | | | (121,488 | ) |
Shares reinvested | | | 258,866 | | | | 322,192 | | | | 275,439 | | | | 365,182 | | | | 2,310 | |
Shares redeemed | | | (1,003,321 | ) | | | (3,317,757 | ) | | | (501,429 | ) | | | (1,562,771 | ) | | | (8,919 | ) |
| | | | | | | | | | | | | | | | | | | | |
Net increase (decrease) | | | (158,465 | ) | | | (1,624,684 | ) | | | 615,115 | | | | 1,029,574 | | | | (99,642 | ) |
| | | | | | | | | | | | | | | | | | | | |
Real Estate Securities Fund | | | | | | | | | | | | | | | | | | | | |
Shares sold | | | | | | | 7,796,557 | | | | | | | | 8,532,940 | | | | | |
Shares reinvested | | | | | | | 327,689 | | | | | | | | 392,118 | | | | | |
Shares redeemed | | | | | | | (9,499,201 | ) | | | | | | | (6,240,521 | ) | | | | |
| | | | | | | | | | | | | | | | | | | | |
Net increase (decrease) | | | | | | | (1,374,955 | ) | | | | | | | 2,684,537 | | | | | |
| | | | | | | | | | | | | | | | | | | | |
Value Equity Fund | | | | | | | | | | | | | | | | | | | | |
Shares sold | | | 5,728,105 | | | | 7,904,174 | | | | 2,473,161 | | | | 7,109,752 | | | | 40,675 | |
Shares exchanged | | | — | | | | — | | | | — | | | | 1,130,694 | | | | (2,203,139 | ) |
Shares reinvested | | | 714,341 | | | | 918,154 | | | | 991,370 | | | | 1,425,172 | | | | 55,079 | |
Shares redeemed | | | (2,327,670 | ) | | | (20,837,377 | ) | | | (1,431,120 | ) | | | (9,988,166 | ) | | | (2,487 | ) |
| | | | | | | | | | | | | | | | | | | | |
Net increase (decrease) | | | 4,114,776 | | | | (12,015,049 | ) | | | 2,033,411 | | | | (322,548 | ) | | | (2,109,872 | ) |
| | | | | | | | | | | | | | | | | | | | |
Growth Equity Fund | | | | | | | | | | | | | | | | | | | | |
Shares sold | | | 1,101,945 | | | | 5,750,705 | | | | 1,673,214 | | | | 5,719,407 | | | | 18,949 | |
Shares exchanged | | | — | | | | — | | | | — | | | | 692,725 | | | | (1,126,367 | ) |
Shares reinvested | | | 4,036 | | | | 8,372 | | | | 57,676 | | | | 71,463 | | | | 255 | |
Shares redeemed | | | (2,591,161 | ) | | | (17,764,875 | ) | | | (1,561,130 | ) | | | (10,192,784 | ) | | | (5,975 | ) |
| | | | | | | | | | | | | | | | | | | | |
Net increase (decrease) | | | (1,485,180 | ) | | | (12,005,798 | ) | | | 169,760 | | | | (3,709,189 | ) | | | (1,113,138 | ) |
| | | | | | | | | | | | | | | | | | | | |
Small Cap Equity Fund | | | | | | | | | | | | | | | | | | | | |
Shares sold | | | 751,626 | | | | 4,013,808 | | | | 883,911 | | | | 3,268,293 | | | | 23,304 | |
Shares exchanged | | | — | | | | — | | | | — | | | | 1,285,304 | | | | (1,999,515 | ) |
Shares reinvested | | | 42,800 | | | | 63,528 | | | | 44,647 | | | | 77,836 | | | | 2,337 | |
Shares redeemed | | | (1,509,442 | ) | | | (7,727,717 | ) | | | (581,343 | ) | | | (3,927,288 | ) | | | (4,198 | ) |
| | | | | | | | | | | | | | | | | | | | |
Net increase (decrease) | | | (715,016 | ) | | | (3,650,381 | ) | | | 347,215 | | | | 704,145 | | | | (1,978,072 | ) |
| | | | | | | | | | | | | | | | | | | | |
International Equity Fund | | | | | | | | | | | | | | | | | | | | |
Shares sold | | | 2,244,270 | | | | 6,022,331 | | | | 2,762,510 | | | | 10,128,688 | | | | 31,617 | |
Shares exchanged | | | — | | | | — | | | | — | | | | 1,687,592 | | | | (2,207,195 | ) |
Shares reinvested | | | 706,621 | | | | 1,518,407 | | | | 767,756 | | | | 2,038,064 | | | | 19,754 | |
Shares redeemed | | | (2,551,588 | ) | | | (19,455,495 | ) | | | (4,990,961 | ) | | | (18,403,843 | ) | | | (10,746 | ) |
| | | | | | | | | | | | | | | | | | | | |
Net increase (decrease) | | | 399,303 | | | | (11,914,757 | ) | | | (1,460,695 | ) | | | (4,549,499 | ) | | | (2,166,570 | ) |
| | | | | | | | | | | | | | | | | | | | |
232
8. BANK BORROWINGS
On October 28, 2010, the Board of Trustees approved a credit agreement with Bank of America, N.A. dated December 3, 2010 through December 1, 2011. The agreement permits up to $50 million, collectively. Interest is charged to each Fund based on its borrowings at a rate equal to the Bank Prime plus 0.60% or the Wall Street Journal LIBOR One Month Floating Rate plus 1.00%. Each Fund also pays a facility fee equal to its pro rata share of the amount of the credit facility at a rate of 0.30% per annum.
On August 3, 2010, the Aggressive Allocation and Medium-Duration Bond Funds borrowed a total of $7,500,000 at a rate of 1.586%. The Medium-Duration Bond Fund repaid the loan in the amount of $4,750,172, which represents principal and one day of accrued interest, on August 4, 2010. The Aggressive Allocation Fund repaid the loan in the amount of $2,750,199, which represents principal and two days of accrued interest, on August 5, 2010. No other Funds borrowed for the year ended December 31, 2010, and there were no outstanding loans at December 31, 2010.
9. FEDERAL INCOME TAXES
Each Fund’s policy is to comply with all sections of the Internal Revenue Code of 1986, as amended, that apply to regulated investment companies and to distribute substantially all of its taxable income and capital gains to shareholders. No provision for income or excise taxes is thus required. Each Fund is treated as a separate entity for federal income tax purposes.
The Funds may be subject to taxes imposed by countries in which they invest in issuers existing or operating in such countries. Such taxes are generally based on income earned. The Funds accrue such taxes when the related income is earned. Dividend and interest income is recorded net of non-U.S. taxes paid. Gains realized by the Funds on the sale of securities in certain countries are subject to non-U.S. taxes. The Funds record a liability based on unrealized gains to provide for potential non-U.S. taxes payable upon the sale of these securities. For year ended December 31, 2010, the International Equity Fund accrued non-U.S. taxes on unrealized gains of $174,779.
Management has analyzed the Funds’ tax positions and has concluded that no provision for income tax is required in the Funds’ financial statements. The Funds are not aware of any tax positions for which it is reasonably possible that the total amounts of unrecognized tax benefits will significantly change in the next twelve months. However, management’s conclusions may be subject to review and adjustment at a later date based on factors including, but not limited to new tax laws, regulations and administrative interpretations (including court decisions). Each of the Funds’ federal tax returns for the prior three fiscal years remains subject to examination by the Internal Revenue Service.
Net investment income (loss) and net realized gains (losses) may differ for financial statements and tax purposes primarily because of deferred losses on straddles and losses deferred due to “wash sale” transactions.
The character of distributions made during the year from net investment income or net realized gains may differ from their ultimate characterization for federal income tax purposes. Also, due to the timing of dividend distributions, the fiscal year in which amounts are distributed may differ from the year that the income or realized gains (losses) were recorded by the Funds. Income dividends and capital gain distributions are determined in accordance with federal income tax regulations, which may differ from GAAP. These differences are primarily due to differing treatments for futures and options transactions, foreign currency transactions, paydowns, losses deferred due to wash sales, straddles and investments in Passive Foreign Investment Companies (“PFIC’s”). Distributions during the year ended December 31, 2010, were characterized as follows for tax purposes:
233
| | | | | | | | | | | | | | | | | | | | |
Fund | | | | | Ordinary
Income | | | Long-Term
Capital Gain | | | Return
of Capital | | | Total
Distribution | |
MyDestination 2005 | | | 2010 | | | $ | 1,382,009 | | | $ | — | | | $ | — | | | $ | 1,382,009 | |
| | | 2009 | | | | 1,564,404 | | | | — | | | | — | | | | 1,564,404 | |
MyDestination 2015 | | | 2010 | | | | 5,104,591 | | | | — | | | | — | | | | 5,104,591 | |
| | | 2009 | | | | 4,412,565 | | | | — | | | | — | | | | 4,412,565 | |
MyDestination 2025 | | | 2010 | | | | 3,787,639 | | | | — | | | | — | | | | 3,787,639 | |
| | | 2009 | | | | 2,884,184 | | | | — | | | | — | | | | 2,884,184 | |
MyDestination 2035 | | | 2010 | | | | 1,312,038 | | | | — | | | | — | | | | 1,312,038 | |
| | | 2009 | | | | 1,043,907 | | | | 124,488 | | | | — | | | | 1,168,395 | |
MyDestination 2045 | | | 2010 | | | | 774,737 | | | | 86,307 | | | | — | | | | 861,044 | |
| | | 2009 | | | | 683,723 | | | | 4,334 | | | | — | | | | 688,057 | |
Conservative Allocation | | | 2010 | | | | 6,148,217 | | | | 1,177,999 | | | | — | | | | 7,326,216 | |
| | | 2009 | | | | 6,283,221 | | | | 9,111,208 | | | | — | | | | 15,394,429 | |
Balanced Allocation | | | 2010 | | | | 30,794,116 | | | | — | | | | — | | | | 30,794,116 | |
| | | 2009 | | | | 26,391,713 | | | | 6,797,379 | | | | — | | | | 33,189,092 | |
Growth Allocation | | | 2010 | | | | 17,932,584 | | | | 5,229,092 | | | | — | | | | 23,161,676 | |
| | | 2009 | | | | 11,529,071 | | | | 3,868,509 | | | | — | | | | 15,397,580 | |
Aggressive Allocation | | | 2010 | | | | 7,735,097 | | | | 6,394,992 | | | | — | | | | 14,130,089 | |
| | | 2009 | | | | 7,894,855 | | | | 4,792,148 | | | | — | | | | 12,687,003 | |
Conservative Allocation I | | | 2010 | | | | 2,200,764 | | | | — | | | | — | | | | 2,200,764 | |
| | | 2009 | | | | 2,128,240 | | | | — | | | | — | | | | 2,128,240 | |
Balanced Allocation I | | | 2010 | | | | 15,332,084 | | | | — | | | | — | | | | 15,332,084 | |
| | | 2009 | | | | 15,067,834 | | | | — | | | | — | | | | 15,067,834 | |
Growth Allocation I | | | 2010 | | | | 6,706,135 | | | | — | | | | — | | | | 6,706,135 | |
| | | 2009 | | | | 6,560,814 | | | | — | | | | — | | | | 6,560,814 | |
Aggressive Allocation I | | | 2010 | | | | 2,510,802 | | | | — | | | | — | | | | 2,510,802 | |
| | | 2009 | | | | 3,254,796 | | | | — | | | | — | | | | 3,254,796 | |
Money Market | | | 2010 | | | | 408,875 | | | | — | | | | — | | | | 408,875 | |
| | | 2009 | | | | 3,671,028 | | | | — | | | | — | | | | 3,671,028 | |
Low-Duration Bond | | | 2010 | | | | 19,384,900 | | | | 1,577,570 | | | | — | | | | 20,962,470 | |
| | | 2009 | | | | 20,184,508 | | | | — | | | | — | | | | 20,184,508 | |
Medium-Duration Bond | | | 2010 | | | | 56,868,924 | | | | 6,383,322 | | | | — | | | | 63,252,246 | |
| | | 2009 | | | | 62,933,294 | | | | — | | | | — | | | | 62,933,294 | |
Extended-Duration Bond | | | 2010 | | | | 26,346,080 | | | | 3,455,445 | | | | — | | | | 29,801,525 | |
| | | 2009 | | | | 26,490,239 | | | | 632,726 | | | | — | | | | 27,122,965 | |
Inflation Protected Bond | | | 2010 | | | | 4,258,151 | | | | 498,839 | | | | — | | | | 4,756,990 | |
| | | 2009 | | | | 1,409,572 | | | | 41,466 | | | | — | | | | 1,451,038 | |
Global Bond | | | 2010 | | | | 12,273,443 | | | | — | | | | — | | | | 12,273,443 | |
| | | 2009 | | | | 13,789,431 | | | | — | | | | — | | | | 13,789,431 | |
Equity Index | | | 2010 | | | | 6,944,528 | | | | — | | | | — | | | | 6,944,528 | |
| | | 2009 | | | | 6,217,465 | | | | — | | | | — | | | | 6,217,465 | |
Real Estate Securities | | | 2010 | | | | 2,634,670 | | | | — | | | | — | | | | 2,634,670 | |
| | | 2009 | | | | 2,070,541 | | | | — | | | | 45,334 | | | | 2,115,875 | |
Value Equity | | | 2010 | | | | 16,090,315 | | | | — | | | | — | | | | 16,090,315 | |
| | | 2009 | | | | 19,742,615 | | | | — | | | | — | | | | 19,742,615 | |
Growth Equity | | | 2010 | | | | 174,095 | | | | — | | | | — | | | | 174,095 | |
| | | 2009 | | | | 1,374,244 | | | | — | | | | — | | | | 1,374,244 | |
Small Cap Equity | | | 2010 | | | | 1,340,931 | | | | — | | | | — | | | | 1,340,931 | |
| | | 2009 | | | | 1,121,177 | | | | — | | | | — | | | | 1,121,177 | |
International Equity | | | 2010 | | | | 27,463,589 | | | | — | | | | — | | | | 27,463,589 | |
| | | 2009 | | | | 29,748,575 | | | | 5,380 | | | | — | | | | 29,753,955 | |
234
At December 31, 2010, the components of distributable earnings on a tax basis were as follows:
| | | | | | | | | | | | | | | | |
Fund | | Undistributed
Ordinary
Income | | | Undistributed
Long-Term
Capital
Gain/ (Capital
Loss
Carryforward) | | | Post-October
Loss
Deferral | | | Net
Unrealized
Appreciation
(Depreciation)
on Investments | |
MyDestination 2005 | | $ | 149,327 | | | $ | (4,792,433 | ) | | $ | (472,988 | ) | | $ | 443,716 | |
MyDestination 2015 | | | 1,490,826 | | | | (7,250,592 | ) | | | (2,484,824 | ) | | | 1,112,516 | |
MyDestination 2025 | | | 642,853 | | | | (1,284,239 | ) | | | — | | | | 2,730,185 | |
MyDestination 2035 | | | 124,835 | | | | 47,692 | | | | — | | | | 4,975,460 | |
MyDestination 2045 | | | 51,091 | | | | 76,265 | | | | — | | | | 8,821,157 | |
Conservative Allocation | | | 139,529 | | | | 4,058,953 | | | | — | | | | 14,730,573 | |
Balanced Allocation | | | 2,195,907 | | | | 3,410,197 | | | | — | | | | 54,808,050 | |
Growth Allocation | | | 444,300 | | | | 5,077,773 | | | | — | | | | 25,227,464 | |
Aggressive Allocation | | | 748,061 | | | | 4,650,064 | | | | — | | | | 6,658,272 | |
Conservative Allocation I | | | 724,828 | | | | (3,904,509 | ) | | | (103,307 | ) | | | (992,371 | ) |
Balanced Allocation I | | | 5,589,325 | | | | (13,653,728 | ) | | | (239,985 | ) | | | (29,293,097 | ) |
Growth Allocation I | | | 1,563,564 | | | | (4,174,277 | ) | | | — | | | | (26,603,415 | ) |
Aggressive Allocation I | | | 2,389,297 | | | | (6,510,682 | ) | | | — | | | | (26,988,415 | ) |
Money Market | | | 7,259 | | | | — | | | | — | | | | — | |
Low-Duration Bond | | | 553,405 | | | | — | | | | (1,167,629 | ) | | | (6,297,430 | ) |
Medium-Duration Bond | | | 247,194 | | | | — | | | | (5,056,236 | ) | | | (18,364,584 | ) |
Extended-Duration Bond | | | 494,619 | | | | 2,037,838 | | | | — | | | | 28,660,653 | |
Inflation Protected Bond | | | 163,978 | | | | 664,227 | | | | — | | | | 2,512,608 | |
Global Bond | | | 1,332,533 | | | | (9,652,729 | ) | | | — | | | | 6,211,682 | |
Equity Index | | | 1,075,513 | | | | 2,856,137 | | | | — | | | | 59,644,585 | |
Real Estate Securities | | | — | | | | (30,921,622 | ) | | | — | | | | 17,110,026 | |
Value Equity | | | 7,719,446 | | | | (151,602,699 | ) | | | — | | | | 363,473 | |
Growth Equity | | | — | | | | (101,927,562 | ) | | | — | | | | 285,434,281 | |
Small Cap Equity | | | — | | | | (67,481,437 | ) | | | (2,661 | ) | | | 79,826,490 | |
International Equity | | | 505,860 | | | | (175,843,352 | ) | | | (129,398 | ) | | | 147,585,999 | |
Post-October loss deferrals have been included in undistributed ordinary income and undistributed long-term capital gains, depending upon the character of the loss deferral.
For Federal income tax purposes, realized capital losses may be carried forward and applied against future realized capital gains. Capital loss carryovers and their expiration dates, were as follows as of December 31, 2010:
| | | | | | | | | | | | | | | | |
| Expiring December 31, | | 2016 | | | 2017 | | | 2018 | | | Total | |
MyDestination 2005 | | $ | 42,414 | | | $ | 3,181,689 | | | $ | 1,568,330 | | | $ | 4,792,433 | |
MyDestination 2015 | | | 889,637 | | | | 3,304,014 | | | | 3,056,941 | | | | 7,250,592 | |
MyDestination 2025 | | | — | | | | 1,284,239 | | | | — | | | | 1,284,239 | |
Conservative Allocation I | | | 650,405 | | | | 2,885,574 | | | | 368,530 | | | | 3,904,509 | |
Balanced Allocation I | | | 4,262,186 | | | | 5,929,663 | | | | 3,461,879 | | | | 13,653,728 | |
Growth Allocation I | | | 412,556 | | | | 2,508,443 | | | | 1,253,278 | | | | 4,174,277 | |
Aggressive Allocation I | | | 3,489,043 | | | | 902,289 | | | | 2,119,350 | | | | 6,510,682 | |
Global Bond | | | — | | | | 9,652,729 | | | | — | | | | 9,652,729 | |
Real Estate Securities | | | — | | | | 30,921,622 | | | | — | | | | 30,921,622 | |
Value Equity | | | 48,251,938 | | | | 103,350,761 | | | | — | | | | 151,602,699 | |
Growth Equity | | | — | | | | 101,927,562 | | | | — | | | | 101,927,562 | |
Small Cap Equity | | | 7,930,222 | | | | 59,551,215 | | | | — | | | | 67,481,437 | |
International Equity | | | — | | | | 175,843,352 | | | | — | | | | 175,843,352 | |
235
During the year ended December 31, 2010, the following Funds utilized capital loss carryforwards to offset capital gains:
| | | | |
| | | Carryforward
Utilized | |
MyDestination 2025 | | $ | 153,095 | |
Balanced Allocation | | | 1,652,242 | |
Growth Allocation | | | 2,029,567 | |
Low-Duration Bond | | | 1,707,456 | |
Extended-Duration Bond | | | 12,901,227 | |
Global Bond | | | 983,250 | |
Equity Index | | | 4,723,485 | |
Real Estate Securities | | | 19,394,139 | |
Value Equity | | | 25,018,846 | |
Growth Equity | | | 94,087,847 | |
Small Cap Equity | | | 60,955,545 | |
International Equity | | | 57,534,591 | |
For federal income tax purposes, post-October loss deferrals, which will reverse in 2011, were as follows as of December 31, 2010:
| | | | | | | | | | | | |
| | | Capital | | | FX | | | Total | |
MyDestination 2005 | | $ | 472,988 | | | $ | — | | | $ | 472,988 | |
MyDestination 2015 | | | 2,484,824 | | | | — | | | | 2,484,824 | |
Conservative Allocation I | | | 103,307 | | | | — | | | | 103,307 | |
Balanced Allocation I | | | 239,985 | | | | — | | | | 239,985 | |
Low-Duration Bond | | | 1,167,629 | | | | — | | | | 1,167,629 | |
Medium-Duration Bond | | | 5,056,236 | | | | — | | | | 5,056,236 | |
Small Cap Equity | | | — | | | | 2,661 | | | | 2,661 | |
International Equity | | | — | | | | 129,398 | | | | 129,398 | |
At December 31, 2010, the aggregate cost of investment securities for federal income tax purposes (excluding foreign currency, securities sold short and derivative related items) and the net unrealized appreciation from investments for those securities having an excess of value over cost and net unrealized depreciation from investments for those securities having an excess of cost over value (based on cost for federal income tax purposes) were as follows:
| | | | | | | | | | | | | | | | |
Fund | | Federal Tax Cost | | | Net Unrealized
Appreciation
(Depreciation) | | | Appreciated
Securities | | | Depreciated
Securities | |
MyDestination 2005 | | $ | 54,578,113 | | | $ | 443,716 | | | $ | 5,686,324 | | | $ | (5,242,608 | ) |
MyDestination 2015 | | | 244,643,508 | | | | 1,112,516 | | | | 15,338,055 | | | | (14,225,539 | ) |
MyDestination 2025 | | | 233,373,422 | | | | 2,730,185 | | | | 14,851,777 | | | | (12,121,592 | ) |
MyDestination 2035 | | | 105,099,314 | | | | 4,975,460 | | | | 8,772,589 | | | | (3,797,129 | ) |
MyDestination 2045 | | | 66,288,616 | | | | 8,821,157 | | | | 10,316,784 | | | | (1,495,627 | ) |
Conservative Allocation | | | 248,259,616 | | | | 14,730,573 | | | | 16,487,638 | | | | (1,757,065 | ) |
Balanced Allocation | | | 1,067,232,240 | | | | 54,808,050 | | | | 67,866,733 | | | | (13,058,683 | ) |
Growth Allocation | | | 817,747,824 | | | | 25,227,464 | | | | 43,236,658 | | | | (18,009,194 | ) |
Aggressive Allocation | | | 739,973,600 | | | | 6,658,272 | | | | 39,235,530 | | | | (32,577,258 | ) |
Conservative Allocation I | | | 72,814,611 | | | | (992,371 | ) | | | 2,956,798 | | | | (3,949,169 | ) |
Balanced Allocation I | | | 376,872,414 | | | | (29,293,097 | ) | | | 9,966,495 | | | | (39,259,592 | ) |
Growth Allocation I | | | 259,919,196 | | | | (26,603,415 | ) | | | 7,008,790 | | | | (33,612,205 | ) |
Aggressive Allocation I | | | 184,223,067 | | | | (26,988,415 | ) | | | 4,593,657 | | | | (31,582,072 | ) |
Money Market | | | 1,297,165,079 | | | | — | | | | — | | | | — | |
Low-Duration Bond | | | 874,040,338 | | | | (6,809,804 | ) | | | 10,239,394 | | | | (17,049,198 | ) |
Medium-Duration Bond | | | 1,249,196,163 | | | | (19,661,767 | ) | | | 27,418,975 | | | | (47,080,742 | ) |
Extended-Duration Bond | | | 416,644,374 | | | | 28,654,246 | | | | 32,873,665 | | | | (4,219,419 | ) |
Inflation Protected Bond | | | 106,891,600 | | | | 2,510,822 | | | | 3,596,794 | | | | (1,085,972 | ) |
Global Bond | | | 188,054,991 | | | | 6,191,471 | | | | 11,941,202 | | | | (5,749,731 | ) |
236
| | | | | | | | | | | | | | | | |
Fund | | Federal Tax Cost | | | Net Unrealized
Appreciation
(Depreciation) | | | Appreciated
Securities | | | Depreciated
Securities | |
Equity Index | | $ | 369,712,439 | | | $ | 59,644,585 | | | $ | 113,485,333 | | | $ | (53,840,748 | ) |
Real Estate Securities | | | 159,218,813 | | | | 17,110,026 | | | | 26,167,560 | | | | (9,057,534 | ) |
Value Equity | | | 1,273,162,228 | | | | 363,473 | | | | 152,355,624 | | | | (151,992,151 | ) |
Growth Equity | | | 1,099,833,887 | | | | 285,434,281 | | | | 323,361,814 | | | | (37,927,533 | ) |
Small Cap Equity | | | 552,610,824 | | | | 79,831,215 | | | | 90,375,746 | | | | (10,544,531 | ) |
International Equity | | | 1,258,060,292 | | | | 149,482,327 | | | | 232,380,617 | | | | (82,898,290 | ) |
The differences between book basis and tax-basis unrealized appreciation (depreciation) is attributable primarily to the tax deferral of losses on wash sales and on investments in PFIC’s.
At December 31, 2010, capital contributions, accumulated undistributed net investment income and accumulated net realized gain (loss) from investments have been adjusted for current period permanent book/tax differences which arose principally from differing book/tax treatments of PFICs, paydown losses, net operating losses, swaps, foreign currency transactions, distributions received from regulated investment companies, defaulted bonds, reclassifications of dividends paid and non-deductible expenses. The following amounts were reclassified within the capital accounts:
| | | | | | | | | | | | |
Fund | | Paid in
Capital | | | Undistributed
Net Investment
Income | | | Accumulated
Net Realized
Gain (Loss) on
Investments,
Currency Translations
and Derivative
Transactions | |
MyDestination 2005 | | $ | — | | | $ | 471,606 | | | $ | (471,606 | ) |
MyDestination 2015 | | | — | | | | 1,299,973 | | | | (1,299,973 | ) |
MyDestination 2025 | | | — | | | | 495,722 | | | | (495,722 | ) |
MyDestination 2035 | | | — | | | | 63,776 | | | | (63,776 | ) |
MyDestination 2045 | | | — | | | | 119 | | | | (119 | ) |
Conservative Allocation | | | — | | | | 1,487,987 | | | | (1,487,987 | ) |
Balanced Allocation | | | — | | | | 6,697,327 | | | | (6,697,327 | ) |
Growth Allocation | | | — | | | | 2,461,601 | | | | (2,461,601 | ) |
Aggressive Allocation | | | — | | | | 2,708 | | | | (2,708 | ) |
Conservative Allocation I | | | — | | | | 517,134 | | | | (517,134 | ) |
Balanced Allocation I | | | — | | | | 3,743,893 | | | | (3,743,893 | ) |
Growth Allocation I | | | — | | | | 1,211,865 | | | | (1,211,865 | ) |
Aggressive Allocation I | | | — | | | | 154 | | | | (154 | ) |
Money Market | | | — | | | | (67,785 | ) | | | 67,785 | |
Low-Duration Bond | | | — | | | | 538,938 | | | | (538,938 | ) |
Medium-Duration Bond | | | — | | | | 202,235 | | | | (202,235 | ) |
Extended-Duration Bond | | | — | | | | 856,597 | | | | (856,597 | ) |
Inflation Protected Bond | | | (1,343 | ) | | | 4,206 | | | | (2,863 | ) |
Global Bond | | | — | | | | 1,926,958 | | | | (1,926,958 | ) |
Real Estate Securities | | | (729,638 | ) | | | 729,638 | | | | — | |
Growth Equity | | | (273,038 | ) | | | 270,717 | | | | 2,321 | |
Small Cap Equity | | | (38,656 | ) | | | 33,676 | | | | 4,980 | |
International Equity | | | — | | | | 5,363,485 | | | | (5,363,485 | ) |
Net investment income, net realized gain (loss) on investments and net assets were not affected by these reclassifications.
10. MARKET AND CREDIT RISK
In the normal course of business, the Funds trade financial instruments and enter into financial transactions where the risk of potential loss exists due to changes in the market (market risk) or due to the failure of the other party to a transaction to perform (credit and counterparty risks).
237
Market Risks — A Fund’s investments in derivatives and other financial instruments expose the Fund to various risks such as, but not limited to, interest rate, foreign currency, equity and commodity risks.
Interest rate risk is the risk that fixed income securities will decline in value because of changes in interest rates. As nominal interest rates rise, the value of certain fixed income securities held by a Fund is likely to decrease. A nominal interest rate can be described as the sum of a real interest rate and an expected inflation rate. Fixed income securities with longer durations tend to be more sensitive to changes in interest rates, usually making them more volatile than securities with shorter durations. Duration is useful primarily as a measure of the sensitivity of a fixed income’s market price to interest rate (i.e. yield) movements.
If a Fund invests directly in foreign currencies or in securities that trade in, and receive revenues in, foreign currencies, or in derivatives that provide exposure to foreign currencies, it will be subject to the risk that those currencies will decline in value relative to the base currency of the Fund, or, in the case of hedging positions, that the Fund’s base currency will decline in value relative to the currency being hedged. Currency rates in foreign countries may fluctuate significantly over short periods of time for a number of reasons, including changes in interest rates, intervention (or the failure to intervene) by U.S. or foreign governments, central banks or supranational entities such as the International Monetary Fund, or by the imposition of currency controls or other political developments in the United States or abroad. As a result, a Fund’s investments in foreign currency denominated securities may reduce the returns of the Fund.
The market values of equities, such as common stocks and preferred stocks, or equity related investments such as futures and options, may decline due to general market conditions which are not specifically related to a particular company, such as real or perceived adverse economic conditions, changes in the general outlook for corporate earnings, changes in interest or currency rates or adverse investor sentiment. Market values may also decline due to factors which affect a particular industry or industries, such as labor shortages or increased production costs and competitive conditions within an industry. Equity securities and equity related investments generally have greater market price volatility than fixed income securities.
A Fund’s investments in commodity-linked derivative instruments may subject the Fund to greater market price volatility than investments in traditional securities. The value of commodity-linked derivative instruments may be affected by changes in overall market movements, commodity index volatility, changes in interest rates, or factors affecting a particular industry or commodity, such as drought, floods, weather, livestock disease, embargoes, tariffs and international economic, political and regulatory developments.
Credit and Counterparty Risks — A Fund will be exposed to credit risk on parties with whom it trades and will also bear the risk of settlement default. A Fund minimizes concentrations of credit risk by undertaking transactions with a large number of customers and counterparties on recognized and reputable exchanges. A Fund could lose money if the issuer or guarantor of a fixed income security, or the counterparty to a derivatives contract, repurchase agreement or a loan of portfolio securities, is unable or unwilling to make timely principal and/or interest payments, or to otherwise honor its obligations. Securities are subject to varying degrees of credit risk, which are often reflected in credit ratings.
Similar to credit risk, a Fund may be exposed to counterparty risk, or the risk that an institution or other entity with which the Fund has unsettled or open transactions will default. Financial assets, which potentially expose a Fund to counterparty risk, consist principally of cash due from counterparties and investments. The investment advisers minimize counterparty risks to the Funds by performing extensive reviews of each counterparty and obtaining approval from the Counterparty Risk Committee prior to entering into transactions with a third party. All transactions in listed securities are settled/paid for upon delivery using approved counterparties. The risk of default is considered minimal, as delivery of securities sold is only made once a Fund has
238
received payment. Payment is made on a purchase once the securities have been delivered by the counterparty. The trade will fail if either party fails to meet its obligation.
The Low-Duration Bond Fund and the Medium-Duration Bond Fund are parties to ISDA (International Swap and Derivatives Association, Inc.) Master Agreements (“Master Agreements”) with certain counterparties that govern over the counter derivative and foreign exchange contracts entered into from time to time. The Master Agreements may contain provisions regarding, among other things, the parties’ general obligations, representations, agreements, collateral requirements, events of default and early termination. With respect to certain counterparties, in accordance with the terms of the Master Agreements, collateral posted to the Funds is held in a segregated account by the Fund’s custodian and with respect to those amounts which can be sold or repledged, are presented in the Fund’s portfolio or Statements of Assets and Liabilities. Collateral posted to the Funds which can not be sold or repledged totaled $1,700,000 and $980,000 in the Low-Duration Bond Fund and Medium-Duration Bond Fund, respectively, at December 31, 2010. Collateral can be in the form of cash, debt securities, equities or other securities as agreed to by the Fund and the applicable counterparty. Collateral requirements are determined based on the Fund’s net position with each counterparty.
11. LEHMAN BROTHERS
On September 15, 2008, Lehman Brothers Holdings Inc. filed for protection under Chapter 11 of the United States Bankruptcy Code. On September 19, 2008, a proceeding under the Securities Investor Protection Act (SIPA) was commenced with respect to Lehman Brothers Inc., a broker-dealer. A trustee appointed under SIPA is administering the bankruptcy estate of Lehman Brothers Inc. Lehman Brothers International (Europe) was placed in administration under the UK Insolvency Act on September 15, 2008. Lehman Brothers Special Financing Inc. filed for protection under Chapter 11 of the United States Bankruptcy Code on October 3, 2008. In connection with these filings, the Lehman Brothers group of companies (collectively “Lehman Brothers”) will be reorganized and/or liquidated in an orderly fashion, subject to court approval. Each Lehman Brothers entity is a separate legal entity that is subject to its own bankruptcy proceeding.
The Low-Duration Bond, Medium-Duration Bond, Global Bond and Small Cap Equity Funds had select holdings, credit default swap agreements, and securities and derivatives transactions outstanding with Lehman Brothers entities as issuer, referenced entity, counterparty or guarantor at the time the relevant Lehman Brothers entity filed for protection or was placed in administration. The security holdings, credit default swap agreements, and securities and derivatives transactions associated with Lehman Brothers have been written down to their estimated recoverable values. Anticipated losses for securities and derivatives transactions associated with Lehman Brothers have been incorporated as components of other receivables on the Statement of Assets and Liabilities and net changes in unrealized appreciation (depreciation) on the Statement of Operations. A facilitated auction occurred on October 10, 2008, comprising multiple pre-approved brokerage agencies to determine the estimated recovery rate for holdings and credit default swap agreements with Lehman Brothers Holdings Inc. as referenced entity. These recovery rates have been utilized in determining estimated recovery values. Claims against Lehman Brothers have been filed on behalf of GuideStone Funds in accordance with the filing requirements.
The Funds’ Sub-Advisers, on behalf of GSCM, have delivered notices of default to the relevant Lehman Brothers entities in accordance with the terms of the applicable agreements. For transactions with Lehman Brothers’ counterparties, the Sub-Advisers have terminated the trades, have obtained quotations from brokers for replacement trades and, where deemed appropriate, have re-opened positions with new counterparties.
239
12. NEW ACCOUNTING PROUNCEMENTS
In January 2010, FASB issued “Improving Disclosures about Fair Value Measurements” (the “Standard”). The Standard will require reporting entities to make new disclosures about purchases, sales, issuance and settlements in the reconciliation of assets in which significant unobservable inputs (Level 3) were used in determining fair value. The new disclosure is effective for interim and annual reporting periods beginning after December 15, 2010. Management is currently evaluating the impact the new Standard will have on its financial statement disclosures.
13. SUBSEQUENT EVENTS
Subsequent events have been evaluated through the date that the financial statements were available to be issued. All subsequent events determined to be relevant and material to the financial statements have been appropriately recorded or disclosed.
240
REPORT OF INDEPENDENT REGISTERED PUBLIC ACCOUNTING FIRM
To the Board of Trustees and
Shareholders of GuideStone Funds:
In our opinion, the accompanying statements of assets and liabilities, including the schedules of investments, and the related statements of operations and of changes in net assets and the financial highlights present fairly, in all material respects, the financial position of MyDestination 2005 Fund, MyDestination 2015 Fund, MyDestination 2025 Fund, MyDestination 2035 Fund, MyDestination 2045 Fund, Conservative Allocation Fund, Balanced Allocation Fund, Growth Allocation Fund, Aggressive Allocation Fund, Conservative Allocation Fund I, Balanced Allocation Fund I, Growth Allocation Fund I, Aggressive Allocation Fund I, Money Market Fund, Low-Duration Bond Fund, Medium-Duration Bond Fund, Extended-Duration Bond Fund, Inflation Protected Bond Fund, Global Bond Fund, Equity Index Fund, Real Estate Securities Fund, Value Equity Fund, Growth Equity Fund, Small Cap Equity Fund, and International Equity Fund (constituting GuideStone Funds, hereafter referred to as the “Trust”) at December 31, 2010, the results of each of their operations for the year then ended, the changes in each of their net assets and the financial highlights for each of the periods indicated, in conformity with accounting principles generally accepted in the United States of America. These financial statements and financial highlights (hereafter referred to as “financial statements”) are the responsibility of the Trust’s management; our responsibility is to express an opinion on these financial statements based on our audits. We conducted our audits of these financial statements in accordance with the standards of the Public Company Accounting Oversight Board (United States). Those standards require that we plan and perform the audit to obtain reasonable assurance about whether the financial statements are free of material misstatement. An audit includes examining, on a test basis, evidence supporting the amounts and disclosures in the financial statements, assessing the accounting principles used and significant estimates made by management, and evaluating the overall financial statement presentation. We believe that our audits, which included confirmation of securities at December 31, 2010 by correspondence with the custodian, brokers and transfer agent of the investee funds, provide a reasonable basis for our opinion.

PricewaterhouseCoopers LLP
Philadelphia, Pennsylvania
February 28, 2011
241
NOTICE TO SHAREHOLDERS (Unaudited)
Each Fund is required by Subchapter M of the Internal Revenue Code of 1986, as amended, to advise its shareholders within 60 days of the Fund’s year end as of the federal tax status of distributions received by each Fund’s shareholders. During the year ended December 31, 2010, the Funds hereby designate the following dividends and distributions paid by each of the Funds:
| | | | | | | | | | | | |
Fund | | Ordinary
Income | | | Long-Term
Capital Gain | | | Return
of Capital | |
MyDestination 2005 | | $ | 1,382,009 | | | $ | — | | | $ | — | |
MyDestination 2015 | | | 5,104,591 | | | | — | | | | — | |
MyDestination 2025 | | | 3,787,639 | | | | — | | | | — | |
MyDestination 2035 | | | 1,312,038 | | | | — | | | | — | |
MyDestination 2045 | | | 774,737 | | | | 86,307 | | | | — | |
Conservative Allocation | | | 6,148,217 | | | | 1,177,999 | | | | — | |
Balanced Allocation | | | 30,794,116 | | | | — | | | | — | |
Growth Allocation | | | 17,932,584 | | | | 5,229,092 | | | | — | |
Aggressive Allocation | | | 7,735,097 | | | | 6,394,992 | | | | — | |
Conservative Allocation I | | | 2,200,764 | | | | — | | | | — | |
Balanced Allocation I | | | 15,332,084 | | | | — | | | | — | |
Growth Allocation I | | | 6,706,135 | | | | — | | | | — | |
Aggressive Allocation I | | | 2,510,802 | | | | — | | | | — | |
Money Market | | | 408,875 | | | | — | | | | — | |
Low-Duration Bond | | | 19,384,900 | | | | 1,577,570 | | | | — | |
Medium-Duration Bond | | | 56,868,924 | | | | 6,383,322 | | | | — | |
Extended-Duration Bond | | | 26,346,080 | | | | 3,455,445 | | | | — | |
Inflation Protected Bond | | | 4,258,151 | | | | 498,839 | | | | — | |
Global Bond | | | 12,273,443 | | | | — | | | | — | |
Equity Index | | | 6,944,528 | | | | — | | | | — | |
Real Estate Securities | | | 2,634,670 | | | | — | | | | — | |
Value Equity | | | 16,090,315 | | | | — | | | | — | |
Growth Equity | | | 174,095 | | | | — | | | | — | |
Small Cap Equity | | | 1,340,931 | | | | — | | | | — | |
International Equity | | | 27,463,589 | | | | — | | | | — | |
Dividends from net investment income and short-term capital gains are treated as ordinary income dividends for federal income tax purposes. Long-term capital gain distributions are taxable as capital gain dividends.
242
NOTICE TO SHAREHOLDERS (Continued)
The following percentages of ordinary income dividends paid for the year ended December 31, 2010, have been designated as qualified for the reduced tax rate under The Job and Growth Tax Relief Reconciliation Act of 2003.
| | | | |
Fund | | | |
MyDestination 2005 | | | 24.49 | % |
MyDestination 2015 | | | 30.92 | % |
MyDestination 2025 | | | 40.79 | % |
MyDestination 2035 | | | 56.87 | % |
MyDestination 2045 | | | 66.50 | % |
Conservative Allocation | | | 17.91 | % |
Balanced Allocation | | | 24.47 | % |
Growth Allocation | | | 36.44 | % |
Aggressive Allocation | | | 84.56 | % |
Conservative Allocation I | | | 20.80 | % |
Balanced Allocation I | | | 27.21 | % |
Growth Allocation I | | | 46.15 | % |
Aggressive Allocation I | | | 92.60 | % |
Equity Index | | | 97.68 | % |
Value Equity | | | 100.00 | % |
Growth Equity | | | 100.00 | % |
Small Cap Equity | | | 100.00 | % |
International Equity | | | 78.77 | % |
All above designations are based on financial information available as of the date of this annual report, and accordingly, are subject to change. It is the intention of the Funds to designate the maximum amount permitted under the Internal Revenue Code and the regulations thereunder. Shareholders are advised to consult their own tax advisers with respect to the tax consequences of their investment in the Funds.
243
FUND MANAGEMENT (Unaudited)
Information pertaining to the Trustees and officers of the Trust is set forth below. The statement of additional information (SAI) includes additional information about the Trustees and is available without charge, upon request, by calling 1-888-98-GUIDE (1-888-984-8433).
| | | | | | | | |
Name, (DOB), Address and Position(s) with Trust | | Term of Office and Length of Time Served1 | | Principal Occupation(s) During Past 5 Years | | Number of
Portfolios
in Fund
Complex
Overseen
by Trustee | | Other Trusteeships/ Directorships Held by Trusteee |
| DISINTERESTED TRUSTEES2 |
| | | | |
Michael R. Buster (1957) 2401 Cedar Springs Road Dallas, TX 75201-1407 Trustee | | Since 2002 | | Executive Pastor, Prestonwood Baptist Church, 1989 - present. | | 25 | | Ouachita Baptist University – Board of Trustees Member. |
| | | | |
Peter L. Chamberlain, Ph.D. (1951) 2401 Cedar Springs Road Dallas, TX 75201-1407 Trustee | | Since 2008 | | Senior Financial Analyst, Summit Wealth Management, Inc., 2006 – present; President, B.R. Chamberlain & Sons, Inc., 1990 – 2006, Registered Investment Adviser. | | 25 | | First Baptist Church of Orlando – Board of Trustees Member and Strategy Team; Rollins College Board of Overseers/Corporate Council – Member; The B.R. Chamberlain Foundation for Public Entertainment – President. |
| | | | |
William Craig George (1958) 2401 Cedar Springs Road Dallas, TX 75201-1407 Trustee | | Since 2004 | | Regional loan administrator, SunTrust Bank, 1995 - present. | | 25 | | N/A |
| | | | |
Joseph A. Mack (1939) 2401 Cedar Springs Road Dallas, TX 75201-1407 Trustee | | Since 2002 | | Director, Office of Public Policy, South Carolina Baptist Convention, 1999 - present. | | 25 | | N/A |
| | | | |
Franklin R. Morgan (1943) 2401 Cedar Springs Road Dallas, TX 75201-1407 Trustee | | Since 2005 | | Retired - Senior Vice President, Director of International Administration, Prudential Securities, Inc., January 1962 - May 2003. | | 25 | | N/A |
| | | | |
William T. Patterson (1939) 2401 Cedar Springs Road Dallas, TX 75201-1407 Trustee | | Since 2009 | | Managing Partner, Patterson Capital, LLC, October 2007 – present; Director and Chairman of Audit Committee, Therizo Capital Management, February 2007 – February 2008; Senior Vice President, Wachovia Securities LLC, July 2003 – January 2007; Senior Vice President, Prudential Financial Inc., October 2000 – July 2003 | | 25 | | N/A |
|
| INTERESTED TRUSTEES2,3 |
| | | | |
Barry D. Hartis (1945) 2401 Cedar Springs Road Dallas, TX 75201-1407 Trustee | | Since 2005 | | Certified Public Accountant, 1976 - present; Vice President of Business and Finance, Greensboro College, January 1998 - June 30, 2005. | | 25 | | N/A |
| | | | |
James W. Hixson (1931) 2401 Cedar Springs Road Dallas, TX 75201-1407 Trustee | | Since 2010 | | Retired | | 25 | | N/A |
244
FUND MANAGEMENT (Continued)
| | | | | | | | |
Name, (DOB), Address and Position(s) with Trust | | Term of Office and Length of Time Served1 | | Principal Occupation(s) During Past 5 Years | | Number of
Portfolios
in Fund
Complex
Overseen
by Trustee | | Other Trusteeships/ Directorships Held by Trusteee |
| OFFICERS WHO ARE NOT TRUSTEES4 |
| | | | |
Ron W. Bass (1966) 2401 Cedar Springs Road Dallas, TX 75201-1407 Chief Compliance Officer and AML Officer | | Since 2009 | | Manager of Broker/Dealer and RIA Compliance, GuideStone Financial Resources of the Southern Baptist Convention, 2008 – present; Marketing Compliance Manager, GuideStone Financial Resources of the Southern Baptist Convention, 2005 – present; Compliance Specialist, GuideStone Financial Resources of the Southern Baptist Convention, 2004 – 2005. | | N/A | | N/A |
| | | | |
Jeffrey P. Billinger (1946) 2401 Cedar Springs Road Dallas, TX 75201-1407 Vice President and Treasurer | | Since 2000 | | Executive Officer and Treasurer, GuideStone Financial Resources of the Southern Baptist Convention, 1995 - present. | | N/A | | N/A |
| | | | |
Rodric E. Cummins (1957) 2401 Cedar Springs Road Dallas, TX 75201-1407 Vice President and Investment Officer | | Since 2000 | | Executive Officer and Chief Investment Officer, GuideStone Financial Resources of the Southern Baptist Convention, 1998 - present. | | N/A | | N/A |
| | | | |
John R. Jones (1953) 2401 Cedar Springs Road Dallas, TX 75201-1407 President | | Since 2000 | | Executive Vice President and Chief Operating Officer, GuideStone Financial Resources of the Southern Baptist Convention, 1995 - present. | | N/A | | N/A |
| | | | |
Rodney R. Miller (1953) 2401 Cedar Springs Road Dallas, TX 75201-1407 Vice President, Secretary and Chief Legal Officer | | Since 2000 | | General Counsel, Legal and Compliance, GuideStone Financial Resources of the Southern Baptist Convention, 1995 - present. | | N/A | | N/A |
| | | | |
Patricia A. Weiland (1959) 2401 Cedar Springs Road Dallas, TX 75201-1407 Vice President — Fund Operations and Sales | | Since 2000 | | Executive Officer, Financial Solutions and Services, GuideStone Financial Resources of the Southern Baptist Convention, 2006 - present; Director, Mutual Funds, GuideStone Financial Resources of the Southern Baptist Convention, 2000 - 2006. | | N/A | | N/A |
| 1 | Each Trustee serves for an indefinite term, until his successor is elected. Officers serve at the pleasure of the Board of Trustees. |
| 2 | The Trust pays no compensation to the Trustees. The Trust reimburses the Trustees for any expenses incurred in attending meetings. The Trust does not compensate the officers for the services they provide to the Funds. |
| 3 | Messrs. Hartis and Hixson are “interested persons” of the Trust as the term is defined in Section 2(a)19 of the Investment Company Act of 1940, due to their positions on the Board of Trustees of GuideStone Financial Resources of the Southern Baptist Convention. In addition, Mr. Hixson may also be deemed an “Interested person” of the Trust due to his positions on the Boards of Trustees of GuideStone Advisors and GuideStone Financial Services. |
| 4 | The executive officers of the Trust may be deemed to be affiliates of the Adviser due to their positions with the Adviser and/or GuideStone Financial Resources. |
245
PROXY VOTING
A description of the policies and procedures that GuideStone Funds uses to determine how to vote proxies relating to their portfolio securities as well as information regarding how GuideStone Funds voted proxies during the most recent 12-month period ended June 30 is available without charge by calling 1-888-98-GUIDE (1-888-984-8433), by visiting our website at www.GuideStoneFunds.org or by visiting the SEC’s website at www.sec.gov.
FORM N-MFP
Beginning December 2009, the GuideStone Money Market Fund began filing Form N-MFP with the SEC. Form N-MFP is filed on a monthly basis by money market mutual funds and includes detailed information about a money market fund’s investments and the market-based price of its portfolio known as its “shadow NAV“ or mark-to-market valuation. The portfolio holdings information is posted on our website, www.GuideStoneFunds.org within five business days after the end of the month. Form N-MFP is made available online with a 60-day delay at www.sec.gov.
QUARTERLY SCHEDULES OF INVESTMENTS
In addition to the semi-annual and annual reports that GuideStone Funds delivers to shareholders and makes available through its website, GuideStone Funds files a complete schedule of portfolio holdings with the SEC for each Fund’s first and third fiscal quarters on Form N-Q. GuideStone Funds does not deliver the schedule for the first and third fiscal quarters to shareholders, however the schedule is posted to our website, www.GuideStoneFunds.org. You may also obtain the Form N-Q filings by accessing the SEC’s website at www.sec.gov or copy them at the SEC’s Public Reference Room in Washington, DC. Information on the operation of the SEC’s Public Reference Room may be obtained by calling the SEC at (800) 732-0330. You can also request copies of this information, upon payment of a fee for duplication, at the SEC’s email address (publicinfo@sec.gov) or by writing the Public Reference section of the SEC, Washington, DC 20549-0102.
246
BOARD REVIEW OF ADVISORY AGREEMENTS
As required by the Investment Company Act of 1940, as amended (the “1940 Act”), the Board of Trustees (the “Board”) of GuideStone Funds (the “Trust”), including all of the Trustees who are not “interested persons” of the Trust, as that term is defined in Section 2(a)19 of the 1940 Act (the “Independent Trustees”), recently considered the renewal of (i) the investment advisory agreement between GuideStone Capital Management (the “Adviser” or “GSCM”) and the Trust on behalf of the Date Target, Asset Allocation and Select Funds (each a “Fund” and together the “Funds”) of the Trust (the “Advisory Agreement”); and (ii) the sub-advisory agreements among the Adviser, each sub-adviser, and the Trust on behalf of each Select Fund (the “Sub-Advisory Agreements”). The Advisory Agreement and each Sub-Advisory Agreement presented for renewal (the “Agreements”) were approved for an additional one-year term at a meeting of the Board held on September 10, 2010. The Board’s decision to approve the Agreements reflects the exercise of its business judgment to continue each existing arrangement. In approving the Agreements, the Board considered information provided by the Adviser, each sub-adviser and a consulting firm engaged by the Adviser with the assistance and advice of counsel to the Independent Trustees and counsel to the Trust.
The Board’s consideration of various factors and its conclusions with respect to such factors formed the basis for the Board’s determination to continue the Agreements. The factors considered by the Board included, but were not limited to: (i) the resources of the Adviser or sub-adviser; (ii) the experience and expertise of the Adviser or sub-adviser; (iii) the financial capabilities of the Adviser or sub-adviser; (iv) the compliance procedures and history of the Adviser or sub-adviser; (v) the performance of the Fund or portfolio account in comparison to relevant benchmarks, similarly managed funds and the Adviser’s or sub-adviser’s other clients; (vi) the amount of the contractual advisory fee in comparison to similarly managed funds and the Adviser’s or sub-adviser’s other clients and the effect of any fee waiver and expense reimbursement arrangement; (vii) the total expenses of the Fund in comparison to similarly managed funds and the use of past and anticipated expense caps; (viii) the profitability of the Adviser or sub-adviser with respect to the Fund or portfolio account and its overall business as well as the effect of fee waivers and expense caps on profitability; (ix) the extent of any economies of scale and whether the fee structure reflects such economies of scale through breakpoints; (x) the existence of any collateral benefits realized by the Adviser or sub-adviser; and (xi) the existence of any collateral benefits realized by the Fund. In its decision to renew each Agreement, the Board was also mindful of the potential disruptions of the Trust’s operations and various risks, uncertainties and other effects that could occur as a result of a decision to terminate or not renew an Agreement. No one factor was determinative in the Board’s consideration of the Agreements.
The Board undertook a review of the terms of the Agreements and the nature and quality of the services provided by the Adviser and each sub-adviser. The Board conducted its analysis on a fund-by-fund basis with respect to the Adviser and each sub-adviser. The Adviser provided the Board with substantial detailed information in the form of reports about each Date Target Fund, Asset Allocation Fund, Select Fund, sub-advisory firm and the Adviser prior to and during the meeting, which addressed most, if not all, of the factors listed above. The Adviser also provided additional information about the Adviser and each sub-adviser in presentations made during the meeting and responded to questions from the Trustees. In addition, the Independent Trustees met separately in executive session with counsel to the Independent Trustees to discuss and consider information presented in connection with the continuation of the Agreements as well as the Trustees’ responsibilities and duties in approving the Agreements.
APPROVAL OF CONTINUATION OF INVESTMENT ADVISORY AGREEMENT
In considering the renewal of the existing Advisory Agreement with GSCM, the Board took into account all the materials provided prior to and during the meeting, the presentations made during the meeting and the comprehensive discussions during the meeting, including the discussions between the Independent Trustees and their independent legal counsel during the executive session. More specifically, the Board examined the nature, extent and quality of the services to be provided by the Adviser to the Funds. The Board evaluated the Adviser’s experience in serving as an investment adviser, including overseeing and managing the allocation of Fund assets among the sub-advisers. The Board considered the experience of key personnel at the Adviser in providing investment management and administrative services and the systems used by such persons and the ability of the Adviser to attract and retain capable personnel. The Board considered the reputation, compliance history, compliance program and financial condition of the Adviser. The Board also considered the terms of the Agreements and the responsibilities that the Adviser has as investment adviser to the Funds, including oversight of sub-adviser compliance with each
247
Fund’s policies and objectives, oversight of general Fund compliance, including compliance with social restrictions and the implementation of Board directives as they relate to the Funds. The Board concluded that each Fund is likely to benefit from the extent and quality of these services as a result of the Adviser’s experience, personnel, operations and resources.
The Board also reviewed a memorandum prepared by a consulting firm engaged by the Adviser for, among other things, supplying research on expense comparisons and investment performance of other similar funds. The memorandum compared each Date Target, Asset Allocation and Select Fund with other funds having the same investment style or objective, based primarily on Morningstar’s style-based investment categories, and compared the share class of each Fund with other funds in the same distribution channel. The Board analyzed the comparative expense information for each Fund and the performance information for each Select Fund in the memorandum, including comparative expense information for each Fund based on a sampling of funds similar in asset size. The Board considered the comparative fee and expense information that had been provided in its evaluation of the management fees charged to each Fund. The Board evaluated the annualized performance results comparing the Select Funds against their peers.
The Board examined fee and expense information for the Select Funds, as compared to other funds in the Funds’ asset-stratified peer groups for the GS4 Class as of June 30, 2010. The Board determined that the management fees (combined advisory and sub-advisory fees) net of any fee waiver or expense reimbursement for each Select Fund were lower than the median management fees for other mutual funds in the Fund’s asset-stratified peer group, except for the Extended-Duration Bond, Real Estate Securities, Growth Equity, Small Cap Equity and International Equity Funds. The Board took into account that the management fees net of any fee waiver or expense reimbursement for the Medium-Duration Bond, Global Bond, Equity Index and Value Equity Funds ranked in the second quartile, and the Money Market, Low-Duration Bond and Inflation Protected Bond Funds ranked in the first quartile among similar funds at similar asset levels. The Board also considered that the management fees net of any fee waiver or expense reimbursement for the Extended-Duration Bond and Small Cap Equity Funds ranked in the third quartile, and for the Real Estate Securities, Growth Equity and International Equity Funds ranked in the fourth quartile, among similar funds at similar asset levels. The Board also evaluated the total expense ratios for other funds in the Funds’ asset-stratified peer groups and determined that each Fund’s total expense ratio was lower than the median total expense ratio for such other funds.
The Board also examined fee and expense information for the Select Funds, as compared to other funds in the peer groups for the GS2 Class as of June 30, 2010. The Board determined that the management fees net of any fee waiver or expense reimbursement for each Select Fund were lower than the median management fees for other mutual funds in each Fund’s peer group, except for the Money Market, Equity Index, Growth Equity, Small Cap Equity and International Equity Funds. The Board noted that the management fees net of any fee waiver or expense reimbursement for the Money Market and Equity Index Funds ranked in the third quartile and the Growth Equity, Small Cap Equity and International Equity Funds ranked in the fourth quartile, among similar funds at the same asset levels. The Board also evaluated the total expense ratios for other funds in the Funds’ peer groups and determined that each Fund’s total expense ratio was lower than the median total expense ratio for such other funds, except for the Small Cap Equity Fund. The total expense ratio for that Fund fell slightly above the median for other funds that Fund’s peer group.
The Board also examined fee and expense information for the Date Target Funds and the Asset Allocation Funds, as compared to other funds in the Funds’ asset-stratified peer groups for the GS4 Class of the Date Target Funds and the GS2 and GS4 Classes of the Asset Allocation Funds as of June 30, 2010. The Board determined that the management fees net of any fee waiver or expense reimbursement for each Date Target Fund were only slightly above the median management fees for other mutual funds in each Fund’s asset-stratified peer group and that the total expense ratios for each Date Target Fund were lower than the median total expense ratio for such other funds. For the Asset Allocation Funds, the Board determined that the management fees net of any fee waiver or expense reimbursement for each Asset Allocation Fund for both the GS2 and GS4 Class were slightly above the median management fees for other mutual funds in each Fund’s asset-stratified peer group and that the total expense ratios for each Asset Allocation Fund for both the GS2 and GS4 Class were lower than the median total expense ratio for such other funds. The Board concluded that the level of the management fees for each Select Fund, Date Target Fund and Asset Allocation Fund was reasonable and compared fairly to that of comparable mutual funds.
248
The Board examined the performance information for the GS4 Class of the Select Funds compared to Morningstar peers, specifically for the three- and five-year average annual total returns for the period ended June 30, 2010. The Board noted that the average annual total returns for the three- and five-year periods ended June 30, 2010, for the Money Market, Low-Duration Bond, Medium-Duration Bond and Extended-Duration Bond Funds ranked in the first quartile; the International Equity Fund ranked in the second quartile; and the Small Cap Equity Fund ranked in the third quartile. For the period ended June 30, 2010, the Board noted that the Value Equity Fund ranked in the fourth quartile for its three-year average annual total returns, and the third quartile for its five-year average annual total returns while the Growth Equity Fund ranked in the third quartile for its three-year average annual total returns and the fourth quartile for its five-year average annual total returns. For the period ended June 30, 2010, the Board noted that the average annual total returns for the Global Bond and the Real Estate Securities Funds ranked in the third quartile.
The Board examined the performance information for the GS4 Class of each Asset Allocation Fund and Date Target Fund compared to the relevant benchmark and to Lipper peer rankings for the three- and five-year periods ended June 30, 2010, for the Asset Allocation Funds and for the three-year period ended June 30, 2010, for the Date Target Funds. The Board noted that the investment performance of each Fund fell below the benchmark for those periods. However, the Board noted that the Balanced Allocation Fund ranked in the first quartile among Lipper peers for the three-year period ended June 30, 2010, and in the second quartile for the five-year period ended June 30, 2010. The Board noted that the Conservative Allocation Fund ranked in the second quartile among Lipper peers for the three- and five-year periods ended June 30, 2010. The Board noted that the Growth Allocation and Aggressive Allocation Funds each ranked in the third quartile among Lipper peers for the three-year period ended June 30, 2010, and that the Growth Allocation Fund ranked in the third quartile for the five-year period ended June 30, 2010, while the Aggressive Allocation Fund ranked in the fourth quartile for that period. The Board also noted that the MyDestination 2005, 2015 and 2025 Funds each ranked in the second quartile among Lipper peers for the three-year period ended June 30, 2010, while the MyDestination 2035 and 2045 Funds each ranked in the third quartile among Lipper peers for that period.
The Board considered the costs to GSCM of serving as the Adviser to the Funds, including the costs associated with the personnel, systems and equipment necessary to manage the Funds in accordance with the existing Advisory Agreement. The Board considered the anticipated revenues that GSCM expected to receive for serving as the Adviser to the Funds, the fact that any profit realized by the Adviser is forwarded to GuideStone Financial Resources, which historically has operated at a deficit with respect to the Trust. The Board also considered the profitability estimates for the Adviser, one without taking into account sub-advisory fees and one taking into account sub-advisory fees. The Board then considered whether any direct or indirect collateral benefits inured to either the Adviser or the Trust as a result of their affiliation with one another. In light of these considerations, the Board concluded that any profits realized in connection with the Adviser’s services appeared reasonable.
The Board considered the extent to which the advisory fee to be paid to the Adviser reflected economies of scale. In this connection, the Board again noted that the management fees for each Fund net of any fee waiver and expense reimbursement were below the median fee for other similar funds at the same asset levels for the GS4 Class, except for the Extended-Duration Bond, Real Estate Securities, Growth Equity, Small Cap Equity and International Equity Funds.
Based on all of the information presented to the Board and its consideration of relevant factors, the Board concluded that the fee paid to the Adviser by each Fund was reasonable, and in the exercise of its business judgment, determined to approve the continuation of the Advisory Agreement for each Fund.
APPROVAL OF CONTINUATION OF SUB-ADVISORY AGREEMENTS
In considering the existing Sub-Advisory Agreements with each sub-adviser, the Board took into account the materials provided prior to and during the meeting, the presentations made during the meeting and the extensive discussions during the meeting, including the discussions the Independent Trustees had during their executive session with their independent legal counsel. More specifically, the Board examined the nature, extent and quality of the services to be provided by each of the sub-advisers to the Select Funds as well as the services to be provided by Northern Trust Investments, N.A. (“NTI”) to each Fund (except the Money Market Fund), in connection with the cash overlay program. The Board evaluated each sub-adviser’s experience in serving as a sub-adviser to a Select Fund and NTI’s experience in managing the cash overlay program. The Board noted that each sub-adviser currently provides investment advice to various clients, including, in some cases, other pooled investment vehicles. The Board noted the experience of key personnel at each sub-adviser in providing investment management services
249
and the systems used by such persons and the ability of each sub-adviser to attract and retain capable personnel. The Board noted the reputation, compliance history, compliance program and financial condition of each sub-adviser. The Board also noted the terms of the existing Sub-Advisory Agreements and the responsibilities that each sub-adviser has towards a Select Fund, including the responsibility of the day-to-day management of the investment portfolio of each Fund, compliance with each Fund’s policies and objectives and the implementation of Board directives as they relate to the Funds. The Board also noted that unique recent market conditions presented extraordinary challenges for active management. The Board concluded that each Fund is likely to benefit from the extent and quality of these services as a result of each sub-adviser’s experience, personnel, operations and resources.
The Board examined performance information for each segment of a Select Fund managed by a sub-adviser. The Board noted that, for many of the sub-advisers, the performance record of the segment of the Select Fund managed by the sub-adviser compared favorably to the relevant Fund benchmark, the composite performance for the sub-adviser’s clients (on a gross fee basis) and the peer universe of similarly managed funds for the period of time the sub-adviser performed advisory services on behalf of the Select Fund. In cases where the sub-adviser’s performance lagged behind the Fund’s benchmark, the Board also considered more recent investment performance, performance measured against other relevant benchmarks and any reductions in the sub-advisory fee. The Board also examined the estimated gross value added return each Equity Select Fund realized through its participation in the cash overlay program.
The Board also noted that, in certain cases, unprecedented market trends due to the economic downturn have contributed to the underperformance of many of the sub-advisers. The Board concluded that, although past performance is no guarantee of future performance, the performance of each Select Fund was satisfactory and the Funds were likely to benefit from each sub-adviser continuing to serve as sub-adviser to the Fund.
The Board examined the fee schedule for each sub-adviser, noting how the fee levels charged to the Trust compared with available information about fees charged by the sub-advisers to their other similarly situated clients, which in many cases include separately managed accounts, as well as how the sub-adviser fee levels for each Select Fund compared to the median sub-advisory fee for the peer universe of similarly managed funds.
The Board also took into account the profitability and the financial capability of each sub-adviser in light of information presented at the meeting. In light of these considerations, the Board concluded that profits realized by each sub-adviser who completed a profitability questionnaire appeared reasonable. For those sub-advisers that did not provide profitability information, the Board relied upon other relevant information, particularly the independent negotiation of the fee schedules, the level of the fees and the sub-adviser’s performance history. The Board noted that, based on the Adviser’s representations, the financial statements of the sub-advisers did not appear to raise any concerns regarding the financial capability of those sub-advisers. The Board also considered the Adviser’s representations in the materials prepared for this meeting that no sub-adviser experienced any material change in its financial condition since the date of its most recent audited financial statements.
The Board considered the extent to which sub-adviser fees to be paid to each sub-adviser reflected economies of scale. The Board noted that each sub-adviser fee schedule either reflected economies of scale by reducing the fee on assets in excess of certain stated breakpoints, or the fee level negotiated was below or on par with the standard fee level for the sub-adviser.
In evaluating the benefits that are expected to accrue to each sub-adviser through its relationship as sub-adviser to a Select Fund, the Board noted that certain sub-advisers allocate portfolio brokerage to affiliated broker-dealers that receive commissions from the execution of Fund trades. The Board also noted that certain sub-advisers expect to benefit from “soft dollar” arrangements by which brokers will provide research and other services to the sub-adviser in exchange for commissions on trades of the portfolio securities of the Select Fund. The Board considered whether any direct or indirect collateral benefits inured to the Trust as a result of its affiliation with each sub-adviser.
Based on all of the information presented to the Board and its consideration of relevant factors, the Board, in the exercise of its reasonable business judgment, determined to approve the continuation of each Sub-Advisory Agreement.
250
INVESTMENT SUB-ADVISERS (Assets under management as of 12/31/10) (Unaudited)
GuideStone Funds employs a broad array of proven investment managers for the benefit of their investors. Each manager is distinctive in its investment management process and business approach.
| | | | | | | | |
Fund | | Sub-Adviser | | Firm
Established | | Total Assets
Managed | |
Money Market | | BlackRock Institutional Management Corporation | | 1988 | | $ | 3.6Tr | |
Low-Duration Bond | | BlackRock Financial Management, Inc. | | 1988 | | $ | 3.6Tr | |
| | Payden & Rygel | | 1983 | | $ | 55.1B | |
| | PIMCO (Pacific Investment Management Company LLC) | | 1971 | | $ | 1.2Tr | |
Medium-Duration Bond | | Goldman Sachs Asset Management, L.P. | | 1984 | | $ | 717B | |
| | PIMCO (Pacific Investment Management Company LLC) | | 1971 | | $ | 1.2Tr | |
| | Western Asset Management Company | | 1971 | | $ | 340B | |
| | Western Asset Management Company Limited | | 1971 | | $ | 45.2B | |
Extended-Duration Bond | | Loomis, Sayles & Company, L.P. | | 1926 | | $ | 151B | |
| | STW Fixed Income Management Ltd. | | 1977 | | $ | 10.5B | |
Inflation Protected Bond | | BlackRock Financial Management, Inc. | | 1988 | | $ | 3.6Tr | |
Global Bond | | Loomis, Sayles & Company, L.P. | | 1926 | | $ | 151B | |
| | Western Asset Management Company | | 1971 | | $ | 340B | |
| | Western Asset Management Company Limited | | 1971 | | $ | 45.2B | |
Equity Index | | Northern Trust Investments, Inc. | | 1889 | | $ | 644B | |
Real Estate Securities | | RREEF America L.L.C. | | 1975 | | $ | 28.7B | |
Value Equity | | Aronson+Johnson+Ortiz, LP | | 1984 | | $ | 19.8B | |
| | Barrow, Hanley, Mewhinney & Straus, LLC | | 1979 | | $ | 60.6B | |
| | Northern Trust Investments, Inc. | | 1889 | | $ | 644B | |
| | TCW Investment Management Company | | 1971 | | $ | 116B | |
Growth Equity | | Columbus Circle Investors | | 1975 | | $ | 16.6B | |
| | Marsico Capital Management, LLC | | 1997 | | $ | 51B | |
| | Rainier Investment Management, Inc.® | | 1991 | | $ | 18.8B | |
| | Sands Capital Management, LLC | | 1992 | | $ | 16.1B | |
Small Cap Equity | | Aronson+Johnson+Ortiz, LP | | 1984 | | $ | 19.8B | |
| | Columbus Circle Investors | | 1975 | | $ | 16.6B | |
| | Lord, Abbett & Co. LLC | | 1929 | | $ | 106.5B | |
| | TimesSquare Capital Management, LLC | | 2000 | | $ | 14.4B | |
| | Western Asset Management Company | | 1971 | | $ | 340B | |
| | Western Asset Management Company Limited | | 1971 | | $ | 45.2B | |
International Equity | | AllianceBernstein L.P. | | 1962 | | $ | 478B | |
| | AQR Capital Management, LLC | | 1998 | | $ | 33B | |
| | Genesis Asset Managers, LLP | | 1989 | | $ | 28.8B | |
| | Lazard Asset Management LLC | | 1970 | | $ | 141B | |
| | McKinley Capital Management, LLC | | 1990 | | $ | 11.9B | |
| | MFS Institutional Advisors, Inc. | | 1970 | | $ | 110B | |
| | Mondrian Investment Partners Ltd. | | 1990 | | $ | 72.7B | |
| | Philadelphia International Advisors, L.P. | | 1956 | | $ | 6.3B | |
| | UBS Global Asset Management (Americas) Inc. | | 1998 | | $ | 152B | |
Custodian for GuideStone Funds Assets | | The Northern Trust Company | | 1889 | | $ | 4.1Tr | |
Cash Overlay for Date Target, Asset Allocation, Bond and Equity Funds | | Northern Trust Investments, Inc. | | 1889 | | $ | 644B | |
You should consider the investment objectives, risks, charges and expenses of each Fund carefully before investing. To obtain a prospectus with this and other information about GuideStone Funds call 1-888-98-GUIDE (1-888-984-8433), visit www.GuideStoneFunds.org or write to GuideStone Funds, 2401 Cedar Springs, Dallas, TX 75201-1498. Read it carefully before you invest. Shares of GuideStone Funds are distributed by BNY Mellon Distributors Inc., 760 Moore Road, King of Prussia, PA 19406.
251
| | | | |
 | | 2401 Cedar Springs Road, Dallas, TX 75201-1498 1-888-98-GUIDE • www.GuideStoneFunds.org | | Funds distributed by BNY Mellon Distributors Inc. 760 Moore Road, King of Prussia, PA 19406 |
| | |
The registrant, as of the end of the period covered by this report, has adopted a code of ethics for the Principal Executive and Senior Financial Officers (“Supplemental Code of Ethics”). Such Supplemental Code of Ethics is attached as an exhibit to this Form N-CSR.
There have been no amendments or waivers, during the period covered by this report, to a provision of the code of ethics that applies to the registrant’s principal executive officer, principal financial officer, principal accounting officer or controller, or persons performing similar functions, regardless of whether these individuals are employed by the registrant or a third party, and that relates to any element of the code of ethics description.
| Item 3. | Audit Committee Financial Expert. |
As of the end of the period covered by the report, the registrant’s board of directors has determined that Carson L. Eddy is qualified to serve as an audit committee financial expert serving on its audit committee and that he is “independent,” as defined by Item 3 of Form N-CSR.
| Item 4. | Principal Accountant Fees and Services. |
Audit Fees
| | (a) | The aggregate fees billed for each of the last two fiscal years for professional services rendered by the principal accountant for the audit of the registrant’s annual financial statements or services that are normally provided by the accountant in connection with statutory and regulatory filings or engagements for those fiscal years are $480,152 and $494,558 for 2009 and 2010, respectively. |
Audit-Related Fees
| | (b) | The aggregate fees billed in each of the last two fiscal years for assurance and related services by the principal accountant that are reasonably related to the performance of the audit of the registrant’s financial statements and are not reported under paragraph (a) of this Item are $36,740 and $37,842 for 2009 and 2010, respectively. Audit-related fees are related to procedures performed and the issuance of the auditors’ reports in connection with the Funds’ 17F-2 security counts. |
Tax Fees
| | (c) | The aggregate fees billed in each of the last two fiscal years for professional services rendered by the principal accountant for tax compliance, tax advice, and tax planning are $91,400 and $94,200 for 2009 and 2010, respectively. Tax fees are related to tax services in connection with Funds’ excise tax calculations and review of the Funds’ applicable tax returns. |
All Other Fees
| | (d) | The aggregate fees billed in each of the last two fiscal years for products and services provided by the principal accountant, other than the services reported in paragraphs (a) through (c) of this Item are $0 and $0 for 2009 and 2010, respectively. |
| | (e)(1) | Disclose the audit committee’s pre-approval policies and procedures described in paragraph (c)(7) of Rule 2-01 of Regulation S-X. |
GuideStone
Non-Audit Services Provided to the Company, Advisor, and Others
The Audit Committee shall pre-approve all permissible non-audit services (e.g., tax services) to be provided to the Company by the Auditors, including the fees therefor;
provided, that if the Committee chooses to delegate the authority to grant pre-approvals to one or more Committee members, each acting on behalf of the Committee, then the Committee shall adopt policies and procedures detailed as to the particular service and designed to safeguard the continued independence of the auditors, consistent with the requirements of the Sarbanes-Oxley Act of 2002 (the “S-O Act”) and related SEC regulations, which shall then be used in making such pre-approvals; and,
further provided, that each delegated pre-approval shall be reported to the Committee during its next regularly scheduled meeting.
The pre-approval requirement for a permitted non-audit service may be waived if:
| | (1) | the aggregate amount of all such non-audit services provided constitutes not more than 5% of the total revenues paid by the Company to the Auditors in the fiscal year in which the non-audit services are provided; |
| | (2) | such services were not recognized by the Company at the time of the engagement to be non-audit services; and |
| | (3) | such services are promptly brought to the attention of, and approved by, the Audit Committee or by a member of the Audit Committee to whom the Committee has delegated the authority to grant such approvals, if any, prior to the Auditors’ completion of the Company’s audit. |
Additionally, if the Auditors’ engagement relates directly to the operations and financial reporting of the Company, to the extent required by Rule 2-01 of Regulation S-X, the Audit Committee shall pre-approve their engagements for non-audit services with:
| | (1) | the Advisor (excluding any subadviser whose role is primarily portfolio management and is sub-contracted or overseen by the Advisor), and |
| | (2) | any entity controlling, controlled by, or under common control with such Advisor that provides ongoing services to the Company (each, a “Control Entity”) |
in accordance with the foregoing paragraph, unless the aggregate amount of all services provided constitutes no more than 5% of the total amount of revenues paid to the Auditors by the Company, the Advisor and any such Control Entity during the fiscal year in which the services are provided that would have to be pre-approved by the Audit Committee pursuant to this paragraph (in the absence of this exception). The Auditors may not perform contemporaneously any prohibited non-audit services for the Company, which currently include the following:
| | 1. | bookkeeping or other services related to the accounting records or financial statements of the Company; |
| | 2. | financial information systems design and implementation; |
| | 3. | appraisal or valuation services, fairness opinions, or contribution-in-kind reports; |
| | 5. | internal audit outsourcing services; |
| | 6. | management functions or human resources; |
| | 7. | broker or dealer, investment adviser, or investment banking services; |
| | 8. | legal services and expert services unrelated to the audit; and |
| | 9. | any other service that the Public Company Accounting Oversight Board determines, by regulation, is impermissible. |
| | (e)(2) | The percentage of services described in each of paragraphs (b) through (d) of this Item that were approved by the audit committee pursuant to paragraph (c)(7)(i)(C) of Rule 2-01 of Regulation S-X are as follows: |
(b) 0%
(c) 0%
(d) 0%
| | (f) | The percentage of hours expended on the principal accountant’s engagement to audit the registrant’s financial statements for the most recent fiscal year that were attributed to work performed by persons other than the principal accountant’s full-time, permanent employees was 0%. |
| | (g) | The aggregate non-audit fees billed by the registrant’s accountant for services rendered to the registrant, and rendered to the registrant’s investment adviser (not including any sub-adviser whose role is primarily portfolio management and is subcontracted with or overseen by another investment adviser), and any entity controlling, controlled by, or under common control with the adviser that provides ongoing services to the registrant for each of the last two fiscal years of the registrant was $0 and $0 for 2009 and 2010, respectively. |
| | (h) | The registrant’s audit committee of the board of directors has considered whether the provision of non-audit services that were rendered to the registrant’s investment adviser (not including any sub-adviser whose role is primarily portfolio management and is subcontracted with or overseen by another investment adviser), and any entity controlling, controlled by, or under common control with the investment adviser that provides ongoing services to the registrant that were not pre-approved pursuant to paragraph (c)(7)(ii) of Rule 2-01 of Regulation S-X is compatible with maintaining the principal accountant’s independence. |
| Item 5. | Audit Committee of Listed registrants. |
Not applicable.
| (a) | Schedule of Investments in securities of unaffiliated issuers as of the close of the reporting period is included as part of the report to shareholders filed under Item 1 of this form. |
| Item 7. | Disclosure of Proxy Voting Policies and Procedures for Closed-End Management Investment Companies. |
Not applicable.
| Item 8. | Portfolio Managers of Closed-End Management Investment Companies. |
Not applicable.
| Item 9. | Purchases of Equity Securities by Closed-End Management Investment Company and Affiliated Purchasers. |
Not applicable.
| Item 10. | Submission of Matters to a Vote of Security Holders. |
Not applicable.
| Item 11. | Controls and Procedures. |
| | (a) | The registrant’s principal executive and principal financial officers, or persons performing similar functions, have concluded that the registrant’s disclosure controls and procedures (as defined in Rule 30a-3(c) under the Investment Company Act of 1940, as amended (the “1940 Act”) (17 CFR 270.30a-3(c))) are effective, as of a date within 90 days of the filing date of the report that includes the disclosure required by this paragraph, based on their evaluation of these controls and procedures required by Rule 30a-3(b) under the 1940 Act (17 CFR 270.30a-3(b)) and Rules 13a-15(b) or 15d-15(b) under the Securities Exchange Act of 1934, as amended (17 CFR 240.13a-15(b) or 240.15d-15(b)). |
| | (b) | There were no changes in the registrant’s internal control over financial reporting (as defined in Rule 30a-3(d) under the 1940 Act (17 CFR 270.30a-3(d)) that occurred during the registrant’s second fiscal quarter of the period covered by this report that has materially affected, or is reasonably likely to materially affect, the registrant’s internal control over financial reporting. |
| | (a)(1) | Code of ethics, or any amendment thereto, that is the subject of disclosure required by Item 2 is attached hereto. |
| | (a)(2) | Certifications pursuant to Rule 30a-2(a) under the 1940 Act and Section 302 of the Sarbanes-Oxley Act of 2002 are attached hereto. |
| | (b) | Certifications pursuant to Rule 30a-2(b) under the 1940 Act and Section 906 of the Sarbanes-Oxley Act of 2002 are attached hereto. |
SIGNATURES
Pursuant to the requirements of the Securities Exchange Act of 1934 and the Investment Company Act of 1940, the registrant has duly caused this report to be signed on its behalf by the undersigned, thereunto duly authorized.
| | | | |
| (registrant) | | GuideStone Funds | | |
| | | | |
| | |
| By (Signature and Title)* | | /s/ John R. Jones | | |
| | John R. Jones, President | | |
| | (principal executive officer) | | |
Pursuant to the requirements of the Securities Exchange Act of 1934 and the Investment Company Act of 1940, this report has been signed below by the following persons on behalf of the registrant and in the capacities and on the dates indicated.
| | | | | | |
| By (Signature and Title)* | | | | /s/ John R. Jones | | |
| | | | John R. Jones, President | | |
| | | | (principal executive officer) | | |
| | | | | | |
| | | |
| By (Signature and Title)* | | | | /s/ Jeffrey P. Billinger | | |
| | | | Jeffrey P. Billinger, Vice President and Treasurer | | |
| | | | (principal financial officer) | | |
| * | Print the name and title of each signing officer under his or her signature. |