UNITED STATES
SECURITIES AND EXCHANGE COMMISSION
Washington, D.C. 20549
FORM N-CSR
CERTIFIED SHAREHOLDER REPORT OF REGISTERED MANAGEMENT
INVESTMENT COMPANIES
Investment Company Act file number 811-10263
| | | | |
| | GuideStone Funds | | |
| | (Exact name of registrant as specified in charter) | | |
| | | | |
| | 2401 Cedar Springs Road Dallas, TX 75201-1407 | | |
| | (Address of principal executive offices) (Zip code) | | |
| | | | |
Rodney R. Miller, Esq. GuideStone Financial Resources of the Southern Baptist Convention 2401 Cedar Springs Road Dallas, TX 75201-1407 |
| | (Name and address of agent for service) | | |
registrant’s telephone number, including area code: 214-720-2142
Date of fiscal year end: December 31
Date of reporting period: December 31, 2009
Form N-CSR is to be used by management investment companies to file reports with the Commission not later than 10 days after the transmission to stockholders of any report that is required to be transmitted to stockholders under Rule 30e-1 under the Investment Company Act of 1940 (17 CFR 270.30e-1). The Commission may use the information provided on Form N-CSR in its regulatory, disclosure review, inspection, and policymaking roles.
A registrant is required to disclose the information specified by Form N-CSR, and the Commission will make this information public. A registrant is not required to respond to the collection of information contained in Form N-CSR unless the Form displays a currently valid Office of Management and Budget (“OMB”) control number. Please direct comments concerning the accuracy of the information collection burden estimate and any suggestions for reducing the burden to Secretary, Securities and Exchange Commission, 100 F Street, NE, Washington, DC 20549. The OMB has reviewed this collection of information under the clearance requirements of 44 U.S.C. § 3507.
| Item 1. | Reports to Stockholders. |
The Report to Shareholders is attached herewith.
GuideStone Funds
Privacy Notice
NOTICE CONCERNING YOUR PRIVACY RIGHTS
This notice will provide you with information concerning our policies with respect to nonpublic personal information that we collect about you in connection with the following financial products and services provided and/or serviced by the entities listed below: individual retirement accounts ( “IRAs”) and/or personal mutual fund accounts.
The confidentiality of your information is important to us as we recognize that you depend on us to keep your information confidential, as described in this notice.
We collect nonpublic personal information about you with regard to your IRA and/or personal mutual fund accounts from the following sources:
| | • | | Information we receive from you on applications or other forms; |
| | • | | Information about your transactions with us, our affiliates or others (including our third party service providers); |
| | • | | Information we receive from others such as service providers, broker-dealers and your personal agents or representatives; and |
| | • | | Information you and others provide to us in correspondence sent to us, whether written,electronic or by telephone. |
We may disclose such nonpublic personal financial information about you to one or more of our affiliates as permitted by law. An affiliate of an organization means any entity that controls, is controlled by or is under common control with that organization. GuideStone Funds, GuideStone Financial Resources of the Southern Baptist Convention (“GuideStone Financial Resources”), GuideStone Capital Management (“GSCM”), GuideStone Trust Services (“GSTS”), GuideStone Financial Services (“GFS”) and GuideStone Advisors (“GA”) are affiliates of one another. GuideStone Funds, GuideStone Financial Resources, GSCM, GSTS, GFS, GA and PFPC Distributors, Inc. do not sell your personal information to nonaffiliated third parties.
We may also disclose any of the personal information that we collect about you to nonaffiliated third parties as permitted by law. For example, we may provide your information to nonaffiliated companies that provide account services or that perform marketing services on our behalf and to other financial institutions with whom we have joint marketing agreements. We restrict access to nonpublic personal information about you to those of our employees who need to know that information in order for us to provide and/or service products or services to you. We also maintain physical, electronic and procedural safeguards to guard your personal information.
These procedures will continue to remain in effect after you cease to receive financial products and services from us.
If you have any questions concerning our customer information policy, please contact a customer relations specialist at 1-888-98-GUIDE (1-888-984-8433).
TABLE OF CONTENTS
This report has been prepared for shareholders of GuideStone Funds. It is not authorized for distribution to prospective investors unless accompanied or preceded by a current prospectus, which contains more complete information about the Funds. Investors are reminded to read the prospectus carefully before investing. Past performance is no guarantee of future results. Share prices will fluctuate and there may be a gain or loss when shares are redeemed. Fund shares are distributed by PFPC Distributors, Inc., 760 Moore Rd., King of Prussia, PA 19406.
1
LETTER FROM THE PRESIDENT

Dear Shareholders:
We are pleased with the manner in which our funds have navigated the treacherous markets over the past two years. While GuideStone Funds’ investment strategies have not been immune to the market dynamics and volatility experienced during the crisis, our first priority has been the protection of our investors’ capital. This effort originates with the hiring and ongoing monitoring of 29 world class investment sub-advisors working on behalf of our investors in GuideStone Funds and the resulting strong fundamental investment basis for all decision-making and investment positions.
Additionally, we have been very active throughout the financial crisis to ensure that the entire infrastructure supporting the investment platform (i.e. investment management, operations and compliance functions) remained rock-solid by continually reviewing all elements of the investment process. As a result of these diligent efforts, the following achievements were realized:
| | • | | As of December 31, 2009, assets under management rose to $8.0 billion, representing a 17.6% increase from the prior year. |
| | • | | All 25 GuideStone Funds ended the year with positive performance. |
We invite you to learn more about GuideStone Funds by contacting us at 1-888-98-GUIDE (1-888-984-8433) or visiting our Web site at www.GuidestoneFunds.org. Thank you for entrusting GuideStone Funds with your investment assets, and we look forward to continuing to serve you.
|
| Sincerely, |
|
 |
| John R. Jones, CFA |
2
FROM THE CHIEF INVESTMENT OFFICER

Rodric E. Cummins, CFA
The close of 2009 signals how far and fast capital markets have come following the dark days of 2008. Global economies transitioned into a recovery phase in the latter half of the year from one of the worst economic and financial crises in modern history. With growing confidence that financial disaster has been averted and economic growth lies ahead, investors’ appetite for risk revived both stock and bond markets alike, resulting in powerful rallies among all global asset classes during the year.
Both the economic recovery and the stabilization of the financial system have been founded thus far on a powerful combination of inventory rebuilding and the government’s aggressive stimulus policies. U.S. Gross Domestic Product, the broadest measure of the nation’s output of goods and services, turned positive in the third quarter, with growth of 2.2% (annualized).
Further, while functionality has not been fully restored to the financial system, confidence has been restored to the point that risk and liquidity premiums in the capital markets are returning to normal.
While the sustainability of the market and economic recovery is highly debated, 2009 represents a welcome relief for investors looking to restore losses suffered during the financial crisis. U.S. stocks, as represented by the S&P 500® Index, rallied over 60% from the trough of the crisis in March to post a return of 26.46% for the year. International stocks were boosted by eye-popping returns in emerging markets to return 41.45% for the year, as measured by the MSCI-ACWI (All Country World Index) Ex-U.S. Index. The bond markets, despite rising interest rates throughout the year, were lead by a strong recovery in the corporate sector and finished the year with a return of 5.93%, as measured by the Barclays Capital U.S. Aggregate Bond Index. Investment grade corporate bonds, an important source of returns for investors in 2009, returned 18.68% for the year, as measured by the Barclays Capital U.S. Aggregate Bond Index – Corporate Sector.
Looking forward, with most market metrics beginning to normalize, the future path of economic growth will hold the key to the direction and magnitude of capital market returns in the periods ahead. Governments around the world have been hugely successful in this recovery with monetary and fiscal stimulus packages designed to stabilize the financial system and restart the global economic engine. As global economies continue the long process toward recovery, periods of anticipation and doubt about the strength and sustainability of future economic growth will certainly fuel further market volatility. Central to that issue will be the economy’s ability to generate enough organic growth, independent of temporary boosts from the inventory rebuilding phase and government stimulus programs, to form the positive feedback loop between business/consumer demand, employment and income needed to support the next economic cycle.
The economic recovery and rally in global financial markets resulted in strong investment returns from stock and bond funds alike in 2009. In sharp contrast to 2008, all 25 Funds posted positive returns for the year. With the exception of the Money Market Fund, all of the Funds with one year of performance posted double digit performance for the year. Global equity markets posted strong gains as investor confidence fueled a return of risk appetites and aggressive cost cutting practices spurred better than expected earnings throughout the year. Consistent with many early stage recoveries from past cycles, stocks of low-quality companies led the market in 2009 across all geographical boundaries and through all market capitalizations. GuideStone Equity Select Funds were led by the Growth Equity Fund and International Equity Fund with returns of 37.99% and 35.61%, respectively.
Performance within the bond markets were driven by the opposing forces of higher interest rates and an improved outlook for creditworthiness in corporate securities. Except for short-term interest rates, which remain near zero due to Federal Reserve policy, the yield curve for U.S. Treasury bonds steepened significantly during the year on concerns that future debt issuance by the government will push rates higher. This resulted in poor performance for the government debt sector, particularly on the long end of the curve where U.S. Treasuries returned -21.40%. In contrast, a powerful narrowing in credit spreads from historical levels resulted from the improved outlook for economic growth. Investment grade corporate bonds returned 18.68% and high yield bonds returned 58.21% (Barclays Capital Bond Indices). GuideStone Select Bond Funds were led by the Global Bond Fund and Extended-Duration Bond Fund with returns of 37.35% and 24.97%, respectively.
With the rally extending across stocks and bonds alike, investors in well-diversified portfolios, such as GuideStone Funds Asset Allocation and Date Target Funds, realized significant recovery levels from losses suffered in 2008. Returns for the Asset Allocation Funds in 2009 ranged from 16.58% for the Conservative Allocation Fund (75% bonds and 25% stocks) to 30.82% for the Aggressive Allocation Fund, representing an all equity allocation. Returns for the MyDestination™ Funds ranged from 21.84% for the MyDestination 2005 Fund to 30.99% for the MyDestination 2035 Fund.
3
Asset Class Performance Comparison
The following graph illustrates the performance of the major assets classes during 2009.
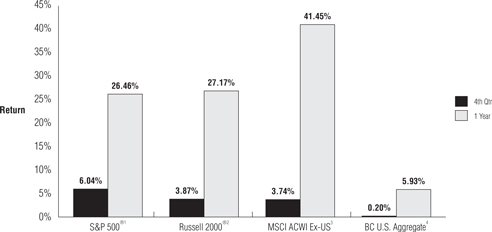
| 1 | The S&P 500® Index includes 500 of the largest stocks (in terms of market value) in the United States. |
| 2 | The Russell 2000® Index is a small-cap index consisting of the smallest 2,000 companies in the Russell 3000® Index, representing approximately 10% of the Russell 3000® Index total market capitalization. |
| 3 | The MSCI ACWI (All Country World Index) Ex-U.S. Index is a free float-adjusted market capitalization index that is designed to measure equity market performance in the global developed and emerging markets excluding the United States. |
| 4 | The Barclays Capital U.S. Aggregate Bond Index represents securities that are SEC-registered, taxable and dollar denominated. The index covers the U.S. investment grade bond market, with index components for government and corporate securities, mortgage pass-through securities and asset-backed securities. |
4
U.S. Economy — Real Gross Domestic Product
Entering into calendar year 2009, the U.S. economy was well within one of its worst recessions in history. The U.S. economy, as measured by the real gross domestic product (“GDP”), fell (5.4)% on an annualized rate in the fourth quarter 2008, marking its second consecutive month of negative economic growth. First quarter 2009 GDP results showed further contraction with an even weaker (6.4)% annualized growth rate, reflecting declines in inventories, housing and business spending. Second quarter 2009 GDP, posted at an annualized rate of (0.7)%, marked four consecutive quarters of negative growth - the longest stretch of declines since quarterly records began in 1947. The U.S. economy had contracted (3.8)% (annualized) in the 12 months ended June 2009, its worst performance in seven decades. While the second quarter 2009 GDP was negative, it provided some welcomed good news – it illustrated improvements compared to recent periods and evidence that stimulus programs and aggressive monetary policies were gaining positive traction in the economy. The second quarter also marked the rebound in the U.S. stock market as investors became less risk averse and more opportunistic about the potential for future corporate earnings growth. Third quarter 2009 GDP increased at an annual rate of 2.2%, its highest level since the third quarter of 2007. Economic growth in the third quarter reflected positive contributions from personal consumption expenditures, exports, private inventory investment, federal government spending and residential fixed investment. With the third quarter providing renewed optimism, the initial release of the fourth quarter GDP was 5.7%, its highest level since September, 2003. Fourth quarter GDP provided hope the economy’s dependence on government support is lessening.
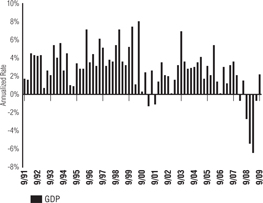
Real Gross Domestic Product (“GDP”) is one of the most widely used economic measures for the overall U.S. economy. GDP measures the output of all goods and services produced by labor and property within the United States during a specific period. The output is usually expressed as an annualized rate for a quarter. Generally, it is viewed as positive for the equity markets when GDP expands reflecting an environment of economic growth and profitability. The converse is true when GDP is contracting.
Data Source: Bloomberg, Bureau of Economic Analysis
S&P 500® Index Returns
The broad U.S. equity market, as measured by the S&P 500® Index, posted a positive annual return of 26.46%. The equity market’s strong performance was a welcome relief to investors, following the devastating (37.00)% annual return experienced during 2008, the market’s worst calendar year performance since 1931. The market downturn of 2008 extended into March 2009 at which time the equity market rebounded strongly, fueled by a sharp rise in lower-quality, lower-valued and smaller-cap stocks. While so-called “junk rallies” are not uncommon after a material market correction (such as the one that occurred in 2008), the junk rally experienced during 2009 was historic in its magnitude, surprising many market pundits. From March 9th through the end of the year, the S&P 500® Index generated a remarkable return of 64.83%. Despite this bounce back, the index remained 28.75% off its 2007 high as of year-end. Volatility within the index significantly declined over the latter part of the year, but 2009 still ranked as the seventh most volatile year in the index’s history. All sectors within the index posted positive returns, led by the information technology sector at roughly 62%. The telecommunications services sector lagged all other sectors with an annual return approximating 8.5%.
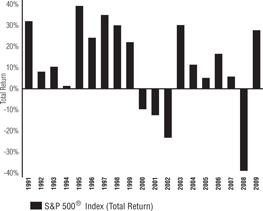
The S&P 500® Index includes 500 leading companies in major industries of the U.S. economy. The index represents about 75% of U.S. equity market capitalization. It is a capitalization-weighted index calculated on a total return basis with dividends reinvested. Constituents are selected by a team of Standard & Poor’s economists and analysts.
Data Source: Standard & Poor’s®
S&P 500® P/E (Excluding Negative Earnings)
The price-to-earnings (“P/E”) ratio (trailing 12 month P/E) ended the year at 22.6x, just above the multiple’s level at the end of 2008. The trailing 12-month P/E was volatile and high during the majority of 2009, reflecting the very difficult environment for corporate earnings in the midst of the recessionary environment. Over the illustrated time period, the average P/E was 27.7x.
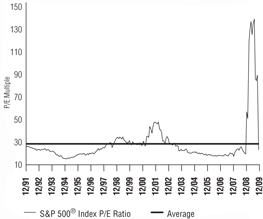
P/E is the ratio of a stock’s price divided by its earnings per share. In this case, the P/E ratio is represented for the entire index. The ratio, or multiple, reflects the price an investor is willing to pay for a dollar of expected earnings per share. The P/E used in the above graph is a trailing 12-month average.
Data Source: Ned Davis Research Group
5
The Conference Board Consumer Confidence Index
U.S. consumer confidence, as measured by the Conference Board’s Index, reflects current appraisals and expectations of business and employment conditions as well as expectations related to future family income. During 2009, U.S. consumer confidence generally moved in-line with economic contraction/ expansion, the high levels of unemployment and the performance of the equity markets. At the beginning of the year, consumer confidence hovered around all time lows as consumers carried over their pessimism related to the state of the economy and their future earnings potential. In February, the Conference Board Index plunged to 25.3, its lowest level since the index began in 1967. It should be noted that the index’s low in February corresponded with the domestic equity market’s low on March 6th. The index began to improve during the second quarter, fueled by renewed optimism and speculation that the economy and unemployment would improve in late 2009. The index increased to 54.8 during May, its highest level during 2009. The improvement in May represented the index’s largest increase in six years. The index trended slightly downward from May and ended the year at 52.9. While the index improved materially during the year, its current level continued to reflect the negative impact high unemployment levels were having on consumers’ outlooks and attitudes.
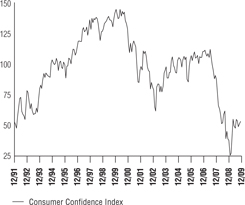
The Conference Board Consumer Confidence Index is based on a monthly survey of a sample of 5000 U.S. households for the purpose of measuring consumer sentiment. The trend in this economic measure is closely monitored given consumers comprise approximately two-thirds of the U.S. Economy. Generally, it is viewed as positive to the economy and equity markets when the index increases. This reflects the fact that consumers are positive regarding their economic outlook and that they are more willing to spend money providing further economic stimulus.
Data Source: Bloomberg, The Conference Board
Federal Reserve
The latter half of 2008 experienced a systematic failure and lack of confidence in the financial system, a deteriorating global economic climate and a severe meltdown in the equity markets. The Federal Reserve (“Fed”) cut the federal funds target rate to 0-0.25% on December 16, 2008, and left the key rate at this historically low level throughout all of calendar year 2009. The Fed was determined, through monetary policy and other sponsored programs, to pump a tremendous amount of liquidity into the economy to counteract the effects of negative economic growth, elevating unemployment, slumping household spending and business investment and a dismal housing market. At the regularly scheduled December 16, 2009, meeting, the Federal Open Market Committee (“FOMC”) stated “that it would maintain the target range for the federal funds rate at 0-0.25% and continues to anticipate that economic conditions, including low rates of resource utilization, subdued inflation trends, and stable inflation expectations, are likely to warrant exceptionally low levels of the federal funds rate for an extended period”. While concerns exist over the Fed leaving rates too low for too long, the central bank appears committed to use all of its available tools and resources to stimulate sustainable economic growth going forward.
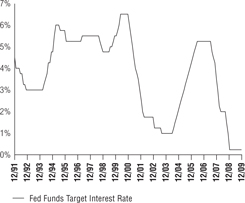
The Federal Reserve (“Fed”) is the central bank of the United States. It was created by Congress to provide the nation with a safer, more flexible, and more stable monetary and financial system. The Federal Funds Rate is the interest rate at which depository institutions lend balances at the Fed to other depository institutions overnight. The rate is one tool the Fed can use in their efforts of controlling the supply of money. Changes in the Federal Funds Rate trigger a chain of events that affect other short-term interest rates, foreign exchange rates, long-term interest rates, the amount of money and credit, and, ultimately, a range of economic variables, including employment, output, and prices of goods and services.
Data Source: Bloomberg
6
U.S. Unemployment
Without doubt, calendar year 2009 was characterized as a historically difficult year for the labor markets, coming off of an already dreadful 2008. Unemployment is a lagging economic indicator, and the material payroll cuts by employers and the quickly rising unemployment rates have begun to reflect the extreme severity of the current recessionary environment. The labor markets entered into 2009 in a troublesome state as the U.S. economy had probably lost more jobs in 2008 than in any year since the end of World War II, as firings had rippled through homebuilders, auto manufacturers, banks and retailers. In January, the unemployment rate had reached 7.6%, its highest level since 1992. To offset rising unemployment, the Federal Reserve maintained a historically low target federal funds rate at 0-0.25% and many government sponsored programs were initiated to stimulate economic growth and consumer spending. Unfortunately for many, it takes time for such programs to gain traction and improve the employment landscape. The unemployment rate continued to trend upward in 2009, topping out at 10.2% in October – its highest rate since 1983. The key labor rate had declined slightly to 10.0% by year-end, evidence that employers continued to be weary of adding to their labor force without more confidence and clarity in the sustainability of the economic recovery. The following should be noted to emphasize the impact of the current economic recession on U.S. employment: In December 2009, the number of unemployed persons was 15.3 million and the unemployment rate was 10.0%. At the start of the recession (December 2007), the number of unemployed persons was 7.7 million with an unemployment rate of 5.0%. Unemployment is an important measure as consumer spending represents roughly 70% of U.S. GDP.
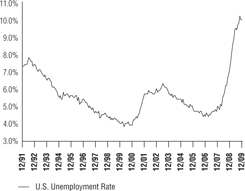
The U.S. unemployment rate measures the numbers of persons unemployed as a percentage of the labor force. Typically, unemployment tends to increase during difficult economic periods and declines during expansionary economic times. Additionally, very low unemployment can place inflationary pressure on the economy as labor markets become very competitive and expensive.
Data Source: Bloomberg, Bureau of Labor Statistics
U.S. Treasury Yield Curve
Over calendar year 2009, the U.S. Treasury yield curve steepened dramatically as short-term rates stayed basically unchanged, while mid-term and long-term yields trended upward. Short-term rates remained at historically low levels as the Federal Reserve (“Fed”), through its aggressive monetary policy, maintained the target federal funds rate at 0-0.25% in an effort to stimulate economic growth. The Fed left the target federal funds rate unchanged throughout the year. The mid-to-long end of the curve, which is more influenced by market forces and inflation expectations, experienced a rise in yields responding to an increase in U.S. Treasury supply and some prospects of economic growth. Yields primarily increased during the first half of the year with some further increases during the fourth quarter. At year-end, yields on the 2-year, 10-year and the 30-year U.S. Treasuries were 1.14%, 3.84% and 4.64%, respectively.
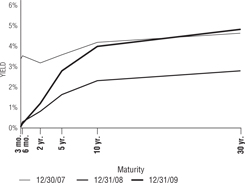
The Treasury yield curve illustrates the relationship between yields on short-term, intermediate-term and long-term Treasury securities. Normally, the shape of the yield curve is upward sloping with rates increasing from the short end of the curve moving higher to the long end. The short end of the curve is impacted more by monetary policy (demand for money) while inflationary expectations and market forces impact the long end of the curve.
Data Source: Bloomberg
7
About Your Expenses (Unaudited)
As a shareholder of the Funds, you incur ongoing costs, including advisory fees and to the extent applicable, distribution (12b-1) fees and/or shareholder services fees, as well as other Fund expenses. This example is intended to help you to understand your ongoing costs (in dollars) of investing in the Funds and to compare these costs with the ongoing costs of investing in other mutual funds. It is based on an investment of $1,000 invested at the beginning of the period and held for the entire period from July 1, 2009 to December 31, 2009.
Actual Expenses
The first section of the table below provides information about actual account values and actual expenses. You may use the information in this section, together with the amount you invested, to estimate the expenses that you incurred over the period. Simply divide your account value by $1,000 (for example, an $8,600 account value divided by $1,000 = 8.6), then multiply the result by the number in the first section under the heading entitled “Expenses Paid During Period” to estimate the expenses attributable to your investment during this period.
Hypothetical Example for Comparison Purposes
The second section of the table below provides information about hypothetical account values and hypothetical expenses based on the Fund’s actual expense ratio and an assumed rate of return of 5% per year before expenses, which is not the Fund’s actual return. Thus, you should not use the hypothetical account values and expenses to estimate the actual ending account balance or your expenses for the period. Rather, these figures are provided to enable you to compare the ongoing costs of investing in the Fund and other funds. To do so, compare this 5% hypothetical example with the 5% hypothetical examples that appear in the shareholder reports of the other funds. Please note that the expenses shown in the table are meant to highlight your ongoing costs only. Therefore, the second section of the table is useful in comparing ongoing costs only and will not help you determine the relative total costs of owning different funds.
| | | | | | | | | | | | | | |
ACTUAL |
Fund | | Class | | Beginning
Account Value
07/01/2009 | | Ending
Account Value
12/31/2009 | | Annualized
Expense
Ratio (1) | | | Expenses
Paid During
Period (2) |
MyDestination 2005 | | GS4 | | $ | 1,000.00 | | $ | 1,146.99 | | 0.20 | % | | $ | 1.08 |
MyDestination 2015 | | GS4 | | | 1,000.00 | | | 1,189.20 | | 0.15 | | | | 0.83 |
MyDestination 2025 | | GS4 | | | 1,000.00 | | | 1,226.25 | | 0.20 | | | | 1.12 |
MyDestination 2035 | | GS4 | | | 1,000.00 | | | 1,244.25 | | 0.20 | | | | 1.13 |
MyDestination 2045 | | GS4 | | | 1,000.00 | | | 1,256.10 | | 0.20 | | | | 1.14 |
Conservative Allocation | | GS4 | | | 1,000.00 | | | 1,091.06 | | 0.12 | | | | 0.63 |
Balanced Allocation | | GS4 | | | 1,000.00 | | | 1,162.44 | | 0.12 | | | | 0.65 |
Growth Allocation | | GS4 | | | 1,000.00 | | | 1,200.52 | | 0.12 | | | | 0.67 |
Aggressive Allocation | | GS4 | | | 1,000.00 | | | 1,238.95 | | 0.12 | | | | 0.68 |
Conservative Allocation I | | GS2 | | | 1,000.00 | | | 1,092.09 | | 0.15 | | | | 0.79 |
Balanced Allocation I | | GS2 | | | 1,000.00 | | | 1,163.24 | | 0.13 | | | | 0.71 |
Growth Allocation I | | GS2 | | | 1,000.00 | | | 1,202.11 | | 0.15 | | | | 0.83 |
Aggressive Allocation I | | GS2 | | | 1,000.00 | | | 1,239.82 | | 0.15 | | | | 0.85 |
Money Market | | GS2 | | | 1,000.00 | | | 1,001.05 | | 0.22 | | | | 1.11 |
| | GS4 | | | 1,000.00 | | | 1,000.22 | | 0.39 | | | | 1.97 |
Low-Duration Bond | | GS2 | | | 1,000.00 | | | 1,046.98 | | 0.36 | | | | 1.86 |
| | GS4 | | | 1,000.00 | | | 1,046.55 | | 0.52 | | | | 2.68 |
Medium-Duration Bond | | GS2 | | | 1,000.00 | | | 1,079.27 | | 0.48 | | | | 2.52 |
| | GS4 | | | 1,000.00 | | | 1,079.34 | | 0.58 | | | | 3.04 |
8
| | | | | | | | | | | | | | |
ACTUAL |
Fund | | Class | | Beginning
Account Value
07/01/2009 | | Ending
Account Value
12/31/2009 | | Annualized
Expense
Ratio (1) | | | Expenses
Paid During
Period (2) |
Extended-Duration Bond | | GS2 | | $ | 1,000.00 | | $ | 1,143.87 | | 0.52 | % | | $ | 2.81 |
| | GS4 | | | 1,000.00 | | | 1,142.26 | | 0.69 | | | | 3.73 |
Inflation Protected Bond | | GS4 | | | 1,000.00 | | | 1,042.79 | | 0.67 | | | | 0.09 |
Global Bond | | GS4 | | | 1,000.00 | | | 1,168.85 | | 0.78 | | | | 4.26 |
Equity Index | | GS2 | | | 1,000.00 | | | 1,224.71 | | 0.23 | | | | 1.29 |
| | GS4 | | | 1,000.00 | | | 1,224.18 | | 0.37 | | | | 2.07 |
Real Estate Securities | | GS4 | | | 1,000.00 | | | 1,440.45 | | 1.26 | | | | 7.75 |
Value Equity | | GS2 | | | 1,000.00 | | | 1,227.85 | | 0.67 | | | | 3.76 |
| | GS4 | | | 1,000.00 | | | 1,225.77 | | 0.84 | | | | 4.71 |
Growth Equity | | GS2 | | | 1,000.00 | | | 1,249.32 | | 0.87 | | | | 4.93 |
| | GS4 | | | 1,000.00 | | | 1,247.45 | | 0.96 | | | | 5.44 |
Small Cap Equity | | GS2 | | | 1,000.00 | | | 1,246.83 | | 1.02 | | | | 5.78 |
| | GS4 | | | 1,000.00 | | | 1,247.03 | | 1.14 | | | | 6.46 |
International Equity | | GS2 | | | 1,000.00 | | | 1,245.73 | | 0.93 | | | | 5.26 |
| | GS4 | | | 1,000.00 | | | 1,245.23 | | 1.11 | | | | 6.28 |
| | | | | | | | | | | | | | |
HYPOTHETICAL (assuming a 5% return before expenses) |
Fund | | Class | | Beginning
Account Value
07/01/2009 | | Ending
Account Value
12/31/2009 | | Annualized
Expense
Ratio (1) | | | Expenses
Paid During
Period (2) |
MyDestination 2005 | | GS4 | | $ | 1,000.00 | | $ | 1,024.20 | | 0.20 | % | | $ | 1.02 |
MyDestination 2015 | | GS4 | | | 1,000.00 | | | 1,024.45 | | 0.15 | | | | 0.77 |
MyDestination 2025 | | GS4 | | | 1,000.00 | | | 1,024.20 | | 0.20 | | | | 1.02 |
MyDestination 2035 | | GS4 | | | 1,000.00 | | | 1,024.20 | | 0.20 | | | | 1.02 |
MyDestination 2045 | | GS4 | | | 1,000.00 | | | 1,024.20 | | 0.20 | | | | 1.02 |
Conservative Allocation | | GS4 | | | 1,000.00 | | | 1,024.60 | | 0.12 | | | | 0.61 |
Balanced Allocation | | GS4 | | | 1,000.00 | | | 1,024.60 | | 0.12 | | | | 0.61 |
Growth Allocation | | GS4 | | | 1,000.00 | | | 1,024.60 | | 0.12 | | | | 0.61 |
Aggressive Allocation | | GS4 | | | 1,000.00 | | | 1,024.60 | | 0.12 | | | | 0.61 |
Conservative Allocation I | | GS2 | | | 1,000.00 | | | 1,024.45 | | 0.15 | | | | 0.77 |
Balanced Allocation I | | GS2 | | | 1,000.00 | | | 1,024.55 | | 0.13 | | | | 0.66 |
Growth Allocation I | | GS2 | | | 1,000.00 | | | 1,024.45 | | 0.15 | | | | 0.77 |
Aggressive Allocation I | | GS2 | | | 1,000.00 | | | 1,024.45 | | 0.15 | | | | 0.77 |
Money Market | | GS2 | | | 1,000.00 | | | 1,024.10 | | 0.22 | | | | 1.12 |
| | GS4 | | | 1,000.00 | | | 1,023.24 | | 0.39 | | | | 1.99 |
Low-Duration Bond | | GS2 | | | 1,000.00 | | | 1,023.39 | | 0.36 | | | | 1.84 |
| | GS4 | | | 1,000.00 | | | 1,022.58 | | 0.52 | | | | 2.65 |
Medium-Duration Bond | | GS2 | | | 1,000.00 | | | 1,022.79 | | 0.48 | | | | 2.45 |
| | GS4 | | | 1,000.00 | | | 1,022.28 | | 0.58 | | | | 2.96 |
Extended-Duration Bond | | GS2 | | | 1,000.00 | | | 1,022.58 | | 0.52 | | | | 2.65 |
| | GS4 | | | 1,000.00 | | | 1,021.73 | | 0.69 | | | | 3.52 |
Inflation Protected Bond | | GS4 | | | 1,000.00 | | | 1,021.83 | | 0.67 | | | | 0.09 |
Global Bond | | GS4 | | | 1,000.00 | | | 1,021.27 | | 0.78 | | | | 3.97 |
Equity Index | | GS2 | | | 1,000.00 | | | 1,024.05 | | 0.23 | | | | 1.17 |
| | GS4 | | | 1,000.00 | | | 1,023.34 | | 0.37 | | | | 1.89 |
9
About Your Expenses (Unaudited) (Continued)
| | | | | | | | | | | | | | |
HYPOTHETICAL (assuming a 5% return before expenses) |
Fund | | Class | | Beginning
Account Value
07/01/2009 | | Ending
Account Value
12/31/2009 | | Annualized
Expense
Ratio (1) | | | Expenses
Paid During
Period (2) |
Real Estate Securities | | GS4 | | $ | 1,000.00 | | $ | 1,018.85 | | 1.26 | % | | $ | 6.41 |
Value Equity | | GS2 | | | 1,000.00 | | | 1,021.83 | | 0.67 | | | | 3.41 |
| | GS4 | | | 1,000.00 | | | 1,020.97 | | 0.84 | | | | 4.28 |
Growth Equity | | GS2 | | | 1,000.00 | | | 1,020.82 | | 0.87 | | | | 4.43 |
| | GS4 | | | 1,000.00 | | | 1,020.37 | | 0.96 | | | | 4.89 |
Small Cap Equity | | GS2 | | | 1,000.00 | | | 1,020.06 | | 1.02 | | | | 5.19 |
| | GS4 | | | 1,000.00 | | | 1,019.46 | | 1.14 | | | | 5.80 |
International Equity | | GS2 | | | 1,000.00 | | | 1,020.52 | | 0.93 | | | | 4.74 |
| | GS4 | | | 1,000.00 | | | 1,019.61 | | 1.11 | | | | 5.65 |
| (1) | Expenses include the effect of contractual waivers by GuideStone Capital Management. The Date Target Funds’ and Asset Allocation Funds’ proportionate share of the operating expenses of the Select Funds is not reflected in the tables above. |
| (2) | Expenses are equal to the Fund’s annualized expense ratios for the period July 1, 2009, through December 31, 2009, multiplied by the average account value over the period, multiplied by 184/365 (to reflect the one-half year period). |
10
MyDestination 2005 Fund
The Fund, through investments in the underlying Select Funds, combines a slightly greater percentage of exposure to fixed income securities with a smaller percentage to equity securities. While the Fund follows an allocation glide path that becomes more conservative over time, the year-end targeted allocations were approximately 54% Fixed Income Select Funds, 33% U.S. Equity Select Funds and 13% Non-U.S. Equity Select Funds.
Please see page 13 for information regarding specific portfolio allocations. Portfolio holdings are subject to change at any time.
The Fund is a fund-of-funds, and its performance is based on the performance of the underlying Select Funds. The Fund generated a strong return of 21.84% during 2009. During the first quarter, the Fund’s absolute returns were negative due to the harmful repercussions of the financial crisis and economic recession, which led to very difficult returns in the domestic and non-U.S. equity markets. The Fund’s diversification into fixed income securities (approximately 52% of the Fund’s market value at the start of the year) helped mitigate the effect of strong negative equity returns during the first quarter. With the aid of government programs, aggressive monetary policy and prospects for an improved economic environment, the capital markets improved after bottoming in early March. All asset classes rebounded strongly as investors became less risk averse, willing to deploy assets into both equities and non-U.S. Treasury fixed income securities. Given the strong rebound in the capital markets, the Fund posted positive absolute returns during the second, third and fourth quarters. The Fund’s absolute returns were most positively influenced by its exposure to the Growth Equity Fund, International Equity Fund and the Medium-Duration Bond Fund.
The Fund outpaced its composite benchmark during the year by 4.00%, benefitting most notably from its exposure to the Fixed Income Select Funds. The majority of the outperformance came from the two largest Fixed Income Select Funds holdings, the Low-Duration Bond Fund and Medium-Duration Bond Fund, which represent over two-thirds of the fixed income allocation. Both of these funds significantly outpaced their respective benchmarks, primarily due to sector allocation strategies that provided an overweight to spread sectors, such as corporate and mortgages, and an underweight to U.S. Treasury securities. When risk appetite returned and investors were willing to re-enter spread sectors to take advantage of historically attractive valuations, exposure to such sectors allowed these Fixed Income Select Funds to greatly outperform. The Fund’s relative performance was positively impacted by exposure to certain U.S. Equity Select Funds, most notably the Value Equity Fund and the Growth Equity Fund. The largest detractor to the Fund’s relative performance was attributed to exposure to the International Equity Fund.
The Fund attempts to achieve its objective by investing in the GuideStone Select Funds. The Fund is managed to a retirement date (“target date”) by adjusting the percentage of fixed income securities and equity securities to become more conservative each year until reaching the retirement year and then approximately 15 years thereafter. The target date in the name of the Fund is the approximate date when an investor plans to start withdrawing money. By investing in the Fund you will also incur the expenses and risks of the underlying Select Funds. The principal risks of the Funds will change depending on the asset mix of the Select Funds in which they invest. You may directly invest in the Select Funds. The Funds’ value will go up and down in response to changes in the share prices of the investments that they own. The amount invested in the Fund is not guaranteed to increase, is not guaranteed against loss, nor is the amount of the original investment guaranteed at the target date. It is possible to lose money by investing in the Fund.
11
MyDestination 2005 Fund
| | | | | | |
Average Annual Total Returns as of 12/31/09 | |
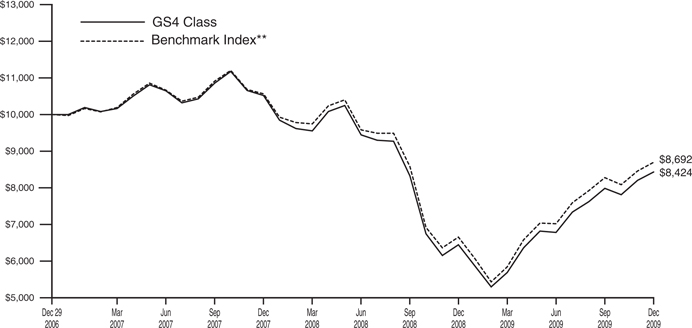
| | | GS4 Class* | | | Benchmark** | |
One Year | | 21.84 | % | | 17.84 | % |
Since Inception | | 0.04 | % | | 0.56 | % |
Inception Date | | 12/29/06 | | | | |
Total Fund Operating Expenses (June 25, 2009 Prospectus)(1) | | 0.98 | % | | | |
| (1) | The Fund’s shareholders indirectly bear the expenses of the GS4 Class shares of the Select Funds in which the Fund invests. Current information regarding the Fund’s Operating Expenses can be found in the Financial Highlights. |
The performance data quoted represents past performance and does not guarantee future results. Current performance may be lower or higher. Performance data current to the most recent month-end may be obtained at www.GuideStoneFunds.org. The investment return and principal value of an investment will fluctuate so that shares, when redeemed, may be worth more or less than their original cost.
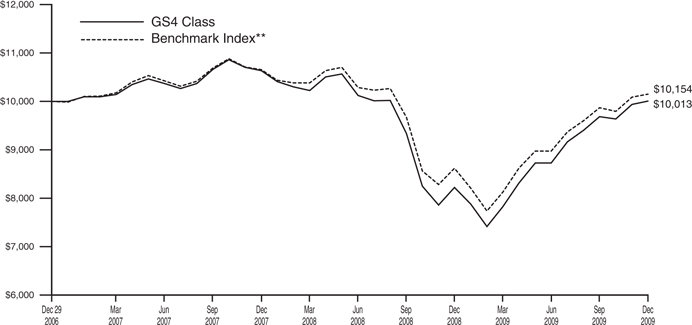
The graph illustrates the results of a hypothetical $10,000 investment in the GS4 Class of the Fund since December 29, 2006 (commencement of operations), with all dividends and capital gains reinvested, with the Fund’s composite benchmark index.
| * | These returns reflect expense waivers by the Fund’s investment adviser. Without these waivers, returns would have been lower. Returns shown do not reflect the deduction of taxes that a shareholder would pay on Fund distributions or the redemption of Fund shares. |
| ** | Represents a composite index as of December 31, 2009, consisting of 19.25% of the Merrill Lynch 1-3 Year Treasury Index, 17.75% of the Barclays Capital U.S. Aggregate Bond Index, 0.50% of the Barclays Capital U.S. Long-Term Government Bond, 0.50% of the Barclays Capital U.S. Long-Term Credit Bond Index, 15.00% of the Barclays Capital U.S. TIPS Index, 0.75% of the Barclays Capital Global Aggregate Bond Index — Unhedged, 0.38% of the Barclays U.S. Corporate High Yield — 2% Issuer Capped Index, 0.37% of the JPMorgan Emerging Markets Bond Index Plus, 2.25% S&P 500® Index, 3.50% of the Dow Jones U.S. Select Real Estate Securities IndexSM, 12.00% of the Russell 1000® Value Index, 12.00% of the Russell 1000® Growth Index, 3.25% of the Russell 2000® Index and 12.50% of the MSCI ACWI (All Country World Index) Ex-U.S. Index. |
The construction of the composite index corresponds to the target percentage allocations to the underlying asset classes as represented by the Fund’s investment in the Select Funds. As the target percentage allocations to the underlying investments change according to the MyDestination Funds™ glide path, the target percentage allocations to the composite index also change.
Unlike a mutual fund, the performance of an index assumes no taxes, transaction costs, management fees or other expenses.
12
| | |
MYDESTINATION 2005 FUND SCHEDULE OF INVESTMENTS | | December 31, 2009 |
| | | | | |
| | | Shares | | Value |
MUTUAL FUNDS — 99.8% | | | | | |
GuideStone Money Market Fund (GS4 Class)¥ | | 957,089 | | $ | 957,089 |
GuideStone Low-Duration Bond Fund (GS4 Class)¥ | | 951,321 | | | 12,405,231 |
GuideStone Medium-Duration Bond Fund (GS4 Class)¥ | | 859,073 | | | 11,477,216 |
GuideStone Extended-Duration Bond Fund (GS4 Class)¥ | | 42,921 | | | 658,407 |
GuideStone Inflation Protected Bond Fund (GS4 Class)¥ | | 944,815 | | | 9,750,494 |
GuideStone Global Bond Fund (GS4 Class)¥ | | 108,659 | | | 1,017,045 |
GuideStone Equity Index Fund (GS4 Class)¥ | | 102,732 | | | 1,490,646 |
GuideStone Real Estate Securities Fund (GS4 Class)¥ | | 358,782 | | | 2,418,192 |
GuideStone Value Equity Fund (GS4 Class)¥ | | 631,204 | | | 7,915,297 |
GuideStone Growth Equity Fund (GS4 Class)¥ | | 505,590 | | | 8,028,765 |
GuideStone Small Cap Equity Fund (GS4 Class)¥ | | 195,465 | | | 2,222,434 |
GuideStone International Equity Fund (GS4 Class)¥ | | 670,500 | | | 8,341,021 |
| | | | | |
Total Mutual Funds
(Cost $68,858,075) | | | | | 66,681,837 |
| | | | | |
TOTAL INVESTMENTS — 99.8%
(Cost $68,858,075) | | | | | 66,681,837 |
Other Assets in Excess of Liabilities — 0.2% | | | | | 148,269 |
| | | | | |
NET ASSETS — 100.0% | | | | $ | 66,830,106 |
| | | | | |
Please see abbreviation and footnote definitions on page 180.
PORTFOLIO SUMMARY (based on net assets)
| | |
| | | % |
Bond Funds | | 52.8 |
Domestic Equity Funds | | 33.1 |
International Equity Fund | | 12.5 |
Money Market Fund | | 1.4 |
| | |
| | 99.8 |
| | |
FAS 157 DISCLOSURE
The following is a summary of the inputs used, as of December 31, 2009, in valuing the Fund’s investments carried at fair value:
| | | | | | |
Valuation Inputs | | Investments
in
Securities | | Other
Financial
Instruments*** |
| | |
Level 1 — Quoted Prices | | | | | | |
Mutual Funds | | $ | 66,681,837 | | $ | — |
Level 2 — Other Significant Observable Inputs | | | — | | | — |
Level 3 — Significant Unobservable Inputs | | | — | | | — |
| | | | | | |
Total | | $ | 66,681,837 | | $ | — |
| | | | | | |
| *** | Other financial instruments are derivative instruments not reflected in the Schedule of Investments, such as futures, forwards and swap contracts, which are valued at the unrealized appreciation (depreciation) on the investment. Details of these investments can be found in the Notes to Financial Statements. |
See Notes to Financial Statements.
13
MyDestination 2015 Fund
The Fund, through investments in the underlying Select Funds, combines a greater percentage of exposure to equity securities with a smaller percentage to fixed income securities. While the Fund follows an allocation glide path that becomes more conservative over time, the year-end targeted allocations were approximately 45% U.S. Equity Select Funds, 38% Fixed Income Select Funds, and 17% Non-U.S. Equity Select Funds.
Please see page 16 for information regarding specific portfolio allocations. Portfolio holdings are subject to change at any time.
The Fund is a fund-of-funds, and its performance is based on the performance of the underlying Select Funds. The Fund generated a strong return of 26.27% during 2009. During the first quarter, the Fund’s absolute returns were negative due to the harmful repercussions of the financial crisis and economic recession, which led to very difficult returns in the domestic and non-U.S. equity markets. The Fund’s diversification into fixed income securities (approximately 36% of the Fund’s market value at the start of the year) helped mitigate the effect of strong negative equity returns during the first quarter. With the aid of government programs, aggressive monetary policy and prospects for an improved economic environment, the capital markets improved after bottoming in early March. All asset classes rebounded strongly as investors became less risk averse, willing to deploy assets into both equities and non-U.S. Treasury fixed income securities. Given the strong rebound in the capital markets, the Fund posted positive absolute returns during the second, third and fourth quarters. The Fund’s absolute returns were most positively influenced by its exposure to the Growth Equity Fund, International Equity Fund and the Value Equity Fund.
The Fund outpaced its composite benchmark during the year by 2.97%, benefitting most notably from its exposure to the Fixed Income Select Funds. The majority of the outperformance came from exposure to the Low-Duration Bond Fund, Medium-Duration Bond Fund and Extended-Duration Bond Fund. All of these funds significantly outpaced their respective benchmarks, primarily due to sector allocation strategies that provided an overweight to spread sectors, such as corporate and mortgages, and an underweight to U.S. Treasury securities. When risk appetite returned and investors were willing to re-enter spread sectors to take advantage of historically attractive valuations, exposure to such sectors allowed these Fixed Income Select Funds to greatly outperform. The Fund’s relative performance was positively impacted by exposure to certain U.S. Equity Select Funds, most notably the Value Equity Fund and Growth Equity Fund. The largest detractor to the Fund’s relative performance was attributed to exposure to the International Equity Fund.
The Fund attempts to achieve its objective by investing in the GuideStone Select Funds. The Fund is managed to a retirement date (“target date”) by adjusting the percentage of fixed income securities and equity securities to become more conservative each year until reaching the retirement year and then approximately 15 years thereafter. The target date in the name of the Fund is the approximate date when an investor plans to start withdrawing money. By investing in the Fund you will also incur the expenses and risks of the underlying Select Funds. The principal risks of the Funds will change depending on the asset mix of the Select Funds in which they invest. You may directly invest in the Select Funds. The Funds’ value will go up and down in response to changes in the share prices of the investments that they own. The amount invested in the Fund is not guaranteed to increase, is not guaranteed against loss, nor is the amount of the original investment guaranteed at the target date. It is possible to lose money by investing in the Fund.
14
MyDestination 2015 Fund
| | | | | | |
Average Annual Total Returns as of 12/31/09 | |
| | | GS4 Class* | | | Benchmark** | |
One Year | | 26.27 | % | | 23.30 | % |
Since Inception | | -1.78 | % | | -1.08 | % |
Inception Date | | 12/29/06 | | | | |
Total Fund Operating Expenses (June 25, 2009 Prospectus)(1) | | 1.07 | % | | | |
| (1) | The Fund’s shareholders indirectly bear the expenses of the GS4 Class shares of the Select Funds in which the Fund invests. Current information regarding the Fund’s Operating Expenses can be found in the Financial Highlights. |
The performance data quoted represents past performance and does not guarantee future results. Current performance may be lower or higher. Performance data current to the most recent month-end may be obtained at www.GuideStoneFunds.org. The investment return and principal value of an investment will fluctuate so that shares, when redeemed, may be worth more or less than their original cost.
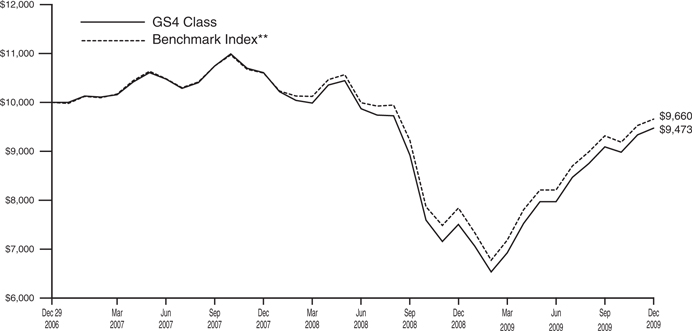
The graph illustrates the results of a hypothetical $10,000 investment in the GS4 Class of the Fund since December 29, 2006 (commencement of operations), with all dividends and capital gains reinvested, with the Fund’s composite benchmark index.
| * | These returns reflect expense waivers by the Fund’s investment adviser. Without these waivers, returns would have been lower. Returns shown do not reflect the deduction of taxes that a shareholder would pay on Fund distributions or the redemption of Fund shares. |
| ** | Represents a composite index as of December 31, 2009, consisting of 6.75% of the Merrill Lynch 1-3 Year Treasury Index, 11.25% of the Barclays Capital U.S. Aggregate Bond Index, 2.13% of the Barclays Capital U.S. Long-Term Government Bond, 2.13% of the Barclays Capital U.S. Long-Term Credit Bond Index, 10.00% of the Barclays Capital U.S. TIPS Index, 2.38% of the Barclays Capital Global Aggregate Bond Index — Unhedged, 1.18% of the Barclays U.S. Corporate High Yield — 2% Issuer Capped Index, 1.18 % of the JPMorgan Emerging Markets Bond Index Plus, 3.00% S&P 500® Index, 6.00% of the Dow Jones U.S. Select Real Estate Securities IndexSM, 16.25% of the Russell 1000® Value Index, 16.25% of the Russell 1000® Growth Index, 4.50% of the Russell 2000® Index and 17.00% of the MSCI ACWI (All Country World Index) Ex-U.S. Index. |
The construction of the composite index corresponds to the target percentage allocations to the underlying asset classes as represented by the Fund’s investment in the Select Funds. As the target percentage allocations to the underlying investments change according to the MyDestination Funds™ glide path, the target percentage allocations to the composite index also change.
Unlike a mutual fund, the performance of an index assumes no taxes, transaction costs, management fees or other expenses.
15
| | |
MYDESTINATION 2015 FUND SCHEDULE OF INVESTMENTS | | December 31, 2009 |
| | | | | | | |
| | | Shares | | Value | |
MUTUAL FUNDS — 99.3% | | | | | | | |
GuideStone Money Market Fund (GS4 Class)¥ | | | 2,405,941 | | $ | 2,405,941 | |
GuideStone Low-Duration Bond Fund (GS4 Class)¥ | | | 1,110,177 | | | 14,476,706 | |
GuideStone Medium-Duration Bond Fund (GS4 Class)¥ | | | 1,795,481 | | | 23,987,621 | |
GuideStone Extended-Duration Bond Fund (GS4 Class)¥ | | | 593,081 | | | 9,097,860 | |
GuideStone Inflation Protected Bond Fund (GS4 Class)¥ | | | 2,052,980 | | | 21,186,757 | |
GuideStone Global Bond Fund (GS4 Class)¥ | | | 1,096,110 | | | 10,259,585 | |
GuideStone Equity Index Fund (GS4 Class)¥ | | | 442,934 | | | 6,426,975 | |
GuideStone Real Estate Securities Fund (GS4 Class)¥ | | | 2,052,420 | | | 13,833,310 | |
GuideStone Value Equity Fund (GS4 Class)¥ | | | 2,771,667 | | | 34,756,701 | |
GuideStone Growth Equity Fund (GS4 Class)¥ | | | 2,220,031 | | | 35,254,089 | |
GuideStone Small Cap Equity Fund (GS4 Class)¥ | | | 878,323 | | | 9,986,530 | |
GuideStone International Equity Fund (GS4 Class)¥ | | | 2,897,015 | | | 36,038,870 | |
| | | | | | | |
Total Mutual Funds
(Cost $239,274,381) | | | | | | 217,710,945 | |
| | | | | | | |
| | |
| | | Par | | | |
U.S. TREASURY OBLIGATIONS — 0.8% | | | | | | | |
U.S. Treasury Bills | | | | | | | |
0.10%, 05/06/10‡‡ | | $ | 10,000 | | | 9,997 | |
0.11%, 05/06/10‡‡ | | | 30,000 | | | 29,990 | |
0.11%, 05/06/10‡‡ | | | 205,000 | | | 204,929 | |
| | | | | | | |
| | | | | | 244,916 | |
| | | | | | | |
U.S. Treasury Note | | | | | | | |
4.50%, 02/15/16 | | | 1,406,000 | | | 1,517,053 | |
| | | | | | | |
Total U.S. Treasury Obligations
(Cost $1,793,126) | | | | | | 1,761,969 | |
| | | | | | | |
TOTAL INVESTMENTS — 100.1%
(Cost $241,067,507) | | | | | | 219,472,914 | |
Liabilities in Excess of Other Assets — (0.1)% | | | | | | (208,461 | ) |
| | | | | | | |
NET ASSETS — 100.0% | | | | | $ | 219,264,453 | |
| | | | | | | |
Please see abbreviation and footnote definitions on page 180.
PORTFOLIO SUMMARY (based on net assets)
| | |
| | | % |
Domestic Equity Funds | | 45.7 |
Bond Funds | | 36.0 |
International Equity Fund | | 16.5 |
Futures Contracts | | 1.1 |
Money Market Fund | | 1.1 |
U.S. Treasury Obligations | | 0.8 |
| | |
| | 101.2 |
| | |
FAS 157 DISCLOSURE
The following is a summary of the inputs used, as of December 31, 2009, in valuing the Fund’s investments carried at fair value:
| | | | | | |
Valuation Inputs | | Investments
in
Securities | | Other
Financial
Instruments*** |
Level 1 — Quoted Prices | | | | | | |
Futures Contracts | | $ | — | | $ | 27,678 |
Mutual Funds | | | 217,710,945 | | | — |
Level 2 — Other Significant Observable Inputs | | | | | | |
U.S. Treasury Obligations | | | 1,761,969 | | | — |
Level 3 — Significant Unobservable Inputs | | | — | | | — |
| | | | | | |
Total | | $ | 219,472,914 | | $ | 27,678 |
| | | | | | |
| *** | Other financial instruments are derivative instruments not reflected in the Schedule of Investments, such as futures, forwards and swap contracts, which are valued at the unrealized appreciation (depreciation) on the investment. Details of these investments can be found in the Notes to Financial Statements. |
See Notes to Financial Statements.
16
MyDestination 2025 Fund
The Fund, through investments in the underlying Select Funds, combines a greater percentage of exposure to equity securities with a much smaller percentage to fixed income securities. While the Fund follows an allocation glide path that becomes more conservative over time, the year-end targeted allocations were approximately 57% U.S. Equity Select Funds, 22% Fixed Income Select Funds and 21% Non-U.S. Equity Select Funds.
Please see page 19 for information regarding specific portfolio allocations. Portfolio holdings are subject to change at any time.
The Fund is a fund-of-funds, and its performance is based on the performance of the underlying Select Funds. The Fund generated a strong return of 30.12% during 2009. During the first quarter, the Fund’s absolute returns were negative due to the harmful repercussions of the financial crisis and economic recession, which led to very difficult returns in the domestic and non-U.S. equity markets. The Fund’s modest diversification into fixed income securities (approximately 21% of the Fund’s market value at the start of the year) helped mitigate the effect of strong negative equity returns during the first quarter. With the aid of government programs, aggressive monetary policy and prospects for an improved economic environment, the capital markets improved after bottoming in early March. All asset classes rebounded strongly as investors became less risk averse, willing to deploy assets into both equities and non-U.S. Treasury fixed income securities. Given the strong rebound in the capital markets, the Fund posted positive absolute returns during the second, third and fourth quarters. The Fund’s absolute returns were most positively influenced by its exposure to the International Equity Fund, Growth Equity Fund, and the Value Equity Fund.
The Fund outpaced its composite benchmark during the year by 2.55%, benefitting most notably from its exposure to the Fixed Income Select Funds. The Medium-Duration Bond Fund, Extended-Duration Bond Fund and Global Bond Fund outpaced their respective benchmarks, primarily due to sector allocation strategies that provided an overweight to spread sectors, such as corporate and mortgages, and an underweight to U.S. Treasury securities. When risk appetite returned and investors were willing to re-enter spread sectors to take advantage of historically attractive valuations, exposure to such sectors allowed these Fixed Income Select Funds to greatly outperform. The Fund’s relative performance was positively impacted by exposure to certain U.S. Equity Select Funds, most notably the Value Equity Fund and Growth Equity Fund. The largest detractor to the Fund’s relative performance was attributed to exposure to the International Equity Fund.
The Fund attempts to achieve its objective by investing in the GuideStone Select Funds. The Fund is managed to a retirement date (“target date”) by adjusting the percentage of fixed income securities and equity securities to become more conservative each year until reaching the retirement year and then approximately 15 years thereafter. The target date in the name of the Fund is the approximate date when an investor plans to start withdrawing money. By investing in the Fund you will also incur the expenses and risks of the underlying Select Funds. The principal risks of the Funds will change depending on the asset mix of the Select Funds in which they invest. You may directly invest in the Select Funds. The Funds’ value will go up and down in response to changes in the share prices of the investments that they own. The amount invested in the Fund is not guaranteed to increase, is not guaranteed against loss, nor is the amount of the original investment guaranteed at the target date. It is possible to lose money by investing in the Fund.
17
MyDestination 2025 Fund
| | | | | | |
Average Annual Total Returns as of 12/31/09 | |
| | | GS4 Class* | | | Benchmark** | |
One Year | | 30.12 | % | | 27.57 | % |
Since Inception | | -3.79 | % | | -2.79 | % |
Inception Date | | 12/29/06 | | | | |
Total Fund Operating Expenses (June 25, 2009 Prospectus)(1) | | 1.11 | % | | | |
| (1) | The Fund’s shareholders indirectly bear the expenses of the GS4 Class shares of the Select Funds in which the Fund invests. Current information regarding the Fund’s Operating Expenses can be found in the Financial Highlights. |
The performance data quoted represents past performance and does not guarantee future results. Current performance may be lower or higher. Performance data current to the most recent month-end may be obtained at www.GuideStoneFunds.org. The investment return and principal value of an investment will fluctuate so that shares, when redeemed, may be worth more or less than their original cost.
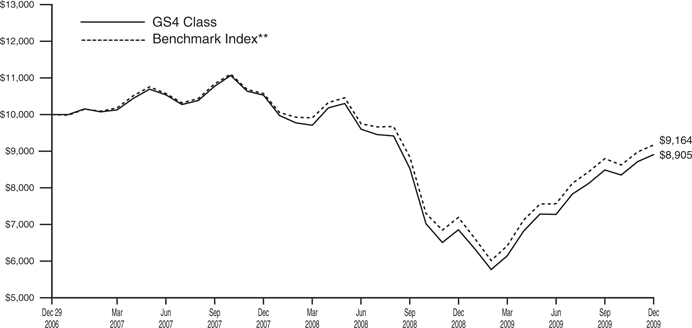
The graph illustrates the results of a hypothetical $10,000 investment in the GS4 Class of the Fund since December 29, 2006 (commencement of operations), with all dividends and capital gains reinvested, with the Fund’s composite benchmark index.
| * | These returns reflect expense waivers by the Fund’s investment adviser. Without these waivers, returns would have been lower. Returns shown do not reflect the deduction of taxes that a shareholder would pay on Fund distributions or the redemption of Fund shares. |
| ** | Represents a composite index as of December 31, 2009, consisting of 7.50% of the Barclays Capital U.S. Aggregate Bond Index, 3.63% of the Barclays Capital U.S. Long-Term Government Bond, 3.62% of the Barclays Capital U.S. Long-Term Credit Bond Index, 3.63% of the Barclays Capital Global Aggregate Bond Index — Unhedged, 1.81% of the Barclays U.S. Corporate High Yield — 2% Issuer Capped Index, 1.81% of the JPMorgan Emerging Markets Bond Index Plus, 3.50% S&P 500® Index, 7.00% of the Dow Jones U.S. Select Real Estate Securities IndexSM, 19.75% of the Russell 1000® Value Index, 19.75% of the Russell 1000® Growth Index, 6.75% of the Russell 2000® Index and 21.25% of the MSCI ACWI (All Country World Index) Ex-U.S. Index. |
The construction of the composite index corresponds to the target percentage allocations to the underlying asset classes as represented by the Fund’s investment in the Select Funds. As the target percentage allocations to the underlying investments change according to the MyDestination Funds™ glide path, the target percentage allocations to the composite index also change.
Unlike a mutual fund, the performance of an index assumes no taxes, transaction costs, management fees or other expenses.
18
| | |
MYDESTINATION 2025 FUND SCHEDULE OF INVESTMENTS | | December 31, 2009 |
| | | | | | |
| | | Shares | | Value |
MUTUAL FUNDS — 99.4% | | | | | | |
GuideStone Money Market Fund (GS4 Class)¥ | | | 2,448,001 | | $ | 2,448,001 |
GuideStone Medium-Duration Bond Fund (GS4 Class)¥ | | | 920,559 | | | 12,298,666 |
GuideStone Extended-Duration Bond Fund (GS4 Class)¥ | | | 780,400 | | | 11,971,332 |
GuideStone Global Bond Fund (GS4 Class)¥ | | | 1,285,109 | | | 12,028,616 |
GuideStone Equity Index Fund (GS4 Class)¥ | | | 394,431 | | | 5,723,198 |
GuideStone Real Estate Securities Fund (GS4 Class)¥ | | | 1,757,905 | | | 11,848,278 |
GuideStone Value Equity Fund (GS4 Class)¥ | | | 2,585,288 | | | 32,419,512 |
GuideStone Growth Equity Fund (GS4 Class)¥ | | | 2,066,255 | | | 32,812,129 |
GuideStone Small Cap Equity Fund (GS4 Class)¥ | | | 1,008,812 | | | 11,470,194 |
GuideStone International Equity Fund (GS4 Class)¥ | | | 2,851,885 | | | 35,477,449 |
| | | | | | |
Total Mutual Funds
(Cost $186,018,574) | | | | | | 168,497,375 |
| | | | | | |
| | |
| | | Par | | |
U.S. TREASURY OBLIGATIONS — 0.6% | | | | | | |
U.S. Treasury Bills | | | | | | |
0.01%, 05/06/10‡‡ | | $ | 60,000 | | | 59,979 |
0.11%, 05/06/10‡‡ | | | 195,000 | | | 194,933 |
| | | | | | |
| | | | | | 254,912 |
| | | | | | |
U.S. Treasury Note | | | | | | |
4.75%, 08/15/17 | | | 680,000 | | | 738,066 |
| | | | | | |
Total U.S. Treasury Obligations
(Cost $993,055) | | | | | | 992,978 |
| | | | | | |
TOTAL INVESTMENTS — 100.0%
(Cost $187,011,629) | | | | | | 169,490,353 |
Other Assets in Excess of Liabilities — 0.0% | | | | | | 72,677 |
| | | | | | |
NET ASSETS — 100.0% | | | | | $ | 169,563,030 |
| | | | | | |
Please see abbreviation and footnote definitions on page 180.
PORTFOLIO SUMMARY (based on net assets)
| | |
| | | % |
Domestic Equity Funds | | 55.6 |
Bond Funds | | 21.4 |
International Equity Fund | | 20.9 |
Futures Contracts | | 1.5 |
Money Market Fund | | 1.5 |
U.S. Treasury Obligations | | 0.6 |
| | |
| | 101.5 |
| | |
FAS 157 DISCLOSURE
The following is a summary of the inputs used, as of December 31, 2009, in valuing the Fund’s investments carried at fair value:
| | | | | | |
Valuation Inputs | | Investments
in
Securities | | Other
Financial
Instruments*** |
Level 1 — Quoted Prices | | | | | | |
Futures Contracts | | $ | — | | $ | 17,969 |
Mutual Funds | | | 168,497,375 | | | — |
Level 2 — Other Significant Observable Inputs | | | | | | |
U.S. Treasury Obligations | | | 992,978 | | | — |
Level 3 — Significant Unobservable Inputs | | | — | | | — |
| | | | | | |
Total | | $ | 169,490,353 | | $ | 17,969 |
| | | | | | |
| *** | Other financial instruments are derivative instruments not reflected in the Schedule of Investments, such as futures, forwards and swap contracts, which are valued at the unrealized appreciation (depreciation) on the investment. Details of these investments can be found in the Notes to Financial Statements. |
See Notes to Financial Statements.
19
MyDestination 2035 Fund
The Fund, through investments in the underlying Select Funds, combines a greater percentage of exposure to equity securities with a much smaller percentage to fixed income securities. While the Fund follows an allocation glide path that becomes more conservative over time, the year-end targeted allocations were approximately 66% U.S. Equity Select Funds, 25% Non-U.S. Equity Select Funds and 9% Fixed Income Select Funds.
Please see page 22 for information regarding specific portfolio allocations. Portfolio holdings are subject to change at any time.
The Fund is a fund-of-funds, and its performance is based on the performance of the underlying Select Funds. The Fund generated a strong return of 30.99% during 2009, benefiting from the double digit returns above 17% experienced by each of the underlying Select Funds during the year. During the first quarter, the Fund’s absolute returns were negative due to the harmful repercussions of the financial crisis and economic recession, which led to very difficult returns in the domestic and non-U.S. equity markets. With the aid of government programs, aggressive monetary policy and prospects for an improved economic environment, the capital markets improved after bottoming in early March. All asset classes rebounded strongly as investors became less risk averse, willing to deploy assets into both equities and non-U.S. Treasury fixed income securities. Given the strong rebound in the capital markets, the Fund posted positive absolute returns during the second, third and fourth quarters. The Fund’s absolute returns were most positively influenced by its exposure to the International Equity Fund, Growth Equity Fund, and the Value Equity Fund.
The Fund slightly outpaced its composite benchmark during the year by 0.18%, benefitting most notably from its modest exposure to the Fixed Income Select Funds. The Global Bond Fund, Extended-Duration Bond Fund, and Medium-Duration Bond Fund outpaced their respective benchmarks, primarily due to sector allocation strategies that provided an overweight to spread sectors such as corporate and mortgages and an underweight to U.S. Treasury securities. When risk appetite returned and investors were willing to re-enter spread sectors to take advantage of historically attractive valuations, exposure to such sectors allowed these Fixed Income Select Funds to greatly outperform. The Fund’s relative performance was positively impacted by exposure to certain U.S. Equity Select Funds, most notably the Value Equity Fund and Growth Equity Fund. The largest detractor to the Fund’s relative performance was attributed to its exposure to the International Equity Fund.
The Fund attempts to achieve its objective by investing in the GuideStone Select Funds. The Fund is managed to a retirement date (“target date”) by adjusting the percentage of fixed income securities and equity securities to become more conservative each year until reaching the retirement year and then approximately 15 years thereafter. The target date in the name of the Fund is the approximate date when an investor plans to start withdrawing money. By investing in the Fund you will also incur the expenses and risks of the underlying Select Funds. The principal risks of the Funds will change depending on the asset mix of the Select Funds in which they invest. You may directly invest in the Select Funds. The Funds’ value will go up and down in response to changes in the share prices of the investments that they own. The amount invested in the Fund is not guaranteed to increase, is not guaranteed against loss, nor is the amount of the original investment guaranteed at the target date. It is possible to lose money by investing in the Fund.
20
MyDestination 2035 Fund
| | | | | | |
Average Annual Total Returns as of 12/31/09 | |
| | | GS4 Class* | | | Benchmark** | |
One Year | | 30.99 | % | | 30.81 | % |
Since Inception | | -5.55 | % | | -4.47 | % |
Inception Date | | 12/29/06 | | | | |
Total Fund Operating Expenses (June 25, 2009 Prospectus)(1) | | 1.15 | % | | | |
| (1) | The Fund’s shareholders indirectly bear the expenses of the GS4 Class shares of the Select Funds in which the Fund invests. Current information regarding the Fund’s Operating Expenses can be found in the Financial Highlights. |
The performance data quoted represents past performance and does not guarantee future results. Current performance may be lower or higher. Performance data current to the most recent month-end may be obtained at www.GuideStoneFunds.org. The investment return and principal value of an investment will fluctuate so that shares, when redeemed, may be worth more or less than their original cost.
The graph illustrates the results of a hypothetical $10,000 investment in the GS4 Class of the Fund since December 29, 2006 (commencement of operations), with all dividends and capital gains reinvested, with the Fund’s composite benchmark index.
| * | These returns reflect expense waivers by the Fund’s investment adviser. Without these waivers, returns would have been lower. Returns shown do not reflect the deduction of taxes that a shareholder would pay on Fund distributions or the redemption of Fund shares. |
| ** | Represents a composite index as of December 31, 2009, consisting of 2.00% of the Barclays Capital U.S. Aggregate Bond Index, 1.00% of the Barclays Capital U.S. Long-Term Government Bond, 1.00% of the Barclays Capital U.S. Long-Term Credit Bond Index, 2.13% of the Barclays Capital Global Aggregate Bond Index — Unhedged, 1.06% of the Barclays U.S. Corporate High Yield — 2% Issuer Capped Index, 1.06% of the JPMorgan Emerging Markets Bond Index Plus, 4.00% S&P 500® Index, 7.25% of the Dow Jones U.S. Select Real Estate Securities IndexSM, 23.00% of the Russell 1000® Value Index, 23.00% of the Russell 1000® Growth Index, 9.00% of the Russell 2000® Index and 25.50% of the MSCI ACWI (All Country World Index) Ex-U.S. Index. |
The construction of the composite index corresponds to the target percentage allocations to the underlying asset classes as represented by the Fund’s investment in the Select Funds. As the target percentage allocations to the underlying investments change according to the MyDestination Funds™ glide path, the target percentage allocations to the composite index also change.
Unlike a mutual fund, the performance of an index assumes no taxes, transaction costs, management fees or other expenses.
21
| | |
MYDESTINATION 2035 FUND SCHEDULE OF INVESTMENTS | | December 31, 2009 |
| | | | | | | |
| | | Shares | | Value | |
MUTUAL FUNDS — 99.6% | | | | | | | |
GuideStone Money Market Fund (GS4 Class)¥ | | | 1,881,218 | | $ | 1,881,218 | |
GuideStone Medium-Duration Bond Fund (GS4 Class)¥ | | | 107,305 | | | 1,433,593 | |
GuideStone Extended-Duration Bond Fund (GS4 Class)¥ | | | 91,461 | | | 1,403,008 | |
GuideStone Global Bond Fund (GS4 Class)¥ | | | 328,104 | | | 3,071,057 | |
GuideStone Equity Index Fund (GS4 Class)¥ | | | 200,137 | | | 2,903,993 | |
GuideStone Real Estate Securities Fund (GS4 Class)¥ | | | 808,894 | | | 5,451,948 | |
GuideStone Value Equity Fund (GS4 Class)¥ | | | 1,330,620 | | | 16,685,977 | |
GuideStone Growth Equity Fund (GS4 Class)¥ | | | 1,061,633 | | | 16,858,729 | |
GuideStone Small Cap Equity Fund (GS4 Class)¥ | | | 593,102 | | | 6,743,574 | |
GuideStone International Equity Fund (GS4 Class)¥ | | | 1,499,694 | | | 18,656,191 | |
| | | | | | | |
Total Mutual Funds
(Cost $81,405,762) | | | | | | 75,089,288 | |
| | | | | | | |
| | |
| | | Par | | | |
U.S. TREASURY OBLIGATIONS — 0.4% | | | | | | | |
U.S. Treasury Bills | | | | | | | |
0.08%, 05/06/10‡‡ | | $ | 15,000 | | | 14,995 | |
0.09%, 05/06/10‡‡ | | | 10,000 | | | 9,997 | |
0.09%, 05/06/10‡‡ | | | 20,000 | | | 19,993 | |
0.11%, 05/06/10‡‡ | | | 115,000 | | | 114,960 | |
| | | | | | | |
| | | | | | 159,945 | |
| | | | | | | |
U.S. Treasury Note | | | | | | | |
4.75%, 08/15/17 | | | 159,000 | | | 172,577 | |
| | | | | | | |
Total U.S. Treasury Obligations
(Cost $335,403) | | | | | | 332,522 | |
| | | | | | | |
TOTAL INVESTMENTS — 100.0%
(Cost $81,741,165) | | | | | | 75,421,810 | |
Liabilities in Excess of Other Assets — 0.0% | | | | | | (2,421 | ) |
| | | | | | | |
NET ASSETS — 100.0% | | | | | $ | 75,419,389 | |
| | | | | | | |
Please see abbreviation and footnote definitions on page 180.
PORTFOLIO SUMMARY (based on net assets)
| | |
| | | % |
Domestic Equity Funds | | 64.5 |
International Equity Fund | | 24.8 |
Bond Funds | | 7.8 |
Futures Contracts | | 2.6 |
Money Market Fund | | 2.5 |
U.S. Treasury Obligations | | 0.4 |
| | |
| | 102.6 |
| | |
FAS 157 DISCLOSURE
The following is a summary of the inputs used, as of December 31, 2009, in valuing the Fund’s investments carried at fair value:
| | | | | | |
Valuation Inputs | | Investments
in
Securities | | Other
Financial
Instruments*** |
Level 1 — Quoted Prices | | | | | | |
Futures Contracts | | $ | — | | $ | 13,860 |
Mutual Funds | | | 75,089,288 | | | — |
Level 2 — Other Significant Observable Inputs | | | | | | |
U.S. Treasury Obligations | | | 332,522 | | | — |
Level 3 — Significant Unobservable Inputs | | | — | | | — |
| | | | | | |
Total | | $ | 75,421,810 | | $ | 13,860 |
| | | | | | |
| *** | Other financial instruments are derivative instruments not reflected in the Schedule of Investments, such as futures, forwards and swap contracts, which are valued at the unrealized appreciation (depreciation) on the investment. Details of these investments can be found in the Notes to Financial Statements. |
See Notes to Financial Statements.
22
MyDestination 2045 Fund
The Fund, through investments in the underlying Select Funds, combines a greater percentage of exposure to U.S. equity securities with a smaller percentage to non-U.S. equity securities. While the Fund follows an allocation glide path that becomes more conservative over time, the year-end targeted allocations were approximately 73% U.S. Equity Select Funds and 27% Non-U.S. Equity Select Funds.
Please see page 25 for information regarding specific portfolio allocations. Portfolio holdings are subject to change at any time.
The Fund is a fund-of-funds, and its performance is based on the performance of the underlying Select Funds. The Fund generated a strong return of 30.71% during 2009, benefiting from the double digit returns above 20.00% experienced by each of the underlying Select Funds during the year. During the first quarter, the Fund’s absolute returns were negative due to the harmful repercussions of the financial crisis and economic recession, which led to very difficult returns in the domestic and non-U.S. equity markets. With the aid of government programs, aggressive monetary policy and prospects for an improved economic environment, the capital markets improved after bottoming in early March. All asset classes rebounded strongly as investors became less risk averse, willing to deploy assets into equities securities. Given the strong rebound in the capital markets, the Fund posted positive absolute returns during the second, third and fourth quarters. The Fund’s absolute returns were most positively influenced by its exposure to the International Equity Fund, Growth Equity Fund, and Value Equity Fund.
The Fund underperformed its composite benchmark during the year by 1.55%. The International Equity Fund was the largest contributor to the Fund’s absolute return but also served as the key driver in the Fund’s relative underperformance during the year. The Fund’s relative performance was positively impacted by exposure to certain U.S. Equity Select Funds, most notably the Value Equity Fund and the Growth Equity Fund.
The Fund attempts to achieve its objective by investing in the GuideStone Select Funds. The Fund is managed to a retirement date (“target date”) by adjusting the percentage of fixed income securities and equity securities to become more conservative each year until reaching the retirement year and then approximately 15 years thereafter. The target date in the name of the Fund is the approximate date when an investor plans to start withdrawing money. By investing in the Fund you will also incur the expenses and risks of the underlying Select Funds. The principal risks of the Funds will change depending on the asset mix of the Select Funds in which they invest. You may directly invest in the Select Funds. The Funds’ value will go up and down in response to changes in the share prices of the investments that they own. The amount invested in the Fund is not guaranteed to increase, is not guaranteed against loss, nor is the amount of the original investment guaranteed at the target date. It is possible to lose money by investing in the Fund.
23
MyDestination 2045 Fund
| | | | | | |
Average Annual Total Returns as of 12/31/09 | |
| | | GS4 Class* | | | Benchmark** | |
One Year | | 30.71 | % | | 32.26 | % |
Since Inception | | -6.57 | % | | -5.39 | % |
Inception Date | | 12/29/06 | | | | |
Total Fund Operating Expenses (June 25, 2009 Prospectus)(1) | | 1.17 | % | | | |
| (1) | The Fund’s shareholders indirectly bear the expenses of the GS4 Class shares of the Select Funds in which the Fund invests. Current information regarding the Fund’s Operating Expenses can be found in the Financial Highlights. |
The performance data quoted represents past performance and does not guarantee future results. Current performance may be lower or higher. Performance data current to the most recent month-end may be obtained at www.GuideStoneFunds.org. The investment return and principal value of an investment will fluctuate so that shares, when redeemed, may be worth more or less than their original cost.
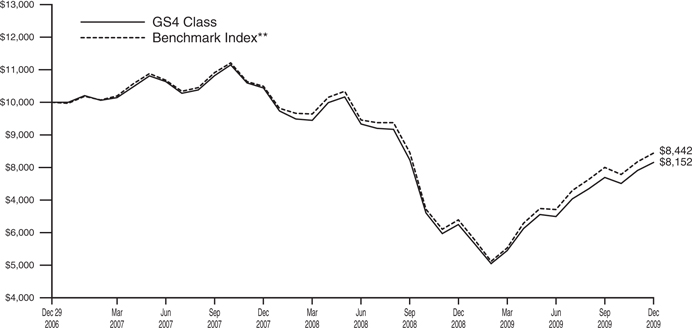
The graph illustrates the results of a hypothetical $10,000 investment in the GS4 Class of the Fund since December 29, 2006 (commencement of operations), with all dividends and capital gains reinvested, with the Fund’s composite benchmark index.
| * | These returns reflect expense waivers by the Fund’s investment adviser. Without these waivers, returns would have been lower. Returns shown do not reflect the deduction of taxes that a shareholder would pay on Fund distributions or the redemption of Fund shares. |
| ** | Represents a composite index as of December 31, 2009, consisting of 5.00% S&P 500® Index, 10.00% of the Dow Jones U.S. Select Real Estate Securities IndexSM, 24.00% of the Russell 1000® Value Index, 24.00% of the Russell 1000® Growth Index, 10.00% of the Russell 2000® Index and 27.00% of the MSCI ACWI (All Country World Index) Ex-U.S. Index. |
The construction of the composite index corresponds to the target percentage allocations to the underlying asset classes as represented by the Fund’s investment in the Select Funds. As the target percentage allocations to the underlying investments change according to the MyDestination FundsTM glide path, the target percentage allocations to the composite index also change.
Unlike a mutual fund, the performance of an index assumes no taxes, transaction costs, management fees or other expenses.
24
| | |
| MYDESTINATION 2045 FUND | | |
| SCHEDULE OF INVESTMENTS | | December 31, 2009 |
| | | | | | | |
| | | Shares | | Value | |
MUTUAL FUNDS — 99.7% | | | | | | | |
GuideStone Money Market Fund (GS4 Class)¥ | | | 1,286,027 | | $ | 1,286,027 | |
GuideStone Equity Index Fund (GS4 Class)¥ | | | 146,479 | | | 2,125,408 | |
GuideStone Real Estate Securities Fund (GS4 Class)¥ | | | 625,331 | | | 4,214,731 | |
GuideStone Value Equity Fund (GS4 Class)¥ | | | 811,207 | | | 10,172,536 | |
GuideStone Growth Equity Fund (GS4 Class)¥ | | | 649,814 | | | 10,319,039 | |
GuideStone Small Cap Equity Fund (GS4 Class)¥ | | | 377,764 | | | 4,295,182 | |
GuideStone International Equity Fund (GS4 Class)¥ | | | 934,347 | | | 11,623,278 | |
| | | | | | | |
Total Mutual Funds
(Cost $42,632,558) | | | | | | 44,036,201 | |
| | | | | | | |
| | |
| | | Par | | | |
U.S. TREASURY OBLIGATIONS — 0.3% | | | | | | | |
U.S. Treasury Bills | | | | | | | |
0.09%, 05/06/10‡‡ | | $ | 20,000 | | | 19,993 | |
0.11%, 05/06/10‡‡ | | | 105,000 | | | 104,964 | |
| | | | | | | |
Total U.S. Treasury Obligations
(Cost $124,953) | | | | | | 124,957 | |
| | | | | | | |
TOTAL INVESTMENTS — 100.0%
(Cost $42,757,511) | | | | | | 44,161,158 | |
Liabilities in Excess of Other Assets — 0.0% | | | | | | (2,071 | ) |
| | | | | | | |
NET ASSETS — 100.0% | | | | | $ | 44,159,087 | |
| | | | | | | |
Please see abbreviation and footnote definitions on page 180.
PORTFOLIO SUMMARY (based on net assets)
| | |
| | | % |
Domestic Equity Funds | | 70.5 |
International Equity Fund | | 26.3 |
Futures Contracts | | 3.0 |
Money Market Fund | | 2.9 |
U.S. Treasury Obligations | | 0.3 |
| | |
| | 103.0 |
| | |
FAS 157 DISCLOSURE
The following is a summary of the inputs used, as of December 31, 2009, in valuing the Fund’s investments carried at fair value:
| | | | | | |
Valuation Inputs | | Investments
in
Securities | | Other
Financial
Instruments*** |
Level 1 — Quoted Prices | | | | | | |
Futures Contracts | | $ | — | | $ | 5,506 |
Mutual Funds | | | 44,036,201 | | | — |
Level 2 — Other Significant Observable Inputs | | | | | | |
U.S. Treasury Obligations | | | 124,957 | | | — |
Level 3 — Significant Unobservable Inputs | | | — | | | — |
| | | | | | |
Total | | $ | 44,161,158 | | $ | 5,506 |
| | | | | | |
| *** | Other financial instruments are derivative instruments not reflected in the Schedule of Investments, such as futures, forwards and swap contracts, which are valued at the unrealized appreciation (depreciation) on the investment. Details of these investments can be found in the Notes to Financial Statements. |
See Notes to Financial Statements.
25
| | |
| STATEMENTS OF ASSETS AND LIABILITIES | | December 31, 2009 |
| | | | | | | | | | | | | | | | | | | | |
| | | MyDestination
2005 Fund | | | MyDestination
2015 Fund | | | MyDestination
2025 Fund | | | MyDestination
2035 Fund | | | MyDestination
2045 Fund | |
Assets | | | | | | | | | | | | | | | | | | | | |
Investments in securities of affiliated issuers, at value | | $ | 66,681,837 | | | $ | 217,710,945 | | | $ | 168,497,375 | | | $ | 75,089,288 | | | $ | 44,036,201 | |
Investments in securities of unaffiliated issuers, at value | | | — | | | | 1,761,969 | | | | 992,978 | | | | 332,522 | | | | 124,957 | |
| | | | | | | | | | | | | | | | | | | | |
Total investments (1) | | | 66,681,837 | | | | 219,472,914 | | | | 169,490,353 | | | | 75,421,810 | | | | 44,161,158 | |
Receivables: | | | | | | | | | | | | | | | | | | | | |
Dividends | | | 10 | | | | 20 | | | | 19 | | | | 13 | | | | 10 | |
Interest | | | — | | | | 23,916 | | | | 12,271 | | | | 2,862 | | | | — | |
Investment securities sold | | | — | | | | — | | | | 752,156 | | | | — | | | | — | |
Fund shares sold | | | 237,008 | | | | 9,911 | | | | 135,252 | | | | 37,929 | | | | 16,710 | |
Prepaid expenses and other assets | | | 21,525 | | | | 22,371 | | | | 22,643 | | | | 22,516 | | | | 21,569 | |
| | | | | | | | | | | | | | | | | | | | |
Total Assets | | | 66,940,380 | | | | 219,529,132 | | | | 170,412,694 | | | | 75,485,130 | | | | 44,199,447 | |
| | | | | | | | | | | | | | | | | | | | |
Liabilities | | | | | | | | | | | | | | | | | | | | |
Payables: | | | | | | | | | | | | | | | | | | | | |
Investment securities purchased | | | — | | | | 54,818 | | | | 750,612 | | | | 11,038 | | | | — | |
Fund shares redeemed | | | 78,538 | | | | 139,527 | | | | 24,086 | | | | 2,507 | | | | — | |
Variation margin | | | — | | | | 25,407 | | | | 26,406 | | | | 19,361 | | | | 13,680 | |
Accrued expenses: | | | | | | | | | | | | | | | | | | | | |
Investment advisory fees | | | 7,734 | | | | 18,656 | | | | 22,524 | | | | 7,059 | | | | 2,560 | |
Distribution (12b-1) fees | | | 11 | | | | 1 | | | | 2 | | | | 4 | | | | 9 | |
Other expenses | | | 23,991 | | | | 26,270 | | | | 26,034 | | | | 25,772 | | | | 24,111 | |
| | | | | | | | | | | | | | | | | | | | |
Total Liabilities | | | 110,274 | | | | 264,679 | | | | 849,664 | | | | 65,741 | | | | 40,360 | |
| | | | | | | | | | | | | | | | | | | | |
Net Assets | | $ | 66,830,106 | | | $ | 219,264,453 | | | $ | 169,563,030 | | | $ | 75,419,389 | | | $ | 44,159,087 | |
| | | | | | | | | | | | | | | | | | | | |
Net Assets Consist of: | | | | | | | | | | | | | | | | | | | | |
Paid-in capital | | $ | 76,349,075 | | | $ | 251,602,097 | | | $ | 192,880,488 | | | $ | 83,111,744 | | | $ | 44,342,428 | |
Undistributed net investment income | | | 102,070 | | | | 1,381,114 | | | | 607,942 | | | | 5,301 | | | | — | |
Accumulated net realized loss on investments and futures transactions | | | (7,444,801 | ) | | | (12,151,843 | ) | | | (6,422,093 | ) | | | (1,392,161 | ) | | | (1,592,494 | ) |
Net unrealized appreciation (depreciation) on investments and futures | | | (2,176,238 | ) | | | (21,566,915 | ) | | | (17,503,307 | ) | | | (6,305,495 | ) | | | 1,409,153 | |
| | | | | | | | | | | | | | | | | | | | |
Net Assets | | $ | 66,830,106 | | | $ | 219,264,453 | | | $ | 169,563,030 | | | $ | 75,419,389 | | | $ | 44,159,087 | |
| | | | | | | | | | | | | | | | | | | | |
Net Asset Value: | | | | | | | | | | | | | | | | | | | | |
$0.001 par value, unlimited shares authorized | | | | | | | | | | | | | | | | | | | | |
Net assets applicable to the GS4 Class | | $ | 66,830,106 | | | $ | 219,264,453 | | | $ | 169,563,030 | | | $ | 75,419,389 | | | $ | 44,159,087 | |
| | | | | | | | | | | | | | | | | | | | |
GS4 shares outstanding | | | 7,556,708 | | | | 26,034,064 | | | | 21,508,490 | | | | 10,033,988 | | | | 5,983,357 | |
| | | | | | | | | | | | | | | | | | | | |
Net asset value, offering and redemption price per GS4 share | | $ | 8.84 | | | $ | 8.42 | | | $ | 7.88 | | | $ | 7.52 | | | $ | 7.38 | |
| | | | | | | | | | | | | | | | | | | | |
|
| |
(1) Investments in securities of affiliated issuers, at cost | | $ | 68,858,075 | | | $ | 239,274,381 | | | $ | 186,018,574 | | | $ | 81,405,762 | | | $ | 42,632,558 | |
Investments in securities of unaffiliated issuers, at cost | | | — | | | | 1,793,126 | | | | 993,055 | | | | 335,403 | | | | 124,953 | |
| | | | | | | | | | | | | | | | | | | | |
Total investments at cost | | $ | 68,858,075 | | | $ | 241,067,507 | | | $ | 187,011,629 | | | $ | 81,741,165 | | | $ | 42,757,511 | |
| | | | | | | | | | | | | | | | | | | | |
See Notes to Financial Statements.
26
| | |
| STATEMENTS OF OPERATIONS | | For the Year Ended December 31, 2009 |
| | | | | | | | | | | | | | | | | | | | |
| | | MyDestination
2005 Fund | | | MyDestination
2015 Fund | | | MyDestination
2025 Fund | | | MyDestination
2035 Fund | | | MyDestination
2045 Fund | |
Investment Income | | | | | | | | | | | | | | | | | | | | |
Income dividends received from affiliated funds | | $ | 1,308,931 | | | $ | 3,958,466 | | | $ | 2,881,246 | | | $ | 941,225 | | | $ | 431,948 | |
Dividends | | | 108,306 | | | | 196,556 | | | | — | | | | — | | | | — | |
Interest | | | 7,299 | | | | 19,301 | | | | 9,979 | | | | 1,917 | | | | 213 | |
| | | | | | | | | | | | | | | | | | | | |
Total Investment Income | | | 1,424,536 | | | | 4,174,323 | | | | 2,891,225 | | | | 943,142 | | | | 432,161 | |
| | | | | | | | | | | | | | | | | | | | |
Expenses | | | | | | | | | | | | | | | | | | | | |
Investment advisory fees | | | 57,267 | | | | 174,655 | | | | 126,793 | | | | 54,186 | | | | 30,839 | |
Transfer agent fees: | | | | | | | | | | | | | | | | | | | | |
GS4 | | | 18,840 | | | | 19,835 | | | | 19,691 | | | | 19,714 | | | | 19,493 | |
GS6 | | | 2,385 | | | | 2,402 | | | | 2,397 | | | | 2,397 | | | | 2,397 | |
Custodian fees | | | 8,361 | | | | 9,260 | | | | 12,087 | | | | 12,315 | | | | 10,104 | |
Distribution (12b-1) fees: | | | | | | | | | | | | | | | | | | | | |
GS6 | | | 405 | | | | 679 | | | | 818 | | | | 514 | | | | 333 | |
Shareholder servicing fees: | | | | | | | | | | | | | | | | | | | | |
GS6 | | | 445 | | | | 746 | | | | 900 | | | | 565 | | | | 367 | |
Accounting and administration fees | | | 10,169 | | | | 17,595 | | | | 14,249 | | | | 8,881 | | | | 7,884 | |
Professional fees | | | 39,895 | | | | 39,895 | | | | 39,895 | | | | 39,895 | | | | 39,895 | |
Blue sky fees: | | | | | | | | | | | | | | | | | | | | |
GS4 | | | 3,438 | | | | 4,427 | | | | 3,672 | | | | 3,427 | | | | 3,486 | |
GS6 | | | 269 | | | | 272 | | | | 268 | | | | 268 | | | | 280 | |
Shareholder reporting fees: | | | | | | | | | | | | | | | | | | | | |
GS4 | | | 662 | | | | 2,574 | | | | 2,979 | | | | 1,472 | | | | 1,067 | |
GS6 | | | 36 | | | | 60 | | | | 60 | | | | 60 | | | | 60 | |
Trustee expenses | | | 629 | | | | 1,858 | | | | 1,295 | | | | 531 | | | | 280 | |
Line of credit facility fees | | | 829 | | | | 2,362 | | | | 1,656 | | | | 682 | | | | 370 | |
Other expenses | | | 8,105 | | | | 8,895 | | | | 8,976 | | | | 8,517 | | | | 8,355 | |
| | | | | | | | | | | | | | | | | | | | |
Total Expenses | | | 151,735 | | | | 285,515 | | | | 235,736 | | | | 153,424 | | | | 125,210 | |
Expenses waived/reimbursed net of amount recaptured(1) | | | (37,186 | ) | | | (1,864 | ) | | | 16,591 | | | | (45,655 | ) | | | (64,242 | ) |
| | | | | | | | | | | | | | | | | | | | |
Net Expenses | | | 114,549 | | | | 283,651 | | | | 252,327 | | | | 107,769 | | | | 60,968 | |
| | | | | | | | | | | | | | | | | | | | |
Net Investment Income | | | 1,309,987 | | | | 3,890,672 | | | | 2,638,898 | | | | 835,373 | | | | 371,193 | |
| | | | | | | | | | | | | | | | | | | | |
Realized and Unrealized Gain (Loss) | | | | | | | | | | | | | | | | | | | | |
Capital gain distributions received from affiliated funds | | | 260,035 | | | | 540,003 | | | | 254,196 | | | | 28,757 | | | | 69 | |
Net realized loss on investment securities of affiliated issuers | | | (6,279,043 | ) | | | (8,529,980 | ) | | | (6,066,248 | ) | | | (927,952 | ) | | | (856,656 | ) |
Net realized gain (loss) on investment securities of unaffiliated issuers | | | 10,983 | | | | (23,879 | ) | | | (33,143 | ) | | | (3,334 | ) | | | — | |
Net realized gain on futures transactions | | | 15,637 | | | | 359,884 | | | | 405,536 | | | | 275,311 | | | | 246,789 | |
| | | | | | | | | | | | | | | | | | | | |
Net realized loss | | | (5,992,388 | ) | | | (7,653,972 | ) | | | (5,439,659 | ) | | | (627,218 | ) | | | (609,798 | ) |
| | | | | | | | | | | | | | | | | | | | |
Change in unrealized appreciation (depreciation) on investment securities of affiliated issuers | | | 15,684,393 | | | | 45,459,909 | | | | 38,709,161 | | | | 16,104,486 | | | | 10,112,359 | |
Change in unrealized appreciation (depreciation) on investment securities of unaffiliated issuers | | | 248,285 | | | | 348,861 | | | | (118 | ) | | | (2,916 | ) | | | (13 | ) |
Change in unrealized appreciation (depreciation) on futures | | | (16,547 | ) | | | (6,171 | ) | | | (8,669 | ) | | | (2,027 | ) | | | (6,128 | ) |
| | | | | | | | | | | | | | | | | | | | |
Net change in unrealized appreciation (depreciation) | | | 15,916,131 | | | | 45,802,599 | | | | 38,700,374 | | | | 16,099,543 | | | | 10,106,218 | |
| | | | | | | | | | | | | | | | | | | | |
Net Realized and Unrealized Gain | | | 9,923,743 | | | | 38,148,627 | | | | 33,260,715 | | | | 15,472,325 | | | | 9,496,420 | |
| | | | | | | | | | | | | | | | | | | | |
Net Increase in Net Assets Resulting from Operations | | $ | 11,233,730 | | | $ | 42,039,299 | | | $ | 35,899,613 | | | $ | 16,307,698 | | | $ | 9,867,613 | |
| | | | | | | | | | | | | | | | | | | | |
| (1) | See Note 3a and 3c in Notes to Financial Statements. |
See Notes to Financial Statements.
27
STATEMENTS OF CHANGES IN NET ASSETS
| | | | | | | | |
| | | MyDestination 2005 Fund
For the Year Ended | |
| | | 12/31/09 | | | 12/31/08 | |
Operations: | | | | | | | | |
Net investment income | | $ | 1,309,987 | | | $ | 1,954,641 | |
Net realized loss on investment securities and futures transactions | | | (5,992,388 | ) | | | (957,809 | ) |
Net change in unrealized appreciation (depreciation) on investment securities and futures | | | 15,916,131 | | | | (16,571,994 | ) |
| | | | | | | | |
Net increase (decrease) in net assets resulting from operations | | | 11,233,730 | | | | (15,575,162 | ) |
| | | | | | | | |
Dividends and Distributions to Shareholders: | | | | | | | | |
Dividends from net investment income(1) | | | | | | | | |
GS4 shares | | | (1,558,574 | ) | | | (2,047,981 | ) |
GS6 shares | | | (5,830 | ) | | | (31,478 | ) |
Distributions from net realized capital gains | | | | | | | | |
GS4 shares | | | — | | | | (1,475,258 | ) |
GS6 shares | | | — | | | | (33,204 | ) |
| | | | | | | | |
Total dividends and distributions | | | (1,564,404 | ) | | | (3,587,921 | ) |
| | | | | | | | |
Capital Share Transactions: | | | | | | | | |
Proceeds from shares sold | | | | | | | | |
GS4 shares | | | 17,780,517 | | | | 24,467,910 | |
GS6 shares | | | 355,124 | | | | 504,471 | |
Proceeds from exchange of GS6 shares for GS4 shares(2) | | | | | | | | |
GS4 shares | | | 1,382,278 | | | | — | |
GS6 shares | | | (1,382,278 | ) | | | — | |
Reinvestment of dividends and distributions | | | | | | | | |
GS4 shares | | | 1,558,574 | | | | 3,523,239 | |
GS6 shares | | | 5,830 | | | | 64,682 | |
| | | | | | | | |
Total proceeds from shares sold and reinvested | | | 19,700,045 | | | | 28,560,302 | |
| | | | | | | | |
Value of shares redeemed | | | | | | | | |
GS4 shares | | | (14,217,632 | ) | | | (16,249,160 | ) |
GS6 shares | | | (133,418 | ) | | | (461,028 | ) |
| | | | | | | | |
Total value of shares redeemed | | | (14,351,050 | ) | | | (16,710,188 | ) |
| | | | | | | | |
Net increase from capital share transactions(3) | | | 5,348,995 | | | | 11,850,114 | |
| | | | | | | | |
Total increase (decrease) in net assets | | | 15,018,321 | | | | (7,312,969 | ) |
| | | | | | | | |
Net Assets: | | | | | | | | |
Beginning of Year | | | 51,811,785 | | | | 59,124,754 | |
| | | | | | | | |
End of Year* | | $ | 66,830,106 | | | $ | 51,811,785 | |
| | | | | | | | |
* Including undistributed net investment income | | $ | 102,070 | | | $ | 101,730 | |
| | | | | | | | |
| (1) | Includes dividends paid from the short-term portion of capital gain distributions received from affiliated funds. |
| (2) | See Note 1 in Notes to Financial Statements. |
| (3) | See Note 7 in Notes to Financial Statements. |
See Notes to Financial Statements.
28
| | | | | | | | | | | | | | | | | | | | | | | | | | | | | | |
MyDestination 2015 Fund
For the Year Ended | | | MyDestination 2025 Fund
For the Year Ended | | | MyDestination 2035 Fund
For the Year Ended | | | MyDestination 2045 Fund
For the Year Ended | |
| 12/31/09 | | | 12/31/08 | | | 12/31/09 | | | 12/31/08 | | | 12/31/09 | | | 12/31/08 | | | 12/31/09 | | | 12/31/08 | |
| | | | | | | | | | | | | | | | | | | | | | | | | | | | | | |
| $ | 3,890,672 | | | $ | 4,877,655 | | | $ | 2,638,898 | | | $ | 2,684,323 | | | $ | 835,373 | | | $ | 789,624 | | | $ | 371,193 | | | $ | 307,365 | |
| | (7,653,972 | ) | | | (3,479,814 | ) | | | (5,439,659 | ) | | | (486,393 | ) | | | (627,218 | ) | | | (590,341 | ) | | | (609,798 | ) | | | (796,458 | ) |
| | 45,802,599 | | | | (59,891,445 | ) | | | 38,700,374 | | | | (48,820,051 | ) | | | 16,099,543 | | | | (19,527,146 | ) | | | 10,106,218 | | | | (7,649,855 | ) |
| | | | | | | | | | | | | | | | | | | | | | | | | | | | | | | |
| | 42,039,299 | | | | (58,493,604 | ) | | | 35,899,613 | | | | (46,622,121 | ) | | | 16,307,698 | | | | (19,327,863 | ) | | | 9,867,613 | | | | (8,138,948 | ) |
| | | | | | | | | | | | | | | | | | | | | | | | | | | | | | | |
| | | | | | | | | | | | | | | | | | | | | | | | | | | | | | |
| | | | | | | | | | | | | | | | | | | | | | | | | | | | | | |
| | (4,379,876 | ) | | | (3,988,233 | ) | | | (2,861,067 | ) | | | (2,302,358 | ) | | | (1,036,881 | ) | | | (625,387 | ) | | | (496,078 | ) | | | (180,010 | ) |
| | (32,689 | ) | | | (18,577 | ) | | | (23,117 | ) | | | (33,073 | ) | | | (6,754 | ) | | | (5,228 | ) | | | (3,261 | ) | | | (30 | ) |
| | | | | | | | | | | | | | | | | | | | | | | | | | | | | | |
| | — | | | | (5,474,206 | ) | | | — | | | | (4,533,694 | ) | | | (118,981 | ) | | | (1,798,281 | ) | | | (188,497 | ) | | | (665,336 | ) |
| | — | | | | (46,540 | ) | | | — | | | | (95,733 | ) | | | (5,779 | ) | | | (57,955 | ) | | | (221 | ) | | | (34,799 | ) |
| | | | | | | | | | | | | | | | | | | | | | | | | | | | | | | |
| | (4,412,565 | ) | | | (9,527,556 | ) | | | (2,884,184 | ) | | | (6,964,858 | ) | | | (1,168,395 | ) | | | (2,486,851 | ) | | | (688,057 | ) | | | (880,175 | ) |
| | | | | | | | | | | | | | | | | | | | | | | | | | | | | | | |
| | | | | | | | | | | | | | | | | | | | | | | | | | | | | | |
| | | | | | | | | | | | | | | | | | | | | | | | | | | | | | |
| | 45,112,706 | | | | 55,390,960 | | | | 43,639,781 | | | | 44,588,486 | | | | 23,054,369 | | | | 24,099,520 | | | | 18,858,620 | | | | 15,130,813 | |
| | 1,621,277 | | | | 705,881 | | | | 1,038,155 | | | | 1,409,701 | | | | 842,870 | | | | 792,304 | | | | 357,765 | | | | 352,767 | |
| | | | | | | | | | | | | | | | | | | | | | | | | | | | | | |
| | 2,917,331 | | | | — | | | | 3,159,998 | | | | — | | | | 2,109,355 | | | | — | | | | 1,269,575 | | | | — | |
| | (2,917,331 | ) | | | — | | | | (3,159,998 | ) | | | — | | | | (2,109,355 | ) | | | — | | | | (1,269,575 | ) | | | — | |
| | | | | | | | | | | | | | | | | | | | | | | | | | | | | | |
| | 4,379,876 | | | | 9,462,439 | | | | 2,861,067 | | | | 6,836,052 | | | | 1,155,862 | | | | 2,423,668 | | | | 684,575 | | | | 845,346 | |
| | 32,689 | | | | 65,117 | | | | 23,117 | | | | 128,806 | | | | 12,533 | | | | 63,183 | | | | 3,482 | | | | 34,829 | |
| | | | | | | | | | | | | | | | | | | | | | | | | | | | | | | |
| | 51,146,548 | | | | 65,624,397 | | | | 47,562,120 | | | | 52,963,045 | | | | 25,065,634 | | | | 27,378,675 | | | | 19,904,442 | | | | 16,363,755 | |
| | | | | | | | | | | | | | | | | | | | | | | | | | | | | | | |
| | | | | | | | | | | | | | | | | | | | | | | | | | | | | | |
| | (16,856,207 | ) | | | (21,287,889 | ) | | | (9,916,293 | ) | | | (7,208,810 | ) | | | (3,639,614 | ) | | | (3,015,460 | ) | | | (3,831,202 | ) | | | (1,237,722 | ) |
| | (44,365 | ) | | | (406,299 | ) | | | (9,820 | ) | | | (418,340 | ) | | | (7,283 | ) | | | (191,533 | ) | | | (21,937 | ) | | | (67,470 | ) |
| | | | | | | | | | | | | | | | | | | | | | | | | | | | | | | |
| | (16,900,572 | ) | | | (21,694,188 | ) | | | (9,926,113 | ) | | | (7,627,150 | ) | | | (3,646,897 | ) | | | (3,206,993 | ) | | | (3,853,139 | ) | | | (1,305,192 | ) |
| | | | | | | | | | | | | | | | | | | | | | | | | | | | | | | |
| | 34,245,976 | | | | 43,930,209 | | | | 37,636,007 | | | | 45,335,895 | | | | 21,418,737 | | | | 24,171,682 | | | | 16,051,303 | | | | 15,058,563 | |
| | | | | | | | | | | | | | | | | | | | | | | | | | | | | | | |
| | 71,872,710 | | | | (24,090,951 | ) | | | 70,651,436 | | | | (8,251,084 | ) | | | 36,558,040 | | | | 2,356,968 | | | | 25,230,859 | | | | 6,039,440 | |
| | | | | | | | | | | | | | | | | | | | | | | | | | | | | | | |
| | | | | | | | | | | | | | | | | | | | | | | | | | | | | | |
| | 147,391,743 | | | | 171,482,694 | | | | 98,911,594 | | | | 107,162,678 | | | | 38,861,349 | | | | 36,504,381 | | | | 18,928,228 | | | | 12,888,788 | |
| | | | | | | | | | | | | | | | | | | | | | | | | | | | | | | |
| $ | 219,264,453 | | | $ | 147,391,743 | | | $ | 169,563,030 | | | $ | 98,911,594 | | | $ | 75,419,389 | | | $ | 38,861,349 | | | $ | 44,159,087 | | | $ | 18,928,228 | |
| | | | | | | | | | | | | | | | | | | | | | | | | | | | | | | |
| $ | 1,381,114 | | | $ | 1,381,316 | | | $ | 607,942 | | | $ | 608,702 | | | $ | 5,301 | | | $ | 185,808 | | | $ | — | | | $ | 127,784 | |
| | | | | | | | | | | | | | | | | | | | | | | | | | | | | | | |
See Notes to Financial Statements.
29
FINANCIAL HIGHLIGHTS
| | | | | | | | | | | | | | | | | | | | | | | | | | | | | | | | | | | | | | | | | | | | |
For a Share Outstanding For the Years Ended December 31, unless otherwise indicated | | Ratios to Average Net Assets | | | | |
| | | Net Asset
Value,
Beginning
of Year | | Net
Investment
Income (1) | | | Capital Gain
Distributions
Received
from
Affiliated
Funds | | | Realized
and
Unrealized
Gain
(Loss) on
Investments | | | Dividends
from Net
Investment
Income (2) | | | Distributions
from Net
Realized
Capital
Gains | | | Net Asset
Value,
End of
Year | | Total
Return | | | Net Assets,
End of Year
(000) | | Expenses,
Net(3) | | | Expenses,
Gross
(3)(4) | | | Investment
Income,
Net
(1)(5) | | | Portfolio
Turnover
Rate | |
MyDestination 2005 Fund* | |
|
GS4 Class | |
2009 | | $ | 7.44 | | $ | 0.18 | # | | $ | 0.04 | | | $ | 1.40 | | | $ | (0.22 | ) | | $ | — | | | $ | 8.84 | | 21.84 | % | | $ | 66,830 | | 0.20 | % | | 0.26 | % | | 2.31 | % | | 57 | % |
2008 | | | 10.35 | | | 0.30 | # | | | 0.08 | | | | (2.75 | ) | | | (0.31 | ) | | | (0.23 | ) | | | 7.44 | | (22.78 | ) | | | 50,678 | | 0.20 | | | 0.29 | | | 3.25 | | | 40 | |
2007 | | | 10.00 | | | 0.33 | # | | | 0.62 | | | | (0.31 | ) | | | (0.28 | ) | | | (0.01 | ) | | | 10.35 | | 6.42 | | | | 57,667 | | 0.20 | | | 0.43 | | | 3.16 | | | 21 | |
|
MyDestination 2015 Fund* | |
|
GS4 Class | |
2009 | | $ | 6.83 | | $ | 0.17 | # | | $ | 0.02 | | | $ | 1.58 | | | $ | (0.18 | ) | | $ | — | | | $ | 8.42 | | 26.27 | % | | $ | 219,264 | | 0.16 | % | | 0.16 | % | | 2.25 | % | | 25 | % |
2008 | | | 10.33 | | | 0.26 | # | | | 0.09 | | | | (3.39 | ) | | | (0.19 | ) | | | (0.27 | ) | | | 6.83 | | (29.31 | ) | | | 146,140 | | 0.20 | | | 0.18 | | | 2.87 | | | 22 | |
2007 | | | 10.00 | | | 0.29 | # | | | 0.83 | | | | (0.50 | ) | | | (0.28 | ) | | | (0.01 | ) | | | 10.33 | | 6.12 | | | | 169,953 | | 0.20 | | | 0.24 | | | 2.74 | | | 7 | |
|
MyDestination 2025 Fund* | |
|
GS4 Class | |
2009 | | $ | 6.18 | | $ | 0.14 | # | | $ | 0.01 | | | $ | 1.69 | | | $ | (0.14 | ) | | $ | — | | | $ | 7.88 | | 30.12 | % | | $ | 169,563 | | 0.20 | % | | 0.19 | % | | 2.11 | % | | 13 | % |
2008 | | | 10.24 | | | 0.21 | # | | | 0.09 | | | | (3.89 | ) | | | (0.15 | ) | | | (0.32 | ) | | | 6.18 | | (35.00 | ) | | | 96,826 | | 0.20 | | | 0.21 | | | 2.47 | | | 10 | |
2007 | | | 10.00 | | | 0.25 | # | | | 1.13 | | | | (0.85 | ) | | | (0.28 | ) | | | (0.01 | ) | | | 10.24 | | 5.29 | | | | 105,102 | | 0.20 | | | 0.30 | | | 2.37 | | | 5 | |
|
MyDestination 2035 Fund* | |
|
GS4 Class | |
2009 | | $ | 5.85 | | $ | 0.10 | # | | $ | — | † | | $ | 1.70 | | | $ | (0.11 | ) | | $ | (0.02 | ) | | $ | 7.52 | | 30.99 | % | | $ | 75,419 | | 0.20 | % | | 0.28 | % | | 1.57 | % | | 4 | % |
2008 | | | 10.24 | | | 0.17 | # | | | 0.09 | | | | (4.25 | ) | | | (0.10 | ) | | | (0.30 | ) | | | 5.85 | | (38.86 | ) | | | 37,637 | | 0.20 | | | 0.40 | | | 2.02 | | | 5 | |
2007 | | | 10.00 | | | 0.19 | # | | | 1.31 | | | | (0.98 | ) | | | (0.28 | ) | | | — | † | | | 10.24 | | 5.20 | | | | 35,117 | | 0.20 | | | 0.64 | | | 1.83 | | | 2 | |
|
MyDestination 2045 Fund* | |
|
GS4 Class | |
2009 | | $ | 5.75 | | $ | 0.08 | # | | $ | — | † | | $ | 1.67 | | | $ | (0.09 | ) | | $ | (0.03 | ) | | $ | 7.38 | | 30.71 | % | | $ | 44,159 | | 0.20 | % | | 0.41 | % | | 1.23 | % | | 7 | % |
2008 | | | 10.12 | | | 0.16 | # | | | 0.10 | | | | (4.34 | ) | | | (0.06 | ) | | | (0.23 | ) | | | 5.75 | | (40.29 | ) | | | 17,998 | | 0.20 | | | 0.79 | | | 1.97 | | | 5 | |
2007 | | | 10.00 | | | 0.17 | # | | | 1.37 | | | | (1.09 | ) | | | (0.28 | ) | | | (0.05 | ) | | | 10.12 | | 4.46 | | | | 11,659 | | 0.19 | | | 1.48 | | | 1.60 | | | 9 | |
| † | Amount represents less than $0.005 per share. |
| # | Calculated using the average shares outstanding method. |
| * | Inception date was December 29, 2006. |
| (1) | Recognition of net investment income by the Fund is affected by the timing of the declaration of dividends by the underlying investment companies in which the Fund invests. |
| (2) | Includes dividends paid from the short-term portion of capital gain distributions received from affiliated Funds. (3) Does not include expenses of the investment companies in which the Fund invests. |
| (4) | The ratio excludes expenses waived/reimbursed net of amount recaptured. |
| (5) | The ratio includes expenses waived/reimbursed net of amount recaptured and fees paid indirectly, where applicable; if expenses waived/reimbursed net of amount recaptured and fees paid indirectly were excluded, the ratio would have been lower than the ratio shown. |
See Notes to Financial Statements.
30
Conservative Allocation Fund
The Fund, through investments in the underlying Select Funds, combines a greater percentage of exposure to fixed income securities with a smaller percentage to equity securities. The Fund has a target of, but is not limited to, an asset allocation of 75% Fixed Income Select Funds, 19% U.S. Equity Select Funds and 6% Non-U.S. Equity Select Funds.
Please see page 33 for information regarding specific portfolio allocations. Portfolio holdings are subject to change at any time.
The Fund is a fund-of-funds, and its performance is based on the performance of the underlying Select Funds. The Fund generated a strong return of 16.58% during 2009. During the first quarter, the Fund’s absolute performance was dampened by the effects of the financial crisis and economic recession, which led to very difficult returns in the equity markets. With the aid of government programs, aggressive monetary policy and prospects for an improved economic environment, the capital markets improved after bottoming in early March. All asset classes rebounded strongly as investors became less risk averse, willing to deploy assets into both equities and non-U.S. Treasury fixed income securities. Given the rebound in the capital markets, the Fund posted positive absolute returns during the second, third and fourth quarters. The Fund’s absolute returns were most positively influenced by its exposure to the Low-Duration Bond Fund, given its significant target weighting and strong annual return. The International Equity Fund and the Growth Equity Fund were the largest contributors from the Fund’s equity allocation.
The Fund outpaced its composite benchmark during the year by 7.28%, benefitting most notably from its exposure to the fixed income markets. At a target weighting of 60%, the Low-Duration Bond Fund contributed the most to the Fund’s relative excess return. The Low-Duration Bond Fund benefited from sector allocation strategies that provided exposure to non-U.S. Treasury sectors, such as corporate bonds and mortgages. When risk appetite returned and investors were willing to re-enter spread sectors to take advantage of historically attractive valuations, exposure to these sectors allowed the Low-Duration Bond Fund to greatly outperform. The Fund’s relative performance was also positively impacted by exposure to certain U.S. Equity Select Funds, most notably the Value Equity Fund and the Growth Equity Fund.
The Fund attempts to achieve its objective by investing in the GuideStone Select Funds. By investing in the Fund you will also incur the expenses and risks of the underlying Select Funds. The principal risks of the Funds will change depending on the asset mix of the Select Funds in which they invest. You may directly invest in the Select Funds. The Funds’ value will go up and down in response to changes in the share prices of the investments that they own. It is possible to lose money by investing in the Fund.
31
Conservative Allocation Fund
| | | | | | |
Average Annual Total Returns as of 12/31/09 | |
| | | GS4 Class* | | | Benchmark** | |
One Year | | 16.58 | % | | 9.30 | % |
Five Year | | 3.38 | % | | 4.01 | % |
Since Inception | | 3.64 | % | | 4.03 | % |
Inception Date | | 08/27/01 | | | | |
Total Fund Operating Expenses (June 25, 2009 Prospectus)(1) | | 0.78 | % | | | |
| (1) | The Fund’s shareholders indirectly bear the expenses of the GS4 Class shares of the Select Funds in which the Fund invests. Current information regarding the Fund’s Operating Expenses can be found in the Financial Highlights. |
The performance data quoted represents past performance and does not guarantee future results. Current performance may be lower or higher. Performance data current to the most recent month-end may be obtained at www.GuideStoneFunds.org. The investment return and principal value of an investment will fluctuate so that shares, when redeemed, may be worth more or less than their original cost.
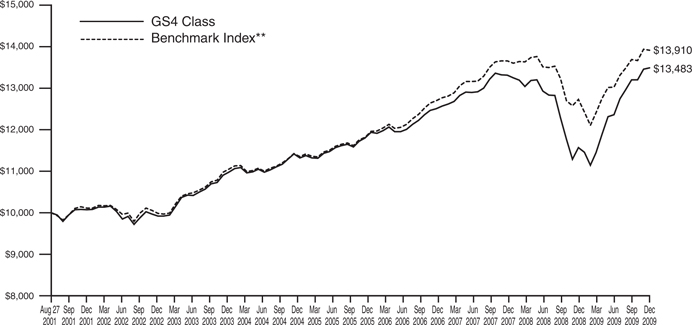
The graph compares the results of a hypothetical $10,000 investment in the GS4 Class of the Fund since August 27, 2001 (commencement of operations), with all dividends and capital gains reinvested, with the Fund’s weighted composite benchmark index.
| * | These returns reflect expense waivers by the Fund’s investment adviser. Without these waivers, returns would have been lower. Returns shown do not reflect the deduction of taxes that a shareholder would pay on Fund distributions or the redemption of Fund shares. |
| ** | Represents a composite index consisting of the Russell 3000® Index, the MSCI ACWI (All Country World Index) Ex-U.S. Index, the Merrill Lynch 1-3 Year Treasury Index and Barclays Capital U.S. TIPS Index, weighted 17.5%, 7.5%, 60% and 15%, respectively. |
The Russell 3000® Index measures the performance of the 3,000 largest U.S. companies based on total market capitalization, which represents approximately 98% of the investable U.S. equity market.
The MSCI ACWI (All Country World Index) Ex-U.S. Index is a free float-adjusted market capitalization index that is designed to measure equity market performance in the global developed (Ex-U.S.) and emerging markets.
The Merrill Lynch 1-3 Year Treasury Index is composed of all U.S. Treasury Notes and Bonds with maturities greater than or equal to one year and less than three years.
The Barclays Capital U.S. TIPS Index measures the performance of the U.S. Treasury Inflation Protected Securities (“TIPS”) market and includes TIPS with one or more years remaining until maturity with total outstanding issue size of $500 million or more.
Unlike a mutual fund, the performance of an index assumes no taxes, transaction costs, management fees or other expenses.
32
| | |
| CONSERVATIVE ALLOCATION FUND | | |
| SCHEDULE OF INVESTMENTS | | December 31, 2009 |
| | | | | | |
| | | Shares | | Value |
MUTUAL FUNDS — 98.1% | | | | | | |
GuideStone Money Market Fund (GS4 Class)¥ | | | 1,458,350 | | $ | 1,458,350 |
GuideStone Low-Duration Bond Fund (GS4 Class)¥ | | | 12,668,243 | | | 165,193,885 |
GuideStone Inflation Protected Bond Fund (GS4 Class)¥ | | | 3,968,183 | | | 40,951,653 |
GuideStone Equity Index Fund (GS4 Class)¥ | | | 335,265 | | | 4,864,696 |
GuideStone Value Equity Fund (GS4 Class)¥ | | | 1,583,624 | | | 19,858,640 |
GuideStone Growth Equity Fund (GS4 Class)¥ | | | 1,283,572 | | | 20,383,118 |
GuideStone Small Cap Equity Fund (GS4 Class)¥ | | | 443,336 | | | 5,040,729 |
GuideStone International Equity Fund (GS4 Class)¥ | | | 1,733,302 | | | 21,562,280 |
| | | | | | |
Total Mutual Funds
(Cost $271,985,242) | | | | | | 279,313,351 |
| | | | | | |
| | |
| | | Par | | |
U.S. TREASURY OBLIGATIONS — 1.8% | | | | | | |
U.S. Treasury Bill | | | | | | |
0.11%, 05/06/10‡‡ | | $ | 215,000 | | | 214,926 |
U.S. Treasury Note | | | | | | |
4.50%, 09/30/11 | | | 4,735,000 | | | 5,021,690 |
| | | | | | |
Total U.S. Treasury Obligations
(Cost $5,252,064) | | | | | | 5,236,616 |
| | | | | | |
TOTAL INVESTMENTS — 99.9%
(Cost $277,237,306) | | | | | | 284,549,967 |
Other Assets in Excess of Liabilities — 0.1% | | | | | | 200,524 |
| | | | | | |
NET ASSETS — 100.0% | | | | | $ | 284,750,491 |
| | | | | | |
Please see abbreviation and footnote definitions on page 180.
PORTFOLIO SUMMARY (based on net assets)
| | |
| | | % |
Bond Funds | | 72.4 |
Domestic Equity Funds | | 17.6 |
International Equity Fund | | 7.6 |
U.S. Treasury Obligations | | 1.8 |
Futures Contracts | | 0.5 |
Money Market Fund | | 0.5 |
| | |
| | 100.4 |
| | |
FAS 157 DISCLOSURE
The following is a summary of the inputs used, as of December 31, 2009, in valuing the Fund’s investments carried at fair value:
| | | | | | |
Valuation Inputs | | Investments
in
Securities | | Other
Financial
Instruments*** |
Level 1 — Quoted Prices | | | | | | |
Futures Contracts | | $ | — | | $ | 20,129 |
Mutual Funds | | | 279,313,351 | | | — |
Level 2 — Other Significant Observable Inputs | | | | | | |
U.S. Treasury Obligations | | | 5,236,616 | | | — |
Level 3 — Significant Unobservable Inputs | | | — | | | — |
| | | | | | |
Total | | $ | 284,549,967 | | $ | 20,129 |
| | | | | | |
| *** | Other financial instruments are derivative instruments not reflected in the Schedule of Investments, such as futures, forwards and swap contracts, which are valued at the unrealized appreciation (depreciation) on the investment. Details of these investments can be found in the Notes to Financial Statements. |
See Notes to Financial Statements.
33
Balanced Allocation Fund
The Fund, through investments in the underlying Select Funds, combines approximately equal percentages of exposure to fixed income securities and equity securities. The Fund has a target of, but is not limited to, an asset allocation of 50% Fixed Income Select Funds, 37% U.S. Equity Select Funds and 13% Non-U.S. Equity Select Funds.
Please see page 36 for information regarding specific portfolio allocations. Portfolio holdings are subject to change at any time.
The Fund is a fund-of-funds, and its performance is based on the performance of the underlying Select Funds. The Fund generated a strong return of 25.05% during 2009, benefiting from the double digit returns experienced by each of the underlying Select Funds during the year. During the first quarter, the Fund’s absolute returns were negative due to the harmful repercussions of the financial crisis and economic recession, which led to very difficult returns in the domestic and non-U.S. equity markets. The Fund’s diversification into fixed income securities (approximately 50% of the Fund’s market value) helped mitigate the effect of strong negative equity returns during the first quarter. With the aid of government programs, aggressive monetary policy and prospects for an improved economic environment, the capital markets improved after bottoming in early March. All asset classes rebounded strongly as investors became less risk averse, willing to deploy assets into both equities and non-U.S. Treasury fixed income securities. Given the strong rebound in the capital markets, the Fund posted positive absolute returns during the second, third and fourth quarters. The Fund’s absolute returns were most positively influenced by its exposure to the Growth Equity Fund, International Equity Fund and the Medium-Duration Bond Fund.
The Fund outpaced its composite benchmark during the year by 5.99%, benefitting most notably from its exposure to the Fixed Income Select Funds. The Medium-Duration Bond Fund, the Extended-Duration Bond Fund and the Low-Duration Bond Fund outpaced their respective benchmarks, primarily due to sector allocation strategies that provided an overweight to spread sectors such as corporate and mortgages and an underweight to U.S. Treasury securities. When risk appetite returned and investors were willing to re-enter spread sectors to take advantage of historically attractive valuations, exposure to such sectors allowed these Fixed Income Select Funds to greatly outperform. The Fund’s relative performance was also positively impacted by exposure to certain U.S. Equity Select Funds, most notably the Value Equity Fund and the Growth Equity Fund.
The Fund attempts to achieve its objective by investing in the GuideStone Select Funds. By investing in the Fund you will also incur the expenses and risks of the underlying Select Funds. The principal risks of the Funds will change depending on the asset mix of the Select Funds in which they invest. You may directly invest in the Select Funds. The Funds’ value will go up and down in response to changes in the share prices of the investments that they own. It is possible to lose money by investing in the Fund.
34
Balanced Allocation Fund
| | | | | | |
Average Annual Total Returns as of 12/31/09 | |
| | | GS4 Class* | | | Benchmark** | |
One Year | | 25.05 | % | | 19.06 | % |
Five Year | | 3.20 | % | | 3.92 | % |
Since Inception | | 4.35 | % | | 4.78 | % |
Inception Date | | 08/27/01 | | | | |
Total Fund Operating Expenses (June 25, 2009 Prospectus)(1) | | 0.88 | % | | | |
| (1) | The Fund’s shareholders indirectly bear the expenses of the GS4 Class shares of the Select Funds in which the Fund invests. Current information regarding the Fund’s Operating Expenses can be found in the Financial Highlights. |
The performance data quoted represents past performance and does not guarantee future results. Current performance may be lower or higher. Performance data current to the most recent month-end may be obtained at www.GuideStoneFunds.org. The investment return and principal value of an investment will fluctuate so that shares, when redeemed, may be worth more or less than their original cost.
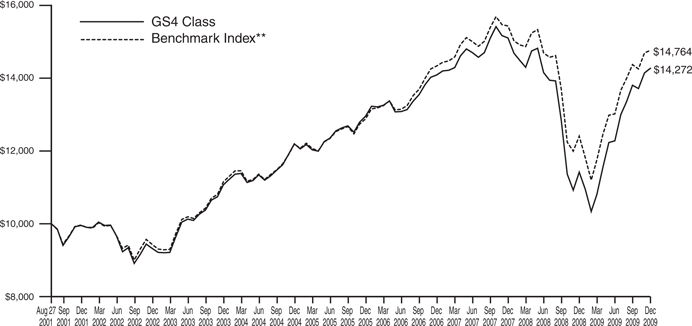
The graph compares the results of a hypothetical $10,000 investment in the GS4 Class of the Fund since August 27, 2001 (commencement of operations), with all dividends and capital gains reinvested, with the Fund’s weighted composite benchmark index.
| * | These returns reflect expense waivers by the Fund’s investment adviser. Without these waivers, returns would have been lower. Returns shown do not reflect the deduction of taxes that a shareholder would pay on Fund distributions or the redemption of Fund shares. |
| ** | Represents a composite index consisting of the Russell 3000® Index, the MSCI ACWI (All Country World Index) Ex-U.S. Index and the Barclays Capital U.S. Aggregate Bond Index, weighted 35%, 15% and 50%, respectively. |
The Russell 3000® Index measures the performance of the 3,000 largest U.S. companies based on total market capitalization, which represents approximately 98% of the investable U.S. equity market.
The MSCI ACWI (All Country World Index) Ex-U.S. Index is a free float-adjusted market capitalization index that is designed to measure equity market performance in the global developed (Ex-U.S.) and emerging markets.
The Barclays Capital U.S. Aggregate Bond Index represents securities that are SEC-registered, taxable and dollar denominated. The index covers the U.S. investment grade bond market, with index components for government and corporate securities, mortgage pass-through securities, and asset-backed securities.
Unlike a mutual fund, the performance of an index assumes no taxes, transaction costs, management fees or other expenses.
35
| | |
| BALANCED ALLOCATION FUND | | |
| SCHEDULE OF INVESTMENTS | | December 31, 2009 |
| | | | | | | |
| | | Shares | | Value | |
MUTUAL FUNDS — 98.6% | | | | | | | |
GuideStone Money Market Fund (GS4 Class)¥ | | | 13,056,266 | | $ | 13,056,266 | |
GuideStone Low-Duration Bond Fund (GS4 Class)¥ | | | 12,341,699 | | | 160,935,757 | |
GuideStone Medium-Duration Bond Fund (GS4 Class)¥ | | | 17,451,295 | | | 233,149,295 | |
GuideStone Extended-Duration Bond Fund (GS4 Class)¥ | | | 6,047,826 | | | 92,773,652 | |
GuideStone Global Bond Fund (GS4 Class)¥ | | | 5,932,729 | | | 55,530,347 | |
GuideStone Equity Index Fund (GS4 Class)¥ | | | 2,419,204 | | | 35,102,654 | |
GuideStone Value Equity Fund (GS4 Class)¥ | | | 12,631,574 | | | 158,399,932 | |
GuideStone Growth Equity Fund (GS4 Class)¥ | | | 10,146,242 | | | 161,122,326 | |
GuideStone Small Cap Equity Fund (GS4 Class)¥ | | | 3,431,667 | | | 39,018,057 | |
GuideStone International Equity Fund (GS4 Class)¥ | | | 13,541,152 | | | 168,451,926 | |
| | | | | | | |
Total Mutual Funds
(Cost $1,150,422,471) | | | | | | 1,117,540,212 | |
| | | | | | | |
| | |
| | | Par | | | |
U.S. TREASURY OBLIGATIONS — 1.4% | | | | | | | |
U.S. Treasury Bill | | | | | | | |
0.11%, 05/06/10‡‡ | | $ | 1,385,000 | | | 1,384,521 | |
U.S. Treasury Note | | | | | | | |
4.25%, 11/15/14 | | | 13,325,000 | | | 14,357,701 | |
| | | | | | | |
Total U.S. Treasury Obligations
(Cost $15,741,683) | | | | | | 15,742,222 | |
| | | | | | | |
TOTAL INVESTMENTS — 100.0%
(Cost $1,166,164,154) | | | | | | 1,133,282,434 | |
Liabilities in Excess of Other Assets — 0.0% | | | | | | (291,128 | ) |
| | | | | | | |
NET ASSETS — 100.0% | | | | | $ | 1,132,991,306 | |
| | | | | | | |
Please see abbreviation and footnote definitions on page 180.
PORTFOLIO SUMMARY (based on net assets)
| | |
| | | % |
Bond Funds | | 47.9 |
Domestic Equity Funds | | 34.7 |
International Equity Fund | | 14.9 |
U.S. Treasury Obligations | | 1.4 |
Futures Contracts | | 1.2 |
Money Market Fund | | 1.1 |
| | |
| | 101.2 |
| | |
FAS 157 DISCLOSURE
The following is a summary of the inputs used, as of December 31, 2009, in valuing the Fund’s investments carried at fair value:
| | | | | | |
Valuation Inputs | | Investments
in
Securities | | Other
Financial
Instruments*** |
Level 1 — Quoted Prices | | | | | | |
Futures Contracts | | $ | — | | $ | 69,500 |
Mutual Funds | | | 1,117,540,212 | | | — |
Level 2 — Other Significant Observable Inputs | | | | | | |
U.S. Treasury Obligations | | | 15,742,222 | | | — |
Level 3 — Significant Unobservable Inputs | | | — | | | — |
| | | | | | |
Total | | $ | 1,133,282,434 | | $ | 69,500 |
| | | | | | |
| *** | Other financial instruments are derivative instruments not reflected in the Schedule of Investments, such as futures, forwards and swap contracts, which are valued at the unrealized appreciation (depreciation) on the investment. Details of these investments can be found in the Notes to Financial Statements. |
See Notes to Financial Statements.
36
Growth Allocation Fund
The Fund, through investments in the underlying Select Funds, combines a greater percentage of exposure to equity securities with a smaller percentage to fixed income securities. The Fund has a target of, but is not limited to, an asset allocation of 56% U.S. Equity Select Funds, 25% Fixed Income Select Funds and 19% Non-U.S. Equity Select Funds.
Please see page 39 for information regarding specific portfolio allocations. Portfolio holdings are subject to change at any time.
The Fund is a fund-of-funds, and its performance is based on the performance of the underlying Select Funds. The Fund generated a strong return of 27.96% during 2009, benefiting from the double digit returns experienced by each of the underlying Select Funds during the year. During the first quarter, the Fund’s absolute returns were negative due to the harmful repercussions of the financial crisis and economic recession, which led to very difficult returns in the domestic and non-U.S. equity markets. The Fund’s moderate diversification into fixed income securities (approximately 25% of the Fund’s total market value) helped mitigate the effect of strong negative equity returns during the first quarter. With the aid of government programs, aggressive monetary policy and prospects for an improved economic environment, the capital markets improved after bottoming in early March. All asset classes rebounded strongly as investors became less risk averse, willing to deploy assets into both equities and non-U.S. Treasury fixed income securities. Given the strong rebound in the capital markets, the Fund posted positive absolute returns during the second, third and fourth quarters. The Fund’s absolute returns were most positively influenced by its exposure to the Growth Equity Fund, the International Equity Fund and the Value Equity Fund. Regarding exposure to fixed income, the Medium-Duration Bond Fund also contributed meaningfully to the Fund’s absolute return.
The Fund outpaced its composite benchmark during the year by 2.30%, benefitting most notably from its exposure to the Fixed Income Select Funds. The Medium-Duration Bond Fund, the Extended-Duration Bond Fund and the Low-Duration Bond Fund outpaced their respective benchmarks, primarily due to sector allocation strategies that provided an overweight to spread sectors such as corporate and mortgages and an underweight to U.S. Treasury securities. When risk appetite returned and investors were willing to re-enter spread sectors to take advantage of historically attractive valuations, exposure to such sectors allowed these Fixed Income Select Funds to greatly outperform. The Fund’s relative performance was also positively impacted by exposure to certain U.S. Equity Select Funds, most notably the Value Equity Fund and the Growth Equity Fund.
The Fund attempts to achieve its objective by investing in the GuideStone Select Funds. By investing in the Fund you will also incur the expenses and risks of the underlying Select Funds. The principal risks of the Funds will change depending on the asset mix of the Select Funds in which they invest. You may directly invest in the Select Funds. The Funds’ value will go up and down in response to changes in the share prices of the investments that they own. It is possible to lose money by investing in the Fund.
37
Growth Allocation Fund
| | | | | | |
Average Annual Total Returns as of 12/31/09 | |
| | | GS4 Class* | | | Benchmark** | |
One Year | | 27.96 | % | | 25.66 | % |
Five Year | | 1.98 | % | | 3.08 | % |
Since Inception | | 3.46 | % | | 4.13 | % |
Inception Date | | 08/27/01 | | | | |
Total Fund Operating Expenses (June 25, 2009 Prospectus)(1) | | 0.96 | % | | | |
| (1) | The Fund’s shareholders indirectly bear the expenses of the GS4 Class shares of the Select Funds in which the Fund invests. Current information regarding the Fund’s Operating Expenses can be found in the Financial Highlights. |
The performance data quoted represents past performance and does not guarantee future results. Current performance may be lower or higher. Performance data current to the most recent month-end may be obtained at www.GuideStoneFunds.org. The investment return and principal value of an investment will fluctuate so that shares, when redeemed, may be worth more or less than their original cost.
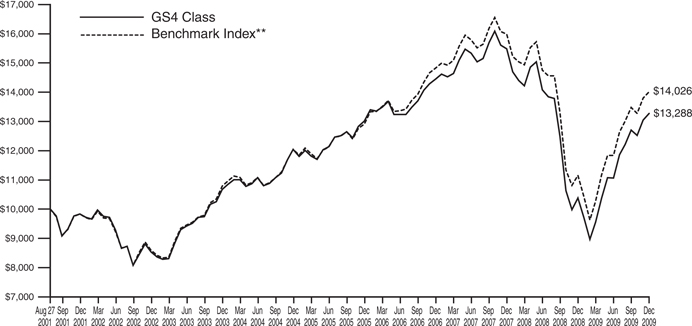
The graph compares the results of a hypothetical $10,000 investment in the GS4 Class of the Fund since August 27, 2001 (commencement of operations), with all dividends and capital gains reinvested, with the Fund’s weighted composite benchmark index.
| * | These returns reflect expense waivers by the Fund’s investment adviser. Without these waivers, returns would have been lower. Returns shown do not reflect the deduction of taxes that a shareholder would pay on Fund distributions or the redemption of Fund shares. |
| ** | Represents a composite index consisting of the Russell 3000® Index, the MSCI ACWI (All Country World Index) Ex-U.S. Index and the Barclays Capital U.S. Aggregate Bond Index, weighted 52.5%, 22.5% and 25%, respectively. |
The Russell 3000® Index measures the performance of the 3,000 largest U.S. companies based on total market capitalization, which represents approximately 98% of the investable U.S. equity market.
The MSCI ACWI (All Country World Index) Ex-U.S. Index is a free float-adjusted market capitalization index that is designed to measure equity market performance in the global developed (Ex-U.S.) and emerging markets.
The Barclays U.S. Capital Aggregate Bond Index represents securities that are SEC-registered, taxable and dollar denominated. The index covers the U.S. investment grade bond market, with index components for government and corporate securities, mortgage pass-through securities and asset-backed securities.
Unlike a mutual fund, the performance of an index assumes no taxes, transaction costs, management fees or other expenses.
38
| | |
| GROWTH ALLOCATION FUND | | |
| SCHEDULE OF INVESTMENTS | | December 31, 2009 |
| | | | | | | |
| | | Shares | | Value | |
MUTUAL FUNDS — 99.3% | | | | | | | |
GuideStone Money Market Fund (GS4 Class)¥ | | | 11,482,976 | | $ | 11,482,976 | |
GuideStone Low-Duration Bond Fund (GS4 Class)¥ | | | 4,512,624 | | | 58,844,612 | |
GuideStone Medium-Duration Bond Fund (GS4 Class)¥ | | | 6,396,947 | | | 85,463,209 | |
GuideStone Extended-Duration Bond Fund (GS4 Class)¥ | | | 2,246,893 | | | 34,467,339 | |
GuideStone Global Bond Fund (GS4 Class)¥ | | | 2,216,327 | | | 20,744,816 | |
GuideStone Equity Index Fund (GS4 Class)¥ | | | 2,661,220 | | | 38,614,305 | |
GuideStone Value Equity Fund (GS4 Class)¥ | | | 14,010,562 | | | 175,692,447 | |
GuideStone Growth Equity Fund (GS4 Class)¥ | | | 11,177,238 | | | 177,494,545 | |
GuideStone Small Cap Equity Fund (GS4 Class)¥ | | | 3,860,484 | | | 43,893,701 | |
GuideStone International Equity Fund (GS4 Class)¥ | | | 15,168,307 | | | 188,693,735 | |
| | | | | | | |
Total Mutual Funds
(Cost $886,651,547) | | | | | | 835,391,685 | |
| | | | | | | |
| | |
| | | Par | | | |
U.S. TREASURY OBLIGATIONS — 0.7% | | | | | | | |
U.S. Treasury Bill | | | | | | | |
0.11%, 05/06/10‡‡ | | $ | 1,385,000 | | | 1,384,521 | |
U.S. Treasury Note | | | | | | | |
4.25%, 11/15/14 | | | 3,935,000 | | | 4,239,966 | |
| | | | | | | |
Total U.S. Treasury Obligations
(Cost $5,624,293) | | | | | | 5,624,487 | |
| | | | | | | |
TOTAL INVESTMENTS — 100.0%
(Cost $892,275,840) | | | | | | 841,016,172 | |
Liabilities in Excess of Other Assets — 0.0% | | | | | | (205,838 | ) |
| | | | | | | |
NET ASSETS — 100.0% | | | | | $ | 840,810,334 | |
| | | | | | | |
Please see abbreviation and footnote definitions on page 180.
PORTFOLIO SUMMARY (based on net assets)
| | |
| | | % |
Domestic Equity Funds | | 51.8 |
Bond Funds | | 23.7 |
International Equity Fund | | 22.4 |
Futures Contracts | | 1.5 |
Money Market Fund | | 1.4 |
U.S. Treasury Obligations | | 0.7 |
| | |
| | 101.5 |
| | |
FAS 157 DISCLOSURE
The following is a summary of the inputs used, as of December 31, 2009, in valuing the Fund’s investments carried at fair value:
| | | | | | |
Valuation Inputs | | Investments
in
Securities | | Other
Financial
Instruments*** |
Level 1 — Quoted Prices | | | | | | |
Futures Contracts | | $ | — | | $ | 122,434 |
Mutual Funds | | | 835,391,685 | | | — |
Level 2 — Other Significant Observable Inputs | | | | | | |
U.S. Treasury Obligations | | | 5,624,487 | | | — |
Level 3 — Significant Unobservable Inputs | | | — | | �� | — |
| | | | | | |
Total | | $ | 841,016,172 | | $ | 122,434 |
| | | | | | |
| *** | Other financial instruments are derivative instruments not reflected in the Schedule of Investments, such as futures, forwards and swap contracts, which are valued at the unrealized appreciation (depreciation) on the investment. Details of these investments can be found in the Notes to Financial Statements. |
See Notes to Financial Statements.
39
Aggressive Allocation Fund
The Fund, through investments in the underlying Select Funds, combines a greater percentage of exposure to U.S. equity securities with a smaller percentage to non-U.S. equity securities. The Fund has a target of, but is not limited to, an asset allocation of 75% U.S. Equity Select Funds and 25% Non-U.S. Select Funds.
Please see page 42 for information regarding specific portfolio allocations. Portfolio holdings are subject to change at any time.
The Fund is a fund-of-funds, and its performance is based on the performance of the underlying Select Funds. The Fund generated a strong return of 30.82% during 2009, benefiting from the double digit returns experienced by each of the underlying Select Funds during the year. During the first quarter, the Fund’s absolute returns were negative due to the harmful repercussions of the financial crisis and economic recession, which led to very difficult returns in the domestic and non-U.S. equity markets. With the aid of government programs, aggressive monetary policy and prospects for an improved economic environment, the capital markets improved after bottoming in early March. All asset classes rebounded strongly as investors became less risk averse, willing to deploy assets into equities securities. Given the strong rebound in the capital markets, the Fund posted positive absolute returns during the second, third and fourth quarters. The Fund’s absolute returns were most positively influenced by its exposure to the Growth Equity Fund, the International Equity Fund and the Value Equity Fund.
The Fund underperformed its composite benchmark during the year by 1.43%. The International Equity Fund was the primary contributor to the Fund’s absolute return but also served as the key driver in the Fund’s relative underperformance during the year. The Fund’s relative performance was positively impacted by exposure to certain U.S. Equity Select Funds, most notably the Value Equity Fund and the Growth Equity Fund.
The Fund attempts to achieve its objective by investing in the GuideStone Select Funds. By investing in the Fund you will also incur the expenses and risks of the underlying Select Funds. The principal risks of the Funds will change depending on the asset mix of the Select Funds in which they invest. You may directly invest in the Select Funds. The Funds’ value will go up and down in response to changes in the share prices of the investments that they own. It is possible to lose money by investing in the Fund.
40
Aggressive Allocation Fund
| | | | | | |
Average Annual Total Returns as of 12/31/09 | |
| | | GS4 Class* | | | Benchmark** | |
One Year | | 30.82 | % | | 32.25 | % |
Five Year | | 0.53 | % | | 2.05 | % |
Since Inception | | 2.35 | % | | 3.29 | % |
Inception Date | | 08/27/01 | | | | |
Total Fund Operating Expenses (June 25, 2009 Prospectus)(1) | | 1.05 | % | | | |
| (1) | The Fund’s shareholders indirectly bear the expenses of the GS4 Class shares of the Select Funds in which the Fund invests. Current information regarding the Fund’s Operating Expenses can be found in the Financial Highlights. |
The performance data quoted represents past performance and does not guarantee future results. Current performance may be lower or higher. Performance data current to the most recent month-end may be obtained at www.GuideStoneFunds.org. The investment return and principal value of an investment will fluctuate so that shares, when redeemed, may be worth more or less than their original cost.
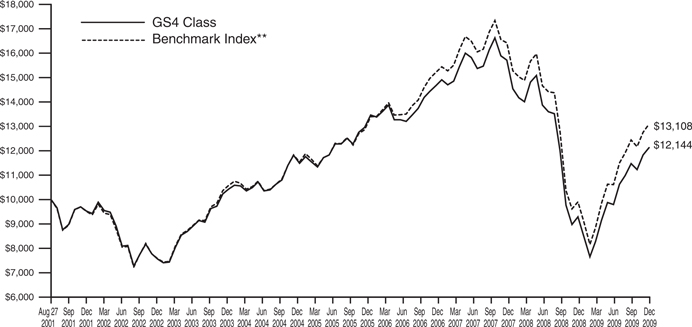
The graph compares the results of a hypothetical $10,000 investment in the GS4 Class of the Fund since August 27, 2001 (commencement of operations), with all dividends and capital gains reinvested, with the Fund’s weighted composite benchmark index.
| * | These returns reflect expense waivers by the Fund’s investment adviser. Without these waivers, returns would have been lower. Returns shown do not reflect the deduction of taxes that a shareholder would pay on Fund distributions or the redemption of Fund shares. |
| ** | Represents a composite index consisting of the Russell 3000® Index and the MSCI ACWI (All Country World Index) Ex-U.S. Index, weighted 70% and 30%, respectively. |
The Russell 3000® Index measures the performance of the 3,000 largest U.S. companies based on total market capitalization, which represents approximately 98% of the investable U.S. equity market.
The MSCI ACWI (All Country World Index) Ex-U.S. Index is a free float-adjusted market capitalization index that is designed to measure equity market performance in the global developed (Ex-U.S.) and emerging markets.
Unlike a mutual fund, the performance of an index assumes no taxes, transaction costs, management fees or other expenses.
41
| | |
| AGGRESSIVE ALLOCATION FUND | | |
| SCHEDULE OF INVESTMENTS | | December 31, 2009 |
| | | | | | | |
| | | Shares | | Value | |
MUTUAL FUNDS — 99.8% | | | | | | | |
GuideStone Money Market Fund (GS4 Class)¥ | | | 12,186,651 | | $ | 12,186,651 | |
GuideStone Equity Index Fund (GS4 Class)¥ | | | 3,086,370 | | | 44,783,229 | |
GuideStone Value Equity Fund (GS4 Class)¥ | | | 15,993,558 | | | 200,559,218 | |
GuideStone Growth Equity Fund (GS4 Class)¥ | | | 12,849,864 | | | 204,055,846 | |
GuideStone Small Cap Equity Fund (GS4 Class)¥ | | | 4,463,398 | | | 50,748,839 | |
GuideStone International Equity Fund (GS4 Class)¥ | | | 17,389,820 | | | 216,329,360 | |
| | | | | | | |
Total Mutual Funds
(Cost $806,935,536) | | | | | | 728,663,143 | |
| | | | | | | |
| | |
| | | Par | | | |
U.S. TREASURY OBLIGATION — 0.2% | | | | | | | |
U.S. Treasury Bill | | | | | | | |
0.11%, 05/06/10‡‡ | | | | | | | |
(Cost $1,434,452) | | $ | 1,435,000 | | | 1,434,504 | |
| | | | | | | |
TOTAL INVESTMENTS — 100.0%
(Cost $808,369,988) | | | | | | 730,097,647 | |
Liabilities in Excess of Other Assets — 0.0% | | | | | | (363,261 | ) |
| | | | | | | |
NET ASSETS — 100.0% | | | | | $ | 729,734,386 | |
| | | | | | | |
Please see abbreviation and footnote definitions on page 180.
PORTFOLIO SUMMARY (based on net assets)
| | |
| | | % |
Domestic Equity Funds | | 68.5 |
International Equity Fund | | 29.6 |
Futures Contracts | | 1.8 |
Money Market Fund | | 1.7 |
U.S. Treasury Obligation | | 0.2 |
| | |
| | 101.8 |
| | |
FAS 157 DISCLOSURE
The following is a summary of the inputs used, as of December 31, 2009, in valuing the Fund’s investments carried at fair value:
| | | | | | |
Valuation Inputs | | Investments
in
Securities | | Other
Financial
Instruments*** |
Level 1 — Quoted Prices | | | | | | |
Futures Contracts | | $ | — | | $ | 192,130 |
Mutual Funds | | | 728,663,143 | | | — |
Level 2 — Other Significant Observable Inputs | | | | | | |
U.S. Treasury Obligation | | | 1,434,504 | | | — |
Level 3 — Significant Unobservable Inputs | | | — | | | — |
| | | | | | |
Total | | $ | 730,097,647 | | $ | 192,130 |
| | | | | | |
| *** | Other financial instruments are derivative instruments not reflected in the Schedule of Investments, such as futures, forwards and swap contracts, which are valued at the unrealized appreciation (depreciation) on the investment. Details of these investments can be found in the Notes to Financial Statements. |
See Notes to Financial Statements.
42
| | |
| STATEMENTS OF ASSETS AND LIABILITIES | | December 31, 2009 |
| | | | | | | | | | | | | | | | |
| | | Conservative
Allocation Fund | | | Balanced
Allocation Fund | | | Growth
Allocation Fund | | | Aggressive
Allocation Fund | |
Assets | | | | | | | | | | | | | | | | |
Investments in securities of affiliated issuers, at value | | $ | 279,313,351 | | | $ | 1,117,540,212 | | | $ | 835,391,685 | | | $ | 728,663,143 | |
Investments in securities of unaffiliated issuers, at value | | | 5,236,616 | | | | 15,742,222 | | | | 5,624,487 | | | | 1,434,504 | |
| | | | | | | | | | | | | | | | |
Total investments (1) | | | 284,549,967 | | | | 1,133,282,434 | | | | 841,016,172 | | | | 730,097,647 | |
Receivables: | | | | | | | | | | | | | | | | |
Dividends | | | 16 | | | | 107 | | | | 93 | | | | 104 | |
Interest | | | 54,441 | | | | 75,829 | | | | 22,399 | | | | — | |
Investment securities sold | | | — | | | | 14,366,025 | | | | 4,241,302 | | | | — | |
Fund shares sold | | | 244,464 | | | | 160,027 | | | | 85,794 | | | | 5,840 | |
Prepaid expenses and other assets | | | 19,276 | | | | 26,457 | | | | 20,967 | | | | 20,241 | |
| | | | | | | | | | | | | | | | |
Total Assets | | | 284,868,164 | | | | 1,147,910,879 | | | | 845,386,727 | | | | 730,123,832 | |
| | | | | | | | | | | | | | | | |
Liabilities | | | | | | | | | | | | | | | | |
Payables: | | | | | | | | | | | | | | | | |
Investment securities purchased | | | 5,361 | | | | 14,436,136 | | | | 4,262,921 | | | | — | |
Fund shares redeemed | | | 41,825 | | | | 174,279 | | | | 57,940 | | | | 133,496 | |
Variation margin | | | 14,250 | | | | 142,500 | | | | 128,250 | | | | 133,950 | |
Accrued expenses: | | | | | | | | | | | | | | | | |
Investment Advisory fees | | | 21,356 | | | | 98,157 | | | | 72,551 | | | | 60,041 | |
Distribution (12b-1) fees | | | 83 | | | | 86 | | | | 71 | | | | 112 | |
Other expenses | | | 34,798 | | | | 68,415 | | | | 54,660 | | | | 61,847 | |
| | | | | | | | | | | | | | | | |
Total Liabilities | | | 117,673 | | | | 14,919,573 | | | | 4,576,393 | | | | 389,446 | |
| | | | | | | | | | | | | | | | |
Net Assets | | $ | 284,750,491 | | | $ | 1,132,991,306 | | | $ | 840,810,334 | | | $ | 729,734,386 | |
| | | | | | | | | | | | | | | | |
Net Assets Consist of: | | | | | | | | | | | | | | | | |
Paid-in-capital | | $ | 278,613,596 | | | $ | 1,168,654,024 | | | $ | 892,391,674 | | | $ | 806,532,600 | |
Undistributed net investment income | | | — | | | | 4,110,528 | | | | 3,813,544 | | | | 4,562 | |
Accumulated net realized gain (loss) on investments and futures transactions | | | (1,195,895 | ) | | | (6,961,026 | ) | | | (4,257,650 | ) | | | 1,277,435 | |
Net unrealized appreciation (depreciation) on investments and futures | | | 7,332,790 | | | | (32,812,220 | ) | | | (51,137,234 | ) | | | (78,080,211 | ) |
| | | | | | | | | | | | | | | | |
Net Assets | | $ | 284,750,491 | | | $ | 1,132,991,306 | | | $ | 840,810,334 | | | $ | 729,734,386 | |
| | | | | | | | | | | | | | | | |
Net Asset Value: | | | | | | | | | | | | | | | | |
$0.001 par value, unlimited shares authorized | | | | | | | | | | | | | | | | |
Net assets applicable to the GS4 Class | | $ | 284,750,491 | | | $ | 1,132,991,306 | | | $ | 840,810,334 | | | $ | 729,734,386 | |
| | | | | | | | | | | | | | | | |
GS4 shares outstanding | | | 25,007,841 | | | | 101,687,287 | | | | 75,676,485 | | | | 69,995,734 | |
| | | | | | | | | | | | | | | | |
Net asset value, offering and redemption price per GS4 share | | $ | 11.39 | | | $ | 11.14 | | | $ | 11.11 | | | $ | 10.43 | |
| | | | | | | | | | | | | | | | |
| |
(1) Investments in securities of affiliated issuers, at cost | | $ | 271,985,242 | | | $ | 1,150,422,471 | | | $ | 886,651,547 | | | $ | 806,935,536 | |
Investments in securities of unaffiliated issuers, at cost | | | 5,252,064 | | | | 15,741,683 | | | | 5,624,293 | | | | 1,434,452 | |
| | | | | | | | | | | | | | | | |
Total investments at cost | | $ | 277,237,306 | | | $ | 1,166,164,154 | | | $ | 892,275,840 | | | $ | 808,369,988 | |
| | | | | | | | | | | | | | | | |
See Notes to Financial Statements.
43
| | |
| STATEMENTS OF OPERATIONS | | For the Year Ended December 31, 2009 |
| | | | | | | | | | | | | | | | |
| | | Conservative
Allocation Fund | | | Balanced
Allocation Fund | | | Growth
Allocation Fund | | | Aggressive
Allocation Fund | |
Investment Income | | | | | | | | | | | | | | | | |
Income dividends received from affiliated funds | | $ | 6,543,182 | | | $ | 26,384,555 | | | $ | 14,295,831 | | | $ | 7,895,202 | |
Interest | | | 35,569 | | | | 235,442 | | | | 87,795 | | | | 2,851 | |
| | | | | | | | | | | | | | | | |
Total Investment Income | | | 6,578,751 | | | | 26,619,997 | | | | 14,383,626 | | | | 7,898,053 | |
| | | | | | | | | | | | | | | | |
Expenses | | | | | | | | | | | | | | | | |
Investment advisory fees | | | 265,596 | | | | 1,001,628 | | | | 735,409 | | | | 624,447 | |
Transfer agent fees: | | | | | | | | | | | | | | | | |
GS4 shares | | | 25,906 | | | | 50,511 | | | | 38,889 | | | | 36,695 | |
GS6 shares | | | 2,418 | | | | 2,427 | | | | 2,417 | | | | 2,427 | |
Custodian fees | | | 10,294 | | | | 20,231 | | | | 16,043 | | | | 25,639 | |
Distribution (12b-1) fees: | | | | | | | | | | | | | | | | |
GS6 shares | | | 3,587 | | | | 5,188 | | | | 3,296 | | | | 3,629 | |
Shareholder servicing fees: | | | | | | | | | | | | | | | | |
GS6 shares | | | 3,942 | | | | 5,708 | | | | 3,626 | | | | 3,995 | |
Accounting and administration fees | | | 24,824 | | | | 71,159 | | | | 54,225 | | | | 46,821 | |
Professional fees | | | 40,734 | | | | 40,761 | | | | 40,768 | | | | 40,760 | |
Blue sky fees: | | | | | | | | | | | | | | | | |
GS4 shares | | | 12,939 | | | | 8,961 | | | | 14,260 | | | | 12,910 | |
GS6 shares | | | 250 | | | | 185 | | | | 202 | | | | 212 | |
Shareholder reporting fees: | | | | | | | | | | | | | | | | |
GS4 shares | | | 13,971 | | | | 51,318 | | | | 39,163 | | | | 37,396 | |
GS6 shares | | | 73 | | | | 73 | | | | 73 | | | | 85 | |
Trustee expenses | | | 3,003 | | | | 10,407 | | | | 7,380 | | | | 5,988 | |
Line of credit facility fees | | | 3,877 | | | | 13,929 | | | | 10,021 | | | | 8,307 | |
Other expenses | | | 8,662 | | | | 9,142 | | | | 8,909 | | | | 6,924 | |
| | | | | | | | | | | | | | | | |
Total Expenses | | | 420,076 | | | | 1,291,628 | | | | 974,681 | | | | 856,235 | |
Expenses waived/reimbursed(1) | | | (93,258 | ) | | | (97,716 | ) | | | (102,990 | ) | | | (116,674 | ) |
| | | | | | | | | | | | | | | | |
Net Expenses | | | 326,818 | | | | 1,193,912 | | | | 871,691 | | | | 739,561 | |
| | | | | | | | | | | | | | | | |
Net Investment Income | | | 6,251,933 | | | | 25,426,085 | | | | 13,511,935 | | | | 7,158,492 | |
| | | | | | | | | | | | | | | | |
Realized and Unrealized Loss | | | | | | | | | | | | | | | | |
Capital gain distributions received from affiliated funds | | | 42,931 | | | | 5,178,766 | | | | 1,868,416 | | | | 1,763 | |
Net realized gain (loss) on investment securities of affiliated issuers | | | 7,883,477 | | | | (6,727,201 | ) | | | (5,540,630 | ) | | | (1,210,958 | ) |
Net realized gain (loss) on investment securities of unaffiliated issuers | | | 20,637 | | | | (262,573 | ) | | | (128,614 | ) | | | 58 | |
Net realized gain (loss) on futures transactions | | | (404,312 | ) | | | 2,350,161 | | | | 2,142,171 | | | | 3,589,974 | |
| | | | | | | | | | | | | | | | |
Net realized gain (loss) | | | 7,542,733 | | | | 539,153 | | | | (1,658,657 | ) | | | 2,380,837 | |
| | | | | | | | | | | | | | | | |
Change in unrealized appreciation on investment securities of affiliated issuers | | | 26,370,106 | | | | 196,639,052 | | | | 169,721,715 | | | | 161,665,025 | |
Change in unrealized appreciation (depreciation) on investment securities of unaffiliated issuers | | | (15,511 | ) | | | 324 | | | | 4 | | | | (109 | ) |
Change in unrealized appreciation (depreciation) on futures | | | (6,377 | ) | | | 53,703 | | | | (25,118 | ) | | | 54,701 | |
| | | | | | | | | | | | | | | | |
Net change in unrealized appreciation (depreciation) | | | 26,348,218 | | | | 196,693,079 | | | | 169,696,601 | | | | 161,719,617 | |
| | | | | | | | | | | | | | | | |
Net Realized and Unrealized Gain | | | 33,890,951 | | | | 197,232,232 | | | | 168,037,944 | | | | 164,100,454 | |
| | | | | | | | | | | | | | | | |
Net Increase in Net Assets Resulting from Operations | | $ | 40,142,884 | | | $ | 222,658,317 | | | $ | 181,549,879 | | | $ | 171,258,946 | |
| | | | | | | | | | | | | | | | |
| (1) | See Note 3a and 3c in Notes to Financial Statements. |
See Notes to Financial Statements.
44
(This page intentionally left blank)
45
STATEMENTS OF CHANGES IN NET ASSETS
| | | | | | | | | | | | | | | | |
| | | Conservative Allocation Fund | | | Balanced Allocation Fund | |
| | | For the Year Ended | | | For the Year Ended | |
| | | 12/31/09 | | | 12/31/08 | | | 12/31/09 | | | 12/31/08 | |
Operations: | | | | | | | | | | | | | | | | |
Net investment income | | $ | 6,251,933 | | | $ | 10,269,108 | | | $ | 25,426,085 | | | $ | 35,620,140 | |
Net realized gain (loss) on investment securities and futures transactions | | | 7,542,733 | | | | 8,824,621 | | | | 539,153 | | | | 61,327,554 | |
Net change in unrealized appreciation (depreciation) on investment securities and futures | | | 26,348,218 | | | | (60,614,730 | ) | | | 196,693,079 | | | | (415,693,032 | ) |
| | | | | | | | | | | | | | | | |
Net increase (decrease) in net assets resulting from operations | | | 40,142,884 | | | | (41,521,001 | ) | | | 222,658,317 | | | | (318,745,338 | ) |
| | | | | | | | | | | | | | | | |
Dividends and Distributions to Shareholders: | | | | | | | | | | | | | | | | |
Dividends from net investment income(1) | | | | | | | | | | | | | | | | |
GS4 shares | | | (6,154,064 | ) | | | (9,693,871 | ) | | | (26,203,247 | ) | | | (40,400,725 | ) |
GS6 shares | | | (129,157 | ) | | | (568,343 | ) | | | (188,348 | ) | | | (1,249,223 | ) |
Distributions from net realized capital gains | | | | | | | | | | | | | | | | |
GS4 shares | | | (9,032,931 | ) | | | (11,948,499 | ) | | | (6,561,722 | ) | | | (87,603,110 | ) |
GS6 shares | | | (78,277 | ) | | | (724,405 | ) | | | (235,775 | ) | | | (2,600,874 | ) |
| | | | | | | | | | | | | | | | |
Total dividends and distributions | | | (15,394,429 | ) | | | (22,935,118 | ) | | | (33,189,092 | ) | | | (131,853,932 | ) |
| | | | | | | | | | | | | | | | |
Capital Share Transactions: | | | | | | | | | | | | | | | | |
Proceeds from shares sold | | | | | | | | | | | | | | | | |
GS4 shares | | | 37,517,620 | | | | 47,483,596 | | | | 66,019,986 | | | | 49,002,929 | |
GS6 shares | | | 1,736,060 | | | | 10,824,099 | | | | 712,549 | | | | 2,037,778 | |
Proceeds from exchange of GS6 shares for GS4 shares(2) | | | | | | | | | | | | | | | | |
GS4 shares | | | 11,903,681 | | | | — | | | | 16,986,754 | | | | — | |
GS6 shares | | | (11,903,681 | ) | | | — | | | | (16,986,754 | ) | | | — | |
Reinvestment of dividends and distributions | | | | | | | | | | | | | | | | |
GS4 shares | | | 15,174,582 | | | | 21,623,391 | | | | 32,760,925 | | | | 127,987,706 | |
GS6 shares | | | 207,434 | | | | 1,292,748 | | | | 424,123 | | | | 3,850,097 | |
| | | | | | | | | | | | | | | | |
Total proceeds from shares sold and reinvested | | | 54,635,696 | | | | 81,223,834 | | | | 99,917,583 | | | | 182,878,510 | |
| | | | | | | | | | | | | | | | |
Value of shares redeemed | | | | | | | | | | | | | | | | |
GS4 shares | | | (51,093,327 | ) | | | (74,845,193 | ) | | | (78,208,293 | ) | | | (178,146,050 | ) |
GS6 shares | | | (196,593 | ) | | | (13,199,672 | ) | | | (95,773 | ) | | | (1,652,196 | ) |
| | | | | | | | | | | | | | | | |
Total value of shares redeemed | | | (51,289,920 | ) | | | (88,044,865 | ) | | | (78,304,066 | ) | | | (179,798,246 | ) |
| | | | | | | | | | | | | | | | |
Net increase (decrease) from capital share transactions(3) | | | 3,345,776 | | | | (6,821,031 | ) | | | 21,613,517 | | | | 3,080,264 | |
| | | | | | | | | | | | | | | | |
Total increase (decrease) in net assets | | | 28,094,231 | | | | (71,277,150 | ) | | | 211,082,742 | | | | (447,519,006 | ) |
| | | | | | | | | | | | | | | | |
Net Assets: | | | | | | | | | | | | | | | | |
Beginning of Year | | | 256,656,260 | | | | 327,933,410 | | | | 921,908,564 | | | | 1,369,427,570 | |
| | | | | | | | | | | | | | | | |
End of Year* | | $ | 284,750,491 | | | $ | 256,656,260 | | | $ | 1,132,991,306 | | | $ | 921,908,564 | |
| | | | | | | | | | | | | | | | |
* Including undistributed net investment income | | $ | — | | | $ | 6,254 | | | $ | 4,110,528 | | | $ | — | |
| | | | | | | | | | | | | | | | |
| (1) | Includes dividends paid from the short-term portion of capital gain distributions received from affiliated funds. |
| (2) | See Note 1 in Notes to Financial Statements. |
| (3) | See Note 7 in Notes to Financial Statements. |
See Notes to Financial Statements.
46
| | | | | | | | | | | | | | |
| Growth Allocation Fund | | | Aggressive Allocation Fund | |
| For the Year Ended | | | For the Year Ended | |
| 12/31/09 | | | 12/31/08 | | | 12/31/09 | | | 12/31/08 | |
| | | | | | | | | | | | | | |
| $ | 13,511,935 | | | $ | 19,512,882 | | | $ | 7,158,492 | | | $ | 9,729,470 | |
| | (1,658,657 | ) | | | 33,387,179 | | | | 2,380,837 | | | | 25,916,936 | |
| | 169,696,601 | | | | (402,388,211 | ) | | | 161,719,617 | | | | (436,941,190 | ) |
| | | | | | | | | | | | | | | |
| | 181,549,879 | | | | (349,488,150 | ) | | | 171,258,946 | | | | (401,294,784 | ) |
| | | | | | | | | | | | | | | |
| | | | | | | | | | | | | | |
| | | | | | | | | | | | | | |
| | (11,476,397 | ) | | | (21,309,114 | ) | | | (7,153,930 | ) | | | (9,439,716 | ) |
| | (48,836 | ) | | | (523,396 | ) | | | — | | | | (296,932 | ) |
| | | | | | | | | | | | | | |
| | (3,758,322 | ) | | | (71,442,300 | ) | | | (5,357,679 | ) | | | (74,709,707 | ) |
| | (114,025 | ) | | | (1,729,302 | ) | | | (175,394 | ) | | | (2,468,492 | ) |
| | | | | | | | | | | | | | | |
| | (15,397,580 | ) | | | (95,004,112 | ) | | | (12,687,003 | ) | | | (86,914,847 | ) |
| | | | | | | | | | | | | | | |
| | | | | | | | | | | | | | |
| | | | | | | | | | | | | | |
| | 38,935,556 | | | | 39,141,307 | | | | 41,717,915 | | | | 39,353,913 | |
| | 1,111,513 | | | | 2,441,653 | | | | 495,847 | | | | 1,160,837 | |
| | | | | | | | | | | | | | |
| | 11,004,801 | | | | — | | | | 12,055,110 | | | | — | |
| | (11,004,801 | ) | | | — | | | | (12,055,110 | ) | | | — | |
| | | | | | | | | | | | | | |
| | 15,233,766 | | | | 92,746,748 | | | | 12,511,448 | | | | 84,148,111 | |
| | 162,861 | | | | 2,252,698 | | | | 175,394 | | | | 2,765,424 | |
| | | | | | | | | | | | | | | |
| | 55,443,696 | | | | 136,582,406 | | | | 54,900,604 | | | | 127,428,285 | |
| | | | | | | | | | | | | | | |
| | | | | | | | | | | | | | |
| | (58,417,111 | ) | | | (122,227,222 | ) | | | (42,757,835 | ) | | | (100,170,087 | ) |
| | (245,720 | ) | | | (1,641,495 | ) | | | (156,279 | ) | | | (1,067,413 | ) |
| | | | | | | | | | | | | | | |
| | (58,662,831 | ) | | | (123,868,717 | ) | | | (42,914,114 | ) | | | (101,237,500 | ) |
| | | | | | | | | | | | | | | |
| | (3,219,135 | ) | | | 12,713,689 | | | | 11,986,490 | | | | 26,190,785 | |
| | | | | | | | | | | | | | | |
| | 162,933,164 | | | | (431,778,573 | ) | | | 170,558,433 | | | | (462,018,846 | ) |
| | | | | | | | | | | | | | | |
| | | | | | | | | | | | | | |
| | 677,877,170 | | | | 1,109,655,743 | | | | 559,175,953 | | | | 1,021,194,799 | |
| | | | | | | | | | | | | | | |
| $ | 840,810,334 | | | $ | 677,877,170 | | | $ | 729,734,386 | | | $ | 559,175,953 | |
| | | | | | | | | | | | | | | |
| $ | 3,813,544 | | | $ | — | | | $ | 4,562 | | | $ | — | |
| | | | | | | | | | | | | | | |
See Notes to Financial Statements.
47
FINANCIAL HIGHLIGHTS
| | | | | | | | | | | | | | | | | | | | | | | | | | | | | | | | | | | | | | | | | | | | |
For a Share Outstanding For the Years Ended December 31, unless otherwise indicated | | Ratios to Average Net Assets | | | | |
| | | Net Asset
Value,
Beginning
of Year | | Net
Investment
Income (1) | | | Capital Gain
Distributions
Received
from
Affiliated
Funds | | | Realized
and
Unrealized
Gain
(Loss) on
Investments | | | Dividends
from Net
Investment
Income (2) | | | Distributions
from Net
Realized
Capital
Gains | | | Net Asset
Value,
End of
Year | | Total
Return | | | Net Assets,
End of Year
(000) | | Expenses,
Net(3) | | | Expenses,
Gross(3)(4) | | | Investment
Income,
Net
(1)(5) | | | Portfolio
Turnover
Rate | |
Conservative Allocation Fund | |
|
GS4 Class | |
2009 | | $ | 10.33 | | $ | 0.26 | # | | $ | — | † | | $ | 1.44 | | | $ | (0.26 | ) | | $ | (0.38 | ) | | $ | 11.39 | | 16.58 | % | | $ | 284,750 | | 0.12 | % | | 0.16 | % | | 2.37 | % | | 32 | % |
2008 | | | 13.02 | | | 0.42 | # | | | 0.03 | | | | (2.17 | ) | | | (0.42 | ) | | | (0.55 | ) | | | 10.33 | | (13.11 | ) | | | 246,617 | | 0.12 | | | 0.15 | | | 3.36 | | | 17 | |
2007 | | | 13.15 | | | 0.43 | # | | | 0.21 | | | | 0.21 | | | | (0.44 | ) | | | (0.54 | ) | | | 13.02 | | 6.48 | | | | 313,829 | | 0.13 | | | 0.16 | | | 3.13 | | | 13 | |
2006 | | | 12.94 | | | 0.40 | # | | | 0.17 | | | | 0.20 | | | | (0.41 | ) | | | (0.15 | ) | | | 13.15 | | 5.99 | | | | 308,802 | | 0.13 | | | 0.18 | | | 3.08 | | | 9 | |
2005 | | | 13.18 | | | 0.33 | # | | | 0.09 | | | | 0.02 | | | | (0.32 | ) | | | (0.36 | ) | | | 12.94 | | 3.31 | | | | 280,256 | | 0.13 | | | 0.19 | | | 2.51 | | | 20 | |
|
Balanced Allocation Fund | |
|
GS4 Class | |
2009 | | $ | 9.20 | | $ | 0.26 | # | | $ | 0.05 | | | $ | 1.97 | | | $ | (0.27 | ) | | $ | (0.07 | ) | | $ | 11.14 | | 25.05 | % | | $ | 1,132,991 | | 0.12 | % | | 0.13 | % | | 2.58 | % | | 19 | % |
2008 | | | 14.13 | | | 0.39 | # | | | 0.13 | | | | (3.99 | ) | | | (0.43 | ) | | | (1.03 | ) | | | 9.20 | | (24.41 | ) | | | 905,743 | | 0.12 | | | 0.13 | | | 3.05 | | | 19 | |
2007 | | | 14.61 | | | 0.41 | # | | | 0.48 | | | | 0.16 | | | | (0.48 | ) | | | (1.05 | ) | | | 14.13 | | 7.16 | | | | 1,348,204 | | 0.13 | | | 0.13 | | | 2.68 | | | 7 | |
2006 | | | 14.20 | | | 0.36 | # | | | 0.39 | | | | 0.50 | | | | (0.40 | ) | | | (0.44 | ) | | | 14.61 | | 8.78 | | | | 1,400,001 | | 0.13 | | | 0.14 | | | 2.44 | | | 7 | |
2005 | | | 14.27 | | | 0.32 | # | | | 0.21 | | | | 0.36 | | | | (0.36 | ) | | | (0.60 | ) | | | 14.20 | | 6.24 | | | | 1,273,855 | | 0.13 | | | 0.14 | | | 2.18 | | | 10 | |
|
Growth Allocation Fund | |
|
GS4 Class | |
2009 | | $ | 8.86 | | $ | 0.18 | # | | $ | 0.02 | | | $ | 2.25 | | | $ | (0.15 | ) | | $ | (0.05 | ) | | $ | 11.11 | | 27.96 | % | | $ | 840,810 | | 0.12 | % | | 0.13 | % | | 1.88 | % | | 11 | % |
2008 | | | 15.34 | | | 0.28 | # | | | 0.13 | | | | (5.50 | ) | | | (0.29 | ) | | | (1.10 | ) | | | 8.86 | | (32.98 | ) | | | 667,769 | | 0.12 | | | 0.13 | | | 2.15 | | | 13 | |
2007 | | | 16.05 | | | 0.30 | # | | | 0.78 | | | | 0.07 | | | | (0.43 | ) | | | (1.43 | ) | | | 15.34 | | 7.16 | | | | 1,095,092 | | 0.13 | | | 0.13 | | | 1.80 | | | 5 | |
2006 | | | 15.45 | | | 0.27 | # | | | 0.63 | | | | 0.81 | | | | (0.35 | ) | | | (0.76 | ) | | | 16.05 | | 11.03 | | | | 1,137,039 | | 0.13 | | | 0.14 | | | 1.66 | | | 7 | |
2005 | | | 15.03 | | | 0.23 | # | | | 0.31 | | | | 0.68 | | | | (0.31 | ) | | | (0.49 | ) | | | 15.45 | | 8.09 | | | | 1,046,061 | | 0.13 | | | 0.14 | | | 1.50 | | | 5 | |
|
Aggressive Allocation Fund | |
|
GS4 Class | |
2009 | | $ | 8.13 | | $ | 0.10 | # | | $ | — | † | | $ | 2.38 | | | $ | (0.10 | ) | | $ | (0.08 | ) | | $ | 10.43 | | 30.82 | % | | $ | 729,734 | | 0.12 | % | | 0.14 | % | | 1.17 | % | | 3 | % |
2008 | | | 16.31 | | | 0.16 | # | | | 0.12 | | | | (7.01 | ) | | | (0.14 | ) | | | (1.31 | ) | | | 8.13 | | (41.05 | ) | | | 547,313 | | 0.12 | | | 0.13 | | | 1.21 | | | 7 | |
2007 | | | 17.23 | | | 0.17 | # | | | 1.11 | | | | (0.04 | ) | | | (0.36 | ) | | | (1.80 | ) | | | 16.31 | | 7.17 | | | | 1,000,850 | | 0.13 | | | 0.13 | | | 0.94 | | | 2 | |
2006 | | | 16.28 | | | 0.15 | # | | | 0.88 | | | | 1.13 | | | | (0.28 | ) | | | (0.93 | ) | | | 17.23 | | 13.20 | | | | 1,031,999 | | 0.13 | | | 0.14 | | | 0.90 | | | 4 | |
2005 | | | 15.55 | | | 0.13 | # | | | 0.41 | | | | 0.98 | | | | (0.23 | ) | | | (0.56 | ) | | | 16.28 | | 9.75 | | | | 940,769 | | 0.13 | | | 0.14 | | | 0.85 | | | 4 | |
| † | Amount represents less than $0.005 per share. |
| # | Calculated using the average shares outstanding method. |
| (1) | Recognition of net investment income by the Fund is affected by the timing of the declaration of dividends by the underlying investment companies in which the Fund invests. |
| (2) | Includes dividends paid from the short-term portion of capital gain distributions received from affiliated Funds. (3) Does not include expenses of the investment companies in which the Fund invests. |
| (4) | The ratio excludes expenses waived/reimbursed net of amount recaptured. |
| (5) | The ratio includes expenses waived/reimbursed net of amount recaptured and fees paid indirectly, where applicable; if expenses waived/reimbursed net of amount recaptured and fees paid indirectly were excluded, the ratio would have been lower than the ratio shown. |
See Notes to Financial Statements.
48
Conservative Allocation Fund I
The Fund, through investments in the underlying Select Funds, combines a greater percentage of exposure to fixed income securities with a smaller percentage to equity securities. The Fund has a target of, but is not limited to, an asset allocation of 75% Fixed Income Select Funds, 19% U.S. Equity Select Funds and 6% Non-U.S. Equity Select Funds.
Please see page 51 for information regarding specific portfolio allocations. Portfolio holdings are subject to change at any time.
The Fund is a fund-of-funds, and its performance is based on the performance of the underlying Select Funds. The Fund generated a strong return of 17.13% during 2009. During the first quarter, the Fund’s absolute performance was dampened by the effects of the financial crisis and economic recession, which led to very difficult returns in the equity markets. With the aid of government programs, aggressive monetary policy and prospects for an improved economic environment, the capital markets improved after bottoming in early March. All asset classes rebounded strongly as investors became less risk averse, willing to deploy assets into both equities and non-U.S. Treasury fixed income securities. Given the rebound in the capital markets, the Fund posted positive absolute returns during the second, third and fourth quarters. The Fund’s absolute returns were most positively influenced by its exposure to the Low-Duration Bond Fund, given its significant target weighting and strong annual return. The International Equity Fund and the Growth Equity Fund were the largest contributors from the Fund’s equity allocation.
The Fund outpaced its composite benchmark during the year by 7.83%, benefitting most notably from its exposure to the fixed income markets. At a target weighting of 60%, the Low-Duration Bond Fund contributed the most to the Fund’s relative excess return. The Low-Duration Bond Fund benefited from sector allocation strategies that provided exposure to non-U.S. Treasury sectors, such as corporate bonds and mortgages. When risk appetite returned and investors were willing to re-enter spread sectors to take advantage of historically attractive valuations, exposure to these sectors allowed the Low-Duration Bond Fund to greatly outperform. The Fund’s relative performance was also positively impacted by exposure to certain U.S. Equity Select Funds, most notably the Value Equity Fund and the Growth Equity Fund.
The Fund attempts to achieve its objective by investing in the GuideStone Select Funds. By investing in the Fund you will also incur the expenses and risks of the underlying Select Funds. The principal risks of the Funds will change depending on the asset mix of the Select Funds in which they invest. You may directly invest in the Select Funds. The Funds’ value will go up and down in response to changes in the share prices of the investments that they own. It is possible to lose money by investing in the Fund.
49
Conservative Allocation Fund I
| | | | | | |
Average Annual Total Returns as of 12/31/09 | |
| | | GS2 Class* | | | Benchmark** | |
One Year | | 17.13 | % | | 9.30 | % |
Five Year | | 3.60 | % | | 4.01 | % |
Since Inception | | 4.18 | % | | 4.49 | % |
Inception Date | | 07/01/03 | | | | |
Total Fund Operating Expenses (June 25, 2009 Prospectus)(1) | | 0.68 | % | | | |
| (1) | The Fund’s shareholders indirectly bear the expenses of the shares of the Select Funds in which the Fund invests. Current information regarding the Fund’s Operating Expenses can be found in the Financial Highlights. |
The performance data quoted represents past performance and does not guarantee future results. Current performance may be lower or higher. Performance data current to the most recent month-end may be obtained at www.GuideStoneFunds.org. The investment return and principal value of an investment will fluctuate so that shares, when redeemed, may be worth more or less than their original cost.
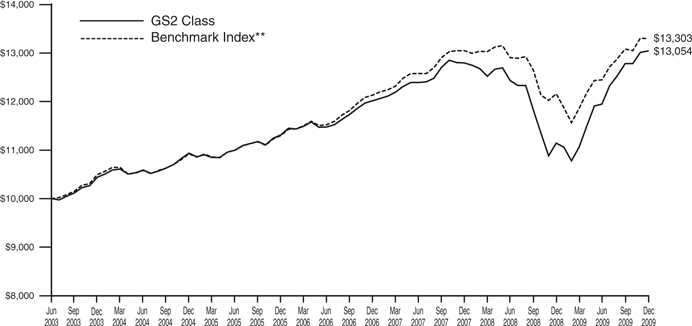
The graph compares the results of a hypothetical $10,000 investment in the GS2 Class of the Fund since July 1, 2003 (commencement of operations), with all dividends and capital gains reinvested, with the Fund’s weighted composite benchmark index.
| * | These returns reflect expense waivers by the Fund’s investment adviser. Without these waivers, returns would have been lower. Returns shown do not reflect the deduction of taxes that a shareholder would pay on Fund distributions or the redemption of Fund shares. |
| ** | Represents a composite index consisting of the Russell 3000® Index, the MSCI ACWI (All Country World Index) Ex-U.S. Index, the Merrill Lynch 1-3 Year Treasury Index and Barclays Capital U.S. TIPS Index, weighted 17.5%, 7.5%, 60% and 15%, respectively. |
The Russell 3000® Index measures the performance of the 3,000 largest U.S. companies based on total market capitalization, which represents approximately 98% of the investable U.S. equity market.
The MSCI ACWI (All Country World Index) Ex-U.S. Index is a free float-adjusted market capitalization index that is designed to measure equity market performance in the global developed (Ex-U.S.) and emerging markets.
The Merrill Lynch 1-3 Year Treasury Index is composed of all U.S. Treasury Notes and Bonds with maturities greater than or equal to one year and less than three years.
The Barclays Capital U.S. TIPS Index measures the performance of the U.S. Treasury Inflation Protected Securities (“TIPS”) market and includes TIPS with one or more years remaining until maturity with total outstanding issue size of $500 million or more.
Unlike a mutual fund, the performance of an index assumes no taxes, transaction costs, management fees or other expenses.
50
| | |
| CONSERVATIVE ALLOCATION FUND I | | |
| SCHEDULE OF INVESTMENTS | | December 31, 2009 |
| | | | | | |
| | | Shares | | Value | |
MUTUAL FUNDS — 100.0% | | | | | | |
GuideStone Money Market Fund (GS2 Class)¥ | | 1,122,056 | | $ | 1,122,056 | |
GuideStone Low-Duration Bond Fund (GS2 Class)¥ | | 4,311,325 | | | 37,508,525 | |
GuideStone Inflation Protected Bond Fund (GS4 Class)¥ | | 900,771 | | | 9,295,960 | |
GuideStone Equity Index Fund (GS2 Class)¥ | | 142,342 | | | 1,105,994 | |
GuideStone Value Equity Fund (GS2 Class)¥ | | 698,986 | | | 4,515,451 | |
GuideStone Growth Equity Fund (GS2 Class)¥ | | 462,994 | | | 4,629,943 | |
GuideStone Small Cap Equity Fund (GS2 Class)¥ | | 151,209 | | | 1,144,652 | |
GuideStone International Equity Fund (GS2 Class)¥ | | 510,108 | | | 4,917,439 | |
| | | | | | |
Total Mutual Funds
(Cost $65,900,917) | | | | | 64,240,020 | |
| | | | | | |
TOTAL INVESTMENTS — 100.0%
(Cost $65,900,917) | | | | | 64,240,020 | |
Liabilities in Excess of Other Assets — 0.0% | | | | | (9,828 | ) |
| | | | | | |
NET ASSETS — 100.0% | | | | $ | 64,230,192 | |
| | | | | | |
Please see abbreviation and footnote definitions on page 180.
PORTFOLIO SUMMARY (based on net assets)
| | |
| | | % |
Bond Funds | | 72.9 |
Domestic Equity Funds | | 17.7 |
International Equity Fund | | 7.7 |
Money Market Fund | | 1.7 |
| | |
| | 100.0 |
| | |
FAS 157 DISCLOSURE
The following is a summary of the inputs used, as of December 31, 2009, in valuing the Fund’s investments carried at fair value:
| | | | | | |
Valuation Inputs | | Investments
in
Securities | | Other
Financial
Instruments*** |
Level 1 — Quoted Prices | | | | | | |
Mutual Funds | | $ | 64,240,020 | | $ | — |
Level 2 — Other Significant Observable Inputs | | | — | | | — |
Level 3 — Significant Unobservable Inputs | | | — | | | — |
| | | | | | |
Total | | $ | 64,240,020 | | $ | — |
| | | | | | |
| *** | Other financial instruments are derivative instruments not reflected in the Schedule of Investments, such as futures, forwards and swap contracts, which are valued at the unrealized appreciation (depreciation) on the investment. Details of these investments can be found in the Notes to Financial Statements. |
See Notes to Financial Statements.
51
Balanced Allocation Fund I
The Fund, through investments in the underlying Select Funds, combines approximately equal percentages of exposure to fixed income securities and equity securities. The Fund has a target of, but is not limited to, an asset allocation of 50% Fixed Income Select Funds, 37% U.S. Equity Select Funds and 13% Non-U.S. Equity Select Funds.
Please see page 54 for information regarding specific portfolio allocations. Portfolio holdings are subject to change at any time.
The Fund is a fund-of-funds, and its performance is based on the performance of the underlying Select Funds. The Fund generated a strong return of 25.28% during 2009, benefiting from the double digit returns experienced by each of the underlying Select Funds during the year. During the first quarter, the Fund’s absolute returns were negative due to the harmful repercussions of the financial crisis and economic recession, which led to very difficult returns in the domestic and non-U.S. equity markets. The Fund’s diversification into fixed income securities (approximately 50% of the Fund’s market value) helped mitigate the effect of strong negative equity returns during the first quarter. With the aid of government programs, aggressive monetary policy and prospects for an improved economic environment, the capital markets improved after bottoming in early March. All asset classes rebounded strongly as investors became less risk averse, willing to deploy assets into both equities and non-U.S. Treasury fixed income securities. Given the strong rebound in the capital markets, the Fund posted positive absolute returns during the second, third and fourth quarters. The Fund’s absolute returns were most positively influenced by its exposure to the Growth Equity Fund, International Equity Fund and the Medium-Duration Bond Fund.
The Fund outpaced its composite benchmark during the year by 6.22%, benefitting most notably from its exposure to the Fixed Income Select Funds. The Medium-Duration Bond Fund, the Extended-Duration Bond Fund and the Low-Duration Bond Fund outpaced their respective benchmarks, primarily due to sector allocation strategies that provided an overweight to spread sectors such as corporate and mortgages and an underweight to U.S. Treasury securities. When risk appetite returned and investors were willing to re-enter spread sectors to take advantage of historically attractive valuations, exposure to such sectors allowed these Fixed Income Select Funds to greatly outperform. The Fund’s relative performance was also positively impacted by exposure to certain U.S. Equity Select Funds, most notably the Value Equity Fund and the Growth Equity Fund.
The Fund attempts to achieve its objective by investing in the GuideStone Select Funds. By investing in the Fund you will also incur the expenses and risks of the underlying Select Funds. The principal risks of the Funds will change depending on the asset mix of the Select Funds in which they invest. You may directly invest in the Select Funds. The Funds’ value will go up and down in response to changes in the share prices of the investments that they own. It is possible to lose money by investing in the Fund.
52
Balanced Allocation Fund I
| | | | | | |
Average Annual Total Returns as of 12/31/09 | |
| | | GS2 Class* | | | Benchmark** | |
One Year | | 25.28 | % | | 19.06 | % |
Five Year | | 3.36 | % | | 3.92 | % |
Since Inception | | 5.51 | % | | 5.86 | % |
Inception Date | | 07/01/03 | | | | |
Total Fund Operating Expenses (June 25, 2009 Prospectus)(1) | | 0.75 | % | | | |
| (1) | The Fund’s shareholders indirectly bear the expenses of the shares of the Select Funds in which the Fund invests. Current information regarding the Fund’s Operating Expenses can be found in the Financial Highlights. |
The performance data quoted represents past performance and does not guarantee future results. Current performance may be lower or higher. Performance data current to the most recent month-end may be obtained at www.GuideStoneFunds.org. The investment return and principal value of an investment will fluctuate so that shares, when redeemed, may be worth more or less than their original cost.
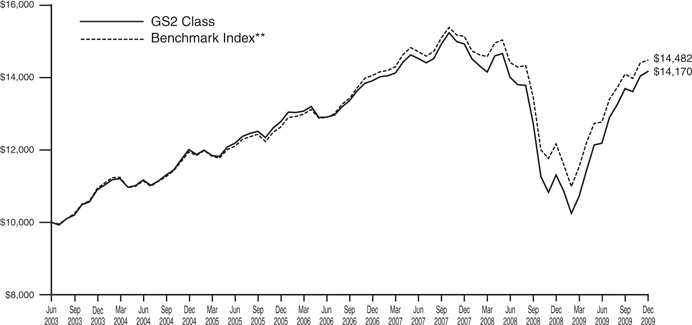
The graph compares the results of a hypothetical $10,000 investment in the GS2 Class of the Fund since July 1, 2003 (commencement of operations), with all dividends and capital gains reinvested, with the Fund’s weighted composite benchmark index.
| * | These returns reflect expense waivers by the Fund’s investment adviser. Without these waivers, returns would have been lower. Returns shown do not reflect the deduction of taxes that a shareholder would pay on Fund distributions or the redemption of Fund shares. |
| ** | Represents a composite index consisting of the Russell 3000® Index, the MSCI ACWI (All Country World Index) Ex-U.S. Index and the Barclays Capital U.S. Aggregate Bond Index, weighted 35%, 15% and 50%, respectively. |
The Russell 3000® Index measures the performance of the 3,000 largest U.S. companies based on total market capitalization, which represents approximately 98% of the investable U.S. equity market.
The MSCI ACWI (All Country World Index) Ex-U.S. Index is a free float-adjusted market capitalization index that is designed to measure equity market performance in the global developed (Ex-U.S.) and emerging markets.
The Barclays Capital U.S. Aggregate Bond Index represents securities that are SEC-registered, taxable and dollar denominated. The index covers the U.S. investment grade fixed rate bond market, with index components for government and corporate securities, mortgage pass-through securities and asset-backed securities.
Unlike a mutual fund, the performance of an index assumes no taxes, transaction costs, management fees or other expenses.
53
| | |
| BALANCED ALLOCATION FUND I | | |
| SCHEDULE OF INVESTMENTS | | December 31, 2009 |
| | | | | | |
| | | Shares | | Value |
MUTUAL FUNDS — 98.9% | | | | | | |
GuideStone Money Market Fund (GS2 Class)¥ | | | 2,741,213 | | $ | 2,741,213 |
GuideStone Low-Duration Bond Fund (GS2 Class)¥ | | | 5,361,542 | | | 46,645,414 |
GuideStone Medium-Duration Bond Fund (GS2 Class)¥ | | | 9,040,082 | | | 67,529,409 |
GuideStone Extended-Duration Bond Fund (GS2 Class)¥ | | | 3,831,364 | | | 26,857,858 |
GuideStone Global Bond Fund (GS4 Class)¥ | | | 1,718,908 | | | 16,088,976 |
GuideStone Equity Index Fund (GS2 Class)¥ | | | 1,314,258 | | | 10,211,786 |
GuideStone Value Equity Fund (GS2 Class)¥ | | | 7,119,875 | | | 45,994,391 |
GuideStone Growth Equity Fund (GS2 Class)¥ | | | 4,671,916 | | | 46,719,156 |
GuideStone Small Cap Equity Fund (GS2 Class)¥ | | | 1,496,213 | | | 11,326,329 |
GuideStone International Equity Fund (GS2 Class)¥ | | | 5,089,064 | | | 49,058,573 |
| | | | | | |
Total Mutual Funds
(Cost $365,047,464) | | | | | | 323,173,105 |
| | | | | | |
| | |
| | | Par | | |
U.S. TREASURY OBLIGATIONS — 1.1% | | | | | | |
U.S. Treasury Bill | | | | | | |
0.11%, 05/06/10‡‡ | | $ | 385,000 | | | 384,867 |
U.S. Treasury Note | | | | | | |
4.25%, 11/15/14 | | | 2,890,000 | | | 3,113,978 |
| | | | | | |
Total U.S. Treasury Obligations
(Cost $3,498,725) | | | | | | 3,498,845 |
| | | | | | |
TOTAL INVESTMENTS — 100.0%
(Cost $368,546,189) | | | | | | 326,671,950 |
Other Assets in Excess of Liabilities — 0.0% | | | | | | 4,039 |
| | | | | | |
NET ASSETS — 100.0% | | | | | $ | 326,675,989 |
| | | | | | |
Please see abbreviation and footnote definitions on page 180.
PORTFOLIO SUMMARY (based on net assets)
| | |
| | | % |
Bond Funds | | 48.1 |
Domestic Equity Funds | | 35.0 |
International Equity Fund | | 15.0 |
U.S. Treasury Obligations | | 1.1 |
Futures Contracts | | 0.9 |
Money Market Fund | | 0.8 |
| | |
| | 100.9 |
| | |
FAS 157 DISCLOSURE
The following is a summary of the inputs used, as of December 31, 2009, in valuing the Fund’s investments carried at fair value:
| | | | | | |
Valuation Inputs | | Investments
in
Securities | | Other
Financial
Instruments*** |
Level 1 — Quoted Prices | | | | | | |
Futures Contracts | | $ | — | | $ | 49,782 |
Mutual Funds | | | 323,173,105 | | | — |
Level 2 — Other Significant Observable Inputs | | | | | | |
U.S. Treasury Obligations | | | 3,498,845 | | | — |
Level 3 — Significant Unobservable Inputs | | | — | | | — |
| | | | | | |
Total | | $ | 326,671,950 | | $ | 49,782 |
| | | | | | |
| *** | Other financial instruments are derivative instruments not reflected in the Schedule of Investments, such as futures, forwards and swap contracts, which are valued at the unrealized appreciation (depreciation) on the investment. Details of these investments can be found in the Notes to Financial Statements. |
See Notes to Financial Statements.
54
Growth Allocation Fund I
The Fund, through investments in the underlying Select Funds, combines a greater percentage of exposure to equity securities with a smaller percentage to fixed income securities. The Fund has a target of, but is not limited to, an asset allocation of 56% U.S. Equity Select Funds, 25% Fixed Income Select Funds and 19% Non-U.S. Equity Select Funds.
Please see page 57 for information regarding specific portfolio allocations. Portfolio holdings are subject to change at any time.
The Fund is a fund-of-funds, and its performance is based on the performance of the underlying Select Funds. The Fund generated a strong return of 28.22% during 2009, benefiting from the double digit returns experienced by each underling Select Fund during the year. During the first quarter, the Fund’s absolute returns were negative due to the harmful repercussions of the financial crisis and economic recession, which led to very difficult returns in the domestic and non-U.S. equity markets. The Fund’s moderate diversification into fixed income securities (approximately 25% of the Fund’s total market value) helped mitigate the effect of strong negative equity returns during the first quarter. With the aid of government programs, aggressive monetary policy and prospects for an improved economic environment, the capital markets improved after bottoming in early March. All asset classes rebounded strongly as investors became less risk averse, willing to deploy assets into both equities and non-U.S. Treasury fixed income securities. Given the strong rebound in the capital markets, the Fund posted positive absolute returns during the second, third and fourth quarters. The Fund’s absolute returns were most positively influenced by its exposure to the Growth Equity Fund, the International Equity Fund and the Value Equity Fund. Regarding exposure to fixed income, the Medium-Duration Bond Fund also contributed meaningfully to the Fund’s absolute return.
The Fund outpaced its composite benchmark during the year by 2.56%, benefitting most notably from its exposure to the Fixed Income Select Funds. The Medium-Duration Bond Fund, the Extended-Duration Bond Fund and the Low-Duration Bond Fund outpaced their respective benchmarks, primarily due to sector allocation strategies that provided an overweight to spread sectors such as corporate and mortgages and an underweight to U.S. Treasury securities. When risk appetite returned and investors were willing to re-enter spread sectors to take advantage of historically attractive valuations, exposure to such sectors allowed these Fixed Income Select Funds to greatly outperform. The Fund’s relative performance was also positively impacted by exposure to certain U.S. Equity Select Funds, most notably the Value Equity Fund and the Growth Equity Fund.
The Fund attempts to achieve its objective by investing in the GuideStone Select Funds. By investing in the Fund you will also incur the expenses and risks of the underlying Select Funds. The principal risks of the Funds will change depending on the asset mix of the Select Funds in which they invest. You may directly invest in the Select Funds. The Funds’ value will go up and down in response to changes in the share prices of the investments that they own. It is possible to lose money by investing in the Fund.
55
Growth Allocation Fund I
| | | | | | |
Average Annual Total Returns as of 12/31/09 | |
| | | GS2 Class* | | | Benchmark** | |
One Year | | 28.22 | % | | 25.66 | % |
Five Year | | 2.17 | % | | 3.08 | % |
Since Inception | | 5.54 | % | | 6.25 | % |
Inception Date | | 07/01/03 | | | | |
Total Fund Operating Expenses (June 25, 2009 Prospectus)(1) | | 0.84 | % | | | |
| (1) | The Fund’s shareholders indirectly bear the expenses of the shares of the Select Funds in which the Fund invests. Current information regarding the Fund’s Operating Expenses can be found in the Financial Highlights. |
The performance data quoted represents past performance and does not guarantee future results. Current performance may be lower or higher. Performance data current to the most recent month-end may be obtained at www.GuideStoneFunds.org. The investment return and principal value of an investment will fluctuate so that shares, when redeemed, may be worth more or less than their original cost.
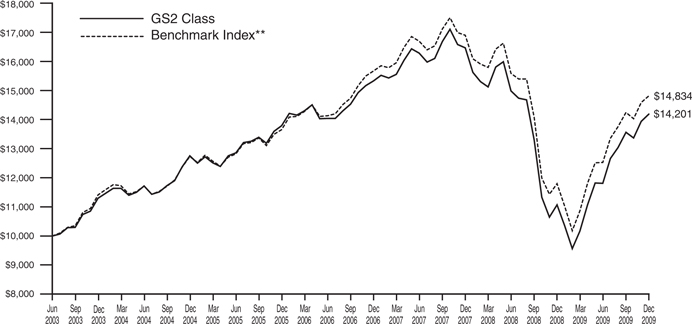
The graph compares the results of a hypothetical $10,000 investment in the GS2 Class of the Fund since July 1, 2003 (commencement of operations), with all dividends and capital gains reinvested, with the Fund’s weighted composite benchmark index.
| * | These returns reflect expense waivers by the Fund’s investment adviser. Without these waivers, returns would have been lower. Returns shown do not reflect the deduction of taxes that a shareholder would pay on Fund distributions or the redemption of Fund shares. |
| ** | Represents a composite index consisting of the Russell 3000® Index, the MSCI ACWI (All Country World Index) Ex-U.S. Index and the Barclays U.S. Capital Aggregate Bond Index, weighted 52.5%, 22.5% and 25%, respectively. |
The Russell 3000® Index measures the performance of the 3,000 largest U.S. companies based on total market capitalization, which represents approximately 98% of the investable U.S. equity market.
The MSCI ACWI (All Country World Index) Ex-U.S. Index is a free float-adjusted market capitalization index that is designed to measure equity market performance in the global developed (Ex-U.S.) and emerging markets.
The Barclays U.S. Capital Aggregate Bond Index represents securities that are SEC-registered, taxable and dollar denominated. The index covers the U.S. investment grade fixed rate bond market, with index components for government and corporate securities, mortgage pass-through securities and asset-backed securities.
Unlike a mutual fund, the performance of an index assumes no taxes, transaction costs, management fees or other expenses.
56
| | |
| GROWTH ALLOCATION FUND I | | |
| SCHEDULE OF INVESTMENTS | | December 31, 2009 |
| | | | | | |
| | | Shares | | Value |
MUTUAL FUNDS — 99.3% | | | | | | |
GuideStone Money Market Fund (GS2 Class)¥ | | | 2,782,247 | | $ | 2,782,247 |
GuideStone Low-Duration Bond Fund (GS2 Class)¥ | | | 1,678,820 | | | 14,605,734 |
GuideStone Medium-Duration Bond Fund (GS2 Class)¥ | | | 2,838,929 | | | 21,206,796 |
GuideStone Extended-Duration Bond Fund (GS2 Class)¥ | | | 1,219,573 | | | 8,549,204 |
GuideStone Global Bond Fund (GS4 Class)¥ | | | 549,817 | | | 5,146,284 |
GuideStone Equity Index Fund (GS2 Class)¥ | | | 1,238,184 | | | 9,620,692 |
GuideStone Value Equity Fund (GS2 Class)¥ | | | 6,763,819 | | | 43,694,274 |
GuideStone Growth Equity Fund (GS2 Class)¥ | | | 4,408,287 | | | 44,082,873 |
GuideStone Small Cap Equity Fund (GS2 Class)¥ | | | 1,440,986 | | | 10,908,264 |
GuideStone International Equity Fund (GS2 Class)¥ | | | 4,882,396 | | | 47,066,296 |
| | | | | | |
Total Mutual Funds
(Cost $251,616,653) | | | | | | 207,662,664 |
| | | | | | |
| | |
| | | Par | | |
U.S. TREASURY OBLIGATIONS — 0.7% | | | | | | |
U.S. Treasury Bill | | | | | | |
0.11%, 05/06/10‡‡ | | $ | 340,000 | | | 339,882 |
U.S. Treasury Note | | | | | | |
4.25%, 11/15/14 | | | 960,000 | | | 1,034,401 |
| | | | | | |
Total U.S. Treasury Obligations
(Cost $1,374,236) | | | | | | 1,374,283 |
| | | | | | |
TOTAL INVESTMENTS — 100.0%
(Cost $252,990,889) | | | | | | 209,036,947 |
Other Assets in Excess of Liabilities — 0.0% | | | | | | 22,218 |
| | | | | | |
NET ASSETS — 100.0% | | | | | $ | 209,059,165 |
| | | | | | |
Please see abbreviation and footnote definitions on page 180.
PORTFOLIO SUMMARY (based on net assets)
| | |
| | | % |
Domestic Equity Funds | | 51.8 |
Bond Funds | | 23.7 |
International Equity Fund | | 22.5 |
Futures Contracts | | 1.4 |
Money Market Fund | | 1.3 |
U.S. Treasury Obligations | | 0.7 |
| | |
| | 101.4 |
| | |
FAS 157 DISCLOSURE
The following is a summary of the inputs used, as of December 31, 2009, in valuing the Fund’s investments carried at fair value:
| | | | | | |
Valuation Inputs | | Investments
in
Securities | | Other
Financial
Instruments*** |
Level 1 — Quoted Prices | | | | | | |
Futures Contracts | | $ | — | | $ | 40,541 |
Mutual Funds | | | 207,662,664 | | | — |
Level 2 — Other Significant Observable Inputs | | | | | | |
U.S. Treasury Obligations | | | 1,374,283 | | | — |
Level 3 — Significant Unobservable Inputs | | | — | | | — |
| | | | | | |
Total | | $ | 209,036,947 | | $ | 40,541 |
| | | | | | |
| *** | Other financial instruments are derivative instruments not reflected in the Schedule of Investments, such as futures, forwards and swap contracts, which are valued at the unrealized appreciation (depreciation) on the investment. Details of these investments can be found in the Notes to Financial Statements. |
See Notes to Financial Statements.
57
Aggressive Allocation Fund I
The Fund, through investments in the underlying Select Funds, combines a greater percentage of exposure to U.S. equity securities with a smaller percentage to non-U.S. equity securities. The Fund has a target of, but is not limited to, an asset allocation of 75% U.S. Equity Select Funds and 25% Non-U.S. Select Funds.
Please see page 60 for information regarding specific portfolio allocations. Portfolio holdings are subject to change at any time.
The Fund is a fund-of-funds, and its performance is based on the performance of the underlying Select Funds. The Fund generated a strong return of 30.87% during 2009, benefiting from the double digit returns experienced by all of the underlying Select Funds during the year. During the first quarter, the Fund’s absolute returns were negative due to the harmful repercussions of the financial crisis and economic recession, which led to very difficult returns in the domestic and non-U.S. equity markets. With the aid of government programs, aggressive monetary policy and prospects for an improved economic environment, the capital markets improved after bottoming in early March. All asset classes rebounded strongly, as investors became less risk averse, willing to deploy assets into equities securities. Given the strong rebound in the capital markets, the Fund posted positive absolute returns during the second, third and fourth quarters. The Fund’s absolute returns were most positively influenced by its exposure to the Growth Equity Fund, the International Equity Fund and the Value Equity Fund.
The Fund underperformed its composite benchmark during the year by 1.38%. The International Equity Fund was the primary contributor to the Fund’s absolute return but also served as the key driver in the Fund’s relative underperformance during the year. The Fund’s relative performance was positively impacted by exposure to certain U.S. Equity Select Funds, most notably the Value Equity Fund and the Growth Equity Fund.
The Fund attempts to achieve its objective by investing in the GuideStone Select Funds. By investing in the Fund you will also incur the expenses and risks of the underlying Select Funds. The principal risks of the Funds will change depending on the asset mix of the Select Funds in which they invest. You may directly invest in the Select Funds. The Funds’ value will go up and down in response to changes in the share prices of the investments that they own. It is possible to lose money by investing in the Fund.
58
Aggressive Allocation Fund I
| | | | | | |
Average Annual Total Returns as of 12/31/09 | |
| | | GS2 Class* | | | Benchmark** | |
One year | | 30.87 | % | | 32.25 | % |
Five year | | 0.71 | % | | 2.05 | % |
Since Inception | | 5.33 | % | | 6.47 | % |
Inception Date | | 07/01/03 | | | | |
Total Fund Operating Expenses (June 25, 2009 Prospectus)(1) | | 0.93 | % | | | |
| (1) | The Fund’s shareholders indirectly bear the expenses of the GS2 Class shares of the Select Funds in which the Fund invests. Current information regarding the Fund’s Operating Expenses can be found in the Financial Highlights. |
The performance data quoted represents past performance and does not guarantee future results. Current performance may be lower or higher. Performance data current to the most recent month-end may be obtained at www.GuideStoneFunds.org. The investment return and principal value of an investment will fluctuate so that shares, when redeemed, may be worth more or less than their original cost.
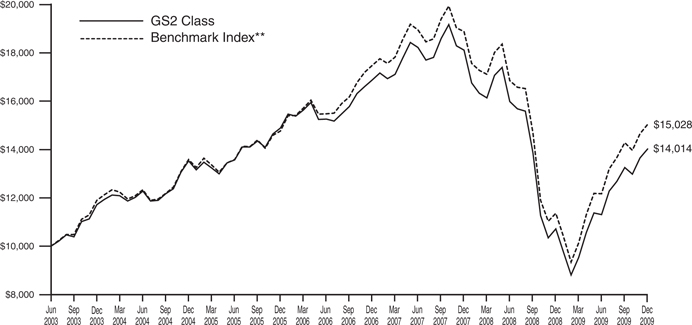
The graph compares the results of a hypothetical $10,000 investment in the GS2 Class of the Fund since July 1, 2003 (commencement of operations), with all dividends and capital gains reinvested, with the Fund’s weighted composite benchmark index.
| * | These returns reflect expense waivers by the Fund’s investment adviser. Without these waivers, returns would have been lower. Returns shown do not reflect the deduction of taxes that a shareholder would pay on Fund distributions or the redemption of Fund shares. |
| ** | Represents a composite index consisting of the Russell 3000® Index and the MSCI ACWI (All Country World Index) Ex-U.S. Index, weighted 70% and 30%, respectively. |
The Russell 3000® Index measures the performance of the 3,000 largest U.S. companies based on total market capitalization, which represents approximately 98% of the investable U.S. equity market.
The MSCI ACWI (All Country World Index) Ex-U.S. Index is a free float-adjusted market capitalization index that is designed to measure equity market performance in the global developed (Ex-U.S.) and emerging markets.
Unlike a mutual fund, the performance of an index assumes no taxes, transaction costs, management fees or other expenses.
59
| | |
| AGGRESSIVE ALLOCATION FUND I | | |
| SCHEDULE OF INVESTMENTS | | December 31, 2009 |
| | | | | | | |
| | | Shares | | Value | |
MUTUAL FUNDS — 99.8% | | | | | | | |
GuideStone Money Market Fund (GS2 Class)¥ | | | 2,391,427 | | $ | 2,391,427 | |
GuideStone Equity Index Fund (GS2 Class)¥ | | | 1,132,315 | | | 8,798,088 | |
GuideStone Value Equity Fund (GS2 Class)¥ | | | 6,089,524 | | | 39,338,327 | |
GuideStone Growth Equity Fund (GS2 Class)¥ | | | 3,996,995 | | | 39,969,950 | |
GuideStone Small Cap Equity Fund (GS2 Class)¥ | | | 1,314,494 | | | 9,950,718 | |
GuideStone International Equity Fund (GS2 Class)¥ | | | 4,413,628 | | | 42,547,374 | |
| | | | | | | |
Total Mutual Funds
(Cost $186,849,815) | | | | | | 142,995,884 | |
| | | | | | | |
| | |
| | | Par | | | |
U.S. TREASURY OBLIGATION — 0.2% | | | | | | | |
U.S. Treasury Bill | | | | | | | |
0.11%, 05/06/10‡‡ | | | | | | | |
(Cost $284,891) | | $ | 285,000 | | | 284,902 | |
| | | | | | | |
TOTAL INVESTMENTS — 100.0%
(Cost $187,134,706) | | | | | | 143,280,786 | |
Liabilities in Excess of Other Assets — 0.0% | | | | | | (16,905 | ) |
| | | | | | | |
NET ASSETS — 100.0% | | | | | $ | 143,263,881 | |
| | | | | | | |
Please see abbreviation and footnote definitions on page 180.
PORTFOLIO SUMMARY (based on net assets)
| | |
| | | % |
Domestic Equity Funds | | 68.4 |
International Equity Fund | | 29.7 |
Futures Contracts | | 1.8 |
Money Market Fund | | 1.7 |
U.S. Treasury Obligation | | 0.2 |
| | |
| | 101.8 |
| | |
FAS 157 DISCLOSURE
The following is a summary of the inputs used, as of December 31, 2009, in valuing the Fund’s investments carried at fair value:
| | | | | | |
Valuation Inputs | | Investments
in
Securities | | Other
Financial
Instruments*** |
Level 1 — Quoted Prices | | | | | | |
Futures Contracts | | $ | — | | $ | 41,289 |
Mutual Funds | | | 142,995,884 | | | — |
Level 2 — Other Significant Observable Inputs | | | | | | |
U.S. Treasury Obligation | | | 284,902 | | | — |
Level 3 — Significant Unobservable Inputs | | | — | | | — |
| | | | | | |
Total | | $ | 143,280,786 | | $ | 41,289 |
| | | | | | |
| *** | Other financial instruments are derivative instruments not reflected in the Schedule of Investments, such as futures, forwards and swap contracts, which are valued at the unrealized appreciation (depreciation) on the investment. Details of these investments can be found in the Notes to Financial Statements. |
See Notes to Financial Statements.
60
| | |
| STATEMENTS OF ASSETS AND LIABILITIES | | December 31, 2009 |
| | | | | | | | | | | | | | | | |
| | | Conservative
Allocation
Fund I | | | Balanced
Allocation
Fund I | | | Growth
Allocation
Fund I | | | Aggressive
Allocation
Fund I | |
Assets | | | | | | | | | | | | | | | | |
Investments in securities of affiliated issuers, at value | | $ | 64,240,020 | | | $ | 323,173,105 | | | $ | 207,662,664 | | | $ | 142,995,884 | |
Investments in securities of unaffiliated issuers, at value | | | — | | | | 3,498,845 | | | | 1,374,283 | | | | 284,902 | |
| | | | | | | | | | | | | | | | |
Total investments (1) | | | 64,240,020 | | | | 326,671,950 | | | | 209,036,947 | | | | 143,280,786 | |
Receivables: | | | | | | | | | | | | | | | | |
Dividends | | | 120 | | | | 343 | | | | 294 | | | | 271 | |
Interest | | | — | | | | 16,453 | | | | 5,464 | | | | — | |
Investment securities sold | | | — | | | | 3,118,012 | | | | 1,032,621 | | | | — | |
Fund shares sold | | | 5,068 | | | | 73,551 | | | | 88,625 | | | | 34,602 | |
Prepaid expenses and other assets | | | 9,113 | | | | 9,114 | | | | 9,114 | | | | 9,113 | |
| | | | | | | | | | | | | | | | |
Total Assets | | | 64,254,321 | | | | 329,889,423 | | | | 210,173,065 | | | | 143,324,772 | |
| | | | | | | | | | | | | | | | |
Liabilities | | | | | | | | | | | | | | | | |
Payables: | | | | | | | | | | | | | | | | |
Investment securities purchased | | | — | | | | 3,130,837 | | | | 1,040,121 | | | | 120 | |
Variation margin | | | — | | | | 31,350 | | | | 30,640 | | | | 26,220 | |
Accrued expenses: | | | | | | | | | | | | | | | | |
Investment Advisory fees | | | 3,763 | | | | 27,912 | | | | 21,111 | | | | 13,403 | |
Other expenses | | | 20,366 | | | | 23,335 | | | | 22,028 | | | | 21,148 | |
| | | | | | | | | | | | | | | | |
Total Liabilities | | | 24,129 | | | | 3,213,434 | | | | 1,113,900 | | | | 60,891 | |
| | | | | | | | | | | | | | | | |
Net Assets | | $ | 64,230,192 | | | $ | 326,675,989 | | | $ | 209,059,165 | | | $ | 143,263,881 | |
| | | | | | | | | | | | | | | | |
Net Assets Consist of: | | | | | | | | | | | | | | | | |
Paid-in-capital | | $ | 71,157,630 | | | $ | 387,321,087 | | | $ | 259,947,689 | | | $ | 192,665,967 | |
Undistributed net investment income | | | 705,488 | | | | 5,272,196 | | | | 1,464,983 | | | | 2,509,336 | |
Accumulated net realized loss on investments and futures transactions | | | (5,972,029 | ) | | | (24,092,837 | ) | | | (8,440,106 | ) | | | (8,098,791 | ) |
Net unrealized appreciation (depreciation) on investments and futures | | | (1,660,897 | ) | | | (41,824,457 | ) | | | (43,913,401 | ) | | | (43,812,631 | ) |
| | | | | | | | | | | | | | | | |
Net Assets | | $ | 64,230,192 | | | $ | 326,675,989 | | | $ | 209,059,165 | | | $ | 143,263,881 | |
| | | | | | | | | | | | | | | | |
Net Asset Value: | | | | | | | | | | | | | | | | |
$0.001 par value, unlimited shares authorized | | | | | | | | | | | | | | | | |
Net assets applicable to the GS2 Class | | $ | 64,230,192 | | | $ | 326,675,989 | | | $ | 209,059,165 | | | $ | 143,263,881 | |
| | | | | | | | | | | | | | | | |
GS2 shares outstanding | | | 7,090,384 | | | | 36,289,123 | | | | 22,907,368 | | | | 15,559,824 | |
| | | | | | | | | | | | | | | | |
Net asset value, offering and redemption price per GS2 share | | $ | 9.06 | | | $ | 9.00 | | | $ | 9.13 | | | $ | 9.21 | |
| | | | | | | | | | | | | | | | |
| |
(1) Investments in securities of affiliated issuers, at cost | | $ | 65,900,917 | | | $ | 365,047,464 | | | $ | 251,616,653 | | | $ | 186,849,815 | |
Investments in securities of unaffiliated issuers, at cost | | | — | | | | 3,498,725 | | | | 1,374,236 | | | | 284,891 | |
| | | | | | | | | | | | | | | | |
Total investments at cost | | $ | 65,900,917 | | | $ | 368,546,189 | | | $ | 252,990,889 | | | $ | 187,134,706 | |
| | | | | | | | | | | | | | | | |
See Notes to Financial Statements.
61
| | |
| STATEMENTS OF OPERATIONS | | For the Year Ended December 31, 2009 |
| | | | | | | | | | | | | | | | |
| | | Conservative
Allocation Fund I | | | Balanced
Allocation Fund I | | | Growth
Allocation Fund I | | | Aggressive
Allocation Fund I | |
Investment Income | | | | | | | | | | | | | | | | |
Income dividends received from affiliated funds | | $ | 2,205,991 | | | $ | 12,839,358 | | | $ | 6,020,069 | | | $ | 2,694,071 | |
Interest | | | 5,514 | | | | 53,250 | | | | 17,838 | | | | 457 | |
| | | | | | | | | | | | | | | | |
Total Investment Income | | | 2,211,505 | | | | 12,892,608 | | | | 6,037,907 | | | | 2,694,528 | |
| | | | | | | | | | | | | | | | |
Expenses | | | | | | | | | | | | | | | | |
Investment advisory fees | | | 57,856 | | | | 284,817 | | | | 179,481 | | | | 122,203 | |
Transfer agent fees | | | 3,854 | | | | 3,910 | | | | 3,879 | | | | 3,836 | |
Custodian fees | | | 7,219 | | | | 10,745 | | | | 8,620 | | | | 6,639 | |
Accounting and administration fees | | | 10,888 | | | | 25,759 | | | | 18,044 | | | | 14,164 | |
Professional fees | | | 40,735 | | | | 40,735 | | | | 40,709 | | | | 40,735 | |
Blue sky fees: | | | | | | | | | | | | | | | | |
GS2 | | | 267 | | | | 267 | | | | 267 | | | | 267 | |
Shareholder reporting fees | | | 369 | | | | 588 | | | | 442 | | | | 515 | |
Trustee expenses | | | 650 | | | | 3,006 | | | | 1,831 | | | | 1,189 | |
Line of credit facility fees | | | 839 | | | | 3,978 | | | | 2,464 | | | | 1,679 | |
Other expenses | | | 7,212 | | | | 7,789 | | | | 7,327 | | | | 7,223 | |
| | | | | | | | | | | | | | | | |
Total Expenses | | | 129,889 | | | | 381,594 | | | | 263,064 | | | | 198,450 | |
Expenses waived/reimbursed net of amount recaptured(1) | | | (41,261 | ) | | | — | | | | 5,602 | | | | (14,709 | ) |
| | | | | | | | | | | | | | | | |
Net expenses | | | 88,628 | | | | 381,594 | | | | 268,666 | | | | 183,741 | |
| | | | | | | | | | | | | | | | |
Net Investment Income | | | 2,122,877 | | | | 12,511,014 | | | | 5,769,241 | | | | 2,510,787 | |
| | | | | | | | | | | | | | | | |
Realized and Unrealized Loss | | | | | | | | | | | | | | | | |
Capital gain distributions received from affiliated funds | | | 9,696 | | | | 2,614,099 | | | | 810,377 | | | | 450 | |
Net realized loss on investment securities of affiliated issuers | | | (3,529,653 | ) | | | (12,207,468 | ) | | | (5,134,514 | ) | | | (3,652,759 | ) |
Net realized gain (loss) on investment securities of unaffiliated issuers | | | 8,854 | | | | (58,087 | ) | | | (31,320 | ) | | | 13 | |
Net realized gain on futures transactions | | | 33,019 | | | | 129,538 | | | | 458,335 | | | | 425,700 | |
| | | | | | | | | | | | | | | | |
Net realized loss | | | (3,478,084 | ) | | | (9,521,918 | ) | | | (3,897,122 | ) | | | (3,226,596 | ) |
| | | | | | | | | | | | | | | | |
Change in unrealized appreciation on investment securities of affiliated issuers | | | 10,439,540 | | | | 61,029,961 | | | | 43,335,676 | | | | 34,590,301 | |
Change in unrealized appreciation (depreciation) on investment securities of unaffiliated issuers | | | (26 | ) | | | 38 | | | | (5 | ) | | | (23 | ) |
Change in unrealized appreciation (depreciation) on futures | | | (12,673 | ) | | | 5,910 | | | | (6,432 | ) | | | 29,049 | |
| | | | | | | | | | | | | | | | |
Net change in unrealized appreciation | | | 10,426,841 | | | | 61,035,909 | | | | 43,329,239 | | | | 34,619,327 | |
| | | | | | | | | | | | | | | | |
Net Realized and Unrealized Gain | | | 6,948,757 | | | | 51,513,991 | | | | 39,432,117 | | | | 31,392,731 | |
| | | | | | | | | | | | | | | | |
Net Increase in Net Assets Resulting from Operations | | $ | 9,071,634 | | | $ | 64,025,005 | | | $ | 45,201,358 | | | $ | 33,903,518 | |
| | | | | | | | | | | | | | | | |
| (1) | See Note 3a and 3c in Notes to Financial Statements. |
See Notes to Financial Statements.
62
(This page intentionally left blank)
63
STATEMENTS OF CHANGES IN NET ASSETS
| | | | | | | | | | | | | | | | |
| | | Conservative Allocation Fund I | | | Balanced Allocation Fund I | |
| | | For the Year Ended | | | For the Year Ended | |
| | | 12/31/09 | | | 12/31/08 | | | 12/31/09 | | | 12/31/08 | |
Operations: | | | | | | | | | | | | | | | | |
Net investment income | | $ | 2,122,877 | | | $ | 3,230,044 | | | $ | 12,511,014 | | | $ | 16,247,663 | |
Net realized loss on investment securities and futures transactions | | | (3,478,084 | ) | | | (1,755,621 | ) | | | (9,521,918 | ) | | | (6,648,178 | ) |
Net change in unrealized appreciation (depreciation) on investment securities and futures | | | 10,426,841 | | | | (9,880,455 | ) | | | 61,035,909 | | | | (94,588,586 | ) |
| | | | | | | | | | | | | | | | |
Net increase (decrease) in net assets resulting from operations | | | 9,071,634 | | | | (8,406,032 | ) | | | 64,025,005 | | | | (84,989,101 | ) |
| | | | | | | | | | | | | | | | |
Dividends and Distributions to Shareholders: | | | | | | | | | | | | | | | | |
Dividends from net investment income(1) | | | (2,128,240 | ) | | | (2,524,105 | ) | | | (15,067,834 | ) | | | (13,746,934 | ) |
Distributions from net realized capital gains | | | — | | | | (1,170,532 | ) | | | — | | | | (13,133,636 | ) |
| | | | | | | | | | | | | | | | |
Total dividends and distributions | | | (2,128,240 | ) | | | (3,694,637 | ) | | | (15,067,834 | ) | | | (26,880,570 | ) |
| | | | | | | | | | | | | | | | |
Capital Share Transactions: | | | | | | | | | | | | | | | | |
Proceeds from GS2 shares sold | | | 8,391,907 | | | | 8,306,973 | | | | 22,306,268 | | | | 21,418,152 | |
Reinvestment of dividends and distributions into GS2 shares | | | 2,122,742 | | | | 3,682,376 | | | | 15,033,265 | | | | 26,811,396 | |
Value of GS2 shares redeemed | | | (7,544,466 | ) | | | (12,802,980 | ) | | | (19,743,274 | ) | | | (30,030,801 | ) |
| | | | | | | | | | | | | | | | |
Net increase (decrease) from capital share transactions(2) | | | 2,970,183 | | | | (813,631 | ) | | | 17,596,259 | | | | 18,198,747 | |
| | | | | | | | | | | | | | | | |
Total increase (decrease) in net assets | | | 9,913,577 | | | | (12,914,300 | ) | | | 66,553,430 | | | | (93,670,924 | ) |
| | | | | | | | | | | | | | | | |
Net Assets: | | | | | | | | | | | | | | | | |
Beginning of Year | | | 54,316,615 | | | | 67,230,915 | | | | 260,122,559 | | | | 353,793,483 | |
| | | | | | | | | | | | | | | | |
End of Year* | | $ | 64,230,192 | | | $ | 54,316,615 | | | $ | 326,675,989 | | | $ | 260,122,559 | |
| | | | | | | | | | | | | | | | |
* Including undistributed net investment income | | $ | 705,488 | | | $ | 705,587 | | | $ | 5,272,196 | | | $ | 5,275,545 | |
| | | | | | | | | | | | | | | | |
| (1) | Includes dividends paid from the short-term portion of capital gain distributions received from affiliated funds. |
| (2) | See Note 7 in Notes to Financial Statements. |
See Notes to Financial Statements.
64
| | | | | | | | | | | | | | |
| Growth Allocation Fund I | | | Aggressive Allocation Fund I | |
| For the Year Ended | | | For the Year Ended | |
| 12/31/09 | | | 12/31/08 | | | 12/31/09 | | | 12/31/08 | |
| | | | | | | | | | | | | | |
| $ | 5,769,241 | | | $ | 7,717,434 | | | $ | 2,510,787 | | | $ | 3,252,965 | |
| | (3,897,122 | ) | | | (1,955,658 | ) | | | (3,226,596 | ) | | | (4,896,449 | ) |
| | 43,329,239 | | | | (86,939,096 | ) | | | 34,619,327 | | | | (76,732,258 | ) |
| | | | | | | | | | | | | | | |
| | 45,201,358 | | | | (81,177,320 | ) | | | 33,903,518 | | | | (78,375,742 | ) |
| | | | | | | | | | | | | | | |
| | | | | | | | | | | | | | |
| | (6,560,814 | ) | | | (7,164,765 | ) | | | (3,254,796 | ) | | | — | |
| | — | | | | (13,479,284 | ) | | | — | | | | (14,453,029 | ) |
| | | | | | | | | | | | | | | |
| | (6,560,814 | ) | | | (20,644,049 | ) | | | (3,254,796 | ) | | | (14,453,029 | ) |
| | | | | | | | | | | | | | | |
| | | | | | | | | | | | | | |
| | 15,197,050 | | | | 14,603,125 | | | | 13,301,477 | | | | 9,952,658 | |
| | 6,539,648 | | | | 20,568,986 | | | | 3,251,584 | | | | 14,434,397 | |
| | (13,133,053 | ) | | | (23,114,496 | ) | | | (13,493,549 | ) | | | (20,849,161 | ) |
| | | | | | | | | | | | | | | |
| | 8,603,645 | | | | 12,057,615 | | | | 3,059,512 | | | | 3,537,894 | |
| | | | | | | | | | | | | | | |
| | 47,244,189 | | | | (89,763,754 | ) | | | 33,708,234 | | | | (89,290,877 | ) |
| | | | | | | | | | | | | | | |
| | | | | | | | | | | | | | |
| | 161,814,976 | | | | 251,578,730 | | | | 109,555,647 | | | | 198,846,524 | |
| | | | | | | | | | | | | | | |
| $ | 209,059,165 | | | $ | 161,814,976 | | | $ | 143,263,881 | | | $ | 109,555,647 | |
| | | | | | | | | | | | | | | |
| $ | 1,464,983 | | | $ | 1,465,194 | | | $ | 2,509,336 | | | $ | 3,253,345 | |
| | | | | | | | | | | | | | | |
See Notes to Financial Statements.
65
FINANCIAL HIGHLIGHTS
| | | | | | | | | | | | | | | | | | | | | | | | | | | | | | | | | | | | | | | | | | | |
For a Share Outstanding For the Years Ended December 31, unless otherwise indicated | | Ratios to Average Net Assets | | | | |
| | | Net Asset
Value,
Beginning
of Year | | Net
Investment
Income (1) | | | Capital Gain
Distributions
Received
from
Affiliated
Funds | | | Realized
and
Unrealized
Gain
(Loss) on
Investments | | | Dividends
from Net
Investment
Income (2) | | | Distributions
from Net
Realized
Capital
Gains | | | Net
Asset
Value,
End of
Year | | Total
Return | | Net Assets,
End of Year
(000) | | Expenses,
Net(3) | | | Expenses,
Gross(3)(4) | | | Investment
Income,
Net
(1)(5) | | | Portfolio
Turnover
Rate | |
Conservative Allocation Fund I | |
|
GS2 Class | |
2009 | | $ | 8.00 | | $ | 0.32 | # | | $ | — | † | | $ | 1.05 | | | $ | (0.31 | ) | | $ | — | | | $ | 9.06 | | 17.13% | | $ | 64,230 | | 0.15 | % | | 0.23 | % | | 3.70 | % | | 35 | % |
2008 | | | 9.86 | | | 0.49 | | | | 0.03 | | | | (1.81 | ) | | | (0.39 | ) | | | (0.18 | ) | | | 8.00 | | (12.98) | | | 54,317 | | 0.15 | | | 0.22 | | | 5.21 | | | 25 | |
2007 | | | 10.05 | | | 0.50 | | | | 0.23 | | | | (0.07 | ) | | | (0.54 | ) | | | (0.31 | ) | | | 9.86 | | 6.55 | | | 67,231 | | 0.16 | | | 0.22 | | | 4.77 | | | 25 | |
2006 | | | 10.15 | | | 0.46 | | | | 0.19 | | | | (0.02 | ) | | | (0.49 | ) | | | (0.24 | ) | | | 10.05 | | 6.21 | | | 57,188 | | 0.17 | | | 0.30 | | | 4.53 | | | 16 | |
2005 | | | 10.31 | | | 0.36 | | | | 0.10 | | | | (0.10 | ) | | | (0.38 | ) | | | (0.14 | ) | | | 10.15 | | 3.46 | | | 54,231 | | 0.17 | | | 0.30 | | | 3.52 | | | 16 | |
|
Balanced Allocation Fund I | |
|
GS2 Class | |
2009 | | $ | 7.53 | | $ | 0.37 | # | | $ | 0.08 | | | $ | 1.46 | | | $ | (0.44 | ) | | $ | — | | | $ | 9.00 | | 25.28% | | $ | 326,676 | | 0.14 | % | | 0.14 | % | | 4.46 | % | | 20 | % |
2008 | | | 11.07 | | | 0.51 | # | | | 0.17 | | | | (3.38 | ) | | | (0.42 | ) | | | (0.42 | ) | | | 7.53 | | (24.26) | | | 260,123 | | 0.14 | | | 0.14 | | | 5.16 | | | 23 | |
2007 | | | 11.35 | | | 0.55 | # | | | 0.66 | | | | (0.38 | ) | | | (0.62 | ) | | | (0.49 | ) | | | 11.07 | | 7.32 | | | 353,793 | | 0.16 | | | 0.14 | | | 4.62 | | | 12 | |
2006 | | | 11.32 | | | 0.46 | # | | | 0.45 | | | | 0.09 | | | | (0.50 | ) | | | (0.47 | ) | | | 11.35 | | 8.85 | | | 262,451 | | 0.17 | | | 0.18 | | | 3.93 | | | 13 | |
2005 | | | 11.23 | | | 0.40 | # | | | 0.25 | | | | 0.07 | | | | (0.46 | ) | | | (0.17 | ) | | | 11.32 | | 6.42 | | | 239,244 | | 0.17 | | | 0.18 | | | 3.49 | | | 11 | |
|
Growth Allocation Fund I | |
|
GS2 Class | |
2009 | | $ | 7.35 | | $ | 0.26 | # | | $ | 0.04 | | | $ | 1.78 | | | $ | (0.30 | ) | | $ | — | | | $ | 9.13 | | 28.22% | | $ | 209,059 | | 0.15 | % | | 0.15 | % | | 3.28 | % | | 13 | % |
2008 | | | 12.53 | | | 0.39 | # | | | 0.16 | | | | (4.69 | ) | | | (0.34 | ) | | | (0.70 | ) | | | 7.35 | | (32.82) | | | 161,815 | | 0.15 | | | 0.14 | | | 3.65 | | | 18 | |
2007 | | | 12.96 | | | 0.41 | | | | 0.92 | | | | (0.37 | ) | | | (0.58 | ) | | | (0.81 | ) | | | 12.53 | | 7.40 | | | 251,579 | | 0.16 | | | 0.15 | | | 3.20 | | | 9 | |
2006 | | | 12.62 | | | 0.34 | | | | 0.73 | | | | 0.35 | | | | (0.44 | ) | | | (0.64 | ) | | | 12.96 | | 11.21 | | | 187,536 | | 0.17 | | | 0.20 | | | 2.73 | | | 9 | |
2005 | | | 12.17 | | | 0.29 | | | | 0.38 | | | | 0.33 | | | | (0.39 | ) | | | (0.16 | ) | | | 12.62 | | 8.20 | | | 159,849 | | 0.17 | | | 0.20 | | | 2.42 | | | 8 | |
|
Aggressive Allocation Fund I | |
|
GS2 Class | |
2009 | | $ | 7.20 | | $ | 0.16 | # | | $ | — | † | | $ | 2.06 | | | $ | (0.21 | ) | | $ | — | | | $ | 9.21 | | 30.87% | | $ | 143,264 | | 0.15 | % | | 0.17 | % | | 2.10 | % | | 5 | % |
2008 | | | 14.07 | | | 0.24 | # | | | 0.14 | | | | (6.15 | ) | | | — | | | | (1.10 | ) | | | 7.20 | | (40.87) | | | 109,556 | | 0.15 | | | 0.16 | | | 2.08 | | | 10 | |
2007 | | | 14.56 | | | 0.27 | | | | 1.37 | | | | (0.56 | ) | | | (0.52 | ) | | | (1.05 | ) | | | 14.07 | | 7.38 | | | 198,847 | | 0.16 | | | 0.15 | | | 1.81 | | | 7 | |
2006 | | | 14.01 | | | 0.21 | | | | 1.09 | | | | 0.57 | | | | (0.36 | ) | | | (0.96 | ) | | | 14.56 | | 13.33 | | | 142,218 | | 0.17 | | | 0.21 | | | 1.47 | | | 8 | |
2005 | | | 13.16 | | | 0.18 | | | | 0.52 | | | | 0.62 | | | | (0.31 | ) | | | (0.16 | ) | | | 14.01 | | 9.98 | | | 125,826 | | 0.17 | | | 0.21 | | | 1.38 | | | 5 | |
| † | Amount represents less than $0.005 per share. |
| # | Calculated using the average shares outstanding method. |
| (1) | Recognition of net investment income by the Fund is affected by the timing of the declaration of dividends by the underlying investment companies in which the Fund invests. |
| (2) | Includes dividends paid from the short-term portion of capital gain distributions received from affiliated Funds. (3) Does not include expenses of the investment companies in which the Fund invests. |
| (4) | The ratio excludes expenses waived/reimbursed net of amount recaptured. |
| (5) | The ratio includes expenses waived/reimbursed net of amount recaptured and fees paid indirectly, where applicable; if expenses waived/reimbursed net of amount recaptured and fees paid indirectly were excluded, the ratio would have been lower than the ratio shown. |
See Notes to Financial Statements.
66
Money Market Fund
The Money Market Fund is actively managed and invests in a broad range of high quality, short-term money market instruments denominated exclusively in U.S. dollars. The Fund seeks to maintain, but does not guarantee, a stable per share price of $1.00, while paying monthly dividends based on the daily account value. The Fund returned 0.29% for the one-year period ended December 31, 2009, as compared to a 0.16% return for the Citigroup 3-Month Treasury Bill Index.
Please see page 71 for information regarding specific portfolio allocations. Portfolio holdings are subject to change at any time.
An investment in the Fund is not insured or guaranteed by the Federal Deposit Insurance Corporation or any other governmental agency. Although the Fund seeks to maintain a value of $1.00 per share, it is possible to lose money.
67
Money Market Fund
| | | | | | | | | |
Average Annual Total Returns as of 12/31/09 | |
| | | GS2 Class* | | | GS4 Class* | | | Benchmark** | |
One Year | | 0.47 | % | | 0.29 | % | | 0.16 | % |
Five Year | | 3.31 | % | | 3.12 | % | | 2.88 | % |
Since Inception | | 2.54 | % | | 2.39 | % | | 2.32 | % |
Inception Date | | 08/27/01 | | | 08/27/01 | | | | |
Total Fund Operating Expenses (June 25, 2009 Prospectus)(1) | | 0.20 | % | | 0.40 | % | | | |
| | | | | | |
Yield as of 12/31/09(2) | |
| | | GS2 Class* | | | GS4 Class* | |
7-Day Annualized Yield (Net) | | 0.11 | % | | 0.01 | % |
7-Day Annualized Yield (Gross) | | 0.21 | % | | -0.09 | % |
| (1) | Current information regarding the Fund’s Operating Expenses can be found in the Financial Highlights. |
| (2) | Yield for the Money Market Fund represents the annualization of the Fund’s declared dividends over the period indicated, excluding capital gains distributions. The yield more closely reflects the current earnings of the Fund than the total return. Gross Yield reflects the yield without fee waivers in effect. |
The performance data quoted represents past performance and does not guarantee future results. Current performance may be lower or higher. Performance data current to the most recent month-end may be obtained at www.GuideStoneFunds.org. Investment return will fluctuate so that shares, when redeemed, may be worth more or less than their original cost. The yield for the Money Market Fund represents annualization of the Fund’s declared dividends over the period indicated, excluding capital gains distributions. The 7-day annualized yield more closely reflects the current earnings of the Fund than the total return.

The graph compares the results of a hypothetical $10,000 investment in the GS4 Class of the Fund since August 27, 2001 (commencement of operations), with all dividends and capital gains reinvested, with the Citigroup 3-Month Treasury Bill Index.
| * | These performance figures reflect expense waivers by the Fund’s investment adviser. Without these waivers, performance would have been lower. Performance figures shown do not reflect the deduction of taxes that a shareholder would pay on Fund distributions or the redemption of Fund shares. |
| ** | The Citigroup 3-Month Treasury Bill Index is an unmanaged index that is generally representative of 3-month U.S. Treasury bills, consisting of an average of the last 3-month U.S. Treasury bill issues. |
Unlike a mutual fund, the performance of an index assumes no taxes, transaction costs, management fees or other expenses.
68
| | |
MONEY MARKET FUND SCHEDULE OF INVESTMENTS | | December 31, 2009 |
| | | | | | |
| | | Par | | Value |
AGENCY OBLIGATIONS — 3.8% | | | | | | |
Federal Home Loan Bank | | | | | | |
0.67%, 01/04/10† | | $ | 6,620,000 | | $ | 6,620,000 |
0.76%, 01/04/10† | | | 6,800,000 | | | 6,800,000 |
Federal Home Loan Mortgage Corporation | | | | | | |
0.16%, 02/10/10† | | | 17,000,000 | | | 16,993,126 |
Federal National Mortgage Association | | | | | | |
0.15%, 02/16/10† | | | 15,000,000 | | | 15,003,882 |
| | | | | | |
Total Agency Obligations
(Cost $45,417,008) | | | | | | 45,417,008 |
| | | | | | |
CERTIFICATES OF DEPOSIT — 25.1% | | | | | | |
Abbey National Treasury Services PLC CT | | | | | | |
0.25%, 01/19/10† | | | 10,000,000 | | | 10,000,000 |
0.53%, 01/20/10† | | | 8,500,000 | | | 8,500,000 |
Banco Bilbao Vizcaya Argentaria S.A. NY | | | | | | |
0.32%, 01/11/10† | | | 4,000,000 | | | 4,000,000 |
0.22%, 02/17/10 | | | 7,300,000 | | | 7,300,048 |
0.35%, 04/30/10 | | | 10,000,000 | | | 9,988,431 |
Barclays Bank PLC NY | | | | | | |
0.66%, 02/26/10 | | | 4,000,000 | | | 4,000,000 |
0.58%, 03/15/10 | | | 5,000,000 | | | 5,000,000 |
0.50%, 04/13/10 | | | 5,000,000 | | | 5,000,000 |
BNP Paribas NY | | | | | | |
0.21%, 02/08/10 | | | 12,000,000 | | | 12,000,000 |
0.22%, 02/23/10 | | | 7,000,000 | | | 7,000,000 |
0.23%, 03/15/10 | | | 21,000,000 | | | 21,000,000 |
0.22%, 03/31/10 | | | 10,000,000 | | | 10,000,000 |
Credit Industriel ET Commercial NY | | | | | | |
0.37%, 02/26/10 | | | 5,000,000 | | | 5,000,078 |
0.40%, 03/18/10 | | | 12,000,000 | | | 12,000,126 |
Dexia Credit Local NY | | | | | | |
0.53%, 01/19/10† | | | 14,000,000 | | | 14,000,000 |
DnB NORBank ASA NY | | | | | | |
0.50%, 01/07/10 | | | 10,000,000 | | | 10,000,000 |
KBC Bank NV NY | | | | | | |
0.51%, 01/27/10 | | | 3,000,000 | | | 3,000,000 |
Rabobank Nederland NV NY | | | | | | |
0.28%, 02/04/10† | | | 17,000,000 | | | 17,000,000 |
Royal Bank of Canada NY | | | | | | |
0.23%, 01/12/10† | | | 12,560,000 | | | 12,560,000 |
Royal Bank of Scotland PLC Greenwich CT | | | | | | |
0.52%, 01/19/10† | | | 20,000,000 | | | 20,000,000 |
Societe Generale North America, Inc. NY | | | | | | |
0.53%, 01/07/10 | | | 6,000,000 | | | 6,000,000 |
0.24%, 02/10/10 | | | 2,000,000 | | | 2,000,000 |
State Street Bank and Trust Co. | | | | | | |
0.21%, 01/06/10 | | | 7,000,000 | | | 7,000,000 |
Svenska Handelsbanken NY | | | | | | |
0.20%, 03/22/10 | | | 21,000,000 | | | 21,000,233 |
Toronto Dominion Bank | | | | | | |
0.23%, 01/05/10† | | | 11,000,000 | | | 11,000,000 |
UBS AG Stamford NY | | | | | | |
0.36%, 01/06/10 | | | 15,000,000 | | | 15,000,000 |
0.25%, 02/12/10 | | | 25,000,000 | | | 25,000,000 |
UniCredit SpA NY | | | | | | |
0.31%, 03/11/10 | | | 4,500,000 | | | 4,500,000 |
Westdeutsche Landesbank NY | | | | | | |
0.40%, 01/28/10 | | | 5,000,000 | | | 5,000,000 |
Westpac Banking Corporation NY | | | | | | |
0.28%, 01/19/10† | | | 6,395,000 | | | 6,395,000 |
| | | | | | |
Total Certificates of Deposit
(Cost $300,243,916) | | | | | | 300,243,916 |
| | | | | | |
COMMERCIAL PAPER — 46.3% | | | | | | |
Antalis US Funding Corporation | | | | | | |
0.21%, 01/25/10 | | | 15,000,000 | | | 14,997,500 |
0.24%, 01/25/10 | | | 7,000,000 | | | 6,998,880 |
ANZ National International, Ltd. | | | | | | |
0.33%, 02/01/10 | | | 9,500,000 | | | 9,497,300 |
Atlantis One Funding Corporation | | | | | | |
0.23%, 02/08/10 | | | 25,000,000 | | | 24,993,931 |
0.23%, 02/26/10 | | | 8,000,000 | | | 7,996,889 |
Bank of Nova Scotia | | | | | | |
0.31%, 05/04/10 | | | 1,500,000 | | | 1,500,000 |
Barton Capital Corporation | | | | | | |
0.23%, 02/10/10 | | | 26,000,000 | | | 25,992,489 |
BPCE SA | | | | | | |
0.27%, 01/11/10 | | | 26,000,000 | | | 25,998,050 |
Cancara Asset Securitisation LLC | | | | | | |
0.27%, 02/16/10 | | | 19,000,000 | | | 18,993,445 |
0.27%, 02/17/10 | | | 7,800,000 | | | 7,797,251 |
CBA Delaware Finance, Inc. | | | | | | |
0.20%, 02/12/10 | | | 35,000,000 | | | 34,991,833 |
Danske Corporation | | | | | | |
0.20%, 03/10/10 | | | 5,000,000 | | | 4,998,111 |
DnB NOR Bank ASA | | | | | | |
0.29%, 01/14/10 | | | 15,000,000 | | | 14,998,429 |
0.19%, 03/15/10 | | | 5,000,000 | | | 4,998,074 |
Eksportfinans ASA | | | | | | |
0.29%, 01/11/10† | | | 10,000,000 | | | 10,000,000 |
Erasmus Capital Corporation | | | | | | |
0.06%, 01/05/10 | | | 5,000,000 | | | 4,999,833 |
0.27%, 02/01/10 | | | 20,000,000 | | | 19,995,350 |
ING US Funding LLC | | | | | | |
0.22%, 02/05/10 | | | 35,000,000 | | | 34,992,514 |
0.19%, 02/17/10 | | | 20,000,000 | | | 19,995,039 |
JPMorgan Chase Funding, Inc. | | | | | | |
0.28%, 04/07/10 | | | 10,000,000 | | | 9,992,533 |
KBC Financial Products International, Ltd. | | | | | | |
0.55%, 01/21/10 | | | 3,000,000 | | | 2,999,083 |
Liberty Street Funding LLC | | | | | | |
0.15%, 01/12/10 | | | 9,700,000 | | | 9,699,318 |
0.19%, 01/26/10 | | | 7,000,000 | | | 6,998,882 |
Nieuw Amsterdam Receivables Corporation | | | | | | |
0.28%, 01/05/10 | | | 20,000,000 | | | 19,999,378 |
0.20%, 01/12/10 | | | 6,000,000 | | | 5,999,633 |
Nordea North America | | | | | | |
0.23%, 01/25/10 | | | 15,000,000 | | | 14,997,700 |
Old Line Funding LLC | | | | | | |
0.16%, 01/13/10 | | | 10,000,000 | | | 9,999,233 |
Romulus Funding Corporation | | | | | | |
0.33%, 01/21/10 | | | 5,000,000 | | | 4,999,083 |
Scaldis Capital LLC | | | | | | |
0.20%, 01/12/10 | | | 19,400,000 | | | 19,398,222 |
See Notes to Financial Statements.
69
MONEY MARKET FUND
SCHEDULE OF INVESTMENTS (Continued)
| | | | | | | |
| | | Par | | Value | |
0.21%, 01/15/10 | | $ | 10,000,000 | | $ | 9,998,872 | |
0.30%, 02/17/10 | | | 7,000,000 | | | 6,997,258 | |
0.25%, 03/01/10 | | | 4,000,000 | | | 3,998,361 | |
Societe Generale North America, Inc. | | | | | | | |
0.26%, 01/21/10 | | | 22,000,000 | | | 21,996,822 | |
0.42%, 01/27/10 | | | 4,000,000 | | | 3,998,787 | |
0.22%, 03/15/10 | | | 21,000,000 | | | 20,990,632 | |
Solitaire Funding LLC | | | | | | | |
0.25%, 01/11/10 | | | 9,000,000 | | | 8,999,375 | |
0.31%, 02/02/10 | | | 17,000,000 | | | 16,995,316 | |
0.29%, 02/17/10 | | | 5,800,000 | | | 5,797,804 | |
0.26%, 02/26/10 | | | 10,000,000 | | | 9,995,956 | |
Straight-A Funding LLC | | | | | | | |
0.18%, 02/01/10 | | | 16,000,000 | | | 15,997,245 | |
Surrey Funding Corporation | | | | | | | |
0.15%, 01/12/10 | | | 6,000,000 | | | 5,999,578 | |
Sydney Capital Corporation | | | | | | | |
0.62%, 03/16/10 | | | 4,295,000 | | | 4,289,526 | |
UniCredit Bank Ireland PLC | | | | | | | |
0.30%, 02/26/10 | | | 13,000,000 | | | 12,993,933 | |
0.32%, 03/09/10 | | | 6,000,000 | | | 5,996,427 | |
| | | | | | | |
Total Commercial Paper
(Cost $554,863,875) | | | | | | 554,863,875 | |
| | | | | | | |
MUNICIPAL BONDS — 9.6% | | | | | | | |
City of Houston, Series 2008D-1 Revenue Bond | | | | | | | |
0.38%, 01/07/10† | | | 5,000,000 | | | 5,000,000 | |
City of Philadelphia, Series 2009B General Obligation Bond (LOC-Wachovia Bank N.A.) | | | | | | | |
0.30%, 01/07/10† | | | 10,000,000 | | | 10,000,000 | |
Cook County Series 2002A General Obligation Bond | | | | | | | |
0.40%, 01/06/10† | | | 26,800,000 | | | 26,800,000 | |
New York City Housing Development Corporation, Series J-2-B Multi-Family Housing Revenue Bond | | | | | | | |
0.27%, 01/06/10† | | | 10,100,000 | | | 10,100,000 | |
New York City Industrial Development Agency, New York Law School Project, Series A Revenue Bond (LOC-JPMorgan Chase Bank) | | | | | | | |
0.20%, 01/07/10† | | | 8,000,000 | | | 8,000,000 | |
New York City Municipal Water Finance Authority, Series B Revenue Bond | | | | | | | |
0.20%, 01/07/10† | | | 6,800,000 | | | 6,800,000 | |
New York Housing Finance Agency, Biltmore Tower Housing Project, Series A Revenue Bond | | | | | | | |
0.20%, 01/06/10† | | | 4,000,000 | | | 4,000,000 | |
New York Mortgage Agency, Series 125 Homeowner Mortgage Revenue Bond | | | | | | | |
0.40%, 01/06/10† | | | 6,600,000 | | | 6,600,000 | |
Ohio Housing Finance Agency Series C Residential Mortgage Revenue Bond | | | | | | | |
0.30%, 01/06/10† | | | 10,500,000 | | | 10,500,000 | |
State of Texas, Veterans’ Housing Assistance Program, Series A-2 General Obligation Bond | | | | | | | |
0.25%, 01/06/10† | | | 7,700,000 | | | 7,700,000 | |
Triborough Bridge & Tunnel Authority Series 2003B Revenue Bond | | | | | | | |
0.24%, 01/06/10† | | | 9,000,000 | | | 9,000,000 | |
Wisconsin Housing & Economic Development Authority Series D Home Ownership Revenue Bond | | | | | | | |
0.28%, 01/06/10† | | | 10,050,000 | | | 10,050,000 | |
| | | | | | | |
Total Municipal Bonds
(Cost $114,550,000) | | | | | | 114,550,000 | |
| | | | | | | |
TIME DEPOSITS — 1.2% | | | | | | | |
Citibank N.A. | | | | | | | |
0.09%, 01/04/10 | | | | | | | |
(Cost $14,470,000) | | | 14,470,000 | | | 14,470,000 | |
| | | | | | | |
U.S. TREASURY OBLIGATIONS — 8.0% | | | | | | | |
U.S. Treasury Bills | | | | | | | |
0.23%, 06/10/10W | | | 4,500,000 | | | 4,495,400 | |
0.25%, 06/17/10W | | | 16,000,000 | | | 15,981,444 | |
0.55%, 07/01/10WD | | | 11,000,000 | | | 10,969,859 | |
0.31%, 07/15/10WD | | | 23,000,000 | | | 22,961,379 | |
0.32%, 07/15/10WD | | | 10,000,000 | | | 9,982,938 | |
0.39%, 07/15/10WD | | | 23,600,000 | | | 23,550,784 | |
0.47%, 07/29/10WD | | | 2,500,000 | | | 2,493,178 | |
0.32%, 08/26/10W | | | 5,500,000 | | | 5,488,594 | |
| | | | | | | |
Total U.S. Treasury Obligations
(Cost $95,923,576) | | | | | | 95,923,576 | |
| | | | | | | |
VARIABLE RATE OBLIGATIONS — 6.1% | | | | | | | |
Commonwealth Bank of Australia | | | | | | | |
0.30%, 01/28/10 144A† | | | 6,000,000 | | | 6,000,000 | |
HSBC Bank Middle East Ltd. | | | | | | | |
0.88%, 01/28/10 | | | 5,000,000 | | | 5,000,000 | |
KBC Bank NV | | | | | | | |
0.90%, 01/04/10† | | | 6,690,000 | | | 6,690,000 | |
Procter & Gamble International Funding SCA | | | | | | | |
0.29%, 02/07/10†D | | | 27,000,000 | | | 27,000,000 | |
Rabobank Nederland NV | | | | | | | |
0.28%, 01/07/10 144A† | | | 11,800,000 | | | 11,800,000 | |
Roche Holdings, Inc. | | | | | | | |
1.26%, 02/25/10 144A† | | | 10,500,000 | | | 10,517,542 | |
Westpac Banking Corporation | | | | | | | |
0.28%, 01/21/10† | | | 6,100,000 | | | 6,100,000 | |
| | | | | | | |
Total Variable Rate Obligations
(Cost $73,107,542) | | | | | | 73,107,542 | |
| | | | | | | |
| | |
| | | Shares | | | |
MONEY MARKET FUND — 5.9% | | | | | | | |
Northern Institutional Liquid Assets Portfolio§
(Cost $71,313,750) | | | 71,313,750 | | | 71,313,750 | |
| | | | | | | |
TOTAL INVESTMENTS — 106.0%
(Cost $1,269,889,667) | | | | | | 1,269,889,667 | |
Liabilities in Excess of Other Assets — (6.0)% | | | | | | (71,632,054 | ) |
| | | | | | | |
NET ASSETS — 100.0% | | | | | $ | 1,198,257,613 | |
| | | | | | | |
Please see abbreviation and footnote definitions on page 180.
See Notes to Financial Statements.
70
PORTFOLIO SUMMARY (based on net assets)
| | |
| | | % |
Commercial Paper | | 46.3 |
Certificates of Deposit | | 25.1 |
Municipal Bonds | | 9.6 |
U.S. Treasury Obligations | | 8.0 |
Variable Rate Obligations | | 6.1 |
Money Market Fund | | 5.9 |
Agency Obligations | | 3.8 |
Time Deposits | | 1.2 |
| | |
| | 106.0 |
| | |
FAS 157 DISCLOSURE
The following is a summary of the inputs used, as of December 31, 2009, in valuing the Fund’s investments carried at fair value:
| | | | | | |
Valuation Inputs | | Investments
in
Securities | | Other
Financial
Instruments*** |
| | |
Level 1 — Quoted Prices | | | | | | |
Money Market Fund | | $ | 71,313,750 | | $ | — |
Level 2 — Other Significant Observable Inputs | | | | | | |
Agency Obligations | | | 45,417,008 | | | — |
Certificates Of Deposit | | | 300,243,916 | | | — |
Commercial Paper | | | 554,863,875 | | | — |
Municipal Bonds | | | 114,550,000 | | | — |
Time Deposits | | | 14,470,000 | | | — |
U.S. Treasury Obligations | | | 95,923,576 | | | — |
Variable Rate Obligations | | | 73,107,542 | | | — |
Level 3 — Significant Unobservable Inputs | | | — | | | — |
| | | | | | |
Total | | $ | 1,269,889,667 | | $ | — |
| | | | | | |
| *** | Other financial instruments are derivative instruments not reflected in the Schedule of Investments, such as futures, forwards and swap contracts, which are valued at the unrealized appreciation (depreciation) on the investment. Details of these investments can be found in the Notes to Financial Statements. |
See Notes to Financial Statements.
71
Low-Duration Bond Fund
The Low-Duration Bond Fund invests in a diversified portfolio composed primarily of investment grade fixed income securities with an average dollar-weighted duration normally between one to three years. The Fund significantly outperformed its all-Treasury benchmark, the Merrill Lynch 1-3 Year Treasury Index, for the one-year period ended December 31, 2009 (11.97% versus 0.78%). Non-Treasury fixed income assets continued to gain throughout the year as government policies helped push investors out of cash and toward higher yielding, riskier assets. As a result, the Fund’s benchmark-relative performance was positively impacted by its underweight exposure to Treasuries and overweight exposure to various non-Treasury sectors resulting in solid absolute and benchmark-relative performance for the year.
Please see page 84 for information regarding specific portfolio allocations. Portfolio holdings are subject to change at any time.
72
Low-Duration Bond Fund
| | | | | | | | | |
Average Annual Total Returns as of 12/31/09 | |
| | | GS2 Class* | | | GS4 Class* | | | Benchmark** | |
One Year | | 12.29 | % | | 11.97 | % | | 0.78 | % |
Five Year | | 4.14 | % | | 3.96 | % | | 4.04 | % |
Since Inception | | 3.85 | % | | 3.74 | % | | 3.75 | % |
Inception Date | | 08/27/01 | | | 08/27/01 | | | | |
Total Fund Operating Expenses (June 25, 2009 Prospectus)(1) | | 0.42 | % | | 0.62 | % | | | |
| (1) | Current information regarding the Fund’s Operating Expenses can be found in the Financial Highlights. |
The performance data quoted represents past performance and does not guarantee future results. Current performance may be lower or higher. Performance data current to the most recent month-end may be obtained at www.GuideStoneFunds.org. The investment return and principal value of an investment will fluctuate so that shares, when redeemed, may be worth more or less than their original cost.

The graph compares the results of a hypothetical $10,000 investment in the GS4 Class of the Fund since August 27, 2001 (commencement of operations), with all dividends and capital gains reinvested, with the Merrill Lynch 1-3 Year Treasury Index.
| * | These returns reflect expense waivers by the Fund’s investment adviser. Without these waivers, returns would have been lower. Returns shown do not reflect the deduction of taxes that a shareholder would pay on Fund distributions or the redemption of Fund shares. |
| ** | The Merrill Lynch 1-3 Year Treasury Index is composed of all U.S. Treasury Notes and Bonds with maturities greater than or equal to one year and less than three years. |
Unlike a mutual fund, the performance of an index assumes no taxes, transaction costs, management fees or other expenses.
73
| | |
LOW-DURATION BOND FUND SCHEDULE OF INVESTMENTS | | December 31, 2009 |
| | | | | | |
| | | Par | | Value |
AGENCY OBLIGATIONS — 1.4% | | | | | | |
Federal Home Loan Bank | | | | | | |
5.38%, 06/13/14 | | $ | 895,000 | | $ | 994,719 |
5.25%, 09/12/14 | | | 895,000 | | | 989,315 |
Federal National Mortgage Association | | | | | | |
6.25%, 02/01/11 | | | 1,275,000 | | | 1,339,829 |
2.00%, 02/11/11 | | | 1,780,000 | | | 1,783,225 |
0.88%, 01/12/12 | | | 1,500,000 | | | 1,489,188 |
5.25%, 08/01/12 | | | 1,580,000 | | | 1,687,085 |
3.50%, 08/25/14 | | | 750,000 | | | 755,481 |
Small Business Administration | | | | | | |
6.95%, 11/01/16 | | | 469,216 | | | 502,495 |
| | | | | | |
Total Agency Obligations
(Cost $9,287,006) | | | | | | 9,541,337 |
| | | | | | |
ASSET-BACKED SECURITIES — 11.3% | | | | | | |
Accredited Mortgage Loan Trust | | | | | | |
0.28%, 02/25/37† | | | 535,964 | | | 518,495 |
Ally Auto Receivables Trust | | | | | | |
1.32%, 03/15/12 144A | | | 690,000 | | | 690,635 |
American Express Issuance Trust | | | | | | |
4.02%, 01/18/11 | | | 2,580,000 | | | 2,591,019 |
Americredit Automobile Receivables Trust | | | | | | |
4.24%, 08/06/12† | | | 994,617 | | | 1,012,712 |
Amresco Independence Funding, Inc. | | | | | | |
1.75%, 06/15/26 144A† | | | 268,732 | | | 170,746 |
Asset-Backed Securities Corporation Home Equity | | | | | | |
0.51%, 09/25/34† | | | 100,868 | | | 83,870 |
Bank of America Auto Trust | | | | | | |
1.16%, 02/15/12 144A | | | 740,000 | | | 741,636 |
2.13%, 09/15/13 144A | | | 1,765,000 | | | 1,781,892 |
Bear Stearns Asset-Backed Securities Trust | | | | | | |
0.28%, 11/25/36† | | | 303,514 | | | 275,216 |
1.23%, 10/25/37† | | | 1,187,669 | | | 748,575 |
0.42%, 01/25/47† | | | 1,443,308 | | | 1,271,664 |
BMW Vehicle Lease Trust | | | | | | |
2.04%, 04/15/11 | | | 1,800,000 | | | 1,808,589 |
BNC Mortgage Loan Trust | | | | | | |
0.35%, 11/25/36† | | | 1,030,000 | | | 914,336 |
0.29%, 03/25/37† | | | 1,227,528 | | | 1,180,923 |
Business Loan Express | | | | | | |
2.25%, 01/01/25 144A† | | | 181,206 | | | 99,910 |
Capital Auto Receivables Asset Trust | | | | | | |
1.19%, 12/15/10 144A† | | | 519,663 | | | 519,828 |
Carmax Auto Owner Trust | | | | | | |
5.24%, 07/15/11 | | | 780,355 | | | 785,951 |
CenterPoint Energy Transition Bond Co., LLC | | | | | | |
4.97%, 08/01/14 | | | 2,477,480 | | | 2,581,831 |
Chase Issuance Trust | | | | | | |
0.63%, 09/17/12† | | | 2,500,000 | | | 2,501,012 |
0.68%, 09/17/12† | | | 2,500,000 | | | 2,501,886 |
0.25%, 03/15/13† | | | 1,100,000 | | | 1,095,454 |
Citigroup Mortgage Loan Trust, Inc. | | | | | | |
0.29%, 07/25/45† | | | 2,417,200 | | | 1,742,780 |
Conseco Financial Corporation | | | | | | |
6.04%, 11/01/29 | | | 21,948 | | | 20,539 |
CSAB Mortgage Backed Trust | | | | | | |
5.72%, 09/25/36 STEP | | | 887,990 | | | 554,850 |
Daimler Chrysler Auto Trust | | | | | | |
1.17%, 07/08/11† | | | 441,408 | | | 441,873 |
5.28%, 03/08/13 | | | 2,610,000 | | | 2,727,739 |
FHLMC Structured Pass-Through Securities | | | | | | |
0.49%, 08/25/31† | | | 999,501 | | | 906,009 |
Ford Credit Auto Lease Trust | | | | | | |
2.60%, 05/15/11 144A | | | 830,000 | | | 836,619 |
Ford Credit Auto Owner Trust | | | | | | |
5.07%, 12/15/10 | | | 328,592 | | | 329,763 |
1.13%, 01/15/11† | | | 224,491 | | | 224,614 |
1.21%, 01/15/12 | | | 950,000 | | | 951,857 |
0.27%, 02/15/12† | | | 2,299,427 | | | 2,293,321 |
3.96%, 04/15/12 | | | 3,057,361 | | | 3,110,507 |
7.12%, 02/15/13 144A | | | 925,000 | | | 965,177 |
2.79%, 08/15/13 | | | 2,150,000 | | | 2,191,005 |
2.17%, 10/15/13 | | | 2,525,000 | | | 2,549,980 |
2.98%, 08/15/14 | | | 1,255,000 | | | 1,270,958 |
Fremont Home Loan Trust | | | | | | |
0.28%, 10/25/36† | | | 42,818 | | | 37,980 |
GSAA Trust | | | | | | |
0.55%, 12/25/34† | | | 422,850 | | | 303,891 |
Honda Auto Receivables Owner Trust | | | | | | |
1.50%, 08/15/11 | | | 1,250,000 | | | 1,256,156 |
2.22%, 09/15/11 | | | 1,000,000 | | | 1,006,788 |
2.79%, 01/15/13 | | | 1,520,000 | | | 1,550,794 |
Hyundai Auto Receivables Trust | | | | | | |
1.11%, 02/15/12 | | | 480,000 | | | 480,283 |
IFC SBA Loan-Backed Adjustable Rate Certificate | | | | | | |
1.25%, 01/15/24 144A† | | | 199,345 | | | 148,048 |
JP Morgan Mortgage Acquisition Corporation | | | | | | |
0.28%, 05/25/37† | | | 1,569,791 | | | 1,435,661 |
Long Beach Mortgage Loan Trust | | | | | | |
0.28%, 11/25/36��� | | | 5,805 | | | 5,805 |
Morgan Stanley ABS Capital I | | | | | | |
0.28%, 11/25/36† | | | 483,060 | | | 470,483 |
0.27%, 01/25/37† | | | 487,195 | | | 459,613 |
0.34%, 02/25/37† | | | 1,015,509 | | | 887,783 |
0.29%, 05/25/37† | | | 1,204,497 | | | 953,980 |
Nissan Auto Lease Trust | | | | | | |
2.01%, 04/15/11 | | | 940,000 | | | 945,025 |
1.22%, 09/15/11 | | | 640,000 | | | 641,174 |
PG&E Energy Recovery Funding LLC | | | | | | |
4.37%, 06/25/14 | | | 350,000 | | | 366,403 |
Residential Asset Mortgage Products, Inc. | | | | | | |
0.35%, 12/25/36† | | | 1,392,123 | | | 1,254,784 |
Securitized Asset-Backed Receivables LLC Trust | | | | | | |
0.27%, 01/25/37† | | | 500,242 | | | 461,868 |
SLM Student Loan Trust | | | | | | |
1.38%, 10/25/16† | | | 3,985,000 | | | 4,054,555 |
1.58%, 01/25/18† | | | 3,975,000 | | | 4,086,461 |
Soundview Home Equity Loan Trust | | | | | | |
1.08%, 08/25/31† | | | 1,161,971 | | | 1,043,519 |
See Notes to Financial Statements.
74
| | | | | | |
| | | Par | | Value |
0.35%, 01/25/37† | | $ | 653,610 | | $ | 612,374 |
0.29%, 08/25/37† | | | 611,748 | | | 592,165 |
Structured Asset Investment Loan Trust | | | | | | |
0.28%, 07/25/36† | | | 73,066 | | | 69,446 |
Structured Asset Securities Corporation | | | | | | |
4.90%, 04/25/35† | | | 1,167,970 | | | 774,266 |
0.28%, 10/25/36† | | | 245,773 | | | 233,273 |
Structured Asset Receivables Trust | | | | | | |
0.78%, 04/21/11 144A† | | | 1,435,262 | | | 1,320,441 |
Turquoise Card Backed Securities PLC | | | | | | |
0.27%, 06/15/12† | | | 1,390,000 | | | 1,381,634 |
TXU Electric Delivery Transition Bond Co. LLC | | | | | | |
4.81%, 11/17/14 | | | 2,107,051 | | | 2,208,239 |
Volkswagen Auto Lease Trust | | | | | | |
2.87%, 07/15/11 | | | 684,580 | | | 690,618 |
Wachovia Auto Loan Owner Trust | | | | | | |
5.08%, 04/20/12 144A | | | 1,970,629 | | | 1,993,832 |
Wells Fargo Home Equity Trust | | | | | | |
0.32%, 04/25/37† | | | 939,246 | | | 903,328 |
| | | | | | |
Total Asset-Backed Securities
(Cost $79,875,734) | | | | | | 77,624,441 |
| | | | | | |
CORPORATE BONDS — 21.7% | | | | | | |
3M Co. | | | | | | |
4.50%, 11/01/11 | | | 590,000 | | | 624,864 |
Abbott Laboratories | | | | | | |
5.60%, 05/15/11 | | | 750,000 | | | 795,738 |
AEP Texas Central Transition Funding LLC | | | | | | |
4.98%, 07/01/13 | | | 2,900,000 | | | 3,072,817 |
Agilent Technologies, Inc. | | | | | | |
4.45%, 09/14/12 | | | 610,000 | | | 631,538 |
5.50%, 09/14/15 | | | 310,000 | | | 325,339 |
Allstate Corporation | | | | | | |
6.20%, 05/16/14 | | | 1,275,000 | | | 1,411,397 |
American Electric Power Co., Inc. | | | | | | |
5.25%, 06/01/15 | | | 1,600,000 | | | 1,659,402 |
American Express Bank FSB | | | | | | |
0.29%, 04/26/10† | | | 1,000,000 | | | 997,210 |
American Express Co. | | | | | | |
8.13%, 05/20/19 | | | 1,200,000 | | | 1,424,490 |
American Express Credit Corporation | | | | | | |
0.38%, 10/04/10† | | | 100,000 | | | 99,758 |
0.39%, 06/16/11† | | | 100,000 | | | 98,689 |
American Honda Finance Corporation | | | | | | |
2.60%, 06/29/11 144A† | | | 600,000 | | | 614,430 |
American International Group, Inc. | | | | | | |
0.92%, 07/19/13(E)† | | | 400,000 | | | 443,922 |
8.25%, 08/15/18 144A | | | 1,350,000 | | | 1,269,342 |
AvalonBay Communities, Inc. | | | | | | |
6.13%, 11/01/12D | | | 317,000 | | | 336,589 |
BA Credit Card Trust | | | | | | |
4.15%, 04/19/10(E) | | | 970,000 | | | 1,398,312 |
BAE Systems Holdings Inc | | | | | | |
6.40%, 12/15/11 144A | | | 520,000 | | | 552,517 |
Bank of America Corporation | | | | | | |
4.38%, 12/01/10D | | | 1,290,000 | | | 1,332,039 |
5.38%, 06/15/14D | | | 650,000 | | | 673,887 |
6.50%, 08/01/16 | | | 500,000 | | | 538,382 |
Bank of America NA | | | | | | |
0.80%, 06/23/10† | | | 2,500,000 | | | 2,505,782 |
Bank of New York Mellon Corporation | | | | | | |
0.35%, 03/23/12† | | | 980,000 | | | 974,146 |
4.30%, 05/15/14D | | | 790,000 | | | 832,272 |
BB&T Corporation | | | | | | |
3.38%, 09/25/13D | | | 400,000 | | | 403,503 |
Bear Stearns Cos. LLC | | | | | | |
6.95%, 08/10/12 | | | 1,165,000 | | | 1,302,409 |
BellSouth Corporation | | | | | | |
4.75%, 11/15/12 | | | 1,300,000 | | | 1,389,077 |
Berkshire Hathaway Finance Corporation | | | | | | |
4.00%, 04/15/12D | | | 3,495,000 | | | 3,664,651 |
Board of Trustees of The Leland Stanford Junior University | | | | | | |
3.63%, 05/01/14D | | | 425,000 | | | 437,676 |
Bottling Group LLC | | | | | | |
6.95%, 03/15/14D | | | 1,320,000 | | | 1,520,204 |
Burlington Northern Santa Fe Corporation | | | | | | |
6.75%, 07/15/11 | | | 600,000 | | | 646,391 |
7.00%, 02/01/14D | | | 365,000 | | | 414,608 |
CareFusion Corporation | | | | | | |
4.13%, 08/01/12 144AD | | | 1,720,000 | | | 1,774,261 |
Caterpillar Financial Services Corporation | | | | | | |
5.75%, 02/15/12D | | | 575,000 | | | 620,963 |
Cellco Partnership/Verizon Wireless Capital LLC | | | | | | |
3.75%, 05/20/11 | | | 4,325,000 | | | 4,461,289 |
5.25%, 02/01/12D | | | 2,585,000 | | | 2,743,065 |
5.55%, 02/01/14D | | | 400,000 | | | 434,508 |
Cisco Systems, Inc. | | | | | | |
5.25%, 02/22/11D | | | 750,000 | | | 787,213 |
Citibank Credit Card Issuance Trust | | | | | | |
5.38%, 04/11/11(E) | | | 1,590,000 | | | 2,335,710 |
Citigroup Funding, Inc. | | | | | | |
1.33%, 05/07/10† | | | 6,000,000 | | | 6,014,310 |
1.38%, 05/05/11 | | | 610,000 | | | 614,103 |
2.25%, 12/10/12D | | | 1,050,000 | | | 1,058,989 |
Comcast Cable Communications LLC | | | | | | |
6.75%, 01/30/11 | | | 1,060,000 | | | 1,118,980 |
ConocoPhillips | | | | | | |
4.75%, 10/15/12 | | | 2,225,000 | | | 2,385,730 |
4.75%, 02/01/14 | | | 400,000 | | | 429,875 |
Consumers Energy Co. | | | | | | |
5.38%, 04/15/13 | | | 475,000 | | | 510,409 |
COX Communications, Inc. | | | | | | |
7.75%, 11/01/10 | | | 1,225,000 | | | 1,282,667 |
7.13%, 10/01/12D | | | 420,000 | | | 466,844 |
CSX Corporation | | | | | | |
6.75%, 03/15/11 | | | 575,000 | | | 610,871 |
5.75%, 03/15/13 | | | 1,225,000 | | | 1,326,183 |
CVS Caremark Corporation | | | | | | |
0.56%, 06/01/10† | | | 1,380,000 | | | 1,380,738 |
5.75%, 08/15/11 | | | 975,000 | | | 1,038,656 |
See Notes to Financial Statements.
75
LOW-DURATION BOND FUND
SCHEDULE OF INVESTMENTS (Continued)
| | | | | | |
| | | Par | | Value |
Daimler Finance NA LLC | | | | | | |
7.30%, 01/15/12 | | $ | 350,000 | | $ | 380,680 |
Dominion Resources, Inc. | | | | | | |
1.30%, 06/17/10† | | | 900,000 | | | 904,038 |
Dow Chemical Co. | | | | | | |
4.85%, 08/15/12D | | | 1,500,000 | | | 1,577,409 |
Dr Pepper Snapple Group, Inc. | | | | | | |
1.70%, 12/21/11 | | | 620,000 | | | 619,675 |
Duke Energy Ohio, Inc. | | | | | | |
5.70%, 09/15/12 | | | 1,375,000 | | | 1,492,161 |
Eli Lilly & Co. | | | | | | |
3.55%, 03/06/12 | | | 200,000 | | | 208,246 |
Enterprise Products Operating LLC | | | | | | |
4.95%, 06/01/10 | | | 1,080,000 | | | 1,094,822 |
7.50%, 02/01/11 | | | 600,000 | | | 635,908 |
6.13%, 02/01/13D | | | 1,005,000 | | | 1,075,859 |
6.38%, 02/01/13 | | | 750,000 | | | 812,127 |
Equifax, Inc. | | | | | | |
4.45%, 12/01/14 | | | 140,000 | | | 140,856 |
Exelon Generation Co. LLC | | | | | | |
5.35%, 01/15/14 | | | 808,000 | | | 853,772 |
Express Scripts, Inc. | | | | | | |
5.25%, 06/15/12D | | | 550,000 | | | 584,766 |
Florida Power Corporation | | | | | | |
6.65%, 07/15/11 | | | 600,000 | | | 643,369 |
FPL Group Capital, Inc. | | | | | | |
5.63%, 09/01/11 | | | 475,000 | | | 505,472 |
General Electric Capital Corporation | | | | | | |
6.13%, 02/22/11 | | | 1,230,000 | | | 1,300,096 |
2.63%, 12/28/12‡‡ | | | 1,400,000 | | | 1,426,797 |
5.90%, 05/13/14D | | | 460,000 | | | 502,069 |
3.75%, 11/14/14 | | | 660,000 | | | 659,573 |
6.50%, 09/15/67 144A(U)† | | | 1,600,000 | | | 2,132,058 |
GMAC, Inc. | | | | | | |
1.75%, 10/30/12 | | | 2,000,000 | | | 1,988,340 |
Goldman Sachs Group, Inc. | | | | | | |
1.63%, 07/15/11D | | | 400,000 | | | 403,730 |
3.63%, 08/01/12 | | | 1,290,000 | | | 1,329,907 |
6.00%, 05/01/14D | | | 600,000 | | | 656,888 |
Hewlett-Packard Co. | | | | | | |
4.25%, 02/24/12D | | | 486,000 | | | 510,043 |
Hospira, Inc. | | | | | | |
5.55%, 03/30/12 | | | 555,000 | | | 591,868 |
HSBC Finance Corporation | | | | | | |
0.33%, 03/12/10† | | | 1,095,000 | | | 1,094,397 |
0.52%, 05/10/10† | | | 2,600,000 | | | 2,599,405 |
1.78%, 10/20/10† | | | 600,000 | | | 603,445 |
International Business Machines Corporation | | | | | | |
2.10%, 05/06/13D | | | 1,250,000 | | | 1,248,500 |
John Deere Capital Corporation | | | | | | |
0.77%, 08/19/10† | | | 500,000 | | | 501,380 |
0.98%, 01/18/11† | | | 760,000 | | | 764,862 |
JPMorgan Chase & Co. | | | | | | |
5.60%, 06/01/11 | | | 520,000 | | | 550,621 |
Kraft Foods, Inc. | | | | | | |
5.63%, 08/11/10D | | | 495,000 | | | 509,214 |
6.00%, 02/11/13 | | | 950,000 | | | 1,019,510 |
Lehman Brothers Holdings, Inc. | | | | | | |
6.63%, 01/18/12# | | | 600,000 | | | 120,000 |
6.75%, 12/28/17# | | | 2,600,000 | | | 780 |
6.88%, 05/02/18# | | | 2,400,000 | | | 510,000 |
Merrill Lynch & Co., Inc. | | | | | | |
2.52%, 05/12/10† | | | 400,000 | | | 403,299 |
Metropolitan Life Global Funding I | | | | | | |
0.85%, 09/17/10 144A†D | | | 2,300,000 | | | 2,302,314 |
2.16%, 06/10/11 144A† | | | 1,625,000 | | | 1,658,181 |
2.88%, 09/17/12 144A | | | 2,225,000 | | | 2,243,908 |
Microsoft Corporation | | | | | | |
2.95%, 06/01/14D | | | 900,000 | | | 910,576 |
MidAmerican Energy Co. | | | | | | |
5.13%, 01/15/13D | | | 515,000 | | | 548,446 |
MidAmerican Energy Holdings Co. | | | | | | |
5.88%, 10/01/12 | | | 550,000 | | | 599,382 |
Midamerican Funding LLC | | | | | | |
6.75%, 03/01/11 | | | 600,000 | | | 626,846 |
Morgan Stanley | | | | | | |
2.37%, 05/14/10† | | | 4,400,000 | | | 4,432,032 |
6.75%, 04/15/11 | | | 1,430,000 | | | 1,515,528 |
2.25%, 03/13/12 | | | 2,030,000 | | | 2,063,121 |
6.00%, 05/13/14 | | | 1,155,000 | | | 1,243,050 |
4.20%, 11/20/14D | | | 420,000 | | | 420,753 |
Nabors Industries, Inc. | | | | | | |
6.15%, 02/15/18D | | | 1,650,000 | | | 1,717,647 |
9.25%, 01/15/19 | | | 2,300,000 | | | 2,821,364 |
New York Life Global Funding | | | | | | |
4.65%, 05/09/13 144A | | | 275,000 | | | 289,075 |
Novartis Capital Corporation | | | | | | |
4.13%, 02/10/14 | | | 210,000 | | | 220,955 |
Oracle Corporation | | | | | | |
5.00%, 01/15/11D | | | 1,040,000 | | | 1,081,773 |
Overseas Private Investment Corporation | | | | | | |
48.09%, 07/12/10W | | | 1,760,216 | | | 1,878,279 |
9.05%, 07/12/12W | | | 2,100,000 | | | 2,367,936 |
5.75%, 04/15/14 | | | 1,600,000 | | | 1,818,415 |
Pacific Gas & Electric Co. | | | | | | |
1.21%, 06/10/10† | | | 1,000,000 | | | 1,004,130 |
Pfizer, Inc. | | | | | | |
4.45%, 03/15/12 | | | 700,000 | | | 740,743 |
3.63%, 06/03/13(E) | | | 100,000 | | | 148,143 |
Praxair, Inc. | | | | | | |
1.75%, 11/15/12 | | | 330,000 | | | 327,037 |
Procter & Gamble Co. | | | | | | |
4.60%, 01/15/14D | | | 535,000 | | | 570,179 |
3.50%, 02/15/15D | | | 200,000 | | | 204,841 |
Progress Energy, Inc. | | | | | | |
7.10%, 03/01/11 | | | 1,120,000 | | | 1,185,766 |
Prudential Financial, Inc. | | | | | | |
3.63%, 09/17/12D | | | 945,000 | | | 959,593 |
Roche Holdings, Inc. | | | | | | |
4.50%, 03/01/12 144AD | | | 2,296,000 | | | 2,412,770 |
Southeast Supply Header LLC | | | | | | |
4.85%, 08/15/14 144A | | | 945,000 | | | 965,884 |
Sprint Capital Corporation | | | | | | |
8.38%, 03/15/12 | | | 1,000,000 | | | 1,040,000 |
Standard Chartered Bank | | | | | | |
0.67%, 11/16/11† | | | 1,340,000 | | | 1,340,033 |
TD Ameritrade Holding Corporation | | | | | | |
4.15%, 12/01/14 | | | 660,000 | | | 651,427 |
Thermo Fisher Scientific, Inc. | | | | | | |
2.15%, 12/28/12 144A | | | 370,000 | | | 365,153 |
See Notes to Financial Statements.
76
| | | | | | |
| | | Par | | Value |
TIAA Global Markets, Inc. | | | | | | |
5.13%, 10/10/12 144A | | $ | 235,000 | | $ | 253,392 |
Time Warner Cable, Inc. | | | | | | |
5.40%, 07/02/12 | | | 1,325,000 | | | 1,416,497 |
Union Pacific Corporation | | | | | | |
6.13%, 01/15/12 | | | 365,000 | | | 396,971 |
United Parcel Service, Inc. | | | | | | |
4.50%, 01/15/13 | | | 1,410,000 | | | 1,500,172 |
Verizon Global Funding Corporation | | | | | | |
7.25%, 12/01/10 | | | 675,000 | | | 713,482 |
6.88%, 06/15/12D | | | 445,000 | | | 492,950 |
Wachovia Corporation | | | | | | |
0.37%, 03/15/11† | | | 540,000 | | | 538,730 |
5.30%, 10/15/11 | | | 394,000 | | | 418,417 |
Wells Fargo & Co. | | | | | | |
3.75%, 10/01/14 | | | 360,000 | | | 359,326 |
Western Corporate Federal Credit Union | | | | | | |
1.75%, 11/02/12 | | | 1,875,000 | | | 1,867,860 |
XTO Energy, Inc. | | | | | | |
5.00%, 08/01/10 | | | 1,020,000 | | | 1,044,968 |
7.50%, 04/15/12 | | | 475,000 | | | 529,921 |
| | | | | | |
Total Corporate Bonds
(Cost $151,370,423) | | | | | | 148,950,653 |
| | | | | | |
FOREIGN BONDS — 15.4% | | | | | | |
Australia — 1.9% | | | | | | |
Australia & New Zealand Banking Group, Ltd. | | | | | | |
0.88%, 08/04/11 144A† | | | 600,000 | | | 600,359 |
0.53%, 06/18/12 144A† | | | 1,575,000 | | | 1,564,051 |
BHP Billiton Finance USA, Ltd. | | | | | | |
5.50%, 04/01/14 | | | 200,000 | | | 219,575 |
Commonwealth Bank of Australia | | | | | | |
2.40%, 01/12/12 144AD | | | 1,004,000 | | | 1,029,919 |
3.75%, 10/15/14 144A | | | 720,000 | | | 722,534 |
Macquarie Bank, Ltd. | | | | | | |
4.10%, 12/17/13 144A | | | 3,410,000 | | | 3,586,522 |
Macquarie Group, Ltd. | | | | | | |
7.30%, 08/01/14 144AD | | | 300,000 | | | 329,914 |
National Australia Bank, Ltd. | | | | | | |
0.73%, 02/08/10 144A† | | | 1,600,000 | | | 1,600,205 |
Suncorp-Metway, Ltd. | | | | | | |
0.63%, 12/17/10 144A† | | | 2,405,000 | | | 2,411,010 |
Westpac Banking Corporation | | | | | | |
2.25%, 11/19/12 | | | 620,000 | | | 618,965 |
Woodside Finance, Ltd. | | | | | | |
4.50%, 11/10/14 144A | | | 490,000 | | | 494,903 |
| | | | | | |
| | | | | | 13,177,957 |
| | | | | | |
Bermuda — 0.2% | | | | | | |
Ingersoll-Rand Global Holding Co., Ltd. | | | | | | |
1.77%, 08/13/10† | | | 545,000 | | | 544,556 |
9.50%, 04/15/14 | | | 880,000 | | | 1,052,491 |
| | | | | | |
| | | | | | 1,597,047 |
| | | | | | |
Canada — 1.7% | | | | | | |
CDP Financial, Inc. | | | | | | |
3.00%, 11/25/14 144A | | | 735,000 | | | 718,027 |
Devon Financing Corporation | | | | | | |
6.88%, 09/30/11 | | | 1,570,000 | | | 1,706,219 |
Export Development Canada | | | | | | |
2.38%, 03/19/12 | | | 1,410,000 | | | 1,435,326 |
Province of Ontario | | | | | | |
0.72%, 05/22/12† | | | 1,475,000 | | | 1,490,672 |
1.88%, 11/19/12 | | | 775,000 | | | 767,812 |
4.10%, 06/16/14 | | | 2,195,000 | | | 2,293,059 |
Rogers Communications, Inc. | | | | | | |
6.25%, 06/15/13 | | | 1,300,000 | | | 1,425,193 |
6.38%, 03/01/14 | | | 320,000 | | | 354,628 |
TELUS Corporation | | | | | | |
8.00%, 06/01/11 | | | 728,000 | | | 788,400 |
Toronto-Dominion Bank | | | | | | |
1.52%, 09/10/10(E)† | | | 550,000 | | | 792,361 |
| | | | | | |
| | | | | | 11,771,697 |
| | | | | | |
Cayman Islands — 0.1% | | | | | | |
Petroleum Export, Ltd. | | | | | | |
4.62%, 06/15/10 144A | | | 188,889 | | | 186,051 |
4.63%, 06/15/10 144A | | | 188,889 | | | 186,061 |
| | | | | | |
| | | | | | 372,112 |
| | | | | | |
Denmark — 0.3% | | | | | | |
FIH Erhvervsbank A/S | | | | | | |
2.45%, 08/17/12 144A | | | 450,000 | | | 453,066 |
1.75%, 12/06/12 144A | | | 1,735,000 | | | 1,718,252 |
| | | | | | |
| | | | | | 2,171,318 |
| | | | | | |
France — 0.8% | | | | | | |
BNP Paribas | | | | | | |
1.26%, 06/11/12† | | | 600,000 | | | 608,009 |
French Government Bond | | | | | | |
3.75%, 10/25/19(E) | | | 2,700,000 | | | 3,905,028 |
Societe Financement de l’Economie Francaise | | | | | | |
2.38%, 03/26/12 144A | | | 1,155,000 | | | 1,170,184 |
| | | | | | |
| | | | | | 5,683,221 |
| | | | | | |
Germany — 1.9% | | | | | | |
Bundesrepublik Deutschland | | | | | | |
3.75%, 01/04/19(E) | | | 5,100,000 | | | 7,560,637 |
Deutsche Bank AG | | | | | | |
3.88%, 08/18/14 | | | 700,000 | | | 715,562 |
Federal Republic of Germany | | | | | | |
1.50%, 09/21/12 144AD | | | 3,300,000 | | | 3,277,065 |
Landwirtschaftliche Rentenbank | | | | | | |
4.13%, 07/15/13D | | | 1,315,000 | | | 1,387,576 |
| | | | | | |
| | | | | | 12,940,840 |
| | | | | | |
India — 0.1% | | | | | | |
ICICI Bank, Ltd. | | | | | | |
5.50%, 03/25/15 144AD | | | 790,000 | | | 787,169 |
| | | | | | |
Italy — 0.4% | | | | | | |
Atlantia SpA | | | | | | |
1.17%, 06/09/11(E)† | | | 900,000 | | | 1,290,049 |
Telecom Italia SpA | | | | | | |
1.25%, 12/06/12(E)† | | | 900,000 | | | 1,262,565 |
| | | | | | |
| | | | | | 2,552,614 |
| | | | | | |
Japan — 0.1% | | | | | | |
Japan Finance Corporation | | | | | | |
2.00%, 06/24/11 | | | 500,000 | | | 506,212 |
| | | | | | |
See Notes to Financial Statements.
77
LOW-DURATION BOND FUND
SCHEDULE OF INVESTMENTS (Continued)
| | | | | | |
| | | Par | | Value |
Luxembourg — 0.6% | | | | | | |
Covidien International Finance SA | | | | | | |
5.45%, 10/15/12 | | $ | 1,165,000 | | $ | 1,261,428 |
Gaz Capital SA | | | | | | |
9.25%, 04/23/19D | | | 2,300,000 | | | 2,576,000 |
| | | | | | |
| | | | | | 3,837,428 |
| | | | | | |
Mexico — 0.2% | | | | | | |
Petroleos Mexicanos | | | | | | |
4.88%, 03/15/15 144AD | | | 1,250,000 | | | 1,241,487 |
| | | | | | |
Netherlands — 2.5% | | | | | | |
Achmea Hypotheekbank NV | | | | | | |
3.20%, 11/03/14 144A | | | 790,000 | | | 789,346 |
Deutsche Telekom International Finance BV | | | | | | |
8.50%, 06/15/10 | | | 3,220,000 | | | 3,327,999 |
EDP Finance BV | | | | | | |
5.38%, 11/02/12 144A | | | 550,000 | | | 592,653 |
Fortis Bank Nederland NV | | | | | | |
1.25%, 06/10/11(E) | | | 600,000 | | | 861,832 |
Globaldrive BV | | | | | | |
4.00%, 10/20/16 | | | 2,128,723 | | | 3,080,922 |
ING Bank NV | | | | | | |
2.63%, 02/09/12 144A | | | 1,200,000 | | | 1,226,909 |
Koninklijke KPN NV | | | | | | |
8.00%, 10/01/10D | | | 1,430,000 | | | 1,501,773 |
LeasePlan Corporation NV | | | | | | |
3.00%, 05/07/12 144A | | | 1,525,000 | | | 1,567,249 |
Nederlandse Waterschapsbank NV | | | | | | |
4.63%, 07/25/11(E) | | | 1,000,000 | | | 1,500,968 |
Shell International Finance BV | | | | | | |
4.00%, 03/21/14 | | | 2,650,000 | | | 2,768,034 |
| | | | | | |
| | | | | | 17,217,685 |
| | | | | | |
New Zealand — 0.4% | | | | | | |
ANZ National International, Ltd. | | | | | | |
6.20%, 07/19/13 144A | | | 750,000 | | | 808,044 |
Westpac Securities NZ, Ltd. | | | | | | |
2.50%, 05/25/12 144A | | | 1,800,000 | | | 1,826,111 |
| | | | | | |
| | | | | | 2,634,155 |
| | | | | | |
Norway — 0.5% | | | | | | |
Eksportfinans ASA | | | | | | |
5.00%, 02/14/12 | | | 1,125,000 | | | 1,199,709 |
Statoil ASA | | | | | | |
3.88%, 04/15/14 | | | 1,385,000 | | | 1,440,691 |
2.90%, 10/15/14D | | | 650,000 | | | 648,028 |
| | | | | | |
| | | | | | 3,288,428 |
| | | | | | |
Supranational — 0.4% | | | | | | |
European Investment Bank | | | | | | |
4.75%, 04/15/11(E) | | | 1,500,000 | | | 2,249,310 |
3.13%, 06/04/14 | | | 600,000 | | | 607,581 |
| | | | | | |
| | | | | | 2,856,891 |
| | | | | | |
Sweden — 0.2% | | | | | | |
Svenska Handelsbanken AB | | | | | | |
2.88%, 09/14/12 144A | | | 1,575,000 | | | 1,585,735 |
| | | | | | |
Switzerland — 0.5% | | | | | | |
Credit Suisse | | | | | | |
3.45%, 07/02/12 | | | 1,000,000 | | | 1,029,215 |
UBS AG | | | | | | |
1.20%, 05/05/10† | | | 500,000 | | | 500,656 |
1.17%, 06/19/10† | | | 1,550,000 | | | 1,539,290 |
| | | | | | |
| | | | | | 3,069,161 |
| | | | | | |
United Kingdom — 2.6% | | | | | | |
Bank of England PLC | | | | | | |
2.38%, 03/19/12 144A | | | 600,000 | | | 612,744 |
Barclays Bank PLC | | | | | | |
4.25%, 10/27/11(E) | | | 1,000,000 | | | 1,500,637 |
2.70%, 03/05/12 144A | | | 740,000 | | | 756,492 |
5.45%, 09/12/12D | | | 1,050,000 | | | 1,136,221 |
5.93%, 12/15/49 144A† | | | 3,800,000 | | | 2,888,000 |
BP Capital Markets PLC | | | | | | |
5.25%, 11/07/13 | | | 525,000 | | | 572,345 |
3.63%, 05/08/14 | | | 600,000 | | | 614,417 |
3.88%, 03/10/15 | | | 1,100,000 | | | 1,131,476 |
Lloyds TSB Bank PLC | | | | | | |
0.87%, 06/09/11(E) | | | 400,000 | | | 573,746 |
National Grid PLC | | | | | | |
1.09%, 01/18/12(E)† | | | 850,000 | | | 1,205,167 |
Nationwide Building Society | | | | | | |
0.45%, 05/17/12 144A†D | | | 1,100,000 | | | 1,097,902 |
Royal Bank of Scotland PLC | | | | | | |
2.63%, 05/11/12 144A | | | 1,100,000 | | | 1,122,080 |
Royal Bank of Scotland Group PLC | | | | | | |
0.51%, 03/30/12 144A† | | | 2,700,000 | | | 2,693,366 |
Vodafone Group PLC | | | | | | |
0.54%, 02/27/12† | | | 950,000 | | | 947,033 |
4.15%, 06/10/14D | | | 1,040,000 | | | 1,071,014 |
| | | | | | |
| | | | | | 17,922,640 |
| | | | | | |
Total Foreign Bonds
(Cost $104,414,240) | | | | | | 105,213,797 |
| | | | | | |
MORTGAGE-BACKED SECURITIES — 37.5% | | | | | | |
Adjustable Rate Mortgage Trust | | | | | | |
5.89%, 03/25/37 | | | 3,196,701 | | | 1,712,799 |
American Home Mortgage Investment Trust | | | | | | |
2.70%, 10/25/34† | | | 1,013,490 | | | 756,639 |
American Home Mortgage Assets | | | | | | |
0.50%, 11/25/35† | | | 667,511 | | | 355,154 |
1.46%, 11/25/46† | | | 1,353,465 | | | 706,525 |
Arran Residential Mortgages Funding PLC | | | | | | |
0.28%, 09/16/36† | | | 1,526,727 | | | 1,517,690 |
0.26%, 09/20/36† | | | 80,121 | | | 79,303 |
Banc of America Commercial Mortgage, Inc. | | | | | | |
3.88%, 09/11/36 | | | 994,097 | | | 1,005,466 |
Banc of America Funding Corporation | | | | | | |
6.09%, 01/20/47 | | | 1,145,296 | | | 808,113 |
Banc of America Mortgage Securities, Inc. | | | | | | |
6.50%, 10/25/31 | | | 294,886 | | | 288,625 |
Bear Stearns Adjustable Rate Mortgage Trust | | | | | | |
3.77%, 01/25/34 | | | 443,382 | | | 392,647 |
4.57%, 07/25/34† | | | 941,634 | | | 825,466 |
3.87%, 10/25/34† | | | 452,663 | | | 339,857 |
2.94%, 03/25/35† | | | 1,707,572 | | | 1,494,263 |
See Notes to Financial Statements.
78
| | | | | | |
| | | Par | | Value |
Bear Stearns Alt-A Trust | | | | | | |
0.97%, 11/25/34† | | $ | 482,097 | | $ | 336,542 |
5.38%, 09/25/35 | | | 706,386 | | | 472,565 |
Bear Stearns Commercial Mortgage Securities | | | | | | |
0.34%, 03/15/19 144A† | | | 1,332,054 | | | 1,164,154 |
4.48%, 06/11/41 | | | 600,000 | | | 600,727 |
4.03%, 02/13/46 | | | 49,411 | | | 49,513 |
Commercial Mortgage Pass-Through Certificates | | | | | | |
7.42%, 08/15/33 | | | 764,370 | | | 768,869 |
Countrywide Alternative Loan Trust | | | | | | |
6.00%, 10/25/32 | | | 135,008 | | | 118,680 |
5.50%, 07/01/35 | | | 706,507 | | | 635,025 |
Countrywide Home Loan Mortgage Pass-Through Trust | | | | | | |
0.77%, 02/25/35† | | | 240,073 | | | 157,981 |
Credit Suisse First Boston Mortgage Securities Corp | | | | | | |
5.44%, 09/15/34 | | | 2,072,470 | | | 2,135,874 |
Deutsche ALT-A Securities, Inc. | | | | | | |
5.87%, 10/25/36 STEP | | | 790,745 | | | 434,217 |
5.89%, 10/25/36 STEP | | | 790,745 | | | 434,584 |
DLJ Commercial Mortgage Corporation | | | | | | |
7.18%, 11/10/33 | | | 1,557,509 | | | 1,586,540 |
Federal Home Loan Mortgage Corporation | | | | | | |
15.25%, 08/01/11 | | | 505 | | | 561 |
5.38%, 09/15/11 | | | 1,996,865 | | | 2,070,682 |
5.00%, 11/15/16 | | | 548,000 | | | 558,078 |
3.50%, 12/01/18 | | | 2,069,623 | | | 2,025,879 |
10.75%, 02/01/19 | | | 59,922 | | | 61,849 |
0.46%, 02/15/19† | | | 812,009 | | | 812,311 |
6.00%, 11/01/22 | | | 1,276,229 | | | 1,365,136 |
3.33%, 07/01/27† | | | 21,749 | | | 22,328 |
0.58%, 12/15/30† | | | 598,478 | | | 596,753 |
2.83%, 06/01/33† | | | 1,829,137 | | | 1,862,813 |
6.00%, 07/01/33 | | | 889,996 | | | 953,825 |
3.48%, 04/01/34† | | | 1,498,401 | | | 1,542,000 |
2.75%, 10/01/34† | | | 490,430 | | | 504,910 |
3.89%, 08/01/35† | | | 1,617,922 | | | 1,681,134 |
3.17%, 10/01/35† | | | 1,255,288 | | | 1,290,291 |
5.83%, 04/01/36† | | | 2,525,195 | | | 2,685,289 |
Federal Housing Authority | | | | | | |
7.43%, 09/01/22 | | | 1,473 | | | 1,458 |
Federal National Mortgage Association | | | | | | |
5.00%, 01/01/18 | | | 2,361,774 | | | 2,489,010 |
5.50%, 12/01/18 | | | 841,673 | | | 894,907 |
4.00%, 11/25/19 | | | 662,213 | | | 678,598 |
3.59%, 12/01/24† | | | 70,245 | | | 71,581 |
9.00%, 05/01/25 | | | 74,003 | | | 85,119 |
9.00%, 07/01/25 | | | 81,831 | | | 94,037 |
5.50%, 11/25/27 | | | 1,673,860 | | | 1,730,109 |
4.50%, 01/13/30 | | | 5,100,000 | | | 5,090,438 |
0.83%, 05/25/30† | | | 1,741,866 | | | 1,728,009 |
0.89%, 05/25/30† | | | 1,377,289 | | | 1,367,939 |
3.30%, 09/01/31† | | | 62,230 | | | 63,317 |
3.31%, 03/25/32 | | | 272,962 | | | 248,311 |
5.50%, 10/01/32 | | | 1,370,599 | | | 1,442,056 |
3.38%, 04/01/33† | | | 341,109 | | | 353,777 |
5.50%, 05/01/33 | | | 10,790,259 | | | 11,341,012 |
3.31%, 06/01/33† | | | 190,041 | | | 194,257 |
5.50%, 06/01/33 | | | 16,417 | | | 17,255 |
5.50%, 07/01/33 | | | 15,384 | | | 16,169 |
5.50%, 08/01/33 | | | 7,392,314 | | | 7,769,631 |
3.31%, 10/01/33† | | | 725,483 | | | 749,885 |
5.50%, 10/01/33 | | | 84,748 | | | 89,074 |
3.24%, 12/01/33† | | | 216,733 | | | 222,146 |
5.50%, 04/01/34 | | | 3,532,420 | | | 3,716,585 |
4.50%, 06/01/34 | | | 55,482 | | | 55,817 |
3.15%, 09/01/34† | | | 529,661 | | | 538,981 |
3.19%, 09/01/34† | | | 761,248 | | | 774,729 |
4.50%, 09/01/34 | | | 211,926 | | | 212,942 |
2.78%, 10/01/34† | | | 852,963 | | | 870,201 |
3.00%, 10/01/34† | | | 910,365 | | | 926,052 |
4.50%, 12/01/34 | | | 64,483 | | | 64,792 |
4.50%, 02/01/35 | | | 2,312,035 | | | 2,318,778 |
4.50%, 03/01/35 | | | 1,314,793 | | | 1,318,628 |
4.50%, 04/01/35 | | | 2,309,362 | | | 2,316,098 |
4.50%, 05/01/35 | | | 759,114 | | | 761,328 |
4.50%, 06/01/35 | | | 59,365 | | | 59,538 |
5.00%, 06/01/35 | | | 28,258,065 | | | 29,054,296 |
4.50%, 08/01/35 | | | 1,433,833 | | | 1,438,015 |
4.69%, 08/01/35† | | | 4,337,648 | | | 4,512,175 |
4.40%, 09/01/35† | | | 1,614,532 | | | 1,681,543 |
4.50%, 09/01/35 | | | 900,088 | | | 902,714 |
4.50%, 10/01/35 | | | 566,198 | | | 567,849 |
5.33%, 10/01/35† | | | 1,607,193 | | | 1,695,196 |
4.50%, 11/01/35 | | | 617,987 | | | 619,790 |
4.85%, 12/01/35† | | | 107,133 | | | 109,469 |
5.00%, 05/01/36 | | | 1,965,274 | | | 2,020,650 |
6.00%, 11/01/36 | | | 1,020,956 | | | 1,084,447 |
5.00%, 12/01/36 | | | 12,842,006 | | | 13,203,857 |
6.00%, 09/01/37 | | | 1,013,311 | | | 1,076,326 |
5.50%, 11/01/37 | | | 8,541,522 | | | 8,977,496 |
0.99%, 01/25/40† | | | 4,000,000 | | | 3,973,041 |
1.83%, 07/01/44† | | | 282,403 | | | 277,484 |
0.49%, 09/15/44† | | | 15,214 | | | 15,165 |
FHLMC Multifamily Structured Pass-Through Certificates | | | | | | |
2.23%, 07/25/13 | | | 1,144,717 | | | 1,151,707 |
3.61%, 06/25/14 | | | 1,095,000 | | | 1,119,645 |
FHLMC Structured Pass-Through Securities | | | | | | |
1.24%, 05/25/43† | | | 1,256,343 | | | 1,232,989 |
2.03%, 07/25/44† | | | 2,161,228 | | | 2,058,408 |
First Horizon Alternative Mortgage Securities | | | | | | |
2.60%, 06/25/34† | | | 723,817 | | | 570,845 |
GE Capital Commercial Mortgage Corporation | | | | | | |
5.56%, 06/10/38 | | | 311,126 | | | 317,678 |
GMAC Commercial Mortgage Securities, Inc. | | | | | | |
6.70%, 04/15/34 | | | 2,297,911 | | | 2,402,514 |
Government National Mortgage Association | | | | | | |
6.00%, 02/15/11 | | | 5,090 | | | 5,115 |
4.38%, 06/20/17† | | | 15,105 | | | 15,502 |
4.38%, 06/20/21† | | | 7,640 | | | 7,868 |
4.13%, 10/20/27† | | | 51,737 | | | 52,831 |
8.50%, 10/15/29 | | | 27,640 | | | 32,008 |
0.83%, 02/16/30† | | | 212,914 | | | 212,088 |
8.50%, 03/15/30 | | | 4,053 | | | 4,697 |
8.50%, 04/15/30 | | | 12,951 | | | 15,006 |
8.50%, 05/15/30 | | | 136,340 | | | 157,972 |
See Notes to Financial Statements.
79
LOW-DURATION BOND FUND
SCHEDULE OF INVESTMENTS (Continued)
| | | | | | |
| | | Par | | Value |
8.50%, 06/15/30 | | $ | 13,199 | | $ | 15,293 |
8.50%, 07/15/30 | | | 74,844 | | | 86,716 |
8.50%, 08/15/30 | | | 19,413 | | | 22,494 |
8.50%, 09/15/30 | | | 2,330 | | | 2,700 |
8.50%, 11/15/30 | | | 51,902 | | | 60,137 |
8.50%, 12/15/30 | | | 38,007 | | | 44,037 |
8.50%, 02/15/31 | | | 19,131 | | | 22,176 |
0.53%, 03/20/37† | | | 3,759,730 | | | 3,686,141 |
0.53%, 05/20/37† | | | 1,571,511 | | | 1,539,724 |
6.50%, 10/20/37 | | | 2,342,689 | | | 2,498,699 |
6.00%, 01/01/38 TBA | | | 4,000,000 | | | 4,226,248 |
6.00%, 07/20/38 | | | 2,747,146 | | | 2,912,290 |
6.50%, 07/20/38 | | | 2,357,318 | | | 2,514,046 |
6.50%, 08/20/38 | | | 563,818 | | | 601,303 |
6.50%, 09/20/38 | | | 1,644,137 | | | 1,753,448 |
Gracechurch Mortgage Financing PLC | | | | | | |
0.31%, 11/20/56 144A† | | | 246,605 | | | 244,556 |
Greenpoint Mortgage Funding Trust | | | | | | |
0.41%, 01/25/37† | | | 1,120,715 | | | 556,172 |
0.50%, 11/25/45† | | | 320,621 | | | 180,344 |
GS Mortgage Securities Corporation II | | | | | | |
6.04%, 08/15/18 144A | | | 164,136 | | | 169,265 |
42.37%, 01/10/40 IO 144AW | | | 20,252,244 | | | 27,839 |
GSR Mortgage Loan Trust | | | | | | |
3.69%, 08/25/34 | | | 571,355 | | | 502,989 |
4.00%, 09/25/34 | | | 727,087 | | | 608,890 |
3.26%, 09/25/35† | | | 1,543,618 | | | 1,344,094 |
3.34%, 09/25/35† | | | 3,053,104 | | | 2,647,363 |
HarborView Mortgage Loan Trust | | | | | | |
5.32%, 12/19/35 | | | 2,255,298 | | | 1,697,214 |
0.44%, 11/19/36† | | | 2,316,336 | | | 1,359,665 |
Impac Secured Assets CMN Owner Trust | | | | | | |
0.31%, 01/25/37† | | | 170,300 | | | 94,225 |
Indymac Index Mortgage Loan Trust | | | | | | |
0.50%, 06/25/37† | | | 871,172 | | | 186,671 |
0.42%, 09/25/46† | | | 1,272,648 | | | 625,912 |
JP Morgan Mortgage Trust | | | | | | |
5.02%, 02/25/35† | | | 690,541 | | | 634,547 |
3.63%, 07/25/35† | | | 2,307,703 | | | 2,041,283 |
Lanark Master Issuer PLC | | | | | | |
0.37%, 12/22/54† | | | 521,020 | | | 519,054 |
LB-UBS Commercial Mortgage Trust | | | | | | |
6.16%, 07/14/16 144A | | | 1,276,128 | | | 1,317,902 |
7.95%, 05/15/25 | | | 601,892 | | | 602,683 |
6.37%, 12/15/28 | | | 1,520,000 | | | 1,587,290 |
5.31%, 04/15/37 IO 144AW | | | 12,366,278 | | | 41,470 |
Luminent Mortgage Trust | | | | | | |
0.49%, 11/25/35† | | | 1,785,334 | | | 1,031,341 |
0.40%, 12/25/36† | | | 1,361,371 | | | 629,833 |
MASTR Adjustable Rate Mortgages Trust | | | | | | |
3.62%, 12/25/33† | | | 757,115 | | | 676,100 |
MLCC Mortgage Investors, Inc. | | | | | | |
2.89%, 12/25/34 | | | 1,197,622 | | | 1,079,471 |
5.27%, 02/25/36 | | | 1,334,642 | | | 1,141,239 |
Morgan Stanley Capital I | | | | | | |
5.36%, 12/15/44 | | | 3,517,690 | | | 3,605,489 |
Pendeford Master Issuer PLC | | | | | | |
0.37%, 02/12/16 144A† | | | 930,000 | | | 926,695 |
Permanent Master Issuer PLC | | | | | | |
0.33%, 01/15/16† | | | 2,940,000 | | | 2,938,601 |
PNC Mortgage Acceptance Corporation | | | | | | |
7.30%, 10/12/33 | | | 1,696,344 | | | 1,731,858 |
Provident Funding Mortgage Loan Trust | | | | | | |
3.20%, 04/25/34 | | | 1,410,868 | | | 1,313,312 |
Prudential Securities Secured Financing Corporation | | | | | | |
8.04%, 05/17/32 | | | 1,955,000 | | | 1,989,975 |
Residential Accredit Loans, Inc. | | | | | | |
0.63%, 01/25/33† | | | 411,178 | | | 380,713 |
Residential Asset Securitization Trust | | | | | | |
0.53%, 05/25/35† | | | 977,352 | | | 643,004 |
Residential Funding Mortgage Securities I | | | | | | |
6.50%, 03/25/32 | | | 50,233 | | | 50,300 |
Station Place Securitization Trust | | | | | | |
1.74%, 12/29/10 144A† | | | 1,410,000 | | | 1,402,950 |
Structured Adjustable Rate Mortgage Loan Trust | | | | | | |
3.26%, 03/25/34† | | | 849,075 | | | 765,592 |
3.39%, 08/25/34 | | | 1,113,730 | | | 869,798 |
0.53%, 09/25/34† | | | 197,522 | | | 147,592 |
Structured Asset Mortgage Investments, Inc. | | | | | | |
2.16%, 10/19/34† | | | 581,822 | | | 418,849 |
0.48%, 07/19/35† | | | 166,786 | | | 95,906 |
0.51%, 02/25/36† | | | 1,021,193 | | | 553,636 |
0.30%, 08/25/36† | | | 182,981 | | | 180,814 |
Structured Asset Securities Corporation | | | | | | |
0.28%, 05/25/36† | | | 176,531 | | | 168,243 |
TBW Mortgage Backed Pass Through Certificates | | | | | | |
6.01%, 07/25/37 STEP | | | 700,000 | | | 288,415 |
Thornburg Mortgage Securities Trust | | | | | | |
0.35%, 07/25/36† | | | 712,595 | | | 691,484 |
0.33%, 03/25/37† | | | 2,228,932 | | | 2,140,652 |
0.36%, 06/25/37† | | | 1,238,457 | | | 1,203,265 |
0.35%, 10/25/46† | | | 1,771,103 | | | 1,736,877 |
0.34%, 11/25/46† | | | 2,382,669 | | | 2,291,151 |
TIAA Retail Commercial Trust | | | | | | |
5.67%, 08/15/39 | | | 1,859,497 | | | 1,923,902 |
Wachovia Bank Commercial Mortgage Trust | | | | | | |
4.04%, 02/15/35 | | | 814,354 | | | 823,872 |
Washington Mutual Alternative Mortgage Pass-Through Certificates | | | | | | |
1.38%, 05/25/47† | | | 1,049,673 | | | 226,172 |
Washington Mutual Mortgage Pass-Through Certificates | | | | | | |
0.77%, 12/25/27† | | | 2,245,445 | | | 1,686,063 |
4.67%, 05/25/35 | | | 3,550,000 | | | 2,522,701 |
5.67%, 02/25/37 | | | 1,199,632 | | | 763,351 |
5.64%, 05/25/37† | | | 1,355,670 | | | 884,256 |
5.79%, 07/25/37 | | | 3,134,485 | | | 2,121,266 |
1.94%, 06/25/42† | | | 41,209 | | | 29,774 |
0.54%, 01/25/45† | | | 1,294,647 | | | 984,273 |
See Notes to Financial Statements.
80
| | | | | | | | |
| | | Par | | | Value | |
0.55%, 08/25/45† | | $ | 502,733 | | | $ | 350,667 | |
0.52%, 10/25/45† | | | 522,289 | | | | 374,034 | |
1.52%, 06/25/46† | | | 1,905,750 | | | | 1,086,822 | |
1.28%, 01/25/47† | | | 1,093,388 | | | | 523,663 | |
Washington Mutual MSC Mortgage Pass-Through Certificates | | | | | | | | |
3.54%, 11/25/30† | | | 102,180 | | | | 84,435 | |
Wells Fargo Mortgage-Backed Securities Trust | | | | | | | | |
3.11%, 12/25/34† | | | 1,420,482 | | | | 1,295,822 | |
4.23%, 02/25/35† | | | 2,617,355 | | | | 2,344,027 | |
5.24%, 04/25/36 | | | 2,626,334 | | | | 2,124,075 | |
| | | | | | | | |
Total Mortgage-Backed Securities
(Cost $269,432,012) | | | | | | | 256,667,817 | |
| | | | | | | | |
MUNICIPAL BONDS — 2.5% | | | | | | | | |
Chicago Transit Authority | | | | | | | | |
6.90%, 12/01/40 | | | 1,300,000 | | | | 1,380,314 | |
Citizens Property Insurance Corporation High Risk Account Series A-1 Revenue Bond | | | | | | | | |
5.00%, 06/01/12 | | | 1,100,000 | | | | 1,149,302 | |
Dallas County Hospital District Series B | | | | | | | | |
6.17%, 08/15/34 | | | 1,300,000 | | | | 1,282,255 | |
New York Urban Development Corporation | | | | | | | | |
2.48%, 12/15/13 | | | 2,600,000 | | | | 2,558,816 | |
State of California General Obligation Bond | | | | | | | | |
4.85%, 10/01/14 | | | 800,000 | | | | 790,624 | |
5.00%, 11/01/32 | | | 1,300,000 | | | | 1,196,871 | |
7.50%, 04/01/34 | | | 1,600,000 | | | | 1,554,576 | |
5.65%, 04/01/39† | | | 1,800,000 | | | | 1,841,958 | |
7.55%, 04/01/39 | | | 3,400,000 | | | | 3,298,238 | |
State of Georgia General Obligation Bond | | | | | | | | |
5.50%, 07/01/11 | | | 1,750,000 | | | | 1,880,480 | |
| | | | | | | | |
Total Municipal Bonds
(Cost $17,095,319) | | | | | | | 16,933,434 | |
| | | | | | | | |
| | |
| | | Number of
Contracts | | | | |
PURCHASED OPTION — 0.0% | | | | | | | | |
Put Options — 0.0% | | | | | | | | |
90-Day Eurodollar Futures, Strike Price $98.75, Expires 09/13/10
(Cost $155,302) | | | 140 | | | | 101,500 | |
| | | | | | | | |
| | |
| | | Par | | | | |
U.S. TREASURY OBLIGATIONS — 3.1% | | | | | | | | |
U.S. Treasury Bills | | | | | | | | |
0.14%, 04/29/10D | | $ | 4,000,000 | | | | 3,999,016 | |
0.38%, 09/23/10D | | | 6,000,000 | | | | 5,985,942 | |
| | | | | | | | |
| | | | | | | 9,984,958 | |
| | | | | | | | |
U.S. Treasury Bonds | | | | | | | | |
8.00%, 11/15/21 | | | 600,000 | | | | 817,219 | |
7.25%, 08/15/22D | | | 900,000 | | | | 1,166,204 | |
7.50%, 11/15/24D | | | 100,000 | | | | 133,719 | |
| | | | | | | | |
| | | | | | | 2,117,142 | |
| | | | | | | | |
U.S. Treasury Inflationary Index Bonds | | | | | | | | |
4.25%, 01/15/10 | | | 2,550,000 | | | | 3,284,303 | |
| | | | | | | | |
U.S. Treasury Notes | | | | | | | | |
2.38%, 08/31/10 | | | 770,000 | | | | 780,437 | |
1.00%, 07/31/11‡‡ | | | 752,000 | | | | 753,381 | |
1.75%, 11/15/11‡‡ | | | 500,000 | | | | 506,465 | |
2.38%, 09/30/14D‡‡ | | | 300,000 | | | | 297,562 | |
2.63%, 12/31/14 | | | 375,000 | | | | 374,034 | |
3.00%, 08/31/16D | | | 1,100,000 | | | | 1,082,212 | |
3.13%, 10/31/16 | | | 1,000,000 | | | | 987,735 | |
3.25%, 12/31/16 | | | 900,000 | | | | 892,688 | |
| | | | | | | | |
| | | | | | | 5,674,514 | |
| | | | | | | | |
Total U.S. Treasury Obligations
(Cost $21,129,094) | | | | | | | 21,060,917 | |
| | | | | | | | |
| | |
| | | Shares | | | | |
MONEY MARKET FUNDS — 10.4% | | | | | | | | |
GuideStone Money Market Fund (GS4 Class)¥ | | | 19,126,543 | | | | 19,126,543 | |
Northern Institutional Liquid Assets Portfolio§ | | | 52,482,052 | | | | 52,482,052 | |
| | | | | | | | |
Total Money Market Funds
(Cost $71,608,595) | | | | | | | 71,608,595 | |
| | | | | | | | |
| | |
| | | Par | | | | |
REPURCHASE AGREEMENTS — 4.5% | | | | | | | | |
Citigroup Global Markets, Inc. 0.03% (dated 12/31/09, due 01/04/10, repurchase price $19,200,064, collateralized by Federal Home Loan Mortgage Corporation Bond, 4.000%, due 07/01/24, total market value $19,917,040)‡‡ | | $ | 19,200,000 | | | | 19,200,000 | |
Deutsche Bank Securities, Inc. 0.08% (dated 12/28/09, due 01/15/10, repurchase price $11,600,464, collateralized by U.S. Treasury Inflationary Index Bond, 3.375%, due 04/15/32, total market value $12,000,623) | | | 11,600,000 | | | | 11,600,000 | |
| | | | | | | | |
Total Repurchase Agreements
(Cost $30,800,000) | | | | | | | 30,800,000 | |
| | | | | | | | |
TOTAL INVESTMENTS — 107.8%
(Cost $755,167,725) | | | | | | | 738,502,491 | |
| | | | | | | | |
| | |
| | | Number of
Contracts | | | | |
WRITTEN OPTIONS — (0.1)% | | | | | | | | |
Call Options — 0.0% | | | | | | | | |
10-Year U.S. Treasury Note Futures, Strike Price $119.00, Expires 02/19/10 (CHASE) | | | (6 | ) | | | (750 | ) |
| | | | | | | | |
See Notes to Financial Statements.
81
LOW-DURATION BOND FUND
SCHEDULE OF INVESTMENTS (Continued)
| | | | | | | | |
| | | Notional
Amount | | | Value | |
Call Swaptions — 0.0% | | | | | | | | |
3-Month LIBOR, Strike Price $2.75, Expires 04/19/10 (BNP) | | $ | (1,000,000 | ) | | $ | (771 | ) |
3-Month LIBOR, Strike Price $3.25, Expires 02/17/10 (BAR) | | | (2,700,000 | ) | | | (735 | ) |
3-Month LIBOR, Strike Price $3.25, Expires 02/17/10 (MSCS) | | | (1,500,000 | ) | | | (408 | ) |
3-Month LIBOR, Strike Price $3.25, Expires 04/19/10 (BAR) | | | (1,300,000 | ) | | | (2,205 | ) |
3-Month LIBOR, Strike Price $3.25, Expires 04/19/10 (CS) | | | (5,700,000 | ) | | | (9,669 | ) |
3-Month LIBOR, Strike Price $3.25, Expires 04/19/10 (RBS) | | | (4,000,000 | ) | | | (6,785 | ) |
| | | | | | | | |
| | | | | | | (20,573 | ) |
| | | | | | | | |
| | |
| | | Number of
Contracts | | | | |
Put Options — 0.0% | | | | | | | | |
10-Year U.S. Treasury Note Futures, Strike Price $115.00, Expires 02/19/10 (CHASE) | | | (6 | ) | | | (5,813 | ) |
90-Day Eurodollar Futures, Strike Price $98.25, Expires 09/13/10 (CITIG) | | | (140 | ) | | | (57,750 | ) |
| | |
| | | Notional
Amount | | | | |
3-Month LIBOR, Strike Price $10.00, Expires 07/10/12 (CS) | | $ | (100,000 | ) | | | (330 | ) |
3-Month LIBOR, Strike Price $4.25, Expires 04/20/10 (BNP) | | | (1,800,000 | ) | | | (33,595 | ) |
| | | | | | | | |
| | | | | | | (97,488 | ) |
| | | | | | | | |
Put Swaptions — (0.1)% | | | | | | | | |
3-Month LIBOR, Strike Price $10.00, Expires 07/10/12 (MSCS) | | | (3,800,000 | ) | | | (12,470 | ) |
3-Month LIBOR, Strike Price $10.00, Expires 07/11/12 (BAR) | | | (200,000 | ) | | | (1,256 | ) |
3-Month LIBOR, Strike Price $10.00, Expires 07/11/12 (RBS) | | | (300,000 | ) | | | (985 | ) |
3-Month LIBOR, Strike Price $4.00, Expires 02/17/10 (BAR) | | | (2,700,000 | ) | | | (43,940 | ) |
3-Month LIBOR, Strike Price $4.00, Expires 02/17/10 (DEUT) | | | (4,300,000 | ) | | | (69,979 | ) |
3-Month LIBOR, Strike Price $4.00, Expires 02/17/10 (MSCS) | | | (2,300,000 | ) | | | (37,431 | ) |
3-Month LIBOR, Strike Price $4.00, Expires 04/19/10 (BNP) | | | (1,000,000 | ) | | | (10,701 | ) |
3-Month LIBOR, Strike Price $4.25, Expires 04/19/10 (BAR) | | | (1,300,000 | ) | | | (24,263 | ) |
3-Month LIBOR, Strike Price $4.25, Expires 04/19/10 (CS) | | | (6,600,000 | ) | | | (123,183 | ) |
3-Month LIBOR, Strike Price $4.25, Expires 04/19/10 (RBS) | | | (10,400,000 | ) | | | (194,106 | ) |
| | | | | | | | |
| | | | | | | (518,314 | ) |
| | | | | | | | |
Total Written Options
(Premiums received $(561,299)) | | | | | | | (637,125 | ) |
| | | | | | | | |
| | |
| | | Par | | | | |
TBA SALE COMMITMENTS — (12.9)% | | | | | | | | |
Federal National Mortgage Association (BAR) | | | | | | | | |
4.50%, 01/13/30 TBA | | | (9,000,000 | ) | | | (8,983,125 | ) |
Federal National Mortgage Association (CS) | | | | | | | | |
5.00%, 01/01/28 TBA | | | (15,000,000 | ) | | | (15,391,410 | ) |
Federal National Mortgage Association (JPM) | | | | | | | | |
5.50%, 01/01/40 TBA | | | (23,000,000 | ) | | | (24,074,537 | ) |
Federal National Mortgage Association (MSCS) | | | | | | | | |
5.00%, 01/01/28 TBA | | | (31,000,000 | ) | | | (31,808,914 | ) |
Federal National Mortgage Association (RBS) | | | | | | | | |
5.50%, 01/01/40 TBA | | | (8,000,000 | ) | | | (8,373,752 | ) |
| | | | | | | | |
Total TBA Sale Commitments
(Cost $(89,672,734)) | | | | | | | (88,631,738 | ) |
| | | | | | | | |
Other Assets in Excess of Liabilities — 5.2% | | | | | | | 35,822,853 | |
| | | | | | | | |
NET ASSETS — 100.0% | | | | | | $ | 685,056,481 | |
| | | | | | | | |
Please see abbreviation and footnote definitions on page 180.
See Notes to Financial Statements.
82
Swap agreements outstanding at December 31, 2009:
| | | | | | | | | | | | | | | | | | | | | | | |
Reference Obligation | | Fixed
Deal
(Pay) Rate | | | Maturity
Date | | Counterparty | | Currency | | Notional
Amount | | Market
Value | | | Upfront
Premiums
Paid/
(Received) | | Unrealized
Appreciation
(Depreciation) | |
Credit Default Swaps on Corporate Issues — Buy Protection | |
American Electric Power, 6.25% due 06/01/15 | | (0.62 | )% | | 06/20/15 | | CITI | | USD | | $ | 1,600,000 | | $ | (7,860 | ) | | $ | — | | $ | (7,860 | ) |
Nabors Industries, 6.15% due 02/15/18 | | (0.63 | )% | | 03/20/18 | | CITI | | USD | | | 3,300,000 | | | 73,317 | | | | — | | | 73,317 | |
Nabors Industries, 5.375% due 08/15/12 | | (1.00 | )% | | 03/20/19 | | BNP | | USD | | | 2,700,000 | | | 1,726 | | | | 8,659 | | | (6,933 | ) |
Morgan Stanley ABS Capital I, 7.02% due 12/27/33 | | (0.54 | )% | | 12/27/33 | | MSCS | | USD | | | 477,669 | | | 300,366 | | | | — | | | 300,366 | |
Long Beach Mortgage Trust, 6.72% due 02/25/34 | | (0.49 | )% | | 02/25/34 | | BAR | | USD | | | 478,402 | | | 357,281 | | | | — | | | 357,281 | |
Specialty Underwriting & Residential Finance, 6.62% due 02/25/35 | | (0.59 | )% | | 02/25/35 | | BAR | | USD | | | 437,951 | | | 303,206 | | | | — | | | 303,206 | |
Structured Asset Investment Loan Trust, 6.14% due 02/25/35 | | (0.61 | )% | | 02/25/35 | | BAR | | USD | | | 168,074 | | | 163,368 | | | | — | | | 163,368 | |
| | | | | | | | | | | | | | | | | | | | | | | |
| | | | | | | | | | | $ | 9,162,096 | | $ | 1,191,404 | | | $ | 8,659 | | $ | 1,182,745 | |
| | | | | | | | | | | | | | | | | | | | | | | |
| | | | | | | | | | | | | | | | | | | | | | | | | | |
Reference Obligation | | Implied
Credit
Spread | | | Fixed
Deal
(Pay) Rate | | | Maturity
Date | | Counterparty | | Currency | | Notional
Amount | | Market
Value | | | Upfront
Premiums
Paid/
(Received) | | | Unrealized
Appreciation
(Depreciation) |
Credit Default Swaps on Corporate Issues — Sell Protection |
National Australia Bank, 0.61% due 02/08/11 | | 52.77 | % | | 0.61 | % | | 03/20/10 | | UBS | | USD | | $ | 1,000,000 | | $ | (1,159 | ) | | $ | (1,251 | ) | | $ | 92 |
| | | | | | | | | | | | | | | | | | | | | | | | | | |
| | | | | | | | | | | | | | | | | | | | | |
Reference Obligation | | Fixed
Deal
(Pay) Rate | | | Maturity
Date | | Counterparty | | Currency | | Notional
Amount | | Market
Value | | Upfront
Premiums
Paid/
(Received) | | Unrealized
Appreciation
(Depreciation) |
Credit Default Swaps on Credit Indices — Buy Protection |
Dow Jones CDX HY-8 Index | | (1.63 | )% | | 06/20/12 | | CITI | | USD | | $ | 4,900,000 | | $ | 164,321 | | $ | — | | $ | 164,321 |
Dow Jones CDX IG9 10Y Index | | (0.80 | )% | | 12/20/17 | | GSC | | USD | | | 6,872,800 | | | 211,471 | | | 95,803 | | | 115,668 |
Dow Jones CDX IG9 10Y Index | | (0.80 | )% | | 12/20/17 | | MSCS | | USD | | | 5,227,200 | | | 160,837 | | | 70,512 | | | 90,325 |
Dow Jones CDX IG9 10Y Index | | (0.80 | )% | | 12/20/17 | | BAR | | USD | | | 2,420,000 | | | 74,462 | | | 27,094 | | | 47,367 |
Dow Jones CDX IG9 10Y Index | | (0.80 | )% | | 12/20/17 | | RBS | | USD | | | 2,032,800 | | | 62,548 | | | 24,622 | | | 37,926 |
| | | | | | | | | | | | | | | | | | | | | |
| | | | | | | | | | | $ | 21,452,800 | | $ | 673,639 | | $ | 218,031 | | $ | 455,607 |
| | | | | | | | | | | | | | | | | | | | | |
See Notes to Financial Statements.
83
LOW-DURATION BOND FUND
SCHEDULE OF INVESTMENTS (Continued)
| | | | | | | | | | | | | | | | | | | | | | |
Reference Obligation | | Fixed
Deal
(Pay)
Rate | | | Maturity
Date | | Counterparty | | Currency | | Notional
Amount | | Market
Value | | Upfront
Premiums
Paid/
(Received) | | Unrealized
Appreciation
(Depreciation) | |
Interest Rate Swaps | |
Brazil Cetip Interbank Deposit | | (11.65 | )% | | 01/02/12 | | HSBC | | BRL | | $ | 3,200,000 | | $ | 18,000 | | $ | 21,009 | | $ | (3,009 | ) |
Brazil Cetip Interbank Deposit | | (11.65 | )% | | 01/02/12 | | GSC | | BRL | | | 2,500,000 | | | 14,063 | | | 15,976 | | | (1,913 | ) |
| | | | | | | | | | | | | | | | | | | | | | |
| | | | | | | | | | | $ | 5,700,000 | | $ | 32,063 | | $ | 36,985 | | $ | (4,922 | ) |
| | | | | | | | | | | | | | | | | | | | | | |
Total Swap agreements outstanding at December 31, 2009 | | $ | 1,895,947 | | $ | 262,424 | | $ | 1,633,522 | |
| | | | | | | | | | | | | | | | | | | | | | |
Please see abbreviation and footnote definitions on page 180.
PORTFOLIO SUMMARY (based on net assets)
| | | |
| | | % | |
Mortgage-Backed Securities | | 37.5 | |
Futures Contracts | | 23.4 | |
Corporate Bonds | | 21.7 | |
Foreign Bonds | | 15.4 | |
Asset-Backed Securities | | 11.3 | |
Money Market Funds | | 10.4 | |
Repurchase Agreements | | 4.5 | |
U.S. Treasury Obligations | | 3.1 | |
Municipal Bonds | | 2.5 | |
Forward Foreign Currency Contracts | | 1.6 | |
Agency Obligations | | 1.4 | |
Swap Agreements | | 0.2 | |
Purchased Option | | — | ** |
Written Options | | (0.1 | ) |
TBA Sale Commitments | | (12.9 | ) |
| | | |
| | 120.0 | |
| | | |
| ** | Rounds to less than 0.005%. |
See Notes to Financial Statements.
84
FAS 157 DISCLOSURE
The following is a summary of the inputs used, as of December 31, 2009, in valuing the Fund’s investments carried at fair value:
| | | | | | | |
Valuation Inputs | | Investments
in
Securities | | | Other
Financial
Instruments*** |
| | |
Assets: | | | | | | | |
Level 1 — Quoted Prices | | | | | | | |
Futures Contracts | | $ | — | | | $ | 29,260 |
Money Market Funds | | | 71,608,595 | | | | — |
Purchased Option | | | 101,500 | | | | — |
Level 2 — Other Significant Observable Inputs | | | | | | | |
Agency Obligations | | | 9,541,337 | | | | — |
Asset-Backed Securities | | | 77,624,441 | | | | — |
Corporate Bonds | | | 147,132,238 | | | | — |
Foreign Bonds | | | 105,213,797 | | | | — |
Forward Foreign Currency Contracts | | | — | | | | 654,141 |
Mortgage-Backed Securities | | | 256,667,817 | | | | — |
Municipal Bonds | | | 16,933,434 | | | | — |
Repurchase Agreements | | | 30,800,000 | | | | — |
Swap Agreements | | | — | | | | 1,895,947 |
U.S. Treasury Obligations | | | 21,060,917 | | | | — |
Level 3 — Significant Unobservable Inputs | | | | | | | |
Corporate Bonds | | | 1,818,415 | | | | — |
| | | | | | | |
Total Assets | | $ | 738,502,491 | | | $ | 2,579,348 |
| | | | | | | |
| | |
Liabilities: | | | | | | | |
Level 1 — Quoted Prices | | | | | | | |
Written Options | | $ | (64,313 | ) | | $ | — |
Level 2 — Other Significant Observable Inputs | | | | | | | |
TBA Sale Commitments | | | (88,631,738 | ) | | | — |
Written Options | | | (572,812 | ) | | | — |
Level 3 — Significant Unobservable Inputs | | | — | | | | — |
| | | | | | | |
Total Liabilities | | $ | (89,268,863 | ) | | $ | — |
| | | | | | | |
| *** | Other financial instruments are derivative instruments not reflected in the Schedule of Investments, such as futures, forwards and swap contracts, which are valued at the unrealized appreciation (depreciation) on the investment. Details of these investments can be found in the Notes to Financial Statements. |
The following is a reconciliation of assets in which significant unobservable inputs (Level 3) were used in determining fair value:
| | | | | | | |
| | | Investments
in
Securities | | | Other
Financial
Instruments*** |
| | |
Balance, 12/31/08 Corporate Bonds | | $ | 3,740,617 | | | $ | — |
Accrued discounts/premiums Corporate Bonds | | | 182,518 | | | | — |
Realized gain (loss) Corporate Bonds | | | — | | | | — |
Change in unrealized appreciation (depreciation) Corporate Bonds | | | 263,216 | | | | — |
Net purchases (sales) Corporate Bonds | | | — | | | | — |
Transfers in and/or out of Level 3 Corporate Bonds | | | (2,367,936 | ) | | | — |
| | | | | | | |
Balance, 12/31/09 | | $ | 1,818,415 | | | $ | — |
| | | | | | | |
| *** | Other financial instruments are derivative instruments not reflected in the Schedule of Investments, such as futures, forwards and swap contracts, which are valued at the unrealized appreciation (depreciation) on the investment. Details of these investments can be found in the Notes to Financial Statements. |
See Notes to Financial Statements.
85
Medium-Duration Bond Fund
The Medium-Duration Bond Fund invests in a diversified portfolio composed primarily of investment grade fixed income securities with an average dollar-weighted duration normally between three to seven years. The Fund significantly outperformed its benchmark, the Barclays Capital U.S. Aggregate Bond Index, for the one-year period ended December 31, 2009 (16.97% versus 5.93%). The Fund’s benchmark-relative performance was positively impacted by allocations to non-U.S. Treasury sectors of the Barclays Capital U.S. Aggregate Bond Index as these components outperformed U.S. Treasuries throughout the year.
Please see page 105 for information regarding specific portfolio allocations. Portfolio holdings are subject to change at any time.
86
Medium-Duration Bond Fund
| | | | | | | | | |
Average Annual Total Returns as of 12/31/09 | |
| | | GS2 Class* | | | GS4 Class* | | | Benchmark** | |
One Year | | 17.07 | % | | 16.97 | % | | 5.93 | % |
Five Year | | 5.18 | % | | 5.07 | % | | 4.97 | % |
Since Inception | | 5.76 | % | | 5.72 | % | | 5.41 | % |
Inception Date | | 08/27/01 | | | 08/27/01 | | | | |
Total Fund Operating Expenses (June 25, 2009 Prospectus)(1) | | 0.49 | % | | 0.68 | % | | | |
| (1) | Current information regarding the Fund’s Operating Expenses can be found in the Financial Highlights. |
The performance data quoted represents past performance and does not guarantee future results. Current performance may be lower or higher. Performance data current to the most recent month-end may be obtained at www.GuideStoneFunds.org. The investment return and principal value of an investment will fluctuate so that shares, when redeemed, may be worth more or less than their original cost.
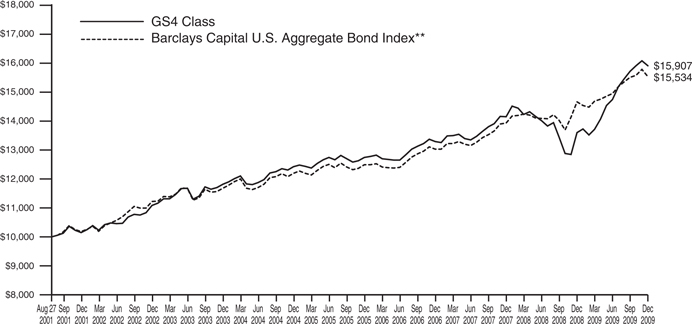
The graph compares the results of a hypothetical $10,000 investment in the GS4 Class of the Fund since August 27, 2001 (commencement of operations), with all dividends and capital gains reinvested, with the Barclays Capital U.S. Aggregate Bond Index.
| * | These returns reflect expense waivers by the Fund’s investment adviser. Without these waivers, returns would have been lower. Returns shown do not reflect the deduction of taxes that a shareholder would pay on Fund distributions or the redemption of Fund shares. |
| ** | The Barclays Capital U.S. Aggregate Bond Index represents securities that are SEC-registered, taxable and dollar denominated. The index covers the U.S. investment grade bond market, with index components for government and corporate securities, mortgage pass-through securities and asset-backed securities. |
Unlike a mutual fund, the performance of an index assumes no taxes, transaction costs, management fees or other expenses.
87
| | |
MEDIUM-DURATION BOND FUND SCHEDULE OF INVESTMENTS | | December 31, 2009 |
| | | | | | |
| | | Par | | Value |
AGENCY OBLIGATIONS — 1.0% | | | | | | |
Federal Farm Credit Bank | | | | | | |
5.05%, 11/06/17 | | $ | 400,000 | | $ | 426,552 |
Federal Home Loan Bank | | | | | | |
1.63%, 07/27/11 | | | 2,440,000 | | | 2,464,278 |
Federal Home Loan Mortgage Corporation | | | | | | |
3.00%, 07/28/14 | | | 660,000 | | | 669,627 |
5.30%, 12/01/15 | | | 1,300,000 | | | 1,438,132 |
Federal National Mortgage Association | | | | | | |
5.25%, 08/01/12 | | | 2,400,000 | | | 2,562,660 |
Tennessee Valley Authority | | | | | | |
5.25%, 09/15/39 | | | 350,000 | | | 348,094 |
5.38%, 04/01/56 | | | 1,800,000 | | | 1,790,393 |
| | | | | | |
Total Agency Obligations
(Cost $9,575,420) | | | | | | 9,699,736 |
| | | | | | |
ASSET-BACKED SECURITIES — 4.0% | | | | | | |
Access Group, Inc. | | | | | | |
1.58%, 10/27/25† | | | 1,802,598 | | | 1,855,487 |
Ally Auto Receivables Trust | | | | | | |
0.40%, 05/15/10 144A | | | 963,789 | | | 963,100 |
Amortizing Residential Collateral Trust | | | | | | |
0.51%, 01/01/32† | | | 41,296 | | | 20,657 |
Asset-Backed Securities Corporation Home Equity | | | | | | |
0.51%, 09/25/34† | | | 168,112 | | | 139,783 |
Bayview Financial Acquisition Trust | | | | | | |
0.91%, 02/28/44† | | | 573,745 | | | 475,167 |
Bear Stearns Asset-Backed Securities, Inc. | | | | | | |
6.00%, 10/25/36 | | | 3,346,406 | | | 1,842,392 |
6.50%, 10/25/36 | | | 3,281,873 | | | 1,695,752 |
Capital Auto Receivables Asset Trust | | | | | | |
1.19%, 12/15/10 144A† | | | 623,596 | | | 623,794 |
Chase Issuance Trust | | | | | | |
0.68%, 09/17/12† | | | 3,600,000 | | | 3,602,715 |
CIT Mortgage Loan Trust | | | | | | |
1.23%, 10/25/37 144A†@ | | | 665,810 | | | 585,149 |
1.92%, 10/25/37 144A†@ | | | 800,000 | | | 352,214 |
2.65%, 10/25/37 144A†@ | | | 430,000 | | | 184,492 |
Countrywide Home Equity Loan Trust | | | | | | |
0.52%, 05/15/34† | | | 422,069 | | | 182,928 |
0.47%, 12/15/35† | | | 1,079,099 | | | 372,853 |
0.37%, 07/15/36† | | | 1,450,324 | | | 515,450 |
Daimler Chrysler Auto Trust | | | | | | |
1.72%, 09/10/12† | | | 4,300,000 | | | 4,311,547 |
EMC Mortgage Loan Trust | | | | | | |
0.78%, 11/25/41 144A† | | | 181,988 | | | 143,780 |
FBR Securitization Trust | | | | | | |
0.49%, 10/25/35† | | | 164,197 | | | 161,180 |
Ford Credit Auto Owner Trust | | | | | | |
0.36%, 09/15/10 144A | | | 1,804,426 | | | 1,803,633 |
1.43%, 12/15/10† | | | 162,793 | | | 162,882 |
1.13%, 01/15/11† | | | 568,710 | | | 569,021 |
1.65%, 06/15/12† | | | 2,600,000 | | | 2,617,353 |
Franklin Auto Trust | | | | | | |
1.81%, 06/20/12† | | | 700,000 | | | 704,421 |
GMAC Mortgage Corporation Loan Trust | | | | | | |
7.00%, 09/25/37 | | | 470,119 | | | 226,580 |
GSAMP Trust | | | | | | |
0.34%, 05/25/46 144A† | | | 487,304 | | | 458,061 |
Hertz Vehicle Financing LLC | | | | | | |
5.29%, 03/25/16 144A | | | 650,000 | | | 644,973 |
HFC Home Equity Loan Asset-Backed Certificates | | | | | | |
1.43%, 11/20/36† | | | 1,092,494 | | | 928,479 |
Lehman XS Trust | | | | | | |
0.53%, 11/25/35† | | | 928,801 | | | 530,515 |
0.53%, 11/25/35 STEP | | | 1,106,484 | | | 695,542 |
0.50%, 12/25/35† | | | 240,792 | | | 147,523 |
0.50%, 02/25/36† | | | 1,178,532 | | | 601,251 |
Madison Avenue Manufactured Housing Contract | | | | | | |
0.58%, 03/25/32† | | | 415,253 | | | 395,509 |
Morgan Stanley Dean Witter Credit Corporation HELOC Trust | | | | | | |
0.42%, 07/25/17 STEP | | | 128,582 | | | 59,984 |
Nelnet Student Loan Trust | | | | | | |
1.76%, 04/25/24† | | | 780,000 | | | 814,316 |
Provident Bank Home Equity Loan Trust | | | | | | |
0.77%, 08/25/31† | | | 128,628 | | | 38,844 |
Residential Asset Mortgage Products, Inc. | | | | | | |
0.71%, 03/25/34† | | | 384,551 | | | 236,370 |
Residential Funding Securities LLC | | | | | | |
0.68%, 06/25/33 144A† | | | 389,907 | | | 302,501 |
Salomon Brothers Mortgage Securities VII, Inc. | | | | | | |
0.71%, 03/25/28 STEP | | | 63,425 | | | 57,698 |
Securitized Asset-Backed Receivables LLC Trust | | | | | | |
0.46%, 02/25/37† | | | 3,071,895 | | | 1,356,984 |
SLM Student Loan Trust | | | | | | |
1.78%, 04/25/23† | | | 6,956,910 | | | 7,231,634 |
Structured Asset Securities Corporation | | | | | | |
0.53%, 04/25/31 144A† | | | 3,235,845 | | | 2,188,392 |
| | | | | | |
Total Asset-Backed Securities
(Cost $51,300,610) | | | | | | 40,800,906 |
| | | | | | |
CORPORATE BONDS — 24.9% | | | | | | |
Abbey National Treasury Services PLC | | | | | | |
3.88%, 11/10/14 144AD | | | 3,800,000 | | | 3,817,704 |
AES Corporation | | | | | | |
8.75%, 05/15/13 144A | | | 325,000 | | | 334,750 |
7.75%, 10/15/15 | | | 270,000 | | | 275,400 |
8.00%, 10/15/17 | | | 1,490,000 | | | 1,536,562 |
Agilent Technologies, Inc. | | | | | | |
5.50%, 09/14/15 | | | 575,000 | | | 603,452 |
Allied Waste North America, Inc. | | | | | | |
7.13%, 05/15/16 | | | 125,000 | | | 133,295 |
Allstate Life Global Funding Trusts | | | | | | |
5.38%, 04/30/13 | | | 400,000 | | | 427,315 |
See Notes to Financial Statements.
88
| | | | | | |
| | | Par | | Value |
American Achievement Corporation | | | | | | |
8.25%, 04/01/12 144A | | $ | 30,000 | | $ | 30,075 |
American Electric Power Co., Inc. | | | | | | |
5.25%, 06/01/15 | | | 2,300,000 | | | 2,385,390 |
American Express Bank FSB | | | | | | |
0.29%, 04/26/10† | | | 400,000 | | | 398,884 |
6.00%, 09/13/17 | | | 1,100,000 | | | 1,143,033 |
American Express Co. | | | | | | |
6.80%, 09/01/66†D | | | 1,340,000 | | | 1,212,700 |
American Express Credit Corporation | | | | | | |
0.38%, 10/04/10† | | | 200,000 | | | 199,516 |
5.88%, 05/02/13 | | | 2,600,000 | | | 2,792,325 |
5.13%, 08/25/14D | | | 880,000 | | | 928,241 |
American General Finance Corporation | | | | | | |
6.90%, 12/15/17 | | | 780,000 | | | 542,339 |
American International Group, Inc. | | | | | | |
5.60%, 10/18/16 | | | 600,000 | | | 497,189 |
5.85%, 01/16/18 | | | 1,220,000 | | | 1,002,563 |
8.25%, 08/15/18 144A | | | 3,200,000 | | | 3,008,810 |
6.25%, 03/15/37 | | | 680,000 | | | 377,400 |
Anadarko Petroleum Corporation | | | | | | |
6.45%, 09/15/36 | | | 100,000 | | | 104,776 |
ANZ Capital Trust II | | | | | | |
5.36%, 12/29/49 144A‡‡ | | | 800,000 | | | 707,997 |
Apache Corporation | | | | | | |
6.00%, 09/15/13 | | | 680,000 | | | 753,061 |
Arizona Public Service Co. | | | | | | |
8.75%, 03/01/19 | | | 525,000 | | | 612,650 |
ASIF Global Financing XIX | | | | | | |
4.90%, 01/17/13 144A | | | 100,000 | | | 92,088 |
Astoria Financial Corporation | | | | | | |
5.75%, 10/15/12 | | | 450,000 | | | 419,998 |
AT&T, Inc. | | | | | | |
5.10%, 09/15/14 | | | 550,000 | | | 592,232 |
6.40%, 05/15/38 | | | 475,000 | | | 489,759 |
6.55%, 02/15/39 | | | 430,000 | | | 454,587 |
BAC Capital Trust XIV | | | | | | |
5.63%, 12/31/49† | | | 40,000 | | | 27,900 |
Baker Hughes, Inc. | | | | | | |
7.50%, 11/15/18 | | | 870,000 | | | 1,040,242 |
Bank of America Corporation | | | | | | |
0.54%, 10/14/16†D | | | 1,700,000 | | | 1,504,228 |
5.75%, 12/01/17 | | | 3,130,000 | | | 3,210,241 |
5.65%, 05/01/18 | | | 2,700,000 | | | 2,746,675 |
8.13%, 12/15/49† | | | 20,000 | | | 19,280 |
Bear Stearns Cos. LLC | | | | | | |
6.95%, 08/10/12 | | | 1,600,000 | | | 1,788,717 |
5.70%, 11/15/14 | | | 1,000,000 | | | 1,101,509 |
6.40%, 10/02/17 | | | 1,200,000 | | | 1,310,110 |
7.25%, 02/01/18 | | | 3,345,000 | | | 3,845,556 |
BellSouth Capital Funding | | | | | | |
7.88%, 02/15/30 | | | 460,000 | | | 526,641 |
BellSouth Corporation | | | | | | |
4.75%, 11/15/12 | | | 40,000 | | | 42,741 |
6.88%, 10/15/31 | | | 10,000 | | | 10,533 |
Boardwalk Pipelines LP | | | | | | |
5.88%, 11/15/16 | | | 625,000 | | | 639,134 |
Boeing Capital Corporation | | | | | | |
4.70%, 10/27/19 | | | 230,000 | | | 224,821 |
Boeing Co. | | | | | | |
4.88%, 02/15/20 | | | 300,000 | | | 301,409 |
6.63%, 02/15/38 | | | 210,000 | | | 234,023 |
Boston Scientific Corporation | | | | | | |
4.50%, 01/15/15 | | | 350,000 | | | 351,105 |
6.00%, 01/15/20 | | | 225,000 | | | 230,331 |
CareFusion Corporation | | | | | | |
6.38%, 08/01/19 144A | | | 650,000 | | | 697,092 |
Caterpillar Financial Services Corporation | | | | | | |
6.20%, 09/30/13 | | | 980,000 | | | 1,092,976 |
Cellco Partnership/Verizon Wireless Capital LLC | | | | | | |
8.50%, 11/15/18 | | | 175,000 | | | 217,421 |
CenterPoint Energy Resources Corporation | | | | | | |
5.95%, 01/15/14D | | | 525,000 | | | 553,366 |
Chesapeake Energy Corporation | | | | | | |
6.25%, 01/15/18D | | | 140,000 | | | 135,100 |
7.25%, 12/15/18D | | | 205,000 | | | 207,562 |
Chubb Corporation | | | | | | |
6.50%, 05/15/38D | | | 150,000 | | | 165,744 |
6.38%, 03/29/67†D | | | 375,000 | | | 352,500 |
CitiFinancial, Inc. | | | | | | |
6.63%, 06/01/15D | | | 300,000 | | | 298,460 |
Citigroup Funding, Inc. | | | | | | |
1.88%, 10/22/12D | | | 3,900,000 | | | 3,887,898 |
1.88%, 11/15/12 | | | 1,000,000 | | | 998,113 |
Citigroup, Inc. | | | | | | |
6.50%, 08/19/13 | | | 850,000 | | | 906,144 |
6.38%, 08/12/14 | | | 550,000 | | | 576,371 |
5.00%, 09/15/14D | | | 1,745,000 | | | 1,683,953 |
6.01%, 01/15/15D | | | 520,000 | | | 531,542 |
5.50%, 02/15/17 | | | 1,160,000 | | | 1,099,325 |
6.13%, 11/21/17 | | | 1,000,000 | | | 1,009,536 |
6.13%, 05/15/18D | | | 4,800,000 | | | 4,833,778 |
5.88%, 05/29/37 | | | 350,000 | | | 309,394 |
6.88%, 03/05/38 | | | 1,340,000 | | | 1,341,489 |
Comcast Cable Communications LLC | | | | | | |
6.75%, 01/30/11 | | | 230,000 | | | 242,798 |
Comcast Cable Communications Holdings, Inc. | | | | | | |
8.38%, 03/15/13 | | | 83,000 | | | 95,742 |
9.46%, 11/15/22 | | | 275,000 | | | 354,406 |
Comcast Corporation | | | | | | |
6.50%, 01/15/17 | | | 60,000 | | | 66,518 |
5.70%, 05/15/18D | | | 1,250,000 | | | 1,316,249 |
Comcast Holdings Corporation | | | | | | |
10.63%, 07/15/12 | | | 550,000 | | | 649,324 |
Commonwealth Edison Co. | | | | | | |
5.40%, 12/15/11 | | | 650,000 | | | 694,807 |
Community Health Systems, Inc. | | | | | | |
8.88%, 07/15/15 | | | 250,000 | | | 259,375 |
Complete Production Services, Inc. | | | | | | |
8.00%, 12/15/16 | | | 280,000 | | | 277,550 |
ConocoPhillips | | | | | | |
8.75%, 05/25/10 | | | 230,000 | | | 237,686 |
ConocoPhillips Holding Co. | | | | | | |
6.95%, 04/15/29 | | | 1,460,000 | | | 1,659,578 |
COX Communications, Inc. | | | | | | |
4.63%, 01/15/10D | | | 800,000 | | | 800,670 |
See Notes to Financial Statements.
89
MEDIUM-DURATION BOND FUND
SCHEDULE OF INVESTMENTS (Continued)
| | | | | | |
| | | Par | | Value |
8.38%, 03/01/39 144AD | | $ | 500,000 | | $ | 624,534 |
CSC Holdings, Inc. | | | | | | |
7.63%, 04/01/11D | | | 500,000 | | | 518,750 |
6.75%, 04/15/12 | | | 60,000 | | | 62,250 |
CVS Pass-Through Trust | | | | | | |
6.94%, 01/10/30 144A | | | 960,782 | | | 968,444 |
Daimler Finance NA LLC | | | | | | |
5.88%, 03/15/11 | | | 590,000 | | | 617,068 |
5.75%, 09/08/11D | | | 1,900,000 | | | 1,996,581 |
7.30%, 01/15/12 | | | 550,000 | | | 598,211 |
6.50%, 11/15/13 | | | 100,000 | | | 109,718 |
DaVita, Inc. | | | | | | |
6.63%, 03/15/13D | | | 310,000 | | | 312,325 |
Dean Foods Co. | | | | | | |
7.00%, 06/01/16D | | | 375,000 | | | 369,375 |
Delta Air Lines, Inc. | | | | | | |
6.82%, 08/10/22 | | | 437,676 | | | 415,245 |
DI Finance | | | | | | |
9.50%, 02/15/13 | | | 60,000 | | | 61,050 |
DIRECTV Holdings LLC | | | | | | |
5.88%, 10/01/19 144AD | | | 250,000 | | | 254,743 |
Discover Bank | | | | | | |
8.70%, 11/18/19 | | | 425,000 | | | 456,087 |
DISH DBS Corporation | | | | | | |
7.00%, 10/01/13D | | | 10,000 | | | 10,338 |
6.63%, 10/01/14 | | | 30,000 | | | 30,337 |
7.75%, 05/31/15 | | | 200,000 | | | 210,500 |
Dominion Resources, Inc. | | | | | | |
1.30%, 06/17/10† | | | 4,000,000 | | | 4,017,948 |
4.75%, 12/15/10 | | | 70,000 | | | 72,071 |
5.70%, 09/17/12 | | | 1,230,000 | | | 1,329,987 |
6.00%, 11/30/17 | | | 3,800,000 | | | 4,092,019 |
Dow Chemical Co. | | | | | | |
7.60%, 05/15/14D | | | 550,000 | | | 626,429 |
5.90%, 02/15/15 | | | 200,000 | | | 215,153 |
Duke Energy Carolinas LLC | | | | | | |
5.63%, 11/30/12 | | | 580,000 | | | 633,618 |
Dynegy Holdings, Inc. | | | | | | |
7.75%, 06/01/19 | | | 395,000 | | | 344,638 |
Eastman Kodak Co. | | | | | | |
7.25%, 11/15/13D | | | 490,000 | | | 406,700 |
Edison Mission Energy | | | | | | |
7.00%, 05/15/17D | | | 240,000 | | | 190,800 |
7.20%, 05/15/19 | | | 320,000 | | | 244,000 |
7.63%, 05/15/27 | | | 120,000 | | | 81,900 |
El Paso Corporation | | | | | | |
7.00%, 06/15/17 | | | 710,000 | | | 707,722 |
7.80%, 08/01/31D | | | 750,000 | | | 709,825 |
El Paso Natural Gas Co. | | | | | | |
7.50%, 11/15/26 | | | 300,000 | | | 330,586 |
El Paso Performance-Linked Trust | | | | | | |
7.75%, 07/15/11 144A | | | 1,460,000 | | | 1,504,035 |
Energy Future Holdings Corporation | | | | | | |
5.55%, 11/15/14 | | | 120,000 | | | 85,704 |
6.50%, 11/15/24 | | | 370,000 | | | 175,645 |
6.55%, 11/15/34 | | | 865,000 | | | 405,357 |
Energy Transfer Partners LP | | | | | | |
5.95%, 02/01/15D | | | 825,000 | | | 875,129 |
6.70%, 07/01/18 | | | 1,180,000 | | | 1,265,480 |
Enterprise Products Operating LLC | | | | | | |
6.65%, 04/15/18 | | | 650,000 | | | 705,157 |
8.38%, 08/01/66† | | | 350,000 | | | 341,672 |
7.03%, 01/15/68† | | | 350,000 | | | 321,603 |
Exelon Corporation | | | | | | |
5.63%, 06/15/35 | | | 675,000 | | | 612,352 |
FirstEnergy Corporation | | | | | | |
6.45%, 11/15/11 | | | 3,000 | | | 3,218 |
7.38%, 11/15/31 | | | 1,490,000 | | | 1,619,550 |
Ford Motor Credit Co. LLC | | | | | | |
8.00%, 12/15/16D | | | 1,300,000 | | | 1,303,437 |
Ford Motor Credit Co., LLC | | | | | | |
5.50%, 06/15/11†D | | | 607,000 | | | 601,689 |
12.00%, 05/15/15 | | | 1,320,000 | | | 1,532,256 |
Forest City Enterprises, Inc. | | | | | | |
6.50%, 02/01/17 | | | 70,000 | | | 53,550 |
Freeport-McMoRan Copper & Gold, Inc. | | | | | | |
8.38%, 04/01/17 | | | 1,420,000 | | | 1,557,031 |
Frontier Communications Corporation | | | | | | |
7.88%, 01/15/27 | | | 50,000 | | | 46,250 |
General Electric Capital Corporation | | | | | | |
2.00%, 09/28/12 | | | 2,900,000 | | | 2,905,672 |
2.63%, 12/28/12D | | | 2,100,000 | | | 2,140,196 |
5.45%, 01/15/13D | | | 150,000 | | | 159,574 |
6.00%, 08/07/19 | | | 1,850,000 | | | 1,923,835 |
General Electric Co. | | | | | | |
5.00%, 02/01/13 | | | 920,000 | | | 974,017 |
Georgia-Pacific LLC | | | | | | |
8.13%, 05/15/11D | | | 4,000 | | | 4,220 |
GlaxoSmithKline Capital, Inc. | | | | | | |
5.65%, 05/15/18 | | | 1,470,000 | | | 1,588,189 |
GMAC, Inc. | | | | | | |
7.75%, 01/19/10 144A | | | 326,000 | | | 326,408 |
6.88%, 09/15/11 144A | | | 1,101,000 | | | 1,095,495 |
1.75%, 10/30/12 | | | 3,000,000 | | | 2,982,510 |
7.50%, 12/31/13 144A | | | 177,000 | | | 172,575 |
8.00%, 12/31/18 144A | | | 62,000 | | | 55,180 |
Goldman Sachs Capital II | | | | | | |
5.79%, 12/29/49† | | | 60,000 | | | 46,800 |
Goldman Sachs Group, Inc. | | | | | | |
4.50%, 06/15/10 | | | 930,000 | | | 946,866 |
5.75%, 10/01/16 | | | 1,900,000 | | | 2,005,406 |
6.25%, 09/01/17 | | | 1,700,000 | | | 1,825,888 |
5.95%, 01/18/18 | | | 2,300,000 | | | 2,432,620 |
HCA, Inc. | | | | | | |
6.30%, 10/01/12D | | | 32,000 | | | 32,160 |
9.13%, 11/15/14D | | | 60,000 | | | 63,450 |
6.50%, 02/15/16 | | | 686,000 | | | 655,130 |
9.25%, 11/15/16 | | | 480,000 | | | 516,600 |
9.63%, 11/15/16 PIK | | | 95,720 | | | 103,856 |
7.88%, 02/15/20 144A | | | 125,000 | | | 130,469 |
7.69%, 06/15/25 | | | 250,000 | | | 230,175 |
Hess Corporation | | | | | | |
8.13%, 02/15/19 | | | 410,000 | | | 495,269 |
7.88%, 10/01/29 | | | 260,000 | | | 312,676 |
7.30%, 08/15/31 | | | 1,000,000 | | | 1,139,651 |
HSBC Finance Corporation | | | | | | |
0.52%, 05/10/10† | | | 7,850,000 | | | 7,848,202 |
8.00%, 07/15/10 | | | 440,000 | | | 456,040 |
7.00%, 05/15/12D | | | 390,000 | | | 424,303 |
6.38%, 11/27/12 | | | 70,000 | | | 76,283 |
See Notes to Financial Statements.
90
| | | | | | |
| | | Par | | Value |
Humana, Inc. | | | | | | |
7.20%, 06/15/18 | | $ | 240,000 | | $ | 245,843 |
ILFC E-Capital Trust II | | | | | | |
6.25%, 12/21/65 144A† | | | 280,000 | | | 148,400 |
International Business Machines Corporation | | | | | | |
0.86%, 07/28/11† | | | 3,700,000 | | | 3,734,647 |
International Lease Finance Corporation | | | | | | |
4.95%, 02/01/11 | | | 300,000 | | | 277,736 |
International Paper Co. | | | | | | |
7.95%, 06/15/18D | | | 200,000 | | | 231,045 |
JC Penney Corporation, Inc. | | | | | | |
7.40%, 04/01/37 | | | 50,000 | | | 49,875 |
JPMorgan Chase & Co. | | | | | | |
5.75%, 01/02/13D | | | 320,000 | | | 341,511 |
5.15%, 10/01/15 | | | 1,890,000 | | | 1,959,601 |
JPMorgan Chase Bank NA | | | | | | |
6.00%, 10/01/17 | | | 800,000 | | | 857,870 |
JPMorgan Chase Capital XXVII | | | | | | |
7.00%, 11/01/39D | | | 375,000 | | | 379,379 |
Kerr-McGee Corporation | | | | | | |
6.95%, 07/01/24 | | | 450,000 | | | 488,478 |
7.88%, 09/15/31 | | | 1,830,000 | | | 2,140,355 |
Kinder Morgan Energy Partners LP | | | | | | |
6.75%, 03/15/11 | | | 110,000 | | | 116,363 |
7.13%, 03/15/12D | | | 500,000 | | | 545,508 |
5.85%, 09/15/12 | | | 40,000 | | | 43,074 |
5.00%, 12/15/13 | | | 200,000 | | | 210,150 |
6.00%, 02/01/17 | | | 510,000 | | | 536,227 |
Kroger Co. | | | | | | |
6.15%, 01/15/20 | | | 500,000 | | | 536,132 |
L-3 Communications Corporation | | | | | | |
6.38%, 10/15/15 | | | 120,000 | | | 121,050 |
Lamar Media Corporation | | | | | | |
6.63%, 08/15/15 | | | 20,000 | | | 19,300 |
Lehman Brothers Holdings Capital Trust VII | | | | | | |
5.86%, 11/29/49# | | | 2,330,000 | | | 699 |
Lehman Brothers Holdings, Inc. | | | | | | |
6.63%, 01/18/12# | | | 200,000 | | | 40,000 |
5.25%, 02/06/12# | | | 390,000 | | | 78,000 |
5.63%, 01/24/13# | | | 2,300,000 | | | 483,000 |
6.20%, 09/26/14# | | | 300,000 | | | 60,000 |
6.50%, 07/19/17# | | | 150,000 | | | 45 |
6.75%, 12/28/17# | | | 3,340,000 | | | 1,002 |
Merrill Lynch & Co., Inc. | | | | | | |
0.50%, 02/05/10† | | | 600,000 | | | 600,207 |
2.52%, 05/12/10† | | | 4,200,000 | | | 4,234,637 |
5.45%, 02/05/13 | | | 2,645,000 | | | 2,785,227 |
6.05%, 05/16/16 | | | 500,000 | | | 505,158 |
5.70%, 05/02/17 | | | 400,000 | | | 392,647 |
6.40%, 08/28/17 | | | 775,000 | | | 816,826 |
6.88%, 04/25/18 | | | 525,000 | | | 566,556 |
MetLife Capital Trust IV | | | | | | |
7.88%, 12/15/37 144A | | | 300,000 | | | 301,500 |
MetLife Capital Trust X | | | | | | |
9.25%, 04/08/38 144A† | | | 300,000 | | | 342,000 |
MetLife, Inc. | | | | | | |
6.40%, 12/15/36 | | | 150,000 | | | 133,500 |
Metropolitan Life Global Funding I | | | | | | |
0.85%, 09/17/10 144A†D | | | 3,200,000 | | | 3,203,219 |
Morgan Stanley | | | | | | |
0.56%, 01/15/10† | | | 500,000 | | | 500,037 |
2.37%, 05/14/10† | | | 600,000 | | | 604,368 |
6.75%, 04/15/11 | | | 700,000 | | | 741,867 |
5.63%, 01/09/12 | | | 410,000 | | | 432,888 |
5.75%, 08/31/12 | | | 3,325,000 | | | 3,568,513 |
1.05%, 03/01/13(E)† | | | 500,000 | | | 682,834 |
0.73%, 10/18/16† | | | 340,000 | | | 315,461 |
5.95%, 12/28/17 | | | 450,000 | | | 464,882 |
6.63%, 04/01/18 | | | 1,775,000 | | | 1,922,140 |
Motors Liquidation Co. | | | | | | |
8.25%, 07/15/23# | | | 210,000 | | | 56,700 |
8.38%, 07/05/33(E)# | | | 170,000 | | | 51,787 |
Nabors Industries, Inc. | | | | | | |
9.25%, 01/15/19 | | | 3,300,000 | | | 4,048,044 |
Nevada Power Co. | | | | | | |
5.88%, 01/15/15 | | | 350,000 | | | 376,011 |
6.65%, 04/01/36D | | | 300,000 | | | 316,704 |
New Cingular Wireless Services, Inc. | | | | | | |
8.13%, 05/01/12 | | | 135,000 | | | 152,623 |
Nisource Finance Corporation | | | | | | |
7.88%, 11/15/10 | | | 2,660,000 | | | 2,789,223 |
10.75%, 03/15/16 | | | 200,000 | | | 246,727 |
NRG Energy, Inc. | | | | | | |
7.25%, 02/01/14 | | | 285,000 | | | 289,275 |
7.38%, 02/01/16 | | | 80,000 | | | 80,300 |
7.38%, 01/15/17 | | | 35,000 | | | 35,175 |
Occidental Petroleum Corporation | | | | | | |
7.00%, 11/01/13 | | | 1,120,000 | | | 1,287,956 |
Omnicom Group, Inc. | | | | | | |
5.90%, 04/15/16 | | | 700,000 | | | 746,566 |
ONEOK Partners LP | | | | | | |
6.65%, 10/01/36 | | | 375,000 | | | 383,675 |
6.85%, 10/15/37D | | | 325,000 | | | 340,961 |
Overseas Private Investment Corporation | | | | | | |
48.09%, 07/12/10W | | | 2,437,222 | | | 2,600,694 |
9.05%, 07/12/12W | | | 3,000,000 | | | 3,382,766 |
Pacific Gas & Electric Co. | | | | | | |
8.25%, 10/15/18 | | | 40,000 | | | 48,921 |
6.05%, 03/01/34 | | | 580,000 | | | 607,492 |
5.80%, 03/01/37 | | | 250,000 | | | 254,245 |
Patrons’ Legacy | | | | | | |
5.65%, 01/17/17 144A | | | 1,290,357 | | | 1,025,460 |
Peabody Energy Corporation | | | | | | |
6.88%, 03/15/13 | | | 25,000 | | | 25,406 |
7.88%, 11/01/26 | | | 1,500,000 | | | 1,531,875 |
Pemex Project Funding Master Trust | | | | | | |
9.13%, 10/13/10 | | | 235,000 | | | 248,512 |
6.63%, 06/15/35 | | | 159,000 | | | 151,591 |
PepsiCo, Inc. | | | | | | |
7.90%, 11/01/18 | | | 650,000 | | | 799,037 |
Phoenix Life Insurance Co. | | | | | | |
7.15%, 12/15/34 144A@ | | | 425,000 | | | 209,640 |
Pricoa Global Funding I | | | | | | |
0.38%, 01/30/12 144A† | | | 2,300,000 | | | 2,238,516 |
0.45%, 09/27/13 144A† | | | 1,700,000 | | | 1,592,492 |
Pride International, Inc. | | | | | | |
7.38%, 07/15/14 | | | 130,000 | | | 134,875 |
Private Export Funding Corporation | | | | | | |
5.45%, 09/15/17 | | | 3,200,000 | | | 3,432,522 |
See Notes to Financial Statements.
91
MEDIUM-DURATION BOND FUND
SCHEDULE OF INVESTMENTS (Continued)
| | | | | | |
| | | Par | | Value |
Progress Energy, Inc. | | | | | | |
5.63%, 01/15/16 | | $ | 150,000 | | $ | 159,484 |
7.75%, 03/01/31D | | | 350,000 | | | 412,668 |
ProLogis | | | | | | |
1.88%, 11/15/37 | | | 350,000 | | | 311,500 |
PVNGS II Funding Corporation, Inc. | | | | | | |
8.00%, 12/30/15 | | | 1,118,000 | | | 1,206,820 |
Qwest Capital Funding, Inc. | | | | | | |
7.25%, 02/15/11D | | | 200,000 | | | 204,000 |
Qwest Corporation | | | | | | |
8.88%, 03/15/12 | | | 200,000 | | | 216,000 |
Reed Elsevier Capital, Inc. | | | | | | |
8.63%, 01/15/19 | | | 860,000 | | | 1,048,134 |
Reinsurance Group of America, Inc. | | | | | | |
6.75%, 12/15/35† | | | 250,000 | | | 211,570 |
Roche Holdings, Inc. | | | | | | |
6.00%, 03/01/19 144A | | | 430,000 | | | 473,347 |
Service Corporation International | | | | | | |
7.63%, 10/01/18 | | | 90,000 | | | 89,550 |
7.50%, 04/01/27 | | | 200,000 | | | 179,000 |
Simon Property Group LP | | | | | | |
10.35%, 04/01/19D | | | 750,000 | | | 943,539 |
SLM Corporation | | | | | | |
5.45%, 04/25/11D | | | 350,000 | | | 349,136 |
5.00%, 10/01/13 | | | 350,000 | | | 322,245 |
Sonat, Inc. | | | | | | |
7.63%, 07/15/11 | | | 460,000 | | | 476,422 |
Southern Natural Gas Co. | | | | | | |
8.00%, 03/01/32 | | | 400,000 | | | 461,988 |
Sovereign Bank | | | | | | |
1.99%, 08/01/13† | | | 250,000 | | | 244,767 |
Sprint Capital Corporation | | | | | | |
7.63%, 01/30/11D | | | 1,100,000 | | | 1,131,625 |
8.38%, 03/15/12 | | | 465,000 | | | 483,600 |
6.90%, 05/01/19 | | | 30,000 | | | 27,750 |
8.75%, 03/15/32 | | | 170,000 | | | 161,075 |
Sprint Nextel Corporation | | | | | | |
0.65%, 06/28/10†D | | | 1,100,000 | | | 1,082,798 |
Steel Dynamics, Inc. | | | | | | |
6.75%, 04/01/15 | | | 225,000 | | | 224,156 |
Suburban Propane Partners | | | | | | |
6.88%, 12/15/13 | | | 195,000 | | | 195,975 |
SunTrust Preferred Capital I | | | | | | |
5.85%, 12/31/49† | | | 357,000 | | | 244,545 |
Teachers Insurance & Annuity Association of America | | | | | | |
6.85%, 12/16/39 144A | | | 590,000 | | | 611,879 |
Tenet Healthcare Corporation | | | | | | |
9.25%, 02/01/15D | | | 1,262,000 | | | 1,350,340 |
Tennessee Gas Pipeline Co. | | | | | | |
7.00%, 10/15/28 | | | 175,000 | | | 187,409 |
7.63%, 04/01/37D | | | 50,000 | | | 56,401 |
Time Warner Cable, Inc. | | | | | | |
8.75%, 02/14/19 | | | 650,000 | | | 793,502 |
8.25%, 04/01/19 | | | 310,000 | | | 369,858 |
6.75%, 06/15/39 | | | 290,000 | | | 304,713 |
Time Warner, Inc. | | | | | | |
6.88%, 05/01/12 | | | 60,000 | | | 65,720 |
7.70%, 05/01/32 | | | 220,000 | | | 259,096 |
Time Warner Entertainment Co. LP | | | | | | |
8.38%, 07/15/33 | | | 590,000 | | | 707,301 |
Transatlantic Holdings, Inc. | | | | | | |
8.00%, 11/30/39 | | | 300,000 | | | 306,312 |
Travelers Cos., Inc. | | | | | | |
6.25%, 03/15/37† | | | 400,000 | | | 364,908 |
Unilever Capital Corporation | | | | | | |
7.13%, 11/01/10 | | | 285,000 | | | 300,477 |
Union Pacific Corporation | | | | | | |
6.65%, 01/15/11 | | | 260,000 | | | 274,310 |
United Air Lines, Inc. | | | | | | |
9.21%, 01/21/17+@ | | | 81,116 | | | — |
9.56%, 10/19/18@ | | | 169,104 | | | 50,731 |
United Parcel Service, Inc. | | | | | | |
4.50%, 01/15/13 | | | 1,290,000 | | | 1,372,498 |
UnitedHealth Group, Inc. | | | | | | |
4.88%, 02/15/13 | | | 370,000 | | | 387,396 |
4.88%, 04/01/13 | | | 410,000 | | | 429,969 |
US Bank NA | | | | | | |
4.38%, 02/28/17(E)† | | | 250,000 | | | 347,635 |
US Central Federal Credit Union | | | | | | |
1.25%, 10/19/11 | | | 800,000 | | | 800,134 |
1.90%, 10/19/12 | | | 600,000 | | | 599,936 |
Ventas Realty LP | | | | | | |
9.00%, 05/01/12 | | | 40,000 | | | 42,000 |
6.50%, 06/01/16 | | | 70,000 | | | 67,900 |
Verizon Communications, Inc. | | | | | | |
5.55%, 02/15/16 | | | 2,100,000 | | | 2,266,736 |
6.10%, 04/15/18 | | | 290,000 | | | 315,720 |
5.85%, 09/15/35 | | | 600,000 | | | 586,993 |
6.40%, 02/15/38 | | | 895,000 | | | 938,756 |
8.95%, 03/01/39 | | | 810,000 | | | 1,099,412 |
Verizon Global Funding Corporation | | | | | | |
7.38%, 09/01/12 | | | 290,000 | | | 327,092 |
4.38%, 06/01/13D | | | 140,000 | | | 147,022 |
Wachovia Bank NA | | | | | | |
7.80%, 08/18/10 | | | 250,000 | | | 260,908 |
6.60%, 01/15/38 | | | 900,000 | | | 953,045 |
Wachovia Capital Trust III | | | | | | |
5.80%, 03/15/42† | | | 580,000 | | | 449,500 |
Wachovia Corporation | | | | | | |
5.25%, 08/01/14 | | | 1,850,000 | | | 1,917,170 |
5.63%, 10/15/16 | | | 520,000 | | | 532,440 |
5.75%, 02/01/18 | | | 600,000 | | | 627,150 |
WEA Finance LLC | | | | | | |
7.13%, 04/15/18 144A | | | 500,000 | | | 547,532 |
WellPoint, Inc. | | | | | | |
5.88%, 06/15/17 | | | 720,000 | | | 742,895 |
Wells Fargo & Co. | | | | | | |
4.38%, 01/31/13 | | | 600,000 | | | 623,654 |
7.98%, 03/15/49† | | | 3,600,000 | | | 3,627,000 |
Wells Fargo Capital X | | | | | | |
5.95%, 12/15/36 | | | 200,000 | | | 175,000 |
Wells Fargo Capital XIII | | | | | | |
7.70%, 12/29/49†D | | | 500,000 | | | 487,500 |
Wells Fargo Capital XV | | | | | | |
9.75%, 09/26/44†D | | | 990,000 | | | 1,064,250 |
Westlake Chemical Corporation | | | | | | |
6.63%, 01/15/16 | | | 54,000 | | | 51,907 |
Whirlpool Corporation | | | | | | |
8.00%, 05/01/12 | | | 125,000 | | | 135,498 |
8.60%, 05/01/14D | | | 150,000 | | | 169,994 |
Williams Cos., Inc. | | | | | | |
7.50%, 01/15/31 | | | 20,000 | | | 21,634 |
See Notes to Financial Statements.
92
| | | | | | |
| | | Par | | Value |
7.75%, 06/15/31 | | $ | 200,000 | | $ | 219,920 |
8.75%, 03/15/32D | | | 1,308,000 | | | 1,569,452 |
Windstream Corporation | | | | | | |
8.63%, 08/01/16 | | | 630,000 | | | 644,175 |
XTO Energy, Inc. | | | | | | |
7.50%, 04/15/12 | | | 43,000 | | | 47,972 |
5.50%, 06/15/18 | | | 970,000 | | | 1,036,421 |
6.50%, 12/15/18 | | | 445,000 | | | 509,381 |
6.75%, 08/01/37 | | | 30,000 | | | 35,457 |
ZFS Finance USA Trust I | | | | | | |
6.15%, 12/15/65 144A†D | | | 525,000 | | | 483,000 |
| | | | | | |
Total Corporate Bonds
(Cost $252,264,775) | | | | | | 251,051,769 |
| | | | | | |
FOREIGN BONDS — 10.1% | | | | | | |
Australia — 0.3% | | | | | | |
Commonwealth Bank of Australia | | | | | | |
5.00%, 10/15/19 144AD | | | 190,000 | | | 188,999 |
Commonwealth Bank of Australia | | | | | | |
3.75%, 10/15/14 144A | | | 440,000 | | | 441,549 |
QBE Insurance Group, Ltd. | | | | | | |
5.65%, 07/01/23 144A†@ | | | 525,000 | | | 456,617 |
Westpac Banking Corporation | | | | | | |
1.90%, 12/14/12 144A@ | | | 1,500,000 | | | 1,488,943 |
| | | | | | |
| | | | | | 2,576,108 |
| | | | | | |
Bermuda — 0.2% | | | | | | |
Arch Capital Group, Ltd. | | | | | | |
7.35%, 05/01/34 | | | 400,000 | | | 399,219 |
Aspen Insurance Holdings, Ltd. | | | | | | |
6.00%, 08/15/14 | | | 325,000 | | | 328,790 |
Catlin Insurance Co., Ltd. | | | | | | |
7.25%, 12/31/49 144A†@ | | | 375,000 | | | 277,500 |
Endurance Specialty Holdings, Ltd. | | | | | | |
6.15%, 10/15/15D | | | 250,000 | | | 261,258 |
Merna Reinsurance, Ltd. | | | | | | |
2.00%, 07/07/10 144A†D | | | 950,000 | | | 935,845 |
| | | | | | |
| | | | | | 2,202,612 |
| | | | | | |
Brazil — 0.1% | | | | | | |
Federative Republic of Brazil | | | | | | |
8.25%, 01/20/34 | | | 600,000 | | | 769,500 |
| | | | | | |
Canada — 0.2% | | | | | | |
Anadarko Finance Co. | | | | | | |
7.50%, 05/01/31 | | | 100,000 | | | 112,498 |
Canadian Natural Resources, Ltd. | | | | | | |
5.85%, 02/01/35 | | | 50,000 | | | 49,120 |
6.50%, 02/15/37 | | | 325,000 | | | 345,877 |
Hydro Quebec | | | | | | |
6.30%, 05/11/11 | | | 305,000 | | | 325,882 |
OPTI Canada, Inc. | | | | | | |
8.25%, 12/15/14 | | | 125,000 | | | 103,594 |
Petro-Canada | | | | | | |
6.05%, 05/15/18 | | | 175,000 | | | 188,431 |
Province of Ontario | | | | | | |
4.10%, 06/16/14 | | | 400,000 | | | 417,870 |
Rogers Cable, Inc. | | | | | | |
6.75%, 03/15/15 | | | 10,000 | | | 11,318 |
Rogers Communications, Inc. | | | | | | |
6.38%, 03/01/14 | | | 340,000 | | | 376,792 |
Sun Media Corporation | | | | | | |
7.63%, 02/15/13 | | | 90,000 | | | 82,462 |
Suncor Energy, Inc. | | | | | | |
6.10%, 06/01/18D | | | 200,000 | | | 214,961 |
| | | | | | |
| | | | | | 2,228,805 |
| | | | | | |
Cayman Islands — 0.4% | | | | | | |
MUFG Capital Finance 1, Ltd. | | | | | | |
6.35%, 07/25/25† | | | 450,000 | | | 414,000 |
Petrobras International Finance Co. | | | | | | |
6.13%, 10/06/16 | | | 301,000 | | | 324,327 |
5.75%, 01/20/20 | | | 205,000 | | | 209,569 |
Petroleum Export, Ltd. | | | | | | |
4.62%, 06/15/10 144A | | | 100,000 | | | 98,498 |
4.63%, 06/15/10 144A | | | 133,333 | | | 131,337 |
Resona Preferred Global Securities Cayman, Ltd. | | | | | | |
7.19%, 07/30/49 144A† | | | 690,000 | | | 564,963 |
Shinsei Finance Cayman, Ltd. | | | | | | |
6.42%, 07/20/49 144A† | | | 1,130,000 | | | 658,950 |
Systems 2001 Asset Trust LLC | | | | | | |
6.66%, 09/15/13 144A | | | 566,919 | | | 578,519 |
Vale Overseas, Ltd. | | | | | | |
6.88%, 11/21/36 | | | 601,000 | | | 601,998 |
Willow Re, Ltd. | | | | | | |
6.30%, 06/16/10 144A# | | | 300,000 | | | 198,000 |
| | | | | | |
| | | | | | 3,780,161 |
| | | | | | |
Chile — 0.0% | | | | | | |
Codelco, Inc. | | | | | | |
4.75%, 10/15/14 144A | | | 210,000 | | | 225,328 |
| | | | | | |
France — 1.5% | | | | | | |
AXA SA | | | | | | |
6.46%, 12/14/18 144A† | | | 150,000 | | | 117,750 |
Compagnie Generale de Geophysique - Veritas | | | | | | |
7.50%, 05/15/15 | | | 200,000 | | | 199,500 |
7.75%, 05/15/17 | | | 155,000 | | | 154,612 |
Credit Agricole SA | | | | | | |
8.38%, 10/13/19 144A†D | | | 1,180,000 | | | 1,254,766 |
French Government Bond | | | | | | |
3.75%, 10/25/19(E) | | | 5,000,000 | | | 7,231,533 |
Legrand France SA | | | | | | |
8.50%, 02/15/25 | | | 250,000 | | | 261,800 |
Societe Financement del’Economie Francaise | | | | | | |
3.38%, 05/05/14 144A | | | 2,800,000 | | | 2,857,350 |
2.88%, 09/22/14 144A | | | 2,600,000 | | | 2,582,588 |
| | | | | | |
| | | | | | 14,659,899 |
| | | | | | |
Germany — 0.5% | | | | | | |
Bundesrepublik Deutschland | | | | | | |
3.75%, 01/04/19(E) | | | 2,000,000 | | | 2,964,956 |
Landwirtschaftliche Rentenbank | | | | | | |
1.88%, 09/24/12 | | | 2,200,000 | | | 2,190,001 |
| | | | | | |
| | | | | | 5,154,957 |
| | | | | | |
Iceland — 0.1% | | | | | | |
Glitnir Banki HF | | | | | | |
6.33%, 07/28/11 144A#@ | | | 600,000 | | | 129,000 |
6.38%, 09/25/12 144A#@ | | | 580,000 | | | 124,700 |
6.69%, 06/15/16 144A#@D | | | 1,000,000 | | | 2,600 |
7.45%, 09/14/16 144A#@ | | | 100,000 | | | 260 |
See Notes to Financial Statements.
93
MEDIUM-DURATION BOND FUND
SCHEDULE OF INVESTMENTS (Continued)
| | | | | | |
| | | Par | | Value |
Kaupthing Bank HF | | | | | | |
5.75%, 10/04/11 144A#@ | | $ | 250,000 | | $ | 63,125 |
7.63%, 02/28/15 144A#@ | | | 2,490,000 | | | 616,275 |
7.13%, 05/19/16 144A#@ | | | 350,000 | | | 910 |
Landsbanki Islands HF | | | | | | |
6.10%, 08/25/11 144A#@ | | | 1,500,000 | | | 75,000 |
| | | | | | |
| | | | | | 1,011,870 |
| | | | | | |
India — 0.1% | | | | | | |
ICICI Bank, Ltd. | | | | | | |
6.38%, 04/30/22† | | | 230,000 | | | 206,766 |
ICICI Bank, Ltd. | | | | | | |
6.38%, 04/30/22 144A† | | | 298,000 | | | 268,274 |
| | | | | | |
| | | | | | 475,040 |
| | | | | | |
Ireland — 0.1% | | | | | | |
DEPFA ACS Bank | | | | | | |
5.13%, 03/16/37 144A@ | | | 800,000 | | | 595,984 |
VIP Finance Ireland Ltd. for OJSC Vimpel Communications | | | | | | |
8.38%, 04/30/13 144AD | | | 120,000 | | | 127,500 |
9.13%, 04/30/18 | | | 100,000 | | | 107,600 |
| | | | | | |
| | | | | | 831,084 |
| | | | | | |
Italy — 0.1% | | | | | | |
Telecom Italia Capital SA | | | | | | |
6.20%, 07/18/11 | | | 150,000 | | | 158,828 |
5.25%, 11/15/13 | | | 165,000 | | | 173,697 |
4.95%, 09/30/14 | | | 260,000 | | | 269,767 |
5.25%, 10/01/15 | | | 130,000 | | | 136,089 |
| | | | | | |
| | | | | | 738,381 |
| | | | | | |
Japan — 0.1% | | | | | | |
Aiful Corporation | | | | | | |
5.00%, 08/10/10 144AD | | | 500,000 | | | 432,500 |
Resona Bank, Ltd. | | | | | | |
4.13%, 06/27/38 144A(E)†@ | | | 325,000 | | | 409,995 |
5.85%, 07/15/49 144A†@ | | | 475,000 | | | 415,093 |
| | | | | | |
| | | | | | 1,257,588 |
| | | | | | |
Jersey — 0.1% | | | | | | |
HSBC Capital Funding LP | | | | | | |
4.61%, 12/29/49 144A†D | | | 960,000 | | | 821,844 |
Swiss Re Capital I LP | | | | | | |
6.85%, 05/29/49 144A† | | | 650,000 | | | 526,034 |
| | | | | | |
| | | | | | 1,347,878 |
| | | | | | |
Luxembourg — 0.6% | | | | | | |
ArcelorMittal | | | | | | |
6.13%, 06/01/18 | | | 475,000 | | | 490,924 |
Enel Finance International SA | | | | | | |
5.70%, 01/15/13 144A@D | | | 700,000 | | | 755,988 |
FMC Finance III SA | | | | | | |
6.88%, 07/15/17 | | | 250,000 | | | 249,375 |
Gaz Capital for Gazprom | | | | | | |
6.51%, 03/07/22 144A | | | 100,000 | | | 92,000 |
Hellas Telecommunications Finance | | | | | | |
6.72%, 10/15/12(E)† | | | 375,000 | | | 449,095 |
RSHB Capital SA for OJSC Russian Agricultural Bank | | | | | | |
6.30%, 05/15/17 144A | | | 300,000 | | | 303,600 |
TNK-BP Finance SA | | | | | | |
7.50%, 07/18/16 144A | | | 580,000 | | | 597,400 |
Tyco International Group SA | | | | | | |
6.00%, 11/15/13 | | | 2,920,000 | | | 3,201,292 |
| | | | | | |
| | | | | | 6,139,674 |
| | | | | | |
Marshall Islands — 0.0% | | | | | | |
Teekay Shipping Corporation | | | | | | |
8.88%, 07/15/11 | | | 176,000 | | | 183,260 |
| | | | | | |
Mexico — 0.2% | | | | | | |
America Movil Sab de CV | | | | | | |
5.63%, 11/15/17D | | | 270,000 | | | 280,892 |
Kansas City Southern de Mexico SA de CV | | | | | | |
9.38%, 05/01/12D | | | 120,000 | | | 125,100 |
Mexico Government International Bond | | | | | | |
6.75%, 09/27/34 | | | 1,031,000 | | | 1,092,860 |
Petroleos Mexicanos | | | | | | |
8.00%, 05/03/19 | | | 720,000 | | | 837,000 |
| | | | | | |
| | | | | | 2,335,852 |
| | | | | | |
Netherlands — 1.1% | | | | | | |
Achmea Hypotheekbank NV | | | | | | |
3.20%, 11/03/14 144A | | | 2,000,000 | | | 1,998,344 |
Deutsche Telekom International Finance BV | | | | | | |
8.50%, 06/15/10 | | | 3,400,000 | | | 3,514,036 |
5.75%, 03/23/16D | | | 510,000 | | | 542,253 |
Fortis Bank Nederland NV | | | | | | |
1.25%, 06/10/11(E) | | | 700,000 | | | 1,005,471 |
ING Bank NV | | | | | | |
3.90%, 03/19/14 144A | | | 500,000 | | | 515,133 |
Koninklijke KPN NV | | | | | | |
8.00%, 10/01/10 | | | 780,000 | | | 819,149 |
LeasePlan Corporation NV | | | | | | |
3.00%, 05/07/12 144A | | | 2,200,000 | | | 2,260,950 |
Rabobank Nederland NV | | | | | | |
11.00%, 06/30/19 144A† | | | 687,000 | | | 856,868 |
| | | | | | |
| | | | | | 11,512,204 |
| | | | | | |
New Zealand — 0.2% | | | | | | |
ANZ National International, Ltd. | | | | | | |
3.25%, 04/02/12 144A | | | 1,900,000 | | | 1,958,180 |
| | | | | | |
Peru — 0.1% | | | | | | |
Republic of Peru | | | | | | |
7.13%, 03/30/19D | | | 380,000 | | | 438,900 |
| | | | | | |
Qatar — 0.1% | | | | | | |
Qatar Government International Bond | | | | | | |
5.15%, 04/09/14 | | | 510,000 | | | 538,050 |
5.25%, 01/20/20 144AD | | | 580,000 | | | 587,250 |
Ras Laffan Liquefied Natural Gas Co., Ltd. III | | | | | | |
6.75%, 09/30/19 144A | | | 250,000 | | | 271,731 |
| | | | | | |
| | | | | | 1,397,031 |
| | | | | | |
South Korea — 0.0% | | | | | | |
Export-Import Bank of Korea | | | | | | |
5.25%, 02/10/14 144A | | | 235,000 | | | 247,863 |
| | | | | | |
Spain — 0.1% | | | | | | |
Telefonica Emisiones SAU | | | | | | |
6.42%, 06/20/16 | | | 900,000 | | | 1,000,271 |
| | | | | | |
See Notes to Financial Statements.
94
| | | | | | |
| | | Par | | Value |
Supranational — 0.4% | | | | | | |
African Development Bank | | | | | | |
1.75%, 10/01/12 | | $ | 2,300,000 | | $ | 2,286,561 |
European Investment Bank | | | | | | |
3.00%, 04/08/14 | | | 2,000,000 | | | 2,018,456 |
| | | | | | |
| | | | | | 4,305,017 |
| | | | | | |
Sweden — 0.3% | | | | | | |
Nordea Bank AB | | | | | | |
3.70%, 11/13/14 144A | | | 630,000 | | | 629,478 |
Svensk Exportkredit AB | | | | | | |
3.25%, 09/16/14 | | | 500,000 | | | 500,460 |
Swedbank AB | | | | | | |
2.80%, 02/10/12 144AD | | | 2,000,000 | | | 2,044,146 |
| | | | | | |
| | | | | | 3,174,084 |
| | | | | | |
Switzerland — 0.4% | | | | | | |
UBS AG | | | | | | |
1.20%, 05/05/10† | | | 100,000 | | | 100,131 |
1.17%, 06/19/10† | | | 3,700,000 | | | 3,674,433 |
| | | | | | |
| | | | | | 3,774,564 |
| | | | | | |
United Arab Emirates — 0.0% | | | | | | |
Dolphin Energy, Ltd. | | | | | | |
5.89%, 06/15/19 144A | | | 277,200 | | | 280,475 |
| | | | | | |
United Kingdom — 2.8% | | | | | | |
Anglo American Capital PLC | | | | | | |
9.38%, 04/08/14 144A@ | | | 100,000 | | | 120,102 |
9.38%, 04/08/19 144AD | | | 275,000 | | | 349,881 |
Barclays Bank PLC | | | | | | |
5.20%, 07/10/14 | | | 2,260,000 | | | 2,398,027 |
6.05%, 12/04/17 144A | | | 230,000 | | | 234,437 |
BP Capital Markets PLC | | | | | | |
5.25%, 11/07/13 | | | 940,000 | | | 1,024,770 |
3.88%, 03/10/15 | | | 310,000 | | | 318,871 |
HSBC Holdings PLC | | | | | | |
6.80%, 06/01/38D | | | 425,000 | | | 462,754 |
Lloyds TSB Bank PLC | | | | | | |
0.87%, 06/09/11(E) | | | 500,000 | | | 717,183 |
2.80%, 04/02/12 144A | | | 5,600,000 | | | 5,704,750 |
12.00%, 12/16/39 144A†@ | | | 3,200,000 | | | 3,142,043 |
Royal Bank of Scotland PLC | | | | | | |
2.63%, 05/11/12 144A | | | 6,100,000 | | | 6,222,445 |
4.88%, 08/25/14 144AD | | | 425,000 | | | 431,260 |
Royal Bank of Scotland Group PLC | | | | | | |
0.51%, 03/30/12 144A† | | | 3,900,000 | | | 3,890,418 |
1.50%, 03/30/12 144A@ | | | 2,400,000 | | | 2,378,045 |
6.40%, 10/21/19 | | | 760,000 | | | 758,924 |
7.64%, 03/31/45† | | | 300,000 | | | 162,193 |
| | | | | | |
| | | | | | 28,316,103 |
| | | | | | |
Total Foreign Bonds
(Cost $107,966,389) | | | | | | 102,322,689 |
| | | | | | |
LOAN AGREEMENTS — 0.6% | | | | | | |
Chrysler Finance Co. Bridge Loan | | | | | | |
4.24%, 08/03/14 | | | 6,618,717 | | | 6,443,321 |
Ford Motor Co. Tranche B | | | | | | |
3.29%, 11/29/13† | | | 52,487 | | | 48,354 |
| | | | | | |
Total Loan Agreements
(Cost $6,443,930) | | | | | | 6,491,675 |
| | | | | | |
MORTGAGE-BACKED SECURITIES — 38.7% | | | | | | |
ABN AMRO Mortgage Corporation | | | | | | |
0.01%, 06/25/33 IOW@ | | | 148,389 | | | 10,282 |
American Home Mortgage Assets | | | | | | |
1.46%, 11/25/46† | | | 1,557,123 | | | 812,837 |
1.24%, 02/25/47† | | | 2,301,351 | | | 1,046,190 |
Bank of America Commercial Mortgage, Inc. | | | | | | |
5.12%, 10/10/45 | | | 3,000,000 | | | 2,940,576 |
5.63%, 07/10/46 | | | 1,000,000 | | | 936,812 |
Bank of America Funding Corporation | | | | | | |
0.31%, 07/20/36† | | | 1,188,234 | | | 1,054,017 |
Bank of America Mortgage Securities, Inc. | | | | | | |
4.09%, 07/25/34† | | | 422,820 | | | 375,453 |
Bear Stearns Adjustable Rate Mortgage Trust | | | | | | |
5.63%, 02/25/33 | | | 164,582 | | | 160,938 |
3.63%, 04/25/34 | | | 237,880 | | | 210,047 |
5.27%, 05/25/34 | | | 947,092 | | | 841,578 |
2.94%, 03/25/35† | | | 1,671,998 | | | 1,463,133 |
Bear Stearns Alt-A Trust | | | | | | |
0.87%, 04/25/34† | | | 112,320 | | | 84,779 |
5.31%, 05/25/35 | | | 621,002 | | | 439,940 |
5.38%, 09/25/35 | | | 927,131 | | | 620,241 |
Bear Stearns Structured Products, Inc. | | | | | | |
5.63%, 01/26/36 | | | 1,588,571 | | | 916,615 |
Chase Mortgage Finance Corporation | | | | | | |
3.90%, 02/25/37 | | | 838,342 | | | 760,477 |
4.06%, 02/25/37 | | | 327,841 | | | 286,626 |
Citigroup Mortgage Loan Trust, Inc. | | | | | | |
4.90%, 12/25/35† | | | 2,080,539 | | | 1,569,014 |
Commercial Mortgage Pass-Through Certificates | | | | | | |
5.77%, 06/10/46 | | | 2,500,000 | | | 2,451,472 |
Commerical Mortgage Asset Trust | | | | | | |
7.55%, 01/17/10 | | | 57,886 | | | 58,006 |
Countrywide Alternative Loan Trust | | | | | | |
5.50%, 10/25/33 | | | 167,358 | | | 161,789 |
0.58%, 09/25/35† | | | 2,197,500 | | | 1,146,136 |
2.04%, 09/25/35† | | | 309,507 | | | 181,889 |
0.56%, 10/25/35† | | | 1,420,630 | | | 741,408 |
0.53%, 11/20/35† | | | 721,692 | | | 385,134 |
0.55%, 11/20/35† | | | 599,152 | | | 338,506 |
0.56%, 11/20/35† | | | 1,112,825 | | | 573,009 |
0.56%, 11/20/35† | | | 2,115,071 | | | 1,110,157 |
0.50%, 12/25/35† | | | 739,415 | | | 391,059 |
0.53%, 12/25/35† | | | 1,510,918 | | | 796,760 |
0.50%, 02/25/36† | | | 1,609,600 | | | 860,322 |
6.00%, 08/25/37 | | | 1,400,062 | | | 940,714 |
1.92%, 04/25/43† | | | 2,799,031 | | | 1,263,999 |
0.44%, 06/25/46† | | | 1,214,775 | | | 581,672 |
0.42%, 09/25/46† | | | 1,589,710 | | | 755,908 |
Countrywide Home Loan Mortgage Pass-Through Trust | | | | | | |
3.46%, 02/19/34 | | | 1,480,079 | | | 1,224,061 |
See Notes to Financial Statements.
95
MEDIUM-DURATION BOND FUND
SCHEDULE OF INVESTMENTS (Continued)
| | | | | | |
| | | Par | | Value |
3.62%, 11/20/34 | | $ | 298,901 | | $ | 236,100 |
0.65%, 11/25/34 144A† | | | 33,713 | | | 27,180 |
0.59%, 03/25/35 144A† | | | 117,294 | | | 91,585 |
0.47%, 03/25/36† | | | 526,789 | | | 283,276 |
Credit Suisse Mortgage Capital Certificates | | | | | | |
5.38%, 02/15/40 | | | 2,200,000 | | | 1,775,796 |
CS First Boston Mortgage Securities Corporation | | | | | | |
0.01%, 07/25/33 IOW@ | | | 189,860 | | | — |
2.50%, 07/25/33 IOW@ | | | 341,228 | | | 29,776 |
0.01%, 08/25/33 IOW@ | | | 258,837 | | | — |
6.53%, 06/15/34 | | | 1,475,956 | | | 1,533,741 |
Federal Home Loan Mortgage Corporation | | | | | | |
4.50%, 04/02/14 | | | 4,600,000 | | | 4,946,329 |
7.00%, 11/01/14 | | | 28,794 | | | 31,070 |
7.00%, 04/01/15 | | | 32,052 | | | 34,585 |
7.00%, 12/01/15 | | | 22,139 | | | 23,619 |
8.50%, 06/01/16 | | | 12,325 | | | 13,558 |
4.50%, 05/01/18 | | | 49,247 | | | 51,361 |
4.50%, 06/01/18 | | | 29,199 | | | 30,406 |
8.50%, 06/01/18 | | | 5,852 | | | 6,438 |
4.50%, 09/01/18 | | | 70,777 | | | 73,704 |
4.50%, 10/01/18 | | | 92,155 | | | 95,950 |
4.50%, 01/01/19 | | | 36,535 | | | 38,046 |
4.50%, 03/01/19 | | | 33,537 | | | 34,924 |
5.00%, 06/01/20 | | | 434,378 | | | 457,236 |
5.00%, 07/01/20 | | | 426,724 | | | 448,646 |
4.51%, 04/15/22 POW@ | | | 22,256 | | | 19,835 |
8.00%, 08/01/24 | | | 4,398 | | | 5,044 |
7.50%, 11/01/29 | | | 13,688 | | | 15,395 |
7.50%, 12/01/29 | | | 23,400 | | | 26,319 |
7.50%, 02/01/31 | | | 32,942 | | | 37,009 |
3.16%, 07/01/31† | | | 29,587 | | | 30,509 |
3.11%, 08/01/31† | | | 3,752 | | | 3,872 |
7.50%, 11/01/31 | | | 10,243 | | | 11,501 |
3.98%, 04/01/32† | | | 7,138 | | | 7,330 |
2.98%, 03/01/34† | | | 8,232 | | | 8,545 |
5.00%, 12/01/34 | | | 110,096 | | | 113,250 |
5.50%, 05/01/35 | | | 1,767,169 | | | 1,857,921 |
0.01%, 08/15/35W†@ | | | 35,327 | | | 32,169 |
5.00%, 11/01/35 | | | 1,420,056 | | | 1,458,960 |
5.50%, 11/01/35 | | | 600,671 | | | 631,518 |
5.00%, 12/01/35 | | | 107,440 | | | 110,383 |
5.50%, 01/01/36 | | | 309,100 | | | 324,973 |
6.00%, 02/01/36 | | | 1,327,282 | | | 1,411,067 |
6.00%, 11/01/36 | | | 20,818 | | | 22,133 |
5.00%, 01/01/37 | | | 330,443 | | | 339,496 |
6.08%, 01/01/37† | | | 1,789,974 | | | 1,894,942 |
5.67%, 04/01/37† | | | 3,015,003 | | | 3,178,843 |
6.00%, 04/01/37 | | | 10,771 | | | 11,451 |
0.01%, 04/15/37W†@ | | | 37,348 | | | 29,024 |
0.01%, 06/15/37W†@ | | | 97,533 | | | 76,320 |
0.73%, 06/15/37† | | | 2,148,022 | | | 2,116,019 |
5.50%, 07/01/37 | | | 508,790 | | | 533,567 |
6.00%, 07/01/37 | | | 3,162 | | | 3,359 |
5.65%, 09/01/37† | | | 3,998,386 | | | 4,231,896 |
6.00%, 09/01/37 | | | 140,742 | | | 149,494 |
6.00%, 11/01/37 | | | 21,769 | | | 23,123 |
5.00%, 04/01/38 | | | 84,494 | | | 86,743 |
5.50%, 04/01/38 | | | 217,124 | | | 227,698 |
6.00%, 04/01/38 | | | 22,160 | | | 23,538 |
6.00%, 05/01/38 | | | 823,921 | | | 874,468 |
6.00%, 07/01/38 | | | 50,728 | | | 53,841 |
6.00%, 12/01/38 | | | 146,585 | | | 155,578 |
5.00%, 01/01/39 TBA | | | 200,000 | | | 205,062 |
6.00%, 01/01/39 | | | 70,850 | | | 75,194 |
6.00%, 02/01/39 | | | 22,849 | | | 24,251 |
5.00%, 03/01/39 | | | 476,640 | | | 489,252 |
5.00%, 04/01/39 | | | 1,308,718 | | | 1,343,344 |
5.00%, 05/01/39 | | | 385,449 | | | 395,647 |
5.00%, 06/01/39 | | | 2,317,545 | | | 2,378,863 |
5.00%, 07/01/39 | | | 588,403 | | | 603,981 |
4.50%, 09/01/39 | | | 988,003 | | | 986,562 |
5.00%, 09/01/39 | | | 1,089,870 | | | 1,118,706 |
5.00%, 10/01/39 | | | 897,590 | | | 921,339 |
5.00%, 11/01/39 | | | 495,235 | | | 508,339 |
4.50%, 01/01/40 TBA | | | 1,000,000 | | | 997,500 |
Federal Housing Administration | | | | | | |
7.43%, 10/01/18 | | | 170,767 | | | 182,055 |
Federal National Mortgage Association | | | | | | |
4.00%, 06/01/13 | | | 39,833 | | | 40,758 |
4.00%, 07/01/13 | | | 53,873 | | | 55,336 |
4.00%, 08/01/13 | | | 76,241 | | | 78,045 |
4.00%, 09/01/13 | | | 149,597 | | | 153,163 |
4.00%, 10/01/13 | | | 312,710 | | | 320,219 |
8.00%, 06/01/15 | | | 23,131 | | | 25,325 |
8.00%, 06/15/15 | | | 9,898 | | | 10,836 |
8.00%, 07/01/15 | | | 19,270 | | | 21,097 |
8.00%, 09/01/15 | | | 35,361 | | | 38,117 |
5.00%, 11/01/17 | | | 137,656 | | | 145,072 |
5.00%, 12/01/17 | | | 736,509 | | | 775,594 |
5.00%, 01/01/18 | | | 1,816,301 | | | 1,914,029 |
5.00%, 02/01/18 | | | 359,321 | | | 378,632 |
5.50%, 02/01/18 | | | 132,262 | | | 140,008 |
5.00%, 04/01/18 | | | 624,216 | | | 657,650 |
5.00%, 05/01/18 | | | 859,131 | | | 905,253 |
5.00%, 06/01/18 | | | 105,044 | | | 110,670 |
4.00%, 09/01/18 | | | 2,785,498 | | | 2,856,309 |
4.50%, 09/01/18 | | | 88,794 | | | 92,550 |
4.50%, 10/01/18 | | | 185,099 | | | 192,928 |
4.50%, 11/01/18 | | | 41,857 | | | 43,627 |
5.00%, 11/01/18 | | | 173,162 | | | 182,491 |
4.50%, 12/01/18 | | | 70,398 | | | 73,376 |
4.50%, 01/01/19 | | | 48,809 | | | 50,874 |
5.00%, 02/01/19 | | | 116,653 | | | 122,755 |
4.50%, 03/01/19 | | | 67,018 | | | 69,853 |
5.00%, 03/01/19 | | | 913,548 | | | 961,337 |
5.00%, 04/01/19 | | | 683,686 | | | 719,450 |
4.50%, 05/01/19 | | | 156,386 | | | 162,611 |
4.50%, 07/01/19 | | | 42,871 | | | 44,578 |
5.00%, 08/01/19 | | | 459,589 | | | 483,631 |
6.00%, 09/01/19 | | | 595,426 | | | 638,112 |
5.00%, 10/01/19 | | | 198,419 | | | 208,798 |
5.00%, 11/01/19 | | | 820,543 | | | 863,466 |
6.00%, 12/01/20 | | | 1,114,104 | | | 1,193,975 |
6.65%, 08/25/21 IOW@ | | | 185 | | | 4,283 |
8.99%, 10/25/21 IOW@ | | | 301 | | | 6,267 |
21.67%, 01/25/22† | | | 2,506 | | | 2,536 |
9.50%, 05/01/22 | | | 3,684 | | | 4,091 |
2.72%, 07/01/22† | | | 14,543 | | | 14,751 |
6.00%, 01/01/23 | | | 109,495 | | | 117,820 |
4.50%, 04/01/23 | | | 1,438,719 | | | 1,482,943 |
5.50%, 09/01/23 | | | 608,512 | | | 644,813 |
5.50%, 10/01/23 | | | 84,473 | | | 89,512 |
4.50%, 12/01/23 | | | 168,249 | | | 173,421 |
See Notes to Financial Statements.
96
| | | | | | |
| | | Par | | Value |
5.00%, 12/01/23 | | $ | 723,974 | | $ | 757,393 |
5.00%, 01/01/24 TBA | | | 3,100,000 | | | 3,239,500 |
5.50%, 01/01/24 TBA | | | 3,600,000 | | | 3,807,000 |
9.50%, 07/01/24 | | | 6,900 | | | 7,640 |
4.50%, 01/19/25 TBA | | | 2,000,000 | | | 2,056,876 |
2.52%, 07/01/27† | | | 26,037 | | | 26,435 |
3.22%, 08/01/27† | | | 63,981 | | | 65,388 |
2.52%, 11/01/27† | | | 62,389 | | | 63,344 |
5.50%, 04/01/29 | | | 514 | | | 543 |
3.14%, 02/01/30† | | | 161,580 | | | 165,682 |
0.83%, 05/25/30† | | | 1,438,052 | | | 1,426,613 |
3.37%, 06/01/30† | | | 22,738 | | | 22,631 |
8.00%, 10/01/30 | | | 51,335 | | | 58,856 |
0.68%, 10/18/30† | | | 54,786 | | | 54,366 |
3.20%, 12/01/30† | | | 7,755 | | | 8,028 |
2.52%, 01/01/31† | | | 8,620 | | | 8,759 |
3.07%, 05/01/31† | | | 18,127 | | | 18,672 |
3.00%, 06/01/31† | | | 7,240 | | | 7,401 |
6.00%, 01/01/32 | | | 95,591 | | | 102,190 |
6.00%, 03/01/32 | | | 223,266 | | | 238,773 |
6.00%, 04/01/32 | | | 545,568 | | | 583,076 |
2.52%, 06/01/32† | | | 9,887 | | | 10,049 |
2.72%, 08/01/32† | | | 37,050 | | | 37,663 |
4.50%, 01/01/33 | | | 1,400,000 | | | 1,439,813 |
5.50%, 01/01/33 | | | 1,000,001 | | | 1,052,136 |
3.59%, 02/01/33† | | | 4,166 | | | 4,265 |
5.50%, 03/01/33 | | | 84,108 | | | 88,401 |
2.72%, 05/01/33† | | | 82,587 | | | 83,976 |
5.50%, 05/01/33 | | | 12,890,215 | | | 13,548,154 |
6.00%, 05/01/33 | | | 15,067 | | | 16,103 |
5.50%, 06/01/33 | | | 24,564 | | | 25,818 |
5.50%, 07/01/33 | | | 281,614 | | | 295,988 |
0.01%, 07/25/33 IOW†@ | | | 279,630 | | | 2,126 |
5.00%, 08/01/33 | | | 32,235 | | | 33,214 |
5.50%, 09/01/33 | | | 8,048 | | | 8,459 |
6.00%, 12/01/33 | | | 6,578 | | | 7,027 |
5.50%, 02/01/34 | | | 10,298 | | | 10,823 |
5.50%, 04/01/34 | | | 1,638 | | | 1,722 |
0.01%, 04/25/34 IOW†@ | | | 465,992 | | | 13,014 |
5.50%, 06/01/34 | | | 142,954 | | | 150,251 |
0.01%, 06/25/34 IOW†@ | | | 619,807 | | | 7,823 |
5.00%, 08/01/34 | | | 264,301 | | | 272,079 |
5.50%, 08/01/34 | | | 16,221 | | | 17,049 |
5.50%, 10/01/34 | | | 1,092 | | | 1,147 |
6.00%, 10/01/34 | | | 72,053 | | | 76,849 |
4.28%, 12/01/34† | | | 805,817 | | | 812,650 |
4.50%, 12/01/34 | | | 275,125 | | | 276,443 |
5.50%, 12/01/34 | | | 109,561 | | | 115,153 |
6.00%, 12/01/34 | | | 2,484 | | | 2,650 |
6.00%, 01/01/35 | | | 1,615,038 | | | 1,722,539 |
4.50%, 02/01/35 | | | 323,340 | | | 324,889 |
4.50%, 03/01/35 | | | 1,170,628 | | | 1,174,043 |
5.00%, 03/01/35 | | | 225,725 | | | 232,368 |
4.50%, 04/01/35 | | | 763,668 | | | 765,896 |
6.00%, 04/01/35 | | | 1,650,345 | | | 1,762,737 |
4.50%, 05/01/35 | | | 591,474 | | | 593,199 |
6.00%, 05/01/35 | | | 2,871,445 | | | 3,055,397 |
0.93%, 05/25/35W†@ | | | 47,701 | | | 45,360 |
5.00%, 06/01/35 | | | 2,454,094 | | | 2,526,311 |
4.50%, 07/01/35 | | | 390,918 | | | 392,059 |
5.50%, 07/01/35 | | | 697 | | | 732 |
6.00%, 07/01/35 | | | 869,813 | | | 925,536 |
5.00%, 08/01/35 | | | 184,323 | | | 189,517 |
5.50%, 08/01/35 | | | 1,744 | | | 1,832 |
6.00%, 08/01/35 | | | 775 | | | 824 |
4.50%, 09/01/35 | | | 104,072 | | | 104,375 |
5.00%, 09/01/35‡‡ | | | 7,012,614 | | | 7,226,646 |
5.50%, 09/01/35 | | | 681,957 | | | 716,339 |
4.50%, 10/01/35 | | | 242,367 | | | 243,074 |
6.00%, 10/01/35 | | | 225,279 | | | 240,188 |
2.52%, 11/01/35† | | | 31,035 | | | 31,568 |
2.63%, 11/01/35† | | | 464,544 | | | 467,193 |
2.63%, 11/01/35† | | | 430,170 | | | 432,623 |
2.63%, 11/01/35† | | | 400,444 | | | 402,738 |
2.64%, 11/01/35† | | | 387,688 | | | 389,909 |
2.66%, 11/01/35† | | | 430,712 | | | 433,201 |
6.00%, 11/01/35 | | | 2,061,299 | | | 2,196,463 |
5.00%, 12/01/35 | | | 5,365,813 | | | 5,523,714 |
5.50%, 12/01/35 | | | 8,077 | | | 8,489 |
6.00%, 12/01/35 | | | 38,480 | | | 41,131 |
6.00%, 01/01/36 | | | 170,878 | | | 181,825 |
6.00%, 02/01/36 | | | 39,882 | | | 42,362 |
5.00%, 03/01/36 | | | 3,917,343 | | | 4,027,722 |
6.00%, 03/01/36 | | | 36,808 | | | 39,097 |
5.50%, 04/01/36 | | | 596,028 | | | 623,191 |
6.00%, 04/01/36 | | | 32,485 | | | 34,506 |
6.50%, 04/01/36 | | | 736,371 | | | 790,218 |
3.95%, 05/01/36† | | | 364,005 | | | 376,337 |
5.00%, 05/01/36 | | | 2,947,911 | | | 3,030,975 |
6.00%, 06/01/36 | | | 16,818 | | | 17,863 |
6.00%, 07/01/36 | | | 37,287 | | | 39,606 |
6.00%, 08/01/36 | | | 122,777 | | | 130,412 |
0.68%, 08/25/36† | | | 2,594,685 | | | 2,567,018 |
5.00%, 09/01/36 | | | 721,187 | | | 741,508 |
5.50%, 09/01/36 | | | 20,910,012 | | | 21,977,295 |
6.00%, 09/01/36 | | | 412,333 | | | 437,975 |
6.00%, 09/25/36W†@ | | | 39,638 | | | 34,498 |
6.00%, 10/01/36 | | | 40,937 | | | 43,483 |
6.50%, 10/01/36 | | | 507,315 | | | 544,412 |
5.50%, 11/01/36 | | | 1,506,473 | | | 1,579,835 |
6.00%, 11/01/36 | | | 238,787 | | | 253,637 |
6.50%, 11/01/36 | | | 308,622 | | | 331,383 |
5.00%, 12/01/36 | | | 19,718,693 | | | 20,274,309 |
5.50%, 12/01/36 | | | 4,721 | | | 4,951 |
6.00%, 12/01/36 | | | 413,846 | | | 439,582 |
6.00%, 01/01/37 | | | 224,216 | | | 238,146 |
5.49%, 02/01/37† | | | 3,021,059 | | | 3,182,376 |
5.50%, 02/01/37 | | | 1,607 | | | 1,685 |
5.50%, 03/01/37 | | | 82,233 | | | 86,353 |
6.50%, 03/01/37 | | | 689,606 | | | 739,280 |
5.50%, 04/01/37 | | | 21,879 | | | 22,942 |
6.00%, 04/01/37 | | | 199,166 | | | 211,271 |
6.50%, 04/01/37 | | | 432,451 | | | 463,601 |
5.50%, 05/01/37 | | | 7,059 | | | 7,397 |
6.00%, 05/01/37 | | | 111,226 | | | 117,986 |
6.50%, 05/01/37 | | | 576,412 | | | 617,932 |
5.50%, 06/01/37 | | | 1,086 | | | 1,138 |
6.00%, 06/01/37 | | | 10,743 | | | 11,396 |
5.50%, 07/01/37 | | | 11,930 | | | 12,501 |
6.00%, 07/01/37 | | | 7,663,249 | | | 8,129,045 |
6.00%, 08/01/37 | | | 178,512 | | | 189,363 |
6.50%, 08/01/37 | | | 832,672 | | | 892,651 |
6.00%, 09/01/37 | | | 215,016 | | | 228,085 |
6.50%, 09/01/37 | | | 648,981 | | | 695,728 |
6.00%, 10/01/37 | | | 400,322 | | | 424,654 |
6.50%, 10/01/37 | | | 511,448 | | | 548,288 |
6.00%, 11/01/37 | | | 192,603 | | | 204,309 |
2.52%, 12/01/37† | | | 137,174 | | | 139,580 |
See Notes to Financial Statements.
97
MEDIUM-DURATION BOND FUND
SCHEDULE OF INVESTMENTS (Continued)
| | | | | | |
| | | Par | | Value |
6.00%, 12/01/37 | | $ | 2,776 | | $ | 2,944 |
2.52%, 01/01/38† | | | 60,984 | | | 60,635 |
6.00%, 01/01/38 | | | 31,762 | | | 33,683 |
5.00%, 02/01/38 | | | 4,042,246 | | | 4,152,760 |
5.50%, 02/01/38 | | | 1,136 | | | 1,190 |
6.00%, 02/01/38 | | | 273,933 | | | 290,412 |
4.50%, 03/01/38 | | | 60,022 | | | 59,978 |
5.00%, 03/01/38 | | | 1,370,525 | | | 1,407,995 |
5.50%, 03/01/38 | | | 3,352 | | | 3,513 |
6.00%, 03/01/38 | | | 260,769 | | | 276,550 |
4.50%, 04/01/38 | | | 1,676,966 | | | 1,675,736 |
6.00%, 04/01/38 | | | 10,769 | | | 11,417 |
5.50%, 05/01/38 | | | 92,253 | | | 96,674 |
6.00%, 05/01/38 | | | 209,639 | | | 222,250 |
5.50%, 06/01/38 | | | 182,758 | | | 191,515 |
6.00%, 06/01/38 | | | 70,540 | | | 74,784 |
5.50%, 07/01/38 | | | 1,056,811 | | | 1,107,450 |
6.00%, 07/01/38 | | | 66,032 | | | 70,005 |
5.50%, 08/01/38 | | | 5,857 | | | 6,138 |
6.00%, 08/01/38 | | | 93,357 | | | 98,973 |
5.50%, 09/01/38 | | | 44,579 | | | 46,716 |
6.00%, 09/01/38 | | | 668,165 | | | 708,359 |
5.50%, 10/01/38 | | | 47,247 | | | 49,511 |
6.00%, 10/01/38 | | | 156,326 | | | 165,730 |
5.50%, 11/01/38 | | | 90,218 | | | 94,541 |
5.50%, 12/01/38 | | | 933,612 | | | 981,260 |
6.00%, 12/01/38 | | | 112,724 | | | 119,505 |
6.00%, 01/01/39 | | | 82,890 | | | 87,870 |
5.00%, 02/01/39 | | | 271,047 | | | 278,472 |
5.50%, 02/01/39 | | | 7,591 | | | 7,954 |
6.00%, 02/01/39 | | | 1,464,580 | | | 1,553,599 |
5.00%, 03/01/39 | | | 373,054 | | | 383,253 |
5.00%, 05/01/39 | | | 614,414 | | | 631,179 |
4.50%, 06/01/39 | | | 68,194 | | | 68,137 |
5.00%, 06/01/39 | | | 86,669 | | | 89,030 |
5.00%, 07/01/39 | | | 757,466 | | | 778,106 |
4.50%, 08/01/39 | | | 29,764 | | | 29,740 |
4.50%, 09/01/39 | | | 198,275 | | | 198,110 |
5.00%, 09/01/39 | | | 435,468 | | | 447,330 |
4.50%, 10/01/39 | | | 695,462 | | | 694,883 |
5.00%, 10/01/39 | | | 1,847,611 | | | 1,897,939 |
5.00%, 11/01/39 | | | 199,101 | | | 204,524 |
4.00%, 01/01/40 TBA | | | 1,000,000 | | | 1,005,781 |
4.50%, 01/01/40 TBA | | | 7,000,000 | | | 6,986,875 |
4.50%, 01/13/40 TBA | | | 23,000,000 | | | 22,956,875 |
0.99%, 01/25/40† | | | 5,900,000 | | | 5,860,236 |
4.00%, 04/13/40 TBA | | | 2,000,000 | | | 1,930,624 |
2.03%, 06/01/40† | | | 107,711 | | | 107,411 |
2.03%, 10/01/40† | | | 298,232 | | | 297,431 |
2.52%, 11/01/40† | | | 50,055 | | | 49,766 |
FFCA Secured Lending Corporation | | | | | | |
8.00%, 07/18/20 IO 144AW@ | | | 997,080 | | | 18,286 |
FHLMC Structured Pass-Through Securities | | | | | | |
2.03%, 07/25/44† | | | 2,180,524 | | | 2,076,787 |
First Horizon Alternative Mortgage Securities | | | | | | |
2.60%, 06/25/34† | | | 962,397 | | | 759,003 |
First Horizon Asset Securities, Inc. | | | | | | |
3.01%, 12/25/34† | | | 114,170 | | | 100,844 |
First Union National Bank Commercial Mortgage Trust | | | | | | |
7.20%, 10/01/32 | | | 1,078,846 | | | 1,102,491 |
GMAC Commercial Mortgage Securities, Inc. | | | | | | |
6.28%, 11/15/39 | | | 2,000,000 | | | 2,102,065 |
GMAC Mortgage Corporation Loan Trust | | | | | | |
4.59%, 06/25/34† | | | 415,298 | | | 372,864 |
Government National Mortgage Association | | | | | | |
7.00%, 10/15/25 | | | 58,002 | | | 64,360 |
7.00%, 01/15/26 | | | 18,895 | | | 20,981 |
7.00%, 07/15/27 | | | 143,566 | | | 159,508 |
7.00%, 12/15/27 | | | 1,504 | | | 1,670 |
7.00%, 01/15/28 | | | 31,075 | | | 34,575 |
7.00%, 03/15/28 | | | 176,442 | | | 196,026 |
7.00%, 07/15/28 | | | 23,166 | | | 25,775 |
7.50%, 07/15/28 | | | 14,856 | | | 16,723 |
6.50%, 08/15/28 | | | 16,942 | | | 18,302 |
7.00%, 08/15/28 | | | 35,103 | | | 39,056 |
7.50%, 08/15/28 | | | 15,263 | | | 17,182 |
6.50%, 09/15/28 | | | 63,924 | | | 69,056 |
6.00%, 10/15/28 | | | 15,940 | | | 17,028 |
7.00%, 10/15/28 | | | 65,532 | | | 72,913 |
6.00%, 12/15/28 | | | 2,471 | | | 2,640 |
6.00%, 01/15/29 | | | 497 | | | 531 |
7.50%, 03/15/29 | | | 45,586 | | | 51,283 |
7.50%, 11/15/29 | | | 24,113 | | | 27,156 |
4.13%, 11/20/29† | | | 77,239 | | | 78,986 |
8.50%, 08/15/30 | | | 3,835 | | | 4,443 |
8.50%, 11/20/30 | | | 23,250 | | | 26,845 |
6.00%, 04/15/31 | | | 4,329 | | | 4,625 |
6.50%, 08/15/31 | | | 156,480 | | | 166,500 |
7.50%, 08/15/31 | | | 35,963 | | | 40,601 |
6.50%, 10/15/31 | | | 262,497 | | | 280,336 |
6.00%, 11/15/31 | | | 830,941 | | | 878,846 |
6.50%, 11/15/31 | | | 234,341 | | | 249,346 |
6.00%, 12/15/31 | | | 186,781 | | | 197,549 |
6.00%, 01/15/32 | | | 263,102 | | | 281,066 |
6.00%, 02/15/32 | | | 491,210 | | | 519,529 |
6.50%, 02/15/32 | | | 410,585 | | | 440,797 |
36.48%, 02/16/32† | | | 158,960 | | | 276,937 |
6.00%, 04/15/32 | | | 297,317 | | | 317,617 |
6.50%, 04/15/32 | | | 285,190 | | | 303,452 |
7.50%, 04/15/32 | | | 90,224 | | | 101,538 |
6.50%, 06/15/32 | | | 858,698 | | | 920,842 |
6.50%, 07/15/32 | | | 95,568 | | | 101,687 |
6.50%, 08/15/32 | | | 413,882 | | | 440,384 |
6.50%, 09/15/32 | | | 441,197 | | | 469,448 |
6.00%, 10/15/32 | | | 452,855 | | | 478,963 |
6.00%, 11/15/32 | | | 372,083 | | | 394,470 |
6.00%, 12/15/32 | | | 167,462 | | | 177,116 |
6.50%, 12/15/32 | | | 26,308 | | | 27,992 |
6.00%, 01/15/33 | | | 217,129 | | | 229,647 |
6.00%, 02/15/33 | | | 145,492 | | | 153,879 |
6.50%, 03/15/33 | | | 49,892 | | | 53,087 |
5.00%, 04/15/33 | | | 201,279 | | | 208,568 |
6.50%, 04/15/33 | | | 1,063,090 | | | 1,131,162 |
5.00%, 05/15/33 | | | 1,691,402 | | | 1,753,073 |
6.00%, 05/15/33 | | | 801,455 | | | 847,659 |
5.00%, 06/15/33 | | | 204,809 | | | 212,226 |
6.00%, 06/15/33 | | | 100,019 | | | 105,785 |
5.00%, 07/15/33 | | | 561,192 | | | 581,515 |
See Notes to Financial Statements.
98
| | | | | | |
| | | Par | | Value |
5.00%, 08/15/33 | | $ | 1,068,756 | | $ | 1,103,029 |
5.00%, 09/15/33 | | | 747,764 | | | 770,405 |
5.00%, 10/15/33 | | | 391,852 | | | 404,394 |
6.00%, 10/15/33 | | | 642,788 | | | 679,845 |
6.50%, 10/15/33 | | | 243,733 | | | 259,339 |
5.00%, 11/15/33 | | | 51,240 | | | 53,099 |
6.00%, 12/15/33 | | | 690,640 | | | 730,457 |
5.00%, 01/15/34 | | | 342,658 | | | 354,746 |
5.00%, 03/15/34 | | | 409,259 | | | 423,696 |
5.00%, 04/15/34 | | | 153,807 | | | 159,233 |
5.00%, 05/15/34 | | | 93,890 | | | 97,202 |
5.00%, 06/15/34 | | | 654,948 | | | 678,053 |
6.00%, 06/15/34 | | | 76,600 | | | 81,543 |
5.00%, 08/15/34 | | | 451,020 | | | 466,930 |
5.00%, 11/15/34 | | | 947,152 | | | 980,565 |
5.00%, 12/15/34 | | | 839,299 | | | 868,907 |
5.00%, 01/15/35 | | | 625,873 | | | 646,974 |
6.00%, 02/15/36 | | | 10,331 | | | 10,944 |
6.00%, 08/15/36 | | | 475,535 | | | 503,477 |
0.53%, 03/20/37† | | | 3,809,200 | | | 3,734,643 |
0.53%, 05/20/37† | | | 1,622,205 | | | 1,589,393 |
5.50%, 05/15/38 | | | 240,867 | | | 252,658 |
6.00%, 12/15/38 | | | 349,820 | | | 370,278 |
5.50%, 01/15/39 | | | 849,585 | | | 891,174 |
5.50%, 02/15/39 | | | 116,409 | | | 122,108 |
5.50%, 03/15/39 | | | 1,237,551 | | | 1,298,131 |
5.00%, 04/15/39 | | | 70,388 | | | 72,520 |
5.00%, 05/15/39 | | | 209,188 | | | 215,521 |
5.00%, 06/15/39 | | | 799,726 | | | 823,940 |
5.00%, 10/15/39 | | | 497,772 | | | 512,843 |
5.50%, 01/01/40 TBA | | | 4,000,000 | | | 4,190,000 |
6.00%, 01/01/40 TBA | | | 2,000,000 | | | 2,113,124 |
6.00%, 01/21/40 TBA | | | 2,000,000 | | | 2,113,124 |
Greenpoint Mortgage Funding Trust | | | | | | |
0.41%, 01/25/37† | | | 1,419,573 | | | 704,485 |
0.31%, 02/25/47† | | | 2,865,221 | | | 2,215,474 |
GS Mortgage Securities Corporation II | | | | | | |
4.68%, 07/10/39 | | | 1,300,000 | | | 1,305,443 |
GSMPS Mortgage Loan Trust | | | | | | |
0.46%, 02/25/35 144A† | | | 245,518 | | | 196,483 |
0.58%, 09/25/35 144A† | | | 2,177,223 | | | 1,614,226 |
GSR Mortgage Loan Trust | | | | | | |
3.34%, 09/25/35† | | | 915,931 | | | 794,209 |
HarborView Mortgage Loan Trust | | | | | | |
0.47%, 01/19/36 STEP | | | 227,284 | | | 124,588 |
5.91%, 08/19/36 | | | 1,504,445 | | | 925,476 |
0.42%, 12/19/38† | | | 1,368,423 | | | 752,622 |
Impac CMB Trust | | | | | | |
0.95%, 10/25/34†@ | | | 120,410 | | | 61,718 |
0.49%, 11/25/35 STEP | | | 1,162,000 | | | 673,372 |
Impac Secured Assets CMN Owner Trust | | | | | | |
0.48%, 03/25/36† | | | 875,931 | | | 472,452 |
Indymac ARM Trust | | | | | | |
2.50%, 01/25/32† | | | 20,514 | | | 14,507 |
Indymac INDA Mortgage Loan Trust | | | | | | |
6.16%, 11/25/37† | | | 661,684 | | | 479,805 |
Indymac Index Mortgage Loan Trust | | | | | | |
0.53%, 07/25/35† | | | 2,155,073 | | | 1,196,889 |
5.10%, 09/25/35 | | | 528,861 | | | 386,998 |
0.45%, 04/25/46† | | | 942,280 | | | 438,665 |
0.42%, 09/25/46† | | | 1,592,265 | | | 783,106 |
JP Morgan Alternative Loan Trust | | | | | | |
0.49%, 01/25/36† | | | 746,144 | | | 510,539 |
JP Morgan Chase Commercial Mortgage Securities Corporation | | | | | | |
4.90%, 09/12/37 | | | 1,700,000 | | | 1,640,069 |
5.34%, 05/15/47 | | | 300,000 | | | 260,180 |
JP Morgan Mortgage Trust | | | | | | |
5.02%, 02/25/35† | | | 906,335 | | | 832,843 |
3.97%, 07/25/35† | | | 556,685 | | | 499,358 |
4.02%, 07/25/35† | | | 566,606 | | | 505,661 |
4.07%, 07/25/35† | | | 511,373 | | | 466,376 |
5.06%, 07/25/35 | | | 489,218 | | | 405,306 |
LB-UBS Commercial Mortgage Trust | | | | | | |
4.66%, 07/15/30 | | | 1,000,000 | | | 1,007,195 |
26.74%, 06/15/36 IO 144AW@ | | | 4,132,384 | | | 44,083 |
4.95%, 09/15/40 | | | 810,000 | | | 784,894 |
5.87%, 09/15/45 | | | 200,000 | | | 175,542 |
Luminent Mortgage Trust | | | | | | |
0.40%, 12/25/36† | | | 3,729,784 | | | 1,725,571 |
0.43%, 02/25/46† | | | 1,051,301 | | | 525,824 |
MASTR Adjustable Rate Mortgages Trust | | | | | | |
3.19%, 05/25/34 | | | 318,704 | | | 275,635 |
5.62%, 11/25/35 144A | | | 1,212,672 | | | 681,129 |
0.43%, 05/25/47† | | | 3,499,181 | | | 1,654,801 |
MASTR Reperforming Loan Trust | | | | | | |
7.00%, 08/25/34 144A | | | 773,356 | | | 731,426 |
MLCC Mortgage Investors, Inc. | | | | | | |
1.00%, 11/25/29 STEP | | | 436,670 | | | 338,816 |
Nomura Asset Acceptance Corporation | | | | | | |
6.50%, 03/25/34 144A | | | 125,923 | | | 121,004 |
6.50%, 10/25/34 144A | | | 143,520 | | | 133,518 |
Prime Mortgage Trust | | | | | | |
5.50%, 05/25/35 144A | | | 6,335,624 | | | 4,957,857 |
6.00%, 05/25/35 144A | | | 4,136,065 | | | 3,281,371 |
RBSGC Mortgage Pass-Through Certificates | | | | | | |
0.68%, 01/25/37† | | | 1,276,511 | | | 627,921 |
Residential Accredit Loans, Inc. | | | | | | |
1.54%, 01/25/46† | | | 971,954 | | | 516,107 |
Residential Funding Mortgage Securities I | | | | | | |
5.19%, 09/25/35 | | | 612,149 | | | 502,942 |
Sequoia Mortgage Trust | | | | | | |
1.32%, 07/20/33† | | | 244,203 | | | 225,717 |
1.04%, 10/20/34 STEP | | | 227,124 | | | 174,423 |
Structured Adjustable Rate Mortgage Loan Trust | | | | | | |
2.96%, 05/25/34 | | | 401,494 | | | 351,614 |
3.25%, 09/25/34 | | | 182,819 | | | 149,646 |
3.05%, 11/25/34 | | | 770,502 | | | 623,786 |
0.57%, 08/25/35† | | | 618,373 | | | 439,573 |
Structured Asset Mortgage Investments, Inc. | | | | | | |
0.48%, 07/19/35† | | | 218,906 | | | 125,877 |
See Notes to Financial Statements.
99
MEDIUM-DURATION BOND FUND
SCHEDULE OF INVESTMENTS (Continued)
| | | | | | |
| | | Par | | Value |
0.54%, 12/25/35† | | $ | 943,792 | | $ | 507,944 |
0.46%, 02/25/36† | | | 997,743 | | | 550,799 |
Structured Asset Securities Corporation | | | | | | |
0.58%, 06/25/35 144A† | | | 270,194 | | | 202,625 |
Thornburg Mortgage Securities Trust | | | | | | |
6.20%, 09/25/37 | | | 1,296,139 | | | 1,035,770 |
6.20%, 09/25/37 | | | 1,289,342 | | | 1,029,913 |
Wachovia Bank Commercial Mortgage Trust | | | | | | |
5.21%, 10/15/44 STRIP | | | 3,000,000 | | | 2,985,730 |
Washington Mutual Alternative Mortgage Pass-Through Certificates | | | | | | |
1.38%, 11/25/46† | | | 2,249,117 | | | 963,632 |
Washington Mutual Mortgage Pass-Through Certificates | | | | | | |
0.77%, 12/25/27† | | | 2,048,043 | | | 1,537,838 |
3.88%, 02/25/33† | | | 21,903 | | | 17,678 |
3.14%, 06/25/34 | | | 447,557 | | | 412,371 |
5.57%, 12/25/36 | | | 715,410 | | | 477,865 |
5.67%, 02/25/37 | | | 1,201,024 | | | 764,237 |
5.83%, 02/25/37† | | | 781,517 | | | 538,912 |
1.94%, 06/25/42† | | | 48,577 | | | 35,098 |
0.52%, 07/25/45† | | | 1,356,242 | | | 989,450 |
0.55%, 07/25/45† | | | 883,849 | | | 654,492 |
0.55%, 08/25/45† | | | 2,966,125 | | | 2,068,935 |
0.52%, 10/25/45† | | | 2,688,257 | | | 1,925,175 |
0.50%, 12/25/45† | | | 735,515 | | | 513,872 |
0.52%, 12/25/45† | | | 1,559,291 | | | 991,114 |
1.30%, 04/25/47† | | | 1,619,877 | | | 866,972 |
Wells Fargo Alternative Loan Trust | | | | | | |
6.53%, 12/28/37 | | | 2,191,182 | | | 1,411,444 |
Wells Fargo Mortgage-Backed Securities Trust | | | | | | |
3.56%, 10/25/35 | | | 696,077 | | | 618,947 |
| | | | | | |
Total Mortgage-Backed Securities
(Cost $418,589,460) | | | | | | 390,912,880 |
| | | | | | |
MUNICIPAL BONDS — 0.9% | | | | | | |
Chicago Transit Authority | | | | | | |
6.90%, 12/01/40 | | | 1,800,000 | | | 1,911,204 |
Illinois Finance Authority | | | | | | |
5.75%, 07/01/33 | | | 1,800,000 | | | 1,966,536 |
South Carolina Transportation Infrastructure Bank, Series A Revenue Bond (AMBAC Insured) | | | | | | |
5.00%, 10/01/23 | | | 2,700,000 | | | 2,762,910 |
State of California General Obligation Bond | | | | | | |
7.50%, 04/01/34 | | | 525,000 | | | 510,095 |
7.55%, 04/01/39 | | | 475,000 | | | 460,783 |
7.30%, 10/01/39 | | | 360,000 | | | 339,430 |
Virginia State Housing Development Authority, Commonwealth Mortgage, Series H Revenue Bond (NATL-RE Insured) | | | | | | |
5.38%, 07/01/36 | | | 1,000,000 | | | 1,004,730 |
| | | | | | |
Total Municipal Bonds
(Cost $8,595,430) | | | | | | 8,955,688 |
| | | | | | |
U.S. TREASURY OBLIGATIONS — 17.7% | | | | | | |
U.S. Treasury Bills | | | | | | |
0.13%, 03/25/10 | | | 310,000 | | | 309,975 |
0.14%, 05/27/10 | | | 12,500,000 | | | 12,492,550 |
| | | | | | |
| | | | | | 12,802,525 |
| | | | | | |
U.S. Treasury Bonds | | | | | | |
1.13%, 12/15/12D | | | 480,000 | | | 472,461 |
7.88%, 02/15/21D | | | 3,600,000 | | | 4,839,750 |
8.13%, 05/15/21D | | | 3,000,000 | | | 4,104,846 |
8.00%, 11/15/21 | | | 900,000 | | | 1,225,829 |
7.25%, 08/15/22D | | | 2,100,000 | | | 2,721,142 |
7.50%, 11/15/24 | | | 1,800,000 | | | 2,406,938 |
5.50%, 08/15/28D | | | 1,500,000 | | | 1,672,032 |
4.38%, 02/15/38D | | | 600,000 | | | 576,188 |
3.50%, 02/15/39D | | | 594,000 | | | 486,709 |
4.25%, 05/15/39D‡‡ | | | 16,310,000 | | | 15,305,924 |
4.50%, 08/15/39D | | | 9,080,000 | | | 8,877,126 |
4.38%, 11/15/39D | | | 5,950,000 | | | 5,697,131 |
| | | | | | |
| | | | | | 48,386,076 |
| | | | | | |
U.S. Treasury Inflationary Index Bonds | | | | | | |
4.25%, 01/15/10 | | | 5,300,000 | | | 6,826,198 |
0.88%, 04/15/10D | | | 2,100,000 | | | 2,407,291 |
2.00%, 01/15/16D | | | 1,400,000 | | | 1,612,115 |
2.50%, 07/15/16 | | | 900,000 | | | 1,050,298 |
2.38%, 01/15/25D | | | 1,140,000 | | | 1,382,741 |
2.38%, 01/15/27D | | | 1,350,000 | | | 1,526,470 |
1.75%, 01/15/28 | | | 3,000 | | | 2,976 |
3.88%, 04/15/29‡‡ | | | 3,578,000 | | | 6,068,989 |
| | | | | | |
| | | | | | 20,877,078 |
| | | | | | |
U.S. Treasury Notes | | | | | | |
1.00%, 07/31/11‡‡ | | | 1,512,000 | | | 1,514,776 |
2.38%, 10/31/14‡‡ | | | 3,000,000 | | | 2,968,359 |
2.13%, 11/30/14D | | | 29,620,000 | | | 28,928,166 |
2.63%, 12/31/14 | | | 3,870,000 | | | 3,860,027 |
3.25%, 07/31/16D | | | 4,700,000 | | | 4,709,917 |
3.00%, 09/30/16D‡‡ | | | 16,200,000 | | | 15,905,111 |
3.13%, 10/31/16D | | | 11,890,000 | | | 11,744,169 |
2.75%, 11/30/16D | | | 4,170,000 | | | 4,015,906 |
3.25%, 12/31/16 | | | 5,890,000 | | | 5,842,150 |
3.13%, 05/15/19D | | | 952,000 | | | 901,871 |
3.38%, 11/15/19D | | | 15,420,000 | | | 14,837,016 |
| | | | | | |
| | | | | | 95,227,468 |
| | | | | | |
U.S. Treasury STRIPS | | | | | | |
4.26%, 05/15/20W | | | 800,000 | | | 516,980 |
4.89%, 11/15/26W | | | 600,000 | | | 265,900 |
| | | | | | |
| | | | | | 782,880 |
| | | | | | |
Total U.S. Treasury Obligations
(Cost $182,098,159) | | | | | | 178,076,027 |
| | | | | | |
| | |
| | | Shares | | |
COMMON STOCK — 0.0% | | | | | | |
Producer Durables — 0.0% | | | | | | |
Nortek, Inc.+*
(Cost $62,000) | | | 1,362 | | | 47,670 |
| | | | | | |
PREFERRED STOCKS — 0.3% | | | | | | |
CORTS Trust for Ford Motor Co.D | | | 9,100 | | | 201,565 |
Federal Home Loan Mortgage Corporation | | | 55,675 | | | 58,459 |
See Notes to Financial Statements.
100
| | | | | | | | |
| | | Shares | | | Value | |
Federal National Mortgage Association | | | 42,050 | | | $ | 46,730 | |
Motors Liquidation Co. CONV | | | 40,650 | | | | 231,705 | |
Preferred Blocker (GMAC), Inc. | | | 290 | | | | 191,146 | |
Wells Fargo & Co. | | | 2,400 | | | | 2,203,200 | |
| | | | | | | | |
Total Preferred Stocks
(Cost $4,877,346) | | | | | | | 2,932,805 | |
| | | | | | | | |
| | |
| | | Par | | | | |
REPURCHASE AGREEMENTS — 3.5% | | | | | | | | |
BNP Paribas Securities Corporation | | | | | | | | |
0.01% (dated 12/31/09, due 01/04/10, repurchase price $24,900,014, collateralized by U.S. Treasury Bond, 4.500%, due 02/15/36, total market value $25,445,621)‡‡ | | $ | 24,900,000 | | | | 24,900,000 | |
Deutsche Bank Securities, Inc. | | | | | | | | |
0.08% (dated 12/28/09, due 01/15/10, repurchase price $10,500,420, collateralized by U.S. Treasury Inflationary Index Bond, 3.375%, due 04/15/32, total market value $10,863,403) | | | 10,500,000 | | | | 10,500,000 | |
| | | | | | | | |
Total Repurchase Agreements
(Cost $35,400,000) | | | | | | | 35,400,000 | |
| | | | | | | | |
| | |
| | | Shares | | | | |
MONEY MARKET FUNDS — 19.4% | | | | | | | | |
GuideStone Money Market Fund (GS4 Class)¥ | | | 30,286,113 | | | | 30,286,113 | |
Northern Institutional Liquid Assets Portfolio§ | | | 165,010,049 | | | | 165,010,049 | |
| | | | | | | | |
Total Money Market Funds
(Cost $195,296,162) | | | | | | | 195,296,162 | |
| | | | | | | | |
TOTAL INVESTMENTS — 121.1%
(Cost $1,272,469,681) | | | | | | | 1,221,988,007 | |
| | | | | | | | |
| | |
| | | Number of
Contracts | | | | |
WRITTEN OPTIONS — (0.1)% | | | | | | | | |
Call Options — 0.0% | | | | | | | | |
10-Year U.S. Treasury Note Futures, Strike Price $116.00, Expires 02/22/10 (JPM) | | | (1 | ) | | | (16 | ) |
10-Year U.S. Treasury Note Futures, Strike Price $117.50, Expires 02/21/10 (JPM) | | | (10 | ) | | | (3,750 | ) |
10-Year U.S. Treasury Note Futures, Strike Price $119.00, Expires 02/19/10 (JPM) | | | (157 | ) | | | (19,625 | ) |
90-Day Eurodollar Futures, Strike Price $99.13, Expires 09/14/10 (GSC) | | | (15 | ) | | | (7,875 | ) |
90-Day Eurodollar Futures, Strike Price $99.38, Expires 06/15/10 (GSC) | | | (43 | ) | | | (17,737 | ) |
| | |
| | | Notional
Amount | | | | |
3-Month LIBOR, Strike Price $3.25, Expires 04/20/10 (BNP) | | $ | (1,500,000 | ) | | | (2,544 | ) |
3-Month LIBOR, Strike Price $3.25, Expires 04/20/10 (DEUT) | | | (14,100,000 | ) | | | (23,917 | ) |
| | | | | | | | |
| | | | | | | (75,464 | ) |
| | | | | | | | |
| | |
| | | Number of
Contracts | | | | |
Put Options — 0.0% | | | | | | | | |
10-Year U.S. Treasury Note Futures, Strike Price $114.00, Expires 02/19/10 (JPM) | | | (10 | ) | | | (6,094 | ) |
10-Year U.S. Treasury Note Futures, Strike Price $115.00, Expires 02/19/10 (JPM) | | | (168 | ) | | | (162,750 | ) |
10-Year U.S. Treasury Note Futures, Strike Price $116.00, Expires 02/22/10 (JPM) | | | (1 | ) | | | (1,438 | ) |
90-Day Eurodollar Futures, Strike Price $99.13, Expires 09/14/10 (GSC) | | | (15 | ) | | | (16,312 | ) |
90-Day Eurodollar Futures, Strike Price $99.38, Expires 03/15/10 (ADV) | | | (7 | ) | | | (350 | ) |
90-Day Eurodollar Futures, Strike Price $99.38, Expires 06/15/10 (GSC) | | | (43 | ) | | | (23,650 | ) |
| | |
| | | Notional
Amount | | | | |
3-Month LIBOR, Strike Price $10.00, Expires 07/11/12 (CS) | | $ | (100,000 | ) | | | (330 | ) |
3-Month LIBOR, Strike Price $4.25, Expires 04/20/10 (BNP) | | | (1,500,000 | ) | | | (27,996 | ) |
| | | | | | | | |
| | | | | | | (238,920 | ) |
| | | | | | | | |
Put Swaptions — (0.1)% | | | | | | | | |
3-Month LIBOR, Strike Price $10.00, Expires 07/11/12 (BAR) | | | (300,000 | ) | | | (1,884 | ) |
3-Month LIBOR, Strike Price $10.00, Expires 07/11/12 (MSCS) | | | (5,600,000 | ) | | | (18,377 | ) |
3-Month LIBOR, Strike Price $10.00, Expires 07/11/12 (RBS) | | | (500,000 | ) | | | (1,641 | ) |
3-Month LIBOR, Strike Price $4.25, Expires 04/20/10 (BTAB) | | | (23,000,000 | ) | | | (429,274 | ) |
3-Month LIBOR, Strike Price $4.25, Expires 04/20/10 (MSCS) | | | (11,200,000 | ) | | | (209,038 | ) |
3-Month LIBOR, Strike Price $6.00, Expires 09/01/10 (MSCS) | | | (16,200,000 | ) | | | (65,442 | ) |
| | | | | | | | |
| | | | | | | (725,656 | ) |
| | | | | | | | |
Total Written Options
(Premiums received $(937,881)) | | | | | | | (1,040,040 | ) |
| | | | | | | | |
See Notes to Financial Statements.
101
MEDIUM-DURATION BOND FUND
SCHEDULE OF INVESTMENTS (Continued)
| | | | | | | | |
| | | Par | | | Value | |
TBA SALE COMMITMENTS — (7.4)% | | | | | | | | |
Federal Home Loan Mortgage Corporation (BNP) | | | | | | | | |
5.00%, 01/01/40 TBA | | $ | (3,000,000 | ) | | $ | (3,075,936 | ) |
Federal Home Loan Mortgage Corporation (DEUT) | | | | | | | | |
5.00%, TBA | | | (2,000,000 | ) | | | (2,050,624 | ) |
Federal National Mortgage Association (BOA) | | | | | | | | |
6.00%, 01/01/39 TBA | | | (1,000,000 | ) | | | (1,059,062 | ) |
Federal National Mortgage Association (CS) | | | | | | | | |
5.00%, 01/01/28 TBA | | | (27,000,000 | ) | | | (27,704,538 | ) |
Federal National Mortgage Association (DEUT) | | | | | | | | |
5.00%, 01/01/28 TBA | | | (3,000,000 | ) | | | (3,078,282 | ) |
Federal National Mortgage Association (JPM) | | | | | | | | |
5.50%, 01/01/40 TBA | | | (35,000,000 | ) | | | (36,635,165 | ) |
Federal National Mortgage Association (MSCS) | | | | | | | | |
5.00%, 01/01/28 TBA | | | (1,000,000 | ) | | | (1,026,094 | ) |
| | | | | | | | |
Total TBA Sale Commitments
(Cost $(75,428,867)) | | | | | | | (74,629,701 | ) |
| | | | | | | | |
Liabilities in Excess of Other Assets — (13.6)% | | | | | | | (137,600,416 | ) |
| | | | | | | | |
NET ASSETS — 100.0% | | | | | | $ | 1,008,717,850 | |
| | | | | | | | |
Please see abbreviation and footnote definitions on page 180.
See Notes to Financial Statements.
102
Swap agreements outstanding at December 31, 2009:
| | | | | | | | | | | | | | | | | | | | | | | |
Reference Obligation | | Fixed
Deal
(Pay) Rate | | | Maturity
Date | | Counter-
party | | Currency | | Notional
Amount | | Market
Value | | | Upfront
Premiums
Paid/
Received | | Unrealized
Appreciation
(Depreciation) | |
Credit Default Swaps on Corporate Issues — Buy Protection | |
CitiFinancial, | | | | | | | | | | | | | | | | | | | | | | | |
6.63% due 06/01/15 | | (0.15 | )% | | 06/20/15 | | BAR | | USD | | $ | 300,000 | | $ | 21,490 | | | $ | — | | $ | 21,490 | |
Dominion Resources, | | | | | | | | | | | | | | | | | | | | | | | |
6.00% due 11/30/17 | | (0.69 | )% | | 12/20/17 | | CITI | | USD | | | 3,800,000 | | | (52,621 | ) | | | — | | | (52,621 | ) |
Target Corporation, | | | | | | | | | | | | | | | | | | | | | | | |
5.88% due 03/01/12 | | (0.11 | )% | | 06/20/12 | | MSCS | | USD | | | 1,200,000 | | | 5,121 | | | | — | | | 5,121 | |
OMNICOM Goup, Inc., | | | | | | | | | | | | | | | | | | | | | | | |
5.90% due 04/15/16 | | (0.39 | )% | | 06/20/16 | | MSCS | | USD | | | 700,000 | | | 11,579 | | | | — | | | 11,579 | |
DaimlerChrysler NA Holdings, | | | | | | | | | | | | | | | | | | | | | | | |
5.75 due 09/08/11 | | (0.58 | )% | | 09/20/11 | | BAR | | USD | | | 900,000 | | | (2,565 | ) | | | — | | | (2,565 | ) |
Nabors Industries, | | | | | | | | | | | | | | | | | | | | | | | |
5.375% due 05/15/12 | | (1.00 | )% | | 03/20/19 | | BNP | | USD | | | 3,900,000 | | | 2,494 | | | | 12,365 | | | (9,871 | ) |
American Electric Power, | | | | | | | | | | | | | | | | | | | | | | | |
5.25% 06/01/15 | | (0.62 | )% | | 06/20/15 | | CITI | | USD | | | 2,300,000 | | | (11,299 | ) | | | — | | | (11,299 | ) |
| | | | | | | | | | | | | | | | | | | | | | | |
| | | | | | | | | | | $ | 13,100,000 | | $ | (25,801 | ) | | $ | 12,365 | | $ | (38,166 | ) |
| | | | | | | | | | | | | | | | | | | | | | | |
| | | | | | | | | | | | | | | | | | | | | | | | | | |
Reference Obligation | | Implied
Credit
Spread | | | Fixed
Deal
(Pay) Rate | | | Maturity
Date | | Counter-
party | | Currency | | Notional
Amount | | Market
Value | | | Upfront
Premiums
Paid/
(Received) | | Unrealized
Appreciation
(Depreciation) | |
Credit Default Swaps on Corporate Issues — Sell Protection | |
Russian Federation, | | | | | | | | | | | | | | | | | | | | | | | | | | |
7.50% due 03/31/30 | | 70.80 | % | | 1.00 | % | | 12/20/10 | | CITI | | USD | | $ | 3,700,000 | | $ | 7,131 | | | $ | 1,710 | | $ | 5,421 | |
Russian Federation, | | | | | | | | | | | | | | | | | | | | | | | | | | |
7.50% due 03/31/30 | | 70.80 | % | | 1.00 | % | | 12/20/10 | | DEUT | | USD | | | 100,000 | | | 193 | | | | 342 | | | (149 | ) |
Federated Republic of Brazil, | | | | | | | | | | | | | | | | | | | | | | | | | | |
12.25% due 03/06/30 | | 13.47 | % | | 1.04 | % | | 05/20/17 | | DEUT | | USD | | | 1,000,000 | | | (18,344 | ) | | | — | | | (18,344 | ) |
GMAC LLC, | | | | | | | | | | | | | | | | | | | | | | | | | | |
6.88% due 08/28/12 | | 50.30 | % | | 3.53 | % | | 09/20/17 | | DEUT | | USD | | | 4,100,000 | | | (293,267 | ) | | | — | | | (293,267 | ) |
| | | | | | | | | | | | | | | | | | | | | | | | | | |
| | | | | | | | | | | | | | $ | 8,900,000 | | $ | (304,287 | ) | | $ | 2,052 | | $ | (306,339 | ) |
| | | | | | | | | | | | | | | | | | | | | | | | | | |
| | | | | | | | | | | | | | | | | | | | | | | | |
Reference Obligation | | Fixed
Deal
(Pay) Rate | | | Maturity
Date | | Counter-
party | | Currency | | Notional
Amount | | Market
Value | | | Upfront
Premiums
Paid/
(Received) | | | Unrealized
Appreciation
(Depreciation) | |
Credit Default Swaps on Credit Indices — Buy Protection | |
Dow Jones CDX HY-8 Index | | (1.60 | )% | | 06/20/12 | | MLCS | | USD | | $ | 1,200,000 | | $ | 41,121 | | | $ | — | | | $ | 41,121 | |
Dow Jones CDX IG513 Index | | (1.00 | )% | | 12/20/14 | | DEUT | | USD | | | 2,800,000 | | | (22,413 | ) | | | (4,978 | ) | | | (17,435 | ) |
Dow Jones CDX IG513 Index | | (1.00 | )% | | 12/20/14 | | DEUT | | USD | | | 2,100,000 | | | (16,810 | ) | | | 223 | | | | (17,033 | ) |
Dow Jones CDX IG513 Index | | (1.00 | )% | | 12/20/14 | | BOA | | USD | | | 2,200,000 | | | (16,395 | ) | | | 10,258 | | | | (26,653 | ) |
Dow Jones CDX IG513 Index | | (1.00 | )% | | 12/20/14 | | DEUT | | USD | | | 2,000,000 | | | (16,010 | ) | | | (890 | ) | | | (15,120 | ) |
Dow Jones CDX IG513 Index | | (1.00 | )% | | 12/20/14 | | DEUT | | USD | | | 4,400,000 | | | (35,221 | ) | | | (4,789 | ) | | | (30,432 | ) |
Dow Jones CDX IG513 Index | | (1.00 | )% | | 12/20/14 | | DEUT | | USD | | | 1,900,000 | | | (15,209 | ) | | | 968 | | | | (16,177 | ) |
See Notes to Financial Statements.
103
MEDIUM-DURATION BOND FUND
SCHEDULE OF INVESTMENTS (Continued)
| | | | | | | | | | | | | | | | | | | | | | | |
Reference Obligation | | Fixed
Deal
(Pay) Rate | | | Maturity
Date | | Counter-
party | | Currency | | Notional
Amount | | Market
Value | | | Upfront
Premiums
Paid/
(Received) | | | Unrealized
Appreciation
(Depreciation) |
Dow Jones CDX IG10 Index | | (1.50 | )% | | 06/20/18 | | MSCS | | USD | | $ | 12,003,200 | | $ | (216,573 | ) | | $ | (412,231 | ) | | $ | 195,658 |
Dow Jones CDX IG10 Index | | (0.80 | )% | | 06/20/18 | | RBS | | USD | | | 7,163,200 | | | 220,406 | | | | 86,764 | | | | 133,642 |
Dow Jones CDX IG9 Index | | (1.50 | )% | | 06/20/18 | | DEUT | | USD | | | 3,000,800 | | | (54,143 | ) | | | (75,614 | ) | | | 21,471 |
| | | | | | | | | | | | | | | | | | | | | | | |
| | | | | | | | | | | $ | 38,767,200 | | $ | (131,247 | ) | | $ | (400,289 | ) | | $ | 269,042 |
| | | | | | | | | | | | | | | | | | | | | | | |
| | | | | | | | | | | | | | | | | | | | | | | | | | | |
| | | | | | | | | | | | | | | | | | | | Upfront | | | | |
Reference Obligation | | Implied
Credit
Srpead | | | Fixed
Deal
(Pay) Rate | | | Maturity
Date | | Counter-
party | | Currency | | Notional
Amount | | Market
Value | | | Premiums
Paid/
(Received) | | | Unrealized
Appreciation
(Depreciation) | |
Credit Default Swaps on Credit Indices — Sell Protection | |
ABX.HE.AAA Index | | 3.95 | % | | 0.09 | % | | 08/25/37 | | CS | | USD | | $ | 1,000,000 | | $ | (653,089 | ) | | $ | (256,953 | ) | | $ | (396,136 | ) |
| | | | | | | | | | | | | | | | | | | | | | | | | | | |
| | | | | | | | | | | | | | | | | | | | | | | | |
Reference Obligation | | Fixed
Deal
(Pay) Rate | | | Maturity
Date | | Counter-
party | | Currency | | Notional Amount | | Market
Value | | | Upfront
Premiums
Paid/
(Received) | | | Unrealized
Appreciation
(Depreciation) | |
Interest Rate Swaps | | | | | | | | | | | | | | | | | | | | | | | | |
KWCDC Index | | (2.82 | )% | | 01/28/11 | | DEUT | | KRW | | $ | 927,000,000 | | $ | 495 | | | $ | — | | | $ | 495 | |
KWCDC Index | | (2.83 | )% | | 01/28/11 | | JPM | | KRW | | | 901,000,000 | | | (6,559 | ) | | | — | | | | (6,559 | ) |
KWCDC Index | | (3.87 | )% | | 06/12/11 | | DEUT | | KRW | | | 400,000,000 | | | 249 | | | | (29 | ) | | | 278 | |
KWCDC Index | | (3.90 | )% | | 06/15/11 | | JPM | | KRW | | | 720,000,000 | | | 269 | | | | (17 | ) | | | 287 | |
KWCDC Index | | (3.72 | )% | | 06/22/11 | | JPM | | KRW | | | 2,300,000,000 | | | (5,962 | ) | | | (48 | ) | | | (5,914 | ) |
KWCDC Index | | (3.69 | )% | | 06/26/11 | | DEUT | | KRW | | | 2,280,000,000 | | | 272 | | | | (136 | ) | | | 408 | |
KWCDC Index | | 3.62 | % | | 07/06/11 | | DEUT | | KRW | | | 964,630,000 | | | 2,329 | | | | — | | | | 2,329 | |
KWCDC Index | | 3.63 | % | | 07/07/11 | | DEUT | | KRW | | | 1,611,662,000 | | | 3,866 | | | | — | | | | 3,866 | |
KWCDC Index | | 3.66 | % | | 07/08/11 | | JPM | | KRW | | | 766,531,000 | | | (43 | ) | | | — | | | | (43 | ) |
Brazil CETIP Interbank Deposit | | 10.12 | % | | 01/02/12 | | MSCS | | BRL | | | 8,000,000 | | | (215,905 | ) | | | (72,156 | ) | | | (143,750 | ) |
Brazil CETIP Interbank Deposit | | 11.02 | % | | 01/02/12 | | UBS | | BRL | | | 1,600,000 | | | (4,444 | ) | | | — | | | | (4,444 | ) |
BZDIOVRA Index | | 11.74 | % | | 01/02/12 | | DEUT | | BRL | | | 5,600,000 | | | 8,055 | | | | — | | | | 8,055 | |
BZDIOVRA Index | | 11.76 | % | | 01/02/12 | | CITI | | BRL | | | 2,700,000 | | | 3,831 | | | | — | | | | 3,831 | |
BZDIOVRA Index | | 11.76 | % | | 01/02/12 | | JPM | | BRL | | | 2,600,000 | | | 3,689 | | | | — | | | | 3,689 | |
BZDIOVRA Index | | 11.74 | % | | 12/02/12 | | DEUT | | BRL | | | 4,000,000 | | | 3,301 | | | | — | | | | 3,301 | |
3-Month LIBOR | | (3.25 | )% | | 06/16/17 | | DEUT | | USD | | | 7,400,000 | | | 247,006 | | | | 84,328 | | | | 162,678 | |
3-Month LIBOR | | (3.25 | )% | | 06/16/17 | | CITI | | USD | | | 6,500,000 | | | 218,958 | | | | 78,239 | | | | 140,719 | |
3-Month LIBOR | | 5.00 | % | | 06/16/17 | | DEUT | | USD | | | 8,000,000 | | | (269,487 | ) | | | (311,707 | ) | | | 42,220 | |
3-Month LIBOR | | 4.57 | % | | 09/04/17 | | DEUT | | USD | | | 4,800,000 | | | (24,739 | ) | | | — | | | | (24,739 | ) |
3-Month LIBOR | | (4.71 | )% | | 09/04/22 | | DEUT | | USD | | | 2,800,000 | | | 59,567 | | | | — | | | | 59,567 | |
| | | | | | | | | | | | | | | | | | | | | | | | |
| | | | | | | | | | | $ | 10,924,823,000 | | $ | 24,748 | | | $ | (221,526 | ) | | $ | 246,274 | |
| | | | | | | | | | | | | | | | | | | | | | | | |
Total Swap agreements outstanding at December 31, 2009 | | | | | | | $ | (1,089,676 | ) | | $ | (864,351 | ) | | $ | (225,325 | ) |
| | | | | | | | | | | | | | | | | | | | | | | | |
Please see abbreviation and footnote definitions on page 180.
See Notes to Financial Statements.
104
PORTFOLIO SUMMARY (based on net assets)
| | | |
| | | % | |
Mortgage-Backed Securities | | 38.7 | |
Futures Contracts | | 35.8 | |
Corporate Bonds | | 24.9 | |
Money Market Funds | | 19.4 | |
U.S. Treasury Obligations | | 17.7 | |
Foreign Bonds | | 10.1 | |
Asset-Backed Securities | | 4.0 | |
Repurchase Agreements | | 3.5 | |
Agency Obligations | | 1.0 | |
Municipal Bonds | | 0.9 | |
Loan Agreements | | 0.6 | |
Preferred Stocks | | 0.3 | |
Common Stock | | — | ** |
Swap Agreements | | (0.1 | ) |
Written Options | | (0.1 | ) |
Forward Foreign Currency Contracts | | (0.6 | ) |
TBA Sale Commitments | | (7.4 | ) |
| | | |
| | 148.7 | |
| | | |
| ** | Rounds to less than 0.005%. |
FAS 157 DISCLOSURE
The following is a summary of the inputs used, as of December 31, 2009, in valuing the Fund’s investments carried at fair value:
| | | | | | | | |
Valuation Inputs | | Investments in
Securities | | | Other
Financial
Instruments*** | |
Assets: | | | | | | | | |
Level 1 — Quoted Prices | | | | | | | | |
Futures Contracts | | $ | — | | | $ | 254,607 | |
Money Market Funds | | | 195,296,162 | | | | — | |
Preferred Stocks | | | 2,932,805 | | | | — | |
Level 2 — Other Significant Observable Inputs | | | | | | | | |
Agency Obligations | | | 9,699,736 | | | | — | |
Asset-Backed Securities | | | 40,800,906 | | | | — | |
Corporate Bonds | | | 251,051,769 | | | | — | |
Foreign Bonds | | | 102,322,689 | | | | — | |
Forward Foreign Currency Contracts | | | — | | | | 460,478 | |
Loan Agreements | | | 6,491,675 | | | | — | |
Mortgage-Backed Securities | | | 390,912,880 | | | | — | |
Municipal Bonds | | | 8,955,688 | | | | — | |
Repurchase Agreements | | | 35,400,000 | | | | — | |
U.S. Treasury Obligations | | | 178,076,027 | | | | — | |
Level 3 — Significant Unobservable Inputs | | | | | | | | |
Common Stock | | | 47,670 | | | | — | |
| | | | | | | | |
Total Assets | | $ | 1,221,988,007 | | | $ | 715,085 | |
| | | | | | | | |
| | |
Liabilities: | | | | | | | | |
Level 1 — Quoted Prices | | $ | — | | | $ | — | |
Written Options | | | (259,598 | ) | | | — | |
Level 2 — Other Significant Observable Inputs | | | | | | | | |
TBA Sale Commitments | | | (74,629,701 | ) | | | — | |
Swap Agreements | | | — | | | | (1,089,676 | ) |
Written Options | | | (780,442 | ) | | | — | |
Level 3 — Significant Unobservable Inputs | | | — | | | | — | |
| | | | | | | | |
Total Liabilities | | $ | (75,669,741 | ) | | $ | (1,089,676 | ) |
| | | | | | | | |
| *** | Other financial instruments are derivative instruments not reflected in the Schedule of Investments, such as futures, forwards and swap contracts, which are valued at the unrealized appreciation (depreciation) on the investment. Details of these investments can be found in the Notes to Financial Statements. |
See Notes to Financial Statements.
105
MEDIUM-DURATION BOND FUND
SCHEDULE OF INVESTMENTS (Continued)
The following is a reconciliation of assets in which significant unobservable inputs (Level 3) were used in determining fair value:
| | | | | | | |
| | | Investments
in Securities | | | Other
Financial
Instruments*** |
Balance, 12/31/08 | | | | | | | |
Common Stock | | $ | — | | | $ | — |
Corporate Bonds | | | 3,215,765 | | | | — |
Mortgage-Backed Securities | | | 252,215 | | | | — |
Preferred Stocks | | | 87,000 | | | | — |
Accrued discounts/premiums | | | | | | | |
Common Stock | | | — | | | | — |
Corporate Bonds | | | 150,522 | | | | — |
Mortgage-Backed Securities | | | 2,073 | | | | — |
Preferred Stocks | | | — | | | | — |
Realized gain (loss) | | | | | | | |
Common Stock | | | — | | | | — |
Corporate Bonds | | | — | | | | — |
Mortgage-Backed Securities | | | 1,547 | | | | — |
Preferred Stocks | | | — | | | | — |
Change in unrealizedappreciation (depreciation) | | | | | | | |
Common Stock | | | — | | | | — |
Corporate Bonds | | | 244,234 | | | | — |
Mortgage-Backed Securities | | | 14,675 | | | | — |
Preferred Stocks | | | 104,146 | | | | — |
Net purchases (sales) | | | | | | | |
Common Stock | | | — | | | | — |
Corporate Bonds | | | — | | | | — |
Mortgage-Backed Securities | | | (88,455 | ) | | | — |
Preferred Stocks | | | — | | | | — |
Transfers in and/or out of Level 3 | | | | | | | |
Common Stock | | | 47,670 | | | | — |
Corporate Bonds | | | (3,610,521 | ) | | | — |
Mortgage-Backed Securities | | | (182,055 | ) | | | — |
Preferred Stocks | | | (191,146 | ) | | | — |
| | | | | | | |
Balance, 12/31/09 | | $ | 47,670 | | | $ | — |
| | | | | | | |
| *** | Other financial instruments are derivative instruments not reflected in the Schedule of Investments, such as futures, forwards and swap contracts, which are valued at the unrealized appreciation (depreciation) on the investment. Details of these investments can be found in the Notes to Financial Statements. |
See Notes to Financial Statements.
106
Extended-Duration Bond Fund
The Extended-Duration Bond Fund invests in a diversified portfolio composed primarily of investment grade fixed income securities with an average dollar-weighted duration normally greater than or equal to seven years. The Fund’s return for the one-year period ended December 31, 2009, was 24.97%, which significantly outperformed its composite benchmark, 50% Barclays Capital U.S. Long-term Government Index / 50% Barclays Capital U.S. Long-term Credit Index, that returned 1.58%. The Fund’s benchmark-relative performance was positively impacted by its underweight exposure to U.S. Treasuries and overweight exposure to non-U.S. Treasury sectors during the year.
Please see page 113 for information regarding specific portfolio allocations. Portfolio holdings are subject to change at any time.
107
Extended-Duration Bond Fund
| | | | | | | | | |
Average Annual Total Returns as of 12/31/09 | |
| | | GS2 Class* | | | GS4 Class* | | | Benchmark** | |
One Year | | 25.27 | % | | 24.97 | % | | 1.58 | % |
Five Year | | 6.68 | % | | 6.49 | % | | 4.97 | % |
Since Inception | | 7.85 | % | | 7.72 | % | | 6.55 | % |
Inception Date | | 08/27/01 | | | 08/27/01 | | | | |
Total Fund Operating Expenses (June 25, 2009 Prospectus)(1) | | 0.52 | % | | 0.71 | % | | | |
| (1) | Current information regarding the Fund’s Operating Expenses can be found in the Financial Highlights. |
The performance data quoted represents past performance and does not guarantee future results. Current performance may be lower or higher. Performance data current to the most recent month-end may be obtained at www.GuideStoneFunds.org. The investment return and principal value of an investment will fluctuate so that shares, when redeemed, may be worth more or less than their original cost.

The graph compares the results of a hypothetical $10,000 investment in the GS4 Class of the Fund since August 27, 2001 (commencement of operations), with all dividends and capital gains reinvested, with the weighted composite benchmark index.
| * | These returns reflect expense waivers by the Fund’s investment adviser. Without these waivers, returns would have been lower. Returns shown do not reflect the deduction of taxes that a shareholder would pay on Fund distributions or the redemption of Fund shares. |
| ** | Represents a weighted composite benchmark index consisting of 50% Barclays Capital U.S. Long-Term Government Bond Index and 50% Barclays Capital U.S. Long-Term Credit Bond Index. |
The Barclays Capital U.S. Long-Term Government Bond Index is composed of all bonds covered by the Barclays Capital U.S. Government Bond Index with maturities of 10 years or greater.
The Barclays Capital U.S. Long-Term Credit Bond Index is composed of a subset of the Barclays Capital U.S. Credit Bond Index covering all corporate, publicly issued, fixed-rate, nonconvertible U.S. debt issues rated at least Baa with at least $50 million principal outstanding and maturity greater than 10 years.
Unlike a mutual fund, the performance of an index assumes no taxes, transaction costs, management fees or other expenses.
108
| | |
EXTENDED-DURATION BOND FUND SCHEDULE OF INVESTMENTS | | December 31, 2009 |
| | | | | | |
| | | Par | | Value |
ASSET-BACKED SECURITIES — 7.4% | | | | | | |
Capital One Multi-Asset Execution Trust | | | | | | |
5.75%, 07/15/20 | | $ | 11,500,000 | | $ | 12,427,822 |
Citibank Credit Card Issuance Trust | | | | | | |
6.15%, 06/15/39 | | | 10,650,000 | | | 11,566,740 |
Community Program Loan Trust | | | | | | |
4.50%, 04/01/29 | | | 1,950,000 | | | 1,745,972 |
Discover Card Master Trust | | | | | | |
5.65%, 03/16/20 | | | 7,600,000 | | | 8,167,704 |
| | | | | | |
Total Asset-Backed Securities
(Cost $31,626,166) | | | | | | 33,908,238 |
| | | | | | |
CORPORATE BONDS — 56.1% | | | | | | |
Aflac, Inc. | | | | | | |
8.50%, 05/15/19 | | | 2,700,000 | | | 3,115,538 |
Alcoa, Inc. | | | | | | |
5.87%, 02/23/22 | | | 10,000 | | | 9,305 |
6.75%, 01/15/28 | | | 235,000 | | | 227,513 |
5.95%, 02/01/37 | | | 85,000 | | | 73,174 |
Allegheny Technologies, Inc. | | | | | | |
9.38%, 06/01/19 | | | 3,613,000 | | | 4,165,460 |
American Express Co. | | | | | | |
8.15%, 03/19/38 | | | 4,902,000 | | | 6,152,530 |
American International Group, Inc. | | | | | | |
5.85%, 01/16/18 | | | 6,027,000 | | | 4,952,826 |
8.25%, 08/15/18 | | | 3,447,000 | | | 3,241,052 |
6.25%, 05/01/36 | | | 3,020,000 | | | 2,248,478 |
Anadarko Petroleum Corporation | | | | | | |
6.45%, 09/15/36 | | | 1,840,000 | | | 1,927,875 |
Archer-Daniels-Midland Co. | | | | | | |
6.45%, 01/15/38 | | | 1,885,000 | | | 2,105,894 |
Arrow Electronics, Inc. | | | | | | |
6.88%, 07/01/13 | | | 205,000 | | | 223,759 |
AT&T Corporation | | | | | | |
6.50%, 03/15/29 | | | 125,000 | | | 124,767 |
6.50%, 09/01/37 | | | 10,015,000 | | | 10,414,408 |
Avnet, Inc. | | | | | | |
6.00%, 09/01/15 | | | 875,000 | | | 889,487 |
Bank of America Corporation | | | | | | |
7.63%, 06/01/19 | | | 5,790,000 | | | 6,709,701 |
Barclays Financial LLC | | | | | | |
4.16%, 02/22/10 144A(T) | | | 25,000,000 | | | 754,102 |
4.10%, 03/22/10 144A(T) | | | 7,000,000 | | | 211,870 |
4.06%, 09/16/10 144A(W) | | | 730,000,000 | | | 626,543 |
Bell South Telecommunications, Inc. | | | | | | |
7.00%, 12/01/95 | | | 1,000,000 | | | 983,643 |
Boeing Co. | | | | | | |
5.88%, 02/15/40 | | | 1,621,000 | | | 1,665,017 |
Bruce Mansfield Unit | | | | | | |
6.85%, 06/01/34@ | | | 1,244,664 | | | 1,171,154 |
Camden Property Trust | | | | | | |
5.70%, 05/15/17 | | | 25,000 | | | 23,615 |
Caterpillar Financial Services Corporation | | | | | | |
6.13%, 02/17/14 | | | 1,225,000 | | | 1,370,243 |
5.85%, 09/01/17D | | | 100,000 | | | 106,880 |
5.45%, 04/15/18D | | | 35,000 | | | 36,516 |
Caterpillar, Inc. | | | | | | |
8.25%, 12/15/38 | | | 1,000,000 | | | 1,338,981 |
Chesapeake Energy Corporation | | | | | | |
6.50%, 08/15/17 | | | 45,000 | | | 44,325 |
6.88%, 11/15/20 | | | 320,000 | | | 310,400 |
Chevron Phillips Chemical Co. LLC | | | | | | |
8.25%, 06/15/19 144AD | | | 1,185,000 | | | 1,397,049 |
CIT Group, Inc. | | | | | | |
7.00%, 05/01/13 | | | 102,626 | | | 96,468 |
7.00%, 05/01/14 | | | 153,940 | | | 143,357 |
7.00%, 05/01/15 | | | 153,940 | | | 138,546 |
7.00%, 05/01/16 | | | 256,570 | | | 227,064 |
7.00%, 05/01/17D | | | 359,197 | | | 313,399 |
Citigroup, Inc. | | | | | | |
6.88%, 06/01/25 | | | 2,441,000 | | | 2,119,323 |
5.88%, 05/29/37 | | | 4,141,000 | | | 3,660,569 |
8.13%, 07/15/39 | | | 4,174,000 | | | 4,725,189 |
Comcast Corporation | | | | | | |
5.65%, 06/15/35 | | | 660,000 | | | 618,930 |
6.50%, 11/15/35 | | | 555,000 | | | 577,287 |
6.45%, 03/15/37 | | | 2,415,000 | | | 2,498,119 |
6.95%, 08/15/37 | | | 625,000 | | | 683,370 |
Commonwealth Edison Co. | | | | | | |
4.75%, 12/01/11@ | | | 201,000 | | | 200,467 |
ConocoPhillips | | | | | | |
5.90%, 05/15/38D | | | 1,000,000 | | | 1,028,590 |
Continental Airlines, Inc. | | | | | | |
9.00%, 07/08/16D | | | 2,000,000 | | | 2,146,250 |
8.31%, 04/02/18D | | | 431,948 | | | 395,232 |
7.57%, 03/15/20 | | | 274,482 | | | 249,779 |
Corning, Inc. | | | | | | |
6.20%, 03/15/16 | | | 230,000 | | | 244,413 |
7.25%, 08/15/36 | | | 850,000 | | | 868,658 |
Cox Communications, Inc. | | | | | | |
6.75%, 03/15/11 | | | 250,000 | | | 262,937 |
Cummins, Inc. | | | | | | |
6.75%, 02/15/27 | | | 1,000,000 | | | 964,111 |
7.13%, 03/01/28 | | | 425,000 | | | 420,260 |
5.65%, 03/01/98 | | | 1,520,000 | | | 950,559 |
DCP Midstream LP | | | | | | |
6.45%, 11/03/36 144AD | | | 490,000 | | | 465,106 |
Dillard’s, Inc. | | | | | | |
7.75%, 07/15/26 | | | 890,000 | | | 680,850 |
7.00%, 12/01/28 | | | 500,000 | | | 370,000 |
Dow Chemical Co. | | | | | | |
9.40%, 05/15/39 | | | 4,331,000 | | | 5,743,417 |
Duke Realty LP | | | | | | |
5.95%, 02/15/17D | | | 70,000 | | | 65,241 |
First Industrial LP | | | | | | |
7.60%, 07/15/28 | | | 1,000,000 | | | 760,280 |
Foot Locker, Inc. | | | | | | |
8.50%, 01/15/22 | | | 1,000,000 | | | 950,000 |
Ford Motor Co. | | | | | | |
6.63%, 10/01/28 | | | 680,000 | | | 528,700 |
6.38%, 02/01/29 | | | 1,255,000 | | | 975,763 |
Ford Motor Credit Co. LLC | | | | | | |
7.00%, 10/01/13 | | | 315,000 | | | 314,780 |
8.00%, 12/15/16D | | | 1,000,000 | | | 1,002,644 |
General Electric Capital Corporation | | | | | | |
4.88%, 03/04/15 | | | 510,000 | | | 530,391 |
5.63%, 05/01/18 | | | 30,000 | | | 30,793 |
6.75%, 03/15/32 | | | 4,865,000 | | | 4,974,511 |
See Notes to Financial Statements.
109
EXTENDED-DURATION BOND FUND
SCHEDULE OF INVESTMENTS (Continued)
| | | | | | |
| | | Par | | Value |
6.15%, 08/07/37 | | $ | 6,114,000 | | $ | 5,792,128 |
5.88%, 01/14/38 | | | 150,000 | | | 139,339 |
Georgia-Pacific LLC | | | | | | |
8.00%, 01/15/24 | | | 30,000 | | | 30,750 |
7.38%, 12/01/25 | | | 240,000 | | | 230,400 |
7.25%, 06/01/28 | | | 300,000 | | | 280,500 |
7.75%, 11/15/29 | | | 2,700,000 | | | 2,679,750 |
8.88%, 05/15/31 | | | 60,000 | | | 63,900 |
GMAC, Inc. | | | | | | |
6.88%, 08/28/12 144AD | | | 158,000 | | | 156,420 |
8.00%, 11/01/31 144AD | | | 199,000 | | | 181,090 |
Goldman Sachs Group, Inc. | | | | | | |
5.00%, 10/01/14 | | | 815,000 | | | 860,325 |
6.15%, 04/01/18 | | | 415,000 | | | 444,978 |
GTE Corporation | | | | | | |
6.94%, 04/15/28 | | | 10,000 | | | 10,286 |
Halliburton Co. | | | | | | |
7.45%, 09/15/39 | | | 3,070,000 | | | 3,811,218 |
HCA, Inc. | | | | | | |
6.30%, 10/01/12D | | | 1,500,000 | | | 1,507,500 |
7.58%, 09/15/25 | | | 1,000,000 | | | 895,000 |
7.05%, 12/01/27 | | | 500,000 | | | 431,250 |
HCP, Inc. | | | | | | |
6.00%, 03/01/15 | | | 1,500,000 | | | 1,491,855 |
Highwoods Realty LP | | | | | | |
5.85%, 03/15/17 | | | 260,000 | | | 237,521 |
7.50%, 04/15/18 | | | 1,500,000 | | | 1,462,323 |
Historic TW, Inc. | | | | | | |
6.63%, 05/15/29 | | | 60,000 | | | 62,735 |
Home Depot, Inc. | | | | | | |
5.88%, 12/16/36 | | | 875,000 | | | 847,396 |
HSBC Bank USA NA | | | | | | |
7.00%, 01/15/39 | | | 5,948,000 | | | 6,685,237 |
Intel Corporation | | | | | | |
3.25%, 08/01/39 CONV 144AD | | | 1,155,000 | | | 1,332,581 |
International Paper Co. | | | | | | |
8.70%, 06/15/38 | | | 4,101,000 | | | 5,006,181 |
iStar Financial, Inc. | | | | | | |
8.63%, 06/01/13 | | | 635,000 | | | 412,750 |
5.95%, 10/15/13 | | | 305,000 | | | 180,712 |
5.70%, 03/01/14 | | | 1,171,000 | | | 667,470 |
JC Penney Corporation, Inc. | | | | | | |
6.38%, 10/15/36 | | | 810,000 | | | 723,330 |
JPMorgan Chase Capital XXV | | | | | | |
6.80%, 10/01/37 | | | 10,214,000 | | | 10,179,691 |
Kinder Morgan Energy Partners LP | | | | | | |
5.80%, 03/15/35 | | | 280,000 | | | 260,243 |
Kraft Foods, Inc. | | | | | | |
6.50%, 11/01/31 | | | 1,700,000 | | | 1,712,658 |
7.00%, 08/11/37 | | | 525,000 | | | 560,894 |
6.88%, 02/01/38 | | | 3,243,000 | | | 3,413,977 |
Lennar Corporation | | | | | | |
5.60%, 05/31/15D | | | 935,000 | | | 861,369 |
6.50%, 04/15/16D | | | 625,000 | | | 578,125 |
Lowe’s Cos., Inc. | | | | | | |
6.65%, 09/15/37 | | | 3,051,000 | | | 3,491,696 |
Macy’s Retail Holdings, Inc. | | | | | | |
6.38%, 03/15/37D | | | 240,000 | | | 204,000 |
Manufacturers & Traders Trust Co. | | | | | | |
6.63%, 12/04/17 | | | 8,970,000 | | | 9,213,087 |
MetLife, Inc. | | | | | | |
7.72%, 02/15/19 | | | 7,300,000 | | | 8,592,954 |
MidAmerican Energy Holdings Co. | | | | | | |
5.88%, 10/01/12 | | | 1,000,000 | | | 1,089,785 |
Morgan Stanley | | | | | | |
4.75%, 04/01/14 | | | 100,000 | | | 100,670 |
5.45%, 01/09/17 | | | 5,000 | | | 5,061 |
5.55%, 04/27/17D | | | 185,000 | | | 186,096 |
6.63%, 04/01/18 | | | 70,000 | | | 75,803 |
5.63%, 09/23/19 | | | 195,000 | | | 196,790 |
6.25%, 08/09/26D | | | 100,000 | | | 103,673 |
Mosaic Global Holdings, Inc. | | | | | | |
7.38%, 08/01/18 | | | 500,000 | | | 550,151 |
7.30%, 01/15/28D | | | 690,000 | | | 728,025 |
Motorola, Inc. | | | | | | |
6.50%, 11/15/28D | | | 500,000 | | | 431,184 |
Nextel Communications, Inc. | | | | | | |
6.88%, 10/31/13 | | | 215,000 | | | 209,625 |
5.95%, 03/15/14 | | | 325,000 | | | 305,094 |
7.38%, 08/01/15D | | | 550,000 | | | 537,625 |
NGPL PipeCo LLC | | | | | | |
7.12%, 12/15/17 144A | | | 640,000 | | | 707,306 |
NiSource Finance Corporation | | | | | | |
6.15%, 03/01/13 | | | 1,000,000 | | | 1,065,520 |
6.40%, 03/15/18 | | | 1,640,000 | | | 1,707,268 |
Nortel Networks Capital Corporation | | | | | | |
7.88%, 06/15/26# | | | 450,000 | | | 303,750 |
Nucor Corporation | | | | | | |
6.40%, 12/01/37 | | | 3,000,000 | | | 3,231,906 |
Owens Corning, Inc. | | | | | | |
6.50%, 12/01/16 | | | 240,000 | | | 246,117 |
7.00%, 12/01/36 | | | 355,000 | | | 332,047 |
Pioneer Natural Resources Co. | | | | | | |
7.20%, 01/15/28D | | | 2,500,000 | | | 2,270,275 |
Prologis | | | | | | |
5.63%, 11/15/15D | | | 35,000 | | | 33,322 |
Pulte Homes, Inc. | | | | | | |
5.20%, 02/15/15 | | | 38,000 | | | 35,625 |
7.88%, 06/15/32D | | | 1,500,000 | | | 1,387,500 |
6.38%, 05/15/33 | | | 1,000,000 | | | 812,500 |
Qwest Corporation | | | | | | |
7.25%, 09/15/25 | | | 1,000,000 | | | 930,000 |
6.88%, 09/15/33 | | | 2,250,000 | | | 1,991,250 |
Sempra Energy | | | | | | |
6.00%, 10/15/39 | | | 5,338,000 | | | 5,289,131 |
SLM Corporation | | | | | | |
5.00%, 10/01/13 | | | 250,000 | | | 230,175 |
5.38%, 05/15/14 | | | 200,000 | | | 184,648 |
Southern Natural Gas Co. | | | | | | |
7.35%, 02/15/31 | | | 1,750,000 | | | 1,919,386 |
Sprint Capital Corporation | | | | | | |
6.90%, 05/01/19 | | | 55,000 | | | 50,875 |
6.88%, 11/15/28D | | | 2,350,000 | | | 1,965,188 |
8.75%, 03/15/32 | | | 20,000 | | | 18,950 |
Target Corporation | | | | | | |
6.50%, 10/15/37 | | | 5,400,000 | | | 5,941,215 |
7.00%, 01/15/38 | | | 3,050,000 | | | 3,570,440 |
Tennessee Gas Pipeline Co. | | | | | | |
7.00%, 10/15/28 | | | 750,000 | | | 803,180 |
Textron, Inc. | | | | | | |
6.63%, 04/07/20(U) | | | 160,000 | | | 225,649 |
See Notes to Financial Statements.
110
| | | | | | |
| | | Par | | Value |
Time Warner Cable, Inc. | | | | | | |
6.55%, 05/01/37 | | $ | 1,049,000 | | $ | 1,072,350 |
6.75%, 06/15/39D | | | 3,770,000 | | | 3,961,267 |
Time Warner, Inc. | | | | | | |
7.63%, 04/15/31 | | | 35,000 | | | 40,771 |
6.50%, 11/15/36D | | | 40,000 | | | 41,901 |
Time Warner Entertainment Co. LP | | | | | | |
8.38%, 07/15/33 | | | 1,049,000 | | | 1,257,557 |
Toll Brothers Finance Corporation | | | | | | |
5.15%, 05/15/15D | | | 1,285,000 | | | 1,230,976 |
Toro Co. | | | | | | |
6.63%, 05/01/37@ | | | 300,000 | | | 242,852 |
Union Pacific Resources Group | | | | | | |
7.15%, 05/15/28 | | | 250,000 | | | 248,329 |
United Technologies Corporation | | | | | | |
6.13%, 07/15/38 | | | 3,548,000 | | | 3,857,226 |
UnitedHealth Group, Inc. | | | | | | |
5.80%, 03/15/36 | | | 2,095,000 | | | 1,883,591 |
6.50%, 06/15/37 | | | 767,000 | | | 758,731 |
6.63%, 11/15/37 | | | 2,526,000 | | | 2,538,547 |
Verizon Communications, Inc. | | | | | | |
5.85%, 09/15/35 | | | 2,420,000 | | | 2,367,539 |
6.40%, 02/15/38 | | | 968,000 | | | 1,015,325 |
6.90%, 04/15/38 | | | 1,000,000 | | | 1,111,982 |
8.95%, 03/01/39 | | | 105,000 | | | 142,516 |
7.35%, 04/01/39D | | | 979,000 | | | 1,139,466 |
Verizon Maryland, Inc. | | | | | | |
5.13%, 06/15/33 | | | 50,000 | | | 39,680 |
Verizon New York, Inc. | | | | | | |
7.38%, 04/01/32 | | | 385,000 | | | 415,894 |
Wachovia Bank NA | | | | | | |
5.85%, 02/01/37 | | | 6,077,000 | | | 5,832,534 |
6.60%, 01/15/38 | | | 3,757,000 | | | 3,978,434 |
WellPoint, Inc. | | | | | | |
5.95%, 12/15/34 | | | 846,000 | | | 804,383 |
6.38%, 06/15/37D | | | 2,766,000 | | | 2,823,793 |
Western Union Co. | | | | | | |
6.20%, 11/17/36D | | | 5,155,000 | | | 5,144,479 |
Weyerhaeuser Co. | | | | | | |
8.50%, 01/15/25D | | | 520,000 | | | 536,969 |
Williams Cos., Inc. | | | | | | |
7.50%, 01/15/31 | | | 1,250,000 | | | 1,352,095 |
7.75%, 06/15/31 | | | 80,000 | | | 87,968 |
8.75%, 03/15/32D | | | 70,000 | | | 83,992 |
Xerox Capital Trust I | | | | | | |
8.00%, 02/01/27 | | | 1,500,000 | | | 1,488,418 |
XTO Energy, Inc. | | | | | | |
6.10%, 04/01/36D | | | 50,000 | | | 54,172 |
| | | | | | |
Total Corporate Bonds
(Cost $248,015,943) | | | | | | 258,567,619 |
| | | | | | |
FOREIGN BONDS — 27.1% | | | | | | |
Australia — 3.3% | | | | | | |
Barrick Australia Finance, Ltd. | | | | | | |
5.95%, 10/15/39D | | | 5,383,000 | | | 5,271,626 |
General Electric Capital Australia Funding, Ltd. | | | | | | |
8.00%, 02/13/12(A) | | | 60,000 | | | 55,840 |
New South Wales Treasury Corporation | | | | | | |
7.00%, 12/01/10(A) | | | 1,125,000 | | | 1,033,960 |
New South Wales Treasury Corporation | | | | | | |
6.00%, 05/01/12(A) | | | 60,000 | | | 54,992 |
Qantas Airways, Ltd. | | | | | | |
6.05%, 04/15/16 144AD | | | 345,000 | | | 348,482 |
Queensland Treasury Corporation | | | | | | |
6.00%, 06/14/11(A) | | | 785,000 | | | 718,627 |
Rio Tinto Finance USA, Ltd. | | | | | | |
7.13%, 07/15/28D | | | 6,830,000 | | | 7,751,633 |
| | | | | | |
| | | | | | 15,235,160 |
| | | | | | |
Brazil — 0.3% | | | | | | |
Federative Republic of Brazil | | | | | | |
10.25%, 01/10/28(B) | | | 2,525,000 | | | 1,457,569 |
| | | | | | |
Canada — 6.1% | | | | | | |
British Columbia Generic Residual | | | | | | |
3.16%, 06/09/14 STRIP(C)W | | | 7,230,000 | | | 6,014,342 |
Canada Generic Residual | | | | | | |
4.44%, 06/01/25 STRIP(C)W | | | 3,685,000 | | | 1,789,913 |
Canadian Pacific Railroad Co. NY | | | | | | |
7.13%, 10/15/31 | | | 500,000 | | | 535,093 |
Methanex Corporation | | | | | | |
6.00%, 08/15/15 | | | 25,000 | | | 21,349 |
Ontario Generic Residual | | | | | | |
5.06%, 07/13/22 STRIP(C)W | | | 3,900,000 | | | 1,991,299 |
5.23%, 03/08/29 STRIP(C)W | | | 7,000,000 | | | 2,432,949 |
Saskatchewan Residual | | | | | | |
3.06%, 04/10/14 STRIP(C)W | | | 6,500,000 | | | 5,422,623 |
4.80%, 02/04/22 STRIP(C)W | | | 3,000,000 | | | 1,543,242 |
Talisman Energy, Inc. | | | | | | |
5.85%, 02/01/37D | | | 670,000 | | | 642,263 |
6.25%, 02/01/38 | | | 450,000 | | | 451,994 |
TransCanada Pipelines, Ltd. | | | | | | |
6.20%, 10/15/37D | | | 6,291,000 | | | 6,666,189 |
7.63%, 01/15/39 | | | 360,000 | | | 444,839 |
| | | | | | |
| | | | | | 27,956,095 |
| | | | | | |
Cayman Islands — 0.6% | | | | | | |
Enersis SA | | | | | | |
7.40%, 12/01/16D | | | 625,000 | | | 699,128 |
Transocean, Inc. | | | | | | |
1.50%, 12/15/37 CONV | | | 60,000 | | | 58,050 |
XL Capital, Ltd. | | | | | | |
6.38%, 11/15/24D | | | 585,000 | | | 548,165 |
6.25%, 05/15/27D | | | 1,530,000 | | | 1,394,838 |
| | | | | | |
| | | | | | 2,700,181 |
| | | | | | |
Finland — 0.4% | | | | | | |
Nokia OYJ | | | | | | |
6.63%, 05/15/39D | | | 1,792,000 | | | 1,954,794 |
| �� | | | | | |
France — 0.4% | | | | | | |
EDF SA | | | | | | |
6.95%, 01/26/39 144A | | | 1,400,000 | | | 1,661,411 |
| | | | | | |
Ireland — 0.0% | | | | | | |
Elan Finance PLC | | | | | | |
8.88%, 12/01/13D | | | 85,000 | | | 85,000 |
| | | | | | |
See Notes to Financial Statements.
111
EXTENDED-DURATION BOND FUND
SCHEDULE OF INVESTMENTS (Continued)
| | | | | | | |
| | | Par | | Value | |
Italy — 0.5% | | | | | | | |
Telecom Italia Capital SA | | | | | | | |
6.38%, 11/15/33 | | $ | 410,000 | | $ | 405,452 | |
6.00%, 09/30/34D | | | 415,000 | | | 393,687 | |
7.72%, 06/04/38 | | | 1,273,000 | | | 1,470,223 | |
| | | | | | | |
| | | | | | 2,269,362 | |
| | | | | | | |
Luxembourg — 2.0% | | | | | | | |
ArcelorMittal | | | | | | | |
7.00%, 10/15/39D | | | 2,523,000 | | | 2,665,052 | |
Covidien International Finance SA | | | | | | | |
6.55%, 10/15/37 | | | 4,807,000 | | | 5,397,550 | |
Tyco International Finance SA | | | | | | | |
8.50%, 01/15/19 | | | 794,000 | | | 960,525 | |
| | | | | | | |
| | | | | | 9,023,127 | |
| | | | | | | |
Malaysia — 0.0% | | | | | | | |
Telekom Malaysia BHD | | | | | | | |
7.88%, 08/01/25 144A | | | 225,000 | | | 266,250 | |
| | | | | | | |
Mexico — 1.0% | | | | | | | |
Mexican Bonos | | | | | | | |
9.00%, 12/20/12(M) | | | 11,350,000 | | | 920,095 | |
7.25%, 12/15/16(M) | | | 13,150,000 | | | 990,654 | |
8.00%, 12/07/23(M) | | | 34,000,000 | | | 2,514,267 | |
| | | | | | | |
| | | | | | 4,425,016 | |
| | | | | | | |
Netherlands — 1.8% | | | | | | | |
Koninklijke Philips Electronics NV | | | | | | | |
6.88%, 03/11/38 | | | 7,500,000 | | | 8,536,260 | |
| | | | | | | |
Norway — 0.5% | | | | | | | |
Norway Government Bond | | | | | | | |
5.00%, 05/15/15(K) | | | 540,000 | | | 98,967 | |
4.25%, 05/19/17(K) | | | 11,940,000 | | | 2,098,868 | |
| | | | | | | |
| | | | | | 2,197,835 | |
| | | | | | | |
Philippines — 0.1% | | | | | | | |
Quezon Power (Philippines), Ltd. | | | | | | | |
8.86%, 06/15/17 | | | 340,000 | | | 317,900 | |
| | | | | | | |
Supranational — 1.9% | | | | | | | |
Inter-American Development Bank | | | | | | | |
6.00%, 12/15/17(Z) | | | 7,865,000 | | | 5,637,186 | |
International Bank For Reconstruction & Development | | | | | | | |
1.43%, 03/05/14 | | | 4,700,000 | | | 3,226,620 | |
| | | | | | | |
| | | | | | 8,863,806 | |
| | | | | | | |
United Kingdom — 8.2% | | | | | | | |
Barclays Bank PLC | | | | | | | |
10.18%, 06/12/21 144A | | | 7,312,000 | | | 9,454,687 | |
HBOS PLC | | | | | | | |
6.75%, 05/21/18 144A | | | 10,684,000 | | | 9,929,143 | |
HSBC Holdings PLC | | | | | | | |
6.80%, 06/01/38D | | | 2,000,000 | | | 2,177,666 | |
Standard Chartered Bank | | | | | | | |
6.40%, 09/26/17 144A | | | 9,027,000 | | | 9,349,083 | |
Tesco PLC | | | | | | | |
6.15%, 11/15/37 144A | | | 5,800,000 | | | 6,040,515 | |
Vodafone Group PLC | | | | | | | |
6.15%, 02/27/37 | | | 1,000,000 | | | 1,045,223 | |
| | | | | | | |
| | | | | | 37,996,317 | |
| | | | | | | |
Total Foreign Bonds
(Cost $114,886,540) | | | | | | 124,946,083 | |
| | | | | | | |
MORTGAGE-BACKED SECURITY — 0.0% | | | | | | | |
Federal Home Loan Mortgage Corporation | | | | | | | |
5.00%, 12/01/31
(Cost $132,722) | | | 140,709 | | | 145,087 | |
| | | | | | | |
MUNICIPAL BONDS — 3.6% | | | | | | | |
Los Angeles Unified School District, Series KRY General Obligation Bond | | | | | | | |
5.76%, 07/01/29 | | | 2,280,000 | | | 2,110,368 | |
5.75%, 07/01/34 | | | 3,415,000 | | | 3,157,441 | |
New Jersey State Turnpike Authority Series F Revenue Bond | | | | | | | |
7.41%, 01/01/40 | | | 2,342,000 | | | 2,624,820 | |
North Texas Tollway Authority Revenue Bond | | | | | | | |
6.72%, 01/01/49 | | | 3,620,000 | | | 3,763,823 | |
State of California General Obligation Bond | | | | | | | |
7.50%, 04/01/34 | | | 2,455,000 | | | 2,385,302 | |
7.55%, 04/01/39 | | | 2,535,000 | | | 2,459,127 | |
| | | | | | | |
Total Municipal Bonds
(Cost $16,914,605) | | | | | | 16,500,881 | |
| | | | | | | |
U.S. TREASURY OBLIGATIONS — 1.9% | | | | | | | |
U.S. Treasury Bond | | | | | | | |
4.38%, 11/15/39D | | | 1,420,000 | | | 1,359,651 | |
| | | | | | | |
U.S. Treasury STRIP | | | | | | | |
| | | | | | | |
4.80%, 05/15/38WD | | | 28,740,000 | | | 7,463,433 | |
| | | | | | | |
Total U.S. Treasury Obligations
(Cost $10,396,245) | | | | | | 8,823,084 | |
| | | | | | | |
| | |
| | | Shares | | | |
PREFERRED STOCKS — 0.1% | | | | | | | |
Chesapeake Energy Corporation CONVD | | | 330 | | | 29,040 | |
El Paso Energy Capital Trust I CONV | | | 5,350 | | | 195,543 | |
Preferred Blocker (GMAC), Inc. | | | 82 | | | 54,048 | |
| | | | | | | |
Total Preferred Stocks
(Cost $278,115) | | | | | | 278,631 | |
| | | | | | | |
MONEY MARKET FUNDS — 11.0% | | | | | | | |
GuideStone Money Market Fund (GS4 Class)¥ | | | 11,543,798 | | | 11,543,798 | |
Northern Institutional Liquid Assets Portfolio§ | | | 39,267,942 | | | 39,267,942 | |
| | | | | | | |
Total Money Market Funds
(Cost $50,811,740) | | | | | | 50,811,740 | |
| | | | | | | |
TOTAL INVESTMENTS — 107.2%
(Cost $473,062,076) | | | | | | 493,981,363 | |
Liabilities in Excess of Other Assets — (7.2)% | | | | | | (33,319,986 | ) |
| | | | | | | |
NET ASSETS — 100.0% | | | | | $ | 460,661,377 | |
| | | | | | | |
Please see abbreviation and footnote definitions on page 180.
See Notes to Financial Statements.
112
PORTFOLIO SUMMARY (based on net assets)
| | | |
| | | % | |
Corporate Bonds | | 56.1 | |
Foreign Bonds | | 27.1 | |
Money Market Funds | | 11.0 | |
Asset-Backed Securities | | 7.4 | |
Municipal Bonds | | 3.6 | |
U.S. Treasury Obligations | | 1.9 | |
Preferred Stocks | | 0.1 | |
Mortgage-Backed Security | | — | ** |
| | | |
| | 107.2 | |
| | | |
| ** | Rounds to less than 0.005%. |
FAS 157 DISCLOSURE
The following is a summary of the inputs used, as of December 31, 2009, in valuing the Fund’s assets carried at fair value:
| | | | | | |
Valuation Inputs | | Investments in
Securities | | Other
Financial
Instruments*** |
Level 1 — Quoted Prices | | | | | | |
Money Market Funds | | $ | 50,811,740 | | $ | — |
Preferred Stocks | | | 278,631 | | | — |
Level 2 — Other Significant Observable Inputs | | | | | | |
Asset-Backed Securities | | | 33,908,238 | | | — |
Corporate Bonds | | | 258,567,619 | | | — |
Foreign Bonds | | | 124,946,083 | | | — |
Mortgage-Backed Security | | | 145,087 | | | — |
Municipal Bonds | | | 16,500,881 | | | — |
U.S. Treasury Obligations | | | 8,823,084 | | | — |
Level 3 — Significant Unobservable Inputs | | | — | | | — |
| | | | | | |
Total | | $ | 493,981,363 | | $ | — |
| | | | | | |
| *** | Other financial instruments are derivative instruments not reflected in the Schedule of Investments, such as futures, forwards and swap contracts, which are valued at the unrealized appreciation (depreciation) on the investment. Details of these investments can be found in the Notes to Financial Statements. |
The following is a reconciliation of assets in which significant unobservable inputs (Level 3) were used in determining fair value:
| | | | | | | |
| | | Investments in
Securities | | | Other
Financial
Instruments*** |
Balance, 12/31/08 | | | | | | | |
Corporate Bonds | | $ | 692,028 | | | $ | — |
Preferred Stocks | | | 24,600 | | | | — |
Accrued discounts/premiums | | | | | | | |
Corporate Bonds | | | 3,758 | | | | — |
Preferred Stocks | | | — | | | | — |
Realized gain (loss) | | | — | | | | — |
Corporate Bonds | | | — | | | | — |
Preferred Stocks | | | — | | | | — |
Changed in unrealizedappreciation (depreciation) | | | | | | | |
Corporate Bonds | | | (363,936 | ) | | | — |
Preferred Stocks | | | 29,448 | | | | — |
Net purchases (sales) | | | | | | | |
Corporate Bonds | | | (119,980 | ) | | | — |
Preferred Stocks | | | — | | | | — |
Transfers in and/or out of Level 3 | | | | | | | |
Corporate Bonds | | | (211,870 | ) | | | — |
Preferred Stocks | | | (54,048 | ) | | | — |
| | | | | | | |
Balance, 12/31/09 | | $ | — | | | $ | — |
| | | | | | | |
| *** | Other financial instruments are derivative instruments not reflected in the Schedule of Investments, such as futures, forwards and swap contracts, which are valued at the unrealized appreciation (depreciation) on the investment. Details of these investments can be found in the Notes to Schedules of Investments. |
See Notes to Financial Statements.
113
Inflation Protected Bond Fund
The Inflation Protected Bond Fund was incepted on June 25, 2009. The Fund is actively managed and is primarily comprised of inflation-indexed debt securities with an average dollar-weighted duration normally between four and ten years. The Fund underperformed its benchmark, the Barclays Capital U.S. TIPS Index, for the since-inception period ended December 31, 2009 (5.12% versus 5.79%). Performance was positively impacted by the breakeven inflation positioning as the Fund was underweight breakeven inflation throughout most of the first half of the period and overweight throughout the fourth quarter. Performance was negatively impacted by the Fund’s breakeven inflation positioning in September, as well as its underweight to U.S. TIPS with maturities shorter than five years, as the real yield curve steepened throughout the latter part of the year which drove real yields lower.
Please see page 116 for information regarding specific portfolio allocations. Portfolio holdings are subject to change at any time.
114
Inflation Protected Bond Fund
| | | | | | |
Average Annual Total Returns as of 12/31/09 | |
| | | GS4 Class* | | | Benchmark** | |
Since Inception | | 5.12 | % | | 5.79 | % |
Inception Date | | 06/25/09 | | | | |
Total Fund Operating Expenses (June 25, 2009 Prospectus)(1) | | 0.75 | % | | | |
| (1) | Current information regarding the Fund’s Operating Expenses can be found in the Financial Highlights. |
The performance data quoted represents past performance and does not guarantee future results. Current performance may be lower or higher. Performance data current to the most recent month-end may be obtained at www.GuideStoneFunds.org. The investment return and principal value of an investment will fluctuate so that shares, when redeemed, may be worth more or less than their original cost.
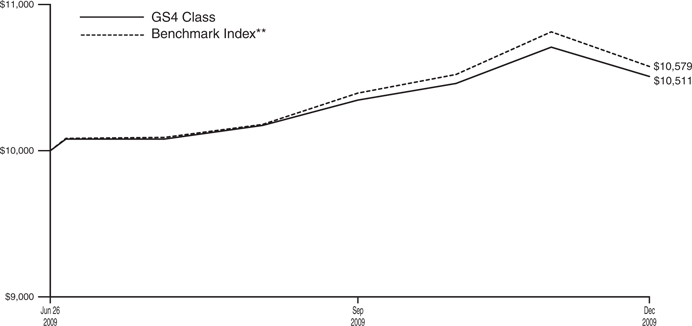
The graph compares the results of a hypothetical $10,000 investment in the GS4 Class of the Fund since June 25, 2009 (commencement of operations), with all dividends and capital gains reinvested, with the Barclays Capital U.S. TIPS index.
| * | These returns reflect expense waivers by the Fund’s investment adviser. Without these waivers, returns would have been lower. Returns shown do not reflect the deduction of taxes that a shareholder would pay on Fund distributions or the redemption of Fund shares. |
| ** | The Barclays Capital U.S. TIPS Index measures the performance of the U.S. Treasury Inflation Protected Securities (“TIPS”) market and includes TIPS with one or more years remaining maturity with total outstanding issue size of $500 million or more. |
Unlike a mutual fund, the performance of an index assumes no taxes, transaction costs, management fees or other expenses.
115
| | |
| INFLATION PROTECTED BOND FUND | | |
| SCHEDULE OF INVESTMENTS | | December 31, 2009 |
| | | | | | | |
| | | Par | | Value | |
U.S. TREASURY OBLIGATIONS — 91.6% | | | | | | | |
U.S. Treasury Inflationary Index Bonds | | | | | | | |
2.38%, 04/15/11D | | $ | 250,000 | | $ | 280,653 | |
3.38%, 01/15/12 | | | 1,800,000 | | | 2,346,462 | |
2.00%, 04/15/12D | | | 1,660,000 | | | 1,850,169 | |
3.00%, 07/15/12D | | | 3,870,000 | | | 5,008,327 | |
0.63%, 04/15/13D | | | 600,000 | | | 624,760 | |
1.88%, 07/15/13 | | | 5,645,000 | | | 7,005,841 | |
2.00%, 01/15/14D | | | 2,235,000 | | | 2,768,389 | |
2.00%, 07/15/14D‡‡ | | | 6,565,000 | | | 7,985,242 | |
1.63%, 01/15/15D | | | 2,940,000 | | | 3,465,700 | |
1.88%, 07/15/15D | | | 2,010,000 | | | 2,356,520 | |
2.00%, 01/15/16D | | | 2,760,000 | | | 3,178,169 | |
2.50%, 07/15/16D | | | 1,290,000 | | | 1,505,427 | |
2.38%, 01/15/17D | | | 1,690,000 | | | 1,958,892 | |
2.63%, 07/15/17 | | | 2,740,000 | | | 3,146,536 | |
1.63%, 01/15/18D | | | 2,385,000 | | | 2,523,087 | |
1.38%, 07/15/18D | | | 4,110,000 | | | 4,134,918 | |
2.13%, 01/15/19D | | | 1,695,000 | | | 1,812,474 | |
1.88%, 07/15/19D | | | 2,810,000 | | | 2,957,362 | |
2.38%, 01/15/25D | | | 4,230,000 | | | 5,130,696 | |
2.00%, 01/15/26D | | | 2,730,000 | | | 2,993,562 | |
2.38%, 01/15/27D | | | 2,200,000 | | | 2,487,582 | |
1.75%, 01/15/28D | | | 4,705,000 | | | 4,667,531 | |
3.63%, 04/15/28D | | | 1,020,000 | | | 1,688,420 | |
2.50%, 01/15/29 | | | 3,710,000 | | | 4,015,861 | |
3.88%, 04/15/29 | | | 2,780,000 | | | 4,715,424 | |
| | | | | | | |
Total U.S. Treasury Obligations
(Cost $78,560,910) | | | | | | 80,608,004 | |
| | | | | | | |
| | |
| | | Shares | | | |
MONEY MARKET FUNDS — 52.7% | | | | | | | |
GuideStone Money Market Fund (GS4 Class)¥ | | | 6,707,246 | | | 6,707,246 | |
Northern Institutional Liquid Assets Portfolio§ | | | 39,658,228 | | | 39,658,228 | |
| | | | | | | |
Total Money Market Funds
(Cost $46,365,474) | | | | | | 46,365,474 | |
| | | | | | | |
TOTAL INVESTMENTS — 144.3%
(Cost $124,926,384) | | | | | | 126,973,478 | |
| | |
Liabilities in Excess of Other Assets — (44.3)% | | | | | | (38,979,761 | ) |
| | | | | | | |
NET ASSETS — 100.0% | | | | | $ | 87,993,717 | |
| | | | | | | |
Please see abbreviation and footnote definitions on page 180.
PORTFOLIO SUMMARY (based on net assets)
| | |
| | | % |
U.S. Treasury Obligations | | 91.6 |
Money Market Funds | | 52.7 |
Futures Contracts | | 6.5 |
| | |
| | 150.8 |
| | |
FAS 157 DISCLOSURE
The following is a summary of the inputs used, as of December 31, 2009, in valuing the Fund’s assets carried at fair value:
| | | | | | |
Valuation Inputs | | Investments
in
Securities | | Other
Financial
Instruments*** |
Assets: | | | | | | |
Level 1 — Quoted Prices | | | | | | |
Futures Contracts | | $ | — | | $ | 3,178 |
Money Market Funds | | | 46,365,474 | | | — |
Level 2 — Other Significant Observable Inputs | | | | | | |
U.S. Treasury Obligations | | | 80,608,004 | | | — |
Level 3 — Significant Unobservable Inputs | | | — | | | — |
| | | | | | |
Total | | $ | 126,973,478 | | $ | 3,178 |
| | | | | | |
| *** | Other financial instruments are derivative instruments not reflected in the Schedule of Investments, such as futures, forwards and swap contracts, which are valued at the unrealized appreciation (depreciation) on the investment. Details of these investments can be found in the Notes to Financial Statements. |
See Notes to Financial Statements.
116
Global Bond Fund
The Global Bond Fund is actively managed and invests in a diversified portfolio composed primarily of global fixed income securities with an average dollar-weighted duration normally between three to ten years. For the one-year period ended December 31, 2009, the Fund significantly outperformed its composite benchmark, 50% Barclays Capital Global Aggregate Bond Index – Unhedged, 25% JPMorgan Emerging Markets Bond Index Plus and 25% Barclays Capital U.S. Corporate High Yield Index – 2% Issuer Capped (37.35% versus 23.29%). The Fund’s benchmark-relative performance was positively impacted by its underweight exposure to U.S. Treasuries and overweight exposure to non-U.S. Treasury sectors throughout the year. The Global Bond Fund invests in high yield securities, commonly known as “junk bonds”. While offering higher currency yields, these securities generally are considered speculative and are subject to greater risks than higher-rated bonds. Securities of emerging countries may involve additional risks, including price volatility, reduced liquidity, currency fluctuation and financial reporting requirements as well as political and economic instability.
Please see page 128 for information regarding specific portfolio allocations. Portfolio holdings are subject to change at any time.
117
Global Bond Fund
| | | | | | |
Average Annual Total Returns as of 12/31/09 | |
| | | GS4 Class* | | | Benchmark** | |
One Year | | 37.35 | % | | 23.29 | % |
Since Inception | | 5.42 | % | | 7.04 | % |
Inception Date | | 12/29/06 | | | | |
Total Fund Operating Expenses (June 25, 2009 Prospectus)(1) | | 0.80 | % | | | |
| (1) | Current information regarding the Fund’s Operating Expenses can be found in the Financial Highlights. |
The performance data quoted represents past performance and does not guarantee future results. Current performance may be lower or higher. Performance data current to the most recent month-end may be obtained at www.GuideStoneFunds.org. The investment return and principal value of an investment will fluctuate so that shares, when redeemed, may be worth more or less than their original cost.

The graph compares the results of a hypothetical $10,000 investment in the GS4 Class of the Fund since December 29, 2006 (commencement of operations), with all dividends and capital gains reinvested, with the weighted composite index.
| * | These returns reflect expense waivers by the Fund’s investment adviser. Without these waivers, returns would have been lower. Returns shown do not reflect the deduction of taxes that a shareholder would pay on Fund distributions or the redemption of Fund shares. |
| ** | Represents a weighted composite benchmark index consisting of 25% JPMorgan Emerging Markets Bond Index Plus, 50% Barclays Capital Global Aggregate Bond Index — Unhedged and 25% Barclays Capital U.S. Corporate High Yield – 2% Issuer Capped Index. The JPMorgan Emerging Markets Bond Index Plus is a traditional, market-capitalization weighted index comprised of U.S. dollar denominated Brady bonds, Eurobonds and traded loans issued by sovereign entities. |
The Barclays Capital Global Aggregate Bond Index — Unhedged provides a broad-based measure of the global investment grade fixed-rate debt markets.
The Barclays Capital U.S. Corporate High Yield – 2% Issuer Capped Index is an issuer-constrained version of the Barclays Capital U.S. Corporate High Yield Index that covers the U.S.-denominated, non-investment grade, fixed-rate and taxable corporate bond market.
Unlike a mutual fund, the performance of an index assumes no taxes, transaction costs, management fees or other expenses.
118
| | |
| GLOBAL BOND FUND | | |
| SCHEDULE OF INVESTMENTS | | December 31, 2009 |
| | | | | | |
| | | Par | | Value |
AGENCY OBLIGATION — 0.0% | | | | | | |
Federal National Mortgage Association | | | | | | |
0.40%, 01/25/10W‡‡
(Cost $132,965) | | $ | 133,000 | | $ | 133,000 |
| | | | | | |
ASSET-BACKED SECURITIES — 2.4% | | | | | | |
Bear Stearns Asset-Backed Securities Trust | | | | | | |
0.71%, 10/25/33 STEP | | | 116,239 | | | 110,347 |
Capital One Multi-Asset Execution Trust | | | | | | |
0.26%, 03/16/15† | | | 720,000 | | | 707,893 |
Carrington Mortgage Loan Trust | | | | | | |
0.55%, 10/25/35† | | | 77,817 | | | 71,541 |
Chase Issuance Trust | | | | | | |
0.60%, 11/15/12† | | | 1,135,000 | | | 1,132,952 |
0.48%, 04/15/19† | | | 760,000 | | | 657,154 |
Citibank Credit Card Issuance Trust | | | | | | |
6.30%, 06/20/14 | | | 710,000 | | | 733,015 |
Discover Card Master Trust I | | | | | | |
0.32%, 06/16/15† | | | 655,000 | | | 637,559 |
GMAC Mortgage Corporation Loan Trust | | | | | | |
0.41%, 12/25/36† | | | 1,329,883 | | | 532,965 |
Lehman XS Trust | | | | | | |
0.32%, 02/25/37† | | | 360,608 | | | 312,603 |
Morgan Stanley Mortgage Loan Trust | | | | | | |
0.35%, 10/25/36† | | | 57,776 | | | 57,812 |
Origen Manufactured Housing | | | | | | |
0.38%, 11/15/18† | | | 67,526 | | | 62,098 |
RAAC Series | | | | | | |
0.57%, 07/25/37 144A† | | | 40,678 | | | 40,396 |
Residential Asset Securities Corporation | | | | | | |
6.35%, 03/25/32 | | | 60,240 | | | 42,000 |
Security National Mortgage Loan Trust | | | | | | |
0.51%, 01/25/37 144A† | | | 173,016 | | | 148,486 |
| | | | | | |
Total Asset-Backed Securities
(Cost $5,932,151) | | | | | | 5,246,821 |
| | | | | | |
CORPORATE BONDS — 44.4% | | | | | | |
ACCO Brands Corporation | | | | | | |
10.63%, 03/15/15 144AD | | | 75,000 | | | 82,875 |
Advanced Micro Devices, Inc. | | | | | | |
8.13%, 12/15/17 144AD | | | 25,000 | | | 25,031 |
AES Corporation | | | | | | |
8.38%, 03/01/11(U) | | | 50,000 | | | 81,365 |
8.75%, 05/15/13 144A | | | 312,000 | | | 321,360 |
8.00%, 10/15/17 | | | 315,000 | | | 324,844 |
Affinion Group, Inc. | | | | | | |
10.13%, 10/15/13 | | | 220,000 | | | 227,150 |
11.50%, 10/15/15 | | | 105,000 | | | 110,512 |
Alcoa, Inc. | | | | | | |
5.87%, 02/23/22 | | | 5,000 | | | 4,653 |
6.75%, 01/15/28 | | | 185,000 | | | 179,106 |
5.95%, 02/01/37 | | | 65,000 | | | 55,957 |
Allied Waste North America, Inc. | | | | | | |
7.13%, 05/15/16 | | | 225,000 | | | 239,932 |
Altegrity, Inc. | | | | | | |
10.50%, 11/01/15 144A | | | 150,000 | | | 134,625 |
American Axle & Manufacturing Holdings, Inc. | | | | | | |
9.25%, 01/15/17 144A | | | 10,000 | | | 10,200 |
American Express Credit Corporation | | | | | | |
5.13%, 08/25/14D | | | 390,000 | | | 411,379 |
American General Finance Corporation | | | | | | |
5.75%, 09/15/16 | | | 700,000 | | | 473,192 |
American International Group, Inc. | | | | | | |
5.05%, 10/01/15 | | | 100,000 | | | 83,525 |
AMH Holdings, Inc. | | | | | | |
11.25%, 03/01/14 STEP | | | 15,000 | | | 14,550 |
Amkor Technology, Inc. | | | | | | |
7.75%, 05/15/13 | | | 660,000 | | | 673,200 |
Anadarko Petroleum Corporation | | | | | | |
5.95%, 09/15/16 | | | 20,000 | | | 21,664 |
Appleton Papers, Inc. | | | | | | |
11.25%, 12/15/15 144A | | | 102,000 | | | 86,828 |
Ashtead Capital, Inc. | | | | | | |
9.00%, 08/15/16 144A | | | 140,000 | | | 140,875 |
Ashton Woods USA LLC | | | | | | |
41.09%, 06/30/15 STEP 144AW@ | | | 20,800 | | | 5,190 |
Associates Corporation of North America | | | | | | |
6.95%, 11/01/18 | | | 125,000 | | | 126,594 |
AT&T Corporation | | | | | | |
6.50%, 03/15/29 | | | 580,000 | | | 578,920 |
AT&T, Inc. | | | | | | |
6.45%, 06/15/34 | | | 115,000 | | | 117,624 |
6.55%, 02/15/39 | | | 220,000 | | | 232,579 |
Baltimore Gas & Electric Co. | | | | | | |
5.20%, 06/15/33 | | | 1,125,000 | | | 984,861 |
Banca Popolare di Lodi Investors Trust III | | | | | | |
6.74%, 06/30/36(E)† | | | 260,000 | | | 306,098 |
Baxter International, Inc. | | | | | | |
4.50%, 08/15/19 | | | 60,000 | | | 60,160 |
Belden & Blake Corporation | | | | | | |
8.75%, 07/15/12 | | | 165,000 | | | 155,100 |
Berry Petroleum Co. | | | | | | |
10.25%, 06/01/14 | | | 80,000 | | | 87,400 |
Biomet, Inc. | | | | | | |
10.00%, 10/15/17 | | | 20,000 | | | 21,825 |
10.38%, 10/15/17 PIK | | | 535,000 | | | 583,150 |
Blockbuster, Inc. | | | | | | |
11.75%, 10/01/14 144AD | | | 170,000 | | | 162,350 |
Boeing Capital Corporation | | | | | | |
5.80%, 01/15/13 | | | 60,000 | | | 65,386 |
Boeing Co. | | | | | | |
4.88%, 02/15/20 | | | 40,000 | | | 40,188 |
Boston Scientific Corporation | | | | | | |
7.00%, 11/15/35 | | | 215,000 | | | 212,044 |
Buffets Restaurants Holdings, Inc. | | | | | | |
12.50%, 11/01/14#@ | | | 105,000 | | | — |
Caterpillar Financial Services Corporation | | | | | | |
6.13%, 02/17/14 | | | 40,000 | | | 44,743 |
5.45%, 04/15/18D | | | 25,000 | | | 26,083 |
CC Holdings GS V LLC | | | | | | |
7.75%, 05/01/17 144A | | | 350,000 | | | 374,500 |
See Notes to Financial Statements.
119
GLOBAL BOND FUND
SCHEDULE OF INVESTMENTS (Continued)
| | | | | | |
| | | Par | | Value |
CDX North America High Yield | | | | | | |
7.63%, 06/29/12 144A | | $ | 841,290 | | $ | 897,025 |
Cengage Learning Acquisitions, Inc. | | | | | | |
10.50%, 01/15/15 144A | | | 100,000 | | | 96,125 |
Ceridian Corporation | | | | | | |
12.25%, 11/15/15 144AD | | | 63,900 | | | 60,545 |
Charter Communications Operating LLC | | | | | | |
10.88%, 09/15/14 144A | | | 140,000 | | | 157,500 |
Chesapeake Energy Corporation | | | | | | |
6.50%, 08/15/17D | | | 1,190,000 | | | 1,172,150 |
6.25%, 01/15/18D | | | 30,000 | | | 28,950 |
7.25%, 12/15/18 | | | 110,000 | | | 111,375 |
Chiquita Brands International, Inc. | | | | | | |
7.50%, 11/01/14D | | | 450,000 | | | 447,750 |
CII Carbon LLC | | | | | | |
11.13%, 11/15/15 144A | | | 190,000 | | | 192,138 |
Cincinnati Bell Telephone Co. LLC | | | | | | |
6.30%, 12/01/28D | | | 155,000 | | | 121,675 |
CIT Group, Inc. | | | | | | |
7.00%, 05/01/13D | | | 61,634 | | | 57,936 |
7.00%, 05/01/14 | | | 92,453 | | | 86,097 |
7.00%, 05/01/15 | | | 92,453 | | | 83,208 |
7.00%, 05/01/16 | | | 154,090 | | | 136,370 |
7.00%, 05/01/17D | | | 215,726 | | | 188,221 |
Citigroup, Inc. | | | | | | |
6.38%, 08/12/14 | | | 1,355,000 | | | 1,419,968 |
CMP Susquehanna Radio Holdings Corporation | | | | | | |
9.88%, 05/15/14 144A@ | | | 6,000 | | | 2,089 |
Colorado Interstate Gas Co. | | | | | | |
5.95%, 03/15/15 | | | 20,000 | | | 21,104 |
6.80%, 11/15/15 | | | 125,000 | | | 138,633 |
Comcast Corporation | | | | | | |
6.50%, 01/15/15 | | | 60,000 | | | 67,294 |
6.50%, 01/15/17 | | | 60,000 | | | 66,518 |
5.65%, 06/15/35 | | | 400,000 | | | 375,109 |
Commerzbank Capital Funding Trust I | | | | | | |
5.01%, 04/12/37(E)† | | | 500,000 | | | 336,705 |
Community Health Systems, Inc. | | | | | | |
8.88%, 07/15/15 | | | 100,000 | | | 103,750 |
Complete Production Services, Inc. | | | | | | |
8.00%, 12/15/16D | | | 80,000 | | | 79,300 |
ConocoPhillips | | | | | | |
6.50%, 02/01/39 | | | 150,000 | | | 167,050 |
Continental Airlines, Inc. | | | | | | |
9.00%, 07/08/16 | | | 1,250,000 | | | 1,341,406 |
5.98%, 04/19/22 | | | 545,000 | | | 525,925 |
Countrywide Financial Corporation | | | | | | |
5.80%, 06/07/12 | | | 90,000 | | | 95,590 |
6.25%, 05/15/16 | | | 280,000 | | | 285,177 |
Cricket Communications, Inc. | | | | | | |
7.75%, 05/15/16D | | | 150,000 | | | 150,375 |
Cummins, Inc. | | | | | | |
5.65%, 03/01/98 | | | 1,500,000 | | | 938,052 |
DAE Aviation Holdings, Inc. | | | | | | |
11.25%, 08/01/15 144A | | | 230,000 | | | 195,500 |
Delhaize America, Inc. | | | | | | |
9.00%, 04/15/31D | | | 301,000 | | | 386,405 |
Delta Air Lines, Inc. | | | | | | |
9.50%, 09/15/14 144AD | | | 40,000 | | | 41,750 |
12.25%, 03/15/15 144AD | | | 40,000 | | | 40,200 |
Deutsche Postbank Funding Trust IV | | | | | | |
5.98%, 06/29/49(E)† | | | 300,000 | | | 267,715 |
Developers Diversified Realty Corporation | | | | | | |
5.38%, 10/15/12 | | | 315,000 | | | 296,240 |
DI Finance | | | | | | |
9.50%, 02/15/13 | | | 180,000 | | | 183,150 |
DISH DBS Corporation | | | | | | |
7.00%, 10/01/13D | | | 600,000 | | | 620,250 |
Dole Food Co., Inc. | | | | | | |
8.00%, 10/01/16 144A | | | 40,000 | | | 40,800 |
Dollar General Corporation | | | | | | |
10.63%, 07/15/15 | | | 24,000 | | | 26,700 |
Dominion Resources, Inc. | | | | | | |
8.88%, 01/15/19 | | | 250,000 | | | 312,062 |
DR Horton, Inc. | | | | | | |
6.50%, 04/15/16 | | | 345,000 | | | 338,100 |
Dynegy Holdings, Inc. | | | | | | |
7.50%, 06/01/15D | | | 307,000 | | | 288,580 |
7.75%, 06/01/19D | | | 746,000 | | | 650,885 |
Edison Mission Energy | | | | | | |
7.63%, 05/15/27 | | | 180,000 | | | 122,850 |
El Paso Corporation | | | | | | |
8.25%, 02/15/16 | | | 335,000 | | | 359,288 |
El Paso Natural Gas Co. | | | | | | |
8.63%, 01/15/22D | | | 90,000 | | | 105,470 |
8.38%, 06/15/32 | | | 75,000 | | | 89,443 |
El Pollo Loco, Inc. | | | | | | |
11.75%, 12/01/12 144A | | | 20,000 | | | 20,850 |
11.75%, 11/15/13 | | | 175,000 | | | 160,125 |
Embarq Corporation | | | | | | |
8.00%, 06/01/36 | | | 1,245,000 | | | 1,343,077 |
Energy Future Holdings Corporation | | | | | | |
11.25%, 11/01/17 PIK | | | 1,000,004 | | | 712,503 |
6.50%, 11/15/24 | | | 370,000 | | | 175,645 |
6.55%, 11/15/34 | | | 300,000 | | | 140,586 |
Energy Transfer Partners LP | | | | | | |
9.00%, 04/15/19 | | | 100,000 | | | 119,393 |
Enterprise Products Operating LLC | | | | | | |
9.75%, 01/31/14D | | | 250,000 | | | 298,626 |
8.38%, 08/01/66† | | | 60,000 | | | 58,572 |
Erac USA Finance Co. | | | | | | |
6.38%, 10/15/17 144A | | | 245,000 | | | 247,842 |
7.00%, 10/15/37 144A | | | 1,065,000 | | | 1,045,571 |
FirstEnergy Corporation | | | | | | |
7.38%, 11/15/31 | | | 45,000 | | | 48,913 |
Ford Motor Co. | | | | | | |
4.25%, 11/15/16D | | | 830,000 | | | 1,044,762 |
6.63%, 10/01/28 | | | 850,000 | | | 660,875 |
Ford Motor Credit Co. LLC | | | | | | |
7.00%, 10/01/13 | | | 650,000 | | | 649,547 |
Ford Motor Credit Co., LLC | | | | | | |
3.03%, 01/13/12† | | | 37,500 | | | 34,922 |
7.50%, 08/01/12D | | | 500,000 | | | 504,519 |
See Notes to Financial Statements.
120
| | | | | | |
| | | Par | | Value |
Freeport-McMoRan Copper & Gold, Inc. | | | | | | |
8.38%, 04/01/17 | | $ | 470,000 | | $ | 515,355 |
Freescale Semiconductor, Inc. | | | | | | |
10.13%, 12/15/16 | | | 130,000 | | | 105,300 |
Fresenius US Finance II, Inc. | | | | | | |
8.75%, 07/15/15 144A(E) | | | 30,000 | | | 49,027 |
Frontier Communications Corporation | | | | | | |
7.13%, 03/15/19D | | | 120,000 | | | 114,000 |
7.88%, 01/15/27 | | | 405,000 | | | 374,625 |
General Electric Capital Corporation | | | | | | |
3.49%, 03/08/12(G) | | | 200,000 | | | 143,528 |
7.63%, 12/10/14(Z) | | | 905,000 | | | 690,590 |
4.88%, 03/04/15 | | | 370,000 | | | 384,793 |
6.50%, 09/28/15(Z) | | | 255,000 | | | 181,288 |
6.75%, 09/26/16(Z) | | | 150,000 | | | 106,297 |
5.63%, 05/01/18 | | | 25,000 | | | 25,661 |
6.00%, 08/07/19 | | | 410,000 | | | 426,364 |
6.75%, 03/15/32 | | | 30,000 | | | 30,675 |
5.88%, 01/14/38 | | | 100,000 | | | 92,893 |
Georgia-Pacific LLC | | | | | | |
8.00%, 01/15/24 | | | 355,000 | | | 363,875 |
8.88%, 05/15/31 | | | 785,000 | | | 836,025 |
GMAC, Inc. | | | | | | |
5.75%, 05/21/10 144A | | | 117,000 | | | 116,708 |
5.38%, 06/06/11 144A | | | 415,000 | | | 403,588 |
6.00%, 12/15/11 144AD | | | 1,016,000 | | | 1,005,840 |
7.50%, 12/31/13 144A | | | 87,000 | | | 84,825 |
6.75%, 12/01/14 144AD | | | 399,000 | | | 383,040 |
8.00%, 12/31/18 144A | | | 104,000 | | | 92,560 |
8.00%, 11/01/31 144AD | | | 757,000 | | | 688,870 |
Goldman Sachs Group, Inc. | | | | | | |
5.00%, 10/01/14 | | | 600,000 | | | 633,368 |
6.15%, 04/01/18 | | | 300,000 | | | 321,671 |
Goodyear Tire & Rubber Co. | | | | | | |
7.00%, 03/15/28 | | | 690,000 | | | 600,300 |
GXS Worldwide, Inc. | | | | | | |
9.75%, 06/15/15 144A | | | 570,000 | | | 562,875 |
H&E Equipment Services, Inc. | | | | | | |
8.38%, 07/15/16D | | | 120,000 | | | 120,750 |
Hawaiian Telcom Communications, Inc. | | | | | | |
12.50%, 05/01/15#@ | | | 65,000 | | | 6 |
Hawker Beechcraft Acquisition Co. LLC | | | | | | |
8.88%, 04/01/15 PIK | | | 345,881 | | | 212,717 |
HCA, Inc. | | | | | | |
8.75%, 11/01/10(U) | | | 140,000 | | | 229,519 |
7.88%, 02/01/11D | | | 240,000 | | | 248,100 |
6.25%, 02/15/13 | | | 480,000 | | | 469,200 |
5.75%, 03/15/14 | | | 40,000 | | | 37,800 |
6.38%, 01/15/15 | | | 870,000 | | | 825,412 |
7.19%, 11/15/15 | | | 205,000 | | | 191,162 |
6.50%, 02/15/16 | | | 220,000 | | | 210,100 |
9.25%, 11/15/16 | | | 60,000 | | | 64,575 |
9.63%, 11/15/16 PIK | | | 194,596 | | | 211,137 |
7.50%, 12/15/23 | | | 555,000 | | | 509,903 |
8.36%, 04/15/24 | | | 90,000 | | | 85,950 |
7.69%, 06/15/25 | | | 775,000 | | | 713,544 |
7.58%, 09/15/25 | | | 570,000 | | | 510,150 |
Headwaters, Inc. | | | | | | |
11.38%, 11/01/14 144AD | | | 55,000 | | | 57,612 |
Hercules Offshore, Inc. | | | | | | |
10.50%, 10/15/17 144AD | | | 80,000 | | | 84,800 |
Hertz Corporation | | | | | | |
8.88%, 01/01/14 | | | 250,000 | | | 256,875 |
Hess Corporation | | | | | | |
8.13%, 02/15/19 | | | 310,000 | | | 374,472 |
Hexion US Finance Corporation | | | | | | |
9.75%, 11/15/14D | | | 1,170,000 | | | 1,152,450 |
Highwoods Realty LP | | | | | | |
5.85%, 03/15/17 | | | 180,000 | | | 164,438 |
Home Depot, Inc. | | | | | | |
5.88%, 12/16/36 | | | 1,690,000 | | | 1,636,686 |
Host Hotels & Resorts LP | | | | | | |
2.63%, 04/15/27 144A | | | 750,000 | | | 706,875 |
Idearc, Inc. | | | | | | |
8.00%, 11/15/16# | | | 185,000 | | | 13,875 |
Intel Corporation | | | | | | |
2.95%, 12/15/35D | | | 580,000 | | | 562,600 |
3.25%, 08/01/39 CONV 144AD | | | 460,000 | | | 530,725 |
Intelsat Corporation | | | | | | |
9.25%, 08/15/14 | | | 270,000 | | | 278,775 |
International Lease Finance Corporation | | | | | | |
5.00%, 04/15/10 | | | 45,000 | | | 44,328 |
5.63%, 09/15/10D | | | 115,000 | | | 113,776 |
5.13%, 11/01/10 | | | 100,000 | | | 96,026 |
5.55%, 09/05/12 | | | 50,000 | | | 41,659 |
6.38%, 03/25/13 | | | 245,000 | | | 201,573 |
International Paper Co. | | | | | | |
7.95%, 06/15/18 | | | 635,000 | | | 733,569 |
iStar Financial, Inc. | | | | | | |
5.65%, 09/15/11D | | | 92,000 | | | 68,540 |
5.50%, 06/15/12 | | | 75,000 | | | 45,750 |
8.63%, 06/01/13 | | | 75,000 | | | 48,750 |
5.95%, 10/15/13 | | | 954,000 | | | 565,245 |
5.70%, 03/01/14 | | | 62,000 | | | 35,340 |
6.05%, 04/15/15D | | | 20,000 | | | 11,450 |
5.88%, 03/15/16 | | | 22,000 | | | 12,595 |
JC Penney Corporation, Inc. | | | | | | |
6.38%, 10/15/36 | | | 1,270,000 | | | 1,134,110 |
7.63%, 03/01/38 | | | 1,300,000 | | | 1,176,500 |
Jones Apparel Group, Inc. | | | | | | |
6.13%, 11/15/34 | | | 135,000 | | | 112,387 |
K Hovnanian Enterprises, Inc. | | | | | | |
6.38%, 12/15/14 | | | 795,000 | | | 580,350 |
Kerr-McGee Corporation | | | | | | |
6.95%, 07/01/24 | | | 30,000 | | | 32,565 |
Keystone Automotive Operations, Inc. | | | | | | |
9.75%, 11/01/13 | | | 45,000 | | | 19,575 |
Kinder Morgan Energy Partners LP | | | | | | |
5.95%, 02/15/18D | | | 1,060,000 | | | 1,124,577 |
6.50%, 02/01/37 | | | 75,000 | | | 75,809 |
6.95%, 01/15/38 | | | 90,000 | | | 96,224 |
L-3 Communications Corporation | | | | | | |
6.13%, 01/15/14 | | | 45,000 | | | 45,506 |
6.38%, 10/15/15 | | | 450,000 | | | 453,937 |
Lamar Media Corporation | | | | | | |
6.63%, 08/15/15 | | | 20,000 | | | 19,300 |
Lehman Brothers Holdings, Inc. | | | | | | |
5.25%, 02/06/12# | | | 130,000 | | | 26,000 |
See Notes to Financial Statements.
121
GLOBAL BOND FUND
SCHEDULE OF INVESTMENTS (Continued)
| | | | | | |
| | | Par | | Value |
Leiner Health Products, Inc. | | | | | | |
11.00%, 06/01/12#@ | | $ | 285,000 | | $ | 385 |
Lennar Corporation | | | | | | |
5.60%, 05/31/15D | | | 1,400,000 | | | 1,289,750 |
Level 3 Communications, Inc. | | | | | | |
3.50%, 06/15/12 | | | 195,000 | | | 171,600 |
Level 3 Financing, Inc. | | | | | | |
9.25%, 11/01/14 | | | 260,000 | | | 247,000 |
8.75%, 02/15/17D | | | 1,185,000 | | | 1,087,238 |
Mariner Energy, Inc. | | | | | | |
8.00%, 05/15/17D | | | 70,000 | | | 67,550 |
Marsh & McLennan Cos., Inc. | | | | | | |
5.88%, 08/01/33D | | | 1,000,000 | | | 890,435 |
Masco Corporation | | | | | | |
6.13%, 10/03/16D | | | 265,000 | | | 252,871 |
5.85%, 03/15/17D | | | 90,000 | | | 83,861 |
6.50%, 08/15/32 | | | 145,000 | | | 123,730 |
Maxtor Corporation | | | | | | |
5.75%, 03/01/12@ | | | 104,000 | | | 100,880 |
MBIA Insurance Corporation | | | | | | |
14.00%, 01/15/33 144A†D | | | 435,000 | | | 193,575 |
Mead Johnson Nutrition Co. | | | | | | |
4.90%, 11/01/19 144A | | | 100,000 | | | 99,340 |
5.90%, 11/01/39 144A | | | 30,000 | | | 29,645 |
Merrill Lynch & Co., Inc. | | | | | | |
6.05%, 06/01/34 | | | 700,000 | | | 630,247 |
6.11%, 01/29/37 | | | 1,300,000 | | | 1,202,284 |
Metals USA, Inc. | | | | | | |
11.13%, 12/01/15 | | | 140,000 | | | 142,275 |
Michaels Stores, Inc. | | | | | | |
10.00%, 11/01/14 | | | 70,000 | | | 72,800 |
Mirant Mid Atlantic Pass Through Trust | | | | | | |
10.06%, 12/30/28 | | | 165,630 | | | 174,740 |
Morgan Stanley | | | | | | |
4.75%, 04/01/14 | | | 50,000 | | | 50,335 |
Motorola, Inc. | | | | | | |
6.50%, 09/01/25 | | | 720,000 | | | 626,993 |
6.50%, 11/15/28D | | | 155,000 | | | 133,667 |
6.63%, 11/15/37 | | | 625,000 | | | 545,338 |
Motors Liquidation Co. | | | | | | |
8.38%, 07/05/33(E)# | | | 250,000 | | | 76,157 |
Mutual of Omaha Insurance Co. | | | | | | |
6.80%, 06/15/36 144A | | | 1,200,000 | | | 1,012,200 |
Neiman-Marcus Group, Inc. | | | | | | |
9.00%, 10/15/15 PIKD | | | 381,595 | | | 374,917 |
7.13%, 06/01/28 | | | 30,000 | | | 26,550 |
Nevada Power Co. | | | | | | |
8.25%, 06/01/11 | | | 290,000 | | | 313,582 |
5.88%, 01/15/15 | | | 100,000 | | | 107,432 |
NewPage Corporation | | | | | | |
11.38%, 12/31/14 144A | | | 285,000 | | | 289,275 |
Nextel Communications, Inc. | | | | | | |
5.95%, 03/15/14 | | | 970,000 | | | 910,588 |
7.38%, 08/01/15D | | | 1,615,000 | | | 1,578,662 |
Norcraft Holdings LP | | | | | | |
9.75%, 09/01/12 STEP@ | | | 89,000 | | | 85,885 |
Northrop Grumman Corporation | | | | | | |
5.05%, 08/01/19D | | | 100,000 | | | 102,309 |
NRG Energy, Inc. | | | | | | |
7.38%, 02/01/16 | | | 300,000 | | | 301,125 |
Orion Power Holdings, Inc. | | | | | | |
12.00%, 05/01/10 | | | 55,000 | | | 56,650 |
Owens Corning, Inc. | | | | | | |
7.00%, 12/01/36D | | | 220,000 | | | 205,776 |
Oxford Industries, Inc. | | | | | | |
11.38%, 07/15/15 144A | | | 135,000 | | | 149,175 |
Panhandle Eastern Pipeline Co. LP | | | | | | |
7.00%, 06/15/18D | | | 1,100,000 | | | 1,216,600 |
Peabody Energy Corporation | | | | | | |
6.88%, 03/15/13 | | | 5,000 | | | 5,081 |
Pemex Project Funding Master Trust | | | | | | |
6.63%, 06/15/35D | | | 1,240,000 | | | 1,182,217 |
Penhall International Corporation | | | | | | |
12.00%, 08/01/14 144A@ | | | 205,000 | | | 129,662 |
PetroHawk Energy Corporation | | | | | | |
9.13%, 07/15/13 | | | 70,000 | | | 73,500 |
Pioneer Natural Resources Co. | | | | | | |
5.88%, 07/15/16 | | | 900,000 | | | 866,067 |
7.20%, 01/15/28 | | | 315,000 | | | 286,055 |
Plains Exploration & Production Co. | | | | | | |
10.00%, 03/01/16D | | | 75,000 | | | 82,500 |
8.63%, 10/15/19 | | | 55,000 | | | 56,788 |
ProLogis | | | | | | |
6.63%, 05/15/18D | | | 15,000 | | | 14,248 |
2.25%, 04/01/37 | | | 580,000 | | | 540,850 |
1.88%, 11/15/37 | | | 545,000 | | | 485,050 |
Quicksilver Resources, Inc. | | | | | | |
11.75%, 01/01/16 | | | 95,000 | | | 108,300 |
Qwest Capital Funding, Inc. | | | | | | |
6.50%, 11/15/18 | | | 225,000 | | | 195,750 |
Qwest Communications International, Inc. | | | | | | |
7.25%, 02/15/11 | | | 35,000 | | | 35,350 |
7.50%, 02/15/14 | | | 20,000 | | | 20,175 |
Qwest Corporation | | | | | | |
7.88%, 09/01/11 | | | 100,000 | | | 105,250 |
3.50%, 06/15/13† | | | 100,000 | | | 96,750 |
7.63%, 06/15/15 | | | 300,000 | | | 312,000 |
6.50%, 06/01/17 | | | 65,000 | | | 64,188 |
7.50%, 06/15/23D | | | 110,000 | | | 104,500 |
7.25%, 09/15/25 | | | 105,000 | | | 97,650 |
6.88%, 09/15/33 | | | 2,500,000 | | | 2,212,500 |
7.25%, 10/15/35 | | | 110,000 | | | 97,350 |
RailAmerica, Inc. | | | | | | |
9.25%, 07/01/17 | | | 130,000 | | | 138,938 |
Reynolds Group Issuer LLC | | | | | | |
9.50%, 06/15/17(E) | | | 170,000 | | | 238,220 |
RH Donnelley Corporation | | | | | | |
6.88%, 01/15/13# | | | 320,000 | | | 31,600 |
RH Donnelley, Inc. | | | | | | |
11.75%, 05/15/15 144A# | | | 310,000 | | | 257,300 |
RSC Equipment Rental, Inc. | | | | | | |
9.50%, 12/01/14 | | | 160,000 | | | 161,000 |
10.00%, 07/15/17 144AD | | | 80,000 | | | 87,400 |
Ryerson, Inc. | | | | | | |
12.00%, 11/01/15 144A | | | 145,000 | | | 152,250 |
Salem Communications Corporation | | | | | | |
9.63%, 12/15/16 144A | | | 15,000 | | | 15,788 |
Sandridge Energy, Inc. | | | | | | |
9.88%, 05/15/16 144AD | | | 185,000 | | | 195,638 |
See Notes to Financial Statements.
122
| | | | | | |
| | | Par | | Value |
Service Corporation International | | | | | | |
7.50%, 04/01/27 | | $ | 75,000 | | $ | 67,125 |
Simon Property Group LP | | | | | | |
5.75%, 12/01/15 | | | 25,000 | | | 25,525 |
5.88%, 03/01/17 | | | 15,000 | | | 15,043 |
SLM Corporation | | | | | | |
6.50%, 06/15/10(Z) | | | 275,000 | | | 194,409 |
5.38%, 01/15/13D | | | 650,000 | | | 613,580 |
5.00%, 10/01/13 | | | 380,000 | | | 349,866 |
4.75%, 03/17/14(E) | | | 170,000 | | | 210,803 |
5.38%, 05/15/14 | | | 1,000,000 | | | 923,240 |
8.45%, 06/15/18 | | | 769,000 | | | 759,939 |
Sprint Capital Corporation | | | | | | |
8.38%, 03/15/12 | | | 60,000 | | | 62,400 |
8.75%, 03/15/32D | | | 755,000 | | | 715,362 |
Steel Dynamics, Inc. | | | | | | |
7.38%, 11/01/12 | | | 45,000 | | | 46,575 |
Stone Energy Corporation | | | | | | |
8.25%, 12/15/11 | | | 115,000 | | | 115,144 |
Suburban Propane Partners | | | | | | |
6.88%, 12/15/13 | | | 145,000 | | | 145,725 |
Talecris Biotherapeutics Holdings Corporation | | | | | | |
7.75%, 11/15/16 144A | | | 50,000 | | | 51,000 |
Teachers Insurance & Annuity Association of America | | | | | | |
6.85%, 12/16/39 144A | | | 100,000 | | | 103,708 |
Tenet Healthcare Corporation | | | | | | |
7.38%, 02/01/13D | | | 1,100,000 | | | 1,108,250 |
9.00%, 05/01/15 144AD | | | 85,000 | | | 92,225 |
10.00%, 05/01/18 144AD | | | 55,000 | | | 61,875 |
8.88%, 07/01/19 144A | | | 377,000 | | | 409,045 |
6.88%, 11/15/31 | | | 85,000 | | | 68,425 |
Terra Capital, Inc. | | | | | | |
7.75%, 11/01/19 144A | | | 45,000 | | | 48,375 |
Textron Financial Corporation | | | | | | |
5.13%, 08/15/14 | | | 30,000 | | | 28,395 |
Textron, Inc. | | | | | | |
6.20%, 03/15/15 | | | 255,000 | | | 265,704 |
7.25%, 10/01/19 | | | 175,000 | | | 181,453 |
6.63%, 04/07/20(U) | | | 130,000 | | | 183,340 |
Time Warner Cable, Inc. | | | | | | |
5.85%, 05/01/17 | | | 1,200,000 | | | 1,262,684 |
8.75%, 02/14/19 | | | 190,000 | | | 231,947 |
8.25%, 04/01/19 | | | 130,000 | | | 155,102 |
6.75%, 06/15/39 | | | 80,000 | | | 84,059 |
Time Warner, Inc. | | | | | | |
6.88%, 05/01/12 | | | 90,000 | | | 98,580 |
Toledo Edison Co. | | | | | | |
6.15%, 05/15/37 | | | 125,000 | | | 123,910 |
Toys “R” Us, Inc. | | | | | | |
7.38%, 10/15/18 | | | 335,000 | | | 308,200 |
Unicredito Italiano Capital Trust III | | | | | | |
4.03%, 10/29/49(E)† | | | 250,000 | | | 240,119 |
United Air Lines, Inc. | | | | | | |
10.40%, 11/01/16D | | | 795,000 | | | 837,731 |
United Rentals North America, Inc. | | | | | | |
7.75%, 11/15/13 | | | 505,000 | | | 474,700 |
7.00%, 02/15/14D | | | 655,000 | | | 596,050 |
UnitedHealth Group, Inc. | | | | | | |
5.80%, 03/15/36 | | | 790,000 | | | 710,280 |
Universal Hospital Services, Inc. | | | | | | |
3.86%, 06/01/15† | | | 20,000 | | | 16,950 |
8.50%, 06/01/15 PIK | | | 20,000 | | | 19,800 |
Univision Communications, Inc. | | | | | | |
12.00%, 07/01/14 144AD | | | 215,000 | | | 237,844 |
US Oncology Holdings, Inc. | | | | | | |
6.43%, 03/15/12 PIK | | | 146,440 | | | 137,654 |
US Oncology, Inc. | | | | | | |
9.13%, 08/15/17D | | | 155,000 | | | 163,525 |
USG Corporation | | | | | | |
6.30%, 11/15/16 | | | 1,250,000 | | | 1,125,000 |
Valor Telecommunications Enterprises Finance Corporation | | | | | | |
7.75%, 02/15/15 | | | 125,000 | | | 128,838 |
Vanguard Health Holding Co. II LLC | | | | | | |
9.00%, 10/01/14 | | | 220,000 | | | 229,075 |
Ventas Realty LP | | | | | | |
9.00%, 05/01/12 | | | 305,000 | | | 320,250 |
Verizon Communications, Inc. | | | | | | |
5.85%, 09/15/35 | | | 16,000 | | | 15,653 |
Verizon Global Funding Corporation | | | | | | |
6.88%, 06/15/12 | | | 30,000 | | | 33,233 |
Verizon New York, Inc. | | | | | | |
7.38%, 04/01/32 | | | 115,000 | | | 124,228 |
Verizon Pennsylvania, Inc. | | | | | | |
6.00%, 12/01/28D | | | 90,000 | | | 80,499 |
Visteon Corporation | | | | | | |
8.25%, 08/01/10# | | | 17,000 | | | 4,548 |
12.25%, 12/31/16 144A# | | | 62,000 | | | 26,350 |
W&T Offshore, Inc. | | | | | | |
8.25%, 06/15/14 144A | | | 50,000 | | | 47,750 |
Wachovia Corporation | | | | | | |
5.25%, 08/01/14 | | | 120,000 | | | 124,357 |
Waste Management, Inc. | | | | | | |
7.38%, 08/01/10D | | | 50,000 | | | 51,801 |
WEA Finance LLC | | | | | | |
6.75%, 09/02/19 144AD | | | 780,000 | | | 839,016 |
WellPoint, Inc. | | | | | | |
7.00%, 02/15/19D | | | 80,000 | | | 89,627 |
Western Union Co. | | | | | | |
6.20%, 11/17/36 | | | 620,000 | | | 618,735 |
Westvaco Corporation | | | | | | |
8.20%, 01/15/30 | | | 150,000 | | | 154,701 |
7.95%, 02/15/31 | | | 135,000 | | | 132,067 |
Weyerhaeuser Co. | | | | | | |
8.50%, 01/15/25D | | | 405,000 | | | 418,216 |
Whiting Petroleum Corporation | | | | | | |
7.00%, 02/01/14 | | | 130,000 | | | 131,138 |
Williams Cos., Inc. | | | | | | |
7.13%, 09/01/11 | | | 525,000 | | | 561,291 |
7.50%, 01/15/31 | | | 130,000 | | | 140,618 |
Windstream Corporation | | | | | | |
8.63%, 08/01/16 | | | 650,000 | | | 664,625 |
XTO Energy, Inc. | | | | | | |
7.50%, 04/15/12 | | | 30,000 | | | 33,469 |
| | | | | | |
Total Corporate Bonds
(Cost $93,766,684) | | | | | | 98,294,122 |
| | | | | | |
See Notes to Financial Statements.
123
GLOBAL BOND FUND
SCHEDULE OF INVESTMENTS (Continued)
| | | | | | |
| | | Par | | Value |
FOREIGN BONDS — 36.8% | | | | | | |
Argentina — 0.2% | | | | | | |
Republic of Argentina | | | | | | |
7.00%, 09/12/13D | | $ | 488,000 | | $ | 448,228 |
| | | | | | |
Australia — 2.5% | | | | | | |
Australia Government Bond | | | | | | |
4.00%, 08/20/20 | | | 1,140,000 | | | 1,587,032 |
3.00%, 09/20/25 | | | 730,000 | | | 666,547 |
FMG Finance Party, Ltd. | | | | | | |
9.75%, 09/01/13(E) | | | 80,000 | | | 116,404 |
National Capital Instruments LLC | | | | | | |
1.66%, 12/29/49(E)† | | | 150,000 | | | 147,297 |
New South Wales Treasury Corporation | | | | | | |
7.00%, 12/01/10(A) | | | 2,825,000 | | | 2,596,390 |
Rio Tinto Finance USA, Ltd. | | | | | | |
9.00%, 05/01/19 | | | 380,000 | | | 481,726 |
| | | | | | |
| | | | | | 5,595,396 |
| | | | | | |
Austria — 0.1% | | | | | | |
PE Paper Escrow GmbH | | | | | | |
11.75%, 08/01/14 144A(E) | | | 192,000 | | | 300,701 |
| | | | | | |
Bermuda — 0.6% | | | | | | |
NCL Corporation Ltd. | | | | | | |
11.75%, 11/15/16 144A | | | 80,000 | | | 79,400 |
White Mountains Re Group, Ltd. | | | | | | |
6.38%, 03/20/17 144A | | | 1,250,000 | | | 1,174,741 |
| | | | | | |
| | | | | | 1,254,141 |
| | | | | | |
Brazil — 3.0% | | | | | | |
Brazil Notas do Tesouro Nacional, Series F | | | | | | |
10.00%, 01/01/12(B) | | | 2,000,000 | | | 1,168,407 |
Centrais Eletricas Brasileiras SA | | | | | | |
6.88%, 07/30/19D | | | 100,000 | | | 108,875 |
Centrais Eletricas Brasileiras SA | | | | | | |
6.88%, 07/30/19 144A | | | 230,000 | | | 250,413 |
Federative Republic of Brazil | | | | | | |
10.25%, 01/10/28(B) | | | 6,000,000 | | | 3,463,529 |
7.13%, 01/20/37 | | | 310,000 | | | 357,275 |
11.00%, 08/17/40D | | | 700,000 | | | 936,250 |
Gerdau Holdings, Inc. | | | | | | |
7.00%, 01/20/20 144AD | | | 100,000 | | | 103,250 |
Globo Comunicacao e Participacoes SA | | | | | | |
7.25%, 04/26/22 | | | 170,000 | | | 178,500 |
NET Servicos de Comunicacao SA | | | | | | |
7.50%, 01/27/20 144A | | | 130,000 | | | 133,250 |
| | | | | | |
| | | | | | 6,699,749 |
| | | | | | |
Canada — 7.4% | | | | | | |
Bell Canada | | | | | | |
6.55%, 05/01/29 144A(C) | | | 380,000 | | | 356,201 |
7.30%, 02/23/32 144A(C) | | | 640,000 | | | 651,560 |
6.10%, 03/16/35 144A(C) | | | 380,000 | | | 337,685 |
Bombardier, Inc. | | | | | | |
7.25%, 11/15/16(E) | | | 161,000 | | | 237,725 |
Canadian Government | | | | | | |
5.25%, 06/01/12(C) | | | 10,000,000 | | | 10,342,688 |
Conoco Funding Co. | | | | | | |
6.35%, 10/15/11 | | | 70,000 | | | 76,190 |
Nortel Networks, Ltd. | | | | | | |
6.88%, 09/01/23# | | | 380,000 | | | 172,900 |
Novelis, Inc. | | | | | | |
7.25%, 02/15/15 | | | 125,000 | | | 119,688 |
OPTI Canada, Inc. | | | | | | |
7.88%, 12/15/14 | | | 50,000 | | | 41,250 |
8.25%, 12/15/14 | | | 70,000 | | | 58,012 |
Province of Manitoba | | | | | | |
6.38%, 09/01/15(Z) | | | 815,000 | | | 588,669 |
Province of Quebec | | | | | | |
6.75%, 11/09/15(Z) | | | 2,650,000 | | | 1,972,200 |
Rogers Communications, Inc. | | | | | | |
9.63%, 05/01/11 | | | 450,000 | | | 493,926 |
7.88%, 05/01/12 | | | 240,000 | | | 269,113 |
Stone Container Finance Company of Canada II | | | | | | |
7.38%, 07/15/14# | | | 330,000 | | | 312,262 |
Sun Media Corporation | | | | | | |
7.63%, 02/15/13 | | | 100,000 | | | 91,625 |
Talisman Energy, Inc. | | | | | | |
6.25%, 02/01/38 | | | 80,000 | | | 80,354 |
Teck Resources, Ltd. | | | | | | |
9.75%, 05/15/14 144A | | | 55,000 | | | 63,731 |
10.25%, 05/15/16 144A | | | 50,000 | | | 58,500 |
10.75%, 05/15/19 | | | 95,000 | | | 114,000 |
| | | | | | |
| | | | | | 16,438,279 |
| | | | | | |
Cayman Islands — 1.7% | | | | | | |
EEB International, Ltd. | | | | | | |
8.75%, 10/31/14D | | | 200,000 | | | 217,000 |
MUFG Capital Finance 2, Ltd. | | | | | | |
4.85%, 07/25/36(E)† | | | 500,000 | | | 562,345 |
Odebrecht Finance, Ltd. | | | | | | |
7.50%, 10/18/17 | | | 130,000 | | | 135,200 |
7.00%, 04/21/20 144AD | | | 250,000 | | | 254,062 |
Petrobras International Finance Co. | | | | | | |
6.88%, 01/20/40D | | | 160,000 | | | 164,224 |
Shinsei Finance Cayman, Ltd. | | | | | | |
6.42%, 07/20/49 144A† | | | 120,000 | | | 69,977 |
SMFG Preferred Capital, Ltd. | | | | | | |
6.16%, 12/31/49(U)† | | | 350,000 | | | 438,510 |
TGI International, Ltd. | | | | | | |
9.50%, 10/03/17D | | | 130,000 | | | 141,050 |
Transocean, Inc. | | | | | | |
1.50%, 12/15/37 CONV | | | 50,000 | | | 48,375 |
Vale Overseas, Ltd. | | | | | | |
6.88%, 11/21/36 | | | 1,211,000 | | | 1,213,011 |
XL Capital, Ltd. | | | | | | |
6.25%, 05/15/27D | | | 640,000 | | | 583,462 |
| | | | | | |
| | | | | | 3,827,216 |
| | | | | | |
Chile — 0.1% | | | | | | |
Celulosa Arauco y Constitucion SA | | | | | | |
7.25%, 07/29/19D | | | 300,000 | | | 327,133 |
| | | | | | |
Colombia — 0.5% | | | | | | |
Ecopetrol SA | | | | | | |
7.63%, 07/23/19 144AD | | | 340,000 | | | 378,590 |
Empresas Publicas de Medellin ESP | | | | | | |
7.63%, 07/29/19 144A | | | 120,000 | | | 132,600 |
See Notes to Financial Statements.
124
| | | | | | |
| | | Par | | Value |
Republic of Colombia | | | | | | |
7.38%, 03/18/19D | | $ | 200,000 | | $ | 227,500 |
7.38%, 09/18/37D | | | 400,000 | | | 438,000 |
| | | | | | |
| | | | | | 1,176,690 |
| | | | | | |
Denmark — 0.3% | | | | | | |
Nordic Telephone Co. Holdings ApS | | | | | | |
6.22%, 05/01/16(E)†D | | | 111,000 | | | 159,124 |
8.25%, 05/01/16(E) | | | 200,000 | | | 309,646 |
8.88%, 05/01/16 144A | | | 265,000 | | | 281,563 |
| | | | | | |
| | | | | | 750,333 |
| | | | | | |
Finland — 0.1% | | | | | | |
M-real OYJ | | | | | | |
5.59%, 12/15/10(E)† | | | 150,000 | | | 209,656 |
| | | | | | |
France — 1.4% | | | | | | |
AXA SA | | | | | | |
6.21%, 10/05/49(E)† | | | 360,000 | | | 438,537 |
Banque Federative du Credit Mutuel | | | | | | |
4.47%, 10/28/35(E)† | | | 157,000 | | | 174,708 |
Compagnie Generale de Geophysique - Veritas | | | | | | |
7.50%, 05/15/15 | | | 90,000 | | | 89,775 |
Credit Agricole SA | | | | | | |
8.38%, 10/13/19 144A†D | | | 250,000 | | | 265,840 |
7.88%, 10/26/19(E)† | | | 200,000 | | | 307,682 |
4.13%, 11/09/49(E)† | | | 250,000 | | | 270,511 |
Dexia Credit Local | | | | | | |
4.30%, 11/18/49(E)† | | | 500,000 | | | 329,286 |
Europcar Groupe SA | | | | | | |
4.21%, 05/15/13(E)† | | | 105,000 | | | 126,191 |
8.13%, 05/15/14(E) | | | 50,000 | | | 61,284 |
France Government Bond OAT | | | | | | |
4.00%, 04/25/45(E) | | | 320,000 | | | 438,541 |
French Government Bond | | | | | | |
4.52%, 10/25/32(E)W | | | 1,030,000 | | | 541,974 |
Korreden SA | | | | | | |
11.00%, 08/01/14(E) | | | 69,333 | | | 32,302 |
| | | | | | |
| | | | | | 3,076,631 |
| | | | | | |
Germany — 3.4% | | | | | | |
Bayerische Landesbank | | | | | | |
5.75%, 10/23/17(E) | | | 550,000 | | | 756,243 |
Bundesrepublik Deutschland | | | | | | |
4.00%, 07/04/16(E)D | | | 2,000 | | | 3,051 |
3.75%, 01/04/19(E) | | | 3,140,000 | | | 4,654,981 |
4.25%, 07/04/39(E) | | | 400,000 | | | 586,986 |
HSH Nordbank AG | | | | | | |
1.01%, 02/14/17(E)† | | | 52,000 | | | 44,925 |
7.41%, 06/30/49(E) | | | 450,000 | | | 153,211 |
HT1 Funding GmbH | | | | | | |
6.35%, 07/29/49(E)† | | | 433,000 | | | 380,114 |
Kabel Deutschland GmbH | | | | | | |
10.75%, 07/01/14(E)D | | | 106,000 | | | 161,453 |
Kreditanstalt fuer Wiederaufbau | | | | | | |
10.75%, 02/01/10(I) | | | 26,800,000 | | | 216,475 |
UPC Germany GmbH | | | | | | |
8.13%, 12/01/17 | | | 100,000 | | | 101,625 |
9.63%, 12/01/19 144A(E) | | | 258,000 | | | 373,554 |
| | | | | | |
| | | | | | 7,432,618 |
| | | | | | |
Greece — 0.5% | | | | | | |
Hellenic Republic Government Bond | | | | | | |
3.70%, 07/20/15 | | | 800,000 | | | 1,064,622 |
| | | | | | |
Iceland — 0.0% | | | | | | |
Kaupthing Bank HF | | | | | | |
7.13%, 05/19/16 144A#@ | | | 150,000 | | | 390 |
| | | | | | |
Indonesia — 0.0% | | | | | | |
Indonesia Government International Bond | | | | | | |
6.88%, 01/17/18D | | | 100,000 | | | 109,750 |
| | | | | | |
Ireland — 0.5% | | | | | | |
Ardagh Glass Finance PLC | | | | | | |
7.13%, 06/15/17 144A(E) | | | 112,000 | | | 144,502 |
Ardagh Glass Group PLC | | | | | | |
10.75%, 03/01/15 PIK(E) | | | 179,382 | | | 232,723 |
Elan Finance PLC | | | | | | |
8.88%, 12/01/13D | | | 235,000 | | | 235,000 |
Smurfit Kappa Acquisitions | | | | | | |
7.75%, 11/15/19 144A(E) | | | 225,000 | | | 319,078 |
VIP Finance Ireland Ltd. for OJSC Vimpel Communications | | | | | | |
8.38%, 04/30/13 144A | | | 100,000 | | | 106,250 |
| | | | | | |
| | | | | | 1,037,553 |
| | | | | | |
Italy — 0.1% | | | | | | |
Banco Popolare SC | | | | | | |
6.16%, 06/29/49(E)† | | | 200,000 | | | 169,159 |
UniCredit SpA | | | | | | |
4.38%, 01/29/20(E) | | | 100,000 | | | 145,533 |
| | | | | | |
| | | | | | 314,692 |
| | | | | | |
Japan — 0.2% | | | | | | |
Resona Bank, Ltd. | | | | | | |
5.99%, 08/10/49(U)† | | | 300,000 | | | 428,867 |
| | | | | | |
Jersey — 0.3% | | | | | | |
HSBC Capital Funding LP | | | | | | |
5.37%, 03/24/14(E)† | | | 420,000 | | | 510,272 |
RZB Finance Jersey IV, Ltd. | | | | | | |
5.17%, 05/16/16(E)† | | | 250,000 | | | 163,066 |
| | | | | | |
| | | | | | 673,338 |
| | | | | | |
Luxembourg — 1.9% | | | | | | |
Evraz Group SA | | | | | | |
8.88%, 04/24/13 144AD | | | 160,000 | | | 160,800 |
Evraz Group SA | | | | | | |
8.88%, 04/24/13 | | | 100,000 | | | 100,100 |
Fiat Finance & Trade, Ltd. SA | | | | | | |
9.00%, 07/30/12(E) | | | 59,000 | | | 91,868 |
Fortis Hybrid Financing | | | | | | |
5.13%, 06/29/49(E)† | | | 250,000 | | | 234,743 |
Lecta SA | | | | | | |
3.34%, 02/15/14(E)† | | | 200,000 | | | 232,235 |
Lecta SA | | | | | | |
3.34%, 02/15/14 144A(E)† | | | 102,000 | | | 118,440 |
RSHB Capital SA for OJSC Russian Agricultural Bank | | | | | | |
7.18%, 05/16/13D | | | 200,000 | | | 212,120 |
9.00%, 06/11/14D | | | 200,000 | | | 227,750 |
6.97%, 09/21/16†D | | | 100,000 | | | 98,980 |
RSHB Capital SA for OJSC Russian Agricultural Bank | | | | | | |
7.13%, 01/14/14 144A | | | 120,000 | | | 127,572 |
See Notes to Financial Statements.
125
GLOBAL BOND FUND
SCHEDULE OF INVESTMENTS (Continued)
| | | | | | |
| | | Par | | Value |
9.00%, 06/11/14 144A | | $ | 560,000 | | $ | 638,400 |
6.30%, 05/15/17 144A | | | 386,000 | | | 390,632 |
TNK-BP Finance SA | | | | | | |
7.88%, 03/13/18 | | | 630,000 | | | 652,050 |
Tyco International Group SA | | | | | | |
6.38%, 10/15/11 | | | 90,000 | | | 96,548 |
UBS Luxembourg SA for OJSC Vimpel Communications | | | | | | |
8.25%, 05/23/16 | | | 255,000 | | | 263,925 |
Wind Acquisition Finance SA | | | | | | |
11.00%, 12/01/15(E) | | | 53,000 | | | 82,436 |
Wind Acquisition Finance SA | | | | | | |
11.00%, 12/01/15 144A(E) | | | 200,000 | | | 311,080 |
12.00%, 12/01/15 144A | | | 105,000 | | | 112,875 |
| | | | | | |
| | | | | | 4,152,554 |
| | | | | | |
Malaysia — 0.4% | | | | | | |
Petronas Capital, Ltd. | | | | | | |
5.25%, 08/12/19 | | | 200,000 | | | 201,325 |
Petronas Capital, Ltd. | | | | | | |
5.25%, 08/12/19 144A | | | 600,000 | | | 602,527 |
| | | | | | |
| | | | | | 803,852 |
| | | | | | |
Mexico — 1.6% | | | | | | |
America Movil Sab de CV | | | | | | |
5.63%, 11/15/17D | | | 98,000 | | | 101,953 |
Axtel SAB de CV | | | | | | |
7.63%, 02/01/17 144A | | | 490,000 | | | 482,650 |
Axtel SAB de CV | | | | | | |
7.63%, 02/01/17D | | | 20,000 | | | 19,700 |
Grupo Televisa SA | | | | | | |
6.63%, 03/18/25D | | | 100,000 | | | 99,319 |
6.63%, 01/15/40 144AD | | | 200,000 | | | 198,785 |
Kansas City Southern de Mexico SA de CV | | | | | | |
7.63%, 12/01/13 | | | 140,000 | | | 138,600 |
12.50%, 04/01/16 | | | 160,000 | | | 184,800 |
Mexican Bonos | | | | | | |
8.00%, 12/07/23(M) | | | 30,500,000 | | | 2,255,445 |
United Mexican States | | | | | | |
6.05%, 01/11/40 | | | 20,000 | | | 19,326 |
| | | | | | |
| | | | | | 3,500,578 |
| | | | | | |
Netherlands — 2.2% | | | | | | |
ABN Amro Bank NV | | | | | | |
4.31%, 02/10/49(E)† | | | 595,000 | | | 421,875 |
Carlson Wagonlit BV | | | | | | |
6.47%, 05/01/15(E)† | | | 321,000 | | | 345,127 |
Carlson Wagonlit BV | | | | | | |
6.47%, 05/01/15 144A(E)† | | | 200,000 | | | 217,899 |
Clondalkin Acquisition BV | | | | | | |
2.71%, 12/15/13 144A(E)† | | | 66,000 | | | 86,808 |
Clondalkin Industries BV | | | | | | |
8.00%, 03/15/14 144A(E) | | | 150,000 | | | 193,529 |
Deutsche Telekom International Finance BV | | | | | | |
5.75%, 03/23/16D | | | 80,000 | | | 85,059 |
ELM BV for Swiss Life Insurance & Pension Group | | | | | | |
5.85%, 04/12/49(E)† | | | 300,000 | | | 292,444 |
ELM BV for Swiss Reinsurance Co. | | | | | | |
5.25%, 05/25/49(E)†D | | | 400,000 | | | 481,672 |
Hollandwide Parent BV | | | | | | |
8.00%, 08/01/14(E)W | | | 191,000 | | | 2,738 |
Impress Holdings BV | | | | | | |
3.87%, 09/15/13 144A(E)† | | | 200,000 | | | 272,374 |
9.25%, 09/15/14 144A(E) | | | 150,000 | | | 224,709 |
ING Verzekeringen NV | | | | | | |
6.25%, 06/21/21(E)† | | | 250,000 | | | 323,767 |
KazMunaiGaz Finance Sub BV | | | | | | |
8.38%, 07/02/13 144A | | | 230,000 | | | 246,962 |
Lukoil International Finance BV | | | | | | |
6.36%, 06/07/17D | | | 650,000 | | | 641,875 |
OI European Group BV | | | | | | |
6.88%, 03/31/17 144A(E) | | | 100,000 | | | 139,054 |
Shell International Finance BV | | | | | | |
6.38%, 12/15/38 | | | 130,000 | | | 145,672 |
SNS Bank NV | | | | | | |
11.25%, 11/29/49(E)† | | | 65,000 | | | 93,903 |
SNS Reaal NV | | | | | | |
6.26%, 03/17/38(E)† | | | 170,000 | | | 151,705 |
UPC Holding BV | | | | | | |
8.00%, 11/01/16(E) | | | 304,000 | | | 420,546 |
| | | | | | |
| | | | | | 4,787,718 |
| | | | | | |
Norway — 0.7% | | | | | | |
Norway Government Bond | | | | | | |
5.00%, 05/15/15(K) | | | 355,000 | | | 65,062 |
4.25%, 05/19/17(K) | | | 8,060,000 | | | 1,416,824 |
Trico Shipping AS | | | | | | |
11.88%, 11/01/14 144A | | | 100,000 | | | 104,625 |
| | | | | | |
| | | | | | 1,586,511 |
| | | | | | |
Panama — 0.3% | | | | | | |
AES El Salvador Trust | | | | | | |
6.75%, 02/01/16 | | | 100,000 | | | 89,283 |
Panama Government International Bond | | | | | | |
7.25%, 03/15/15 | | | 51,000 | | | 58,268 |
9.38%, 04/01/29D | | | 80,000 | | | 106,800 |
6.70%, 01/26/36D | | | 296,000 | | | 313,760 |
| | | | | | |
| | | | | | 568,111 |
| | | | | | |
Peru — 0.1% | | | | | | |
Republic of Peru | | | | | | |
8.38%, 05/03/16D | | | 50,000 | | | 60,625 |
7.35%, 07/21/25 | | | 40,000 | | | 46,000 |
6.55%, 03/14/37D | | | 19,000 | | | 19,855 |
| | | | | | |
| | | | | | 126,480 |
| | | | | | |
Poland — 0.9% | | | | | | |
Poland Government Bond | | | | | | |
5.75%, 09/23/22(V) | | | 6,070,000 | | | 2,022,212 |
| | | | | | |
Qatar — 0.3% | | | | | | |
Qatar Government International Bond | | | | | | |
4.00%, 01/20/15 144AD | | | 160,000 | | | 161,200 |
Ras Laffan Liquefied Natural Gas Co., Ltd. III | | | | | | |
5.50%, 09/30/14D | | | 250,000 | | | 262,183 |
6.75%, 09/30/19 | | | 250,000 | | | 276,725 |
| | | | | | |
| | | | | | 700,108 |
| | | | | | |
Russia — 0.3% | | | | | | |
Russian Federation | | | | | | |
7.50%, 03/31/30 STEP | | | 524,520 | | | 597,297 |
| | | | | | |
See Notes to Financial Statements.
126
| | | | | | |
| | | Par | | Value |
Singapore — 0.1% | | | | | | |
Prime Dig Pte Ltd. | | | | | | |
11.75%, 11/03/14 144A | | $ | 230,000 | | $ | 233,450 |
| | | | | | |
South Africa — 0.1% | | | | | | |
Edcon Holdings Proprietary, Ltd. | | | | | | |
6.21%, 06/15/15(E)† | | | 96,000 | | | 71,563 |
Edcon Holdings Proprietary, Ltd. | | | | | | |
6.21%, 06/15/15 144A(E)† | | | 224,000 | | | 166,979 |
| | | | | | |
| | | | | | 238,542 |
| | | | | | |
Spain — 0.1% | | | | | | |
Campofrio Food SA | | | | | | |
8.25%, 10/31/16 144A(E) | | | 220,000 | | | 319,717 |
| | | | | | |
Supranational — 0.5% | | | | | | |
Inter-American Development Bank | | | | | | |
9.53%, 09/23/13(N)W | | | 15,900,000,000 | | | 1,190,427 |
| | | | | | |
Sweden — 0.2% | | | | | | |
Corral Petroleum Holdings AB | | | | | | |
2.24%, 04/15/10 PIK 144A(E) | | | 155,173 | | | 166,836 |
Nordea Bank AB | | | | | | |
3.70%, 11/13/14 144A | | | 220,000 | | | 219,818 |
| | | | | | |
| | | | | | 386,654 |
| | | | | | |
Switzerland — 0.2% | | | | | | |
UBS AG | | | | | | |
5.63%, 05/19/14(E) | | | 250,000 | | | 385,454 |
| | | | | | |
Thailand — 0.2% | | | | | | |
True Move Co., Ltd. | | | | | | |
10.75%, 12/16/13 144A | | | 461,000 | | | 447,170 |
| | | | | | |
Trinidad And Tobago — 0.1% | | | | | | |
Petroleum Co. of Trinidad & Tobago, Ltd. | | | | | | |
9.75%, 08/14/19 144A | | | 240,000 | | | 269,700 |
| | | | | | |
Turkey — 0.9% | | | | | | |
Republic of Turkey | | | | | | |
7.50%, 07/14/17 | | | 100,000 | | | 113,695 |
7.00%, 03/11/19 | | | 100,000 | | | 109,820 |
6.88%, 03/17/36D | | | 1,695,000 | | | 1,733,137 |
| | | | | | |
| | | | | | 1,956,652 |
| | | | | | |
United Arab Emirates — 0.5% | | | | | | |
DP World, Ltd. | | | | | | |
6.85%, 07/02/37 144A | | | 1,300,000 | | | 1,005,231 |
| | | | | | |
United Kingdom — 1.5% | | | | | | |
Ashtead Holdings PLC | | | | | | |
8.63%, 08/01/15 144A | | | 160,000 | | | 161,600 |
Barclays Bank PLC | | | | | | |
6.37%, 12/15/49(U)† | | | 350,000 | | | 438,122 |
FCE Bank PLC | | | | | | |
7.13%, 01/16/12(E) | | | 200,000 | | | 283,584 |
Infinis PLC | | | | | | |
9.13%, 12/15/14 144A(U) | | | 190,000 | | | 314,176 |
ISS Financing PLC | | | | | | |
11.00%, 06/15/14(E) | | | 50,000 | | | 77,591 |
ISS Financing PLC | | | | | | |
11.00%, 06/15/14 144A(E) | | | 62,000 | | | 96,213 |
LBG Capital No.2 PLC | | | | | | |
6.39%, 05/12/20(E) | | | 470,000 | | | 508,694 |
Lloyds TSB Bank PLC | | | | | | |
6.25%, 04/15/14(E) | | | 140,000 | | | 219,253 |
Royal Bank of Scotland Group PLC | | | | | | |
7.09%, 10/29/49(E)† | | | 500,000 | | | 359,570 |
Vedanta Resources PLC | | | | | | |
8.75%, 01/15/14D | | | 320,000 | | | 325,600 |
Virgin Media Finance PLC | | | | | | |
9.75%, 04/15/14(U) | | | 94,577 | | | 160,399 |
9.13%, 08/15/16 | | | 410,000 | | | 434,087 |
9.50%, 08/15/16D | | | 50,000 | | | 53,625 |
| | | | | | |
| | | | | | 3,432,514 |
| | | | | | |
Venezuela — 0.6% | | | | | | |
Venezuela Government International Bond | | | | | | |
8.50%, 10/08/14 | | | 26,000 | | | 20,605 |
5.75%, 02/26/16D | | | 1,420,000 | | | 928,112 |
9.38%, 01/13/34D | | | 207,000 | | | 140,243 |
7.00%, 03/31/38 | | | 246,000 | | | 136,530 |
| | | | | | |
| | | | | | 1,225,490 |
| | | | | | |
Virgin Islands (British) — 0.2% | | | | | | |
GTL Trade Finance, Inc. | | | | | | |
7.25%, 10/20/17 | | | 150,000 | | | 157,875 |
GTL Trade Finance, Inc. | | | | | | |
7.25%, 10/20/17 144AD | | | 189,000 | | | 198,923 |
| | | | | | |
| | | | | | 356,798 |
| | | | | | |
Total Foreign Bonds
(Cost $83,580,074) | | | | | | 81,459,203 |
| | | | | | |
MORTGAGE-BACKED SECURITIES — 2.9% | | | | | | |
Bayview Commercial Asset Trust | | | | | | |
0.46%, 07/25/36 144A† | | | 251,071 | | | 161,274 |
Countrywide Alternative Loan Trust | | | | | | |
0.46%, 07/20/35† | | | 489,349 | | | 258,561 |
Countrywide Home Loan Mortgage Pass-Through Trust | | | | | | |
0.63%, 09/25/35 144A† | | | 575,030 | | | 431,320 |
Credit Suisse Mortgage Capital Certificates | | | | | | |
5.70%, 09/15/40 | | | 220,000 | | | 175,523 |
Federal Home Loan Mortgage Corporation | | | | | | |
5.50%, 11/01/37 | | | 661,241 | | | 693,959 |
5.00%, 03/01/38 | | | 598,855 | | | 614,760 |
Federal National Mortgage Association | | | | | | |
5.00%, 01/01/24 TBA | | | 300,000 | | | 313,500 |
4.50%, 01/01/25 TBA | | | 100,000 | | | 102,844 |
5.00%, 01/01/28 TBA | | | 1,900,000 | | | 1,949,579 |
6.50%, 10/01/36 | | | 528,725 | | | 567,388 |
Government National Mortgage Association | | | | | | |
6.00%, 01/01/39 TBA | | | 200,000 | | | 211,812 |
JPMorgan Chase Commercial Mortgage Securities Corporation | | | | | | |
5.42%, 01/15/49 | | | 80,000 | | | 67,484 |
5.82%, 06/15/49 | | | 165,000 | | | 143,690 |
MASTR Adjustable Rate Mortgages Trust | | | | | | |
1.43%, 12/25/46† | | | 733,902 | | | 220,844 |
See Notes to Financial Statements.
127
GLOBAL BOND FUND
SCHEDULE OF INVESTMENTS (Continued)
| | | | | | | |
| | | Par | | Value | |
MASTR Reperforming Loan Trust | | | | | | | |
0.58%, 05/25/35 144A† | | $ | 630,014 | | $ | 499,992 | |
| | | | | | | |
Total Mortgage-Backed Securities
(Cost $7,321,797) | | | | | | 6,412,530 | |
| | | | | | | |
| | |
U.S. TREASURY OBLIGATIONS — 3.8% | | | | | | | |
U.S. Treasury Bonds | | | | | | | |
3.50%, 02/15/39D | | | 3,500,000 | | | 2,867,816 | |
4.25%, 05/15/39D | | | 40,000 | | | 37,538 | |
| | | | | | | |
| | | | | | 2,905,354 | |
| | | | | | | |
U.S. Treasury Inflationary Index Bonds | | | | | | | |
3.88%, 04/15/29‡‡ | | | 1,560,000 | | | 2,646,065 | |
| | | | | | | |
U.S. Treasury Notes | | | | | | | |
4.50%, 04/30/12 | | | 30,000 | | | 32,173 | |
1.88%, 04/30/14D | | | 1,330,000 | | | 1,303,089 | |
2.63%, 07/31/14 | | | 50,000 | | | 50,265 | |
2.38%, 09/30/14D | | | 110,000 | | | 109,106 | |
4.50%, 05/15/17D | | | 920,000 | | | 983,753 | |
2.75%, 02/15/19D | | | 450,000 | | | 414,422 | |
| | | | | | | |
| | | | | | 2,892,808 | |
| | | | | | | |
Total U.S. Treasury Obligations
(Cost $8,691,615) | | | | | | 8,444,227 | |
| | | | | | | |
| | |
| | | Shares | | | |
COMMON STOCKS — 0.1% | | | | | | | |
Financial Services — 0.1% | | | | | | | |
Charter Communications, Inc.* | | | 2,769 | | | 98,300 | |
Freddie MacD* | | | 104,601 | | | 153,763 | |
Georgia Gulf Corp* | | | 6,177 | | | 107,356 | |
| | | | | | | |
| | | | | | 359,419 | |
| | | | | | | |
Producer Durables — 0.0% | | | | | | | |
Nortek, Inc.+D* | | | 179 | | | 6,265 | |
| | | | | | | |
Total Common Stocks
(Cost $2,089,548) | | | | | | 365,684 | |
| | | | | | | |
PREFERRED STOCKS — 1.2% | | | | | | | |
Bank of America Corporation CONV | | | 602 | | | 529,158 | |
CIT Group, Inc.D | | | 2,194 | | | 307 | |
Citigroup, Inc. | | | 1,100 | | | 114,774 | |
CMP Susquehanna Radio Holdings Corporation@ | | | 1,493 | | | 1 | |
El Paso Energy Capital Trust I CONV | | | 500 | | | 18,275 | |
Fannie Mae | | | 3,700 | | | 5,229 | |
Federal Home Loan Mortgage Corporation | | | 10,625 | | | 11,156 | |
Federal National Mortgage Association | | | 15,650 | | | 17,215 | |
Freddie Mac | | | 24,500 | | | 28,117 | |
Lucent Technologies Capital Trust I CONV | | | 1,891 | | | 1,469,307 | |
Preferred Blocker (GMAC), Inc. | | | 615 | | | 405,362 | |
| | | | | | | |
Total Preferred Stocks
(Cost $3,210,958) | | | | | | 2,598,901 | |
| | | | | | | |
RIGHTS/WARRANTS — 0.0% | | | | | | | |
Buffets Restaurants Holdings, Inc.* | | | 89 | | | — | |
Charter Communications, Inc. | | | 110 | | | 550 | |
CMP Susquehanna Radio Holdings Corporation@ | | | 1,706 | | | 2 | |
Nortek, Inc.+ | | | 184 | | | 2,346 | |
| | | | | | | |
Total Rights/Warrants
(Cost $50,348) | | | | | | 2,898 | |
| | | | | | | |
MONEY MARKET FUNDS — 22.5% | | | | | | | |
GuideStone Money Market Fund (GS4 Class)¥ | | | 14,865,457 | | | 14,865,457 | |
Northern Institutional Liquid Assets Portfolio§ | | | 35,007,405 | | | 35,007,405 | |
| | | | | | | |
Total Money Market Funds
(Cost $49,872,862) | | | | | | 49,872,862 | |
| | | | | | | |
| | |
TOTAL INVESTMENTS — 114.1%
(Cost $254,649,002) | | | | | | 252,830,248 | |
| | |
Liabilities in Excess of Other Assets — (14.1)% | | | | | | (31,275,675 | ) |
| | | | | | | |
| | |
NET ASSETS — 100.0% | | | | | $ | 221,554,573 | |
| | | | | | | |
Please see abbreviation and footnote definitions on page 180.
PORTFOLIO SUMMARY (based on net assets)
| | | |
| | | % | |
Corporate Bonds | | 44.4 | |
Foreign Bonds | | 36.8 | |
Money Market Funds | | 22.5 | |
U.S. Treasury Obligations | | 3.8 | |
Mortgage-Backed Securities | | 2.9 | |
Asset-Backed Securities | | 2.4 | |
Preferred Stocks | | 1.2 | |
Common Stocks | | 0.1 | |
Agency Obligation | | — | ** |
Rights/Warrants | | — | ** |
Forward Foreign Currency Contracts | | (1.2 | ) |
Futures Contracts | | (3.0 | ) |
| | | |
| | 109.9 | |
| | | |
| ** | Rounds to less than 0.005%. |
See Notes to Financial Statements.
128
FAS 157 DISCLOSURE
The following is a summary of the inputs used, as of December 31, 2009, in valuing the Fund’s assets carried at fair value:
| | | | | | |
Valuation Inputs | | Investments
in
Securities | | Other
Financial
Instruments*** |
Assets: | | | | | | |
Level 1 — Quoted Prices | | | | | | |
Common Stocks | | $ | 359,419 | | $ | — |
Futures Contracts | | | — | | | 103,485 |
Money Market Funds | | | 49,872,862 | | | — |
Preferred Stocks | | | 2,598,593 | | | — |
Rights/Warrants | | | 550 | | | — |
Level 2 — Other Significant Observable Inputs | | | | | | |
Agency Obligation | | | 133,000 | | | — |
Asset-Backed Securities | | | 5,246,821 | | | — |
Corporate Bonds | | | 98,294,122 | | | — |
Foreign Bonds | | | 81,459,203 | | | — |
Forward Foreign Currency Contracts | | | — | | | 353,855 |
Mortgage-Backed Securities | | | 6,412,530 | | | — |
Preferred Stocks | | | 308 | | | — |
Rights/Warrants | | | 2,348 | | | — |
U.S. Treasury Obligations | | | 8,444,227 | | | — |
Level 3 — Significant Unobservable Inputs | | | | | | |
Common Stocks | | | 6,265 | | | — |
| | | | | | |
Total | | $ | 252,830,248 | | $ | 457,340 |
| | | | | | |
| *** | Other financial instruments are derivative instruments not reflected in the Schedule of Investments, such as futures, forwards and swap contracts, which are valued at the unrealized appreciation (depreciation) on the investment. Details of these investments can be found in the Notes to Financial Statements. |
The following is a reconciliation of assets in which significant unobservable inputs (Level 3) were used in determining fair value:
| | | | | | | |
| | | Investments
in
Securities | | | Other
Financial
Instruments*** |
Balance, 12/31/08 | | | | | | | |
Corporate Bonds | | $ | 1,205,795 | | | $ | — |
Common Stocks | | | — | | | | — |
Accrued discounts/premiums | | | | | | | |
Corporate Bonds | | | (38,046 | ) | | | — |
Common Stocks | | | — | | | | — |
Realized gain (loss) | | | | | | | |
Corporate Bonds | | | (756,377 | ) | | | — |
Common Stocks | | | — | | | | — |
Change in unrealized appreciation (depreciation) | | | | | | | |
Corporate Bonds | | | 127,711 | | | | — |
Common Stocks | | | — | | | | — |
Net purchases (sales) | | | | | | | |
Corporate Bonds | | | (244,990 | ) | | | — |
Common Stocks | | | — | | | | — |
Transfers in and/or out of Level 3 | | | | | | | |
Corporate Bonds | | | (294,093 | ) | | | — |
Common Stocks | | | 6,265 | | | | — |
| | | | | | | |
Balance, 12/31/09 | | $ | 6,265 | | | $ | — |
| | | | | | | |
| *** | Other financial instruments are derivative instruments not reflected in the Schedule of Investments, such as futures, forwards and swap contracts, which are valued at the unrealized appreciation (depreciation) on the investment. Details of these investments can be found in the Notes to Financial Statements. |
See Notes to Financial Statements.
129
Equity Index Fund
The Equity Index Fund is a passively managed Fund benchmarked against the S&P 500® Index. The Fund is comprised of domestic, large-cap equity stocks with both value and growth-style orientations. The objective of the Fund is to closely replicate the performance of the S&P 500® Index within the investment guidelines. The Fund returned 26.14% for the one-year period ending December 31, 2009, as compared to a 26.46% return for the S&P 500® Index. The slight return differential was primarily a result of social restrictions and expenses within the Fund.
Please see page 136 for information regarding specific portfolio allocations. Portfolio holdings are subject to change at any time.
130
Equity Index Fund
| | | | | | | | | |
Average Annual Total Returns as of 12/31/09 | |
| | | GS2 Class* | | | GS4 Class* | | | Benchmark** | |
One Year | | 26.38 | % | | 26.14 | % | | 26.46 | % |
Five Year | | 0.15 | % | | -0.02 | % | | 0.42 | % |
Since Inception | | 0.85 | % | | 0.78 | % | | 1.20 | % |
Inception Date | | 08/27/01 | | | 08/27/01 | | | | |
Total Fund Operating Expenses (June 25, 2009 Prospectus)(1) | | 0.22 | % | | 0.42 | % | | | |
| (1) | Current information regarding the Fund’s Operating Expenses can be found in the Financial Highlights. |
The performance data quoted represents past performance and does not guarantee future results. Current performance may be lower or higher. Performance data current to the most recent month-end may be obtained at www.GuideStoneFunds.org. The investment return and principal value of an investment will fluctuate so that shares, when redeemed, may be worth more or less than their original cost.
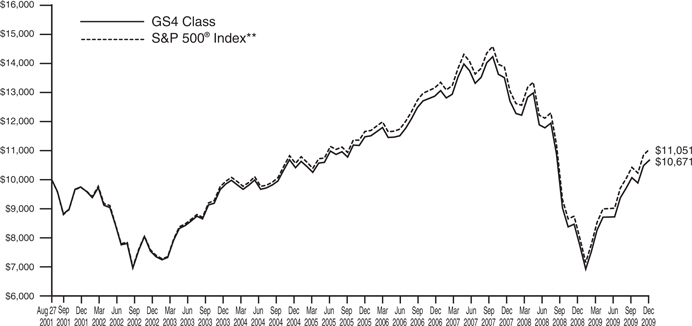
The graph compares the results of a hypothetical $10,000 investment in the GS4 Class of the Fund since August 27, 2001 (commencement of operations), with all dividends and capital gains reinvested, with the S&P 500® Index.
| * | These returns reflect expense waivers by the Fund’s investment adviser. Without these waivers, returns would have been lower. Returns shown do not reflect the deduction of taxes that a shareholder would pay on Fund distributions or the redemption of Fund shares. |
| ** | The S&P 500® Index is an unmanaged index (with no defined investment objective) of common stocks, includes reinvestment of dividends, and is a registered trademark of McGraw-Hill Co., Inc. The S&P 500® Index includes 500 of the largest stocks (in terms of market value) in the United States. |
Unlike a mutual fund, the performance of an index assumes no taxes, transaction costs, management fees or other expenses.
131
| | |
| EQUITY INDEX FUND | | |
| SCHEDULE OF INVESTMENTS | | December 31, 2009 |
| | | | | |
| | | Shares | | Value |
COMMON STOCKS — 97.5% | | | | | |
Consumer Discretionary — 11.2% | | | | | |
Amazon.com, Inc.* | | 12,964 | | $ | 1,743,917 |
Apollo Group, Inc. Class A* | | 4,927 | | | 298,478 |
AutoNation, Inc.D* | | 3,582 | | | 68,595 |
AutoZone, Inc.D* | | 1,154 | | | 182,413 |
Avon Products, Inc. | | 16,588 | | | 522,522 |
Bed Bath & Beyond, Inc.D* | | 10,210 | | | 394,412 |
Best Buy Co., Inc. | | 13,184 | | | 520,241 |
Big Lots, Inc.* | | 3,100 | | | 89,838 |
Black & Decker Corporation | | 2,302 | | | 149,239 |
Carnival CorporationD* | | 16,900 | | | 535,561 |
CBS Corporation Class B | | 26,085 | | | 366,494 |
Coach, Inc. | | 12,236 | | | 446,981 |
Comcast Corporation Class A | | 110,946 | | | 1,870,550 |
Costco Wholesale Corporation | | 16,967 | | | 1,003,937 |
Darden Restaurants, Inc. | | 5,582 | | | 195,761 |
DeVry, Inc. | | 2,484 | | | 140,917 |
DIRECTV Group, Inc. Class AD* | | 37,134 | | | 1,238,419 |
DR Horton, Inc.D | | 10,934 | | | 118,853 |
Eastman Kodak Co.D* | | 9,900 | | | 41,778 |
eBay, Inc.* | | 43,496 | | | 1,023,896 |
Estee Lauder Cos., Inc. (The) Class AD | | 4,582 | | | 221,585 |
Expedia, Inc.D* | | 8,039 | | | 206,683 |
Family Dollar Stores, Inc.D | | 5,214 | | | 145,106 |
Fastenal Co.D | | 5,073 | | | 211,240 |
Ford Motor Co.D* | | 128,346 | | | 1,283,460 |
GameStop Corporation Class AD* | | 6,487 | | | 142,325 |
Gannett Co., Inc. | | 9,419 | | | 139,872 |
Gap, Inc. (The) | | 18,427 | | | 386,046 |
Genuine Parts Co.D | | 6,272 | | | 238,085 |
Goodyear Tire & Rubber Co. (The)* | | 9,100 | | | 128,310 |
H&R Block, Inc. | | 13,250 | | | 299,715 |
Harley-Davidson, Inc.D | | 9,000 | | | 226,800 |
Harman International Industries, Inc. | | 2,771 | | | 97,761 |
Hasbro, Inc.D | | 4,753 | | | 152,381 |
Home Depot, Inc. | | 65,966 | | | 1,908,396 |
Interpublic Group of Companies, Inc.* | | 18,334 | | | 135,305 |
Johnson Controls, Inc. | | 25,909 | | | 705,761 |
Kohl’s Corporation* | | 11,959 | | | 644,949 |
Leggett & Platt, Inc.D | | 5,822 | | | 118,769 |
Lennar Corporation Class A | | 6,175 | | | 78,855 |
Limited Brands, Inc. | | 10,627 | | | 204,463 |
Lowe’s Cos., Inc. | | 57,127 | | | 1,336,201 |
Macy’s, Inc.D | | 16,312 | | | 273,389 |
Marriott International, Inc. Class AD | | 10,015 | | | 272,909 |
Marriott International, Ltd. Placeholder Shares+ | | 82,125 | | | — |
Mattel, Inc. | | 13,933 | | | 278,381 |
McDonald’s Corporation | | 41,823 | | | 2,611,428 |
McGraw-Hill Co., Inc. (The) | | 12,085 | | | 404,968 |
Meredith CorporationD | | 1,400 | | | 43,190 |
New York Times Co. (The) Class AD* | | 4,400 | | | 54,384 |
Newell Rubbermaid, Inc.D | | 10,841 | | | 162,723 |
News Corporation | | 87,186 | | | 1,193,576 |
NIKE, Inc. Class B | | 15,170 | | | 1,002,282 |
Nordstrom, Inc.D | | 6,487 | | | 243,781 |
Office Depot, Inc.* | | 10,500 | | | 67,725 |
Omnicom Group, Inc. | | 12,100 | | | 473,715 |
O’Reilly Automotive, Inc.* | | 5,200 | | | 198,224 |
Penney (J.C.) Co., Inc.D | | 9,203 | | | 244,892 |
Polo Ralph Lauren Corporation | | 2,234 | | | 180,909 |
Priceline.com, Inc.D* | | 1,695 | | | 370,357 |
Pulte Homes, Inc.D* | | 12,061 | | | 120,610 |
RadioShack Corporation | | 5,100 | | | 99,450 |
Ross Stores, Inc. | | 4,803 | | | 205,136 |
Scripps Networks Interactive, Inc. | | 3,400 | | | 141,100 |
Sears Holdings CorporationD* | | 1,897 | | | 158,305 |
Snap-On, Inc.D | | 2,200 | | | 92,972 |
Stanley Works (The)D | | 3,136 | | | 161,535 |
Staples, Inc. | | 28,262 | | | 694,963 |
Starbucks Corporation* | | 28,946 | | | 667,495 |
Starwood Hotels & Resorts Worldwide, Inc.D | | 7,146 | | | 261,329 |
Target Corporation | | 29,110 | | | 1,408,051 |
Tiffany & Co. | | 4,859 | | | 208,937 |
Time Warner Cable, Inc.D* | | 13,634 | | | 564,311 |
Time Warner, Inc.D* | | 45,370 | | | 1,322,082 |
TJX Cos., Inc. | | 16,364 | | | 598,104 |
VF Corporation | | 3,437 | | | 251,726 |
Wal-Mart Stores, Inc. | | 82,704 | | | 4,420,529 |
Walt Disney Co. (The) | | 74,592 | | | 2,405,592 |
Washington Post Co. (The) | | 254 | | | 111,658 |
Western Union Co. (The) | | 26,869 | | | 506,481 |
Whirlpool Corporation | | 2,894 | | | 233,430 |
Wyndham Worldwide Corporation | | 7,080 | | | 142,804 |
Yum! Brands, Inc.D | | 18,087 | | | 632,502 |
| | | | | |
| | | | | 43,450,805 |
| | | | | |
Consumer Staples — 8.0% | | | | | |
Archer-Daniels-Midland Co. | | 24,811 | | | 776,832 |
Campbell Soup Co. | | 7,401 | | | 250,154 |
Clorox Co. | | 5,334 | | | 325,374 |
Coca-Cola Co. (The) | | 89,901 | | | 5,124,357 |
Coca-Cola Enterprises, Inc.D | | 12,282 | | | 260,378 |
Colgate-Palmolive Co. | | 19,248 | | | 1,581,223 |
ConAgra Foods, Inc. | | 17,000 | | | 391,850 |
CVS Caremark Corporation | | 54,726 | | | 1,762,724 |
Dean Foods Co.* | | 7,148 | | | 128,950 |
Dr Pepper Snapple Group, Inc. | | 9,769 | | | 276,463 |
General Mills, Inc.D | | 12,707 | | | 899,783 |
Heinz (H.J.) Co.D | | 12,347 | | | 527,958 |
Hershey Co. (The) | | 6,454 | | | 230,989 |
Hormel Foods CorporationD | | 2,600 | | | 99,970 |
J.M. Smucker Co. (The) | | 4,593 | | | 283,618 |
Kellogg Co. | | 9,900 | | | 526,680 |
Kimberly-Clark Corporation | | 16,137 | | | 1,028,088 |
Kraft Foods, Inc. Class A | | 57,151 | | | 1,553,364 |
Kroger Co. (The) | | 25,471 | | | 522,920 |
McCormick & Co., Inc.D | | 5,094 | | | 184,046 |
Mead Johnson Nutrition Co.D | | 8,665 | | | 378,659 |
Pepsi Bottling Group, Inc. | | 5,528 | | | 207,300 |
PepsiCo, Inc. | | 60,517 | | | 3,679,434 |
Procter & Gamble Co. (The) | | 113,324 | | | 6,870,834 |
Safeway, Inc. | | 15,633 | | | 332,827 |
Sara Lee Corporation | | 27,194 | | | 331,223 |
SUPERVALU, Inc.D | | 8,048 | | | 102,290 |
Sysco Corporation | | 22,895 | | | 639,686 |
Tyson Foods, Inc. Class A | | 11,713 | | | 143,719 |
See Notes to Financial Statements.
132
| | | | | |
| | | Shares | | Value |
Walgreen Co. | | 38,307 | | $ | 1,406,633 |
Whole Foods Market, Inc.D* | | 5,550 | | | 152,347 |
| | | | | |
| | | | | 30,980,673 |
| | | | | |
Energy — 11.6% | | | | | |
Anadarko Petroleum Corporation | | 18,986 | | | 1,185,106 |
Apache Corporation | | 13,069 | | | 1,348,329 |
Baker Hughes, Inc. | | 12,000 | | | 485,760 |
BJ Services Co. | | 11,151 | | | 207,409 |
Cabot Oil & Gas CorporationD | | 4,055 | | | 176,758 |
Cameron International CorporationD* | | 9,482 | | | 396,348 |
Chesapeake Energy Corporation | | 25,054 | | | 648,398 |
Chevron Corporation | | 77,842 | | | 5,993,056 |
ConocoPhillips | | 57,571 | | | 2,940,151 |
Consol Energy, Inc. | | 7,008 | | | 348,998 |
Denbury Resources, Inc.D* | | 9,928 | | | 146,934 |
Devon Energy Corporation | | 17,293 | | | 1,271,036 |
Diamond Offshore Drilling, Inc.D | | 2,669 | | | 262,683 |
El Paso Corporation | | 27,351 | | | 268,860 |
EOG Resources, Inc. | | 9,837 | | | 957,140 |
EQT Corporation | | 5,053 | | | 221,928 |
Exterran Holdings, Inc.* | | 13 | | | 279 |
Exxon Mobil Corporation | | 184,159 | | | 12,557,802 |
First Solar, Inc.D* | | 1,861 | | | 251,979 |
FMC Technologies, Inc.D* | | 4,700 | | | 271,848 |
Halliburton Co. | | 34,971 | | | 1,052,277 |
Hess Corporation | | 11,200 | | | 677,600 |
Marathon Oil Corporation | | 27,317 | | | 852,837 |
Massey Energy Co.D | | 3,400 | | | 142,834 |
Murphy Oil Corporation | | 7,397 | | | 400,917 |
Nabors Industries, Ltd.* | | 10,833 | | | 237,134 |
National Oilwell Varco, Inc. | | 16,137 | | | 711,480 |
Noble Energy, Inc.D | | 6,700 | | | 477,174 |
Occidental Petroleum Corporation | | 31,546 | | | 2,566,267 |
Peabody Energy Corporation | | 10,300 | | | 465,663 |
Pioneer Natural Resouces Co. | | 4,500 | | | 216,765 |
Range Resources Corporation | | 6,077 | | | 302,939 |
Rowan Cos., Inc.* | | 4,574 | | | 103,555 |
Schlumberger, Ltd. | | 46,522 | | | 3,028,117 |
Smith International, Inc. | | 9,680 | | | 263,006 |
Southwestern Energy Co.* | | 13,467 | | | 649,109 |
Spectra Energy Corporation | | 24,930 | | | 511,314 |
Sunoco, Inc. | | 4,734 | | | 123,557 |
Tesoro CorporationD | | 5,500 | | | 74,525 |
Valero Energy Corporation | | 21,644 | | | 362,537 |
Williams Cos., Inc. (The) | | 22,360 | | | 471,349 |
XTO Energy, Inc. | | 22,470 | | | 1,045,529 |
| | | | | |
| | | | | 44,677,287 |
| | | | | |
Financial Services — 15.2% | | | | | |
Aflac, Inc. | | 18,118 | | | 837,957 |
Allstate Corporation (The) | | 20,990 | | | 630,540 |
American Express Co. | | 46,075 | | | 1,866,959 |
American International Group, Inc.D* | | 5,154 | | | 154,517 |
Ameriprise Financial, Inc. | | 9,940 | | | 385,871 |
AON Corporation | | 10,759 | | | 412,500 |
Apartment Investment & Management Co. Class A REIT | | 4,439 | | | 70,669 |
Assurant, Inc. | | 4,621 | | | 136,227 |
AvalonBay Communities, Inc. REITD | | 3,091 | | | 253,802 |
Bank of America CorporationD | | 385,456 | | | 5,804,967 |
Bank of New York Mellon Corporation (The) | | 46,837 | | | 1,310,031 |
BB&T Corporation | | 26,858 | | | 681,387 |
Boston Properties, Inc. REITD | | 5,326 | | | 357,215 |
Capital One Financial Corporation | | 17,489 | | | 670,528 |
CB Richard Ellis Group, Inc. Class AD* | | 10,527 | | | 142,851 |
Chubb Corporation | | 13,217 | | | 650,012 |
Cincinnati Financial CorporationD | | 6,369 | | | 167,123 |
Citigroup, Inc. | | 757,009 | | | 2,505,700 |
CME Group, Inc. | | 2,589 | | | 869,775 |
Comerica, Inc. | | 5,693 | | | 168,342 |
Discover Financial Services | | 20,853 | | | 306,748 |
Dun & Bradstreet Corporation | | 2,000 | | | 168,740 |
E*TRADE Financial Corporation* | | 62,683 | | | 109,695 |
Equifax, Inc. | | 4,800 | | | 148,272 |
Equity Residential REITD | | 10,900 | | | 368,202 |
Federated Investors, Inc. Class BD | | 3,300 | | | 90,750 |
Fidelity National Information Services, Inc. | | 12,805 | | | 300,149 |
Fifth Third BancorpD | | 30,994 | | | 302,191 |
First Horizon National CorporationD* | | 8,671 | | | 116,191 |
First Horizon National Corporation Placeholder Shares+ | | 56,626 | | | — |
Fiserv, Inc.* | | 5,902 | | | 286,129 |
Franklin Resources, Inc. | | 5,760 | | | 606,816 |
Genworth Financial, Inc. Class A* | | 19,370 | | | 219,849 |
Goldman Sachs Group, Inc. (The) | | 19,982 | | | 3,373,761 |
Hartford Financial Services Group, Inc. | | 14,800 | | | 344,248 |
HCP, Inc. REITD | | 11,254 | | | 343,697 |
Health Care REIT, Inc.D | | 4,869 | | | 215,794 |
Host Hotels & Resorts, Inc. REIT* | | 25,248 | | | 294,644 |
Hudson City Bancorp, Inc. | | 18,231 | | | 250,312 |
Huntington Bancshares, Inc.D | | 28,549 | | | 104,204 |
IntercontinentalExchange, Inc.* | | 2,806 | | | 315,114 |
Invesco, Ltd. | | 16,876 | | | 396,417 |
Janus Capital Group, Inc. | | 6,708 | | | 90,223 |
JPMorgan Chase & Co. | | 152,868 | | | 6,370,010 |
KeyCorp | | 33,338 | | | 185,026 |
Kimco Realty Corporation REITD | | 15,865 | | | 214,653 |
Legg Mason, Inc.D | | 6,280 | | | 189,405 |
Leucadia National CorporationD* | | 7,210 | | | 171,526 |
Lincoln National Corporation | | 11,515 | | | 286,493 |
Loews Corporation | | 13,992 | | | 508,609 |
M&T Bank CorporationD | | 3,155 | | | 211,038 |
Marsh & McLennan Cos., Inc.D | | 20,574 | | | 454,274 |
Marshall & Ilsley CorporationD | | 19,448 | | | 105,992 |
Mastercard, Inc. Class AD | | 3,734 | | | 955,829 |
MetLife, Inc. | | 31,705 | | | 1,120,772 |
Moody’s CorporationD | | 7,686 | | | 205,985 |
Morgan Stanley | | 52,570 | | | 1,556,072 |
See Notes to Financial Statements.
133
EQUITY INDEX FUND
SCHEDULE OF INVESTMENTS (Continued)
| | | | | |
| | | Shares | | Value |
NASDAQ OMX Group, Inc. (The)D* | | 5,500 | | $ | 109,010 |
Northern Trust CorporationD | | 9,399 | | | 492,508 |
NYSE Euronext | | 9,903 | | | 250,546 |
People’s United Financial, Inc.* | | 13,484 | | | 225,183 |
Plum Creek Timber Co., Inc. REITD | | 6,400 | | | 241,664 |
PNC Financial Services Group, Inc. | | 17,973 | | | 948,795 |
Principal Financial Group, Inc.D | | 12,248 | | | 294,442 |
Progressive Corporation (The)* | | 26,068 | | | 468,963 |
ProLogis REITD | | 18,390 | | | 251,759 |
Prudential Financial, Inc. | | 17,938 | | | 892,595 |
Public Storage REITD | | 5,230 | | | 425,983 |
Regions Financial Corporation | | 45,394 | | | 240,134 |
Schwab (Charles) Corporation (The) | | 36,901 | | | 694,477 |
Simon Property Group, Inc. REITD | | 11,071 | | | 883,466 |
SLM Corporation* | | 18,100 | | | 203,987 |
State Street Corporation | | 19,121 | | | 832,528 |
SunTrust Banks, Inc.D | | 19,476 | | | 395,168 |
T. Rowe Price Group, Inc.D | | 9,911 | | | 527,761 |
Torchmark CorporationD | | 3,200 | | | 140,640 |
Total System Services, Inc.D | | 7,432 | | | 128,351 |
Travelers Cos., Inc. (The) | | 21,146 | | | 1,054,340 |
Unum Group | | 12,793 | | | 249,719 |
US Bancorp | | 73,956 | | | 1,664,750 |
Ventas, Inc. REITD | | 5,969 | | | 261,084 |
Visa, Inc.D | | 17,357 | | | 1,518,043 |
Vornado Realty Trust REITD | | 6,021 | | | 421,109 |
Wells Fargo & Co. | | 198,253 | | | 5,350,848 |
XL Capital, Ltd. Class A | | 13,546 | | | 248,298 |
Zions BancorporationD | | 5,672 | | | 72,772 |
| | | | | |
| | | | | 58,853,726 |
| | | | | |
Healthcare — 12.5% | | | | | |
Abbott Laboratories | | 59,979 | | | 3,238,266 |
Aetna, Inc.D | | 16,797 | | | 532,465 |
Allergan, Inc. | | 11,904 | | | 750,071 |
AmerisourceBergen Corporation | | 11,428 | | | 297,928 |
Amgen, Inc.* | | 39,253 | | | 2,220,542 |
Bard (C.R.), Inc. | | 3,711 | | | 289,087 |
Baxter International, Inc. | | 23,332 | | | 1,369,122 |
Becton Dickinson & Co. | | 9,165 | | | 722,752 |
Biogen Idec, Inc.* | | 11,159 | | | 597,006 |
Boston Scientific Corporation* | | 58,200 | | | 523,800 |
Bristol-Myers Squibb Co.D | | 63,447 | | | 1,602,047 |
Cardinal Health, Inc. | | 14,247 | | | 459,323 |
CareFusion CorporationD* | | 6,820 | | | 170,568 |
Celgene Corporation* | | 17,883 | | | 995,725 |
Cephalon, Inc.* | | 2,997 | | | 187,043 |
CIGNA Corporation | | 10,729 | | | 378,412 |
Conventry Health Care, Inc.* | | 5,578 | | | 135,490 |
DaVita, Inc.* | | 3,913 | | | 229,850 |
DENTSPLY International, Inc. | | 5,903 | | | 207,609 |
Eli Lilly & Co.D | | 39,372 | | | 1,405,974 |
Express Scripts, Inc.* | | 10,701 | | | 925,101 |
Forest Laboratories, Inc.* | | 11,737 | | | 376,875 |
Genzyme Corporation* | | 10,330 | | | 506,273 |
Gilead Sciences, Inc.* | | 34,881 | | | 1,509,650 |
Hospira, Inc* | | 6,392 | | | 325,992 |
Humana, Inc.* | | 6,546 | | | 287,304 |
IMS Health, Inc. | | 6,909 | | | 145,504 |
Intuitive Surgical, Inc.D* | | 1,496 | | | 453,767 |
Johnson & Johnson | | 106,992 | | | 6,891,355 |
King Pharmaceuticals, Inc.D* | | 9,987 | | | 122,540 |
Laboratory Corporation of America Holdings* | | 4,147 | | | 310,361 |
Life Technologies Corporation* | | 6,947 | | | 362,842 |
McKesson Corporation | | 10,406 | | | 650,375 |
Medco Health Solutions, Inc.* | | 18,518 | | | 1,183,485 |
Medtronic, Inc. | | 42,860 | | | 1,884,983 |
Merck & Co., Inc. | | 118,482 | | | 4,329,332 |
Millipore Corporation* | | 2,100 | | | 151,935 |
Mylan, Inc.D* | | 11,966 | | | 220,533 |
Patterson Cos., Inc.D* | | 3,760 | | | 105,205 |
PerkinElmer, Inc. | | 4,400 | | | 90,596 |
Pfizer, Inc. | | 313,111 | | | 5,695,489 |
Quest Diagnostics, Inc. | | 5,992 | | | 361,797 |
St. Jude Medical, Inc.* | | 12,962 | | | 476,742 |
Stryker Corporation | | 11,054 | | | 556,790 |
Tenet Healthcare CorporationD* | | 17,431 | | | 93,953 |
Thermo Fisher Scientific, Inc.* | | 15,924 | | | 759,416 |
UnitedHealth Group, Inc. | | 45,053 | | | 1,373,215 |
Varian Medical Systems, Inc.* | | 4,828 | | | 226,192 |
Watson Pharmaceuticals, Inc.D* | | 4,164 | | | 164,936 |
WellPoint, Inc.* | | 17,750 | | | 1,034,648 |
Zimmer Holdings, Inc.* | | 8,320 | | | 491,795 |
| | | | | |
| | | | | 48,382,061 |
| | | | | |
Materials & Processing — 3.9% | | | | | |
Air Products & Chemicals, Inc. | | 8,185 | | | 663,476 |
Airgas, Inc.D | | 3,136 | | | 149,274 |
AK Steel Holding Corporation | | 4,300 | | | 91,805 |
Alcoa, Inc.D | | 37,600 | | | 606,112 |
Allegheny Technologies, Inc.D | | 3,886 | | | 173,976 |
Ball CorporationD | | 3,692 | | | 190,876 |
Bemis Co., Inc. | | 4,203 | | | 124,619 |
CF Industries Holdings, Inc. | | 1,900 | | | 172,482 |
Cliffs Natural Resources, Inc. | | 5,093 | | | 234,736 |
Dow Chemical Co. (The) | | 44,324 | | | 1,224,672 |
Du Pont (E.I.) de Nemours & Co. | | 34,954 | | | 1,176,901 |
Eastman Chemical Co.D | | 2,881 | | | 173,551 |
Ecolab, Inc. | | 9,320 | | | 415,486 |
FMC CorporationD | | 2,800 | | | 156,128 |
Freeport-McMoRan Copper & Gold, Inc.* | | 16,707 | | | 1,341,405 |
International Flavors & Fragrances, Inc. | | 3,156 | | | 129,838 |
International Paper Co. | | 16,620 | | | 445,084 |
Masco Corporation | | 13,629 | | | 188,217 |
MeadWestvaco CorporationD | | 6,796 | | | 194,570 |
Monsanto Co. | | 21,134 | | | 1,727,705 |
Newmont Mining Corporation | | 18,914 | | | 894,821 |
Nucor CorporationD | | 12,199 | | | 569,083 |
Owens-Illinois, Inc.* | | 6,400 | | | 210,368 |
Pactiv CorporationD* | | 5,193 | | | 125,359 |
PPG Industries, Inc. | | 6,569 | | | 384,549 |
Praxair, Inc. | | 11,866 | | | 952,958 |
Precision Castparts CorporationD | | 5,506 | | | 607,587 |
Sealed Air Corporation | | 6,000 | | | 131,160 |
Sherwin-Williams Co. (The)D | | 3,689 | | | 227,427 |
Sigma-Aldrich CorporationD | | 4,781 | | | 241,584 |
Titanium Metals CorporationD* | | 3,500 | | | 43,820 |
See Notes to Financial Statements.
134
| | | | | |
| | | Shares | | Value |
United States Steel CorporationD | | 5,479 | | $ | 302,003 |
Vulcan Materials Co.D | | 4,963 | | | 261,401 |
Weyerhaeuser Co. | | 8,211 | | | 354,223 |
| | | | | |
| | | | | 14,887,256 |
| | | | | |
Producer Durables — 10.3% | | | | | |
3M Co. | | 27,463 | | | 2,270,366 |
Agilent Technologies, Inc.D* | | 13,263 | | | 412,081 |
Automatic Data Processing, Inc. | | 19,491 | | | 834,605 |
Avery Dennison Corporation | | 4,338 | | | 158,294 |
Boeing Co. (The)D | | 28,121 | | | 1,522,190 |
Burlington Northern Santa Fe Corporation | | 10,173 | | | 1,003,261 |
Caterpillar, Inc. | | 24,222 | | | 1,380,412 |
CH Robinson Worldwide, Inc. | | 6,445 | | | 378,515 |
Cintas CorporationD | | 5,000 | | | 130,250 |
CSX Corporation | | 15,320 | | | 742,867 |
Cummins, Inc. | | 7,809 | | | 358,121 |
Danaher Corporation | | 10,045 | | | 755,384 |
Deere & Co. | | 16,462 | | | 890,430 |
Dover Corporation | | 7,200 | | | 299,592 |
Eaton Corporation | | 6,368 | | | 405,132 |
Emerson Electric Co. | | 29,105 | | | 1,239,873 |
Expeditors International of Washington, Inc.D | | 8,200 | | | 284,786 |
FedEx Corporation | | 12,078 | | | 1,007,909 |
FLIR Systems, Inc.* | | 5,863 | | | 191,837 |
Flowserve Corporation | | 2,131 | | | 201,443 |
Fluor Corporation | | 6,978 | | | 314,289 |
General Dynamics Corporation | | 14,997 | | | 1,022,345 |
General Electric Co. | | 413,141 | | | 6,250,823 |
Goodrich CorporationD | | 4,900 | | | 314,825 |
Grainger (W.W.), Inc. | | 2,492 | | | 241,300 |
Honeywell International, Inc. | | 29,630 | | | 1,161,496 |
Illinois Tool Works, Inc. | | 15,034 | | | 721,482 |
Iron Mountain, Inc.* | | 7,043 | | | 160,299 |
ITT CorporationD | | 7,009 | | | 348,628 |
Jacobs Engineering Group, Inc.D* | | 4,700 | | | 176,767 |
L-3 Communications Holdings, Inc. | | 4,525 | | | 393,449 |
Lexmark International, Inc. Class AD* | | 2,839 | | | 73,757 |
Lockheed Martin Corporation | | 12,408 | | | 934,943 |
Monster Worldwide, Inc.D* | | 5,187 | | | 90,254 |
Norfolk Southern Corporation | | 14,311 | | | 750,183 |
Northrop Grumman Corporation | | 12,164 | | | 679,359 |
PACCAR, Inc. | | 14,068 | | | 510,246 |
Pall Corporation | | 4,407 | | | 159,533 |
Parker Hannifin Corporation | | 6,333 | | | 341,222 |
Paychex, Inc.D | | 12,360 | | | 378,710 |
Pitney Bowes, Inc.D | | 8,193 | | | 186,473 |
Quanta Services, Inc.* | | 8,271 | | | 172,368 |
Raytheon Co. | | 14,877 | | | 766,463 |
Republic Services, Inc. | | 12,469 | | | 352,997 |
Robert Half International, Inc.D | | 5,800 | | | 155,034 |
Rockwell Automation, Inc. | | 5,525 | | | 259,564 |
Rockwell Collins, Inc. | | 6,013 | | | 332,880 |
Roper Industries, Inc.D | | 3,564 | | | 186,647 |
RR Donnelley & Sons Co. | | 8,073 | | | 179,786 |
Ryder System, Inc. | | 2,100 | | | 86,457 |
Southwest Airlines Co.D | | 28,570 | | | 326,555 |
Stericycle, Inc.* | | 3,223 | | | 177,813 |
Textron, Inc.D | | 10,396 | | | 195,549 |
Union Pacific Corporation | | 19,520 | | | 1,247,328 |
United Parcel Service, Inc. Class B | | 38,550 | | | 2,211,614 |
United Technologies Corporation | | 36,357 | | | 2,523,539 |
Waste Management, Inc.D | | 18,923 | | | 639,787 |
Waters Corporation* | | 3,700 | | | 229,252 |
Xerox Corporation | | 33,477 | | | 283,215 |
| | | | | |
| | | | | 40,004,579 |
| | | | | |
Technology — 18.2% | | | | | |
Adobe Systems, Inc.* | | 20,313 | | | 747,112 |
Advanced Micro Devices, Inc.D* | | 21,343 | | | 206,600 |
Affiliated Computer Services, Inc. Class A* | | 3,812 | | | 227,538 |
Akamai Technologies, Inc.D* | | 6,463 | | | 163,708 |
Altera Corporation | | 11,562 | | | 261,648 |
American Tower Corporation Class A* | | 15,458 | | | 667,940 |
Amphenol Corporation Class A | | 6,600 | | | 304,788 |
Analog Devices, Inc. | | 11,278 | | | 356,159 |
Apple, Inc.* | | 34,950 | | | 7,369,557 |
Applied Materials, Inc. | | 51,487 | | | 717,729 |
Autodesk, Inc.* | | 8,844 | | | 224,726 |
BMC Software, Inc.* | | 7,100 | | | 284,710 |
Broadcom Corporation Class A* | | 16,654 | | | 523,768 |
CA, Inc. | | 15,560 | | | 349,478 |
Cisco Systems, Inc.* | | 222,956 | | | 5,337,567 |
Citrix Systems, Inc.* | | 7,171 | | | 298,385 |
Cognizant Technology Solutions Corporation Class AD* | | 11,390 | | | 515,967 |
Computer Sciences CorporationD* | | 5,889 | | | 338,794 |
Compuware Corporation* | | 9,600 | | | 69,408 |
Corning, Inc. | | 60,172 | | | 1,161,921 |
Dell, Inc.* | | 67,144 | | | 964,188 |
Electronic Arts, Inc.* | | 12,500 | | | 221,875 |
EMC Corporation* | | 78,905 | | | 1,378,470 |
Google, Inc. Class A* | | 9,346 | | | 5,794,333 |
Harris Corporation | | 5,219 | | | 248,163 |
Hewlett-Packard Co. | | 91,880 | | | 4,732,739 |
Intel Corporation | | 214,222 | | | 4,370,129 |
International Business Machines Corporation | | 50,926 | | | 6,666,213 |
Intuit, Inc.D* | | 12,244 | | | 376,013 |
Jabil Circuit, Inc. | | 7,203 | | | 125,116 |
JDS Uniphase Corporation* | | 8,475 | | | 69,919 |
Juniper Networks, Inc.* | | 20,300 | | | 541,401 |
KLA-Tencor CorporationD | | 6,541 | | | 236,523 |
Linear Technology CorporationD | | 8,812 | | | 269,119 |
LSI CorporationD* | | 25,978 | | | 156,128 |
McAfee, Inc.* | | 6,054 | | | 245,611 |
MEMC Electronic Materials, Inc.* | | 8,500 | | | 115,770 |
Microchip Technology, Inc.D | | 7,282 | | | 211,615 |
Micron Technology, Inc.D* | | 32,647 | | | 344,752 |
Microsoft Corporation | | 299,530 | | | 9,132,670 |
Molex, Inc.D | | 5,250 | | | 113,138 |
Motorola, Inc.* | | 89,785 | | | 696,732 |
National Semiconductor Corporation | | 9,020 | | | 138,547 |
See Notes to Financial Statements.
135
EQUITY INDEX FUND
SCHEDULE OF INVESTMENTS (Continued)
| | | | | | | |
| | | Shares | | Value | |
NetApp, Inc.* | | | 13,297 | | $ | 457,284 | |
Novell, Inc.* | | | 13,400 | | | 55,610 | |
Novellus Systems, Inc.D* | | | 3,613 | | | 84,327 | |
NVIDIA CorporationD* | | | 21,768 | | | 406,626 | |
Oracle Corporation | | | 151,621 | | | 3,720,779 | |
QLogic Corporation* | | | 4,700 | | | 88,689 | |
QUALCOMM, Inc. | | | 64,797 | | | 2,997,509 | |
Red Hat, Inc.D* | | | 7,255 | | | 224,180 | |
SAIC, Inc.* | | | 12,069 | | | 228,587 | |
Salesforce.com, Inc.* | | | 4,200 | | | 309,834 | |
SanDisk CorporationD* | | | 9,016 | | | 261,374 | |
Sun Microsystems, Inc.* | | | 29,802 | | | 279,245 | |
Symantec CorporationD* | | | 31,638 | | | 566,004 | |
Tellabs, Inc.* | | | 15,000 | | | 85,200 | |
Teradata Corporation* | | | 6,700 | | | 210,581 | |
Teradyne, Inc.D* | | | 6,900 | | | 74,037 | |
Texas Instruments, Inc. | | | 48,620 | | | 1,267,037 | |
VeriSign, Inc.* | | | 7,600 | | | 184,224 | |
Western Digital Corporation* | | | 8,765 | | | 386,975 | |
Xilinx, Inc.D | | | 10,800 | | | 270,648 | |
Yahoo!, Inc.D* | | | 45,944 | | | 770,940 | |
| | | | | | | |
| | | | | | 70,206,357 | |
| | | | | | | |
Utilities — 6.6% | | | | | | | |
AES Corporation (The)* | | | 25,767 | | | 342,959 | |
Allegheny Energy, Inc. | | | 6,700 | | | 157,316 | |
Ameren Corporation | | | 9,381 | | | 262,199 | |
American Electric Power Co., Inc. | | | 18,611 | | | 647,477 | |
AT&T, Inc. | | | 228,887 | | | 6,415,703 | |
Centerpoint Energy, Inc. | | | 14,843 | | | 215,372 | |
CenturyTel, Inc. | | | 11,650 | | | 421,847 | |
CMS Energy CorporationD | | | 8,600 | | | 134,676 | |
Consolidated Edison, Inc. | | | 10,800 | | | 490,644 | |
Constellation Energy Group, Inc. | | | 7,724 | | | 271,653 | |
Dominion Resources, Inc. | | | 23,225 | | | 903,917 | |
DTE Energy Co. | | | 6,375 | | | 277,886 | |
Duke Energy CorporationD | | | 50,601 | | | 870,843 | |
Edison International | | | 12,536 | | | 436,002 | |
Entergy Corporation | | | 7,341 | | | 600,787 | |
Exelon Corporation | | | 25,665 | | | 1,254,249 | |
FirstEnergy Corporation | | | 11,741 | | | 545,369 | |
FPL Group, Inc. | | | 15,989 | | | 844,539 | |
Frontier Communications CorporationD | | | 12,000 | | | 93,720 | |
Integrys Energy Group, Inc.D | | | 2,956 | | | 124,122 | |
MetroPCS Communications, Inc.D* | | | 10,100 | | | 77,063 | |
Nicor, Inc. | | | 1,700 | | | 71,570 | |
NiSource, Inc.D | | | 11,066 | | | 170,195 | |
Northeast Utilities | | | 6,805 | | | 175,501 | |
Pepco Holdings, Inc.D | | | 8,533 | | | 143,781 | |
PG&E CorporationD | | | 14,501 | | | 647,470 | |
Pinnacle West Capital Corporation | | | 4,066 | | | 148,734 | |
PPL Corporation | | | 14,630 | | | 472,695 | |
Progress Energy, Inc. | | | 10,757 | | | 441,145 | |
Public Service Enterprise Group, Inc. | | | 19,769 | | | 657,319 | |
Questar Corporation | | | 6,694 | | | 278,270 | |
Qwest Communications International, Inc.D | | | 58,601 | | | 246,710 | |
SCANA Corporation | | | 4,397 | | | 165,679 | |
Sempra Energy | | | 9,600 | | | 537,408 | |
Southern Co. | | | 30,926 | | | 1,030,454 | |
Sprint Nextel Corporation* | | | 115,885 | | | 424,139 | |
TECO Energy, Inc.D | | | 8,000 | | | 129,760 | |
Verizon Communications, Inc. | | | 110,217 | | | 3,651,489 | |
Windstream Corporation | | | 16,699 | | | 183,522 | |
Wisconsin Energy Corporation | | | 4,519 | | | 225,182 | |
Xcel Energy Inc.D | | | 17,586 | | | 373,175 | |
| | | | | | | |
| | | | | | 25,562,541 | |
| | | | | | | |
Total Common Stocks
(Cost $351,767,913) | | | | | | 377,005,285 | |
| | | | | | | |
MONEY MARKET FUNDS — 14.2% | | | | | | | |
GuideStone Money Market Fund (GS4 Class)¥ | | | 8,292,644 | | | 8,292,644 | |
Northern Institutional Liquid Assets Portfolio§ | | | 46,798,625 | | | 46,798,625 | |
| | | | | | | |
Total Money Market Funds
(Cost $55,091,269) | | | | | | 55,091,269 | |
| | | | | | | |
| | |
| | | Par | | | |
U.S. TREASURY OBLIGATION — 0.4% | | | | | | | |
U.S. Treasury Bill | | | | | | | |
0.11%, 05/06/10‡‡
(Cost $1,444,448) | | $ | 1,445,000 | | | 1,444,500 | |
| | | | | | | |
| | |
TOTAL INVESTMENTS — 112.1%
(Cost $408,303,630) | | | | | | 433,541,054 | |
Liabilities in Excess of Other Assets — (12.1)% | | | | | | (46,837,278 | ) |
| | | | | | | |
| | |
NET ASSETS — 100.0% | | | | | $ | 386,703,776 | |
| | | | | | | |
Please see abbreviation and footnote definitions on page 180.
PORTFOLIO SUMMARY (based on net assets)
| | |
| | | % |
Technology | | 18.2 |
Financial Services | | 15.2 |
Money Market Funds | | 14.2 |
Healthcare | | 12.5 |
Energy | | 11.6 |
Consumer Discretionary | | 11.2 |
Producer Durables | | 10.3 |
Consumer Staples | | 8.0 |
Utilities | | 6.6 |
Materials & Processing | | 3.9 |
Futures Contracts | | 2.4 |
U.S. Treasury Obligation | | 0.4 |
| | |
| | 114.5 |
| | |
See Notes to Financial Statements.
136
FAS 157 DISCLOSURE
The following is a summary of the inputs used, as of December 31, 2009, in valuing the Fund’s assets carried at fair value:
| | | | | | |
Valuation Inputs | | Investments
in
Securities | | Other
Financial
Instruments*** |
| | |
Level 1 — Quoted Prices | | | | | | |
Common Stocks | | $ | 377,005,285 | | $ | — |
Futures Contracts | | | — | | | 145,392 |
Money Market Funds | | | 55,091,269 | | | — |
Level 2 — Other Significant Observable Inputs | | | | | | |
U.S. Treasury Obligations | | | 1,444,500 | | | — |
Level 3 — Significant Unobservable Inputs | | | — | | | — |
| | | | | | |
Total | | $ | 433,541,054 | | $ | 145,392 |
| | | | | | |
| *** | Other financial instruments are derivative instruments not reflected in the Schedule of Investments, such as futures, forwards and swap contracts, which are valued at the unrealized appreciation (depreciation) on the investment. Details of these investments can be found in the Notes to Financial Statements. |
See Notes to Financial Statements.
137
Real Estate Securities Fund
The Real Estate Securities Fund provides exposure to real estate by investing in public real estate securities with strong cash flow growth potential that provides the capacity for sustained dividend increases. The Fund is diversified among property sectors and geographical locations. The Fund became a registered mutual fund on December 29, 2006, but prior to that, it was offered as a private fund that operated from 2000 to 2006. Overall, REITs performed well during 2009 as strong fourth quarter performance capped off a highly volatile year. The Fund outperformed its benchmark, the Dow Jones U.S. Select Real Estate Securities Index, in 2009 by 220 basis points (31.21% versus 29.01%). Positive relative performance during the year can be attributed to strong security selection, while sector allocation slightly detracted from performance.
Please see page 140 for information regarding specific portfolio allocations. Portfolio holdings are subject to change at any time.
This Fund invests substantial assets in Real Estate Investment Trusts (“REITs”) that involve risks not associated with investing in stocks. Risks include declines in the value of real estate, general and economic conditions, changes in the value of the underlying property and defaults by borrowers. The value of assets in the real estate industry may go through cycles of relative underperformance and outperformance in comparison to equity securities markets in general.
138
Real Estate Securities Fund
| | | | | | |
Average Annual Total Returns as of 12/31/09 | |
| | | GS4 Class* | | | Benchmark** | |
One Year | | 31.21 | % | | 29.01 | % |
Since Inception | | -12.98 | % | | -13.75 | % |
Inception Date | | 12/29/06 | | | | |
Total Fund Operating Expenses (June 25, 2009 Prospectus)(1) | | 1.26 | % | | | |
| (1) | Current information regarding the Fund’s Operating Expenses can be found in the Financial Highlights. |
The performance data quoted represents past performance and does not guarantee future results. Current performance may be lower or higher. Performance data current to the most recent month-end may be obtained at www.GuideStoneFunds.org. The investment return and principal value of an investment will fluctuate so that shares, when redeemed, may be worth more or less than their original cost.
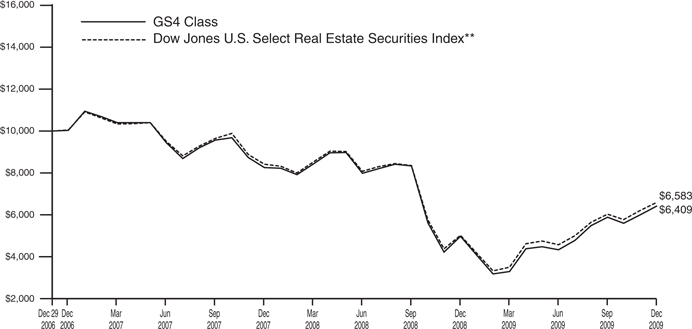
The graph compares the results of a hypothetical $10,000 investment in the GS4 Class of the Fund since December 29, 2006 (commencement of operations), with all dividends and capital gains reinvested, with the Dow Jones Wilshire Real Estate Securities Index.
| * | These returns reflect expense waivers by the Fund’s investment adviser. Without these waivers, returns would have been lower. Returns shown do not reflect the deduction of taxes that a shareholder would pay on Fund distributions or the redemption of Fund shares. |
| ** | The Dow Jones U.S. Select Real Estate Securities Index is an unmanaged, broad-based, market capitalization-weighted index comprised of publicly traded REITs and real estate operating companies, not including special purpose or healthcare REITs. It is comprised of major companies engaged in the equity ownership and operation of commercial real estate. |
Unlike a mutual fund, the performance of an index assumes no taxes, transaction costs, management fees or other expenses.
139
| | |
REAL ESTATE SECURITIES FUND SCHEDULE OF INVESTMENTS | | December 31, 2009 |
| | | | | | | |
| | | Shares | | Value | |
COMMON STOCKS — 96.2% | | | | | | | |
Financial Services — 96.2% | | | | | | | |
American Campus Communities, Inc. REIT | | | 92,250 | | $ | 2,592,225 | |
Apartment Investment & Management Co. Class A REITD | | | 240,900 | | | 3,835,128 | |
AvalonBay Communities, Inc. REITD | | | 67,285 | | | 5,524,771 | |
BioMed Realty Trust, Inc. REITD | | | 153,050 | | | 2,415,129 | |
Boston Properties, Inc. REITD | | | 123,592 | | | 8,289,315 | |
Brandywine Realty Trust REIT | | | 80,700 | | | 919,980 | |
BRE Properties, Inc. REITD | | | 95,250 | | | 3,150,870 | |
Camden Property Trust REITD | | | 11,450 | | | 485,136 | |
Cogdell Spencer, Inc. REIT | | | 102,950 | | | 582,697 | |
DiamondRock Hospitality Co. REITD | | | 63,800 | | | 540,386 | |
Digital Realty Trust, Inc. REITD | | | 85,000 | | | 4,273,800 | |
Douglas Emmett, Inc. REITD | | | 76,350 | | | 1,087,988 | |
Duke Realty Corporation REIT | | | 123,900 | | | 1,507,863 | |
Education Realty Trust, Inc. REIT | | | 16,700 | | | 80,828 | |
Equity Residential REITD | | | 111,700 | | | 3,773,226 | |
Government Properties Income Trust REIT | | | 8,900 | | | 204,522 | |
HCP, Inc. REITD | | | 104,850 | | | 3,202,119 | |
Health Care REIT, Inc.D | | | 95,950 | | | 4,252,504 | |
Host Hotels & Resorts, Inc. REIT* | | | 140,591 | | | 1,640,693 | |
Kilroy Realty Corporation REITD | | | 74,050 | | | 2,271,114 | |
LaSalle Hotel Properties REITD | | | 92,850 | | | 1,971,205 | |
LTC Properties, Inc. REIT | | | 21,725 | | | 581,144 | |
Mack-Cali Realty Corporation REIT | | | 39,900 | | | 1,379,343 | |
Nationwide Health Properties, Inc. REIT | | | 115,060 | | | 4,047,811 | |
ProLogis REITD | | | 395,550 | | | 5,415,080 | |
PS Business Parks, Inc. REIT | | | 28,100 | | | 1,406,405 | |
Public Storage REITD | | | 69,880 | | | 5,691,726 | |
Ramco-Gershenson Properties Trust REITD | | | 61,550 | | | 587,187 | |
Regency Centers Corporation REITD | | | 163,600 | | | 5,735,816 | |
Retail Opportunity Investment Corporation* | | | 56,700 | | | 573,237 | |
Senior Housing Properties Trust REIT | | | 184,535 | | | 4,035,780 | |
Simon Property Group, Inc. REITD | | | 198,700 | | | 15,856,263 | |
SL Green Realty Corporation REIT | | | 57,300 | | | 2,878,752 | |
Sovran Self Storage, Inc. REITD | | | 98,950 | | | 3,535,484 | |
Strategic Hotels & Resorts, Inc. REITD* | | | 21,750 | | | 40,455 | |
Sunstone Hotel Investors, Inc. REITD* | | | 213,500 | | | 1,895,880 | |
Tanger Factory Outlet Centers REITD | | | 35,300 | | | 1,376,347 | |
Taubman Centers, Inc. REITD | | | 80,700 | | | 2,897,937 | |
Vornado Realty Trust REITD | | | 49,656 | | | 3,472,941 | |
Washington Real Estate Investment Trust REITD | | | 105,350 | | | 2,902,392 | |
| | | | | | | |
| | |
Total Common Stocks
(Cost $96,059,406) | | | | | | 116,911,479 | |
| | | | | | | |
MONEY MARKET FUNDS — 52.3% | | | | | | | |
GuideStone Money Market Fund (GS4 Class)¥ | | | 4,497,289 | | | 4,497,289 | |
Northern Institutional Liquid Assets Portfolio§ | | | 59,066,649 | | | 59,066,649 | |
| | | | | | | |
Total Money Market Funds
(Cost $63,563,938) | | | | | | 63,563,938 | |
| | | | | | | |
| | |
| | | Par | | | |
U.S. TREASURY OBLIGATIONS — 0.3% | | | | | | | |
U.S. Treasury Bills | | | | | | | |
0.11%, 05/06/10‡‡ | | $ | 315,000 | | | 314,891 | |
1.08%, 05/06/10‡‡ | | | 15,000 | | | 14,995 | |
| | | | | | | |
Total U.S. Treasury Obligations
(Cost $329,874) | | | | | | 329,886 | |
| | | | | | | |
| | |
TOTAL INVESTMENTS — 148.8%
(Cost $159,953,218) | | | | | | 180,805,303 | |
| | |
Liabilities in Excess of Other Assets — (48.8)% | | | | | | (59,272,106 | ) |
| | | | | | | |
| | |
NET ASSETS — 100.0% | | | | | $ | 121,533,197 | |
| | | | | | | |
Please see abbreviation and footnote definitions on page 180.
PORTFOLIO SUMMARY (based on net assets)
| | |
| | | % |
Financial Services | | 96.2 |
Money Market Funds | | 52.3 |
Futures Contracts | | 4.1 |
U.S. Treasury Obligations | | 0.3 |
| | |
| | 152.9 |
| | |
See Notes to Financial Statements.
140
FAS 157 DISCLOSURE
The following is a summary of the inputs used, as of December 31, 2009, in valuing the Fund’s assets carried at fair value:
| | | | | | |
Valuation Inputs | | Investments
in
Securities | | Other
Financial
Instruments*** |
| | |
Level 1 — Quoted Prices | | | | | | |
Common Stocks | | $ | 116,911,479 | | $ | — |
Futures Contracts | | | — | | | 167,085 |
Money Market Funds | | | 63,563,938 | | | — |
Level 2 — Other Significant Observable Inputs | | | | | | |
U.S. Treasury Obligations | | | 329,886 | | | — |
Level 3 — Significant Unobservable Inputs | | | — | | | — |
| | | | | | |
Total | | $ | 180,805,303 | | $ | 167,085 |
| | | | | | |
| *** | Other financial instruments are derivative instruments not reflected in the Schedule of Investments, such as futures, forwards and swap contracts, which are valued at the unrealized appreciation (depreciation) on the investment. Details of these investments can be found in the Notes to Financial Statements. |
See Notes to Financial Statements.
141
Value Equity Fund
The Value Equity Fund invests in a diversified portfolio of large and medium-size U.S. companies whose stocks are considered to be attractive from a valuation perspective. The Fund’s performance exceeded its benchmark, the Russell 1000® Value Index, for the one-year period ended December 31, 2009 (21.16% versus 19.69%). All sectors within the Russell 1000® Value Index experienced solid positive performance returns for 2009. The Fund benefited from an overweight exposure to the technology sector, which gained over 60% for the year.
Please see page 146 for information regarding specific portfolio allocations. Portfolio holdings are subject to change at any time.
142
Value Equity Fund
| | | | | | | | | |
Average Annual Total Returns as of 12/31/09 | |
| | | GS2 Class* | | | GS4 Class* | | | Benchmark** | |
One Year | | 21.35 | % | | 21.16 | % | | 19.69 | % |
Five Year | | -0.68 | % | | -0.87 | % | | -0.25 | % |
Since Inception | | 2.21 | % | | 1.92 | % | | 2.45 | % |
Inception Date | | 08/27/01 | | | 08/27/01 | | | | |
Total Fund Operating Expenses (June 25, 2009 Prospectus)(1) | | 0.68 | % | | 0.87 | % | | | |
| (1) | Current information regarding the Fund’s Operating Expenses can be found in the Financial Highlights. |
The performance data quoted represents past performance and does not guarantee future results. Current performance may be lower or higher. Performance data current to the most recent month-end may be obtained at www.GuideStoneFunds.org. The investment return and principal value of an investment will fluctuate so that shares, when redeemed, may be worth more or less than their original cost.
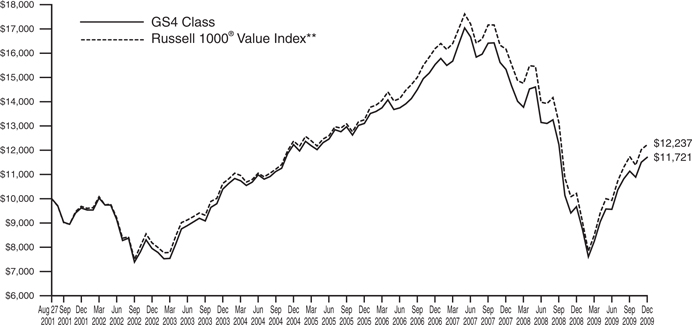
The graph compares the results of a hypothetical $10,000 investment in the GS4 Class of the Fund since August 27, 2001 (commencement of operations), with all dividends and capital gains reinvested, with the Russell 1000® Value Index.
| * | These returns reflect expense waivers by the Fund’s investment adviser. Without these waivers, returns would have been lower. Returns shown do not reflect the deduction of taxes that a shareholder would pay on Fund distributions or the redemption of Fund shares. |
| ** | The Russell 1000® Value Index is a large-cap index consisting of those Russell 1000® Index securities with a less-than-average growth orientation. Companies in this index tend to exhibit lower price-to-book and price-to-earnings ratios, higher dividend yields and lower forecasted growth values than the growth universe. |
Unlike a mutual fund, the performance of an index assumes no taxes, transaction costs, management fees or other expenses.
143
| | |
| VALUE EQUITY FUND | | |
| SCHEDULE OF INVESTMENTS | | December 31, 2009 |
| | | | | |
| | | Shares | | Value |
COMMON STOCKS — 93.3% | | | | | |
Consumer Discretionary — 10.5% | | | | | |
Big Lots, Inc.* | | 69,900 | | $ | 2,025,702 |
BJ’s Wholesale Club, Inc.D* | | 32,700 | | | 1,069,617 |
Carnival Corporation* | | 303,500 | | | 9,617,915 |
Coach, Inc. | | 96,500 | | | 3,525,145 |
Comcast Corporation Class A | | 607,128 | | | 10,236,178 |
DIRECTV Group, Inc. Class AD* | | 143,404 | | | 4,782,524 |
eBay, Inc.* | | 41,900 | | | 986,326 |
Ford Motor Co.D* | | 153,400 | | | 1,534,000 |
Gannett Co., Inc. | | 154,000 | | | 2,286,900 |
Gap, Inc. (The) | | 409,800 | | | 8,585,310 |
Garmin, Ltd.D | | 87,600 | | | 2,689,320 |
H&R Block, Inc. | | 130,000 | | | 2,940,600 |
Home Depot, Inc. | | 561,401 | | | 16,241,331 |
Johnson Controls, Inc. | | 14,879 | | | 405,304 |
Kohl’s Corporation* | | 1,000 | | | 53,930 |
Lennar Corporation Class AD | | 297,551 | | | 3,799,726 |
Liberty Media Corporation - Starz* | | 2,540 | | | 117,221 |
Lowe’s Cos., Inc. | | 49,400 | | | 1,155,466 |
Macy’s, Inc. | | 171,600 | | | 2,876,016 |
Mattel, Inc. | | 295,100 | | | 5,896,098 |
McDonald’s Corporation | | 136,000 | | | 8,491,840 |
Netflix, Inc.D* | | 30,500 | | | 1,681,770 |
News Corporation | | 111,300 | | | 1,523,697 |
Stanley Works (The)D | | 246,600 | | | 12,702,366 |
Time Warner Cable, Inc.D* | | 17,446 | | | 722,090 |
Time Warner, Inc.D* | | 473,532 | | | 13,798,723 |
TJX Cos., Inc. | | 50,900 | | | 1,860,395 |
Walt Disney Co. (The) | | 93,281 | | | 3,008,312 |
| | | | | |
| | | | | 124,613,822 |
| | | | | |
Consumer Staples — 4.8% | | | | | |
Archer-Daniels-Midland Co. | | 13,800 | | | 432,078 |
Coca-Cola Co. (The) | | 24,656 | | | 1,405,392 |
ConAgra Foods, Inc. | | 181,700 | | | 4,188,185 |
CVS Caremark Corporation | | 159,741 | | | 5,145,258 |
Dean Foods Co.* | | 228,100 | | | 4,114,924 |
General Mills, Inc. | | 9,400 | | | 665,614 |
Herbalife, Ltd. | | 62,200 | | | 2,523,454 |
Kimberly-Clark Corporation | | 150,500 | | | 9,588,355 |
Kraft Foods, Inc. Class A | | 337,851 | | | 9,182,790 |
Kroger Co. (The) | | 95,600 | | | 1,962,668 |
Procter & Gamble Co. (The) | | 111,732 | | | 6,774,311 |
Safeway, Inc. | | 68,900 | | | 1,466,881 |
Sara Lee Corporation | | 243,500 | | | 2,965,830 |
Sysco CorporationD | | 208,100 | | | 5,814,314 |
| | | | | |
| | | | | 56,230,054 |
| | | | | |
Energy — 14.3% | | | | | |
Anadarko Petroleum Corporation | | 75,860 | | | 4,735,181 |
Apache Corporation | | 33,350 | | | 3,440,720 |
Baker Hughes, Inc. | | 123,900 | | | 5,015,472 |
Chesapeake Energy CorporationD | | 30,700 | | | 794,516 |
Chevron Corporation | | 376,054 | | | 28,952,397 |
ConocoPhillips | | 431,192 | | | 22,020,975 |
Devon Energy Corporation | | 97,455 | | | 7,162,943 |
EOG Resources, Inc. | | 12,473 | | | 1,213,623 |
Exxon Mobil Corporation | | 457,271 | | | 31,181,309 |
Halliburton Co. | | 43,900 | | | 1,320,951 |
Hess Corporation | | 14,200 | | | 859,100 |
Marathon Oil Corporation | | 557,434 | | | 17,403,089 |
Murphy Oil Corporation | | 63,200 | | | 3,425,440 |
National Oilwell Varco, Inc. | | 20,500 | | | 903,845 |
Occidental Petroleum Corporation | | 192,606 | | | 15,668,498 |
Oil States International, Inc.D* | | 37,100 | | | 1,457,659 |
Patterson-UTI Energy, Inc.D | | 197,200 | | | 3,027,020 |
Schlumberger, Ltd. | | 31,900 | | | 2,076,371 |
Spectra Energy Corporation | | 267,450 | | | 5,485,400 |
Sunoco, Inc. | | 109,600 | | | 2,860,560 |
Valero Energy CorporationD | | 308,632 | | | 5,169,586 |
Walter Energy, Inc. | | 25,200 | | | 1,897,812 |
Williams Cos., Inc. (The) | | 94,000 | | | 1,981,520 |
XTO Energy, Inc. | | 28,400 | | | 1,321,452 |
| | | | | |
| | | | | 169,375,439 |
| | | | | |
Financial Services — 18.1% | | | | | |
Aflac, Inc. | | 76,600 | | | 3,542,750 |
Allstate Corporation (The) | | 295,100 | | | 8,864,804 |
American Express Co. | | 350,300 | | | 14,194,156 |
American Financial Group, Inc. | | 106,700 | | | 2,662,165 |
Ameriprise Financial, Inc. | | 125,600 | | | 4,875,792 |
Assurant, Inc. | | 45,200 | | | 1,332,496 |
Bank of America Corporation | | 869,426 | | | 13,093,556 |
Bank of New York Mellon Corporation (The) | | 46,490 | | | 1,300,325 |
BB&T Corporation | | 33,593 | | | 852,254 |
BlackRock, Inc.D | | 1,037 | | | 240,791 |
Capital One Financial Corporation | | 279,155 | | | 10,702,803 |
Chubb Corporation | | 105,845 | | | 5,205,457 |
Citigroup, Inc. | | 1,736,171 | | | 5,746,726 |
CME Group, Inc. | | 3,100 | | | 1,041,445 |
Endurance Specialty Holdings, Ltd.D | | 84,700 | | | 3,153,381 |
Federated Investors, Inc. Class BD | | 61,700 | | | 1,696,750 |
Franklin Resources, Inc. | | 43,000 | | | 4,530,050 |
Goldman Sachs Group, Inc. (The) | | 53,609 | | | 9,051,344 |
HRPT Properties Trust REITD | | 172,300 | | | 1,114,781 |
Hudson City Bancorp, Inc. | | 224,500 | | | 3,082,385 |
JPMorgan Chase & Co. | | 870,006 | | | 36,253,150 |
Loews Corporation | | 16,048 | | | 583,345 |
MBIA, Inc.D* | | 467,900 | | | 1,862,242 |
MetLife, Inc. | | 28,200 | | | 996,870 |
Moody’s CorporationD | | 100,300 | | | 2,688,040 |
Morgan Stanley | | 148,700 | | | 4,401,520 |
NYSE Euronext | | 127,000 | | | 3,213,100 |
Platinum Underwriters Holdings, Ltd. | | 56,100 | | | 2,148,069 |
PNC Financial Services Group, Inc.D | | 22,600 | | | 1,193,054 |
Progressive Corporation (The)* | | 86,400 | | | 1,554,336 |
Prudential Financial, Inc. | | 10,841 | | | 539,448 |
SEI Investments Co. | | 53,400 | | | 935,568 |
Simon Property Group, Inc. REITD | | 6,787 | | | 541,603 |
SLM Corporation* | | 487,100 | | | 5,489,617 |
State Street Corporation | | 11,300 | | | 492,002 |
SunTrust Banks, Inc.D | | 83,100 | | | 1,686,099 |
T. Rowe Price Group, Inc. | | 57,700 | | | 3,072,525 |
Taubman Centers, Inc. REITD | | 59,100 | | | 2,122,281 |
Torchmark Corporation | | 57,200 | | | 2,513,940 |
See Notes to Financial Statements.
144
| | | | | |
| | | Shares | | Value |
Travelers Cos., Inc. (The) | | 321,721 | | $ | 16,041,009 |
Unum Group | | 64,900 | | | 1,266,848 |
US Bancorp | | 93,844 | | | 2,112,428 |
Wells Fargo & Co. | | 884,239 | | | 23,865,611 |
XL Capital, Ltd. Class A | | 148,400 | | | 2,720,172 |
| | | | | |
| | | | | 214,577,088 |
| | | | | |
Healthcare — 12.6% | | | | | |
Aetna, Inc. | | 69,600 | | | 2,206,320 |
AmerisourceBergen Corporation | | 138,100 | | | 3,600,267 |
Amgen, Inc.* | | 58,900 | | | 3,331,973 |
Boston Scientific Corporation* | | 673,400 | | | 6,060,600 |
Bristol-Myers Squibb Co.D | | 829,815 | | | 20,952,829 |
Cardinal Health, Inc. | | 108,300 | | | 3,491,592 |
CareFusion CorporationD* | | 54,150 | | | 1,354,292 |
Eli Lilly & Co. | | 23,600 | | | 842,756 |
Forest Laboratories, Inc.* | | 52,500 | | | 1,685,775 |
Hologic, Inc.* | | 308,200 | | | 4,468,900 |
Johnson & Johnson | | 213,713 | | | 13,765,254 |
McKesson Corporation | | 67,700 | | | 4,231,250 |
Medtronic, Inc. | | 93,100 | | | 4,094,538 |
Merck & Co., Inc. | | 92,311 | | | 3,373,044 |
Pfizer, Inc. | | 1,836,333 | | | 33,402,897 |
Tenet Healthcare CorporationD* | | 776,600 | | | 4,185,874 |
Thermo Fisher Scientific, Inc.* | | 19,331 | | | 921,895 |
UnitedHealth Group, Inc. | | 419,805 | | | 12,795,657 |
Watson Pharmaceuticals, Inc.* | | 167,900 | | | 6,650,519 |
WellPoint, Inc.* | | 296,973 | | | 17,310,556 |
Zimmer Holdings, Inc.* | | 10,500 | | | 620,655 |
| | | | | |
| | | | | 149,347,443 |
| | | | | |
Materials & Processing — 4.0% | | | | | |
Air Products & Chemicals, Inc. | | 6,700 | | | 543,102 |
Alcoa, Inc. | | 550,000 | | | 8,866,000 |
Bemis Co., Inc. | | 48,800 | | | 1,446,920 |
Dow Chemical Co. (The)D | | 55,324 | | | 1,528,602 |
Du Pont (E.I.) de Nemours & Co. | | 247,823 | | | 8,344,200 |
Eastman Chemical Co.D | | 42,600 | | | 2,566,224 |
Freeport-McMoRan Copper & Gold, Inc.* | | 7,900 | | | 634,291 |
International Paper Co. | | 58,000 | | | 1,553,240 |
Lubrizol Corporation | | 42,500 | | | 3,100,375 |
MeadWestvaco Corporation | | 227,300 | | | 6,507,599 |
Nucor Corporation | | 15,400 | | | 718,410 |
Owens CorningD* | | 44,700 | | | 1,146,108 |
Owens-Illinois, Inc.* | | 43,600 | | | 1,433,132 |
Southern Copper CorporationD | | 79,600 | | | 2,619,636 |
United States Steel CorporationD | | 102,300 | | | 5,638,776 |
| | | | | |
| | | | | 46,646,615 |
| | | | | |
Producer Durables — 10.9% | | | | | |
3M Co. | | 36,900 | | | 3,050,523 |
Boeing Co. (The) | | 33,076 | | | 1,790,404 |
Burlington Northern Santa Fe Corporation | | 116,789 | | | 11,517,731 |
Caterpillar, Inc. | | 14,700 | | | 837,753 |
CSX Corporation | | 19,631 | | | 951,907 |
Cummins, Inc. | | 44,600 | | | 2,045,356 |
Danaher CorporationD | | 4,700 | | | 353,440 |
Deere & Co. | | 15,500 | | | 838,395 |
Dover Corporation | | 54,200 | | | 2,255,262 |
Emerson Electric Co. | | 225,600 | | | 9,610,560 |
FedEx Corporation | | 44,111 | | | 3,681,063 |
Gardner Denver, Inc. | | 45,200 | | | 1,923,260 |
General Dynamics Corporation | | 41,774 | | | 2,847,734 |
General Electric Co. | | 1,273,551 | | | 19,268,827 |
Honeywell International, Inc. | | 420,000 | | | 16,464,000 |
Illinois Tool Works, Inc. | | 244,800 | | | 11,747,952 |
KBR, Inc. | | 158,800 | | | 3,017,200 |
L-3 Communications Holdings, Inc. | | 28,900 | | | 2,512,855 |
Norfolk Southern Corporation | | 39,100 | | | 2,049,622 |
Northrop Grumman Corporation | | 153,865 | | | 8,593,360 |
Oshkosh Corporation | | 46,700 | | | 1,729,301 |
PACCAR, Inc.D | | 1,200 | | | 43,524 |
Paychex, Inc.D | | 108,500 | | | 3,324,440 |
Raytheon Co. | | 215,777 | | | 11,116,831 |
RR Donnelley & Sons Co. | | 63,000 | | | 1,403,010 |
Union Pacific Corporation | | 33,800 | | | 2,159,820 |
United Technologies Corporation | | 3,400 | | | 235,994 |
Waste Management, Inc. | | 112,600 | | | 3,807,006 |
| | | | | |
| | | | | 129,177,130 |
| | | | | |
Technology — 8.0% | | | | | |
Activision Blizzard, Inc.* | | 11,400 | | | 126,654 |
AOL, Inc.D* | | 16,217 | | | 377,532 |
Applied Materials, Inc. | | 521,500 | | | 7,269,710 |
Avnet, Inc.* | | 58,500 | | | 1,764,360 |
CA, Inc. | | 132,600 | | | 2,978,196 |
Corning, Inc. | | 11,100 | | | 214,341 |
Dell, Inc.* | | 356,800 | | | 5,123,648 |
EMC Corporation* | | 89,577 | | | 1,564,910 |
Google, Inc. Class A* | | 2,900 | | | 1,797,942 |
Hewlett-Packard Co. | | 207,922 | | | 10,710,062 |
Ingram Micro, Inc. Class A* | | 93,900 | | | 1,638,555 |
Intel Corporation | | 662,300 | | | 13,510,920 |
International Business Machines Corporation | | 157,700 | | | 20,642,930 |
Microsoft Corporation | | 203,000 | | | 6,189,470 |
Motorola, Inc.* | | 603,400 | | | 4,682,384 |
NeuStar, Inc. Class A* | | 86,600 | | | 1,995,264 |
Seagate Technology | | 110,400 | | | 2,008,176 |
Symantec Corporation* | | 170,800 | | | 3,055,612 |
Texas Instruments, Inc. | | 136,800 | | | 3,565,008 |
Western Digital Corporation* | | 31,800 | | | 1,403,970 |
Yahoo!, Inc.* | | 201,700 | | | 3,384,526 |
| | | | | |
| | | | | 94,004,170 |
| | | | | |
Utilities — 10.1% | | | | | |
Alliant Energy Corporation | | 50,700 | | | 1,534,182 |
American Electric Power Co., Inc. | | 207,300 | | | 7,211,967 |
AT&T, Inc. | | 1,412,629 | | | 39,595,991 |
Constellation Energy Group, Inc. | | 42,700 | | | 1,501,759 |
Dominion Resources, Inc.D | | 128,620 | | | 5,005,891 |
DTE Energy Co. | | 84,500 | | | 3,683,355 |
Duke Energy Corporation | | 331,100 | | | 5,698,231 |
Edison International | | 80,500 | | | 2,799,790 |
Entergy Corporation | | 86,900 | | | 7,111,896 |
Exelon Corporation | | 29,905 | | | 1,461,457 |
FirstEnergy Corporation | | 14,952 | | | 694,520 |
FPL Group, Inc. | | 17,500 | | | 924,350 |
Mirant Corporation* | | 199,100 | | | 3,040,257 |
Nokia Corporation ADRD | | 327,600 | | | 4,209,660 |
NRG Energy, Inc.D* | | 60,500 | | | 1,428,405 |
See Notes to Financial Statements.
145
VALUE EQUITY FUND
SCHEDULE OF INVESTMENTS (Continued)
| | | | | | | |
| | | Shares | | Value | |
NV Energy, Inc. | | | 208,000 | | $ | 2,575,040 | |
PG&E CorporationD | | | 18,000 | | | 803,700 | |
Progress Energy, Inc. Contingent Value Obligation+* | | | 3,100 | | | 1,209 | |
Public Service Enterprise Group, Inc. | | | 108,700 | | | 3,614,275 | |
Qwest Communications International, Inc.D | | | 1,458,200 | | | 6,139,022 | |
Sempra Energy | | | 76,800 | | | 4,299,264 | |
Southern Co. | | | 39,085 | | | 1,302,312 | |
Sprint Nextel Corporation* | | | 137,500 | | | 503,250 | |
Verizon Communications, Inc. | | | 444,288 | | | 14,719,262 | |
| | | | | | | |
| | | | | | 119,859,045 | |
| | | | | | | |
Total Common Stocks
(Cost $1,189,046,767) | | | | | | 1,103,830,806 | |
| | | | | | | |
FOREIGN COMMON STOCKS — 3.6% | | | | | | | |
Bermuda — 0.3% | | | | | | | |
Credicorp, Ltd. | | | 45,800 | | | 3,527,516 | |
| | | | | | | |
Canada — 0.5% | | | | | | | |
BCE, Inc. | | | 90,900 | | | 2,509,749 | |
Research In Motion, Ltd.* | | | 20,400 | | | 1,377,816 | |
Shaw Communications, Inc. Class BD | | | 91,200 | | | 1,875,984 | |
| | | | | | | |
| | | | | | 5,763,549 | |
| | | | | | | |
Panama — 0.2% | | | | | | | |
Copa Holdings SA Class A | | | 43,500 | | | 2,369,445 | |
| | | | | | | |
Russia — 0.2% | | | | | | | |
CTC Media, Inc.* | | | 119,000 | | | 1,773,100 | |
| | | | | | | |
Singapore — 0.7% | | | | | | | |
Flextronics International, Ltd.* | | | 1,201,138 | | | 8,780,319 | |
| | | | | | | |
Switzerland — 1.5% | | | | | | | |
Foster Wheeler AG* | | | 44,000 | | | 1,295,360 | |
Tyco Electronics, Ltd. | | | 282,075 | | | 6,924,941 | |
Tyco International, Ltd.* | | | 272,075 | | | 9,707,636 | |
| | | | | | | |
| | | | | | 17,927,937 | |
| | | | | | | |
United Kingdom — 0.2% | | | | | | | |
Ensco International PLC | | | 65,700 | | | 2,624,058 | |
| | | | | | | |
Total Foreign Common Stocks
(Cost $43,275,912) | | | | | | 42,765,924 | |
| | | | | | | |
MONEY MARKET FUNDS — 12.6% | | | | | | | |
GuideStone Money Market Fund (GS4 Class)¥ | | | 34,433,647 | | | 34,433,647 | |
Northern Institutional Liquid Assets Portfolio§ | | | 114,534,540 | | | 114,534,540 | |
| | | | | | | |
Total Money Market Funds
(Cost $148,968,187) | | | | | | 148,968,187 | |
| | | | | | | |
| | |
| | | Par | | | |
U.S. TREASURY OBLIGATIONS — 0.3% | | | | | | | |
U.S. Treasury Bills | | | | | | | |
0.10%, 05/06/10‡‡ | | $ | 210,000 | | | 209,927 | |
0.11%, 05/06/10‡‡ | | | 3,225,000 | | | 3,223,884 | |
| | | | | | | |
Total U.S. Treasury Obligations
(Cost $3,433,699) | | | | | | 3,433,811 | |
| | | | | | | |
TOTAL INVESTMENTS — 109.8%
(Cost $1,384,724,565) | | | | | | 1,298,998,728 | |
Liabilities in Excess of Other Assets — (9.8)% | | | | | | (116,061,814 | ) |
| | | | | | | |
Net Assets — 100.0% | | | | | $ | 1,182,936,914 | |
| | | | | | | |
Please see abbreviation and footnote definitions on page 180.
PORTFOLIO SUMMARY (based on net assets)
| | |
| | | % |
Financial Services | | 18.1 |
Energy | | 14.3 |
Healthcare | | 12.6 |
Money Market Funds | | 12.6 |
Producer Durabless | | 10.9 |
Consumer Discretionary | | 10.5 |
Utilities | | 10.1 |
Technology | | 8.0 |
Consumer Staples | | 4.8 |
Materials & Processing | | 4.0 |
Foreign Common Stocks | | 3.6 |
Futures Contracts | | 3.1 |
U.S. Treasury Obligations | | 0.3 |
| | |
| | 112.9 |
| | |
See Notes to Financial Statements.
146
FAS 157 DISCLOSURE
The following is a summary of the inputs used, as of December 31, 2009, in valuing the Fund’s assets carried at fair value:
| | | | | | |
Valuation Inputs | | Investments
in
Securities | | Other
Financial
Instruments*** |
Level 1 — Quoted Prices | | | | | | |
Common Stocks | | $ | 1,103,829,597 | | $ | — |
Foreign Common Stocks | | | 42,765,924 | | | — |
Futures Contracts | | | — | | | 468,620 |
Money Market Funds | | | 148,968,187 | | | — |
Level 2 — Other Significant Observable Inputs | | | | | | |
U.S. Treasury Obligations | | | 3,433,811 | | | — |
Level 3 — Significant Unobservable Inputs | | | | | | |
Common Stocks | | | 1,209 | | | — |
| | | | | | |
Total | | $ | 1,298,998,728 | | $ | 468,620 |
| | | | | | |
The following is a reconciliation of assets in which significant unobservable inputs (Level 3) were used in determining fair value:
| | | | | | |
| | | Investments
in
Securities | | Other
Financial
Instruments*** |
Balance, 12/31/08 | | | | | | |
Common Stocks | | | 1,209 | | $ | — |
Accrued discounts/premiums | | | | | | |
Common Stocks | | | — | | | — |
Realized gain (loss) | | | | | | |
Common Stocks | | | — | | | — |
Changed in unrealized appreciation (depreciation) | | | | | | |
Common Stocks | | | — | | | — |
Net purchases (sales) | | | | | | |
Common Stocks | | | — | | | — |
Transfers in and/or out of Level 3 | | | | | | |
Common Stocks | | | — | | | — |
| | | | | | |
Balance, 12/31/09 | | $ | 1,209 | | $ | — |
| | | | | | |
| *** | Other financial instruments are derivative instruments not reflected in the Schedule of Investments, such as futures, forwards and swap contracts, which are valued at the unrealized appreciation (depreciation) on the investment. Details of these investments can be found in the Notes to Financial Statements. |
See Notes to Financial Statements.
147
Growth Equity Fund
The Growth Equity Fund invests in a diversified portfolio of large and medium-size U.S. companies whose stocks are considered to have above average potential for growth in revenue and earnings. Across the market capitalization spectrum, Russell’s style indices indicated that growth stocks outperformed value stocks in 2009. The Fund outperformed its benchmark, the Russell 1000® Growth Index, for the one-year period ended December 31, 2009 (37.99% versus 37.21%). Security selection within the energy and technology sectors contributed to benchmark-relative returns, while security selection within the producer durables and financial services sectors detracted from benchmark-relative performance during the year.
Please see page 152 for information regarding specific portfolio allocations. Portfolio holdings are subject to change at any time.
148
Growth Equity Fund
| | | | | | | | | |
Average Annual Total Returns as of 12/31/09 | |
| | | GS2 Class* | | | GS4 Class* | | | Benchmark** | |
One Year | | 38.14 | % | | 37.99 | % | | 37.21 | % |
Five Year | | -0.36 | % | | -0.48 | % | | 1.63 | % |
Since Inception | | 0.13 | % | | 0.01 | % | | 0.70 | % |
Inception Date | | 08/27/01 | | | 08/27/01 | | | | |
Total Fund Operating Expenses (June 25, 2009 Prospectus)(1) | | 0.87 | % | | 1.06 | % | | | |
| (1) | Current information regarding the Fund’s Operating Expenses can be found in the Financial Highlights. |
The performance data quoted represents past performance and does not guarantee future results. Current performance may be lower or higher. Performance data current to the most recent month-end may be obtained at www.GuideStoneFunds.org. The investment return and principal value of an investment will fluctuate so that shares, when redeemed, may be worth more or less than their original cost.
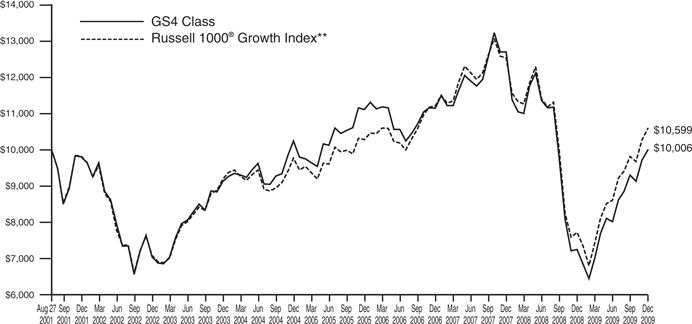
The graph compares the results of a hypothetical $10,000 investment in the GS4 Class of the Fund since August 27, 2001 (commencement of operations), with all dividends and capital gains reinvested, with the Russell 1000® Growth Index.
| * | These returns reflect expense waivers by the Fund’s investment adviser. Without these waivers, returns would have been lower. Returns shown do not reflect the deduction of taxes that a shareholder would pay on Fund distributions or the redemption of Fund shares. |
| ** | The Russell 1000® Growth Index is a large-cap index consisting of those Russell 1000® Index securities with greater-than-average growth orientation. Companies in this index tend to exhibit higher price-to-book and price-to-earnings-ratios, lower dividend yields and higher forecasted growth values than the value universe. |
Unlike a mutual fund, the performance of an index assumes no taxes, transaction costs, management fees or other expenses.
149
| | |
| GROWTH EQUITY FUND | | |
| SCHEDULE OF INVESTMENTS | | December 31, 2009 |
| | | | | |
| | | Shares | | Value |
COMMON STOCKS — 92.4% | | | | | |
Consumer Discretionary — 15.8% | | | | | |
Amazon.com, Inc.* | | 329,955 | | $ | 44,385,547 |
Apollo Group, Inc. Class A* | | 38,800 | | | 2,350,504 |
Avon Products, Inc. | | 110,080 | | | 3,467,520 |
Bed Bath & Beyond, Inc.D* | | 102,600 | | | 3,963,438 |
Best Buy Co., Inc.D | | 181,340 | | | 7,155,676 |
Carnival CorporationD* | | 141,330 | | | 4,478,748 |
Coach, Inc. | | 67,950 | | | 2,482,213 |
Comcast Corporation Class A | | 161,090 | | | 2,715,977 |
DIRECTV Group, Inc. Class AD* | | 157,002 | | | 5,236,017 |
Dreamworks Animation SKG, Inc. Class AD* | | 34,060 | | | 1,360,697 |
eBay, Inc.* | | 257,220 | | | 6,054,959 |
Estee Lauder Cos., Inc. (The) Class AD | | 116,846 | | | 5,650,672 |
Ford Motor Co.D* | | 594,594 | | | 5,945,940 |
Gap, Inc. (The) | | 255,580 | | | 5,354,401 |
Home Depot, Inc. | | 156,000 | | | 4,513,080 |
Kohl’s Corporation* | | 161,550 | | | 8,712,391 |
Lowe’s Cos., Inc. | | 171,190 | | | 4,004,134 |
McDonald’s Corporation | | 192,038 | | | 11,990,853 |
Newell Rubbermaid, Inc.D | | 78,460 | | | 1,177,685 |
NIKE, Inc. Class B | | 266,425 | | | 17,602,700 |
Nordstrom, Inc.D | | 45,882 | | | 1,724,245 |
Priceline.com, Inc.* | | 34,183 | | | 7,468,985 |
Staples, Inc. | | 266,500 | | | 6,553,235 |
Starbucks CorporationD* | | 599,230 | | | 13,818,244 |
Starwood Hotels & Resorts Worldwide, Inc.D | | 147,500 | | | 5,394,075 |
Target CorporationD | | 81,480 | | | 3,941,188 |
Time Warner, Inc.D* | | 148,840 | | | 4,337,198 |
VF Corporation | | 16,500 | | | 1,208,460 |
Wal-Mart Stores, Inc. | | 23,780 | | | 1,271,041 |
Walt Disney Co. (The)D | | 92,180 | | | 2,972,805 |
Western Union Co. (The) | | 105,760 | | | 1,993,576 |
| | | | | |
| | | | | 199,286,204 |
| | | | | |
Consumer Staples — 3.4% | | | | | |
Church & Dwight Co., Inc.D | | 51,600 | | | 3,119,220 |
Colgate-Palmolive Co. | | 86,140 | | | 7,076,401 |
Dr Pepper Snapple Group, Inc. | | 80,700 | | | 2,283,810 |
General Mills, Inc.D | | 79,630 | | | 5,638,600 |
Hansen Natural Corporation* | | 73,688 | | | 2,829,619 |
J.M. Smucker Co. (The) | | 45,390 | | | 2,802,833 |
PepsiCo, Inc. | | 216,670 | | | 13,173,536 |
Procter & Gamble Co. (The) | | 51,300 | | | 3,110,319 |
Whole Foods Market, Inc.D* | | 99,200 | | | 2,723,040 |
| | | | | |
| | | | | 42,757,378 |
| | | | | |
Energy — 7.6% | | | | | |
Cameron International CorporationD* | | 146,640 | | | 6,129,552 |
Chesapeake Energy Corporation | | 140,400 | | | 3,633,552 |
Chevron Corporation | | 76,940 | | | 5,923,611 |
Devon Energy Corporation | | 49,640 | | | 3,648,540 |
EOG Resources, Inc. | | 47,741 | | | 4,645,199 |
FMC Technologies, Inc.D* | | 244,400 | | | 14,136,096 |
National Oilwell Varco, Inc. | | 402,800 | | | 17,759,452 |
Newfield Exploration Co.* | | 36,330 | | | 1,752,196 |
Schlumberger, Ltd. | | 220,900 | | | 14,378,381 |
Southwestern Energy Co.D* | | 93,590 | | | 4,511,038 |
Transocean, Ltd.* | | 219,986 | | | 18,214,841 |
Walter Energy, Inc. | | 27,030 | | | 2,035,629 |
| | | | | |
| | | | | 96,768,087 |
| | | | | |
Financial Services — 14.7% | | | | | |
American Express Co. | | 311,539 | | | 12,623,560 |
Ameriprise Financial, Inc. | | 47,590 | | | 1,847,444 |
Annaly Capital Management, Inc. REIT | | 58,960 | | | 1,022,956 |
Bank of America CorporationD | | 320,160 | | | 4,821,610 |
Capital One Financial Corporation | | 129,266 | | | 4,956,059 |
CME Group, Inc. | | 26,700 | | | 8,969,865 |
Franklin Resources, Inc. | | 59,040 | | | 6,219,864 |
Goldman Sachs Group, Inc. (The) | | 106,812 | | | 18,034,138 |
IntercontinentalExchange, Inc.* | | 156,100 | | | 17,530,030 |
Invesco, Ltd. | | 81,330 | | | 1,910,442 |
JPMorgan Chase & Co. | | 405,036 | | | 16,877,850 |
Marsh & McLennan Cos., Inc. | | 56,130 | | | 1,239,350 |
Mastercard, Inc. Class AD | | 58,386 | | | 14,945,648 |
Morgan Stanley | | 225,840 | | | 6,684,864 |
Schwab (Charles) Corporation (The) | | 287,430 | | | 5,409,433 |
State Street Corporation | | 69,060 | | | 3,006,872 |
US Bancorp | | 164,328 | | | 3,699,023 |
Visa, Inc.D | | 490,828 | | | 42,927,817 |
Wells Fargo & Co. | | 471,026 | | | 12,712,992 |
| | | | | |
| | | | | 185,439,817 |
| | | | | |
Healthcare — 13.6% | | | | | |
Abbott Laboratories | | 271,502 | | | 14,658,393 |
Alexion Pharmaceuticals, Inc.D* | | 26,430 | | | 1,290,313 |
Allergan, Inc. | | 298,570 | | | 18,812,896 |
Amgen, Inc.* | | 148,560 | | | 8,404,039 |
Baxter International, Inc. | | 83,290 | | | 4,887,457 |
Celgene Corporation* | | 75,240 | | | 4,189,363 |
Cephalon, Inc.* | | 13,150 | | | 820,692 |
Covance, Inc.D* | | 20,380 | | | 1,112,137 |
Express Scripts, Inc.* | | 56,510 | | | 4,885,289 |
Genzyme Corporation* | | 282,500 | | | 13,845,325 |
Gilead Sciences, Inc.* | | 220,641 | | | 9,549,342 |
Illumina, Inc.D* | | 170,491 | | | 5,225,549 |
Intuitive Surgical, Inc.D* | | 89,200 | | | 27,056,144 |
Johnson & Johnson | | 82,822 | | | 5,334,565 |
Life Technologies Corporation* | | 48,500 | | | 2,533,155 |
Medtronic, Inc. | | 115,610 | | | 5,084,528 |
Merck & Co., Inc. | | 152,319 | | | 5,565,736 |
Mylan, Inc.D* | | 268,400 | | | 4,946,612 |
Qiagen NVD* | | 102,770 | | | 2,293,826 |
Shire PLC ADRD | | 55,210 | | | 3,240,827 |
St. Jude Medical, Inc.* | | 70,320 | | | 2,586,370 |
Stryker CorporationD | | 73,609 | | | 3,707,685 |
Teva Pharmaceutical Industries, Ltd. ADR | | 62,870 | | | 3,532,037 |
Thermo Fisher Scientific, Inc.* | | 121,900 | | | 5,813,411 |
UnitedHealth Group, Inc. | | 128,660 | | | 3,921,557 |
Varian Medical Systems, Inc.D* | | 180,600 | | | 8,461,110 |
| | | | | |
| | | | | 171,758,358 |
| | | | | |
Materials & Processing — 5.8% | | | | | |
ABB, Ltd. ADRD* | | 184,930 | | | 3,532,163 |
Air Products & Chemicals, Inc. | | 30,356 | | | 2,460,657 |
Albemarle CorporationD | | 56,410 | | | 2,051,632 |
Dow Chemical Co. (The)D | | 388,118 | | | 10,723,700 |
See Notes to Financial Statements.
150
| | | | | | |
| | | Shares | | Value |
FMC CorporationD | | | 33,360 | | $ | 1,860,154 |
Freeport-McMoRan Copper & Gold, Inc.D* | | | 157,130 | | | 12,615,968 |
Monsanto Co. | | | 159,200 | | | 13,014,600 |
Newmont Mining Corporation | | | 76,900 | | | 3,638,139 |
PPG Industries, Inc. | | | 60,207 | | | 3,524,518 |
Praxair, Inc. | | | 190,846 | | | 15,326,842 |
Precision Castparts Corporation | | | 43,480 | | | 4,798,018 |
| | | | | | |
| | | | | | 73,546,391 |
| | | | | | |
Producer Durables — 6.7% | | | | | | |
3M Co. | | | 78,450 | | | 6,485,462 |
America Movil SAB de CV ADR Series LD | | | 194,500 | | | 9,137,610 |
AMETEK, Inc.D | | | 42,700 | | | 1,632,848 |
Caterpillar, Inc. | | | 48,500 | | | 2,764,015 |
CSX Corporation | | | 80,360 | | | 3,896,656 |
Cummins, Inc. | | | 135,560 | | | 6,216,782 |
Danaher Corporation | | | 34,950 | | | 2,628,240 |
Deere & Co. | | | 51,730 | | | 2,798,076 |
Expeditors International of Washington, Inc. | | | 135,200 | | | 4,695,496 |
FedEx Corporation | | | 27,500 | | | 2,294,875 |
FLIR Systems, Inc.D* | | | 183,800 | | | 6,013,936 |
FTI Consulting, Inc.* | | | 23,770 | | | 1,120,993 |
General Dynamics Corporation | | | 120,142 | | | 8,190,080 |
Iron Mountain, Inc.D* | | | 222,680 | | | 5,068,197 |
Norfolk Southern Corporation | | | 97,038 | | | 5,086,732 |
Oshkosh Corporation | | | 45,710 | | | 1,692,641 |
Union Pacific Corporation | | | 154,631 | | | 9,880,921 |
United Technologies Corporation | | | 77,040 | | | 5,347,346 |
| | | | | | |
| | | | | | 84,950,906 |
| | | | | | |
Technology — 24.3% | | | | | | |
Adobe Systems, Inc.* | | | 169,781 | | | 6,244,545 |
American Tower Corporation Class A* | | | 242,358 | | | 10,472,289 |
Amphenol Corporation Class A | | | 106,412 | | | 4,914,106 |
Apple, Inc.* | | | 302,850 | | | 63,858,951 |
Broadcom Corporation Class AD* | | | 560,360 | | | 17,623,322 |
Check Point Software Technologies, Ltd.* | | | 123,090 | | | 4,170,289 |
Cisco Systems, Inc.* | | | 774,537 | | | 18,542,416 |
Citrix Systems, Inc.D* | | | 46,650 | | | 1,941,107 |
Cognizant Technology Solutions Corporation Class A* | | | 99,680 | | | 4,515,504 |
EMC Corporation* | | | 439,820 | | | 7,683,656 |
Equinix, Inc.D* | | | 9,408 | | | 998,659 |
Google, Inc. Class A* | | | 84,832 | | | 52,594,143 |
Hewlett-Packard Co. | | | 146,686 | | | 7,555,796 |
Intel Corporation | | | 353,260 | | | 7,206,504 |
International Business Machines Corporation | | | 59,987 | | | 7,852,298 |
Juniper Networks, Inc.* | | | 144,680 | | | 3,858,616 |
Marvell Technology Group, Ltd.D* | | | 486,980 | | | 10,104,835 |
Microsoft Corporation | | | 334,140 | | | 10,187,929 |
NetApp, Inc.D* | | | 41,980 | | | 1,443,692 |
NVIDIA CorporationD* | | | 293,756 | | | 5,487,362 |
Oracle Corporation | | | 185,260 | | | 4,546,280 |
QUALCOMM, Inc. | | | 671,476 | | | 31,062,480 |
Rovi Corporation* | | | 7 | | | 223 |
Salesforce.com, Inc.D* | | | 216,300 | | | 15,956,451 |
Trimble Navigation, Ltd.D* | | | 48,050 | | | 1,210,860 |
VMware, Inc.D* | | | 110,700 | | | 4,691,466 |
Yahoo!, Inc.* | | | 133,294 | | | 2,236,673 |
| | | | | | |
| | | | | | 306,960,452 |
| | | | | | |
Utilities — 0.5% | | | | | | |
AES Corporation (The)* | | | 465,750 | | | 6,199,132 |
| | | | | | |
Total Common Stocks
(Cost $955,426,723) | | | | | | 1,167,666,725 |
| | | | | | |
FOREIGN COMMON STOCKS — 3.2% | | | | | | |
Brazil — 0.6% | | | | | | |
Petroleo Brasileiro SA ADR | | | 160,170 | | | 7,636,906 |
| | | | | | |
Canada — 0.5% | | | | | | |
Potash Corporation of Saskatchewan, Inc. | | | 49,213 | | | 5,339,610 |
Research In Motion, Ltd.D* | | | 20,650 | | | 1,394,701 |
| | | | | | |
| | | | | | 6,734,311 |
| | | | | | |
China — 0.5% | | | | | | |
Baidu, Inc. ADR* | | | 16,090 | | | 6,616,691 |
| | | | | | |
France — 0.2% | | | | | | |
Total SA ADRD | | | 49,100 | | | 3,144,364 |
| | | | | | |
Switzerland — 0.5% | | | | | | |
Ace, Ltd.* | | | 50,320 | | | 2,536,128 |
Alcon, Inc. | | | 19,390 | | | 3,186,746 |
| | | | | | |
| | | | | | 5,722,874 |
| | | | | | |
United Kingdom — 0.9% | | | | | | |
BHP Billiton PLC ADRD | | | 93,800 | | | 5,989,130 |
HSBC Holdings PLC ADRD | | | 87,600 | | | 5,001,084 |
| | | | | | |
| | | | | | 10,990,214 |
| | | | | | |
Total Foreign Common Stocks
(Cost $34,112,927) | | | | | | 40,845,360 |
| | | | | | |
PREFERRED STOCK — 0.1% | | | | | | |
Wells Fargo & Co.D
(Cost $678,134) | | | 35,400 | | | 909,780 |
| | | | | | |
RIGHT/WARRANT — 0.0% | | | | | | |
Krispy Kreme Doughnuts, Inc.*
(Cost $74) | | | 7,410 | | | 445 |
| | | | | | |
MONEY MARKET FUNDS — 18.8% | | | | | | |
GuideStone Money Market Fund (GS4 Class)¥ | | | 47,454,582 | | | 47,454,582 |
Northern Institutional Liquid Assets Portfolio§ | | | 190,203,025 | | | 190,203,025 |
| | | | | | |
Total Money Market Funds
(Cost $237,657,607) | | | | | | 237,657,607 |
| | | | | | |
| | |
| | | Par | | |
U.S. TREASURY OBLIGATIONS — 0.4% | | | | | | |
U.S. Treasury Bills | | | | | | |
0.10%, 05/06/10‡‡ | | $ | 385,000 | | | 384,867 |
0.11%, 05/06/10‡‡ | | | 4,710,000 | | | 4,708,370 |
| | | | | | |
Total U.S. Treasury Obligations
(Cost $5,093,069) | | | | | | 5,093,237 |
| | | | | | |
See Notes to Financial Statements.
151
GROWTH EQUITY FUND
SCHEDULE OF INVESTMENTS (Continued)
| | | | |
| | | Value | |
TOTAL INVESTMENTS — 114.9%
(Cost $1,232,968,534) | | $ | 1,452,173,154 | |
| Liabilities in Excess of Other Assets — (14.9)% | | | (188,493,641 | ) |
| | | | |
| NET ASSETS — 100.0% | | $ | 1,263,679,513 | |
| | | | |
Please see abbreviation and footnote definitions on page 180.
PORTFOLIO SUMMARY (based on net assets)
| | | |
| | | % | |
Technology | | 24.3 | |
Money Market Funds | | 18.8 | |
Consumer Discretionary | | 15.8 | |
Financial Services | | 14.7 | |
Healthcare | | 13.6 | |
Energy | | 7.6 | |
Producer Durables | | 6.7 | |
Materials & Processing | | 5.8 | |
Futures Contracts | | 4.0 | |
Consumer Staples | | 3.4 | |
Foreign Common Stocks | | 3.2 | |
Utilities | | 0.5 | |
U.S. Treasury Obligations | | 0.4 | |
Preferred Stock | | 0.1 | |
Right/Warrant | | — | ** |
| | | |
| | 118.9 | |
| | | |
| ** | Rounds to less than 0.005%. |
FAS 157 DISCLOSURE
The following is a summary of the inputs used, as of December 31, 2009, in valuing the Fund’s assets carried at fair value:
| | | | | | |
Valuation Inputs | | Investments
in
Securities | | Other
Financial
Instruments*** |
Level 1 — Quoted Prices | | | | | | |
Common Stocks | | $ | 1,167,666,725 | | $ | — |
Foreign Common Stocks | | | 40,845,360 | | | — |
Futures Contracts | | | — | | | 625,462 |
Money Market Funds | | | 237,657,607 | | | — |
Preferred Stock | | | 909,780 | | | — |
Right/Warrant | | | 445 | | | — |
Level 2 — Other Significant Observable Inputs | | | | | | |
U.S. Treasury Obligations | | | 5,093,237 | | | — |
Level 3 — Significant Unobservable Inputs | | | — | | | — |
| | | | | | |
Total | | $ | 1,452,173,154 | | $ | 625,462 |
| | | | | | |
| *** | Other financial instruments are derivative instruments not reflected in the Schedule of Investments, such as futures, forwards and swap contracts, which are valued at the unrealized appreciation (depreciation) on the investment. Details of these investments can be found in the Notes to Financial Statements. |
See Notes to Financial Statements.
152
Small Cap Equity Fund
The Small Cap Equity Fund is comprised of domestic, small-cap stocks with both value and growth style orientations. The Fund outperformed its benchmark, the Russell 2000® Index, for the one-year period ended December 31, 2009 (27.93% versus 27.17%). Security selection within the financial services sector contributed to benchmark-relative returns, while security selection within the consumer discretionary sector detracted from benchmark-relative performance during the year.
Please see page 163 for information regarding specific portfolio allocations. Portfolio holdings are subject to change at any time.
Small company stocks are generally riskier than large company stocks due to greater volatility and less liquidity.
153
Small Cap Equity Fund
| | | | | | | | | |
Average Annual Total Returns as of 12/31/09 | |
| | | GS2 Class* | | | GS4 Class* | | | Benchmark** | |
One Year | | 28.12 | % | | 27.93 | % | | 27.17 | % |
Five Year | | -0.67 | % | | -0.80 | % | | 0.51 | % |
Since Inception | | 3.01 | % | | 2.86 | % | | 4.56 | % |
Inception Date | | 08/27/01 | | | 08/27/01 | | | | |
Total Fund Operating Expenses (June 25, 2009 Prospectus)(1) | | 1.04 | % | | 1.24 | % | | | |
| (1) | Current information regarding the Fund’s Operating Expenses can be found in the Financial Highlights. |
The performance data quoted represents past performance and does not guarantee future results. Current performance may be lower or higher. Performance data current to the most recent month-end may be obtained at www.GuideStoneFunds.org. The investment return and principal value of an investment will fluctuate so that shares, when redeemed, may be worth more or less than their original cost.
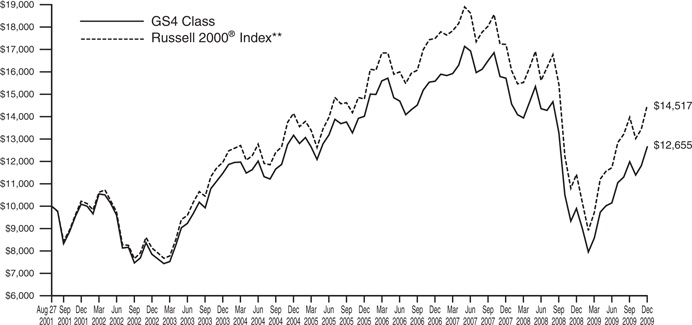
The graph compares the results of a hypothetical $10,000 investment in the GS4 Class of the Fund since August 27, 2001 (commencement of operations), with all dividends and capital gains reinvested, with the Russell 2000® Index.
| * | These returns reflect expense waivers by the Fund’s investment adviser. Without these waivers, returns would have been lower. Returns shown do not reflect the deduction of taxes that a shareholder would pay on Fund distributions or the redemption of Fund shares. |
| ** | The Russell 2000® Index is a small-cap equity index comprised of the 2,000 smallest companies in the Russell 3000® Index, which represents approximately 10% of the total market capitalization of the Russell 3000® Index. |
Unlike a mutual fund, the performance of an index assumes no taxes, transaction costs, management fees or other expenses.
154
| | |
| SMALL CAP EQUITY FUND | | |
| SCHEDULE OF INVESTMENTS | | December 31, 2009 |
| | | | | |
| | | Shares | | Value |
COMMON STOCKS — 84.1% | | | | | |
Consumer Discretionary — 10.1% | | | | | |
Aaron’s, Inc.D | | 50,600 | | $ | 1,403,138 |
Aeropostale, Inc.D* | | 14,655 | | | 499,003 |
American Greetings Corporation Class A | | 46,200 | | | 1,006,698 |
American Public Education, Inc.D* | | 53,800 | | | 1,848,568 |
AnnTaylor Stores CorporationD* | | 32,500 | | | 443,300 |
Arbitron, Inc.D | | 30,100 | | | 704,942 |
Archipelago Learning, Inc.* | | 12,380 | | | 256,266 |
ATC Technology Corporation* | | 48,200 | | | 1,149,570 |
Bare Escentuals, Inc.D* | | 135,800 | | | 1,660,834 |
BJ’s Wholesale Club, Inc.* | | 11,600 | | | 379,436 |
Bob Evans Farms, Inc.D | | 18,800 | | | 544,260 |
Capella Education Co.D* | | 12,000 | | | 903,600 |
Cheesecake Factory, Inc. (The)D* | | 25,500 | | | 550,545 |
Chico’s FAS, Inc.D* | | 44,800 | | | 629,440 |
Citi Trends, Inc.* | | 29,600 | | | 817,552 |
Corinthian Colleges, Inc.D* | | 61,300 | | | 844,101 |
CROCS, Inc.D* | | 83,900 | | | 482,425 |
Deckers Outdoor Corporation* | | 20,700 | | | 2,105,604 |
DG Fastchannel, Inc.* | | 46,100 | | | 1,287,573 |
Dillard’s, Inc. Class AD | | 49,100 | | | 905,895 |
Drew Industries, Inc.* | | 46,800 | | | 966,420 |
DSW, Inc.D* | | 16,900 | | | 437,372 |
Education Management Corporation* | | 25,500 | | | 561,255 |
FGX International Holdings, Ltd.D* | | 27,900 | | | 546,561 |
Guess ?, Inc. | | 17,200 | | | 727,560 |
Harman International Industries, Inc. | | 13,200 | | | 465,696 |
Houston Wire & Cable Co.D | | 38,800 | | | 461,720 |
Iconix Brand Group, Inc.D* | | 39,900 | | | 504,735 |
Insight Enterprises, Inc.D* | | 25,500 | | | 291,210 |
J Crew Group, Inc.D* | | 15,600 | | | 697,944 |
Jo-Ann Stores, Inc.D* | | 7,100 | | | 257,304 |
John Wiley & Sons, Inc. | | 30,200 | | | 1,264,776 |
Jones Apparel Group, Inc. | | 46,100 | | | 740,366 |
JOS. A. Bank Clothiers, Inc.D* | | 11,700 | | | 493,623 |
Kirkland’s, Inc.* | | 14,100 | | | 244,917 |
Mohawk Industries, Inc.* | | 7,100 | | | 337,960 |
Monro Muffler Brake, Inc. | | 26,700 | | | 892,848 |
Netflix, Inc.D* | | 9,300 | | | 512,802 |
Nu Skin Enterprises, Inc. Cl A | | 11,600 | | | 311,692 |
Papa John’s International, Inc.* | | 46,700 | | | 1,090,912 |
PF Chang’s China Bistro, Inc.D* | | 17,200 | | | 652,052 |
Rent-A-Center, Inc.* | | 35,700 | | | 632,604 |
Rush Enterprises, Inc. Class AD* | | 49,421 | | | 587,616 |
Scholastic Corporation | | 36,000 | | | 1,073,880 |
Skechers USA, Inc. Class A* | | 24,700 | | | 726,427 |
Steven Madden, Ltd.D* | | 42,300 | | | 1,744,452 |
Tech Data Corporation* | | 34,100 | | | 1,591,106 |
Tempur-Pedic International, Inc.D* | | 32,491 | | | 767,762 |
Timberland Co. (The)D* | | 30,700 | | | 550,451 |
Tupperware Brands CorporationD | | 17,300 | | | 805,661 |
Ulta Salon Cosmetics & Fragrance, Inc.* | | 50,388 | | | 915,046 |
ValueClick, Inc.* | | 79,400 | | | 803,528 |
Vitamin Shoppe, Inc.* | | 11,700 | | | 260,208 |
WESCO International, Inc.D* | | 34,400 | | | 929,144 |
| | | | | |
| | | | | 42,270,360 |
| | | | | |
Consumer Staples — 3.0% | | | | | |
Chattem, Inc.D* | | 14,800 | | | 1,380,840 |
Chiquita Brands International, Inc.D* | | 45,500 | | | 820,820 |
Diamond Foods, Inc.D | | 18,900 | | | 671,706 |
Fresh Del Monte Produce, Inc.* | | 22,200 | | | 490,620 |
Green Mountain Coffee Roasters, Inc.D* | | 13,172 | | | 1,073,123 |
Hansen Natural Corporation* | | 38,200 | | | 1,466,880 |
Helen of Troy, Ltd.* | | 37,583 | | | 919,280 |
Herbalife, Ltd. | | 36,100 | | | 1,464,577 |
J & J Snack Foods Corporation | | 27,052 | | | 1,080,998 |
Lancaster Colony CorporationD | | 15,800 | | | 785,260 |
Peet’s Coffee & Tea, Inc.* | | 9,000 | | | 299,970 |
PetMed Express, Inc.D | | 36,700 | | | 647,021 |
TreeHouse Foods, Inc.D* | | 14,288 | | | 555,231 |
United Natural Foods, Inc.* | | 37,700 | | | 1,008,098 |
| | | | | |
| | | | | 12,664,424 |
| | | | | |
Energy — 6.1% | | | | | |
Approach Resources, Inc.D* | | 49,600 | | | 382,912 |
Arena Resources, Inc.D* | | 62,900 | | | 2,712,248 |
Atlas Energy, Inc. | | 21,600 | | | 651,672 |
Brigham Exploration Co.D* | | 82,600 | | | 1,119,230 |
Cal Dive International, Inc.* | | 177,500 | | | 1,341,900 |
CARBO Ceramics, Inc.D | | 13,800 | | | 940,746 |
Comstock Resources, Inc.* | | 40,200 | | | 1,630,914 |
Concho Resources, Inc.* | | 34,800 | | | 1,562,520 |
Contango Oil* | | 20,100 | | | 944,901 |
CVR Energy, Inc.* | | 81,000 | | | 555,660 |
Dril-Quip, Inc.* | | 10,100 | | | 570,448 |
EXCO Resources, Inc. | | 146,239 | | | 3,104,654 |
Exterran Holdings, Inc.D* | | 44,800 | | | 960,960 |
Gulf Island Fabrication, Inc.D | | 10,100 | | | 212,403 |
Hercules Offshore, Inc.* | | 184,300 | | | 880,954 |
Holly CorporationD | | 33,800 | | | 866,294 |
Oil States International, Inc.D* | | 35,000 | | | 1,375,150 |
Patterson-UTI Energy, Inc. | | 37,900 | | | 581,765 |
Quicksilver Resources, Inc.D* | | 35,800 | | | 537,358 |
Rex Energy Corporation* | | 20,300 | | | 243,600 |
Rosetta Resources, Inc.* | | 22,300 | | | 444,439 |
St. Mary Land & Exploration Co. | | 15,400 | | | 527,296 |
Sunoco, Inc. | | 24,000 | | | 626,400 |
T-3 Energy Services, Inc.* | | 17,749 | | | 452,599 |
Walter Energy, Inc. | | 8,400 | | | 632,604 |
Whiting Petroleum CorporationD* | | 9,300 | | | 664,485 |
Willbros Group, Inc.* | | 67,200 | | | 1,133,664 |
| | | | | |
| | | | | 25,657,776 |
| | | | | |
Financial Services — 16.4% | | | | | |
American Equity Investment Life Holding Co. | | 66,700 | | | 496,248 |
American Financial Group, Inc. | | 50,500 | | | 1,259,975 |
American Physicians Capital, Inc. | | 15,600 | | | 472,992 |
AMERISAFE, Inc.* | | 31,518 | | | 566,379 |
Amtrust Financial Services, Inc. | | 48,700 | | | 575,634 |
Argo Group International Holdings, Ltd.* | | 27,152 | | | 791,209 |
See Notes to Financial Statements.
155
SMALL CAP EQUITY FUND
SCHEDULE OF INVESTMENTS (Continued)
| | | | | |
| | | Shares | | Value |
Assurant, Inc. | | 35,100 | | $ | 1,034,748 |
AXIS Capital Holdings, Ltd. | | 49,000 | | | 1,392,090 |
Banco Latinoamericano de Exportaciones SA | | 62,000 | | | 861,800 |
Bank of the Ozarks, Inc.D | | 28,200 | | | 825,414 |
BOK Financial CorporationD | | 11,300 | | | 536,976 |
Brown & Brown, Inc.D | | 63,800 | | | 1,146,486 |
Cash America International, Inc.D | | 21,500 | | | 751,640 |
City Holding Co.D | | 24,900 | | | 805,017 |
Cohen & Steers, Inc.D | | 21,200 | | | 484,208 |
Cybersource CorporationD* | | 75,786 | | | 1,524,056 |
Delphi Financial Group, Inc. | | 50,700 | | | 1,134,159 |
Duff & Phelps Corporation | | 42,100 | | | 768,746 |
DuPont Fabros Technology, Inc. REIT | | 58,800 | | | 1,057,812 |
Endurance Specialty Holdings, Ltd.D | | 35,100 | | | 1,306,773 |
Euronet Worldwide, Inc.* | | 20,800 | | | 456,560 |
Evercore Partners, Inc. Class AD | | 24,300 | | | 738,720 |
Federated Investors, Inc. Class BD | | 35,700 | | | 981,750 |
First Cash Financial Services, Inc.D* | | 40,800 | | | 905,352 |
FPIC Insurance Group, Inc.* | | 11,500 | | | 444,130 |
GFI Group, Inc.D | | 72,400 | | | 330,868 |
Global Payments, Inc. | | 79,000 | | | 4,254,940 |
HCC Insurance Holdings, Inc. | | 104,535 | | | 2,923,844 |
Home Bancshares, Inc.D | | 18,400 | | | 442,888 |
Horace Mann Educators Corporation | | 62,100 | | | 776,250 |
HRPT Properties Trust REIT | | 181,700 | | | 1,175,599 |
IBERIABANK Corporation | | 7,700 | | | 414,337 |
Infinity Property & Casualty Corporation | | 24,600 | | | 999,744 |
International Bancshares CorporationD | | 66,100 | | | 1,251,273 |
Jack Henry & Associates, Inc.D | | 48,200 | | | 1,114,384 |
Jones Lang LaSalle, Inc.D | | 38,900 | | | 2,349,560 |
LTC Properties, Inc. REIT | | 37,800 | | | 1,011,150 |
Mercury General Corporation | | 15,400 | | | 604,604 |
National Financial Partners Corporation* | | 108,400 | | | 876,956 |
National Health Investors, Inc. REIT | | 30,600 | | | 1,131,894 |
NBH Holdings Corporation+@ | | 30,300 | | | 613,575 |
Net 1 UEPS Technologies, Inc.* | | 51,300 | | | 996,246 |
NewAlliance Bancshares, Inc.D | | 69,600 | | | 835,896 |
Ocwen Financial Corporation* | | 53,200 | | | 509,124 |
optionsXpress Holdings, Inc.D | | 151,290 | | | 2,337,431 |
Pacwest BancorpD | | 13,500 | | | 272,025 |
Park National CorporationD | | 14,400 | | | 847,872 |
Pennsylvania Real Estate Investment Trust REITD | | 92,600 | | | 783,396 |
Platinum Underwriters Holdings, Ltd. | | 32,500 | | | 1,244,425 |
Portfolio Recovery Associates, Inc.D* | | 13,500 | | | 605,880 |
ProAssurance Corporation* | | 18,600 | | | 999,006 |
PS Business Parks, Inc. REIT | | 19,600 | | | 980,980 |
Republic Bancorp, Inc. Class AD | | 27,600 | | | 568,560 |
RLI Corporation | | 23,700 | | | 1,262,025 |
Safety Insurance Group, Inc. | | 51,800 | | | 1,876,714 |
StanCorp Financial Group, Inc. | | 63,800 | | | 2,553,276 |
Stifel Financial Corporation* | | 12,800 | | | 758,272 |
SWS Group, Inc.D | | 19,500 | | | 235,950 |
Taubman Centers, Inc. REITD | | 35,300 | | | 1,267,623 |
Torchmark Corporation | | 21,800 | | | 958,110 |
Tower Group, Inc.D | | 48,600 | | | 1,137,726 |
Trustmark Corporation | | 26,600 | | | 599,564 |
United Bankshares, Inc.D | | 32,700 | | | 653,019 |
Unitrin, Inc. | | 51,500 | | | 1,135,575 |
Whitney Holding Corporation | | 35,400 | | | 322,494 |
World Acceptance CorporationD* | | 33,100 | | | 1,185,973 |
Wright Express Corporation* | | 74,300 | | | 2,367,198 |
| | | | | |
| | | | | 68,885,100 |
| | | | | |
Healthcare — 11.0% | | | | | |
Affymax Inc* | | 24,400 | | | 603,656 |
Alexion Pharmaceuticals, Inc.* | | 15,120 | | | 738,158 |
Align Technology, Inc.D* | | 97,900 | | | 1,744,578 |
Allscripts-Misys Healthcare Solutions, Inc.D* | | 36,200 | | | 732,326 |
Amedisys, Inc.D* | | 34,334 | | | 1,667,259 |
American Medical Systems Holdings, Inc.* | | 21,800 | | | 420,522 |
athenahealth, Inc.D* | | 7,257 | | | 328,307 |
BioMarin Pharmaceuticals, Inc.D* | | 48,400 | | | 910,404 |
Bio-Rad Laboratories, Inc. Class A* | | 21,200 | | | 2,044,952 |
Brookdale Senior Living, Inc.* | | 39,900 | | | 725,781 |
Catalyst Health Solutions, Inc.* | | 55,200 | | | 2,013,144 |
Centene Corporation* | | 31,000 | | | 656,270 |
Cooper Cos., Inc.D | | 40,400 | | | 1,540,048 |
Cubist Pharmaceuticals, Inc.D* | | 40,200 | | | 762,594 |
Dionex CorporationD* | | 13,200 | | | 975,084 |
Emergency Medical Services Corporation Class A* | | 29,800 | | | 1,613,670 |
Endo Pharmaceuticals Holdings, Inc.* | | 41,500 | | | 851,165 |
Five Star Quality Care, Inc.+ | | 2,086 | | | — |
Genoptix, Inc.D* | | 15,400 | | | 547,162 |
Gen-Probe, Inc.D* | | 14,900 | | | 639,210 |
Haemonetics Corporation* | | 15,900 | | | 876,885 |
Health Net, Inc.* | | 62,900 | | | 1,464,941 |
Healthspring, Inc.* | | 75,000 | | | 1,320,750 |
Hill-Rom Holdings, Inc.D | | 47,600 | | | 1,141,924 |
Human Genome Sciences, Inc.D* | | 21,500 | | | 657,900 |
ICON PLC ADR* | | 91,200 | | | 1,981,776 |
Incyte Corporation, Ltd.D* | | 54,300 | | | 494,673 |
Invacare Corporation | | 22,400 | | | 558,656 |
IPC The Hospitalist Co., Inc.* | | 10,100 | | | 335,825 |
LifePoint Hospitals, Inc.D* | | 6,000 | | | 195,060 |
Magellan Health Services, Inc.* | | 60,200 | | | 2,451,946 |
MedAssets, Inc.D* | | 38,700 | | | 820,827 |
Mednax, Inc.* | | 13,600 | | | 817,496 |
PerkinElmer, Inc. | | 66,000 | | | 1,358,940 |
Phase Forward, Inc.* | | 50,200 | | | 770,570 |
PSS World Medical, Inc.D* | | 19,200 | | | 433,344 |
Psychiatric Solutions, Inc.* | | 31,000 | | | 655,340 |
Salix Pharmaceuticals, Ltd.* | | 18,000 | | | 457,200 |
Sirona Dental Systems, Inc.* | | 45,689 | | | 1,450,169 |
SXC Health Solutions CorporationD* | | 12,200 | | | 658,190 |
Techne Corporation | | 17,400 | | | 1,192,944 |
Thoratec CorporationD* | | 24,427 | | | 657,575 |
See Notes to Financial Statements.
156
| | | | | |
| | | Shares | | Value |
United Therapeutics CorporationD* | | 19,000 | | $ | 1,000,350 |
VCA Antech, Inc.D* | | 43,800 | | | 1,091,496 |
Volcano CorporationD* | | 67,900 | | | 1,180,102 |
WellCare Health Plans, Inc.D* | | 59,800 | | | 2,198,248 |
Zoll Medical Corporation* | | 17,500 | | | 467,600 |
| | | | | |
| | | | | 46,205,017 |
| | | | | |
Materials & Processing — 5.3% | | | | | |
AAON, Inc.D | | 14,600 | | | 284,554 |
AK Steel Holding Corporation | | 14,000 | | | 298,900 |
Apogee Enterprises, Inc.D | | 61,700 | | | 863,800 |
Beacon Roofing Supply, Inc.D* | | 39,967 | | | 639,472 |
Belden, Inc. | | 32,500 | | | 712,400 |
Bemis Co., Inc. | | 30,700 | | | 910,255 |
Cabot Corporation | | 45,900 | | | 1,203,957 |
CLARCOR, Inc. | | 46,400 | | | 1,505,216 |
Compass Minerals International, Inc. | | 9,300 | | | 624,867 |
H.B. Fuller Co. | | 48,100 | | | 1,094,275 |
Innophos Holdings, Inc. | | 38,800 | | | 892,012 |
Interline Brands, Inc.* | | 55,400 | | | 956,758 |
Kaiser Aluminum Corporation | | 12,600 | | | 524,412 |
Kraton Performance Polymers, Inc.D* | | 28,800 | | | 390,528 |
Lennox International, Inc.D | | 19,100 | | | 745,664 |
Lubrizol Corporation | | 17,100 | | | 1,247,445 |
Minerals Technologies, Inc. | | 18,600 | | | 1,013,142 |
NewMarket Corporation | | 10,000 | | | 1,147,700 |
OM Group, Inc.* | | 25,800 | | | 809,862 |
Owens CorningD* | | 6,300 | | | 161,532 |
RBC Bearings, Inc.* | | 18,300 | | | 445,239 |
Reliance Steel & Aluminum Co. | | 31,700 | | | 1,370,074 |
RTI International Metals, Inc.* | | 10,000 | | | 251,700 |
Schulman (A), Inc. | | 42,400 | | | 855,632 |
Sonoco Products Co. | | 14,500 | | | 424,125 |
Stepan Co. | | 9,100 | | | 589,771 |
Watsco, Inc.D | | 43,100 | | | 2,111,038 |
| | | | | |
| | | | | 22,074,330 |
| | | | | |
Producer Durables — 14.6% | | | | | |
A.O. Smith CorporationD | | 29,998 | | | 1,301,613 |
Actuant Corporation Class A | | 48,268 | | | 894,406 |
Advisory Board Co. (The)* | | 29,700 | | | 910,602 |
Alaska Air Group, Inc.D* | | 19,800 | | | 684,288 |
Allegiant Travel Co.D* | | 28,000 | | | 1,320,760 |
AMN Healthcare Services, Inc.* | | 67,500 | | | 611,550 |
Arkansas Best Corporation | | 24,919 | | | 733,366 |
B/E Aerospace* | | 17,400 | | | 408,900 |
Briggs & Stratton CorporationD | | 71,400 | | | 1,335,894 |
Chart Industries, Inc.* | | 28,600 | | | 473,330 |
Clean Harbors, Inc.* | | 21,300 | | | 1,269,693 |
Columbus McKinnon Corporation* | | 55,100 | | | 752,666 |
Corporate Executive Board Co. (The)D | | 38,800 | | | 885,416 |
CoStar Group, Inc.D* | | 22,100 | | | 923,117 |
Curtiss-Wright Corporation | | 39,400 | | | 1,234,008 |
Darling International, Inc.* | | 40,900 | | | 342,742 |
Dycom Industries, Inc.* | | 72,300 | | | 580,569 |
DynCorp International, Inc.* | | 45,800 | | | 657,230 |
EMCOR Group, Inc.* | | 18,500 | | | 497,650 |
EnPro Industries, Inc.D* | | 24,200 | | | 639,122 |
FARO Technologies, Inc.D* | | 42,400 | | | 909,056 |
FTI Consulting, Inc.D* | | 43,800 | | | 2,065,608 |
Gardner Denver, Inc. | | 45,700 | | | 1,944,535 |
Genco Shipping & Trading, Ltd.D* | | 34,900 | | | 781,062 |
Genesee & Wyoming, Inc. Class A* | | 26,700 | | | 871,488 |
Graco, Inc. | | 28,800 | | | 822,816 |
Granite Construction, Inc.D | | 31,800 | | | 1,070,388 |
Healthcare Services Group, Inc. | | 27,100 | | | 581,566 |
Heartland Express, Inc.D | | 52,000 | | | 794,040 |
HEICO Corporation Class AD | | 21,100 | | | 859,196 |
Hewitt Associates, Inc. Class A* | | 17,000 | | | 718,420 |
HUB Group, Inc.* | | 18,000 | | | 482,940 |
ICF International, Inc.* | | 9,484 | | | 254,171 |
IDEX Corporation | | 44,911 | | | 1,398,978 |
JB Hunt Transport Services, Inc.D | | 30,000 | | | 968,100 |
KBR, Inc. | | 79,700 | | | 1,514,300 |
Kennametal, Inc.D | | 31,200 | | | 808,704 |
Kforce, Inc.* | | 117,100 | | | 1,463,750 |
Knight Transportation, Inc.D | | 87,200 | | | 1,682,088 |
Lexmark International, Inc. Class A* | | 34,000 | | | 883,320 |
MAXIMUS, Inc. | | 13,600 | | | 680,000 |
Maxwell Technologies, Inc.D* | | 13,200 | | | 235,488 |
McGrath RentCorpD | | 23,200 | | | 518,752 |
Middleby CorporationD* | | 18,000 | | | 882,360 |
Mobile Mini, Inc.D* | | 29,700 | | | 418,473 |
Moog, Inc. Class A* | | 24,100 | | | 704,443 |
On Assignment, Inc.D* | | 108,000 | | | 772,200 |
Orbital Sciences Corporation* | | 66,600 | | | 1,016,316 |
Oshkosh Corporation | | 34,900 | | | 1,292,347 |
Regal-Beloit Corporation | | 23,900 | | | 1,241,366 |
Republic Airways Holdings, Inc.D* | | 85,800 | | | 634,062 |
Resources Connection, Inc.* | | 53,400 | | | 1,133,148 |
Robert Half International, Inc.D | | 22,700 | | | 606,771 |
Skywest, Inc.D | | 46,200 | | | 781,704 |
SPX Corporation | | 20,600 | | | 1,126,820 |
Standard Parking Corporation* | | 26,600 | | | 422,408 |
Stericycle, Inc.D* | | 12,900 | | | 711,693 |
SYKES Enterprises, Inc.* | | 107,100 | | | 2,727,837 |
TeleTech Holdings, Inc.* | | 28,700 | | | 574,861 |
Tennant Co. | | 13,800 | | | 361,422 |
Thomas & Betts Corporation* | | 19,000 | | | 680,010 |
Toro Co.D | | 18,100 | | | 756,761 |
TransDigm Group, Inc. | | 42,000 | | | 1,994,580 |
Triumph Group, Inc. | | 12,400 | | | 598,300 |
UniFirst Corporation | | 12,300 | | | 591,753 |
WABCO Holdings, Inc. | | 65,000 | | | 1,676,350 |
Zebra Technologies Corporation* | | 32,776 | | | 929,528 |
| | | | | |
| | | | | 61,401,201 |
| | | | | |
Technology — 13.3% | | | | | |
3PAR, Inc.D* | | 50,400 | | | 597,240 |
ADC Telecommunications, Inc.D* | | 65,100 | | | 404,271 |
Amkor Technology, Inc.D* | | 113,700 | | | 814,092 |
AsiaInfo Holdings, Inc.* | | 16,100 | | | 490,567 |
Atheros Communications, Inc.D* | | 20,600 | | | 705,344 |
Avnet, Inc.* | | 23,500 | | | 708,760 |
Blackboard, Inc.D* | | 19,900 | | | 903,261 |
See Notes to Financial Statements.
157
SMALL CAP EQUITY FUND
SCHEDULE OF INVESTMENTS (Continued)
| | | | | |
| | | Shares | | Value |
Bottomline Technologies, Inc.* | | 34,900 | | $ | 613,193 |
Cadence Design Systems, Inc.* | | 124,200 | | | 743,958 |
Cavium Networks, Inc.D* | | 20,600 | | | 490,898 |
CommVault Systems, Inc.* | | 26,000 | | | 615,940 |
Compuware Corporation* | | 94,600 | | | 683,958 |
CPI International, Inc.* | | 47,800 | | | 632,872 |
Cree, Inc.D* | | 18,300 | | | 1,031,571 |
CSG Systems International, Inc.* | | 31,500 | | | 601,335 |
Cymer, Inc.* | | 33,100 | | | 1,270,378 |
DealerTrack Holdings, Inc.* | | 79,700 | | | 1,497,563 |
DigitalGlobe, Inc.* | | 23,400 | | | 566,280 |
DTS, Inc.D* | | 14,700 | | | 502,887 |
EarthLink, Inc.D | | 95,600 | | | 794,436 |
EPIQ Systems, Inc.D* | | 35,700 | | | 499,443 |
F5 Networks, Inc.* | | 21,931 | | | 1,161,904 |
Finisar CorporationD* | | 40,800 | | | 363,936 |
FormFactor, Inc.D* | | 45,300 | | | 985,728 |
Hittite Microwave Corporation* | | 23,000 | | | 937,250 |
i2 Technologies, Inc.D* | | 33,000 | | | 630,960 |
Informatica CorporationD* | | 30,100 | | | 778,386 |
Ingram Micro, Inc. Class A* | | 75,600 | | | 1,319,220 |
Integrated Device Technology, Inc.* | | 73,200 | | | 473,604 |
Intersil Corporation Class AD | | 34,400 | | | 527,696 |
Jabil Circuit, Inc. | | 61,400 | | | 1,066,518 |
Kenexa CorporationD* | | 28,900 | | | 377,145 |
LivePerson, Inc.* | | 63,800 | | | 444,686 |
Mantech International Corporation Class A* | | 17,200 | | | 830,416 |
MicroStrategy, Inc. Class A* | | 5,900 | | | 554,718 |
Monolithic Power Systems, Inc.D* | | 61,126 | | | 1,465,190 |
Netezza CorporationD* | | 110,400 | | | 1,070,880 |
NETGEAR, Inc.D* | | 33,900 | | | 735,291 |
Netlogic Microsystems, Inc.D* | | 20,934 | | | 968,407 |
NeuStar, Inc. Class A* | | 32,600 | | | 751,104 |
Nuance Communications, Inc.D* | | 41,333 | | | 642,315 |
Omnivision Technologies, Inc.* | | 37,600 | | | 546,328 |
Plantronics, Inc. | | 20,700 | | | 537,786 |
PMC-Sierra, Inc.D* | | 29,200 | | | 252,872 |
Power Intergrations, Inc. | | 46,700 | | | 1,698,012 |
Rambus, Inc.D* | | 10,800 | | | 263,520 |
Riverbed Technology, Inc.D* | | 26,300 | | | 604,111 |
SBA Communications Corporation Class AD* | | 68,682 | | | 2,346,177 |
Scansource, Inc.* | | 47,100 | | | 1,257,570 |
Semtech Corporation* | | 72,767 | | | 1,237,767 |
SkillSoft PLC ADR* | | 118,400 | | | 1,240,832 |
SolarWinds, Inc.D* | | 29,900 | | | 687,999 |
Solera Holdings, Inc.D | | 117,600 | | | 4,234,776 |
SRA International, Inc. Class A* | | 36,000 | | | 687,600 |
Stanley, Inc.D* | | 34,000 | | | 931,940 |
Stratasys, Inc.D* | | 30,292 | | | 523,446 |
SuccessFactors, Inc.D* | | 27,600 | | | 457,608 |
Sybase, Inc.D* | | 23,333 | | | 1,012,652 |
Taleo Corporation Class AD* | | 11,600 | | | 272,832 |
TNS, Inc.* | | 11,400 | | | 292,866 |
Ultimate Software Group, Inc.D* | | 47,000 | | | 1,380,390 |
Varian Semiconductor Equipment Associates, Inc.* | | 35,925 | | | 1,288,989 |
Veeco Instruments, Inc.D* | | 38,291 | | | 1,265,135 |
Viasat, Inc.D* | | 31,800 | | | 1,010,604 |
Vishay Intertechnology, Inc.* | | 54,200 | | | 452,570 |
| | | | | |
| | | | | 55,737,983 |
| | | | | |
Utilities — 4.3% | | | | | |
Alliant Energy Corporation | | 41,000 | | | 1,240,660 |
El Paso Electric Co.* | | 36,300 | | | 736,164 |
Energen Corporation | | 28,900 | | | 1,352,520 |
General Communication, Inc. Class A* | | 76,900 | | | 490,622 |
IDACORP, Inc.D | | 24,500 | | | 782,775 |
j2 Global Communications, Inc.D* | | 36,700 | | | 746,845 |
Mirant Corporation* | | 89,200 | | | 1,362,084 |
National Fuel Gas Co.D | | 33,500 | | | 1,675,000 |
Neutral Tandem, Inc.D* | | 14,300 | | | 325,325 |
NorthWestern Corporation | | 18,500 | | | 481,370 |
NTELOS Holdings Corporation | | 50,500 | | | 899,910 |
NV Energy, Inc. | | 117,000 | | | 1,448,460 |
OGE Energy Corporation | | 45,200 | | | 1,667,428 |
Oneok, Inc. | | 32,600 | | | 1,452,982 |
PNM Resources, Inc.D | | 43,600 | | | 551,540 |
Southern Union Co. | | 24,100 | | | 547,070 |
TECO Energy, Inc.D | | 34,600 | | | 561,212 |
Telephone & Data Systems, Inc. | | 42,600 | | | 1,444,992 |
USA Mobility, Inc.D | | 37,300 | | | 410,673 |
| | | | | |
| | | | | 18,177,632 |
| | | | | |
Total Common Stocks
(Cost $310,342,281) | | | | | 353,073,823 |
| | | | | |
FOREIGN COMMON STOCKS — 2.0% | | | | | |
Bermuda — 0.5% | | | | | |
Montpelier Re Holdings, Ltd.D | | 70,000 | | | 1,212,400 |
VistaPrint NVD* | | 14,500 | | | 821,570 |
| | | | | |
| | | | | 2,033,970 |
| | | | | |
Brazil — 0.0% | | | | | |
Gol Linhas Aereas Inteligentes SA ADRD | | 16,700 | | | 256,345 |
| | | | | |
British Virgin Islands — 0.2% | | | | | |
UTi Worldwide, Inc. | | 58,100 | | | 831,992 |
| | | | | |
Canada — 0.1% | | | | | |
Westport Innovations, Inc.* | | 32,491 | | | 376,246 |
| | | | | |
China — 0.2% | | | | | |
Longtop Financial Technologies, Ltd. ADRD* | | 19,693 | | | 729,035 |
VanceInfo Technologies, Inc. ADR* | | 12,850 | | | 246,848 |
| | | | | |
| | | | | 975,883 |
| | | | | |
Germany — 0.1% | | | | | |
Aixtron AG ADRD | | 10,500 | | | 351,750 |
| | | | | |
Greece — 0.1% | | | | | |
Diana Shipping, Inc.D* | | 32,100 | | | 464,808 |
| | | | | |
Israel — 0.1% | | | | | |
Given Imaging, Ltd. | | 21,300 | | | 371,898 |
RRSat Global Communications Network, Ltd. | | 16,700 | | | 188,710 |
| | | | | |
| | | | | 560,608 |
| | | | | |
Netherlands — 0.2% | | | | | |
AerCap Holdings NVD* | | 50,600 | | | 458,436 |
ASM International N.V.D* | | 13,400 | | | 344,782 |
| | | | | |
| | | | | 803,218 |
| | | | | |
See Notes to Financial Statements.
158
| | | | | | |
| | | Shares | | Value |
Puerto Rico — 0.2% | | | | | | |
Oriental Financial Group | | | 62,700 | | $ | 677,160 |
| | | | | | |
Singapore — 0.3% | | | | | | |
Verigy, Ltd.D* | | | 88,200 | | | 1,135,134 |
| | | | | | |
Total Foreign Common Stocks
(Cost $9,275,419) | | | | | | 8,467,114 |
| | | | | | |
PREFERRED STOCKS — 0.0% | | | | | | |
Federal Home Loan Mortgage Corporation | | | 5,125 | | | 5,381 |
Federal National Mortgage Association | | | 3,750 | | | 4,175 |
Preferred Blocker (GMAC), Inc. | | | 73 | | | 48,116 |
| | | | | | |
Total Preferred Stocks
(Cost $249,415) | | | | | | 57,672 |
| | | | | | |
MONEY MARKET FUNDS — 34.9% | | | | | | |
GuideStone Money Market Fund (GS4 Class)¥ | | | 18,257,471 | | | 18,257,472 |
Northern Institutional Liquid Assets Portfolio§ | | | 128,525,687 | | | 128,525,687 |
| | | | | | |
Total Money Market Funds
(Cost $146,783,159) | | | | | | 146,783,159 |
| | | | | | |
| | |
| | | Par | | |
AGENCY OBLIGATIONS — 0.8% | | | | | | |
Farmer Mac Guaranteed Trust | | | | | | |
5.13%, 04/19/17 144A | | $ | 250,000 | | | 260,947 |
Federal Home Loan Banks | | | | | | |
1.50%, 01/16/13 | | | 50,000 | | | 49,337 |
Federal Home Loan Mortgage Corporation | | | | | | |
4.38%, 01/25/10 | | | 260,000 | | | 260,632 |
Federal National Mortgage Association | | | | | | |
0.10%, 01/25/10W‡‡ | | | 2,000 | | | 2,000 |
0.10%, 01/25/10W | | | 120,000 | | | 120,000 |
0.15%, 01/25/10W‡‡ | | | 100,000 | | | 100,000 |
0.30%, 01/25/10W | | | 185,000 | | | 185,001 |
0.31%, 01/25/10W | | | 150,000 | | | 150,000 |
0.31%, 01/25/10W | | | 10,000 | | | 10,000 |
0.40%, 01/25/10W | | | 1,801,000 | | | 1,801,006 |
5.25%, 08/01/12 | | | 110,000 | | | 117,455 |
5.00%, 02/13/17 | | | 230,000 | | | 250,040 |
6.37%, 10/09/19W | | | 70,000 | | | 38,100 |
Tennessee Valley Authority | | | | | | |
5.25%, 09/15/39 | | | 50,000 | | | 49,728 |
| | | | | | |
Total Agency Obligations
(Cost $3,389,356) | | | | | | 3,394,246 |
| | | | | | |
ASSET-BACKED SECURITIES — 0.4% | | | | | | |
Bear Stearns Asset-Backed Securities Trust | | | | | | |
0.68%, 10/27/32† | | | 23,779 | | | 15,772 |
0.68%, 12/25/33† | | | 251,161 | | | 210,835 |
Drive Auto Receivables Trust | | | | | | |
5.33%, | | | | | | |
04/15/14 STEP 144A | | | 242,750 | | | 243,558 |
EMC Mortgage Loan Trust | | | | | | |
0.88%, | | | | | | |
02/25/41 STEP 144A | | | 74,578 | | | 53,118 |
GSAA Trust | | | | | | |
0.50%, 07/25/37† | | | 200,000 | | | 94,313 |
Hertz Vehicle Financing LLC | | | | | | |
5.29%, 03/25/16 144A | | | 90,000 | | | 89,304 |
Lehman XS Trust | | | | | | |
0.53%, 11/25/35† | | | 260,064 | | | 148,544 |
0.53%, 12/25/35† | | | 128,423 | | | 34,247 |
0.35%, 06/25/37† | | | 191,748 | | | 110,118 |
0.49%, 02/25/46† | | | 273,233 | | | 141,965 |
0.30%, 08/25/46† | | | 84,934 | | | 76,232 |
MASTR Specialized Loan Trust | | | | | | |
0.58%, 05/25/37 144A† | | | 241,167 | | | 103,789 |
Nelnet Student Loan Trust | | | | | | |
1.76%, 04/25/24† | | | 80,000 | | | 83,519 |
Option One Mortgage Loan Trust | | | | | | |
1.03%, 11/25/32† | | | 24,730 | | | 16,939 |
Renaissance Home Equity Loan Trust | | | | | | |
0.66%, 06/25/33† | | | 20,444 | | | 13,251 |
Securitized Asset-Backed Receivables LLC Trust | | | | | | |
0.46%, 02/25/37† | | | 250,767 | | | 110,774 |
Wachovia Asset Securitization, Inc. | | | | | | |
0.60%, 09/27/32† | | | 63,492 | | | 37,593 |
0.66%, 12/25/32† | | | 33,056 | | | 21,431 |
0.52%, 03/25/33† | | | 36,616 | | | 22,470 |
| | | | | | |
Total Asset-Backed Securities
(Cost $2,504,641) | | | | | | 1,627,772 |
| | | | | | |
CORPORATE BONDS — 2.6% | | | | | | |
AES Corporation | | | | | | |
7.75%, 10/15/15 | | | 30,000 | | | 30,600 |
8.00%, 10/15/17D | | | 100,000 | | | 103,125 |
8.00%, 06/01/20 | | | 190,000 | | | 194,275 |
Alcoa, Inc. | | | | | | |
6.00%, 07/15/13D | | | 80,000 | | | 84,341 |
American Express Co. | | | | | | |
8.13%, 05/20/19 | | | 100,000 | | | 118,708 |
6.80%, 09/01/66† | | | 140,000 | | | 126,700 |
American Express Credit Corporation | | | | | | |
5.13%, 08/25/14D | | | 10,000 | | | 10,548 |
American International Group, Inc. | | | | | | |
5.85%, 01/16/18 | | | 190,000 | | | 156,137 |
Anadarko Petroleum Corporation | | | | | | |
6.45%, 09/15/36 | | | 280,000 | | | 293,372 |
Apache Corporation | | | | | | |
5.63%, 01/15/17 | | | 110,000 | | | 117,429 |
AT&T, Inc. | | | | | | |
5.50%, 02/01/18 | | | 90,000 | | | 94,060 |
5.80%, 02/15/19 | | | 140,000 | | | 149,500 |
BAC Capital Trust XIV | | | | | | |
5.63%, 12/31/49† | | | 10,000 | | | 6,975 |
Baker Hughes, Inc. | | | | | | |
7.50%, 11/15/18 | | | 70,000 | | | 83,698 |
Bank of America Corporation | | | | | | |
5.75%, 12/01/17 | | | 190,000 | | | 194,871 |
8.13%, 12/15/49† | | | 20,000 | | | 19,280 |
8.00%, 12/29/49† | | | 60,000 | | | 57,848 |
Bear Stearns Cos. LLC | | | | | | |
7.25%, 02/01/18 | | | 140,000 | | | 160,950 |
Boeing Capital Corporation | | | | | | |
4.70%, 10/27/19 | | | 40,000 | | | 39,099 |
Boeing Co. | | | | | | |
4.88%, 02/15/20 | | | 60,000 | | | 60,282 |
See Notes to Financial Statements.
159
SMALL CAP EQUITY FUND
SCHEDULE OF INVESTMENTS (Continued)
| | | | | | |
| | | Par | | Value |
Caterpillar Financial Services Corporation | | | | | | |
6.20%, 09/30/13 | | $ | 110,000 | | $ | 122,681 |
Cellco Partnership/Verizon Wireless Capital LLC | | | | | | |
8.50%, 11/15/18 | | | 60,000 | | | 74,544 |
Chesapeake Energy Corporation | | | | | | |
6.88%, 11/15/20D | | | 100,000 | | | 97,000 |
Citigroup, Inc. | | | | | | |
6.50%, 08/19/13 | | | 140,000 | | | 149,247 |
6.38%, 08/12/14 | | | 30,000 | | | 31,438 |
5.00%, 09/15/14 | | | 160,000 | | | 154,403 |
5.50%, 10/15/14 | | | 70,000 | | | 70,951 |
6.88%, 03/05/38 | | | 130,000 | | | 130,144 |
Comcast Corporation | | | | | | |
6.50%, 01/15/17 | | | 360,000 | | | 399,110 |
Community Health Systems, Inc. | | | | | | |
8.88%, 07/15/15 | | | 30,000 | | | 31,125 |
ConocoPhillips Holding Co. | | | | | | |
6.95%, 04/15/29 | | | 180,000 | | | 204,605 |
Countrywide Financial Corporation | | | | | | |
6.25%, 05/15/16 | | | 50,000 | | | 50,925 |
CVS Pass-Through Trust | | | | | | |
6.94%, 01/10/30 | | | 86,470 | | | 87,160 |
DaVita, Inc. | | | | | | |
6.63%, 03/15/13D | | | 35,000 | | | 35,263 |
Dominion Resources, Inc. | | | | | | |
5.70%, 09/17/12 | | | 120,000 | | | 129,755 |
Dr Pepper Snapple Group, Inc. | | | | | | |
6.82%, 05/01/18 | | | 100,000 | | | 112,363 |
Duke Energy Carolinas LLC | | | | | | |
5.63%, 11/30/12 | | | 130,000 | | | 142,018 |
Dynegy Holdings, Inc. | | | | | | |
7.75%, 06/01/19D | | | 45,000 | | | 39,263 |
Edison Mission Energy | | | | | | |
7.20%, 05/15/19 | | | 100,000 | | | 76,250 |
Energy Future Holdings Corporation | | | | | | |
11.25%, 11/01/17 PIK | | | 561,800 | | | 400,283 |
6.50%, 11/15/24 | | | 20,000 | | | 9,494 |
6.55%, 11/15/34 | | | 10,000 | | | 4,686 |
Energy Transfer Partners LP | | | | | | |
6.70%, 07/01/18 | | | 100,000 | | | 107,244 |
Enterprise Products Operating LLC | | | | | | |
6.30%, 09/15/17D | | | 170,000 | | | 183,289 |
FirstEnergy Corporation | | | | | | |
7.38%, 11/15/31 | | | 140,000 | | | 152,172 |
Ford Motor Credit Co., LLC | | | | | | |
12.00%, 05/15/15 | | | 140,000 | | | 162,512 |
Freeport-McMoRan Copper & Gold, Inc. | | | | | | |
8.38%, 04/01/17 | | | 65,000 | | | 71,273 |
General Electric Capital Corporation | | | | | | |
6.00%, 08/07/19D | | | 260,000 | | | 270,377 |
6.38%, 11/15/67† | | | 130,000 | | | 113,588 |
GMAC, Inc. | | | | | | |
6.63%, 05/15/12 144AD | | | 348,000 | | | 344,520 |
1.75%, 10/30/12 | | | 100,000 | | | 99,417 |
7.50%, 12/31/13 144A | | | 37,000 | | | 36,075 |
Goldman Sachs Capital II | | | | | | |
5.79%, 12/29/49† | | | 10,000 | | | 7,800 |
Goldman Sachs Group, Inc. | | | | | | |
4.50%, 06/15/10 | | | 100,000 | | | 101,814 |
5.95%, 01/18/18 | | | 100,000 | | | 105,766 |
HCA, Inc. | | | | | | |
9.63%, 11/15/16 PIKD | | | 52,593 | | | 57,063 |
Hess Corporation | | | | | | |
7.30%, 08/15/31 | | | 120,000 | | | 136,758 |
HSBC Finance Corporation | | | | | | |
4.63%, 09/15/10 | | | 290,000 | | | 297,250 |
Humana, Inc. | | | | | | |
7.20%, 06/15/18 | | | 30,000 | | | 30,730 |
JPMorgan Chase & Co. | | | | | | |
6.13%, 06/27/17 | | | 200,000 | | | 211,712 |
Kinder Morgan Energy Partners LP | | | | | | |
6.00%, 02/01/17 | | | 70,000 | | | 73,600 |
6.95%, 01/15/38 | | | 120,000 | | | 128,299 |
Kroger Co. | | | | | | |
6.15%, 01/15/20 | | | 70,000 | | | 75,058 |
L-3 Communications Corporation | | | | | | |
6.38%, 10/15/15D | | | 85,000 | | | 85,744 |
Lehman Brothers Holdings Capital Trust VII | | | | | | |
5.86%, 11/29/49# | | | 10,000 | | | 3 |
Lehman Brothers Holdings E-Capital Trust I | | | | | | |
3.59%, 08/19/65# | | | 50,000 | | | 15 |
Lehman Brothers Holdings, Inc. | | | | | | |
6.50%, 07/19/17# | | | 160,000 | | | 48 |
6.75%, 12/28/17# | | | 120,000 | | | 36 |
Merrill Lynch & Co., Inc. | | | | | | |
5.45%, 02/05/13 | | | 220,000 | | | 231,664 |
MetLife, Inc. | | | | | | |
6.75%, 06/01/16D | | | 50,000 | | | 56,066 |
6.40%, 12/15/36 | | | 120,000 | | | 106,800 |
Morgan Stanley | | | | | | |
5.63%, 01/09/12 | | | 160,000 | | | 168,932 |
NewPage Corporation | | | | | | |
10.00%, 05/01/12 | | | 20,000 | | | 14,400 |
NRG Energy, Inc. | | | | | | |
7.25%, 02/01/14D | | | 10,000 | | | 10,150 |
7.38%, 02/01/16D | | | 30,000 | | | 30,113 |
Occidental Petroleum Corporation | | | | | | |
7.00%, 11/01/13 | | | 100,000 | | | 114,996 |
Pacific Gas & Electric Co. | | | | | | |
5.63%, 11/30/17D | | | 30,000 | | | 32,082 |
6.05%, 03/01/34 | | | 80,000 | | | 83,792 |
Pemex Project Funding Master Trust | | | | | | |
6.63%, 06/15/35 | | | 90,000 | | | 85,806 |
PepsiCo, Inc. | | | | | | |
7.90%, 11/01/18 | | | 60,000 | | | 73,757 |
Qwest Communications International, Inc. | | | | | | |
7.50%, 02/15/14 | | | 50,000 | | | 50,438 |
Reed Elsevier Capital, Inc. | | | | | | |
8.63%, 01/15/19 | | | 90,000 | | | 109,688 |
Roche Holdings, Inc. | | | | | | |
6.00%, 03/01/19 144A | | | 90,000 | | | 99,073 |
SLM Corporation | | | | | | |
1.44%, 04/01/14† | | | 30,000 | | | 22,416 |
See Notes to Financial Statements.
160
| | | | | | |
| | | Par | | Value |
Sonat, Inc. | | | | | | |
7.63%, 07/15/11 | | $ | 100,000 | | $ | 103,570 |
Sprint Capital Corporation | | | | | | |
6.90%, 05/01/19D | | | 100,000 | | | 92,500 |
Steel Dynamics, Inc. | | | | | | |
7.38%, 11/01/12 | | | 25,000 | | | 25,875 |
SunTrust Capital VIII | | | | | | |
6.10%, 12/15/36† | | | 100,000 | | | 69,837 |
Teachers Insurance & Annuity Association of America | | | | | | |
6.85%, 12/16/39 144A | | | 70,000 | | | 72,596 |
Time Warner Cable, Inc. | | | | | | |
6.75%, 07/01/18 | | | 110,000 | | | 121,039 |
7.30%, 07/01/38 | | | 90,000 | | | 100,092 |
Travelers Cos., Inc. | | | | | | |
6.25%, 03/15/37† | | | 100,000 | | | 91,227 |
United Parcel Service, Inc. | | | | | | |
4.50%, 01/15/13 | | | 100,000 | | | 106,395 |
UnitedHealth Group, Inc. | | | | | | |
4.88%, 02/15/13 | | | 100,000 | | | 104,702 |
Ventas Realty LP | | | | | | |
9.00%, 05/01/12 | | | 20,000 | | | 21,000 |
Verizon Communications, Inc. | | | | | | |
8.95%, 03/01/39 | | | 70,000 | | | 95,011 |
Verizon Global Funding Corporation | | | | | | |
7.38%, 09/01/12 | | | 100,000 | | | 112,790 |
Wachovia Corporation | | | | | | |
5.63%, 10/15/16 | | | 270,000 | | | 276,459 |
5.75%, 02/01/18 | | | 120,000 | | | 125,430 |
WellPoint, Inc. | | | | | | |
5.88%, 06/15/17 | | | 110,000 | | | 113,498 |
Williams Cos., Inc. | | | | | | |
7.88%, 09/01/21 | | | 50,000 | | | 57,464 |
7.50%, 01/15/31 | | | 30,000 | | | 32,450 |
7.75%, 06/15/31 | | | 50,000 | | | 54,980 |
8.75%, 03/15/32 | | | 10,000 | | | 11,999 |
Windstream Corporation | | | | | | |
8.63%, 08/01/16 | | | 20,000 | | | 20,450 |
Wyeth | | | | | | |
5.95%, 04/01/37 | | | 60,000 | | | 62,781 |
XTO Energy, Inc. | | | | | | |
7.50%, 04/15/12 | | | 110,000 | | | 122,719 |
| | | | | | |
Total Corporate Bonds
(Cost $10,904,264) | | | | | | 10,791,706 |
| | | | | | |
FOREIGN BONDS — 0.5% | | | | | | |
Australia — 0.1% | | | | | | |
Commonwealth Bank of Australia | | | | | | |
5.00%, 10/15/19 144A | | | 20,000 | | | 19,895 |
Commonwealth Bank of Australia | | | | | | |
3.75%, 10/15/14 144A | | | 60,000 | | | 60,211 |
Rio Tinto Finance USA, Ltd. | | | | | | |
9.00%, 05/01/19 | | | 180,000 | | | 228,186 |
| | | | | | |
| | | | | | 308,292 |
| | | | | | |
Canada — 0.1% | | | | | | |
Devon Financing Corporation | | | | | | |
6.88%, 09/30/11 | | | 150,000 | | | 163,015 |
OPTI Canada, Inc. | | | | | | |
7.88%, 12/15/14 | | | 30,000 | | | 24,750 |
8.25%, 12/15/14 | | | 10,000 | | | 8,287 |
| | | | | | |
| | | | | | 196,052 |
| | | | | | |
Cayman Islands — 0.1% | | | | | | |
Petrobras International Finance Co. | | | | | | |
6.13%, 10/06/16 | | | 40,000 | | | 43,100 |
5.75%, 01/20/20 | | | 32,000 | | | 32,713 |
Resona Preferred Global Securities Cayman, Ltd. | | | | | | |
7.19%, 07/30/49 144A† | | | 60,000 | | | 49,127 |
Shinsei Finance Cayman, Ltd. | | | | | | |
6.42%, 07/20/49 144A† | | | 100,000 | | | 58,314 |
Vale Overseas, Ltd. | | | | | | |
6.88%, 11/21/36 | | | 60,000 | | | 60,100 |
| | | | | | |
| | | | | | 243,354 |
| | | | | | |
France — 0.0% | | | | | | |
Compagnie Generale de Geophysique - Veritas | | | | | | |
7.50%, 05/15/15 | | | 50,000 | | | 49,875 |
Credit Agricole SA | | | | | | |
8.38%, 10/13/19 144A†D | | | 120,000 | | | 127,603 |
| | | | | | |
| | | | | | 177,478 |
| | | | | | |
Iceland — 0.0% | | | | | | |
Glitnir Banki HF | | | | | | |
6.69%, 06/15/16 144A#@ | | | 130,000 | | | 338 |
Kaupthing Bank HF | | | | | | |
7.63%, 02/28/15 144A#@ | | | 310,000 | | | 76,725 |
| | | | | | |
| | | | | | 77,063 |
| | | | | | |
India — 0.0% | | | | | | |
ICICI Bank, Ltd. | | | | | | |
6.38%, 04/30/22 144A† | | | 110,000 | | | 99,027 |
| | | | | | |
Italy — 0.0% | | | | | | |
Telecom Italia Capital SA | | | | | | |
5.25%, 10/01/15D | | | 60,000 | | | 62,811 |
| | | | | | |
Japan — 0.0% | | | | | | |
Aiful Corporation | | | | | | |
6.00%, 12/12/11 144AD | | | 100,000 | | | 71,500 |
| | | | | | |
Luxembourg — 0.0% | | | | | | |
FMC Finance III SA | | | | | | |
6.88%, 07/15/17 | | | 40,000 | | | 39,900 |
TNK-BP Finance SA | | | | | | |
6.63%, 03/20/17 144A | | | 100,000 | | | 98,250 |
| | | | | | |
| | | | | | 138,150 |
| | | | | | |
Mexico — 0.0% | | | | | | |
America Movil Sab de CV | | | | | | |
5.63%, 11/15/17D | | | 30,000 | | | 31,210 |
Kansas City Southern de Mexico SA de CV | | | | | | |
9.38%, 05/01/12 | | | 20,000 | | | 20,850 |
Mexico Government International Bond | | | | | | |
6.75%, 09/27/34 | | | 50,000 | | | 53,000 |
| | | | | | |
| | | | | | 105,060 |
| | | | | | |
Netherlands — 0.1% | | | | | | |
Deutsche Telekom International Finance BV | | | | | | |
5.75%, 03/23/16 | | | 75,000 | | | 79,743 |
See Notes to Financial Statements.
161
SMALL CAP EQUITY FUND
SCHEDULE OF INVESTMENTS (Continued)
| | | | | | |
| | | Par | | Value |
Koninklijke KPN NV | | | | | | |
8.00%, 10/01/10 | | $ | 110,000 | | $ | 115,521 |
| | | | | | |
| | | | | | 195,264 |
| | | | | | |
Russia — 0.0% | | | | | | |
Russian Federation | | | | | | |
7.50%, 03/31/30 STEP | | | 12,220 | | | 13,916 |
| | | | | | |
United Kingdom — 0.1% | | | | | | |
Barclays Bank PLC | | | | | | |
5.20%, 07/10/14 | | | 100,000 | | | 106,107 |
BP Capital Markets PLC | | | | | | |
5.25%, 11/07/13 | | | 90,000 | | | 98,116 |
3.88%, 03/10/15 | | | 30,000 | | | 30,859 |
Royal Bank of Scotland Group PLC | | | | | | |
6.40%, 10/21/19D | | | 100,000 | | | 99,415 |
WPP Finance UK | | | | | | |
8.00%, 09/15/14 | | | 100,000 | | | 113,839 |
| | | | | | |
| | | | | | 448,336 |
| | | | | | |
Total Foreign Bonds
(Cost $2,383,779) | | | | | | 2,136,303 |
| | | | | | |
MORTGAGE-BACKED SECURITIES — 3.3% | | | | | | |
American Home Mortgage Investment Trust | | | | | | |
0.58%, 04/25/44 STEP | | | 34,591 | | | 27,239 |
0.52%, 11/25/45† | | | 238,669 | | | 131,059 |
Bear Stearns Adjustable Rate Mortgage Trust | | | | | | |
4.80%, 02/25/35 | | | 90,697 | | | 74,579 |
3.79%, 08/25/35 | | | 241,072 | | | 161,494 |
Bear Stearns Mortgage Funding Trust | | | | | | |
0.44%, 12/25/36† | | | 232,043 | | | 53,110 |
Commercial Mortgage Lease-Backed Certificates | | | | | | |
6.75%, 06/20/31 144A | | | 274,146 | | | 294,993 |
Countrywide Alternative Loan Trust | | | | | | |
0.47%, 07/25/35† | | | 214,338 | | | 112,376 |
0.49%, 07/25/35† | | | 286,806 | | | 155,118 |
0.42%, 09/25/46† | | | 309,029 | | | 137,974 |
CS First Boston Mortgage Securities Corporation | | | | | | |
6.00%, 10/25/35 | | | 121,903 | | | 92,532 |
Federal Home Loan Mortgage Corporation | | | | | | |
5.98%, 05/01/37† | | | 59,239 | | | 62,938 |
5.50%, 01/01/39 TBA | | | 100,000 | | | 104,750 |
Federal National Mortgage Association | | | | | | |
5.00%, 01/01/28 TBA | | | 3,500,000 | | | 3,591,329 |
6.50%, 01/14/28 TBA | | | 1,800,000 | | | 1,927,688 |
3.37%, 09/01/35† | | | 110,505 | | | 113,300 |
6.00%, 01/01/39 TBA | | | 300,000 | | | 317,719 |
4.50%, 01/01/40 TBA | | | 400,000 | | | 399,250 |
5.50%, 01/01/40 TBA | | | 1,100,000 | | | 1,151,391 |
First Horizon Alternative Mortgage Securities | | | | | | |
2.71%, 02/25/36† | | | 159,996 | | | 88,299 |
0.60%, 02/25/37† | | | 95,099 | | | 47,018 |
General Electric Capital Commercial Mortgage Corporation | | | | | | |
5.34%, 03/10/44† | | | 300,000 | | | 286,156 |
GMAC Commercial Mortgage Securities, Inc. | | | | | | |
5.24%, 11/10/45 | | | 100,000 | | | 96,967 |
Government National Mortgage Association | | | | | | |
5.50%, 01/01/38 TBA | | | 400,000 | | | 419,248 |
6.00%, 01/01/38 TBA | | | 400,000 | | | 422,625 |
5.00%, 01/01/39 TBA | | | 500,000 | | | 514,140 |
6.00%, 01/01/39 TBA | | | 200,000 | | | 211,812 |
5.00%, 01/01/40 | | | 100,000 | | | 102,766 |
1.38%, 11/20/59† | | | 300,076 | | | 301,945 |
Greenpoint Mortgage Funding Trust | | | | | | |
0.49%, 10/25/45† | | | 62,652 | | | 32,238 |
GS Mortgage Securities Corporation II | | | | | | |
6.71%, 08/15/18 144A | | | 110,000 | | | 113,710 |
Harborview Mortgage Loan Trust | | | | | | |
0.47%, 06/19/35† | | | 270,716 | | | 155,991 |
Homestar Mortgage Acceptance Corporation | | | | | | |
0.68%, 07/25/34† | | | 105,321 | | | 73,709 |
Impac CMB Trust | | | | | | |
1.03%, 03/25/33† | | | 19,597 | | | 14,644 |
Indymac INDA Mortgage Loan Trust | | | | | | |
6.16%, 11/25/37† | | | 144,940 | | | 105,100 |
MASTR Adjustable Rate Mortgages Trust | | | | | | |
3.10%, 11/21/34† | | | 200,000 | | | 162,295 |
1.43%, 12/25/46† | | | 293,561 | | | 88,338 |
Merrill Lynch Mortgage Investors, Inc. | | | | | | |
5.06%, 05/25/34† | | | 41,878 | | | 39,824 |
4.26%, 02/25/35 | | | 244,101 | | | 211,938 |
Merrill Lynch Mortgage Trust | | | | | | |
5.05%, 07/12/38 | | | 100,000 | | | 97,186 |
Morgan Stanley Capital I | | | | | | |
5.69%, 04/15/49 | | | 350,000 | | | 294,922 |
Residential Accredit Loans, Inc. | | | | | | |
3.67%, 12/26/34 | | | 281,503 | | | 189,569 |
0.63%, 10/25/45† | | | 175,797 | | | 90,345 |
Structured Adjustable Rate Mortgage Loan Trust | | | | | | |
3.02%, 11/25/34 | | | 81,616 | | | 56,346 |
Structured Asset Mortgage Investments, Inc. | | | | | | |
0.44%, 08/25/36† | | | 273,035 | | | 132,037 |
0.41%, 09/25/47† | | | 331,356 | | | 174,813 |
Terwin Mortgage Trust | | | | | | |
0.31%, 10/25/37 144A† | | | 53,370 | | | 53,395 |
Washington Mutual Alternative Mortgage Pass-Through Certificates | | | | | | |
1.38%, 05/25/47† | | | 322,976 | | | 69,591 |
Washington Mutual Mortgage Pass-Through Certificates | | | | | | |
5.61%, 11/25/36 | | | 237,699 | | | 174,867 |
Wells Fargo Mortgage-Backed Securities Trust | | | | | | |
0.63%, 05/25/33† | | | 139,789 | | | 137,828 |
5.24%, 04/25/36 | | | 190,809 | | | 167,152 |
| | | | | | |
Total Mortgage-Backed Securities
(Cost $16,364,522) | | | | | | 14,035,653 |
| | | | | | |
See Notes to Financial Statements.
162
| | | | | | | | |
| | | Par | | | Value | |
MUNICIPAL BOND — 0.0% | | | | | | | | |
State of California General Obligation Bond | | | | | | | | |
7.30%, 10/01/39
(Cost $50,412) | | $ | 50,000 | | | $ | 47,143 | |
| | | | | | | | |
| | |
| | | Number of
Contracts | | | | |
PURCHASED OPTION — 0.0% | | | | | | | | |
Call Options — 0.0% | | | | | | | | |
10-Year U.S. Treasury Note Futures, Strike Price $117.50, Expires 02/21/10
(Cost $4,945) | | | 7 | | | | 2,625 | |
| | | | | | | | |
| | |
| | | Par | | | | |
U.S. TREASURY OBLIGATIONS — 4.3% | | | | | | | | |
U.S. Treasury Bills | | | | | | | | |
0.11%, 05/06/10‡‡ | | $ | 1,385,000 | | | | 1,384,521 | |
0.14%, 05/27/10 | | | 3,400,000 | | | | 3,397,973 | |
0.22%, 06/10/10 | | | 4,000,000 | | | | 3,997,000 | |
| | | | | | | | |
| | | | | | | 8,779,494 | |
| | | | | | | | |
U.S. Treasury Bonds | | | | | | | | |
3.50%, 02/15/39D | | | 819,000 | | | | 671,069 | |
4.25%, 05/15/39D | | | 490,000 | | | | 459,835 | |
4.50%, 08/15/39D | | | 1,290,000 | | | | 1,261,177 | |
4.38%, 11/15/39D | | | 870,000 | | | | 833,026 | |
| | | | | | | | |
| | | | | | | 3,225,107 | |
| | | | | | | | |
U.S. Treasury Inflationary Index Bonds | | | | | | | | |
2.38%, 01/15/27 | | | 245,000 | | | | 277,026 | |
1.75%, 01/15/28‡‡ | | | 200,000 | | | | 198,407 | |
2.50%, 01/15/29D‡‡ | | | 150,000 | | | | 162,367 | |
| | | | | | | | |
| | | | | | | 637,800 | |
| | | | | | | | |
U.S. Treasury Notes | | | | | | | | |
2.38%, 09/30/14D | | | 290,000 | | | | 287,643 | |
3.13%, 10/31/16 | | | 700,000 | | | | 691,414 | |
2.75%, 11/30/16D | | | 720,000 | | | | 693,394 | |
3.25%, 12/31/16 | | | 300,000 | | | | 297,563 | |
3.38%, 11/15/19D | | | 3,410,000 | | | | 3,281,078 | |
| | | | | | | | |
| | | | | | | 5,251,092 | |
| | | | | | | | |
Total U.S. Treasury Obligations
(Cost $18,097,149) | | | | | | | 17,893,493 | |
| | | | | | | | |
TOTAL INVESTMENTS — 132.9%
(Cost $520,349,342) | | | | | | | 558,310,709 | |
| | | | | | | | |
| | |
| | | Number of
Contracts | | | | |
WRITTEN OPTIONS — 0.0% | | | | | | | | |
Call Options — 0.0% | | | | | | | | |
90-Day Eurodollar Futures, Strike Price $99.25, Expires 09/13/10 (MLCS) | | | (9 | ) | | | (3,319 | ) |
90-Day Eurodollar Futures, Strike Price $99.38, Expires 06/15/10 (ADVE) | | | (5 | ) | | | (2,062 | ) |
90-Day Eurodollar Futures, Strike Price $99.50, Expires 03/15/10 (MLCS) | | | (7 | ) | | | (3,106 | ) |
| | | | | | | | |
| | | | | | | (8,487 | ) |
| | | | | | | | |
Put Options — 0.0% | | | | | | | | |
90-Day Eurodollar Futures, Strike Price $98.75, Expires 09/13/10 (MLCS) | | | (7 | ) | | | (5,075 | ) |
90-Day Eurodollar Futures, Strike Price $99.13, Expires 03/15/10 (MLCS) | | | (12 | ) | | | (300 | ) |
90-Day Eurodollar Futures, Strike Price $99.38, Expires 06/15/10 (ADVE) | | | (5 | ) | | | (2,750 | ) |
| | | | | | | | |
| | | | | | | (8,125 | ) |
| | | | | | | | |
Total Written Options
(Premiums received $(19,934)) | | | | | | | (16,612 | ) |
| | | | | | | | |
Liabilities in Excess of Other Assets — (32.9)% | | | | | | | (138,218,464 | ) |
| | | | | | | | |
NET ASSETS — 100.0% | | | | | | $ | 420,075,633 | |
| | | | | | | | |
Please see abbreviation and footnote definitions on page 180.
PORTFOLIO SUMMARY (based on net assets)
| | | |
| | | % | |
Money Market Funds | | 34.9 | |
Financial Services | | 16.4 | |
Producer Durables | | 14.6 | |
Futures Contracts | | 14.5 | |
Technology | | 13.3 | |
Healthcare | | 11.0 | |
Consumer Discretionary | | 10.1 | |
Energy | | 6.1 | |
Materials & Processing | | 5.3 | |
U.S. Treasury Obligations | | 4.3 | |
Utilities | | 4.3 | |
Mortgage-Backed Securities | | 3.3 | |
Consumer Staples | | 3.0 | |
Corporate Bonds | | 2.6 | |
Foreign Common Stocks | | 2.0 | |
Agency Obligations | | 0.8 | |
Foreign Bonds | | 0.5 | |
Asset-Backed Securities | | 0.4 | |
Municipal Bond | | — | ** |
Preferred Stocks | | — | ** |
Purchased Options | | — | ** |
Written Options | | — | ** |
| | | |
| | 147.4 | |
| | | |
| ** | Rounds to less than 0.005%. |
See Notes to Financial Statements.
163
SMALL CAP EQUITY FUND
SCHEDULE OF INVESTMENTS (Continued)
FAS 157 DISCLOSURE
The following is a summary of the inputs used, as of December 31, 2009, in valuing the Fund’s assets carried at fair value:
| | | | | | | |
Valuation Inputs | | Investments
in
Securities | | | Other
Financial
Instruments*** |
Assets: | | | | | | | |
Level 1 — Quoted Prices | | | | | | | |
Common Stocks | | $ | 352,460,248 | | | $ | — |
Foreign Common Stocks | | | 8,467,114 | | | | — |
Futures Contracts | | | — | | | | 2,629,232 |
Money Market Funds | | | 146,783,159 | | | | — |
Preferred Stocks | | | 57,672 | | | | — |
Purchased Option | | | 2,625 | | | | — |
Level 2 — Other Significant Observable Inputs | | | | | | | |
Agency Obligations | | | 3,394,246 | | | | — |
Asset-Backed Securities | | | 1,627,772 | | | | — |
Corporate Bonds | | | 10,791,706 | | | | — |
Foreign Bonds | | | 2,136,303 | | | | — |
Mortgage-Backed Securities | | | 14,035,653 | | | | — |
Municipal Bond | | | 47,143 | | | | — |
U.S. Treasury Obligations | | | 17,893,493 | | | | — |
Level 3 — Significant Unobservable Inputs | | | | | | | |
Common Stocks | | | 613,575 | | | | — |
| | | | | | | |
Total Assets | | $ | 558,310,709 | | | $ | 2,629,232 |
| | | | | | | |
| | |
Liabilities: | | | | | | | |
Level 1 — Quoted Prices | | | | | | | |
Written Options | | $ | (16,612 | ) | | $ | — |
Level 2 — Other Significant Observable Inputs | | | — | | | | — |
Level 3 — Significant Unobservable Inputs | | | — | | | | — |
| | | | | | | |
Total Liabilities | | $ | (16,612 | ) | | $ | — |
| | | | | | | |
| *** | Other financial instruments are derivative instruments not reflected in the Schedule of Investments, such as futures, forwards and swap contracts, which are valued at the unrealized appreciation (depreciation) on the investment. Details of these investments can be found in the Notes to Financial Statements. |
The following is a reconciliation of assets in which significant unobservable inputs (Level 3) were used in determining fair value:
| | | | | | | |
| | | Investments
in
Securities | | | Other
Financial
Instruments*** |
Balance, 12/31/08 | | | | | | | |
Common Stocks | | $ | — | | | $ | — |
Corporate Bonds | | | 44,045 | | | | — |
Preferred Stocks | | | 21,900 | | | | — |
Accrued discounts/premiums | | | | | | | |
Common Stocks | | | — | | | | — |
Corporate Bonds | | | 1,980 | | | | — |
Preferred Stocks | | | — | | | | — |
Realized gain (loss) | | | | | | | |
Common Stocks | | | — | | | | — |
Corporate Bonds | | | 10,922 | | | | — |
Preferred Stocks | | | — | | | | — |
Changed in unrealized appreciation (depreciation) | | | | | | | |
Common Stocks | | | — | | | | — |
Corporate Bonds | | | 7,123 | | | | — |
Preferred Stocks | | | 26,216 | | | | — |
Net purchases (sales) | | | | | | | |
Common Stocks | | | — | | | | — |
Corporate Bonds | | | (27,995 | ) | | | — |
Preferred Stocks | | | — | | | | — |
Transfers in and/or out of Level 3 | | | | | | | |
Common Stocks | | | 613,575 | | | | — |
Corporate Bonds | | | (36,075 | ) | | | — |
Preferred Stocks | | | (48,116 | ) | | | — |
| | | | | | | |
Balance, 12/31/09 | | $ | 613,575 | | | $ | — |
| | | | | | | |
| *** | Other financial instruments are derivative instruments not reflected in the Schedule of Investments, such as futures, forwards and swap contracts, which are valued at the unrealized appreciation (depreciation) on the investment. Details of these investments can be found in the Notes to Financial Statements. |
See Notes to Financial Statements.
164
International Equity Fund
The International Equity Fund is primarily comprised of international stocks located in developed countries, and to a lesser extent, in international stocks located in emerging markets. During 2009, global financial markets staged a remarkable recovery from their lows in early March. The Fund underperformed its benchmark, the MSCI ACWI (All Country World Index) Ex-U.S., for the one-year period ended December 31, 2009 (35.61% versus 41.45%). Overweight exposure and security selection within the health care sector detracted from benchmark-relative returns. Security selection in Japan also detracted from benchmark-relative performance during the year.
Please see page 178 for information regarding specific portfolio allocations. Portfolio holdings are subject to change at any time.
Foreign securities may involve additional risks, social and political instability, reduced market liquidity and currency volatility.
165
International Equity Fund
| | | | | | | | | |
Average Annual Total Returns as of 12/31/09 | |
| | | GS2 Class* | | | GS4 Class* | | | Benchmark** | |
One Year | | 35.81 | % | | 35.61 | % | | 41.45 | % |
Five Year | | 4.36 | % | | 4.17 | % | | 5.83 | % |
Since Inception | | 6.45 | % | | 6.28 | % | | 7.39 | % |
Inception Date | | 08/27/01 | | | 08/27/01 | | | | |
Total Fund Operating Expenses (June 25, 2009 Prospectus)(1) | | 1.09 | % | | 1.29 | % | | | |
| (1) | Current information regarding the Fund’s Operating Expenses can be found in the Financial Highlights. |
The performance data quoted represents past performance and does not guarantee future results. Current performance may be lower or higher. Performance data current to the most recent month-end may be obtained at www.GuideStoneFunds.org. The investment return and principal value of an investment will fluctuate so that shares, when redeemed, may be worth more or less than their original cost.
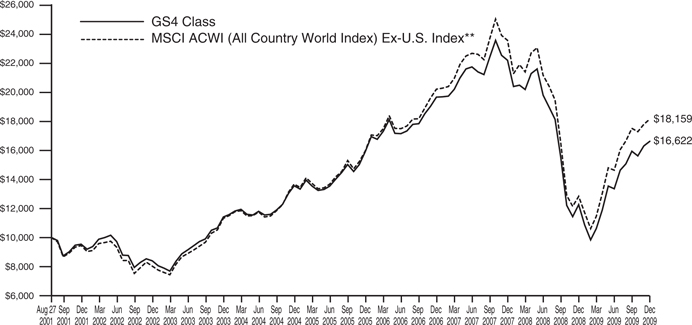
The graph compares the results of a hypothetical $10,000 investment in the GS4 Class of the Fund since August 27, 2001 (commencement of operations), with all dividends and capital gains reinvested, with the MSCI ACWI (All Country World Index) Ex-U.S. Index.
| * | These returns reflect expense waivers by the Fund’s investment adviser. Without these waivers, returns would have been lower. Returns shown do not reflect the deduction of taxes that a shareholder would pay on Fund distributions or the redemption of Fund shares. |
| ** | The MSCI ACWI (All Country World Index) Ex-U.S. Index is a free float-adjusted market capitalization index that is designed to measure equity market performance in the global developed (Ex-U.S.) and emerging markets. |
Unlike a mutual fund, the performance of an index assumes no taxes, transaction costs, management fees or other expenses.
166
| | |
INTERNATIONAL EQUITY FUND SCHEDULE OF INVESTMENTS | | December 31, 2009 |
| | | | | |
| | | Shares | | Value |
FOREIGN COMMON STOCKS — 96.0% | | | | | |
Argentina — 0.0% | | | | | |
Banco Macro SA ADRD | | 15,300 | | $ | 455,328 |
| | | | | |
Australia — 5.1% | | | | | |
ABC Learning Centres, Ltd.+@* | | 2,281 | | | 1,106 |
AGL Energy, Ltd.‡‡ | | 3,193 | | | 40,133 |
Amcor, Ltd.‡‡ | | 1,082,359 | | | 6,025,858 |
AMP, Ltd.‡‡ | | 292,315 | | | 1,765,678 |
Ansell, Ltd.‡‡ | | 8,815 | | | 86,037 |
ASX, Ltd.‡‡ | | 1,237 | | | 38,565 |
Australia and New Zealand Banking Group, Ltd.‡‡ | | 17,996 | | | 366,730 |
AWE, Ltd.*‡‡ | | 61,850 | | | 154,835 |
AXA Asia Pacific Holdings, Ltd.‡‡ | | 6,597 | | | 38,572 |
Beach Energy, Ltd.‡‡ | | 25,473 | | | 20,957 |
BGP Group REIT Entitlement Shares+* | | 63,198 | | | — |
BHP Billiton, Ltd.‡‡ | | 220,718 | | | 8,446,132 |
Boral, Ltd.‡‡ | | 20,258 | | | 107,526 |
Brambles, Ltd.‡‡ | | 21,010 | | | 127,424 |
Caltex Australia, Ltd.*‡‡ | | 13,745 | | | 114,337 |
Centamin Egypt, Ltd.* | | 79,600 | | | 156,534 |
CFS Retail Property Trust REIT‡‡ | | 16,818 | | | 28,637 |
Challenger Financial Services Group, Ltd.‡‡ | | 32,537 | | | 122,467 |
Coca-Cola Amatil, Ltd. | | 477,013 | | | 4,918,244 |
Commonwealth Bank of Australia‡‡ | | 50,162 | | | 2,448,998 |
Computershare, Ltd.‡‡ | | 2,076 | | | 21,241 |
CSL, Ltd. | | 19,630 | | | 570,829 |
David Jones, Ltd.‡‡ | | 16,359 | | | 78,708 |
Dexus Property Group REIT‡‡ | | 21,504 | | | 16,314 |
Downer EDI, Ltd.‡‡ | | 230,939 | | | 1,923,275 |
Energy Resources of Australia, Ltd.‡‡ | | 1,940 | | | 41,401 |
Goodman Group REIT‡‡ | | 17,816 | | | 10,079 |
GPT Group REIT‡‡ | | 63,198 | | | 33,960 |
Iluka Resources, Ltd.* | | 231,390 | | | 739,664 |
Incitec Pivot, Ltd. | | 399,172 | | | 1,262,628 |
Insurance Australia Group, Ltd.‡‡ | | 13,683 | | | 49,145 |
JB Hi-Fi, Ltd.‡‡ | | 97,531 | | | 1,968,794 |
MacArthur Coal, Ltd.D | | 49,007 | | | 491,948 |
Macquarie Group, Ltd.D‡‡ | | 48,472 | | | 2,076,838 |
Macquarie Infrastructure Group‡‡ | | 24,356 | | | 29,009 |
MAP Group‡‡ | | 61,355 | | | 166,066 |
Metcash, Ltd.‡‡ | | 19,144 | | | 76,763 |
Mineral Deposits, Ltd.D* | | 138,300 | | | 121,909 |
Mirvac Group REIT‡‡ | | 18,008 | | | 25,126 |
National Australia Bank, Ltd.‡‡ | | 213,875 | | | 5,219,411 |
Newcrest Mining, Ltd.‡‡ | | 3,230 | | | 102,309 |
OneSteel, Ltd.‡‡ | | 20,706 | | | 62,192 |
Orica, Ltd.‡‡ | | 5,505 | | | 127,991 |
Origin Energy, Ltd.‡‡ | | 6,116 | | | 92,017 |
OZ Minerals, Ltd.* | | 629,946 | | | 671,446 |
QBE Insurance Group, Ltd. | | 277,225 | | | 6,326,352 |
Quantas Airways, Ltd.‡‡ | | 34,152 | | | 91,121 |
Ramsay Health Care, Ltd.‡‡ | | 10,283 | | | 100,142 |
Rio Tinto, Ltd.‡‡ | | 3,412 | | | 227,767 |
Santos, Ltd.‡‡ | | 9,030 | | | 113,729 |
Sigma Pharmaceuticals, Ltd.‡‡ | | 238,551 | | | 211,547 |
Sims Metal Management, Ltd.‡‡ | | 3,008 | | | 58,937 |
Sonic Healthcare, Ltd.‡‡ | | 4,705 | | | 64,800 |
Stockland REIT‡‡ | | 12,232 | | | 43,096 |
Telstra Corporation, Ltd.‡‡ | | 2,865,418 | | | 8,809,356 |
Transurban Group | | 4,915 | | | 24,325 |
Wesfarmers, Ltd.‡‡ | | 326,128 | | | 9,116,844 |
Wesfarmers, Ltd. Price Protected Shares‡‡ | | 1,627 | | | 45,429 |
West Australian Newspapers Holdings, Ltd.‡‡ | | 13,590 | | | 98,206 |
Westfield Group REIT‡‡ | | 14,169 | | | 158,578 |
Westpac Banking Corporation‡‡ | | 51,769 | | | 1,169,394 |
Woodside Petroleum, Ltd.‡‡ | | 2,034 | | | 85,778 |
| | | | | |
| | | | | 67,733,234 |
| | | | | |
Austria — 0.3% | | | | | |
OMV AG | | 60,954 | | | 2,674,427 |
Vienna Insurance Group | | 14,071 | | | 722,251 |
Wienerberger AGD* | | 34,180 | | | 620,282 |
| | | | | |
| | | | | 4,016,960 |
| | | | | |
Belgium — 0.3% | | | | | |
Bekaert SA‡‡ | | 394 | | | 60,807 |
Delhaize Group SA‡‡ | | 19,434 | | | 1,486,687 |
Dexia SAD* | | 50,677 | | | 318,999 |
Fortis* | | 345,986 | | | 1,280,721 |
Groupe Bruxelles Lambert SA | | 457 | | | 43,152 |
Nyrstar* | | 40,146 | | | 477,456 |
Solvay SA‡‡ | | 287 | | | 30,908 |
Umicore‡‡ | | 5,339 | | | 178,102 |
| | | | | |
| | | | | 3,876,832 |
| | | | | |
Bermuda — 0.5% | | | | | |
Catlin Group, Ltd.‡‡ | | 9,309 | | | 50,972 |
Credicorp, Ltd. | | 31,201 | | | 2,403,101 |
Hiscox, Ltd.‡‡ | | 177,246 | | | 903,212 |
Seadrill, Ltd.D | | 84,350 | | | 2,146,115 |
Signet Jewelers, Ltd.* | | 39,877 | | | 1,063,299 |
| | | | | |
| | | | | 6,566,699 |
| | | | | |
Brazil — 2.5% | | | | | |
Amil Participacoes SA | | 111,437 | | | 876,903 |
Anhanguera Educacional Participacoes SA* | | 5,100 | | | 72,853 |
Banco do Brasil SA | | 59,061 | | | 1,007,532 |
Banco Santander Brasil SA ADRD | | 194,915 | | | 2,717,115 |
BM&FBovespa SA | | 86,000 | | | 605,112 |
BR Malls Participacoes SA* | | 33,253 | | | 410,649 |
Brasil Telecom SA ADRD* | | 75,222 | | | 1,833,454 |
CIA Paranaense de Energia ADRD | | 94,671 | | | 2,030,693 |
Companhia Brasileira de Distribuicao Grupo Pao de Acucar ADRD | | 7,180 | | | 539,362 |
Companhia Siderurgica Nacional SA | | 49,234 | | | 1,583,634 |
Cyrela Brazil Realty SA | | 88,000 | | | 1,238,370 |
Fibria Celulose SA* | | 12,862 | | | 288,786 |
Fibria Celulose SA ADRD* | | 6,126 | | | 139,918 |
Gafisa SA | | 49,000 | | | 794,808 |
Gerdau SA ADRD | | 11,000 | | | 187,330 |
Gol Linhas Aereas Inteligentes SA ADRD | | 8,700 | | | 133,545 |
Hypermarcas SA* | | 17,500 | | | 402,068 |
See Notes to Financial Statements.
167
INTERNATIONAL EQUITY FUND
SCHEDULE OF INVESTMENTS (Continued)
| | | | | |
| | | Shares | | Value |
Itau Unibanco Holding SA ADRD | | 24,230 | | $ | 553,413 |
Localiza Rent A Car SA | | 50,095 | | | 555,908 |
Lojas Renner SA | | 40,705 | | | 918,844 |
Marfrig Alimentos SA | | 77,571 | | | 851,900 |
Multiplan Empreendimentos Imobiliarios SA | | 4,000 | | | 74,555 |
PDG Realty SA Empreendimentos e Participacoes | | 53,400 | | | 532,160 |
Petroleo Brasileiro SA ADR | | 145,110 | | | 6,550,132 |
Redecard SA* | | 86,700 | | | 1,444,171 |
Tegma Gestao Logistica | | 5,497 | | | 48,939 |
Tele Norte Leste Participacoes SA ADRD | | 15,000 | | | 321,300 |
Totvs SA | | 11,173 | | | 757,275 |
Tractebel Energia SA | | 48,735 | | | 602,680 |
Transmissora Alianca de Energia Eletrica SA | | 35,600 | | | 763,939 |
Triunfo Participacoes e Investimentos SA* | | 45,500 | | | 148,966 |
Usinas Siderurgicas de Minas Gerais SA | | 21,858 | | | 628,873 |
Usinas Siderurgicas de Minas Gerais SA ADR | | 33,800 | | | 981,214 |
Vale SA ADRD | | 106,800 | | | 2,719,399 |
| | | | | |
| | | | | 33,315,800 |
| | | | | |
Canada — 1.1% | | | | | |
Bombardier, Inc. Class BD | | 306,600 | | | 1,407,162 |
Canadian National Railway Co.D | | 46,980 | | | 2,575,736 |
Falcon Oil & Gas, Ltd.* | | 433,398 | | | 64,232 |
First Quantum Minerals, Ltd. | | 23,050 | | | 1,768,889 |
Goldcorp, Inc.D | | 97,790 | | | 3,847,058 |
Lundin Mining Corporation* | | 178,000 | | | 731,845 |
Research In Motion, Ltd.D* | | 10,400 | | | 702,416 |
Talisman Energy, Inc.D | | 187,000 | | | 3,520,610 |
Teck Resources, Ltd. Class B* | | 20,100 | | | 707,637 |
| | | | | |
| | | | | 15,325,585 |
| | | | | |
Cayman Islands — 0.1% | | | | | |
Subsea 7, Inc.* | | 63,400 | | | 1,049,805 |
| | | | | |
Chile — 0.2% | | | | | |
Banco Santander Chile ADRD | | 7,486 | | | 484,943 |
Centros Comerciales Sudamericanos SA | | 50,872 | | | 172,162 |
Embotelladora Andina SA ADR Class AD | | 20,000 | | | 339,000 |
Embotelladora Andina SA ADR Class BD | | 28,000 | | | 571,200 |
Empresas La Polar SA | | 31,400 | | | 179,040 |
Enersis SA ADRD | | 37,900 | | | 866,394 |
S.A.C.I. Falabella | | 73,572 | | | 434,306 |
Sociedad Quimica y Minera de Chile SA ADRD | | 3,700 | | | 139,009 |
| | | | | |
| | | | | 3,186,054 |
| | | | | |
China — 2.7% | | | | | |
Baidu, Inc. ADRD* | | 400 | | | 164,492 |
Bank of China, Ltd. | | 4,499,000 | | | 2,417,730 |
China Coal Energy Co. Class H | | 237,000 | | | 430,055 |
China Construction Bank Corporation Class H | | 3,038,670 | | | 2,595,474 |
China Life Insurance Co., Ltd. Class HD | | 825,000 | | | 4,036,961 |
China Longyuan Power Group Corporation Class HD* | | 65,000 | | | 84,170 |
China Merchants Bank Co., Ltd. Class H | | 563,000 | | | 1,464,874 |
China Pacific Insurance Group Co., Ltd. Class H* | | 37,000 | | | 147,458 |
China Petroleum & Chemical Corporation Class H | | 985,700 | | | 868,447 |
China Railway Group, Ltd. Class HD* | | 604,000 | | | 466,511 |
China Shenhua Energy Co., Ltd. Class H | | 695,156 | | | 3,374,510 |
China Shipping Development Co., Ltd. Class H | | 88,000 | | | 130,876 |
China Zhongwang Holdings, Ltd.D* | | 320,800 | | | 255,531 |
Ctrip.com International, Ltd. ADRD* | | 10,700 | | | 768,902 |
Foxconn International Holdings, Ltd.* | | 16,000 | | | 18,419 |
Great Wall Motor Co., Ltd. Class HD | | 243,500 | | | 301,660 |
Guangzhou R&F Properties Co., Ltd. Class HD | | 257,600 | | | 449,308 |
Huaneng Power International, Inc. Class H | | 2,912,000 | | | 1,630,447 |
Industrial & Commercial Bank of China Class HD | | 7,500,753 | | | 6,177,362 |
Longfor Properties Co., Ltd.* | | 149,000 | | | 168,152 |
Netease.com ADRD* | | 50,300 | | | 1,891,783 |
New World Department Store China, Ltd. | | 467,337 | | | 426,568 |
Parkson Retail Group, Ltd.D | | 647,267 | | | 1,139,007 |
Perfect World Co., Ltd. ADR* | | 14,370 | | | 566,753 |
Shanda Games, Ltd. ADRD* | | 15,800 | | | 161,002 |
Sina CorporationD* | | 24,400 | | | 1,102,392 |
Tencent Holdings, Ltd.D | | 86,200 | | | 1,864,314 |
Trina Solar, Ltd. GDRD* | | 30,780 | | | 1,661,197 |
Want Want China Holdings, Ltd. | | 1,316,309 | | | 919,226 |
Xinao Gas Holdings, Ltd. | | 381,250 | | | 976,114 |
| | | | | |
| | | | | 36,659,695 |
| | | | | |
Colombia — 0.1% | | | | | |
BanColombia SA | | 64,300 | | | 726,692 |
BanColombia SA ADRD | | 12,794 | | | 582,255 |
| | | | | |
| | | | | 1,308,947 |
| | | | | |
Cyprus — 0.1% | | | | | |
Bank of Cyprus Public Co., Ltd. | | 176,930 | | | 1,238,792 |
Marfin Popular Bank Public Co., Ltd. | | 75,677 | | | 245,544 |
| | | | | |
| | | | | 1,484,336 |
| | | | | |
Czech Republic — 0.1% | | | | | |
CEZ AS | | 22,320 | | | 1,048,005 |
| | | | | |
Denmark — 0.6% | | | | | |
A P Moller - Maersk A/S‡‡ | | 84 | | | 590,176 |
Coloplast A/S Class B | | 611 | | | 55,254 |
Danisco A/S‡‡ | | 1,690 | | | 112,756 |
Danske Bank A/S*‡‡ | | 7,780 | | | 174,657 |
FLSmidth & Co. A/S | | 19,757 | | | 1,384,094 |
H Lundbeck A/S | | 44,900 | | | 811,218 |
Novo-Nordisk A/S Class B‡‡ | | 76,979 | | | 4,914,479 |
Vestas Wind Systems A/SD* | | 7,413 | | | 451,325 |
| | | | | |
| | | | | 8,493,959 |
| | | | | |
See Notes to Financial Statements.
168
| | | | | |
| | | Shares | | Value |
Egypt — 0.3% | | | | | |
Commercial International Bank, Ltd. | | 21,334 | | $ | 212,006 |
El Swedy Cables Holding Co. | | 49,735 | | | 612,503 |
Orascom Construction Industries | | 57,994 | | | 2,628,102 |
Orascom Construction Industries GDR | | 5,738 | | | 266,817 |
| | | | | |
| | | | | 3,719,428 |
| | | | | |
Estonia — 0.0% | | | | | |
Tallink Group, Ltd.* | | 668,760 | | | 353,854 |
| | | | | |
Finland — 0.5% | | | | | |
Elisa OYJ‡‡ | | 3,519 | | | 80,319 |
Fortum OYJ‡‡ | | 5,339 | | | 144,844 |
Metso OYJ‡‡ | | 8,290 | | | 291,604 |
Nokia OYJ | | 204,230 | | | 2,640,690 |
Outokumpu OYJ‡‡ | | 7,752 | | | 146,746 |
Sampo OYJ‡‡ | | 5,553 | | | 135,271 |
Stora Enso OYJ Class R* | | 88,419 | | | 620,154 |
UPM-Kymmene OYJ‡‡ | | 247,280 | | | 2,939,863 |
| | | | | |
| | | | | 6,999,491 |
| | | | | |
France — 7.9% | | | | | |
Air Liquide SA | | 17,117 | | | 2,035,687 |
Alstom SA‡‡ | | 7,009 | | | 490,180 |
Atos Origin SA*‡‡ | | 2,752 | | | 126,079 |
AXA SA | | 217,909 | | | 5,116,278 |
BNP Paribas‡‡ | | 57,212 | | | 4,537,940 |
Bourbon SA‡‡ | | 1,810 | | | 67,980 |
Bouygues SA‡‡ | | 28,437 | | | 1,472,986 |
Cap Gemini SA‡‡ | | 48,102 | | | 2,194,420 |
Carrefour SA | | 193,794 | | | 9,295,670 |
Casino Guichard Perrachon SAD | | 27,854 | | | 2,481,654 |
Christian Dior SA‡‡ | | 33,545 | | | 3,437,683 |
CNP Assurances‡‡ | | 2,194 | | | 212,457 |
Compagnie de Saint-Gobain‡‡ | | 146,595 | | | 7,952,232 |
Compagnie Generale de Geophysique - Veritas*‡‡ | | 698 | | | 14,837 |
Compagnie Generale des Etablissements Michelin Class B‡‡ | | 21,226 | | | 1,625,673 |
Compagnie Generale d’Optique Essilor International SAD | | 17,900 | | | 1,070,626 |
Credit Agricole SA‡‡ | | 78,737 | | | 1,381,822 |
France Telecom SA‡‡ | | 281,768 | | | 7,040,890 |
GDF Suez‡‡ | | 7,162 | | | 310,265 |
Gecina SA REIT | | 5,235 | | | 569,225 |
Groupe Danone | | 36,035 | | | 2,209,011 |
Klepierre REIT | | 623 | | | 25,241 |
Lafarge SA | | 25,161 | | | 2,072,111 |
Lagardere SCA‡‡ | | 2,554 | | | 103,400 |
Natixis* | | 1,317 | | | 6,576 |
Nexans SA | | 8,431 | | | 669,706 |
Peugeot SAD*‡‡ | | 14,493 | | | 487,218 |
PPR‡‡ | | 2,972 | | | 356,744 |
Publicis Groupe SA‡‡ | | 4,552 | | | 185,085 |
Sanofi-Aventis SA‡‡ | | 50,391 | | | 3,962,888 |
Schneider Electric SA‡‡ | | 25,855 | | | 3,006,227 |
SCOR SE‡‡ | | 16,071 | | | 403,736 |
Societe BIC SA‡‡ | | 5,391 | | | 372,437 |
Societe Generale‡‡ | | 118,918 | | | 8,262,414 |
SOITECD* | | 55,370 | | | 789,905 |
Technip SAD | | 32,474 | | | 2,284,759 |
Total SA‡‡ | | 338,774 | | | 21,759,418 |
Total SA ADRD | | 4,200 | | | 268,968 |
Unibail-Rodamco SE REIT‡‡ | | 3,962 | | | 870,371 |
Vallourec‡‡ | | 5,539 | | | 1,002,107 |
Vivendi SA‡‡ | | 119,775 | | | 3,554,887 |
WendelD | | 19,400 | | | 1,178,814 |
| | | | | |
| | | | | 105,266,607 |
| | | | | |
Germany — 6.2% | | | | | |
Aareal Bank AGD* | | 30,389 | | | 570,666 |
Aixtron AG | | 20,830 | | | 700,038 |
Allianz SE‡‡ | | 32,757 | | | 4,060,555 |
BASF SE‡‡ | | 128,369 | | | 7,944,840 |
Bayer AG‡‡ | | 70,139 | | | 5,612,768 |
Bayerische Motoren Werke AG | | 35,627 | | | 1,621,821 |
Beiersdorf AG | | 31,420 | | | 2,070,871 |
Daimler AG‡‡ | | 57,965 | | | 3,087,425 |
Deutsche Bank AGD‡‡ | | 49,746 | | | 3,517,538 |
Deutsche Boerse AG‡‡ | | 28,685 | | | 2,375,392 |
Deutsche Lufthansa AG‡‡ | | 156,348 | | | 2,640,046 |
Deutsche Post AG‡‡ | | 15,590 | | | 301,305 |
Deutsche Telekom AG | | 481,866 | | | 7,068,879 |
E.ON AG‡‡ | | 24,459 | | | 1,026,643 |
GEA Group AG‡‡ | | 135,601 | | | 3,020,648 |
Hannover Rueckversicherung AG*‡‡ | | 77,945 | | | 3,641,616 |
Hochtief AG‡‡ | | 2,493 | | | 190,133 |
Infineon Technologies AG*‡‡ | | 33,605 | | | 186,957 |
Linde AG | | 23,603 | | | 2,843,741 |
Merck KGaA | | 19,410 | | | 1,820,032 |
Metro AG‡‡ | | 33,596 | | | 2,051,800 |
MTU Aero Engines Holding AG‡‡ | | 5,642 | | | 307,063 |
Muenchener Rueckver-sicherungs AG‡‡ | | 24,067 | | | 3,748,667 |
RWE AG‡‡ | | 170,162 | | | 16,512,908 |
Salzgitter AG‡‡ | | 2,822 | | | 276,524 |
SAP AGD | | 31,524 | | | 1,502,847 |
Siemens AG‡‡ | | 15,033 | | | 1,379,591 |
Software AG‡‡ | | 730 | | | 79,554 |
Suedzucker AG‡‡ | | 4,711 | | | 98,156 |
Symrise AG | | 72,108 | | | 1,536,997 |
ThyssenKrupp AG‡‡ | | 6,155 | | | 231,380 |
United Internet AG* | | 27,285 | | | 359,565 |
Volkswagen AG‡‡ | | 477 | | | 52,850 |
| | | | | |
| | | | | 82,439,816 |
| | | | | |
Greece — 0.4% | | | | | |
Coca Cola Hellenic | | | | | |
Bottling Co. SA | | 109,741 | | | 2,498,074 |
National Bank of Greece SA* | | 5,401 | | | 138,762 |
Public Power Corporation SA* | | 128,774 | | | 2,388,241 |
| | | | | |
| | | | | 5,025,077 |
| | | | | |
Hong Kong — 3.2% | | | | | |
ASM Pacific Technology, Ltd. | | 1,400 | | | 13,237 |
Beijing Enterprises Holdings, Ltd. | | 103,500 | | | 749,627 |
Belle International Holdings, Ltd. | | 863,000 | | | 999,763 |
BOC Hong Kong Holdings, Ltd.‡‡ | | 49,000 | | | 110,087 |
Cheung Kong Holdings, Ltd.‡‡ | | 10,000 | | | 128,502 |
Cheung Kong Infrastructure Holdings, Ltd.‡‡ | | 2,000 | | | 7,605 |
China Mengniu Dairy Co., Ltd.* | | 283,000 | | | 1,006,015 |
See Notes to Financial Statements.
169
INTERNATIONAL EQUITY FUND
SCHEDULE OF INVESTMENTS (Continued)
| | | | | |
| | | Shares | | Value |
China Mobile, Ltd. | | 383,749 | | $ | 3,570,605 |
China Overseas Land & Investment, Ltd.D | | 1,811,892 | | | 3,796,442 |
China Resources Land, Ltd. | | 156,000 | | | 351,150 |
China Unicom Hong Kong, Ltd. | | 2,254,000 | | | 2,957,853 |
CLP Holdings, Ltd.‡‡ | | 8,500 | | | 57,524 |
CNOOC, Ltd. | | 916,000 | | | 1,427,079 |
Dairy Farm International Holdings, Ltd. | | 212,400 | | | 1,272,276 |
Esprit Holdings, Ltd.‡‡ | | 292,372 | | | 1,939,796 |
Hang Lung Group, Ltd.‡‡ | | 5,000 | | | 24,728 |
Henderson Land Development Co., Ltd.‡‡ | | 9,000 | | | 67,255 |
Hong Kong & China Gas Co., Ltd.‡‡ | | 38,000 | | | 95,310 |
Hong Kong Electric Holdings, Ltd. | | 640,500 | | | 3,488,990 |
Hong Kong Exchanges and Clearing, Ltd.‡‡ | | 7,400 | | | 131,664 |
Hopewell Holdings‡‡ | | 8,000 | | | 25,794 |
Hutchison Whampoa, Ltd.‡‡ | | 479,600 | | | 3,281,365 |
Hysan Development Co., Ltd. | | 339,000 | | | 959,400 |
Jardine Matheson Holdings, Ltd. | | 112,800 | | | 3,388,819 |
Kerry Properties, Ltd. | | 11,000 | | | 55,638 |
Li & Fung, Ltd.‡‡ | | 516,000 | | | 2,133,375 |
Lifestyle International Holdings, Ltd. | | 4,000 | | | 7,436 |
Link (The) REIT‡‡ | | 16,000 | | | 40,828 |
Mongolia Energy Co., Ltd.*‡‡ | | 15,000 | | | 7,632 |
New World Development, Ltd.‡‡ | | 17,000 | | | 34,636 |
Noble Group, Ltd. | | 460,000 | | | 1,055,126 |
NWS Holdings, Ltd. | | 6,000 | | | 11,012 |
Pacific Basin Shipping, Ltd.D | | 432,000 | | | 309,623 |
PCCW, Ltd.‡‡ | | 14,000 | | | 3,372 |
Shangri-La Asia, Ltd. | | 262,000 | | | 490,880 |
Shougang Concord International Enterprises Co., Ltd. | | 896,000 | | | 222,292 |
Sino Land Co., Ltd. | | 208,000 | | | 400,446 |
Sun Hung Kai Properties, Ltd.‡‡ | | 303,000 | | | 4,505,354 |
Swire Pacific, Ltd. Class A‡‡ | | 5,500 | | | 66,514 |
Television Broadcasts, Ltd.‡‡ | | 16,000 | | | 76,871 |
VTech Holdings, Ltd.D | | 109,000 | | | 1,039,628 |
Wharf Holdings, Ltd.‡‡ | | 416,250 | | | 2,388,868 |
Wheelock & Co., Ltd.‡‡ | | 13,000 | | | 39,654 |
Yue Yuen Industrial Holdings, Ltd.‡‡ | | 23,000 | | | 66,591 |
| | | | | |
| | | | | 42,806,662 |
| | | | | |
Hungary — 0.2% | | | | | |
MOL Hungarian Oil and Gas PLC* | | 22,930 | | | 2,066,862 |
MOL Hungarian Oil and Gas PLC ADR* | | 7,460 | | | 337,640 |
| | | | | |
| | | | | 2,404,502 |
| | | | | |
India — 2.0% | | | | | |
Ambuja Cements, Ltd. | | 622,021 | | | 1,389,125 |
Andhra Bank | | 351,068 | | | 783,550 |
Asian Paints, Ltd. | | 32,048 | | | 1,236,219 |
Bharat Heavy Electricals, Ltd. | | 13,180 | | | 678,508 |
Cairn India, Ltd.* | | 55,001 | | | 331,742 |
Container Corporation of India, Ltd. | | 27,063 | | | 759,661 |
Dabur India, Ltd. | | 169,795 | | | 576,355 |
HDFC Bank, Ltd. | | 86,916 | | | 3,166,995 |
Housing Development Finance Corporation | | 72,888 | | | 4,170,290 |
ICICI Bank, Ltd. ADRD | | 25,000 | | | 942,750 |
Indraprastha Gas, Ltd. | | 5,887 | | | 25,167 |
Infosys Technologies, Ltd. | | 51,331 | | | 2,856,832 |
Infosys Technologies, Ltd. ADRD | | 25,550 | | | 1,412,148 |
Larsen & Toubro, Ltd. | | 46,780 | | | 1,684,274 |
Opto Circuits India, Ltd. | | 79,558 | | | 386,130 |
Sesa Goa, Ltd. | | 49,223 | | | 431,733 |
Shriram Transport Finance Co., Ltd. | | 134,094 | | | 1,406,337 |
Steel Authority of India, Ltd. | | 121,572 | | | 627,574 |
Sterlite Industries India, Ltd. | | 83,840 | | | 1,546,750 |
Sun Pharmaceuticals Industries, Ltd. | | 65,293 | | | 2,110,684 |
Welspun-Gujarat Stahl, Ltd. | | 89,872 | | | 519,867 |
| | | | | |
| | | | | 27,042,691 |
| | | | | |
Indonesia — 0.9% | | | | | |
PT Astra International Tbk | | 265,500 | | | 976,083 |
PT Bank Central Asia Tbk | | 1,333,000 | | | 682,319 |
PT Bank Danamon Indonesia Tbk | | 1,032,769 | | | 494,307 |
PT Bank Rakyat Indonesia | | 4,616,981 | | | 3,710,822 |
PT Indocement Tunggal Prakarsa Tbk | | 1,019,838 | | | 1,474,216 |
PT Panin Life Tbk* | | 20,081,000 | | | 295,603 |
PT Ramayana Lestari Sentosa Tbk | | 3,163,500 | | | 205,227 |
PT Tambang Batubara Bukit Asam Tbk | | 97,000 | | | 176,626 |
PT Telekomunikasi Indonesia Tbk | | 3,840,307 | | | 3,822,742 |
| | | | | |
| | | | | 11,837,945 |
| | | | | |
Ireland — 0.1% | | | | | |
CRH PLC* | | 23,673 | | | 643,655 |
Experian PLC‡‡ | | 12,700 | | | 125,447 |
Shire PLC | | 38,690 | | | 755,998 |
| | | | | |
| | | | | 1,525,100 |
| | | | | |
Israel — 0.9% | | | | | |
Check Point Software | | | | | |
Technologies, Ltd.D* | | 33,220 | | | 1,125,494 |
Israel Chemicals, Ltd. | | 14,439 | | | 189,600 |
Nice Systems, Ltd. ADRD* | | 32,570 | | | 1,010,973 |
Teva Pharmaceutical Industries, Ltd. ADR | | 161,925 | | | 9,096,946 |
| | | | | |
| | | | | 11,423,013 |
| | | | | |
Italy — 1.9% | | | | | |
Atlantia SpA‡‡ | | 2,224 | | | 58,162 |
Banca Popolare di Milano‡‡ | | 6,389 | | | 45,392 |
Banco Popolare SC* | | 79,969 | | | 599,062 |
Buzzi Unicem SpA‡‡ | | 1,884 | | | 30,312 |
Enel SpA‡‡ | | 46,608 | | | 269,832 |
ENI SpA‡‡ | | 218,633 | | | 5,567,660 |
Fiat SpA* | | 103,308 | | | 1,097,599 |
Finmeccanica SpA | | 24,307 | | | 389,176 |
Intesa Sanpaolo SpA*‡‡ | | 1,293,520 | | | 5,820,865 |
Italcementi SpA‡‡ | | 8,299 | | | 113,519 |
Mediaset SpA‡‡ | | 369,076 | | | 3,034,519 |
Pirelli & C SpA*‡‡ | | 22,160 | | | 13,271 |
Prysmian SpA‡‡ | | 11,868 | | | 207,158 |
See Notes to Financial Statements.
170
| | | | | |
| | | Shares | | Value |
Saipem SpA | | 108,233 | | $ | 3,735,165 |
Telecom Italia SpA‡‡ | | 196,203 | | | 306,066 |
UniCredit SpA*‡‡ | | 1,245,001 | | | 4,162,980 |
| | | | | |
| | | | | 25,450,738 |
| | | | | |
Japan — 14.4% | | | | | |
77 Bank, Ltd. (The) | | 137,000 | | | 728,898 |
Advantest CorporationD | | 55,000 | | | 1,432,792 |
Aeon Credit Service Co., Ltd.D | | 135,600 | | | 1,309,078 |
Aioi Insurance Co., Ltd. | | 2,000 | | | 9,587 |
Aisin Seiki Co., Ltd. | | 12,800 | | | 369,802 |
Ajinomoto Co., Inc. | | 38,000 | | | 357,651 |
Alfresa Holdings Corporation | | 1,700 | | | 67,591 |
Amada Co., Ltd. | | 9,000 | | | 56,372 |
Aozora Bank, Ltd.* | | 3,000 | | | 3,189 |
Asahi Glass Co., Ltd.D‡‡ | | 290,000 | | | 2,758,475 |
Asics Corporation | | 11,000 | | | 98,723 |
Astellas Pharma, Inc.D‡‡ | | 220,700 | | | 8,233,986 |
Brother Industries, Ltd. | | 10,700 | | | 123,055 |
Canon Marketing Japan, Inc.‡‡ | | 6,200 | | | 91,363 |
Canon, Inc.‡‡ | | 356,650 | | | 15,171,203 |
Central Glass Co., Ltd.‡‡ | | 7,000 | | | 26,792 |
Central Japan Railway Co.‡‡ | | 204 | | | 1,365,418 |
Chiyoda Corporation | | 4,000 | | | 30,893 |
Chubu Electric Power Co., Inc.‡‡ | | 3,400 | | | 81,108 |
Chuo Mitsui Trust Holdings, Inc.D | | 569,300 | | | 1,917,753 |
Credit Saison Co., Ltd.‡‡ | | 10,300 | | | 115,352 |
Dai Nippon Printing Co., Ltd.‡‡ | | 14,000 | | | 178,500 |
Daicel Chemical Industries, Ltd. | | 17,000 | | | 99,856 |
Daihatsu Motor Co., Ltd. | | 4,000 | | | 39,983 |
Daito Trust Construction Co., Ltd.‡‡ | | 34,100 | | | 1,614,566 |
Daiwa House Industry Co., Ltd. | | 82,000 | | | 881,714 |
Daiwa Securities Group, Inc.‡‡ | | 343,000 | | | 1,726,179 |
Denki Kagaku Kogyo KK | | 6,000 | | | 26,823 |
Denso Corporation | | 77,500 | | | 2,341,800 |
Doutor Nichires Holdings Co., Ltd. | | 1,100 | | | 14,168 |
Dowa Holdings Co., Ltd. | | 22,000 | | | 121,726 |
eAccess, Ltd.D | | 530 | | | 311,508 |
East Japan Railway Co.‡‡ | | 7,400 | | | 468,273 |
Ebara Corporation*‡‡ | | 19,000 | | | 82,054 |
Elpida Memory, Inc.* | | 1,600 | | | 26,077 |
FamilyMart Co., Ltd.‡‡ | | 3,000 | | | 88,564 |
Fanuc, Ltd.D‡‡ | | 8,900 | | | 829,490 |
Fuji Electric Holdings Co., Ltd. | | 30,000 | | | 51,882 |
Fuji Heavy Industries, Ltd.* | | 9,000 | | | 43,977 |
Fuji Media Holdings, Inc. | | 33 | | | 45,724 |
FUJIFILM Holdings Corporation‡‡ | | 89,400 | | | 2,699,914 |
Fujikura, Ltd. | | 35,000 | | | 182,301 |
Fujitsu, Ltd.D‡‡ | | 272,000 | | | 1,764,831 |
Fukuoka Financial Group, Inc. | | 46,000 | | | 160,308 |
Funai Electric Co., Ltd.‡‡ | | 4,500 | | | 225,996 |
Furukawa Electric Co., Ltd. | | 11,000 | | | 45,939 |
Gunma Bank, Ltd. (The) | | 107,000 | | | 547,236 |
Hakuhodo DY Holdings, Inc.‡‡ | | 960 | | | 46,762 |
Hino Motors, Ltd.* | | 11,000 | | | 38,058 |
Hisamitsu Pharmaceutical Co., Inc. | | 25,900 | | | 836,440 |
Hitachi Capital Corporation | | 4,800 | | | 58,359 |
Hitachi Chemical Co., Ltd. | | 42,500 | | | 866,165 |
Hokuhoku Financial Group, Inc. | | 112,000 | | | 228,996 |
Honda Motor Co., Ltd.D‡‡ | | 101,700 | | | 3,450,516 |
Hoya CorporationD | | 60,100 | | | 1,603,605 |
Ibiden Co., Ltd. | | 9,500 | | | 340,709 |
IHI Corporation* | | 60,000 | | | 95,685 |
Inpex Corporation | | 680 | | | 5,141,504 |
Isuzu Motors, Ltd.* | | 43,000 | | | 80,772 |
ITOCHU Corporation‡‡ | | 168,000 | | | 1,240,966 |
JFE Holdings, Inc.D‡‡ | | 57,100 | | | 2,257,076 |
JGC Corporation‡‡ | | 57,000 | | | 1,050,367 |
JTEKT Corporation | | 47,100 | | | 605,782 |
Jupiter Telecommunications Co., Ltd. | | 103 | | | 101,920 |
Kagoshima Bank, Ltd. (The) | | 8,000 | | | 55,984 |
Kaken Pharmaceutical Co., Ltd.‡‡ | | 2,000 | | | 16,993 |
Kaneka Corporation‡‡ | | 25,000 | | | 159,283 |
Kansai Paint Co., Ltd.‡‡ | | 33,000 | | | 276,552 |
Kao Corporation‡‡ | | 322,700 | | | 7,562,958 |
Kawasaki Kisen Kaisha, Ltd.* | | 16,000 | | | 45,716 |
KDDI Corporation‡‡ | | 1,848 | | | 9,788,234 |
Keio Corporation | | 7,000 | | | 42,241 |
Keisei Electric Railway Co., Ltd. | | 4,000 | | | 21,882 |
Keyence Corporation | | 4,600 | | | 954,692 |
Kinden Corporation | | 14,000 | | | 118,630 |
Koito Manufacturing Co., Ltd. | | 44,000 | | | 706,200 |
Komatsu, Ltd.D | | 41,000 | | | 858,293 |
Konica Minolta Holdings, Inc. | | 174,500 | | | 1,798,245 |
Kuraray Co., Ltd. | | 81,000 | | | 953,339 |
Kyoei Steel, Ltd. | | 12,500 | | | 230,369 |
Lawson, Inc.‡‡ | | 22,500 | | | 993,708 |
Leopalace21 Corporation*‡‡ | | 4,600 | | | 19,060 |
Maeda Road Construction Co., Ltd. | | 37,000 | | | 272,650 |
Makita Corporation | | 2,000 | | | 68,696 |
Marubeni CorporationD | | 457,000 | | | 2,524,434 |
Mazda Motor Corporation* | | 11,000 | | | 25,293 |
Mediceo Paltac Holdings Co., Ltd. | | 4,600 | | | 57,015 |
Miraca Holdings, Inc.‡‡ | | 11,000 | | | 302,729 |
Mitsubishi Corporation‡‡ | | 305,200 | | | 7,602,029 |
Mitsubishi Electric CorporationD* | | 136,000 | | | 1,010,288 |
Mitsubishi Estate Co., Ltd.‡‡ | | 7,000 | | | 111,760 |
Mitsubishi Gas Chemical Co., Inc. | | 17,000 | | | 85,665 |
Mitsubishi UFJ Financial Group, Inc.‡‡ | | 53,200 | | | 262,049 |
Mitsubishi UFJ Lease & Finance Co., Ltd.‡‡ | | 2,020 | | | 60,854 |
Mitsui & Co., Ltd.‡‡ | | 23,300 | | | 330,533 |
Mitsui Chemicals, Inc. | | 44,000 | | | 113,928 |
Mitsui Engineering & Shipbuilding Co., Ltd. | | 58,000 | | | 139,688 |
Mitsui Fudosan Co., Ltd.‡‡ | | 43,000 | | | 727,047 |
Mitsui Mining & Smelting Co., Ltd.* | | 13,000 | | | 33,787 |
Mitsui OSK Lines, Ltd.‡‡ | | 6,000 | | | 31,696 |
Mitsui Sumitomo Insurance Group Holdings, Inc.‡‡ | | 900 | | | 22,987 |
Mitsumi Electric Co., Ltd.‡‡ | | 6,600 | | | 116,573 |
Mizuho Financial Group, Inc.‡‡ | | 23,300 | | | 41,900 |
Mizuho Securities Co., Ltd. | | 64,000 | | | 193,659 |
See Notes to Financial Statements.
171
INTERNATIONAL EQUITY FUND
SCHEDULE OF INVESTMENTS (Continued)
| | | | | |
| | | Shares | | Value |
Mochida Pharmaceutical Co., Ltd.‡‡ | | 7,000 | | $ | 62,614 |
Musashino Bank, Ltd. (The)‡‡ | | 1,700 | | | 40,320 |
Namco Bandai Holdings, Inc. | | 3,500 | | | 33,435 |
NHK Spring Co., Ltd. | | 12,000 | | | 111,729 |
Nihon Yamamura Glass Co., Ltd. | | 103,000 | | | 339,002 |
Nintendo Co., Ltd.‡‡ | | 100 | | | 23,883 |
Nippon Kayaku Co., Ltd. | | 6,000 | | | 54,158 |
Nippon Meat Packers, Inc. | | 117,000 | | | 1,354,532 |
Nippon Mining Holdings, Inc. | | 31,000 | | | 133,045 |
Nippon Oil Corporation‡‡ | | 140,000 | | | 649,049 |
Nippon Shokubai Co., Ltd. | | 18,000 | | | 154,733 |
Nippon Telegraph & Telephone Corporation‡‡ | | 12,400 | | | 489,834 |
Nippon Television Network Corporation | | 590 | | | 76,690 |
Nishi-Nippon City Bank, Ltd. (The) | | 67,000 | | | 164,059 |
Nissan Motor Co., Ltd.*‡‡ | | 249,200 | | | 2,189,928 |
Nissan Shatai Co., Ltd.‡‡ | | 7,000 | | | 62,551 |
Nissay Dowa General Insurance Co., Ltd. | | 1,000 | | | 4,798 |
Nisshin Seifun Group, Inc.‡‡ | | 17,000 | | | 229,736 |
Nitto Denko Corporation‡‡ | | 83,400 | | | 2,996,019 |
Nomura Holdings, Inc. | | 163,000 | | | 1,212,167 |
NTT DoCoMo, Inc.‡‡ | | 614 | | | 856,822 |
OJI Paper Co., Ltd.‡‡ | | 20,000 | | | 83,796 |
Okinawa Electric Power Co., Inc. (The) | | 8,200 | | | 437,912 |
Omron Corporation‡‡ | | 2,000 | | | 35,969 |
ORIX CorporationD‡‡ | | 14,410 | | | 981,085 |
Osaka Gas Co., Ltd.‡‡ | | 317,000 | | | 1,068,371 |
Otsuka Corporation | | 1,500 | | | 74,817 |
Pacific Metals Co., Ltd. | | 9,000 | | | 68,295 |
Panasonic Electric Works Co., Ltd. | | 22,000 | | | 266,549 |
Promise Co., Ltd.* | | 4,450 | | | 34,154 |
Rakuten, Inc. | | 3,083 | | | 2,347,158 |
Rengo Co., Ltd.‡‡ | | 18,000 | | | 106,986 |
Resona Holdings, Inc. | | 4,700 | | | 47,750 |
Rohm Co., Ltd.‡‡ | | 500 | | | 32,631 |
Sakai Chemical Industry Co., Ltd. | | 81,000 | | | 367,593 |
Santen Pharmaceutical Co., Ltd. | | 33,400 | | | 1,072,886 |
Sanyo Electric Co., Ltd.* | | 9,000 | | | 16,624 |
SBI Holdings, Inc. | | 176 | | | 31,510 |
Secom Co., Ltd.‡‡ | | 600 | | | 28,498 |
Seino Holdings Corporation | | 18,000 | | | 114,254 |
Sekisui House, Ltd.‡‡ | | 257,000 | | | 2,333,108 |
Seven & I Holdings Co., Ltd.D‡‡ | | 286,900 | | | 5,857,997 |
Sharp Corporation‡‡ | | 3,000 | | | 37,885 |
Shimamura Co., Ltd.D | | 22,200 | | | 2,121,149 |
Shimano, Inc.D | | 30,500 | | | 1,231,334 |
Shin-Etsu Chemical Co., Ltd.‡‡ | | 81,700 | | | 4,612,603 |
Shinko Electric Industries Co., Ltd. | | 36,300 | | | 528,401 |
Shiseido Co., Ltd. | | 73,100 | | | 1,404,896 |
Softbank Corporation‡‡ | | 4,100 | | | 96,114 |
Sohgo Security Services Co., Ltd. | | 30,600 | | | 343,025 |
Sojitz Corporation | | 6,600 | | | 12,488 |
Sompo Japan Insurance, Inc.‡‡ | | 331,000 | | | 2,134,088 |
Sony Corporation‡‡ | | 85,200 | | | 2,476,891 |
Stanley Electric Co., Ltd.‡‡ | | 7,100 | | | 144,010 |
Sumco CorporationD‡‡ | | 42,100 | | | 743,917 |
Sumitomo Bakelite Co., Ltd. | | 4,000 | | | 19,755 |
Sumitomo CorporationD | | 146,000 | | | 1,486,667 |
Sumitomo Electric Industries, Ltd. | | 4,300 | | | 53,560 |
Sumitomo Metal Mining Co., Ltd.‡‡ | | 5,000 | | | 73,787 |
Sumitomo Mitsui Financial Group, Inc.‡‡ | | 4,700 | | | 134,867 |
Sumitomo Realty & Development Co., Ltd.‡‡ | | 3,000 | | | 56,632 |
Sumitomo Trust & Banking Co., Ltd. (The)‡‡ | | 6,000 | | | 29,460 |
Suzuken Co., Ltd.‡‡ | | 2,700 | | | 88,796 |
Taiyo Yuden Co., Ltd.D | | 46,000 | | | 595,521 |
Takeda Pharmaceutical Co., Ltd.‡‡ | | 243,500 | | | 10,032,412 |
TDK Corporation‡‡ | | 1,700 | | | 103,890 |
THK Co., Ltd. | | 6,700 | | | 119,144 |
Toho Gas Co., Ltd.‡‡ | | 138,000 | | | 733,243 |
Tokai Rika Co., Ltd. | | 6,000 | | | 136,087 |
Tokio Marine Holdings, Inc. | | 208,000 | | | 5,676,101 |
Tokuyama Corporation‡‡ | | 18,000 | | | 100,646 |
Tokyo Electron, Ltd.‡‡ | | 21,100 | | | 1,354,355 |
Tokyo Gas Co., Ltd. | | 238,000 | | | 949,999 |
Tokyo Steel Manufacturing Co., Ltd.‡‡ | | 11,500 | | | 129,462 |
Tokyu Land Corporation | | 164,000 | | | 609,198 |
Toppan Printing Co., Ltd.‡‡ | | 11,000 | | | 89,563 |
Toshiba CorporationD* | | 462,000 | | | 2,563,568 |
Toyo Seikan Kaisha, Ltd.‡‡ | | 8,700 | | | 132,535 |
Toyo Suisan Kaisha, Ltd.‡‡ | | 24,000 | | | 553,450 |
Toyoda Gosei Co., Ltd. | | 24,600 | | | 745,227 |
Toyota Motor Corporation‡‡ | | 157,240 | | | 6,629,327 |
Toyota Tsusho Corporation | | 6,600 | | | 97,663 |
Trend Micro, Inc.D | | 35,000 | | | 1,329,436 |
Uni-Charm Corporation | | 49,100 | | | 4,602,895 |
USS Co., Ltd.‡‡ | | 2,670 | | | 162,992 |
West Japan Railway Co.D‡‡ | | 839 | | | 2,812,845 |
Yamada Denki Co., Ltd. | | 18,290 | | | 1,233,862 |
Yamaguchi Financial Group, Inc. | | 5,000 | | | 46,413 |
Yamaha Corporation | | 5,800 | | | 69,881 |
Yamatake Corporation | | 2,100 | | | 46,679 |
Yamato Holdings Co., Ltd.D‡‡ | | 110,800 | | | 1,542,327 |
Yamato Kogyo Co., Ltd. | | 2,300 | | | 75,198 |
Yokogawa Electric Corporation | | 7,900 | | | 69,769 |
| | | | | |
| | | | | 193,570,851 |
| | | | | |
Jersey — 0.0% | | | | | |
KazakhGold Group, Ltd. GDR* | | 12,556 | | | 92,493 |
| | | | | |
Kazakhstan — 0.0% | | | | | |
Kazmunaigas Exploration Production GDR | | 11,564 | | | 287,944 |
| | | | | |
Luxembourg — 0.1% | | | | | |
ArcelorMittal‡‡ | | 16,635 | | | 760,323 |
Evraz Group SA GDRD* | | 18,619 | | | 525,987 |
Millicom International Cellular SA ADR‡‡ | | 858 | | | 63,673 |
| | | | | 1,349,983 |
| | | | | |
Malaysia — 0.2% | | | | | |
Airasia Bhd* | | 1,369,700 | | | 549,895 |
AMMB Holdings Bhd | | 261,257 | | | 380,133 |
CIMB Group Holdings Bhd | | 567,937 | | | 2,125,274 |
See Notes to Financial Statements.
172
| | | | | |
| | | Shares | | Value |
Public Bank Bhd | | 41,200 | | $ | 135,431 |
| | | | | |
| | | | | 3,190,733 |
| | | | | |
Mexico — 0.9% | | | | | |
America Movil SAB de CV ADR Series L | | 152,030 | | | 7,142,369 |
Corporacion Moctezuma SAB de CV@ | | 200,607 | | | 460,038 |
Grupo Financiero Inbursa SAD | | 407,154 | | | 1,201,358 |
Grupo Televisa SA ADR | | 87,756 | | | 1,821,815 |
Megacable Holdings SAB de CV* | | 274,062 | | | 578,208 |
Urbi Desarrollos Urbanos SABde CVD* | | 314,900 | | | 710,103 |
Wal-Mart de Mexico SAB de CV Series V | | 116,598 | | | 519,620 |
| | | | | |
| | | | | 12,433,511 |
| | | | | |
Netherlands — 3.6% | | | | | |
Aegon NV* | | 306 | | | 1,959 |
Akzo Nobel NV‡‡ | | 41,490 | | | 2,751,403 |
ASML Holding NV | | 19,672 | | | 671,637 |
Corio NV REIT | | 363 | | | 24,731 |
ING Groep NV*‡‡ | | 593,359 | | | 5,714,272 |
James Hardie Industries NV*‡‡ | | 115,066 | | | 875,223 |
Koninklijke Ahold NV‡‡ | | 31,397 | | | 415,969 |
Koninklijke DSM NV‡‡ | | 23,750 | | | 1,166,919 |
Koninklijke Philips Electronics NVD | | 97,396 | | | 2,875,630 |
New World Resources NVD | | 40,606 | | | 365,707 |
Randstad Holding NV*‡‡ | | 5,630 | | | 280,134 |
Reed Elsevier NV | | 599,434 | | | 7,354,655 |
Royal Dutch Shell PLC‡‡ | | 20,324 | | | 615,008 |
Royal Dutch Shell PLC Class A | | 284,497 | | | 8,572,454 |
Royal Dutch Shell PLC Class B‡‡ | | 127,362 | | | 3,709,184 |
SBM Offshore NV | | 157,690 | | | 3,093,893 |
TNT NV‡‡ | | 110,400 | | | 3,391,870 |
Unilever NVD‡‡ | | 191,288 | | | 6,225,807 |
| | | | | |
| | | | | 48,106,455 |
| | | | | |
New Zealand — 0.2% | | | | | |
Telecom Corporation of New Zealand, Ltd.‡‡ | | 1,079,934 | | | 1,940,150 |
| | | | | |
Nigeria — 0.1% | | | | | |
First City Monument Bank PLC* | | 9,539,191 | | | 458,229 |
Guaranty Trust Bank PLC | | 373,542 | | | 38,714 |
Guaranty Trust Bank PLC ADR | | 90,285 | | | 541,710 |
United Bank for Africa PLC* | | 9,376,458 | | | 677,366 |
| | | | | |
| | | | | 1,716,019 |
| | | | | |
Norway — 1.1% | | | | | |
DnB NOR ASAD* | | 381,363 | | | 4,117,100 |
Statoil ASA | | 150,537 | | | 3,754,346 |
Tandberg ASAD | | 26,200 | | | 745,143 |
Telenor ASA* | | 474,900 | | | 6,634,227 |
| | | | | |
| | | | | 15,250,816 |
| | | | | |
Panama — 0.1% | | | | | |
Copa Holdings SA Class A | | 21,700 | | | 1,181,999 |
| | | | | |
Philippines — 0.2% | | | | | |
International Container Terminal Services, Inc. | | 1,178,750 | | | 570,449 |
Philippine Long Distance Telephone Co. | | 38,940 | | | 2,198,367 |
| | | | | |
| | | | | 2,768,816 |
| | | | | |
Poland — 0.0% | | | | | |
Powszechna Kasa Oszczednosci Bank Polski SA | | 34,047 | | | 449,174 |
| | | | | |
Russia — 1.8% | | | | | |
Gazprom OAO ADR | | 180,939 | | | 4,532,522 |
Globaltrans Investment PLC GDR* | | 13,057 | | | 129,264 |
Kalina ADR | | 5,200 | | | 81,990 |
LSR Group GDR* | | 71,100 | | | 647,010 |
Lukoil OAO ADRD | | 50,326 | | | 2,838,387 |
Magnit OAO@ | | 26,534 | | | 1,827,489 |
Mobile Telesystems OJSC ADRD | | 36,696 | | | 1,794,068 |
NovaTek OAO GDR | | 23,062 | | | 1,522,092 |
Novorossiysk Commercial Sea Port GDR | | 86,936 | | | 1,000,633 |
Pharmstandard GDR* | | 15,423 | | | 316,017 |
Raspadskaya@* | | 228,472 | | | 1,066,964 |
Rosneft Oil Co. GDR | | 140,746 | | | 1,185,081 |
Sberbank of Russian Federation | | 946,137 | | | 2,657,699 |
Seventh Continent* | | 21,076 | | | 84,304 |
Vimpel-Communications ADR | | 117,470 | | | 2,183,767 |
X5 Retail Group NV GDR* | | 64,102 | | | 2,035,682 |
| | | | | |
| | | | | 23,902,969 |
| | | | | |
Singapore — 1.4% | | | | | |
Ascendas Real Estate | | | | | |
Investment Trust‡‡ | | 6,000 | | | 9,419 |
CapitaMall Trust REIT‡‡ | | 16,000 | | | 20,422 |
CapitaMalls Asia, Ltd.* | | 10,000 | | | 18,080 |
ComfortDelgro Corporation, Ltd.‡‡ | | 12,000 | | | 13,958 |
DBS Group Holdings, Ltd.‡‡ | | 11,000 | | | 119,581 |
Golden Agri-Resources, Ltd.* | | 998,000 | | | 359,642 |
Jardine Cycle & Carriage, Ltd.‡‡ | | 4,000 | | | 76,372 |
Keppel Corporation, Ltd. | | 9,000 | | | 52,426 |
Neptune Orient Lines, Ltd.‡‡ | | 46,000 | | | 53,689 |
Oversea-Chinese Banking Corporation, Ltd.‡‡ | | 599,852 | | | 3,862,535 |
Raffles Education Corporation, Ltd. | | 1,984,000 | | | 568,262 |
SembCorp Industries, Ltd.‡‡ | | 597,000 | | | 1,559,979 |
SembCorp Marine, Ltd.‡‡ | | 15,000 | | | 39,137 |
Singapore Exchange, Ltd.‡‡ | | 5,000 | | | 29,441 |
Singapore Technologies Engineering, Ltd.‡‡ | | 10,000 | | | 23,016 |
Singapore Telecommunications, Ltd.‡‡ | | 2,362,000 | | | 5,202,581 |
StarHub, Ltd.‡‡ | | 7,000 | | | 10,691 |
United Overseas Bank, Ltd.‡‡ | | 317,000 | | | 4,412,563 |
UOL Group, Ltd.‡‡ | | 3,186 | | | 9,181 |
Wilmar International Ltd.D | | 519,000 | | | 2,359,899 |
Yangzijiang Shipbuilding Holdings, Ltd.‡‡ | | 12,000 | | | 10,249 |
| | | | | |
| | | | | 18,811,123 |
| | | | | |
South Africa — 1.1% | | | | | |
African Bank Investments, Ltd. | | 45,359 | | | 182,568 |
Aspen Pharmacare Holdings, Ltd.* | | 26,447 | | | 263,320 |
Aveng, Ltd. | | 51,788 | | | 279,008 |
Bidvest Group, Ltd. | | 108,949 | | | 1,899,356 |
See Notes to Financial Statements.
173
INTERNATIONAL EQUITY FUND
SCHEDULE OF INVESTMENTS (Continued)
| | | | | |
| | | Shares | | Value |
FirstRand, Ltd. | | 284,054 | | $ | 702,882 |
Impala Platinum Holdings, Ltd. | | 5,500 | | | 150,338 |
Imperial Holdings, Ltd. | | 40,494 | | | 483,172 |
MTN Group, Ltd. | | 147,741 | | | 2,351,497 |
Naspers, Ltd. | | 21,253 | | | 860,113 |
Pick’n Pay Stores, Ltd. | | 68,590 | | | 385,716 |
Sasol, Ltd. | | 101,597 | | | 4,071,400 |
Standard Bank Group, Ltd. | | 208,372 | | | 2,862,018 |
| | | | | |
| | | | | 14,491,388 |
| | | | | |
South Korea — 1.9% | | | | | |
Amorepacific Corporation* | | 1,657 | | | 1,329,044 |
GS Engineering & Construction Corporation* | | 12,478 | | | 1,156,948 |
Hynix Semiconductor, Inc.* | | 7,300 | | | 145,170 |
Hyundai Motor Co.* | | 6,024 | | | 623,554 |
KB Financial Group, Inc.* | | 15,746 | | | 801,790 |
Korea Electric Power Corporation | | 78,860 | | | 2,301,873 |
Korean Air Lines Co., Ltd.* | | 4,800 | | | 225,756 |
KTB Securities Co., Ltd.* | | 35,429 | | | 122,707 |
LG Chem, Ltd.* | | 690 | | | 135,238 |
LG Display Co., Ltd.* | | 19,160 | | | 647,807 |
LG Electronics, Inc. | | 4,840 | | | 504,561 |
MegaStudy Co., Ltd.* | | 2,136 | | | 439,090 |
POSCO | | 2,853 | | | 1,504,591 |
Samsung Electro-Mechanics Co., Ltd.* | | 1,150 | | | 105,762 |
Samsung Electronics Co., Ltd. | | 13,408 | | | 9,194,268 |
Samsung Electronics Co., Ltd. (Non-Voting Shares) GDR 144A | | 5,507 | | | 1,241,407 |
Samsung Fire & Marine Insurance Co., Ltd. | | 8,217 | | | 1,406,494 |
Shinhan Financial Group Co., Ltd.* | | 96,251 | | | 3,561,680 |
| | | | | |
| | | | | 25,447,740 |
| | | | | |
Spain — 4.5% | | | | | |
Banco Bilbao Vizcaya Argentaria SA‡‡ | | 69,036 | | | 1,258,182 |
Banco Espanol de Credito SA‡‡ | | 13,857 | | | 169,750 |
Banco Santander SA‡‡ | | 1,120,218 | | | 18,511,214 |
Bolsas y Mercados Espanoles SA‡‡ | | 1,314 | | | 42,381 |
Corporacion Financiera Alba SA | | 7,249 | | | 378,528 |
Ebro Puleva SA‡‡ | | 16,314 | | | 339,150 |
Enagas | | 73,321 | | | 1,625,399 |
Endesa SA‡‡ | | 10,635 | | | 366,760 |
Gestevision Telecinco SAD | | 40,861 | | | 594,331 |
Iberdrola SAD‡‡ | | 1,003,043 | | | 9,611,913 |
Inditex SA | | 32,055 | | | 2,001,913 |
Mapfre SAD* | | 702,665 | | | 2,945,177 |
Red Electrica de Espana SA | | 7,807 | | | 435,649 |
Repsol YPF SA‡‡ | | 11,122 | | | 298,454 |
Tecnicas Reunidas SA‡‡ | | 10,245 | | | 589,190 |
Telefonica SA‡‡ | | 757,879 | | | 21,212,293 |
Viscofan SA | | 18,870 | | | 479,232 |
| | | | | |
| | | | | 60,859,516 |
| | | | | |
Sri Lanka — 0.0% | | | | | |
Dialog Telekom, Ltd.* | | 2,452,710 | | | 155,438 |
| | | | | |
Sweden — 0.6% | | | | | |
Assa Abloy AB Class B | | 108,742 | | | 2,094,912 |
Atlas Copco AB Class A | | 912 | | | 13,406 |
Boliden AB‡‡ | | 10,588 | | | 135,677 |
Electrolux ABD*‡‡ | | 65,115 | | | 1,530,145 |
Hennes & Mauritz AB Class B‡‡ | | 6,216 | | | 344,594 |
Holmen AB‡‡ | | 1,216 | | | 30,980 |
Investor AB‡‡ | | 3,383 | | | 62,661 |
Nordea Bank AB‡‡ | | 30,729 | | | 311,346 |
Skanska AB‡‡ | | 19,291 | | | 327,330 |
Svenska Cellulosa AB‡‡ | | 18,035 | | | 240,455 |
Svenska Handelsbanken AB‡‡ | | 44,220 | | | 1,259,817 |
Swedbank AB*‡‡ | | 11,890 | | | 117,063 |
Tele2 AB‡‡ | | 29,958 | | | 460,193 |
Telefonaktiebolaget LM Ericsson Class B‡‡ | | 64,536 | | | 594,121 |
Volvo AB Class B‡‡ | | 3,110 | | | 26,675 |
| | | | | |
| | | | | 7,549,375 |
| | | | | |
Switzerland — 7.2% | | | | | |
ABB, Ltd.*‡‡ | | 175,007 | | | 3,372,267 |
Alcon, Inc. | | 4,400 | | | 723,140 |
Baloise Holding AG‡‡ | | 14,168 | | | 1,176,331 |
Clariant AG*‡‡ | | 12,629 | | | 149,339 |
Compagnie Financiere Richemont SA‡‡ | | 69,286 | | | 2,329,871 |
Credit Suisse Group AG‡‡ | | 23,962 | | | 1,187,110 |
GAM Holding, Ltd. | | 52,135 | | | 631,306 |
Holcim, Ltd.* | | 28,540 | | | 2,218,055 |
Julius Baer Group, Ltd. | | 62,610 | | | 2,201,896 |
Kuehne + Nagel International AG‡‡ | | 721 | | | 70,102 |
Nestle SA‡‡ | | 413,471 | | | 20,067,246 |
Nobel Biocare Holding AG | | 7,425 | | | 248,850 |
Novartis AG‡‡ | | 361,648 | | | 19,749,319 |
Roche Holding AG‡‡ | | 87,480 | | | 14,960,203 |
Schindler Holding AG‡‡ | | 6,085 | | | 465,929 |
Sonova Holding AG* | | 14,947 | | | 1,810,830 |
STMicroelectronics NV‡‡ | | 87,414 | | | 799,783 |
Sulzer AG‡‡ | | 2,778 | | | 217,934 |
Swatch Group AG (The) | | 33,722 | | | 4,349,270 |
Swiss Life Holding AG*‡‡ | | 981 | | | 124,819 |
Swisscom AG‡‡ | | 244 | | | 93,187 |
Syngenta AG | | 1,577 | | | 445,357 |
Synthes, Inc. | | 22,544 | | | 2,948,623 |
UBS AG*‡‡ | | 158,751 | | | 2,472,106 |
Xstrata PLC* | | 246,341 | | | 4,393,749 |
Zurich Financial Services AG‡‡ | | 43,541 | | | 9,519,094 |
| | | | | |
| | | | | 96,725,716 |
| | | | | |
Taiwan — 1.9% | | | | | |
Acer, Inc. | | 699,730 | | | 2,099,726 |
Asustek Computer, Inc. | | 236,000 | | | 454,558 |
Cathay Financial Holding Co., Ltd.* | | 365,000 | | | 679,551 |
Chunghwa Telecom Co., Ltd. | | 1,145,763 | | | 2,136,901 |
Hon Hai Precision Industry Co., Ltd. | | 353,950 | | | 1,655,321 |
MediaTek, Inc. | | 242,792 | | | 4,218,451 |
Novatek Microelectronics Corporation, Ltd. | | 105,445 | | | 352,225 |
Quanta Computer, Inc. | | 232,848 | | | 505,204 |
Taishin Financial Holding Co., Ltd.* | | 2,533,000 | | | 993,294 |
Taiwan Semiconductor Manufacturing Co., Ltd. | | 3,777,348 | | | 7,613,232 |
See Notes to Financial Statements.
174
| | | | | |
| | | Shares | | Value |
Taiwan Semiconductor Manufacturing Co., Ltd. ADRD | | 292,348 | | $ | 3,344,461 |
United Microelectronics Corporation* | | 1,173,000 | | | 633,711 |
Yuanta Financial Holding Co., Ltd. | | 1,142,000 | | | 835,610 |
| | | | | |
| | | | | 25,522,245 |
| | | | | |
Thailand — 0.2% | | | | | |
Central Pattana PCL@ | | 944,692 | | | 575,250 |
CP ALL PCL | | 735,868 | | | 547,376 |
Siam Commercial Bank PCL | | 555,888 | | | 1,446,409 |
| | | | | |
| | | | | 2,569,035 |
| | | | | |
Turkey — 0.5% | | | | | |
Coca-Cola Icecek AS | | 74,153 | | | 741,461 |
Turk Hava Yollari | | 107,552 | | | 411,739 |
Türkiye Garanti Bankasi AS | | 962,571 | | | 4,100,464 |
Yapi ve Kredi Bankasi AS* | | 810,896 | | | 1,786,748 |
| | | | | |
| | | | | 7,040,412 |
| | | | | |
United Arab Emirates — 0.0% | | | | | |
DP World, Ltd. | | 460,600 | | | 195,815 |
| | | | | |
United Kingdom — 15.8% | | | | | |
Aberdeen Asset Management PLC | | 407,450 | | | 875,527 |
Aegis Group PLC‡‡ | | 71,913 | | | 138,892 |
Aggreko PLCD | | 178,194 | | | 2,660,186 |
AMEC PLC‡‡ | | 160,223 | | | 2,041,315 |
Anglo American PLCD*‡‡ | | 255,385 | | | 10,993,051 |
Antofagasta PLC | | 126,991 | | | 2,020,116 |
ARM Holdings PLC D | | 552,520 | | | 1,577,686 |
AstraZeneca PLC‡‡ | | 190,978 | | | 8,975,421 |
Atkins WS PLC‡‡ | | 57,354 | | | 564,916 |
Autonomy Corporation PLC* | | 30,192 | | | 733,194 |
Aviva PLC‡‡ | | 774,305 | | | 4,925,460 |
BAE Systems PLC‡‡ | | 658,398 | | | 3,810,591 |
Barclays PLC‡‡ | | 439,941 | | | 1,938,578 |
BBA Aviation PLC‡‡ | | 70,616 | | | 186,230 |
Berkeley Group Holdings PLC*‡‡ | | 8,909 | | | 117,505 |
BG Group PLC‡‡ | | 396,775 | | | 7,164,268 |
BHP Billiton PLC‡‡ | | 417,260 | | | 13,302,221 |
BP PLC‡‡ | | 1,906,962 | | | 18,413,927 |
Bradford & Bingley PLC+D* | | 28,672 | | | — |
Brit Insurance Holdings NV‡‡ | | 93,255 | | | 294,515 |
British Land Co. PLC‡‡ REIT | | 4,511 | | | 34,736 |
Britvic PLC | | 76,817 | | | 503,727 |
BT Group PLC‡‡ | | 930,268 | | | 2,025,962 |
Burberry Group PLC | | 3,690 | | | 35,441 |
Capita Group PLC (The) | | 60,786 | | | 734,993 |
Centrica PLC‡‡ | | 30,350 | | | 137,472 |
Charter International PLC‡‡ | | 11,322 | | | 131,158 |
Close Brothers Group PLC | | 56,783 | | | 631,024 |
Compass Group PLC | | 914,164 | | | 6,542,202 |
Cookson Group PLC* | | 4,312 | | | 29,172 |
CSR PLC* | | 84,084 | | | 552,849 |
Daily Mail and General Trust PLC‡‡ | | 23,402 | | | 157,286 |
Dimension Data Holdings PLC | | 299,909 | | | 360,969 |
Drax Group PLC‡‡ | | 4,406 | | | 29,374 |
DSG International PLC* | | 60,153 | | | 35,255 |
Eurasian Natural Resources Corporation‡‡ | | 12,342 | | | 180,780 |
Firstgroup PLC | | 256,224 | | | 1,752,735 |
GlaxoSmithKline PLC‡‡ | | 797,128 | | | 16,903,776 |
Hammerson PLC REIT‡‡ | | 6,134 | | | 41,751 |
Hays PLC‡‡ | | 146,445 | | | 244,888 |
Home Retail Group PLC‡‡ | | 54,214 | | | 245,886 |
HSBC Holdings PLC‡‡ | | 483,253 | | | 5,513,105 |
ICAP PLC | | 127,560 | | | 879,785 |
IG Group Holdings PLC | | 158,825 | | | 971,819 |
IMI PLC‡‡ | | 26,713 | | | 222,821 |
International Personal Finance PLC‡‡ | | 98,523 | | | 329,821 |
International Power PLC‡‡ | | 33,316 | | | 166,010 |
Intertek Group PLC | | 95,259 | | | 1,925,380 |
Invensys PLC‡‡ | | 18,331 | | | 88,187 |
Investec PLC‡‡ | | 15,172 | | | 103,666 |
J Sainsbury PLC‡‡ | | 300,374 | | | 1,566,202 |
John Wood Group PLC | | 51,460 | | | 255,674 |
Johnson Matthey PLC‡‡ | | 8,037 | | | 198,260 |
Kazakhmys PLC*‡‡ | | 3,627 | | | 76,796 |
Kesa Electricals PLC‡‡ | | 89,222 | | | 214,336 |
Kingfisher PLC‡‡ | | 66,957 | | | 246,482 |
Land Securities Group PLC REIT‡‡ | | 3,636 | | | 40,020 |
Logica PLC‡‡ | | 74,526 | | | 136,353 |
Marks & Spencer Group PLC | | 207,900 | | | 1,343,230 |
Mondi PLC‡‡ | | 219,740 | | | 1,178,909 |
National Grid PLC‡‡ | | 84,868 | | | 926,325 |
Next PLC | | 68,208 | | | 2,280,603 |
Old Mutual PLC*‡‡ | | 39,903 | | | 69,878 |
Pearson PLC‡‡ | | 222,452 | | | 3,189,504 |
Persimmon PLC*‡‡ | | 23,825 | | | 180,158 |
Petrofac, Ltd.‡‡ | | 256,717 | | | 4,297,418 |
Prudential PLC | | 502,188 | | | 5,140,518 |
Reckitt Benckiser Group PLC‡‡ | | 111,338 | | | 6,026,726 |
Reed Elsevier PLC | | 240,630 | | | 1,975,459 |
Rexam PLC‡‡ | | 568,121 | | | 2,655,897 |
Rio Tinto PLC‡‡ | | 97,307 | | | 5,254,255 |
Rolls-Royce Group PLC+*‡‡ | | 18,046,479 | | | 2,194,682 |
Royal Bank of Scotland Group PLC* | | 96,393 | | | 44,746 |
RSA Insurance Group PLC‡‡ | | 60,356 | | | 117,258 |
Scottish & Southern Energy PLC‡‡ | | 113,031 | | | 2,115,683 |
Smith & Nephew PLC | | 42,743 | | | 439,670 |
SSL International PLC | | 72,940 | | | 921,321 |
Standard Chartered PLC‡‡ | | 324,547 | | | 8,193,465 |
Tate & Lyle PLC | | 58,216 | | | 404,916 |
Taylor Wimpey PLC* | | 425,408 | | | 266,395 |
Tesco PLC‡‡ | | 772,572 | | | 5,329,798 |
Tullow Oil PLC | | 189,495 | | | 3,975,679 |
Unilever PLC‡‡ | | 313,972 | | | 10,064,466 |
Vedanta Resources PLCD | | 41,723 | | | 1,745,097 |
Vodafone Group PLC‡‡ | | 4,056,524 | | | 9,393,724 |
Wellstream Holdings PLC | | 99,986 | | | 850,752 |
WH Smith PLC‡‡ | | 22,472 | | | 178,772 |
WM Morrison Supermarkets PLC‡‡ | | 596,589 | | | 2,661,757 |
Wolseley PLC*‡‡ | | 7,143 | | | 142,980 |
WPP PLC‡‡ | | 308,031 | | | 3,012,629 |
| | | | | |
| | | | | 211,552,422 |
| | | | | |
Total Foreign Common Stocks
(Cost $1,126,213,936) | | | | | 1,287,978,301 |
| | | | | |
See Notes to Financial Statements.
175
INTERNATIONAL EQUITY FUND
SCHEDULE OF INVESTMENTS (Continued)
| | | | | | | | |
| | | Shares | | | Value | |
FOREIGN PREFERRED STOCKS — 1.3% | | | | | | | | |
Belgium — 0.0% | | | | | | | | |
Fortis* | | | 106,120 | | | $ | 304 | |
| | | | | | | | |
Brazil — 0.9% | | | | | | | | |
Banco Bradesco SA | | | 141,950 | | | | 2,966,195 | |
Eletropaulo Metropolitana de Sao Paulo SA Class B | | | 43,751 | | | | 866,979 | |
Investimentos Itau SA | | | 472,963 | | | | 3,219,194 | |
Petroleo Brasileiro SA | | | 162,700 | | | | 3,428,758 | |
Ultrapar Participacoes SA | | | 40,528 | | | | 1,864,848 | |
| | | | | | | | |
| | | | | | | 12,345,974 | |
| | | | | | | | |
Chile — 0.0% | | | | | | | | |
Embotelladora Andina SA Class A | | | 38,000 | | | | 106,355 | |
Embotelladora Andina SA Class B | | | 28,700 | | | | 98,258 | |
| | | | | | | | |
| | | | | | | 204,613 | |
| | | | | | | | |
Germany — 0.2% | | | | | | | | |
Henkel AG & Co. KGaA | | | 32,870 | | | | 1,726,104 | |
ProSiebenSat.1 Media AG | | | 47,891 | | | | 548,686 | |
Volkswagen AG‡‡ | | | 5,234 | | | | 493,708 | |
| | | | | | | | |
| | | | | | | 2,768,498 | |
| | | | | | | | |
Russia — 0.0% | | | | | | | | |
MDM Bank OAO | | | 673,300 | | | | 366,949 | |
| | | | | | | | |
South Korea — 0.2% | | | | | | | | |
Samsung Electronics Co., Ltd. | | | 4,243 | | | | 1,912,504 | |
| | | | | | | | |
Total Foreign Preferred Stocks
(Cost $14,268,096) | | | | | | | 17,598,842 | |
| | | | | | | | |
RIGHTS — 0.0% | | | | | | | | |
Fortis +D* | | | 355,003 | | | | — | |
Woodside Petroleum, Ltd.+‡‡ | | | 273 | | | | 1,251 | |
| | | | | | | | |
Total Rights
(Cost $0) | | | | | | | 1,251 | |
| | | | | | | | |
MONEY MARKET FUNDS — 12.1% | | | | | | | | |
GuideStone Money Market Fund (GS4 Class)¥ | | | 44,690,963 | | | | 44,690,963 | |
Northern Institutional Liquid | | | | | | | | |
Assets Portfolio§ | | | 118,006,826 | | | | 118,006,826 | |
| | | | | | | | |
Total Money Market Funds
(Cost $162,697,789) | | | | | | | 162,697,789 | |
| | | | | | | | |
| | |
| | | Par | | | | |
U.S. TREASURY OBLIGATIONS — 0.5% | | | | | | | | |
U.S. Treasury Bills | | | | | | | | |
0.06%, 06/05/10‡‡ | | $ | 5,600,000 | | | | 5,598,062 | |
0.08%, 06/05/10‡‡ | | | 830,000 | | | | 829,713 | |
0.08%, 06/05/10‡‡ | | | 20,000 | | | | 19,993 | |
0.10%, 06/05/10‡‡ | | | 325,000 | | | | 324,888 | |
| | | | | | | | |
Total U.S. Treasury Obligations
(Cost $6,773,049) | | | | | | | 6,772,656 | |
| | | | | | | | |
TOTAL INVESTMENTS — 109.9%
(Cost $1,309,952,870) | | | | | | | 1,475,048,839 | |
| | | | | | | | |
| | |
| | | Shares | | | | |
SECURITIES SOLD SHORT — (1.6)% | | | | | | | | |
Australia — (0.2)% | | | | | | | | |
Adelaide Brighton, Ltd. | | | (29,913 | ) | | | (73,611 | ) |
Alumina, Ltd. | | | (68,826 | ) | | | (112,517 | ) |
Asciano Group | | | (30,000 | ) | | | (48,568 | ) |
AWB, Ltd.* | | | (66,667 | ) | | | (67,255 | ) |
Bank of Queensland, Ltd. | | | (7,710 | ) | | | (79,374 | ) |
Bendigo and Adelaide Bank, Ltd. | | | (16,277 | ) | | | (142,878 | ) |
Cochlear, Ltd. | | | (2,088 | ) | | | (128,942 | ) |
ConnectEast Group | | | (311,353 | ) | | | (120,867 | ) |
DUET Group | | | (49,090 | ) | | | (78,724 | ) |
Fairfax Media, Ltd. | | | (14,466 | ) | | | (22,485 | ) |
Fortescue Metals Group, Ltd. | | | (7,921 | ) | | | (31,331 | ) |
Iluka Resources, Ltd.* | | | (49,642 | ) | | | (158,686 | ) |
Incitec Pivot, Ltd. | | | (56,225 | ) | | | (177,846 | ) |
Leighton Holdings, Ltd. | | | (1,000 | ) | | | (33,898 | ) |
Nufarm, Ltd. | | | (10,092 | ) | | | (97,963 | ) |
Perpetual, Ltd. | | | (2,207 | ) | | | (73,124 | ) |
Primary Health Care, Ltd. | | | (15,693 | ) | | | (84,057 | ) |
Seek, Ltd. | | | (18,999 | ) | | | (117,321 | ) |
Spark Infrastructure Group 144A | | | (107,577 | ) | | | (133,177 | ) |
WorleyParsons, Ltd. | | | (2,338 | ) | | | (60,707 | ) |
| | | | | | | | |
| | | | | | | (1,843,331 | ) |
| | | | | | | | |
Belgium — 0.0% | | | | | | | | |
Colruyt SA | | | (11 | ) | | | (2,654 | ) |
Telenet Group Holding NV | | | (4,504 | ) | | | (128,359 | ) |
| | | | | | | | |
| | | | | | | (131,013 | ) |
| | | | | | | | |
Denmark — (0.1)% | | | | | | | | |
DSV A/S | | | (14,719 | ) | | | (266,751 | ) |
FLSmidth & Co. A/S | | | (454 | ) | | | (31,805 | ) |
Topdanmark A/S | | | (1,077 | ) | | | (145,044 | ) |
TrygVesta AS | | | (130 | ) | | | (8,546 | ) |
William Demant Holding | | | (1,192 | ) | | | (89,592 | ) |
| | | | | | | | |
| | | | | | | (541,738 | ) |
| | | | | | | | |
Finland — (0.1)% | | | | | | | | |
Neste Oil OYJ | | | (2,999 | ) | | | (53,292 | ) |
Nokian Renkaat OYJ | | | (11,383 | ) | | | (276,026 | ) |
Pohjola Bank PLC | | | (3,493 | ) | | | (37,673 | ) |
Rautaruukki OYJ | | | (9,189 | ) | | | (212,555 | ) |
Sanoma OYJ | | | (2,575 | ) | | | (58,096 | ) |
YIT OYJ | | | (1,434 | ) | | | (29,594 | ) |
| | | | | | | | |
| | | | | | | (667,236 | ) |
| | | | | | | | |
France — (0.1)% | | | | | | | | |
Accor SA | | | (20 | ) | | | (1,094 | ) |
Bureau Veritas SA | | | (2,888 | ) | | | (150,545 | ) |
Eiffage SA | | | (2,208 | ) | | | (124,449 | ) |
Electricite de France | | | (5,736 | ) | | | (340,909 | ) |
Iliad SA | | | (2,823 | ) | | | (337,360 | ) |
Ipsen SA | | | (1,042 | ) | | | (57,778 | ) |
JC Decaux SA | | | (5,241 | ) | | | (127,214 | ) |
Neopost SA | | | (428 | ) | | | (35,325 | ) |
Societe Television Francaise 1 | | | (24,058 | ) | | | (441,835 | ) |
Wendel | | | (1,249 | ) | | | (75,894 | ) |
| | | | | | | | |
| | | | | | | (1,692,403 | ) |
| | | | | | | | |
Germany — (0.1)% | | | | | | | | |
Beiersdorf AG | | | (2,453 | ) | | | (161,676 | ) |
Celesio AG | | | (261 | ) | | | (6,609 | ) |
Commerzbank AG | | | (29,052 | ) | | | (243,828 | ) |
Fraport AG Frankfurt Airport Services Worldwide | | | (4,111 | ) | | | (212,247 | ) |
Fresenius Medical Care AG & Co. KGaA | | | (1,873 | ) | | | (99,357 | ) |
Hamburger Hafen und Logistik AG | | | (2,171 | ) | | | (83,853 | ) |
See Notes to Financial Statements.
176
| | | | | | | |
| | | Shares | | | Value | |
K+S AG | | (3,469 | ) | | $ | (197,848 | ) |
SGL Carbon SE | | (3,094 | ) | | | (91,462 | ) |
Solarworld AG | | (5,974 | ) | | | (131,472 | ) |
TUI AG | | (6,889 | ) | | | (57,596 | ) |
| | | | | | | |
| | | | | | (1,285,948 | ) |
| | | | | | | |
Ireland — 0.0% | | | | | | | |
Shire PLC | | (1,786 | ) | | | (34,898 | ) |
| | | | | | | |
Italy — 0.0% | | | | | | | |
A2A SpA | | (93,599 | ) | | | (196,371 | ) |
Saras SpA | | (33,584 | ) | | | (105,452 | ) |
Unipol Gruppo Finanziario SpA | | (113,623 | ) | | | (155,420 | ) |
| | | | | | | |
| | | | | | (457,243 | ) |
| | | | | | | |
Japan — (0.3)% | | | | | | | |
ABC-Mart, Inc. | | (3,100 | ) | | | (85,994 | ) |
Aeon Credit Service Co., Ltd. | | (4,000 | ) | | | (38,616 | ) |
Air Water, Inc. | | (5,000 | ) | | | (58,894 | ) |
Bank of Kyoto, Ltd. (The) | | (5,000 | ) | | | (40,413 | ) |
Daiichi Sankyo Co., Ltd. | | (2,400 | ) | | | (50,331 | ) |
Daikin Industries, Ltd. | | (1,700 | ) | | | (67,145 | ) |
Disco Corporation | | (500 | ) | | | (31,318 | ) |
Eisai Co., Ltd. | | (3,100 | ) | | | (113,974 | ) |
Hamamatsu Photonics KK | | (2,100 | ) | | | (51,153 | ) |
Hiroshima Bank, Ltd. (The) | | (14,000 | ) | | | (53,944 | ) |
Hisamitsu Pharmaceutical Co., Inc. | | (1,300 | ) | | | (41,983 | ) |
Hitachi Construction Machinery Co., Ltd. | | (3,700 | ) | | | (96,987 | ) |
Hitachi Metals, Ltd. | | (10,000 | ) | | | (96,208 | ) |
Jafco Co., Ltd. | | (3,400 | ) | | | (82,285 | ) |
Japan Petroleum Exploration Co., Ltd. | | (800 | ) | | | (35,274 | ) |
Japan Steel Works, Ltd. (The) | | (5,000 | ) | | | (63,755 | ) |
Joyo Bank, Ltd. (The) | | (24,000 | ) | | | (96,442 | ) |
Kajima Corporation | | (15,000 | ) | | | (30,350 | ) |
Kawasaki Heavy Industries, Ltd. | | (29,000 | ) | | | (73,607 | ) |
Kintetsu Corporation | | (27,000 | ) | | | (89,493 | ) |
Matsui Securities Co., Ltd. | | (3,000 | ) | | | (20,901 | ) |
McDonald’s Holdings Co. Japan, Ltd. | | (4,700 | ) | | | (89,893 | ) |
Mitsubishi Chemical Holdings Corporation | | (5,000 | ) | | | (21,291 | ) |
Mitsubishi Electric Corporation* | | (2,000 | ) | | | (14,857 | ) |
Mitsubishi Heavy Industries, Ltd. | | (26,000 | ) | | | (91,700 | ) |
Mitsubishi Motors Corporation* | | (3,000 | ) | | | (4,170 | ) |
Mitsubishi Rayon Co., Ltd. | | (23,000 | ) | | | (92,514 | ) |
Mitsubishi Tanabe Pharma Corporation | | (3,000 | ) | | | (37,433 | ) |
Mizuho Trust & Banking Co., Ltd. | | (101,000 | ) | | | (94,230 | ) |
NGK Spark Plug Co., Ltd. | | (4,000 | ) | | | (45,377 | ) |
Nikon Corporation | | (3,600 | ) | | | (71,087 | ) |
Nitori Co., Ltd. | | (550 | ) | | | (40,937 | ) |
NOK Corporation | | (1,600 | ) | | | (22,068 | ) |
Nomura Research Institute, Ltd. | | (5,700 | ) | | | (112,095 | ) |
NSK, Ltd. | | (22,000 | ) | | | (161,434 | ) |
NTT Data Corporation | | (7 | ) | | | (21,706 | ) |
Olympus Corporation | | (2,900 | ) | | | (93,498 | ) |
Oracle Corporation | | (3,000 | ) | | | (124,994 | ) |
Oriental Land Co., Ltd. | | (200 | ) | | | (13,160 | ) |
Rakuten, Inc. | | (94 | ) | | | (71,564 | ) |
Ricoh Co., Ltd. | | (9,000 | ) | | | (128,958 | ) |
Shimadzu Corporation | | (26,000 | ) | | | (173,174 | ) |
Shimizu Corporation | | (31,000 | ) | | | (111,345 | ) |
Shiseido Co., Ltd. | | (1,800 | ) | | | (34,594 | ) |
Sony Financial Holdings, Inc. | | (10 | ) | | | (26,024 | ) |
Square Enix Holdings Co., Ltd. | | (1,600 | ) | | | (33,754 | ) |
Sumitomo Chemical Co., Ltd. | | (20,000 | ) | | | (87,748 | ) |
Sumitomo Metal Industries, Ltd. | | (37,000 | ) | | | (99,457 | ) |
Sumitomo Rubber Industries, Inc. | | (8,000 | ) | | | (69,546 | ) |
Suruga Bank, Ltd. | | (17,000 | ) | | | (148,143 | ) |
Sysmex Corporation | | (400 | ) | | | (20,915 | ) |
Taiheiyo Cement Corporation | | (70,000 | ) | | | (79,853 | ) |
Taisei Corporation | | (6,000 | ) | | | (10,295 | ) |
Taiyo Nippon Sanso Corporation | | (3,000 | ) | | | (31,928 | ) |
Takashimaya Co., Ltd. | | (13,000 | ) | | | (82,832 | ) |
Toray Industries, Inc. | | (10,000 | ) | | | (54,406 | ) |
Tosoh Corporation | | (9,000 | ) | | | (24,855 | ) |
TOTO, Ltd. | | (8,000 | ) | | | (50,868 | ) |
Toyota Industries Corporation | | (2,700 | ) | | | (80,638 | ) |
Trend Micro, Inc. | | (400 | ) | | | (15,194 | ) |
Tsumura & Co. | | (1,600 | ) | | | (51,725 | ) |
Uni-Charm Corporation | | (300 | ) | | | (28,124 | ) |
Ushio, Inc. | | (3,600 | ) | | | (60,034 | ) |
Yahoo! Japan Corporation | | (421 | ) | | | (126,580 | ) |
Yakult Honsha Co., Ltd. | | (7,500 | ) | | | (227,057 | ) |
| | | | | | | |
| | | | | | (4,401,122 | ) |
| | | | | | | |
Luxembourg — 0.0% | | | | | | | |
Oriflame Cosmetics SA | | (4,666 | ) | | | (278,200 | ) |
| | | | | | | |
Netherlands — 0.0% | | | | | | | |
ASML Holding NV | | (2,700 | ) | | | (92,183 | ) |
Fugro NV | | (1,570 | ) | | | (90,179 | ) |
Koninklijke Boskalis Westminster NV | | (4,256 | ) | | | (163,844 | ) |
SBM Offshore NV | | (4,841 | ) | | | (94,981 | ) |
| | | | | | | |
| | | | | | (441,187 | ) |
| | | | | | | |
Papua New Guinea — 0.0% | | | | | | | |
Oil Search, Ltd. | | (12,464 | ) | | | (68,337 | ) |
| | | | | | | |
Spain — (0.1)% | | | | | | | |
Abengoa SA | | (7,156 | ) | | | (231,205 | ) |
Acciona SA | | (510 | ) | | | (66,661 | ) |
Cintra Concesiones de Infraestructuras de Transporte SA | | (57,194 | ) | | | (675,480 | ) |
Enagas | | (2,246 | ) | | | (49,790 | ) |
Gas Natural SDG SA | | (8,461 | ) | | | (182,380 | ) |
Gestevision Telecinco SA | | (7,844 | ) | | | (114,092 | ) |
Grifols SA | | (13,046 | ) | | | (229,078 | ) |
| | | | | | | |
| | | | | | (1,548,686 | ) |
| | | | | | | |
Sweden — (0.1)% | | | | | | | |
Alliance Oil Co., Ltd. GDR | | (23,388 | ) | | | (331,880 | ) |
Getinge AB | | (10,027 | ) | | | (191,636 | ) |
Hexagon AB | | (19,801 | ) | | | (290,379 | ) |
Lundin Petroleum AB | | (31,378 | ) | | | (247,558 | ) |
Sandvik AB | | (2,956 | ) | | | (35,596 | ) |
TeliaSonera AB | | (71,225 | ) | | | (514,785 | ) |
| | | | | | | |
| | | | | | (1,611,834 | ) |
| | | | | | | |
Switzerland — (0.1)% | | | | | | | |
Givaudan SA | | (409 | ) | | | (327,267 | ) |
Lindt & Spruengli AG | | (4 | ) | | | (98,232 | ) |
See Notes to Financial Statements.
177
INTERNATIONAL EQUITY FUND
SCHEDULE OF INVESTMENTS (Continued)
| | | | | | | |
| | | Shares | | | Value | |
Logitech International SA | | (6,231 | ) | | $ | (108,076 | ) |
Lonza Group AG | | (6,170 | ) | | | (434,732 | ) |
Nobel Biocare Holding AG | | (3,122 | ) | | | (104,634 | ) |
Straumann Holding AG | | (357 | ) | | | (100,269 | ) |
Swiss Reinsurance Co., Ltd. | | (3,747 | ) | | | (179,499 | ) |
| | | | | | | |
| | | | | | (1,352,709 | ) |
| | | | | | | |
United Kingdom — (0.4)% | | | | | | | |
Admiral Group PLC | | (5,526 | ) | | | (105,661 | ) |
Aggreko PLC | | (13,203 | ) | | | (197,102 | ) |
Associated British Foods PLC | | (8,118 | ) | | | (107,623 | ) |
Autonomy Corporation PLC* | | (1,378 | ) | | | (33,464 | ) |
Bellway PLC | | (4,364 | ) | | | (57,522 | ) |
Bunzl PLC | | (18,922 | ) | | | (205,688 | ) |
Cable & Wireless PLC | | (17,102 | ) | | | (38,906 | ) |
Cairn Energy PLC* | | (85,850 | ) | | | (459,579 | ) |
Capita Group PLC (The) | | (19,877 | ) | | | (240,342 | ) |
Carnival PLC* | | (3,214 | ) | | | (109,495 | ) |
Cobham PLC | | (20,434 | ) | | | (82,539 | ) |
easyJet PLC | | (17,757 | ) | | | (100,715 | ) |
Firstgroup PLC | | (37,258 | ) | | | (254,868 | ) |
Inmarsat PLC | | (27,132 | ) | | | (302,337 | ) |
Intercontinental Hotels Group PLC | | (3,627 | ) | | | (52,113 | ) |
ITV PLC | | (281,215 | ) | | | (236,958 | ) |
Lonmin PLC | | (7,195 | ) | | | (226,120 | ) |
Man Group PLC | | (28,733 | ) | | | (141,807 | ) |
Pennon Group PLC | | (27,682 | ) | | | (239,676 | ) |
Prudential PLC | | (4,385 | ) | | | (44,886 | ) |
Reed Elsevier PLC | | (26,473 | ) | | | (217,331 | ) |
Serco Group PLC | | (10,240 | ) | | | (87,330 | ) |
Smith & Nephew PLC | | (7,434 | ) | | | (76,469 | ) |
Smiths Group PLC | | (9,577 | ) | | | (156,123 | ) |
Standard Life PLC | | (86,712 | ) | | | (301,182 | ) |
Tomkins PLC | | (21,809 | ) | | | (67,772 | ) |
United Business Media, Ltd. | | (660 | ) | | | (4,927 | ) |
United Utilities Group PLC | | (56,345 | ) | | | (450,377 | ) |
VT Group PLC | | (20,457 | ) | | | (170,749 | ) |
Whitbread PLC | | (3,043 | ) | | | (69,051 | ) |
| | | | | | | |
| | | | | | (4,838,712 | ) |
| | | | | | | |
Total Securities Sold Short
(Cost $(17,737,052)) | | | | | | (21,194,597 | ) |
| | | | | | | |
Liabilities in Excess of Other Assets — (8.3)% | | | | | | (111,743,951 | ) |
| | | | | | | |
NET ASSETS — 100.0% | | | | | $ | 1,342,110,291 | |
| | | | | | | |
Please see abbreviation and footnote definitions on page 180.
PORTFOLIO SUMMARY (based on net assets)
| | | |
| | | % | |
Foreign Common Stocks | | | |
United Kingdom | | 15.8 | |
Japan | | 14.4 | |
France | | 7.9 | |
Switzerland | | 7.2 | |
Germany | | 6.2 | |
Australia | | 5.1 | |
Spain | | 4.5 | |
Netherlands | | 3.6 | |
Hong Kong | | 3.2 | |
China | | 2.7 | |
Brazil | | 2.5 | |
India | | 2.0 | |
Italy | | 1.9 | |
South Korea | | 1.9 | |
Taiwan | | 1.9 | |
Russia | | 1.8 | |
Singapore | | 1.4 | |
Canada | | 1.1 | |
Norway | | 1.1 | |
South Africa | | 1.1 | |
Indonesia | | 0.9 | |
Israel | | 0.9 | |
Mexico | | 0.9 | |
Denmark | | 0.6 | |
Sweden | | 0.6 | |
Bermuda | | 0.5 | |
Finland | | 0.5 | |
Turkey | | 0.5 | |
Greece | | 0.4 | |
Austria | | 0.3 | |
Belgium | | 0.3 | |
Egypt | | 0.3 | |
Chile | | 0.2 | |
Hungary | | 0.2 | |
Malaysia | | 0.2 | |
New Zealand | | 0.2 | |
Philippines | | 0.2 | |
Thailand | | 0.2 | |
Cayman Islands | | 0.1 | |
Colombia | | 0.1 | |
Cyprus | | 0.1 | |
Czech Republic | | 0.1 | |
Ireland | | 0.1 | |
Luxembourg | | 0.1 | |
Nigeria | | 0.1 | |
Panama | | 0.1 | |
Argentina | | — | ** |
Estonia | | — | ** |
Jersey | | — | ** |
Kazakhstan | | — | ** |
Poland | | — | ** |
Sri Lanka | | — | ** |
United Arab Emirates | | — | ** |
| | | |
Total Foreign Common Stocks | | 96.0 | |
| | | |
Total Money Market Funds | | 12.1 | |
| | | |
Total Foreign Preferred Stocks | | 1.3 | |
| | | |
Total U.S. Treasury Obligations | | 0.5 | |
| | | |
Total Futures Contracts | | 4.2 | |
| | | |
Total Rights | | — | ** |
| | | |
Total Forward Foreign Currency Contracts | | 0.3 | |
| | | |
Total Securities Sold Short | | (1.6 | ) |
| | | |
Total Investments | | 112.8 | |
| | | |
| ** | Rounds to less than 0.005%. |
See Notes to Financial Statements.
178
FAS 157 DISCLOSURE
The following is a summary of the inputs used, as of December 31, 2009, in valuing the Fund’s assets carried at fair value:
| | | | | | | | |
Valuation Inputs | | Investments
in
Securities | | | Other
Financial
Instruments*** | |
| | |
Assets: | | | | | | | | |
Level 1 — Quoted Prices | | | | | | | | |
Foreign Common Stocks | | $ | 129,903,120 | | | $ | — | |
Foreign Preferred Stocks | | | 12,550,587 | | | | — | |
Futures Contracts | | | — | | | | (177,222 | ) |
Money Market Funds | | | 162,697,789 | | | | — | |
Rights | | | | | | | — | |
Level 2 — Other Significant Observable Inputs | | | | | | | | |
Foreign Common Stocks | | | 1,158,075,181 | | | | — | |
Foreign Preferred Stocks | | | 5,048,255 | | | | — | |
Forward Foreign Currency Contracts | | | — | | | | (194,646 | ) |
U.S. Treasury Obligations | | | 6,772,656 | | | | — | |
Level 3 — Significant Unobservable Inputs | | | | | | | | |
Rights | | | 1,251 | | | | — | |
| | | | | | | | |
Total Assets | | $ | 1,475,048,839 | | | $ | (371,868 | ) |
| | | | | | | | |
| | |
Liabilities: | | | | | | | | |
Level 1 — Quoted Prices | | | | | | | | |
| | $ | — | | | $ | — | |
Level 2 — Other Significant Observable Inputs | | | | | | | | |
Securities Sold Short | | | (21,194,597 | ) | | | — | |
Level 3 — Significant | | | | | | | | |
Unobservable Inputs | | | — | | | | — | |
| | | | | | | | |
Total Liabilities | | $ | (21,194,597 | ) | | $ | — | |
| | | | | | | | |
The following is a reconciliation of assets in which significant unobservable inputs (Level 3) were used in determining fair value:
| | | | | | |
| | | Investments
in
Securities | | | Other
Financial
Instruments*** |
Balance, 12/31/08 Rights | | $ | 31,580 $ | | | — |
Accrued discounts/premiums Rights | | | — | | | — |
Realized gain (loss) Rights | | | — | | | — |
Changed in unrealized appreciation (depreciation) Rights | | | 5,471,601 | | | — |
Net purchases (sales) Rights | | | (1,803,775 | ) | | — |
Transfers in and/or out of Level 3 Rights | | | (3,698,155 | ) | | — |
| | | | | | |
Balance, 12/31/09 | | $ | 1,251 $ | | | — |
| | | | | | |
| *** | Other financial instruments are derivative instruments not reflected in the Schedule of Investments, such as futures, forwards and swap contracts, which are valued at the unrealized appreciation (depreciation) on the investment. Details of these investments can be found in the Notes to Financial Statements. |
See Notes to Financial Statements.
179
ABBREVIATIONS AND FOOTNOTES
INVESTMENT ABBREVIATIONS:
| | | | |
ADR | | — | | American Depository Receipt |
CONV | | — | | Convertible |
GDR | | — | | Global Depository Receipt |
IO | | — | | Interest Only (Principal amount shown is notional) |
PIK | | — | | Payment-in-Kind Bonds |
PO | | — | | Principal Only |
REIT | | — | | Real Estate Investment Trust |
STEP | | — | | Stepped Coupon Bonds (1) |
STRIP | | — | | Stripped Security |
TBA | | — | | To be announced. |
144A | | — | | Security was purchased pursuant to Rule 144A under the Securities Act of 1933 and may not be resold subject to that rule except to qualified institutional buyers. As of December 31, 2009, the total market values and percentages of net assets for 144A securities by fund were as follows: |
| | | | | | |
Fund | | Value of
144A Securities | | Percentage of
Net Assets | |
Money Market | | $ | 28,317,542 | | 2.36 | % |
Low-Duration Bond | | | 71,040,290 | | 10.37 | |
Medium-Duration Bond | | | 98,887,628 | | 9.80 | |
Extended-Duration Bond | | | 42,881,638 | | 9.31 | |
Global Bond | | | 29,185,590 | | 13.17 | |
Small Cap Equity | | | 2,426,068 | | 0.58 | |
International Equity | | | 1,108,230 | | 0.08 | |
INVESTMENT FOOTNOTES:
| | | | |
‡‡ | | — | | All or a portion of the security was held as collateral for open futures,options,securities sold short and/or swap contracts. |
@ | | — | | Illiquid. |
* | | — | | Non-income producing security. |
# | | — | | Security in default. |
+ | | — | | Security is valued at fair value (2) . |
§ | | — | | Security purchased with the cash proceeds from securities loaned. |
† | | — | | Variable rate security (1) . |
W | | — | | Interest rates shown reflect the effective yields as of December 31, 2009. |
¥ | | — | | Affiliated fund. |
D | | — | | Security either partially or fully on loan. |
| (1) | Interest rates shown reflect the rates currently in effect. Maturity date for money market instruments is the date of the next interest rate reset. |
| (2) | Fair valued securities were held in the Medium-Duration Bond Fund, Global Bond Fund, Equity Index Fund, Value Equity Fund, Small Cap Equity Fund and International Equity Fund at an aggregate market value of $47,670, $8,611, $0, $1,209, $613,575 and $2,197,039, respectively, which amounted to 0.00%, 0.00%, 0.00%, 0.00%, 0.15% and 0.16% of each of those funds, repectively. |
FOREIGN BOND FOOTNOTES:
| | | | |
(A) | | — | | Par is denominated in Australian Dollars (AUD). |
(B) | | — | | Par is denominated in Brazilian Real (BRL). |
(C) | | — | | Par is denominated in Canadian Dollars (CAD). |
(E) | | — | | Par is denominated in Euro (EUR). |
(G) | | — | | Par is denominated in Singapore Dollars (SGD). |
(I) | | — | | Par is denominated in Iceland Kronur (ISK). |
(K) | | — | | Par is denominated in Norweigan Krone (NOK). |
(M) | | — | | Par is denominated in Mexican Pesos (MXN). |
(N) | | — | | Par is denominated in Indonesian Rupiahs (IDR). |
(T) | | — | | Par is denominated in Thailand Baht (THB). |
(U) | | — | | Par is denominated in British Pounds (GBP). |
(V) | | — | | Par is denominated in Polish Zloty (PLN). |
(W) | | — | | Par is denominated in South Korean Won (KRW). |
(Z) | | — | | Par is denominated in New Zealand Dollars (NZD). |
COUNTERPARTY ABBREVIATIONS:
| | | | |
ADV | | — | | Counterparty to contract is Advantage Investments. |
ADVE | | — | | Counterparty to contract is Advest. |
BAR | | — | | Counterparty to contract is Barclays Capital. |
BNP | | — | | Counterparty to contract is BNP Paribas. |
BOA | | — | | Counterparty to contract is Bank of America. |
BTAB | | — | | Counterparty to contract is Deutsche Bank Alex Brown. |
CHASE | | — | | Counterparty to contract is Chase Securities, Inc. |
CITI | | — | | Counterparty to contract is Citibank NA London. |
CITIG | | — | | Counterparty to contract is Citigroup Global Markets, Inc. |
CS | | — | | Counterparty to contract is Credit Suisse International. |
DEUT | | — | | Counterparty to contract is Deutsche Bank AG. |
GSC | | — | | Counterparty to contract is Goldman Sachs Capital Markets, LP. |
HKSB | | — | | Counterparty to contract is HongKong & Shanghai Bank. |
HSBC | | — | | Counterparty to contract is HSBC Securities. |
JPM | | — | | Counterparty to contract is JPMorgan Chase Bank. |
MLCS | | — | | Counterparty to contract is Merrill Lynch Capital Services, Inc. |
MSCS | | — | | Counterparty to contract is Morgan Stanley Capital Services. |
RBS | | — | | Counterparty to contract is Royal Bank of Scotland. |
UBS | | — | | Counterparty to contract is UBS AG. |
180
| | |
| STATEMENTS OF ASSETS AND LIABILITIES | | December 31, 2009 |
| | | | | | | | | | | |
| | | Money
Market Fund | | Low-Duration
Bond Fund | | | Medium-Duration
Bond Fund | |
Assets | | | | | | | | | | | |
Investments in securities of unaffiliated issuers, at value | | $ | 1,269,889,667 | | $ | 719,375,948 | | | $ | 1,191,701,894 | |
Investments in securities of affiliated issuers, at value | | | — | | | 19,126,543 | | | | 30,286,113 | |
| | | | | | | | | | | |
Total investments (1)(2) | | | 1,269,889,667 | | | 738,502,491 | | | | 1,221,988,007 | |
Cash | | | 29 | | | 1,057,575 | | | | 2,203,914 | |
Cash collateral for derivatives | | | — | | | — | | | | 80,000 | |
Foreign currency (3) | | | — | | | 2,359,088 | | | | 2,428,580 | |
Receivables: | | | | | | | | | | | |
Dividends and reclaims | | | — | | | 108 | | | | 244 | |
Interest | | | 288,798 | | | 4,334,411 | | | | 7,234,996 | |
Securities lending | | | 7,195 | | | 3,398 | | | | 12,078 | |
Investment securities sold | | | — | | | 96,449,825 | | | | 101,153,989 | |
Maturities | | | — | | | 119,444 | | | | 204,630 | |
Fund shares sold | | | 3,970,735 | | | 9,141 | | | | 21,999 | |
Variation margin | | | — | | | 13,367 | | | | 13,737 | |
Unrealized appreciation on foreign currency exchange contracts | | | — | | | 889,663 | | | | 884,904 | |
Unrealized appreciation on swap agreements | | | — | | | 1,904,966 | | | | 861,421 | |
Prepaid expenses and other assets | | | 47,370 | | | 29,772 | | | | 33,024 | |
| | | | | | | | | | | |
Total Assets | | | 1,274,203,794 | | | 845,673,249 | | | | 1,337,121,523 | |
| | | | | | | | | | | |
Liabilities | | | | | | | | | | | |
TBA sale commitments, at value (4) | | | — | | | 88,631,738 | | | | 74,629,701 | |
Options written at value (5) | | | — | | | 637,125 | | | | 1,040,040 | |
Unrealized depreciation on foreign currency exchange contracts | | | — | | | 235,522 | | | | 424,426 | |
Unrealized depreciation on swap agreements | | | — | | | 9,019 | | | | 1,951,097 | |
Collateral held for securities on loan at value | | | 71,313,750 | | | 52,482,052 | | | | 165,010,049 | |
Collateral held for derivatives | | | — | | | 3,670,000 | | | | 4,877,000 | |
Payables: | | | | | | | | | | | |
Investment securities purchased | | | — | | | 14,503,292 | | | | 79,482,430 | |
Fund shares redeemed | | | 4,151,090 | | | 23,979 | | | | 190,150 | |
Variation margin | | | — | | | 61,560 | | | | 183,101 | |
Distributions | | | 4,924 | | | — | | | | — | |
Securities lending | | | 1,439 | | | 679 | | | | 2,416 | |
Accrued expenses | | | | | | | | | | | |
Advisory fees | | | 80,202 | | | 159,655 | | | | 262,950 | |
Distribution (12b-1) fees | | | 151 | | | 42 | | | | 47 | |
Shareholder servicing fees | | | 169,432 | | | 91,189 | | | | 139,577 | |
Other expenses | | | 225,193 | | | 110,916 | | | | 210,689 | |
| | | | | | | | | | | |
Total Liabilities | | | 75,946,181 | | | 160,616,768 | | | | 328,403,673 | |
| | | | | | | | | | | |
Net Assets | | $ | 1,198,257,613 | | $ | 685,056,481 | | | $ | 1,008,717,850 | |
| | | | | | | | | | | |
Net Assets Consist of: | | | | | | | | | | | |
Paid-in-capital | | $ | 1,198,182,569 | | $ | 700,647,897 | | | $ | 1,056,705,398 | |
Undistributed (distributions in excess of) net investment income | | | 75,044 | | | (152,642 | ) | | | (59,115 | ) |
Undistributed (accumulated) net realized gain (loss) on investments, foreign currency transactions and derivative transactions | | | — | | | (1,691,630 | ) | | | 1,360,268 | |
Net unrealized appreciation (depreciation) on investments, foreign currency translations and derivative transactions | | | — | | | (13,747,144 | ) | | | (49,288,701 | ) |
| | | | | | | | | | | |
Net Assets | | $ | 1,198,257,613 | | $ | 685,056,481 | | | $ | 1,008,717,850 | |
| | | | | | | | | | | |
Net Asset Value: | | | | | | | | | | | |
$0.001 par value, unlimited shares authorized | | | | | | | | | | | |
Net assets applicable to the GS2 Class | | $ | 133,323,357 | | $ | 115,740,535 | | | $ | 139,917,356 | |
| | | | | | | | | | | |
GS2 shares outstanding | | | 133,313,205 | | | 13,310,358 | | | | 18,724,047 | |
| | | | | | | | | | | |
Net asset value, offering and redemption price per GS2 share | | $ | 1.00 | | $ | 8.70 | | | $ | 7.47 | |
| | | | | | | | | | | |
| | | |
Net assets applicable to the GS4 Class | | $ | 1,064,934,256 | | $ | 569,315,946 | | | $ | 868,800,494 | |
| | | | | | | | | | | |
GS4 shares outstanding | | | 1,064,834,717 | | | 43,664,528 | | | | 65,038,201 | |
| | | | | | | | | | | |
Net asset value, offering and redemption price per GS4 share | | $ | 1.00 | | $ | 13.04 | | | $ | 13.36 | |
| | | | | | | | | | | |
|
| |
(1) Investments in securities of unaffiliated issuers, at cost | | $ | 1,269,889,667 | | $ | 736,041,182 | | | $ | 1,242,183,568 | |
Investments in securities of affiliated issuers, at cost | | | — | | | 19,126,543 | | | | 30,286,113 | |
| | | | | | | | | | | |
Total investments at cost | | $ | 1,269,889,667 | | $ | 755,167,725 | | | $ | 1,272,469,681 | |
| | | | | | | | | | | |
(2) Includes securities loaned of: | | $ | 69,926,990 | | $ | 51,357,050 | | | $ | 161,307,687 | |
| | | | | | | | | | | |
(3) Foreign currency at cost | | $ | — | | $ | 2,373,125 | | | $ | 2,417,889 | |
| | | | | | | | | | | |
(4) TBA sale commitments at cost | | $ | — | | $ | 89,672,734 | | | $ | 75,428,867 | |
| | | | | | | | | | | |
(5) Premiums received on options written | | $ | — | | $ | 561,299 | | | $ | 937,881 | |
| | | | | | | | | | | |
See Notes to Financial Statements.
181
| | |
| STATEMENTS OF ASSETS AND LIABILITIES | | December 31, 2009 |
| | | | | | | | | | | |
| | | Extended-Duration
Bond fund | | | Inflation Protected
Bond Fund | | Global
Bond Fund | |
Assets | | | | | | | | | | | |
Investments in securities of unaffiliated issuers, at value | | $ | 482,437,565 | | | $ | 120,266,232 | | $ | 237,964,791 | |
Investments in securities of affiliated issuers, at value | | | 11,543,798 | | | | 6,707,246 | | | 14,865,457 | |
| | | | | | | | | | | |
Total investments (1)(2) | | | 493,981,363 | | | | 126,973,478 | | | 252,830,248 | |
Cash | | | — | | | | — | | | 43,970 | |
Cash collateral for derivatives | | | — | | | | — | | | — | |
Foreign currency (3) | | | — | | | | — | | | 1,586,014 | |
Receivables: | | | | | | | | | | | |
Dividends and reclaims | | | 106 | | | | 56 | | | 11,028 | |
Interest | | | 6,372,205 | | | | 729,497 | | | 3,561,702 | |
Securities lending | | | 3,384 | | | | 1,368 | | | 6,338 | |
Investment securities sold | | | — | | | | — | | | 1,087,409 | |
Fund shares sold | | | 22,215 | | | | 32,209 | | | 3,296 | |
Variation margin | | | — | | | | — | | | 12,037 | |
Unrealized appreciation on foreign currency exchange contracts | | | — | | | | — | | | 1,161,177 | |
Prepaid expenses and other assets | | | 25,693 | | | | 8,713 | | | 14,899 | |
| | | | | | | | | | | |
Total Assets | | | 500,404,966 | | | | 127,745,321 | | | 260,318,118 | |
| | | | | | | | | | | |
Liabilities | | | | | | | | | | | |
Foreign currency overdraft (3) | | | 158,416 | | | | — | | | — | |
Securities sold short, at value (4) | | | — | | | | — | | | — | |
Options written at value(5) | | | — | | | | — | | | — | |
Unrealized depreciation on foreign currency exchange contracts | | | — | | | | — | | | 807,322 | |
Collateral held for securities on loan at value | | | 39,267,942 | | | | 39,658,228 | | | 35,007,405 | |
Payables: | | | | | | | | | | | |
Investment securities purchased | | | — | | | | — | | | 2,614,766 | |
Dividends on short sales | | | — | | | | — | | | — | |
Fund shares redeemed | | | 15,191 | | | | 2,247 | | | 131,254 | |
Variation margin | | | — | | | | 3,172 | | | 3,299 | |
Securities lending | | | 677 | | | | 273 | | | 1,267 | |
Deferred foreign capital gains taxes | | | — | | | | — | | | — | |
Accrued expenses | | | | | | | | | | | |
Advisory fees | | | 178,329 | | | | 50,444 | | | 85,449 | |
Distribution (12b-1) fees | | | 55 | | | | — | | | — | |
Shareholder servicing fees | | | 63,354 | | | | 14,139 | | | 35,583 | |
Other expenses | | | 59,625 | | | | 23,101 | | | 77,200 | |
| | | | | | | | | | | |
Total Liabilities | | | 39,743,589 | | | | 39,751,604 | | | 38,763,545 | |
| | | | | | | | | | | |
Net Assets | | $ | 460,661,377 | | | $ | 87,993,717 | | $ | 221,554,573 | |
| | | | | | | | | | | |
Net Assets Consist of: | | | | | | | | | | | |
Paid-in-capital | | $ | 452,978,806 | | | $ | 85,568,010 | | $ | 235,016,222 | |
Undistributed (distributions in excess of) net investment income | | | 692,095 | | | | 64,492 | | | (651,947 | ) |
Undistributed (accumulated) net realized gain (loss) on investments, foreign currency transactions and derivative transactions | | | (13,934,959 | ) | | | 308,857 | | | (11,486,443 | ) |
Net unrealized appreciation (depreciation) on investments, foreign currency translations and derivative transactions | | | 20,925,435 | | | | 2,052,358 | | | (1,323,259 | ) |
| | | | | | | | | | | |
Net Assets | | $ | 460,661,377 | | | $ | 87,993,717 | | $ | 221,554,573 | |
| | | | | | | | | | | |
Net Asset Value: | | | | | | | | | | | |
$0.001 par value, unlimited shares authorized | | | | | | | | | | | |
Net assets applicable to the GS2 Class | | $ | 67,699,358 | | | | N/A | | | N/A | |
| | | | | | | | | | | |
GS2 shares outstanding | | | 9,654,051 | | | | N/A | | | N/A | |
| | | | | | | | | | | |
Net asset value, offering and redemption price per GS2 share | | $ | 7.01 | | | | N/A | | | N/A | |
| | | | | | | | | | | |
| | | |
Net assets applicable to the GS4 Class | | $ | 392,962,019 | | | $ | 87,993,717 | | $ | 221,554,573 | |
| | | | | | | | | | | |
GS4 shares outstanding | | | 25,613,704 | | | | 8,523,606 | | | 23,675,337 | |
| | | | | | | | | | | |
Net asset value, offering and redemption price per GS4 share | | $ | 15.34 | | | $ | 10.32 | | $ | 9.36 | |
| | | | | | | | | | | |
|
| |
(1) Investments in securities of unaffiliated issuers, at cost | | $ | 461,518,278 | | | $ | 118,219,138 | | $ | 239,783,545 | |
Investments in securities of affiliated issuers, at cost | | | 11,543,798 | | | | 6,707,246 | | | 14,865,457 | |
| | | | | | | | | | | |
Total investments at cost | | $ | 473,062,076 | | | $ | 124,926,384 | | $ | 254,649,002 | |
| | | | | | | | | | | |
(2) Includes securities loaned of: | | $ | 38,271,474 | | | $ | 38,797,058 | | $ | 34,383,671 | |
| | | | | | | | | | | |
(3) Foreign currency (Foreign currency overdraft) at cost | | $ | 160,212 | | | $ | — | | $ | 1,541,636 | |
| | | | | | | | | | | |
(4) Securities Sold Short at proceeds | | $ | — | | | $ | — | | $ | — | |
| | | | | | | | | | | |
(5) Premiums received on options written | | $ | — | | | $ | — | | $ | — | |
| | | | | | | | | | | |
(6) Net of ($595,400) accrued foreign capital gains taxes on appreciated securities | | | | | | | | | | | |
See Notes to Financial Statements.
182
| | | | | | | | | | | | | | | | | | | | | | |
Equity
Index Fund | | | Real Estate
Securities Fund | | | Value
Equity Fund | | | Growth
Equity Fund | | | Small Cap
Equity Fund | | | International
Equity Fund | |
| | | | | |
| $ | 425,248,410 | | | $ | 176,308,014 | | | $ | 1,264,565,081 | | | $ | 1,404,718,572 | | | $ | 540,053,238 | | | $ | 1,430,357,876 | |
| | 8,292,644 | | | | 4,497,289 | | | | 34,433,647 | | | | 47,454,582 | | | | 18,257,471 | | | | 44,690,963 | |
| | | | | | | | | | | | | | | | | | | | | | | |
| | 433,541,054 | | | | 180,805,303 | | | | 1,298,998,728 | | | | 1,452,173,154 | | | | 558,310,709 | | | | 1,475,048,839 | |
| | — | | | | — | | | | — | | | | — | | | | 69,997 | | | | 902,502 | |
| | — | | | | — | | | | — | | | | — | | | | 686,462 | | | | 2,403,000 | |
| | — | | | | — | | | | — | | | | 2,322 | | | | 12,938 | | | | 1,572,822 | |
| | 443,103 | | | | 338,160 | | | | 1,412,647 | | | | 725,081 | | | | 201,480 | | | | 2,437,349 | |
| | — | | | | — | | | | — | | | | — | | | | 318,245 | | | | — | |
| | 7,007 | | | | 3,926 | | | | 13,731 | | | | 13,048 | | | | 23,694 | | | | 26,658 | |
| | — | | | | 3,395,858 | | | | 4,418,654 | | | | 4,155,292 | | | | 2,866,631 | | | | 1,820,022 | |
| | 4,194 | | | | 439 | | | | 67,988 | | | | 53,329 | | | | 52,039 | | | | 488,399 | |
| | — | | | | — | | | | — | | | | — | | | | — | | | | 22,950 | |
| | — | | | | — | | | | — | | | | — | | | | — | | | | 547,044 | |
| | 23,972 | | | | 22,669 | | | | 36,694 | | | | 40,576 | | | | 25,144 | | | | 38,088 | |
| | | | | | | | | | | | | | | | | | | | | | | |
| | 434,019,330 | | | | 184,566,355 | | | | 1,304,948,442 | | | | 1,457,162,802 | | | | 562,567,339 | | | | 1,485,307,673 | |
| | | | | | | | | | | | | | | | | | | | | | | |
| | | | | |
| | — | | | | — | | | | — | | | | — | | | | — | | | | — | |
| | — | | | | — | | | | — | | | | — | | | | — | | | | 21,194,597 | |
| | — | | | | — | | | | — | | | | — | | | | 16,612 | | | | — | |
| | — | | | | — | | | | — | | | | — | | | | — | | | | 741,690 | |
| | 46,798,625 | | | | 59,066,649 | | | | 114,534,540 | | | | 190,203,025 | | | | 128,525,687 | | | | 118,006,826 | |
| | 76,646 | | | | 3,659,369 | | | | 6,171,544 | | | | 1,615,702 | | | | 12,751,273 | | | | 482,752 | |
| | — | | | | — | | | | — | | | | — | | | | — | | | | 32,674 | |
| | 104,118 | | | | 106,077 | | | | 43,229 | | | | 83,739 | | | | 72,986 | | | | 42,078 | |
| | 96,900 | | | | 49,861 | | | | 373,920 | | | | 524,400 | | | | 638,638 | | | | 515,306 | |
| | 1,401 | | | | 785 | | | | 2,746 | | | | 2,609 | | | | 4,731 | | | | 5,332 | |
| | — | | | | — | | | | — | | | | — | | | | — | | | | 595,400 | |
| | 40,223 | | | | 89,218 | | | | 629,876 | | | | 798,703 | | | | 319,035 | | | | 819,282 | |
| | 48 | | | | — | | | | 109 | | | | 93 | | | | 118 | | | | 178 | |
| | 51,695 | | | | 19,275 | | | | 160,921 | | | | 169,861 | | | | 56,402 | | | | 178,028 | |
| | 145,898 | | | | 41,924 | | | | 94,643 | | | | 85,157 | | | | 106,224 | | | | 583,239 | |
| | | | | | | | | | | | | | | | | | | | | | | |
| | 47,315,554 | | | | 63,033,158 | | | | 122,011,528 | | | | 193,483,289 | | | | 142,491,706 | | | | 143,197,382 | |
| | | | | | | | | | | | | | | | | | | | | | | |
| $ | 386,703,776 | | | $ | 121,533,197 | | | $ | 1,182,936,914 | | | $ | 1,263,679,513 | | | $ | 420,075,633 | | | $ | 1,342,110,291 | |
| | | | | | | | | | | | | | | | | | | | | | | |
| | | | | |
| $ | 369,331,380 | | | $ | 166,687,728 | | | $ | 1,460,696,439 | | | $ | 1,295,909,799 | | | $ | 514,024,965 | | | $ | 1,464,997,084 | |
| | 1,623,542 | | | | — | | | | 7,789,164 | | | | 169,198 | | | | 47,515 | | | | (3,162,445 | ) |
| | (9,633,962 | ) | | | (66,173,701 | ) | | | (200,291,472 | ) | | | (252,229,566 | ) | | | (134,581,966 | ) | | | (280,439,289 | ) |
| | 25,382,816 | | | | 21,019,170 | | | | (85,257,217 | ) | | | 219,830,082 | | | | 40,585,119 | | | | 160,714,941 | (6) |
| | | | | | | | | | | | | | | | | | | | | | | |
| $ | 386,703,776 | | | $ | 121,533,197 | | | $ | 1,182,936,914 | | | $ | 1,263,679,513 | | | $ | 420,075,633 | | | $ | 1,342,110,291 | |
| | | | | | | | | | | | | | | | | | | | | | | |
| | | | | |
| $ | 65,217,373 | | | | N/A | | | $ | 181,122,981 | | | $ | 196,025,821 | | | $ | 64,032,974 | | | $ | 240,482,721 | |
| | | | | | | | | | | | | | | | | | | | | | | |
| | 8,394,394 | | | | N/A | | | | 28,050,289 | | | | 19,612,092 | | | | 8,459,534 | | | | 24,936,565 | |
| | | | | | | | | | | | | | | | | | | | | | | |
| $ | 7.77 | | | | N/A | | | $ | 6.46 | | | $ | 10.00 | | | $ | 7.57 | | | $ | 9.64 | |
| | | | | | | | | | | | | | | | | | | | | | | |
| $ | 321,486,403 | | | $ | 121,533,197 | | | $ | 1,001,813,933 | | | $ | 1,067,653,692 | | | $ | 356,042,659 | | | $ | 1,101,627,570 | |
| | | | | | | | | | | | | | | | | | | | | | | |
| | 22,153,102 | | | | 18,028,736 | | | | 79,892,968 | | | | 67,250,504 | | | | 31,314,727 | | | | 88,563,994 | |
| | | | | | | | | | | | | | | | | | | | | | | |
| $ | 14.51 | | | $ | 6.74 | | | $ | 12.54 | | | $ | 15.88 | | | $ | 11.37 | | | $ | 12.44 | |
| | | | | | | | | | | | | | | | | | | | | | | |
| | | | | |
| $ | 400,010,986 | | | $ | 155,455,929 | | | $ | 1,350,290,918 | | | $ | 1,185,513,952 | | | $ | 502,091,871 | | | $ | 1,265,261,907 | |
| | 8,292,644 | | | | 4,497,289 | | | | 34,433,647 | | | | 47,454,582 | | | | 18,257,471 | | | | 44,690,963 | |
| | | | | | | | | | | | | | | | | | | | | | | |
| $ | 408,303,630 | | | $ | 159,953,218 | | | $ | 1,384,724,565 | | | $ | 1,232,968,534 | | | $ | 520,349,342 | | | $ | 1,309,952,870 | |
| | | | | | | | | | | | | | | | | | | | | | | |
| $ | 45,207,192 | | | $ | 56,669,396 | | | $ | 110,381,781 | | | $ | 184,498,548 | | | $ | 124,082,458 | | | $ | 114,068,939 | |
| | | | | | | | | | | | | | | | | | | | | | | |
| $ | — | | | $ | — | | | $ | — | | | $ | 2,321 | | | $ | 12,926 | | | $ | 1,576,850 | |
| | | | | | | | | | | | | | | | | | | | | | | |
| $ | — | | | $ | — | | | $ | — | | | $ | — | | | $ | — | | | $ | 17,737,052 | |
| | | | | | | | | | | | | | | | | | | | | | | |
| $ | — | | | $ | — | | | $ | — | | | $ | — | | | $ | 19,934 | | | $ | — | |
| | | | | | | | | | | | | | | | | | | | | | | |
See Notes to Financial Statements.
183
| | |
| STATEMENTS OF OPERATIONS | | For the Year Ended December 31, 2009 |
| | | | | | | | | | | | |
| | | Money
Market Fund | | | Low-Duration
Bond Fund | | | Medium-Duration
Bond Fund | |
Investment Income | | | | | | | | | | | | |
Dividends | | $ | — | | | $ | 52,500 | | | $ | 242,955 | |
Income distributions received from affiliated funds | | | — | | | | 47,365 | | | | 72,857 | |
Interest | | | 8,087,707 | | | | 23,785,961 | | | | 40,906,999 | |
Securities lending | | | 99,262 | | | | 169,486 | | | | 187,780 | |
Less foreign taxes withheld | | | — | | | | — | | | | — | |
| | | | | | | | | | | | |
Total Investment Income | | | 8,186,969 | | | | 24,055,312 | | | | 41,410,591 | |
| | | | | | | | | | | | |
Expenses | | | | | | | | | | | | |
Investment advisory fees | | | 1,823,203 | | | | 2,182,989 | | | | 3,702,712 | |
Transfer agent fees: | | | | | | | | | | | | |
GS2 shares | | | 4,345 | | | | 4,049 | | | | 4,025 | |
GS4 shares | | | 51,240 | | | | 23,644 | | | | 23,152 | |
GS6 shares | | | 2,421 | | | | 2,409 | | | | 2,416 | |
Custodian fees | | | 20,403 | | | | 97,605 | | | | 206,714 | |
Distribution (12b-1) fees: | | | | | | | | | | | | |
GS6 shares | | | 3,076 | | | | 1,914 | | | | 4,804 | |
Shareholder servicing fees: | | | | | | | | | | | | |
GS4 shares | | | 1,931,641 | | | | 991,944 | | | | 1,453,206 | |
GS6 shares | | | 9,218 | | | | 5,741 | | | | 14,409 | |
Accounting and administration fees | | | 247,720 | | | | 240,360 | | | | 426,344 | |
Professional fees | | | 54,180 | | | | 57,792 | | | | 57,792 | |
Blue sky fees: | | | | | | | | | | | | |
GS2 shares | | | 1,956 | | | | 1,599 | | | | 1,599 | |
GS4 shares | | | 35,455 | | | | 15,761 | | | | 18,203 | |
GS6 shares | | | 272 | | | | 173 | | | | 181 | |
Shareholder reporting fees: | | | | | | | | | | | | |
GS2 shares | | | 846 | | | | 551 | | | | 701 | |
GS4 shares | | | 43,503 | | | | 3,708 | | | | 8,091 | |
GS6 shares | | | 110 | | | | 73 | | | | 73 | |
Trustee expenses | | | 14,488 | | | | 7,307 | | | | 9,527 | |
Line of credit facility fees | | | 18,068 | | | | 9,510 | | | | 12,924 | |
Dividend expense on securities sold short | | | — | | | | — | | | | — | |
Other expenses | | | 500,677 | | | | 36,742 | | | | 40,783 | |
| | | | | | | | | | | | |
Total expenses | | | 4,762,822 | | | | 3,683,871 | | | | 5,987,656 | |
Expenses waived/reimbursed net of amount recaptured(2) | | | (176,881 | ) | | | (573,533 | ) | | | (933,714 | ) |
Fees paid indirectly | | | — | | | | — | | | | — | |
| | | | | | | | | | | | |
Net expenses | | | 4,585,941 | | | | 3,110,338 | | | | 5,053,942 | |
| | | | | | | | | | | | |
Net Investment Income | | | 3,601,028 | | | | 20,944,974 | | | | 36,356,649 | |
| | | | | | | | | | | | |
Realized and Unrealized Gain (Loss) | | | | | | | | | | | | |
Net realized gain (loss) from: | | | | | | | | | | | | |
Investment securities and securities sold short | | | 60,542 | | | | (3,827,556 | ) | | | 7,549,540 | |
Futures transactions | | | — | | | | 9,994,159 | | | | 12,913,191 | |
Swap agreements | | | — | | | | 5,882,301 | | | | 7,505,803 | |
Option contracts written | | | — | | | | 4,022,816 | | | | 3,895,070 | |
Option contracts purchased | | | — | | | | (3,777,897 | ) | | | (3,281,291 | ) |
Foreign currency transactions | | | — | | | | (3,820,808 | ) | | | (3,086,939 | ) |
| | | | | | | | | | | | |
Net realized gain (loss) | | | 60,542 | | | | 8,473,015 | | | | 25,495,374 | |
| | | | | | | | | | | | |
Net change in unrealized appreciation (depreciation) on: | | | | | | | | | | | | |
Investment securities and securities sold short (net of estimated capital gains taxes of ($584,998) for International Equity) | | | — | | | | 40,520,277 | | | | 69,500,169 | |
Futures | | | — | | | | (7,816,937 | ) | | | (6,152,992 | ) |
Swap agreements | | | — | | | | 7,614,812 | | | | 8,162,957 | |
Option contracts written | | | — | | | | 3,455,893 | | | | 7,378,552 | |
Option contracts purchased | | | — | | | | (4,519,114 | ) | | | (7,860,470 | ) |
Foreign currency translations | | | — | | | | 1,411,911 | | | | 3,011,487 | |
| | | | | | | | | | | | |
Net change in unrealized appreciation (depreciation) | | | — | | | | 40,666,842 | | | | 74,039,703 | |
| | | | | | | | | | | | |
Net Realized and Unrealized Gain | | | 60,542 | | | | 49,139,857 | | | | 99,535,077 | |
| | | | | | | | | | | | |
Net Increase in Net Assets Resulting from Operations | | $ | 3,661,570 | | | $ | 70,084,831 | | | $ | 135,891,726 | |
| | | | | | | | | | | | |
| (1) | Inception date was June 25, 2009. |
| (2) | See Note 3a and 3c in Notes to Financial Statements. |
See Notes to Financial Statements.
184
| | | | | | | | | | | | | | | | | | | | | | | | | | | | | | | | | | |
Extended- Duration Bond Fund | | | Inflation
Protected
Bond Fund(1) | | | Global
Bond
Fund | | | Equity
Index
Fund | | | Real Estate
Securities
Fund | | | Value
Equity
Fund | | | Growth
Equity
Fund | | | Small
Cap Equity
Fund | | | International
Equity Fund | |
| | | | | | | | |
| $ | 19,468 | | | $ | — | | | $ | 228,951 | | | $ | 7,041,942 | | | $ | 3,117,339 | | | $ | 27,485,894 | | | $ | 11,293,623 | | | $ | 3,365,549 | | | $ | 39,319,912 | |
| | 23,092 | | | | 2,417 | | | | 36,827 | | | | 29,453 | | | | 12,309 | | | | 103,715 | | | | 151,710 | | | | 62,810 | | | | 78,602 | |
| | 30,459,460 | | | | 1,684,263 | | | | 14,015,566 | | | | 3,067 | | | | (610 | ) | | | 9,416 | | | | 14,878 | | | | 1,326,610 | | | | — | |
| | 65,747 | | | | 9,392 | | | | 79,493 | | | | 255,935 | | | | 94,149 | | | | 694,170 | | | | 480,741 | | | | 411,984 | | | | 1,205,428 | |
| | — | | | | — | | | | — | | | | — | | | | (2,111 | ) | | | (55,426 | ) | | | (154,650 | ) | | | (4,369 | ) | | | (3,408,225 | ) |
| | | | | | | | | | | | | | | | | | | | | | | | | | | | | | | | | | | |
| | 30,567,767 | | | | 1,696,072 | | | | 14,360,837 | | | | 7,330,397 | | | | 3,221,076 | | | | 28,237,769 | | | | 11,786,302 | | | | 5,162,584 | | | | 37,195,717 | |
| | | | | | | | | | | | | | | | | | | | | | | | | | | | | | | | | | | |
| | | | | | | | |
| | 1,966,084 | | | | 129,143 | | | | 885,899 | | | | 493,412 | | | | 822,873 | | | | 6,679,352 | | | | 9,184,920 | | | | 3,327,981 | | | | 11,479,826 | |
| | | | | | | | |
| | 3,909 | | | | — | | | | — | | | | 3,905 | | | | — | | | | 3,747 | | | | 3,841 | | | | 3,953 | | | | 3,751 | |
| | 23,138 | | | | 10,140 | | | | 7,312 | | | | 24,297 | | | | 22,170 | | | | 27,394 | | | | 26,330 | | | | 27,305 | | | | 33,052 | |
| | 2,406 | | | | — | | | | — | | | | 2,399 | | | | — | | | | 2,425 | | | | 2,417 | | | | 2,411 | | | | 2,413 | |
| | 23,168 | | | | 5,858 | | | | 41,757 | | | | 31,997 | | | | 25,701 | | | | 45,633 | | | | 94,228 | | | | 88,892 | | | | 1,100,039 | |
| | | | | | | | |
| | 4,978 | | | | — | | | | — | | | | 219 | | | | — | | | | 3,388 | | | | 2,521 | | | | 3,362 | | | | 4,588 | |
| | | | | | | | |
| | 668,750 | | | | 77,128 | | | | 358,906 | | | | 506,607 | | | | 171,980 | | | | 1,662,709 | | | | 1,739,903 | | | | 561,281 | | | | 1,854,945 | |
| | 14,934 | | | | — | | | | — | | | | 656 | | | | — | | | | 10,174 | | | | 7,567 | | | | 10,093 | | | | 13,778 | |
| | 122,574 | | | | 8,914 | | | | 131,353 | | | | 94,186 | | | | 32,913 | | | | 232,342 | | | | 235,358 | | | | 134,751 | | | | 727,648 | |
| | 51,696 | | | | 26,485 | | | | 50,571 | | | | 63,737 | | | | 56,292 | | | | 63,737 | | | | 50,200 | | | | 50,249 | | | | 50,989 | |
| | | | | | | | |
| | 1,599 | | | | — | | | | — | | | | 1,599 | | | | — | | | | 1,599 | | | | 1,599 | | | | 1,599 | | | | 1,599 | |
| | 15,418 | | | | 19,454 | | | | 16,207 | | | | 12,914 | | | | 6,052 | | | | 12,859 | | | | 13,465 | | | | 12,742 | | | | 13,071 | |
| | 212 | | | | — | | | | — | | | | 181 | | | | — | | | | 199 | | | | 193 | | | | 242 | | | | 209 | |
| | | | | | | | |
| | 515 | | | | — | | | | — | | | | 551 | | | | — | | | | 664 | | | | 588 | | | | 774 | | | | 1,069 | |
| | 8,460 | | | | 1,163 | | | | 2,419 | | | | 11,000 | | | | 8,319 | | | | 18,808 | | | | 14,055 | | | | 17,592 | | | | 33,025 | |
| | 73 | | | | — | | | | — | | | | 60 | | | | — | | | | 109 | | | | 97 | | | | 85 | | | | 97 | |
| | 4,555 | | | | 427 | | | | 2,091 | | | | 3,224 | | | | 924 | | | | 10,556 | | | | 11,154 | | | | 3,625 | | | | 12,498 | |
| | 6,164 | | | | 268 | | | | 2,664 | | | | 4,457 | | | | 1,176 | | | | 14,422 | | | | 15,095 | | | | 4,873 | | | | 16,302 | |
| | — | | | | — | | | | — | | | | — | | | | — | | | | — | | | | — | | | | — | | | | 512,048 | |
| | 17,100 | | | | 4,658 | | | | 23,196 | | | | 30,598 | | | | 9,756 | | | | 34,504 | | | | 35,420 | | | | 22,585 | | | | 393,991 | |
| | | | | | | | | | | | | | | | | | | | | | | | | | | | | | | | | | | |
| | 2,935,733 | | | | 283,638 | | | | 1,522,375 | | | | 1,285,999 | | | | 1,158,156 | | | | 8,824,621 | | | | 11,438,951 | | | | 4,274,395 | | | | 16,254,938 | |
| | (131,489 | ) | | | (11,702 | ) | | | (24,304 | ) | | | (174,050 | ) | | | (7,621 | ) | | | (309,605 | ) | | | (1,093,273 | ) | | | (292,309 | ) | | | (2,823,373 | ) |
| | — | | | | — | | | | — | | | | — | | | | — | | | | (56,757 | ) | | | (64,391 | ) | | | (23,005 | ) | | | (62,293 | ) |
| | | | | | | | | | | | | | | | | | | | | | | | | | | | | | | | | | | |
| | 2,804,244 | | | | 271,936 | | | | 1,498,071 | | | | 1,111,949 | | | | 1,150,535 | | | | 8,458,259 | | | | 10,281,287 | | | | 3,959,081 | | | | 13,369,272 | |
| | | | | | | | | | | | | | | | | | | | | | | | | | | | | | | | | | | |
| | 27,763,523 | | | | 1,424,136 | | | | 12,862,766 | | | | 6,218,448 | | | | 2,070,541 | | | | 19,779,510 | | | | 1,505,015 | | | | 1,203,503 | | | | 23,826,445 | |
| | | | | | | | | | | | | | | | | | | | | | | | | | | | | | | | | | | |
| | | | | | | | |
| | (12,756,756 | ) | | | 227,889 | | | | (8,478,974 | ) | | | (5,042,942 | ) | | | (20,577,238 | ) | | | (75,513,998 | ) | | | (120,906,491 | ) | | | (55,415,337 | ) | | | (176,555,713 | ) |
| | — | | | | 170,713 | | | | 848,894 | | | | 2,464,058 | | | | 1,534,547 | | | | 11,338,932 | | | | 11,702,062 | | | | 13,500,978 | | | | 9,711,337 | |
| | — | | | | — | | | | — | | | | — | | | | — | | | | — | | | | — | | | | — | | | | 34,619 | |
| | — | | | | — | | | | — | | | | — | | | | — | | | | — | | | | — | | | | 109,871 | | | | — | |
| | — | | | | — | | | | (222,499 | ) | | | — | | | | — | | | | — | | | | — | | | | (9,572 | ) | | | — | |
| | (955,936 | ) | | | 1,649 | | | | (400,181 | ) | | | — | | | | — | | | | — | | | | (139 | ) | | | (56,343 | ) | | | 1,632,677 | |
| | | | | | | | | | | | | | | | | | | | | | | | | | | | | | | | | | | |
| | (13,712,692 | ) | | | 400,251 | | | | (8,252,760 | ) | | | (2,578,884 | ) | | | (19,042,691 | ) | | | (64,175,066 | ) | | | (109,204,568 | ) | | | (41,870,403 | ) | | | (165,177,080 | ) |
| | | | | | | | | | | | | | | | | | | | | | | | | | | | | | | | | | | |
| | | | | | | | |
| | 78,000,304 | | | | 2,047,094 | | | | 55,722,440 | | | | 75,909,872 | | | | 49,368,670 | | | | 257,282,899 | | | | 465,017,169 | | | | 132,868,362 | | | | 524,805,557 | |
| | — | | | | 3,178 | | | | 29,650 | | | | (146,271 | ) | | | (71,220 | ) | | | (19,258 | ) | | | (393,955 | ) | | | (132,785 | ) | | | (836,614 | ) |
| | — | | | | — | | | | — | | | | — | | | | — | | | | — | | | | — | | | | — | | | | 116,543 | |
| | — | | | | — | | | | — | | | | — | | | | — | | | | — | | | | — | | | | 131,380 | | | | — | |
| | — | | | | — | | | | (272,678 | ) | | | — | | | | — | | | | — | | | | — | | | | (2,320 | ) | | | — | |
| | 67,265 | | | | 2,086 | | | | (715,412 | ) | | | — | | | | — | | | | — | | | | (1 | ) | | | 35,711 | | | | (426,885 | ) |
| | | | | | | | | | | | | | | | | | | | | | | | | | | | | | | | | | | |
| | 78,067,569 | | | | 2,052,358 | | | | 54,764,000 | | | | 75,763,601 | | | | 49,297,450 | | | | 257,263,641 | | | | 464,623,213 | | | | 132,900,348 | | | | 523,658,601 | |
| | | | | | | | | | | | | | | | | | | | | | | | | | | | | | | | | | | |
| | 64,354,877 | | | | 2,452,609 | | | | 46,511,240 | | | | 73,184,717 | | | | 30,254,759 | | | | 193,088,575 | | | | 355,418,645 | | | | 91,029,945 | | | | 358,481,521 | |
| | | | | | | | | | | | | | | | | | | | | | | | | | | | | | | | | | | |
| $ | 92,118,400 | | | $ | 3,876,745 | | | $ | 59,374,006 | | | $ | 79,403,165 | | | $ | 32,325,300 | | | $ | 212,868,085 | | | $ | 356,923,660 | | | $ | 92,233,448 | | | $ | 382,307,966 | |
| | | | | | | | | | | | | | | | | | | | | | | | | | | | | | | | | | | |
See Notes to Financial Statements.
185
STATEMENTS OF CHANGES IN NET ASSETS
| | | | | | | | |
| | | Money Market Fund | |
| | | For the Year Ended | |
| | | 12/31/09 | | | 12/31/08 | |
Operations: | | | | | | | | |
Net investment income | | $ | 3,601,028 | | | $ | 30,499,308 | |
Net realized gain (loss) on investment securities, foreign currency transactions and derivative transactions | | | 60,542 | | | | 87,123 | |
Net change in unrealized appreciation (depreciation) on investment securities, foreign currency translations and derivative transactions | | | — | | | | — | |
| | | | | | | | |
Net increase in net assets resulting from operations | | | 3,661,570 | | | | 30,586,431 | |
| | | | | | | | |
| | |
Dividends and Distributions to Shareholders: | | | | | | | | |
Dividends from net investment income | | | | | | | | |
GS2 shares | | | (769,065 | ) | | | (3,742,477 | ) |
GS4 shares | | | (2,824,065 | ) | | | (26,602,255 | ) |
GS6 shares | | | (7,898 | ) | | | (154,576 | ) |
Distributions from net realized capital gains | | | | | | | | |
GS2 shares | | | (7,898 | ) | | | — | |
GS4 shares | | | (62,102 | ) | | | — | |
GS6 shares | | | — | | | | — | |
| | | | | | | | |
Total dividends and distributions | | | (3,671,028 | ) | | | (30,499,308 | ) |
| | | | | | | | |
| | |
Capital Share Transactions: | | | | | | | | |
Proceeds from shares sold | | | | | | | | |
GS2 shares | | | 102,344,425 | | | | 174,901,124 | |
GS4 shares | | | 2,886,053,282 | | | | 4,070,538,346 | |
GS6 shares | | | 1,367,352 | | | | 3,546,544 | |
Proceeds from exchange of GS6 shares for GS4 shares(1) | | | | | | | | |
GS4 shares | | | 9,761,236 | | | | — | |
GS6 shares | | | (9,761,236 | ) | | | — | |
Reinvestment of dividends and distributions | | | | | | | | |
GS2 shares | | | 644,744 | | | | 3,367,839 | |
GS4 shares | | | 2,050,152 | | | | 16,558,471 | |
GS6 shares | | | 7,898 | | | | 154,558 | |
| | | | | | | | |
Total proceeds from shares sold and reinvested | | | 2,992,467,853 | | | | 4,269,066,882 | |
| | | | | | | | |
Value of shares redeemed | | | | | | | | |
GS2 shares | | | (141,405,488 | ) | | | (119,120,727 | ) |
GS4 shares | | | (2,803,066,431 | ) | | | (4,056,623,451 | ) |
GS6 shares | | | (421,134 | ) | | | (873,423 | ) |
| | | | | | | | |
Total value of shares redeemed | | | (2,944,893,053 | ) | | | (4,176,617,601 | ) |
| | | | | | | | |
Net increase (decrease) from capital share transactions(2) | | | 47,574,800 | | | | 92,449,281 | |
| | | | | | | | |
Total increase (decrease) in net assets | | | 47,565,342 | | | | 92,536,404 | |
| | | | | | | | |
| | |
Net Assets: | | | | | | | | |
Beginning of Year | | | 1,150,692,271 | | | | 1,058,155,867 | |
| | | | | | | | |
End of Year* | | $ | 1,198,257,613 | | | $ | 1,150,692,271 | |
| | | | | | | | |
|
| |
* Including undistributed (distributions in excess of) net investment income | | $ | 75,044 | | | $ | 84,502 | |
| | | | | | | | |
| (1) | See Note 1 in Notes to Financial Statements. |
| (2) | See Note 7 in Notes to Financial Statements. |
See Notes to Financial Statements.
186
| | | | | | | | | | | | | | | | | | | | | | | | | | | | | | | | | | |
Low-Duration
Bond Fund | | | Medium-Duration
Bond Fund | | | Extended-Duration
Bond Fund | | | Inflation
Protected
Bond Fund | | | Global
Bond Fund | |
| For the Year Ended | | | For the Year Ended | | | For the Year Ended | | | For the
Period | | | For the Year Ended | |
| 12/31/09 | | | 12/31/08 | | | 12/31/09 | | | 12/31/08 | | | 12/31/09 | | | 12/31/08 | | | 06/25/09 -
12/31/09 | | | 12/31/09 | | | 12/31/08 | |
| | | | | | | | |
| $ | 20,944,974 | | | $ | 30,702,495 | | | $ | 36,356,649 | | | $ | 54,680,407 | | | $ | 27,763,523 | | | $ | 32,896,917 | | | $ | 1,424,136 | | | $ | 12,862,766 | | | $ | 11,820,489 | |
| | | | | | | | |
| | 8,473,015 | | | | 10,248,330 | | | | 25,495,374 | | | | 25,910,258 | | | | (13,712,692 | ) | | | 3,536,736 | | | | 400,251 | | | | (8,252,760 | ) | | | (771,149 | ) |
| | | | | | | | |
| | 40,666,842 | | | | (62,157,691 | ) | | | 74,039,703 | | | | (129,485,267 | ) | | | 78,067,569 | | | | (81,975,842 | ) | | | 2,052,358 | | | | 54,764,000 | | | | (56,189,843 | ) |
| | | | | | | | | | | | | | | | | | | | | | | | | | | | | | | | | | | |
| | 70,084,831 | | | | (21,206,866 | ) | | | 135,891,726 | | | | (48,894,602 | ) | | | 92,118,400 | | | | (45,542,189 | ) | | | 3,876,745 | | | | 59,374,006 | | | | (45,140,503 | ) |
| | | | | | | | | | | | | | | | | | | | | | | | | | | | | | | | | | | |
| | | | | | | | |
| | (4,819,001 | ) | | | (7,859,812 | ) | | | (8,289,189 | ) | | | (11,645,709 | ) | | | (7,203,294 | ) | | | (8,411,202 | ) | | | — | | | | — | | | | — | |
| | (15,263,843 | ) | | | (25,918,642 | ) | | | (29,716,113 | ) | | | (44,817,988 | ) | | | (18,714,067 | ) | | | (24,338,771 | ) | | | (1,359,644 | ) | | | (13,789,431 | ) | | | (13,354,129 | ) |
| | (101,664 | ) | | | (331,598 | ) | | | (303,734 | ) | | | (1,129,043 | ) | | | (571,919 | ) | | | (1,871,633 | ) | | | — | | | | — | | | | — | |
| | | | | | | | |
| | — | | | | — | | | | (5,307,160 | ) | | | (5,325,358 | ) | | | (162,568 | ) | | | (1,551,879 | ) | | | — | | | | — | | | | — | |
| | — | | | | — | | | | (19,148,776 | ) | | | (20,940,453 | ) | | | (426,577 | ) | | | (4,629,238 | ) | | | (91,394 | ) | | | — | | | | (1,286,826 | ) |
| | — | | | | — | | | | (168,322 | ) | | | (605,256 | ) | | | (44,540 | ) | | | (351,828 | ) | | | — | | | | — | | | | — | |
| | | | | | | | | | | | | | | | | | | | | | | | | | | | | | | | | | | |
| | (20,184,508 | ) | | | (34,110,052 | ) | | | (62,933,294 | ) | | | (84,463,807 | ) | | | (27,122,965 | ) | | | (41,154,551 | ) | | | (1,451,038 | ) | | | (13,789,431 | ) | | | (14,640,955 | ) |
| | | | | | | | | | | | | | | | | | | | | | | | | | | | | | | | | | | |
| | | | | | | | |
| | 21,205,424 | | | | 13,419,447 | | | | 23,176,665 | | | | 26,755,295 | | | | 5,901,308 | | | | 12,386,781 | | | | — | | | | — | | | | — | |
| | 100,049,225 | | | | 74,611,719 | | | | 116,757,280 | | | | 94,933,988 | | | | 33,154,694 | | | | 27,666,880 | | | | 85,910,487 | | | | 33,309,227 | | | | 122,278,692 | |
| | 254,107 | | | | 598,495 | | | | 144,295 | | | | 708,473 | | | | 49,106 | | | | 170,965 | | | | — | | | | — | | | | — | |
| | | | | | | | |
| | 6,028,341 | | | | — | | | | 14,963,529 | | | | — | | | | 15,327,294 | | | | — | | | | — | | | | — | | | | — | |
| | (6,028,341 | ) | | | — | | | | (14,963,529 | ) | | | — | | | | (15,327,294 | ) | | | — | | | | — | | | | — | | | | — | |
| | | | | | | | |
| | 4,814,646 | | | | 7,855,439 | | | | 13,585,942 | | | | 16,454,325 | | | | 7,356,577 | | | | 9,955,235 | | | | — | | | | — | | | | — | |
| | 15,261,292 | | | | 25,915,895 | | | | 48,861,482 | | | | 65,754,384 | | | | 19,139,457 | | | | 28,967,078 | | | | 1,451,038 | | | | 13,789,383 | | | | 14,640,955 | |
| | 101,664 | | | | 331,598 | | | | 472,056 | | | | 1,734,299 | | | | 616,459 | | | | 2,223,461 | | | | — | | | | — | | | | — | |
| | | | | | | | | | | | | | | | | | | | | | | | | | | | | | | | | | | |
| | 141,686,358 | | | | 122,732,593 | | | | 202,997,720 | | | | 206,340,764 | | | | 66,217,601 | | | | 81,370,400 | | | | 87,361,525 | | | | 47,098,610 | | | | 136,919,647 | |
| | | | | | | | | | | | | | | | | | | | | | | | | | | | | | | | | | | |
| | | | | | | | |
| | (22,503,752 | ) | | | (38,248,100 | ) | | | (13,815,713 | ) | | | (58,514,727 | ) | | | (16,838,462 | ) | | | (17,257,194 | ) | | | — | | | | — | | | | — | |
| | (110,793,220 | ) | | | (206,206,149 | ) | | | (118,612,655 | ) | | | (394,054,838 | ) | | | (91,273,123 | ) | | | (132,897,070 | ) | | | (1,793,515 | ) | | | (38,593,388 | ) | | | (35,006,076 | ) |
| | (74,922 | ) | | | (311,460 | ) | | | (176,672 | ) | | | (200,010 | ) | | | (44,729 | ) | | | (165,272 | ) | | | — | | | | — | | | | — | |
| | | | | | | | | | | | | | | | | | | | | | | | | | | | | | | | | | | |
| | (133,371,894 | ) | | | (244,765,709 | ) | | | (132,605,040 | ) | | | (452,769,575 | ) | | | (108,156,314 | ) | | | (150,319,536 | ) | | | (1,793,515 | ) | | | (38,593,388 | ) | | | (35,006,076 | ) |
| | | | | | | | | | | | | | | | | | | | | | | | | | | | | | | | | | | |
| | 8,314,464 | | | | (122,033,116 | ) | | | 70,392,680 | | | | (246,428,811 | ) | | | (41,938,713 | ) | | | (68,949,136 | ) | | | 85,568,010 | | | | 8,505,222 | | | | 101,913,571 | |
| | | | | | | | | | | | | | | | | | | | | | | | | | | | | | | | | | | |
| | 58,214,787 | | | | (177,350,034 | ) | | | 143,351,112 | | | | (379,787,220 | ) | | | 23,056,722 | | | | (155,645,876 | ) | | | 87,993,717 | | | | 54,089,797 | | | | 42,132,113 | |
| | | | | | | | | | | | | | | | | | | | | | | | | | | | | | | | | | | |
| | | | | | | | |
| | 626,841,694 | | | | 804,191,728 | | | | 865,366,738 | | | | 1,245,153,958 | | | | 437,604,655 | | | | 593,250,531 | | | | — | | | | 167,464,776 | | | | 125,332,663 | |
| | | | | | | | | | | | | | | | | | | | | | | | | | | | | | | | | | | |
| $ | 685,056,481 | | | $ | 626,841,694 | | | $ | 1,008,717,850 | | | $ | 865,366,738 | | | $ | 460,661,377 | | | $ | 437,604,655 | | | $ | 87,993,717 | | | $ | 221,554,573 | | | $ | 167,464,776 | |
| | | | | | | | | | | | | | | | | | | | | | | | | | | | | | | | | | | |
| $ | (152,642 | ) | | $ | 2,004,153 | | | $ | (59,115 | ) | | $ | 3,256,156 | | | $ | 692,095 | | | $ | (55,475 | ) | | $ | 64,492 | | | $ | (651,947 | ) | | $ | (16,036 | ) |
| | | | | | | | | | | | | | | | | | | | | | | | | | | | | | | | | | | |
See Notes to Financial Statements.
187
STATEMENTS OF CHANGES IN NET ASSETS
| | | | | | | | | | | | | | | | |
| | | Equity Index Fund | | | Real Estate
Securities Fund | |
| | | For the Year Ended | | | For the Year Ended | |
| | | 12/31/09 | | | 12/31/08 | | | 12/31/09 | | | 12/31/08 | |
Operations: | | | | | | | | | | | | | | | | |
Net investment income | | $ | 6,218,448 | | | $ | 8,054,465 | | | $ | 2,070,541 | | | $ | 2,328,218 | |
Net realized loss on investment securities, foreign currency transactions and derivative transactions | | | (2,578,884 | ) | | | (3,835,975 | ) | | | (19,042,691 | ) | | | (44,494,060 | ) |
Net change in unrealized appreciation (depreciation) on investment securities, foreign currency translations and derivative transactions | | | 75,763,601 | | | | (186,466,450 | ) | | | 49,297,450 | | | | (8,562,119 | ) |
| | | | | | | | | | | | | | | | |
Net increase (decrease) in net assets resulting from operations | | | 79,403,165 | | | | (182,247,960 | ) | | | 32,325,300 | | | | (50,727,961 | ) |
| | | | | | | | | | | | | | | | |
Dividends and Distributions to Shareholders: | | | | | | | | | | | | | | | | |
Dividends from net investment income | | | | | | | | | | | | | | | | |
GS2 shares | | | (1,801,063 | ) | | | (1,831,863 | ) | | | — | | | | — | |
GS4 shares | | | (4,402,101 | ) | | | (4,586,589 | ) | | | (2,070,541 | ) | | | (2,388,143 | ) |
GS6 shares | | | (14,301 | ) | | | (18,532 | ) | | | — | | | | — | |
Distributions from net realized capital gains | | | | | | | | | | | | | | | | |
GS2 shares | | | — | | | | (695,874 | ) | | | — | | | | — | |
GS4 shares | | | — | | | | (1,977,420 | ) | | | — | | | | — | |
GS6 shares | | | — | | | | (7,511 | ) | | | — | | | | — | |
Return of Capital | | | | | | | | | | | | | | | | |
GS2 shares | | | — | | | | — | | | | — | | | | — | |
GS4 shares | | | — | | | | — | | | | (45,334 | ) | | | (99,004 | ) |
GS6 shares | | | — | | | | — | | | | — | | | | — | |
| | | | | | | | | | | | | | | | |
Total dividends and distributions | | | (6,217,465 | ) | | | (9,117,789 | ) | | | (2,115,875 | ) | | | (2,487,147 | ) |
| | | | | | | | | | | | | | | | |
Capital Share Transactions: | | | | | | | | | | | | | | | | |
Proceeds from shares sold | | | | | | | | | | | | | | | | |
GS2 shares | | | 5,404,027 | | | | 7,040,123 | | | | — | | | | — | |
GS4 shares | | | 26,274,116 | | | | 22,884,918 | | | | 40,121,237 | | | | 84,159,228 | |
GS6 shares | | | 169,604 | | | | 524,851 | | | | — | | | | — | |
GS8 shares | | | — | | | | — | | | | — | | | | — | |
Proceeds from exchange of GS6 shares for GS4 shares(1) | | | | | | | | | | | | | | | | |
GS4shares | | | 752,012 | | | | — | | | | — | | | | — | |
GS6 shares | | | (752,012 | ) | | | — | | | | — | | | | — | |
Reinvestment of dividends and distributions | | | | | | | | | | | | | | | | |
GS2 shares | | | 1,798,674 | | | | 2,524,043 | | | | — | | | | — | |
GS4 shares | | | 4,401,738 | | | | 6,563,344 | | | | 2,115,821 | | | | 2,446,782 | |
GS6 shares | | | 14,301 | | | | 26,043 | | | | — | | | | — | |
| | | | | | | | | | | | | | | | |
Total proceeds from shares sold and reinvested | | | 38,062,460 | | | | 39,563,322 | | | | 42,237,058 | | | | 86,606,010 | |
| | | | | | | | | | | | | | | | |
Value of shares redeemed | | | | | | | | | | | | | | | | |
GS2 shares | | | (3,267,371 | ) | | | (8,877,183 | ) | | | — | | | | — | |
GS4 shares | | | (18,417,132 | ) | | | (53,088,621 | ) | | | (31,492,535 | ) | | | (49,586,856 | ) |
GS6 shares | | | (53,435 | ) | | | (197,779 | ) | | | — | | | | — | |
| | | | | | | | | | | | | | | | |
Total value of shares redeemed | | | (21,737,938 | ) | | | (62,163,583 | ) | | | (31,492,535 | ) | | | (49,586,856 | ) |
| | | | | | | | | | | | | | | | |
Net increase (decrease) from capital share transactions(2) | | | 16,324,522 | | | | (22,600,261 | ) | | | 10,744,523 | | | | 37,019,154 | |
| | | | | | | | | | | | | | | | |
Total increase (decrease) in net assets | | | 89,510,222 | | | | (213,966,010 | ) | | | 40,953,948 | | | | (16,195,954 | ) |
| | | | | | | | | | | | | | | | |
Net Assets: | | | | | | | | | | | | | | | | |
Beginning of Period | | | 297,193,554 | | | | 511,159,564 | | | | 80,579,249 | | | | 96,775,203 | |
| | | | | | | | | | | | | | | | |
End of Period* | | $ | 386,703,776 | | | $ | 297,193,554 | | | $ | 121,533,197 | | | $ | 80,579,249 | |
| | | | | | | | | | | | | | | | |
|
| |
* Including undistributed (distributions in excess of) net investment income | | $ | 1,623,542 | | | $ | 1,622,559 | | | $ | — | | | $ | — | |
| | | | | | | | | | | | | | | | |
| (1) | See Note 1 in Notes to Financial Statements. |
| (2) | See Note 7 in Notes to Financial Statements. |
See Notes to Financial Statements.
188
| | | | | | | | | | | | | | | | | | | | | | | | | | | | | | |
| Value Equity Fund | | | Growth Equity Fund | | | Small Cap Equity Fund | | | International Equity Fund | |
| For the Year Ended | | | For the Year Ended | | | For the Year Ended | | | For the Year Ended | |
| 12/31/09 | | | 12/31/08 | | | 12/31/09 | | | 12/31/08 | | | 12/31/09 | | | 12/31/08 | | | 12/31/09 | | | 12/31/08 | |
| | | | | | | |
| $ | 19,779,510 | | | $ | 28,680,309 | | | $ | 1,505,015 | | | $ | 2,438,359 | | | $ | 1,203,503 | | | $ | 2,549,818 | | | $ | 23,826,445 | | | $ | 40,980,349 | |
| | | | | | | |
| | (64,175,066 | ) | | | (118,299,560 | ) | | | (109,204,568 | ) | | | (77,879,679 | ) | | | (41,870,403 | ) | | | (88,724,230 | ) | | | (165,177,080 | ) | | | (87,271,419 | ) |
| | | | | | | |
| | 257,263,641 | | | | (509,658,839 | ) | | | 464,623,213 | | | | (641,077,277 | ) | | | 132,900,348 | | | | (113,441,348 | ) | | | 523,658,601 | | | | (776,771,510 | ) |
| | | | | | | | | | | | | | | | | | | | | | | | | | | | | | | |
| | 212,868,085 | | | | (599,278,090 | ) | | | 356,923,660 | | | | (716,518,597 | ) | | | 92,233,448 | | | | (199,615,760 | ) | | | 382,307,966 | | | | (823,062,580 | ) |
| | | | | | | | | | | | | | | | | | | | | | | | | | | | | | | |
| | | | | | | |
| | (5,200,697 | ) | | | (5,427,637 | ) | | | (483,098 | ) | | | (760,505 | ) | | | (308,721 | ) | | | (614,201 | ) | | | (6,734,271 | ) | | | (9,679,437 | ) |
| | (14,265,973 | ) | | | (15,120,026 | ) | | | (889,232 | ) | | | (1,656,101 | ) | | | (799,277 | ) | | | (1,982,895 | ) | | | (22,872,522 | ) | | | (32,423,305 | ) |
| | (275,945 | ) | | | (371,566 | ) | | | (1,914 | ) | | | (2,559 | ) | | | (13,179 | ) | | | (103,815 | ) | | | (134,700 | ) | | | (701,696 | ) |
| | | | | | | |
| | — | | | | (1,791,283 | ) | | | — | | | | — | | | | — | | | | — | | | | (2,529 | ) | | | (8,347,976 | ) |
| | — | | | | (5,776,508 | ) | | | — | | | | — | | | | — | | | | — | | | | (9,714 | ) | | | (30,093,735 | ) |
| | — | | | | (145,613 | ) | | | — | | | | — | | | | — | | | | — | | | | (219 | ) | | | (687,438 | ) |
| | — | | | | — | | | | — | | | | — | | | | — | | | | (168,554 | ) | | | — | | | | — | |
| | — | | | | — | | | | — | | | | — | | | | — | | | | (544,164 | ) | | | — | | | | — | |
| | — | | | | — | | | | — | | | | — | | | | — | | | | (28,490 | ) | | | — | | | | — | |
| | | | | | | | | | | | | | | | | | | | | | | | | | | | | | | |
| | (19,742,615 | ) | | | (28,632,633 | ) | | | (1,374,244 | ) | | | (2,419,165 | ) | | | (1,121,177 | ) | | | (3,442,119 | ) | | | (29,753,955 | ) | | | (81,933,587 | ) |
| | | | | | | | | | | | | | | | | | | | | | | | | | | | | | | |
| | | | | | | |
| | 12,902,236 | | | | 26,364,928 | | | | 12,713,753 | | | | 28,172,361 | | | | 5,492,162 | | | | 20,033,750 | | | | 20,280,057 | | | | 104,596,517 | |
| | 72,329,322 | | | | 119,844,786 | | | | 71,786,841 | | | | 122,481,304 | | | | 30,796,225 | | | | 38,592,188 | | | | 93,746,559 | | | | 275,354,383 | |
| | 202,991 | | | | 384,635 | | | | 130,568 | | | | 295,093 | | | | 121,495 | | | | 274,544 | | | | 203,417 | | | | 699,797 | |
| | — | | | | — | | | | — | | | | 1,150,180 | | | | — | | | | — | | | | — | | | | — | |
| | | | | | | |
| | 10,999,393 | | | | — | | | | 8,465,100 | | | | — | | | | 11,250,269 | | | | — | | | | 15,254,145 | | | | — | |
| | (10,999,393 | ) | | | — | | | | (8,465,100 | ) | | | — | | | | (11,250,269 | ) | | | — | | | | (15,254,145 | ) | | | — | |
| | | | | | | |
| | 5,194,371 | | | | 7,209,480 | | | | 482,587 | | | | 759,609 | | | | 308,317 | | | | 781,539 | | | | 6,729,926 | | | | 17,999,891 | |
| | 14,264,827 | | | | 20,894,776 | | | | 889,208 | | | | 1,656,068 | | | | 799,160 | | | | 2,526,659 | | | | 22,880,793 | | | | 62,512,863 | |
| | 275,945 | | | | 517,179 | | | | 1,914 | | | | 2,559 | | | | 13,179 | | | | 132,305 | | | | 134,919 | | | | 1,389,134 | |
| | | | | | | | | | | | | | | | | | | | | | | | | | | | | | | |
| | 105,169,692 | | | | 175,215,784 | | | | 86,004,871 | | | | 154,517,174 | | | | 37,530,538 | | | | 62,340,985 | | | | 143,975,671 | | | | 462,552,585 | |
| | | | | | | | | | | | | | | | | | | | | | | | | | | | | | | |
| | | | | | | |
| | (7,838,330 | ) | | | (28,656,106 | ) | | | (12,252,310 | ) | | | (26,886,067 | ) | | | (3,541,206 | ) | | | (16,975,850 | ) | | | (36,708,492 | ) | | | (38,548,254 | ) |
| | (107,020,416 | ) | | | (175,032,062 | ) | | | (131,924,307 | ) | | | (186,516,510 | ) | | | (37,084,961 | ) | | | (71,310,720 | ) | | | (200,124,972 | ) | | | (144,223,290 | ) |
| | (12,384 | ) | | | (127,031 | ) | | | (41,306 | ) | | | (149,108 | ) | | | (22,607 | ) | | | (74,701 | ) | | | (67,761 | ) | | | (300,712 | ) |
| | | | | | | | | | | | | | | | | | | | | | | | | | | | | | | |
| | (114,871,130 | ) | | | (203,815,199 | ) | | | (144,217,923 | ) | | | (213,551,685 | ) | | | (40,648,774 | ) | | | (88,361,271 | ) | | | (236,901,225 | ) | | | (183,072,256 | ) |
| | | | | | | | | | | | | | | | | | | | | | | | | | | | | | | |
| | (9,701,438 | ) | | | (28,599,415 | ) | | | (58,213,052 | ) | | | (59,034,511 | ) | | | (3,118,236 | ) | | | (26,020,286 | ) | | | (92,925,554 | ) | | | 279,480,329 | |
| | | | | | | | | | | | | | | | | | | | | | | | | | | | | | | |
| | 183,424,032 | | | | (656,510,138 | ) | | | 297,336,364 | | | | (777,972,273 | ) | | | 87,994,035 | | | | (229,078,165 | ) | | | 259,628,457 | | | | (625,515,838 | ) |
| | | | | | | | | | | | | | | | | | | | | | | | | | | | | | | |
| | | | | | | |
| | 999,512,882 | | | | 1,656,023,020 | | | | 966,343,149 | | | | 1,744,315,422 | | | | 332,081,598 | | | | 561,159,763 | | | | 1,082,481,834 | | | | 1,707,997,672 | |
| | | | | | | | | | | | | | | | | | | | | | | | | | | | | | | |
| $ | 1,182,936,914 | | | $ | 999,512,882 | | | $ | 1,263,679,513 | | | $ | 966,343,149 | | | $ | 420,075,633 | | | $ | 332,081,598 | | | $ | 1,342,110,291 | | | $ | 1,082,481,834 | |
| | | | | | | | | | | | | | | | | | | | | | | | | | | | | | | |
| $ | 7,789,164 | | | $ | 7,752,269 | | | $ | 169,198 | | | $ | 38,545 | | | $ | 47,515 | | | $ | (21,274 | ) | | $ | (3,162,445 | ) | | $ | 506,726 | |
| | | | | | | | | | | | | | | | | | | | | | | | | | | | | | | |
See Notes to Financial Statements.
189
FINANCIAL HIGHLIGHTS
| | | | | | | | | | | | | | | | | | | | | | | | | | | | | | | | | | | | | | | | |
For a Share Outstanding For the Years Ended December 31, unless otherwise indicated | | Ratios to Average Net Assets | | | Portfolio
Turnover
Rate | |
| | | Net Asset
Value,
Beginning
of Year | | Net
Investment
Income | | | Realized
and
Unrealized
Gain
(Loss) on
Investments | | | Dividends
from Net
Investment
Income | | | Distributions
from Net
Realized
Capital
Gains | | | Net Asset
Value,
End of
Year | | Total
Return | | | Net
Assets,
End of
Year
(000) | | Expenses,
Net | | | Expenses,
Gross(1) | | | Investment
Income,
Net(2) | | |
Money Market Fund | |
|
GS2 Class | |
2009 | | $ | 1.00 | | $ | — | † | | $ | — | † | | $ | — | † | | $ | — | † | | $ | 1.00 | | 0.47 | % | | $ | 133,323 | | 0.23 | %(3) | | 0.23 | %(3) | | 0.49 | % | | N/A | |
2008 | | | 1.00 | | | 0.03 | | | | — | † | | | (0.03 | ) | | | — | | | | 1.00 | | 2.95 | | | | 171,739 | | 0.20 | | | 0.20 | | | 2.86 | | | N/A | |
2007 | | | 1.00 | | | 0.05 | | | | — | † | | | (0.05 | ) | | | — | | | | 1.00 | | 5.23 | | | | 112,581 | | 0.23 | | | 0.23 | | | 5.11 | | | N/A | |
2006 | | | 1.00 | | | 0.05 | | | | — | † | | | (0.05 | ) | | | — | | | | 1.00 | | 4.92 | | | | 100,559 | | 0.26 | | | 0.26 | | | 4.82 | | | N/A | |
2005 | | | 1.00 | | | 0.03 | | | | — | † | | | (0.03 | ) | | | — | | | | 1.00 | | 3.07 | | | | 93,103 | | 0.27 | | | 0.26 | | | 3.03 | | | N/A | |
GS4 Class | |
2009 | | $ | 1.00 | | $ | — | † | | $ | — | † | | $ | — | † | | $ | — | † | | $ | 1.00 | | 0.29 | % | | $ | 1,064,934 | | 0.41 | %(3) | | 0.43 | %(3) | | 0.28 | % | | N/A | |
2008 | | | 1.00 | | | 0.03 | | | | — | † | | | (0.03 | ) | | | — | | | | 1.00 | | 2.75 | | | | 970,146 | | 0.40 | (3) | | 0.40 | (3) | | 2.72 | | | N/A | |
2007 | | | 1.00 | | | 0.05 | | | | — | † | | | (0.05 | ) | | | — | | | | 1.00 | | 5.03 | | | | 939,596 | | 0.43 | | | 0.43 | | | 4.92 | | | N/A | |
2006 | | | 1.00 | | | 0.05 | | | | — | † | | | (0.05 | ) | | | — | | | | 1.00 | | 4.72 | | | | 930,582 | | 0.46 | | | 0.46 | | | 4.64 | | | N/A | |
2005 | | | 1.00 | | | 0.03 | | | | — | † | | | (0.03 | ) | | | — | | | | 1.00 | | 2.88 | | | | 766,322 | | 0.46 | | | 0.46 | | | 2.84 | | | N/A | |
|
Low-Duration Bond Fund | |
|
GS2 Class | |
2009 | | $ | 8.11 | | $ | 0.29 | # | | $ | 0.69 | | | $ | (0.39 | ) | | $ | — | | | $ | 8.70 | | 12.29 | % | | $ | 115,741 | | 0.36 | % | | 0.42 | % | | 3.47 | % | | 322 | % |
2008 | | | 8.90 | | | 0.36 | # | | | (0.60 | ) | | | (0.55 | ) | | | — | | | | 8.11 | | (2.76 | ) | | | 105,223 | | 0.36 | | | 0.41 | | | 4.19 | | | 427 | |
2007 | | | 8.89 | | | 0.42 | # | | | 0.12 | | | | (0.53 | ) | | | — | | | | 8.90 | | 6.22 | | | | 133,374 | | 0.42 | | | 0.45 | | | 4.71 | | | 248 | |
2006 | | | 9.06 | | | 0.38 | # | | | (0.03 | ) | | | (0.52 | ) | | | — | | | | 8.89 | | 3.94 | | | | 105,991 | | 0.45 | | | 0.47 | | | 4.22 | | | 168 | |
2005 | | | 9.32 | | | 0.30 | # | | | (0.15 | ) | | | (0.41 | ) | | | — | † | | | 9.06 | | 1.60 | | | | 104,681 | | 0.45 | | | 0.48 | | | 3.30 | | | 196 | |
GS4 Class | |
2009 | | $ | 11.99 | | $ | 0.42 | # | | $ | 1.00 | | | $ | (0.37 | ) | | $ | — | | | $ | 13.04 | | 11.97 | % | | $ | 569,316 | | 0.52 | % | | 0.62 | % | | 3.30 | % | | 322 | % |
2008 | | | 12.88 | | | 0.51 | # | | | (0.87 | ) | | | (0.53 | ) | | | — | | | | 11.99 | | (2.84 | ) | | | 515,996 | | 0.52 | | | 0.61 | | | 4.03 | | | 427 | |
2007 | | | 12.63 | | | 0.58 | # | | | 0.17 | | | | (0.50 | ) | | | — | | | | 12.88 | | 6.11 | | | | 665,292 | | 0.58 | | | 0.64 | | | 4.54 | | | 248 | |
2006 | | | 12.66 | | | 0.58 | # | | | (0.11 | ) | | | (0.50 | ) | | | — | | | | 12.63 | | 3.75 | | | | 697,687 | | 0.61 | | | 0.66 | | | 4.05 | | | 168 | |
2005 | | | 12.87 | | | 0.40 | # | | | (0.22 | ) | | | (0.39 | ) | | | — | † | | | 12.66 | | 1.39 | | | | 789,077 | | 0.61 | | | 0.67 | | | 3.13 | | | 196 | |
| † | Amount represents less than $0.005 per share. |
| # | Calculated using the average shares outstanding method. |
| (1) | The ratio excludes expenses waived/reimbursed net of amount recaptured. |
| (2) | The ratio includes expenses waived/reimbursed net of amount recaptured and fees paid indirectly, where applicable; if expenses waived/reimbursed net of amount recaptured and fees paid indirectly were excluded, the ratio would have been lower than the ratio shown. |
| (3) | See Note 12 in Notes to Financial Statements. |
See Notes to Financial Statements.
190
| | | | | | | | | | | | | | | | | | | | | | | | | | | | | | | | | | | | | | | | | | | | |
| | | Net Asset
Value,
Beginning
of Year | | Net
Investment
Income | | | Realized
and
Unrealized
Gain
(Loss) on
Investments | | | Dividends
from Net
Investment
Income | | | Distributions
from Net
Realized
Capital
Gains | | | Return
of
Capital | | | Net
Asset
Value,
End of
Year | | Total
Return | | | Net
Assets,
End of
Year
(000) | | Ratios to Average Net Assets | | | Portfolio
Turnover
Rate | |
| | | | | | | | | | | | Expenses,
Net | | | Expenses,
Gross(1) | | | Investment
Income,
Net(2) | | |
Medium-Duration Bond Fund | |
|
GS2 Class | |
2009 | | $ | 7.13 | | $ | 0.31 | # | | $ | 0.85 | | | $ | (0.51 | ) | | $ | (0.31 | ) | | $ | — | | | $ | 7.47 | | 17.07 | % | | $ | 139,917 | | 0.48 | % | | 0.51 | % | | 4.17 | % | | 427 | % |
2008 | | | 8.42 | | | 0.40 | # | | | (0.72 | ) | | | (0.65 | ) | | | (0.32 | ) | | | — | | | | 7.13 | | (3.88 | ) | | | 112,240 | | 0.47 | | | 0.48 | | | 5.07 | | | 566 | |
2007 | | | 8.52 | | | 0.42 | # | | | 0.12 | | | | (0.64 | ) | | | — | † | | | — | | | | 8.42 | | 6.65 | | | | 151,466 | | 0.48 | | | 0.49 | | | 5.02 | | | 428 | |
2006 | | | 8.71 | | | 0.39 | # | | | (0.01 | ) | | | (0.57 | ) | | | — | | | | — | | | | 8.52 | | 4.50 | | | | 113,051 | | 0.50 | | | 0.50 | | | 4.60 | | | 440 | |
2005 | | | 9.06 | | | 0.34 | # | | | (0.10 | ) | | | (0.53 | ) | | | (0.06 | ) | | | — | | | | 8.71 | | 2.62 | | | | 100,800 | | 0.50 | | | 0.53 | | | 3.84 | | | 465 | |
GS4 Class | |
2009 | | $ | 12.16 | | $ | 0.53 | # | | $ | 1.48 | | | $ | (0.50 | ) | | $ | (0.31 | ) | | $ | — | | | $ | 13.36 | | 16.97 | % | | $ | 868,800 | | 0.58 | % | | 0.70 | % | | 4.08 | % | | 427 | % |
2008 | | | 13.64 | | | 0.65 | # | | | (1.18 | ) | | | (0.63 | ) | | | (0.32 | ) | | | — | | | | 12.16 | | (3.89 | ) | | | 738,610 | | 0.58 | | | 0.67 | | | 4.96 | | | 566 | |
2007 | | | 13.42 | | | 0.66 | # | | | 0.18 | | | | (0.62 | ) | | | — | † | | | — | | | | 13.64 | | 6.46 | | | | 1,079,034 | | 0.61 | | | 0.68 | | | 4.88 | | | 428 | |
2006 | | | 13.40 | | | 0.60 | # | | | (0.03 | ) | | | (0.55 | ) | | | — | | | | — | | | | 13.42 | | 4.37 | | | | 1,108,958 | | 0.62 | | | 0.69 | | | 4.48 | | | 440 | |
2005 | | | 13.63 | | | 0.50 | # | | | (0.16 | ) | | | (0.51 | ) | | | (0.06 | ) | | | — | | | | 13.40 | | 2.50 | | | | 981,935 | | 0.62 | | | 0.71 | | | 3.71 | | | 465 | |
|
Extended-Duration Bond Fund | |
|
GS2 Class | |
2009 | | $ | 6.31 | | $ | 0.44 | # | | $ | 1.04 | | | $ | (0.76 | ) | | $ | (0.02 | ) | | $ | — | | | $ | 7.01 | | 25.27 | % | | $ | 67,699 | | 0.53 | % | | 0.53 | % | | 6.78 | % | | 41 | % |
2008 | | | 7.95 | | | 0.47 | # | | | (1.11 | ) | | | (0.85 | ) | | | (0.15 | ) | | | — | | | | 6.31 | | (8.12 | ) | | | 64,834 | | 0.52 | | | 0.52 | | | 6.66 | | | 40 | |
2007 | | | 8.13 | | | 0.41 | # | | | 0.23 | | | | (0.69 | ) | | | (0.13 | ) | | | — | | | | 7.95 | | 8.45 | | | | 75,841 | | 0.53 | | | 0.53 | | | 5.21 | | | 101 | |
2006 | | | 8.44 | | | 0.40 | # | | | (0.03 | ) | | | (0.65 | ) | | | (0.03 | ) | | | — | | | | 8.13 | | 4.75 | | | | 59,916 | | 0.57 | | | 0.57 | | | 4.91 | | | 100 | |
2005 | | | 8.90 | | | 0.44 | # | | | 0.04 | | | | (0.68 | ) | | | (0.26 | ) | | | — | | | | 8.44 | | 5.65 | | | | 57,372 | | 0.56 | | | 0.57 | | | 4.90 | | | 38 | |
GS4 Class | |
2009 | | $ | 12.97 | | $ | 0.91 | # | | $ | 2.22 | | | $ | (0.74 | ) | | $ | (0.02 | ) | | $ | — | | | $ | 15.34 | | 24.97 | % | | $ | 392,962 | | 0.69 | % | | 0.73 | % | | 6.60 | % | | 41 | % |
2008 | | | 15.20 | | | 0.90 | # | | | (2.15 | ) | | | (0.83 | ) | | | (0.15 | ) | | | — | | | | 12.97 | | (8.28 | ) | | | 357,073 | | 0.69 | | | 0.71 | | | 6.45 | | | 40 | |
2007 | | | 14.81 | | | 0.74 | # | | | 0.44 | | | | (0.66 | ) | | | (0.13 | ) | | | — | | | | 15.20 | | 8.29 | | | | 500,252 | | 0.72 | | | 0.72 | | | 5.02 | | | 101 | |
2006 | | | 14.82 | | | 0.69 | # | | | (0.04 | ) | | | (0.63 | ) | | | (0.03 | ) | | | — | | | | 14.81 | | 4.56 | | | | 467,877 | | 0.73 | | | 0.76 | | | 4.75 | | | 100 | |
2005 | | | 14.93 | | | 0.71 | # | | | 0.10 | | | | (0.66 | ) | | | (0.26 | ) | | | — | | | | 14.82 | | 5.54 | | | | 393,851 | | 0.73 | | | 0.76 | | | 4.72 | | | 38 | |
|
Inflation Protected Bond Fund | |
|
GS4 Class | |
2009(3)(4) | | $ | 10.00 | | $ | 0.19 | # | | $ | 0.32 | | | $ | (0.18 | ) | | $ | (0.01 | ) | | $ | — | | | $ | 10.32 | | 5.12 | % | | $ | 87,994 | | 0.35 | % | | 0.36 | % | | 1.83 | % | | 55 | % |
|
Global Bond Fund | |
|
GS4 Class | |
2009 | | $ | 7.34 | | $ | 0.56 | # | | $ | 2.07 | | | $ | (0.61 | ) | | $ | — | | | $ | — | | | $ | 9.36 | | 37.35 | % | | $ | 221,555 | | 0.79 | % | | 0.81 | % | | 6.81 | % | | 96 | % |
2008 | | | 10.14 | | | 0.64 | # | | | (2.59 | ) | | | (0.75 | ) | | | (0.10 | ) | | | — | | | | 7.34 | | (20.28 | ) | | | 167,465 | | 0.78 | | | 0.80 | | | 7.20 | | | 176 | |
2007 | | | 10.12 | | | 0.61 | | | | 0.08 | | | | (0.64 | ) | | | (0.03 | ) | | | — | | | | 10.14 | | 7.00 | | | | 125,333 | | 0.79 | | | 0.80 | | | 6.07 | | | 255 | |
2006(4)(5) | | | 10.12 | | | — | † | | | — | † | | | — | † | | | — | | | | — | † | | | 10.12 | | 0.04 | | | | 104,635 | | 1.04 | | | 1.42 | | | 4.32 | | | — | |
| † | Amount represents less than $0.005 per share. |
| # | Calculated using the average shares outstanding method. |
| (1) | The ratio excludes expenses waived/reimbursed net of amount recaptured. |
| (2) | The ratio includes expenses waived/reimbursed net of amount recaptured and fees paid indirectly, where applicable; if expenses waived/reimbursed net of amount recaptured and fees paid indirectly were excluded, the ratio would have been lower than the ratio shown. |
| (3) | Inception date was June 26, 2009. |
| (4) | Total return is not annualized. Ratios are annualized. (5) Inception date was December 29, 2006. |
See Notes to Financial Statements.
191
FINANCIAL HIGHLIGHTS (Continued)
| | | | | | | | | | | | | | | | | | | | | | | | | | | | | | | | | | | | | | | | | | | | |
For a Share Outstanding For the Years Ended December 31, unless otherwise indicated | | Ratios to Average Net Assets | | | Portfolio
Turnover
Rate | |
| | | Net Asset
Value,
Beginning
of Year | | Net
Investment
Income | | | Realized
and
Unrealized
Gain
(Loss) on
Investments | | | Dividends
from Net
Investment
Income | | | Distributions
from Net
Realized
Capital
Gains | | | Excess
Distribution/
Return of
Capital | | | Net
Asset
Value,
End of
Year | | Total
Return | | | Net
Assets,
End of
Year
(000) | | Expenses,
Net | | | Expenses,
Gross(1) | | | Investment
Income/
(Loss),
Net(2) | | |
Equity Index Fund | |
|
GS2 Class | |
2009 | | $ | 6.36 | | $ | 0.14 | # | | $ | 1.49 | | | $ | (0.22 | ) | | $ | — | | | $ | — | | | $ | 7.77 | | 26.38 | % | | $ | 65,217 | | 0.22 | % | | 0.24 | % | | 2.05 | % | | 4 | % |
2008 | | | 10.57 | | | 0.18 | # | | | (4.06 | ) | | | (0.24 | ) | | | (0.09 | ) | | | — | | | | 6.36 | | (37.32 | ) | | | 49,472 | | 0.21 | | | 0.22 | | | 2.11 | | | 5 | |
2007 | | | 11.08 | | | 0.20 | # | | | 0.39 | | | | (0.32 | ) | | | (0.78 | ) | | | — | | | | 10.57 | | 5.19 | | | | 81,104 | | 0.22 | | | 0.22 | | | 1.77 | | | 5 | |
2006 | | | 9.96 | | | 0.18 | # | | | 1.33 | | | | (0.28 | ) | | | (0.11 | ) | | | — | | | | 11.08 | | 15.37 | | | | 74,634 | | 0.23 | | | 0.23 | | | 1.74 | | | 5 | |
2005 | | | 9.78 | | | 0.16 | # | | | 0.30 | | | | (0.24 | ) | | | (0.04 | ) | | | — | | | | 9.96 | | 4.80 | | | | 62,214 | | 0.23 | | | 0.24 | | | 1.63 | | | 6 | |
GS4 Class | | | | | | | |
2009 | | $ | 11.70 | | $ | 0.24 | # | | $ | 2.77 | | | $ | (0.20 | ) | | $ | — | | | $ | — | | | $ | 14.51 | | 26.14 | % | | $ | 321,486 | | 0.37 | % | | 0.43 | % | | 1.90 | % | | 4 | % |
2008 | | | 19.07 | | | 0.31 | # | | | (7.37 | ) | | | (0.22 | ) | | | (0.09 | ) | | | — | | | | 11.70 | | (37.37 | ) | | | 247,077 | | 0.37 | | | 0.42 | | | 1.95 | | | 5 | |
2007 | | | 19.17 | | | 0.32 | # | | | 0.64 | | | | (0.28 | ) | | | (0.78 | ) | | | — | | | | 19.07 | | 4.95 | | | | 429,423 | | 0.39 | | | 0.42 | | | 1.59 | | | 5 | |
2006 | | | 16.97 | | | 0.28 | # | | | 2.28 | | | | (0.25 | ) | | | (0.11 | ) | | | — | | | | 19.17 | | 15.19 | | | | 466,429 | | 0.40 | | | 0.43 | | | 1.57 | | | 5 | |
2005 | | | 16.47 | | | 0.24 | # | | | 0.51 | | | | (0.21 | ) | | | (0.04 | ) | | | — | | | | 16.97 | | 4.61 | | | | 402,865 | | 0.40 | | | 0.43 | | | 1.46 | | | 6 | |
| | |
Real Estate Securities Fund | | | | | | | |
| | |
GS4 Class | | | | | | | |
2009 | | $ | 5.25 | | $ | 0.12 | # | | $ | 1.49 | | | $ | (0.12 | ) | | $ | — | | | $ | — | † | | $ | 6.74 | | 31.21 | % | | $ | 121,533 | | 1.27 | % | | 1.28 | % | | 2.29 | % | | 128 | % |
2008 | | | 9.04 | | | 0.18 | # | | | (3.80 | ) | | | (0.16 | ) | | | — | | | | (0.01 | ) | | | 5.25 | | (40.35 | ) | | | 80,579 | | 1.26 | | | 1.25 | | | 2.21 | | | 94 | |
2007 | | | 12.55 | | | 0.11 | # | | | (2.12 | ) | | | (0.11 | ) | | | (1.39 | ) | | | — | | | | 9.04 | | (16.23 | ) | | | 96,775 | | 1.20 | | | 1.22 | | | 0.94 | | | 119 | |
2006(3)(4) | | | 12.50 | | | — | † | | | 0.05 | | | | — | | | | — | | | | — | | | | 12.55 | | 0.40 | | | | 107,035 | | 1.33 | | | 1.88 | | | (1.16 | ) | | — | |
| | |
Value Equity Fund | | | | | | | |
| | |
GS2 Class | | | | | | | |
2009 | | $ | 5.52 | | $ | 0.11 | # | | $ | 1.02 | | | $ | (0.19 | ) | | $ | — | | | $ | — | | | $ | 6.46 | | 21.35 | % | | $ | 181,123 | | 0.68 | % | | 0.69 | % | | 2.06 | % | | 32 | % |
2008 | | | 9.10 | | | 0.17 | # | | | (3.46 | ) | | | (0.22 | ) | | | (0.07 | ) | | | — | | | | 5.52 | | (36.81 | ) | | | 143,506 | | 0.66 | (5) | | 0.67 | | | 2.29 | | | 52 | |
2007 | | | 10.62 | | | 0.18 | # | | | (0.27 | ) | | | (0.28 | ) | | | (1.15 | ) | | | — | | | | 9.10 | | (1.18 | ) | | | 230,436 | | 0.69 | | | 0.69 | | | 1.70 | | | 45 | |
2006 | | | 10.75 | | | 0.18 | # | | | 1.78 | | | | (0.28 | ) | | | (1.81 | ) | | | — | | | | 10.62 | | 18.76 | | | | 181,940 | | 0.72 | (5) | | 0.72 | | | 1.70 | | | 76 | |
2005 | | | 11.44 | | | 0.20 | # | | | 0.65 | | | | (0.28 | ) | | | (1.26 | ) | | | — | | | | 10.75 | | 7.40 | | | | 156,279 | | 0.73 | (5) | | 0.73 | | | 1.72 | | | 54 | |
GS4 Class | | | | | | | |
2009 | | $ | 10.53 | | $ | 0.20 | # | | $ | 1.98 | | | $ | (0.17 | ) | | $ | — | | | $ | — | | | $ | 12.54 | | 21.16 | % | | $ | 1,001,814 | | 0.85 | %(5) | | 0.88 | % | | 1.89 | % | | 32 | % |
2008 | | | 17.03 | | | 0.30 | # | | | (6.54 | ) | | | (0.19 | ) | | | (0.07 | ) | | | — | | | | 10.53 | | (36.95 | ) | | | 844,459 | | 0.85 | (5) | | 0.86 | | | 2.09 | | | 52 | |
2007 | | | 18.65 | | | 0.29 | # | | | (0.52 | ) | | | (0.24 | ) | | | (1.15 | ) | | | — | | | | 17.03 | | (1.39 | ) | | | 1,407,534 | | 0.88 | | | 0.88 | | | 1.50 | | | 45 | |
2006 | | | 17.50 | | | 0.28 | # | | | 2.93 | | | | (0.25 | ) | | | (1.81 | ) | | | — | | | | 18.65 | | 18.64 | | | | 1,434,773 | | 0.90 | (5) | | 0.91 | | | 1.52 | | | 76 | |
2005 | | | 17.74 | | | 0.28 | # | | | 0.99 | | | | (0.25 | ) | | | (1.26 | ) | | | — | | | | 17.50 | | 7.13 | | | | 1,279,940 | | 0.90 | (5) | | 0.93 | | | 1.53 | | | 54 | |
| † | Amount represents less than $0.005 per share. |
| # | Calculated using the average shares outstanding method. |
| (1) | The ratio excludes expenses waived/reimbursed net of amount recaptured. |
| (2) | The ratio includes expenses waived/reimbursed net of amount recaptured and fees paid indirectly, where applicable; if expenses waived/reimbursed net of amount recaptured and fees paid indirectly were excluded, the ratio would have been lower than the ratio shown. |
| (3) | Inception date was December 29, 2006. |
| (4) | Total return is not annualized. Ratios are annualized. |
| (5) | The ratio excludes the effect of expense offsets for fees paid indirectly; if expense offsets were included, the ratio would have been lower than the ratio shown. |
See Notes to Financial Statements.
192
| | | | | | | | | | | | | | | | | | | | | | | | | | | | | | | | | | | | | | | | | | | | |
| | | | | | | | | | | | | | | | | | | | | | | | | | | Ratios to Average Net Assets | | | | |
| | | Net Asset
Value,
Beginning
of Year | | Net
Investment
Income/
(Loss) | | | Realized
and
Unrealized
Gain (Loss)
on
Investments | | | Dividends
from Net
Investment
Income | | | Distributions
from Net
Realized
Capital
Gains | | | Excess
Distribution/
Return of
Capital | | | Net Asset
Value,
End of
Year | | Total
Return | | | Net
Assets,
End of
Year
(000) | | Expenses,
Net | | | Expenses,
Gross(1) | | | Investment
Income/
(Loss),
Net(2) | | | Portfolio
Turnover
Rate | |
Growth Equity Fund | |
|
GS2 Class | |
2009 | | $ | 7.26 | | $ | 0.02 | | | $ | 2.74 | | | $ | (0.02 | ) | | $ | — | | | $ | — | | | $ | 10.00 | | 38.14 | % | | $ | 196,026 | | 0.88 | %(3) | | 0.89 | % | | 0.22 | % | | 78 | % |
2008 | | | 12.76 | | | 0.03 | | | | (5.49 | ) | | | (0.04 | ) | | | — | | | | — | | | | 7.26 | | (42.84 | ) | | | 141,138 | | 0.87 | (3) | | 0.87 | | | 0.26 | | | 99 | |
2007 | | | 11.23 | | | 0.02 | | | | 1.55 | | | | (0.04 | ) | | | — | | | | — | | | | 12.76 | | 13.99 | | | | 242,557 | | 0.89 | | | 0.88 | | | 0.24 | | | 51 | |
2006 | | | 11.18 | | | — | † | | | 0.05 | | | | — | | | | — | | | | — | | | | 11.23 | | 0.45 | | | | 179,852 | | 0.89 | (3) | | 0.90 | | | 0.00 | | | 48 | |
2005 | | | 10.29 | | | (0.03 | ) | | | 0.92 | | | | — | | | | — | | | | — | | | | 11.18 | | 8.65 | | | | 172,118 | | 0.87 | (3) | | 0.89 | | | (0.10 | ) | | 49 | |
GS4 Class | |
2009 | | $ | 11.52 | | $ | 0.01 | † | | $ | 4.36 | | | $ | (0.01 | ) | | $ | — | | | $ | — | | | $ | 15.88 | | 37.99 | % | | $ | 1,067,654 | | 0.97 | %(3) | | 1.09 | % | | 0.13 | % | | 78 | % |
2008 | | | 20.22 | | | 0.02 | | | | (8.70 | ) | | | (0.02 | ) | | | — | | | | — | | | | 11.52 | | (42.92 | ) | | | 817,315 | | 0.97 | (3) | | 1.06 | | | 0.16 | | | 99 | |
2007 | | | 17.77 | | | 0.02 | | | | 2.45 | | | | (0.02 | ) | | | — | | | | — | | | | 20.22 | | 13.90 | | | | 1,488,091 | | 1.00 | | | 1.07 | | | 0.13 | | | 51 | |
2006 | | | 17.71 | | | (0.02 | ) | | | 0.08 | | | | — | | | | — | | | | — | | | | 17.77 | | 0.34 | | | | 1,343,147 | | 1.01 | (3) | | 1.09 | | | (0.12 | ) | | 48 | |
2005 | | | 16.33 | | | (0.04 | ) | | | 1.42 | | | | — | | | | — | | | | — | | | | 17.71 | | 8.45 | | | | 1,362,599 | | 0.99 | (3) | | 1.08 | | | (0.22 | ) | | 49 | |
|
Small Cap Equity Fund | |
|
GS2 Class | |
2009 | | $ | 5.94 | | $ | 0.03 | # | | $ | 1.64 | | | $ | (0.04 | ) | | $ | — | | | $ | — | | | $ | 7.57 | | 28.12 | % | | $ | 64,033 | | 1.04 | %(3) | | 1.05 | % | | 0.44 | % | | 130 | % |
2008 | | | 9.60 | | | 0.05 | # | | | (3.61 | ) | | | (0.08 | ) | | | — | | | | (0.02 | ) | | | 5.94 | | (37.05 | ) | | | 48,159 | | 1.03 | (3) | | 1.04 | | | 0.66 | | | 147 | |
2007 | | | 11.33 | | | 0.06 | # | | | 0.09 | | | | (0.07 | ) | | | (1.81 | )�� | | | — | | | | 9.60 | | 1.05 | | | | 76,792 | | 1.05 | | | 1.05 | | | 0.48 | | | 119 | |
2006 | | | 11.40 | | | (0.01 | )# | | | 1.32 | | | | — | | | | (1.38 | ) | | | — | | | | 11.33 | | 11.40 | | | | 66,695 | | 1.06 | (3) | | 1.06 | | | (0.05 | ) | | 86 | |
2005 | | | 12.51 | | | (0.01 | )# | | | 0.84 | | | | — | | | | (1.94 | ) | | | — | | | | 11.40 | | 6.48 | | | | 62,009 | | 1.10 | (3) | | 1.07 | | | (0.06 | ) | | 97 | |
GS4 Class | |
2009 | | $ | 8.91 | | $ | 0.03 | # | | $ | 2.46 | | | $ | (0.03 | ) | | $ | — | | | $ | — | | | $ | 11.37 | | 27.93 | % | | $ | 356,043 | | 1.15 | %(3) | | 1.25 | % | | 0.33 | % | | 130 | % |
2008 | | | 14.31 | | | 0.07 | # | | | (5.39 | ) | | | (0.06 | ) | | | — | | | | (0.02 | ) | | | 8.91 | | (37.19 | ) | | | 272,588 | | 1.15 | (3) | | 1.24 | | | 0.55 | | | 147 | |
2007 | | | 16.00 | | | 0.06 | # | | | 0.11 | | | | (0.05 | ) | | | (1.81 | ) | | | — | | | | 14.31 | | 0.87 | | | | 466,522 | | 1.18 | | | 1.25 | | | 0.34 | | | 119 | |
2006 | | | 15.61 | | | (0.03 | )# | | | 1.80 | | | | — | | | | (1.38 | ) | | | — | | | | 16.00 | | 11.27 | | | | 486,358 | | 1.21 | (3) | | 1.25 | | | (0.20 | ) | | 86 | |
2005 | | | 16.48 | | | (0.03 | )# | | | 1.10 | | | | — | | | | (1.94 | ) | | | — | | | | 15.61 | | 6.37 | | | | 463,367 | | 1.22 | (3) | | 1.27 | | | (0.19 | ) | | 97 | |
|
International Equity Fund | |
|
GS2 Class | |
2009 | | $ | 7.32 | | $ | 0.17 | # | | $ | 2.42 | | | $ | (0.27 | ) | | $ | — | † | | $ | — | | | $ | 9.64 | | 35.81 | % | | $ | 240,483 | | 0.94 | %(3) | | 1.17 | % | | 1.88 | % | | 59 | % |
2008 | | | 14.61 | | | 0.34 | # | | | (6.89 | ) | | | (0.39 | ) | | | (0.35 | ) | | | — | | | | 7.32 | | (44.72 | ) | | | 193,281 | | 0.94 | (3) | | 1.08 | | | 2.77 | | | 88 | |
2007 | | | 15.80 | | | 0.26 | # | | | 1.79 | | | | (0.27 | ) | | | (2.97 | ) | | | — | | | | 14.61 | | 13.21 | | | | 279,652 | | 0.96 | | | 1.07 | | | 1.44 | | | 66 | |
2006 | | | 14.71 | | | 0.25 | | | | 3.23 | | | | (0.35 | ) | | | (2.04 | ) | | | — | | | | 15.80 | | 23.78 | | | | 199,989 | | 0.97 | (3) | | 1.10 | | | 1.46 | | | 26 | |
2005 | | | 12.93 | | | 0.29 | | | | 1.99 | | | | (0.30 | ) | | | (0.20 | ) | | | — | | | | 14.71 | | 17.66 | | | | 176,819 | | 0.97 | (3) | | 1.12 | | | 1.43 | | | 30 | |
|
GS4 Class | |
2009 | | $ | 9.38 | | $ | 0.20 | # | | $ | 3.11 | | | $ | (0.25 | ) | | $ | — | † | | $ | — | | | $ | 12.44 | | 35.61 | % | | $ | 1,101,628 | | 1.12 | %(3) | | 1.36 | % | | 1.73 | % | | 59 | % |
2008 | | | 18.32 | | | 0.40 | # | | | (8.63 | ) | | | (0.36 | ) | | | (0.35 | ) | | | — | | | | 9.38 | | (44.81 | ) | | | 873,618 | | 1.12 | (3) | | 1.28 | | | 2.56 | | | 88 | |
2007 | | | 19.09 | | | 0.28 | # | | | 2.16 | | | | (0.24 | ) | | | (2.97 | ) | | | — | | | | 18.32 | | 12.96 | | | | 1,400,548 | | 1.14 | | | 1.27 | | | 1.25 | | | 66 | |
2006 | | | 17.37 | | | 0.26 | | | | 3.82 | | | | (0.32 | ) | | | (2.04 | ) | | | — | | | | 19.09 | | 23.58 | | | | 1,254,839 | | 1.15 | (3) | | 1.29 | | | 1.28 | | | 26 | |
2005 | | | 15.20 | | | 0.23 | | | | 2.41 | | | | (0.27 | ) | | | (0.20 | ) | | | — | | | | 17.37 | | 17.39 | | | | 1,120,234 | | 1.15 | (3) | | 1.31 | | | 1.24 | | | 30 | |
| † | Amount represents less than $0.005 per share. |
| # | Calculated using the average shares outstanding method. |
| (1) | The ratio excludes expenses waived/reimbursed net of amount recaptured. |
| (2) | The ratio includes expenses waived/reimbursed net of amount recaptured and fees paid indirectly, where applicable; if expenses waived/reimbursed net of amount recaptured and fees paid indirectly were excluded, the ratio would have been lower than the ratio shown. |
| (3) | The ratio excludes the effect of expense offsets for fees paid indirectly; if expense offsets were included, the ratio would have been lower than the ratio shown. |
See Notes to Financial Statements.
193
NOTES TO FINANCIAL STATEMENTS
1. DESCRIPTION OF THE FUNDS
GuideStone Funds (the “Trust”) was organized as a Delaware statutory trust on March 2, 2000. The Trust has established twenty-five series (each, a “Fund” and together, the “Funds”). Each Fund is a diversified, open-end management investment company, registered under the Investment Company Act of 1940, as amended (the “1940 Act”). The MyDestination 2005, MyDestination 2015, MyDestination 2025, MyDestination 2035 and MyDestination 2045 Funds, each referred to as a “Date Target Fund” and together as the “Date Target Funds,” commenced operations on December 29, 2006. The Conservative Allocation Fund, Balanced Allocation Fund, Growth Allocation Fund, Aggressive Allocation Fund, Conservative Allocation Fund I, Balanced Allocation Fund I, Growth Allocation Fund I and Aggressive Allocation Fund I are each referred to as an “Asset Allocation Fund” and together as the “Asset Allocation Funds.” The remaining Funds are each referred to as a “Select Fund” and are together referred to as the “Select Funds.” The Low-Duration Bond Fund, Medium-Duration Bond Fund, Extended-Duration Bond Fund, Inflation Protected Bond Fund and Global Bond Fund are together referred to as the “Bond Funds.” The Equity Index Fund, Real Estate Securities Fund, Value Equity Fund, Growth Equity Fund, Small Cap Equity Fund and International Equity Fund are together referred to as the “Equity Funds.” The Money Market Fund is referred to as the “Money Market Fund.” The Inflation Protected Bond Fund commenced operations as a registered investment company on June 25, 2009.
There are two classes of shares issued by the Funds — the GS2 Class and the GS4 Class (each, a “Class” and together the “Classes”), except for the Date Target Funds, the Inflation Protected Bond Fund, the Global Bond Fund, and the Real Estate Securities Fund, which issued the GS4 Class only. The Conservative Allocation Fund I, Balanced Allocation Fund I, Growth Allocation Fund I and Aggressive Allocation Fund I issued the GS2 Class only. All Classes of shares have identical voting, dividend and liquidation rights. Income, expenses (other than class specific expenses) and realized and unrealized gains or losses on investments are allocated to each Class of shares based upon its relative net assets. The distribution fee (expense specific to the GS6 Class) ceased with the elimination of the GS6 Class.
Prior to May 1, 2009, GS6 Class shares of the Funds were also available. On April 30, 2009, shares of the GS6 Class of each Fund were exchanged at each Fund’s applicable net asset value (“NAV”) for equivalent shares of the GS4 Class of the same Fund, and the GS6 Class was terminated effective May 1, 2009.
Each Fund is a separate mutual fund with its own investment objective, strategies and risks. The Select Funds invest directly in particular types of fixed-income obligations, stocks and other investments. The Asset Allocation and Date Target Funds primarily invest in a different mix of the Select Funds to meet a specified investment strategy. The Asset Allocation and Date Target Funds are commonly referred to as “Fund of Funds”.
2. SIGNIFICANT ACCOUNTING POLICIES
The following significant accounting policies are in conformity with generally accepted accounting principles (“GAAP”) in the United States of America which require management to make estimates and assumptions that affect the reported amounts of assets, liabilities, disclosures of contingent assets and liabilities at the date of the financial statements and the reported amounts of income and expenses during the reporting period. Actual results could differ from those estimates and those differences could be significant.
a. Valuation of Securities
The Funds (except the Money Market Fund) each value securities traded on national securities exchanges or included in national
market systems at the last quoted sale price, or official close price, on the principal exchange on which they were traded, or, in
194
NOTES TO FINANCIAL STATEMENTS—(Continued)
the absence of any sale or official close price, at the closing bid price. Securities which are primarily traded on foreign exchanges are generally valued at the closing values of such securities on their respective exchanges, except that when an occurrence subsequent to the time when the foreign security is valued is likely to have changed such value, then the fair value of those securities will be determined through procedures established by or under the direction of the Board of Trustees of the Trust (the “Board of Trustees”). Non-exchange traded securities for which an over-the-counter quotation is readily available are valued at the last quoted bid price.
Debt securities, excluding asset-backed and mortgage-backed securities, are valued at the mean of the last bid and ask prices available. Asset-backed and mortgage-backed securities are valued at the last bid price. Certain debt securities may be valued on the basis of broker quotations, valuations provided by a pricing service which may use a matrix, formula or other objective method that takes into consideration market indices, matrices, yield curves and other specific adjustments or by a sub-adviser using various methodologies approved by the Board of Trustees.
Short-term securities maturing in more than 60 days from the valuation date are valued at the mean of the last bid and ask prices; those maturing in 60 days or less are generally valued at amortized cost.
Forward foreign exchange contracts are valued based upon closing exchange rates from each respective foreign market.
Futures contracts are valued at the closing settlement price on the exchange on which they are primarily traded.
Options and warrants for which the primary market is a national securities exchange are valued at the last sale price on the exchange on which they are traded, or, in the absence of any sale, at the closing bid price. Options and warrants not traded on a national securities exchange are valued at the last quoted bid price.
Swap agreements are valued daily based upon the terms specific to each agreement with its counterparty.
To the extent available, valuations of portfolio securities are provided by independent pricing services approved by the Board of Trustees. Securities for which market quotations are not readily available are valued at fair value according to methods established in good faith by the Board of Trustees. Due to the potential excessive volatility at the time valuations are developed, pricing techniques may materially vary from the actual amounts realized upon sale of the securities.
For securities that principally trade on a foreign market or exchange, a significant gap in time can exist between the time of a particular security’s last trade and the time at which a Fund calculates its NAV. The closing prices of such securities may no longer reflect their market value at the time the Fund calculates its NAV if an event that could materially affect the value of those securities (a “Significant Event”) has occurred between the time of the security’s last close and the time that the Fund calculates its NAV. A Significant Event may relate to a single issuer or to an entire market sector. If a Fund becomes aware of a Significant Event that has occurred with respect to a security or group of securities after the closing of the exchange or market on which the security or securities principally trade, but before the time at which the Fund calculates its NAV, a Valuation Committee meeting may be called. The Trust uses Interactive Data Corporation (“ID”) as a third party fair valuation vendor. ID provides a fair value for foreign equity securities held by the Trust based on certain factors and methodologies applied by ID in the event that there is movement in the U.S. market that exceeds a specific threshold established by the Valuation Committee in consultation with, and approved by, the Trustees. Such methodologies generally involve tracking valuation correlations between the U.S. market and each non-U.S. security. As part of the valuation procedures, a “confidence interval” is used, when the threshold is exceeded, to determine the level of correlation between the value of a foreign equity security and movements in the U.S. market before a particular security will be fair valued. In the event that the threshold established by the Valuation Committee is exceeded on a specific day, the Trust will typically value non-U.S. equity securities in its portfolio that exceed the applicable confidence interval based upon the fair values provided by ID.
195
NOTES TO FINANCIAL STATEMENTS—(Continued)
The Asset Allocation and Date Target Funds value their investments in the underlying Select Funds daily at the closing NAV of each respective Select Fund.
The Financial Accounting Standards Board’s (“FASB”) “Fair Value Measurements and Disclosures” defines fair value as the price that a fund would receive to sell an asset or pay to transfer a liability in an orderly transaction between market participants at the measurement date. It establishes and requires disclosure of a fair value hierarchy, separately for each major category of assets and liabilities, that segregates fair value measurements into levels (Levels 1, 2, and 3). Categorization of fair value measurements is determined by the nature of the inputs as follows:
| | | | |
| Level 1 | | – | | quoted prices in active markets for identical securities. |
| | |
| Level 2 | | – | | prices determined using other significant observable inputs (including quoted prices for similar securities, interest rates, prepayment speeds, credit risk, etc.). |
| | |
| Level 3 | | – | | prices determined using significant unobservable inputs (including the Fund’s own assumptions in determining the fair value of investments). |
Valuation levels are not necessarily an indication of the risk associated with investing in those securities. For fair valuations using significant unobservable inputs, a reconciliation of the beginning to ending balances for reported market values that presents changes attributable to total realized and unrealized gains or losses, purchases and sales, and transfers in/out of the Level 3 category during the period is required. A fair value hierarchy and Level 3 reconciliation have been included in the Schedules of Investments for each respective Fund.
b. Fixed Income Securities
The Bond Funds and the Small Cap Equity Fund may invest in mortgage-related and other asset-backed securities. These securities include mortgage pass-through securities, collateralized mortgage obligations, commercial mortgage-backed securities, stripped mortgage-backed securities, asset-backed securities, collateralized debt obligations and other securities that directly or indirectly represent a participation in, or are secured by and payable from, mortgage loans on real property. Mortgage-related and other asset-backed securities are interests in pools of loans or other receivables. Mortgage-related securities are created from pools of residential or commercial mortgage loans, including mortgage loans made by savings and loan institutions, mortgage bankers, commercial banks and others. Asset-backed securities are created from many types of assets, including auto loans, credit card receivables, home equity loans, and student loans. These securities provide a monthly payment which consists of both interest and principal payments. Interest payments may be determined by fixed or adjustable rates. The rate of prepayments on underlying mortgages will affect the price and volatility of a mortgage-related security and may have the effect of shortening or extending the effective duration of the security relative to what was anticipated at the time of purchase. The timely payment of principal and interest of certain mortgage-related securities is guaranteed with the full faith and credit of the United States Government. Pools created and guaranteed by non-governmental issuers, including government-sponsored corporations, may be supported by various forms of insurance or guarantees, but there can be no assurance that the private insurers or guarantors can meet their obligations under the insurance policies or guarantee arrangements.
Collateralized Mortgage Obligations (“CMOs”) are debt obligations of a legal entity that are collateralized by mortgages and divided into classes. CMOs are structured into multiple classes, often referred to as “tranches,” with each class bearing a
196
NOTES TO FINANCIAL STATEMENTS—(Continued)
different stated maturity and entitled to a different schedule for payments of principal and interest, including pre-payments. Commercial Mortgage-Backed Securities (“CMBS”) include securities that reflect an interest in, and are secured by, mortgage loans on commercial real property. Many of the risks of investing in CMBS reflect the risks of investing in the real estate securing the underlying mortgage loans. These risks reflect the effects of local and other economic conditions on real estate markets, the ability of tenants to make loan payments, and the ability of a property to attract and retain tenants. CMOs and CMBS may be less liquid and may exhibit greater price volatility than other types of mortgage- or asset-backed securities.
Stripped Mortgage-Backed Securities (“SMBS”) are derivative multi-class mortgage securities. SMBS are usually structured with two classes that receive different proportions of the interest and principal distributions on a pool of mortgage assets. A common type of SMBS will have one class receiving some of the interest and most of the principal from the mortgage assets, while the other class will receive most of the interest and the remainder of the principal. In the most extreme case, one class will receive all of the interest (the interest-only or “IO” class), while the other class will receive the entire principal (the principal-only or “PO” class). Payments received for IOs are included in interest income on the Statements of Operations. Because little to no principal will be received at the maturity of an IO, adjustments are made to the book value of the security on a monthly basis until maturity. These adjustments are included in interest income on the Statements of Operations. Payments received for POs are treated as reductions to the cost and par value of the securities.
Inflation-indexed bonds are fixed-income securities whose principal value is periodically adjusted to the rate of inflation. The interest rate on these bonds is generally fixed at issuance at a rate lower than typical bonds. Over the life of an inflation-indexed bond, however, interest will be paid based on a principal value, which is adjusted for inflation. Any increase or decrease in the principal amount of an inflation-indexed bond will be included as interest income on the Statements of Operations, even though investors do not receive their principal until maturity.
“TBA” (to be announced) purchase commitments are commitments to purchase securities for a fixed price at a future date, typically not exceeding 45 days. TBAs may be considered securities in themselves and involve a risk of loss if the value of the security to be purchased declines prior to settlement date. This risk is in addition to the risk of decline in each Fund’s other assets. Unsettled TBAs are valued at the current market value of the underlying securities, according to the procedures described in the section entitled “Valuation of Securities”.
During the period ended December 31, 2009, the Funds entered into dollar roll transactions, pursuant to which they sell a mortgage-backed TBA or security and simultaneously purchase a similar, but not identical, TBA with the same issuer, rate and terms. The Funds may execute a “roll” to obtain better underlying mortgage securities or to increase yield. The Funds account for dollar roll transactions as purchases and sales, which has the effect of increasing their portfolio turnover rates. Risks associated with dollar rolls are that actual mortgages received by the Funds may be less favorable than those anticipated or that counterparties may fail to perform under the terms of the contracts.
TBA sale commitments are commitments to sell mortgage-backed securities for a fixed price at a future date. TBA sales commitments are considered securities in themselves and involve a risk of loss if the value of the security to be purchased or sold declines or increases prior to settlement date, which is in addition to the risk of decline in the value of the Fund’s other assets.
U.S. Government securities are obligations of and, in certain cases, guaranteed by, the U.S. Government, its agencies or instrumentalities. The U.S. Government does not guarantee the NAV of the Funds’ shares. Some U.S. Government securities, such as Treasury bills, notes and bonds, and securities guaranteed by the Government National Mortgage Association (“GNMA” or “Ginnie Mae”), are supported by the full faith and credit of the United States government; others, such as those of the Federal Home Loan Bank, are supported by the right of the issuer to borrow from the U.S. Department of the Treasury (the “U.S.
197
NOTES TO FINANCIAL STATEMENTS—(Continued)
Treasury”); others, such as those of the Federal National Mortgage Association (“FNMA” or “Fannie Mae”), are supported by the discretionary authority of the U.S. Government to purchase the agency’s obligations; and still others, such as those of the Student Loan Marketing Association, are supported only by the credit of the instrumentality. U.S. Government securities may include zero coupon securities, which do not distribute interest on a current basis and tend to be subject to greater risk than interest-paying securities of similar maturities.
Government-related guarantors (i.e., not backed by the full faith and credit of the United States Government) include FNMA and the Federal Home Loan Mortgage Corporation (“FHLMC” or “Freddie Mac”). FNMA is a government-sponsored corporation the common stock of which is owned entirely by private stockholders. FNMA purchases conventional (i.e., not insured or guaranteed by any government agency) residential mortgages from a list of approved seller/servicers which include state and federally chartered savings and loan associations, mutual savings banks, commercial banks and credit unions and mortgage bankers. Pass-through securities issued by FNMA are guaranteed as to timely payment of principal and interest by FNMA, but are not backed by the full faith and credit of the United States Government. FHLMC issues Participation Certificates (“PCs”), which are pass-through securities, each representing an undivided interest in a pool of residential mortgages. FHLMC guarantees the timely payment of interest and ultimate collection of principal, but PCs are not backed by the full faith and credit of the United States Government.
On September 6, 2008, the Federal Housing Finance Agency (“FHFA”) placed FNMA and FHMLC into conservatorship. As the conservator, FHFA succeeded to all rights, titles, powers and privileges of FNMA and FHLMC and of any stockholder, officer or director of FNMA and FHLMC with respect to FNMA and FHLMC and the assets of FNMA and FHLMC. FHFA selected a new chief executive officer and chairman of the board of directors for each of FNMA and FHLMC. On September 7, 2008, the U.S. Treasury announced three additional steps taken by it in connection with the conservatorship. First, the U.S. Treasury entered into a Senior Preferred Stock Purchase Agreement with each of FNMA and FHLMC pursuant to which the U.S. Treasury would purchase up to an aggregate of $100 billion of each of FNMA and FHLMC to maintain a positive net worth in each enterprise. This agreement contained various covenants that limit each enterprise’s operations. In exchange for entering into these agreements, the U.S. Treasury received $1 billion of each enterprise’s senior preferred stock and warrants to purchase 79.9% of each enterprise’s common stock. Second, the U.S. Treasury announced the creation of a new secured lending facility which is available to each of FNMA and FHLMC as a liquidity backstop. Third, the U.S. Treasury announced the creation of a temporary program to purchase mortgage-backed securities issued by each of FNMA and FHLMC. Both the liquidity backstop and the mortgage-backed securities purchase program expired in December 2009. FNMA and FHLMC are continuing to operate as going concerns while in conservatorship and each remain liable for all of its obligations, including its guaranty obligations, associated with its mortgage-backed securities. The liquidity backstop and the Senior Preferred Stock Purchase Agreements are both intended to enhance each of FNMA’s and FHLMC’s ability to meet its obligations. On December 24, 2009, the U.S. Treasury amended the Senior Preferred Stock Purchase Agreements to allow the cap on its funding commitment to increase as necessary to accommodate any cumulative reduction in the net worth of FNMA and FHMLC over the next three years.
c. Foreign Currency Translations
Investment securities and other assets and liabilities denominated in foreign currencies are translated into U.S. dollar amounts at the date of valuation. Purchases and sales of investment securities and income and expense items denominated in foreign currencies are translated into U.S. dollar amounts on the respective dates of such transactions.
198
NOTES TO FINANCIAL STATEMENTS—(Continued)
The Funds isolate that portion of the results of operations resulting from changes in foreign exchange rates on investments from the fluctuations arising from changes in market prices of securities held.
Reported net realized foreign exchange gains or losses arise from sales of portfolio securities, sales and maturities of short-term securities, sales of foreign currencies, currency gains or losses realized between the trade and settlement dates on securities transactions, and the difference between the amounts of dividends, interest, and foreign withholding taxes recorded on the Fund’s books and the U.S. dollar equivalent of the amounts actually received or paid. Net unrealized foreign exchange gains and losses arise from changes in the values of assets and liabilities, including investments in securities at fiscal period end, resulting from changes in the exchange rate.
d. Loan Participations
The Bond Funds and the Small Cap Equity Fund may invest in direct debt instruments which are interests in amounts owed to lenders or lending syndicates by corporate borrowers. A Fund’s investments in loans may be in the form of participations in loans. A loan is often administered by a bank or other financial institution (the “lender”) that acts as agent for all holders. The agent administers the terms of the loan, as specified in the loan agreement. A Fund may invest in multiple series or tranches of a loan, which may have varying terms and carry different associated risks. A Fund generally has no right to enforce compliance with the terms of the loan agreement with the borrower. As a result, a Fund may be subject to the credit risk of both the borrower and the lender that is selling the loan agreement. When investing in a loan participation, a Fund has the right to receive payments of principal, interest and any fees to which it is entitled only from the lender selling the loan agreement and only upon receipt of payments by the lender from the borrower. A Fund may receive a commitment fee based on the undrawn portion of the underlying line of credit portion of a floating rate loan. In certain circumstances, a Fund may receive a prepayment penalty fee upon the prepayment of a floating rate loan by a borrower. Fees earned/paid are recorded as a component of interest income or interest expense on the Statements of Operations.
The Bond Funds and the Small Cap Equity Fund invest in loan participations with credit quality comparable to that of issuers of its securities investments. Indebtedness of companies whose creditworthiness is poor involves substantially greater risks and may be highly speculative.
e. REITs
The Real Estate Securities Fund invests substantial assets in real estate investment trusts (“REITs”) that involve risks not associated with investing in stocks. Risks include declines in the value of real estate, general and economic conditions, changes in the value of the underlying property and defaults by borrowers. The value of assets in the real estate industry may go through cycles of relative underperformance and outperformance in comparison to equity securities markets in general.
Dividend income is recorded using management’s estimate of the income included in distributions received from REIT investments. The actual amounts of income, return of capital and capital gains are only determined by each REIT after its fiscal year-end and may differ from the estimated amount. Estimates of income are adjusted in the Funds to the actual amounts when the amounts are determined.
f. Repurchase Agreements
Each Fund may agree to purchase securities from financial institutions subject to the seller’s agreement to repurchase them at a mutually agreed upon date and price. It is the Fund’s policy that repurchase agreements are fully collateralized by U.S. Treasury and Government Agency securities. All collateral is held by the Fund’s custodian bank or a bank with which the custodian bank has entered into a subcustodian agreement, or is segregated in the Federal Reserve Book Entry System. In connection with transactions in repurchase agreements, if the seller defaults and the value of the collateral declines, or if the seller enters an insolvency proceeding, realization of the collateral by the Fund may be delayed or limited.
199
NOTES TO FINANCIAL STATEMENTS—(Continued)
g. Short Sales
A short sale is a transaction in which a Fund sells a security it does not own. The Fund’s obligation to replace the security borrowed and sold short will be fully collateralized at all times by cash equivalents deposited in an account with the Fund’s custodian. If the price of the security sold short increases between the time of the short sale and the time the Fund replaces the borrowed security, the Fund will realize a loss, and if the price declines during the period, the Fund will realize a gain. Any realized gain will be decreased, and any realized loss increased, by the amount of transaction costs.
The Equity Funds may sell short exchange-listed equity futures contracts to reduce market exposure. The Date Target Funds, Asset Allocation Funds, Bond Funds and Small Cap Equity Fund may sell short U.S. Treasury securities and exchange-listed U.S. Treasury futures contracts to reduce market exposure. The Low-Duration Bond, Medium-Duration Bond and Small Cap Equity Funds will occasionally enter into a short sale to initiate a dollar roll transaction. The International Equity Fund may establish short positions in stocks of foreign companies with a market value of up to 5% of the Fund’s assets.
At December 31, 2009, the value of securities sold short in the International Equity Fund amounted to $21,194,597.
h. Derivative Financial Instruments
The Funds may engage in various portfolio strategies to seek to increase its return by hedging its portfolio against adverse movements in the equity, debt and currency markets. Losses may arise due to changes in the value of the contract if the counterparty does not perform under the contract. The Funds, in their normal course of business, may enter into contracts that contain a variety of representations and warranties and which provide general indemnifications. The Funds’ exposure may include future claims that may be made against the Funds that have not yet occurred.
Financial Futures Contracts — The Funds (except the Money Market Fund) may purchase or sell financial futures contracts and the options on such futures contracts for the purpose of hedging risk on existing securities, demonstrating purchase of securities or gaining market exposure on cash balances. Financial futures contracts are contracts for the delivery of securities at a specified future date at an agreed upon price or yield. Upon entering into a contract, the Funds deposit and maintain as collateral such initial margin as required by the exchange on which the transaction is effected.
Pursuant to the contract, the Funds agree to pay to or receive from the broker an amount of cash equal to the daily fluctuation in the value of the contract. Such payments or receipts are known as variation margin and are recorded by the Funds as unrealized gains or losses until the contract is closed or settled.
Risks of entering into futures contracts include the possibility that there will be an imperfect price correlation between the futures and the underlying securities. Second, it is possible that a lack of liquidity for futures contracts could exist in the secondary market, resulting in an inability to close a futures position prior to its maturity date. Third, the purchase of a futures contract involves the risk that a Fund could lose more than the original margin deposit required to initiate a futures transaction. Futures contracts involve, to varying degrees, risk of loss in excess of the variation margin disclosed on the Statements of Assets and Liabilities.
Foreign Currency Options and Futures — The International Equity Fund, Small Cap Equity Fund and the Bond Funds may also enter into futures contracts on foreign currencies and related options on transactions as a short or long hedge against possible variations in foreign exchange rates.
200
NOTES TO FINANCIAL STATEMENTS—(Continued)
Forward Foreign Exchange Contracts — Certain Funds may enter into forward foreign currency exchange contracts to hedge against adverse exchange rate fluctuation to the U.S. dollar or between different foreign currencies in connection with either specific security transactions or portfolio positions. Each contract is valued daily and the change in value is recorded as an unrealized gain or loss. When the contract is closed, a realized gain or loss is recorded equal to the difference between the opening value and the closing value of the contract. These contracts may involve market risk in excess of the unrealized gain or loss reflected on the Statements of Assets and Liabilities. The Funds could be exposed to risk if the counterparties to the contracts are unable to meet the terms of the contract and from unanticipated movements in the value of a foreign currency relative to the U.S. dollar.
Options — Certain Funds are authorized to write and purchase put and call options. The risk in writing a call option is that the Funds give up the opportunity for profit if the market price of the security increases. The risk in writing a put option is that the Funds may incur a loss if the market price of the security decreases and the option is exercised. The risk in purchasing an option is that the Funds pay a premium whether or not the option is exercised. The Funds also have the additional risk of being unable to enter into a closing transaction at an acceptable price if a liquid secondary market does not exist. The Funds also may write over-the-counter options where completing the obligation depends upon the credit standing of the other party and that party’s ability to perform. Option contracts also involve the risk that they may not work as intended due to unanticipated developments in market conditions or other causes.
Options purchased are recorded as an asset, and written options are recorded as liabilities to the extent of premiums paid or received. Each Fund will realize a gain or loss when the option transaction expires or closes. When an option is exercised, the proceeds on sales for a written call option, the purchase cost for a written put option or the cost of a security for a purchased put or call option is adjusted by the amount of the premium received or paid.
When a Fund writes a call or put option, an amount equal to the premium received is recorded as a liability and subsequently marked to market to reflect the current value of the option written. These liabilities are reflected as written options outstanding on the Statements of Assets and Liabilities.
Certain Funds may write swaption contracts to manage exposure to fluctuations in interest rates and to enhance portfolio yield. Swaption contracts written by the Funds represent an option that gives the purchaser the right, but not the obligation, to enter into a previously agreed upon swap contract on a future date. If a written call swaption is exercised, the writer will enter a swap and is obligated to pay the fixed-rate and receive a floating rate in exchange. If a written put swaption is exercised, the writer will enter a swap and is obligated to pay the floating rate and receive a fixed rate in exchange. Swaptions are marked-to-market daily based upon quotations from market makers. When a Fund writes a swaption, the premium received is recorded as a liability and is subsequently adjusted to the current market value of the swaption.
Entering into a swaption contract involves, to varying degrees, the elements of credit, market and interest rate risk in excess of the associated option and swap contract amounts reported in the Statement of Assets and Liabilities. The Funds bear the market risk arising from any change in index values or interest rates.
Swap Agreements — Each Select Fund may enter into swap agreements. The Equity Funds may enter into equity swap contracts and the Bond Funds and the Small Cap Equity Fund may enter into interest rate and credit default swaps. The Bond Funds and International Equity Fund may enter into cross-currency swaps, and each Select Fund may enter into total return swaps.
201
NOTES TO FINANCIAL STATEMENTS—(Continued)
Swap agreements are privately negotiated agreements between a Fund and a counterparty to exchange or swap investment cash flows, assets, foreign currencies or market-linked returns at specified, future intervals. A swap may be entered into in order to, among other things, change the maturity of a Fund’s portfolio, to protect a Fund’s value from changes in interest rates, to expose a Fund to a different security or market, or to help a Fund achieve a strategy relative to an index or other benchmark. By entering into a swap agreement, a Fund is exposed to the risk of unanticipated movements in interest rates or in the value of an underlying security or index (or the risk that the counterparty will not fulfill its obligation under the agreement). Credit default swaps involve the payment of amounts based on a specified rate multiplied by a notional amount as well as upon an event of default. In connection with these agreements, securities are set aside as collateral by the Fund’s custodian.
Swaps are marked-to-market daily based upon values from third party vendors or quotations from market makers to the extent available and the change in value, if any, is recorded as an unrealized gain or loss on the Statements of Assets and Liabilities. In the event that market quotations are not readily available or deemed reliable, certain swap agreements may be valued pursuant to guidelines established by the Board of Trustees. In the event that market quotes are not readily available and the swap cannot be valued pursuant to one of the valuation methods, the value of the swap will be determined in good faith by the Valuation Committee of the Board of Trustees, generally based upon recommendations provided by the Fund’s sub-adviser.
Payments received or made at the beginning of the measurement period are reflected as such on the Statements of Assets and Liabilities and represent payments made or received upon entering into the swap agreement to compensate for differences between the stated terms of the swap agreement and prevailing market conditions (credit spreads, currency exchange rates, interest rates, and other relevant factors). These upfront payments are recorded as realized gains or losses on the Statements of Operations upon termination or maturity of the swap. A liquidation payment received or made at the termination of the swap is recorded as realized gain or loss on the Statements of Operations. Net periodic payments received or paid by a Fund are included as part of realized gains or losses on the Statements of Operations.
Certain of the Fund’s derivative agreements contain provisions that require the Fund to maintain a predetermined level of net assets, and/or provide limits regarding the decline of the Fund’s NAV over one-month, three-month and 12-month periods. If the Fund were to violate such provisions, the counterparties to the derivative instruments could request immediate payment or demand immediate collateralization on derivative instruments in net liability positions. For the fiscal year ending December 31, 2009, the Fund did maintain the required level of net assets and/or the NAV of the Fund did not decline below the limits set forth in the derivative agreements.
Entering into these agreements involves, to varying degrees, elements of credit, market and documentation risk in excess of the amounts recognized on the Statements of Assets and Liabilities. Such risks involve the possibility that there will be no liquid market for these agreements, that the counterparty to the agreements may default on its obligation to perform or disagree as to the meaning of contractual terms in the agreements and that there may be unfavorable changes in interest rates.
Credit Default Swaps — Credit default swap agreements involve one party making a stream of payments (referred to as the buyer of protection) to another party (the seller of protection) in exchange for the right to receive a specified return in the event of a default or other credit event for the referenced entity, obligation or index. As a seller of protection on credit default swap agreements, a Fund will generally receive from the buyer of protection a fixed rate of income throughout the
202
NOTES TO FINANCIAL STATEMENTS—(Continued)
term of the swap provided that there is no credit event. As the seller, a Fund would effectively add leverage to its portfolio because, in addition to its total net assets, a Fund would be subject to investment exposure on the notional amount of the swap.
Any upfront payments made or received upon entering a credit default swap contract are treated as part of the cost and are reflected as part of the unrealized gain (loss) on valuation. Upon termination of the swap contract, the amount included in the cost is reversed and becomes part of the swap’s realized gain (loss).
The sub-advisers monitor a variety of factors including cash flow assumptions, market activity, market sentiment and valuation as part of its ongoing process of assessing payment and performance risk. As payment and performance risk increases, the value of a credit default swap increases, resulting in recognition of unrealized gains for long positions and unrealized losses for short positions. Conversely, as payment and performance risk decreases, unrealized gains are recognized for short positions and unrealized losses are recognized for long positions. Any current or future declines in the fair value of the swap may be partially offset by upfront payments received by the Fund as a seller of protection if applicable. The change in value is recorded within unrealized appreciation (depreciation) until the occurrence of a credit event or the termination of the swap, at which time a realized gain (loss) is recorded.
If a Fund is a seller of protection and a credit event occurs, as defined under the terms of that particular swap agreement, a Fund will either (i) pay to the buyer of protection an amount equal to the notional amount of the swap and take delivery of the referenced obligation, other deliverable obligations or underlying securities comprising the referenced index or (ii) pay a net settlement amount in the form of cash or securities equal to the notional amount of the swap less the recovery value of the referenced obligation or underlying securities comprising the referenced index. If a Fund is a buyer of protection and a credit event occurs, as defined under the terms of that particular swap agreement, a Fund will either (i) receive from the seller of protection an amount equal to the notional amount of the swap and deliver the referenced obligation, other deliverable obligations or underlying securities comprising the referenced index or (ii) receive a net settlement amount in the form of cash or securities equal to the notional amount of the swap less the recovery value of the referenced obligation or underlying securities comprising the referenced index. Recovery values are assumed by market makers considering either industry standard recovery rates or entity specific factors and considerations until a credit event occurs. If a credit event has occurred, the recovery value is determined by a facilitated auction whereby a minimum number of allowable broker bids, together with a specified valuation method, are used to calculate the settlement value.
Credit default swap agreements on corporate issues or sovereign issues of an emerging country involve one party making a stream of payments to another party in exchange for the right to receive a specified return in the event of a default or other credit event. If a credit event occurs and cash settlement is not elected, a variety of other deliverable obligations may be delivered in lieu of the specific referenced obligation. The ability to deliver other obligations may result in a cheapest-to-deliver option (the buyer of protection’s right to choose the deliverable obligation with the lowest value following a credit event). A Fund may use credit default swaps on corporate issues or sovereign issues of an emerging country to provide a measure of protection against defaults of the issuers (i.e., to reduce risk where a Fund owns or has exposure to the referenced obligation) or to take an active long or short position with respect to the likelihood of a particular issuer’s default.
Credit default swap agreements on asset-backed securities involve one party making a stream of payments to another party in exchange for the right to receive a specified return in the event of a default or other credit event. Unlike credit default swaps on corporate issues or sovereign issues of an emerging country, deliverable obligations in most instances would be
203
NOTES TO FINANCIAL STATEMENTS—(Continued)
limited to the specific referenced obligation as performance for asset-backed securities can vary across deals. Prepayments, principal paydowns, and other write down or loss events on the underlying mortgage loans will reduce the outstanding principal balance of the referenced obligation. These reductions may be temporary or permanent as defined under the terms of the swap agreement and the notional amount for the swap agreement will be adjusted by corresponding amounts. A Fund may use credit default swaps on asset-backed securities to provide a measure of protection against defaults of the referenced obligation or to take an active long or short position with respect to the likelihood of a particular referenced obligation’s default.
Credit default swap agreements on credit indices involve one party making a stream of payments to another party in exchange for the right to receive a specified return in the event of a write-down, principal shortfall, interest shortfall or default of all or part of the referenced entities comprising the credit index. A credit index is a list of a basket of credit instruments or exposures designed to be representative of some part of the credit market as a whole. These indices are made up of reference credits that are judged by a poll of dealers to be the most liquid entities in the credit default swap market based on the sector of the index. Components of the indices may include, but are not limited to, investment grade securities, high yield securities, asset-backed securities, emerging markets, and/or various credit ratings within each sector. Credit indices are traded using credit default swaps with standardized terms including a fixed spread and standard maturity dates. An index credit default swap references all the names in the index, and if there is a default, the credit event is settled based on that name’s weight in the index. The composition of the indices changes periodically, usually every six months, and for most indices, each name has an equal weight in the index. A Fund may use credit default swaps on credit indices to hedge a portfolio of credit default swaps or bonds with a credit default swap on indices which is less expensive than it would be to buy many credit default swaps to achieve a similar effect. Credit-default swaps on indices are benchmarks for protecting investors owning bonds against default, and traders use them to speculate on changes in credit quality.
Implied credit spreads, represented in absolute terms, utilized in determining the market value of credit default swap agreements on corporate issues or sovereign issues of an emerging country as of period end are disclosed in the footnotes to the Schedules of Investments and serve as an indicator of the current status of the payment/performance risk and represent the likelihood or risk of default for the credit derivative. The implied credit spread of a particular referenced entity reflects the cost of buying/selling protection and may include upfront payments required to be made to enter into the agreement. For credit default swap agreements on asset-backed securities and credit indices, the quoted market prices and resulting values serve as the indicator of the current status of the payment/performance risk. Wider credit spreads and increasing market values, in absolute terms when compared to the notional amount of the swap, represent a deterioration of the referenced entity’s credit soundness and a greater likelihood or risk of default or other credit event occurring as defined under the terms of the agreement.
The maximum potential amount of future payments (undiscounted) that a Fund as a seller of protection could be required to make under a credit default swap agreement would be an amount equal to the notional amount of the agreement. These potential amounts would be partially offset by any recovery values of the respective referenced obligations, upfront payments received upon entering into the agreement, or net amounts received from the settlement of buy protection credit default swap agreements entered into by a Fund for the same referenced entity or entities.
Credit default swaps involve greater risks than if the Funds had invested in the referenced obligation directly. In addition to general market risks, credit default swaps are subject to liquidity risk and counterparty credit risk. The Funds enter into credit default swaps with counterparties meeting defined criteria for financial strength. A buyer also may lose its investment and recover nothing should a credit event not occur. If a credit event did occur, the value of the referenced obligation received by the seller, coupled with the periodic payments previously received, may be less than the full notional value it pays to the buyer, resulting in a loss of value.
204
NOTES TO FINANCIAL STATEMENTS—(Continued)
Cross-Currency Swap Agreements — Cross-currency swap agreements involve two parties exchanging two different currencies with an agreement to reverse the exchange at a later date at specified exchange rates. The exchange of currencies at the inception date of the contract takes place at the current spot rate. The re-exchange at maturity may take place at the same exchange rate, a specified rate, or the then current spot rate. Interest payments, if applicable, are made between the parties based on interest rates available in the two currencies at the inception of the contract. The terms of cross-currency swap contracts may extend for many years. Cross-currency swaps are usually negotiated with commercial and investment banks. Some cross-currency swaps may not provide for exchanging principal cash flows but only for exchanging interest cash flows.
Interest Rate Swap Agreements — Interest rate swap agreements involve the exchange by a Fund with another party of their respective commitments to pay or receive interest with respect to the notional amount of principal. Certain forms of interest rate swap agreements may include: (i) interest rate caps, under which, in return for a premium, one party agrees to make payments to the other to the extent that interest rates exceed a specified rate, or “cap”, (ii) interest rate floors, under which, in return for a premium, one party agrees to make payments to the other to the extent that interest rates fall below a specified rate, or “floor”, (iii) interest rate collars, under which a party sells a cap and purchases a floor or vice versa in an attempt to protect itself against interest rate movements exceeding given minimum or maximum levels, (iv) callable interest rate swaps, under which the counterparty may terminate the swap transaction in whole at zero cost by a predetermined date and time prior to the maturity date, (v) spread locks, which allow the interest rate swap users to lock in the forward differential (or spread) between the interest rate swap rate and a specified benchmark, or (vi) basis swap, under which two parties can exchange variable interest rates based on different money markets.
Total Return Swap Agreements — Total return swap agreements on commodities involve commitments where exchanged cash flows based on the price of a commodity and in return receives either fixed or determined by floating price or rate. One party would receive payments based on the market value of the commodity involved and pay a fixed amount. Total return swap agreements on indices involve commitments to pay interest in exchange for a market-linked return. One counterparty pays out the total return of a specific reference asset, which may be an equity, index, or bond, and in return receives a regular stream of payments. To the extent the total return of the security or index underlying the transaction exceeds or falls short of the offsetting interest rate obligation, a Fund will receive a payment from or make a payment to the counterparty.
FASB “Derivatives and Hedging” includes required disclosure for (i) the nature and terms of the derivative, reasons for entering into the derivative, the events or circumstances that would require the seller to perform under the derivative, and the current status of the payment/performance risk of the derivative, (ii) the maximum potential amount of future payments (undiscounted) the seller could be required to make under the derivative, (iii) the fair value of the derivative, and (iv) the nature of any recourse provisions and assets held either as collateral or by third parties. FASB “Guarantees” require additional disclosures about the current status of the payment/performance risk of a guarantee. All of this information has been incorporated for the current period as part of the Schedules of Investments within the Swap agreements outstanding disclosure and in the Notes to Financial Statements.
As of December 31, 2009, the Low-Duration Bond Fund and the Medium-Duration Bond Fund are the buyers (“receiving protection”) on a total notional amount of $30,614,896 and $51,867,200, respectively, and the sellers (“providing
205
NOTES TO FINANCIAL STATEMENTS—(Continued)
protection”) on a total notional amount of $1,000,000 and $9,900,000, respectively. The notional amounts of the swaps are not recorded in the financial statements; however, the notional amount does approximate the maximum potential amount of future payments that the Funds could be required to make if the Funds were the seller of protection and a credit event were to occur. Those credit default swaps for which the Funds are providing protection at balance sheet date are summarized as follows:
| | | | | | | | | | | | | | | | | | | |
| Written Credit Derivative Contracts | | Single Name
Credit Default Swaps | | | Credit Default
Swap Index | | | |
| Reference Asset | | Corporate
Debt | | | Sovereign
Debt | | | Asset-Backed
Securities | | | Corporate
Debt | | Total | |
Low-Duration Bond Fund | | | | | | | | | | | | | | | | | | | |
Fair value of written credit derivatives | | $ | (1,159 | ) | | $ | — | | | $ | — | | | $ | — | | $ | (1,159 | ) |
Maximum potential amount of future payments | | | 1,000,000 | | | | — | | | | — | | | | — | | | 1,000,000 | |
Recourse provisions with third parties to recover any amounts paid under the credit derivative (including any purchased credit protection) | | | — | | | | — | | | | — | | | | — | | | — | |
Collateral held by the Funds or other third parties which the Funds can obtain upon occurrence of triggering event | | | — | | | | — | | | | — | | | | — | | | — | |
| | | |
| | | Single Name
Credit Default Swaps | | | Credit Default Swap Index | | | |
| Reference Asset | | Corporate
Debt | | | Sovereign
Debt | | | Asset-Backed
Securities | | | Corporate
Debt | | Total | |
Medium-Duration Bond | | | | | | | | | | | | | | | | | | | |
Fair value of written credit derivatives | | $ | (293,267 | ) | | $ | (11,020 | ) | | $ | (653,089 | ) | | $ | — | | $ | (957,376 | ) |
Maximum potential amount of future payments | | | 4,100,000 | | | | 4,800,000 | | | | 1,000,000 | | | | — | | | 9,900,000 | |
Recourse provisions with third parties to recover any amounts paid under the credit derivative (including any purchased credit protection) | | | — | | | | — | | | | — | | | | — | | | — | |
Collateral held by the Funds or other third parties which the Funds can obtain upon occurrence of triggering event | | | — | | | | — | | | | — | | | | — | | | — | |
The credit spread disclosed below for each referenced obligation where the Funds are the seller of protection is a representation of the current payment/performance risk of the swap.
| | | | | | | | | | | | | | | |
| | | Maximum Potential Amount of Futures Payments by Contract Term |
Current credit spread on underlying (in basis points) | | 0-6
Months | | 6-12
Months | | 5-10
Years | | More
Than
10 Years | | Total |
Low-Duration Bond Fund | | | | | | | | | | | | | | | |
0 - 100 | | $ | — | | $ | — | | $ | — | | $ | — | | $ | — |
101 - 250 | | | — | | | — | | | — | | | — | | | — |
251 - 500 | | | — | | | — | | | — | | | — | | | — |
501 - 1,000 | | | — | | | — | | | — | | | — | | | — |
Greater than 1,000 | | | 1,000,000 | | | — | | | — | | | — | | | 1,000,000 |
| | | | | | | | | | | | | | | |
Total | | $ | 1,000,000 | | $ | — | | $ | — | | $ | — | | $ | 1,000,000 |
| | | | | | | | | | | | | | | |
| | | | | |
Medium-Duration Bond Fund | | | | | | | | | | | | | | | |
| | | | | |
0 - 100 | | $ | — | | $ | — | | $ | — | | $ | — | | $ | — |
101 - 250 | | | — | | | — | | | — | | | — | | | — |
251 - 500 | | | — | | | — | | | — | | | 1,000,000 | | | 1,000,000 |
501 - 1,000 | | | — | | | — | | | — | | | — | | | — |
Greater than 1,000 | | | — | | | 3,800,000 | | | 5,100,000 | | | — | | | 8,900,000 |
| | | | | | | | | | | | | | | |
Total | | $ | — | | $ | 3,800,000 | | $ | 5,100,000 | | $ | 1,000,000 | | $ | 9,900,000 |
| | | | | | | | | | | | | | | |
206
NOTES TO FINANCIAL STATEMENTS—(Continued)
Derivative Holdings Categorized by Risk Exposure
FASB “Derivatives and Hedging” also requires all companies to disclose information intended to enable financial statement users to understand how and why the entity uses derivative instruments, how derivatives are accounted for, and how derivative instruments affect the entity’s financial position, results of operations, and cash flows.
| | | | |
| | | Location on the Statements of Assets and Liabilities |
Derivative Type | | Asset Derivatives | | Liability Derivatives |
| Interest rate contracts | | Investments in securities of unaffiliated issuers, at value | | Options written at value |
| | Receivables: Variation margin* | | Payables: Variation margin* |
| | Unrealized appreciation on swap agreements | | Unrealized depreciation on swap agreements |
| Foreign exchange contracts | | Unrealized appreciation on foreign currency | | Unrealized depreciation on foreign currency |
| | exchange contracts | | exchange contracts |
| Credit contracts | | Unrealized appreciation on swap agreements | | Unrealized depreciation on swap agreements |
| Equity contracts | | Receivables: Variation margin* | | Payables: Variation margin* |
| * | The variation margin shown on the Statements of Assets and Liabilities is the daily change in the unrealized appreciation (depreciation) for open futures contracts. The variation margin presented below is the cumulative change in unrealized appreciation (depreciation) from the date the contract was opened until December 31, 2009. |
| | | | | | | | | | | | | | | | | |
| | | Asset Derivative Value |
| Fund | | Total Value at
December 31, 2009 | | | Interest Rate
Contracts | | | Foreign Exchange
Contracts | | Credit
Contracts | | Equity
Contracts |
MyDestination 2015 Fund | | $ | 27,678 | | | $ | — | | | $ | — | | $ | — | | $ | 27,678 |
MyDestination 2025 Fund | | | 17,969 | | | | — | | | | — | | | — | | | 17,969 |
MyDestination 2035 Fund | | | 13,860 | | | | — | | | | — | | | — | | | 13,860 |
MyDestination 2045 Fund | | | 5,506 | | | | — | | | | — | | | — | | | 5,506 |
Conservative Allocation Fund | | | 20,129 | | | | — | | | | — | | | — | | | 20,129 |
Balanced Allocation Fund | | | 69,500 | | | | — | | | | — | | | — | | | 69,500 |
Growth Allocation Fund | | | 122,434 | | | | — | | | | — | | | — | | | 122,434 |
Aggressive Allocation Fund | | | 192,130 | | | | — | | | | — | | | — | | | 192,130 |
Balanced Allocation Fund I | | | 49,782 | | | | — | | | | — | | | — | | | 49,782 |
Growth Allocation Fund I | | | 40,451 | | | | — | | | | — | | | — | | | 40,451 |
Aggressive Allocation Fund I | | | 41,289 | | | | — | | | | — | | | — | | | 41,289 |
Low-Duration Bond Fund | | | 2,619,658 | | | | (142,906 | ) | | | 889,661 | | | 1,872,903 | | | — |
Medium-Duration Bond Fund | | | 1,477,707 | | | | 283,270 | | | | 884,902 | | | 309,535 | | | — |
Inflation Protected Bond Fund | | | (36,495 | ) | | | (36,495 | ) | | | — | | | — | | | — |
Global Bond Fund | | | 1,124,072 | | | | (37,105 | ) | | | 1,161,177 | | | — | | | — |
Equity Index Fund | | | 145,392 | | | | — | | | | — | | | — | | | 145,392 |
Real Estate Securities Fund | | | 167,085 | | | | — | | | | — | | | — | | | 167,085 |
Value Equity Fund | | | 468,620 | | | | — | | | | — | | | — | | | 468,620 |
Growth Equity Fund | | | 625,462 | | | | — | | | | — | | | — | | | 625,462 |
Small Cap Equity Fund | | | 2,498,600 | | | | (107,230 | ) | | | — | | | — | | | 2,605,830 |
International Equity Fund | | | 900,987 | | | | — | | | | 547,046 | | | — | | | 353,941 |
| |
| | | Liability Derivative Value |
Low-Duration Bond Fund | | $ | 575,935 | | | $ | 331,396 | | | $ | 235,520 | | $ | 9,019 | | $ | — |
Medium-Duration Bond Fund | | | 2,892,338 | | | | 1,043,956 | | | | 424,424 | | | 1,423,958 | | | — |
Inflation Protected Bond Fund | | | (39,673 | ) | | | (39,673 | ) | | | — | | | — | | | — |
Global Bond Fund | | | 666,732 | | | | (140,590 | ) | | | 807,322 | | | — | | | — |
Small Cap Equity Fund | | | (116,645 | ) | | | (116,645 | ) | | | — | | | — | | | — |
International Equity Fund | | | 1,272,855 | | | | — | | | | 741,692 | | | — | | | 531,163 |
207
NOTES TO FINANCIAL STATEMENTS—(Continued)
| | |
Derivative Type | | Location on the Statements of Operations |
Interest rate contracts | | Net realized gain (loss) from: Futures transactions |
| | Net realized gain (loss) from: Swap agreements |
| | Net realized gain (loss) from: Option contracts written |
| | Net realized gain (loss) from: Option contracts purchased |
| | Net change in unrealized appreciation (depreciation) on: Futures |
| | Net change in unrealized appreciation (depreciation) on: Swap agreements |
| | Net change in unrealized appreciation (depreciation) on: Option contracts written |
| | Net change in unrealized appreciation (depreciation) on: Option contracts purchased |
Foreign exchange contracts | | Net realized gain (loss) from: Foreign currency transactions |
| | Net realized gain (loss) from: Option contracts purchased |
| | Net change in unrealized appreciation (depreciation) on: Foreign currency translations |
| | Net change in unrealized appreciation (depreciation) on: Option contracts purchased |
Credit contracts | | Net realized gain (loss) from: Swap agreements |
| | Net change in unrealized appreciation (depreciation) on: Swap agreements |
Equity contracts | | Net realized gain (loss) from: Futures transactions |
| | Net change in unrealized appreciation (depreciation) on: Futures |
| | | | | | | | | | | | | | | | | | |
| | | Realized Gain (Loss) on Derivatives Recognized in Income | |
| Fund | | Total Value
at
December 31, 2009 | | | Interest Rate
Contracts | | Foreign Exchange
Contracts | | | Credit
Contracts | | Equity
Contracts | |
MyDestination 2005 Fund | | $ | 15,637 | | | $ | — | | $ | — | | | $ | — | | $ | 15,637 | |
MyDestination 2015 Fund | | | 359,884 | | | | — | | | — | | | | — | | | 359,884 | |
MyDestination 2025 Fund | | | 405,536 | | | | — | | | — | | | | — | | | 405,536 | |
MyDestination 2035 Fund | | | 275,311 | | | | — | | | — | | | | — | | | 275,311 | |
MyDestination 2045 Fund | | | 246,789 | | | | — | | | — | | | | — | | | 246,789 | |
Conservative Allocation Fund | | | (404,312 | ) | | | — | | | — | | | | — | | | (404,312 | ) |
Balanced Allocation Fund | | | 2,350,161 | | | | — | | | — | | | | — | | | 2,350,161 | |
Growth Allocation Fund | | | 2,142,171 | | | | — | | | — | | | | — | | | 2,142,171 | |
Aggressive Allocation Fund | | | 3,589,974 | | | | — | | | — | | | | — | | | 3,589,974 | |
Conservative Allocation Fund I | | | 33,019 | | | | — | | | — | | | | — | | | 33,019 | |
Balanced Allocation Fund I | | | 129,538 | | | | — | | | — | | | | — | | | 129,538 | |
Growth Allocation Fund I | | | 458,335 | | | | — | | | — | | | | — | | | 458,335 | |
Aggressive Allocation Fund I | | | 425,700 | | | | — | | | — | | | | — | | | 425,700 | |
Low-Duration Bond Fund | | | 12,321,051 | | | | 12,255,789 | | | (2,517,039 | ) | | | 2,582,301 | | | — | |
Medium-Duration Bond Fund | | | 19,750,601 | | | | 17,253,798 | | | (879,547 | ) | | | 3,376,350 | | | — | |
Inflation Protected Bond Fund | | | 170,713 | | | | 170,713 | | | — | | | | — | | | — | |
Global Bond Fund | | | 1,775,308 | | | | 631,489 | | | 1,143,819 | | | | — | | | — | |
Equity Index Fund | | | 2,464,058 | | | | — | | | — | | | | — | | | 2,464,058 | |
Real Estate Securities Fund | | | 1,534,547 | | | | — | | | — | | | | — | | | 1,534,547 | |
Value Equity Fund | | | 11,338,932 | | | | — | | | — | | | | — | | | 11,338,932 | |
Growth Equity Fund | | | 11,702,062 | | | | | | | | | | | | | | 11,702,062 | |
Small Cap Equity Fund | | | 13,588,374 | | | | 365,176 | | | (12,903 | ) | | | — | | | 13,236,101 | |
International Equity Fund | | | 11,086,867 | | | | — | | | 1,489,693 | | | | — | | | 9,597,174 | |
| |
| | | Change in Unrealized Appreciation (Depreciation) on Derivatives Recognized in Income | |
| Fund | | Total Value
at
December 31, 2009 | | | Interest Rate
Contracts | | Foreign Exchange
Contracts | | | Credit
Contracts | | Equity
Contracts | |
MyDestination 2005 Fund | | $ | (16,547 | ) | | $ | — | | $ | — | | | $ | — | | $ | (16,547 | ) |
MyDestination 2015 Fund | | | (6,171 | ) | | | — | | | — | | | | — | | | (6,171 | ) |
MyDestination 2025 Fund | | | (8,669 | ) | | | — | | | — | | | | — | | | (8,669 | ) |
MyDestination 2035 Fund | | | (2,027 | ) | | | — | | | — | | | | — | | | (2,027 | ) |
MyDestination 2045 Fund | | | (6,128 | ) | | | — | | | — | | | | — | | | (6,128 | ) |
208
NOTES TO FINANCIAL STATEMENTS—(Continued)
| | | | | | | | | | | | | | | | | | | | |
| | | Change in Unrealized Appreciation (Depreciation) on Derivatives Recognized in Income | |
| Fund | | Total Value at
December 31, 2009 | | | Interest Rate
Contracts | | | Foreign Exchange
Contracts | | | Credit
Contracts | | | Equity
Contracts | |
Conservative Allocation Fund | | $ | (6,377 | ) | | $ | — | | | $ | — | | | $ | — | | | $ | (6,377 | ) |
Balanced Allocation Fund | | | 53,703 | | | | — | | | | — | | | | — | | | | 53,703 | |
Growth Allocation Fund | | | (25,118 | ) | | | — | | | | — | | | | — | | | | (25,118 | ) |
Aggressive Allocation Fund | | | 54,701 | | | | — | | | | — | | | | — | | | | 54,701 | |
Conservative Allocation Fund I | | | (12,673 | ) | | | — | | | | — | | | | — | | | | (12,673 | ) |
Balanced Allocation Fund I | | | 5,910 | | | | — | | | | — | | | | — | | | | 5,910 | |
Growth Allocation Fund I | | | (6,432 | ) | | | — | | | | — | | | | — | | | | (6,432 | ) |
Aggressive Allocation Fund I | | | 29,049 | | | | — | | | | — | | | | — | | | | 29,049 | |
Low-Duration Bond Fund | | | 6,667 | | | | 3,441,626 | | | | 1,007,396 | | | | (4,442,355 | ) | | | — | |
Medium-Duration Bond Fund | | | 4,310,137 | | | | 5,511,932 | | | | 2,297,256 | | | | (3,499,051 | ) | | | — | |
Inflation Protected Bond Fund | | | 3,178 | | | | 3,178 | | | | — | | | | — | | | | — | |
Global Bond Fund | | | (816,197 | ) | | | 29,650 | | | | (845,847 | ) | | | — | | | | — | |
Equity Index Fund | | | (146,271 | ) | | | — | | | | — | | | | — | | | | (146,271 | ) |
Real Estate Securities Fund | | | (71,220 | ) | | | — | | | | — | | | | — | | | | (71,220 | ) |
Value Equity Fund | | | (19,258 | ) | | | — | | | | — | | | | — | | | | (19,258 | ) |
Growth Equity Fund | | | (393,955 | ) | | | — | | | | — | | | | — | | | | (393,955 | ) |
Small Cap Equity Fund | | | 4,103 | | | | (123,200 | ) | | | 7,828 | | | | — | | | | 119,475 | |
International Equity Fund | | | (1,243,016 | ) | | | — | | | | (522,945 | ) | | | 116,543 | | | | (836,614 | ) |
Volume of Derivative Transactions
The table below summarizes the average balance of derivative holdings by fund during the year ended December 31, 2009. The average balance of derivatives held is indicative of the trading volume of each Fund.
| | | | | | | | | | | | | | | | |
| | | Asset Derivative Volume |
| Fund | | Average Volume
for the Year
Ended
December 31,
2009 | | Forward
Foreign
Currency
Contracts
(Average
Cost) | | | Futures
Contracts
(Average
Notional Value) | | Purchased
Option
Contracts
(Average
Notional
Cost) | | Swap
Contracts
(Average Notional
Amount) |
MyDestination 2005 Fund | | $ | 526,538 | | $ | — | | | $ | 526,538 | | $ | — | | $ | — |
MyDestination 2015 Fund | | | 1,704,469 | | | — | | | | 1,704,469 | | | — | | | — |
MyDestination 2025 Fund | | | 1,547,350 | | | — | | | | 1,547,350 | | | — | | | — |
MyDestination 2035 Fund | | | 895,422 | | | — | | | | 895,422 | | | — | | | — |
MyDestination 2045 Fund | | | 712,439 | | | — | | | | 712,439 | | | — | | | — |
Conservative Allocation Fund | | | 2,713,079 | | | — | | | | 2,713,079 | | | — | | | — |
Balanced Allocation Fund | | | 15,176,540 | | | — | | | | 15,176,540 | | | — | | | — |
Growth Allocation Fund | | | 14,398,141 | | | — | | | | 14,398,141 | | | — | | | — |
Aggressive Allocation Fund | | | 14,253,299 | | | — | | | | 14,253,299 | | | — | | | — |
Conservative Allocation Fund I | | | 374,757 | | | — | | | | 374,757 | | | — | | | — |
Balanced Allocation Fund I | | | 3,491,424 | | | — | | | | 3,491,424 | | | — | | | — |
Growth Allocation Fund I | | | 2,867,884 | | | — | | | | 2,867,884 | | | — | | | — |
Aggressive Allocation Fund I | | | 2,335,570 | | | — | | | | 2,335,570 | | | — | | | — |
Low-Duration Bond Fund | | | 447,929,560 | | | (9,844,159 | ) | | | 270,832,874 | | | 1,099,760 | | | 185,841,085 |
Medium-Duration Bond Fund | | | 6,950,784,286 | | | (1,870,799 | ) | | | 107,247,155 | | | 2,059,874 | | | 6,843,348,056 |
Inflation Protected Bond Fund | | | 3,025,298 | | | — | | | | 3,025,298 | | | — | | | — |
Global Bond Fund | | | 20,494,106 | | | 9,544,080 | | | | 10,671,759 | | | 278,267 | | | — |
Equity Index Fund | | | 11,392,366 | | | — | | | | 11,392,366 | | | — | | | — |
Real Estate Securities Fund | | | 4,584,681 | | | — | | | | 4,584,681 | | | — | | | — |
Value Equity Fund | | | 43,809,532 | | | — | | | | 43,809,532 | | | — | | | — |
Growth Equity Fund | | | 53,469,173 | | | — | | | | 53,469,173 | | | — | | | — |
Small Cap Equity Fund | | | 66,851,466 | | | 12,423 | | | | 66,834,645 | | | 4,398 | | | — |
International Equity Fund | | | 73,425,060 | | | 17,342,311 | | | | 56,082,749 | | | — | | | — |
209
NOTES TO FINANCIAL STATEMENTS—(Continued)
| | | | | | | | | | | | | | | | | | |
| | | Liability Derivative Volume |
| Fund | | Average
Volume for
the Year
Ended
December 31,
2009 | | | Forward
Foreign
Currency
Contracts
(Average Cost) | | | Futures
Contracts
(Average
Notional
Value) | | Written
Option
Contracts
(Average
Notional
Cost) | | | Swap
Contracts
(Average
Notional
Amount) |
Low-Duration Bond Fund | | $ | 10,089,655 | | | $ | (8,404,404 | ) | | $ | 19,334,544 | | $ | (840,485 | ) | | $ | — |
Medium-Duration Bond Fund | | | 17,202,052 | | | | (5,103,377 | ) | | | 23,670,447 | | | (1,365,018 | ) | | | — |
Inflation Protected Bond Fund | | | 7,175,189 | | | | — | | | | 7,175,189 | | | — | | | | — |
Global Bond Fund | | | (2,379,955 | ) | | | (7,726,400 | ) | | | 5,346,445 | | | — | | | | — |
Inflation Protected Bond Fund | | | 7,175,189 | | | | — | | | | 7,175,189 | | | — | | | | — |
Small Cap Equity Fund | | | 2,096,537 | | | | (172,066 | ) | | | 2,298,231 | | | (29,628 | ) | | | — |
International Equity Fund | | | (5,312,838 | ) | | | (13,554,469 | ) | | | 8,241,631 | | | — | | | | — |
i. Dividends and Distributions to Shareholders
Dividends from net investment income for the Money Market Fund are declared daily and paid monthly. Dividends from net investment income for the Bond Funds are declared and paid monthly. Dividends from net investment income, if any, for the Equity Index Fund, Real Estate Securities Fund, Value Equity Fund and Growth Equity Fund are declared and paid semi-annually. Dividends from net investment income, if any, for the Small Cap Equity Fund, International Equity Fund, the Asset Allocation Funds and the Date Target Funds are declared and paid annually. Net realized capital gains, if any, will be distributed at least annually by each of the Funds. Dividends and distributions to shareholders are recorded on the ex-dividend date.
j. Expenses
Expenses arising in connection with a Fund are charged directly to that Fund. Expenses common to all Funds are generally allocated to each Fund in proportion to their relative net assets. Each Class of shares bears its pro-rata portion of expenses attributable to its Class, except that each Class separately bears expenses related specifically to that Class, such as shareholder reporting, registration, transfer agent, shareholder servicing and distribution fees.
f. Security Transactions, Income and Realized Gains and Losses
Security transactions are accounted for on the date securities are purchased or sold (the trade date). Dividend income is recognized on the ex-dividend date, except certain dividends from foreign securities where the ex-date may have passed, which are recorded as soon as the Fund is informed of the ex-dividend date. Interest income is accrued daily, including the amortization of market premium and the accretion of market discount. Realized gains and losses from security transactions are on an identified cost basis.
3. FEES AND OTHER TRANSACTIONS WITH AFFILIATES
a. Investment Advisory Fees
Pursuant to a separate investment advisory agreement, GuideStone Capital Management (“GSCM” or “Adviser”) acts as the Adviser to the Funds. As Adviser, it supervises the investments of the Funds and for such services is paid a fee. GSCM and the Trust have entered into sub-advisory agreements with various sub-advisers to manage each Select Fund’s investments. Under the general supervision of GSCM, the sub-advisers make the day-to-day investment decisions for the Select Funds, and for such services, each sub-adviser receives a fee from the Funds.
210
NOTES TO FINANCIAL STATEMENTS—(Continued)
The advisory fees paid to GSCM and aggregate sub-advisory fees paid to the sub-advisers, listed at the end of this report, are computed daily based upon the net assets of each Fund. The actual advisory fees accrued and the sub-advisory fees accrued during the year ended December 31, 2009, based upon average daily net assets, were as follows:
| | | | | | |
Fund | | Advisory Fees | | | Sub-Adviser Fees | |
MyDestination 2005 | | 0.10 | % | | — | |
MyDestination 2015 | | 0.10 | % | | — | |
MyDestination 2025 | | 0.10 | % | | — | |
MyDestination 2035 | | 0.10 | % | | — | |
MyDestination 2045 | | 0.10 | % | | — | |
Conservative Allocation | | 0.10 | % | | — | |
Balanced Allocation | | 0.10 | % | | — | |
Growth Allocation | | 0.10 | % | | — | |
Aggressive Allocation | | 0.10 | % | | — | |
Conservative Allocation I | | 0.10 | % | | — | |
Balanced Allocation I | | 0.10 | % | | — | |
Growth Allocation I | | 0.10 | % | | — | |
Aggressive Allocation I | | 0.10 | % | | — | |
Money Market | | 0.09 | % | | 0.07 | % |
Low-Duration Bond | | 0.13 | % | | 0.22 | % |
Medium-Duration Bond | | 0.21 | % | | 0.21 | % |
Extended-Duration Bond | | 0.25 | % | | 0.22 | % |
Inflation Protected Bond | | 0.20 | % | | 0.12 | % |
Global Bond | | 0.21 | % | | 0.26 | % |
Equity Index | | 0.13 | % | | 0.02 | % |
Real Estate Securities | | 0.28 | % | | 0.63 | % |
Value Equity | | 0.40 | % | | 0.25 | % |
Growth Equity | | 0.45 | % | | 0.39 | % |
Small Cap Equity | | 0.27 | % | | 0.68 | % |
International Equity | | 0.47 | % | | 0.50 | % |
For the year ended December 31, 2009, advisory fees (excluding sub-advisory fees) and waivers for each Fund were as follows:
| | | | | | | | | | | |
| | | Gross
Advisory Fee | | Waiver/
Reimbursements | | | Net Advisory Fee
(Reimbursement) | |
MyDestination 2005 | | $ | 56,671 | | $ | (37,186 | ) | | $ | 19,485 | |
MyDestination 2015 | | | 172,631 | | | (1,864 | ) | | | 170,767 | |
MyDestination 2025 | | | 124,945 | | | 16,591 | | | | 141,536 | |
MyDestination 2035 | | | 53,120 | | | (45,655 | ) | | | 7,465 | |
MyDestination 2045 | | | 29,987 | | | (64,242 | ) | | | (34,255 | ) |
Conservative Allocation | | | 262,526 | | | (93,258 | ) | | | 169,268 | |
Balanced Allocation | | | 983,596 | | | (97,716 | ) | | | 885,880 | |
Growth Allocation | | | 718,281 | | | (102,990 | ) | | | 615,291 | |
Aggressive Allocation | | | 607,494 | | | (116,674 | ) | | | 490,820 | |
Conservative Allocation I | | | 57,436 | | | (41,261 | ) | | | 16,175 | |
Balanced Allocation I | | | 280,627 | | | — | | | | 280,627 | |
Growth Allocation I | | | 176,063 | | | 5,602 | | | | 181,665 | |
Aggressive Allocation I | | | 119,426 | | | (14,709 | ) | | | 104,717 | |
Money Market | | | 1,058,634 | | | (176,881 | ) | | | 881,753 | |
Low-Duration Bond | | | 817,754 | | | (573,533 | ) | | | 244,221 | |
Medium-Duration Bond | | | 1,867,110 | | | (933,714 | ) | | | 933,396 | |
Extended-Duration Bond | | | 1,047,245 | | | (131,489 | ) | | | 915,756 | |
Inflation Protected Bond | | | 81,187 | | | (11,702 | ) | | | 69,485 | |
Global Bond | | | 396,686 | | | (24,304 | ) | | | 372,382 | |
Equity Index | | | 417,049 | | | (174,050 | ) | | | 242,999 | |
Real Estate Securities | | | 253,444 | | | (7,621 | ) | | | 245,823 | |
Value Equity | | | 4,122,652 | | | (309,605 | ) | | | 3,813,047 | |
Growth Equity | | | 4,863,772 | | | (1,093,273 | ) | | | 3,770,499 | |
Small Cap Equity | | | 946,753 | | | (292,309 | ) | | | 654,444 | |
International Equity | | | 5,571,539 | | | (2,823,373 | ) | | | 2,748,166 | |
211
NOTES TO FINANCIAL STATEMENTS—(Continued)
b. Distribution and Shareholder Servicing Fees
The Board of Trustees has adopted a Shareholder Service Plan for the GS4 Class of each Select Fund. Under this Plan, the GS4 Class of each Select Fund is authorized to pay fees to parties that provide services for and maintain shareholder accounts. The GS4 Class of each Select Fund is authorized to pay service fees of 0.19% of average daily net assets.
Prior to May 1, 2009, the Board of Trustees had adopted a separate Plan of Distribution for the GS6 Class of each Select Fund, Asset Allocation Fund and Date Target Fund pursuant to Rule 12b-1 under the 1940 Act (“12b-1 Plan”). Under the 12b-1 Plan, the assets of each Select Fund could be used to compensate GuideStone Financial Resources, the Underwriter or others for certain expenses relating to the distribution of shares of the Funds to investors. With the termination of the GS6 Class, the plan was no longer in effect as of May 1, 2009.
c. Expense Limitation
GSCM has agreed, through April 30, 2010, to waive fees and reimburse expenses of the GS2 Class and GS4 Class of each Fund (excluding interest, taxes, brokerage commissions and extraordinary expenses) which exceed, in the aggregate, the annual percentage rate of each Class’s average daily net assets as follows:
| | | | | | |
Fund | | GS2 Class | | | GS4 Class | |
MyDestination 2005 | | NA | | | 0.20 | % |
MyDestination 2015 | | NA | | | 0.20 | % |
MyDestination 2025 | | NA | | | 0.20 | % |
MyDestination 2035 | | NA | | | 0.20 | % |
MyDestination 2045 | | NA | | | 0.20 | % |
Conservative Allocation | | NA | | | 0.12 | % |
Balanced Allocation | | NA | | | 0.12 | % |
Growth Allocation | | NA | | | 0.12 | % |
Aggressive Allocation | | NA | | | 0.12 | % |
Conservative Allocation I | | 0.15 | % | | NA | |
Balanced Allocation I | | 0.15 | % | | NA | |
Growth Allocation I | | 0.15 | % | | NA | |
Aggressive Allocation I | | 0.15 | % | | NA | |
Money Market | | 0.20 | % | | 0.39 | % |
Low-Duration Bond | | 0.36 | % | | 0.52 | % |
Medium-Duration Bond | | 0.48 | % | | 0.58 | % |
Extended-Duration Bond | | 0.63 | % | | 0.69 | % |
Inflation Protected Bond | | NA | | | 0.67 | % |
Global Bond | | NA | | | 1.02 | % |
Equity Index | | 0.23 | % | | 0.37 | % |
Real Estate Securities | | NA | | | 1.29 | % |
Value Equity | | 0.74 | % | | 0.85 | % |
Growth Equity | | 0.88 | % | | 0.97 | % |
Small Cap Equity | | 1.12 | % | | 1.15 | % |
International Equity | | 0.94 | % | | 1.12 | % |
Each Fund in turn agrees to reimburse GSCM for any operating expenses in excess of the expense limitation paid, waived or assumed by GSCM for that Fund during the limitation period, provided GSCM would not be entitled to reimbursement for any amount that would cause operating expenses to exceed the expense limitation during the year in which the reimbursement would be made, and provided further that no amount will be reimbursed by the Fund more than three years after the year in which it was incurred or waived by GSCM.
212
NOTES TO FINANCIAL STATEMENTS—(Continued)
At December 31, 2009, the amounts subject to possible future reimbursement under the expense limitation agreement are as follows:
| | | | | | | | | | | | | | | | | | |
| | | GS2 Class | | GS4 Class |
| | | 2007 | | 2008 | | 2009 | | 2007 | | 2008 | | 2009 |
MyDestination 2005 | | | NA | | | NA | | | NA | | $ | 73,659 | | $ | 51,833 | | $ | 34,663 |
MyDestination 2025 | | | NA | | | NA | | | NA | | | 78,409 | | | 13,471 | | | 18,459 |
MyDestination 2035 | | | NA | | | NA | | | NA | | | 83,799 | | | 74,281 | | | 42,923 |
MyDestination 2045 | | | NA | | | NA | | | NA | | | 81,724 | | | 87,558 | | | 60,981 |
Conservative Allocation | | | NA | | | NA | | | NA | | | 112,077 | | | 100,571 | | | 94,137 |
Balanced Allocation | | | NA | | | NA | | | NA | | | 70,118 | | | 91,086 | | | 97,716 |
Growth Allocation | | | NA | | | NA | | | NA | | | 70,805 | | | 94,991 | | | 102,990 |
Aggressive Allocation | | | NA | | | NA | | | NA | | | 73,850 | | | 98,613 | | | 116,674 |
Conservative Allocation I | | $ | 40,190 | | $ | 43,693 | | $ | 41,261 | | | NA | | | NA | | | NA |
Growth Allocation I | | | — | | | 0 | | | 5602 | | | NA | | | NA | | | NA |
Aggressive Allocation I | | | — | | | 7,921 | | | 14,709 | | | NA | | | NA | | | NA |
Low-Duration Bond | | | 35,442 | | | 59,618 | | | 62,697 | | | 401,137 | | | 502,736 | | | 480,368 |
Medium-Duration Bond | | | — | | | — | | | 21,118 | | | 580,875 | | | 811,087 | | | 829,796 |
Extended-Duration Bond | | | — | | | — | | | — | | | 28,687 | | | 83,138 | | | 112,701 |
Inflation Protected Bond | | | NA | | | NA | | | NA | | | — | | | — | | | 3,859 |
Equity Index | | | — | | | — | | | 141 | | | 132,178 | | | 155,209 | | | 152,180 |
Value Equity | | | — | | | — | | | — | | | 60,746 | | | 71,410 | | | 233,562 |
Growth Equity | | | — | | | — | | | 9,812 | | | 1,016,986 | | | 1,003,684 | | | 990,164 |
Small Cap Equity | | | — | | | — | | | — | | | 334,121 | | | 310,319 | | | 244,965 |
International Equity | | | 297,143 | | | 376,091 | | | 451,372 | | | 1,775,807 | | | 1,844,484 | | | 2,302,219 |
During the period ended December 31, 2009, GSCM recaptured $18,459 from the GS4 Class of the MyDestination 2025 Fund and $5,602 from the GS2 Class of the Growth Allocation I Fund.
d. Brokerage Service Arrangements
The Adviser directs the sub-advisers to place security trades with designated brokers who have agreed to pay certain custody, transfer agency or other operating expenses through the use of Brokerage Service Arrangements on behalf of the Funds shown below.
| | | |
Fund | | Expenses Paid
Through Brokerage
Service Arrangements |
Value Equity | | $ | 56,757 |
Growth Equity | | | 64,391 |
Small Cap Equity | | | 23,005 |
International Equity | | | 62,293 |
e. Administrator, Transfer Agent and Distributor
Certain employees of PNC Global Investment Servicing (U.S.), Inc. (“PNC”), an indirect, wholly-owned subsidiary of The PNC Financial Services Group, Inc., are officers of the Funds. PNC serves as Administrator and Transfer Agent of the Funds.
For its services as Administrator, PNC is entitled to receive fees, computed daily and paid monthly, based upon the average daily net assets of each Fund. The fees, excluding out of pocket expenses, currently range between 0.004% and 0.02% of average daily net assets. For its services as Transfer Agent, PNC receives a fee based mainly upon the number of accounts serviced. Certain minimum fees and transaction charges may apply. For the year ended December 31, 2009, PNC received $2,578,576 in aggregate fees and expenses for services rendered under the various agreements described above.
213
NOTES TO FINANCIAL STATEMENTS—(Continued)
PFPC Distributors, Inc. (“PDI”), also an indirect, wholly-owned subsidiary of The PNC Financial Services Group, Inc., serves as the Underwriter for the Funds. The Funds do not pay any fees to PDI in its capacity as Underwriter. The fees are paid by GSCM.
f. Investments in Affiliates
A summary of the Fund of Fund’s total long-term and short-term purchases and sales of the shares of the underlying Select Funds during the year ended December 31, 2009 is as follows:
| | | | | | | | | | | | | | | | | | |
| | | Balance
at
12/31/08 | | Balance
at
12/31/09 | | Purchases | | Sales Proceeds | | Dividend
Income | | Distributions
of Realized
Gains |
MyDestination 2005 Fund | | | | | | | | | | | | | | | | | | |
Money Market Fund | | $ | 968,818 | | $ | 957,089 | | $ | 21,466,317 | | $ | 21,478,123 | | $ | 4,487 | | $ | — |
Low-Duration Bond Fund | | | 8,033,469 | | | 12,405,231 | | | 5,147,800 | | | 1,821,000 | | | 289,719 | | | — |
Medium-Duration Bond Fund | | | 9,071,198 | | | 11,477,216 | | | 2,937,700 | | | 2,011,500 | | | 380,127 | | | 249,309 |
Extended-Duration Bond Fund | | | 670,814 | | | 658,407 | | | 98,000 | | | 244,500 | | | 30,843 | | | 679 |
Inflation Protected Bond Fund | | | — | | | 9,750,494 | | | 9,889,090 | | | 587,500 | | | 155,520 | | | 9,973 |
Global Bond Fund | | | 1,258,320 | | | 1,017,045 | | | 163,500 | | | 750,500 | | | 82,867 | | | — |
Equity Index Fund | | | 1,211,560 | | | 1,490,646 | | | 197,500 | | | 258,417 | | | 22,445 | | | — |
Real Estate Securities Fund | | | 2,080,517 | | | 2,418,192 | | | 772,000 | | | 1,167,861 | | | 47,647 | | | — |
Value Equity Fund | | | 6,402,219 | | | 7,915,297 | | | 1,373,200 | | | 1,333,300 | | | 111,246 | | | — |
Growth Equity Fund | | | 6,299,854 | | | 8,028,765 | | | 863,100 | | | 1,403,588 | | | 6,442 | | | — |
Small Cap Equity Fund | | | 1,740,702 | | | 2,222,434 | | | 344,500 | | | 405,364 | | | 5,174 | | | — |
International Equity Fund | | | 6,670,673 | | | 8,341,021 | | | 1,576,000 | | | 2,221,347 | | | 172,414 | | | 74 |
| | | | | | | | | | | | | | | | | | |
| | $ | 44,408,144 | | $ | 66,681,837 | | $ | 44,828,707 | | $ | 33,683,000 | | $ | 1,308,931 | | $ | 260,035 |
| | | | | | | | | | | | | | | | | | |
| | | | | | |
MyDestination 2015 Fund | | | | | | | | | | | | | | | | | | |
Money Market Fund | | $ | 2,058,688 | | $ | 2,405,941 | | $ | 35,474,104 | | $ | 35,126,980 | | $ | 5,451 | | $ | — |
Low-Duration Bond Fund | | | 9,393,613 | | | 14,476,706 | | | 4,528,900 | | | 650,700 | | | 337,214 | | | — |
Medium-Duration Bond Fund | | | 17,812,210 | | | 23,987,621 | | | 6,366,850 | | | 3,100,000 | | | 756,992 | | | 509,618 |
Extended-Duration Bond Fund | | | 6,878,936 | | | 9,097,860 | | | 1,787,000 | | | 1,200,000 | | | 392,138 | | | 7,994 |
Inflation Protected Bond Fund | | | — | | | 21,186,757 | | | 20,288,850 | | | — | | | 320,431 | | | 22,100 |
Global Bond Fund | | | 7,117,184 | | | 10,259,585 | | | 1,688,390 | | | 1,133,314 | | | 607,627 | | | — |
Equity Index Fund | | | 4,138,033 | | | 6,426,975 | | | 1,007,240 | | | — | | | 83,479 | | | — |
Real Estate Securities Fund | | | 8,875,612 | | | 13,833,310 | | | 3,687,700 | | | 2,562,215 | | | 239,754 | | | — |
Value Equity Fund | | | 23,674,520 | | | 34,756,701 | | | 5,057,130 | | | 162,402 | | | 442,298 | | | — |
Growth Equity Fund | | | 23,628,295 | | | 35,254,089 | | | 2,812,200 | | | 503,365 | | | 25,524 | | | — |
Small Cap Equity Fund | | | 6,675,566 | | | 9,986,530 | | | 1,236,800 | | | 85,484 | | | 21,840 | | | — |
International Equity Fund | | | 25,051,682 | | | 36,038,870 | | | 4,514,550 | | | 3,166,472 | | | 725,717 | | | 291 |
| | | | | | | | | | | | | | | | | | |
| | $ | 135,304,339 | | $ | 217,710,945 | | $ | 88,449,714 | | $ | 47,690,933 | | $ | 3,958,466 | | $ | 540,003 |
| | | | | | | | | | | | | | | | | | |
214
NOTES TO FINANCIAL STATEMENTS—(Continued)
| | | | | | | | | | | | | | | | | | |
| | | Balance
at
12/31/08 | | Balance
at
12/31/09 | | Purchases | | Sales Proceeds | | Dividend
Income | | Distributions
of Realized
Gains |
MyDestination 2025 Fund | | | | | | | | | | | | | | | | | | |
Money Market Fund | | $ | 1,511,269 | | $ | 2,448,001 | | $ | 33,739,121 | | $ | 32,802,529 | | $ | 4,796 | | $ | — |
Medium-Duration Bond Fund | | | 7,510,305 | | | 12,298,666 | | | 5,118,390 | | | 1,668,900 | | | 351,947 | | | 244,525 |
Extended-Duration Bond Fund | | | 6,817,149 | | | 11,971,332 | | | 4,284,740 | | | 1,160,000 | | | 468,974 | | | 9,419 |
Global Bond Fund | | | 6,945,170 | | | 12,028,616 | | | 3,898,000 | | | 1,660,365 | | | 666,975 | | | — |
Equity Index Fund | | | 3,325,149 | | | 5,723,198 | | | 1,296,150 | | | 26,404 | | | 70,130 | | | — |
Real Estate Securities Fund | | | 6,777,056 | | | 11,848,278 | | | 3,568,000 | | | 1,917,508 | | | 202,146 | | | — |
Value Equity Fund | | | 19,248,272 | | | 32,419,512 | | | 7,723,000 | | | 114,189 | | | 378,536 | | | — |
Growth Equity Fund | | | 19,257,555 | | | 32,812,129 | | | 5,965,250 | | | 607,107 | | | 21,716 | | | — |
Small Cap Equity Fund | | | 6,740,349 | | | 11,470,194 | | | 2,374,400 | | | 122,192 | | | 24,249 | | | — |
International Equity Fund | | | 21,030,605 | | | 35,477,449 | | | 7,610,790 | | | 1,937,849 | | | 691,777 | | | 252 |
| | | | | | | | | | | | | | | | | | |
| | $ | 99,162,879 | | $ | 168,497,375 | | $ | 75,577,841 | | $ | 42,017,043 | | $ | 2,881,246 | | $ | 254,196 |
| | | | | | | | | | | | | | | | | | |
| | | | | | |
MyDestination 2035 Fund | | | | | | | | | | | | | | | | | | |
Money Market Fund | | $ | 799,768 | | $ | 1,881,218 | | $ | 16,208,984 | | $ | 15,127,627 | | $ | 2,461 | | $ | — |
Medium-Duration Bond Fund | | | 601,992 | | | 1,433,593 | | | 692,700 | | | — | | | 37,777 | | | 27,755 |
Extended-Duration Bond Fund | | | 612,942 | | | 1,403,008 | | | 568,800 | | | — | | | 50,621 | | | 878 |
Global Bond Fund | | | 1,475,529 | | | 3,071,057 | | | 964,000 | | | 50,000 | | | 158,187 | | | — |
Equity Index Fund | | | 1,478,651 | | | 2,903,993 | | | 871,600 | | | — | | | 33,746 | | | — |
Real Estate Securities Fund | | | 2,980,706 | | | 5,451,948 | | | 1,599,300 | | | 744,000 | | | 91,767 | | | — |
Value Equity Fund | | | 8,722,950 | | | 16,685,977 | | | 5,098,100 | | | — | | | 183,923 | | | — |
Growth Equity Fund | | | 8,729,656 | | | 16,858,729 | | | 4,026,700 | | | — | | | 10,524 | | | — |
Small Cap Equity Fund | | | 3,572,980 | | | 6,743,574 | | | 1,750,800 | | | — | | | 13,851 | | | — |
International Equity Fund | | | 9,861,117 | | | 18,656,191 | | | 4,249,500 | | | — | | | 358,368 | | | 124 |
| | | | | | | | | | | | | | | | | | |
| | $ | 38,836,291 | | $ | 75,089,288 | | $ | 36,030,484 | | $ | 15,921,627 | | $ | 941,225 | | $ | 28,757 |
| | | | | | | | | | | | | | | | | | |
| | | | | | |
MyDestination 2045 Fund | | | | | | | | | | | | | | | | | | |
Money Market Fund | | $ | 615,665 | | $ | 1,286,027 | | $ | 13,182,087 | | $ | 12,511,791 | | $ | 2,226 | | $ | — |
Equity Index Fund | | | 905,663 | | | 2,125,408 | | | 815,300 | | | 8,000 | | | 23,401 | | | — |
Real Estate Securities Fund | | | 1,820,248 | | | 4,214,731 | | | 2,556,000 | | | 1,466,670 | | | 70,933 | | | — |
Value Equity Fund | | | 4,362,388 | | | 10,172,536 | | | 4,017,850 | | | — | | | 103,066 | | | — |
Growth Equity Fund | | | 4,313,063 | | | 10,319,039 | | | 3,700,450 | | | 153,500 | | | 5,912 | | | — |
Small Cap Equity Fund | | | 1,853,328 | | | 4,295,182 | | | 1,593,200 | | | 81,500 | | | 8,660 | | | — |
International Equity Fund | | | 4,936,379 | | | 11,623,278 | | | 4,106,980 | | | 206,500 | | | 217,748 | | | 69 |
| | | | | | | | | | | | | | | | | | |
| | $ | 18,806,734 | | $ | 44,036,201 | | $ | 29,971,867 | | $ | 14,427,961 | | $ | 431,948 | | $ | 69 |
| | | | | | | | | | | | | | | | | | |
| | | | | | |
Conservative Allocation Fund | | | | | | | | | | | | | | | | | | |
Money Market Fund | | $ | 6,976,338 | | $ | 1,458,350 | | $ | 44,721,633 | | $ | 50,239,725 | | $ | 12,774 | | $ | — |
Low-Duration Bond Fund | | | 191,870,436 | | | 165,193,885 | | | 11,290,000 | | | 57,500,000 | | | 4,974,763 | | | — |
Inflation Protected Bond Fund | | | — | | | 40,951,653 | | | 39,316,000 | | | 340,000 | | | 685,047 | | | 42,716 |
Equity Index Fund | | | 3,186,397 | | | 4,864,696 | | | 624,000 | | | — | | | 63,622 | | | — |
Value Equity Fund | | | 16,369,472 | | | 19,858,640 | | | 3,417,000 | | | 4,000,000 | | | 315,850 | | | — |
Growth Equity Fund | | | 15,883,235 | | | 20,383,118 | | | 2,070,000 | | | 3,700,000 | | | 18,080 | | | — |
Small Cap Equity Fund | | | 3,382,582 | | | 5,040,729 | | | 1,000,000 | | | 750,000 | | | 12,084 | | | — |
International Equity Fund | | | 18,170,957 | | | 21,562,280 | | | 3,388,000 | | | 6,650,000 | | | 460,962 | | | 215 |
| | | | | | | | | | | | | | | | | | |
| | $ | 255,839,417 | | $ | 279,313,351 | | $ | 105,826,633 | | $ | 123,179,725 | | $ | 6,543,182 | | $ | 42,931 |
| | | | | | | | | | | | | | | | | | |
215
NOTES TO FINANCIAL STATEMENTS—(Continued)
| | | | | | | | | | | | | | | | | | |
| | | Balance
at
12/31/08 | | Balance
at
12/31/09 | | Purchases | | Sales Proceeds | | Dividend
Income | | Distributions
of Realized
Gains |
Balanced Allocation Fund | | | | | | | | | | | | | | | | | | |
Money Market Fund | | $ | 17,075,297 | | $ | 13,056,266 | | $ | 112,598,336 | | $ | 116,618,108 | | $ | 42,250 | | $ | — |
Low-Duration Bond Fund | | | 135,896,147 | | | 160,935,757 | | | 27,900,000 | | | 18,000,000 | | | 4,063,269 | | | — |
Medium-Duration Bond Fund | | | 198,792,996 | | | 233,149,295 | | | 31,150,000 | | | 27,000,000 | | | 7,794,820 | | | 5,076,155 |
Extended-Duration Bond Fund | | | 92,013,140 | | | 92,773,652 | | | 4,100,000 | | | 22,000,000 | | | 4,460,293 | | | 101,129 |
Global Bond Fund | | | 44,812,789 | | | 55,530,347 | | | — | | | 4,900,000 | | | 3,604,945 | | | — |
Equity Index Fund | | | 26,134,241 | | | 35,102,654 | | | 2,000,000 | | | — | | | 466,775 | | | — |
Value Equity Fund | | | 126,482,650 | | | 158,399,932 | | | 9,250,000 | | | 6,500,000 | | | 2,177,807 | | | — |
Growth Equity Fund | | | 118,903,380 | | | 161,122,326 | | | 6,500,000 | | | 10,500,000 | | | 134,871 | | | — |
Small Cap Equity Fund | | | 30,217,906 | | | 39,018,057 | | | 1,000,000 | | | 750,000 | | | 88,381 | | | — |
International Equity Fund | | | 128,947,791 | | | 168,451,926 | | | 13,500,000 | | | 24,900,000 | | | 3,551,144 | | | 1,482 |
| | | | | | | | | | | | | | | | | | |
| | $ | 919,276,337 | | $ | 1,117,540,212 | | $ | 207,998,336 | | $ | 231,168,108 | | $ | 26,384,555 | | $ | 5,178,766 |
| | | | | | | | | | | | | | | | | | |
| | | | | | |
Growth Allocation Fund | | | | | | | | | | | | | | | | | | |
Money Market Fund | | $ | 15,860,800 | | $ | 11,482,976 | | $ | 87,115,740 | | $ | 91,494,222 | | $ | 38,804 | | $ | — |
Low-Duration Bond Fund | | | 51,157,003 | | | 58,844,612 | | | 10,700,000 | | | 8,500,000 | | | 1,481,703 | | | — |
Medium-Duration Bond Fund | | | 74,737,446 | | | 85,463,209 | | | 13,850,000 | | | 14,000,000 | | | 2,791,855 | | | 1,830,680 |
Extended-Duration Bond Fund | | | 34,536,688 | | | 34,467,339 | | | 1,600,000 | | | 8,500,000 | | | 1,639,764 | | | 36,137 |
Global Bond Fund | | | 16,484,979 | | | 20,744,816 | | | — | | | 1,500,000 | | | 1,319,647 | | | — |
Equity Index Fund | | | 30,612,686 | | | 38,614,305 | | | — | | | — | | | 538,833 | | | — |
Value Equity Fund | | | 142,084,796 | | | 175,692,447 | | | 6,500,000 | | | 4,000,000 | | | 2,369,407 | | | — |
Growth Equity Fund | | | 132,965,044 | | | 177,494,545 | | | 1,750,000 | | | 6,500,000 | | | 141,787 | | | — |
Small Cap Equity Fund | | | 32,530,991 | | | 43,893,701 | | | 2,000,000 | | | — | | | 96,943 | | | — |
International Equity Fund | | | 144,592,562 | | | 188,693,735 | | | 7,000,000 | | | 16,500,000 | | | 3,877,088 | | | 1,598 |
| | | | | | | | | | | | | | | | | | |
| | $ | 675,562,995 | | $ | 835,391,685 | | $ | 130,515,740 | | $ | 150,994,222 | | $ | 14,295,831 | | $ | 1,868,416 |
| | | | | | | | | | | | | | | | | | |
| | | | | | |
Aggressive Allocation Fund | | | | | | | | | | | | | | | | | | |
Money Market Fund | | $ | 9,922,332 | | $ | 12,186,651 | | $ | 45,319,224 | | $ | 43,055,609 | | $ | 32,754 | | $ | — |
Equity Index Fund | | | 34,741,840 | | | 44,783,229 | | | 1,500,000 | | | 600,000 | | | 605,957 | | | — |
Value Equity Fund | | | 157,589,627 | | | 200,559,218 | | | 8,250,000 | | | — | | | 2,623,165 | | | — |
Growth Equity Fund | | | 152,632,187 | | | 204,055,846 | | | 4,250,000 | | | 8,000,000 | | | 155,887 | | | — |
Small Cap Equity Fund | | | 37,948,385 | | | 50,748,839 | | | 2,000,000 | | | — | | | 112,106 | | | — |
International Equity Fund | | | 165,196,175 | | | 216,329,360 | | | 600,000 | | | 7,950,000 | | | 4,365,332 | | | 1,763 |
| | | | | | | | | | | | | | | | | | |
| | $ | 558,030,546 | | $ | 728,663,143 | | $ | 61,919,224 | | $ | 59,605,609 | | $ | 7,895,202 | | $ | 1,763 |
| | | | | | | | | | | | | | | | | | |
| | | | | | |
Conservative Allocation Fund I | | | | | | | | | | | | | | | | | | |
Money Market Fund | | $ | 958,132 | | $ | 1,122,056 | | $ | 18,967,913 | | $ | 18,804,082 | | $ | 2,873 | | $ | — |
Low-Duration Bond Fund | | | 41,000,397 | | | 37,508,525 | | | 4,028,000 | | | 11,908,000 | | | 1,716,963 | | | — |
Inflation Protected Bond Fund | | | — | | | 9,295,960 | | | 8,984,000 | | | 124,000 | | | 152,648 | | | 9,636 |
Equity Index Fund | | | 678,837 | | | 1,105,994 | | | 212,000 | | | 20,000 | | | 28,197 | | | — |
Value Equity Fund | | | 3,497,213 | | | 4,515,451 | | | 848,000 | | | 744,000 | | | 145,089 | | | — |
Growth Equity Fund | | | 3,391,073 | | | 4,629,943 | | | 604,000 | | | 724,000 | | | 12,079 | | | — |
Small Cap Equity Fund | | | 721,920 | | | 1,144,652 | | | 264,000 | | | 156,000 | | | 5,756 | | | — |
International Equity Fund | | | 3,877,851 | | | 4,917,439 | | | 880,000 | | | 1,316,000 | | | 142,386 | | | 60 |
| | | | | | | | | | | | | | | | | | |
| | $ | 54,125,423 | | $ | 64,240,020 | | $ | 34,787,913 | | $ | 33,796,082 | | $ | 2,205,991 | | $ | 9,696 |
| | | | | | | | | | | | | | | | | | |
216
NOTES TO FINANCIAL STATEMENTS—(Continued)
| | | | | | | | | | | | | | | | | | |
| | | Balance
at
12/31/08 | | Balance
at
12/31/09 | | Purchases | | Sales Proceeds | | Dividend
Income | | Distributions
of Realized
Gains |
Balanced Allocation Fund I | | | | | | | | | | | | | | | | | | |
Money Market Fund | | $ | 5,999,022 | | $ | 2,741,213 | | $ | 29,942,888 | | $ | 33,200,895 | | $ | 15,624 | | $ | — |
Low-Duration Bond Fund | | | 38,093,577 | | | 46,645,414 | | | 9,200,000 | | | 5,093,000 | | | 1,827,784 | | | — |
Medium-Duration Bond Fund | | | 55,830,680 | | | 67,529,409 | | | 10,566,000 | | | 7,578,000 | | | 3,986,243 | | | 2,553,471 |
Extended-Duration Bond Fund | | | 25,806,958 | | | 26,857,858 | | | 2,066,000 | | | 6,434,000 | | | 2,793,458 | | | 60,083 |
Global Bond Fund | | | 12,580,825 | | | 16,088,976 | | | 678,000 | | | 1,652,000 | | | 1,034,467 | | | — |
Equity Index Fund | | | 7,331,849 | | | 10,211,786 | | | 980,000 | | | 136,000 | | | 269,933 | | | — |
Value Equity Fund | | | 35,536,821 | | | 45,994,391 | | | 4,390,000 | | | 2,472,000 | | | 1,323,751 | | | — |
Growth Equity Fund | | | 33,369,069 | | | 46,719,156 | | | 3,620,000 | | | 3,635,000 | | | 118,650 | | | — |
Small Cap Equity Fund | | | 8,481,111 | | | 11,326,329 | | | 656,000 | | | 300,000 | | | 54,944 | | | — |
International Equity Fund | | | 36,194,674 | | | 49,058,573 | | | 5,250,000 | | | 7,160,000 | | | 1,414,504 | | | 545 |
| | | | | | | | | | | | | | | | | | |
| | $ | 259,224,586 | | $ | 323,173,105 | | $ | 67,348,888 | | $ | 67,660,895 | | $ | 12,839,358 | | $ | 2,614,099 |
| | | | | | | | | | | | | | | | | | |
| | | | | | |
Growth Allocation Fund I | | | | | | | | | | | | | | | | | | |
Money Market Fund | | $ | 3,473,075 | | $ | 2,782,247 | | $ | 16,941,857 | | $ | 17,632,848 | | $ | 13,481 | | $ | — |
Low-Duration Bond Fund | | | 12,236,460 | | | 14,605,734 | | | 2,876,000 | | | 1,889,000 | | | 572,275 | | | — |
Medium-Duration Bond Fund | | | 17,878,309 | | | 21,206,796 | | | 3,632,000 | | | 2,994,000 | | | 1,226,551 | | | 791,362 |
Extended-Duration Bond Fund | | | 8,257,704 | | | 8,549,204 | | | 564,000 | | | 1,979,000 | | | 881,840 | | | 18,508 |
Global Bond Fund | | | 3,956,674 | | | 5,146,284 | | | 108,000 | | | 339,000 | | | 325,468 | | | — |
Equity Index Fund | | | 7,317,326 | | | 9,620,692 | | | 524,000 | | | 228,000 | | | 268,025 | | | — |
Value Equity Fund | | | 34,017,017 | | | 43,694,274 | | | 2,764,000 | | | 908,000 | | | 1,243,699 | | | — |
Growth Equity Fund | | | 31,779,658 | | | 44,082,873 | | | 2,044,000 | | | 1,987,000 | | | 108,942 | | | — |
Small Cap Equity Fund | | | 7,777,936 | | | 10,908,264 | | | 948,000 | | | 160,000 | | | 51,866 | | | — |
International Equity Fund | | | 34,569,205 | | | 47,066,296 | | | 3,380,000 | | | 4,284,000 | | | 1,327,924 | | | 507 |
| | | | | | | | | | | | | | | | | | |
| | $ | 161,263,364 | | $ | 207,662,664 | | $ | 33,781,857 | | $ | 32,400,848 | | $ | 6,020,069 | | $ | 810,377 |
| | | | | | | | | | | | | | | | | | |
| | | | | | |
Aggressive Allocation Fund I | | | | | | | | | | | | | | | | | | |
Money Market Fund | | $ | 2,108,707 | | $ | 2,391,427 | | $ | 12,389,103 | | $ | 12,106,543 | | $ | 12,515 | | $ | — |
Equity Index Fund | | | 6,789,344 | | | 8,798,088 | | | 480,000 | | | 308,000 | | | 241,517 | | | — |
Value Equity Fund | | | 30,831,473 | | | 39,338,327 | | | 2,140,000 | | | 586,000 | | | 1,106,790 | | | — |
Growth Equity Fund | | | 29,811,694 | | | 39,969,950 | | | 1,324,000 | | | 2,132,000 | | | 96,953 | | | — |
Small Cap Equity Fund | | | 7,419,483 | | | 9,950,718 | | | 668,000 | | | 292,000 | | | 47,725 | | | — |
International Equity Fund | | | 32,272,915 | | | 42,547,374 | | | 1,530,000 | | | 2,964,000 | | | 1,188,571 | | | 450 |
| | | | | | | | | | | | | | | | | | |
| | $ | 109,233,616 | | $ | 142,995,884 | | $ | 18,531,103 | | $ | 18,388,543 | | $ | 2,694,071 | | $ | 450 |
| | | | | | | | | | | | | | | | | | |
217
NOTES TO FINANCIAL STATEMENTS—(Continued)
4. SECURITIES LENDING
Through an agreement with The Northern Trust Company (“Northern Trust”) (the Funds’ custodian) the Select Funds may lend portfolio securities to certain brokers, dealers and other financial institutions that pay the Select Funds a negotiated fee. The Select Funds receive cash or U.S. government securities as collateral against the loaned securities in an amount at least equal to the market value of the loaned securities. The Funds continue to own the loaned securities and the securities remain in the investment portfolio. However, in the event of default or bankruptcy by the other party to the agreement, realization and/or retention of the collateral may be subject to legal proceedings. Cash collateral has been invested in a short-term money market fund of Northern Trust, an affiliate of the Funds, that invests in securities that satisfy the quality requirements of Rule 2a-7 and have short maturities. At December 31, 2009, the market values of loaned securities and collateral received were as follows:
| | | | | | | | | | | | |
Fund | | Value of
Securities
Loaned | | Value of Cash
Collateral | | Value of
Non-cash
Collateral | | Total Value of
Collateral |
Money Market | | $ | 69,926,990 | | $ | 71,313,750 | | $ | — | | $ | 71,313,750 |
Low-Duration Bond | | | 51,357,050 | | | 52,482,052 | | | — | | | 52,482,052 |
Medium-Duration Bond | | | 161,307,687 | | | 165,010,049 | | | — | | | 165,010,049 |
Extended-Duration Bond | | | 38,271,474 | | | 39,267,942 | | | — | | | 39,267,942 |
Inflation Protected Bond | | | 38,797,058 | | | 39,658,228 | | | — | | | 39,658,228 |
Global Bond | | | 34,383,671 | | | 35,007,405 | | | — | | | 35,007,405 |
Equity Index | | | 45,207,192 | | | 46,798,625 | | | — | | | 46,798,625 |
Real Estate Securities | | | 56,669,396 | | | 59,066,649 | | | — | | | 59,066,649 |
Value Equity | | | 110,381,781 | | | 114,534,540 | | | 49,643 | | | 114,584,183 |
Growth Equity | | | 184,498,548 | | | 190,203,025 | | | — | | | 190,203,025 |
Small Cap Equity | | | 124,082,458 | | | 128,525,687 | | | — | | | 128,525,687 |
International Equity | | | 114,068,939 | | | 118,006,826 | | | 1,429,556 | | | 119,436,382 |
5. 10% SHAREHOLDERS
The Date Target and Asset Allocation Funds do not invest in the underlying Select Funds for the purpose of exercising management or control; however, investments made by each Date Target and Asset Allocation Fund within each of its principal investment strategies may represent a significant portion of an underlying Select Fund’s net assets. At December 31, 2009, the Date Target and Asset Allocation Funds were the owner of record of the following approximate percentages of the total outstanding shares of the underlying Select Funds as detailed below:
| | | | | | | | | | | | | | | | | | | | | | | | | | | | | | | | | |
Fund | | Low-
Duration
Bond | | | Medium-
Duration
Bond | | | Extended-
Duration
Bond | | | Inflation
Protected
Bond | | | Global
Bond | | | Equity
Index | | | Real
Estate
Securities | | | Value
Equity | | | Growth
Equity | | | Small
Cap
Equity | | | International
Equity | |
MyDestination 2005 | | 1.67 | % | | 1.03 | % | | 0.12 | % | | 11.08 | % | | 0.46 | % | | 0.34 | % | | 1.99 | % | | 0.58 | % | | 0.58 | % | | 0.49 | % | | 0.59 | % |
MyDestination 2015 | | 1.95 | | | 2.14 | | | 1.68 | | | 24.09 | | | 4.63 | | | 1.45 | | | 11.38 | | | 2.57 | | | 2.56 | | | 2.21 | | | 2.55 | |
MyDestination 2025 | | — | | | 1.10 | | | 2.21 | | | — | | | 5.43 | | | 1.29 | | | 9.75 | | | 2.40 | | | 2.38 | | | 2.54 | | | 2.51 | |
MyDestination 2035 | | — | | | 0.13 | | | 0.26 | | | — | | | 1.39 | | | 0.66 | | | 4.49 | | | 1.23 | | | 1.22 | | | 1.49 | | | 1.32 | |
MyDestination 2045 | | — | | | — | | | — | | | — | | | — | | | 0.48 | | | 3.47 | | | 0.75 | | | 0.75 | | | 0.95 | | | 0.82 | |
Conservative Allocation | | 22.23 | | | — | | | — | | | 46.56 | | | — | | | 1.10 | | | — | | | 1.47 | | | 1.48 | | | 1.11 | | | 1.53 | |
Balanced Allocation | | 21.66 | | | 20.83 | | | 17.15 | | | — | | | 25.06 | | | 7.92 | | | — | | | 11.70 | | | 11.68 | | | 8.63 | | | 11.93 | |
Growth Allocation | | 7.92 | | | 7.64 | | | 6.37 | | | — | | | 9.36 | | | 8.71 | | | — | | | 12.98 | | | 12.87 | | | 9.71 | | | 13.36 | |
Aggressive Allocation | | — | | | — | | | — | | | — | | | — | | | 10.10 | | | — | | | 14.82 | | | 14.79 | | | 11.22 | | | 15.32 | |
Conservative Allocation I | | 7.57 | | | — | | | — | | | 10.57 | | | — | | | 0.47 | | | — | | | 0.65 | | | 0.53 | | | 0.38 | | | 0.45 | |
Balanced Allocation I | | 9.41 | | | 10.79 | | | 10.86 | | | — | | | 7.26 | | | 4.30 | | | — | | | 6.60 | | | 5.38 | | | 3.76 | | | 4.48 | |
Growth Allocation I | | 2.95 | | | 3.39 | | | 3.46 | | | — | | | 2.32 | | | 4.05 | | | — | | | 6.27 | | | 5.08 | | | 3.62 | | | 4.30 | |
Aggressive Allocation I | | — | | | — | | | — | | | — | | | — | | | 3.71 | | | — | | | 5.64 | | | 4.60 | | | 3.30 | | | 3.89 | |
218
NOTES TO FINANCIAL STATEMENTS—(Continued)
6. INVESTMENT TRANSACTIONS
For the period ended December 31, 2009, the cost of purchases and proceeds from sales and maturities for each Fund were as follows:
| | | | | | | | | | | | |
| | | Cost of Purchases and Proceeds from
Sales and Maturities of Long-Term
Securities (other than U.S. Government
Obligations) | | Cost of Purchases and Proceeds from
Sales and Maturities of Long-Term U.S.
Government Obligations |
| | | Purchases | | Sale and Maturity
Proceeds | | Purchases | | Sale and Maturity
Proceeds |
MyDestination 2005 | | $ | 25,118,307 | | $ | 21,327,992 | | $ | 10,390,893 | | $ | 10,402,160 |
MyDestination 2015 | | | 57,573,374 | | | 29,312,496 | | | 14,691,776 | | | 13,110,170 |
MyDestination 2025 | | | 41,838,720 | | | 9,214,515 | | | 8,132,582 | | | 7,357,555 |
MyDestination 2035 | | | 19,821,500 | | | 794,000 | | | 1,454,962 | | | 1,275,293 |
MyDestination 2045 | | | 16,789,780 | | | 1,916,170 | | | — | | | — |
Conservative Allocation | | | 61,105,000 | | | 72,940,000 | | | 21,937,839 | | | 16,781,955 |
Balanced Allocation | | | 95,400,000 | | | 114,550,000 | | | 93,009,803 | | | 78,353,336 |
Growth Allocation | | | 43,400,003 | | | 59,500,000 | | | 35,094,594 | | | 30,715,588 |
Aggressive Allocation | | | 16,600,000 | | | 16,550,000 | | | — | | | — |
Conservative Allocation I | | | 15,820,000 | | | 14,992,000 | | | 5,023,833 | | | 5,011,605 |
Balanced Allocation I | | | 37,406,000 | | | 34,460,000 | | | 23,116,772 | | | 19,938,022 |
Growth Allocation I | | | 16,840,000 | | | 14,768,000 | | | 8,350,371 | | | 7,283,161 |
Aggressive Allocation I | | | 6,142,000 | | | 6,282,000 | | | — | | | — |
Low-Duration Bond | | | 1,518,167,037 | | | 1,521,993,889 | | | 572,969,803 | | | 609,902,179 |
Medium-Duration Bond | | | 242,850,191 | | | 290,825,201 | | | 3,916,598,184 | | | 4,063,149,786 |
Extended-Duration Bond | | | 156,505,312 | | | 221,930,177 | | | 9,437,099 | | | 2,246,892 |
Inflation Protected Bond | | | — | | | — | | | 117,478,510 | | | 39,317,887 |
Global Bond | | | 48,837,558 | | | 43,657,325 | | | 121,032,540 | | | 129,945,380 |
Equity Index | | | 32,824,572 | | | 12,164,009 | | | — | | | — |
Real Estate Securities | | | 124,074,712 | | | 110,288,969 | | | — | | | — |
Value Equity | | | 314,178,963 | | | 315,380,585 | | | — | | | — |
Growth Equity | | | 788,846,281 | | | 810,427,990 | | | — | | | — |
Small Cap Equity | | | 265,776,068 | | | 258,208,791 | | | 179,243,046 | | | 173,792,476 |
International Equity | | | 683,775,828 | | | 793,891,469 | | | — | | | — |
Futures Contracts
Investments as of December 31, 2009, included cash and securities that were valued and pledged as collateral to cover initial margin deposits. The market value of the open futures contracts is as follows:
| | | | | | | | |
| | | Open Long
(Short) Contracts | | Market Value
of Contracts | | Net Unrealized
Appreciation
(Depreciation)
on Futures |
MyDestination 2015 Fund | | | | | | | | |
March 2010 S&P 500® E-Mini | | 45 | | $ | 2,499,075 | | $ | 27,678 |
| | | | | | | | |
MyDestination 2025 Fund | | | | | | | | |
March 2010 S&P 500® E-Mini | | 47 | | $ | 2,610,145 | | $ | 17,969 |
| | | | | | | | |
MyDestination 2035 Fund | | | | | | | | |
March 2010 S&P 500® E-Mini | | 35 | | $ | 1,943,725 | | $ | 13,860 |
| | | | | | | | |
MyDestination 2045 Fund | | | | | | | | |
March 2010 S&P 500® E-Mini | | 24 | | $ | 1,332,840 | | $ | 5,506 |
| | | | | | | | |
Conservative Allocation Fund | | | | | | | | |
March 2010 S&P 500® | | 5 | | $ | 1,388,375 | | $ | 20,129 |
| | | | | | | | |
Balanced Allocation Fund | | | | | | | | |
March 2010 S&P 500® | | 50 | | $ | 13,883,750 | | $ | 69,500 |
| | | | | | | | |
219
NOTES TO FINANCIAL STATEMENTS—(Continued)
| | | | | | | | | | | |
| | | Open Long
(Short) Contracts | | | Market Value
of Contracts | | | Net Unrealized
Appreciation
(Depreciation)
on Futures | |
Growth Allocation Fund | | | | | | | | | | | |
March 2010 S&P 500® | | 45 | | | $ | 12,495,375 | | | $ | 122,434 | |
| | | | | | | | | | | |
Aggressive Allocation Fund | | | | | | | | | | | |
March 2010 S&P 500® | | 47 | | | $ | 13,050,725 | | | $ | 192,130 | |
| | | | | | | | | | | |
Balanced Allocation Fund I | | | | | | | | | | | |
March 2010 S&P 500® E-Mini | | 55 | | | $ | 3,054,425 | | | $ | 49,782 | |
| | | | | | | | | | | |
Growth Allocation Fund I | | | | | | | | | | | |
March 2010 S&P 500® E-Mini | | 54 | | | $ | 2,998,890 | | | $ | 40,541 | |
| | | | | | | | | | | |
Aggressive Allocation Fund I | | | | | | | | | | | |
March 2010 S&P 500® E-Mini | | 46 | | | $ | 2,554,610 | | | $ | 41,289 | |
| | | | | | | | | | | |
Low-Duration Bond Fund | | | | | | | | | | | |
March 2010 90-Day Euro | | 66 | | | $ | 16,441,425 | | | $ | 230,175 | |
March 2010 2-Year U.S.Treasury Note | | 536 | | | | 115,918,375 | | | | (512,769 | ) |
March 2010 2-Year U.S.Treasury Note | | (10 | ) | | | 2,162,656 | | | | 8,871 | |
March 2010 5-Year U.S.Treasury Note | | (156 | ) | | | (17,843,720 | ) | | | 282,345 | |
March 2010 10-Year U.S. Treasury Note | | 11 | | | | 1,269,984 | | | | (31,391 | ) |
March 2010 10-Year U.S. Treasury Note | | (5 | ) | | | 577,266 | | | | 14,513 | |
March 2010 Euro-BOBL | | 20 | | | | 3,316,083 | | | | (24,128 | ) |
June 2010 90-Day EURIBOR | | 108 | | | | 38,266,488 | | | | 61,644 | |
| | | | | | | | | | | |
| | | | | | | | | $ | 29,260 | |
| | | | | | | | | | | |
Medium-Duration Bond Fund | | | | | | | | | | | |
January 2010 90-Day Euro | | 86 | | | $ | 21,443,563 | | | $ | 7,871 | |
March 2010 90-Day Euro | | 128 | | | | 31,886,402 | | | | 302,065 | |
March 2010 2-Year U.S.Treasury Note | | 193 | | | | 41,739,267 | | | | (216,082 | ) |
March 2010 5-Year U.S.Treasury Note | | 181 | | | | 20,703,290 | | | | (368,744 | ) |
March 2010 5-Year U.S.Treasury Note | | (119 | ) | | | 13,611,555 | | | | 193,121 | |
March 2010 10-Year U.S. Treasury Note | | 208 | | | | 24,014,251 | | | | (701,178 | ) |
March 2010 10-Year U.S. Treasury Note | | (103 | ) | | | 11,891,673 | | | | 330,103 | |
March 2010 Euro-BOBL | | 57 | | | | 9,450,838 | | | | (77,355 | ) |
March 2010 Euro-Bund | | 14 | | | | 2,432,244 | | | | (33,101 | ) |
March 2010 U.S. LongTreasury Bond | | 110 | | | | 12,691,250 | | | | (380,122 | ) |
June 2010 90-Day EURIBOR | | 17 | | | | 6,023,429 | | | | 25,876 | |
June 2010 90-Day Euro | | 44 | | | | 10,925,200 | | | | 79,200 | |
June 2010 90-Day Sterling | | 127 | | | | 25,384,819 | | | | 187,181 | |
September 2010 90-Day EURIBOR | | 103 | | | | 36,356,463 | | | | 250,565 | |
September 2010 90-Day Euro | | 376 | | | | 92,966,000 | | | | 655,207 | |
| | | | | | | | | | | |
| | | | | | | | | $ | 254,607 | |
| | | | | | | | | | | |
Inflation Protected Bond Fund | | | | | | | | | | | |
March 2010 2-Year U.S.Treasury Note | | 27 | | | $ | 5,839,172 | | | $ | (31,507 | ) |
March 2010 5-Year U.S.Treasury Note | | 4 | | | | 457,531 | | | | (3,492 | ) |
220
NOTES TO FINANCIAL STATEMENTS—(Continued)
| | | | | | | | | | | |
| | | Open Long
(Short) Contracts | | | Market Value
of Contracts | | | Net Unrealized
Appreciation
(Depreciation)
on Futures | |
March 2010 10-Year U.S. Treasury Note | | 5 | | | $ | 577,266 | | | $ | (1,496 | ) |
March 2010 U.S. LongTreasury Bond | | (10 | ) | | | (1,153,750 | ) | | | 39,673 | |
| | | | | | | | | | | |
| | | | | | | | | $ | 3,178 | |
| | | | | | | | | | | |
Global Bond Fund | | | | | | | | | | | |
March 2010 90-Day Sterling | | (4 | ) | | $ | (739,437 | ) | | $ | 18,646 | |
March 2010 5-Year U.S.Treasury Note | | (58 | ) | | | (6,634,203 | ) | | | 116,468 | |
March 2010 10-Year U.S. Treasury Note | | 13 | | | | 1,500,891 | | | | (37,105 | ) |
March 2010 Euro-BOBL | | (4 | ) | | | (663,217 | ) | | | 5,476 | |
| | | | | | | | | | | |
| | | | | | | | | $ | 103,485 | |
| | | | | | | | | | | |
Equity Index Fund | | | | | | | | | | | |
March 2010 S&P 500® | | 34 | | | $ | 9,440,950 | | | $ | 145,392 | |
| | | | | | | | | | | |
Real Estate Securities Fund | | | | | | | | | | | |
March 2010 Russell 2000® IMM-Mini | | 79 | | | $ | 4,928,810 | | | $ | 167,085 | |
| | | | | | | | | | | |
Value Equity Fund | | | | | | | | | | | |
September 2009 S&P 500® | | 123 | | | $ | 34,154,025 | | | $ | 428,988 | |
September 2009 S&P 500® E-Mini | | 41 | | | | 2,276,935 | | | | 39,632 | |
| | | | | | | | | | | |
| | | | | | | | | $ | 468,620 | |
| | | | | | | | | | | |
Growth Equity Fund | | | | | | | | | | | |
March 2010 S&P 500® | | 184 | | | $ | 51,092,200 | | | $ | 625,462 | |
| | | | | | | | | | | |
Small Cap Equity Fund | | | | | | | | | | | |
March 2010 90-Day Euro | | 10 | | | $ | 2,491,126 | | | $ | 13,368 | |
March 2010 2-Year U.S.Treasury Note | | 1 | | | | 216,266 | | | | (972 | ) |
March 2010 5-Year U.S.Treasury Note | | (34 | ) | | | (3,889,015 | ) | | | 58,234 | |
March 2010 10-Year U.S. Treasury Note | | 53 | | | | 6,119,014 | | | | (122,252 | ) |
March 2010 Euro-Bund | | (5 | ) | | | (868,659 | ) | | | 12,937 | |
March 2010 Russell 2000® IMM-Mini | | 933 | | | | 58,209,870 | | | | 2,605,830 | |
March 2010 U.S. LongTreasury Bond | | (12 | ) | | | (1,384,500 | ) | | | 62,087 | |
| | | | | | | | | | | |
| | | | | | | | | $ | 2,629,232 | |
| | | | | | | | | | | |
International Equity Fund | | | | | | | | | | | |
January 2010 AEX Index | | 52 | | | $ | 5,001,936 | | | $ | 155,585 | |
January 2010 CAC40 Index | | 54 | | | | 3,051,178 | | | | 75,123 | |
January 2010 Hang Seng Index | | (6 | ) | | | (848,340 | ) | | | (27,421 | ) |
January 2010 IBEX 35 | | 20 | | | | 3,418,726 | | | | 72,189 | |
January 2010 OMX Index | | 40 | | | | 532,520 | | | | (1,815 | ) |
March 2010 DAX Index | | (2 | ) | | | (427,161 | ) | | | (11,170 | ) |
March 2010 FTSE 100 Index® | | 59 | | | | 5,109,324 | | | | 102,678 | |
March 2010 MSCI EAFE Index E-Mini | | 469 | | | | 36,788,360 | | | | (178,602 | ) |
March 2010 MSCI Emerging Markets E-Mini | | 182 | | | | 8,986,250 | | | | 12,351 | |
March 2010 S&P MIB Index | | 31 | | | | 5,173,483 | | | | 129,657 | |
March 2010 S&P/TSE 60 Index | | (12 | ) | | | (1,585,236 | ) | | | (33,703 | ) |
221
NOTES TO FINANCIAL STATEMENTS—(Continued)
| | | | | | | | | | | |
| | | Open Long
(Short) Contracts | | | Market Value
of Contracts | | | Net Unrealized
Appreciation
(Depreciation)
on Futures | |
March 2010 SPI 200 Index® | | (71 | ) | | $ | (7,779,017 | ) | | $ | (362,402 | ) |
March 2010 Swiss Synthetic Future | | 74 | | | | 4,703,271 | | | | (13,225 | ) |
March 2010 Swiss Synthetic Future | | (74 | ) | | | (4,802,600 | ) | | | (82,796 | ) |
March 2010 TOPIX Index® | | (13 | ) | | | (1,262,511 | ) | | | (13,671 | ) |
| | | | | | | | | | | |
| | | | | | | | | $ | (177,222 | ) |
| | | | | | | | | | | |
Forward Foreign Currency Contracts
As of December 31, 2009, the following Funds have forward foreign currency exchange contracts that obligate them to deliver currencies at specified future dates. The unrealized appreciation and/or depreciation on these contracts is included in the accompanying financial statements. The terms of the open contracts are as follows:
| | | | | | | | | | | | | | |
Fund/ Expiration
Date | | Currency to be Delivered | | Counter-
party | | Amount of
Currency to
be Delivered | | Currency to be Received | | Amount of
Currency
to be
Received | | Net
Unrealized
Appreciation
(Depreciation) | |
Low-Duration Bond Fund | | | | | | | | | | | | |
01/11/10 | | Australian Dollars | | RBS | | 86,000 | | U.S. Dollars | | 77,161 | | $ | 2,578 | |
01/11/10 | | Euro | | CITIG | | 5,528,000 | | U.S. Dollars | | 7,924,573 | | | 268,234 | |
01/11/10 | | Euro | | CITIG | | 1,558,000 | | U.S. Dollars | | 2,233,445 | | | 62,069 | |
01/13/10 | | U.S. Dollars | | BNP | | 436,069 | | United Kingdom Pounds | | 270,000 | | | (13,584 | ) |
01/13/10 | | U.S. Dollars | | HSBC | | 784,925 | | United Kingdom Pounds | | 486,000 | | | (24,946 | ) |
01/13/10 | | United Kingdom Pounds | | CITI | | 2,918,000 | | U.S. Dollars | | 4,712,779 | | | 140,322 | |
01/14/10 | | Japanese Yen | | CS | | 5,780,000 | | U.S. Dollars | | 62,065 | | | 3,417 | |
01/20/10 | | Euro | | CITI | | 763,500 | | U.S. Dollars | | 1,094,493 | | | 60,748 | |
01/20/10 | | Euro | | CITIG | | 2,264,000 | | U.S. Dollars | | 3,245,491 | | | 119,947 | |
01/20/10 | | Euro | | CITIG | | 996,000 | | U.S. Dollars | | 1,427,786 | | | 61,989 | |
01/20/10 | | Euro | | CITIG | | 859,500 | | U.S. Dollars | | 1,232,111 | | | 30,514 | |
01/20/10 | | U.S. Dollars | | CITIG | | 129,017 | | Euro | | 90,000 | | | (3,278 | ) |
01/26/10 | | Euro | | DEUT | | 5,565,000 | | U.S. Dollars | | 7,977,494 | | | 5,944 | |
02/02/10 | | Brazilian Reals | | HSBC | | 17,400 | | U.S. Dollars | | 9,923 | | | 77 | |
02/02/10 | | Brazilian Reals | | HSBC | | 15,651 | | U.S. Dollars | | 8,925 | | | 75 | |
02/02/10 | | Brazilian Reals | | JPM | | 6,964 | | U.S. Dollars | | 3,971 | | | 29 | |
02/02/10 | | Brazilian Reals | | RBS | | 6,955 | | U.S. Dollars | | 3,966 | | | 34 | |
03/17/10 | | Euro | | GSC | | 4,525,000 | | U.S. Dollars | | 6,486,053 | | | 86,759 | |
03/29/10 | | Chinese Yuan Renminbi | | BAR | | 1,078,576 | | U.S. Dollars | | 158,129 | | | 871 | |
03/29/10 | | Chinese Yuan Renminbi | | DEUT | | 7,063,666 | | U.S. Dollars | | 1,035,596 | | | 11,804 | |
03/29/10 | | Chinese Yuan Renminbi | | DEUT | | 14,395,071 | | U.S. Dollars | | 2,110,446 | | | 10,531 | |
03/29/10 | | U.S. Dollars | | BAR | | 167,134 | | Chinese Yuan Renminbi | | 1,140,000 | | | (1,580 | ) |
03/29/10 | | U.S. Dollars | | DEUT | | 794,143 | | Chinese Yuan Renminbi | | 5,416,747 | | | (8,457 | ) |
03/29/10 | | U.S. Dollars | | DEUT | | 1,351 | | Chinese Yuan Renminbi | | 9,214 | | | (11 | ) |
03/29/10 | | U.S. Dollars | | HKSB | | 1,143,020 | | Chinese Yuan Renminbi | | 7,796,386 | | | (9,780 | ) |
03/29/10 | | U.S. Dollars | | JPM | | 10,673 | | Chinese Yuan Renminbi | | 72,800 | | | (98 | ) |
03/29/10 | | U.S. Dollars | | MLCS | | 1,187,850 | | Chinese Yuan Renminbi | | 8,102,165 | | | (11,583 | ) |
06/07/10 | | Chinese Yuan Renminbi | | BAR | | 922,257 | | U.S. Dollars | | 135,367 | | | 633 | |
06/07/10 | | Chinese Yuan Renminbi | | DEUT | | 4,573,395 | | U.S. Dollars | | 671,274 | | | 3,766 | |
06/07/10 | | Chinese Yuan Renminbi | | JPM | | 17,135,189 | | U.S. Dollars | | 2,515,069 | | | 18,785 | |
06/07/10 | | U.S. Dollars | | BAR | | 582,429 | | Chinese Yuan Renminbi | | 3,968,093 | | | (6,571 | ) |
06/07/10 | | U.S. Dollars | | BAR | | 579,204 | | Chinese Yuan Renminbi | | 3,946,124 | | | (6,796 | ) |
06/07/10 | | U.S. Dollars | | DEUT | | 349,895 | | Chinese Yuan Renminbi | | 2,383,836 | | | (4,105 | ) |
06/07/10 | | U.S. Dollars | | HKSB | | 657,044 | | Chinese Yuan Renminbi | | 4,476,448 | | | (7,956 | ) |
222
NOTES TO FINANCIAL STATEMENTS—(Continued)
| | | | | | | | | | | | | | |
Fund/ Expiration
Date | | Currency to be Delivered | | Counter-
party | | Amount of
Currency to
be Delivered | | Currency to be Received | | Amount of
Currency to
be Received | | Net
Unrealized
Appreciation
(Depreciation) | |
06/07/10 | | U.S. Dollars | | JPM | | 604,723 | | Chinese Yuan Renminbi | | 4,119,984 | | $ | (7,277 | ) |
06/07/10 | | U.S. Dollars | | JPM | | 128,550 | | Chinese Yuan Renminbi | | 875,810 | | | (1,450 | ) |
06/07/10 | | U.S. Dollars | | MLCS | | 188,785 | | Chinese Yuan Renminbi | | 1,286,194 | | | (2,215 | ) |
06/07/10 | | U.S. Dollars | | MLCS | | 231,080 | | Chinese Yuan Renminbi | | 1,574,352 | | | (2,920 | ) |
11/17/10 | | U.S. Dollars | | DEUT | | 2,124,286 | | Chinese Yuan Renminbi | | 14,395,071 | | | (44,627 | ) |
11/17/10 | | U.S. Dollars | | GSC | | 1,022,727 | | Chinese Yuan Renminbi | | 6,930,440 | | | (22,273 | ) |
11/23/10 | | U.S. Dollars | | BAR | | 155,586 | | Chinese Yuan Renminbi | | 1,054,090 | | | (3,414 | ) |
11/23/10 | | U.S. Dollars | | JPM | | 2,529,187 | | Chinese Yuan Renminbi | | 17,135,189 | | | (50,637 | ) |
06/15/11 | | U.S. Dollars | | HSBC | | 48,537 | | Chinese Yuan Renminbi | | 319,176 | | | 537 | |
11/04/11 | | U.S. Dollars | | DEUT | | 388,036 | | Chinese Yuan Renminbi | | 2,490,150 | | | (1,964 | ) |
| | | | | | | | | | | | | | |
| | | | | | | | | | | | $ | 654,141 | |
| | | | | | | | | | | | | | |
Medium-Duration Bond Fund | | | | | | | | | | | | |
01/13/10 | | Euro | | HSBC | | 223,249 | | U.S. Dollars | | 320,034 | | $ | 14,546 | |
01/13/10 | | U.S. Dollars | | BNP | | 720,322 | | United Kingdom Pounds | | 446,000 | | | (22,439 | ) |
01/13/10 | | U.S. Dollars | | BNP | | 1,296,902 | | United Kingdom Pounds | | 803,000 | | | (41,217 | ) |
01/13/10 | | U.S. Dollars | | GSC | | 4,160,424 | | United Kingdom Pounds | | 2,576,000 | | | 38,850 | |
01/13/10 | | United Kingdom Pounds | | CITI | | 4,302,000 | | U.S. Dollars | | 6,948,038 | | | 206,876 | |
01/14/10 | | Japanese Yen | | CS | | 3,447,000 | | U.S. Dollars | | 37,014 | | | 2,038 | |
01/21/10 | | Canadian Dollars | | JPM | | 1,782,000 | | U.S. Dollars | | 1,703,911 | | | (29,899 | ) |
01/21/10 | | U.S. Dollars | | RBS | | 1,781,362 | | Canadian Dollars | | 1,863,000 | | | 12,141 | |
01/26/10 | | Euro | | BTAB | | 2,182,000 | | U.S. Dollars | | 3,127,923 | | | 2,331 | |
02/02/10 | | Brazilian Reals | | BTAB | | 826,454 | | U.S. Dollars | | 471,294 | | | (15,294 | ) |
02/02/10 | | Brazilian Reals | | BTAB | | 803,152 | | U.S. Dollars | | 458,005 | | | (14,005 | ) |
02/02/10 | | Brazilian Reals | | GSC | | 802,796 | | U.S. Dollars | | 457,803 | | | (13,803 | ) |
02/02/10 | | Brazilian Reals | | HKSB | | 826,090 | | U.S. Dollars | | 471,086 | | | (15,086 | ) |
02/02/10 | | Brazilian Reals | | HSBC | | 1,076,441 | | U.S. Dollars | | 613,852 | | | 5,148 | |
02/02/10 | | Brazilian Reals | | HSBC | | 1,202,340 | | U.S. Dollars | | 685,647 | | | 5,353 | |
02/02/10 | | Brazilian Reals | | JPM | | 539,710 | | U.S. Dollars | | 307,775 | | | 2,225 | |
02/02/10 | | Brazilian Reals | | RBS | | 516,424 | | U.S. Dollars | | 294,496 | | | 2,504 | |
02/02/10 | | U.S. Dollars | | HKSB | | 3,989,974 | | Brazilian Reals | | 6,996,759 | | | 353,409 | |
02/12/10 | | U.S. Dollars | | BTAB | | 2,106 | | Malaysian Ringgits | | 7,224 | | | (33 | ) |
02/12/10 | | U.S. Dollars | | BTAB | | 292 | | Malaysian Ringgits | | 1,000 | | | (6 | ) |
02/12/10 | | U.S. Dollars | | CITI | | 76 | | Malaysian Ringgits | | 260 | | | 2 | |
02/17/10 | | Canadian Dollars | | CS | | 1,842,980 | | U.S. Dollars | | 1,762,198 | | | (30,155 | ) |
02/17/10 | | U.S. Dollars | | JPM | | 1,123,692 | | Canadian Dollars | | 1,175,203 | | | 17,451 | |
03/17/10 | | Euro | | GSC | | 8,056,000 | | U.S. Dollars | | 11,547,324 | | | 154,460 | |
03/29/10 | | Chinese Yuan Renminbi | | BAR | | 1,248,165 | | U.S. Dollars | | 182,992 | | | 1,008 | |
03/29/10 | | Chinese Yuan Renminbi | | DEUT | | 16,664,586 | | U.S. Dollars | | 2,443,177 | | | 12,192 | |
03/29/10 | | Chinese Yuan Renminbi | | JPM | | 8,173,728 | | U.S. Dollars | | 1,198,341 | | | 13,659 | |
03/29/10 | | U.S. Dollars | | BAR | | 12,359 | | Chinese Yuan Renminbi | | 84,300 | | | (113 | ) |
03/29/10 | | U.S. Dollars | | BTAB | | 1,568 | | Chinese Yuan Renminbi | | 10,697 | | | (13 | ) |
03/29/10 | | U.S. Dollars | | CITI | | 1,374,911 | | Chinese Yuan Renminbi | | 9,378,089 | | | (13,407 | ) |
03/29/10 | | U.S. Dollars | | DEUT | | 1,322,980 | | Chinese Yuan Renminbi | | 9,023,871 | | | (11,320 | ) |
03/29/10 | | U.S. Dollars | | DEUT | | 193,480 | | Chinese Yuan Renminbi | | 1,319,700 | | | (1,829 | ) |
03/29/10 | | U.S. Dollars | | DEUT | | 919,212 | | Chinese Yuan Renminbi | | 6,269,821 | | | (9,788 | ) |
04/22/10 | | U.S. Dollars | | JPM | | 90,664 | | Mexican Pesos | | 1,202,254 | | | 567 | |
06/07/10 | | Chinese Yuan Renminbi | | BAR | | 1,071,445 | | U.S. Dollars | | 157,265 | | | 735 | |
06/07/10 | | Chinese Yuan Renminbi | | BTAB | | 5,304,395 | | U.S. Dollars | | 778,569 | | | 4,368 | |
06/07/10 | | Chinese Yuan Renminbi | | JPM | | 21,864,223 | | U.S. Dollars | | 3,209,187 | | | 23,969 | |
06/07/10 | | U.S. Dollars | | BAR | | 710,978 | | Chinese Yuan Renminbi | | 4,843,903 | | | (8,022 | ) |
06/07/10 | | U.S. Dollars | | BAR | | 707,697 | | Chinese Yuan Renminbi | | 4,821,544 | | | (8,303 | ) |
223
NOTES TO FINANCIAL STATEMENTS—(Continued)
| | | | | | | | | | | | | | |
Fund/ Expiration
Date | | Currency to be Delivered | | Counter-
party | | Amount of
Currency to
be Delivered | | Currency to be Received | | Amount of
Currency to
be Received | | Net
Unrealized
Appreciation
(Depreciation) | |
06/07/10 | | U.S. Dollars | | CITI | | 282,431 | | Chinese Yuan Renminbi | | 1,924,208 | | $ | (3,569 | ) |
06/07/10 | | U.S. Dollars | | CITI | | 229,310 | | Chinese Yuan Renminbi | | 1,562,288 | | | (2,690 | ) |
06/07/10 | | U.S. Dollars | | DEUT | | 426,990 | | Chinese Yuan Renminbi | | 2,909,088 | | | (5,010 | ) |
06/07/10 | | U.S. Dollars | | HSBC | | 801,297 | | Chinese Yuan Renminbi | | 5,459,246 | | | (9,703 | ) |
06/07/10 | | U.S. Dollars | | JPM | | 739,106 | | Chinese Yuan Renminbi | | 5,035,536 | | | (8,894 | ) |
06/07/10 | | U.S. Dollars | | JPM | | 247,211 | | Chinese Yuan Renminbi | | 1,684,250 | | | (2,789 | ) |
11/17/10 | | U.S. Dollars | | DEUT | | 2,459,199 | | Chinese Yuan Renminbi | | 16,664,586 | | | (51,663 | ) |
11/17/10 | | U.S. Dollars | | GSC | | 1,504,241 | | Chinese Yuan Renminbi | | 10,193,384 | | | (32,759 | ) |
11/23/10 | | U.S. Dollars | | BAR | | 180,049 | | Chinese Yuan Renminbi | | 1,219,828 | | | (3,951 | ) |
11/23/10 | | U.S. Dollars | | JPM | | 3,227,202 | | Chinese Yuan Renminbi | | 21,864,223 | | | (64,612 | ) |
06/15/11 | | U.S. Dollars | | HKSB | | 1,001,072 | | Chinese Yuan Renminbi | | 6,583,005 | | | 11,072 | |
11/04/11 | | U.S. Dollars | | BTAB | | 800,946 | | Chinese Yuan Renminbi | | 5,139,925 | | | (4,054 | ) |
| | | | | | | | | | | | | | |
| | | | | | | | | | | | $ | 460,478 | |
| | | | | | | | | | | | | | |
Global Bond Fund | | | | | | | | | | | | | | |
02/17/10 | | Australian Dollars | | CS | | 1,170,000 | | U.S. Dollars | | 1,045,849 | | $ | 4,636 | |
02/17/10 | | Australian Dollars | | CS | | 850,000 | | U.S. Dollars | | 759,805 | | | 22,705 | |
02/17/10 | | Australian Dollars | | JPM | | 760,000 | | U.S. Dollars | | 679,355 | | | 12,445 | |
02/17/10 | | Australian Dollars | | MLCS | | 631,336 | | U.S. Dollars | | 564,344 | | | 2,912 | |
02/17/10 | | Euro | | GSC | | 564,482 | | U.S. Dollars | | 809,161 | | | 23,686 | |
02/17/10 | | Euro | | JPM | | 3,689,856 | | U.S. Dollars | | 5,289,257 | | | 176,527 | |
02/17/10 | | Euro | | JPM | | 500,000 | | U.S. Dollars | | 716,729 | | | 30,084 | |
02/17/10 | | Euro | | JPM | | 250,000 | | U.S. Dollars | | 358,365 | | | 10,430 | |
02/17/10 | | Euro | | MLCS | | 6,697,336 | | U.S. Dollars | | 9,600,355 | | | 341,039 | |
02/17/10 | | Euro | | MSCS | | 808,255 | | U.S. Dollars | | 1,158,601 | | | 40,770 | |
02/17/10 | | Japanese Yen | | JPM | | 792,642,781 | | U.S. Dollars | | 8,512,727 | | | 284,641 | |
02/17/10 | | Japanese Yen | | JPM | | 141,912,000 | | U.S. Dollars | | 1,524,089 | | | 75,911 | |
02/17/10 | | Japanese Yen | | MLCS | | 128,025,470 | | U.S. Dollars | | 1,374,952 | | | 46,700 | |
02/17/10 | | Turkish Lira | | CS | | 407,987 | | U.S. Dollars | | 271,173 | | | (3,201 | ) |
02/17/10 | | U.S. Dollars | | CS | | 2,244,801 | | Euro | | 1,566,003 | | | (82,061 | ) |
02/17/10 | | U.S. Dollars | | CS | | 633,641 | | Japanese Yen | | 59,000,000 | | | (37,500 | ) |
02/17/10 | | U.S. Dollars | | DEUT | | 666,490 | | Australian Dollars | | 745,608 | | | (3,290 | ) |
02/17/10 | | U.S. Dollars | | DEUT | | 1,433,459 | | Euro | | 1,000,000 | | | (50,541 | ) |
02/17/10 | | U.S. Dollars | | DEUT | | 6,446,242 | | Japanese Yen | | 600,226,840 | | | (208,674 | ) |
02/17/10 | | U.S. Dollars | | GSC | | 10,239,931 | | Japanese Yen | | 953,467,400 | | | (250,183 | ) |
02/17/10 | | U.S. Dollars | | GSC | | 353,483 | | Mexican Pesos | | 4,650,275 | | | 6,032 | |
02/17/10 | | U.S. Dollars | | GSC | | 132,670 | | South African Rand | | 988,065 | | | 7,638 | |
02/17/10 | | U.S. Dollars | | JPM | | 1,106,657 | | Canadian Dollars | | 1,157,388 | | | 17,187 | |
02/17/10 | | U.S. Dollars | | JPM | | 1,067,863 | | Canadian Dollars | | 1,116,816 | | | 7,863 | |
02/17/10 | | U.S. Dollars | | JPM | | 1,286,613 | | Japanese Yen | | 119,800,000 | | | (45,401 | ) |
02/17/10 | | U.S. Dollars | | JPM | | 1,051,095 | | Norweigan Krone | | 6,098,710 | | | (8,905 | ) |
02/17/10 | | U.S. Dollars | | MLCS | | 524,910 | | Australian Dollars | | 587,221 | | | (3,237 | ) |
02/17/10 | | U.S. Dollars | | UBS | | 3,225,282 | | Euro | | 2,250,000 | | | (112,570 | ) |
02/17/10 | | United Kingdom Pounds | | CS | | 1,049,574 | | U.S. Dollars | | 650,000 | | | 22,738 | |
02/17/10 | | United Kingdom Pounds | | DEUT | | 807,364 | | U.S. Dollars | | 500,000 | | | 17,336 | |
02/17/10 | | United Kingdom Pounds | | GSC | | 322,946 | | U.S. Dollars | | 200,000 | | | 7,454 | |
02/17/10 | | United Kingdom Pounds | | JPM | | 108,765 | | U.S. Dollars | | 67,358 | | | 2,443 | |
02/24/10 | | U.S. Dollars | | DEUT | | 600,133 | | South Korean Won | | 700,000,000 | | | (1,759 | ) |
| | | | | | | | | | | | | | |
| | | | | | | | | | | | $ | 353,855 | |
| | | | | | | | | | | | | | |
224
NOTES TO FINANCIAL STATEMENTS—(Continued)
| | | | | | | | | | | | | | |
Fund/ Expiration
Date | | Currency to be Delivered | | Counter-
party | | Amount of
Currency to
be Delivered | | Currency to be Received | | Amount of
Currency to
be Received | | Net
Unrealized
Appreciation
(Depreciation) | |
International Equity Fund | | | | | | | | | | | | |
03/17/10 | | Australian Dollars | | BAR | | 16,000 | | U.S. Dollars | | 14,259 | | $ | 125 | |
03/17/10 | | Australian Dollars | | BAR | | 979,000 | | U.S. Dollars | | 872,461 | | | 13,319 | |
03/17/10 | | Australian Dollars | | BAR | | 30,000 | | U.S. Dollars | | 26,735 | | | (344 | ) |
03/17/10 | | Canadian Dollars | | BAR | | 8,959,000 | | U.S. Dollars | | 8,566,132 | | | (22,982 | ) |
03/17/10 | | Danish Kroner | | BAR | | 10,000 | | U.S. Dollars | | 1,925 | | | 98 | |
03/17/10 | | Danish Kroner | | BAR | | 100,000 | | U.S. Dollars | | 19,247 | | | 315 | |
03/17/10 | | Danish Kroner | | BAR | | 3,000 | | U.S. Dollars | | 577 | | | 4 | |
03/17/10 | | Euro | | BAR | | 73,000 | | U.S. Dollars | | 104,637 | | | 5,154 | |
03/17/10 | | Euro | | BAR | | 9,000 | | U.S. Dollars | | 12,900 | | | 634 | |
03/17/10 | | Euro | | BAR | | 5,976,000 | | U.S. Dollars | | 8,565,890 | | | 396,661 | |
03/17/10 | | Euro | | BAR | | 702,000 | | U.S. Dollars | | 1,006,234 | | | 16,064 | |
03/17/10 | | Euro | | BAR | | 1,268,000 | | U.S. Dollars | | 1,817,528 | | | 11,246 | |
03/17/10 | | Hong Kong Dollars | | BAR | | 54,000 | | U.S. Dollars | | 6,968 | | | 5 | |
03/17/10 | | Hong Kong Dollars | | BAR | | 311,000 | | U.S. Dollars | | 40,132 | | | 30 | |
03/17/10 | | Hong Kong Dollars | | BAR | | 52,000 | | U.S. Dollars | | 6,710 | | | 5 | |
03/17/10 | | Hong Kong Dollars | | BAR | | 201,000 | | U.S. Dollars | | 25,938 | | | 17 | |
03/17/10 | | Hong Kong Dollars | | BAR | | 81,000 | | U.S. Dollars | | 10,452 | | | (5 | ) |
03/17/10 | | Japanese Yen | | BAR | | 44,898,000 | | U.S. Dollars | | 482,262 | | | 22,662 | |
03/17/10 | | Japanese Yen | | BAR | | 39,924,000 | | U.S. Dollars | | 428,835 | | | 15,138 | |
03/17/10 | | Japanese Yen | | BAR | | 72,163,000 | | U.S. Dollars | | 775,124 | | | 11,809 | |
03/17/10 | | New Zealand Dollars | | BAR | | 388,000 | | U.S. Dollars | | 280,162 | | | (786 | ) |
03/17/10 | | Singapore Dollars | | BAR | | 18,000 | | U.S. Dollars | | 12,802 | | | 169 | |
03/17/10 | | Singapore Dollars | | BAR | | 142,000 | | U.S. Dollars | | 100,994 | | | 1,486 | |
03/17/10 | | Singapore Dollars | | BAR | | 4,000 | | U.S. Dollars | | 2,845 | | | 43 | |
03/17/10 | | Singapore Dollars | | BAR | | 17,000 | | U.S. Dollars | | 12,091 | | | 138 | |
03/17/10 | | Swedish Kronor | | BAR | | 859,000 | | U.S. Dollars | | 120,111 | | | (2,164 | ) |
03/17/10 | | Switzerland Francs | | BAR | | 590,000 | | U.S. Dollars | | 570,623 | | | 11,555 | |
03/17/10 | | Switzerland Francs | | BAR | | 1,634,000 | | U.S. Dollars | | 1,580,337 | | | 23,855 | |
03/17/10 | | Switzerland Francs | | BAR | | 492,000 | | U.S. Dollars | | 475,842 | | | (1,797 | ) |
03/17/10 | | U.S. Dollars | | BAR | | 3,565 | | Australian Dollars | | 4,000 | | | (83 | ) |
03/17/10 | | U.S. Dollars | | BAR | | 8,749,561 | | Australian Dollars | | 9,818,000 | | | (202,318 | ) |
03/17/10 | | U.S. Dollars | | BAR | | 198,732 | | Australian Dollars | | 223,000 | | | 2,643 | |
03/17/10 | | U.S. Dollars | | BAR | | 332,740 | | Canadian Dollars | | 348,000 | | | 2,019 | |
03/17/10 | | U.S. Dollars | | BAR | | 1,586,250 | | Canadian Dollars | | 1,659,000 | | | (7,770 | ) |
03/17/10 | | U.S. Dollars | | BAR | | 2,117 | | Danish Kroner | | 11,000 | | | (85 | ) |
03/17/10 | | U.S. Dollars | | BAR | | 280,425 | | Danish Kroner | | 1,457,000 | | | (14,780 | ) |
03/17/10 | | U.S. Dollars | | BAR | | 4,042 | | Danish Kroner | | 21000.00 | | | (132 | ) |
03/17/10 | | U.S. Dollars | | BAR | | 11,163 | | Danish Kroner | | 58,000 | | | (9 | ) |
03/17/10 | | U.S. Dollars | | BAR | | 44,435 | | Euro | | 31,000 | | | (1,531 | ) |
03/17/10 | | U.S. Dollars | | BAR | | 31,534 | | Euro | | 22,000 | | | (1,000 | ) |
03/17/10 | | U.S. Dollars | | BAR | | 861,462 | | Euro | | 601,000 | | | (784 | ) |
03/17/10 | | U.S. Dollars | | BAR | | 534,651 | | Euro | | 373,000 | | | (21,069 | ) |
03/17/10 | | U.S. Dollars | | BAR | | 15,872 | | Hong Kong Dollars | | 123,000 | | | (8 | ) |
03/17/10 | | U.S. Dollars | | BAR | | 36,003 | | Hong Kong Dollars | | 279,000 | | | 6 | |
03/17/10 | | U.S. Dollars | | BAR | | 19,744 | | Hong Kong Dollars | | 153,000 | | | (5 | ) |
03/17/10 | | U.S. Dollars | | BAR | | 1,147,997 | | Japanese Yen | | 106,877,000 | | | (88,891 | ) |
03/17/10 | | U.S. Dollars | | BAR | | 44,770 | | Japanese Yen | | 4,168,000 | | | (3,501 | ) |
225
NOTES TO FINANCIAL STATEMENTS—(Continued)
| | | | | | | | | | | | | | |
Fund/ Expiration
Date | | Currency to be Delivered | | Counter-
party | | Amount of
Currency
to be
Delivered | | Currency to be Received | | Amount of
Currency to
be Received | | Net
Unrealized
Appreciation
(Depreciation) | |
03/17/10 | | U.S. Dollars | | BAR | | 90,882 | | Japanese Yen | | 8,461,000 | | $ | (5,485 | ) |
03/17/10 | | U.S. Dollars | | BAR | | 307,276 | | Japanese Yen | | 28,607,000 | | | (15,608 | ) |
03/17/10 | | U.S. Dollars | | BAR | | 57,111 | | Japanese Yen | | 5,317,000 | | | (1,277 | ) |
03/17/10 | | U.S. Dollars | | BAR | | 7,062,290 | | Norweigan Krone | | 41,033,000 | | | (171,251 | ) |
03/17/10 | | U.S. Dollars | | BAR | | 162,474 | | Norweigan Krone | | 944,000 | | | (1,467 | ) |
03/17/10 | | U.S. Dollars | | BAR | | 6,884 | | Norweigan Krone | | 40,000 | | | 24 | |
03/17/10 | | U.S. Dollars | | BAR | | 23,471 | | Singapore Dollars | | 33,000 | | | (228 | ) |
03/17/10 | | U.S. Dollars | | BAR | | 105,262 | | Singapore Dollars | | 148,000 | | | (248 | ) |
03/17/10 | | U.S. Dollars | | BAR | | 66,278 | | Swedish Kronor | | 474,000 | | | (2,111 | ) |
03/17/10 | | U.S. Dollars | | BAR | | 327,334 | | Swedish Kronor | | 2,341,000 | | | (12,328 | ) |
03/17/10 | | U.S. Dollars | | BAR | | 881,047 | | Swedish Kronor | | 6,301,000 | | | (11,098 | ) |
03/17/10 | | U.S. Dollars | | BAR | | 52,994 | | Swedish Kronor | | 379,000 | | | (194 | ) |
03/17/10 | | U.S. Dollars | | BAR | | 448,144 | | Swedish Kronor | | 3,205,000 | | | 5 | |
03/17/10 | | U.S. Dollars | | BAR | | 2,848,281 | | Switzerland Francs | | 2,945,000 | | | (98,965 | ) |
03/17/10 | | U.S. Dollars | | BAR | | 426,517 | | Switzerland Francs | | 441,000 | | | 4,899 | |
03/17/10 | | U.S. Dollars | | BAR | | 828,855 | | Switzerland Francs | | 857,000 | | | (3,598 | ) |
03/17/10 | | U.S. Dollars | | BAR | | 1,164,003 | | United Kingdom Pounds | | 721,000 | | | (33,723 | ) |
03/17/10 | | U.S. Dollars | | BAR | | 4,843 | | United Kingdom Pounds | | 3,000 | | | (91 | ) |
03/17/10 | | U.S. Dollars | | BAR | | 1,123,642 | | United Kingdom Pounds | | 696,000 | | | (13,971 | ) |
03/17/10 | | U.S. Dollars | | BAR | | 537,605 | | United Kingdom Pounds | | 333,000 | | | 3,647 | |
03/17/10 | | United Kingdom Pounds | | BAR | | 32,000 | | U.S. Dollars | | 51,662 | | | 1,368 | |
03/17/10 | | United Kingdom Pounds | | BAR | | 218,000 | | U.S. Dollars | | 351,945 | | | 1,847 | |
03/17/10 | | United Kingdom Pounds | | BAR | | 5,000 | | U.S. Dollars | | 8,072 | | | 54 | |
03/17/10 | | United Kingdom Pounds | | BAR | | 15,000 | | U.S. Dollars | | 24,216 | | | (3 | ) |
| | | | | | | | | | | | | | |
| | | | | | | | | | | | $ | (194,646 | ) |
| | | | | | | | | | | | | | |
Please see abbreviation and footnote definitions on page 180.
Options Written
Transactions in options written during the period ended December 31, 2009 were as follows:
| | | | | | | | | | | |
Low-Duration Bond Fund | | Number of
Contracts | | | Notional
Amount | | | Premiums
Received | |
Options written, 12/31/08 | | — | | | $ | 37,000,000 | | | $ | 3,687,541 | |
| | | | | | | | | | | |
Options written | | 236 | | | | 106,400,000 | | | | 911,007 | |
Options expired | | (24 | ) | | | (92,400,000 | ) | | | (4,017,932 | ) |
Options closed | | (60 | ) | | | — | | | | (19,317 | ) |
| | | | | | | | | | | |
Options written, 12/31/09 | | 152 | | | $ | 51,000,000 | | | $ | 561,299 | |
| | | | | | | | | | | |
| | | |
Medium-Duration Bond Fund | | Number of
Contracts | | | Notional
Amount | | | Premiums
Received | |
Options written, 12/31/08 | | 2 | | | $ | 73,200,000 | | | $ | 5,614,864 | |
| | | | | | | | | | | |
Options written | | 1,988 | | | | 218,600,000 | | | | 1,955,589 | |
Options expired | | (1,291 | ) | | | (195,700,000 | ) | | | (5,917,482 | ) |
Options closed | | (229 | ) | | | (22,100,000 | ) | | | (715,090 | ) |
| | | | | | | | | | | |
Options written, 12/31/09 | | 470 | | | $ | 74,000,000 | | | $ | 937,881 | |
| | | | | | | | | | | |
226
NOTES TO FINANCIAL STATEMENTS—(Continued)
| | | | | | | | | | |
Small Cap Equity Fund | | Number of
Contracts | | | Notional
Amount | | Premiums
Received | |
Options written, 12/31/08 | | 89 | | | $ | — | | $ | 81,114 | |
| | | | | | | | | | |
Options written | | 241 | | | | — | | | 163,016 | |
Options expired | | (86 | ) | | | — | | | (72,643 | ) |
Options closed | | (199 | ) | | | — | | | (151,553 | ) |
| | | | | | | | | | |
Options written, 12/31/09 | | 45 | | | $ | — | | $ | 19,934 | |
| | | | | | | | | | |
7. CAPITAL SHARE TRANSACTIONS
Transactions in shares of capital stock were as follows:
| | | | | | | | | | | | |
| | | Year Ended December 31,
2009 | | | Year Ended December 31,
2008 | |
| | | GS4 | | | GS6 | | | GS4 | | | GS6 | |
MyDestination 2005 | | | | | | | | | | | | |
Shares sold | | 2,213,197 | | | 50,038 | | | 2,578,136 | | | 56,867 | |
Shares exchanged | | 184,772 | | | (183,044 | ) | | — | | | — | |
Shares reinvested | | 182,815 | | | 773 | | | 470,720 | | | 8,600 | |
Shares redeemed | | (1,839,744 | ) | | (19,104 | ) | | (1,805,238 | ) | | (55,337 | ) |
| | | | | | | | | | | | |
Net increase (decrease) | | 741,040 | | | (151,337 | ) | | 1,243,618 | | | 10,130 | |
| | | | | | | | | | | | |
MyDestination 2015 | | | | | | | | | | | | |
Shares sold | | 6,079,553 | | | 247,957 | | | 6,021,065 | | | 80,777 | |
Shares exchanged | | 431,494 | | | (427,887 | ) | | — | | | — | |
Shares reinvested | | 575,590 | | | 4,807 | | | 1,381,039 | | | 9,488 | |
Shares redeemed | | (2,440,561 | ) | | (6,551 | ) | | (2,468,448 | ) | | (56,916 | ) |
| | | | | | | | | | | | |
Net increase (decrease) | | 4,646,076 | | | (181,674 | ) | | 4,933,656 | | | 33,349 | |
| | | | | | | | | | | | |
MyDestination 2025 | | | | | | | | | | | | |
Shares sold | | 6,514,115 | | | 178,840 | | | 5,197,306 | | | 175,155 | |
Shares exchanged | | 519,224 | | | (517,312 | ) | | — | | | — | |
Shares reinvested | | 396,790 | | | 3,796 | | | 1,107,495 | | | 20,895 | |
Shares redeemed | | (1,600,886 | ) | | (1,813 | ) | | (892,400 | ) | | (61,065 | ) |
| | | | | | | | | | | | |
Net increase (decrease) | | 5,829,243 | | | (336,489 | ) | | 5,412,401 | | | 134,985 | |
| | | | | | | | | | | | |
MyDestination 2035 | | | | | | | | | | | | |
Shares sold | | 3,674,311 | | | 156,527 | | | 2,939,696 | | | 92,123 | |
Shares exchanged | | 367,932 | | | (364,947 | ) | | — | | | — | |
Shares reinvested | | 167,185 | | | 2,176 | | | 416,311 | | | 10,875 | |
Shares redeemed | | (603,775 | ) | | (1,335 | ) | | (356,667 | ) | | (31,178 | ) |
| | | | | | | | | | | | |
Net increase (decrease) | | 3,605,653 | | | (207,579 | ) | | 2,999,340 | | | 71,820 | |
| | | | | | | | | | | | |
MyDestination 2045 | | | | | | | | | | | | |
Shares sold | | 3,146,539 | | | 67,736 | | | 1,972,366 | | | 43,400 | |
Shares exchanged | | 226,386 | | | (224,243 | ) | | — | | | — | |
Shares reinvested | | 98,130 | | | 616 | | | 148,529 | | | 6,121 | |
Shares redeemed | | (617,369 | ) | | (4,681 | ) | | (143,582 | ) | | (10,397 | ) |
| | | | | | | | | | | | |
Net increase (decrease) | | 2,853,686 | | | (160,572 | ) | | 1,977,313 | | | 39,124 | |
| | | | | | | | | | | | |
227
NOTES TO FINANCIAL STATEMENTS—(Continued)
| | | | | | | | | | | | |
| | | Year Ended December 31,
2009 | | | Year Ended December 31,
2008 | |
| | | GS4 | | | GS6 | | | GS4 | | | GS6 | |
Conservative Allocation Fund | | | | | | | | | | | | |
Shares sold | | 3,409,502 | | | 269,055 | | | 3,830,825 | | | 1,335,856 | |
Shares exchanged | | 1,134,656 | | | (1,811,024 | ) | | — | | | — | |
Shares reinvested | | 1,343,985 | | | 31,621 | | | 2,072,716 | | | 194,313 | |
Shares redeemed | | (4,764,021 | ) | | (30,545 | ) | | (6,132,632 | ) | | (1,625,132 | ) |
| | | | | | | | | | | | |
Net (decrease) | | 1,124,122 | | | (1,540,893 | ) | | (229,091 | ) | | (94,963 | ) |
| | | | | | | | | | | | |
Balanced Allocation Fund | | | | | | | | | | | | |
Shares sold | | 6,475,848 | | | 152,629 | | | 3,881,710 | | | 277,834 | |
Shares exchanged | | 1,936,474 | | | (3,506,545 | ) | | — | | | — | |
Shares reinvested | | 3,173,514 | | | 87,810 | | | 13,664,245 | | | 751,815 | |
Shares redeemed | | (8,328,776 | ) | | (20,612 | ) | | (14,547,876 | ) | | (250,354 | ) |
| | | | | | | | | | | | |
Net increase (decrease) | | 3,257,060 | | | (3,286,718 | ) | | 2,998,079 | | | 779,295 | |
| | | | | | | | | | | | |
Growth Allocation Fund | | | | | | | | | | | | |
Shares sold | | 4,090,589 | | | 237,995 | | | 3,068,016 | | | 311,761 | |
Shares exchanged | | 1,254,537 | | | (2,246,107 | ) | | — | | | — | |
Shares reinvested | | 1,504,652 | | | 33,305 | | | 10,412,402 | | | 442,625 | |
Shares redeemed | | (6,540,396 | ) | | (53,186 | ) | | (9,482,818 | ) | | (249,371 | ) |
| | | | | | | | | | | | |
Net increase (decrease) | | 309,382 | | | (2,027,993 | ) | | 3,997,600 | | | 505,015 | |
| | | | | | | | | | | | |
Aggressive Allocation Fund | | | | | | | | | | | | |
Shares sold | | 4,873,795 | | | 111,653 | | | 3,141,389 | | | 134,125 | |
Shares exchanged | | 1,515,794 | | | (2,573,184 | ) | | — | | | — | |
Shares reinvested | | 1,335,155 | | | 37,558 | | | 10,394,753 | | | 571,773 | |
Shares redeemed | | (5,033,707 | ) | | (35,096 | ) | | (7,577,349 | ) | | (148,560 | ) |
| | | | | | | | | | | | |
Net increase (decrease) | | 2,691,037 | | | (2,459,069 | ) | | 5,958,793 | | | 557,338 | |
| | | | | | | | | | | | |
| | | | |
| | | GS2 | | | | | | GS2 | | | | |
Conservative Allocation Fund I | | | | | | | | |
Shares sold | | 968,454 | | | | 898,141 | | |
Shares reinvested | | 234,040 | | | | 458,199 | | |
Shares redeemed | | (899,677 | ) | | | (1,390,576 | ) | |
| | | | | | | | |
Net (decrease) | | 302,817 | | | | (34,236 | ) | |
| | | | | | | | |
Balanced Allocation Fund I | | | | | | | | |
Shares sold | | 2,654,936 | | | | 2,176,193 | | |
Shares reinvested | | 1,664,813 | | | | 3,505,813 | | |
Shares redeemed | | (2,553,059 | ) | | | (3,132,150 | ) | |
| | | | | | | | |
Net increase | | 1,766,690 | | | | 2,549,856 | | |
| | | | | | | | |
Growth Allocation Fund I | | | | | | | | |
Shares sold | | 1,910,217 | | | | 1,391,073 | | |
Shares reinvested | | 713,157 | | | | 2,776,308 | | |
Shares redeemed | | (1,732,764 | ) | | | (2,236,325 | ) | |
| | | | | | | | |
Net increase | | 890,610 | | | | 1,931,056 | | |
| | | | | | | | |
Aggressive Allocation Fund I | | | | | | | | |
Shares sold | | 1,699,702 | | | | 881,962 | | |
Shares reinvested | | 350,764 | | | | 2,044,532 | | |
Shares redeemed | | (1,712,562 | ) | | | (1,840,613 | ) | |
| | | | | | | | |
Net increase | | 337,904 | | | | 1,085,881 | | |
| | | | | | | | |
228
NOTES TO FINANCIAL STATEMENTS—(Continued)
| | | | | | | | | | | | | | | | | | |
| | | Year Ended December 31, 2009 | | | Year Ended December 31, 2008 | |
| | | GS2 | | | GS4 | | | GS6 | | | GS2 | | | GS4 | | | GS6 | |
Money Market Fund | | | | | | | | | | | | | | | | | | |
Shares sold | | 102,344,425 | | | 2,886,054,721 | | | 1,365,914 | | | 174,901,124 | | | 4,070,538,152 | | | 3,546,545 | |
Shares exchanged | | — | | | 9,761,236 | | | (9,761,137 | ) | | — | | | — | | | — | |
Shares reinvested | | 644,744 | | | 2,050,152 | | | 7,898 | | | 3,367,839 | | | 16,558,522 | | | 154,558 | |
Shares redeemed | | (141,405,488 | ) | | (2,803,066,431 | ) | | (421,233 | ) | | (119,120,727 | ) | | (4,056,623,451 | ) | | (873,423 | ) |
| | | | | | | | | | | | | | | | | | |
Net increase (decrease) | | (38,416,319 | ) | | 94,799,678 | | | (8,808,558 | ) | | 59,148,236 | | | 30,473,223 | | | 2,827,680 | |
| | | | | | | | | | | | | | | | | | |
| | | | | | |
Low-Duration Bond Fund | | | | | | | | | | | | | | | | | | |
Shares sold | | 2,468,591 | | | 7,846,621 | | | 30,894 | | | 1,544,065 | | | 5,832,714 | | | 68,587 | |
Shares exchanged | | — | | | 489,313 | | | (723,673 | ) | | — | | | — | | | — | |
Shares reinvested | | 567,258 | | | 1,207,547 | | | 12,328 | | | 924,880 | | | 2,084,429 | | | 38,993 | |
Shares redeemed | | (2,692,163 | ) | | (8,924,341 | ) | | (9,054 | ) | | (4,482,124 | ) | | (16,505,332 | ) | | (35,787 | ) |
| | | | | | | | | | | | | | | | | | |
Net increase (decrease) | | 343,686 | | | 619,140 | | | (689,505 | ) | | (2,013,179 | ) | | (8,588,189 | ) | | 71,793 | |
| | | | | | | | | | | | | | | | | | |
| | | | | | |
Medium-Duration Bond Fund | | | | | | | | | | | | | | | | | | |
Shares sold | | 3,074,949 | | | 8,917,482 | | | 20,156 | | | 3,207,707 | | | 7,021,197 | | | 87,296 | |
Shares exchanged | | — | | | 1,213,587 | | | (2,078,297 | ) | | — | | | — | | | — | |
Shares reinvested | | 1,837,631 | | | 3,766,018 | | | 66,716 | | | 2,156,956 | | | 5,171,411 | | | 227,556 | |
Shares redeemed | | (1,927,699 | ) | | (9,609,788 | ) | | (24,765 | ) | | (7,621,389 | ) | | (30,536,247 | ) | | (25,004 | ) |
| | | | | | | | | | | | | | | | | | |
Net increase (decrease) | | 2,984,881 | | | 4,287,299 | | | (2,016,190 | ) | | (2,256,726 | ) | | (18,343,639 | ) | | 289,848 | |
| | | | | | | | | | | | | | | | | | |
| | | | | | |
Extended-Duration Bond Fund | | | | | | | | | | | | | | | | | | |
Shares sold | | 906,347 | | | 2,390,121 | | | 8,130 | | | 1,689,108 | | | 1,932,832 | | | 24,149 | |
Shares exchanged | | — | | | 1,233,982 | | | (2,593,714 | ) | | — | | | — | | | — | |
Shares reinvested | | 1,135,939 | | | 1,388,639 | | | 104,274 | | | 1,461,454 | | | 2,130,785 | | | 328,365 | |
Shares redeemed | | (2,659,695 | ) | | (6,932,227 | ) | | (7,292 | ) | | (2,415,249 | ) | | (9,446,049 | ) | | (22,623 | ) |
| | | | | | | | | | | | | | | | | | |
Net increase (decrease) | | (617,409 | ) | | (1,919,485 | ) | | (2,488,602 | ) | | 735,313 | | | (5,382,432 | ) | | 329,891 | |
| | | | | | | | | | | | | | | | | | |
| | | | | | |
Inflation Protected Bond Fund(1) | | | | | | | | | | | | | | | | | | |
Shares sold | | | | | 8,555,948 | | | | | | | | | | | | | |
Shares reinvested | | | | | 141,953 | | | | | | | | | | | | | |
Shares redeemed | | | | | (174,295 | ) | | | | | | | | | | | | |
| | | | | | | | | | | | | | | | | | |
Net increase | | | | | 8,523,606 | | | | | | | | | | | | | |
| | | | | | | | | | | | | | | | | | |
(1) Inception date was June 25, 2009. | |
Global Bond Fund | | | | | | | | | | | | | | | | | | |
Shares sold | | | | | 3,948,026 | | | | | | | | | 12,869,898 | | | | |
Shares reinvested | | | | | 1,687,037 | | | | | | | | | 1,740,619 | | | | |
Shares redeemed | | | | | (4,785,608 | ) | | | | | | | | (4,150,771 | ) | | | |
| | | | | | | | | | | | | | | | | | |
Net increase (decrease) | | | | | 849,455 | | | | | | | | | 10,459,746 | | | | |
| | | | | | | | | | | | | | | | | | |
229
NOTES TO FINANCIAL STATEMENTS—(Continued)
| | | | | | | | | | | | | | | | | | |
| | | Year Ended December 31, 2009 | | | Year Ended December 31, 2008 | |
| | | GS2 | | | GS4 | | | GS6 | | | GS2 | | | GS4 | | | GS6 | |
Equity Index Fund | | | | | | | | | | | | | | | | | | |
Shares sold | | 841,105 | | | 2,160,596 | | | 28,455 | | | 820,528 | | | 1,486,319 | | | 59,695 | |
Shares exchanged | | — | | | 66,567 | | | (121,488 | ) | | — | | | — | | | — | |
Shares reinvested | | 275,439 | | | 365,182 | | | 2,310 | | | 311,273 | | | 437,304 | | | 3,175 | |
Shares redeemed | | (501,429 | ) | | (1,562,771 | ) | | (8,919 | ) | | (1,027,162 | ) | | (3,313,360 | ) | | (22,137 | ) |
| | | | | | | | | | | | | | | | | | |
Net increase (decrease) | | 615,115 | | | 1,029,574 | | | (99,642 | ) | | 104,639 | | | (1,389,737 | ) | | 40,733 | |
| | | | | | | | | | | | | | | | | | |
| | | | | | |
Real Estate Securities Fund | | | | | | | | | | | | | | | | | | |
Shares sold | | | | | 8,532,940 | | | | | | | | | 10,637,842 | | | | |
Shares reinvested | | | | | 392,118 | | | | | | | | | 386,418 | | | | |
Shares redeemed | | | | | (6,240,521 | ) | | | | | | | | (6,384,635 | ) | | | |
| �� | | | | | | | | | | | | | | | | | |
Net increase | | | | | 2,684,537 | | | | | | | | | 4,639,625 | | | | |
| | | | | | | | | | | | | | | | | | |
| | | | | | |
Value Equity Fund | | | | | | | | | | | | | | | | | | |
Shares sold | | 2,473,161 | | | 7,109,752 | | | 40,675 | | | 3,486,962 | | | 8,453,832 | | | 52,086 | |
Shares exchanged | | — | | | 1,130,694 | | | (2,203,139 | ) | | — | | | — | | | — | |
Shares reinvested | | 991,370 | | | 1,425,172 | | | 55,079 | | | 1,038,380 | | | 1,565,141 | | | 74,232 | |
Shares redeemed | | (1,431,120 | ) | | (9,988,166 | ) | | (2,487 | ) | | (3,826,610 | ) | | (12,449,297 | ) | | (16,490 | ) |
| | | | | | | | | | | | | | | | | | |
Net increase (decrease) | | 2,033,411 | | | (322,548 | ) | | (2,109,872 | ) | | 698,732 | | | (2,430,324 | ) | | 109,828 | |
| | | | | | | | | | | | | | | | | | |
| | | | | | |
Growth Equity Fund | | | | | | | | | | | | | | | | | | |
Shares sold | | 1,673,214 | | | 5,719,407 | | | 18,949 | | | 2,871,383 | | | 8,033,364 | | | 30,730 | |
Shares exchanged | | — | | | 692,725 | | | (1,126,367 | ) | | — | | | — | | | — | |
Shares reinvested | | 57,676 | | | 71,463 | | | 255 | | | 89,784 | | | 126,685 | | | 372 | |
Shares redeemed | | (1,561,130 | ) | | (10,192,784 | ) | | (5,975 | ) | | (2,524,921 | ) | | (10,808,932 | ) | | (14,792 | ) |
| | | | | | | | | | | | | | | | | | |
Net increase (decrease) | | 169,760 | | | (3,709,189 | ) | | (1,113,138 | ) | | 436,246 | | | (2,648,883 | ) | | 16,310 | |
| | | | | | | | | | | | | | | | | | |
| | | | | | |
Small Cap Equity Fund | | | | | | | | | | | | | | | | | | |
Shares sold | | 883,911 | | | 3,268,293 | | | 23,304 | | | 2,366,155 | | | 3,557,451 | | | 35,880 | |
Shares exchanged | | — | | | 1,285,304 | | | (1,999,515 | ) | | — | | | — | | | — | |
Shares reinvested | | 44,647 | | | 77,836 | | | 2,337 | | | 138,470 | | | 298,452 | | | 24,255 | |
Shares redeemed | | (581,343 | ) | | (3,927,288 | ) | | (4,198 | ) | | (2,394,207 | ) | | (5,853,574 | ) | | (10,548 | ) |
| | | | | | | | | | | | | | | | | | |
Net increase (decrease) | | 347,215 | | | 704,145 | | | (1,978,072 | ) | | 110,418 | | | (1,997,671 | ) | | 49,587 | |
| | | | | | | | | | | | | | | | | | |
| | | | | | |
International Equity Fund | | | | | | | | | | | | | | | | | | |
Shares sold | | 2,762,510 | | | 10,128,688 | | | 31,617 | | | 8,764,143 | | | 19,289,876 | | | 62,220 | |
Shares exchanged | | — | | | 1,687,592 | | | (2,207,195 | ) | | — | | | — | | | — | |
Shares reinvested | | 767,756 | | | 2,038,064 | | | 19,754 | | | 2,467,529 | | | 6,721,576 | | | 193,967 | |
Shares redeemed | | (4,990,961 | ) | | (18,403,843 | ) | | (10,746 | ) | | (3,979,501 | ) | | (9,340,113 | ) | | (27,121 | ) |
| | | | | | | | | | | | | | | | | | |
Net increase (decrease) | | (1,460,695 | ) | | (4,549,499 | ) | | (2,166,570 | ) | | 7,252,171 | | | 16,671,339 | | | 229,066 | |
| | | | | | | | | | | | | | | | | | |
230
NOTES TO FINANCIAL STATEMENTS—(Continued)
8. BANK BORROWINGS
On October 29, 2009, the Board of Trustees approved a credit agreement with Bank of America, N.A. dated December 2, 2009 through December 2, 2010. The agreement permits up to $50 million, collectively. Interest is charged to each Fund based on its borrowings at a rate equal to the Bank Prime plus 0.60% or the Wall Street Journal LIBOR One Month Floating Rate plus 1.00%. Each Fund also pays a facility fee equal to its pro rata share of the amount of the credit facility at a rate of 0.30% per annum.
On March 4, 2009, the MyDestination 2005 Fund borrowed $250,000 at a rate of 1.49625%. The Fund repaid the loan in the amount of $250,007, which represents principal and one day of accrued interest, on March 5, 2009. On May 28, 2009, the MyDestination 2015 and MyDestination 2025 Funds borrowed a total of $3,250,000 at a rate of 1.31625%. The Funds repaid the loan in the amount of $3,250,119, which represents principal and one day of accrued interest, on May 29, 2009. On September 2, 2009, the MyDestination 2005 Fund borrowed $250,000 at a rate of 1.25625%. The Fund repaid the loan in the amount of $250,008, which represents principal and one day of accrued interest, on September 3, 2009. On September 10, the MyDestination 2005 Fund borrowed $250,000 at a rate of 1.25125%. The fund repaid the loan in the amount of $250,008, which represents principal and one day of accrued interest on September 11, 2009. No other Funds borrowed for the year ended December 31, 2009, and there were no outstanding loans at December 31, 2009.
9. FEDERAL INCOME TAXES
Each Fund’s policy is to comply with all sections of the Internal Revenue Code of 1986, as amended, that apply to regulated investment companies and to distribute substantially all of its taxable income to shareholders. No provision for income or excise taxes is thus required. Each Fund is treated as a separate entity for federal income tax purposes.
The Funds may be subject to taxes imposed by countries in which they invest in issuers existing or operating in such countries. Such taxes are generally based on income earned. The Funds accrue such taxes when the related income is earned. Dividend and interest income is recorded net of non-U.S. taxes paid. Gains realized by the Funds on the sale of securities in certain countries are subject to non-U.S. taxes. The Funds record a liability based on unrealized gains to provide for potential non-U.S. taxes payable upon the sale of these securities. For the year ended December 31, 2009, the International Equity Fund accrued non-U.S. taxes on unrealized gains of $595,400.
231
NOTES TO FINANCIAL STATEMENTS—(Continued)
Net investment income (loss) and net realized gains (losses) may differ for financial statements and tax purposes primarily because of deferred losses on certain futures contracts and losses deferred due to “wash sale” transactions. The character of distributions made during the year from net investment income or net realized gains may differ from their ultimate characterization for federal income tax purposes. Also, due to the timing of dividend distributions, the fiscal year in which amounts are distributed may differ from the year that the income or realized gains (losses) were recorded by the Funds. Income dividends and capital gain distributions are determined in accordance with federal income tax regulations, which may differ from GAAP. These differences are primarily due to differing treatments for futures and options transactions, foreign currency transactions, paydowns, losses deferred due to wash sales and investments in Passive Foreign Investment Companies (“PFIC’s”). Distributions during the year ended December 31, 2009, were characterized as follows for tax purposes:
| | | | | | | | | | | | | | |
Fund | | | | Ordinary
Income | | Long-Term
Capital Gain | | Return of
Capital | | Total
Distribution |
MyDestination 2005 | | 2009 | | $ | 1,564,404 | | $ | — | | $ | — | | $ | 1,564,404 |
| | 2008 | | | 2,083,566 | | | 1,504,355 | | | — | | | 3,587,921 |
MyDestination 2015 | | 2009 | | | 4,412,565 | | | — | | | — | | | 4,412,565 |
| | 2008 | | | 4,008,790 | | | 5,518,766 | | | — | | | 9,527,556 |
MyDestination 2025 | | 2009 | | | 2,884,184 | | | — | | | — | | | 2,884,184 |
| | 2008 | | | 2,335,600 | | | 4,629,258 | | | — | | | 6,964,858 |
MyDestination 2035 | | 2009 | | | 1,043,907 | | | 124,488 | | | — | | | 1,168,395 |
| | 2008 | | | 630,615 | | | 1,856,236 | | | — | | | 2,486,851 |
MyDestination 2045 | | 2009 | | | 683,723 | | | 4,334 | | | — | | | 688,057 |
| | 2008 | | | 180,040 | | | 700,135 | | | — | | | 880,175 |
Conservative Allocation | | 2009 | | | 6,283,221 | | | 9,111,208 | | | — | | | 15,394,429 |
| | 2008 | | | 10,292,290 | | | 12,642,828 | | | — | | | 22,935,118 |
Balanced Allocation | | 2009 | | | 26,391,713 | | | 6,797,379 | | | — | | | 33,189,092 |
| | 2008 | | | 41,644,877 | | | 90,209,055 | | | — | | | 131,853,932 |
Growth Allocation | | 2009 | | | 11,529,071 | | | 3,868,509 | | | — | | | 15,397,580 |
| | 2008 | | | 21,830,650 | | | 73,173,462 | | | — | | | 95,004,112 |
Aggressive Allocation | | 2009 | | | 7,894,855 | | | 4,792,148 | | | — | | | 12,687,003 |
| | 2008 | | | 9,741,630 | | | 77,173,217 | | | — | | | 86,914,847 |
Conservative Allocation I | | 2009 | | | 2,128,240 | | | — | | | — | | | 2,128,240 |
| | 2008 | | | 2,530,981 | | | 1,163,656 | | | — | | | 3,694,637 |
Balanced Allocation I | | 2009 | | | 15,067,834 | | | — | | | — | | | 15,067,834 |
| | 2008 | | | 13,748,251 | | | 13,132,319 | | | — | | | 26,880,570 |
Growth Allocation I | | 2009 | | | 6,560,814 | | | — | | | — | | | 6,560,814 |
| | 2008 | | | 7,165,766 | | | 13,478,283 | | | — | | | 20,644,049 |
Aggressive Allocation I | | 2009 | | | 3,254,796 | | | — | | | — | | | 3,254,796 |
| | 2008 | | | 20 | | | 14,453,009 | | | — | | | 14,453,029 |
Money Market | | 2009 | | | 3,671,028 | | | — | | | — | | | 3,671,028 |
| | 2008 | | | 30,499,308 | | | — | | | — | | | 30,499,308 |
Low-Duration Bond | | 2009 | | | 20,184,508 | | | — | | | — | | | 20,184,508 |
| | 2008 | | | 34,110,052 | | | — | | | — | | | 34,110,052 |
Medium-Duration Bond | | 2009 | | | 62,933,294 | | | — | | | — | | | 62,933,294 |
| | 2008 | | | 81,631,018 | | | 2,832,789 | | | — | | | 84,463,807 |
Extended-Duration Bond | | 2009 | | | 26,490,239 | | | 632,726 | | | — | | | 27,122,965 |
| | 2008 | | | 38,263,627 | | | 2,890,924 | | | — | | | 41,154,551 |
Inflation Protected Bond | | 2009 | | | 1,409,572 | | | 41,466 | | | — | | | 1,451,038 |
Global Bond | | 2009 | | | 13,789,431 | | | — | | | — | | | 13,789,431 |
| | 2008 | | | 14,374,673 | | | 266,282 | | | — | | | 14,640,955 |
Equity Index | | 2009 | | | 6,217,465 | | | — | | | — | | | 6,217,465 |
| | 2008 | | | 6,439,050 | | | 2,678,739 | | | — | | | 9,117,789 |
Real Estate Securities | | 2009 | | | 2,070,541 | | | — | | | 45,334 | | | 2,115,875 |
| | 2008 | | | 2,388,143 | | | — | | | 99,004 | | | 2,487,147 |
Value Equity | | 2009 | | | 19,742,615 | | | — | | | — | | | 19,742,615 |
| | 2008 | | | 20,928,040 | | | 7,704,593 | | | — | | | 28,632,633 |
Growth Equity | | 2009 | | | 1,374,244 | | | — | | | — | | | 1,374,244 |
| | 2008 | | | 2,419,165 | | | — | | | — | | | 2,419,165 |
Small Cap Equity | | 2009 | | | 1,121,177 | | | — | | | — | | | 1,121,177 |
| | 2008 | | | 2,699,065 | | | 1,846 | | | 741,208 | | | 3,442,119 |
International Equity | | 2009 | | | 29,748,575 | | | 5,380 | | | — | | | 29,753,955 |
| | 2008 | | | 42,815,653 | | | 39,117,934 | | | — | | | 81,933,587 |
232
NOTES TO FINANCIAL STATEMENTS—(Continued)
At December 31, 2009, the components of distributable earnings on a tax basis were as follows:
| | | | | | | | | | | | | | | |
Fund | | Undistributed
Ordinary
Income | | Undistributed
Long-Term
Capital
Gain/(Capital
Loss
Carryforward) | | | Post-October
Loss
Deferral | | | Net
Unrealized
Appreciation
(Depreciation)
on Investments | |
MyDestination 2005 | | $ | 102,070 | | $ | (3,224,103 | ) | | $ | (20,275 | ) | | $ | (6,376,661 | ) |
MyDestination 2015 | | | 1,381,114 | | | (4,193,651 | ) | | | — | | | | (29,525,107 | ) |
MyDestination 2025 | | | 607,942 | | | (1,437,334 | ) | | | — | | | | (22,488,066 | ) |
MyDestination 2035 | | | 93,959 | | | — | | | | — | | | | (7,786,314 | ) |
MyDestination 2045 | | | 128,800 | | | — | | | | — | | | | (312,141 | ) |
Conservative Allocation | | | 69,350 | | | 96,439 | | | | — | | | | 5,971,106 | |
Balanced Allocation | | | 4,110,528 | | | (1,652,242 | ) | | | — | | | | (38,121,004 | ) |
Growth Allocation | | | 3,813,544 | | | (2,029,567 | ) | | | — | | | | (53,365,317 | ) |
Aggressive Allocation | | | 721,565 | | | 1,078,253 | | | | — | | | | (78,598,032 | ) |
Conservative Allocation I | | | 705,488 | | | (3,535,979 | ) | | | — | | | | (4,096,947 | ) |
Balanced Allocation I | | | 5,272,196 | | | (10,191,849 | ) | | | (513,122 | ) | | | (55,212,323 | ) |
Growth Allocation I | | | 1,464,983 | | | (2,920,999 | ) | | | (230,455 | ) | | | (49,202,053 | ) |
Aggressive Allocation I | | | 2,509,336 | | | (4,391,332 | ) | | | (93,006 | ) | | | (47,427,084 | ) |
Money Market | | | 75,044 | | | — | | | | — | | | | — | |
Low-Duration Bond | | | 909,865 | | | (1,707,456 | ) | | | — | | | | (14,793,825 | ) |
Medium-Duration Bond | | | 3,441,382 | | | — | | | | (625,586 | ) | | | (50,803,344 | ) |
Extended-Duration Bond | | | 692,095 | | | (12,901,227 | ) | | | (598,356 | ) | | | 20,490,059 | |
Inflation Protected Bond | | | 313,658 | | | 62,869 | | | | — | | | | 2,049,180 | |
Global Bond | | | 912,189 | | | (10,635,979 | ) | | | (140,203 | ) | | | (3,597,656 | ) |
Equity Index | | | 1,623,542 | | | (4,723,485 | ) | | | (226,103 | ) | | | 20,698,442 | |
Real Estate Securities | | | — | | | (50,315,761 | ) | | | (309,186 | ) | | | 5,470,416 | |
Value Equity | | | 7,789,164 | | | (176,621,545 | ) | | | — | | | | (108,927,144 | ) |
Growth Equity | | | 169,205 | | | (196,015,409 | ) | | | (1,265,434 | ) | | | 164,881,352 | |
Small Cap Equity | | | 47,515 | | | (128,436,982 | ) | | | — | | | | 34,440,135 | |
International Equity | | | 3,066,280 | | | (233,377,943 | ) | | | (116,285 | ) | | | 107,541,155 | |
Post-October loss deferrals have been included in undistributed ordinary income and undistributed long-term capital gains, depending upon the character of the loss deferral.
For Federal income tax purposes, realized capital losses may be carried forward and applied against future realized capital gains. Capital loss carryovers and their expiration dates, were as follows as of December 31, 2009:
| | | | | | | | | | | | | | | |
| Expiring December 31, | | 2011 | | 2014 | | 2016 | | 2017 | | Total |
| | | | | |
MyDestination 2005 | | $ | — | | $ | — | | $ | 42,414 | | $ | 3,181,689 | | $ | 3,224,103 |
MyDestination 2015 | | | — | | | — | | | 889,637 | | | 3,304,014 | | | 4,193,651 |
MyDestination 2025 | | | — | | | — | | | 31,687 | | | 1,405,647 | | | 1,437,334 |
Balanced Allocation | | | — | | | — | | | — | | | 1,652,242 | | | 1,652,242 |
Growth Allocation | | | — | | | — | | | — | | | 2,029,567 | | | 2,029,567 |
Conservative Allocation I | | | — | | | — | | | 650,405 | | | 2,885,574 | | | 3,535,979 |
Balanced Allocation I | | | — | | | — | | | 4,262,186 | | | 5,929,663 | | | 10,191,849 |
Growth Allocation I | | | — | | | — | | | 412,556 | | | 2,508,443 | | | 2,920,999 |
Aggressive Allocation I | | | — | | | — | | | 3,489,043 | | | 902,289 | | | 4,391,332 |
Low-Duration Bond | | | — | | | 1,707,456 | | | — | | | — | | | 1,707,456 |
Extended-Duration Bond | | | — | | | — | | | — | | | 12,901,227 | | | 12,901,227 |
Global Bond | | | — | | | — | | | 705,051 | | | 9,930,928 | | | 10,635,979 |
Equity Index | | | — | | | — | | | 1,612,695 | | | 3,110,790 | | | 4,723,485 |
233
NOTES TO FINANCIAL STATEMENTS—(Continued)
| | | | | | | | | | | | | | | |
| Expiring December 31, | | 2011 | | 2014 | | 2016 | | 2017 | | Total |
| | | | | |
Real Estate Securities | | $ | — | | $ | — | | $ | 12,320,254 | | $ | 37,995,507 | | $ | 50,315,761 |
Value Equity | | | — | | | — | | | 73,270,784 | | | 103,350,761 | | | 176,621,545 |
Growth Equity | | | 45,483,748 | | | — | | | — | | | 150,531,661 | | | 196,015,409 |
Small Cap Equity | | | — | | | — | | | 69,003,843 | | | 59,433,139 | | | 128,436,982 |
International Equity | | | — | | | — | | | — | | | 233,377,943 | | | 233,377,943 |
During the year ended December 31, 2009, the Low Duration Bond Fund utilized capital loss carryforwards in the amount of $5,648,615 to offset capital gains.
For federal income tax purposes, post-October loss deferrals, which will reverse in 2010, were as follows as of December 31, 2009:
| | | | | | | | | |
| | | Capital | | FX | | Total |
MyDestination 2005 | | $ | 20,275 | | $ | — | | $ | 20,275 |
Balanced Allocation I | | | 513,122 | | | — | | | 513,122 |
Growth Allocation I | | | 230,455 | | | — | | | 230,455 |
Aggressive Allocation I | | | 93,006 | | | — | | | 93,006 |
Medium-Duration Bond | | | 603,931 | | | 21,655 | | | 625,586 |
Extended-Duration Bond | | | 598,356 | | | — | | | 598,356 |
Global Bond | | | 135,738 | | | 4,465 | | | 140,203 |
Equity Index | | | 226,103 | | | — | | | 226,103 |
Real Estate Securities | | | 309,186 | | | — | | | 309,186 |
Growth Equity | | | 1,265,427 | | | 7 | | | 1,265,434 |
International Equity | | | — | | | 116,285 | | | 116,285 |
At December 31, 2009, the aggregate cost of investment securities for federal income tax purposes (excluding foreign currency, securities sold short and derivative related items) and the net unrealized appreciation from investments for those securities having an excess of value over cost and net unrealized depreciation from investments for those securities having an excess of cost over value (based on cost for federal income tax purposes) were as follows:
| | | | | | | | | | | | | | |
Fund | | Federal Tax Cost | | Net Unrealized
Appreciation
(Depreciation) | | | Appreciated
Securities | | Depreciated
Securities | |
MyDestination 2005 | | $ | 73,058,498 | | $ | (6,376,661 | ) | | $ | 1,250,877 | | $ | (7,627,538 | ) |
MyDestination 2015 | | | 248,998,021 | | | (29,525,107 | ) | | | 3,367,722 | | | (32,892,829 | ) |
MyDestination 2025 | | | 191,978,419 | | | (22,488,066 | ) | | | 2,172,385 | | | (24,660,451 | ) |
MyDestination 2035 | | | 83,208,124 | | | (7,786,314 | ) | | | 1,096,639 | | | (8,882,953 | ) |
MyDestination 2045 | | | 44,473,298 | | | (312,140 | ) | | | 2,160,993 | | | (2,473,133 | ) |
Conservative Allocation | | | 278,578,861 | | | 5,971,106 | | | | 11,376,128 | | | (5,405,022 | ) |
Balanced Allocation | | | 1,171,403,438 | | | (38,121,004 | ) | | | 20,726,482 | | | (58,847,486 | ) |
Growth Allocation | | | 894,381,489 | | | (53,365,317 | ) | | | 6,371,847 | | | (59,737,164 | ) |
Aggressive Allocation | | | 808,695,679 | | | (78,598,032 | ) | | | 1,982,966 | | | (80,580,998 | ) |
Conservative Allocation I | | | 68,336,967 | | | (4,096,947 | ) | | | 426,594 | | | (4,523,541 | ) |
Balanced Allocation I | | | 381,884,273 | | | (55,212,323 | ) | | | 601,523 | | | (55,813,846 | ) |
Growth Allocation I | | | 258,239,001 | | | (49,202,054 | ) | | | 60,394 | | | (49,262,448 | ) |
Aggressive Allocation I | | | 190,707,870 | | | (47,427,084 | ) | | | 50 | | | (47,427,134 | ) |
Money Market | | | 1,269,889,667 | | | — | | | | — | | | — | |
Low-Duration Bond | | | 755,576,091 | | | (17,073,600 | ) | | | 12,120,155 | | | (29,193,755 | ) |
Medium-Duration Bond | | | 1,273,684,191 | | | (51,696,184 | ) | | | 27,064,962 | | | (78,761,146 | ) |
Extended-Duration Bond | | | 473,497,452 | | | 20,483,911 | | | | 32,608,194 | | | (12,124,283 | ) |
Inflation Protected Bond | | | 124,926,384 | | | 2,047,094 | | | | 2,789,788 | | | (742,694 | ) |
Global Bond | | | 256,490,181 | | | (3,659,933 | ) | | | 11,527,006 | | | (15,186,939 | ) |
234
NOTES TO FINANCIAL STATEMENTS—(Continued)
| | | | | | | | | | | | | | |
Fund | | Federal Tax Cost | | Net Unrealized
Appreciation
(Depreciation) | | | Appreciated
Securities | | Depreciated
Securities | |
Equity Index | | $ | 412,842,612 | | $ | 20,698,442 | | | $ | 93,400,541 | | $ | (72,702,099 | ) |
Real Estate Securities | | | 175,334,887 | | | 5,470,416 | | | | 21,664,509 | | | (16,194,093 | ) |
Value Equity | | | 1,407,925,872 | | | (108,927,144 | ) | | | 109,895,666 | | | (218,822,810 | ) |
Growth Equity | | | 1,287,291,802 | | | 164,881,352 | | | | 235,152,223 | | | (70,270,871 | ) |
Small Cap Equity | | | 523,877,030 | | | 34,433,679 | | | | 60,418,493 | | | (25,984,814 | ) |
International Equity | | | 1,363,248,928 | | | 111,799,911 | | | | 220,808,559 | | | (109,008,648 | ) |
The differences between book basis and tax-basis unrealized appreciation is attributable primarily to the tax deferral of losses on wash sales and on investments in PFIC’s.
At December 31, 2009, capital contributions, accumulated undistributed net investment income and accumulated net realized gain (loss) from investments have been adjusted for current period permanent book/tax differences which arose principally from differing book/tax treatments of paydown gains, net operating losses and foreign currency transactions. The following amounts were reclassified within the capital accounts:
| | | | | | | | | | | | |
Fund | | Paid in
Capital | | | Accumulated
Undistributed
Income | | | Accumulated Net
Realized
Gain (Loss) on
Investments,
Currency Translations
and Derivative
Transactions | |
MyDestination 2005 | | $ | — | | | $ | 254,757 | | | $ | (254,757 | ) |
MyDestination 2015 | | | — | | | | 521,691 | | | | (521,691 | ) |
MyDestination 2025 | | | — | | | | 244,526 | | | | (244,526 | ) |
MyDestination 2035 | | | — | | | | 27,755 | | | | (27,755 | ) |
MyDestination 2045 | | | — | | | | 362 | | | | (362 | ) |
Conservative Allocation | | | — | | | | 25,034 | | | | (25,034 | ) |
Balanced Allocation | | | — | | | | 5,076,037 | | | | (5,076,037 | ) |
Growth Allocation | | | — | | | | 1,826,842 | | | | (1,826,842 | ) |
Conservative Allocation I | | | — | | | | 5,264 | | | | (5,264 | ) |
Balanced Allocation I | | | — | | | | 2,553,471 | | | | (2,553,471 | ) |
Growth Allocation I | | | — | | | | 791,362 | | | | (791,362 | ) |
Money Market | | | — | | | | (9,458 | ) | | | 9,458 | |
Low-Duration Bond | | | — | | | | (2,917,261 | ) | | | 2,917,261 | |
Medium-Duration Bond | | | — | | | | (1,362,884 | ) | | | 1,362,884 | |
Extended-Duration Bond | | | — | | | | (526,673 | ) | | | 526,673 | |
Global Bond | | | — | | | | 290,754 | | | | (290,754 | ) |
Growth Equity | | | (21 | ) | | | (118 | ) | | | 139 | |
Small Cap Equity | | | (11,361 | ) | | | (13,537 | ) | | | 24,898 | |
International Equity | | | — | | | | 2,245,877 | | | | (2,245,877 | ) |
Net investment income, net realized gain (loss) on investments and net assets were not affected by these reclassifications.
Management has analyzed the Funds’ tax positions and has concluded that no provision for income tax is required in the Funds’ financial statements. The Funds are not aware of any tax positions for which it is reasonably possible that the total amounts of unrecognized tax benefits will significantly change in the next twelve months. However, management’s conclusions may be subject to review and adjustment at a later date based on factors including, but not limited to, further implementation guidance from the FASB, new tax laws, regulations and administrative interpretations (including court decisions). Each of the Funds’ federal tax returns for the prior three fiscal years remains subject to examination by the Internal Revenue Service.
235
NOTES TO FINANCIAL STATEMENTS—(Continued)
10. MARKET AND CREDIT RISK
In the normal course of business ,the Funds trade financial instruments and enter into financial transactions where the risk of potential loss exists due to changes in the market (market risk) or due to the failure of the other party to a transaction to perform (credit and counterparty risks).
Market Risks — A Fund’s investments in derivatives and other financial instruments expose the Fund to various risks such as, but not limited to, interest rate, foreign currency, equity and commodity risks.
Interest rate risk is the risk that fixed income securities will decline in value because of changes in interest rates. As nominal interest rates rise, the value of certain fixed income securities held by a Fund is likely to decrease. A nominal interest rate can be described as the sum of a real interest rate and an expected inflation rate. Fixed income securities with longer durations tend to be more sensitive to changes in interest rates, usually making them more volatile than securities with shorter durations. Duration is useful primarily as a measure of the sensitivity of a fixed income’s market price to interest rate (i.e. yield) movements.
If a Fund invests directly in foreign currencies or in securities that trade in, and receive revenues in, foreign currencies, or in derivatives that provide exposure to foreign currencies, it will be subject to the risk that those currencies will decline in value relative to the base currency of the Fund, or, in the case of hedging positions, that the Fund’s base currency will decline in value relative to the currency being hedged. Currency rates in foreign countries may fluctuate significantly over short periods of time for a number of reasons, including changes in interest rates, intervention (or the failure to intervene) by U.S. or foreign governments, central banks or supranational entities such as the International Monetary Fund, or by the imposition of currency controls or other political developments in the United States or abroad. As a result, a Fund’s investments in foreign currency denominated securities may reduce the returns of the Fund.
The market values of equities, such as common stocks and preferred stocks, or equity related investments such as futures and options, may decline due to general market conditions which are not specifically related to a particular company, such as real or perceived adverse economic conditions, changes in the general outlook for corporate earnings, changes in interest or currency rates or adverse investor sentiment. Market values may also decline due to factors which affect a particular industry or industries, such as labor shortages or increased production costs and competitive conditions within an industry. Equity securities and equity related investments generally have greater market price volatility than fixed income securities.
A Fund’s investments in commodity-linked derivative instruments may subject the Fund to greater market price volatility than investments in traditional securities. The value of commodity-linked derivative instruments may be affected by changes in overall market movements, commodity index volatility, changes in interest rates, or factors affecting a particular industry or commodity, such as drought, floods, weather, livestock disease, embargoes, tariffs and international economic, political and regulatory developments.
Credit and Counterparty Risks — A Fund will be exposed to credit risk on parties with whom it trades and will also bear the risk of settlement default. A Fund minimizes concentrations of credit risk by undertaking transactions with a large number of customers and counterparties on recognized and reputable exchanges. A Fund could lose money if the issuer or guarantor of a fixed income security, or the counterparty to a derivatives contract, repurchase agreement or a loan of portfolio securities, is unable or unwilling to make timely principal and/or interest payments, or to otherwise honor its obligations. Securities are subject to varying degrees of credit risk, which are often reflected in credit ratings.
Similar to credit risk, a Fund may be exposed to counterparty risk, or the risk that an institution or other entity with which the Fund has unsettled or open transactions will default. Financial assets, which potentially expose a Fund to counterparty risk,
236
NOTES TO FINANCIAL STATEMENTS—(Continued)
consist principally of cash due from counterparties and investments. The investment advisers minimize counterparty risks to the Funds by performing extensive reviews of each counterparty and obtaining approval from the Counterparty Risk Committee prior to entering into transactions with a third party. All transactions in listed securities are settled/paid for upon delivery using approved counterparties. The risk of default is considered minimal, as delivery of securities sold is only made once a Fund has received payment. Payment is made on a purchase once the securities have been delivered by the counterparty. The trade will fail if either party fails to meet its obligation.
The Low Duration Bond Fund and the Medium Duration Bond Fund are parties to ISDA (International Swap and Derivatives Association, Inc.) Master Agreements (“Master Agreements”) with certain counterparties that govern over the counter derivative and foreign exchange contracts entered into from time to time. The Master Agreements may contain provisions regarding, among other things, the parties’ general obligations, representations, agreements, collateral requirements, events of default and early termination. With respect to certain counterparties, in accordance with the terms of the Master Agreements, collateral posted to the Funds is held in a segregated account by the Fund’s custodian and with respect to those amounts which can be sold or repledged, are presented in the Fund’s portfolio or Statements of Assets and Liabilities. Collateral posted to the Funds which can not be sold or repledged totaled $3,670,000 and $4,877,000 in the Low Duration Bond Fund and Medium Duration Bond Fund, respectively, at December 31, 2009. Collateral can be in the form of cash, debt securities, equities or other securities as agreed to by the Fund and the applicable counterparty. Collateral requirements are determined based on the Fund’s net position with each counterparty.
11. LEHMAN BROTHERS
On September 15, 2008, Lehman Brothers Holdings Inc. filed for protection under Chapter 11 of the United States Bankruptcy Code. On September 19, 2008, a proceeding under the Securities Investor Protection Act (SIPA) was commenced with respect to Lehman Brothers Inc., a broker-dealer. A trustee appointed under SIPA is administering the bankruptcy estate of Lehman Brothers Inc. Lehman Brothers International (Europe) was placed in administration under the UK Insolvency Act on September 15, 2008. Lehman Brothers Special Financing Inc. filed for protection under Chapter 11 of the United States Bankruptcy Code on October 3, 2008. In connection with these filings, the Lehman Brothers group of companies (collectively “Lehman Brothers”) will be reorganized and/or liquidated in an orderly fashion, subject to court approval. Each Lehman Brothers entity is a separate legal entity that is subject to its own bankruptcy proceeding.
The Low-Duration Bond, Medium-Duration Bond, Global Bond and Small Cap Equity Funds had select holdings, credit default swap agreements, and securities and derivatives transactions outstanding with Lehman Brothers entities as issuer, referenced entity, counterparty or guarantor at the time the relevant Lehman Brothers entity filed for protection or was placed in administration. The security holdings, credit default swap agreements, and securities and derivatives transactions associated with Lehman Brothers have been written down to their estimated recoverable values. Anticipated losses for securities and derivatives transactions associated with Lehman Brothers have been incorporated as components of other receivables on the Statement of Assets and Liabilities and net changes in unrealized appreciation (depreciation) on the Statement of Operations. A facilitated auction occurred on October 10, 2008, comprising multiple pre-approved brokerage agencies to determine the estimated recovery rate for holdings and credit default swap agreements with Lehman Brothers Holdings Inc. as referenced entity. These recovery rates have been utilized in determining estimated recovery values. Claims against Lehman Brothers have been filed on behalf of GuideStone Funds in accordance with the filing requirements.
237
NOTES TO FINANCIAL STATEMENTS—(Continued)
The Funds’ Sub-Advisers, on behalf of GSCM, have delivered notices of default to the relevant Lehman Brothers entities in accordance with the terms of the applicable agreements. For transactions with Lehman Brothers’ counterparties, the Sub-Advisers have terminated the trades, have obtained quotations from brokers for replacement trades and, where deemed appropriate, have re-opened positions with new counterparties.
12. U.S. TREASURY DEPARTMENT TEMPORARY GUARANTEE PROGRAM
The Money Market Fund participated in the U.S. Department of the Treasury (the “Treasury”) Temporary Guarantee Program for Money Market Funds (the “Program”). The Fund bore the expense of its participation in the Program without regard to any expense limitation in effect. The Program expired on September 18, 2009.
13. NEW ACCOUNTING PRONOUNCEMENTS
In January 2010, the Financial Accounting Standards Board (“FASB”) issued Accounting Standards Update (“ASU”) No. 2010-06 “Improving Disclosures about Fair Value Measurements”. ASU 2010-06 amends FASB Accounting Standards Codification Topic 820, Fair Value Measurements and Disclosures, to require additional disclosures regarding fair value measurements. Certain disclosures required by ASU No. 2010-06 are effective for interim and annual reporting periods beginning after December 15, 2009, and other required disclosures are effective for fiscal years beginning after December 15, 2010, and for interim periods within those fiscal years. Management is currently evaluating the impact ASU No. 2010-06 will have on its financial statement disclosures.
14. SUBSEQUENT EVENTS
Subsequent events have been evaluated through the date that the financial statements were available to be issued. All subsequent events determined to be relevant and material to the financial statements have been appropriately recorded or disclosed.
On February 2, 2010, The PNC Financial Services Group, Inc. (“PNC Financial”) entered into a Stock Purchase Agreement (the “Stock Purchase Agreement”) with The Bank of New York Mellon Corporation (“BNY Mellon”). Upon the terms and subject to the conditions set forth in the Stock Purchase Agreement, which has been approved by the board of directors of each company, PNC Financial will sell to BNY Mellon (the “Stock Sale”) 100% of the issued and outstanding shares of PNC Global Investment Servicing Inc.
The Stock Sale also includes PNC Global Investment Servicing (U.S.) Inc., PFPC Trust Company and PFPC Distributors, Inc., indirect, wholly-owned subsidiaries of PNC Financial, and is expected to close in the third quarter of 2010.
238
REPORT OF INDEPENDENT REGISTERED PUBLIC ACCOUNTING FIRM
To the Board of Trustees and
Shareholders of GuideStone Funds:
In our opinion, the accompanying statements of assets and liabilities, including the schedules of investments, and the related statements of operations and of changes in net assets and the financial highlights, present fairly, in all material respects, the financial position of MyDestination 2005 Fund, MyDestination 2015 Fund, MyDestination 2025 Fund, MyDestination 2035 Fund, MyDestination 2045 Fund, Conservative Allocation Fund, Balanced Allocation Fund, Growth Allocation Fund, Aggressive Allocation Fund, Conservative Allocation Fund I, Balanced Allocation Fund I, Growth Allocation Fund I, Aggressive Allocation Fund I, Money Market Fund, Low-Duration Bond Fund, Medium-Duration Bond Fund, Extended-Duration Bond Fund, Inflation Protected Bond Fund, Global Bond Fund, Equity Index Fund, Real Estate Securities Fund, Value Equity Fund, Growth Equity Fund, Small Cap Equity Fund, and International Equity Fund (constituting GuideStone Funds, hereafter referred to as the “Trust”) at December 31, 2009, and the results of their operations, the changes in their net assets and their financial highlights for each of the periods indicated, in conformity with accounting principles generally accepted in the United States of America. These financial statements and financial highlights (hereafter referred to as “financial statements”) are the responsibility of the Trust’s management; our responsibility is to express an opinion on these financial statements based on our audits. We conducted our audits of these financial statements in accordance with the standards of the Public Company Accounting Oversight Board (United States). Those standards require that we plan and perform the audit to obtain reasonable assurance about whether the financial statements are free of material misstatement. An audit includes examining, on a test basis, evidence supporting the amounts and disclosures in the financial statements, assessing the accounting principles used and significant estimates made by management, and evaluating the overall financial statement presentation. We believe that our audits, which included confirmation of securities at December 31, 2009 by correspondence with the custodian and brokers, provide a reasonable basis for our opinion.
|
 |
|
| PricewaterhouseCoopers LLP |
| Philadelphia, Pennsylvania |
| February 25, 2010 |
239
NOTICE TO SHAREHOLDERS (Unaudited)
Each Fund is required by Subchapter M of the Internal Revenue Code of 1986, as amended, to advise its shareholders within 60 days of the Fund’s year end as of the federal tax status of distributions received by each Fund’s shareholders. During the year ended December 31, 2009, the Funds hereby designate the following dividends and distributions paid by each of the Funds:
| | | | | | | | | |
Fund | | Ordinary
Income | | Long-Term
Capital Gain | | Return
of Capital |
MyDestination 2005 | | $ | 1,564,404 | | $ | — | | $ | — |
MyDestination 2015 | | | 4,412,565 | | | — | | | — |
MyDestination 2025 | | | 2,884,184 | | | — | | | — |
MyDestination 2035 | | | 1,043,907 | | | 124,488 | | | — |
MyDestination 2045 | | | 683,723 | | | 4,334 | | | — |
Conservative Allocation | | | 6,283,221 | | | 9,111,208 | | | — |
Balanced Allocation | | | 26,391,713 | | | 6,797,379 | | | — |
Growth Allocation | | | 11,529,071 | | | 3,868,509 | | | — |
Aggressive Allocation | | | 7,894,855 | | | 4,792,148 | | | — |
Conservative Allocation I | | | 2,128,240 | | | — | | | — |
Balanced Allocation I | | | 15,067,834 | | | — | | | — |
Growth Allocation I | | | 6,560,814 | | | — | | | — |
Aggressive Allocation I | | | 3,254,796 | | | — | | | — |
Money Market | | | 3,671,028 | | | — | | | — |
Low-Duration Bond | | | 20,184,508 | | | — | | | — |
Medium-Duration Bond | | | 62,933,294 | | | — | | | — |
Extended-Duration Bond | | | 26,490,239 | | | 632,726 | | | — |
Inflation Protected Bond | | | 1,409,572 | | | 41,466 | | | — |
Global Bond | | | 13,789,431 | | | — | | | — |
Equity Index | | | 6,217,465 | | | — | | | — |
Real Estate Securities | | | 2,070,541 | | | — | | | 45,334 |
Value Equity | | | 19,742,615 | | | — | | | — |
Growth Equity | | | 1,374,244 | | | — | | | — |
Small Cap Equity | | | 1,121,177 | | | — | | | — |
International Equity | | | 29,748,575 | | | 5,380 | | | — |
Dividends from net investment income and short-term capital gains are treated as ordinary income dividends for federal income tax purposes. Long-term capital gain distributions are taxable as capital gain dividends.
240
NOTICE TO SHAREHOLDERS (Continued)
The following percentages of ordinary income dividends paid for the year ended December 31, 2009, have been designated as qualified for the reduced tax rate under The Job and Growth Tax Relief Reconciliation Act of 2003.
| | | |
Fund | | | |
MyDestination 2005 | | 18.29 | % |
MyDestination 2015 | | 26.42 | % |
MyDestination 2025 | | 36.16 | % |
MyDestination 2035 | | 50.16 | % |
MyDestination 2045 | | 45.60 | % |
Conservative Allocation | | 12.62 | % |
Balanced Allocation | | 22.05 | % |
Growth Allocation | | 55.26 | % |
Aggressive Allocation | | 90.25 | % |
Conservative Allocation I | | 14.43 | % |
Balanced Allocation I | | 19.52 | % |
Growth Allocation I | | 42.25 | % |
Aggressive Allocation I | | 76.22 | % |
Equity Index | | 100.00 | % |
Value Equity | | 100.00 | % |
Growth Equity | | 100.00 | % |
Small Cap Equity | | 100.00 | % |
International Equity | | 83.11 | % |
All above designations are based on financial information available as of the date of this annual report, and accordingly, are subject to change. It is the intention of the Funds to designate the maximum amount permitted under the Internal Revenue Code and the regulations thereunder. Shareholders are advised to consult their own tax advisers with respect to the tax consequences of their investment in the Funds.
241
FUND MANAGEMENT (Unaudited)
Information pertaining to the Trustees and officers of the Trust is set forth below. The statement of additional information (SAI) includes additional information about the Trustees and is available without charge, upon request, by calling 1-888-98-GUIDE (1-888-984-8433).
| | | | | | | | |
Name, (DOB),Address and Position(s) with Trust | | Term of
Office and
Length of
Time Served1 | | Principal Occupation(s) During
Past 5 Years | | Number of
Portfolios in
Fund
Complex
Overseen by
Trustee | | Other Trusteeships/ Directorships
Held by Trusteee |
| DISINTERESTED TRUSTEES2 |
| | | | |
Michael R. Buster (1957) 2401 Cedar Springs Road Dallas, TX 75201-1407 Trustee | | Since 2002 | | Executive Pastor, Prestonwood Baptist Church, 1989 - present. | | 25 | | N/A |
| | | | |
Peter L. Chamberlain, Ph.D. (1951) 2401 Cedar Springs Road Dallas, TX 75201-1407 Trustee | | Since 2008 | | Senior Financial Analyst, Summit Wealth Management, Inc., 2006 – present; President, B.R. Chamberlain & Sons, Inc., 1990 – 2006, Registered Investment Adviser. | | 25 | | First Baptist Church of Orlando – Board of Trustee Member and Strategy Team; Rollins College Board of Overseers/Corporate Council – Member; the B.R. Chamberlain Foundation for Public Entertainment –President. |
| | | | |
William Craig George (1958) 2401 Cedar Springs Road Dallas, TX 75201-1407 Trustee | | Since 2004 | | Regional loan administrator, SunTrust Bank, 1995 - present. | | 25 | | N/A |
| | | | |
Joseph A. Mack (1939) 2401 Cedar Springs Road Dallas, TX 75201-1407 Trustee | | Since 2002 | | Director, Office of Public Policy, South Carolina Baptist Convention, 1999 - Present. | | 25 | | N/A |
| | | | |
Franklin Raymond Morgan (1943) 2401 Cedar Springs Road Dallas, TX 75201-1407 Trustee | | Since 2005 | | Retired - Senior Vice President, Director of International Administration, Prudential Securities, Inc., January 1962 - May 2003. | | 25 | | N/A |
| | | | |
William T. Patterson (1939) 2401 Cedar Springs Road Dallas, TX 75201-1407 Trustee | | Since 2009 | | Managing Partner, Patterson Capital, LLC, October 2007 – Present; Director and Chairman of Audit Committee, Therizo Capital Management, February 2007 – February 2008; Senior Vice President, Wachovia Securities LLC, July 2003 – January 2007; Senior Vice President, Prudential Financial Inc., October 2000 – July 2003 | | 25 | | N/A |
|
| INTERESTED TRUSTEES2,3 |
| | | | |
Barry Hartis (1945) 2401 Cedar Springs Road Dallas, TX 75201-1407 Trustee | | Since 2005 | | Certified Public Accountant,1976 - present; Vice President of Business and Finance, Greensboro College, January 1998 - June 30, 2005. | | 25 | | N/A |
| | | | |
Gerald B. Jones (1932) 2401 Cedar Springs Road Dallas, TX 75201-1407 Trustee | | Since 2000 | | President, Flying Investments, November 2006 - present. Owner Jones Motorcars, Inc. 1957 - October 2006. | | 25 | | Bank of Arkansas — Director |
242
FUND MANAGEMENT (Continued)
| | | | | | | | |
Name, (DOB),Address and Position(s) with Trust | | Term of
Office and
Length of
Time Served1 | | Principal Occupation(s) During
Past 5 Years | | Number of
Portfolios in
Fund
Complex
Overseen by
Trustee | | Other Trusteeships/ Directorships
Held by Trusteee |
|
| OFFICERS WHO ARE NOT TRUSTEES2,4 |
| | | | |
Ron W. Bass (1966) 2401 Cedar Springs Road Dallas, TX 75201-1407 Chief Compliance Officer and AML Officer | | Since 2009 | | Manager of Broker/Dealer and RIA Compliance, GuideStone Financial Resources of the Southern Baptist Convention, 2008 – present; Marketing Compliance Manager, GuideStone Financial Resources of the Southern Baptist Convention, 2005 – present; Compliance Specialist, GuideStone Financial Resources of the Southern Baptist Convention, 2004 – 2005. | | N/A | | N/A |
| | | | |
Jeffrey P. Billinger (1946) 2401 Cedar Springs Road Dallas, TX 75201-1407 Vice President and Treasurer | | Since 2000 | | Executive Officer and Treasurer, GuideStone Financial Resources of the Southern Baptist Convention, 1995 - present. | | N/A | | N/A |
| | | | |
Rodric E. Cummins (1957) 2401 Cedar Springs Road Dallas, TX 75201-1407 Vice President and Investment Officer | | Since 2000 | | Executive Officer and Chief Investment Officer, GuideStone Financial Resources of the Southern Baptist Convention, 1998 - present. | | N/A | | N/A |
| | | | |
John R. Jones (1953) 2401 Cedar Springs Road Dallas, TX 75201-1407 President | | Since 2000 | | Executive Vice President and Chief Operating Officer, GuideStone Financial Resources of the Southern Baptist Convention, 1995 - present. | | N/A | | N/A |
| | | | |
Rodney R. Miller (1953) 2401 Cedar Springs Road Dallas, TX 75201-1407 Vice President and Secretary | | Since 2000 | | General Counsel, Legal and Compliance, GuideStone Financial Resources of the Southern Baptist Convention, 1995 - present. | | N/A | | N/A |
| | | | |
Patricia A. Weiland (1959) 2401 Cedar Springs Road Dallas, TX 75201-1407 Vice President — Fund Operations and Sales | | Since 2000 | | Executive Officer, Financial Solutions and Services, GuideStone Financial Resources of the Southern Baptist Convention, 2006 - present; Director, Mutual Funds, GuideStone Financial Resources of the Southern Baptist Convention, 2000 - 2006. | | N/A | | N/A |
| 1 | Each Trustee serves for an indefinite term, until his/her successor is elected. Officers serve at the pleasure of the Board of Trustees. |
| 2 | The Trust pays no compensation to the Trustees. The Trust reimburses the Trustees for any expenses incurred in attending meetings. The Trust does not compensate the officers for the services they provide to the Funds. |
| 3 | Messrs. Gerald Jones and Hartis serve as trustees and are to be “interested persons” of the Trust as the term is defined in the Investment Company Act of 1940, due to their positions on the Board of Trustees of GuideStone Financial Resources of the Southern Baptist Convention. |
| 4 | The executive officers of the Trust may be deemed to be affiliates of the Adviser due to their positions with the Adviser and/or GuideStone Financial Resources. |
243
PROXY VOTING
A description of the policies and procedures that GuideStone Funds uses to determine how to vote proxies relating to their portfolio securities as well as information regarding how GuideStone Funds voted proxies during the most recent 12-month period ended June 30 is available without charge by calling 1-888-98-GUIDE (1-888-984-8433), by visiting our Web site at www.GuideStoneFunds.org or by visiting the SEC’s Web site at www.sec.gov.
QUARTERLY SCHEDULES OF INVESTMENTS
In addition to the semi-annual and annual reports that GuideStone Funds delivers to shareholders and makes available through its Web site, GuideStone Funds files a complete schedule of portfolio holdings with the U.S. Securities and Exchange Commission (SEC) for each Fund’s first and third fiscal quarters on Form N-Q. GuideStone Funds does not deliver the schedule for the first and third fiscal quarters to shareholders, however the schedule is posted to our Web site, www.GuideStoneFunds.org. You may also obtain the Form N-Q filings by accessing the SEC’s Web site at www.sec.gov or copy them at the SEC’s Public Reference Room in Washington, DC. Information on the operation of the SEC’s Public Reference Room may be obtained by calling the SEC at (800) 732-0330. You can also request copies of this information, upon payment of a fee for duplication, at the SEC’s email address (publicinfo@sec.gov) or by writing the Public Reference section of the SEC, Washington, DC 20549-0102.
244
BOARD REVIEW OF ADVISORY AGREEMENTS
As required by the Investment Company Act of 1940, as amended (the “1940 Act”), the Board of Trustees (the “Board”) of GuideStone Funds (the “Trust”), including all of the Trustees who are not “interested persons” of the Trust, as that term is defined in the 1940 Act (the “Independent Trustees”), recently considered the renewal of (i) the investment advisory agreement between GuideStone Capital Management (the “Adviser” or “GSCM”) and the Trust on behalf of the Date Target, Asset Allocation and Select Funds (each a “Fund” and together the “Funds”) of the Trust (the “Advisory Agreement”); and (ii) the sub-advisory agreements among the Adviser, each sub-adviser, and the Trust on behalf of each Select Fund (the “Sub-Advisory Agreements”). It was noted that certain Sub-Advisory Agreements with respect to the Inflation Protected Bond and Small Cap Equity Funds were not presented for renewal because they had been approved recently for an initial two-year term in accordance with Section 15(a) of the 1940 Act. The Advisory Agreement and each Sub-Advisory Agreement presented for renewal (the “Agreements”) were approved for an additional one-year term at a meeting of the Board held on September 11, 2009. The Board’s decision to approve the Agreements reflects the exercise of its business judgment to continue each existing arrangement. In approving the Agreements, the Board considered information provided by the Adviser, each sub-adviser and a consulting firm engaged by the Adviser with the assistance and advice of counsel to the Independent Trustees and counsel to the Trust.
The Board’s consideration of various factors and its conclusions with respect to such factors formed the basis for the Board’s determination to continue the Agreements. The factors considered by the Board included, but were not limited to: (i) the resources of the Adviser or sub-adviser; (ii) the experience and expertise of the Adviser or sub-adviser; (iii) the financial capability of the Adviser or sub-adviser; (iv) the compliance procedures and history of the Adviser or sub-adviser; (v) the performance of the Fund in comparison to relevant benchmarks, similarly managed funds and the Adviser’s or sub-adviser’s other clients; (vi) the amount of the contractual advisory fee in comparison to similarly managed funds and the Adviser’s or sub-adviser’s other clients and the effect of any fee waiver and expense reimbursement arrangement; (vii) the total expenses of the Fund in comparison to similarly managed funds and the use of past and anticipated expense caps; (viii) the profitability of the Adviser or sub-adviser with respect to the Fund and its overall business; (ix) the extent of any economies of scale and whether the fee structure reflects such economies of scale; (x) the existence of any collateral benefits realized by the Adviser or sub-adviser; and (xi) the existence of any collateral benefits realized by the Fund. In its decision to renew each Agreement, the Board was also mindful of the potential disruptions of the Trust’s operations and various risks, uncertainties and other effects that could occur as a result of a decision to terminate or not renew an Agreement. No one factor was determinative in the Board’s consideration of the Agreements.
The Board undertook a review of the terms of the Agreements and the nature and quality of the services provided by the Adviser and each sub-adviser. The Board conducted its analysis on a fund-by-fund basis with respect to the Adviser and each sub-adviser. The Adviser provided the Board with substantial detailed information in the form of reports about each Date Target Fund, Asset Allocation Fund, Select Fund, sub-advisory firm and the Adviser prior to and during the meeting, which addressed most, if not all, of the factors listed above. The Adviser also provided additional information about the Adviser and each sub-adviser in presentations made during the meeting and responded to questions from the Trustees. In addition, the Independent Trustees met separately in executive session with counsel to the Independent Trustees to discuss and consider information presented in connection with the continuation of the Agreements as well as the Trustees’ responsibilities and duties in approving the Agreements.
APPROVAL OF CONTINUATION OF INVESTMENT ADVISORY AGREEMENT
In considering the renewal of the existing Advisory Agreement with GSCM, the Board took into account all the materials provided prior to and during the meeting, the presentations made during the meeting and the extensive discussions during the meeting, including the discussions between the Independent Trustees and their independent legal counsel during the executive session. More specifically, the Board examined the nature, extent and quality of the services to be provided by the Adviser to the Funds. The Board evaluated the Adviser’s experience in serving as an investment adviser, including overseeing and managing the allocation of Fund assets among the sub-advisers. The Board considered the experience of key personnel at the Adviser in providing investment management and administrative services, the systems and services used by such persons and the ability of the Adviser to attract and retain capable personnel. The Board considered the reputation, compliance history, compliance program and financial condition of the Adviser. The Board also considered the terms of the Advisory and Sub-Advisory
245
Agreements and the responsibilities that the Adviser has as investment adviser to the Funds, including oversight of sub-adviser compliance with each Fund’s policies and objectives, oversight of general Fund compliance, including compliance with social restrictions, and the implementation of Board directives as they relate to the Funds. The Board concluded that each Fund is likely to benefit from the extent and quality of these services as a result of the Adviser’s experience, personnel, operations and resources.
The Board also reviewed a memorandum prepared by a consulting firm engaged by the Adviser for, among other things, supplying research on expense comparisons and investment performance of other similar funds. The memorandum compared each Date Target, Asset Allocation and Select Fund with other funds having the same investment style or objective, based primarily on Morningstar’s style-based investment categories, and compared the share class of each Fund with other funds in the same distribution channel. The Board analyzed the comparative expense information for each Fund and the performance information for each Select Fund in the memorandum, including comparative expense information for each Fund based on a sampling of funds similar in asset size. The Board considered the comparative fee and expense information that had been provided in its evaluation of the management fees charged to each Fund. The Board evaluated the annualized performance results comparing the Select Funds against their peers.
The Board examined fee and expense information for the Select Funds, as compared to other funds in the Funds’ asset-stratified peer groups for the GS4 Class as of June 30, 2009. The Board determined that the management fees (combined advisory and sub-advisory fees) net of any fee waiver or expense reimbursement for each Select Fund were lower than the median management fees for other mutual funds in the Fund’s asset-stratified peer group, except for the Real Estate Securities, Growth Equity, Small Cap Equity and International Equity Funds. The Board took into account that the management fees net of any fee waiver or expense reimbursement for the Money Market, Low-Duration Bond, Extended-Duration Bond and Global Bond Funds ranked in the first quartile and for the Medium-Duration Bond, Equity Index and Value Equity Funds ranked in the second quartile among similar funds at the same asset levels. The Board also considered that the management fees net of any fee waiver or expense reimbursement for the Small Cap Equity and International Equity Funds ranked in the third quartile and for the Growth Equity and Real Estate Securities Funds ranked in the fourth quartile among similar funds at the same asset levels. The Board also evaluated the total expense ratios for other funds in the Funds’ asset-stratified peer groups and determined that each Fund’s total expense ratio was lower than the median total expense ratio for such other funds.
The Board also examined fee and expense information for the Select Funds, as compared to other funds in the peer groups for the GS2 Class as of June 30, 2009. The Board determined that the management fees net of any fee waiver or expense reimbursement for each Select Fund were lower than the median management fees for other mutual funds in each Fund’s peer group, except for the Extended-Duration Bond, Equity Index, Growth Equity, Small Cap Equity and International Equity Funds. The Board noted that the management fees net of any fee waiver or expense reimbursement for the Extended-Duration Bond, Equity Index Fund, and Small Cap Equity Funds ranked in the third quartile and for the Growth Equity and International Equity Funds ranked in the fourth quartile, among similar funds at the same asset levels. The Board also evaluated the total expense ratios for other funds in the Funds’ peer groups and determined that each Fund’s total expense ratio was lower than the median total expense ratio for such other funds, except for the Extended-Duration Bond, Growth Equity and Small Cap Equity Funds. The total expense ratios for each of those Funds fell slightly above the median for other funds in each Fund’s peer group.
The Board also examined fee and expense information for the Date Target Funds and the Asset Allocation Funds, as compared to other funds in the Funds’ asset-stratified peer groups for the GS4 Class of the Date Target Funds and the GS2 and GS4 Classes of the Asset Allocation Funds as of June 30, 2009. The Board determined that the management fees net of any fee waiver or expense reimbursement for each Date Target Fund were only slightly above the median management fees for other mutual funds in each Fund’s asset-stratified peer group and that the total expense ratios for each Date Target Fund were lower than the median total expense ratio for such other funds. For the Asset Allocation Funds, the Board determined that the management fees net of any fee waiver or expense reimbursement for each Asset Allocation Fund for both the GS2 and GS4 Class were lower than the median management fees for other mutual funds in each Fund’s asset-stratified peer group and that the total expense ratios for each Asset Allocation Fund for both the GS2 and GS4 Class were lower than the median total expense ratio for such other funds. The Board concluded that the level of the management fees for each Select Fund, Date Target Fund and Asset Allocation Fund was reasonable and compared favorably to that of comparable mutual funds.
246
The Board examined the performance information for the GS4 Class of the Select Funds compared to Morningstar peers for the one-, three- and five-year periods ended June 30, 2009. The Board noted that the average annual total returns for the Money Market and Extended-Duration Bond Funds ranked in the first quartile for the three- and five-year periods, and the average annual total returns for the Low-Duration Bond and Medium-Duration Bond Funds for the one-, three- and five-year periods ended June 30, 2009, ranked in the second quartile. The Board noted that the average annual total return for the Global Bond Fund for the one-year period ended June 30, 2009, ranked in the fourth quartile. With respect to the Equity Select Funds, the Board noted that average annual total returns for the Value Equity and Growth Equity Funds for the one-, three- and five-year periods ended June 30, 2009, fell either within the third or fourth quartile. The Board further noted that the average annual total returns for the Small Cap Equity Fund for the one-, three- and five-year periods and the Real Estate Securities Fund for the one-year period ended June 30, 2009, fell within the third quartile. The Board also noted that the average annual total returns for the International Equity Fund for the one- and five-year periods ended June 30, 2009, fell within the second quartile and in the third quartile for the three-year period ended June 30, 2009.
The Board also examined the performance information for the GS4 Class of each Asset Allocation Fund compared to the relevant benchmark and to Lipper peer rankings for the three- and five-year periods ended June 30, 2009. The Board noted that the investment performance of each Fund fell below the benchmark for each of those periods. However, the Board noted that the Growth Allocation Fund ranked in the first quartile among Lipper peers for the three- and five-year periods ended June 30, 2009, and the Balanced Allocation Fund ranked in the second quartile among Lipper peers for those periods. The Board also noted that the Conservative Allocation and Aggressive Allocation Funds each ranked within the third quartile for both the three- and five-year periods ended June 30, 2009.
The Board considered the costs to GSCM of serving as the Adviser to the Funds, including the costs associated with the personnel, systems and equipment necessary to manage the Funds in accordance with the existing Advisory Agreement. The Board considered the anticipated revenues that GSCM expected to receive for serving as the Adviser to the Funds, the fact that any profit realized by the Adviser is forwarded to GuideStone Financial Resources, which historically has operated at a deficit with respect to the Trust. The Board also considered the profitability estimates for the Adviser, one without taking into account sub-advisory fee expenses borne by the Fund and one taking into account sub-advisory fee expenses. The Board then considered whether any direct or indirect collateral benefits inured to either the Adviser or the Trust as a result of their affiliation with one another. In light of these considerations, the Board concluded that any profits realized in connection with the Adviser’s services appeared reasonable.
The Board considered the extent to which the advisory fee to be paid to the Adviser reflected economies of scale. In this connection, the Board again noted that the management fees for each Fund net of any fee waiver and expense reimbursement were below the median fee for other similar funds at the same asset levels, except for the Real Estate Securities, Growth Equity, Small Cap Equity and International Equity Funds.
Based on all of the information presented to the Board and its consideration of relevant factors, the Board concluded that the fee paid to the Adviser by each Fund was reasonable, and in the exercise of its business judgment, determined to approve the continuation of the Advisory Agreement for each Fund.
APPROVAL OF CONTINUATION OF SUB-ADVISORY AGREEMENTS
In considering the existing Sub-Advisory Agreements with each sub-adviser, the Board took into account the materials provided prior to and during the meeting, the presentations made during the meeting and the extensive discussions during the meeting, including the discussions the Independent Trustees had during their executive session with their independent legal counsel. More specifically, the Board examined the nature, extent and quality of the services to be provided by each of the sub-advisers to the Select Funds as well as the services to be provided by Northern Trust Investments, N.A. to each Fund, except the Money Market Fund, in connection with the cash overlay program. The Board evaluated each sub-adviser’s experience in serving as a sub-adviser to a Select Fund and Northern’s experience in managing the cash overlay program and noted that each sub-adviser currently provides investment advice to various clients, including, in some cases, other pooled investment vehicles. The Board noted the experience of key personnel at each sub-adviser in providing investment management services and the systems used by such persons and the ability of each sub-adviser to attract and retain capable personnel. The Board noted the reputation, compliance history, compliance program and financial condition of each sub-adviser. The Board also noted the terms of the
247
existing Sub-Advisory Agreements and the responsibilities that each sub-adviser has towards a Select Fund, including the responsibility of the day-to-day management of the investment portfolio of each Fund, compliance with each Fund’s policies and objectives and the implementation of Board’s directives as they relate to the Funds. The Board concluded that each Fund is likely to benefit from the extent and quality of these services as a result of each sub-adviser’s experience, personnel, operations and resources.
The Board examined performance information for each segment of a Select Fund managed by a sub-adviser. The Board noted that, for many of the sub-advisers, the performance record of the segment of the Select Fund managed by the sub-adviser compared favorably to the relevant Fund benchmark, the composite performance for the sub-adviser’s clients (on a gross fee basis) and the peer universe of similarly managed funds for the period of time the sub-adviser performed advisory services on behalf of the Select Fund.
The Board also noted that, in certain cases, unprecedented market trends due to the economic downturn have contributed to the underperformance of many of the sub-advisers. The Board further noted that each of those sub-advisers had or was in the process of taking corrective action to address such underperformance to the extent the underperformance was related to securities selection and that each sub-adviser fulfilled a particular investment mandate for the Select Fund it advised. The Board concluded that, although past performance is no guarantee of future performance, the performance of each Select Fund was satisfactory and the Funds were likely to benefit from each sub-adviser continuing to serve as a sub-adviser to the Funds.
The Board examined the fee schedule for each sub-adviser, noting how the fee levels charged to the Trust compared with available information about fees charged by the sub-advisers to their other similarly situated clients, as well as how the sub-adviser fee levels for each Select Fund compared to the median sub-advisory fee for the peer universe of similarly managed funds.
The Board also took into account the profitability and the financial capability of each sub-adviser in light of information presented at the meeting. In light of these considerations, the Board concluded that profits realized by each sub-adviser who completed a profitability questionnaire appeared reasonable. For those sub-advisers that did not provide profitability information, the Board relied upon other relevant information, particularly the independent negotiation of the fee schedules, the level of the fees and the sub-adviser’s performance history. The Board noted that, based on the Adviser’s representations, the financial statements of the sub-advisers did not appear to raise any concerns regarding the financial capability of those sub-advisers. The Board also considered the Adviser’s representations in the materials prepared for this meeting, that no sub-adviser experienced any material change in its financial condition since the date of its most recent audited financial statements.
The Board considered the extent to which sub-adviser fees to be paid to each sub-adviser reflected economies of scale. The Board noted that each sub-adviser fee schedule either reflected economies of scale by reducing the fee on assets in excess of certain stated breakpoints, or the fee level negotiated was below or on par with the standard fee level for the sub-adviser.
In evaluating the benefits that are expected to accrue to each sub-adviser through its relationship as sub-adviser to a Select Fund, the Board noted that certain sub-advisers allocate portfolio brokerage to affiliated broker-dealers that receive commissions from the execution of Fund trades. The Board also noted that certain sub-advisers expect to benefit from “soft dollar” arrangements by which brokers will provide research and other services to the sub-adviser in exchange for commissions on trades of the portfolio securities of the Select Fund. The Board considered whether any direct or indirect collateral benefits inured to the Trust as a result of its affiliation with each sub-adviser.
Based on all of the information presented to the Board and its consideration of relevant factors, the Board, in the exercise of its reasonable business judgment, determined to approve the continuation of each Sub-Advisory Agreement.
248
INVESTMENT SUB-ADVISERS (Assets under management as of 12/31/09) (Unaudited)
GuideStone Funds employs a broad array of proven investment managers for the benefit of their investors. Each manager is distinctive in its investment management process and business approach.
| | | | | | | |
Fund | | Sub-Adviser | | Firm
Established | | Total Assets
Managed |
Money Market | | BlackRock Institutional Management Corporation | | 1988 | | $ | 3.3Tr |
Low-Duration Bond | | BlackRock Financial Management, Inc. | | 1988 | | $ | 3.3Tr |
| | Payden & Rygel | | 1983 | | $ | 50.2B |
| | PIMCO (Pacific Investment Management Company LLC) | | 1971 | | $ | 1.0Tr |
Medium-Duration Bond | | Goldman Sachs Asset Management, L.P. | | 1984 | | $ | 753B |
| | PIMCO (Pacific Investment Management Company LLC) | | 1971 | | $ | 1.0Tr |
| | Western Asset Management Company | | 1971 | | $ | 482B |
| | Western Asset Management Company Limited | | 1971 | | $ | 56.2B |
Extended-Duration Bond | | Loomis, Sayles & Company, L.P. | | 1926 | | $ | 142B |
| | STW Fixed Income Management Ltd. | | 1977 | | $ | 9.9B |
Inflation Protected Bond | | BlackRock Financial Management, Inc. | | 1988 | | $ | 3.3Tr |
Global Bond | | Loomis, Sayles & Company, L.P. | | 1926 | | $ | 142B |
| | Western Asset Management Company | | 1971 | | $ | 482B |
| | Western Asset Management Company Limited | | 1971 | | $ | 56.2B |
Equity Index | | Northern Trust Investments, N.A. | | 1889 | | $ | 627B |
Real Estate Securities | | RREEF America L.L.C. | | 1975 | | $ | 62.4B |
Value Equity | | Aronson+Johnson+Ortiz, LP | | 1984 | | $ | 20.1B |
| | Barrow, Hanley, Mewhinney & Straus, LLC | | 1979 | | $ | 55.0B |
| | Northern Trust Investments, N.A. | | 1889 | | $ | 627B |
| | TCW Investment Management Company | | 1971 | | $ | 101B |
Growth Equity | | Columbus Circle Investors | | 1975 | | $ | 15.7B |
| | Marsico Capital Management, LLC | | 1997 | | $ | 55.2B |
| | Rainier Investment Management, Inc.® | | 1991 | | $ | 17.3B |
| | Sands Capital Management, LLC | | 1992 | | $ | 13.9B |
Small Cap Equity | | Aronson+Johnson+Ortiz, LP | | 1984 | | $ | 20.1B |
| | Columbus Circle Investors | | 1975 | | $ | 15.7B |
| | Lord, Abbett & Co. LLC | | 1929 | | $ | 88.9B |
| | TimesSquare Capital Management, LLC | | 2000 | | $ | 11.8B |
| | Western Asset Management Company | | 1971 | | $ | 482B |
| | Western Asset Management Company Limited | | 1971 | | $ | 56.2B |
International Equity | | AllianceBernstein L.P. | | 1962 | | $ | 496B |
| | AQR Capital Management, LLC | | 1998 | | $ | 23.5B |
| | Genesis Asset Managers, LLP | | 1989 | | $ | 21.8B |
| | Lazard Asset Management LLC | | 1970 | | $ | 116.5B |
| | McKinley Capital Management, LLC | | 1990 | | $ | 12.7B |
| | MFS Institutional Advisors, Inc. | | 1970 | | $ | 183B |
| | Mondrian Investment Partners Ltd. | | 1990 | | $ | 64.4B |
| | Philadelphia International Advisors, L.P. | | 1956 | | $ | 6.7B |
| | UBS Global Asset Management (Americas) Inc. | | 1998 | | $ | 144B |
Custodian for GuideStone Funds Assets | | The Northern Trust Company | | 1889 | | $ | 3.7Tr |
Cash Overlay for Date Target, Asset Allocation, Bond and Equity Funds | | Northern Trust Investments, N.A. | | 1889 | | $ | 627B |
You should consider the investment objectives, risks, charges and expenses of each Fund carefully before investing. To obtain a prospectus with this and other information about GuideStone Funds call 1-888-98-GUIDE (1-800-984-8433), visit www.GuideStoneFunds.org or write to GuideStone Funds, 2401 Cedar Springs, Dallas, TX 75201-1498. Read it carefully before you invest. Shares of GuideStone Funds are distributed by PFPC Distributors, Inc., 760 Moore Road, King of Prussia, PA 19406.
249
| | | | |
 | | 2401 Cedar Springs Road, Dallas, TX 75201-1498 | | Funds distributed by PFPC Distributors, Inc. |
| | 1-888-98-GUIDE • www.GuideStoneFunds.org | | 760 Moore Road, King of Prussia, PA 19406 |
Item 2. Code of Ethics.
The registrant, as of the end of the period covered by this report, has adopted a code of ethics for the Principal Executive and Senior Financial Officers (“Supplemental Code of Ethics”). Such Supplemental Code of Ethics is attached as an exhibit to this Form N-CSR.
There have been no amendments or waivers, during the period covered by this report, to a provision of the code of ethics that applies to the registrant’s principal executive officer, principal financial officer, principal accounting officer or controller, or persons performing similar functions, regardless of whether these individuals are employed by the registrant or a third party, and that relates to any element of the code of ethics description.
Item 3. Audit Committee Financial Expert.
The Board of Trustees of GuideStone Funds (the “Board”) has determined that there is currently no audit committee financial expert. Julie P. Fry, the Board’s previously designated audit committee financial expert, passed away in December 2009 and has not been replaced.
Item 4. Principal Accountant Fees and Services.
Audit Fees
| | (a) | The aggregate fees billed for each of the last two fiscal years for professional services rendered by the principal accountant for the audit of the registrant’s annual financial statements or services that are normally provided by the accountant in connection with statutory and regulatory filings or engagements for those fiscal years are $460,152 and $480,152 for 2008 and 2009, respectively. |
Audit-Related Fees
| | (b) | The aggregate fees billed in each of the last two fiscal years for assurance and related services by the principal accountant that are reasonably related to the performance of the audit of the registrant’s financial statements and are not reported under paragraph (a) of this Item are $36,740 and $36,740 for 2008 and 2009, respectively. Audit-related fees are related to procedures performed and the issuance of the auditors’ reports in connection with the Funds’ 17F-2 security counts. |
Tax Fees
| | (c) | The aggregate fees billed in each of the last two fiscal years for professional services rendered by the principal accountant for tax compliance, tax advice, and tax planning are $86,900 and $91,400 for 2008 and 2009, respectively. Tax fees are related to tax services in connection with Funds’ excise tax calculations and review of the Funds’ applicable tax returns. |
All Other Fees
| | (d) | The aggregate fees billed in each of the last two fiscal years for products and services provided by the principal accountant, other than the services reported in paragraphs (a) through (c) of this Item are $0 and $0 for 2008 and 2009, respectively |
| | (e)(1) | Disclose the audit committee’s pre-approval policies and procedures described in paragraph (c)(7) of Rule 2-01 of Regulation S-X. |
GuideStone
Non-Audit Services Provided to the Company, Advisor, and Others
The Audit Committee shall pre-approve all permissible non-audit services (e.g., tax services) to be provided to the Company by the Auditors, including the fees therefor;
provided, that if the Committee chooses to delegate the authority to grant pre-approvals to one or more Committee members, each acting on behalf of the Committee, then the Committee shall adopt policies and procedures detailed as to the particular service and designed to safeguard the continued independence of the auditors, consistent with the requirements of the Sarbanes-Oxley Act of 2002 (the “S-O Act”) and related SEC regulations, which shall then be used in making such pre-approvals; and,
further provided, that each delegated pre-approval shall be reported to the Committee during its next regularly scheduled meeting.
The pre-approval requirement for a permitted non-audit service may be waived if:
| | (1) | the aggregate amount of all such non-audit services provided constitutes not more than 5% of the total revenues paid by the Company to the Auditors in the fiscal year in which the non-audit services are provided; |
| | (2) | such services were not recognized by the Company at the time of the engagement to be non-audit services; and |
| | (3) | such services are promptly brought to the attention of, and approved by, the Audit Committee or by a member of the Audit Committee to whom the Committee has delegated the authority to grant such approvals, if any, prior to the Auditors’ completion of the Company’s audit. |
Additionally, if the Auditors’ engagement relates directly to the operations and financial reporting of the Company, to the extent required by Rule 2-01 of Regulation S-X, the Audit Committee shall pre-approve their engagements for non-audit services with:
| | (1) | the Advisor (excluding any subadviser whose role is primarily portfolio management and is sub-contracted or overseen by the Advisor), and |
| | (2) | any entity controlling, controlled by, or under common control with such Advisor that provides ongoing services to the Company (each, a “Control Entity”) |
in accordance with the foregoing paragraph, unless the aggregate amount of all services provided constitutes no more than 5% of the total amount of revenues paid to the Auditors by the Company, the Advisor and any such Control Entity during the fiscal year in which the services are provided that would have to be pre-approved by the Audit Committee pursuant to this paragraph (in the absence of this exception). The Auditors may not perform contemporaneously any prohibited non-audit services for the Company, which currently include the following:
| | 1. | bookkeeping or other services related to the accounting records or financial statements of the Company; |
| | 2. | financial information systems design and implementation; |
| | 3. | appraisal or valuation services, fairness opinions, or contribution-in-kind reports; |
| | 5. | internal audit outsourcing services; |
| | 6. | management functions or human resources; |
| | 7. | broker or dealer, investment adviser, or investment banking services; |
| | 8. | legal services and expert services unrelated to the audit; and |
| | 9. | any other service that the Public Company Accounting Oversight Board determines, by regulation, is impermissible. |
| | (e)(2) | The percentage of services described in each of paragraphs (b) through (d) of this Item that were approved by the audit committee pursuant to paragraph (c)(7)(i)(C) of Rule 2-01 of Regulation S-X are as follows: |
(b) 0%
(c) 0%
(d) 0%
| | (f) | The percentage of hours expended on the principal accountant’s engagement to audit the registrant’s financial statements for the most recent fiscal year that were attributed to work performed by persons other than the principal accountant’s full-time, permanent employees was 0%. |
| | (g) | The aggregate non-audit fees billed by the registrant’s accountant for services rendered to the registrant, and rendered to the registrant’s investment adviser (not including any sub-adviser whose role is primarily portfolio management and is subcontracted with or overseen by another investment adviser), and any entity controlling, controlled by, or under common control with the |
| | adviser that provides ongoing services to the registrant for each of the last two fiscal years of the registrant was $0 and $0 for 2008 and 2009, respectively. |
| | (h) | The registrant’s audit committee of the board of directors has considered whether the provision of non-audit services that were rendered to the registrant’s investment adviser (not including any sub-adviser whose role is primarily portfolio management and is subcontracted with or overseen by another investment adviser), and any entity controlling, controlled by, or under common control with the investment adviser that provides ongoing services to the registrant that were not pre-approved pursuant to paragraph (c)(7)(ii) of Rule 2-01 of Regulation S-X is compatible with maintaining the principal accountant’s independence. |
Item 5. Audit Committee of Listed registrants.
Not applicable.
Item 6. Investments.
| (a) | Schedule of Investments in securities of unaffiliated issuers as of the close of the reporting period is included as part of the report to shareholders filed under Item 1 of this form. |
Item 7. Disclosure of Proxy Voting Policies and Procedures for Closed-End Management Investment Companies.
Not applicable.
Item 8. Portfolio Managers of Closed-End Management Investment Companies.
Not applicable.
Item 9. Purchases of Equity Securities by Closed-End Management Investment Company and Affiliated Purchasers.
Not applicable.
Item 10. Submission of Matters to a Vote of Security Holders.
Not applicable.
Item 11. Controls and Procedures.
| | (a) | The registrant’s principal executive and principal financial officers, or persons performing similar functions, have concluded that the registrant’s disclosure controls and procedures (as defined in Rule 30a-3(c) under the Investment Company Act of 1940, as amended (the “1940 Act”) (17 CFR 270.30a-3(c))) are effective, as of a date within 90 days of the filing date of the report that includes the disclosure required by this paragraph, based on their evaluation of these controls and procedures required by Rule 30a-3(b) under the 1940 Act (17 CFR 270.30a-3(b)) and Rules 13a-15(b) or 15d-15(b) under the Securities Exchange Act of 1934, as amended (17 CFR 240.13a-15(b) or 240.15d-15(b)). |
| | (b) | There were no changes in the registrant’s internal control over financial reporting (as defined in Rule 30a-3(d) under the 1940 Act (17 CFR 270.30a-3(d)) that occurred during the registrant’s second fiscal quarter of the period covered by this report that has materially affected, or is reasonably likely to materially affect, the registrant’s internal control over financial reporting. |
Item 12. Exhibits.
| | (a)(1) | Code of ethics, or any amendment thereto, that is the subject of disclosure required by Item 2 is attached hereto. |
| | (a)(2) | Certifications pursuant to Rule 30a-2(a) under the 1940 Act and Section 302 of the Sarbanes-Oxley Act of 2002 are attached hereto. |
| | (b) | Certifications pursuant to Rule 30a-2(b) under the 1940 Act and Section 906 of the Sarbanes-Oxley Act of 2002 are attached hereto. |
SIGNATURES
Pursuant to the requirements of the Securities Exchange Act of 1934 and the Investment Company Act of 1940, the registrant has duly caused this report to be signed on its behalf by the undersigned, thereunto duly authorized.
| | |
| (registrant) | | GuideStone Funds |
| |
| By (Signature and Title)* | | /s/ John R. Jones |
| | John R. Jones, President |
| | (principal executive officer) |
| |
| Date | | March 3, 2010 |
Pursuant to the requirements of the Securities Exchange Act of 1934 and the Investment Company Act of 1940, this report has been signed below by the following persons on behalf of the registrant and in the capacities and on the dates indicated.
| | |
| By (Signature and Title)* | | /s/ John R. Jones |
| | John R. Jones, President |
| | (principal executive officer) |
| |
| Date | | March 3, 2010 |
| |
| By (Signature and Title)* | | /s/ Jeffrey P. Billinger |
| | Jeffrey P. Billinger, Vice President and Treasurer |
| | (principal financial officer) |
| |
| Date | | March 3, 2010 |
| * | Print the name and title of each signing officer under his or her signature. |