UNITED STATES
SECURITIES AND EXCHANGE COMMISSION
Washington, D.C. 20549
FORM N-CSR
CERTIFIED SHAREHOLDER REPORT OF REGISTERED
MANAGEMENT INVESTMENT COMPANIES
Investment Company Act file number 811-10263
GuideStone Funds
(Exact name of registrant as specified in charter)
2401 Cedar Springs Road
Dallas, TX 75201-1407
(Address of principal executive offices) (Zip code)
Rodney R. Miller, Esq.
GuideStone Financial Resources of the Southern Baptist Convention
2401 Cedar Springs Road
Dallas, TX 75201-1407
(Name and address of agent for service)
registrant’s telephone number, including area code: 214-720-2142
Date of fiscal year end: December 31
Date of reporting period: December 31, 2006
Form N-CSR is to be used by management investment companies to file reports with the Commission not later than 10 days after the transmission to stockholders of any report that is required to be transmitted to stockholders under Rule 30e-1 under the Investment Company Act of 1940 (17 CFR 270.30e-1). The Commission may use the information provided on Form N-CSR in its regulatory, disclosure review, inspection, and policymaking roles.
A registrant is required to disclose the information specified by Form N-CSR, and the Commission will make this information public. A registrant is not required to respond to the collection of information contained in Form N-CSR unless the Form displays a currently valid Office of Management and Budget (“OMB”) control number. Please direct comments concerning the accuracy of the information collection burden estimate and any suggestions for reducing the burden to Secretary, Securities and Exchange Commission, 100 F Street, NE, Washington, DC 20549. The OMB has reviewed this collection of information under the clearance requirements of 44 U.S.C. § 3507.
| Item 1. | Reports to Stockholders. |
The Report to Shareholders is attached herewith.

GuideStone Funds
GuideStone Financial Resources of the Southern Baptist Convention (“GuideStone Financial Resources”)
GuideStone Capital Management (“GSCM”)
GuideStone Financial Services (“GSFS”)
PFPC Distributors, Inc. (“PFPC”)
NOTICE CONCERNING YOUR PRIVACY RIGHTS
This notice will provide you with information concerning our policies with respect to nonpublic personal information that we collect about you in connection with the following financial products and services provided and/or serviced by the entities listed above: individual retirement accounts (“IRAs”) and/or personal mutual fund accounts.
The confidentiality of your information is important to us as we recognize that you depend on us to keep your information confidential, as described in this notice.
We collect nonpublic personal information about you with regard to your IRA and/or personal mutual fund accounts from the following sources:
| | • | | Information we receive from you on applications or other forms; |
| | • | | Information about your transactions with us, our affiliates or others (including our third-party service providers); |
| | • | | Information we receive from others such as service providers, broker-dealers and your personal agents or representatives; and |
| | • | | Information you and others provide to us in correspondence sent to us, whether written, electronic or by telephone. |
We may disclose such nonpublic personal financial information about you to one or more of our affiliates. An affiliate of an organization means any entity that controls, is controlled by, or is under common control with that organization. For example, GuideStone Financial Resources, GSCM and GSFS are affiliates of one another. GuideStone Funds, GuideStone Financial Resources, GSCM, GSFS and PFPC do not sell your personal information to nonaffiliated third parties.
We may also disclose any of the personal information that we collect about you to nonaffiliated third parties as permitted by law. For example, we may provide your information to nonaffiliated companies that provide account services or that perform marketing services on our behalf and to other financial institutions with whom we have joint marketing agreements. We restrict access to nonpublic personal information about you to those of our employees who need to know that information in order for us to provide and/or service products or services to you. We also maintain physical, electronic, and procedural safeguards to guard your personal information.
These procedures will continue to remain in effect after you cease to receive financial products and services from us.
If you have any questions concerning our customer information policy, please contact a customer service representative at 1-888-98-GUIDE.
TABLE OF CONTENTS
| | |
Letter from the President | | 2 |
| |
From the Chief Investment Officer | | 3 |
| |
About Your Expenses | | 6 |
| |
Blended Funds: | | |
Flexible Income Fund | | 10 |
Growth & Income Fund | | 13 |
Capital Opportunities Fund | | 16 |
Global Equity Fund | | 19 |
| |
Financial Statements | | 22 |
| |
Flexible Income Fund I | | 28 |
Growth & Income Fund I | | 31 |
Capital Opportunities Fund I | | 34 |
Global Equity Fund I | | 37 |
Financial Statements | | 40 |
| |
Select Funds: | | |
Money Market Fund | | 45 |
Low-Duration Bond Fund | | 49 |
Medium-Duration Bond Fund | | 60 |
Extended-Duration Bond Fund | | 79 |
Global Bond Fund | | 84 |
Equity Index Fund | | 90 |
Real Estate Securities Fund | | 97 |
Value Equity Fund | | 99 |
Growth Equity Fund | | 105 |
Small Cap Equity Fund | | 109 |
International Equity Fund | | 117 |
| |
Schedule of Investments – Abbreviations and Footnotes 126 | | |
| |
Financial Statements | | 128 |
| |
Notes to Financial Statements | | 141 |
| |
Report of Independent Registered Public Accounting Firm | | 159 |
| |
Fund Management (Unaudited) | | 160 |
| |
BOARD REVIEW OF ADVISORY AGREEMENTS | | 162 |
This report has been prepared for shareholders of GuideStone Funds. It is not authorized for distribution to prospective investors unless accompanied or preceded by a current prospectus, which contains more complete information about the Funds. Investors are reminded to read the prospectus carefully before investing. Past performance is no guarantee of future results. Share prices will fluctuate and there may be a gain or loss when shares are redeemed.
1
LETTER FROM THE PRESIDENT

We are pleased to bring you the 2006 Annual Report for GuideStone Funds. Within these pages you will find the results of another successful year of mutual fund performance and investment operations.
During 2006, GuideStone Funds celebrated a milestone event – the five year anniversary of our registered mutual funds! This event highlighted our commitment now and in the future to Christian-based funds with competitive performance.
As we review the year, we can report assets for GuideStone Funds totaled $9.3 billion as of December 31, 2006, representing a 10.46% increase from the prior year. The global economy, including U.S. stocks, rallied in the fourth quarter of 2006 to cap off a year of strong performance. The 2006 year ended on a positive note with lower oil prices, healthy corporate earnings, and generally positive economic data. Overall we are pleased that all of the GuideStone Funds closed the year with positive performance as well as positive returns since their inception on August 27, 2001.
In December, GuideStone Funds increased its fund offerings to include two new funds: the Real Estate Securities Fund and Global Bond Fund. Our goal is to enhance and broaden the availability of funds in multiple asset classes to better meet the needs of our participants. Effective January 3, 2007, the Real Estate Securities Fund will be available to investors through a Personal Investment Account or an Individual Retirement Account. The new Global Bond Fund is not available for direct investment by shareholders, but will be utilized within our new Date Target Funds family.
We are excited to announce that in January 2007, GuideStone Funds will launch five Date Target Funds, known as MyDestination Funds. Each MyDestination Fund invests in pre-selected GuideStone Select Funds so the investor gets a well-rounded portfolio, managed by investment professionals to help meet their objectives.
With date target funds – or life cycle funds – participants choose the fund closest to their retirement date. This gives the investor the opportunity to invest in one fund that is diversified and age appropriate. The funds are targeted to retirement dates in 10-year increments from 2005 to 2045. GuideStone Funds is the nation’s only mutual fund company with Christian-based date target funds.
We look forward to a new year of serving you. We appreciate your business and thank you for the confidence you place in us.
Sincerely,

John R. Jones
The MyDestination Funds attempt to achieve their objectives by investing in the GuideStone Select Funds. By investing in these fund-of-funds, you will incur the expenses of the MyDestination Funds in addition to those of the underlying Select Funds. You may invest in the Select Funds directly, except the Global Bond Fund. The MyDestination Funds are also subject to the risks of the underlying funds they hold.
2
FROM THE CHIEF INVESTMENT OFFICER

Rodric E. Cummins, CFA
The year 2006 was a year of two halves. With the Federal Reserve, economic growth and inflation in the spotlight, it was a year that under-promised early and over-delivered late. Investors that succeeded did so by embracing the sound investment principles of diversification and patience.
The inflection point for 2006 came at the mid-year peak in oil prices which closely coincided with a pause in the Federal Reserve’s tightening monetary policy. These two factors combined to renew investors confidence that inflationary pressures were easing and that the Federal Reserve was successfully steering the U.S. economy toward continued growth. With corporate profits booming and equity valuations at cyclical lows, equity investors celebrated the prospects for continued economic growth by pushing prices in many major indices to record highs during a strong fourth quarter rally. The S&P 500® Index gained 6.70% during the fourth quarter, netting a total return for the year of 15.78%.
With financial markets posting a wide range of returns in 2006, risk-oriented investors with well-diversified global portfolios were handsomely rewarded. Strong corporate earnings and continued economic growth favored stocks over bonds and value-oriented stock strategies over historically high growth companies. For the fourth consecutive year, stock markets showed the strongest returns from companies located in foreign countries. The MSCI® EAFE Index (Net), representative of non-U.S. developed markets, returned 10.35% during the fourth quarter and 26.34% for the year. Emerging market stocks, as represented by the MSCI® Emerging Market Index (Net), returned 17.60% for the quarter and 32.17% for the year. In contrast, single digit returns were posted for the year in investments such as cash, bonds and certain equity segments. The bond market, as represented by the Lehman Brothers Aggregate Bond Index, posted a return of 4.33% in 2006.
Asset Class Performance Comparison
The following graph illustrates the performance of the major assets classes during 2006.
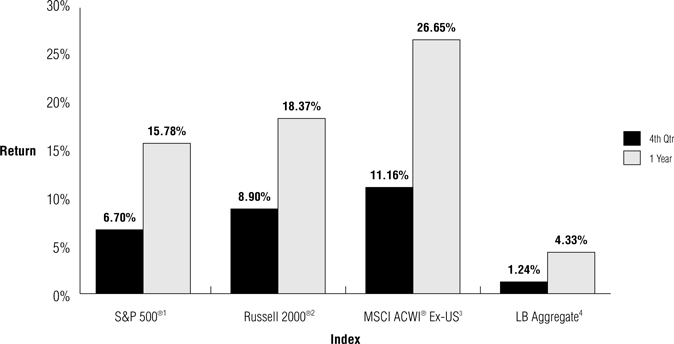
1 | The S&P 500® Index includes 500 of the largest stocks (in terms of market value) in the United States. |
2 | The Russell 2000® Index is a small-cap index consisting of the smallest 2000 companies in the Russell 3000® index, representing approximately 8% of the Russell 3000® Index total market capitalization. |
3 | The MSCI ACWI® Ex-U.S. is a free float-adjusted market capitalization index that is designed to measure equity market performance in the global developed and emerging markets excluding the U.S. |
4 | The Lehman Brothers Aggregate Bond Index includes fixed rate debt issues rated investment grade or higher by Moody’s Investor’s Service, Standard and Poor’s® Corporation, or Fitch Investor’s Service, in that order. |
3
U.S. Economy — Real Gross Domestic Product
Following a poor showing in the 4th quarter of 2005, the U.S. economy, as measured by the real gross domestic product, rebounded at an annual rate of 5.6% in the 1st quarter of 2006. The acceleration in real GDP growth in the 1st quarter reflected an upturn in expenditures for durable goods, acceleration in exports and an upturn in federal government spending. Second quarter GDP came in at an annual rate of 2.6% reflecting a cooling of the housing market and decelerating spending. Growth slowed further in the third quarter leading to an annual GDP rate of 2.0% reflecting an acceleration in imports, a larger decrease in residential fixed investment, and lower state and local government spending.
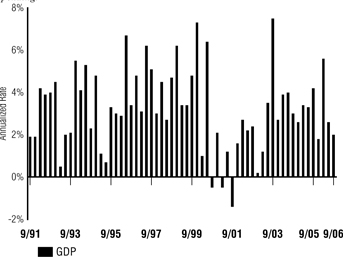
Real Gross Domestic Product (“GDP”) is one of the most widely used economic measures for the overall U.S. economy. GDP measures the output of all goods and services produced by labor and property within the U.S. during a specific period. The output is usually expressed as an annualized rate for a quarter. Generally, it is viewed as positive for the equity markets when GDP expands reflecting an environment of economic growth and profitability. The converse is true when GDP is contracting.
Data Source: Bloomberg
S&P 500® Index Returns
The broad U.S. equity market, as measured by the S&P 500® Index, posted a positive annual return of 15.78% during 2006, capping a fourth consecutive year in positive territory. Performance for the year came in three distinct phases: markets rallied out of the gate with the S&P 500® Index gaining 6.9% through early May, stocks then pulled back significantly through mid-June (down 7.5%) on fears that interest rates had risen to a level that would stifle economic growth both here and abroad. The third phase was marked by renewed confidence that inflation and interest rates were at acceptable levels. This confidence drove equity markets sharply higher off their June 13th lows, with the S&P 500® gaining 17.1% from that point. Value stocks significantly outpaced growth stocks within the index for the year by almost a two-to-one margin.
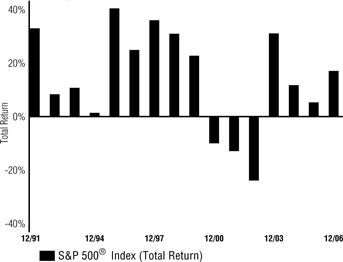
The S&P 500® Index includes 500 leading companies in major industries of the U.S. economy. The index represents about 75% of U.S. equity market capitalization. It is a capitalization-weighted index calculated on a total return basis with dividends reinvested. Constituents are selected by a team of Standard & Poor’s® economists and analysts.
Data Source: Standard & Poor’s®
S&P 500® P/E (Excluding Negative Earnings)
The price-to-earnings (P/E) ratio for the S&P 500® Index ended the year at virtually the same level as the end of 2005. With a 15.78% total return, this shows the “earnings” side of the equation also rose about 15% for the companies within the index. For the fifteen year period show in the graph, the average P/E is just above 24. It is worth noting this valuation measure for the broad market index has consistently declined over the last three years, a testament to strong corporate profitability. While the market may appear to be valued at a discount, longer period historical P/E ratios suggest the market is trading closer to its historical average.
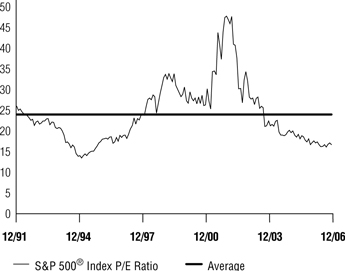
P/E is the ratio of a stock’s price divided by its earnings per share. In this case, the P/E ratio is represented for the entire index. The ratio, or multiple, reflects the price an investor is willing to pay for a dollar of expected earnings per share.
Data Source: Ned Davis Research Group
The Conference Board Consumer Confidence Index
U.S. consumer confidence, as measured by the Conference Board’s Index, generally moved with the fortunes of the stock market and energy prices for most of 2006. The index peaked at 109.8 in April (its highest level since May 2002) just prior to the sharp pullback in the equity markets in May and June. Consumer sentiment dipped accordingly in ensuing months. High oil prices contributed to a year-low reading of 100.2 during August. A subsequent reversal of energy prices to the downside during September eventually trickled through to an improving outlook by Americans. Consumer confidence rebounded strongly in December to 109.0.
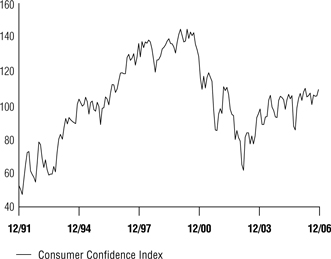
The Conference Board Consumer Confidence Index is a based on a monthly survey of a sample of 5000 U.S. households for the purpose of measuring consumer sentiment. The trend in this economic measure is closely monitored given consumers comprise approximately two-thirds of the U.S. Economy. Generally, it is viewed as positive to the economy and equity markets when the index increases. This reflects the fact that consumers are positive regarding their economic outlook and that they are more willing to spend money providing further economic stimulus.
Data Source: Bloomberg
4
Federal Reserve
January 2006 may have marked a change in leadership at the Federal Reserve (“Fed”) but its tightening campaign, which began in June 2004, continued without pause. Rebounding economic growth and the resulting inflationary concerns forced incoming Fed Chairman Ben Bernanke to raise the Fed Funds Rate by .25% on four separate occasions during the first half of 2006. Such action elevated the key interest rate to 5.25% by June 29th. A slumping housing market, an equity market slump, and fresh geopolitical concerns eventually resulted in the sporadic weakening of economic data during the summer. This was enough to give the Fed “pause” and at its August 8th meeting, interest rates were held steady. No further interest rate hikes occurred over the remainder of the year, but the Fed remained on watch for signs that inflation was not contained.
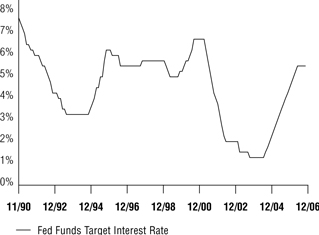
The Federal Reserve, often referred to as “the Fed,” is the central bank of the United States. It was created by Congress to provide the nation with a safer, more flexible, and more stable monetary and financial system. The federal funds rate is the interest rate at which depository institutions lend balances at the Federal Reserve to other depository institutions overnight. The rate is one tool the Fed can use in their efforts of controlling the supply of money. Changes in the federal funds rate trigger a chain of events that affect other short-term interest rates, foreign exchange rates, long-term interest rates, the amount of money and credit, and, ultimately, a range of economic variables, including employment, output, and prices of goods and services.
Data Source: Bloomberg
U.S. Unemployment
Overall employment levels improved during 2006. The unemployment rate fell from 4.9% at the end of 2005 to 4.5% at the end of 2006. The lowest level occurred in October at 4.4%, a level not seen since the spring of 2001. During 2006, payroll employment rose by 1.8 million jobs. The largest numbers of jobs created occurred in the professional and business services, healthcare, and food service industries. Manufacturing lost 72,000 jobs during 2006. The number of unemployed persons was essentially unchanged in December at 6.8 million; down from 7.3 million a year earlier. While the unemployment rate dropped, the average hourly rate rose slightly above 4% during the year.
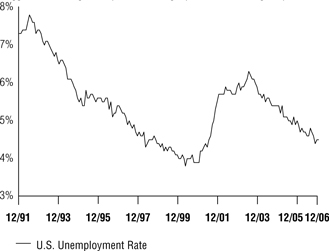
The U.S. unemployment rate measures the numbers of persons unemployed as a percentage of the labor force. Typically, unemployment tends to increase during difficult economic periods and declines during expansionary economic times. Additionally, very low unemployment can place inflationary pressure on the economy as labor markets become very competitive and expensive.
Data Source: Bloomberg
U.S. Treasury Yield Curve
Interest rates across the curve rose sharply during the first quarter of 2006 in response to a rebounding economy, record Treasury issuance, and Federal Reserve tightening. The 30- year Treasury Bond came out of retirement to help finance the burgeoning federal deficit. Rates continued higher during the second quarter driven by concerns over rising inflation with the curve slightly inverted from 6-months to 5 years out. On the back of weaker economic data and geopolitical concerns, treasuries rallied and yields fell during the third quarter particularly at the long end. The 2-10 year portion of the curve was inverted at the end of the third quarter. Interest rates were higher in the fourth quarter driven by the realization that the Fed was not likely to ease monetary policy during the first half of 2007. The yield curve continued its slow but steady flattening trend. The yield on the bellwether 30-year Treasury Bond ended the year at 4.81%, up from 4.54% 12 months earlier.
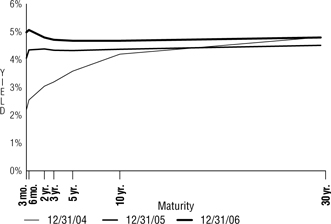
The Treasury yield curve illustrates the relationship between yields on short-term, intermediate-term and long-term Treasury securities. Normally, the shape of the yield curve is upward sloping with rates increasing from the short end of the curve moving higher to the long end. The short end of the curve is impacted more by monetary policy (demand for money) while inflationary expectations and market forces impact the long end of the curve.
Data Source: Bloomberg
5
About Your Expenses
As a shareholder of the Funds, you incur ongoing costs, including advisory fees and to the extent applicable, distribution (12b-1) fees and/or shareholder services fees, as well as other Fund expenses. This example is intended to help you to understand your ongoing costs (in dollars) of investing in the Funds and to compare these costs with the ongoing costs of investing in other mutual funds. It is based on an investment of $1,000 invested at the beginning of the period and held for the entire period from July 1, 2006 to December 31, 2006.
Actual Expenses
The first section of the table below provides information about actual account values and actual expenses. You may use the information in this section, together with the amount you invested, to estimate the expenses that you incurred over the period. Simply divide your account value by $1,000 (for example, an $8,600 account value divided by $1,000 = 8.6), then multiply the result by the number in the first section under the heading entitled “Expenses Paid During Period” to estimate the expenses attributable to your investment during this period.
Hypothetical Example for Comparison Purposes
The second section of the table below provides information about hypothetical account values and hypothetical expenses based on the Fund’s actual expense ratio and an assumed rate of return of 5% per year before expenses, which is not the Fund’s actual return. Thus, you should not use the hypothetical account values and expenses to estimate the actual ending account balance or your expenses for the period. Rather, these figures are provided to enable you to compare the ongoing costs of investing in the Fund and other funds. To do so, compare this 5% hypothetical example with the 5% hypothetical examples that appear in the shareholder reports of the other funds. Please note that the expenses shown in the table are meant to highlight your ongoing costs only. Therefore, the second section of the table is useful in comparing ongoing costs only, and will not help you determine the relative total costs of owning different funds.
| | | | | | | | | | | | | | |
ACTUAL |
Fund | | Class | | Beginning
Account Value
7/1/2006 | | Ending
Account Value
12/31/2006 | | Annualized
Expense
Ratio (1) | | | Expenses
Paid During
Period (2) |
Flexible Income | | GS4 | | $ | 1,000.00 | | $ | 1,046.15 | | 0.13 | % | | $ | 0.67 |
| | GS6 | | | 1,000.00 | | | 1,043.86 | | 0.49 | | | | 2.52 |
| | GS8 | | | 1,000.00 | | | 1,043.24 | | 0.80 | | | | 4.12 |
| | | | | |
Growth & Income | | GS4 | | | 1,000.00 | | | 1,077.18 | | 0.13 | | | | 0.68 |
| | GS6 | | | 1,000.00 | | | 1,076.06 | | 0.37 | | | | 1.94 |
| | GS8 | | | 1,000.00 | | | 1,073.42 | | 0.84 | | | | 4.39 |
| | | | | |
Capital Opportunities | | GS4 | | | 1,000.00 | | | 1,091.22 | | 0.13 | | | | 0.69 |
| | GS6 | | | 1,000.00 | | | 1,089.41 | | 0.49 | | | | 2.58 |
| | GS8 | | | 1,000.00 | | | 1,087.02 | | 0.81 | | | | 4.26 |
| | | | | |
Global Equity | | GS4 | | | 1,000.00 | | | 1,104.89 | | 0.13 | | | | 0.69 |
| | GS6 | | | 1,000.00 | | | 1,103.32 | | 0.38 | | | | 2.01 |
| | GS8 | | | 1,000.00 | | | 1,100.99 | | 0.83 | | | | 4.40 |
| | | | | |
Flexible Income I | | GS2 | | | 1,000.00 | | | 1,046.61 | | 0.17 | | | | 0.88 |
| | | | | |
Growth & Income I | | GS2 | | | 1,000.00 | | | 1,078.02 | | 0.17 | | | | 0.89 |
| | | | | |
Capital Opportunities I | | GS2 | | | 1,000.00 | | | 1,092.18 | | 0.17 | | | | 0.90 |
| | | | | |
Global Equity I | | GS2 | | | 1,000.00 | | | 1,105.67 | | 0.17 | | | | 0.90 |
| | | | | |
Money Market | | GS2 | | | 1,000.00 | | | 1,025.97 | | 0.26 | | | | 1.33 |
| | GS4 | | | 1,000.00 | | | 1,024.99 | | 0.46 | | | | 2.35 |
| | GS6 | | | 1,000.00 | | | 1,022.85 | | 0.86 | | | | 4.38 |
| | GS8 | | | 1,000.00 | | | 1,021.32 | | 1.17 | | | | 5.96 |
6
ACTUAL
| | | | | | | | | | | | | | |
Fund | | Class | | Beginning
Account Value
7/1/2006 | | Ending Account Value
12/31/2006 | | Annualized
Expense
Ratio (1) | | | Expenses
Paid During
Period (2) |
Low-Duration Bond | | GS2 | | $ | 1,000.00 | | $ | 1,028.33 | | 0.45 | % | | $ | 2.30 |
| | GS4 | | | 1,000.00 | | | 1,027.16 | | 0.61 | | | | 3.12 |
| | GS6 | | | 1,000.00 | | | 1,024.81 | | 1.00 | | | | 5.10 |
| | GS8 | | | 1,000.00 | | | 1,023.54 | | 1.30 | | | | 6.63 |
| | | | | |
Medium-Duration Bond | | GS2 | | | 1,000.00 | | | 1,050.99 | | 0.50 | | | | 2.58 |
| | GS4 | | | 1,000.00 | | | 1,050.48 | | 0.62 | | | | 3.20 |
| | GS6 | | | 1,000.00 | | | 1,048.76 | | 1.05 | | | | 5.42 |
| | GS8 | | | 1,000.00 | | | 1,045.87 | | 1.35 | | | | 6.96 |
| | | | | |
Extended-Duration Bond | | GS2 | | | 1,000.00 | | | 1,081.98 | | 0.55 | | | | 2.89 |
| | GS4 | | | 1,000.00 | | | 1,082.11 | | 0.73 | | | | 3.83 |
| | GS6 | | | 1,000.00 | | | 1,078.06 | | 1.00 | | | | 5.24 |
| | GS8 | | | 1,000.00 | | | 1,076.74 | | 1.50 | | | | 7.85 |
| | | | | |
Global Bond (3) | | GS4 | | | 1,000.00 | | | 1,000.00 | | 1.04 | | | | 5.24 |
| | | | | |
Equity Index | | GS2 | | | 1,000.00 | | | 1,124.03 | | 0.23 | | | | 1.23 |
| | GS4 | | | 1,000.00 | | | 1,123.55 | | 0.40 | | | | 2.14 |
| | GS6 | | | 1,000.00 | | | 1,122.33 | | 0.60 | | | | 3.21 |
| | GS8 | | | 1,000.00 | | | 1,120.62 | | 0.90 | | | | 4.81 |
| | | | | |
Real Estate Securities (3) | | GS4 | | | 1,000.00 | | | 1,000.00 | | 1.33 | | | | 6.70 |
| | | | | |
Value Equity | | GS2 | | | 1,000.00 | | | 1,131.38 | | 0.71 | | | | 3.81 |
| | GS4 | | | 1,000.00 | | | 1,130.97 | | 0.89 | | | | 4.78 |
| | GS6 | | | 1,000.00 | | | 1,128.93 | | 1.19 | | | | 6.39 |
| | GS8 | | | 1,000.00 | | | 1,127.22 | | 1.59 | | | | 8.53 |
| | | | | |
Growth Equity | | GS2 | | | 1,000.00 | | | 1,055.45 | | 0.89 | | | | 4.61 |
| | GS4 | | | 1,000.00 | | | 1,055.22 | | 1.01 | | | | 5.23 |
| | GS6 | | | 1,000.00 | | | 1,053.69 | | 1.42 | | | | 7.35 |
| | GS8 | | | 1,000.00 | | | 1,052.07 | | 1.71 | | | | 8.84 |
| | | | | |
Small Cap Equity | | GS2 | | | 1,000.00 | | | 1,060.98 | | 1.01 | | | | 5.25 |
| | GS4 | | | 1,000.00 | | | 1,060.43 | | 1.19 | | | | 6.18 |
| | GS6 | | | 1,000.00 | | | 1,059.04 | | 1.54 | | | | 7.99 |
| | GS8 | | | 1,000.00 | | | 1,056.82 | | 1.89 | | | | 9.80 |
| | | | | |
International Equity | | GS2 | | | 1,000.00 | | | 1,148.06 | | 0.95 | | | | 5.14 |
| | GS4 | | | 1,000.00 | | | 1,147.23 | | 1.13 | | | | 6.12 |
| | GS6 | | | 1,000.00 | | | 1,145.65 | | 1.42 | | | | 7.68 |
| | GS8 | | | 1,000.00 | | | 1,144.39 | | 1.78 | | | | 9.62 |
HYPOTHETICAL (assuming a 5% return before expenses)
| | | | | | | | | | | | | | |
Fund | | Class | | Beginning
Account Value
7/1/2006 | | Ending
Account Value
12/31/2006 | | Annualized
Expense
Ratio (1) | | | Expenses
Paid During
Period (2) |
Flexible Income | | GS4 | | $ | 1,000.00 | | $ | 1,024.55 | | 0.13 | % | | $ | 0.66 |
| | GS6 | | | 1,000.00 | | | 1,022.74 | | 0.49 | | | | 2.50 |
| | GS8 | | | 1,000.00 | | | 1,021.17 | | 0.80 | | | | 4.08 |
| | | | | |
Growth & Income | | GS4 | | | 1,000.00 | | | 1,024.55 | | 0.13 | | | | 0.66 |
| | GS6 | | | 1,000.00 | | | 1,023.34 | | 0.37 | | | | 1.89 |
| | GS8 | | | 1,000.00 | | | 1,020.97 | | 0.84 | | | | 4.28 |
7
About Your Expenses (Continued)
HYPOTHETICAL (assuming a 5% return before expenses)
| | | | | | | | | | | | | | |
Fund | | Class | | Beginning
Account Value
7/1/2006 | | Ending
Account Value
12/31/2006 | | Annualized
Expense Ratio
(1) | | | Expenses
Paid During
Period (2) | |
Capital Opportunities | | GS4 | | $ | 1,000.00 | | $ | 1,024.55 | | 0.13 | % | | 0.66 | % |
| | GS6 | | | 1,000.00 | | | 1,022.74 | | 0.49 | | | 2.50 | |
| | GS8 | | | 1,000.00 | | | 1,021.12 | | 0.81 | | | 4.13 | |
| | | | | |
Global Equity | | GS4 | | | 1,000.00 | | | 1,024.55 | | 0.13 | | | 0.66 | |
| | GS6 | | | 1,000.00 | | | 1,023.29 | | 0.38 | | | 1.94 | |
| | GS8 | | | 1,000.00 | | | 1,021.02 | | 0.83 | | | 4.23 | |
| | | | | |
Flexible Income I | | GS2 | | | 1,000.00 | | | 1,024.35 | | 0.17 | | | 0.87 | |
| | | | | |
Growth & Income I | | GS2 | | | 1,000.00 | | | 1,024.35 | | 0.17 | | | 0.87 | |
| | | | | |
Capital Opportunities I | | GS2 | | | 1,000.00 | | | 1,024.35 | | 0.17 | | | 0.87 | |
| | | | | |
Global Equity I | | GS2 | �� | | 1,000.00 | | | 1,024.35 | | 0.17 | | | 0.87 | |
| | | | | |
Money Market | | GS2 | | | 1,000.00 | | | 1,023.89 | | 0.26 | | | 1.33 | |
| | GS4 | | | 1,000.00 | | | 1,022.89 | | 0.46 | | | 2.35 | |
| | GS6 | | | 1,000.00 | | | 1,020.87 | | 0.86 | | | 4.38 | |
| | GS8 | | | 1,000.00 | | | 1,019.31 | | 1.17 | | | 5.96 | |
| | | | | |
Low-Duration Bond | | GS2 | | | 1,000.00 | | | 1,022.94 | | 0.45 | | | 2.29 | |
| | GS4 | | | 1,000.00 | | | 1,022.13 | | 0.61 | | | 3.11 | |
| | GS6 | | | 1,000.00 | | | 1,020.16 | | 1.00 | | | 5.09 | |
| | GS8 | | | 1,000.00 | | | 1,018.65 | | 1.30 | | | 6.61 | |
| | | | | |
Medium-Duration Bond | | GS2 | | | 1,000.00 | | | 1,022.68 | | 0.50 | | | 2.55 | |
| | GS4 | | | 1,000.00 | | | 1,022.08 | | 0.62 | | | 3.16 | |
| | GS6 | | | 1,000.00 | | | 1,019.91 | | 1.05 | | | 5.35 | |
| | GS8 | | | 1,000.00 | | | 1,018.40 | | 1.35 | | | 6.87 | |
| | | | | |
Extended-Duration Bond | | GS2 | | | 1,000.00 | | | 1,022.43 | | 0.55 | | | 2.80 | |
| | GS4 | | | 1,000.00 | | | 1,021.53 | | 0.73 | | | 3.72 | |
| | GS6 | | | 1,000.00 | | | 1,020.16 | | 1.00 | | | 5.09 | |
| | GS8 | | | 1,000.00 | | | 1,017.64 | | 1.50 | | | 7.63 | |
| | | | | |
Global Bond (3) | | GS4 | | | 1,000.00 | | | 1,019.96 | | 1.04 | | | 5.30 | |
| | | | | |
Equity Index | | GS2 | | | 1,000.00 | | | 1,024.05 | | 0.23 | | | 1.17 | |
| | GS4 | | | 1,000.00 | | | 1,023.19 | | 0.40 | | | 2.04 | |
| | GS6 | | | 1,000.00 | | | 1,022.18 | | 0.60 | | | 3.06 | |
| | GS8 | | | 1,000.00 | | | 1,020.67 | | 0.90 | | | 4.58 | |
| | | | | |
Real Estate Securities (3) | | GS4 | | | 1,000.00 | | | 1,018.50 | | 1.33 | | | 6.77 | |
| | | | | |
Value Equity | | GS2 | | | 1,000.00 | | | 1,021.63 | | 0.71 | | | 3.62 | |
| | GS4 | | | 1,000.00 | | | 1,020.72 | | 0.89 | | | 4.53 | |
| | GS6 | | | 1,000.00 | | | 1,019.21 | | 1.19 | | | 6.06 | |
| | GS8 | | | 1,000.00 | | | 1,017.19 | | 1.59 | | | 8.08 | |
| | | | | |
Growth Equity | | GS2 | | | 1,000.00 | | | 1,020.72 | | 0.89 | | | 4.53 | |
| | GS4 | | | 1,000.00 | | | 1,020.11 | | 1.01 | | | 5.14 | |
| | GS6 | | | 1,000.00 | | | 1,018.05 | | 1.42 | | | 7.22 | |
| | GS8 | | | 1,000.00 | | | 1,016.59 | | 1.71 | | | 8.69 | |
| | | | | |
Small Cap Equity | | GS2 | | | 1,000.00 | | | 1,020.11 | | 1.01 | | | 5.14 | |
| | GS4 | | | 1,000.00 | | | 1,019.21 | | 1.19 | | | 6.06 | |
| | GS6 | | | 1,000.00 | | | 1,017.44 | | 1.54 | | | 7.83 | |
| | GS8 | | | 1,000.00 | | | 1,015.68 | | 1.89 | | | 9.60 | |
8
HYPOTHETICAL (assuming a 5% return before expenses)
| | | | | | | | | | | | | | |
Fund | | Class | | Beginning
Account Value
7/1/2006 | | Ending
Account Value
12/31/2006 | | Annualized
Expense
Ratio (1) | | | Expenses
Paid During
Period (2) |
International Equity | | GS2 | | $ | 1,000.00 | | $ | 1,020.42 | | 0.95 | % | | $ | 4.84 |
| | GS4 | | | 1,000.00 | | | 1,019.51 | | 1.13 | | | | 5.75 |
| | GS6 | | | 1,000.00 | | | 1,018.05 | | 1.42 | | | | 7.22 |
| | GS8 | | | 1,000.00 | | | 1,016.23 | | 1.78 | | | | 9.05 |
| (1) | Expenses include the effect of contractual waivers by GuideStone Capital Management. The Blended Funds’ proportionate share of the operating expenses of the Select Funds is not reflected in the tables above. |
| (2) | Expenses are equal to the Fund’s annualized expense ratios for the period July 1, 2006 through December 31, 2006, multiplied by the average account value over the period, multiplied by 184/365 (to reflect the one-half year period). |
| (3) | The Global Bond Fund and Real Estate Securities Fund commenced operations on 12/29/2006. The expense figures shown reflect the expenses that would have been paid over the time period 07/01/2006-12/31/2006, assuming the Funds were in operation throughout the entire period. |
9
Flexible Income Fund
The Fund is constructed using a blend of seven GuideStone Funds Select Funds GS4. The Fund’s actual asset allocation at quarter-end was 19% U.S. Equity, 6% Non-U.S. Equity, and 75% Fixed Income. The Fund’s returns were positive for the quarter and the year; however it trailed its composite benchmark. The largest component of the Fund, the Low-Duration Bond Fund GS4, generated a positive return for the quarter and the year, with performance slightly trailing its underlying benchmark (Merrill Lynch 1-3 Year Treasury Index). The Fund’s benchmark-relative underperformance for the year was most impacted by its exposure to the Growth Equity Fund GS4. The Growth Equity Fund’s returns were slightly positive for the year but it significantly trailed its underlying benchmark index.
Please see page 12 for information regarding specific portfolio allocations. Portfolio holdings are subject to change at any time.
The Blended Funds attempt to achieve their objectives by investing in the GuideStone Select Funds. By investing in these fund-of-funds, you will incur the expenses of the Blended Funds in addition to those of the underlying funds. You may invest in the Select Funds directly, except the Global Bond Fund. The Blended Funds are also subject to the risks of the underlying funds they hold.
10
Flexible Income Fund
| | | | | | | | | | | | | | | |
Average Annual Total Returns as of 12/31/06 | |
| | | GS4 Class* | | | GS6 Class* | | | Benchmark** | | | GS8 Class* | | | GS8 Class Benchmark** | |
One Year | | 5.99 | % | | 5.66 | % | | 7.43 | % | | 5.36 | % | | 7.43 | % |
Five Year | | 4.40 | % | | 4.12 | % | | 4.60 | % | | N/A | | | N/A | |
Since Inception | | 4.26 | % | | 3.98 | % | | 4.56 | % | | 4.46 | % | | 5.75 | % |
Inception Date | | 08/27/01 | | | 08/27/01 | | | 08/27/01 | | | 11/08/04 | | | 11/08/04 | |
The performance data quoted represents past performance and does not guarantee future results. Current performance may be lower or higher. Performance data current to the most recent month-end may be obtained at www.GuideStone.org. The investment return and principal value of an investment will fluctuate so that shares, when redeemed, may be worth more or less than their original cost.
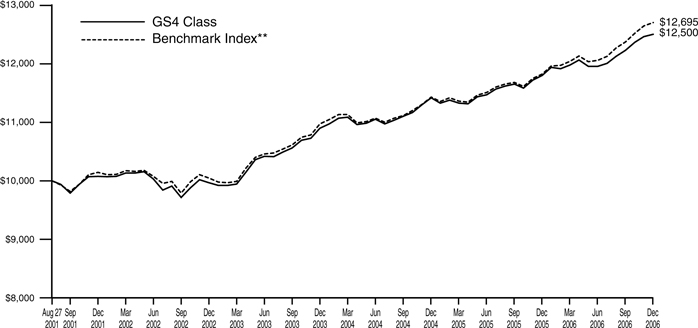
The graph compares the results of a hypothetical $10,000 investment in the GS4 Class of the Fund since August 27, 2001 (commencement of operations), with all dividends and capital gains reinvested, with the Fund’s weighted composite benchmark index.
| * | These returns reflect expense waivers by the Fund’s investment advisor. Without these waivers, returns would have been lower. Returns shown do not reflect the deduction of taxes that a shareholder would pay on Fund distributions or the redemption of Fund shares. |
** | Represents a weighted composite benchmark index consisting of the Russell 3000® Index, the MSCI ACWI® Ex-U.S. and the Merrill Lynch 1-3 Year Treasury Index. |
The Russell 3000® Index measures the performance of the 2,959 largest U.S. companies based on total market capitalization, which represents approximately 98% of the investable U.S. equity market.
The MSCI ACWI® Ex-U.S. is a market-capitalization weighted index composed of companies representative of the market structure of developed and emerging market countries in the Americas (excluding the U.S.), Europe/Middle East, and Asia/ Pacific Regions. It excludes closed markets and those shares in otherwise free markets that are not purchasable by foreigners.
The Merrill Lynch 1-3 Year Treasury Index is composed of all U.S. Treasury Notes and Bonds with maturities greater than or equal to one year and less than three years.
Unlike a mutual fund, the performance of an index assumes no taxes, transaction costs, management fees or other expenses.
11
| | |
| Flexible Income Fund | | |
| SCHEDULE OF INVESTMENTS | | December 31, 2006 |
| | | | | |
| | | Shares | | Value |
AFFILIATED MUTUAL FUNDS — 98.8% | | | | | |
GuideStone Funds Equity Index Fund (GS4 Class)¥ | | 299,208 | | $ | 5,735,827 |
GuideStone Funds Growth Equity Fund (GS4 Class)¥ | | 1,424,667 | | | 25,316,326 |
GuideStone Funds International Equity Fund (GS4 Class)¥ | | 1,064,551 | | | 20,322,280 |
GuideStone Funds Low-Duration Bond Fund (GS4 Class)¥ | | 18,836,731 | | | 237,907,912 |
GuideStone Funds Money Market Fund (GS4 Class)¥ | | 3,026,183 | | | 3,026,183 |
GuideStone Funds Small Cap Equity Fund (GS4 Class)¥ | | 397,467 | | | 6,359,472 |
GuideStone Funds Value Equity Fund (GS4 Class)¥ | | 1,324,030 | | | 24,693,158 |
| | | | | |
Total Affiliated Mutual Funds | | | | | |
(Cost $ 278,212,983) | | | | | 323,361,158 |
| | | | | |
| | | | | | |
| | | Par | | |
U.S. TREASURY OBLIGATIONS — 1.1% | | | | | | |
U.S. Treasury Bill 4.85%, 02/22/07‡‡ | | $ | 70,000 | | | 69,512 |
U.S. Treasury Note 5.00%, 07/31/08 | | | 3,605,000 | | | 3,612,044 |
| | | | | | |
Total U.S. Treasury Obligations | | | | | | |
(Cost $3,687,274) | | | | | | 3,681,556 |
| | | | | | |
TOTAL INVESTMENTS — 99.9% | | | | | | |
(Cost $281,900,257) | | | | | | 327,042,714 |
| | |
Other Assets in Excess of | | | | | | |
Liabilities — 0.1% | | | | | | 363,372 |
| | | | | | |
NET ASSETS — 100.0% | | | | | $ | 327,406,086 |
| | | | | | |
| | |
PORTFOLIO SUMMARY (based on net assets) | | |
| |
| | | % |
Bond Fund | | 72.7 |
Domestic Equity Funds | | 19.0 |
International Equity Fund | | 6.2 |
U.S. Treasury Obligations | | 1.1 |
Money Market Fund | | 0.9 |
Futures Contracts | | 0.3 |
| | |
| | 100.2 |
| | |
| | | | |
| 12 | | See Notes to Financial Statements. | | |
Growth & Income Fund
The Fund is constructed using a blend of nine GuideStone Funds Select Funds GS4. The Fund’s asset allocation at quarter-end was 37% U.S. Equity, 13% Non-U.S. Equity, and 50% Fixed Income. The Fund experienced a positive return for the quarter and the year yet underperformed its composite benchmark. For the year, the Fund’s positive performance was primarily due to the Fund’s underlying investment in the International Equity Fund GS4 and the Value Equity Fund GS4. The Fund’s benchmark-relative underperformance for the year was primarily driven by its exposure to the Growth Equity Fund GS4. The largest component of the Fund, the Medium-Duration Bond Fund GS4, posted a return that slightly trailed its underlying benchmark, the Lehman Brothers Aggregate Bond Index, for the year.
Please see page 15 for information regarding specific portfolio allocations. Portfolio holdings are subject to change at any time.
The Blended Funds attempt to achieve their objectives by investing in the GuideStone Select Funds. By investing in these fund-of-funds, you will incur the expenses of the Blended Funds in addition to those of the underlying funds. You may invest in the Select Funds directly, except the Global Bond Fund. The Blended Funds are also subject to the risks of the underlying funds they hold.
13
Growth & Income Fund
| | | | | | | | | | | | | | | |
Average Annual Total Returns as of 12/31/06 | |
| | | GS4 Class* | | | GS6 Class* | | | Benchmark** | | | GS8 Class* | | | GS8 Class Benchmark** | |
One Year | | 8.78 | % | | 8.30 | % | | 11.29 | % | | 8.03 | % | | 11.29 | % |
Five Year | | 7.20 | % | | 6.86 | % | | 7.56 | % | | N/A | | | N/A | |
Since Inception | | 6.62 | % | | 6.29 | % | | 6.96 | % | | 7.95 | % | | 9.46 | % |
Inception Date | | 08/27/01 | | | 08/27/01 | | | 08/27/01 | | | 11/08/04 | | | 11/08/04 | |
The performance data quoted represents past performance and does not guarantee future results. Current performance may be lower or higher. Performance data current to the most recent month-end may be obtained at www.GuideStone.org. The investment return and principal value of an investment will fluctuate so that shares, when redeemed, may be worth more or less than their original cost.
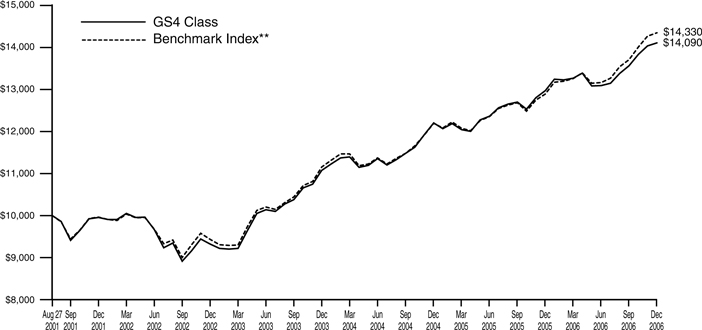
The graph compares the results of a hypothetical $10,000 investment in the GS4 Class of the Fund since August 27, 2001 (commencement of operations), with all dividends and capital gains reinvested, with the Fund’s weighted composite benchmark index.
| * | These returns reflect expense waivers by the Fund’s investment advisor. Without these waivers, returns would have been lower. Returns shown do not reflect the deduction of taxes that a shareholder would pay on Fund distributions or the redemption of Fund shares. |
** | Represents a weighted composite benchmark index consisting of the Russell 3000® Index, the MSCI ACWI® Ex-U.S. and the Lehman Brothers Aggregate Bond Index. |
The Russell 3000® Index measures the performance of the 2,959 largest U.S. companies based on total market capitalization, which represents approximately 98% of the investable U.S. equity market.
The MSCI ACWI® Ex-U.S. is a market-capitalization weighted index composed of companies representative of the market structure of developed and emerging market countries in the Americas (excluding the U.S.), Europe/Middle East, and Asia/ Pacific Regions. It excludes closed markets and those shares in otherwise free markets that are not purchased by foreigners.
The Lehman Brothers Aggregate Bond Index represents securities that are SEC-registered, taxable, and dollar denominated. The index covers the U.S. investment grade fixed rate bond market, with index components for government and corporate securities, mortgage pass-through securities, and asset-backed securities.
Unlike a mutual fund, the performance of an index assumes no taxes, transaction costs, management fees or other expenses.
14
| | |
Growth & Income Fund | | |
SCHEDULE OF INVESTMENTS | | December 31, 2006 |
| | | | | | |
| | | Shares | | Value |
AFFILIATED MUTUAL FUNDS — 99.1% | | | | | | |
GuideStone Funds Equity Index Fund (GS4 Class)¥ | | | 2,455,697 | | $ | 47,075,708 |
GuideStone Funds Extended-Duration Bond Fund (GS4 Class)¥ | | | 9,361,180 | | | 138,545,465 |
GuideStone Funds Growth Equity Fund (GS4 Class)¥ | | | 11,679,976 | | | 207,553,181 |
GuideStone Funds International Equity Fund (GS4 Class)¥ | | | 9,889,904 | | | 188,798,274 |
GuideStone Funds Low-Duration Bond Fund (GS4 Class)¥ | | | 16,027,252 | | | 202,424,191 |
GuideStone Funds Medium-Duration Bond Fund (GS4 Class)¥ | | | 25,656,028 | | | 344,047,334 |
GuideStone Funds Money Market Fund (GS4 Class)¥ | | | 18,010,225 | | | 18,010,225 |
GuideStone Funds Small Cap Equity Fund (GS4 Class)¥ | | | 3,335,598 | | | 53,369,567 |
GuideStone Funds Value Equity Fund (GS4 Class)¥ | | | 11,374,733 | | | 212,138,774 |
| | | | | | |
Total Affiliated Mutual Funds | | | | | | |
(Cost $1,180,653,781) | | | | | | 1,411,962,719 |
| | | | | | |
| | |
| | | Par | | |
U.S. TREASURY OBLIGATIONS — 0.9% | | | | | | |
U.S. Treasury Bills | | | | | | |
4.82%, 02/22/07‡‡ | | $ | 50,000 | | | 49,651 |
4.85%, 02/22/07‡‡ | | | 550,000 | | | 546,166 |
| | | | | | |
| | | | | | 595,817 |
| | | | | | |
U.S. Treasury Note | | | | | | |
4.88%, 02/15/12 | | | 11,790,000 | | | 11,901,462 |
| | | | | | |
Total U.S. Treasury Obligations | | | | | | |
(Cost $12,494,310) | | | | | | 12,497,279 |
| | | | | | |
TOTAL INVESTMENTS — 100.0% | | | | | | |
(Cost $1,193,148,091) | | | | | | 1,424,459,998 |
| | |
Other Assets in Excess of | | | | | | |
Liabilities — 0.0% | | | | | | 64,787 |
| | | | | | |
NET ASSETS — 100.0% | | | | | $ | 1,424,524,785 |
| | | | | | |
PORTFOLIO SUMMARY (based on net assets)
| | |
| | | % |
Bond Funds | | 48.1 |
Domestic Equity Funds | | 36.5 |
International Equity Fund | | 13.2 |
Money Market Fund | | 1.3 |
U.S. Treasury Obligations | | 0.9 |
Futures Contracts | | 0.9 |
| | |
| | 100.9 |
| | |
| | | | |
| | See Notes to Financial Statements. | | 15 |
Capital Opportunities Fund
The Fund is constructed using a blend of nine GuideStone Funds Select Funds GS4. The Fund’s asset allocation at quarter-end was 56% U.S. Equity, 19% Non-U.S. Equity, and 25% Fixed Income. The Fund posted a positive return for the quarter and the year yet trailed its composite benchmark. Strong overall performance can be attributed to positive returns in domestic and non-U.S. equity markets. For the year, the Fund’s positive performance was primarily driven by its underlying investment in the International Equity Fund GS4 and the Value Equity Fund GS4. The largest detractor to benchmark-relative underperformance was the Fund’s investment in the Growth Equity Fund GS4.
Please see page 18 for information regarding specific portfolio allocations. Portfolio holdings are subject to change at any time.
The Blended Funds attempt to achieve their objectives by investing in the GuideStone Select Funds. By investing in these fund-of-funds, you will incur the expenses of the Blended Funds in addition to those of the underlying funds. You may invest in the Select Funds directly, except the Global Bond Fund. The Blended Funds are also subject to the risks of the underlying funds they hold.
16
Capital Opportunities Fund
| | | | | | | | | | | | | | | |
Average Annual Total Returns as of 12/31/06 | |
| | | GS4 Class* | | | GS6 Class* | | | Benchmark** | | | GS8 Class* | | | GS8 Class Benchmark** | |
One Year | | 11.03 | % | | 10.58 | % | | 14.81 | % | | 10.24 | % | | 14.81 | % |
Five Year | | 8.02 | % | | 7.57 | % | | 8.58 | % | | N/A | | | N/A | |
Since Inception | | 7.14 | % | | 6.73 | % | | 7.65 | % | | 10.41 | % | | 12.46 | % |
Inception Date | | 08/27/01 | | | 08/27/01 | | | 08/27/01 | | | 11/08/04 | | | 11/08/04 | |
The performance data quoted represents past performance and does not guarantee future results. Current performance may be lower or higher. Performance data current to the most recent month-end may be obtained at www.GuideStone.org. The investment return and principal value of an investment will fluctuate so that shares, when redeemed, may be worth more or less than their original cost.
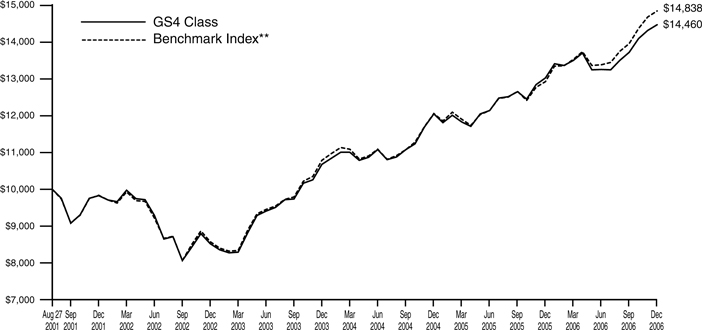
The graph compares the results of a hypothetical $10,000 investment in the GS4 Class of the Fund since August 27, 2001 (commencement of operations), with all dividends and capital gains reinvested, with the Fund’s weighted composite benchmark index.
| * | These returns reflect expense waivers by the Fund’s investment advisor. Without these waivers, returns would have been lower. Returns shown do not reflect the deduction of taxes that a shareholder would pay on Fund distributions or the redemption of Fund shares. |
** | Represents a weighted composite benchmark index consisting of the Russell 3000® Index, the MSCI ACWI® Ex-U.S. and the Lehman Brothers Aggregate Bond Index. |
The Russell 3000® Index measures the performance of the 2,959 largest U.S. companies based on total market capitalization, which represents approximately 98% of the investable U.S. equity market.
The MSCI ACWI® Ex-U.S. is a market-capitalization weighted index composed of companies representative of the market structure of developed and emerging market countries in the Americas (excluding the U.S.), Europe/Middle East, and Asia/ Pacific Regions. It excludes closed markets and those shares in otherwise free markets that are not purchasable by foreigners.
The Lehman Brothers Aggregate Bond Index represents securities that are SEC-registered, taxable, and dollar denominated. The index covers the U.S. investment grade fixed rate bond market, with index components for government and corporate securities, mortgage pass-through securities, and asset-backed securities.
Unlike a mutual fund, the performance of an index assumes no taxes, transaction costs, management fees or other expenses.
17
| | |
| Capital Opportunities Fund | | |
| SCHEDULE OF INVESTMENTS | | December 31, 2006 |
| | | | | | |
| | | Shares | | Value |
AFFILIATED MUTUAL FUNDS — 99.5% | | | | | | |
GuideStone Funds Equity Index Fund (GS4 Class)¥ | | | 2,984,703 | | $ | 57,216,752 |
GuideStone Funds Extended-Duration Bond Fund (GS4 Class)¥ | | | 3,799,492 | | | 56,232,485 |
GuideStone Funds Growth Equity Fund (GS4 Class)¥ | | | 14,173,212 | | | 251,857,978 |
GuideStone Funds International Equity Fund (GS4 Class)¥ | | | 11,555,852 | | | 220,601,217 |
GuideStone Funds Low-Duration Bond Fund (GS4 Class)¥ | | | 6,588,117 | | | 83,207,921 |
GuideStone Funds Medium-Duration Bond Fund (GS4 Class)¥ | | | 10,327,015 | | | 138,485,274 |
GuideStone Funds Money Market Fund (GS4 Class)¥ | | | 19,406,341 | | | 19,406,341 |
GuideStone Funds Small Cap Equity Fund (GS4 Class)¥ | | | 3,995,457 | | | 63,927,308 |
GuideStone Funds Value Equity Fund (GS4 Class)¥ | | | 13,841,182 | | | 258,138,043 |
| | | | | | |
Total Affiliated Mutual Funds | | | | | | |
(Cost $923,758,612) | | | | | | 1,149,073,319 |
| | | | | | |
| | |
| | | Par | | |
U.S. TREASURY OBLIGATIONS — 0.5% | | | | | | |
U.S. Treasury Bill 4.85%, 02/22/07‡‡ | | $ | 730,000 | | | 724,911 |
U.S. Treasury Note 4.88%, 02/15/12 | | | 4,720,000 | | | 4,764,623 |
| | | | | | |
Total U.S. Treasury Obligations | | | | | | |
(Cost $5,467,387) | | | | | | 5,489,534 |
| | | | | | |
TOTAL INVESTMENTS — 100.0% | | | | | | |
(Cost $929,225,999) | | | | | | 1,154,562,853 |
Other Assets in Excess of | | | | | | |
Liabilities — 0.0% | | | | | | 22,381 |
| | | | | | |
NET ASSETS — 100.0% | | | | | $ | 1,154,585,234 |
| | | | | | |
PORTFOLIO SUMMARY (based on net assets)
| | |
| | | % |
Domestic Equity Funds | | 54.6 |
Bond Funds | | 24.1 |
International Equity Fund | | 19.1 |
Money Market Fund | | 1.7 |
Futures Contracts | | 1.3 |
U.S. Treasury Obligations | | 0.5 |
| | |
| | 101.3 |
| | |
| | | | |
| 18 | | See Notes to Financial Statements. | | |
Global Equity Fund
The Fund is constructed using a blend of six GuideStone Funds Select Funds GS4. The Fund’s asset allocation at quarter-end was 74% U.S. Equity, 25% Non-U.S. Equity, and 1% Fixed Income. The Fund posted a positive return for the quarter and the year yet trailed its composite benchmark. Strong overall performance can be attributed to positive returns in the domestic and non-U.S. equity markets. For the year, the Fund’s positive performance was primarily driven by its underlying investment in the International Equity Fund GS4 and the Value Equity Fund GS4. The Fund’s benchmark-relative underperformance was due to exposure to the Growth Equity Fund GS4.
Please see page 21 for information regarding specific portfolio allocations. Portfolio holdings are subject to change at any time.
The Blended Funds attempt to achieve their objectives by investing in the GuideStone Select Funds. By investing in these fund-of-funds, you will incur the expenses of the Blended Funds in addition to those of the underlying funds. You may invest in the Select Funds directly, except the Global Bond Fund. The Blended Funds are also subject to the risks of the underlying funds they hold.
19
Global Equity Fund
| | | | | | | | | | | | | | | |
Average Annual Total Returns as of 12/31/06 | |
| | | GS4 Class* | | | GS6 Class* | | | Benchmark** | | | GS8 Class* | | | GS8 Class Benchmark** | |
One Year | | 13.20 | % | | 12.79 | % | | 18.40 | % | | 12.36 | % | | 18.40 | % |
Five Year | | 8.65 | % | | 8.31 | % | | 9.48 | % | | N/A | | | N/A | |
Since Inception | | 7.46 | % | | 7.19 | % | | 8.20 | % | | 12.89 | % | | 15.66 | % |
Inception Date | | 08/27/01 | | | 08/27/01 | | | 08/27/01 | | | 11/08/04 | | | 11/08/04 | |
The performance data quoted represents past performance and does not guarantee future results. Current performance may be lower or higher. Performance data current to the most recent month-end may be obtained at www.GuideStone.org. The investment return and principal value of an investment will fluctuate so that shares, when redeemed, may be worth more or less than their original cost.
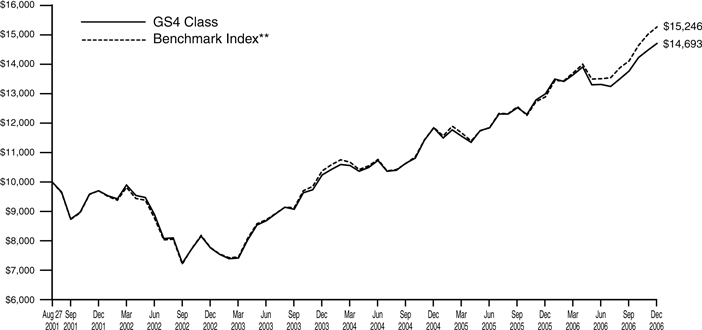
The graph compares the results of a hypothetical $10,000 investment in the GS4 Class of the Fund since August 27, 2001 (commencement of operations), with all dividends and capital gains reinvested, with the Fund’s weighted composite benchmark index.
| * | These returns reflect expense waivers by the Fund’s investment advisor. Without these waivers, returns would have been lower. Returns shown do not reflect the deduction of taxes that a shareholder would pay on Fund distributions or the redemption of Fund shares. |
** | Represents a weighted composite benchmark index consisting of the Russell 3000® Index and the MSCI ACWI® Ex-U.S. |
The Russell 3000® Index measures the performance of the 2,959 largest U.S. companies based on total market capitalization, which represents approximately 98% of the investable U.S. equity market.
The MSCI ACWI® Ex-U.S. is a market-capitalization weighted index composed of companies representative of the market structure of developed and emerging market countries in the Americas (excluding the U.S.), Europe/Middle East, and Asia/ Pacific Regions. It excludes closed markets and those shares in otherwise free markets that are not purchasable by foreigners.
Unlike a mutual fund, the performance of an index assumes no taxes, transaction costs, management fees or other expenses.
20
| | |
| Global Equity Fund | | |
SCHEDULE OF INVESTMENTS | | December 31, 2006 |
| | | | | |
| | | Shares | | Value |
AFFILIATED MUTUAL FUNDS — 99.9% | | | | | |
GuideStone Funds Equity Index Fund (GS4 Class)¥ | | 3,649,412 | | $ | 69,959,231 |
GuideStone Funds Growth Equity Fund (GS4 Class)¥ | | 17,395,220 | | | 309,113,061 |
GuideStone Funds International Equity Fund (GS4 Class)¥ | | 13,651,667 | | | 260,610,316 |
GuideStone Funds Money Market Fund (GS4 Class)¥ | | 16,867,592 | | | 16,867,592 |
GuideStone Funds Small Cap Equity Fund (GS4 Class)¥ | | 4,892,517 | | | 78,280,279 |
GuideStone Funds Value Equity Fund (GS4 Class)¥ | | 17,169,248 | | | 320,206,476 |
| | | | | |
Total Affiliated Mutual Funds | | | | | |
(Cost $808,464,455) | | | | | 1,055,036,955 |
| | | | | |
| | | | | | |
| | | Par | | |
U.S. TREASURY OBLIGATION — 0.1% | | | | | | |
U.S. Treasury Bill 4.85%, 02/22/07‡‡ | | | | | | |
(Cost $695,096) | | $ | 700,000 | | | 695,120 |
| | | | | | |
TOTAL INVESTMENTS — 100.0% | | | | | | |
(Cost $809,159,551) | | | | | | 1,055,732,075 |
Other Assets in Excess of Liabilities — 0.0% | | | | | | 311,976 |
| | | | | | |
NET ASSETS — 100.0% | | | | | $ | 1,056,044,051 |
| | | | | | |
| | |
PORTFOLIO SUMMARY (based on net assets) | | |
| | | % |
Domestic Equity Funds | | 73.6 |
International Equity Fund | | 24.7 |
Money Market Fund | | 1.6 |
Futures Contracts | | 1.1 |
U.S. Treasury Obligation | | 0.1 |
| | |
| | 101.1 |
| | |
| | | | |
| | See Notes to Financial Statements. | | 21 |
STATEMENTS OF ASSETS AND LIABILITIES
December 31, 2006
| | | | | | | | | | | | |
| | | Flexible
Income Fund | | Growth &
Income Fund | | Capital
Opportunities Fund | | Global
Equity Fund |
Assets | | | | | | | | | | | | |
Investments in securities of affiliated issuers, at value | | $ | 323,361,158 | | $ | 1,411,962,719 | | $ | 1,149,073,319 | | $ | 1,055,036,955 |
Investments in securities of unaffiliated issuers, at value | | | 3,681,556 | | | 12,497,279 | | | 5,489,534 | | | 695,120 |
| | | | | | | | | | | | |
Total investments (1) | | | 327,042,714 | | | 1,424,459,998 | | | 1,154,562,853 | | | 1,055,732,075 |
Receivables: | | | | | | | | | | | | |
Dividends | | | 12,525 | | | 70,673 | | | 76,597 | | | 76,345 |
Interest | | | 75,430 | | | 217,006 | | | 86,913 | | | — |
Fund shares sold | | | 374,875 | | | 92,504 | | | 155,383 | | | 388,733 |
Prepaid expenses and other assets | | | 22,859 | | | 32,963 | | | 39,848 | | | 29,702 |
| | | | | | | | | | | | |
Total Assets | | | 327,528,403 | | | 1,424,873,144 | | | 1,154,921,594 | | | 1,056,226,855 |
| | | | | | | | | | | | |
| | | | |
Liabilities | | | | | | | | | | | | |
Payables: | | | | | | | | | | | | |
Fund shares redeemed | | | 53,347 | | | 112,065 | | | 126,594 | | | 1,554 |
Variation margin | | | 4,050 | | | 44,550 | | | 55,350 | | | 43,200 |
Distributions payable | | | — | | | 10,024 | | | — | | | — |
Accrued expenses: | | | | | | | | | | | | |
Advisory fees | | | 14,583 | | | 94,968 | | | 79,960 | | | 66,141 |
Distribution (12b-1) fees | | | 2,540 | | | 3,444 | | | 2,832 | | | 3,195 |
Shareholder servicing fees | | | 2,218 | | | 2,951 | | | 2,302 | | | 2,805 |
Other expenses | | | 45,579 | | | 80,357 | | | 69,322 | | | 65,909 |
| | | | | | | | | | | | |
Total Liabilities | | | 122,317 | | | 348,359 | | | 336,360 | | | 182,804 |
| | | | | | | | | | | | |
Net Assets | | $ | 327,406,086 | | $ | 1,424,524,785 | | $ | 1,154,585,234 | | $ | 1,056,044,051 |
| | | | | | | | | | | | |
| | | | |
Net Assets Consist of: | | | | | | | | | | | | |
Paid-in-capital | | $ | 277,527,318 | | $ | 1,154,997,728 | | $ | 882,690,836 | | $ | 751,758,456 |
Undistributed net investment income | | | 233 | | | — | | | 9,400 | | | — |
Accumulated net realized gain on investments | | | 4,739,067 | | | 38,164,869 | | | 46,488,264 | | | 57,692,436 |
Net unrealized appreciation (depreciation) on investments and futures transactions | | | 45,139,468 | | | 231,362,188 | | | 225,396,734 | | | 246,593,159 |
| | | | | | | | | | | | |
Net Assets | | $ | 327,406,086 | | $ | 1,424,524,785 | | $ | 1,154,585,234 | | $ | 1,056,044,051 |
| | | | | | | | | | | | |
| | | | |
Net Asset Value: | | | | | | | | | | | | |
$0.001 par value, unlimited shares authorized | | | | | | | | | | | | |
Net assets applicable to the GS4 Class | | $ | 308,801,752 | | $ | 1,400,000,742 | | $ | 1,137,038,764 | | $ | 1,031,998,719 |
| | | | | | | | | | | | |
GS4 shares outstanding | | | 23,483,634 | | | 95,802,119 | | | 70,855,796 | | | 59,885,848 |
| | | | | | | | | | | | |
Net asset value, offering and redemption price per GS4share | | $ | 13.15 | | $ | 14.61 | | $ | 16.05 | | $ | 17.23 |
| | | | | | | | | | | | |
Net assets applicable to the GS6 Class | | $ | 12,859,573 | | $ | 16,080,209 | | $ | 9,447,752 | | $ | 16,886,634 |
| | | | | | | | | | | | |
GS6 shares outstanding | | | 1,424,737 | | | 1,722,807 | | | 885,847 | | | 1,407,324 |
| | | | | | | | | | | | |
Net asset value, offering and redemption price per GS6share | | $ | 9.03 | | $ | 9.33 | | $ | 10.67 | | $ | 12.00 |
| | | | | | | | | | | | |
Net assets applicable to the GS8 Class | | $ | 5,744,761 | | $ | 8,443,834 | | $ | 8,098,718 | | $ | 7,158,698 |
| | | | | | | | | | | | |
GS8 shares outstanding | | | 636,481 | | | 906,334 | | | 760,396 | | | 597,403 |
| | | | | | | | | | | | |
Net asset value, offering and redemption price per GS8share | | $ | 9.03 | | $ | 9.32 | | $ | 10.65 | | $ | 11.98 |
| | | | | | | | | | | | |
(1) Investments in securities of affiliated issuers, at cost | | $ | 278,212,983 | | $ | 1,180,653,781 | | $ | 923,758,612 | | $ | 808,464,455 |
Investments in securities of unaffiliated issuers, at cost | | | 3,687,274 | | | 12,494,310 | | | 5,467,387 | | | 695,096 |
| �� | | | | | | | | | | | |
Total investments at cost | | $ | 281,900,257 | | $ | 1,193,148,091 | | $ | 929,225,999 | | $ | 809,159,551 |
| | | | | | | | | | | | |
| | | | |
| 22 | | See Notes to Financial Statements. | | |
STATEMENTS OF OPERATIONS
For the Year Ended December 31, 2006
| | | | | | | | | | | | | | | | |
| | | Flexible
Income Fund | | | Growth &
Income Fund | | | Capital
Opportunities Fund | | | Global Equity Fund | |
Investment Income | | | | | | | | | | | | | | | | |
Income dividends received from affiliated funds | | $ | 9,875,173 | | | $ | 33,936,835 | | | $ | 19,313,838 | | | $ | 10,244,008 | |
Interest | | | 169,981 | | | | 515,887 | | | | 228,077 | | | | 51,225 | |
| | | | | | | | | | | | | | | | |
Total Investment Income | | | 10,045,154 | | | | 34,452,722 | | | | 19,541,915 | | | | 10,295,233 | |
| | | | | | | | | | | | | | | | |
| | | | |
Expenses | | | | | | | | | | | | | | | | |
Investment advisory fees | | | 316,527 | | | | 1,356,970 | | | | 1,103,636 | | | | 1,014,030 | |
Transfer agent fees | | | | | | | | | | | | | | | | |
GS4 shares | | | 35,839 | | | | 60,708 | | | | 48,373 | | | | 48,620 | |
GS6 shares | | | 7,632 | | | | 7,750 | | | | 7,799 | | | | 7,744 | |
GS8 shares | | | 7,768 | | | | 7,877 | | | | 7,858 | | | | 7,859 | |
Custodian fees | | | 13,688 | | | | 30,662 | | | | 24,552 | | | | 24,057 | |
Distribution (12b-1) fees: | | | | | | | | | | | | | | | | |
GS6 shares | | | 12,431 | | | | 14,368 | | | | 7,991 | | | | 15,191 | |
GS8 shares | | | 16,400 | | | | 19,992 | | | | 21,311 | | | | 19,159 | |
Shareholder servicing fees: | | | | | | | | | | | | | | | | |
GS6 shares | | | 13,672 | | | | 15,799 | | | | 8,782 | | | | 16,704 | |
GS8 shares | | | 11,477 | | | | 13,969 | | | | 14,898 | | | | 13,402 | |
Accounting and administration fees | | | 94,484 | | | | 217,928 | | | | 192,600 | | | | 183,452 | |
Professional fees | | | 58,426 | | | | 58,426 | | | | 58,426 | | | | 58,426 | |
Blue sky fees | | | | | | | | | | | | | | | | |
GS4 shares | | | 8,417 | | | | 11,084 | | | | 8,163 | | | | 8,376 | |
GS6 shares | | | 11,870 | | | | 12,574 | | | | 12,125 | | | | 12,530 | |
GS8 shares | | | 5,957 | | | | 7,362 | | | | 6,638 | | | | 5,403 | |
Shareholder reporting fees | | | | | | | | | | | | | | | | |
GS4 shares | | | 12,959 | | | | 41,644 | | | | 29,602 | | | | 28,501 | |
GS6 shares | | | 31 | | | | 31 | | | | 31 | | | | 31 | |
GS8 shares | | | 45 | | | | 105 | | | | 86 | | | | 87 | |
Trustee fees | | | 2,445 | | | | 10,560 | | | | 8,421 | | | | 7,742 | |
Line of credit facility fees | | | 1,423 | | | | 6,181 | | | | 4,953 | | | | 4,546 | |
Other expenses | | | 17,576 | | | | 26,647 | | | | 21,034 | | | | 19,573 | |
| | | | | | | | | | | | | | | | |
Total Expenses | | | 649,067 | | | | 1,920,637 | | | | 1,587,279 | | | | 1,495,433 | |
Expenses waived/reimbursed (See Footnote 3a and 3c) | | | (159,859 | ) | | | (77,128 | ) | | | (80,467 | ) | | | (92,374 | ) |
Fees paid indirectly | | | (2,153 | ) | | | (2,114 | ) | | | (2,750 | ) | | | (3,574 | ) |
| | | | | | | | | | | | | | | | |
Net Expenses | | | 487,055 | | | | 1,841,395 | | | | 1,504,062 | | | | 1,399,485 | |
| | | | | | | | | | | | | | | | |
Net Investment Income | | | 9,558,099 | | | | 32,611,327 | | | | 18,037,853 | | | | 8,895,748 | |
| | | | | | | | | | | | | | | | |
Realized and Unrealized Gain (Loss) | | | | | | | | | | | | | | | | |
Capital gain distributions received from affiliated funds | | | 4,675,836 | | | | 41,573,319 | | | | 49,657,625 | | | | 60,913,778 | |
Net realized gain on investment securities of affiliated issuers | | | 2,768,363 | | | | 22,525,012 | | | | 29,009,908 | | | | 30,886,284 | |
Net realized loss on investment securities of unaffiliated issuers | | | (21,760 | ) | | | (122,619 | ) | | | (61,582 | ) | | | — | |
Net realized gain on futures transactions | | | 99,134 | | | | 899,336 | | | | 883,130 | | | | 1,041,873 | |
| | | | | | | | | | | | | | | | |
Net realized gain | | | 7,521,573 | | | | 64,875,048 | | | | 79,489,081 | | | | 92,841,935 | |
| | | | | | | | | | | | | | | | |
Change in unrealized appreciation (depreciation) on investment securities of affiliated issuers | | | 1,177,397 | | | | 16,324,289 | | | | 17,138,713 | | | | 23,120,670 | |
Change in unrealized appreciation (depreciation) on investment securities of unaffiliated issuers | | | (8,727 | ) | | | (52,541 | ) | | | 491 | | | | (101 | ) |
Change in unrealized appreciation (depreciation) on futures | | | 7,340 | | | | 215,606 | | | | 250,503 | | | | 187,122 | |
| | | | | | | | | | | | | | | | |
Net change in unrealized appreciation (depreciation) | | | 1,176,010 | | | | 16,487,354 | | | | 17,389,707 | | | | 23,307,691 | |
| | | | | | | | | | | | | | | | |
Net Realized and Unrealized Gain (Loss) | | | 8,697,583 | | | | 81,362,402 | | | | 96,878,788 | | | | 116,149,626 | |
| | | | | | | | | | | | | | | | |
Net Increase in Net Assets Resulting from Operations | | $ | 18,255,682 | | | $ | 113,973,729 | | | $ | 114,916,641 | | | $ | 125,045,374 | |
| | | | | | | | | | | | | | | | |
| | | | |
| | See Notes to Financial Statements. | | 23 |
STATEMENTS OF CHANGES IN NET ASSETS
| | | | | | | | | | | | | | | | |
| | | Flexible Income Fund | | | Growth & Income Fund | |
| | | For the Year Ended | | | For the Year Ended | |
| | | 12/31/06 | | | 12/31/05 | | | 12/31/06 | | | 12/31/05 | |
Operations: | | | | | | | | | | | | | | | | |
Net investment income | | $ | 9,558,099 | | | $ | 6,710,228 | | | $ | 32,611,327 | | | $ | 26,617,634 | |
Net realized gain on investment securities and futures transactions | | | 7,521,573 | | | | 8,806,341 | | | | 64,875,048 | | | | 67,104,253 | |
Net change in unrealized appreciation (depreciation) on investment securities and futures | | | 1,176,010 | | | | (6,564,844 | ) | | | 16,487,354 | | | | (18,769,800 | ) |
| | | | | | | | | | | | | | | | |
Net increase in net assets resulting from operations | | | 18,255,682 | | | | 8,951,725 | | | | 113,973,729 | | | | 74,952,087 | |
| | | | | | | | | | | | | | | | |
| | | | |
Dividends and Distributions to Shareholders: | | | | | | | | | | | | | | | | |
Dividends from net investment income(1) | | | | | | | | | | | | | | | | |
GS4 shares | | | (9,432,798 | ) | | | (6,681,233 | ) | | | (37,055,835 | ) | | | (31,655,255 | ) |
GS6 shares | | | (521,636 | ) | | | (368,835 | ) | | | (608,167 | ) | | | (472,113 | ) |
GS8 shares | | | (217,451 | ) | | | (145,933 | ) | | | (298,157 | ) | | | (178,317 | ) |
Distributions from net realized capital gains | | | | | | | | | | | | | | | | |
GS4 shares | | | (3,380,204 | ) | | | (7,416,359 | ) | | | (39,876,138 | ) | | | (50,654,356 | ) |
GS6 shares | | | (202,252 | ) | | | (453,084 | ) | | | (688,428 | ) | | | (813,928 | ) |
GS8 shares | | | (90,433 | ) | | | (197,762 | ) | | | (369,454 | ) | | | (339,052 | ) |
| | | | | | | | | | | | | | | | |
Total dividends and distributions | | | (13,844,774 | ) | | | (15,263,206 | ) | | | (78,896,179 | ) | | | (84,113,021 | ) |
| | | | | | | | | | | | | | | | |
| | | | |
Capital Share Transactions: | | | | | | | | | | | | | | | | |
Proceeds from shares sold | | | | | | | | | | | | | | | | |
GS4 shares | | | 48,268,169 | | | | 51,005,980 | | | | 97,344,717 | | | | 111,946,233 | |
GS6 shares | | | 18,487 | | | | — | | | | 1,078,834 | | | | — | |
GS8 shares | | | 190,451 | | | | 80,457 | | | | 2,360,849 | | | | 375,343 | |
Reinvestment of dividends and distributions | | | | | | | | | | | | | | | | |
GS4 shares | | | 12,806,009 | | | | 14,088,998 | | | | 76,917,838 | | | | 82,297,754 | |
GS6 shares | | | 723,888 | | | | 821,918 | | | | 1,296,595 | | | | 1,286,043 | |
GS8 shares | | | 307,884 | | | | 343,695 | | | | 667,611 | | | | 517,368 | |
| | | | | | | | | | | | | | | | |
Total proceeds from shares sold and reinvested | | | 62,314,888 | | | | 66,341,048 | | | | 179,666,444 | | | | 196,422,741 | |
| | | | | | | | | | | | | | | | |
Value of shares redeemed | | | | | | | | | | | | | | | | |
GS4 shares | | | (37,007,976 | ) | | | (50,125,060 | ) | | | (83,449,394 | ) | | | (195,957,184 | ) |
GS6 shares | | | (34 | ) | | | — | | | | (57,598 | ) | | | — | |
GS8 shares | | | (23,806 | ) | | | — | | | | (290,737 | ) | | | (93 | ) |
| | | | | | | | | | | | | | | | |
Total value of shares redeemed | | | (37,031,816 | ) | | | (50,125,060 | ) | | | (83,797,729 | ) | | | (195,957,277 | ) |
| | | | | | | | | | | | | | | | |
Net increase (decrease) from capital share transactions (See Footnote 7) | | | 25,283,072 | | | | 16,215,988 | | | | 95,868,715 | | | | 465,464 | |
| | | | | | | | | | | | | | | | |
Total increase (decrease) in net assets | | | 29,693,980 | | | | 9,904,507 | | | | 130,946,265 | | | | (8,695,470 | ) |
| | | | | | | | | | | | | | | | |
Net Assets: | | | | | | | | | | | | | | | | |
Beginning of Period | | | 297,712,106 | | | | 287,807,599 | | | | 1,293,578,520 | | | | 1,302,273,990 | |
| | | | | | | | | | | | | | | | |
End of Period* | | $ | 327,406,086 | | | $ | 297,712,106 | | | $ | 1,424,524,785 | | | $ | 1,293,578,520 | |
| | | | | | | | | | | | | | | | |
* Including undistributed (distributions in excess of) net investment income | | $ | 233 | | | $ | 1,857 | | | $ | — | | | $ | 4,573 | |
| | | | | | | | | | | | | | | | |
(1) | Includes dividends paid from the short-term portion of capital gain distributions received from affiliated funds. |
| | | | |
| 24 | | See Notes to Financial Statements. | | |
| | | | | | | | | | | | | | |
Capital Opportunities Fund | | | Global Equity Fund | |
| For the Year Ended | | | For the Year Ended | |
| 12/31/06 | | | 12/31/05 | | | 12/31/06 | | | 12/31/05 | |
| | | | | | | | | | | | | | |
| $ | 18,037,853 | | | $ | 14,963,030 | | | $ | 8,895,748 | | | $ | 7,527,757 | |
| | 79,489,081 | | | | 56,530,883 | | | | 92,841,935 | | | | 61,273,033 | |
| | | | | | | | | | | | | | |
| | 17,389,707 | | | | 6,915,250 | | | | 23,307,691 | | | | 16,984,803 | |
| | | | | | | | | | | | | | | |
| | 114,916,641 | | | | 78,409,163 | | | | 125,045,374 | | | | 85,785,593 | |
| | | | | | | | | | | | | | | |
| | | | | | | | | | | | | | |
| | | | | | | | | | | | | | |
| | (23,978,727 | ) | | | (20,445,230 | ) | | | (16,325,661 | ) | | | (13,392,673 | ) |
| | (260,944 | ) | | | (179,258 | ) | | | (330,326 | ) | | | (236,192 | ) |
| | (205,398 | ) | | | (131,752 | ) | | | (116,960 | ) | | | (77,886 | ) |
| | | | | | | | | | | | | | |
| | (50,378,326 | ) | | | (31,761,906 | ) | | | (52,469,226 | ) | | | (30,910,635 | ) |
| | (611,374 | ) | | | (328,938 | ) | | | (1,183,298 | ) | | | (651,282 | ) |
| | (536,666 | ) | | | (264,881 | ) | | | (505,083 | ) | | | (268,175 | ) |
| | | | | | | | | | | | | | | |
| | (75,971,435 | ) | | | (53,111,965 | ) | | | (70,930,554 | ) | | | (45,536,843 | ) |
| | | | | | | | | | | | | | | |
| | | | | | | | | | | | | | |
| | | | | | | | | | | | | | |
| | 50,622,132 | | | | 50,580,207 | | | | 75,250,021 | | | | 62,443,657 | |
| | 1,063,580 | | | | — | | | | 648,927 | | | | — | |
| | 1,966,580 | | | | 513,587 | | | | 692,148 | | | | 151,657 | |
| | 74,356,367 | | | | 52,206,192 | | | | 68,793,854 | | | | 44,301,986 | |
| | 872,318 | | | | 508,197 | | | | 1,513,624 | | | | 887,475 | |
| | 742,063 | | | | 396,633 | | | | 622,043 | | | | 346,061 | |
| | | | | | | | | | | | | | | |
| | 129,623,040 | | | | 104,204,816 | | | | 147,520,617 | | | | 108,130,836 | |
| | | | | | | | | | | | | | | |
| | | | | | | | | | | | | | |
| | (73,037,809 | ) | | | (125,641,164 | ) | | | (106,442,575 | ) | | | (142,475,893 | ) |
| | (144 | ) | | | — | | | | (66,258 | ) | | | — | |
| | (707,360 | ) | | | (30 | ) | | | (218,026 | ) | | | — | |
| | | | | | | | | | | | | | | |
| | (73,745,313 | ) | | | (125,641,194 | ) | | | (106,726,859 | ) | | | (142,475,893 | ) |
| | | | | | | | | | | | | | | |
| | | | | | | | | | | | | | |
| | 55,877,727 | | | | (21,436,378 | ) | | | 40,793,758 | | | | (34,345,057 | ) |
| | | | | | | | | | | | | | | |
| | 94,822,933 | | | | 3,860,820 | | | | 94,908,578 | | | | 5,903,693 | |
| | | | | | | | | | | | | | | |
| | | | | | | | | | | | | | |
| | 1,059,762,301 | | | | 1,055,901,481 | | | | 961,135,473 | | | | 955,231,780 | |
| | | | | | | | | | | | | | | |
| $ | 1,154,585,234 | | | $ | 1,059,762,301 | | | $ | 1,056,044,051 | | | $ | 961,135,473 | |
| | | | | | | | | | | | | | | |
| | | | | | | | | | | | | | |
| $ | 9,400 | | | $ | 3,668 | | | $ | — | | | $ | 3,258 | |
| | | | | | | | | | | | | | | |
| | | | |
| | See Notes to Financial Statements. | | 25 |
FINANCIAL HIGHLIGHTS
| | | | | | | | | | | | | | | | | | | | | | | | | | | | | | | | | | | | | | | | | | | | | | | | | |
| For a Share Outstanding Throughout the Years Ending December 31, unless otherwise indicated | | Ratios to Average Net Assets | |
| | | Net Asset
Value,
Beginning
of Period | | Net
Investment
Income (1) | | | Capital Gain
Distributions
Received
from
Affiliated
Funds | | Realized
and
Unrealized
Gain (Loss)
on
Investments | | | Dividends
from Net
Investment
Income (2) | | | Distributions
from Net
Realized
Capital
Gains | | | Net
Asset
Value,
End of
Period | | Total
Return (3) | | | Net Assets,
End of
Period (000) | | Expenses,
Net (4)(5) | | | Expenses,
Including
Expense
Reduction
(4)(5) | | | Expenses,
Before
Waivers
and
Expense
Reduction
(4)(5) | | | Investment
Income,
Net (1)(4) | | | Investment
Income/
(Loss),
Excluding
Waivers
and
Expense
Reduction
(1)(4) | | | Portfolio
Turnover
Rate (3) | |
Flexible Income Fund | |
GS4 Class | |
2006 | | $ | 12.94 | | $ | 0.40 | # | | $ | 0.17 | | $ | 0.20 | | | $ | (0.41 | ) | | $ | (0.15 | ) | | $ | 13.15 | | 5.99 | % | | $ | 308,802 | | 0.13 | % | | 0.13 | % | | 0.18 | % | | 3.08 | % | | 3.03 | % | | 9 | % |
2005 | | | 13.18 | | | 0.33 | # | | | 0.09 | | | 0.02 | | | | (0.32 | ) | | | (0.36 | ) | | | 12.94 | | 3.31 | | | | 280,256 | | 0.13 | | | 0.13 | | | 0.19 | | | 2.51 | | | 2.45 | | | 20 | |
2004 | | | 13.00 | | | 0.21 | # | | | 0.04 | | | 0.37 | | | | (0.31 | ) | | | (0.13 | ) | | | 13.18 | | 4.76 | | | | 270,913 | | 0.13 | | | 0.13 | | | 0.17 | | | 1.60 | | | 1.56 | | | 11 | |
2003 | | | 12.40 | | | 0.31 | | | | 0.02 | | | 0.82 | | | | (0.22 | ) | | | (0.33 | ) | | | 13.00 | | 9.33 | | | | 253,828 | | 0.13 | | | 0.13 | | | 0.20 | | | 2.01 | | | 1.94 | | | 13 | |
2002 | | | 13.15 | | | 0.38 | | | | 0.10 | | | (0.62 | ) | | | (0.44 | ) | | | (0.17 | ) | | | 12.40 | | (1.10 | ) | | | 263,646 | | 0.13 | | | 0.13 | | | 0.17 | | | 2.86 | | | 2.82 | | | 14 | |
2001(6) | | | 13.29 | | | 0.17 | | | | 0.06 | | | (0.12 | ) | | | (0.22 | ) | | | (0.03 | ) | | | 13.15 | | 0.79 | | | | 286,628 | | 0.13 | | | 0.13 | | | 0.18 | | | 3.67 | | | 3.62 | | | 4 | |
|
GS6 Class | |
2006 | | $ | 9.05 | | $ | 0.25 | # | | $ | 0.17 | | $ | 0.09 | | | $ | (0.38 | ) | | $ | (0.15 | ) | | $ | 9.03 | | 5.66 | % | | $ | 12,860 | | 0.50 | % | | 0.50 | % | | 0.53 | % | | 2.70 | % | | 2.67 | % | | 9 | % |
2005 | | | 9.42 | | | 0.20 | # | | | 0.09 | | | (0.02 | ) | | | (0.28 | ) | | | (0.36 | ) | | | 9.05 | | 2.90 | | | | 12,161 | | 0.50 | | | 0.50 | | | 0.56 | | | 2.10 | | | 2.04 | | | 20 | |
2004 | | | 9.41 | | | 0.11 | # | | | 0.04 | | | 0.27 | | | | (0.28 | ) | | | (0.13 | ) | | | 9.42 | | 4.52 | | | | 11,815 | | 0.36 | | | 0.36 | | | 0.45 | | | 1.14 | | | 1.05 | | | 11 | |
2003 | | | 9.12 | | | 0.21 | | | | 0.02 | | | 0.59 | | | | (0.20 | ) | | | (0.33 | ) | | | 9.41 | | 9.06 | | | | 19,674 | | 0.35 | | | 0.35 | | | 0.46 | | | 1.90 | | | 1.79 | | | 13 | |
2002 | | | 9.83 | | | 0.23 | | | | 0.10 | | | (0.45 | ) | | | (0.42 | ) | | | (0.17 | ) | | | 9.12 | | (1.27 | ) | | | 16,234 | | 0.32 | | | 0.32 | | | 0.43 | | | 2.82 | | | 2.71 | | | 14 | |
2001(6) | | | 10.00 | | | 0.10 | | | | 0.06 | | | (0.08 | ) | | | (0.22 | ) | | | (0.03 | ) | | | 9.83 | | 0.72 | | | | 325 | | 0.48 | | | 0.48 | | | 66.47 | | | 6.69 | | | (59.30 | ) | | 4 | |
|
GS8 Class | |
2006 | | $ | 9.05 | | $ | 0.22 | # | | $ | 0.17 | | $ | 0.10 | | | $ | (0.36 | ) | | $ | (0.15 | ) | | $ | 9.03 | | 5.36 | % | | $ | 5,745 | | 0.80 | % | | 0.80 | % | | 0.92 | % | | 2.40 | % | | 2.28 | % | | 9 | % |
2005 | | | 9.42 | | | 0.17 | # | | | 0.09 | | | (0.01 | ) | | | (0.26 | ) | | | (0.36 | ) | | | 9.05 | | 2.61 | | | | 5,295 | | 0.80 | | | 0.80 | | | 0.97 | | | 1.81 | | | 1.64 | | | 20 | |
2004(7) | | | 9.53 | | | 0.06 | # | | | 0.04 | | | 0.05 | | | | (0.13 | ) | | | (0.13 | ) | | | 9.42 | �� | 1.56 | | | | 5,080 | | 0.45 | | | 0.45 | | | 1.03 | | | 4.43 | | | 3.85 | | | 11 | |
|
Growth & Income Fund | |
|
GS4 Class | |
2006 | | $ | 14.20 | | $ | 0.36 | # | | $ | 0.39 | | $ | 0.50 | | | $ | (0.40 | ) | | $ | (0.44 | ) | | $ | 14.61 | | 8.78 | % | | $ | 1,400,001 | | 0.13 | % | | 0.13 | % | | 0.14 | % | | 2.44 | % | | 2.43 | % | | 7 | % |
2005 | | | 14.27 | | | 0.32 | # | | | 0.21 | | | 0.36 | | | | (0.36 | ) | | | (0.60 | ) | | | 14.20 | | 6.24 | | | | 1,273,855 | | 0.13 | | | 0.13 | | | 0.14 | | | 2.18 | | | 2.17 | | | 10 | |
2004 | | | 13.41 | | | 0.26 | # | | | 0.11 | | | 0.99 | | | | (0.30 | ) | | | (0.20 | ) | | | 14.27 | | 10.13 | | | | 1,283,982 | | 0.13 | | | 0.13 | | | 0.13 | | | 1.90 | | | 1.90 | | | 6 | |
2003 | | | 11.82 | | | 0.29 | | | | 0.15 | | | 1.78 | | | | (0.36 | ) | | | (0.27 | ) | | | 13.41 | | 18.79 | | | | 1,120,080 | | 0.13 | | | 0.13 | | | 0.13 | | | 2.22 | | | 2.22 | | | 10 | |
2002 | | | 13.44 | | | 0.36 | | | | 0.12 | | | (1.33 | ) | | | (0.42 | ) | | | (0.35 | ) | | | 11.82 | | (6.37 | ) | | | 1,019,700 | | 0.13 | | | 0.13 | | | 0.13 | | | 2.68 | | | 2.68 | | | 12 | |
2001(6) | | | 13.74 | | | 0.14 | | | | 0.06 | | | (0.27 | ) | | | (0.19 | ) | | | (0.04 | ) | | | 13.44 | | (0.47 | ) | | | 1,156,044 | | 0.13 | | | 0.13 | | | 0.17 | | | 2.87 | | | 2.83 | | | 4 | |
|
GS6 Class | |
2006 | | $ | 9.36 | | $ | 0.20 | # | | $ | 0.39 | | $ | 0.19 | | | $ | (0.37 | ) | | $ | (0.44 | ) | | $ | 9.33 | | 8.30 | % | | $ | 16,080 | | 0.48 | % | | 0.48 | % | | 0.48 | % | | 2.11 | % | | 2.11 | % | | 7 | % |
2005 | | | 9.71 | | | 0.18 | # | | | 0.21 | | | 0.19 | | | | (0.33 | ) | | | (0.60 | ) | | | 9.36 | | 5.96 | | | | 13,888 | | 0.48 | | | 0.48 | | | 0.48 | | | 1.82 | | | 1.82 | | | 10 | |
2004 | | | 9.28 | | | 0.12 | # | | | 0.11 | | | 0.66 | | | | (0.26 | ) | | | (0.20 | ) | | | 9.71 | | 9.66 | | | | 13,118 | | 0.46 | | | 0.46 | | | 0.52 | | | 1.28 | | | 1.22 | | | 6 | |
2003 | | | 8.34 | | | 0.16 | | | | 0.15 | | | 1.23 | | | | (0.33 | ) | | | (0.27 | ) | | | 9.28 | | 18.52 | | | | 22,650 | | 0.45 | | | 0.45 | | | 0.54 | | | 2.00 | | | 1.91 | | | 10 | |
2002 | | | 9.72 | | | 0.21 | | | | 0.12 | | | (0.96 | ) | | | (0.40 | ) | | | (0.35 | ) | | | 8.34 | | (6.59 | ) | | | 17,009 | | 0.37 | | | 0.37 | | | 0.45 | | | 2.64 | | | 2.56 | | | 12 | |
2001(6) | | | 10.00 | | | 0.07 | | | | 0.06 | | | (0.18 | ) | | | (0.19 | ) | | | (0.04 | ) | | | 9.72 | | (0.52 | ) | | | 1,334 | | 0.48 | | | 0.48 | | | 6.53 | | | 4.44 | | | (1.61 | ) | | 4 | |
|
GS8 Class | |
2006 | | $ | 9.35 | | $ | 0.17 | # | | $ | 0.39 | | $ | 0.19 | | | $ | (0.34 | ) | | $ | (0.44 | ) | | $ | 9.32 | | 8.03 | % | | $ | 8,444 | | 0.87 | % | | 0.87 | % | | 0.87 | % | | 1.81 | % | | 1.81 | % | | 7 | % |
2005 | | | 9.72 | | | 0.14 | # | | | 0.21 | | | 0.17 | | | | (0.29 | ) | | | (0.60 | ) | | | 9.35 | | 5.39 | | | | 5,836 | | 0.90 | | | 0.90 | | | 0.92 | | | 1.44 | | | 1.42 | | | 10 | |
2004(7) | | | 9.74 | | | 0.07 | # | | | 0.11 | | | 0.16 | | | | (0.16 | ) | | | (0.20 | ) | | | 9.72 | | 3.50 | | | | 5,174 | | 0.61 | | | 0.61 | | | 1.13 | | | 4.84 | | | 4.32 | | | 6 | |
| † | Amount represents less than $0.005 per share. |
| # | Calculated using the average shares outstanding method. |
| (1) | Recognition of net investment income by the Fund is affected by the timing of the declaration of dividends by the underlying investment companies in which the Fund invests. |
| (2) | Includes dividends paid from the short-term portion of capital gain distributions received from affiliated funds. |
| (5) | Does not include expenses of the investment companies in which the Fund invests. |
| (6) | Inception date was August 27, 2001. |
| (7) | Inception date was November 8, 2004. |
| | | | |
| 26 | | See Notes to Financial Statements. | | |
| | | | | | | | | | | | | | | | | | | | | | | | | | | | | | | | | | | | | | | | | | | | | | | | | | |
| | | Net Asset
Value,
Beginning
of Period | | Net Investment
Income (1) | | | Capital Gain
Distributions
Received
from
Affiliated
Funds | | | Realized
and
Unrealized
Gain (Loss) on
Investments | | | Dividends
from Net
Investment
Income (2) | | | Distributions
from Net
Realized
Capital
Gains | | | Net Asset
Value,
End of
Period | | Total
Return (3) | | | Net Assets,
End of Period (000) | | Ratios to Average Net Assets | | | | |
| | | | | | | | | | | Expenses,
Net (4)(5) | | | Expenses,
Including
Expense
Reduction (4)(5) | | | Expenses,
Before Waivers
and
Expense
Reduction (4)(5) | | | Investment
Income,
Net (1)(4) | | | Investment
Income/ (Loss),
Excluding
Waivers and
Expense
Reduction (1)(4) | | | Portfolio
Turnover
Rate (3) | |
Capital Opportunities Fund | | | | |
|
GS4 Class | |
2006 | | $ | 15.45 | | $ | 0.27 | # | | $ | 0.63 | | | $ | 0.81 | | | $ | (0.35 | ) | | $ | (0.76 | ) | | $ | 16.05 | | 11.03 | % | | $ | 1,137,039 | | 0.13 | % | | 0.13 | % | | 0.14 | % | | 1.66 | % | | 1.65 | % | | 7 | % |
2005 | | | 15.03 | | | 0.23 | # | | | 0.31 | | | | 0.68 | | | | (0.31 | ) | | | (0.49 | ) | | | 15.45 | | 8.09 | | | | 1,046,061 | | 0.13 | | | 0.13 | | | 0.14 | | | 1.50 | | | 1.49 | | | 5 | |
2004 | | | 13.62 | | | 0.19 | # | | | 0.08 | | | | 1.47 | | | | (0.21 | ) | | | (0.12 | ) | | | 15.03 | | 12.80 | | | | 1,043,625 | | 0.13 | | | 0.13 | | | 0.13 | | | 1.33 | | | 1.33 | | | 3 | |
2003 | | | 11.17 | | | 0.19 | | | | 0.07 | | | | 2.56 | | | | (0.23 | ) | | | (0.14 | ) | | | 13.62 | | 25.23 | | | | 900,021 | | 0.13 | | | 0.13 | | | 0.14 | | | 1.54 | | | 1.53 | | | 8 | |
2002 | | | 13.37 | | | 0.22 | | | | 0.06 | | | | (2.05 | ) | | | (0.24 | ) | | | (0.19 | ) | | | 11.17 | | (13.25 | ) | | | 745,968 | | 0.13 | | | 0.13 | | | 0.14 | | | 1.72 | | | 1.71 | | | 10 | |
2001(6) | | | 13.71 | | | 0.08 | | | | 0.03 | | | | (0.34 | ) | | | (0.11 | ) | | | — | † | | | 13.37 | | (1.68 | ) | | | 883,648 | | 0.13 | | | 0.13 | | | 0.17 | | | 1.76 | | | 1.72 | | | 3 | |
|
GS6 Class | |
2006 | | $ | 10.61 | | $ | 0.14 | # | | $ | 0.63 | | | $ | 0.35 | | | $ | (0.30 | ) | | $ | (0.76 | ) | | $ | 10.67 | | 10.58 | % | | $ | 9,448 | | 0.59 | % | | 0.59 | % | | 0.59 | % | | 1.27 | % | | 1.27 | % | | 7 | % |
2005 | | | 10.57 | | | 0.11 | # | | | 0.31 | | | | 0.37 | | | | (0.26 | ) | | | (0.49 | ) | | | 10.61 | | 7.43 | | | | 7,571 | | 0.62 | | | 0.62 | | | 0.62 | | | 1.01 | | | 1.01 | | | 5 | |
2004 | | | 9.67 | | | 0.07 | # | | | 0.08 | | | | 1.03 | | | | (0.16 | ) | | | (0.12 | ) | | | 10.57 | | 12.28 | | | | 7,042 | | 0.56 | | | 0.56 | | | 0.61 | | | 0.66 | | | 0.61 | | | 3 | |
2003 | | | 8.01 | | | 0.11 | | | | 0.07 | | | | 1.82 | | | | (0.20 | ) | | | (0.14 | ) | | | 9.67 | | 24.93 | | | | 13,585 | | 0.52 | | | 0.52 | | | 0.62 | | | 1.20 | | | 1.10 | | | 8 | |
2002 | | | 9.73 | | | 0.12 | | | | 0.06 | | | | (1.50 | ) | | | (0.21 | ) | | | (0.19 | ) | | | 8.01 | | (13.56 | ) | | | 9,859 | | 0.42 | | | 0.42 | | | 0.55 | | | 1.54 | | | 1.41 | | | 10 | |
2001(6) | | | 10.00 | | | 0.03 | | | | 0.03 | | | | (0.22 | ) | | | (0.11 | ) | | | — | † | | | 9.73 | | (1.64 | ) | | | 331 | | 0.48 | | | 0.48 | | | 43.03 | | | 3.87 | | | (38.68 | ) | | 3 | |
|
GS8 Class | |
2006 | | $ | 10.60 | | $ | 0.11 | # | | $ | 0.63 | | | $ | 0.35 | | | $ | (0.28 | ) | | $ | (0.76 | ) | | $ | 10.65 | | 10.24 | % | | $ | 8,099 | | 0.85 | % | | 0.85 | % | | 0.85 | % | | 1.00 | % | | 1.00 | % | | 7 | % |
2005 | | | 10.56 | | | 0.08 | # | | | 0.31 | | | | 0.37 | | | | (0.23 | ) | | | (0.49 | ) | | | 10.60 | | 7.21 | | | | 6,131 | | 0.92 | | | 0.92 | | | 0.92 | | | 0.76 | | | 0.76 | | | 5 | |
2004(7) | | | 10.31 | | | 0.04 | # | | | 0.08 | | | | 0.35 | | | | (0.10 | ) | | | (0.12 | ) | | | 10.56 | | 4.63 | | | | 5,234 | | 1.00 | | | 1.00 | | | 1.06 | | | 2.93 | | | 2.87 | | | 3 | |
| |
Global Equity Fund | | | | |
|
GS4 Class | |
2006 | | $ | 16.28 | | $ | 0.15 | # | | $ | 0.88 | | | $ | 1.13 | | | $ | (0.28 | ) | | $ | (0.93 | ) | | $ | 17.23 | | 13.20 | % | | $ | 1,031,999 | | 0.13 | % | | 0.13 | % | | 0.14 | % | | 0.90 | % | | 0.89 | % | | 4 | % |
2005 | | | 15.55 | | | 0.13 | # | | | 0.41 | | | | 0.98 | | | | (0.23 | ) | | | (0.56 | ) | | | 16.28 | | 9.75 | | | | 940,769 | | 0.13 | | | 0.13 | | | 0.14 | | | 0.85 | | | 0.84 | | | 4 | |
2004 | | | 13.64 | | | 0.11 | # | | | 0.04 | | | | 1.96 | | | | (0.12 | ) | | | (0.08 | ) | | | 15.55 | | 15.47 | | | | 936,734 | | 0.13 | | | 0.13 | | | 0.13 | | | 0.77 | | | 0.77 | | | 2 | |
2003 | | | 10.40 | | | 0.10 | | | | — | | | | 3.23 | | | | (0.09 | ) | | | — | | | | 13.64 | | 31.99 | | | | 801,407 | | 0.13 | | | 0.13 | | | 0.14 | | | 0.82 | | | 0.81 | | | 4 | |
2002 | | | 13.14 | | | 0.08 | | | | — | † | | | (2.71 | ) | | | (0.08 | ) | | | (0.03 | ) | | | 10.40 | | (20.04 | ) | | | 616,043 | | 0.13 | | | 0.13 | | | 0.14 | | | 0.68 | | | 0.67 | | | 6 | |
2001(6) | | | 13.57 | | | 0.03 | | | | — | | | | (0.43 | ) | | | (0.03 | ) | | | — | † | | | 13.14 | | (2.96 | ) | | | 810,507 | | 0.13 | | | 0.13 | | | 0.17 | | | 0.61 | | | 0.57 | | | 3 | |
|
GS6 Class | |
2006 | | $ | 11.67 | | $ | 0.07 | # | | $ | 0.88 | | | $ | 0.55 | | | $ | (0.24 | ) | | $ | (0.93 | ) | | $ | 12.00 | | 12.79 | % | | $ | 16,887 | | 0.47 | % | | 0.47 | % | | 0.47 | % | | 0.58 | % | | 0.58 | % | | 4 | % |
2005 | | | 11.35 | | | 0.06 | # | | | 0.41 | | | | 0.60 | | | | (0.19 | ) | | | (0.56 | ) | | | 11.67 | | 9.40 | | | | 14,441 | | 0.50 | | | 0.50 | | | 0.50 | | | 0.48 | | | 0.48 | | | 4 | |
2004 | | | 10.00 | | | 0.04 | # | | | 0.04 | | | | 1.43 | | | | (0.08 | ) | | | (0.08 | ) | | | 11.35 | | 15.17 | | | | 13,202 | | 0.44 | | | 0.44 | | | 0.50 | | | 0.37 | | | 0.31 | | | 2 | |
2003 | | | 7.65 | | | 0.05 | | | | — | | | | 2.36 | | | | (0.06 | ) | | | — | | | | 10.00 | | 31.53 | | | | 17,973 | | 0.43 | | | 0.43 | | | 0.48 | | | 0.53 | | | 0.48 | | | 4 | |
2002 | | | 9.70 | | | 0.04 | | | | — | † | | | (2.00 | ) | | | (0.06 | ) | | | (0.03 | ) | | | 7.65 | | (20.25 | ) | | | 12,805 | | 0.35 | | | 0.35 | | | 0.44 | | | 0.53 | | | 0.44 | | | 6 | |
2001(6) | | | 10.00 | | | 0.02 | | | | — | | | | (0.29 | ) | | | (0.03 | ) | | | — | † | | | 9.70 | | (2.75 | ) | | | 207 | | 0.48 | | | 0.48 | | | 66.34 | | | 1.57 | | | (64.29 | ) | | 3 | |
|
GS8 Class | |
2006 | | $ | 11.66 | | $ | 0.03 | # | | $ | 0.88 | | | $ | 0.54 | | | $ | (0.20 | ) | | $ | (0.93 | ) | | $ | 11.98 | | 12.36 | % | | $ | 7,159 | | 0.85 | % | | 0.85 | % | | 0.85 | % | | 0.21 | % | | 0.21 | % | | 4 | % |
2005 | | | 11.35 | | | 0.01 | # | | | 0.41 | | | | 0.61 | | | | (0.16 | ) | | | (0.56 | ) | | | 11.66 | | 8.97 | | | | 5,926 | | 0.87 | | | 0.87 | | | 0.92 | | | 0.13 | | | 0.08 | | | 4 | |
2004(7) | | | 10.83 | | | 0.03 | # | | | 0.04 | | | | 0.57 | | | | (0.04 | ) | | | (0.08 | ) | | | 11.35 | | 5.94 | | | | 5,296 | | 0.87 | | | 0.87 | | | 1.04 | | | 1.64 | | | 1.47 | | | 2 | |
| | | | |
| | See Notes to Financial Statements. | | 27 |
Flexible Income Fund I
The Fund is constructed using a blend of seven GuideStone Funds Select Funds GS2. The Fund’s actual asset allocation at quarter-end was 19% U.S. Equity, 6% Non-U.S. Equity, and 75% Fixed Income. The Fund’s returns were positive for the quarter and the year; however it trailed its composite benchmark. The largest component of the Fund, the Low-Duration Bond Fund GS2, generated a positive return for the quarter and the year, with performance slightly trailing its underlying benchmark (Merrill Lynch 1-3 Year Treasury Index). The Fund’s benchmark-relative underperformance for the year was most impacted by its exposure to the Growth Equity Fund GS2. The Growth Equity Fund’s returns were slightly positive for the year but it significantly trailed its underlying benchmark index.
Please see page 30 for information regarding specific portfolio allocations. Portfolio holdings are subject to change at any time.
The Blended Funds attempt to achieve their objectives by investing in the GuideStone Select Funds. By investing in these fund-of-funds, you will incur the expenses of the Blended Funds in addition to those of the underlying funds. You may invest in the Select Funds directly, except the Global Bond Fund. The Blended Funds are also subject to the risks of the underlying funds they hold.
28
Flexible Income Fund I
| | | | | | |
Average Annual Total Returns as of 12/31/06 | |
| | | GS2 Class* | | | Benchmark** | |
One Year | | 6.21 | % | | 7.43 | % |
Since Inception | | 5.40 | % | | 5.70 | % |
Inception Date | | 07/01/03 | | | 07/01/03 | |
The performance data quoted represents past performance and does not guarantee future results. Current performance may be lower or higher. Performance data current to the most recent month-end may be obtained at www.GuideStone.org. The investment return and principal value of an investment will fluctuate so that shares, when redeemed, may be worth more or less than their original cost.

The graph compares the results of a hypothetical $10,000 investment in the GS2 Class of the Fund since July 1, 2003 (commencement of operations), with all dividends and capital gains reinvested, with the Fund’s weighted composite benchmark index.
| * | These returns reflect expense waivers by the Fund’s investment advisor. Without these waivers, returns would have been lower. Returns shown do not reflect the deduction of taxes that a shareholder would pay on Fund distributions or the redemption of Fund shares. |
** | Represents a weighted composite benchmark index consisting of the Russell 3000® Index, the MSCI ACWI® Ex-U.S. and the Merrill Lynch 1-3 Year Treasury Index. |
The Russell 3000® Index measures the performance of the 2,959 largest U.S. companies based on total market capitalization, which represents approximately 98% of the investable U.S. equity market.
The MSCI ACWI® Ex-U.S. is a market-capitalization weighted index composed of companies representative of the market structure of developed and emerging market countries in the Americas (excluding the U.S.), Europe/Middle East, and Asia/ Pacific Regions. It excludes closed markets and those shares in otherwise free markets that are not purchasable by foreigners.
The Merrill Lynch 1-3 Year Treasury Index is composed of all U.S. Treasury Notes and Bonds with maturities greater than or equal to one year and less than three years.
Unlike a mutual fund, the performance of an index assumes no taxes, transaction costs, management fees or other expenses.
29
| | |
| Flexible Income Fund I | | |
SCHEDULE OF INVESTMENTS | | December 31, 2006 |
| | | | | | | |
| | | Shares | | Value | |
AFFILIATED MUTUAL FUNDS — 98.9% | | | | | | | |
GuideStone Funds Equity Index Fund (GS2 Class)¥ | | | 90,381 | | $ | 1,001,419 | |
GuideStone Funds Growth Equity Fund (GS2 Class)¥ | | | 393,732 | | | 4,421,611 | |
GuideStone Funds International Equity Fund (GS2 Class)¥ | | | 224,534 | | | 3,547,641 | |
GuideStone Funds Low-Duration Bond Fund (GS2 Class)¥ | | | 4,675,167 | | | 41,562,232 | |
GuideStone Funds Money Market Fund (GS2 Class)¥ | | | 621,033 | | | 621,033 | |
GuideStone Funds Small Cap Equity Fund (GS2 Class)¥ | | | 98,042 | | | 1,110,817 | |
GuideStone Funds Value Equity Fund (GS2 Class)¥ | | | 405,729 | | | 4,308,839 | |
| | | | | | | |
Total Affiliated Mutual Funds | | | | | | | |
(Cost $57,992,099) | | | | | | 56,573,592 | |
| | | | | | | |
| | |
| | | Par | | | |
U.S. TREASURY OBLIGATIONS — 1.1% | | | | | | | |
U.S. Treasury Bill 4.85%, 02/22/07‡‡ | | $ | 20,000 | | | 19,860 | |
U.S. Treasury Note 5.00%, 07/31/08 | | | 595,000 | | | 596,163 | |
| | | | | | | |
Total U.S. Treasury Obligations | | | | | | | |
(Cost $616,663) | | | | | | 616,023 | |
| | | | | | | |
TOTAL INVESTMENTS — 100.0% | | | | | | | |
(Cost $58,608,762) | | | | | | 57,189,615 | |
| | |
Liabilities in Excess of Other | | | | | | | |
Assets — 0.0% | | | | | | (1,430 | ) |
| | | | | | | |
NET ASSETS — 100.0% | | | | | $ | 57,188,185 | |
| | | | | | | |
PORTFOLIO SUMMARY (based on net assets)
| | |
| | | % |
Bond Fund | | 72.7 |
Domestic Equity Funds | | 18.9 |
International Equity Fund | | 6.2 |
U.S. Treasury Obligations | | 1.1 |
Money Market Fund | | 1.1 |
Futures Contracts | | 0.4 |
| | |
| | 100.4 |
| | |
| | | | |
| 30 | | See Notes to Financial Statements. | | |
Growth & Income Fund I
The Fund is constructed using a blend of nine GuideStone Funds Select Funds GS2. The Fund’s asset allocation at quarter-end was 37% U.S. Equity, 13% Non-U.S. Equity, and 50% Fixed Income. The Fund experienced a positive return for the quarter and the year yet underperformed its composite benchmark. For the year, the Fund’s positive performance was primarily due to the Fund’s underlying investment in the International Equity Fund GS2 and the Value Equity Fund GS2. The Fund’s benchmark-relative underperformance for the year was primarily driven by its exposure to the Growth Equity Fund GS2. The largest component of the Fund, the Medium-Duration Bond Fund GS2, posted a return slightly ahead of its underlying benchmark, the Lehman Brothers Aggregate Bond Index for the year.
Please see page 33 for information regarding specific portfolio allocations. Portfolio holdings are subject to change at any time.
The Blended Funds attempt to achieve their objectives by investing in the GuideStone Select Funds. By investing in these fund-of-funds, you will incur the expenses of the Blended Funds in addition to those of the underlying funds. You may invest in the Select Funds directly, except the Global Bond Fund. The Blended Funds are also subject to the risks of the underlying funds they hold.
31
Growth & Income Fund I
| | | | | | |
Average Annual Total Returns as of 12/31/06 | |
| | | GS2 Class* | | | Benchmark** | |
One Year | | 8.85 | % | | 11.29 | % |
Since Inception | | 9.89 | % | | 10.22 | % |
Inception Date | | 07/01/03 | | | 07/01/03 | |
The performance data quoted represents past performance and does not guarantee future results. Current performance may be lower or higher. Performance data current to the most recent month-end may be obtained at www.GuideStone.org. The investment return and principal value of an investment will fluctuate so that shares, when redeemed, may be worth more or less than their original cost.
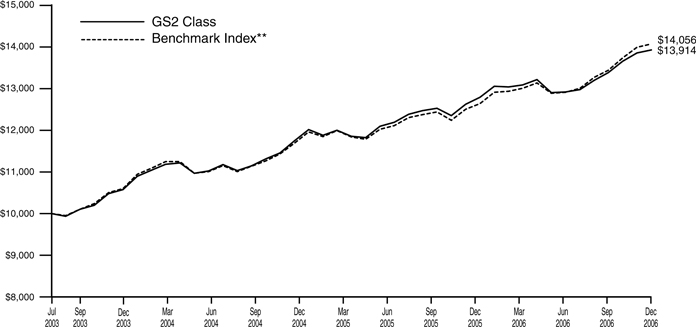
The graph compares the results of a hypothetical $10,000 investment in the GS2 Class of the Fund since July 1, 2003 (commencement of operations), with all dividends and capital gains reinvested, with the Fund’s weighted composite benchmark index.
| * | These returns reflect expense waivers by the Fund’s investment advisor. Without these waivers, returns would have been lower. Returns shown do not reflect the deduction of taxes that a shareholder would pay on Fund distributions or the redemption of Fund shares. |
** | Represents a weighted composite benchmark index consisting of the Russell 3000® Index, the MSCI ACWI® Ex-U.S. and the Lehman Brothers Aggregate Bond Index. |
The Russell 3000® Index measures the performance of the 2,959 largest U.S. companies based on total market capitalization, which represents approximately 98% of the investable U.S. equity market.
The MSCI ACWI® Ex-U.S. is a market-capitalization weighted index composed of companies representative of the market structure of developed and emerging market countries in the Americas (excluding the U.S.), Europe/Middle East, and Asia/ Pacific Regions. It excludes closed markets and those shares in otherwise free markets that are not purchased by foreigners.
The Lehman Brothers Aggregate Bond Index represents securities that are SEC-registered, taxable, and dollar denominated. The index covers the U.S. investment grade fixed rate bond market, with index components for government and corporate securities, mortgage pass-through securities, and asset-backed securities.
Unlike a mutual fund, the performance of an index assumes no taxes, transaction costs, management fees or other expenses.
32
| | |
| Growth & Income Fund I | | |
| SCHEDULE OF INVESTMENTS | | December 31, 2006 |
| | | | | |
| | | Shares | | Value |
AFFILIATED MUTUAL FUNDS — 99.0% | | | | | |
GuideStone Funds Equity Index Fund (GS2 Class)¥ | | 781,759 | | $ | 8,661,886 |
GuideStone Funds Extended-Duration Bond Fund (GS2 Class)¥ | | 3,138,331 | | | 25,514,630 |
GuideStone Funds Growth Equity Fund (GS2 Class)¥ | | 3,400,277 | | | 38,185,107 |
GuideStone Funds International Equity Fund (GS2 Class)¥ | | 2,199,186 | | | 34,747,146 |
GuideStone Funds Low-Duration Bond Fund (GS2 Class)¥ | | 4,190,880 | | | 37,256,922 |
GuideStone Funds Medium-Duration Bond Fund (GS2 Class)¥ | | 7,434,555 | | | 63,268,061 |
GuideStone Funds Money Market Fund (GS2 Class)¥ | | 3,568,611 | | | 3,568,611 |
GuideStone Funds Small Cap Equity Fund (GS2 Class)¥ | | 866,954 | | | 9,822,586 |
GuideStone Funds Value Equity Fund (GS2 Class)¥ | | 3,673,568 | | | 39,013,288 |
| | | | | |
Total Affiliated Mutual Funds | | | | | |
(Cost $256,951,987) | | | | | 260,038,237 |
| | | | | |
| | | | | | | |
| | | Par | | | |
U.S. TREASURY OBLIGATIONS — 1.0% | | | | | | | |
U.S. Treasury Bill 4.85%, 02/22/07‡‡ | | $ | 130,000 | | | 129,094 | |
U.S. Treasury Note 4.88%, 02/15/12 | | | 2,385,000 | | | 2,407,548 | |
| | | | | | | |
Total U.S. Treasury Obligations | | | | | | | |
(Cost $2,540,297) | | | | | | 2,536,642 | |
| | | | | | | |
TOTAL INVESTMENTS — 100.0% | | | | | | | |
(Cost $259,492,284) | | | | | | 262,574,879 | |
| | |
Liabilities in Excess of Other Assets — 0.0% | | | | | | (123,664 | ) |
| | | | | | | |
NET ASSETS — 100.0% | | | | | $ | 262,451,215 | |
| | | | | | | |
| | |
PORTFOLIO SUMMARY (based on net assets) |
| | | % |
Bond Funds | | 48.0 |
Domestic Equity Funds | | 36.4 |
International Equity Fund | | 13.2 |
Money Market Fund | | 1.4 |
U.S. Treasury Obligations | | 1.0 |
Futures Contracts | | 0.9 |
| | |
| | 100.9 |
| | |
| | | | |
| | See Notes to Financial Statements. | | 33 |
Capital Opportunities Fund I
The Fund is constructed using a blend of nine GuideStone Funds Select Funds GS2. The Fund’s asset allocation at quarter-end was 56% U.S. Equity, 19% Non-U.S. Equity, and 25% Fixed Income. The Fund posted a positive return for the quarter and the year yet trailed its composite benchmark. Strong overall performance can be attributed to positive returns in domestic and non-U.S. equity markets. For the year, the Fund’s positive performance was primarily driven by its underlying investment in the International Equity Fund GS2 and the Value Equity Fund GS2. The largest detractor to benchmark-relative underperformance was the Fund’s investment in the Growth Equity Fund GS2.
Please see page 36 for information regarding specific portfolio allocations. Portfolio holdings are subject to change at any time.
The Blended Funds attempt to achieve their objectives by investing in the GuideStone Select Funds. By investing in these fund-of-funds, you will incur the expenses of the Blended Funds in addition to those of the underlying funds. You may invest in the Select Funds directly, except the Global Bond Fund. The Blended Funds are also subject to the risks of the underlying funds they hold.
34
Capital Opportunities Fund I
| | | | | | |
Average Annual Total Returns as of 12/31/06 | |
| | | GS2 Class* | | | Benchmark** | |
One Year | | 11.21 | % | | 14.81 | % |
Since Inception | | 13.02 | % | | 13.74 | % |
Inception Date | | 07/01/03 | | | 07/01/03 | |
The performance data quoted represents past performance and does not guarantee future results. Current performance may be lower or higher. Performance data current to the most recent month-end may be obtained at www.GuideStone.org. The investment return and principal value of an investment will fluctuate so that shares, when redeemed, may be worth more or less than their original cost.
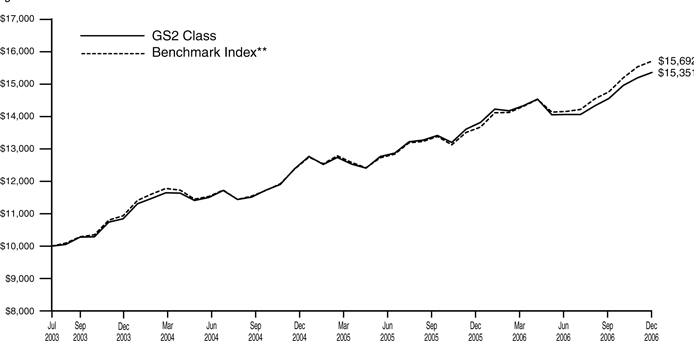
The graph compares the results of a hypothetical $10,000 investment in the GS2 Class of the Fund since July 1, 2003 (commencement of operations), with all dividends and capital gains reinvested, with the Fund’s weighted composite benchmark index.
| * | These returns reflect expense waivers by the Fund’s investment advisor. Without these waivers, returns would have been lower. Returns shown do not reflect the deduction of taxes that a shareholder would pay on Fund distributions or the redemption of Fund shares. |
** | Represents a weighted composite benchmark index consisting of the Russell 3000® Index, the MSCI ACWI® Ex-U.S. and the Lehman Brothers Aggregate Bond Index. |
The Russell 3000® Index measures the performance of the 2,959 largest U.S. companies based on total market capitalization, which represents approximately 98% of the investable U.S. equity market.
The MSCI ACWI® Ex-U.S. is a market-capitalization weighted index composed of companies representative of the market structure of developed and emerging market countries in the Americas (excluding the U.S.), Europe/Middle East, and Asia/ Pacific Regions. It excludes closed markets and those shares in otherwise free markets that are not purchasable by foreigners.
The Lehman Brothers Aggregate Bond Index represents securities that are SEC-registered, taxable, and dollar denominated. The index covers the U.S. investment grade fixed rate bond market, with index components for government and corporate securities, mortgage pass-through securities, and asset-backed securities.
Unlike a mutual fund, the performance of an index assumes no taxes, transaction costs, management fees or other expenses.
35
| | |
Capital Opportunities Fund I | | |
SCHEDULE OF INVESTMENTS | | December 31, 2006 |
| | | | | | | |
| | | Shares | | Value | |
AFFILIATED MUTUAL FUNDS — 99.5% | | | | | | | |
GuideStone Funds Equity Index Fund (GS2 Class)¥ | | | 837,480 | | $ | 9,279,277 | |
GuideStone Funds Extended-Duration Bond Fund (GS2 Class)¥ | | | 1,122,850 | | | 9,128,768 | |
GuideStone Funds Growth Equity Fund (GS2 Class)¥ | | | 3,641,168 | | | 40,890,312 | |
GuideStone Funds International Equity Fund (GS2 Class)¥ | | | 2,265,428 | | | 35,793,768 | |
GuideStone Funds Low-Duration Bond Fund (GS2 Class)¥ | | | 1,519,955 | | | 13,512,404 | |
GuideStone Funds Medium-Duration Bond Fund (GS2 Class)¥ | | | 2,637,510 | | | 22,445,212 | |
GuideStone Funds Money Market Fund (GS2 Class)¥ | | | 3,282,488 | | | 3,282,488 | |
GuideStone Funds Small Cap Equity Fund (GS2 Class)¥ | | | 915,463 | | | 10,372,196 | |
GuideStone Funds Value Equity Fund (GS2 Class)¥ | | | 3,942,454 | | | 41,868,857 | |
| | | | | | | |
Total Affiliated Mutual Funds | | | | | | | |
(Cost $175,802,807) | | | | | | 186,573,282 | |
| | | | | | | |
| | |
| | | Par | | | |
U.S. TREASURY OBLIGATIONS — 0.5% | | | | | | | |
U.S. Treasury Bills | | | | | | | |
4.85%, 02/22/07‡‡ | | $ | 130,000 | | | 129,094 | |
4.95%, 02/22/07‡‡ | | | 50,000 | | | 49,651 | |
| | | | | | | |
| | | | | | 178,745 | |
| | | | | | | |
U.S. Treasury Note | | | | | | | |
4.88%, 02/15/12 | | | 815,000 | | | 822,705 | |
| | | | | | | |
Total U.S. Treasury Obligations | | | | | | | |
(Cost $1,004,468) | | | | | | 1,001,450 | |
| | | | | | | |
TOTAL INVESTMENTS — 100.0% | | | | | | | |
(Cost $176,807,275) | | | | | | 187,574,732 | |
| | |
Liabilities in Excess of Other | | | | | | | |
Assets — 0.0% | | | | | | (38,383 | ) |
| | | | | | | |
NET ASSETS — 100.0% | | | | | $ | 187,536,349 | |
| | | | | | | |
PORTFOLIO SUMMARY (based on net assets)
| | |
| | | % |
Domestic Equity Funds | | 54.6 |
Bond Funds | | 24.0 |
International Equity Fund | | 19.1 |
Money Market Fund | | 1.8 |
Futures Contracts | | 1.3 |
U.S. Treasury Obligations | | 0.5 |
| | |
| | 101.3 |
| | |
| | | | |
| 36 | | See Notes to Financial Statements. | | |
Global Equity Fund I
The Fund is constructed using a blend of six GuideStone Funds Select Funds GS2. The Fund’s asset allocation at quarter-end was 73% U.S. Equity, 25% Non-U.S. Equity, and 2% Fixed Income. The Fund posted a positive return for the quarter and the year yet trailed its composite benchmark. Strong overall performance can be attributed to positive returns in the domestic and non-U.S. equity markets. For the year, the Fund’s positive performance was primarily driven by its underlying investment in the International Equity Fund GS2 and the Value Equity Fund GS2. The Fund’s benchmark-relative underperformance was due to exposure to the Growth Equity Fund GS2.
Please see page 39 for information regarding specific portfolio allocations. Portfolio holdings are subject to change at any time.
The Blended Funds attempt to achieve their objectives by investing in the GuideStone Select Funds. By investing in these fund-of-funds, you will incur the expenses of the Blended Funds in addition to those of the underlying funds. You may invest in the Select Funds directly, except the Global Bond Fund. The Blended Funds are also subject to the risks of the underlying funds they hold.
37
Global Equity Fund I
| | | | | | |
Average Annual Total Returns as of 12/31/06 | |
| | | GS2 Class* | | | Benchmark** | |
One year | | 13.33 | % | | 18.40 | % |
Since Inception | | 16.10 | % | | 17.30 | % |
Inception Date | | 07/01/03 | | | 07/01/03 | |
The performance data quoted represents past performance and does not guarantee future results. Current performance may be lower or higher. Performance data current to the most recent month-end may be obtained at www.GuideStone.org. The investment return and principal value of an investment will fluctuate so that shares, when redeemed, may be worth more or less than their original cost.
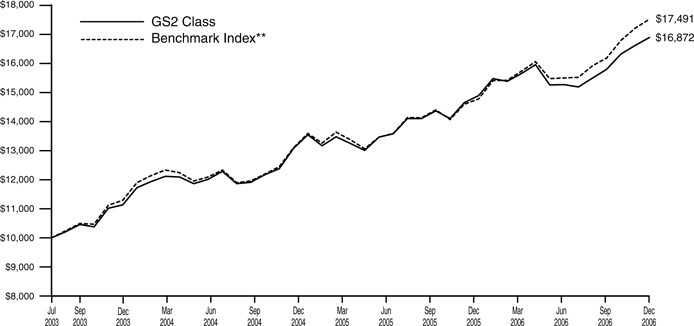
The graph compares the results of a hypothetical $10,000 investment in the GS2 Class of the Fund since July 1, 2003 (commencement of operations), with all dividends and capital gains reinvested, with the Fund’s weighted composite benchmark index.
| * | These returns reflect expense waivers by the Fund’s investment advisor. Without these waivers, returns would have been lower. Returns shown do not reflect the deduction of taxes that a shareholder would pay on Fund distributions or the redemption of Fund shares. |
** | Represents a weighted composite benchmark index consisting of the Russell 3000® Index and the MSCI ACWI® Ex-U.S. |
The Russell 3000® Index measures the performance of the 2,959 largest U.S. companies based on total market capitalization, which represents approximately 98% of the investable U.S. equity market.
The MSCI ACWI® Ex-U.S. is a market-capitalization weighted index composed of companies representative of the market structure of developed and emerging market countries in the Americas (excluding the U.S.), Europe/Middle East, and Asia/ Pacific Regions. It excludes closed markets and those shares in otherwise free markets that are not purchasable by foreigners.
Unlike a mutual fund, the performance of an index assumes no taxes, transaction costs, management fees or other expenses.
38
| | |
| Global Equity Fund I | | |
| SCHEDULE OF INVESTMENTS | | December 31, 2006 |
| | | | | | | |
| | | Shares | | Value | |
AFFILIATED MUTUAL FUNDS — 100.0% | | | | | | | |
GuideStone Funds Equity Index Fund (GS2 Class)¥ | | | 850,090 | | $ | 9,418,997 | |
GuideStone Funds Growth Equity Fund (GS2 Class)¥ | | | 3,685,220 | | | 41,385,017 | |
GuideStone Funds International Equity Fund (GS2 Class)¥ | | | 2,207,513 | | | 34,878,703 | |
GuideStone Funds Money Market Fund (GS2 Class)¥ | | | 2,900,147 | | | 2,900,147 | |
GuideStone Funds Small Cap Equity Fund (GS2 Class)¥ | | | 924,371 | | | 10,473,129 | |
GuideStone Funds Value Equity Fund (GS2 Class)¥ | | | 4,058,956 | | | 43,106,116 | |
| | | | | | | |
Total Affiliated Mutual Funds | | | | | | | |
(Cost $132,777,323) | | | | | | 142,162,109 | |
| | |
| | | Par | | | |
U.S. TREASURY OBLIGATION — 0.1% | | | | | | | |
U.S. Treasury Bill | | | | | | | |
4.85%, 02/22/07‡‡ | | | | | | | |
(Cost $139,019) | | $ | 140,000 | | | 139,024 | |
| | | | | | | |
| | |
TOTAL INVESTMENTS — 100.1% | | | | | | | |
(Cost $132,916,342) | | | | | | 142,301,133 | |
| | |
Liabilities in Excess of Other Assets — (0.1)% | | | | | | (83,254 | ) |
| | | | | | | |
NET ASSETS — 100.0% | | | | | $ | 142,217,879 | |
| | | | | | | |
| | |
PORTFOLIO SUMMARY (based on net assets) | | | | | | | |
| | |
| | | | | % | |
Domestic Equity Funds | | | | | | 73.4 | |
International Equity Fund | | | | | | 24.5 | |
Money Market Fund | | | | | | 2.1 | |
Futures Contracts | | | | | | 1.6 | |
U.S. Treasury Obligation | | | | | | 0.1 | |
| | | | | | | |
| | | | | | 101.7 | |
| | | | | | | |
| | | | |
| | See Notes to Financial Statements. | | 39 |
STATEMENTS OF ASSETS AND LIABILITIES
December 31, 2006
| | | | | | | | | | | | | |
| | | Flexible
Income Fund I | | | Growth &
Income Fund I | | Capital
Opportunities Fund I | | Global Equity Fund I |
Assets | | | | | | | | | | | | | |
Investments in securities of affiliated issuers, at value | | $ | 56,573,592 | | | $ | 260,038,237 | | $ | 186,573,282 | | $ | 142,162,109 |
Investments in securities of unaffiliated issuers, at value | | | 616,023 | | | | 2,536,642 | | | 1,001,450 | | | 139,024 |
| | | | | | | | | | | | | |
Total investments (1) | | | 57,189,615 | | | | 262,574,879 | | | 187,574,732 | | | 142,301,133 |
Receivables: | | | | | | | | | | | | | |
Dividends | | | 2,023 | | | | 14,154 | | | 12,527 | | | 10,460 |
Interest | | | 12,450 | | | | 43,917 | | | 15,007 | | | — |
Fund shares sold | | | 260 | | | | — | | | — | | | 26 |
Receivable from advisor | | | 3,865 | | | | — | | | — | | | — |
Prepaid expenses and other assets | | | 5,720 | | | | 5,720 | | | 5,720 | | | 5,720 |
| | | | | | | | | | | | | |
Total Assets | | | 57,213,933 | | | | 262,638,670 | | | 187,607,986 | | | 142,317,339 |
| | | | | | | | | | | | | |
| | | | |
Liabilities | | | | | | | | | | | | | |
Payables: | | | | | | | | | | | | | |
Fund shares redeemed | | | — | | | | 90,131 | | | 21,796 | | | 57,394 |
Variation margin | | | 810 | | | | 8,910 | | | 9,180 | | | 8,370 |
Distributions payable | | | — | | | | 36,512 | | | — | | | — |
Accrued expenses: | | | | | | | | | | | | | |
Advisory fees | | | — | | | | 19,118 | | | 8,814 | | | 5,194 |
Other expenses | | | 24,938 | | | | 32,784 | | | 31,847 | | | 28,502 |
| | | | | | | | | | | | | |
Total Liabilities | | | 25,748 | | | | 187,455 | | | 71,637 | | | 99,460 |
| | | | | | | | | | | | | |
Net Assets | | $ | 57,188,185 | | | $ | 262,451,215 | | $ | 187,536,349 | | $ | 142,217,879 |
| | | | | | | | | | | | | |
| | | | |
Net Assets Consist of: | | | | | | | | | | | | | |
Paid-in-capital | | $ | 57,773,687 | | | $ | 251,069,435 | | $ | 166,891,485 | | $ | 122,621,907 |
Undistributed net investment income | | | 81 | | | | — | | | — | | | 519 |
Accumulated net realized gain on investments | | | 833,828 | | | | 8,298,664 | | | 9,878,974 | | | 10,213,414 |
Net unrealized appreciation (depreciation) on investments and futures transactions | | | (1,419,411 | ) | | | 3,083,116 | | | 10,765,890 | | | 9,382,039 |
| | | | | | | | | | | | | |
Net Assets | | $ | 57,188,185 | | | $ | 262,451,215 | | $ | 187,536,349 | | $ | 142,217,879 |
| | | | | | | | | | | | | |
| | | | |
Net Asset Value: | | | | | | | | | | | | | |
$0.001 par value, unlimited shares authorized | | | | | | | | | | | | | |
Net assets applicable to the GS2 Class | | $ | 57,188,185 | | | $ | 262,451,215 | | $ | 187,536,349 | | $ | 142,217,879 |
| | | | | | | | | | | | | |
GS2 shares outstanding | | | 5,692,279 | | | | 23,124,361 | | | 14,474,944 | | | 9,768,685 |
| | | | | | | | | | | | | |
Net asset value, offering and redemption price per GS2 share | | $ | 10.05 | | | $ | 11.35 | | $ | 12.96 | | $ | 14.56 |
| | | | | | | | | | | | | |
| | | | | | | | | | | | | |
(1) Investments in securities of affiliated issuers, at cost | | $ | 57,992,099 | | | $ | 256,951,987 | | $ | 175,802,807 | | $ | 132,777,323 |
| Investments in securities of unaffiliated issuers, at cost | | | 616,663 | | | | 2,540,297 | | | 1,004,468 | | | 139,019 |
| | | | | | | | | | | | | |
Total investments at cost | | $ | 58,608,762 | | | $ | 259,492,284 | | $ | 176,807,275 | | $ | 132,916,342 |
| | | | | | | | | | | | | |
| | |
| 40 | | See Notes to Financial Statements. |
| | |
| STATEMENTS OF OPERATIONS | | |
| For the Year Ended December 31, 2006 | | |
| | | | | | | | | | | | | | | | |
| | | Flexible
Income Fund I | | | Growth &
Income Fund I | | | Capital
Opportunities Fund I | | | Global Equity Fund I | |
Investment Income | | | | | | | | | | | | | | | | |
Income dividends received from affiliated funds | | $ | 2,577,247 | | | $ | 10,044,057 | | | $ | 4,916,285 | | | $ | 2,173,552 | |
Interest | | | 28,923 | | | | 96,890 | | | | 38,730 | | | | 6,422 | |
| | | | | | | | | | | | | | | | |
Total Investment Income | | | 2,606,170 | | | | 10,140,947 | | | | 4,955,015 | | | | 2,179,974 | |
| | | | | | | | | | | | | | | | |
Expenses | | | | | | | | | | | | | | | | |
Investment advisory fees | | | 56,076 | | | | 249,992 | | | | 172,978 | | | | 134,214 | |
Transfer agent fees | | | 7,366 | | | | 14,700 | | | | 14,680 | | | | 7,482 | |
Custodian fees | | | 9,006 | | | | 14,318 | | | | 12,623 | | | | 10,851 | |
Accounting and administration fees | | | 22,759 | | | | 80,402 | | | | 57,475 | | | | 45,948 | |
Professional fees | | | 58,426 | | | | 58,426 | | | | 58,426 | | | | 58,546 | |
Shareholder reporting fees | | | 181 | | | | 232 | | | | 228 | | | | 221 | |
Trustee fees | | | 427 | | | | 1,896 | | | | 1,330 | | | | 1,012 | |
Line of credit facility fees | | | 250 | | | | 1,118 | | | | 785 | | | | 597 | |
Other expenses | | | 14,721 | | | | 15,283 | | | | 16,467 | | | | 15,328 | |
| | | | | | | | | | | | | | | | |
Total Expenses | | | 169,212 | | | | 436,367 | | | | 334,992 | | | | 274,199 | |
Expenses waived/reimbursed (See Footnote 3a and 3c) | | | (74,843 | ) | | | (16,300 | ) | | | (44,435 | ) | | | (48,541 | ) |
Fees paid indirectly | | | (2,233 | ) | | | (1,595 | ) | | | (2,081 | ) | | | (2,220 | ) |
| | | | | | | | | | | | | | | | |
Net expenses | | | 92,136 | | | | 418,472 | | | | 288,476 | | | | 223,438 | |
| | | | | | | | | | | | | | | | |
Net Investment Income | | | 2,514,034 | | | | 9,722,475 | | | | 4,666,539 | | | | 1,956,536 | |
| | | | | | | | | | | | | | | | |
| | | | |
Realized and Unrealized Gain (Loss) | | | | | | | | | | | | | | | | |
Capital gain distributions received from affiliated funds | | | 1,167,936 | | | | 10,843,951 | | | | 11,403,765 | | | | 11,517,440 | |
Net realized gain on investment securities of affiliated issuers | | | 520,548 | | | | 3,304,659 | | | | 3,194,049 | | | | 3,832,493 | |
Net realized loss on investment securities of unaffiliated issuers | | | (3,906 | ) | | | (20,999 | ) | | | (2,496 | ) | | | — | |
Net realized gain on futures transactions | | | 15,809 | | | | 169,761 | | | | 193,351 | | | | 198,729 | |
| | | | | | | | | | | | | | | | |
Net realized gain | | | 1,700,387 | | | | 14,297,372 | | | | 14,788,669 | | | | 15,548,662 | |
| | | | | | | | | | | | | | | | |
Change in unrealized appreciation (depreciation) on investment securities of affiliated issuers | | | (888,740 | ) | | | (2,715,650 | ) | | | (1,193,379 | ) | | | (845,698 | ) |
Change in unrealized appreciation (depreciation) on investment securities of unaffiliated issuers | | | (1,021 | ) | | | (8,975 | ) | | | (6,894 | ) | | | (9 | ) |
Change in unrealized appreciation (depreciation) on futures | | | 1,425 | | | | 25,620 | | | | 30,928 | | | | 32,133 | |
| | | | | | | | | | | | | | | | |
Net change in unrealized appreciation (depreciation) | | | (888,336 | ) | | | (2,699,005 | ) | | | (1,169,345 | ) | | | (813,574 | ) |
| | | | | | | | | | | | | | | | |
Net Realized and Unrealized Gain (Loss) | | | 812,051 | | | | 11,598,367 | | | | 13,619,324 | | | | 14,735,088 | |
| | | | | | | | | | | | | | | | |
Net Increase in Net Assets Resulting from Operations | | $ | 3,326,085 | | | $ | 21,320,842 | | | $ | 18,285,863 | | | $ | 16,691,624 | |
| | | | | | | | | | | | | | | | |
| | | | |
| | See Notes to Financial Statements. | | 41 |
STATEMENTS OF CHANGES IN NET ASSETS
| | | | | | | | | | | | | | | | |
| | | Flexible Income Fund I | | | Growth & Income Fund I | |
| | | For the Year Ended | | | For the Year Ended | |
| | | 12/31/06 | | | 12/31/05 | | | 12/31/06 | | | 12/31/05 | |
Operations: | | | | | | | | | | | | | | | | |
Net investment income | | $ | 2,514,034 | | | $ | 1,830,186 | | | $ | 9,722,475 | | | $ | 7,773,603 | |
Net realized gain on investment securities and futures transactions | | | 1,700,387 | | | | 1,213,257 | | | | 14,297,372 | | | | 9,148,867 | |
Net change in unrealized appreciation (depreciation) on investment securities and futures | | | (888,336 | ) | | | (1,198,806 | ) | | | (2,699,005 | ) | | | (2,317,487 | ) |
| | | | | | | | | | | | | | | | |
Net increase in net assets resulting from operations | | | 3,326,085 | | | | 1,844,637 | | | | 21,320,842 | | | | 14,604,983 | |
| | | | | | | | | | | | | | | | |
| | | | |
Dividends and Distributions to Shareholders: | | | | | | | | | | | | | | | | |
Dividends from net investment income(1) | | | (2,664,833 | ) | | | (1,960,531 | ) | | | (11,094,525 | ) | | | (9,389,155 | ) |
Distributions from net realized capital gains | | | (1,273,583 | ) | | | (695,374 | ) | | | (10,048,649 | ) | | | (3,407,754 | ) |
| | | | | | | | | | | | | | | | |
Total dividends and distributions | | | (3,938,416 | ) | | | (2,655,905 | ) | | | (21,143,174 | ) | | | (12,796,909 | ) |
| | | | | | | | | | | | | | | | |
| | | | |
Capital Share Transactions: | | | | | | | | | | | | | | | | |
Proceeds from GS2 shares sold | | | 6,364,329 | | | | 26,280,249 | | | | 18,379,727 | | | | 115,223,447 | |
Reinvestment of dividends and distributions into GS2 shares | | | 3,938,416 | | | | 2,655,905 | | | | 21,106,662 | | | | 12,765,942 | |
Value of GS2 shares redeemed | | | (6,733,659 | ) | | | (5,340,931 | ) | | | (16,456,454 | ) | | | (12,719,755 | ) |
| | | | | | | | | | | | | | | | |
Net increase from capital share transactions (See Footnote 7) | | | 3,569,086 | | | | 23,595,223 | | | | 23,029,935 | | | | 115,269,634 | |
| | | | | | | | | | | | | | | | |
Total increase in net assets | | | 2,956,755 | | | | 22,783,955 | | | | 23,207,603 | | | | 117,077,708 | |
| | | | | | | | | | | | | | | | |
| | | | |
Net Assets: | | | | | | | | | | | | | | | | |
Beginning of Period | | | 54,231,430 | | | | 31,447,475 | | | | 239,243,612 | | | | 122,165,904 | |
| | | | | | | | | | | | | | | | |
End of Period* | | $ | 57,188,185 | | | $ | 54,231,430 | | | $ | 262,451,215 | | | $ | 239,243,612 | |
| | | | | | | | | | | | | | | | |
*Including undistributed (distributions in excess of) net investment income | | $ | 81 | | | $ | — | | | $ | — | | | $ | — | |
| | | | | | | | | | | | | | | | |
(1) | Includes dividends paid from the short-term portion of capital gain distributions received from affiliated funds. |
| | |
| 42 | | See Notes to Financial Statements. |
| | | | | | | | | | | | | |
Capital Opportunities Fund I | | | Global Equity Fund I | |
For the Year Ended | | | For the Year Ended | |
| 12/31/06 | | 12/31/05 | | | 12/31/06 | | | 12/31/05 | |
| $ | 4,666,539 | | $ | 3,555,535 | | | $ | 1,956,536 | | | $ | 1,566,580 | |
| | 14,788,669 | | | 7,661,333 | | | | 15,548,662 | | | | 7,058,840 | |
| | (1,169,345) | | | 1,249,654 | | | | (813,574 | ) | | | 3,271,382 | |
| | | | | | | | | | | | | | |
| | 18,285,863 | | | 12,466,522 | | | | 16,691,624 | | | | 11,896,802 | |
| | | | | | | | | | | | | | |
| | (6,115,489) | | | (4,846,404 | ) | | | (3,422,335 | ) | | | (2,745,940 | ) |
| | (8,535,324) | | | (1,893,666 | ) | | | (8,647,866 | ) | | | (1,346,880 | ) |
| | | | | | | | | | | | | | |
| | (14,650,813) | | | (6,740,070 | ) | | | (12,070,201 | ) | | | (4,092,820 | ) |
| | | | | | | | | | | | | | |
| | 18,830,322 | | | 85,516,600 | | | | 11,000,461 | | | | 87,397,534 | |
| | 14,650,813 | | | 6,740,071 | | | | 12,070,201 | | | | 4,092,820 | |
| | (9,428,660) | | | (8,741,940 | ) | | | (11,299,905 | ) | | | (7,011,778 | ) |
| | | | | | | | | | | | | | |
| | 24,052,475 | | | 83,514,731 | | | | 11,770,757 | | | | 84,478,576 | |
| | | | | | | | | | | | | | |
| | 27,687,525 | | | 89,241,183 | | | | 16,392,180 | | | | 92,282,558 | |
| | | | | | | | | | | | | | |
| | 159,848,824 | | | 70,607,641 | | | | 125,825,699 | | | | 33,543,141 | |
| | | | | | | | | | | | | | |
| $ | 187,536,349 | | $ | 159,848,824 | | | $ | 142,217,879 | | | $ | 125,825,699 | |
| | | | | | | | | | | | | | |
| $ | — | | $ | 539 | | | $ | 519 | | | $ | 170 | |
| | | | | | | | | | | | | | |
| | | | |
| | See Notes to Financial Statements. | | 43 |
FINANCIAL HIGHLIGHTS
For a Share Outstanding Throughout the Years Ending December 31, unless otherwise indicated
| | | | | | | | | | | | | | | | | | | | | | | | | | | | | | | | | | | | | | | | | | | | | | | | | |
| | | Ratios to Average Net Assets | |
| | | Net Asset
Value,
Beginning
of Period | | Net Investment
Income (1) | | | Capital Gain
Distributions
Received
from
Affiliated
Funds | | Realized
and
Unrealized
Gain (Loss) on
Investments | | | Dividends
from Net
Investment
Income (2) | | | Distributions
from Net
Realized
Capital
Gains | | | Net Asset
Value,
End of
Period | | Total
Return (3) | | | Net Assets,
End of Period
(000) | | Expenses,
Net (4)(5) | | | Expenses,
Including
Expense
Reduction
(4)(5) | | | Expenses,
Before
Waivers
and
Expense
Reduction
(4)(5) | | | Investment
Income,
Net (1)(4) | | | Investment
Income,
Excluding
Waivers and
Expense
Reduction
(1)(4) | | | Portfolio
Turnover
Rate (3) | |
Flexible Income Fund I | | | | |
GS2 Class | | | | |
2006 | | $ | 10.15 | | $ | 0.46 | | | $ | 0.19 | | $ | (0.02 | ) | | $ | (0.49 | ) | | $ | (0.24 | ) | | $ | 10.05 | | 6.21 | % | | $ | 57,188 | | 0.17 | % | | 0.17 | % | | 0.30 | % | | 4.53 | % | | 4.40 | % | | 16 | % |
2005 | | | 10.31 | | | 0.36 | | | | 0.10 | | | (0.10 | ) | | | (0.38 | ) | | | (0.14 | ) | | | 10.15 | | 3.46 | | | | 54,231 | | 0.17 | | | 0.17 | | | 0.30 | | | 3.52 | | | 3.39 | | | 16 | |
2004 | | | 10.31 | | | 0.25 | | | | 0.05 | | | 0.19 | | | | (0.36 | ) | | | (0.13 | ) | | | 10.31 | | 4.77 | | | | 31,447 | | 0.17 | | | 0.17 | | | 0.39 | | | 2.42 | | | 2.20 | | | 23 | |
2003(6) | | | 10.00 | | | 0.18 | | | | 0.10 | | | 0.16 | | | | (0.12 | ) | | | (0.01 | ) | | | 10.31 | | 4.40 | | | | 28,636 | | 0.17 | | | 0.17 | | | 0.51 | | | 4.16 | | | 3.82 | | | 8 | |
| |
Growth & Income Fund I | | | | |
GS2 Class | | | | |
2006 | | $ | 11.32 | | $ | 0.46 | # | | $ | 0.45 | | $ | 0.09 | | | $ | (0.50 | ) | | $ | (0.47 | ) | | $ | 11.35 | | 8.85 | % | | $ | 262,451 | | 0.17 | % | | 0.17 | % | | 0.18 | % | | 3.93 | % | | 3.92 | % | | 13 | % |
2005 | | | 11.23 | | | 0.40 | # | | | 0.25 | | | 0.07 | | | | (0.46 | ) | | | (0.17 | ) | | | 11.32 | | 6.42 | | | | 239,244 | | 0.17 | | | 0.17 | | | 0.18 | | | 3.49 | | | 3.48 | | | 11 | |
2004 | | | 10.62 | | | 0.34 | # | | | 0.14 | | | 0.60 | | | | (0.36 | ) | | | (0.11 | ) | | | 11.23 | | 10.26 | | | | 122,166 | | 0.17 | | | 0.17 | | | 0.22 | | | 3.07 | | | 3.02 | | | 10 | |
2003(6) | | | 10.00 | | | 0.21 | | | | 0.17 | | | 0.51 | | | | (0.26 | ) | | | (0.01 | ) | | | 10.62 | | 8.94 | | | | 71,982 | | 0.17 | | | 0.17 | | | 0.28 | | | 4.76 | | | 4.65 | | | 5 | |
| |
Capital Opportunities Fund I | | | | |
GS2 Class | | | | |
2006 | | $ | 12.62 | | $ | 0.34 | | | $ | 0.73 | | $ | 0.35 | | | $ | (0.44 | ) | | $ | (0.64 | ) | | $ | 12.96 | | 11.21 | % | | $ | 187,536 | | 0.17 | % | | 0.17 | % | | 0.20 | % | | 2.73 | % | | 2.70 | % | | 9 | % |
2005 | | | 12.17 | | | 0.29 | | | | 0.38 | | | 0.33 | | | | (0.39 | ) | | | (0.16 | ) | | | 12.62 | | 8.20 | | | | 159,849 | | 0.17 | | | 0.17 | | | 0.20 | | | 2.42 | | | 2.39 | | | 8 | |
2004 | | | 11.11 | | | 0.24 | | | | 0.09 | | | 1.09 | | | | (0.26 | ) | | | (0.10 | ) | | | 12.17 | | 12.88 | | | | 70,608 | | 0.17 | | | 0.17 | | | 0.27 | | | 2.13 | | | 2.03 | | | 7 | |
2003(6) | | | 10.00 | | | 0.15 | | | | 0.09 | | | 1.07 | | | | (0.18 | ) | | | (0.02 | ) | | | 11.11 | | 13.02 | | | | 57,489 | | 0.17 | | | 0.17 | | | 0.31 | | | 3.24 | | | 3.10 | | | 3 | |
| |
Global Equity Fund I | | | | |
GS2 Class | | | | |
2006 | | $ | 14.01 | | $ | 0.21 | | | $ | 1.09 | | $ | 0.57 | | | $ | (0.36 | ) | | $ | (0.96 | ) | | $ | 14.56 | | 13.33 | % | | $ | 142,218 | | 0.17 | % | | 0.17 | % | | 0.21 | % | | 1.47 | % | | 1.43 | % | | 8 | % |
2005 | | | 13.16 | | | 0.18 | | | | 0.52 | | | 0.62 | | | | (0.31 | ) | | | (0.16 | ) | | | 14.01 | | 9.98 | | | | 125,826 | | 0.17 | | | 0.17 | | | 0.21 | | | 1.38 | | | 1.34 | | | 5 | |
2004 | | | 11.62 | | | 0.15 | | | | 0.05 | | | 1.60 | | | | (0.15 | ) | | | (0.11 | ) | | | 13.16 | | 15.48 | | | | 33,543 | | 0.17 | | | 0.17 | | | 0.41 | | | 1.29 | | | 1.05 | | | 7 | |
2003(6) | | | 10.00 | | | 0.09 | | | | — | | | 1.63 | | | | (0.09 | ) | | | (0.01 | ) | | | 11.62 | | 17.16 | | | | 25,678 | | 0.17 | | | 0.17 | | | 0.50 | | | 1.69 | | | 1.36 | | | 1 | |
| # | Calculated using the average shares outstanding method. |
| (1) | Recognition of net investment income by the Fund is affected by the timing of the declaration of dividends by the underlying investment companies in which the Fund invests. |
| (2) | Includes dividends paid from the short-term portion of capital gain distributions received from affiliated funds. |
| (5) | Does not include expenses of the investment companies in which the Fund invests. |
| (6) | Inception date was July 1, 2003. |
| | |
| 44 | | See Notes to Financial Statements. |
Money Market Fund
The Fund is comprised of a broad range of high quality, short-term money market instruments. The Fund posted a positive return and performed as expected relative to its benchmark index, the Citigroup 3-month T-bill Index for the fourth quarter and year. The Fund, benefiting from higher short-term interest rates in response to Fed tightenings, generated an annual return of 4.72%, the Fund’s highest calendar year annual return since its inception. The Fund’s 7-day annualized yield also increased materially during the year. As evidence, the Fund’s annualized yield was 4.91% at year-end, compared to 3.92% one year ago. The average weighted maturity of the Fund was 37 days at quarter-end, a slight decrease from 42 days at September 30, 2006. Maturities within the Fund remained fairly concentrated between 15 and 90 days. At year-end, major sector holdings were commercial paper, floating rate corporate/bank notes and certificate and time deposits. During the quarter, the percentage of assets invested in commercial paper decreased while the allocation to floating rate notes increased. At the sub-adviser level, BlackRock utilized several strategies that added incremental excess return relative to the benchmark index. In response to expectations of relatively stable monetary policy, a laddered portfolio structure was maintained throughout the quarter. Available cash was deployed in commercial paper and certificates of deposit in the 30-90 day range at a premium over the federal funds target rate. Securities due in the 90-day range and variable rate obligations were also added during the fourth quarter.
Please see page 48 for information regarding specific portfolio allocations. Portfolio holdings are subject to change at any time.
An investment in the Fund is not insured or guaranteed by the FDIC or any other governmental agency. Although the Fund seeks to maintain a value of $1.00 per share, it is possible to lose money.
45
Money Market Fund
| | | | | | | | | | | | | | | | | | |
Average Annual Total Returns as of 12/31/06 | |
| | | GS2 Class* | | | GS4 Class* | | | GS6 Class* | | | Benchmark** | | | GS8 Class* | | | GS8 Class Benchmark** | |
One Year | | 4.92 | % | | 4.72 | % | | 4.29 | % | | 4.76 | % | | 3.98 | % | | 4.76 | % |
Five Year | | 2.39 | % | | 2.20 | % | | 1.88 | % | | 2.35 | % | | N/A | | | N/A | |
Since Inception | | 2.36 | % | | 2.23 | % | | 1.91 | % | | 2.38 | % | | 2.91 | % | | 3.74 | % |
Inception Date | | 08/27/01 | | | 08/27/01 | | | 08/27/01 | | | 08/27/01 | | | 11/08/04 | | | 11/08/04 | |
| | | | | | | | | | |
| 7-Day Annualized Yield as of 12/31/06 | |
| GS2 Class* | | | GS4 Class* | | | GS6 Class* | | | GS8 Class* | |
| 5.11 | % | | 4.91 | % | | 4.50 | % | | 4.20 | % |
The performance data quoted represents past performance and does not guarantee future results. Current performance may be lower or higher. Performance data current to the most recent month-end may be obtained at www.GuideStone.org. Investment return will fluctuate so that shares, when redeemed, may be worth more or less than their original cost. The yield for the Money Market Fund represents annualization of the Fund’s declared dividends over the period indicated, excluding capital gains distributions. The 7-day annualized yield more closely reflects the current earnings of the Fund than the total return.
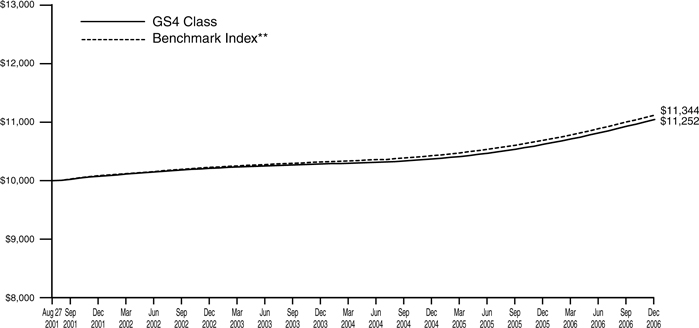
The graph compares the results of a hypothetical $10,000 investment in the GS4 Class of the Fund since August 27, 2001 (commencement of operations), with all dividends and capital gains reinvested, with the Citigroup 3-Month Index.
| * | These performance figures reflect expense waivers by the Fund’s investment advisor. Without these waivers, performance would have been lower. Performance figures shown do not reflect the deduction of taxes that a shareholder would pay on Fund distributions or the redemption of Fund shares. |
| ** | The Citigroup 3-Month Index is composed of the monthly return equivalents of yield averages that are not marked to market. The 3-Month Treasury Bill Index consists of the last three 3-month Treasury bill issues. |
Unlike a mutual fund, the performance of an index assumes no taxes, transaction costs, management fees or other expenses.
46
| | |
| Money Market Fund | | |
| SCHEDULE OF INVESTMENTS | | December 31, 2006 |
| | | | | | |
| | | Par | | Value |
CERTIFICATES OF DEPOSIT — 12.9% | | | | | | |
Barclays Bank PLC NY | | | | | | |
5.32%, 01/12/07 | | $ | 15,000,000 | | $ | 15,000,000 |
5.30%, 03/06/07 | | | 35,000,000 | | | 35,000,000 |
Mizuho Corporate Bank NY | | | | | | |
5.33%, 02/26/07 | | | 9,000,000 | | | 9,000,000 |
Royal Bank of Scotland NY | | | | | | |
4.81%, 01/16/07 | | | 8,540,000 | | | 8,540,000 |
4.87%, 02/02/07 | | | 17,000,000 | | | 17,000,000 |
Washington Mutual Bank FA | | | | | | |
5.33%, 02/16/07 | | | 50,000,000 | | | 50,000,000 |
| | | | | | |
| | |
Total Certificates of Deposit | | | | | | |
(Cost $134,540,000) | | | | | | 134,540,000 |
| | | | | | |
| | |
COMMERCIAL PAPER — 65.9% | | | | | | |
BASF AG | | | | | | |
5.25%, 01/17/07 | | | 9,825,000 | | | 9,802,075 |
Bear Stearns Co., Inc. | | | | | | |
5.24%, 01/30/07 | | | 31,000,000 | | | 30,869,146 |
5.25%, 02/09/07 | | | 4,000,000 | | | 3,977,250 |
Beethoven Funding Corporation | | | | | | |
5.25%, 03/01/07 | | | 29,178,000 | | | 28,926,948 |
5.25%, 03/05/07 | | | 21,000,000 | | | 20,807,062 |
CIT Group, Inc. | | | | | | |
5.25%, 02/20/07 | | | 13,279,000 | | | 13,182,174 |
Citigroup Funding, Inc. | | | | | | |
5.24%, 01/08/07 | | | 5,700,000 | | | 5,694,192 |
5.25%, 01/23/07 | | | 32,000,000 | | | 31,897,333 |
Countrywide Financial Corporation | | | | | | |
5.40%, 01/02/07 | | | 27,223,000 | | | 27,218,917 |
Crown Point Capital Co. LLC | | | | | | |
5.26%, 01/16/07 | | | 3,000,000 | | | 2,993,425 |
DEPFA Bank PLC | | | | | | |
5.26%, 01/25/07 | | | 17,000,000 | | | 16,940,387 |
Dorada Finance, Inc. | | | | | | |
5.26%, 01/22/07 | | | 12,175,000 | | | 12,137,643 |
Erasmus Capital Corporation | | | | | | |
5.26%, 03/15/07 | | | 25,000,000 | | | 24,733,347 |
5.27%, 03/19/07 | | | 13,365,000 | | | 13,214,350 |
Five Finance, Inc. | | | | | | |
5.26%, 02/14/07 | | | 9,000,000 | | | 8,942,140 |
General Electric Capital Services, Inc. | | | | | | |
5.24%, 02/08/07 | | | 29,000,000 | | | 28,839,598 |
5.25%, 02/14/07 | | | 5,000,000 | | | 4,967,917 |
Grampian Funding LLC | | | | | | |
5.25%, 02/06/07 | | | 18,000,000 | | | 17,905,500 |
HBOS Treasury Services PLC | | | | | | |
5.25%, 01/22/07 | | | 35,000,000 | | | 34,892,915 |
Hudson-Thames LLC | | | | | | |
5.27%, 03/20/07 | | | 8,000,000 | | | 7,908,653 |
Irish Life & Permanent PLC | | | | | | |
5.25%, 01/31/07 | | | 22,000,000 | | | 21,903,750 |
5.25%, 04/11/07 | | | 9,000,000 | | | 8,868,750 |
K2 (USA) LLC | | | | | | |
5.26%, 01/18/07 | | | 11,400,000 | | | 11,371,684 |
Lake Constance Funding LLC | | | | | | |
5.25%, 03/08/07 | | | 25,000,000 | | | 24,759,375 |
Lehman Brothers Holdings, Inc. | | | | | | |
5.36%, 04/12/07† | | | 23,000,000 | | | 23,000,000 |
Links Finance LLC | | | | | | |
5.26%, 01/12/07 | | | 22,000,000 | | | 21,964,675 |
Lockhart Funding LLC | | | | | | |
5.29%, 02/05/07 | | | 11,000,000 | | | 10,943,426 |
Metlife Funding, Inc. | | | | | | |
5.24%, 01/17/07 | | | 6,000,000 | | | 5,986,027 |
Morgan Stanley | | | | | | |
5.37%, 05/16/07 | | | 25,000,000 | | | 25,000,000 |
5.37%, 07/09/07 | | | 8,000,000 | | | 8,000,000 |
Nationwide Building Society | | | | | | |
5.25%, 01/30/07 | | | 28,000,000 | | | 27,881,583 |
Nestle Capital Corporation | | | | | | |
5.23%, 03/15/07 | | | 28,000,000 | | | 27,703,052 |
Societe Generale NA | | | | | | |
5.25%, 03/08/07 | | | 14,000,000 | | | 13,865,250 |
Solitaire Funding LLC | | | | | | |
5.27%, 01/22/07 | | | 3,000,000 | | | 2,990,778 |
Surrey Funding Corporation | | | | | | |
5.25%, 01/12/07 | | | 42,000,000 | | | 41,932,625 |
UBS Finance Delaware LLC | | | | | | |
5.24%, 01/24/07 | | | 40,000,000 | | | 39,866,089 |
Unicredito Italiano Bank (Ireland) PLC | | | | | | |
5.38%, 01/22/07 | | | 11,100,000 | | | 11,065,164 |
5.38%, 01/25/07 | | | 12,900,000 | | | 12,853,732 |
| | | | | | |
| | |
Total Commercial Paper | | | | | | |
(Cost $685,806,932) | | | | | | 685,806,932 |
| | | | | | |
| | |
MASTER NOTES — 5.2% | | | | | | |
Citigroup Global Markets, Inc. | | | | | | |
5.38%, 01/02/07† | | | 15,000,000 | | | 15,000,000 |
Goldman Sachs Group | | | | | | |
5.37%, 01/24/07†@ | | | 21,150,000 | | | 21,150,000 |
Morgan Stanley Mortgage Capital, Inc. | | | | | | |
5.48%, 01/02/07† | | | 5,075,000 | | | 5,075,000 |
5.42%, 01/05/07† | | | 12,591,000 | | | 12,591,000 |
| | | | | | |
| | |
Total Master Notes | | | | | | |
(Cost $53,816,000) | | | | | | 53,816,000 |
| | | | | | |
| | |
MUNICIPAL BOND — 0.9% | | | | | | |
Bergen County, New Jersey Improvement Authority, Series D Revenue Bond (Wachovia Bank NA Insured) | | | | | | |
5.40%, 01/04/07† | | | | | | |
(Cost $10,000,000) | | | 10,000,000 | | | 10,000,000 |
| | | | | | |
| | |
VARIABLE RATE OBLIGATIONS — 14.9% | | | | | | |
Allstate Life Global Funding II | | | | | | |
5.36%, 01/29/07 144A† | | | 20,000,000 | | | 20,000,000 |
American Honda Finance Corporation | | | | | | |
5.47%, 03/08/07 144A† | | | 35,000,000 | | | 35,009,797 |
Bear Stearns Co., Inc. | | | | | | |
5.41%, 01/29/07† | | | 10,000,000 | | | 10,000,000 |
Bosma Industries for the Blind, Inc. | | | | | | |
5.50%, 01/04/07† | | | 785,000 | | | 785,000 |
General Electric Capital Corporation | | | | | | |
5.48%, 01/17/07† | | | 2,240,000 | | | 2,240,994 |
5.31%, 01/24/07† | | | 5,500,000 | | | 5,500,000 |
Lehman Brothers Holdings, Inc. | | | | | | |
5.50%, 02/15/07† | | | 15,000,000 | | | 15,002,258 |
Merrill Lynch & Co., Inc. | | | | | | |
5.34%, 02/28/07† | | | 10,000,000 | | | 10,000,000 |
| | | | |
| | See Notes to Financial Statements. | | 47 |
| | |
| Money Market Fund | | |
| SCHEDULE OF INVESTMENTS (Continued) | | |
| | | | | | |
| | | Par | | Value |
Metropolitan Life Global Funding I | | | | | | |
5.45%, 01/29/07 144A† | | $ | 10,000,000 | | $ | 10,000,000 |
Park Street Properties I LLC | | | | | | |
5.35%, 01/03/07† | | | 450,000 | | | 450,000 |
Principal Life Income Funding Trusts | | | | | | |
5.38%, 03/07/07† | | | 6,400,000 | | | 6,403,551 |
Racers Trust | | | | | | |
5.37%, 01/22/07 144A† | | | 8,600,000 | | | 8,600,000 |
SDB Capital LLC | | | | | | |
5.35%, 01/04/07† | | | 11,615,000 | | | 11,615,000 |
Shipley Group LP | | | | | | |
5.50%, 01/04/07† | | | 1,300,000 | | | 1,300,000 |
Skandinaviska Enskilda Banken AB | | | | | | |
5.34%, 03/08/07 144A† | | | 10,000,000 | | | 10,000,000 |
Westpac Banking Corporation | | | | | | |
5.39%, 03/12/07† | | | 8,250,000 | | | 8,250,000 |
| | | | | | |
Total Variable Rate Obligations | | | | | | |
(Cost $155,156,600) | | | | | | 155,156,600 |
| | | | | | |
TOTAL INVESTMENTS — 99.8% | | | | | | |
(Cost $1,039,319,532) | | | | | | 1,039,319,532 |
| | |
Other Assets in Excess of Liabilities — 0.2% | | | | | | 2,062,920 |
| | | | | | |
NET ASSETS — 100.0% | | | | | $ | 1,041,382,452 |
| | | | | | |
| | |
PORTFOLIO SUMMARY (based on net assets) | | |
| |
| | | % |
Commercial Paper | | 65.9 |
Variable Rate Obligations | | 14.9 |
Certificates of Deposit | | 12.9 |
Master Notes | | 5.2 |
Municipal Bond | | 0.9 |
| | |
| | 99.8 |
| | |
| | |
| 48 | | See Notes to Financial Statements. |
Low-Duration Bond Fund
The Fund is comprised of high quality, fixed income securities primarily with shorter maturities. The Fund posted a positive return but slightly underperformed its benchmark index, the Merrill Lynch 1-3 Year Treasury Index, during the fourth quarter and year. Active management added value during the year but was not quite enough to overcome expenses. 2006 was the best performing year for low-duration bonds since 2002. The Fund’s benchmark relative performance was positively impacted by its underweight to the Treasury sector and significant overweights to higher yielding sectors such as mortgages, corporates and asset-backed securities. Longer-than-benchmark duration positions by several sub-advisers during the quarter negatively impacted performance as interest rates rose, especially during December. Two of the three sub-advisers outpaced the benchmark during the quarter. Payden & Rygel delivered the strongest benchmark relative performance due to allocations to yield-enhancing sectors such as mortgages, corporates and asset-backed securities. This exposure generated higher income relative to the benchmark.
Please see page 59 for information regarding specific portfolio allocations. Portfolio holdings are subject to change at any time.
49
Low-Duration Bond Fund
| | | | | | | | | | | | | | | | | | |
Average Annual Total Returns as of 12/31/06 | |
| | | GS2 Class* | | | GS4 Class* | | | GS6 Class* | | | Benchmark** | | | GS8 Class* | | | GS8 Class Benchmark** | |
One Year | | 3.94 | % | | 3.75 | % | | 3.43 | % | | 3.96 | % | | 3.04 | % | | 3.96 | % |
Five Year | | 3.09 | % | | 2.92 | % | | 2.67 | % | | 2.82 | % | | N/A | | | N/A | |
Since Inception | | 3.18 | % | | 3.10 | % | | 2.79 | % | | 3.14 | % | | 1.78 | % | | 2.63 | % |
Inception Date | | 08/27/01 | | | 08/27/01 | | | 08/27/01 | | | 08/27/01 | | | 11/08/04 | | | 11/08/04 | |
The performance data quoted represents past performance and does not guarantee future results. Current performance may be lower or higher. Performance data current to the most recent month-end may be obtained at www.GuideStone.org. The investment return and principal value of an investment will fluctuate so that shares, when redeemed, may be worth more or less than their original cost.
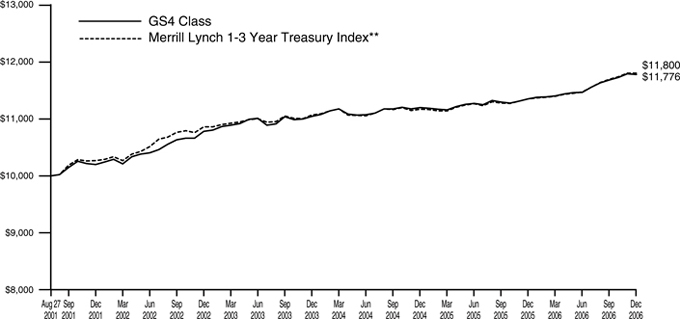
The graph compares the results of a hypothetical $10,000 investment in the GS4 Class of the Fund since August 27, 2001 (commencement of operations), with all dividends and capital gains reinvested, with the Merrill Lynch 1-3 Year Treasury Index.
| * | These returns reflect expense waivers by the Fund’s investment advisor. Without these waivers, returns would have been lower. Returns shown do not reflect the deduction of taxes that a shareholder would pay on Fund distributions or the redemption of Fund shares. |
| ** | The Merrill Lynch 1-3 Year Treasury Index is composed of all U.S. Treasury Notes and Bonds with maturities greater than or equal to one year and less than three years. |
Unlike a mutual fund, the performance of an index assumes no taxes, transaction costs, management fees or other expenses.
50
| | |
| Low-Duration Bond Fund | | |
| SCHEDULE OF INVESTMENTS | | December 31, 2006 |
| | | | | | |
| | | Par | | Value |
AGENCY OBLIGATION — 0.1% | | | | | | |
Small Business Administration | | | | | | |
6.95%, 11/10/16 | | | | | | |
(Cost $1,067,305) | | $ | 1,051,876 | | $ | 1,088,582 |
| | | | | | |
ASSET-BACKED SECURITIES — 23.3% | | | | | | |
Accredited Mortgage Loan Trust | | | | | | |
5.42%, 09/25/35 STEP | | | 378,806 | | | 378,840 |
ACE Securities Corporation | | | | | | |
5.55%, 04/25/35† | | | 2,102,799 | | | 2,104,049 |
Amresco Independence Funding, Inc. | | | | | | |
6.75%, 06/15/26 144A† | | | 693,749 | | | 691,497 |
Argent Securities, Inc. | | | | | | |
5.45%, 11/25/35† | | | 187,286 | | | 187,304 |
Asset-Backed Securities Corporation Home Equity | | | | | | |
5.60%, 09/25/34† | | | 371,151 | | | 370,952 |
5.37%, 11/25/36† | | | 1,653,570 | | | 1,653,596 |
BA Credit Card Trust | | | | | | |
4.72%, 05/15/13 | | | 2,725,000 | | | 2,691,789 |
Bear Stearns Asset-Backed Securities, Inc. | | | | | | |
5.43%, 02/25/29† | | | 1,220,359 | | | 1,220,532 |
5.44%, 11/25/35† | | | 1,495,468 | | | 1,495,770 |
5.43%, 01/25/36† | | | 2,942,216 | | | 2,942,629 |
5.37%, 11/25/36† | | | 1,640,131 | | | 1,639,620 |
Business Loan Express | | | | | | |
7.25%, 01/01/25 144A† | | | 389,289 | | | 378,693 |
Capital Auto Receivables Asset Trust | | | | | | |
2.00%, 11/15/07D | | | 103,305 | | | 103,167 |
3.35%, 02/15/08 | | | 1,653,219 | | | 1,647,795 |
4.05%, 07/15/09‡‡ | | | 2,575,000 | | | 2,557,015 |
5.31%, 10/20/09 144A | | | 1,900,000 | | | 1,900,182 |
5.32%, 03/20/10 144A | | | 2,300,000 | | | 2,302,603 |
Carrington Mortgage Loan Trust | | | | | | |
5.42%, 04/25/36† | | | 1,132,117 | | | 1,132,360 |
Chase Issuance Trust | | | | | | |
3.22%, 06/15/10 | | | 2,425,000 | | | 2,387,379 |
5.37%, 02/15/12† | | | 1,725,000 | | | 1,726,770 |
Chase Manhattan Auto Owner Trust | | | | | | |
5.13%, 05/15/11 | | | 1,500,000 | | | 1,499,988 |
5.11%, 04/15/14 | | | 1,500,000 | | | 1,502,680 |
Citibank Credit Card Issuance Trust | | | | | | |
2.55%, 01/20/09 | | | 3,025,000 | | | 3,020,755 |
5.44%, 03/20/09† | | | 1,800,000 | | | 1,800,365 |
Citigroup Mortgage Loan Trust, Inc. | | | | | | |
5.41%, 04/25/36 STEP | | | 1,347,915 | | | 1,348,165 |
CNH Equipment Trust | | | | | | |
3.48%, 09/15/11 | | | 1,350,000 | | | 1,321,253 |
Countrywide Asset-Backed Certificates | | | | | | |
5.50%, 03/25/25† | | | 1,085,322 | | | 1,085,496 |
5.44%, 02/01/27† | | | 1,515,538 | | | 1,515,788 |
5.44%, 11/25/28† | | | 782,376 | | | 782,502 |
DaimlerChrysler Auto Trust | | | | | | |
3.49%, 12/08/08 | | | 921,579 | | | 916,599 |
5.33%, 08/08/10 | | | 2,825,000 | | | 2,830,733 |
Discover Card Master Trust I | | | | | | |
5.36%, 09/16/10† | | | 2,425,000 | | | 2,426,375 |
Encore Credit Receivables Trust | | | | | | |
5.45%, 01/01/36† | | | 311,269 | | | 311,301 |
FHLMC Structured Pass-Through Securities | | | | | | |
5.61%, 08/25/31† | | | 1,907,352 | | | 1,915,835 |
Fieldstone Mortgage Investment Corporation | | | | | | |
5.47%, 02/25/36 STEP | | | 1,330,280 | | | 1,330,468 |
First Franklin Mortgage Loan Asset-Backed Certificates | | | | | | |
5.37%, 11/25/36† | | | 1,845,890 | | | 1,845,920 |
5.37%, 12/25/36† | | | 1,648,919 | | | 1,648,794 |
Ford Credit Auto Owner Trust | | | | | | |
4.24%, 03/15/08 | | | 447,780 | | | 447,353 |
5.26%, 10/15/10 | | | 3,825,000 | | | 3,827,630 |
5.25%, 09/15/11 | | | 2,900,000 | | | 2,905,559 |
Fremont Home Loan Trust | | | | | | |
5.37%, 10/25/36† | | | 436,198 | | | 436,205 |
GE Capital Credit Card Master Note Trust | | | | | | |
5.08%, 09/15/12 | | | 2,500,000 | | | 2,503,206 |
Green Tree Financial Corporation | | | | | | |
6.04%, 11/01/29 | | | 37,975 | | | 38,251 |
GSAA Trust | | | | | | |
5.67%, 12/25/34† | | | 1,116,617 | | | 1,118,219 |
GSAMP Trust | | | | | | |
5.46%, 09/25/35† | | | 63,346 | | | 63,341 |
5.42%, 01/25/36† | | | 460,455 | | | 460,462 |
Harley-Davidson Motorcycle Trust | | | | | | |
5.22%, 06/15/13 | | | 2,650,000 | | | 2,660,133 |
Home Equity Asset Trust | | | | | | |
5.47%, 01/25/36† | | | 1,101,742 | | | 1,101,944 |
5.46%, 02/25/36† | | | 603,260 | | | 603,398 |
Honda Auto Receivables Owner Trust | | | | | | |
2.40%, 02/21/08 | | | 571,775 | | | 570,085 |
3.30%, 06/15/08 | | | 1,126,035 | | | 1,120,006 |
5.10%, 09/18/08 | | | 3,270,466 | | | 3,267,401 |
2.91%, 10/20/08 | | | 1,444,767 | | | 1,430,584 |
3.53%, 10/21/08 | | | 1,631,920 | | | 1,620,704 |
3.87%, 04/20/09 | | | 2,850,374 | | | 2,825,479 |
4.46%, 05/20/09 | | | 2,425,000 | | | 2,409,476 |
Hyundai Auto Receivables Trust | | | | | | |
5.13%, 02/16/09 | | | 440,336 | | | 439,992 |
IFC SBA Loan-Backed Adjustable Rate Certificate | | | | | | |
6.25%, 01/15/24 144A† | | | 446,503 | | | 446,503 |
Indymac Residential Asset-Backed Trust | | | | | | |
5.41%, 06/25/36† | | | 1,133,112 | | | 1,133,324 |
JP Morgan Mortgage Acquisition Corporation | | | | | | |
5.43%, 05/25/25 STEP | | | 673,977 | | | 674,069 |
Long Beach Auto Receivables Trust | | | | | | |
5.17%, 08/15/11 | | | 4,100,000 | | | 4,099,845 |
Long Beach Mortgage Loan Trust | | | | | | |
5.42%, 03/25/36 STEP | �� | | 1,603,232 | | | 1,603,490 |
5.38%, 06/25/36† | | | 369,390 | | | 369,433 |
5.36%, 11/25/36† | | | 1,268,763 | | | 1,268,783 |
| | |
See Notes to Financial Statements. | | 51 |
| | |
| Low-Duration Bond Fund | | |
| SCHEDULE OF INVESTMENTS (Continued) | | |
| | | | | | |
| | | Par | | Value |
MASTR Asset-Backed Securities Trust | | | | | | |
5.42%, 12/25/35† | | $ | 1,416,045 | | $ | 1,416,302 |
MBNA Credit Card Master Note Trust | | | | | | |
5.85%, 03/15/10† | | | 1,800,000 | | | 1,806,013 |
Merrill Lynch Mortgage Investors, Inc. | | | | | | |
5.35%, 06/25/37† | | | 1,301,700 | | | 1,301,800 |
Morgan Stanley ABS Capital I | | | | | | |
5.45%, 05/25/32 STEP | | | 938,398 | | | 938,587 |
5.38%, 06/25/36† | | | 2,407,380 | | | 2,407,420 |
5.39%, 06/25/36† | | | 137,252 | | | 137,255 |
Nelnet Student Loan Trust | | | | | | |
5.35%, 10/27/14† | | | 6,034,902 | | | 6,034,902 |
5.39%, 01/26/15† | | | 4,430,507 | | | 4,432,096 |
5.47%, 07/25/16† | | | 900,000 | | | 901,979 |
5.47%, 10/25/16† | | | 1,808,825 | | | 1,808,775 |
New Century Home Equity Loan Trust | | | | | | |
5.43%, 01/25/36 STEP | | | 1,066,499 | | | 1,066,678 |
Nissan Auto Receivables Owner Trust | | | | | | |
2.70%, 12/17/07 | | | 109,975 | | | 109,862 |
5.18%, 08/15/08 | | | 3,700,000 | | | 3,697,110 |
Nomura Home Equity Loan, Inc. | | | | | | |
5.43%, 02/25/36† | | | 1,233,761 | | | 1,234,021 |
5.39%, 03/25/36† | | | 2,649,515 | | | 2,649,842 |
Novastar Home Equity Loan | | | | | | |
5.40%, 06/25/36† | | | 1,937,890 | | | 1,938,023 |
Option One Mortgage Loan Trust | | | | | | |
5.45%, 11/25/35 STEP | | | 933,080 | | | 933,197 |
5.40%, 07/25/36† | | | 991,213 | | | 991,289 |
5.36%, 02/25/37† | | | 1,601,912 | | | 1,601,812 |
Ownit Mortgage Loan Asset-Backed Certificates | | | | | | |
5.47%, 08/25/36† | | | 1,352,742 | | | 1,352,964 |
PBG Equipment Trust | | | | | | |
6.27%, 01/20/12 144A | | | 254,867 | | | 255,024 |
People’s Choice Home Loan Securities Trust | | | | | | |
5.47%, 08/25/35 STEP | | | 397,725 | | | 397,766 |
Popular ABS Mortgage Pass-Through Trust | | | | | | |
5.60%, 09/25/34† | | | 1,103,380 | | | 1,103,857 |
Quest Trust | | | | | | |
5.88%, 06/25/34 144A† | | | 135,486 | | | 135,892 |
Renaissance Home Equity Loan Trust | | | | | | |
5.43%, 05/25/36† | | | 1,496,498 | | | 1,496,920 |
Residential Asset Mortgage Products, Inc. | | | | | | |
5.46%, 05/25/25 STEP | | | 496,087 | | | 496,142 |
5.43%, 07/25/36† | | | 2,738,464 | | | 2,738,689 |
Residential Asset Securities Corporation | | | | | | |
5.42%, 04/25/36 STEP | | | 752,745 | | | 752,937 |
SACO I, Inc. | | | | | | |
5.46%, 11/25/35† | | | 340,007 | | | 340,017 |
Saxon Asset Securities Trust | | | | | | |
5.41%, 03/25/36 STEP | | | 1,758,063 | | | 1,758,183 |
Securitized Asset-Backed Receivables LLC Trust | | | | | | |
5.37%, 05/25/36† | | | 2,151,573 | | | 2,151,764 |
SG Mortgage Securities Trust | | | | | | |
5.42%, 09/25/35† | | | 249,184 | | | 249,205 |
SLC Student Loan Trust | | | | | | |
5.33%, 12/15/10† | | | 1,095,533 | | | 1,095,036 |
SLM Student Loan Trust | | | | | | |
5.56%, 01/25/13† | | | 2,495,569 | | | 2,499,682 |
5.35%, 07/25/13† | | | 7,878,636 | | | 7,877,968 |
5.37%, 10/25/18† | | | 2,536,443 | | | 2,535,650 |
Soundview Home Equity Loan Trust | | | | | | |
5.42%, 04/25/36† | | | 741,444 | | | 741,552 |
Specialty Underwriting & Residential Finance | | | | | | |
5.47%, 06/25/36† | | | 866,830 | | | 866,933 |
5.35%, 06/25/37† | | | 541,514 | | | 541,557 |
5.40%, 11/25/37† | | | 1,635,115 | | | 1,634,348 |
Structured Asset Investment Loan Trust | | | | | | |
5.42%, 03/25/36 STEP | | | 1,371,278 | | | 1,371,371 |
5.37%, 07/25/36† | | | 585,576 | | | 585,585 |
Structured Asset Receivables Trust | | | | | | |
5.11%, 04/21/11 144A† | | | 3,242,274 | | | 3,241,261 |
Structured Asset Securities Corporation | | | | | | |
4.90%, 04/25/35† | | | 1,928,078 | | | 1,863,203 |
5.37%, 10/25/36† | | | 1,762,790 | | | 1,762,949 |
USAA Auto Owner Trust | | | | | | |
2.06%, 04/15/08 | | | 27,774 | | | 27,736 |
3.03%, 06/16/08 | | | 486,322 | | | 485,097 |
3.16%, 02/17/09 | | | 1,388,651 | | | 1,378,857 |
5.31%, 03/16/09 | | | 3,700,000 | | | 3,700,055 |
3.90%, 07/15/09 | | | 2,177,636 | | | 2,161,201 |
4.89%, 08/15/12 | | | 2,500,000 | | | 2,488,340 |
Wachovia Auto Loan Owner Trust | | | | | | |
5.08%, 04/20/12 144A | | | 3,000,000 | | | 2,996,718 |
Wachovia Student Loan Trust | | | | | | |
5.36%, 10/25/13 144A† | | | 824,442 | | | 824,442 |
Whole Auto Loan Trust | | | | | | |
3.26%, 03/15/11 | | | 4,000,000 | | | 3,930,976 |
| | | | | | |
| | |
Total Asset-Backed Securities | | | | | | |
(Cost $189,575,715) | | | | | | 189,307,274 |
| | | | | | |
| | |
CORPORATE BONDS — 11.5% | | | | | | |
Abbott Laboratories | | | | | | |
5.38%, 05/15/09D | | | 690,000 | | | 694,475 |
American Express Centurion Bank | | | | | | |
5.35%, 05/07/08† | | | 1,900,000 | | | 1,900,868 |
American International Group, Inc. | | | | | | |
2.88%, 05/15/08 | | | 1,410,000 | | | 1,364,653 |
Anadarko Petroleum Corporation | | | | | | |
5.76%, 09/15/09† | | | 925,000 | | | 929,465 |
ASIF Global Financing XXIII | | | | | | |
3.90%, 10/22/08 144A | | | 420,000 | | | 409,903 |
Bank One Corporation | | | | | | |
2.63%, 06/30/08D | | | 360,000 | | | 346,312 |
6.00%, 08/01/08 | | | 550,000 | | | 557,009 |
| | |
| 52 | | See Notes to Financial Statements. |
| | | | | | |
| | | Par | | Value |
BellSouth Corporation | | | | | | |
4.20%, 09/15/09 | | $ | 2,217,000 | | $ | 2,156,580 |
Burlington Northern Santa Fe Corporation | | | | | | |
7.88%, 04/15/07 | | | 1,900,000 | | | 1,912,211 |
Caterpillar Financial Services Corporation | | | | | | |
5.45%, 10/28/08† | | | 5,500,000 | | | 5,511,511 |
Citigroup, Inc. | | | | | | |
3.50%, 02/01/08 | | | 1,600,000 | | | 1,571,618 |
3.63%, 02/09/09D | | | 2,750,000 | | | 2,670,005 |
Clorox Co. | | | | | | |
5.49%, 12/14/07† | | | 1,500,000 | | | 1,502,031 |
Comcast LCI Holdings | | | | | | |
7.63%, 02/15/08 | | | 725,000 | | | 742,117 |
ConocoPhillips Australia Funding Co. | | | | | | |
5.47%, 04/09/09† | | | 1,100,000 | | | 1,101,576 |
Countrywide Home Loans, Inc. | | | | | | |
3.25%, 05/21/08D | | | 2,094,000 | | | 2,036,377 |
CSX Corporation | | | | | | |
6.25%, 10/15/08 | | | 1,710,000 | | | 1,734,718 |
DaimlerChrysler NA Holding Corporation | | | | | | |
5.83%, 09/10/07† | | | 3,800,000 | | | 3,809,002 |
4.05%, 06/04/08 | | | 1,130,000 | | | 1,106,235 |
Dominion Resources, Inc. | | | | | | |
5.66%, 09/28/07† | | | 3,500,000 | | | 3,502,146 |
Federated Department Stores, Inc. | | | | | | |
6.63%, 09/01/08 | | | 150,000 | | | 152,499 |
FedEx Corporation | | | | | | |
5.46%, 08/08/07† | | | 1,800,000 | | | 1,802,542 |
Gannett Co., Inc. | | | | | | |
4.13%, 06/15/08D | | | 2,390,000 | | | 2,342,972 |
General Electric Capital Corporation | | | | | | |
8.75%, 05/21/07 | | | 610,000 | | | 617,767 |
3.45%, 07/16/07 | | | 1,300,000 | | | 1,287,667 |
5.42%, 01/15/08†D | | | 5,275,000 | | | 5,281,604 |
9.83%, 12/15/08 | | | 350,000 | | | 379,816 |
5.40%, 03/16/09† | | | 3,800,000 | | | 3,803,409 |
Golden West Financial Corporation | | | | | | |
4.13%, 08/15/07 | | | 310,000 | | | 307,574 |
HSBC Bank USA NA | | | | | | |
5.46%, 09/21/07† | | | 400,000 | | | 400,437 |
HSBC Finance Corporation | | | | | | |
6.40%, 06/17/08 | | | 2,390,000 | | | 2,427,456 |
4.13%, 12/15/08D | | | 700,000 | | | 686,416 |
4.13%, 11/16/09 | | | 700,000 | | | 681,003 |
Kellogg Co. | | | | | | |
2.88%, 06/01/08 | | | 1,950,000 | | | 1,882,774 |
May Department Stores Co. (The) | | | | | | |
3.95%, 07/15/07 | | | 1,370,000 | | | 1,356,852 |
Merrill Lynch & Co., Inc. | | | | | | |
4.83%, 10/27/08 | | | 1,720,000 | | | 1,709,740 |
5.46%, 08/14/09† | | | 3,700,000 | | | 3,704,111 |
MidAmerican Energy Holdings Co. | | | | | | |
3.50%, 05/15/08D | | | 1,236,000 | | | 1,205,534 |
Oracle Corporation and Ozark Holding, Inc. | | | | | | |
5.00%, 01/15/11 144AD | | | 450,000 | | | 445,872 |
PSEG Funding Trust I | | | | | | |
5.38%, 11/16/07 | | | 275,000 | | | 274,481 |
SLM Corporation | | | | | | |
4.00%, 01/15/09 | | | 2,151,000 | | | 2,104,246 |
Sprint Capital Corporation | | | | | | |
6.38%, 05/01/09D | | | 1,080,000 | | | 1,102,213 |
Time Warner, Inc. | | | | | | |
5.61%, 11/13/09† | | | 5,600,000 | | | 5,608,058 |
Transocean, Inc. | | | | | | |
5.57%, 09/05/08† | | | 1,900,000 | | | 1,902,052 |
U.S. Bancorp | | | | | | |
5.38%, 04/28/09† | | | 3,700,000 | | | 3,703,829 |
U.S. Bank NA | | | | | | |
6.50%, 02/01/08 | | | 580,000 | | | 585,295 |
U.S. Central Federal Credit Union | | | | | | |
2.75%, 05/30/08 | | | 610,000 | | | 586,709 |
Union Pacific Corporation | | | | | | |
5.75%, 10/15/07 | | | 375,000 | | | 375,274 |
6.79%, 11/09/07D | | | 650,000 | | | 656,391 |
Verizon Global Funding Corporation | | | | | | |
6.13%, 06/15/07D | | | 875,000 | | | 877,306 |
5.50%, 08/15/07† | | | 5,400,000 | | | 5,400,022 |
Wachovia Corporation | | | | | | |
3.50%, 08/15/08D | | | 540,000 | | | 525,216 |
Washington Mutual Bank | | | | | | |
5.42%, 11/16/07†D | | | 3,800,000 | | | 3,803,808 |
| | | | | | |
| | |
Total Corporate Bonds | | | | | | |
(Cost $93,794,160) | | | | | | 93,539,757 |
| | | | | | |
| | |
FOREIGN BONDS — 6.4% | | | | | | |
Cayman Islands — 0.3% | | | | | | |
Petroleum Export, Ltd. | | | | | | |
4.62%, 06/15/10 144A | | | 1,322,222 | | | 1,302,062 |
4.63%, 06/15/10 144A | | | 1,322,222 | | | 1,302,076 |
| | | | | | |
| | | | | | 2,604,138 |
| | | | | | |
| | |
France — 0.9% | | | | | | |
French Treasury Bill | | | | | | |
3.08%, 02/08/07(E) | | | 1,380,000 | | | 1,815,286 |
French Treasury Note | | | | | | |
2.25%, 03/12/07(E) | | | 3,940,000 | | | 5,186,674 |
| | | | | | |
| | | | | | 7,001,960 |
| | | | | | |
| | |
Germany — 3.6% | | | | | | |
Bundesobligation | | | | | | |
4.00%, 02/16/07(E) | | | 5,450,000 | | | 7,197,338 |
Bundesrepublik Deutschland | | | | | | |
6.00%, 01/04/07(E) | | | 13,960,000 | | | 18,435,198 |
German Treasury Bill | | | | | | |
2.47%, 01/17/07(E)W | | | 2,700,000 | | | 3,559,381 |
| | | | | | |
| | | | | | 29,191,917 |
| | | | | | |
| | |
Italy — 0.2% | | | | | | |
Telecom Italia Capital SA | | | | | | |
4.00%, 11/15/08D | | | 2,000,000 | | | 1,948,566 |
| | | | | | |
| | |
Luxembourg — 0.6% | | | | | | |
Unicredito Luxembourg Finance SA | | | | | | |
5.43%, 10/24/08 144A† | | | 3,800,000 | | | 3,801,854 |
| | | | |
| | See Notes to Financial Statements. | | 53 |
| | |
| Low-Duration Bond Fund | | |
| SCHEDULE OF INVESTMENTS (Continued) | | |
| | | | | | |
| | | Par | | Value |
VTB Capital SA for Vneshtorgbank | | | | | | |
5.97%, 08/01/08 144A† | | $ | 800,000 | | $ | 801,400 |
| | | | | | |
| | | | | | 4,603,254 |
| | | | | | |
| | |
Netherlands — 0.2% | | | | | | |
Deutsche Telekom International Finance BV | | | | | | |
3.88%, 07/22/08 | | | 1,770,000 | | | 1,732,988 |
| | | | | | |
| | |
New Zealand — 0.1% | | | | | | |
General Electric Capital Corporation | | | | | | |
6.50%, 09/28/15(Z)D | | | 1,185,000 | | | 807,879 |
| | | | | | |
| | |
Norway — 0.2% | | | | | | |
Eksportfinans | | | | | | |
3.38%, 01/15/08 | | | 1,630,000 | | | 1,598,976 |
| | | | | | |
| | |
South Korea — 0.2% | | | | | | |
Export-Import Bank of Korea | | | | | | |
5.59%, 10/04/11 144A† | | | 1,700,000 | | | 1,701,744 |
| | | | | | |
| | |
United Kingdom — 0.1% | | | | | | |
Nationwide Building Society | | | | | | |
3.50%, 07/31/07 144A | | | 325,000 | | | 321,541 |
Vodafone Group PLC | | | | | | |
3.95%, 01/30/08D | | | 230,000 | | | 226,621 |
| | | | | | |
| | | | | | 548,162 |
| | | | | | |
| | |
Total Foreign Bonds | | | | | | |
(Cost $51,066,010) | | | | | | 51,739,584 |
| | | | | | |
| | |
MORTGAGE-BACKED SECURITIES — 50.0% | | | | | | |
Adjustable Rate Mortgage Trust | | | | | | |
5.62%, 11/25/35 STEP | | | 1,654,863 | | | 1,657,486 |
American Home Mortgage Assets | | | | | | |
5.62%, 11/25/35† | | | 1,892,166 | | | 1,895,529 |
American Home Mortgage Investment Trust | | | | | | |
4.29%, 10/25/34† | | | 1,990,204 | | | 1,954,256 |
Arkle Master Issuer PLC | | | | | | |
5.33%, 11/19/07 144A† | | | 1,800,000 | | | 1,803,103 |
Banc of America Commercial Mortgage, Inc. | | | | | | |
3.88%, 09/11/36 | | | 2,324,349 | | | 2,243,503 |
Banc of America Funding Corporation | | | | | | |
4.58%, 12/20/36† | | | 2,993,410 | | | 2,948,977 |
Bank of America Mortgage Securities | | | | | | |
6.50%, 10/01/19 | | | 697,668 | | | 707,040 |
Bear Stearns Adjustable Rate Mortgage Trust | | | | | | |
3.61%, 12/01/33† | | | 1,700,072 | | | 1,696,121 |
4.64%, 01/25/34† | | | 880,478 | | | 877,879 |
4.01%, 07/25/34† | | | 2,254,974 | | | 2,203,024 |
Bear Stearns Alt-A Trust | | | | | | |
5.72%, 06/25/34† | | | 1,556,023 | | | 1,560,127 |
6.20%, 05/25/36† | | | 2,530,859 | | | 2,548,652 |
Bear Stearns Commercial Mortgage Securities | | | | | | |
5.46%, 03/15/19 144A† | | | 1,900,000 | | | 1,900,055 |
3.87%, 02/11/41 | | | 3,650,000 | | | 3,551,413 |
Chase Commercial Mortgage Securities Corporation | | | | | | |
7.76%, 04/15/32 | | | 1,778,017 | | | 1,878,547 |
Citigroup Commercial Mortgage Trust | | | | | | |
4.15%, 09/20/49 144A | | | 1,044,040 | | | 1,025,141 |
Commercial Mortgage Acceptance Corporation | | | | | | |
6.03%, 09/15/30 | | | 1,041,889 | | | 1,045,860 |
Commercial Mortgage Pass-Through Certificates | | | | | | |
7.42%, 08/15/33 | | | 2,176,164 | | | 2,277,856 |
Countrywide Alternative Loan Trust | | | | | | |
6.00%, 10/25/32 | | | 379,998 | | | 380,400 |
5.50%, 05/31/35 | | | 1,584,371 | | | 1,579,352 |
Countrywide Home Loan Mortgage Pass-Through Trust | | | | | | |
4.25%, 09/25/33† | | | 2,947,411 | | | 2,929,721 |
5.62%, 01/25/35 STEP | | | 531,214 | | | 531,997 |
CS First Boston Mortgage Securities Corporation | | | | | | |
4.30%, 07/15/36 | | | 1,000,000 | | | 976,640 |
Deutsche ALT-A Securities, Inc. | | | | | | |
5.43%, 03/30/36† | | | 1,622,991 | | | 1,623,464 |
DLJ Commercial Mortgage Corporation | | | | | | |
7.18%, 11/10/33 | | | 2,144,241 | | | 2,261,442 |
Federal Home Loan Mortgage Corporation | | | | | | |
8.50%, 12/01/07 | | | 1,361 | | | 1,368 |
8.50%, 01/01/08 | | | 1,465 | | | 1,473 |
8.00%, 05/01/08 | | | 4,807 | | | 4,843 |
8.75%, 07/01/08 | | | 1,856 | | | 1,890 |
8.00%, 01/01/09 | | | 1,030 | | | 1,037 |
7.50%, 03/01/09 | | | 10,030 | | | 10,089 |
3.50%, 10/15/10 | | | 2,133,003 | | | 2,124,634 |
16.25%, 07/01/11 | | | 211 | | | 229 |
15.25%, 08/01/11 | | | 1,490 | | | 1,695 |
5.38%, 09/15/11 | | | 5,955,876 | | | 5,954,414 |
4.00%, 08/01/15 | | | 2,291,701 | | | 2,194,771 |
5.00%, 11/15/16 | | | 2,211,589 | | | 2,194,117 |
3.50%, 12/01/18 | | | 3,462,689 | | | 3,193,108 |
10.75%, 02/01/19 | | | 85,060 | | | 91,005 |
4.25%, 06/15/24 | | | 2,162,487 | | | 2,131,648 |
7.10%, 07/01/27† | | | 47,723 | | | 48,776 |
5.50%, 10/15/27 | | | 2,669,580 | | | 2,675,926 |
5.61%, 06/01/28† | | | 347,724 | | | 346,272 |
5.70%, 12/15/30† | | | 1,345,748 | | | 1,347,877 |
6.00%, 04/01/33 | | | 1,671,635 | | | 1,689,080 |
4.57%, 06/01/33† | | | 4,336,315 | | | 4,312,652 |
3.98%, 04/01/34† | | | 3,445,269 | | | 3,388,449 |
4.39%, 10/01/34† | | | 1,115,618 | | | 1,100,027 |
5.50%, 05/15/35 | | | 2,244,829 | | | 2,251,193 |
4.72%, 08/01/35† | | | 3,025,251 | | | 3,003,855 |
4.78%, 08/01/35† | | | 2,618,538 | | | 2,602,621 |
9.45%, 08/01/35 IOW | | | 2,564,041 | | | 596,873 |
4.82%, 10/01/35† | | | 1,475,571 | | | 1,472,517 |
5.04%, 12/01/35† | | | 7,381,409 | | | 7,298,549 |
5.22%, 02/01/36† | | | 4,574,021 | | | 4,555,352 |
5.88%, 04/01/36† | | | 4,614,093 | | | 4,679,868 |
6.09%, 10/01/36† | | | 3,797,760 | | | 3,830,305 |
6.04%, 11/01/36† | | | 6,750,000 | | | 6,818,030 |
Federal Housing Authority | | | | | | |
7.43%, 09/01/22 | | | 1,707 | | | 1,722 |
Federal National Mortgage Association | | | | | | |
6.00%, 08/01/08 | | | 93,429 | | | 93,411 |
| | |
| 54 | | See Notes to Financial Statements. |
| | | | | | |
| | | Par | | Value |
6.50%, 11/01/08 | | $ | 122,165 | | $ | 122,529 |
5.50%, 12/01/17 | | | 8,227,388 | | | 8,247,022 |
4.00%, 07/01/18 | | | 213,372 | | | 201,488 |
4.00%, 08/01/18 | | | 856,617 | | | 808,904 |
4.00%, 05/01/19 | | | 4,686,194 | | | 4,416,468 |
4.00%, 06/01/19 | | | 7,772,595 | | | 7,325,223 |
4.00%, 08/01/19 | | | 424,272 | | | 399,852 |
4.00%, 10/01/19 | | | 1,480,292 | | | 1,395,090 |
4.00%, 11/25/19 | | | 739,037 | | | 675,721 |
4.00%, 12/01/19 | | | 1,018,304 | | | 959,693 |
4.00%, 01/01/20 | | | 225,390 | | | 212,212 |
4.00%, 07/01/20 | | | 55,610 | | | 52,359 |
6.00%, 01/01/22 TBA | | | 9,100,000 | | | 9,225,125 |
5.75%, 08/25/23 | | | 1,327,036 | | | 1,324,560 |
6.57%, 12/01/24† | | | 191,915 | | | 191,249 |
9.00%, 05/01/25 | | | 91,793 | | | 99,202 |
9.00%, 07/01/25 | | | 110,622 | | | 119,357 |
5.92%, 05/25/30† | | | 2,613,903 | | | 2,628,919 |
6.00%, 05/25/30† | | | 2,652,917 | | | 2,657,144 |
5.60%, 09/25/30† | | | 150,763 | | | 150,833 |
5.50%, 01/01/31 TBA | | | 15,600,000 | | | 15,414,750 |
7.10%, 09/01/31† | | | 123,328 | | | 124,729 |
3.31%, 03/25/32 | | | 486,908 | | | 448,671 |
4.25%, 04/01/33† | | | 847,984 | | | 847,197 |
4.15%, 06/01/33† | | | 283,578 | | | 279,963 |
5.50%, 06/01/33 | | | 27,020 | | | 26,744 |
5.50%, 07/01/33 | | | 26,086 | | | 25,820 |
4.24%, 10/01/33† | | | 1,752,747 | | | 1,734,403 |
5.50%, 10/01/33 | | | 137,362 | | | 135,962 |
4.28%, 12/01/33† | | | 576,372 | | | 571,908 |
4.50%, 06/01/34 | | | 73,420 | | | 68,979 |
5.75%, 08/25/34 | | | 1,066,668 | | | 1,063,743 |
4.50%, 09/01/34 | | | 278,702 | | | 261,546 |
4.94%, 09/01/34† | | | 1,403,938 | | | 1,395,745 |
5.09%, 09/01/34† | | | 935,177 | | | 932,543 |
4.76%, 10/01/34† | | | 1,482,855 | | | 1,467,977 |
5.11%, 10/01/34† | | | 1,691,260 | | | 1,685,797 |
9.88%, 11/01/34 IOW | | | 2,184,607 | | | 504,119 |
4.50%, 12/01/34 | | | 92,222 | | | 86,545 |
4.50%, 02/01/35 | | | 3,277,927 | | | 3,072,650 |
4.50%, 03/01/35 | | | 1,921,546 | | | 1,801,210 |
4.50%, 04/01/35 | | | 3,120,184 | | | 2,924,786 |
4.50%, 05/01/35 | | | 1,140,654 | | | 1,069,223 |
4.50%, 06/01/35 | | | 66,691 | | | 62,514 |
4.86%, 06/01/35† | | | 2,316,018 | | | 2,294,652 |
4.50%, 08/01/35 | | | 1,901,330 | | | 1,782,259 |
4.69%, 08/01/35† | | | 6,262,702 | | | 6,186,735 |
4.40%, 09/01/35† | | | 3,001,928 | | | 2,945,866 |
4.50%, 09/01/35 | | | 1,168,442 | | | 1,095,270 |
4.64%, 09/01/35† | | | 3,913,049 | | | 3,863,012 |
7.50%, 09/01/35 | | | 2,295,693 | | | 2,386,134 |
4.50%, 10/01/35 | | | 838,417 | | | 785,912 |
5.33%, 10/01/35† | | | 2,398,296 | | | 2,377,667 |
4.50%, 11/01/35 | | | 717,416 | | | 672,488 |
4.88%, 12/01/35† | | | 324,778 | | | 323,839 |
5.50%, 01/12/36 TBA | | | 200,000 | | | 197,625 |
6.50%, 01/12/36 TBA | | | 6,000,000 | | | 6,112,500 |
6.00%, 02/01/36 | | | 973,919 | | | 980,727 |
4.50%, 06/01/36 | | | 58,208 | | | 54,540 |
4.50%, 07/01/36 | | | 905,775 | | | 848,692 |
6.00%, 07/01/36 | | | 2,948,756 | | | 2,968,722 |
6.00%, 08/01/36 | | | 1,962,298 | | | 1,975,584 |
5.93%, 09/01/36† | | | 4,280,914 | | | 4,317,209 |
6.00%, 10/01/36 | | | 10,866,863 | | | 10,940,439 |
8.84%, 10/01/36 IOW | | | 2,469,574 | | | 603,116 |
5.00%, 01/01/37 TBA | | | 6,000,000 | | | 5,791,872 |
6.00%, 01/11/37 TBA | | | 1,000,000 | | | 1,006,562 |
6.14%, 04/01/40† | | | 444,555 | | | 453,016 |
6.03%, 07/01/44† | | | 742,100 | | | 747,431 |
6.50%, 12/31/49 | | | 3,748,000 | | | 3,789,195 |
FHLMC Structured Pass-Through Securities | | | | | | |
6.35%, 05/25/43† | | | 2,192,669 | | | 2,235,326 |
6.16%, 07/25/44† | | | 4,615,076 | | | 4,637,040 |
First Horizon Alternative Mortgage Securities | | | | | | |
4.75%, 06/25/34† | | | 1,117,891 | | | 1,110,069 |
First Horizon Asset Securities, Inc. | | | | | | |
5.34%, 10/25/35† | | | 3,507,263 | | | 3,494,756 |
General Electric Capital Commercial Mortgage Corporation | | | | | | |
5.56%, 06/10/38 | | | 773,774 | | | 778,503 |
4.35%, 06/10/48 | | | 2,870,000 | | | 2,799,762 |
GMAC Commercial Mortgage Securities, Inc. | | | | | | |
7.72%, 03/15/33 | | | 2,120,000 | | | 2,244,122 |
7.18%, 08/15/36 | | | 1,267,314 | | | 1,312,582 |
Government National Mortgage Association | | | | | | |
6.00%, 12/15/08 | | | 124,368 | | | 124,786 |
6.00%, 02/15/11 | | | 215,396 | | | 216,464 |
5.38%, 06/20/17† | | | 26,582 | | | 26,707 |
5.38%, 06/20/21† | | | 13,050 | | | 13,162 |
5.13%, 10/20/27† | | | 94,520 | | | 95,744 |
8.50%, 10/15/29 | | | 88,481 | | | 94,925 |
8.50%, 01/15/30 | | | 42,343 | | | 45,436 |
5.95%, 02/16/30† | | | 357,647 | | | 361,843 |
8.50%, 03/15/30 | | | 5,327 | | | 5,717 |
8.50%, 04/15/30 | | | 14,998 | | | 16,093 |
8.50%, 05/15/30 | | | 161,642 | | | 173,449 |
8.50%, 06/15/30 | | | 45,408 | | | 48,724 |
8.50%, 07/15/30 | | | 168,172 | | | 180,452 |
8.50%, 08/15/30 | | | 30,357 | | | 32,574 |
8.50%, 09/15/30 | | | 5,088 | | | 5,460 |
8.50%, 10/15/30 | | | 46,390 | | | 49,779 |
8.50%, 11/15/30 | | | 80,645 | | | 86,535 |
8.50%, 12/15/30 | | | 79,903 | | | 85,738 |
8.50%, 02/15/31 | | | 68,913 | | | 73,823 |
3.75%, 05/20/34† | | | 1,831,485 | | | 1,799,833 |
3.75%, 06/20/34† | | | 2,473,698 | | | 2,430,954 |
6.00%, 06/15/36 | | | 954,783 | | | 968,096 |
Greenpoint Mortgage Funding Trust | | | | | | |
5.62%, 11/25/45 STEP | | | 824,144 | | | 825,400 |
GS Mortgage Securities Corporation II | | | | | | |
6.04%, 08/15/18 144A | | | 393,028 | | | 400,354 |
6.14%, 10/18/30 | | | 2,235,298 | | | 2,252,064 |
5.90%, 01/10/40 IO 144AW† | | | 37,862,776 | | | 654,818 |
GSR Mortgage Loan Trust | | | | | | |
3.68%, 06/01/34† | | | 2,143,586 | | | 2,142,550 |
4.21%, 09/25/34† | | | 2,988,562 | | | 2,983,776 |
4.78%, 09/25/34† | | | 2,336,569 | | | 2,321,027 |
4.55%, 09/25/35† | | | 5,900,310 | | | 5,834,090 |
4.54%, 10/25/35† | | | 4,960,588 | | | 4,872,754 |
4.58%, 10/25/35† | | | 2,487,162 | | | 2,461,651 |
| | | | |
| | See Notes to Financial Statements. | | 55 |
| | |
| Low-Duration Bond Fund | | |
| SCHEDULE OF INVESTMENTS (Continued) | | |
| | | | | | |
| | | Par | | Value |
HarborView Mortgage Loan Trust | | | | | | |
5.63%, 11/19/35 STEP | | $ | 2,479,352 | | $ | 2,486,121 |
5.32%, 12/19/35† | | | 4,345,284 | | | 4,336,210 |
Impac Secured Assets CMN Owner Trust | | | | | | |
5.47%, 05/25/36† | | | 1,709,480 | | | 1,709,267 |
5.40%, 01/25/37† | | | 1,857,168 | | | 1,857,160 |
JP Morgan Mortgage Trust | | | | | | |
3.89%, 08/25/34† | | | 3,438,131 | | | 3,367,402 |
LB-UBS Commercial Mortgage Trust | | | | | | |
3.33%, 09/15/27 | | | 2,472,000 | | | 2,412,386 |
4.21%, 11/15/27 | | | 3,100,000 | | | 3,032,516 |
6.13%, 08/15/33 IO 144AW† | | | 32,786,922 | | | 500,135 |
Luminent Mortgage Trust | | | | | | |
5.61%, 11/26/35 STEP | | | 2,959,193 | | | 2,963,311 |
Merrill Lynch Mortgage Investors, Inc. | | | | | | |
4.24%, 08/25/34† | | | 3,008,993 | | | 2,975,793 |
MLCC Mortgage Investors, Inc. | | | | | | |
5.73%, 03/15/25 STEP | | | 739,101 | | | 741,901 |
4.73%, 12/25/34† | | | 2,387,519 | | | 2,357,016 |
5.40%, 02/25/36† | | | 2,507,626 | | | 2,497,355 |
Morgan Stanley Capital I | | | | | | |
6.53%, 03/15/31 | | | 2,894,545 | | | 2,942,243 |
NationsLink Funding Corporation | | | | | | |
6.32%, 01/20/31 | | | 1,924,459 | | | 1,947,898 |
Nomura Asset Acceptance Corporation | | | | | | |
5.05%, 06/25/10† | | | 2,666,592 | | | 2,645,862 |
Opteum Mortgage Acceptance Corporation | | | | | | |
5.44%, 12/25/35 STEP | | | 1,987,013 | | | 1,984,986 |
5.41%, 12/31/49 STEP | | | 2,204,005 | | | 2,202,874 |
PNC Mortgage Acceptance Corporation | | | | | | |
5.91%, 03/12/34 | | | 1,783,855 | | | 1,796,012 |
Provident Funding Mortgage Loan Trust | | | | | | |
4.05%, 04/25/34† | | | 3,687,847 | | | 3,622,677 |
Residential Accredit Loans, Inc. | | | | | | |
6.00%, 12/25/16 | | | 57,786 | | | 57,571 |
5.75%, 01/25/33† | | | 807,870 | | | 810,725 |
Residential Funding Mortgage Securities I | | | | | | |
6.50%, 03/25/32 | | | 167,584 | | | 168,531 |
Structured Adjustable Rate Mortgage Loan Trust | | | | | | |
4.92%, 03/25/34† | | | 1,449,028 | | | 1,444,765 |
5.34%, 08/25/34† | | | 1,799,006 | | | 1,795,429 |
5.65%, 09/25/34† | | | 467,772 | | | 468,414 |
5.41%, 05/25/35† | | | 3,148,511 | | | 3,155,706 |
Structured Asset Mortgage Investments, Inc. | | | | | | |
7.28%, 10/19/34† | | | 785,540 | | | 792,849 |
5.63%, 05/25/35 STEP | | | 1,494,489 | | | 1,492,610 |
5.42%, 08/25/36† | | | 1,622,571 | | | 1,621,985 |
Structured Asset Securities Corporation | | | | | | |
5.40%, 05/25/36† | | | 1,240,287 | | | 1,240,306 |
Thornburg Mortgage Securities Trust | | | | | | |
5.47%, 04/25/36† | | | 1,900,000 | | | 1,895,269 |
TIAA Retail Commercial Trust | | | | | | |
6.68%, 06/19/31 144A | | | 2,790,000 | | | 2,873,227 |
Wachovia Bank Commercial Mortgage Trust | | | | | | |
4.04%, 02/15/34 | | | 2,334,002 | | | 2,269,686 |
4.38%, 10/15/41 | | | 3,600,000 | | | 3,514,600 |
Washington Mutual Asset Securities Corporation | | | | | | |
4.24%, 05/25/36 144A | | | 1,438,175 | | | 1,416,344 |
Washington Mutual Mortgage Securities Corporation | | | | | | |
7.22%, 03/25/32† | | | 254,716 | | | 253,755 |
Washington Mutual, Inc. | | | | | | |
5.59%, 12/25/27 STEP | | | 3,923,138 | | | 3,922,430 |
4.67%, 05/25/35† | | | 3,550,000 | | | 3,537,995 |
6.16%, 06/25/42† | | | 176,804 | | | 176,880 |
5.63%, 01/25/45 STEP | | | 2,300,186 | | | 2,304,308 |
5.51%, 04/25/45† | | | 435,434 | | | 435,817 |
5.64%, 08/25/45† | | | 1,061,599 | | | 1,064,490 |
5.61%, 10/25/45 STEP | | | 1,088,901 | | | 1,090,365 |
5.74%, 06/25/46† | | | 3,408,917 | | | 3,425,923 |
Wells Fargo Mortgage-Backed Securities Trust | | | | | | |
4.75%, 04/25/19 | | | 3,414,074 | | | 3,297,781 |
3.99%, 01/25/35† | | | 2,703,694 | | | 2,648,236 |
4.54%, 02/25/35† | | | 4,388,334 | | | 4,303,552 |
| | | | | | |
| | |
Total Mortgage-Backed Securities | | | | | | |
(Cost $409,007,777) | | | | | | 406,954,411 |
| | | | | | |
| | |
MUNICIPAL BOND — 0.0% | | | | | | |
Sales Tax Asset Receivable Corporation, New York, Series B Revenue Bond (FSA Insured) | | | | | | |
3.60%, 10/15/08 | | | | | | |
(Cost $425,000) | | | 425,000 | | | 413,904 |
| | | | | | |
| | |
| | | Number of
Contracts | | |
PURCHASED OPTIONS — 0.3% | | | | | | |
Call Options — 0.2% | | | | | | |
1-Year Eurodollar Mid-CRV Futures, Strike Price $95.00, Expires 09/14/07 | | | 234 | | | 219,375 |
1-Year Eurodollar Mid-CRV Futures, Strike Price $95.25, Expires 09/14/07 | | | 1,765 | | | 1,103,125 |
90-Day Eurodollar Futures, Strike Price $95.00, Expires 09/17/07 | | | 29 | | | 13,412 |
| | | | | | |
| | | | | | 1,335,912 |
| | | | | | |
| | |
Call Swaptions — 0.1% | | | | | | |
3-Month LIBOR, Strike Price $4.50, Expires 01/22/07 | | | 440 | | | 1 |
3-Month LIBOR, Strike Price $4.75, Expires 07/02/07 | | | 2,290 | | | 16,971 |
3-Month LIBOR, Strike Price $5.00, Expires 03/08/07 | | | 2,640 | | | 37,250 |
3-Month LIBOR, Strike Price $5.00, Expires 12/20/07 | | | 2,130 | | | 129,941 |
3-Month LIBOR, Strike Price $5.04, Expires 09/17/07 | | | 710 | | | 37,784 |
3-Month LIBOR, Strike Price $5.21, Expires 12/12/11 | | | 740 | | | 274,451 |
3-Month LIBOR, Strike Price $5.25, Expires 06/07/07 | | | 1,600 | | | 93,872 |
| | |
| 56 | | See Notes to Financial Statements. |
| | | | | | | | |
| | | Number of Contracts | | | Value | |
3-Month LIBOR, Strike Price $5.25, Expires 07/02/07 | | | 3,350 | | | $ | 212,658 | |
3-Month LIBOR, Strike Price $5.50, Expires 06/29/07 | | | 1,750 | | | | 168,753 | |
| | | | | | | | |
| | | | | | | 971,681 | |
| | | | | | | | |
| | |
Put Options — 0.0% | | | | | | | | |
90-Day Eurodollar Futures, Strike Price $90.50, Expires 09/17/07 | | | 618 | | | | 3,862 | |
90-Day Eurodollar Futures, Strike Price $91.25, Expires 06/18/07 | | | 702 | | | | 4,388 | |
90-Day Eurodollar Futures, Strike Price $91.75, Expires 12/17/07 | | | 5 | | | | 31 | |
90-Day Eurodollar Futures, Strike Price $92.00, Expires 03/19/07 | | | 87 | | | | 544 | |
| | | | | | | | |
| | | | | | | 8,825 | |
| | | | | | | | |
| | |
Put Swaption — 0.0% | | | | | | | | |
3-Month LIBOR, Strike Price $5.21, Expires 12/12/11 | | | 740 | | | | 351,879 | |
| | | | | | | | |
| | |
Total Purchased Options | | | | | | | | |
(Cost $3,325,954) | | | | | | | 2,668,297 | |
| | | | | | | | |
| | |
| | | Shares | | | | |
MONEY MARKET FUNDS — 10.0% | | | | | | | | |
GuideStone Funds Money Market Fund (GS4 Class)¥ | | | 34,658,661 | | | | 34,658,661 | |
Northern Institutional Liquid Assets Portfolio§ | | | 46,899,932 | | | | 46,899,932 | |
| | | | | | | | |
| | |
Total Money Market Funds | | | | | | | | |
(Cost $81,558,593) | | | | | | | 81,558,593 | |
| | | | | | | | |
| | |
| | | Par | | | | |
U.S. TREASURY OBLIGATIONS — 12.7% | | | | | | | | |
U.S. Treasury Bills | | | | | | | | |
4.80%, 03/15/07‡‡ | | $ | 1,350,000 | | | | 1,337,154 | |
4.81%, 03/15/07‡‡ | | | 455,000 | | | | 450,670 | |
| | | | | | | | |
| | | | | | | 1,787,824 | |
| | | | | | | | |
U.S. Treasury Inflationary Index Bonds | | | | | | | | |
3.38%, 01/15/07 | | | 41,300,000 | | | | 52,557,894 | |
3.63%, 01/15/08 | | | 5,900,000 | | | | 7,454,583 | |
0.88%, 04/15/10D | | | 4,800,000 | | | | 4,851,567 | |
2.50%, 07/15/16D | | | 5,320,000 | | | | 5,360,801 | |
| | | | | | | | |
| | | | | | | 70,224,845 | |
| | | | | | | | |
U.S. Treasury Notes | | | | | | | | |
4.88%, 08/15/09D | | | 21,453,000 | | | | 21,524,245 | |
4.63%, 11/15/09D | | | 9,434,000 | | | | 9,407,472 | |
5.13%, 06/30/11 | | | 400,000 | | | | 406,875 | |
| | | | | | | | |
| | | | | | | 31,338,592 | |
| | | | | | | | |
| | |
Total U.S. Treasury Obligations | | | | | | | | |
(Cost $103,573,771) | | | | | | | 103,351,261 | |
| | | | | | | | |
| | |
TOTAL INVESTMENTS — 114.3% | | | | | | | | |
(Cost $933,394,285) | | | | | | | 930,621,663 | |
| | | | | | | | |
| | |
| | | Number of
Contracts | | | | |
WRITTEN OPTIONS — (0.1)% | | | | | | | | |
Call Swaptions — (0.1)% | | | | | | | | |
3-Month LIBOR, Strike Price $4.56, Expires 01/22/07 | | | (189 | ) | | | (19 | ) |
3-Month LIBOR, Strike Price $4.75, Expires 07/02/07 | | | (500 | ) | | | (20,878 | ) |
3-Month LIBOR, Strike Price $5.04, Expires 03/08/07 | | | (113 | ) | | | (52,014 | ) |
3-Month LIBOR, Strike Price $5.15, Expires 12/20/07 | | | (930 | ) | | | (141,328 | ) |
3-Month LIBOR, Strike Price $5.34, Expires 06/07/07 | | | (700 | ) | | | (111,860 | ) |
3-Month LIBOR, Strike Price $5.37, Expires 07/02/07 | | | (1,460 | ) | | | (256,843 | ) |
3-Month LIBOR, Strike Price $5.60, Expires 06/29/07 | | | (760 | ) | | | (192,257 | ) |
| | | | | | | | |
| | |
Total Written Options | | | | | | | | |
(Premiums received $(817,243)) | | | | | | | (775,199 | ) |
| | | | | | | | |
| | |
Liabilities in Excess of Other Assets — (14.2)% | | | | | | | (115,996,344 | ) |
| | | | | | | | |
| | |
NET ASSETS — 100.0% | | | | | | $ | 813,850,120 | |
| | | | | | | | |
| | | | |
| | See Notes to Financial Statements. | | 57 |
| | |
| Low-Duration Bond Fund | | |
| SCHEDULE OF INVESTMENTS (Continued) | | |
Swap agreements outstanding at December 31, 2006:
| | | | | | | | | | |
Description | | Expiration Date | | Notional Value | | | Unrealized Appreciation (Depreciation) | |
British Pounds | | | | | | | | | | |
| Receive fixed rate payments of 5.00% and pay variable rate payments on the six month LIBOR floating rate(d) | | 09/15/10 | | | 20,600,000 | | | $ | (589,320 | ) |
| Receive variable rate payments on the six month LIBOR floating rate and pay fixed rate payments of 4.00%(i) | | 12/15/35 | | | (100,000 | ) | | | 150 | |
| Receive variable rate payments on the six month LIBOR floating rate and pay fixed rate payments of 4.00%(d) | | 12/15/35 | | | (5,000,000 | ) | | | 7,520 | |
| | | | | | | | | | |
| | | | | | | | | (581,650 | ) |
| | | | | | | | | | |
| | | |
Euros | | | | | | | | | | |
| Receive fixed rate payments of 2.09% and pay variable rate payments on the France CPI Ex Tobacco(j) | | 10/15/10 | | | 1,500,000 | | | | 24,061 | |
| Receive floating par in the event of default on the DJ ITRAXX6HIVOL Index and pay fixed rate payments of 0.85%(g) | | 12/20/16 | | | (900,000 | ) | | | (5,393 | ) |
| Receive floating par in the event of default on the DJ ITRAXX6HI4 Index and pay fixed rate payments of 0.85%(i) | | 12/20/16 | | | (2,600,000 | ) | | | (15,582 | ) |
| Receive floating par in the event of default on the DJ ITRAXX6HI4 Index and pay fixed rate payments of 0.85%(d) | | 12/20/16 | | | (3,100,000 | ) | | | (18,579 | ) |
| Receive floating par in the event of default on the DJ ITRAXX6HI4 Index and pay fixed rate payments of 0.85%(j) | | 12/20/16 | | | (2,100,000 | ) | | | (12,585 | ) |
| | | | | | | | | | |
| | | | | | | | | (28,078 | ) |
| | | | | | | | | | |
| | | |
Japanese Yen | | | | | | | | | | |
| Receive variable rate payments on the six month LIBOR floating rate and pay fixed rate payments of 2.00%(h) | | 06/20/16 | | | (200,000,000 | ) | | | (22,770 | ) |
| Receive variable rate payments on the six month LIBOR floating rate and pay fixed rate payments of 2.00%(d) | | 06/20/16 | | | (80,000,000 | ) | | | (9,108 | ) |
| | | | | | | | | | |
| | | | | | | | | (31,878 | ) |
| | | | | | | | | | |
| | | |
U.S. Dollars | | | | | | | | | | |
| Receive fixed rate payments of 0.32% and pay floating par in the event of default on Morgan Stanley (Gazprom), 9.625% due 03/01/13(l) | | 02/20/07 | | $ | 900,000 | | | | 175 | |
| Receive fixed rate payments of 0.61% and pay floating par in the event of default on Russian Federation, 5.00% due 03/31/30(h) | | 03/20/07 | | | 1,300,000 | | | | 1,365 | |
| Receive fixed rate payments of 0.70% and pay floating par in the event of default on Russian Federation, 5.00% due 03/31/30(a) | | 03/20/07 | | | 3,700,000 | | | | 4,643 | |
| Receive fixed rate payments of 0.77% and pay floating par in the event of default on Russian Federation, 5.00% due 03/31/30(g) | | 05/20/07 | | | 200,000 | | | | 445 | |
| Receive fixed rate payments of 0.055% and pay floating par in the event of default on American International Group, 5.60% due 10/18/16(e) | | 03/20/08 | | | 3,000,000 | | | | 1,260 | |
| Receive fixed rate payments of 5.00% and pay variable rate payments on the three month LIBOR floating rate(d) | | 06/20/09 | | | 14,300,000 | | | | (14,714 | ) |
| Receive floating par in the event of default on the DJ CDX HVOL7 Index and pay fixed rate payments of 0.75%(d) | | 12/20/11 | | | (9,000,000 | ) | | | 15,466 | |
| Receive variable rate payments on the three month LIBOR floating rate and pay fixed rate payments of 5.00%(a) | | 06/20/14 | | | (100,000 | ) | | | 580 | |
| Receive floating par in the event of default on the DJ CDX IG7 Index and pay fixed rate payments of 0.65%(c) | | 12/20/16 | | | (7,300,000 | ) | | | (47,054 | ) |
| Receive variable rate payments on the three month LIBOR floating rate and pay fixed rate payments of 5.00%(f) | | 06/20/17 | | | (9,000,000 | ) | | | 122,558 | |
| Receive floating par in the event of default on Asset Backed Funding Certificates, 8.8225% due 11/25/32 and pay fixed rate payments of 2.35%(b) | | 11/25/32 | | | (1,000,000 | ) | | | 10,575 | |
| | |
| 58 | | See Notes to Financial Statements. |
| | | | | | | | | | |
Description | | Expiration
Date | | Notional
Value | | | Unrealized
Appreciation
(Depreciation) | |
| Receive floating par in the event of default on Morgan Stanley ABS Capital I, 7.0225% due 12/27/33 and pay fixed rate payments of 0.54%(c) | | 12/27/33 | | $ | (2,400,000 | ) | | $ | 3,225 | |
| Receive floating par in the event of default on Long Beach Mortgage Trust, 6.7225% due 02/25/34 and pay fixed rate payments of 0.49%(d) | | 02/25/34 | | | (2,400,000 | ) | | | (763 | ) |
| Receive floating par in the event of default on Specialty Underwriting & Residential Finance, 6.6225% due 02/25/35 and pay fixed rate payments of 0.59%(d) | | 02/25/35 | | | (2,400,000 | ) | | | (3,910 | ) |
| Receive floating par in the event of default on Structured Asset Investment Loan Trust, 6.1425% due 02/25/35 and pay fixed rate payments of 0.61%(d) | | 02/25/35 | | | (2,400,000 | ) | | | (6,386 | ) |
| Receive floating par in the event of default on the ABX.HE.A.06-1 Index and pay fixed rate payments of 0.54%(a) | | 07/25/45 | | | (1,000,000 | ) | | | (3,679 | ) |
| Receive floating par in the event of default on the ABX.HE.A.06-1 Index and pay fixed rate payments of 0.54%(h) | | 07/25/45 | | | (8,000,000 | ) | | | (29,431 | ) |
| Receive floating par in the event of default on the ABX.HE.A.06-1 Index and pay fixed rate payments of 0.54%(b) | | 07/25/45 | | | (1,000,000 | ) | | | (3,679 | ) |
| Receive floating par in the event of default on the ABX.HE.BBB.06-2 Index and pay fixed rate payments of 1.33%(h) | | 05/25/46 | | $ | (300,000 | ) | | $ | 10,636 | |
| | | | | | | | | | |
| | | | | | | | | 61,312 | |
| | | | | | | | | | |
| | | | | | | | $ | (580,294 | ) |
| | | | | | | | | | |
Forward volatility option with premium to be determined on a future date outstanding at December 31, 2006:
| | | | | | | | | |
Description | | Expiration
Date | | Notional
Value | | Unrealized
Depreciation | |
Call & Put—OTC U.S. dollar Forward Delta Neutral Straddle vs. Japanese Yen, Strike Price and premium determined on 03/20/07, based upon implied volatility parameter of 8.50% (b) | | 03/20/08 | | $ | 19,100,000 | | $ | (184,888 | ) |
| | | | | | | | | |
PORTFOLIO SUMMARY (based on net assets)
| | | |
| |
| | | % | |
Futures Contracts | | 89.1 | |
Mortgage-Backed Securities | | 50.0 | |
Asset-Backed Securities | | 23.3 | |
U.S. Treasury Obligations | | 12.7 | |
Corporate Bonds | | 11.5 | |
Money Market Funds | | 10.0 | |
Foreign Bonds | | 6.4 | |
Purchased Options | | 0.3 | |
Agency Obligation | | 0.1 | |
Foreign Exchange Volatility Contract | | — | ** |
Municipal Bond | | — | ** |
Written Options | | (0.1 | ) |
Swap Agreements | | (0.1 | ) |
Forward Foreign Currency Contracts | | (0.6 | ) |
| | | |
| | 202.6 | |
| | | |
| ** | Rounds to less than 0.005%. |
| | | | |
| | See Notes to Financial Statements. | | 59 |
Medium-Duration Bond Fund
The Fund is primarily comprised of investment grade securities. The GS4 Class posted a positive return and outperformed its benchmark index, the Lehman Brothers Aggregate Bond Index, during the year. Active management added value during the year. The 2006 performance of the broad bond market outpaced 2005, but was below historical norms. The Fund’s benchmark relative performance was positively impacted by several sub-advisers maintaining shorter-than-benchmark duration positions as interest rates increased. Exposure to mortgages and modest allocations to high yield, emerging market and municipal securities also benefited relative returns. A longer-than-benchmark duration position by a sub-adviser during the quarter negatively impacted performance as interest rates rose, especially during December. The Fund’s underweight to the corporate sector was also a drag on performance. Two of the three sub-advisers outpaced their benchmark during the quarter. Western Asset Management Company delivered the strongest benchmark relative performance due to its exposure to the mortgage sector and its tactical duration strategies. Modest exposure to high yield and emerging market securities also benefited their relative returns.
Please see page 78 for information regarding specific portfolio allocations. Portfolio holdings are subject to change at any time.
60
Medium-Duration Bond Fund
| | | | | | | | | | | | | | | | | | |
Average Annual Total Returns as of 12/31/06 | |
| | | GS2 Class* | | | GS4 Class* | | | GS6 Class* | | | Benchmark** | | | GS8 Class* | | | GS8 Class Benchmark** | |
One Year | | 4.50 | % | | 4.37 | % | | 3.89 | % | | 4.33 | % | | 3.58 | % | | 4.33 | % |
Five Year | | 5.68 | % | | 5.54 | % | | 5.21 | % | | 5.06 | % | | N/A | | | N/A | |
Since Inception | | 5.47 | % | | 5.47 | % | | 5.12 | % | | 5.07 | % | | 2.89 | % | | 3.44 | % |
Inception Date | | 08/27/01 | | | 08/27/01 | | | 08/27/01 | | | 08/27/01 | | | 11/08/04 | | | 11/08/04 | |
The performance data quoted represents past performance and does not guarantee future results. Current performance may be lower or higher. Performance data current to the most recent month-end may be obtained at www.GuideStone.org. The investment return and principal value of an investment will fluctuate so that shares, when redeemed, may be worth more or less than their original cost.
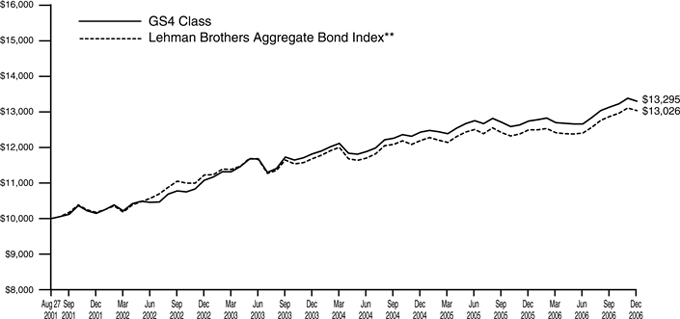
The graph compares the results of a hypothetical $10,000 investment in the GS4 Class of the Fund since August 27, 2001 (commencement of operations), with all dividends and capital gains reinvested, with the Lehman Brothers Aggregate Bond Index.
| * | These returns reflect expense waivers by the Fund’s investment advisor. Without these waivers, returns would have been lower. Returns shown do not reflect the deduction of taxes that a shareholder would pay on Fund distributions or the redemption of Fund shares. |
| ** | The Lehman Brothers Aggregate Bond Index represents securities that are SEC-registered, taxable, and dollar denominated. The index covers the U.S. investment grade fixed rate bond market, with index components for government and corporate securities, mortgage pass-through securities, and asset-backed securities. |
Unlike a mutual fund, the performance of an index assumes no taxes, transaction costs, management fees or other expenses.
61
| | |
| Medium-Duration Bond Fund | | |
| SCHEDULE OF INVESTMENTS | | December 31, 2006 |
| | | | | | |
| | | Par | | Value |
AGENCY OBLIGATIONS — 5.8% | | | | | | |
Federal Farm Credit Bank | | | | | | |
4.85%, 12/16/09 | | $ | 2,700,000 | | $ | 2,685,593 |
4.50%, 08/08/11 | | | 3,000,000 | | | 2,914,293 |
4.80%, 10/19/15 | | | 1,500,000 | | | 1,482,424 |
5.20%, 11/28/16 | | | 1,400,000 | | | 1,422,417 |
4.95%, 01/03/17 | | | 6,200,000 | | | 6,177,885 |
Federal Home Loan Bank | | | | | | |
4.25%, 09/12/08 | | | 3,000,000 | | | 2,961,762 |
5.40%, 01/02/09 | | | 990,000 | | | 988,982 |
3.50%, 02/13/09 | | | 1,000,000 | | | 970,325 |
4.38%, 09/11/09 | | | 3,000,000 | | | 2,956,323 |
4.08%, 04/26/10 | | | 1,500,000 | | | 1,461,825 |
4.38%, 09/17/10 | | | 700,000 | | | 687,979 |
4.88%, 11/18/11 | | | 1,700,000 | | | 1,695,062 |
5.00%, 03/08/13 | | | 5,000,000 | | | 5,013,640 |
5.25%, 09/13/13 | | | 5,900,000 | | | 5,998,406 |
7.38%, 02/13/15 | | | 2,500,000 | | | 2,897,957 |
Federal Home Loan Mortgage Corporation | | | | | | |
4.50%, 08/04/08 | | | 3,000,000 | | | 2,975,295 |
4.48%, 09/19/08 | | | 10,000,000 | | | 9,907,170 |
5.55%, 12/11/08 | | | 660,000 | | | 659,881 |
4.75%, 11/03/09 | | | 1,000,000 | | | 995,197 |
6.88%, 09/15/10 | | | 1,490,000 | | | 1,588,443 |
5.63%, 03/15/11 | | | 1,440,000 | | | 1,478,372 |
5.63%, 11/23/35 | | | 1,260,000 | | | 1,218,293 |
Federal National Mortgage Association | | | | | | |
5.00%, 06/25/07‡‡ | | | 260,000 | | | 253,696 |
5.40%, 04/13/09 | | | 230,000 | | | 230,077 |
7.25%, 01/15/10 | | | 1,400,000 | | | 1,490,467 |
7.13%, 06/15/10 | | | 1,600,000 | | | 1,711,869 |
5.13%, 04/15/11 | | | 700,000 | | | 705,678 |
6.00%, 05/15/11 | | | 1,700,000 | | | 1,771,791 |
4.38%, 07/17/13 | | | 6,200,000 | | | 5,980,886 |
| | | | | | |
| | |
Total Agency Obligations | | | | | | |
(Cost $71,689,421) | | | | | | 71,281,988 |
| | | | | | |
| | |
ASSET-BACKED SECURITIES — 3.8% | | | | | | |
Amortizing Residential Collateral Trust | | | | | | |
5.63%, 04/25/32† | | | 75,697 | | | 75,621 |
AQ Finance NIM Trust | | | | | | |
5.54%, 01/25/09 144A† | | | 13,965 | | | 13,964 |
Argent Securities, Inc. | | | | | | |
5.45%, 11/25/35† | | | 198,303 | | | 198,322 |
5.37%, 10/25/36† | | | 1,512,602 | | | 1,512,627 |
Asset-Backed Securities Corporation Home Equity | | | | | | |
5.60%, 09/25/34† | | | 618,584 | | | 618,252 |
Bayview Financial Acquisition Trust | | | | | | |
5.80%, 02/28/44† | | | 1,113,704 | | | 1,114,989 |
Chase Credit Card Master Trust | | | | | | |
5.47%, 02/15/10† | | | 1,700,000 | | | 1,701,937 |
Citibank Credit Card Issuance Trust | | | | | | |
6.47%, 02/09/09† | | | 670,000 | | | 670,570 |
Conseco Finance Securitizations Corporation | | | | | | |
6.75%, 02/01/33 IOW@ | | | 9,900,000 | | | 67,171 |
Countrywide Home Equity Loan Trust | | | | | | |
5.61%, 04/15/28† | | | 111,487 | | | 111,486 |
5.70%, 03/15/29† | | | 1,295,919 | | | 1,298,845 |
5.64%, 05/15/29† | | | 916,455 | | | 918,917 |
5.59%, 12/15/35† | | | 3,556,288 | | | 3,558,297 |
5.57%, 02/15/36† | | | 1,584,476 | | | 1,584,806 |
5.46%, 08/15/36† | | | 3,671,928 | | | 3,674,446 |
CS First Boston Mortgage Securities Corporation | | | | | | |
5.49%, 05/25/35 STEP | | | 766,101 | | | 766,240 |
EMC Mortgage Loan Trust | | | | | | |
5.90%, 11/25/41 144A† | | | 421,711 | | | 423,691 |
EQCC Trust | | | | | | |
5.62%, 10/25/31† | | | 61,332 | | | 61,337 |
First Franklin Mortgage Loan Asset-Backed Certificates | | | | | | |
5.37%, 11/25/36† | | | 1,943,042 | | | 1,943,073 |
First Horizon Asset Back Trust | | | | | | |
5.61%, 10/25/34† | | | 526,526 | | | 528,134 |
Fleet Home Equity Loan Trust | | | | | | |
5.53%, 05/30/31† | | | 524,739 | | | 524,878 |
Ford Credit Auto Owner Trust | | | | | | |
5.36%, 09/15/08† | | | 358,120 | | | 358,137 |
GSAMP Trust | | | | | | |
5.46%, 09/25/35† | | | 52,167 | | | 52,163 |
Honda Auto Receivables Owner Trust | | | | | | |
5.34%, 11/15/07 | | | 1,560,712 | | | 1,560,469 |
5.10%, 09/18/08 | | | 3,447,248 | | | 3,444,018 |
Lehman XS Trust | | | | | | |
5.62%, 11/25/35† | | | 4,304,171 | | | 4,312,722 |
5.59%, 01/30/40† | | | 2,139,689 | | | 2,144,254 |
Madison Avenue Manufactured Housing Contract | | | | | | |
5.70%, 09/25/08† | | | 1,246,845 | | | 1,250,917 |
MASTR Asset-Backed Securities Trust | | | | | | |
5.51%, 03/25/35 STEP | | | 1,308,261 | | | 1,308,754 |
MBNA Credit Card Master Note Trust | | | | | | |
5.85%, 03/15/10† | | | 1,900,000 | | | 1,906,347 |
Morgan Stanley Dean Witter Credit Corporation HELOC Trust | | | | | | |
5.51%, 07/25/17 STEP | | | 223,433 | | | 223,610 |
Nelnet Student Loan Trust | | | | | | |
5.39%, 01/26/15† | | | 3,149,396 | | | 3,150,526 |
Nissan Auto Receivables Owner Trust | | | | | | |
5.18%, 08/15/08 | | | 3,800,000 | | | 3,797,032 |
Provident Bank Home Equity Loan Trust | | | | | | |
5.62%, 08/25/31† | | | 225,984 | | | 226,100 |
Quest Trust | | | | | | |
5.88%, 06/25/34 144A† | | | 118,550 | | | 118,905 |
Residential Asset Mortgage Products, Inc. | | | | | | |
5.56%, 03/25/34 STEP | | | 649,017 | | | 649,826 |
Salomon Brothers Mortgage Securities VII | | | | | | |
5.83%, 03/30/28 STEP | | | 98,020 | | | 98,036 |
SG Mortgage Securities Trust | | | | | | |
5.42%, 09/25/35† | | | 263,842 | | | 263,865 |
| | |
| 62 | | See Notes to Financial Statements. |
| | | | | | |
| | | Par | | Value |
Triad Auto Receivables Owner Trust | | | | | | |
5.34%, 11/13/07 | | $ | 1,489,128 | | $ | 1,489,368 |
| | | | | | |
| | |
Total Asset-Backed Securities | | | | | | |
(Cost $48,005,149) | | | | | | 47,722,652 |
| | | | | | |
| | |
COMMERCIAL PAPER — 0.8% | | | | | | |
Bank of America Corporation | | | | | | |
5.23%, 03/09/07 | | | | | | |
(Cost $10,694,877) | | | 10,800,000 | | | 10,695,733 |
| | | | | | |
| | |
CORPORATE BONDS — 12.6% | | | | | | |
AES Corporation (The) | | | | | | |
9.50%, 06/01/09 | | | 42,000 | | | 45,150 |
9.38%, 09/15/10 | | | 30,000 | | | 32,738 |
8.75%, 05/15/13 144A | | | 520,000 | | | 559,650 |
9.00%, 05/15/15 144A | | | 760,000 | | | 820,800 |
Allied Waste North America, Inc. | | | | | | |
7.13%, 05/15/16 | | | 375,000 | | | 373,125 |
American Achievement Corporation | | | | | | |
8.25%, 04/01/12 | | | 30,000 | | | 30,862 |
Amerigas Partners LP | | | | | | |
7.25%, 05/20/15 | | | 80,000 | | | 81,400 |
AmerisourceBergen Corporation | | | | | | |
5.88%, 09/15/15D | | | 130,000 | | | 127,761 |
Ameritech Capital Funding Corporation | | | | | | |
6.25%, 05/18/09 | | | 100,000 | | | 101,506 |
AMFM, Inc. | | | | | | |
8.00%, 11/01/08 | | | 1,075,000 | | | 1,118,105 |
Anadarko Petroleum Corporation | | | | | | |
5.76%, 09/15/09† | | | 1,070,000 | | | 1,075,165 |
5.95%, 09/15/16D | | | 400,000 | | | 401,569 |
6.45%, 09/15/36 | | | 150,000 | | | 152,077 |
ANZ Capital Trust I | | | | | | |
4.48%, 01/29/49 144A | | | 125,000 | | | 121,574 |
5.36%, 12/29/49 144A | | | 800,000 | | | 780,394 |
ASIF Global Financing XIX | | | | | | |
4.90%, 01/17/13 144AD | | | 100,000 | | | 97,645 |
Astoria Financial Corporation | | | | | | |
5.75%, 10/15/12 | | | 450,000 | | | 449,975 |
AT&T, Inc. | | | | | | |
4.13%, 09/15/09D | | | 250,000 | | | 242,966 |
5.30%, 11/15/10D | | | 175,000 | | | 175,175 |
5.10%, 09/15/14D | | | 550,000 | | | 534,859 |
Bank of America Corporation | | | | | | |
5.38%, 08/15/11D | | | 240,000 | | | 241,904 |
5.64%, 10/14/16† | | | 1,700,000 | | | 1,710,781 |
Bank One Corporation | | | | | | |
4.13%, 09/01/07D | | | 1,100,000 | | | 1,091,232 |
Bank United Corporation | | | | | | |
8.88%, 05/01/07 | | | 125,000 | | | 126,376 |
Beazer Homes USA, Inc. | | | | | | |
8.63%, 05/15/11 | | | 10,000 | | | 10,350 |
BellSouth Capital Funding | | | | | | |
7.88%, 02/15/30D | | | 460,000 | | | 535,682 |
BellSouth Corporation | | | | | | |
4.75%, 11/15/12D | | | 40,000 | | | 38,649 |
6.88%, 10/15/31 | | | 10,000 | | | 10,624 |
Boardwalk Pipelines LP | | | | | | |
5.88%, 11/15/16 | | | 400,000 | | | 396,732 |
Boeing Co. | | | | | | |
6.63%, 02/15/38 | | | 210,000 | | | 238,636 |
CenterPoint Energy Resources Corporation | | | | | | |
5.95%, 01/15/14 | | | 525,000 | | | 527,888 |
Charter Communications Operating LLC | | | | | | |
8.00%, 04/30/12 144A@D | | | 250,000 | | | 260,938 |
Chesapeake Energy Corporation | | | | | | |
6.25%, 01/15/18 | | | 140,000 | | | 135,450 |
Cincinnati Bell, Inc. | | | | | | |
7.00%, 02/15/15D | | | 130,000 | | | 130,812 |
CitiFinancial, Inc. | | | | | | |
6.63%, 06/01/15 | | | 300,000 | | | 322,808 |
Citigroup, Inc. | | | | | | |
5.00%, 03/06/07D | | | 2,200,000 | | | 2,198,550 |
Citizens Communications Co. | | | | | | |
9.25%, 05/15/11D | | | 40,000 | | | 44,450 |
Clear Channel Communications, Inc. | | | | | | |
4.63%, 01/15/08D | | | 20,000 | | | 19,814 |
4.25%, 05/15/09 | | | 250,000 | | | 242,264 |
5.50%, 09/15/14D | | | 765,000 | | | 646,290 |
Cleveland Electric Illuminating Co. (The) | | | | | | |
5.65%, 12/15/13 | | | 60,000 | | | 59,885 |
7.88%, 11/01/17 | | | 2,050,000 | | | 2,401,032 |
Clorox Co. | | | | | | |
5.49%, 12/14/07† | | | 1,500,000 | | | 1,502,031 |
Comcast Cable Communications Holdings, Inc. | | | | | | |
6.75%, 01/30/11D | | | 740,000 | | | 776,051 |
8.38%, 03/15/13D | | | 225,000 | | | 256,604 |
9.46%, 11/15/22D | | | 275,000 | | | 356,920 |
Commonwealth Edison Co. | | | | | | |
5.40%, 12/15/11 | | | 650,000 | | | 645,561 |
ConocoPhillips | | | | | | |
5.37%, 04/11/07† | | | 4,000,000 | | | 4,000,704 |
8.75%, 05/25/10D | | | 230,000 | | | 255,046 |
ConocoPhillips Holding Co. | | | | | | |
6.95%, 04/15/29D | | | 1,670,000 | | | 1,902,589 |
Cox Communications, Inc. | | | | | | |
4.63%, 01/15/10D | | | 800,000 | | | 783,608 |
Cox Enterprises, Inc. | | | | | | |
4.38%, 05/01/08 144A | | | 600,000 | | | 589,796 |
CSC Holdings, Inc. | | | | | | |
7.63%, 04/01/11D | | | 590,000 | | | 604,012 |
6.75%, 04/15/12 | | | 60,000 | | | 58,800 |
7.63%, 07/15/18 | | | 45,000 | | | 44,044 |
D.R. Horton, Inc. | | | | | | |
8.50%, 04/15/12 | | | 10,000 | | | 10,468 |
DaimlerChrysler NA Holding Corporation | | | | | | |
5.83%, 09/10/07† | | | 3,700,000 | | | 3,708,765 |
5.88%, 03/15/11 | | | 590,000 | | | 592,766 |
5.75%, 09/08/11 | | | 900,000 | | | 898,640 |
7.30%, 01/15/12D | | | 550,000 | | | 584,453 |
6.50%, 11/15/13D | | | 100,000 | | | 102,812 |
DaVita, Inc. | | | | | | |
7.25%, 03/15/15D | | | 135,000 | | | 138,375 |
Dean Foods Co. | | | | | | |
7.00%, 06/01/16 | | | 375,000 | | | 380,625 |
Devon Energy Corporation | | | | | | |
7.95%, 04/15/32 | | | 725,000 | | | 885,280 |
| | | | |
| | See Notes to Financial Statements. | | 63 |
| | |
| Medium-Duration Bond Fund | | |
| SCHEDULE OF INVESTMENTS (Continued) | | |
| | | | | | |
| | | Par | | Value |
DI Finance | | | | | | |
9.50%, 02/15/13 | | $ | 90,000 | | $ | 95,850 |
DirecTV Holdings LLC | | | | | | |
8.38%, 03/15/13 | | | 155,000 | | | 161,975 |
Dominion Resources, Inc. | | | | | | |
4.13%, 02/15/08 | | | 70,000 | | | 68,974 |
5.13%, 12/15/09D | | | 230,000 | | | 228,686 |
4.75%, 12/15/10 | | | 70,000 | | | 68,452 |
5.70%, 09/17/12D | | | 770,000 | | | 779,667 |
DRS Technologies, Inc. | | | | | | |
6.63%, 02/01/16D | | | 90,000 | | | 91,125 |
Dryden Investor Trust | | | | | | |
7.16%, 07/23/08@ | | | 914,254 | | | 926,292 |
Duke Energy Corporation | | | | | | |
5.63%, 11/30/12D | | | 710,000 | | | 723,721 |
Dynegy Holdings, Inc. | | | | | | |
8.75%, 02/15/12D | | | 150,000 | | | 159,750 |
E*Trade Financial Corporation | | | | | | |
7.38%, 09/15/13 | | | 40,000 | | | 41,800 |
Eastman Kodak Co. | | | | | | |
7.25%, 11/15/13D | | | 490,000 | | | 489,574 |
Echostar DBS Corporation | | | | | | |
5.75%, 10/01/08 | | | 500,000 | | | 499,375 |
6.63%, 10/01/14D | | | 30,000 | | | 29,325 |
7.13%, 02/01/16D | | | 230,000 | | | 231,150 |
El Paso Corporation | | | | | | |
8.05%, 10/15/30D | | | 600,000 | | | 669,000 |
7.80%, 08/01/31D | | | 950,000 | | | 1,042,625 |
7.75%, 01/15/32D | | | 530,000 | | | 583,000 |
El Paso Natural Gas Co. | | | | | | |
8.38%, 06/15/32 | | | 210,000 | | | 255,347 |
El Paso Performance-Linked Trust | | | | | | |
7.75%, 07/15/11 144AD | | | 1,460,000 | | | 1,551,250 |
Electronic Data Systems Corporation | | | | | | |
7.13%, 10/15/09D | | | 1,000,000 | | | 1,043,158 |
Embarq Corporation | | | | | | |
8.00%, 06/01/36D | | | 150,000 | | | 156,546 |
Energy Transfer Partners LP | | | | | | |
5.65%, 08/01/12D | | | 275,000 | | | 274,166 |
5.95%, 02/01/15D | | | 475,000 | | | 478,452 |
Entergy Gulf States, Inc. | | | | | | |
6.10%, 12/08/08 144A† | | | 1,900,000 | | | 1,905,060 |
Enterprise Products Operating LP | | | | | | |
4.95%, 06/01/10 | | | 650,000 | | | 639,518 |
8.38%, 08/01/45† | | | 350,000 | | | 379,754 |
EOP Operating LP | | | | | | |
7.75%, 11/15/07 | | | 100,000 | | | 102,083 |
Exelon Corporation | | | | | | |
5.63%, 06/15/35D | | | 1,190,000 | | | 1,124,776 |
Farmer Mac Guaranteed Notes Trust | | | | | | |
5.50%, 07/15/11 144A | | | 4,200,000 | | | 4,281,358 |
Firstar Bank NA | | | | | | |
7.13%, 12/01/09 | | | 170,000 | | | 178,873 |
FirstEnergy Corporation | | | | | | |
6.45%, 11/15/11D | | | 70,000 | | | 73,073 |
7.38%, 11/15/31 | | | 1,550,000 | | | 1,770,562 |
Ford Motor Co. | | | | | | |
6.00%, 11/29/13†@ | | | 2,700,000 | | | 2,700,000 |
7.45%, 07/16/31D | | | 550,000 | | | 434,500 |
Ford Motor Credit Co. | | | | | | |
6.63%, 06/16/08D | | | 350,000 | | | 349,880 |
7.38%, 10/28/09 | | | 3,700,000 | | | 3,710,205 |
5.70%, 01/15/10D | | | 125,000 | | | 119,907 |
7.88%, 06/15/10 | | | 500,000 | | | 504,528 |
7.38%, 02/01/11D | | | 680,000 | | | 673,744 |
10.61%, 06/15/11 144A†D | | | 607,000 | | | 648,612 |
7.25%, 10/25/11 | | | 50,000 | | | 49,012 |
Forest City Enterprises, Inc. | | | | | | |
7.63%, 06/01/15 | | | 20,000 | | | 20,500 |
6.50%, 02/01/17 | | | 70,000 | | | 68,950 |
Fresenius Medical Care Capital Trust II | | | | | | |
7.88%, 02/01/08 | | | 169,000 | | | 172,380 |
General Electric Capital Corporation | | | | | | |
4.13%, 09/01/09D | | | 740,000 | | | 721,945 |
6.00%, 06/15/12D | | | 460,000 | | | 476,729 |
General Electric Co. | | | | | | |
5.00%, 02/01/13D | | | 1,070,000 | | | 1,059,494 |
General Motors Acceptance Corporation | | | | | | |
6.13%, 08/28/07 | | | 1,740,000 | | | 1,740,614 |
5.13%, 05/09/08 | | | 570,000 | | | 564,087 |
5.85%, 01/14/09D | | | 220,000 | | | 219,270 |
5.63%, 05/15/09 | | | 1,490,000 | | | 1,479,043 |
7.75%, 01/19/10D | | | 500,000 | | | 523,686 |
6.88%, 09/15/11 | | | 575,000 | | | 590,363 |
General Motors Corporation | | | | | | |
8.25%, 07/15/23D | | | 210,000 | | | 196,350 |
8.38%, 07/05/33(E) | | | 170,000 | | | 218,806 |
Genworth Financial, Inc. | | | | | | |
6.15%, 11/15/36†D | | | 250,000 | | | 250,105 |
Georgia Gulf Corporation | | | | | | |
9.50%, 10/15/14 144AD | | | 50,000 | | | 49,000 |
Georgia-Pacific Corporation | | | | | | |
8.13%, 05/15/11D | | | 4,000 | | | 4,220 |
7.50%, 12/20/12† | | | 571,428 | | | 574,761 |
Goldman Sachs Group LP | | | | | | |
4.50%, 06/15/10D | | | 930,000 | | | 910,943 |
Greenpoint Financial Corporation | | | | | | |
3.20%, 06/06/08 | | | 300,000 | | | 289,818 |
HCA, Inc. | | | | | | |
6.30%, 10/01/12 | | | 32,000 | | | 29,360 |
9.13%, 11/15/14 144A | | | 60,000 | | | 64,275 |
6.50%, 02/15/16D | | | 957,000 | | | 811,058 |
9.25%, 11/15/16 144A | | | 480,000 | | | 515,400 |
9.63%, 11/15/16 144A | | | 310,000 | | | 334,025 |
7.69%, 06/15/25 | | | 250,000 | | | 208,176 |
Hertz Corporation | | | | | | |
8.88%, 01/01/14 144AD | | | 95,000 | | | 99,988 |
Hess Corporation | | | | | | |
7.30%, 08/15/31D | | | 1,320,000 | | | 1,477,621 |
Host Marriott LP | | | | | | |
6.75%, 06/01/16D | | | 30,000 | | | 30,188 |
HSBC Bank USA NA | | | | | | |
5.46%, 09/21/07† | | | 300,000 | | | 300,328 |
HSBC Finance Corporation | | | | | | |
4.63%, 01/15/08D | | | 1,130,000 | | | 1,122,717 |
8.00%, 07/15/10 | | | 440,000 | | | 478,339 |
7.00%, 05/15/12 | | | 390,000 | | | 420,964 |
6.38%, 11/27/12D | | | 70,000 | | | 73,799 |
| | |
| 64 | | See Notes to Financial Statements. |
| | | | | | |
| | | Par | | Value |
Idearc, Inc. | | | | | | |
8.00%, 11/15/16 144A | | $ | 95,000 | | $ | 96,900 |
ILFC E-Capital Trust II | | | | | | |
6.25%, 12/21/45 144A† | | | 280,000 | | | 284,925 |
iStar Financial, Inc. | | | | | | |
5.13%, 04/01/11 | | | 175,000 | | | 171,545 |
5.65%, 09/15/11 | | | 250,000 | | | 249,708 |
5.95%, 10/15/13 144A@ | | | 200,000 | | | 201,285 |
6.50%, 12/15/13 | | | 125,000 | | | 127,974 |
Jacuzzi Brands, Inc. | | | | | | |
9.63%, 07/01/10 | | | 75,000 | | | 80,062 |
JC Penny Co., Inc. | | | | | | |
7.40%, 04/01/37 | | | 50,000 | | | 54,678 |
JPM Capital Trust II | | | | | | |
7.95%, 02/01/27 | | | 700,000 | | | 728,454 |
JPMorgan Chase & Co. | | | | | | |
5.75%, 01/02/13D | | | 320,000 | | | 326,075 |
5.15%, 10/01/15D | | | 1,890,000 | | | 1,857,902 |
Kansas City Southern Railway | | | | | | |
9.50%, 10/01/08 | | | 119,000 | | | 124,950 |
Kerr-McGee Corporation | | | | | | |
6.95%, 07/01/24D | | | 750,000 | | | 800,814 |
7.88%, 09/15/31D | | | 2,000,000 | | | 2,393,074 |
Kinder Morgan Energy Partners LP | | | | | | |
6.30%, 02/01/09 | | | 150,000 | | | 152,064 |
6.75%, 03/15/11D | | | 150,000 | | | 156,215 |
7.13%, 03/15/12 | | | 30,000 | | | 31,881 |
5.00%, 12/15/13D | | | 200,000 | | | 190,355 |
Koch Forest Products, Inc. | | | | | | |
6.56%, 12/20/12† | | | 3,047,619 | | | 3,065,396 |
6.98%, 12/20/12† | | | 350,952 | | | 352,049 |
L-3 Communications Corporation | | | | | | |
7.63%, 06/15/12 | | | 250,000 | | | 260,000 |
6.38%, 10/15/15D | | | 370,000 | | | 368,150 |
Lamar Media Corporation | | | | | | |
7.25%, 01/01/13D | | | 110,000 | | | 112,612 |
6.63%, 08/15/15 | | | 80,000 | | | 79,700 |
Land O’ Lakes, Inc. | | | | | | |
9.00%, 12/15/10 | | | 125,000 | | | 133,281 |
Lehman Brothers Holdings, Inc. | | | | | | |
4.00%, 01/22/08D | | | 1,120,000 | | | 1,104,850 |
Liberty Media Corporation | | | | | | |
7.88%, 07/15/09 | | | 10,000 | | | 10,478 |
5.70%, 05/15/13 | | | 25,000 | | | 23,678 |
3.75%, 02/15/30 CONV | | | 40,000 | | | 24,800 |
Liberty Mutual Group | | | | | | |
7.00%, 03/15/34 144AD | | | 75,000 | | | 77,454 |
Lincoln National Corporation | | | | | | |
7.00%, 05/17/49† | | | 525,000 | | | 557,400 |
Lyondell Chemical Co. | | | | | | |
8.00%, 09/15/14D | | | 55,000 | | | 57,338 |
8.25%, 09/15/16D | | | 35,000 | | | 36,925 |
MacDermid, Inc. | | | | | | |
9.13%, 07/15/11 | | | 111,000 | | | 115,995 |
Merrill Lynch & Co., Inc. | | | | | | |
3.38%, 09/14/07 | | | 420,000 | | | 414,536 |
Midamerican Energy Holdings Co. | | | | | | |
6.13%, 04/01/36D | | | 750,000 | | | 758,617 |
Midwest Generation LLC | | | | | | |
8.75%, 05/01/34 | | | 250,000 | | | 272,500 |
Mizuho JGB Investment LLC | | | | | | |
9.87%, 12/31/49 144A†@ | | | 250,000 | | | 265,020 |
Morgan Stanley | | | | | | |
3.63%, 04/01/08 | | | 110,000 | | | 107,806 |
5.63%, 01/09/12D | | | 410,000 | | | 417,208 |
5.82%, 10/18/16† | | | 340,000 | | | 342,528 |
Nelnet, Inc. | | | | | | |
7.40%, 09/29/36† | | | 475,000 | | | 489,620 |
New Cingular Wireless Services, Inc. | | | | | | |
7.88%, 03/01/11 | | | 650,000 | | | 709,630 |
8.13%, 05/01/12D | | | 135,000 | | | 152,077 |
Nextel Communications, Inc. | | | | | | |
5.95%, 03/15/14D | | | 294,000 | | | 286,714 |
7.38%, 08/01/15D | | | 130,000 | | | 133,433 |
Niagara Mohawk Power Corporation | | | | | | |
7.75%, 10/01/08 | | | 1,340,000 | | | 1,389,202 |
Nortek, Inc. | | | | | | |
8.50%, 09/01/14 | | | 62,000 | | | 61,070 |
NRG Energy, Inc. | | | | | | |
7.25%, 02/01/14D | | | 210,000 | | | 212,100 |
Omnicare, Inc. | | | | | | |
6.88%, 12/15/15 | | | 34,000 | | | 33,745 |
Omnicom Group, Inc. | | | | | | |
5.90%, 04/15/16D | | | 700,000 | | | 708,653 |
Oncor Electric Delivery Co. | | | | | | |
6.38%, 01/15/15 | | | 30,000 | | | 30,972 |
Oxford Industries, Inc. | | | | | | |
8.88%, 06/01/11 | | | 60,000 | | | 62,250 |
Pacific Energy Partners LP | | | | | | |
7.13%, 06/15/14 | | | 60,000 | | | 61,642 |
Pacific Gas & Electric Co. | | | | | | |
6.05%, 03/01/34D | | | 710,000 | | | 718,478 |
PartnerRe Finance II | | | | | | |
6.44%, 12/01/49† | | | 75,000 | | | 75,414 |
Patrons’ Legacy | | | | | | |
5.65%, 01/17/17 144A | | | 608,180 | | | 602,848 |
Peabody Energy Corporation | | | | | | |
6.88%, 03/15/13 | | | 145,000 | | | 149,350 |
7.88%, 11/01/26 | | | 2,000,000 | | | 2,160,000 |
Pemex Project Funding Master Trust | | | | | | |
9.13%, 10/13/10 | | | 1,075,000 | | | 1,208,300 |
6.63%, 06/15/35D | | | 60,000 | | | 61,455 |
PHH Corporation | | | | | | |
6.00%, 03/01/08D | | | 1,075,000 | | | 1,075,858 |
Phoenix Life Insurance Co. | | | | | | |
7.15%, 12/15/34 144A | | | 275,000 | | | 291,793 |
Pogo Producing Co. | | | | | | |
6.88%, 10/01/17D | | | 130,000 | | | 124,800 |
Popular North America, Inc. | | | | | | |
5.20%, 12/12/07 | | | 400,000 | | | 398,764 |
4.25%, 04/01/08D | | | 300,000 | | | 295,661 |
5.65%, 04/15/09 | | | 250,000 | | | 250,722 |
Pride International, Inc. | | | | | | |
7.38%, 07/15/14D | | | 130,000 | | | 134,875 |
Progress Energy, Inc. | | | | | | |
5.63%, 01/15/16 | | | 150,000 | | | 149,913 |
7.75%, 03/01/31 | | | 350,000 | | | 421,948 |
Prudential Funding LLC | | | | | | |
6.60%, 05/15/08 144A | | | 600,000 | | | 608,533 |
Pulte Homes, Inc. | | | | | | |
6.25%, 02/15/13 | | | 1,100,000 | | | 1,117,990 |
| | | | |
| | See Notes to Financial Statements. | | 65 |
| | |
| Medium-Duration Bond Fund | | |
| SCHEDULE OF INVESTMENTS (Continued) | | |
| | | | | | |
| | | Par | | Value |
PVNGS II Funding Corporation, Inc. | | | | | | |
8.00%, 12/30/15 | | $ | 1,677,000 | | $ | 1,860,771 |
Qwest Capital Funding, Inc. | | | | | | |
7.25%, 02/15/11D | | | 200,000 | | | 205,250 |
Qwest Corporation | | | | | | |
5.63%, 11/15/08 | | | 600,000 | | | 603,750 |
8.88%, 03/15/12 | | | 200,000 | | | 223,750 |
7.50%, 06/15/23 | | | 500,000 | | | 506,250 |
Rabobank Capital Funding II | | | | | | |
5.26%, 12/29/13 144A† | | | 50,000 | | | 48,968 |
Rabobank Capital Funding Trust III | | | | | | |
5.25%, 10/31/49 144A† | | | 350,000 | | | 338,090 |
Reader’s Digest Association, Inc. | | | | | | |
6.50%, 03/01/11 | | | 50,000 | | | 51,625 |
Reinsurance Group of America, Inc. | | | | | | |
6.75%, 12/15/35† | | | 250,000 | | | 250,268 |
Residential Capital LLC | | | | | | |
6.38%, 06/30/10 | | | 850,000 | | | 860,558 |
Safeco Corporation | | | | | | |
4.20%, 02/01/08 | | | 450,000 | | | 443,970 |
SemGroup LP | | | | | | |
8.75%, 11/15/15 144AD | | | 55,000 | | | 55,550 |
Service Corporation International | | | | | | |
7.63%, 10/01/18D | | | 90,000 | | | 95,850 |
Sinclair Broadcast Group, Inc. | | | | | | |
8.00%, 03/15/12D | | | 20,000 | | | 20,750 |
SLM Corporation | | | | | | |
4.94%, 04/01/09† | | | 1,130,000 | | | 1,100,123 |
Sonat, Inc. | | | | | | |
7.63%, 07/15/11D | | | 460,000 | | | 489,900 |
Southern Natural Gas Co. | | | | | | |
8.88%, 03/15/10 | | | 130,000 | | | 137,032 |
8.00%, 03/01/32 | | | 400,000 | | | 469,400 |
Sovereign Bank | | | | | | |
4.38%, 08/01/13† | | | 525,000 | | | 516,631 |
Sprint Capital Corporation | | | | | | |
6.13%, 11/15/08D | | | 310,000 | | | 313,800 |
7.63%, 01/30/11 | | | 250,000 | | | 267,909 |
8.38%, 03/15/12D | | | 340,000 | | | 378,271 |
6.88%, 11/15/28 | | | 275,000 | | | 276,052 |
8.75%, 03/15/32 | | | 350,000 | | | 422,456 |
Sprint Nextel Corporation | | | | | | |
6.00%, 12/01/16 | | | 700,000 | | | 683,493 |
Suburban Propane Partners LP | | | | | | |
6.88%, 12/15/13 | | | 195,000 | | | 192,075 |
Sungard Data Systems, Inc. | | | | | | |
9.13%, 08/15/13D | | | 120,000 | | | 126,600 |
TCI Communications Financing III | | | | | | |
9.65%, 03/31/27 | | | 2,610,000 | | | 2,753,960 |
Tenet Healthcare Corporation | | | | | | |
9.88%, 07/01/14D | | | 170,000 | | | 173,825 |
9.25%, 02/01/15D | | | 1,655,000 | | | 1,663,275 |
Tennessee Valley Authority | | | | | | |
5.38%, 04/01/46 | | | 1,800,000 | | | 1,839,361 |
Time Warner Entertainment Co. LP | | | | | | |
8.38%, 07/15/33D | | | 590,000 | | | 715,187 |
Time Warner, Inc. | | | | | | |
5.61%, 11/13/09† | | | 2,600,000 | | | 2,603,741 |
6.88%, 05/01/12 | | | 110,000 | | | 116,372 |
5.88%, 11/15/16D | | | 300,000 | | | 299,797 |
7.70%, 05/01/32D | | | 600,000 | | | 678,985 |
6.50%, 11/15/36 | | | 250,000 | | | 249,646 |
Transcontinental Gas Pipe Line Corporation | | | | | | |
6.65%, 04/15/08 144A† | | | 1,500,000 | | | 1,509,375 |
Transocean, Inc. | | | | | | |
5.57%, 09/05/08† | | | 2,000,000 | | | 2,002,160 |
TXU Corporation | | | | | | |
4.80%, 11/15/09 | | | 500,000 | | | 490,470 |
5.55%, 11/15/14D | | | 110,000 | | | 104,978 |
6.55%, 11/15/34D | | | 1,080,000 | | | 1,015,446 |
TXU Energy Co. LLC | | | | | | |
7.00%, 03/15/13 | | | 150,000 | | | 157,150 |
Tyco International Group SA Participation Certificate Trust | | | | | | |
4.44%, 06/15/07 144A@ | | | 400,000 | | | 398,024 |
Unilever Capital Corporation | | | | | | |
7.13%, 11/01/10D | | | 285,000 | | | 302,987 |
Union Pacific Corporation | | | | | | |
6.65%, 01/15/11 | | | 260,000 | | | 271,973 |
United Air Lines, Inc. | | | | | | |
9.21%, 01/21/17@# | | | 117,826 | | | 8,321 |
9.56%, 10/19/18@# | | | 236,236 | | | 134,212 |
United Telephone Co. of Kansas | | | | | | |
6.89%, 07/01/08@ | | | 500,000 | | | 501,293 |
Ventas Realty LP | | | | | | |
8.75%, 05/01/09D | | | 70,000 | | | 74,725 |
9.00%, 05/01/12D | | | 30,000 | | | 34,050 |
6.50%, 06/01/16D | | | 70,000 | | | 72,100 |
Verizon Communications, Inc. | | | | | | |
5.55%, 02/15/16D | | | 2,100,000 | | | 2,096,447 |
Verizon Global Funding Corporation | | | | | | |
7.38%, 09/01/12D | | | 290,000 | | | 317,433 |
4.38%, 06/01/13D | | | 140,000 | | | 132,215 |
5.85%, 09/15/35 | | | 600,000 | | | 576,595 |
Vintage Petroleum, Inc. | | | | | | |
8.25%, 05/01/12 | | | 250,000 | | | 262,382 |
Visteon Corporation | | | | | | |
8.25%, 08/01/10 | | | 145,000 | | | 142,100 |
Wachovia Bank NA | | | | | | |
5.49%, 03/23/09† | | | 750,000 | | | 750,560 |
Wachovia Capital Trust III | | | | | | |
5.80%, 08/29/49†D | | | 580,000 | | | 585,327 |
Wachovia Corporation | | | | | | |
5.25%, 08/01/14D | | | 1,850,000 | | | 1,830,286 |
Washington Mutual, Inc. | | | | | | |
8.25%, 04/01/10 | | | 250,000 | | | 269,476 |
Waste Management, Inc. | | | | | | |
7.75%, 05/15/32D | | | 980,000 | | | 1,159,368 |
Wells Fargo Capital X | | | | | | |
5.95%, 12/15/36D | | | 200,000 | | | 196,693 |
Westlake Chemical Corporation | | | | | | |
6.63%, 01/15/16D | | | 85,000 | | | 82,662 |
Weyerhaeuser Co. | | | | | | |
6.75%, 03/15/12D | | | 735,000 | | | 771,683 |
Williams Cos., Inc. | | | | | | |
7.50%, 01/15/31D | | | 270,000 | | | 281,475 |
7.75%, 06/15/31D | | | 200,000 | | | 211,000 |
8.75%, 03/15/32D | | | 1,130,000 | | | 1,282,550 |
| | |
| 66 | | See Notes to Financial Statements. |
| | | | | | |
| | | Par | | Value |
Windstream Corporation | | | | | | |
8.63%, 08/01/16 144A | | $ | 50,000 | | $ | 55,000 |
8.63%, 08/01/16D | | | 250,000 | | | 275,000 |
Xerox Corporation | | | | | | |
7.13%, 06/15/10 | | | 250,000 | | | 263,750 |
6.75%, 02/01/17 | | | 90,000 | | | 94,500 |
XTO Energy, Inc. | | | | | | |
7.50%, 04/15/12D | | | 43,000 | | | 46,769 |
ZFS Finance USA Trust I | | | | | | |
6.15%, 12/15/49 144A†D | | | 500,000 | | | 507,845 |
| | | | | | |
| | |
Total Corporate Bonds | | | | | | |
(Cost $153,511,594) | | | | | | 156,650,263 |
| | | | | | |
| | |
FOREIGN BONDS — 11.0% | | | | | | |
Australia — 0.0% | | | | | | |
QBE Insurance Group, Ltd. | | | | | | |
5.65%, 07/01/23 144A† | | | 525,000 | | | 510,140 |
| | | | | | |
| | |
Bermuda — 0.4% | | | | | | |
ACE, Ltd. | | | | | | |
6.00%, 04/01/07 | | | 350,000 | | | 350,384 |
Arch Capital Group, Ltd. | | | | | | |
7.35%, 05/01/34 | | | 475,000 | | | 525,579 |
Aspen Insurance Holdings, Ltd. | | | | | | |
6.00%, 08/15/14 | | | 325,000 | | | 320,562 |
Endurance Specialty Holdings, Ltd. | | | | | | |
6.15%, 10/15/15 | | | 525,000 | | | 524,143 |
Intelsat Bermuda, Ltd. | | | | | | |
9.25%, 06/15/16 144AD | | | 60,000 | | | 64,800 |
Intelsat, Ltd. | | | | | | |
6.50%, 11/01/13 | | | 110,000 | | | 94,050 |
Tyco International Group SA | | | | | | |
6.13%, 11/01/08 | | | 90,000 | | | 91,153 |
6.00%, 11/15/13D | | | 2,920,000 | | | 3,025,479 |
| | | | | | |
| | | | | | 4,996,150 |
| | | | | | |
| | |
Brazil — 0.3% | | | | | | |
Federal Republic of Brazil | | | | | | |
7.88%, 03/07/15 | | | 25,000 | | | 27,912 |
8.88%, 04/15/24 | | | 99,000 | | | 123,502 |
10.13%, 05/15/27 | | | 821,000 | | | 1,155,558 |
7.13%, 01/20/37D | | | 142,000 | | | 152,934 |
11.00%, 08/17/40D | | | 1,171,000 | | | 1,553,039 |
Petrobras International Finance Co. | | | | | | |
6.13%, 10/06/16 | | | 850,000 | | | 862,750 |
| | | | | | |
| | | | | | 3,875,695 |
| | | | | | |
| | |
Canada — 0.5% | | | | | | |
Anadarko Finance Co. | | | | | | |
7.50%, 05/01/31 | | | 400,000 | | | 455,196 |
Bombardier, Inc. | | | | | | |
7.25%, 11/15/16 144A(E)D | | | 250,000 | | | 335,889 |
Canadian Government Inflationary Index | | | | | | |
4.00%, 12/01/31(C) | | | 230,000 | | | 341,638 |
Canadian Natural Resources, Ltd. | | | | | | |
6.50%, 02/15/37D | | | 300,000 | | | 301,955 |
ChevronTexaco Capital Co. | | | | | | |
3.50%, 09/17/07 | | | 690,000 | | | 682,021 |
Conoco Funding Co. | | | | | | |
7.25%, 10/15/31 | | | 315,000 | | | 372,516 |
General Motors Nova Scotia Finance Co. | | | | | | |
6.85%, 10/15/08D | | | 1,670,000 | | | 1,665,825 |
Hydro Quebec | | | | | | |
6.30%, 05/11/11 | | | 305,000 | | | 319,105 |
OPTI Canada, Inc. | | | | | | |
8.25%, 12/15/14 144A | | | 115,000 | | | 118,737 |
Quebecor Media, Inc. | | | | | | |
7.75%, 03/15/16 | | | 40,000 | | | 41,050 |
Rogers Cable, Inc. | | | | | | |
5.50%, 03/15/14D | | | 350,000 | | | 336,416 |
6.75%, 03/15/15 | | | 10,000 | | | 10,353 |
Rogers Wireless, Inc. | | | | | | |
8.52%, 12/15/10† | | | 250,000 | | | 255,625 |
6.38%, 03/01/14 144A | | | 100,000 | | | 101,750 |
6.38%, 03/01/14 | | | 30,000 | | | 30,525 |
Sun Media Corporation | | | | | | |
7.63%, 02/15/13 | | | 50,000 | | | 50,938 |
Western Oil Sands, Inc. | | | | | | |
8.38%, 05/01/12 | | | 165,000 | | | 183,975 |
Xstrata Finance Canada, Ltd. | | | | | | |
5.50%, 11/16/11 144A | | | 500,000 | | | 500,406 |
| | | | | | |
| | | | | | 6,103,920 |
| | | | | | |
| | |
Cayman Islands — 0.5% | | | | | | |
MUFG Capital Finance 1, Ltd. | | | | | | |
6.35%, 07/25/25†D | | | 450,000 | | | 457,877 |
Petroleum Export, Ltd. | | | | | | |
4.62%, 06/15/10 144A | | | 700,000 | | | 689,327 |
4.63%, 06/15/10 144A | | | 933,333 | | | 919,112 |
Resona Preferred Global Securities Cayman, Ltd. | | | | | | |
7.19%, 07/30/15 144A†D | | | 690,000 | | | 721,107 |
Shinsei Finance Cayman, Ltd. | | | | | | |
6.42%, 07/20/48 144A†D | | | 830,000 | | | 830,489 |
Systems 2001 Asset Trust LLC | | | | | | |
6.66%, 09/15/13 144A | | | 858,327 | | | 899,230 |
Vale Overseas, Ltd. | | | | | | |
8.25%, 01/17/34D | | | 40,000 | | | 47,582 |
6.88%, 11/21/36D | | | 1,120,000 | | | 1,154,323 |
| | | | | | |
| | | | | | 5,719,047 |
| | | | | | |
| | |
Chile — 0.0% | | | | | | |
Codelco, Inc. | | | | | | |
4.75%, 10/15/14 144A | | | 210,000 | | | 200,023 |
| | | | | | |
| | |
Colombia — 0.0% | | | | | | |
Republic of Colombia | | | | | | |
7.38%, 09/18/37 | | | 458,000 | | | 492,808 |
| | | | | | |
| | |
France — 1.8% | | | | | | |
AXA SA | | | | | | |
6.46%, 12/14/18 144A†@ | | | 275,000 | | | 272,077 |
6.38%, 12/14/36 144A†@D | | | 275,000 | | | 272,422 |
Compagnie Generale de Geophysique SA | | | | | | |
7.50%, 05/15/15 | | | 70,000 | | | 70,700 |
French Treasury Bill | | | | | | |
2.74%, 01/18/07(E)W | | | 14,800,000 | | | 19,506,969 |
French Treasury Note | | | | | | |
2.25%, 03/12/07(E) | | | 1,050,000 | | | 1,382,499 |
Legrand SA | | | | | | |
8.50%, 02/15/25 | | | 250,000 | | | 288,750 |
| | | | | | |
| | | | | | 21,793,417 |
| | | | | | |
| | | | |
| | See Notes to Financial Statements. | | 67 |
| | |
| Medium-Duration Bond Fund | | |
| SCHEDULE OF INVESTMENTS (Continued) | | |
| | | | | | |
| | | Par | | Value |
Germany — 3.2% | | | | | | |
Bundesobligation | | | | | | |
4.00%, 02/16/07(E) | | | 21,700,000 | | $ | 28,657,291 |
Bundesschatzanweisungen | | | | | | |
2.50%, 03/23/07(E) | | | 6,020,000 | | | 7,927,916 |
Deutsche Bundesrepublik | | | | | | |
3.75%, 01/04/15(E) | | | 1,450,000 | | | 1,887,525 |
German Treasury Bill | | | | | | |
2.52%, 01/17/07(E)W | | | 600,000 | | | 790,973 |
Kabel Deutschland GmbH | | | | | | |
10.63%, 07/01/14 | | $ | 145,000 | | | 161,494 |
| | | | | | |
| | | | | | 39,425,199 |
| | | | | | |
| | |
Iceland — 0.4% | | | | | | |
Glitnir Banki HF | | | | | | |
6.33%, 07/28/11 144AD | | | 600,000 | | | 616,693 |
6.69%, 06/15/16 144A† | | | 1,000,000 | | | 1,033,357 |
Kaupthing Bank HF | | | | | | |
5.37%, 04/12/11 144A† | | | 1,630,000 | | | 1,643,211 |
5.75%, 10/04/11 144A | | | 250,000 | | | 249,985 |
7.13%, 05/19/16 144A | | | 350,000 | | | 371,875 |
Landsbanki Islands HF | | | | | | |
6.10%, 08/25/11 144A | | | 1,500,000 | | | 1,526,532 |
| | | | | | |
| | | | | | 5,441,653 |
| | | | | | |
| | |
Italy — 0.2% | | | | | | |
Republic of Italy | | | | | | |
3.80%, 03/27/08(J) | | | 156,000,000 | | | 1,362,649 |
Telecom Italia Capital SA | | | | | | |
4.00%, 01/15/10D | | | 225,000 | | | 215,001 |
5.25%, 11/15/13D | | | 165,000 | | | 157,548 |
4.95%, 09/30/14 | | | 835,000 | | | 774,793 |
5.25%, 10/01/15D | | | 130,000 | | | 121,642 |
| | | | | | |
| | | | | | 2,631,633 |
| | | | | | |
| | |
Japan — 0.1% | | | | | | |
Aiful Corporation | | | | | | |
5.00%, 08/10/10 144AD | | | 600,000 | | | 582,710 |
Resona Bank, Ltd. | | | | | | |
4.13%, 06/27/49 144A(E)†@ | | | 500,000 | | | 638,108 |
5.85%, 07/15/49 144A†@ | | | 475,000 | | | 464,635 |
| | | | | | |
| | | | | | 1,685,453 |
| | | | | | |
| | |
Luxembourg — 0.7% | | | | | | |
Gaz Capital for Gazprom | | | | | | |
6.21%, 11/22/16 144AD | | | 1,300,000 | | | 1,312,350 |
GazInvest Luxemburg SA for Gazprombank | | | | | | |
7.25%, 10/30/08 | | | 700,000 | | | 720,510 |
TNK-BP Finance SA | | | | | | |
7.50%, 07/18/16 144A | | | 780,000 | | | 831,675 |
Unicredito Luxembourg Finance SA | | | | | | |
5.43%, 10/24/08 144A† | | | 4,000,000 | | | 4,001,952 |
VTB Capital SA for Vneshtorgbank | | | | | | |
5.97%, 08/01/08 144A† | | | 970,000 | | | 971,697 |
5.98%, 08/01/08 144A† | | | 800,000 | | | 800,848 |
| | | | | | |
| | | | | | 8,639,032 |
| | | | | | |
| | |
Malaysia — 0.1% | | | | | | |
Petronas Capital, Ltd. | | | | | | |
7.88%, 05/22/22 144A | | | 430,000 | | | 530,702 |
| | | | | | |
| | |
Marshall Islands — 0.0% | | | | | | |
Teekay Shipping Corporation | | | | | | |
8.88%, 07/15/11D | | | 176,000 | | | 189,860 |
| | | | | | |
| | |
Mexico — 0.4% | | | | | | |
America Movil SA de CV | | | | | | |
5.50%, 03/01/14 | | | 300,000 | | | 294,007 |
United Mexican States | | | | | | |
5.63%, 01/15/17 | | | 300,000 | | | 301,050 |
11.50%, 05/15/26D | | | 1,070,000 | | | 1,733,400 |
8.30%, 08/15/31D | | | 660,000 | | | 845,460 |
7.50%, 04/08/33D | | | 1,083,000 | | | 1,280,647 |
| | | | | | |
| | | | | | 4,454,564 |
| | | | | | |
| | |
Netherlands — 0.3% | | | | | | |
Deutsche Telekom International Finance BV | | | | | | |
5.75%, 03/23/16D | | | 510,000 | | | 503,394 |
8.25%, 06/15/30 | | | 600,000 | | | 739,732 |
Majapahit Holding BV | | | | | | |
7.25%, 10/17/11 144A@ | | | 50,000 | | | 51,563 |
NXP BV | | | | | | |
7.88%, 10/15/14 144AD | | | 30,000 | | | 31,162 |
Rabobank Nederland | | | | | | |
0.20%, 06/20/08(J) | | | 150,000,000 | | | 1,251,512 |
Royal KPN NV | | | | | | |
8.00%, 10/01/10D | | | 780,000 | | | 842,288 |
TPSA Finance BV | | | | | | |
7.75%, 12/10/08 144AD | | | 375,000 | | | 389,522 |
| | | | | | |
| | | | | | 3,809,173 |
| | | | | | |
| | |
Panama — 0.1% | | | | | | |
Republic of Panama | | | | | | |
9.63%, 08/08/11 | | | 1,000 | | | 1,145 |
7.13%, 01/29/26 | | | 538,000 | | | 583,730 |
9.38%, 04/01/29 | | | 21,000 | | | 28,140 |
6.70%, 01/26/36D | | | 549,000 | | | 573,705 |
| | | | | | |
| | | | | | 1,186,720 |
| | | | | | |
| | |
Puerto Rico — 0.0% | | | | | | |
Telecomunicaciones de Puerto Rico, Inc. | | | | | | |
6.80%, 05/15/09 | | | 350,000 | | | 357,463 |
| | | | | | |
| | |
Russia — 0.7% | | | | | | |
Ministry Finance of Russia | | | | | | |
3.00%, 05/14/08 | | | 750,000 | | | 725,775 |
Russian Federation | | | | | | |
8.25%, 03/31/10 | | | 2,255,591 | | | 2,363,634 |
5.00%, 03/31/30 STEP | | | 4,700,000 | | | 5,317,214 |
| | | | | | |
| | | | | | 8,406,623 |
| | | | | | |
| | |
South Korea — 0.0% | | | | | | |
Export-Import Bank of Korea | | | | | | |
5.25%, 02/10/14 144A | | | 235,000 | | | 233,095 |
| | | | | | |
| | |
Supranational — 0.8% | | | | | | |
Inter-American Development Bank | | | | | | |
1.00%, 03/24/15 | | | 13,000,000 | | | 9,412,884 |
| | | | | | |
| | |
United Kingdom — 0.5% | | | | | | |
HBOS Capital Funding LP | | | | | | |
6.07%, 12/31/49 144A†D | | | 600,000 | | | 609,281 |
HSBC Capital Funding LP | | | | | | |
4.61%, 12/29/49 144A†D | | | 960,000 | | | 896,466 |
| | |
| 68 | | See Notes to Financial Statements. |
| | | | | | |
| | | Par | | Value |
Royal & Sun Alliance Insurance Group | | | | | | |
8.50%, 12/08/14(U)† | | $ | 150,000 | | $ | 332,377 |
Royal Bank of Scotland Group PLC | | | | | | |
5.37%, 12/21/07 144A† | | | 1,100,000 | | | 1,101,149 |
United Kingdom Gilt | | | | | | |
4.25%, 03/07/11(U) | | | 1,600,000 | | | 3,039,474 |
| | | | | | |
| | | | | | 5,978,747 |
| | | | | | |
| | |
Venezuela — 0.0% | | | | | | |
Petrozuata Finance, Inc. | | | | | | |
8.22%, 04/01/17 144A | | | 140,000 | | | 140,350 |
| | | | | | |
| | |
Total Foreign Bonds | | | | | | |
(Cost $131,693,123) | | | | | | 136,214,351 |
| | | | | | |
| | |
MORTGAGE-BACKED SECURITIES — 55.3% | | | | | | |
ABN AMRO Mortgage Corporation | | | | | | |
16.67%, 06/25/33 IOW@ | | | 700,503 | | | 75,297 |
Banc of America Commercial Mortgage, Inc. | | | | | | |
5.12%, 10/10/45† | | | 3,000,000 | | | 2,954,709 |
5.63%, 07/10/46 | | | 1,000,000 | | | 1,020,799 |
5.18%, 09/10/47† | | | 3,000,000 | | | 2,980,992 |
Banc of America Funding Corporation | | | | | | |
5.41%, 07/20/36† | | | 4,010,562 | | | 4,004,444 |
Bear Stearns Adjustable Rate Mortgage Trust | | | | | | |
5.62%, 02/25/33† | | | 387,903 | | | 386,439 |
3.52%, 06/25/34† | | | 1,300,000 | | | 1,256,577 |
Bear Stearns Alt-A Trust | | | | | | |
5.64%, 02/25/34 STEP | | | 209,505 | | | 209,608 |
5.39%, 05/25/35† | | | 1,041,986 | | | 1,038,400 |
Bear Stearns Commercial Mortgage Securities | | | | | | |
5.71%, 09/11/38† | | | 1,500,000 | | | 1,546,368 |
CC Mortgage Funding Corporation | | | | | | |
5.70%, 07/25/34 144A† | | | 434,121 | | | 434,340 |
Citigroup Commercial Mortgage Trust | | | | | | |
5.39%, 11/15/36 144A† | | | 995,836 | | | 997,553 |
Commerical Mortgage Asset Trust | | | | | | |
7.55%, 01/17/10† | | | 440,000 | | | 459,511 |
Countrywide Alternative Loan Trust | | | | | | |
5.67%, 09/25/35† | | | 4,128,494 | | | 4,142,970 |
5.68%, 10/25/35 STEP | | | 2,884,247 | | | 2,889,056 |
5.65%, 11/20/35† | | | 5,728,352 | | | 5,748,293 |
5.67%, 11/20/35† | | | 2,669,347 | | | 2,681,405 |
5.70%, 11/20/35† | | | 1,218,445 | | | 1,222,061 |
5.59%, 12/25/35† | | | 1,504,340 | | | 1,505,941 |
5.62%, 12/25/35 STEP | | | 2,128,947 | | | 2,128,927 |
5.59%, 02/25/36 STEP | | | 2,283,039 | | | 2,286,499 |
5.63%, 03/20/46† | | | 847,314 | | | 848,143 |
Countrywide Home Loan Mortgage Pass-Through Trust | | | | | | |
5.56%, 03/25/36† | | | 1,113,598 | | | 1,115,059 |
CS First Boston Mortgage Securities Corporation | | | | | | |
15.72%, 04/25/33 IOW@ | | | 63,663 | | | 2,716 |
15.16%, 05/25/33 IOW@ | | | 51,126 | | | 2,307 |
19.58%, 06/25/33 IOW@ | | | 50,526 | | | 2,862 |
8.67%, 07/25/33 IOW†@ | | | 536,147 | | | 3,096 |
16.95%, 07/25/33 IOW@ | | | 829,726 | | | 107,713 |
8.89%, 08/25/33 IOW†@ | | | 633,272 | | | 3,773 |
6.53%, 06/15/34 | | | 1,500,000 | | | 1,569,125 |
Federal Home Loan Mortgage Corporation | | | | | | |
7.00%, 11/01/14 | | | 96,576 | | | 99,202 |
7.00%, 04/01/15 | | | 77,972 | | | 80,092 |
8.00%, 06/01/15 | | | 1,092 | | | 1,098 |
7.00%, 12/01/15 | | | 66,201 | | | 68,012 |
6.00%, 04/15/16 | | | 135,715 | | | 135,614 |
8.50%, 06/01/16 | | | 15,672 | | | 16,607 |
4.50%, 05/01/18 | | | 222,453 | | | 214,974 |
4.50%, 06/01/18 | | | 52,668 | | | 50,883 |
8.50%, 06/01/18 | | | 11,774 | | | 12,476 |
4.50%, 09/01/18 | | | 212,613 | | | 205,408 |
4.50%, 10/01/18 | | | 155,095 | | | 149,849 |
4.50%, 11/01/18 | | | 159,798 | | | 154,395 |
4.50%, 12/01/18 | | | 494,400 | | | 477,647 |
5.00%, 12/01/18 | | | 935,161 | | | 920,846 |
4.50%, 01/01/19 | | | 58,313 | | | 56,337 |
4.50%, 03/01/19 | | | 115,453 | | | 111,528 |
4.50%, 06/01/19 | | | 2,141,540 | | | 2,068,968 |
0.24%, 04/15/22 POW@ | | | 46,418 | | | 46,065 |
8.00%, 08/01/24 | | | 8,169 | | | 8,607 |
7.50%, 11/01/29 | | | 25,020 | | | 26,111 |
6.50%, 12/01/29 | | | 526,441 | | | 540,278 |
7.50%, 12/01/29 | | | 39,080 | | | 40,784 |
7.50%, 02/01/31 | | | 53,369 | | | 55,516 |
7.19%, 07/01/31† | | | 64,294 | | | 65,474 |
7.23%, 08/01/31† | | | 20,641 | | | 21,063 |
7.50%, 11/01/31 | | | 49,009 | | | 50,953 |
7.09%, 04/01/32† | | | 21,057 | | | 21,268 |
4.29%, 03/01/34† | | | 19,958 | | | 19,644 |
5.50%, 05/01/35 | | | 2,817,287 | | | 2,786,737 |
5.00%, 09/01/35 | | | 2,235,658 | | | 2,157,894 |
5.00%, 10/01/35 | | | 878,898 | | | 848,327 |
5.00%, 12/01/35 | | | 3,970,412 | | | 3,832,309 |
5.00%, 01/01/36 TBA | | | 2,200,000 | | | 2,122,314 |
4.43%, 02/01/36 POW@ | | | 1,315,785 | | | 986,854 |
6.00%, 02/01/36 | | | 2,672,177 | | | 2,691,940 |
4.00%, 01/01/49 | | | 4,685,327 | | | 4,409,991 |
Federal Housing Administration | | | | | | |
7.43%, 10/01/18† | | | 380,491 | | | 376,669 |
Federal National Mortgage Association | | | | | | |
6.50%, 05/25/08 | | | 114,236 | | | 114,488 |
20.00%, 10/25/08 IOW†@ | | | 93,827 | | | 1,090 |
4.00%, 06/01/13 | | | 110,901 | | | 107,305 |
4.00%, 07/01/13 | | | 147,936 | | | 143,141 |
4.00%, 08/01/13 | | | 205,358 | | | 198,656 |
4.00%, 09/01/13 | | | 388,856 | | | 376,075 |
4.00%, 10/01/13 | | | 804,699 | | | 778,039 |
8.00%, 06/01/15 | | | 54,704 | | | 57,523 |
8.00%, 06/15/15 | | | 14,468 | | | 15,214 |
8.00%, 07/01/15 | | | 59,943 | | | 63,032 |
8.00%, 09/01/15 | | | 83,641 | | | 86,432 |
5.00%, 12/25/15 | | | 309,812 | | | 307,764 |
6.00%, 05/01/16 | | | 222,661 | | | 225,975 |
6.00%, 07/01/16 | | | 26,849 | | | 27,249 |
5.00%, 11/01/17 | | | 279,732 | | | 275,870 |
5.00%, 12/01/17 | | | 2,176,223 | | | 2,145,655 |
5.00%, 01/01/18 | | | 3,409,584 | | | 3,361,867 |
| | | | |
| | See Notes to Financial Statements. | | 69 |
| | |
| Medium-Duration Bond Fund | | |
| SCHEDULE OF INVESTMENTS (Continued) | | |
| | | | | | |
| | | Par | | Value |
5.00%, 02/01/18 | | $ | 605,608 | | $ | 597,125 |
5.50%, 02/01/18 | | | 243,351 | | | 243,333 |
4.50%, 04/01/18 | | | 181,826 | | | 175,834 |
5.00%, 04/01/18 | | | 171,919 | | | 169,389 |
4.50%, 05/01/18 | | | 1,534,977 | | | 1,484,398 |
5.00%, 05/01/18 | | | 1,137,370 | | | 1,120,633 |
4.50%, 06/01/18 | | | 2,068,796 | | | 2,000,629 |
5.00%, 06/01/18 | | | 144,662 | | | 142,183 |
4.50%, 07/01/18 | | | 108,844 | | | 105,257 |
4.00%, 09/01/18 | | | 4,654,680 | | | 4,395,417 |
4.50%, 09/01/18 | | | 2,968,690 | | | 2,870,871 |
4.50%, 10/01/18 | | | 81,668 | | | 78,977 |
4.50%, 11/01/18 | | | 317,772 | | | 307,301 |
5.00%, 11/01/18 | | | 586,771 | | | 578,137 |
4.50%, 12/01/18 | | | 399,597 | | | 386,430 |
4.50%, 01/01/19 | | | 82,444 | | | 79,728 |
4.50%, 03/01/19 | | | 116,008 | | | 112,186 |
5.00%, 04/01/19 | | | 967,562 | | | 953,324 |
4.00%, 05/01/19 | | | 12,359,479 | | | 11,661,819 |
4.50%, 06/01/19 | | | 14,282 | | | 13,794 |
4.50%, 09/01/19 | | | 965,691 | | | 933,871 |
4.50%, 03/01/20 | | | 275,711 | | | 266,626 |
4.50%, 04/01/20 | | | 721,330 | | | 697,562 |
5.50%, 01/01/21 TBA | | | 10,800,000 | | | 10,796,630 |
6.88%, 08/25/21 IOW@ | | | 336 | | | 8,311 |
10.37%, 10/25/21 IOW@ | | | 642 | | | 13,888 |
6.00%, 01/01/22 TBA | | | 550,000 | | | 557,563 |
4.50%, 01/17/22 TBA | | | 3,000,000 | | | 2,893,125 |
18.56%, 01/25/22† | | | 192,412 | | | 222,553 |
4.16%, 03/25/22† | | | 196,880 | | | 194,905 |
9.50%, 05/01/22 | | | 8,092 | | | 8,785 |
5.13%, 07/01/22† | | | 36,533 | | | 36,845 |
6.00%, 01/01/23 | | | 195,961 | | | 198,556 |
9.50%, 07/01/24 | | | 15,138 | | | 16,366 |
5.43%, 07/01/27† | | | 57,442 | | | 57,892 |
6.64%, 08/01/27† | | | 145,125 | | | 147,189 |
5.39%, 11/01/27† | | | 107,669 | | | 108,513 |
6.50%, 12/25/28 | | | 31,912 | | | 31,893 |
7.39%, 02/01/30† | | | 192,304 | | | 191,859 |
5.92%, 05/25/30† | | | 2,770,007 | | | 2,785,919 |
7.15%, 06/01/30† | | | 82,333 | | | 84,475 |
8.00%, 10/01/30 | | | 85,462 | | | 90,140 |
5.77%, 10/18/30† | | | 82,738 | | | 83,440 |
7.17%, 12/01/30† | | | 19,888 | | | 20,145 |
5.43%, 01/01/31† | | | 18,094 | | | 18,236 |
6.95%, 05/01/31† | | | 19,613 | | | 19,618 |
6.88%, 06/01/31† | | | 73,039 | | | 74,442 |
6.93%, 06/01/31† | | | 12,715 | | | 12,962 |
6.00%, 01/01/32 | | | 137,697 | | | 138,977 |
6.00%, 03/01/32 | | | 419,550 | | | 423,545 |
6.50%, 03/01/32 | | | 473,888 | | | 488,723 |
6.00%, 04/01/32 | | | 966,044 | | | 974,859 |
5.53%, 06/01/32† | | | 22,706 | | | 22,885 |
5.13%, 08/01/32† | | | 42,312 | | | 42,962 |
5.00%, 01/01/33 TBA | | | 7,500,000 | | | 7,371,090 |
5.64%, 02/01/33† | | | 29,814 | | | 30,205 |
5.13%, 05/01/33† | | | 114,246 | | | 115,950 |
5.50%, 05/01/33‡‡ | | | 20,907,908 | | | 20,694,780 |
0.01%, 07/25/33 IOW†@ | | | 496,386 | | | 19,163 |
3.85%, 10/01/33† | | | 1,659,662 | | | 1,636,303 |
5.50%, 04/01/34 | | | 16,971,689 | | | 16,799,808 |
0.01%, 04/25/34 IOW†@ | | | 721,048 | | | 18,348 |
0.01%, 06/25/34 IOW†@ | | | 1,103,104 | | | 39,050 |
5.50%, 09/01/34 | | | 16,250,366 | | | 16,076,150 |
7.50%, 09/01/34 | | | 44,939 | | | 46,564 |
4.50%, 10/01/34 | | | 332,946 | | | 313,016 |
6.00%, 10/01/34 | | | 191,449 | | | 192,884 |
4.50%, 11/01/34 | | | 1,418,083 | | | 1,331,399 |
5.50%, 11/01/34‡‡ | | | 20,806,809 | | | 20,583,745 |
4.50%, 12/01/34 | | | 437,920 | | | 410,963 |
4.61%, 12/01/34† | | | 1,030,683 | | | 1,018,058 |
6.00%, 01/01/35 | | | 2,958,878 | | | 2,981,054 |
4.50%, 02/01/35 | | | 477,487 | | | 448,095 |
5.50%, 02/01/35 | | | 27,008,771 | | | 26,719,217 |
4.50%, 03/01/35 | | | 1,930,556 | | | 1,810,143 |
4.50%, 04/01/35 | | | 998,732 | | | 936,187 |
4.50%, 05/01/35 | | | 853,395 | | | 799,953 |
6.00%, 05/01/35 | | | 3,797,915 | | | 3,824,460 |
7.50%, 05/01/35 | | | 475,150 | | | 492,332 |
7.50%, 06/01/35 | | | 55,906 | | | 57,928 |
4.50%, 07/01/35 | | | 498,705 | | | 467,474 |
6.00%, 07/01/35 | | | 1,119,742 | | | 1,127,568 |
4.50%, 09/01/35 | | | 137,834 | | | 129,202 |
5.50%, 09/01/35 | | | 1,802,647 | | | 1,782,059 |
7.50%, 09/01/35 | | | 55,961 | | | 57,984 |
4.50%, 10/01/35 | | | 344,182 | | | 322,628 |
6.00%, 10/01/35 | | | 341,157 | | | 343,541 |
7.50%, 10/01/35 | | | 919,291 | | | 952,534 |
4.52%, 11/01/35 POW@ | | | 1,441,491 | | | 1,086,004 |
5.35%, 11/01/35† | | | 50,797 | | | 51,207 |
6.00%, 11/01/35 | | | 1,740,688 | | | 1,752,854 |
6.67%, 11/01/35† | | | 2,816,292 | | | 2,911,189 |
6.77%, 11/01/35† | | | 707,378 | | | 731,192 |
4.50%, 01/01/36 TBA | | | 1,800,000 | | | 1,686,375 |
5.50%, 01/01/36 TBA | | | 4,900,000 | | | 4,841,813 |
6.00%, 01/01/36 TBA | | | 37,150,000 | | | 37,393,778 |
6.50%, 01/01/36 TBA | | | 21,480,000 | | | 21,882,750 |
5.00%, 01/12/36 TBA | | | 59,050,000 | | | 57,001,674 |
5.00%, 02/01/36 TBA | | | 1,000,000 | | | 965,312 |
5.00%, 02/01/36‡‡ | | | 18,841,146 | | | 18,195,686 |
6.00%, 02/01/36 | | | 1,322,366 | | | 1,331,319 |
5.47%, 05/01/36† | | | 621,928 | | | 626,948 |
5.50%, 06/01/36 | | | 985,985 | | | 974,379 |
7.50%, 06/01/36 | | | 922,416 | | | 955,757 |
6.00%, 07/01/36 | | | 1,411,312 | | | 1,420,867 |
6.00%, 08/01/36 | | | 2,972,068 | | | 2,992,192 |
7.50%, 08/01/36 | | | 45,213 | | | 46,847 |
6.00%, 09/01/36 | | | 3,864,480 | | | 3,890,646 |
6.00%, 10/01/36 | | | 18,997,453 | | | 19,126,295 |
7.50%, 10/01/36 | | | 430,583 | | | 446,147 |
6.00%, 01/11/37 TBA | | | 23,000,000 | | | 23,150,926 |
6.50%, 01/11/37 TBA | | | 45,000,000 | | | 45,843,750 |
5.40%, 12/01/37† | | | 232,294 | | | 234,193 |
5.43%, 01/01/38† | | | 100,421 | | | 101,246 |
6.06%, 06/01/40† | | | 205,815 | | | 209,535 |
6.06%, 10/01/40† | | | 509,133 | | | 518,370 |
5.43%, 11/01/40† | | | 73,065 | | | 73,671 |
FFCA Secured Lending Corporation | | | | | | |
9.25%, 07/18/20 IO 144AW†@ | | | 1,538,734 | | | 50,009 |
FHLMC Structured Pass-Through Securities | | | | | | |
6.16%, 07/25/44† | | | 4,513,103 | | | 4,534,582 |
First Horizon Alternative Mortgage Securities | | | | | | |
4.75%, 06/25/34† | | | 1,192,417 | | | 1,184,074 |
| | |
| 70 | | See Notes to Financial Statements. |
| | | | | | |
| | | Par | | Value |
First Union National Bank Commercial Mortgage Trust | | | | | | |
7.20%, 10/01/32 | | $ | 1,500,000 | | $ | 1,583,750 |
GE Capital Commercial Mortgage Corporation | | | | | | |
5.51%, 11/10/45† | | | 1,230,000 | | | 1,235,437 |
GMAC Commercial Mortgage Securities, Inc. | | | | | | |
6.87%, 08/15/07 | | | 185,737 | �� | | 186,333 |
6.28%, 11/15/39 | | | 2,000,000 | | | 2,084,203 |
Government National Mortgage Association | | | | | | |
7.00%, 10/15/25 | | | 68,280 | | | 70,593 |
7.00%, 01/15/26 | | | 31,768 | | | 32,858 |
7.00%, 07/15/27 | | | 240,515 | | | 248,832 |
7.00%, 12/15/27 | | | 4,120 | | | 4,262 |
7.00%, 01/15/28 | | | 33,407 | | | 34,523 |
7.00%, 03/15/28 | | | 296,534 | | | 306,781 |
7.00%, 07/15/28 | | | 31,565 | | | 32,619 |
7.50%, 07/15/28 | | | 15,786 | | | 16,489 |
6.50%, 08/15/28 | | | 35,137 | | | 36,155 |
7.00%, 08/15/28 | | | 48,095 | | | 49,701 |
7.50%, 08/15/28 | | | 38,294 | | | 40,000 |
6.50%, 09/15/28 | | | 184,322 | | | 189,666 |
7.00%, 10/15/28 | | | 80,719 | | | 83,415 |
7.50%, 03/15/29 | | | 75,801 | | | 79,258 |
7.50%, 11/15/29 | | | 42,794 | | | 44,652 |
5.13%, 11/20/29† | | | 170,080 | | | 172,536 |
8.50%, 08/15/30 | | | 6,452 | | | 6,923 |
8.50%, 11/20/30 | | | 47,214 | | | 50,473 |
6.50%, 08/15/31 | | | 280,529 | | | 287,826 |
7.50%, 08/15/31 | | | 97,463 | | | 101,746 |
6.50%, 10/15/31 | | | 442,609 | | | 454,331 |
6.00%, 11/15/31 | | | 1,106,736 | | | 1,122,167 |
6.50%, 11/15/31 | | | 393,205 | | | 403,433 |
6.00%, 12/15/31 | | | 350,646 | | | 355,535 |
6.00%, 01/15/32 | | | 614,810 | | | 624,236 |
6.00%, 02/15/32 | | | 651,567 | | | 660,652 |
6.50%, 02/15/32 | | | 757,433 | | | 777,796 |
7.50%, 02/15/32 | | | 46,569 | | | 48,626 |
12.60%, 02/16/32† | | | 269,315 | | | 332,993 |
6.00%, 04/15/32 | | | 654,220 | | | 664,251 |
6.50%, 04/15/32 | | | 486,944 | | | 499,609 |
7.50%, 04/15/32 | | | 108,701 | | | 113,503 |
6.50%, 06/15/32 | | | 1,589,631 | | | 1,632,441 |
6.50%, 07/15/32 | | | 226,427 | | | 232,317 |
6.50%, 08/15/32 | | | 702,542 | | | 720,816 |
6.50%, 09/15/32 | | | 765,858 | | | 785,780 |
6.00%, 10/15/32 | | | 721,137 | | | 731,192 |
6.00%, 11/15/32 | | | 652,598 | | | 661,943 |
6.00%, 12/15/32 | | | 315,174 | | | 319,569 |
6.50%, 12/15/32 | | | 49,708 | | | 51,001 |
6.00%, 01/15/33 | | | 325,389 | | | 329,926 |
6.00%, 02/15/33 | | | 254,391 | | | 257,938 |
6.50%, 03/15/33 | | | 135,189 | | | 138,705 |
5.00%, 04/15/33 | | | 324,148 | | | 315,635 |
6.50%, 04/15/33 | | | 1,898,933 | | | 1,948,326 |
5.00%, 05/15/33 | | | 2,596,854 | | | 2,528,948 |
6.00%, 05/15/33 | | | 2,298,459 | | | 2,330,506 |
5.00%, 06/15/33 | | | 339,825 | | | 330,901 |
6.00%, 06/15/33 | | | 215,026 | | | 218,024 |
5.00%, 07/15/33 | | | 803,822 | | | 782,713 |
5.00%, 08/15/33 | | | 1,602,921 | | | 1,559,285 |
5.00%, 09/15/33 | | | 1,154,766 | | | 1,122,871 |
5.00%, 10/15/33 | | | 630,471 | | | 613,338 |
6.00%, 10/15/33 | | | 1,043,623 | | | 1,058,174 |
6.50%, 10/15/33 | | | 394,292 | | | 404,548 |
5.00%, 11/15/33 | | | 76,978 | | | 74,966 |
6.00%, 12/15/33 | | | 1,184,351 | | | 1,200,864 |
5.00%, 01/15/34 | | | 515,653 | | | 501,834 |
5.00%, 03/15/34 | | | 655,673 | | | 638,101 |
5.00%, 04/15/34 | | | 248,237 | | | 241,584 |
5.00%, 05/15/34 | | | 155,827 | | | 151,651 |
5.00%, 06/15/34 | | | 980,544 | | | 954,266 |
5.00%, 08/15/34 | | | 633,638 | | | 616,658 |
5.00%, 11/15/34 | | | 1,443,522 | | | 1,404,839 |
5.00%, 12/15/34 | | | 1,429,276 | | | 1,390,975 |
5.00%, 01/15/35 | | | 886,497 | | | 862,247 |
6.00%, 06/15/36 | | | 954,783 | | | 968,096 |
GS Mortgage Securities Corporation II | | | | | | |
4.68%, 07/10/39 | | | 1,300,000 | | | 1,262,495 |
GSMPS Mortgage Loan Trust | | | | | | |
5.58%, 02/25/35 144A�� | | | 804,891 | | | 804,856 |
5.70%, 09/25/35† | | | 3,011,082 | | | 3,015,515 |
GSR Mortgage Loan Trust | | | | | | |
4.54%, 10/25/35† | | | 1,488,176 | | | 1,461,826 |
HarborView Mortgage Loan Trust | | | | | | |
5.63%, 11/19/35 STEP | | | 708,386 | | | 710,320 |
5.56%, 01/19/36 STEP | | | 556,951 | | | 558,419 |
5.57%, 01/19/36 STEP | | | 2,373,163 | | | 2,380,113 |
5.54%, 12/19/37† | | | 3,248,114 | | | 3,248,114 |
Impac CMB Trust | | | | | | |
5.68%, 10/25/34† | | | 365,885 | | | 366,080 |
5.58%, 11/25/35 STEP | | | 2,182,214 | | | 2,185,377 |
Impac Secured Assets CMN Owner Trust | | | | | | |
5.57%, 05/25/35† | | | 1,940,985 | | | 1,939,868 |
Indymac ARM Trust | | | | | | |
6.51%, 09/28/31† | | | 40,386 | | | 40,249 |
Indymac Index Mortgage Loan Trust | | | | | | |
5.10%, 09/25/35† | | | 722,789 | | | 701,560 |
5.54%, 04/25/46† | | | 1,745,523 | | | 1,746,873 |
JP Morgan Chase Commercial Mortgage Securities Corporation | | | | | | |
4.90%, 09/12/37 | | | 2,900,000 | | | 2,814,164 |
4.92%, 10/15/42† | | | 200,000 | | | 194,162 |
JPMorgan Chase Commercial Mortgage Securities Corporation | | | | | | |
5.43%, 12/12/43 | | | 3,000,000 | | | 3,015,215 |
LB-UBS Commercial Mortgage Trust | | | | | | |
4.66%, 07/15/30 | | | 1,000,000 | | | 970,591 |
4.74%, 07/15/30 | | | 830,000 | | | 797,893 |
5.16%, 02/15/31 | | | 2,000,000 | | | 1,974,311 |
7.58%, 06/15/36 IO 144AW†@ | | | 4,548,696 | | | 163,416 |
4.95%, 09/15/40 | | | 900,000 | | | 877,778 |
Luminent Mortgage Trust | | | | | | |
5.52%, 02/25/46† | | | 1,779,950 | | | 1,780,582 |
MASTR Adjustable Rate Mortgages Trust | | | | | | |
5.19%, 05/25/34† | | | 644,112 | | | 642,189 |
5.51%, 11/25/46† | | | 1,985,429 | | | 1,984,498 |
| | | | |
| | See Notes to Financial Statements. | | 71 |
| | |
| Medium-Duration Bond Fund | | |
| SCHEDULE OF INVESTMENTS (Continued) | | |
| | | | | | |
| | | Par | | Value |
MASTR Reperforming Loan Trust | | | | | | |
7.00%, 08/25/34 144A | | $ | 1,218,212 | | $ | 1,257,265 |
MLCC Mortgage Investors, Inc. | | | | | | |
5.78%, 09/25/27 STEP | | | 958,122 | | | 958,962 |
Morgan Stanley Capital I | | | | | | |
5.16%, 10/12/42† | | | 3,000,000 | | | 2,964,118 |
Nomura Asset Acceptance Corporation | | | | | | |
5.05%, 06/25/10† | | | 2,818,969 | | | 2,797,054 |
Opteum Mortgage Acceptance Corporation | | | | | | |
5.49%, 08/25/35 STEP | | | 1,690,153 | | | 1,690,693 |
Prime Mortgage Trust | | | | | | |
5.50%, 05/25/35 144A | | | 8,995,867 | | | 8,934,643 |
6.00%, 05/25/35 144A | | | 1,352,874 | | | 1,363,560 |
6.00%, 11/25/36 144A | | | 4,606,111 | | | 4,591,487 |
Residential Asset Mortgage Products, Inc. | | | | | | |
5.77%, 06/25/33 144A† | | | 1,133,993 | | | 1,136,831 |
Sequoia Mortgage Trust | | | | | | |
5.91%, 07/20/33† | | | 490,575 | | | 491,059 |
5.80%, 11/20/34 STEP | | | 533,490 | | | 534,452 |
Structured Adjustable Rate Mortgage Loan Trust | | | | | | |
5.66%, 08/25/35† | | | 1,760,958 | | | 1,766,846 |
Structured Asset Mortgage Investments, Inc. | | | | | | |
5.63%, 12/25/35 STEP | | | 1,978,905 | | | 1,982,888 |
5.55%, 02/25/36† | | | 1,688,115 | | | 1,689,022 |
Thornburg Mortgage Securities Trust | | | | | | |
5.43%, 06/25/09† | | | 4,194,893 | | | 4,185,848 |
5.52%, 12/25/35† | | | 4,335,293 | | | 4,331,246 |
5.52%, 01/25/36† | | | 6,171,043 | | | 6,162,517 |
Wachovia Bank Commercial Mortgage Trust | | | | | | |
5.20%, 10/15/44† | | | 3,000,000 | | | 2,985,728 |
WAMU Alternative Mortgage Pass-Through Certificates | | | | | | |
5.60%, 11/25/46† | | | 2,973,681 | | | 2,973,681 |
Washington Mutual, Inc. | | | | | | |
8.75%, 01/25/08 IOW†@ | | | 775,046 | | | 7,839 |
8.74%, 05/25/08 IOW@ | | | 1,714,580 | | | 7,242 |
8.96%, 06/25/08 IOW†@ | | | 2,689,304 | | | 27,894 |
5.59%, 12/25/27 STEP | | | 3,578,247 | | | 3,577,601 |
4.68%, 02/25/33† | | | 143,763 | | | 142,063 |
5.57%, 12/27/36† | | | 1,000,000 | | | 1,000,000 |
6.16%, 06/25/42† | | | 154,591 | | | 154,657 |
5.61%, 07/25/45† | | | 3,142,479 | | | 3,153,066 |
5.64%, 07/25/45† | | | 2,075,244 | | | 2,082,138 |
5.64%, 08/25/45† | | | 1,676,208 | | | 1,680,774 |
5.67%, 08/25/45† | | | 4,587,223 | | | 4,599,718 |
5.61%, 10/25/45† | | | 5,604,638 | | | 5,612,175 |
5.58%, 11/25/45† | | | 2,237,218 | | | 2,244,651 |
5.59%, 12/25/45† | | | 1,607,706 | | | 1,612,156 |
5.61%, 12/25/45† | | | 3,408,336 | | | 3,418,165 |
5.58%, 11/25/46† | | | 964,437 | | | 964,437 |
9.74%, 01/01/49 IOW†@ | | | 1,956,512 | | | 13,820 |
Wells Fargo Mortgage-Backed Securities Trust | | | | | | |
3.54%, 09/25/34† | | | 2,440,000 | | | 2,379,520 |
4.97%, 10/25/35† | | | 2,155,044 | | | 2,142,245 |
5.09%, 03/25/36† | | | 3,642,057 | | | 3,617,599 |
Zuni Mortgage Loan Trust | | | | | | |
5.45%, 07/25/36† | | | 3,789,138 | | | 3,784,419 |
| | | | | | |
| | |
Total Mortgage-Backed Securities | | | | | | |
(Cost $689,326,522) | | | | | | 685,919,223 |
| | | | | | |
| | |
MUNICIPAL BONDS — 0.3% | | | | | | |
South Carolina Transportation Infrastructure Bank, Series A Revenue Bond (AMBAC Insured) | | | | | | |
5.00%, 10/01/23 | | | 2,700,000 | | | 2,820,150 |
Virginia State Housing Development Authority, Commonwealth Mortgage, Series H Revenue Bond (MBIA Insured) | | | | | | |
5.38%, 07/01/36 | | | 1,000,000 | | | 1,042,650 |
| | | | | | |
| | |
Total Municipal Bonds | | | | | | |
(Cost $3,630,079) | | | | | | 3,862,800 |
| | | | | | |
| | |
| | | Number of
Contracts | | |
PURCHASED OPTIONS — 0.2% | | | | | | |
Call Options — 0.0% | | | | | | |
10-Year U.S. Treasury Note Futures, Strike Price $115.00, Expires 02/23/07 | | | 249 | | | 3,891 |
1-Year Eurodollar Mid-CRV Futures, Strike Price $95.00, Expires 09/14/07 | | | 250 | | | 234,375 |
1-Year Eurodollar Mid-CRV Futures, Strike Price $95.25, Expires 09/14/07 | | | 453 | | | 283,125 |
| | | | | | |
| | | | | | 521,391 |
| | | | | | |
| | |
Call Swaptions — 0.1% | | | | | | |
3-Month LIBOR, Strike Price $4.50, Expires 01/22/07 | | | 5,500 | | | 1 |
3-Month LIBOR, Strike Price $4.75, Expires 07/02/07 | | | 3,110 | | | 23,048 |
3-Month LIBOR, Strike Price $5.00, Expires 03/08/07 | | | 2,780 | | | 39,226 |
3-Month LIBOR, Strike Price $5.00, Expires 12/20/07 | | | 2,240 | | | 136,652 |
3-Month LIBOR, Strike Price $5.04, Expires 09/17/07 | | | 750 | | | 39,913 |
3-Month LIBOR, Strike Price $5.08, Expires 04/19/07 | | | 1,010 | | | 30,239 |
3-Month LIBOR, Strike Price $5.21, Expires 12/12/11 | | | 990 | | | 367,171 |
3-Month LIBOR, Strike Price $5.25, Expires 06/07/07 | | | 1,700 | | | 99,739 |
3-Month LIBOR, Strike Price $5.25, Expires 07/02/07 | | | 3,540 | | | 224,719 |
3-Month LIBOR, Strike Price $5.37, Expires 07/02/07 | | | 3,880 | | | 305,317 |
3-Month LIBOR, Strike Price $5.75, Expires 04/27/09 | | | 280 | | | 249,270 |
6-Month LIBOR, Strike Price $5.19, Expires 09/14/07 | | | 350 | | | 9,715 |
| | | | | | |
| | | | | | 1,525,010 |
| | | | | | |
| | |
| 72 | | See Notes to Financial Statements. |
| | | | | | |
| | | Number of
Contracts | | Value |
Put Options — 0.0% | | | | | | |
30-Year Federal National Mortgage Association, Strike Price $89.63, Expires 02/05/07 | | | 400 | | $ | 133 |
30-Year Federal National Mortgage Association, Strike Price $90.75, Expires 02/05/07 | | | 540 | | | 279 |
30-Year Federal National Mortgage Association, Strike Price $91.00, Expires 02/05/07 | | | 560 | | | 351 |
30-Year Federal National Mortgage Association, Strike Price $92.50, Expires 03/06/07 | | | 2,300 | | | 1,587 |
30-Year Federal National Mortgage Association, Strike Price $93.00, Expires 03/06/07 | | | 600 | | | 282 |
30-Year Federal National Mortgage Association, Strike Price $93.13, Expires 03/06/07 | | | 1,030 | | | 331 |
30-Year Federal National Mortgage Association, Strike Price $94.50, Expires 03/06/07 | | | 440 | | | 616 |
90-Day Eurodollar Futures, Strike Price $91.25, Expires 06/18/07 | | | 180 | | | 1,125 |
90-Day Eurodollar Futures, Strike Price $95.00, Expires 09/17/07 | | | 29 | | | 13,412 |
| | | | | | |
| | | | | | 18,116 |
| | | | | | |
| | |
Put Swaptions — 0.1% | | | | | | |
3-Month LIBOR, Strike Price $5.21, Expires 12/12/11 | | | 990 | | | 470,757 |
3-Month LIBOR, Strike Price $6.25, Expires 04/27/09 | | | 280 | | | 51,067 |
| | | | | | |
| | | | | | 521,824 |
| | | | | | |
| | |
Total Purchased Options | | | | | | |
(Cost $2,901,767) | | | | | | 2,586,341 |
| | | | | | |
| | |
| | | Shares | | |
PREFERRED STOCKS — 0.1% | | | | | | |
CORTS Trust for Ford Motor Co. | | | 9,100 | | | 178,269 |
General Motors Corporation CONV | | | 40,650 | | | 861,373 |
| | | | | | |
| | |
Total Preferred Stocks | | | | | | |
(Cost $873,008) | | | | | | 1,039,642 |
| | | | | | |
| | |
RIGHTS — 0.0% | | | | | | |
United Mexican States Recovery Rights Series E, | | | | | | |
06/30/07 | | | | | | |
(Cost $0) | | | 1,100,000 | | | 15,950 |
| | | | | | |
| | |
MONEY MARKET FUNDS — 29.2% | | | | | | |
GuideStone Funds Money Market Fund (GS4 Class)¥ | | | 104,258,409 | | $ | 104,258,409 |
Northern Institutional Liquid Assets Portfolio§ | | | 258,993,690 | | | 258,993,690 |
| | | | | | |
| | |
Total Money Market Funds | | | | | | |
(Cost $363,252,099) | | | | | | 363,252,099 |
| | | | | | |
| | |
| | | Par | | |
U.S. TREASURY OBLIGATIONS — 27.9% | | | | | | |
U.S. Treasury Bills | | | | | | |
4.80%, 03/15/07‡‡ | | $ | 770,000 | | | 762,673 |
4.81%, 03/15/07‡‡ | | | 865,000 | | | 856,769 |
| | | | | | |
| | | | | | 1,619,442 |
| | | | | | |
U.S. Treasury Bonds | | | | | | |
5.38%, 02/15/31D | | | 1,600,000 | | | 1,714,376 |
4.50%, 02/15/36D | | | 10,022,000 | | | 9,533,438 |
| | | | | | |
| | | | | | 11,247,814 |
| | | | | | |
U.S. Treasury Inflationary Index Bonds | | | | | | |
3.38%, 01/15/07D | | | 19,500,000 | | | 24,815,470 |
0.88%, 04/15/10D | | | 15,200,000 | | | 15,363,296 |
2.38%, 04/15/11D | | | 7,010,000 | | | 7,104,605 |
3.38%, 01/15/12D | | | 60,000 | | | 71,250 |
1.88%, 07/15/13D | | | 700,000 | | | 743,673 |
2.00%, 01/15/14D | | | 600,000 | | | 637,090 |
2.00%, 07/15/14D | | | 3,000,000 | | | 3,119,906 |
1.88%, 07/15/15D | | | 12,000,000 | | | 11,941,078 |
2.50%, 07/15/16D | | | 4,980,000 | | | 5,018,193 |
2.38%, 01/15/25D | | | 1,140,000 | | | 1,216,092 |
2.00%, 01/15/26D | | | 1,660,000 | | | 1,588,684 |
3.88%, 04/15/29D | | | 4,468,000 | | | 6,912,177 |
| | | | | | |
| | | | | | 78,531,514 |
| | | | | | |
U.S. Treasury Notes | | | | | | |
2.25%, 02/15/07D | | | 22,000,000 | | | 21,932,988 |
3.38%, 02/15/08 | | | 850,000 | | | 835,424 |
4.88%, 10/31/08D | | | 16,000,000 | | | 16,012,512 |
3.25%, 01/15/09 | | | 1,100,000 | | | 1,067,689 |
4.50%, 02/15/09D | | | 480,000 | | | 477,244 |
3.63%, 07/15/09 | | | 200,000 | | | 194,789 |
4.88%, 08/15/09D | | | 4,400,000 | | | 4,414,612 |
3.38%, 10/15/09D | | | 1,400,000 | | | 1,351,111 |
3.50%, 12/15/09 | | | 8,000,000 | | | 7,735,944 |
3.63%, 01/15/10 | | | 1,300,000 | | | 1,260,290 |
3.50%, 02/15/10D | | | 3,200,000 | | | 3,088,502 |
3.88%, 09/15/10 | | | 10,100,000 | | | 9,821,068 |
4.25%, 10/15/10 | | | 500,000 | | | 492,422 |
4.50%, 11/15/10D | | | 25,915,000 | | | 25,738,882 |
4.38%, 12/15/10 | | | 7,500,000 | | | 7,415,925 |
4.50%, 02/28/11 | | | 13,200,000 | | | 13,106,676 |
4.75%, 03/31/11 | | | 1,800,000 | | | 1,803,587 |
4.88%, 04/30/11D | | | 11,790,000 | | | 11,870,137 |
5.13%, 06/30/11 | | | 8,300,000 | | | 8,442,660 |
4.88%, 07/31/11 | | | 33,900,000 | | | 34,148,962 |
4.63%, 10/31/11D | | | 3,000,000 | | | 2,990,040 |
4.25%, 08/15/13D | | | 200,000 | | | 195,047 |
4.25%, 08/15/14 | | | 7,000,000 | | | 6,797,112 |
4.25%, 11/15/14D | | | 1,760,000 | | | 1,707,888 |
4.25%, 08/15/15D | | | 2,890,000 | | | 2,797,431 |
4.50%, 11/15/15D | | | 6,890,000 | | | 6,786,113 |
5.13%, 05/15/16D | | | 3,070,000 | | | 3,163,181 |
| | | | |
| | See Notes to Financial Statements. | | 73 |
| | |
| Medium-Duration Bond Fund | | |
| SCHEDULE OF INVESTMENTS (Continued) | | |
| | | | | | | | |
| | | Par | | | Value | |
4.88%, 08/15/16D | | $ | 23,110,000 | | | $ | 23,393,467 | |
4.50%, 11/15/16 | | | 4,810,000 | | | | 4,779,942 | |
4.63%, 11/15/16D | | | 6,400,000 | | | | 6,360,006 | |
| | | | | | | | |
| | | | | | | 230,181,651 | |
| | | | | | | | |
U.S. Treasury STRIPS | | | | | | | | |
4.98%, 11/15/21WD | | | 19,680,000 | | | | 9,482,887 | |
4.99%, 08/15/24WD | | | 19,700,000 | | | | 8,265,253 | |
4.96%, 11/15/24WD | | | 2,200,000 | | | | 916,502 | |
4.96%, 02/15/25W | | | 4,100,000 | | | | 1,684,251 | |
4.96%, 08/15/25WD | | | 3,100,000 | | | | 1,247,105 | |
4.97%, 05/15/26WD | | | 1,500,000 | | | | 579,513 | |
4.96%, 11/15/26WD | | | 3,600,000 | | | | 1,359,742 | |
4.92%, 08/15/27W | | | 1,050,000 | | | | 385,373 | |
4.91%, 11/15/27WD | | | 400,000 | | | | 145,036 | |
| | | | | | | | |
| | | | | | | 24,065,662 | |
| | | | | | | | |
| | |
Total U.S. Treasury Obligations | | | | | | | | |
(Cost $346,847,064) | | | | | | | 345,646,083 | |
| | | | | | | | |
| | |
TOTAL INVESTMENTS — 147.0% | | | | | | | | |
(Cost $1,822,424,703) | | | | | | | 1,824,887,125 | |
| | | | | | | | |
| | |
| | | Number of
Contracts | | | | |
WRITTEN OPTIONS — (0.1)% | | | | | | | | |
Call Swaptions — (0.1)% | | | | | | | | |
3-Month LIBOR, Strike Price $4.56, Expires 01/22/07 | | | (2,370 | ) | | | (24 | ) |
3-Month LIBOR, Strike Price $4.75, Expires 07/02/07 | | | (680 | ) | | | (28,394 | ) |
3-Month LIBOR, Strike Price $5.04, Expires 03/08/07 | | | (1,200 | ) | | | (55,236 | ) |
3-Month LIBOR, Strike Price $5.15, Expires 12/20/07 | | | (970 | ) | | | (147,406 | ) |
3-Month LIBOR, Strike Price $5.22, Expires 04/19/07 | | | (440 | ) | | | (47,555 | ) |
3-Month LIBOR, Strike Price $5.34, Expires 06/07/07 | | | (700 | ) | | | (111,860 | ) |
3-Month LIBOR, Strike Price $5.37, Expires 07/02/07 | | | (1,540 | ) | | | (270,917 | ) |
3-Month LIBOR, Strike Price $5.50, Expires 07/02/07 | | | (1,270 | ) | | | (339,166 | ) |
6-Month LIBOR, Strike Price $4.85, Expires 09/14/07 | | | (100 | ) | | | (9,166 | ) |
| | | | | | | | |
| | | | | | | (1,009,724 | ) |
| | | | | | | | |
| | |
Put Option — 0.0% | | | | | | | | |
15-Year U.S. Treasury Long Bond Futures, Strike Price $112.00, Expires 02/24/08 | | | (23 | ) | | | (31,985 | ) |
| | | | | | | | |
| | |
Total Written Options | | | | | | | | |
(Premiums received $(1,044,466)) | | | | | | | (1,041,709 | ) |
| | | | | | | | |
| | |
| | | Par | | | | |
SECURITIES SOLD SHORT — (4.2)% | | | | | | | | |
Federal National Mortgage Association | | | | | | | | |
5.50%, 02/13/36 TBA | | $ | (38,900,000 | ) | | | (38,425,887 | ) |
5.00%, 01/11/37 TBA | | | (15,000,000 | ) | | | (14,479,680 | ) |
| | | | | | | | |
| | |
Total Securities Sold Short | | | | | | | | |
(Cost $(53,316,215)) | | | | | | | (52,905,567 | ) |
| | | | | | | | |
| | |
Liabilities in Excess of Other Assets — (42.7)% | | | | | | | (529,864,992 | ) |
| | | | | | | | |
NET ASSETS — 100.0% | | | | | | $ | 1,241,074,857 | |
| | | | | | | | |
| | |
| 74 | | See Notes to Financial Statements. |
Swap agreements outstanding at December 31, 2006:
| | | | | | | | | |
Description | | Expiration
Date | | Notional Value | | | Unrealized
Appreciation
(Depreciation) | |
Australian Dollars | | | | | | | | | |
Receive fixed rate payments of 6.00% and pay variable rate payments on the six month BB floating rate(i) | | 06/15/17 | | 1,000,000 | | | $ | (21,024 | ) |
| | | | | | | | | |
| | | |
British Pounds | | | | | | | | | |
Receive fixed rate payments of 5.00% and pay variable rate payments on the six month LIBOR floating rate(d) | | 06/15/09 | | 800,000 | | | | (14,777 | ) |
Receive fixed rate payments of 5.00% and pay variable rate payments on the six month LIBOR floating rate(i) | | 09/15/10 | | 4,000,000 | | | | (114,431 | ) |
Receive fixed rate payments of 5.00% and pay variable rate payments on the six month LIBOR floating rate(d) | | 09/15/10 | | 10,200,000 | | | | (291,799 | ) |
Receive fixed rate payments of 5.00% and pay variable rate payments on the six month LIBOR floating rate(f) | | 09/15/15 | | 2,500,000 | | | | (59,035 | ) |
Receive fixed rate payments of 5.00% and pay variable rate payments on the six month LIBOR floating rate(m) | | 09/15/15 | | 400,000 | | | | (9,445 | ) |
Receive variable rate payments on the six month LIBOR floating rate and pay fixed rate payments of 4.00%(i) | | 12/15/35 | | (4,900,000 | ) | | | 7,369 | |
Receive variable rate payments on the six month LIBOR floating rate and pay fixed rate payments of 4.00%(d) | | 12/15/35 | | (3,700,000 | ) | | | 5,565 | |
| | | | | | | | | |
| | | | | | | | (476,553 | ) |
| | | | | | | | | |
| | | |
Canadian Dollars | | | | | | | | | |
Receive fixed rate payments of 4.50% and pay variable rate payments on the six month CBK floating rate(h) | | 06/15/27 | | 5,100,000 | | | | (111,962 | ) |
| | | | | | | | | |
| | | |
Euros | | | | | | | | | |
Receive fixed rate payments of 2.1455% and pay variable rate payments on the France CPI Ex Tobacco(b) | | 10/15/10 | | 300,000 | | | | 5,813 | |
Receive floating par in the event of default on the DJ ITRAXX6HIVOL Index and pay fixed rate payments of 0.85%(g) | | 12/20/16 | | (1,200,000 | ) | | | (7,191 | ) |
Receive floating par in the event of default on the DJ ITRAXX6HI4 Index and pay fixed rate payments of 0.85%(g) | | 12/20/16 | | (2,900,000 | ) | | | (17,380 | ) |
Receive floating par in the event of default on the DJ ITRAXX6HI4 Index and pay fixed rate payments of 0.85%(i) | | 12/20/16 | | (3,600,000 | ) | | | (21,575 | ) |
Receive floating par in the event of default on the DJ ITRAXX6HI4 Index and pay fixed rate payments of 0.85%(d) | | 12/20/16 | | (1,300,000 | ) | | | (7,791 | ) |
Receive floating par in the event of default on the DJ ITRAXX6HI4 Index and pay fixed rate payments of 0.85%(j) | | 12/20/16 | | (2,900,000 | ) | | | (17,380 | ) |
| | | | | | | | | |
| | | | | | | | (65,504 | ) |
| | | | | | | | | |
| | | |
Japanese Yen | | | | | | | | | |
Receive variable rate payments on the six month LIBOR floating rate and pay fixed rate payments of 2.00%(h) | | 06/20/16 | | (210,000,000 | ) | | | (23,908 | ) |
Receive variable rate payments on the six month LIBOR floating rate and pay fixed rate payments of 2.00%(d) | | 06/20/16 | | (80,000,000 | ) | | | (9,108 | ) |
| | | | | | | | | |
| | | | | | | | (33,016 | ) |
| | | | | | | | | |
| | | | |
| | See Notes to Financial Statements. | | 75 |
| | |
| Medium-Duration Bond Fund | | |
| SCHEDULE OF INVESTMENTS (Continued) | | |
| | | | | | | | | | |
Description | | Expiration
Date | | Notional
Value | | | Unrealized
Appreciation
(Depreciation) | |
U.S. Dollars | | | | | | | | | | |
Receive fixed rate payments of 0.61% and pay floating par in the event of default on Russian Federation, 5.00% due 03/31/30(h) | | 03/20/07 | | $ | 1,300,000 | | | $ | 1,365 | |
Receive fixed rate payments of 0.77% and pay floating par in the event of default on Russian Federation, 5.00% due 03/31/30(g) | | 05/20/07 | | | 100,000 | | | | 223 | |
CMBS AAA 10 Year Index Basis Total Return Swap(k) | | 05/31/07 | | | 11,000,000 | | | | 22,821 | |
Receive fixed rate payments of 0.055% and pay floating par in the event of default on American International Group, 5.60% due 10/18/16(e) | | 03/20/08 | | | 5,600,000 | | | | 2,353 | |
Receive floating par in the event of default on Republic of Philippines, 8.25% due 01/15/14 and pay fixed rate of 2.47%(e) | | 09/20/08 | | | (1,000,000 | ) | | | (33,416 | ) |
Receive floating par in the event of default on RadioShack Corporation, 7.375% due 05/15/11 and pay fixed rate payments of 0.37%(b) | | 12/20/08 | | | (300,000 | ) | | | 3,012 | |
Receive floating par in event of default on Emerson Electric Co., 4.625% due 10/15/12 and pay fixed rate payments of 0.22%(c) | | 12/20/08 | | | (300,000 | ) | | | (937 | ) |
Receive floating par in event of default on Devon Financing Corporation, 6.875% due 09/30/11 and pay fixed rate payments of 0.35%(h) | | 12/20/08 | | | (500,000 | ) | | | (2,112 | ) |
Receive floating par in event of default on Anadarko Petroleum Corporation, 5.000% due 10/01/12 and pay fixed rate payments of 0.27%(h) | | 12/20/08 | | | (300,000 | ) | | | (766 | ) |
Receive floating par in event of default on Carnival Corporation, 6.150% due 04/15/08 and pay fixed rate payments of 0.44%(b) | | 12/20/08 | | | (300,000 | ) | | | (2,209 | ) |
Receive floating par in event of default on Countrywide Home Loan, 6.250% due 04/15/09 and pay fixed rate payments of 0.42%(c) | | 12/20/08 | | | (300,000 | ) | | | (1,885 | ) |
Receive floating par in event of default on Occidental Petroleum, 6.750% due 01/15/12 and pay fixed rate payments of 0.28%(h) | | 12/20/08 | | | (300,000 | ) | | | (1,250 | ) |
Receive floating par in event of default on Kroger Co. 6.750% due 04/15/12 and pay fixed rate payments of 0.53%(c) | | 12/20/08 | | | (300,000 | ) | | | (2,548 | ) |
Receive fixed rate payments of 5.00% and pay variable rate payments on the three month LIBOR floating rate(b) | | 06/18/09 | | | 55,000,000 | | | | 20,786 | |
Receive fixed rate payments of 5.00% and pay variable rate payments on the three month LIBOR floating rate(b) | | 06/20/09 | | | 10,000,000 | | | | (10,290 | ) |
Receive fixed rate payments of 5.00% and pay variable rate payments on the three month LIBOR floating rate(k) | | 06/21/10 | | | 36,000,000 | | | | (17,435 | ) |
Receive floating par in the event of default on Republic of Turkey, 11.875% due 01/15/30 and pay fixed rate of 2.70%(c) | | 09/20/10 | | | (400,000 | ) | | | (19,996 | ) |
Receive floating par in the event of default on Republic of Turkey, 11.875% due 01/15/30 and pay fixed rate of 2.25%(c) | | 09/20/10 | | | (1,000,000 | ) | | | (35,006 | ) |
| | |
| 76 | | See Notes to Financial Statements. |
| | | | | | | | | | |
Description | | Expiration
Date | | Notional Value | | | Unrealized
Appreciation
(Depreciation) | |
Receive floating par in the event of default on DaimlerChrysler NA Holding, 5.75% due 09/08/11 and pay fixed rate of 0.58%(d) | | 09/20/11 | | $ | (900,000 | ) | | $ | (3,705 | ) |
Receive floating par in the event of default on the DJ CDX HVOL7 Index and pay fixed rate payments of 0.75%(d) | | 12/20/11 | | | (9,700,000 | ) | | | 16,668 | |
Receive variable rate payments on the three month LIBOR and pay fixed rate payments of 5.00%(f) | | 12/20/11 | | | (13,000,000 | ) | | | 48,143 | |
Receive floating par in the event of default on International Lease Finance Corp, 5.40% due 02/15/12 and pay fixed rate of 0.17%(d) | | 03/20/12 | | | (400,000 | ) | | | (463 | ) |
Receive floating par in the event of default on XL Capital (Europe) PLC, 6.50% due 01/15/12 and pay fixed rate of 0.205%(d) | | 03/20/12 | | | (500,000 | ) | | | (1,040 | ) |
Receive floating par in the event of default on Pulte Homes Inc., 6.25% due 02/15/13 and pay fixed rate of 0.72%(d) | | 03/20/13 | | | (1,100,000 | ) | | | (8,763 | ) |
Receive floating par in the event of default on Sealed Air Corp, 5.625% due 07/15/13 and pay fixed rate of 0.58%(c) | | 09/20/13 | | | (400,000 | ) | | | (1,829 | ) |
Receive floating par in the event of default on Citifinancial, 6.625% due 06/01/15 and pay fixed rate of 0.145%(d) | | 06/20/15 | | | (300,000 | ) | | | 9 | |
Receive floating par in the event of default on Republic of Hungary, 4.75% due 02/03/15 and pay fixed rate of 0.535%(c) | | 05/20/16 | | | (1,600,000 | ) | | | (15,577 | ) |
Receive floating par in the event of default on Republic of Hungary, 4.75% due 02/03/15 and pay fixed rate of 0.54%(g) | | 05/20/16 | | | (1,400,000 | ) | | | (14,144 | ) |
Receive floating par in the event of default on Republic of Hungary, 4.75% due 02/03/15 and pay fixed rate of 0.545%(i) | | 05/20/16 | | | (2,800,000 | ) | | | (29,316 | ) |
Receive floating par in the event of default on Omnicom Group Inc., 5.90% due 04/15/16 and pay fixed rate of 0.39%(c) | | 06/20/16 | | | (700,000 | ) | | | (2,194 | ) |
Receive floating par in the event of default on Bank of America, 5.62% due 10/14/16 and pay fixed rate of 0.17%(f) | | 12/20/16 | | | (1,700,000 | ) | | | 719 | |
Receive floating par in the event of default on the DJ CDX IG7 Index and pay fixed rate payments of 0.65%(c) | | 12/20/16 | | | (7,800,000 | ) | | | (50,276 | ) |
Receive variable rate payments on the three month LIBOR floating rate and pay fixed rate payments of 5.00%(i) | | 06/20/17 | | | (8,100,000 | ) | | | 110,302 | |
Receive floating par in the event of default on Asset Backed Funding Certificates, 8.8225% due 11/25/32 and pay fixed rate of 2.35%(b) | | 11/25/32 | | | (1,000,000 | ) | | | 10,575 | |
Receive fixed rate payments of 5.00% and pay variable rate payments on the three month LIBOR floating rate(i) | | 06/20/37 | | | 4,200,000 | | | | (189,978 | ) |
Receive fixed rate payments of 5.00% and pay variable rate payments on the three month LIBOR floating rate(m) | | 06/20/37 | | | 8,600,000 | | | | (389,003 | ) |
Receive fixed rate payments of 5.00% and pay variable rate payments on the three month LIBOR floating rate(f) | | 06/20/37 | | | 5,900,000 | | | | (266,874 | ) |
| | | | |
| | See Notes to Financial Statements. | | 77 |
| | |
| Medium-Duration Bond Fund | | |
| SCHEDULE OF INVESTMENTS (Continued) | | |
| | | | | | | | | | |
Description | | Expiration
Date | | Notional
Value | | | Unrealized
Appreciation
(Depreciation) | |
Receive floating par in the event of default on the ABX.HE.A.06-1 Index and pay fixed rate payments of 0.54%(e) | | 07/25/45 | | $ | (7,700,000 | ) | | $ | (28,328 | ) |
Receive floating par in the event of default on the ABX.HE.A.06-1 Index and pay fixed rate payments of 0.54%(b) | | 07/25/45 | | | (2,000,000 | ) | | | (7,358 | ) |
Receive floating par in the event of default on the ABX.HE.BBB.06-2 Index and pay fixed rate payments of 1.33%(e) | | 05/25/46 | | | (1,800,000 | ) | | | 63,819 | |
| | | | | | | | | | |
| | | | | | | | | (835,903 | ) |
| | | | | | | | | | |
| | | | | | | | $ | (1,543,962 | ) |
| | | | | | | | | | |
|
| Forward volatility option with premium to be determined on a future date outstanding at December 31, 2006: | |
| | | |
Description | | Expiration Date | | Notional Value | | | Unrealized Depreciation | |
Call & Put—OTC U.S. dollar Forward Delta Neutral Straddle vs. Japanese Yen, Strike Price and premium determined on 03/20/07, based upon implied volatility parameter of 8.50% (b) | | 03/20/08 | | $ | 20,200,000 | | | $ | (195,536 | ) |
| | | | | | | | | | |
PORTFOLIO SUMMARY (based on net assets)
| | | |
| | | % | |
Mortgage-Backed Securities | | 55.3 | |
Futures Contracts | | 48.1 | |
Money Market Funds | | 29.2 | |
U.S. Treasury Obligations | | 27.9 | |
Corporate Bonds | | 12.6 | |
Foreign Bonds | | 11.0 | |
Agency Obligations | | 5.8 | |
Asset-Backed Securities | | 3.8 | |
Commercial Paper | | 0.8 | |
Municipal Bonds | | 0.3 | |
Purchased Options | | 0.2 | |
Preferred Stocks | | 0.1 | |
Forward Volatility Option | | — | ** |
Rights | | — | ** |
Swap Agreements | | (0.1 | ) |
Written Options | | (0.1 | ) |
Forward Foreign Currency Contracts | | (3.3 | ) |
Securities Sold Short | | (4.2 | ) |
| | | |
| | 187.4 | |
| | | |
| ** | Rounds to less than 0.005%. |
| | |
| 78 | | See Notes to Financial Statements. |
| | |
| | |
| Extended-Duration Bond Fund | | |
The Fund is primarily comprised of investment grade fixed income securities with longer maturities. The Fund posted a positive absolute return and outperformed its composite benchmark index, 50% Lehman Brothers Long-term Government Index and 50% Lehman Brothers Long-term Credit Index, during the fourth quarter and year. Despite the headwind of rising long-term interest rates, the Fund was the best performing fixed income Select Fund (excluding the Money Market Fund) for the year on an absolute return basis. The Fund’s benchmark relative performance was positively impacted by its allocations to high yield, emerging markets and non-U.S. dollar denominated securities. A modest allocation to municipals also added value. During a period of spread tightening, one sub-adviser’s significant overweight to the lower-yielding Treasury sector negatively impacted performance during the quarter. Both of the sub-advisers within the Fund outpaced the composite benchmark during the quarter. Loomis Sayles generated the greatest relative outperformance during the period given their allocations to extended sectors such as high-yield, emerging market and non-U.S. dollar denominated securities.
Please see page 83 for information regarding specific portfolio allocations. Portfolio holdings are subject to change at any time.
Extended-Duration Bond Fund
| | | | | | | | | | | | | | | | | | |
Average Annual Total Returns as of 12/31/06 | |
| | | GS2 Class* | | | GS4 Class* | | | GS6 Class* | | | Benchmark** | | | GS8 Class* | | | GS8 Class Benchmark** | |
One Year | | 4.75 | % | | 4.56 | % | | 4.09 | % | | 2.77 | % | | 3.79 | % | | 2.77 | % |
Five Year | | 8.07 | % | | 7.91 | % | | 7.61 | % | | 7.44 | % | | N/A | | | N/A | |
Since Inception | | 7.95 | % | | 7.87 | % | | 7.48 | % | | 7.06 | % | | 4.92 | % | | 4.67 | % |
Inception Date | | 08/27/01 | | | 08/27/01 | | | 08/27/01 | | | 08/27/01 | | | 11/08/04 | | | 11/08/04 | |
The performance data quoted represents past performance and does not guarantee future results. Current performance may be lower or higher. Performance data current to the most recent month-end may be obtained at www.GuideStone.org. The investment return and principal value of an investment will fluctuate so that shares, when redeemed, may be worth more or less than their original cost.
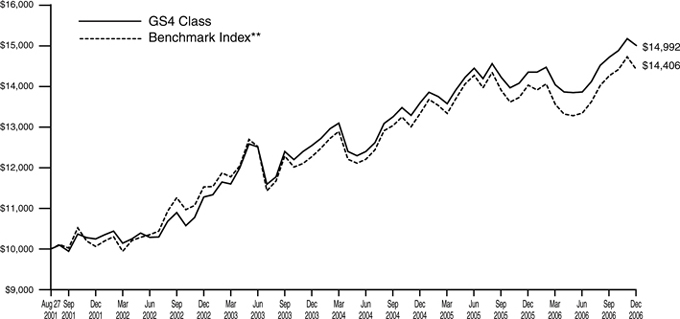
The graph compares the results of a hypothetical $10,000 investment in the GS4 Class of the Fund since August 27, 2001 (commencement of operations), with all dividends and capital gains reinvested, with the weighted composite benchmark index.
| * | These returns reflect expense waivers by the Fund’s investment advisor. Without these waivers, returns would have been lower. Returns shown do not reflect the deduction of taxes that a shareholder would pay on Fund distributions or the redemption of Fund shares. |
| ** | Represents a weighted composite benchmark index consisting of the Lehman Brothers Long-Term Government Bond Index and the Lehman Brothers Long-Term Credit Bond Index. |
The Lehman Brothers Long-Term Government Bond Index is composed of all bonds covered by the Lehman Brothers Government Bond Index with maturities of 10 years or greater.
The Lehman Brothers Long-Term Credit Index is composed of a subset of the Lehman Brothers Credit Bond Index covering all corporate, publicly issued, fixed-rate, nonconvertible U.S. debt issues rated at least Baa with at least $50 million principal outstanding and maturity greater than 10 years.
Unlike a mutual fund, the performance of an index assumes no taxes, transaction costs, management fees or other expenses.
| | |
Extended-Duration Bond Fund | | |
SCHEDULE OF INVESTMENTS | | December 31, 2006 |
| | | | | | |
| | | Par | | Value |
AGENCY OBLIGATION — 0.3% | | | | | | |
Federal National Mortgage Association | | | | | | |
2.29%, 02/19/09(G) | | | | | | |
(Cost $1,477,847) | | | 2,500,000 | | $ | 1,592,833 |
| | | | | | |
| | |
ASSET-BACKED SECURITY — 0.3% | | | | | | |
Community Program Loan Trust | | | | | | |
4.50%, 04/01/29 | | | | | | |
(Cost $1,673,976) | | $ | 1,950,000 | | | 1,837,683 |
| | | | | | |
| | |
CORPORATE BONDS — 15.0% | | | | | | |
Alberton’s, Inc. | | | | | | |
6.63%, 06/01/28 | | | 105,000 | | | 95,850 |
7.45%, 08/01/29 | | | 985,000 | | | 967,269 |
8.00%, 05/01/31D | | | 110,000 | | | 112,129 |
Albertson’s, Inc. | | | | | | |
7.75%, 06/15/26 | | | 800,000 | | | 801,954 |
Anadarko Petroleum Corporation | | | | | | |
5.95%, 09/15/16 | | | 1,080,000 | | | 1,084,237 |
6.45%, 09/15/36 | | | 760,000 | | | 770,524 |
Arrow Electronics, Inc. | | | | | | |
6.88%, 07/01/13 | | | 250,000 | | | 261,139 |
ASIF Global Financing XXVII | | | | | | |
2.38%, 02/26/09 144A(G) | | | 6,700,000 | | | 4,266,997 |
Avnet, Inc. | | | | | | |
6.00%, 09/01/15 | | | 875,000 | | | 864,186 |
Barclays Financial LLC | | | | | | |
4.16%, 02/22/10 144A(T) | | | 25,000,000 | | | 657,475 |
4.10%, 03/22/10 144A(T) | | | 30,000,000 | | | 786,262 |
4.06%, 09/16/10 144A(W) | | | 730,000,000 | | | 767,991 |
Borden, Inc. | | | | | | |
7.88%, 02/15/23D | | | 1,200,000 | | | 966,000 |
Bristol-Myers Squibb Co. | | | | | | |
4.86%, 09/15/23 CONV† | | | 1,000,000 | | | 1,005,000 |
Chesapeake Energy Corporation | | | | | | |
6.88%, 01/15/16D | | | 610,000 | | | 618,387 |
6.50%, 08/15/17D | | | 45,000 | | | 44,212 |
6.88%, 11/15/20D | | | 320,000 | | | 316,000 |
CIT Group, Inc. | | | | | | |
5.50%, 12/01/14(U) | | | 600,000 | | | 1,152,502 |
Comcast Corporation | | | | | | |
5.50%, 03/15/11 | | | 500,000 | | | 502,574 |
5.65%, 06/15/35 | | | 570,000 | | | 519,146 |
6.50%, 11/15/35 | | | 555,000 | | | 560,743 |
6.45%, 03/15/37 | | | 2,480,000 | | | 2,489,568 |
Commonwealth Edison Co. | | | | | | |
4.75%, 12/01/11@ | | | 402,000 | | | 388,412 |
Constellation Energy Group, Inc. | | | | | | |
4.55%, 06/15/15D | | | 750,000 | | | 695,509 |
Continental Airlines, Inc. | | | | | | |
6.95%, 02/02/11 | | | 311,850 | | | 308,927 |
8.31%, 04/02/18D | | | 479,233 | | | 496,306 |
7.57%, 03/15/20D | | | 421,412 | | | 425,890 |
Corning, Inc. | | | | | | |
6.20%, 03/15/16 | | | 230,000 | | | 234,574 |
7.25%, 08/15/36D | | | 850,000 | | | 913,795 |
Cox Communications, Inc. | | | | | | |
6.75%, 03/15/11D | | | 250,000 | | | 261,592 |
Cummins, Inc. | | | | | | |
7.13%, 03/01/28D | | | 425,000 | | | 443,006 |
DCP Midstream LP | | | | | | |
6.45%, 11/03/36 144AD | | | 490,000 | | | 505,149 |
Devon Energy Corporation | | | | | | |
4.95%, 08/15/08 CONV | | | 963,000 | | | 1,338,570 |
Dillard’s, Inc. | | | | | | |
7.75%, 07/15/26 | | | 890,000 | | | 894,450 |
7.00%, 12/01/28D | | | 500,000 | | | 480,000 |
El Paso Corporation | | | | | | |
7.00%, 05/15/11D | | | 400,000 | | | 417,000 |
EOP Operating LP | | | | | | |
7.25%, 06/15/28D | | | 500,000 | | | 549,493 |
First Industrial LP | | | | | | |
7.60%, 07/15/28 | | | 1,000,000 | | | 1,118,837 |
Foot Locker, Inc. | | | | | | |
8.50%, 01/15/22 | | | 1,000,000 | | | 987,500 |
Ford Motor Co. | | | | | | |
6.63%, 10/01/28D | | | 680,000 | | | 496,400 |
6.38%, 02/01/29D | | | 1,255,000 | | | 906,737 |
Ford Motor Credit Co. | | | | | | |
5.70%, 01/15/10 | | | 135,000 | | | 129,500 |
7.00%, 10/01/13D | | | 315,000 | | | 301,214 |
8.00%, 12/15/16 | | | 1,000,000 | | | 989,819 |
General Motors Acceptance Corporation | | | | | | |
6.88%, 08/28/12 | | | 250,000 | | | 257,004 |
Georgia-Pacific Corporation | | | | | | |
8.00%, 01/15/24 | | | 30,000 | | | 30,600 |
7.38%, 12/01/25D | | | 240,000 | | | 235,200 |
7.25%, 06/01/28D | | | 300,000 | | | 292,500 |
7.75%, 11/15/29D | | | 3,700,000 | | | 3,709,250 |
8.88%, 05/15/31 | | | 60,000 | | | 63,750 |
GTE Corporation | | | | | | |
6.94%, 04/15/28 | | | 10,000 | | | 10,514 |
HCA, Inc. | | | | | | |
6.30%, 10/01/12 | | | 1,500,000 | | | 1,376,250 |
7.58%, 09/15/25 | | | 1,000,000 | | | 818,672 |
7.05%, 12/01/27 | | | 500,000 | | | 378,818 |
Health Care Property Investors, Inc. | | | | | | |
6.00%, 03/01/15D | | | 1,500,000 | | | 1,493,958 |
Highwoods Properties, Inc. | | | | | | |
7.50%, 04/15/18 | | | 1,500,000 | | | 1,669,689 |
Historic TW, Inc. | | | | | | |
6.63%, 05/15/29 | | | 60,000 | | | 60,942 |
HSBC Bank USA NA | | | | | | |
3.31%, 08/25/10 144A | | | 700,000 | | | 746,830 |
IMC Global, Inc. | | | | | | |
7.38%, 08/01/18 | | | 500,000 | | | 477,500 |
7.30%, 01/15/28D | | | 690,000 | | | 638,250 |
iStar Financial, Inc. | | | | | | |
5.70%, 03/01/14D | | | 1,171,000 | | | 1,162,082 |
Kinder Morgan Energy Partners LP | | | | | | |
5.80%, 03/15/35 | | | 280,000 | | | 255,284 |
Kinder Morgan, Inc. | | | | | | |
7.25%, 03/01/28D | | | 500,000 | | | 483,691 |
Lennar Corporation | | | | | | |
5.60%, 05/31/15 | | | 935,000 | | | 895,497 |
6.50%, 04/15/16 144AD | | | 625,000 | | | 635,228 |
MidAmerican Energy Holdings Co. | | | | | | |
5.88%, 10/01/12D | | | 1,000,000 | | | 1,019,177 |
Motorola, Inc. | | | | | | |
6.50%, 11/15/28D | | | 500,000 | | | 531,439 |
NiSource Finance Corporation | | | | | | |
6.15%, 03/01/13 | | | 1,000,000 | | | 1,019,735 |
| | |
See Notes to Financial Statements. | | 81 |
| | |
| Extended-Duration Bond Fund | | |
| SCHEDULE OF INVESTMENTS (Continued) | | |
| | | | | | |
| | | Par | | Value |
Northern Telecom Capital | | | | | | |
7.88%, 06/15/26 | | $ | 450,000 | | $ | 405,000 |
Owens Corning, Inc. | | | | | | |
6.50%, 12/01/16 144A | | | 240,000 | | | 244,244 |
7.00%, 12/01/36 144A | | | 355,000 | | | 359,606 |
Pemex Project Funding Master Trust | | | | | | |
8.63%, 02/01/22 | | | 1,000,000 | | | 1,238,500 |
8.63%, 12/01/23D | | | 1,000,000 | | | 1,233,750 |
Pioneer Natural Resources Co. | | | | | | |
7.20%, 01/15/28 | | | 2,500,000 | | | 2,367,160 |
Preston Corporation | | | | | | |
7.00%, 05/01/11 CONV | | | 250,000 | | | 236,250 |
Pulte Homes, Inc. | | | | | | |
7.88%, 06/15/32 | | | 1,500,000 | | | 1,654,184 |
6.38%, 05/15/33D | | | 1,000,000 | | | 936,523 |
Qwest Corporation | | | | | | |
7.25%, 09/15/25D | | | 1,000,000 | | | 1,032,500 |
6.88%, 09/15/33D | | | 2,250,000 | | | 2,160,000 |
Raytheon Co. | | | | | | |
6.40%, 12/15/18 | | | 2,600,000 | | | 2,787,884 |
7.20%, 08/15/27 | | | 250,000 | | | 291,960 |
7.00%, 11/01/28 | | | 750,000 | | | 861,364 |
Southern Natural Gas Co. | | | | | | |
7.35%, 02/15/31 | | | 1,750,000 | | | 1,935,056 |
Sprint Capital Corporation | | | | | | |
6.88%, 11/15/28 | | | 3,305,000 | | | 3,317,642 |
Swift Energy Co. | | | | | | |
7.63%, 07/15/11D | | | 150,000 | | | 153,375 |
Tennessee Gas Pipeline Co. | | | | | | |
7.00%, 10/15/28 | | | 750,000 | | | 795,658 |
Time Warner, Inc. | | | | | | |
7.63%, 04/15/31 | | | 35,000 | | | 39,215 |
6.50%, 11/15/36 | | | 120,000 | | | 119,830 |
Toll Brothers Finance Corporation | | | | | | |
5.15%, 05/15/15 | | | 1,285,000 | | | 1,179,372 |
Union Pacific Resources Group | | | | | | |
7.15%, 05/15/28 | | | 250,000 | | | 272,104 |
Verizon Global Funding Corporation | | | | | | |
5.85%, 09/15/35D | | | 2,420,000 | | | 2,325,601 |
Verizon Maryland, Inc. | | | | | | |
5.13%, 06/15/33D | | | 50,000 | | | 41,153 |
Verizon New York, Inc. | | | | | | |
7.38%, 04/01/32D | | | 385,000 | | | 398,671 |
Western Union Co. | | | | | | |
6.20%, 11/17/36 144A | | | 2,060,000 | | | 1,941,422 |
Williams Cos, Inc. | | | | | | |
7.50%, 01/15/31D | | | 1,250,000 | | | 1,303,125 |
Xerox Capital Trust I | | | | | | |
8.00%, 02/01/27D | | | 1,500,000 | | | 1,539,375 |
XTO Energy, Inc. | | | | | | |
6.10%, 04/01/36 | | | 50,000 | | | 48,960 |
| | | | | | |
Total Corporate Bonds | | | | | | |
(Cost $76,930,253) | | | | | | 82,374,169 |
| | | | | | |
| | |
FOREIGN BONDS — 10.7% | | | | | | |
Argentina — 0.1% | | | | | | |
Republic of Argentina | | | | | | |
4.01%, 08/03/12† | | | 385,000 | | | 281,435 |
| | | | | | |
| | |
Australia — 0.1% | | | | | | |
Qantas Airways, Ltd. | | | | | | |
6.05%, 04/15/16 144A | | | 345,000 | | | 307,586 |
| | | | | | |
| | |
Brazil — 1.0% | | | | | | |
Federal Republic of Brazil | | | | | | |
8.25%, 01/20/34D | | | 4,750,000 | | | 5,771,250 |
| | | | | | |
| | |
Canada — 4.0% | | | | | | |
British Columbia Generic Residual | | | | | | |
4.23%, 06/09/14 STRIP(C) W | | | 10,230,000 | | | 6,367,049 |
Canada Generic Residual | | | | | | |
4.23%, 06/01/25 STRIP(C)W | | | 4,110,000 | | | 1,631,806 |
Canadian Government | | | | | | |
4.50%, 09/01/07(C) | | | 1,480,000 | | | 1,271,862 |
4.25%, 09/01/08(C) | | | 2,800,000 | | | 2,409,059 |
Kinder Morgan Finance Co. | | | | | | |
5.70%, 01/05/16 | | | 125,000 | | | 114,886 |
6.40%, 01/05/36D | | | 665,000 | | | 594,721 |
Methanex Corporation | | | | | | |
6.00%, 08/15/15 | | | 25,000 | | | 23,752 |
Ontario Generic Residual | | | | | | |
4.70%, 07/13/22 STRIP(C)W | | | 3,900,000 | | | 1,627,021 |
4.67%, 03/08/29 STRIP(C)W | | | 7,000,000 | | | 2,109,334 |
Saskatchewan Residual | | | | | | |
4.30%, 04/10/14 STRIP(C)W | | | 7,500,000 | | | 4,698,152 |
4.68%, 02/04/22 STRIP(C)W | | | 3,000,000 | | | 1,279,852 |
| | | | | | |
| | | | | | 22,127,494 |
| | | | | | |
| | |
Cayman Islands — 0.1% | | | | | | |
Enersis SA | | | | | | |
7.40%, 12/01/16D | | | 625,000 | | | 688,211 |
| | | | | | |
| | |
Egypt — 1.3% | | | | | | |
Egypt Government AID Bonds | | | | | | |
4.45%, 09/15/15 | | | 7,365,000 | | | 7,129,519 |
| | | | | | |
| | |
Malaysia — 0.0% | | | | | | |
Telekom Malaysia BHD | | | | | | |
7.88%, 08/01/25 144A | | | 225,000 | | | 275,448 |
| | | | | | |
| | |
Mexico — 0.7% | | | | | | |
Mexican Bonos | | | | | | |
9.00%, 12/20/12(M) | | | 23,000,000 | | | 2,300,000 |
8.00%, 12/07/23(M) | | | 17,000,000 | | | 1,642,720 |
| | | | | | |
| | | | | | 3,942,720 |
| | | | | | |
| | |
Philippines — 0.2% | | | | | | |
Philippine Long Distance Telephone Co. | | | | | | |
8.35%, 03/06/17 | | | 500,000 | | | 570,000 |
Quezon Power (Philippines), Ltd. | | | | | | |
8.86%, 06/15/17D | | | 424,700 | | | 428,947 |
| | | | | | |
| | | | | | 998,947 |
| | | | | | |
| | |
Spain — 0.6% | | | | | | |
Telefonica Emisones SAU | | | | | | |
7.05%, 06/20/36 | | | 3,105,000 | | | 3,308,614 |
| | | | | | |
| | |
Supranational — 2.0% | | | | | | |
Inter-American Development Bank | | | | | | |
13.58%, 05/11/09(B)W | | | 7,500,000 | | | 2,571,378 |
6.00%, 12/15/17(Z) | | | 12,250,000 | | | 8,263,485 |
| | | | | | |
| | | | | | 10,834,863 |
| | | | | | |
| | |
Sweden — 0.4% | | | | | | |
Swedish Government | | | | | | |
6.50%, 05/05/08(K) | | | 14,640,000 | | | 2,216,759 |
| | | | | | |
| | |
| 82 | | See Notes to Financial Statements. |
| | | | | | | |
| | | Par | | Value | |
Venezuela — 0.2% | | | | | | | |
Cerro Negro Finance, Ltd. | | | | | | | |
7.90%, 12/01/20 144A | | $ | 500,000 | | $ | 487,500 | |
Petrozuata Finance, Inc. | | | | | | | |
8.37%, 10/01/22 144A | | | 450,000 | | | 441,000 | |
| | | | | | | |
| | | | | | 928,500 | |
| | | | | | | |
Total Foreign Bonds | | | | | | | |
(Cost $ 49,200,409) | | | | | | 58,811,346 | |
| | | | | | | |
| | |
MORTGAGE-BACKED SECURITIES — 0.2% | | | | | | | |
Federal Home Loan Mortgage Corporation | | | | | | | |
5.00%, 12/01/31 | | | 202,230 | | | 195,651 | |
Federal National Mortgage Association | | | | | | | |
5.00%, 07/25/23 | | | 584,794 | | | 581,378 | |
| | | | | | | |
Total Mortgage-Backed Securities | | | | | | | |
(Cost $714,195) | | | | | | 777,029 | |
| | | | | | | |
| | |
| | | Shares | | | |
PREFERRED STOCK — 0.2% | | | | | | | |
Travelers Property Casualty Corporation | | | | | | | |
4.50%, 04/15/32 CONVD | | | | | | | |
(Cost $989,021) | | | 44,125 | | | 1,153,427 | |
| | | | | | | |
| | |
MONEY MARKET FUNDS — 53.4% | | | | | | | |
GuideStone Funds Money Market Fund (GS4 Class)¥ | | | 14,475,319 | | | 14,475,319 | |
Northern Institutional Liquid Assets Portfolio§ | | | 278,446,396 | | | 278,446,396 | |
| | | | | | | |
Total Money Market Funds | | | | | | | |
(Cost $292,921,715) | | | | | | 292,921,715 | |
| | | | | | | |
| | |
| | | Par | | | |
U.S. TREASURY OBLIGATIONS — 69.9% | | | | | | | |
U.S. Treasury Bonds | | | | | | | |
8.13%, 08/15/19D | | $ | 10,480,000 | | | 13,695,233 | |
8.00%, 11/15/21D | | | 192,517,000 | | | 255,265,606 | |
5.38%, 02/15/31 | | | 2,660,000 | | | 2,850,150 | |
4.50%, 02/15/36D | | | 102,135,000 | | | 97,156,021 | |
| | | | | | | |
| | | | | | 368,967,010 | |
| | | | | | | |
U.S. Treasury Note | | | | | | | |
4.63%, 10/31/11D | | | 15,000,000 | | | 14,950,200 | |
| | | | | | | |
Total U.S. Treasury Obligations | | | | | | | |
(Cost $ 384,980,154) | | | | | | 383,917,210 | |
| | | | | | | |
| | |
TOTAL INVESTMENTS — 150.0% | | | | | | | |
(Cost $808,887,570) | | | | | | 823,385,412 | |
| | |
Liabilities in Excess of Other | | | | | | | |
Assets — (50.0)% | | | | | | (274,314,758 | ) |
| | | | | | | |
NET ASSETS — 100.0% | | | | | $ | 549,070,654 | |
| | | | | | | |
| | |
PORTFOLIO SUMMARY (based on net assets) | | |
| | | % |
U.S. Treasury Obligations | | 69.9 |
Money Market Funds | | 53.4 |
Corporate Bonds | | 15.0 |
Foreign Bonds | | 10.7 |
Agency Obligation | | 0.3 |
Asset-Backed Security | | 0.3 |
Mortgage-Backed Securities | | 0.2 |
Preferred Stock | | 0.2 |
| | |
| | 150.0 |
| | |
| | |
See Notes to Financial Statements. | | 83 |
The Global Bond Fund was launched on December 29, 2006 and is a diversified portfolio composed primarily of global fixed income securities with an average dollar-weighted duration normally between three to ten years.
The Global Bond Fund invests in high yield securities, commonly known as “junk bonds”. While offering higher currency yields, these securities generally are considered speculative and are subject to greater risks than higher-rated bonds. Securities of emerging countries may involve additional risks including price volatility, reduced liquidity, currency fluctuation and financial reporting requirements as well as political and economic instability. This fund is not available for direct investment.
Please see page 89 for information regarding specific portfolio allocations. Portfolio holdings are subject to change at any time.
| | |
| Global Bond Fund | | |
| SCHEDULE OF INVESTMENTS | | December 31, 2006 |
| | | | | | |
| | | Par | | Value |
ASSET-BACKED SECURITY — 1.0% | | | | | | |
RAAC Series | | | | | | |
5.69%, 07/25/37 144A† | | | | | | |
(Cost $ 959,460) | | $ | 958,265 | | $ | 958,713 |
| | | | | | |
| | |
CORPORATE BONDS — 25.4% | | | | | | |
Activant Solutions, Inc. | | | | | | |
9.50%, 05/01/16 144A | | | 65,000 | | | 60,775 |
AES Corporation (The) | | | | | | |
8.75%, 05/15/13 | | | 500,000 | | | 538,125 |
Affinion Group, Inc. | | | | | | |
10.13%, 10/15/13 | | | 140,000 | | | 149,100 |
Aleris International, Inc. | | | | | | |
10.00%, 12/15/16 144A | | | 15,000 | | | 15,112 |
Allegheny Energy Supply | | | | | | |
7.80%, 03/15/11 | | | 90,000 | | | 96,975 |
8.25%, 04/15/12 144A | | | 190,000 | | | 209,475 |
Alliant Techsystems, Inc. | | | | | | |
6.75%, 04/01/16 | | | 100,000 | | | 100,250 |
Allied Waste North America, Inc. | | | | | | |
8.50%, 12/01/08 | | | 70,000 | | | 73,938 |
6.38%, 04/15/11 | | | 130,000 | | | 129,025 |
7.13%, 05/15/16 | | | 225,000 | | | 223,875 |
American International Group, Inc. | | | | | | |
5.05%, 10/01/15 | | | 100,000 | | | 97,407 |
Anadarko Petroleum Corporation | | | | | | |
5.95%, 09/15/16 | | | 40,000 | | | 40,157 |
Appleton Papers, Inc. | | | | | | |
8.13%, 06/15/11 | | | 40,000 | | | 41,000 |
9.75%, 06/15/14 | | | 100,000 | | | 103,500 |
Ashtead Capital, Inc. | | | | | | |
9.00%, 08/15/16 144A | | | 140,000 | | | 150,500 |
Ashton Woods USA LLC | | | | | | |
9.50%, 10/01/15 | | | 35,000 | | | 32,025 |
Associated Materials, Inc. | | | | | | |
9.75%, 04/15/12 | | | 120,000 | | | 124,200 |
Autonation, Inc. | | | | | | |
7.51%, 04/15/13† | | | 425,000 | | | 429,250 |
Avis Budget Car Rental LLC | | | | | | |
7.87%, 05/15/14 144A† | | | 225,000 | | | 218,250 |
Ball Corporation | | | | | | |
6.88%, 12/15/12 | | | 300,000 | | | 307,500 |
Berry Plastics Holding Corporation | | | | | | |
8.88%, 09/15/14 144A | | | 60,000 | | | 61,200 |
Boeing Capital Corporation, Ltd. | | | | | | |
5.80%, 01/15/13 | | | 60,000 | | | 61,672 |
Brookstone Co., Inc. | | | | | | |
12.00%, 10/15/12 | | | 25,000 | | | 24,562 |
Case New Holland, Inc. | | | | | | |
9.25%, 08/01/11 | | | 240,000 | | | 255,300 |
7.13%, 03/01/14 | | | 70,000 | | | 71,400 |
Charter Communications Holdings LLC | | | | | | |
12.13%, 01/15/12 STEP | | | 70,000 | | | 65,625 |
Chesapeake Energy Corporation | | | | | | |
7.50%, 09/15/13 | | | 265,000 | | | 277,256 |
6.25%, 01/15/18 | | | 30,000 | | | 29,025 |
Citizens Communications Co. | | | | | | |
9.25%, 05/15/11 | | | 200,000 | | | 222,250 |
7.88%, 01/15/27 144A | | | 30,000 | | | 30,450 |
Clear Channel Communi-cations, Inc. | | | | | | |
4.63%, 01/15/08 | | | 50,000 | | | 49,534 |
CMP Susquehanna Corporation | | | | | | |
9.88%, 05/15/14 144A | | | 80,000 | | | 80,000 |
CMS Energy Corporation | | | | | | |
8.90%, 07/15/08 | | | 40,000 | | | 42,000 |
Colorado Interstate Gas Co. | | | | | | |
5.95%, 03/15/15 | | | 20,000 | | | 19,833 |
6.80%, 11/15/15 | | | 125,000 | | | 130,598 |
Comcast Corporation | | | | | | |
6.50%, 01/15/15 | | | 60,000 | | | 62,613 |
6.50%, 01/15/17 | | | 60,000 | | | 62,727 |
Complete Production Services, Inc. | | | | | | |
8.00%, 12/15/16 144A | | | 80,000 | | | 82,400 |
Continental Airlines, Inc. | | | | | | |
8.75%, 12/01/11 | | | 50,000 | | | 50,625 |
Corrections Corp. of America | | | | | | |
7.50%, 05/01/11 | | | 270,000 | | | 279,450 |
6.25%, 03/15/13 | | | 130,000 | | | 129,513 |
Crum & Forster Holdings Corporation | | | | | | |
| | |
10.38%, 06/15/13 | | | 50,000 | | �� | 54,375 |
Delhaize America, Inc. | | | | | | |
8.13%, 04/15/11 | | | 190,000 | | | 205,914 |
9.00%, 04/15/31 | | | 325,000 | | | 387,499 |
Dex Media East LLC | | | | | | |
9.88%, 11/15/09 | | | 200,000 | | | 210,000 |
12.13%, 11/15/12 | | | 70,000 | | | 77,263 |
Dex Media West LLC | | | | | | |
9.88%, 08/15/13 | | | 275,000 | | | 301,125 |
Dex Media, Inc. | | | | | | |
9.00%, 11/15/13 STEP | | | 10,000 | | | 8,975 |
DI Finance | | | | | | |
9.50%, 02/15/13 | | | 90,000 | | | 95,850 |
DirecTV Holdings LLC | | | | | | |
8.38%, 03/15/13 | | | 500,000 | | | 522,500 |
Duke Energy Corporation | | | | | | |
3.75%, 03/05/08 | | | 50,000 | | | 49,083 |
Echostar DBS Corporation | | | | | | |
7.13%, 02/01/16 | | | 800,000 | | | 804,000 |
El Paso Natural Gas Co. | | | | | | |
7.63%, 08/01/10 | | | 90,000 | | | 94,500 |
8.63%, 01/15/22 | | | 90,000 | | | 109,448 |
8.38%, 06/15/32 | | | 75,000 | | | 91,196 |
Encore Acquisition Co. | | | | | | |
7.25%, 12/01/17 | | | 15,000 | | | 14,588 |
EPL Finance Corporation | | | | | | |
11.75%, 11/15/13 | | | 30,000 | | | 32,700 |
Exco Resources, Inc. | | | | | | |
7.25%, 01/15/11 | | | 125,000 | | | 127,500 |
FirstEnergy Corporation | | | | | | |
6.45%, 11/15/11 | | | 100,000 | | | 104,389 |
7.38%, 11/15/31 | | | 70,000 | | | 79,961 |
Ford Motor Credit Co. | | | | | | |
6.63%, 06/16/08 | | | 90,000 | | | 89,969 |
5.63%, 10/01/08 | | | 240,000 | | | 235,775 |
5.80%, 01/12/09 | | | 500,000 | | | 491,152 |
8.11%, 01/13/12† | | | 37,500 | | | 37,205 |
9.96%, 04/15/12† | | | 100,000 | | | 106,106 |
Forest Oil Corporation | | | | | | |
8.00%, 06/15/08 | | | 100,000 | | | 102,875 |
8.00%, 12/15/11 | | | 70,000 | | | 73,150 |
| | |
See Notes to Financial Statements. | | 85 |
| | |
| Global Bond Fund | | |
| SCHEDULE OF INVESTMENTS (Continued) | | |
| | | | | | |
| | | Par | | Value |
Freescale Semiconductor, Inc. | | | | | | |
8.88%, 12/15/14 144A | | $ | 25,000 | | $ | 25,031 |
General Electric Capital Corporation | | | | | | |
6.75%, 03/15/32 | | | 30,000 | | | 34,469 |
Geokinetics, Inc. | | | | | | |
11.86%, 12/15/12 144A† | | | 35,000 | | | 35,350 |
GMAC LLC | | | | | | |
6.75%, 12/01/14 | | | 650,000 | | | 668,654 |
8.00%, 11/01/31 | | | 600,000 | | | 690,841 |
Goldman Sachs Group, Inc. | | | | | | |
6.65%, 05/15/09 | | | 20,000 | | | 20,659 |
Hanover Compressor Co. | | | | | | |
8.63%, 12/15/10 | | | 50,000 | | | 52,500 |
7.50%, 04/15/13 | | | 40,000 | | | 40,600 |
Hanover Equipment Trust | | | | | | |
8.75%, 09/01/11 | | | 90,000 | | | 94,275 |
Hawaiian Telcom Communications, Inc. | | | | | | |
10.89%, 05/01/13† | | | 25,000 | | | 25,125 |
12.50%, 05/01/15 | | | 200,000 | | | 210,500 |
HCA, Inc. | | | | | | |
7.88%, 02/01/11 | | | 240,000 | | | 241,205 |
9.25%, 11/15/16 144A | | | 60,000 | | | 64,425 |
9.63%, 11/15/16 144A | | | 45,000 | | | 48,488 |
Hertz Corporation | | | | | | |
8.88%, 01/01/14 | | | 500,000 | | | 526,250 |
Hess Corporation | | | | | | |
6.65%, 08/15/11 | | | 60,000 | | | 62,538 |
HSBC Finance Corporation | | | | | | |
4.63%, 01/15/08 | | | 120,000 | | | 119,227 |
Intelsat Corporation | | | | | | |
9.00%, 08/15/14 | | | 240,000 | | | 254,700 |
9.00%, 06/15/16 144A | | | 160,000 | | | 170,200 |
JPMorgan Chase & Co. | | | | | | |
3.63%, 05/01/08 | | | 100,000 | | | 97,716 |
Kerr-McGee Corporation | | | | | | |
6.95%, 07/01/24 | | | 20,000 | | | 21,355 |
Kimball Hill, Inc. | | | | | | |
10.50%, 12/15/12 | | | 40,000 | | | 37,600 |
Koppers, Inc. | | | | | | |
9.88%, 10/15/13 | | | 75,000 | | | 81,938 |
Kraft Foods, Inc. | | | | | | |
4.13%, 11/12/09 | | | 40,000 | | | 38,823 |
5.63%, 11/01/11 | | | 30,000 | | | 30,351 |
L-3 Communications Corporation | | | | | | |
7.63%, 06/15/12 | | | 600,000 | | | 624,000 |
6.13%, 01/15/14 | | | 45,000 | | | 44,212 |
6.38%, 10/15/15 | | | 450,000 | | | 447,750 |
Lamar Media Corporation | | | | | | |
6.63%, 08/15/15 | | | 100,000 | | | 99,625 |
Lehman Brothers Holdings, Inc. | | | | | | |
4.00%, 01/22/08 | | | 130,000 | | | 128,241 |
Levi Strauss & Co. | | | | | | |
8.63%, 04/01/13(E) | | | 200,000 | | | 281,170 |
9.75%, 01/15/15 | | | 145,000 | | | 156,962 |
8.88%, 04/01/16 | | | 50,000 | | | 52,500 |
Linens ‘n Things, Inc. | | | | | | |
11.00%, 01/15/14† | | | 35,000 | | | 34,125 |
Lyondell Chemical Co. | | | | | | |
11.13%, 07/15/12 | | | 45,000 | | | 48,600 |
8.00%, 09/15/14 | | | 190,000 | | | 198,075 |
8.25%, 09/15/16 | | | 140,000 | | | 147,700 |
Metals USA Holdings Corporation | | | | | | |
11.37%, 01/15/12 144A† | | | 240,000 | | | 231,600 |
Michael’s Stores, Inc. | | | | | | |
12.94%, 11/01/16 STEP 144A | | | 30,000 | | | 16,425 |
Midwest Generation LLC | | | | | | |
8.30%, 07/02/09 | | | 99,175 | | | 102,089 |
8.56%, 01/02/16 | | | 450,792 | | | 497,280 |
Mirant Mid-Atlantic LLC | | | | | | |
9.13%, 06/30/17 | | | 152,070 | | | 171,744 |
Morgan Stanley | | | | | | |
3.63%, 04/01/08 | | | 60,000 | | | 58,803 |
4.75%, 04/01/14 | | | 50,000 | | | 47,878 |
Mueller Group, Inc. | | | | | | |
10.00%, 05/01/12 | | | 105,000 | | | 114,712 |
Neiman-Marcus Group, Inc. | | | | | | |
9.00%, 10/15/15 | | | 100,000 | | | 109,625 |
Nevada Power Co. | | | | | | |
8.25%, 06/01/11 | | | 290,000 | | | 318,242 |
5.88%, 01/15/15 | | | 100,000 | | | 100,037 |
NewPage Corporation | | | | | | |
10.00%, 05/01/12 | | | 25,000 | | | 26,500 |
11.62%, 05/01/12† | | | 185,000 | | | 200,725 |
Norcraft Holdings LP | | | | | | |
9.85%, 09/01/12 STEP | | | 190,000 | | | 161,500 |
NRG Energy, Inc. | | | | | | |
7.38%, 02/01/16 | | | 300,000 | | | 302,250 |
Oncor Electric Delivery Co. | | | | | | |
6.38%, 01/15/15 | | | 100,000 | | | 103,239 |
Orion Power Holdings, Inc. | | | | | | |
12.00%, 05/01/10 | | | 55,000 | | | 62,700 |
Owens Brockway Glass Container, Inc. | | | | | | |
8.25%, 05/15/13 | | | 300,000 | | | 311,625 |
Pemex Project Funding Master Trust | | | | | | |
6.63%, 06/15/35 | | | 1,640,000 | | | 1,679,770 |
PetroHawk Energy Corporation | | | | | | |
9.13%, 07/15/13 | | | 90,000 | | | 94,950 |
Qwest Communications International, Inc. | | | | | | |
8.87%, 02/15/09† | | | 100,000 | | | 101,750 |
7.25%, 02/15/11 | | | 35,000 | | | 35,963 |
Qwest Corporaiton | | | | | | |
7.63%, 06/15/15 | | | 300,000 | | | 322,500 |
Qwest Corporation | | | | | | |
7.88%, 09/01/11 | | | 100,000 | | | 107,000 |
8.88%, 03/15/12 | | | 20,000 | | | 22,375 |
8.58%, 06/15/13† | | | 100,000 | | | 108,750 |
Rainbow National Services LLC | | | | | | |
8.75%, 09/01/12 144A | | | 100,000 | | | 105,625 |
10.38%, 09/01/14 144A | | | 300,000 | | | 334,875 |
Rental Services Corporation | | | | | | |
9.50%, 12/01/14 144A | | | 60,000 | | | 62,250 |
RH Donnelley Finance Corporation I | | | | | | |
10.88%, 12/15/12 144A | | | 200,000 | | | 219,000 |
RH Donnelley, Inc. | | | | | | |
10.88%, 12/15/12 | | | 100,000 | | | 109,500 |
SemGroup LP | | | | | | |
8.75%, 11/15/15 | | | 105,000 | | | 106,050 |
| | |
| 86 | | See Notes to Financial Statements. |
| | | | | | |
| | | Par | | Value |
Sinclair Broadcast Group, Inc. | | | | | | |
8.75%, 12/15/11 | | $ | 225,000 | | $ | 235,406 |
8.00%, 03/15/12 | | | 125,000 | | | 129,688 |
Sprint Capital Corporation | | | | | | |
8.38%, 03/15/12 | | | 60,000 | | | 66,754 |
Tenet Healthcare Corporation | | | | | | |
9.88%, 07/01/14 | | | 375,000 | | | 383,438 |
Time Warner, Inc. | | | | | | |
6.88%, 05/01/12 | | | 90,000 | | | 95,213 |
Triad Hospitals, Inc. | | | | | | |
7.00%, 11/15/13 | | | 50,000 | | | 50,562 |
Turning Stone Resort Casino Enterprise | | | | | | |
9.13%, 09/15/14 144A | | | 65,000 | | | 66,788 |
Unicredito Italiano Capital | | | | | | |
Trust III | | | | | | |
4.03%, 10/29/49(E)† | | | 250,000 | | | 308,065 |
Valor Telecommunications Enterprises LLC | | | | | | |
7.75%, 02/15/15 | | | 125,000 | | | 135,156 |
Verizon Global Funding Corporation | | | | | | |
6.88%, 06/15/12 | | | 30,000 | | | 32,078 |
Verso Paper Holdings LLC | | | | | | |
9.24%, 08/01/14 144A† | | | 160,000 | | | 163,200 |
Wachovia Corporation | | | | | | |
5.25%, 08/01/14 | | | 120,000 | | | 118,721 |
Waste Management, Inc. | | | | | | |
7.38%, 08/01/10 | | | 50,000 | | | 53,227 |
7.38%, 05/15/29 | | | 50,000 | | | 56,624 |
WDAC Subsidiary Corporation | | | | | | |
8.50%, 12/01/14 144A(E) | | | 200,000 | | | 279,850 |
Weyerhaeuser Co. | | | | | | |
6.75%, 03/15/12 | | | 120,000 | | | 125,989 |
Williams Cos., Inc. | | | | | | |
7.13%, 09/01/11 | | | 525,000 | | | 548,625 |
7.50%, 01/15/31 | | | 130,000 | | | 135,525 |
Windstream Corporation | | | | | | |
8.63%, 08/01/16 | | | 650,000 | | | 715,000 |
WMG Acquisition Corporation | | | | | | |
7.38%, 04/15/14 | | | 150,000 | | | 149,250 |
WMG Holdings Corporation | | | | | | |
8.66%, 12/15/14 STEP | | | 100,000 | | | 80,500 |
Xerox Corporation | | | | | | |
9.75%, 01/15/09 | | | 500,000 | | | 542,500 |
XTO Energy, Inc. | | | | | | |
7.50%, 04/15/12 | | | 30,000 | | | 32,629 |
| | | | | | |
| | |
Total Corporate Bonds | | | | | | |
(Cost $26,197,870) | | | | | | 26,543,470 |
| | | | | | |
| | |
FOREIGN BONDS — 35.6% | | | | | | |
Argentina — 0.5% | | | | | | |
Republic of Argentina | | | | | | |
2.00%, 01/03/10(P)† | | | 360,000 | | | 180,424 |
4.01%, 08/03/12† | | | 410,000 | | | 299,710 |
| | | | | | |
| | | | | | 480,134 |
| | | | | | |
| | |
Australia — 0.9% | | | | | | |
Queensland Treasury Corporation | | | | | | |
6.00%, 06/14/11(A) | | | 1,220,000 | | | 954,795 |
| | | | | | |
| | |
Bermuda — 0.4% | | | | | | |
AES China Generating Co., Ltd. | | | | | | |
8.25%, 06/26/10 | | | 130,000 | | | 130,078 |
Intelsat Subsidiary Holding Co., Ltd. | | | | | | |
8.25%, 01/15/13 | | | 300,000 | | | 306,000 |
| | | | | | |
| | | | | | 436,078 |
| | | | | | |
| | |
Brazil — 2.4% | | | | | | |
Federal Republic of Brazil | | | | | | |
11.00%, 08/17/40 | | | 1,870,000 | | | 2,480,087 |
| | | | | | |
| | |
Canada — 1.8% | | | | | | |
Bombardier, Inc. | | | | | | |
7.25%, 11/15/16(E) | | | 161,000 | | | 215,938 |
Conoco Funding Co. | | | | | | |
6.35%, 10/15/11 | | | 70,000 | | | 73,256 |
OPTI Canada, Inc. | | | | | | |
8.25%, 12/15/14 144A | | | 65,000 | | | 67,113 |
Quebecor Media, Inc. | | | | | | |
7.75%, 03/15/16 | | | 100,000 | | | 102,625 |
Rogers Cable, Inc. | | | | | | |
7.88%, 05/01/12 | | | 240,000 | | | 260,610 |
8.75%, 05/01/32 | | | 60,000 | | | 73,200 |
Rogers Wireless, Inc. | | | | | | |
9.63%, 05/01/11 | | | 450,000 | | | 513,000 |
7.25%, 12/15/12 | | | 250,000 | | | 266,250 |
Western Oil Sands, Inc. | | | | | | |
8.38%, 05/01/12 | | | 300,000 | | | 334,500 |
| | | | | | |
| | | | | | 1,906,492 |
| | | | | | |
| | |
Cayman Islands — 0.5% | | | | | | |
Shinsei Finance Cayman, Ltd. | | | | | | |
6.42%, 07/20/48† | | | 120,000 | | | 120,071 |
Vale Overseas, Ltd. | | | | | | |
6.88%, 11/21/36 | | | 390,000 | | | 401,952 |
| | | | | | |
| | | | | | 522,023 |
| | | | | | |
Colombia — 0.4% | | | | | | |
Republic of Colombia | | | | | | |
7.38%, 09/18/37 | | | 400,000 | | | 430,400 |
| | | | | | |
| | |
Denmark — 3.3% | | | | | | |
Nordea Kredit Realkreditaktie-selskab | | | | | | |
4.00%, 10/01/38(D) | | | 9,300,000 | | | 1,510,542 |
Nordic Telephone Co. Holdings ApS | | | | | | |
8.25%, 05/01/16 144A(E) | | | 200,000 | | | 291,730 |
8.88%, 05/01/16 144A | | | 265,000 | | | 284,875 |
Nykredit Realkredit A/S | | | | | | |
4.00%, 10/01/38(D) | | | 8,600,000 | | | 1,396,845 |
| | | | | | |
| | | | | | 3,483,992 |
| | | | | | |
| | |
Ecuador — 0.1% | | | | | | |
Republic of Ecuador | | | | | | |
10.00%, 08/15/30 STEP | | | 150,000 | | | 111,750 |
| | | | | | |
| | |
France — 0.8% | | | | | | |
AXA SA | | | | | | |
5.78%, 07/31/49(E)† | | | 200,000 | | | 274,064 |
Compagnie Generale de Geophysique SA | | | | | | |
7.50%, 05/15/15 | | | 90,000 | | | 90,900 |
Dexia Municipal Agency | | | | | | |
1.55%, 10/31/13(J) | | | 51,000,000 | | | 429,260 |
| | | | | | |
| | | | | | 794,224 |
| | | | | | |
| | |
See Notes to Financial Statements. | | 87 |
| | |
| Global Bond Fund | | |
| SCHEDULE OF INVESTMENTS (Continued) | | |
| | | | | | |
| | | Par | | Value |
Germany — 5.8% | | | | | | |
Bundesobligation | | | | | | |
3.50%, 10/14/11(E) | | | 2,400,000 | | $ | 3,109,853 |
Bundesrepublik Deutschland | | | | | | |
4.00%, 07/04/16(E) | | | 2,200,000 | | | 2,913,656 |
| | | | | | |
| | | | | | 6,023,509 |
| | | | | | |
| | |
Iceland — 0.3% | | | | | | |
Kaupthing Bank HF | | | | | | |
7.13%, 05/19/16 | | $ | 150,000 | | | 159,375 |
Landsbanki Islands HF | | | | | | |
6.10%, 08/25/11 | | | 150,000 | | | 152,653 |
| | | | | | |
| | | | | | 312,028 |
| | |
Ireland — 0.3% | | | | | | |
Smurfit Kappa Funding PLC | | | | | | |
9.63%, 10/01/12 | | | 90,000 | | | 95,850 |
7.75%, 04/01/15(E) | | | 200,000 | | | 266,649 |
| | | | | | |
| | | | | | 362,499 |
| | |
Japan — 0.5% | | | | | | |
Resona Bank, Ltd. | | | | | | |
5.99%, 08/10/49(U)† | | | 250,000 | | | 488,419 |
| | | | | | |
| | |
Jersey — 0.3% | | | | | | |
RZB Finance Jersey IV, Ltd. | | | | | | |
5.17%, 05/16/16(E)† | | | 250,000 | | | 326,497 |
| | | | | | |
| | |
Luxembourg — 2.3% | | | | | | |
Basell AF SCA | | | | | | |
8.38%, 08/15/15 144A | | | 200,000 | | | 206,500 |
Fortis Hybrid Financing | | | | | | |
5.13%, 06/29/49(E)† | | | 250,000 | | | 332,118 |
Gaz Capital for Gazprom | | | | | | |
6.21%, 11/22/16 144A | | | 200,000 | | | 201,900 |
Lighthouse International Co. SA | | | | | | |
8.00%, 04/30/14 144A(E) | | | 200,000 | | | 290,080 |
RSHB Capital SA for OJSC Russian Agricultural Bank | | | | | | |
7.18%, 05/16/13 144A | | | 250,000 | | | 264,063 |
6.97%, 09/21/16 STEP | | | 100,000 | | | 103,535 |
TNK-BP Finance SA | | | | | | |
7.50%, 07/18/16 | | | 250,000 | | | 266,562 |
Tyco International Group SA | | | | | | |
6.38%, 10/15/11 | | | 90,000 | | | 94,281 |
6.50%, 11/21/31(U) | | | 165,000 | | | 366,035 |
Wind Acquisition Finance SA | | | | | | |
9.75%, 12/01/15 144A(E) | | | 200,000 | | | 304,270 |
| | | | | | |
| | | | | | 2,429,344 |
| | | | | | |
| | |
Malaysia — 0.1% | | | | | | |
Penerbangan Malaysia Berhad | | | | | | |
5.63%, 03/15/16 | | | 100,000 | | | 101,662 |
| | | | | | |
| | |
Mexico — 1.4% | | | | | | |
Kansas City Southern de Mexico SA de CV | | | | | | |
7.63%, 12/01/13 144A | | | 140,000 | | | 140,350 |
United Mexican States | | | | | | |
8.00%, 12/19/13(M) | | | 10,500,000 | | | 1,005,290 |
7.50%, 04/08/33 | | | 320,000 | | | 378,400 |
| | | | | | |
| | | | | | 1,524,040 |
| | | | | | |
| | |
Netherlands — 2.2% | | | | | | |
ABN Amro Bank NV | | | | | | |
4.31%, 02/10/49(E)† | | | 395,000 | | | 495,503 |
Carlson Wagonlit BV | | | | | | |
9.31%, 05/01/15 144A(E)† | | | 200,000 | | | 274,900 |
Deutsche Telekom International Finance BV | | | | | | |
5.75%, 03/23/16 | | | 80,000 | | | 78,964 |
ELM BV for Swiss Reinsurance Co. | | | | | | |
5.25%, 05/25/49(E)† | | | 200,000 | | | 267,290 |
Fresenius Finance BV | | | | | | |
5.50%, 01/31/16 144A(E) | | | 200,000 | | | 273,249 |
Impress Holdings BV | | | | | | |
6.48%, 09/15/13 144A(E)† | | | 200,000 | | | 270,609 |
TuranAlem Finance BV | | | | | | |
7.13%, 12/21/09(U) | | | 200,000 | | | 393,790 |
UPC Holding BV | | | | | | |
7.75%, 01/15/14 144A(E) | | | 200,000 | | | 265,989 |
| | | | | | |
| | | | | | 2,320,294 |
| | | | | | |
| | |
Panama — 0.3% | | | | | | |
AES El Salvador Trust | | | | | | |
6.75%, 02/01/16 | | | 190,000 | | | 189,947 |
Republic of Panama | | | | | | |
9.38%, 04/01/29 | | | 80,000 | | | 107,200 |
| | | | | | |
| | | | | | 297,147 |
| | | | | | |
| | |
Peru — 0.3% | | | | | | |
Republic of Peru | | | | | | |
5.00%, 03/07/17† | | | 121,600 | | | 121,296 |
7.35%, 07/21/25 | | | 110,000 | | | 124,850 |
8.75%, 11/21/33 | | | 70,000 | | | 92,400 |
| | | | | | |
| | | | | | 338,546 |
| | | | | | |
| | |
Philippines — 0.1% | | | | | | |
Republic of Philippines | | | | | | |
10.63%, 03/16/25 | | | 10,000 | | | 14,387 |
7.75%, 01/14/31 | | | 50,000 | | | 57,000 |
| | | | | | |
| | | | | | 71,387 |
| | | | | | |
| | |
Russia — 2.6% | | | | | | |
OAO Gazprom | | | | | | |
6.79%, 10/29/09(R) | | | 10,040,000 | | | 382,523 |
7.00%, 10/27/11(R) | | | 3,350,000 | | | 127,839 |
Russian Federation | | | | | | |
5.00%, 03/31/30 | | | 1,970,000 | | | 2,228,704 |
| | | | | | |
| | | | | | 2,739,066 |
| | | | | | |
| | |
South Africa — 2.3% | | | | | | |
New Reclamation Group (Proprietary), Ltd. | | | | | | |
8.13%, 02/01/13 144A(E) | | | 153,040 | | | 212,120 |
Republic of South Africa | | | | | | |
8.75%, 12/21/14(S) | | | 14,200,000 | | | 2,155,172 |
| | | | | | |
| | | | | | 2,367,292 |
| | | | | | |
| | |
Thailand — 0.4% | | | | | | |
True Move Co., Ltd. | | | | | | |
10.75%, 12/16/13 144A | | | 461,000 | | | 451,780 |
| | | | | | |
| | |
Turkey — 0.5% | | | | | | |
Republic of Turkey | | | | | | |
6.88%, 03/17/36 | | | 520,000 | | | 499,200 |
| | | | | | |
| | |
United Kingdom — 3.3% | | | | | | |
Ashtead Holdings PLC | | | | | | |
8.63%, 08/01/15 144A | | | 160,000 | | | 167,200 |
First Hydro Finance PLC | | | | | | |
9.00%, 07/31/21(U) | | | 100,000 | | | 240,695 |
| | |
| 88 | | See Notes to Financial Statements. |
| | | | | | | |
| | | Par | | Value | |
Heating Finance PLC | | | | | | | |
7.88%, 03/31/14 144A(U) | | | 100,000 | | $ | 188,945 | |
Inmarsat Finance PLC | | | | | | | |
7.63%, 06/30/12 | | $ | 50,000 | | | 51,875 | |
NTL Cable PLC | | | | | | | |
8.75%, 04/15/14 | | | 425,000 | | | 446,781 | |
9.75%, 04/15/14 144A(U) | | | 100,000 | | | 208,280 | |
9.13%, 08/15/16 | | | 200,000 | | | 212,250 | |
United Kingdom Gilt | | | | | | | |
4.25%, 03/07/11(U) | | | 1,000,000 | | | 1,899,243 | |
| | | | | | | |
| | | | | | 3,415,269 | |
| | | | | | | |
| | |
Venezuela — 1.5% | | | | | | | |
Bolivarian Republic of Venezuela | | | | | | | |
9.38%, 01/13/34 | | | 290,000 | | | 383,525 | |
Petrozuata Finance, Inc. | | | | | | | |
8.22%, 04/01/17 | | | 290,000 | | | 290,725 | |
Republic of Venezuela | | | | | | | |
5.75%, 02/26/16 | | | 990,000 | | | 941,292 | |
| | | | | | | |
| | | | | | 1,615,542 | |
| | | | | | | |
Total Foreign Bonds | | | | | | | |
(Cost $36,678,842) | | | | | | 37,283,496 | |
| | | | | | | |
| | |
MORTGAGE-BACKED SECURITIES — 18.3% | | | | | | | |
Countrywide Home Loan Mortgage Pass-Through Trust | | | | | | | |
5.72%, 09/25/35 144A† | | | 968,992 | | | 974,255 | |
Federal National Mortgage Association | | | | | | | |
5.50%, 01/ 01/21 TBA | | | 1,300,000 | | | 1,299,595 | |
5.00%, 01/01/33 TBA | | | 1,300,000 | | | 1,277,656 | |
5.50%, 01/01/36 TBA | | | 3,000,000 | | | 2,964,375 | |
6.50%, 01/12/36 TBA | | | 1,200,000 | | | 1,222,500 | |
5.00%, 01/01/37 TBA | | | 5,900,000 | | | 5,695,341 | |
6.00%, 01/11/37 TBA | | | 2,700,000 | | | 2,717,717 | |
Government National Mortgage Association | | | | | | | |
| | |
6.00%, 01/01/37 TBA | | | 1,200,000 | | | 1,216,500 | |
6.50%, 01/01/37 TBA | | | 800,000 | | | 820,500 | |
MASTR Reperforming Loan Trust | | | | | | | |
5.67%, 05/25/35 144A† | | | 963,738 | | | 965,605 | |
| | | | | | | |
Total Mortgage-Backed Securities | | | | | | | |
(Cost $19,284,514) | | | | | | 19,154,044 | |
| | | | | | | |
| | | Number of
Contracts | | | |
| | |
PURCHASED OPTIONS — 0.2% | | | | | | | |
Put Options — 0.2% | | | | | | | |
U.S. Dollar vs. Euro, Strike | | | | | | | |
Price $ 1.33, Expires 03/06/07 | | | 4,000,000 | | | 56,928 | |
U.S. Dollar vs. Japanese Yen, | | | | | | | |
Strike Price $117.30, Expires 01/18/07 | | | 6,000,000 | | | 12,930 | |
U.S. Dollar vs. Japanese Yen, | | | | | | | |
Strike Price $120.50, Expires 02/06/07 | | | 7,300,000 | | | 140,408 | |
| | | | | | | |
Total Purchased Options | | | | | | | |
(Cost $496,330) | | | | | | 210,266 | |
| | | | | | | |
| | |
| | | Shares | | Value | |
| | |
MONEY MARKET FUND — 18.2% | | | | | | | |
GuideStone Funds Money Market Fund (GS4 Class)¥ | | | | | | | |
(Cost $19,032,626) | | | 19,032,626 | | $ | 19,032,626 | |
| | | | | | | |
| | |
| | | Par | | | |
U.S. TREASURY OBLIGATIONS — 13.3% | | | | | | | |
U.S. Treasury Bond | | | | | | | |
6.25%, 05/15/30 | | $ | 1,900,000 | | | 2,263,970 | |
| | | | | | | |
U.S. Treasury Inflationary Index Bonds | | | | | | | |
0.88%, 04/15/10 | | | 4,250,000 | | | 4,295,658 | |
2.00%, 01/15/16 | | | 1,800,000 | | | 1,768,590 | |
| | | | | | | |
| | | | | | 6,064,248 | |
| | | | | | | |
U.S. Treasury Note | | | | | | | |
4.88%, 04/30/11 | | | 5,600,000 | | | 5,638,063 | |
| | | | | | | |
Total U.S. Treasury Obligations | | | | | | | |
(Cost $14,017,395) | | | | | | 13,966,281 | |
| | | | | | | |
| | |
TOTAL INVESTMENTS — 112.0% | | | | | | | |
(Cost $116,667,037) | | | | | | 117,148,896 | |
| | | | | | | |
Liabilities in Excess of Other Assets — (12.0)% | | | | | | (12,513,594 | ) |
| | | | | | | |
| | | | | $ | 104,635,302 | |
| | | | | | | |
NET ASSETS — 100.0% | | | | | | | |
PORTFOLIO SUMMARY (based on net assets)
| | | |
| | | % | |
Foreign Bonds | | 35.6 | |
Corporate Bonds | | 25.4 | |
Mortgage-Backed Securities | | 18.3 | |
Money Market Fund | | 18.2 | |
U.S. Treasury Obligations | | 13.3 | |
Asset-Backed Security | | 1.0 | |
Purchased Options | | 0.2 | |
Forward Foreign Currency Contracts | | (2.6 | ) |
| | | |
| | 109.4 | |
| | | |
| | |
See Notes to Financial Statements. | | 89 |
The Fund is passively managed and is comprised of domestic, large-cap equity stocks with both value and growth-style orientations. The Fund performed in-line with expectations during the quarter and the year. The performance differential between the benchmark and the Fund is primarily a result of expenses and social restrictions within the Fund.
Please see page 96 for information regarding specific portfolio allocations. Portfolio holdings are subject to change at any time.
| | | | | | | | | | | | | | | | | | |
Average Annual Total Returns as of 12/31/06 | |
| | | GS2 Class* | | | GS4 Class* | | | GS6 Class* | | | Benchmark** | | | GS8 Class* | | | GS8 Class Benchmark** | |
One Year | | 15.37 | % | | 15.19 | % | | 14.97 | % | | 15.78 | % | | 14.63 | % | | 15.78 | % |
Five Year | | 5.86 | % | | 5.72 | % | | 5.60 | % | | 6.19 | % | | N/A | | | N/A | |
Since Inception | | 4.84 | % | | 4.83 | % | | 4.70 | % | | 5.25 | % | | 10.64 | % | | 11.62 | % |
Inception Date | | 08/27/01 | | | 08/27/01 | | | 08/27/01 | | | 08/27/01 | | | 11/08/04 | | | 11/08/04 | |
The performance data quoted represents past performance and does not guarantee future results. Current performance may be lower or higher. Performance data current to the most recent month-end may be obtained at www.GuideStone.org. The investment return and principal value of an investment will fluctuate so that shares, when redeemed, may be worth more or less than their original cost.
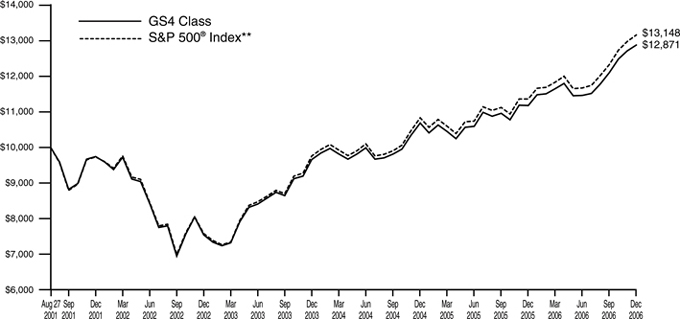
The graph compares the results of a hypothetical $10,000 investment in the GS4 Class of the Fund since August 27, 2001 (commencement of operations), with all dividends and capital gains reinvested, with the S&P 500® Index.
| * | These returns reflect expense waivers by the Fund’s investment advisor. Without these waivers, returns would have been lower. Returns shown do not reflect the deduction of taxes that a shareholder would pay on Fund distributions or the redemption of Fund shares. |
** | The S&P 500® Index is an unmanaged index (with no defined investment objective) of common stocks, includes reinvestment of dividends, and is a registered trademark of McGraw-Hill Co., Inc. The S&P 500® Index includes 500 of the largest stocks (in terms of market value) in the United States. |
Unlike a mutual fund, the performance of an index assumes no taxes, transaction costs, management fees or other expenses.
| | |
Equity Index Fund | | |
SCHEDULE OF INVESTMENTS | | December 31, 2006 |
| | | | | |
| | | Shares | | Value |
COMMON STOCKS — 96.8% | | | | | |
Auto & Transportation — 2.3% | | | | | |
Burlington Northern Santa Fe Corporation | | 16,100 | | $ | 1,188,341 |
CSX Corporation | | 19,300 | | | 664,499 |
FedEx Corporation | | 13,300 | | | 1,444,646 |
Ford Motor Co.D | | 82,227 | | | 617,525 |
General Motors CorporationD | | 24,700 | | | 758,784 |
Genuine Parts Co.D | | 7,300 | | | 346,239 |
Goodyear Tire & Rubber Co. (The)D* | | 7,700 | | | 161,623 |
Harley-Davidson, Inc. | | 11,700 | | | 824,499 |
Norfolk Southern Corporation | | 18,400 | | | 925,336 |
PACCAR, Inc.D | | 10,912 | | | 708,189 |
Southwest Airlines Co. | | 33,800 | | | 517,816 |
Union Pacific Corporation | | 11,700 | | | 1,076,634 |
United Parcel Service, Inc. Class B | | 47,500 | | | 3,561,550 |
| | | | | |
| | | | | 12,795,681 |
| | | | | |
| | |
Consumer Discretionary — 11.3% | | | | | |
Allied Waste Industries, Inc.* | | 10,400 | | | 127,816 |
Amazon.com, Inc.* | | 13,884 | | | 547,863 |
Apollo Group, Inc. Class AD* | | 6,121 | | | 238,535 |
AutoNation, Inc.D* | | 7,325 | | | 156,169 |
AutoZone, Inc.D* | | 2,400 | | | 277,344 |
Avon Products, Inc.D | | 19,400 | | | 640,976 |
Bed Bath & Beyond, Inc.* | | 12,700 | | | 483,870 |
Best Buy Co., Inc. | | 17,725 | | | 871,893 |
Big Lots, Inc.D* | | 4,800 | | | 110,016 |
Black & Decker Corporation | | 3,400 | | | 271,898 |
Carnival Corporation | | 19,400 | | | 951,570 |
CBS Corporation Class B | | 34,300 | | | 1,069,474 |
Cintas CorporationD | | 6,100 | | | 242,231 |
Circuit City Stores, Inc. | | 6,200 | | | 117,676 |
Clear Channel Communications, Inc. | | 21,700 | | | 771,218 |
Coach, Inc.* | | 16,000 | | | 687,360 |
Convergys CorporationD* | | 6,000 | | | 142,680 |
Costco Wholesale Corporation | | 20,400 | | | 1,078,548 |
Darden Restaurants, Inc. | | 6,150 | | | 247,045 |
Dillard’s, Inc. Class AD | | 2,900 | | | 101,413 |
DIRECTV Group, Inc. (The)* | | 34,100 | | | 850,454 |
Dollar General CorporationD | | 13,600 | | | 218,416 |
Donnelley (R.R.) & Sons Co. | | 9,100 | | | 323,414 |
Eastman Kodak Co.D | | 12,500 | | | 322,500 |
eBay, Inc.* | | 51,400 | | | 1,545,598 |
Electronic Arts, Inc.* | | 13,600 | | | 684,896 |
Estee Lauder Cos., Inc. Class AD | | 5,400 | | | 220,428 |
Family Dollar Stores, Inc. | | 6,700 | | | 196,511 |
Federated Department Stores, Inc. | | 23,812 | | | 907,952 |
Gannett Co., Inc. | | 10,400 | | | 628,784 |
Gap, Inc. (The) | | 23,600 | | | 460,200 |
Google, Inc.* | | 9,359 | | | 4,309,632 |
Harman International Industries, Inc. | | 2,800 | | | 279,748 |
Hasbro, Inc.D | | 7,100 | | | 193,475 |
Hilton Hotels Corporation | | 16,700 | | | 582,830 |
Home Depot, Inc. (The) | | 90,150 | | | 3,620,424 |
IAC InterActiveCorp* | | 9,800 | | | 364,168 |
International Flavors & Fragrances, Inc. | | 3,900 | | | 191,724 |
Interpublic Group Cos., Inc.D* | | 18,948 | | | 231,923 |
Jones Apparel Group, Inc. | | 5,100 | | | 170,493 |
Kimberly-Clark Corporation | | 19,800 | | | 1,345,410 |
Kohl’s Corporation* | | 14,300 | | | 978,549 |
Leggett & Platt, Inc.D | | 8,000 | | | 191,200 |
Limited Brands | | 15,000 | | | 434,100 |
Liz Claiborne, Inc. | | 4,608 | | | 200,264 |
Lowe’s Cos., Inc. | | 66,800 | | | 2,080,820 |
Marriott International, Inc. Class A | | 14,700 | | | 701,484 |
Mattel, Inc. | | 16,500 | | | 373,890 |
McDonald’s Corporation | | 54,200 | | | 2,402,686 |
McGraw-Hill Co., Inc. (The) | | 15,600 | | | 1,061,112 |
Meredith CorporationD | | 1,700 | | | 95,795 |
Monster Worldwide, Inc.* | | 5,500 | | | 256,520 |
New York Times Co. Class AD | | 6,000 | | | 146,160 |
Newell Rubbermaid, Inc.D | | 11,700 | | | 338,715 |
Nike, Inc. Class BD | | 8,400 | | | 831,852 |
Nordstrom, Inc. | | 9,800 | | | 483,532 |
Office Depot, Inc.* | | 12,500 | | | 477,125 |
OfficeMax, Inc.D | | 3,000 | | | 148,950 |
Omnicom Group, Inc. | | 7,700 | | | 804,958 |
Penney (JC) Co., Inc.D | | 10,000 | | | 773,600 |
RadioShack CorporationD | | 5,800 | | | 97,324 |
Robert Half International, Inc. | | 7,300 | | | 270,976 |
Sabre Holdings Corporation | | 6,400 | | | 204,096 |
Scripps Co. (E.W.) Class A | | 3,700 | | | 184,778 |
Sears Holdings CorporationD* | | 3,689 | | | 619,494 |
Snap-On, Inc. | | 2,400 | | | 114,336 |
Stanley Works (The) | | 3,300 | | | 165,957 |
Staples, Inc. | | 31,500 | | | 841,050 |
Starbucks Corporation* | | 33,100 | | | 1,172,402 |
Starwood Hotels & Resorts Worldwide, Inc. | | 9,700 | | | 606,250 |
Target Corporation | | 37,500 | | | 2,139,375 |
Tiffany & Co.D | | 6,100 | | | 239,364 |
Time Warner, Inc. | | 177,600 | | | 3,868,128 |
TJX Cos., Inc. | | 20,000 | | | 570,400 |
Tribune Co.D | | 8,300 | | | 255,474 |
Univision Communications, Inc. Class AD* | | 10,700 | | | 378,994 |
VeriSign, Inc.* | | 11,100 | | | 266,955 |
VF CorporationD | | 4,000 | | | 328,320 |
Wal-Mart Stores, Inc. | | 107,600 | | | 4,968,968 |
Walt Disney Co. (The) | | 91,902 | | | 3,149,482 |
Waste Management, Inc. | | 24,100 | | | 886,157 |
Wendy’s International, Inc.D | | 5,000 | | | 165,450 |
Whirlpool CorporationD | | 3,295 | | | 273,524 |
Wyndham Worldwide Corporation* | | 8,880 | | | 284,338 |
Yahoo!, Inc.* | | 54,700 | | | 1,397,038 |
Yum! Brands, Inc. | | 11,900 | | | 699,720 |
| | | | | |
| | | | | 63,714,237 |
| | | | | |
| | |
Consumer Staples — 5.6% | | | | | |
Campbell Soup Co. | | 9,700 | | | 377,233 |
Clorox Co. | | 6,400 | | | 410,560 |
Coca-Cola Co. (The) | | 89,800 | | | 4,332,850 |
Coca-Cola Enterprises, Inc. | | 12,800 | | | 261,376 |
Colgate-Palmolive Co. | | 22,600 | | | 1,474,424 |
ConAgra Foods, Inc. | | 22,000 | | | 594,000 |
CVS Corporation | | 35,600 | | | 1,100,396 |
Dean Foods Co.* | | 5,900 | | | 249,452 |
General Mills, Inc. | | 15,200 | | | 875,520 |
Heinz (H.J.) Co. | | 14,500 | | | 652,645 |
Hershey Co. (The)D | | 7,700 | | | 383,460 |
Kellogg Co. | | 10,900 | | | 545,654 |
Kroger Co. | | 32,200 | | | 742,854 |
| | |
| 92 | | See Notes to Financial Statements. |
| | | | | |
| | | Shares | | Value |
McCormick & Co., Inc.D | | 5,700 | | $ | 219,792 |
Pepsi Bottling Group, Inc. | | 6,100 | | | 188,551 |
PepsiCo, Inc. | | 72,540 | | | 4,537,377 |
Procter & Gamble Co. | | 139,517 | | | 8,966,758 |
Safeway, Inc. | | 19,600 | | | 677,376 |
Sara Lee CorporationD | | 32,700 | | | 556,881 |
SUPERVALU, Inc. | | 8,948 | | | 319,891 |
SYSCO Corporation | | 27,200 | | | 999,872 |
Tyson Foods, Inc. Class AD | | 11,700 | | | 192,465 |
Walgreen Co. | | 44,000 | | | 2,019,160 |
Whole Foods Market, Inc.D | | 6,300 | | | 295,659 |
Wrigley (W.M.), Jr. Co.D | | 9,625 | | | 497,805 |
| | | | | |
| | | | | 31,472,011 |
| | | | | |
| | |
Financial Services — 23.1% | | | | | |
ACE, Ltd. | | 14,000 | | | 847,980 |
AFLAC, Inc. | | 21,500 | | | 989,000 |
Allstate Corporation (The) | | 27,952 | | | 1,819,955 |
AMBAC Financial Group, Inc.D | | 4,700 | | | 418,629 |
American Express Co. | | 53,500 | | | 3,245,845 |
American International Group, Inc. | | 114,192 | | | 8,182,999 |
Ameriprise Financial, Inc. | | 10,640 | | | 579,880 |
AON CorporationD | | 13,900 | | | 491,226 |
Apartment Investment & Management Co. Class A REITD | | 4,300 | | | 240,886 |
Archstone-Smith Trust REIT | | 9,100 | | | 529,711 |
Automatic Data Processing, Inc. | | 24,500 | | | 1,206,625 |
Bank of America Corporation | | 198,763 | | | 10,611,956 |
Bank of New York Co., Inc. (The) | | 33,600 | | | 1,322,832 |
BB&T Corporation | | 23,700 | | | 1,041,141 |
Bear Stearns Cos., Inc. (The) | | 5,210 | | | 848,084 |
Block (H&R), Inc. | | 13,800 | | | 317,952 |
Boston Properties, Inc. REIT | | 5,200 | | | 581,776 |
Capital One Financial Corporation | | 19,537 | | | 1,500,832 |
CB Richard Ellis Group, Inc. Class A* | | 8,000 | | | 265,600 |
Chicago Mercantile Exchange Holdings, Inc. | | 1,500 | | | 764,625 |
Chubb Corporation | | 17,700 | | | 936,507 |
CIGNA Corporation | | 4,900 | | | 644,693 |
Cincinnati Financial Corporation | | 7,386 | | | 334,660 |
CIT Group, Inc. | | 9,000 | | | 501,930 |
Citigroup, Inc. | | 216,430 | | | 12,055,151 |
Comerica, Inc. | | 7,200 | | | 422,496 |
Commerce Bancorp, Inc.D | | 8,500 | | | 299,795 |
Compass Bancshares, Inc.D | | 5,400 | | | 322,110 |
Countrywide Financial Corporation | | 26,508 | | | 1,125,265 |
Dow Jones & Co., Inc.D | | 2,954 | | | 112,252 |
E*TRADE Financial Corporation* | | 18,600 | | | 417,012 |
Equifax, Inc.D | | 5,900 | | | 239,540 |
Equity Office Properties Trust REIT | | 15,900 | | | 765,903 |
Equity Residential Properties Trust REIT | | 12,800 | | | 649,600 |
Fannie Mae | | 42,500 | | | 2,524,075 |
Federated Investors, Inc. Class BD | | 4,500 | | | 152,010 |
Fidelity National Information Services, Inc. | | 7,100 | | | 284,639 |
Fifth Third BancorpD | | 23,994 | | | 982,074 |
First Data Corporation | | 33,217 | | | 847,698 |
First Horizon National CorporationD | | 5,200 | | | 217,256 |
Fiserv, Inc.* | | 7,700 | | | 403,634 |
Franklin Resources, Inc. | | 7,200 | | | 793,224 |
Freddie Mac | | 30,400 | | | 2,064,160 |
Genworth Financial, Inc. Class A | | 19,500 | | | 667,095 |
Goldman Sachs Group, Inc. | | 19,012 | | | 3,790,042 |
Hartford Financial Services Group, Inc. | | 13,200 | | | 1,231,692 |
Huntington Bancshares, Inc.D | | 11,300 | | | 268,375 |
Janus Capital Group, Inc.D | | 9,600 | | | 207,264 |
JPMorgan Chase & Co. | | 152,030 | | | 7,343,049 |
KeyCorp | | 17,200 | | | 654,116 |
Kimco Realty Corporation REIT | | 9,100 | | | 409,045 |
Legg Mason, Inc.D | | 5,740 | | | 545,587 |
Lehman Brothers Holdings, Inc. | | 23,400 | | | 1,828,008 |
Lincoln National CorporationD | | 12,619 | | | 837,871 |
Loews Corporation | | 20,400 | | | 845,988 |
M & T Bank CorporationD | | 3,600 | | | 439,776 |
Marsh & McLennan Cos., Inc. | | 23,700 | | | 726,642 |
Marshall & Ilsley Corporation | | 10,800 | | | 519,588 |
MBIA, Inc.D | | 6,200 | | | 452,972 |
Mellon Financial Corporation | | 17,800 | | | 750,270 |
Merrill Lynch & Co., Inc. | | 38,880 | | | 3,619,728 |
MetLife, Inc. | | 33,000 | | | 1,947,330 |
MGIC Investment CorporationD | | 3,700 | | | 231,398 |
Moody’s Corporation | | 10,500 | | | 725,130 |
Morgan Stanley | | 47,000 | | | 3,827,210 |
National City Corporation | | 27,000 | | | 987,120 |
Northern Trust Corporation | | 8,100 | | | 491,589 |
Paychex, Inc. | | 14,500 | | | 573,330 |
Plum Creek Timber Co., Inc. REITD | | 7,700 | | | 306,845 |
PNC Financial Services Group, Inc. | | 12,600 | | | 932,904 |
Principal Financial Group | | 12,100 | | | 710,270 |
Progressive Corporation (The) | | 33,996 | | | 823,383 |
Prologis Trust REIT | | 10,700 | | | 650,239 |
Prudential Financial, Inc. | | 21,400 | | | 1,837,404 |
Public Storage, Inc. REITD | | 5,125 | | | 499,687 |
Regions Financial Corporation | | 32,029 | | | 1,197,885 |
Ryder System, Inc.D | | 2,700 | | | 137,862 |
Safeco Corporation | | 5,400 | | | 337,770 |
Schwab (Charles) Corporation (The) | | 44,850 | | | 867,399 |
Simon Property Group, Inc. REIT | | 9,900 | | | 1,002,771 |
SLM Corporation | | 18,100 | | | 882,737 |
Sovereign Bancorp, Inc.D | | 16,065 | | | 407,890 |
St. Paul Travelers Cos., Inc. | | 30,656 | | | 1,645,921 |
State Street Corporation | | 14,700 | | | 991,368 |
SunTrust Banks, Inc. | | 15,800 | | | 1,334,310 |
Synovus Financial CorporationD | | 13,600 | | | 419,288 |
T Rowe Price Group, Inc. | | 11,400 | | | 498,978 |
Torchmark Corporation | | 4,600 | | | 293,296 |
UnumProvident CorporationD | | 14,500 | | | 301,310 |
US Bancorp | | 78,300 | | | 2,833,677 |
Vornado Realty Trust REITD | | 5,200 | | | 631,800 |
Wachovia Corporation | | 84,283 | | | 4,799,914 |
Washington Mutual, Inc. | | 41,946 | | | 1,908,123 |
Wells Fargo & Co. | | 147,260 | | | 5,236,566 |
Western Union Co. | | 33,217 | | | 744,725 |
| | |
See Notes to Financial Statements. | | 93 |
| | |
| Equity Index Fund | | |
| SCHEDULE OF INVESTMENTS (Continued) | | |
| | | | | |
| | | Shares | | Value |
XL Capital, Ltd. Class AD | | 7,700 | | $ | 554,554 |
Zions Bancorporation | | 4,500 | | | 370,980 |
| | | | | |
| | | | | 129,983,289 |
| | | | | |
| | |
Healthcare — 11.6% | | | | | |
Abbott Laboratories | | 67,100 | | | 3,268,441 |
Aetna, Inc. | | 24,200 | | | 1,044,956 |
Allergan, Inc. | | 6,615 | | | 792,080 |
AmerisourceBergen Corporation | | 8,944 | | | 402,122 |
Amgen, Inc.* | | 51,265 | | | 3,501,912 |
Bard (C.R.), Inc.D | | 4,400 | | | 365,068 |
Bausch & Lomb, Inc.D | | 2,400 | | | 124,944 |
Baxter International, Inc. | | 28,300 | | | 1,312,837 |
Becton Dickinson & Co. | | 10,900 | | | 764,635 |
Biogen Idec, Inc.D* | | 15,330 | | | 754,083 |
Biomet, Inc. | | 10,900 | | | 449,843 |
Boston Scientific Corporation* | | 52,100 | | | 895,078 |
Bristol-Myers Squibb Co. | | 86,100 | | | 2,266,152 |
Cardinal Health, Inc. | | 18,000 | | | 1,159,740 |
Caremark Rx, Inc. | | 19,000 | | | 1,085,090 |
Celgene Corporation* | | 16,300 | | | 937,739 |
Conventry Health Care, Inc.* | | 6,730 | | | 336,836 |
Eli Lilly & Co. | | 43,300 | | | 2,255,930 |
Express Scripts, Inc.* | | 6,000 | | | 429,600 |
Forest Laboratories, Inc.* | | 14,000 | | | 708,400 |
Genzyme Corporation* | | 11,600 | | | 714,328 |
Gilead Sciences, Inc.* | | 19,900 | | | 1,292,107 |
Health Management Associates, Inc. Class AD | | 10,200 | | | 215,322 |
Hospira, Inc* | | 6,550 | | | 219,949 |
Humana, Inc.* | | 7,100 | | | 392,701 |
IMS Health, Inc. | | 8,600 | | | 236,328 |
Johnson & Johnson | | 128,190 | | | 8,463,104 |
King Pharmaceuticals, Inc.D* | | 10,100 | | | 160,792 |
Laboratory Corporation of America HoldingsD* | | 5,500 | | | 404,085 |
Manor Care, Inc.D | | 3,500 | | | 164,220 |
McKesson Corporation | | 12,900 | | | 654,030 |
Medco Health Solutions, Inc.* | | 12,876 | | | 688,093 |
Medimmune, Inc.D* | | 10,600 | | | 343,122 |
Medtronic, Inc. | | 50,500 | | | 2,702,255 |
Merck & Co., Inc. | | 95,200 | | | 4,150,720 |
Millipore CorporationD* | | 2,200 | | | 146,520 |
Mylan Laboratories, Inc. | | 9,300 | | | 185,628 |
Patterson Cos., Inc.D* | | 6,000 | | | 213,060 |
Pfizer, Inc. | | 319,183 | | | 8,266,840 |
Quest Diagnostics, Inc.D | | 7,100 | | | 376,300 |
Schering-Plough Corporation | | 64,300 | | | 1,520,052 |
St. Jude Medical, Inc.* | | 15,600 | | | 570,336 |
Stryker Corporation | | 13,100 | | | 721,941 |
Tenet Healthcare CorporationD* | | 19,450 | | | 135,567 |
UnitedHealth Group, Inc. | | 59,300 | | | 3,186,189 |
Watson Pharmaceuticals, Inc.* | | 4,600 | | | 119,738 |
WellPoint, Inc.* | | 27,312 | | | 2,149,181 |
Wyeth | | 58,800 | | | 2,994,096 |
Zimmer Holdings, Inc.* | | 10,820 | | | 848,072 |
| | | | | |
| | | | | 65,090,162 |
| | | | | |
| | |
Integrated Oils — 6.4% | | | | | |
Chevron Corporation | | 96,141 | | | 7,069,262 |
ConocoPhillips | | 72,058 | | | 5,184,573 |
ExxonMobil Corporation | | 255,844 | | | 19,605,326 |
Hess Corporation | | 11,900 | | | 589,883 |
Marathon Oil Corporation | | 15,892 | | | 1,470,010 |
Murphy Oil Corporation | | 8,000 | | | 406,800 |
Occidental Petroleum Corporation | | 37,500 | | | 1,831,125 |
| | | | | |
| | | | | 36,156,979 |
| | | | | |
| | |
Materials & Processing — 3.5% | | | | | |
Air Products & Chemicals, Inc. | | 9,500 | | | 667,660 |
Alcoa, Inc. | | 38,100 | | | 1,143,381 |
Allegheny Technologies, Inc. | | 4,500 | | | 408,060 |
American Standard Cos., Inc. | | 7,700 | | | 353,045 |
Archer-Daniels-Midland Co. | | 28,427 | | | 908,527 |
Ashland, Inc.D | | 2,800 | | | 193,704 |
Avery Dennison CorporationD | | 4,600 | | | 312,478 |
Ball Corporation | | 4,592 | | | 200,211 |
Bemis Co. | | 4,500 | | | 152,910 |
Dow Chemical Co. (The) | | 42,400 | | | 1,693,456 |
duPont (E.I.) de Nemours & Co. | | 39,955 | | | 1,946,208 |
Eastman Chemical Co. | | 3,500 | | | 207,585 |
Ecolab, Inc. | | 7,800 | | | 352,560 |
Fluor CorporationD | | 3,700 | | | 302,105 |
Freeport-McMoRan Copper & Gold, Inc. Class BD | | 8,500 | | | 473,705 |
Hercules, Inc.D* | | 4,600 | | | 88,826 |
International Paper Co. | | 20,235 | | | 690,013 |
Masco Corporation | | 17,400 | | | 519,738 |
MeadWestvaco Corporation | | 8,045 | | | 241,833 |
Monsanto Co. | | 24,020 | | | 1,261,771 |
Newmont Mining Corporation | | 19,500 | | | 880,425 |
Nucor Corporation | | 13,500 | | | 737,910 |
Pactiv Corporation* | | 6,500 | | | 231,985 |
Phelps Dodge Corporation | | 9,000 | | | 1,077,480 |
PPG Industries, Inc. | | 7,100 | | | 455,891 |
Praxair, Inc. | | 13,880 | | | 823,500 |
Realogy Corporation* | | 10,544 | | | 319,694 |
Rohm & Haas Co.D | | 6,700 | | | 342,504 |
Sealed Air CorporationD | | 3,500 | | | 227,220 |
Sherwin-Williams Co. | | 4,800 | | | 305,184 |
Sigma-Aldrich CorporationD | | 2,900 | | | 225,388 |
Temple-Inland, Inc. | | 5,500 | | | 253,165 |
United States Steel Corporation | | 5,500 | | | 402,270 |
Vulcan Materials Co. | | 4,200 | | | 377,454 |
Weyerhaeuser Co. | | 10,600 | | | 748,890 |
| | | | | |
| | | | | 19,526,736 |
| | | | | |
| | |
Other — 4.2% | | | | | |
3M Co. | | 33,300 | | | 2,595,069 |
Brunswick Corporation | | 4,000 | | | 127,600 |
Eaton Corporation | | 6,400 | | | 480,896 |
General Electric Co. | | 452,200 | | | 16,826,362 |
Honeywell International, Inc. | | 36,300 | | | 1,642,212 |
ITT Industries, Inc. | | 7,900 | | | 448,878 |
Johnson Controls, Inc.D | | 8,392 | | | 721,041 |
Textron, Inc.D | | 5,500 | | | 515,735 |
| | | | | |
| | | | | 23,357,793 |
| | | | | |
| | |
Other Energy — 3.3% | | | | | |
Anadarko Petroleum Corporation | | 19,800 | | | 861,696 |
Apache Corporation | | 14,648 | | | 974,239 |
Baker Hughes, Inc. | | 14,600 | | | 1,090,036 |
BJ Services Co. | | 13,500 | | | 395,820 |
Chesapeake Energy CorporationD | | 16,600 | | | 482,230 |
Consol Energy, Inc.D | | 8,200 | | | 263,466 |
Devon Energy Corporation | | 19,200 | | | 1,287,936 |
Dynegy, Inc. Class AD* | | 15,624 | | | 113,118 |
El Paso CorporationD | | 30,800 | | | 470,624 |
| | |
| 94 | | See Notes to Financial Statements. |
| | | | | |
| | | Shares | | Value |
EOG Resources, Inc.D | | 10,500 | | $ | 655,725 |
Halliburton Co. | | 45,200 | | | 1,403,460 |
Nabors Industries, Ltd.D* | | 13,700 | | | 407,986 |
National Oilwell Varco, Inc.D* | | 7,500 | | | 458,850 |
Noble Corporation | | 5,900 | | | 449,285 |
Peabody Energy Corporation | | 11,600 | | | 468,756 |
Rowan Cos., Inc. | | 4,800 | | | 159,360 |
Schlumberger, Ltd. | | 52,000 | | | 3,284,320 |
Smith International, Inc. | | 8,800 | | | 361,416 |
Sunoco, Inc.D | | 5,800 | | | 361,688 |
TransOcean, Inc.* | | 12,800 | | | 1,035,392 |
Valero Energy Corporation | | 26,800 | | | 1,371,088 |
Weatherford International, Ltd.* | | 15,098 | | | 630,945 |
Williams Cos., Inc. | | 25,800 | | | 673,896 |
XTO Energy, Inc. | | 16,466 | | | 774,725 |
| | | | | |
| | | | | 18,436,057 |
| | | | | |
| | |
Producer Durables — 4.9% | | | | | |
Agilent Technologies, Inc.* | | 17,900 | | | 623,815 |
American Power Conversion CorporationD | | 7,400 | | | 226,366 |
Applied Materials, Inc.D | | 60,700 | | | 1,119,915 |
Boeing Co. (The) | | 35,000 | | | 3,109,400 |
Caterpillar, Inc. | | 28,700 | | | 1,760,171 |
Centex CorporationD | | 5,200 | | | 292,604 |
Cooper Industries, Ltd. Class A | | 3,900 | | | 352,677 |
Cummins, Inc. | | 2,200 | | | 259,996 |
Danaher Corporation | | 10,200 | | | 738,888 |
Deere & Co. | | 10,100 | | | 960,207 |
Dover Corporation | | 9,000 | | | 441,180 |
DR Horton, Inc. | | 11,700 | | | 309,933 |
Emerson Electric Co. | | 35,800 | | | 1,578,422 |
Goodrich Corporation | | 5,500 | | | 250,525 |
Grainger (W.W.), Inc.D | | 3,500 | | | 244,790 |
Illinois Tool Works, Inc. | | 18,200 | | | 840,658 |
Ingersoll-Rand Co., Ltd. Class A | | 14,100 | | | 551,733 |
KB HOMED | | 3,500 | | | 179,480 |
KLA-Tencor CorporationD | | 8,700 | | | 432,825 |
Lennar Corporation Class AD | | 6,000 | | | 314,760 |
Lexmark International, Inc.* | | 4,500 | | | 329,400 |
Lockheed Martin Corporation | | 15,800 | | | 1,454,706 |
Molex, Inc. | | 6,450 | | | 204,013 |
Northrop Grumman Corporation | | 15,356 | | | 1,039,601 |
Novellus Systems, Inc.D* | | 5,700 | | | 196,194 |
Pall CorporationD | | 5,200 | | | 179,660 |
Parker Hannifin Corporation | | 5,400 | | | 415,152 |
Pitney Bowes, Inc. | | 9,700 | | | 448,043 |
Pulte Homes, Inc. | | 9,308 | | | 308,281 |
Rockwell Collins, Inc.D | | 7,500 | | | 474,675 |
Tektronix, Inc.D | | 3,500 | | | 102,095 |
Teradyne, Inc.D* | | 8,100 | | | 121,176 |
Terex Corporation* | | 4,500 | | | 290,610 |
Thermo Electron Corporation* | | 17,310 | | | 783,970 |
Tyco International, Ltd. | | 88,284 | | | 2,683,834 |
United Technologies Corporation | | 44,500 | | | 2,782,140 |
Waters Corporation* | | 4,500 | | | 220,365 |
Xerox Corporation* | | 42,300 | | | 716,985 |
| | | | | |
| | | | | 27,339,245 |
| | | | | |
Technology — 12.8% | | | | | |
ADC Telecommunications, Inc.* | | 4,828 | | $ | 70,151 |
Adobe Systems, Inc.* | | 25,300 | | | 1,040,336 |
Advanced Micro Devices, Inc.* | | 23,500 | | | 478,225 |
Affiliated Computer Services, Inc. Class A* | | 5,000 | | | 244,200 |
Altera CorporationD* | | 15,500 | | | 305,040 |
Analog Devices, Inc. | | 15,700 | | | 516,059 |
Apple Computer, Inc.* | | 37,200 | | | 3,156,048 |
Applera Corporation-Applied Biosystems Group | | 8,100 | | | 297,189 |
Autodesk, Inc.* | | 10,360 | | | 419,166 |
Avaya, Inc.D* | | 19,448 | | | 271,883 |
BMC Software, Inc.* | | 9,300 | | | 299,460 |
Broadcom Corporation Class A* | | 20,750 | | | 670,432 |
CA, Inc.D | | 19,770 | | | 447,790 |
Ciena CorporationD* | | 3,928 | | | 108,845 |
Cisco Systems, Inc.* | | 268,100 | | | 7,327,173 |
Citrix Systems, Inc.* | | 7,900 | | | 213,695 |
Cognizant Technology Solutions Corporation Class A* | | 6,200 | | | 478,392 |
Computer Sciences Corporation* | | 7,500 | | | 400,275 |
Compuware CorporationD* | | 16,100 | | | 134,113 |
Comverse Technology, Inc.D* | | 8,400 | | | 177,324 |
Corning, Inc.* | | 67,900 | | | 1,270,409 |
Dell, Inc.* | | 100,000 | | | 2,509,000 |
Electronic Data Systems Corporation | | 22,200 | | | 611,610 |
EMC Corporation* | | 101,300 | | | 1,337,160 |
General Dynamics Corporation | | 17,500 | | | 1,301,125 |
Hewlett-Packard Co. | | 119,702 | | | 4,930,525 |
Intel Corporation | | 253,500 | | | 5,133,375 |
International Business Machines Corporation | | 66,600 | | | 6,470,190 |
Intuit, Inc.* | | 14,900 | | | 454,599 |
Jabil Circuit, Inc. | | 8,000 | | | 196,400 |
JDS Uniphase CorporationD* | | 8,875 | | | 147,858 |
Juniper Networks, Inc.D* | | 25,100 | | | 475,394 |
L-3 Communications Holdings, Inc. | | 5,300 | | | 433,434 |
Linear Technology Corporation | | 13,000 | | | 394,160 |
LSI Logic CorporationD* | | 16,700 | | | 150,300 |
Maxim Integrated Products, Inc. | | 14,000 | | | 428,680 |
Micron Technology, Inc.* | | 31,700 | | | 442,532 |
Microsoft Corporation | | 379,430 | | | 11,329,780 |
Motorola, Inc. | | 107,100 | | | 2,201,976 |
National Semiconductor Corporation | | 13,500 | | | 306,450 |
NCR CorporationD* | | 7,800 | | | 333,528 |
Network Appliance, Inc.* | | 16,600 | | | 652,048 |
Novell, Inc.D* | | 15,900 | | | 98,580 |
Nvidia Corporation* | | 15,300 | | | 566,253 |
Oracle Corporation* | | 176,300 | | | 3,021,782 |
PerkinElmer, Inc.D | | 5,300 | | | 117,819 |
PMC-Sierra, Inc.D* | | 9,800 | | | 65,758 |
QLogic Corporation* | | 7,000 | | | 153,440 |
Qualcomm, Inc. | | 72,700 | | | 2,747,333 |
Raytheon Co. | | 19,900 | | | 1,050,720 |
Rockwell Automation, Inc. | | 7,800 | | | 476,424 |
Sandisk CorporationD* | | 9,900 | | | 425,997 |
Sanmina-SCI Corporation* | | 24,900 | | | 85,905 |
Solectron Corporation* | | 40,200 | | | 129,444 |
Sun Microsystems, Inc.D* | | 154,700 | | | 838,474 |
| | |
See Notes to Financial Statements. | | 95 |
| | |
| Equity Index Fund | | |
| SCHEDULE OF INVESTMENTS (Continued) | | |
| | | | | | | |
| | | Shares | | Value | |
Symantec Corporation* | | | 41,170 | | $ | 858,395 | |
Symbol Technologies, Inc. | | | 10,457 | | | 156,228 | |
Tellabs, Inc.* | | | 20,400 | | | 209,304 | |
Texas Instruments, Inc. | | | 67,000 | | | 1,929,600 | |
Unisys CorporationD* | | | 13,900 | | | 108,976 | |
Xilinx, Inc. | | | 15,400 | | | 366,674 | |
| | | | | | | |
| | | | | | 71,973,435 | |
| | | | | | | |
| | |
Utilities — 7.8% | | | | | | | |
AES Corporation (The)* | | | 29,100 | | | 641,364 | |
Allegheny Energy, Inc.* | | | 7,000 | | | 321,370 | |
Alltel Corporation | | | 17,000 | | | 1,028,160 | |
Ameren CorporationD | | | 9,200 | | | 494,316 | |
American Electric Power Co., Inc. | | | 17,800 | | | 757,924 | |
AT&T, Inc. | | | 170,500 | | | 6,095,375 | |
BellSouth Corporation | | | 79,300 | | | 3,735,823 | |
Centerpoint Energy, Inc.D | | | 14,400 | | | 238,752 | |
CenturyTel, Inc. | | | 5,200 | | | 227,032 | |
Citizens Communications Co.D | | | 14,500 | | | 208,365 | |
CMS Energy CorporationD* | | | 9,000 | | | 150,300 | |
Comcast Corporation Class A* | | | 91,715 | | | 3,882,296 | |
Consolidated Edison, Inc.D | | | 10,400 | | | 499,928 | |
Constellation Energy Group, Inc. | | | 7,600 | | | 523,412 | |
Dominion Resources, Inc. | | | 15,600 | | | 1,307,904 | |
DTE Energy Co.D | | | 7,300 | | | 353,393 | |
Duke Energy Corporation | | | 54,368 | | | 1,805,561 | |
Edison International | | | 14,500 | | | 659,460 | |
Embarq CorporationD | | | 6,444 | | | 338,696 | |
Entergy Corporation | | | 9,352 | | | 863,377 | |
Exelon Corporation | | | 29,624 | | | 1,833,429 | |
FirstEnergy Corporation | | | 14,184 | | | 855,295 | |
FPL Group, Inc.D | | | 18,100 | | | 985,002 | |
KeySpan CorporationD | | | 8,100 | | | 333,558 | |
Kinder Morgan, Inc.D | | | 4,800 | | | 507,600 | |
Nicor, Inc.D | | | 2,100 | | | 98,280 | |
NiSource, Inc. | | | 11,000 | | | 265,100 | |
Peoples Energy Corporation | | | 1,235 | | | 55,044 | |
PG&E CorporationD | | | 15,800 | | | 747,814 | |
Pinnacle West Capital CorporationD | | | 4,000 | | | 202,760 | |
PPL Corporation | | | 16,200 | | | 580,608 | |
Progress Energy, Inc.D | | | 11,200 | | | 549,696 | |
Public Service Enterprise Group, Inc. | | | 10,900 | | | 723,542 | |
Questar Corporation | | | 3,800 | | | 315,590 | |
Qwest Communications International, Inc.D* | | | 69,700 | | | 583,389 | |
Sempra Energy | | | 11,800 | | | 661,272 | |
Southern Co. (The)D | | | 33,100 | | | 1,220,066 | |
Sprint Nextel Corporation | | | 126,993 | | | 2,398,898 | |
TECO Energy, Inc.D | | | 10,000 | | | 172,300 | |
TXU Corporation | | | 20,400 | | | 1,105,884 | |
Verizon Communications, Inc. | | | 126,774 | | | 4,721,064 | |
Windstream Corporation | | | 20,599 | | | 292,918 | |
Xcel Energy Inc.D | | | 17,000 | | | 392,020 | |
| | | | | | | |
| | | | | | 43,733,937 | |
| | | | | | | |
Total Common Stocks | | | | | | | |
(Cost $400,198,785) | | | | | | 543,579,562 | |
| | | | | | | |
| | |
MONEY MARKET FUNDS — 9.1% | | | | | | | |
GuideStone Funds Money Market Fund (GS4 Class)¥ | | | 16,644,946 | | | 16,644,946 | |
Northern Institutional Liquid Assets Portfolio§ | | | 34,402,994 | | | 34,402,994 | |
| | | | | | | |
Total Money Market Funds | | | | | | | |
(Cost $51,047,940) | | | | | | 51,047,940 | |
| | | | | | | |
| | | Par | | | |
U.S. TREASURY OBLIGATIONS — 0.1% | | | | | | | |
U.S. Treasury Bills | | | | | | | |
4.80%, 02/22/07‡‡ | | $ | 30,000 | | | 29,791 | |
4.81%, 02/22/07‡‡ | | | 20,000 | | | 19,860 | |
4.85%, 02/22/07‡‡ | | | 620,000 | | | 615,678 | |
| | | | | | | |
Total U.S. Treasury Obligations | | | | | | | |
(Cost $665,310) | | | | | | 665,329 | |
| | | | | | | |
| | |
TOTAL INVESTMENTS — 106.0% | | | | | | | |
(Cost $451,912,035) | | | | | | 595,292,831 | |
| | |
Liabilities in Excess of Other | | | | | | | |
Assets — (6.0)% | | | | | | (33,747,755 | ) |
| | | | | | | |
NET ASSETS — 100.0% | | | | | $ | 561,545,076 | |
| | | | | | | |
| | |
PORTFOLIO SUMMARY (based on net assets) | | |
| | | % |
Financial Services | | 23.1 |
Technology | | 12.8 |
Healthcare | | 11.6 |
Consumer Discretionary | | 11.3 |
Money Market Funds | | 9.1 |
Utilities | | 7.8 |
Integrated Oils | | 6.4 |
Consumer Staples | | 5.6 |
Producer Durables | | 4.9 |
Other | | 4.2 |
Materials & Processing | | 3.5 |
Other Energy | | 3.3 |
Auto & Transportation | | 2.3 |
Futures Contracts | | 2.1 |
U.S. Treasury Obligations | | 0.1 |
| | |
| | 108.1 |
| | |
| | |
| 96 | | See Notes to Financial Statements. |
Real Estate Securities Fund
The Fund is comprised of publicly traded real estate securities. The Fund outperformed its benchmark, the Dow Jones Wilshire Real Estate Securities Index, during the fourth quarter and the year. Security selection within the self-storage, regional mall and office sectors contributed to benchmark-relative outperformance for the quarter. Positions in Equity Office Properties (5.02%) and Simon (9.51%) were among the biggest contributors to performance, while Biomed Realty Trust (1.00%) and Mack-Cali Realty (1.60%) detracted from benchmark-relative performance.
Please see page 98 for information regarding specific portfolio allocations. Portfolio holdings are subject to change at any time.
97
| | |
Real Estate Securities Fund | | |
SCHEDULE OF INVESTMENTS | | December 31, 2006 |
| | | | | | | |
| | | Shares | | Value | |
COMMON STOCKS — 94.5% | | | | | | | |
Consumer Discretionary — 3.1% | | | | | | | |
Hilton Hotels Corporation | | | 28,200 | | $ | 984,180 | |
Starwood Hotels & Resorts Worldwide, Inc. | | | 37,515 | | | 2,344,687 | |
| | | | | | | |
| | | | | | 3,328,867 | |
| | | | | | | |
| | |
Financial Services — 91.4% | | | | | | | |
AMB Property Corporation REIT | | | 47,950 | | | 2,810,350 | |
American Campus Communities, Inc. REIT | | | 11,150 | | | 317,440 | |
Apartment Investment & Management Co. Class A REIT | | | 55,600 | | | 3,114,712 | |
Archstone-Smith Trust REIT | | | 113,200 | | | 6,589,372 | |
AvalonBay Communities, Inc. REIT | | | 51,700 | | | 6,723,585 | |
BioMed Realty Trust, Inc. REIT | | | 35,150 | | | 1,005,290 | |
Boston Properties, Inc. REIT | | | 35,250 | | | 3,943,770 | |
Brookfield Properties Corporation | | | 38,950 | | | 1,531,904 | |
DiamondRock Hospitality Co. REIT | | | 22,750 | | | 409,728 | |
Digital Realty Trust, Inc. REIT | | | 74,100 | | | 2,536,443 | |
Equity Lifestyle Properties, Inc. REIT | | | 33,500 | | | 1,823,405 | |
Equity Office Properties Trust REIT | | | 104,850 | | | 5,050,624 | |
Equity Residential Properties Trust REIT | | | 49,500 | | | 2,512,125 | |
Essex Property Trust, Inc. REIT | | | 23,500 | | | 3,037,375 | |
Federal Realty Investors Trust REIT | | | 35,000 | | | 2,975,000 | |
FelCor Lodging Trust, Inc. REIT | | | 41,300 | | | 901,992 | |
Host Hotels & Resorts, Inc. REIT | | | 187,377 | | | 4,600,105 | |
LaSalle Hotel Properties REIT | | | 15,300 | | | 701,505 | |
Macerich Co. (The) REIT | | | 62,050 | | | 5,371,669 | |
Mack-Cali Realty Corporation REIT | | | 31,600 | | | 1,611,600 | |
Parkway Properties, Inc. REIT | | | 6,400 | | | 326,464 | |
Prologis Trust REIT | | | 61,000 | | | 3,706,970 | |
Public Storage, Inc. REIT | | | 63,830 | | | 6,223,425 | |
Regency Centers Corporation REIT | | | 52,800 | | | 4,127,376 | |
Simon Property Group, Inc. REIT | | | 95,250 | | | 9,647,872 | |
SL Green Realty Corporation REIT | | | 33,050 | | | 4,388,379 | |
Sovran Self Storage, Inc. REIT | | | 15,650 | | | 896,432 | |
Tanger Factory Outlet Centrs REIT | | | 28,300 | | | 1,105,964 | |
Taubman Centers, Inc. REIT | | | 35,750 | | | 1,818,245 | |
Vornado Realty Trust REIT | | | 66,156 | | | 8,037,954 | |
| | | | | | | |
| | | | | | 97,847,075 | |
| | | | | | | |
Total Common Stocks | | | | | | | |
(Cost $87,473,166) | | | | | | 101,175,942 | |
| | | | | | | |
| | |
MONEY MARKET FUND — 5.3% | | | | | | | |
GuideStone Funds Money Market Fund (GS4 Class)¥ | | | | | | | |
(Cost $5,673,643) | | | 5,673,643 | | | 5,673,643 | |
| | | | | | | |
| | |
| | | Par | | | |
U.S. TREASURY OBLIGATION — 0.2% | | | | | | | |
U.S. Treasury Bill | | | | | | | |
4.85%, 02/22/07‡‡ | | | | | | | |
(Cost $218,458) | | $ | 220,000 | | | 218,526 | |
| | | | | | | |
| | |
TOTAL INVESTMENTS — 100.0% | | | | | | | |
(Cost $93,365,267) | | | | | | 107,068,111 | |
| | |
Liabilities in Excess of Other Assets — 0.0% | | | | | | (32,661 | ) |
| | | | | | | |
| | |
NET ASSETS — 100.0% | | | | | $ | 107,035,450 | |
| | | | | | | |
| | |
PORTFOLIO SUMMARY (based on net assets) | | |
| | | % |
Financial Services | | 91.4 |
Money Market Fund | | 5.3 |
Futures Contracts | | 4.9 |
Consumer Discretionary | | 3.1 |
U.S. Treasury Obligation | | 0.2 |
| | |
| | 104.9 |
| | |
| | |
| 98 | | See Notes to Financial Statements. |
Value Equity Fund
The Fund is comprised of domestic, large-cap value oriented stocks. The Fund generated a positive return while underperforming its benchmark, the Russell 1000® Value Index, during the fourth quarter and the year. Overweight exposure in the healthcare sector and security selection in the consumer discretionary sector detracted from benchmark-relative performance during the quarter. The Fund’s holdings in Pfizer (2.93%), Federated Department Stores (0.51%) and Tenet Healthcare (0.34%) detracted from performance, while outperforming holdings included ExxonMobil (3.00%), ConocoPhillips (2.20%) and Citigroup (3.43%). For the quarter, Aronson+Johnson+Ortiz delivered the strongest performance among the active managers largely due to its security selection in the financial services sector.
Please see page 104 for information regarding specific portfolio allocations. Portfolio holdings are subject to change at any time.
99
| | | | | | | | | | | | | | | | | | |
Average Annual Total Returns as of 12/31/06 | |
| | | GS2 Class* | | | GS4 Class* | | | GS6 Class* | | | Benchmark** | | | GS8 Class* | | | GS8 Class Benchmark** | |
One Year | | 18.76 | % | | 18.64 | % | | 18.21 | % | | 22.25 | % | | 17.75 | % | | 22.25 | % |
Five Year | | 10.28 | % | | 10.09 | % | | 9.78 | % | | 10.86 | % | | N/A | | | N/A | |
Since Inception | | 8.98 | % | | 8.62 | % | | 8.45 | % | | 9.46 | % | | 13.77 | % | | 16.11 | % |
Inception Date | | 08/27/01 | | | 08/27/01 | | | 08/27/01 | | | 08/27/01 | | | 11/08/04 | | | 11/08/04 | |
The performance data quoted represents past performance and does not guarantee future results. Current performance may be lower or higher. Performance data current to the most recent month-end may be obtained at www.GuideStone.org. The investment return and principal value of an investment will fluctuate so that shares, when redeemed, may be worth more or less than their original cost.

The graph compares the results of a hypothetical $10,000 investment in the GS4 Class of the Fund since August 27, 2001 (commencement of operations), with all dividends and capital gains reinvested, with the Russell 1000® Value Index.
| * | These returns reflect expense waivers by the Fund’s investment advisor. Without these waivers, returns would have been lower. Returns shown do not reflect the deduction of taxes that a shareholder would pay on Fund distributions or the redemption of Fund shares. |
** | The Russell 1000® Value Index is a large-cap index consisting of those Russell 1000® index securities with a less-than-average growth orientation. Companies in this index tend to exhibit lower price-to-book and price-earnings-ratios, higher dividend yields and lower forecasted growth values than the growth universe. |
Unlike a mutual fund, the performance of an index assumes no taxes, transaction costs, management fees or other expenses.
| | |
| Value Equity Fund | | |
| SCHEDULE OF INVESTMENTS | | December 31, 2006 |
| | | | | |
| | | Shares | | Value |
COMMON STOCKS — 95.6% | | | | | |
Auto & Transportation — 2.7% | | | | | |
Autoliv, Inc.D | | 57,800 | | $ | 3,485,340 |
Burlington Northern Santa Fe Corporation | | 144,200 | | | 10,643,402 |
Con-Way, Inc. | | 70,000 | | | 3,082,800 |
CSX Corporation | | 313,100 | | | 10,780,033 |
General Motors CorporationD | | 83,900 | | | 2,577,408 |
Norfolk Southern Corporation | | 75,700 | | | 3,806,953 |
Tidewater, Inc.D | | 87,100 | | | 4,212,156 |
Union Pacific Corporation | | 57,000 | | | 5,245,140 |
| | | | | |
| | | | | 43,833,232 |
| | | | | |
Consumer Discretionary — 10.4% | | | | | |
American Eagle OutfittersD | | 57,300 | | | 1,788,333 |
Avis Budget Group, Inc. | | 3,580 | | | 77,650 |
Avon Products, Inc. | | 185,600 | | | 6,132,224 |
Big Lots, Inc.D* | | 77,500 | | | 1,776,300 |
Brinker International, Inc.D | | 86,250 | | | 2,601,300 |
Carnival Corporation | | 99,900 | | | 4,900,095 |
CBS Corporation Class B | | 27,400 | | | 854,332 |
CDW Corporation | | 6,500 | | | 457,080 |
Clear Channel Communications, Inc. | | 202,500 | | | 7,196,850 |
Costco Wholesale Corporation | | 6,200 | | | 327,794 |
DIRECTV Group, Inc. (The)* | | 159,000 | | | 3,965,460 |
Eastman Kodak Co.D | | 241,700 | | | 6,235,860 |
Estee Lauder Cos., Inc. Class A | | 37,800 | | | 1,542,996 |
Federated Department Stores, Inc. | | 210,000 | | | 8,007,300 |
Gannett Co., Inc. | | 128,500 | | | 7,769,110 |
Gap, Inc. (The) | | 10,100 | | | 196,950 |
Hasbro, Inc.D | | 128,200 | | | 3,493,450 |
Home Depot, Inc. (The) | | 35,400 | | | 1,421,664 |
Idearc, Inc.D* | | 5,935 | | | 170,043 |
Interpublic Group Cos., Inc.D* | | 166,300 | | | 2,035,512 |
ITT Educational Services, Inc.D* | | 22,400 | | | 1,486,688 |
Jones Apparel Group, Inc. | | 34,600 | | | 1,156,678 |
Kimberly-Clark Corporation | | 170,500 | | | 11,585,475 |
Kohl’s Corporation* | | 21,400 | | | 1,464,402 |
Mattel, Inc. | | 430,700 | | | 9,759,662 |
McDonald’s Corporation | | 324,900 | | | 14,402,817 |
Newell Rubbermaid, Inc.D | | 108,100 | | | 3,129,495 |
Office Depot, Inc.D* | | 108,000 | | | 4,122,360 |
Penney (JC) Co., Inc.D | | 20,000 | | | 1,547,200 |
RadioShack CorporationD | | 128,050 | | | 2,148,679 |
Reader’s Digest AssociationD | | 100,000 | | | 1,670,000 |
Rogers Communications, Inc. Class BD | | 38,500 | | | 2,294,600 |
Sears Holdings Corporation* | | 3,500 | | | 587,755 |
Shaw Communications, Inc. Class BD | | 104,100 | | | 3,301,011 |
Sony Corporation ADRD | | 152,000 | | | 6,510,160 |
Stanley Works (The)D | | 187,500 | | | 9,429,375 |
Time Warner, Inc. | | 938,400 | | | 20,438,352 |
Wal-Mart Stores, Inc. | | 165,500 | | | 7,642,790 |
Walt Disney Co. (The) | | 54,000 | | | 1,850,580 |
Waste Management, Inc. | | 93,800 | | | 3,449,026 |
Wyndham Worldwide Corporation* | | 43,790 | | $ | 1,402,156 |
| | | | | |
| | | | | 170,329,564 |
| | | | | |
Consumer Staples — 3.7% | | | | | |
Coca-Cola Co. (The) | | 112,500 | | | 5,428,125 |
Colgate-Palmolive Co. | | 2,200 | | | 143,528 |
ConAgra Foods, Inc. | | 506,100 | | | 13,664,700 |
CVS Corporation | | 3,200 | | | 98,912 |
General Mills, Inc. | | 75,600 | | | 4,354,560 |
Heinz (H.J.) Co. | | 81,400 | | | 3,663,814 |
Kellogg Co. | | 2,600 | | | 130,156 |
Kraft Foods, Inc. Class AD | | 228,900 | | | 8,171,730 |
Kroger Co. | | 204,300 | | | 4,713,201 |
NBTY, Inc.D* | | 84,800 | | | 3,525,136 |
Pepsi Bottling Group, Inc. | | 24,400 | | | 754,204 |
Procter & Gamble Co. | | 105,900 | | | 6,806,193 |
Safeway, Inc. | | 205,200 | | | 7,091,712 |
Sara Lee CorporationD | | 157,100 | | | 2,675,413 |
| | | | | |
| | | | | 61,221,384 |
| | | | | |
Financial Services — 29.5% | | | | | |
ACE, Ltd. | | 60,000 | | | 3,634,200 |
Allstate Corporation (The) | | 313,200 | | | 20,392,452 |
American Express Co. | | 76,000 | | | 4,610,920 |
American International Group, Inc. | | 246,000 | | | 17,628,360 |
Assurant, Inc. | | 55,000 | | | 3,038,750 |
Axis Capital Holdings, Ltd. | | 46,600 | | | 1,555,042 |
Bank of America Corporation | | 583,234 | | | 31,138,863 |
Bank of New York Co., Inc. (The) | | 29,200 | | | 1,149,604 |
BB&T Corporation | | 22,200 | | | 975,246 |
Bear Stearns Cos., Inc. (The) | | 4,900 | | | 797,622 |
Brascan CorporationD | | 51,400 | | | 2,476,452 |
Capital One Financial Corporation | | 175,600 | | | 13,489,592 |
Chubb Corporation | | 242,100 | | | 12,809,511 |
Citigroup, Inc. | | 966,133 | | | 53,813,608 |
Comerica, Inc.D | | 145,800 | | | 8,555,544 |
Countrywide Financial Corporation | | 145,100 | | | 6,159,495 |
Credicorp, Ltd. | | 3,500 | | | 143,290 |
Fannie Mae | | 167,800 | | | 9,965,642 |
Fifth Third BancorpD | | 19,400 | | | 794,042 |
First Marblehead CorporationD | | 76,800 | | | 4,197,120 |
Fiserv, Inc.* | | 47,000 | | | 2,463,740 |
Freddie Mac | | 152,300 | | | 10,341,170 |
Genworth Financial, Inc. Class A | | 18,600 | | | 636,306 |
Goldman Sachs Group, Inc. | | 29,700 | | | 5,920,695 |
Hanover Insurance Group, Inc.D | | 32,900 | | | 1,605,520 |
Hartford Financial Services Group, Inc. | | 169,600 | | | 15,825,376 |
IndyMac Bancorp, Inc.D | | 65,800 | | | 2,971,528 |
Jones Lang LaSalle, Inc.D | | 32,800 | | | 3,023,176 |
JPMorgan Chase & Co. | | 991,212 | | | 47,875,540 |
KeyCorp | | 152,850 | | | 5,812,886 |
Lehman Brothers Holdings, Inc. | | 94,100 | | | 7,351,092 |
Lincoln National Corporation | | 11,400 | | | 756,960 |
Loews Corporation | | 106,300 | | | 4,408,261 |
| | |
See Notes to Financial Statements. | | 101 |
| | |
| Value Equity Fund | | |
| SCHEDULE OF INVESTMENTS (Continued) | | |
| | | | | |
| | | Shares | | Value |
Marsh & McLennan Cos., Inc. | | 22,400 | | $ | 686,784 |
Mellon Financial Corporation | | 1,300 | | | 54,795 |
Merrill Lynch & Co., Inc. | | 252,867 | | | 23,541,918 |
MetLife, Inc. | | 18,800 | | | 1,109,388 |
MGIC Investment CorporationD | | 81,800 | | | 5,115,772 |
Morgan Stanley | | 238,200 | | | 19,396,626 |
National City CorporationD | | 153,800 | | | 5,622,928 |
PMI Group, Inc. (The)D | | 69,000 | | | 3,254,730 |
PNC Financial Services Group, Inc. | | 12,100 | | | 895,884 |
Principal Financial Group | | 61,400 | | | 3,604,180 |
Progressive Corporation (The) | | 23,300 | | | 564,326 |
Prudential Financial, Inc. | | 17,100 | | | 1,468,206 |
Radian Group, Inc.D | | 53,800 | | | 2,900,358 |
Regions Financial Corporation | | 29,600 | | | 1,107,040 |
Reinsurance Group of America, Inc.D | | 29,100 | | | 1,620,870 |
Safeco CorporationD | | 47,200 | | | 2,952,360 |
Simon Property Group, Inc. REIT | | 4,100 | | | 415,289 |
SLM Corporation | | 166,300 | | | 8,110,451 |
St. Paul Travelers Cos., Inc. | | 339,700 | | | 18,238,493 |
State Street Corporation | | 900 | | | 60,696 |
SunTrust Banks, Inc. | | 78,800 | | | 6,654,660 |
UnionBanCal CorporationD | | 28,300 | | | 1,733,375 |
Unitrin, Inc.D | | 14,700 | | | 736,617 |
UnumProvident CorporationD | | 184,100 | | | 3,825,598 |
US Bancorp | | 285,700 | | | 10,339,483 |
Wachovia Corporation | | 215,045 | | | 12,246,801 |
Washington Mutual, Inc. | | 416,500 | | | 18,946,585 |
Wells Fargo & Co. | | 384,500 | | | 13,672,820 |
XL Capital, Ltd. Class A | | 115,200 | | | 8,296,704 |
| | | | | |
| | | | | 483,491,342 |
| | | | | |
| | |
Healthcare — 9.9% | | | | | |
Abbott Laboratories | | 12,400 | | | 604,004 |
Aetna, Inc. | | 257,100 | | | 11,101,578 |
AmerisourceBergen CorporationD | | 85,600 | | | 3,848,576 |
Baxter International, Inc. | | 201,500 | | | 9,347,585 |
Biogen Idec, Inc.* | | 7,100 | | | 349,249 |
Boston Scientific Corporation* | | 208,400 | | | 3,580,312 |
Bristol-Myers Squibb Co. | | 325,800 | | | 8,575,056 |
Cardinal Health, Inc. | | 103,200 | | | 6,649,176 |
Caremark Rx, Inc.D | | 1,400 | | | 79,954 |
Community Health Systems, Inc.* | | 118,600 | | | 4,331,272 |
Eli Lilly & Co. | | 9,700 | | | 505,370 |
Forest Laboratories, Inc.* | | 62,100 | | | 3,142,260 |
Johnson & Johnson | | 42,000 | | | 2,772,840 |
Kindred Healthcare, Inc.D* | | 75,289 | | | 1,901,047 |
McKesson Corporation | | 70,100 | | | 3,554,070 |
Medco Health Solutions, Inc.* | | 70,100 | | | 3,746,144 |
Merck & Co., Inc. | | 61,800 | | | 2,694,480 |
Millennium Pharmeceuticals, Inc.D* | | 449,200 | | | 4,896,280 |
Pfizer, Inc. | | 1,772,900 | | | 45,918,110 |
Tenet Healthcare CorporationD* | | 766,300 | | | 5,341,111 |
Teva Pharmaceutical Industries, Ltd. ADRD | | 125,852 | | | 3,911,480 |
Triad Hospitals, Inc.D* | | 61,614 | | | 2,577,314 |
UnitedHealth Group, Inc. | | 76,900 | | | 4,131,837 |
Watson Pharmaceuticals, Inc.* | | 137,000 | | | 3,566,110 |
WellPoint, Inc.* | | 156,800 | | | 12,338,592 |
Wyeth | | 240,500 | | | 12,246,260 |
| | | | | |
| | | | | 161,710,067 |
| | | | | |
| | |
Integrated Oils — 9.5% | | | | | |
BP PLC ADRD | | 104,568 | | | 7,016,513 |
Chevron Corporation | | 636,470 | | | 46,799,639 |
ConocoPhillips | | 479,200 | | | 34,478,440 |
ExxonMobil Corporation | | 614,200 | | | 47,066,146 |
Marathon Oil Corporation | | 81,400 | | | 7,529,500 |
Occidental Petroleum Corporation | | 270,900 | | | 13,228,047 |
| | | | | |
| | | | | 156,118,285 |
| | | | | |
| | |
Materials & Processing — 4.6% | | | | | |
Alcoa, Inc. | | 363,100 | | | 10,896,631 |
Archer-Daniels-Midland Co. | | 26,600 | | | 850,136 |
Dow Chemical Co. (The) | | 197,700 | | | 7,896,138 |
duPont (E.I.) de Nemours & Co.D | | 182,300 | | | 8,879,833 |
Greif, Inc. Class AD | | 13,900 | | | 1,645,760 |
International Paper Co. | | 19,090 | | | 650,969 |
Louisiana-Pacific Corporation | | 62,800 | | | 1,352,084 |
Lyondell Chemical Co.D | | 134,900 | | | 3,449,393 |
MeadWestvaco Corporation | | 363,500 | | | 10,926,810 |
Methanex CorporationD | | 119,100 | | | 3,259,767 |
Newmont Mining Corporation | | 900 | | | 40,635 |
Nucor Corporation | | 67,800 | | | 3,705,948 |
Owens-Illinois, Inc.D* | | 186,100 | | | 3,433,545 |
Pactiv Corporation* | | 145,084 | | | 5,178,048 |
Phelps Dodge Corporation | | 8,300 | | | 993,676 |
Realogy Corporation* | | 80,913 | | | 2,453,282 |
Smurfit-Stone Container CorporationD* | | 125,100 | | | 1,321,056 |
Steel Dynamics, Inc.D | | 65,400 | | | 2,122,230 |
Timken Co. | | 68,100 | | | 1,987,158 |
United States Steel Corporation | | 50,000 | | | 3,657,000 |
Weyerhaeuser Co. | | 10,000 | | | 706,500 |
| | | | | |
| | | | | 75,406,599 |
| | | | | |
| | |
Other — 2.1% | | | | | |
3M Co. | | 51,400 | | | 4,005,602 |
General Electric Co. | | 370,700 | | | 13,793,747 |
Honeywell International, Inc. | | 380,000 | | | 17,191,200 |
Johnson Controls, Inc. | | 3,400 | | | 292,128 |
| | | | | |
| | | | | 35,282,677 |
| | | | | |
| | |
Other Energy — 1.3% | | | | | |
Anadarko Petroleum Corporation | | 128,900 | | | 5,609,728 |
Apache Corporation | | 13,500 | | | 897,885 |
Devon Energy Corporation | | 17,900 | | | 1,200,732 |
EOG Resources, Inc. | | 5,400 | | | 337,230 |
Holly CorporationD | | 55,100 | | | 2,832,140 |
Massey Energy Co.D | | 137,100 | | | 3,184,833 |
PanCanadian Energy CorporationD | | 74,500 | | | 3,423,275 |
| | |
| 102 | | See Notes to Financial Statements. |
| | | | | | | |
| | | Shares | | Value | |
Valero Energy Corporation | | | 25,000 | | $ | 1,279,000 | |
Williams Cos., Inc. | | | 87,030 | | | 2,273,224 | |
| | | | | | | |
| | | | | | 21,038,047 | |
| | | | | | | |
| | |
Producer Durables — 4.6% | | | | | | | |
American Power Conversion Corporation | | | 250,200 | | | 7,653,618 | |
Caterpillar, Inc. | | | 22,800 | | | 1,398,324 | |
Centex Corporation | | | 68,200 | | | 3,837,614 | |
Deere & Co. | | | 9,600 | | | 912,672 | |
Emerson Electric Co. | | | 183,200 | | | 8,077,288 | |
Illinois Tool Works, Inc. | | | 123,500 | | | 5,704,465 | |
Lennar Corporation Class A | | | 69,100 | | | 3,624,986 | |
Lexmark International, Inc.D* | | | 101,500 | | | 7,429,800 | |
Lockheed Martin Corporation | | | 43,300 | | | 3,986,631 | |
Northrop Grumman Corporation | | | 178,200 | | | 12,064,140 | |
Parker Hannifin Corporation | | | 37,800 | | | 2,906,064 | |
Pitney Bowes, Inc. | | | 86,100 | | | 3,976,959 | |
Tyco International, Ltd. | | | 265,900 | | | 8,083,360 | |
United Technologies Corporation | | | 81,900 | | | 5,120,388 | |
| | | | | | | |
| | | | | | 74,776,309 | |
| | | | | | | |
| | |
Technology — 6.0% | | | | | | | |
Alcatel Lucent Sponsored ADRD | | | 435,463 | | | 6,192,289 | |
Anixter International, Inc.D* | | | 18,700 | | | 1,015,410 | |
Avnet, Inc.D* | | | 117,300 | | | 2,994,669 | |
Electronic Data Systems Corporation | | | 323,500 | | | 8,912,425 | |
EMC Corporation* | | | 11,600 | | | 153,120 | |
General Dynamics Corporation | | | 16,400 | | | 1,219,340 | |
Hewlett-Packard Co. | | | 319,300 | | | 13,151,967 | |
Intel Corporation | | | 382,900 | | | 7,753,725 | |
International Business Machines Corporation | | | 174,600 | | | 16,962,390 | |
Intersil Corporation Class AD | | | 118,300 | | | 2,829,736 | |
Jabil Circuit, Inc. | | | 46,911 | | | 1,151,665 | |
Microsoft Corporation | | | 110,000 | | | 3,284,600 | |
Motorola, Inc. | | | 161,900 | | | 3,328,664 | |
Nokia Corporation ADRD | | | 580,400 | | | 11,793,728 | |
Raytheon Co. | | | 105,100 | | | 5,549,280 | |
Seagate Technology, Inc.+* | | | 4,600 | | | — | |
Solectron Corporation* | | | 1,305,500 | | | 4,203,710 | |
Sun Microsystems, Inc.* | | | 1,550,700 | | | 8,404,794 | |
Symantec Corporation* | | | 22,800 | | | 475,380 | |
| | | | | | | |
| | | | | | 99,376,892 | |
| | | | | | | |
| | |
Utilities — 11.3% | | | | | | | |
Alltel Corporation | | | 15,800 | | | 955,584 | |
American Electric Power Co., Inc. | | | 277,800 | | | 11,828,724 | |
AT&T, Inc.D | | | 683,109 | | | 24,421,147 | |
BellSouth Corporation | | | 497,500 | | | 23,437,225 | |
CenturyTel, Inc. | | | 86,300 | | | 3,767,858 | |
Comcast Corporation Class A* | | | 361,800 | | | 15,314,994 | |
Dominion Resources, Inc. | | | 83,200 | | | 6,975,488 | |
Duke Energy Corporation | | | 254,200 | | | 8,441,982 | |
Edison International | | | 80,500 | | | 3,661,140 | |
Energen Corporation | | | 33,100 | | | 1,553,714 | |
Energy East CorporationD | | | 60,900 | | | 1,510,320 | |
Entergy Corporation | | | 217,900 | | | 20,116,528 | |
Exelon Corporation | | | 4,200 | | | 259,938 | |
FirstEnergy Corporation | | | 48,800 | | | 2,942,640 | |
FPL Group, Inc.D | | | 16,400 | | | 892,488 | |
PG&E Corporation | | | 38,000 | | | 1,798,540 | |
PPL Corporation | | | 242,700 | | | 8,698,368 | |
Progress Energy, Inc. Contingent Value Obligation+* | | | 3,100 | | | 1,209 | |
Public Service Enterprise Group, Inc. | | | 10,200 | | | 677,076 | |
Qwest Communications International, Inc.D* | | | 1,168,000 | | | 9,776,160 | |
Southern Co. (The) | | | 30,200 | | | 1,113,172 | |
Sprint Nextel Corporation | | | 205,907 | | | 3,889,583 | |
Telephone & Data Systems, Inc.D | | | 22,400 | | | 1,216,992 | |
TXU Corporation | | | 22,400 | | | 1,214,304 | |
Verizon Communications, Inc. | | | 837,624 | | | 31,193,118 | |
Windstream Corporation | | | 16,542 | | | 235,227 | |
| | | | | | | |
| | | | | | 185,893,519 | |
| | | | | | | |
Total Common Stocks | | | | | | | |
(Cost $1,245,008,626) | | | | | | 1,568,477,917 | |
| | | | | | | |
| | |
MONEY MARKET FUNDS — 11.7% | | | | | | | |
GuideStone Funds Money Market Fund (GS4 Class)¥ | | | 68,576,737 | | | 68,576,737 | |
Northern Institutional Liquid Assets Portfolio§ | | | 122,875,591 | | | 122,875,591 | |
| | | | | | | |
Total Money Market Funds | | | | | | | |
(Cost $191,452,328) | | | | | | 191,452,328 | |
| | | | | | | |
| | |
| | | Par | | | |
U.S. TREASURY OBLIGATIONS — 0.2% | | | | | | | |
U.S. Treasury Bills | | | | | | | |
4.85%, 02/22/07‡‡ | | $ | 2,840,000 | | | 2,820,201 | |
4.89%, 02/22/07‡‡ | | | 20,000 | | | 19,861 | |
4.92%, 02/22/07‡‡ | | | 400,000 | | | 397,211 | |
4.94%, 02/22/07‡‡ | | | 750,000 | | | 744,772 | |
| | | | | | | |
Total U.S. Treasury Obligations | | | | | | | |
(Cost $3,981,771) | | | | | | 3,982,045 | |
| | | | | | | |
TOTAL INVESTMENTS — 107.5% | | | | | | | |
(Cost $1,440,442,725) | | | | | | 1,763,912,290 | |
| | |
Liabilities in Excess of Other Assets — (7.5)% | | | | | | (122,556,502 | ) |
| | | | | | | |
Net Assets — 100.0% | | | | | $ | 1,641,355,788 | |
| | | | | | | |
| | |
See Notes to Financial Statements. | | 103 |
| | |
| Value Equity Fund | | |
| SCHEDULE OF INVESTMENTS (Continued) | | |
PORTFOLIO SUMMARY (based on net assets)
| | |
| | | % |
Financial Services | | 29.5 |
Money Market Funds | | 11.7 |
Utilities | | 11.3 |
Consumer Discretionary | | 10.4 |
Healthcare | | 9.9 |
Integrated Oils | | 9.5 |
Technology | | 6.0 |
Materials & Processing | | 4.6 |
Producer Durables | | 4.6 |
Consumer Staples | | 3.7 |
Futures Contracts | | 3.6 |
Auto & Transportation | | 2.7 |
Other | | 2.1 |
Other Energy | | 1.3 |
U.S. Treasury Obligations | | 0.2 |
| | |
| | 111.1 |
| | |
| | |
| 104 | | See Notes to Financial Statements. |
Growth Equity Fund
The Fund is comprised of domestic, large-cap growth oriented stocks. The Fund generated a positive return while underperforming its benchmark, the Russell 1000® Growth Index, during the fourth quarter and the year. Security selection in the healthcare sector was the primary detractor from benchmark-relative performance during the quarter. Positions in Genzyme (2.48%), Varian Medical Systems (1.31%) and Motorola (0.53%) detracted from overall fund performance, while some of the fund’s better performing holdings included Google (4.76%), Intercontinental Exchange (0.98%) and Cisco (1.50%).
Please see page 108 for information regarding specific portfolio allocations. Portfolio holdings are subject to change at any time.
105
Growth Equity Fund
| | | | | | | | | | | | | | | | | | |
Average Annual Total Returns as of 12/31/06 | |
| | | GS2 Class* | | | GS4 Class* | | | GS6 Class* | | | Benchmark** | | | GS8 Class* | | | GS8 Class Benchmark** | |
One Year | | 0.45 | % | | 0.34 | % | | 0.00 | % | | 9.07 | % | | (0.37 | )% | | 9.07 | % |
Five Year | | 2.70 | % | | 2.60 | % | | 2.30 | % | | 2.69 | % | | N/A | | | N/A | |
Since Inception | | 2.19 | % | | 2.07 | % | | 1.78 | % | | 2.18 | % | | 6.20 | % | | 8.84 | % |
Inception Date | | 08/27/01 | | | 08/27/01 | | | 08/27/01 | | | 08/27/01 | | | 11/08/04 | | | 11/08/04 | |
The performance data quoted represents past performance and does not guarantee future results. Current performance may be lower or higher. Performance data current to the most recent month-end may be obtained at www.GuideStone.org. The investment return and principal value of an investment will fluctuate so that shares, when redeemed, may be worth more or less than their original cost.
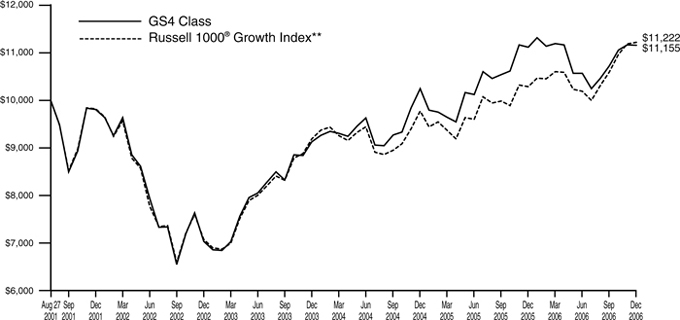
The graph compares the results of a hypothetical $10,000 investment in the GS4 Class of the Fund since August 27, 2001 (commencement of operations), with all dividends and capital gains reinvested, with the Russell 1000® Growth Index.
| * | These returns reflect expense waivers by the Fund’s investment advisor. Without these waivers, returns would have been lower. Returns shown do not reflect the deduction of taxes that a shareholder would pay on Fund distributions or the redemption of Fund shares. |
** | The Russell 1000® Growth Index is a large-cap index consisting of those Russell 1000® Index securities with greater-than-average growth orientation. Companies in this index tend to exhibit higher price-to-book and price-earnings-ratios, lower dividend yields and higher forecasted growth values than the value universe. |
Unlike a mutual fund, the performance of an index assumes no taxes, transaction costs, management fees or other expenses.
106
| | |
| Growth Equity Fund | | |
| SCHEDULE OF INVESTMENTS | | December 31, 2006 |
| | | | | |
| | | Shares | | Value |
COMMON STOCKS — 96.0% | | | | | |
Auto & Transportation — 4.3% | | | | | |
Burlington Northern Santa Fe Corporation | | 272,937 | | $ | 20,145,480 |
CH Robinson Worldwide, Inc.D | | 103,600 | | | 4,236,204 |
Expeditors International Washington, Inc. | | 160,790 | | | 6,511,995 |
FedEx Corporation | | 199,618 | | | 21,682,507 |
Toyota Motor Corporation ADRD | | 35,596 | | | 4,780,899 |
Union Pacific Corporation | | 99,004 | | | 9,110,348 |
| | | | | |
| | | | | 66,467,433 |
| | | | | |
| | |
Consumer Discretionary — 17.9% | | | | | |
Amazon.com, Inc.D* | | 371,200 | | | 14,647,552 |
Coach, Inc.* | | 168,025 | | | 7,218,354 |
eBay, Inc.* | | 916,200 | | | 27,550,134 |
Federated Department Stores, Inc. | | 305,581 | | | 11,651,803 |
Google, Inc.* | | 152,735 | | | 70,331,413 |
Interpublic Group Cos., Inc.* | | 400 | | | 4,896 |
Iron Mountain, Inc.D* | | 109,800 | | | 4,539,132 |
Lowe’s Cos., Inc. | | 864,841 | | | 26,939,797 |
Marriott International, Inc. Class A | | 218,650 | | | 10,433,978 |
Nordstrom, Inc. | | 38,234 | | | 1,886,466 |
Penney (JC) Co., Inc. | | 113,000 | | | 8,741,680 |
Starbucks CorporationD* | | 996,832 | | | 35,307,789 |
Target Corporation | | 187,311 | | | 10,686,093 |
Univision Communications, Inc. Class AD* | | 160,300 | | | 5,677,826 |
Walt Disney Co. (The) | | 313,100 | | | 10,729,937 |
Yahoo!, Inc.* | | 685,800 | | | 17,515,332 |
Yum! Brands, Inc. | | 191,299 | | | 11,248,381 |
| | | | | |
| | | | | 275,110,563 |
| | | | | |
| | |
Consumer Staples — 6.0% | | | | | |
Colgate-Palmolive Co. | | 155,400 | | | 10,138,296 |
PepsiCo, Inc. | | 370,303 | | | 23,162,452 |
Procter & Gamble Co. | | 501,225 | | | 32,213,731 |
Walgreen Co.D | | 580,400 | | | 26,634,556 |
| | | | | |
| | | | | 92,149,035 |
| | | | | |
| | |
Financial Services — 16.3% | | | | | |
American International Group, Inc. | | 232,500 | | | 16,660,950 |
CB Richard Ellis Group, Inc. Class A* | | 253,980 | | | 8,432,136 |
Chicago Mercantile Exchange Holdings, Inc.D | | 37,000 | | | 18,860,750 |
Citigroup, Inc. | | 323,455 | | | 18,016,443 |
Commerce Bancorp, Inc.D | | 275,850 | | | 9,729,230 |
Countrywide Financial Corporation | | 363,300 | | | 15,422,085 |
Franklin Resources, Inc. | | 87,200 | | | 9,606,824 |
Genworth Financial, Inc. Class A | | 140,500 | | | 4,806,505 |
Goldman Sachs Group, Inc. | | 116,964 | | | 23,316,773 |
IntercontinentalExchange, Inc.D* | | 134,600 | | | 14,523,340 |
Legg Mason, Inc.D | | 31,400 | | | 2,984,570 |
Lehman Brothers Holdings, Inc. | | 164,660 | | | 12,863,239 |
Merrill Lynch & Co., Inc. | | 130,000 | | | 12,103,000 |
Moody’s CorporationD | | 212,300 | | | 14,661,438 |
Progressive Corporation (The) | | 758,680 | | | 18,375,230 |
SLM CorporationD | | 312,700 | | | 15,250,379 |
UBS AG | | 190,227 | | | 11,476,395 |
US Bancorp | | 136,500 | | | 4,939,935 |
Wells Fargo & Co. | | 305,087 | | | 10,848,894 |
Zions Bancorporation | | 107,200 | | | 8,837,568 |
| | | | | |
| | | | | 251,715,684 |
| | | | | |
| | |
Healthcare — 21.2% | | | | | |
Abbott Laboratories | | 145,300 | | | 7,077,563 |
Abraxis BioScience, Inc.D* | | 148,800 | | | 4,068,192 |
Aetna, Inc. | | 161,110 | | | 6,956,730 |
Allergan, Inc. | | 216,300 | | | 25,899,762 |
Amgen, Inc.* | | 135,400 | | | 9,249,174 |
Amylin Pharmaceuticals, Inc.D* | | 252,685 | | | 9,114,348 |
Cardinal Health, Inc. | | 80,100 | | | 5,160,843 |
Cerner CorporationD* | | 102,700 | | | 4,672,850 |
Genentech, Inc.D* | | 764,142 | | | 61,994,840 |
Genzyme Corporation* | | 594,587 | | | 36,614,668 |
Gilead Sciences, Inc.* | | 164,700 | | | 10,693,971 |
Intuitive Surgical, Inc.D* | | 69,400 | | | 6,655,460 |
Novartis AG ADRD | | 118,100 | | | 6,783,664 |
Patterson Cos., Inc.D* | | 132,600 | | | 4,708,626 |
Shire PLC ADRD | | 97,450 | | | 6,018,512 |
St. Jude Medical, Inc.* | | 156,200 | | | 5,710,672 |
Stryker CorporationD | | 141,500 | | | 7,798,065 |
Teva Pharmaceutical Industries, Ltd. ADRD | | 452,000 | | | 14,048,160 |
UnitedHealth Group, Inc. | | 614,127 | | | 32,997,044 |
Varian Medical Systems, Inc.D* | | 407,400 | | | 19,380,018 |
WellPoint, Inc.* | | 93,700 | | | 7,373,253 |
Wyeth | | 216,500 | | | 11,024,180 |
Zimmer Holdings, Inc.D* | | 281,400 | | | 22,056,132 |
| | | | | |
| | | | | 326,056,727 |
| | | | | |
| | |
Materials & Processing — 1.7% | | | | | |
Fluor CorporationD | | 75,000 | | | 6,123,750 |
Monsanto Co. | | 192,788 | | | 10,127,154 |
Praxair, Inc.D | | 123,116 | | | 7,304,472 |
St. Joe Co.D | | 49,943 | | | 2,675,446 |
| | | | | |
| | | | | 26,230,822 |
| | | | | |
| | |
Other — 1.7% | | | | | |
General Electric Co. | | 707,800 | | | 26,337,238 |
| | | | | |
| | |
Other Energy — 4.8% | | | | | |
Baker Hughes, Inc. | | 35,500 | | | 2,650,430 |
Canadian Natural Resources, Ltd.D | | 123,200 | | | 6,557,936 |
Dynegy, Inc. Class A* | | 170 | | | 1,231 |
NRG Energy, Inc.D* | | 33,925 | | | 1,900,139 |
Schlumberger, Ltd. | | 742,962 | | | 46,925,480 |
TransOcean, Inc.D* | | 87,600 | | | 7,085,964 |
Valero Energy Corporation | | 45,900 | | | 2,348,244 |
Weatherford International, Ltd.* | | 154,300 | | | 6,448,197 |
| | | | | |
| | | | | 73,917,621 |
| | | | | |
| | |
See Notes to Financial Statements. | | 107 |
| | |
| Growth Equity Fund | | |
| SCHEDULE OF INVESTMENTS (Continued) | | |
| | | | | | | |
| | | Shares | | Value | |
Producer Durables — 4.0% | | | | | | | |
Boeing Co. | | | 142,929 | | $ | 12,697,813 | |
KB HOMED | | | 90,490 | | | 4,640,327 | |
Lennar Corporation Class AD | | | 107,713 | | | 5,650,624 | |
Lockheed Martin Corporation | | | 129,429 | | | 11,916,528 | |
Pulte Homes, Inc.D | | | 254,835 | | | 8,440,135 | |
United Technologies Corporation | | | 298,023 | | | 18,632,398 | |
| | | | | | | |
| | | | | | 61,977,825 | |
| | | | | | | |
| | |
Technology — 14.6% | | | | | | | |
Apple Computer, Inc.* | | | 352,600 | | | 29,914,584 | |
Autodesk, Inc.* | | | 209,715 | | | 8,485,069 | |
Broadcom Corporation Class A* | | | 465,600 | | | 15,043,536 | |
Cisco Systems, Inc.* | | | 812,836 | | | 22,214,808 | |
Corning, Inc.* | | | 149,600 | | | 2,799,016 | |
Dell, Inc.* | | | 188,600 | | | 4,731,974 | |
General Dynamics Corporation | | | 157,765 | | | 11,729,828 | |
Hewlett-Packard Co. | | | 398,600 | | | 16,418,334 | |
Intel Corporation | | | 702,373 | | | 14,223,053 | |
Marvell Technology Group, Ltd.D* | | | 368,400 | | | 7,069,596 | |
Microsoft Corporation | | | 443,400 | | | 13,239,924 | |
Motorola, Inc. | | | 381,200 | | | 7,837,472 | |
Network Appliance, Inc.* | | | 412,225 | | | 16,192,198 | |
Qualcomm, Inc. | | | 999,570 | | | 37,773,750 | |
Salesforce.com, Inc.D* | | | 347,100 | | | 12,651,795 | |
Seagate Technology, Inc.+* | | | 5,600 | | | — | |
Texas Instruments, Inc. | | | 150,300 | | | 4,328,640 | |
| | | | | | | |
| | | | | | 224,653,577 | |
| | | | | | | |
| | |
Utilities — 3.5% | | | | | | | |
America Movil SA de CV ADR Series L | | | 479,571 | | | 21,686,200 | |
AT&T, Inc. | | | 405,700 | | | 14,503,775 | |
Comcast Corporation Class A* | | | 409,557 | | | 17,336,548 | |
| | | | | | | |
| | | | | | 53,526,523 | |
| | | | | | | |
Total Common Stocks | | | | | | | |
(Cost $1,191,586,562) | | | | | | 1,478,143,048 | |
| | | | | | | |
| | |
MONEY MARKET FUNDS — 11.5% | | | | | | | |
GuideStone Funds Money Market Fund (GS4 Class) ¥ | | | 58,839,845 | | | 58,839,845 | |
Northern Institutional Liquid Assets Portfolio§ | | | 118,791,161 | | | 118,791,161 | |
| | | | | | | |
Total Money Market Funds | | | | | | | |
(Cost $177,631,006) | | | | | | 177,631,006 | |
| | | | | | | |
| | | Par | | | |
U.S. TREASURY OBLIGATION — 0.3% | | | | | | | |
U.S. Treasury Bill | | | | | | | |
4.85%, 02/22/07‡‡ (Cost $4,170,577) | | $ | 4,200,000 | | | 4,170,721 | |
| | | | | | | |
| | |
TOTAL INVESTMENTS — 107.8% | | | | | | | |
(Cost $1,373,388,145) | | | | | | 1,659,944,775 | |
| | |
Liabilities in Excess of Other Assets — (7.8)% | | | | | | (119,464,162 | ) |
| | | | | | | |
| | |
NET ASSETS — 100.0% | | | | | $ | 1,540,480,613 | |
| | | | | | | |
| | |
PORTFOLIO SUMMARY (based on net assets) | | | | | | | |
| | | | | % | |
Healthcare | | | | | | 21.2 | |
Consumer Discretionary | | | | | | 17.9 | |
Financial Services | | | | | | 16.3 | |
Technology | | | | | | 14.6 | |
Money Market Funds | | | | | | 11.5 | |
Consumer Staples | | | | | | 6.0 | |
Other Energy | | | | | | 4.8 | |
Auto & Transportation | | | | | | 4.3 | |
Producer Durables | | | | | | 4.0 | |
Utilities | | | | | | 3.5 | |
Futures Contracts | | | | | | 3.1 | |
Materials & Processing | | | | | | 1.7 | |
Other | | | | | | 1.7 | |
U.S. Treasury Obligation | | | | | | 0.3 | |
| | | | | | | |
| | | | | | 110.9 | |
| | | | | | | |
| | |
| 108 | | See Notes to Financial Statements. |
Small Cap Equity Fund
The Fund is comprised of domestic, small-cap stocks with both value and growth style orientations. The Fund generated a positive return while underperforming its benchmark, the Russell 2000® Index, during the fourth quarter and the year. Security selection within the consumer discretionary and financial services sectors detracted from benchmark-relative performance during the quarter. The Fund’s holdings in LCA-Vision (0.56%), Select Comfort (0.71%) and Doral Financial (0.08%) detracted from performance, while outperforming holdings included Medarex (0.41%), J&J Snack Foods (0.47%) and Exco Resources (0.45%). During the quarter, Provident delivered the strongest benchmark-relative returns and was rewarded for its security selection in the technology sector.
Please see page 116 for information regarding specific portfolio allocations. Portfolio holdings are subject to change at any time.
Small company stocks are generally riskier than large company stocks due to greater volatility and less liquidity.
109
Small Cap Equity Fund
| | | | | | | | | | | | | | | | | | |
Average Annual Total Returns as of 12/31/06 | |
| | | GS2 Class* | | | GS4 Class* | | | GS6 Class* | | | Benchmark** | | | GS8 Class* | | | GS8 Class Benchmark** | |
One Year | | 11.40 | % | | 11.27 | % | | 10.84 | % | | 18.37 | % | | 10.44 | % | | 18.37 | % |
Five Year | | 9.21 | % | | 9.11 | % | | 8.78 | % | | 11.39 | % | | N/A | | | N/A | |
Since Inception | | 8.83 | % | | 8.67 | % | | 8.37 | % | | 11.04 | % | | 11.25 | % | | 14.69 | % |
Inception Date | | 08/27/01 | | | 08/27/01 | | | 08/27/01 | | | 08/27/01 | | | 11/08/04 | | | 11/08/04 | |
The performance data quoted represents past performance and does not guarantee future results. Current performance may be lower or higher. Performance data current to the most recent month-end may be obtained at www.GuideStone.org. The investment return and principal value of an investment will fluctuate so that shares, when redeemed, may be worth more or less than their original cost.
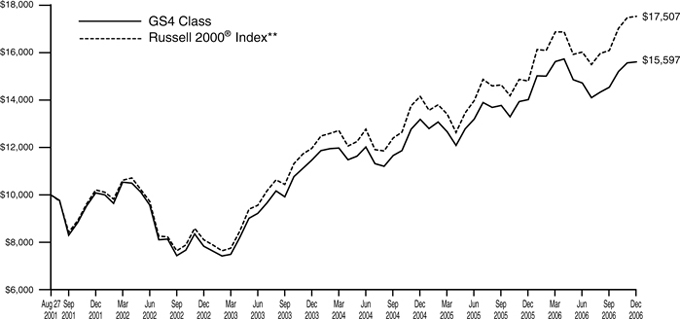
The graph compares the results of a hypothetical $10,000 investment in the GS4 Class of the Fund since August 27, 2001 (commencement of operations), with all dividends and capital gains reinvested, with the Russell 2000® Index.
| * | These returns reflect expense waivers by the Fund’s investment advisor. Without these waivers, returns would have been lower. Returns shown do not reflect the deduction of taxes that a shareholder would pay on Fund distributions or the redemption of Fund shares. |
** | The Russell 2000® Index is a small-cap equity index comprised of the 2,000 smallest companies in the Russell 3000® Index, which represents approximately 8% of the total market capitalization of the Russell 3000® Index. |
Unlike a mutual fund, the performance of an index assumes no taxes, transaction costs, management fees or other expenses.
110
| | |
| Small Cap Equity Fund | | |
| SCHEDULE OF INVESTMENTS | | December 31, 2006 |
| | | | | |
| | | Shares | | Value |
COMMON STOCKS — 95.9% | | | | | |
Auto & Transportation — 3.8% | | | | | |
Accuride CorporationD* | | 69,500 | | $ | 782,570 |
AirTran Holdings, Inc.D* | | 43,300 | | | 508,342 |
American Commercial Lines, Inc.D* | | 8,500 | | | 556,835 |
American Railcar Industries, Inc.D | | 7,700 | | | 262,108 |
Arkansas Best CorporationD | | 18,390 | | | 662,040 |
ArvinMeritor, Inc.D | | 38,600 | | | 703,678 |
Autoliv, Inc. | | 31,600 | | | 1,905,480 |
Commercial Vehicle Group, Inc.* | | 6,610 | | | 144,098 |
Copa Holdings SA Class A | | 22,000 | | | 1,024,320 |
ExpressJet Holdings, Inc.D* | | 77,600 | | | 628,560 |
Freightcar America, Inc.D | | 14,400 | | | 798,480 |
General Maritime CorporationD | | 30,000 | | | 1,055,700 |
Goodyear Tire & Rubber Co. (The)D* | | 9,200 | | | 193,108 |
Greenbrier Co., Inc.D | | 20,500 | | | 615,000 |
Horizon Lines, Inc. Class AD | | 26,700 | | | 719,832 |
JB Hunt Transport Services, Inc. | | 71,800 | | | 1,491,286 |
Laidlaw International, Inc. | | 32,200 | | | 979,846 |
Noble International, Ltd.D | | 28,550 | | | 572,428 |
OMI CorporationD | | 96,200 | | | 2,036,554 |
Pacer International, Inc. | | 20,100 | | | 598,377 |
Republic Airways Holdings, Inc.D* | | 9,748 | | | 163,571 |
Sea Containers, Ltd. Class AD | | 50,000 | | | 35,000 |
Thor Industries, Inc.D | | 19,780 | | | 870,122 |
TRW Automotive Holdings CorporationD* | | 19,800 | | | 512,226 |
Tsakos Energy Navigation, Ltd.D | | 35,900 | | | 1,647,810 |
UTI Worldwide, Inc.D | | 43,000 | | | 1,285,700 |
Wabash National CorporationD | | 58,092 | | | 877,189 |
| | | | | |
| | | | | 21,630,260 |
| | | | | |
| | |
Consumer Discretionary — 18.0% | | | | | |
Aaron Rents, Inc.D | | 49,550 | | | 1,426,049 |
Administaff, Inc.D | | 9,500 | | | 406,315 |
Advisory Board Co. (The)D* | | 32,100 | | | 1,718,634 |
American Woodmark CorporationD | | 32,300 | | | 1,351,755 |
America’s Car-Mart, Inc.D* | | 24,470 | | | 290,214 |
Asbury Automotive Group, Inc. | | 30,700 | | | 723,292 |
Barrett Business Services, Inc.D | | 25,100 | | | 587,842 |
Big Lots, Inc.D* | | 22,200 | | | 508,824 |
BJ’s Wholesale Club, Inc.* | | 43,400 | | | 1,350,174 |
Blockbuster, Inc. Class AD* | | 129,300 | | | 683,997 |
Brinker International, Inc. | | 40,650 | | | 1,226,004 |
Brown Shoe Co., Inc. | | 14,300 | | | 682,682 |
Buckle, Inc.D | | 18,700 | | | 950,895 |
Buffalo Wild Wings, Inc.D* | | 11,900 | | | 633,080 |
Build-A-Bear Workshop, Inc.D* | | 36,020 | | | 1,009,280 |
Capella Education Co.* | | 21,300 | | | 516,525 |
Casual Male Retail Group, Inc.D* | | 35,000 | | | 456,750 |
CEC Entertainment, Inc.* | | 17,800 | | | 716,450 |
Central Garden & Pet Co.D* | | 26,500 | | | 1,283,130 |
Charlotte Russe Holding, Inc.D* | | 44,900 | | | 1,380,675 |
Computer Learning Centers* | | 24,439 | | | 2 |
Conn’s, Inc.D* | | 41,300 | | | 961,051 |
Convergys Corporation* | | 64,100 | | | 1,524,298 |
Corporate Executive Board Co. | | 20,300 | | | 1,780,310 |
CoStar Group, Inc.D* | | 32,850 | | | 1,759,446 |
CRA International, Inc.* | | 10,100 | | | 529,240 |
CROCS, Inc.D* | | 23,430 | | | 1,012,176 |
Ctrip.com International, Ltd. ADRD | | 11,300 | | | 706,024 |
Deckers Outdoor CorporationD* | | 17,200 | | | 1,031,140 |
Dillard’s, Inc. Class A | | 31,800 | | | 1,112,046 |
Dress Barn, Inc.D* | | 46,700 | | | 1,089,511 |
DTS, Inc.D* | | 16,150 | | | 390,668 |
Emergency Medical Services LP Class AD* | | 30,000 | | | 629,400 |
Entravision Communications Corporation Class AD* | | 214,758 | | | 1,765,311 |
EZCORP, Inc. Class AD* | | 82,200 | | | 1,335,750 |
FirstService CorporationD* | | 29,400 | | | 679,140 |
Furniture Brands International, Inc.D | | 57,100 | | | 926,733 |
Gymboree CorporationD* | | 16,300 | | | 622,008 |
Harris Interactive, Inc.D* | | 100,744 | | | 507,750 |
Hasbro, Inc. | | 69,800 | | | 1,902,050 |
Heelys, Inc.* | | 1,100 | | | 35,321 |
Heidrick & Struggles International, Inc.D* | | 16,600 | | | 703,176 |
Helen of Troy, Ltd.D* | | 42,000 | | | 1,018,920 |
Herbalife, Ltd.* | | 34,300 | | | 1,377,488 |
Hibbett Sporting Goods, Inc.* | | 16,500 | | | 503,745 |
Home Solutions of America, Inc.D* | | 74,900 | | | 438,914 |
Houston Wire & Cable Co.D* | | 52,400 | | | 1,095,160 |
Iconix Brand Group, Inc.D* | | 92,700 | | | 1,797,453 |
IKON Office Solutions, Inc.D | | 45,600 | | | 746,472 |
Inter Parfums, Inc.D | | 27,900 | | | 535,401 |
ITT Educational Services, Inc.D* | | 19,600 | | | 1,300,852 |
Jack in the Box, Inc.* | | 16,500 | | | 1,007,160 |
Jackson Hewitt Tax Service, Inc.D | | 55,200 | | | 1,875,144 |
Jakks Pacific, Inc.D* | | 55,800 | | | 1,218,672 |
Jones Apparel Group, Inc. | | 11,500 | | | 384,445 |
K2, Inc.D* | | 87,100 | | | 1,148,849 |
Kenexa CorporationD* | | 40,800 | | | 1,357,008 |
Kforce, Inc.* | | 39,000 | | | 474,630 |
Knot, Inc.D* | | 15,100 | | | 396,224 |
Life Time Fitness, Inc.D* | | 28,800 | | | 1,397,088 |
Liquidity Services, Inc.D* | | 17,170 | | | 295,496 |
LoJack CorporationD* | | 28,300 | | | 483,364 |
Marvel Entertainment, Inc.D* | | 20,000 | | | 538,200 |
Monro Muffler Brake, Inc. | | 18,900 | | | 663,390 |
MWI Veterinary Supply, Inc.D* | | 25,000 | | | 807,500 |
On Assignment, Inc.D* | | 82,000 | | | 963,500 |
Orient-Express Hotels, Ltd. Class AD | | 24,000 | | | 1,135,680 |
Outdoor Channel Holdings, Inc.D* | | 37,900 | | | 486,257 |
| | |
See Notes to Financial Statements. | | 111 |
| | |
| Small Cap Equity Fund | | |
| SCHEDULE OF INVESTMENTS (Continued) | | |
| | | | | |
| | | Shares | | Value |
Parlux Fragrance, Inc.D* | | 106,900 | | $ | 595,433 |
Perry Ellis International, Inc.D* | | 5,490 | | | 225,090 |
Physicians Formula Holdings, Inc.D* | | 16,600 | | | 310,254 |
Playtex Products, Inc.D* | | 65,800 | | | 946,862 |
Pool CorporationD | | 74,925 | | | 2,934,812 |
Resources Connection, Inc.D* | | 92,000 | | | 2,929,280 |
Rocky Brands, Inc.D* | | 55,000 | | | 886,600 |
Ruby Tuesday, Inc.D | | 27,900 | | | 765,576 |
Rush Enterprises, Inc. Class AD* | | 49,681 | | | 840,603 |
Schawk, Inc.D | | 54,300 | | | 1,061,022 |
Select Comfort CorporationD* | | 223,465 | | | 3,886,056 |
Shaw Communications, Inc. Class BD | | 56,900 | | | 1,804,299 |
Source Interlink Cos., Inc.D* | | 54,900 | | | 447,984 |
Stanley Furniture Co., Inc.D | | 20,960 | | | 449,592 |
Steiner Leisure, Ltd.* | | 31,400 | | | 1,428,700 |
Strayer Education, Inc.D | | 26,500 | | | 2,810,325 |
Tech Data Corporation* | | 31,600 | | | 1,196,692 |
Tempur-Pedic International, Inc.D* | | 36,830 | | | 753,542 |
THQ, Inc.D* | | 65,900 | | | 2,143,068 |
Toro Co.D | | 29,500 | | | 1,375,585 |
Tractor Supply Co.D* | | 26,400 | | | 1,180,344 |
Travelzoo, Inc.D* | | 39,500 | | | 1,183,025 |
True Religion Apparel, Inc.D* | | 65,770 | | | 1,006,939 |
United Natural Foods, Inc.D* | | 23,300 | | | 836,936 |
United Online, Inc.D | | 108,200 | | | 1,436,896 |
Universal Electronics, Inc.D* | | 60,285 | | | 1,267,191 |
USANA Health Sciences, Inc.D* | | 43,500 | | | 2,247,210 |
ValueClick, Inc.D* | | 35,620 | | | 841,701 |
VistaPrint, Ltd.D* | | 22,100 | | | 731,731 |
WESCO International, Inc.* | | 17,300 | | | 1,017,413 |
World Fuel Services CorporationD | | 32,800 | | | 1,458,288 |
Zumiez, Inc.* | | 7,700 | | | 227,458 |
| | | | | |
| | | | | 103,578,637 |
| | | | | |
Consumer Staples — 1.3% | | | | | |
Chiquita Brands International, Inc.D | | 25,190 | | | 402,284 |
J & J Snack Foods CorporationD | | 62,252 | | | 2,577,233 |
Long’s Drug Stores Corporation | | 14,800 | | | 627,224 |
NBTY, Inc.D* | | 39,700 | | | 1,650,329 |
Pilgrim’s Pride Corporation | | 22,400 | | | 659,232 |
Ralcorp Holdings, Inc.D* | | 26,200 | | | 1,333,318 |
| | | | | |
| | | | | 7,249,620 |
| | | | | |
Financial Services — 22.2% | | | | | |
A.G. Edwards, Inc. | | 35,800 | | | 2,265,782 |
Accredited Home Lenders Holding Co.D* | | 26,500 | | | 722,920 |
Advanta Corporation Class BD | | 35,700 | | | 1,557,591 |
Affiliated Managers Group, Inc.D* | | 7,770 | | | 816,860 |
Alliance Data Systems Corporation* | | 20,000 | | | 1,249,400 |
American Equity Investment Life Holding Co.D | | 102,000 | | | 1,329,060 |
American Financial Group, Inc. | | 22,200 | | | 797,202 |
American Home Mortgage Investment Corporation REITD | | 38,900 | | | 1,366,168 |
American Physicians Capital, Inc.D* | | 11,700 | | | 468,468 |
AmeriCredit CorporationD* | | 22,800 | | | 573,876 |
Amerisafe, Inc.* | | 23,810 | | | 368,102 |
Arch Capital Group, Ltd.* | | 19,900 | | | 1,345,439 |
Argonaut Group, Inc.D* | | 30,900 | | | 1,077,174 |
Assurant, Inc. | | 23,900 | | | 1,320,475 |
Assured Guaranty, Ltd. | | 37,200 | | | 989,520 |
Asta Funding, Inc.D | | 83,140 | | | 2,530,782 |
Banco Latinoamericano de Exportaciones SAD | | 53,400 | | | 905,664 |
Bancshares of Florida, Inc.D* | | 28,000 | | | 573,440 |
BankUnited Financial Corporation Class AD | | 78,900 | | | 2,206,044 |
Brookline Bancorp, Inc.D | | 87,123 | | | 1,147,410 |
Cash America International, Inc.D | | 21,800 | | | 1,022,420 |
Center Financial Corporation | | 500 | | | 11,985 |
Central Pacific Financial CorporationD | | 24,600 | | | 953,496 |
Cohen & Steers, Inc.D | | 19,800 | | | 795,366 |
Colonial BancGroup, Inc. | | 75,900 | | | 1,953,666 |
Commerce Group, Inc.D | | 50,800 | | | 1,511,300 |
CompuCredit CorporationD* | | 40,000 | | | 1,592,400 |
Corus Bankshares, Inc.D | | 100,780 | | | 2,324,995 |
Covanta Holding Corporation* | | 43,800 | | | 965,352 |
Credicorp, Ltd. | | 29,800 | | | 1,220,012 |
CVB Financial CorporationD | | 48,682 | | | 703,942 |
Cybersource CorporationD* | | 50,676 | | | 558,449 |
Digital Insight Corporation* | | 13,000 | | | 500,370 |
Doral Financial CorporationD | | 147,500 | | | 423,325 |
Downey Financial CorporationD | | 26,920 | | | 1,953,854 |
Eaton Vance Corporation | | 21,500 | | | 709,715 |
Euronet Worldwide, Inc.D* | | 17,200 | | | 510,668 |
ExlService Holdings, Inc.D* | | 10,900 | | | 229,336 |
Federated Investors, Inc. Class B | | 20,100 | | | 678,978 |
First Acceptance CorporationD* | | 30,311 | | | 324,934 |
First American CorporationD | | 28,200 | | | 1,147,176 |
First Bancorp Puerto RicoD | | 83,300 | | | 793,849 |
First Cash Financial Services, Inc.D* | | 50,100 | | | 1,296,087 |
First Marblehead Corporation | | 33,000 | | | 1,803,450 |
First Regional BancorpD* | | 36,800 | | | 1,254,512 |
FirstFed Financial CorporationD* | | 40,000 | | | 2,678,800 |
Fremont General CorporationD | | 142,500 | | | 2,309,925 |
GFI Group, Inc.D* | | 7,200 | | | 448,272 |
Global Payments, Inc. | | 40,300 | | | 1,865,890 |
Hanmi Financial CorporationD | | 14,900 | | | 335,697 |
Hanover Insurance Group, Inc. | | 27,700 | | | 1,351,760 |
| | |
| 112 | | See Notes to Financial Statements. |
| | | | | |
| | | Shares | | Value |
HCC Insurance Holdings, Inc.D | | 40,135 | | $ | 1,287,932 |
HealthExtras, Inc.* | | 45,600 | | | 1,098,960 |
Hilb, Rogal & Hobbs Co.D | | 97,872 | | | 4,122,369 |
Huron Consulting Group, Inc.D* | | 41,816 | | | 1,895,937 |
IndyMac Bancorp, Inc.D | | 36,900 | | | 1,666,404 |
Infinity Property & Casualty CorporationD | | 30,300 | | | 1,466,217 |
Investors Financial Services CorporationD | | 77,600 | | | 3,311,192 |
Jack Henry & Associates, Inc.D | | 67,900 | | | 1,453,060 |
Jefferies Group, Inc.D | | 34,400 | | | 922,608 |
Jones Lang LaSalle, Inc.D | | 20,800 | | | 1,917,136 |
Kingsway Financial Services, Inc.D | | 49,000 | | | 1,021,650 |
Knight Capital Group, Inc. Class AD* | | 50,200 | | | 962,334 |
Markel Corporation* | | 4,535 | | | 2,177,253 |
Max Re Capital, Ltd. | | 52,100 | | | 1,293,122 |
MCG Capital CorporationD | | 53,200 | | | 1,081,024 |
Midwest Banc Holdings, Inc.D | | 23,100 | | | 548,625 |
MoneyGram International, Inc.D | | 29,300 | | | 918,848 |
National Interstate CorporationD | | 20,000 | | | 486,000 |
New Century Financial Corporation REITD | | 26,400 | | | 833,976 |
Ocwen Financial CorporationD* | | 80,400 | | | 1,275,144 |
Odyssey Re Holdings Corporation | | 32,500 | | | 1,212,250 |
Ohio Casualty CorporationD | | 116,871 | | | 3,483,924 |
Online Resources CorporationD* | | 40,800 | | | 416,568 |
optionsXpress Holdings, Inc.D | | 93,900 | | | 2,130,591 |
Pacific Capital BancorpD | | 35,000 | | | 1,175,300 |
Philadelphia Consolidated Holding CorporationD* | | 15,300 | | | 681,768 |
PMI Group, Inc. (The)D | | 44,500 | | | 2,099,065 |
Portfolio Recovery Associates, Inc.D* | | 27,610 | | | 1,289,111 |
Primus Guaranty, Ltd.* | | 75,100 | | | 867,405 |
PrivateBancorp, Inc.D | | 46,261 | | | 1,925,845 |
Radian Group, Inc. | | 38,200 | | | 2,059,362 |
Reinsurance Group of America, Inc.D | | 27,800 | | | 1,548,460 |
RenaissanceRe Holdings, Ltd. | | 21,500 | | | 1,290,000 |
Ryder System, Inc. | | 28,500 | | | 1,455,210 |
Safety Insurance Group, Inc.D | | 22,500 | | | 1,140,975 |
Sotheby’s Holdings Class AD | | 24,700 | | | 766,194 |
SWS Group, Inc.D | | 36,200 | | | 1,292,340 |
TierOne CorporationD | | 39,900 | | | 1,261,239 |
Tower Group, Inc.D | | 2,200 | | | 68,354 |
Triad Guaranty, Inc.D* | | 42,270 | | | 2,319,355 |
United Rentals, Inc.* | | 23,300 | | | 592,519 |
Unitrin, Inc. | | 24,200 | | | 1,212,662 |
USI Holdings CorporationD* | | 164,587 | | | 2,528,056 |
Webster Financial CorporationD | | 34,300 | | | 1,671,096 |
Williams Scotsman International, Inc.D* | | 109,945 | | | 2,157,121 |
World Acceptance CorporationD* | | 24,200 | | | 1,136,190 |
Wright Express CorporationD* | | 49,700 | | | 1,549,149 |
Zenith National Insurance Corporation | | 26,200 | | | 1,229,042 |
| | | | | |
| | | | | 128,140,300 |
| | | | | |
| | |
Healthcare — 11.7% | | | | | |
Adeza Biomedical CorporationD* | | 34,200 | | | 509,922 |
Akorn, Inc.D* | | 54,470 | | | 340,438 |
Amedisys, Inc.D* | | 114,800 | | | 3,773,476 |
American Dental Partners, Inc.* | | 42,300 | | | 799,047 |
AMERIGROUP CorporationD* | | 23,500 | | | 843,415 |
Apria Healthcare Group, Inc.D* | | 42,800 | | | 1,140,620 |
Arqule, Inc.D* | | 99,920 | | | 591,527 |
Arthrocare CorporationD* | | 16,740 | | | 668,261 |
Aspreva Pharmaceuticals CorporationD* | | 14,800 | | | 303,696 |
AtriCure, Inc.D* | | 42,700 | | | 384,300 |
BioMarin Pharmaceuticals, Inc.D* | | 87,600 | | | 1,435,764 |
Bio-Rad Laboratories, Inc. Class A* | | 10,500 | | | 866,460 |
Biosite, Inc.D* | | 9,690 | | | 473,356 |
Cardiome Pharma CorporationD* | | 39,200 | | | 437,080 |
Centene CorporationD* | | 21,990 | | | 540,294 |
Chattem, Inc.D* | | 31,300 | | | 1,567,504 |
Coley Pharmaceutical Group, Inc.D* | | 30,200 | | | 292,638 |
Conor Medsystems, Inc.D* | | 32,500 | | | 1,018,225 |
Dade Behring Holdings, Inc. | | 39,000 | | | 1,552,590 |
DJO, Inc.D* | | 20,200 | | | 864,964 |
Five Star Quality Care, Inc.+* | | 2,086 | | | — |
Genesis HealthCare Corporation* | | 16,000 | | | 755,680 |
Haemonetics Corporation* | | 21,800 | | | 981,436 |
Healthspring, Inc.* | | 52,830 | | | 1,075,091 |
Healthways, Inc.D* | | 9,600 | | | 458,016 |
Icon PLC ADRD* | | 40,450 | | | 1,524,965 |
Idexx Laboratories, Inc.* | | 7,200 | | | 570,960 |
Immucor, Inc.D* | | 29,400 | | | 859,362 |
Kensey Nash CorporationD* | | 25,100 | | | 798,180 |
King Pharmaceuticals, Inc.* | | 64,900 | | | 1,033,208 |
Kyphon, Inc.D* | | 48,500 | | | 1,959,400 |
LCA-Vision, Inc.D | | 89,610 | | | 3,079,000 |
Lifecell CorporationD* | | 23,850 | | | 575,739 |
Magellan Health Services, Inc.* | | 44,200 | | | 1,910,324 |
Matria Healthcare, Inc.D* | | 52,400 | | | 1,505,452 |
Medarex, Inc.D* | | 152,230 | | | 2,251,482 |
Medicines Co.D* | | 41,300 | | | 1,310,036 |
Mentor CorporationD | | 30,100 | | | 1,470,987 |
MGI Pharma, Inc.D* | | 50,290 | | | 925,839 |
Mylan Laboratories, Inc. | | 32,300 | | | 644,708 |
Nektar TherapeuticsD* | | 94,220 | | | 1,433,086 |
Option Care, Inc.D | | 120,291 | | | 1,714,147 |
Panacos Pharmaceuticals, Inc.D* | | 93,000 | | | 372,930 |
| | |
See Notes to Financial Statements. | | 113 |
| | |
| Small Cap Equity Fund | | |
| SCHEDULE OF INVESTMENTS (Continued) | | |
| | | | | |
| | | Shares | | Value |
PDL BioPharma, Inc.D* | | 51,200 | | $ | 1,031,168 |
Pediatrix Medical Group, Inc.* | | 45,200 | | | 2,210,280 |
Pharmion CorporationD* | | 24,000 | | | 617,760 |
PolyMedica CorporationD | | 27,205 | | | 1,099,354 |
Psychiatric Solutions, Inc.* | | 13,000 | | | 487,760 |
Radiation Therapy Services, Inc.D* | | 7,600 | | | 239,552 |
Respironics, Inc.* | | 41,900 | | | 1,581,725 |
Salix Pharmaceuticals, Ltd.D* | | 78,420 | | | 954,371 |
Sciele Pharma, Inc.D* | | 25,550 | | | 613,200 |
Stereotaxis, Inc.D* | | 55,500 | | | 572,760 |
Stericycle, Inc.D* | | 14,400 | | | 1,087,200 |
SuperGen, Inc.D* | | 58,600 | | | 297,688 |
Symmetry Medical, Inc.D* | | 116,000 | | | 1,604,280 |
Syneron Medical, Ltd.D* | | 77,900 | | | 2,113,427 |
United Surgical Partners International, Inc.D* | | 94,200 | | | 2,670,570 |
VCA Antech, Inc.* | | 52,500 | | | 1,689,975 |
Ventana Medical Systems* | | 16,200 | | | 697,086 |
WellCare Health Plans, Inc.* | | 9,800 | | | 675,220 |
West Pharmaceutical Services, Inc.D | | 6,400 | | | 327,872 |
Zoll Medical Corporation* | | 26,800 | | | 1,560,832 |
| | | | | |
| | | | | 67,745,685 |
| | | | | |
| | |
Integrated Oils — 0.1% | | | | | |
Petrocorp, Inc. Escrow Shares+* | | 500 | | | — |
Vaalco Energy, Inc.D* | | 101,200 | | | 683,100 |
| | | | | |
| | | | | 683,100 |
| | | | | |
| | |
Materials & Processing — 10.4% | | | | | |
Acuity Brands, Inc.D | | 27,200 | | | 1,415,488 |
Albemarle Corporation | | 13,500 | | | 969,300 |
Armor Holdings, Inc.D* | | 28,720 | | | 1,575,292 |
Beacon Roofing Supply, Inc.D* | | 241,367 | | | 4,542,527 |
Bemis Co. | | 22,700 | | | 771,346 |
Building Materials Holding CorporationD | | 26,100 | | | 644,409 |
Cal Dive International, Inc.D* | | 40,800 | | | 512,040 |
Carpenter Technology Corporation | | 27,400 | | | 2,809,048 |
Century Aluminum Co.D* | | 24,600 | | | 1,098,390 |
Clarcor, Inc.D | | 43,700 | | | 1,477,497 |
Cleveland-Cliffs, Inc.D | | 21,300 | | | 1,031,772 |
Commercial Metals Co. | | 103,572 | | | 2,672,158 |
Eagle Materials, Inc. | | 41,090 | | | 1,776,321 |
Encore Wire CorporationD* | | 23,200 | | | 510,632 |
Energizer Holdings, Inc.* | | 10,100 | | | 716,999 |
EnerSysD* | | 41,200 | | | 659,200 |
Ennis, Inc.D | | 62,000 | | | 1,516,520 |
Foster Wheeler, Ltd.* | | 12,000 | | | 661,680 |
Granite Construction, Inc. | | 13,000 | | | 654,160 |
Greif, Inc. Class AD | | 7,400 | | | 876,160 |
Hexcel CorporationD* | | 110,872 | | | 1,930,281 |
Infrasource Services, Inc.* | | 33,300 | | | 724,941 |
Innerworkings, Inc.D* | | 42,200 | | | 673,512 |
Lamson & Sessions Co.D* | | 92,000 | | | 2,231,920 |
Lone Star Technologies, Inc.* | | 6,420 | | | 310,792 |
Lundin Mining CorporationD* | | 21,780 | | | 802,811 |
Metal Management, Inc.D | | 23,900 | | | 904,615 |
Methanex CorporationD | | 60,200 | | | 1,647,674 |
Mobile Mini, Inc.D* | | 55,400 | | | 1,492,476 |
Mueller Industries, Inc. | | 40,500 | | | 1,283,850 |
NCI Building Systems, Inc.* | | 26,200 | | | 1,355,850 |
Nuco2, Inc.D* | | 30,100 | | | 740,159 |
OM Group, Inc.* | | 27,400 | | | 1,240,672 |
Pactiv Corporation* | | 40,500 | | | 1,445,445 |
PolyOne CorporationD* | | 80,200 | | | 601,500 |
PW Eagle, Inc.D | | 54,500 | | | 1,880,250 |
Quintana Maritime, Ltd.D | | 41,170 | | | 453,693 |
RBC Bearings, Inc.D* | | 41,300 | | | 1,183,658 |
Reliance Steel & Aluminum Co. | | 7,000 | | | 275,660 |
Resource Capital CorporationD | | 39,000 | | | 661,050 |
RTI International Metals, Inc.D* | | 10,900 | | | 852,598 |
Ryerson, Inc.D | | 7,300 | | | 183,157 |
Schnitzer Steel Industries, Inc. Class AD | | 33,100 | | | 1,314,070 |
Senomyx, Inc.D* | | 21,900 | | | 284,481 |
Spartech Corporation | | 26,300 | | | 689,586 |
Steel Dynamics, Inc. | | 81,120 | | | 2,632,344 |
Superior Essex, Inc.D* | | 27,200 | | | 904,400 |
Timken Co. | | 43,700 | | | 1,275,166 |
Tredegar CorporationD | | 34,100 | | | 771,001 |
Watsco, Inc.D | | 46,500 | | | 2,192,940 |
| | | | | |
| | | | | 59,831,491 |
| | | | | |
| | |
Other — 0.3% | | | | | |
Lancaster Colony CorporationD | | 27,100 | | | 1,200,801 |
Ritchie Bros. Auctioneers, Inc.D | | 13,200 | | | 706,728 |
| | | | | |
| | | | | 1,907,529 |
| | | | | |
| | |
Other Energy — 3.8% | | | | | |
Alon USA Energy, Inc.D | | 11,400 | | | 299,934 |
Arena Resources, Inc.D* | | 13,300 | | | 568,043 |
ATP Oil & Gas CorporationD* | | 14,100 | | | 557,937 |
Basic Energy Services, Inc.D* | | 25,200 | | | 621,180 |
Brigham Exploration Co.D* | | 84,600 | | | 618,426 |
Bronco Drilling Co., Inc.D* | | 19,900 | | | 342,081 |
Comstock Resources, Inc.* | | 25,100 | | | 779,606 |
Delek US Holdings, Inc.D | | 43,470 | | | 712,473 |
Denbury Resources, Inc.* | | 47,800 | | | 1,328,362 |
EXCO Resources, Inc.D* | | 143,800 | | | 2,431,658 |
Foundation Coal Holdings, Inc.D | | 27,500 | | | 873,400 |
Gulf Island Fabrication, Inc. | | 11,560 | | | 426,564 |
Hercules Offshore, Inc.* | | 29,650 | | | 856,885 |
Holly CorporationD | | 26,600 | | | 1,367,240 |
Hydril Co.D* | | 14,000 | | | 1,052,660 |
Ormat Technologies, Inc.D | | 10,100 | | | 371,882 |
Petroquest Energy, Inc.D* | | 56,402 | | | 718,561 |
Quicksilver Resources, Inc.D* | | 22,900 | | | 837,911 |
Swift Energy Co.D* | | 10,300 | | | 461,543 |
Tesoro Corporation | | 12,200 | | | 802,394 |
TODCO Class AD* | | 20,800 | | | 710,736 |
Toreador Resources CorporationD* | | 17,800 | | | 458,706 |
Unit Corporation* | | 9,550 | | | 462,698 |
Universal Compression Holdings, Inc.* | | 31,200 | | | 1,937,832 |
| | |
| 114 | | See Notes to Financial Statements. |
| | | | | |
| | | Shares | | Value |
Veritas DGC, Inc.* | | 15,500 | | $ | 1,327,265 |
W-H Energy Services, Inc.* | | 12,400 | | | 603,756 |
Whiting Petroleum CorporationD* | | 10,280 | | | 479,048 |
| | | | | |
| | | | | 22,008,781 |
| | | | | |
| | |
Producer Durables — 7.4% | | | | | |
Actuant Corporation Class AD | | 55,034 | | | 2,622,370 |
Allied Defense Group, Inc. (The)D* | | 19,040 | | | 404,600 |
Altra Holdings, Inc.D* | | 21,400 | | | 300,670 |
Applied Industrial Technologies, Inc.D | | 27,100 | | | 713,001 |
Arris Group, Inc.* | | 60,300 | | | 754,353 |
ATMI, Inc.* | | 16,500 | | | 503,745 |
Beazer Homes USA, Inc.D | | 17,600 | | | 827,376 |
Bucyrus International, Inc. Class AD | | 32,700 | | | 1,692,552 |
Cognex CorporationD | | 36,800 | | | 876,576 |
Color Kinetics, Inc.D* | | 27,500 | | | 587,125 |
Columbus McKinnon CorporationD* | | 30,530 | | | 641,741 |
Curtiss-Wright CorporationD | | 55,000 | | | 2,039,400 |
Cymer, Inc.D* | | 21,600 | | | 949,320 |
Dionex CorporationD* | | 14,700 | | | 833,637 |
Flow International CorporationD* | | 51,600 | | | 568,632 |
Gehl Co.D* | | 29,100 | | | 801,123 |
Genlyte Group, Inc.* | | 23,676 | | | 1,849,332 |
Graco, Inc. | | 49,600 | | | 1,965,152 |
H&E Equipment Services, Inc.* | | 22,400 | | | 554,848 |
Headwaters, Inc.D* | | 31,700 | | | 759,532 |
Hovnanian Enterprises, Inc. Class AD* | | 25,300 | | | 857,670 |
Itron, Inc.D* | | 4,150 | | | 215,136 |
Ladish Co., Inc.D* | | 36,400 | | | 1,349,712 |
Lexmark International, Inc.D* | | 23,000 | | | 1,683,600 |
Measurement Specialties, Inc.D* | | 91,400 | | | 1,977,896 |
Meritage Homes CorporationD* | | 39,000 | | | 1,861,080 |
MKS Instruments, Inc.D* | | 41,100 | | | 928,038 |
MTC Technologies, Inc.D* | | 22,300 | | | 525,165 |
Orbital Sciences CorporationD* | | 68,400 | | | 1,261,296 |
Polycom, Inc.* | | 43,100 | | | 1,332,221 |
Regal-Beloit CorporationD | | 16,500 | | | 866,415 |
Robbins & Myers, Inc.D | | 32,300 | | | 1,483,216 |
Rudolph Technologies, Inc.D* | | 46,100 | | | 733,912 |
SBA Communications Corporation Class AD* | | 37,800 | | | 1,039,500 |
Sonic SolutionsD* | | 34,400 | | | 560,720 |
Spectralink CorporationD* | | 83,200 | | | 715,520 |
Technical Olympic USA, Inc.D | | 108,700 | | | 1,105,479 |
Technitrol, Inc.D | | 28,400 | | | 678,476 |
Triumph Group, Inc.D | | 28,500 | | | 1,494,255 |
Varian Semiconductor Equipment Associates, Inc.* | | 15,050 | | | 685,076 |
X-Rite, Inc.D* | | 86,555 | | | 1,064,627 |
| | | | | |
| | | | | 42,664,095 |
| | | | | |
| | |
Technology — 13.1% | | | | | |
Aeroflex, Inc.D* | | 54,300 | | | 636,396 |
Alvarion, Ltd.D* | | 79,500 | | | 534,240 |
American Reprographics Co.D* | | 34,200 | | | 1,139,202 |
Anixter International, Inc.* | | 12,900 | | | 700,470 |
Applied Micro Circuits Corporation* | | 126,200 | | | 449,272 |
Avid Technology, Inc.D* | | 18,100 | | | 674,406 |
Avnet, Inc.* | | 65,600 | | | 1,674,768 |
Avocent CorporationD* | | 43,500 | | | 1,472,475 |
Bottomline Technologies, Inc.D* | | 30,900 | | | 353,805 |
CACI International, Inc. Class A* | | 47,857 | | | 2,703,920 |
Cbeyond, Inc.D* | | 22,300 | | | 682,157 |
CDC Corporation Class AD* | | 155,490 | | | 1,477,155 |
Cogent Communications Group, Inc.D* | | 34,000 | | | 551,480 |
Comtech TelecommunicationsD* | | 67,250 | | | 2,560,208 |
CPI International, Inc.D* | | 43,500 | | | 652,500 |
Cree, Inc.D* | | 40,100 | | | 694,532 |
CSG Systems International, Inc.* | | 20,000 | | | 534,600 |
Daktronics, Inc.D | | 17,900 | | | 659,615 |
DealerTrack Holdings, Inc.D* | | 45,100 | | | 1,326,842 |
Emageon, Inc.D* | | 44,900 | | | 689,664 |
Epicor Software CorporationD* | | 179,100 | | | 2,419,641 |
Equinix, Inc.D* | | 25,650 | | | 1,939,653 |
F5 Networks, Inc.* | | 13,900 | | | 1,031,519 |
FLIR Systems, Inc.D* | | 19,500 | | | 620,685 |
FormFactor, Inc.D* | | 31,300 | | | 1,165,925 |
Foundry Networks, Inc.D* | | 97,600 | | | 1,462,048 |
Guidance Software, Inc.* | | 30,700 | | | 477,999 |
Ingram Micro, Inc. Class A* | | 96,100 | | | 1,961,401 |
j2 Global Communications, Inc.D* | | 64,400 | | | 1,754,900 |
Keane, Inc.D* | | 14,900 | | | 177,459 |
Komag, Inc.D* | | 47,500 | | | 1,799,300 |
Lionbridge Technologies, Inc.D* | | 99,800 | | | 642,712 |
Merge Technologies, Inc.D* | | 58,600 | | | 384,416 |
Micros Systems, Inc.* | | 28,400 | | | 1,496,680 |
MicroStrategy, Inc. Class AD* | | 12,000 | | | 1,368,120 |
NAM TAI Electronics, Inc. | | 43,800 | | | 665,322 |
Neoware, Inc.D* | | 50,100 | | | 661,821 |
Ness Technologies, Inc.* | | 35,500 | | | 506,230 |
Netgear, Inc.D* | | 34,400 | | | 903,000 |
NovAtel, Inc.D* | | 25,500 | | | 1,017,450 |
Nuance Communications, Inc.D* | | 98,870 | | | 1,133,050 |
Omniture, Inc.D* | | 4,500 | | | 63,360 |
Openwave Systems, Inc.D* | | 60,000 | | | 553,800 |
Parametric Technology CorporationD* | | 37,200 | | | 670,344 |
PDF Solutions, Inc.D* | | 61,000 | | | 881,450 |
PerkinElmer, Inc. | | 47,000 | | | 1,044,810 |
Power Intergrations, Inc.D* | | 75,500 | | | 1,770,475 |
Radisys CorporationD* | | 71,577 | | | 1,193,189 |
RADVision, Ltd.* | | 35,400 | | | 710,832 |
RF Micro Devices, Inc.D* | | 121,700 | | | 826,343 |
SafeNet, Inc.D* | | 23,200 | | | 555,408 |
| | |
See Notes to Financial Statements. | | 115 |
| | |
| Small Cap Equity Fund | | |
| SCHEDULE OF INVESTMENTS (Continued) | | |
| | | | | | | |
| | | Shares | | Value | |
Scansource, Inc.D* | | | 38,000 | | $ | 1,155,200 | |
Semtech CorporationD* | | | 63,800 | | | 833,866 | |
SI International, Inc.D* | | | 27,000 | | | 875,340 | |
Silicon Motion Technology Corporation ADRD* | | | 92,800 | | | 1,472,736 | |
Sirf Technology Holdings, Inc.D* | | | 23,000 | | | 586,960 | |
Stanley, Inc.D* | | | 20,400 | | | 344,964 | |
Stratasys, Inc.D* | | | 59,596 | | | 1,871,910 | |
Supertex, Inc.D* | | | 17,300 | | | 679,025 | |
Synaptics, Inc.D* | | | 18,500 | | | 549,265 | |
Talx CorporationD | | | 108,500 | | | 2,978,325 | |
Tessera Technologies, Inc.D* | | | 42,200 | | | 1,702,348 | |
Transaction Systems Architects, Inc.D* | | | 31,200 | | | 1,016,184 | |
Trident Microsystems, Inc.D* | | | 61,350 | | | 1,115,343 | |
Ultimate Software Group, Inc.D* | | | 31,501 | | | 732,713 | |
Vasco Data Security InternationalD* | | | 35,400 | | | 419,490 | |
VeriFone Holdings, Inc.D* | | | 40,100 | | | 1,419,540 | |
Verint Systems, Inc.D* | | | 16,000 | | | 548,480 | |
Viasat, Inc.* | | | 29,700 | | | 885,357 | |
Volterra Semiconductor CorporationD* | | | 25,800 | | | 387,000 | |
WebEx Communications, Inc.D* | | | 15,800 | | | 551,262 | |
Websense, Inc.D* | | | 92,702 | | | 2,116,387 | |
Xyratex, Ltd.D* | | | 29,300 | | | 632,294 | |
Zoran Corporation* | | | 50,900 | | | 742,122 | |
| | | | | | | |
| | | | | | 75,643,160 | |
| | | | | | | |
| | |
Utilities — 3.8% | | | | | | | |
AGL Resources, Inc.D | | | 44,600 | | | 1,735,386 | |
Alliant Energy Corporation | | | 49,800 | | | 1,880,946 | |
CenturyTel, Inc. | | | 48,300 | | | 2,108,778 | |
El Paso Electric Co.D* | | | 44,000 | | | 1,072,280 | |
Empire District Electric Co.D | | | 20,380 | | | 503,182 | |
Energen Corporation | | | 40,200 | | | 1,886,988 | |
Energy East CorporationD | | | 76,900 | | | 1,907,120 | |
General Communication, Inc. Class AD* | | | 33,000 | | | 519,090 | |
Globalstar, Inc.* | | | 15,200 | | | 211,432 | |
MDU Resources Group, Inc.D | | | 31,650 | | | 811,506 | |
NeuStar, Inc. Class AD* | | | 25,700 | | | 833,708 | |
NiSource, Inc. | | | 51,200 | | | 1,233,920 | |
Pepco Holdings, Inc.D | | | 27,000 | | | 702,270 | |
Pinnacle West Capital Corporation | | | 42,100 | | | 2,134,049 | |
Telephone & Data Systems, Inc. | | | 8,000 | | | 434,640 | |
Unisource Energy CorporationD | | | 25,950 | | | 947,954 | |
Westar Energy, Inc.D | | | 30,500 | | | 791,780 | |
Wisconsin Energy Corporation | | | 48,800 | | | 2,316,048 | |
| | | | | | | |
| | | | | | 22,031,077 | |
| | | | | | | |
Total Common Stocks | | | | | | | |
(Cost $481,532,627) | | | | | | 553,113,735 | |
| | | | | | | |
| | |
EXCHANGE TRADED FUND — 0.0% | | | | | | | |
iShares Russell 2000D | | | | | | | |
(Cost $ 338,352) | | | 4,750 | | | 370,927 | |
| | | | | | | |
| | |
MONEY MARKET FUNDS — 52.0% | | | | | | | |
GuideStone Funds Money Market Fund (GS4 Class) ¥ | | | 22,605,076 | | | 22,605,076 | |
Northern Institutional Liquid Assets Portfolio§ | | | 277,398,014 | | | 277,398,014 | |
| | | | | | | |
Total Money Market Funds | | | | | | | |
(Cost $300,003,090) | | | | | | 300,003,090 | |
| | | | | | | |
| | |
| | | Par | | | |
CORPORATE BOND — 0.0% | | | | | | | |
TIMCO Aviation Services, Inc. PIK | | | | | | | |
8.00%, 01/01/07+ (Cost $ 0) | | $ | 1,214 | | | — | |
| | | | | | | |
| | |
U.S. TREASURY OBLIGATION — 0.3% | | | | | | | |
U.S. Treasury Bill | | | | | | | |
4.85%, 02/22/07‡‡ | | | | | | | |
(Cost $1,549,071) | | | 1,560,000 | | | 1,549,125 | |
| | | | | | | |
| | |
TOTAL INVESTMENTS — 148.2% | | | | | | | |
(Cost $783,423,140) | | | | | | 855,036,877 | |
| | |
Liabilities in Excess of Other Assets — (48.2)% | | | | | | (278,111,165 | ) |
| | | | | | | |
Net Assets — 100.0% | | | | | $ | 576,925,712 | |
| | | | | | | |
| | |
PORTFOLIO SUMMARY (based on net assets) | | | | | | | |
| | | | | % | |
Money Market Funds | | | | | | 52.0 | |
Financial Services | | | | | | 22.2 | |
Consumer Discretionary | | | | | | 18.0 | |
Technology | | | | | | 13.1 | |
Healthcare | | | | | | 11.7 | |
Materials & Processing | | | | | | 10.4 | |
Producer Durables | | | | | | 7.4 | |
Auto & Transportation | | | | | | 3.8 | |
Other Energy | | | | | | 3.8 | |
Utilities | | | | | | 3.8 | |
Futures Contracts | | | | | | 3.4 | |
Consumer Staples | | | | | | 1.3 | |
Other | | | | | | 0.3 | |
U.S. Treasury Obligation | | | | | | 0.3 | |
Integrated Oils | | | | | | 0.1 | |
Corporate Bond | | | | | | — | ** |
Exchange Traded Fund | | | | | | — | ** |
| | | | | | | |
| | | | | | 151.6 | |
| | | | | | | |
| ** | Rounds to less than 0.005%. |
| | |
| 116 | | See Notes to Financial Statements. |
| | |
| | |
| International Equity Fund | | |
The Fund is primarily comprised of international stocks located in developed countries, and to a lesser extent, in international stocks located in emerging markets (economies not deemed to be developed). The Fund generated a positive return while underperforming its benchmark, the MSCI® ACWI ex-U.S., during the fourth quarter and the year. Security selection in the consumer discretionary and materials sectors detracted from benchmark-relative returns during the quarter. The Fund’s holdings in Nitto Denko (0.38%), High Tech Computer (0.25%) and Hirose Electric (0.33%) were among the largest detractors from performance, while Telefonica (1.04%), Mitsubishi Estate (1.07%) and Total Fina Elf(1.70%) were among the largest contributors to Fund performance for the quarter. At the sub-adviser level, Oechsle delivered the strongest benchmark-relative performance during the quarter largely due to its security selection in the telecommunication services sector.
Please see page 125 for information regarding specific portfolio allocations. Portfolio holdings are subject to change at any time.
Foreign securities may involve additional risks, social and political instability, reduced market liquidity and currency volatility.
| | |
| | |
| International Equity Fund | | |
| | | | | | | | | | | | | | | | | | |
Average Annual Total Returns as of 12/31/06 | |
| | | GS2 Class* | | | GS4 Class* | | | GS6 Class* | | | Benchmark** | | | GS8 Class* | | | GS8 Class Benchmark** | |
One Year | | 23.78 | % | | 23.58 | % | | 23.14 | % | | 26.65 | % | | 22.78 | % | | 26.65 | % |
Five Year | | 15.78 | % | | 15.56 | % | | 15.26 | % | | 16.42 | % | | N/A | | | N/A | |
Since Inception | | 13.65 | % | | 13.47 | % | | 13.02 | % | | 14.02 | % | | 21.99 | % | | 24.10 | % |
Inception Date | | 08/27/01 | | | 08/27/01 | | | 08/27/01 | | | 08/27/01 | | | 11/08/04 | | | 11/08/04 | |
The performance data quoted represents past performance and does not guarantee future results. Current performance may be lower or higher. Performance data current to the most recent month-end may be obtained at www.GuideStone.org. The investment return and principal value of an investment will fluctuate so that shares, when redeemed, may be worth more or less than their original cost.
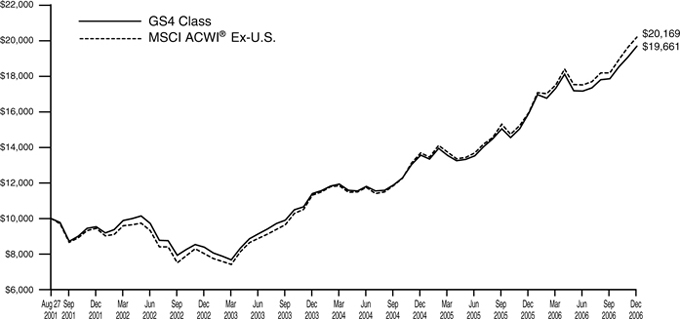
The graph compares the results of a hypothetical $10,000 investment in the GS4 Class of the Fund since August 27, 2001 (commencement of operations), with all dividends and capital gains reinvested, with the MSCI ACWI® Ex-U.S.
| * | These returns reflect expense waivers by the Fund’s investment advisor. Without these waivers, returns would have been lower. Returns shown do not reflect the deduction of taxes that a shareholder would pay on Fund distributions or the redemption of Fund shares. |
** | The MSCI ACWI® Ex-U.S. is a market-capitalization weighted index composed of companies representative of the market structure of developed and emerging market countries in the Americas (excluding the U.S.), Europe/Middle East, and Asia/ Pacific Regions. It excludes closed markets and those shares in otherwise free markets that are not purchasable by foreigners. |
| Unlike | a mutual fund, the performance of an index assumes no taxes, transaction costs, management fees or other expenses. |
| | |
| International Equity Fund | | |
| SCHEDULE OF INVESTMENTS | | December 31, 2006 |
| | | | | |
| | | Shares | | Value |
FOREIGN COMMON STOCKS — 95.7% | | | | | |
| | |
Argentina — 0.0% | | | | | |
Banco Macro SA ADRD | | 16,400 | | $ | 511,844 |
| | | | | |
| | |
Australia — 3.3% | | | | | |
Amcor, Ltd.D | | 785,696 | | | 4,496,354 |
Brambles, Ltd.D* | | 118,740 | | | 1,190,268 |
Coca-Cola Amatil, Ltd.D | | 659,905 | | | 4,042,138 |
Equinox Minerals, Ltd.* | | 96,300 | | | 156,075 |
Insurance Australia Group, Ltd.D | | 212,912 | | | 1,067,190 |
Lend Lease Corporation, Ltd.D | | 414,209 | | | 6,029,043 |
Macquarie Bank, Ltd.D | | 18,341 | | | 1,142,702 |
National Australia Bank, Ltd.D | | 279,655 | | | 8,918,091 |
Promina Group, Ltd.D | | 16,807 | | | 91,805 |
QBE Insurance Group, Ltd.D | | 22,981 | | | 523,339 |
Rinker Group, Ltd.D | | 110,918 | | | 1,580,328 |
Telstra Corporation, Ltd.* | | 2,224,814 | | | 7,025,184 |
Toll Holdings, Ltd.D | | 40,100 | | | 578,297 |
Wesfarmers, Ltd.D | | 88,726 | | | 2,629,136 |
Woodside Petroleum, Ltd.D | | 278,257 | | | 8,370,531 |
Woolworths, Ltd.D | | 59,683 | | | 1,125,943 |
| | | | | |
| | | | | 48,966,424 |
| | | | | |
| | |
Austria — 0.1% | | | | | |
Erste Bank Der Oesterreichischen Sparkassen AG | | 11,600 | | | 888,179 |
Raiffeisen International Bank Holding AG | | 3,400 | | | 516,987 |
Telekom Austria AG | | 21,700 | | | 579,437 |
| | | | | |
| | | | | 1,984,603 |
| | | | | |
| | |
Bahrain — 0.0% | | | | | |
Investcorp Bank BSC GDR* | | 12,825 | | | 303,952 |
| | | | | |
| | |
Belgium — 1.2% | | | | | |
Colruyt SA | | 40,100 | | | 8,564,689 |
Fortis | | 175,132 | | | 7,469,494 |
UCB SAD | | 16,500 | | | 1,131,509 |
| | | | | |
| | | | | 17,165,692 |
| | | | | |
| | |
Brazil — 1.2% | | | | | |
All America Latina Logistica SA | | 45,500 | | | 472,144 |
Aracruz Celulose SA ADRD | | 3,600 | | | 220,464 |
Arcelor Brasil SA | | 28,974 | | | 569,580 |
Banco do Brasil SA | | 51,100 | | | 1,530,728 |
Brasil Ecodiesel Industria e Comercio de Biocombustiveis e Oleos Vegetais SA* | | 37,600 | | | 207,667 |
Brasil Telecom Participacoes SA ADRD | | 26,600 | | | 1,135,554 |
Centrais Eletricas Brasileiras SA | | 13,535,400 | | | 323,671 |
Companhia Brasileira de Distribuicao Grupo Pao de Acucar ADRD | | 33,900 | | | 1,158,363 |
Companhia Vale do Rio Doce ADRD | | 197,100 | | | 5,173,875 |
CPFL Energia SA ADRD | | 6,200 | | | 254,076 |
Gol Linhas Aereas Inteligentes SA ADRD | | 1,400 | | | 40,138 |
Localiza Rent A Car SA | | 6,600 | | | 198,479 |
Lojas Renner SA | | 33,500 | | | 481,371 |
Petroleo Brasileiro SA ADR | | 25,300 | | | 2,346,828 |
Positivo Informatica SA* | | 6,900 | | | 74,280 |
Tele Norte Leste Participacoes SA ADRD | | 95,400 | | | 1,423,368 |
Terna Participacoes SA* | | 13,300 | | | 150,026 |
Tim Participacoes SA ADRD | | 11,000 | | | 380,820 |
Totvs SA* | | 6,200 | | | 137,233 |
Unibanco ADR | | 8,900 | | | 827,344 |
| | | | | |
| | | | | 17,106,009 |
| | | | | |
| | |
Canada — 2.3% | | | | | |
Abitibi-Consolidated, Inc.D | | 76,300 | | | 195,633 |
Alcan, Inc. | | 78,300 | | | 3,812,438 |
Barrick Gold CorporationD | | 76,600 | | | 2,351,620 |
Cameco Corporation | | 64,300 | | | 2,602,547 |
Canadian Imperial Bank of Commerce | | 7,800 | | | 657,497 |
Canadian Natural Resources, Ltd. | | 51,700 | | | 2,755,353 |
Canadian Oil Sands Trust | | 19,000 | | | 531,312 |
EnCana Corporation | | 12,200 | | | 561,379 |
Falcon Oil & Gas, Ltd.* | | 137,800 | | | 451,396 |
Finning International, Inc. | | 17,000 | | | 696,677 |
First Quantum Minerals, Ltd. | | 26,700 | | | 1,436,715 |
Methanex Corporation | | 28,600 | | | 782,352 |
Potash Corporation of SaskatchewanD | | 29,577 | | | 4,238,726 |
Rogers Communications, Inc. Class B | | 22,400 | | | 666,535 |
Royal Bank of CanadaD | | 13,200 | | | 628,221 |
Shaw Communications, Inc. Class B | | 19,100 | | | 604,537 |
Shoppers Drug Mart Corporation | | 15,000 | | | 644,300 |
Suncor Energy, Inc. | | 98,300 | | | 7,737,390 |
Talisman Energy, Inc. | | 137,100 | | | 2,327,814 |
TELUS Corporation | | 10,400 | | | 477,304 |
Toronto-Dominion Bank | | 11,600 | | | 693,523 |
| | | | | |
| | | | | 34,853,269 |
| | | | | |
| | |
Chile — 0.2% | | | | | |
Banco de Credito e Inversiones | | 23,100 | | | 687,987 |
Banco Santander Chile SA ADRD | | 11,000 | | | 529,760 |
Centros Comerciales Sudamericanos SA | | 85,378 | | | 267,082 |
Embotelladora Andina SA ADR Class A | | 30,100 | | | 466,249 |
Embotelladora Andina SA ADR Class B | | 36,500 | | | 617,945 |
Empresas CMPC SA | | 7,900 | | | 265,669 |
Enersis SA ADR | | 24,900 | | | 398,400 |
Masisa SA ADRD | | 8,200 | | | 84,460 |
Sonda SA* | | 28,948 | | | 34,971 |
| | | | | |
| | | | | 3,352,523 |
| | | | | |
| | |
China — 0.9% | | | | | |
Aluminum Corp of China, Ltd. Class H | | 1,321,000 | | | 1,222,787 |
China Coal Energy Co. Class H* | | 96,000 | | | 62,327 |
China Communications Construction Co., Ltd. Class H* | | 326,000 | | | 322,299 |
China Construction Bank Class H 144AD | | 3,892,000 | | | 2,476,814 |
China Petroleum & Chemical Corporation Class H | | 348,000 | | | 322,127 |
| | |
See Notes to Financial Statements. | | 119 |
| | |
| International Equity Fund | | |
| SCHEDULE OF INVESTMENTS (Continued) | | |
| | | | | |
| | | Shares | | Value |
China Shenhua Energy Co., Ltd. Class HD | | 1,724,900 | | $ | 4,151,309 |
Industrial & Commercial Bank of China Class H* | | 5,531,000 | | | 3,434,520 |
Jiangsu Express Co., Ltd. Class H | | 316,600 | | | 199,038 |
Sina CorporationD* | | 16,300 | | | 467,810 |
| | | | | |
| | | | | 12,659,031 |
| | | | | |
| | |
Colombia — 0.1% | | | | | |
BanColombia SA | | 76,200 | | | 591,627 |
BanColombia SA ADRD | | 12,200 | | | 380,030 |
| | | | | |
| | | | | 971,657 |
| | | | | |
| | |
Denmark — 0.8% | | | | | |
Danske Bank A/S | | 54,070 | | | 2,402,558 |
H Lundbeck A/S | | 78,000 | | | 2,150,634 |
Novo-Nordisk AS Class B | | 85,169 | | | 7,093,898 |
| | | | | |
| | | | | 11,647,090 |
| | | | | |
| | |
Egypt — 0.4% | | | | | |
El Sewedy Cables Holding Co.* | | 21,230 | | | 161,067 |
MobiNil - Egyptian Mobile Services | | 34,645 | | | 1,100,329 |
Orascom Construction Industries | | 59,414 | | | 2,846,254 |
Orascom Construction Industries GDR 144A | | 3,084 | | | 295,481 |
Orascom Telecom Holding SAE | | 7,958 | | | 525,796 |
Orascom Telecom Holding SAE GDRD | | 4,056 | | | 267,986 |
| | | | | |
| | | | | 5,196,913 |
| | | | | |
| | |
Estonia — 0.0% | | | | | |
Tallink Group, Ltd.* | | 55,140 | | | 371,943 |
| | | | | |
| | |
Finland — 0.9% | | | | | |
Neste Oil OYJD | | 15,700 | | | 477,290 |
Nokia Oyj | | 326,800 | | | 6,677,928 |
Stora Enso OYJ Class R | | 32,300 | | | 511,649 |
UPM-Kymmene OYJD | | 247,900 | | | 6,256,812 |
| | | | | |
| | | | | 13,923,679 |
| | | | | |
| | |
France — 9.6% | | | | | |
Accor SAD | | 13,400 | | | 1,038,321 |
Air France-KLMD | | 16,400 | | | 690,378 |
Air LiquideD | | 13,753 | | | 3,266,008 |
Assurances Generales de France | | 23,100 | | | 3,601,228 |
AXA SA | | 100,700 | | | 4,076,918 |
BNP Paribas SA | | 43,340 | | | 4,728,468 |
Bouygues SA | | 69,796 | | | 4,480,469 |
Carrefour SA | | 106,069 | | | 6,432,328 |
Casino Guichard Perrachon SA | | 24,300 | | | 2,258,227 |
Compagnie de Saint-GobainD | | 121,515 | | | 10,209,794 |
Compagnie Generale des Etablissements Michelin Class BD | | 9,100 | | | 870,900 |
Compagnie Generale d’Optique Essilor International SAD | | 6,400 | | | 688,113 |
Dassault Systemes SAD | | 9,500 | | | 504,125 |
France Telecom SA | | 264,167 | | | 7,305,523 |
Groupe DanoneD | | 8,700 | | | 1,318,408 |
Lafarge SA | | 27,100 | | | 4,031,641 |
L’Oreal SA | | 70,800 | | | 7,093,552 |
Neuf Cegetel* | | 75,802 | | | 2,691,669 |
PagesJaunes Groupe SAD | | 17,972 | | | 357,518 |
Renault SAD | | 78,872 | | | 9,474,427 |
Safran SAD | | 25,800 | | | 598,725 |
Sanofi-AventisD | | 129,338 | | $ | 11,942,701 |
Schneider Electric SA | | 18,500 | | | 2,053,792 |
Societe BIC SA | | 14,600 | | | 1,016,633 |
Societe Generale Class A | | 49,848 | | | 8,462,085 |
Societe Television Francaise 1D | | 166,400 | | | 6,174,515 |
Thales SAD | | 25,900 | | | 1,291,667 |
Total SAD | | 331,033 | | | 23,880,870 |
Valeo SAD | | 57,100 | | | 2,376,560 |
Veolia EnvironnementD | | 109,822 | | | 8,466,246 |
Vivendi SA | | 27,000 | | | 1,055,336 |
| | | | | |
| | | | | 142,437,145 |
| | | | | |
| | |
Germany — 5.1% | | | | | |
Adidas-Salomon AG | | 100,084 | | | 4,984,713 |
Allianz AG | | 28,800 | | | 5,883,556 |
BASF AG | | 29,393 | | | 2,865,386 |
Bayer AG | | 187,607 | | | 10,069,435 |
Bayerische Motoren Werke AGD | | 58,600 | | | 3,365,700 |
Commerzbank AGD | | 21,000 | | | 799,749 |
Continental AG | | 32,700 | | | 3,802,878 |
DaimlerChrysler AG | | 24,400 | | | 1,507,386 |
Deutsche Bank AG | | 34,466 | | | 4,610,632 |
Deutsche Post AG | | 22,200 | | | 669,326 |
Deutsche Telekom AG | | 45,415 | | | 829,706 |
E.ON AG | | 23,200 | | | 3,149,173 |
Hannover Rueckversicherung AGD | | 62,800 | | | 2,908,091 |
Metro AGD | | 27,700 | | | 1,766,467 |
RWE AGD | | 83,481 | | | 9,201,589 |
SAP AG | | 41,200 | | | 2,189,574 |
SAP AG ADRD | | 4,500 | | | 238,950 |
Siemens AG | | 128,092 | | | 12,705,211 |
Volkswagen AGD | | 36,985 | | | 4,193,309 |
| | | | | |
| | | | | 75,740,831 |
| | | | | |
| | |
Greece — 0.3% | | | | | |
National Bank of Greece SA | | 32,726 | | | 1,507,672 |
Public Power Corporation | | 102,000 | | | 2,585,176 |
| | | | | |
| | | | | 4,092,848 |
| | | | | |
| | |
Hong Kong — 4.5% | | | | | |
Bank of East Asia, Ltd.D | | 272,600 | | | 1,543,786 |
China Mengniu Dairy Co., Ltd. | | 684,000 | | | 1,798,311 |
China Mobile, Ltd.D | | 917,500 | | | 7,926,668 |
China Yurun Food Group, Ltd. | | 1,132,000 | | | 1,043,472 |
CLP Holdings, Ltd.D | | 1,150,000 | | | 8,501,215 |
CNOOC, Ltd.D | | 9,265,000 | | | 8,802,483 |
Denway Motors, Ltd.D | | 4,290,000 | | | 1,737,333 |
Esprit Holdings, Ltd. | | 60,500 | | | 675,524 |
GOME Electrical Appliances Holdings, Ltd.D | | 975,000 | | | 764,627 |
Hang Lung Properties, Ltd.D | | 392,000 | | | 982,734 |
Hong Kong & China Gas Co., Ltd.D | | 3,684,000 | | | 8,288,443 |
Hong Kong Electric Holdings, Ltd. | | 754,000 | | | 3,693,275 |
Hutchison Whampoa, Ltd.D | | 556,000 | | | 5,650,566 |
Jardine Matheson Holdings, Ltd. | | 124,000 | | | 2,653,600 |
Johnson Electric Holdings, Ltd.D | | 446,500 | | | 305,960 |
Li & Fung, Ltd. | | 385,000 | | | 1,197,820 |
Shui On Land, Ltd.D* | | 748,000 | | | 652,960 |
Solomon Systech International, Ltd. | | 1,758,600 | | | 273,570 |
| | |
| 120 | | See Notes to Financial Statements. |
| | | | | |
| | | Shares | | Value |
Sun Hung Kai Properties, Ltd. | | 62,000 | | $ | 712,199 |
Swire Pacific, Ltd. Class AD | | 530,000 | | | 5,692,953 |
Techtronic Industries Co.D | | 1,180,000 | | | 1,529,177 |
Wharf Holdings, Ltd.D | | 682,000 | | | 2,520,795 |
| | | | | |
| | | | | 66,947,471 |
| | | | | |
| | |
Hungary — 0.2% | | | | | |
MOL Hungarian Oil and Gas PLCD | | 17,473 | | | 1,981,738 |
MOL Hungarian Oil and Gas PLC ADR | | 14,081 | | | 1,598,194 |
| | | | | |
| | | | | 3,579,932 |
| | | | | |
| | |
India — 1.3% | | | | | |
Andhra Bank, Ltd. | | 728,084 | | | 1,427,051 |
Asian Paints, Ltd. | | 61,700 | | | 1,026,707 |
Bharat Heavy Electricals, Ltd. | | 22,116 | | | 1,148,948 |
Bharti Airtel, Ltd.* | | 221,994 | | | 3,159,628 |
Container Corporation of India, Ltd. | | 25,722 | | | 1,235,162 |
GAIL India, Ltd. GDR | | 28,500 | | | 1,004,625 |
Gujarat Ambuja Cements, Ltd. | | 740,200 | | | 2,358,907 |
Hero Honda Motors, Ltd. | | 46,560 | | | 803,386 |
Housing Development Finance Corporation | | 16,021 | | | 588,897 |
Indraprastha Gas, Ltd. | | 74,444 | | | 195,949 |
Infosys Technologies, Ltd. ADR | | 23,579 | | | 1,286,470 |
Punjab National Bank, Ltd. | | 16,921 | | | 193,831 |
Ranbaxy Laboratories, Ltd. | | 132,754 | | | 1,175,170 |
Sesa GOA, Ltd. | | 22,920 | | | 730,685 |
State Bank of India, Ltd. GDR | | 2,838 | | | 211,147 |
Sun Pharmaceuticals Industries, Ltd. | | 52,600 | | | 1,167,456 |
Tata Motors, Ltd. | | 49,480 | | | 1,006,816 |
Tata Motors, Ltd. ADRD | | 7,000 | | | 143,010 |
| | | | | |
| | | | | 18,863,845 |
| | | | | |
| | |
Indonesia — 1.1% | | | | | |
Bank Rakyat Indonesia | | 5,841,100 | | | 3,350,483 |
PT Bank Central Asia TBK | | 1,792,000 | | | 1,038,009 |
PT Bank Mandiri Persero TBK | | 5,574,723 | | | 1,806,438 |
PT Panin Life TBK | | 26,999,000 | | | 494,982 |
PT Ramayana Lestari Sentosa TBK | | 6,099,500 | | | 591,517 |
PT Telekomunikasi Indonesia TBK | | 7,671,100 | | | 8,646,009 |
| | | | | |
| | | | | 15,927,438 |
| | | | | |
| | |
Ireland — 1.0% | | | | | |
Allied Irish Banks PLC | | 98,500 | | | 2,941,152 |
CRH PLC | | 199,857 | | | 8,325,888 |
DEPFA Bank PLC | | 41,600 | | | 744,083 |
Irish Life & Permanent PLC | | 35,300 | | | 973,889 |
Kingspan Group PLC | | 69,531 | | | 1,842,106 |
| | | | | |
| | | | | 14,827,118 |
| | | | | |
| | |
Israel — 0.5% | | | | | |
Bank Hapoalim, Ltd. | | 119,700 | | | 563,712 |
Bank Leumi Le-Israel BM | | 49,800 | | | 202,744 |
Check Point Software Technologies, Ltd.* | | 100,000 | | | 2,192,000 |
Syneron Medical, Ltd.D* | | 9,900 | | | 268,587 |
Teva Pharmaceutical Industries, Ltd. ADR | | 150,300 | | | 4,671,324 |
| | | | | |
| | | | | 7,898,367 |
| | | | | |
| | |
Italy — 2.4% | | | | | |
Banca Popolare di Milano | | 221,529 | | $ | 3,845,431 |
ENI SpA | | 152,691 | | | 5,135,723 |
FastWebD* | | 64,961 | | | 3,714,752 |
Intesa Sanpaolo SpAD | | 1,317,121 | | | 10,171,154 |
Mediaset SpA | | 167,700 | | | 1,990,130 |
SanPaolo IMI SpAD | | 19,900 | | | 462,332 |
UniCredito Italiano SpA | | 1,186,454 | | | 10,399,386 |
| | | | | |
| | | | | 35,718,908 |
| | | | | |
| | |
Japan — 22.5% | | | | | |
Advantest Corporation | | 93,900 | | | 5,381,270 |
Aeon Co., Ltd. | | 78,700 | | | 1,702,891 |
Astellas Pharma, Inc. | | 152,900 | | | 6,950,876 |
Bank of Yokohama, Ltd. | | 19,000 | | | 148,800 |
Bridgestone Corporation | | 135,100 | | | 3,014,079 |
Canon, Inc. | | 302,350 | | | 17,022,352 |
Credit Saison Co., Ltd. | | 36,000 | | | 1,240,284 |
Daikin Industries, Ltd. | | 176,000 | | | 6,122,768 |
Daito Trust Construction Co., Ltd. | | 40,500 | | | 1,858,157 |
Daiwa House Industry Co., Ltd. | | 34,000 | | | 591,404 |
Denso Corporation | | 193,400 | | | 7,670,669 |
Eisai Co., Ltd. | | 140,100 | | | 7,699,290 |
Elpida Memory, Inc.D* | | 8,000 | | | 439,645 |
FamilyMart Co., Ltd. | | 68,000 | | | 1,851,351 |
Fanuc, Ltd. | | 123,600 | | | 12,172,531 |
Fast Retailing Co., Ltd.D | | 25,700 | | | 2,453,275 |
FUJIFILM Holdings Corporation | | 57,000 | | | 2,342,171 |
Funai Electric Co., Ltd.D | | 10,100 | | | 817,302 |
Hirose Electric Co., Ltd.D | | 41,000 | | | 4,654,510 |
Hitachi, Ltd. | | 267,000 | | | 1,664,754 |
Honda Motor Co., Ltd. | | 195,200 | | | 7,709,256 |
Hoya Corporation | | 22,000 | | | 857,779 |
Idemitsu Kosan Co., Ltd. | | 4,600 | | | 463,073 |
Inpex Holdings, Inc. | | 82 | | | 673,888 |
JSR CorporationD | | 75,700 | | | 1,959,212 |
Kao Corporation | | 330,000 | | | 8,901,307 |
KDDI Corporation | | 756 | | | 5,126,608 |
Keyence CorporationD | | 31,220 | | | 7,736,463 |
Kuraray Co., Ltd. | | 151,000 | | | 1,781,471 |
Marubeni Corporation | | 361,000 | | | 1,832,226 |
Matsushita Electric Industrial Co., Ltd. | | 107,000 | | | 2,135,414 |
Millea Holdings, Inc. | | 342,000 | | | 12,070,081 |
Mitsubishi Corporation | | 203,400 | | | 3,828,545 |
Mitsubishi Estate Co., Ltd. | | 583,100 | | | 15,091,366 |
Mitsubishi Heavy Industries, Ltd. | | 811,000 | | | 3,686,828 |
Mitsubishi UFJ Financial Group, Inc. | | 949 | | | 11,722,449 |
Mitsui & Co., Ltd. | | 35,000 | | | 523,507 |
Mitsui OSK Lines, Ltd. | | 63,000 | | | 621,503 |
Mizuho Financial Group, Inc. | | 353 | | | 2,521,323 |
Murata Manufacturing Co., Ltd. | | 7,200 | | | 487,038 |
NGK Spark Plug Co., Ltd. | | 22,000 | | | 414,100 |
Nikko Cordial Corporation | | 235,000 | | | 2,695,475 |
Nintendo Co., Ltd. | | 7,700 | | | 1,999,328 |
Nippon Electric Glass Co., Ltd. | | 57,000 | | | 1,197,429 |
Nippon Telegraph & Telephone Corporation | | 731 | | | 3,599,563 |
Nissan Motor Co., Ltd. | | 211,100 | | | 2,541,963 |
Nitto Denko Corporation | | 105,800 | | | 5,298,668 |
Nomura Holdings, Inc. | | 30,000 | | | 565,943 |
NTT Data Corporation | | 682 | | | 3,415,588 |
| | | | |
| | See Notes to Financial Statements. | | 121 |
| | |
| International Equity Fund | | |
| SCHEDULE OF INVESTMENTS (Continued) | | |
| | | | | |
| | | Shares | | Value |
NTT DoCoMo, Inc. | | 3,740 | | $ | 5,908,323 |
NTT Urban Development CorporationD | | 260 | | | 502,500 |
Odakyu Electric Railway Co., Ltd.D | | 93,000 | | | 594,706 |
OKUMA CorporationD | | 125,000 | | | 1,449,519 |
Onward Kashiyama Co., Ltd. | | 114,000 | | | 1,455,115 |
ORIX Corporation | | 44,540 | | | 12,893,601 |
Pioneer CorporationD | | 98,300 | | | 1,349,710 |
Ricoh Co., Ltd. | | 149,000 | | | 3,042,477 |
Rohm Co., Ltd. | | 65,400 | | | 6,512,247 |
Secom Co., Ltd. | | 105,000 | | | 5,443,889 |
Sekisui Chemical Co., Ltd. | | 257,000 | | | 2,049,435 |
Sharp Corporation | | 102,000 | | | 1,757,069 |
Shimamura Co., Ltd.D | | 37,400 | | | 4,296,105 |
Shin-Etsu Chemical Co., Ltd. | | 104,100 | | | 6,971,783 |
SMC Corporation | | 12,000 | | | 1,702,113 |
Softbank CorporationD | | 267,600 | | | 5,205,613 |
Sony CorporationD | | 120,000 | | | 5,142,641 |
Sumitomo Chemical Co., Ltd. | | 396,000 | | | 3,071,367 |
Sumitomo Corporation | | 143,000 | | | 2,140,103 |
Sumitomo Metal Industries, Ltd. | | 153,000 | | | 664,686 |
Sumitomo Mitsui Financial Group, Inc. | | 759 | | | 7,781,018 |
Sumitomo Realty & Development Co., Ltd. | | 43,000 | | | 1,380,278 |
Suzuki Motor Corporation | | 110,300 | | | 3,114,222 |
T&D Holdings, Inc. | | 52,300 | | | 3,458,687 |
Takeda Pharmaceutical Co., Ltd. | | 256,300 | | | 17,595,656 |
TIS, Inc.D | | 34,200 | | | 808,983 |
Tokyo Electric Power Company, Inc. | | 34,800 | | | 1,125,835 |
Tokyo Electron, Ltd. | | 24,000 | | | 1,891,685 |
Tokyo Gas Co., Ltd. | | 598,000 | | | 3,180,824 |
Tokyu CorporationD | | 432,000 | | | 2,766,136 |
Toshiba Corporation | | 346,000 | | | 2,253,267 |
Toyota Motor Corporation | | 185,600 | | | 12,414,403 |
Trend Micro, Inc. | | 34,000 | | | 997,101 |
Ushio, Inc.D | | 26,000 | | | 534,179 |
West Japan Railway Co. | | 413 | | | 1,766,455 |
Yahoo! Japan CorporationD | | 3,094 | | | 1,232,348 |
Yamada Denki Co., Ltd. | | 18,490 | | | 1,569,253 |
Yamato Holdings Co., Ltd. | | 76,500 | | | 1,176,379 |
| | | | | |
| | | | | 334,455,484 |
| | | | | |
| | |
Luxembourg — 0.0% | | | | | |
SES Global Receipts | | 30,700 | | | 534,935 |
| | | | | |
| | |
Malaysia — 0.2% | | | | | |
AirAsia BHD* | | 1,471,200 | | | 629,680 |
Bumiputra-Commerce Holdings BHD | | 851,300 | | | 1,870,061 |
IOI Corporation BHD | | 190,800 | | | 995,102 |
Transmile Group BHD | | 24,300 | | | 97,806 |
| | | | | |
| | | | | 3,592,649 |
| | | | | |
| | |
Mexico — 0.8% | | | | | |
America Movil SA de CV ADR Series L | | 49,500 | | | 2,238,390 |
Cemex SA de CV | | 1,141,198 | | | 3,867,376 |
Consorcio ARA SA de CV | | 1,500 | | | 10,205 |
Corporacion Moctezuma SA de CV | | 177,000 | | | 491,530 |
Grupo Mexico SA de CV Series B | | 33,500 | | | 122,799 |
Grupo Televisa SA ADR | | 93,101 | | | 2,514,658 |
Urbi Desarrollos Urbanos SA* | | 108,400 | | | 391,336 |
Wal-Mart de Mexico SA de CV Series V | | 550,908 | | | 2,423,832 |
| | | | | |
| | | | | 12,060,126 |
| | | | | |
| | |
Netherlands — 4.3% | | | | | |
ABN AMRO Holding NV | | 64,087 | | | 2,059,954 |
Aegon NV | | 58,533 | | | 1,115,724 |
Akzo Nobel NV | | 41,000 | | | 2,500,970 |
ING Groep NV | | 350,830 | | | 15,555,910 |
Koninklijke Numico NVD | | 130,765 | | | 7,034,089 |
Koninklijke Philips Electronics NV | | 43,700 | | | 1,648,088 |
Reed Elsevier NV | | 523,182 | | | 8,922,858 |
Royal Dutch Shell PLC Class A | | 500,270 | | | 17,645,323 |
Royal Dutch Shell PLC Class B | | 12,441 | | | 436,031 |
Royal KPN NV | | 124,400 | | | 1,768,580 |
TNT NV | | 64,000 | | | 2,752,452 |
Trader Media East, Ltd. GDRD* | | 30,400 | | | 304,000 |
Unilever NV | | 78,000 | | | 2,131,345 |
| | | | | |
| | | | | 63,875,324 |
| | | | | |
| | |
New Zealand — 0.2% | | | | | |
Telecom Corporation of New Zealand, Ltd.D | | 955,696 | | | 3,272,402 |
| | | | | |
| | |
Norway — 0.6% | | | | | |
DnB NOR ASA | | 48,400 | | | 686,971 |
Norsk Hydro ASAD | | 99,000 | | | 3,072,315 |
Norske Skogindustrier ASA | | 27,284 | | | 470,399 |
Telenor ASAD | | 230,806 | | | 4,340,198 |
Yara International ASA | | 28,000 | | | 636,547 |
| | | | | |
| | | | | 9,206,430 |
| | | | | |
| | |
Peru — 0.1% | | | | | |
Compania de Minas | | | | | |
Buenaventura SA ADRD | | 4,800 | | | 134,688 |
Credicorp, Ltd.D | | 28,500 | | | 1,166,790 |
| | | | | |
| | | | | 1,301,478 |
| | | | | |
| | |
Philippines — 0.2% | | | | | |
Globe Telecom, Inc. | | 35,800 | | | 901,386 |
SM Prime Holdings, Inc. | | 6,884,000 | | | 1,508,726 |
| | | | | |
| | | | | 2,410,112 |
| | | | | |
| | |
Poland — 0.1% | | | | | |
Powszechna Kasa Oszczednosci Bank Polski SA | | 107,296 | | | 1,736,959 |
| | | | | |
| | |
Portugal — 0.1% | | | | | |
Portugal Telecom SGPS SA | | 133,060 | | | 1,728,348 |
| | | | | |
| | |
Russia — 1.2% | | | | | |
CTC Media, Inc.D* | | 8,000 | | | 192,080 |
Kalina ADR | | 2,300 | | | 118,450 |
LUKOIL ADRD | | 62,431 | | | 5,490,806 |
Mechel OAO ADR | | 8,200 | | | 208,936 |
Mining and Metallurgical Co. Norilsk Nickel ADRD | | 4,340 | | | 681,380 |
Mobile Telesystems ADRD | | 83,400 | | | 4,185,846 |
OAO Gazprom ADRD | | 75,889 | | | 3,490,894 |
Polyus Gold Co. ADR* | | 4,419 | | | 217,857 |
Severstal GDR* | | 13,200 | | | 147,840 |
TMK OAO GDRD* | | 3,300 | | | 108,240 |
Vimpel-Communications ADR* | | 11,600 | | | 915,820 |
Wimm-Bill-Dann Foods OJSC ADRD | | 4,000 | | | 266,200 |
| | |
| 122 | | See Notes to Financial Statements. |
| | | | | |
| | | Shares | | Value |
X 5 Retail Group NV GDR* | | 50,322 | | $ | 1,308,372 |
| | | | | |
| | | | | 17,332,721 |
| | | | | |
| | |
Singapore — 1.1% | | | | | |
DBS Group Holdings, Ltd. | | 464,000 | | | 6,837,098 |
Oversea-Chinese Banking Corporation | | 570,800 | | | 2,865,630 |
Singapore Telecommunications, Ltd. | | 2,678,592 | | | 5,728,301 |
United Overseas Bank, Ltd. | | 54,000 | | | 683,032 |
| | | | | |
| | | | | 16,114,061 |
| | | | | |
| | |
South Africa — 1.0% | | | | | |
ABSA Group, Ltd. | | 37,330 | | | 665,880 |
Alexander Forbes, Ltd. | | 375,700 | | | 835,692 |
AngloGold Ashanti, Ltd. ADRD | | 22,389 | | | 1,054,298 |
Aveng, Ltd.D | | 34,711 | | | 166,298 |
Barloworld, Ltd.D | | 13,319 | | | 311,456 |
FirstRand, Ltd.D | | 258,495 | | | 818,250 |
Gold Fields, Ltd. | | 42,836 | | | 810,819 |
Impala Platinum Holdings, Ltd. | | 11,551 | | | 303,053 |
MTN Group, Ltd. | | 93,069 | | | 1,131,969 |
Naspers, Ltd. | | 35,354 | | | 836,811 |
Pick’n Pay Stores, Ltd.D | | 72,990 | | | 344,486 |
Sasol, Ltd. | | 90,192 | | | 3,328,099 |
Standard Bank Group, Ltd. | | 307,912 | | | 4,148,959 |
Tiger Brands, Ltd. | | 17,930 | | | 437,177 |
| | | | | |
| | | | | 15,193,247 |
| | | | | |
| | |
South Korea — 2.6% | | | | | |
Amorepacific Corporation* | | 608 | | | 377,423 |
Daelim Industrial Co., Ltd. | | 11,210 | | | 908,926 |
Hankook Tire Co., Ltd. | | 73,395 | | | 1,242,043 |
Hyundai Mobis | | 5,261 | | | 483,313 |
Hyundai Motor Co. | | 38,560 | | | 2,786,656 |
Kookmin Bank | | 46,591 | | | 3,746,010 |
Kookmin Bank ADR | | 27,154 | | | 2,189,699 |
Korea Electric Power Corporation | | 67,710 | | | 3,086,994 |
Lotte Shopping Co., Ltd.* | | 3,089 | | | 1,284,676 |
Lotte Shopping Co., Ltd. GDR 144AD* | | 5 | | | 104 |
NCSoft Corporation* | | 10,820 | | | 617,489 |
Pacific Corporation | | 371 | | | 67,817 |
Samsung Electronics Co., Ltd. | | 7,114 | | | 4,666,845 |
Samsung Electronics Co., Ltd. (Non-Voting Shares) GDR 144A | | 9,909 | | | 2,557,161 |
Samsung Electronics Co., Ltd. GDR 144AD | | 8,974 | | | 2,957,389 |
Samsung Fire & Marine Insurance Co., Ltd. | | 5,500 | | | 949,520 |
Samsung Securities Co., Ltd. | | 43,240 | | | 2,338,024 |
Shinhan Financial Group Co., Ltd. | | 23,820 | | | 1,216,613 |
Shinsegae Co., Ltd. | | 5,700 | | | 3,550,387 |
SK Telecom Co., Ltd. | | 6,000 | | | 1,434,431 |
S-Oil Corporation | | 14,850 | | | 1,090,136 |
STX Pan Ocean Co., Ltd. | | 601,000 | | | 403,606 |
Tae Young Corporation | | 9,700 | | | 780,260 |
| | | | | |
| | | | | 38,735,522 |
| | | | | |
| | |
Spain — 3.3% | | | | | |
Banco Bilbao Vizcaya Argentaria SA | | 147,600 | | | 3,553,857 |
Banco Santander Central Hispano SA | | 632,835 | | | 11,812,140 |
Grupo Ferrovial SAD | | 6,900 | | $ | 673,559 |
Iberdrola SA | | 128,851 | | | 5,633,351 |
Inditex SAD | | 168,586 | | | 9,081,902 |
Repsol YPF SA | | 82,138 | | | 2,840,757 |
Telefonica SA | | 686,485 | | | 14,607,799 |
| | | | | |
| | | | | 48,203,365 |
| | | | | |
| | |
Sri Lanka — 0.0% | | | | | |
Dialog Telekom, Ltd. | | 1,043,200 | | | 257,281 |
| | | | | |
| | |
Sweden — 1.6% | | | | | |
Assa Abloy AB Class BD | | 167,526 | | | 3,646,152 |
Atlas Copco AB Class A | | 18,500 | | | 621,535 |
Hennes & Mauritz AB Class B | | 115,000 | | | 5,812,196 |
Nordea Bank AB | | 218,000 | | | 3,396,119 |
Scania AB Class B | | 8,400 | | | 590,188 |
Telefonaktiebolaget LM Ericsson Class B | | 2,219,500 | | | 8,964,304 |
TeliaSonera AB | | 69,900 | | | 574,336 |
| | | | | |
| | | | | 23,604,830 |
| | | | | |
| | |
Switzerland — 3.9% | | | | | |
Adecco SAD | | 8,276 | | | 565,430 |
Compagnie Financiere Richemont AG Class A | | 74,974 | | | 4,368,612 |
Credit Suisse Group | | 26,475 | | | 1,852,272 |
Holcim, Ltd. | | 30,567 | | | 2,802,080 |
Nestle SA | | 36,161 | | | 12,849,990 |
Nobel Biocare Holding AG | | 8,257 | | | 2,441,185 |
Novartis AG | | 281,399 | | | 16,223,455 |
Petroplus Holdings AG* | | 5,176 | | | 314,341 |
Roche Holding AG | | 43,513 | | | 7,802,700 |
Swiss Reinsurance | | 43,552 | | | 3,702,903 |
Swisscom AG | | 3,312 | | | 1,253,722 |
Xstrata PLC | | 17,066 | | | 852,081 |
Zurich Financial Services AG | | 11,900 | | | 3,203,283 |
| | | | | |
| | | | | 58,232,054 |
| | | | | |
| | |
Taiwan — 1.3% | | | | | |
Advanced Semiconductor Engineering, Inc.* | | 744,000 | | | 844,806 |
Advantech Co., Ltd. | | 149,473 | | | 536,699 |
AU Optronics Corporation | | 1,211,542 | | | 1,684,298 |
Basso Industry Corporation | | 44,548 | | | 59,265 |
Cathay Financial Holding Co., Ltd. | | 559,273 | | | 1,270,100 |
Chinatrust Financial Holding Co. | | 670,040 | | | 560,337 |
Faraday Technology Corporation | | 296,369 | | | 716,706 |
Foxconn Technology Co., Ltd. | | 47,255 | | | 566,306 |
High Tech Computer Corporation | | 179,200 | | | 3,547,153 |
Largan Precision Co., Ltd. | | 20,100 | | | 388,614 |
MediaTek, Inc. | | 121,000 | | | 1,251,404 |
Novatek Microelectronics Corp., Ltd. | | 88,000 | | | 398,343 |
Phoenixtec Power Co., Ltd. | | 405,605 | | | 446,869 |
Radiant Opto-Electronics Corporation | | 147,000 | | | 235,038 |
Taiwan Semiconductor Manufacturing Co., Ltd. | | 2,600,126 | | | 5,386,175 |
Taiwan Semiconductor Manufacturing Co., Ltd. ADRD | | 10,917 | | | 119,323 |
| | | | |
| | See Notes to Financial Statements. | | 123 |
| | |
| International Equity Fund | | |
| SCHEDULE OF INVESTMENTS (Continued) | | |
| | | | | | |
| | | Shares | | Value | |
Vanguard International Semiconductor Corporation | | 1,034,620 | | $ | 776,322 | |
| | | | | | |
| | | | | 18,787,758 | |
| | | | | | |
| | |
Thailand — 0.1% | | | | | | |
Airports of Thailand Public Co., Ltd. | | 579,200 | | | 955,803 | |
Central Pattana PCL | | 126,100 | | | 80,391 | |
PTT Public Co., Ltd. | | 195,600 | | | 1,158,702 | |
| | | | | | |
| | | | | 2,194,896 | |
| | | | | | |
| | |
Turkey — 0.3% | | | | | | |
Arcelik AS | | 36,947 | | | 217,950 | |
Coca-Cola Icecek Uretim AS* | | 70,653 | | | 534,078 | |
Ford Otomotiv Sanayi AS | | 14,432 | | | 116,231 | |
Migros Turk TAS* | | 120,174 | | | 1,553,642 | |
Türkiye Garanti Bankasi AS | | 64,801 | | | 214,249 | |
Türkiye Is Bankasi | | 160,216 | | | 735,713 | |
Yapi ve Kredi Bankasi* | | 390,358 | | | 678,404 | |
| | | | | | |
| | | | | 4,050,267 | |
| | | | | | |
| | |
United Kingdom — 12.8% | | | | | | |
Alliance Boots Group PLC | | 266,735 | | | 4,373,947 | |
Anglo American PLCD | | 117,711 | | | 5,740,225 | |
ARM Holdings PLCD | | 110,000 | | | 270,838 | |
AstraZeneca PLCD | | 118,800 | | | 6,379,265 | |
Aviva PLC | | 349,563 | | | 5,626,081 | |
BAE Systems PLC | | 365,500 | | | 3,046,848 | |
Barclays PLC | | 167,323 | | | 2,391,593 | |
BG Group PLC | | 1,190,582 | | | 16,154,787 | |
BHP Billiton PLCD | | 57,740 | | | 1,057,906 | |
BP PLC | | 1,074,627 | | | 11,940,769 | |
Capita Group PLC | | 165,595 | | | 1,968,088 | |
Carnival PLC | | 49,844 | | | 2,525,724 | |
Cattles PLC | | 237,000 | | | 2,038,303 | |
Centrica PLC | | 409,500 | | | 2,842,358 | |
Compass Group PLC | | 149,101 | | | 846,617 | |
Daily Mail & General Trust | | 53,700 | | | 753,880 | |
Emap PLC | | 98,000 | | | 1,549,449 | |
GKN PLC | | 427,284 | | | 2,325,788 | |
GlaxoSmithKline PLC | | 381,943 | | | 10,050,936 | |
HBOS PLC | | 655,341 | | | 14,525,211 | |
HSBC Holdings PLCD | | 235,956 | | | 4,320,603 | |
Imperial Chemical Industries PLC | | 25,800 | | | 228,332 | |
Johnston Press PLC | | 42,300 | | | 325,079 | |
Kingfisher PLC | | 1,576,340 | | | 7,361,172 | |
Lloyds TSB Group PLC | | 821,967 | | | 9,197,701 | |
National Grid PLC | | 51,000 | | | 735,947 | |
Northern Rock PLC | | 18,400 | | | 424,397 | |
Prudential PLC | | 287,000 | | | 3,930,776 | |
Reckitt Benckiser PLC | | 150,720 | | | 6,887,798 | |
Reed Elsevier PLC | | 186,400 | | | 2,045,645 | |
Rexam PLC | | 241,400 | | | 2,483,812 | |
Rio Tinto PLC | | 112,700 | | | 5,997,663 | |
Royal Bank of Scotland Group PLC | | 446,979 | | | 17,442,274 | |
Scottish & Southern Energy PLC | | 57,700 | | | 1,755,640 | |
Smiths Group PLC | | 123,451 | | | 2,396,603 | |
Standard Chartered PLC | | 73,200 | | | 2,138,398 | |
Tesco PLC | | 130,100 | | | 1,030,397 | |
Travis Perkins PLC | | 56,100 | | | 2,179,281 | |
Tullow Oil PLC | | 78,700 | | | 613,291 | |
Unilever PLC | | 269,919 | | | 7,546,931 | |
Vodafone Group PLC | | 2,857,005 | | | 7,915,459 | |
Wm Morrison Supermarkets PLC | | 1,225,000 | | | 6,104,254 | |
Yell Group PLC | | 65,700 | | | 733,245 | |
| | | | | | |
| | | | | 190,203,311 | |
| | | | | | |
| | |
Total Foreign Common Stocks | | | | | | |
(Cost $931,311,663) | | | | | 1,422,132,092 | |
| | | | | | |
| | |
FOREIGN PREFERRED STOCKS — 0.7% | | | | | | |
| | |
Australia — 0.2% | | | | | | |
Telstra Corporation, Ltd. Receipts | | 1,298,203 | | | 2,756,531 | |
| | | | | | |
| | |
Brazil — 0.3% | | | | | | |
Centrais Eletricas Brasileiras SA Class B | | 43,181,800 | | | 968,129 | |
Companhia de Tecidos do Norte de Minas - Coteminas | | 2,595,260 | | | 303,681 | |
Companhia Energetica de Minas Gerais | | 924,500 | | | 45,431 | |
Companhia Vale do Rio Doce Class A | | 10,666 | | | 270,082 | |
Eletropaulo Metropolitana de Sao Paulo SA Class B* | | 3,701,900 | | | 188,864 | |
Investimentos Itau SA | | 540,807 | | | 2,764,153 | |
| | | | | | |
| | | | | 4,540,340 | |
| | | | | | |
| | |
South Korea — 0.2% | | | | | | |
Samsung Electronics Co., Ltd. | | 4,643 | | | 2,394,420 | |
| | | | | | |
| | |
Total Foreign Preferred Stocks | | | | | | |
(Cost $6,147,406) | | | | | 9,691,291 | |
| | | | | | |
| | |
MONEY MARKET FUNDS — 18.5% | | | | | | |
GuideStone Funds Money Market Fund (GS4 Class)¥ | | 52,688,175 | | | 52,688,175 | |
Northern Institutional Liquid Assets Portfolio§ | | 222,122,117 | | | 222,122,117 | |
| | | | | | |
| | |
Total Money Market Funds | | | | | | |
(Cost $274,810,292) | | | | | 274,810,292 | |
| | | | | | |
| | |
MUTUAL FUND — 0.0% | | | | | | |
Macquarie IMM Global REITs Fund of Funds | | | | | | |
(Cost $320,140) | | 20,400 | | | 688,368 | |
| | | | | | |
| | |
TOTAL INVESTMENTS — 114.9% | | | | | | |
(Cost $1,212,589,501) | | | | | 1,707,322,043 | |
| | |
Liabilities in Excess of Other Assets — (14.9)% | | | | | (220,806,329 | ) |
| | | | | | |
NET ASSETS — 100.0% | | | | $ | 1,486,515,714 | |
| | | | | | |
| | |
| 124 | | See Notes to Financial Statements. |
PORTFOLIO SUMMARY (based on net assets)
| | | |
| | | % | |
Japan | | 22.5 | |
Money Market Funds | | 18.5 | |
United Kingdom | | 12.8 | |
France | | 9.6 | |
Germany | | 5.1 | |
Hong Kong | | 4.5 | |
Netherlands | | 4.3 | |
Switzerland | | 3.9 | |
Australia | | 3.5 | |
Spain | | 3.3 | |
South Korea | | 2.8 | |
Italy | | 2.4 | |
Canada | | 2.3 | |
Sweden | | 1.6 | |
Brazil | | 1.5 | |
India | | 1.3 | |
Taiwan | | 1.3 | |
Belgium | | 1.2 | |
Russia | | 1.2 | |
Indonesia | | 1.1 | |
Singapore | | 1.1 | |
Ireland | | 1.0 | |
South Africa | | 1.0 | |
China | | 0.9 | |
Finland | | 0.9 | |
Denmark | | 0.8 | |
Mexico | | 0.8 | |
Norway | | 0.6 | |
Israel | | 0.5 | |
Egypt | | 0.4 | |
Greece | | 0.3 | |
Turkey | | 0.3 | |
Chile | | 0.2 | |
Hungary | | 0.2 | |
Malaysia | | 0.2 | |
New Zealand | | 0.2 | |
Philippines | | 0.2 | |
Austria | | 0.1 | |
Colombia | | 0.1 | |
Peru | | 0.1 | |
Poland | | 0.1 | |
Portugal | | 0.1 | |
Thailand | | 0.1 | |
Argentina | | — | ** |
Bahrain | | — | ** |
Estonia | | — | ** |
Luxembourg | | — | ** |
Mutual Fund | | — | ** |
Sri Lanka | | — | ** |
Forward Foreign Currency Contracts | | (1.2 | ) |
| | | |
| | 113.7 | |
| | | |
| ** | Rounds to less than 0.005%. |
| | | | |
| | See Notes to Financial Statements. | | 125 |
| | |
| SCHEDULE OF INVESTMENTS – ABBREVIATIONS AND FOOTNOTES |
| | |
INVESTMENT ABBREVIATIONS:
| | | | |
ADR | | — | | American Depository Receipt |
CONV | | — | | Convertible |
GDR | | — | | Global Depository Receipt |
IO | | — | | Interest Only (Principal amount shown is notional) |
PIK | | — | | Payment-in-Kind Bonds |
PO | | — | | Principal Only |
REIT | | — | | Real Estate Investment Trust |
STEP | | — | | Stepped Coupon Bonds (1) |
STRIP | | — | | Stripped Security |
TBA | | — | | To be announced. |
144A | | — | | Security was purchased pursuant to Rule 144A under the Securities Act of 1933 and may not be resold subject to that rule except to qualified institutional buyers. As of December 31, 2006, the total market values and percentages of net assets for 144A securities by fund were as follows: |
| | | | | | |
Fund | | Value of 144A Securities | | Percentage of Net Assets | |
Money Market | | $ | 83,609,797 | | 8.03 | % |
Low-Duration Bond | | | 33,832,444 | | 4.16 | |
Medium-Duration Bond | | | 63,776,322 | | 5.14 | |
Extended-Duration Bond | | | 12,422,738 | | 2.26 | |
Global Bond | | | 9,993,795 | | 9.55 | |
International Equity | | | 8,286,949 | | 0.56 | |
INVESTMENT FOOTNOTES:
| | | | |
‡‡ | | — | | All or a portion of the security was held as collateral for open futures, options, swap contracts and/or short sales. |
@ | | — | | Illiquid. |
* | | — | | Non-income producing security. |
# | | — | | Security in default. Income accrual halted. |
+ | | — | | Security is valued at fair value (2). |
§ | | — | | Security purchased with the cash collateral from securities loaned. |
† | | — | | Variable rate security (1). |
W | | — | | Interest rates shown reflect the effective yields as of December 31, 2006. |
¥ | | — | | Affiliated fund. |
D | | — | | Security either partially or fully on loan. |
| (1) | Interest rates shown reflect the rates currently in effect. Maturity date for money market instruments is the date of the next interest rate reset. |
| (2) | Fair valued securities were held in the Value Equity Fund, Growth Equity Fund and Small Cap Equity Fund at an aggregate market value of $1,209, $0 and $0, respectively, which amounted to 0.00% of each of those funds. |
FOREIGN BOND FOOTNOTES:
| | | | |
(A) | | — | | Par is denominated in Australian Dollars. |
(B) | | — | | Par is denominated in Brazilian Reals. |
(C) | | — | | Par is denominated in Canadian Dollars. |
(D) | | — | | Par is denominated in Danish Krones. |
(E) | | — | | Par is denominated in Euros. |
(G) | | — | | Par is denominated in Singapore Dollars. |
(J) | | — | | Par is denominated in Japanese Yen. |
(K) | | — | | Par is denominated in Swedish Kronas. |
(M) | | — | | Par is denominated in Mexican Pesos. |
(P) | | — | | Par is denominated in Argentinian Pesos. |
(R) | | — | | Par is denominated in Russian Rubles. |
(S) | | — | | Par is denominated in South African Rand. |
(T) | | — | | Par is denominated in Thailand Bahts. |
(U) | | — | | Par is denominated in British Pounds. |
(W) | | — | | Par is denominated in South Korean Won. |
(Z) | | — | | Par is denominated in New Zealand Dollars. |
SWAP AGREEMENT FOOTNOTES:
| | | | |
(a) | | — | | Counter party to contract is Goldman Sachs Capital Markets, LP. |
(b) | | — | | Counter party to contract is UBS AG. |
(c) | | — | | Counter party to contract is Morgan Stanley Capital Services. |
(d) | | — | | Counter party to contract is Barclays Capital. |
(e) | | — | | Counter party to contract is Lehman Brothers Special Financing, Inc. |
(f) | | — | | Counter party to contract is Citibank NA London. |
(g) | | — | | Counter party to contract is JPMorgan Chase Bank. |
(h) | | — | | Counter party to contract is Merrill Lynch Capital Services, Inc. |
(i) | | — | | Counter party to contract is Deutsche Bank AG. |
(j) | | — | | Counter party to contract is BNP Paribas. |
(k) | | — | | Counter party to contract is Bank of America. |
(l) | | — | | Counter party to contract is Credit HSBC Bank USA, N.A. |
(m) | | — | | Counter party to contract is Royal Bank of Scotland. |
(This page intentionally left blank)
127
| | |
| STATEMENTS OF ASSETS AND LIABILITIES | | |
| December 31, 2006 | | |
| | | | | | | | | | | | |
| | | Money Market
Fund | | | Low-Duration
Bond Fund | | | Medium-Duration
Bond Fund | |
Assets | | | | | | | | | | | | |
Investments in securities of unaffiliated issuers, at value | | $ | 1,039,319,532 | | | $ | 895,963,002 | | | $ | 1,720,628,716 | |
Investments in securities of affiliated issuers, at value | | | — | | | | 34,658,661 | | | | 104,258,409 | |
| | | | | | | | | | | | |
Total investments (1)(2) | | | 1,039,319,532 | | | | 930,621,663 | | | | 1,824,887,125 | |
Cash | | | 552 | | | | 21,177,121 | | | | 14,474,439 | |
Cash collateral for futures | | | — | | | | — | | | | 71,810 | |
Foreign currency (3) | | | — | | | | 7,361,844 | | | | 7,215,114 | |
Receivables: | | | | | | | | | | | | |
Dividends and reclaims | | | — | | | | 58,425 | | | | 410,772 | |
Interest | | | 3,269,046 | | | | 6,065,728 | | | | 11,581,906 | |
Interest on swaps | | | — | | | | 10,333 | | | | 8,523 | |
Investment securities sold | | | — | | | | 14,918,718 | | | | 103,983,389 | |
Maturities | | | — | | | | 738,245 | | | | 21,207 | |
Fund shares sold | | | 3,104,157 | | | | 12,911 | | | | 707,054 | |
Variation margin | | | — | | | | 76,052 | | | | 44,140 | |
Securities lending | | | — | | | | 2,679 | | | | 17,005 | |
Unrealized appreciation on foreign currency exchange contracts | | | — | | | | 421,708 | | | | 393,718 | |
Unrealized appreciation on swap agreements | | | — | | | | 202,659 | | | | 319,542 | |
Prepaid expenses and other assets | | | 49,006 | | | | 55,143 | | | | 28,811 | |
| | | | | | | | | | | | |
Total Assets | | | 1,045,742,293 | | | | 981,723,229 | | | | 1,964,164,555 | |
| | | | | | | | | | | | |
| | | |
Liabilities | | | | | | | | | | | | |
Cash overdraft | | | — | | | | — | | | | — | |
Securities sold short, at value (proceeds $ 53,316,215) | | | — | | | | — | | | | 52,905,567 | |
Options written at value (4) | | | — | | | | 775,199 | | | | 1,041,709 | |
Unrealized depreciation on foreign currency exchange contracts | | | — | | | | 726,364 | | | | 797,621 | |
Unrealized depreciation on swap agreements | | | — | | | | 782,953 | | | | 1,863,504 | |
Unrealized depreciation on forward volatility option | | | — | | | | 184,888 | | | | 195,536 | |
Collateral held for securities on loan at value | | | — | | | | 46,899,932 | | | | 258,993,690 | |
Payables: | | | | | | | | | | | | |
Investment securities purchased | | | — | | | | 117,932,904 | | | | 406,443,534 | |
Fund shares redeemed | | | 1,923,196 | | | | 16,882 | | | | 24,112 | |
Interest on swaps | | | — | | | | 28,791 | | | | 38,812 | |
Variation margin | | | — | | | | 64,656 | | | | 60,868 | |
Distributions | | | 2,009,225 | | | | — | | | | — | |
Securities lending | | | — | | | | 803 | | | | 5,101 | |
Deferred foreign capital gains taxes | | | — | | | | — | | | | — | |
Accrued expenses | | | | | | | | | | | | |
Advisory fees | | | 187,014 | | | | 239,787 | | | | 367,583 | |
Distribution (12b-1) fees | | | 1,788 | | | | 1,793 | | | | 2,528 | |
Shareholder servicing fees | | | 154,239 | | | | 118,687 | | | | 184,092 | |
Other expenses | | | 84,379 | | | | 99,470 | | | | 165,441 | |
| | | | | | | | | | | | |
Total Liabilities | | | 4,359,841 | | | | 167,873,109 | | | | 723,089,698 | |
| | | | | | | | | | | | |
Net Assets | | $ | 1,041,382,452 | | | $ | 813,850,120 | | | $ | 1,241,074,857 | |
| | | | | | | | | | | | |
| | | |
Net Assets Consist of: | | | | | | | | | | | | |
Paid-in-capital | | $ | 1,041,391,616 | | | $ | 837,213,530 | | | $ | 1,245,214,652 | |
Undistributed (distributions in excess of) net investment income | | | — | | | | (383,132 | ) | | | (723,086 | ) |
Undistributed(accumulated)netrealizedgain(loss)oninvestments,foreigncurrencytransactions and derivative transactions | | | (9,164 | ) | | | (19,581,361 | ) | | | (4,377,779 | ) |
Net unrealized appreciation (depreciation) on investments, foreign currency translations and derivative transactions | | | — | | | | (3,398,917 | ) | | | 961,070 | |
| | | | | | | | | | | | |
Net Assets | | $ | 1,041,382,452 | | | $ | 813,850,120 | | | $ | 1,241,074,857 | |
| | | | | | | | | | | | |
| | | |
Net Asset Value: | | | | | | | | | | | | |
$0.001 par value, unlimited shares authorized | | | | | | | | | | | | |
Net assets applicable to the GS2 Class | | $ | 100,558,804 | | | $ | 105,990,861 | | | $ | 113,050,905 | |
| | | | | | | | | | | | |
GS2 shares outstanding | | | 100,559,770 | | | | 11,924,060 | | | | 13,272,589 | |
| | | | | | | | | | | | |
Net asset value, offering and redemption price per GS2 share | | $ | 1.00 | | | $ | 8.89 | | | $ | 8.52 | |
| | | | | | | | | | | | |
| | | |
Net assets applicable to the GS4 Class | | $ | 930,582,161 | | | $ | 697,686,565 | | | $ | 1,108,958,419 | |
| | | | | | | | | | | | |
GS4 shares outstanding | | | 930,553,795 | | | | 55,219,405 | | | | 82,642,856 | |
| | | | | | | | | | | | |
Net asset value, offering and redemption price per GS4 share | | $ | 1.00 | | | $ | 12.63 | | | $ | 13.42 | |
| | | | | | | | | | | | |
| | | |
Net assets applicable to the GS6 class | | $ | 4,784,072 | | | $ | 5,159,349 | | | $ | 13,709,248 | |
| | | | | | | | | | | | |
GS6 shares outstanding | | | 4,786,107 | | | | 577,895 | | | | 1,596,781 | |
| | | | | | | | | | | | |
Net asset value, offering and redemption price per GS6 share | | $ | 1.00 | | | $ | 8.93 | | | $ | 8.59 | |
| | | | | | | | | | | | |
| | | |
Net assets applicable to the GS8 class | | $ | 5,457,415 | | | $ | 5,013,345 | | | $ | 5,356,285 | |
| | | | | | | | | | | | |
GS8 shares outstanding | | | 5,457,438 | | | | 561,274 | | | | 623,544 | |
| | | | | | | | | | | | |
Net asset value, offering and redemption price per GS8 share | | $ | 1.00 | | | $ | 8.93 | | | $ | 8.59 | |
| | | | | | | | | | | | |
| | | |
(1) Investments in securities of unaffiliated issuers, at cost | | $ | 1,039,319,532 | | | $ | 898,735,624 | | | $ | 1,718,166,294 | |
Investments in securities of affiliated issuers, at cost | | | — | | | | 34,658,661 | | | | 104,258,409 | |
| | | | | | | | | | | | |
Total investments at cost | | $ | 1,039,319,532 | | | $ | 933,394,285 | | | $ | 1,822,424,703 | |
| | | | | | | | | | | | |
(2) Includes securities loaned of: | | $ | — | | | $ | 45,386,451 | | | $ | 251,271,309 | |
| | | | | | | | | | | | |
(3) Foreign currency at cost | | $ | — | | | $ | 7,278,653 | | | $ | 7,147,582 | |
| | | | | | | | | | | | |
(4) Premiums received on options written | | $ | — | | | $ | (817,243 | ) | | $ | (1,044,466 | ) |
| | | | | | | | | | | | |
(5) Net of ($ 86,618) accrued foreign capital gains taxes on appreciated securities | | | | | | | | | | | | |
| | |
| 128 | | See Notes to Financial Statements. |
| | | | | | | | | | | | | | | | | | | | | | | | | | | | |
Extended-Duration
Bond Fund | | Global Bond
Fund | | | Equity Index Fund | | | Real Estate
Securities Fund | | | Value Equity Fund | | | Growth Equity Fund | | | Small Cap
Equity Fund | | International
Equity Fund | |
| $ | 808,910,093 | | $ | 98,116,270 | | | $ | 578,647,885 | | | $ | 101,394,468 | | | $ | 1,695,335,553 | | | $ | 1,601,104,930 | | | $ | 832,431,801 | | $ | 1,654,633,868 | |
| | 14,475,319 | | | 19,032,626 | | | | 16,644,946 | | | | 5,673,643 | | | | 68,576,737 | | | | 58,839,845 | | | | 22,605,076 | | | 52,688,175 | |
| | | | | | | | | | | | | | | | | | | | | | | | | | | | | |
| | 823,385,412 | | | 117,148,896 | | | | 595,292,831 | | | | 107,068,111 | | | | 1,763,912,290 | | | | 1,659,944,775 | | | | 855,036,877 | | | 1,707,322,043 | |
| | 314,810 | | | 2,718,843 | | | | 12,061 | | | | — | | | | 129,687 | | | | 50,156 | | | | 1,585,052 | | | 27,407 | |
| | — | | | — | | | | — | | | | — | | | | — | | | | — | | | | — | | | — | |
| | 258,921 | | | 1,459,980 | | | | — | | | | — | | | | — | | | | — | | | | — | | | 1,225,175 | |
| | 145,318 | | | 99,367 | | | | 740,881 | | | | 555,005 | | | | 1,906,547 | | | | 1,252,833 | | | | 435,134 | | | 1,613,788 | |
| | 6,323,028 | | | 1,189,996 | | | | — | | | | — | | | | — | | | | — | | | | 49 | | | — | |
| | — | | | — | | | | — | | | | — | | | | — | | | | — | | | | — | | | — | |
| | — | | | 4,135,524 | | | | 80,758 | | | | 153,203 | | | | 771,925 | | | | — | | | | 1,855,310 | | | 1,029,383 | |
| | — | | | — | | | | — | | | | — | | | | — | | | | — | | | | — | | | — | |
| | 80,017 | | | 10 | | | | 117,164 | | | | 175,909 | | | | 189,060 | | | | 397 | | | | 280 | | | 129,308 | |
| | — | | | — | | | | — | | | | 11,071 | | | | — | | | | — | | | | — | | | — | |
| | 66,234 | | | — | | | | 2,063 | | | | — | | | | 7,240 | | | | 22,541 | | | | 106,740 | | | 35,702 | |
| | — | | | 228,058 | | | | — | | | | — | | | | — | | | | — | | | | — | | | 44,855 | |
| | — | | | — | | | | — | | | | — | | | | — | | | | — | | | | — | | | — | |
| | 24,204 | | | — | | | | 32,986 | | | | — | | | | 34,342 | | | | 30,640 | | | | 29,812 | | | 41,031 | |
| | | | | | | | | | | | | | | | | | | | | | | | | | | | | |
| | 830,597,944 | | | 126,980,674 | | | | 596,278,744 | | | | 107,963,299 | | | | 1,766,951,091 | | | | 1,661,301,342 | | | | 859,049,254 | | | 1,711,468,692 | |
| | | | | | | | | | | | | | | | | | | | | | | | | | | | | |
| | | | | | | |
| | — | | | — | | | | — | | | | 573,447 | | | | — | | | | — | | | | — | | | — | |
| | — | | | — | | | | — | | | | — | | | | — | | | | — | | | | — | | | — | |
| | — | | | — | | | | — | | | | — | | | | — | | | | — | | | | — | | | — | |
| | — | | | 182,562 | | | | — | | | | — | | | | — | | | | — | | | | — | | | 640,222 | |
| | — | | | — | | | | — | | | | — | | | | — | | | | — | | | | — | | | — | |
| | — | | | — | | | | — | | | | — | | | | — | | | | — | | | | — | | | — | |
| | 278,446,396 | | | — | | | | 34,402,994 | | | | — | | | | 122,875,591 | | | | 118,791,161 | | | | 277,398,014 | | | 222,122,117 | |
| | 2,699,961 | | | 22,104,286 | | | | — | | | | 211,530 | | | | 1,080,409 | | | | — | | | | 3,683,068 | | | 418,926 | |
| | — | | | — | | | | 60,257 | | | | 25,190 | | | | 161,750 | | | | 475,398 | | | | 221,221 | | | 60,576 | |
| | — | | | — | | | | — | | | | — | | | | — | | | | — | | | | — | | | — | |
| | — | | | — | | | | 44,550 | | | | — | | | | 221,829 | | | | 180,900 | | | | 151,280 | | | — | |
| | — | | | — | | | | — | | | | — | | | | — | | | | — | | | | — | | | — | |
| | 19,868 | | | — | | | | 618 | | | | — | | | | 2,172 | | | | 6,762 | | | | 31,984 | | | 10,710 | |
| | — | | | — | | | | — | | | | — | | | | — | | | | — | | | | — | | | 86,618 | |
| | 204,954 | | | 31,771 | | | | 60,051 | | | | 97,627 | | | | 884,963 | | | | 1,032,639 | | | | 452,935 | | | 976,755 | |
| | 2,750 | | | — | | | | 2,778 | | | | — | | | | 3,155 | | | | 2,471 | | | | 3,068 | | | 3,894 | |
| | 79,933 | | | 1,633 | | | | 80,523 | | | | 1,668 | | | | 233,940 | | | | 222,965 | | | | 85,073 | | | 206,984 | |
| | 73,428 | | | 25,120 | | | | 81,897 | | | | 18,387 | | | | 131,494 | | | | 108,433 | | | | 96,899 | | | 426,176 | |
| | | | | | | | | | | | | | | | | | | | | | | | | | | | | |
| | 281,527,290 | | | 22,345,372 | | | | 34,733,668 | | | | 927,849 | | | | 125,595,303 | | | | 120,820,729 | | | | 282,123,542 | | | 224,952,978 | |
| | | | | | | | | | | | | | | | | | | | | | | | | | | | | |
| $ | 549,070,654 | | $ | 104,635,302 | | | $ | 561,545,076 | | | $ | 107,035,450 | | | $ | 1,641,355,788 | | | $ | 1,540,480,613 | | | $ | 576,925,712 | | $ | 1,486,515,714 | |
| | | | | | | | | | | | | | | | | | | | | | | | | | | | | |
| | | | | | | |
| $ | 530,662,729 | | $ | 104,105,993 | | | $ | 421,842,050 | | | $ | 93,354,265 | | | $ | 1,321,958,298 | | | $ | 1,420,134,514 | | | $ | 495,428,943 | | $ | 984,737,388 | |
| | 169,393 | | | (14,870 | ) | | | 39,815 | | | | — | | | | 81,956 | | | | — | | | | — | | | (11,284,687 | ) |
| | 3,732,617 | | | — | | | | (3,740,416 | ) | | | (32,730 | ) | | | (4,365,207 | ) | | | (166,391,507 | ) | | | 10,049,445 | | | 18,978,789 | |
| | 14,505,915 | | | 544,179 | | | | 143,403,627 | | | | 13,713,915 | | | | 323,680,741 | | | | 286,737,606 | | | | 71,447,324 | | | 494,084,224 | (5) |
| | | | | | | | | | | | | | | | | | | | | | | | | | | | | |
| $ | 549,070,654 | | $ | 104,635,302 | | | $ | 561,545,076 | | | $ | 107,035,450 | | | $ | 1,641,355,788 | | | $ | 1,540,480,613 | | | $ | 576,925,712 | | $ | 1,486,515,714 | |
| | | | | | | | | | | | | | | | | | | | | | | | | | | | | |
| | | | | | | |
| $ | 59,916,330 | | | N/A | | | $ | 74,633,773 | | | | N/A | | | $ | 181,940,335 | | | $ | 179,852,399 | | | $ | 66,695,144 | | $ | 199,988,929 | |
| | | | | | | | | | | | | | | | | | | | | | | | | | | | | |
| | 7,368,892 | | | N/A | | | | 6,735,268 | | | | N/A | | | | 17,127,987 | | | | 16,012,660 | | | | 5,884,781 | | | 12,655,071 | |
| | | | | | | | | | | | | | | | | | | | | | | | | | | | | |
| $ | 8.13 | | | N/A | | | $ | 11.08 | | | | N/A | | | $ | 10.62 | | | $ | 11.23 | | | $ | 11.33 | | $ | 15.80 | |
| | | | | | | | | | | | | | | | | | | | | | | | | | | | | |
| $ | 467,877,306 | | $ | 104,635,302 | | | $ | 466,428,940 | | | $ | 107,035,450 | | | $ | 1,434,773,409 | | | $ | 1,343,146,544 | | | $ | 486,357,608 | | $ | 1,254,839,470 | |
| | | | | | | | | | | | | | | | | | | | | | | | | | | | | |
| | 31,592,923 | | | 10,342,731 | | | | 24,332,581 | | | | 8,527,025 | | | | 76,940,947 | | | | 75,569,991 | | | | 30,397,195 | | | 65,728,004 | |
| | | | | | | | | | | | | | | | | | | | | | | | | | | | | |
| $ | 14.81 | | $ | 10.12 | | | $ | 19.17 | | | $ | 12.55 | | | $ | 18.65 | | | $ | 17.77 | | | $ | 16.00 | | $ | 19.09 | |
| | | | | | | | | | | | | | | | | | | | | | | | | | | | | |
| | | | | | | |
| $ | 15,729,722 | | | N/A | | | $ | 14,232,855 | | | | N/A | | | $ | 17,797,947 | | | $ | 11,706,095 | | | $ | 17,482,887 | | $ | 23,876,609 | |
| | | | | | | | | | | | | | | | | | | | | | | | | | | | | |
| | 1,935,620 | | | N/A | | | | 1,276,979 | | | | N/A | | | | 1,687,181 | | | | 1,065,537 | | | | 1,589,098 | | | 1,531,562 | |
| | | | | | | | | | | | | | | | | | | | | | | | | | | | | |
| $ | 8.13 | | | N/A | | | $ | 11.15 | | | | N/A | | | $ | 10.55 | | | $ | 10.99 | | | $ | 11.00 | | $ | 15.59 | |
| | | | | | | | | | | | | | | | | | | | | | | | | | | | | |
| | | | | | | |
| $ | 5,547,296 | | | N/A | | | $ | 6,249,508 | | | | N/A | | | $ | 6,844,097 | | | $ | 5,775,575 | | | $ | 6,390,073 | | $ | 7,810,706 | |
| | | | | | | | | | | | | | | | | | | | | | | | | | | | | |
| | 682,954 | | | N/A | | | | 560,516 | | | | N/A | | | | 649,847 | | | | 529,416 | | | | 586,092 | | | 502,097 | |
| | | | | | | | | | | | | | | | | | | | | | | | | | | | | |
| $ | 8.12 | | | N/A | | | $ | 11.15 | | | | N/A | | | $ | 10.53 | | | $ | 10.91 | | | $ | 10.90 | | $ | 15.56 | |
| | | | | | | | | | | | | | | | | | | | | | | | | | | | | |
| | | | | | | |
| $ | 794,412,251 | | $ | 97,634,411 | | | $ | 435,267,089 | | | $ | 87,691,624 | | | $ | 1,371,865,988 | | | $ | 1,314,548,300 | | | $ | 760,818,064 | | $ | 1,159,901,326 | |
| | 14,475,319 | | | 19,032,626 | | | | 16,644,946 | | | | 5,673,643 | | | | 68,576,737 | | | | 58,839,845 | | | | 22,605,076 | | | 52,688,175 | |
| | | | | | | | | | | | | | | | | | | | | | | | | | | | | |
| $ | 808,887,570 | | $ | 116,667,037 | | | $ | 451,912,035 | | | $ | 93,365,267 | | | $ | 1,440,442,725 | | | $ | 1,373,388,145 | | | $ | 783,423,140 | | $ | 1,212,589,501 | |
| | | | | | | | | | | | | | | | | | | | | | | | | | | | | |
| $ | 269,896,989 | | $ | — | | | $ | 33,463,028 | | | $ | — | | | $ | 119,113,966 | | | $ | 115,242,962 | | | $ | 268,174,101 | | $ | 212,023,705 | |
| | | | | | | | | | | | | | | | | | | | | | | | | | | | | |
| $ | 257,648 | | $ | 1,458,279 | | | $ | — | | | $ | — | | | $ | — | | | $ | — | | | $ | — | | $ | 1,218,940 | |
| | | | | | | | | | | | | | | | | | | | | | | | | | | | | |
| $ | — | | $ | — | | | $ | — | | | $ | — | | | $ | — | | | $ | — | | | $ | — | | $ | — | |
| | | | | | | | | | | | | | | | | | | | | | | | | | | | | |
| | | | |
| | See Notes to Financial Statements. | | 129 |
| | |
| STATEMENTS OF OPERATIONS | | |
| For the Year Ended December 31, 2006 | | |
| | | | | | | | | | | | |
| | | Money
Market Fund | | | Low-Duration
Bond Fund | | | Medium-Duration
Bond Fund | |
Investment Income | | | | | | | | | | | | |
Dividends | | $ | — | | | $ | — | | | $ | 122,631 | |
Income dividends received from affiliated funds | | | — | | | | 1,361,688 | | | | 2,752,563 | |
Interest | | | 46,093,067 | | | | 41,472,905 | | | | 54,745,627 | |
Securities Lending | | | — | | | | 39,498 | | | | 163,985 | |
Less foreign taxes withheld | | | — | | | | (56,268 | ) | | | — | |
| | | | | | | | | | | | |
Total Investment Income | | | 46,093,067 | | | | 42,817,823 | | | | 57,784,806 | |
| | | | | | | | | | | | |
| | | |
Expenses | | | | | | | | | | | | |
Investment advisory fees | | | 1,854,864 | | | | 3,771,293 | | | | 4,892,808 | |
Transfer agent fees: | | | | | | | | | | | | |
GS2 shares | | | 4,116 | | | | 3,778 | | | | 3,851 | |
GS4 shares | | | 43,212 | | | | 29,227 | | | | 32,314 | |
GS6 shares | | | 7,739 | | | | 7,795 | | | | 7,771 | |
GS8 shares | | | 7,973 | | | | 7,859 | | | | 7,857 | |
Custodian fees | | | 25,022 | | | | 109,469 | | | | 183,630 | |
Distribution (12b-1) fees: | | | | | | | | | | | | |
GS6 shares | | | 4,675 | | | | 11,057 | | | | 13,323 | |
GS8 shares | | | 15,841 | | | | 15,290 | | | | 15,535 | |
Shareholder servicing fees: | | | | | | | | | | | | |
GS4 shares | | | 1,520,452 | | | | 1,537,798 | | | | 1,932,595 | |
GS6 shares | | | 14,017 | | | | 33,152 | | | | 39,947 | |
GS8 shares | | | 21,116 | | | | 20,377 | | | | 20,701 | |
Accounting and administration fees | | | 346,855 | | | | 412,665 | | | | 537,127 | |
Professional fees | | | 69,029 | | | | 73,243 | | | | 79,366 | |
Blue sky fees: | | | | | | | | | | | | |
GS2 shares | | | 1,567 | | | | 1,567 | | | | 1,567 | |
GS4 shares | | | 8,489 | | | | 8,835 | | | | 8,392 | |
GS6 shares | | | 12,509 | | | | 12,521 | | | | 12,596 | |
GS8 shares | | | 5,198 | | | | 5,528 | | | | 5,132 | |
Shareholder reporting fees: | | | | | | | | | | | | |
GS2 shares | | | 210 | | | | 259 | | | | 234 | |
GS4 shares | | | 17,318 | | | | 4,439 | | | | 7,938 | |
GS6 shares | | | 25 | | | | 25 | | | | 16 | |
GS8 shares | | | 102 | | | | 72 | | | | 85 | |
Trustee fees | | | 7,387 | | | | 7,293 | | | | 8,599 | |
Line of credit facility fees | | | 4,609 | | | | 4,156 | | | | 5,086 | |
Other expenses | | | 32,026 | | | | 42,617 | | | | 69,539 | |
| | | | | | | | | | | | |
Total expenses | | | 4,024,351 | | | | 6,120,315 | | | | 7,886,009 | |
Expenses waived/reimbursed net of amount recaptured (See Footnote 3a and 3c) | | | (12,676 | ) | | | (523,156 | ) | | | (839,380 | ) |
Fees paid indirectly | | | (12,291 | ) | | | (659,367 | ) | | | (428,505 | ) |
| | | | | | | | | | | | |
Net expenses | | | 3,999,384 | | | | 4,937,792 | | | | 6,618,124 | |
| | | | | | | | | | | | |
Net Investment Income (Loss) | | | 42,093,683 | | | | 37,880,031 | | | | 51,166,682 | |
| | | | | | | | | | | | |
| | | |
Realized and Unrealized Gain (Loss) | | | | | | | | | | | | |
Net realized gain (loss) from: | | | | | | | | | | | | |
Investment securities (net of capital gains taxes of $60,815 for International Equity)* | | | (790 | ) | | | (4,506,522 | ) | | | 3,107,918 | |
Futures transactions | | | — | | | | (2,332,606 | ) | | | (1,445,705 | ) |
Swap agreements | | | — | | | | (389,626 | ) | | | (102,790 | ) |
Option contracts written | | | — | | | | 365,781 | | | | 903,213 | |
Option contracts purchased | | | — | | | | (400,090 | ) | | | (338,363 | ) |
Foreign currency transactions | | | — | | | | (390,765 | ) | | | (2,247,455 | ) |
| | | | | | | | | | | | |
Net realized gain (loss) | | | (790 | ) | | | (7,653,828 | ) | | | (123,182 | ) |
| | | | | | | | | | | | |
Net change in unrealized appreciation (depreciation) on: | | | | | | | | | | | | |
Investment securities (net of estimated deferred capital gains taxes of $42,710 for International Equity) | | | — | | | | 6,492,455 | | | | (621,166 | ) |
Futures | | | — | | | | 348,841 | | | | (103,083 | ) |
Swap agreements | | | — | | | | (419,610 | ) | | | (653,517 | ) |
Option contracts written | | | — | | | | (91,479 | ) | | | (794,792 | ) |
Option contracts purchased | | | — | | | | (694,299 | ) | | | (471,961 | ) |
Foreign currency translations | | | — | | | | (69,894 | ) | | | 384,147 | |
| | | | | | | | | | | | |
Net change in unrealized appreciation (depreciation) | | | — | | | | 5,566,014 | | | | (2,260,372 | ) |
| | | | | | | | | | | | |
Net Realized and Unrealized Gain (Loss) | | | (790 | ) | | | (2,087,814 | ) | | | (2,383,554 | ) |
| | | | | | | | | | | | |
Net Increase in Net Assets Resulting from Operations | | $ | 42,092,893 | | | $ | 35,792,217 | | | $ | 48,783,128 | |
| | | | | | | | | | | | |
| * | Net increase from payments by affiliates and net gains (losses) realized on the disposal of investments in violation of restrictions (See Footnote 11) |
| | |
| 130 | | See Notes to Financial Statements. |
| | | | | | | | | | | | | | | | | | | | | | | | | | | | | |
Extended-Duration Bond Fund | | Global Bond
Fund | | | Equity Index
Fund | | | Real Estate
Securities Fund | | | Value Equity
Fund | | | Growth Equity
Fund | | | Small Cap
Equity Fund | | | International
Equity Fund | |
| $ | 49,640 | | $ | — | | | $ | 9,482,209 | | | $ | — | | | $ | 33,639,994 | | | $ | 10,074,437 | | | $ | 3,929,071 | | | $ | 36,239,799 | |
| | 428,147 | | | 7,510 | | | | 572,200 | | | | 1,402 | | | | 2,726,326 | | | | 2,937,710 | | | | 1,104,178 | | | | 2,127,414 | |
| | 24,725,341 | | | 38,548 | | | | 34,711 | | | | 89 | | | | 204,237 | | | | 192,641 | | | | 71,659 | | | | 19,102 | |
| | 303,217 | | | — | | | | 31,425 | | | | — | | | | 114,539 | | | | 175,681 | | | | 583,381 | | | | 302,245 | |
| | — | | | — | | | | — | | | | — | | | | (72,779 | ) | | | (98,135 | ) | | | (6,751 | ) | | | (2,573,385 | ) |
| | | | | | | | | | | | | | | | | | | | | | | | | | | | | | |
| | 25,506,345 | | | 46,058 | | | | 10,120,545 | | | | 1,491 | | | | 36,612,317 | | | | 13,282,334 | | | | 5,681,538 | | | | 36,115,175 | |
| | | | | | | | | | | | | | | | | | | | | | | | | | | | | | |
| | | | | | | |
| | 2,268,782 | | | 3,523 | | | | 807,083 | | | | 7,956 | | | | 10,139,762 | | | | 12,811,127 | | | | 5,581,398 | | | | 13,393,914 | |
| | 3,621 | | | — | | | | 3,512 | | | | — | | | | 3,669 | | | | 3,675 | | | | 3,529 | | | | 3,668 | |
| | 31,769 | | | 63 | | | | 33,507 | | | | 59 | | | | 40,563 | | | | 35,812 | | | | 40,611 | | | | 44,321 | |
| | 7,659 | | | — | | | | 7,704 | | | | — | | | | 7,777 | | | | 7,794 | | | | 7,655 | | | | 7,759 | |
| | 7,812 | | | — | | | | 7,789 | | | | — | | | | 7,861 | | | | 7,842 | | | | 7,797 | | | | 7,836 | |
| | 38,077 | | | 255 | | | | 31,191 | | | | 78 | | | | 92,960 | | | | 82,771 | | | | 109,815 | | | | 1,200,002 | |
| | 15,065 | | | — | | | | 12,724 | | | | — | | | | 16,089 | | | | 11,162 | | | | 16,511 | | | | 21,072 | |
| | 15,956 | | | — | | | | 17,194 | | | | — | | | | 18,113 | | | | 16,753 | | | | 18,128 | | | | 20,711 | |
| | 737,627 | | | 1,633 | | | | 811,706 | | | | 1,668 | | | | 2,530,702 | | | | 2,505,723 | | | | 917,379 | | | | 2,258,263 | |
| | 45,163 | | | — | | | | 38,153 | | | | — | | | | 48,236 | | | | 33,484 | | | | 49,515 | | | | 63,183 | |
| | 21,261 | | | — | | | | 22,915 | | | | — | | | | 24,134 | | | | 22,337 | | | | 24,164 | | | | 27,599 | |
| | 199,246 | | | 671 | | | | 218,411 | | | | 289 | | | | 604,835 | | | | 586,025 | | | | 246,078 | | | | 712,221 | |
| | 71,612 | | | 6,500 | | | | 67,733 | | | | 6,500 | | | | 67,733 | | | | 67,733 | | | | 70,836 | | | | 73,938 | |
| | 1,567 | | | — | | | | 1,567 | | | | — | | | | 1,568 | | | | 1,567 | | | | 1,567 | | | | 1,567 | |
| | 10,270 | | | — | | | | 7,689 | | | | — | | | | 8,400 | | | | 8,787 | | | | 10,074 | | | | 9,220 | |
| | 10,924 | | | — | | | | 12,643 | | | | — | | | | 11,851 | | | | 12,542 | | | | 12,496 | | | | 12,496 | |
| | 5,514 | | | — | | | | 4,455 | | | | — | | | | 5,741 | | | | 5,728 | | | | 6,841 | | | | 5,945 | |
| | 129 | | | — | | | | 81 | | | | — | | | | 309 | | | | 76 | | | | 10 | | | | 180 | |
| | 8,433 | | | 7 | | | | 10,626 | | | | 73 | | | | 29,294 | | | | 12,830 | | | | 19,985 | | | | 21,517 | |
| | 31 | | | — | | | | 31 | | | | — | | | | 26 | | | | 18 | | | | 31 | | | | 31 | |
| | 54 | | | — | | | | 51 | | | | — | | | | 157 | | | | 68 | | | | 41 | | | | 65 | |
| | 3,529 | | | — | | | | 4,140 | | | | — | | | | 11,926 | | | | 11,416 | | | | 4,141 | | | | 10,782 | |
| | 2,075 | | | — | | | | 2,421 | | | | — | | | | 7,010 | | | | 6,730 | | | | 2,467 | | | | 6,323 | |
| | 29,815 | | | — | | | | 39,663 | | | | — | | | | 48,459 | | | | 39,953 | | | | 29,634 | | | | 91,394 | |
| | | | | | | | | | | | | | | | | | | | | | | | | | | | | | |
| | 3,535,991 | | | 12,652 | | | | 2,162,989 | | | | 16,623 | | | | 13,727,175 | | | | 16,291,953 | | | | 7,180,703 | | | | 17,994,007 | |
| | (135,208) | | | (3,712 | ) | | | (169,692 | ) | | | (4,947 | ) | | | (250,052 | ) | | | (1,208,620 | ) | | | (274,430 | ) | | | (2,092,511 | ) |
| | (7,632) | | | — | | | | (2,534 | ) | | | — | | | | (120,248 | ) | | | (98,748 | ) | | | (74,073 | ) | | | (170,457 | ) |
| | | | | | | | | | | | | | | | | | | | | | | | | | | | | | |
| | 3,393,151 | | | 8,940 | | | | 1,990,763 | | | | 11,676 | | | | 13,356,875 | | | | 14,984,585 | | | | 6,832,200 | | | | 15,731,039 | |
| | | | | | | | | | | | | | | | | | | | | | | | | | | | | | |
| | 22,113,194 | | | 37,118 | | | | 8,129,782 | | | | (10,185 | ) | | | 23,255,442 | | | | (1,702,251 | ) | | | (1,150,662 | ) | | | 20,384,136 | |
| | | | | | | | | | | | | | | | | | | | | | | | | | | | | | |
| | | | | | | |
| | 6,223,097 | | | 231 | | | | 1,983,624 | | | | (1,683 | ) | | | 143,655,573 | | | | 69,537,386 | | | | 53,660,487 | | | | 157,759,817 | |
| | — | | | — | | | | 762,583 | | | | (31,047 | ) | | | 3,702,149 | | | | 4,801,800 | | | | 1,150,195 | | | | — | |
| | — | | | — | | | | — | | | | — | | | | — | | | | — | | | | — | | | | — | |
| | — | | | — | | | | — | | | | — | | | | — | | | | — | | | | — | | | | — | |
| | — | | | — | | | | — | | | | — | | | | — | | | | — | | | | — | | | | (933,648 | ) |
| | 777,263 | | | (14,870 | ) | | | — | | | | — | | | | — | | | | — | | | | — | | | | (1,374,184 | ) |
| | | | | | | | | | | | | | | | | | | | | | | | | | | | | | |
| | 7,000,360 | | | (14,639 | ) | | | 2,746,207 | | | | (32,730 | ) | | | 147,357,722 | | | | 74,339,186 | | | | 54,810,682 | | | | 155,451,985 | |
| | | | | | | | | | | | | | | | | | | | | | | | | | | | | | |
| | (10,280,600) | | | 59,171 | | | | 62,567,678 | | | | 457,924 | | | | 89,937,731 | | | | (67,449,676 | ) | | | 6,616,821 | | | | 122,043,402 | |
| | — | | | — | | | | 101,698 | | | | (10,366 | ) | | | 899,618 | | | | 558,123 | | | | 38,622 | | | | — | |
| | — | | | — | | | | — | | | | — | | | | — | | | | — | | | | — | | | | — | |
| | — | | | — | | | | — | | | | — | | | | — | | | | — | | | | — | | | | — | |
| | — | | | (18,824 | ) | | | — | | | | — | | | | — | | | | — | | | | — | | | | 190,840 | |
| | 12,993 | | | (13,725 | ) | | | — | | | | — | | | | — | | | | — | | | | — | | | | (1,003,391 | ) |
| | | | | | | | | | | | | | | | | | | | | | | | | | | | | | |
| | (10,267,607) | | | 26,622 | | | | 62,669,376 | | | | 447,558 | | | | 90,837,349 | | | | (66,891,553 | ) | | | 6,655,443 | | | | 121,230,851 | |
| | | | | | | | | | | | | | | | | | | | | | | | | | | | | | |
| | (3,267,247) | | | 11,983 | | | | 65,415,583 | | | | 414,828 | | | | 238,195,071 | | | | 7,447,633 | | | | 61,466,125 | | | | 276,682,836 | |
| | | | | | | | | | | | | | | | | | | | | | | | | | | | | | |
| $ | 18,845,947 | | $ | 49,101 | | | $ | 73,545,365 | | | $ | 404,643 | | | $ | 261,450,513 | | | $ | 5,745,382 | | | $ | 60,315,463 | | | $ | 297,066,972 | |
| | | | | | | | | | | | | | | | | | | | | | | | | | | | | | |
| | | | |
| | See Notes to Financial Statements. | | 131 |
| | |
| STATEMENTS OF CHANGES IN NET ASSETS | | |
| | |
| | | | | | | | |
| | | Money Market Fund | |
| | | For the Year Ended | |
| | | 12/31/06 | | | 12/31/05 | |
Operations: | | | | | | | | |
Net investment income | | $ | 42,093,683 | | | $ | 25,691,987 | |
Net realized gain (loss) on investment securities, foreign currency transactions and futures transactions** | | | (790 | ) | | | (5,430 | ) |
Net change in unrealized appreciation (depreciation) on investment securities, foreign currency translations, and futures contracts | | | — | | | | — | |
| | | | | | | | |
Net increase in net assets resulting from operations | | | 42,092,893 | | | | 25,686,557 | |
| | | | | | | | |
| | |
Dividends and Distributions to Shareholders: | | | | | | | | |
Dividends from net investment income | | | | | | | | |
GS2 shares | | | (4,561,908 | ) | | | (2,748,269 | ) |
GS4 shares | | | (37,128,467 | ) | | | (22,725,193 | ) |
GS6 shares | | | (196,811 | ) | | | (111,774 | ) |
GS8 shares | | | (206,497 | ) | | | (107,373 | ) |
Distributions from net realized capital gains | | | | | | | | |
GS2 shares | | | — | | | | — | |
GS4 shares | | | — | | | | — | |
GS6 shares | | | — | | | | — | |
GS8 shares | | | — | | | | — | |
Return of Capital | | | | | | | | |
GS4 shares | | | — | | | | — | |
| | | | | | | | |
Total dividends and distributions | | | (42,093,683 | ) | | | (25,692,609 | ) |
| | | | | | | | |
| | |
Capital Share Transactions: | | | | | | | | |
Proceeds from shares sold | | | | | | | | |
GS2 shares | | | 79,181,546 | | | | 97,579,053 | |
GS4 shares | | | 2,625,551,003 | | | | 2,495,446,536 | |
GS6 shares | | | 3 | | | | 43,984 | |
GS8 shares | | | 183,052 | | | | 54,568 | |
Reinvestment of dividends and distributions | | | | | | | | |
GS2 shares | | | 4,122,997 | | | | 2,495,133 | |
GS4 shares | | | 20,032,228 | | | | 11,467,878 | |
GS6 shares | | | 196,806 | | | | 111,760 | |
GS8 shares | | | 206,490 | | | | 107,373 | |
| | | | | | | | |
Total proceeds from shares sold and reinvested | | | 2,729,474,125 | | | | 2,607,306,285 | |
| | | | | | | | |
Value of shares redeemed | | | | | | | | |
GS2 shares | | | (75,848,387 | ) | | | (68,344,589 | ) |
GS4 shares | | | (2,481,322,504 | ) | | | (2,578,673,372 | ) |
GS6 shares | | | — | | | | (44,371 | ) |
GS8 shares | | | (77,413 | ) | | | (23,730 | ) |
| | | | | | | | |
Total value of shares redeemed | | | (2,557,248,304 | ) | | | (2,647,086,062 | ) |
| | | | | | | | |
Net increase (decrease) from capital share transactions (See Footnote 7) | | | 172,225,821 | | | | (39,779,777 | ) |
| | | | | | | | |
Total increase (decrease) in net assets | | | 172,225,031 | | | | (39,785,829 | ) |
| | | | | | | | |
| | |
Net Assets: | | | | | | | | |
Beginning of Period | | | 869,157,421 | | | | 908,943,250 | |
| | | | | | | | |
End of Period* | | $ | 1,041,382,452 | | | $ | 869,157,421 | |
| | | | | | | | |
| | $ | — | | | $ | — | |
| | | | | | | | |
| * | Including undistributed (distributions in excess of) net investment income |
| ** | Net increase from payments by affiliates and net gains (losses) realized on the disposal of investments in violation of restrictions (See Footnote 11) |
| | |
| 132 | | See Notes to Financial Statements. |
| | | | | | | | | | | | | | | | | | | | | | | | | | |
Low-Duration Bond Fund | | | Medium-Duration Bond Fund | | | Extended-Duration Bond Fund | | | Global Bond Fund | |
| For the Year Ended | | | For the Year Ended | | | For the Year Ended | | | For the Period | |
| 12/31/06 | | | 12/31/05 | | | 12/31/06 | | | 12/31/05 | | | 12/31/06 | | | 12/31/05 | | | 12/29/06 — 12/31/06 | |
| $ | 37,880,031 | | | $ | 27,489,857 | | | $ | 51,166,682 | | | $ | 37,575,293 | | | $ | 22,113,194 | | | $ | 22,113,407 | | | $ | 37,118 | |
| | (7,653,828) | | | | (10,659,334 | ) | | | (123,182 | ) | | | (1,097,926 | ) | | | 7,000,360 | | | | 5,519,087 | | | | (14,639 | ) |
| | 5,566,014 | | | | (4,406,789 | ) | | | (2,260,372 | ) | | | (11,782,137 | ) | | | (10,267,607 | ) | | | (1,883,245 | ) | | | 26,622 | |
| | | | | | | | | | | | | | | | | | | | | | | | | | | |
| | 35,792,217 | | | | 12,423,734 | | | | 48,783,128 | | | | 24,695,230 | | | | 18,845,947 | | | | 25,749,249 | | | | 49,101 | |
| | | | | | | | | | | | | | | | | | | | | | | | | | | |
| | | | | | |
| | (6,176,871) | | | | (4,479,831 | ) | | | (7,048,220 | ) | | | (5,612,463 | ) | | | (4,592,657 | ) | | | (4,268,161 | ) | | | — | |
| | (31,326,942) | | | | (22,992,157 | ) | | | (42,144,853 | ) | | | (34,648,385 | ) | | | (16,960,882 | ) | | | (17,074,698 | ) | | | (37,349 | ) |
| | (537,130) | | | | (466,469 | ) | | | (799,560 | ) | | | (721,610 | ) | | | (1,130,524 | ) | | | (1,179,267 | ) | | | — | |
| | (248,064) | | | | (177,594 | ) | | | (295,361 | ) | | | (253,597 | ) | | | (377,081 | ) | | | (357,326 | ) | | | — | |
| | — | | | | (1,147 | ) | | | — | | | | (645,746 | ) | | | (218,937 | ) | | | (1,712,320 | ) | | | — | |
| | — | | | | (6,206 | ) | | | — | | | | (4,143,819 | ) | | | (916,112 | ) | | | (6,850,285 | ) | | | — | |
| | — | | | | (124 | ) | | | — | | | | (84,242 | ) | | | (57,846 | ) | | | (452,529 | ) | | | — | |
| | — | | | | (55 | ) | | | — | | | | (32,762 | ) | | | (20,424 | ) | | | (160,140 | ) | | | — | |
| | — | | | | — | | | | — | | | | — | | | | — | | | | — | | | | (5,039 | ) |
| | | | | | | | | | | | | | | | | | | | | | | | | | | |
| | (38,289,007) | | | | (28,123,583 | ) | | | (50,287,994 | ) | | | (46,142,624 | ) | | | (24,274,463 | ) | | | (32,054,726 | ) | | | (42,388 | ) |
| | | | | | | | | | | | | | | | | | | | | | | | | | | |
| | | | | | |
| | 11,679,234 | | | | 48,785,555 | | | | 14,336,480 | | | | 49,692,680 | | | | 7,532,886 | | | | 29,365,042 | | | | — | |
| | 95,576,676 | | | | 106,691,749 | | | | 167,068,043 | | | | 194,463,337 | | | | 124,460,706 | | | | 83,231,124 | | | | 10 | |
| | 10,173,105 | | | | 474,994 | | | | 8,912 | | | | 565,914 | | | | — | | | | 915,722 | | | | — | |
| | 10,036,153 | | | | 1,242 | | | | 49,857 | | | | 642 | | | | 16,629 | | | | 597 | | | | — | |
| | | | | | |
| | 6,065,107 | | | | 4,405,558 | | | | 6,832,970 | | | | 6,068,879 | | | | 4,709,175 | | | | 5,855,155 | | | | — | |
| | 31,324,774 | | | | 22,996,558 | | | | 42,143,289 | | | | 38,787,840 | | | | 17,893,535 | | | | 24,555,600 | | | | 42,388 | |
| | 537,130 | | | | 466,593 | | | | 799,560 | | | | 805,854 | | | | 1,189,044 | | | | 1,631,795 | | | | — | |
| | 248,064 | | | | 177,649 | | | | 295,361 | | | | 286,358 | | | | 397,744 | | | | 517,466 | | | | — | |
| | | | | | | | | | | | | | | | | | | | | | | | | | | |
| | 165,640,243 | | | | 183,999,898 | | | | 231,534,472 | | | | 290,671,504 | | | | 156,199,719 | | | | 146,072,501 | | | | 42,398 | |
| | | | | | | | | | | | | | | | | | | | | | | | | | | |
| | | | | | |
| | (14,483,247) | | | | (5,405,010 | ) | | | (6,603,831 | ) | | | (4,002,381 | ) | | | (7,599,575 | ) | | | (7,220,381 | ) | | | — | |
| | (217,968,892) | | | | (118,147,765 | ) | | | (83,398,997 | ) | | | (87,788,179 | ) | | | (65,754,001 | ) | | | (111,075,009 | ) | | | — | |
| | (16,799,428) | | | | (5,304,186 | ) | | | (5,173 | ) | | | (4,180,127 | ) | | | — | | | | (10,716,919 | ) | | | — | |
| | (10,218,770) | | | | (57 | ) | | | (8,533 | ) | | | — | | | | (7,795 | ) | | | — | | | | — | |
| | (259,470,337) | | | | (128,857,018 | ) | | | (90,016,534 | ) | | | (95,970,687 | ) | | | (73,361,371 | ) | | | (129,012,309 | ) | | | — | |
| | (93,830,094) | | | | 55,142,880 | | | | 141,517,938 | | | | 194,700,817 | | | | 82,838,348 | | | | 17,060,192 | | | | 42,398 | |
| | (96,326,884) | | | | 39,443,031 | | | | 140,013,072 | | | | 173,253,423 | | | | 77,409,832 | | | | 10,754,715 | | | | 49,111 | |
| | | | | | | | | | | | | | | | | | | | | | | | | | | |
| | | | | | |
| | 910,177,004 | | | | 870,733,973 | | | | 1,101,061,785 | | | | 927,808,362 | | | | 471,660,822 | | | | 460,906,107 | | | | 104,586,191 | |
| | | | | | | | | | | | | | | | | | | | | | | | | | | |
| $ | 813,850,120 | | | $ | 910,177,004 | | | $ | 1,241,074,857 | | | $ | 1,101,061,785 | | | $ | 549,070,654 | | | $ | 471,660,822 | | | $ | 104,635,302 | |
| | | | | | | | | | | | | | | | | | | | | | | | | | | |
| $ | (383,132) | | | $ | 92,980 | | | $ | (723,086 | ) | | $ | (312,037 | ) | | $ | 169,393 | | | $ | 147,830 | | | $ | (14,870 | ) |
| | | | | | | | | | | | | | | | | | | | | | | | | | | |
| | | | |
| | See Notes to Financial Statements. | | 133 |
| | |
| STATEMENTS OF CHANGES IN NET ASSETS | | |
| | |
| | | | | | | | | | | | |
| | | Equity Index Fund | | | Real Estate Securities Fund | |
| | | For the Year Ended | | | For the Period | |
| | | 12/31/06 | | | 12/31/05 | | | 12/29/06 — 12/31/06 | |
Operations: | | | | | | | | | | | | |
Net investment income (loss) | | $ | 8,129,782 | | | $ | 6,839,477 | | | $ | (10,185 | ) |
Net realized gain (loss) on investment securities, foreign currency transactions and futures transactions | | | 2,746,207 | | | | 5,134,962 | | | | (32,730 | ) |
Net change in unrealized appreciation (depreciation) on investment securities, foreign currency translations, and futures contracts | | | 62,669,376 | | | | 9,385,998 | | | | 447,558 | |
| | | | | | | | | | | | |
Net increase in net assets resulting from operations | | | 73,545,365 | | | | 21,360,437 | | | | 404,643 | |
| | | | | | | | | | | | |
| | | |
Dividends and Distributions to Shareholders: | | | | | | | | | | | | |
Dividends from net investment income | | | | | | | | | | | | |
GS2 shares | | | (1,811,027 | ) | | | (1,447,323 | ) | | | — | |
GS4 shares | | | (5,917,983 | ) | | | (5,001,471 | ) | | | — | |
GS6 shares | | | (294,832 | ) | | | (247,026 | ) | | | — | |
GS8 shares | | | (113,746 | ) | | | (93,751 | ) | | | — | |
Distributions from net realized capital gains | | | | | | | | | | | | |
GS2 shares | | | (754,969 | ) | | | (264,015 | ) | | | — | |
GS4 shares | | | (2,752,967 | ) | | | (1,007,668 | ) | | | — | |
GS6 shares | | | (143,616 | ) | | | (50,704 | ) | | | — | |
GS8 shares | | | (63,092 | ) | | | (22,896 | ) | | | — | |
| | | | | | | | | | | | |
Total dividends and distributions | | | (11,852,232 | ) | | | (8,134,854 | ) | | | — | |
| | | | | | | | | | | | |
| | | |
Capital Share Transactions: | | | | | | | | | | | | |
Proceeds from shares sold | | | | | | | | | | | | |
GS2 shares | | | 7,932,747 | | | | 28,530,125 | | | | — | |
GS4 shares | | | 44,732,850 | | | | 42,657,409 | | | | 175,910 | |
GS6 shares | | | 520,858 | | | | — | | | | — | |
GS8 shares | | | 52,202 | | | | 1,205 | | | | — | |
Reinvestment of dividends and distributions | | | | | | | | | | | | |
GS2 shares | | | 2,548,084 | | | | 1,693,048 | | | | — | |
GS4 shares | | | 8,670,638 | | | | 6,008,602 | | | | — | |
GS6 shares | | | 438,448 | | | | 297,730 | | | | — | |
GS8 shares | | | 176,838 | | | | 116,700 | | | | — | |
| | | | | | | | | | | | |
Total proceeds from shares sold and reinvested | | | 65,072,665 | | | | 79,304,819 | | | | 175,910 | |
| | | | | | | | | | | | |
Value of shares redeemed | | | | | | | | | | | | |
GS2 shares | | | (5,326,752 | ) | | | (5,429,955 | ) | | | — | |
GS4 shares | | | (42,290,763 | ) | | | (75,399,007 | ) | | | (25,189 | ) |
GS6 shares | | | (105,112 | ) | | | — | | | | — | |
GS8 shares | | | (16,915 | ) | | | — | | | | — | |
| | | | | | | | | | | | |
Total value of shares redeemed | | | (47,739,542 | ) | | | (80,828,962 | ) | | | (25,189 | ) |
| | | | | | | | | | | | |
Net increase (decrease) from capital share transactions (See Footnote 7) | | | 17,333,123 | | | | (1,524,143 | ) | | | 150,721 | |
| | | | | | | | | | | | |
Total increase (decrease) in net assets | | | 79,026,256 | | | | 11,701,440 | | | | 555,364 | |
| | | | | | | | | | | | |
| | | |
Net Assets: | | | | | | | | | | | | |
Beginning of Period | | | 482,518,820 | | | | 470,817,380 | | | | 106,480,086 | |
| | | | | | | | | | | | |
End of Period* | | $ | 561,545,076 | | | $ | 482,518,820 | | | $ | 107,035,450 | |
| | | | | | | | | | | | |
| | $ | 39,815 | | | $ | 49,002 | | | $ | — | |
| | | | | | | | | | | | |
| * | Including undistributed (distributions in excess of) net investment income |
| | |
| 134 | | See Notes to Financial Statements. |
| | | | | | | | | | | | | | | | | | | | | | | | | | | | | |
| Value Equity Fund | | | Growth Equity Fund | | | Small Cap Equity Fund | | | International Equity Fund | |
| For the Year Ended | | | For the Year Ended | | | For the Year Ended | | | For the Year Ended | |
| 12/31/06 | | 12/31/05 | | | 12/31/06 | | | 12/31/05 | | | 12/31/06 | | | 12/31/05 | | | 12/31/06 | | | 12/31/05 | |
| $ | 23,255,442 | | $ | 21,726,574 | | | $ | (1,702,251 | ) | | $ | (3,158,666 | ) | | $ | (1,150,662 | ) | | $ | (997,229 | ) | | $ | 20,384,136 | | | $ | 17,340,082 | |
| | 147,357,722 | | | 103,688,872 | | | | 74,339,186 | | | | 65,893,593 | | | | 54,810,682 | | | | 58,732,966 | | | | 155,451,985 | | | | 93,816,550 | |
| | 90,837,349 | | | (27,125,867 | ) | | | (66,891,553 | ) | | | 60,393,513 | | | | 6,655,443 | | | | (23,098,045 | ) | | | 121,230,851 | | | | 88,506,831 | |
| | | | | | | | | | | | | | | | | | | | | | | | | | | | | | |
| | 261,450,513 | | | 98,289,579 | | | | 5,745,382 | | | | 123,128,440 | | | | 60,315,463 | | | | 34,637,692 | | | | 297,066,972 | | | | 199,663,463 | |
| | | | | | | | | | | | | | | | | | | | | | | | | | | | | | |
| | | | | | | |
| | (4,415,960) | | | (3,776,410 | ) | | | — | | | | — | | | | — | | | | — | | | | (4,337,809 | ) | | | (3,522,540 | ) |
| | (18,405,273) | | | (17,465,290 | ) | | | — | | | | — | | | | — | | | | — | | | | (20,582,825 | ) | | | (17,131,295 | ) |
| | (348,342) | | | (286,556 | ) | | | — | | | | — | | | | — | | | | — | | | | (419,099 | ) | | | (298,613 | ) |
| | (111,201) | | | (91,028 | ) | | | — | | | | — | | | | — | | | | — | | | | (114,866 | ) | | | (80,453 | ) |
| | | | | | | |
| | (26,469,711) | | | (16,300,818 | ) | | | — | | | | — | | | | (7,266,322 | ) | | | (9,061,949 | ) | | | (22,414,884 | ) | | | (2,372,854 | ) |
| | (127,117,029) | | | (85,737,706 | ) | | | — | | | | — | | | | (38,915,250 | ) | | | (51,308,587 | ) | | | (119,856,372 | ) | | | (12,803,717 | ) |
| | (2,615,565) | | | (1,574,230 | ) | | | — | | | | — | | | | (1,946,822 | ) | | | (2,313,815 | ) | | | (2,709,902 | ) | | | (260,237 | ) |
| | (992,929) | | | (589,222 | ) | | | — | | | | — | | | | (718,391 | ) | | | (848,678 | ) | | | (889,165 | ) | | | (85,266 | ) |
| | | | | | | | | | | | | | | | | | | | | | | | | | | | | | |
| | (180,476,010) | | | (125,821,260 | ) | | | — | | | | — | | | | (48,846,785 | ) | | | (63,533,029 | ) | | | (171,324,922 | ) | | | (36,554,975 | ) |
| | | | | | | | | | | | | | | | | | | | | | | | | | | | | | |
| | | | | | | |
| | 11,350,209 | | | 82,260,741 | | | | 18,448,736 | | | | 87,716,607 | | | | 8,276,686 | | | | 36,479,492 | | | | 16,785,257 | | | | 77,135,236 | |
| | 55,916,491 | | | 69,243,699 | | | | 73,453,988 | | | | 56,539,195 | | | | 60,055,857 | | | | 92,602,096 | | | | 100,447,788 | | | | 92,232,819 | |
| | 79,937 | | | 659,974 | | | | 375,355 | | | | 325,805 | | | | 213,366 | | | | 414,999 | | | | 330,919 | | | | 1,580,532 | |
| | 269,845 | | | 3,181 | | | | 97,250 | | | | 1,057 | | | | 127,287 | | | | 5,651 | | | | 159,389 | | | | 5,310 | |
| | | | | | | |
| | 30,795,143 | | | 19,689,834 | | | | — | | | | — | | | | 7,266,323 | | | | 8,955,618 | | | | 26,683,375 | | | | 5,807,372 | |
| | 145,514,189 | | | 103,197,880 | | | | — | | | | — | | | | 38,912,441 | | | | 51,300,141 | | | | 140,427,878 | | | | 29,934,318 | |
| | 2,963,907 | | | 1,860,786 | | | | — | | | | — | | | | 1,946,822 | | | | 2,313,815 | | | | 3,129,000 | | | | 558,850 | |
| | 1,104,130 | | | 680,250 | | | | — | | | | — | | | | 718,391 | | | | 848,679 | | | | 1,004,032 | | | | 165,719 | |
| | | | | | | | | | | | | | | | | | | | | | | | | | | | | | |
| | 247,993,851 | | | 277,596,345 | | | | 92,375,329 | | | | 144,582,664 | | | | 117,517,173 | | | | 192,920,491 | | | | 288,967,638 | | | | 207,420,156 | |
| | | | | | | | | | | | | | | | | | | | | | | | | | | | | | |
| | | | | | | |
| | (14,490,017) | | | (12,032,159 | ) | | | (11,648,012 | ) | | | (14,078,107 | ) | | | (10,679,211 | ) | | | (7,311,452 | ) | | | (33,456,390 | ) | | | (14,569,008 | ) |
| | (129,899,750) | | | (180,802,337 | ) | | | (97,743,433 | ) | | | (207,536,437 | ) | | | (87,995,931 | ) | | | (91,442,536 | ) | | | (217,111,405 | ) | | | (213,587,734 | ) |
| | (15,502) | | | (4,427,418 | ) | | | (68,887 | ) | | | (3,275,639 | ) | | | (197 | ) | | | (3,287,987 | ) | | | (20,378 | ) | | | (4,705,492 | ) |
| | (33,300) | | | (4 | ) | | | (10,826 | ) | | | — | | | | (30,749 | ) | | | (3 | ) | | | (24,684 | ) | | | (1 | ) |
| | | | | | | | | | | | | | | | | | | | | | | | | | | | | | |
| | (144,438,569) | | | (197,261,918 | ) | | | (109,471,158 | ) | | | (224,890,183 | ) | | | (98,706,088 | ) | | | (102,041,978 | ) | | | (250,612,857 | ) | | | (232,862,235 | ) |
| | | | | | | | | | | | | | | | | | | | | | | | | | | | | | |
| | | | | | | |
| | 103,555,282 | | | 80,334,427 | | | | (17,095,829 | ) | | | (80,307,519 | ) | | | 18,811,085 | | | | 90,878,513 | | | | 38,354,781 | | | | (25,442,079 | ) |
| | | | | | | | | | | | | | | | | | | | | | | | | | | | | | |
| | 184,529,785 | | | 52,802,746 | | | | (11,350,447 | ) | | | 42,820,921 | | | | 30,279,763 | | | | 61,983,176 | | | | 164,096,831 | | | | 137,666,409 | |
| | | | | | | | | | | | | | | | | | | | | | | | | | | | | | |
| | | | | | | |
| | 1,456,826,003 | | | 1,404,023,257 | | | | 1,551,831,060 | | | | 1,509,010,139 | | | | 546,645,949 | | | | 484,662,773 | | | | 1,322,418,883 | | | | 1,184,752,474 | |
| | | | | | | | | | | | | | | | | | | | | | | | | | | | | | |
| $ | 1,641,355,788 | | $ | 1,456,826,003 | | | $ | 1,540,480,613 | | | $ | 1,551,831,060 | | | $ | 576,925,712 | | | $ | 546,645,949 | | | $ | 1,486,515,714 | | | $ | 1,322,418,883 | |
| | | | | | | | | | | | | | | | | | | | | | | | | | | | | | |
| | | | | | | |
| $ | 81,956 | | $ | 107,290 | | | $ | — | | | $ | — | | | $ | — | | | $ | — | | | $ | (11,284,687 | ) | | $ | (7,227,733 | ) |
| | | | | | | | | | | | | | | | | | | | | | | | | | | | | | |
| | | | |
| | See Notes to Financial Statements. | | 135 |
FINANCIAL HIGHLIGHTS
| | | | | | | | | | | | | | | | | | | | | | | | | | | | | | | | | | | | | | | | | | | | | | |
| For a Share Outstanding Throughout the Years Ending December 31, unless otherwise indicated | | Ratios to Average Net Assets (1) | | | | |
| | | Net Asset
Value,
Beginning
of Period | | Net Investment
Income | | | Realized
and
Unrealized
Gain (Loss) on
Investments | | | Dividends
from Net
Investment
Income | | | Distributions
from Net
Realized
Capital
Gains | | | Net Asset
Value,
End of
Period | | Total
Return (2) | | | Net Assets,
End of Period
(000) | | Expenses,
Net | | | Expenses,
Including
Expense
Reduction | | | Expenses,
Before
Waivers
and
Expense
Reduction | | | Investment
Income,
Net | | | Investment
Income/
(Loss),
Excluding
Waivers and
Expense
Reduction | | | Portfolio
Turnover
Rate (2) | |
Money Market Fund | |
| | | | | | | | | | | | | |
GS2 Class | | | | | | | | | | | | | | | | | | | | | | | | | | | | | | | | | | | | | | | | | | | |
2006 | | $ | 1.00 | | $ | 0.05 | | | $ | — | † | | $ | (0.05 | ) | | $ | — | | | $ | 1.00 | | 4.92 | % | | $ | 100,559 | | 0.26 | % | | 0.26 | % | | 0.26 | % | | 4.82 | % | | 4.82 | % | | N/A | |
2005 | | | 1.00 | | | 0.03 | †† | | | — | † | | | (0.03 | )†† | | | — | | | | 1.00 | | 3.07 | | | | 93,103 | | 0.27 | | | 0.27 | | | 0.26 | | | 3.03 | | | 3.04 | | | N/A | |
2004 | | | 1.00 | | | 0.01 | | | | — | † | | | (0.01 | ) | | | — | | | | 1.00 | | 1.19 | | | | 61,374 | | 0.27 | | | 0.27 | | | 0.27 | | | 1.17 | | | 1.17 | | | N/A | |
2003 | | | 1.00 | | | 0.01 | | | | — | † | | | (0.01 | ) | | | — | † | | | 1.00 | | 1.04 | | | | 63,373 | | 0.27 | | | 0.27 | | | 0.28 | | | 0.91 | | | 0.90 | | | N/A | |
2002 | | | 1.00 | | | 0.02 | | | | — | | | | (0.02 | ) | | | — | † | | | 1.00 | | 1.80 | | | | 5,493 | | 0.25 | | | 0.25 | | | 0.55 | | | 1.75 | | | 1.45 | | | N/A | |
2001(3) | | | 1.00 | | | 0.01 | | | | — | | | | (0.01 | ) | | | — | | | | 1.00 | | 0.66 | | | | 25 | | 0.25 | | | 0.25 | | | 90.37 | | | 2.60 | | | (87.52 | ) | | N/A | |
GS4 Class | | | | | | | | | | | | | | | | | | | | | | | | | | | | | | | | | | | | | | | | | | | |
2006 | | $ | 1.00 | | $ | 0.05 | | | $ | — | † | | $ | (0.05 | ) | | $ | — | | | $ | 1.00 | | 4.72 | % | | $ | 930,582 | | 0.46 | % | | 0.46 | % | | 0.46 | % | | 4.64 | % | | 4.64 | % | | N/A | |
2005 | | | 1.00 | | | 0.03 | †† | | | — | † | | | (0.03 | )†† | | | — | | | | 1.00 | | 2.88 | | | | 766,322 | | 0.46 | | | 0.46 | | | 0.46 | | | 2.84 | | | 2.84 | | | N/A | |
2004 | | | 1.00 | | | 0.01 | | | | — | † | | | (0.01 | ) | | | — | | | | 1.00 | | 0.99 | | | | 838,087 | | 0.46 | | | 0.46 | | | 0.45 | | | 0.98 | | | 0.99 | | | N/A | |
2003 | | | 1.00 | | | 0.01 | | | | — | † | | | (0.01 | ) | | | — | † | | | 1.00 | | 0.85 | | | | 853,062 | | 0.45 | | | 0.45 | | | 0.45 | | | 0.84 | | | 0.84 | | | N/A | |
2002 | | | 1.00 | | | 0.02 | | | | — | | | | (0.02 | ) | | | — | † | | | 1.00 | | 1.60 | | | | 906,302 | | 0.45 | | | 0.44 | | | 0.50 | | | 1.58 | | | 1.52 | | | N/A | |
2001(3) | | | 1.00 | | | 0.01 | | | | — | | | | (0.01 | ) | | | — | | | | 1.00 | | 0.94 | | | | 996,380 | | 0.44 | | | 0.44 | | | 0.49 | | | 2.72 | | | 2.67 | | | N/A | |
GS6 Class | | | | | | | | | | | | | | | | | | | | | | | | | | | | | | | | | | | | | | | | | | | |
2006 | | $ | 1.00 | | $ | 0.04 | | | $ | — | † | | $ | (0.04 | ) | | $ | — | | | $ | 1.00 | | 4.29 | % | | $ | 4,784 | | 0.87 | % | | 0.87 | % | | 1.09 | % | | 4.21 | % | | 3.99 | % | | N/A | |
2005 | | | 1.00 | | | 0.02 | †† | | | — | † | | | (0.02 | )†† | | | — | | | | 1.00 | | 2.50 | | | | 4,587 | | 0.83 | | | 0.83 | | | 1.43 | | | 2.47 | | | 1.87 | | | N/A | |
2004 | | | 1.00 | | | 0.01 | | | | — | † | | | (0.01 | ) | | | — | | | | 1.00 | | 0.73 | | | | 4,476 | | 0.72 | | | 0.72 | | | 1.09 | | | 0.68 | | | 0.31 | | | N/A | |
2003 | | | 1.00 | | | 0.01 | | | | — | † | | | (0.01 | ) | | | — | † | | | 1.00 | | 0.57 | | | | 8,035 | | 0.73 | | | 0.73 | | | 0.91 | | | 0.61 | | | 0.43 | | | N/A | |
2002 | | | 1.00 | | | 0.01 | | | | — | | | | (0.01 | ) | | | — | † | | | 1.00 | | 1.38 | | | | 16,538 | | 0.65 | | | 0.65 | | | 0.77 | | | 1.35 | | | 1.23 | | | N/A | |
2001(3) | | | 1.00 | | | 0.01 | | | | — | | | | (0.01 | ) | | | — | | | | 1.00 | | 0.81 | | | | 788 | | 0.75 | | | 0.75 | | | 16.37 | | | 1.98 | | | (13.64 | ) | | N/A | |
GS8 Class | | | | | | | | | | | | | | | | | | | | | | | | | | | | | | | | | | | | | | | | | | | |
2006 | | $ | 1.00 | | $ | 0.04 | | | $ | — | † | | $ | (0.04 | ) | | $ | — | | | $ | 1.00 | | 3.98 | % | | $ | 5,457 | | 1.17 | % | | 1.17 | % | | 1.21 | % | | 3.91 | % | | 3.87 | % | | N/A | |
2005 | | | 1.00 | | | 0.02 | †† | | | — | † | | | (0.02 | )†† | | | — | | | | 1.00 | | 2.15 | | | | 5,145 | | 1.17 | | | 1.17 | | | 1.25 | | | 2.13 | | | 2.05 | | | N/A | |
2004(4) | | | 1.00 | | | — | † | | | — | † | | | — | † | | | — | | | | 1.00 | | 0.14 | | | | 5,007 | | 1.17 | | | 1.17 | | | 1.31 | | | 0.94 | | | 0.80 | | | N/A | |
| | | | | | | | | | | | |
Low-Duration Bond Fund | | | | | | | | | | | | | | | | | | | | | | | | | | | | | | | | | | | | | | | | |
| | | | | | | | | | | | | |
GS2 Class | | | | | | | | | | | | | | | | | | | | | | | | | | | | | | | | | | | | | | | | | | | |
2006 | | $ | 9.06 | | $ | 0.38 | # | | $ | (0.03 | ) | | $ | (0.52 | ) | | $ | — | | | $ | 8.89 | | 3.94 | % | | $ | 105,991 | | 0.45 | % | | 0.45 | % | | 0.47 | % | | 4.22 | % | | 4.20 | % | | 168 | % |
2005 | | | 9.32 | | | 0.30 | # | | | (0.15 | ) | | | (0.41 | ) | | | — | † | | | 9.06 | | 1.60 | | | | 104,681 | | 0.45 | | | 0.45 | | | 0.48 | | | 3.30 | | | 3.27 | | | 196 | |
2004 | | | 9.51 | | | 0.21 | # | | | (0.07 | ) | | | (0.28 | ) | | | (0.05 | ) | | | 9.32 | | 1.47 | | | | 59,777 | | 0.45 | | | 0.45 | | | 0.49 | | | 2.22 | | | 2.18 | | | 289 | |
2003 | | | 9.76 | | | 0.22 | # | | | 0.03 | | | | (0.37 | ) | | | (0.13 | ) | | | 9.51 | | 2.61 | | | | 53,726 | | 0.45 | | | 0.45 | | | 0.50 | | | 2.30 | | | 2.25 | | | 179 | |
2002 | | | 9.85 | | | 0.37 | # | | | 0.19 | | | | (0.50 | ) | | | (0.15 | ) | | | 9.76 | | 5.89 | | | | 6,320 | | 0.46 | | | 0.45 | | | 0.78 | | | 3.71 | | | 3.38 | | | 182 | |
2001(3) | | | 10.00 | | | 0.15 | | | | — | | | | (0.22 | ) | | | (0.08 | ) | | | 9.85 | | 1.54 | | | | 25 | | 0.45 | | | 0.45 | | | 57.60 | | | 4.73 | | | (52.42 | ) | | 80 | |
GS4 Class | | | | | | | | | | | | | | | | | | | | | | | | | | | | | | | | | | | | | | | | | | | |
2006 | | $ | 12.66 | | $ | 0.58 | # | | $ | (0.11 | ) | | $ | (0.50 | ) | | $ | — | | | $ | 12.63 | | 3.75 | % | | $ | 697,687 | | 0.61 | % | | 0.61 | % | | 0.66 | % | | 4.05 | % | | 4.00 | % | | 168 | % |
2005 | | | 12.87 | | | 0.40 | # | | | (0.22 | ) | | | (0.39 | ) | | | — | † | | | 12.66 | | 1.39 | | | | 789,077 | | 0.61 | | | 0.61 | | | 0.67 | | | 3.13 | | | 3.07 | | | 196 | |
2004 | | | 13.00 | | | 0.27 | # | | | (0.09 | ) | | | (0.26 | ) | | | (0.05 | ) | | | 12.87 | | 1.38 | | | | 789,866 | | 0.61 | | | 0.61 | | | 0.67 | | | 2.06 | | | 2.00 | | | 289 | |
2003 | | | 13.16 | | | 0.32 | # | | | — | | | | (0.35 | ) | | | (0.13 | ) | | | 13.00 | | 2.45 | | | | 727,265 | | 0.61 | | | 0.61 | | | 0.67 | | | 2.43 | | | 2.37 | | | 179 | |
2002 | | | 13.06 | | | 0.46 | # | | | 0.27 | | | | (0.48 | ) | | | (0.15 | ) | | | 13.16 | | 5.71 | | | | 763,987 | | 0.62 | | | 0.61 | | | 0.72 | | | 3.50 | | | 3.39 | | | 182 | |
2001(3) | | | 13.10 | | | 0.21 | | | | 0.05 | | | | (0.22 | ) | | | (0.08 | ) | | | 13.06 | | 1.96 | | | | 812,387 | | 0.61 | | | 0.61 | | | 0.72 | | | 4.47 | | | 4.36 | | | 80 | |
GS6 Class | | | | | | | | | | | | | | | | | | | | | | | | | | | | | | | | | | | | | | | | | | | |
2006 | | $ | 9.09 | | $ | 0.60 | # | | $ | (0.30 | ) | | $ | (0.46 | ) | | $ | — | | | $ | 8.93 | | 3.43 | % | | $ | 5,159 | | 1.00 | % | | 1.00 | % | | 1.05 | % | | 3.63 | % | | 3.58 | % | | 168 | % |
2005 | | | 9.36 | | | 0.25 | # | | | (0.16 | ) | | | (0.36 | ) | | | — | † | | | 9.09 | | 0.96 | | | | 11,380 | | 0.94 | | | 0.94 | | | 1.05 | | | 2.74 | | | 2.63 | | | 196 | |
2004 | | | 9.54 | | | 0.17 | # | | | (0.06 | ) | | | (0.24 | ) | | | (0.05 | ) | | | 9.36 | | 1.17 | | | | 16,087 | | 0.85 | | | 0.85 | | | 0.90 | | | 1.82 | | | 1.77 | | | 289 | |
2003 | | | 9.79 | | | 0.21 | # | | | — | | | | (0.33 | ) | | | (0.13 | ) | | | 9.54 | | 2.20 | | | | 22,452 | | 0.85 | | | 0.84 | | | 0.87 | | | 2.18 | | | 2.15 | | | 179 | |
2002 | | | 9.86 | | | 0.33 | # | | | 0.22 | | | | (0.47 | ) | | | (0.15 | ) | | | 9.79 | | 5.70 | | | | 20,985 | | 0.79 | | | 0.79 | | | 0.93 | | | 3.35 | | | 3.21 | | | 182 | |
2001(3) | | | 10.00 | | | 0.22 | | | | (0.06 | ) | | | (0.22 | ) | | | (0.08 | ) | | | 9.86 | | 1.54 | | | | 3,458 | | 0.85 | | | 0.85 | | | 74.57 | | | 4.18 | | | (69.54 | ) | | 80 | |
GS8 Class | | | | | | | | | | | | | | | | | | | | | | | | | | | | | | | | | | | | | | | | | | | |
2006 | | $ | 9.10 | | $ | 0.31 | # | | $ | (0.04 | ) | | $ | (0.44 | ) | | $ | — | | | $ | 8.93 | | 3.04 | % | | $ | 5,013 | | 1.30 | % | | 1.30 | % | | 1.43 | % | | 3.37 | % | | 3.24 | % | | 168 | % |
2005 | | | 9.36 | | | 0.23 | # | | | (0.16 | ) | | | (0.33 | ) | | | — | † | | | 9.10 | | 0.73 | | | | 5,040 | | 1.30 | | | 1.30 | | | 1.50 | | | 2.44 | | | 2.24 | | | 196 | |
2004(4) | | | 9.50 | | | 0.02 | # | | | (0.01 | ) | | | (0.10 | ) | | | (0.05 | ) | | | 9.36 | | 0.05 | | | | 5,004 | | 1.30 | | | 1.30 | | | 1.53 | | | 1.35 | | | 1.12 | | | 289 | |
| † | Amount represents less than $0.005 per share. |
| †† | Amount has been restated. See Footnote 12 in Notes to Financial Statements. |
| # | Calculated using the average shares outstanding method. |
| * | Net increase from payments by affiliates and net gains (losses) realized on the disposal of investments in violation of restrictions. As a result, there was no effect to realized and unrealized gain (loss) on investments per share or total return. (See Footnote 11) |
| (3) | Inception date was August 27, 2001. |
| (4) | Inception date was November 8, 2004. |
| (5) | Inception date was December 29, 2006. |
| | |
| 136 | | See Notes to Financial Statements. |
| | | | | | | | | | | | | | | | | | | | | | | | | | | | | | | | | | | | | | | | | | | | | | | | | | |
| | | | | | | | | | | | | | | | | | | | | | | | | | | Ratios to Average Net Assets (1) | | | | |
| | | Net Asset
Value,
Beginning
of Period | | Net Investment
Income | | | Realized
and
Unrealized
Gain (Loss) on
Investments | | | Dividends
from Net
Investment
Income | | | Distributions
from Net
Realized
Capital
Gains | | | Return
of
Capital | | | Net Asset
Value,
End of
Period | | Total
Return (2)* | | | Net Assets,
End of Period
(000) | | Expenses,
Net | | | Expenses,
Including
Expense
Reduction | | | Expenses,
Before
Waivers
and
Expense
Reduction | | | Investment
Income,
Net | | | Investment
Income/
(Loss),
Excluding
Waivers and
Expense
Reduction | | | Portfolio
Turnover
Rate (2) | |
| Medium-Duration Bond Fund | |
GS2 Class | |
2006 | | $ | 8.71 | | $ | 0.39 | # | | $ | (0.01 | ) | | $ | (0.57 | ) | | $ | — | | | $ | — | | | $ | 8.52 | | 4.50 | % | | $ | 113,051 | | 0.50 | % | | 0.50 | % | | 0.50 | % | | 4.60 | % | | 4.60 | % | | 440 | % |
2005 | | | 9.06 | | | 0.34 | # | | | (0.10 | ) | | | (0.53 | ) | | | (0.06 | ) | | | — | | | | 8.71 | | 2.62 | | | | 100,800 | | 0.50 | | | 0.50 | | | 0.53 | | | 3.84 | | | 3.81 | | | 465 | |
2004 | | | 9.24 | | | 0.28 | # | | | 0.21 | | | | (0.45 | ) | | | (0.22 | ) | | | — | | | | 9.06 | | 5.34 | | | | 52,865 | | 0.50 | | | 0.50 | | | 0.53 | | | 2.97 | | | 2.94 | | | 372 | |
2003 | | | 9.47 | | | 0.28 | # | | | 0.36 | | | | (0.58 | ) | | | (0.29 | ) | | | — | | | | 9.24 | | 6.80 | | | | 46,521 | | 0.50 | | | 0.50 | | | 0.55 | | | 2.96 | | | 2.91 | | | 458 | |
2002 | | | 9.65 | | | 0.46 | # | | | 0.40 | | | | (0.67 | ) | | | (0.37 | ) | | | — | | | | 9.47 | | 9.25 | | | | 7,218 | | 0.51 | | | 0.50 | | | 0.82 | | | 4.77 | | | 4.45 | | | 543 | |
2001(3) | | | 10.00 | | | 0.16 | | | | (0.08 | ) | | | (0.23 | ) | | | (0.20 | ) | | | — | † | | | 9.65 | | 0.89 | | | | 25 | | 0.52 | | | 0.50 | | | 92.28 | | | 4.99 | | | (86.79 | ) | | 247 | |
GS4 Class | |
2006 | | $ | 13.40 | | $ | 0.60 | # | | $ | (0.03 | ) | | $ | (0.55 | ) | | $ | — | | | $ | — | | | $ | 13.42 | | 4.37 | % | | $ | 1,108,958 | | 0.62 | % | | 0.62 | % | | 0.69 | % | | 4.48 | % | | 4.41 | % | | 440 | % |
2005 | | | 13.63 | | | 0.50 | # | | | (0.16 | ) | | | (0.51 | ) | | | (0.06 | ) | | | — | | | | 13.40 | | 2.50 | | | | 981,935 | | 0.62 | | | 0.62 | | | 0.71 | | | 3.71 | | | 3.62 | | | 465 | |
2004 | | | 13.58 | | | 0.39 | # | | | 0.31 | | | | (0.43 | ) | | | (0.22 | ) | | | — | | | | 13.63 | | 5.20 | | | | 853,377 | | 0.62 | | | 0.62 | | | 0.72 | | | 2.85 | | | 2.75 | | | 372 | |
2003 | | | 13.54 | | | 0.46 | # | | | 0.43 | | | | (0.56 | ) | | | (0.29 | ) | | | — | | | | 13.58 | | 6.62 | | | | 741,743 | | 0.62 | | | 0.62 | | | 0.71 | | | 3.37 | | | 3.28 | | | 458 | |
2002 | | | 13.37 | | | 0.62 | # | | | 0.57 | | | | (0.65 | ) | | | (0.37 | ) | | | — | | | | 13.54 | | 9.15 | | | | 767,926 | | 0.63 | | | 0.62 | | | 0.77 | | | 4.62 | | | 4.47 | | | 543 | |
2001(3) | | | 13.60 | | | 0.22 | | | | (0.02 | ) | | | (0.23 | ) | | | (0.20 | ) | | | — | † | | | 13.37 | | 1.49 | | | | 827,774 | | 0.64 | | | 0.62 | | | 0.77 | | | 4.62 | | | 4.47 | | | 247 | |
GS6 Class | |
2006 | | $ | 8.78 | | $ | 0.35 | # | | $ | (0.02 | ) | | $ | (0.52 | ) | | $ | — | | | $ | — | | | $ | 8.59 | | 3.89 | % | | $ | 13,709 | | 1.05 | % | | 1.05 | % | | 1.05 | % | | 4.05 | % | | 4.05 | % | | 440 | % |
2005 | | | 9.12 | | | 0.29 | # | | | (0.09 | ) | | | (0.48 | ) | | | (0.06 | ) | | | — | | | | 8.78 | | 2.18 | | | | 13,195 | | 1.00 | | | 1.00 | | | 1.06 | | | 3.29 | | | 3.21 | | | 465 | |
2004 | | | 9.30 | | | 0.24 | # | | | 0.21 | | | | (0.41 | ) | | | (0.22 | ) | | | — | | | | 9.12 | | 4.88 | | | | 16,524 | | 0.90 | | | 0.90 | | | 0.95 | | | 2.61 | | | 2.56 | | | 372 | |
2003 | | | 9.53 | | | 0.29 | # | | | 0.31 | | | | (0.54 | ) | | | (0.29 | ) | | | — | | | | 9.30 | | 6.33 | | | | 22,640 | | 0.90 | | | 0.90 | | | 0.96 | | | 3.03 | | | 2.97 | | | 458 | |
2002 | | | 9.70 | | | 0.42 | # | | | 0.41 | | | | (0.63 | ) | | | (0.37 | ) | | | — | | | | 9.53 | | 8.90 | | | | 19,289 | | 0.90 | | | 0.90 | | | 1.03 | | | 4.37 | | | 4.24 | | | 543 | |
2001(3) | | | 10.00 | | | 0.17 | | | | (0.04 | ) | | | (0.23 | ) | | | (0.20 | ) | | | — | † | | | 9.70 | | 1.30 | | | | 123 | | 0.92 | | | 0.90 | | | 58.64 | | | 4.49 | | | (53.25 | ) | | 247 | |
GS8 Class | |
2006 | | $ | 8.78 | | $ | 0.32 | # | | $ | (0.02 | ) | | $ | (0.49 | ) | | $ | — | | | $ | — | | | $ | 8.59 | | 3.58 | % | | $ | 5,356 | | 1.35 | % | | 1.35 | % | | 1.45 | % | | 3.75 | % | | 3.65 | % | | 440 | % |
2005 | | | 9.13 | | | 0.27 | # | | | (0.11 | ) | | | (0.45 | ) | | | (0.06 | ) | | | — | | | | 8.78 | | 1.73 | | | | 5,132 | | 1.35 | | | 1.35 | | | 1.52 | | | 2.96 | | | 2.81 | | | 465 | |
2004(4) | | | 9.46 | | | 0.02 | # | | | 0.07 | | | | (0.20 | ) | | | (0.22 | ) | | | — | | | | 9.13 | | 0.87 | | | | 5,043 | | 1.35 | | | 1.35 | | | 1.59 | | | 1.41 | | | 1.17 | | | 372 | |
|
| Extended-Duration Bond Fund | |
GS2 Class | |
2006 | | $ | 8.44 | | $ | 0.40 | # | | $ | (0.03 | )* | | $ | (0.65 | ) | | $ | (0.03 | ) | | $ | — | | | $ | 8.13 | | 4.75 | % | | $ | 59,916 | | 0.57 | % | | 0.57 | % | | 0.57 | % | | 4.91 | % | | 4.91 | % | | 100 | % |
2005 | | | 8.90 | | | 0.44 | # | | | 0.04 | | | | (0.68 | ) | | | (0.26 | ) | | | — | | | | 8.44 | | 5.65 | | | | 57,372 | | 0.56 | | | 0.56 | | | 0.57 | | | 4.90 | | | 4.89 | | | 38 | |
2004 | | | 9.23 | | | 0.47 | # | | | 0.27 | | | | (0.76 | ) | | | (0.31 | ) | | | — | | | | 8.90 | | 8.49 | | | | 32,309 | | 0.57 | | | 0.57 | | | 0.57 | | | 5.17 | | | 5.17 | | | 66 | |
2003 | | | 9.64 | | | 0.54 | # | | | 0.51 | | | | (0.79 | ) | | | (0.67 | ) | | | — | | | | 9.23 | | 11.32 | | | | 29,004 | | 0.59 | | | 0.59 | | | 0.60 | | | 5.49 | | | 5.48 | | | 121 | |
2002 | | | 9.84 | | | 0.65 | | | | 0.29 | | | | (0.90 | ) | | | (0.24 | ) | | | — | | | | 9.64 | | 10.27 | | | | 6,506 | | 0.64 | | | 0.64 | | | 0.88 | | | 6.47 | | | 6.23 | | | 45 | |
2001(3) | | | 10.00 | | | 0.24 | | | | (0.03 | ) | | | (0.33 | ) | | | (0.04 | ) | | | — | | | | 9.84 | | 2.13 | | | | 26 | | 0.66 | | | 0.65 | | | 90.75 | | | 6.62 | | | (83.48 | ) | | 22 | |
GS4 Class | |
2006 | | $ | 14.82 | | $ | 0.69 | # | | $ | (0.04 | )* | | $ | (0.63 | ) | | $ | (0.03 | ) | | $ | — | | | $ | 14.81 | | 4.56 | % | | $ | 467,877 | | 0.73 | % | | 0.73 | % | | 0.76 | % | | 4.75 | % | | 4.72 | % | | 100 | % |
2005 | | | 14.93 | | | 0.71 | # | | | 0.10 | | | | (0.66 | ) | | | (0.26 | ) | | | — | | | | 14.82 | | 5.54 | | | | 393,851 | | 0.73 | | | 0.73 | | | 0.76 | | | 4.72 | | | 4.69 | | | 38 | |
2004 | | | 14.78 | | | 0.75 | # | | | 0.45 | | | | (0.74 | ) | | | (0.31 | ) | | | — | | | | 14.93 | | 8.37 | | | | 399,459 | | 0.73 | | | 0.73 | | | 0.75 | | | 5.01 | | | 4.99 | | | 66 | |
2003 | | | 14.62 | | | 0.83 | # | | | 0.77 | | | | (0.77 | ) | | | (0.67 | ) | | | — | | | | 14.78 | | 11.19 | | | | 385,110 | | 0.73 | | | 0.73 | | | 0.75 | | | 5.46 | | | 5.44 | | | 121 | |
2002 | | | 14.37 | | | 0.90 | | | | 0.47 | | | | (0.88 | ) | | | (0.24 | ) | | | — | | | | 14.62 | | 10.03 | | | | 401,198 | | 0.73 | | | 0.73 | | | 0.82 | | | 6.29 | | | 6.20 | | | 45 | |
2001(3) | | | 14.38 | | | 0.32 | | | | 0.03 | | | | (0.32 | ) | | | (0.04 | ) | | | — | | | | 14.37 | | 2.48 | | | | 404,278 | | 0.74 | | | 0.73 | | | 0.84 | | | 6.32 | | | 6.21 | | | 22 | |
GS6 Class | |
2006 | | $ | 8.44 | | $ | 0.36 | # | | $ | (0.03 | )* | | $ | (0.61 | ) | | $ | (0.03 | ) | | $ | — | | | $ | 8.13 | | 4.09 | % | | $ | 15,730 | | 1.08 | % | | 1.08 | % | | 1.08 | % | | 4.39 | % | | 4.39 | % | | 100 | % |
2005 | | | 8.89 | | | 0.39 | # | | | 0.05 | | | | (0.63 | ) | | | (0.26 | ) | | | — | | | | 8.44 | | 5.19 | | | | 15,100 | | 1.09 | | | 1.09 | | | 1.09 | | | 4.37 | | | 4.37 | | | 38 | |
2004 | | | 9.22 | | | 0.44 | # | | | 0.27 | | | | (0.73 | ) | | | (0.31 | ) | | | — | | | | 8.89 | | 8.05 | | | | 24,043 | | 0.98 | | | 0.98 | | | 0.96 | | | 4.76 | | | 4.78 | | | 66 | |
2003 | | | 9.63 | | | 0.52 | # | | | 0.50 | | | | (0.76 | ) | | | (0.67 | ) | | | — | | | | 9.22 | | 10.95 | | | | 27,978 | | 0.93 | | | 0.93 | | | 0.94 | | | 5.25 | | | 5.24 | | | 121 | |
2002 | | | 9.83 | | | 0.62 | | | | 0.29 | | | | (0.87 | ) | | | (0.24 | ) | | | — | | | | 9.63 | | 9.93 | | | | 24,812 | | 0.91 | | | 0.91 | | | 1.03 | | | 6.18 | | | 6.06 | | | 45 | |
2001(3) | | | 10.00 | | | 0.32 | | | | (0.13 | ) | | | (0.32 | ) | | | (0.04 | ) | | | — | | | | 9.83 | | 1.91 | | | | 8,553 | | 1.06 | | | 1.05 | | | 28.96 | | | 6.14 | | | (21.77 | ) | | 22 | |
GS8 Class | |
2006 | | $ | 8.44 | | $ | 0.32 | # | | $ | (0.03 | )* | | $ | (0.58 | ) | | $ | (0.03 | ) | | $ | — | | | $ | 8.12 | | 3.79 | % | | $ | 5,547 | | 1.50 | % | | 1.50 | % | | 1.51 | % | | 3.97 | % | | 3.96 | % | | 100 | % |
2005 | | | 8.89 | | | 0.35 | # | | | 0.06 | | | | (0.60 | ) | | | (0.26 | ) | | | — | | | | 8.44 | | 4.81 | | | | 5,339 | | 1.50 | | | 1.50 | | | 1.56 | | | 3.95 | | | 3.89 | | | 38 | |
2004(4) | | | 9.23 | | | 0.06 | # | | | 0.11 | | | | (0.20 | ) | | | (0.31 | ) | | | — | | | | 8.89 | | 1.91 | | | | 5,096 | | 1.50 | | | 1.50 | | | 1.61 | | | 4.31 | | | 4.20 | | | 66 | |
| | | | |
| Global Bond Fund | | | | | | | | | | | | | |
GS4 Class | |
2006(5) | | $ | 10.12 | | $ | — | † | | $ | — | † | | $ | — | † | | $ | — | | | $ | — | † | | $ | 10.12 | | 0.04 | % | | $ | 104,635 | | 1.04 | % | | 1.04 | % | | 1.42 | % | | 4.32 | % | | 3.94 | % | | 0 | % |
| | | | |
| | See Notes to Financial Statements. | | 137 |
FINANCIAL HIGHLIGHTS (Continued)
| | | | | | | | | | | | | | | | | | | | | | | | | | | | | | | | | | | | | | | | | | | | | | | | | | |
| For a Share Outstanding Throughout the Years Ending December 31, unless otherwise indicated | | Ratios to Average Net Assets (1) | | | | |
| | | Net Asset
Value,
Beginning
of Period | | Net
Investment
Income | | | Realized
and
Unrealized
Gain (Loss)
on
Investments | | | Dividends
from Net
Investment
Income | | | Distributions
from Net
Realized
Capital
Gains | | | Excess
Distribution/
Return of
Capital | | | Net
Asset
Value,
End
of
Period | | Total
Return
(2) | | | Net
Assets,
End of
Period
(000) | | Expenses,
Net | | | Expenses,
Including
Expense
Reduction | | | Expenses,
Before
Waivers
and
Expense
Reduction | | | Investment
Income/
(Loss), Net | | | Investment
Income/
(Loss),
Excluding
Waivers
and
Expense
Reduction | | | Portfolio
Turnover
Rate (2) | |
| Equity Index Fund | |
GS2 Class | |
2006 | | $ | 9.96 | | $ | 0.18 | # | | $ | 1.33 | | | $ | (0.28 | ) | | $ | (0.11 | ) | | $ | — | | | $ | 11.08 | | 15.37 | % | | $ | 74,634 | | 0.23 | % | | 0.23 | % | | 0.23 | % | | 1.74 | % | | 1.74 | % | | 5 | % |
2005 | | | 9.78 | | | 0.16 | # | | | 0.30 | | | | (0.24 | ) | | | (0.04 | ) | | | — | | | | 9.96 | | 4.80 | | | | 62,214 | | 0.23 | | | 0.23 | | | 0.24 | | | 1.63 | | | 1.62 | | | 6 | |
2004 | | | 9.08 | | | 0.16 | # | | | 0.81 | | | | (0.27 | ) | | | — | | | | — | † | | | 9.78 | | 10.77 | | | | 36,148 | | 0.25 | | | 0.25 | | | 0.23 | | | 1.75 | | | 1.77 | | | 2 | |
2003 | | | 7.22 | | | 0.12 | # | | | 1.91 | | | | (0.17 | ) | | | — | | | | — | | | | 9.08 | | 28.19 | | | | 33,009 | | 0.25 | | | 0.25 | | | 0.28 | | | 1.46 | | | 1.43 | | | 2 | |
2002 | | | 9.58 | | | 0.14 | | | | (2.29 | ) | | | (0.18 | ) | | | (0.03 | ) | | | — | | | | 7.22 | | (22.57 | ) | | | 4,737 | | 0.25 | | | 0.25 | | | 0.60 | | | 1.40 | | | 1.05 | | | 3 | |
2001(3) | | | 10.00 | | | 0.03 | | | | (0.34 | ) | | | (0.06 | ) | | | (0.05 | ) | | | — | | | | 9.58 | | (3.14 | ) | | | 28 | | 0.25 | | | 0.25 | | | 86.25 | | | 1.19 | | | (84.81 | ) | | 3 | |
GS4 Class | |
2006 | | $ | 16.97 | | $ | 0.28 | # | | $ | 2.28 | | | $ | (0.25 | ) | | $ | (0.11 | ) | | $ | — | | | $ | 19.17 | | 15.19 | % | | $ | 466,429 | | 0.40 | % | | 0.40 | % | | 0.43 | % | | 1.57 | % | | 1.54 | % | | 5 | % |
2005 | | | 16.47 | | | 0.24 | # | | | 0.51 | | | | (0.21 | ) | | | (0.04 | ) | | | — | | | | 16.97 | | 4.61 | | | | 402,865 | | 0.40 | | | 0.40 | | | 0.43 | | | 1.46 | | | 1.43 | | | 6 | |
2004 | | | 15.12 | | | 0.25 | # | | | 1.35 | | | | (0.25 | ) | | | — | | | | — | | | | 16.47 | | 10.60 | | | | 417,962 | | 0.40 | | | 0.40 | | | 0.41 | | | 1.60 | | | 1.59 | | | 2 | |
2003 | | | 11.93 | | | 0.18 | # | | | 3.16 | | | | (0.15 | ) | | | — | | | | — | | | | 15.12 | | 28.03 | | | | 382,067 | | 0.40 | | | 0.40 | | | 0.44 | | | 1.33 | | | 1.29 | | | 2 | |
2002 | | | 15.64 | | | 0.17 | | | | (3.69 | ) | | | (0.16 | ) | | | (0.03 | ) | | | — | | | | 11.93 | | (22.59 | ) | | | 295,261 | | 0.40 | | | 0.40 | | | 0.51 | | | 1.21 | | | 1.10 | | | 3 | |
2001 (3) | | | 16.15 | | | 0.05 | | | | (0.46 | ) | | | (0.05 | ) | | | (0.05 | ) | | | — | | | | 15.64 | | (2.55 | ) | | | 401,471 | | 0.40 | | | 0.40 | | | 0.53 | | | 0.98 | | | 0.85 | | | 3 | |
GS6 Class | |
2006 | | $ | 10.02 | | $ | 0.14 | # | | $ | 1.34 | | | $ | (0.24 | ) | | $ | (0.11 | ) | | $ | — | | | $ | 11.15 | | 14.97 | % | | $ | 14,233 | | 0.60 | % | | 0.60 | % | | 0.78 | % | | 1.37 | % | | 1.19 | % | | 5 | % |
2005 | | | 9.83 | | | 0.13 | # | | | 0.31 | | | | (0.21 | ) | | | (0.04 | ) | | | — | | | | 10.02 | | 4.54 | | | | 12,019 | | 0.56 | | | 0.56 | | | 0.82 | | | 1.30 | | | 1.04 | | | 6 | |
2004 | | | 9.14 | | | 0.13 | # | | | 0.81 | | | | (0.25 | ) | | | — | | | | — | | | | 9.83 | | 10.37 | | | | 11,502 | | 0.45 | | | 0.45 | | | 0.72 | | | 1.41 | | | 1.14 | | | 2 | |
2003 | | | 7.26 | | | 0.10 | # | | | 1.93 | | | | (0.15 | ) | | | — | | | | — | | | | 9.14 | | 28.09 | | | | 17,395 | | 0.45 | | | 0.45 | | | 0.73 | | | 1.28 | | | 1.00 | | | 2 | |
2002 | | | 9.63 | | | 0.13 | | | | (2.31 | ) | | | (0.16 | ) | | | (0.03 | ) | | | — | | | | 7.26 | | (22.71 | ) | | | 12,890 | | 0.45 | | | 0.45 | | | 0.81 | | | 1.21 | | | 0.85 | | | 3 | |
2001(3) | | | 10.00 | | | 0.02 | | | | (0.28 | ) | | | (0.06 | ) | | | (0.05 | ) | | | — | | | | 9.63 | | (2.65 | ) | | | 367 | | 0.45 | | | 0.45 | | | 28.52 | | | 0.95 | | | (27.12 | ) | | 3 | |
GS8 Class | |
2006 | | $ | 10.02 | | $ | 0.11 | # | | $ | 1.34 | | | $ | (0.21 | ) | | $ | (0.11 | ) | | $ | — | | | $ | 11.15 | | 14.63 | % | | $ | 6,250 | | 0.90 | % | | 0.90 | % | | 1.14 | % | | 1.07 | % | | 0.83 | % | | 5 | % |
2005 | | | 9.84 | | | 0.09 | # | | | 0.31 | | | | (0.18 | ) | | | (0.04 | ) | | | — | | | | 10.02 | | 4.09 | | | | 5,421 | | 0.90 | | | 0.90 | | | 1.19 | | | 0.96 | | | 0.67 | | | 6 | |
2004(4) | | | 9.55 | | | 0.04 | # | | | 0.35 | | | | (0.10 | ) | | | — | | | | — | | | | 9.84 | | 4.11 | | | | 5,205 | | 0.90 | | | 0.90 | | | 1.27 | | | 3.18 | | | 2.81 | | | 2 | |
|
| Real Estate Securities Fund | |
GS4 Class | |
2006(5) | | $ | 12.50 | | $ | — | † | | $ | 0.05 | | | $ | — | | | $ | — | | | $ | — | | | $ | 12.55 | | 0.40 | % | | $ | 107,035 | | 1.33 | % | | 1.33 | % | | 1.88 | % | | (1.16 | )% | | (1.71 | )% | | 0 | % |
| † | Amount represents less than $0.005 per share. |
| # | Calculated using the average shares outstanding method. |
| (3) | Inception date was August 27, 2001. |
| (4) | Inception date was November 8, 2004. |
| (5) | Inception date was December 29, 2006. |
| | |
| 138 | | See Notes to Financial Statements. |
| | | | | | | | | | | | | | | | | | | | | | | | | | | | | | | | | | | | | | | | | | | | | | | | | | |
| | | | | | | | | | | | | | | | | | | | | | | | | | | Ratios to Average Net Assets (1) | | | | |
| | | Net Asset
Value,
Beginning
of Period | | Net
Investment
Income/
(Loss) | | | Realized
and
Unrealized
Gain (Loss)
on
Investments | | | Dividends
from Net
Investment
Income | | | Distributions
from Net
Realized
Capital
Gains | | | Excess
Distribution/
Return of
Capital | | | Net
Asset
Value,
End
of
Period | | Total
Return
(2) | | | Net
Assets,
End of
Period
(000) | | Expenses,
Net | | | Expenses,
Including
Expense
Reduction | | | Expenses,
Before
Waivers
and
Expense
Reduction | | | Investment
Income/
Waivers
and (Loss),
Net | | | Investment
Income/
(Loss),
Excluding
Portfolio
Expense
Reduction | | | Portfoloio
Turnover
Rate (2) | |
| Value Equity Fund | |
GS2 Class | |
2006 | | $ | 10.75 | | $ | 0.18 | # | | $ | 1.78 | | | $ | (0.28 | ) | | $ | (1.81 | ) | | $ | — | | | $ | 10.62 | | 18.76 | % | | $ | 181,940 | | 0.72 | % | | 0.71 | % | | 0.72 | % | | 1.70 | % | | 1.69 | % | | 76 | % |
2005 | | | 11.44 | | | 0.20 | # | | | 0.65 | | | | (0.28 | ) | | | (1.26 | ) | | | — | | | | 10.75 | | 7.40 | | | | 156,279 | | 0.73 | | | 0.72 | | | 0.73 | | | 1.72 | | | 1.71 | | | 54 | |
2004 | | | 9.94 | | | 0.17 | # | | | 1.59 | | | | (0.26 | ) | | | — | † | | | — | | | | 11.44 | | 17.83 | | | | 75,123 | | 0.75 | | | 0.74 | | | 0.74 | | | 1.64 | | | 1.64 | | | 56 | |
2003 | | | 7.77 | | | 0.14 | # | | | 2.26 | | | | (0.23 | ) | | | — | | | | — | | | | 9.94 | | 31.09 | | | | 69,991 | | 0.76 | | | 0.75 | | | 0.78 | | | 1.62 | | | 1.59 | | | 54 | |
2002 | | | 9.64 | | | 0.16 | | | | (1.80 | ) | | | (0.23 | ) | | | — | | | | — | † | | | 7.77 | | (17.22 | ) | | | 5,265 | | 0.76 | | | 0.72 | | | 1.06 | | | 1.77 | | | 1.43 | | | 70 | |
2001(3) | | | 10.00 | | | 0.06 | | | | (0.35 | ) | | | (0.07 | ) | | | — | | | | — | | | | 9.64 | | (2.88 | ) | | | 77 | | 0.76 | | | 0.76 | | | 81.37 | | | 1.60 | | | (79.01 | ) | | 21 | |
GS4 Class | |
2006 | | $ | 17.50 | | $ | 0.28 | # | | $ | 2.93 | | | $ | (0.25 | ) | | $ | (1.81 | ) | | $ | — | | | $ | 18.65 | | 18.64 | % | | $ | 1,434,773 | | 0.90 | % | | 0.89 | % | | 0.91 | % | | 1.52 | % | | 1.50 | % | | 76 | % |
2005 | | | 17.74 | | | 0.28 | # | | | 0.99 | | | | (0.25 | ) | | | (1.26 | ) | | | — | | | | 17.50 | | 7.13 | | | | 1,279,940 | | 0.90 | | | 0.89 | | | 0.93 | | | 1.53 | | | 1.49 | | | 54 | |
2004 | | | 15.28 | | | 0.24 | # | | | 2.45 | | | | (0.23 | ) | | | — | | | | — | | | | 17.74 | | 17.71 | | | | 1,305,669 | | 0.90 | | | 0.89 | | | 0.92 | | | 1.49 | | | 1.46 | | | 56 | |
2003 | | | 11.85 | | | 0.21 | # | | | 3.43 | | | | (0.21 | ) | | | —�� | | | | — | | | | 15.28 | | 30.84 | | | | 1,152,116 | | 0.90 | | | 0.88 | | | 0.94 | | | 1.59 | | | 1.53 | | | 54 | |
2002 | | | 14.57 | | | 0.21 | | | | (2.73 | ) | | | (0.20 | ) | | | — | | | | — | † | | | 11.85 | | (17.37 | ) | | | 938,583 | | 0.90 | | | 0.87 | | | 0.98 | | | 1.57 | | | 1.46 | | | 70 | |
2001(3) | | | 15.21 | | | 0.06 | | | | (0.64 | ) | | | (0.06 | ) | | | — | | | | — | | | | 14.57 | | (3.79 | ) | | | 1,159,209 | | 0.90 | | | 0.90 | | | 1.00 | | | 1.29 | | | 1.19 | | | 21 | |
GS6 Class | |
2006 | | $ | 10.69 | | $ | 0.12 | # | | $ | 1.78 | | | $ | (0.23 | ) | | $ | (1.81 | ) | | $ | — | | | $ | 10.55 | | 18.21 | % | | $ | 17,798 | | 1.24 | % | | 1.23 | % | | 1.24 | % | | 1.18 | % | | 1.17 | % | | 76 | % |
2005 | | | 11.39 | | | 0.14 | # | | | 0.64 | | | | (0.22 | ) | | | (1.26 | ) | | | — | | | | 10.69 | | 6.78 | | | | 15,003 | | 1.25 | | | 1.24 | | | 1.27 | | | 1.17 | | | 1.14 | | | 54 | |
2004 | | | 9.90 | | | 0.12 | # | | | 1.59 | | | | (0.22 | ) | | | — | | | | — | | | | 11.39 | | 17.35 | | | | 17,968 | | 1.15 | | | 1.14 | | | 1.22 | | | 1.20 | | | 1.12 | | | 56 | |
2003 | | | 7.75 | | | 0.11 | # | | | 2.23 | | | | (0.19 | ) | | | — | | | | — | | | | 9.90 | | 30.46 | | | | 19,680 | | 1.15 | | | 1.13 | | | 1.20 | | | 1.33 | | | 1.26 | | | 54 | |
2002 | | | 9.61 | | | 0.15 | | | | (1.82 | ) | | | (0.19 | ) | | | — | | | | — | † | | | 7.75 | | (17.48 | ) | | | 13,987 | | 1.15 | | | 1.11 | | | 1.29 | | | 1.38 | | | 1.20 | | | 70 | |
2001(3) | | | 10.00 | | | 0.03 | | | | (0.35 | ) | | | (0.07 | ) | | | — | | | | — | | | | 9.61 | | (3.23 | ) | | | 168 | | 1.15 | | | 1.15 | | | 65.50 | | | 1.12 | | | (63.23 | ) | | 21 | |
GS8 Class | |
2006 | | $ | 10.68 | | $ | 0.08 | # | | $ | 1.77 | | | $ | (0.19 | ) | | $ | (1.81 | ) | | $ | — | | | $ | 10.53 | | 17.75 | % | | $ | 6,844 | | 1.60 | % | | 1.59 | % | | 1.65 | % | | 0.82 | % | | 0.76 | % | | 76 | % |
2005 | | | 11.39 | | | 0.10 | # | | | 0.63 | | | | (0.18 | ) | | | (1.26 | ) | | | — | | | | 10.68 | | 6.39 | | | | 5,603 | | 1.60 | | | 1.59 | | | 1.71 | | | 0.83 | | | 0.71 | | | 54 | |
2004(4) | | | 10.89 | | | 0.03 | # | | | 0.54 | | | | (0.07 | ) | | | — | | | | — | | | | 11.39 | | 5.28 | | | | 5,262 | | 1.60 | | | 1.59 | | | 1.79 | | | 1.71 | | | 1.51 | | | 56 | |
|
| Growth Equity Fund | |
GS2 Class | |
2006 | | $ | 11.18 | | $ | — | † | | $ | 0.05 | | | $ | — | | | $ | — | | | $ | — | | | $ | 11.23 | | 0.45 | % | | $ | 179,852 | | 0.89 | % | | 0.88 | % | | 0.90 | % | | 0.00 | % | | (0.02 | )% | | 48 | % |
2005 | | | 10.29 | | | (0.03 | ) | | | 0.92 | | | | — | | | | — | | | | — | | | | 11.18 | | 8.65 | | | | 172,118 | | 0.87 | | | 0.86 | | | 0.89 | | | (0.10 | ) | | (0.13 | ) | | 49 | |
2004 | | | 9.16 | | | — | † | | | 1.13 | | | | — | | | | — | | | | — | | | | 10.29 | | 12.34 | | | | 84,177 | | 0.87 | | | 0.86 | | | 0.89 | | | 0.01 | | | (0.02 | ) | | 56 | |
2003 | | | 7.07 | | | (0.01 | ) | | | 2.10 | | | | — | | | | — | | | | — | | | | 9.16 | | 29.56 | | | | 79,547 | | 0.81 | | | 0.79 | | | 0.85 | | | (0.03 | ) | | (0.09 | ) | | 77 | |
2002 | | | 9.83 | | | 0.01 | | | | (2.77 | ) | | | — | | | | — | | | | — | | | | 7.07 | | (28.08 | ) | | | 4,553 | | 0.78 | | | 0.75 | | | 1.14 | | | 0.09 | | | (0.30 | ) | | 41 | |
2001(3) | | | 10.00 | | | — | † | | | (0.17 | ) | | | — | | | | — | | | | — | | | | 9.83 | | (1.70 | ) | | | 29 | | 0.78 | | | 0.78 | | | 83.19 | | | 0.02 | | | (82.39 | ) | | 9 | |
GS4 Class | |
2006 | | $ | 17.71 | | $ | (0.02 | ) | | $ | 0.08 | | | $ | — | | | $ | — | | | $ | — | | | $ | 17.77 | | 0.34 | % | | $ | 1,343,147 | | 1.01 | % | | 1.00 | % | | 1.09 | % | | (0.12 | )% | | (0.21 | )% | | 48 | % |
2005 | | | 16.33 | | | (0.04 | ) | | | 1.42 | | | | — | | | | — | | | | — | | | | 17.71 | | 8.45 | | | | 1,362,599 | | 0.99 | | | 0.98 | | | 1.08 | | | (0.22 | ) | | (0.32 | ) | | 49 | |
2004 | | | 14.55 | | | (0.02 | ) | | | 1.80 | | | | — | | | | — | | | | — | | | | 16.33 | | 12.23 | | | | 1,405,754 | | 0.99 | | | 0.98 | | | 1.08 | | | (0.11 | ) | | (0.21 | ) | | 56 | |
2003 | | | 11.23 | | | (0.01 | ) | | | 3.33 | | | | — | | | | — | | | | — | | | | 14.55 | | 29.56 | | | | 1,285,223 | | 0.92 | | | 0.90 | | | 1.01 | | | (0.07 | ) | | (0.18 | ) | | 77 | |
2002 | | | 15.63 | | | (0.01 | ) | | | (4.39 | ) | | | — | | | | — | | | | — | | | | 11.23 | | (28.15 | ) | | | 1,049,709 | | 0.90 | | | 0.88 | | | 1.02 | | | (0.05 | ) | | (0.19 | ) | | 41 | |
2001(3) | | | 15.93 | | | (0.01 | ) | | | (0.29 | ) | | | — | | | | — | | | | — | | | | 15.63 | | (1.88 | ) | | | 1,354,301 | | 0.90 | | | 0.90 | | | 1.05 | | | (0.11 | ) | | (0.26 | ) | | 9 | |
GS6 Class | |
2006 | | $ | 10.99 | | $ | (0.05 | ) | | $ | 0.05 | | | $ | — | | | $ | — | | | $ | — | | | $ | 10.99 | | 0.00 | % | | $ | 11,706 | | 1.41 | % | | 1.40 | % | | 1.48 | % | | (0.52 | )% | | (0.60 | )% | | 48 | % |
2005 | | | 10.17 | | | (0.09 | ) | | | 0.91 | | | | — | | | | — | | | | — | | | | 10.99 | | 8.06 | | | | 11,406 | | 1.34 | | | 1.33 | | | 1.47 | | | (0.57 | ) | | (0.71 | ) | | 49 | |
2004 | | | 9.08 | | | (0.07 | ) | | | 1.16 | | | | — | | | | — | | | | — | | | | 10.17 | | 12.00 | | | | 13,780 | | 1.24 | | | 1.23 | | | 1.44 | | | (0.42 | ) | | (0.63 | ) | | 56 | |
2003 | | | 7.03 | | | (0.02 | ) | | | 2.07 | | | | — | | | | — | | | | — | | | | 9.08 | | 29.16 | | | | 18,099 | | 1.17 | | | 1.15 | | | 1.33 | | | (0.33 | ) | | (0.51 | ) | | 77 | |
2002 | | | 9.81 | | | (0.02 | ) | | | (2.76 | ) | | | — | | | | — | | | | — | | | | 7.03 | | (28.34 | ) | | | 12,503 | | 1.15 | | | 1.12 | | | 1.36 | | | (0.28 | ) | | (0.52 | ) | | 41 | |
2001(3) | | | 10.00 | | | — | † | | | (0.19 | ) | | | — | | | | — | | | | — | | | | 9.81 | | (1.90 | ) | | | 309 | | 1.15 | | | 1.15 | | | 47.77 | | | (0.32 | ) | | (46.94 | ) | | 9 | |
GS8 Class | |
2006 | | $ | 10.95 | | $ | (0.08 | ) | | $ | 0.04 | | | $ | — | | | $ | — | | | $ | — | | | $ | 10.91 | | (0.37 | )% | | $ | 5,776 | | 1.71 | % | | 1.70 | % | | 1.84 | % | | (0.82 | )% | | (0.96 | )% | | 48 | % |
2005 | | | 10.16 | | | (0.09 | ) | | | 0.88 | | | | — | | | | — | | | | — | | | | 10.95 | | 7.78 | | | | 5,708 | | 1.69 | | | 1.68 | | | 1.88 | | | (0.92 | ) | | (1.12 | ) | | 49 | |
2004(4) | | | 9.59 | | | — | † | | | 0.57 | | | | — | | | | — | | | | — | | | | 10.16 | | 5.94 | | | | 5,299 | | 1.69 | | | 1.67 | | | 1.97 | | | 0.30 | | | — | | | 56 | |
| | | | |
| | See Notes to Financial Statements. | | 139 |
FINANCIAL HIGHLIGHTS (Continued)
| | | | | | | | | | | | | | | | | | | | | | | | | | | | | | | | | | | | | | | | | | | | | | | | | | |
| For a Share Outstanding Throughout the Years Ending December 31, unless otherwise indicated | | Ratios to Average Net Assets (1) | | | | |
| | | Net Asset
Value,
Beginning
of Period | | Net
Investment
Income/
(Loss) | | | Realized
and
Unrealized
Gain (Loss)
on
Investments | | | Dividends
from Net
Investment
Income | | | Distributions
from Net
Realized
Capital
Gains | | | Return
of
Capital | | | Net
Asset
Value,
End of
Period | | Total
Return
(2) | | | Net
Assets,
End of
Period
(000) | | Expenses,
Net | | | Expenses,
Including
Expense
Reduction | | | Expenses,
Before
Waivers
and
Expense
Reduction | | | Investment
Income/
(Loss), Net | | | Investment
Income/
(Loss),
Excluding
Waivers
and
Expense
Reduction | | | Portfolio
Turnover
Rate (2) | |
Small Cap Equity Fund | | | | | | | | | | | | | | | | | | | | | | | | | | | | | | | | | | | | | | | | | | | | |
| | | | | | | | | | | | | | | |
GS2 Class | | | | | | | | | | | | | | | | | | | | | | | | | | | | | | | | | | | | | | | | | | | | | | | | | | |
2006 | | $ | 11.40 | | $ | (0.01 | )# | | $ | 1.32 | | | $ | — | | | $ | (1.38 | ) | | $ | — | | | $ | 11.33 | | 11.40 | % | | $ | 66,695 | | 1.06 | % | | 1.05 | % | | 1.06 | % | | (0.05 | )% | | (0.06 | )% | | 86 | % |
2005 | | | 12.51 | | | (0.01 | )# | | | 0.84 | | | | — | | | | (1.94 | ) | | | — | | | | 11.40 | | 6.48 | | | | 62,009 | | 1.10 | | | 1.09 | | | 1.07 | | | (0.06 | ) | | (0.04 | ) | | 97 | |
2004 | | | 11.52 | | | (0.01 | ) | | | 1.74 | | | | — | | | | (0.74 | ) | | | — | | | | 12.51 | | 15.04 | | | | 28,639 | | 1.18 | | | 1.15 | | | 1.20 | | | (0.10 | ) | | (0.15 | ) | | 148 | |
2003 | | | 7.88 | | | (0.03 | ) | | | 3.67 | | | | — | | | | — | | | | — | | | | 11.52 | | 46.19 | | | | 25,415 | | 1.18 | | | 1.12 | | | 1.27 | | | (0.26 | ) | | (0.41 | ) | | 131 | |
2002 | | | 10.12 | | | (0.01 | ) | | | (2.23 | ) | | | — | | | | — | | | | — | | | | 7.88 | | (22.13 | ) | | | 4,869 | | 1.18 | | | 1.11 | | | 1.60 | | | (0.12 | ) | | (0.61 | ) | | 160 | |
2001(3) | | | 10.00 | | | — | † | | | 0.12 | | | | — | | | | — | | | | — | | | | 10.12 | | 1.20 | | | | 81 | | 1.18 | | | 1.18 | | | 76.30 | | | 0.12 | | | (75.00 | ) | | 92 | |
| | | | | | | | | | | | | | | |
GS4 Class | | | | | | | | | | | | | | | | | | | | | | | | | | | | | | | | | | | | | | | | | | | | | | | | | | |
2006 | | $ | 15.61 | | $ | (0.03 | )# | | $ | 1.80 | | | $ | — | | | $ | (1.38 | ) | | $ | — | | | $ | 16.00 | | 11.27 | % | | $ | 486,358 | | 1.21 | % | | 1.20 | % | | 1.25 | % | | (0.20 | )% | | (0.25 | )% | | 86 | % |
2005 | | | 16.48 | | | (0.03 | )# | | | 1.10 | | | | — | | | | (1.94 | ) | | | — | | | | 15.61 | | 6.37 | | | | 463,367 | | 1.22 | | | 1.21 | | | 1.27 | | | (0.19 | ) | | (0.26 | ) | | 97 | |
2004 | | | 14.99 | | | (0.02 | ) | | | 2.25 | | | | — | | | | (0.74 | ) | | | — | | | | 16.48 | | 14.89 | | | | 432,763 | | 1.25 | | | 1.22 | | | 1.37 | | | (0.16 | ) | | (0.31 | ) | | 148 | |
2003 | | | 10.25 | | | (0.04 | ) | | | 4.78 | | | | — | | | | — | | | | — | | | | 14.99 | | 46.24 | | | | 357,703 | | 1.25 | | | 1.19 | | | 1.43 | | | (0.34 | ) | | (0.58 | ) | | 131 | |
2002 | | | 13.18 | | | (0.02 | ) | | | (2.91 | ) | | | — | | | | — | | | | — | | | | 10.25 | | (22.23 | ) | | | 232,992 | | 1.25 | | | 1.19 | | | 1.51 | | | (0.19 | ) | | (0.51 | ) | | 160 | |
2001(3) | | | 13.07 | | | (0.01 | ) | | | 0.12 | | | | — | | | | — | | | | — | | | | 13.18 | | 0.84 | | | | 321,743 | | 1.25 | | | 1.25 | | | 1.52 | | | (0.13 | ) | | (0.40 | ) | | 92 | |
| | | | | | | | | | | | | | | |
GS6 Class | | | | | | | | | | | | | | | | | | | | | | | | | | | | | | | | | | | | | | | | | | | | | | | | | | |
2006 | | $ | 11.16 | | $ | (0.07 | )# | | $ | 1.29 | | | $ | — | | | $ | (1.38 | ) | | $ | — | | | $ | 11.00 | | 10.84 | % | | $ | 17,483 | | 1.58 | % | | 1.57 | % | | 1.57 | % | | (0.57 | )% | | (0.57 | )% | | 86 | % |
2005 | | | 12.34 | | | (0.06 | )# | | | 0.82 | | | | — | | | | (1.94 | ) | | | — | | | | 11.16 | | 6.00 | | | | 15,577 | | 1.57 | | | 1.56 | | | 1.59 | | | (0.53 | ) | | (0.56 | ) | | 97 | |
2004 | | | 11.41 | | | (0.08 | ) | | | 1.75 | | | | — | | | | (0.74 | ) | | | — | | | | 12.34 | | 14.66 | | | | 17,875 | | 1.50 | | | 1.47 | | | 1.69 | | | (0.43 | ) | | (0.65 | ) | | 148 | |
2003 | | | 7.83 | | | (0.04 | ) | | | 3.62 | | | | — | | | | — | | | | — | | | | 11.41 | | 45.72 | | | | 22,520 | | 1.50 | | | 1.44 | | | 1.70 | | | (0.59 | ) | | (0.85 | ) | | 131 | |
2002 | | | 10.09 | | | (0.04 | ) | | | (2.22 | ) | | | — | | | | — | | | | — | | | | 7.83 | | (22.40 | ) | | | 12,878 | | 1.50 | | | 1.43 | | | 1.82 | | | (0.44 | ) | | (0.83 | ) | | 160 | |
2001(3) | | | 10.00 | | | — | † | | | 0.09 | | | | — | | | | — | | | | — | | | | 10.09 | | 0.90 | | | | 115 | | 1.50 | | | 1.50 | | | 123.38 | | | (0.28 | ) | | (122.16 | ) | | 92 | |
| | | | | | | | | | | | | | | |
GS8 Class | | | | | | | | | | | | | | | | | | | | | | | | | | | | | | | | | | | | | | | | | | | | | | | | | | |
2006 | | $ | 11.11 | | $ | (0.10 | )# | | $ | 1.27 | | | $ | — | | | $ | (1.38 | ) | | $ | — | | | $ | 10.90 | | 10.44 | % | | $ | 6,390 | | 1.91 | % | | 1.90 | % | | 1.99 | % | | (0.90 | )% | | (0.99 | )% | | 86 | % |
2005 | | | 12.34 | | | (0.11 | )# | | | 0.82 | | | | — | | | | (1.94 | ) | | | — | | | | 11.11 | | 5.61 | | | | 5,694 | | 1.92 | | | 1.91 | | | 2.07 | | | (0.88 | ) | | (1.04 | ) | | 97 | |
2004(4) | | | 12.14 | | | (0.01 | ) | | | 0.95 | | | | — | | | | (0.74 | ) | | | — | | | | 12.34 | | 7.77 | | | | 5,386 | | 1.95 | | | 1.91 | | | 2.19 | | | (0.68 | ) | | (0.96 | ) | | 148 | |
| | | | | | | | | | | | | |
International Equity Fund | | | | | | | | | | | | | | | | | | | | | | | | | | | | | | | | | | | | | | | | | | | | |
| | | | | | | | | | | | | | | |
GS2 Class | | | | | | | | | | | | | | | | | | | | | | | | | | | | | | | | | | | | | | | | | | | | | | | | | | |
2006 | | $ | 14.71 | | $ | 0.25 | | | $ | 3.23 | | | $ | (0.35 | ) | | $ | (2.04 | ) | | $ | — | | | $ | 15.80 | | 23.78 | % | | $ | 199,989 | | 0.97 | % | | 0.96 | % | | 1.10 | % | | 1.60 | % | | 1.46 | % | | 26 | % |
2005 | | | 12.93 | | | 0.29 | | | | 1.99 | | | | (0.30 | ) | | | (0.20 | ) | | | — | | | | 14.71 | | 17.66 | | | | 176,819 | | 0.97 | | | 0.95 | | | 1.12 | | | 1.59 | | | 1.43 | | | 30 | |
2004 | | | 11.06 | | | 0.16 | | | | 1.93 | | | | (0.22 | ) | | | — | | | | — | | | | 12.93 | | 18.93 | | | | 87,300 | | 0.97 | | | 0.95 | | | 1.13 | | | 1.32 | | | 1.14 | | | 33 | |
2003 | | | 8.26 | | | 0.08 | # | | | 2.90 | | | | (0.18 | ) | | | — | | | | — | | | | 11.06 | | 36.06 | | | | 50,390 | | 0.97 | | | 0.95 | | | 1.14 | | | 0.86 | | | 0.67 | | | 33 | |
2002 | | | 9.50 | | | 0.11 | | | | (1.22 | ) | | | (0.13 | ) | | | — | | | | — | † | | | 8.26 | | (11.72 | ) | | | 5,416 | | 0.96 | | | 0.93 | | | 1.43 | | | 1.29 | | | 0.79 | | | 30 | |
2001(3) | | | 10.00 | | | — | † | | | (0.47 | ) | | | (0.03 | ) | | | — | | | | — | | | | 9.50 | | (4.69 | ) | | | 27 | | 0.96 | | | 0.96 | | | 88.97 | | | 0.11 | | | (87.90 | ) | | 20 | |
| | | | | | | | | | | | | | | |
GS4 Class | | | | | | | | | | | | | | | | | | | | | | | | | | | | | | | | | | | | | | | | | | | | | | | | | | |
2006 | | $ | 17.37 | | $ | 0.26 | | | $ | 3.82 | | | $ | (0.32 | ) | | $ | (2.04 | ) | | $ | — | | | $ | 19.09 | | 23.58 | % | | $ | 1,254,839 | | 1.15 | % | | 1.14 | % | | 1.29 | % | | 1.43 | % | | 1.28 | % | | 26 | % |
2005 | | | 15.20 | | | 0.23 | | | | 2.41 | | | | (0.27 | ) | | | (0.20 | ) | | | — | | | | 17.37 | | 17.39 | | | | 1,120,234 | | 1.15 | | | 1.13 | | | 1.31 | | | 1.42 | | | 1.24 | | | 30 | |
2004 | | | 12.96 | | | 0.17 | | | | 2.26 | | | | (0.19 | ) | | | — | | | | — | | | | 15.20 | | 18.80 | | | | 1,072,556 | | 1.15 | | | 1.13 | | | 1.31 | | | 1.22 | | | 1.04 | | | 33 | |
2003 | | | 9.66 | | | 0.15 | # | | | 3.31 | | | | (0.16 | ) | | | — | | | | — | | | | 12.96 | | 35.81 | | | | 920,664 | | 1.15 | | | 1.13 | | | 1.31 | | | 1.39 | | | 1.21 | | | 33 | |
2002 | | | 11.09 | | | 0.11 | | | | (1.43 | ) | | | (0.11 | ) | | | — | | | | — | † | | | 9.66 | | (11.94 | ) | | | 698,704 | | 1.15 | | | 1.12 | | | 1.35 | | | 1.00 | | | 0.77 | | | 30 | |
2001(3) | | | 11.66 | | | 0.01 | | | | (0.55 | ) | | | (0.03 | ) | | | — | | | | — | | | | 11.09 | | (4.61 | ) | | | 795,363 | | 1.15 | | | 1.15 | | | 1.37 | | | 0.28 | | | 0.06 | | | 20 | |
| | | | | | | | | | | | | | | |
GS6 Class | | | | | | | | | | | | | | | | | | | | | | | | | | | | | | | | | | | | | | | | | | | | | | | | | | |
2006 | | $ | 14.56 | | $ | 0.18 | | | $ | 3.17 | | | $ | (0.28 | ) | | $ | (2.04 | ) | | $ | — | | | $ | 15.59 | | 23.14 | % | | $ | 23,877 | | 1.47 | % | | 1.46 | % | | 1.60 | % | | 1.10 | % | | 0.96 | % | | 26 | % |
2005 | | | 12.80 | | | 0.13 | | | | 2.06 | | | | (0.23 | ) | | | (0.20 | ) | | | — | | | | 14.56 | | 17.15 | | | | 19,123 | | 1.45 | | | 1.43 | | | 1.64 | | | 1.11 | | | 0.91 | | | 30 | |
2004 | | | 10.95 | | | 0.12 | | | | 1.90 | | | | (0.17 | ) | | | — | | | | — | | | | 12.80 | | 18.52 | | | | 19,551 | | 1.35 | | | 1.33 | | | 1.58 | | | 1.06 | | | 0.81 | | | 33 | |
2003 | | | 8.19 | | | 0.10 | # | | | 2.80 | | | | (0.14 | ) | | | — | | | | — | | | | 10.95 | | 35.47 | | | | 20,434 | | 1.36 | | | 1.34 | | | 1.50 | | | 1.14 | | | 0.98 | | | 33 | |
2002 | | | 9.43 | | | 0.06 | | | | (1.21 | ) | | | (0.09 | ) | | | — | | | | — | † | | | 8.19 | | (12.18 | ) | | | 14,078 | | 1.37 | | | 1.34 | | | 1.64 | | | 0.88 | | | 0.58 | | | 30 | |
2001(3) | | | 10.00 | | | (0.01 | )# | | | (0.53 | ) | | | (0.03 | ) | | | — | | | | — | | | | 9.43 | | (5.40 | ) | | | 51 | | 1.45 | | | 1.45 | | | 256.83 | | | (0.32 | ) | | (255.70 | ) | | 20 | |
| | | | | | | | | | | | | | | |
GS8 Class | | | | | | | | | | | | | | | | | | | | | | | | | | | | | | | | | | | | | | | | | | | | | | | | | | |
2006 | | $ | 14.54 | | $ | 0.14 | | | $ | 3.16 | | | $ | (0.24 | ) | | $ | (2.04 | ) | | $ | — | | | $ | 15.56 | | 22.78 | % | | $ | 7,811 | | 1.80 | % | | 1.79 | % | | 2.00 | % | | 0.76 | % | | 0.55 | % | | 26 | % |
2005 | | | 12.80 | | | 0.11 | | | | 2.02 | | | | (0.19 | ) | | | (0.20 | ) | | | — | | | | 14.54 | | 16.67 | | | | 6,243 | | 1.80 | | | 1.78 | | | 2.11 | | | 0.76 | | | 0.43 | | | 30 | |
2004(4) | | | 12.05 | | | — | † | | | 0.84 | | | | (0.09 | ) | | | — | | | | — | | | | 12.80 | | 6.93 | | | | 5,346 | | 1.80 | | | 1.78 | | | 2.16 | | | (0.37 | ) | | (0.75 | ) | | 33 | |
| † | Amount represents less than $0.005 per share. |
| # | Calculated using the average shares outstanding method. |
| (3) | Inception date was August 27, 2001. |
| (4) | Inception date was November 8, 2004. |
| | |
| 140 | | See Notes to Financial Statements. |
NOTES TO FINANCIAL STATEMENTS
1. DESCRIPTION OF THE FUNDS
GuideStone Funds (the “Trust”) was organized as a Delaware statutory trust on March 2, 2000. The Trust has established nineteen series (each a “Fund” and together, the “Funds”). Each Fund is a diversified, open-end management investment company, registered under the Investment Company Act of 1940, as amended (the “1940 Act”). The Global Bond and Real Estate Securities Funds commenced operations as a registered investment company on December 29, 2006. Prior to December 29, 2006 they operated as unregistered entities.
The Flexible Income Fund, Growth & Income Fund, Capital Opportunities Fund, Global Equity Fund, Flexible Income Fund I, Growth & Income Fund I, Capital Opportunities Fund I and Global Equity Fund I are each referred to as a “Blended Fund” and together are referred to as the “Blended Funds.” The remaining Funds are each referred to as a “Select Fund” and are together referred to as the “Select Funds.” The Low-Duration Bond Fund, Medium-Duration Bond Fund, Extended-Duration Bond Fund and Global Bond Fund are together referred to as the “Bond Funds.” The Equity Index Fund, Real Estate Securities Fund, Value Equity Fund, Growth Equity Fund, Small Cap Equity Fund, and International Equity Fund are together referred to as the “Equity Funds.” The Money Market Fund is referred to as the “Money Market Fund.”
There are four classes of shares issued by the Funds — the GS2 Class, the GS4 Class, the GS6 Class and the GS8 Class. All classes of shares have identical voting, dividend and liquidation rights. The distribution fee (class specific expense) differs among classes. Income, expenses (other than class specific expenses) and realized and unrealized gains or losses on investments are allocated to each class of shares based upon its relative net assets.
Each Fund is a separate mutual fund with its own investment objective, strategies and risks. The Select Funds invest directly in particular types of fixed income obligations, stocks and other investments. The Blended Funds primarily invest in a different mix of the Select Funds to meet a specified investment strategy. The Blended Funds are commonly referred to as “Fund of Funds”.
2. SIGNIFICANT ACCOUNTING POLICIES
The following significant accounting policies are in conformity with generally accepted accounting principles in the United States of America which requires management to make estimates and assumptions that affect the reported amounts of assets and liabilities and disclosures of contingent assets and liabilities at the date of the financial statements and the reported amounts of income and expenses during the reporting period. Actual results could differ from those estimates.
a. Valuation of Securities
The Funds (except the Money Market Fund) each value securities traded on national securities exchanges or included in national market systems at the last quoted sale price, or official close price, on the principal exchange on which they were traded, or, in the absence of any sale, or official close price, at the closing bid price. Securities which are primarily traded on foreign exchanges are generally valued at the closing values of such securities on their respective exchanges, except that when an occurrence subsequent to the time when the foreign security is valued is likely to have changed such value, then the fair value of those securities will be determined through procedures established by or under the direction of the Board of Trustees. Non-exchange traded securities for which an over-the-counter quotation is readily available are valued at the last quoted bid price. Debt securities, excluding asset-backed and mortgage-backed securities, are valued at the mean of the last bid and asked prices available. Asset-backed and mortgage-backed securities are valued at the last bid price. Options and warrants for which the primary market is a national securities exchange are valued at the last sale price on the exchange on which they are traded, or, in the absence of any sale, at the closing bid price. Options and warrants not traded on a national securities exchange are valued at the last quoted bid price. Short-term securities maturing in more than 60 days from the valuation date are valued at the mean of the last bid
141
and asked prices; those maturing in 60 days or less are valued at amortized cost. Futures contracts are valued at the closing settlement price on the exchange on which they are primarily traded. Forward foreign exchange contracts are valued based upon closing exchange rates from each respective foreign market. Swap agreements are valued daily based upon the terms specific to each agreement with its counterparty. To the extent available, valuations of portfolio securities are provided by independent pricing services approved by the Board of Trustees. Debt securities are valued on the basis of broker quotations or valuations provided by a pricing service which may use a matrix, formula or other objective method that takes into consideration market indices, matrices, yield curves and other specific adjustments. Certain fixed income securities are valued by the sub-adviser using various methodologies. Securities for which market quotations are not readily available are valued at fair value according to methods established in good faith by the Board of Trustees.
For securities that principally trade on a foreign market or exchange, a significant gap in time can exist between the time of a particular security’s last trade and the time at which a Fund calculates its net asset value. The closing prices of such securities may no longer reflect their market value at the time the Fund calculates its net asset value if an event that could materially affect the value of those securities (a “Significant Event”) has occurred between the time of the security’s last close and the time that the Fund calculates its net asset value. A Significant Event may relate to a single issuer or to an entire market sector. If a Fund becomes aware of a Significant Event that has occurred with respect to a security or group of securities after the closing of the exchange or market on which the security or securities principally trade, but before the time at which the Fund calculates its net asset value, a Valuation Committee meeting may be called. The Trust uses FT-Interactive Data (“FT”) as a third party fair valuation vendor. FT provides a fair value for foreign equity securities held by the Trust based on certain factors and methodologies applied by FT in the event that there is movement in the U.S. market that exceeds a specific threshold established by the Valuation Committee in consultation with, and approved by, the Trustees. Such methodologies generally involve tracking valuation correlations between the U.S. market and each non-U.S. security. As part of the valuation procedures a “confidence interval” is used, when the threshold is exceeded, to determine the level of correlation between the value of a foreign equity security and movements in the U.S. market before a particular security will be fair valued. In the event that the threshold established by the Committee is exceeded on a specific day, the Trust will typically value non-U.S. equity securities in its portfolio that exceed the applicable confidence interval based upon the fair values provided by FT.
The Money Market Fund uses the amortized cost method, which approximates market value, to determine the value of its portfolio securities.
The Blended Funds value their investments in the underlying Select Funds daily at the closing net asset value of each respective Select Fund.
b. Repurchase Agreements
Each Fund may agree to purchase securities from financial institutions subject to the seller’s agreement to repurchase them at a mutually agreed upon date and price. It is the Fund’s policy that repurchase agreements are fully collateralized by U.S. Treasury and Government Agency securities. All collateral is held by the Fund’s custodian bank or a bank with which the custodian bank has entered into a subcustodian agreement, or is segregated in the Federal Reserve Book Entry System. In connection with transactions in repurchase agreements, if the seller defaults and the value of the collateral declines, or if the seller enters an insolvency proceeding, realization of the collateral by the Fund may be delayed or limited.
c. Derivative Financial Instruments
The Funds may engage in various portfolio strategies to seek to increase its return by hedging its portfolio against adverse movements in the equity, debt and currency markets. Losses may arise due to changes in the value of the contract if the counterparty does not perform under the contract. The Funds, in their normal course of business, may enter into contracts
142
that contain a variety of representations and warranties, and which provide general indemnifications. The Funds’ exposure may include future claims that may be made against the Funds that have not yet occurred. However, based on experience, the Funds expect the risk of loss to be remote.
Financial Futures Contracts — The Funds (except the Money Market Fund) may purchase or sell financial futures contracts and the options on such futures contracts for the purpose of hedging risk on existing securities, the intended purchase of securities or to gain market exposure on cash balances. Financial futures contracts are contracts for the delivery of securities at a specified future date at an agreed upon price or yield. Upon entering into a contract, the Funds deposit and maintain as collateral such initial margin as required by the exchange on which the transaction is effected.
Pursuant to the contract, the Funds agree to pay to or receive from the broker an amount of cash equal to the daily fluctuation in the value of the contract. Such payments or receipts are known as variation margin and are recorded by the Funds as unrealized gains or losses until the contract is closed or settled.
Risks of entering into futures contracts include the possibility that there will be an imperfect price correlation between the futures and the underlying securities. Second, it is possible that a lack of liquidity for futures contracts could exist in the secondary market, resulting in an inability to close a futures position prior to its maturity date. Third, the purchase of a futures contract involves the risk that a fund could lose more than the original margin deposit required to initiate a futures transaction.
Options — Certain Funds are authorized to write and purchase put and call options. The risk in writing a call option is that the Funds give up the opportunity for profit if the market price of the security increases. The risk in writing a put option is that the Funds may incur a loss if the market price of the security decreases and the option is exercised. The risk in purchasing an option is that the Funds pay a premium whether or not the option is exercised. The Funds also have the additional risk of being unable to enter into a closing transaction at an acceptable price if a liquid secondary market does not exist. The Funds also may write over-the-counter options where completing the obligation depends upon the credit standing of the other party and this party’s ability to perform. Option contracts also involve the risk that they may not work as intended due to unanticipated developments in market conditions or other causes.
Options purchased are recorded as an asset and written options are recorded as liabilities to the extent of premiums paid or received. Each Fund will realize a gain or loss when the option transaction expires or closes. When an option is exercised, the proceeds on sales for a written call option, the purchase cost for a written put option or the cost of a security for a purchased put or call option is adjusted by the amount of the premium received or paid.
Certain Funds may write swaption contracts to manage exposure to fluctuations in interest rates and to enhance portfolio yield. Swaption contracts written by the Funds represent an option that gives the purchaser the right, but not the obligation, to enter into a previously agreed upon swap contract on a future date. If a written call swaption is exercised, the writer will enter a swap and is obligated to pay the fixed rate and receive a floating rate in exchange. If a written put swaption is exercised, the writer will enter a swap and is obligated to pay the floating rate and receive a fixed rate in exchange. Swaptions are marked to market daily based upon quotations from market makers. When a Fund writes a swaption, the premium received is recorded as a liability and is subsequently adjusted to the current market value of the swaption.
Entering into a swaption contract involves, to varying degrees, the elements of credit, market and interest rate risk in excess of the amounts reported in the Statement of Assets and Liabilities, associated with both option
143
contracts and swap contracts. The Funds bear the market risk arising from any change in index values or interest rates.
Forward Foreign Exchange Contracts — Certain Funds may enter into forward foreign currency exchange contracts to hedge against adverse exchange rate fluctuation to the U.S. dollar or between different foreign currencies in connection with either specific security transactions or portfolio positions. Each contract is valued daily and the change in value is recorded as an unrealized gain or loss. When the contract is closed, a realized gain or loss is recorded equal to the difference between the opening value and the closing value of the contract. The Funds could be exposed to risk if the counterparties to the contracts are unable to meet the terms of the contract and from unanticipated movements in the value of a foreign currency relative to the U.S. dollar.
Foreign Currency Options and Futures — The International Equity Fund and the Bond Funds may also enter into futures contracts on foreign currencies and related options on transactions as a short or long hedge against possible variations in foreign exchange rates.
TBAs — The Bond Funds may enter into “TBA” (to be announced) purchase commitments to purchase securities for a fixed price at a future date, typically not exceeding 45 days. TBAs may be considered securities in themselves, and involve a risk of loss if the value of the security to be purchased declines prior to settlement date. This risk is in addition to the risk of decline in each Fund’s other assets. Unsettled TBAs are valued at the current market value of the underlying securities, according to the procedures described under “Valuation of Securities” above.
Dollar Rolls — During the year ended December 31, 2006, GuideStone Funds entered into dollar roll transactions, pursuant to which they sell a mortgage-backed TBA or security and simultaneously purchase a similar, but not identical, TBA with the same issuer, rate and terms. The Funds may execute a “roll” to obtain better underlying mortgage securities or to increase yield. The Funds account for dollar roll transactions as purchases and sales, which has the effect of increasing their portfolio turnover rates. Risks associated with dollar rolls are that actual mortgages received by the Funds may be less favorable than those anticipated or that counterparties may fail to perform under the terms of the contracts.
Swap Agreements — Each Select Fund may enter into swap agreements. The Equity Funds may enter into equity swap contracts, the Bond Funds may enter into interest rate and credit default swaps, the International Equity and Bond Funds may enter into currency swaps and each Select Fund may enter into total return swaps.
Swap agreements are the exchange of one security or asset for another. A swap may be entered into in order to, among other things, change the maturity of a fund’s portfolio, to protect a fund’s value from changes in interest rates, to expose a fund to a different security or market, or to help a fund achieve a strategy relative to an index or other benchmark. By entering into a swap agreement, a fund is exposed to the risk of unanticipated movements in interest rates or in the value of an underlying security or index, or that the counterparty will not fulfill its obligation under the agreement. Credit default swaps involve the payment of amounts based on a specified rate multiplied by a notional amount as well as upon an event of default. In connection with these agreements, securities may be set aside as collateral by the Fund’s custodian.
d. Foreign Currency Translations
Securities and other assets and liabilities denominated in foreign currencies are translated daily into U.S. dollars. Foreign currency amounts related to the purchase or sale of securities and income and expenses are translated at the exchange rate on the transaction date. The effect of changes in foreign exchange rates on realized and unrealized security gains or losses is reflected as a component of such gains or losses. In the statement of operations, net realized gains or
144
losses from foreign currency transactions, if any, may arise from sales of foreign currency, closed forward contracts, exchange gains or losses realized between the trade date and settlement date on securities transactions, and other translation gains or losses on dividends, interest income and foreign withholding taxes.
e. Dividends and Distributions to Shareholders
Dividends from net investment income for the Money Market Fund are declared daily and paid monthly. Dividends from net investment income for the Bond Funds are declared and paid monthly. Dividends from net investment income, if any, for the Equity Index Fund, Real Estate Securities Fund, Growth Equity Fund and Value Equity Fund are declared and paid semi-annually. Dividends from net investment income, if any, for the Small Cap Equity Fund, International Equity Fund and the Blended Funds are declared and paid annually. Net realized capital gains, if any, will be distributed at least annually by each of the Funds. Dividends and distributions to shareholders are recorded on the ex-dividend date.
f. Security Transactions, Income and Realized Gains and Losses
Security transactions are accounted for on the date securities are purchased or sold (the trade date). Dividend income is recognized on the ex-dividend date and interest income is accrued daily, including the amortization of market premium and the accretion of market discount. Realized gains and losses from security transactions are identified on an identified cost basis.
g. Expenses
Expenses arising in connection with a Fund are charged directly to that Fund. Expenses common to all Funds of the Trust are generally allocated to each Fund in proportion to their relative net assets. Each class of shares bears its pro-rata portion of expenses attributable to its class, except that each class separately bears expenses related specifically to that class, such as printing, transfer agent, service and distribution fees.
h. REITS
The Real Estate Securities Fund invests substantial assets in real estate investment trusts (REITs) that involve risks not associated with investing in stocks. Risks include declines in the value of real estate, general and economic conditions, changes in the value of the underlying property and defaults by borrowers. The value of assets in the real estate industry may go through cycles of relative underperformance and outperformance in comparison to equity securities markets in general.
Dividend income is recorded using management’s estimate of the income included in distributions received from REIT investments. The actual amounts of income, return of capital, and capital gains are only determined by each REIT after its fiscal year-end, and may differ from the estimated amount.
i. Short Sales
A short sale is a transaction in which a Fund sells a security it does not own. The Low-Duration and Medium-Duration Bond Funds will occasionally enter into a short sale to initiate a dollar roll transaction. The Fund’s obligation to replace the security borrowed and sold short will be fully collateralized at all times by cash equivalents deposited in an account with the Fund’s custodian. If the price of the security sold short increases between the time of the short sale and the time the Fund replaces the borrowed security, the Fund will realize a loss, and if the price declines during the period, the Fund will realize a gain. Any realized gain will be decreased, and any realized loss increased, by the amount of transaction costs.
At December 31, 2006, the value of securities sold short in the Medium-Duration Bond Fund amounted to $52,905,567.
3. FEES AND OTHER TRANSACTIONS WITH AFFILIATES
a. Investment Advisory Fees
Pursuant to a separate investment advisory agreement, GuideStone Capital Management (“GSCM” or “Investment Advisor”) acts as the Investment Advisor to the Funds. As Investment Advisor it supervises the investments of the Funds and for such services is paid a fee.
145
GSCM and the Trust have entered into sub-advisory agreements with various sub-advisers to manage each Select Fund’s investments. Under the general supervision of GSCM, the sub-advisers make the day-to-day investment decisions for the Select Funds and for such services each sub-adviser receives a fee from the Funds.
The advisory fees paid to GSCM and aggregate sub-advisory fees paid to the sub-advisers, listed at the end of this report, are computed daily based upon the net assets of each Fund. The actual advisory and sub-advisory fees accrued during the period ended December 31, 2006, based upon average daily net assets, were as follows:
| | | | | | |
Fund | | Advisory Fees | | | Sub-Adviser Fees | |
Flexible Income | | 0.10 | % | | — | |
Growth & Income | | 0.10 | % | | — | |
Capital Opportunities | | 0.10 | % | | — | |
Global Equity | | 0.10 | % | | — | |
Flexible Income I | | 0.10 | % | | — | |
Growth & Income I | | 0.10 | % | | — | |
Capital Opportunities I | | 0.10 | % | | — | |
Global Equity I | | 0.10 | % | | — | |
Money Market | | 0.14 | % | | 0.07 | % |
Low-Duration Bond | | 0.20 | % | | 0.20 | % |
Medium-Duration Bond | | 0.23 | % | | 0.20 | % |
Extended-Duration Bond | | 0.27 | % | | 0.22 | % |
Global Bond | | 0.21 | % | | 0.20 | % |
Equity Index | | 0.14 | % | | 0.02 | % |
Real Estate Securities | | 0.30 | % | | 0.67 | % |
Value Equity | | 0.43 | % | | 0.24 | % |
Growth Equity | | 0.48 | % | | 0.37 | % |
Small Cap Equity | | 0.30 | % | | 0.68 | % |
International Equity | | 0.47 | % | | 0.49 | % |
For the period ended December 31, 2006, advisory fees and waivers for each Fund were as follows:
| | | | | | | | | | | |
| | | Gross
Advisory Fee | | Waiver/
Reimbursements | | | Net Advisory Fee
(Reimbursement) | |
Flexible Income | | $ | 313,133 | | $ | (159,859 | ) | | $ | 153,274 | |
Growth & Income | | | 1,341,512 | | | (77,128 | ) | | | 1,264,384 | |
Capital Opportunities | | | 1,091,554 | | | (80,467 | ) | | | 1,011,087 | |
Global Equity | | | 1,003,899 | | | (92,374 | ) | | | 911,525 | |
Flexible Income I | | | 55,511 | | | (74,843 | ) | | | (19,332 | ) |
Growth & Income I | | | 247,098 | | | (16,300 | ) | | | 230,798 | |
Capital Opportunities I | | | 170,916 | | | (44,435 | ) | | | 126,481 | |
Global Equity I | | | 132,740 | | | (48,541 | ) | | | 84,199 | |
Money Market | | | 1,266,736 | | | (12,676 | ) | | | 1,254,060 | |
Low-Duration Bond | | | 1,865,818 | | | (523,156 | ) | | | 1,342,662 | |
Medium-Duration Bond | | | 2,626,056 | | | (839,380 | ) | | | 1,786,676 | |
Extended-Duration Bond | | | 1,257,880 | | | (135,208 | ) | | | 1,122,672 | |
Global Bond | | | 1,805 | | | (3,712 | ) | | | (1,907 | ) |
Equity Index | | | 718,754 | | | (169,692 | ) | | | 549,062 | |
Real Estate Securities | | | 2,634 | | | (4,947 | ) | | | (2,313 | ) |
Value Equity | | | 6,537,246 | | | (250,052 | ) | | | 6,287,194 | |
Growth Equity | | | 7,237,768 | | | (1,208,620 | ) | | | 6,029,148 | |
Small Cap Equity | | | 1,710,801 | | | (274,430 | ) | | | 1,436,371 | |
International Equity | | | 6,589,788 | | | (2,092,511 | ) | | | 4,497,277 | |
b. Distribution and Shareholder Servicing Fees
The Board of Trustees has adopted Shareholder Service Plans for the GS4, GS6 and GS8 Class of each Select Fund and the GS6 and GS8 Class of each Blended Fund (“Service Plans”) and a separate Plan of Distribution for the GS6 and GS8 Class of each Select Fund and Blended Fund pursuant to Rule 12b-1 under the 1940 Act (“ 12b-1 Plan”).
Under the Service Plans, the GS4, GS6 and GS8 Class of each Select Fund and the GS6 and GS8 Class of each applicable Blended Fund are authorized to pay fees to parties that provide services for and maintain shareholder accounts. The GS4, GS6 and GS8 Class of each Select Fund are authorized to pay service fees of 0.19%, 0.30% and 0.40% of average daily net assets, respectively. The GS6 and GS8 Class of each applicable Blended Fund are authorized to pay service fees of 0.11% and 0.21% of average daily net assets, respectively.
Under the 12b-1 Plan, the assets of each Select Fund and Blended Fund may be used to compensate GuideStone Financial Resources, the Distributor or others for certain expenses relating to the distribution of shares of the Funds to investors. Under the 12b-1 Plan, the maximum amount
146
payable as a percentage of average daily net assets on an annual basis is 0.10% by the GS6 Class of each Select Fund and applicable Blended Fund and 0.30% by the GS8 Class of each Select Fund and applicable Blended Fund.
c. Expense Limitation
GSCM has agreed, through April 30, 2007, to waive fees and reimburse expenses of the GS2 Class, GS4 Class, GS6 Class and the GS8 Class of each Fund (excluding interest, taxes, brokerage commissions and extraordinary expenses) which exceed, in the aggregate, the annual percentage rate of each class’s average daily net assets as follows:
| | | | | | | | | | | | |
Fund | | GS2 Class | | | GS4 Class | | | GS6 Class | | | GS8 Class | |
Flexible Income | | NA | | | 0.13 | % | | 0.50 | % | | 0.80 | % |
Growth & Income | | NA | | | 0.13 | % | | 0.60 | % | | 0.90 | % |
Capital Opportunities | | NA | | | 0.13 | % | | 0.70 | % | | 1.00 | % |
Global Equity | | NA | | | 0.13 | % | | 0.57 | % | | 0.87 | % |
Flexible Income I | | 0.17 | % | | NA | | | NA | | | NA | |
Growth & Income I | | 0.17 | % | | NA | | | NA | | | NA | |
Capital Opportunities I | | 0.17 | % | | NA | | | NA | | | NA | |
Global Equity I | | 0.17 | % | | NA | | | NA | | | NA | |
Money Market | | 0.27 | % | | 0.46 | % | | 0.87 | % | | 1.17 | % |
Low-Duration Bond | | 0.45 | % | | 0.61 | % | | 1.00 | % | | 1.30 | % |
Medium-Duration Bond | | 0.50 | % | | 0.62 | % | | 1.05 | % | | 1.35 | % |
Extended-Duration Bond | | 0.65 | % | | 0.73 | % | | 1.20 | % | | 1.50 | % |
Global Bond | | NA | | | 1.04 | % | | NA | | | NA | |
Equity Index | | 0.25 | % | | 0.40 | % | | 0.60 | % | | 0.90 | % |
Real Estate Securities | | NA | | | 1.33 | % | | NA | | | NA | |
Value Equity | | 0.76 | % | | 0.90 | % | | 1.30 | % | | 1.60 | % |
Growth Equity | | 0.90 | % | | 1.02 | % | | 1.42 | % | | 1.72 | % |
Small Cap Equity | | 1.14 | % | | 1.21 | % | | 1.61 | % | | 1.91 | % |
International Equity | | 0.97 | % | | 1.15 | % | | 1.50 | % | | 1.80 | % |
During the period January 1, 2006 through May 16, 2006, the expense caps for the Growth Equity Fund GS2 Class, GS4 Class, GS6 Class and GS8 Class were 0.87%, 0.99%, 1.39% and 1.69%, respectively.
Each Fund in turn agrees to reimburse GSCM for any operating expenses in excess of the expense limitation paid, waived or assumed by GSCM for that Fund during the limitation period, provided GSCM would not be entitled to reimbursement for any amount that would cause operating expenses to exceed the expense limitation during the year in which the reimbursement would be made, and provided further that no amount will be reimbursed by the Fund more than three years after the year in which it was incurred or waived by GSCM.
At December 31, 2006, the amounts subject to possible future reimbursement under the expense limitation agreement are as follows:
| | | | | | | | | | | | |
| | | GS2 Class | | GS4 Class | | GS6 Class | | GS8 Class |
Flexible Income | | | NA | | $ | 385,009 | | $ | 28,962 | | $ | 19,711 |
Growth & Income | | | NA | | | 147,726 | | | 13,813 | | | 4,958 |
Capital Opportunities | | | NA | | | 185,556 | | | 6,516 | | | — |
Global Equity | | | NA | | | 215,605 | | | 12,349 | | | 3,968 |
Flexible Income I | | $ | 207,560 | | | NA | | | NA | | | NA |
Growth & Income I | | | 92,647 | | | NA | | | NA | | | NA |
Capital Opportunities I | | | 157,661 | | | NA | | | NA | | | NA |
Global Equity I | | | 167,056 | | | NA | | | NA | | | NA |
Money Market | | | — | | | — | | | 69,588 | | | 7,140 |
Low-Duration Bond | | | 70,979 | | | 1,271,466 | | | 27,873 | | | 18,153 |
Medium-Duration Bond | | | 11,522 | | | 1,953,068 | | | 16,281 | | | 14,276 |
Extended-Duration Bond | | | — | | | 277,102 | | | — | | | 4,235 |
Global Bond | | | NA | | | 3,296 | | | NA | | | NA |
Equity Index | | | — | | | 228,128 | | | 98,243 | | | 31,305 |
Real Estate Securities | | | NA | | | 4,866 | | | NA | | | NA |
Value Equity | | | — | | | 559,809 | | | 14,291 | | | 9,235 |
Growth Equity | | | 42,311 | | | 3,119,194 | | | 56,634 | | | 18,804 |
Small Cap Equity | | | — | | | 814,859 | | | 40,092 | | | 14,140 |
International Equity | | | 560,324 | | | 4,744,274 | | | 108,552 | | | 33,258 |
During the year ended December 31, 2006, GSCM recaptured the following amounts:
| | | | | | |
| | | GS6 Class | | GS8 Class |
Growth & Income | | $ | 344 | | | — |
Capital Opportunities | | | — | | $ | 398 |
Value Equity | | | 389 | | | — |
Small Cap Equity | | | 1,240 | | | — |
d. Brokerage Service and Other Arrangements
The Investment Advisor directs the sub-advisers to place security trades with designated brokers who have agreed to pay certain custody, transfer agency or other operating expenses through the use of Brokerage Service Arrangements on behalf of the Equity Funds. The amount of expenses paid through Brokerage Service Arrangements for the year ended December 31, 2006, were as follows:
| | | |
Fund | | Expenses Paid Through Brokerage Service Arrangements |
Value Equity | | $ | 100,675 |
Growth Equity | | | 88,469 |
Small Cap Equity | | | 67,819 |
International Equity | | | 155,667 |
In addition, the Funds have entered into arrangements with its custodian whereby net interest earned on uninvested cash
147
balances was used to reduce a portion of each Fund’s custody expenses. Custody expense in the accompanying financial statements is presented before reduction for credits. During the year ended December 31, 2006, expenses reduced were as follows:
| | | |
Fund | | Reduction to
Expenses |
Flexible Income | | $ | 2,153 |
Growth & Income | | | 2,114 |
Capital Opportunities | | | 2,750 |
Global Equity | | | 3,574 |
Flexible Income I | | | 2,233 |
Growth & Income I | | | 1,595 |
Capital Opportunities I | | | 2,081 |
Global Equity I | | | 2,220 |
Money Market | | | 12,291 |
Low-Duration Bond | | | 659,367 |
Medium-Duration Bond | | | 428,505 |
Extended-Duration Bond | | | 7,632 |
Equity Index | | | 2,534 |
Value Equity | | | 19,573 |
Growth Equity | | | 10,279 |
Small Cap Equity | | | 6,254 |
International Equity | | | 14,790 |
e. Administrator, Transfer Agent and Distributor
Certain employees of PFPC Inc. (“PFPC”), an indirect, wholly-owned subsidiary of The PNC Financial Services Group, Inc. (“PNC”), are officers of the Funds. PFPC serves as Administrator and Transfer agent of the Funds.
For its services as Administrator, PFPC is entitled to receive fees, computed daily and paid monthly, based upon the average daily net assets of each Fund. The fees, excluding out of pocket expenses, currently range between .008% and .0375% of average daily net assets. For its services as Transfer Agent, PFPC receives a fee based mainly upon the number of accounts serviced. Certain minimum fees and transaction charges may apply. For the year ended December 31, 2006, PFPC received $5,564,623 in aggregate fees and expenses for services rendered under the various agreements described above.
PFPC Distributors, Inc. (“PDI”), also an indirect, wholly owned subsidiary of PNC, serves as the Distributor for the Funds. The Funds do not pay any fees to PDI in its capacity as Distributor.
4. SECURITIES LENDING
Through an agreement with Northern Trust (the Funds’ custodian) the Select Funds may lend portfolio securities to certain brokers, dealers and other financial institutions that pay the Select Funds a negotiated fee. The Select Funds receive cash, letters of credit or U.S. Government securities as collateral against the loaned securities in an amount at least equal to the market value of the loaned Securities. The Funds continue to own the loaned securities and the securities remain in the investment portfolio. However, in the event of default or bankruptcy by the other party to the agreement, realization and/or retention of the collateral may be subject to legal proceedings. Cash collateral has been invested in a short-term money market fund of Northern Trust. At December 31, 2006, the market values of loaned securities and collateral received were as follows:
| | | | | | |
Fund | | Value of
Securities Loaned | | Value of
Collateral |
Low-Duration Bond | | $ | 45,386,451 | | $ | 46,899,932 |
Medium-Duration Bond | | | 251,271,309 | | | 258,993,690 |
Extended-Duration Bond | | | 269,896,989 | | | 278,446,396 |
Equity Index | | | 33,463,028 | | | 34,402,994 |
Value Equity | | | 119,113,966 | | | 122,875,591 |
Growth Equity | | | 115,242,962 | | | 118,791,161 |
Small Cap Equity | | | 268,174,101 | | | 277,398,014 |
International Equity | | | 212,023,705 | | | 222,122,117 |
148
5. 10% SHAREHOLDERS
The Blended Funds do not invest in the underlying funds for the purpose of exercising management or control; however, investments made by each Blended Fund within each of its principal investment strategies may represent a significant portion of an underlying fund’s net assets. At December 31, 2006, the Blended Funds were the owner of record of the following approximate percentages of the total outstanding shares of the underlying funds as detailed below:
| | | | | | | | | | | | |
GS2 Class | | Flexible
Income
Fund I | | | Growth &
Income
Fund I | | | Capital
Opportunities
Fund I | | | Global
Equity
Fund I | |
Low-Duration Bond | | 39.21 | % | | 35.15 | % | | 12.75 | % | | — | |
Medium-Duration Bond | | — | | | 56.01 | | | 19.87 | | | — | |
Extended-Duration Bond | | — | | | 42.59 | | | 15.24 | | | — | |
Equity Index | | 1.34 | | | 11.61 | | | 12.43 | | | 12.62 | % |
Value Equity | | 2.37 | | | 21.45 | | | 23.02 | | | 23.70 | |
Growth Equity | | 2.46 | | | 21.23 | | | 22.74 | | | 23.01 | |
Small Cap Equity | | 1.67 | | | 14.73 | | | 15.56 | | | 15.71 | |
International Equity | | 1.77 | | | 17.38 | | | 17.90 | | | 17.44 | |
| | | | |
GS4 Class | | Flexible
Income
Fund | | | Growth &
Income
Fund | | | Capital
Opportunities
Fund | | | Global
Equity
Fund | |
Low-Duration Bond | | 34.11 | % | | 29.02 | % | | 11.93 | % | | — | |
Medium-Duration Bond | | — | | | 31.04 | | | 12.50 | | | — | |
Extended-Duration Bond | | — | | | 29.63 | | | 12.03 | | | — | |
Equity Index | | 1.23 | | | 10.09 | | | 12.27 | | | 15.00 | % |
Value Equity | | 1.72 | | | 14.78 | | | 17.99 | | | 22.31 | |
Growth Equity | | 1.89 | | | 15.46 | | | 18.76 | | | 23.02 | |
Small Cap Equity | | 1.31 | | | 10.97 | | | 13.14 | | | 16.10 | |
International Equity | | 1.62 | | | 15.05 | | | 17.58 | | | 20.77 | |
6. INVESTMENT TRANSACTIONS
For the year ended December 31, 2006, the cost of purchases and proceeds from sales and maturities (other than short-term and U.S. Government obligations) for each Fund were as follows:
| | | | | | |
| | | Purchases | | Sale and Maturity
Proceeds |
Flexible Income | | $ | 17,850,000 | | $ | 7,000,000 |
Growth & Income | | | 73,550,000 | | | 54,550,000 |
Capital Opportunities | | | 56,150,000 | | | 76,050,000 |
Global Equity | | | 42,600,000 | | | 72,200,000 |
Flexible Income I | | | 3,334,000 | | | 3,865,000 |
Growth & Income I | | | 21,938,000 | | | 20,442,000 |
Capital Opportunities I | | | 21,057,000 | | | 11,744,000 |
Global Equity I | | | 10,967,000 | | | 11,016,000 |
Low-Duration Bond | | | 605,582,723 | | | 584,945,561 |
Medium-Duration Bond | | | 511,638,819 | | | 406,134,329 |
Extended-Duration Bond | | | 33,010,051 | | | 85,652,917 |
Equity Index | | | 32,163,775 | | | 25,407,612 |
Value Equity | | | 1,091,289,123 | | | 1,158,851,214 |
Growth Equity | | | 685,269,910 | | | 718,510,059 |
Small Cap Equity | | | 470,032,101 | | | 500,584,427 |
International Equity | | | 349,094,193 | | | 476,641,737 |
For the period ended December 31, 2006, the cost of purchases and proceeds from sales and maturities of long-term U.S. Government obligations for each Fund were as follows:
| | | | | | |
| | | Purchases | | Sale and Maturity
Proceeds |
Flexible Income | | $ | 20,266,329 | | $ | 19,920,306 |
Growth & Income | | | 43,346,120 | | | 44,191,364 |
Capital Opportunities | | | 14,517,807 | | | 14,473,384 |
Flexible Income I | | | 5,351,577 | | | 5,300,045 |
Growth & Income I | | | 10,744,700 | | | 10,437,669 |
Capital Opportunities I | | | 3,904,950 | | | 3,870,550 |
Low-Duration Bond | | | 856,247,612 | | | 829,935,209 |
Medium-Duration Bond | | | 5,268,091,998 | | | 5,214,342,125 |
Extended-Duration Bond | | | 327,112,575 | | | 196,973,447 |
Global Bond | | | — | | | 92,549 |
149
Futures Contracts
Investments in securities as of December 31, 2006 included securities that were valued and pledged as collateral to cover initial margin deposits. The market value of this collateral and open futures contracts is as follows:
| | | | | | | | | | | | | |
| | | Value of
Collateral | | Open Purchase
(Sale) Contracts | | | Notional Value
on Futures | | Net Unrealized
Gain
(Loss) on Futures | |
Flexible Income Fund | | | | | | | | | | | | | |
March 2007 S&P 500® | | $ | 69,512 | | 3 | | | $ | 1,071,300 | | $ | (2,989 | ) |
| | | | | | | | | | | | | |
| | | | |
Growth & Income Fund | | | | | | | | | | | | | |
March 2007 S&P 500® | | | 595,817 | | 33 | | | | 11,784,300 | | $ | 50,281 | |
| | | | | | | | | | | | | |
| | | | |
Capital Opportunities Fund | | | | | | | | | | | | | |
March 2007 S&P 500® | | | 724,911 | | 41 | | | | 14,641,100 | | $ | 59,880 | |
| | | | | | | | | | | | | |
| | | | |
Global Equity Fund | | | | | | | | | | | | | |
March 2007 S&P 500® | | | 695,120 | | 32 | | | | 11,427,200 | | $ | 20,635 | |
| | | | | | | | | | | | | |
| | | | |
Flexible Income Fund I | | | | | | | | | | | | | |
March 2007 S&P 500® E-Mini | | | 19,860 | | 3 | | | | 214,260 | | $ | (264 | ) |
| | | | | | | | | | | | | |
| | | | |
Growth & Income Fund I | | | | | | | | | | | | | |
March 2007 S&P 500® E-Mini | | | 129,094 | | 33 | | | | 2,356,860 | | $ | 521 | |
| | | | | | | | | | | | | |
| | | | |
Capital Opportunities Fund I | | | | | | | | | | | | | |
March 2007 S&P 500® E-Mini | | | 178,745 | | 34 | | | | 2,428,280 | | $ | (1,567 | ) |
| | | | | | | | | | | | | |
| | | | |
Global Equity Fund I | | | | | | | | | | | | | |
March 2007 S&P 500® E-Mini | | | 139,024 | | 31 | | | | 2,214,020 | | $ | (2,752 | ) |
| | | | | | | | | | | | | |
| | | | |
Low-Duration Bond Fund | | | | | | | | | | | | | |
June 2007 90-Day Euro | | | 50,553 | | 29 | | | | 6,870,825 | | $ | (11,063 | ) |
June 2008 90-Day Euro | | | 113,135 | | 168 | | | | 39,956,700 | | | (95,700 | ) |
September 2007 90-Day Euro | | | 488,433 | | 565 | | | | 134,067,437 | | | (120,188 | ) |
December 2007 90-Day Euro | | | 292,277 | | (45 | ) | | | 95,762,875 | | | (15,943 | ) |
December 2008 90-Day Euro | | | 220,232 | | 327 | | | | 77,781,038 | | | 44,963 | |
June 2007 3-Month Euro EURIBOR | | | 173,933 | | 194 | | | | 61,429,279 | | | (108,630 | ) |
March 2007 5-Year U.S. Treasury Note | | | 93,305 | | (303 | ) | | | 31,833,937 | | | 178,448 | |
June 2007 90-Day Sterling | | | 39,947 | | 61 | | | | 14,108,484 | | | (34,093 | ) |
September 2007 90-Day Sterling | | | 94,967 | | 145 | | | | 33,540,109 | | | (83,312 | ) |
March 2007 Euro Bund | | | 867 | | 2 | | | | 306,330 | | | (7,339 | ) |
March 2007 2-Year U.S. Treasury Note | | | 576,881 | | 262 | | | | 186,892,625 | | | (29,486 | ) |
March 2007 10-Year U.S. Treasury Note | | | 236,135 | | (356 | ) | | | 38,258,875 | | | 474,723 | |
March 2007 U.S. Long Treasury Bond | | | 12,936 | | (41 | ) | | | 4,568,938 | | | 82,320 | |
| | | | | | | | | | | | | |
| | | | | | | | | | | $ | 274,700 | |
| | | | | | | | | | | | | |
| | | | |
Medium-Duration Bond Fund | | | | | | | | | | | | | |
March 2008 90-Day Euro | | | 129,532 | | 190 | | | | 45,177,250 | | $ | (42,800 | ) |
June 2007 90-Day Euro | | | 25,814 | | 38 | | | | 9,003,150 | | | (20,900 | ) |
June 2008 90-Day Euro | | | 214,807 | | 315 | | | | 74,918,813 | | | (169,300 | ) |
September 2007 90-Day Euro | | | 615,006 | | 806 | | | | 191,253,725 | | | (99,908 | ) |
December 2007 90-Day Euro | | | 127,407 | | 187 | | | | 44,435,875 | | | (88,112 | ) |
December 2008 90-Day Euro | | | 79,794 | | 117 | | | | 27,829,912 | | | 16,087 | |
June 2007 3-Month Euro EURIBOR | | | 223,340 | | 246 | | | | 77,894,858 | | | (137,747 | ) |
March 2007 5-Year U.S. Treasury Note | | | 82,399 | | (224 | ) | | | 23,744,125 | | | 166,428 | |
June 2007 90-Day Sterling | | | 43,104 | | 65 | | | | 15,033,631 | | | (36,321 | ) |
September 2007 90-Day Sterling | | | 100,809 | | 152 | | | | 35,159,287 | | | (87,350 | ) |
March 2007 Euro Bund | | | 104,882 | | 47 | | | | 7,198,746 | | | (46,472 | ) |
March 2007 10-Year U.S. Treasury Note | | | 192,094 | | (304 | ) | | | 43,632,312 | | | 369,729 | |
150
| | | | | | | | | | | | | |
| | | Value of Collateral | | Open Purchase (Sale) Contracts | | | Notional Value on Futures | | Net Unrealized Gain (Loss) on Futures | |
March 2007 U.S. Long Treasury Bond | | $ | 5,960 | | (2 | ) | | $ | 1,114,375 | | $ | 6,877 | |
| | | | | | | | | | | | | |
| | | | | | | | | | | $ | (169,789 | ) |
| | | | | | | | | | | | | |
| | | | |
Equity Index Fund | | | | | | | | | | | | | |
March 2007 S&P 500® | | | 665,329 | | 33 | | | | 11,784,300 | | $ | 22,831 | |
| | | | | | | | | | | | | |
| | | | |
Real Estate Securities Fund | | | | | | | | | | | | | |
March 2007 Russell 2000® IMM-Mini | | | 218,526 | | 66 | | | | 5,246,340 | | $ | 11,071 | |
| | | | | | | | | | | | | |
| | | | |
Value Equity Fund | | | | | | | | | | | | | |
March 2007 S&P 500® | | | 3,872,811 | | 158 | | | | 56,421,800 | | $ | 207,025 | |
March 2007 S&P 500® E-Mini | | | 109,234 | | 34 | | | | 2,428,280 | | | 4,151 | |
| | | | | | | | | | | | | |
| | | | | | | | | | | $ | 211,176 | |
| | | | | | | | | | | | | |
| | | | |
Growth Equity Fund | | | | | | | | | | | | | |
March 2007 S&P 500® | | | 4,170,720 | | 134 | | | | 47,851,400 | | $ | 180,976 | |
| | | | | | | | | | | | | |
| | | | |
Small Cap Equity Fund | | | | | | | | | | | | | |
March 2007 Russell 2000® IMM-Mini | | | 1,549,125 | | 248 | | | | 19,713,520 | | $ | (166,413 | ) |
| | | | | | | | | | | | | |
Forward Foreign Currency Contracts
As of December 31, 2006, the following Funds have forward foreign currency exchange contracts that obligate it to deliver currencies at specified future dates. The unrealized appreciation and/or depreciation on these contracts is included in the accompanying financial statements. The terms of the open contracts are as follows:
| | | | | | | | | | | | |
Fund/Expiration Date | | Currency to be Delivered | | Amount of Currency to be Delivered | | Currency to be Received | | Amount of Currency to be Received | | Net Unrealized Appreciation (Depreciation) | |
Low-Duration Bond Fund | | | | | | | | | | | | |
1/10/2007 | | New Zealand Dollars | | 1,615,306 | | US Dollars | | 1,061,303 | | $ | (75,894 | ) |
1/10/2007 | | US Dollars | | 345,633 | | New Zealand Dollars | | 501,827 | | | 7,660 | |
1/11/2007 | | Euros | | 1,840,000 | | Norwegian Kroner | | 14,999,073 | | | (23,436 | ) |
1/11/2007 | | US Dollars | | 3,706,875 | | Singapore Dollars | | 5,845,000 | | | 106,621 | |
1/11/2007 | | Euros | | 1,820,000 | | Swedish Kronor | | 16,457,095 | | | 1,964 | |
1/11/2007 | | British Pounds | | 561,000 | | US Dollars | | 1,093,389 | | | (5,146 | ) |
1/23/2007 | | Euros | | 37,016,000 | | US Dollars | | 48,589,419 | | | (336,334 | ) |
1/23/2007 | | US Dollars | | 23,985,728 | | Euros | | 18,220,000 | | | 96,485 | |
2/15/2007 | | US Dollars | | 11,228,639 | | Japanese Yen | | 1,310,472,000 | | | (146,432 | ) |
2/15/2007 | | Japanese Yen | | 106,000,000 | | US Dollars | | 922,708 | | | 26,303 | |
3/16/2007 | | US Dollars | | 1,700,000 | | Chinese Yuan | | 13,128,000 | | | 550 | |
8/16/2007 | | US Dollars | | 5,851,000 | | Chinese Yuan | | 45,169,720 | | | 131,479 | |
| | | | | | | | | | | | |
| | | | | | | | | | $ | (216,180 | ) |
| | | | | | | | | | | | |
| | | | | |
Medium-Duration Bond Fund | | | | | | | | | | | | |
1/11/2007 | | British Pounds | | 2,122,000 | | US Dollars | | 4,135,778 | | $ | (19,463 | ) |
1/12/2007 | | Mexican Pesos | | 38,801,757 | | US Dollars | | 3,492,665 | | | (97,984 | ) |
1/12/2007 | | US Dollars | | 3,561,363 | | Mexican Pesos | | 38,801,757 | | | 29,286 | |
1/23/2007 | | Euros | | 43,297,000 | | US Dollars | | 56,829,765 | | | (397,872 | ) |
1/30/2007 | | Euros | | 842,371 | | US Dollars | | 1,107,990 | | | (5,791 | ) |
2/7/2007 | | Canadian Dollars | | 2,362,022 | | US Dollars | | 2,096,630 | | | 68,755 | |
2/7/2007 | | US Dollars | | 1,497,673 | | Canadian Dollars | | 1,694,245 | | | (43,106 | ) |
2/7/2007 | | US Dollars | | 4,668,979 | | Euros | | 3,630,000 | | | 134,614 | |
2/7/2007 | | Euros | | 1,448,485 | | US Dollars | | 1,825,787 | | | (98,267 | ) |
151
| | | | | | | | | | | | |
Fund/Expiration Date | | Currency to be Delivered | | Amount of Currency
to be Delivered | | Currency to be Received | | Amount of Currency
to be Received | | Net Unrealized
Appreciation
(Depreciation) | |
2/15/2007 | | Japanese Yen | | 68,000,000 | | US Dollars | | 591,926 | | $ | 16,874 | |
2/15/2007 | | US Dollars | | 9,240,104 | | Japanese Yen | | 1,078,394,000 | | | (120,500 | ) |
3/16/2007 | | US Dollars | | 1,800,000 | | Chinese Yuan | | 13,900,000 | | | 552 | |
8/16/2007 | | US Dollars | | 6,143,000 | | Chinese Yuan | | 47,423,960 | | | 138,040 | |
9/19/2007 | | US Dollars | | 2,828,000 | | Russian Rubles | | 74,079,460 | | | (9,041 | ) |
| | | | | | | | | | | | |
| | | | | | | | | | $ | (403,903 | ) |
| | | | | | | | | | | | |
| | | | | |
Global Bond Fund | | | | | | | | | | | | |
2/7/2007 | | Danish Kroner | | 4,600,000 | | US Dollars | | 787,487 | | $ | (28,319 | ) |
2/7/2007 | | US Dollars | | 797,669 | | Danish Kroner | | 4,600,000 | | | 18,136 | |
2/7/2007 | | Japanese Yen | | 91,669,600 | | US Dollars | | 800,000 | | | 25,538 | |
2/7/2007 | | US Dollars | | 783,233 | | Japanese Yen | | 91,669,600 | | | (8,771 | ) |
2/7/2007 | | Euros | | 3,510,000 | | US Dollars | | 4,663,824 | | | 21,354 | |
2/7/2007 | | US Dollars | | 4,623,385 | | Euros | | 3,510,000 | | | 19,085 | |
2/7/2007 | | US Dollars | | 773,888 | | Australian Dollars | | 995,201 | | | 10,804 | |
2/7/2007 | | Australian Dollars | | 1,245,201 | | US Dollars | | 956,833 | | | (24,977 | ) |
2/7/2007 | | British Pounds | | 1,900,000 | | US Dollars | | 3,648,036 | | | (73,039 | ) |
2/7/2007 | | Turkish Lira | | 1,219,640 | | US Dollars | | 836,000 | | | (12,582 | ) |
2/7/2007 | | US Dollars | | 3,084,000 | | Turkish Lira | | 4,609,560 | | | 123,168 | |
2/7/2007 | | South African Rand | | 8,179,865 | | US Dollars | | 1,136,127 | | | (24,901 | ) |
| | | | | | | | | | | | |
| | | | | | | | | | $ | 45,496 | |
| | | | | | | | | | | | |
| | | | | |
International Equity Fund | | | | | | | | | | | | |
1/11/2007 | | Euros | | 717,018 | | Japanese Yen | | 105,874,816 | | $ | (55,855 | ) |
1/25/2007 | | Euros | | 862,425 | | Australian Dollars | | 1,439,042 | | | (4,983 | ) |
1/31/2007 | | British Pounds | | 9,220,500 | | US Dollars | | 17,524,070 | | | (533,671 | ) |
| | | | | | | | | | | | |
| | | | | | | | | | $ | (594,509 | ) |
| | | | | | | | | | | | |
Options Written
Transactions in options written during the year ended December 31, 2006 were as follows:
| | | | | | | |
Low-Duration Bond Fund | | Number of
Contracts | | | Premiums
Received | |
Options written, 12/31/05 | | 1,074 | | | $ | 379,043 | |
| | | | | | | |
Options written | | 8,901 | | | | 860,849 | |
Options expired | | (5,116 | ) | | | (311,710 | ) |
Options closed | | (207 | ) | | | (110,939 | ) |
| | | | | | | |
Options written, 12/31/06 | | 4,652 | | | $ | 817,243 | |
| | | | | | | |
| | |
Medium-Duration Bond Fund | | Number of
Contracts | | | Premiums
Received | |
Options written, 12/31/05 | | 5,636 | | | $ | 1,021,660 | |
| | | | | | | |
Options written | | 15,713 | | | | 1,186,741 | |
Options expired | | (10,826 | ) | | | (1,075,530 | ) |
Options closed | | (1,230 | ) | | | (88,405 | ) |
| | | | | | | |
Options written, 12/31/06 | | 9,293 | | | $ | 1,044,466 | |
| | | | | | | |
152
7. CAPITAL SHARE TRANSACTIONS
Transactions in shares of capital stock were as follows:
| | | | | | | | | | | | | | | | | |
| | | Year Ended December 31, 2006 | | | Year Ended December 31, 2005 | |
| | | GS4 | | | GS6 | | | GS8 | | | GS4 | | | GS6 | | GS8 | |
Flexible Income Fund | | | | | | | | | | | | | | | | | |
Shares sold | | 3,656,910 | | | 1,952 | | | 20,520 | | | 3,824,308 | | | — | | 8,453 | |
Shares reinvested | | 965,157 | | | 79,237 | | | 33,701 | | | 1,073,334 | | | 89,168 | | 37,286 | |
Shares redeemed | | (2,794,715 | ) | | (4 | ) | | (2,547 | ) | | (3,795,558 | ) | | — | | — | |
| | | | | | | | | | | | | | | | | |
Net increase | | 1,827,352 | | | 81,185 | | | 51,674 | | | 1,102,084 | | | 89,168 | | 45,739 | |
| | | | | | | | | | | | | | | | | |
| | | | | | |
Growth & Income Fund | | | | | | | | | | | | | | | | | |
Shares sold | | 6,656,150 | | | 108,276 | | | 242,284 | | | 7,705,632 | | | — | | 37,621 | |
Shares reinvested | | 5,184,934 | | | 136,009 | | | 70,158 | | | 5,682,960 | | | 133,984 | | 54,000 | |
Shares redeemed | | (5,727,250 | ) | | (5,934 | ) | | (30,147 | ) | | (13,663,368 | ) | | — | | (9 | ) |
| | | | | | | | | | | | | | | | | |
Net increase (decrease) | | 6,113,834 | | | 238,351 | | | 282,295 | | | (274,776 | ) | | 133,984 | | 91,612 | |
| | | | | | | | | | | | | | | | | |
| | | | | | |
Capital Opportunities Fund | | | | | | | | | | | | | | | | | |
Shares sold | | 3,141,769 | | | 92,585 | | | 177,712 | | | 3,308,317 | | | — | | 46,234 | |
Shares reinvested | | 4,554,611 | | | 80,040 | | | 68,198 | | | 3,318,258 | | | 46,828 | | 36,627 | |
Shares redeemed | | (4,562,176 | ) | | (13 | ) | | (63,800 | ) | | (8,321,585 | ) | | — | | (3 | ) |
| | | | | | | | | | | | | | | | | |
Net increase (decrease) | | 3,134,204 | | | 172,612 | | | 182,110 | | | (1,695,010 | ) | | 46,828 | | 82,858 | |
| | | | | | | | | | | | | | | | | |
| | | | | | |
Global Equity Fund | | | | | | | | | | | | | | | | | |
Shares sold | | 4,436,590 | | | 51,247 | | | 55,947 | | | 3,985,734 | | | — | | 12,413 | |
Shares reinvested | | 3,930,458 | | | 123,874 | | | 51,063 | | | 2,666,766 | | | 74,409 | | 29,063 | |
Shares redeemed | | (6,254,366 | ) | | (5,418 | ) | | (17,766 | ) | | (9,133,897 | ) | | — | | — | |
| | | | | | | | | | | | | | | | | |
Net increase (decrease) | | 2,112,682 | | | 169,703 | | | 89,244 | | | (2,481,397 | ) | | 74,409 | | 41,476 | |
| | | | | | | | | | | | | | | | | |
| | | | | | |
| | | GS2 | | | | | | | | | GS2 | | | | | | |
Flexible Income Fund I | | | | | | | | | | | | | | | | | |
Shares sold | | 614,244 | | | | | | | | | 2,547,905 | | | | | | |
Shares reinvested | | 385,613 | | | | | | | | | 258,626 | | | | | | |
Shares redeemed | | (648,186 | ) | | | | | | | | (515,007 | ) | | | | | |
| | | | | | | | | | | | | | | | | |
Net increase | | 351,671 | | | | | | | | | 2,291,524 | | | | | | |
| | | | | | | | | | | | | | | | | |
| | | | | | |
Growth & Income Fund I | | | | | | | | | | | | | | | | | |
Shares sold | | 1,573,469 | | | | | | | | | 10,263,212 | | | | | | |
Shares reinvested | | 1,820,120 | | | | | | | | | 1,112,570 | | | | | | |
Shares redeemed | | (1,411,973 | ) | | | | | | | | (1,110,745 | ) | | | | | |
| | | | | | | | | | | | | | | | | |
Net increase | | 1,981,616 | | | | | | | | | 10,265,037 | | | | | | |
| | | | | | | | | | | | | | | | | |
| | | | | | |
Capital Opportunities Fund I | | | | | | | | | | | | | | | | | |
Shares sold | | 1,427,771 | | | | | | | | | 7,039,835 | | | | | | |
Shares reinvested | | 1,106,323 | | | | | | | | | 526,433 | | | | | | |
Shares redeemed | | (722,160 | ) | | | | | | | | (704,572 | ) | | | | | |
| | | | | | | | | | | | | | | | | |
Net increase | | 1,811,934 | | | | | | | | | 6,861,696 | | | | | | |
| | | | | | | | | | | | | | | | | |
| | | | | | |
Global Equity Fund I | | | | | | | | | | | | | | | | | |
Shares sold | | 749,622 | | | | | | | | | 6,666,685 | | | | | | |
Shares reinvested | | 811,924 | | | | | | | | | 287,774 | | | | | | |
Shares redeemed | | (772,028 | ) | | | | | | | | (523,621 | ) | | | | | |
| | | | | | | | | | | | | | | | | |
Net increase | | 789,518 | | | | | | | | | 6,430,838 | | | | | | |
| | | | | | | | | | | | | | | | | |
153
| | | | | | | | | | | | | | | | | | | | | | | | |
| | | Year Ended December 31, 2006 | | | Year Ended December 31, 2005 | |
| | | GS2 | | | GS4 | | | GS6 | | | GS8 | | | GS2 | | | GS4 | | | GS6 | | | GS8 | |
Money Market Fund | | | | | | | | | | | | | | | | | | | | | | | | |
Shares sold | | 79,181,546 | | | 2,625,551,003 | | | 3 | | | 183,052 | | | 97,579,053 | | | 2,495,446,536 | | | 43,983 | | | 54,568 | |
Shares reinvested | | 4,122,997 | | | 20,032,228 | | | 196,806 | | | 206,490 | | | 2,495,133 | | | 11,467,878 | | | 111,760 | | | 107,373 | |
Shares redeemed | | (75,848,387 | ) | | (2,481,322,504 | ) | | — | | | (77,413 | ) | | (68,344,589 | ) | | (2,578,673,372 | ) | | (44,371 | ) | | (23,730 | ) |
| | | | | | | | | | | | | | | | | | | | | | | | |
Net increase (decrease) | | 7,456,156 | | | 164,260,727 | | | 196,809 | | | 312,129 | | | 31,729,597 | | | (71,758,958 | ) | | 111,372 | | | 138,211 | |
| | | | | | | | | | | | | | | | | | | | | | | | |
| | | | | | | | |
Low-Duration Bond Fund | | | | | | | | | | | | | | | | | | | | | | | | |
Shares sold | | 1,297,497 | | | 7,540,226 | | | 1,126,024 | | | 1,110,208 | | | 5,248,419 | | | 8,353,061 | | | 51,030 | | | 135 | |
Shares reinvested | | 677,209 | | | 2,479,092 | | | 59,684 | | | 27,560 | | | 480,713 | | | 1,805,474 | | | 50,668 | | | 19,301 | |
Shares redeemed | | (1,607,636 | ) | | (17,130,252 | ) | | (1,858,956 | ) | | (1,130,399 | ) | | (585,221 | ) | | (9,214,663 | ) | | (569,745 | ) | | (6 | ) |
| | | | | | | | | | | | | | | | | | | | | | | | |
Net increase (decrease) | | 367,070 | | | (7,110,934 | ) | | (673,248 | ) | | 7,369 | | | 5,143,911 | | | 943,872 | | | (468,047 | ) | | 19,430 | |
| | | | | | | | | | | | | | | | | | | | | | | | |
| | | | | | | | |
Medium-Duration Bond Fund | | | | | | | | | | | | | | | | | | | | | | | | |
Shares sold | | 1,671,942 | | | 12,489,105 | | | 1,025 | | | 5,732 | | | 5,497,788 | | | 14,239,642 | | | 62,271 | | | 73 | |
Shares reinvested | | 801,315 | | | 3,170,861 | | | 93,047 | | | 34,362 | | | 682,179 | | | 2,861,364 | | | 89,901 | | | 31,950 | |
Shares redeemed | | (770,305 | ) | | (6,269,958 | ) | | (598 | ) | | (989 | ) | | (444,179 | ) | | (6,447,573 | ) | | (459,868 | ) | | — | |
| | | | | | | | | | | | | | | | | | | | | | | | |
Net increase (decrease) | | 1,702,952 | | | 9,390,008 | | | 93,474 | | | 39,105 | | | 5,735,788 | | | 10,653,433 | | | (307,696 | ) | | 32,023 | |
| | | | | | | | | | | | | | | | | | | | | | | | |
| | | | | | | | |
Extended-Duration Bond Fund | | | | | | | | | | | | | | | | | | | | | | | | |
Shares sold | | 928,267 | | | 8,351,957 | | | — | | | 2,034 | | | 3,301,097 | | | 5,503,394 | | | 102,426 | | | 68 | |
Shares reinvested | | 580,534 | | | 1,230,516 | | | 146,627 | | | 49,077 | | | 672,556 | | | 1,637,275 | | | 187,340 | | | 59,570 | |
Shares redeemed | | (934,248 | ) | | (4,562,953 | ) | | — | | | (956 | ) | | (810,810 | ) | | (7,325,967 | ) | | (1,204,900 | ) | | — | |
| | | | | | | | | | | | | | | | | | | | | | | | |
Net increase (decrease) | | 574,553 | | | 5,019,520 | | | 146,627 | | | 50,155 | | | 3,162,843 | | | (185,298 | ) | | (915,134 | ) | | 59,638 | |
| | | | | | | | | | | | | | | | | | | | | | | | |
| | | | | | | | |
Global Bond Fund(1) | | | | | | | | | | | | | | | | | | | | | | | | |
Shares sold | | | | | 1 | | | | | | | | | | | | | | | | | | | |
Shares reinvested | | | | | 4,189 | | | | | | | | | | | | | | | | | | | |
Shares redeemed | | | | | — | | | | | | | | | | | | | | | | | | | |
| | | | | | | | | | | | | | | | | | | | | | | | |
Net increase | | | | | 4,190 | | | | | | | | | | | | | | | | | | | |
| | | | | | | | | | | | | | | | | | | | | | | | |
| | | | | | | | |
Equity Index Fund | | | | | | | | | | | | | | | | | | | | | | | | |
Shares sold | | 760,927 | | | 2,502,116 | | | 46,073 | | | 4,865 | | | 2,936,130 | | | 2,592,192 | | | — | | | 120 | |
Shares reinvested | | 237,789 | | | 469,656 | | | 40,598 | | | 16,350 | | | 171,170 | | | 357,906 | | | 29,955 | | | 11,720 | |
Shares redeemed | | (508,852 | ) | | (2,375,932 | ) | | (9,295 | ) | | (1,563 | ) | | (558,730 | ) | | (4,595,480 | ) | | — | | | — | |
| | | | | | | | | | | | | | | | | | | | | | | | |
Net increase (decrease) | | 489,864 | | | 595,840 | | | 77,376 | | | 19,652 | | | 2,548,570 | | | (1,645,382 | ) | | 29,955 | | | 11,840 | |
| | | | | | | | | | | | | | | | | | | | | | | | |
154
| | | | | | | | | | | | | | | | | | | | | | | |
| | | Year Ended December 31, 2006 | | | Year Ended December 31, 2005 |
| | | GS2 | | | GS4 | | | GS6 | | | GS8 | | | GS2 | | | GS4 | | | GS6 | | | GS8 |
Real Estate Securities Fund(1) |
Shares sold | | | | | 14,017 | | | | | | | | | | | | | | | | | | |
Shares reinvested | | | | | — | | | | | | | | | | | | | | | | | | |
Shares redeemed | | | | | (2,008 | ) | | | | | | | | | | | | | | | | | |
| | | | | | | | | | | | | | | | | | | | | | | |
Net increase | | | | | 12,009 | | | | | | | | | | | | | | | | | | |
| | | | | | | | | | | | | | | | | | | | | | | |
| | | | | | | | |
Value Equity Fund | | | | | | | | | | | | | | | | | | | | | | | |
Shares sold | | 1,004,773 | | | 2,999,625 | | | 6,797 | | | 24,170 | | | 7,236,109 | | | 3,861,126 | | | 58,317 | | | 273 |
Shares reinvested | | 2,869,649 | | | 7,841,423 | | | 278,467 | | | 103,981 | | | 1,782,966 | | | 5,787,541 | | | 169,839 | | | 62,261 |
Shares redeemed | | (1,286,505 | ) | | (7,023,963 | ) | | (1,460 | ) | | (2,985 | ) | | (1,044,581 | ) | | (10,142,136 | ) | | (402,264 | ) | | — |
| | | | | | | | | | | | | | | | | | | | | | | |
Net increase (decrease) | | 2,587,917 | | | 3,817,085 | | | 283,804 | | | 125,166 | | | 7,974,494 | | | (493,469 | ) | | (174,108 | ) | | 62,534 |
| | | | | | | | | | | | | | | | | | | | | | | |
| | | | | | | | |
Growth Equity Fund | | | | | | | | | | | | | | | | | | | | | | | |
Shares sold | | 1,675,252 | | | 4,244,023 | | | 33,874 | | | 8,954 | | | 8,581,238 | | | 3,451,460 | | | 33,645 | | | 99 |
Shares reinvested | | — | | | — | | | — | | | — | | | — | | | — | | | — | | | — |
Shares redeemed | | (1,061,893 | ) | | (5,622,252 | ) | | (6,212 | ) | | (1,013 | ) | | (1,360,673 | ) | | (12,607,943 | ) | | (350,859 | ) | | — |
| | | | | | | | | | | | | | | | | | | | | | | |
Net increase (decrease) | | 613,359 | | | (1,378,229 | ) | | 27,662 | | | 7,941 | | | 7,220,565 | | | (9,156,483 | ) | | (317,214 | ) | | 99 |
| | | | | | | | | | | | | | | | | | | | | | | |
| | | | | | | | |
Small Cap Equity Fund | | | | | | | | | | | | | | | | | | | | | | | |
Shares sold | | 686,981 | | | 3,634,970 | | | 17,275 | | | 10,645 | | | 2,961,871 | | | 5,734,325 | | | 34,416 | | | 453 |
Shares reinvested | | 637,396 | | | 2,416,922 | | | 175,865 | | | 65,487 | | | 776,723 | | | 3,248,901 | | | 204,944 | | | 75,572 |
Shares redeemed | | (880,093 | ) | | (5,341,920 | ) | | (16 | ) | | (2,722 | ) | | (587,859 | ) | | (5,552,728 | ) | | (291,639 | ) | | — |
| | | | | | | | | | | | | | | | | | | | | | | |
Net increase (decrease) | | 444,284 | | | 709,972 | | | 193,124 | | | 73,410 | | | 3,150,735 | | | 3,430,498 | | | (52,279 | ) | | 76,025 |
| | | | | | | | | | | | | | | | | | | | | | | |
| | | | | | | | |
International Equity Fund | | | | | | | | | | | | | | | | | | | | | | | |
Shares sold | | 1,037,499 | | | 5,262,328 | | | 19,348 | | | 9,817 | | | 5,946,070 | | | 5,799,684 | | | 123,176 | | | 371 |
Shares reinvested | | 1,675,167 | | | 7,326,014 | | | 199,772 | | | 64,362 | | | 391,556 | | | 1,711,897 | | | 38,117 | | | 11,325 |
Shares redeemed | | (2,075,826 | ) | | (11,343,731 | ) | | (1,299 | ) | | (1,494 | ) | | (1,070,163 | ) | | (13,605,130 | ) | | (374,414 | ) | | — |
| | | | | | | | | | | | | | | | | | | | | | | |
Net increase (decrease) | | 636,840 | | | 1,244,611 | | | 217,821 | | | 72,685 | | | 5,267,463 | | | (6,093,549 | ) | | (213,121 | ) | | 11,696 |
| | | | | | | | | | | | | | | | | | | | | | | |
(1) | Inception date was December 29, 2006. |
8. BANK BORROWINGS
The Trust, on behalf of and for the benefit of the Funds, has a credit agreement with Bank of America, N.A., dated December 1, 2006, whereby each Fund is permitted to have bank borrowings for temporary or emergency purposes to fund shareholder redemptions. The agreement permits borrowings up to $50 million, collectively. Interest is charged to each Fund based on its borrowings at a rate equal to the Bank prime rate minus two percent or the Wall Street Journal LIBOR One Month Floating Rate plus 0.50%. Each Fund also pays a facility fee equal to its pro rata share of the amount of the credit facility at a rate of 0.12% per annum. None of the Funds had any outstanding borrowings during the year ended December 31, 2006.
155
9. FEDERAL INCOME TAXES
Income dividends and capital gain distributions are determined in accordance with federal income tax regulations, which may differ from GAAP. These differences are primarily due to differing treatments for futures and options transactions, foreign currency transactions, paydowns, losses deferred due to wash sales, investments in Passive Foreign Investment Companies (“PFIC’s”) and excise tax regulations. Distributions during the period ended December 31, 2006 and the year ended December 31, 2005 were characterized as follows for tax purposes:
| | | | | | | | | |
Fund | | Ordinary
Income | | Long-Term
Capital Gain | | Return of Capital |
Flexible Income | | | | | | | | | |
2006 | | $ | 10,179,210 | | $ | 3,665,564 | | $ | — |
2005 | | | 7,202,701 | | | 8,060,505 | | | — |
| | | |
Growth & Income | | | | | | | | | |
2006 | | | 38,147,927 | | | 40,748,252 | | | — |
2005 | | | 32,658,116 | | | 51,454,905 | | | — |
| | | |
Capital Opportunities | | | | | | | | | |
2006 | | | 24,736,064 | | | 51,235,371 | | | — |
2005 | | | 21,044,662 | | | 32,067,303 | | | — |
| | | |
Global Equity | | | | | | | | | |
2006 | | | 17,264,066 | | | 53,666,488 | | | — |
2005 | | | 14,036,479 | | | 31,500,364 | | | — |
| | | |
Flexible Income I | | | | | | | | | |
2006 | | | 2,665,895 | | | 1,272,521 | | | — |
2005 | | | 1,960,483 | | | 695,422 | | | — |
| | | |
Growth & Income I | | | | | | | | | |
2006 | | | 11,122,184 | | | 10,020,990 | | | — |
2005 | | | 9,387,903 | | | 3,409,006 | | | — |
| | | |
Capital Opportunities I | | | | | | | | | |
2006 | | | 6,171,476 | | | 8,479,337 | | | — |
2005 | | | 4,868,226 | | | 1,871,844 | | | — |
| | | |
Global Equity I | | | | | | | | | |
2006 | | | 3,516,616 | | | 8,553,585 | | | — |
2005 | | | 2,761,080 | | | 1,331,740 | | | — |
| | | |
Money Market | | | | | | | | | |
2006 | | | 42,093,683 | | | — | | | — |
2005 | | | 25,692,609 | | | — | | | — |
| | | |
Low-Duration Bond | | | | | | | | | |
2006 | | | 38,289,007 | | | — | | | — |
2005 | | | 28,121,329 | | | 2,254 | | | — |
| | | |
Medium-Duration Bond | | | | | | | | | |
2006 | | | 50,287,994 | | | — | | | — |
2005 | | | 44,837,310 | | | 1,305,314 | | | — |
| | | |
Extended-Duration Bond | | | | | | | | | |
2006 | | | 23,061,143 | | | 1,213,320 | | | — |
2005 | | | 25,266,825 | | | 6,787,901 | | | — |
| | | |
Global Bond | | | | | | | | | |
2006 | | | 37,349 | | | — | | | 5,039 |
| | | |
Equity Index | | | | | | | | | |
2006 | | | 8,794,069 | | $ | 3,058,163 | | | — |
2005 | | | 6,790,475 | | | 1,344,379 | | | — |
| | | |
Value Equity | | | | | | | | | |
2006 | | | 38,680,720 | | | 141,795,290 | | | — |
2005 | | | 43,128,602 | | | 82,692,658 | | | — |
| | | |
Small Cap Equity | | | | | | | | | |
2006 | | | 16,751,192 | | | 32,095,593 | | | — |
2005 | | | 18,650,756 | | | 44,882,273 | | | — |
| | | |
International Equity | | | | | | | | | |
2006 | | | 41,665,598 | | | 129,659,324 | | | — |
2005 | | | 21,032,901 | | | 15,522,074 | | | — |
At December 31, 2006, the components of distributable earnings on a tax basis were as follows:
| | | | | | | | | | | |
Fund | | Undistributed
Ordinary
Income | | Undistributed
Long-Term
Capital Gain/ (Capital Loss
Carryforward) | | | Net Unrealized
Appreciation
(Depreciation)
on Investments | |
Flexible Income | | $ | 13,737 | | $ | 5,039,842 | | | $ | 44,825,189 | |
Growth & Income | | | 134,394 | | | 39,127,651 | | | | 230,265,012 | |
Capital Opportunities | | | 142,127 | | | 46,415,417 | | | | 225,336,854 | |
Global Equity | | | 132,746 | | | 57,714,890 | | | | 246,437,959 | |
Flexible Income I | | | 2,076 | | | 1,125,962 | | | | (1,713,540 | ) |
Growth & Income I | | | 28,107 | | | 9,711,600 | | | | 1,642,073 | |
Capital Opportunities I | | | 31,345 | | | 10,226,203 | | | | 10,387,316 | |
Global Equity I | | | 21,343 | | | 10,189,838 | | | | 9,384,791 | |
Money Market | | | — | | | (8,532 | ) | | | — | |
Low-Duration Bond | | | 162,068 | | | (18,445,864 | ) | | | (3,485,920 | ) |
Medium-Duration Bond | | | 1,281,343 | | | (3,490,933 | ) | | | (1,930,205 | ) |
Extended-Duration Bond | | | 391,035 | | | 5,219,297 | | | | 12,796,593 | |
Global Bond | | | — | | | — | | | | 599,086 | |
Equity Index | | | 39,815 | | | — | | | | 140,548,424 | |
Real Estate Securities | | | — | | | — | | | | 13,702,844 | |
Value Equity | | | 3,335,335 | | | 5,601,254 | | | | 310,460,901 | |
Growth Equity | | | — | | | (159,767,108 | ) | | | 280,113,207 | |
Small Cap Equity | | | 3,554,302 | | | 7,555,381 | | | | 70,387,086 | |
International Equity | | | 1,777,551 | | | 22,428,184 | | | | 477,680,895 | |
Post-October loss deferrals have been included in undistributed ordinary income and undistributed long-term capital gains, depending upon the character of the loss deferral.
156
For federal income tax purposes, capital loss carryovers and their expiration dates, were as follows as of December 31, 2006:
| | | | | | | | | | | | |
| | | Money
Market | | Low Duration
Bond | | Medium
Duration
Bond | | Growth Equity |
Expiring December 31, | | | | | | | | | | | | |
2010 | | | — | | | — | | | — | | $ | 36,470,601 |
2011 | | $ | 2,028 | | | — | | | — | | | 123,296,507 |
2013 | | | 5,370 | | $ | 9,988,046 | | $ | 1,264,463 | | | — |
2014 | | | 1,134 | | | 8,457,818 | | | 2,226,470 | | | — |
| | | | | | | | | | | | |
Total | | $ | 8,532 | | $ | 18,445,864 | | $ | 3,490,933 | | $ | 159,767,108 |
| | | | | | | | | | | | |
For federal income tax purposes, post-October loss deferrals, which will reverse in 2007, were as follows as of December 31, 2006:
| | | | | | | | | |
| | | Capital | | FX | | Total |
Money Market | | $ | 632 | | | — | | $ | 632 |
Low-Duration Bond | | | 1,070,013 | | $ | 523,681 | | | 1,593,694 |
Global Bond | | | — | | | 69,777 | | | 69,777 |
Equity Index | | | 885,213 | | | — | | | 885,213 |
Real Estate Securities | | | 21,659 | | | — | | | 21,659 |
International Equity | | | — | | | 108,304 | | | 108,304 |
At December 31, 2006, the net unrealized appreciation from investments for those securities having an excess of value over cost and net unrealized depreciation from investments for those securities having an excess of cost over value (based on cost for federal income tax purposes) was as follows:
| | | | | | | | | | | |
Fund | | Net Unrealized
Appreciation
(Depreciation) | | | Appreciated
Securities | | Depreciated
Securities | |
Flexible Income | | $ | 44,825,189 | | | $ | 46,909,692 | | $ | (2,084,503 | ) |
Growth & Income | | | 230,265,012 | | | | 236,795,949 | | | (6,530,937 | ) |
Capital Opportunities | | | 225,336,854 | | | | 229,227,178 | | | (3,890,324 | ) |
Global Equity | | | 246,437,959 | | | | 247,630,774 | | | (1,192,815 | ) |
Flexible Income I | | | (1,713,540 | ) | | | 1,481,507 | | | (3,195,047 | ) |
Growth & Income I | | | 1,642,073 | | | | 14,080,508 | | | (12,438,435 | ) |
Capital Opportunities I | | | 10,387,316 | | | | 16,147,074 | | | (5,759,758 | ) |
Global Equity I | | | 9,384,791 | | | | 12,094,983 | | | (2,710,192 | ) |
Low-Duration Bond | | | (3,135,912 | ) | | | 2,266,519 | | | (5,402,431 | ) |
Medium-Duration Bond | | | (759,515 | ) | | | 11,189,310 | | | (11,948,825 | ) |
Extended-Duration Bond | | | 12,789,520 | | | | 18,271,798 | | | (5,482,278 | ) |
Global Bond | | | 481,859 | | | | 1,137,295 | | | (655,436 | ) |
Equity Index | | | 140,548,424 | | | | 187,945,093 | | | (47,396,669 | ) |
Real Estate Securities | | | 13,702,844 | | | | 14,060,279 | | | (357,435 | ) |
Value Equity | | | 310,460,901 | | | | 332,109,898 | | | (21,648,997 | ) |
Growth Equity | | | 280,113,207 | | | | 318,691,665 | | | (38,578,458 | ) |
Small Cap Equity | | | 70,387,086 | | | | 94,352,210 | | | (23,965,124 | ) |
International Equity | | | 477,734,704 | | | | 495,550,152 | | | (17,815,448 | ) |
The differences between book basis and tax-basis unrealized appreciation is attributable primarily to the tax deferral of losses on wash sales and on investments in PFIC’s.
At December 31, 2006, the aggregate cost of investment securities for federal income tax purposes was as follows (excluding foreign currency and derivative related items):
| | | |
Fund | | Federal Tax Cost |
Flexible Income | | $ | 282,217,525 |
Growth & Income | | | 1,194,194,986 |
Capital Opportunities | | | 929,225,999 |
Global Equity | | | 809,294,116 |
Flexible Income I | | | 58,903,155 |
Growth & Income I | | | 260,932,806 |
Capital Opportunities I | | | 177,187,416 |
Global Equity I | | | 132,916,342 |
Money Market | | | 1,039,319,532 |
Low-Duration Bond | | | 933,757,575 |
Medium-Duration Bond | | | 1,825,646,640 |
Extended-Duration Bond | | | 810,595,892 |
Global Bond | | | 116,667,037 |
Equity Index | | | 454,744,407 |
Real Estate Securities | | | 93,365,267 |
Value Equity | | | 1,453,451,389 |
Growth Equity | | | 1,379,831,568 |
Small Cap Equity | | | 784,649,791 |
International Equity | | | 1,229,587,339 |
157
At December 31, 2006, capital contributions, accumulated undistributed net investment income and accumulated net realized gain (loss) from investments have been adjusted for current period permanent book/tax differences which arose principally from differing book/tax treatments of paydown gains, net operating losses and foreign currency transactions. The following amounts were reclassified within the capital accounts:
| | | | | | | | | | | | |
Fund | | Paid in
Capital | | | Accumulated
Undistributed
Income | | | Accumulated Net Realized
Gain (Loss) on
Investments,
Currency Translations
and Derivative
Transactions | |
Flexible Income | | | — | | | $ | 612,161 | | | $ | (612,161 | ) |
Growth & Income | | | — | | | | 5,346,259 | | | | (5,346,259 | ) |
Capital Opportunities | | | — | | | | 6,412,948 | | | | (6,412,948 | ) |
Global Equity | | | — | | | | 7,873,941 | | | | (7,873,941 | ) |
Flexible Income I | | | — | | | | 150,880 | | | | (150,880 | ) |
Growth & Income I | | | — | | | | 1,372,050 | | | | (1,372,050 | ) |
Capital Opportunities I | | | — | | | | 1,448,411 | | | | (1,448,411 | ) |
Global Equity I | | | — | | | | 1,466,148 | | | | (1,466,148 | ) |
Low-Duration Bond | | | — | | | | (67,136 | ) | | | 67,136 | |
Medium-Duration Bond | | | — | | | | (1,289,737 | ) | | | 1,289,737 | |
Extended-Duration Bond | | | — | | | | 969,512 | | | | (969,512 | ) |
Global Bond | | $ | (5,039 | ) | | | (9,600 | ) | | | 14,639 | |
Equity Index | | | — | | | | (1,381 | ) | | | 1,381 | |
Real Estate Securities | | | (10,185 | ) | | | 10,185 | | | | — | |
Growth Equity | | | (1,702,251 | ) | | | 1,702,251 | | | | — | |
Small Cap Equity | | | — | | | | 1,150,662 | | | | (1,150,662 | ) |
International Equity | | | — | | | | 1,013,509 | | | | (1,013,509 | ) |
Net investment income, net realized gain (loss) on investments and net assets were not affected by these reclassifications.
10. NEW ACCOUNTING PRONOUNCEMENTS
In July 2006, the Financial Accounting Standards Board (“FASB”) issued FASB Interpretation No. 48 (“FIN 48”), “Accounting for Uncertainty in Income Taxes.” This pronouncement provides guidance on the recognition, measurement, classification, and disclosures related to uncertain tax positions, along with any related interest and penalties. FIN 48 is effective for fiscal years beginning after December 15, 2006, with the Funds required to implement FIN 48 in the NAV calculation by June 30, 2007. The Funds are in the process of evaluating the effect, if any, that the adoption of FIN 48 will have on the financial statements.
In September 2006, the Financial Accounting Standards Board issued FASB Statement No. 157, Fair Value Measurements, (“Statement 157”). Statement 157 establishes a framework for measuring fair value in generally accepted accounting principles, clarifies the definition of fair value within that framework, and expands disclosures about the use of fair value measurements. Statement 157 is intended to increase consistency and comparability among fair value estimates used in financial reporting. Statement 157 is effective for fiscal years beginning after November 15, 2007. Management does not expect the adoption of Statement 157 to have an impact on the amounts reported in the financial statements.
11. INVESTMENT NOT MEETING INVESTMENT GUIDELINES
During the year ended December 31, 2006, one of the Extended-Duration Bond Fund’s sub-advisers purchased a security that did not meet the Fund’s investment guidelines. The security was subsequently sold at a loss of $20,623, for which the Fund was fully reimbursed by the sub-adviser.
12. FINANCIAL HIGHLIGHTS RESTATEMENT FOR MONEY MARKET FUND
Due to a procedural error, net investment income per share and dividends from net investment income per share were incorrectly reported in the 2005 financial highlights of the Money Market Fund. Such amounts have been restated, as shown below, in the financial highlights for the year ended December 31, 2005.
| | | | | | |
| Net Investment Income Per Share |
| | | 2005 |
| | | Originally | | Corrected |
Class | | Reported | | Value |
GS2 | | $ | 0.00 | | $ | 0.03 |
GS4 | | | 0.00 | | | 0.03 |
GS6 | | | 0.00 | | | 0.02 |
GS8 | | | 0.00 | | | 0.02 |
| | | | | | | | |
| Dividends from Net Investment Income Per Share | |
| | | 2005 | |
Class | | Originally Reported | | | Corrected Value | |
GS2 | | $ | (0.00 | ) | | $ | (0.03 | ) |
GS4 | | | (0.00 | ) | | | (0.03 | ) |
GS6 | | | (0.00 | ) | | | (0.02 | ) |
GS8 | | | (0.00 | ) | | | (0.02 | ) |
158
REPORT OF INDEPENDENT REGISTERED PUBLIC ACCOUNTING FIRM
To the Board of Trustees and
Shareholders of GuideStone Funds:
In our opinion, the accompanying statements of assets and liabilities, including the schedules of investments, and the related statements of operations and of changes in net assets and the financial highlights, after the restatement described in Note 12, present fairly, in all material respects, the financial position of Flexible Income Fund, Growth & Income Fund, Capital Opportunities Fund, Global Equity Fund, Flexible Income Fund I, Growth & Income Fund I, Capital Opportunities Fund I, Global Equity Fund I, Money Market Fund, Low-Duration Bond Fund, Medium-Duration Bond Fund, Extended-Duration Bond Fund, Global Bond Fund, Equity Index Fund, Real Estate Securities Fund, Value Equity Fund, Growth Equity Fund, Small Cap Equity Fund, and International Equity Fund (constituting GuideStone Funds, hereafter referred to as the “Trust”) at December 31, 2006, and the results of their operations, the changes in their net assets and their financial highlights for each of the periods indicated, in conformity with accounting principles generally accepted in the United States of America. These financial statements and financial highlights (hereafter referred to as “financial statements”) are the responsibility of the Trust’s management; our responsibility is to express an opinion on these financial statements based on our audits. We conducted our audits of these financial statements in accordance with the standards of the Public Company Accounting Oversight Board (United States). Those standards require that we plan and perform the audit to obtain reasonable assurance about whether the financial statements are free of material misstatement. An audit includes examining, on a test basis, evidence supporting the amounts and disclosures in the financial statements, assessing the accounting principles used and significant estimates made by management, and evaluating the overall financial statement presentation. We believe that our audits, which included confirmation of securities at December 31, 2006 by correspondence with the custodian and brokers, provide a reasonable basis for our opinion.

Philadelphia, Pennsylvania
February 23, 2007
159
FUND MANAGEMENT (UNAUDITED)
Information pertaining to the Trustees and officers of the Trust is set forth below. The statement of additional information (SAI) includes additional information about the Trustees and is available without charge, upon request, by calling 1-888-98-GUIDE.
| | | | | | | | |
Name, (DOB), Address and Position(s) with Trust | | Term of Office and Length of Time Served1 | | Principal Occupation(s) During Past 5 Years | | Number of
Portfolios
in Fund
Complex
Overseen
by Trustee | | Other Trusteeships/ Directorships Held by Trusteee |
| DISINTERESTED TRUSTEES |
| | | | |
Michael R. Buster (11/18/57) 3656 Bridle Road Prosper, TX 75078 Trustee | | Since 2002 | | Executive Pastor, Prestonwood Baptist Church, 1989 - Present. | | 19 | | None |
| | | | |
William Craig George (7/8/58) 617 Glen Eden Drive Raleigh, NC 27612 Trustee | | Since 2004 | | Regional loan administrator, SunTrust Bank, 1995 - present. | | 19 | | None |
| | | | |
Joseph A. Mack (11/22/39) 186 Preserve Lane Columbia, SC 29209 Trustee | | Since 2002 | | Director, Office of Public Policy, South Carolina Baptist Convention, 1999 - Present; Deputy Director, SC Retirement Systems. | | 19 | | None |
| | | | |
Kevin P. Mahoney (7/26/57) 2401 Cedar Springs Road Dallas, TX 75201-1407 Trustee | | Since 2004 | | Executive Pastor, FBC West Palm Beach, FL, July 2000 - present; Administrative Pastor, FBC Merritt Island, FL, June 1995 - June 2000. | | 19 | | None |
| | | | |
Franklin Raymond Morgan (6/1/43) 23914 Seven Winds San Antonio, TX 78258 Trustee | | Since 2005 | | Retired - Senior Vice President, Director of International Administration, Prudential Securities, Inc., January 1962 - May 2003. | | 19 | | None |
| | | | |
James Ray Taylor (10/19/33) 3009 Tanglewood Park West Fort Worth, Texas 76109 Trustee | | Since 2002 | | Retired since 1994. | | 19 | | None |
|
| INTERESTED TRUSTEES2 |
| | | | |
Barry Hartis (10/6/45) 12 Waxwing Cove Greensboro, NC 27455-1373 Trustee | | Since 2005 | | Certified Public Accountant 1976 - Present, Vice President for Business and Finance, Greensboro College, January 1998 - June 30, 2005. | | 19 | | |
| | | | |
Gerald B. Jones (5/24/32) 4625 Bridgewater Fayetteville, AR 72703-0003 Trustee | | Since 2000 | | President, Flying Investments, November 2006 - present. Owner Jones Motorcars, Inc. 1957 - October 2006. | | 19 | | Bank of Arkansas —Director |
|
| OFFICERS WHO ARE NOT TRUSTEES |
| | | | |
Jeffrey P. Billinger (12/5/46) 2401 Cedar Springs Road Dallas, TX 75201-1407 Vice President and Treasurer | | Since 2000 | | Executive Officer and Treasurer, GuideStone Financial Resources of the Southern Baptist Convention, 1995 - Present. | | N/A | | N/A |
160
FUND MANAGEMENT (UNAUDITED) (Continued)
| | | | | | | | |
Name, (DOB), Address and Position(s) with Trust | | Term of Office
and Length of
Time Served1 | | Principal Occupation(s) During Past 5 Years | | Number of
Portfolios
in Fund
Complex
Overseen
by Trustee | | Other Trusteeships/
Directorships Held by Trusteee |
Rodric E. Cummins (6/28/57) 2401 Cedar Springs Road Dallas, TX 75201-1407 Vice President and Investment Officer | | Since 2000 | | Executive Officer and Chief Investment Officer, GuideStone Financial Resources of the Southern Baptist Convention, 1998-Present. | | N/A | | N/A |
| | | | |
John R. Jones (12/6/53) 2401 Cedar Springs Road Dallas, TX 75201-1407 President | | Since 2000 | | Executive Vice President and Chief Operating Officer, GuideStone Financial Resources of the Southern Baptist Convention, 1995 - Present. | | N/A | | N/A |
| | | | |
Rodney R. Miller (5/23/53) 2401 Cedar Springs Road Dallas, TX 75201-1407 Vice President, Secretary and Chief Legal Officer | | Since 2000 | | General Counsel, Legal and Compliance, GuideStone Financial Resources of the Southern Baptist Convention, 1995 - Present. | | N/A | | N/A |
| | | | |
Patricia A. Weiland (8/25/59) 2401 Cedar Springs Road Dallas, TX 75201-1407 Vice President and Chief Compliance Officer | | Since 2000 | | Executive Officer, Financial Solutions and Services, GuideStone Financial Resources of the Southern Baptist Convention, 2006 - present; Director, Mutual Funds, GuideStone Financial Resources of the Southern Baptist Convention, 2000 - 2006. | | N/A | | N/A |
1 | Each Trustee and officer serves for an indefinite term, until his/her successor is elected. Officers serve at the pleasure of the Board of Trustees. |
2 | Messrs. Jones and Hartis serve as trustees and are to be “interested persons” of the Trust as the term is defined in the Investment Company Act of 1940, as amended, due to their positions on the Board of Trustees of GuideStone Financial Resources of the Southern Baptist Convention. |
PROXY VOTING
A description of the policies and procedures that GuideStone Funds uses to determine how to vote proxies relating to their portfolio securities as well as information regarding how GuideStone Funds voted proxies during the most recent 12-month period ended June 30 is available without charge by calling 1-888-98-GUIDE, by visiting our website at www.GuideStone.org or by visiting the SEC’s website at www.sec.gov.
QUARTERLY SCHEDULES OF INVESTMENTS
In addition to the semi-annual and annual reports that GuideStone Funds delivers to shareholders and makes available through its website, GuideStone Funds files a complete schedule of portfolio holdings with the Securities and Exchange Commission (SEC) for each Fund’s first and third fiscal quarters on Form N-Q. GuideStone Funds does not deliver the schedule for the first and third fiscal quarters to shareholders, however the schedule is posted to our website, www.GuideStone.org. You may also obtain the Form N-Q filings by accessing the SEC’s website at www.sec.gov or copy them at the SEC’s Public Reference Room in Washington, DC. Information on the operation of the SEC’s Public Reference Room may be obtained by calling the SEC at (800) 732-0330. You can also request copies of this information, upon payment of a fee for duplication, at the SEC’s email address (publicinfo@sec.gov) or by writing the Public Reference section of the SEC, Washington, DC 20549-0102.
161
BOARD REVIEW OF ADVISORY AGREEMENTS
As required by the Investment Company Act of 1940, as amended (the “1940 Act”), the Board of Trustees (the “Board”) of GuideStone Funds (the “Trust”), including all of the Trustees who are not “interested persons” of the Trust, as that term is defined in the 1940 Act (the “Independent Trustees”), recently considered the renewal of (i) the investment advisory agreement between GCM (the “Adviser” or “GCM”) and the Trust on behalf of the Blended and Select Funds that comprise the Trust (the “Advisory Agreement”); and (ii) the sub-advisory agreements among the Adviser, each sub-adviser and the Trust on behalf of each Select Fund (the “Sub-Advisory Agreements”). The Advisory Agreement and each Sub-Advisory Agreement (the “Agreements”) were approved for an additional one-year term at a meeting of the Board held on September 13-14, 2006. The Board’s decision to approve the Agreements reflects the exercise of its business judgment to continue each existing arrangement. In approving the Agreements, the Board considered information provided by the Adviser, each sub-adviser and a consulting firm engaged by the Adviser with the assistance and advice of counsel to the Independent Trustees and counsel to the Trust.
The Board’s consideration of various factors and its conclusions with respect to such factors formed the basis for the Board’s determination to continue the Advisory and Sub-Advisory Agreements. The factors considered by the Board included, but were not limited to: (i) the resources of the adviser; (ii) the experience and expertise of the adviser; (iii) the financial capability of the adviser; (iv) the compliance procedures and history of the adviser; (v) the performance of the fund in comparison to relevant benchmarks, similarly managed funds and the adviser’s other clients; (vi) the amount of the contractual advisory fee in comparison to similarly managed funds and the adviser’s other clients and the effect of any fee waiver and expense reimbursement arrangement; (vii) the total expenses of the fund in comparison to similarly managed funds and the use of past and anticipated expense caps; (viii) the profitability of the adviser with respect to the fund and its overall business; (ix) the extent of any economies of scale and whether the fee structure reflects such economies of scale; (x) the existence of any collateral benefits realized by the adviser; and (xi) the existence of any collateral benefits realized by the fund. In its decision to renew each Agreement, the Board was also mindful of the potential disruptions of the Trust’s operations and various risks, uncertainties and other effects that could occur as a result of a decision to terminate or not renew an Agreement. No one factor was determinative in the Board’s consideration of the Advisory and Sub-Advisory Agreements.
The Board undertook a review of the terms of each Advisory and Sub-Advisory Agreement and the nature and quality of the services provided by the Adviser and each sub-adviser. The Board conducted its analysis on a fund-by-fund basis with respect to the Adviser and each Sub-adviser. Management provided the Board with substantial detailed information in the form of reports about each of the nine Select Funds, eight Blended Funds, twenty-nine sub-advisory firms and the Adviser prior to and during the meeting and at the meeting held on May 22-23, 2006, which information addressed most, if not all, of the factors listed above. Management also provided additional information about the Adviser and each Sub-adviser in presentations made during the meeting and responded to questions from the Trustees. In addition, the Independent Trustees met separately in executive session with counsel to the Independent Trustees to discuss and consider information presented in connection with the continuation of the Advisory and Sub-Advisory Agreements as well as the Trustees’ responsibilities and duties in approving the Agreements. A lengthy discussion also took place among the Trustees, management, Fund counsel and counsel to the Independent Trustees regarding the information presented for the Select and Blended Funds, including the management fees charged by the Blended Funds and the Select Funds as well as the sub-advisory fees, during executive sessions held prior to the meeting.
APPROVAL OF CONTINUATION OF INVESTMENT ADVISORY AGREEMENT
In considering the renewal of the existing advisory agreement with the Adviser, the Trustees took into account all the materials provided prior to and during the meeting and at the May meeting, the presentations made during the meeting, and the extensive discussions during the meeting and at the May meeting, including the discussions the Independent Trustees had during their executive session with their independent legal counsel. More specifically, the Trustees examined the nature, extent and quality of the services to be provided by the Adviser to the Funds. The Trustees evaluated the Adviser’s experience in serving as an Adviser, including overseeing and managing the allocation of
162
Fund assets among the sub-advisers. The Trustees noted the experience of key personnel at the Adviser in providing investment management and administrative services and the systems used by such persons and the ability of the Adviser to attract and retain capable personnel. The Trustees noted the reputation, compliance history, compliance program, and financial condition of the Adviser. The Trustees also noted the terms of the advisory and sub-advisory agreements and the responsibilities that the Adviser has as Adviser to the Funds, including oversight of sub-adviser compliance with each Fund’s policies and objectives, oversight of general Fund compliance, including compliance with social restrictions, and the implementation of Board of Trustees directives as they relate to the Funds. The Trustees concluded that each Fund is likely to benefit from the extent and quality of these services as a result of the Adviser’s experience, personnel, operations and resources.
The Trustees also reviewed a memorandum prepared by a consulting firm engaged by the Adviser for, among other things, supplying research on expense comparisons and investment performance of other similar funds. The memorandum compared each Select Fund with other funds having the same investment style or objective, and compared the share class of each Fund (other than the GS8 class) with other funds in the same broad distribution channel, the GS2 class against other institutional share classes and the GS4 and GS6 classes against a broad set of retail share classes. The Board analyzed the comparative expense and performance information in the memorandum, including comparative expense information for each Fund based on a sampling of funds similar in asset size. The Trustees considered the comparative performance, fee and expense information that had been provided in their evaluation of the management fees charged to each Select Fund. The Board evaluated the annualized performance results comparing the Funds against their peers, noting that most of the Funds provided above average returns with below average net expenses. The Board also considered data provided by management that analyzed the performance of the Blended Funds.
The Trustees examined fee and expense information for the Select Funds, as compared to other funds in the Funds’ asset-stratified peer groups for the GS4 class, provided by the consulting firm, as of February 28, 2006 at the May meeting. The Trustees determined that the management fees (combined advisory and sub-advisory fees) for each Select Fund were lower than the median management fees for other mutual funds in the Fund’s asset-stratified peer group, except for the Growth Equity Fund, the Small Cap Equity Fund and the International Equity Fund. The Trustees noted that the Adviser was currently reimbursing the expenses of most Funds, including the Growth Equity Fund, the Small Cap Equity Fund and the International Equity Fund, and the management fees of each Fund net of any fee waiver or expense reimbursement were below the median fees for other similar funds at the same asset levels, except for the Growth Equity Fund and the Small Cap Equity Fund. The Trustees also noted that the management fees net of any fee waiver or expense reimbursement for the Growth Equity Fund and the Small Cap Equity Fund ranked in the third quartile among other similar funds at the same asset levels, with the management fees net of any fee waiver or expense reimbursement for the Growth Equity Fund only slightly above the median. The Trustees also evaluated the expense ratios for other funds in the Funds’ asset-stratified peer groups and determined that each Fund’s expense ratio was significantly lower than the median expense ratio for such other funds. The Trustees further noted that the compensation to be received by the Adviser for each Fund under the advisory agreement remained the same. The Trustees concluded that the level of each Fund’s management fees was reasonable and compared fairly to that of comparable mutual funds.
The Trustees examined the performance information for the Select Funds (GS4 class) compared to Morningstar peers for the one and three-year periods ended June 30, 2006. The Trustees noted that the average annual total returns for the Select Funds generally ranked in the first and second quartile among the Morningstar peers, except for the Extended Duration Bond Fund and Growth Equity Fund for the one-year period ended June 30, 2006 and the Small Cap Equity Fund for the one and three-year periods ended June 30, 2006. The Trustees evaluated the performance of the Small Cap Equity Fund, which ranked in the fourth quartile for the three-year period ended June 30, 2006 and in the third quartile for the three-year period ended February 28, 2006. The Trustees also noted that the average annual total returns for the Blended Funds for the three-year period ended June 30, 2006 were above the median of unaffiliated funds in the Funds’ Lipper peer groups for the same time period, except for the Global Equity Fund. The Trustees noted that 18 out of 28 sub-advisers to the Funds with three-year performance history outperformed their respective benchmarks for the three-year period ended June 30, 2006 and that the Adviser
163
added economic value to the Funds through the selection of sub-advisers. The Trustees acknowledged that changes had been made to the sub-adviser line-up for the Small Cap Equity Fund in 2005 for the purpose of improving Fund performance.
The Trustees considered the costs to the Adviser of serving as the Adviser to the Funds, including the costs associated with the personnel, systems and equipment necessary to manage the Funds in accordance with the existing advisory agreement. The Trustees considered the anticipated revenues that the Adviser expected to receive for serving as the investment manager to the Funds, the fact that the Adviser was currently reimbursing the expenses of most Funds and the fact that any profit realized by the Adviser is forwarded to GuideStone Financial Resources which currently operates and historically has operated at a deficit with respect to the Trust. The Trustees considered the profitability estimates for the Adviser on a Fund-by-Fund basis with revenues and expenses allocated based on average Fund net assets, one without taking into account sub-advisory fee expenses borne by the Fund, the second taking into account sub-advisory fee expenses, and the third taking into account expenses associated with distribution and shareholder servicing fees. The Trustees also considered whether any direct or indirect collateral benefits inured to either the Adviser or the Trust as a result of their affiliation with one another. In light of these considerations, the Trustees concluded that any profits realized in connection with the Adviser’s services appeared reasonable.
The Trustees considered the extent to which the advisory fee to be paid to the Adviser reflected economies of scale. In this connection, the Trustees again noted that the Adviser was currently reimbursing the expenses of most Funds and the management fees for each Fund net of any fee waiver or expense reimbursement was below the median fee for other similar funds at the same asset levels, except for the Growth Equity Fund, the Small Cap Equity Fund and the International Equity Fund. Based on their review, the Trustees concluded that each Fund’s advisory fee was reasonable.
Based on all of the information presented to the Board and its consideration of relevant factors, the Board concluded that the fee paid to the Adviser by each Fund was reasonable, and in the exercise of its business judgment, determined to approve the continuation of the Advisory Agreement for each Fund.
APPROVAL OF CONTINUATION OF SUB-ADVISORY AGREEMENTS
In considering the existing sub-advisory agreements with each sub-adviser, the Trustees took into account the materials provided prior to and during the meeting and at the May meeting, the presentations made during the meeting and at the May meeting; and the extensive discussions during the meeting, including the discussions the Independent Trustees had during their executive session with their independent legal counsel. More specifically, the Trustees examined the nature, extent and quality of the services to be provided by each of the sub-advisers to the Select Funds. The Trustees evaluated each sub-adviser’s experience in serving as a sub-adviser to a Select Fund and noted that each sub-adviser currently provides investment advice to various clients, including other pooled investment vehicles. The Trustees noted the experience of key personnel at each sub-adviser in providing investment management services and the systems used by such persons, and the ability of each sub-adviser to attract and retain capable personnel. The Trustees noted the reputation, compliance history, compliance program and financial condition of each sub-adviser. The Trustees also noted the terms of the existing sub-advisory agreements and the responsibilities that each has as a sub-adviser to a Select Fund, including the responsibility of the day-to-day management of the investment portfolio of the Fund, compliance with each Fund’s policies and objectives, and the implementation of Board of Trustees directives as they relate to the Funds. The Trustees concluded that each Fund is likely to benefit from the extent and quality of these services as a result of each sub-adviser’s experience, personnel, operations and resources.
The Board considered standardized reports for each sub-adviser to each Select Fund. The standardized reports compiled by management included, among other things, a summary of investment performance of the Fund and sub-adviser, including comparisons with relevant benchmarks, composite performance for the sub-adviser and the peer universe of similarly managed funds, information regarding management style, services provided, risk versus return analysis, organizational structures, investment management experience, investment philosophies, personnel, changes in personnel, compliance procedures and policies, brokerage and soft dollar practices, compliance history, financial information, including profitability analysis, and economies of scale realized.
164
The Trustees examined performance information for each segment of a Select Fund managed by a sub-adviser. The Trustees noted that, for the majority of sub-advisers, the performance record of the segment of the Select Fund managed by the sub-adviser compared favorably to the relevant Fund benchmark, the composite performance for the sub-adviser’s clients (on a gross fee basis) and the peer universe of similarly managed funds for the period of time the sub-adviser performed advisory services on behalf of the Select Fund. The Trustees noted sub-advisers did underperform the relevant benchmark for the year-to-date and one-year periods ended June 30, 2006. Two of the sub-advisers outperformed the benchmark for the two-year period ended June 30, 2006.
Four sub-advisers underperformed the relevant Fund benchmark over the three-year period ended June 30, 2006 and two of the sub-advisers also underperformed the relevant Fund benchmark for the year-to-date and one-year periods ended June 30, 2006. The Trustees noted that, in certain cases, market trends, changes in personnel and a short history of managing Fund assets, may have contributed to the underperformance and each of the sub-advisers had or was in the process of taking action to address any such underperformance and that each sub-adviser fulfilled a particular investment mandate for the Select Fund it advised. The Trustees concluded that, although past performance is no guarantee of future performance, the performance of each Select Fund was satisfactory and the Funds were likely to benefit from each sub-adviser continuing to serve as sub-adviser to the Fund.
The Trustees examined the fee schedule for each sub-adviser, noting how the fee levels charged to the Trust compared with available information about fees charged by the sub-advisers to their other similarly situated clients, as well as how the sub-adviser fee levels for each Select Fund compared to the median sub-advisory fee for the peer universe of similarly managed funds.
The Trustees also examined the profitability and the financial capability of each sub-adviser in light of information presented at the May Board meeting. The Trustees noted that at the May Board meeting, they had concluded that the profitability estimates provided by each sub-adviser who completed a profitability questionnaire fell within industry norms, except in the case of one sub-adviser. With regard to that sub-adviser, the Board noted that the sub-adviser consistently outperformed the relevant benchmark for the Fund and the median for the peer universe of similarly managed funds as well as other sub-advisers to the Fund. For the three sub-advisers that did not provide profitability information, the Trustees had relied upon other relevant information, particularly the independent negotiation of the fee schedules, the level of the fees, and the sub-adviser’s performance history. The Trustees noted at the May meeting that, based on the Adviser’s representations, the financial statements of the sub-advisers did not appear to raise any concerns regarding the financial capability of those sub-advisers. The Trustees also considered the Adviser’s representations that no sub-adviser experienced any material change in its financial condition since the date of its most recent audited financial statements.
The Trustees considered the extent to which sub-adviser fees to be paid to each sub-adviser reflected economies of scale. The Trustees noted that each sub-adviser fee schedule either reflected economies of scale by reducing the fee on assets in excess of certain stated breakpoints, or the fee level negotiated was below or on par with the standard fee level for the sub-adviser.
In evaluating the benefits that are expected to accrue to each sub-adviser through its relationship as sub-adviser to a Select Fund, the Trustees noted that certain sub-advisers allocate portfolio brokerage to affiliated broker-dealers that receive commissions from the execution of Fund trades. The Trustees also noted that certain sub-advisers expect to benefit from “soft dollar” arrangements by which brokers will provide research and other services to the sub-adviser in exchange for commissions on trades of the portfolio securities of the Select Fund. The Trustees considered whether any direct or indirect collateral benefits inured to the Trust as a result of its affiliation with each sub-adviser.
Based on all of the information presented to the Board and its consideration of relevant factors, the Board, in the exercise of its reasonable business judgment, determined to approve the continuation of each Sub-Advisory Agreement.
BOARD REVIEW AND APPROVAL OF NEW SUB-ADVISORY AGREEMENTS FOR LOW-DURATION BOND FUND, MONEY MARKET FUND AND INTERNATIONAL EQUITY FUND
In conjunction with the Board’s consideration of the renewal of the Sub-Advisory Agreements, the Board, including all of the Independent Trustees, as required by the 1940 Act, also considered the approval of (i) the Sub-Advisory Agreement
165
among GCM, BlackRock Financial Management, Inc. (“BFM”) and the Trust on behalf of the Low-Duration (the “BFM Sub-Advisory Agreement”); (ii) the Sub-Advisory agreement among GCM, BlackRock Institutional Management Corporation (“BIMC”) and the Trust on behalf of the Money Market Fund (the “BIMC Sub-Advisory Agreement”) and (iii) the Sub-Advisory Agreement among GCM, Walter Scott & Partners Limited (“WSP”) and the Trust on behalf of the International Equity Fund (the “WSP Sub-Advisory Agreement”).
Approval of Sub-Advisory Agreement For Low-Duration Bond Fund
BlackRock Advisers, Inc., which was responsible for managing a portion of the assets of the Low-Duration Bond Fund, is and was controlled by BlackRock, Inc. On September 29, 2006, BlackRock Advisers, Inc. underwent a corporate restructuring, whereby Merrill Lynch Investment Management, a financial management and advisory company, now owns a majority equity interest in BlackRock, Inc. The remaining interests in BlackRock, Inc. are largely held by a broad group of key professionals within the organization. As a result the advisory business of BlackRock Advisers, Inc. has undergone a change of control and been restructured as BFM, a Delaware limited liability company.
At the September 13-14, 2006 meeting, the Board, including a majority of the Independent Trustees, considered the appointment of BFM as sub-adviser to the Low-Duration Bond Fund, as proposed by the Adviser. The Board reviewed information provided by BFM in connection with its consideration of the appointment, as well as the proposed new sub-advisory agreement. The Board reviewed the services proposed and analyzed the factors they deemed relevant, noting that the nature, quality and scope of the services to be provided to the Low-Duration Bond Fund would not change as a result of the corporate restructuring. The Board also considered the proposed compensation for services provided by BFM as a sub-adviser to the Low-Duration Bond Fund, which did not result in an increase in management fees for the Low-Duration Bond Fund.
The Board noted that the BFM Sub-Advisory Agreement is substantially identical to the Low-Duration Bond Fund’s former sub-advisory agreement with BlackRock Advisers, Inc. The fees payable to BFM under the new sub-advisory agreement are identical to the fees under the former sub-advisory agreement. The Board also noted that there are no changes to the investment personnel or to the services provided to the Low-Duration Bond Fund as a result of the corporate restructuring. The Board also considered the favorable past performance history of the investment management team at BlackRock Advisers, Inc., now BFM, in managing its assigned segment of the Low-Duration Bond Fund, noting that BlackRock Advisers, Inc. significantly outperformed the relevant benchmark for the Fund in all years as well as the median for the peer universe of similarly managed funds.
Based on all of the information presented to the Board and its consideration of relevant factors, the Board, in the exercise of its reasonable business judgment, determined to approve the BFM Sub-Advisory Agreement. Effective October 2, 2006, BFM began managing assets of the Low-Duration Bond Fund.
Approval of Sub-Advisory Agreement For Money Market Fund
BlackRock Institutional Management Corporation, which was responsible for managing the assets of the Money Market Fund, is and was controlled by BlackRock, Inc. On September 29, 2006, BlackRock Institutional Management Corporation underwent a corporate restructuring whereby Merrill Lynch Investment Management now owns a majority equity interest in BlackRock, Inc. As a result, the advisory business of BlackRock Institutional Management Corporation has been restructured as a Delaware limited liability company with the same name.
At the September 13-14, 2006 meeting, the Board, including a majority of the Independent Trustees, considered the appointment of BIMC as sub-adviser to the Money Market Fund, as proposed by the Adviser. The Board reviewed information provided by BIMC in connection with its consideration of the appointment, as well as the proposed new sub-advisory agreement. The Board reviewed the services proposed and analyzed the factors they deemed relevant, noting that the nature, quality and scope of the services to be provided to the Money Market Fund would not change as a result of the corporate restructuring. The Board also considered the proposed compensation for services provided by BIMC as sub-adviser to the Money Market Fund, which did not result in an increase in management fees for the Money Market Fund.
The Board noted that the BIMC Sub-Advisory Agreement is substantially identical to the Money Market Fund’s former sub-advisory agreement with BlackRock Institutional
166
Management Corporation. The fees payable to BIMC under the new sub-advisory agreement are identical to the fees under the former sub-advisory agreement. The Board also noted that there are no changes to the investment personnel or to the services provided to the Money Market Fund as a result of the corporate restructuring. The Board also considered the favorable past performance history of the investment management team at BlackRock Institutional Management Corporation in managing the Money Market Fund, noting that BlackRock Institutional Management Corporation significantly outperformed the relevant benchmark for the Fund in all years.
Based on all of the information presented to the Board and its consideration of relevant factors, the Board, in the exercise of its reasonable business judgment, determined to approve the BIMC Sub-Advisory Agreement. Effective October 2, 2006, BIMC began managing the Money Market Fund’s assets.
Approval of Sub-Advisory Agreement For International Equity Fund
Walter Scott & Partners Limited, which was responsible for managing a portion of the assets of the International Equity Fund, underwent a financial restructuring, resulting in a change in control. Mellon Asset Management, a large global asset management firm located in the United States, now owns a controlling interest in Walter Scott. The advisory business of Walter Scott will remain an independent subsidiary with no change to its structure or investment philosophy.
At the September 13-14, 2006 meeting, the Board, including a majority of the Independent Trustees, considered the appointment of Walter Scott as sub-adviser to the International Equity Fund, as proposed by the Adviser. The Board had attended a presentation by senior management of Walter Scott at its July 27-28, 2006 meeting, during which management had discussed the reasons for entering the transaction with Mellon Asset Management, which included gaining back office efficiencies and compliance assistance. The purchase transaction would present opportunities for broadening Walter Scott’s client base, creating efficiencies to manage client assets, and utilizing the comprehensive compliance systems that Mellon Asset Management has in place. Management of Walter Scott noted that autonomy with respect to its investment management process would be preserved, and that there would be no change in the nature, quality and scope of the services provided to the International Equity Fund as a result of the acquisition.
The Board reviewed information provided by Walter Scott in connection with its consideration of the appointment, as well as the proposed new sub-advisory agreement. It was noted that this financial restructuring would infuse capital while retaining the existing culture and independence of Walter Scott & Partners Limited. In considering the appointment of Walter Scott, the Board reviewed the services proposed and analyzed the factors they deemed relevant, noting that the nature, quality and scope of the services to be provided to the International Equity Fund would not change as a result of the acquisition. The Board also considered the proposed compensation for Walter Scott’s services as a sub-adviser to the International Equity Fund, which did not result in an increase in management fees and the total management fee paid by the International Equity Fund, which did not change, relative to its peers.
The Board noted that the WSP Sub-Advisory Agreement is substantially identical to the International Equity Fund’s former sub-advisory agreement with Walter Scott & Partners Limited. The fees payable to Walter Scott under the WSP Sub-Advisory Agreement are identical to the fees under the former sub-advisory agreement. The Board also noted that there are no changes to the investment personnel or to the services provided to the International Equity Fund as a result of the acquisition. The Board also considered the favorable past performance history of the investment management team at Walter Scott & Partners Limited in managing its assigned segment of the International Equity Fund, noting that Walter Scott & Partners Limited’s performance was in line with the relevant benchmark for the Fund in most years.
Based on all of the information presented to the Board and its consideration of relevant factors, the Board, in the exercise of its reasonable business judgment, determined to approve the WSP Sub-Advisory Agreement. Effective October 2, 2006, Walter Scott began managing assets of the International Equity Fund.
BOARD REVIEW OF NEW INVESTMENT ADVISORY AGREEMENT FOR REAL ESTATE SECURITIES FUND AND GLOBAL BOND FUND
As required by the 1940 Act, the Board, including all of the Independent Trustees considered the approval of the investment agreement between GCM and the Trust on behalf of the Real Estate Securities Fund and the Global Bond Fund (the “New Advisory Agreement”). The New Advisory
167
Agreement was approved for a one-year term at a meeting of the Board held on September 13-14, 2006. The Board’s decision to approve the New Advisory Agreement reflects the exercise of its business judgment. In approving the New Advisory Agreement, the Board considered information provided by the Adviser and each sub-adviser to the new series with the assistance and advice of counsel to the Independent Trustees and counsel to the Trust.
The Board’s consideration of various factors and its conclusions with respect to such factors noted previously formed the basis for the Board’s determination to approve the New Advisory Agreement. No one factor was determinative in the Board’s consideration of the New Advisory Agreement.
The Board undertook a review of the terms of the New Advisory Agreement and the nature and quality of the services provided by the Adviser and each sub-adviser. The Board conducted its analysis on the Real Estate Securities Fund and Global Bond Fund with respect to the Adviser and each sub-adviser. Management provided the Board with substantial detailed information in the form of reports about each of the Funds, two sub-advisory firms and the Adviser prior to and during the meeting and at the meeting held on July 27-28, 2006, which information addressed most, if not all, of the factors previously noted. Management also provided additional information about the Adviser and each sub-adviser in presentations made during the meeting and at the July Board meeting and responded to questions from the Trustees. In addition, the Independent Trustees met separately in executive session with counsel to the Independent Trustees to discuss and consider information presented in connection with the approval of the New Advisory Agreement as well as the Trustees’ responsibilities and duties in approving the Agreement. A lengthy discussion also took place among the Trustees, management, Fund counsel and counsel to the Independent Trustees regarding the information presented for the Funds, including the management fees charged by the Funds as well as the sub-advisory fees, during executive sessions held prior to and during the meeting.
APPROVAL OF NEW INVESTMENT ADVISORY AGREEMENT FOR REAL ESTATE SECURITIES FUND AND GLOBAL BOND FUND
In considering the approval of the New Advisory Agreement with the Adviser, on behalf of the new series, the Trustees took into account all the materials provided prior to and during the meeting and at the July 27-28, 2006 meeting, the presentations made during the meeting, and the extensive discussions during the meeting, including the discussions the Independent Trustees had during their executive session with their independent legal counsel. More specifically, the Trustees examined the nature, extent and quality of the services to be provided by the Adviser to the Real Estate Securities Fund and the Global Bond Fund. The Trustees evaluated the Adviser’s experience in serving as an Adviser, including overseeing and managing the allocation of Select Fund assets among the sub-advisers. The Trustees noted the experience of key personnel at the Adviser. The Trustees noted the reputation, compliance history, compliance program, and financial condition of the Adviser. The Trustees also noted the terms of the advisory agreements and the responsibilities that the Adviser currently has as Adviser to the Select Funds. The Trustees concluded that the Real Estate Securities Fund and the Global Bond Fund are each likely to benefit from the extent and quality of these services as a result of the Adviser’s experience, personnel, operations and resources.
The Trustees noted that the Adviser conducted extensive research in connection with the organization and investment strategy of the Real Estate Securities Fund and Global Bond Fund. The Trustees also noted the Adviser’s due diligence with respect to the evaluation and recommendation of sub-advisers to manage each Fund.
The Trustees examined the fee and expense information for the Real Estate Securities Fund and the Global Bond Fund in comparison to the fees and expenses of other similarly managed funds for the GS4 class. The Trustees noted that the management fees (combined advisory and sub-advisory fees) for the Real Estate Securities Fund fell above the median for its peers and resided in the third quartile and that the management fees for the Global Bond Fund fell below the median for its peers and resided in the first quartile. The Trustees noted that the Adviser indicated that it will contractually agree to waive and reimburse expenses of the Real Estate Securities Fund and the Global Bond Fund to limit total annual operating expenses of each Fund. Taking the expense waivers and reimbursements into account, the Trustees concluded that the level of each Fund’s management fees and expense ratios was reasonable and compared fairly to that of comparable mutual funds. The Trustees noted the Adviser’s history with the Trust and that the Adviser added economic value to the other Select Funds.
168
Based on the information presented to the Board and its evaluation of that information, the Board, in the exercise of its reasonable business judgment, determined to approve the investment advisory agreement with the Adviser.
BOARD REVIEW OF NEW SUB-ADVISORY AGREEMENTS FOR REAL ESTATE SECURITIES FUND AND GLOBAL BOND FUND
As required by the 1940 Act, the Board, including all of the Independent Trustees considered the approval of (i) the approval of the sub-advisory agreement among the Adviser, RREEF America L.L.C. (“RREEF”) and the Trust on behalf of the Real Estate Securities Fund (the “RREEF Sub-Advisory Agreement”); and (ii) the approval of the sub-advisory agreement among the Adviser, Western Asset Management Company (“WAMCO”) and Western Asset Management Limited (“WAML”) (WAMCO and WAML together known as “Western”), and the Trust on behalf of the Global Bond Fund (the “Western Sub-Advisory Agreement”). The RREEF Sub-Advisory Agreement and the Western Sub-Advisory Agreement (together, the “New Sub-Advisory Agreements”) were each approved for a one-year term at the meeting of the Board held on September 13-14, 2006. The Board’s decision to approve the New Sub-Advisory Agreements reflects the exercise of its business judgment to enter into each new sub-advisory arrangement. In approving the New Sub-Advisory Agreements, the Board considered information provided by the Adviser and each sub-adviser with the assistance and advice of counsel to the Independent Trustees and counsel to the Trust.
The Board’s consideration of various factors and its conclusions with respect to such factors noted previously formed the basis for the Board’s determination to approve the New Sub-Advisory Agreements. No one factor was determinative in the Board’s consideration of the Advisory and Sub-Advisory Agreements.
The Board undertook a review of the terms of each New Sub-Advisory Agreement and the nature and quality of the services to be provided by each sub-adviser. Management provided the Board with substantial detailed information in the form of reports about each sub-adviser prior to the meeting which information addressed most, if not all, of the factors listed previously. Management also provided additional information about each sub-adviser in presentations made during the meeting, discussed the comprehensive screening process used to recommend each new sub-adviser and responded to questions from the Trustees. In addition, the Independent Trustees met separately in executive session with counsel to the Independent Trustees to discuss and consider information presented in connection with the approval of the New Sub-Advisory Agreements as well as the Trustees’ responsibilities and duties in approving the Agreements.
APPROVAL OF NEW SUB-ADVISORY AGREEMENTS FOR REAL ESTATE SECURITIES FUND AND GLOBAL BOND FUND
In considering the approval of the New Sub-Advisory Agreements, the Trustees took into account the materials provided prior to and during the meeting, and the extensive discussions during the meeting, including the discussions the Independent Trustees had during their executive session with their independent legal counsel. More specifically, the Trustees examined the nature, extent and quality of the services to be provided by RREEF and Western the Real Estate Securities Fund and Global Bond Fund, respectively. The Trustees evaluated each sub-adviser’s experience in serving as a sub-adviser to its client accounts and portfolios and noted that Western currently provides investment advice to various clients, including to other series of the Trust and that RREEF currently provides investment advice to an unregistered fund offered by GuideStone Financial Resources. The Trustees considered the experience of key personnel at each sub-adviser in providing investment management services and the systems used by such persons, and the ability of each sub-adviser to attract and retain capable personnel. The Trustees also considered the reputation, compliance history, compliance program and financial condition of each sub-adviser. The Trustees noted the terms of the New Sub-Advisory Agreements and the responsibilities that each would have as a sub-adviser to the Fund, including the responsibility of the day-to-day management of the investment portfolio of the Fund, compliance with the Fund’s policies and objectives, and the implementation of Board of Trustees directives as they relate to the Fund. The Trustees concluded that the Real Estate Securities Fund and Global Bond Fund are likely to benefit from the extent and quality of these services as a result of each sub-adviser’s experience, personnel, operations and resources.
The Board considered reports for each sub-adviser. The reports compiled by management included, among other things, a summary of the composite investment performance of the sub-adviser’s client accounts and portfolios, including
169
a comparison with the relevant benchmark for the respective Fund and the peer universe of similarly managed funds, information regarding management style, risk versus return analysis, organizational structures, investment management experience, investment philosophies and personnel. Management also provided additional information regarding compliance procedures and policies, brokerage and soft dollar practices, compliance history, financial information and potential economies of scale.
The Trustees reviewed the services to be provided to each Fund by each sub-adviser, examined the investment philosophy and process of each sub-adviser and noted that each sub-adviser would fulfill a particular investment mandate for the Real Estate Securities Fund and Global Bond Fund. The Trustees concluded that, although past performance is no guarantee of future performance, the composite performance record for the client accounts and portfolios managed by each sub-adviser was favorable and that both Funds were likely to benefit from the investment management expertise of each sub-adviser.
The Trustees examined composite performance information for the client accounts and portfolios managed by each sub-adviser. For each sub-adviser, the composite performance record compared favorably to the relevant benchmark for the respective Fund. With regard to proposed fees, the Trustees noted that the proposed sub-advisory fees include breakpoints at various asset levels. The Trustees noted that the management fees (combined advisory and sub-advisory fees) for the Real Estate Securities Fund fell above the median for its peers and resided in the third quartile, and that the management fees for the Global Bond Fund fell below the median for its peers and resided in the first quartile. The Trustees also considered the voluntary waiver and expense limitation arrangements that the Adviser has entered into with the Funds to limit total annual operating expenses of the Funds until April 30, 2008. Taking the expense waivers and reimbursements into account, the Trustees concluded that the level of each Fund’s management fees and expense ratios was reasonable and compared fairly to that of comparable mutual funds.
The Trustees also considered information related to the financial capability of each sub-adviser. Specifically, the Trustees considered the representations of the Adviser with respect to the level of assets and shareholder’s equity for the sub-advisers who made their most recent year-end financial statements available to the Adviser for review. The Trustees also relied upon other relevant information, particularly the independent negotiation of the fee schedules, the level of the fees, and the sub-adviser’s performance history. The Trustees noted that, based on the Adviser’s representations and the other information provided, no concerns appeared to be raised regarding the financial capability of the sub-advisers. The Trustees noted that there is no historical profitability information with regard to the sub-advisers’ arrangements with the Funds.
The Trustees reviewed information regarding the compliance history and compliance program of each firm, noting that RREEF and Western had no significant compliance or regulatory issues based on available information. The Trustees also considered that the Trust currently employs each sub-adviser to manage the assets of another Fund of the Trust or another product offered by GuideStone Financial Resources, and the Adviser’s and their familiarity with each sub-adviser’s organization generally.
Based on all of the information presented to the Board and its consideration of relevant factors, the Board, in the exercise of its reasonable business judgment, concluded that the approval of the New Sub-Advisory Agreements was reasonable and fair to the Trust and its shareholders and determined to approve each New Sub-Advisory Agreement.
170
INVESTMENT SUB-ADVISERS (Assets under management as of 12/31/06)
GuideStone Funds employs a broad array of proven investment managers for the benefit of their investors. Each manager is distinctive in their investment management process and business approach.
| | | | | | | |
Fund | | Sub-Adviser | | Firm
Established | | Total Assets
Managed |
Money Market | | BlackRock Institutional Management Corporation | | 1988 | | $ | 1.1Tr |
Low-Duration Bond | | BlackRock Financial Management, Inc | | 1988 | | | 1.1Tr |
| | Payden & Rygel | | 1983 | | | 54.1B |
| | PIMCO (Pacific Investment Management Company, LLC) | | 1971 | | | 667.8B |
Medium-Duration Bond | | Goldman Sachs Asset Management, L.P. | | 1984 | | | 664.4B |
| | PIMCO (Pacific Investment Management Company, LLC) | | 1971 | | | 667.8B |
| | Western Asset Management Company | | 1971 | | | 574.6B |
Extended-Duration Bond | | Loomis, Sayles & Company, L.P. | | 1926 | | | 96.5B |
| | STW Fixed Income Management, Ltd. | | 1977 | | | 10.7B |
Global Bond | | Western Asset Management Company | | 1971 | | | 574.6B |
Equity Index | | Northern Trust Investments, N.A. | | 1889 | | | 697.2B |
Real Estate Securities | | RREEF America, LLC | | 1975 | | | 73.1B |
Value Equity | | Aronson+Johnson+Ortiz, LP | | 1984 | | | 28.3B |
| | Barrow, Hanley, Mewhinney & Straus, Inc. | | 1979 | | | 65.5B |
| | Equinox Capital Management, LLC | | 1989 | | | 6.8B |
| | Northern Trust Investments, N.A. | | 1889 | | | 697.2B |
| | TCW Investment Management Company | | 1971 | | | 145.0B |
Growth Equity | | Marsico Capital Management, LLC | | 1997 | | | 83.7B |
| | RCM Capital Management, LLC | | 1970 | | | 152.2B |
| | Sands Capital Management, LLC | | 1992 | | | 19.6B |
| | TCW Investment Management Company | | 1971 | | | 145.0B |
Small Cap Equity | | Aronson+Johnson+Ortiz, L.P. | | 1984 | | | 28.3B |
| | Lord, Abbett & Company, LLC | | 1929 | | | 112.2B |
| | Lotsoff Capital Management | | 1981 | | | 5.8B |
| | Provident Investment Council, Inc. | | 1951 | | | 3.2B |
| | TimesSquare Capital Management, LLC | | 2000 | | | 8.7B |
International Equity | | AllianceBernstein, L.P. | | 1962 | | | 716.9B |
| | Capital Guardian Trust Company | | 1968 | | | 161.9B |
| | Genesis Asset Managers, LLP | | 1990 | | | 20.9B |
| | Mondrian Investment Partners Ltd. | | 1990 | | | 53.1B |
| | Oechsle International Advisors, LLC | | 1998 | | | 15.4B |
| | Philadelphia International Advisors, L.P. | | 1956 | | | 8.4B |
| | Walter Scott & Partners Ltd. | | 1983 | | | 30.9B |
Custodian for GuideStone Funds Assets | | The Northern Trust Company | | 1889 | | | 3.5Tr |
You should consider the investment objectives, risks, charges and expenses of each investment fund carefully before investing. To obtain a prospectus with this and other information about GuideStone Funds call 1-888-98-GUIDE, visit www.GuideStone.org or write to GuideStone Funds, 2401 Cedar Springs, Dallas, TX 75201-1498. Read it carefully before you invest. Shares of GuideStone Funds are distributed by PFPC Distributors, Inc., 760 Moore Road, King of Prussia, PA 19406.
171
[THIS PAGE INTENTIONALLY LEFT BLANK]
| | | | |
 | | 2401 Cedar Springs Road, Dallas, TX 75201-1498 | | Funds distributed by PFPC Distributors, Inc. |
| | 1.800.262.0511 • www.GuideStone.org | | 760 Moore Road, King of Prussia, PA 19406 |
| | (a) | The registrant, as of the end of the period covered by this report, has adopted a code of ethics that applies to the registrant’s principal executive officer, principal financial officer, principal accounting officer or controller, or persons performing similar functions, regardless of whether these individuals are employed by the registrant or a third party. |
| | (c) | There have been no amendments, during the period covered by this report, to a provision of the code of ethics that applies to the registrant’s principal executive officer, principal financial officer, principal accounting officer or controller, or persons performing similar functions, regardless of whether these individuals are employed by the registrant or a third party, and that relates to any element of the code of ethics description. |
| | (d) | The registrant has not granted any waivers, including an implicit waiver, from a provision of the code of ethics that applies to the registrant’s principal executive officer, principal financial officer, principal accounting officer or controller, or persons performing similar functions, regardless of whether these individuals are employed by the registrant or a third party, that relates to one or more of the items set forth in paragraph (b) of this item’s instructions. |
| Item 3. | Audit Committee Financial Expert. |
As of the end of the period covered by the report, the registrant’s board of directors has determined that Kevin Mahoney is qualified to serve as an audit committee financial expert serving on its audit committee and that he is “independent,” as defined by Item 3 of Form N-CSR.
| Item 4. | Principal Accountant Fees and Services. |
Audit Fees
| | (a) | The aggregate fees billed for each of the last two fiscal years for professional services rendered by the principal accountant for the audit of the registrant’s annual financial statements or services that are normally provided by the accountant in connection with statutory and regulatory filings or engagements for those fiscal years are $265,000 and $306,800 for 2005 and 2006, respectively. |
Audit-Related Fees
| | (b) | The aggregate fees billed in each of the last two fiscal years for assurance and related services by the principal accountant that are reasonably related to the performance of the audit of the registrant’s financial statements and are not reported under paragraph (a) of this Item are $23,000 and $28,000 for 2005 and 2006, respectively. These fees are for Rule 17F-2 security counts and a non-recurring N-1A filing. |
Tax Fees
| | (c) | The aggregate fees billed in each of the last two fiscal years for professional services rendered by the principal accountant for tax compliance, tax advice, and tax planning are $60,400 and $65,900 for 2005 and 2006, respectively. Tax fees are for excise calculation review and review of US Income Tax Return |
All Other Fees
| | (d) | The aggregate fees billed in each of the last two fiscal years for products and services provided by the principal accountant, other than the services reported in paragraphs (a) through (c) of this Item are $0 for 2005 and 2006, respectively. |
| | (e)(1) | Disclose the audit committee’s pre-approval policies and procedures described in paragraph (c)(7) of Rule 2-01 of Regulation S-X. |
GuideStone
Non-Audit Services Provided to the Company, Advisor, and Others
The Audit Committee shall pre-approve all permissible non-audit services (e.g., tax services) to be provided to the Company by the Auditors, including the fees therefor;
provided, that if the Committee chooses to delegate the authority to grant pre-approvals to one or more Committee members, each acting on behalf of the Committee, then the Committee shall adopt policies and procedures detailed as to the particular service and designed to safeguard the continued independence of the auditors, consistent with the requirements of the Sarbanes-Oxley Act of 2002 (the “S-O Act”) and related SEC regulations, which shall then be used in making such pre-approvals; and,
further provided, that each delegated pre-approval shall be reported to the Committee during its next regularly scheduled meeting.
The pre-approval requirement for a permitted non-audit service may be waived if:
| | (1) | the aggregate amount of all such non-audit services provided constitutes not more than 5% of the total revenues paid by the Company to the Auditors in the fiscal year in which the non-audit services are provided; |
| | (2) | such services were not recognized by the Company at the time of the engagement to be non-audit services; and |
| | (3) | such services are promptly brought to the attention of, and approved by, the Audit Committee or by a member of the Audit Committee to whom the Committee has delegated the authority to grant such approvals, if any, prior to the Auditors’ completion of the Company’s audit. |
Additionally, if the Auditors’ engagement relates directly to the operations and financial reporting of the Company, to the extent required by Rule 2-01 of Regulation S-X, the Audit Committee shall pre-approve their engagements for non-audit services with:
| | (1) | the Advisor (excluding any subadviser whose role is primarily portfolio management and is sub-contracted or overseen by the Advisor), and |
| | (2) | any entity controlling, controlled by, or under common control with such Advisor that provides ongoing services to the Company (each, a “Control Entity”) |
in accordance with the foregoing paragraph, unless the aggregate amount of all services provided constitutes no more than 5% of the total amount of revenues paid to the Auditors by the Company, the Advisor and any such Control Entity during the fiscal year in which the services are provided that would have to be pre-approved by the Audit Committee pursuant to this paragraph (in the absence of this exception). The Auditors may not perform contemporaneously any prohibited non-audit services for the Company, which currently include the following:
| | 1. | bookkeeping or other services related to the accounting records or financial statements of the Company; |
| | 2. | financial information systems design and implementation; |
| | 3. | appraisal or valuation services, fairness opinions, or contribution-in-kind reports; |
| | 5. | internal audit outsourcing services; |
| | 6. | management functions or human resources; |
| | 7. | broker or dealer, investment adviser, or investment banking services; |
| | 8. | legal services and expert services unrelated to the audit; and |
| | 9. | any other service that the Public Company Accounting Oversight Board determines, by regulation, is impermissible. |
| | (e)(2) | The percentage of services described in each of paragraphs (b) through (d) of this Item that were approved by the audit committee pursuant to paragraph (c)(7)(i)(C) of Rule 2-01 of Regulation S-X are as follows: |
| | (f) | The percentage of hours expended on the principal accountant’s engagement to audit the registrant’s financial statements for the most recent fiscal year that were attributed to work performed by persons other than the principal accountant’s full-time, permanent employees was 0%. |
| | (g) | The aggregate non-audit fees billed by the registrant’s accountant for services rendered to the registrant, and rendered to the registrant’s investment adviser (not including any sub-adviser whose role is primarily portfolio management and is subcontracted with or overseen by another investment adviser), and any entity controlling, controlled by, or under common control with the adviser that provides ongoing services to the registrant for each of the last two fiscal years of the registrant was $83,400 and $93,900 for 2005 and 2006, respectively. |
| | (h) | The registrant’s audit committee of the board of directors has considered whether the provision of non-audit services that were rendered to the registrant’s investment adviser (not including any sub-adviser whose role is primarily portfolio management and is subcontracted with or overseen by another investment adviser), and any entity controlling, controlled by, or under common control with the investment adviser that provides ongoing services to the registrant that were not pre-approved pursuant to paragraph (c)(7)(ii) of Rule 2-01 of Regulation S-X is compatible with maintaining the principal accountant’s independence. |
| Item 5. | Audit Committee of Listed registrants. |
Not applicable.
| Item 6. | Schedule of Investments. |
Schedule of Investments in securities of unaffiliated issuers as of the close of the reporting period is included as part of the report to shareholders filed under Item 1 of this form.
| Item 7. | Disclosure of Proxy Voting Policies and Procedures for Closed-End Management Investment Companies. |
Not applicable.
| Item 8. | Portfolio Managers of Closed-End Management Investment Companies. |
Not applicable.
| Item 9. | Purchases of Equity Securities by Closed-End Management Investment Company and Affiliated Purchasers. |
Not applicable.
| Item 10. | Submission of Matters to a Vote of Security Holders. |
Not applicable.
| Item 11. | Controls and Procedures. |
| | (a) | The registrant’s principal executive and principal financial officers, or persons performing similar functions, have concluded that the registrant’s disclosure controls and procedures (as defined in Rule 30a-3(c) under the Investment Company Act of 1940, as amended (the “1940 Act”) (17 CFR 270.30a-3(c))) are effective, as of a date within 90 days of the filing date of the report that includes the disclosure required by this paragraph, based on their evaluation of these controls and procedures required by Rule 30a-3(b) under the 1940 Act (17 CFR 270.30a-3(b)) and Rules 13a-15(b) or 15d-15(b) under the Securities Exchange Act of 1934, as amended (17 CFR 240.13a-15(b) or 240.15d-15(b)). However, prior to the filing of the Registrant’s Form N-CSR, such principal officers had become aware of matters relating to the Registrant’s reporting of certain financial highlights information that necessitated restatement of financial highlight information included in Item 1 of this filing. As a result, management of the Registrant has reevaluated certain disclosure controls and procedures determined not to be effective, as discussed more fully below. |
Prior to the filing of this Form N-CSR, the registrant identified the following control deficiency existed as of and prior to December 31, 2006, that was determined to be a material weakness in the registrant’s internal control over financial reporting. The registrant’s control over the process used to accumulate, review and report the net investment income per share and dividends per share for the Money Market Fund did not operate effectively. As a result, net investment income per share and dividends per share of the Money Market Fund were computed incorrectly. This control deficiency resulted in an audit adjustment to the 2006 calculations and a restatement in the financial highlights of the Money Market Fund’s 2005 net investment income and dividends per share as included in Item 1 of this filing.
Since December 31, 2006 and prior to the filing of this Form N-CSR, management of the registrant has revised and enhanced its internal control over financial reporting, and in doing so, increased the effectiveness of such controls, so that such financial highlight information is presented in accordance with generally accepted accounting principles.
| | (b) | There were no changes in the registrant’s internal control over financial reporting (as defined in Rule 30a-3(d) under the 1940 Act (17 CFR 270.30a-3(d)) that occurred during the second half of the registrant’s fiscal year that has materially affected, or is reasonably likely to materially affect, the registrant’s internal control over financial reporting. However, as discussed above, subsequent to December 31, 2006, the Registrant is further enhancing controls related to the reporting of certain financial highlights information. |
| | |
| |
| (a)(1) | | Code of ethics that is the subject of disclosure required by Item 2 is incorporated by reference to the registrant’s Form N-CSR as filed with the SEC on March 4, 2005 (SEC Accession No. 0000893220-05-000465). |
| |
| (a)(2) | | Certifications pursuant to Rule 30a-2(a) under the 1940 Act and Section 302 of the Sarbanes-Oxley Act of 2002 are attached hereto. |
| |
| (a)(3) | | Not applicable. |
| |
| (b) | | Certifications pursuant to Rule 30a-2(b) under the 1940 Act and Section 906 of the Sarbanes-Oxley Act of 2002 are attached hereto. |
SIGNATURES
Pursuant to the requirements of the Securities Exchange Act of 1934 and the Investment Company Act of 1940, the registrant has duly caused this report to be signed on its behalf by the undersigned, thereunto duly authorized.
| | | | |
| (registrant) GuideStone Funds | | |
| | |
| By (Signature and Title)* | | /s/ John R. Jones | | |
| | John R. Jones, President | | |
| | (principal executive officer) | | |
| |
| Date March 6, 2007 | | |
Pursuant to the requirements of the Securities Exchange Act of 1934 and the Investment Company Act of 1940, this report has been signed below by the following persons on behalf of the registrant and in the capacities and on the dates indicated.
| | | | |
| | |
| By (Signature and Title)* | | /s/ John R. Jones | | |
| | John R. Jones, President | | |
| | (principal executive officer) | | |
| |
| Date March 6, 2007 | | |
| | |
| By (Signature and Title)* | | /s/ Jeffrey P. Billinger | | |
| | Jeffrey P. Billinger, Vice President and Treasurer | | |
| | (principal financial officer) | | |
| |
| Date March 6, 2007 | | |
| * | Print the name and title of each signing officer under his or her signature. |