UNITED STATES
SECURITIES AND EXCHANGE COMMISSION
Washington, D.C. 20549
FORM N-CSR
CERTIFIED SHAREHOLDER REPORT OF REGISTERED MANAGEMENT
INVESTMENT COMPANIES
| | |
Investment Company Act file number | | 811-10263 |
GuideStone Funds
|
| (Exact name of registrant as specified in charter) |
|
2401 Cedar Springs Road Dallas, TX 75201-1407 |
| (Address of principal executive offices) (Zip code) |
Rodney R. Miller, Esq.
GuideStone Financial Resources of the Southern Baptist Convention
2401 Cedar Springs Road
Dallas, TX 75201-1407
|
| (Name and address of agent for service) |
registrant’s telephone number, including area code: 214-720-2142
Date of fiscal year end: December 31
Date of reporting period: December 31, 2005
Form N-CSR is to be used by management investment companies to file reports with the Commission not later than 10 days after the transmission to stockholders of any report that is required to be transmitted to stockholders under Rule 30e-1 under the Investment Company Act of 1940 (17 CFR 270.30e-1). The Commission may use the information provided on Form N-CSR in its regulatory, disclosure review, inspection, and policymaking roles.
A registrant is required to disclose the information specified by Form N-CSR, and the Commission will make this information public. A registrant is not required to respond to the collection of information contained in Form N-CSR unless the Form displays a currently valid Office of Management and Budget (“OMB”) control number. Please direct comments concerning the accuracy of the information collection burden estimate and any suggestions for reducing the burden to Secretary, Securities and Exchange Commission, 100 F Street, NE, Washington, DC 20549. The OMB has reviewed this collection of information under the clearance requirements of 44 U.S.C. § 3507.
| Item 1. | Reports to Stockholders. |
The Report to Shareholders is attached herewith.
GuideStone Funds
GuideStone Financial Resources of the Southern Baptist Convention (“GuideStone Financial Resources”)
GuideStone Capital Management (“GSCM”)
GuideStone Financial Services (“GSFS”)
PFPC Distributors, Inc. (“PFPC”)
NOTICE CONCERNING YOUR PRIVACY RIGHTS
This notice will provide you with information concerning our policies with respect to nonpublic personal information that we collect about you in connection with the following financial products and services provided and/or serviced by the entities listed above: individual retirement accounts (“IRAs”) and/or personal mutual fund accounts.
The confidentiality of your information is important to us as we recognize that you depend on us to keep your information confidential, as described in this notice.
We collect nonpublic personal information about you with regard to your IRA and/or personal mutual fund accounts from the following sources:
| | • | | Information we receive from you on applications or other forms; |
| | • | | Information about your transactions with us, our affiliates or others (including our third-party service providers); |
| | • | | Information we receive from others such as service providers, broker-dealers and your personal agents or representatives; and |
| | • | | Information you and others provide to us in correspondence sent to us, whether written, electronic or by telephone. |
We may disclose such nonpublic personal financial information about you to one or more of our affiliates. An affiliate of an organization means any entity that controls, is controlled by, or is under common control with that organization. For example, GuideStone Financial Resources, GSCM and GSFS are affiliates of one another. GuideStone Funds, GuideStone Financial Resources, GSCM, GSFS and PFPC do not sell your personal information to nonaffiliated third parties.
We may also disclose any of the personal information that we collect about you to nonaffiliated third parties as permitted by law. For example, we may provide your information to nonaffiliated companies that provide account services or that perform marketing services on our behalf and to other financial institutions with whom we have joint marketing agreements. We restrict access to nonpublic personal information about you to those of our employees who need to know that information in order for us to provide and/or service products or services to you. We also maintain physical, electronic, and procedural safeguards to guard your personal information.
These procedures will continue to remain in effect after you cease to receive financial products and services from us.
If you have any questions concerning our customer information policy, please contact a customer service representative at 1-888-98-GUIDE.
TABLE OF CONTENTS
This report has been prepared for shareholders of GuideStone Funds. It is not authorized for distribution to prospective investors unless accompanied or preceded by a current prospectus, which contains more complete information about the Funds. Investors are reminded to read the prospectus carefully before investing. Past performance is no guarantee of future results. Share prices will fluctuate and there may be a gain or loss when shares are redeemed.
1
LETTER FROM THE PRESIDENT

We are pleased to bring to you the 2005 annual report for GuideStone Funds. Within these pages you will find the results of another successful year of mutual fund and investment operations.
During the past year we completed the transition of our mutual funds and investment advisor to the GuideStone brand. During 2005 our mutual funds (formerly known as AB Funds Trust) adopted the name of GuideStone Funds, and our investment advisor (formerly known as SBC Financial Services, Inc.) became known as GuideStone Capital Management. In addition to our name change, GuideStone Funds now have ticker symbols and are available on NASDAQ. Now you can go to such publications as the Wall Street Journal, USA Today or the internet to see GuideStone Funds. GuideStone Funds is the largest Christian-based mutual fund family in the country, and the new brand provides us the opportunity to better position our services within the investment management industry.
While the new name signals important new horizons for us, there is absolutely no change in our investment philosophy or process that would jeopardize the high-quality of investment management services you have experienced and expect from GuideStone Funds. We continue to follow our research-based, results-driven passion for investing.
As of December 31, 2005, assets managed in GuideStone Funds totaled $8.7 billion, representing a 5.97% increase from the prior year. Investment returns in the capital markets during 2005 were generally below levels of the past few years. An aging economic cycle, high oil prices and rising short-term interest rates provided a modest headwind for financial securities during the year. Despite a lower investment return environment, we are pleased that all GuideStone Funds provided investors with positive returns for the year. As always, we continue to focus our efforts on achieving excellence within the investment management community.
Through GuideStone Funds, investors gain access to 27 underlying investment management firms, providing investment management expertise on a global platform. Our investment strategies are designed in whole to take advantage of investment opportunities in the global equity and fixed income markets. Our dedication to insightful and value-added portfolio management, a rigorous compliance program, and a governance process based on shareholder advocacy, work toward one goal, which is to provide our investors with uncompromised results.
This report reflects our commitment to keep you fully informed on the results of your investments. We hope you will find the information valuable. If you have questions regarding its content, please call us at 1-888-98-GUIDE or visit our web site at www.guidestonefunds.org. Our customer service specialists are ready to serve you.
Thank you for choosing to invest in GuideStone Funds.
Sincerely,

John Jones
2
FROM THE CHIEF INVESTMENT OFFICER

Rodric E. Cummins, CFA
Global economic expansion and low inflation, which have been central themes in the financial markets throughout 2005, continued to provide a healthy investment climate for investors through the fourth quarter. The year 2005 provided investors with positive returns across all major asset classes but in most cases at levels far below long-term historical averages. Over the past 12 months, the S&P 500® Index has returned 4.93% compared to 2.43% for the Lehman Rodric E. Cummins, CFA Brothers Aggregate Bond Index.
Investors with globally diversified portfolios participated in a significant market advance in international stocks during the year. For the third consecutive year, international stocks posted strong returns and outpaced U.S. stocks. Non-U.S. equity markets, as represented by the MSCI ACWI® (Morgan Stanley Capital International All Country World Index) Ex-U.S., posted a return of 16.62% for the year. International equity markets were once again led by stocks in emerging countries, which returned 34.00% for the year as measured by the MSCI Emerging Market Index.
Below average returns in the U.S. capital markets in 2005 reflect the dynamics typically associated with late stage economic cycles. During periods of economic expansion, stronger growth normally results in higher corporate profits and inflationary pressures which benefit equity returns in relation to bond investments. This has been the case in each of the past three years. However, dating back to 2003, capital market returns have diminished with each passing year. As economies mature, profit margins often come under pressure from rising costs and decelerating earnings growth. The cumulative effect of a tightening monetary policy dampens the prospects for future robust economic growth. The current economic cycle and capital market results follow this classic pattern. The capital markets’ process of discounting the effect of these factors into future economic growth likely explains the diminished capital market returns in the U.S. in 2005.
As the economic cycle continues to mature, heightened awareness will be placed on the actions of the Federal Reserve (“the Fed”). More so than in the past, the Fed will increasingly face significant trade-offs between growth and inflation as future rate hikes are considered.
The broad fixed income market, as measured by the Lehman Brothers Aggregate Bond Index, posted very modest returns of 0.59% and 2.43% for the quarter and calendar year 2005, respectively. Although positive, the bond market’s annual return was well below historical averages and trailed the broad U.S. equity market. The secular shift of rising short-term rates in response to the Fed’s persistent tightening campaign, sustained economic growth, and inflationary fears “primarily tied to higher energy prices”, provided a cumulative headwind for the bond market during the year.
The quarter, much like 2005, was characterized by a significant flattening of the yield curve as short and mid-term rates increased while longer-term rates remained anchored in place. Shaking off some of the interruption effect of the hurricanes hitting the Gulf Coast region, the economy seemed to get back on track as reflected by the third quarter GDP figure of 4.1% (annualized real growth), its highest level since the third quarter of 2004. With economic growth remaining strong, the Fed continued its tightening efforts by raising the Fed Funds rate .25% on two separate occasions to end the year at 4.25%. The increase at the December Federal Open Market Committee meeting marked the 13th consecutive .25% increase by the Fed since mid 2004. The Fed’s previously hawkish tone diminished in December as it removed its comments that the current monetary policy was “accommodative”. This caused some market pundits to believe we may be nearing the end of the Fed’s tightening cycle as long as inflation remains benign. The combination of strong economic data and Fed tightening helped push short-term rates higher, partially inverting the yield curve between the 2-year and 5-year Treasury. While short-term rates were rising, long-term rates remained noticeably unchanged reflecting easing inflationary concerns and strong demand for Treasuries by pension funds and non-U.S. investors. The yield on the bellwether 30-year Treasury bond ended the year at 4.54%. During the quarter, caution entered into the market as the Treasury sector, the safest of all fixed income investments, was one of the top performing sectors. The period marked the first time since the third quarter of 2002 that Treasuries outperformed spread sectors within the Lehman Brothers Aggregate Bond Index (including corporates and mortgages) on an equivalent duration basis. The extended sector of emerging market bonds was the best performing sector supported by investor demand and improving fundamentals and credit quality.
3
As the year ended, inflation appeared to be contained with expectations of moderating economic growth. Areas of focus remain the possibility of a cooling in the housing market, the level of consumer spending and the potential for higher energy prices. The bond market anticipated a high probability that the Fed will raise rates during the first quarter and possibly pause after that time. The first quarter of 2006 will mark the transition from Alan Greenspan to Ben Bernanke as Chairman of the Fed.
U.S. equity investors experienced modest gains in the fourth quarter of 2005 primarily due to the strong returns generated in the month of November. The broad market, as represented by the S&P 500® Index, advanced 2.10% during the quarter and 4.93% for the year. The materials, financials and industrials sectors were the best performing sectors during the quarter. The energy and utilities sectors posted the weakest index performance for the quarter, but clearly outperformed all sectors for the year.
According to the Russell Indices, virtually all market cap and style segments generated positive returns for the quarter and year. Large-cap stocks outperformed small-cap stocks for the quarter and ended six consecutive calendar years of underperforming the small-cap index. Large-cap growth stocks outpaced large-cap value oriented stocks for the quarter but underperformed for the year.
Developed international stocks, as represented by the MSCI EAFE (Europe, Australasia, Far East) Index, posted a return of 4.08% during the quarter and 13.54% for the year. The appreciation of the U.S. dollar versus other major currencies dampened returns for U.S. investors. Emerging markets outperformed the developed world as the MSCI Emerging Markets Index returned 7.18% for the quarter and 34.00% for the year.
Asset Class Performance Comparison
The following graph illustrates the performance of the major assets classes during 2005.
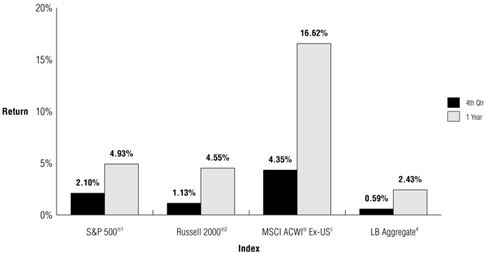
| 1 | The S&P 500® Index includes 500 of the largest stocks (in terms of market value) in the United States. |
| 2 | The Russell 2000® Index is a small-cap index consisting of the smallest 2000 companies in the Russell 3000® index, representing approximately 8% of the Russell 3000® Index total market capitalization. |
| 3 | The MSCI ACWI® Ex-U.S. is a free float-adjusted market capitalization index that is designed to measure equity market performance in the global developed and emerging markets excluding the U.S. |
| 4 | The Lehman Brothers Aggregate Bond Index includes f ixed rate debt issues rated investment grade or higher by Moody’s Investor’s Service, Standard and Poor’s® Corporation, or Fitch Investor’s Service, in that order. |
4
U.S. Economy — Gross Domestic Product
The U.S. economy was resilient to tightening monetary policy, severe hurricanes and higher energy prices and continued its momentum throughout 2005. The U.S. economy generated positive economic growth, as measured by GDP, above the 3% threshold for the previous ten quarters through the period ending September 30, 2005. This ten quarter period was the longest streak since 1986. Third quarter GDP expanded at an annual rate of 4.1%, led by strong consumer spending, business investment and home building.
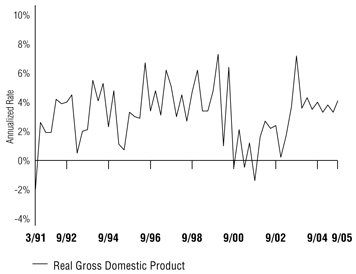
Gross Domestic Product (“GDP”) is one of, if not the most widely used economic measures for the overall U.S. economy. GDP measures the total market value of all final goods and services produced within the U.S. during a specific period. The index is the percent change from quarter to quarter of GDP and is often presented as an annualized rate. Generally, it is viewed as positive for the equity markets as GDP expands reflecting an environment of economic growth and profitability. The converse is true when GDP is contracting.
Data Source: Bloomberg
S&P 500® Returns
The broad U.S. equity market, as measured by the S&P 500® Index, posted a positive annual return of 4.93% during 2005, capping its third consecutive year in positive territory. Although positive, the annual return was somewhat lackluster, well below its historical average and the performance of the broad international equity market. During the year, there was a modest dispersion among growth and value oriented stocks, but there was a large divergence among sector returns. Despite negative returns during the fourth quarter, the energy and utilities sectors were the best performers, generating annual returns of 31.4% and 16.8% respectively.
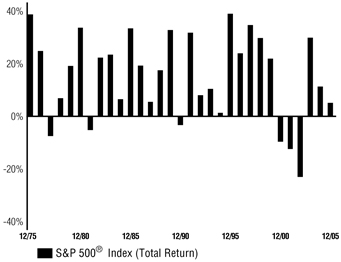
The S&P 500® Index is used as a measure for the performance of large-cap, U.S. stocks.
S&P 500® P/E Excluding Negative Earnings
The price-to-earnings (P/E) ratio for the S&P 500® Index ended the year slightly below 2004 levels and in-line with the historical average over the illustrated time period. It is worth noting this valuation measure for the broad market index has consistently contracted towards its average over the previous few years.
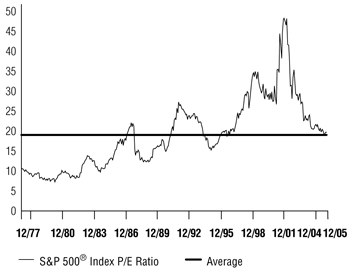
P/E is the ratio of a stock’s price divided by its earnings per share. In this case, the P/E ratio is represented for the entire index. The ratio, or multiple, reflects the price an investor is willing to pay for a dollar of expected earnings per share.
Data Source: Ned Davis Research Group
Consumer Confidence
U.S. consumer confidence, as measured by the Conference Board’s Index, fell sharply during the latter part of 2005, reaching a two-year low during October. The decline was attributable to the effects of the devastating hurricanes that hit the Gulf Coast region coupled with concerns over higher energy prices. Consumer confidence rebounded strongly in November and December to pre-hurricane levels, responding to declining gasoline prices and an improving labor market. During the year, consumer confidence peaked at 106.2, its highest level since June 2002.
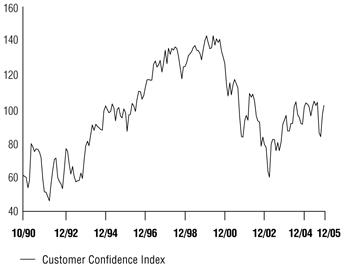
The Consumer Confidence Index is computed on a monthly basis for the purpose of measuring consumers’ attitude toward the economy. The trend in this economic measure is closely monitored given consumers comprise approximately two-thirds of the U.S. economy. Generally, it is viewed as positive to the economy and equity markets when the index increases. This reflects the fact that consumers are positive regarding their economic outlook and that they are more willing to spend money providing further economic stimulus.
Data Source: Bloomberg
5
Federal Reserve Bank
With economic growth remaining strong, the Federal Reserve Bank (“Fed”) continued its tightening campaign, raising the Fed Funds rate by .25% on eight separate occasions during 2005. Such action elevated the key interest rate to 4.25% by year-end. The tightening at the December Federal Open Market Committee meeting marked the 13th consecutive .25% increase by the Fed since mid 2004. The Fed’s previously hawkish tone diminished in December as it removed comments from their statement that the current monetary policy was “accommodative”. This caused some market pundits to believe we may be nearing the end of the Fed’s tightening cycle as long as inflation remains benign. First quarter 2006 will mark the transition from Chairman Alan Greenspan to Ben Bernanke as Chairman of the Fed. Greenspan has steered the Fed as Chairman since 1987.
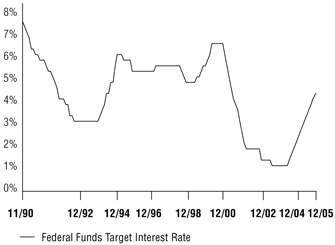
The Federal Reserve Bank is the central bank of the U.S. with the responsibility of implementing monetary policy. The Federal Funds rate is the rate banks with excess reserves loan funds to banks needing additional reserves. The Fed Funds rate is one tool the Fed can use in their efforts of controlling money supply. It is viewed as a stimulus to the economy and to equity markets when the Fed lowers the Federal Funds rate given money supply increases. Contrarily, the opposite is true when the Fed increases the Fed Funds rate creating an environment for money supply contraction.
Data Source: Bloomberg
U.S. Unemployment
The U.S. unemployment rate gradually improved throughout 2005. The year began with the unemployment rate at 5.20% and following a brief peak of 5.40% in February, steadily improved to its year-end level of 4.90%. Prior to the latter half of 2005, the unemployment rate had not reached the 4.90% level since August 2001. During 2005, the economy was resilient and shook off the effects of hurricanes and higher energy prices to create more than two million jobs during the period.
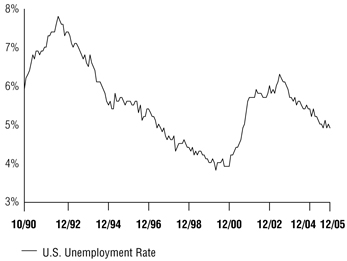
The U.S. unemployment rate measures the numbers of persons unemployed as a percentage of the labor force. Typically, unemployment tends to increase during and is associated with diffcult economic periods. Conversely, the unemployment rate generally declines during and is accompanied by expansionary economic times. Additionally, very low unemployment can place inflationary pressure on the economy as labor markets become very competitive and expensive.
Data Source: Bloomberg
U.S. Treasury Yield Curve
The U.S. Treasury yield curve flattened materially during 2005 as short-term rates increased while long-term rates remained relatively constant. The yield curve ended the year partially inverted between the 2-year and 5-year Treasury. Maturities on the short-end of the yield curve (up to three years) increased over 1.00% during the year in response to the Fed’s tightening efforts which resulted in the Fed Funds rate reaching 4.25% by year-end. Contrarily, long-term rates remained more stable given the lack of inflationary pressure and strong demand from non-U.S. investors and pension funds. The yield on the bellwether 30-year Treasury-Bond ended the year at 4.54%.
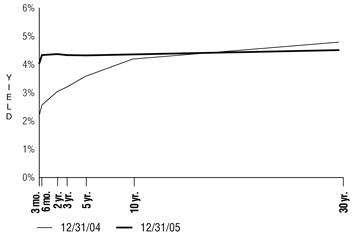
The Treasury yield curve illustrates the relationship between yields on short-term, intermediate-term and long-term Treasury securities. Normally, the shape of the yield curve is upward sloping with rates increasing from the short end of the curve moving higher to the long end. The short end of the curve is impacted more by monetary policy (demand for money) while inflationary expectations and market forces impact the long end of the curve.
Data Source: Bloomberg
6
About Your Expenses
As a shareholder of the Funds, you incur ongoing costs, including advisory fees and to the extent applicable, distribution (12b-1) fees and/or shareholder services fees, as well as other Fund expenses. This Example is intended to help you to understand your ongoing costs (in dollars) of investing in the Funds and to compare these costs with the ongoing costs of investing in other mutual funds. It is based on an investment of $1,000 invested at the beginning of the period and held for the entire period from July 1, 2005 to December 31, 2005.
Actual Expenses
The first section of the table below provides information about actual account values and actual expenses. You may use the information in this section, together with the amount you invested, to estimate the expenses that you incurred over the period. Simply divide your account value by $1,000 (for example, an $8,600 account value divided by $1,000 = 8.6), then multiply the result by the number in the first section under the heading entitled “Expenses Paid During Period” to estimate the expenses attributable to your investment during this period.
Hypothetical Example for Comparison Purposes
The second section of the table below provides information about hypothetical account values and hypothetical expenses based on the Fund’s actual expense ratio and an assumed rate of return of 5% per year before expenses, which is not the Fund’s actual return. Thus, you should not use the hypothetical account values and expenses to estimate the actual ending account balance or your expenses for the period. Rather, these figures are provided to enable you to compare the ongoing costs of investing in the Fund and other funds. To do so, compare this 5% hypothetical example with the 5% hypothetical examples that appear in the shareholder reports of the other funds. Please note that the expenses shown in the table are meant to highlight your ongoing costs only. Therefore, the second section of the table is useful in comparing ongoing costs only, and will not help you determine the relative total costs of owning different funds.
ACTUAL
| | | | | | | | | | | | | | |
Fund | | Class | | Beginning
Account Value
7/1/2005 | | Ending
Account Value
12/31/2005 | | Annualized
Expense
Ratio (1) | | | Expenses
Paid During
Period (2) |
Flexible Income | | GS4 | | $ | 1,000.00 | | $ | 1,028.43 | | 0.13 | % | | $ | 0.66 |
| | GS6 | | | 1,000.00 | | | 1,025.75 | | 0.50 | | | | 2.55 |
| | GS8 | | | 1,000.00 | | | 1,023.96 | | 0.80 | | | | 4.08 |
Growth & Income | | GS4 | | | 1,000.00 | | | 1,048.44 | | 0.13 | | | | 0.67 |
| | GS6 | | | 1,000.00 | | | 1,047.71 | | 0.37 | | | | 1.91 |
| | GS8 | | | 1,000.00 | | | 1,044.22 | | 0.90 | | | | 4.64 |
Capital Opportunities | | GS4 | | | 1,000.00 | | | 1,073.08 | | 0.13 | | | | 0.68 |
| | GS6 | | | 1,000.00 | | | 1,070.27 | | 0.55 | | | | 2.87 |
| | GS8 | | | 1,000.00 | | | 1,069.07 | | 0.85 | | | | 4.43 |
Global Equity | | GS4 | | | 1,000.00 | | | 1,096.80 | | 0.13 | | | | 0.69 |
| | GS6 | | | 1,000.00 | | | 1,095.89 | | 0.43 | | | | 2.27 |
| | GS8 | | | 1,000.00 | | | 1,092.52 | | 0.87 | | | | 4.59 |
Flexible Income I | | GS2 | | | 1,000.00 | | | 1,028.65 | | 0.17 | | | | 0.87 |
Growth & Income I | | GS2 | | | 1,000.00 | | | 1,049.26 | | 0.17 | | | | 0.88 |
Capital Opportunities I | | GS2 | | | 1,000.00 | | | 1,073.15 | | 0.17 | | | | 0.89 |
Global Equity I | | GS2 | | | 1,000.00 | | | 1,097.32 | | 0.17 | | | | 0.90 |
Money Market | | GS2 | | | 1,000.00 | | | 1,017.86 | | 0.27 | | | | 1.37 |
| | GS4 | | | 1,000.00 | | | 1,016.90 | | 0.46 | | | | 2.34 |
| | GS6 | | | 1,000.00 | | | 1,014.80 | | 0.87 | | | | 4.42 |
| | GS8 | | | 1,000.00 | | | 1,013.27 | | 1.17 | | | | 5.94 |
7
About Your Expenses (Continued)
ACTUAL
| | | | | | | | | | | | | | |
Fund | | Class | | Beginning
Account Value
7/1/2005 | | Ending
Account Value
12/31/2005 | | Annualized
Expense
Ratio (1) | | | Expenses
Paid During
Period (2) |
Low-Duration Bond | | GS2 | | $ | 1,000.00 | | $ | 1,007.95 | | 0.45 | % | | $ | 2.28 |
| | GS4 | | | 1,000.00 | | | 1,007.18 | | 0.61 | | | | 3.09 |
| | GS6 | | | 1,000.00 | | | 1,003.81 | | 1.00 | | | | 5.05 |
| | GS8 | | | 1,000.00 | | | 1,003.23 | | 1.30 | | | | 6.56 |
Medium-Duration Bond | | GS2 | | | 1,000.00 | | | 1,000.28 | | 0.50 | | | | 2.52 |
| | GS4 | | | 1,000.00 | | | 999.53 | | 0.62 | | | | 3.12 |
| | GS6 | | | 1,000.00 | | | 998.39 | | 1.05 | | | | 5.29 |
| | GS8 | | | 1,000.00 | | | 995.67 | | 1.35 | | | | 6.79 |
Extended-Duration Bond | | GS2 | | | 1,000.00 | | | 993.59 | | 0.57 | | | | 2.86 |
| | GS4 | | | 1,000.00 | | | 993.49 | | 0.73 | | | | 3.67 |
| | GS6 | | | 1,000.00 | | | 991.89 | | 1.10 | | | | 5.52 |
| | GS8 | | | 1,000.00 | | | 989.76 | | 1.50 | | | | 7.52 |
Equity Index | | GS2 | | | 1,000.00 | | | 1,056.19 | | 0.24 | | | | 1.24 |
| | GS4 | | | 1,000.00 | | | 1,055.06 | | 0.40 | | | | 2.07 |
| | GS6 | | | 1,000.00 | | | 1,053.88 | | 0.60 | | | | 3.11 |
| | GS8 | | | 1,000.00 | | | 1,052.27 | | 0.90 | | | | 4.66 |
Value Equity | | GS2 | | | 1,000.00 | | | 1,053.45 | | 0.73 | | | | 3.78 |
| | GS4 | | | 1,000.00 | | | 1,052.38 | | 0.90 | | | | 4.66 |
| | GS6 | | | 1,000.00 | | | 1,050.01 | | 1.25 | | | | 6.46 |
| | GS8 | | | 1,000.00 | | | 1,048.66 | | 1.60 | | | | 8.26 |
Growth Equity | | GS2 | | | 1,000.00 | | | 1,098.23 | | 0.87 | | | | 4.60 |
| | GS4 | | | 1,000.00 | | | 1,097.95 | | 0.99 | | | | 5.24 |
| | GS6 | | | 1,000.00 | | | 1,095.71 | | 1.39 | | | | 7.34 |
| | GS8 | | | 1,000.00 | | | 1,093.91 | | 1.69 | | | | 8.92 |
Small Cap Equity | | GS2 | | | 1,000.00 | | | 1,063.11 | | 1.10 | | | | 5.72 |
| | GS4 | | | 1,000.00 | | | 1,062.46 | | 1.20 | | | | 6.24 |
| | GS6 | | | 1,000.00 | | | 1,059.99 | | 1.60 | | | | 8.31 |
| | GS8 | | | 1,000.00 | | | 1,058.65 | | 1.90 | | | | 9.86 |
International Equity | | GS2 | | | 1,000.00 | | | 1,177.45 | | 0.97 | | | | 5.32 |
| | GS4 | | | 1,000.00 | | | 1,176.23 | | 1.15 | | | | 6.31 |
| | GS6 | | | 1,000.00 | | | 1,175.17 | | 1.50 | | | | 8.22 |
| | GS8 | | | 1,000.00 | | | 1,173.16 | | 1.80 | | | | 9.86 |
HYPOTHETICAL (assuming a 5% return before expenses)
| | | | | | | | | | | | | | |
Fund | | Class | | Beginning
Account Value
7/1/2005 | | Ending
Account Value
12/31/2005 | | Annualized
Expense
Ratio (1) | | | Expenses
Paid During
Period (2) |
Flexible Income | | GS4 | | $ | 1,000.00 | | $ | 1,024.55 | | 0.13 | % | | $ | 0.66 |
| | GS6 | | | 1,000.00 | | | 1,022.68 | | 0.50 | | | | 2.55 |
| | GS8 | | | 1,000.00 | | | 1,021.17 | | 0.80 | | | | 4.08 |
Growth & Income | | GS4 | | | 1,000.00 | | | 1,024.55 | | 0.13 | | | | 0.66 |
| | GS6 | | | 1,000.00 | | | 1,023.34 | | 0.37 | | | | 1.89 |
| | GS8 | | | 1,000.00 | | | 1,020.67 | | 0.90 | | | | 4.58 |
Capital Opportunities | | GS4 | | | 1,000.00 | | | 1,024.55 | | 0.13 | | | | 0.66 |
| | GS6 | | | 1,000.00 | | | 1,022.43 | | 0.55 | | | | 2.80 |
| | GS8 | | | 1,000.00 | | | 1,020.92 | | 0.85 | | | | 4.33 |
8
HYPOTHETICAL (assuming a 5% return before expenses)
| | | | | | | | | | | | | | |
Fund | | Class | | Beginning
Account Value
7/1/2005 | | Ending
Account Value
12/31/2005 | | Annualized
Expense
Ratio (1) | | | Expenses
Paid During
Period (2) |
Global Equity | | GS4 | | $ | 1,000.00 | | $ | 1,024.55 | | 0.13 | % | | $ | 0.66 |
| | GS6 | | | 1,000.00 | | | 1,023.04 | | 0.43 | | | | 2.19 |
| | GS8 | | | 1,000.00 | | | 1,020.82 | | 0.87 | | | | 4.43 |
Flexible Income I | | GS2 | | | 1,000.00 | | | 1,024.35 | | 0.17 | | | | 0.87 |
Growth & Income I | | GS2 | | | 1,000.00 | | | 1,024.35 | | 0.17 | | | | 0.87 |
Capital Opportunities I | | GS2 | | | 1,000.00 | | | 1,024.35 | | 0.17 | | | | 0.87 |
Global Equity I | | GS2 | | | 1,000.00 | | | 1,024.35 | | 0.17 | | | | 0.87 |
Money Market | | GS2 | | | 1,000.00 | | | 1,023.84 | | 0.27 | | | | 1.38 |
| | GS4 | | | 1,000.00 | | | 1,022.89 | | 0.46 | | | | 2.35 |
| | GS6 | | | 1,000.00 | | | 1,020.82 | | 0.87 | | | | 4.43 |
| | GS8 | | | 1,000.00 | | | 1,019.31 | | 1.17 | | | | 5.96 |
Low-Duration Bond | | GS2 | | | 1,000.00 | | | 1,022.94 | | 0.45 | | | | 2.29 |
| | GS4 | | | 1,000.00 | | | 1,022.13 | | 0.61 | | | | 3.11 |
| | GS6 | | | 1,000.00 | | | 1,020.16 | | 1.00 | | | | 5.09 |
| | GS8 | | | 1,000.00 | | | 1,018.65 | | 1.30 | | | | 6.61 |
Medium-Duration Bond | | GS2 | | | 1,000.00 | | | 1,022.68 | | 0.50 | | | | 2.55 |
| | GS4 | | | 1,000.00 | | | 1,022.08 | | 0.62 | | | | 3.16 |
| | GS6 | | | 1,000.00 | | | 1,019.91 | | 1.05 | | | | 5.35 |
| | GS8 | | | 1,000.00 | | | 1,018.40 | | 1.35 | | | | 6.87 |
Extended-Duration Bond | | GS2 | | | 1,000.00 | | | 1,022.33 | | 0.57 | | | | 2.91 |
| | GS4 | | | 1,000.00 | | | 1,021.53 | | 0.73 | | | | 3.72 |
| | GS6 | | | 1,000.00 | | | 1,019.66 | | 1.10 | | | | 5.60 |
| | GS8 | | | 1,000.00 | | | 1,017.64 | | 1.50 | | | | 7.63 |
Equity Index | | GS2 | | | 1,000.00 | | | 1,024.00 | | 0.24 | | | | 1.22 |
| | GS4 | | | 1,000.00 | | | 1,023.19 | | 0.40 | | | | 2.04 |
| | GS6 | | | 1,000.00 | | | 1,022.18 | | 0.60 | | | | 3.06 |
| | GS8 | | | 1,000.00 | | | 1,020.67 | | 0.90 | | | | 4.58 |
Value Equity | | GS2 | | | 1,000.00 | | | 1,021.53 | | 0.73 | | | | 3.72 |
| | GS4 | | | 1,000.00 | | | 1,020.67 | | 0.90 | | | | 4.58 |
| | GS6 | | | 1,000.00 | | | 1,018.90 | | 1.25 | | | | 6.36 |
| | GS8 | | | 1,000.00 | | | 1,017.14 | | 1.60 | | | | 8.13 |
Growth Equity | | GS2 | | | 1,000.00 | | | 1,020.82 | | 0.87 | | | | 4.43 |
| | GS4 | | | 1,000.00 | | | 1,020.21 | | 0.99 | | | | 5.04 |
| | GS6 | | | 1,000.00 | | | 1,018.20 | | 1.39 | | | | 7.07 |
| | GS8 | | | 1,000.00 | | | 1,016.69 | | 1.69 | | | | 8.59 |
Small Cap Equity | | GS2 | | | 1,000.00 | | | 1,019.66 | | 1.10 | | | | 5.60 |
| | GS4 | | | 1,000.00 | | | 1,019.16 | | 1.20 | | | | 6.11 |
| | GS6 | | | 1,000.00 | | | 1,017.14 | | 1.60 | | | | 8.13 |
| | GS8 | | | 1,000.00 | | | 1,015.63 | | 1.90 | | | | 9.65 |
International Equity | | GS2 | | | 1,000.00 | | | 1,020.32 | | 0.97 | | | | 4.94 |
| | GS4 | | | 1,000.00 | | | 1,019.41 | | 1.15 | | | | 5.85 |
| | GS6 | | | 1,000.00 | | | 1,017.64 | | 1.50 | | | | 7.63 |
| | GS8 | | | 1,000.00 | | | 1,016.13 | | 1.80 | | | | 9.15 |
| (1) | Expenses include the effect of contractual waivers by GuideStone Capital Management. The Blended Funds’ proportionate share of the operating expenses of the Select Funds is not reflected in the tables above. |
| (2) | Expenses are equal to the Fund’s annualized expense ratios for the period July 1, 2005 through December 31, 2005, multiplied by the average account value over the period, multiplied by 184/365 (to reflect the one-half year period). |
9
Flexible Income Fund
Utilizing investments in the underlying Select Funds, the Fund’s actual asset allocation at quarter-end was 18% U.S. Equity, 6% Non-U.S. Equity, and 76% Fixed Income. The Fund outperformed its composite benchmark for the quarter.
The Fund was positively impacted by its exposure to the GuideStone Funds Growth Equity Fund (+5.48%) and the GuideStone Funds International Equity Fund (+5.83%). The largest component of the Fund, the GuideStone Funds Low-Duration Bond Fund (+0.50%), lagged its underlying benchmark (Merrill Lynch 1-3 Year Treasury Index) while still generating an overall positive return. That fund’s benchmark-relative performance was negatively impacted by its underweight to the Treasury sector given many spread sectors (such as corporate bonds and mortgages) underperformed Treasuries on a duration equivalent basis. During the quarter, certain sub-advisers maintained longer-than-benchmark duration positions which also negatively impacted relative performance as short-term rates increased.
| * | Percentages in parentheses are the fourth quarter performances for the respective underlying Select Funds. |
10
Flexible Income Fund
Average Annual Total Returns as of 12/31/05
| | | | | | | | | | | | | | | |
| | | GS4 Class*
| | | GS6 Class*
| | | Benchmark**
| | | GS8 Class*
| | | GS8 Class Benchmark**
| |
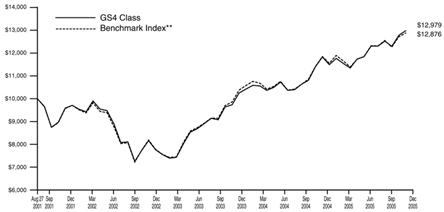
One Year | | 3.31 | % | | 2.90 | % | | 3.43 | % | | 2.61 | % | | 3.43 | % |
Since Inception | | 3.87 | % | | 3.60 | % | | 3.91 | % | | 3.67 | % | | 4.30 | % |
Inception Date | | 08/27/01 | | | 08/27/01 | | | 08/27/01 | | | 11/08/04 | | | 11/08/04 | |
The performance data quoted represents past performance and does not guarantee future results. Current performance may be lower or higher. Performance data current to the most recent month-end may be obtained at www.GuideStone.org. The investment return and principal value of an investment will fluctuate so that shares, when redeemed, may be worth more or less than their original cost.
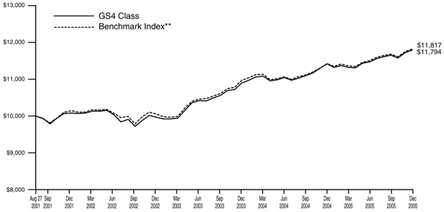
The graph compares the results of a hypothetical $10,000 investment in the GS4 Class of the Fund since August 27, 2001 (commencement of operations), with all dividends and capital gains reinvested, with the Fund’s weighted composite benchmark index.
| * | These returns reflect expense waivers by the Fund’s investment advisor. Without these waivers, returns would have been lower. Returns shown do not reflect the deduction of taxes that a shareholder would pay on Fund distributions or the redemption of Fund shares. |
| ** | Represents a weighted composite benchmark index consisting of the Russell 3000® Index, the MSCI ACWI® Ex-U.S. and the Merrill Lynch 1-3 Year Treasury Index. |
The Russell 3000® Index measures the performance of the 3,000 largest U.S. companies based on total market capitalization, which represents approximately 98% of the investable U.S. equity market.
The MSCI ACWI® Ex-U.S. is a market-capitalization weighted index composed of companies representative of the market structure of developed and emerging market countries in the Americas (excluding the U.S.), Europe/Middle East, and Asia/ Pacific Regions. It excludes closed markets and those shares in otherwise free markets that are not purchasable by foreigners. The Merrill Lynch 1-3 Year Treasury Index is composed of all U.S. Treasury Notes and Bonds with maturities greater than or equal to one year and less than three years.
Unlike a mutual fund, the performance of an index assumes no taxes, transaction costs, management fees or other expenses.
11
| | |
| Flexible Income Fund | | |
| SCHEDULE OF INVESTMENTS | | December 31, 2005 |
| | | | | | |
| | | Shares | | Value |
AFFILIATED MUTUAL FUNDS — 98.8% | | | | | | |
GuideStone Funds Equity Index Fund (GS4 Class)¥ | | | 290,520 | | $ | 4,930,132 |
GuideStone Funds Growth Equity Fund (GS4 Class)¥ | | | 1,226,723 | | | 21, 725,267 |
GuideStone Funds International Equity Fund (GS4 Class)¥ | | | 1,043,488 | | | 18,125,393 |
GuideStone Funds Low-Duration Bond Fund (GS4 Class)¥ | | | 17,271,115 | | | 218,652,321 |
GuideStone Funds Money Market Fund (GS4 Class)¥ | | | 3,095,890 | | | 3,095,890 |
GuideStone Funds Small Cap Equity Fund (GS4 Class)¥ | | | 354,126 | | | 5,527,908 |
GuideStone Funds Value Equity Fund (GS4 Class)¥ | | | 1,266,626 | | | 22,165,961 |
| | | | | | |
TOTAL AFFILIATED MUTUAL FUNDS
(Cost $250,252,094) | | | | | | 294,222,872 |
| | | | | | |
| | | Par | | |
U.S. TREASURY OBLIGATIONS — 1.2% | | | | | | |
U.S. Treasury Bills | | | | | | |
3.94%, 04/06/06‡‡ | | $ | 90,000 | | | 89,073 |
4.10%, 04/06/06‡‡ | | | 45,000 | | | 44,537 |
| | | | | | |
| | | | | | 133,610 |
| | | | | | |
U.S. Treasury Note | | | | | | |
4.25%, 10/31/07 | | | 3,300,000 | | | 3,291,364 |
| | | | | | |
TOTAL U.S. TREASURY OBLIGATIONS | | | | | | |
(Cost $3,421,965) | | | | | | 3,424,974 |
| | | | | | |
Total Investments — 100.0% | | | | | | |
(Cost $253,674,059) | | | | | | 297,647,846 |
Other Assets in Excess of | | | | | | |
Liabilities — 0.0% | | | | | | 64,260 |
| | | | | | |
Net Assets — 100.0% | | | | | $ | 297,712,106 |
| | | | | | |
| ‡�� | All or a portion of the security was held as collateral for open futures contracts. |
PORTFOLIO SUMMARY+
| | |
| | | % |
Bond Funds | | 73.4 |
Domestic Equity Funds | | 18.3 |
International Equity Funds | | 6.1 |
U.S. Treasury Obligations | | 1.2 |
Money Market Funds | | 1.0 |
Futures Contracts | | 0.3 |
| | |
| | 100.3 |
| | |
See Notes to Financial Statements.
12
Growth & Income Fund
Utilizing investments in the underlying Select Funds, the Fund’s actual asset allocation at quarter-end was 37% U.S. Equity, 14% Non-U.S. Equity, and 49% Fixed Income. The Fund outperformed its composite benchmark for the quarter.
The Fund was positively impacted by its exposure to the GuideStone Funds Growth Equity Fund (+5.48%) and the GuideStone Funds International Equity Fund (+5.83%). The largest component of the Fund, the GuideStone Funds Medium-Duration Bond Fund (+0.31%), lagged its underlying benchmark (Lehman Brothers Aggregate Bond Index) while still generating an overall positive return. That fund’s benchmark-relative performance was negatively impacted by its yield curve strategy (exposure to shorter maturities).
| * | Percentages in parentheses are the fourth quarter performances for the respective underlying Select Funds. |
13
Growth & Income Fund
Average Annual Total Returns as of 12/31/05
| | | | | | | | | | | | | | | |
| | | GS4 Class*
| | | GS6 Class*
| | | Benchmark**
| | | GS8 Class*
| | | GS8 Class Benchmark**
| |
One Year | | 6.24 | % | | 5.96 | % | | 5.70 | % | | 5.39 | % | | 5.70 | % |
Since Inception | | 6.13 | % | | 5.84 | % | | 5.98 | % | | 7.88 | % | | 7.89 | % |
Inception Date | | 08/27/01 | | | 08/27/01 | | | 08/27/01 | | | 11/08/04 | | | 11/08/04 | |
The performance data quoted represents past performance and does not guarantee future results. Current performance may be lower or higher. Performance data current to the most recent month-end may be obtained at www.GuideStone.org. The investment return and principal value of an investment will fluctuate so that shares, when redeemed, may be worth more or less than their original cost.
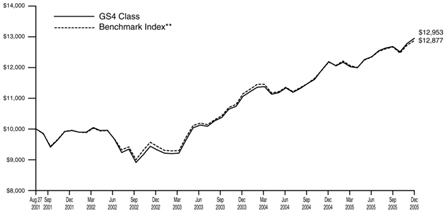
The graph compares the results of a hypothetical $10,000 investment in the GS4 Class of the Fund since August 27, 2001
(commencement of operations), with all dividends and capital gains reinvested, with the Fund’s weighted composite benchmark index.
| * | These returns reflect expense waivers by the Fund’s investment advisor. Without these waivers, returns would have been lower. Returns shown do not reflect the deduction of taxes that a shareholder would pay on Fund distributions or the redemption of Fund shares. |
| ** | Represents a weighted composite benchmark index consisting of the Russell 3000® Index, the MSCI ACWI® Ex-U.S. and the Lehman Brothers Aggregate Bond Index. |
The Russell 3000® Index measures the performance of the 3,000 largest U.S. companies based on total market capitalization, which represents approximately 98% of the investable U.S. equity market.
The MSCI ACWI® Ex-U.S. is a market-capitalization weighted index composed of companies representative of the market structure of developed and emerging market countries in the Americas (excluding the U.S.), Europe/Middle East, and Asia/ Pacific Regions. It excludes closed markets and those shares in otherwise free markets that are not purchased by foreigners.
The Lehman Brothers Aggregate Bond Index represents securities that are SEC-registered, taxable, and dollar denominated. The index covers the U.S. investment grade fixed rate bond market, with index components for government and corporate securities, mortgage pass-through securities, and asset-backed securities.
Unlike a mutual fund, the performance of an index assumes no taxes, transaction costs, management fees or other expenses.
14
| | |
| Growth & Income Fund | | |
| SCHEDULE OF INVESTMENTS | | December 31, 2005 |
| | | | | | | |
| | | Shares | | Value | |
AFFILIATED MUTUAL FUNDS — 98.9% | | | | | | | |
GuideStone Funds Equity Index Fund (GS4 Class)¥ | | | 2,314,915 | | $ | 39,284,107 | |
GuideStone Funds Extended- Duration Bond Fund (GS4 Class) ¥ | | | 8,645,201 | | | 128,121,874 | |
GuideStone Funds Growth Equity Fund (GS4 Class)¥ | | | 10,777,199 | | | 190,864,198 | |
GuideStone Funds International Equity Fund (GS4 Class)¥ | | | 10,198,052 | | | 177,140,162 | |
GuideStone Funds Low-Duration Bond Fund (GS4 Class)¥ | | | 14,399,692 | | | 182,300,097 | |
GuideStone Funds Medium-Duration Bond Fund (GS4 Class)¥ | | | 22,937,377 | | | 307,360,852 | |
GuideStone Funds Money Market Fund (GS4 Class)¥ | | | 18,541,482 | | | 18,541,482 | |
GuideStone Funds Small Cap Equity Fund (GS4 Class)¥ | | | 3,066,537 | | | 47,868,648 | |
GuideStone Funds Value Equity Fund (GS4 Class)¥ | | | 10,765,851 | | | 188,402,401 | |
| | | | | | | |
TOTAL AFFILIATED MUTUAL FUNDS
(Cost $ 1,064,899,172) | | | | | | 1,279,883,821 | |
| | | | | | | |
| | | Par | | | |
U.S. TREASURY OBLIGATIONS — 1.1% | | | | | | | |
U.S. Treasury Bill 3.94%, 04/06/06‡‡ | | $ | 805,000 | | | 796,713 | |
U.S. Treasury Note 5.00%, 02/15/11 | | | 12,555,000 | | | 12,935,090 | |
| | | | | | | |
TOTAL U.S. TREASURY OBLIGATIONS
(Cost $13,676,293) | | | | | | 13,731,803 | |
| | | | | | | |
Total Investments — 100.0%
(Cost $1,078,575,465) | | | | | | 1,293,615,624 | |
Liabilities in Excess of Other Assets — 0.0% | | | | | | (37,104 | ) |
| | | | | | | |
Net Assets — 100.0% | | | | | $ | 1,293,578,520 | |
| | | | | | | |
| ‡‡ | All or a portion of the security was held as collateral for open futures contracts. |
| | |
| |
| | | % |
Bond Funds | | 47.7 |
Domestic Equity Funds | | 36.1 |
International Equity Funds | | 13.7 |
Money Market Funds | | 1.4 |
U.S. Treasury Obligations | | 1.1 |
Futures Contracts | | 1.0 |
| | |
| | 101.0 |
| | |
See Notes to Financial Statements.
15
Capital Opportunities Fund
Utilizing investments in the underlying Select Funds, the Fund’s actual asset allocation at quarter-end was 54% U.S. Equity, 21% Non-U.S. Equity, and 25% Fixed Income. The Fund outperformed its composite benchmark for the quarter.
Strong overall performance can be attributed to positive returns in domestic and non-U.S. equity markets. The Fund was positively impacted by its exposure to the GuideStone Funds Growth Equity Fund (+5.48%), GuideStone Funds International Equity Fund (+5.83%) and GuideStone Funds Small Cap Equity Fund (+1.86%).
| * | Percentages in parentheses are the fourth quarter performances for the respective underlying Select Funds. |
16
Capital Opportunities Fund
Average Annual Total Returns as of 12/31/05
| | | | | | | | | | | | | | | |
| | | GS4 Class*
| | | GS6 Class*
| | | Benchmark**
| | | GS8 Class*
| | | GS8 Class Benchmark**
| |
One Year | | 8.09 | % | | 7.43 | % | | 7.23 | % | | 7.21 | % | | 7.23 | % |
Since Inception | | 6.26 | % | | 5.89 | % | | 6.07 | % | | 10.56 | % | | 10.45 | % |
Inception Date | | 08/27/01 | | | 08/27/01 | | | 08/27/01 | | | 11/08/04 | | | 11/08/04 | |
The performance data quoted represents past performance and does not guarantee future results. Current performance may be lower or higher. Performance data current to the most recent month-end may be obtained at www.GuideStone.org. The investment return and principal value of an investment will fluctuate so that shares, when redeemed, may be worth more or less than their original cost.
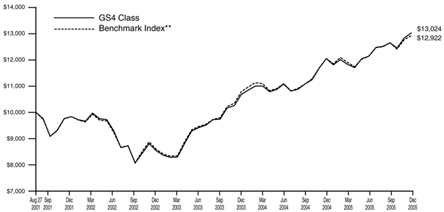
The graph compares the results of a hypothetical $10,000 investment in the GS4 Class of the Fund since August 27, 2001
(commencement of operations), with all dividends and capital gains reinvested, with the Fund’s weighted composite benchmark index.
| * | These returns reflect expense waivers by the Fund’s investment advisor. Without these waivers, returns would have been lower. Returns shown do not reflect the deduction of taxes that a shareholder would pay on Fund distributions or the redemption of Fund shares. |
| ** | Represents a weighted composite benchmark index consisting of the Russell 3000® Index, the MSCI ACWI® Ex-U.S. and the Lehman Brothers Aggregate Bond Index. |
The Russell 3000® Index measures the performance of the 3,000 largest U.S. companies based on total market capitalization, which represents approximately 98% of the investable U.S. equity market.
The MSCI ACWI® Ex-U.S. is a market-capitalization weighted index composed of companies representative of the market structure of developed and emerging market countries in the Americas (excluding the U.S.), Europe/Middle East, and Asia/ Pacific Regions. It excludes closed markets and those shares in otherwise free markets that are not purchasable by foreigners.
The Lehman Brothers Aggregate Bond Index represents securities that are SEC-registered, taxable, and dollar denominated. The index covers the U.S. investment grade fixed rate bond market, with index components for government and corporate securities, mortgage pass-through securities, and asset-backed securities.
Unlike a mutual fund, the performance of an index assumes no taxes, transaction costs, management fees or other expenses.
17
| | |
Capital Opportunities Fund SCHEDULE OF INVESTMENTS | | December 31, 2005 |
| | | | | | | |
| | | Shares | | Value | |
AFFILIATED MUTUAL FUNDS — 99.5% | | | | | | | |
GuideStone Funds Equity Index Fund (GS4 Class)¥ | | | 2,400,704 | | $ | 40,739,955 | |
GuideStone Funds Extended- Duration Bond Fund (GS4 Class)¥ | | | 3,577,788 | | | 53,022,813 | |
GuideStone Funds Growth Equity Fund (GS4 Class)¥ | | | 13,378,962 | | | 236,941,412 | |
GuideStone Funds International Equity Fund (GS4 Class)¥ | | | 12,306,705 | | | 213,767,462 | |
GuideStone Funds Low-Duration Bond Fund (GS4 Class)¥ | | | 5,862,410 | | | 74,218,117 | |
GuideStone Funds Medium-Duration Bond Fund (GS4 Class)¥ | | | 9,169,466 | | | 122,870,843 | |
GuideStone Funds Money Market Fund (GS4 Class)¥ | | | 19,009,262 | | | 19,009,262 | |
GuideStone Funds Small Cap Equity Fund (GS4 Class)¥ | | | 3,824,289 | | | 59,697,158 | |
GuideStone Funds Value Equity Fund (GS4 Class)¥ | | | 13,368,278 | | | 233,944,873 | |
| | | | | | | |
TOTAL AFFILIATED MUTUAL FUNDS
(Cost $846,035,901) | | | | | | 1,054,211,895 | |
| | | | | | | |
| | | Par | | | |
U.S. TREASURY OBLIGATIONS — 0.5% | | | | | | | |
U.S. Treasury Bill | | | | | | | |
3.94%, 04/06/06‡‡ | | $ | 910,000 | | | 900,632 | |
U.S. Treasury Note | | | | | | | |
5.00%, 02/15/11 | | | 4,645,000 | | | 4,785,623 | |
| | | | | | | |
TOTAL U.S. TREASURY OBLIGATIONS
(Cost $5,664,599) | | | | | | 5,686,255 | |
| | | | | | | |
Total Investments — 100.0%
(Cost $851,700,500) | | | | | | 1,059,898,150 | |
Liabilities in Excess of Other Assets — 0.0% | | | | | | (135,849 | ) |
| | | | | | | |
Net Assets — 100.0% | | | | | $ | 1,059,762,301 | |
| | | | | | | |
| | |
‡‡ All or a portion of the security was held as collateral for open futures contracts. | | |
| |
PORTFOLIO SUMMARY+ | | |
| | |
| |
| | | % |
Domestic Equity Funds | | 53.9 |
Bond Funds | | 23.6 |
International Equity Funds | | 20.2 |
Money Market Funds | | 1.8 |
Futures Contracts | | 1.3 |
U.S. Treasury Obligations | | 0.5 |
| | |
| | 101.3 |
| | |
See Notes to Financial Statements.
18
Global Equity Fund
Utilizing investments in the underlying Select Funds, the Fund’s actual asset allocation at quarter-end was 72% U.S. Equity, 27% Non-U.S. Equity, and 1% Fixed Income. The Fund outperformed its composite benchmark for the quarter.
Strong overall performance can be attributed to positive returns in domestic and non-U.S. equity markets. The Fund was positively impacted by its exposure to the GuideStone Funds Growth Equity Fund (+5.48%), GuideStone Funds International Equity Fund (+5.83%) and GuideStone Funds Small Cap Equity Fund (+1.86%).
| * | Percentages in parentheses are the fourth quarter performances for the respective underlying Select Funds. |
19
Global Equity Fund
Average Annual Total Returns as of 12/31/05
| | | | | | | | | | | | | | | |
| | | GS4 Class*
| | | GS6 Class*
| | | Benchmark**
| | | GS8 Class*
| | | GS8 Class Benchmark**
| |
One Year | | 9.75 | % | | 9.40 | % | | 8.73 | % | | 8.97 | % | | 8.73 | % |
Since Inception | | 6.18 | % | | 5.94 | % | | 5.98 | % | | 13.35 | % | | 13.32 | % |
Inception Date | | 08/27/01 | | | 08/27/01 | | | 08/27/01 | | | 11/08/04 | | | 11/08/04 | |
The performance data quoted represents past performance and does not guarantee future results. Current performance may be lower or higher. Performance data current to the most recent month-end may be obtained at www.GuideStone.org. The investment return and principal value of an investment will fluctuate so that shares, when redeemed, may be worth more or less than their original cost.
The graph compares the results of a hypothetical $10,000 investment in the GS4 Class of the Fund since August 27, 2001
(commencement of operations), with all dividends and capital gains reinvested, with the Fund’s weighted composite benchmark index.
| * | These returns reflect expense waivers by the Fund’s investment advisor. Without these waivers, returns would have been lower. Returns shown do not reflect the deduction of taxes that a shareholder would pay on Fund distributions or the redemption of Fund shares. |
| ** | Represents a weighted composite benchmark index consisting of the Russell 3000® Index and the MSCI ACWI® Ex-U.S. The Russell 3000® Index measures the performance of the 3,000 largest U.S. companies based on total market capitalization, which represents approximately 98% of the investable U.S. equity market. |
The MSCI ACWI® Ex-U.S. is a market-capitalization weighted index composed of companies representative of the market structure of developed and emerging market countries in the Americas (excluding the U.S.), Europe/Middle East, and Asia/ Pacific Regions. It excludes closed markets and those shares in otherwise free markets that are not purchasable by foreigners.
Unlike a mutual fund, the performance of an index assumes no taxes, transaction costs, management fees or other expenses.
20
| | |
Global Equity Fund SCHEDULE OF INVESTMENTS | | December 31, 2005 |
| | | | | | | |
| | | Shares | | Value | |
AFFILIATED MUTUAL FUNDS — 99.9% | | | | | | | |
GuideStone Funds Equity Index Fund (GS4 Class)¥ | | | 3,018,069 | | $ | 51,216,637 | |
GuideStone Funds Growth Equity Fund (GS4 Class)¥ | | | 16,218,813 | | | 287,235,170 | |
GuideStone Funds International Equity Fund (GS4 Class)¥ | | | 14,530,019 | | | 252,386,424 | |
GuideStone Funds Money Market Fund (GS4 Class)¥ | | | 16,893,117 | | | 16,893,117 | |
GuideStone Funds Small Cap Equity Fund (GS4 Class)¥ | | | 4,459,932 | | | 69,619,538 | |
GuideStone Funds Value Equity Fund (GS4 Class)¥ | | | 16,167,781 | | | 282,936,160 | |
| | | | | | | |
TOTAL AFFILIATED MUTUAL FUNDS
(Cost $736,835,216) | | | | | | 960,287,046 | |
| | | | | | | |
| | | Par | | | |
U.S. TREASURY OBLIGATION — 0.1% | | | | | | | |
U.S. Treasury Bill | | | | | | | |
3.94%, 04/06/06‡‡ | | | | | | | |
(Cost $1,281,544) | | $ | 1,295,000 | | | 1,281,669 | |
| | | | | | | |
Total Investments — 100.0%
(Cost $738,116,760) | | | | | | 961,568,715 | |
Liabilities in Excess of Other Assets — 0.0% | | | | | | (433,242 | ) |
| | | | | | | |
Net Assets — 100.0% | | | | | $ | 961,135,473 | |
| | | | | | | |
| | |
‡‡ All or a portion of the security was held as collateral for open futures contracts. | | |
| |
PORTFOLIO SUMMARY+ | | |
| | |
| |
| | | % |
Domestic Equity Funds | | 71.9 |
International Equity Funds | | 26.2 |
Money Market Funds | | 1.8 |
Futures Contracts | | 1.3 |
U.S. Treasury Obligations | | 0.1 |
| | |
| | 101.3 |
| | |
See Notes to Financial Statements.
21
STATEMENTS OF ASSETS AND LIABILITIES
December 31, 2005
| | | | | | | | | | | | |
| | | Flexible Income Fund | | Growth &
Income Fund | | Capital
Opportunities Fund | | Global Equity Fund |
Assets | | | | | | | | | | | | |
Investments in securities of affiliated issuers, at value | | $ | 294,222,872 | | $ | 1,279,883,821 | | $ | 1,054,211,895 | | $ | 960,287,046 |
Investments in securities of unaffiliated issuers, at value | | | 3,424,974 | | | 13,731,803 | | | 5,686,255 | | | 1,281,669 |
| | | | | | | | | | | | |
Total investments (1) | | | 297,647,846 | | | 1,293,615,624 | | | 1,059,898,150 | | | 961,568,715 |
Receivables: | | | | | | | | | | | | |
Dividends | | | 9,086 | | | 57,715 | | | 51,134 | | | 53,019 |
Interest | | | 24,013 | | | 237,098 | | | 88,134 | | | — |
Investment securities sold | | | — | | | — | | | — | | | 1,000,000 |
Fund shares sold | | | 276,160 | | | 52,086 | | | 185,204 | | | 375,316 |
Prepaid expenses and other assets | | | 17,419 | | | 19,524 | | | 16,287 | | | 16,547 |
| | | | | | | | | | | | |
Total Assets | | | 297,974,524 | | | 1,293,982,047 | | | 1,060,238,909 | | | 963,013,597 |
| | | | | | | | | | | | |
Liabilities | | | | | | | | | | | | |
Payables: | | | | | | | | | | | | |
Investment securities purchased | | | — | | | — | | | — | | | 1,000,000 |
Fund shares redeemed | | | 205,294 | | | 199,129 | | | 286,698 | | | 703,964 |
Variation margin | | | 3,975 | | | 54,325 | | | 59,625 | | | 54,325 |
Accrued expenses: | | | | | | | | | | | | |
Advisory fees | | | 7,706 | | | 79,357 | | | 68,192 | | | 59,540 |
Distribution (12b-1) fees | | | 2,372 | | | 2,624 | | | 2,154 | | | 2,729 |
Shareholder servicing fees | | | 2,073 | | | 2,307 | | | 1,765 | | | 2,401 |
Other expenses | | | 40,998 | | | 65,785 | | | 58,174 | | | 55,165 |
| | | | | | | | | | | | |
Total Liabilities | | | 262,418 | | | 403,527 | | | 476,608 | | | 1,878,124 |
| | | | | | | | | | | | |
Net Assets | | $ | 297,712,106 | | $ | 1,293,578,520 | | $ | 1,059,762,301 | | $ | 961,135,473 |
| | | | | | | | | | | | |
Net Assets Consist of: | | | | | | | | | | | | |
Paid-in-capital | | $ | 252,244,246 | | $ | 1,059,129,013 | | $ | 826,813,109 | | $ | 710,964,698 |
Undistributed net investment income | | | 1,857 | | | 4,573 | | | 3,668 | | | 3,258 |
Undistributed net realized gain on investments | | | 1,502,545 | | | 19,570,100 | | | 24,938,497 | | | 26,882,049 |
Net unrealized appreciation (depreciation) on investments and futures transactions | | | 43,963,458 | | | 214,874,834 | | | 208,007,027 | | | 223,285,468 |
| | | | | | | | | | | | |
Net Assets | | $ | 297,712,106 | | $ | 1,293,578,520 | | $ | 1,059,762,301 | | $ | 961,135,473 |
| | | | | | | | | | | | |
Net Asset Value: | | | | | | | | | | | | |
$0.001 par value, unlimited shares authorized | | | | | | | | | | | | |
Net assets applicable to the GS4 Class | | $ | 280,256,037 | | $ | 1,273,854,733 | | $ | 1,046,060,859 | | $ | 940,768,984 |
| | | | | | | | | | | | |
GS4 shares outstanding | | | 21,656,282 | | | 89,688,285 | | | 67,721,592 | | | 57,773,166 |
| | | | | | | | | | | | |
Net asset value, offering and redemption price per GS4 share | | $ | 12.94 | | $ | 14.20 | | $ | 15.45 | | $ | 16.28 |
| | | | | | | | | | | | |
Net assets applicable to the GS6 Class | | $ | 12,161,369 | | $ | 13,888,019 | | $ | 7,570,892 | | $ | 14,440,727 |
| | | | | | | | | | | | |
GS6 shares outstanding | | | 1,343,552 | | | 1,484,456 | | | 713,235 | | | 1,237,621 |
| | | | | | | | | | | | |
Net asset value, offering and redemption price per GS6 share | | $ | 9.05 | | $ | 9.36 | | $ | 10.61 | | $ | 11.67 |
| | | | | | | | | | | | |
Net assets applicable to the GS8 Class | | $ | 5,294,700 | | $ | 5,835,768 | | $ | 6,130,550 | | $ | 5,925,762 |
| | | | | | | | | | | | |
GS8 shares outstanding | | | 584,807 | | | 624,039 | | | 578,286 | | | 508,159 |
| | | | | | | | | | | | |
Net asset value, offering and redemption price per GS8 share | | $ | 9.05 | | $ | 9.35 | | $ | 10.60 | | $ | 11.66 |
| | | | | | | | | | | | |
__________ | | | | | | | | | | | | |
| | | | |
(1) Investments in securities of affiliated issuers, at cost | | $ | 250,252,094 | | $ | 1,064,899,172 | | $ | 846,035,901 | | $ | 736,835,216 |
Investments in securities of unaffiliated issuers, at cost | | | 3,421,965 | | | 13,676,293 | | | 5,664,599 | | | 1,281,544 |
| | | | | | | | | | | | |
Total investments at cost | | $ | 253,674,059 | | $ | 1,078,575,465 | | $ | 851,700,500 | | $ | 738,116,760 |
| | | | | | | | | | | | |
See Notes to Financial Statements.
22
STATEMENTS OF OPERATIONS
For the Year Ended December 31, 2005
| | | | | | | | | | | | | | | | |
| | | Flexible Income Fund | | | Growth & Income Fund | | | Capital Opportunities Fund | | | Global Equity Fund | |
| | | | |
Investment Income | | | | | | | | | | | | | | | | |
Income distributions received from affiliated funds | | $ | 6,751,515 | | | $ | 27,857,133 | | | $ | 16,171,664 | | | $ | 8,747,367 | |
Interest | | | 387,569 | | | | 439,060 | | | | 171,094 | | | | 38,170 | |
| | | | | | | | | | | | | | | | |
Total Investment Income | | | 7,139,084 | | | | 28,296,193 | | | | 16,342,758 | | | | 8,785,537 | |
| | | | | | | | | | | | | | | | |
Expenses | | | | | | | | | | | | | | | | |
Investment advisory fees | | | 273,287 | | | | 1,239,961 | | | | 1,013,177 | | | | 908,919 | |
Transfer agent fees | | | | | | | | | | | | | | | | |
GS4 shares | | | 38,005 | | | | 60,569 | | | | 49,685 | | | | 47,383 | |
GS6 shares | | | 6,546 | | | | 4,636 | | | | 5,664 | | | | 5,877 | |
GS8 shares | | | 6,566 | | | | 5,582 | | | | 6,094 | | | | 6,212 | |
Custodian fees | | | 10,940 | | | | 27,800 | | | | 24,255 | | | | 21,720 | |
Distribution (12b-1) fees: | | | | | | | | | | | | | | | | |
GS6 shares | | | 11,875 | | | | 13,290 | | | | 7,139 | | | | 13,406 | |
GS8 shares | | | 15,341 | | | | 15,884 | | | | 16,093 | | | | 16,163 | |
Shareholder servicing fees: | | | | | | | | | | | | | | | | |
GS6 shares | | | 13,062 | | | | 14,619 | | | | 7,852 | | | | 14,747 | |
GS8 shares | | | 10,731 | | | | 11,107 | | | | 11,253 | | | | 11,303 | |
Accounting and administration fees | | | 83,278 | | | | 203,441 | | | | 180,891 | | | | 170,289 | |
Professional fees | | | 50,682 | | | | 50,681 | | | | 50,682 | | | | 50,681 | |
Blue sky fees | | | | | | | | | | | | | | | | |
GS4 shares | | | 3,384 | | | | 4,011 | | | | 3,549 | | | | 3,619 | |
GS6 shares | | | 16,266 | | | | 17,122 | | | | 16,195 | | | | 16,705 | |
GS8 shares | | | 8,725 | | | | 9,363 | | | | 8,944 | | | | 8,687 | |
Shareholder reporting fees | | | | | | | | | | | | | | | | |
GS4 shares | | | 16,850 | | | | 45,046 | | | | 31,347 | | | | 27,760 | |
GS6 shares | | | (1,026 | ) | | | (2,602 | ) | | | (1,689 | ) | | | (1,321 | ) |
GS8 shares | | | 30 | | | | 73 | | | | 61 | | | | 35 | |
Trustee fees | | | 3,115 | | | | 14,139 | | | | 11,572 | | | | 10,376 | |
Line of credit facility fees | | | 1,320 | | | | 5,982 | | | | 4,896 | | | | 4,392 | |
Other expenses | | | 16,830 | | | | 16,559 | | | | 16,235 | | | | 16,131 | |
| | | | | | | | | | | | | | | | |
Total Expenses | | | 585,807 | | | | 1,757,263 | | | | 1,463,895 | | | | 1,353,084 | |
Expenses waived (See Footnote 3c) | | | (156,185 | ) | | | (77,821 | ) | | | (83,384 | ) | | | (94,588 | ) |
Fees paid indirectly | | | (766 | ) | | | (883 | ) | | | (783 | ) | | | (716 | ) |
| | | | | | | | | | | | | | | | |
Net Expenses | | | 428,856 | | | | 1,678,559 | | | | 1,379,728 | | | | 1,257,780 | |
| | | | | | | | | | | | | | | | |
Net Investment Income | | | 6,710,228 | | | | 26,617,634 | | | | 14,963,030 | | | | 7,527,757 | |
| | | | | | | | | | | | | | | | |
Realized and Unrealized Gain (Loss) | | | | | | | | | | | | | | | | |
Capital gain distributions received from affiliated funds | | | 2,318,945 | | | | 23,576,467 | | | | 26,276,068 | | | | 29,693,788 | |
Net realized gain on investment securities of affiliated issuers | | | 6,741,001 | | | | 43,272,055 | | | | 29,998,020 | | | | 31,144,202 | |
Net realized loss on investment securities of unaffiliated issuers | | | (340,628 | ) | | | (384,115 | ) | | | (114,986 | ) | | | — | |
Net realized gain on futures transactions | | | 87,023 | | | | 639,846 | | | | 371,781 | | | | 435,043 | |
| | | | | | | | | | | | | | | | |
Net realized gain | | | 8,806,341 | | | | 67,104,253 | | | | 56,530,883 | | | | 61,273,033 | |
| | | | | | | | | | | | | | | | |
Change in unrealized appreciation (depreciation) on investment securities of affiliated issuers | | | (6,537,536 | ) | | | (18,485,039 | ) | | | 7,387,129 | | | | 17,434,571 | |
Change in unrealized appreciation (depreciation) on investment securities of unaffiliated issuers | | | 2,878 | | | | 116,906 | | | | 18,362 | | | | 1 | |
Change in unrealized appreciation (depreciation) on futures transactions | | | (30,186 | ) | | | (401,667 | ) | | | (490,241 | ) | | | (449,769 | ) |
| | | | | | | | | | | | | | | | |
Net change in unrealized appreciation (depreciation) | | | (6,564,844 | ) | | | (18,769,800 | ) | | | 6,915,250 | | | | 16,984,803 | |
| | | | | | | | | | | | | | | | |
Net Realized and Unrealized Gain | | | 2,241,497 | | | | 48,334,453 | | | | 63,446,133 | | | | 78,257,836 | |
| | | | | | | | | | | | | | | | |
Net Increase in Net Assets Resulting from Operations | | $ | 8,951,725 | | | $ | 74,952,087 | | | $ | 78,409,163 | | | $ | 85,785,593 | |
| | | | | | | | | | | | | | | | |
See Notes to Financial Statements.
23
STATEMENTS OF CHANGES IN NET ASSETS
| | | | | | | | | | | | | | | | |
| | | Flexible Income Fund For the Year Ended | | | Growth & Income Fund For the Year Ended | |
| | | 12/31/05 | | | 12/31/04 | | | 12/31/05 | | | 12/31/04 | |
Increase (Decrease) in Net Assets | | | | | | | | | | | | | | | | |
Operations: | | | | | | | | | | | | | | | | |
Net investment income | | $ | 6,710,228 | | | $ | 4,442,425 | | | $ | 26,617,634 | | | $ | 22,567,484 | |
Net realized gain on investment securities and futures transactions | | | 8,806,341 | | | | 2,765,368 | | | | 67,104,253 | | | | 20,647,833 | |
Net change in unrealized appreciation (depreciation) on investment securities and futures transactions | | | (6,564,844 | ) | | | 5,788,623 | | | | (18,769,800 | ) | | | 74,730,812 | |
| | | | | | | | | | | | | | | | |
Net increase in net assets resulting from operations | | | 8,951,725 | | | | 12,996,416 | | | | 74,952,087 | | | | 117,946,129 | |
| | | | | | | | | | | | | | | | |
Dividends and Distributions to Shareholders: | | | | | | | | | | | | | | | | |
Dividends from net investment income | | | | | | | | | | | | | | | | |
GS4 shares | | | (6,681,233 | ) | | | (6,071,685 | ) | | | (31,655,255 | ) | | | (25,716,823 | ) |
GS6 shares | | | (368,835 | ) | | | (501,693 | ) | | | (472,113 | ) | | | (502,343 | ) |
GS8 shares | | | (145,933 | ) | | | (67,733 | ) | | | (178,317 | ) | | | (83,573 | ) |
Distributions from net realized capital gains | | | | | | | | | | | | | | | | |
GS4 shares | | | (7,416,359 | ) | | | (2,610,188 | ) | | | (50,654,356 | ) | | | (17,361,990 | ) |
GS6 shares | | | (453,084 | ) | | | (158,099 | ) | | | (813,928 | ) | | | (257,791 | ) |
GS8 shares | | | (197,762 | ) | | | (67,996 | ) | | | (339,052 | ) | | | (101,694 | ) |
| | | | | | | | | | | | | | | | |
Total dividends and distributions | | | (15,263,206 | ) | | | (9,477,394 | ) | | | (84,113,021 | ) | | | (44,024,214 | ) |
| | | | | | | | | | | | | | | | |
Capital Share Transactions: | | | | | | | | | | | | | | | | |
Proceeds from shares sold | | | | | | | | | | | | | | | | |
GS4 shares | | | 51,005,980 | | | | 48,024,107 | | | | 111,946,233 | | | | 153,845,536 | |
GS6 shares | | | — | | | | 15,945,619 | | | | — | | | | 19,362,637 | |
GS8 shares | | | 80,457 | | | | 5,135,729 | | | | 375,343 | | | | 5,185,267 | |
Reinvestment of dividends and distributions | | | | | | | | | | | | | | | | |
GS4 shares | | | 14,088,998 | | | | 8,677,858 | | | | 82,297,754 | | | | 43,069,121 | |
GS6 shares | | | 821,918 | | | | 655,380 | | | | 1,286,043 | | | | 755,405 | |
GS8 shares | | | 343,695 | | | | 135,729 | | | | 517,368 | | | | 185,267 | |
| | | | | | | | | | | | | | | | |
Total proceeds from shares sold and reinvested | | | 66,341,048 | | | | 78,574,422 | | | | 196,422,741 | | | | 222,403,233 | |
| | | | | | | | | | | | | | | | |
Value of shares redeemed | | | | | | | | | | | | | | | | |
GS4 shares | | | (50,125,060 | ) | | | (43,073,535 | ) | | | (195,957,184 | ) | | | (105,690,796 | ) |
GS6 shares | | | — | | | | (24,578,758 | ) | | | — | | | | (30,905,541 | ) |
GS8 shares | | | — | | | | (135,729 | ) | | | (93 | ) | | | (185,267 | ) |
| | | | | | | | | | | | | | | | |
Total value of shares redeemed | | | (50,125,060 | ) | | | (67,788,022 | ) | | | (195,957,277 | ) | | | (136,781,604 | ) |
| | | | | | | | | | | | | | | | |
Net increase (decrease) from capital share transactions (See Footnote 6) | | | 16,215,988 | | | | 10,786,400 | | | | 465,464 | | | | 85,621,629 | |
| | | | | | | | | | | | | | | | |
Total increase (decrease) in net assets | | | 9,904,507 | | | | 14,305,422 | | | | (8,695,470 | ) | | | 159,543,544 | |
| | | | | | | | | | | | | | | | |
Net Assets: | | | | | | | | | | | | | | | | |
Beginning of Year | | | 287,807,599 | | | | 273,502,177 | | | | 1,302,273,990 | | | | 1,142,730,446 | |
| | | | | | | | | | | | | | | | |
End of Year* | | $ | 297,712,106 | | | $ | 287,807,599 | | | $ | 1,293,578,520 | | | $ | 1,302,273,990 | |
| | | | | | | | | | | | | | | | |
* Including undistributed (distributions in excess of ) net investment income | | $ | 1,857 | | | $ | 1,869 | | | $ | 4,573 | | | $ | 170 | |
| | | | | | | | | | | | | | | | |
See Notes to Financial Statements.
24
| | | | | | | | | | | | | | |
Capital Opportunities Fund For the Year Ended | | | Global Equity Fund For the Year Ended | |
| 12/31/05 | | | 12/31/04 | | | 12/31/05 | | | 12/31/04 | |
| | | | | | | | | | | | | | |
| | | | | | | | | | | | | | |
| $ | 14,963,030 | | | $ | 12,600,561 | | | $ | 7,527,757 | | | $ | 6,566,473 | |
| | 56,530,883 | | | | 12,650,343 | | | | 61,273,033 | | | | 8,717,411 | |
| | 6,915,250 | | | | 93,256,334 | | | | 16,984,803 | | | | 111,931,107 | |
| | | | | | | | | | | | | | | |
| | 78,409,163 | | | | 118,507,238 | | | | 85,785,593 | | | | 127,214,991 | |
| | | | | | | | | | | | | | | |
| | | | | | | | | | | | | | |
| | | | | | | | | | | | | | |
| | (20,445,230 | ) | | | (13,922,864 | ) | | | (13,392,673 | ) | | | (6,887,129 | ) |
| | (179,258 | ) | | | (156,894 | ) | | | (236,192 | ) | | | (123,145 | ) |
| | (131,752 | ) | | | (50,485 | ) | | | (77,886 | ) | | | (19,437 | ) |
| | | | | | | | | | | | | | |
| | (31,761,906 | ) | | | (8,449,675 | ) | | | (30,910,635 | ) | | | (4,836,704 | ) |
| | (328,938 | ) | | | (80,682 | ) | | | (651,282 | ) | | | (93,170 | ) |
| | (264,881 | ) | | | (59,990 | ) | | | (268,175 | ) | | | (37,396 | ) |
| | | | | | | | | | | | | | | |
| | (53,111,965 | ) | | | (22,720,590 | ) | | | (45,536,843 | ) | | | (11,996,981 | ) |
| | | | | | | | | | | | | | | |
| | | | | | | | | | | | | | |
| | | | | | | | | | | | | | |
| | 50,580,207 | | | | 87,587,097 | | | | 62,443,657 | | | | 76,650,981 | |
| | — | | | | 10,493,516 | | | | — | | | | 14,911,322 | |
| | 513,587 | | | | 5,129,834 | | | | 151,657 | | | | 5,019,253 | |
| | | | | | | | | | | | | | |
| | 52,206,192 | | | | 22,372,401 | | | | 44,301,986 | | | | 11,723,725 | |
| | 508,197 | | | | 237,515 | | | | 887,475 | | | | 216,268 | |
| | 396,633 | | | | 110,475 | | | | 346,061 | | | | 56,833 | |
| | | | | | | | | | | | | | | |
| | 104,204,816 | | | | 125,930,838 | | | | 108,130,836 | | | | 108,578,382 | |
| | | | | | | | | | | | | | | |
| | | | | | | | | | | | | | |
| | (125,641,164 | ) | | | (60,847,320 | ) | | | (142,475,893 | ) | | | (65,903,638 | ) |
| | — | | | | (18,445,454 | ) | | | — | | | | (22,021,876 | ) |
| | (30 | ) | | | (129,741 | ) | | | — | | | | (19,358 | ) |
| | | | | | | | | | | | | | | |
| | (125,641,194 | ) | | | (79,422,515 | ) | | | (142,475,893 | ) | | | (87,944,872 | ) |
| | | | | | | | | | | | | | | |
| | (21,436,378 | ) | | | 46,508,323 | | | | (34,345,057 | ) | | | 20,633,510 | |
| | | | | | | | | | | | | | | |
| | 3,860,820 | | | | 142,294,971 | | | | 5,903,693 | | | | 135,851,520 | |
| | | | | | | | | | | | | | | |
| | | | | | | | | | | | | | |
| | 1,055,901,481 | | | | 913,606,510 | | | | 955,231,780 | | | | 819,380,260 | |
| | | | | | | | | | | | | | | |
| $ | 1,059,762,301 | | | $ | 1,055,901,481 | | | $ | 961,135,473 | | | $ | 955,231,780 | |
| | | | | | | | | | | | | | | |
| $ | 3,668 | | | $ | (100,590 | ) | | $ | 3,258 | | | $ | 4,528 | |
| | | | | | | | | | | | | | | |
See Notes to Financial Statements.
25
FINANCIAL HIGHLIGHTS
For a Share Outstanding Throughout the Year Ending December 31, unless otherwise indicated
| | | | | | | | | | | | | | | | | | | | | | | | | | | | | | | | | | | | | | | | | | | | | | | | | |
| | | | | | | | | | | | | | | | | | | | | | | | | | | | | Ratios to Average Net Assets | | | | |
| | | Net Asset
Value,
Beginning
of Year | | Net Investment
Income (1) | | | Capital Gain
Distributions
Received
from
Affiliated
Funds | | Realized
and
Unrealized
Gain (Loss)
on
Investments | | | Dividends
from Net
Investment
Income (2) | | | Distributions
from Net
Realized
Capital
Gains | | | Net Asset
Value,
End of
Year | | Total
Return (3) | | | Net Assets, End
of Year (000) | | Expenses,
Net (4)(5) | | | Expenses,
Including
Expense
Reduction
(4)(5) | | | Expenses,
Before
Waivers
and
Expense
Reduction
(4)(5) | | | Investment
Income,
Net (1)(4) | | | Investment
Income/
(Loss),
Excluding
Waivers
and
Expense
Reduction
(1)(4) | | | Portfolio
Turnover
Rate (3) | |
Flexible Income Fund | | | | | | | | | | | | | | | | | | | | | | | | | | | | | | | | | | | | | | | |
GS4 Class | | | | | | | | | | | | | | | | | | | | | | | | | | | | | | | | | | | | | | | | | | | | | | |
2005 | | $ | 13.18 | | $ | 0.33 | # | | $ | 0.09 | | $ | 0.02 | | | $ | (0.32 | ) | | $ | (0.36 | ) | | $ | 12.94 | | 3.31 | % | | $ | 280,256 | | 0.13 | % | | 0.13 | % | | 0.19 | % | | 2.51 | % | | 2.45 | % | | 20 | % |
2004 | | | 13.00 | | | 0.21 | # | | | 0.04 | | | 0.37 | | | | (0.31 | ) | | | (0.13 | ) | | | 13.18 | | 4.76 | | | | 270,913 | | 0.13 | | | 0.13 | | | 0.17 | | | 1.60 | | | 1.56 | | | 11 | |
2003 | | | 12.40 | | | 0.31 | | | | 0.02 | | | 0.82 | | | | (0.22 | ) | | | (0.33 | ) | | | 13.00 | | 9.33 | | | | 253,828 | | 0.13 | | | 0.13 | | | 0.20 | | | 2.01 | | | 1.94 | | | 13 | |
2002 | | | 13.15 | | | 0.38 | | | | 0.10 | | | (0.62 | ) | | | (0.44 | ) | | | (0.17 | ) | | | 12.40 | | (1.10 | ) | | | 263,646 | | 0.13 | | | 0.13 | | | 0.17 | | | 2.86 | | | 2.82 | | | 14 | |
2001(6) | | | 13.29 | | | 0.17 | | | | 0.06 | | | (0.12 | ) | | | (0.22 | ) | | | (0.03 | ) | | | 13.15 | | 0.79 | | | | 286,628 | | 0.13 | | | 0.13 | | | 0.18 | | | 3.67 | | | 3.62 | | | 4 | |
GS6 Class | | | | | | | | | | | | | | | | | | | | | | | | | | | | | | | | | | | | | | | | | | | | | | |
2005 | | $ | 9.42 | | $ | 0.20 | # | | $ | 0.09 | | $ | (0.02 | ) | | $ | (0.28 | ) | | $ | (0.36 | ) | | $ | 9.05 | | 2.90 | % | | $ | 12,161 | | 0.50 | % | | 0.50 | % | | 0.56 | % | | 2.10 | % | | 2.04 | % | | 20 | % |
2004 | | | 9.41 | | | 0.11 | # | | | 0.04 | | | 0.27 | | | | (0.28 | ) | | | (0.13 | ) | | | 9.42 | | 4.52 | | | | 11,815 | | 0.36 | | | 0.36 | | | 0.45 | | | 1.14 | | | 1.05 | | | 11 | |
2003 | | | 9.12 | | | 0.21 | | | | 0.02 | | | 0.59 | | | | (0.20 | ) | | | (0.33 | ) | | | 9.41 | | 9.06 | | | | 19,674 | | 0.35 | | | 0.35 | | | 0.46 | | | 1.90 | | | 1.79 | | | 13 | |
2002 | | | 9.83 | | | 0.23 | | | | 0.10 | | | (0.45 | ) | | | (0.42 | ) | | | (0.17 | ) | | | 9.12 | | (1.27 | ) | | | 16,234 | | 0.32 | | | 0.32 | | | 0.43 | | | 2.82 | | | 2.71 | | | 14 | |
2001(6) | | | 10.00 | | | 0.10 | | | | 0.06 | | | (0.08 | ) | | | (0.22 | ) | | | (0.03 | ) | | | 9.83 | | 0.72 | | | | 325 | | 0.48 | | | 0.48 | | | 66.47 | | | 6.69 | | | (59.30 | ) | | 4 | |
GS8 Class | | | | | | | | | | | | | | | | | | | | | | | | | | | | | | | | | | | | | | | | | | | | | | |
2005 | | $ | 9.42 | | $ | 0.17 | # | | $ | 0.09 | | $ | (0.01 | ) | | $ | (0.26 | ) | | $ | (0.36 | ) | | $ | 9.05 | | 2.61 | % | | $ | 5,295 | | 0.80 | % | | 0.80 | % | | 0.97 | % | | 1.81 | % | | 1.64 | % | | 20 | % |
2004(7) | | | 9.53 | | | 0.06 | # | | | 0.04 | | | 0.05 | | | | (0.13 | ) | | | (0.13 | ) | | | 9.42 | | 1.56 | | | | 5,080 | | 0.45 | | | 0.45 | | | 1.03 | | | 4.43 | | | 3.85 | | | 11 | |
Growth & Income Fund | | | | | | | | | | | | | | | | | | | | | | | | | | | | | | | | | | | | | | | | | | | |
GS4 Class | | | | | | | | | | | | | | | | | | | | | | | | | | | | | | | | | | | | | | | | | | | | | | |
2005 | | $ | 14.27 | | $ | 0.32 | # | | $ | 0.21 | | $ | 0.36 | | | $ | (0.36 | ) | | $ | (0.60 | ) | | $ | 14.20 | | 6.24 | % | | $ | 1,273,855 | | 0.13 | % | | 0.13 | % | | 0.14 | % | | 2.18 | % | | 2.17 | % | | 10 | % |
2004 | | | 13.41 | | | 0.26 | # | | | 0.11 | | | 0.99 | | | | (0.30 | ) | | | (0.20 | ) | | | 14.27 | | 10.13 | | | | 1,283,982 | | 0.13 | | | 0.13 | | | 0.13 | | | 1.90 | | | 1.90 | | | 6 | |
2003 | | | 11.82 | | | 0.29 | | | | 0.15 | | | 1.78 | | | | (0.36 | ) | | | (0.27 | ) | | | 13.41 | | 18.79 | | | | 1,120,080 | | 0.13 | | | 0.13 | | | 0.13 | | | 2.22 | | | 2.22 | | | 10 | |
2002 | | | 13.44 | | | 0.36 | | | | 0.12 | | | (1.33 | ) | | | (0.42 | ) | | | (0.35 | ) | | | 11.82 | | (6.37 | ) | | | 1,019,700 | | 0.13 | | | 0.13 | | | 0.13 | | | 2.68 | | | 2.68 | | | 12 | |
2001(6) | | | 13.74 | | | 0.14 | | | | 0.06 | | | (0.27 | ) | | | (0.19 | ) | | | (0.04 | ) | | | 13.44 | | (0.47 | ) | | | 1,156,044 | | 0.13 | | | 0.13 | | | 0.17 | | | 2.87 | | | 2.83 | | | 4 | |
GS6 Class | | | | | | | | | | | | | | | | | | | | | | | | | | | | | | | | | | | | | | | | | | | | | | |
2005 | | $ | 9.71 | | $ | 0.18 | # | | $ | 0.21 | | $ | 0.19 | | | $ | (0.33 | ) | | $ | (0.60 | ) | | $ | 9.36 | | 5.96 | % | | $ | 13,888 | | 0.48 | % | | 0.48 | % | | 0.48 | % | | 1.82 | % | | 1.82 | % | | 10 | % |
2004 | | | 9.28 | | | 0.12 | # | | | 0.11 | | | 0.66 | | | | (0.26 | ) | | | (0.20 | ) | | | 9.71 | | 9.66 | | | | 13,118 | | 0.46 | | | 0.46 | | | 0.52 | | | 1.28 | | | 1.22 | | | 6 | |
2003 | | | 8.34 | | | 0.16 | | | | 0.15 | | | 1.23 | | | | (0.33 | ) | | | (0.27 | ) | | | 9.28 | | 18.52 | | | | 22,650 | | 0.45 | | | 0.45 | | | 0.54 | | | 2.00 | | | 1.91 | | | 10 | |
2002 | | | 9.72 | | | 0.21 | | | | 0.12 | | | (0.96 | ) | | | (0.40 | ) | | | (0.35 | ) | | | 8.34 | | (6.59 | ) | | | 17,009 | | 0.37 | | | 0.37 | | | 0.45 | | | 2.64 | | | 2.56 | | | 12 | |
2001(6) | | | 10.00 | | | 0.07 | | | | 0.06 | | | (0.18 | ) | | | (0.19 | ) | | | (0.04 | ) | | | 9.72 | | (0.52 | ) | | | 1,334 | | 0.48 | | | 0.48 | | | 6.53 | | | 4.44 | | | (1.61 | ) | | 4 | |
GS8 Class | | | | | | | | | | | | | | | | | | | | | | | | | | | | | | | | | | | | | | | | | | | | | | |
2005 | | $ | 9.72 | | $ | 0.14 | # | | $ | 0.21 | | $ | 0.17 | | | $ | (0.29 | ) | | $ | (0.60 | ) | | $ | 9.35 | | 5.39 | % | | $ | 5,836 | | 0.90 | % | | 0.90 | % | | 0.92 | % | | 1.44 | % | | 1.42 | % | | 10 | % |
2004(7) | | | 9.74 | | | 0.07 | # | | | 0.11 | | | 0.16 | | | | (0.16 | ) | | | (0.20 | ) | | | 9.72 | | 3.50 | | | | 5,174 | | 0.61 | | | 0.61 | | | 1.13 | | | 4.84 | | | 4.32 | | | 6 | |
| † | Amount represents less than $0.005 per share. |
| # | Calculated using the average shares outstanding method. |
| (1) | Recognition of net investment income by the Fund is affected by the timing of the declaration of dividends by the underlying investment companies in which the Fund invests. |
| (2) | Includes dividends paid from the short-term portion of capital gain distributions received from affiliated funds. |
| (5) | Does not include expenses of the investment companies in which the Fund invests. |
| (6) | Inception date was August 27, 2001. |
| (7) | Inception date was November 8, 2004. |
See Notes to Financial Statements.
26
| | | | | | | | | | | | | | | | | | | | | | | | | | | | | | | | | | | | | | | | | | | | | | | | | | |
| | | | | | | | | | | | | | | | | | | | | | | | | | | Ratios to Average Net Assets | | | | |
| | | Net Asset
Value,
Beginning
of Year | | Net Investment
Income/
(Loss) (1) | | | Capital Gain
Distributions
Received
from
Affiliated
Funds | | | Realized
and
Unrealized
Gain (Loss)
on
Investments | | | Dividends
from Net
Investment
Income (2) | | | Distributions
from Net
Realized
Capital
Gains | | | Net Asset
Value,
End of
Year | | Total
Return (3) | | | Net Assets, End of Year
(000) | | Expenses,
Net (4)(5) | | | Expenses,
Including
Expense
Reduction
(4)(5) | | | Expenses,
Before
Waivers
and
Expense
Reduction
(4)(5) | | | Investment
Income/
(Loss), Net
(1)(4) | | | Investment
Income/
(Loss),
Excluding
Waivers
and
Expense
Reduction
(1)(4) | | | Portfolio
Turnover
Rate (3) | |
Capital Opportunities Fund | | | | | | | | | | | | | | | | | | | | | | | | | | | | | | | | | | | | | | | | |
GS4 Class | | | | | | | | | | | | | | | | | | | | | | | | | | | | | | | | | | | | | | | | | | | | | | | |
2005 | | $ | 15.03 | | $ | 0.23 | # | | $ | 0.31 | | | $ | 0.68 | | | $ | (0.31 | ) | | $ | (0.49 | ) | | $ | 15.45 | | 8.09 | % | | $ | 1,046,061 | | 0.13 | % | | 0.13 | % | | 0.14 | % | | 1.50 | % | | 1.49 | % | | 5 | % |
2004 | | | 13.62 | | | 0.19 | # | | | 0.08 | | | | 1.47 | | | | (0.21 | ) | | | (0.12 | ) | | | 15.03 | | 12.80 | | | | 1,043,625 | | 0.13 | | | 0.13 | | | 0.13 | | | 1.33 | | | 1.33 | | | 3 | |
2003 | | | 11.17 | | | 0.19 | | | | 0.07 | | | | 2.56 | | | | (0.23 | ) | | | (0.14 | ) | | | 13.62 | | 25.23 | | | | 900,021 | | 0.13 | | | 0.13 | | | 0.14 | | | 1.54 | | | 1.53 | | | 8 | |
2002 | | | 13.37 | | | 0.22 | | | | 0.06 | | | | (2.05 | ) | | | (0.24 | ) | | | (0.19 | ) | | | 11.17 | | (13.25 | ) | | | 745,968 | | 0.13 | | | 0.13 | | | 0.14 | | | 1.72 | | | 1.71 | | | 10 | |
2001(6) | | | 13.71 | | | 0.08 | | | | 0.03 | | | | (0.34 | ) | | | (0.11 | ) | | | — | † | | | 13.37 | | (1.68 | ) | | | 883,648 | | 0.13 | | | 0.13 | | | 0.17 | | | 1.76 | | | 1.72 | | | 3 | |
GS6 Class | | | | | | | | | | | | | | | | | | | | | | | | | | | | | | | | | | | | | | | | | | | | | | | |
2005 | | $ | 10.57 | | $ | 0.11 | # | | $ | 0.31 | | | $ | 0.37 | | | $ | (0.26 | ) | | $ | (0.49 | ) | | $ | 10.61 | | 7.43 | % | | $ | 7,571 | | 0.62 | % | | 0.62 | % | | 0.62 | % | | 1.01 | % | | 1.01 | % | | 5 | % |
2004 | | | 9.67 | | | 0.07 | # | | | 0.08 | | | | 1.03 | | | | (0.16 | ) | | | (0.12 | ) | | | 10.57 | | 12.28 | | | | 7,042 | | 0.56 | | | 0.56 | | | 0.61 | | | 0.66 | | | 0.61 | | | 3 | |
2003 | | | 8.01 | | | 0.11 | | | | 0.07 | | | | 1.82 | | | | (0.20 | ) | | | (0.14 | ) | | | 9.67 | | 24.93 | | | | 13,585 | | 0.52 | | | 0.52 | | | 0.62 | | | 1.20 | | | 1.10 | | | 8 | |
2002 | | | 9.73 | | | 0.12 | | | | 0.06 | | | | (1.50 | ) | | | (0.21 | ) | | | (0.19 | ) | | | 8.01 | | (13.56 | ) | | | 9,859 | | 0.42 | | | 0.42 | | | 0.55 | | | 1.54 | | | 1.41 | | | 10 | |
2001(6) | | | 10.00 | | | 0.03 | | | | 0.03 | | | | (0.22 | ) | | | (0.11 | ) | | | — | † | | | 9.73 | | (1.64 | ) | | | 331 | | 0.48 | | | 0.48 | | | 43.03 | | | 3.87 | | | (38.68 | ) | | 3 | |
GS8 Class | | | | | | | | | | | | | | | | | | | | | | | | | | | | | | | | | | | | | | | | | | | | | | | |
2005 | | $ | 10.56 | | $ | 0.08 | # | | $ | 0.31 | | | $ | 0.37 | | | $ | (0.23 | ) | | $ | (0.49 | ) | | $ | 10.60 | | 7.21 | % | | $ | 6,131 | | 0.92 | % | | 0.92 | % | | 0.92 | % | | 0.76 | % | | 0.76 | % | | 5 | % |
2004(7) | | | 10.31 | | | 0.04 | # | | | 0.08 | | | | 0.35 | | | | (0.10 | ) | | | (0.12 | ) | | | 10.56 | | 4.63 | | | | 5,234 | | 1.00 | | | 1.00 | | | 1.06 | | | 2.93 | | | 2.87 | | | 3 | |
Global Equity Fund | | | | | | | | | | | | | | | | | | | | | | | | | | | | | | | | | | | | | | | | | | | | |
GS4 Class | | | | | | | | | | | | | | | | | | | | | | | | | | | | | | | | | | | | | | | | | | | | | | | |
2005 | | $ | 15.55 | | $ | 0.13 | # | | $ | 0.41 | | | $ | 0.98 | | | $ | (0.23 | ) | | $ | (0.56 | ) | | $ | 16.28 | | 9.75 | % | | $ | 940,769 | | 0.13 | % | | 0.13 | % | | 0.14 | % | | 0.85 | % | | 0.84 | % | | 4 | % |
2004 | | | 13.64 | | | 0.11 | # | | | 0.04 | | | | 1.96 | | | | (0.12 | ) | | | (0.08 | ) | | | 15.55 | | 15.47 | | | | 936,734 | | 0.13 | | | 0.13 | | | 0.13 | | | 0.77 | | | 0.77 | | | 2 | |
2003 | | | 10.40 | | | 0.10 | | | | — | | | | 3.23 | | | | (0.09 | ) | | | — | | | | 13.64 | | 31.99 | | | | 801,407 | | 0.13 | | | 0.13 | | | 0.14 | | | 0.82 | | | 0.81 | | | 4 | |
2002 | | | 13.14 | | | 0.08 | | | | — | † | | | (2.71 | ) | | | (0.08 | ) | | | (0.03 | ) | | | 10.40 | | (20.04 | ) | | | 616,043 | | 0.13 | | | 0.13 | | | 0.14 | | | 0.68 | | | 0.67 | | | 6 | |
2001(6) | | | 13.57 | | | 0.03 | | | | — | | | | (0.43 | ) | | | (0.03 | ) | | | — | † | | | 13.14 | | (2.96 | ) | | | 810,507 | | 0.13 | | | 0.13 | | | 0.17 | | | 0.61 | | | 0.57 | | | 3 | |
GS6 Class | | | | | | | | | | | | | | | | | | | | | | | | | | | | | | | | | | | | | | | | | | | | | | | |
2005 | | $ | 11.35 | | $ | 0.06 | # | | $ | 0.41 | | | $ | 0.60 | | | $ | (0.19 | ) | | $ | (0.56 | ) | | $ | 11.67 | | 9.40 | % | | $ | 14,441 | | 0.50 | % | | 0.50 | % | | 0.50 | % | | 0.48 | % | | 0.48 | % | | 4 | % |
2004 | | | 10.00 | | | 0.04 | # | | | 0.04 | | | | 1.43 | | | | (0.08 | ) | | | (0.08 | ) | | | 11.35 | | 15.17 | | | | 13,202 | | 0.44 | | | 0.44 | | | 0.50 | | | 0.37 | | | 0.31 | | | 2 | |
2003 | | | 7.65 | | | 0.05 | | | | — | | | | 2.36 | | | | (0.06 | ) | | | — | | | | 10.00 | | 31.53 | | | | 17,973 | | 0.43 | | | 0.43 | | | 0.48 | | | 0.53 | | | 0.48 | | | 4 | |
2002 | | | 9.70 | | | 0.04 | | | | — | † | | | (2.00 | ) | | | (0.06 | ) | | | (0.03 | ) | | | 7.65 | | (20.25 | ) | | | 12,805 | | 0.35 | | | 0.35 | | | 0.44 | | | 0.53 | | | 0.44 | | | 6 | |
2001(6) | | | 10.00 | | | 0.02 | | | | — | | | | (0.29 | ) | | | (0.03 | ) | | | — | † | | | 9.70 | | (2.75 | ) | | | 207 | | 0.48 | | | 0.48 | | | 66.34 | | | 1.57 | | | (64.29 | ) | | 3 | |
GS8 Class | | | | | | | | | | | | | | | | | | | | | | | | | | | | | | | | | | | | | | | | | | | | | | | |
2005 | | $ | 11.35 | | $ | 0.01 | # | | $ | 0.41 | | | $ | 0.61 | | | $ | (0.16 | ) | | $ | (0.56 | ) | | $ | 11.66 | | 8.97 | % | | $ | 5,926 | | 0.87 | % | | 0.87 | % | | 0.92 | % | | 0.13 | % | | 0.08 | % | | 4 | % |
2004(7) | | | 10.83 | | | 0.03 | # | | | 0.04 | | | | 0.57 | | | | (0.04 | ) | | | (0.08 | ) | | | 11.35 | | 5.94 | | | | 5,296 | | 0.87 | | | 0.87 | | | 1.04 | | | 1.64 | | | 1.47 | | | 2 | |
See Notes to Financial Statements.
27
Flexible Income Fund I
Utilizing investments in the underlying Select Funds, the Fund’s actual asset allocation at quarter-end was 18% U.S. Equity, 6% Non-U.S. Equity, and 76% Fixed Income. The Fund outperformed its composite benchmark for the quarter.
The Fund was positively impacted by its exposure to the GuideStone Funds Growth Equity Fund (+5.48%) and the GuideStone Funds International Equity Fund (+5.83%). The largest component of the Fund, the GuideStone Funds Low-Duration Bond Fund (+0.50%), lagged its underlying benchmark (Merrill Lynch 1-3 Year Treasury Index) while still generating an overall positive return. That fund’s benchmark-relative performance was negatively impacted by its underweight to the Treasury sector given many spread sectors (such as corporate bonds and mortgages) underperformed Treasuries on a duration equivalent basis. During the quarter, certain sub-advisers maintained longer-than-benchmark duration positions which also negatively impacted relative performance as short-term rates increased.
| * | Percentages in parentheses are the fourth quarter performances for the respective underlying Select Funds. |
28
Flexible Income Fund I
Average Annual Total Returns as of 12/31/05
| | | | | | |
| | | GS2 Class* | | | Benchmark** | |
One Year | | 3.46 | % | | 3.43 | % |
Since Inception | | 5.07 | % | | 5.01 | % |
Inception Date | | 07/01/03 | | | 07/01/03 | |
The performance data quoted represents past performance and does not guarantee future results. Current performance may be lower or higher. Performance data current to the most recent month-end may be obtained at www.GuideStone.org. The investment return and principal value of an investment will fluctuate so that shares, when redeemed, may be worth more or less than their original cost.
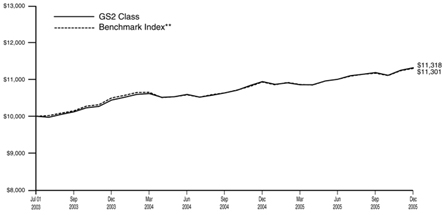
The graph compares the results of a hypothetical $10,000 investment in the GS2 Class of the Fund since July 1, 2003 (commencement of operations), with all dividends and capital gains reinvested, with the Fund’s weighted composite benchmark index.
| * | These returns reflect expense waivers by the Fund’s investment advisor. Without these waivers, returns would have been lower. Returns shown do not reflect the deduction of taxes that a shareholder would pay on Fund distributions or the redemption of Fund shares. |
| ** | Represents a weighted composite benchmark index consisting of the Russell 3000® Index, the MSCI ACWI® Ex-U.S. and the Merrill Lynch 1-3 Year Treasury Index. |
The Russell 3000® Index measures the performance of the 3,000 largest U.S. companies based on total market capitalization, which represents approximately 98% of the investable U.S. equity market.
The MSCI ACWI® Ex-U.S. is a market-capitalization weighted index composed of companies representative of the market structure of developed and emerging market countries in the Americas (excluding the U.S.), Europe/Middle East, and Asia/Pacific Regions. It excludes closed markets and those shares in otherwise free markets that are not purchasable by foreigners.
The Merrill Lynch 1-3 Year Treasury Index is composed of all U.S. Treasury Notes and Bonds with maturities greater than or equal to one year and less than three years.
Unlike a mutual fund, the performance of an index assumes no taxes, transaction costs, management fees or other expenses.
29
| | |
Flexible Income Fund I SCHEDULE OF INVESTMENTS | | December 31, 2005 |
| | | | | | |
| | | Shares | | Value |
AFFILIATED MUTUAL FUNDS — 98.9% | | | | | | |
GuideStone Funds Equity Index Fund (GS2 Class)¥ | | | 90,242 | | $ | 898,811 |
GuideStone Funds Growth Equity Fund (GS2 Class)¥ | | | 353,932 | | | 3,956,954 |
GuideStone Funds International Equity Fund (GS2 Class)¥ | | | 224,409 | | | 3,301,060 |
GuideStone Funds Low-Duration Bond Fund (GS2 Class)¥ | | | 4,407,011 | | | 39,927,522 |
GuideStone Funds Money Market Fund (GS2 Class)¥ | | | 510,924 | | | 510,924 |
GuideStone Funds Small Cap Equity Fund (GS2 Class)¥ | | | 88,301 | | | 1,006,634 |
GuideStone Funds Value Equity Fund (GS2 Class)¥ | | | 375,878 | | | 4,040,691 |
| | | | | | |
TOTAL AFFILIATED MUTUAL FUNDS
(Cost $54,172,363) | | | | | | 53,642,596 |
| | | | | | |
| | |
| | | Par | | |
U.S. TREASURY OBLIGATIONS — 1.1% | | | | | | |
U.S. Treasury Bill 3.94%, 04/06/06‡‡ | | $ | 20,000 | | | 19,794 |
U.S. Treasury Note 4.25%, 10/31/07 | | | 550,000 | | | 548,561 |
| | | | | | |
TOTAL U.S. TREASURY OBLIGATIONS
(Cost $567,974) | | | | | | 568,355 |
| | | | | | |
Total Investments — 100.0%
(Cost $54,740,337) | | | | | | 54,210,951 |
Other Assets in Excess of Liabilities — 0.0% | | | | | | 20,479 |
| | | | | | |
Net Assets — 100.0% | | | | | $ | 54,231,430 |
| | | | | | |
‡‡ All or a portion of the security was held as collateral for open futures contracts.
PORTFOLIO SUMMARY+
| | |
| | | % |
Bond Funds | | 73.6 |
Domestic Equity Funds | | 18.3 |
International Equity Funds | | 6.1 |
U.S. Treasury Obligations | | 1.1 |
Money Market Funds | | 0.9 |
Futures Contracts | | 0.2 |
| | |
| | 100.2 |
| | |
See Notes to Financial Statements.
30
Growth & Income Fund I
Utilizing investments in the underlying Select Funds, the Fund’s actual asset allocation at quarter-end was 37% U.S. Equity, 14% Non-U.S. Equity, and 49% Fixed Income. The Fund outperformed its composite benchmark for the quarter.
The Fund was positively impacted by its exposure to the GuideStone Funds Growth Equity/Fund (+5.48%) and the GuideStone Funds International Equity Fund (+5.83%). The largest component of the Fund, the GuideStone Funds Medium-Duration Bond Fund (+0.31%), lagged its underlying benchmark (Lehman Brothers Aggregate Bond Index) while still generating an overall positive return. That fund’s benchmark-relative performance was negatively impacted by its yield curve strategy (exposure to shorter maturities).
| * | Percentages in parentheses are the fourth quarter performances for the respective underlying Select Funds. |
31
Growth & Income Fund I
Average Annual Total Returns as of 12/31/05
| | | | | | |
| | | GS2 Class* | | | Benchmark** | |
One Year | | 6.42 | % | | 5.70 | % |
Since Inception | | 10.31 | % | | 9.79 | % |
Inception Date | | 07/01/03 | | | 07/01/03 | |
The performance data quoted represents past performance and does not guarantee future results. Current performance may be lower or higher. Performance data current to the most recent month-end may be obtained at www.GuideStone.org. The investment return and principal value of an investment will fluctuate so that shares, when redeemed, may be worth more or less than their original cost.
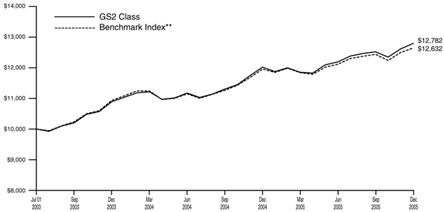
The graph compares the results of a hypothetical $10,000 investment in the GS2 Class of the Fund since July 1, 2003 (commencement of operations), with all dividends and capital gains reinvested, with the Fund’s weighted composite benchmark index.
| * | These returns reflect expense waivers by the Fund’s investment advisor. Without these waivers, returns would have been lower. Returns shown do not reflect the deduction of taxes that a shareholder would pay on Fund distributions or the redemption of Fund shares. |
| ** | Represents a weighted composite benchmark index consisting of the Russell 3000® Index, the MSCI ACWI® Ex-U.S. and the Lehman Brothers Aggregate Bond Index. |
The Russell 3000® Index measures the performance of the 3,000 largest U.S. companies based on total market capitalization, which represents approximately 98% of the investable U.S. equity market.
The MSCI ACWI® Ex-U.S. is a market-capitalization weighted index composed of companies representative of the market structure of developed and emerging market countries in the Americas (excluding the U.S.), Europe/Middle East, and Asia/Pacific Regions. It excludes closed markets and those shares in otherwise free markets that are not purchased by foreigners.
The Lehman Brothers Aggregate Bond Index represents securities that are SEC-registered, taxable, and dollar denominated. The index covers the U.S. investment grade fixed rate bond market, with index components for government and corporate securities, mortgage pass-through securities, and asset-backed securities.
Unlike a mutual fund, the performance of an index assumes no taxes, transaction costs, management fees or other expenses.
32
| | |
Growth & Income Fund I SCHEDULE OF INVESTMENTS | | December 31, 2005 |
| | | | | | |
| | | Shares | | Value |
AFFILIATED MUTUAL FUNDS — 99.1% | | | | | | |
GuideStone Funds Equity Index Fund (GS2 Class)¥ | | | 728,711 | | $ | 7,257,966 |
GuideStone Funds Extended- Duration Bond Fund (GS2 Class) ¥ | | | 2,822,627 | | | 23,822,971 |
GuideStone Funds Growth Equity Fund (GS2 Class)¥ | | | 3,153,562 | | | 35,256,817 |
GuideStone Funds International Equity Fund (GS2 Class)¥ | | | 2,223,963 | | | 32,714,499 |
GuideStone Funds Low-Duration Bond Fund (GS2 Class)¥ | | | 3,726,906 | | | 33,765,765 |
GuideStone Funds Medium-Duration Bond Fund (GS2 Class)¥ | | | 6,561,901 | | | 57,154,162 |
GuideStone Funds Money Market Fund (GS2 Class)¥ | | | 3,338,038 | | | 3,338,038 |
GuideStone Funds Small Cap Equity Fund (GS2 Class)¥ | | | 775,522 | | | 8,840,954 |
GuideStone Funds Value Equity Fund (GS2 Class)¥ | | | 3,239,955 | | | 34,829,515 |
| | | | | | |
TOTAL AFFILIATED MUTUAL FUNDS
(Cost $231,178,787) | | | | | | |
| | | | | | 236,980,687 |
| | | | | | |
| | | Par | | |
U.S. TREASURY OBLIGATIONS— 0.9% | | | | | | |
U.S. Treasury Bill | | | | | | |
3.94%, 04/06/06‡‡ | | $ | 130,000 | | | 128,662 |
U.S. Treasury Note | | | | | | |
5.00%, 02/15/11 | | | 2,070,000 | | | 2,132,667 |
| | | | | | |
TOTAL U.S. TREASURY OBLIGATIONS
(Cost $2,256,009) | | | | | | |
| | | | | | 2,261,329 |
| | | | | | |
Total Investments — 100.0%
(Cost $233,434,796) | | | | | | 239,242,016 |
Other Assets in Excess of Liabilities — 0.0% | | | | | | 1,596 |
| | | | | | |
Net Assets — 100.0% | | | | | $ | 239,243,612 |
| | | | | | |
| ‡‡ | All or a portion of the security was held as collateral for open futures contracts. |
PORTFOLIO SUMMARY+
| | |
| | | % |
Bond Funds | | 48.0 |
Domestic Equity Funds | | 36.0 |
International Equity Funds | | 13.7 |
Money Market Funds | | 1.4 |
U.S. Treasury Obligations | | 0.9 |
Futures Contracts | | 0.9 |
| | |
| | 100.9 |
| | |
See Notes to Financial Statements.
33
Capital Opportunities Fund I
Utilizing investments in the underlying Select Funds, the Fund’s actual asset allocation at quarter-end was 54% U.S. Equity, 21% Non-U.S. Equity, and 25% Fixed Income. The Fund outperformed its composite benchmark for the quarter.
Strong overall performance can be attributed to positive returns in domestic and non-U.S. equity markets. The Fund was positively impacted by its exposure to the GuideStone Funds Growth Equity Fund (+5.48%), GuideStone Funds International Equity Fund (+5.83%) and GuideStone Funds Small Cap Equity Fund (+1.86%).
| * | Percentages in parentheses are the fourth quarter performances for the respective underlying Select Funds. |
34
Capital Opportunities Fund I
Average Annual Total Returns as of 12/31/05
| | | | | | |
| | | GS2 Class* | | | Benchmark** | |
One Year | | 8.20 | % | | 7.23 | % |
Since Inception | | 13.75 | % | | 13.31 | % |
Inception Date | | 07/01/03 | | | 07/01/03 | |
The performance data quoted represents past performance and does not guarantee future results. Current performance may be lower or higher. Performance data current to the most recent month-end may be obtained at www.GuideStone.org. The investment return and principal value of an investment will fluctuate so that shares, when redeemed, may be worth more or less than their original cost.
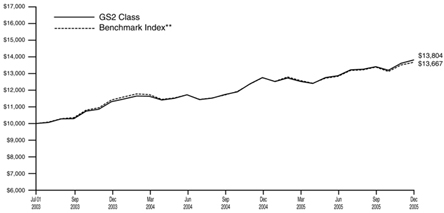
The graph compares the results of a hypothetical $10,000 investment in the GS2 Class of the Fund since July 1, 2003
(commencement of operations), with all dividends and capital gains reinvested, with the Fund’s weighted composite benchmark index.
| * | These returns reflect expense waivers by the Fund’s investment advisor. Without these waivers, returns would have been lower. Returns shown do not reflect the deduction of taxes that a shareholder would pay on Fund distributions or the redemption of Fund shares. |
| ** | Represents a weighted composite benchmark index consisting of the Russell 3000® Index, the MSCI ACWI® Ex-U.S. and the Lehman Brothers Aggregate Bond Index. |
The Russell 3000® Index measures the performance of the 3,000 largest U.S. companies based on total market capitalization, which represents approximately 98% of the investable U.S. equity market.
The MSCI ACWI® Ex-U.S. is a market-capitalization weighted index composed of companies representative of the market structure of developed and emerging market countries in the Americas (excluding the U.S.), Europe/Middle East, and Asia/ Pacific Regions. It excludes closed markets and those shares in otherwise free markets that are not purchasable by foreigners.
The Lehman Brothers Aggregate Bond Index represents securities that are SEC-registered, taxable, and dollar denominated. The index covers the U.S. investment grade fixed rate bond market, with index components for government and corporate securities, mortgage pass-through securities, and asset-backed securities.
Unlike a mutual fund, the performance of an index assumes no taxes, transaction costs, management fees or other expenses.
35
| | |
Capital Opportunities Fund I SCHEDULE OF INVESTMENTS | | December 31, 2005 |
| | | | | | | |
| | | Shares | | Value | |
AFFILIATED MUTUAL FUNDS — 99.4% | | | | | | | |
GuideStone Funds Equity Index Fund (GS2 Class)¥ | | | 614,828 | | $ | 6,123,682 | |
GuideStone Funds Extended- Duration Bond Fund (GS2 Class) ¥ | | | 950,194 | | | 8,019,636 | |
GuideStone Funds Growth Equity Fund (GS2 Class)¥ | | | 3,184,939 | | | 35,607,622 | |
GuideStone Funds International Equity Fund (GS2 Class)¥ | | | 2,183,410 | | | 32,117,966 | |
GuideStone Funds Low-Duration Bond Fund (GS2 Class)¥ | | | 1,234,326 | | | 11,182,990 | |
GuideStone Funds Medium-Duration Bond Fund (GS2 Class)¥ | | | 2,133,935 | | | 18,586,574 | |
GuideStone Funds Money Market Fund (GS2 Class)¥ | | | 3,179,849 | | | 3,179,849 | |
GuideStone Funds Small Cap Equity Fund (GS2 Class)¥ | | | 786,844 | | | 8,970,019 | |
GuideStone Funds Value Equity Fund (GS2 Class)¥ | | | 3,272,946 | | | 35,184,174 | |
| | | | | | | |
TOTAL AFFILIATED MUTUAL FUNDS
(Cost $147,008,658) | | | | | | 158,972,512 | |
| | | | | | | |
| | | Par | | | |
U.S. TREASURY OBLIGATIONS— 0.6% | | | | | | | |
U.S. Treasury Bills | | | | | | | |
3.94%, 04/06/06‡‡ | | $ | 125,000 | | | 123,713 | |
3.95%, 04/06/06‡‡ | | | 5,000 | | | 4,949 | |
| | | | | | | |
| | | | | | 128,662 | |
| | | | | | | |
U.S. Treasury Note | | | | | | | |
5.00%, 02/15/11 | | | 775,000 | | | 798,462 | |
| | | | | | | |
TOTAL U.S. TREASURY OBLIGATIONS
(Cost $923,248) | | | | | | 927,124 | |
| | | | | | | |
Total Investments — 100.0%
(Cost $147,931,906) | | | | | | 159,899,636 | |
Liabilities in Excess of Other Assets — 0.0% | | | | | | (50,812 | ) |
| | | | | | | |
Net Assets — 100.0% | | | | | $ | 159,848,824 | |
| | | | | | | |
| ‡‡ | All or a portion of the security was held as collateral for open futures contracts. |
PORTFOLIO SUMMARY+
| | |
| | | % |
Domestic Equity Funds | | 53.7 |
Bond Funds | | 23.6 |
International Equity Funds | | 20.1 |
Money Market Funds | | 2.0 |
Futures Contracts | | 1.5 |
U.S. Treasury Obligations | | 0.6 |
| | |
| | 101.5 |
| | |
See Notes to Financial Statements.
36
Global Equity Fund I
Utilizing investments in the underlying Select Funds, the Fund’s actual asset allocation at quarter-end was 72% U.S. Equity, 27% Non-U.S. Equity, and 1% Fixed Income. The Fund outperformed its composite benchmark for the quarter.
Strong overall performance can be attributed to positive returns in domestic and non-U.S. equity markets. The Fund was positively impacted by its exposure to the GuideStone Funds Growth Equity Fund (+5.48%), GuideStone Funds International Equity Fund (+5.83%) and GuideStone Funds Small Cap Equity Fund (+1.86%).
| * | Percentages in parentheses are the fourth quarter performances for the respective underlying Select Funds. |
37
Global Equity Fund I
Average Annual Total Returns as of 12/31/05
| | | | | | |
| | | GS2 Class* | | | Benchmark** | |
One year | | 9.98 | % | | 8.73 | % |
Since Inception | | 17.22 | % | | 16.86 | % |
Inception Date | | 07/01/03 | | | 07/01/03 | |
The performance data quoted represents past performance and does not guarantee future results. Current performance may be lower or higher. Performance data current to the most recent month-end may be obtained at www.GuideStone.org. The investment return and principal value of an investment will fluctuate so that shares, when redeemed, may be worth more or less than their original cost.
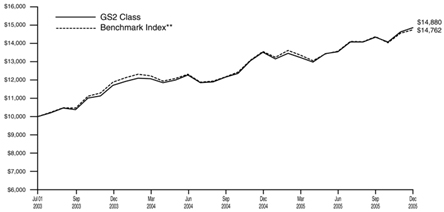
The graph compares the results of a hypothetical $10,000 investment in the GS2 Class of the Fund since July 1, 2003
(commencement of operations), with all dividends and capital gains reinvested, with the Fund’s weighted composite benchmark index.
| * | These returns reflect expense waivers by the Fund’s investment advisor. Without these waivers, returns would have been lower. Returns shown do not reflect the deduction of taxes that a shareholder would pay on Fund distributions or the redemption of Fund shares. |
| ** | Represents a weighted composite benchmark index consisting of the Russell 3000® Index and the MSCI ACWI® Ex-U.S. |
The Russell 3000® Index measures the performance of the 3,000 largest U.S. companies based on total market capitalization, which represents approximately 98% of the investable U.S. equity market.
The MSCI ACWI® Ex-U.S. is a market-capitalization weighted index composed of companies representative of the market structure of developed and emerging market countries in the Americas (excluding the U.S.), Europe/Middle East, and Asia/ Pacific Regions. It excludes closed markets and those shares in otherwise free markets that are not purchasable by foreigners.
Unlike a mutual fund, the performance of an index assumes no taxes, transaction costs, management fees or other expenses.
38
| | |
Global Equity Fund I SCHEDULE OF INVESTMENTS | | December 31, 2005 |
| | | | | | | |
| | | Shares | | Value | |
AFFILIATED MUTUAL FUNDS — 100.0% | | | | | | | |
GuideStone Funds Equity Index Fund (GS2 Class)¥ | | | 656,104 | | $ | 6,534,794 | |
GuideStone Funds Growth Equity Fund (GS2 Class)¥ | | | 3,343,098 | | | 37,375,837 | |
GuideStone Funds International Equity Fund (GS2 Class)¥ | | | 2,240,279 | | | 32,954,502 | |
GuideStone Funds Money Market Fund (GS2 Class)¥ | | | 3,062,936 | | | 3,062,936 | |
GuideStone Funds Small Cap Equity Fund (GS2 Class)¥ | | | 794,580 | | | 9,058,217 | |
GuideStone Funds Value Equity Fund (GS2 Class)¥ | | | 3,425,977 | | | 36,829,252 | |
| | | | | | | |
TOTAL AFFILIATED MUTUAL FUNDS
(Cost $115,585,054) | | | | | | 125,815,538 | |
| | | | | | | |
| | | Par | | | |
U.S. TREASURY OBLIGATION — 0.1% | | | | | | | |
U.S. Treasury Bill | | | | | | | |
3.94%, 04/06/06‡‡ | | | | | | | |
(Cost $138,545) | | $ | 140,000 | | | 138,559 | |
| | | | | | | |
Total Investments — 100.1%
(Cost $115,723,599) | | | | | | 125,954,097 | |
| | |
Liabilities in Excess of Other Assets — (0.1)% | | | | | | (128,398 | ) |
| | | | | | | |
Net Assets — 100.0% | | | | | $ | 125,825,699 | |
| | | | | | | |
| ‡‡ | All or a portion of the security was held as collateral for open futures contracts. |
PORTFOLIO SUMMARY+
| | |
| | | % |
Domestic Equity Funds | | 71.3 |
International Equity Funds | | 26.2 |
Money Market Funds | | 2.4 |
Futures Contracts | | 2.0 |
U.S. Treasury Obligations | | 0.1 |
| | |
| | 102.0 |
| | |
See Notes to Financial Statements.
39
STATEMENTS OF ASSETS AND LIABILITIES
December 31, 2005
| | | | | | | | | | | | | |
| | | Flexible
Income Fund I | | | Growth &
Income Fund I | | Capital
Opportunities Fund I | | Global Equity Fund I |
Assets | | | | | | | | | | | | | |
Investments in securities of affiliated issuers, at value | | $ | 53,642,596 | | | $ | 236,980,687 | | $ | 158,972,512 | | $ | 125,815,538 |
Investments in securities of unaffiliated issuers, at value | | | 568,355 | | | | 2,261,329 | | | 927,124 | | | 138,559 |
| | | | | | | | | | | | | |
Total investments (1) | | | 54,210,951 | | | | 239,242,016 | | | 159,899,636 | | | 125,954,097 |
Receivables: | | | | | | | | | | | | | |
Dividends | | | 1,617 | | | | 10,300 | | | 9,669 | | | 9,317 |
Interest | | | 3,990 | | | | 39,087 | | | 14,635 | | | — |
Fund shares sold | | | 31,718 | | | | 4,661 | | | — | | | — |
Receivable from advisor | | | 4,238 | | | | — | | | — | | | 1,494 |
Prepaid expenses and other assets | | | 5,655 | | | | 5,654 | | | 5,654 | | | 5,654 |
| | | | | | | | | | | | | |
Total Assets | | | 54,258,169 | | | | 239,301,718 | | | 159,929,594 | | | 125,970,562 |
| | | | | | | | | | | | | |
Liabilities | | | | | | | | | | | | | |
Payables: | | | | | | | | | | | | | |
Fund shares redeemed | | | — | | | | — | | | 32,633 | | | 100,710 |
Variation margin | | | 530 | | | | 9,010 | | | 10,335 | | | 10,600 |
Accrued expenses: | | | | | | | | | | | | | |
Advisory fees | | | — | | | | 8,295 | | | 1,737 | | | — |
Other expenses | | | 26,209 | | | | 40,801 | | | 36,065 | | | 33,553 |
| | | | | | | | | | | | | |
Total Liabilities | | | 26,739 | | | | 58,106 | | | 80,770 | | | 144,863 |
| | | | | | | | | | | | | |
Net Assets | | $ | 54,231,430 | | | $ | 239,243,612 | | $ | 159,848,824 | | $ | 125,825,699 |
| | | | | | | | | | | | | |
Net Assets Consist of: | | | | | | | | | | | | | |
Paid-in-capital | | $ | 54,204,601 | | | $ | 228,039,500 | | $ | 142,839,010 | | $ | 110,851,150 |
Undistributed net investment income | | | — | | | | — | | | 539 | | | 170 |
Undistributed net realized gain on investments | | | 557,904 | | | | 5,421,991 | | | 5,074,040 | | | 4,778,766 |
Net unrealized appreciation (depreciation) on investments and futures transactions | | | (531,075 | ) | | | 5,782,121 | | | 11,935,235 | | | 10,195,613 |
| | | | | | | | | | | | | |
Net Assets | | $ | 54,231,430 | | | $ | 239,243,612 | | $ | 159,848,824 | | $ | 125,825,699 |
| | | | | | | | | | | | | |
Net Asset Value: | | | | | | | | | | | | | |
$0.001 par value, unlimited shares authorized | | | | | | | | | | | | | |
Net assets applicable to the GS2 Class | | $ | 54,231,430 | | | $ | 239,243,612 | | $ | 159,848,824 | | $ | 125,825,699 |
| | | | | | | | | | | | | |
GS2 shares outstanding | | | 5,340,608 | | | | 21,142,745 | | | 12,663,010 | | | 8,979,167 |
| | | | | | | | | | | | | |
Net asset value, offering and redemption price per GS2 share | | $ | 10.15 | | | $ | 11.32 | | $ | 12.62 | | $ | 14.01 |
| | | | | | | | | | | | | |
__________ | | | | | | | | | | | | | |
| | | | |
(1) Investments in securities of affiliated issuers, at cost | | $ | 54,172,363 | | | $ | 231,178,787 | | $ | 147,008,658 | | $ | 115,585,054 |
Investments in securities of unaffiliated issuers, at cost | | | 567,974 | | | | 2,256,009 | | | 923,248 | | | 138,545 |
| | | | | | | | | | | | | |
Total investments at cost | | $ | 54,740,337 | | | $ | 233,434,796 | | $ | 147,931,906 | | $ | 115,723,599 |
| | | | | | | | | | | | | |
See Notes to Financial Statements.
40
STATEMENTS OF OPERATIONS
For the Year Ended December 31, 2005
| | | | | | | | | | | | | | | | |
| | | Flexible Income Fund I | | | Growth &
Income Fund I | | | Capital
Opportunities Fund I | | | Global Equity Fund I | |
Investment Income | | | | | | | | | | | | | | | | |
Income distributions received from affiliated funds | | $ | 1,896,579 | | | $ | 8,072,493 | | | $ | 3,775,010 | | | $ | 1,753,544 | |
Interest | | | 21,350 | | | | 78,486 | | | | 29,421 | | | | 5,524 | |
| | | | | | | | | | | | | | | | |
Total Investment Income | | | 1,917,929 | | | | 8,150,979 | | | | 3,804,431 | | | | 1,759,068 | |
| | | | | | | | | | | | | | | | |
Expenses | | | | | | | | | | | | | | | | |
Investment advisory fees | | | 52,581 | | | | 225,281 | | | | 148,734 | | | | 115,125 | |
Transfer agent fees | | | 7,494 | | | | 14,796 | | | | 14,746 | | | | 7,511 | |
Custodian fees | | | 8,415 | | | | 13,449 | | | | 13,452 | | | | 9,898 | |
Accounting and administration fees | | | 19,112 | | | | 70,553 | | | | 47,674 | | | | 37,661 | |
Professional fees | | | 50,680 | | | | 50,681 | | | | 50,681 | | | | 50,681 | |
Shareholder reporting fees | | | 291 | | | | 336 | | | | 313 | | | | 336 | |
Trustee fees | | | 601 | | | | 2,567 | | | | 1,693 | | | | 1,309 | |
Line of credit facility fees | | | 252 | | | | 1,089 | | | | 628 | | | | 552 | |
Other expenses | | | 16,274 | | | | 23,621 | | | | 21,137 | | | | 21,208 | |
| | | | | | | | | | | | | | | | |
Total Expenses | | | 155,700 | | | | 402,373 | | | | 299,058 | | | | 244,281 | |
Expenses waived and reimbursed (See Footnote 3c) | | | (67,274 | ) | | | (24,235 | ) | | | (49,406 | ) | | | (51,008 | ) |
Fees paid indirectly | | | (683 | ) | | | (762 | ) | | | (756 | ) | | | (785 | ) |
| | | | | | | | | | | | | | | | |
Net expenses | | | 87,743 | | | | 377,376 | | | | 248,896 | | | | 192,488 | |
| | | | | | | | | | | | | | | | |
Net Investment Income | | | 1,830,186 | | | | 7,773,603 | | | | 3,555,535 | | | | 1,566,580 | |
| | | | | | | | | | | | | | | | |
Realized and Unrealized Gain (Loss) | | | | | | | | | | | | | | | | |
Capital gain distributions received from affiliated funds | | | 617,505 | | | | 6,478,082 | | | | 5,793,971 | | | | 5,626,017 | |
Net realized gain on investment securities of affiliated issuers | | | 603,204 | | | | 2,652,998 | | | | 1,823,687 | | | | 1,388,243 | |
Net realized loss on investment securities of unaffiliated issuers | | | (11,486 | ) | | | (73,176 | ) | | | (21,794 | ) | | | — | |
Net realized gain on futures transactions | | | 4,034 | | | | 90,963 | | | | 65,469 | | | | 44,580 | |
| | | | | | | | | | | | | | | | |
Net realized gain | | | 1,213,257 | | | | 9,148,867 | | | | 7,661,333 | | | | 7,058,840 | |
| | | | | | | | | | | | | | | | |
Change in unrealized appreciation (depreciation) on investment securities of affiliated issuers | | | (1,195,925 | ) | | | (2,280,118 | ) | | | 1,290,966 | | | | 3,307,796 | |
Change in unrealized appreciation (depreciation) on investment securities of unaffiliated issuers | | | 586 | | | | 13,146 | | | | 3,396 | | | | 6 | |
Change in unrealized appreciation (depreciation) on futures transactions | | | (3,467 | ) | | | (50,515 | ) | | | (44,708 | ) | | | (36,420 | ) |
| | | | | | | | | | | | | | | | |
Net change in unrealized appreciation (depreciation) | | | (1,198,806 | ) | | | (2,317,487 | ) | | | 1,249,654 | | | | 3,271,382 | |
| | | | | | | | | | | | | | | | |
Net Realized and Unrealized Gain | | | 14,451 | | | | 6,831,380 | | | | 8,910,987 | | | | 10,330,222 | |
| | | | | | | | | | | | | | | | |
Net Increase in Net Assets Resulting from Operations | | $ | 1,844,637 | | | $ | 14,604,983 | | | $ | 12,466,522 | | | $ | 11,896,802 | |
| | | | | | | | | | | | | | | | |
See Notes to Financial Statements.
41
STATEMENTS OF CHANGES IN NET ASSETS
| | | | | | | | | | | | | | | | |
| | | Flexible Income Fund I For the Year Ended | | | Growth & Income Fund I For the Year Ended | |
| | | 12/31/05 | | | 12/31/04 | | | 12/31/05 | | | 12/31/04 | |
Increase (Decrease) in Net Assets | | | | | | | | | | | | | | | | |
Operations: | | | | | | | | | | | | | | | | |
Net investment income | | $ | 1,830,186 | | | $ | 718,522 | | | $ | 7,773,603 | | | $ | 3,305,240 | |
Net realized gain on investment securities and futures transactions | | | 1,213,257 | | | | 434,608 | | | | 9,148,867 | | | | 2,169,966 | |
Net change in unrealized appreciation (depreciation) on investment securities and futures transactions | | | (1,198,806 | ) | | | 263,876 | | | | (2,317,487 | ) | | | 4,858,804 | |
| | | | | | | | | | | | | | | | |
Net increase in net assets resulting from operations | | | 1,844,637 | | | | 1,417,006 | | | | 14,604,983 | | | | 10,334,010 | |
| | | | | | | | | | | | | | | | |
Dividends and Distributions to Shareholders: | | | | | | | | | | | | | | | | |
Dividends from net investment income | | | (1,960,531 | ) | | | (1,043,136 | ) | | | (9,389,155 | ) | | | (3,800,931 | ) |
Distributions from net realized capital gains | | | (695,374 | ) | | | (396,033 | ) | | | (3,407,754 | ) | | | (1,176,513 | ) |
| | | | | | | | | | | | | | | | |
Total dividends and distributions | | | (2,655,905 | ) | | | (1,439,169 | ) | | | (12,796,909 | ) | | | (4,977,444 | ) |
| | | | | | | | | | | | | | | | |
Capital Share Transactions: | | | | | | | | | | | | | | | | |
Proceeds from GS2 shares sold | | | 26,280,249 | | | | 6,337,762 | | | | 115,223,447 | | | | 50,049,807 | |
Reinvestment of dividends and distributions into GS2 shares | | | 2,655,905 | | | | 1,439,169 | | | | 12,765,942 | | | | 4,971,999 | |
Value of GS2 shares redeemed | | | (5,340,931 | ) | | | (4,942,846 | ) | | | (12,719,755 | ) | | | (10,194,902 | ) |
| | | | | | | | | | | | | | | | |
Net increase from capital share transactions (See Footnote 6) | | | 23,595,223 | | | | 2,834,085 | | | | 115,269,634 | | | | 44,826,904 | |
| | | | | | | | | | | | | | | | |
Total increase in net assets | | | 22,783,955 | | | | 2,811,922 | | | | 117,077,708 | | | | 50,183,470 | |
| | | | | | | | | | | | | | | | |
Net Assets: | | | | | | | | | | | | | | | | |
Beginning of Year | | | 31,447,475 | | | | 28,635,553 | | | | 122,165,904 | | | | 71,982,434 | |
| | | | | | | | | | | | | | | | |
End of Year* | | $ | 54,231,430 | | | $ | 31,447,475 | | | $ | 239,243,612 | | | $ | 122,165,904 | |
| | | | | | | | | | | | | | | | |
* Including undistributed (distributions in excess of) net investment income | | $ | — | | | $ | (147 | ) | | $ | — | | | $ | (89 | ) |
| | | | | | | | | | | | | | | | |
See Notes to Financial Statements.
42
| | | | | | | | | | | | | | |
Capital Opportunities Fund I For the Year Ended | | | Global Equity Fund I For the Year Ended | |
| 12/31/05 | | | 12/31/04 | | | 12/31/05 | | | 12/31/04 | |
| $ | 3,555,535 | | | $ | 1,329,255 | | | $ | 1,566,580 | | | $ | 368,233 | |
| | 7,661,333 | | | | 998,467 | | | | 7,058,840 | | | | 480,384 | |
| | 1,249,654 | | | | 5,534,236 | | | | 3,271,382 | | | | 3,495,260 | |
| | | | | | | | | | | | | | | |
| | 12,466,522 | | | | 7,861,958 | | | | 11,896,802 | | | | 4,343,877 | |
| | | | | | | | | | | | | | | |
| | (4,846,404 | ) | | | (1,473,261 | ) | | | (2,745,940 | ) | | | (372,357 | ) |
| | (1,893,666 | ) | | | (589,198 | ) | | | (1,346,880 | ) | | | (264,035 | ) |
| | | | | | | | | | | | | | | |
| | (6,740,070 | ) | | | (2,062,459 | ) | | | (4,092,820 | ) | | | (636,392 | ) |
| | | | | | | | | | | | | | | |
| | 85,516,600 | | | | 11,750,036 | | | | 87,397,534 | | | | 7,880,313 | |
| | 6,740,071 | | | | 2,062,459 | | | | 4,092,820 | | | | 636,392 | |
| | (8,741,940 | ) | | | (6,492,871 | ) | | | (7,011,778 | ) | | | (4,359,088 | ) |
| | | | | | | | | | | | | | | |
| | 83,514,731 | | | | 7,319,624 | | | | 84,478,576 | | | | 4,157,617 | |
| | | | | | | | | | | | | | | |
| | 89,241,183 | | | | 13,119,123 | | | | 92,282,558 | | | | 7,865,102 | |
| | | | | | | | | | | | | | | |
| | 70,607,641 | | | | 57,488,518 | | | | 33,543,141 | | | | 25,678,039 | |
| | | | | | | | | | | | | | | |
| $ | 159,848,824 | | | $ | 70,607,641 | | | $ | 125,825,699 | | | $ | 33,543,141 | |
| | | | | | | | | | | | | | | |
| $ | 539 | | | $ | 252 | | | $ | 170 | | | $ | 27 | |
| | | | | | | | | | | | | | | |
See Notes to Financial Statements.
43
FINANCIAL HIGHLIGHTS
For a Share Outstanding Throughout the Year Ending December 31, unless otherwise indicated
| | | | | | | | | | | | | | | | | | | | | | | | | | | | | | | | | | | | | | | | | | | | | | | | | |
| | | Ratios to Average Net Assets | | | | |
| | | Net Asset
Value,
Beginning
of Year | | Net Investment
Income (1) | | | Capital Gain
Distributions
Received
from
Affiliated
Funds | | Realized
and
Unrealized
Gain
(Loss) on
Investments | | | Dividends
from Net
Investment
Income (2) | | | Distributions
from Net
Realized
Capital
Gains | | | Net Asset
Value,
End of
Year | | Total Return (3) | | | Net Assets,
End of Year (000) | | Expenses,
Net (4)(5) | | | Expenses,
Including
Expense
Reduction
(4)(5) | | | Expenses,
Before
Waivers
and
Expense
Reduction
(4)(5) | | | Investment
Income,
Net (1)(4) | | | Investment
Income,
Excluding
Waivers
and
Expense
Reduction
(1)(4) | | | Portfolio
Turnover
Rate (3) | |
Flexible Income Fund I | |
GS2 Class | | | | | | | | | | | | | | | | | | | | | | | | | | | | | | | | | | | | | | | | | | | | | | | | | |
2005 | | $ | 10.31 | | $ | 0.36 | | | $ | 0.10 | | $ | (0.10 | ) | | $ | (0.38 | ) | | $ | (0.14 | ) | | $ | 10.15 | | 3.46 | % | | $ | 54,231 | | 0.17 | % | | 0.17 | % | | 0.30 | % | | 3.52 | % | | 3.39 | % | | 16 | % |
2004 | | | 10.31 | | | 0.25 | | | | 0.05 | | | 0.19 | | | | (0.36 | ) | | | (0.13 | ) | | | 10.31 | | 4.77 | | | | 31,447 | | 0.17 | | | 0.17 | | | 0.39 | | | 2.42 | | | 2.20 | | | 23 | |
2003(6) | | | 10.00 | | | 0.18 | | | | 0.10 | | | 0.16 | | | | (0.12 | ) | | | (0.01 | ) | | | 10.31 | | 4.40 | | | | 28,636 | | 0.17 | | | 0.17 | | | 0.51 | | | 4.16 | | | 3.82 | | | 8 | |
Growth & Income Fund I | |
GS2 Class | | | | | | | | | | | | | | | | | | | | | | | | | | | | | | | | | | | | | | | | | | | | | | | | | |
2005 | | $ | 11.23 | | $ | 0.40 | # | | $ | 0.25 | | $ | 0.07 | | | $ | (0.46 | ) | | $ | (0.17 | ) | | $ | 11.32 | | 6.42 | % | | $ | 239,244 | | 0.17 | % | | 0.17 | % | | 0.18 | % | | 3.49 | % | | 3.48 | % | | 11 | % |
2004 | | | 10.62 | | | 0.34 | # | | | 0.14 | | | 0.60 | | | | (0.36 | ) | | | (0.11 | ) | | | 11.23 | | 10.26 | | | | 122,166 | | 0.17 | | | 0.17 | | | 0.22 | | | 3.07 | | | 3.02 | | | 10 | |
2003(6) | | | 10.00 | | | 0.21 | | | | 0.17 | | | 0.51 | | | | (0.26 | ) | | | (0.01 | ) | | | 10.62 | | 8.94 | | | | 71,982 | | 0.17 | | | 0.17 | | | 0.28 | | | 4.76 | | | 4.65 | | | 5 | |
Capital Opportunities Fund I | |
GS2 Class | | | | | | | | | | | | | | | | | | | | | | | | | | | | | | | | | | | | | | | | | | | | | | | | | |
2005 | | $ | 12.17 | | $ | 0.29 | | | $ | 0.38 | | $ | 0.33 | | | $ | (0.39 | ) | | $ | (0.16 | ) | | $ | 12.62 | | 8.20 | % | | $ | 159,849 | | 0.17 | % | | 0.17 | % | | 0.20 | % | | 2.42 | % | | 2.39 | % | | 8 | % |
2004 | | | 11.11 | | | 0.24 | | | | 0.09 | | | 1.09 | | | | (0.26 | ) | | | (0.10 | ) | | | 12.17 | | 12.88 | | | | 70,608 | | 0.17 | | | 0.17 | | | 0.27 | | | 2.13 | | | 2.03 | | | 7 | |
2003(6) | | | 10.00 | | | 0.15 | | | | 0.09 | | | 1.07 | | | | (0.18 | ) | | | (0.02 | ) | | | 11.11 | | 13.02 | | | | 57,489 | | 0.17 | | | 0.17 | | | 0.31 | | | 3.24 | | | 3.10 | | | 3 | |
Global Equity Fund I | |
GS2 Class | | | | | | | | | | | | | | | | | | | | | | | | | | | | | | | | | | | | | | | | | | | | | | | | | |
2005 | | $ | 13.16 | | $ | 0.18 | | | $ | 0.52 | | $ | 0.62 | | | $ | (0.31 | ) | | $ | (0.16 | ) | | $ | 14.01 | | 9.98 | % | | $ | 125,826 | | 0.17 | % | | 0.17 | % | | 0.21 | % | | 1.38 | % | | 1.34 | % | | 5 | % |
2004 | | | 11.62 | | | 0.15 | | | | 0.05 | | | 1.60 | | | | (0.15 | ) | | | (0.11 | ) | | | 13.16 | | 15.48 | | | | 33,543 | | 0.17 | | | 0.17 | | | 0.41 | | | 1.29 | | | 1.05 | | | 7 | |
2003(6) | | | 10.00 | | | 0.09 | | | | — | | | 1.63 | | | | (0.09 | ) | | | (0.01 | ) | | | 11.62 | | 17.16 | | | | 25,678 | | 0.17 | | | 0.17 | | | 0.50 | | | 1.69 | | | 1.36 | | | 1 | |
| # | Calculated using the average shares outstanding method. |
| (1) | Recognition of net investment income by the Fund is affected by the timing of the declaration of dividends by the underlying investment companies in which the Fund invests. |
| (2) | Includes dividends paid from the short-term portion of capital gain distributions received from affiliated funds. |
| (5) | Does not include expenses of the investment companies in which the Fund invests. |
| (6) | Inception date was July 1, 2003. |
See Notes to Financial Statements.
44
Money Market Fund
The Fund is comprised of a broad range of high quality, short-term money market instruments. The Fund posted a positive return for the quarter and performed as expected relative to its benchmark index, the Citigroup 3-Month Treasury Bill Index. The Fund was GuideStone Funds’ top performing Fixed Income Select Fund during the quarter, reflecting the rise in short-term interest rates amidst the Fed’s persistent tightening campaign. The rise in short-term rates has benefited investors within the Fund during the quarter and throughout 2005. The average weighted maturity of the Fund was 41 days at quarter-end, an increase from 31 days at September 30, 2005. Purchases of corporate obligations and certificates of deposits with maturities of one-year contributed to the increase in the average weighted maturity. Maturities within the Fund are primarily concentrated between 15 and 60 days. Major sector holdings were commercial paper and floating rate corporate/bank notes. The Fund utilized multiple strategies that added incremental return in excess of the benchmark. One such strategy was investing in securities maturing at or near subsequent Federal Open Market Committee meetings with expectations of investing the proceeds at higher rates.
45
Money Market Fund
Average Annual Total Returns as of 12/31/05
| | | | | | | | | | | | | | | | | | |
| | | GS2 Class* | | | GS4 Class* | | | GS6 Class* | | | Benchmark** | | | GS8 Class* | | | GS8 Class Benchmark** | |
One Year | | 3.07 | % | | 2.88 | % | | 2.50 | % | | 3.00 | % | | 2.15 | % | | 3.00 | % |
Since Inception | | 1.78 | % | | 1.67 | % | | 1.37 | % | | 1.85 | % | | 1.99 | % | | 2.86 | % |
Inception Date | | 08/27/01 | | | 08/27/01 | | | 08/27/01 | | | 08/27/01 | | | 11/08/04 | | | 11/08/04 | |
7-Day Annualized Yield as of 12/31/05
| | | | | | | | | | |
GS2
Class* | | | GS4
Class* | | | GS6
Class* | | | GS8
Class* | |
| 4.13 | % | | 3.92 | % | | 3.53 | % | | 3.23 | % |
The performance data quoted represents past performance and does not guarantee future results. Current performance may be lower or higher. Performance data current to the most recent month-end may be obtained at www.GuideStone.org. Investment return will fluctuate so that shares, when redeemed, may be worth more or less than their original cost. The yield for the Money Market Fund represents annualization of the Fund’s declared dividends over the period indicated, excluding capital gains distributions. The 7-day annualized yield more closely reflects the current earnings of the Fund than the total return.
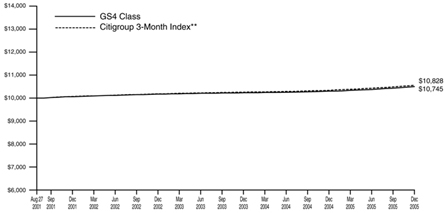
The graph compares the results of a hypothetical $10,000 investment in the GS4 Class of the Fund since August 27, 2001 (commencement of operations), with all dividends and capital gains reinvested, with the Citigroup 3-Month Index.
| * | These performance figures reflect expense waivers by the Fund’s investment advisor. Without these waivers, performance would have been lower. Performance figures shown do not reflect the deduction of taxes that a shareholder would pay on Fund distributions or the redemption of Fund shares. |
| ** | The Citigroup 3-Month Index is composed of the monthly return equivalents of yield averages that are not marked to market. The 3-Month Treasury Bill Index consists of the last three 3-month Treasury bill issues. |
Unlike a mutual fund, the performance of an index assumes no taxes, transaction costs, management fees or other expenses.
An investment in the Fund is not insured or guaranteed by the FDIC or any other governmental agency. Although the Fund seeks to maintain a value of $1.00 per share, it is possible to lose money.
46
| | |
Money Market Fund SCHEDULE OF INVESTMENTS | | December 31, 2005 |
| | | | | | |
| | | Par | | Value |
CERTIFICATES OF DEPOSIT — 17.4% | | | | | | |
Banque Nationale de Paris | | | | | | |
4.51%, 10/19/06 | | $ | 10,000,000 | | $ | 10,000,000 |
Credit Suisse First Boston NY | | | | | | |
4.30%, 01/23/06 | | | 44,000,000 | | | 44,000,000 |
First Tennessee Bank NA | | | | | | |
4.28%, 01/30/06 | | | 33,000,000 | | | 33,000,000 |
Societe Generale NY | | | | | | |
4.78%, 12/06/06 | | | 9,000,000 | | | 9,000,000 |
Washington Mutual Bank FA | | | | | | |
4.30%, 01/17/06 | | | 11,000,000 | | | 10,999,951 |
Wells Fargo Bank NA | | | | | | |
4.27%, 01/11/06 | | | 39,000,000 | | | 39,000,000 |
4.29%, 01/23/06 | | | 5,000,000 | | | 5,000,000 |
| | | | | | |
TOTAL CERTIFICATES OF DEPOSIT
(Cost $150,999,951) | | | | | | 150,999,951 |
| | | | | | |
COMMERCIAL PAPER — 54.6% | | | | | | |
Amstel Funding Corporation | | | | | | |
4.35%, 03/02/06 | | | 15,000,000 | | | 14,891,250 |
Atomium Funding LLC | | | | | | |
4.25%, 01/23/06 | | | 19,312,000 | | | 19,261,842 |
Banco Santander Puerto Rico | | | | | | |
4.31%, 01/18/06 | | | 20,000,000 | | | 19,959,294 |
Barclays US Funding Corporation | | | | | | |
4.20%, 02/03/06 | | | 30,000,000 | | | 29,884,638 |
Cancara Asset Securitization, Ltd. | | | | | | |
4.43%, 03/28/06 | | | 9,000,000 | | | 8,904,755 |
CIT Group, Inc. | | | | | | |
4.30%, 01/23/06 | | | 17,150,000 | | | 17,104,934 |
4.35%, 02/09/06 | | | 10,660,000 | | | 10,609,765 |
Citibank Credit Card Issuance Trust | | | | | | |
4.27%, 01/24/06 | | | 2,000,000 | | | 1,994,544 |
4.28%, 01/25/06 | | | 6,500,000 | | | 6,481,453 |
Citigroup Funding, Inc. | | | | | | |
4.25%, 01/23/06 | | | 8,000,000 | | | 7,979,222 |
4.24%, 01/30/06 | | | 21,000,000 | | | 20,928,273 |
4.21%, 02/01/06 | | | 15,000,000 | | | 14,945,685 |
Corporate Asset Funding Co., Inc. | | | | | | |
4.21%, 01/26/06 | | | 31,196,000 | | | 31,104,795 |
Crown Point Capital Co. LLC | | | | | | |
4.20%, 02/06/06 | | | 10,000,000 | | | 9,958,000 |
Eurohypo AG | | | | | | |
4.21%, 02/03/06 | | | 15,000,000 | | | 14,942,113 |
General Electric Capital Corporation | | | | | | |
4.23%, 01/27/06 | | | 35,000,000 | | | 34,893,075 |
Goldman Sachs Group, Inc. | | | | | | |
4.28%, 01/12/06 | | | 12,845,000 | | | 12,828,202 |
Irish Life & Permanent PLC | | | | | | |
4.40%, 03/17/06 | | | 35,000,000 | | | 34,679,167 |
4.41%, 03/21/06 | | | 9,000,000 | | | 8,912,902 |
Lockhart Funding LLC | | | | | | |
4.22%, 01/10/06 | | | 11,000,000 | | | 10,988,395 |
4.32%, 01/17/06 | | | 5,000,000 | | | 4,990,400 |
4.24%, 01/19/06 | | | 5,000,000 | | | 4,989,400 |
MBNA Credit Card Master Note Trust | | | | | | |
4.33%, 02/08/06 | | | 14,000,000 | | | 13,936,012 |
4.39%, 02/21/06 | | | 2,000,000 | | | 1,987,562 |
4.42%, 03/09/06 | | | 20,000,000 | | | 19,835,478 |
Monument Gardens Funding LLC | | | | | | |
4.25%, 01/19/06 | | $ | 32,000,000 | | $ | 31,932,000 |
Nordea North America, Inc. | | | | | | |
4.22%, 01/20/06 | | | 8,900,000 | | | 8,880,178 |
Prudential Funding LLC | | | | | | |
4.23%, 01/17/06 | | | 12,000,000 | | | 11,977,440 |
4.27%, 01/20/06 | | | 30,000,000 | | | 29,932,392 |
Stadshypotek Delaware, Inc. | | | | | | |
4.31%, 02/07/06 | | | 15,000,000 | | | 14,933,554 |
| | | | | | |
TOTAL COMMERCIAL PAPER
(Cost $474,646,720) | | | | | | 474,646,720 |
| | | | | | |
CORPORATE BONDS — 1.5% | | | | | | |
Toyota Motor Credit Corporation | | | | | | |
3.85%, 11/02/06 | | | | | | |
(Cost $12,931,225) | | | 13,000,000 | | | 12,931,225 |
| | | | | | |
MASTER NOTES — 4.3% | | | | | | |
Morgan Stanley Mortgage Capital | | | | | | |
4.42%, 12/30/06 | | | | | | |
(Cost $37,000,000) | | | 37,000,000 | | | 37,000,000 |
| | | | | | |
MUNICIPAL BONDS — 1.1% | | | | | | |
Bergen County, New Jersey | | | | | | |
Improvement Authority, | | | | | | |
Series D Revenue Bond | | | | | | |
(Wachovia Bank NA Insured) | | | | | | |
4.35%, 04/01/25† | | | | | | |
(Cost $10,000,000) | | | 10,000,000 | | | 10,000,000 |
| | | | | | |
VARIABLE RATE OBLIGATIONS — 21.2% | | | | | | |
Allstate Life Global Funding II | | | | | | |
4.37%, 01/26/07† | | | 20,000,000 | | | 20,000,000 |
Bear Stearns Cos., Inc. (The) | | | | | | |
4.42%, 01/26/07† | | | 10,000,000 | | | 10,000,000 |
Cullinan Finance Corporation | | | | | | |
4.46%, 09/15/06† | | | 25,000,000 | | | 24,997,385 |
General Electric Capital Corporation | | | | | | |
4.47%, 01/17/07† | | | 2,240,000 | | | 2,241,811 |
Lehman Brothers Holdings, Inc. | | | | | | |
4.30%, 03/30/06 | | | 25,000,000 | | | 25,000,000 |
4.30%, 04/12/06 | | | 5,000,000 | | | 5,000,000 |
Links Finance LLC | | | | | | |
4.26%, 04/05/06† | | | 3,950,000 | | | 3,949,700 |
Metropolitan Life Global Funding I | | | | | | |
4.45%, 11/28/06† | | | 10,000,000 | | | 10,000,000 |
Morgan Stanley | | | | | | |
4.33%, 04/11/06 | | | 2,000,000 | | | 2,000,000 |
National City Bank | | | | | | |
4.28%, 07/07/06† | | | 25,000,000 | | | 24,998,781 |
Racers Trust | | | | | | |
4.37%, 06/22/06† | | | 8,600,000 | | | 8,600,000 |
4.39%, 08/21/06† | | | 23,000,000 | | | 23,000,000 |
Shipley Group LP | | | | | | |
4.48%, 10/01/14† | | | 1,400,000 | | | 1,400,000 |
U.S. Bank NA | | | | | | |
4.31%, 09/29/06† | | | 15,000,000 | | | 14,997,500 |
Westpac Banking Corporation | | | | | | |
4.49%, 04/11/07† | | | 8,250,000 | | | 8,250,000 |
| | | | | | |
TOTAL VARIABLE RATE OBLIGATIONS
(Cost $184,435,177) | | | | | | 184,435,177 |
| | | | | | |
See Notes to Financial Statements.
47
Money Market Fund
SCHEDULE OF INVESTMENTS (Continued)
| | | | |
| | | Value | |
Total Investments — 100.1%
(Cost $870,013,073) | | $ | 870,013,073 | |
Liabilities in Excess of Other | | | | |
Assets — (0.1)% | | | (855,652 | ) |
| | | | |
Net Assets — 100.0% | | $ | 869,157,421 | |
| | | | |
| |
PORTFOLIO SUMMARY+ | | | | |
| | |
| | | Value |
| |
| | | % |
Commercial Paper | | 54.6 |
Variable Rate Obligations | | 21.2 |
Certificates of Deposit | | 17.4 |
Master Note | | 4.3 |
Corporate Bond | | 1.5 |
Municipal Bond | | 1.1 |
| | |
| | 100.1 |
| | |
See Notes to Financial Statements.
48
Low-Duration Bond Fund
The Fund is comprised of high quality, fixed income securities primarily with shorter maturities. The Fund posted a positive return, but slightly underperformed its benchmark index, the Merrill Lynch 1-3 Year Treasury Index, during the quarter. The Fund’s benchmark-relative performance was positively impacted by its security selection within the mortgage sector. Modest exposure to emerging market debt, non-U.S. dollar debt, and municipal bonds also benefited relative returns. The Fund’s benchmark-relative performance was negatively impacted by its underweight to the Treasury sector given most spread sectors (such as corporates and mortgages) underperformed Treasuries on a duration equivalent basis. During the period, certain sub-advisers maintained longer-than-benchmark duration positions which also negatively impacted relative performance as short-term rates increased. At the sub-adviser level, BlackRock delivered the strongest benchmark-relative performance due to its shorter-than-benchmark duration position and security selection within certain non-benchmark sectors including non-U.S. dollar debt and mortgages.
49
Low-Duration Bond Fund
Average Annual Total Returns as of 12/31/05
| | | | | | | | | | | | | | | | | | |
| | | GS2 Class* | | | GS4 Class* | | | GS6 Class* | | | Benchmark** | | | GS8 Class* | | | GS8 Class Benchmark** | |
One Year | | 1.60 | % | | 1.39 | % | | 0.96 | % | | 1.66 | % | | 0.73 | % | | 1.66 | % |
Since Inception | | 3.00 | % | | 2.95 | % | | 2.65 | % | | 2.95 | % | | 0.69 | % | | 1.48 | % |
Inception Date | | 08/27/01 | | | 08/27/01 | | | 08/27/01 | | | 08/27/01 | | | 11/08/04 | | | 11/08/04 | |
The performance data quoted represents past performance and does not guarantee future results. Current performance may be lower or higher. Performance data current to the most recent month-end may be obtained at www.GuideStone.org. The investment return and principal value of an investment will fluctuate so that shares, when redeemed, may be worth more or less than their original cost.
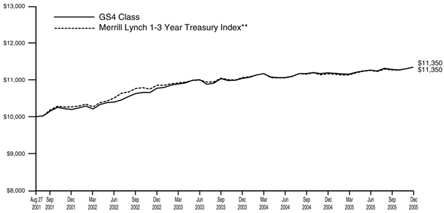
The graph compares the results of a hypothetical $10,000 investment in the GS4 Class of the Fund since August 27, 2001 (commencement of operations), with all dividends and capital gains reinvested, with the Merrill Lynch 1-3 Year Treasury Index.
| * | These returns reflect expense waivers by the Fund’s investment advisor. Without these waivers, returns would have been lower. Returns shown do not reflect the deduction of taxes that a shareholder would pay on Fund distributions or the redemption of Fund shares. |
| ** | The Merrill Lynch 1-3 Year Treasury Index is composed of all U.S. Treasury Notes and Bonds with maturities greater than or equal to one year and less than three years. |
Unlike a mutual fund, the performance of an index assumes no taxes, transaction costs, management fees or other expenses.
50
| | |
| Low-Duration Bond Fund | | |
| SCHEDULE OF INVESTMENTS | | December 31, 2005 |
| | | | | | |
| | | Par | | Value |
AGENCY OBLIGATIONS — 11.3% | | | | | | |
Federal Home Loan Bank | | | | | | |
4.04%, 01/11/06 | | $ | 9,000,000 | | $ | 8,987,892 |
4.38%, 10/03/08 | | | 3,500,000 | | | 3,451,787 |
Federal Home Loan Mortgage Corporation | | | | | | |
3.75%, 01/10/06 | | | 3,400,000 | | | 3,396,208 |
5.25%, 01/15/06D | | | 9,575,000 | | | 9,576,791 |
4.18%, 02/21/06 | | | 9,700,000 | | | 9,640,523 |
4.22%, 02/28/06 | | | 9,700,000 | | | 9,632,831 |
4.23%, 02/28/06 | | | 1,800,000 | | | 1,787,536 |
3.37%, 04/28/08 | | | 3,980,000 | | | 3,862,877 |
3.75%, 03/03/09 | | | 2,060,000 | | | 2,000,614 |
Federal National Mortgage Association | | | | | | |
4.20%, 02/22/06 | | | 9,700,000 | | | 9,642,412 |
4.22%, 02/22/06 | | | 1,600,000 | | | 1,590,501 |
4.24%, 03/01/06 | | | 1,700,000 | | | 1,688,601 |
4.29%, 03/08/06 | | | 9,800,000 | | | 9,726,216 |
4.32%, 03/15/06 | | | 7,600,000 | | | 7,536,525 |
4.32%, 03/22/06 | | | 4,000,000 | | | 3,963,296 |
3.99%, 03/29/06 | | | 1,900,000 | | | 1,881,002 |
2.75%, 05/10/06 | | | 3,775,000 | | | 3,750,840 |
2.77%, 12/29/06 | | | 1,505,000 | | | 1,476,483 |
2.71%, 01/30/07 | | | 7,500,000 | | | 7,341,202 |
Small Business Administration | | | | | | |
6.95%, 11/10/16 | | | 1,371,050 | | | 1,429,705 |
| | | | | | |
TOTAL AGENCY OBLIGATIONS
(Cost $102,495,342) | | | | | | 102,363,842 |
| | | | | | |
ASSET-BACKED SECURITIES — 20.9% | | | | | | |
Amresco Independence Funding, Inc. | | | | | | |
4.25%, 06/15/26 144A† | | | 886,189 | | | 882,995 |
Argent Securities, Inc. | | | | | | |
4.48%, 11/25/35† | | | 1,573,595 | | | 1,573,718 |
Bank One Issuance Trust | | | | | | |
4.42%, 10/15/08† | | | 2,925,000 | | | 2,925,218 |
4.48%, 12/15/10† | | | 3,050,000 | | | 3,058,934 |
Bayview Financial Acquisition Trust | | | | | | |
7.01%, 05/25/29 144A | | | 251,415 | | | 249,811 |
BMW Vehicle Owner Trust | | | | | | |
4.04%, 02/25/09 | | | 2,775,000 | | | 2,749,793 |
Business Loan Express | | | | | | |
6.00%, 01/01/25 144A† | | | 549,360 | | | 535,591 |
Capital Auto Receivables Asset Trust | | | | | | |
3.58%, 10/16/06‡‡ | | | 201,418 | | | 201,243 |
2.00%, 11/15/07‡‡ | | | 2,077,084 | | | 2,050,932 |
3.35%, 02/15/08 | | | 3,225,000 | | | 3,185,191 |
1.96%, 01/15/09 | | | 4,100,000 | | | 4,034,812 |
4.05%, 07/15/09 | | | 2,575,000 | | | 2,546,664 |
Capital One Multi-Asset Execution Trust | | | | | | |
2.95%, 08/17/09 | | | 3,500,000 | | | 3,449,450 |
Carrington Mortgage Loan Trust | | | | | | |
4.46%, 06/25/35† | | | 1,150,256 | | | 1,150,250 |
Chase Credit Card Master Trust | | | | | | |
5.50%, 11/17/08 | | | 3,040,000 | | | 3,051,979 |
Chase Issuance Trust | | | | | | |
3.22%, 06/15/10 | | | 6,525,000 | | | 6,349,414 |
Chase Manhattan Auto Owner Trust | | | | | | |
2.08%, 05/15/08 | | | 2,709,518 | | | 2,678,937 |
Citibank Credit Card Issuance Trust | | | | | | |
2.70%, 01/15/08 | | | 2,515,000 | | | 2,513,043 |
5.65%, 06/16/08 | | | 2,950,000 | | | 2,961,035 |
2.55%, 01/20/09 | | | 7,725,000 | | | 7,544,798 |
Citibank Credit Card Master Trust I | | | | | | |
6.10%, 05/15/08 | | | 3,125,300 | | | 3,140,359 |
Conseco Finance Securitizations Corporation | | | | | | |
4.74%, 12/15/29† | | | 200,465 | | | 200,460 |
Countrywide Asset-Backed Certificates | | | | | | |
4.34%, 03/25/25† | | | 2,406,422 | | | 2,407,281 |
4.46%, 02/01/27† | | | 3,750,000 | | | 3,750,000 |
4.50%, 11/25/28† | | | 3,228,066 | | | 3,228,058 |
4.48%, 01/25/35† | | | 2,725,000 | | | 2,724,883 |
4.46%, 07/25/35† | | | 1,260,691 | | | 1,260,756 |
4.47%, 08/25/35† | | | 613,343 | | | 613,417 |
CS First Boston Mortgage Securities Corporation | | | | | | |
4.71%, 05/25/43 STEP 144A† | | | 34,684 | | | 34,684 |
Daimler Chrysler Auto Trust | | | | | | |
3.09%, 01/08/08 | | | 2,762,664 | | | 2,740,776 |
3.28%, 12/08/09 | | | 4,300,000 | | | 4,177,880 |
Encore Credit Receivables Trust | | | | | | |
4.29%, 01/01/36† | | | 2,137,783 | | | 2,137,779 |
Equity One ABS, Inc. | | | | | | |
4.54%, 07/25/34† | | | 118,265 | | | 118,244 |
Fannie Mae Grantor Trust | | | | | | |
4.42%, 07/25/35 STEP† | | | 1,096,391 | | | 1,096,530 |
FHLMC Structured Pass-Through Securities | | | | | | |
4.51%, 08/25/31† | | | 2,939,927 | | | 2,954,100 |
Fieldstone Mortgage Investment Corporation | | | | | | |
4.50%, 02/25/36 STEP† | | | 2,477,769 | | | 2,477,982 |
First Franklin Mortgage Loan Asset-Backed Certificates | | | | | | |
4.49%, 03/25/25† | | | 1,970,150 | | | 1,970,362 |
Ford Credit Auto Owner Trust | | | | | | |
3.08%, 07/15/07 | | | 1,176,007 | | | 1,172,950 |
4.24%, 03/15/08 | | | 2,825,000 | | | 2,817,245 |
Green Tree Financial Corporation | | | | | | |
6.04%, 11/01/29 | | | 45,767 | | | 45,302 |
GSAA Trust | | | | | | |
4.51%, 12/25/34† | | | 1,851,905 | | | 1,852,662 |
GSAMP Trust | | | | | | |
4.49%, 09/25/35† | | | 1,515,556 | | | 1,515,556 |
Home Equity Asset Trust | | | | | | |
4.49%, 02/25/36† | | | 1,636,588 | | | 1,636,868 |
Home Equity Mortgage Trust | | | | | | |
4.50%, 07/25/35 STEP† | | | 689,007 | | | 689,056 |
Honda Auto Receivables Owner Trust | | | | | | |
2.30%, 10/18/07 | | | 1,807,391 | | | 1,790,468 |
3.30%, 06/15/08 | | | 2,980,000 | | | 2,948,087 |
2.91%, 10/20/08 | | | 2,700,000 | | | 2,647,074 |
3.53%, 10/21/08 | | | 2,875,000 | | | 2,835,714 |
2.79%, 03/16/09 | | | 4,700,000 | | | 4,596,519 |
See Notes to Financial Statements.
51
Low-Duration Bond Fund
SCHEDULE OF INVESTMENTS (Continued)
| | | | | | |
| | | Par | | Value |
4.46%, 05/20/09 | | $ | 2,425,000 | | $ | 2,407,279 |
JP Morgan Mortgage Acquisition Corporation | | | | | | |
4.45%, 05/25/25† | | | 2,450,000 | | | 2,450,000 |
Master Asset-Backed Securities Trust | | | | | | |
4.51%, 12/25/34† | | | 370,330 | | | 370,351 |
MBNA Credit Card Master Note Trust | | | | | | |
5.75%, 10/15/08 | | | 3,225,000 | | | 3,237,276 |
MBNA Master Credit Card Trust USA | | | | | | |
4.55%, 12/15/08† | | | 5,610,000 | | | 5,615,904 |
Morgan Stanley ABS Capital I | | | | | | |
4.48%, 05/25/32 STEP† | | | 2,549,082 | | | 2,549,299 |
New Century Home Equity Loan Trust | | | | | | |
4.49%, 03/25/35 STEP† | | | 2,432,215 | | | 2,432,070 |
4.46%, 01/25/36 STEP† | | | 2,813,333 | | | 2,808,938 |
Nissan Auto Receivables Owner Trust | | | | | | |
2.01%, 11/15/07 | | | 2,429,542 | | | 2,403,147 |
2.70%, 12/17/07 | | | 3,175,000 | | | 3,142,393 |
Option One Mortgage Loan Trust | | | | | | |
4.48%, 11/25/35 STEP† | | | 3,024,573 | | | 3,024,799 |
Ownit Mortgage Loan Asset-Backed Certificates | | | | | | |
4.31%, 08/25/36† | | | 2,984,127 | | | 2,984,109 |
Park Place Securities, Inc. | | | | | | |
4.49%, 08/25/35† | | | 2,770,593 | | | 2,770,593 |
PBG Equipment Trust | | | | | | |
6.27%, 01/20/12 144A | | | 455,504 | | | 455,914 |
People’s Choice Home Loan Securities Trust | | | | | | |
4.50%, 08/25/35 STEP† | | | 2,452,418 | | | 2,452,608 |
Quest Trust | | | | | | |
4.94%, 06/25/34 144A† | | | 449,647 | | | 450,538 |
Residential Asset Mortgage Products, Inc. | | | | | | |
4.49%, 05/25/25 STEP† | | | 2,275,021 | | | 2,275,362 |
SG Mortgage Securities Trust | | | | | | |
4.48%, 09/25/35† | | | 1,623,636 | | | 1,623,627 |
SLM Student Loan Trust | | | | | | |
4.26%, 01/25/13† | | | 1,700,000 | | | 1,697,817 |
4.23%, 04/25/14† | | | 1,055,178 | | | 1,055,667 |
Specialty Underwriting & Residential Finance | | | | | | |
4.31%, 06/25/36† | | | 2,931,662 | | | 2,931,877 |
Structured Asset Securities Corporation | | | | | | |
4.90%, 04/25/35† | | | 2,541,078 | | | 2,487,753 |
SVO Timeshare Mortgage Corporation | | | | | | |
5.47%, 10/20/13 144A | | | 1,295,746 | | | 1,295,226 |
TMS SBA Loan Trust | | | | | | |
5.11%, 04/15/24† | | | 323,010 | | | 313,371 |
5.00%, 01/15/25† | | | 396,479 | | | 385,643 |
5.48%, 01/25/25† | | | 237,887 | | | 237,566 |
USAA Auto Owner Trust | | | | | | |
3.55%, 09/17/07 | | | 1,509,002 | | | 1,504,573 |
2.06%, 04/15/08 | | | 1,929,410 | | | 1,907,227 |
3.03%, 06/16/08 | | | 3,000,000 | | | 2,971,861 |
3.16%, 02/17/09 | | | 3,325,000 | | | 3,277,755 |
3.90%, 07/15/09 | | | 1,700,000 | | | 1,680,519 |
4.00%, 12/15/09 | | | 4,175,000 | | | 4,125,558 |
2.04%, 02/16/10 | | | 4,100,000 | | | 4,040,783 |
Whole Auto Loan Trust | | | | | | |
3.26%, 03/15/11 | | | 4,000,000 | | | 3,891,478 |
| | | | | | |
TOTAL ASSET-BACKED SECURITIES
(Cost $192,009,047) | | | | | | 190,533,741 |
| | | | | | |
CORPORATE BONDS — 12.0% | | | | | | |
AIG SunAmerica Global Financing IX | | | | | | |
5.10%, 01/17/07 144A | | | 1,680,000 | | | 1,683,560 |
ASIF Global Financing XXIII | | | | | | |
3.90%, 10/22/08 144A | | | 420,000 | | | 408,908 |
AT&T Wireless Services, Inc. | | | | | | |
7.50%, 05/01/07 | | | 2,090,000 | | | 2,161,119 |
Bank One Corporation | | | | | | |
2.63%, 06/30/08 | | | 360,000 | | | 341,328 |
6.00%, 08/01/08 | | | 550,000 | | | 564,725 |
Bayerische Landesbank NY | | | | | | |
2.50%, 04/28/06 | | | 2,475,000 | | | 2,458,376 |
BellSouth Corporation | | | | | | |
4.26%, 04/26/06 144A† | | | 1,075,000 | | | 1,073,796 |
Citigroup, Inc. | | | | | | |
3.50%, 02/01/08 | | | 1,600,000 | | | 1,558,461 |
Clorox Co. | | | | | | |
4.61%, 12/14/07† | | | 1,500,000 | | | 1,503,529 |
Countrywide Home Loans, Inc. | | | | | | |
3.25%, 05/21/08 | | | 1,800,000 | | | 1,729,463 |
Credit Suisse First Boston USA, Inc. | | | | | | |
4.63%, 01/15/08D | | | 2,160,000 | | | 2,150,721 |
CSX Corporation | | | | | | |
6.25%, 10/15/08 | | | 1,710,000 | | | 1,764,980 |
DaimlerChrysler NA Holding Corporation | | | | | | |
6.40%, 05/15/06 | | | 1,700,000 | | | 1,708,583 |
4.99%, 05/24/06† | | | 4,600,000 | | | 4,606,440 |
5.30%, 08/08/06† | | | 400,000 | | | 401,795 |
4.70%, 03/07/07† | | | 3,100,000 | | | 3,097,889 |
4.75%, 01/15/08 | | | 850,000 | | | 842,647 |
4.05%, 06/04/08 | | | 1,130,000 | | | 1,100,672 |
Dominion Resources, Inc. | | | | | | |
4.82%, 09/28/07† | | | 3,500,000 | | | 3,503,283 |
Federated Department Stores, Inc. | | | | | | |
6.63%, 09/01/08 | | | 150,000 | | | 155,548 |
Fred Meyer, Inc. Holding Co. | | | | | | |
7.45%, 03/01/08 | | | 1,440,000 | | | 1,501,197 |
Gannett Co., Inc. | | | | | | |
4.13%, 06/15/08 | | | 2,390,000 | | | 2,329,758 |
General Electric Capital Corporation | | | | | | |
1.40%, 11/02/06(J) | | | 405,000,000 | | | 3,471,757 |
8.75%, 05/21/07 | | | 610,000 | | | 642,100 |
3.45%, 07/16/07D | | | 1,300,000 | | | 1,275,586 |
3.45%, 01/15/08† | | | 5,275,000 | | | 5,237,400 |
4.25%, 01/15/08 | | | 1,940,000 | | | 1,918,363 |
4.48%, 03/04/08† | | | 2,900,000 | | | 2,902,813 |
9.83%, 12/15/08 | | | 350,000 | | | 395,900 |
Golden West Financial Corporation | | | | | | |
4.13%, 08/15/07 | | | 310,000 | | | 306,932 |
HSBC Bank USA NA | | | | | | |
4.57%, 09/21/07† | | | 1,400,000 | | | 1,403,063 |
See Notes to Financial Statements.
52
| | | | | | |
| | | Par | | Value |
HSBC Finance Corporation | | | | | | |
5.75%, 01/30/07 | | $ | 2,280,000 | | $ | 2,299,391 |
4.13%, 12/15/08D | | | 700,000 | | | 683,986 |
John Deere Capital Corporation | | | | | | |
3.90%, 01/15/08 | | | 1,970,000 | | | 1,932,349 |
Kellogg Co. | | | | | | |
2.88%, 06/01/08 | | | 1,950,000 | | | 1,858,956 |
Lenfest Communications, Inc. | | | | | | |
7.63%, 02/15/08 | | | 725,000 | | | 759,488 |
May Department Stores Co. (The) | | | | | | |
3.95%, 07/15/07D | | | 945,000 | | | 929,579 |
MCI, Inc. | | | | | | |
6.91%, 05/01/07D | | | 237,000 | | | 239,370 |
8.74%, 05/01/14D | | | 203,000 | | | 225,076 |
Merck & Co., Inc. | | | | | | |
5.25%, 07/01/06 | | | 300,000 | | | 300,432 |
4.73%, 02/22/11 144A† | | | 1,300,000 | | | 1,299,805 |
Merrill Lynch & Co., Inc. | | | | | | |
4.83%, 10/27/08D | | | 1,720,000 | | | 1,717,626 |
Morgan Stanley Warehouse Facility | | | | | | |
4.64%, 09/29/06†@ | | | 9,900,000 | | | 9,900,000 |
Motorola, Inc. | | | | | | |
4.61%, 11/16/07 | | | 1,489,000 | | | 1,480,355 |
National Rural Utilities Cooperative Finance Corporation | | | | | | |
6.00%, 05/15/06 | | | 2,340,000 | | | 2,351,024 |
Northrop Grumman Corporation | | | | | | |
7.00%, 03/01/06 | | | 340,000 | | | 341,242 |
4.08%, 11/16/06 | | | 450,000 | | | 446,618 |
Prudential Financial, Inc. | | | | | | |
4.10%, 11/15/06 STEP | | | 1,600,000 | | | 1,589,826 |
Prudential Insurance Co. of America | | | | | | |
6.38%, 07/23/06 144A | | | 650,000 | | | 655,314 |
PSEG Funding Trust I | | | | | | |
5.38%, 11/16/07 | | | 275,000 | | | 275,540 |
PSEG Power LLC | | | | | | |
6.88%, 04/15/06 | | | 1,500,000 | | | 1,507,873 |
SLM Corporation | | | | | | |
5.63%, 04/10/07 | | | 730,000 | | | 734,592 |
Southern California Edison Co. | | | | | | |
6.38%, 01/15/06 | | | 1,500,000 | | | 1,500,530 |
4.56%, 12/13/07†D | | | 3,500,000 | | | 3,501,670 |
Sprint Capital Corporation | | | | | | |
7.13%, 01/30/06 | | | 3,825,000 | | | 3,831,189 |
6.00%, 01/15/07 | | | 2,280,000 | | | 2,302,864 |
Time Warner, Inc. | | | | | | |
6.15%, 05/01/07D | | | 2,290,000 | | | 2,319,147 |
TXU Energy Co. LLC | | | | | | |
4.92%, 01/17/06 144A† | | | 5,100,000 | | | 5,099,847 |
U.S. Bank National Association | | | | | | |
6.50%, 02/01/08 | | | 580,000 | | | 600,026 |
U.S. Central Credit Union | | | | | | |
2.75%, 05/30/08 | | | 610,000 | | | 582,014 |
Union Pacific Corporation | | | | | | |
5.75%, 10/15/07 | | | 375,000 | | | 380,339 |
6.79%, 11/09/07 | | | 650,000 | | | 671,203 |
Verizon Global Funding Corporation | | | | | | |
6.13%, 06/15/07 | | | 875,000 | | | 890,169 |
Verizon Wireless Capital LLC | | | | | | |
5.38%, 12/15/06 | | $ | 1,070,000 | | $ | 1,073,769 |
Wachovia Corporation | | | | | | |
3.50%, 08/15/08D | | | 540,000 | | | 522,110 |
| | | | | | |
TOTAL CORPORATE BONDS
(Cost $111,158,425) | | | | | | 109,004,011 |
| | | | | | |
FOREIGN BONDS — 5.0% | | | | | | |
Bermuda — 0.0% | | | | | | |
Tyco International Group SA | | | | | | |
5.80%, 08/01/06 | | | 425,000 | | | 426,838 |
| | | | | | |
Canada — 0.1% | | | | | | |
Canadian National Railway Co. | | | | | | |
6.45%, 07/15/06† | | | 750,000 | | | 756,597 |
| | | | | | |
Cayman Islands — 0.4% | | | | | | |
Petroleum Export, Ltd. | | | | | | |
4.62%, 06/15/10 144A | | | 1,700,000 | | | 1,684,926 |
4.63%, 06/15/10 144A | | | 1,700,000 | | | 1,684,926 |
| | | | | | |
| | | | | | 3,369,852 |
| | | | | | |
France — 1.2% | | | | | | |
French Treasury Bill | | | | | | |
2.27%, 03/23/06(E)W | | | 200,000 | | | 235,547 |
2.41%, 05/24/06(E)W | | | 8,290,000 | | | 9,720,265 |
French Treasury Note | | | | | | |
5.00%, 01/12/06(E) | | | 820,000 | | | 971,296 |
| | | | | | |
| | | | | | 10,927,108 |
| | | | | | |
Germany — 0.6% | | | | | | |
Deutsche Bundesrepublik | | | | | | |
4.75%, 07/04/34(E)D | | | 450,000 | | | 642,205 |
4.00%, 01/04/37(E) | | | 1,825,000 | | | 2,331,008 |
German Treasury Bill | | | | | | |
2.04%, 02/15/06(E)W | | | 2,200,000 | | | 2,597,665 |
| | | | | | |
| | | | | | 5,570,878 |
| | | | | | |
Italy — 0.5% | | | | | | |
Republic of Italy | | | | | | |
2.75%, 12/15/06 | | | 2,375,000 | | | 2,333,200 |
Telecom Italia Capital SA | | | | | | |
4.00%, 11/15/08 | | | 2,000,000 | | | 1,940,876 |
| | | | | | |
| | | | | | 4,274,076 |
| | | | | | |
Netherlands — 1.3% | | | | | | |
Deutsche Telekom International Finance BV | | | | | | |
3.88%, 07/22/08D | | | 1,770,000 | | | 1,729,821 |
Dutch Treasury Certificate | | | | | | |
1.96%, 01/31/06(E)W | | | 9,050,000 | | | 10,695,601 |
| | | | | | |
| | | | | | 12,425,422 |
| | | | | | |
New Zealand — 0.2% | | | | | | |
General Electric Capital Corporation | | | | | | |
6.50%, 09/28/15(Z)D | | | 1,595,000 | | | 1,074,491 |
New Zealand | | | | | | |
6.50%, 04/15/13(Z) | | | 790,000 | | | 565,502 |
| | | | | | |
| | | | | | 1,639,993 |
| | | | | | |
Norway — 0.2% | | | | | | |
Eksportfinans | | | | | | |
3.38%, 01/15/08 | | | 1,630,000 | | | 1,590,267 |
| | | | | | |
South Korea — 0.2% | | | | | | |
Korea Development Bank | | | | | | |
4.57%, 10/20/09†D | | | 1,750,000 | | | 1,763,981 |
| | | | | | |
See Notes to Financial Statements.
53
Low-Duration Bond Fund
SCHEDULE OF INVESTMENTS (Continued)
| | | | | | |
| | | Par | | Value |
United Kingdom — 0.3% | | | | | | |
Nationwide Building Society | | | | | | |
3.50%, 07/31/07 144AD | | $ | 325,000 | | $ | 318,548 |
Vodafone Group PLC | | | | | | |
3.95%, 01/30/08 | | | 2,650,000 | | | 2,604,926 |
| | | | | | |
| | | | | | 2,923,474 |
| | | | | | |
TOTAL FOREIGN BONDS
(Cost $45,962,804) | | | | | | 45,668,486 |
| | | | | | |
MORTGAGE-BACKED SECURITIES — 36.5% | | | | | | |
Adjustable Rate Mortgage Trust | | | | | | |
4.65%, 11/25/35 STEP† | | | 2,631,471 | | | 2,632,855 |
American Home Mortgage Assets | | | | | | |
4.46%, 11/25/35† | | | 4,143,524 | | | 4,146,242 |
American Home Mortgage Investment Trust | | | | | | |
4.29%, 10/25/34† | | | 2,590,348 | | | 2,530,625 |
Bank of America Mortgage Securities | | | | | | |
6.50%, 10/01/19 | | | 910,332 | | | 929,550 |
Bear Stearns Adjustable Rate Mortgage Trust | | | | | | |
3.22%, 12/01/33† | | | 2,361,641 | | | 2,313,181 |
4.69%, 01/25/34† | | | 1,135,804 | | | 1,124,966 |
4.01%, 07/25/34† | | | 2,619,072 | | | 2,545,158 |
Bear Stearns Alt-A Trust | | | | | | |
4.56%, 06/25/34† | | | 2,418,854 | | | 2,422,672 |
Bear Stearns Commercial Mortgage Securities | | | | | | |
3.87%, 02/11/41 | | | 2,040,000 | | | 1,962,364 |
Chase Commercial Mortgage Securities Corporation | | | | | | |
7.76%, 04/15/32 | | | 2,111,619 | | | 2,265,729 |
Citigroup Commercial Mortgage Trust | | | | | | |
4.15%, 09/20/49 144A | | | 1,767,901 | | | 1,737,308 |
Commercial Mortgage Acceptance Corporation | | | | | | |
6.03%, 09/15/30 | | | 1,800,804 | | | 1,829,358 |
Commercial Mortgage Pass-Through Certificates | | | | | | |
4.55%, 03/15/20 144A† | | | 1,700,000 | | | 1,699,781 |
7.42%, 08/15/33 | | | 2,180,000 | | | 2,344,077 |
Countrywide Alternative Loan Trust | | | | | | |
6.00%, 10/25/32 | | | 516,066 | | | 509,111 |
5.50%, 05/31/35 | | | 1,878,453 | | | 1,876,174 |
Countrywide Home Loan Mortgage Pass-Through Trust | | | | | | |
4.65%, 01/25/35 STEP† | | | 1,616,668 | | | 1,615,943 |
Credit-Based Asset Servicing and Securitization LLC | | | | | | |
4.70%, 02/25/30† | | | 296,441 | | | 296,646 |
Federal Home Loan Mortgage Corporation | | | | | | |
8.50%, 12/01/07 | | | 5,767 | | | 5,906 |
8.50%, 01/01/08 | | | 4,709 | | | 4,823 |
8.00%, 05/01/08 | | | 10,099 | | | 10,082 |
8.75%, 07/01/08 | | | 5,575 | | | 5,787 |
8.00%, 01/01/09 | | | 2,863 | | | 2,921 |
7.50%, 03/01/09 | | | 30,010 | | | 29,949 |
16.25%, 07/01/11 | | | 313 | | | 353 |
15.25%, 08/01/11 | | | 1,721 | | | 1,947 |
5.00%, 11/15/16 | | | 3,722,754 | | | 3,718,500 |
3.50%, 12/01/18 | | | 3,895,611 | | | 3,615,627 |
10.75%, 02/01/19 | | | 99,061 | | | 106,688 |
4.25%, 06/15/24 | | | 2,814,774 | | | 2,776,830 |
5.53%, 07/01/27† | | | 78,556 | | | 81,249 |
3.98%, 06/01/28† | | | 469,509 | | | 466,694 |
4.72%, 12/15/30† | | | 1,669,171 | | | 1,673,847 |
6.00%, 04/01/33 | | | 2,013,357 | | | 2,038,453 |
4.55%, 06/01/33† | | | 6,222,489 | | | 6,163,038 |
4.40%, 10/01/34† | | | 1,325,834 | | | 1,301,440 |
5.50%, 05/15/35 | | | 2,476,610 | | | 2,500,253 |
4.72%, 08/01/35† | | | 3,329,377 | | | 3,300,412 |
4.84%, 08/01/35† | | | 3,320,814 | | | 3,305,926 |
4.82%, 10/01/35† | | | 1,818,354 | | | 1,819,255 |
5.38%, 05/25/43† | | | 2,989,864 | | | 3,044,696 |
4.56%, 07/25/44† | | | 7,037,238 | | | 7,141,910 |
Federal Housing Authority | | | | | | |
7.43%, 09/01/22 | | | 1,774 | | | 1,804 |
Federal National Mortgage Association | | | | | | |
6.00%, 08/01/08 | | | 205,189 | | | 209,926 |
6.50%, 11/01/08 | | | 263,789 | | | 271,823 |
4.16%, 12/01/09† | | | 1,214,970 | | | 1,214,970 |
4.00%, 07/01/18 | | | 247,512 | | | 236,795 |
5.50%, 07/01/18 | | | 3,375,986 | | | 3,398,400 |
4.00%, 08/01/18 | | | 976,617 | | | 934,329 |
4.00%, 05/01/19 | | | 5,284,991 | | | 5,052,658 |
4.00%, 06/01/19 | | | 8,785,866 | | | 8,399,629 |
4.00%, 08/01/19 | | | 475,064 | | | 454,179 |
4.00%, 10/01/19 | | | 1,626,861 | | | 1,555,342 |
4.00%, 12/01/19 | | | 1,167,135 | | | 1,115,827 |
4.00%, 01/01/20 | | | 747,079 | | | 713,447 |
5.50%, 01/01/20 | | | 833,656 | | | 839,116 |
4.00%, 03/01/20 | | | 624,865 | | | 597,332 |
4.00%, 07/01/20 | | | 965,993 | | | 922,505 |
5.50%, 08/01/20 | | | 6,313,008 | | | 6,353,276 |
5.50%, 10/01/20 | | | 1,992,327 | | | 2,005,036 |
5.75%, 08/25/23 | | | 2,535,825 | | | 2,550,881 |
5.10%, 03/01/24† | | | 100,782 | | | 99,222 |
4.95%, 12/01/24† | | | 222,396 | | | 221,431 |
9.00%, 05/01/25 | | | 96,204 | | | 104,817 |
9.00%, 07/01/25 | | | 252,027 | | | 274,139 |
4.98%, 05/25/30† | | | 3,238,766 | | | 3,249,609 |
5.03%, 05/25/30† | | | 3,287,106 | | | 3,261,175 |
4.63%, 09/25/30† | | | 292,261 | | | 292,280 |
4.99%, 12/01/30† | | | 62,400 | | | 62,967 |
5.65%, 09/01/31† | | | 187,436 | | | 192,344 |
3.31%, 03/25/32 | | | 596,321 | | | 556,664 |
4.27%, 04/01/33† | | | 1,251,222 | | | 1,239,571 |
4.20%, 06/01/33† | | | 377,459 | | | 372,712 |
5.50%, 06/01/33 | | | 31,098 | | | 30,870 |
5.50%, 07/01/33 | | | 30,543 | | | 30,319 |
4.25%, 10/01/33† | | | 2,286,447 | | | 2,244,060 |
5.50%, 10/01/33 | | | 168,474 | | | 167,238 |
4.30%, 12/01/33† | | | 741,512 | | | 728,021 |
5.50%, 08/01/34 | | | 88,314 | | | 87,534 |
5.75%, 08/25/34 | | | 2,705,851 | | | 2,708,003 |
5.02%, 09/01/34† | | | 1,912,483 | | | 1,917,367 |
5.11%, 09/01/34† | | | 1,325,620 | | | 1,327,265 |
5.50%, 09/01/34 | | | 5,669,039 | | | 5,618,956 |
4.82%, 10/01/34† | | | 1,997,850 | | | 1,993,972 |
5.17%, 10/01/34† | | | 2,462,840 | | | 2,475,047 |
5.50%, 10/01/34 | | | 740,822 | | | 734,277 |
5.50%, 11/01/34 | | | 18,116,628 | | | 17,956,577 |
5.50%, 12/01/34 | | | 1,090,013 | | | 1,080,383 |
See Notes to Financial Statements.
54
| | | | | | |
| | | Par | | Value |
5.50%, 02/01/35 | | $ | 9,210,103 | | $ | 9,128,736 |
4.87%, 06/01/35† | | | 2,828,563 | | | 2,801,719 |
5.50%, 06/01/35 | | | 1,449,436 | | | 1,435,546 |
5.50%, 07/01/35 | | | 10,512,232 | | | 10,411,490 |
4.70%, 08/01/35† | | | 6,995,459 | | | 6,912,383 |
4.49%, 09/01/35† | | | 3,486,972 | | | 3,425,917 |
4.64%, 09/01/35† | | | 4,096,960 | | | 4,048,206 |
5.04%, 10/01/35† | | | 4,341,136 | | | 4,337,744 |
5.33%, 10/01/35† | | | 2,574,737 | | | 2,552,079 |
5.50%, 01/12/36 TBA | | | 8,100,000 | | | 8,019,000 |
6.17%, 04/01/40† | | | 590,096 | | | 602,283 |
First Horizon Alternative Mortgage Securities | | | | | | |
4.77%, 06/25/34† | | | 1,508,228 | | | 1,496,292 |
First Horizon Asset Securities, Inc. | | | | | | |
5.35%, 10/25/35† | | | 4,048,950 | | | 4,040,740 |
General Electric Capital Commercial Mortgage Corporation | | | | | | |
5.56%, 06/10/38 | | | 1,414,338 | | | 1,428,083 |
GMAC Commercial Mortgage Securities, Inc. | | | | | | |
7.72%, 03/15/33 | | | 2,120,000 | | | 2,306,860 |
7.18%, 08/15/36 | | | 1,444,840 | | | 1,531,084 |
Government National Mortgage Association | | | | | | |
8.25%, 03/15/06 | | | 23 | | | 23 |
8.25%, 05/15/06 | | | 845 | | | 853 |
6.00%, 12/15/08 | | | 235,663 | | | 239,408 |
6.00%, 02/15/11 | | | 394,400 | | | 401,667 |
4.38%, 06/20/17† | | | 35,024 | | | 35,057 |
4.38%, 06/20/21† | | | 18,281 | | | 18,329 |
4.13%, 10/20/27† | | | 126,147 | | | 127,337 |
8.50%, 10/15/29 | | | 117,059 | | | 126,393 |
8.50%, 01/15/30 | | | 42,869 | | | 46,275 |
4.97%, 02/16/30† | | | 455,180 | | | 460,256 |
8.50%, 03/15/30 | | | 6,181 | | | 6,672 |
8.50%, 04/15/30 | | | 15,564 | | | 16,801 |
8.50%, 05/15/30 | | | 239,298 | | | 258,310 |
8.50%, 06/15/30 | | | 66,863 | | | 72,176 |
8.50%, 07/15/30 | | | 197,747 | | | 213,462 |
8.50%, 08/15/30 | | | 47,783 | | | 51,579 |
8.50%, 09/15/30 | | | 9,264 | | | 10,000 |
8.50%, 10/15/30 | | | 47,016 | | | 50,751 |
8.50%, 11/15/30 | | | 120,323 | | | 129,883 |
8.50%, 12/15/30 | | | 108,566 | | | 117,192 |
8.50%, 02/15/31 | | | 84,439 | | | 91,127 |
3.75%, 05/20/34†D | | | 2,262,340 | | | 2,211,653 |
3.75%, 06/20/34†D | | | 3,122,787 | | | 3,052,413 |
Greenpoint Mortgage Funding Trust | | | | | | |
4.65%, 11/25/45 STEP† | | | 1,544,220 | | | 1,542,487 |
GS Mortgage Securities Corporation II | | | | | | |
6.04%, 08/15/18 144A | | | 459,605 | | | 472,694 |
6.14%, 10/18/30 | | | 2,396,695 | | | 2,452,873 |
5.37%, 01/10/40 IO 144AW† | | | 40,737,064 | | | 1,004,454 |
GSR Mortgage Loan Trust | | | | | | |
3.69%, 06/01/34† | | | 2,879,885 | | | 2,825,266 |
4.81%, 09/25/34† | | | 2,842,069 | | | 2,817,901 |
4.55%, 09/25/35† | | | 3,293,030 | | | 3,260,121 |
4.54%, 10/25/35† | | | 5,662,965 | | | 5,570,326 |
HarborView Mortgage Loan Trust | | | | | | |
5.33%, 12/19/35† | | | 4,950,592 | | | 4,942,477 |
4.68%, 01/01/49 STEP† | | | 3,453,733 | | | 3,456,565 |
IFC SBA Loan-Backed Adjustable Rate Certificate | | | | | | |
5.25%, 01/15/24 144A† | | | 544,370 | | | 544,370 |
Impac Secured Assets CMN Owner Trust | | | | | | |
4.46%, 05/25/36† | | | 3,700,000 | | | 3,700,023 |
LB-UBS Commercial Mortgage Trust | | | | | | |
3.62%, 08/15/33 IO 144AW† | | | 36,085,312 | | | 878,688 |
Luminent Mortgage Trust | | | | | | |
4.64%, 11/26/35 STEP† | | | 3,957,010 | | | 3,884,313 |
MLCC Mortgage Investors, Inc. | | | | | | |
4.75%, 03/15/25 STEP† | | | 1,058,327 | | | 1,062,429 |
4.74%, 12/25/34† | | | 2,718,777 | | | 2,687,978 |
Morgan Stanley Capital I | | | | | | |
6.53%, 03/15/31 | | | 2,960,000 | | | 3,070,433 |
NationsLink Funding Corporation | | | | | | |
6.32%, 01/20/31 | | | 2,070,966 | | | 2,132,984 |
Nomura Asset Acceptance Corporation | | | | | | |
5.05%, 06/25/10† | | | 3,352,577 | | | 3,327,008 |
Nomura Asset Securities Corporation | | | | | | |
6.59%, 03/15/30 | | | 3,300,000 | | | 3,410,632 |
Residential Accredit Loans, Inc. | | | | | | |
6.00%, 12/25/16 | | | 165,525 | | | 165,649 |
4.78%, 01/25/33† | | | 1,050,871 | | | 1,052,168 |
Residential Asset Securitization Trust | | | | | | |
4.78%, 05/25/33† | | | 2,298,684 | | | 2,302,446 |
Residential Funding Mortgage Securities I | | | | | | |
6.50%, 03/25/32 | | | 206,898 | | | 209,801 |
5.50%, 09/25/33 | | | 1,754,614 | | | 1,755,262 |
SACO I, Inc. | | | | | | |
4.49%, 11/25/35† | | | 2,976,958 | | | 2,976,805 |
Structured Adjustable Rate Mortgage Loan Trust | | | | | | |
4.92%, 03/25/34† | | | 1,871,363 | | | 1,835,168 |
5.38%, 08/25/34† | | | 2,330,245 | | | 2,338,005 |
4.68%, 09/25/34† | | | 1,106,213 | | | 1,106,719 |
5.43%, 05/25/35† | | | 3,977,557 | | | 3,986,817 |
Structured Asset Mortgage Investments, Inc. | | | | | | |
5.95%, 10/19/34† | | | 1,525,096 | | | 1,546,684 |
4.67%, 05/25/35 STEP† | | | 1,700,000 | | | 1,701,065 |
Structured Asset Securities Corporation | | | | | | |
7.50%, 07/25/16 | | | 15,112 | | | 15,069 |
Washington Mutual Asset Securities Corporation | | | | | | |
4.24%, 05/25/36 144A | | | 2,593,096 | | | 2,547,833 |
Washington Mutual Mortgage Securities Corporation | | | | | | |
5.61%, 03/25/32† | | | 477,808 | | | 476,904 |
Washington Mutual, Inc. | | | | | | |
4.65%, 12/25/27 STEP† | | | 4,774,707 | | | 4,771,190 |
4.73%, 06/25/42† | | | 292,374 | | | 290,547 |
4.69%, 01/25/45 STEP† | | | 4,069,232 | | | 4,070,777 |
4.67%, 10/25/45 STEP† | | | 1,663,726 | | | 1,660,550 |
See Notes to Financial Statements.
55
Low-Duration Bond Fund
SCHEDULE OF INVESTMENTS (Continued)
| | | | | | |
| | | Par | | Value |
Wells Fargo Mortgage-Backed Securities Trust | | | | | | |
3.99%, 01/25/35† | | $ | 3,078,563 | | $ | 3,016,231 |
4.55%, 02/25/35† | | | 5,095,682 | | | 5,006,507 |
| | | | | | |
TOTAL MORTGAGE-BACKED SECURITIES
(Cost $335,763,262) | | | | | | 331,844,419 |
| | | | | | |
MUNICIPAL BONDS — 0.7% | | | | | | |
Honolulu, Hawaii City & County, Series B General Obligation Bond (MBIA Insured) | | | | | | |
5.00%, 07/01/12 | | | 1,200,000 | | | 1,293,564 |
New York City, New York Municipal Water Finance Authority Water & Sewer System, Series C Revenue Bond | | | | | | |
5.00%, 06/15/35 | | | 3,200,000 | | | 3,320,416 |
Sales Tax Asset Receivable Corporation, New York, Series B Revenue Bond (FSA Insured) | | | | | | |
3.60%, 10/15/08 | | | 425,000 | | | 412,399 |
Texas State Public Finance Authority, Series B Revenue Bond | | | | | | |
2.63%, 06/15/06 | | | 1,365,000 | | | 1,352,687 |
| | | | | | |
TOTAL MUNICIPAL BONDS
(Cost $6,395,560) | | | | | | 6,379,066 |
| | | | | | |
| | | Number of
Contracts | | |
PURCHASED OPTIONS — 0.0% | | | | | | |
Call Options — 0.0% | | | | | | |
90-Day Eurodollar Futures, Strike Price $95.25, Expires 03/13/06 | | | 150 | | | 21,563 |
90-Day Eurodollar Futures, Strike Price $95.25, Expires 06/19/06 | | | 159 | | | 39,750 |
| | | | | | |
| | | | | | 61,313 |
| | | | | | |
Call Swaptions — 0.0% | | | | | | |
3-Month LIBOR, Strike Price $4.25, Expires 10/19/06 | | | 87 | | | 12,972 |
3-Month LIBOR, Strike Price $4.25, Expires 10/24/06 | | | 87 | | | 13,346 |
3-Month LIBOR, Strike Price $4.50, Expires 10/06/06 | | | 345 | | | 90,148 |
3-Month LIBOR, Strike Price $4.75, Expires 08/10/06 | | | 570 | | | 21,210 |
| | | | | | |
| | | | | | 137,676 |
| | | | | | |
Put Options — 0.0% | | | | | | |
90-Day Eurodollar Futures, Strike Price $94.50, Expires 06/19/06 | | | 443 | | | 5,537 |
90-Day Eurodollar Futures, Strike Price $95.25, Expires 12/18/06 | | | 66 | | | 48,675 |
| | | | | | |
| | | | | | 54,212 |
| | | | | | |
TOTAL PURCHASED OPTIONS
(Cost $401,447) | | | | | | 253,201 |
| | | | | | |
| | | | | | | | |
| | | Shares | | | Value | |
PREFERRED STOCK — 0.0% | | | | | | | | |
Fannie Mae†
(Cost $53,500) | | | 1,070 | | | $ | 58,315 | |
| | | | | | | | |
MONEY MARKET FUNDS — 11.7% | | | | | | | | |
GuideStone Funds Money Market Fund (GS4 Class)¥ | | | 38,676,484 | | | | 38,676,484 | |
Northern Institutional Liquid Assets Portfolio§ | | | 67,991,017 | | | | 67,991,017 | |
| | | | | | | | |
TOTAL MONEY MARKET FUNDS
(Cost $106,667,501) | | | | | | | 106,667,501 | |
| | | | | | | | |
| | | Par | | | | |
U.S. TREASURY OBLIGATIONS — 8.7% | | | | | | | | |
U.S. Treasury Bills | | | | | | | | |
3.90%, 03/02/06‡‡ | | $ | 400,000 | | | | 397,515 | |
3.82%, 03/16/06‡‡ | | | 100,000 | | | | 99,220 | |
3.83%, 03/16/06‡‡ | | | 345,000 | | | | 342,308 | |
| | | | | | | | |
| | | | | | | 839,043 | |
| | | | | | | | |
U.S. Treasury Bond | | | | | | | | |
10.38%, 11/15/12D | | | 2,535,000 | | | | 2,802,364 | |
| | | | | | | | |
U.S. Treasury Notes | | | | | | | | |
2.25%, 04/30/06D | | | 7,145,000 | | | | 7,100,630 | |
2.50%, 05/31/06D | | | 3,680,000 | | | | 3,654,126 | |
2.75%, 07/31/06D | | | 2,670,000 | | | | 2,645,700 | |
2.38%, 08/31/06D | | | 1,030,000 | | | | 1,016,643 | |
3.50%, 05/31/07D | | | 23,130,000 | | | | 22,846,311 | |
4.00%, 08/31/07 | | | 20,000,000 | | | | 19,873,440 | |
4.25%, 10/31/07D | | | 11,000,000 | | | | 10,971,213 | |
3.75%, 05/15/08D | | | 5,233,000 | | | | 5,160,230 | |
4.13%, 08/15/08D | | | 2,090,000 | | | | 2,079,142 | |
4.25%, 10/15/10D | | | 180,000 | | | | 179,114 | |
| | | | | | | | |
| | | | | | | 75,526,549 | |
| | | | | | | | |
TOTAL U.S. TREASURY OBLIGATIONS
(Cost $79,783,533) | | | | | | | 79,167,956 | |
| | | | | | | | |
Total Investments — 106.8%
(Cost $980,690,421) | | | | | | | 971,940,538 | |
| | | | | | | | |
| | | Number of
Contracts | | | | |
WRITTEN OPTIONS — 0.0% | | | | | | | | |
Call Options — 0.0% | | | | | | | | |
1-Year Eurodollar Mid-CRV Futures, Strike Price $95.50, Expires 03/10/06 | | | (150 | ) | | | (23,438 | ) |
90-Day Eurodollar Futures, Strike Price $95.50, Expires 06/19/06 | | | (318 | ) | | | (31,800 | ) |
| | | | | | | | |
| | | | | | | (55,238 | ) |
| | | | | | | | |
Call Swaptions — 0.0% | | | | | | | | |
3-Month LIBOR, Strike Price $4.31, Expires 10/19/06 | | | (38 | ) | | | (16,120 | ) |
3-Month LIBOR, Strike Price $4.31, Expires 10/24/06 | | | (37 | ) | | | (16,043 | ) |
3-Month LIBOR, Strike Price $4.54, Expires 10/06/06 | | | (149 | ) | | | (102,169 | ) |
3-Month LIBOR, Strike Price $4.78, Expires 08/10/06 | | | (250 | ) | | | (23,775 | ) |
| | | | | | | | |
| | | | | | | (158,107 | ) |
| | | | | | | | |
See Notes to Financial Statements.
56
| | | | | | | | |
| | | Number of
Contracts | | | Value | |
Put Options — 0.0% | | | | | | | | |
90-Day Eurodollar Futures, | | | | | | | | |
Strike Price $94.75, Expires | | | | | | | | |
12/18/06 | | | (132 | ) | | $ | (32,175 | ) |
| | | | | | | | |
TOTAL WRITTEN OPTIONS
(Premiums received $(379,043)) | | | | | | | (245,520 | ) |
| | | | | | | | |
| | | Par | | | | |
SECURITY SOLD SHORT — (0.1)% | | | | | | | | |
Federal National Mortgage Association TBA
(Cost $(948,906)) | | $ | (1,000,000 | ) | | | (954,688 | ) |
| | | | | | | | |
Liabilities in Excess of Other | | | | | | | | |
Assets — (6.7)% | | | | | | | (60,563,326 | ) |
| | | | | | | | |
Net Assets — 100.0% | | | | | | $ | 910,177,004 | |
| | | | | | | | |
Swap agreements outstanding at December 31, 2005:
| | | | | | | | | | |
Description | | Expiration Date | | Notional Value | | | Unrealized Appreciation (Depreciation) | |
British Pounds | | | | | | | | | | |
Receive fixed rate payments of 5.00% and pay variable rate payments on the six month LIBOR floating rate(f) | | 09/15/10 | | | 4,600,000 | | | $ | 156,351 | |
Receive fixed rate payments of 5.00% and pay variable rate payments on the six month LIBOR floating rate(d) | | 09/15/10 | | | 4,000,000 | | | | 135,957 | |
Receive variable rate payments on the six month LIBOR floating rate and pay fixed rate payments of 5.00%(i) | | 06/18/34 | | | (100,000 | ) | | | (15,762 | ) |
Receive variable rate payments on the six month LIBOR floating rate and pay fixed rate payments of 5.00%(d) | | 06/18/34 | | | (4,000,000 | ) | | | (630,474 | ) |
| | | | | | | | | | |
| | | | | | | | | (353,928 | ) |
| | | | | | | | | | |
Euros | | | | | | | | | | |
Receive fixed rate payments of 2.09%and pay variable rate payments on the France CPI Ex Tobacco(j) | | 10/15/10 | | | 1,500,000 | | | | 4,586 | |
Receive variable rate payments on the six month LIBOR floating rate and pay fixed rate payments of 4.00%(d) | | 12/15/14 | | | (7,300,000 | ) | | | (396,561 | ) |
| | | | | | | | | | |
| | | | | | | | | (391,975 | ) |
| | | | | | | | | | |
Japanese Yen | | | | | | | | | | |
Receive variable rate payments on the six month LIBOR floating rate and pay fixed rate payments of 1.50%(h) | | 06/15/15 | | | (200,000,000 | ) | | | 19,769 | |
Receive variable rate payments on the six month LIBOR floating rate and pay fixed rate payments of 1.50%(d) | | 06/15/15 | | | (80,000,000 | ) | | | 7,908 | |
| | | | | | | | | | |
| | | | | | | | | 27,677 | |
| | | | | | | | | | |
U.S. Dollars | | | | | | | | | | |
Receive fixed rate payments of 0.61%and pay floating par on the in event of default on Russian Federation, 5.00% due 3/31/2030(h) | | 03/20/07 | | $ | 1,300,000 | | | | 3,774 | |
Receive fixed rate payments of 0.70%and pay floating par on the in event of default on Russian Federation, 5.00% due 3/31/2030(a) | | 03/20/07 | | | 3,700,000 | | | | 14,723 | |
See Notes to Financial Statements.
57
Low-Duration Bond Fund
SCHEDULE OF INVESTMENTS (Continued)
| | | | | | | | | | |
Description | | Expiration
Date | | Notional
Value | | | Unrealized
Appreciation
(Depreciation) | |
Receive fixed rate payments of 0.77% and pay floating par on the in event of default on Russian Federation, 5.00% due 3/31/2030(g) | | 05/20/07 | | $ | 200,000 | | | $ | 1,064 | |
Receive fixed rate payments of 5.00% and pay variable rate payments on the three month LIBOR floating rate(d) | | 06/21/08 | | | 24,300,000 | | | | 57,837 | |
Receive variable rate payments on the three month LIBOR floating rate and pay fixed rate payments of 5.00%(a) | | 06/21/11 | | | (12,100,000 | ) | | | (55,331 | ) |
Receive variable rate payments on the three month LIBOR floating rate and pay fixed rate payments of 5.00%(d) | | 06/21/13 | | | (100,000 | ) | | | (504 | ) |
| | | | | | | | | | |
| | | | | | | | | 21,563 | |
| | | | | | | | | | |
| | | | | | | | $ | (696,663 | ) |
| | | | | | | | | | |
| | | |
| | | % | |
Futures Contracts | | 68.2 | |
Mortgage-Backed Securities | | 36.5 | |
Asset-Backed Securities | | 20.9 | |
Corporate Bonds | | 12.0 | |
Money Market Funds | | 11.7 | |
Agency Obligations | | 11.3 | |
U.S. Treasury Obligations | | 8.7 | |
Foreign Bonds | | 5.0 | |
Municipal Bonds | | 0.7 | |
Preferred Stock | | — | * |
Purchased Options | | — | * |
Written Options | | — | * |
Securities Sold Short | | (0.1 | ) |
Swap Agreements | | (0.1 | ) |
Forward Foreign Currency Contracts | | (3.1 | ) |
| | | |
| | 171.7 | |
| | | |
| * | Rounds to less than 0.005%. |
See Notes to Financial Statements.
58
Medium-Duration Bond Fund
The Fund is primarily comprised of investment grade fixed income securities. The Fund posted a positive return but underperformed its benchmark index, the Lehman Brothers Aggregate Bond Index, during the quarter. The Fund’s benchmark-relative performance was positively impacted by its security selection within the mortgage sector and a modest tactical allocation to emerging market debt. The Fund’s benchmark-relative performance was negatively impacted by its yield curve strategy (exposure to shorter maturities). At the sub-adviser level, Goldman Sachs delivered the best benchmark-relative performance due to its shorter-than-benchmark duration position and its security selection within the non-benchmark sector of high yield bonds.
59
Medium-Duration Bond Fund
Average Annual Total Returns as of 12/31/05
| | | | | | | | | | | | | | | | | | |
| | | GS2 Class* | | | GS4 Class* | | | GS6 Class* | | | Benchmark** | | | GS8 Class* | | | GS8 Class Benchmark** | |
One Year | | 2.62 | % | | 2.50 | % | | 2.18 | % | | 2.43 | % | | 1.73 | % | | 2.43 | % |
Since Inception | | 5.70 | % | | 5.72 | % | | 5.40 | % | | 5.23 | % | | 2.28 | % | | 2.66 | % |
Inception Date | | 08/27/01 | | | 08/27/01 | | | 08/27/01 | | | 08/27/01 | | | 11/08/04 | | | 11/08/04 | |
The performance data quoted represents past performance and does not guarantee future results. Current performance may be lower or higher. Performance data current to the most recent month-end may be obtained at www.GuideStone.org. The investment return and principal value of an investment will fluctuate so that shares, when redeemed, may be worth more or less than their original cost.
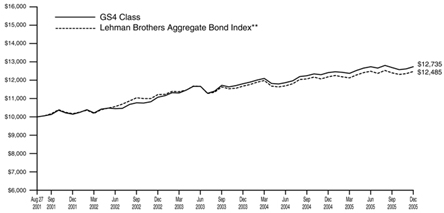
The graph compares the results of a hypothetical $10,000 investment in the GS4 Class of the Fund since August 27, 2001 (commencement of operations), with all dividends and capital gains reinvested, with the Lehman Brothers Aggregate Bond Index.
| * | These returns reflect expense waivers by the Fund’s investment advisor. Without these waivers, returns would have been lower. Returns shown do not reflect the deduction of taxes that a shareholder would pay on Fund distributions or the redemption of Fund shares. |
| ** | The Lehman Brothers Aggregate Bond Index represents securities that are SEC-registered, taxable, and dollar denominated. The index covers the U.S. investment grade fixed rate bond market, with index components for government and corporate securities, mortgage pass-through securities, and asset-backed securities. |
Unlike a mutual fund, the performance of an index assumes no taxes, transaction costs, management fees or other expenses.
60
| | |
Medium-Duration Bond Fund SCHEDULE OF INVESTMENTS | | December 31, 2005 |
| | | | | | |
| | | Par | | Value |
AGENCY OBLIGATIONS — 11.2% | | | | | | |
Federal Farm Credit Bank | | | | | | |
4.85%, 12/16/09 | | $ | 2,700,000 | | $ | 2,706,040 |
4.50%, 08/08/11 | | | 3,000,000 | | | 2,927,109 |
4.80%, 10/19/15 | | | 1,500,000 | | | 1,497,916 |
Federal Home Loan Bank | | | | | | |
2.50%, 04/11/06 | | | 5,000,000 | | | 4,971,755 |
2.88%, 05/22/06 | | | 3,000,000 | | | 2,980,479 |
4.36%, 12/13/06† | | | 4,900,000 | | | 4,901,441 |
4.25%, 09/12/08 | | | 3,000,000 | | | 2,963,934 |
3.50%, 02/13/09 | | | 1,000,000 | | | 965,819 |
4.38%, 09/11/09 | | | 3,000,000 | | | 2,960,952 |
4.08%, 04/26/10 | | | 1,500,000 | | | 1,462,782 |
7.38%, 02/13/15 | | | 2,500,000 | | | 2,972,475 |
5.00%, 12/11/15 | | | 2,600,000 | | | 2,635,662 |
Federal Home Loan Mortgage Corporation | | | | | | |
4.18%, 02/21/06 | | | 10,200,000 | | | 10,137,457 |
4.23%, 02/28/06 | | | 2,600,000 | | | 2,581,996 |
3.55%, 11/15/07 | | | 6,000,000 | | | 5,873,628 |
4.20%, 12/28/07 | | | 5,000,000 | | | 4,938,640 |
4.50%, 08/04/08 | | | 6,000,000 | | | 5,939,280 |
4.48%, 09/19/08 | | | 10,000,000 | | | 9,900,890 |
6.88%, 09/15/10D | | | 554,000 | | | 603,665 |
4.13%, 10/18/10D | | | 3,200,000 | | | 3,115,398 |
5.63%, 11/23/35 | | | 1,770,000 | | | 1,791,967 |
Federal National Mortgage Association | | | | | | |
4.29%, 03/08/06 | | | 10,100,000 | | | 10,023,957 |
4.32%, 03/15/06 | | | 10,200,000 | | | 10,114,810 |
4.32%, 03/22/06 | | | 10,400,000 | | | 10,304,570 |
3.99%, 03/29/06 | | | 3,700,000 | | | 3,663,004 |
4.33%, 05/15/06‡‡ | | | 260,000 | | | 255,820 |
3.25%, 07/12/06 | | | 5,000,000 | | | 4,965,525 |
3.05%, 10/13/06 | | | 2,000,000 | | | 1,975,326 |
4.75%, 12/15/10 | | | 3,000,000 | | | 3,003,312 |
| | | | | | |
TOTAL AGENCY OBLIGATIONS
(Cost $123,436,435) | | | | | | 123,135,609 |
| | | | | | |
ASSET-BACKED SECURITIES — 3.2% | | | | | | |
Amortizing Residential Collateral Trust | | | | | | |
4.66%, 04/25/32† | | | 117,837 | | | 117,762 |
AQ Finance NIM Trust | | | | | | |
4.60%, 01/25/09 144A† | | | 24,801 | | | 24,798 |
Argent Securities, Inc. | | | | | | |
4.48%, 11/25/35† | | | 1,666,160 | | | 1,666,290 |
Bayview Financial Acquisition Trust | | | | | | |
4.83%, 02/28/44† | | | 1,770,921 | | | 1,775,895 |
Chesapeake Funding LLC | | | | | | |
4.58%, 08/07/08† | | | 552,211 | | | 552,244 |
Citibank Credit Card Issuance Trust | | | | | | |
5.28%, 02/09/09† | | | 670,000 | | | 675,517 |
Conseco Finance Securitizations Corporation | | | | | | |
6.77%, 09/01/32 | | | 418,332 | | | 419,645 |
4.20%, 02/01/33 IOW@ | | | 11,232,000 | | | 342,576 |
Countrywide Home Equity Loan Trust | | | | | | |
4.63%, 04/15/28† | | | 176,791 | | | 176,738 |
4.72%, 03/15/29† | | | 2,088,524 | | | 2,093,815 |
4.66%, 05/15/29† | | | 1,751,594 | | | 1,756,551 |
4.61%, 12/15/35† | | | 6,088,846 | | | 6,088,185 |
4.60%, 02/15/36† | | | 3,000,000 | | | 3,000,000 |
CS First Boston Mortgage Securities Corporation | | | | | | |
4.52%, 05/25/35 STEP† | | | 1,746,150 | | | 1,746,394 |
EMC Mortgage Loan Trust | | | | | | |
4.93%, 11/25/41 144A† | | | 833,332 | | | 835,209 |
EQCC Trust | | | | | | |
4.68%, 10/25/31† | | | 186,504 | | | 186,715 |
First Horizon Asset Back Trust | | | | | | |
4.67%, 10/25/34† | | | 999,087 | | | 1,001,482 |
Fleet Home Equity Loan Trust | | | | | | |
4.58%, 05/30/31† | | | 852,729 | | | 852,140 |
GSAMP Trust | | | | | | |
4.49%, 09/25/35† | | | 1,248,105 | | | 1,248,105 |
HFC Home Equity Loan Asset-Backed Certificates | | | | | | |
4.72%, 10/20/32† | | | 336,763 | | | 336,882 |
Household Mortgage Loan Trust | | | | | | |
4.70%, 06/20/33† | | | 303,500 | | | 303,871 |
Madison Avenue Manufactured Housing Contract | | | | | | |
4.73%, 09/25/08† | | | 1,571,395 | | | 1,572,788 |
Master Asset-Backed Securities Trust | | | | | | |
4.51%, 12/25/34† | | | 82,295 | | | 82,300 |
4.57%, 03/25/35 STEP† | | | 2,000,000 | | | 2,000,670 |
Morgan Stanley Dean Witter Credit Corporation HELOC Trust | | | | | | |
4.57%, 07/25/17 STEP† | | | 415,008 | | | 415,066 |
Provident Bank Home Equity Loan Trust | | | | | | |
4.65%, 08/25/31† | | | 316,063 | | | 316,440 |
Quest Trust | | | | | | |
4.94%, 06/25/34 144A† | | | 393,441 | | | 394,221 |
Residential Asset Mortgage Products, Inc. | | | | | | |
4.62%, 03/25/34 STEP† | | | 1,696,577 | | | 1,696,562 |
Salomon Brothers Mortgage Securities VII | | | | | | |
4.86%, 03/30/28 STEP† | | | 157,335 | | | 157,341 |
SG Mortgage Securities Trust | | | | | | |
4.48%, 09/25/35† | | | 1,719,144 | | | 1,719,134 |
SLM Student Loan Trust | | | | | | |
4.26%, 01/25/13† | | | 1,400,000 | | | 1,398,203 |
Structured Asset Securities Corporation | | | | | | |
4.83%, 02/25/33† | | | 87,702 | | | 87,930 |
SVO Timeshare Mortgage Corporation | | | | | | |
5.47%, 10/20/13 144A | | | 225,712 | | | 225,621 |
| | | | | | |
TOTAL ASSET-BACKED SECURITIES
(Cost $35,541,648) | | | | | | 35,267,090 |
| | | | | | |
COMMERCIAL PAPER — 1.0% | | | | | | |
General Electric Capital Corporation | | | | | | |
4.09%, 01/19/06 | | | 4,400,000 | | | 4,390,688 |
4.12%, 01/24/06 | | | 6,500,000 | | | 6,482,056 |
4.13%, 01/25/06 | | | 200,000 | | | 199,424 |
| | | | | | |
TOTAL COMMERCIAL PAPER
(Cost $11,073,342) | | | | | | 11,072,168 |
| | | | | | |
See Notes to Financial Statements.
61
Medium-Duration Bond Fund
SCHEDULE OF INVESTMENTS (Continued)
| | | | | | |
| | | Par | | Value |
CORPORATE BONDS — 10.4% | | | | | | |
ACE Capital Trust II | | | | | | |
9.70%, 04/01/30D | | $ | 60,000 | | $ | 83,722 |
ACE INA Holdings, Inc. | | | | | | |
8.30%, 08/15/06 | | | 550,000 | | | 561,245 |
AES Corporation (The) | | | | | | |
9.50%, 06/01/09D | | | 42,000 | | | 45,570 |
9.38%, 09/15/10D | | | 30,000 | | | 32,925 |
8.75%, 05/15/13 144AD | | | 520,000 | | | 568,750 |
9.00%, 05/15/15 144AD | | | 760,000 | | | 836,000 |
Alltel Corporation | | | | | | |
4.66%, 05/17/07 | | | 350,000 | | | 348,527 |
Amerada Hess Corporation | | | | | | |
7.30%, 08/15/31 | | | 1,320,000 | | | 1,532,383 |
7.13%, 03/15/33 | | | 400,000 | | | 455,505 |
American Achievement Corporation | | | | | | |
8.25%, 04/01/12 | | | 30,000 | | | 30,600 |
Amerigas Partners LP | | | | | | |
7.25%, 05/20/15D | | | 80,000 | | | 82,000 |
AmerisourceBergen Corporation | | | | | | |
5.88%, 09/15/15 144A | | | 130,000 | | | 131,788 |
Ameritech Capital Funding | | | | | | |
6.25%, 05/18/09 | | | 100,000 | | | 102,760 |
AMFM, Inc. | | | | | | |
8.00%, 11/01/08D | | | 1,075,000 | | | 1,143,608 |
ANZ Capital Trust I | | | | | | |
4.48%, 01/29/49 144A | | | 125,000 | | | 121,072 |
5.36%, 12/29/49 144A | | | 800,000 | | | 791,778 |
Apache Corporation | | | | | | |
6.25%, 04/15/12 | | | 300,000 | | | 322,793 |
ASIF Global Financing XIX | | | | | | |
4.90%, 01/17/13 144A | | | 380,000 | | | 378,653 |
Astoria Financial Corporation | | | | | | |
5.75%, 10/15/12 | | | 450,000 | | | 460,473 |
Bank One Corporation | | | | | | |
4.13%, 09/01/07D | | | 1,100,000 | | | 1,087,318 |
Bank United Corporation | | | | | | |
8.88%, 05/01/07 | | | 125,000 | | | 130,231 |
Beazer Homes USA | | | | | | |
8.63%, 05/15/11D | | | 10,000 | | | 10,500 |
BellSouth Capital Funding | | | | | | |
7.88%, 02/15/30 | | | 460,000 | | | 556,970 |
BellSouth Corporation | | | | | | |
4.75%, 11/15/12D | | | 40,000 | | | 39,035 |
6.88%, 10/15/31D | | | 10,000 | | | 11,012 |
Boeing Co. (The) | | | | | | |
6.63%, 02/15/38 | | | 210,000 | | | 245,238 |
Case New Holland, Inc. | | | | | | |
9.25%, 08/01/11 | | | 49,000 | | | 52,675 |
Cendant Corporation | | | | | | |
6.25%, 01/15/08D | | | 150,000 | | | 152,777 |
CenterPoint Energy Resources Corporation | | | | | | |
7.88%, 04/01/13D | | | 50,000 | | | 57,260 |
5.95%, 01/15/14 | | | 750,000 | | | 770,624 |
Charter Communications Operating LLC | | | | | | |
8.00%, 04/30/12 144A@ | | | 250,000 | | | 250,000 |
Chesapeake Energy Corporation | | | | | | |
7.50%, 09/15/13D | | | 50,000 | | | 53,375 |
6.25%, 01/15/18 | | | 140,000 | | | 137,900 |
Cincinnati Bell, Inc. | | | | | | |
7.00%, 02/15/15D | | | 191,000 | | | 188,135 |
Citigroup, Inc. | | | | | | |
5.00%, 03/06/07D | | | 2,200,000 | | | 2,203,852 |
Citizens Communications Co. | | | | | | |
9.25%, 05/15/11 | | | 40,000 | | | 44,300 |
Clear Channel Communications, Inc. | | | | | | |
4.63%, 01/15/08D | | | 20,000 | | | 19,735 |
4.25%, 05/15/09 | | | 250,000 | | | 240,499 |
5.50%, 09/15/14D | | | 1,925,000 | | | 1,845,134 |
Cleveland Electric Illuminating Co. (The) | | | | | | |
5.65%, 12/15/13 | | | 60,000 | | | 61,263 |
7.88%, 11/01/17 | | | 2,050,000 | | | 2,485,555 |
Clorox Co. | | | | | | |
4.61%, 12/14/07† | | | 1,500,000 | | | 1,503,530 |
CNA Financial Corporation | | | | | | |
6.75%, 11/15/06 | | | 180,000 | | | 182,455 |
Comcast Cable Communications, Inc. | | | | | | |
6.75%, 01/30/11D | | | 740,000 | | | 784,356 |
Comcast Cable Communications Holdings, Inc. | | | | | | |
8.38%, 03/15/13 | | | 225,000 | | | 260,792 |
9.46%, 11/15/22 | | | 275,000 | | | 361,157 |
Comcast Corporation | | | | | | |
10.50%, 06/15/06 | | | 650,000 | | | 663,850 |
Computer Associates International, Inc. | | | | | | |
5.00%, 12/01/09 144A†@D | | | 700, 000 | | | 683,181 |
ConocoPhillips | | | | | | |
8.75%, 05/25/10 | | | 230,000 | | | 264,815 |
ConocoPhillips Holding Co. | | | | | | |
6.95%, 04/15/29 | | | 860,000 | | | 1,041,193 |
Cox Communications, Inc. | | | | | | |
4.63%, 01/15/10 | | | 800,000 | | | 775,142 |
Cox Enterprises, Inc. | | | | | | |
4.38%, 05/01/08 144A | | | 600,000 | | | 586,216 |
CSC Holdings, Inc. | | | | | | |
7.63%, 04/01/11D | | | 590,000 | | | 590,000 |
6.75%, 04/15/12 144A | | | 60,000 | | | 57,000 |
7.63%, 07/15/18 | | | 45,000 | | | 42,975 |
D.R. Horton, Inc. | | | | | | |
8.50%, 04/15/12 | | | 10,000 | | | 10,734 |
DaimlerChrysler NA Holding Corporation | | | | | | |
4.99%, 05/24/06† | | | 1,200,000 | | | 1,201,680 |
5.30%, 08/08/06† | | | 2,200,000 | | | 2,209,874 |
7.30%, 01/15/12 | | | 550,000 | | | 594,179 |
6.50%, 11/15/13 | | | 210,000 | | | 220,218 |
Dana Corporation | | | | | | |
5.85%, 01/15/15D | | | 200,000 | | | 143,000 |
DaVita, Inc. | | | | | | |
7.25%, 03/15/15D | | | 30,000 | | | 30,525 |
Delta Air Lines, Inc. | | | | | | |
6.42%, 07/02/12 | | | 400,000 | | | 405,145 |
6.72%, 01/02/23D | | | 697,837 | | | 707,815 |
Devon Energy Corporation | | | | | | |
7.95%, 04/15/32 | | | 745,000 | | | 963,845 |
DirecTV Holdings LLC | | | | | | |
6.38%, 06/15/15 | | | 180,000 | | | 176,850 |
Dominion Resources, Inc. | | | | | | |
4.13%, 02/15/08 | | | 70,000 | | | 68,736 |
See Notes to Financial Statements.
62
| | | | | | |
| | | Par | | Value |
5.13%, 12/15/09 | | $ | 230,000 | | $ | 229,530 |
4.75%, 12/15/10 | | | 70,000 | | | 68,485 |
5.70%, 09/17/12 | | | 270,000 | | | 274,919 |
Dryden Investor Trust | | | | | | |
7.16%, 07/23/08 144A@ | | | 1,243,436 | | | 1,275,818 |
Dynegy Holdings, Inc. | | | | | | |
8.75%, 02/15/12D | | | 910,000 | | | 987,350 |
E*Trade Financial Corporation | | | | | | |
7.38%, 09/15/13 144AD | | | 40,000 | | | 40,700 |
Eastman Kodak Co. | | | | | | |
7.25%, 11/15/13D | | | 490,000 | | | 470,799 |
Echostar DBS Corporation | | | | | | |
5.75%, 10/01/08 | | | 500,000 | | | 492,500 |
7.30%, 10/01/08†D | | | 103,000 | | | 105,575 |
6.63%, 10/01/14 | | | 30,000 | | | 28,913 |
El Paso Corporation | | | | | | |
2.30%, 02/28/21 CONVWD | | | 70,000 | | | 38,500 |
8.05%, 10/15/30D | | | 600,000 | | | 615,000 |
7.80%, 08/01/31D | | | 1,150,000 | | | 1,152,875 |
7.75%, 01/15/32D | | | 530,000 | | | 533,975 |
El Paso Natural Gas Co. | | | | | | |
8.38%, 06/15/32D | | | 210,000 | | | 238,232 |
Entergy Gulf States, Inc. | | | | | | |
5.21%, 12/08/08 144A† | | | 1,900,000 | | | 1,901,125 |
EOP Operating LP | | | | | | |
7.75%, 11/15/07D | | | 100,000 | | | 104,798 |
Exelon Corporation | | | | | | |
5.63%, 06/15/35D | | | 1,000,000 | | | 945,656 |
Firstar Bank NA | | | | | | |
7.13%, 12/01/09 | | | 170,000 | | | 183,568 |
FirstEnergy Corporation | | | | | | |
5.50%, 11/15/06 | | | 600,000 | | | 602,282 |
6.45%, 11/15/11 | | | 70,000 | | | 74,290 |
7.38%, 11/15/31D | | | 1,700,000 | | | 2,012,258 |
Ford Motor Co. | | | | | | |
7.45%, 07/16/31D | | | 950,000 | | | 650,750 |
Ford Motor Credit Co. | | | | | | |
6.88%, 02/01/06D | | | 450,000 | | | 449,041 |
4.95%, 01/15/08 | | | 760,000 | | | 681,271 |
6.63%, 06/16/08 | | | 350,000 | | | 317,642 |
7.38%, 10/28/09 | | | 3,050,000 | | | 2,707,159 |
5.70%, 01/15/10D | | | 125,000 | | | 106,349 |
7.88%, 06/15/10 | | | 500,000 | | | 450,352 |
7.38%, 02/01/11D | | | 3,980,000 | | | 3,492,076 |
7.25%, 10/25/11 | | | 50,000 | | | 43,242 |
Forest City Enterprises, Inc. | | | | | | |
7.63%, 06/01/15 | | | 20,000 | | | 21,300 |
6.50%, 02/01/17 | | | 49,000 | | | 48,265 |
Fresenius Medical Care Capital Trust II | | | | | | |
7.88%, 02/01/08 | | | 169,000 | | | 174,915 |
General Electric Capital Corporation | | | | | | |
5.45%, 01/15/13 | | | 460,000 | | | 471,880 |
General Electric Co. | | | | | | |
5.00%, 02/01/13 | | | 1,070,000 | | | 1,071,022 |
General Motors Acceptance Corporation | | | | | | |
6.75%, 01/15/06D | | | 475,000 | | | 474,690 |
4.00%, 02/09/06(E)D | | | 350,000 | | | 413,349 |
5.75%, 02/14/06(E)D | | | 325,000 | | | 384,381 |
6.13%, 02/01/07D | | | 110,000 | | | 105,038 |
5.22%, 03/20/07† | | | 900,000 | | | 850,392 |
6.15%, 04/05/07 | | | 380,000 | | | 359,033 |
6.13%, 08/28/07 | | | 1,460,000 | | | 1,353,897 |
5.13%, 05/09/08D | | | 220,000 | | | 195,955 |
5.85%, 01/14/09 | | | 220,000 | | | 196,949 |
5.63%, 05/15/09D | | | 1,490,000 | | | 1,326,620 |
7.75%, 01/19/10D | | | 500,000 | | | 467,336 |
6.88%, 09/15/11 | | | 650,000 | | | 593,440 |
General Motors Corporation | | | | | | |
8.25%, 07/15/23D | | | 210,000 | | | 135,975 |
8.38%, 07/05/33(E) | | | 170,000 | | | 134,307 |
8.38%, 07/15/33D | | | 2,600,000 | | | 1,729,000 |
Georgia-Pacific Corporation | | | | | | |
8.13%, 05/15/11 | | | 4,000 | | | 4,025 |
9.50%, 12/01/11 | | | 15,000 | | | 15,881 |
Greenpoint Financial Corporation | | | | | | |
3.20%, 06/06/08 | | | 300,000 | | | 288,825 |
HCA, Inc. | | | | | | |
7.69%, 06/15/25 | | | 250,000 | | | 260,853 |
Hertz Corporation | | | | | | |
8.88%, 01/01/14 144A | | | 95,000 | | | 97,256 |
Host Marriott LP | | | | | | |
9.50%, 01/15/07D | | | 550,000 | | | 572,000 |
9.25%, 10/01/07 | | | 32,000 | | | 33,920 |
HSBC Bank USA NA | | | | | | |
4.57%, 09/21/07†@ | | | 1,300,000 | | | 1,302,844 |
HSBC Finance Corporation | | | | | | |
8.00%, 07/15/10 | | | 440,000 | | | 491,324 |
7.00%, 05/15/12 | | | 390,000 | | | 427,161 |
6.38%, 11/27/12 | | | 70,000 | | | 74,485 |
IMC Global, Inc. | | | | | | |
10.88%, 06/01/08 | | | 49,000 | | | 54,513 |
10.88%, 08/01/13 | | | 50,000 | | | 57,688 |
International Paper Co. | | | | | | |
5.50%, 01/15/14 | | | 220,000 | | | 216,568 |
iStar Financial, Inc. | | | | | | |
8.75%, 08/15/08 | | | 200,000 | | | 216,347 |
5.80%, 03/15/11 | | | 175,000 | | | 176,329 |
6.50%, 12/15/13 | | | 125,000 | | | 128,269 |
JC Penny Co., Inc. | | | | | | |
7.40%, 04/01/37D | | | 50,000 | | | 56,111 |
JPM Capital Trust II | | | | | | |
7.95%, 02/01/27D | | | 700,000 | | | 745,956 |
JPMorgan Chase & Co. | | | | | | |
5.75%, 01/02/13 | | | 320,000 | | | 330,484 |
Kansas City Southern Railway | | | | | | |
9.50%, 10/01/08 | | | 119,000 | | | 129,413 |
Kerr-McGee Corporation | | | | | | |
7.88%, 09/15/31D | | | 550,000 | | | 655,410 |
L-3 Communications Corporation | | | | | | |
7.63%, 06/15/12 | | | 250,000 | | | 264,375 |
6.38%, 10/15/15 144A | | | 250,000 | | | 250,625 |
La Quinta Properties, Inc. | | | | | | |
7.00%, 08/15/12 | | | 20,000 | | | 21,750 |
Lamar Media Corporation | | | | | | |
7.25%, 01/01/13 | | | 110,000 | | | 114,675 |
Lehman Brothers Holdings, Inc. | | | | | | |
4.00%, 01/22/08D | | | 570,000 | | | 560,832 |
Liberty Media Corporation | | | | | | |
7.88%, 07/15/09D | | | 10,000 | | | 10,587 |
5.70%, 05/15/13D | | | 25,000 | | | 23,419 |
3.75%, 02/15/30 CONV | | | 40,000 | | | 22,250 |
Liberty Mutual Group | | | | | | |
5.75%, 03/15/14 144A | | | 250,000 | | | 247,167 |
See Notes to Financial Statements.
63
Medium-Duration Bond Fund
SCHEDULE OF INVESTMENTS (Continued)
| | | | | | |
| | | Par | | Value |
7.00%, 03/15/34 144A | | $ | 75,000 | | $ | 77,582 |
Lockheed Martin Corporation | | | | | | |
8.50%, 12/01/29 | | | 190,000 | | | 259,743 |
Lyondell Chemical Co. | | | | | | |
9.63%, 05/01/07 | | | 48,000 | | | 50,340 |
MacDermid, Inc. | | | | | | |
9.13%, 07/15/11 | | | 111,000 | | | 118,076 |
Merrill Lynch & Co., Inc. | | | | | | |
3.38%, 09/14/07 | | | 420,000 | | | 409,680 |
Millennium America, Inc. | | | | | | |
9.25%, 06/15/08 | | | 4,000 | | | 4,335 |
Mirant North America LLC | | | | | | |
7.38%, 12/31/13 144AD | | | 55,000 | | | 55,894 |
Mizuho JGB Investment LLC | | | | | | |
9.87%, 12/31/49 144A† | | | 250,000 | | | 276,639 |
New Cingular Wireless Services, Inc. | | | | | | |
7.88%, 03/01/11 | | | 100,000 | | | 112,326 |
8.13%, 05/01/12 | | | 135,000 | | | 156,179 |
NextCard Credit Card Master Note Trust | | | | | | |
10.27%, 12/15/06 | | | 910,000 | | | 79,789 |
Nextel Communications, Inc. | | | | | | |
5.95%, 03/15/14 | | | 294,000 | | | 295,919 |
7.38%, 08/01/15 | | | 130,000 | | | 137,298 |
Niagara Mohawk Power Corporation | | | | | | |
7.75%, 10/01/08 | | | 1,340,000 | | | 1,431,594 |
Nortek, Inc. | | | | | | |
8.50%, 09/01/14D | | | 125,000 | | | 121,250 |
Northrop Grumman Corporation | | | | | | |
4.08%, 11/16/06 | | | 280,000 | | | 277,896 |
Omnicare, Inc. | | | | | | |
6.88%, 12/15/15D | | | 239,000 | | | 243,780 |
Oncor Electric Delivery Co. | | | | | | |
6.38%, 01/15/15 | | | 140,000 | | | 148,817 |
Oxford Industries, Inc. | | | | | | |
8.88%, 06/01/11 | | | 60,000 | | | 61,425 |
Pacific Energy Partners LP | | | | | | |
7.13%, 06/15/14 | | | 60,000 | | | 62,100 |
Pacific Gas & Electric Co. | | | | | | |
6.05%, 03/01/34 | | | 710,000 | | | 737,342 |
Patrons’ Legacy | | | | | | |
5.65%, 01/17/17 144A | | | 640,000 | | | 644,907 |
Peabody Energy Corporation | | | | | | |
6.88%, 03/15/13D | | | 145,000 | | | 151,525 |
Pemex Project Funding Master Trust | | | | | | |
9.13%, 10/13/10 | | | 1,075,000 | | | 1,240,013 |
PHH Corporation | | | | | | |
6.00%, 03/01/08D | | | 750,000 | | | 761,384 |
Plains Exploration & Production Co. | | | | | | |
7.13%, 06/15/14D | | | 100,000 | | | 104,000 |
Pogo Producing Co. | | | | | | |
6.88%, 10/01/17 144AD | | | 60,000 | | | 58,800 |
Popular North America, Inc. | | | | | | |
6.13%, 10/15/06 | | | 200,000 | | | 201,169 |
4.25%, 04/01/08 | | | 300,000 | | | 294,398 |
3.88%, 10/01/08 | | | 250,000 | | | 241,758 |
PPL Capital Funding Trust I | | | | | | |
7.29%, 05/18/06 | | | 1,400,000 | | | 1,408,625 |
Pride International, Inc. | | | | | | |
7.38%, 07/15/14D | | | 130,000 | | | 140,075 |
Prudential Funding LLC | | | | | | |
6.60%, 05/15/08 144A | | | 600,000 | | | 623,858 |
PVNGS II Funding Corporation, Inc. | | | | | | |
8.00%, 12/30/15 | | | 1,719,000 | | | 1,889,380 |
Qwest Capital Funding, Inc. | | | | | | |
7.25%, 02/15/11D | | | 200,000 | | | 203,500 |
Qwest Corporation | | | | | | |
5.63%, 11/15/08D | | | 600,000 | | | 597,000 |
8.88%, 03/15/12D | | | 250,000 | | | 283,125 |
7.50%, 06/15/23 | | | 500,000 | | | 499,375 |
Rabobank Capital Funding II | | | | | | |
5.26%, 12/29/13 144A† | | | 50,000 | | | 49,616 |
Rabobank Capital Funding Trust III | | | | | | |
5.25%, 10/31/49 144A† | | | 350,000 | | | 343,882 |
Raytheon Co. | | | | | | |
6.00%, 12/15/10 | | | 5,000 | | | 5,178 |
5.50%, 11/15/12D | | | 10,000 | | | 10,242 |
5.38%, 04/01/13D | | | 115,000 | | | 116,745 |
Reader’s Digest Association, Inc. | | | | | | |
6.50%, 03/01/11 | | | 50,000 | | | 49,125 |
Russell Corporation | | | | | | |
9.25%, 05/01/10D | | | 71,000 | | | 72,331 |
Safeco Corporation | | | | | | |
4.20%, 02/01/08 | | | 450,000 | | | 442,896 |
SBC Communications, Inc. | | | | | | |
4.13%, 09/15/09 | | | 425,000 | | | 410,736 |
5.10%, 09/15/14 | | | 430,000 | | | 420,787 |
SemGroup LP | | | | | | |
8.75%, 11/15/15 144A | | | 10,000 | | | 10,275 |
Simon Property Group LP | | | | | | |
7.38%, 01/20/06 | | | 900,000 | | | 900,932 |
Sinclair Broadcast Group, Inc. | | | | | | |
8.00%, 03/15/12 | | | 20,000 | | | 20,700 |
SLM Corporation | | | | | | |
4.77%, 04/01/09† | | | 1,100,000 | | | 1,064,503 |
Solo Cup Co. | | | | | | |
8.50%, 02/15/14D | | | 45,000 | | | 39,600 |
Sonat, Inc. | | | | | | |
7.63%, 07/15/11D | | | 460,000 | | | 470,350 |
Southern California Edison Co. | | | | | | |
6.38%, 01/15/06 | | | 500,000 | | | 500,177 |
Southern Natural Gas Co. | | | | | | |
8.88%, 03/15/10D | | | 130,000 | | | 139,583 |
8.00%, 03/01/32 | | | 400,000 | | | 440,605 |
Sovereign Bancorp, Inc. | | | | | | |
4.72%, 08/25/06† | | | 300,000 | | | 300,267 |
Sovereign Bank | | | | | | |
4.38%, 08/01/13† | | | 525,000 | | | 515,578 |
Sprint Capital Corporation | | | | | | |
4.78%, 08/17/06 STEP | | | 710,000 | | | 709,537 |
6.00%, 01/15/07 | | | 290,000 | | | 292,908 |
6.13%, 11/15/08 | | | 310,000 | | | 318,984 |
7.63%, 01/30/11 | | | 250,000 | | | 275,974 |
8.38%, 03/15/12 | | | 300,000 | | | 348,118 |
6.88%, 11/15/28D | | | 550,000 | | | 602,777 |
Suburban Propane Partners LP | | | | | | |
6.88%, 12/15/13 | | | 120,000 | | | 112,800 |
Sungard Data Systems, Inc. | | | | | | |
9.13%, 08/15/13 144AD | | | 120,000 | | | 124,800 |
See Notes to Financial Statements.
64
| | | | | | |
| | | Par | | Value |
TCI Communications Financing III | | | | | | |
9.65%, 03/31/27 | | $ | 2,610,000 | | $ | 2,825,119 |
Tenet Healthcare Corporation | | | | | | |
9.88%, 07/01/14 | | | 170,000 | | | 172,975 |
9.25%, 02/01/15 144AD | | | 1,655,000 | | | 1,650,863 |
Terex Corporation | | | | | | |
7.38%, 01/15/14 | | | 20,000 | | | 19,900 |
Time Warner Entertainment Co. LP | | | | | | |
8.38%, 07/15/33 | | | 320,000 | | | 379,125 |
Time Warner, Inc. | | | | | | |
6.88%, 05/01/12 | | | 110,000 | | | 117,243 |
7.70%, 05/01/32 | | | 1,310,000 | | | 1,477,732 |
Transcontinental Gas Pipe Line Corporation | | | | | | |
5.43%, 04/15/08 144A† | | | 1,500,000 | | | 1,517,624 |
TXU Corporation | | | | | | |
4.80%, 11/15/09 | | | 500,000 | | | 483,436 |
6.50%, 11/15/24 | | | 275,000 | | | 262,452 |
6.55%, 11/15/34D | | | 1,080,000 | | | 1,025,890 |
TXU Energy Co. LLC | | | | | | |
4.92%, 01/17/06 144A† | | | 700,000 | | | 699,979 |
7.00%, 03/15/13 | | | 150,000 | | | 160,076 |
Tyco International Group SA Participation Certificate Trust | | | | | | |
4.44%, 06/15/07 144A@ | | | 400,000 | | | 395,249 |
Tyson Foods, Inc. | | | | | | |
7.25%, 10/01/06 | | | 100,000 | | | 101,620 |
Unilever Capital Corporation | | | | | | |
7.13%, 11/01/10 | | | 285,000 | | | 310,639 |
Union Pacific Corporation | | | | | | |
6.65%, 01/15/11 | | | 260,000 | | | 277,245 |
United Air Lines, Inc. | | | | | | |
9.21%, 01/21/17#@ | | | 200,000 | | | 141,607 |
9.56%, 10/19/18#@ | | | 262,152 | | | 165,888 |
United Telephone Co. of Kansas | | | | | | |
6.89%, 07/01/08@ | | | 500,000 | | | 510,094 |
Ventas Realty LP | | | | | | |
8.75%, 05/01/09D | | | 70,000 | | | 75,950 |
9.00%, 05/01/12 | | | 30,000 | | | 34,350 |
6.50%, 06/01/16 144A | | | 70,000 | | | 70,700 |
Verizon Global Funding Corporation | | | | | | |
6.88%, 06/15/12D | | | 40,000 | | | 43,466 |
7.38%, 09/01/12D | | | 480,000 | | | 536,028 |
4.38%, 06/01/13 | | | 140,000 | | | 132,796 |
Vintage Petroleum, Inc. | | | | | | |
8.25%, 05/01/12 | | | 250,000 | | | 269,375 |
Visteon Corporation | | | | | | |
8.25%, 08/01/10 | | | 150,000 | | | 128,250 |
Washington Mutual, Inc. | | | | | | |
8.25%, 04/01/10 | | | 250,000 | | | 278,617 |
Waste Management, Inc. | | | | | | |
7.75%, 05/15/32 | | | 980,000 | | | 1,213,920 |
Westlake Chemical Corporation | | | | | | |
8.75%, 07/15/11 | | | 32,000 | | | 34,400 |
Weyerhaeuser Co. | | | | | | |
6.75%, 03/15/12D | | | 705,000 | | | 749,226 |
Williams Cos., Inc. | | | | | | |
7.50%, 01/15/31D | | | 270,000 | | | 280,800 |
7.75%, 06/15/31 | | | 200,000 | | | 212,000 |
8.75%, 03/15/32D | | | 1,130,000 | | | 1,316,450 |
Xerox Corporation | | | | | | |
7.13%, 06/15/10 | | | 250,000 | | | 261,562 |
XTO Energy, Inc. | | | | | | |
7.50%, 04/15/12 | | | 43,000 | | | 48,159 |
6.25%, 04/15/13 | | | 255,000 | | | 270,651 |
| | | | | | |
TOTAL CORPORATE BONDS
(Cost $114,993,761) | | | | | | 115,059,277 |
| | | | | | |
FOREIGN BONDS — 9.5% | | | | | | |
Argentina — 0.1% | | | | | | |
Republic of Argentina | | | | | | |
4.01%, 08/03/12† | | | 250,000 | | | 197,000 |
2.00%, 01/03/16(R) | | | 660,000 | | | 389,708 |
5.83%, 12/31/33(R) | | | 630,000 | | | 243,563 |
4.75%, 12/15/35(R)W† | | | 5,252,226 | | | 83,855 |
10.23%, 12/15/35W†@D | | | 2,240,000 | | | 119,280 |
| | | | | | |
| | | | | | 1,033,406 |
| | | | | | |
Australia — 0.2% | | | | | | |
QBE Insurance Group, Ltd. | | | | | | |
5.65%, 07/01/23 144A† | | | 525,000 | | | 522,656 |
Queensland Treasury Corporation | | | | | | |
6.00%, 06/14/11(A) | | | 2,430,000 | | | 1,835,337 |
| | | | | | |
| | | | | | 2,357,993 |
| | | | | | |
Bermuda — 0.5% | | | | | | |
Arch Capital Group, Ltd. | | | | | | |
7.35%, 05/01/34 | | | 550,000 | | | 622,509 |
Endurance Specialty Holdings, Ltd. | | | | | | |
6.15%, 10/15/15D | | | 525,000 | | | 529,920 |
Intelsat, Ltd. | | | | | | |
6.50%, 11/01/13 | | | 110,000 | | | 82,500 |
8.63%, 01/15/15 144A | | | 30,000 | | | 30,450 |
Tyco International Group SA | | | | | | |
6.38%, 02/15/06 | | | 100,000 | | | 100,166 |
5.80%, 08/01/06 | | | 800,000 | | | 803,460 |
6.13%, 11/01/08 | | | 90,000 | | | 91,929 |
6.00%, 11/15/13 | | | 2,920,000 | | | 2,987,385 |
| | | | | | |
| | | | | | 5,248,319 |
| | | | | | |
Brazil — 0.5% | | | | | | |
Federal Republic of Brazil | | | | | | |
5.19%, 04/15/06†D | | | 176,000 | | | 176,116 |
14.50%, 10/15/09D | | | 900,000 | | | 1,154,250 |
5.25%, 04/15/12† | | | 114,708 | | | 113,561 |
12.50%, 01/05/16(B)D | | | 620,000 | | | 221,533 |
8.88%, 04/15/24D | | | 99,000 | | | 110,632 |
10.13%, 05/15/27D | | | 800,000 | | | 1,008,000 |
12.25%, 03/06/30 | | | 140,000 | | | 202,300 |
11.00%, 08/17/40D | | | 2,145,000 | | | 2,767,586 |
| | | | | | |
| | | | | | 5,753,978 |
| | | | | | |
Bulgaria — 0.1% | | | | | | |
Republic of Bulgaria | | | | | | |
8.25%, 01/15/15 | | | 480,000 | | | 580,848 |
| | | | | | |
Canada — 0.4% | | | | | | |
Bombardier Capital Funding LP | | | | | | |
6.13%, 05/14/07(E) | | | 250,000 | | | 301,523 |
Canadian Government Inflationary Index | | | | | | |
4.00%, 12/01/31(C) | | | 770,000 | | | 1,213,990 |
Conoco Funding Co. | | | | | | |
7.25%, 10/15/31 | | | 315,000 | | | 393,753 |
See Notes to Financial Statements.
65
Medium-Duration Bond Fund
SCHEDULE OF INVESTMENTS (Continued)
| | | | | | |
| | | Par | | Value |
General Motors Nova Scotia Finance Co. | | | | | | |
6.85%, 10/15/08 | | $ | 1,670,000 | | $ | 1,260,850 |
Hydro Quebec | | | | | | |
6.30%, 05/11/11 | | | 305,000 | | | 325,716 |
Rogers Cable, Inc. | | | | | | |
5.50%, 03/15/14 | | | 350,000 | | | 329,437 |
Rogers Wireless, Inc. | | | | | | |
7.62%, 12/15/10† | | | 250,000 | | | 259,375 |
6.38%, 03/01/14 144A | | | 100,000 | | | 100,750 |
6.38%, 03/01/14D | | | 30,000 | | | 30,225 |
7.50%, 03/15/15D | | | 10,000 | | | 10,850 |
Sun Media Corporation | | | | | | |
7.63%, 02/15/13 | | | 50,000 | | | 51,500 |
Western Oil Sands, Inc. | | | | | | |
8.38%, 05/01/12 | | | 95,000 | | | 107,231 |
| | | | | | |
| | | | | | 4,385,200 |
| | | | | | |
Cayman Islands — 0.4% | | | | | | |
ACE, Ltd. | | | | | | |
6.00%, 04/01/07 | | | 350,000 | | | 353,829 |
Petroleum Export, Ltd. | | | | | | |
4.62%, 06/15/10 144A | | | 900,000 | | | 892,020 |
4.63%, 06/15/10 144A | | | 1,200,000 | | | 1,189,360 |
Resona Preferred Global Securities Caymand, Ltd. | | | | | | |
7.19%, 07/30/15 144A†D | | | 690,000 | | | 733,331 |
Systems 2001 Asset Trust LLC | | | | | | |
6.66%, 09/15/13 144A | | | 869,394 | | | 925,709 |
| | | | | | |
| | | | | | 4,094,249 |
| | | | | | |
Chile — 0.0% | | | | | | |
Codelco, Inc. | | | | | | |
4.75%, 10/15/14 144AD | | | 210,000 | | | 203,881 |
| | | | | | |
Colombia — 0.1% | | | | | | |
Republic of Colombia | | | | | | |
11.75%, 02/25/20D | | | 605,000 | | | 839,437 |
8.13%, 05/21/24D | | | 50,000 | | | 54,250 |
| | | | | | |
| | | | | | 893,687 |
| | | | | | |
Egypt — 0.2% | | | | | | |
Egypt Government AID Bonds | | | | | | |
4.45%, 09/15/15 | | | 2,600,000 | | | 2,552,672 |
| | | | | | |
France — 2.0% | | | | | | |
French Treasury Bill | | | | | | |
1.20%, 01/05/06(E)W | | | 700,000 | | | 828,560 |
2.11%, 02/09/06(E)W | | | 900,000 | | | 1,062,948 |
2.27%, 03/23/06(E)W | | | 4,600,000 | | | 5,417,595 |
2.41%, 05/24/06(E)W | | | 8,320,000 | | | 9,755,441 |
French Treasury Note | | | | | | |
5.00%, 01/12/06(E) | | | 4,270,000 | | | 5,057,847 |
Legrand SA | | | | | | |
8.50%, 02/15/25 | | | 250,000 | | | 301,875 |
| | | | | | |
| | | | | | 22,424,266 |
| | | | | | |
Germany — 0.7% | | | | | | |
Deutsche Bundesrepublik | | | | | | |
6.50%, 07/04/27(E) | | | 2,000,000 | | | 3,400,620 |
German Treasury Bill | | | | | | |
1.61%, 01/18/06(E)W | | | 3,100,000 | | | 3,666,953 |
Kabel Deutschland GmbH | | | | | | |
10.63%, 07/01/14 144A | | | 75,000 | | | 79,313 |
| | | | | | |
| | | | | | 7,146,886 |
| | | | | | |
Guatemala — 0.0% | | | | | | |
Republic of Guatemala | | | | | | |
8.13%, 10/06/34 144A | | | 20,000 | | | 21,900 |
| | | | | | |
Hungary — 0.2% | | | | | | |
Hungary Government Bond | | | | | | |
9.25%, 10/12/07(H) | | | 461,600,000 | | | 2,248,444 |
| | | | | | |
Ireland — 0.0% | | | | | | |
Eircom Funding | | | | | | |
8.25%, 08/15/13 | | | 130,000 | | | 139,750 |
| | | | | | |
Italy — 0.2% | | | | | | |
Republic of Italy | | | | | | |
3.80%, 03/27/08(J) | | | 156,000,000 | | | 1,426,335 |
Telecom Italia Capital SA | | | | | | |
4.00%, 01/15/10 | | | 225,000 | | | 214,496 |
5.25%, 11/15/13 | | | 165,000 | | | 162,167 |
4.95%, 09/30/14 | | | 835,000 | | | 798,888 |
5.25%, 10/01/15D | | | 130,000 | | | 126,504 |
| | | | | | |
| | | | | | 2,728,390 |
| | | | | | |
Japan — 0.2% | | | | | | |
Aiful Corporation | | | | | | |
5.00%, 08/10/10 144A | | | 600,000 | | | 592,902 |
Resona Bank, Ltd. | | | | | | |
4.13%, 06/27/49 144A(E)† | | | 500,000 | | | 588,270 |
5.85%, 07/15/49 144A† | | | 475,000 | | | 473,897 |
| | | | | | |
| | | | | | 1,655,069 |
| | | | | | |
Malaysia — 0.0% | | | | | | |
Petronas Capital, Ltd. | | | | | | |
7.88%, 05/22/22 144A | | | 430,000 | | | 538,436 |
| | | | | | |
Marshall Islands — 0.0% | | | | | | |
Teekay Shipping Corporation | | | | | | |
8.88%, 07/15/11 | | | 176,000 | | | 199,760 |
| | | | | | |
Mexico — 1.1% | | | | | | |
America Movil SA de CV | | | | | | |
4.13%, 03/01/09 | | | 200,000 | | | 194,900 |
5.50%, 03/01/14 | | | 300,000 | | | 297,030 |
6.38%, 03/01/35D | | | 250,000 | | | 247,825 |
United Mexican States | | | | | | |
7.50%, 01/14/12D | | | 750,000 | | | 838,125 |
8.00%, 12/19/13(M) | | | 43,750,000 | | | 4,062,897 |
11.50%, 05/15/26D | | | 1,070,000 | | | 1,752,125 |
8.30%, 08/15/31 | | | 660,000 | | | 849,750 |
7.50%, 04/08/33 | | | 3,172,000 | | | 3,763,578 |
| | | | | | |
| | | | | | 12,006,230 |
| | | | | | |
Netherlands — 1.0% | | | | | | |
Deutsche Telekom International Finance BV | | | | | | |
8.25%, 06/15/30 | | | 600,000 | | | 765,400 |
Dutch Treasury Certificate | | | | | | |
1.96%, 01/31/06(E)W | | | 6,630,000 | | | 7,835,562 |
2.11%, 02/28/06(E)W | | | 1,500,000 | | | 1,769,624 |
TPSA Finance BV | | | | | | |
7.75%, 12/10/08 144A | | | 375,000 | | | 401,898 |
| | | | | | |
| | | | | | 10,772,484 |
| | | | | | |
Panama — 0.1% | | | | | | |
Republic of Panama | | | | | | |
9.38%, 01/16/23 | | | 560,000 | | | 704,200 |
7.13%, 01/29/26 | | | 630,000 | | | 641,025 |
8.88%, 09/30/27D | | | 30,000 | | | 35,850 |
| | | | | | |
| | | | | | 1,381,075 |
| | | | | | |
See Notes to Financial Statements.
66
| | | | | | |
| | | Par | | Value |
Peru — 0.1% | | | | | | |
Republic of Peru | | | | | | |
5.00%, 03/07/17† | | $ | 213,200 | | $ | 205,205 |
5.00%, 03/07/17 144A† | | | 492,000 | | | 466,170 |
8.75%, 11/21/33 | | | 130,000 | | | 146,900 |
| | | | | | |
| | | | | | 818,275 |
| | | | | | |
Qatar — 0.1% | | | | | | |
State of Qatar | | | | | | |
9.75%, 06/15/30 | | | 630,000 | | | 964,089 |
| | | | | | |
Russia — 1.0% | | | | | | |
Ministry Finance of Russia | | | | | | |
3.00%, 05/14/08D | | | 1,400,000 | | | 1,331,260 |
Russian Federation | | | | | | |
8.25%, 03/31/10 | | | 2,900,000 | | | 3,094,010 |
5.00%, 03/31/30 STEPD | | | 5,650,000 | | | 6,392,297 |
| | | | | | |
| | | | | | 10,817,567 |
| | | | | | |
South Korea — 0.0% | | | | | | |
Export-Import Bank of Korea | | | | | | |
5.25%, 02/10/14 144A | | | 235,000 | | | 236,435 |
| | | | | | |
United Kingdom — 0.3% | | | | | | |
BP Capital Markets PLC | | | | | | |
2.75%, 12/29/06D | | | 740,000 | | | 726,261 |
HBOS Capital Funding LP | | | | | | |
6.07%, 12/31/49 144A† | | | 600,000 | | | 620,963 |
HSBC Capital Funding LP | | | | | | |
4.61%, 12/29/49 144A†D | | | 960,000 | | | 907,767 |
Royal & Sun Alliance Insurance Group | | | | | | |
8.50%, 12/08/14(U)† | | | 150,000 | | | 308,320 |
Royal Bank of Scotland Group PLC | | | | | | |
4.50%, 12/21/07 144A† | | | 1,100,000 | | | 1,100,381 |
| | | | | | |
| | | | | | 3,663,692 |
| | | | | | |
Venezuela — 0.0% | | | | | | |
Petrozuata Finance, Inc. | | | | | | |
8.22%, 04/01/17 144A | | | 140,000 | | | 131,600 |
| | | | | | |
TOTAL FOREIGN BONDS
(Cost $102,029,219) | | | | | | 104,998,581 |
| | | | | | |
MORTGAGE-BACKED SECURITIES — 58.6% | | | | | | |
ABN Amro Mortgage Corporation | | | | | | |
15.02%, 06/25/33 IOW@ | | | 837,261 | | | 85,644 |
Bear Stearns Adjustable Rate Mortgage Trust | | | | | | |
5.62%, 02/25/33† | | | 430,050 | | | 429,734 |
3.51%, 06/25/34† | | | 1,300,000 | | | 1,244,948 |
Bear Stearns Alt-A Trust | | | | | | |
4.70%, 02/25/34 STEP† | | | 364,956 | | | 365,275 |
5.42%, 05/25/35† | | | 1,405,597 | | | 1,402,896 |
Chevy Chase Funding LLC | | | | | | |
4.39%, 07/25/34 | | | 1,134,670 | | | 1,136,718 |
Commercial Mortgage Pass-Through Certificates | | | | | | |
4.55%, 03/15/20 144A† | | | 1,800,000 | | | 1,799,768 |
Commerical Mortgage Asset Trust | | | | | | |
7.55%, 01/17/10† | | | 440,000 | | | 473,632 |
Countrywide Alternative Loan Trust | | | | | | |
4.73%, 09/25/35† | | | 6,492,284 | | | 6,487,428 |
4.71%, 10/25/35 STEP† | | | 4,078,251 | | | 4,077,714 |
4.67%, 11/20/35† | | | 1,987,426 | | | 1,988,309 |
4.69%, 11/20/35† | | | 3,463,586 | | | 3,466,186 |
4.70%, 12/20/35† | | | 6,178,456 | | | 6,185,827 |
4.49%, 12/25/35† | | | 2,107,305 | | | 2,107,065 |
4.68%, 12/25/35 STEP† | | | 2,488,988 | | | 2,489,660 |
4.65%, 02/25/36 STEP† | | | 2,700,000 | | | 2,700,000 |
Credit-Based Asset Servicing and Securitization | | | | | | |
4.67%, 08/25/33† | | | 376,040 | | | 376,359 |
CS First Boston Mortgage Securities Corporation | | | | | | |
15.77%, 04/25/33 IOW@ | | | 100,003 | | | 6,089 |
14.67%, 05/25/33 IOW@ | | | 94,694 | | | 4,393 |
0.00%, 06/25/33 IOW@ | | | 71,738 | | | 4,110 |
11.63%, 07/25/33 IOW†@ | | | 689,127 | | | 5,455 |
15.57%, 07/25/33 IOW@ | | | 901,038 | | | 58,707 |
11.69%, 08/25/33 IOW†@ | | | 765,548 | | | 5,005 |
Fannie Mae Grantor Trust | | | | | | |
4.42%, 07/25/35 STEP† | | | 64,494 | | | 64,502 |
Federal Home Loan Mortgage Corporation | | | | | | |
8.00%, 10/01/07 | | | 667 | | | 676 |
5.50%, 08/15/14 | | | 117,194 | | | 117,078 |
7.00%, 11/01/14 | | | 141,551 | | | 146,910 |
7.00%, 04/01/15 | | | 109,610 | | | 113,759 |
8.00%, 06/01/15 | | | 6,272 | | | 6,406 |
7.00%, 12/01/15 | | | 84,317 | | | 87,505 |
6.00%, 04/15/16 | | | 273,812 | | | 274,706 |
8.50%, 06/01/16 | | | 16,612 | | | 17,864 |
8.50%, 06/01/18 | | | 15,003 | | | 16,134 |
8.00%, 04/15/22 POW@ | | | 58,588 | | | 58,306 |
8.00%, 08/01/24 | | | 10,484 | | | 11,210 |
5.00%, 10/01/25 | | | 1,985,858 | | | 1,939,936 |
5.50%, 11/01/25 | | | 1,994,709 | | | 1,991,800 |
5.50%, 01/01/26 TBA | | | 1,000,000 | | | 997,266 |
7.50%, 11/01/29 | | | 34,214 | | | 35,936 |
6.50%, 12/01/29 | | | 649,773 | | | 668,888 |
7.50%, 12/01/29 | | | 53,201 | | | 55,879 |
7.50%, 02/01/31 | | | 54,218 | | | 56,907 |
5.61%, 07/01/31† | | | 113,707 | | | 115,493 |
5.62%, 08/01/31† | | | 78,914 | | | 80,288 |
7.50%, 11/01/31 | | | 60,959 | | | 63,978 |
6.50%, 12/01/31 | | | 208,143 | | | 213,972 |
5.35%, 04/01/32† | | | 48,782 | | | 48,899 |
6.50%, 12/01/32 | | | 3,865,188 | | | 3,969,820 |
4.27%, 03/01/34† | | | 26,745 | | | 26,164 |
6.50%, 07/01/34 | | | 1,560,170 | | | 1,599,006 |
5.50%, 05/01/35 | | | 2,918,763 | | | 2,892,616 |
5.00%, 01/01/36 TBA | | | 2,200,000 | | | 2,129,186 |
5.00%, 01/12/36 TBA | | | 7,500,000 | | | 7,258,590 |
4.56%, 07/25/44† | | | 6,887,682 | | | 6,990,129 |
Federal Housing Administration | | | | | | |
7.43%, 10/01/18 | | | 401,232 | | | 397,164 |
Federal National Mortgage Association | | | | | | |
6.50%, 05/25/08 | | | 250,445 | | | 253,235 |
20.00%, 10/25/08 IOW†@ | | | 431,494 | | | 26,842 |
8.00%, 06/01/15 | | | 81,509 | | | 87,042 |
8.00%, 06/15/15 | | | 72,140 | | | 77,038 |
8.00%, 07/01/15 | | | 66,722 | | | 71,251 |
8.00%, 09/01/15 | | | 117,488 | | | 125,463 |
6.00%, 10/25/15 | | | 180,724 | | | 180,679 |
5.00%, 12/25/15 | | | 471,068 | | | 470,351 |
6.00%, 05/01/16 | | | 257,022 | | | 262,734 |
See Notes to Financial Statements.
67
Medium-Duration Bond Fund
SCHEDULE OF INVESTMENTS (Continued)
| | | | | | |
| | | Par | | Value |
6.00%, 07/01/16 | | $ | 44,949 | | $ | 45,947 |
6.00%, 02/01/17 | | | 661,310 | | | 675,957 |
5.00%, 12/01/17 | | | 1,143,790 | | | 1,133,084 |
4.50%, 01/01/18 | | | 37,503 | | | 36,593 |
5.00%, 01/01/18 | | | 2,743,180 | | | 2,718,082 |
5.00%, 02/01/18 | | | 150,878 | | | 149,481 |
5.50%, 02/01/18 | | | 299,870 | | | 301,825 |
4.50%, 04/01/18 | | | 932,101 | | | 909,094 |
4.50%, 05/01/18 | | | 44,114 | | | 43,025 |
4.50%, 06/01/18 | | | 1,181,650 | | | 1,152,484 |
4.50%, 07/01/18 | | | 101,471 | | | 98,966 |
4.50%, 08/01/18 | | | 296,683 | | | 289,358 |
4.50%, 09/01/18 | | | 143,090 | | | 139,558 |
4.00%, 05/01/19 | | | 10,941,394 | | | 10,465,891 |
5.50%, 01/01/20 TBA | | | 3,000,000 | | | 3,017,814 |
5.50%, 01/01/21 TBA | | | 10,800,000 | | | 10,864,130 |
4.49%, 08/25/21 IOW@ | | | 402 | | | 10,226 |
8.00%, 10/25/21 IOW@ | | | 790 | | | 17,620 |
18.91%, 01/25/22† | | | 319,231 | | | 379,182 |
4.04%, 03/25/22† | | | 373,045 | | | 366,777 |
9.50%, 05/01/22 | | | 10,898 | | | 11,935 |
4.01%, 07/01/22† | | | 61,735 | | | 62,687 |
6.00%, 01/01/23 | | | 240,929 | | | 245,163 |
9.50%, 07/01/24 | | | 20,895 | | | 22,817 |
4.22%, 07/01/27† | | | 68,792 | | | 68,970 |
5.21%, 08/01/27† | | | 230,849 | | | 235,905 |
4.22%, 11/01/27† | | | 115,551 | | | 115,849 |
6.50%, 12/25/28 | | | 96,348 | | | 96,214 |
6.50%, 12/01/29 | | | 390,890 | | | 402,777 |
7.39%, 02/01/30† | | | 200,058 | | | 202,279 |
4.98%, 05/25/30† | | | 3,432,126 | | | 3,443,616 |
5.55%, 06/01/30† | | | 160,645 | | | 165,302 |
8.00%, 10/01/30 | | | 115,602 | | | 123,486 |
4.82%, 10/18/30† | | | 107,938 | | | 108,760 |
5.66%, 12/01/30† | | | 36,174 | | | 37,072 |
4.22%, 01/01/31† | | | 28,873 | | | 29,007 |
5.66%, 04/01/31† | | | 43,085 | | | 44,337 |
6.42%, 05/01/31† | | | 20,423 | | | 20,812 |
5.36%, 06/01/31† | | | 47,308 | | | 48,384 |
5.38%, 06/01/31† | | | 95,776 | | | 97,966 |
5.49%, 06/01/31† | | | 64,818 | | | 66,493 |
6.00%, 01/01/32 | | | 145,003 | | | 146,651 |
6.00%, 03/01/32 | | | 489,688 | | | 495,344 |
6.50%, 03/01/32 | | | 626,753 | | | 648,971 |
6.00%, 04/01/32 | | | 1,190,331 | | | 1,203,675 |
4.22%, 06/01/32† | | | 35,651 | | | 35,855 |
4.01%, 08/01/32† | | | 56,029 | | | 56,251 |
5.00%, 01/01/33 TBA | | | 7,500,000 | | | 7,417,965 |
4.50%, 01/15/33 TBA | | | 3,000,000 | | | 2,824,686 |
3.57%, 02/01/33† | | | 61,832 | | | 62,882 |
4.01%, 05/01/33† | | | 142,575 | | | 143,202 |
5.50%, 01/01/34 TBA | | | 27,000,000 | | | 26,730,000 |
5.50%, 04/01/34 | | | 19,850,265 | | | 19,704,693 |
5.50%, 09/01/34 | | | 18,903,053 | | | 18,736,054 |
4.50%, 10/01/34 | | | 368,358 | | | 348,329 |
4.50%, 11/01/34 | | | 1,493,610 | | | 1,410,676 |
5.50%, 11/01/34 | | | 24,153,120 | | | 23,939,739 |
6.50%, 11/01/34 | | | 353,329 | | | 362,485 |
4.50%, 12/01/34 | | | 499,561 | | | 471,548 |
4.71%, 12/01/34† | | | 1,295,591 | | | 1,287,659 |
6.50%, 12/01/34 | | | 498,144 | | | 512,055 |
4.50%, 02/01/35 | | | 529,975 | | | 500,257 |
5.50%, 02/01/35 | | | 31,338,761 | | | 31,061,899 |
4.50%, 03/01/35 | | | 2,092,761 | | | 1,972,000 |
4.50%, 04/01/35 | | | 1,060,330 | | | 998,588 |
4.50%, 05/01/35 | | | 869,311 | | | 818,692 |
5.50%, 09/01/35 | | | 1,989,617 | | | 1,970,549 |
6.00%, 10/01/35 | | | 297,680 | | | 300,502 |
2.73%, 11/01/35† | | | 799,317 | | | 809,650 |
3.40%, 11/01/35† | | | 798,262 | | | 813,050 |
4.07%, 11/01/35† | | | 896,170 | | | 904,308 |
4.22%, 11/01/35† | | | 58,495 | | | 58,853 |
4.50%, 11/01/35† | | | 798,691 | | | 808,287 |
4.81%, 11/01/35† | | | 799,073 | | | 817,512 |
6.00%, 11/01/35 | | | 998,919 | | | 1,008,388 |
4.50%, 01/01/36 TBA | | | 1,800,000 | | | 1,694,812 |
5.50%, 01/01/36 TBA | | | 23,000,000 | | | 22,770,000 |
6.00%, 01/01/36 TBA | | | 8,300,000 | | | 8,375,215 |
6.50%, 01/01/36 TBA | | | 3,700,000 | | | 3,794,812 |
5.00%, 01/12/36 TBA | | | 63,800,000 | | | 61,806,250 |
5.50%, 01/12/36 TBA | | | 114,200,000 | | | 113,058,000 |
6.00%, 01/12/36 TBA | | | 8,000,000 | | | 8,072,496 |
6.00%, 02/13/36 TBA | | | 4,000,000 | | | 4,031,248 |
4.49%, 05/01/36† | | | 755,506 | | | 760,326 |
4.22%, 12/01/37† | | | 269,554 | | | 271,226 |
4.22%, 01/01/38† | | | 121,294 | | | 122,051 |
4.56%, 06/01/40† | | | 286,524 | | | 284,302 |
4.56%, 10/01/40† | | | 819,888 | | | 832,275 |
4.22%, 11/01/40† | | | 98,456 | | | 99,077 |
Federal Republic of Brazil | | | | | | |
4.31%, 04/15/12 | | | 336,475 | | | 333,110 |
FFCA Secured Lending Corporation | | | | | | |
8.00%, 07/18/20 IO 144AW†@ | | | 2,447,619 | | | 95,610 |
First Horizon Alternative Mortgage Securities | | | | | | |
4.77%, 06/25/34† | | | 1,608,777 | | | 1,596,044 |
First Nationwide Trust | | | | | | |
8.50%, 09/25/31 | | | 12,299 | | | 12,259 |
First Union Commercial Mortgage Securities, Inc. | | | | | | |
7.38%, 04/18/07 | | | 2,895,489 | | | 2,941,710 |
First Union National Bank Commercial Mortgage Trust | | | | | | |
7.20%, 10/01/32 | | | 1,500,000 | | | 1,624,765 |
GMAC Commercial Mortgage Securities, Inc. | | | | | | |
6.87%, 08/15/07 | | | 358,922 | | | 366,872 |
6.28%, 11/15/39 | | | 2,000,000 | | | 2,110,506 |
Government National Mortgage Association | | | | | | |
7.00%, 10/15/25 | | | 69,930 | | | 73,609 |
7.00%, 01/15/26 | | | 40,737 | | | 42,884 |
7.00%, 07/15/27 | | | 305,849 | | | 321,668 |
7.00%, 12/15/27 | | | 4,198 | | | 4,415 |
7.00%, 01/15/28 | | | 34,071 | | | 35,806 |
7.00%, 03/15/28 | | | 375,831 | | | 395,300 |
7.00%, 07/15/28 | | | 43,713 | | | 45,940 |
7.50%, 07/15/28 | | | 16,049 | | | 16,897 |
6.50%, 08/15/28 | | | 48,870 | | | 51,171 |
7.00%, 08/15/28 | | | 61,526 | | | 64,660 |
7.50%, 08/15/28 | | | 42,417 | | | 44,658 |
6.50%, 09/15/28 | | | 233,998 | | | 245,015 |
7.00%, 10/15/28 | | | 82,302 | | | 86,495 |
7.50%, 03/15/29 | | | 95,927 | | | 101,064 |
7.50%, 11/15/29 | | | 101,218 | | | 106,508 |
4.13%, 11/20/29†D | | | 253,117 | | | 254,893 |
8.50%, 08/15/30 | | | 8,399 | | | 9,066 |
See Notes to Financial Statements.
68
| | | | | | |
| | | Par | | Value |
8.50%, 11/20/30 | | $ | 63,772 | | $ | 68,583 |
6.50%, 08/15/31 | | | 345,441 | | | 360,597 |
7.50%, 08/15/31 | | | 116,290 | | | 122,290 |
6.50%, 10/15/31 | | | 603,679 | | | 630,395 |
6.00%, 11/15/31 | | | 1,253,867 | | | 1,284,039 |
6.50%, 11/15/31 | | | 468,728 | | | 489,293 |
6.00%, 12/15/31 | | | 447,682 | | | 458,454 |
6.00%, 01/15/32 | | | 779,412 | | | 799,011 |
6.00%, 02/15/32 | | | 1,061,851 | | | 1,087,402 |
6.50%, 02/15/32 | | | 856,922 | | | 895,072 |
7.50%, 02/15/32 | | | 47,132 | | | 49,563 |
17.17%, 02/16/32† | | | 336,122 | | | 416,313 |
6.00%, 04/15/32 | | | 890,951 | | | 913,356 |
6.50%, 04/15/32 | | | 655,021 | | | 683,760 |
7.50%, 04/15/32 | | | 179,377 | | | 188,627 |
6.50%, 06/15/32 | | | 2,078,775 | | | 2,171,479 |
6.50%, 07/15/32 | | | 309,645 | | | 323,230 |
6.50%, 08/15/32 | | | 1,168,327 | | | 1,219,587 |
6.50%, 09/15/32 | | | 954,526 | | | 996,405 |
6.00%, 10/15/32 | | | 853,134 | | | 873,663 |
6.00%, 11/15/32 | | | 900,983 | | | 922,898 |
6.00%, 12/15/32 | | | 388,928 | | | 398,287 |
6.50%, 12/15/32 | | | 54,854 | | | 57,261 |
6.00%, 01/15/33 | | | 404,129 | | | 413,853 |
6.00%, 02/15/33D | | | 329,494 | | | 337,423 |
6.50%, 03/15/33 | | | 265,253 | | | 276,891 |
5.00%, 04/15/33 | | | 400,758 | | | 396,067 |
6.50%, 04/15/33 | | | 2,505,838 | | | 2,615,782 |
5.00%, 05/15/33D | | | 2,770,911 | | | 2,738,335 |
5.00%, 05/15/33 | | | 268,946 | | | 265,798 |
6.00%, 05/15/33 | | | 3,055,654 | | | 3,129,182 |
6.50%, 05/15/33 | | | 127,886 | | | 133,497 |
5.00%, 06/15/33 | | | 480,500 | | | 474,876 |
6.00%, 06/15/33 | | | 356,617 | | | 365,198 |
5.00%, 07/15/33 | | | 979,226 | | | 967,764 |
5.00%, 08/15/33 | | | 1,732,351 | | | 1,711,007 |
5.00%, 09/15/33 | | | 1,443,560 | | | 1,425,516 |
5.00%, 10/15/33 | | | 730,344 | | | 721,407 |
6.00%, 10/15/33 | | | 1,308,292 | | | 1,339,774 |
6.50%, 10/15/33 | | | 544,083 | | | 567,955 |
5.00%, 11/15/33 | | | 92,299 | | | 91,214 |
6.00%, 12/15/33 | | | 1,276,015 | | | 1,306,719 |
5.00%, 01/15/34 | | | 602,701 | | | 595,501 |
5.00%, 03/15/34 | | | 778,921 | | | 769,617 |
5.00%, 04/15/34 | | | 281,505 | | | 278,144 |
5.00%, 05/15/34 | | | 179,498 | | | 177,353 |
5.00%, 06/15/34 | | | 1,241,555 | | | 1,226,723 |
5.00%, 08/15/34 | | | 737,546 | | | 728,735 |
5.00%, 11/15/34 | | | 1,041,713 | | | 1,029,268 |
5.00%, 11/15/34D | | | 699,246 | | | 690,893 |
5.00%, 12/15/34 | | | 1,645,315 | | | 1,625,661 |
5.00%, 01/15/35 | | | 688,768 | | | 680,158 |
5.00%, 12/01/36 TBA | | | 500,000 | | | 493,281 |
GS Mortgage Securities Corporation II | | | | | | |
4.68%, 07/10/39 | | | 1,300,000 | | | 1,266,249 |
GSMPS Mortgage Loan Trust | | | | | | |
4.61%, 02/25/35 144A† | | | 1,926,706 | | | 1,926,528 |
4.73%, 09/25/35† | | | 3,763,208 | | | 3,762,121 |
GSR Mortgage Loan Trust | | | | | | |
4.54%, 10/25/35† | | | 1,698,889 | | | 1,671,098 |
HarborView Mortgage Loan Trust | | | | | | |
4.61%, 01/19/36 STEP† | | | 992,790 | | | 992,790 |
4.62%, 01/19/36 STEP† | | | 2,985,402 | | | 2,985,402 |
4.68%, 01/01/49 STEP† | | | 986,781 | | | 987,590 |
Impac CMB Trust | | | | | | |
5.29%, 03/25/33† | | | 226,031 | | | 226,107 |
4.74%, 10/25/34† | | | 882,346 | | | 882,819 |
4.64%, 11/25/35 STEP† | | | 2,939,930 | | | 2,938,708 |
Impac Secured Assets CMN Owner Trust | | | | | | |
4.59%, 05/25/35† | | | 2,500,000 | | | 2,500,000 |
Indymac ARM Trust | | | | | | |
5.17%, 09/28/31† | | | 84,951 | | | 84,694 |
JP Morgan Chase Commercial Mortgage Securities Corporation | | | | | | |
4.90%, 09/12/37 | | | 2,900,000 | | | 2,840,568 |
LB-UBS Commercial Mortgage Trust | | | | | | |
4.66%, 07/15/30 | | | 1,000,000 | | | 972,189 |
4.74%, 07/15/30 | | | 830,000 | | | 805,020 |
6.58%, 06/15/36 IO 144AW†@ | | | 5,231,906 | | | 213,981 |
4.95%, 09/15/40 | | | 900,000 | | | 886,573 |
Lehman XS Trust | | | | | | |
4.68%, 11/25/35† | | | 6,407,670 | | | 6,407,652 |
4.64%, 01/30/40† | | | 2,500,000 | | | 2,500,000 |
Master Reperforming Loan Trust | | | | | | |
7.00%, 08/25/34 144A | | | 1,561,540 | | | 1,612,442 |
MLCC Mortgage Investors, Inc. | | | | | | |
4.45%, 09/25/27 STEP† | | | 2,011,683 | | | 2,008,665 |
Nomura Asset Acceptance Corporation | | | | | | |
5.05%, 06/25/10† | | | 3,544,153 | | | 3,517,123 |
Nomura Asset Securities Corporation | | | | | | |
7.07%, 04/13/36 | | | 83,660 | | | 83,903 |
7.12%, 04/13/36 | | | 2,000,000 | | | 2,009,022 |
Opteum Mortgage Acceptance Corporation | | | | | | |
4.55%, 08/25/35 STEP† | | | 3,579,734 | | | 3,579,657 |
Residential Asset Mortgage Products, Inc. | | | | | | |
4.56%, 07/25/41 | | | 1,699,445 | | | 1,703,526 |
Residential Asset Securitization Trust | | | | | | |
4.83%, 04/25/33† | | | 146,143 | | | 146,209 |
Sequoia Mortgage Trust | | | | | | |
4.18%, 07/20/33† | | | 967,544 | | | 969,669 |
4.38%, 11/20/34 STEP† | | | 1,104,682 | | | 1,104,314 |
Structured Adjustable Rate Mortgage Loan Trust | | | | | | |
4.72%, 08/25/35† | | | 3,420,171 | | | 3,411,955 |
Structured Asset Mortgage Investments, Inc. | | | | | | |
4.69%, 12/25/35 STEP† | | | 3,553,458 | | | 3,550,257 |
Structured Asset Securities Corporation | | | | | | |
7.50%, 07/25/16 | | | 15,112 | | | 15,069 |
Washington Mutual, Inc. | | | | | | |
11.53%, 01/25/08 IOW†@ | | | 932,401 | | | 14,265 |
11.12%, 05/25/08 IOW@ | | | 1,973,965 | | | 10,267 |
11.19%, 06/25/08 IOW†@ | | | 3,139,349 | | | 42,197 |
4.65%, 12/25/27 STEP† | | | 4,354,953 | | | 4,351,745 |
4.68%, 02/25/33† | | | 189,943 | | | 188,210 |
4.73%, 06/25/42† | | | 255,826 | | | 254,227 |
See Notes to Financial Statements
69
Medium-Duration Bond Fund
SCHEDULE OF INVESTMENTS (Continued)
| | | | | | |
| | | Par | | Value |
4.67%, 07/25/45 STEP† | | $ | 3,706,261 | | $ | 3,698,491 |
4.70%, 07/25/45† | | | 3,932,540 | | | 3,929,525 |
4.70%, 08/25/45† | | | 10,771,882 | | | 10,771,882 |
4.67%, 10/25/45 STEP† | | | 8,563,296 | | | 8,546,947 |
4.64%, 11/25/45† | | | 2,967,489 | | | 2,965,982 |
4.64%, 12/25/45† | | | 2,500,000 | | | 2,500,000 |
4.66%, 12/25/45† | | | 5,300,000 | | | 5,298,938 |
12.40%, 01/01/49IOW†@ | | | 2,414,682 | | | 15,132 |
Wells Fargo Mortgage-Backed Securities Trust | | | | | | |
3.54%, 09/25/34† | | | 2,440,000 | | | 2,342,467 |
4.98%, 10/25/35† | | | 2,735,971 | | | 2,724,162 |
| | | | | | |
TOTAL MORTGAGE-BACKED SECURITIES
(Cost $645,490,823) | | | | | | 644,901,219 |
| | | | | | |
MUNICIPAL BONDS — 1.1% | | | | | | |
Las Vegas Valley, Nevada Water District, Series A General Obligation Bond (FGIC Insured) | | | | | | |
5.00%, 06/01/32 | | | 1,000,000 | | | 1,034,150 |
Liberty Development Corporation | | | | | | |
5.25%, 10/01/35 | | | 320,000 | | | 363,693 |
Massachusetts State Special Obligation, Series A Revenue Bond, Pre-refunded 06/01/12 @ 100 (FGIC Insured) | | | | | | |
5.00%, 06/01/12 | | | 2,945,000 | | | 3,152,799 |
Massachusetts State Water Resources Authority, Series J Revenue Bond (FSA Insured) | | | | | | |
5.00%, 08/01/32 | | | 1,250,000 | | | 1,289,487 |
Minnesota State General Obligation Bond | | | | | | |
5.00%, 10/01/20 | | | 200,000 | | | 211,836 |
New York City, New York Industrial Development Agency, American Airlines - JFK International Airport, Revenue Bond (Guaranty Agreement - AMR Corporation) | | | | | | |
7.63%, 08/01/25† | | | 230,000 | | | 236,445 |
New York State Urban Development Corporation, Series A Revenue Bond, Pre-refunded 03/15/12 @ 100 | | | | | | |
5.13%, 03/15/12 | | | 1,500,000 | | | 1,633,740 |
South Carolina Transportation Infrastructure Bank, Series A Revenue Bond (AMBAC Insured) | | | | | | |
5.00%, 10/01/23 | | | 2,700,000 | | | 2,817,369 |
Virginia State Housing Development Authority, Commonwealth Mortgage, Series H Revenue Bond (MBIA Insured) | | | | | | |
5.38%, 07/01/36 | | | 1,000,000 | | | 1,034,270 |
| | | | | | |
TOTAL MUNICIPAL BONDS
(Cost $11,055,295) | | | | | | 11,773,789 |
| | | | | | |
| | |
| | | Number of
Contracts | | |
PURCHASED OPTIONS — 0.1% | | | | | | |
Call Options — 0.0% | | | | | | |
90-Day Eurodollar Futures, Strike Price $94.50, Expires 03/13/06 | | | 23 | | | 1,668 |
90-Day Eurodollar Futures, Strike Price $95.25, Expires 03/13/06 | | | 156 | | | 22,425 |
90-Day Eurodollar Futures, Strike Price $95.25, Expires 06/19/06 | | | 165 | | | 41,250 |
| | | | | | |
| | | | | | 65,343 |
| | | | | | |
Call Swaptions — 0.1% | | | | | | |
3-Month LIBOR, Strike Price $4.25, Expires 10/12/06 | | | 1,030 | | | 14,729 |
3-Month LIBOR, Strike Price $4.25, Expires 10/19/06 | | | 910 | | | 13,568 |
3-Month LIBOR, Strike Price $4.25, Expires 10/24/06 | | | 920 | | | 14,113 |
3-Month LIBOR, Strike Price $4.50, Expires 10/18/06 | | | 2,250 | | | 62,370 |
3-Month LIBOR, Strike Price $4.75, Expires 08/10/06 | | | 450 | | | 16,744 |
3-Month LIBOR, Strike Price $5.75, Expires 04/27/09 | | | 280 | | | 363,342 |
| | | | | | |
| | | | | | 484,866 |
| | | | | | |
Put Options — 0.0% | | | | | | |
5-Year U.S. Treasury Note Futures, Strike Price $101.50, Expires 02/24/06 | | | 154 | | | 240 |
90-Day Eurodollar Futures, Strike Price $91.75, Expires 12/18/06 | | | 199 | | | 1,244 |
| | | | | | |
| | | | | | 1,484 |
| | | | | | |
Put Swaptions — 0.0% | | | | | | |
30-Year Federal National Mortgage Association, Strike Price $92.25, Expires 01/05/06 | | | 2,090 | | | 684 |
30-Year Federal National Mortgage Association, Strike Price $94.38, Expires 01/05/06 | | | 4,300 | | | 5,388 |
3-Month LIBOR, Strike Price $6.25, Expires 04/27/09 | | | 280 | | | 83,798 |
| | | | | | |
| | | | | | 89,870 |
| | | | | | |
TOTAL PURCHASED OPTIONS
(Cost $680,564) | | | | | | 641,563 |
| | | | | | |
| | |
| | | Shares | | |
PREFERRED STOCK — 0.1% | | | | | | |
CORTS Trust for Ford Motor Co. | | | 9,100 | | | 145,782 |
Fannie Mae†D | | | 15,290 | | | 833,305 |
General Motors Corporation CONV | | | 51,150 | | | 762,135 |
| | | | | | |
TOTAL PREFERRED STOCK
(Cost $1,834,341) | | | | | | 1,741,222 |
| | | | | | |
See Notes to Financial Statements.
70
| | | | | | | | |
| | | Shares | | | Value | |
RIGHTS/WARRANTS — 0.0% | | | | | | | | |
United Mexican States Recovery Rights Series D, | | | | | | | | |
06/30/06 | | | 1,100,000 | | | $ | 22,605 | |
United Mexican States Recovery Rights Series E, | | | | | | | | |
06/30/07* | | | 1,100,000 | | | | 28,875 | |
United Mexican States | | | | | | | | |
Warrants, 09/01/06@* | | | 170,000 | | | | 5,950 | |
| | | | | | | | |
TOTAL RIGHTS/WARRANTS
(Cost $5,950) | | | | | | | 57,430 | |
| | | | | | | | |
MONEY MARKET FUNDS — 29.0% | | | | | | | | |
GuideStone Funds Money Market Fund (GS4 Class)¥ | | | 85,737,738 | | | | 85,737,738 | |
Northern Institutional Liquid Assets Portfolio§ | | | 233,776,896 | | | | 233,776,896 | |
| | | | | | | | |
TOTAL MONEY MARKET FUNDS
(Cost $319,514,634) | | | | | | | 319,514,634 | |
| | | | | | | | |
| | |
| | | Par | | | | |
U.S. TREASURY OBLIGATIONS — 20.9% | | | | | | | | |
U.S. Treasury Bills | | | | | | | | |
3.81%, 03/16/06‡‡ | | $ | 80,000 | | | | 79,376 | |
3.83%, 03/16/06‡‡ | | | 370,000 | | | | 367,113 | |
| | | | | | | | |
| | | | | | | 446,489 | |
| | | | | | | | |
U.S. Treasury Bonds | | | | | | | | |
9.00%, 11/15/18D | | | 7,500,000 | | | | 10,725,000 | |
8.50%, 02/15/20D | | | 2,300,000 | | | | 3,227,187 | |
6.25%, 08/15/23D | | | 2,400,000 | | | | 2,866,690 | |
6.25%, 05/15/30D | | | 850,000 | | | | 1,055,926 | |
| | | | | | | | |
| | | | | | | 17,874,803 | |
| | | | | | | | |
U.S. Treasury Inflationary Index | | | | | | | | |
Bonds | | | | | | | | |
3.38%, 01/15/07D | | | 170,000 | | | | 215,349 | |
4.25%, 01/15/10D | | | 640,000 | | | | 821,579 | |
0.88%, 04/15/10D | | | 3,110,000 | | | | 3,109,438 | |
1.88%, 07/15/13D | | | 1,150,000 | | | | 1,230,457 | |
2.00%, 07/15/14D | | | 1,800,000 | | | | 1,891,941 | |
1.63%, 01/15/15D | | | 1,050,000 | | | | 1,055,509 | |
1.88%, 07/15/15D | | | 15,800,000 | | | | 15,915,993 | |
2.38%, 01/15/25D | | | 1,790,000 | | | | 1,988,487 | |
3.88%, 04/15/29 | | | 4,928,000 | | | | 8,058,470 | |
3.38%, 04/15/32D | | | 60,000 | | | | 72,389 | |
| | | | | | | | |
| | | | | | | 34,359,612 | |
| | | | | | | | |
U.S. Treasury Notes | | | | | | | | |
2.50%, 09/30/06D | | | 27,700,000 | | | | 27,318,045 | |
3.00%, 02/15/08D | | | 5,360,000 | | | | 5,210,719 | |
3.38%, 02/15/08D | | | 850,000 | | | | 832,768 | |
3.75%, 05/15/08D | | | 8,900,000 | | | | 8,776,236 | |
4.38%, 11/15/08D | | | 16,000,000 | | | | 16,007,504 | |
2.63%, 03/15/09D | | | 480,000 | | | | 455,157 | |
4.00%, 06/15/09D | | | 3,240,000 | | | | 3,201,655 | |
3.63%, 07/15/09D | | | 200,000 | | | | 195,172 | |
3.38%, 10/15/09D | | | 1,400,000 | | | | 1,352,368 | |
3.50%, 12/15/09D | | | 8,000,000 | | | | 7,753,440 | |
3.63%, 01/15/10D | | | 1,300,000 | | | | 1,264,758 | |
3.50%, 02/15/10D | | | 10,500,000 | | | | 10,159,579 | |
4.00%, 04/15/10D | | | 1,980,000 | | | | 1,951,848 | |
3.88%, 05/15/10 | | | 6,500,000 | | | | 6,378,892 | |
4.25%, 10/15/10D | | | 25,360,000 | | | | 25,235,203 | |
4.50%, 11/15/10D | | | 10,470,000 | | | | 10,529,721 | |
| | |
| | | Par | | | | |
4.38%, 12/15/10D | | $ | 600,000 | | | | 600,656 | |
3.88%, 02/15/13D | | | 10,220,000 | | | | 9,909,016 | |
4.25%, 08/15/13D | | | 200,000 | | | | 198,274 | |
4.00%, 02/15/14D | | | 3,900,000 | | | | 3,795,496 | |
4.25%, 08/15/14 | | | 1,700,000 | | | | 1,681,939 | |
4.25%, 11/15/14 | | | 7,000,000 | | | | 6,920,704 | |
4.50%, 11/15/15D | | | 80,000 | | | | 80,681 | |
| | | | | | | | |
| | | | | | | 149,809,831 | |
| | | | | | | | |
U.S. Treasury STRIPS | | | | | | | | |
4.57%, 11/15/16W | | | 900,000 | | | | 550,733 | |
4.67%, 08/15/21WD | | | 1,800,000 | | | | 875,241 | |
4.67%, 11/15/21WD | | | 25,380,000 | | | | 12,180,395 | |
4.68%, 11/15/22WD | | | 1,550,000 | | | | 710,249 | |
4.69%, 08/15/24WD | | | 19,700,000 | | | | 8,309,913 | |
4.67%, 11/15/24WD | | | 5,500,000 | | | | 2,306,013 | |
4.68%, 05/15/26WD | | | 1,500,000 | | | | 584,591 | |
4.67%, 11/15/26WD | | | 3,600,000 | | | | 1,373,738 | |
4.63%, 08/15/27WD | | | 1,050,000 | | | | 390,324 | |
| | | | | | | | |
| | | | | | | 27,281,197 | |
| | | | | | | | |
TOTAL U.S. TREASURY OBLIGATIONS
(Cost $228,507,841) | | | | | | | 229,771,932 | |
| | | | | | | | |
Total Investments — 145.1%
(Cost $1,594,163,853) | | | | | | | 1,597,934,514 | |
| | | | | | | | |
| | |
| | | Number of
Contracts | | | | |
WRITTEN OPTIONS — 0.0% | | | | | | | | |
Call Options — 0.0% | | | | | | | | |
1-Year Eurodollar Mid-CRV Futures, Strike Price $95.50, Expires 03/10/06 | | | (156 | ) | | | (24,375 | ) |
90-Day Eurodollar Futures, Strike Price $95.50, Expires 06/19/06 | | | (330 | ) | | | (33,000 | ) |
| | | | | | | | |
| | | | | | | (57,375 | ) |
| | | | | | | | |
Call Swaptions — 0.0% | | | | | | | | |
3-Month LIBOR, Strike Price | | | | | | | | |
$4.00, Expires 07/03/06 | | | (1,380 | ) | | | (10,405 | ) |
3-Month LIBOR, Strike Price | | | | | | | | |
$4.30, Expires 10/12/06 | | | (440 | ) | | | (17,640 | ) |
3-Month LIBOR, Strike Price | | | | | | | | |
$4.31, Expires 10/19/06 | | | (390 | ) | | | (16,544 | ) |
3-Month LIBOR, Strike Price | | | | | | | | |
$4.31, Expires 10/24/06 | | | (400 | ) | | | (17,344 | ) |
3-Month LIBOR, Strike Price | | | | | | | | |
$4.56, Expires 10/18/06 | | | (970 | ) | | | (72,575 | ) |
3-Month LIBOR, Strike Price | | | | | | | | |
$4.78, Expires 08/10/06 | | | (190 | ) | | | (18,069 | ) |
| | | | | | | | |
| | | | | | | (152,577 | ) |
| | | | | | | | |
Put Swaptions — 0.0% | | | | | | | | |
3-Month LIBOR, Strike Price | | | | | | | | |
$6.00, Expires 07/03/06 | | | (1,380 | ) | | | (14,159 | ) |
| | | | | | | | |
TOTAL WRITTEN OPTIONS
(Premiums received $(1,021,660)) | | | | | | | (224,111 | ) |
| | | | | | | | |
Liabilities in Excess of Other | | | | | | | | |
Assets — (45.1)% | | | | | | | (496,648,618 | ) |
| | | | | | | | |
Net Assets — 100.0% | | | | | | $ | 1,101,061,785 | |
| | | | | | | | |
See Notes to Financial Statements.
71
Medium-Duration Bond Fund
SCHEDULE OF INVESTMENTS (Continued)
Swap agreements outstanding at December 31, 2005:
| | | | | | | | | | |
Description | | Expiration
Date | | Notional Value | | | Unrealized
Appreciation
(Depreciation) | |
British Pounds | | | | | | | | | | |
Receive fixed rate payments of 5.00% and pay variable rate payments on the six month LIBOR floating rate(f) | | 09/15/10 | | | 4,100,000 | | | $ | 139,356 | |
Receive fixed rate payments of 5.00% and pay variable rate payments on the six month LIBOR floating rate(d) | | 09/15/10 | | | 2,500,000 | | | | 84,973 | |
Receive fixed rate payments of 5.00% and pay variable rate payments on the six month LIBOR floating rate(f) | | 09/15/15 | | | 2,500,000 | | | | 181,928 | |
Receive variable rate payments on the six month LIBOR floating rate and pay fixed rate payments of 5.00%(d) | | 06/18/34 | | | (3,000,000 | ) | | | (472,855 | ) |
Receive variable rate payments on the six month LIBOR floating rate and pay fixed rate payments of 5.00%(i) | | 06/18/34 | | | (100,000 | ) | | | (15,762 | ) |
| | | | | | | | | | |
| | | | | | | | | (82,360 | ) |
| | | | | | | | | | |
Euros | | | | | | | | | | |
Receive fixed rate payments of 2.1455% and pay variable rate payments on the France CPI Ex Tobacco(b) | | 10/15/10 | | | 300,000 | | | | 2,365 | |
Receive variable rate payments on the six month LIBOR floating rate and pay fixed rate payments of 4.00(i) | | 12/15/14 | | | (5,500,000 | ) | | | (298,779 | ) |
Receive fixed rate payments of 4.00% and pay variable rate payments on the six month LIBOR floating rate(c) | | 12/15/14 | | | 5,500,000 | | | | 274,178 | |
Receive variable rate payments on the six month LIBOR floating rate and pay fixed rate payments of 5.50%(e) | | 12/15/31 | | | (1,900,000 | ) | | | (645,424 | ) |
| | | | | | | | | | |
| | | | | | | | | (667,660 | ) |
| | | | | | | | | | |
| | | |
Description | | Expiration
Date | | Notional Value | | | Unrealized
Appreciation
(Depreciation) | |
Japanese Yen | | | | | | | | | | |
Receive variable rate payments on the six month LIBOR floating rate and pay fixed rate payments of 1.50%(h) | | 06/15/15 | | | (210,000,000 | ) | | $ | 20,758 | |
Receive variable rate payments on the six month LIBOR floating rate and pay fixed rate payments of 1.50%(d) | | 06/15/15 | | | (80,000,000 | ) | | | 7,908 | |
| | | | | | | | | | |
| | | | | | | | | 28,666 | |
| | | | | | | | | | |
U.S. Dollars | | | | | | | | | | |
Receive fixed rate payments of 0.58% and pay floating par in the event of default on Russian Federation, 5.00% due 3/31/2030(c) | | 06/20/06 | | $ | 100,000 | | | | 136 | |
Receive fixed rate payments of 0.61% and pay floating par in the event of default on Russian Federation, 5.00% due 3/31/2030(h) | | 03/20/07 | | | 1,300,000 | | | | 3,774 | |
Receive fixed rate payments of 0.77% and pay floating par in the event of default on Russian Federation, 5.00% due 3/31/2030(g) | | 05/20/07 | | | 100,000 | | | | 532 | |
Receive floating par in the event of default on Republic of Philippines, 8.25% due 1/15/2014 and pay fixed rate of 2.47%(e) | | 09/20/08 | | | (1,000,000 | ) | | | (26,050 | ) |
Receive floating par in the event of default on Radioshack Corporation, 7.375% due 5/15/2011 and pay fixed rate payments of ..37%(b) | | 12/20/08 | | | (300,000 | ) | | | 3,426 | |
Receive floating par in event of default on Emerson Electric Co., 4.625% due 10/15/2012 and pay fixed rate payments of .22%(c) | | 12/20/08 | | | (300,000 | ) | | | (566 | ) |
Receive floating par in event of default on Devon Financing Corporation, 6.875% due 9/30/2011 and pay fixed rate payments of ..35%(h) | | 12/20/08 | | | (500,000 | ) | | | (2,530 | ) |
72 See Notes to Financial Statements.
| | | | | | | | | | |
Description | | Expiration
Date | | Notional
Value | | | Unrealized
Appreciation
(Depreciation) | |
Receive floating par in event of default on Anadarko Petroleum Corporation, 5.000% due 10/01/2012 and pay fixed rate payments of ..27%(h) | | 12/20/08 | | $ | (300,000 | ) | | $ | (680 | ) |
Receive floating par in event of default on Carnival Corporation, 6.150% due 4/15/2008 and pay fixed rate payments of .44%(b) | | 12/20/08 | | | (300,000 | ) | | | (2,609 | ) |
Receive floating par in event of default on Countrywide Home Loan, 6.250% due 4/15/2009 and pay fixed rate payments of .42%(c) | | 12/20/08 | | | (300,000 | ) | | | (1,647 | ) |
Receive floating par in event of default on Occidental Petroleum, 6.750% due 1/15/2012 and pay fixed rate payments of .28%(h) | | 12/20/08 | | | (300,000 | ) | | | (1,000 | ) |
Receive floating par in event of default on Kroger Co. 6.750% due 4/15/2012 and pay fixed rate payments of .53%(c) | | 12/20/08 | | | (300,000 | ) | | | (1,989 | ) |
Receive floating par in the event of default on Republic of Turkey, 11.875 due 1/15/2030 and pay fixed rate of 2.70%(c) | | 09/20/10 | | | (800,000 | ) | | | (42,481 | ) |
Receive floating par in the event of default on Republic of Turkey, 11.875 due 1/15/2030 and pay fixed rate of 2.25%(c) | | 09/20/10 | | | (1,000,000 | ) | | | (34,448 | ) |
Receive fixed rate payments of 5.00% and pay variable rate payments on the three month LIBOR floating rate(d) | | 06/21/11 | | | 14,500,000 | | | | 66,305 | |
Receive fixed rate payments of 5.00% and pay variable rate payments on the three month LIBOR floating rate(g) | | 06/21/16 | | | 4,600,000 | | | | 14,388 | |
| | | | | | | | | | |
| | | | | | | | | (25,439 | ) |
| | | | | | | | | | |
PORTFOLIO SUMMARY+
| | | |
| | | % | |
Mortgage-Backed Securities | | 58.6 | |
Money Market Funds | | 29.0 | |
Futures Contracts | | 26.6 | |
U.S. Treasury Obligations | | 20.9 | |
Agency Obligations | | 11.2 | |
Corporate Bonds | | 10.4 | |
Foreign Bonds | | 9.5 | |
Asset-Backed Securities | | 3.2 | |
Municipal Bonds | | 1.1 | |
Commercial Paper | | 1.0 | |
Purchased Options | | 0.1 | |
Preferred Stock | | 0.1 | |
Rights/Warrants | | — | * |
Written Options | | — | * |
Swap Agreements | | (0.1 | ) |
Forward Foreign Currency Contracts | | (4.2 | ) |
| | | |
| | 167.4 | |
| | | |
| * | Rounds to less than 0.005%. |
See Notes to Financial Statements.
73
Extended-Duration Bond Fund
The Fund is primarily comprised of investment grade fixed income securities with longer maturities. The Fund posted a positive return but slightly underperformed its composite benchmark index, 50% Lehman Brothers Long-Term Government Index and 50% Lehman Brothers Long-Term Credit Index, during the period. The Fund’s benchmark-relative performance was positively impacted by its shorter-than-benchmark duration position as well as an overweight to the Treasury/agency sector. A modest exposure to municipal bonds also benefited relative performance. The Fund’s benchmark-relative performance was negatively impacted by security selection within the credit and non-U.S. dollar sectors. At the sub-adviser level, STW delivered the strongest excess return versus the composite benchmark index primarily due to its overweight to Treasuries and its exposure to municipal bonds.
74
Extended-Duration Bond Fund
Average Annual Total Returns as of 12/31/05
| | | | | | | | | | | | | | | | | | |
| | | GS2 Class* | | | GS4 Class* | | | GS6 Class* | | | Benchmark** | | | GS8 Class* | | | GS8 Class Benchmark** | |
One Year | | 5.65 | % | | 5.54 | % | | 5.19 | % | | 5.18 | % | | 4.81 | % | | 5.18 | % |
Since Inception | | 8.70 | % | | 8.64 | % | | 8.27 | % | | 8.08 | % | | 5.92 | % | | 6.35 | % |
Inception Date | | 08/27/01 | | | 08/27/01 | | | 08/27/01 | | | 08/27/01 | | | 11/08/04 | | | 11/08/04 | |
The performance data quoted represents past performance and does not guarantee future results. Current performance may be lower or higher. Performance data current to the most recent month-end may be obtained at www.GuideStone.org. The investment return and principal value of an investment will fluctuate so that shares, when redeemed, may be worth more or less than their original cost.
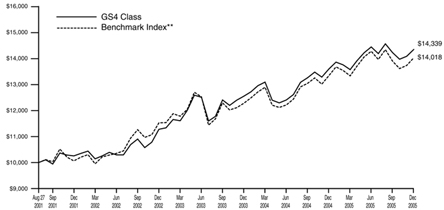
The graph compares the results of a hypothetical $10,000 investment in the GS4 Class of the Fund since August 27, 2001 (commencement of operations), with all dividends and capital gains reinvested, with the weighted composite benchmark index.
| * | These returns reflect expense waivers by the Fund’s investment advisor. Without these waivers, returns would have been lower. Returns shown do not reflect the deduction of taxes that a shareholder would pay on Fund distributions or the redemption of Fund shares. |
| ** | Represents a weighted composite benchmark index consisting of the Lehman Brothers Long-Term Government Bond Index and the Lehman Brothers Long-Term Credit Bond Index. |
The Lehman Brothers Long-Term Government Bond Index is composed of all bonds covered by the Lehman Brothers Government Bond Index with maturities of 10 years or greater.
The Lehman Brothers Long-Term Credit Index is composed of a subset of the Lehman Brothers Credit Bond Index covering all corporate, publicly issued, fixed-rate, nonconvertible U.S. debt issues rated at least Baa with at least $50 million principal outstanding and maturity greater than 10 years.
Unlike a mutual fund, the performance of an index assumes no taxes, transaction costs, management fees or other expenses.
75
| | |
| Extended-Duration Bond Fund | | |
| SCHEDULE OF INVESTMENTS | | December 31, 2005 |
| | | | | | |
| | | Par | | Value |
AGENCY OBLIGATIONS — 1.7% | | | | | | |
Federal National Mortgage Association | | | | | | |
5.25%, 01/15/09D | | $ | 250,000 | | $ | 253,992 |
2.29%, 02/19/09(G) | | | 2,500,000 | | | 1,465,266 |
5.50%, 03/15/11D | | | 6,000,000 | | | 6,208,860 |
| | | | | | |
TOTAL AGENCY OBLIGATIONS
(Cost $7,742,347) | | | | | | 7,928,118 |
| | | | | | |
ASSET-BACKED SECURITIES — 0.4% | | | | | | |
Community Program Loan Trust | | | | | | |
4.50%, 04/01/29 (Cost $1,665,435) | | | 1,950,000 | | | 1,797,857 |
| | | | | | |
CORPORATE BONDS — 15.4% | | | | | | |
Agilysys, Inc. | | | | | | |
9.50%, 08/01/06 | | | 500,000 | | | 509,735 |
AK Steel Corporation | | | | | | |
7.75%, 06/15/12D | | | 250,000 | | | 226,875 |
Alberton’s, Inc. | | | | | | |
6.63%, 06/01/28 | | | 105,000 | | | 89,814 |
7.45%, 08/01/29 | | | 985,000 | | | 915,598 |
8.00%, 05/01/31D | | | 110,000 | | | 108,513 |
American Airlines, Inc. | | | | | | |
6.98%, 04/01/11 | | | 50,068 | | | 51,649 |
8.61%, 10/01/11D | | | 850,000 | | | 845,101 |
Arrow Electronics, Inc. | | | | | | |
6.88%, 07/01/13 | | | 250,000 | | | 267,387 |
ASIF Global Financing XXVII | | | | | | |
2.38%, 02/26/09 144A(G) | | | 6,700,000 | | | 3,922,719 |
Atlas Air, Inc. | | | | | | |
7.20%, 01/02/19D | | | 392,078 | | | 388,444 |
Avnet, Inc. | | | | | | |
6.00%, 09/01/15D | | | 610,000 | | | 594,476 |
Barclays Financial LLC | | | | | | |
4.16%, 02/22/10 144A(T) | | | 25,000,000 | | | 570,993 |
4.10%, 03/22/10 144A(T) | | | 30,000,000 | | | 682,633 |
4.06%, 09/16/10 144A(W) | | | 730,000,000 | | | 691,400 |
Bausch & Lomb, Inc. | | | | | | |
7.13%, 08/01/28 | | | 1,500,000 | | | 1,627,882 |
Borden, Inc. | | | | | | |
7.88%, 02/15/23 | | | 1,200,000 | | | 966,000 |
Bristol-Myers Squibb Co. | | | | | | |
3.99%, 09/15/23 CONV†D | | | 1,060,000 | | | 1,049,453 |
Chesapeake Energy Corporation | | | | | | |
6.88%, 01/15/16 | | | 610,000 | | | 628,300 |
6.50%, 08/15/17 144AD | | | 45,000 | | | 45,450 |
6.88%, 11/15/20 144A | | | 320,000 | | | 325,600 |
CIT Group, Inc. | | | | | | |
5.50%, 12/01/14(U) | | | 600,000 | | | 1,066,214 |
Comcast Corporation | | | | | | |
5.50%, 03/15/11D | | | 500,000 | | | 503,274 |
Commonwealth Edison Co. | | | | | | |
4.75%, 12/01/11@ | | | 470,000 | | | 455,584 |
Constellation Energy Group, Inc. | | | | | | |
4.55%, 06/15/15D | | | 750,000 | | | 704,830 |
Continental Airlines, Inc. | | | | | | |
6.95%, 02/02/11 | | | 382,529 | | | 342,810 |
8.31%, 04/02/18 | | | 498,351 | | | 439,653 |
6.65%, 09/15/19 | | | 2,258,410 | | | 2,208,324 |
6.70%, 06/15/21 | | | 371,953 | | | 362,801 |
Corning, Inc. | | | | | | |
6.20%, 03/15/16 | | | 230,000 | | | 235,648 |
Cox Communications, Inc. | | | | | | |
6.75%, 03/15/11D | | | 250,000 | | | 261,712 |
Cummins, Inc. | | | | | | |
7.13%, 03/01/28 | | | 425,000 | | | 425,000 |
Delphi Corporation | | | | | | |
0.00%, 05/01/29#D | | | 1,810,000 | | | 927,625 |
Devon Energy Corporation | | | | | | |
4.95%, 08/15/08 CONV | | | 963,000 | | | 1,113,469 |
Dillard’s, Inc. | | | | | | |
7.75%, 07/15/26 | | | 890,000 | | | 867,750 |
7.00%, 12/01/28 | | | 500,000 | | | 466,250 |
El Paso Corporation | | | | | | |
7.00%, 05/15/11D | | | 400,000 | | | 399,000 |
EOP Operating LP | | | | | | |
7.25%, 06/15/28 | | | 500,000 | | | 554,378 |
First Industrial LP | | | | | | |
7.60%, 07/15/28 | | | 1,000,000 | | | 1,146,592 |
Foot Locker, Inc. | | | | | | |
8.50%, 01/15/22 | | | 1,000,000 | | | 1,062,500 |
Ford Motor Co. | | | | | | |
6.63%, 10/01/28 | | | 680,000 | | | 442,000 |
6.38%, 02/01/29 | | | 1,255,000 | | | 796,925 |
Ford Motor Credit Co. | | | | | | |
5.70%, 01/15/10D | | | 135,000 | | | 114,857 |
7.00%, 10/01/13D | | | 315,000 | | | 269,536 |
General Motors Acceptance Corporation | | | | | | |
6.88%, 08/28/12 | | | 250,000 | | | 225,624 |
Georgia-Pacific Corporation | | | | | | |
7.38%, 12/01/25 | | | 50,000 | | | 45,250 |
7.25%, 06/01/28D | | | 105,000 | | | 93,581 |
7.75%, 11/15/29D | | | 3,640,000 | | | 3,339,700 |
HCA, Inc. | | | | | | |
6.30%, 10/01/12D | | | 1,500,000 | | | 1,514,990 |
7.58%, 09/15/25D | | | 1,000,000 | | | 1,023,763 |
7.05%, 12/01/27D | | | 500,000 | | | 481,220 |
Health Care Property Investors, Inc. | | | | | | |
6.00%, 03/01/15 | | | 1,500,000 | | | 1,524,500 |
Highwoods Properties, Inc. | | | | | | |
7.50%, 04/15/18 | | | 1,500,000 | | | 1,648,496 |
HSBC Bank USA NA | | | | | | |
3.31%, 08/25/10 144A | | | 700,000 | | | 693,350 |
IMC Global, Inc. | | | | | | |
7.38%, 08/01/18 | | | 500,000 | | | 507,500 |
7.30%, 01/15/28 | | | 690,000 | | | 690,000 |
International Paper Co. | | | | | | |
6.88%, 11/01/23 | | | 300,000 | | | 309,010 |
iStar Financial, Inc. | | | | | | |
5.70%, 03/01/14 | | | 1,171,000 | | | 1,160,001 |
Kinder Morgan, Inc. | | | | | | |
7.25%, 03/01/28D | | | 500,000 | | | 561,360 |
Lennar Corporation | | | | | | |
5.60%, 05/31/15 | | | 410,000 | | | 396,576 |
MidAmerican Energy Holdings Co. | | | | | | |
5.88%, 10/01/12D | | | 1,000,000 | | | 1,033,793 |
Motorola, Inc. | | | | | | |
7.63%, 11/15/10D | | | 80,000 | | | 89,022 |
6.50%, 11/15/28D | | | 500,000 | | | 550,645 |
NiSource Finance Corporation | | | | | | |
6.15%, 03/01/13 | | | 1,000,000 | | | 1,048,774 |
Northern Telecom Capital | | | | | | |
7.88%, 06/15/26 | | | 450,000 | | | 437,625 |
See Notes to Financial Statements.
76
| | | | | | |
| | | Par | | Value |
Pemex Project Funding Master Trust | | | | | | |
8.63%, 02/01/22 | | $ | 1,000,000 | | $ | 1,235,000 |
8.63%, 12/01/23 144A | | | 1,000,000 | | | 1,234,000 |
Pioneer Natural Resources Co. | | | | | | |
7.20%, 01/15/28 | | | 2,500,000 | | | 2,695,680 |
Preston Corporation | | | | | | |
7.00%, 05/01/11 CONV | | | 250,000 | | | 233,750 |
Pulte Homes, Inc. | | | | | | |
7.88%, 06/15/32 | | | 1,500,000 | | | 1,681,894 |
6.38%, 05/15/33 | | | 1,000,000 | | | 935,705 |
Qwest Corporation | | | | | | |
7.25%, 09/15/25D | | | 1,000,000 | | | 1,000,000 |
6.88%, 09/15/33 | | | 2,250,000 | | | 2,126,250 |
Raytheon Co. | | | | | | |
6.40%, 12/15/18 | | | 2,600,000 | | | 2,821,372 |
7.20%, 08/15/27 | | | 250,000 | | | 296,328 |
7.00%, 11/01/28 | | | 750,000 | | | 874,068 |
Southern Natural Gas Co. | | | | | | |
7.35%, 02/15/31D | | | 1,750,000 | | | 1,804,084 |
Sprint Capital Corporation | | | | | | |
6.88%, 11/15/28 | | | 3,450,000 | | | 3,781,059 |
Swift Energy Co. | | | | | | |
7.63%, 07/15/11 | | | 150,000 | | | 153,750 |
Tennessee Gas Pipeline Co. | | | | | | |
7.00%, 10/15/28D | | | 750,000 | | | 743,066 |
Toll Brothers Finance Corporation | | | | | | |
5.15%, 05/15/15 144A | | | 360,000 | | | 334,275 |
Union Pacific Resources Group | | | | | | |
7.15%, 05/15/28 | | | 250,000 | | | 290,054 |
Weyerhaeuser Co. | | | | | | |
7.13%, 07/15/23 | | | 500,000 | | | 529,964 |
7.38%, 03/15/32D | | | 250,000 | | | 278,779 |
Williams COS Inc 7.5% | | | | | | |
7.50%, 01/15/31 | | | 1,250,000 | | | 1,300,000 |
Xerox Capital Trust I | | | | | | |
8.00%, 02/01/27D | | | 1,500,000 | | | 1,552,500 |
| | | | | | |
TOTAL CORPORATE BONDS
(Cost $68,509,423) | | | | | | 72,951,112 |
| | | | | | |
FOREIGN BONDS — 11.8% | | | | | | |
Argentina — 0.1% | | | | | | |
Republic of Argentina | | | | | | |
4.01%, 08/03/12† | | | 385,000 | | | 303,380 |
| | | | | | |
Brazil — 1.1% | | | | | | |
Federal Republic of Brazil | | | | | | |
8.25%, 01/20/34D | | | 4,750,000 | | | 5,054,000 |
| | | | | | |
Canada — 4.6% | | | | | | |
British Columbia Generic Residual | | | | | | |
4.64%, 06/09/14 STRIP(C)W | | | 10,230,000 | | | 6,147,065 |
Canada Generic Residual | | | | | | |
4.18%, 06/01/25 STRIP(C)W | | | 4,110,000 | | | 1,588,031 |
Canadian Government | | | | | | |
4.50%, 09/01/07(C) | | | 4,575,000 | | | 3,977,017 |
Macmillan Bloedel, Ltd. | | | | | | |
7.70%, 02/15/26 | | | 500,000 | | | 574,702 |
Ontario Generic Residual | | | | | | |
4.78%, 07/13/22 STRIP(C)W | | | 3,900,000 | | | 1,578,127 |
4.70%, 03/08/29 STRIP(C)W | | | 7,000,000 | | | 2,069,078 |
Saskatchewan Residual | | | | | | |
4.73%, 04/10/14 STRIP(C)W | | | 7,500,000 | | | 4,506,646 |
4.73%, 02/04/22 STRIP(C)W | | | 3,000,000 | | | 1,241,344 |
| | | | | | |
| | | | | | 21,682,010 |
| | | | | | |
Cayman Islands — 0.2% | | | | | | |
Enersis SA | | | | | | |
7.40%, 12/01/16 | | | 625,000 | | | 680,857 |
| | | | | | |
Vale Overseas, Ltd. | | | | | | |
8.25%, 01/17/34 | | | 100,000 | | | 115,625 |
| | | | | | |
| | | | | | 796,482 |
| | | | | | |
Egypt — 2.3% | | | | | | |
Egypt Government AID Bonds | | | | | | |
4.45%, 09/15/15 | | | 10,915,000 | | | 10,716,314 |
| | | | | | |
Malaysia — 0.0% | | | | | | |
Telekom Malaysia BHD | | | | | | |
7.88%, 08/01/25 144A | | | 225,000 | | | 284,565 |
| | | | | | |
Mexico — 0.6% | | | | | | |
Mexican Bonos | | | | | | |
9.00%, 12/20/12(M) | | | 23,000,000 | | | 2,259,267 |
8.00%, 12/07/23(M) | | | 7,000,000 | | | 621,108 |
| | | | | | |
| | | | | | 2,880,375 |
| | | | | | |
Philippines — 0.2% | | | | | | |
Philippine Long Distance Telephone Co. | | | | | | |
8.35%, 03/06/17 | | | 500,000 | | | 530,000 |
Quezon Power (Philippines), Ltd. | | | | | | |
8.86%, 06/15/17 | | | 446,250 | | | 435,094 |
| | | | | | |
| | | | | | 965,094 |
| | | | | | |
Supranational — 2.1% | | | | | | |
Inter-American Development Bank | | | | | | |
15.25%, 05/11/09(B)W | | | 7,500,000 | | | 1,955,908 |
6.00%, 12/15/17(Z) | | | 12,250,000 | | | 8,184,055 |
| | | | | | |
| | | | | | 10,139,963 |
| | | | | | |
Sweden — 0.4% | | | | | | |
Swedish Government | | | | | | |
6.50%, 05/05/08(K) | | | 14,640,000 | | | 1,994,630 |
| | | | | | |
Venezuela — 0.2% | | | | | | |
Cerro Negro Finance, Ltd. | | | | | | |
7.90%, 12/01/20 144A | | | 500,000 | | | 475,000 |
Petrozuata Finance, Inc. | | | | | | |
8.37%, 10/01/22 144A | | | 450,000 | | | 416,250 |
| | | | | | |
| | | | | | 891,250 |
| | | | | | |
TOTAL FOREIGN BONDS
(Cost $ 46,250,080) | | | | | | 55,708,063 |
| | | | | | |
MORTGAGE-BACKED SECURITIES — 0.3% | | | | | | |
Federal Home Loan Mortgage Corporation | | | | | | |
5.00%, 12/01/31 | | | 234,318 | | | 227,345 |
Federal National Mortgage Association | | | | | | |
5.00%, 07/25/23 | | | 1,122,077 | | | 1,119,335 |
| | | | | | |
TOTAL MORTGAGE-BACKED SECURITIES
(Cost $ 1,219,309) | | | | | | 1,346,680 |
| | | | | | |
See Notes to Financial Statements.
77
Extended-Duration Bond Fund
SCHEDULE OF INVESTMENTS (Continued)
| | | | | | |
| | | Par | | Value |
MUNICIPAL BONDS — 12.7% | | | | | | |
Chicago, Illinois Board of Education, General Obligation Bond (FGIC Insured) | | | | | | |
4.68%, 12/01/22W | | $ | 10,700,000 | | $ | 4,943,614 |
4.72%, 12/01/23W | | | 5,130,000 | | | 2,248,530 |
Chicago, Illinois Wastewater Transmission, Series A Revenue Bond (MBIA Insured) | | | | | | |
4.64%, 01/01/22W | | | 5,000,000 | | | 2,408,850 |
Clark County, Washington School District, Series C General Obligation Bond (FGIC SCH BD GTY Insured) | | | | | | |
4.56%, 12/01/19W | | | 3,600,000 | | | 1,928,376 |
Clovis, California Unified School District, Series A General Obligation Bond (FGIC Insured) | | | | | | |
4.78%, 08/01/25W | | | 9,775,000 | | | 3,885,269 |
Cook County, Illinois Community Consolidated School District, General Obligation Bond (FGIC Insured) | | | | | | |
4.56%, 12/01/19W | | | 3,890,000 | | | 2,095,076 |
Coppell, Texas Independent School District, General Obligation Bond (PSF-GTD Insured) | | | | | | |
4.71%, 08/15/23W | | | 2,195,000 | | | 975,239 |
De Soto, Texas Independent School District, General Obligation Bond (PSF-GTD Insured) | | | | | | |
4.50%, 08/15/18W | | | 2,275,000 | | | 1,297,933 |
4.55%, 08/15/19W | | | 2,590,000 | | | 1,403,961 |
Galveston County, Texas, General Obligation Bond (FGIC Insured) | | | | | | |
4.79%, 02/01/26W | | | 2,500,000 | | | 972,425 |
Granbury, Texas Independent School District, General Obligation Bond (PSF-GTD Insured) | | | | | | |
4.58%, 08/01/20W | | | 1,000,000 | | | 516,180 |
Houston, Texas Water & Sewer System, Series JR-A Revenue Bond (FSA Insured) | | | | | | |
4.61%, 12/01/24W | | | 7,190,000 | | | 2,943,586 |
4.76%, 12/01/24W | | | 2,810,000 | | | 1,178,374 |
Indianapolis, Indiana Local Public Improvement Bond Bank, Series E Revenue Bond (AMBAC Insured) | | | | | | |
4.64%, 02/01/22W | | | 2,550,000 | | | 1,233,512 |
Massachusetts Bay Transportation Authority, Massachusetts, Series A Revenue Bond | | | | | | |
4.19%, 07/01/25W | | | 6,000,000 | | | 6,558,780 |
McKeesport, Pennsylvania Area School District, Series C General Obligation Bond (AMBAC Insured) | | | | | | |
4.81%, 10/01/26W | | | 1,000,000 | | | 373,920 |
Metropolitan Pier & Exposition Authority, Illinois Dedicated State Tax, Series A Revenue Bond (MBIA Insured) | | | | | | |
4.68%, 12/15/22W | | | 16,225,000 | | | 7,607,902 |
Rocklin, California Unified School District, General Obligation Bond (FGIC Insured) | | | | | | |
4.74%, 08/01/24W | | | 2,375,000 | | | 994,959 |
San Jose, California Unified School District, Santa Clara County, Series A General Obligation Bond (FGIC Insured) | | | | | | |
4.50%, 08/01/18W | | | 2,055,000 | | | 1,180,228 |
San Mateo, California Unified High School District, Series C General Obligation Bond (FGIC Insured) | | | | | | |
4.87%, 09/01/28W | | | 4,000,000 | | | 1,341,760 |
Union Elementary School District, California, Series A General Obligation Bond (FGIC Insured) | | | | | | |
4.55%, 09/01/19W | | | 1,750,000 | | | 944,195 |
Washington State Capital Appreciation, Series F General Obligation Bond (MBIA Insured) | | | | | | |
4.85%, 12/01/27W | | | 1,340,000 | | | 469,040 |
Washington State, Motor Vehicle Fuel Tax, Series 03-C General Obligation Bond (MBIA Insured) | | | | | | |
4.70%, 06/01/23W | | | 10,000,000 | | | 4,439,700 |
Will County, Illinois Community United School District No. 365, General Obligation Bond (FSA Insured) | | | | | | |
4.71%, 11/01/23W | | | 17,825,000 | | | 7,843,000 |
| | | | | | |
TOTAL MUNICIPAL BONDS
(Cost $54,511,928) | | | | | | 59,784,409 |
| | | Shares | | |
PREFERRED STOCK — 0.2% | | | | | | |
Travelers Property Casualty Corporation 4.50%, | | | | | | |
04/15/32 CONV | | | | | | |
(Cost $989,021) | | | 44,125 | | | 1,092,535 |
| | | | | | |
MONEY MARKET FUNDS — 31.8% | | | | | | |
GuideStone Funds Money Market Fund (GS4 Class)¥ | | | 6,476,802 | | | 6,476,802 |
Northern Institutional Liquid Assets Portfolio§ | | | 143,436,096 | | | 143,436,096 |
| | | | | | |
TOTAL MONEY MARKET FUNDS
(Cost $149,912,898) | | | | | | 149,912,898 |
| | | | | | |
See Notes to Financial Statements.
78
| | | | | | | |
| | | Par | | Value | |
U.S. TREASURY OBLIGATIONS — 54.9% | | | | |
U.S. Treasury Bonds | �� | | | | | | |
8.13%, 08/15/19D | | $ | 16,650,000 | | $ | 22,593,284 | |
8.00%, 11/15/21D | | | 99,812,000 | | | 137,541,735 | |
6.38%, 08/15/27 | | | 21,500,000 | | | 26,640,693 | |
5.50%, 08/15/28D | | | 55,555,000 | | | 62,484,209 | |
| | | | | | | |
| | | | | | 249,259,921 | |
| | | | | | | |
U.S. Treasury Notes | | | | | | | |
3.63%, 04/30/07D | | | 4,250,000 | | | 4,206,837 | |
3.63%, 06/30/07D | | | 3,000,000 | | | 2,966,721 | |
4.25%, 10/31/07D | | | 1,500,000 | | | 1,496,075 | |
3.00%, 02/15/08D | | | 505,000 | | | 490,935 | |
2.63%, 05/15/08D | | | 495,000 | | | 475,664 | |
| | | | | | | |
| | | | | | 9,636,232 | |
| | | | | | | |
| | |
TOTAL U.S. TREASURY OBLIGATIONS
(Cost $253,838,941) | | | | | | 258,896,153 | |
| | | | | | | |
| | |
Total Investments — 129.2%
(Cost $584,639,382) | | | | | | 609,417,825 | |
| | |
Liabilities in Excess of Other Assets — (29.2)% | | | | | | (137,757,003 | ) |
| | | | | | | |
Net Assets — 100.0% | | | | | $ | 471,660,822 | |
| | | | | | | |
| | |
| |
| | | % |
U.S. Treasury Obligations | | 54.9 |
Money Market Funds | | 31.8 |
Corporate Bonds | | 15.4 |
Municipal Bonds | | 12.7 |
Foreign Bonds | | 11.8 |
Agency Obligations | | 1.7 |
Asset-Backed Securities | | 0.4 |
Mortgage-Backed Securities | | 0.3 |
Preferred Stock | | 0.2 |
| | |
| | 129.2 |
| | |
See Notes to Financial Statements.
79
Equity Index Fund
The Fund is passively managed and is comprised of domestic, large-cap equity stocks with both value and growth style orientations. The Fund performed in-line with its benchmark, the S&P 500® Index, during the quarter. The performance differential between the benchmark and the Fund is primarily a result of expenses and social restrictions within the Fund.
80
Equity Index Fund
Average Annual Total Returns as of 12/31/05
| | | | | | | | | | | | | | | | | | |
| | | GS2 Class* | | | GS4 Class* | | | GS6 Class* | | | Benchmark* | | | GS8 Class* | | | GS8 Class Benchmark** | |
One Year | | 4.80 | % | | 4.61 | % | | 4.54 | % | | 4.93 | % | | 4.09 | % | | 4.93 | % |
Since Inception | | 2.56 | % | | 2.59 | % | | 2.47 | % | | 2.97 | % | | 7.27 | % | | 8.09 | % |
Inception Date | | 08/27/01 | | | 08/27/01 | | | 08/27/01 | | | 08/27/01 | | | 11/08/04 | | | 11/08/04 | |
The performance data quoted represents past performance and does not guarantee future results. Current performance may be lower or higher. Performance data current to the most recent month-end may be obtained at www.GuideStone.org. The investment return and principal value of an investment will fluctuate so that shares, when redeemed, may be worth more or less than their original cost.
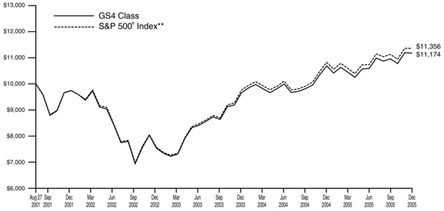
The graph compares the results of a hypothetical $10,000 investment in the GS4 Class of the Fund since August 27, 2001 (commencement of operations), with all dividends and capital gains reinvested, with the S&P 500® Index.
| * | These returns reflect expense waivers by the Fund’s investment advisor. Without these waivers, returns would have been lower. Returns shown do not reflect the deduction of taxes that a shareholder would pay on Fund distributions or the redemption of Fund shares. |
| ** | The S&P 500® Index is an unmanaged index (with no defined investment objective) of common stocks, includes reinvestment of dividends, and is a registered trademark of McGraw-Hill Co., Inc. The S&P 500® Index includes 500 of the largest stocks (in terms of market value) in the United States. |
Unlike a mutual fund, the performance of an index assumes no taxes, transaction costs, management fees or other expenses.
81
Equity Index Fund
| | | | |
SCHEDULE OF INVESTMENTS | | | | December 31, 2005 |
| | | | | |
| | | Shares | | Value |
COMMON STOCKS — 97.7% | | | | | |
Auto & Transportation — 2.4% | | | | | |
Burlington Northern Santa Fe Corporation | | 16,700 | | $ | 1,182,694 |
Cooper Tire & Rubber Co.D | | 3,100 | | | 47,492 |
CSX Corporation | | 9,200 | | | 467,084 |
Dana CorporationD | | 6,200 | | | 44,516 |
FedEx Corporation | | 12,800 | | | 1,323,392 |
Ford Motor Co.D | | 78,827 | | | 608,545 |
General Motors CorporationD | | 24,400 | | | 473,848 |
Genuine Parts Co. | | 7,300 | | | 320,616 |
Goodyear Tire & Rubber Co. (The)D* | | 7,500 | | | 130,350 |
Harley-Davidson, Inc.D | | 12,200 | | | 628,178 |
Navistar International CorporationD* | | 2,900 | | | 82,998 |
Norfolk Southern Corporation | | 17,000 | | | 762,110 |
PACCAR, Inc. | | 7,375 | | | 510,571 |
Southwest Airlines Co. | | 31,200 | | | 512,616 |
Union Pacific Corporation | | 11,700 | | | 941,967 |
United Parcel Service, Inc. | | | | | |
Class B | | 48,000 | | | 3,607,200 |
| | | | | |
| | | | | 11,644,177 |
| | | | | |
Consumer Discretionary — 11.0% | | | | | |
Alberto-Culver Co.D | | 3,750 | | | 171,562 |
Allied Waste Industries, Inc.D | | 11,200 | | | 97,888 |
Amazon.com, Inc.D | | 11,884 | | | 560,331 |
Apollo Group, Inc. Class A | | 6,521 | | | 394,260 |
AutoNation, Inc.D | | 8,900 | | | 193,397 |
AutoZone, Inc. | | 2,400 | | | 220,200 |
Avon Products, Inc. | | 20,600 | | | 588,130 |
Bed Bath & Beyond, Inc. | | 12,600 | | | 455,490 |
Best Buy Co., Inc.D | | 17,425 | | | 757,639 |
Big Lots, Inc.D* | | 4,800 | | | 57,648 |
Black & Decker Corporation | | 3,300 | | | 286,968 |
Carnival Corporation | | 18,900 | | | 1,010,583 |
Cendant Corporation | | 44,400 | | | 765,900 |
Cintas Corporation | | 6,400 | | | 263,552 |
Circuit City Stores, Inc.D | | 8,300 | | | 187,497 |
Clear Channel Communications, Inc.D | | 22,800 | | | 717,060 |
Coach, Inc. | | 16,000 | | | 533,440 |
Convergys Corporation | | 6,000 | | | 95,100 |
Costco Wholesale Corporation | | 20,600 | | | 1,019,082 |
Darden Restaurants, Inc. | | 6,250 | | | 243,000 |
Dillard’s, Inc. Class AD | | 3,500 | | | 86,870 |
Dollar General CorporationD | | 13,600 | | | 259,352 |
Donnelley (R.R.) & Sons Co. | | 9,100 | | | 311,311 |
Eastman Kodak Co.D | | 13,000 | | | 304,200 |
eBay, Inc. | | 49,200 | | | 2,127,900 |
Electronic Arts, Inc. | | 13,100 | | | 685,261 |
Family Dollar Stores, Inc.D | | 7,000 | | | 173,530 |
Federated Department Stores, Inc. | | 11,456 | | | 759,876 |
Gannett Co., Inc. | | 10,600 | | | 642,042 |
Gap, Inc. (The) | | 25,100 | | | 442,764 |
Hasbro, Inc. | | 7,400 | | | 149,332 |
Hilton Hotels Corporation | | 14,200 | | | 342,362 |
Home Depot, Inc. (The) | | 92,250 | | | 3,734,280 |
International Flavors & Fragrances, Inc. | | 3,900 | | | 130,650 |
Interpublic Group Cos., Inc.D* | | 17,500 | | | 168,875 |
Jones Apparel Group, Inc.D | | 5,100 | | | 156,672 |
Kimberly-Clark Corporation | | 20,600 | | | 1,228,790 |
Knight-Ridder, Inc.D | | 3,000 | | | 189,900 |
Kohl’s Corporation | | 14,600 | | | 709,560 |
Leggett & Platt, Inc. | | 8,000 | | | 183,680 |
Limited Brands | | 15,000 | | | 335,250 |
Liz Claiborne, Inc.D | | 4,608 | | | 165,059 |
Lowe’s Cos., Inc. | | 33,500 | | | 2,233,110 |
Marriott International, Inc. | | | | | |
Class A | | 7,400 | | | 495,578 |
Mattel, Inc. | | 17,400 | | | 275,268 |
Maytag Corporation | | 3,300 | | | 62,106 |
McDonald’s Corporation | | 54,100 | | | 1,824,252 |
McGraw-Hill Co., Inc. (The) | | 15,800 | | | 815,754 |
Meredith CorporationD | | 1,900 | | | 99,446 |
Monster Worldwide, Inc. | | 5,200 | | | 212,264 |
New York Times Co. Class AD | | 6,000 | | | 158,700 |
Newell Rubbermaid, Inc. | | 11,500 | | | 273,470 |
Nike, Inc. Class B | | 8,200 | | | 711,678 |
Nordstrom, Inc. | | 9,600 | | | 359,040 |
Office Depot, Inc. | | 13,400 | | | 420,760 |
OfficeMax, Inc.D | | 3,000 | | | 76,080 |
Omnicom Group, Inc. | | 7,800 | | | 664,014 |
Penney (JC) Co., Inc. | | 10,900 | | | 606,040 |
RadioShack CorporationD | | 5,800 | | | 121,974 |
Reebok International, Ltd.D | | 2,300 | | | 133,929 |
Robert Half International, Inc. | | 6,800 | | | 257,652 |
Sabre Holdings Corporation | | 5,800 | | | 139,838 |
Scripps Co. (E.W.) Class A | | 3,700 | | | 177,674 |
Sears Holdings CorporationD | | 4,289 | | | 495,508 |
Snap-On, Inc.D | | 2,400 | | | 90,144 |
Stanley Works (The) | | 3,200 | | | 153,728 |
Staples, Inc. | | 31,200 | | | 708,552 |
Starbucks Corporation | | 33,000 | | | 990,330 |
Starwood Hotels & Resorts Worldwide, Inc. | | 9,400 | | | 600,284 |
Target Corporation | | 37,900 | | | 2,083,363 |
Tiffany & Co.D | | 6,100 | | | 233,569 |
Time Warner, Inc. | | 201,900 | | | 3,521,136 |
TJX Cos., Inc. | | 20,000 | | | 464,600 |
Tribune Co. | | 11,900 | | | 360,094 |
Univision Communications, Inc. Class AD | | 9,900 | | | 290,961 |
VF CorporationD | | 4,100 | | | 226,894 |
Wal-Mart Stores, Inc. | | 107,600 | | | 5,035,680 |
Walt Disney Co. (The) | | 82,800 | | | 1,984,716 |
Waste Management, Inc. | | 24,300 | | | 737,505 |
Wendy’s International, Inc. | | 4,800 | | | 265,248 |
Whirlpool Corporation | | 2,900 | | | 242,904 |
Yahoo!, Inc. | | 54,700 | | | 2,143,146 |
Yum! Brands, Inc. | | 12,100 | | | 567,248 |
| | | | | |
| | | | | 53,220,480 |
| | | | | |
Consumer Staples — 5.9% | | | | | |
Albertson’s, Inc.D | | 16,200 | | | 345,870 |
Campbell Soup Co.D | | 9,100 | | | 270,907 |
Clorox Co. | | 6,400 | | | 364,096 |
Coca-Cola Co. (The) | | 89,500 | | | 3,607,745 |
Coca-Cola Enterprises, Inc. | | 14,100 | | | 270,297 |
Colgate-Palmolive Co. | | 22,100 | | | 1,212,185 |
ConAgra Foods, Inc. | | 22,000 | | | 446,160 |
CVS Corporation | | 34,500 | | | 911,490 |
General Mills, Inc. | | 15,200 | | | 749,664 |
Heinz (H.J.) Co. | | 14,700 | | | 495,684 |
Hershey Co. (The) | | 8,400 | | | 464,100 |
Kellogg Co. | | 11,100 | | | 479,742 |
Kroger Co.* | | 31,000 | | | 585,280 |
McCormick & Co., Inc. | | 5,700 | | | 176,244 |
See Notes to Financial Statements.
82
| | | | | |
| | | Shares | | Value |
Pepsi Bottling Group, Inc. | | 7,000 | | $ | 200,270 |
PepsiCo, Inc. | | 71,740 | | | 4,238,399 |
Procter & Gamble Co. | | 144,317 | | | 8,353,068 |
Safeway, Inc.D | | 18,700 | | | 442,442 |
Sara Lee Corporation | | 33,000 | | | 623,700 |
SUPERVALU, Inc.D | | 5,600 | | | 181,888 |
SYSCO Corporation | | 26,700 | | | 829,035 |
Tyson Foods, Inc. Class AD | | 10,700 | | | 182,970 |
Walgreen Co. | | 43,700 | | | 1,934,162 |
Whole Foods Market, Inc. | | 5,900 | | | 456,601 |
Wrigley (W.M.), Jr. Co. | | 7,800 | | | 518,622 |
| | | | | |
| | | | | 28,340,621 |
| | | | | |
Financial Services — 22.3% | | | | | |
AFLAC, Inc. | | 21,100 | | | 979,462 |
Allstate Corporation (The) | | 28,952 | | | 1,565,435 |
AMBAC Financial Group, Inc. | | 4,500 | | | 346,770 |
American Express Co. | | 53,200 | | | 2,737,672 |
American International Group, Inc. | | 111,792 | | | 7,627,568 |
Ameriprise Financial, Inc. | | 10,640 | | | 436,240 |
AmSouth Bancorporation | | 14,700 | | | 385,287 |
AON Corporation | | 13,700 | | | 492,515 |
Apartment Investment & Management Co. Class A REITD | | 4,100 | | | 155,267 |
Archstone-Smith Trust REIT | | 8,400 | | | 351,876 |
Automatic Data Processing, Inc. | | 24,500 | | | 1,124,305 |
Bank of America Corporation | | 173,640 | | | 8,013,486 |
Bank of New York Co., Inc. (The) | | 32,500 | | | 1,035,125 |
BB&T Corporation | | 23,700 | | | 993,267 |
Bear Stearns Cos., Inc. (The) | | 4,710 | | | 544,146 |
Block (H&R), Inc. | | 13,800 | | | 338,790 |
Capital One Financial Corporation | | 12,300 | | | 1,062,720 |
Chubb Corporation | | 8,200 | | | 800,730 |
CIGNA Corporation | | 5,700 | | | 636,690 |
Cincinnati Financial Corporation | | 7,386 | | | 330,007 |
CIT Group, Inc. | | 8,900 | | | 460,842 |
Citigroup, Inc. | | 217,830 | | | 10,571,290 |
Comerica, Inc.D | | 7,200 | | | 408,672 |
Compass Bancshares, Inc.D | | 4,700 | | | 226,963 |
Countrywide Financial Corporation | | 25,408 | | | 868,700 |
Dow Jones & Co., Inc.D | | 2,954 | | | 104,837 |
E*TRADE Financial CorporationD | | 15,300 | | | 319,158 |
Equifax, Inc.D | | 5,700 | | | 216,714 |
Equity Office Properties Trust REIT | | 17,800 | | | 539,874 |
Equity Residential Properties Trust REIT | | 11,900 | | | 465,528 |
Fannie Mac | | 41,700 | | | 2,035,377 |
Federated Investors, Inc. Class B | | 4,500 | | | 166,680 |
Fifth Third BancorpD | | 23,294 | | | 878,650 |
First Data Corporation | | 33,817 | | | 1,454,469 |
First Horizon National CorporationD | | 5,200 | | | 199,888 |
Fiserv, Inc. | | 8,200 | | | 354,814 |
Franklin Resources, Inc. | | 6,600 | | | 620,466 |
Freddie Mac | | 30,200 | | | 1,973,570 |
Genworth Financial, Inc. Class A | | 16,200 | | | 560,196 |
Golden West Financial Corporation | | 11,300 | | | 745,800 |
Goldman Sachs Group, Inc. | | 19,412 | | | 2,479,107 |
Hartford Financial Services Group, Inc. | | 13,300 | | | 1,142,337 |
Homestore, Inc. | | 3 | | | 15 |
Huntington Bancshares, Inc. | | 9,600 | | | 228,000 |
Janus Capital Group, Inc. | | 10,000 | | | 186,300 |
Jefferson-Pilot CorporationD | | 5,700 | | | 324,501 |
JPMorgan Chase & Co. | | 152,530 | | | 6,053,916 |
KeyCorp | | 17,200 | | | 566,396 |
Lehman Brothers Holdings, Inc. | | 11,500 | | | 1,473,955 |
Lincoln National CorporationD | | 7,300 | | | 387,119 |
Loews Corporation | | 5,900 | | | 559,615 |
M & T Bank CorporationD | | 3,900 | | | 425,295 |
Marsh & McLennan Cos., Inc. | | 23,200 | | | 736,832 |
Marshall & Ilsley CorporationD | | 9,300 | | | 400,272 |
MBIA, Inc.D | | 5,900 | | | 354,944 |
MBNA CorporationD | | 54,150 | | | 1,470,173 |
Mellon Financial Corporation | | 17,800 | | | 609,650 |
Merrill Lynch & Co., Inc. | | 39,880 | | | 2,701,072 |
MetLife, Inc. | | 32,300 | | | 1,582,700 |
MGIC Investment Corporation | | 4,100 | | | 269,862 |
Moody’s Corporation | | 11,000 | | | 675,620 |
Morgan Stanley | | 46,700 | | | 2,649,758 |
National City Corporation | | 25,800 | | | 866,106 |
North Fork Bancorporation, Inc. | | 20,350 | | | 556,776 |
Northern Trust Corporation | | 8,100 | | | 419,742 |
Paychex, Inc. | | 14,900 | | | 567,988 |
Plum Creek Timber Co., Inc. REIT | | 7,700 | | | 277,585 |
PNC Financial Services Group, Inc.D | | 12,000 | | | 741,960 |
Principal Financial Group | | 12,600 | | | 597,618 |
Progressive Corporation (The) | | 8,399 | | | 980,835 |
Prologis Trust REIT | | 10,500 | | | 490,560 |
Prudential Financial, Inc. | | 22,100 | | | 1,617,499 |
Public Storage, Inc. REITD | | 4,200 | | | 284,424 |
Regions Financial Corporation | | 20,308 | | | 693,721 |
Ryder System, Inc.D | | 2,700 | | | 110,754 |
Safeco Corporation | | 5,600 | | | 316,400 |
Schwab (Charles) Corporation (The) | | 44,750 | | | 656,482 |
Simon Property Group, Inc. REIT | | 8,400 | | | 643,692 |
SLM Corporation | | 17,900 | | | 986,111 |
Sovereign Bancorp, Inc. | | 14,900 | | | 322,138 |
St. Paul Travelers Cos., Inc. | | 29,856 | | | 1,333,668 |
State Street Corporation | | 14,000 | | | 776,160 |
SunTrust Banks, Inc. | | 15,300 | | | 1,113,228 |
Synovus Financial Corporation | | 12,700 | | | 343,027 |
T Rowe Price Group, Inc.D | | 5,300 | | | 381,759 |
Torchmark CorporationD | | 4,600 | | | 255,760 |
UnumProvident CorporationD | | 12,400 | | | 282,100 |
US Bancorp | | 78,100 | | | 2,334,409 |
Vornado Realty Trust REIT | | 5,000 | | | 417,350 |
Wachovia Corporation | | 68,782 | | | 3,635,817 |
Washington Mutual, Inc. | | 43,046 | | | 1,872,501 |
Wells Fargo & Co. | | 72,730 | | | 4,569,626 |
XL Capital, Ltd. Class A | | 7,500 | | | 505,350 |
Zions Bancorporation | | 3,700 | | | 279,572 |
| | | | | |
| | | | | 107,638,003 |
| | | | | |
Healthcare — 13.3% | | | | | |
Abbott Laboratories | | 67,700 | | | 2,669,411 |
ACE, Ltd. | | 11,800 | | | 630,592 |
See Notes to Financial Statements.
83
Equity Index Fund
SCHEDULE OF INVESTMENTS (Continued)
| | | | | |
| | | Shares | | Value |
Aetna, Inc. | | 12,500 | | $ | 1,178,875 |
Allergan, Inc. | | 5,500 | | | 593,780 |
AmerisourceBergen Corporation | | 8,944 | | | 370,282 |
Amgen, Inc.* | | 53,228 | | | 4,197,560 |
Bard (C.R.), Inc. | | 4,400 | | | 290,048 |
Bausch & Lomb, Inc. | | 2,200 | | | 149,380 |
Baxter International, Inc. | | 26,400 | | | 993,960 |
Becton Dickinson & Co. | | 10,600 | | | 636,848 |
Biogen Idec, Inc. | | 14,730 | | | 667,711 |
Biomet, Inc.D | | 11,300 | | | 413,241 |
Boston Scientific Corporation | | 26,100 | | | 639,189 |
Bristol-Myers Squibb Co. | | 85,800 | | | 1,971,684 |
Cardinal Health, Inc. | | 18,200 | | | 1,251,250 |
Caremark Rx, Inc. | | 19,400 | | | 1,004,726 |
Chiron CorporationD | | 5,200 | | | 231,192 |
Conventry Health Care, Inc. | | 6,630 | | | 377,645 |
Eli Lilly & Co. | | 49,100 | | | 2,778,569 |
Express Scripts, Inc. | | 6,400 | | | 536,320 |
Fisher Scientific International, Inc.D* | | 5,000 | | | 309,300 |
Forest Laboratories, Inc.D | | 15,000 | | | 610,200 |
Genzyme Corporation | | 11,300 | | | 799,814 |
Gilead Sciences, Inc. | | 19,400 | | | 1,021,022 |
Guidant Corporation | | 14,200 | | | 919,450 |
HCA, Inc.D | | 15,600 | | | 787,800 |
Health Management Associates, Inc. Class A | | 10,200 | | | 223,992 |
Hospira, Inc | | 6,550 | | | 280,209 |
Humana, Inc.* | | 7,300 | | | 396,609 |
IMS Health, Inc. | | 9,800 | | | 244,216 |
Johnson & Johnson | | 128,190 | | | 7,704,219 |
King Pharmaceuticals, Inc. | | 10,100 | | | 170,892 |
Laboratory Corporation of America HoldingsD | | 5,900 | | | 317,715 |
Manor Care, Inc.D | | 3,700 | | | 147,149 |
McKesson Corporation | | 12,900 | | | 665,511 |
Medco Health Solutions, Inc. | | 13,476 | | | 751,961 |
Medimmune, Inc.D | | 10,400 | | | 364,208 |
Medtronic, Inc. | | 52,400 | | | 3,016,668 |
Merck & Co., Inc. | | 95,300 | | | 3,031,493 |
Millipore Corporation* | | 2,100 | | | 138,684 |
Mylan Laboratories, Inc.D | | 9,300 | | | 185,628 |
Patterson Cos., Inc.D | | 6,000 | | | 200,400 |
Pfizer, Inc. | | 317,583 | | | 7,406,035 |
Quest Diagnostics, Inc. | | 7,200 | | | 370,656 |
Schering-Plough Corporation | | 63,100 | | | 1,315,635 |
St. Jude Medical, Inc.* | | 16,000 | | | 803,200 |
Stryker Corporation | | 13,000 | | | 577,590 |
Tenet Healthcare Corporation* | | 19,450 | | | 148,987 |
UnitedHealth Group, Inc. | | 58,900 | | | 3,660,046 |
Watson Pharmaceuticals, Inc. | | 4,600 | | | 149,546 |
WellPoint, Inc. | | 28,500 | | | 2,274,015 |
Wyeth | | 57,600 | | | 2,653,632 |
Zimmer Holdings, Inc. | | 10,720 | | | 722,957 |
| | | | | |
| | | | | 63,951,702 |
| | | | | |
Integrated Oils — 5.6% | | | | | |
Amerada Hess Corporation | | 3,600 | | | 456,552 |
Chevron Corporation | | 97,041 | | | 5,509,029 |
ConocoPhillips | | 60,200 | | | 3,502,436 |
ExxonMobil Corporation | | 267,944 | | | 15,050,415 |
Marathon Oil Corporation | | 15,992 | | | 975,032 |
Murphy Oil Corporation | | 7,000 | | | 377,930 |
Occidental Petroleum Corporation | | 16,900 | | | 1,349,972 |
| | | | | |
| | | | | 27,221,366 |
| | | | | |
Materials & Processing — 3.5% | | | | | |
Air Products & Chemicals, Inc. | | 9,500 | | | 562,305 |
Alcoa, Inc. | | 37,000 | | | 1,094,090 |
Allegheny Technologies, Inc. | | 3,900 | | | 140,712 |
American Standard Cos., Inc. | | 7,900 | | | 315,605 |
Archer-Daniels-Midland Co. | | 27,427 | | | 676,350 |
Ashland, Inc.D | | 2,900 | | | 167,910 |
Avery Dennison Corporation | | 4,600 | | | 254,242 |
Ball CorporationD | | 4,592 | | | 182,394 |
Bemis Co.D | | 4,500 | | | 125,415 |
Dow Chemical Co. (The) | | 41,300 | | | 1,809,766 |
duPont (E.I.) de Nemours & Co. | | 39,555 | | | 1,681,087 |
Eastman Chemical Co.D | | 3,800 | | | 196,042 |
Ecolab, Inc. | | 9,100 | | | 330,057 |
Engelhard Corporation | | 5,200 | | | 156,780 |
Fluor CorporationD | | 3,500 | | | 270,410 |
Freeport-McMoRan Copper & Gold, Inc. Class BD | | 8,100 | | | 435,780 |
Hercules, Inc.* | | 4,600 | | | 51,980 |
International Paper Co. | | 21,100 | | | 709,171 |
Louisiana-Pacific Corporation | | 4,500 | | | 123,615 |
Masco Corporation | | 18,600 | | | 561,534 |
MeadWestvaco Corporation | | 8,045 | | | 225,501 |
Monsanto Co. | | 11,360 | | | 880,741 |
Newmont Mining CorporationD | | 19,200 | | | 1,025,280 |
Nucor CorporationD | | 6,800 | | | 453,696 |
Pactiv CorporationD | | 6,400 | | | 140,800 |
Phelps Dodge Corporation | | 4,200 | | | 604,254 |
PPG Industries, Inc. | | 7,200 | | | 416,880 |
Praxair, Inc. | | 13,580 | | | 719,197 |
Rohm & Haas Co. | | 6,700 | | | 324,414 |
Sealed Air CorporationD | | 3,500 | | | 196,595 |
Sherwin-Williams Co. (The)D | | 5,600 | | | 254,352 |
Sigma-Aldrich CorporationD | | 2,900 | | | 183,541 |
Temple-Inland, Inc. | | 5,000 | | | 224,250 |
United States Steel Corporation | | 5,200 | | | 249,964 |
Vulcan Materials Co. | | 4,300 | | | 291,325 |
Weyerhaeuser Co.D | | 10,700 | | | 709,838 |
| | | | | |
| | | | | 16,745,873 |
| | | | | |
Other — 4.5% | | | | | |
3M Co. | | 32,700 | | | 2,534,250 |
Brunswick Corporation | | 4,000 | | | 162,640 |
Eaton Corporation | | 6,300 | | | 422,667 |
General Electric Co. | | 456,800 | | | 16,010,840 |
Honeywell International, Inc. | | 36,300 | | | 1,352,175 |
ITT Industries, Inc. | | 3,900 | | | 400,998 |
Johnson Controls, Inc.D | | 7,992 | | | 582,697 |
Textron, Inc. | | 5,800 | | | 446,484 |
| | | | | |
| | | | | 21,912,751 |
| | | | | |
Other Energy — 3.6% | | | | | |
Anadarko Petroleum Corporation | | 10,000 | | | 947,500 |
Apache Corporation | | 14,148 | | | 969,421 |
Baker Hughes, Inc. | | 14,200 | | | 863,076 |
BJ Services Co. | | 13,600 | | | 498,712 |
Burlington Resources, Inc.D | | 16,400 | | | 1,413,680 |
Devon Energy Corporation | | 19,500 | | | 1,219,530 |
Dynegy, Inc. Class AD* | | 14,500 | | | 70,180 |
El Paso CorporationD | | 27,400 | | | 333,184 |
EOG Resources, Inc. | | 10,100 | | | 741,037 |
See Notes to Financial Statements.
84
| | | | | |
| | | Shares | | Value |
Halliburton Co. | | 21,800 | | $ | 1,350,728 |
Kerr-McGee CorporationD | | 4,965 | | | 451,120 |
Nabors Industries, Ltd. | | 6,500 | | | 492,375 |
National Oilwell Varco, Inc.D | | 7,300 | | | 457,710 |
Noble CorporationD | | 5,600 | | | 395,024 |
Rowan Cos., Inc.D | | 5,200 | | | 185,328 |
Schlumberger, Ltd. | | 25,800 | | | 2,506,470 |
Sunoco, Inc. | | 5,900 | | | 462,442 |
TransOcean, Inc.* | | 14,300 | | | 996,567 |
Valero Energy Corporation | | 26,200 | | | 1,351,920 |
Weatherford International, Ltd. | | 14,198 | | | 513,967 |
Williams Cos., Inc. | | 24,200 | | | 560,714 |
XTO Energy, Inc.D | | 15,566 | | | 683,970 |
| | | | | |
| | | | | 17,464,655 |
| | | | | |
Producer Durables — 4.9% | | | | | |
Agilent Technologies, Inc. | | 17,700 | | | 589,233 |
American Power Conversion Corporation | | 7,400 | | | 162,800 |
Andrew CorporationD | | 6,700 | | | 71,891 |
Applied Materials, Inc. | | 71,500 | | | 1,282,710 |
Boeing Co. (The) | | 35,300 | | | 2,479,472 |
Caterpillar, Inc. | | 29,000 | | | 1,675,330 |
Centex Corporation | | 5,800 | | | 414,642 |
Cooper Industries, Ltd. Class A | | 3,900 | | | 284,700 |
Cummins, Inc.D | | 1,800 | | | 161,514 |
Danaher CorporationD | | 10,600 | | | 591,268 |
Deere & Co.D | | 10,400 | | | 708,344 |
Dover Corporation | | 8,500 | | | 344,165 |
DR Horton, Inc. | | 12,200 | | | 435,906 |
Emerson Electric Co. | | 17,500 | | | 1,307,250 |
Goodrich Corporation | | 5,500 | | | 226,050 |
Grainger (W.W.), Inc.D | | 3,700 | | | 263,070 |
Illinois Tool Works, Inc. | | 9,200 | | | 809,508 |
Ingersoll-Rand Co., Ltd. Class A | | 14,600 | | | 589,402 |
KB HOME | | 3,500 | | | 254,310 |
KLA-Tencor Corporation | | 8,700 | | | 429,171 |
Lennar Corporation Class A | | 5,800 | | | 353,916 |
Lexmark International, Inc.D | | 5,100 | | | 228,633 |
Lockheed Martin Corporation | | 16,300 | | | 1,037,169 |
Molex, Inc. | | 6,950 | | | 180,353 |
Northrop Grumman Corporation | | 15,556 | | | 935,071 |
Novellus Systems, Inc. | | 5,900 | | | 142,308 |
Pall CorporationD | | 5,200 | | | 139,672 |
Parker Hannifin Corporation | | 5,000 | | | 329,800 |
Pitney Bowes, Inc.D | | 9,700 | | | 409,825 |
Pulte Homes, Inc. | | 9,308 | | | 366,363 |
Rockwell Collins, Inc. | | 8,100 | | | 376,407 |
Tektronix, Inc.D | | 3,500 | | | 98,735 |
Teradyne, Inc. | | 8,100 | | | 118,017 |
Thermo Electron Corporation* | | 6,710 | | | 202,172 |
Tyco International, Ltd.D | | 87,684 | | | 2,530,560 |
United Technologies Corporation | | 43,800 | | | 2,448,858 |
Waters CorporationD | | 5,000 | | | 189,000 |
Xerox Corporation* | | 41,800 | | | 612,370 |
| | | | | |
| | | | | 23,779,965 |
| | | | | |
Technology — 13.7% | | | | | |
ADC Telecommunications, Inc.D | | 4,828 | | | 107,858 |
Adobe Systems, Inc. | | 25,700 | | | 949,872 |
Advanced Micro Devices, Inc.* | | 17,400 | | | 532,440 |
Affiliated Computer Services, Inc. Class A | | 5,400 | | | 319,572 |
Altera Corporation | | 15,500 | | | 287,215 |
Analog Devices, Inc. | | 15,700 | | | 563,159 |
Apple Computer, Inc.* | | 35,700 | | | 2,566,473 |
Applera Corporation-Applied Biosystems Group | | 8,400 | | | 223,104 |
Applied Micro Circuits CorporationD | | 13,000 | | | 33,410 |
Autodesk, Inc. | | 10,160 | | | 436,372 |
Avaya, Inc.D | | 19,248 | | | 205,376 |
BMC Software, Inc. | | 9,300 | | | 190,557 |
Broadcom Corporation Class A | | 12,300 | | | 579,945 |
CIENA CorporationD | | 23,700 | | | 70,389 |
Cisco Systems, Inc. | | 264,500 | | | 4,528,240 |
Citrix Systems, Inc.D | | 7,100 | | | 204,338 |
Computer Associates International, Inc. | | 20,770 | | | 585,506 |
Computer Sciences Corporation* | | 8,000 | | | 405,120 |
Compuware Corporation | | 16,100 | | | 144,417 |
Comverse Technology, Inc. | | 8,400 | | | 223,356 |
Corning, Inc.* | | 63,200 | | | 1,242,512 |
Dell, Inc. | | 103,300 | | | 3,097,967 |
Electronic Data Systems Corporation | | 21,900 | | | 526,476 |
EMC Corporation* | | 103,200 | | | 1,405,584 |
Freescale Semiconductor, Inc. Series B | | 17,011 | | | 428,167 |
Gateway, Inc.D | | 12,700 | | | 31,877 |
General Dynamics Corporation | | 8,400 | | | 958,020 |
Hewlett-Packard Co. | | 123,402 | | | 3,532,999 |
Intel Corporation | | 263,800 | | | 6,584,448 |
International Business Machines Corporation | | 68,800 | | | 5,655,360 |
Intuit, Inc. | | 7,800 | | | 415,740 |
Jabil Circuit, Inc. | | 8,000 | | | 296,720 |
JDS Uniphase CorporationD | | 71,000 | | | 167,560 |
L-3 Communications Holdings, Inc.D | | 4,900 | | | 364,315 |
Linear Technology Corporation | | 12,800 | | | 461,696 |
LSI Logic CorporationD | | 16,000 | | | 128,000 |
Lucent Technologies, Inc.D* | | 191,976 | | | 510,656 |
Maxim Integrated Products, Inc. | | 13,800 | | | 500,112 |
Mercury Interactive CorporationD | | 3,500 | | | 97,265 |
Micron Technology, Inc.D* | | 26,600 | | | 354,046 |
Microsoft Corporation | | 397,000 | | | 10,381,550 |
Motorola, Inc. | | 106,400 | | | 2,403,576 |
National Semiconductor CorporationD | | 15,000 | | | 389,700 |
NCR Corporation | | 7,800 | | | 264,732 |
Network Appliance, Inc. | | 16,000 | | | 432,000 |
Novell, Inc.D | | 15,900 | | | 140,397 |
Nvidia Corporation | | 7,700 | | | 281,512 |
Oracle Corporation | | 162,500 | | | 1,984,125 |
Parametric Technology CorporationD | | 11,200 | | | 68,320 |
PerkinElmer, Inc.D | | 5,300 | | | 124,868 |
PMC-Sierra, Inc.D | | 7,500 | | | 57,825 |
QLogic Corporation | | 3,800 | | | 123,538 |
Qualcomm, Inc. | | 70,100 | | | 3,019,908 |
Raytheon Co. | | 18,700 | | | 750,805 |
Rockwell Automation, Inc. | | 7,500 | | | 443,700 |
Sanmina-SCI Corporation | | 21,800 | | | 92,868 |
Scientific-Atlanta, Inc. | | 6,400 | | | 275,648 |
See Notes to Financial Statements.
85
Equity Index Fund
SCHEDULE OF INVESTMENTS (Continued)
| | | | | | | |
| | | Shares | | Value | |
Siebel Systems, Inc. | | | 22,500 | | $ | 238,050 | |
Solectron Corporation | | | 40,200 | | | 147,132 | |
Sun Microsystems, Inc.D | | | 146,900 | | | 615,511 | |
Symantec Corporation | | | 46,570 | | | 814,975 | |
Symbol Technologies, Inc. | | | 10,457 | | | 134,059 | |
Tellabs, Inc. | | | 19,600 | | | 213,640 | |
Texas Instruments, Inc. | | | 70,700 | | | 2,267,349 | |
Unisys CorporationD* | | | 13,900 | | | 81,037 | |
Xilinx, Inc. | | | 14,500 | | | 365,545 | |
| | | | | | | |
| | | | | | 66,028,609 | |
| | | | | | | |
Utilities — 7.0% | | | | | | | |
AES Corporation (The)* | | | 27,500 | | | 435,325 | |
Allegheny Energy, Inc.D* | | | 6,600 | | | 208,890 | |
Alltel Corporation | | | 16,200 | | | 1,022,220 | |
Ameren CorporationD | | | 9,200 | | | 471,408 | |
American Electric Power Co., Inc. | | | 17,800 | | | 660,202 | |
AT&T, Inc. | | | 168,500 | | | 4,126,564 | |
BellSouth Corporation | | | 79,000 | | | 2,140,900 | |
Centerpoint Energy, Inc.D | | | 12,800 | | | 164,480 | |
CenturyTel, Inc. | | | 5,600 | | | 185,696 | |
Cinergy CorporationD | | | 7,800 | | | 331,188 | |
Citizens Communications Co. | | | 14,500 | | | 177,335 | |
CMS Energy CorporationD* | | | 8,600 | | | 124,786 | |
Comcast Corporation Class A* | | | 94,615 | | | 2,456,205 | |
Consolidated Edison, Inc.D | | | 10,100 | | | 467,933 | |
Constellation Energy Group, Inc. | | | 7,300 | | | 420,480 | |
Dominion Resources, Inc. | | | 14,700 | | | 1,134,840 | |
DTE Energy Co.D | | | 7,300 | | | 315,287 | |
Duke Energy CorporationD | | | 39,900 | | | 1,095,255 | |
Edison InternationalD | | | 14,500 | | | 632,345 | |
Entergy Corporation | | | 9,352 | | | 642,015 | |
Exelon Corporation | | | 29,124 | | | 1,547,649 | |
FirstEnergy Corporation | | | 13,784 | | | 675,278 | |
FPL Group, Inc.D | | | 16,500 | | | 685,740 | |
KeySpan CorporationD | | | 7,900 | | | 281,951 | |
Kinder Morgan, Inc. | | | 4,500 | | | 413,775 | |
Nicor, Inc.D | | | 1,800 | | | 70,758 | |
NiSource, Inc.D | | | 11,000 | | | 229,460 | |
Peoples Energy CorporationD | | | 1,600 | | | 56,112 | |
PG&E CorporationD | | | 14,700 | | | 545,664 | |
Pinnacle West Capital CorporationD | | | 3,800 | | | 157,130 | |
PPL Corporation | | | 15,600 | | | 458,640 | |
Progress Energy, Inc.D | | | 11,200 | | | 491,904 | |
Public Service Enterprise Group, Inc.D | | | 10,600 | | | 688,682 | |
Qwest Communications International, Inc.D* | | | 68,700 | | | 388,155 | |
Sempra Energy | | | 10,900 | | | 488,756 | |
Southern Co. (The) | | | 32,300 | | | 1,115,319 | |
Sprint Nextel Corporation | | | 126,193 | | | 2,947,869 | |
TECO Energy, Inc.D | | | 10,000 | | | 171,800 | |
TXU Corporation | | | 21,200 | | | 1,064,028 | |
Verizon Communications, Inc. | | | 119,134 | | | 3,588,316 | |
Xcel Energy, Inc.D | | | 16,700 | | | 308,282 | |
| | | | | | | |
| | | | | | 33,588,622 | |
| | | | | | | |
TOTAL COMMON STOCKS
(Cost $390,723,774) | | | | | | 471,536,824 | |
| | | | | | | |
MONEY MARKET FUNDS — 10.1% | | | | | | | |
GuideStone Funds Money Market Fund (GS4 Class)¥ | | | 9,259,159 | | | 9,259,159 | |
Northern Institutional Liquid Assets Portfolio§ | | | 39,296,287 | | | 39,296,287 | |
| | | | | | | |
TOTAL MONEY MARKET FUNDS
(Cost $48,555,446) | | | | | | 48,555,446 | |
| | | | | | | |
| | |
| | | Par | | | |
U.S. TREASURY OBLIGATION — 0.1% | | | | | | | |
U.S. Treasury Bill 3.94%, 04/06/06‡‡
(Cost $697,675) | | $ | 705,000 | | | 697,743 | |
| | | | | | | |
Total Investments — 107.9%
(Cost $439,976,895) | | | | | | 520,790,013 | |
Liabilities in Excess of Other Assets — (7.9)% | | | | | | (38,271,193 | ) |
| | | | | | | |
Net Assets — 100.0% | | | | | $ | 482,518,820 | |
| | | | | | | |
| | |
PORTFOLIO SUMMARY+ | | | | | | | |
| | | | |
| | |
| | | | | % |
Financial Services | | | | 22.3 |
Technology | | | | 13.7 |
Healthcare | | | | 13.3 |
Consumer Discretionary | | | | 11.0 |
Money Market Funds | | | | 10.1 |
Utilities | | | | 7.0 |
Consumer Staples | | | | 5.9 |
Integrated Oils | | | | 5.6 |
Producer Durables | | | | 4.9 |
Other | | | | 4.5 |
Other Energy | | | | 3.6 |
Materials & Processing | | | | 3.5 |
Auto & Transportation | | | | 2.4 |
Futures Contracts | | | | 1.4 |
U.S. Treasury Obligations | | | | 0.1 |
| | | | |
| | | | 109.3 |
| | | | |
See Notes to Financial Statements.
86
Value Equity Fund
The Fund is comprised of domestic, large-cap value oriented stocks. The Fund generated a positive return while slightly underperforming its benchmark, the Russell 1000® Value Index, during the fourth quarter. Security selection in the autos & transportation and technology sectors benefited benchmark-relative performance during the quarter. Underweight exposure in the financial services sector and security selection in the consumer staples sector detracted from benchmark-relative performance. The Fund’s holdings in ConocoPhillips, ExxonMobil and Chevron detracted from performance, while outperforming holdings included JPMorgan Chase, Bank of America and Citigroup. At the sub-adviser level, Equinox delivered the strongest benchmark-relative performance largely due to its security selection in the financial services and materials & processing sectors.
87
Value Equity Fund
Average Annual Total Returns as of 12/31/05
| | | | | | | | | | | | | | | | | | |
| | | GS2 Class* | | | GS4 Class* | | | GS6 Class* | | | Benchmark** | | | GS8 Class* | | | GS8 Class
Benchmark** | |
One Year | | 7.40 | % | | 7.13 | % | | 6.78 | % | | 7.05 | % | | 6.39 | % | | 7.05 | % |
Since Inception | | 6.85 | % | | 6.44 | % | | 6.32 | % | | 6.71 | % | | 10.41 | % | | 11.01 | % |
Inception Date | | 08/27/01 | | | 08/27/01 | | | 08/27/01 | | | 08/27/01 | | | 11/08/04 | | | 11/08/04 | |
The performance data quoted represents past performance and does not guarantee future results. Current performance may be lower or higher. Performance data current to the most recent month-end may be obtained at www.GuideStone.org. The investment return and principal value of an investment will fluctuate so that shares, when redeemed, may be worth more or less than their original cost.
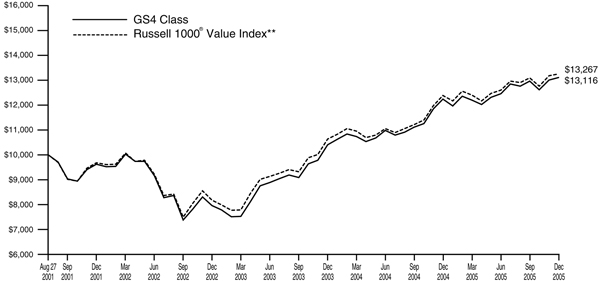
The graph compares the results of a hypothetical $10,000 investment in the GS4 Class of the Fund since August 27, 2001 (commencement of operations), with all dividends and capital gains reinvested, with the Russell 1000® Value Index.
| * | These returns reflect expense waivers by the Fund’s investment advisor. Without these waivers, returns would have been lower. Returns shown do not reflect the deduction of taxes that a shareholder would pay on Fund distributions or the redemption of Fund shares. |
| ** | The Russell 1000® Value Index is a large-cap index consisting of those Russell 1000® index securities with a less-than-average growth orientation. Companies in this index tend to exhibit lower price-to-book and price-earnings-ratios, higher dividend yields and lower forecasted growth values than the growth universe. |
Unlike a mutual fund, the performance of an index assumes no taxes, transaction costs, management fees or other expenses.
88
Value Equity Fund
| | |
| SCHEDULE OF INVESTMENTS | | December 31, 2005 |
| | | | | |
| | | Shares | | Value |
COMMON STOCKS — 95.6% | | | | | |
Auto & Transportation — 2.0% | | | | | |
Alexander & Baldwin, Inc.D | | 2,400 | | $ | 130,176 |
Autoliv, Inc. | | 5,400 | | | 245,268 |
BorgWarner, Inc. | | 2,500 | | | 151,575 |
Burlington Northern Santa Fe CorporationD | | 179,800 | | | 12,733,436 |
Dana CorporationD | | 8,800 | | | 63,184 |
EGL, Inc. | | 3,900 | | | 146,523 |
Ford Motor Co.D | | 110,795 | | | 855,337 |
General Motors Corporation | | 28,600 | | | 555,412 |
Genuine Parts Co. | | 10,300 | | | 452,376 |
Goodyear Tire & Rubber Co. (The)D* | | 6,000 | | | 104,280 |
Laidlaw International, Inc.D | | 5,800 | | | 134,734 |
Lear CorporationD | | 4,300 | | | 122,378 |
Norfolk Southern CorporationD | | 21,600 | | | 968,328 |
Overseas Shipholding Group, Inc. | | 1,900 | | | 95,741 |
PACCAR, Inc.D | | 1,750 | | | 121,153 |
Southwest Airlines Co. | | 24,550 | | | 403,356 |
Swift Transportation Co., Inc. | | 2,300 | | | 46,690 |
Tidewater, Inc.D | | 3,100 | | | 137,826 |
TRW Automotive Holdings CorporationD | | 20,500 | | | 540,175 |
Union Pacific Corporation | | 130,800 | | | 10,530,708 |
Yellow Roadway CorporationD | | 3,500 | | | 156,135 |
| | | | | |
| | | | | 28,694,791 |
| | | | | |
Consumer Discretionary — 9.8% | | | | | |
Adesa, Inc,D | | 5,200 | | | 126,984 |
Alberto-Culver Co.D | | 2,850 | | | 130,388 |
Allied Waste Industries, Inc.D | | 9,500 | | | 83,030 |
American Greetings | | | | | |
Corporation Class A | | 3,900 | | | 85,683 |
AnnTaylor Stores CorporationD | | 2,200 | | | 75,944 |
AutoNation, Inc. | | 10,500 | | | 228,165 |
Barnes & Noble, Inc.D | | 2,900 | | | 123,743 |
Belo Corporation Class AD | | 4,700 | | | 100,627 |
BJ’s Wholesale Club, Inc.D | | 4,100 | | | 121,196 |
Black & Decker Corporation | | 4,000 | | | 347,840 |
Borders Group, Inc.D | | 4,600 | | | 99,682 |
Brink’s Co. (The)D | | 1,400 | | | 67,074 |
Career Education Corporation | | 31,800 | | | 1,072,296 |
Carnival CorporationD | | 76,900 | | | 4,111,843 |
CBRL Group, Inc.D | | 1,500 | | | 52,725 |
CCE Spinco, Inc. | | 2,878 | | | 37,703 |
Cendant CorporationD | | 693,730 | | | 11,966,843 |
Circuit City Stores, Inc.D | | 199,300 | | | 4,502,187 |
Claire’s Stores, Inc. | | 400 | | | 11,688 |
Clear Channel Communications, Inc.D | | 23,025 | | | 724,136 |
Coach, Inc. | | 60,300 | | | 2,010,402 |
Columbia Sportswear Co.D | | 900 | | | 42,957 |
Convergys CorporationD | | 8,500 | | | 134,725 |
Costco Wholesale Corporation | | 18,500 | | | 915,195 |
Dillard’s, Inc. Class A | | 4,900 | | | 121,618 |
DIRECTV Group, Inc. (The)D* | | 4,232 | | | 59,756 |
Discovery Holding Co. Class AD | | 11,110 | | | 168,317 |
Dollar Tree Stores, Inc. | | 3,000 | | | 71,820 |
Donnelley (R.R.) & Sons Co. | | 13,500 | | | 461,835 |
Eastman Kodak Co.D | | 388,400 | | | 9,088,560 |
Education Management Corporation | | 9,700 | | | 325,047 |
Expedia, Inc. | | 5,580 | | | 133,697 |
Family Dollar Stores, Inc.D | | 3,300 | | | 81,807 |
Federated Department Stores, Inc. | | 16,107 | | | 1,068,377 |
Foot Locker, Inc.D | | 5,000 | | | 117,950 |
Gannett Co., Inc.D | | 179,500 | | | 10,872,315 |
Hasbro, Inc. | | 9,325 | | | 188,178 |
Hearst-Argyle Television, Inc. | | 1,800 | | | 42,930 |
Hewitt Associates, Inc. Class AD | | 1,700 | | | 47,617 |
Home Depot, Inc. (The) | | 77,900 | | | 3,153,392 |
IAC InterActiveCorpD | | 5,580 | | | 157,970 |
International Speedway Corporation Class AD | | 1,500 | | | 71,850 |
Interpublic Group Cos., Inc.D* | | 5,000 | | | 48,250 |
Jones Apparel Group, Inc. | | 7,500 | | | 230,400 |
Kimberly-Clark Corporation | | 17,100 | | | 1,020,015 |
Knight-Ridder, Inc.D | | 4,500 | | | 284,850 |
Lamar Advertising Co. | | 1,300 | | | 59,982 |
Laureate Education, Inc.D | | 700 | | | 36,757 |
Lee Enterprises, Inc. | | 2,700 | | | 99,657 |
Leggett & Platt, Inc. | | 7,700 | | | 176,792 |
Liberty Global, Inc.D | | 5,600 | | | 118,720 |
Liberty Global, Inc. Class AD | | 11,457 | | | 257,782 |
Liberty Media Corporation Class A | | 362,400 | | | 2,852,088 |
Liz Claiborne, Inc. | | 6,600 | | | 236,412 |
Manpower, Inc.D | | 3,800 | | | 176,700 |
Mattel, Inc.D | | 351,200 | | | 5,555,984 |
McClatchy Co. Class A | | 1,100 | | | 65,010 |
McDonald’s CorporationD | | 590,100 | | | 19,898,172 |
Mohawk Industries, Inc.D | | 2,300 | | | 200,054 |
New York Times Co. Class AD | | 9,900 | | | 261,855 |
Newell Rubbermaid, Inc.D | | 326,400 | | | 7,761,792 |
Office Depot, Inc.D | | 170,800 | | | 5,363,120 |
OfficeMax, Inc.D | | 5,300 | | | 134,408 |
Omnicom Group, Inc. | | 54,600 | | | 4,648,098 |
Outback Steakhouse, Inc.D | | 300 | | | 12,483 |
Penney (JC) Co., Inc. | | 8,600 | | | 478,160 |
Polo Ralph Lauren CorporationD | | 2,500 | | | 140,350 |
Reebok International, Ltd.D | | 2,500 | | | 145,575 |
Rent-A-Center, Inc.D | | 2,500 | | | 47,150 |
Republic Services, Inc.D | | 31,500 | | | 1,182,825 |
Sabre Holdings Corporation | | 9,300 | | | 224,223 |
Saks, Inc.D* | | 6,700 | | | 112,962 |
Sears Holdings CorporationD | | 3,297 | | | 380,902 |
Service Corporation InternationalD | | 18,100 | | | 148,058 |
ServiceMaster Co. | | 7,100 | | | 84,845 |
Snap-On, Inc.D | | 3,400 | | | 127,704 |
Stanley Works (The)D | | 205,000 | | | 9,848,200 |
Starwood Hotels & Resorts Worldwide, Inc. | | 5,200 | | | 332,072 |
See Notes to Financial Statements.
89
Value Equity Fund
SCHEDULE OF INVESTMENTS (Continued)
| | | | | |
| | | Shares | | Value |
Take-Two Interactive Software, Inc.D | | 1,300 | | $ | 23,010 |
Tech Data Corporation | | 11,000 | | | 436,480 |
Telewest Global, Inc.D | | 16,300 | | | 388,266 |
Tiffany & Co. | | 5,100 | | | 195,279 |
Time Warner, Inc. | | 272,800 | | | 4,757,632 |
Tribune Co. | | 15,800 | | | 478,108 |
Univision Communications, Inc. Class A | | 7,095 | | | 208,522 |
VF Corporation | | 67,500 | | | 3,735,450 |
Wal-Mart Stores, Inc.D | | 86,300 | | | 4,038,840 |
Walt Disney Co. (The) | | 92,300 | | | 2,212,431 |
Warner Music Group CorporationD | | 2,000 | | | 38,540 |
Waste Management, Inc.D | | 298,157 | | | 9,049,065 |
Wendy’s International, Inc.D | | 3,700 | | | 204,462 |
Westwood One, Inc. | | 3,400 | | | 55,420 |
Whirlpool Corporation | | 4,100 | | | 343,416 |
Yum! Brands, Inc. | | 9,000 | | | 421,920 |
| | | | | |
| | | | | 142,745,340 |
| | | | | |
Consumer Staples — 2.4% | | | | | |
Albertson’s, Inc.D | | 106,700 | | | 2,278,045 |
Campbell Soup Co.D | | 6,800 | | | 202,436 |
Clorox Co. | | 9,241 | | | 525,720 |
Coca-Cola Co. (The) | | 49,700 | | | 2,003,407 |
Coca-Cola Enterprises, Inc. | | 18,000 | | | 345,060 |
Colgate-Palmolive Co. | | 9,200 | | | 504,620 |
ConAgra Foods, Inc.D | | 492,900 | | | 9,996,012 |
Dean Foods Co. | | 8,950 | | | 337,057 |
Del Monte Foods Co.D | | 11,200 | | | 116,816 |
General Mills, Inc. | | 17,200 | | | 848,304 |
Heinz (H.J.) Co.D | | 191,800 | | | 6,467,496 |
Hershey Co. (The) | | 1,400 | | | 77,350 |
Hormel Foods Corporation | | 43,600 | | | 1,424,848 |
J.M. Smucker Co. (The) | | 3,400 | | | 149,600 |
Kellogg Co. | | 6,100 | | | 263,642 |
Kraft Foods, Inc. Class A | | 17,100 | | | 481,194 |
Kroger Co.* | | 46,600 | | | 879,808 |
McCormick & Co., Inc. | | 2,000 | | | 61,840 |
Pepsi Bottling Group, Inc. | | 5,600 | | | 160,216 |
PepsiAmericas, Inc. | | 4,200 | | | 97,692 |
Pilgrim’s Pride CorporationD | | 1,400 | | | 46,424 |
Rite Aid CorporationD* | | 30,700 | | | 106,836 |
Safeway, Inc.D | | 128,900 | | | 3,049,774 |
Sara Lee CorporationD | | 155,215 | | | 2,933,564 |
Smithfield Foods, Inc. | | 6,100 | | | 186,660 |
SUPERVALU, Inc. | | 53,013 | | | 1,721,862 |
TreeHouse Foods, Inc.D | | 2,790 | | | 52,229 |
Tyson Foods, Inc. Class A | | 13,781 | | | 235,655 |
| | | | | |
| | | | | 35,554,167 |
| | | | | |
Financial Services — 32.0% | | | | | |
A.G. Edwards, Inc. | | 4,700 | | | 220,242 |
AFLAC, Inc. | | 6,500 | | | 301,730 |
Alleghany CorporationD* | | 312 | | | 88,608 |
Allied Capital CorporationD | | 7,600 | | | 223,212 |
Allstate Corporation (The)D | | 353,200 | | | 19,097,524 |
AMB Property Corporation REIT | | 4,900 | | | 240,933 |
AMBAC Financial Group, Inc. | | 5,750 | | | 443,095 |
American Capital Strategies, Ltd.D | | 7,000 | | | 253,470 |
American Financial Group, Inc. TBA | | 2,200 | | | 84,282 |
American Financial Realty Trust REITD | | 6,000 | | | 72,000 |
American International Group, Inc. | | 101,433 | | | 6,920,774 |
American National Insurance Co. | | 500 | | | 58,495 |
AmeriCredit CorporationD | | 5,800 | | | 148,654 |
Ameritrade Holding Corporation | | 9,400 | | | 225,600 |
AmerUs Group Co.D | | 3,100 | | | 175,677 |
AmSouth Bancorporation | | 20,900 | | | 547,789 |
Annaly Mortgage Management, Inc. REITD | | 9,300 | | | 101,742 |
AON Corporation | | 19,500 | | | 701,025 |
Apartment Investment & Management Co. Class A REITD | | 5,600 | | | 212,072 |
Archstone-Smith Trust Reit | | 13,500 | | | 565,515 |
Arden Realty, Inc. REIT | | 5,200 | | | 233,116 |
Arthur J. Gallagher & Co.D | | 2,000 | | | 61,760 |
Associated Banc-CorpD | | 42,700 | | | 1,389,885 |
Assurant, Inc. | | 6,600 | | | 287,034 |
Astoria Financial Corporation | | 6,900 | | | 202,860 |
AvalonBay Communities, Inc. REITD | | 4,200 | | | 374,850 |
Bank of America CorporationD | | 929,284 | | | 42,886,457 |
Bank of Hawaii CorporationD | | 3,200 | | | 164,928 |
Bank of New York Co., Inc. (The) | | 48,700 | | | 1,551,095 |
BB&T Corporation | | 34,729 | | | 1,455,492 |
Bear Stearns Cos., Inc. (The) | | 7,000 | | | 808,710 |
BISYS Group, Inc. (The)D | | 3,000 | | | 42,030 |
BOK Financial CorporationD | | 1,057 | | | 48,020 |
Boston Properties, Inc. REITD | | 6,400 | | | 474,432 |
BRE Properties, Inc. Class A REIT | | 3,900 | | | 177,372 |
Camden Property Trust REIT | | 3,800 | | | 220,096 |
Capital One Financial Corporation | | 12,700 | | | 1,097,280 |
CapitalSource, Inc.D | | 1,900 | | | 42,560 |
Capitol Federal FinancialD | | 1,300 | | | 42,822 |
CarrAmerica Realty Corporation REITD | | 4,500 | | | 155,835 |
CBL & Associates Properties, Inc. REITD | | 22,000 | | | 869,220 |
Centerpoint Properties Corporation REIT | | 2,800 | | | 138,544 |
Checkfree CorporationD | | 800 | | | 36,720 |
Chubb Corporation | | 124,600 | | | 12,167,190 |
CIGNA CorporationD | | 80,700 | | | 9,014,190 |
Cincinnati Financial Corporation | | 10,255 | | | 458,193 |
CIT Group, Inc. | | 88,300 | | | 4,572,174 |
Citigroup, Inc. | | 918,567 | | | 44,578,057 |
City National Corporation | | 2,400 | | | 173,856 |
CNA Financial CorporationD | | 1,500 | | | 49,095 |
Colonial BancGroup, Inc.D | | 26,300 | | | 626,466 |
Comerica, Inc.D | | 139,700 | | | 7,929,372 |
Commerce Bancorp, Inc.D | | 400 | | | 13,764 |
Commerce Bancshares, Inc.D | | 3,787 | | | 197,378 |
Commerce Group, Inc. | | 1,200 | | | 68,736 |
See Notes to Financial Statements.
90
| | | | | |
| | | Shares | | Value |
Compass Bancshares, Inc.D | | 8,600 | | $ | 415,294 |
Conseco, Inc.D | | 10,600 | | | 245,602 |
Countrywide Financial Corporation | | 33,500 | | | 1,145,365 |
Crescent Real Estate Equities Co. REITD | | 262,000 | | | 5,192,840 |
Cullen/Frost Bankers, Inc.D | | 3,000 | | | 161,040 |
Deluxe CorporationD | | 3,700 | | | 111,518 |
Developers Diversified Realty Corporation REIT | | 6,100 | | | 286,822 |
Downey Financial CorporationD | | 1,600 | | | 109,424 |
Duke Realty Corporation REITD | | 8,400 | | | 280,560 |
E*trade Financial CorporationD | | 23,100 | | | 481,866 |
Equifax, Inc. | | 2,600 | | | 98,852 |
Equity Office Properties Trust REIT | | 25,885 | | | 785,092 |
Equity Residential Properties Trust Reit | | 19,200 | | | 751,104 |
Erie Indemnity Co. Class AD | | 1,700 | | | 90,440 |
Essex Property Trust, Inc. REITD | | 1,800 | | | 165,960 |
Fair Isaac & Co., Inc. | | 600 | | | 26,502 |
Fannie Mae | | 174,300 | | | 8,507,583 |
Federal Realty Investors Trust REIT | | 2,700 | | | 163,755 |
Federated Investors, Inc. Class B | | 500 | | | 18,520 |
Fidelity National Financial, Inc. | | 9,879 | | | 363,448 |
Fidelity National Title Group, Inc.D | | 1,728 | | | 42,077 |
Fifth Third BancorpD | | 28,800 | | | 1,086,336 |
First American CorporationD | | 5,700 | | | 258,210 |
First Horizon National CorporationD | | 8,800 | | | 338,272 |
FirstMerit CorporationD | | 5,000 | | | 129,550 |
Freddie Mac | | 164,900 | | | 10,776,215 |
Friedman, Billings, Ramsey Group, Inc. Class A REITD | | 9,900 | | | 98,010 |
Fulton Financial CorporationD | | 9,050 | | | 159,280 |
General Growth Properties, Inc. REIT | | 86,000 | | | 4,041,140 |
Genworth Financial, Inc. Class A | | 13,400 | | | 463,372 |
Global Payments, Inc. | | 3,700 | | | 172,457 |
Golden West Financial Corporation | | 9,300 | | | 613,800 |
Goldman Sachs Group, Inc. | | 21,276 | | | 2,717,158 |
Hanover Insurance Group, Inc. | | 3,200 | | | 133,664 |
Hartford Financial Services Group, Inc. | | 245,400 | | | 21,077,406 |
HCC Insurance Holdings, Inc. | | 4,200 | | | 124,656 |
Health Care Property Investors, Inc. REITD | | 7,800 | | | 199,368 |
Health Care REIT, Inc.D | | 3,000 | | | 101,700 |
Healthcare Realty Trust, Inc. REITD | | 2,000 | | | 66,540 |
Hospitality Properites Trust REITD | | 4,000 | | | 160,400 |
Host Marriott Corporation REITD | | 26,600 | | | 504,070 |
HRPT Properties Trust REITD | | 10,500 | | | 108,675 |
Huntington Bancshares, Inc. | | 15,700 | | | 372,875 |
Independence Community Bank Corporation | | 4,900 | | | 194,677 |
IndyMac Bancorp, Inc. | | 2,400 | | | 93,648 |
International Bancshares CorporationD | | 2,625 | | | 77,070 |
iStar Financial, Inc. REITD | | 6,500 | | | 231,725 |
Janus Capital Group, Inc. | | 15,400 | | | 286,902 |
Jefferies Group, Inc.D | | 3,400 | | | 152,932 |
Jefferson-Pilot Corporation | | 8,400 | | | 478,212 |
JPMorgan Chase & Co.D | | 833,538 | | | 33,083,123 |
KeyCorpD | | 245,550 | | | 8,085,962 |
Kimco Realty Corporation REITD | | 11,600 | | | 372,128 |
Lehman Brothers Holdings, Inc. | | 17,242 | | | 2,209,907 |
Leucadia National CorporationD | | 4,750 | | | 225,435 |
Liberty Property Trust REITD | | 5,000 | | | 214,250 |
Lincoln National Corporation | | 83,700 | | | 4,438,611 |
Loews Corporation | | 9,100 | | | 863,135 |
M & T Bank CorporationD | | 4,500 | | | 490,725 |
Macerich Co. (The) REITD | | 3,200 | | | 214,848 |
Mack-Cali Realty Corporation REITD | | 4,900 | | | 211,680 |
Markel Corporation | | 300 | | | 95,115 |
Marsh & McLennan Cos., Inc. | | 34,100 | | | 1,083,016 |
Marshall & Ilsley CorporationD | | 14,800 | | | 636,992 |
MBIA, Inc.D | | 8,250 | | | 496,320 |
MBNA Corporation | | 483,300 | | | 13,121,595 |
Mellon Financial Corporation | | 24,400 | | | 835,700 |
Mercantile Bankshares CorporationD | | 4,700 | | | 265,268 |
Mercury General CorporationD | | 1,500 | | | 87,330 |
Merrill Lynch & Co., Inc.D | | 145,967 | | | 9,886,345 |
MetLife, Inc. | | 26,100 | | | 1,278,900 |
MGIC Investment Corporation | | 94,700 | | | 6,233,154 |
Mills Corporation (The) REITD | | 21,700 | | | 910,098 |
Morgan StanleyD | | 309,000 | | | 17,532,660 |
National City Corporation | | 36,937 | | | 1,239,975 |
Nationwide Financial Services Class AD | | 52,800 | | | 2,323,200 |
New Century Financial Corporation REITD | | 1,900 | | | 68,533 |
New Plan Excel Realty Trust REITD | | 5,900 | | | 136,762 |
New York Community Bancorp, Inc.D | | 17,954 | | | 296,600 |
North Fork Bancorporation, Inc. | | 173,208 | | | 4,738,971 |
Northern Trust CorporationD | | 5,300 | | | 274,646 |
Old Republic International Corporation | | 51,550 | | | 1,353,703 |
Pan Pacific Retail Properties, Inc. REIT | | 2,400 | | | 160,536 |
Philadelphia Consolidated Holding Corporation | | 500 | | | 48,345 |
See Notes to Financial Statements.
91
Value Equity Fund
SCHEDULE OF INVESTMENTS (Continued)
| | | | | |
| | | Shares | | Value |
Plum Creek Timber Co., Inc. REIT | | 10,862 | | $ | 391,575 |
PMI Group, Inc. (The)D | | 6,700 | | | 275,169 |
PNC Financial Services Group, Inc. | | 18,600 | | | 1,150,038 |
Popular, Inc. | | 16,400 | | | 346,860 |
Principal Financial Group | | 18,700 | | | 886,941 |
Progressive Corporation
(The) | | 1,200 | | | 140,136 |
Prologis Trust REIT | | 15,031 | | | 702,248 |
Protective Life Corporation | | 11,300 | | | 494,601 |
Prudential Financial, Inc.D | | 30,500 | | | 2,232,295 |
Public Storage, Inc. Reit | | 1,900 | | | 128,668 |
Radian Group, Inc.D | | 4,900 | | | 287,091 |
Raymond James Financial, Inc.D | | 3,600 | | | 135,612 |
Rayonier, Inc. REITD | | 5,310 | | | 211,604 |
Realty Income Corporation REITD | | 3,500 | | | 75,670 |
Reckson Associates Realty Corporation REITD | | 4,000 | | | 143,920 |
Regency Centers Corporation REITD | | 3,400 | | | 200,430 |
Regions Financial Corporation | | 30,249 | | | 1,033,306 |
Reinsurance Group of America, Inc.D | | 1,700 | | | 81,192 |
RenaissanceRe Holdings, Ltd.D | | 39,700 | | | 1,751,167 |
Ryder System, Inc.D | | 3,100 | | | 127,162 |
Safeco Corporation | | 8,500 | | | 480,250 |
Shurgard Storage Centers, Inc. Class A REIT | | 2,700 | | | 153,117 |
Simon Property Group, Inc. Reit | | 6,857 | | | 525,452 |
Sky Financial Group, Inc. | | 6,100 | | | 169,702 |
SL Green Realty Corporation REITD | | 2,300 | | | 175,697 |
SLM CorporationD | | 179,500 | | | 9,888,655 |
South Financial Group, Inc.D | | 3,500 | | | 96,390 |
Sovereign Bancorp, Inc. | | 21,900 | | | 473,478 |
St. Paul Travelers Cos., Inc. | | 175,191 | | | 7,825,782 |
Stancorp Financial Group, Inc. | | 4,200 | | | 209,790 |
State Street CorporationD | | 14,000 | | | 776,160 |
Suntrust Banks, Inc. | | 81,774 | | | 5,949,876 |
Synovus Financial Corporation | | 24,000 | | | 648,240 |
TCF Financial CorporationD | | 1,200 | | | 32,568 |
TD Banknorth, Inc.D | | 4,998 | | | 145,192 |
Thornburg Mortgage, Inc. REITD | | 7,600 | | | 199,120 |
Torchmark CorporationD | | 7,100 | | | 394,760 |
Transatlantic Holdings, Inc.D | | 1,375 | | | 92,400 |
Trizec Properties, Inc. REITD | | 7,000 | | | 160,440 |
UnionBanCal Corporation | | 55,500 | | | 3,813,960 |
United Dominion Realty Trust, Inc. REITD | | 6,900 | | | 161,736 |
Unitrin, Inc.D | | 1,600 | | | 72,080 |
UnumProvident CorporationD | | 395,400 | | | 8,995,350 |
US BancorpD | | 117,125 | | | 3,500,866 |
Valley National BancorpD | | 5,812 | | | 140,069 |
Vornado Realty Trust REIT | | 8,000 | | | 667,760 |
W.R. Berkley Corporation | | 5,812 | | | 276,767 |
Wachovia Corporation | | 360,028 | | | 19,031,080 |
Washington Federal, Inc.D | | 5,097 | | | 117,180 |
Washington Mutual, Inc.D | | 584,221 | | | 25,413,614 |
Webster Financial CorporationD | | 3,100 | | | 145,390 |
Weingarten Realty Investors REITD | | 4,100 | | | 155,021 |
Wells Fargo & Co.D | | 195,872 | | | 12,306,638 |
Westcorp | | 1,100 | | | 73,271 |
WFS Financial, Inc.D | | 200 | | | 15,230 |
Whitney Holding CorporationD | | 4,200 | | | 115,752 |
Wilmington Trust CorporationD | | 3,900 | | | 151,749 |
XL Capital, Ltd. Class AD | | 145,600 | | | 9,810,528 |
Zions Bancorporation | | 6,200 | | | 468,472 |
| | | | | |
| | | | | 466,092,847 |
| | | | | |
Healthcare — 11.2% | | | | | |
Abbott Laboratories | | 11,800 | | | 465,274 |
ACE, Ltd.D | | 188,300 | | | 10,062,752 |
Aetna, Inc. | | 3,600 | | | 339,516 |
Amerisourcebergen Corporation | | 24,492 | | | 1,013,969 |
Bausch & Lomb, Inc.D | | 500 | | | 33,950 |
Baxter International, Inc. | | 317,700 | | | 11,961,405 |
Becton Dickinson & Co. | | 61,600 | | | 3,700,928 |
Biogen Idec, Inc. | | 11,700 | | | 530,361 |
Bristol-Myers Squibb Co.D | | 379,900 | | | 8,730,102 |
Cardinal Health, Inc.D | | 91,700 | | | 6,304,375 |
Caremark Rx, Inc. | | 3,000 | | | 155,370 |
Charles River Laboratories International, Inc.D | | 2,000 | | | 84,740 |
Chiron CorporationD | | 1,000 | | | 44,460 |
Community Health Systems, Inc.D | | 154,000 | | | 5,904,360 |
Cooper Cos., Inc.D | | 800 | | | 41,040 |
Eli Lilly & Co. | | 4,600 | | | 260,314 |
Emdeon CorporationD | | 6,100 | | | 51,606 |
Endo Pharmaceuticals Holdings, Inc.D | | 47,300 | | | 1,431,298 |
Fisher Scientif ic International, Inc.D* | | 3,200 | | | 197,952 |
Gilead Sciences, Inc. | | 79,000 | | | 4,157,770 |
Health Management Associates, Inc. Class AD | | 1,600 | | | 35,136 |
Health Net, Inc.D | | 146,100 | | | 7,531,455 |
Hospira, Inc | | 5,700 | | | 243,846 |
Humana, Inc.* | | 2,600 | | | 141,258 |
Invitrogen CorporationD | | 1,700 | | | 113,288 |
IVAX CorporationD* | | 207,750 | | | 6,508,807 |
Kindred Healthcare, Inc.D | | 180,389 | | | 4,646,821 |
King Pharmaceuticals, Inc. | | 14,300 | | | 241,956 |
McKesson Corporation | | 71,200 | | | 3,673,208 |
Medco Health Solutions, Inc.D | | 43,417 | | | 2,422,669 |
Merck & Co., Inc. | | 251,600 | | | 8,003,396 |
Millennium Pharmeceuticals, Inc. | | 9,600 | | | 93,120 |
Mylan Laboratories, Inc.D | | 10,900 | | | 217,564 |
Omnicare, Inc. | | 4,300 | | | 246,046 |
Pediatrix Medical Group, Inc.D | | 4,900 | | | 433,993 |
Pf izer, Inc. | | 1,499,800 | | | 34,975,336 |
Schering-Plough CorporationD | | 430,500 | | | 8,975,925 |
Sierra Health Services, Inc.D | | 300 | | | 23,988 |
See Notes to Financial Statements.
92
| | | | | |
| | | Shares | | Value |
Tenet Healthcare Corporation* | | 26,600 | | $ | 203,756 |
Triad Hospitals, Inc.D | | 99,914 | | | 3,919,626 |
UnitedHealth Group, Inc. | | 2,420 | | | 150,379 |
Universal Health Services, Inc. Class BD | | 1,000 | | | 46,740 |
Watson Pharmaceuticals, Inc.D | | 142,600 | | | 4,635,926 |
WellPoint, Inc. | | 124,525 | | | 9,935,879 |
WyethD | | 217,800 | | | 10,034,046 |
| | | | | |
| | | | | 162,925,706 |
| | | | | |
Integrated Oils — 7.0% | | | | | |
Amerada Hess Corporation | | 4,900 | | | 621,418 |
BP PLC ADRD | | 170,468 | | | 10,947,455 |
Chevron CorporationD | | 570,837 | | | 32,406,416 |
ConocoPhillipsD | | 510,164 | | | 29,681,342 |
Marathon Oil CorporationD | | 151,292 | | | 9,224,273 |
Occidental Petroleum CorporationD | | 244,100 | | | 19,498,708 |
| | | | | |
| | | | | 102,379,612 |
| | | | | |
Materials & Processing — 3.9% | | | | | |
Air Products & Chemicals, Inc. | | 13,400 | | | 793,146 |
Airgas, Inc.D | | 3,000 | | | 98,700 |
Albemarle CorporationD | | 1,600 | | | 61,360 |
Alcoa, Inc. | | 333,200 | | | 9,852,724 |
AptarGroup, Inc. | | 1,700 | | | 88,740 |
Archer-Daniels-Midland Co. | | 41,089 | | | 1,013,255 |
Ashland, Inc.D | | 4,200 | | | 243,180 |
Avery Dennison Corporation | | 1,700 | | | 93,959 |
Ball Corporation | | 6,500 | | | 258,180 |
Bemis Co.D | | 6,300 | | | 175,581 |
Cabot CorporationD | | 4,100 | | | 146,780 |
Celanese Corporation Series AD | | 4,400 | | | 84,128 |
Chemtura CorporationD | | 8,300 | | | 105,410 |
CSX Corporation | | 83,900 | | | 4,259,603 |
Cytec Industries, Inc.D | | 3,000 | | | 142,890 |
Dow Chemical Co. (The) | | 86,944 | | | 3,809,886 |
duPont (E.I.) de Nemours & Co. | | 48,400 | | | 2,057,000 |
Eastman Chemical Co.D | | 9,800 | | | 505,582 |
Energizer Holdings, Inc. | | 1,200 | | | 59,748 |
Engelhard CorporationD | | 7,400 | | | 223,110 |
FMC Corporation* | | 2,000 | | | 106,340 |
Harsco CorporationD | | 800 | | | 54,008 |
Huntsman Corporation | | 4,700 | | | 80,934 |
International Paper Co. | | 30,500 | | | 1,025,105 |
Jacobs Engineering Group, Inc.* | | 700 | | | 47,509 |
Lafarge North America, Inc. | | 2,000 | | | 110,040 |
Louisiana-Pacific Corporation | | 7,900 | | | 217,013 |
Lubrizol Corporation | | 4,500 | | | 195,435 |
Lyondell Chemical Co.D | | 157,600 | | | 3,754,032 |
Martin Marietta Materials, Inc. | | 900 | | | 69,048 |
Masco Corporation | | 5,500 | | | 166,045 |
MeadWestvaco CorporationD | | 363,552 | | | 10,190,362 |
Monsanto Co. | | 3,600 | | | 279,108 |
Mosaic Co. (The)D | | 7,100 | | | 103,873 |
Newmont Mining Corporation | | 26,400 | | | 1,409,760 |
Nucor CorporationD | | 10,000 | | | 667,200 |
Owens-Illinois, Inc.D | | 9,200 | | | 193,568 |
Packaging Corporation of AmericaD | | 4,400 | | | 100,980 |
Pactiv CorporationD | | 382,100 | | | 8,406,200 |
Phelps Dodge Corporation | | 2,800 | | | 402,836 |
PPG Industries, Inc. | | 10,300 | | | 596,370 |
Praxair, Inc. | | 3,200 | | | 169,472 |
Precision Castparts Corporation | | 5,200 | | | 269,412 |
Rohm & Haas Co. | | 9,500 | | | 459,990 |
RPM International, Inc.D | | 6,900 | | | 119,853 |
Scotts Miracle-Gro Co. (The) Class AD | | 2,000 | | | 90,480 |
Sealed Air CorporationD | | 3,000 | | | 168,510 |
Sigma-Aldrich Corporation | | 4,500 | | | 284,805 |
Smurf it-Stone Container CorporationD | | 17,500 | | | 247,975 |
Sonoco Products Co. | | 5,800 | | | 170,520 |
Temple-Inland, Inc. | | 6,600 | | | 296,010 |
Timken Co.D | | 3,300 | | | 105,666 |
United States Steel CorporationD | | 7,200 | | | 346,104 |
USG CorporationD* | | 2,500 | | | 162,500 |
Valspar CorporationD | | 7,400 | | | 182,558 |
Vulcan Materials Co. | | 2,500 | | | 169,375 |
Weyerhaeuser Co. | | 14,800 | | | 981,832 |
| | | | | |
| | | | | 56,473,790 |
| | | | | |
Other — 1.2% | | | | | |
3M Co. | | 61,800 | | | 4,789,500 |
Brunswick Corporation | | 2,200 | | | 89,452 |
Carlisle Cos., Inc.D | | 1,400 | | | 96,810 |
Eaton Corporation | | 6,700 | | | 449,503 |
General Electric Co. | | 240,500 | | | 8,429,525 |
Hillenbrand Industries, Inc.D | | 2,500 | | | 123,525 |
Honeywell International, Inc. | | 53,400 | | | 1,989,150 |
ITT Industries, Inc. | | 500 | | | 51,410 |
Johnson Controls, Inc. | | 9,400 | | | 685,354 |
SPX CorporationD | | 4,300 | | | 196,811 |
Teleflex, Inc.D | | 2,100 | | | 136,458 |
Textron, Inc. | | 5,900 | | | 454,182 |
Wesco Financial CorporationD | | 100 | | | 38,500 |
| | | | | |
| | | | | 17,530,180 |
| | | | | |
Other Energy — 5.2% | | | | | |
Anadarko Petroleum Corporation | | 104,800 | | | 9,929,800 |
Apache Corporation | | 20,282 | | | 1,389,723 |
Arch Coal, Inc.D | | 2,600 | | | 206,700 |
Burlington Resources, Inc. | | 24,000 | | | 2,068,800 |
Chesapeake Energy CorporationD | | 12,700 | | | 402,971 |
Consol Energy, Inc.D | | 1,700 | | | 110,806 |
Cooper Cameron Corporation | | 2,200 | | | 91,080 |
Devon Energy Corporation | | 117,538 | | | 7,350,826 |
Dynegy, Inc. Class AD* | | 18,900 | | | 91,476 |
El Paso CorporationD | | 39,172 | | | 476,331 |
ENSCO International, Inc. | | 2,900 | | | 128,615 |
Equitable Resources, Inc. | | 1,800 | | | 66,042 |
ExxonMobil Corporation | | 636,300 | | | 35,740,971 |
Forest Oil Corporation* | | 3,800 | | | 173,166 |
Helmerich & Payne, Inc.D | | 700 | | | 43,337 |
Kerr-McGee Corporation | | 7,091 | | | 644,288 |
See Notes to Financial Statements.
93
Value Equity Fund
SCHEDULE OF INVESTMENTS (Continued)
| | | | | |
| | | Shares | | Value |
National Oilwell Varco, Inc. | | 4,481 | | $ | 280,959 |
Newf ield Exploration Co.D | | 2,700 | | | 135,189 |
Noble Energy, Inc. | | 9,800 | | | 394,940 |
NRG Energy, Inc.D | | 5,500 | | | 259,160 |
Pioneer Natural Resouces Co. | | 7,703 | | | 394,933 |
Pogo Producing Co.D | | 4,300 | | | 214,183 |
Pride International, Inc.D | | 3,900 | | | 119,925 |
Reliant Energy, Inc.D | | 19,775 | | | 204,078 |
Rowan Cos., Inc.D | | 2,800 | | | 99,792 |
Sunoco, Inc. | | 31,800 | | | 2,492,484 |
Tesoro Corporation | | 25,800 | | | 1,587,990 |
Unit CorporationD* | | 700 | | | 38,521 |
Valero Energy Corporation | | 37,326 | | | 1,926,022 |
Vintage Petroleum, Inc.D | | 3,400 | | | 181,322 |
Williams Cos., Inc. | | 385,500 | | | 8,932,035 |
| | | | | |
| | | | | 76,176,465 |
| | | | | |
Producer Durables — 6.2% | | | | | |
Agilent Technologies, Inc.D | | 4,600 | | | 153,134 |
Alliant Techsystems, Inc.D | | 1,000 | | | 76,170 |
American Power Conversion CorporationD | | 270,100 | | | 5,942,200 |
American Tower Corporation Class A* | | 1,600 | | | 43,360 |
Andrew Corporation | | 8,600 | | | 92,278 |
Beazer Homes USA, Inc.D | | 1,600 | | | 116,544 |
Centex Corporation | | 3,700 | | | 264,513 |
Crown Castle International Corporation | | 5,600 | | | 150,696 |
Cummins, Inc.D | | 1,300 | | | 116,649 |
Deere & Co.D | | 13,700 | | | 933,107 |
Diebold, Inc.D | | 1,000 | | | 38,000 |
Dover CorporationD | | 3,400 | | | 137,666 |
DR Horton, Inc. | | 4,633 | | | 165,537 |
Emerson Electric Co.D | | 156,200 | | | 11,668,140 |
Grainger (W.W.), Inc. | | 4,000 | | | 284,400 |
Hubbell, Inc. Class BD | | 3,600 | | | 162,432 |
Illinois Tool Works, Inc.D | | 51,600 | | | 4,540,284 |
Ingersoll-Rand Co., Ltd. Class A | | 43,800 | | | 1,768,206 |
JLG Industries, Inc.D | | 18,600 | | | 849,276 |
Kb Home | | 800 | | | 58,128 |
LAM Research Corporation | | 51,800 | | | 1,848,224 |
Lennar Corporation Class A | | 3,500 | | | 213,570 |
Lexmark International, Inc.D | | 81,100 | | | 3,635,713 |
MDC Holdings, Inc.D | | 810 | | | 50,204 |
Meritage Homes Corporation* | | 1,300 | | | 81,796 |
Mettler Toledo International, Inc. | | 1,100 | | | 60,720 |
Molex, Inc. | | 3,500 | | | 90,825 |
Nokia Corporation ADRD | | 742,900 | | | 13,595,070 |
Northrop Grumman Corporation | | 287,970 | | | 17,309,877 |
Novellus Systems, Inc.D | | 4,700 | | | 113,364 |
Pall CorporationD | | 7,200 | | | 193,392 |
Parker Hannif in Corporation | | 11,500 | | | 758,540 |
Pentair, Inc. | | 1,600 | | | 55,232 |
Pitney Bowes, Inc. | | 6,400 | | | 270,400 |
Pulte Homes, Inc. | | 13,100 | | | 515,616 |
Roper Industries, Inc.D | | 600 | | | 23,706 |
Ryland Group, Inc.D | | 600 | | | 43,278 |
Standard-Pacific Corporation | | 3,800 | | | 139,840 |
Steelcase, Inc. Class AD | | 2,900 | | | 45,907 |
Tektronix, Inc. | | 4,300 | | | 121,303 |
Teradyne, Inc.D | | 2,900 | | | 42,253 |
Terex CorporationD* | | 3,400 | | | 201,960 |
Thermo Electron CorporationD* | | 6,100 | | | 183,793 |
Thomas & Betts CorporationD* | | 2,100 | | | 88,116 |
Tyco International, Ltd.D | | 310,800 | | | 8,969,688 |
United Technologies Corporation | | 232,700 | | | 13,010,257 |
Xerox Corporation* | | 60,200 | | | 881,930 |
| | | | | |
| | | | | 90,105,294 |
| | | | | |
Technology — 4.3% | | | | | |
ADC Telecommunications, Inc.D | | 7,842 | | | 175,190 |
Advanced Micro Devices, Inc.D* | | 11,200 | | | 342,720 |
Affiliated Computer Services, Inc. Class AD | | 3,100 | | | 183,458 |
Applera Corporation- Applied Biosystems Group | | 12,000 | | | 318,720 |
Arrow Electronics, Inc.* | | 7,900 | | | 253,037 |
Avaya, Inc.D | | 7,700 | | | 82,159 |
Avid Technology, Inc.D | | 400 | | | 21,904 |
Avnet, Inc.D* | | 6,200 | | | 148,428 |
AVX CorporationD | | 1,900 | | | 27,512 |
BEA Systems, Inc.D | | 20,400 | | | 191,760 |
BMC Software, Inc. | | 7,800 | | | 159,822 |
Cadence Design Systems, Inc.D | | 8,300 | | | 140,436 |
Ceridian CorporationD | | 4,000 | | | 99,400 |
Computer Associates International, Inc.D | | 7,300 | | | 205,787 |
Computer Sciences Corporation* | | 35,200 | | | 1,782,528 |
Compuware Corporation | | 14,300 | | | 128,271 |
Comverse Technology, Inc. | | 2,100 | | | 55,839 |
Electronic Data Systems CorporationD | | 460,000 | | | 11,058,400 |
Freescale Semiconductor, Inc. Series B | | 21,500 | | | 541,155 |
General Dynamics Corporation | | 22,100 | | | 2,520,505 |
Harris Corporation | | 1,800 | | | 77,418 |
Hewlett-Packard Co. | | 537,850 | | | 15,398,646 |
Ingram Micro, Inc. Class A | | 5,300 | | | 105,629 |
International Business Machines Corporation | | 15,300 | | | 1,257,660 |
International Rectifier CorporationD | | 1,200 | | | 38,280 |
Intersil Corporation Class A | | 5,900 | | | 146,792 |
Jds Uniphase CorporationD | | 49,200 | | | 116,112 |
Juniper Networks, Inc. | | 8,800 | | | 196,240 |
L-3 Communications Holdings, Inc. | | 3,100 | | | 230,485 |
LSI Logic CorporationD | | 15,300 | | | 122,400 |
Lucent Technologies, Inc.D* | | 275,300 | | | 732,298 |
Micron Technology, Inc.* | | 18,200 | | | 242,242 |
Microsoft Corporation | | 212,700 | | | 5,562,105 |
Motorola, Inc. | | 402,900 | | | 9,101,511 |
NCR Corporation | | 8,300 | | | 281,702 |
Novell, Inc.D | | 25,400 | | | 224,282 |
PerkinElmer, Inc. | | 17,100 | | | 402,876 |
Raytheon Co.D | | 108,400 | | | 4,352,260 |
Reynolds & Reynolds Co. (The) Class AD | | 2,600 | | | 72,982 |
See Notes to Financial Statements.
94
| | | | | | |
| | | Shares | | Value |
Sandisk CorporationD | | | 2,600 | | $ | 163,332 |
Sanmina-SCI CorporationD | | | 18,076 | | | 77,004 |
Scientific-Atlanta, Inc. | | | 1,400 | | | 60,298 |
Seagate TechnologyD | | | 107,000 | | | 2,138,930 |
Seagate Technology, Inc.+ | | | 4,600 | | | — |
Siebel Systems, Inc. | | | 27,800 | | | 294,124 |
Solectron Corporation | | | 32,700 | | | 119,682 |
Sun Microsystems, Inc.D | | | 87,500 | | | 366,625 |
Sybase, Inc.D | | | 6,400 | | | 139,904 |
Symantec Corporation | | | 24,282 | | | 424,935 |
Symbol Technologies, Inc. | | | 2,325 | | | 29,807 |
Synopsys, Inc. | | | 20,800 | | | 417,248 |
Tellabs, Inc. | | | 28,366 | | | 309,189 |
Unisys Corporation* | | | 19,400 | | | 113,102 |
Vishay Intertechnology, Inc.D | | | 7,500 | | | 103,200 |
| | | | | | |
| | | | | | 61,856,331 |
| | | | | | |
Utilities — 10.4% | | | | | | |
AGL Resources, Inc.D | | | 4,400 | | | 153,164 |
Allegheny Energy, Inc.D* | | | 9,600 | | | 303,840 |
Alliant Energy Corporation | | | 55,600 | | | 1,559,024 |
Alltel Corporation | | | 20,600 | | | 1,299,860 |
Ameren Corporation | | | 12,800 | | | 655,872 |
American Electric Power Co., Inc.D | | | 331,700 | | | 12,302,753 |
Aqua America, Inc.D | | | 7,366 | | | 201,092 |
AT&T, Inc. | | | 680,337 | | | 16,661,453 |
Atmos Energy CorporationD | | | 3,800 | | | 99,408 |
BellSouth Corporation | | | 116,200 | | | 3,149,020 |
Centerpoint Energy, Inc.D | | | 21,500 | | | 276,275 |
CenturyTel, Inc. | | | 8,900 | | | 295,124 |
Cinergy CorporationD | | | 13,200 | | | 560,472 |
Citizens Communications Co. | | | 19,700 | | | 240,931 |
CMS Energy CorporationD* | | | 13,800 | | | 200,238 |
Comcast Corporation Class AD* | | | 357,363 | | | 9,277,144 |
Consolidated Edison, Inc.D | | | 16,200 | | | 750,546 |
Constellation Energy Group, Inc. | | | 10,700 | | | 616,320 |
Dominion Resources, Inc.D | | | 21,919 | | | 1,692,147 |
DPL, Inc.D | | | 9,100 | | | 236,691 |
DTE Energy Co. | | | 95,300 | | | 4,116,007 |
Duke Energy CorporationD | | | 278,300 | | | 7,639,335 |
Edison InternationalD | | | 20,100 | | | 876,561 |
Energen Corporation | | | 34,900 | | | 1,267,568 |
Energy East Corporation | | | 67,900 | | | 1,548,120 |
Entergy Corporation | | | 188,700 | | | 12,954,255 |
Exelon CorporationD | | | 145,274 | | | 7,719,860 |
FirstEnergy Corporation | | | 20,712 | | | 1,014,681 |
FPL Group, Inc. | | | 24,800 | | | 1,030,688 |
Great Plains Energy, Inc.D | | | 4,100 | | | 114,636 |
Hawaiian Electric Industries, Inc.D | | | 4,800 | | | 124,320 |
KeySpan CorporationD | | | 100,800 | | | 3,597,552 |
Kinder Morgan, Inc. | | | 800 | | | 73,560 |
MCI, Inc.D | | | 17,000 | | | 335,410 |
MDU Resources Group, Inc.D | | | 6,950 | | | 227,543 |
National Fuel Gas Co.D | | | 4,300 | | | 134,117 |
Nisource, Inc.D | | | 15,700 | | | 327,502 |
Nortel Networks CorporationD* | | | 1,288,500 | | | 3,942,810 |
Northeast UtilitiesD | | | 9,500 | | | 187,055 |
NSTARD | | | 6,200 | | | 177,940 |
NTL, Inc.D | | | 4,900 | | | 333,592 |
OGE Energy CorporationD | | | 5,200 | | | 139,308 |
Oneok, Inc.D | | | 6,100 | | | 162,443 |
Pepco Holdings, Inc. | | | 10,398 | | | 232,603 |
PG&E CorporationD | | | 23,200 | | | 861,184 |
Piedmont Natural Gas Co., Inc.D | | | 3,100 | | | 74,896 |
Pinnacle West Capital CorporationD | | | 5,400 | | | 223,290 |
PNM Resources, Inc.D | | | 4,900 | | | 120,001 |
PPL CorporationD | | | 270,700 | | | 7,958,580 |
Progress Energy, Inc.D | | | 16,300 | | | 715,896 |
Progress Energy, Inc. Contingent Value Obligation+ | | | 3,100 | | | 1,209 |
Public Service Enterprise Group, Inc.D | | | 14,600 | | | 948,562 |
Puget Energy, Inc.D | | | 5,900 | | | 120,478 |
Questar CorporationD | | | 4,400 | | | 333,080 |
Qwest Communications International, Inc.D* | | | 91,700 | | | 518,105 |
SCANA Corporation | | | 6,600 | | | 259,908 |
Sempra Energy | | | 17,000 | | | 762,280 |
Southern Co. (The)D | | | 48,200 | | | 1,664,346 |
Southern Union Co.D* | | | 4,935 | | | 116,614 |
Sprint Nextel Corporation | | | 144,684 | | | 3,379,818 |
TECO Energy, Inc.D | | | 11,600 | | | 199,288 |
Telephone & Data Systems, Inc.D | | | 5,600 | | | 201,768 |
TXU Corporation | | | 96,800 | | | 4,858,392 |
UGI Corporation | | | 7,600 | | | 156,560 |
US Cellular CorporationD | | | 500 | | | 24,700 |
Vectren CorporationD | | | 4,500 | | | 122,220 |
Verizon Communications, Inc.D | | | 935,124 | | | 28,165,935 |
Westar Energy, Inc. | | | 5,100 | | | 109,650 |
Western Gas Resources, Inc.D | | | 700 | | | 32,963 |
Wisconsin Energy Corporation | | | 7,000 | | | 273,420 |
WPS Resources CorporationD | | | 2,200 | | | 121,682 |
Xcel Energy, Inc.D | | | 26,540 | | | 489,928 |
| | | | | | |
| | | | | | 151,623,593 |
| | | | | | |
TOTAL COMMON STOCKS
(Cost $1,158,632,878) | | | | | | 1,392,158,116 |
| | | | | | |
MONEY MARKET FUNDS — 20.7% | | | | | | |
GuideStone Funds Money Market Fund (GS4 Class) ¥ | | | 61,632,845 | | | 61,632,845 |
Northern Institutional Liquid Assets Portfolio§ | | | 239,770,675 | | | 239,770,675 |
| | | | | | |
TOTAL MONEY MARKET FUNDS
(Cost $301,403,520) | | | | | | 301,403,520 |
| | | | | | |
| | |
| | | Par | | |
U.S. TREASURY OBLIGATION — 0.3% | | | | | | |
U.S. Treasury Bill 3.94%, 04/06/06‡‡
(Cost $4,799,605) | | $ | 4,850,000 | | | 4,800,074 |
| | | | | | |
See Notes to Financial Statements.
95
Value Equity Fund
SCHEDULE OF INVESTMENTS (Continued)
| | | | | | |
| | | Shares | | Value | |
PREFERRED STOCK — 0.0% | | | | | | |
Simon Property Group, L.P. REIT 6.00%
(Cost $30,524) | | 570 | | $ | 36,651 | |
| | | | | | |
Total Investments — 116.6%
(Cost $1,464,866,527) | | | | | 1,698,398,361 | |
Liabilities in Excess of Other Assets — (16.6)% | | | | | (241,572,358 | ) |
| | | | | | |
Net Assets — 100.0% | | | | $ | 1,456,826,003 | |
| | | | | | |
| | |
PORTFOLIO SUMMARY+ | | | | | | |
| | | |
| |
| | | % | |
Financial Services | | 32.0 | |
Money Market Funds | | 20.7 | |
Healthcare | | 11.2 | |
Utilities | | 10.4 | |
Consumer Discretionary | | 9.8 | |
Integrated Oils | | 7.0 | |
Producer Durables | | 6.2 | |
Other Energy | | 5.2 | |
Technology | | 4.3 | |
Materials & Processing | | 3.9 | |
Futures Contracts | | 3.8 | |
Consumer Staples | | 2.4 | |
Auto & Transportation | | 2.0 | |
Other | | 1.2 | |
U.S. Treasury Obligations | | 0.3 | |
Preferred Stock | | — | * |
| | | |
| | 120.4 | |
| | | |
| * | Rounds to less than 0.005%. |
See Notes to Financial Statements.
96
Growth Equity Fund
The Fund is comprised of domestic, large-cap growth oriented stocks. The Fund posted a solid positive return and outperformed its benchmark, the Russell 1000® Growth Index, during the fourth quarter. Security selection in the consumer discretionary and health care sectors added value to benchmark-relative performance. Some of the Fund’s better performing holdings included Google, Genentech and Starbucks, while positions in Dell, XM Satellite Radio and Apollo Group detracted from overall fund performance. At the sub-adviser level, Sands delivered the strongest performance returns as a result of its security selection in the health care and consumer discretionary sectors.
97
Growth Equity Fund
Average Annual Total Returns as of 12/31/05
| | | | | | | | | | | | |
| | | GS2 Class* | | GS4 Class* | | GS6 Class* | | Benchmark** | | GS8 Class* | | GS8 Class Benchmark** |
One Year | | 8.65% | | 8.45% | | 8.06% | | 5.26% | | 7.78% | | 5.26% |
Since Inception | | 2.60% | | 2.47% | | 2.19% | | 0.66% | | 12.28% | | 8.63% |
Inception Date | | 08/27/01 | | 08/27/01 | | 08/27/01 | | 08/27/01 | | 11/08/04 | | 11/08/04 |
The performance data quoted represents past performance and does not guarantee future results. Current performance may be lower or higher. Performance data current to the most recent month-end may be obtained at www.GuideStone.org. The investment return and principal value of an investment will fluctuate so that shares, when redeemed, may be worth more or less than their original cost.
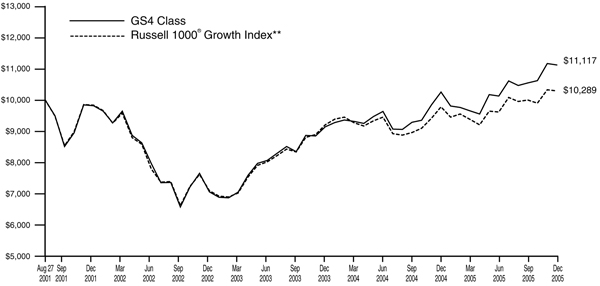
The graph compares the results of a hypothetical $10,000 investment in the GS4 Class of the Fund since August 27, 2001 (commencement of operations), with all dividends and capital gains reinvested, with the Russell 1000® Growth Index.
| * | These returns reflect expense waivers by the Fund’s investment advisor. Without these waivers, returns would have been lower. Returns shown do not reflect the deduction of taxes that a shareholder would pay on Fund distributions or the redemption of Fund shares. |
| ** | The Russell 1000® Growth Index is a large-cap index consisting of those Russell 1000® Index securities with greater-than-average growth orientation. Companies in this index tend to exhibit higher price-to-book and price-earnings-ratios, lower dividend yields and higher forecasted growth values than the value universe. |
Unlike a mutual fund, the performance of an index assumes no taxes, transaction costs, management fees or other expenses.
98
| | |
Growth Equity Fund SCHEDULE OF INVESTMENTS | | December 31, 2005 |
| | | | | |
| | | Shares | | Value |
COMMON STOCKS — 97.3% | | | | | |
Auto & Transportation — 2.1% | | | | | |
Burlington Northern Santa Fe Corporation | | 90,765 | | $ | 6,427,977 |
FedEx Corporation | | 160,058 | | | 16,548,397 |
Toyota Motor Corporation ADRD | | 35,596 | | | 3,724,054 |
Union Pacific Corporation | | 73,291 | | | 5,900,658 |
| | | | | |
| | | | | 32,601,086 |
| | | | | |
Consumer Discretionary — 26.4% | | | | | |
Amazon.com, Inc.D | | 406,600 | | | 19,171,190 |
Apollo Group, Inc. Class AD | | 453,100 | | | 27,394,430 |
Bed Bath & Beyond, Inc.D | | 206,400 | | | 7,461,360 |
Carnival Corporation | | 109,875 | | | 5,875,016 |
Coach, Inc. | | 146,000 | | | 4,867,640 |
eBay, Inc. | | 1,172,075 | | | 50,692,244 |
Electronic Arts, Inc. | | 178,900 | | | 9,358,259 |
Google, Inc.D | | 173,740 | | | 72,077,776 |
Home Depot, Inc. (The) | | 136,057 | | | 5,507,587 |
Iron Mountain, Inc.D | | 110,500 | | | 4,665,310 |
Lowe’s Cos., Inc. | | 483,057 | | | 32,200,580 |
Marriott International, Inc. Class AD | | 130,900 | | | 8,766,373 |
Nike, Inc. Class B | | 83,325 | | | 7,231,777 |
Penney (JC) Co., Inc.D | | 135,050 | | | 7,508,780 |
Pixar, Inc.D | | 312,500 | | | 16,475,000 |
Starbucks Corporation | | 1,345,634 | | | 40,382,476 |
Target Corporation | | 337,325 | | | 18,542,755 |
Univision Communications, Inc. Class AD | | 160,000 | | | 4,702,400 |
XM Satellite Radio Holdings, Inc. Class AD | | 330,005 | | | 9,002,536 |
Yahoo!, Inc.D | | 1,292,475 | | | 50,639,171 |
Yum! Brands, Inc. | | 166,235 | | | 7,793,097 |
| | | | | |
| | | | | 410,315,757 |
| | | | | |
Consumer Staples — 4.3% | | | | | |
CVS Corporation | | 166,527 | | | 4,399,643 |
Procter & Gamble Co. | | 535,771 | | | 31,010,425 |
Walgreen Co. | | 648,452 | | | 28,700,485 |
Wrigley (W.M.), Jr. Co.D | | 49,650 | | | 3,301,229 |
| | | | | |
| | | | | 67,411,782 |
| | | | | |
Financial Services — 14.5% | | | | | |
AFLAC, Inc.D | | 204,700 | | | 9,502,174 |
American International Group, Inc. | | 173,600 | | | 11,844,728 |
Capital One Financial Corporation | | 109,900 | | | 9,495,360 |
Chicago Mercantile Exchange Holdings, Inc.D | | 63,056 | | | 23,172,449 |
Citigroup, Inc. | | 168,700 | | | 8,187,011 |
Commerce Bancorp, Inc.D | | 272,545 | | | 9,378,273 |
Countrywide Financial CorporationD | | 420,782 | | | 14,386,537 |
Franklin Resources, Inc.D | | 107,000 | | | 10,059,070 |
Genworth Financial, Inc. Class AD | | 140,500 | | | 4,858,490 |
Goldman Sachs Group, Inc. | | 33,512 | | | 4,279,818 |
Homestore, Inc. | | 200 | | | 1,020 |
Lehman Brothers Holdings, Inc. | | 93,585 | | | 11,994,789 |
Merrill Lynch & Co., Inc. | | 130,000 | | | 8,804,900 |
Moody’s CorporationD | | 213,700 | | | 13,125,454 |
PepsiCo, Inc. | | 278,613 | | | 16,460,456 |
Progressive Corporation (The) | | 302,646 | | $ | 35,343,000 |
SLM Corporation | | 218,855 | | | 12,056,722 |
UBS AGD | | 113,673 | | | 10,815,986 |
UCBH Holdings, Inc.D | | 81,344 | | | 1,454,431 |
Zions BancorporationD | | 125,000 | | | 9,445,000 |
| | | | | |
| | | | | 224,665,668 |
| | | | | |
Healthcare — 24.7% | | | | | |
Abbott Laboratories | | 113,725 | | | 4,484,177 |
Aetna, Inc. | | 99,700 | | | 9,402,707 |
Allergan, Inc.D | | 135,800 | | | 14,660,968 |
American Pharmaceutical Partners, Inc.D | | 149,800 | | | 5,810,742 |
Amgen, Inc.* | | 394,410 | | | 31,103,172 |
Amylin Pharmaceuticals, Inc.D | | 80,819 | | | 3,226,294 |
Genentech, Inc. | | 939,838 | | | 86,935,015 |
Genzyme Corporation | | 267,524 | | | 18,935,349 |
Gilead Sciences, Inc. | | 148,000 | | | 7,789,240 |
Health Net, Inc. | | 92,275 | | | 4,756,776 |
Intuitive Surgical, Inc.D | | 48,300 | | | 5,664,141 |
IVAX Corporation* | | 169,400 | | | 5,307,302 |
Johnson & Johnson | | 178,100 | | | 10,703,810 |
Medtronic, Inc. | | 621,055 | | | 35,754,136 |
Novartis AG ADRD | | 130,225 | | | 6,834,208 |
Patterson Cos., Inc.D | | 133,500 | | | 4,458,900 |
Pfizer, Inc. | | 168,900 | | | 3,938,748 |
Quest Diagnostics, Inc.D | | 121,370 | | | 6,248,128 |
Shire PLC ADRD | | 115,200 | | | 4,468,608 |
Stryker CorporationD | | 192,400 | | | 8,548,332 |
Teva Pharmaceutical Industries, Ltd. ADRD | | 539,750 | | | 23,214,647 |
UnitedHealth Group, Inc. | | 704,547 | | | 43,780,551 |
Varian Medical Systems, Inc.D* | | 149,200 | | | 7,510,728 |
Wyeth | | 223,925 | | | 10,316,225 |
Zimmer Holdings, Inc. | | 276,079 | | | 18,618,768 |
| | | | | |
| | | | | 382,471,672 |
| | | | | |
Materials & Processing — 0.2% | | | | | |
St. Joe Co. (The)D | | 49,943 | | | 3,357,168 |
| | | | | |
Other — 2.2% | | | | | |
General Electric Co. | | 950,607 | | | 33,318,775 |
| | | | | |
Other Energy — 2.6% | | | | | |
Baker Hughes, Inc. | | 120,850 | | | 7,345,263 |
Canadian Natural Resources, Ltd.D | | 178,625 | | | 8,863,373 |
Halliburton Co. | | 71,080 | | | 4,404,117 |
Noble CorporationD | | 79,975 | | | 5,641,436 |
Schlumberger, Ltd. | | 51,600 | | | 5,012,940 |
Valero Energy Corporation | | 107,550 | | | 5,549,580 |
Weatherford International, Ltd.D | | 92,300 | | | 3,341,260 |
| | | | | |
| | | | | 40,157,969 |
| | | | | |
Producer Durables — 3.5% | | | | | |
Boeing Co. (The) | | 125,000 | | | 8,780,000 |
Caterpillar, Inc. | | 222,799 | | | 12,871,098 |
KB HOMED | | 80,758 | | | 5,867,876 |
Lennar Corporation Class A | | 107,713 | | | 6,572,647 |
Lockheed Martin Corporation | | 88,708 | | | 5,644,490 |
MDC Holdings, Inc.D | | 52,834 | | | 3,274,652 |
Toll Brothers, Inc.D | | 54,390 | | | 1,884,070 |
See Notes to Financial Statements.
99
Growth Equity Fund
SCHEDULE OF INVESTMENTS (Continued)
| | | | | | | |
| | | Shares | | Value | |
United Technologies Corporation | | | 175,000 | | $ | 9,784,250 | |
| | | | | | | |
| | | | | | 54,679,083 | |
| | | | | | | |
Technology — 16.7% | | | | | | | |
Adobe Systems, Inc. | | | 296,720 | | | 10,966,771 | |
Apple Computer, Inc.* | | | 399,590 | | | 28,726,525 | |
Autodesk, Inc. | | | 163,600 | | | 7,026,620 | |
Avaya, Inc.D | | | 548,025 | | | 5,847,427 | |
Cisco Systems, Inc. | | | 265,900 | | | 4,552,208 | |
Cognizant Technology | | | | | | | |
Solutions Corporation | | | | | | | |
Class AD | | | 94,925 | | | 4,779,474 | |
Corning, Inc.* | | | 267,200 | | | 5,253,152 | |
Dell, Inc. | | | 743,900 | | | 22,309,561 | |
EMC Corporation* | | | 494,325 | | | 6,732,706 | |
General Dynamics Corporation | | | 67,284 | | | 7,673,740 | |
Hewlett-Packard Co. | | | 366,650 | | | 10,497,190 | |
Marvell Technology Group, Ltd.D | | | 188,500 | | | 10,572,965 | |
Maxim Integrated Products, Inc.D | | | 164,880 | | | 5,975,251 | |
Microsoft Corporation | | | 380,500 | | | 9,950,075 | |
Motorola, Inc. | | | 914,139 | | | 20,650,400 | |
Network Appliance, Inc.D | | | 472,225 | | | 12,750,075 | |
Oracle Corporation | | | 362,550 | | | 4,426,736 | |
Qualcomm, Inc. | | | 959,813 | | | 41,348,744 | |
Red Hat, Inc.D | | | 357,600 | | | 9,741,024 | |
Salesforce.com, Inc.D | | | 179,000 | | | 5,736,950 | |
Sandisk CorporationD | | | 132,525 | | | 8,325,220 | |
Seagate Technology, Inc.+ | | | 5,600 | | | — | |
Symbol Technologies, Inc. | | | 380 | | | 4,872 | |
Texas Instruments, Inc. | | | 215,400 | | | 6,907,878 | |
Xilinx, Inc. | | | 345,300 | | | 8,705,013 | |
| | | | | | | |
| | | | | | 259,460,577 | |
| | | | | | | |
Utilities — 0.1% | | | | | | | |
America Movil SA de CV ADR Series L | | | 34,470 | | | 1,008,592 | |
| | | | | | | |
TOTAL COMMON STOCKS
(Cost $1,155,442,229) | | | | | | 1,509,448,129 | |
| | | | | | | |
MONEY MARKET FUNDS — 16.1% | | | | | | | |
GuideStone Funds Money Market Fund (GS4 Class) ¥ | | | 39,952,766 | | | 39,952,766 | |
Northern Institutional Liquid Assets Portfolio§ | | | 210,318,844 | | | 210,318,844 | |
| | | | | | | |
TOTAL MONEY MARKET FUNDS
(Cost $250,271,610) | | | | | | 250,271,610 | |
| | | | | | | |
| | |
| | | Par | | | |
U.S. TREASURY OBLIGATION — 0.3% | | | | | | | |
U.S. Treasury Bill 3.94%, 04/06/06‡‡
(Cost $4,156,359) | | $ | 4,200,000 | | | 4,156,765 | |
| | | | | | | |
Total Investments — 113.7%
(Cost $1,409,870,198) | | | | | | 1,763,876,504 | |
Liabilities in Excess of Other Assets — (13.7)% | | | | | | (212,045,444 | ) |
| | | | | | | |
Net Assets — 100.0% | | | | | $ | 1,551,831,060 | |
| | | | | | | |
| | |
PORTFOLIO SUMMARY+ | | | | | | | |
| | |
| |
| | | % |
Consumer Discretionary | | 26.4 |
Healthcare | | 24.7 |
Technology | | 16.7 |
Money Market Funds | | 16.1 |
Financial Services | | 14.5 |
Consumer Staples | | 4.3 |
Producer Durables | | 3.5 |
Other Energy | | 2.6 |
Other | | 2.2 |
Auto & Transportation | | 2.1 |
Futures Contracts | | 1.8 |
U.S. Treasury Obligations | | 0.3 |
Materials & Processing | | 0.2 |
Utilities | | 0.1 |
| | |
| | 115.5 |
| | |
See Notes to Financial Statements.
100
Small Cap Equity Fund
The Fund is comprised of domestic, small-cap stocks with both value and growth style orientations. The Fund generated a positive return while outperforming its benchmark, the Russell 2000® Index, during the fourth quarter. Security selection within the consumer discretionary, financial services and health care sectors benefited benchmark-relative performance. The Fund’s holdings in Select Comfort, Medarex and Actuant were the largest contributors to performance, while Massey Energy, William Lyon Homes and Kensey Nash were the largest detractors from fund performance for the period. At the sub-adviser level, Lord Abbett delivered the strongest benchmark-relative returns and was rewarded for its security selection in the consumer discretionary and producer durables sectors.
101
Small Cap Equity Fund
Average Annual Total Returns as of 12/31/05
| | | | | | | | | | | | | | | | | | |
| | | GS2 Class* | | | GS4 Class* | | | GS6 Class* | | | Benchmark** | | | GS8 Class* | | | GS8 Class Benchmark** | |
One Year | | 6.48 | % | | 6.37 | % | | 6.00 | % | | 4.55 | % | | 5.61 | % | | 4.55 | % |
Since Inception | | 8.24 | % | | 8.08 | % | | 7.81 | % | | 9.42 | % | | 11.96 | % | | 11.57 | % |
Inception Date | | 08/27/01 | | | 08/27/01 | | | 08/27/01 | | | 08/27/01 | | | 11/08/04 | | | 11/08/04 | |
The performance data quoted represents past performance and does not guarantee future results. Current performance may be lower or higher. Performance data current to the most recent month-end may be obtained at www.GuideStone.org. The investment return and principal value of an investment will fluctuate so that shares, when redeemed, may be worth more or less than their original cost.
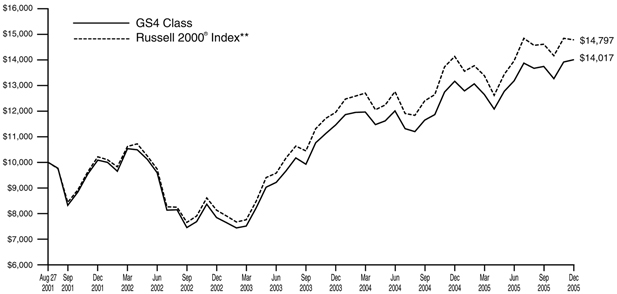
The graph compares the results of a hypothetical $10,000 investment in the GS4 Class of the Fund since August 27, 2001 (commencement of operations), with all dividends and capital gains reinvested, with the Russell 2000® Index.
| * | These returns reflect expense waivers by the Fund’s investment advisor. Without these waivers, returns would have been lower. Returns shown do not reflect the deduction of taxes that a shareholder would pay on Fund distributions or the redemption of Fund shares. |
| ** | The Russell 2000® Index is a small-cap equity index comprised of the 2,000 smallest companies in the Russell 3000® Index, which represents approximately 8% of the total market capitalization of the Russell 3000® Index. |
Unlike a mutual fund, the performance of an index assumes no taxes, transaction costs, management fees or other expenses. Small company stocks are generally riskier than large company stocks due to greater volatility and less liquidity.
102
Small Cap Equity Fund
| | |
| SCHEDULE OF INVESTMENTS | | December 31, 2005 |
| | | | | |
| | | Shares | | Value |
COMMON STOCKS — 95.8% | | | | | |
Auto & Transportation — 3.8% | | | | | |
Accuride Corporation | | 15,000 | | $ | 193,500 |
Arkansas Best CorporationD | | 30,600 | | | 1,336,608 |
Autoliv, Inc. | | 37,400 | | | 1,698,708 |
CNF, Inc. | | 19,400 | | | 1,084,266 |
Dana CorporationD | | 23,700 | | | 170,166 |
Excel Maritime Carriers, Ltd.D* | | 25,920 | | | 296,784 |
ExpressJet Holdings, Inc.D | | 77,600 | | | 627,784 |
Genesee & Wyoming, Inc. Class AD | | 20,800 | | | 781,040 |
Greenbrier Co., Inc. | | 20,200 | | | 573,680 |
Noble International, Ltd.D | | 13,800 | | | 287,592 |
Old Dominion Freight Line, Inc.D | | 17,212 | | | 464,380 |
OMI CorporationD | | 93,700 | | | 1,700,655 |
Pacer International, Inc. | | 31,000 | | | 807,860 |
Republic Airways Holdings, Inc.D | | 22,748 | | | 345,769 |
Sea Containers, Ltd. Class AD | | 54,100 | | | 678,414 |
Teekay Shipping CorporationD | | 32,400 | | | 1,292,760 |
Tenneco Automotive, Inc.D* | | 40,700 | | | 798,127 |
Thor Industries, Inc.D | | 12,500 | | | 500,875 |
Titan International, Inc.D | | 19,700 | | | 339,825 |
TRW Automotive Holdings Corporation | | 30,900 | | | 814,215 |
Tsakos Energy Navigation, Ltd.D | | 16,000 | | | 586,720 |
UTI Worldwide, Inc.D | | 21,850 | | | 2,028,554 |
Vitran Corporation, Inc.* | | 51,061 | | | 1,005,902 |
Wabash National CorporationD | | 111,792 | | | 2,129,638 |
Winnebago Industries, Inc.D | | 10,100 | | | 336,128 |
| | | | | |
| | | | | 20,879,950 |
| | | | | |
Consumer Discretionary — 17.5% | | | | | |
Aaron Rents, Inc.D | | 38,650 | | | 814,742 |
Advance Auto Parts, Inc. | | 12,050 | | | 523,693 |
Advisory Board Co. (The)D | | 17,500 | | | 834,225 |
Advo, Inc. | | 4,600 | | | 129,628 |
American Woodmark CorporationD | | 6,500 | | | 161,135 |
America’s Car-Mart, Inc.D | | 8,100 | | | 133,812 |
aQuantive, Inc.D | | 8,500 | | | 214,540 |
Bj’s Wholesale Club, Inc. | | 43,400 | | | 1,282,904 |
Brinker International, Inc. | | 15,100 | | | 583,766 |
Brown Shoe Co., Inc.D | | 16,000 | | | 678,880 |
Carmike Cinemas, Inc.D | | 17,500 | | | 443,800 |
Central Garden & Pet Co.D | | 32,000 | | | 1,470,080 |
Charlotte Russe Holding, Inc.D | | 33,300 | | | 693,639 |
Chemed Corporation | | 12,400 | | | 616,032 |
Citadel Broadcasting CorporationD | | 16,200 | | | 217,728 |
Coinstar, Inc.D | | 17,700 | | | 404,091 |
Computer Learning Centers | | 24,439 | | | 2 |
Convergys Corporation | | 64,100 | | | 1,015,985 |
Copart, Inc. | | 10,500 | | | 242,130 |
Corporate Executive Board Co. | | 21,000 | | | 1,883,700 |
CoStar Group, Inc.D | | 29,450 | | | 1,271,357 |
CRA International, Inc. | | 12,000 | | | 572,280 |
Ctrip.com International, Ltd. ADRD | | 8,800 | | | 508,200 |
Darden Restaurants, Inc. | | 20,600 | | | 800,928 |
Dave & Buster’s, Inc.D | | 52,100 | | | 917,481 |
Deckers Outdoor CorporationD | | 31,100 | | | 858,982 |
Dex Media, Inc. | | 5,500 | | | 148,995 |
Dillard’s, Inc. Class A | | 26,500 | | | 657,730 |
Domino’s Pizza, Inc.D | | 26,600 | | | 643,720 |
DTS, Inc.D | | 13,450 | | | 199,060 |
EarthLink, Inc.D | | 103,100 | | | 1,145,441 |
Educate, Inc.D | | 39,300 | | | 463,740 |
Education Management Corporation | | 127,200 | | | 4,262,472 |
Entercom Communications Corporation | | 19,100 | | | 566,697 |
Entravision Communications Corporation Class AD | | 228,758 | | | 1,628,757 |
Furniture Brands International, Inc.D | | 57,100 | | | 1,275,043 |
GameStop Corporation Class AD | | 11,900 | | | 378,658 |
Gaylord Entertainment Co.* | | 18,200 | | | 793,338 |
Global Imaging Systems, Inc.D | | 40,459 | | | 1,401,095 |
Guitar Center, Inc.D | | 8,300 | | | 415,083 |
Handleman Co.D | | 22,700 | | | 281,934 |
Harris Interactive, Inc.D | | 206,644 | | | 890,636 |
Heidrick & Struggles International, Inc.D | | 31,500 | | | 1,009,575 |
Helen of Troy, Ltd.D | | 36,300 | | | 584,793 |
Herbalife, Ltd. | | 34,400 | | | 1,118,688 |
Hibbett Sporting Goods, Inc. | | 12,900 | | | 367,392 |
Hudson Highland Group, Inc.D | | 22,400 | | | 388,864 |
Insight Enterprises, Inc. | | 73,900 | | | 1,449,179 |
Inter Parfums, Inc.D | | 35,100 | | | 630,396 |
Jack in the Box, Inc.D | | 18,600 | | | 649,698 |
Jackson Hewitt Tax Service, Inc. | | 28,500 | | | 789,735 |
Jakks Pacific, Inc.D | | 20,700 | | | 433,458 |
K-Swiss, Inc. Class AD | | 26,700 | | | 866,148 |
Life Time Fitness, Inc.D | | 18,800 | | | 716,092 |
Lithia Motors, Inc.D | | 5,300 | | | 166,632 |
Marchex, Inc. Class BD | | 24,400 | | | 548,756 |
MarineMax, Inc.D | | 10,800 | | | 340,956 |
Marvel Entertainment, Inc.D | | 35,400 | | | 579,852 |
Monro Muffler Brake, Inc.D | | 21,500 | | | 651,880 |
MPS Group, Inc. | | 65,700 | | | 898,119 |
MSC Industrial Direct Co., Inc. Class A | | 10,600 | | | 426,332 |
MWI Veterinary Supply, Inc.D | | 22,200 | | | 572,982 |
Navigant Consulting, Inc.D | | 26,600 | | | 584,668 |
Netflix, Inc.D | | 27,400 | | | 741,444 |
Novatel, Inc.D | | 21,700 | | | 599,137 |
Orient-Express Hotels, Ltd. Class A | | 15,900 | | | 501,168 |
Outdoor Channel Holdings, Inc.D | | 35,900 | | | 484,650 |
Oxford Industries, Inc.D | | 22,900 | | | 1,252,630 |
Pantry, Inc.D | | 23,300 | | | 1,094,867 |
Papa John’s International, Inc.D | | 12,800 | | | 759,168 |
Parlux Fragrance, Inc.D | | 26,700 | | | 815,151 |
Perry Ellis International, Inc.D | | 32,300 | | | 613,700 |
Providence Service Corporation | | 9,200 | | | 264,868 |
See Notes to Financial Statements.
103
Small Cap Equity Fund
SCHEDULE OF INVESTMENTS (Continued)
| | | | | |
| | | Shares | | Value |
Quicksilver, Inc.D | | 29,800 | | $ | 412,432 |
Radio One, Inc. Class D | | 62,700 | | | 648,945 |
Rare Hospitality International, Inc. | | 11,150 | | | 338,849 |
Red Robin Gourmet Burgers, Inc.D | | 13,000 | | | 662,480 |
Regent Communications, Inc. | | 196,497 | | | 911,746 |
Resources Connection, Inc.D | | 86,400 | | | 2,251,584 |
Rocky Shoes and Boots, Inc.D | | 15,200 | | | 370,272 |
Rush Enterprises, Inc. Class AD | | 51,681 | | | 769,013 |
Russell CorporationD | | 19,000 | | | 255,740 |
SCP Pool CorporationD | | 85,725 | | | 3,190,684 |
Select Comfort CorporationD | | 182,557 | | | 4,992,934 |
Shaw Communications, Inc. Class B | | 56,900 | | | 1,233,592 |
SM&AD | | 131,283 | | | 1,080,459 |
Source Interlink Cos., Inc.D | | 51,200 | | | 569,344 |
The Sports Authority, Inc.D | | 25,300 | | | 787,589 |
Sportsman’s Guide, Inc.D | | 6,500 | | | 155,025 |
Stamps.com, Inc.D* | | 14,300 | | | 328,328 |
Stanley Furniture Co., Inc.D | | 36,000 | | | 834,480 |
Steiner Leisure, Ltd. | | 21,700 | | | 771,652 |
Strayer Education, Inc.D | | 20,300 | | | 1,902,110 |
Tech Data Corporation | | 36,000 | | | 1,428,480 |
Texas Roadhouse, Inc. Class A | | 28,400 | | | 441,620 |
THQ, Inc.D | | 36,800 | | | 877,680 |
Too, Inc.D | | 46,900 | | | 1,323,049 |
Toro Co. | | 59,400 | | | 2,599,938 |
Tractor Supply Co. | | 11,900 | | | 629,986 |
TRX, Inc.D | | 56,400 | | | 441,612 |
Tuesday Morning CorporationD | | 63,800 | | | 1,334,696 |
UniFirst Corporation | | 13,600 | | | 422,960 |
United Natural Foods, Inc.D | | 39,900 | | | 1,053,360 |
United Online, Inc.D | | 71,700 | | | 1,019,574 |
Universal Electronics, Inc.D | | 72,585 | | | 1,250,640 |
Universal Technical Institute, Inc.D | | 10,600 | | | 327,964 |
USANA Health Sciences, Inc.D | | 4,100 | | | 157,276 |
Vail Resorts, Inc.D | | 28,800 | | | 951,264 |
ValueClick, Inc.D | | 31,600 | | | 572,276 |
Ventiv Health, Inc. | | 15,900 | | | 375,558 |
Warnaco Group, Inc. (The) | | 65,520 | | | 1,750,694 |
WESCO International, Inc. | | 30,700 | | | 1,311,811 |
West Corporation | | 38,200 | | | 1,610,130 |
| | | | | |
| | | | | 95,674,943 |
| | | | | |
Consumer Staples — 1.6% | | | | | |
Casey’s General Stores, Inc. | | 53,400 | | | 1,324,320 |
J & J Snack Foods CorporationD | | 35,176 | | | 2,089,806 |
John B. Sanfillippo & SonD* | | 34,900 | | | 451,257 |
Long’s Drug Stores CorporationD | | 14,500 | | | 527,655 |
Nash Finch Co.D | | 11,400 | | | 290,472 |
Pilgrim’s Pride CorporationD | | 45,000 | | | 1,492,200 |
Ruddick CorporationD | | 27,300 | | | 580,944 |
Sanderson Farms, Inc.D | | 19,700 | | | 601,441 |
SUPERVALU, Inc. | | 47,600 | | | 1,546,048 |
| | | | | |
| | | | | 8,904,143 |
| | | | | |
Financial Services — 22.1% | | | | | |
Accredited Home Lenders Holding Co.D | | 46,500 | | | 2,305,470 |
Affiliated Managers Group, Inc.D | | 16,200 | | | 1,300,050 |
Alliance Data Systems Corporation | | 100,300 | | | 3,570,680 |
American Equity Investment Life Holding Co.D | | 26,800 | | | 349,740 |
American Financial Group, Inc. | | 25,000 | | | 957,750 |
American Home Mortgage Investment Corporation REITD | | 29,500 | | | 960,815 |
American Safety Insurance Holdings, Ltd.* | | 7,200 | | | 120,456 |
Arch Capital Group, Ltd. | | 13,800 | | | 755,550 |
Argonaut Group, Inc.D* | | 33,000 | | | 1,081,410 |
Assurant, Inc. | | 23,900 | | | 1,039,411 |
Assured Guaranty, Ltd. | | 30,100 | | | 764,239 |
Asta Funding, Inc.D | | 80,000 | | | 2,187,200 |
Axis Capital Holdings, Ltd.D | | 46,300 | | | 1,448,264 |
Banco Latinoamericano de Exportaciones SAD | | 53,400 | | | 977,220 |
Bank of Hawaii Corporation | | 27,800 | | | 1,432,812 |
Brookline Bancorp, Inc.D | | 77,323 | | | 1,095,667 |
Cardinal Financial CorporationD | | 36,500 | | | 401,500 |
CB Richard Ellis Group, Inc. Class A | | 25,600 | | | 1,506,560 |
City National Corporation | | 15,700 | | | 1,137,308 |
Cohen & Steers, Inc.D | | 33,300 | | | 620,379 |
Colonial Bancgroup, Inc. | | 27,900 | | | 664,578 |
Commerce Bancshares, Inc.D | | 22,811 | | | 1,188,909 |
Commerce Group, Inc. | | 10,800 | | | 618,624 |
CompuCredit CorporationD | | 38,300 | | | 1,473,784 |
Corus Bankshares, Inc.D | | 20,100 | | | 1,131,027 |
CVB Financial CorporationD | | 35,746 | | | 726,001 |
DealerTrack Holdings, Inc.D | | 42,300 | | | 887,454 |
Digital Insight CorporationD | | 33,300 | | | 1,066,266 |
Direct General CorporationD | | 42,900 | | | 725,010 |
Donegal Group, Inc. Class A | | 6,133 | | | 142,531 |
Doral Financial CorporationD | | 75,100 | | | 796,060 |
Downey Financial CorporationD | | 24,900 | | | 1,702,911 |
DST Systems, Inc.D | | 22,000 | | | 1,318,020 |
Dun & Bradstreet Corporation | | 10,700 | | | 716,472 |
Eaton Vance CorporationD | | 48,200 | | | 1,318,752 |
Endurance Specialty Holdings, Ltd. | | 9,800 | | | 351,330 |
Euronet Worldwide, Inc.D | | 28,300 | | | 786,740 |
Fair Isaac & Co., Inc. | | 29,000 | | | 1,280,930 |
Fieldstone Investment Corporation REITD | | 20,200 | | | 239,572 |
First Acceptance CorporationD* | | 31,611 | | | 325,277 |
First American Corporation | | 38,700 | | | 1,753,110 |
First Bancorp Puerto RicoD | | 108,300 | | | 1,344,003 |
First Cash Financial Services, Inc. | | 35,300 | | | 1,029,348 |
FirstFed Financial CorporationD* | | 47,000 | | | 2,562,440 |
Franklin Bank CorporationD | | 11,900 | | | 214,081 |
Fremont General CorporationD | | 109,600 | | | 2,546,008 |
See Notes to Financial Statements.
104
| | | | | |
| | | Shares | | Value |
Global Payments, Inc. | | 52,000 | | $ | 2,423,720 |
Greenhill & Co., Inc.D | | 20,400 | | | 1,145,664 |
Hanmi Financial Corporation | | 28,559 | | | 510,064 |
HCC Insurance Holdings, Inc. | | 120,035 | | | 3,562,639 |
HealthExtras, Inc.D | | 28,200 | | | 707,820 |
Henry (Jack) & Associates, Inc.D | | 95,200 | | | 1,816,416 |
Hilb, Rogal & Hobbs Co.D | | 80,282 | | | 3,091,660 |
Huron Consulting Group, Inc. | | 25,500 | | | 611,745 |
Independence Community Bank Corporation | | 16,000 | | | 635,680 |
IndyMac Bancorp, Inc. | | 36,900 | | | 1,439,838 |
Infinity Property & Casualty CorporationD | | 30,300 | | | 1,127,463 |
Investment Technology Group, Inc.* | | 39,800 | | | 1,410,512 |
Investors Financial Services CorporationD | | 55,100 | | | 2,029,333 |
iPayment, Inc. | | 10,800 | | | 448,416 |
ITLA Capital CorporationD | | 4,200 | | | 205,170 |
Jefferies Group, Inc.D | | 19,500 | | | 877,110 |
Jones Lang LaSalle, Inc.D | | 26,900 | | | 1,354,415 |
Kingsway Financial Services, Inc.D | | 12,000 | | | 241,560 |
Knight Capital Group, Inc. Class AD | | 112,700 | | | 1,114,603 |
LandAmerica Financial Group, Inc.D | | 22,100 | | | 1,379,040 |
Markel Corporation | | 4,700 | | | 1,490,135 |
Max Re Capital, Ltd. | | 41,500 | | | 1,077,755 |
Meadowbrook Insurance Group, Inc.D* | | 25,600 | | | 149,504 |
Midwest Banc Holdings, Inc.D | | 26,200 | | | 582,950 |
Municipal Mortgage & Equity LLCD | | 42,500 | | | 1,097,775 |
National Financial Partners Corporation | | 10,800 | | | 567,540 |
National Interstate CorporationD | | 14,900 | | | 284,143 |
New Century Financial Corporation REITD | | 15,400 | | | 555,478 |
North Pointe Holdings CorporationD | | 45,100 | | | 693,187 |
Nuveen Investments, Inc. Class AD | | 17,400 | | | 741,588 |
Ohio Casualty CorporationD | | 106,871 | | | 3,026,586 |
optionsXpress Holdings, Inc.D | | 39,900 | | | 979,545 |
Philadelphia Consolidated Holding Corporation | | 4,100 | | | 396,429 |
Phoenix Cos., Inc.D | | 22,700 | | | 309,628 |
Piper Jaffray Cos., Inc.D | | 33,400 | | | 1,349,360 |
Platinum Underwriters Holdings, Ltd. | | 22,900 | | | 711,503 |
PMI Group, Inc. (The)D | | 44,500 | | | 1,827,615 |
Portfolio Recovery Associates, Inc.D | | 20,600 | | | 956,664 |
Primus Guaranty, Ltd.D | | 64,500 | | | 841,725 |
PrivateBancorp, Inc.D | | 31,861 | | | 1,133,296 |
Provident Financial Holdings, Inc.D | | 4,300 | | | 113,090 |
Quanta Capital Holdings, Ltd.D | | 65,400 | | | 333,540 |
R&G Financial Corporation Class BD | | 68,200 | | | 900,240 |
Radian Group, Inc. | | 57,400 | | | 3,363,066 |
Raymond James Financial, Inc.D | | 33,300 | | | 1,254,411 |
Republic First Bancorp, Inc. | | 20,892 | | | 274,730 |
Ryder System, Inc. | | 25,400 | | | 1,041,908 |
Saxon Capital, Inc. REITD | | 74,500 | | | 844,085 |
Selective Insurance GroupD | | 2,600 | | | 138,060 |
Stancorp Financial Group, Inc. | | 32,200 | | | 1,608,390 |
Stewart Information Services CorporationD | | 24,100 | | | 1,172,947 |
Texas Capital Bancshares, Inc.D | | 45,500 | | | 1,019,655 |
Texas United Bancshares, Inc.D | | 9,037 | | | 164,112 |
TierOne CorporationD | | 39,900 | | | 1,173,459 |
UCBH Holdings, Inc.D | | 39,200 | | | 700,896 |
UICID | | 37,400 | | | 1,328,074 |
United America Indemnity, Ltd. Class AD | | 14,100 | | | 258,876 |
USI Holdings CorporationD | | 180,187 | | | 2,481,175 |
W Holding Co., Inc. | | 12,500 | | | 102,875 |
W.R. Berkley Corporation | | 13,500 | | | 642,870 |
Webster Financial Corporation | | 19,500 | | | 914,550 |
Williams Scotsman International, Inc.D | | 27,600 | | | 477,756 |
Wilmington Trust Corporation | | 16,900 | | | 657,579 |
Wintrust Financial CorporationD | | 14,500 | | | 796,050 |
World Acceptance CorporationD | | 40,800 | | | 1,162,800 |
Wright Express CorporationD | | 45,700 | | | 1,005,400 |
Zenith National Insurance Corporation | | 28,350 | | | 1,307,502 |
| | | | | |
| | | | | 121,065,089 |
| | | | | |
Healthcare — 12.5% | | | | | |
Adeza Biomedical Corporation | | 30,400 | | | 639,920 |
Alpharma, Inc. Class A | | 50,300 | | | 1,434,053 |
Amedisys, Inc.D | | 68,100 | | | 2,876,544 |
American Dental Partners, Inc.D | | 33,000 | | | 596,640 |
American Healthways, Inc.D | | 17,100 | | | 773,775 |
Andrx CorporationD | | 26,300 | | | 433,161 |
Angiotech Pharmaceuticals, Inc.D | | 22,500 | | | 295,875 |
Arqule, Inc.D | | 39,400 | | | 241,128 |
Arthrocare CorporationD | | 9,350 | | | 394,009 |
Aspect Medical Systems, Inc.D | | 11,200 | | | 384,720 |
Aspreva Pharmaceuticals CorporationD | | 20,000 | | | 314,400 |
AtriCure, Inc. | | 38,200 | | | 406,830 |
Axcan Pharma, Inc.D | | 30,600 | | | 463,284 |
BioMarin Pharmaceuticals, Inc. | | 61,400 | | | 661,892 |
Bio-Rad Laboratories, Inc. Class A | | 14,900 | | | 975,056 |
Biosite, Inc.D | | 8,700 | | | 489,723 |
Biovail CorporationD | | 29,700 | | | 704,781 |
See Notes to Financial Statements.
105
Small Cap Equity Fund
SCHEDULE OF INVESTMENTS (Continued)
| | | | | |
| | | Shares | | Value |
Cantel Medical CorporationD | | 5,100 | | $ | 91,494 |
Cell Genesys, Inc.D | | 24,200 | | | 143,506 |
Charles River Laboratories International, Inc.D | | 11,600 | | | 491,492 |
Chattem, Inc.D* | | 18,100 | | | 658,659 |
Connetics CorporationD | | 33,700 | | | 486,965 |
Curis, Inc.D | | 99,600 | | | 354,576 |
CV Therapeutics, Inc.D | | 23,300 | | | 576,209 |
Dade Behring Holdings, Inc. | | 39,000 | | | 1,594,710 |
DaVita, Inc. | | 24,000 | | | 1,215,360 |
Digene CorporationD | | 18,600 | | | 542,562 |
Discovery Partners International, Inc. | | 30,200 | | | 80,030 |
DJ Orthopedics, Inc. | | 30,000 | | | 827,400 |
Eclipsys CorporationD | | 41,800 | | | 791,274 |
Enzon Pharmaceuticals, Inc. | | 16,700 | | | 123,580 |
ev3, Inc.D | | 29,000 | | | 427,460 |
Five Star Quality Care, Inc.+ | | 2,086 | | | — |
Genesis HealthCare CorporationD | | 17,400 | | | 635,448 |
Genitope CorporationD | | 28,700 | | | 228,165 |
Haemonetics CorporationD | | 11,400 | | | 557,004 |
Icon PLC ADR | | 48,675 | | | 2,002,490 |
ICU Medical, Inc.D | | 22,000 | | | 862,620 |
Illumina, Inc.D | | 9,700 | | | 136,770 |
Immucor, Inc.D | | 9,700 | | | 226,592 |
Integra LifeSciences Holdings CorporationD | | 16,300 | | | 577,998 |
Intuitive Surgical, Inc. | | 7,300 | | | 856,071 |
IRIS International, Inc.D | | 21,200 | | | 463,432 |
Kensey Nash CorporationD | | 38,200 | | | 841,546 |
King Pharmaceuticals, Inc. | | 107,600 | | | 1,820,592 |
Kyphon, Inc. | | 42,700 | | | 1,743,441 |
LCA-Vision, Inc.D | | 68,510 | | | 3,254,910 |
Ligand Pharmaceuticals, Inc. Class BD | | 11,100 | | | 123,765 |
Magellan Health Services, Inc. | | 40,600 | | | 1,276,870 |
Medarex, Inc.D | | 187,400 | | | 2,595,490 |
Medicines Co.D | | 45,850 | | | 800,083 |
MGI Pharma, Inc.D | | 28,480 | | | 488,717 |
Nektar TherapeuticsD | | 52,700 | | | 867,442 |
Neurometrix, Inc.D | | 9,100 | | | 248,248 |
OCA, Inc.D | | 93,800 | | | 37,520 |
Odyssey HealthCare, Inc.D | | 24,900 | | | 464,136 |
On Assignment, Inc. | | 30,000 | | | 327,300 |
Onyx Pharmaceuticals, Inc.D | | 14,400 | | | 414,144 |
Option Care, Inc.D | | 116,491 | | | 1,556,320 |
Orthofix International NV | | 27,600 | | | 1,100,964 |
Owens & Minor, Inc. | | 22,600 | | | 622,178 |
Panacos Pharmaceuticals, Inc. | | 67,000 | | | 464,310 |
Par Pharmaceutical Cos., Inc.D* | | 53,722 | | | 1,683,647 |
Pediatrix Medical Group, Inc. | | 23,900 | | | 2,116,823 |
Pharmacyclics, Inc.D | | 16,800 | | | 59,640 |
Pharmion CorporationD | | 31,300 | | | 556,201 |
PolyMedica CorporationD | | 27,705 | | | 927,286 |
Protein Design Labs, Inc.D | | 14,500 | | | 412,090 |
Psychiatric Solutions, Inc.D* | | 10,100 | | | 593,274 |
QLT, Inc.D | | 74,200 | | | 471,912 |
Radiation Therapy Services, Inc.D | | 24,500 | | | 865,095 |
RehabCare Group, Inc. | | 5,700 | | | 115,140 |
Respironics, Inc. | | 35,600 | | | 1,319,692 |
Savient Pharmaceuticals, Inc.D | | 96,500 | | | 360,910 |
Sierra Health Services, Inc. | | 10,300 | | | 823,588 |
Stereotaxis, Inc.D | | 76,500 | | | 658,665 |
Stericycle, Inc.D | | 23,800 | | | 1,401,344 |
Steris Corporation | | 4,200 | | | 105,084 |
SuperGen, Inc.D | | 33,000 | | | 166,650 |
SurModics, Inc.D | | 20,900 | | | 773,091 |
Symmetry Medical, Inc.D | | 109,300 | | | 2,119,327 |
Syneron Medical, Ltd.D | | 7,700 | | | 244,475 |
Tanox, Inc.D | | 19,500 | | | 319,215 |
Techne CorporationD | | 14,300 | | | 802,945 |
TriPath Imaging, Inc.D | | 119,889 | | | 724,130 |
United Surgical Partners International, Inc.D | | 17,750 | | | 570,662 |
VCA Antech, Inc. | | 68,200 | | | 1,923,240 |
Ventana Medical SystemsD | | 26,400 | | | 1,118,040 |
WellCare Health Plans, Inc.D | | 18,400 | | | 751,640 |
| | | | | |
| | | | | 68,069,440 |
| | | | | |
Integrated Oils — 0.3% | | | | | |
Giant Industries, Inc.D* | | 22,400 | | | 1,163,904 |
KCS Energy, Inc.* | | 12,000 | | | 290,640 |
Petrocorp, Inc. Escrow Shares+ | | 500 | | | — |
| | | | | |
| | | | | 1,454,544 |
| | | | | |
Materials & Processing — 9.3% | | | | | |
Agrium, Inc.D | | 56,700 | | | 1,246,833 |
Aleris International, Inc.D* | | 37,500 | | | 1,209,000 |
AptarGroup, Inc. | | 29,100 | | | 1,519,020 |
Armor Holdings, Inc.D | | 12,300 | | | 524,595 |
Beacon Roofing Supply, Inc.D | | 88,478 | | | 2,541,973 |
Building Materials Holding CorporationD | | 13,600 | | | 927,656 |
Carpenter Technology CorporationD | | 19,500 | | | 1,374,165 |
Century Aluminum Co.D* | | 37,700 | | | 988,117 |
Chaparral Steel, Co.D | | 15,600 | | | 471,900 |
Chicago Bridge & Iron Co. NV | | 7,500 | | | 189,075 |
Cleveland-Cliffs, Inc.D | | 25,601 | | | 2,267,480 |
Commercial Metals Co.D | | 91,836 | | | 3,447,523 |
DHB Industries, Inc.D | | 34,200 | | | 152,874 |
Eagle Materials, Inc.D | | 13,200 | | | 1,615,152 |
Eastman Chemical Co. | | 14,500 | | | 748,055 |
ElkCorp | | 56,462 | | | 1,900,511 |
Energy Conversion Devices, Inc.D | | 4,800 | | | 195,600 |
Forest City Enterprises, Inc. Class AD | | 26,600 | | | 1,008,938 |
Gibraltar Industries, Inc. | | 40,772 | | | 935,310 |
Gold Kist, Inc.D | | 15,300 | | | 228,735 |
Granite Construction, Inc. | | 10,300 | | | 369,873 |
Griffon Corporation | | 35,200 | | | 838,112 |
H.B. Fuller Co.D | | 36,200 | | | 1,160,934 |
Hexcel CorporationD* | | 148,672 | | | 2,683,530 |
Hughes Supply, Inc. | | 56,700 | | | 2,032,695 |
Infrasource Services, Inc.D | | 40,900 | | | 534,972 |
Interline Brands, Inc. | | 14,600 | | | 332,150 |
IPSCO, Inc.D | | 19,900 | | | 1,651,302 |
Lone Star Technologies, Inc.D | | 19,700 | | | 1,017,702 |
See Notes to Financial Statements.
106
| | | | | |
| | | Shares | | Value |
Martin Marietta Materials, Inc. | | 12,900 | | $ | 989,688 |
Maverick Tube CorporationD | | 27,600 | | | 1,100,136 |
Methanex Corporation | | 96,300 | | | 1,804,662 |
Minerals Technologies, Inc. | | 3,000 | | | 167,670 |
Mobile Mini, Inc.D | | 30,900 | | | 1,464,660 |
Quanex CorporationD | | 22,300 | | | 1,114,331 |
RBC Bearings, Inc.D | | 36,200 | | | 588,250 |
Reliance Steel & Aluminum Co.D | | 22,500 | | | 1,375,200 |
Ryerson Tull, Inc.D | | 7,300 | | | 177,536 |
Silgan Holdings, Inc.D | | 13,800 | | | 498,456 |
Steel Dynamics, Inc.D | | 42,400 | | | 1,505,624 |
Symyx TechnologiesD | | 24,200 | | | 660,418 |
Texas Industries, Inc.D | | 14,800 | | | 737,632 |
Timken Co. | | 32,600 | | | 1,043,852 |
Trammell Crow Co.D | | 82,800 | | | 2,123,820 |
Valspar CorporationD | | 26,000 | | | 641,420 |
Wellman, Inc.D | | 82,400 | | | 558,672 |
| | | | | |
| | | | | 50,665,809 |
| | | | | |
Other — 0.2% | | | | | |
Ritchie Bros. Auctioneers, Inc.D | | 13,200 | | | 557,700 |
Walter Industries, Inc.D | | 14,900 | | | 740,828 |
| | | | | |
| | | | | 1,298,528 |
| | | | | |
Other Energy — 5.9% | | | | | |
Alon USA Energy, Inc.D | | 20,200 | | | 396,930 |
Arch Coal, Inc.D | | 10,400 | | | 826,800 |
ATP Oil & Gas CorporationD | | 23,800 | | | 880,838 |
Brigham Exploration Co.D | | 68,200 | | | 808,852 |
CARBO Ceramics, Inc. | | 1,200 | | | 67,824 |
Carrizo Oil & Gas, Inc.D | | 14,400 | | | 355,824 |
Denbury Resources, Inc. | | 59,200 | | | 1,348,576 |
Encore Acquisition Co. | | 26,250 | | | 841,050 |
Energy Partners, Ltd.D | | 36,700 | | | 799,693 |
Foundation Coal Holdings, Inc.D | | 21,400 | | | 813,200 |
Grey Wolf, Inc.D | | 33,892 | | | 261,985 |
Hydril Co. | | 11,900 | | | 744,940 |
Key Energy Services, Inc. | | 39,303 | | | 529,411 |
KFX, Inc.D | | 25,100 | | | 429,461 |
Massey Energy Co.D | | 84,626 | | | 3,204,787 |
NRG Energy, Inc.D | | 30,400 | | | 1,432,448 |
Oil States International, Inc.D | | 17,100 | | | 541,728 |
Petroquest Energy, Inc.D | | 72,082 | | | 596,839 |
Pioneer Drilling Co.D | | 28,600 | | | 512,798 |
Pride International, Inc. | | 116,396 | | | 3,579,177 |
Quicksilver Resources, Inc.D | | 20,400 | | | 857,004 |
Remington Oil & Gas Corporation | | 15,200 | | | 554,800 |
St. Mary Land & Exploration Co.D | | 31,800 | | | 1,170,558 |
Tesoro Corporation | | 12,400 | | | 763,220 |
TODCO Class A | | 34,200 | | | 1,301,652 |
Toreador Resources CorporationD | | 15,800 | | | 332,906 |
Unit Corporation* | | 64,550 | | | 3,552,187 |
Universal Compression Holdings, Inc.D | | 33,800 | | | 1,389,856 |
Veritas DGC, Inc.D | | 43,400 | | | 1,540,266 |
Warren Resources, Inc.D | | 24,900 | | | 393,918 |
W-H Energy Services, Inc. | | 22,100 | | | 731,068 |
Whiting Petroleum CorporationD | | 13,900 | | | 556,000 |
| | | | | |
| | | | | 32,116,596 |
| | | | | |
Producer Durables — 8.1% | | | | | |
A.O. Smith Corporation | | 24,400 | | | 856,440 |
Actuant Corporation Class AD | | 81,134 | | | 4,527,277 |
Advanced Energy Industries, Inc.D | | 49,800 | | | 589,134 |
AGCO CorporationD’ | | 56,600 | | | 937,862 |
Alamo Group, Inc.D | | 24,700 | | | 506,350 |
Allied Defense Group, Inc. (The)D | | 16,400 | | | 373,428 |
Argon ST, Inc.D* | | 19,000 | | | 588,620 |
Arris Group, Inc.D | | 72,000 | | | 681,840 |
Astec Industries, Inc.D | | 11,750 | | | 383,755 |
ASV, Inc.D | | 19,600 | | | 489,608 |
ATMI, Inc.D | | 25,100 | | | 702,047 |
Beazer Homes USA, Inc.D | | 40,300 | | | 2,935,452 |
Centex Corporation | | 24,848 | | | 1,776,384 |
Cognex CorporationD | | 28,900 | | | 869,601 |
Cummins, Inc.D | | 17,500 | | | 1,570,275 |
Cymer, Inc. | | 19,600 | | | 695,996 |
Dionex CorporationD | | 16,000 | | | 785,280 |
ESCO Technologies, Inc.* | | 9,000 | | | 400,410 |
General Cable CorporationD* | | 8,600 | | | 169,420 |
Genlyte Group, Inc.D | | 29,976 | | | 1,605,814 |
Headwaters, Inc.D | | 27,200 | | | 963,968 |
Hovnanian Enterprises, Inc. Class AD | | 10,700 | | | 531,148 |
Itron, Inc. | | 13,650 | | | 546,546 |
Joy Global, Inc. | | 12,000 | | | 480,000 |
KB HOME | | 18,200 | | | 1,322,412 |
LAM Research Corporation | | 17,400 | | | 620,832 |
M/I Homes, Inc.D | | 28,200 | | | 1,145,484 |
Magnetek, Inc.D | | 33,800 | | | 109,850 |
Manitowoc Co., Inc.D | | 13,200 | | | 662,904 |
Measurement Specialties, Inc.D | | 95,300 | | | 2,320,555 |
Meritage Homes Corporation* | | 6,300 | | | 396,396 |
MTC Technologies, Inc.D | | 21,100 | | | 577,718 |
Orbital Sciences CorporationD | | 62,400 | | | 801,216 |
Orleans Homebuilders, Inc.D | | 32,300 | | | 592,705 |
Polycom, Inc. | | 25,000 | | | 382,500 |
Rofin-Sinar Technologies, Inc. | | 7,000 | | | 304,290 |
Roper Industries, Inc. | | 18,500 | | | 730,935 |
Rudolph Technologies, Inc.D | | 30,800 | | | 396,704 |
Ryland Group, Inc. | | 50,632 | | | 3,652,086 |
Sonic SolutionsD | | 10,800 | | | 163,188 |
Spectralink CorporationD | | 47,500 | | | 563,825 |
Standard-Pacific Corporation | | 20,800 | | | 765,440 |
Technical Olympic USA, Inc.D | | 44,600 | | | 940,614 |
United Industrial CorporationD | | 22,900 | | | 947,373 |
Varian Semiconductor Equipment Associates, Inc.D | | 21,000 | | | 922,530 |
VistaPrint, Ltd. | | 19,000 | | | 432,326 |
William Lyon Homes, Inc.D | | 9,000 | | | 908,100 |
See Notes to Financial Statements.
107
Small Cap Equity Fund
SCHEDULE OF INVESTMENTS (Continued)
| | | | | |
| | | Shares | | Value |
X-Rite, Inc.D | | 88,155 | | $ | 881,550 |
| | | | | |
| | | | | 44,508,188 |
| | | | | |
Technology — 11.0% | | | | | |
Aeroflex, Inc. | | 57,100 | | | 613,825 |
Alliance Semiconductor CorporationD | | 63,900 | | | 166,140 |
Alvarion, Ltd.D | | 64,500 | | | 562,440 |
American Reprographics Co. | | 34,900 | | | 886,809 |
Anaren, Inc. | | 45,000 | | | 703,350 |
Ansys, Inc. | | 17,200 | | | 734,268 |
Anteon International CorporationD | | 29,500 | | | 1,603,325 |
Atheros Communications, Inc.D | | 41,900 | | | 544,700 |
Avid Technology, Inc.D | | 41,200 | | | 2,256,112 |
Avocent Corporation | | 17,000 | | | 462,230 |
CACI International, Inc. Class AD | | 32,057 | | | 1,839,431 |
CallWave, Inc.D | | 27,400 | | | 136,726 |
Catapult Communications CorporationD | | 20,900 | | | 309,111 |
Coherent, Inc.D | | 12,100 | | | 359,128 |
CommScope, Inc.D | | 32,700 | | | 658,251 |
CSG Systems International, Inc.D | | 36,000 | | | 803,520 |
Cypress Semiconductor CorporationD | | 13,400 | | | 190,950 |
Emageon, Inc.D | | 44,900 | | | 713,910 |
Embarcadero Technologies, Inc. | | 63,800 | | | 464,464 |
Epicor Software CorporationD | | 53,600 | | | 757,368 |
EPIQ Systems, Inc.D | | 20,200 | | | 374,508 |
Equinix, Inc.D | | 24,250 | | | 988,430 |
F5 Networks, Inc. | | 12,100 | | | 691,999 |
Filenet Corporation | | 15,000 | | | 387,750 |
FLIR Systems, Inc.D | | 26,600 | | | 593,978 |
Genesis Microchip, Inc.D | | 46,700 | | | 844,803 |
Herley Industries, Inc.D | | 49,800 | | | 822,198 |
Hutchinson Technology, Inc.D | | 26,500 | | | 753,925 |
Imation Corporation | | 15,000 | | | 691,050 |
Informatica Corporation | | 97,300 | | | 1,167,600 |
Ingram Micro, Inc. Class A | | 74,400 | | | 1,482,792 |
Innovative Solutions & Support, Inc.D | | 14,250 | | | 182,115 |
InPhonic, Inc.D | | 7,100 | | | 61,699 |
Integrated Device Technology, Inc. | | 75,130 | | | 990,213 |
Intergraph CorporationD | | 40,200 | | | 2,002,362 |
IxiaD | | 24,400 | | | 360,632 |
j2 Global Communications, Inc.D | | 20,100 | | | 859,074 |
Kanbay International, Inc.D | | 38,800 | | | 616,532 |
Komag, Inc.D | | 27,700 | | | 960,082 |
LSI Logic CorporationD | | 67,700 | | | 541,600 |
Mantech International Corporation Class AD | | 14,500 | | | 403,970 |
Mercury Computer Systems, Inc.D | | 24,300 | | | 501,309 |
Merge Technologies, Inc.D | | 50,400 | | | 1,262,016 |
Micros Systems, Inc. | | 13,600 | | | 657,152 |
Microsemi CorporationD* | | 62,300 | | | 1,723,218 |
MicroStrategy, Inc. Class AD | | 12,000 | | | 992,880 |
Multi-Fineline Electronix, Inc.D | | 12,600 | | | 606,942 |
NAM TAI Electronics, Inc.D | | 26,100 | | | 587,250 |
Neoware Systems, Inc.D | | 20,600 | | | 479,980 |
Netgear, Inc.D | | 38,000 | | | 731,500 |
New Skies Satellites Holdings, Ltd.D | | 20,400 | | | 444,108 |
Novatel Wireless, Inc.D | | 28,900 | | | 349,979 |
Omnivision Technologies, Inc.D | | 44,300 | | | 884,228 |
Openwave Systems, Inc.D | | 18,800 | | | 328,436 |
Park Electrochemical Corporation | | 27,200 | | | 706,656 |
Plexus CorporationD | | 55,900 | | | 1,271,166 |
Portalplayer, Inc.D | | 19,600 | | | 555,072 |
Progress Software Corporation | | 9,100 | | | 258,258 |
Rackable Systems, Inc. | | 6,600 | | | 187,968 |
Radisys CorporationD | | 52,477 | | | 909,951 |
RADVision, Ltd.D | | 29,500 | | | 489,190 |
SafeNet, Inc.D | | 31,100 | | | 1,002,042 |
Sapient CorporationD | | 91,900 | | | 522,911 |
Semtech Corporation | | 24,500 | | | 447,370 |
Serena Software, Inc. | | 40,100 | | | 939,944 |
SI International, Inc.D | | 19,900 | | | 608,343 |
Sigmatel, Inc.D | | 22,700 | | | 297,370 |
Stratasys, Inc.D | | 62,096 | | | 1,553,021 |
Synaptics, Inc.D | | 17,400 | | | 430,128 |
Talx CorporationD | | 17,600 | | | 804,496 |
Tessera Technologies, Inc.D | | 14,700 | | | 379,995 |
Trident Microsystems, Inc.D | | 26,800 | | | 482,400 |
Trimble Navigation, Ltd. | | 20,700 | | | 734,643 |
Vasco Data Security InternationalD | | 14,750 | | | 145,435 |
Viasat, Inc.D | | 26,100 | | | 697,653 |
Volterra Semiconductor CorporationD | | 18,400 | | | 276,000 |
WebEx Communications, Inc. | | 36,300 | | | 785,169 |
Websense, Inc.D | | 43,301 | | | 2,842,277 |
Wind River Systems, Inc.D | | 100,500 | | | 1,484,385 |
Witness Systems, Inc.D | | 42,000 | | | 826,140 |
Xyratex, Ltd.D | | 7,200 | | | 127,296 |
| | | | | |
| | | | | 59,857,647 |
| | | | | |
Utilities — 3.5% | | | | | |
Alliant Energy Corporation | | 49,800 | | | 1,396,392 |
Avista Corporation | | 34,600 | | | 612,766 |
CenturyTel, Inc. | | 54,400 | | | 1,803,904 |
CMS Energy CorporationD* | | 39,000 | | | 565,890 |
El Paso Electric Co.D | | 28,500 | | | 599,640 |
Energen Corporation | | 40,200 | | | 1,460,064 |
Energy East Corporation | | 37,900 | | | 864,120 |
Golden Telecom, Inc.D | | 29,600 | | | 768,416 |
IDT CorporationD | | 43,200 | | | 499,392 |
MDU Resources Group, Inc. | | 21,100 | | | 690,814 |
NeuStar, Inc. Class AD | | 19,900 | | | 606,751 |
Northeast Utilities | | 68,600 | | | 1,350,734 |
Oneok, Inc.D | | 51,100 | | | 1,360,793 |
Premiere Global Services, Inc.D | | 83,300 | | | 677,229 |
Sierra Pacific Resources* | | 174,900 | | | 2,280,696 |
Ubiquitel, Inc. | | 55,000 | | | 543,950 |
UGI Corporation | | 56,600 | | | 1,165,960 |
See Notes to Financial Statements.
108
| | | | | | | |
| | | Shares | | Value | |
Wisconsin Energy CorporationD | | | 48,800 | | $ | 1,906,128 | |
| | | | | | | |
| | | | | | 19,153,639 | |
| | | | | | | |
TOTAL COMMON STOCKS
(Cost $458,657,665) | | | | | | 523,648,516 | |
| | | | | | | |
MUTUAL FUNDS — 0.1% | | | | | | | |
iShares Russell 2000 | | | | | | | |
(Cost $524,308) | | | 7,950 | | | 530,186 | |
| | | | | | | |
MONEY MARKET FUNDS — 48.7% | | | | | | | |
GuideStone Funds Money Market Fund (GS4 Class) ¥ | | | 19,118,712 | | | 19,118,712 | |
Northern Institutional Liquid Assets Portfolio§ | | | 247,201,966 | | | 247,201,966 | |
| | | | | | | |
TOTAL MONEY MARKET FUNDS
(Cost $266,320,678) | | | | | | 266,320,678 | |
| | | | | | | |
| | | Par | | | |
CORPORATE BOND — 0.0% | | | | | | | |
TIMCO Aviation Services, Inc. PIK 8.00%, 01/01/07+ (Cost $(37)) | | $ | 1,214 | | | — | |
| | | | | | | |
U.S. TREASURY OBLIGATION — 0.3% | | | | | | | |
U.S. Treasury Bill 3.94%, 04/06/06‡‡ (Cost $1,543,791) | | | 1,560,000 | | | 1,543,941 | |
| | | | | | | |
Total Investments — 144.9%
(Cost $727,046,405) | | | | | | 792,043,321 | |
Liabilities in Excess of Other Assets — (44.9)% | | | | | | (245,397,372 | ) |
| | | | | | | |
Net Assets — 100.0% | | | | | $ | 546,645,949 | |
| | | | | | | |
PORTFOLIO SUMMARY+
| | | |
| | | % | |
Money Market Funds | | 48.7 | |
Financial Services | | 22.1 | |
Consumer Discretionary | | 17.5 | |
Healthcare | | 12.5 | |
Technology | | 11.0 | |
Materials & Processing | | 9.3 | |
Producer Durables | | 8.1 | |
Other Energy | | 5.9 | |
Auto & Transportation | | 3.8 | |
Utilities | | 3.5 | |
Futures Contracts | | 2.7 | |
Consumer Staples | | 1.6 | |
Integrated Oils | | 0.3 | |
U.S. Treasury Obligations | | 0.3 | |
Other | | 0.2 | |
Mutual Funds | | 0.1 | |
Coporate Bond | | — | * |
| | | |
| | 147.6 | |
| | | |
| * | Rounds to less than 0.005%. |
See Notes to Financial Statements.
109
International Equity Fund
The Fund is primarily comprised of international stocks located in developed countries, and to a much lesser extent, in international stocks located in emerging markets (economies not deemed to be developed). The Fund posted a strong positive return while outperforming its benchmark, the MSCI ACWI ex-U.S., during the fourth quarter. Security selection in the information technology and financials sectors benefited benchmark-relative performance. The Fund’s holdings in Mitsubishi Estate, Softbank and Orix were among the largest contributors to performance, while Vodafone Group, Takeda Pharmaceutical and Total were among the largest detractors from Fund performance for the quarter. At the sub-adviser level, Capital Guardian delivered the strongest benchmark-relative performance largely due to its security selection in the information technology and financials sectors.
110
International Equity Fund
Average Annual Total Returns as of 12/31/05
| | | | | | | | | | | | | | | | | | |
| | | GS2 Class* | | | GS4 Class* | | | GS6 Class* | | | Benchmark** | | | GS8 Class* | | | GS8 Class Benchmark** | |
One Year | | 17.66 | % | | 17.39 | % | | 17.15 | % | | 16.62 | % | | 16.67 | % | | 16.62 | % |
Since Inception | | 11.45 | % | | 11.27 | % | | 10.81 | % | | 11.30 | % | | 21.31 | % | | 21.91 | % |
Inception Date | | 08/27/01 | | | 08/27/01 | | | 08/27/01 | | | 08/27/01 | | | 11/08/04 | | | 11/08/04 | |
The performance data quoted represents past performance and does not guarantee future results. Current performance may be lower or higher. Performance data current to the most recent month-end may be obtained at www.GuideStone.org. The investment return and principal value of an investment will fluctuate so that shares, when redeemed, may be worth more or less than their original cost.
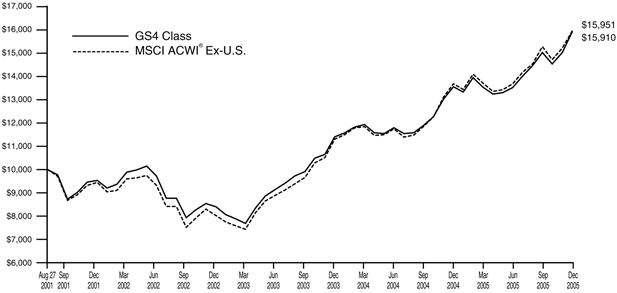
The graph compares the results of a hypothetical $10,000 investment in the GS4 Class of the Fund since August 27, 2001 (commencement of operations), with all dividends and capital gains reinvested, with the MSCI ACWI® Ex-U.S.
| * | These returns reflect expense waivers by the Fund’s investment advisor. Without these waivers, returns would have been lower. Returns shown do not reflect the deduction of taxes that a shareholder would pay on Fund distributions or the redemption of Fund shares. |
| ** | The MSCI ACWI® Ex-U.S. is a market-capitalization weighted index composed of companies representative of the market structure of developed and emerging market countries in the Americas (excluding the U.S.), Europe/Middle East, and Asia/ Pacific Regions. It excludes closed markets and those shares in otherwise free markets that are not purchasable by foreigners. Unlike a mutual fund, the performance of an index assumes no taxes, transaction costs, management fees or other expenses. Foreign securities may involve additional risks, social and political instability, reduced market liquidity and currency volatility. |
111
International Equity Fund
| | |
| SCHEDULE OF INVESTMENTS | | December 31, 2005 |
| | | | | |
| | | Shares | | Value |
FOREIGN COMMON STOCKS — 96.3% | | | | | |
Australia — 3.5% | | | | | |
Amcor, Ltd.D | | 774,792 | | $ | 4,242,960 |
Brambles Industries, Ltd.D | | 42,740 | | | 317,087 |
Coles Myer, Ltd.D | | 718,919 | | | 5,381,073 |
Goodman Fielder, Ltd. | | 293,000 | | | 448,928 |
Insurance Australia Group, Ltd.D | | 70,878 | | | 281,627 |
John Fairfax Holdings, Ltd.D | | 495,000 | | | 1,455,167 |
Lend Lease Corporation, Ltd.D | | 414,209 | | | 4,396,948 |
Macquarie Bank, Ltd. | | 8,445 | | | 421,919 |
National Australia Bank, Ltd.D | | 261,912 | | | 6,221,049 |
Promina Group, Ltd. | | 78,500 | | | 278,534 |
QBE Insurance Group, Ltd.D | | 38,781 | | | 557,235 |
Quantas Airways, Ltd. | | 836,256 | | | 2,476,759 |
Rinker Group, Ltd. | | 109,318 | | | 1,318,320 |
Telstra Corporation, Ltd. | | 1,415,414 | | | 4,077,925 |
Wesfarmers, Ltd.D | | 77,857 | | | 2,110,135 |
Woodside Petroleum, Ltd.D | | 411,000 | | | 11,808,108 |
Woolworths, Ltd.D | | 74,358 | | | 918,525 |
| | | | | |
| | | | | 46,712,299 |
| | | | | |
Austria — 0.1% | | | | | |
Erste Bank Der Oesterreichischen Sparkassen AG | | 11,600 | | | 644,753 |
Raiffeisen International Bank Holding AGD | | 3,400 | | | 222,467 |
Telekom Austria AGD | | 22,328 | | | 501,031 |
| | | | | |
| | | | | 1,368,251 |
| | | | | |
Belgium — 1.3% | | | | | |
Colruyt SAD | | 40,100 | | | 5,535,487 |
Fortis | | 163,291 | | | 5,198,356 |
Suez SA | | 27,836 | | | 866,054 |
UCB SAD | | 124,400 | | | 5,843,930 |
| | | | | |
| | | | | 17,443,827 |
| | | | | |
Brazil — 1.0% | | | | | |
All America Latina Logistica SA | | 5,100 | | | 217,562 |
All America Latina Logistica SA GDR | | 500 | | | 21,355 |
Aracruz Celulose SA ADR | | 5,700 | | | 228,057 |
Arcelor Brasil SA | | 37,473 | | | 448,721 |
Brasil Telecom Participacoes SA ADRD | | 32,600 | | | 1,217,610 |
Centrais Eletricas Brasileiras SA | | 12,435,400 | | | 202,089 |
Companhia Brasileira de Distribuicao Grupo Pao de Acucar ADRD | | 29,800 | | | 980,420 |
Companhia Vale do Rio Doce ADR | | 103,000 | | | 3,733,750 |
Cosan SA Industria e Comercio | | 1,500 | | | 43,705 |
CPFL Energia SA ADRD | | 7,500 | | | 261,375 |
Gol Linhas Aereas Inteligentes SA ADRD | | 4,800 | | | 135,408 |
Localiza Rent A Car SA | | 10,000 | | | 122,440 |
Lojas Renner SA | | 14,000 | | | 448,984 |
Natura Cosmeticos SA | | 3,800 | | | 167,354 |
Petroleo Brasileiro SA ADR ADR | | 37,200 | | | 2,394,564 |
Tele Norte Leste Participacoes SA ADRD | | 39,900 | | | 715,008 |
Tim Participacoes SA ADRD | | 19,600 | | | 495,488 |
Tractebel Energia SA | | 12,400 | | | 79,810 |
Unibanco ADRD | | 12,300 | | | 781,911 |
| | | | | |
| | | | | 12,695,611 |
| | | | | |
Canada — 2.4% | | | | | |
Abitibi-Consolidated, Inc. | | 76,300 | | | 305,871 |
Alcan, Inc. | | 133,900 | | | 5,501,367 |
Barrick Gold CorporationD | | 15,300 | | | 426,411 |
Cameco Corporation | | 24,400 | | | 1,548,863 |
Canadian Natural Resources, Ltd. | | 22,000 | | | 1,090,679 |
Canadian Tire Corporation, Ltd. Class A | | 1,600 | | | 95,715 |
CGI Group, Inc. | | 107,400 | | | 859,237 |
Falconbridge, Ltd. | | 25,333 | | | 751,850 |
First Quantum Minerals, Ltd. | | 50,900 | | | 1,631,059 |
Inco, Ltd.D | | 35,100 | | | 1,529,307 |
Manulife Financial Corporation | | 10,200 | | | 599,040 |
Methanex Corporation | | 28,600 | | | 537,826 |
Potash Corporation of Saskatchewan | | 22,600 | | | 1,810,022 |
Rogers Communications, Inc. Class B | | 8,400 | | | 355,525 |
Suncor Energy, Inc. | | 142,400 | | | 8,981,692 |
Talisman Energy, Inc. | | 50,700 | | | 2,686,670 |
TELUS Corporation | | 19,000 | | | 782,262 |
TELUS Corporation (Non-Voting) | | 29,200 | | | 1,172,321 |
Toronto-Dominion Bank | | 11,600 | | | 610,012 |
| | | | | |
| | | | | 31,275,729 |
| | | | | |
Cayman Islands — 0.0% | | | | | |
Sina CorporationD | | 18,400 | | | 444,544 |
| | | | | |
Chile — 0.2% | | | | | |
AFP Provida SA ADRD | | 15,300 | | | 434,520 |
Banco de Credito e Inversiones | | 23,100 | | | 576,220 |
Banco Santander Chile SA ADRD | | 12,400 | | | 553,040 |
Centros Comerciales Sudamericanos SA | | 4,000 | | | 7,894 |
Embotelladora Andina SA ADR Class AD | | 30,100 | | | 392,805 |
Embotelladora Andina SA ADR Class BD | | 36,500 | | | 508,810 |
Empresas CMPC SA | | 4,300 | | | 106,183 |
Enersis SA ADRD | | 25,100 | | | 275,849 |
Masisa SA ADRD | | 11,000 | | | 104,060 |
| | | | | |
| | | | | 2,959,381 |
| | | | | |
China — 0.4% | | | | | |
China Construction Bank Class H | | 7,081,000 | | | 2,465,768 |
China Petroleum & Chemical Corporation Class H | | 1,602,000 | | | 795,458 |
Jiangsu Expressway Co., Ltd. Class H | | 1,174,600 | | | 662,768 |
PetroChina Co., Ltd. Class H | | 890,000 | | | 728,882 |
| | | | | |
| | | | | 4,652,876 |
| | | | | |
Colombia — 0.1% | | | | | |
BanColombia SA | | 73,000 | | | 489,753 |
BanColombia SA ADR | | 16,800 | | | 484,344 |
| | | | | |
| | | | | 974,097 |
| | | | | |
Denmark — 1.0% | | | | | |
Danske Bank A/SD | | 60,694 | | | 2,138,062 |
See Notes to Financial Statements.
112
| | | | | |
| | | Shares | | Value |
Novo-Nordisk AS Class B | | 200,699 | | $ | 11,289,717 |
| | | | | |
| | | | | 13,427,779 |
| | | | | |
Ecuador — 0.1% | | | | | |
Holcim Ecuador SA GDR GDR | | 26,250 | | | 876,750 |
| | | | | |
Egypt — 0.5% | | | | | |
Commercial International Bank, Ltd. GDR | | 3,100 | | | 31,698 |
Commercial International Bank, Ltd. GDRD | | 7,900 | | | 80,779 |
MobiNil - Egyptian Mobile Services | | 62,495 | | | 2,181,812 |
Orascom Construction Industries GDR | | 83,672 | | | 3,188,248 |
Orascom Constructtion Industries GDR | | 4,800 | | | 365,799 |
Orascom Telecom Holding | | 3,650 | | | 383,563 |
Vodafone Egypt Telecommunications SAE | | 20,660 | | | 363,537 |
| | | | | |
| | | | | 6,595,436 |
| | | | | |
Estonia — 0.0% | | | | | |
Tallink Group, Ltd. | | 30,000 | | | 175,808 |
| | | | | |
| | |
Finland — 0.5% | | | | | |
Nokia OYJ | | 142,200 | | | 2,601,004 |
Stora Enso OYJ Class R | | 34,100 | | | 461,842 |
UPM-Kymmene OYJ | | 204,100 | | | 4,001,440 |
| | | | | |
| | | | | 7,064,286 |
| | | | | |
France — 7.0% | | | | | |
Accor SA | | 21,200 | | | 1,166,079 |
Air France-KLMD | | 22,000 | | | 471,166 |
Air LiquideD | | 13,676 | | | 2,631,028 |
Assurances Generales de FranceD | | 27,100 | | | 2,685,392 |
AXA SA | | 111,700 | | | 3,604,890 |
BNP Paribas SA | | 62,600 | | | 5,065,540 |
Bouygues SAD | | 82,300 | | | 4,024,045 |
Carrefour SAD | | 58,083 | | | 2,721,684 |
Compagnie de Saint-Gobain | | 99,057 | | | 5,892,969 |
Dassault Systemes SA | | 9,500 | | | 536,369 |
Eiffage SA | | 18,104 | | | 1,956,853 |
Essilor International SA Compagnie Generale D’Optique | | 6,400 | | | 516,746 |
France Telecom SA | | 142,565 | | | 3,542,732 |
Groupe DanoneD | | 8,700 | | | 908,965 |
Lafarge SA | | 38,500 | | | 3,464,075 |
L’Oreal SAD | | 69,200 | | | 5,144,921 |
PPR SAD | | 6,537 | | | 736,377 |
Safran SA | | 10,600 | | | 253,495 |
Sanofi-Aventis | | 90,249 | | | 7,906,551 |
Schneider Electric SAD | | 27,100 | | | 2,417,494 |
Societe BIC SA | | 14,600 | | | 868,564 |
Societe Generale Class A | | 53,526 | | | 6,584,052 |
Societe Television Francaise 1D | | 166,400 | | | 4,617,680 |
Total SAD | | 78,582 | | | 19,741,556 |
Veolia Environnement | | 112,817 | | | 5,107,465 |
Vivendi Universal SAD | | 19,500 | | | 610,854 |
| | | | | |
| | | | | 93,177,542 |
| | | | | |
Germany — 5.6% | | | | | |
Adidas-Salomon AG | | 28,086 | | | 5,320,137 |
Allianz AGD | | 36,000 | | | 5,452,828 |
BASF AG | | 29,393 | | | 2,251,792 |
Bayer AG | | 204,302 | | $ | 8,535,662 |
Bayerische Motoren Werke AG | | 58,600 | | | 2,570,388 |
Commerzbank AG | | 21,000 | | | 646,903 |
Continental AGD | | 27,000 | | | 2,396,747 |
DaimlerChrysler AG | | 20,900 | | | 1,067,430 |
Deutsche Bank AGD | | 42,625 | | | 4,132,960 |
Deutsche Boerse AGD | | 4,125 | | | 422,721 |
Deutsche Post AGD | | 32,000 | | | 775,877 |
E.ON AG | | 44,200 | | | 4,572,955 |
Hannover Rueckversicherung AGD | | 47,600 | | | 1,686,656 |
Infineon Technologies AGD* | | 57,300 | | | 524,381 |
Metro AG | | 27,700 | | | 1,337,990 |
RWE AGD | | 111,112 | | | 8,228,131 |
SAP AG | | 11,800 | | | 2,139,638 |
SAP AG ADR | | 4,500 | | | 202,815 |
Schering AG | | 61,378 | | | 4,112,843 |
Siemens AG | | 149,449 | | | 12,809,864 |
Volkswagen AGD | | 92,672 | | | 4,894,335 |
| | | | | |
| | | | | 74,083,053 |
| | | | | |
| | | | | |
Ghana — 0.1% | | | | | |
AngloGold Ashanti, Ltd. ADRD | | 26,389 | | | 1,301,769 |
| | | | | |
| | |
Greece — 0.3% | | | | | |
Altana AG | | 10,800 | | | 588,159 |
National Bank of Greece SA | | 26,239 | | | 1,118,311 |
Public Power Corporation | | 102,000 | | | 2,229,178 |
| | | | | |
| | | | | 3,935,648 |
| | | | | |
| | | | | |
Hong Kong — 4.5% | | | | | |
China Mengniu Dairy Co., Ltd. | | 669,000 | | | 569,461 |
China Mobile (Hong Kong), Ltd.D | | 963,500 | | | 4,560,491 |
China Resources Power Holdings Co. | | 1,314,900 | | | 741,933 |
China Shenhua Energy Co., Ltd. Class HD | | 2,608,500 | | | 2,876,410 |
China Telecom Corporation, Ltd. Class H | | 5,442,000 | | | 2,000,309 |
CLP Holdings, Ltd. | | 1,150,000 | | | 6,674,276 |
CNOOC, Ltd.D | | 9,265,000 | | | 6,273,336 |
Denway Motors, Ltd. | | 4,816,000 | | | 1,599,402 |
Global Bio-Chem Technology Group Co., Ltd. | | 1,155,000 | | | 506,471 |
Hang Lung Group, Ltd. | | 200,000 | | | 424,316 |
Hang Lung Properties, Ltd.D | | 1,695,000 | | | 2,645,141 |
Hong Kong & China Gas | | 231,000 | | | 493,064 |
Hong Kong & China Gas Co., Ltd. | | 3,453,000 | | | 7,370,355 |
Hong Kong Electric Holdings, Ltd. | | 636,000 | | | 3,149,794 |
Hutchison Whampoa, Ltd.D | | 556,000 | | | 5,295,648 |
Jardine Matheson Holdings, Ltd. | | 124,000 | | | 2,132,800 |
Johnson Electric Holdings, Ltd.D | | 446,500 | | | 423,255 |
Li & Fung, Ltd. | | 516,000 | | | 994,912 |
Solomon Systech International, Ltd.D | | 1,464,400 | | | 609,092 |
Sun Hung Kai Properties, Ltd.D | | 258,000 | | | 2,512,236 |
Swire Pacific, Ltd. Class AD | | 363,500 | | | 3,262,928 |
Techtronic Industries Co.D | | 659,000 | | | 1,568,107 |
Wharf Holdings, Ltd.D | | 682,000 | | | 2,410,065 |
| | | | | |
| | | | | 59,093,802 |
| | | | | |
See Notes to Financial Statements.
113
International Equity Fund
SCHEDULE OF INVESTMENTS (Continued)
| | | | | |
| | | Shares | | Value |
Hungary — 0.1% | | | | | |
Mol Magyar Olaj-es Gazipari Rt. | | 2,424 | | $ | 226,767 |
Mol Magyar Olaj-es Gazipari Rt. GDR | | 11,481 | | | 1,064,289 |
OTP Bank Rt. | | 17,587 | | | 574,570 |
| | | | | |
| | | | | 1,865,626 |
| | | | | |
India — 1.2% | | | | | |
Andhra Bank, Ltd. | | 883,684 | | | 1,812,736 |
Asian Paints, Ltd. | | 65,600 | | | 841,814 |
Bharat Heavy Electricals, Ltd. | | 9,611 | | | 296,276 |
Bharti Televentures, Ltd. | | 108,775 | | | 835,727 |
Container Corporation of India, Ltd. | | 40,000 | | | 1,288,499 |
GAIL India, Ltd. GDR | | 32,800 | | | 1,169,320 |
Gujarat Ambuja Cements, Ltd. | | 999,000 | | | 1,767,316 |
Hero Honda Motors, Ltd. | | 30,200 | | | 577,018 |
Hindustan Petroleum Corporation, Ltd. | | 21,728 | | | 158,753 |
ICICI Bank, Ltd. ADRD | | 30,900 | | | 889,920 |
Industrial Development Bank of India, Ltd. | | 152,768 | | | 329,846 |
Infosys Technologies, Ltd. ADR | | 17,622 | | | 1,173,658 |
Infosys Technologies, Ltd. ADRD | | 13,234 | | | 1,070,101 |
Jet Airways India, Ltd. | | 17,668 | | | 449,485 |
Ranbaxy Laboratories, Ltd. GDRD | | 167,000 | | | 1,334,330 |
Reliance Industries, Ltd. | | 17,570 | | | 347,397 |
Sesa GOA, Ltd. | | 11,720 | | | 263,677 |
Steel Authority of India | | 125,789 | | | 150,964 |
Sun Pharmaceuticals Industries, Ltd. | | 56,000 | | | 848,992 |
Tata Motors, Ltd. | | 30,858 | | | 447,834 |
Tata Steel, Ltd. | | 45,028 | | | 380,579 |
| | | | | |
| | | | | 16,434,242 |
| | | | | |
Indonesia — 0.7% | | | | | |
Bank Rakyat Indonesia | | 7,582,500 | | | 2,321,980 |
PT Bank Mandiri Persero TBK | | 7,258,723 | | | 1,205,559 |
PT Bumi Resources TBK | | 3,211,500 | | | 247,658 |
PT Panin Life TBK | | 28,581,000 | | | 392,516 |
PT Ramayana Lestari Sentosa TBK | | 6,813,500 | | | 559,442 |
PT Telekomunikasi Indonesia TBK | | 6,652,700 | | | 3,968,589 |
PT Unilever Indonesia TBK | | 743,300 | | | 323,256 |
| | | | | |
| | | | | 9,019,000 |
| | | | | |
Ireland — 0.5% | | | | | |
Allied Irish Banks PLC | | 120,500 | | | 2,590,692 |
CRH PLC | | 128,462 | | | 3,778,286 |
Irish Life & Permanent PLC | | 35,300 | | | 721,321 |
| | | | | |
| | | | | 7,090,299 |
| | | | | |
Israel — 0.3% | | | | | |
Bank Hapoalim, Ltd. | | 119,700 | | | 555,620 |
Bank Leumi Le-Israel BM | | 49,800 | | | 190,832 |
Check Point Software Technologies, Ltd.D | | 66,300 | | | 1,332,630 |
Lipman Electronic Engineering, Ltd.D* | | 7,800 | | | 181,506 |
Teva Pharmaceutical Industries, Ltd. ADRD | | 27,600 | | | 1,187,076 |
| | | | | |
| | | | | 3,447,664 |
| | | | | |
Italy — 2.0% | | | | | |
Banca Intesa SpA | | 2,220,406 | | $ | 11,763,549 |
Ente Nazionale Idrocarburi SpA | | 179,949 | | | 4,991,541 |
Mediaset SpA | | 399,019 | | | 4,227,947 |
UniCredito Italiano SpA | | 746,810 | | | 5,128,036 |
| | | | | |
| | | | | 26,111,073 |
| | | | | |
Japan — 26.2% | | | | | |
Acom Co., Ltd. | | 39,000 | | | 2,506,635 |
Advantest CorporationD | | 47,300 | | | 4,768,703 |
Aeon Co., Ltd. | | 100,800 | | | 2,564,124 |
Aiful Corporation | | 6,900 | | | 576,292 |
Ajinomoto Co., Inc. | | 182,000 | | | 1,862,670 |
Asahi Glass Co., Ltd. | | 216,000 | | | 2,789,401 |
Astellas Pharma, Inc. | | 158,400 | | | 6,178,319 |
Bridgestone Corporation | | 152,000 | | | 3,164,116 |
Canon, Inc. | | 214,800 | | | 12,567,262 |
Chubu Electric Power Co., Inc.D | | 20,100 | | | 478,916 |
Credit Saison Co., Ltd. | | 40,500 | | | 2,022,682 |
Daiichi Sankyo Co., Ltd. | | 62,800 | | | 1,211,430 |
Daikin Industries, Ltd. | | 176,000 | | | 5,148,599 |
Daiwa House Industry Co., Ltd. | | 47,000 | | | 734,879 |
Denso Corporation | | 325,500 | | | 11,233,179 |
East Japan Railway Co. | | 399 | | | 2,743,791 |
Eisai Co., Ltd. | | 140,100 | | | 5,880,315 |
FamilyMart Co., Ltd. | | 68,000 | | | 2,300,589 |
Fanuc, Ltd. | | 136,100 | | | 11,551,796 |
Fast Retailing Co., Ltd. | | 28,900 | | | 2,825,429 |
Hankyu Holdings, Inc. | | 54,000 | | | 351,193 |
Hirose Electric Co., Ltd. | | 41,000 | | | 5,468,521 |
Hitachi, Ltd. | | 425,000 | | | 2,864,926 |
Honda Motor Co., Ltd. | | 97,600 | | | 5,569,576 |
Hoya Corporation | | 22,000 | | | 790,944 |
JS Group Corporation | | 127,000 | | | 2,541,400 |
JSR CorporationD | | 85,000 | | | 2,234,282 |
Kansai Electric Power Co., Inc. (The) | | 59,800 | | | 1,285,395 |
Kao Corporation | | 215,000 | | | 5,760,800 |
KDDI Corporation | | 848 | | | 4,889,473 |
Keyence Corporation | | 29,200 | | | 8,306,779 |
Kuraray Co., Ltd. | | 263,000 | | | 2,725,111 |
Matsushita Electric Industrial Co., Ltd. | | 198,686 | | | 3,832,710 |
Millea Holdings, Inc. | | 772 | | | 13,288,337 |
Mitsubishi CorporationD | | 78,300 | | | 1,732,844 |
Mitsubishi Electric Corporaiton | | 234,700 | | | 1,661,716 |
Mitsubishi Estate Co., Ltd.D | | 942,100 | | | 19,571,332 |
Mitsubishi Heavy Industries, Ltd. | | 646,000 | | | 2,848,349 |
Mitsubishi Tokyo Financial Group, Inc. | | 1,362 | | | 18,477,975 |
Mitsui & Co., Ltd.D | | 56,000 | | | 719,379 |
Mitsui Fudosan Co., Ltd. | | 31,000 | | | 629,542 |
Mitsui Sumitomo Insurance Co., Ltd. | | 42,000 | | | 513,893 |
Mizuho Financial Group, Inc. | | 204 | | | 1,619,061 |
Murata Manufacturing Co., Ltd. | | 7,200 | | | 461,542 |
NGK Spark Plug Co., Ltd.D | | 38,000 | | | 821,639 |
Nidec Corporation | | 8,600 | | | 731,403 |
Nikko Cordial Corporation | | 235,000 | | | 3,722,220 |
Nintendo Co., Ltd. | | 20,000 | | | 2,416,585 |
Nippon Electric Glass Co., Ltd. | | 65,000 | | | 1,419,214 |
Nippon Steel Corporation | | 154,000 | | | 548,438 |
Nippon Telegraph & Telephone Corporation | | 807 | | | 3,667,715 |
See Notes to Financial Statements.
114
| | | | | |
| | | Shares | | Value |
Nissan Motor Co., Ltd. | | 158,900 | | $ | 1,610,086 |
Nitto Denko CorporationD | | 49,900 | | | 3,888,422 |
NTT Data CorporationD | | 765 | | | 3,807,648 |
NTT DoCoMo, Inc. | | 2,440 | | | 3,724,085 |
Obayashi Corporation | | 63,000 | | | 464,213 |
Omron Corporation | | 20,000 | | | 461,271 |
ORIX Corporation | | 35,200 | | | 8,969,008 |
Osaka Gas Co., Ltd. | | 461,000 | | | 1,590,936 |
Pioneer CorporationD | | 110,300 | | | 1,530,087 |
Ricoh Co., Ltd. | | 48,000 | | | 840,463 |
Rohm Co., Ltd. | | 61,200 | | | 6,657,871 |
Secom Co., Ltd. | | 116,000 | | | 6,068,767 |
Sekisui Chemical Co., Ltd. | | 156,000 | | | 1,055,565 |
Sekisui House, Ltd. | | 24,000 | | | 301,997 |
Sharp Corporation | | 119,000 | | | 1,810,201 |
Shimamura Co., Ltd.D | | 16,400 | | | 2,269,454 |
Shin-Etsu Chemical Co., Ltd. | | 139,000 | | | 7,389,918 |
SMC Corporation | | 16,400 | | | 2,343,155 |
Softbank CorporationD | | 193,200 | | | 8,158,189 |
Sompo Japan Insurance, Inc. | | 82,900 | | | 1,121,173 |
Sony Corporation | | 120,000 | | | 4,904,397 |
Sumco Corporation | | 4,800 | | | 251,935 |
Sumitomo Chemical Co., Ltd. | | 312,000 | | | 2,142,875 |
Sumitomo Corporation | | 183,000 | | | 2,366,346 |
Sumitomo Mitsui Financial Group, Inc. | | 659 | | | 6,984,780 |
Sumitomo Realty & Development Co., Ltd. | | 32,000 | | | 695,977 |
Sumitomo Trust & Banking Co., Ltd. | | 310,000 | | | 3,167,423 |
Suzuki Motor Corporation | | 121,300 | | | 2,247,344 |
T&D Holdings, Inc. | | 59,150 | | | 3,922,101 |
Takeda Pharmaceutical Co., Ltd. | | 291,100 | | | 15,747,810 |
Takefuji Corporation | | 28,800 | | | 1,956,061 |
TDK Corporation | | 27,100 | | | 1,868,173 |
TIS, Inc.D | | 22,900 | | | 706,796 |
Tokyo Electric Power Company, Inc. | | 22,100 | | | 536,876 |
Tokyo Electron, Ltd. | | 38,400 | | | 2,412,719 |
Tokyo Gas Co., Ltd.D | | 617,000 | | | 2,741,408 |
Tokyu CorporationD | | 529,000 | | | 3,740,925 |
Toyota Motor Corporation | | 218,900 | | | 11,359,376 |
Trend Micro, Inc. | | 26,500 | | | 1,002,162 |
Uni-Charm CorporationD | | 9,000 | | | 404,460 |
Ushio, Inc.D | | 26,000 | | | 607,368 |
West Japan Railway Co. | | 483 | | | 2,014,974 |
Yahoo! Japan Corporation | | 1,201 | | | 1,822,860 |
Yamada Denki Co., Ltd. | | 15,700 | | | 1,964,913 |
Yamato Transport Co., Ltd. | | 98,500 | | | 1,633,663 |
| | | | | |
| | | | | 345,847,652 |
| | | | | |
Luxembourg — 0.1% | | | | | |
SES Global | | 48,900 | | | 839,440 |
| | | | | |
Malaysia — 0.3% | | | | | |
AirAsia BHD | | 1,208,000 | | | 508,194 |
Astro All Asia Networks PLC | | 100,400 | | | 139,463 |
Commerce Asset Holdings BHD | | 347,900 | | | 524,681 |
IOI Corporation BHD | | 274,500 | | | 900,595 |
MK Land Holdings BHD | | 841,300 | | | 113,524 |
O.Y.L. Industries BHD | | 840,300 | | | 755,925 |
Telekom Malaysia BHD | | 160,300 | | | 405,044 |
Tenaga Nasional BHD | | 157,500 | | | 412,555 |
Titan Chemicals Corporation BHD | | 455,800 | | | 172,455 |
| | | | | |
| | | | | 3,932,436 |
| | | | | |
Mexico — 0.9% | | | | | |
America Movil SA de CV ADR Series L | | 130,883 | | | 3,829,637 |
Cemex SA de CV | | 259,234 | | | 1,537,728 |
Coca-Cola Femsa SA de CV ADRD | | 7,500 | | | 202,575 |
Corporacion GEO SA de CV Class B | | 28,000 | | | 98,754 |
Grupo Mexico SA de CV Series B | | 54,000 | | | 125,953 |
Grupo Televisa SA ADR | | 27,542 | | | 2,217,131 |
Kimberly-Clark de Mexico SAde CV Class A | | 55,000 | | | 196,567 |
Telefonos de Mexico SA de CV ADR Class LD | | 56,500 | | | 1,394,420 |
Urbi Desarrollos Urbanos SA | | 45,700 | | | 315,913 |
Wal-Mart de Mexico SA de CV Series V | | 336,498 | | | 1,867,236 |
| | | | | |
| | | | | 11,785,914 |
| | | | | |
Netherlands — 4.2% | | | | | |
ABN AMRO Holding NV | | 86,698 | | | 2,267,346 |
Aegon NV | | 110,570 | | | 1,799,919 |
Akzo Nobel NV | | 41,000 | | | 1,900,328 |
ING Groep NV | | 345,214 | | | 11,974,819 |
Koninklijke Numico NV | | 63,715 | | | 2,638,605 |
Reed Elsevier NV | | 544,638 | | | 7,608,567 |
Royal Dutch Shell PLC Class A | | 562,934 | | | 17,181,193 |
Royal KPN NV | | 433,600 | | | 4,347,961 |
TNT NV | | 93,600 | | | 2,925,450 |
Unilever NV | | 33,000 | | | 2,260,113 |
| | | | | |
| | | | | 54,904,301 |
| | | | | |
New Zealand — 0.3% | | | | | |
Telecom Corporation of New Zealand, Ltd. | | 955,696 | | | 3,922,108 |
| | | | | |
Norway — 0.5% | | | | | |
DNB NOR ASA | | 66,000 | | | 704,073 |
Norsk Hydro ASA | | 28,000 | | | 2,874,965 |
Norske Skogindustrier ASAD | | 27,284 | | | 433,557 |
Tandberg ASAD | | 92,300 | | | 564,798 |
Telenor ASA | | 228,325 | | | 2,241,200 |
Yara International ASA | | 28,000 | | | 407,598 |
| | | | | |
| | | | | 7,226,191 |
| | | | | |
Panama — 0.0% | | | | | |
Copa Holdings SA Class A | | 2,100 | | | 57,330 |
| | | | | |
Peru — 0.0% | | | | | |
Credicorp, Ltd.D | | 18,700 | | | 426,173 |
| | | | | |
Philippines — 0.1% | | | | | |
Globe Telecom, Inc. | | 24,800 | | | 342,949 |
SM Prime Holdings, Inc. | | 9,390,000 | | | 1,394,168 |
| | | | | |
| | | | | 1,737,117 |
| | | | | |
Poland — 0.1% | | | | | |
Powszechna Kasa Oszczednosci Bank Polski SA | | 120,441 | | | 1,075,250 |
| | | | | |
Portugal — 0.5% | | | | | |
Banco Comercial Portugues SA Series RD | | 1,072,558 | | | 2,958,623 |
See Notes to Financial Statements.
115
International Equity Fund
SCHEDULE OF INVESTMENTS (Continued)
| | | | | |
| | | Shares | | Value |
Portugal Telecom SGPS SAD | | 333,861 | | $ | 3,379,440 |
| | | | | |
| | | | | 6,338,063 |
| | | | | |
Romania — 0.0% | | | | | |
SNP Petrom SA* | | 1,991,000 | | | 303,735 |
| | | | | |
Russia — 0.5% | | | | | |
LUKOIL ADR | | 55,791 | | | 3,319,565 |
Mechel OAO ADRD | | 8,500 | | | 205,445 |
Mining and Metallurgical Co. Norilsk Nickel ADR | | 4,003 | | | 376,682 |
Mobile Telesystems ADR | | 42,300 | | | 1,480,500 |
Uralsvyazinform ADR | | 21,300 | | | 154,638 |
Vimpel-Communications ADRD | | 10,800 | | | 477,684 |
Wimm-Bill-Dann Foods OJSC ADRD | | 49,800 | | | 1,196,694 |
| | | | | |
| | | | | 7,211,208 |
| | | | | |
Singapore — 0.6% | | | | | |
DBS Group Holdings, Ltd. | | 54,000 | | | 535,891 |
Neptune Orient Lines, Ltd. | | 273,000 | | | 551,698 |
Oversea-Chinese Banking Corporation | | 628,800 | | | 2,533,883 |
Singapore Telecommunications, Ltd.D | | 2,819,571 | | | 4,426,115 |
United Overseas Bank, Ltd. | | 47,000 | | | 412,715 |
| | | | | |
| | | | | 8,460,302 |
| | | | | |
South Africa — 1.6% | | | | | |
ABSA Group, Ltd. | | 41,600 | | | 664,022 |
African Bank Investments, Ltd. | | 321,300 | | | 1,244,069 |
Alexander Forbes, Ltd. | | 400,000 | | | 916,634 |
Anglo American PLCD | | 111,440 | | | 3,763,687 |
Aspen Pharmacare Holdings, Ltd. | | 32,847 | | | 173,384 |
Edgars Consolidated Stores, Ltd. | | 46,450 | | | 258,108 |
FirstRand, Ltd. | | 237,438 | | | 692,332 |
Impala Platinum Holdings, Ltd. | | 2,649 | | | 390,181 |
Imperial Holdings, Ltd. | | 3,943 | | | 87,615 |
JD Group, Ltd. | | 16,985 | | | 205,753 |
Liberty Group, Ltd.D | | 6,758 | | | 80,637 |
Massmart Holdings, Ltd. | | 53,419 | | | 436,048 |
Mittal Steel South Africa, Ltd. | | 48,802 | | | 472,402 |
MTN Group, Ltd. | | 363,344 | | | 3,568,839 |
Naspers, Ltd.D | | 39,718 | | | 703,092 |
Pick’n Pay Stores, Ltd. | | 49,700 | | | 225,427 |
Sanlam, Ltd. | | 247,743 | | | 594,740 |
Sasol, Ltd. | | 79,971 | | | 2,862,652 |
Standard Bank Group, Ltd. | | 303,612 | | | 3,637,586 |
Telkom SA, Ltd. | | 22,016 | | | 468,851 |
| | | | | |
| | | | | 21,446,059 |
| | | | | |
South Korea — 3.7% | | | | | |
Amorepacific Corporation | | 980 | | | 305,588 |
Daelim Industrial Co., Ltd. | | 4,690 | | | 331,636 |
Hankook Tire Co., Ltd. | | 85,295 | | | 1,190,516 |
Honam Petrochemical Corporation | | 17,000 | | | 833,140 |
Hyundai Mobis | | 21,980 | | | 1,992,613 |
Hyundai Motor Co. | | 14,530 | | | 1,382,269 |
Kookmin Bank ADR | | 91,241 | | | 6,876,533 |
Kookmin Bank ADRD | | 60,321 | | | 4,506,582 |
Korea Electric Power Corporation | | 62,010 | | | 2,317,670 |
Korea Electric Power Corporation ADRD | | 1,900 | | | 37,031 |
KT Corporation ADR | | 30,870 | | | 1,244,481 |
KT Freetel | | 9,810 | | | 237,372 |
Kumho Tire Co., Inc. | | 18,640 | | | 288,608 |
LG Philips LCD Co., Ltd. | | 27,840 | | | 1,165,589 |
LG.Philips LCD Co., Ltd. ADRD | | 6,300 | | | 135,198 |
NCSoft Corporation* | | 12,140 | | | 913,193 |
Samsung Electronics Co., Ltd. | | 14,023 | | | 8,413,444 |
Samsung Electronics Co., Ltd. (Non-Voting Shares) GDR 144AD | | 10,309 | | | 2,503,694 |
Samsung Electronics Co., Ltd. GDR | | 1,200 | | | 395,400 |
Samsung Electronics Co., Ltd. GDR 144A | | 9,859 | | | 3,213,672 |
Samsung Fire & Marine Insurance Co., Ltd. | | 14,100 | | | 1,771,979 |
Samsung Securities Co., Ltd. | | 46,450 | | | 2,799,526 |
Shinsegae Co., Ltd. | | 7,310 | | | 3,185,789 |
SK Telecom Co., Ltd. | | 6,400 | | | 1,145,198 |
S-Oil Corporation | | 5,220 | | | 364,342 |
STX Pan Ocean Co., Ltd. | | 768,000 | | | 408,793 |
Tae Young Corporation | | 10,000 | | | 702,379 |
| | | | | |
| | | | | 48,662,235 |
| | | | | |
Spain — 3.4% | | | | | |
Acerinox SA | | 61,756 | | | 898,553 |
Banco Bilbao Vizcaya Argentaria SA | | 130,600 | | | 2,331,618 |
Banco Santander Central Hispano SA | | 721,784 | | | 9,527,853 |
Endesa SA | | 60,800 | | | 1,599,413 |
Iberdrola SAD | | 234,085 | | | 6,398,975 |
Inditex SAD | | 154,690 | | | 5,045,414 |
Repsol YPF SA | | 229,937 | | | 6,715,695 |
Telefonica SA | | 869,996 | | | 13,091,088 |
| | | | | |
| | | | | 45,608,609 |
| | | | | |
Sweden — 1.0% | | | | | |
Assa Abloy AB Class B | | 68,000 | | | 1,069,923 |
Atlas Copco AB Class A | | 40,200 | | | 895,638 |
Hennes & Mauritz AB Class B | | 93,400 | | | 3,174,272 |
Nordea Bank AB | | 250,000 | | | 2,628,134 |
Telefonaktiebolaget LM Ericsson ADRD | | 14,600 | | | 502,240 |
Telefonaktiebolaget LM Ericsson Class BD | | 1,251,500 | | | 4,300,579 |
| | | | | |
| | | | | 12,570,786 |
| | | | | |
Switzerland — 3.9% | | | | | |
Adecco SA | | 8,276 | | | 381,664 |
Ciba Specialty Chemicals, Inc.D | | 26,600 | | | 1,720,635 |
Compagnie Financiere Richemont AG Class A | | 74,974 | | | 3,263,584 |
Credit Suisse Group | | 33,185 | | | 1,692,017 |
Geberit AG | | 680 | | | 538,184 |
Givaudan SA | | 750 | | | 508,257 |
Holcim, Ltd. | | 47,817 | | | 3,256,818 |
Nestle SA | | 38,660 | | | 11,562,254 |
Nobel Biocare Holding AG | | 9,269 | | | 2,038,538 |
Novartis AG | | 194,269 | | | 10,208,344 |
Roche Holding AG | | 56,337 | | | 8,458,803 |
Swiss Reinsurance | | 37,922 | | | 2,776,223 |
Swisscom AG | | 3,101 | | | 978,760 |
UBS AG | | 12,165 | | | 1,158,131 |
See Notes to Financial Statements.
116
| | | | | |
| | | Shares | | Value |
Zurich Financial Services AG | | 11,900 | | $ | 2,535,672 |
| | | | | |
| | | | | 51,077,884 |
| | | | | |
Taiwan — 1.6% | | | | | |
Advantech Co., Ltd. | | 151,544 | | | 429,336 |
AU Optronics Corporation | | 1,506,380 | | | 2,248,568 |
Basso Industry Corporation | | 216,060 | | | 489,692 |
Cathay Financial Holding Co., Ltd. | | 813,510 | | | 1,474,536 |
Chi Mei Optoelectronics Corporation | | 396,409 | | | 586,888 |
Chinatrust Financial Holding Co., Ltd. | | 838,173 | | | 663,869 |
Chunghwa Telecom Co., Ltd. | | 347,000 | | | 600,417 |
Faraday Technology Corporation | | 292,934 | | | 517,575 |
Foxconn Technology Co., Ltd. | | 83,700 | | | 416,887 |
High Tech Computer Corporation | | 90,000 | | | 1,688,879 |
HON HAI Precision Industry Co., Ltd. | | 117,961 | | | 646,824 |
Lite-On Technology Corporation | | 120,000 | | | 163,587 |
MediaTek, Inc. | | 110,171 | | | 1,298,834 |
Phoenixtec Power Co., Ltd. | | 419,605 | | | 457,614 |
Quanta Computer, Inc. | | 147,715 | | | 207,444 |
Taiwan Semiconductor Manufacturing Co., Ltd. ADR | | 4,183,035 | | | 7,964,288 |
Taiwan Semiconductor Manufacturing Co., Ltd. ADR | | 35,700 | | | 353,787 |
Vanguard International Semiconductor Corporation | | 1,090,395 | | | 830,423 |
| | | | | |
| | | | | 21,039,448 |
| | | | | |
Thailand — 0.5% | | | | | |
Airports of Thailand Public Co., Ltd. | | 681,100 | | | 871,609 |
Kasikornbank Public Co., Ltd. | | 730,300 | | | 1,335,101 |
PTT Exploration and Production Public Co., Ltd. | | 157,800 | | | 1,815,517 |
PTT Public Co., Ltd.D | | 350,500 | | | 1,930,847 |
Siam City Cement Public Co., Ltd. | | 26,500 | | | 217,038 |
Siam Commercial Bank Public Co., Ltd. | | 104,700 | | | 133,985 |
Thai Oil Public Co., Ltd. | | 137,500 | | | 212,828 |
| | | | | |
| | | | | 6,516,925 |
| | | | | |
Turkey — 0.3% | | | | | |
Arcelik AS | | 35,990 | | | 250,504 |
Migros Turk TAS | | 113,425 | | | 1,100,235 |
Turkcell Iletisim Hizmet AS ADRD | | 12,000 | | | 184,320 |
Türkiye Garanti Bankasi AS* | | 185,912 | | | 674,543 |
Türkiye Is Bankasi | | 97,783 | | | 847,137 |
Yapi ve Kredi Bankasi* | | 89,000 | | | 415,180 |
| | | | | |
| | | | | 3,471,919 |
| | | | | |
United Kingdom — 12.6% | | | | | |
ARM Holdings PLC | | 110,000 | | | 228,997 |
AstraZeneca PLC | | 98,051 | | | 4,793,159 |
Aviva PLC | | 376,563 | | | 4,567,501 |
BG Group PLC | | 1,700,208 | | | 16,805,212 |
BHP Billiton PLC | | 66,164 | | | 1,082,908 |
BOC Group PLC | | 231,887 | | | 4,779,529 |
Boots Group PLCD | | 396,683 | | | 4,129,057 |
BP PLC | | 850,704 | | | 9,059,850 |
Brambles Industries PLC | | 594,564 | | | 4,265,663 |
Cadbury Schweppes PLC | | 50,083 | | | 473,489 |
Capita Group PLC | | 185,880 | | | 1,332,785 |
Carnival PLC | | 66,851 | | | 3,795,542 |
Cattles PLC | | 237,000 | | | 1,342,536 |
Centrica PLC | | 409,500 | | | 1,794,816 |
Compass Group PLC | | 352,168 | | | 1,336,012 |
GKN PLC | | 479,201 | | | 2,374,445 |
GlaxoSmithKline PLC | | 365,437 | | | 9,236,049 |
HBOS PLC | | 608,474 | | | 10,395,447 |
HSBC Holdings PLC | | 65,300 | | | 1,048,206 |
Johnston Press PLC | | 42,300 | | | 338,775 |
Kesa Electricals PLC | | 185,000 | | | 827,555 |
Kingfisher PLC | | 1,457,293 | | | 5,948,466 |
Lloyds TSB Group PLC | | 685,281 | | | 5,759,505 |
Misys PLC | | 564,300 | | | 2,317,957 |
Northern Rock PLC | | 31,400 | | | 509,440 |
Pearson PLC | | 57,000 | | | 674,217 |
Prudential PLC | | 295,000 | | | 2,791,493 |
Reckitt Benckiser PLC | | 150,720 | | | 4,978,792 |
Reed Elsevier PLC | | 218,400 | | | 2,051,621 |
Rio Tinto PLC | | 260,235 | | | 11,887,270 |
Rolls-Royce Group PLC | | 82,300 | | | 605,324 |
Rolls-Royce Group PLC Class B | | 2,748,820 | | | 4,848 |
Royal Bank of Scotland Group PLC | | 290,000 | | | 8,756,429 |
Royal Dutch Shell PLC Class A ADR | | 8,000 | | | 491,920 |
Royal Dutch Shell PLC Class B | | 196,334 | | | 6,276,147 |
Scottish & Southern Energy PLC | | 51,000 | | | 889,734 |
Smith & Nephew PLC | | 319,360 | | | 2,942,334 |
Standard Chartered PLC | | 84,200 | | | 1,876,004 |
Tesco PLC | | 81,300 | | | 463,688 |
Travis Perkins PLC | | 32,000 | | | 770,779 |
Unilever PLC | | 761,162 | | | 7,549,676 |
Vodafone Group PLC | | 4,750,450 | | | 10,257,237 |
Wm Morrison Supermarkets PLC | | 980,000 | | | 3,262,563 |
Wolseley PLC | | 30,000 | | | 632,280 |
Xstrata PLC | | 22,300 | | | 521,790 |
Yell Group PLC | | 51,600 | | | 476,290 |
| | | | | |
| | | | | 166,703,337 |
| | | | | |
TOTAL FOREIGN COMMON STOCKS
(Cost $901,846,755) | | | | | 1,273,390,814 |
| | | | | |
FOREIGN PREFERRED STOCKS — 0.4% | | | | | |
Belgium — 0.0% | | | | | |
Suez SA STRIP | | 27,836 | | | 330 |
| | | | | |
Brazil — 0.2% | | | | | |
Caemi Mineracao e Metalurgica SA | | 163,700 | | | 238,728 |
Centrais Eletricas Brasileiras SA Class B | | 49,600,300 | | | 840,000 |
Companhia de Tecidos do Nortede Minas - Coteminas | | 2,595,260 | | | 237,517 |
Investimentos Itau SA | | 431,966 | | | 1,367,039 |
Universo Online SA | | 7,800 | | | 65,714 |
| | | | | |
| | | | | 2,748,998 |
| | | | | |
See Notes to Financial Statements.
117
International Equity Fund
SCHEDULE OF INVESTMENTS (Continued)
| | | | | | |
| | | Shares | | Value | |
Germany — 0.2% | | | | | | |
Henkel KGaA | | 23,800 | | $ | 2,395,018 | |
| | | | | | |
TOTAL FOREIGN PREFERRED STOCKS
(Cost $3,956,553) | | | | | 5,144,346 | |
| | | | | | |
RIGHTS — 0.0% | | | | | | |
Romania — 0.0% | | | | | | |
SNP Petrom SA, Expires 02/09/06
(Cost $ ) | | 1,991,000 | | | — | |
| | | | | | |
MONEY MARKET FUNDS — 16.1% | | | | | | |
GuideStone Funds Money Market Fund (GS4 Class)¥ | | 41,653,430 | | | 41,653,430 | |
Northern Institutional Liquid Assets Portfolio§ | | 170,860,247 | | | 170,860,247 | |
| | | | | | |
TOTAL MONEY MARKET FUNDS
(Cost $212,513,678) | | | | | 212,513,677 | |
| | | | | | |
| | |
| | | Number of
Contracts | | | |
PURCHASED OPTIONS — 0.0% | | | | | | |
Put Options — 0.0% | | | | | | |
1-Year Euro, Strike Price $1.19, Expires 07/05/06
(Cost $933,648) | | 29,360,000 | | | 742,808 | |
| | | | | | |
Total Investments — 112.8%
(Cost $1,119,250,634) | | | | | 1,491,791,645 | |
Liabilities in Excess of Other Assets — (12.8)% | | | | | (169,372,762 | ) |
| | | | | | |
Net Assets — 100.0% | | | | $ | 1,322,418,883 | |
| | | | | | |
PORTFOLIO SUMMARY+
| | | |
| | | % | |
Japan | | 26.2 | |
Money Market Funds | | 16.1 | |
United Kingdom | | 12.6 | |
France | | 7.0 | |
Germany | | 5.8 | |
Hong Kong | | 4.5 | |
Netherlands | | 4.2 | |
Switzerland | | 3.9 | |
South Korea | | 3.7 | |
Australia | | 3.5 | |
Spain | | 3.4 | |
Canada | | 2.4 | |
Italy | | 2.0 | |
South Africa | | 1.6 | |
Taiwan | | 1.6 | |
Belgium | | 1.3 | |
Brazil | | 1.2 | |
India | | 1.2 | |
Denmark | | 1.0 | |
Sweden | | 1.0 | |
Mexico | | 0.9 | |
Indonesia | | 0.7 | |
Singapore | | 0.6 | |
Egypt | | 0.5 | |
Finland | | 0.5 | |
Ireland | | 0.5 | |
Norway | | 0.5 | |
Portugal | | 0.5 | |
Russia | | 0.5 | |
Thailand | | 0.5 | |
China | | 0.4 | |
Greece | | 0.3 | |
Israel | | 0.3 | |
Malaysia | | 0.3 | |
New Zealand | | 0.3 | |
Turkey | | 0.3 | |
Chile | | 0.2 | |
Austria | | 0.1 | |
Colombia | | 0.1 | |
Ecuador | | 0.1 | |
Ghana | | 0.1 | |
Hungary | | 0.1 | |
Luxembourg | | 0.1 | |
Philippines | | 0.1 | |
Poland | | 0.1 | |
Cayman Islands | | — | * |
Estonia | | — | * |
Options | | — | * |
Panama | | — | * |
Peru | | — | * |
Romania | | — | * |
Rights | | — | |
Forward Foreign Currency Contracts | | (1.1 | ) |
| | | |
| | 111.7 | |
| | | |
| * | Rounds to less than 0.005%. |
See Notes to Financial Statements.
118
SCHEDULE OF INVESTMENTS – ABBREVIATIONS AND FOOTNOTES
| | | | |
INVESTMENT ABBREVIATIONS: |
| | |
ADR | | — | | American Depository Receipt |
CONV | | — | | Convertible |
GDR | | — | | Global Depository Receipt |
IO | | — | | Interest Only (Principal amount shown is notional) |
PIK | | — | | Payment-in-Kind Bonds |
PO | | — | | Principal Only |
REIT | | — | | Real Estate Investment Trust |
STEP | | — | | Stepped Coupon Bonds (1) |
STRIP | | — | | Stripped Security |
TBA | | — | | To be announced. |
144A | | — | | Security was purchased pursuant to Rule 144A under the Securities Act of 1933 and may not be resold subject to that rule except to qualified institutional buyers. |
|
INVESTMENT FOOTNOTES: |
| | |
‡‡ | | — | | All or a portion of the security was held as collateral for open futures, options and/or swap contracts. |
@ | | — | | Illiquid. |
* | | — | | Non-income producing security. |
# | | — | | Security in default. |
+ | | — | | Security is valued at fair value. |
§ | | — | | Security purchased with the cash proceeds from securities loaned. |
† | | — | | Variable rate security (1). |
W | | — | | Interest rates shown reflect the effective yields as of December 31, 2005. |
¥ | | — | | Affiliated fund. |
D | | — | | Security either partially or fully on loan. |
|
FOREIGN BOND FOOTNOTES: |
| | |
(A) | | — | | Par is denominated in Australian Dollars. |
(B) | | — | | Par is denominated in Brazilian Reals. |
(C) | | — | | Par is denominated in Canadian Dollars. |
(E) | | — | | Par is denominated in Euros. |
(G) | | — | | Par is denominated in Singapore Dollars. |
(H) | | — | | Par is denominated in Hungarian Fornits. |
(J) | | — | | Par is denominated in Japanese Yen. |
(K) | | — | | Par is denominated in Swedish Kronas. |
(M) | | — | | Par is denominated in Mexican Pesos. |
(R) | | — | | Par is denominated in Argentinian Pesos. |
(T) | | — | | Par is denominated in Thailand Bahts. |
(U) | | — | | Par is denominated in British Pounds. |
(W) | | — | | Par is denominated in South Korean Won. |
| (Z) | | — | | Par is denominated in New Zealand Dollars. |
|
SWAP AGREEMENT FOOTNOTES: |
| | |
(a) | | — | | Counterparty to contract is Goldman Sachs Capital Markets, LP. |
(b) | | — | | Counterparty to contract is UBS AG. |
(c) | | — | | Counterparty to contract is Morgan Stanley Capital Services. |
(d) | | — | | Counterparty to contract is Barclays Capital. |
(e) | | — | | Counterparty to contract is Lehman Brothers Special Financing, Inc. |
(f) | | — | | Counterparty to contract is Citibank NA London. |
(g) | | — | | Counterparty to contract is JPMorgan Chase Bank. |
(h) | | — | | Counterparty to contract is Merrill Lynch Capital Services, Inc. |
(i) | | — | | Counterparty to contract is Credit HSBC Bank USA, N.A. |
(j) | | — | | Counterparty to contract is BNP Paribas. |
| (1) | Interest rates shown reflect the rates currently in effect. Maturity date for money market instruments is the date of the next interest rate reset. |
119
STATEMENTS OF ASSETS AND LIABILITIES
December 31, 2005
| | | | | | | | | | | | |
| | | Money Market Fund | | | Low-Duration Bond Fund | | | Medium-Duration Bond Fund | |
Assets | | | | | | | | | | | | |
Investments in securities of unaffiliated issuers, at value | | $ | 870,013,073 | | | $ | 933,264,054 | | | $ | 1,512,196,776 | |
Investments in securities of affiliated issuers, at value | | | — | | | | 38,676,484 | | | | 85,737,738 | |
| | | | | | | | | | | | |
Total investments (1)(2) | | | 870,013,073 | | | | 971,940,538 | | | | 1,597,934,514 | |
Cash | | | 207 | | | | 41,518,153 | | | | 27,392,659 | |
Cash collateral for futures | | | — | | | | — | | | | 205,600 | |
Foreign currency (3) | | | — | | | | 2,665,767 | | | | 15,150,739 | |
Receivables: | | | | | | | | | | | | |
Dividends and reclaims | | | — | | | | 115,312 | | | | 343,759 | |
Interest | | | 1,448,411 | | | | 4,377,083 | | | | 7,193,546 | |
Interest on swaps | | | — | | | | 28,581 | | | | 22,192 | |
Investment securities sold | | | — | | | | 948,907 | | | | 71,405,803 | |
Maturities | | | — | | | | 480,470 | | | | 708,614 | |
Fund shares sold | | | 5,450,467 | | | | 3,893 | | | | 281,396 | |
Variation margin | | | — | | | | 1,860 | | | | 27,670 | |
Securities lending | | | — | | | | 10,014 | | | | 47,543 | |
Unrealized appreciation on foreign currency exchange contracts | | | — | | | | 126,216 | | | | 251,181 | |
Unrealized appreciation on swap agreements | | | — | | | | 401,969 | | | | 800,027 | |
Prepaid expenses and other assets | | | 28,858 | | | | 28,622 | | | | 29,319 | |
| | | | | | | | | | | | |
Total Assets | | | 876,941,016 | | | | 1,022,647,385 | | | | 1,721,794,562 | |
| | | | | | | | | | | | |
Liabilities | | | | | | | | | | | | |
Cash overdraft | | | — | | | | — | | | | — | |
Securities sold short, at value (proceeds $ 948,906) | | | — | | | | 954,688 | | | | — | |
Options written at value (4) | | | — | | | | 245,520 | | | | 224,111 | |
Unrealized depreciation on foreign currency exchange contracts | | | — | | | | 244,951 | | | | 898,649 | |
Unrealized depreciation on swap agreements | | | — | | | | 1,098,632 | | | | 1,546,820 | |
Collateral held for securities on loan at value Payables: | | | — | | | | 67,991,017 | | | | 233,776,896 | |
Investment securities purchased | | | — | | | | 40,327,914 | | | | 382,091,923 | |
Fund shares redeemed | | | 6,099,647 | | | | 977,433 | | | | 1,415,337 | |
Interest on swaps | | | — | | | | 5,706 | | | | 22,597 | |
Variation margin | | | — | | | | 111,168 | | | | 106,490 | |
Distributions | | | 1,323,532 | | | | — | | | | — | |
Securities lending | | | — | | | | 3,371 | | | | 14,226 | |
Deferred foreign capital gains taxes | | | — | | | | — | | | | — | |
Accrued expenses | | | | | | | | | | | | |
Advisory fees | | | 104,900 | | | | 106,207 | | | | 106,438 | |
Distribution (12b-1) fees | | | 1,691 | | | | 2,244 | | | | 2,411 | |
Shareholder servicing fees | | | 131,927 | | | | 131,367 | | | | 161,389 | |
Other expenses | | | 121,898 | | | | 270,163 | | | | 365,490 | |
| | | | | | | | | | | | |
Total Liabilities | | | 7,783,595 | | | | 112,470,381 | | | | 620,732,777 | |
| | | | | | | | | | | | |
Net Assets | | $ | 869,157,421 | | | $ | 910,177,004 | | | $ | 1,101,061,785 | |
| | | | | | | | | | | | |
Net Assets Consist of: | | | | | | | | | | | | |
Paid-in-capital | | $ | 869,165,795 | | | $ | 931,043,624 | | | $ | 1,103,696,714 | |
Undistributed (distributions in excess of) net investment income | | | — | | | | 92,980 | | | | (312,037 | ) |
Undistributed (accumulated) net realized gain (loss) on investments, foreign currency transactions and derivative transactions | | | (8,374 | ) | | | (11,994,669 | ) | | | (5,544,334 | ) |
Net unrealized appreciation (depreciation) on investments, foreign currency translations and derivative transactions | | | — | | | | (8,964,931 | ) | | | 3,221,442 | |
| | | | | | | | | | | | |
Net Assets | | $ | 869,157,421 | | | $ | 910,177,004 | | | $ | 1,101,061,785 | |
| | | | | | | | | | | | |
Net Asset Value: | | | | | | | | | | | | |
$0.001 par value, unlimited shares authorized | | | | | | | | | | | | |
Net assets applicable to the GS2 Class | | $ | 93,102,763 | | | $ | 104,680,519 | | | $ | 100,800,323 | |
| | | | | | | | | | | | |
GS2 shares outstanding | | | 93,103,614 | | | | 11,556,990 | | | | 11,569,637 | |
| | | | | | | | | | | | |
Net asset value, offering and redemption price per GS2 share | | $ | 1.00 | | | $ | 9.06 | | | $ | 8.71 | |
| | | | | | | | | | | | |
Net assets applicable to the GS4 Class | | $ | 766,322,282 | | | $ | 789,077,044 | | | $ | 981,934,515 | |
| | | | | | | | | | | | |
GS4 shares outstanding | | | 766,293,068 | | | | 62,330,339 | | | | 73,252,848 | |
| | | | | | | | | | | | |
Net asset value, offering and redemption price per GS4 share | | $ | 1.00 | | | $ | 12.66 | | | $ | 13.40 | |
| | | | | | | | | | | | |
Net assets applicable to the GS6 class | | $ | 4,587,103 | | | $ | 11,379,571 | | | $ | 13,194,526 | |
| | | | | | | | | | | | |
GS6 shares outstanding | | | 4,589,298 | | | | 1,251,143 | | | | 1,503,307 | |
| | | | | | | | | | | | |
Net asset value, offering and redemption price per GS6 share | | $ | 1.00 | | | $ | 9.09 | | | $ | 8.78 | |
| | | | | | | | | | | | |
Net assets applicable to the GS8 class | | $ | 5,145,273 | | | $ | 5,039,870 | | | $ | 5,132,421 | |
| | | | | | | | | | | | |
GS8 shares outstanding | | | 5,145,309 | | | | 553,905 | | | | 584,439 | |
| | | | | | | | | | | | |
Net asset value, offering and redemption price per GS8 share | | $ | 1.00 | | | $ | 9.10 | | | $ | 8.78 | |
| | | | | | | | | | | | |
| __________ | | | | | | | | | | | | |
(1) Investments in securities of unaffiliated issuers, at cost | | $ | 870,013,073 | | | $ | 942,013,937 | | | $ | 1,508,426,115 | |
Investments in securities of affiliated issuers, at cost | | | — | | | | 38,676,484 | | | | 85,737,738 | |
| | | | | | | | | | | | |
Total investments at cost | | $ | 870,013,073 | | | $ | 980,690,421 | | | $ | 1,594,163,853 | |
| | | | | | | | | | | | |
(2) Includes securities loaned of: | | $ | — | | | $ | 74,394,539 | | | $ | 237,222,695 | |
| | | | | | | | | | | | |
(3) Foreign currency at cost | | $ | — | | | $ | 2,680,026 | | | $ | 15,219,928 | |
| | | | | | | | | | | | |
(4) Premiums received on options written | | $ | — | | | $ | (379,043 | ) | | $ | (1,021,660 | ) |
| | | | | | | | | | | | |
(5) Net of ($ 129,328) accrued foreign capital gains taxes on appreciated securities | | | | | | | | | | | | |
See Notes to Financial Statements.
120
| | | | | | | | | | | | | | | | | | | |
Extended-Duration Bond
Fund | | Equity Index Fund | | | Value Equity Fund | | Growth Equity Fund | | | Small Cap Equity
Fund | | International Equity
Fund | |
| | | | | | | | | | | | | | | | | | | |
| $ | 602,941,023 | | $ | 511,530,854 | | | $ | 1,636,765,516 | | $ | 1,723,923,738 | | | $ | 772,924,609 | | $ | 1,450,138,215 | |
| | 6,476,802 | | | 9,259,159 | | | | 61,632,845 | | | 39,952,766 | | | | 19,118,712 | | | 41,653,430 | |
| | | | | | | | | | | | | | | | | | | | |
| | 609,417,825 | | | 520,790,013 | | | | 1,698,398,361 | | | 1,763,876,504 | | | | 792,043,321 | | | 1,491,791,645 | |
| | 169,958 | | | — | | | | — | | | — | | | | 5,591 | | | — | |
| | — | | | — | | | | — | | | — | | | | — | | | — | |
| | 194,437 | | | — | | | | — | | | — | | | | — | | | 1,430,969 | |
| | | | | | | | | | | | | | | | | | | |
| | 36,002 | | | 588,264 | | | | 1,958,230 | | | 796,008 | | | | 381,812 | | | 1,548,107 | |
| | 5,569,831 | | | — | | | | — | | | — | | | | 48 | | | — | |
| | — | | | | | | | — | | | — | | | | — | | | — | |
| | — | | | 547,583 | | | | 9,260,247 | | | — | | | | 1,529,907 | | | 770,572 | |
| | — | | | — | | | | — | | | — | | | | — | | | — | |
| | 30,072 | | | 1,001,812 | | | | 435,765 | | | 72,027 | | | | 1,525,277 | | | 303,500 | |
| | — | | | — | | | | — | | | — | | | | — | | | — | |
| | 24,334 | | | 3,602 | | | | 14,328 | | | 15,983 | | | | 48,710 | | | 26,017 | |
| | — | | | — | | | | — | | | — | | | | — | | | 697,387 | |
| | — | | | — | | | | — | | | — | | | | — | | | — | |
| | 23,217 | | | 23,040 | | | | 35,097 | | | 35,657 | | | | 25,143 | | | 32,399 | |
| | | | | | | | | | | | | | | | | | | | |
| | 615,465,676 | | | 522,954,314 | | | | 1,710,102,028 | | | 1,764,796,179 | | | | 795,559,809 | | | 1,496,600,596 | |
| | | | | | | | | | | | | | | | | | | | |
| | | | | | | | | | | | | | | | | | | |
| | — | | | — | | | | — | | | — | | | | — | | | 7,824 | |
| | — | | | — | | | | — | | | — | | | | — | | | — | |
| | — | | | — | | | | — | | | — | | | | — | | | — | |
| | — | | | — | | | | — | | | — | | | | — | | | 238,027 | |
| | — | | | — | | | | — | | | — | | | | — | | | — | |
| | 143,436,096 | | | 39,296,287 | | | | 239,770,675 | | | 210,318,844 | | | | 247,201,966 | | | 170,860,247 | |
| | — | | | 632,595 | | | | 12,037,175 | | | 775,155 | | | | 966,021 | | | 253,221 | |
| | 40,427 | | | 294,657 | | | | 81,999 | | | 395,650 | | | | 35,082 | | | 1,120,434 | |
| | — | | | — | | | | — | | | — | | | | — | | | — | |
| | — | | | 22,891 | | | | 232,100 | | | 116,600 | | | | 51,375 | | | — | |
| | — | | | — | | | | — | | | — | | | | — | | | — | |
| | 7,270 | | | 1,050 | | | | 4,217 | | | 4,753 | | | | 14,282 | | | 7,750 | |
| | — | | | — | | | | — | | | — | | | | — | | | 129,328 | |
| | | | | | | | | | | | | | | | | | | |
| | 97,750 | | | 43,926 | | | | 501,332 | | | 546,123 | | | | 111,481 | | | 362,587 | |
| | 2,604 | | | 2,428 | | | | 2,707 | | | 2,467 | | | | 2,783 | | | 3,159 | |
| | 68,114 | | | 70,714 | | | | 213,574 | | | 230,399 | | | | 80,999 | | | 185,337 | |
| | 152,593 | | | 70,946 | | | | 432,246 | | | 575,128 | | | | 449,871 | | | 1,013,799 | |
| | | | | | | | | | | | | | | | | | | | |
| | 143,804,854 | | | 40,435,494 | | | | 253,276,025 | | | 212,965,119 | | | | 248,913,860 | | | 174,181,713 | |
| | | | | | | | | | | | | | | | | | | | |
| $ | 471,660,822 | | $ | 482,518,820 | | | $ | 1,456,826,003 | | $ | 1,551,831,060 | | | $ | 546,645,949 | | $ | 1,322,418,883 | |
| | | | | | | | | | | | | | | | | | | | |
| | | | | | | | | | | | | | | | | | | |
| $ | 447,824,381 | | $ | 404,508,927 | | | $ | 1,218,403,016 | | $ | 1,438,932,594 | | | $ | 476,617,858 | | $ | 946,382,607 | |
| | 147,830 | | | 49,002 | | | | 107,290 | | | — | | | | — | | | (7,227,733 | ) |
| | (1,084,911) | | | (2,773,360 | ) | | | 5,472,305 | | | (240,730,693 | ) | | | 5,236,210 | | | 10,410,636 | |
| | 24,773,522 | | | 80,734,251 | | | | 232,843,392 | | | 353,629,159 | | | | 64,791,881 | | | 372,853,373 | (5) |
| | | | | | | | | | | | | | | | | | | | |
| $ | 471,660,822 | | $ | 482,518,820 | | | $ | 1,456,826,003 | | $ | 1,551,831,060 | | | $ | 546,645,949 | | $ | 1,322,418,883 | |
| | | | | | | | | | | | | | | | | | | | |
| $ | 57,371,517 | | $ | 62,214,058 | | | $ | 156,279,088 | | $ | 172,117,948 | | | $ | 62,008,837 | | $ | 176,818,612 | |
| | | | | | | | | | | | | | | | | | | | |
| | 6,794,339 | | | 6,245,404 | | | | 14,540,070 | | | 15,399,301 | | | | 5,440,497 | | | 12,018,231 | |
| | | | | | | | | | | | | | | | | | | | |
| $ | 8.44 | | $ | 9.96 | | | $ | 10.75 | | $ | 11.18 | | | $ | 11.40 | | $ | 14.71 | |
| | | | | | | | | | | | | | | | | | | | |
| $ | 393,850,954 | | $ | 402,865,382 | | | $ | 1,279,940,174 | | $ | 1,362,598,617 | | | $ | 463,366,657 | | $ | 1,120,234,233 | |
| | | | | | | | | | | | | | | | | | | | |
| | | | | 23,736,741 | | | | 73,123,862 | | | 76,948,220 | | | | 29,687,223 | | | 64,483,393 | |
| | | | | | | | | | | | | | | | | | | |
| | $14.82 | | $ | 16.97 | | | $ | 17.50 | | $ | 17.71 | | | $ | 15.61 | | $ | 17.37 | |
| | | | | | | | | | | | | | | | | | | | |
| $ | 15,099,788 | | $ | 12,018,691 | | | $ | 15,003,359 | | $ | 11,406,269 | | | $ | 15,576,802 | | $ | 19,123,325 | |
| | | | | | | | | | | | | | | | | | | | |
| | 1,788,993 | | | 1,199,603 | | | | 1,403,377 | | | 1,037,875 | | | | 1,395,974 | | | 1,313,741 | |
| | | | | | | | | | | | | | | | | | | | |
| $ | 8.44 | | $ | 10.02 | | | $ | 10.69 | | $ | 10.99 | | | $ | 11.16 | | $ | 14.56 | |
| | | | | | | | | | | | | | | | | | | | |
| $ | 5,338,563 | | $ | 5,420,689 | | | $ | 5,603,382 | | $ | 5,708,226 | | | $ | 5,693,653 | | $ | 6,242,713 | |
| | | | | | | | | | | | | | | | | | | | |
| | 632,799 | | | 540,864 | | | | 524,681 | | | 521,475 | | | | 512,682 | | | 429,412 | |
| | | | | | | | | | | | | | | | | | | | |
| $ | 8.44 | | $ | 10.02 | | | $ | 10.68 | | $ | 10.95 | | | $ | 11.11 | | $ | 14.54 | |
| | | | | | | | | | | | | | | | | | | | |
| $ | 578,162,580 | | $ | 430,717,736 | | | $ | 1,403,233,682 | | $ | 1,369,917,432 | | | $ | 707,927,693 | | $ | 1,077,597,204 | |
| | 6,476,802 | | | 9,259,159 | | | | 61,632,845 | | | 39,952,766 | | | | 19,118,712 | | | 41,653,430 | |
| | | | | | | | | | | | | | | | | | | | |
| $ | 584,639,382 | | $ | 439,976,895 | | | $ | 1,464,866,527 | | $ | 1,409,870,198 | | | $ | 727,046,405 | | $ | 1,119,250,634 | |
| | | | | | | | | | | | | | | | | | | | |
| $ | 234,740,368 | | $ | 38,145,959 | | | $ | 234,145,535 | | $ | 208,442,988 | | | $ | 243,954,062 | | $ | 162,793,281 | |
| | | | | | | | | | | | | | | | | | | | |
| $ | 199,668 | | $ | — | | | $ | — | | $ | — | | | $ | — | | $ | 1,420,480 | |
| | | | | | | | | | | | | | | | | | | | |
| $ | — | | $ | — | | | $ | — | | $ | — | | | $ | — | | $ | — | |
| | | | | | | | | | | | | | | | | | | | |
See Notes to Financial Statements.
121
STATEMENTS OF OPERATIONS
For the Year Ended December 31, 2005
| | | | | | | | | | | | |
| | | Money
Market Fund | | | Low-Duration
Bond Fund | | | Medium-
Duration Bond
Fund | |
Investment Income | | | | | | | | | | | | |
Dividends | | $ | — | | | $ | 5,022 | | | $ | 128,832 | |
Income distributions received from affiliated funds | | | — | | | | 770,867 | | | | 3,450,340 | |
Interest | | | 29,659,548 | | | | 31,701,902 | | | | 39,724,972 | |
Securities Lending | | | 13 | | | | 124,816 | | | | 404,167 | |
Less foreign taxes withheld | | | — | | | | — | | | | (533 | ) |
| | | | | | | | | | | | |
Total Investment Income | | | 29,659,561 | | | | 32,602,607 | | | | 43,707,778 | |
| | | | | | | | | | | | |
Expenses | | | | | | | | | | | | |
Investment advisory fees | | | 1,844,192 | | | | 3,555,916 | | | | 4,357,214 | |
Transfer agent fees: | | | | | | | | | | | | |
GS2 shares | | | 4,863 | | | | 4,066 | | | | 4,056 | |
GS4 shares | | | 46,064 | | | | 31,343 | | | | 34,879 | |
GS6 shares | | | 6,177 | | | | 7,086 | | | | 6,930 | |
GS8 shares | | | 6,416 | | | | 6,949 | | | | 6,786 | |
Custodian fees | | | 22,563 | | | | 92,770 | | | | 209,566 | |
Distribution fees: | | | | | | | | | | | | |
GS6 shares | | | 4,533 | | | | 12,740 | | | | 14,157 | |
GS8 shares | | | 15,134 | | | | 14,986 | | | | 15,243 | |
Shareholder servicing fees: | | | | | | | | | | | | |
GS4 shares | | | 1,518,532 | | | | 1,439,989 | | | | 1,708,326 | |
GS6 shares | | | 13,558 | | | | 38,213 | | | | 42,463 | |
GS8 shares | | | 20,191 | | | | 20,032 | | | | 20,349 | |
Accounting and administration fees | | | 342,835 | | | | 398,630 | | | | 531,634 | |
Professional fees | | | 59,765 | | | | 62,383 | | | | 67,220 | |
Blue sky fees: | | | | | | | | | | | | |
GS2 shares | | | 983 | | | | 983 | | | | 933 | |
GS4 shares | | | 3,821 | | | | 2,939 | | | | 2,659 | |
GS6 shares | | | 29,428 | | | | 16,150 | | | | 17,112 | |
GS8 shares | | | 8,268 | | | | 9,353 | | | | 8,572 | |
Shareholder reporting fees: | | | | | | | | | | | | |
GS2 shares | | | 636 | | | | 518 | | | | 543 | |
GS4 shares | | | 16,916 | | | | 7,287 | | | | 11,472 | |
GS6 shares | | | (801 | ) | | | (349 | ) | | | (619 | ) |
GS8 shares | | | 42 | | | | 42 | | | | 43 | |
Trustee fees | | | 10,125 | | | | 10,125 | | | | 11,666 | |
Line of credit facility fees | | | 4,419 | | | | 4,386 | | | | 4,938 | |
Other expenses | | | 28,120 | | | | 39,962 | | | | 69,844 | |
| | | | | | | | | | | | |
Total expenses | | | 4,006,780 | | | | 5,776,499 | | | | 7,145,986 | |
Expenses waived net of amount recaptured (See Footnote 3c) | | | (26,048 | ) | | | (516,540 | ) | | | (895,592 | ) |
Fees paid indirectly | | | (13,158 | ) | | | (147,209 | ) | | | (117,909 | ) |
| | | | | | | | | | | | |
Net expenses | | | 3,967,574 | | | | 5,112,750 | | | | 6,132,485 | |
| | | | | | | | | | | | |
Net Investment Income (Loss) | | | 25,691,987 | | | | 27,489,857 | | | | 37,575,293 | |
| | | | | | | | | | | | |
Realized and Unrealized Gain (Loss) | | | | | | | | | | | | |
Net realized gain (loss) from: | | | | | | | | | | | | |
Investment securities (net of capital gains taxes of $24,149 for International Equity) | | | (5,430 | ) | | | (7,466,501 | ) | | | 5,150,460 | |
Futures transactions | | | — | | | | (4,294,340 | ) | | | (3,788,600 | ) |
Swap agreements | | | — | | | | 321,073 | | | | (4,898,984 | ) |
Option contracts written | | | — | | | | 283,022 | | | | 500,262 | |
Option contracts purchased | | | — | | | | (3,493 | ) | | | (399,912 | ) |
Foreign currency transactions | | | — | | | | 500,905 | | | | 2,338,848 | |
| | | | | | | | | | | | |
Net realized gain (loss) | | | (5,430 | ) | | | (10,659,334 | ) | | | (1,097,926 | ) |
| | | | | | | | | | | | |
Net change in unrealized appreciation (depreciation) on: | | | | | | | | | | | | |
Investment securities (net of estimated deferred capital gains taxes of $37,578 for International Equity) | | | — | | | | (4,015,793 | ) | | | (15,841,835 | ) |
Futures transactions | | | — | | | | 409,715 | | | | (163,167 | ) |
Swap agreements | | | — | | | | (567,759 | ) | | | 4,449,348 | |
Option contracts written | | | — | | | | 889 | | | | 168,727 | |
Option contracts purchased | | | — | | | | (148,246 | ) | | | (84,257 | ) |
Foreign currency translations | | | — | | | | (85,595 | ) | | | (310,953 | ) |
| | | | | | | | | | | | |
Net change in unrealized appreciation (depreciation) | | | — | | | | (4,406,789 | ) | | | (11,782,137 | ) |
| | | | | | | | | | | | |
Net Realized and Unrealized Gain (Loss) | | | (5,430 | ) | | | (15,066,123 | ) | | | (12,880,063 | ) |
| | | | | | | | | | | | |
Net Increase (Decrease) in Net Assets Resulting from Operations | | $ | 25,686,557 | | | $ | 12,423,734 | | | $ | 24,695,230 | |
| | | | | | | | | | | | |
See Notes to Financial Statements.
122
| | | | | | | | | | | | | | | | | | | | | | |
Extended-Duration Bond Fund | | | Equity Index Fund | | | Value Equity Fund | | | Growth Equity Fund | | | Small Cap Equity Fund | | | International Equity Fund | |
| | | | | | | | | | | | | | | | | | | | | | |
| $ | 31,683 | | | $ | 8,329,447 | | | $ | 32,404,051 | | | $ | 9,633,071 | | | $ | 3,875,406 | | | $ | 31,685,880 | |
| | 294,108 | | | | 251,135 | | | | 1,424,519 | | | | 1,512,390 | | | | 862,200 | | | | 1,105,008 | |
| | 25,050,955 | | | | 27,030 | | | | 143,035 | | | | 130,208 | | | | 298,749 | | | | 36,568 | |
| | 164,737 | | | | 41,737 | | | | 165,102 | | | | 167,846 | | | | 311,974 | | | | 334,062 | |
| | — | | | | — | | | | (39,601 | ) | | | (147,270 | ) | | | (13,690 | ) | | | (2,329,016 | ) |
| | | | | | | | | | | | | | | | | | | | | | | |
| | 25,541,483 | | | | 8,649,349 | | | | 34,097,106 | | | | 11,296,245 | | | | 5,334,639 | | | | 30,832,502 | |
| | | | | | | | | | | | | | | | | | | | | | | |
| | | | | | | | | | | | | | | | | | | | | | |
| | 2,274,283 | | | | 728,562 | | | | 9,460,323 | | | | 12,345,551 | | | | 5,126,960 | | | | 11,653,525 | |
| | | | | | | | | | | | | | | | | | | | | | |
| | 4,045 | | | | 3,976 | | | | 4,029 | | | | 3,964 | | | | 4,022 | | | | 4,086 | |
| | 35,721 | | | | 36,231 | | | | 41,121 | | | | 37,890 | | | | 41,768 | | | | 38,796 | |
| | 6,962 | | | | 6,659 | | | | 6,657 | | | | 6,514 | | | | 6,093 | | | | 6,987 | |
| | 6,818 | | | | 6,596 | | | | 6,603 | | | | 6,471 | | | | 6,231 | | | | 6,788 | |
| | 40,678 | | | | 31,527 | | | | 103,472 | | | | 75,815 | | | | 116,232 | | | | 1,086,476 | |
| | | | | | | | | | | | | | | | | | | | | | |
| | 17,518 | | | | 11,541 | | | | 15,551 | | | | 11,485 | | | | 15,614 | | | | 18,118 | |
| | 15,638 | | | | 15,654 | | | | 16,063 | | | | 15,856 | | | | 16,101 | | | | 16,594 | |
| | | | | | | | | | | | | | | | | | | | | | |
| | 742,784 | | | | 743,496 | | | | 2,351,736 | | | | 2,486,386 | | | | 842,787 | | | | 1,956,045 | |
| | 52,536 | | | | 34,625 | | | | 46,653 | | | | 34,450 | | | | 46,843 | | | | 54,284 | |
| | 20,944 | | | | 20,853 | | | | 21,452 | | | | 21,167 | | | | 21,483 | | | | 22,177 | |
| | 195,408 | | | | 195,140 | | | | 561,409 | | | | 572,369 | | | | 228,383 | | | | 625,858 | |
| | 61,096 | | | | 58,032 | | | | 58,321 | | | | 58,032 | | | | 60,482 | | | | 62,933 | |
| | | | | | | | | | | | | | | | | | | | | | |
| | 983 | | | | 983 | | | | 983 | | | | 983 | | | | 983 | | | | 983 | |
| | 3,023 | | | | 3,183 | | | | 2,522 | | | | 3,395 | | | | 3,232 | | | | 3,260 | |
| | 18,346 | | | | 16,005 | | | | 15,723 | | | | 16,251 | | | | 16,070 | | | | 15,937 | |
| | 9,234 | | | | 7,127 | | | | 8,141 | | | | 9,111 | | | | 10,254 | | | | 9,553 | |
| | | | | | | | | | | | | | | | | | | | | | |
| | 478 | | | | 603 | | | | 669 | | | | 601 | | | | 642 | | | | 644 | |
| | 12,341 | | | | 14,188 | | | | 19,791 | | | | 16,201 | | | | 20,956 | | | | 16,082 | |
| | (524 | ) | | | (723 | ) | | | (888 | ) | | | (814 | ) | | | (1,077 | ) | | | (416 | ) |
| | 44 | | | | 44 | | | | 72 | | | | 44 | | | | 71 | | | | 74 | |
| | 5,423 | | | | 5,382 | | | | 16,253 | | | | 17,143 | | | | 6,034 | | | | 13,949 | |
| | 2,298 | | | | 2,280 | | | | 6,882 | | | | 7,254 | | | | 2,556 | | | | 5,904 | |
| | 23,475 | | | | 36,687 | | | | 39,495 | | | | 35,352 | | | | 29,039 | | | | 45,855 | |
| | | | | | | | | | | | | | | | | | | | | | | |
| | 3,549,552 | | | | 1,978,651 | | | | 12,803,033 | | | | 15,781,471 | | | | 6,621,759 | | | | 15,664,492 | |
| | (119,298 | ) | | | (167,286 | ) | | | (309,889 | ) | | | (1,192,559 | ) | | | (213,295 | ) | | | (1,940,476 | ) |
| | (2,178 | ) | | | (1,493 | ) | | | (122,612 | ) | | | (134,001 | ) | | | (76,596 | ) | | | (231,596 | ) |
| | | | | | | | | | | | | | | | | | | | | | | |
| | 3,428,076 | | | | 1,809,872 | | | | 12,370,532 | | | | 14,454,911 | | | | 6,331,868 | | | | 13,492,420 | |
| | | | | | | | | | | | | | | | | | | | | | | |
| | 22,113,407 | | | | 6,839,477 | | | | 21,726,574 | | | | (3,158,666 | ) | | | (997,229 | ) | | | 17,340,082 | |
| | | | | | | | | | | | | | | | | | | | | | | |
| | | | | | | | | | | | | | | | | | | | | | |
| | | | | | | | | | | | | | | | | | | | | | |
| | 3,986,890 | | | | 4,638,321 | | | | 101,981,529 | | | | 63,361,418 | | | | 61,494,457 | | | | 94,192,982 | |
| | — | | | | 496,641 | | | | 1,707,343 | | | | 2,524,262 | | | | (2,761,491 | ) | | | — | |
| | — | | | | — | | | | — | | | | — | | | �� | — | | | | — | |
| | — | | | | — | | | | — | | | | 9,036 | | | | — | | | | — | |
| | — | | | | — | | | | — | | | | — | | | | — | | | | — | |
| | 1,532,197 | | | | — | | | | — | | | | (1,123 | ) | | | — | | | | (376,432 | ) |
| | | | | | | | | | | | | | | | | | | | | | | |
| | 5,519,087 | | | | 5,134,962 | | | | 103,688,872 | | | | 65,893,593 | | | | 58,732,966 | | | | 93,816,550 | |
| | | | | | | | | | | | | | | | | | | | | | | |
| | | | | | | | | | | | | | | | | | | | | | |
| | (1,851,833 | ) | | | 9,567,638 | | | | (26,095,472 | ) | | | 61,035,731 | | | | (19,691,301 | ) | | | 87,152,168 | |
| | — | | | | (181,640 | ) | | | (1,030,395 | ) | | | (642,218 | ) | | | (3,406,744 | ) | | | — | |
| | — | | | | — | | | | — | | | | — | | | | — | | | | — | |
| | — | | | | — | | | | — | | | | — | | | | — | | | | — | |
| | — | | | | — | | | | — | | | | — | | | | — | | | | (190,840 | ) |
| | (31,412 | ) | | | — | | | | — | | | | — | | | | — | | | | 1,545,503 | |
| | | | | | | | | | | | | | | | | | | | | | | |
| | (1,883,245 | ) | | | 9,385,998 | | | | (27,125,867 | ) | | | 60,393,513 | | | | (23,098,045 | ) | | | 88,506,831 | |
| | | | | | | | | | | | | | | | | | | | | | | |
| | 3,635,842 | | | | 14,520,960 | | | | 76,563,005 | | | | 126,287,106 | | | | 35,634,921 | | | | 182,323,381 | |
| | | | | | | | | | | | | | | | | | | | | | | |
| $ | 25,749,249 | | | $ | 21,360,437 | | | $ | 98,289,579 | | | $ | 123,128,440 | | | $ | 34,637,692 | | | $ | 199,663,463 | |
| | | | | | | | | | | | | | | | | | | | | | | |
See Notes to Financial Statements.
123
STATEMENTS OF CHANGES IN NET ASSETS
| | | | | | | | |
| | | Money Market Fund For the Year Ended | |
| | | 12/31/05 | | | 12/31/04 | |
Increase (Decrease) in Net Assets | | | | | | | | |
Operations: | | | | | | | | |
Net investment income | | $ | 25,691,987 | | | $ | 8,848,910 | |
Net realized gain (loss) on investment securities, foreign currency transactions and futures transactions | | | (5,430 | ) | | | 6,557 | |
Net change in unrealized appreciation (depreciation) on investment securities, foreign currency translations, and futures contracts | | | — | | | | — | |
| | | | | | | | |
Net increase in net assets resulting from operations | | | 25,686,557 | | | | 8,855,467 | |
| | | | | | | | |
Dividends and Distributions to Shareholders: | | | | | | | | |
Dividends from net investment income | | | | | | | | |
GS2 shares | | | (2,748,269 | ) | | | (721,686 | ) |
GS4 shares | | | (22,725,193 | ) | | | (8,060,700 | ) |
GS6 shares | | | (111,774 | ) | | | (59,113 | ) |
GS8 shares | | | (107,373 | ) | | | (6,789 | ) |
Distributions from net realized capital gains | | | | | | | | |
GS2 shares | | | — | | | | — | |
GS4 shares | | | — | | | | — | |
GS6 shares | | | — | | | | — | |
GS8 shares | | | — | | | | — | |
| | | | | | | | |
Total dividends and distributions | | | (25,692,609 | ) | | | (8,848,288 | ) |
| | | | | | | | |
Capital Share Transactions: | | | | | | | | |
Proceeds from shares sold | | | | | | | | |
GS2 shares | | | 97,579,053 | | | | 45,386,512 | |
GS4 shares | | | 2,495,446,536 | | | | 2,724,683,826 | |
GS6 shares | | | 43,984 | | | | 11,500,547 | |
GS8 shares | | | 54,568 | | | | 5,004,598 | |
Reinvestment of dividends and distributions | | | | | | | | |
GS2 shares | | | 2,495,133 | | | | 680,196 | |
GS4 shares | | | 11,467,878 | | | | 4,564,114 | |
GS6 shares | | | 111,760 | | | | 56,965 | |
GS8 shares | | | 107,373 | | | | 6,789 | |
| | | | | | | | |
Total proceeds from shares sold and reinvested | | | 2,607,306,285 | | | | 2,791,883,547 | |
| | | | | | | | |
Value of shares redeemed | | | | | | | | |
GS2 shares | | | (68,344,589 | ) | | | (48,066,537 | ) |
GS4 shares | | | (2,578,673,372 | ) | | | (2,744,229,998 | ) |
GS6 shares | | | (44,371 | ) | | | (15,116,865 | ) |
GS8 shares | | | (23,730 | ) | | | (4,288 | ) |
| | | | | | | | |
Total value of shares redeemed | | | (2,647,086,062 | ) | | | (2,807,417,688 | ) |
| | | | | | | | |
Net increase (decrease) from capital share transactions (See Footnote 6) | | | (39,779,777 | ) | | | (15,534,141 | ) |
| | | | | | | | |
Total increase (decrease) in net assets | | | (39,785,829 | ) | | | (15,526,962 | ) |
| | | | | | | | |
Net Assets: | | | | | | | | |
Beginning of Year | | | 908,943,250 | | | | 924,470,212 | |
| | | | | | | | |
End of Year* | | $ | 869,157,421 | | | $ | 908,943,250 | |
| | | | | | | | |
* Including undistributed (distributions in excess of) net investment income | | $ | — | | | $ | 622 | |
| | | | | | | | |
See Notes to Financial Statements.
124
| | | | | | | | | | | | | | | | | | | | | | |
Low-Duration Bond Fund For the Year Ended | | | Medium-Duration Bond Fund For the Year Ended | | | Extended-Duration Bond Fund For the Year Ended | |
| 12/31/05 | | | 12/31/04 | | | 12/31/05 | | | 12/31/04 | | | 12/31/05 | | | 12/31/04 | |
| | | | | | | | | | | | | | | | | | | | | | |
| | | | | | | | | | | | | | | | | | | | | | |
| $ | 27,489,857 | | | $ | 16,837,497 | | | $ | 37,575,293 | | | $ | 23,809,769 | | | $ | 22,113,407 | | | $ | 22,539,211 | |
| | (10,659,334 | ) | | | 2,982,121 | | | | (1,097,926 | ) | | | 18,293,400 | | | | 5,519,087 | | | | 11,848,351 | |
| | (4,406,789 | ) | | | (9,010,994 | ) | | | (11,782,137 | ) | | | 499,348 | | | | (1,883,245 | ) | | | 2,010,009 | |
| | | | | | | | | | | | | | | | | | | | | | | |
| | 12,423,734 | | | | 10,808,624 | | | | 24,695,230 | | | | 42,602,517 | | | | 25,749,249 | | | | 36,397,571 | |
| | | | | | | | | | | | | | | | | | | | | | | |
| | | | | | | | | | | | | | | | | | | | | | |
| | | | | | | | | | | | | | | | | | | | | | |
| | (4,479,831 | ) | | | (1,696,636 | ) | | | (5,612,463 | ) | | | (2,382,746 | ) | | | (4,268,161 | ) | | | (2,557,161 | ) |
| | (22,992,157 | ) | | | (14,809,918 | ) | | | (34,648,385 | ) | | | (24,210,880 | ) | | | (17,074,698 | ) | | | (19,518,971 | ) |
| | (466,469 | ) | | | (500,018 | ) | | | (721,610 | ) | | | (869,129 | ) | | | (1,179,267 | ) | | | (2,123,786 | ) |
| | (177,594 | ) | | | (51,135 | ) | | | (253,597 | ) | | | (103,998 | ) | | | (357,326 | ) | | | (109,063 | ) |
| | | | | | | | | | | | | | | | | | | | | | |
| | (1,147 | ) | | | (306,325 | ) | | | (645,746 | ) | | | (1,226,859 | ) | | | (1,712,320 | ) | | | (1,098,229 | ) |
| | (6,206 | ) | | | (2,934,690 | ) | | | (4,143,819 | ) | | | (13,258,347 | ) | | | (6,850,285 | ) | | | (8,199,186 | ) |
| | (124 | ) | | | (81,975 | ) | | | (84,242 | ) | | | (380,448 | ) | | | (452,529 | ) | | | (820,490 | ) |
| | (55 | ) | | | (25,524 | ) | | | (32,762 | ) | | | (116,137 | ) | | | (160,140 | ) | | | (173,104 | ) |
| | | | | | | | | | | | | | | | | | | | | | | |
| | (28,123,583 | ) | | | (20,406,221 | ) | | | (46,142,624 | ) | | | (42,548,544 | ) | | | (32,054,726 | ) | | | (34,599,990 | ) |
| | | | | | | | | | | | | | | | | | | | | | | |
| | | | | | | | | | | | | | | | | | | | | | |
| | | | | | | | | | | | | | | | | | | | | | |
| | 48,785,555 | | | | 14,462,701 | | | | 49,692,680 | | | | 18,782,002 | | | | 29,365,042 | | | | 14,752,906 | |
| | 106,691,749 | | | | 147,272,390 | | | | 194,463,337 | | | | 198,015,923 | | | | 83,231,124 | | | | 127,568,248 | |
| | 474,994 | | | | 13,279,997 | | | | 565,914 | | | | 16,453,300 | | | | 915,722 | | | | 19,302,731 | |
| | 1,242 | | | | 5,000,000 | | | | 642 | | | | 5,000,000 | | | | 597 | | | | 5,000,000 | |
| | | | | | | | | | | | | | | | | | | | | | |
| | 4,405,558 | | | | 2,002,962 | | | | 6,068,879 | | | | 3,609,605 | | | | 5,855,155 | | | | 3,655,389 | |
| | 22,996,558 | | | | 17,743,865 | | | | 38,787,840 | | | | 37,465,253 | | | | 24,555,600 | | | | 27,717,147 | |
| | 466,593 | | | | 580,489 | | | | 805,854 | | | | 1,246,004 | | | | 1,631,795 | | | | 2,941,873 | |
| | 177,649 | | | | 76,659 | | | | 286,358 | | | | 220,135 | | | | 517,466 | | | | 282,167 | |
| | | | | | | | | | | | | | | | | | | | | | | |
| | 183,999,898 | | | | 200,419,063 | | | | 290,671,504 | | | | 280,792,222 | | | | 146,072,501 | | | | 201,220,461 | |
| | | | | | | | | | | | | | | | | | | | | | | |
| | | | | | | | | | | | | | | | | | | | | | |
| | (5,405,010 | ) | | | (9,242,437 | ) | | | (4,002,381 | ) | | | (14,975,756 | ) | | | (7,220,381 | ) | | | (13,937,947 | ) |
| | (118,147,765 | ) | | | (94,413,598 | ) | | | (87,788,179 | ) | | | (125,341,747 | ) | | | (111,075,009 | ) | | | (144,941,440 | ) |
| | (5,304,186 | ) | | | (19,874,523 | ) | | | (4,180,127 | ) | | | (23,624,543 | ) | | | (10,716,919 | ) | | | (25,324,478 | ) |
| | (57 | ) | | | — | | | | — | | | | — | | | | — | | | | — | |
| | | | | | | | | | | | | | | | | | | | | | | |
| | (128,857,018 | ) | | | (123,530,558 | ) | | | (95,970,687 | ) | | | (163,942,046 | ) | | | (129,012,309 | ) | | | (184,203,865 | ) |
| | | | | | | | | | | | | | | | | | | | | | | |
| | 55,142,880 | | | | 76,888,505 | | | | 194,700,817 | | | | 116,850,176 | | | | 17,060,192 | | | | 17,016,596 | |
| | | | | | | | | | | | | | | | | | | | | | | |
| | 39,443,031 | | | | 67,290,908 | | | | 173,253,423 | | | | 116,904,149 | | | | 10,754,715 | | | | 18,814,177 | |
| | | | | | | | | | | | | | | | | | | | | | | |
| | | | | | | | | | | | | | | | | | | | | | |
| | 870,733,973 | | | | 803,443,065 | | | | 927,808,362 | | | | 810,904,213 | | | | 460,906,107 | | | | 442,091,930 | |
| | | | | | | | | | | | | | | | | | | | | | | |
| $ | 910,177,004 | | | $ | 870,733,973 | | | $ | 1,101,061,785 | | | $ | 927,808,362 | | | $ | 471,660,822 | | | $ | 460,906,107 | |
| | | | | | | | | | | | | | | | | | | | | | | |
| $ | 92,980 | | | $ | 423,201 | | | $ | (312,037 | ) | | $ | (668,717 | ) | | $ | 147,830 | | | $ | 9,888 | |
| | | | | | | | | | | | | | | | | | | | | | | |
See Notes to Financial Statements.
125
STATEMENTS OF CHANGES IN NET ASSETS
| | | | | | | | |
| | | Equity Index Fund For the Year Ended | |
| | | 12/31/05 | | | 12/31/04 | |
Increase (Decrease) in Net Assets | | | | | | | | |
Operations: | | | | | | | | |
Net investment income (loss) | | $ | 6,839,477 | | | $ | 7,069,327 | |
Net realized gain on investment securities, foreign currency transactions and futures transactions | | | 5,134,962 | | | | 2,065,197 | |
Net change in unrealized appreciation (depreciation) on investment securities, foreign currency translations, and futures contracts | | | 9,385,998 | | | | 35,671,490 | |
| | | | | | | | |
Net increase (decrease) in net assets resulting from operations | | | 21,360,437 | | | | 44,806,014 | |
| | | | | | | | |
Dividends and Distributions to Shareholders: | | | | | | | | |
Dividends from net investment income | | | | | | | | |
GS2 shares | | | (1,447,323 | ) | | | (971,702 | ) |
GS4 shares | | | (5,001,471 | ) | | | (6,152,025 | ) |
GS6 shares | | | (247,026 | ) | | | (402,551 | ) |
GS8 shares | | | (93,751 | ) | | | (53,662 | ) |
Distributions from net realized capital gains | | | | | | | | |
GS2 shares | | | (264,015 | ) | | | — | |
GS4 shares | | | (1,007,668 | ) | | | — | |
GS6 shares | | | (50,704 | ) | | | — | |
GS8 shares | | | (22,896 | ) | | | — | |
Excess distribution | | | | | | | | |
GS2 shares | | | — | | | | (1,484 | ) |
GS4 shares | | | — | | | | (10,239 | ) |
GS6 shares | | | — | | | | (470 | ) |
GS8 shares | | | — | | | | (213 | ) |
| | | | | | | | |
Total dividends and distributions | | | (8,134,854 | ) | | | (7,592,346 | ) |
| | | | | | | | |
Capital Share Transactions: | | | | | | | | |
Proceeds from shares sold | | | | | | | | |
GS2 shares | | | 28,530,125 | | | | 5,857,548 | |
GS4 shares | | | 42,657,409 | | | | 49,660,836 | |
GS6 shares | | | — | | | | 12,679,856 | |
GS8 shares | | | 1,205 | | | | 5,053,874 | |
Reinvestment of dividends and distributions | | | | | | | | |
GS2 shares | | | 1,693,048 | | | | 973,186 | |
GS4 shares | | | 6,008,602 | | | | 6,161,862 | |
GS6 shares | | | 297,730 | | | | 402,479 | |
GS8 shares | | | 116,700 | | | | 53,874 | |
| | | | | | | | |
Total proceeds from shares sold and reinvested | | | 79,304,819 | | | | 80,843,515 | |
| | | | | | | | |
Value of shares redeemed | | | | | | | | |
GS2 shares | | | (5,429,955 | ) | | | (6,187,119 | ) |
GS4 shares | | | (75,399,007 | ) | | | (53,362,551 | ) |
GS6 shares | | | — | | | | (20,107,543 | ) |
GS8 shares | | | — | | | | (53,874 | ) |
| | | | | | | | |
Total value of shares redeemed | | | (80,828,962 | ) | | | (79,711,087 | ) |
| | | | | | | | |
Net increase (decrease) from capital share transactions (See Footnote 6) | | | (1,524,143 | ) | | | 1,132,428 | |
| | | | | | | | |
Total increase (decrease) in net assets | | | 11,701,440 | | | | 38,346,096 | |
| | | | | | | | |
Net Assets: | | | | | | | | |
Beginning of Year | | | 470,817,380 | | | | 432,471,284 | |
| | | | | | | | |
End of Year* | | $ | 482,518,820 | | | $ | 470,817,380 | |
| | | | | | | | |
* Including undistributed (distributions in excess of) net investment income | | $ | 49,002 | | | $ | — | |
| | | | | | | | |
See Notes to Financial Statements.
126
| | | | | | | | | | | | | | | | | | | | | | | | | | | | | | |
Value Equity Fund For the Year Ended | | | Growth Equity Fund For the Year Ended | | | Small Cap Equity Fund For the Year Ended | | | International Equity Fund For the Year Ended | |
| 12/31/05 | | | 12/31/04 | | | 12/31/05 | | | 12/31/04 | | | 12/31/05 | | | 12/31/04 | | | 12/31/05 | | | 12/31/04 | |
| | | | | | | | | | | | | | | | | | | | | | | | | | | | | | |
| | | | | | | | | | | | | | | | | | | | | | | | | | | | | | |
| $ | 21,726,574 | | | $ | 19,503,341 | | | $ | (3,158,666 | ) | | $ | (1,471,520 | ) | | $ | (997,229 | ) | | $ | (762,269 | ) | | $ | 17,340,082 | | | $ | 13,088,489 | |
| | 103,688,872 | | | | 89,662,443 | | | | 65,893,593 | | | | 20,737,950 | | | | 58,732,966 | | | | 46,964,658 | | | | 93,816,550 | | | | 49,035,542 | |
| | (27,125,867 | ) | | | 108,014,932 | | | | 60,393,513 | | | | 147,012,085 | | | | (23,098,045 | ) | | | 15,042,600 | | | | 88,506,831 | | | | 124,495,429 | |
| | | | | | | | | | | | | | | | | | | | | | | | | | | | | | | |
| | 98,289,579 | | | | 217,180,716 | | | | 123,128,440 | | | | 166,278,515 | | | | 34,637,692 | | | | 61,244,989 | | | | 199,663,463 | | | | 186,619,460 | |
| | | | | | | | | | | | | | | | | | | | | | | | | | | | | | | |
| | | | | | | | | | | | | | | | | | | | | | | | | | | | | | |
| | | | | | | | | | | | | | | | | | | | | | | | | | | | | | |
| | (3,776,410 | ) | | | (1,737,298 | ) | | | — | | | | — | | | | — | | | | — | | | | (3,522,540 | ) | | | (1,448,031 | ) |
| | (17,465,290 | ) | | | (17,360,065 | ) | | | — | | | | — | | | | — | | | | — | | | | (17,131,295 | ) | | | (13,270,677 | ) |
| | (286,556 | ) | | | (426,787 | ) | | | — | | | | — | | | | — | | | | — | | | | (298,613 | ) | | | (295,546 | ) |
| | (91,028 | ) | | | (34,324 | ) | | | — | | | | — | | | | — | | | | — | | | | (80,453 | ) | | | (35,394 | ) |
| | | | | | | | | | | | | | | | | | | | | | | | | | | | | | |
| | (16,300,818 | ) | | | (272 | ) | | | — | | | | — | | | | (9,061,949 | ) | | | (1,605,087 | ) | | | (2,372,854 | ) | | | — | |
| | (85,737,706 | ) | | | (3,056 | ) | | | — | | | | — | | | | (51,308,587 | ) | | | (18,720,278 | ) | | | (12,803,717 | ) | | | — | |
| | (1,574,230 | ) | | | (65 | ) | | | — | | | | — | | | | (2,313,815 | ) | | | (1,012,977 | ) | | | (260,237 | ) | | | — | |
| | (589,222 | ) | | | (19 | ) | | | — | | | | — | | | | (848,678 | ) | | | (305,972 | ) | | | (85,266 | ) | | | — | |
| | | | | | | | | | | | | | | | | | | | | | | | | | | | | | |
| | — | | | | — | | | | — | | | | — | | | | — | | | | — | | | | — | | | | — | |
| | — | | | | — | | | | — | | | | — | | | | — | | | | — | | | | — | | | | — | |
| | — | | | | — | | | | — | | | | — | | | | — | | | | — | | | | — | | | | — | |
| | — | | | | — | | | | — | | | | — | | | | — | | | | — | | | | — | | | | — | |
| | | | | | | | | | | | | | | | | | | | | | | | | | | | | | | |
| | (125,821,260 | ) | | | (19,561,886 | ) | | | — | | | | — | | | | (63,533,029 | ) | | | (21,644,314 | ) | | | (36,554,975 | ) | | | (15,049,648 | ) |
| | | | | | | | | | | | | | | | | | | | | | | | | | | | | | | |
| | | | | | | | | | | | | | | | | | | | | | | | | | | | | | |
| | 82,260,741 | | | | 15,591,871 | | | | 87,716,607 | | | | 15,216,823 | | | | 36,479,492 | | | | 8,281,035 | | | | 77,135,236 | | | | 36,872,679 | |
| | 69,243,699 | | | | 93,964,007 | | | | 56,539,195 | | | | 89,698,969 | | | | 92,602,096 | | | | 108,621,813 | | | | 92,232,819 | | | | 74,761,876 | |
| | 659,974 | | | | 18,542,472 | | | | 325,805 | | | | 13,128,810 | | | | 414,999 | | | | 20,070,031 | | | | 1,580,532 | | | | 18,807,962 | |
| | 3,181 | | | | 5,034,343 | | | | 1,057 | | | | 5,000,000 | | | | 5,651 | | | | 5,000,000 | | | | 5,310 | | | | 5,035,394 | |
| | 19,689,834 | | | | 1,725,924 | | | | — | | | | — | | | | 8,955,618 | | | | 1,605,087 | | | | 5,807,372 | | | | 1,448,031 | |
| | 103,197,880 | | | | 17,362,675 | | | | — | | | | — | | | | 51,300,141 | | | | 18,717,791 | | | | 29,934,318 | | | | 13,270,599 | |
| | 1,860,786 | | | | 425,791 | | | | — | | | | — | | | | 2,313,815 | | | | 1,012,977 | | | | 558,850 | | | | 295,478 | |
| | 680,250 | | | | 34,343 | | | | — | | | | — | | | | 848,679 | | | | 305,972 | | | | 165,719 | | | | 35,394 | |
| | | | | | | | | | | | | | | | | | | | | | | | | | | | | | | |
| | 277,596,345 | | | | 152,681,426 | | | | 144,582,664 | | | | 123,044,602 | | | | 192,920,491 | | | | 163,614,706 | | | | 207,420,156 | | | | 150,527,413 | |
| | | | | | | | | | | | | | | | | | | | | | | | | | | | | | | |
| | (12,032,159 | ) | | | (22,174,278 | ) | | | (14,078,107 | ) | | | (19,855,335 | ) | | | (7,311,452 | ) | | | (8,746,342 | ) | | | (14,569,008 | ) | | | (12,936,001 | ) |
| | (180,802,337 | ) | | | (142,217,090 | ) | | | (207,536,437 | ) | | | (124,051,039 | ) | | | (91,442,536 | ) | | | (88,070,288 | ) | | | (213,587,734 | ) | | | (92,618,667 | ) |
| | (4,427,418 | ) | | | (23,638,653 | ) | | | (3,275,639 | ) | | | (19,276,237 | ) | | | (3,287,987 | ) | | | (27,373,199 | ) | | | (4,705,492 | ) | | | (23,242,796 | ) |
| | (4 | ) | | | (34,343 | ) | | | — | | | | — | | | | (3 | ) | | | — | | | | (1 | ) | | | (35,394 | ) |
| | | | | | | | | | | | | | | | | | | | | | | | | | | | | | | |
| | (197,261,918 | ) | | | (188,064,364 | ) | | | (224,890,183 | ) | | | (163,182,611 | ) | | | (102,041,978 | ) | | | (124,189,829 | ) | | | (232,862,235 | ) | | | (128,832,858 | ) |
| | | | | | | | | | | | | | | | | | | | | | | | | | | | | | | |
| | 80,334,427 | | | | (35,382,938 | ) | | | (80,307,519 | ) | | | (40,138,009 | ) | | | 90,878,513 | | | | 39,424,877 | | | | (25,442,079 | ) | | | 21,694,555 | |
| | | | | | | | | | | | | | | | | | | | | | | | | | | | | | | |
| | 52,802,746 | | | | 162,235,892 | | | | 42,820,921 | | | | 126,140,506 | | | | 61,983,176 | | | | 79,025,552 | | | | 137,666,409 | | | | 193,264,367 | |
| | | | | | | | | | | | | | | | | | | | | | | | | | | | | | | |
| | | | | | | | | | | | | | | | | | | | | | | | | | | | | | |
| | 1,404,023,257 | | | | 1,241,787,365 | | | | 1,509,010,139 | | | | 1,382,869,633 | | | | 484,662,773 | | | | 405,637,221 | | | | 1,184,752,474 | | | | 991,488,107 | |
| | | | | | | | | | | | | | | | | | | | | | | | | | | | | | | |
| $ | 1,456,826,003 | | | $ | 1,404,023,257 | | | $ | 1,551,831,060 | | | $ | 1,509,010,139 | | | $ | 546,645,949 | | | $ | 484,662,773 | | | $ | 1,322,418,883 | | | $ | 1,184,752,474 | |
| | | | | | | | | | | | | | | | | | | | | | | | | | | | | | | |
| $ | 107,290 | | | $ | — | | | $ | — | | | $ | (833 | ) | | $ | — | | | $ | — | | | $ | (7,227,733 | ) | | $ | (3,534,280 | ) |
| | | | | | | | | | | | | | | | | | | | | | | | | | | | | | | |
See Notes to Financial Statements.
127
FINANCIAL HIGHLIGHTS
For a Share Outstanding Throughout the Year Ending December 31, unless otherwise indicated
| | | | | | | | | | | | | | | | | | | | | | | | | | | | | | | | | | | | | | | | | | | | | | |
| | | | | | | | | | | | | | | | | | | | | | | | Ratios to Average Net Assets (1) | | | | |
| | | Net Asset
Value,
Beginning
of Year | | Net
Investment
Income | | | Realized
and
Unrealized
Gain (Loss) on
Investments | | | Dividends
from Net
Investment
Income | | | Distributions
from Net
Realized
Capital
Gains | | | Net
Asset
Value,
End of
Year | | Total
Return
(2) | | | Net Assets,
End of
Year (000) | | Expenses,
Net | | | Expenses,
Including
Expense
Reduction | | | Expenses,
Before
Waivers
and
Expense
Reduction | | | Investment
Income,
Net | | | Investment
Income/
(Loss),
Excluding
Waivers
and
Expense
Reduction | | | Portfolio
Turnover
Rate (2) | |
Money Market Fund | | | | | | | | | | | | | | | | | | | | | | | | | | | | | | | | | | | | | | | | |
GS2 Class | | | | | | | | | | | | | | | | | | | | | | | | | | | | | | | | | | | | | | | | | | | |
2005 | | $ | 1.00 | | $ | — | † | | $ | — | † | | $ | — | † | | $ | — | | | $ | 1.00 | | 3.07 | % | | $ | 93,103 | | 0.27 | % | | 0.27 | % | | 0.26 | % | | 3.03 | % | | 3.04 | % | | N/A | |
2004 | | | 1.00 | | | 0.01 | | | | — | † | | | (0.01 | ) | | | — | | | | 1.00 | | 1.19 | | | | 61,374 | | 0.27 | | | 0.27 | | | 0.27 | | | 1.17 | | | 1.17 | | | N/A | |
2003 | | | 1.00 | | | 0.01 | | | | — | † | | | (0.01 | ) | | | — | † | | | 1.00 | | 1.04 | | | | 63,373 | | 0.27 | | | 0.27 | | | 0.28 | | | 0.91 | | | 0.90 | | | N/A | |
2002 | | | 1.00 | | | 0.02 | | | | — | | | | (0.02 | ) | | | — | † | | | 1.00 | | 1.80 | | | | 5,493 | | 0.25 | | | 0.25 | | | 0.55 | | | 1.75 | | | 1.45 | | | N/A | |
2001(3) | | | 1.00 | | | 0.01 | | | | — | | | | (0.01 | ) | | | — | | | | 1.00 | | 0.66 | | | | 25 | | 0.25 | | | 0.25 | | | 90.37 | | | 2.60 | | | (87.52 | ) | | N/A | |
GS4 Class | | | | | | | | | | | | | | | | | | | | | | | | | | | | | | | | | | | | | | | | | | | |
2005 | | $ | 1.00 | | $ | — | † | | $ | — | † | | $ | — | † | | $ | — | | | $ | 1.00 | | 2.88 | % | | $ | 766,322 | | 0.46 | % | | 0.46 | % | | 0.46 | % | | 2.84 | % | | 2.84 | % | | N/A | |
2004 | | | 1.00 | | | 0.01 | | | | — | † | | | (0.01 | ) | | | — | | | | 1.00 | | 0.99 | | | | 838,087 | | 0.46 | | | 0.46 | | | 0.45 | | | 0.98 | | | 0.99 | | | N/A | |
2003 | | | 1.00 | | | 0.01 | | | | — | † | | | (0.01 | ) | | | — | † | | | 1.00 | | 0.85 | | | | 853,062 | | 0.45 | | | 0.45 | | | 0.45 | | | 0.84 | | | 0.84 | | | N/A | |
2002 | | | 1.00 | | | 0.02 | | | | — | | | | (0.02 | ) | | | — | † | | | 1.00 | | 1.60 | | | | 906,302 | | 0.45 | | | 0.44 | | | 0.50 | | | 1.58 | | | 1.52 | | | N/A | |
2001(3) | | | 1.00 | | | 0.01 | | | | — | | | | (0.01 | ) | | | — | | | | 1.00 | | 0.94 | | | | 996,380 | | 0.44 | | | 0.44 | | | 0.49 | | | 2.72 | | | 2.67 | | | N/A | |
GS6 Class | | | | | | | | | | | | | | | | | | | | | | | | | | | | | | | | | | | | | | | | | | | |
2005 | | $ | 1.00 | | $ | — | † | | $ | — | † | | $ | — | † | | $ | — | | | $ | 1.00 | | 2.50 | % | | $ | 4,587 | | 0.83 | % | | 0.83 | % | | 1.43 | % | | 2.47 | % | | 1.87 | % | | N/A | |
2004 | | | 1.00 | | | 0.01 | | | | — | † | | | (0.01 | ) | | | — | | | | 1.00 | | 0.73 | | | | 4,476 | | 0.72 | | | 0.72 | | | 1.09 | | | 0.68 | | | 0.31 | | | N/A | |
2003 | | | 1.00 | | | 0.01 | | | | — | † | | | (0.01 | ) | | | — | † | | | 1.00 | | 0.57 | | | | 8,035 | | 0.73 | | | 0.73 | | | 0.91 | | | 0.61 | | | 0.43 | | | N/A | |
2002 | | | 1.00 | | | 0.01 | | | | — | | | | (0.01 | ) | | | — | † | | | 1.00 | | 1.38 | | | | 16,538 | | 0.65 | | | 0.65 | | | 0.77 | | | 1.35 | | | 1.23 | | | N/A | |
2001(3) | | | 1.00 | | | 0.01 | | | | — | | | | (0.01 | ) | | | — | | | | 1.00 | | 0.81 | | | | 788 | | 0.75 | | | 0.75 | | | 16.37 | | | 1.98 | | | (13.64 | ) | | N/A | |
GS8 Class | | | | | | | | | | | | | | | | | | | | | | | | | | | | | | | | | | | | | | | | | | | |
2005 | | $ | 1.00 | | $ | — | † | | $ | — | † | | $ | — | † | | $ | — | | | $ | 1.00 | | 2.15 | % | | $ | 5,145 | | 1.17 | % | | 1.17 | % | | 1.25 | % | | 2.13 | % | | 2.05 | % | | N/A | |
2004(4) | | | 1.00 | | | — | † | | | — | † | | | — | † | | | — | | | | 1.00 | | 0.14 | | | | 5,007 | | 1.17 | | | 1.17 | | | 1.31 | | | 0.94 | | | 0.80 | | | N/A | |
Low-Duration Bond Fund | | | | | | | | | | | | | | | | | | | | | | | | | | | | | | | | |
GS2 Class | | | | | | | | | | | | | | | | | | | | | | | | | | | | | | | | | | | | | | | | | | | |
2005 | | $ | 9.32 | | $ | 0.30 | # | | $ | (0.15 | ) | | $ | (0.41 | ) | | $ | — | † | | $ | 9.06 | | 1.60 | % | | $ | 104,681 | | 0.45 | % | | 0.45 | % | | 0.48 | % | | 3.30 | % | | 3.27 | % | | 196 | % |
2004 | | | 9.51 | | | 0.21 | # | | | (0.07 | ) | | | (0.28 | ) | | | (0.05 | ) | | | 9.32 | | 1.47 | | | | 59,777 | | 0.45 | | | 0.45 | | | 0.49 | | | 2.22 | | | 2.18 | | | 289 | |
2003 | | | 9.76 | | | 0.22 | # | | | 0.03 | | | | (0.37 | ) | | | (0.13 | ) | | | 9.51 | | 2.61 | | | | 53,726 | | 0.45 | | | 0.45 | | | 0.50 | | | 2.30 | | | 2.25 | | | 179 | |
2002 | | | 9.85 | | | 0.37 | # | | | 0.19 | | | | (0.50 | ) | | | (0.15 | ) | | | 9.76 | | 5.89 | | | | 6,320 | | 0.46 | | | 0.45 | | | 0.78 | | | 3.71 | | | 3.38 | | | 182 | |
2001(3) | | | 10.00 | | | 0.15 | | | | — | | | | (0.22 | ) | | | (0.08 | ) | | | 9.85 | | 1.54 | | | | 25 | | 0.45 | | | 0.45 | | | 57.60 | | | 4.73 | | | (52.42 | ) | | 80 | |
GS4 Class | | | | | | | | | | | | | | | | | | | | | | | | | | | | | | | | | | | | | | | | | | | |
2005 | | $ | 12.87 | | $ | 0.40 | # | | $ | (0.22 | ) | | $ | (0.39 | ) | | $ | — | † | | $ | 12.66 | | 1.39 | % | | $ | 789,077 | | 0.61 | % | | 0.61 | % | | 0.67 | % | | 3.13 | % | | 3.07 | % | | 196 | % |
2004 | | | 13.00 | | | 0.27 | # | | | (0.09 | ) | | | (0.26 | ) | | | (0.05 | ) | | | 12.87 | | 1.38 | | | | 789,866 | | 0.61 | | | 0.61 | | | 0.67 | | | 2.06 | | | 2.00 | | | 289 | |
2003 | | | 13.16 | | | 0.32 | # | | | — | | | | (0.35 | ) | | | (0.13 | ) | | | 13.00 | | 2.45 | | | | 727,265 | | 0.61 | | | 0.61 | | | 0.67 | | | 2.43 | | | 2.37 | | | 179 | |
2002 | | | 13.06 | | | 0.46 | # | | | 0.27 | | | | (0.48 | ) | | | (0.15 | ) | | | 13.16 | | 5.71 | | | | 763,987 | | 0.62 | | | 0.61 | | | 0.72 | | | 3.50 | | | 3.39 | | | 182 | |
2001(3) | | | 13.10 | | | 0.21 | | | | 0.05 | | | | (0.22 | ) | | | (0.08 | ) | | | 13.06 | | 1.96 | | | | 812,387 | | 0.61 | | | 0.61 | | | 0.72 | | | 4.47 | | | 4.36 | | | 80 | |
GS6 Class | | | | | | | | | | | | | | | | | | | | | | | | | | | | | | | | | | | | | | | | | | | |
2005 | | $ | 9.36 | | $ | 0.25 | # | | $ | (0.16 | ) | | $ | (0.36 | ) | | $ | — | † | | $ | 9.09 | | 0.96 | % | | $ | 11,380 | | 0.94 | % | | 0.94 | % | | 1.05 | % | | 2.74 | % | | 2.63 | % | | 196 | % |
2004 | | | 9.54 | | | 0.17 | # | | | (0.06 | ) | | | (0.24 | ) | | | (0.05 | ) | | | 9.36 | | 1.17 | | | | 16,087 | | 0.85 | | | 0.85 | | | 0.90 | | | 1.82 | | | 1.77 | | | 289 | |
2003 | | | 9.79 | | | 0.21 | # | | | — | | | | (0.33 | ) | | | (0.13 | ) | | | 9.54 | | 2.20 | | | | 22,452 | | 0.85 | | | 0.84 | | | 0.87 | | | 2.18 | | | 2.15 | | | 179 | |
2002 | | | 9.86 | | | 0.33 | # | | | 0.22 | | | | (0.47 | ) | | | (0.15 | ) | | | 9.79 | | 5.70 | | | | 20,985 | | 0.79 | | | 0.79 | | | 0.93 | | | 3.35 | | | 3.21 | | | 182 | |
2001(3) | | | 10.00 | | | 0.22 | | | | (0.06 | ) | | | (0.22 | ) | | | (0.08 | ) | | | 9.86 | | 1.54 | | | | 3,458 | | 0.85 | | | 0.85 | | | 74.57 | | | 4.18 | | | (69.54 | ) | | 80 | |
GS8 Class | | | | | | | | | | | | | | | | | | | | | | | | | | | | | | | | | | | | | | | | | | | |
2005 | | $ | 9.36 | | $ | 0.23 | # | | $ | (0.16 | ) | | $ | (0.33 | ) | | $ | — | † | | $ | 9.10 | | 0.73 | % | | $ | 5,040 | | 1.30 | % | | 1.30 | % | | 1.50 | % | | 2.44 | % | | 2.24 | % | | 196 | % |
2004(4) | | | 9.50 | | | 0.02 | # | | | (0.01 | ) | | | (0.10 | ) | | | (0.05 | ) | | | 9.36 | | 0.05 | | | | 5,004 | | 1.30 | | | 1.30 | | | 1.53 | | | 1.35 | | | 1.12 | | | 289 | |
| † | Amount represents less than $0.005 per share. |
| # | Calculated using the average shares outstanding method. |
| (3) | Inception date was August 27, 2001. |
| (4) | Inception date was November 8, 2004. |
See Notes to Financial Statements.
128
| | | | | | | | | | | | | | | | | | | | | | | | | | | | | | | | | | | | | | | | | | | | | | | | | | |
| | | | | | | | | | | | | | | | | | | | | | | | | | | Ratios to Average Net Assets (1) | | | | |
| | | Net Asset
Value,
Beginning
of Year | | Net
Investment
Income | | | Realized
and
Unrealized
Gain (Loss) on
Investments | | | Dividends
from Net
Investment
Income | | | Distributions
from Net
Realized
Capital
Gains | | | Return
of
Capital | | | Net
Asset
Value,
End of
Year | | Total
Return
(2) | | | Net Assets,
End of
Year (000) | | Expenses,
Net | | | Expenses,
Including
Expense
Reduction | | | Expenses,
Before
Waivers
and
Expense
Reduction | | | Investment
Income,
Net | | | Investment
Income/
(Loss),
Excluding
Waivers
and
Expense
Reduction | | | Portfolio
Turnover
Rate (2) | |
Medium-Duration Bond Fund | | | | | | | | | | | | | | | | | | | | | | | | | | | | | | | | | | | | | | | | |
GS2 Class | | | | | | | | | | | | | | | | | | | | | | | | | | | | | | | | | | | | | | | | | | | | | | | |
2005 | | $ | 9.06 | | $ | 0.34 | # | | $ | (0.10 | ) | | $ | (0.53 | ) | | $ | (0.06 | ) | | $ | — | | | $ | 8.71 | | 2.62 | % | | $ | 100,800 | | 0.50 | % | | 0.50 | % | | 0.53 | % | | 3.84 | % | | 3.81 | % | | 465 | % |
2004 | | | 9.24 | | | 0.28 | # | | | 0.21 | | | | (0.45 | ) | | | (0.22 | ) | | | — | | | | 9.06 | | 5.34 | | | | 52,865 | | 0.50 | | | 0.50 | | | 0.53 | | | 2.97 | | | 2.94 | | | 372 | |
2003 | | | 9.47 | | | 0.28 | # | | | 0.36 | | | | (0.58 | ) | | | (0.29 | ) | | | — | | | | 9.24 | | 6.80 | | | | 46,521 | | 0.50 | | | 0.50 | | | 0.55 | | | 2.96 | | | 2.91 | | | 458 | |
2002 | | | 9.65 | | | 0.46 | # | | | 0.40 | | | | (0.67 | ) | | | (0.37 | ) | | | — | | | | 9.47 | | 9.25 | | | | 7,218 | | 0.51 | | | 0.50 | | | 0.82 | | | 4.77 | | | 4.45 | | | 543 | |
2001(3) | | | 10.00 | | | 0.16 | | | | (0.08 | ) | | | (0.23 | ) | | | (0.20 | ) | | | — | † | | | 9.65 | | 0.89 | | | | 25 | | 0.52 | | | 0.50 | | | 92.28 | | | 4.99 | | | (86.79 | ) | | 247 | |
GS4 Class | | | | | | | | | | | | | | | | | | | | | | | | | | | | | | | | | | | | | | | | | | | | | | | |
2005 | | $ | 13.63 | | $ | 0.50 | # | | $ | (0.16 | ) | | $ | (0.51 | ) | | $ | (0.06 | ) | | $ | — | | | $ | 13.40 | | 2.50 | % | | $ | 981,935 | | 0.62 | % | | 0.62 | % | | 0.71 | % | | 3.71 | % | | 3.62 | % | | 465 | % |
2004 | | | 13.58 | | | 0.39 | # | | | 0.31 | | | | (0.43 | ) | | | (0.22 | ) | | | — | | | | 13.63 | | 5.20 | | | | 853,377 | | 0.62 | | | 0.62 | | | 0.72 | | | 2.85 | | | 2.75 | | | 372 | |
2003 | | | 13.54 | | | 0.46 | # | | | 0.43 | | | | (0.56 | ) | | | (0.29 | ) | | | — | | | | 13.58 | | 6.62 | | | | 741,743 | | 0.62 | | | 0.62 | | | 0.71 | | | 3.37 | | | 3.28 | | | 458 | |
2002 | | | 13.37 | | | 0.62 | # | | | 0.57 | | | | (0.65 | ) | | | (0.37 | ) | | | — | | | | 13.54 | | 9.15 | | | | 767,926 | | 0.63 | | | 0.62 | | | 0.77 | | | 4.62 | | | 4.47 | | | 543 | |
2001(3) | | | 13.60 | | | 0.22 | | | | (0.02 | ) | | | (0.23 | ) | | | (0.20 | ) | | | — | † | | | 13.37 | | 1.49 | | | | 827,774 | | 0.64 | | | 0.62 | | | 0.77 | | | 4.62 | | | 4.47 | | | 247 | |
GS6 Class | | | | | | | | | | | | | | | | | | | | | | | | | | | | | | | | | | | | | | | | | | | | | | | |
2005 | | $ | 9.12 | | $ | 0.29 | # | | $ | (0.09 | ) | | $ | (0.48 | ) | | $ | (0.06 | ) | | $ | — | | | $ | 8.78 | | 2.18 | % | | $ | 13,195 | | 1.00 | % | | 1.00 | % | | 1.06 | % | | 3.29 | % | | 3.21 | % | | 465 | % |
2004 | | | 9.30 | | | 0.24 | # | | | 0.21 | | | | (0.41 | ) | | | (0.22 | ) | | | — | | | | 9.12 | | 4.88 | | | | 16,524 | | 0.90 | | | 0.90 | | | 0.95 | | | 2.61 | | | 2.56 | | | 372 | |
2003 | | | 9.53 | | | 0.29 | # | | | 0.31 | | | | (0.54 | ) | | | (0.29 | ) | | | — | | | | 9.30 | | 6.33 | | | | 22,640 | | 0.90 | | | 0.90 | | | 0.96 | | | 3.03 | | | 2.97 | | | 458 | |
2002 | | | 9.70 | | | 0.42 | # | | | 0.41 | | | | (0.63 | ) | | | (0.37 | ) | | | — | | | | 9.53 | | 8.90 | | | | 19,289 | | 0.90 | | | 0.90 | | | 1.03 | | | 4.37 | | | 4.24 | | | 543 | |
2001(3) | | | 10.00 | | | 0.17 | | | | (0.04 | ) | | | (0.23 | ) | | | (0.20 | ) | | | — | † | | | 9.70 | | 1.30 | | | | 123 | | 0.92 | | | 0.90 | | | 58.64 | | | 4.49 | | | (53.25 | ) | | 247 | |
GS8 Class | | | | | | | | | | | | | | | | | | | | | | | | | | | | | | | | | | | | | | | | | | | | | | | |
2005 | | $ | 9.13 | | $ | 0.27 | # | | $ | (0.11 | ) | | $ | (0.45 | ) | | $ | (0.06 | ) | | $ | — | | | $ | 8.78 | | 1.73 | % | | $ | 5,132 | | 1.35 | % | | 1.35 | % | | 1.52 | % | | 2.96 | % | | 2.81 | % | | 465 | % |
2004(4) | | | 9.46 | | | 0.02 | # | | | 0.07 | | | | (0.20 | ) | | | (0.22 | ) | | | — | | | | 9.13 | | 0.87 | | | | 5,043 | | 1.35 | | | 1.35 | | | 1.59 | | | 1.41 | | | 1.17 | | | 372 | |
Extended-Duration Bond Fund | | | | | | | | | | | | | | | | | | | | | | | | | | | | | | | | | | | | | | | | |
GS2 Class | | | | | | | | | | | | | | | | | | | | | | | | | | | | | | | | | | | | | | | | | | | | | | | |
2005 | | $ | 8.90 | | $ | 0.44 | # | | $ | 0.04 | | | $ | (0.68 | ) | | $ | (0.26 | ) | | $ | — | | | $ | 8.44 | | 5.65 | % | | $ | 57,372 | | 0.56 | % | | 0.56 | % | | 0.57 | % | | 4.90 | % | | 4.89 | % | | 38 | % |
2004 | | | 9.23 | | | 0.47 | # | | | 0.27 | | | | (0.76 | ) | | | (0.31 | ) | | | — | | | | 8.90 | | 8.49 | | | | 32,309 | | 0.57 | | | 0.57 | | | 0.57 | | | 5.17 | | | 5.17 | | | 66 | |
2003 | | | 9.64 | | | 0.54 | # | | | 0.51 | | | | (0.79 | ) | | | (0.67 | ) | | | — | | | | 9.23 | | 11.32 | | | | 29,004 | | 0.59 | | | 0.59 | | | 0.60 | | | 5.49 | | | 5.48 | | | 121 | |
2002 | | | 9.84 | | | 0.65 | | | | 0.29 | | | | (0.90 | ) | | | (0.24 | ) | | | — | | | | 9.64 | | 10.27 | | | | 6,506 | | 0.64 | | | 0.64 | | | 0.88 | | | 6.47 | | | 6.23 | | | 45 | |
2001(3) | | | 10.00 | | | 0.24 | | | | (0.03 | ) | | | (0.33 | ) | | | (0.04 | ) | | | — | | | | 9.84 | | 2.13 | | | | 26 | | 0.66 | | | 0.65 | | | 90.75 | | | 6.62 | | | (83.48 | ) | | 22 | |
GS4 Class | | | | | | | | | | | | | | | | | | | | | | | | | | | | | | | | | | | | | | | | | | | | | | | |
2005 | | $ | 14.93 | | $ | 0.71 | # | | $ | 0.10 | | | $ | (0.66 | ) | | $ | (0.26 | ) | | $ | — | | | $ | 14.82 | | 5.54 | % | | $ | 393,851 | | 0.73 | % | | 0.73 | % | | 0.76 | % | | 4.72 | % | | 4.69 | % | | 38 | % |
2004 | | | 14.78 | | | 0.75 | # | | | 0.45 | | | | (0.74 | ) | | | (0.31 | ) | | | — | | | | 14.93 | | 8.37 | | | | 399,459 | | 0.73 | | | 0.73 | | | 0.75 | | | 5.01 | | | 4.99 | | | 66 | |
2003 | | | 14.62 | | | 0.83 | # | | | 0.77 | | | | (0.77 | ) | | | (0.67 | ) | | | — | | | | 14.78 | | 11.19 | | | | 385,110 | | 0.73 | | | 0.73 | | | 0.75 | | | 5.46 | | | 5.44 | | | 121 | |
2002 | | | 14.37 | | | 0.90 | | | | 0.47 | | | | (0.88 | ) | | | (0.24 | ) | | | — | | | | 14.62 | | 10.03 | | | | 401,198 | | 0.73 | | | 0.73 | | | 0.82 | | | 6.29 | | | 6.20 | | | 45 | |
2001(3) | | | 14.38 | | | 0.32 | | | | 0.03 | | | | (0.32 | ) | | | (0.04 | ) | | | — | | | | 14.37 | | 2.48 | | | | 404,278 | | 0.74 | | | 0.73 | | | 0.84 | | | 6.32 | | | 6.21 | | | 22 | |
GS6 Class | | | | | | | | | | | | | | | | | | | | | | | | | | | | | | | | | | | | | | | | | | | | | | | |
2005 | | $ | 8.89 | | $ | 0.39 | # | | $ | 0.05 | | | $ | (0.63 | ) | | $ | (0.26 | ) | | $ | — | | | $ | 8.44 | | 5.19 | % | | $ | 15,100 | | 1.09 | % | | 1.09 | % | | 1.09 | % | | 4.37 | % | | 4.37 | % | | 38 | % |
2004 | | | 9.22 | | | 0.44 | # | | | 0.27 | | | | (0.73 | ) | | | (0.31 | ) | | | — | | | | 8.89 | | 8.05 | | | | 24,043 | | 0.98 | | | 0.98 | | | 0.96 | | | 4.76 | | | 4.78 | | | 66 | |
2003 | | | 9.63 | | | 0.52 | # | | | 0.50 | | | | (0.76 | ) | | | (0.67 | ) | | | — | | | | 9.22 | | 10.95 | | | | 27,978 | | 0.93 | | | 0.93 | | | 0.94 | | | 5.25 | | | 5.24 | | | 121 | |
2002 | | | 9.83 | | | 0.62 | | | | 0.29 | | | | (0.87 | ) | | | (0.24 | ) | | | — | | | | 9.63 | | 9.93 | | | | 24,812 | | 0.91 | | | 0.91 | | | 1.03 | | | 6.18 | | | 6.06 | | | 45 | |
2001(3) | | | 10.00 | | | 0.32 | | | | (0.13 | ) | | | (0.32 | ) | | | (0.04 | ) | | | — | | | | 9.83 | | 1.91 | | | | 8,553 | | 1.06 | | | 1.05 | | | 28.96 | | | 6.14 | | | (21.77 | ) | | 22 | |
GS8 Class | | | | | | | | | | | | | | | | | | | | | | | | | | | | | | | | | | | | | | | | | | | | | | | |
2005 | | $ | 8.89 | | $ | 0.35 | # | | $ | 0.06 | | | $ | (0.60 | ) | | $ | (0.26 | ) | | $ | — | | | $ | 8.44 | | 4.81 | % | | $ | 5,339 | | 1.50 | % | | 1.50 | % | | 1.56 | % | | 3.95 | % | | 3.89 | % | | 38 | % |
2004(4) | | | 9.23 | | | 0.06 | # | | | 0.11 | | | | (0.20 | ) | | | (0.31 | ) | | | — | | | | 8.89 | | 1.91 | | | | 5,096 | | 1.50 | | | 1.50 | | | 1.61 | | | 4.31 | | | 4.20 | | | 66 | |
See Notes to Financial Statements.
129
FINANCIAL HIGHLIGHTS (Continued)
For a Share Outstanding Throughout the Year Ending December 31, unless otherwise indicated
| | | | | | | | | | | | | | | | | | | | | | | | | | | | | | | | | | | | | | | | | | | | | | | | | | |
| | | | | | | | | | | | | | | | | | | | | | | | | | | Ratios to Average Net Assets (1) | | | | |
| | | Net Asset
Value,
Beginning
of Year | | Net
Investment
Income | | | Realized
and
Unrealized
Gain (Loss)
on
Investments | | | Dividends
from Net
Investment
Income | | | Distributions
from Net
Realized
Capital
Gains | | | Excess
Distribution/
Return of
Capital | | | Net
Asset
Value,
End of
Year | | Total
Return
(2) | | | Net Assets,
End of Year (000) | | Expenses,
Net | | | Expenses,
Including
Expense
Reduction | | | Expenses,
Before
Waivers
and
Expense
Reduction | | | Investment
Income,
Net | | | Investment
Income/
(Loss),
Excluding
Waivers
and
Expense
Reduction | | | Portfolio
Turnover
Rate (2) | |
Equity Index Fund | | | | | | | | | | | | | | | | | | | | | | | | | | | | | | | | | | | | | | | | | | | | |
GS2 Class | | | | | | | | | | | | | | | | | | | | | | | | | | | | | | | | | | | | | | | | | | | | |
2005 | | $ | 9.78 | | $ | 0.16 | # | | $ | 0.30 | | | $ | (0.24 | ) | | $ | (0.04 | ) | | $ | — | | | $ | 9.96 | | 4.80 | % | | $ | 62,214 | | 0.23 | % | | 0.23 | % | | 0.24 | % | | 1.63 | % | | 1.62 | % | | 6 | % |
2004 | | | 9.08 | | | 0.16 | # | | | 0.81 | | | | (0.27 | ) | | | — | | | | — | † | | | 9.78 | | 10.77 | | | | 36,148 | | 0.25 | | | 0.25 | | | 0.23 | | | 1.75 | | | 1.77 | | | 2 | |
2003 | | | 7.22 | | | 0.12 | # | | | 1.91 | | | | (0.17 | ) | | | — | | | | — | | | | 9.08 | | 28.19 | | | | 33,009 | | 0.25 | | | 0.25 | | | 0.28 | | | 1.46 | | | 1.43 | | | 2 | |
2002 | | | 9.58 | | | 0.14 | | | | (2.29 | ) | | | (0.18 | ) | | | (0.03 | ) | | | — | | | | 7.22 | | (22.57 | ) | | | 4,737 | | 0.25 | | | 0.25 | | | 0.60 | | | 1.40 | | | 1.05 | | | 3 | |
2001(3) | | | 10.00 | | | 0.03 | | | | (0.34 | ) | | | (0.06 | ) | | | (0.05 | ) | | | — | | | | 9.58 | | (3.14 | ) | | | 28 | | 0.25 | | | 0.25 | | | 86.25 | | | 1.19 | | | (84.81 | ) | | 3 | |
GS4 Class | | | | | | | | | | | | | | | | | | | | | | | | | | | | | | | | | | | | | | | | | | | | |
2005 | | $ | 16.47 | | $ | 0.24 | # | | $ | 0.51 | | | $ | (0.21 | ) | | $ | (0.04 | ) | | $ | — | | | $ | 16.97 | | 4.61 | % | | $ | 402,865 | | 0.40 | % | | 0.40 | % | | 0.43 | % | | 1.46 | % | | 1.43 | % | | 6 | % |
2004 | | | 15.12 | | | 0.25 | # | | | 1.35 | | | | (0.25 | ) | | | — | | | | — | | | | 16.47 | | 10.60 | | | | 417,962 | | 0.40 | | | 0.40 | | | 0.41 | | | 1.60 | | | 1.59 | | | 2 | |
2003 | | | 11.93 | | | 0.18 | # | | | 3.16 | | | | (0.15 | ) | | | — | | | | — | | | | 15.12 | | 28.03 | | | | 382,067 | | 0.40 | | | 0.40 | | | 0.44 | | | 1.33 | | | 1.29 | | | 2 | |
2002 | | | 15.64 | | | 0.17 | | | | (3.69 | ) | | | (0.16 | ) | | | (0.03 | ) | | | — | | | | 11.93 | | (22.59 | ) | | | 295,261 | | 0.40 | | | 0.40 | | | 0.51 | | | 1.21 | | | 1.10 | | | 3 | |
2001(3) | | | 16.15 | | | 0.05 | | | | (0.46 | ) | | | (0.05 | ) | | | (0.05 | ) | | | — | | | | 15.64 | | (2.55 | ) | | | 401,471 | | 0.40 | | | 0.40 | | | 0.53 | | | 0.98 | | | 0.85 | | | 3 | |
GS6 Class | | | | | | | | | | | | | | | | | | | | | | | | | | | | | | | | | | | | | | | | | | | | |
2005 | | $ | 9.83 | | $ | 0.13 | # | | $ | 0.31 | | | $ | (0.21 | ) | | $ | (0.04 | ) | | $ | — | | | $ | 10.02 | | 4.54 | % | | $ | 12,019 | | 0.56 | % | | 0.56 | % | | 0.82 | % | | 1.30 | % | | 1.04 | % | | 6 | % |
2004 | | | 9.14 | | | 0.13 | # | | | 0.81 | | | | (0.25 | ) | | | — | | | | — | | | | 9.83 | | 10.37 | | | | 11,502 | | 0.45 | | | 0.45 | | | 0.72 | | | 1.41 | | | 1.14 | | | 2 | |
2003 | | | 7.26 | | | 0.10 | # | | | 1.93 | | | | (0.15 | ) | | | — | | | | — | | | | 9.14 | | 28.09 | | | | 17,395 | | 0.45 | | | 0.45 | | | 0.73 | | | 1.28 | | | 1.00 | | | 2 | |
2002 | | | 9.63 | | | 0.13 | | | | (2.31 | ) | | | (0.16 | ) | | | (0.03 | ) | | | — | | | | 7.26 | | (22.71 | ) | | | 12,890 | | 0.45 | | | 0.45 | | | 0.81 | | | 1.21 | | | 0.85 | | | 3 | |
2001(3) | | | 10.00 | | | 0.02 | | | | (0.28 | ) | | | (0.06 | ) | | | (0.05 | ) | | | — | | | | 9.63 | | (2.65 | ) | | | 367 | | 0.45 | | | 0.45 | | | 28.52 | | | 0.95 | | | (27.12 | ) | | 3 | |
GS8 Class | | | | | | | | | | | | | | | | | | | | | | | | | | | | | | | | | | | | | | | | | | | | |
2005 | | $ | 9.84 | | $ | 0.09 | # | | $ | 0.31 | | | $ | (0.18 | ) | | $ | (0.04 | ) | | $ | — | | | $ | 10.02 | | 4.09 | % | | $ | 5,421 | | 0.90 | % | | 0.90 | % | | 1.19 | % | | 0.96 | % | | 0.67 | % | | 6 | % |
2004(4) | | | 9.55 | | | 0.04 | # | | | 0.35 | | | | (0.10 | ) | | | — | | | | — | | | | 9.84 | | 4.11 | | | | 5,205 | | 0.90 | | | 0.90 | | | 1.27 | | | 3.18 | | | 2.81 | | | 2 | |
Value Equity Fund | | | | | | | | | | | | | | | | | | | | | | | | | | | | | | | | | | | | | | | | | | | | |
GS2 Class | | | | | | | | | | | | | | | | | | | | | | | | | | | | | | | | | | | | | | | | | | | | |
2005 | | $ | 11.44 | | $ | 0.20 | # | | $ | 0.65 | | | $ | (0.28 | ) | | $ | (1.26 | ) | | $ | — | | | $ | 10.75 | | 7.40 | % | | $ | 156,279 | | 0.73 | % | | 0.72 | % | | 0.73 | % | | 1.72 | % | | 1.71 | % | | 54 | % |
2004 | | | 9.94 | | | 0.17 | # | | | 1.59 | | | | (0.26 | ) | | | — | † | | | — | | | | 11.44 | | 17.83 | | | | 75,123 | | 0.75 | | | 0.74 | | | 0.74 | | | 1.64 | | | 1.64 | | | 56 | |
2003 | | | 7.77 | | | 0.14 | # | | | 2.26 | | | | (0.23 | ) | | | — | | | | — | | | | 9.94 | | 31.09 | | | | 69,991 | | 0.76 | | | 0.75 | | | 0.78 | | | 1.62 | | | 1.59 | | | 54 | |
2002 | | | 9.64 | | | 0.16 | | | | (1.80 | ) | | | (0.23 | ) | | | — | | | | — | † | | | 7.77 | | (17.22 | ) | | | 5,265 | | 0.76 | | | 0.72 | | | 1.06 | | | 1.77 | | | 1.43 | | | 70 | |
2001(3) | | | 10.00 | | | 0.06 | | | | (0.35 | ) | | | (0.07 | ) | | | — | | | | — | | | | 9.64 | | (2.88 | ) | | | 77 | | 0.76 | | | 0.76 | | | 81.37 | | | 1.60 | | | (79.01 | ) | | 21 | |
GS4 Class | | | | | | | | | | | | | | | | | | | | | | | | | | | | | | | | | | | | | | | | | | | | |
2005 | | $ | 17.74 | | $ | 0.28 | # | | $ | 0.99 | | | $ | (0.25 | ) | | $ | (1.26 | ) | | $ | — | | | $ | 17.50 | | 7.13 | % | | $ | 1,279,940 | | 0.90 | % | | 0.89 | % | | 0.93 | % | | 1.53 | % | | 1.49 | % | | 54 | % |
2004 | | | 15.28 | | | 0.24 | # | | | 2.45 | | | | (0.23 | ) | | | — | | | | — | | | | 17.74 | | 17.71 | | | | 1,305,669 | | 0.90 | | | 0.89 | | | 0.92 | | | 1.49 | | | 1.46 | | | 56 | |
2003 | | | 11.85 | | | 0.21 | # | | | 3.43 | | | | (0.21 | ) | | | — | | | | — | | | | 15.28 | | 30.84 | | | | 1,152,116 | | 0.90 | | | 0.88 | | | 0.94 | | | 1.59 | | | 1.53 | | | 54 | |
2002 | | | 14.57 | | | 0.21 | | | | (2.73 | ) | | | (0.20 | ) | | | — | | | | — | † | | | 11.85 | | (17.37 | ) | | | 938,583 | | 0.90 | | | 0.87 | | | 0.98 | | | 1.57 | | | 1.46 | | | 70 | |
2001(3) | | | 15.21 | | | 0.06 | | | | (0.64 | ) | | | (0.06 | ) | | | — | | | | — | | | | 14.57 | | (3.79 | ) | | | 1,159,209 | | 0.90 | | | 0.90 | | | 1.00 | | | 1.29 | | | 1.19 | | | 21 | |
GS6 Class | | | | | | | | | | | | | | | | | | | | | | | | | | | | | | | | | | | | | | | | | | | | |
2005 | | $ | 11.39 | | $ | 0.14 | # | | $ | 0.64 | | | $ | (0.22 | ) | | $ | (1.26 | ) | | $ | — | | | $ | 10.69 | | 6.78 | % | | $ | 15,003 | | 1.25 | % | | 1.24 | % | | 1.27 | % | | 1.17 | % | | 1.14 | % | | 54 | % |
2004 | | | 9.90 | | | 0.12 | # | | | 1.59 | | | | (0.22 | ) | | | — | | | | — | | | | 11.39 | | 17.35 | | | | 17,968 | | 1.15 | | | 1.14 | | | 1.22 | | | 1.20 | | | 1.12 | | | 56 | |
2003 | | | 7.75 | | | 0.11 | # | | | 2.23 | | | | (0.19 | ) | | | — | | | | — | | | | 9.90 | | 30.46 | | | | 19,680 | | 1.15 | | | 1.13 | | | 1.20 | | | 1.33 | | | 1.26 | | | 54 | |
2002 | | | 9.61 | | | 0.15 | | | | (1.82 | ) | | | (0.19 | ) | | | — | | | | — | † | | | 7.75 | | (17.48 | ) | | | 13,987 | | 1.15 | | | 1.11 | | | 1.29 | | | 1.38 | | | 1.20 | | | 70 | |
2001(3) | | | 10.00 | | | 0.03 | | | | (0.35 | ) | | | (0.07 | ) | | | — | | | | — | | | | 9.61 | | (3.23 | ) | | | 168 | | 1.15 | | | 1.15 | | | 65.50 | | | 1.12 | | | (63.23 | ) | | 21 | |
GS8 Class | | | | | | | | | | | | | | | | | | | | | | | | | | | | | | | | | | | | | | | | | | | | |
2005 | | $ | 11.39 | | $ | 0.10 | # | | $ | 0.63 | | | $ | (0.18 | ) | | $ | (1.26 | ) | | $ | — | | | $ | 10.68 | | 6.39 | % | | $ | 5,603 | | 1.60 | % | | 1.59 | % | | 1.71 | % | | 0.83 | % | | 0.71 | % | | 54 | % |
2004(4) | | | 10.89 | | | 0.03 | # | | | 0.54 | | | | (0.07 | ) | | | — | | | | — | | | | 11.39 | | 5.28 | | | | 5,262 | | 1.60 | | | 1.59 | | | 1.79 | | | 1.71 | | | 1.51 | | | 56 | |
| † | Amount represents less than $0.005 per share. |
| # | Calculated using the average shares outstanding method. |
| (3) | Inception date was August 27, 2001. |
| (4) | Inception date was November 8, 2004. |
See Notes to Financial Statements.
130
| | | | | | | | | | | | | | | | | | | | | | | | | | | | | | | | | | | | | | | | | | |
| | | | | | | | | | | | | | | | | | | | | Ratios to Average Net Assets (1) | | | | |
| | | Net Asset
Value,
Beginning
of Year | | Net
Investment
Income/
(Loss) | | | Realized
and
Unrealized
Gain (Loss)
on
Investments | | | Distributions
from Net
Realized
Capital
Gains | | | Net
Asset
Value,
End of
Year | | Total
Return
(2) | | | Net Assets,
End of Year
(000) | | Expenses,
Net | | | Expenses,
Including
Expense
Reduction | | | Expenses,
Before
Waivers
and
Expense
Reduction | | | Investment
Income/
(Loss), Net | | | Investment
Income/
(Loss),
Excluding
Waivers
and
Expense
Reduction | | | Portfolio
Turnover
Rate (2) | |
Growth Equity Fund | | | | | | | | | | | | | | | | | | | | | | | | | | | | | | | | | | | | |
GS2 Class | | | | | | | | | | | | | | | | | | | | | | | | | | | | | | | | | | | | |
2005 | | $ | 10.29 | | $ | (0.03 | ) | | $ | 0.92 | | | $ | — | | | $ | 11.18 | | 8.65 | % | | $ | 172,118 | | 0.87 | % | | 0.86 | % | | 0.89 | % | | (0.10 | )% | | (0.13 | )% | | 49 | % |
2004 | | | 9.16 | | | — | | | | 1.13 | | | | — | | | | 10.29 | | 12.34 | | | | 84,177 | | 0.87 | | | 0.86 | | | 0.89 | | | 0.01 | | | (0.02 | ) | | 56 | |
2003 | | | 7.07 | | | (0.01 | ) | | | 2.10 | | | | — | | | | 9.16 | | 29.56 | | | | 79,547 | | 0.81 | | | 0.79 | | | 0.85 | | | (0.03 | ) | | (0.09 | ) | | 77 | |
2002 | | | 9.83 | | | 0.01 | | | | (2.77 | ) | | | — | | | | 7.07 | | (28.08 | ) | | | 4,553 | | 0.78 | | | 0.75 | | | 1.14 | | | 0.09 | | | (0.30 | ) | | 41 | |
2001(3) | | | 10.00 | | | — | † | | | (0.17 | ) | | | — | | | | 9.83 | | (1.70 | ) | | | 29 | | 0.78 | | | 0.78 | | | 83.19 | | | 0.02 | | | (82.39 | ) | | 9 | |
GS4 Class | | | | | | | | | | | | | | | | | | | | | | | | | | | | | | | | | | | | |
2005 | | $ | 16.33 | | $ | (0.04 | ) | | $ | 1.42 | | | $ | — | | | $ | 17.71 | | 8.45 | % | | $ | 1,362,599 | | 0.99 | % | | 0.98 | % | | 1.08 | % | | (0.22 | )% | | (0.32 | )% | | 49 | % |
2004 | | | 14.55 | | | (0.02 | ) | | | 1.80 | | | | — | | | | 16.33 | | 12.23 | | | | 1,405,754 | | 0.99 | | | 0.98 | | | 1.08 | | | (0.11 | ) | | (0.21 | ) | | 56 | |
2003 | | | 11.23 | | | (0.01 | ) | | | 3.33 | | | | — | | | | 14.55 | | 29.56 | | | | 1,285,223 | | 0.92 | | | 0.90 | | | 1.01 | | | (0.07 | ) | | (0.18 | ) | | 77 | |
2002 | | | 15.63 | | | (0.01 | ) | | | (4.39 | ) | | | — | | | | 11.23 | | (28.15 | ) | | | 1,049,709 | | 0.90 | | | 0.88 | | | 1.02 | | | (0.05 | ) | | (0.19 | ) | | 41 | |
2001(3) | | | 15.93 | | | (0.01 | ) | | | (0.29 | ) | | | — | | | | 15.63 | | (1.88 | ) | | | 1,354,301 | | 0.90 | | | 0.90 | | | 1.05 | | | (0.11 | ) | | (0.26 | ) | | 9 | |
GS6 Class | | | | | | | | | | | | | | | | | | | | | | | | | | | | | | | | | | | | |
2005 | | $ | 10.17 | | $ | (0.09 | ) | | $ | 0.91 | | | $ | — | | | $ | 10.99 | | 8.06 | % | | $ | 11,406 | | 1.34 | % | | 1.33 | % | | 1.47 | % | | (0.57 | )% | | (0.71 | )% | | 49 | % |
2004 | | | 9.08 | | | (0.07 | ) | | | 1.16 | | | | — | | | | 10.17 | | 12.00 | | | | 13,780 | | 1.24 | | | 1.23 | | | 1.44 | | | (0.42 | ) | | (0.63 | ) | | 56 | |
2003 | | | 7.03 | | | (0.02 | ) | | | 2.07 | | | | — | | | | 9.08 | | 29.16 | | | | 18,099 | | 1.17 | | | 1.15 | | | 1.33 | | | (0.33 | ) | | (0.51 | ) | | 77 | |
2002 | | | 9.81 | | | (0.02 | ) | | | (2.76 | ) | | | — | | | | 7.03 | | (28.34 | ) | | | 12,503 | | 1.15 | | | 1.12 | | | 1.36 | | | (0.28 | ) | | (0.52 | ) | | 41 | |
2001(3) | | | 10.00 | | | — | † | | | (0.19 | ) | | | — | | | | 9.81 | | (1.90 | ) | | | 309 | | 1.15 | | | 1.15 | | | 47.77 | | | (0.32 | ) | | (46.94 | ) | | 9 | |
GS8 Class | | | | | | | | | | | | | | | | | | | | | | | | | | | | | | | | | | | | |
2005 | | $ | 10.16 | | $ | (0.09 | ) | | $ | 0.88 | | | $ | — | | | $ | 10.95 | | 7.78 | % | | $ | 5,708 | | 1.69 | % | | 1.68 | % | | 1.88 | % | | (0.92 | )% | | (1.12 | )% | | 49 | % |
2004(4) | | | 9.59 | | | — | † | | | 0.57 | | | | — | | | | 10.16 | | 5.94 | | | | 5,299 | | 1.69 | | | 1.67 | | | 1.97 | | | 0.30 | | | — | | | 56 | |
Small Cap Equity Fund | | | | | | | | | | | | | | | | | | | | | | | | | | | | | | | | | | | | |
GS2 Class | | | | | | | | | | | | | | | | | | | | | | | | | | | | | | | | | | | | |
2005 | | $ | 12.51 | | $ | (0.01 | )# | | $ | 0.84 | | | $ | (1.94 | ) | | $ | 11.40 | | 6.48 | % | | $ | 62,009 | | 1.10 | % | | 1.09 | % | | 1.07 | % | | (0.06 | )% | | -0.04 | % | | 97 | % |
2004 | | | 11.52 | | | (0.01 | ) | | | 1.74 | | | | (0.74 | ) | | | 12.51 | | 15.04 | | | | 28,639 | | 1.18 | | | 1.15 | | | 1.20 | | | (0.10 | ) | | (0.15 | ) | | 148 | |
2003 | | | 7.88 | | | (0.03 | ) | | | 3.67 | | | | — | | | | 11.52 | | 46.19 | | | | 25,415 | | 1.18 | | | 1.12 | | | 1.27 | | | (0.26 | ) | | (0.41 | ) | | 131 | |
2002 | | | 10.12 | | | (0.01 | ) | | | (2.23 | ) | | | — | | | | 7.88 | | (22.13 | ) | | | 4,869 | | 1.18 | | | 1.11 | | | 1.60 | | | (0.12 | ) | | (0.61 | ) | | 160 | |
2001(3) | | | 10.00 | | | — | † | | | 0.12 | | | | — | | | | 10.12 | | 1.20 | | | | 81 | | 1.18 | | | 1.18 | | | 76.30 | | | 0.12 | | | (75.00 | ) | | 92 | |
GS4 Class | | | | | | | | | | | | | | | | | | | | | | | | | | | | | | | | | | | | |
2005 | | $ | 16.48 | | $ | (0.03 | )# | | $ | 1.10 | | | $ | (1.94 | ) | | $ | 15.61 | | 6.37 | % | | $ | 463,367 | | 1.22 | % | | 1.21 | % | | 1.27 | % | | (0.19 | )% | | (0.26 | )% | | 97 | % |
2004 | | | 14.99 | | | (0.02 | ) | | | 2.25 | | | | (0.74 | ) | | | 16.48 | | 14.89 | | | | 432,763 | | 1.25 | | | 1.22 | | | 1.37 | | | (0.16 | ) | | (0.31 | ) | | 148 | |
2003 | | | 10.25 | | | (0.04 | ) | | | 4.78 | | | | — | | | | 14.99 | | 46.24 | | | | 357,703 | | 1.25 | | | 1.19 | | | 1.43 | | | (0.34 | ) | | (0.58 | ) | | 131 | |
2002 | | | 13.18 | | | (0.02 | ) | | | (2.91 | ) | | | — | | | | 10.25 | | (22.23 | ) | | | 232,992 | | 1.25 | | | 1.19 | | | 1.51 | | | (0.19 | ) | | (0.51 | ) | | 160 | |
2001(3) | | | 13.07 | | | (0.01 | ) | | | 0.12 | | | | — | | | | 13.18 | | 0.84 | | | | 321,743 | | 1.25 | | | 1.25 | | | 1.52 | | | (0.13 | ) | | (0.40 | ) | | 92 | |
GS6 Class | | | | | | | | | | | | | | | | | | | | | | | | | | | | | | | | | | | | |
2005 | | $ | 12.34 | | $ | (0.06 | )# | | $ | 0.82 | | | $ | (1.94 | ) | | $ | 11.16 | | 6.00 | % | | $ | 15,577 | | 1.57 | % | | 1.56 | % | | 1.59 | % | | (0.53 | )% | | (0.56 | )% | | 97 | % |
2004 | | | 11.41 | | | (0.08 | ) | | | 1.75 | | | | (0.74 | ) | | | 12.34 | | 14.66 | | | | 17,875 | | 1.50 | | | 1.47 | | | 1.69 | | | (0.43 | ) | | (0.65 | ) | | 148 | |
2003 | | | 7.83 | | | (0.04 | ) | | | 3.62 | | | | — | | | | 11.41 | | 45.72 | | | | 22,520 | | 1.50 | | | 1.44 | | | 1.70 | | | (0.59 | ) | | (0.85 | ) | | 131 | |
2002 | | | 10.09 | | | (0.04 | ) | | | (2.22 | ) | | | — | | | | 7.83 | | (22.40 | ) | | | 12,878 | | 1.50 | | | 1.43 | | | 1.82 | | | (0.44 | ) | | (0.83 | ) | | 160 | |
2001(3) | | | 10.00 | | | — | † | | | 0.09 | | | | — | | | | 10.09 | | 0.90 | | | | 115 | | 1.50 | | | 1.50 | | | 123.38 | | | (0.28 | ) | | (122.16 | ) | | 92 | |
GS8 Class | | | | | | | | | | | | | | | | | | | | | | | | | | | | | | | | | | | | |
2005 | | $ | 12.34 | | $ | (0.11 | )# | | $ | 0.82 | | | $ | (1.94 | ) | | $ | 11.11 | | 5.61 | % | | $ | 5,694 | | 1.92 | % | | 1.91 | % | | 2.07 | % | | (0.88 | )% | | (1.04 | )% | | 97 | % |
2004(4) | | | 12.14 | | | (0.01 | ) | | | 0.95 | | | | (0.74 | ) | | | 12.34 | | 7.77 | | | | 5,386 | | 1.95 | | | 1.91 | | | 2.19 | | | (0.68 | ) | | (0.96 | ) | | 148 | |
See Notes to Financial Statements.
131
FINANCIAL HIGHLIGHTS (Continued)
For a Share Outstanding Throughout the Year Ending December 31, unless otherwise indicated
| | | | | | | | | | | | | | | | | | | | | | | | | | | | | | | | | | | | | | | | | | | | | | | | | | |
| | | | | | | | | | | | | | | | | | | | | | | | | | | Ratios to Average Net Assets (1) | | | | |
| | | Net Asset
Value,
Beginning
of Year | | Net
Investment
Income/
(Loss) | | | Realized
and
Unrealized
Gain (Loss)
on
Investments | | | Dividends
from Net
Investment
Income | | | Distributions
from Net
Realized
Capital
Gains | | | Return
of
Capital | | | Net
Asset
Value,
End of
Year | | Total
Return
(2) | | | Net Assets,
End of Year
(000) | | Expenses,
Net | | | Expenses,
Including
Expense
Reduction | | | Expenses,
Before
Waivers
and
Expense
Reduction | | | Investment
Income/
(Loss), Net | | | Investment
Income/
(Loss),
Excluding
Waivers
and
Expense
Reduction | | | Portfolio
Turnover
Rate (2) | |
International Equity Fund | | | | | | | | | | | | | | | | | | | | | | | | | | | | | | | | | | | | | | | | |
GS2 Class | | | | | | | | | | | | | | | | | | | | | | | | | | | | | | | | | | | | | | | | | | | | |
2005 | | $ | 12.93 | | $ | 0.29 | | | $ | 1.99 | | | $ | (0.30 | ) | | $ | (0.20 | ) | | $ | — | | | $ | 14.71 | | 17.66 | % | | $ | 176,819 | | 0.97 | % | | 0.95 | % | | 1.12 | % | | 1.59 | % | | 1.43 | % | | 30 | % |
2004 | | | 11.06 | | | 0.16 | | | | 1.93 | | | | (0.22 | ) | | | — | | | | — | | | | 12.93 | | 18.93 | | | | 87,300 | | 0.97 | | | 0.95 | | | 1.13 | | | 1.32 | | | 1.14 | | | 33 | |
2003 | | | 8.26 | | | 0.08 | # | | | 2.90 | | | | (0.18 | ) | | | — | | | | — | | | | 11.06 | | 36.06 | | | | 50,390 | | 0.97 | | | 0.95 | | | 1.14 | | | 0.86 | | | 0.67 | | | 33 | |
2002 | | | 9.50 | | | 0.11 | | | | (1.22 | ) | | | (0.13 | ) | | | — | | | | — | † | | | 8.26 | | (11.72 | ) | | | 5,416 | | 0.96 | | | 0.93 | | | 1.43 | | | 1.29 | | | 0.79 | | | 30 | |
2001(3) | | | 10.00 | | | — | † | | | (0.47 | ) | | | (0.03 | ) | | | — | | | | — | | | | 9.50 | | (4.69 | ) | | | 27 | | 0.96 | | | 0.96 | | | 88.97 | | | 0.11 | | | (87.90 | ) | | 20 | |
GS4 Class | | | | | | | | | | | | | | | | | | | | | | | | | | | | | | | | | | | | | | | | | | | | |
2005 | | $ | 15.20 | | $ | 0.23 | | | $ | 2.41 | | | $ | (0.27 | ) | | $ | (0.20 | ) | | $ | — | | | $ | 17.37 | | 17.39 | % | | $ | 1,120,234 | | 1.15 | % | | 1.13 | % | | 1.31 | % | | 1.42 | % | | 1.24 | % | | 30 | % |
2004 | | | 12.96 | | | 0.17 | | | | 2.26 | | | | (0.19 | ) | | | — | | | | — | | | | 15.20 | | 18.80 | | | | 1,072,556 | | 1.15 | | | 1.13 | | | 1.31 | | | 1.22 | | | 1.04 | | | 33 | |
2003 | | | 9.66 | | | 0.15 | # | | | 3.31 | | | | (0.16 | ) | | | — | | | | — | | | | 12.96 | | 35.81 | | | | 920,664 | | 1.15 | | | 1.13 | | | 1.31 | | | 1.39 | | | 1.21 | | | 33 | |
2002 | | | 11.09 | | | 0.11 | | | | (1.43 | ) | | | (0.11 | ) | | | — | | | | — | † | | | 9.66 | | (11.94 | ) | | | 698,704 | | 1.15 | | | 1.12 | | | 1.35 | | | 1.00 | | | 0.77 | | | 30 | |
2001(3) | | | 11.66 | | | 0.01 | | | | (0.55 | ) | | | (0.03 | ) | | | — | | | | — | | | | 11.09 | | (4.61 | ) | | | 795,363 | | 1.15 | | | 1.15 | | | 1.37 | | | 0.28 | | | 0.06 | | | 20 | |
GS6 Class | | | | | | | | | | | | | | | | | | | | | | | | | | | | | | | | | | | | | | | | | | | | |
2005 | | $ | 12.80 | | $ | 0.13 | | | $ | 2.06 | | | $ | (0.23 | ) | | $ | (0.20 | ) | | $ | — | | | $ | 14.56 | | 17.15 | % | | $ | 19,123 | | 1.45 | % | | 1.43 | % | | 1.64 | % | | 1.11 | % | | 0.91 | % | | 30 | % |
2004 | | | 10.95 | | | 0.12 | | | | 1.90 | | | | (0.17 | ) | | | — | | | | — | | | | 12.80 | | 18.52 | | | | 19,551 | | 1.35 | | | 1.33 | | | 1.58 | | | 1.06 | | | 0.81 | | | 33 | |
2003 | | | 8.19 | | | 0.10 | # | | | 2.80 | | | | (0.14 | ) | | | — | | | | — | | | | 10.95 | | 35.47 | | | | 20,434 | | 1.36 | | | 1.34 | | | 1.50 | | | 1.14 | | | 0.98 | | | 33 | |
2002 | | | 9.43 | | | 0.06 | | | | (1.21 | ) | | | (0.09 | ) | | | — | | | | — | † | | | 8.19 | | (12.18 | ) | | | 14,078 | | 1.37 | | | 1.34 | | | 1.64 | | | 0.88 | | | 0.58 | | | 30 | |
2001(3) | | | 10.00 | | | (0.01 | )# | | | (0.53 | ) | | | (0.03 | ) | | | — | | | | — | | | | 9.43 | | (5.40 | ) | | | 51 | | 1.45 | | | 1.45 | | | 256.83 | | | (0.32 | ) | | (255.70 | ) | | 20 | |
GS8 Class | | | | | | | | | | | | | | | | | | | | | | | | | | | | | | | | | | | | | | | | | | | | |
2005 | | $ | 12.80 | | $ | 0.11 | | | $ | 2.02 | | | $ | (0.19 | ) | | $ | (0.20 | ) | | $ | — | | | $ | 14.54 | | 16.67 | % | | $ | 6,243 | | 1.80 | % | | 1.78 | % | | 2.11 | % | | 0.76 | % | | 0.43 | % | | 30 | % |
2004(4) | | | 12.05 | | | — | † | | | 0.84 | | | | (0.09 | ) | | | — | | | | — | | | | 12.80 | | 6.93 | | | | 5,346 | | 1.80 | | | 1.78 | | | 2.16 | | | (0.37 | ) | | (0.75 | ) | | 33 | |
| † | Amount represents less than $0.005 per share. |
| # | Calculated using the average shares outstanding method. |
| (3) | Inception date was August 27, 2001. |
| (4) | Inception date was November 8, 2004. |
See Notes to Financial Statements.
132
NOTES TO FINANCIAL STATEMENTS
1. DESCRIPTION OF THE FUNDS
GuideStone Funds (the “Trust”) was organized as a Delaware statutory trust on March 2, 2000. The Trust has established seventeen series (each a “Fund” and together, the “Funds”). Each Fund is a diversified, open-end management investment company and registered under the Investment Company Act of 1940, as amended (the “1940 Act”).
The Flexible Income Fund, Growth & Income Fund, Capital Opportunities Fund, Global Equity Fund, Flexible Income Fund I, Growth & Income Fund I, Capital Opportunities Fund I and Global Equity Fund I are each referred to as a “Blended Fund” and together are referred to as the “Blended Funds.” The remaining Funds are each referred to as a “Select Fund” and are together referred to as the “Select Funds.” The Low-Duration Bond Fund, Medium-Duration Bond Fund and Extended-Duration Bond Fund are together referred to as the “Bond Funds.” The Equity Index Fund, Value Equity Fund, Growth Equity Fund, Small Cap Equity Fund, and International Equity Fund are together referred to as the “Equity Funds.” The Money Market Fund is referred to as the “Money Market Fund.”
There are four classes of shares issued by the Funds — the GS2 Class, the GS4 Class, the GS6 Class and the GS8 Class. All classes of shares have identical voting, dividend and liquidation rights. The distribution fee (class specific expense) differs among classes. Income, expenses (other than class specific expenses) and realized and unrealized gains or losses on investments are allocated to each class of shares based upon its relative net assets.
Each Fund is a separate mutual fund with its own investment objective, strategies and risks. The Select Funds invest directly in particular types of fixed income obligations, stocks and other investments. The Blended Funds primarily invest in a different mix of the Select Funds to meet a specified investment strategy. The Blended Funds are commonly referred to as “Fund of Funds”.
2. SIGNIFICANT ACCOUNTING POLICIES
The following significant accounting policies are in conformity with generally accepted accounting principles in the United States of America which requires management to make estimates and assumptions that affect the reported amounts of assets and liabilities and disclosures of contingent assets and liabilities at the date of the financial statements and the reported amounts of income and expenses during the reporting period. Actual results could differ from those estimates.
a. Valuation of Securities
The Funds (except the Money Market Fund) each value securities traded on national securities exchanges or included in national market systems at the last quoted sale price, or official close price, on the principal exchange on which they were traded, or, in the absence of any sale, or official close price, at the closing bid price. Securities which are primarily traded on foreign exchanges are generally valued at the closing values of such securities on their respective exchanges, except that when an occurrence subsequent to the time when the foreign security is valued is likely to have changed such value, then the fair value of those securities will be determined through procedures established by or under the direction of the Board of Trustees. Non-exchange traded securities for which an over-the-counter quotation is readily available are valued at the last quoted bid price. Debt securities, excluding asset-backed and mortgage-backed securities, are valued at the mean of the last bid and asked prices available. Asset-backed and mortgage-backed securities are valued at the last bid price. Options and warrants for which the primary market is a national securities exchange are valued at the last sale price on the exchange on which they are traded, or, in the absence of any sale, at the closing bid price. Options and warrants not traded on a national securities exchange are valued at the last quoted bid price. Short-term securities maturing in more than 60 days from the valuation date are valued at the mean of the last bid and asked prices; those maturing in 60 days or less are valued at amortized cost. Futures contracts are valued at the closing settlement price on the exchange on which they are primarily
133
traded. Forward foreign exchange contracts are valued based upon closing exchange rates from each respective foreign market. Swap agreements are valued daily based upon the terms specific to each agreement with its counterparty. To the extent available, valuations of portfolio securities are provided by independent pricing services approved by the Board of Trustees. Debt securities are valued on the basis of broker quotations or valuations provided by a pricing service which may use a matrix, formula or other objective method that takes into consideration market indices, matrices, yield curves and other specific adjustments. Certain fixed income securities are valued by the sub-adviser using various methodologies. Securities for which market quotations are not readily available are valued at fair value according to methods established in good faith by the Board of Trustees.
For securities that principally trade on a foreign market or exchange, a significant gap in time can exist between the time of a particular security’s last trade and the time at which a Fund calculates its net asset value. The closing prices of such securities may no longer reflect their market value at the time the Fund calculates its net asset value if an event that could materially affect the value of those securities (a “Significant Event”) has occurred between the time of the security’s last close and the time that the Fund calculates its net asset value. A Significant Event may relate to a single issuer or to an entire market sector. If a Fund becomes aware of a Significant Event that has occurred with respect to a security or group of securities after the closing of the exchange or market on which the security or securities principally trade, but before the time at which the Fund calculates its net asset value, a Valuation Committee meeting may be called. The Trust uses FT-Interactive Data (“FT”) as a third party fair valuation vendor. FT provides a fair value for foreign equity securities held by the Trust based on certain factors and methodologies applied by FT in the event that there is movement in the U.S. market that exceeds a specific threshold established by the Valuation Committee in consultation with, and approved by, the Trustees. Such methodologies generally involve tracking valuation correlations between the U.S. market and each non-U.S. security. As part of the valuation procedures a “confidence interval” is used, when the threshold is exceeded, to determine the level of correlation between the value of a foreign equity security and movements in the U.S. market before a particular security will be fair valued. In the event that the threshold established by the Committee is exceeded on a specific day, the Trust will typically value non-U.S. equity securities in its portfolio that exceed the applicable confidence interval based upon the fair values provided by FT.
The Money Market Fund uses the amortized cost method, which approximates market value, to determine the value of its portfolio securities.
The Blended Funds value their investments in the underlying Select Funds daily at the closing net asset value of each respective Select Fund.
b. Repurchase Agreements
Each Fund may agree to purchase securities from financial institutions subject to the seller’s agreement to repurchase them at a mutually agreed upon date and price. It is the Fund’s policy that repurchase agreements are fully collateralized by U.S. Treasury and Government Agency securities. All collateral is held by the Fund’s custodian bank or a bank with which the custodian bank has entered into a subcustodian agreement, or is segregated in the Federal Reserve Book Entry System. In connection with transactions in repurchase agreements, if the seller defaults and the value of the collateral declines, or if the seller enters an insolvency proceeding, realization of the collateral by the Fund may be delayed or limited.
c. Derivative Financial Instruments
The Funds may engage in various portfolio strategies to seek to increase its return by hedging its portfolio against adverse movements in the equity, debt and currency markets. Losses may arise due to changes in the value of the contract if the counterparty does not perform under the contract. The Funds, in their normal course of business, may enter into contracts that contain a variety of representations and warranties, and which provide general indemnifications. The Funds’ exposure may include future claims that may be made against
134
the Funds that have not yet occurred. However, based on experience, the Funds expect the risk of loss to be remote.
Financial Futures Contracts — The Funds (except the Money Market Fund) may purchase or sell financial futures contracts and the options on such futures contracts for the purpose of hedging risk on existing securities, the intended purchase of securities or to gain market exposure on cash balances. Financial futures contracts are contracts for the delivery of securities at a specified future date at an agreed upon price or yield. Upon entering into a contract, the Funds deposit and maintain as collateral such initial margin as required by the exchange on which the transaction is effected.
Pursuant to the contract, the Funds agree to pay to or receive from the broker an amount of cash equal to the daily fluctuation in the value of the contract. Such payments or receipts are known as variation margin and are recorded by the Funds as unrealized gains or losses until the contract is closed or settled.
Risks of entering into futures contracts include the possibility that there will be an imperfect price correlation between the futures and the underlying securities. Second, it is possible that a lack of liquidity for futures contracts could exist in the secondary market, resulting in an inability to close a futures position prior to its maturity date. Third, the purchase of a futures contract involves the risk that a fund could lose more than the original margin deposit required to initiate a futures transaction.
Options — Certain Funds are authorized to write and purchase put and call options. The risk in writing a call option is that the Funds give up the opportunity for profit if the market price of the security increases. The risk in writing a put option is that the Funds may incur a loss if the market price of the security decreases and the option is exercised. The risk in purchasing an option is that the Funds pay a premium whether or not the option is exercised. The Funds also have the additional risk of being unable to enter into a closing transaction at an acceptable price if a liquid secondary market does not exist. The Funds also may write over-the-counter options where completing the obligation depends upon the credit standing of the other party and this party’s ability to perform. Option contracts also involve the risk that they may not work as intended due to unanticipated developments in market conditions or other causes.
Options purchased are recorded as an asset and written options are recorded as liabilities to the extent of premiums paid or received. Each Fund will realize a gain or loss when the option transaction expires or closes. When an option is exercised, the proceeds on sales for a written call option, the purchase cost for a written put option or the cost of a security for a purchased put or call option is adjusted by the amount of the premium received or paid.
Certain Funds may write swaption contracts to manage exposure to fluctuations in interest rates and to enhance portfolio yield. Swaption contracts written by the Funds represent an option that gives the purchaser the right, but not the obligation, to enter into a previously agreed upon swap contract on a future date. If a written call swaption is exercised, the writer will enter a swap and is obligated to pay the fixed rate and receive a floating rate in exchange. If a written put swaption is exercised, the writer will enter a swap and is obligated to pay the floating rate and receive a fixed rate in exchange. Swaptions are marked to market daily based upon quotations from market makers. When a Fund writes a swaption, the premium received is recorded as a liability and is subsequently adjusted to the current market value of the swaption.
Entering into a swaption contract involves, to varying degrees, the elements of credit, market and interest rate risk in excess of the amounts reported in the Statement of Assets and Liabilities, associated with both option contracts and swap contracts. The Funds bear the market risk arising from any change in index values or interest rates.
135
Forward Foreign Exchange Contracts — Certain Funds may enter into forward foreign currency exchange contracts to hedge against adverse exchange rate fluctuation to the U.S. dollar or between different foreign currencies in connection with either specific security transactions or portfolio positions. Each contract is valued daily and the change in value is recorded as an unrealized gain or loss. When the contract is closed, a realized gain or loss is recorded equal to the difference between the opening value and the closing value of the contract. The Funds could be exposed to risk if the counterparties to the contracts are unable to meet the terms of the contract and from unanticipated movements in the value of a foreign currency relative to the U.S. dollar.
Foreign Currency Options and Futures — The International Equity Fund and the Bond Funds may also enter into futures contracts on foreign currencies and related options on transactions as a short or long hedge against possible variations in foreign exchange rates.
TBAs — The Bond Funds may enter into “TBA” (to be announced) purchase commitments to purchase securities for a fixed price at a future date, typically not exceeding 45 days. TBAs may be considered securities in themselves, and involve a risk of loss if the value of the security to be purchased declines prior to settlement date. This risk is in addition to the risk of decline in each Fund’s other assets. Unsettled TBAs are valued at the current market value of the underlying securities, according to the procedures described under “Valuation of Securities” above.
Dollar Rolls — During the year ended December 31, 2005, GuideStone Funds entered into dollar roll transactions, pursuant to which they sell a mortgage-backed TBA or security and simultaneously purchase a similar, but not identical, TBA with the same issuer, rate and terms. The Funds may execute a “roll” to obtain better underlying mortgage securities or to increase yield. The Funds account for dollar roll transactions as purchases and sales, which has the effect of increasing their portfolio turnover rates. Risks associated with dollar rolls are that actual mortgages received by the Funds may be less favorable than those anticipated or that counterparties may fail to perform under the terms of the contracts.
Swap Agreements — Each Select Fund may enter into swap agreements. The Equity Funds may enter into equity swap contracts, the Bond Funds may enter into interest rate and credit default swaps, the International Equity and Bond Funds may enter into currency swaps and each Select Fund may enter into total return swaps.
Swap agreements are the exchange of one security or asset for another. A swap may be entered into in order to, among other things, change the maturity of a fund’s portfolio, to protect a fund’s value from changes in interest rates, to expose a fund to a different security or market, or to help a fund achieve a strategy relative to an index or other benchmark. By entering into a swap agreement, a fund is exposed to the risk of unanticipated movements in interest rates or in the value of an underlying security or index, or that the counterparty will not fulfill its obligation under the agreement. Credit default swaps involve the payment of amounts based on a specified rate multiplied by a notional amount as well as upon an event of default. In connection with these agreements, securities may be set aside as collateral by the Fund’s custodian.
d. Foreign Currency Translations
Securities and other assets and liabilities denominated in foreign currencies are translated daily into U.S. dollars. Foreign currency amounts related to the purchase or sale of securities and income and expenses are translated at the exchange rate on the transaction date. The effect of changes in foreign exchange rates on realized and unrealized security gains or losses is reflected as a component of such gains or losses. In the statement of operations, net realized gains or losses from foreign currency transactions, if any, may arise from sales of foreign currency, closed forward contracts, exchange gains or losses realized between the trade date and
136
settlement date on securities transactions, and other translation gains or losses on dividends, interest income and foreign withholding taxes.
e. Dividends and Distributions to Shareholders
Dividends from net investment income for the Money Market Fund are declared daily and paid monthly. Dividends from net investment income for the Bond Funds are declared and paid monthly. Dividends from net investment income, if any, for the Equity Index Fund, Growth Equity Fund and Value Equity Fund are declared and paid semi-annually. Dividends from net investment income, if any, for the Small Cap Equity Fund, International Equity Fund and the Blended Funds are declared and paid annually. Net realized capital gains, if any, will be distributed at least annually by each of the Funds. Dividends and distributions to shareholders are recorded on the ex-dividend date.
f. Security Transactions, Income and Realized Gains and Losses
Security transactions are accounted for on the date securities are purchased or sold (the trade date). Dividend income is recognized on the ex-dividend date and interest income is accrued daily, including the amortization of market premium and the accretion of market discount. Realized gains and losses from security transactions are identified on an identified cost basis.
g. Expenses
Expenses arising in connection with a Fund are charged directly to that Fund. Expenses common to all Funds of the Trust are generally allocated to each Fund in proportion to their relative net assets. Each class of shares bears its pro-rata portion of expenses attributable to its class, except that each class separately bears expenses related specifically to that class, such as printing, transfer agent, service and distribution fees.
3. FEES AND OTHER TRANSACTIONS WITH AFFILIATES
a. Investment Advisory Fees
Pursuant to a separate investment advisory agreement, GuideStone Capital Management (“GSCM” or “Investment Advisor”) acts as the Investment Advisor to the Funds. As Investment Advisor it supervises the investments of the Funds and for such services is paid a fee.
GSCM and the Trust have entered into sub-advisory agreements with various sub-advisers to manage each Select Fund’s investments. Under the general supervision of GSCM, the sub-advisers make the day-to-day investment decisions for the Select Funds and for such services each sub-adviser receives a fee from the Funds.
The advisory fees paid to GSCM and aggregate sub-advisory fees paid to the sub-advisers, listed at the end of this report, are computed daily based upon the net assets of each Fund. The actual advisory and sub-advisory fees accrued during the year ended December 31, 2005, based upon average daily net assets, were as follows:
| | | | | | |
Fund | | Advisory Fees | | | Sub-Adviser Fees | |
Flexible Income | | 0.10 | % | | — | |
Growth & Income | | 0.10 | % | | — | |
Capital Opportunities | | 0.10 | % | | — | |
Global Equity | | 0.10 | % | | — | |
Flexible Income I | | 0.10 | % | | — | |
Growth & Income I | | 0.10 | % | | — | |
Capital Opportunities I | | 0.10 | % | | — | |
Global Equity I | | 0.10 | % | | — | |
Money Market | | 0.14 | % | | 0.07 | % |
Low-Duration Bond | | 0.20 | % | | 0.21 | % |
Medium-Duration Bond | | 0.23 | % | | 0.20 | % |
Extended-Duration Bond | | 0.27 | % | | 0.22 | % |
Equity Index | | 0.14 | % | | 0.02 | % |
Value Equity | | 0.43 | % | | 0.24 | % |
Growth Equity | | 0.48 | % | | 0.35 | % |
Small Cap Equity | | 0.30 | % | | 0.68 | % |
International Equity | | 0.47 | % | | 0.49 | % |
For the year ended December 31, 2005, advisory fees and waivers for each Fund were as follows:
| | | | | | | | | | | |
| | | Gross
Advisory
Fee | | Waivers | | | Net Advisory Fee
(Reimbursement) | |
Flexible Income | | $ | 270,346 | | $ | (156,185 | ) | | $ | 114,161 | |
Growth & Income | | | 1,224,320 | | | (77,821 | ) | | | 1,146,499 | |
Capital Opportunities | | | 1,002,217 | | | (83,384 | ) | | | 918,833 | |
Global Equity | | | 899,404 | | | (94,588 | ) | | | 804,816 | |
Flexible Income I | | | 52,016 | | | (67,274 | ) | | | (15,258 | ) |
Growth & Income I | | | 222,435 | | | (24,235 | ) | | | 198,200 | |
Capital Opportunities I | | | 146,851 | | | (49,406 | ) | | | 97,445 | |
Global Equity I | | | 113,691 | | | (51,008 | ) | | | 62,683 | |
Money Market | | | 1,259,455 | | | (26,048 | ) | | | 1,233,407 | |
Low-Duration Bond | | | 1,751,941 | | | (516,540 | ) | | | 1,235,401 | |
137
| | | | | | | | | | |
| | | Gross
Advisory Fee | | Waivers | | | Net Advisory Fee
(Reimbursement) |
Medium-Duration Bond | | $ | 2,326,559 | | $ | (895,592 | ) | | $ | 1,430,967 |
Extended-Duration Bond | | | 1,264,239 | | | (119,298 | ) | | | 1,144,941 |
Equity Index | | | 652,271 | | | (167,286 | ) | | | 484,985 |
Value Equity | | | 6,047,255 | | | (309,889 | ) | | | 5,737,366 |
Growth Equity | | | 7,128,997 | | | (1,192,559 | ) | | | 5,936,438 |
Small Cap Equity | | | 1,566,909 | | | (213,295 | ) | | | 1,353,614 |
International Equity | | | 5,685,936 | | | (1,940,476 | ) | | | 3,745,460 |
b. Distribution and Shareholder Servicing Fees
The Board of Trustees has adopted Shareholder Service Plans for the GS4, GS6 and GS8 Class of each Select Fund and the GS6 and GS8 Class of each Blended Fund (“Service Plans”) and a separate Plan of Distribution for the GS6 and GS8 Class of each Select Fund and Blended Fund pursuant to Rule 12b-1 under the 1940 Act (“ 12b-1 Plan”).
Under the Service Plans, the GS4, GS6 and GS8 Class of each Select Fund and the GS6 and GS8 Class of each applicable Blended Fund are authorized to pay fees to parties that provide services for and maintain shareholder accounts. The GS4, GS6 and GS8 Class of each Select Fund are authorized to pay service fees of 0.19%, 0.30% and 0.40% of average daily net assets, respectively. The GS6 and GS8 Class of each applicable Blended Fund are authorized to pay service fees of 0.11% and 0.21% of average daily net assets, respectively.
Under the 12b-1 Plan, the assets of each Select Fund and Blended Fund may be used to compensate GuideStone Financial Resources, the Distributor or others for certain expenses relating to the distribution of shares of the Funds to investors. Under the 12b-1 Plan, the maximum amount payable as a percentage of average daily net assets on an annual basis is 0.10% by the GS6 Class of each Select Fund and applicable Blended Fund and 0.30% by the GS8 Class of each Select Fund and applicable Blended Fund.
c. Expense Limitation
GSCM has agreed, through April 30, 2006, to waive fees and reimburse expenses of the GS2 Class, GS4 Class, GS6 Class and the GS8 Class of each Fund (excluding interest, taxes, brokerage commissions and extraordinary expenses) which exceed, in the aggregate, the annual percentage rate of each class’s average daily net assets as follows:
| | | | | | | | | | | | |
Fund | | GS2
Class | | | GS4
Class | | | GS6
Class | | | GS8
Class | |
Flexible Income | | — | | | 0.13 | % | | 0.50 | % | | 0.80 | % |
Growth & Income | | — | | | 0.13 | % | | 0.60 | % | | 0.90 | % |
Capital Opportunities | | — | | | 0.13 | % | | 0.70 | % | | 1.00 | % |
Global Equity | | — | | | 0.13 | % | | 0.57 | % | | 0.87 | % |
Flexible Income I | | 0.17 | % | | — | | | — | | | — | |
Growth & Income I | | 0.17 | % | | — | | | — | | | — | |
Capital Opportunities I | | 0.17 | % | | — | | | — | | | — | |
Global Equity I | | 0.17 | % | | — | | | — | | | — | |
Money Market | | 0.27 | % | | 0.46 | % | | 0.87 | % | | 1.17 | % |
Low-Duration Bond | | 0.45 | % | | 0.61 | % | | 1.00 | % | | 1.30 | % |
Medium-Duration Bond | | 0.50 | % | | 0.62 | % | | 1.05 | % | | 1.35 | % |
Extended-Duration Bond | | 0.65 | % | | 0.73 | % | | 1.20 | % | | 1.50 | % |
Equity Index | | 0.25 | % | | 0.40 | % | | 0.60 | % | | 0.90 | % |
Value Equity | | 0.76 | % | | 0.90 | % | | 1.30 | % | | 1.60 | % |
Growth Equity | | 0.87 | % | | 0.99 | % | | 1.39 | % | | 1.69 | % |
Small Cap Equity | | 1.14 | % | | 1.21 | % | | 1.61 | % | | 1.91 | % |
International Equity | | 0.97 | % | | 1.15 | % | | 1.50 | % | | 1.80 | % |
During the period January 1, 2005 through April 18, 2005, GSCM agreed to waive fees and reimburse expenses of the GS6 Class of the Select Funds (excluding interest, taxes, brokerage commissions and extraordinary expenses) which exceeded, in the aggregate, the annual percentage rate of each class’s average daily net assets for the following Funds:
| | | |
Fund | | GS6
Class | |
Money Market | | 0.72 | % |
Low-Duration Bond | | 0.85 | % |
Medium-Duration Bond | | 0.90 | % |
Extended-Duration Bond | | 1.05 | % |
Equity Index | | 0.45 | % |
Value Equity | | 1.15 | % |
Growth Equity | | 1.24 | % |
Small Cap Equity | | 1.50 | % |
International Equity | | 1.35 | % |
During the period April 19, 2005 through April 30, 2005, the expense cap for the Small Cap Equity Fund GS6 Class was 1.65%. During the period January 1, 2005 through April 30, 2005, the expense caps for the Small Cap Equity Fund GS2 Class, GS4 Class and GS8 Class were 1.18%, 1.25% and 1.95%, respectively.
Each Fund in turn agrees to reimburse GSCM for any operating expenses in excess of the expense limitation paid, waived or assumed by GSCM for that Fund during the limitation period, provided GSCM would not be entitled to
138
reimbursement for any amount that would cause operating expenses to exceed the expense limitation during the year in which the reimbursement would be made, and provided further that no amount will be reimbursed by the Fund more than three years after the year in which it was incurred or waived by GSCM.
At December 31, 2005, the amounts subject to possible future reimbursement under the expense limitation agreement are as follows:
| | | | | | | | | | | | |
| | | GS2 Class | | GS4 Class | | GS6 Class | | GS8 Class |
Flexible Income | | | NA | | $ | 336,684 | | $ | 38,506 | | $ | 12,977 |
Growth & Income | | | NA | | | 74,349 | | | 31,248 | | | 4,950 |
Capital Opportunities | | | NA | | | 148,403 | | | 18,400 | | | 398 |
Global Equity | | | NA | | | 185,371 | | | 19,856 | | | 3,884 |
Flexible Income I | | $ | 167,155 | | | NA | | | NA | | | NA |
Growth & Income I | | | 113,368 | | | NA | | | NA | | | NA |
Capital Opportunities I | | | 150,598 | | | NA | | | NA | | | NA |
Global Equity I | | | 155,327 | | | NA | | | NA | | | NA |
Money Market | | | — | | | — | | | 77,677 | | | 5,021 |
Low-Duration Bond | | | 58,594 | | | 1,218,033 | | | 27,410 | | | 11,371 |
Medium-Duration Bond | | | 17,080 | | | 1,763,445 | | | 23,288 | | | 9,164 |
Extended-Duration Bond | | | — | | | 239,411 | | | — | | | 3,765 |
Equity Index | | | — | | | 237,094 | | | 114,599 | | | 17,658 |
Value Equity | | | — | | | 784,017 | | | 21,979 | | | 6,625 |
Growth Equity | | | 39,546 | | | 3,076,420 | | | 71,246 | | | 11,567 |
Small Cap Equity | | | — | | | 1,036,424 | | | 72,025 | | | 8,976 |
International Equity | | | 358,271 | | | 4,179,558 | | | 103,308 | | | 19,445 |
During the year ended December 31, 2005, GSCM recaptured the following amounts:
| | | | | | | | | |
| | | GS2
Class | | GS6
Class | | GS8
Class |
Growth & Income | | | — | | $ | 390 | | | — |
Capital Opportunities | | | — | | | 22 | | $ | 6 |
Money Market | | $ | 5,116 | | | — | | | — |
Small Cap Equity | | | 22,666 | | | — | | | — |
d. Brokerage Service and Other Arrangements
The Investment Advisor directs the sub-advisers to place security trades with designated brokers who have agreed to pay certain custody, transfer agency or other operating expenses through the use of Brokerage Service Arrangements on behalf of the Equity Funds. The amount of expenses paid through Brokerage Service Arrangements for the year ended December 31, 2005 were as follows:
| | | |
Fund | | Expenses Paid Through Brokerage Service Arrangements |
Value Equity | | $ | 119,591 |
Growth Equity | | | 131,415 |
Small Cap Equity | | | 70,478 |
International Equity | | | 227,131 |
In addition, the Funds have entered into arrangements with its custodian whereby net interest earned on uninvested cash balances was used to reduce a portion of each Fund’s custody expenses. Custody expense in the accompanying financial statements is presented before reduction for credits. During the year ended December 31, 2005, expenses reduced were as follows:
| | | |
Fund | | Reduction to Expenses |
Flexible Income | | $ | 766 |
Growth & Income | | | 883 |
Capital Opportunities | | | 783 |
Global Equity | | | 716 |
Flexible Income I | | | 683 |
Growth & Income I | | | 762 |
Capital Opportunities I | | | 756 |
Global Equity I | | | 785 |
Money Market | | | 13,158 |
Low-Duration Bond | | | 147,209 |
Medium-Duration Bond | | | 117,909 |
Extended-Duration Bond | | | 2,178 |
Equity Index | | | 1,493 |
Value Equity | | | 3,021 |
Growth Equity | | | 2,586 |
Small Cap Equity | | | 6,118 |
International Equity | | | 4,465 |
e. Administrator, Transfer Agent and Distributor
Certain employees of PFPC Inc. (“PFPC”), an indirect, wholly-owned subsidiary of The PNC Financial Services Group, Inc. (“PNC”), are officers of the Funds. PFPC serves as Administrator and Transfer agent of the Funds.
For its services as Administrator, PFPC is entitled to receive fees, computed daily and paid monthly, based upon the average daily net assets of each Fund. The fees, excluding out of pocket expenses, currently range between .008% and .0375% of average daily net assets. For its services as Transfer Agent, PFPC receives a fee based mainly upon the number of accounts serviced. Certain minimum fees and transaction charges may apply. For the year ended December 31, 2005,
139
PFPC received $5,280,374 in aggregate fees and expenses for services rendered under the various agreements described above.
PFPC Distributors, Inc. (“PDI”), also an indirect, wholly owned subsidiary of PNC, serves as the Distributor for the Funds. The Funds do not pay any fees to PDI in its capacity as Distributor.
4. SECURITIES LENDING
Through an agreement with Northern Trust (the Funds’ custodian) the Select Funds may lend portfolio securities to certain brokers, dealers and other financial institutions that pay the Select Funds a negotiated fee. The Select Funds receive cash, letters of credit or U.S. Government securities as collateral against the loaned securities in an amount at least equal to the market value of the loaned Securities. The Funds continue to own the loaned securities and the securities remain in the investment portfolio. However, in the event of default or bankruptcy by the other party to the agreement, realization and/or retention of the collateral may be subject to legal proceedings. Cash collateral has been invested in a short-term money market fund of Northern Trust. At December 31, 2005, the market values of loaned securities and collateral received were as follows:
| | | | | | |
Fund | | Market Value of Securities Loaned | | Market Value of Collateral |
Low-Duration Bond | | $ | 74,394,539 | | $ | 76,055,884 |
Medium-Duration Bond | | | 237,222,695 | | | 241,912,239 |
Extended-Duration Bond | | | 234,740,368 | | | 240,029,062 |
Equity Index | | | 38,145,959 | | | 39,384,471 |
Value Equity | | | 234,145,535 | | | 240,911,665 |
Growth Equity | | | 208,442,988 | | | 214,748,197 |
Small Cap Equity | | | 243,954,062 | | | 251,909,169 |
International Equity | | | 162,793,281 | | | 172,547,355 |
5. INVESTMENT TRANSACTIONS
For the year ended December 31, 2005, the cost of purchases and proceeds from sales and maturities (other than short-term and U.S. Government obligations) for each Fund were as follows:
| | | | | | |
| | | Purchases | | Sale and Maturity Proceeds |
Flexible Income | | $ | 27,250,000 | | $ | 27,609,000 |
Growth & Income | | | 72,950,000 | | | 158,683,000 |
Capital Opportunities | | | 38,800,000 | | | 113,874,000 |
Global Equity | | | 31,500,000 | | | 109,505,000 |
Flexible Income I | | | 24,854,000 | | | 4,365,000 |
Growth & Income I | | | 113,291,000 | | | 13,295,000 |
Capital Opportunities I | | | 81,734,000 | | | 7,412,000 |
Global Equity I | | | 83,258,000 | | | 5,161,000 |
Low-Duration Bond | | | 610,936,617 | | | 366,783,200 |
Medium-Duration Bond | | | 621,312,248 | | | 401,652,433 |
Extended-Duration Bond | | | 42,588,181 | | | 26,213,574 |
Equity Index | | | 27,818,455 | | | 32,088,363 |
Value Equity | | | 726,206,525 | | | 757,086,152 |
Growth Equity | | | 708,361,798 | | | 770,715,695 |
Small Cap Equity | | | 592,320,587 | | | 463,474,653 |
International Equity | | | 352,174,951 | | | 406,631,643 |
For the year ended December 31, 2005, the cost of purchases and proceeds from sales and maturities of long-term U.S. Government obligations for each Fund were as follows:
| | | | | | |
| | | Purchases | | Sale and Maturity Proceeds |
Flexible Income | | $ | 26,834,652 | | $ | 26,503,618 |
Growth & Income | | | 48,926,352 | | | 47,315,813 |
Capital Opportunities | | | 13,346,176 | | | 13,049,875 |
Flexible Income I | | | 4,055,698 | | | 3,878,329 |
Growth & Income I | | | 11,663,000 | | | 10,776,384 |
Capital Opportunities I | | | 4,376,394 | | | 3,874,265 |
Low-Duration Bond | | | 981,535,710 | | | 1,113,835,006 |
Medium-Duration Bond | | | 4,413,711,174 | | | 4,122,586,203 |
Extended-Duration Bond | | | 134,427,344 | | | 147,342,740 |
140
Futures Contracts
Investments in securities as of December 31, 2005 included securities that were valued and pledged as collateral to cover initial margin deposits. The market value of this collateral and open futures contracts is as follows:
| | | | | | | | | | | | | |
| | | Market Value of Collateral | | Open Purchase (Sale) Contracts | | | Notional Market Value on Futures | | Net Unrealized Gain (Loss) on Futures | |
Flexible Income Fund | | | | | | | | | | | | | |
March 2006 S&P 500® | | $ | 133,610 | | 3 | | | $ | 941,100 | | $ | (10,329 | ) |
| | | | | | | | | | | | | |
Growth & Income Fund | | | | | | | | | | | | | |
March 2006 S&P 500® | | | 796,713 | | 41 | | | | 12,861,700 | | $ | (165,325 | ) |
| | | | | | | | | | | | | |
Capital Opportunities Fund | | | | | | | | | | | | | |
March 2006 S&P 500® | | | 900,632 | | 45 | | | | 14,116,500 | | $ | (190,623 | ) |
| | | | | | | | | | | | | |
Global Equity Fund | | | | | | | | | | | | | |
March 2006 S&P 500® | | | 1,281,669 | | 41 | | | | 12,861,700 | | $ | (166,487 | ) |
| | | | | | | | | | | | | |
Flexible Income Fund I | | | | | | | | | | | | | |
March 2006 S&P 500® E-Mini | | | 19,794 | | 2 | | | | 125,480 | | $ | (1,689 | ) |
| | | | | | | | | | | | | |
Growth & Income Fund I | | | | | | | | | | | | | |
March 2006 S&P 500® E-Mini | | | 128,662 | | 34 | | | | 2,133,160 | | $ | (25,099 | ) |
| | | | | | | | | | | | | |
Capital Opportunities Fund I | | | | | | | | | | | | | |
March 2006 S&P 500® E-Mini | | | 128,662 | | 39 | | | | 2,446,860 | | $ | (32,495 | ) |
| | | | | | | | | | | | | |
Global Equity Fund I | | | | | | | | | | | | | |
March 2006 S&P 500® E-Mini | | | 138,559 | | 40 | | | | 2,509,600 | | $ | (34,885 | ) |
| | | | | | | | | | | | | |
Low-Duration Bond Fund | | | | | | | | | | | | | |
June 2006 90-Day Euro | | | 305,985 | | 489 | | | | 116,326,988 | | $ | 34,900 | |
December 2006 90-Day Euro | | | 171,375 | | 301 | | | | 74,973,938 | | | (109,910 | ) |
March 2006 2-Year U.S. Treasury Note | | | 1,836,506 | | 1,033 | | | | 211,958,688 | | | 208,064 | |
March 2006 5-Year U.S. Treasury Note | | | 296,275 | | (439 | ) | | | 46,684,906 | | | (139,449 | ) |
March 2006 10-Year U.S. Treasury Note | | | 45,501 | | (48 | ) | | | 5,251,500 | | | (54,540 | ) |
September 2006 90-Day Euro | | | 300,488 | | 590 | | | | 140,361,000 | | | (29,338 | ) |
March 2006 Euro-Bobl | | | 94,973 | | (82 | ) | | | 10,961,227 | | | 1,416 | |
March 2006 Euro Bund | | | 618 | | 2 | | | | 288,491 | | | 2,391 | |
March 2007 90-Day Euro | | | 29,567 | | 58 | | | | 13,811,250 | | | 12,325 | |
| | | | | | | | | | | | | |
| | | | | | | | | | | $ | (74,141 | ) |
| | | | | | | | | | | | | |
Medium-Duration Bond Fund | | | | | | | | | | | | | |
December 2006 90-Day Euro | | | 115,072 | | 72 | | | | 17,136,900 | | $ | (75,960 | ) |
June 2006 90-Day Euro | | | 126,179 | | 297 | | | | 70,652,587 | | | 38,238 | |
March 2006 90-Day Euro | | | 48,468 | | 114 | | | | 27,139,125 | | | (14,825 | ) |
March 2006 Euro Bund | | | 28,852 | | (112 | ) | | | 16,155,516 | | | (78,232 | ) |
March 2006 5-Year U.S. Treasury Note | | | 86,502 | | 180 | | | | 19,141,875 | | | 47,972 | |
March 2006 10-Year U.S. Treasury Note | | | 204,373 | | 162 | | | | 37,854,562 | | | 106,630 | |
March 2006 10-Year Swap | | | 97,113 | | 134 | | | | 14,492,938 | | | 103,265 | |
September 2006 90-Day Euro | | | 147,666 | | 262 | | | | 62,329,800 | | | 23,520 | |
March 2007 90-Day Euro | | | 30,943 | | 70 | | | | 16,668,750 | | | 15,008 | |
March 2006 U.S. Long Treasury Bond | | | 22,741 | | (95 | ) | | | 10,847,813 | | | (232,322 | ) |
| | | | | | | | | | | | | |
| | | | | | | | | | | $ | (66,706 | ) |
| | | | | | | | | | | | | |
141
| | | | | | | | | | | | |
| | | Market Value of Collateral | | Open Purchase (Sale) Contracts | | Notional Market Value on Futures | | Net Unrealized Gain (Loss) on Futures | |
Equity Index Fund | | | | | | | | | | | | |
March 2006 S&P 500® | | $ | 697,743 | | 21 | | $ | 6,587,700 | | $ | (78,867 | ) |
| | | | | | | | | | | | |
Value Equity Fund | | | | | | | | | | | | |
March 2006 Russell 2000® | | | 262,272 | | 9 | | | 3,073,725 | | $ | (25,829 | ) |
March 2006 S&P 500® | | | 4,537,802 | | 166 | | | 52,074,200 | | | (662,613 | ) |
| | | | | | | | | | | | |
| | | | | | | | | | $ | (688,442 | ) |
| | | | | | | | | | | | |
Growth Equity Fund | | | | | | | | | | | | |
March 2006 S&P 500® | | | 4,156,765 | | 88 | | | 27,605,600 | | $ | (377,147 | ) |
| | | | | | | | | | | | |
Small Cap Equity Fund | | | | | | | | | | | | |
March 2006 Russell 2000® | | | 784,920 | | 22 | | | 7,461,300 | | $ | (121,696 | ) |
March 2006 S&P 500® | | | 759,021 | | 23 | | | 7,215,100 | | | (83,339 | ) |
| | | | | | | | | | | | |
| | | | | | | | | | $ | (205,035 | ) |
| | | | | | | | | | | | |
Forward Foreign Currency Contracts
As of December 31, 2005, the following Funds have forward foreign currency exchange contracts that obligate it to deliver currencies at specified future dates. The unrealized appreciation and/or depreciation on these contracts is included in the accompanying financial statements. The terms of the open contracts are as follows:
| | | | | | | | | | | | |
Fund/Expiration Date | | Currency to be Delivered | | Amount of Currency to be Delivered | | Currency to be Received | | Amount of Currency to be Received | | Net Unrealized
Appreciation
(Depreciation) | |
Low-Duration Bond Fund | | | | | | | | | | | | |
1/10/2006 | | US Dollars | | 275,086 | | Japanese Yen | | 32,634,000 | | $ | 2,017 | |
1/12/2006 | | US Dollars | | 322,824 | | British Pounds | | 188,000 | | | 609 | |
1/18/2006 | | Euros | | 26,617,000 | | US Dollars | | 31,326,037 | | | (219,596 | ) |
1/18/2006 | | US Dollars | | 10,423,977 | | Euros | | 8,794,000 | | | (1,604 | ) |
1/20/2006 | | Euros | | 2,916,076 | | US Dollars | | 3,533,972 | | | 77,539 | |
1/20/2006 | | US Dollars | | 240,782 | | Euros | | 200,000 | | | (3,722 | ) |
1/27/2006 | | New Zealand Dollars | | 2,185,401 | | US Dollars | | 1,518,854 | | | 30,498 | |
2/28/2006 | | Euros | | 2,200,000 | | US Dollars | | 2,593,217 | | | (20,029 | ) |
| | | | | | | | | | | | |
| | | | | | | | | | $ | (134,288 | ) |
| | | | | | | | | | | | |
Medium-Duration Bond Fund | | | | | | | | | | | | |
1/10/2006 | | US Dollars | | 6,891,476 | | Japanese Yen | | 817,551,000 | | $ | 50,518 | |
1/12/2006 | | British Pounds | | 3,671,000 | | US Dollars | | 6,306,694 | | | (8,848 | ) |
1/12/2006 | | US Dollars | | 6,506,192 | | British Pounds | | 3,665,000 | | | (200,973 | ) |
1/13/2006 | | US Dollars | | 2,296,571 | | Mexican Pesos | | 24,458,647 | | | (442 | ) |
1/18/2006 | | Euros | | 41,126,000 | | US Dollars | | 48,336,825 | | | (404,418 | ) |
1/18/2006 | | US Dollars | | 9,387,980 | | Euros | | 7,920,000 | | | (1,445 | ) |
1/18/2006 | | Mexican Pesos | | 63,260,404 | | US Dollars | | 5,749,639 | | | (185,216 | ) |
1/26/2006 | | US Dollars | | 934,913 | | Israeli Shekels | | 4,309,875 | | | 549 | |
1/26/2006 | | Israeli Shekels | | 4,890,585 | | US Dollars | | 1,053,438 | | | (8,068 | ) |
1/27/2006 | | Euros | | 1,450,805 | | US Dollars | | 1,741,148 | | | 20,822 | |
1/31/2006 | | Euros | | 900,000 | | US Dollars | | 1,063,175 | | | (4,259 | ) |
2/8/2006 | | Australian Dollars | | 2,406,065 | | US Dollars | | 1,799,736 | | | 38,157 | |
2/8/2006 | | Canadian Dollars | | 2,362,022 | | US Dollars | | 1,994,951 | | | (39,410 | ) |
2/8/2006 | | US Dollars | | 995,935 | | Canadian Dollars | | 1,175,203 | | | 16,244 | |
142
| | | | | | | | | | | | |
Fund/Expiration Date | | Currency to be
Delivered | | Amount of Currency
to be Delivered | | Currency to be
Received | | Amount of Currency
to be Received | | Net Unrealized
Appreciation
(Depreciation) | |
2/8/2006 | | Euros | | 6,691,828 | | US Dollars | | 8,044,399 | | $ | 104,196 | |
2/8/2006 | | US Dollars | | 7,919,508 | | Euros | | 6,691,828 | | | 20,695 | |
3/14/2006 | | Hungarian Forints | | 485,453,100 | | US Dollars | | 2,223,381 | | | (45,570 | ) |
| | | | | | | | | | | | |
| | | | | | | | | | $ | (647,468 | ) |
| | | | | | | | | | | | |
International Equity | | | | | | | | | | | | |
1/10/2006 | | Japanese Yen | | 151,810,960 | | US Dollars | | 1,384,000 | | $ | 94,942 | |
1/10/2006 | | US Dollars | | 1,404,864 | | Japanese Yen | | 151,810,960 | | | (115,806 | ) |
1/12/2006 | | Swiss Francs | | 620,883 | | British Pounds | | 278,186 | | | 5,444 | |
1/24/2006 | | Canadian Dollars | | 2,449,002 | | British Pounds | | 1,170,036 | | | (95,550 | ) |
1/31/2006 | | British Pounds | | 8,530,000 | | US Dollars | | 15,250,872 | | | 577,102 | |
3/14/2006 | | Swiss Francs | | 1,496,703 | | British Pounds | | 663,785 | | | (5,337 | ) |
4/7/2006 | | US Dollars | | 1,247,069 | | Euros | | 1,035,909 | | | (13,893 | ) |
4/7/2006 | | Euros | | 1,035,909 | | US Dollars | | 1,252,000 | | | 18,824 | |
6/14/2006 | | Swiss Francs | | 1,486,916 | | British Pounds | | 663,861 | | | (6,977 | ) |
| | | | | | | | | | | | |
| | | | | | | | | | $ | 458,749 | |
| | | | | | | | | | | | |
Options Written
Transactions in options written during the year ended December 31, 2005 were as follows:
| | | | | | | |
Low-Duration Bond Fund | | Number of
Contracts | | | Premiums
Received | |
Options written, 12/31/04 | | 1,280 | | | $ | 184,960 | |
| | | | | | | |
Options written | | 1,424 | | | | 477,106 | |
Options expired | | (1,600 | ) | | | (273,760 | ) |
Options closed | | (30 | ) | | | (9,263 | ) |
| | | | | | | |
Options written, 12/31/05 | | 1,074 | | | $ | 379,043 | |
| | | | | | | |
| | |
Medium-Duration Bond Fund | | Number of
Contracts | | | Premiums
Received | |
Options written, 12/31/04 | | 6,892 | | | $ | 1,714,774 | |
| | | | | | | |
Options written | | 3,408 | | | | 432,672 | |
Options expired | | (3,629 | ) | | | (841,253 | ) |
Options closed | | (1,035 | ) | | | (284,533 | ) |
| | | | | | | |
Options written, 12/31/05 | | 5,636 | | | $ | 1,021,660 | |
| | | | | | | |
| | |
Growth Equity Fund | | Number of
Contracts | | | Premiums
Received | |
Options written, 12/31/04 | | — | | | $ | — | |
| | | | | | | |
Options written | | 54 | | | | 9,036 | |
Options expired | | (54 | ) | | | (9,036 | ) |
Options closed | | — | | | | — | |
| | | | | | | |
Options written, 12/31/05 | | — | | | $ | — | |
| | | | | | | |
143
6. CAPITAL SHARE TRANSACTIONS
Transactions in shares of capital stock were as follows:
| | | | | | | | | | | | | | | | | |
| | | Year Ended December 31, 2005 | | | Year Ended December 31, 2004 | |
| | | GS4 | | | GS6 | | GS8 | | | GS4 | | | GS6 | | | GS8 | |
Flexible Income Fund | | | | | | | | | | | | | | | | | |
Shares sold | | 3,824,308 | | | — | | 8,453 | | | 3,644,007 | | | 1,668,753 | | | 539,068 | |
Shares reinvested | | 1,073,334 | | | 89,168 | | 37,286 | | | 657,290 | | | 69,167 | | | 14,409 | |
Shares redeemed | | (3,795,558 | ) | | — | | — | | | (3,266,256 | ) | | (2,574,088 | ) | | (14,409 | ) |
| | | | | | | | | | | | | | | | | |
Net increase (decrease) | | 1,102,084 | | | 89,168 | | 45,739 | | | 1,035,041 | | | (836,168 | ) | | 539,068 | |
| | | | | | | | | | | | | | | | | |
Growth & Income Fund | | | | | | | | | | | | | | | | | |
Shares sold | | 7,705,632 | | | — | | 37,621 | | | 11,023,584 | | | 1,990,264 | | | 532,427 | |
Shares reinvested | | 5,682,960 | | | 133,984 | | 54,000 | | | 3,025,333 | | | 77,679 | | | 19,080 | |
Shares redeemed | | (13,663,368 | ) | | — | | (9 | ) | | (7,586,229 | ) | | (3,159,144 | ) | | (19,080 | ) |
| | | | | | | | | | | | | | | | | |
Net increase (decrease) | | (274,776 | ) | | 133,984 | | 91,612 | | | 6,462,688 | | | (1,091,201 | ) | | 532,427 | |
| | | | | | | | | | | | | | | | | |
Capital Opportunities Fund | | | | | | | | | | | | | | | | | |
Shares sold | | 3,308,317 | | | — | | 46,234 | | | 6,104,598 | | | 1,021,152 | | | 497,277 | |
Shares reinvested | | 3,318,258 | | | 46,828 | | 36,627 | | | 1,500,625 | | | 22,673 | | | 10,462 | |
Shares redeemed | | (8,321,585 | ) | | — | | (3 | ) | | (4,253,158 | ) | | (1,782,715 | ) | | (12,311 | ) |
| | | | | | | | | | | | | | | | | |
Net increase (decrease) | | (1,695,010 | ) | | 46,828 | | 82,858 | | | 3,352,065 | | | (738,890 | ) | | 495,428 | |
| | | | | | | | | | | | | | | | | |
Global Equity Fund | | | | | | | | | | | | | | | | | |
Shares sold | | 3,985,734 | | | — | | 12,413 | | | 5,337,749 | | | 1,360,945 | | | 463,434 | |
Shares reinvested | | 2,666,766 | | | 74,409 | | 29,063 | | | 765,384 | | | 19,329 | | | 5,003 | |
Shares redeemed | | (9,133,897 | ) | | — | | — | | | (4,618,460 | ) | | (2,013,639 | ) | | (1,753 | ) |
| | | | | | | | | | | | | | | | | |
Net increase (decrease) | | (2,481,397 | ) | | 74,409 | | 41,476 | | | 1,484,673 | | | (633,365 | ) | | 466,684 | |
| | | | | | | | | | | | | | | | | |
| | | | | | |
| | | GS2 | | | | | | | | GS2 | | | | | | | |
Flexible Income Fund I | | | | | | | | | | | | | | | | | |
Shares sold | | 2,547,905 | | | | | | | | 607,864 | | | | | | | |
Shares reinvested | | 258,626 | | | | | | | | 138,826 | | | | | | | |
Shares redeemed | | (515,007 | ) | | | | | | | (474,127 | ) | | | | | | |
| | | | | | | | | | | | | | | | | |
Net increase | | 2,291,524 | | | | | | | | 272,563 | | | | | | | |
| | | | | | | | | | | | | | | | | |
Growth & Income Fund I | | | | | | | | | | | | | | | | | |
Shares sold | | 10,263,212 | | | | | | | | 4,579,968 | | | | | | | |
Shares reinvested | | 1,112,570 | | | | | | | | 443,757 | | | | | | | |
Shares redeemed | | (1,110,745 | ) | | | | | | | (921,092 | ) | | | | | | |
| | | | | | | | | | | | | | | | | |
Net increase | | 10,265,037 | | | | | | | | 4,102,633 | | | | | | | |
| | | | | | | | | | | | | | | | | |
Capital Opportunities Fund I | | | | | | | | | | | | | | | | | |
Shares sold | | 7,039,835 | | | | | | | | 1,014,142 | | | | | | | |
Shares reinvested | | 526,433 | | | | | | | | 170,884 | | | | | | | |
Shares redeemed | | (704,572 | ) | | | | | | | (557,933 | ) | | | | | | |
| | | | | | | | | | | | | | | | | |
Net increase | | 6,861,696 | | | | | | | | 627,093 | | | | | | | |
| | | | | | | | | | | | | | | | | |
Global Equity Fund I | | | | | | | | | | | | | | | | | |
Shares sold | | 6,666,685 | | | | | | | | 648,062 | | | | | | | |
Shares reinvested | | 287,774 | | | | | | | | 49,042 | | | | | | | |
Shares redeemed | | (523,621 | ) | | | | | | | (358,584 | ) | | | | | | |
| | | | | | | | | | | | | | | | | |
Net increase | | 6,430,838 | | | | | | | | 338,520 | | | | | | | |
| | | | | | | | | | | | | | | | | |
144
| | | | | | | | | | | | | | | | | | | | | | | | |
| | | Year Ended December 31, 2005 | | | Year Ended December 31, 2004 | |
| | | GS2 | | | GS4 | | | GS6 | | | GS8 | | | GS2 | | | GS4 | | | GS6 | | | GS8 | |
Money Market Fund | | | | | | | | | | | | | | | | | | | | | | | | |
Shares sold | | 97,579,053 | | | 2,495,446,536 | | | 43,983 | | | 54,568 | | | 45,386,513 | | | 2,724,683,827 | | | 11,500,548 | | | 5,004,597 | |
Shares reinvested | | 2,495,133 | | | 11,467,878 | | | 111,760 | | | 107,373 | | | 680,196 | | | 4,564,114 | | | 56,965 | | | 6,789 | |
Shares redeemed | | (68,344,589 | ) | | (2,578,673,372 | ) | | (44,371 | ) | | (23,730 | ) | | (48,066,537 | ) | | (2,744,229,998 | ) | | (15,116,865 | ) | | (4,288 | ) |
| | | | | | | | | | | | | | | | | | | | | | | | |
Net increase (decrease) | | 31,729,597 | | | (71,758,958 | ) | | 111,372 | | | 138,211 | | | (1,999,828 | ) | | (14,982,057 | ) | | (3,559,352 | ) | | 5,007,098 | |
| | | | | | | | | | | | | | | | | | | | | | | | |
Low-Duration Bond Fund | | | | | | | | | | | | | | | | | | | | | | | | |
Shares sold | | 5,248,419 | | | 8,353,061 | | | 51,030 | | | 135 | | | 1,522,844 | | | 11,341,798 | | | 1,397,602 | | | 526,316 | |
Shares reinvested | | 480,713 | | | 1,805,474 | | | 50,668 | | | 19,301 | | | 212,603 | | | 1,370,322 | | | 61,346 | | | 8,159 | |
Shares redeemed | | (585,221 | ) | | (9,214,663 | ) | | (569,745 | ) | | (6 | ) | | (972,228 | ) | | (7,254,656 | ) | | (2,092,389 | ) | | — | |
| | | | | | | | | | | | | | | | | | | | | | | | |
Net increase (decrease) | | 5,143,911 | | | 943,872 | | | (468,047 | ) | | 19,430 | | | 763,219 | | | 5,457,464 | | | (633,441 | ) | | 534,475 | |
| | | | | | | | | | | | | | | | | | | | | | | | |
Medium-Duration Bond Fund | | | | | | | | | | | | | | | | | | | | | | | | |
Shares sold | | 5,497,788 | | | 14,239,642 | | | 62,271 | | | 73 | | | 2,017,679 | | | 14,384,711 | | | 1,738,376 | | | 528,541 | |
Shares reinvested | | 682,179 | | | 2,861,364 | | | 89,901 | | | 31,950 | | | 392,757 | | | 2,735,238 | | | 134,574 | | | 23,875 | |
Shares redeemed | | (444,179 | ) | | (6,447,573 | ) | | (459,868 | ) | | — | | | (1,610,530 | ) | | (9,138,068 | ) | | (2,496,490 | ) | | — | |
| | | | | | | | | | | | | | | | | | | | | | | | |
Net increase (decrease) | | 5,735,788 | | | 10,653,433 | | | (307,696 | ) | | 32,023 | | | 799,906 | | | 7,981,881 | | | (623,540 | ) | | 552,416 | |
| | | | | | | | | | | | | | | | | | | | | | | | |
Exended-Duration Bond Fund | | | | | | | | | | | | | | | | | | | | | | | | |
Shares sold | | 3,301,097 | | | 5,503,394 | | | 102,426 | | | 68 | | | 1,592,764 | | | 8,519,523 | | | 2,077,487 | | | 541,712 | |
Shares reinvested | | 672,556 | | | 1,637,275 | | | 187,340 | | | 59,570 | | | 404,013 | | | 1,861,952 | | | 325,052 | | | 31,449 | |
Shares redeemed | | (810,810 | ) | | (7,325,967 | ) | | (1,204,900 | ) | | — | | | (1,508,800 | ) | | (9,670,332 | ) | | (2,731,351 | ) | | — | |
| | | | | | | | | | | | | | | | | | | | | | | | |
Net increase (decrease) | | 3,162,843 | | | (185,298 | ) | | (915,134 | ) | | 59,638 | | | 487,977 | | | 711,143 | | | (328,812 | ) | | 573,161 | |
| | | | | | | | | | | | | | | | | | | | | | | | |
Equity Index Fund | | | | | | | | | | | | | | | | | | | | | | | | |
Shares sold | | 2,936,130 | | | 2,592,192 | | | — | | | 120 | | | 626,229 | | | 3,188,876 | | | 1,315,085 | | | 529,030 | |
Shares reinvested | | 171,170 | | | 357,906 | | | 29,955 | | | 11,720 | | | 101,674 | | | 383,028 | | | 41,965 | | | 5,469 | |
Shares redeemed | | (558,730 | ) | | (4,595,480 | ) | | — | | | — | | | (664,944 | ) | | (3,452,012 | ) | | (2,091,566 | ) | | (5,475 | ) |
| | | | | | | | | | | | | | | | | | | | | | | | |
Net increase (decrease) | | 2,548,570 | | | (1,645,382 | ) | | 29,955 | | | 11,840 | | | 62,959 | | | 119,892 | | | (734,516 | ) | | 529,024 | |
| | | | | | | | | | | | | | | | | | | | | | | | |
Value Equity Fund | | | | | | | | | | | | | | | | | | | | | | | | |
Shares sold | | 7,236,109 | | | 3,861,126 | | | 58,317 | | | 273 | | | 1,498,441 | | | 5,785,172 | | | 1,704,070 | | | 462,149 | |
Shares reinvested | | 1,782,966 | | | 5,787,541 | | | 169,839 | | | 62,261 | | | 158,475 | | | 1,028,686 | | | 39,281 | | | 3,013 | |
Shares redeemed | | (1,044,581 | ) | | (10,142,136 | ) | | (402,264 | ) | | — | | | (2,131,621 | ) | | (8,581,255 | ) | | (2,153,589 | ) | | (3,015 | ) |
| | | | | | | | | | | | | | | | | | | | | | | | |
Net increase (decrease) | | 7,974,494 | | | (493,469 | ) | | (174,108 | ) | | 62,534 | | | (474,705 | ) | | (1,767,397 | ) | | (410,238 | ) | | 462,147 | |
| | | | | | | | | | | | | | | | | | | | | | | | |
145
| | | | | | | | | | | | | | | | | | | | | | | |
| | | Year Ended December 31, 2005 | | Year Ended December 31, 2004 | |
| | | GS2 | | | GS4 | | | GS6 | | | GS8 | | GS2 | | | GS4 | | | GS6 | | | GS8 | |
Growth Equity Fund | | | | | | | | | | | | | | | | | | | | | | | |
Shares sold | | 8,581,238 | | | 3,451,460 | | | 33,645 | | | 99 | | 1,613,851 | | | 5,944,000 | | | 1,354,099 | | | 521,376 | |
Shares reinvested | | — | | | — | | | — | | | — | | — | | | — | | | — | | | — | |
Shares redeemed | | (1,360,673 | ) | | (12,607,943 | ) | | (350,859 | ) | | — | | (2,119,626 | ) | | (8,189,207 | ) | | (1,991,736 | ) | | — | |
| | | | | | | | | | | | | | | | | | | | | | | |
Net increase (decrease) | | 7,220,565 | | | (9,156,483 | ) | | (317,214 | ) | | 99 | | (505,775 | ) | | (2,245,207 | ) | | (637,637 | ) | | 521,376 | |
| | | | | | | | | | | | | | | | | | | | | | | |
Small Cap Equity Fund | | | | | | | | | | | | | | | | | | | | | | | |
Shares sold | | 2,961,871 | | | 5,734,325 | | | 34,416 | | | 453 | | 688,611 | | | 6,941,965 | | | 1,629,128 | | | 411,862 | |
Shares reinvested | | 776,723 | | | 3,248,901 | | | 204,944 | | | 75,572 | | 128,304 | | | 1,135,100 | | | 82,022 | | | 24,795 | |
Shares redeemed | | (587,859 | ) | | (5,552,728 | ) | | (291,639 | ) | | — | | (732,845 | ) | | (5,684,710 | ) | | (2,235,825 | ) | | — | |
| | | | | | | | | | | | | | | | | | | | | | | |
Net increase (decrease) | | 3,150,735 | | | 3,430,498 | | | (52,279 | ) | | 76,025 | | 84,070 | | | 2,392,355 | | | (524,675 | ) | | 436,657 | |
| | | | | | | | | | | | | | | | | | | | | | | |
International Equity Fund | | | | | | | | | | | | | | | | | | | | | | | |
Shares sold | | 5,946,070 | | | 5,799,684 | | | 123,176 | | | 371 | | 3,185,332 | | | 5,416,943 | | | 1,543,393 | | | 417,709 | |
Shares reinvested | | 391,556 | | | 1,711,897 | | | 38,117 | | | 11,325 | | 115,700 | | | 900,425 | | | 23,826 | | | 2,772 | |
Shares redeemed | | (1,070,163 | ) | | (13,605,130 | ) | | (374,414 | ) | | — | | (1,107,875 | ) | | (6,777,507 | ) | | (1,906,068 | ) | | (2,765 | ) |
| | | | | | | | | | | | | | | | | | | | | | | |
Net increase (decrease) | | 5,267,463 | | | (6,093,549 | ) | | (213,121 | ) | | 11,696 | | 2,193,157 | | | (460,139 | ) | | (338,849 | ) | | 417,716 | |
| | | | | | | | | | | | | | | | | | | | | | | |
7. BANK BORROWINGS
The Trust, on behalf of and for the benefit of the Funds, has a credit agreement with Bank of America, N.A., dated December 1, 2005, whereby each Fund is permitted to have bank borrowings for temporary or emergency purposes to fund shareholder redemptions. The agreement permits borrowings up to $50 million, collectively. Interest is charged to each Fund based on its borrowings at a rate equal to the Bank prime rate minus two percent or the Wall Street Journal LIBOR One Month Floating Rate plus 0.50%. Each Fund also pays a facility fee equal to its pro rata share of the amount of the credit facility at a rate of 0.12% per annum. None of the Funds had any outstanding borrowings during the year ended December 31, 2005.
146
8. FEDERAL INCOME TAXES
Each Fund’s policy is to comply with all sections of the Internal Revenue Code that apply to regulated investment companies and to distribute substantially all of its taxable income to shareholders. No provision for income or excise taxes is thus required. Each Fund is treated as a separate entity for federal income tax purposes.
Net investment income (loss) and net realized gains (losses) may differ for financial statement and tax purposes primarily because of deferred losses on certain futures contracts and losses deferred due to “wash sale” transactions. The character of distributions made during the year from net investment income or net realized gains may differ from their ultimate characterization for federal income tax purposes. Also, due to the timing of dividend distributions, the fiscal year in which amounts are distributed may differ from the year that the income or realized gains (losses) were recorded by the Funds.
Income dividends and capital gain distributions are determined in accordance with federal income tax regulations, which may differ from GAAP. These differences are primarily due to differing treatments for futures and options transactions, foreign currency transactions, paydowns, losses deferred due to wash sales, investments in Passive Foreign Investment Companies (“PFIC’s”) and excise tax regulations. Distributions during the years ending December 31, 2005 and 2004 were characterized as follows for tax purposes:
| | | | | | | | | |
Fund | | Ordinary
Income | | Long-Term
Capital Gain | | Total
Distribution |
Flexible Income | | | | | | | | | |
2005 | | $ | 7,202,701 | | $ | 8,060,505 | | $ | 15,263,206 |
2004 | | | 6,674,001 | | | 2,803,393 | | | 9,477,394 |
Growth & Income | | | | | | | | | |
2005 | | | 32,658,116 | | | 51,454,905 | | | 84,113,021 |
2004 | | | 26,687,405 | | | 17,336,809 | | | 44,024,214 |
Capital Opportunities | | | | | | | | | |
2005 | | | 21,044,662 | | | 32,067,303 | | | 53,111,965 |
2004 | | | 14,526,079 | | | 8,194,511 | | | 22,720,590 |
Global Equity | | | | | | | | | |
2005 | | | 14,036,479 | | | 31,500,364 | | | 45,536,843 |
2004 | | | 7,152,360 | | | 4,844,621 | | | 11,996,981 |
Flexible Income I | | | | | | | | | |
2005 | | | 1,960,483 | | | 695,422 | | | 2,655,905 |
2004 | | | 1,154,594 | | | 284,575 | | | 1,439,169 |
Growth & Income I | | | | | | | | | |
2005 | | | 9,387,903 | | | 3,409,006 | | | 12,796,909 |
2004 | | | 3,927,779 | | | 1,049,665 | | | 4,977,444 |
Capital Opportunities I | | | | | | | | | |
2005 | | | 4,868,226 | | | 1,871,844 | | | 6,740,070 |
2004 | | | 1,611,896 | | | 450,563 | | | 2,062,459 |
Global Equity I | | | | | | | | | |
2005 | | | 2,761,080 | | | 1,331,740 | | | 4,092,820 |
2004 | | | 531,130 | | | 105,262 | | | 636,392 |
Money Market | | | | | | | | | |
2005 | | | 25,692,609 | | | — | | | 25,692,609 |
2004 | | | 8,848,288 | | | — | | | 8,848,288 |
Low-Duration Bond | | | | | | | | | |
2005 | | | 28,121,329 | | | 2,254 | | | 28,123,583 |
2004 | | | 17,308,846 | | | 3,097,375 | | | 20,406,221 |
Medium-Duration Bond | | | | | | | | | |
2005 | | | 44,837,310 | | | 1,305,314 | | | 46,142,624 |
2004 | | | 37,814,520 | | | 4,734,024 | | | 42,548,544 |
Extended-Duration Bond | | | | | | | | | |
2005 | | | 25,266,825 | | | 6,787,901 | | | 32,054,726 |
2004 | | | 25,006,677 | | | 9,593,313 | | | 34,599,990 |
Equity Index | | | | | | | | | |
2005 | | | 6,790,475 | | | 1,344,379 | | | 8,134,854 |
2004 | | | 7,592,346 | | | — | | | 7,592,346 |
Value Equity | | | | | | | | | |
2005 | | | 43,128,602 | | | 82,692,658 | | | 125,821,260 |
2004 | | | 19,558,474 | | | 3,412 | | | 19,561,886 |
Small Cap Equity | | | | | | | | | |
2005 | | | 18,650,756 | | | 44,882,273 | | | 63,533,029 |
2004 | | | — | | | 21,644,314 | | | 21,644,314 |
International Equity | | | | | | | | | |
2005 | | | 21,032,901 | | | 15,522,074 | | | 36,554,975 |
2004 | | | 15,049,648 | | | — | | | 15,049,648 |
At December 31, 2005, the components of distributable earnings on a tax basis were as follows:
| | | | | | | | | | | |
Fund | | Undistributed
Ordinary
Income | | Undistributed
Long-Term
Capital Gain/
(Capital Loss
Carryforward) | | | Unrealized
Appreciation
(Depreciation)
on Investments | |
Flexible Income | | $ | 1,857 | | $ | 1,809,484 | | | $ | 43,656,519 | |
Growth & Income | | | 4,573 | | | 20,451,669 | | | | 213,993,265 | |
Capital Opportunities | | | 35,519 | | | 24,716,023 | | | | 208,197,650 | |
Global Equity | | | 138,197 | | | 26,715,186 | | | | 223,317,391 | |
Flexible Income I | | | — | | | 693,802 | | | | (666,974 | ) |
Growth & Income I | | | — | | | 5,741,188 | | | | 5,462,925 | |
Capital Opportunities I | | | 1,428 | | | 5,130,709 | | | | 11,877,677 | |
Global Equity I | | | 22,930 | | | 4,721,121 | | | | 10,230,498 | |
Money Market | | | — | | | (7,398 | ) | | | — | |
Low-Duration Bond | | | — | | | (9,988,046 | ) | | | (8,911,875 | ) |
147
| | | | | | | | | | |
Fund | | Undistributed
Ordinary
Income | | Undistributed
Long-Term
Capital Gain/
(Capital Loss
Carryforward) | | | Unrealized
Appreciation
(Depreciation)
on Investments |
Medium-Duration Bond | | $ | 166,538 | | $ | (1,264,463 | ) | | $ | 2,321,719 |
Extended-Duration Bond | | | 260,756 | | | 390,996 | | | | 23,184,690 |
Equity Index | | | 49,002 | | | — | | | | 78,122,888 |
Value Equity | | | 4,520,903 | | | 12,707,825 | | | | 221,194,258 |
Growth Equity | | | — | | | (235,809,401 | ) | | | 348,707,867 |
Small Cap Equity | | | 1,736,793 | | | 4,374,939 | | | | 63,916,359 |
International Equity | | | 6,264,885 | | | 15,465,877 | | | | 355,008,365 |
Post-October loss deferrals have been included in undistributed ordinary income and undistributed long-term capital gains, depending upon the character of the loss deferral.
For federal income tax purposes, capital loss carryovers and their expiration dates, were as follows as of December 31, 2005:
| | | | | | | | | | | | |
| | | Expiring
12/31/2010 | | Expiring
12/31/2011 | | Expiring
12/31/2013 | | Total |
Money Market | | | — | | $ | 2,028 | | $ | 5,370 | | $ | 7,398 |
Low-Duration Bond | | | — | | | — | | | 9,988,046 | | | 9,988,046 |
Medium-Duration Bond | | | — | | | — | | | 1,264,463 | | | 1,264,463 |
Growth Equity | | $ | 112,512,894 | | | 123,296,507 | | | — | | | 235,809,401 |
For federal income tax purposes, post-October loss deferrals, which will reverse in 2006, were as follows as of December 31, 2005:
| | | | | | | | | |
| | | Capital | | FX and PFIC | | Total |
Money Market | | $ | 976 | | | — | | $ | 976 |
Low-Duration Bond | | | 1,966,698 | | | — | | | 1,966,698 |
Medium-Duration Bond | | | 3,338,183 | | $ | 520,541 | | | 3,858,724 |
Equity Index | | | 161,998 | | | — | | | 161,998 |
International Equity | | | — | | | 702,852 | | | 702,852 |
At December 31, 2005, the net unrealized appreciation from investments for those securities having an excess of value over cost and net unrealized depreciation from investments for those securities having an excess of cost over value (based on cost for federal income tax purposes) was as follows:
| | | | | | | | | | | |
Fund | | Net Unrealized
Appreciation
(Depreciation) | | | Appreciated
Securities | | Depreciated
Securities | |
Flexible Income | | $ | 43,656,519 | | | $ | 45,572,866 | | $ | (1,916,347 | ) |
Growth & Income | | | 213,993,264 | | | | 220,858,805 | | | (6,865,541 | ) |
Capital Opportunities | | | 208,197,650 | | | | 212,595,331 | | | (4,397,681 | ) |
Global Equity | | | 223,317,390 | | | | 225,448,562 | | | (2,131,172 | ) |
Flexible Income I | | | (666,975 | ) | | | 1,689,258 | | | (2,356,233 | ) |
Growth & Income I | | | 5,462,925 | | | | 14,540,114 | | | (9,077,189 | ) |
Capital Opportunities I | | | 11,877,677 | | | | 15,959,879 | | | (4,082,202 | ) |
Global Equity I | | | 10,230,498 | | | | 12,256,265 | | | (2,025,767 | ) |
Low-Duration Bond | | | (8,900,264 | ) | | | 393,327 | | | (9,293,591 | ) |
Medium-Duration Bond | | | 2,202,919 | | | | 12,981,686 | | | (10,778,767 | ) |
Extended-Duration Bond | | | 23,189,611 | | | | 25,910,648 | | | (2,621,037 | ) |
Equity Index | | | 78,122,887 | | | | 139,500,815 | | | (61,377,928 | ) |
Value Equity | | | 221,194,258 | | | | 293,265,370 | | | (72,071,112 | ) |
Growth Equity | | | 348,707,867 | | | | 380,410,268 | | | (31,702,401 | ) |
Small Cap Equity | | | 63,916,359 | | | | 85,648,005 | | | (21,731,646 | ) |
International Equity | | | 354,963,465 | | | | 377,881,322 | | | (22,917,857 | ) |
The differences between book basis and tax-basis unrealized appreciation is attributable primarily to the tax deferral of losses on wash sales and on investments in PFIC’s.
At December 31, 2005, the aggregate cost of investment securities for federal income tax purposes was as follows (excluding foreign currency and derivative related items):
| | | |
Fund | | Federal Tax Cost |
Flexible Income | | $ | 253,991,327 |
Growth & Income | | | 1,079,622,360 |
Capital Opportunities | | | 851,700,500 |
Global Equity | | | 738,251,325 |
Flexible Income I | | | 54,877,926 |
Growth & Income I | | | 233,779,091 |
Capital Opportunities I | | | 148,021,959 |
Global Equity I | | | 115,723,599 |
Money Market | | | 870,013,073 |
Low-Duration Bond | | | 980,840,802 |
Medium-Duration Bond | | | 1,595,731,595 |
Extended-Duration Bond | | | 586,228,214 |
Equity Index | | | 442,667,126 |
Value Equity | | | 1,477,204,103 |
Growth Equity | | | 1,415,168,637 |
Small Cap Equity | | | 728,126,962 |
International Equity | | | 1,136,828,180 |
At December 31, 2005, capital contributions, accumulated undistributed net investment income and accumulated net realized gain (loss) from investments have been adjusted for current period permanent book/tax differences which arose principally from differing book/tax treatments of paydown gains, net operating losses and foreign currency transactions.
148
The following amounts were reclassified within the capital accounts:
| | | | | | | | | | | | |
Fund | | Paid in
Capital | | | Accumulated
Undistributed
Income | | | Accumulated Net
Realized
Gain (Loss) on
Investments,
Currency Translations
and Derivative
Transactions | |
Flexible Income | | | — | | | $ | 485,761 | | | $ | (485,761 | ) |
Growth & Income | | | — | | | | 5,692,454 | | | | (5,692,454 | ) |
Capital Opportunities | | | — | | | | 5,897,468 | | | | (5,897,468 | ) |
Global Equity | | | — | | | | 6,177,724 | | | | (6,177,724 | ) |
Flexible Income I | | | — | | | | 130,492 | | | | (130,492 | ) |
Growth & Income I | | | —�� | | | | 1,615,641 | | | | (1,615,641 | ) |
Capital Opportunities I | | | — | | | | 1,291,156 | | | | (1,291,156 | ) |
Global Equity I | | | — | | | | 1,179,503 | | | | (1,179,503 | ) |
Low-Duration Bond | | $ | (112,051 | ) | | | 295,973 | | | | (183,922 | ) |
Medium-Duration Bond | | | — | | | | 4,017,442 | | | | (4,017,442 | ) |
Extended-Duration Bond | | | — | | | | 903,987 | | | | (903,987 | ) |
Equity Index | | | — | | | | (904 | ) | | | 904 | |
Growth Equity | | | (3,160,622 | ) | | | 3,159,499 | | | | 1,123 | |
Small Cap Equity | | | — | | | | 997,229 | | | | (997,229 | ) |
International Equity | | | — | | | | (634 | ) | | | 634 | |
Net investment income, net realized gain (loss) on investments and net assets were not affected by these reclassifications.
149
REPORT OF INDEPENDENT REGISTERED PUBLIC ACCOUNTING FIRM
To the Board of Trustees and Shareholders of GuideStone Funds:
In our opinion, the accompanying statements of assets and liabilities, including the schedules of investments, and the related statements of operations and of changes in net assets and the financial highlights present fairly, in all material respects, the financial position of Flexible Income Fund, Growth & Income Fund, Capital Opportunities Fund, Global Equity Fund, Flexible Income Fund I, Growth & Income Fund I, Capital Opportunities Fund I, Global Equity Fund I, Money Market Fund, Low-Duration Bond Fund, Medium-Duration Bond Fund, Extended-Duration Bond Fund, Equity Index Fund, Value Equity Fund, Growth Equity Fund, Small Cap Equity Fund, and International Equity Fund (constituting GuideStone Funds, hereafter referred to as the “Trust”) at December 31, 2005, the results of each of their operations for the year then ended, the changes in each of their net assets for each of the two years in the period then ended and the financial highlights for the periods indicated, in conformity with accounting principles generally accepted in the United States of America. These financial statements and financial highlights (hereafter referred to as “financial statements”) are the responsibility of the Trust’s management; our responsibility is to express an opinion on these financial statements based on our audits. We conducted our audits of these financial statements in accordance with the standards of the Public Company Accounting Oversight Board (United States). Those standards require that we plan and perform the audit to obtain reasonable assurance about whether the financial statements are free of material misstatement. An audit includes examining, on a test basis, evidence supporting the amounts and disclosures in the financial statements, assessing the accounting principles used and significant estimates made by management, and evaluating the overall financial statement presentation. We believe that our audits, which included confirmation of securities at December 31, 2005 by correspondence with the custodian and brokers, provide a reasonable basis for our opinion.
PricewaterhouseCoopers LLP
Philadelphia, Pennsylvania
February 24, 2006
150
FUND MANAGEMENT
Information pertaining to the Trustees and officers of the Trust is set forth below. The statement of additional information (SAI) includes additional information about the Trustees and is available without charge, upon request, by calling 1-888-98-GUIDE.
| | | | | | | | |
Name, (DOB), Address and
Position(s) with Trust | | Term of Office
and Length of
Time Served1 | | Principal Occupation(s)
During Past 5 Years | | Number of
Portfolios
in Fund
Complex
Overseen
by Trustee | | Other Trusteeships/
Directorships
Held by Trusteee |
| DISINTERESTED TRUSTEES |
| | | | |
Michael R. Buster (11/18/57) 3656 Bridle Road Prosper, TX 75078
Trustee | | Since 2002 | | Executive Pastor, Prestonwood Baptist Church, 1989 - Present. | | 17 | | None |
| | | | |
William Craig George (7/8/58)
617 Glen Eden Drive
Raleigh, NC 27612
Trustee | | Since 2004 | | Regional loan administrator, SunTrust Bank, 1995 - present. | | 17 | | None |
| | | | |
Joseph A. Mack (11/22/39)
186 Preserve Lane
Columbia, SC 29209
Trustee | | Since 2002 | | Director, Office of Public Policy, South Carolina Baptist Convention, 1999 - Present; Deputy Director, SC Retirement Systems. | | 17 | | None |
| | | | |
Kevin P. Mahoney (7/26/57)
First Baptist Church
1101 South Flagler Drive
West Palm Beach, FL 33401
Trustee | | Since 2004 | | Executive Pastor, FBC West Palm Beach, FL, July 2000 - present; Administrative Pastor, FBC Merritt Island, FL, June 1995 - June 2000. | | 17 | | None |
| | | | |
Franklin Raymond Morgan (6/1/43)
23914 Seven Winds
San Antonio, TX 78258
Trustee | | Since 2005 | | Retired - Senior Vice President, Director of International Adminis- tration, Prudential Securities, Inc., January 1962 - May 2003. | | 17 | | None |
| | | | |
James Ray Taylor (10/19/33)
3009 Tanglewood Park West
Fort Worth, Texas 76109
Trustee | | Since 2002 | | Retired since 1994. | | 17 | | None |
|
| INTERESTED TRUSTEES2 |
| | | | |
Barry Hartis (10/6/45)
12 Waxwing Cove
Greensboro, NC 27455-1373
Trustee | | Since 2005 | | Certified Public Accountant 1976 - Present, Vice President for Business and Finance, Greensboro College, January 1998 - June 30, 2005. | | 17 | | |
| | | | |
Gerald B. Jones (5/24/32)
Jones Motorcars, Inc.
3535 N. College Avenue
Fayetteville, AR 72703-5108
Trustee | | Since 2000 | | Owner Jones Motorcars, Inc. 1957 - Present. | | 17 | | Bank of Arkansas — Director |
|
| OFFICERS WHO ARE NOT TRUSTEES |
| | | | |
Jeffrey P. Billinger (12/5/46)
2401 Cedar Springs Road
Dallas, TX 75201-1407
Vice President and Treasurer | | Since 2000 | | Executive Officer and Treasurer, GuideStone Financial Resources of the Southern Baptist Convention, 1995 - Present. | | N/A | | N/A |
151
FUND MANAGEMENT (Continued)
| | | | | | | | |
Name, (DOB), Address and
Position(s) with Trust | | Term of Office
and Length of
Time Served1 | | Principal Occupation(s)
During Past 5 Years | | Number of
Portfolios
in Fund
Complex
Overseen
by Trustee | | Other Trusteeships/
Directorships Held
by Trusteee |
| | | | |
Rodric E. Cummins (6/28/57) 2401 Cedar Springs Road
Dallas, TX 75201-1407
Vice President and Investment Officer | | Since 2000 | | Executive Officer and Chief Investment Officer, GuideStone Financial Resources of the Southern Baptist Convention, 1998-Present. | | N/A | | N/A |
| | | | |
John R. Jones (12/6/53)
2401 Cedar Springs Road
Dallas, TX 75201-1407
President | | Since 2000 | | Executive Vice President and Chief Operating Officer, GuideStone Financial Resources of the Southern Baptist Convention, 1995 - Present. | | N/A | | N/A |
| | | | |
Rodney R. Miller (5/23/53)
2401 Cedar Springs Road
Dallas, TX 75201-1407
Vice President, Secretary and Chief Legal Officer | | Since 2000 | | General Counsel, Legal and Compliance, GuideStone Financial Resources of the Southern Baptist Convention, 1995 - Present. | | N/A | | N/A |
| | | | |
Patricia A. Weiland (8/25/59)
2401 Cedar Springs Road
Dallas, TX 75201-1407
Vice President and Chief Compliance Officer | | Since 2000 | | Director, Mutual Funds, GuideStone Financial Resources of the Southern Baptist Convention, 2000 - Present. | | N/A | | N/A |
| 1 | Each Trustee and officer serves for an indefinite term, until his/her successor is elected. |
| 2 | Messrs. Jones and Hartis serve as trustees and are to be “interested persons” of the Trust as the term is defined in the Investment Company Act of 1940, as amended. |
PROXY VOTING
A description of the policies and procedures that GuideStone Funds uses to determine how to vote proxies relating to their portfolio securities as well as information regarding how GuideStone Funds voted proxies during the most recent 12-month period ended June 30 is available without charge by calling 1-888-98-GUIDE, by visiting our website at www.GuideStone.org or by visiting the SEC’s website at www.sec.gov.
QUARTERLY SCHEDULES OF INVESTMENTS
In addition to the semi-annual and annual reports that GuideStone Funds delivers to shareholders and makes available through its website, GuideStone Funds files a complete schedule of portfolio holdings with the Securities and Exchange Commission (SEC) for each Fund’s first and third fiscal quarters on Form N-Q. GuideStone Funds does not deliver the schedule for the first and third fiscal quarters to shareholders, however the schedule is posted to our website, www.GuideStone.org. You may also obtain the Form N-Q filings by accessing the SEC’s website at www.sec.gov or copy them at the SEC’s Public Reference Room in Washington, DC. Information on the operation of the SEC’s Public Reference Room may be obtained by calling the SEC at (800) 732-0330. You can also request copies of this information, upon payment of a fee for duplication, at the SEC’s email address (publicinfo@sec.gov) or by writing the Public Reference section of the SEC, Washington, DC 20549-0102.
152
INVESTMENT SUB-ADVISERS (Assets under management as of 12/31/05)
GuideStone Funds employs a broad array of proven investment managers for the benefit of their investors. Each manager is distinctive in their investment management process and business approach.
| | | | | | | |
Fund | | Sub-Adviser | | Firm
Established | | Total Assets
Managed |
| Money Market | | BlackRock Institutional Management Corporation | | 1988 | | $ | 453.0B |
| Low-Duration Bond | | BlackRock Advisors, Inc. | | 1988 | | | 453.0B |
| | Payden & Rygel Investment Counsel | | 1983 | | | 55.7B |
| | PIMCO (Pacific Investment Management Company LLC) | | 1971 | | | 594.0B |
| Medium-Duration Bond | | Goldman Sachs Asset Management, L.P. | | 1984 | | | 496.0B |
| | PIMCO (Pacific Investment Management Company LLC) | | 1971 | | | 594.0B |
| | Western Asset Management Company | | 1971 | | | 249.0B |
| Extended-Duration Bond | | Loomis, Sayles & Company, L. P. | | 1926 | | | 74.5B |
| | STW Fixed Income Management Ltd. | | 1977 | | | 11.6B |
| Equity Index | | Northern Trust Investments, Inc. | | 1889 | | | 618.0B |
| Value Equity | | Barrow, Hanley Mewhinney & Straus, Inc. | | 1979 | | | 55.3B |
| | Equinox Capital Management LLC | | 1989 | | | 6.5B |
| | Northern Trust Investments, Inc. | | 1889 | | | 618.0B |
| | Numeric Investors L. P. | | 1989 | | | 12.2B |
| Growth Equity | | Marsico Capital Management LLC | | 1997 | | | 62.5B |
| | RCM Capital Management LLC | | 1970 | | | 120.0B |
| | Sands Capital Management, Inc. | | 1992 | | | 19.3B |
| | TCW Investment Management Company | | 1971 | | | 123.0B |
| Small Cap Equity | | Aronson+Johnson+Ortiz, LP | | 1984 | | | 23.5B |
| | Lord Abbett & Company LLC | | 1929 | | | 102.0B |
| | Lotsoff Capital Management | | 1981 | | | 5.5B |
| | Provident Investment Council, Inc. | | 1951 | | | 4.4B |
| | TimesSquare Capital Management LLC | | 2000 | | | 6.2B |
| International Equity | | Alliance Capital Management, L.P. | | 1962 | | | 579.0B |
| | Capital Guardian Trust Company | | 1968 | | | 157.0B |
| | Genesis Asset Managers Limited | | 1990 | | | 15.0B |
| | Mondrian Investment Partners Limited | | 1990 | | | 43.8B |
| | Oechsle International Advisors LLC | | 1998 | | | 15.2B |
| | Philadelphia International Advisors, L.P. | | 1956 | | | 6.6B |
| | Walter Scott & Partners Limited | | 1983 | | | 24.0B |
| Custodian for GuideStone Funds Assets | | The Northern Trust Company | | 1889 | | | 2.9Tr |
You should consider the investment objectives, risks, charges and expenses of each investment fund carefully before investing. To obtain a prospectus with this and other information about GuideStone Funds call 1-888-98-GUIDE, visit www.GuideStone.org or write to GuideStone Funds, 2401 Cedar Springs, Dallas, TX 75201-1498. Read it carefully before you invest. Shares of GuideStone Funds are distributed by PFPC Distributors, Inc., 760 Moore Road, King of Prussia, PA 19406.

| | |
| 2401 Cedar Springs Road, Dallas, TX 75201-1498 | | Funds distributed by PFPC Distributors, Inc. |
| 1.888.98.GUIDE • www.GuideStone.org | | 760 Moore Road, King of Prussia, PA 19406 |
| |
| Serving Those Who Serve the Lord “...with the integrity of our hearts and the skillfulness of our hands.” Psalm 78:72 | | |
| | (a) | The registrant, as of the end of the period covered by this report, has adopted a code of ethics that applies to the registrant’s principal executive officer, principal financial officer, principal accounting officer or controller, or persons performing similar functions, regardless of whether these individuals are employed by the registrant or a third party. |
| | (c) | There have been no amendments, during the period covered by this report, to a provision of the code of ethics that applies to the registrant’s principal executive officer, principal financial officer, principal accounting officer or controller, or persons performing similar functions, regardless of whether these individuals are employed by the registrant or a third party, and that relates to any element of the code of ethics description. |
| | (d) | The registrant has not granted any waivers, including an implicit waiver, from a provision of the code of ethics that applies to the registrant’s principal executive officer, principal financial officer, principal accounting officer or controller, or persons performing similar functions, regardless of whether these individuals are employed by the registrant or a third party, that relates to one or more of the items set forth in paragraph (b) of this item’s instructions. |
| Item 3. | Audit Committee Financial Expert. |
As of the end of the period covered by the report, the registrant’s board of directors has determined that Kevin Mahoney is qualified to serve as an audit committee financial expert serving on its audit committee and that he is “independent,” as defined by Item 3 of Form N-CSR.
| Item 4. | Principal Accountant Fees and Services. |
Audit Fees
| | (a) | The aggregate fees billed for each of the last two fiscal years for professional services rendered by the principal accountant for the audit of the registrant’s annual financial statements or services that are normally provided by the accountant in connection with statutory and regulatory filings or engagements for those fiscal years are $250,550 and $265,000 for 2004 and 2005, respectively. |
Audit-Related Fees
| | (b) | The aggregate fees billed in each of the last two fiscal years for assurance and related services by the principal accountant that are reasonably related to the performance of the audit of the |
| | registrant’s financial statements and are not reported under paragraph (a) of this Item are $23,000 and $23,000 for 2004 and 2005, respectively. These fees are for Rule 17f-2 security counts. |
Tax Fees
| | (c) | The aggregate fees billed in each of the last two fiscal years for professional services rendered by the principal accountant for tax compliance, tax advice, and tax planning are $56,950 and $60,400 for 2004 and 2005, respectively. Tax fees are for excise calculation review and review of US Income Tax Return. |
All Other Fees
| | (d) | The aggregate fees billed in each of the last two fiscal years for products and services provided by the principal accountant, other than the services reported in paragraphs (a) through (c) of this Item are $0 for 2004 and 2005, respectively. |
| | (e)(1) | Disclose the audit committee’s pre-approval policies and procedures described in paragraph (c)(7) of Rule 2-01 of Regulation S-X. |
GuideStone
Non-Audit Services Provided to the Company, Advisor, and Others
The Audit Committee shall pre-approve all permissible non-audit services (e.g., tax services) to be provided to the Company by the Auditors, including the fees therefor;
provided, that if the Committee chooses to delegate the authority to grant pre-approvals to one or more Committee members, each acting on behalf of the Committee, then the Committee shall adopt policies and procedures detailed as to the particular service and designed to safeguard the continued independence of the auditors, consistent with the requirements of the Sarbanes-Oxley Act of 2002 (the “S-O Act”) and related SEC regulations, which shall then be used in making such pre-approvals; and,
further provided, that each delegated pre-approval shall be reported to the Committee during its next regularly scheduled meeting.
The pre-approval requirement for a permitted non-audit service may be waived if:
| | (1) | the aggregate amount of all such non-audit services provided constitutes not more than 5% of the total revenues paid by the Company to the Auditors in the fiscal year in which the non-audit services are provided; |
| | (2) | such services were not recognized by the Company at the time of the engagement to be non-audit services; and |
| | (3) | such services are promptly brought to the attention of, and approved by, the Audit Committee or by a member of the Audit Committee to whom the Committee has delegated the authority to grant such approvals, if any, prior to the Auditors’ completion of the Company’s audit. |
Additionally, if the Auditors’ engagement relates directly to the operations and financial reporting of the Company, to the extent required by Rule 2-01 of Regulation S-X, the Audit Committee shall pre-approve their engagements for non-audit services with:
| | (1) | the Advisor (excluding any subadviser whose role is primarily portfolio management and is sub-contracted or overseen by the Advisor), and |
| | (2) | any entity controlling, controlled by, or under common control with such Advisor that provides ongoing services to the Company (each, a “Control Entity”) |
in accordance with the foregoing paragraph, unless the aggregate amount of all services provided constitutes no more than 5% of the total amount of revenues paid to the Auditors by the Company, the Advisor and any such Control Entity during the fiscal year in which the services are provided that would have to be pre-approved by the Audit Committee pursuant to this paragraph (in the absence of this exception). The Auditors may not perform contemporaneously any prohibited non-audit services for the Company, which currently include the following:
| | 1. | bookkeeping or other services related to the accounting records or financial statements of the Company; |
| | 2. | financial information systems design and implementation; |
| | 3. | appraisal or valuation services, fairness opinions, or contribution-in-kind reports; |
| | 5. | internal audit outsourcing services; |
| | 6. | management functions or human resources; |
| | 7. | broker or dealer, investment adviser, or investment banking services; |
| | 8. | legal services and expert services unrelated to the audit; and |
| | 9. | any other service that the Public Company Accounting Oversight Board determines, by regulation, is impermissible. |
| (e)(2) | The percentage of services described in each of paragraphs (b) through (d) of this Item that were approved by the audit committee pursuant to paragraph (c)(7)(i)(C) of Rule 2-01 of Regulation S-X are as follows: |
(b) 100%
(c) 100%
(d) Not applicable.
| (f) | The percentage of hours expended on the principal accountant’s engagement to audit the registrant’s financial statements for the most recent fiscal year that were attributed to work performed by persons other than the principal accountant’s full-time, permanent employees was 0% (zero). |
| | (g) | The aggregate non-audit fees billed by the registrant’s accountant for services rendered to the registrant, and rendered to the registrant’s investment adviser (not including any sub-adviser whose role is primarily portfolio management and is subcontracted with or overseen by another investment adviser), and any entity controlling, controlled by, or under common control with the adviser that provides ongoing services to the registrant for each of the last two fiscal years of the registrant was $79,950 and $83,400 for 2004 and 2005, respectively. |
| | (h) | The registrant’s audit committee of the board of directors has considered whether the provision of non-audit services that were rendered to the registrant’s investment adviser (not including any sub-adviser whose role is primarily portfolio management and is subcontracted with or overseen by another investment adviser), and any entity controlling, controlled by, or under common control with the investment adviser that provides ongoing services to the registrant that were not pre-approved pursuant to paragraph (c)(7)(ii) of Rule 2-01 of Regulation S-X is compatible with maintaining the principal accountant’s independence. |
| Item 5. | Audit Committee of Listed registrants. |
Not applicable.
| Item 6. | Schedule of Investments. |
Schedule of Investments in securities of unaffiliated issuers as of the close of the reporting period is included as part of the report to shareholders filed under Item 1 of this form.
| Item 7. | Disclosure of Proxy Voting Policies and Procedures for Closed-End Management Investment Companies. |
Not applicable.
| Item 8. | Portfolio Managers of Closed-End Management Investment Companies. |
Not applicable.
| Item 9. | Purchases of Equity Securities by Closed-End Management Investment Company and Affiliated Purchasers. |
Not applicable.
| Item 10. | Submission of Matters to a Vote of Security Holders. |
Not applicable.
| Item 11. | Controls and Procedures. |
| | (a) | The registrant’s principal executive and principal financial officers, or persons performing similar functions, have concluded that the registrant’s disclosure controls and procedures (as defined in Rule 30a-3(c) under the Investment Company Act of 1940, as amended (the “1940 Act”) (17 CFR 270.30a-3(c))) are effective, as of a date within 90 days of the filing date of the report that includes the disclosure required by this paragraph, based on their evaluation of these controls and procedures required by Rule 30a-3(b) under the 1940 Act (17 CFR 270.30a-3(b)) and Rules 13a-15(b) or 15d-15(b) under the Securities Exchange Act of 1934, as amended (17 CFR 240.13a-15(b) or 240.15d-15(b)). |
| | (b) | There were no changes in the registrant’s internal control over financial reporting (as defined in Rule 30a-3(d) under the 1940 Act (17 CFR 270.30a-3(d)) that occurred during the registrant’s second fiscal quarter of the period covered by this report that has materially affected, or is reasonably likely to materially affect, the registrant’s internal control over financial reporting. |
| | |
| (a)(1) | | Code of ethics that is the subject of disclosure required by Item 2 is incorporated by reference to the registrant’s Form N-CSR as filed with the SEC on March 4, 2005 (SEC Accession No. 0000893220-05-000465). |
| |
| (a)(2) | | Certifications pursuant to Rule 30a-2(a) under the 1940 Act and Section 302 of the Sarbanes-Oxley Act of 2002 are attached hereto. |
| |
| (a)(3) | | Not applicable. |
| |
| (b) | | Certifications pursuant to Rule 30a-2(b) under the 1940 Act and Section 906 of the Sarbanes-Oxley Act of 2002 are attached hereto. |
SIGNATURES
Pursuant to the requirements of the Securities Exchange Act of 1934 and the Investment Company Act of 1940, the registrant has duly caused this report to be signed on its behalf by the undersigned, thereunto duly authorized.
| | | | | | | | |
| (registrant) GuideStone Funds | | | | |
| | | | |
By (Signature and Title)* | | /s/ John R. Jones | | | | | | |
| | John R. Jones, President | | | | | | |
| | (principal executive officer) | | | | | | |
Pursuant to the requirements of the Securities Exchange Act of 1934 and the Investment Company Act of 1940, this report has been signed below by the following persons on behalf of the registrant and in the capacities and on the dates indicated.
| | | | | | | | |
| | | | |
By (Signature and Title)* | | /s/ John R. Jones | | | | | | |
| | John R. Jones, President | | | | | | |
| | (principal executive officer) | | | | | | |
| | | | | | | | |
| | | | |
By (Signature and Title)* | | /s/ Jeffrey P. Billinger | | | | | | |
| | Jeffrey P. Billinger, Vice President and Treasurer | | | | | | |
| | (principal financial officer) | | | | | | |
| * | Print the name and title of each signing officer under his or her signature. |