UNITED STATES
SECURITIES AND EXCHANGE COMMISSION
Washington, D.C. 20549
FORM N-CSR
CERTIFIED SHAREHOLDER REPORT OF REGISTERED MANAGEMENT
INVESTMENT COMPANIES
| | |
| Investment Company Act file number | | 811-10263 |
GuideStone Funds
|
| (Exact name of registrant as specified in charter) |
| | |
2401 Cedar Springs Road Dallas, TX 75201-1407 |
| (Address of principal executive offices) (Zip code) |
Rodney R. Miller, Esq.
GuideStone Financial Resources of the Southern Baptist Convention
2401 Cedar Springs Road
Dallas, TX 75201-1407
|
(Name and address of agent for service) |
registrant’s telephone number, including area code: 214-720-2142
Date of fiscal year end: December 31
Date of reporting period: December 31, 2008
Form N-CSR is to be used by management investment companies to file reports with the Commission not later than 10 days after the transmission to stockholders of any report that is required to be transmitted to stockholders under Rule 30e-1 under the Investment Company Act of 1940 (17 CFR 270.30e-1). The Commission may use the information provided on Form N-CSR in its regulatory, disclosure review, inspection, and policymaking roles.
A registrant is required to disclose the information specified by Form N-CSR, and the Commission will make this information public. A registrant is not required to respond to the collection of information contained in Form N-CSR unless the Form displays a currently valid Office of Management and Budget (“OMB”) control number. Please direct comments concerning the accuracy of the information collection burden estimate and any suggestions for reducing the burden to Secretary, Securities and Exchange Commission, 100 F Street, NE, Washington, DC 20549. The OMB has reviewed this collection of information under the clearance requirements of 44 U.S.C. § 3507.
| Item 1. | Reports to Stockholders. |
The Report to Shareholders is attached herewith.

GuideStone Funds
GuideStone Financial Resources of the Southern Baptist Convention (“GuideStone Financial Resources”)
GuideStone Capital Management (“GSCM”)
GuideStone Trust Services (“GSTS”)
GuideStone Financial Services (“GFS”)
GuideStone Advisors (“GA”)
PFPC Distributors, Inc. (“PFPC”)
NOTICE CONCERNING YOUR PRIVACY RIGHTS
This notice will provide you with information concerning our policies with respect to nonpublic personal information that we collect about you in connection with the following financial products and services provided and/or serviced by the entities listed above: individual retirement accounts (“IRAs”) and/or personal mutual fund accounts.
The confidentiality of your information is important to us as we recognize that you depend on us to keep your information confidential, as described in this notice.
We collect nonpublic personal information about you with regard to your IRA and/or personal mutual fund accounts from the following sources:
| | • | | Information we receive from you on applications or other forms; |
| | • | | Information about your transactions with us, our affiliates or others (including our third-party service providers); |
| | • | | Information we receive from others such as service providers, broker-dealers and your personal agents or representatives; and |
| | • | | Information you and others provide to us in correspondence sent to us, whether written, electronic or by telephone. |
We may disclose such nonpublic personal financial information about you to one or more of our affiliates. An affiliate of an organization means any entity that controls, is controlled by, or is under common control with that organization. For example, GuideStone Financial Resources, GSCM, GSTS, GFS and GA are affiliates of one another. GuideStone Funds, GuideStone Financial Resources, GSCM, GSTS, GFS, GA and PFPC do not sell your personal information to nonaffiliated third parties.
We may also disclose any of the personal information that we collect about you to nonaffiliated third parties as permitted by law. For example, we may provide your information to nonaffiliated companies that provide account services or that perform marketing services on our behalf and to other financial institutions with whom we have joint marketing agreements. We restrict access to nonpublic personal information about you to those of our employees who need to know that information in order for us to provide and/or service products or services to you. We also maintain physical, electronic, and procedural safeguards to guard your personal information.
These procedures will continue to remain in effect after you cease to receive financial products and services from us.
If you have any questions concerning our customer information policy, please contact a customer service representative at 1-888-98-GUIDE.
TABLE OF CONTENTS
This report has been prepared for shareholders of GuideStone Funds. It is not authorized for distribution to prospective investors unless accompanied or preceded by a current prospectus, which contains more complete information about the Funds. Investors are reminded to read the prospectus carefully before investing. Past performance is no guarantee of future results. Share prices will fluctuate and there may be a gain or loss when shares are redeemed. Fund shares are distributed by PFPC Distributors, Inc., 760 Moore Rd., King of Prussia, PA 19406.
1
LETTER FROM THE PRESIDENT

Dear Valued Shareholders:
During the second half of 2008, investors worldwide felt the effects of extreme volatility within the financial markets. As a result of these acute highs and lows, the tendency for investors to deviate from their investment objectives by making impulsive, emotional decisions can be overwhelming — and potentially ineffective.
History indicates that diversification and appropriate asset allocations can help investors resist the tendency to make emotional decisions during these challenging economic times. Rather than react out of fear to current market conditions, we would encourage investors to evaluate their portfolios based on their long-term goals. These goals should reflect an investor’s risk tolerance, investment time horizon and age. GuideStone Funds offers a diverse family of mutual funds to meet a variety of investment objectives, and our multi-manager investment approach supplies an additional level of diversification by providing access to multiple world-class investment management firms within a single investment fund.
With $7.0 billion in assets under management (as of December 31, 2008), GuideStone Funds is the largest Christian-based registered mutual fund company and is dedicated to providing quality investment products and services to our participants. Several upcoming initiatives include:
| | • | | Fund-specific investment advice will soon be available to retirement plan participants investing in GuideStone Funds. |
| | • | | A continued focus on compliance to ensure that our participants benefit from adequate oversight and rigorous screenings of service providers. |
| | • | | Summary prospectuses will be introduced to provide investors with streamlined information about a Fund’s investment objectives and principal investment strategies, risks and performance and fees. |
| | • | | Financial statements in XBRL will facilitate side-by-side comparison of multiple entities, allow greater reporting transparency and improve the accuracy and reliability of financial data. XBRL stands for eXtensible Business Reporting Language. |
As we continue to work through the market volatility in 2009, we know that many of you remain concerned about your financial future. We at GuideStone Funds are committed to delivering long-term value with integrity to our investors. Please contact us at 1-888-98-GUIDE (1-888-984-8433) or visit our redesigned Web site at www.GuideStoneFunds.org for more information.
We appreciate your ongoing confidence in GuideStone Funds, and we will continue to enhance the products and services offered to you — our shareholders. Thank you for choosing to invest in GuideStone Funds.
|
| Sincerely, |
|
 |
| John R. Jones |
For more information, please contact us at 1-888-98-GUIDE (1-888-984-8433) ¿ www.GuideStoneFunds.com
2
FROM THE CHIEF INVESTMENT OFFICER

Rodric E. Cummins, CFA
The year 2008 was historical by any measure. It can easily be characterized as one of the most tumultuous times in the history of the U.S. financial system. It was a year unlike any seen before by this generation of investors.
Investors experienced the frustration and concern of watching hard-earned investment balances erode under the pressures of a global financial crisis and a U.S. economic recession. The effects were felt universally throughout every asset class and investment strategy. The seemingly endless stream of poor economic data, business failures, and government rescues dominated the headlines in the latter half of the year resulting in one of the most dreadful investment climates in the past 70 years.
U.S. Treasury bonds were the lone bright spot during the year, benefitting from a sharp decline in interest rates and a flight-to-quality. Non-government, high-quality bond investments, normally a harbor of safety in uncertain times, were in the very bulls-eye of the financial crisis, falling victim to an unprecedented level of risk aversion and a historical widening of credit spreads.
U.S. stocks, as measured by the S&P 500® Index, returned –37.00% during 2008, making it the worst year since 1937. Global stock markets posted similar returns for the year.
The year 2008 was a harsh reminder that economic progress is cyclical. The generous allocation of capital during prosperous times often leads to excesses that must be purged from the financial system to make way for future growth.
By all accounts, 2009 is expected to start with continued volatility and economic uncertainty. Having suffered the emotional strains of the past year, it is difficult for investors to turn the page to a new year with the hope for improvement in financial markets, yet there are many reasons to have confidence in these difficult days. Yes, challenges and threats still remain in the economic and financial landscape that may result in a prolonged period of volatility and economic contraction, but our country’s problems are not irreparable. Global central governments have united in a responsive effort through intervention to provide a coordinated solution to the global financial crisis designed to restore the creation and flow of capital that was so severely disrupted in 2008. The U.S. government is fully committed to providing regulatory, fiscal and monetary stimulus that will remove obstacles to progress and unlock the future growth of our economic system.
As we enter 2009, investors should hold fast to the most basic of all investment principles. Investment returns, while never stable or predictable, are undeniably linked over the long-term to the progress and success of capitalism and the growth of global economies. In the short-term, cyclical economic results and investor sentiment can create dislocations between long-term fundamentals and asset pricing. Those periods have historically created tremendous opportunities for investment gains in subsequent years. We maintain that a consistent investment discipline, diversification, and persistence will be the key to investors’ ability to weather this and future storms.
Asset Class Performance Comparison
The following graph illustrates the performance of the major assets classes during 2008.
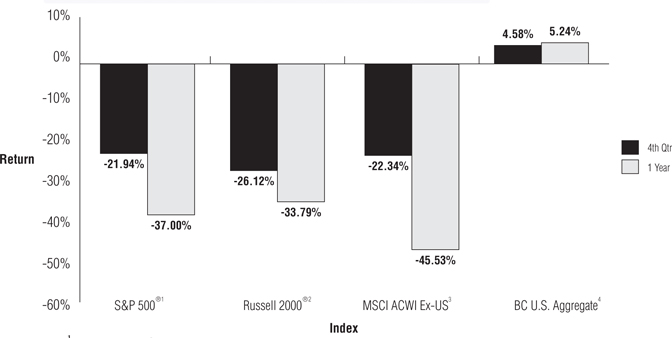
1 | The S&P 500® Index includes 500 of the largest stocks (in terms of market value) in the United States. |
2 | The Russell 2000® Index is a small-cap index consisting of the smallest 2,000 companies in the Russell 3000® Index, representing approximately 10% of the Russell 3000® Index total market capitalization. |
| 3 | The MSCI ACWI (All Country World Index) Ex-U.S. Index is a free float-adjusted market capitalization index that is designed to measure equity market performance in the global developed and emerging markets excluding the United States. |
| 4 | The Barclays Capital U.S. Aggregate Bond Index represents securities that are SEC-registered, taxable and dollar denominated. The index covers the U.S. investment grade bond market, with index components for government and corporate securities, mortgage pass-through securities and asset-backed securities. |
3
U.S. Economy — Real Gross Domestic Product
On December 1, 2008, the National Bureau of Economic Research announced the United States had officially entered a recession in December 2007. The ultimate magnitude and duration of the recession will not be known for some time. The U.S. economy, as measured by the real gross domestic product (GDP) slipped 0.2% on an annualized rate in the fourth quarter of 2007. First quarter 2008 data showed a weak 0.9% annualized GDP growth rate, reflecting positive consumer expenditures (PCE) for services, exports of goods and services and federal government spending. Second quarter GDP rebounded and came in at an annual rate of 2.8% reflecting positive contributions from PCE, nonresidential structures, federal government spending and state and local government spending. As the credit crisis accelerated in the third quarter of 2008, the economy weakened and real GDP growth turned negative (decreasing at a 0.5% annualized rate). The decrease in real GDP in the third quarter reflected negative contributions from PCE, residential fixed investment and equipment and software. Residential fixed investment dropped 16.0 % reflecting the continued troubles in the housing market. In light of the data indicating a severe contraction in the economy due to the effects of the global financial crisis, consensus estimates for fourth quarter GDP are calling for negative GDP growth of at least 5%. Furthermore, forecasts for the first quarter of 2009 indicate a further contraction in economic output.
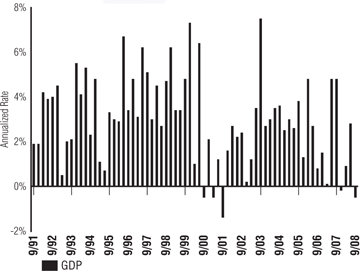
Real Gross Domestic Product (“GDP”) is one of the most widely used economic measures for the overall U.S. economy. GDP measures the output of all goods and services produced by labor and property within the United States during a specific period. The output is usually expressed as an annualized rate for a quarter. Generally, it is viewed as positive for the equity markets when GDP expands reflecting an environment of economic growth and profitability. The converse is true when GDP is contracting.
Data Source: Bloomberg
S&P 500® Index Returns
The accelerating credit crisis and resulting ramifications to the global economy manifested itself in one of the worst calendar years for stock investors. The broad U.S. equity market, as measured by the S&P 500® Index, posted tumbled 37.0% for 2008, wiping out the positive returns achieved by the bull market of the previous five years, when the index had risen an annualized 12.8%, according to Ibbotson Associates. Reacting to unprecedented events, investors fled virtually all sizes and styles of equities. Forced selling by hedge funds and institutional investors contributed to the decline in a falling-domino fashion. As is often the case at inflection points in the markets, the losses came against a backdrop of tremendous volatility in daily index movements. During the fourth quarter, the S&P 500® Index experienced 10 days where the index fell over 5% and seven days where the index gained over 5%. At its intraday low on November 20th, the index had fallen 45% from its September 30th value. From that point to the end of the year, the index gained 20%. The first quarter saw the S&P 500® Index fall 9.44%. The second quarter offered a slight reprieve when shares of rising energy stocks made up for large downdrafts in the share prices of financial companies. The index slipped just 2.73%. The crisis gathered momentum to the downside during the third quarter, and the S&P 500® Index dropped 8.37%. An historic fourth quarter saw the S&P 500® Index dive 21.94%.
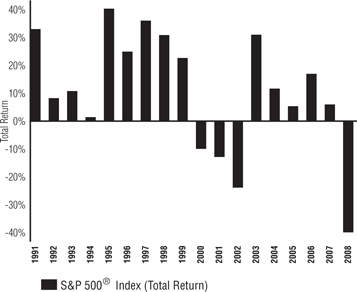
The S&P 500® Index includes 500 leading companies in major industries of the U.S. economy. The index represents about 75% of U.S. equity market capitalization. It is a capitalization-weighted index calculated on a total return basis with dividends reinvested. Constituents are selected by a team of Standard & Poor’s® economists and analysts.
Data Source: Standard & Poor’s®
S&P 500® P/E (Excluding Negative Earnings)
The price-to-earnings (P/E) ratio for the S&P 500® Index ended the year just over 19, almost unchanged from a year earlier. The ratio stayed relatively in the same area as both prices and earnings fell. For the sixteen year period show in the graph, the average P/E is just below 24.
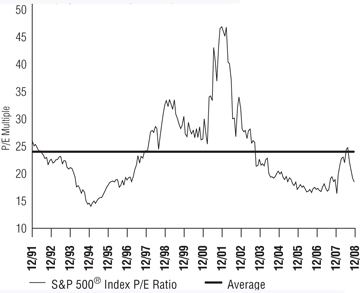
P/E is the ratio of a stock’s price divided by its earnings per share. In this case, the P/E ratio is represented for the entire index. The ratio, or multiple, reflects the price an investor is willing to pay for a dollar of expected earnings per share.
Data Source: Ned Davis Research Group
4
The Conference Board Consumer Confidence Index
U.S. consumer confidence, as measured by the Conference Board’s Index, tumbled for much of the year. Consumers became increasing downbeat about their own personal economic situation as well as the overall economy which was rapidly souring under the weight of a spreading financial system crisis. The index began the year with a reading of 87.9. Sharply rising energy and food prices during the first half of the year sent consumers’ inflation expectations to an all-time high, but the shock translated into a deterioration in consumers’ sentiment about their own financial well-being. By July, the index reading had fallen to 51.9. Moderating prices at the gas pump helped to fuel a small gain in confidence in late summer with some feeling that the overall economy might be showing some signs of stabilizing. The freezing of credit markets following the demise of Lehman Brothers and resulting market panic took a heavy toll on consumer confidence in September and October. The index fell from 61.4 to 38.8 in one month, the third largest monthly decline in the history of the series. By December, the index remained at all-time lows reflecting the rapid and steep deterioration of economic conditions that occurred in the fourth quarter. Expectations for any recovery in the overall economy now appear to be more likely in the second half of 2009.
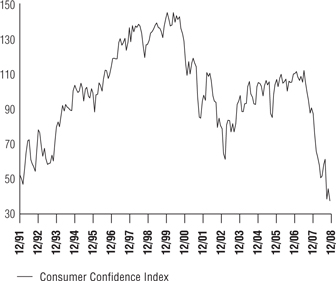
The Conference Board Consumer Confidence Index is based on a monthly survey of a sample of 5,000 U.S. households for the purpose of measuring consumer sentiment. The trend in this economic measure is closely monitored given consumers comprise approximately two-thirds of the U.S. economy. Generally, it is viewed as positive to the economy and equity markets when the index increases. This reflects the fact that consumers are positive regarding their economic outlook and that they are more willing to spend money providing further economic stimulus.
Data Source: Bloomberg
Federal Reserve
2008 began with the Federal Reserve (the “Fed”) moving aggressively in the face of deteriorating financial market conditions and tightening credit conditions. The Fed slashed its target on the Federal Funds Rate by 1.25% during January alone (from 4.25% to 3.00%). As the housing contraction deepened in the early part of the year and financial markets remained under stress, the Fed lowered short-term interest rates by an additional 75 basis points at its March 2008 meeting. In spite of continued economic weakness, rising energy and other commodity prices during the first half of the year began to creep into the Fed’s assessment of inflation. At the April meeting, rates were lowered by just 25 basis points and for the next five months the Federal Funds Rate was held steady at 2.00%. The rapid intensification of the financial market crisis in September forced an unprecedented coordinated rate cut by six global central banks, including the Fed, on October 8th. After a 0.50% cut on October 8th, the Fed cut another 0.50% at its October 29th meeting when they noted that the market turmoil was exerting additional restraint on spending and that households and business were continuing to have difficulty in obtaining credit. On December 16th, in a dramatic response to deteriorating conditions, the Fed effectively reduced the Federal Funds Rate to zero and announced that it would employ all available tools to promote the resumption of sustainable economic growth.
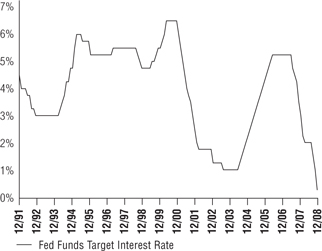
The Federal Reserve (“the Fed“) is the central bank of the United States. It was created by Congress to provide the nation with a safer, more flexible and more stable monetary and financial system. The Federal Funds Rate is the interest rate at which depository institutions lend balances at the Fed to other depository institutions overnight. The rate is one tool the Fed can use in their efforts of controlling the supply of money. Changes in the Federal Funds Rate trigger a chain of events that affect other short-term interest rates, foreign exchange rates, long-term interest rates, the amount of money and credit, and, ultimately, a range of economic variables, including employment, output, and prices of goods and services.
Data Source: Bloomberg
5
U.S. Unemployment
Since the start of the recession in December 2007, the number of unemployed persons in the United States has grown by 3.6 million, and the unemployment rate has risen by 2.3 percentage points (4.9% to 7.2%). The number of long-term unemployed (those jobless for 27 weeks or more) was up by 1.3 million in 2008. In addition, about 1.9 million persons (not seasonally adjusted) were marginally attached to the labor force in December 2008, 564,000 more than 12 months earlier. These individuals wanted and were available for work and had looked for a job sometime in the prior 12 months. They are not counted in the unemployment rate because they had not searched for work in the four weeks preceding the survey. Manufacturing job losses totaled 791,000 in 2008, with nearly half of the decrease occurring in the fourth quarter. Professional and business services lost 490,000 jobs during 2008. Employment in financial activities fell by 148,000 in 2008. On a bright note, health care employment continued to grow, adding 372,000 jobs for 2008. In December, the average workweek for production and nonsupervisory workers on private nonfarm payrolls fell to 33.3 hours, seasonally adjusted – the lowest level on record for the series, which began in 1964.
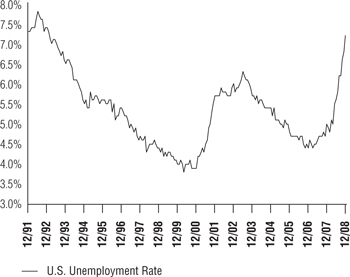
The U.S. unemployment rate measures the numbers of persons unemployed as a percentage of the labor force. Typically, unemployment tends to increase during difficult economic periods and declines during expansionary economic times. Additionally, very low unemployment can place inflationary pressure on the economy as labor markets become very competitive and expensive.
Data Source: Bloomberg
U.S. Treasury Yield Curve
During 2008, U.S. Treasury yields fell materially across the yield curve to historically low levels. The decline in yields was partly due to the Federal Reserve’s easing monetary policy that consisted of seven separate rate cuts, bringing the Federal Funds target rate to 0% - 0.25% by year-end. Investors’ “flight-to-quality” and insatiable appetite for safety in response to the financial crisis and economic recessionary environment also contributed to lower yields. The incredibly high demand for “risk-free” investments pushed bond prices higher and yields lower. Over the 12-month period, the U.S. Treasury yield curve steepened as short-term yields declined greater than long-term yields. Yields on short-term U.S. Treasuries plummeted more than 300 basis points while yields on U.S. Treasury notes and bonds fell as much as 228 basis points. At year-end, yields on the 2-year, 10-year and 30-year U.S. Treasuries were 0.76%, 2.21% and 2.68%, respectively.
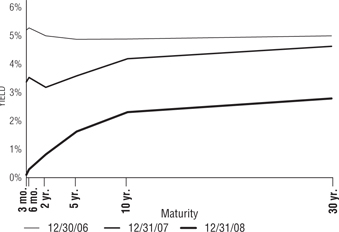
The U.S. Treasury yield curve illustrates the relationship between yields on short-term, intermediate-term and long-term U.S. Treasury securities. Normally, the shape of the yield curve is upward sloping with rates increasing from the short end of the curve moving higher to the long end. The short end of the curve is impacted more by monetary policy (demand for money) while inflationary expectations and market forces impact the long end of the curve.
Data Source: Bloomberg
6
About Your Expenses (Unaudited)
As a shareholder of the Funds, you incur ongoing costs, including advisory fees, and to the extent applicable, distribution (12b-1) fees and/or shareholder services fees, as well as other Fund expenses. This example is intended to help you understand your ongoing costs (in dollars) of investing in the Funds and to compare these costs with the ongoing costs of investing in other mutual funds. It is based on an investment of $1,000 invested at the beginning of the period and held for the entire period from July 1, 2008 to December 31, 2008.
Actual Expenses
The first section of the table below provides information about actual account values and actual expenses. You may use the information in this section, together with the amount you invested, to estimate the expenses that you incurred over the period. Simply divide your account value by $1,000 (for example, an $8,600 account value divided by $1,000 = 8.6), then multiply the result by the number in the first section under the heading entitled “Expenses Paid During Period” to estimate the expenses attributable to your investment during this period.
Hypothetical Example for Comparison Purposes
The second section of the table below provides information about hypothetical account values and hypothetical expenses based on the Fund’s actual expense ratio and an assumed rate of return of 5% per year before expenses, which is not the Fund’s actual return. Thus, you should not use the hypothetical account values and expenses to estimate the actual ending account balance or your expenses for the period. Rather, these figures are provided to enable you to compare the ongoing costs of investing in the Fund and other funds. To do so, compare this 5% hypothetical example with the 5% hypothetical examples that appear in the shareholder reports of the other funds. Please note that the expenses shown in the table are meant to highlight your ongoing costs only. Therefore, the second section of the table is useful in comparing ongoing costs only and will not help you determine the relative total costs of owning different funds.
ACTUAL
| | | | | | | | | | | | | | |
Fund | | Class | | Beginning
Account Value
07/01/08 | | Ending
Account Value
12/31/08 | | Annualized
Expense
Ratio (1) | | | Expenses
Paid During
Period (2) |
MyDestination 2005 | | GS4 | | $ | 1,000.00 | | $ | 811.47 | | 0.20 | % | | $ | 0.91 |
| | GS6 | | | 1,000.00 | | | 808.76 | | 0.50 | | | | 2.27 |
MyDestination 2015 | | GS4 | | | 1,000.00 | | | 759.91 | | 0.19 | | | | 0.84 |
| | GS6 | | | 1,000.00 | | | 760.12 | | 0.50 | | | | 2.21 |
MyDestination 2025 | | GS4 | | | 1,000.00 | | | 713.39 | | 0.20 | | | | 0.86 |
| | GS6 | | | 1,000.00 | | | 712.45 | | 0.50 | | | | 2.15 |
MyDestination 2035 | | GS4 | | | 1,000.00 | | | 681.20 | | 0.20 | | | | 0.85 |
| | GS6 | | | 1,000.00 | | | 680.84 | | 0.50 | | | | 2.11 |
MyDestination 2045 | | GS4 | | | 1,000.00 | | | 668.38 | | 0.20 | | | | 0.84 |
| | GS6 | | | 1,000.00 | | | 668.15 | | 0.50 | | | | 2.10 |
Conservative Allocation | | GS4 | | | 1,000.00 | | | 895.02 | | 0.12 | | | | 0.57 |
| | GS6 | | | 1,000.00 | | | 894.50 | | 0.34 | | | | 1.62 |
Balanced Allocation | | GS4 | | | 1,000.00 | | | 806.73 | | 0.12 | | | | 0.54 |
| | GS6 | | | 1,000.00 | | | 806.33 | | 0.32 | | | | 1.45 |
Growth Allocation | | GS4 | | | 1,000.00 | | | 736.96 | | 0.12 | | | | 0.52 |
| | GS6 | | | 1,000.00 | | | 735.11 | | 0.40 | | | | 1.74 |
Aggressive Allocation | | GS4 | | | 1,000.00 | | | 668.18 | | 0.12 | | | | 0.50 |
| | GS6 | | | 1,000.00 | | | 667.26 | | 0.30 | | | | 1.26 |
Conservative Allocation I | | GS2 | | | 1,000.00 | | | 895.70 | | 0.15 | | | | 0.71 |
Balanced Allocation I | | GS2 | | | 1,000.00 | | | 807.79 | | 0.13 | | | | 0.59 |
Growth Allocation I | | GS2 | | | 1,000.00 | | | 738.36 | | 0.15 | | | | 0.66 |
Aggressive Allocation I | | GS2 | | | 1,000.00 | | | 669.87 | | 0.15 | | | | 0.63 |
7
About Your Expenses (Unaudited) (Continued)
ACTUAL
| | | | | | | | | | | | | | |
Fund | | Class | | Beginning
Account Value
07/01/08 | | Ending
Account Value
12/31/08 | | Annualized
Expense
Ratio (1) | | | Expenses
Paid During
Period (2) |
Money Market (3) | | GS2 | | $ | 1,000.00 | | $ | 1,012.62 | | 0.21 | % | | $ | 1.06 |
| | GS4 | | | 1,000.00 | | | 1,011.63 | | 0.41 | | | | 2.07 |
| | GS6 | | | 1,000.00 | | | 1,009.51 | | 0.82 | | | | 4.14 |
| | | | | |
Low-Duration Bond | | GS2 | | | 1,000.00 | | | 971.05 | | 0.36 | | | | 1.78 |
| | GS4 | | | 1,000.00 | | | 970.66 | | 0.52 | | | | 2.58 |
| | GS6 | | | 1,000.00 | | | 969.53 | | 0.91 | | | | 4.51 |
| | | | | |
Medium-Duration Bond | | GS2 | | | 1,000.00 | | | 970.99 | | 0.48 | | | | 2.38 |
| | GS4 | | | 1,000.00 | | | 969.69 | | 0.58 | | | | 2.87 |
| | GS6 | | | 1,000.00 | | | 968.89 | | 0.93 | | | | 4.60 |
| | | | | |
Extended-Duration Bond | | GS2 | | | 1,000.00 | | | 934.00 | | 0.51 | | | | 2.48 |
| | GS4 | | | 1,000.00 | | | 933.87 | | 0.69 | | | | 3.35 |
| | GS6 | | | 1,000.00 | | | 932.97 | | 0.97 | | | | 4.71 |
| | | | | |
Global Bond | | GS4 | | | 1,000.00 | | | 820.05 | | 0.76 | | | | 3.48 |
| | | | | |
Equity Index | | GS2 | | | 1,000.00 | | | 712.15 | | 0.20 | | | | 0.86 |
| | GS4 | | | 1,000.00 | | | 711.75 | | 0.37 | | | | 1.59 |
| | GS6 | | | 1,000.00 | | | 710.82 | | 0.60 | | | | 2.58 |
| | | | | |
Real Estate Securities | | GS4 | | | 1,000.00 | | | 620.99 | | 1.24 | | | | 5.05 |
| | | | | |
Value Equity | | GS2 | | | 1,000.00 | | | 736.62 | | 0.64 | | | | 2.79 |
| | GS4 | | | 1,000.00 | | | 735.29 | | 0.83 | | | | 3.62 |
| | GS6 | | | 1,000.00 | | | 733.72 | | 1.08 | | | | 4.71 |
| | | | | |
Growth Equity | | GS2 | | | 1,000.00 | | | 638.36 | | 0.85 | | | | 3.50 |
| | GS4 | | | 1,000.00 | | | 638.01 | | 0.95 | | | | 3.91 |
| | GS6 | | | 1,000.00 | | | 637.24 | | 1.27 | | | | 5.23 |
| | | | | |
Small Cap Equity | | GS2 | | | 1,000.00 | | | 689.09 | | 1.00 | | | | 4.25 |
| | GS4 | | | 1,000.00 | | | 688.20 | | 1.13 | | | | 4.80 |
| | GS6 | | | 1,000.00 | | | 687.33 | | 1.41 | | | | 5.98 |
| | | | | |
International Equity | | GS2 | | | 1,000.00 | | | 619.33 | | 0.93 | | | | 3.79 |
| | GS4 | | | 1,000.00 | | | 618.79 | | 1.11 | | | | 4.52 |
| | GS6 | | | 1,000.00 | | | 617.96 | | 1.36 | | | | 5.53 |
HYPOTHETICAL (assuming a 5% return before expenses)
| | | | | | | | | | | | | | |
Fund | | Class | | Beginning
Account Value
07/01/08 | | Ending
Account Value
12/31/08 | | Annualized
Expense
Ratio (1) | | | Expenses
Paid During
Period (2) |
MyDestination 2005 | | GS4 | | $ | 1,000.00 | | $ | 1,024.13 | | 0.20 | % | | $ | 1.02 |
| | GS6 | | | 1,000.00 | | | 1,022.62 | | 0.50 | | | | 2.54 |
MyDestination 2015 | | GS4 | | | 1,000.00 | | | 1,024.18 | | 0.19 | | | | 0.97 |
| | GS6 | | | 1,000.00 | | | 1,022.62 | | 0.50 | | | | 2.54 |
MyDestination 2025 | | GS4 | | | 1,000.00 | | | 1,024.13 | | 0.20 | | | | 1.02 |
| | GS6 | | | 1,000.00 | | | 1,022.62 | | 0.50 | | | | 2.54 |
MyDestination 2035 | | GS4 | | | 1,000.00 | | | 1,024.13 | | 0.20 | | | | 1.02 |
| | GS6 | | | 1,000.00 | | | 1,022.62 | | 0.50 | | | | 2.54 |
MyDestination 2045 | | GS4 | | | 1,000.00 | | | 1,024.13 | | 0.20 | | | | 1.02 |
| | GS6 | | | 1,000.00 | | | 1,022.62 | | 0.50 | | | | 2.54 |
Conservative Allocation | | GS4 | | | 1,000.00 | | | 1,024.53 | | 0.12 | | | | 0.61 |
| | GS6 | | | 1,000.00 | | | 1,023.43 | | 0.34 | | | | 1.73 |
8
HYPOTHETICAL (assuming a 5% return before expenses)
| | | | | | | | | | | | | | |
Fund | | Class | | Beginning
Account Value
07/01/08 | | Ending
Account Value
12/31/08 | | Annualized
Expense
Ratio (1) | | | Expenses
Paid During
Period (2) |
Balanced Allocation | | GS4 | | $ | 1,000.00 | | $ | 1,024.53 | | 0.12 | % | | $ | 0.61 |
| | GS6 | | | 1,000.00 | | | 1,023.53 | | 0.32 | | | | 1.63 |
| | | | | |
Growth Allocation | | GS4 | | | 1,000.00 | | | 1,024.53 | | 0.12 | | | | 0.61 |
| | GS6 | | | 1,000.00 | | | 1,023.13 | | 0.40 | | | | 2.03 |
| | | | | |
Aggressive Allocation | | GS4 | | | 1,000.00 | | | 1,024.53 | | 0.12 | | | | 0.61 |
| | GS6 | | | 1,000.00 | | | 1,023.63 | | 0.30 | | | | 1.53 |
| | | | | |
Conservative Allocation I | | GS2 | | | 1,000.00 | | | 1,024.38 | | 0.15 | | | | 0.76 |
| | | | | |
Balanced Allocation I | | GS2 | | | 1,000.00 | | | 1,024.48 | | 0.13 | | | | 0.66 |
| | | | | |
Growth Allocation I | | GS2 | | | 1,000.00 | | | 1,024.38 | | 0.15 | | | | 0.76 |
| | | | | |
Aggressive Allocation I | | GS2 | | | 1,000.00 | | | 1,024.38 | | 0.15 | | | | 0.76 |
| | | | | |
Money Market (3) | | GS2 | | | 1,000.00 | | | 1,024.08 | | 0.21 | | | | 1.07 |
| | GS4 | | | 1,000.00 | | | 1,023.08 | | 0.41 | | | | 2.08 |
| | GS6 | | | 1,000.00 | | | 1,021.01 | | 0.82 | | | | 4.17 |
| | | | | |
Low-Duration Bond | | GS2 | | | 1,000.00 | | | 1,023.33 | | 0.36 | | | | 1.83 |
| | GS4 | | | 1,000.00 | | | 1,022.52 | | 0.52 | | | | 2.64 |
| | GS6 | | | 1,000.00 | | | 1,020.56 | | 0.91 | | | | 4.62 |
| | | | | |
Medium-Duration Bond | | GS2 | | | 1,000.00 | | | 1,022.72 | | 0.48 | | | | 2.44 |
| | GS4 | | | 1,000.00 | | | 1,022.22 | | 0.58 | | | | 2.95 |
| | GS6 | | | 1,000.00 | | | 1,020.46 | | 0.93 | | | | 4.72 |
| | | | | |
Extended-Duration Bond | | GS2 | | | 1,000.00 | | | 1,022.57 | | 0.51 | | | | 2.59 |
| | GS4 | | | 1,000.00 | | | 1,021.67 | | 0.69 | | | | 3.51 |
| | GS6 | | | 1,000.00 | | | 1,020.26 | | 0.97 | | | | 4.93 |
| | | | | |
Global Bond | | GS4 | | | 1,000.00 | | | 1,021.32 | | 0.76 | | | | 3.86 |
| | | | | |
Equity Index | | GS2 | | | 1,000.00 | | | 1,024.13 | | 0.20 | | | | 1.02 |
| | GS4 | | | 1,000.00 | | | 1,023.28 | | 0.37 | | | | 1.88 |
| | GS6 | | | 1,000.00 | | | 1,022.12 | | 0.60 | | | | 3.05 |
| | | | | |
Real Estate Securities | | GS4 | | | 1,000.00 | | | 1,018.90 | | 1.24 | | | | 6.29 |
| | | | | |
Value Equity | | GS2 | | | 1,000.00 | | | 1,021.92 | | 0.64 | | | | 3.25 |
| | GS4 | | | 1,000.00 | | | 1,020.96 | | 0.83 | | | | 4.22 |
| | GS6 | | | 1,000.00 | | | 1,019.71 | | 1.08 | | | | 5.48 |
| | | | | |
Growth Equity | | GS2 | | | 1,000.00 | | | 1,020.86 | | 0.85 | | | | 4.32 |
| | GS4 | | | 1,000.00 | | | 1,020.36 | | 0.95 | | | | 4.82 |
| | GS6 | | | 1,000.00 | | | 1,018.75 | | 1.27 | | | | 6.44 |
| | | | | |
Small Cap Equity | | GS2 | | | 1,000.00 | | | 1,020.11 | | 1.00 | | | | 5.08 |
| | GS4 | | | 1,000.00 | | | 1,019.46 | | 1.13 | | | | 5.74 |
| | GS6 | | | 1,000.00 | | | 1,018.05 | | 1.41 | | | | 7.15 |
| | | | | |
International Equity | | GS2 | | | 1,000.00 | | | 1,020.46 | | 0.93 | | | | 4.72 |
| | GS4 | | | 1,000.00 | | | 1,019.56 | | 1.11 | | | | 5.63 |
| | GS6 | | | 1,000.00 | | | 1,018.30 | | 1.36 | | | | 6.90 |
| (1) | Expenses include the effect of contractual waivers by GuideStone Capital Management. The Date Target Funds’ and Asset Allocation Funds’ proportionate share of the operating expenses of the Select Funds is not reflected in the tables above. If such fees and expenses had been included, the expenses would have been higher. |
| (2) | Expenses are equal to the Fund’s annualized expense ratios for the period July 1, 2008 through December 31, 2008, multiplied by the average account value over the period, multiplied by 184/366 (to reflect the one-half year period). |
| (3) | See Note 11 in Notes to Financial Statements. |
9
MyDestination 2005 Fund
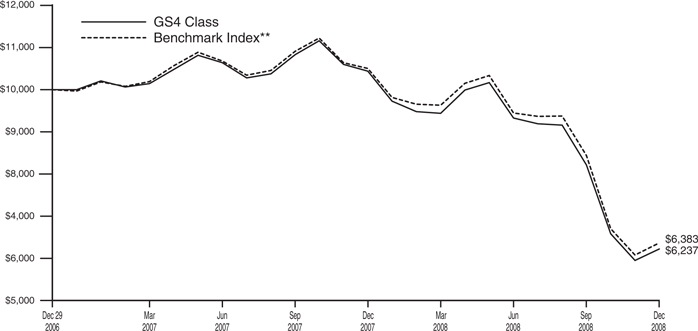
The Fund, through its investment in underlying Select Funds and an Exchange-Traded Fund (ETF), is slightly overweight in fixed-income securities (bonds) as compared to equity securities (stocks). The fixed-income portfolio includes exposure to a wide range of bond investments across the full spectrum of maturities, including Treasury Inflation-Protected Securities (TIPS). The Fund also has a small exposure to public real estate securities through the Real Estate Securities Fund. For the calendar year ending December 31, 2008, the GS4 Class of the Fund returned (22.78)%. The diversification element of the Fund provided some benefit during 2008 in the midst of tumultuous capital markets and the economic uncertainty caused by the financial crisis. However, exposure to the International Equity Fund, Growth Equity Fund and Value Equity Fund contributed the most to the negative absolute return.
Please see page 12 for information regarding specific portfolio allocations. Portfolio holdings are subject to change at any time.
The MyDestination FundsTM attempt to achieve their objectives by investing in the Select Funds and other funds in which the Funds invest. By investing in these fund-of-funds, you will incur the expenses of the MyDestination FundsTM in addition to those of the underlying funds. You may invest in the Select Funds directly. The MyDestination FundsTM are also subject to the risks of the underlying funds they hold.
10
MyDestination 2005 Fund
Average Annual Total Returns as of 12/31/08
| | | | | | | | | |
| | | GS4 Class* | | | GS6 Class* | | | Benchmark** | |
One Year | | (22.78 | )% | | (23.12 | )% | | (19.18 | )% |
Since Inception | | (9.32 | )% | | (9.65 | )% | | (7.08 | )% |
Inception Date | | 12/29/06 | | | 12/29/06 | | | 12/29/06 | |
Total Fund Operating Expenses (August 5, 2008 Prospectus) | | 0.43 | % | | 2.87 | % | | | |
The performance data quoted represents past performance and does not guarantee future results. Current performance may be lower or higher. Performance data current to the most recent month-end may be obtained at www.GuideStoneFunds.org. The investment return and principal value of an investment will fluctuate so that shares, when redeemed, may be worth more or less than their original cost.
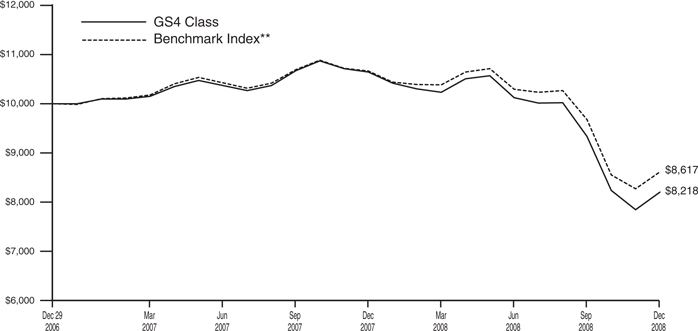
The graph illustrates the results of a hypothetical $10,000 investment in the GS4 Class of the Fund since December 29, 2006 (commencement of operations), with all dividends and capital gains reinvested, with the Fund’s composite benchmark index.
| * | These returns reflect expense waivers by the Fund’s investment adviser. Without these waivers, returns would have been lower. Returns shown do not reflect the deduction of taxes that a shareholder would pay on Fund distributions or the redemption of Fund shares. |
** | The Composite Index is provided for each MyDestination Fund to show how the Fund’s performance compares with the returns of an index of securities similar to those in which the Fund invests. The construction of the Composite Index corresponds to the percentage allocation to the underlying asset class as represented by the Fund’s investment in the Select Funds and / or the TIPS ETF. As the percentage allocation to the underlying investment changes according to the MyDestination Funds™ glide path, the percentage allocation to the Composite Index will also change. The Composite Index is derived by applying the Fund’s target allocations over time to the results of the following indices, as applicable: S&P 500® Index, Russell 1000® Value Index, Russell 1000® Growth Index, Russell 2000® Index, MSCI ACWI (All Country World Index) Ex-U.S. Index, Merrill Lynch 1-3 Year Treasury Index, Barclays Capital U.S. Aggregate Bond Index, Barclays Capital U.S. Long-Term Government Bond Index, Barclays Capital U.S. Long-Term Credit Bond Index, Barclays Capital Global Aggregate Bond Index, Barclays Capital U.S. Corporate High Yield – 2% Issuer Capped Index, Dow Jones Wilshire Real Estate Securities Index, JPMorgan Emerging Markets Bond Index Plus and iShares Barclays TIPS Bond Fund. |
The Barclays Capital U.S. Aggregate Bond Index represents securities that are SEC-registered, taxable and dollar denominated. The index covers the U.S. investment grade bond market, with index components for government and corporate securities, mortgage pass-through securities and asset-backed securities.
Unlike a mutual fund, the performance of an index assumes no taxes, transaction costs, management fees or other expenses.
11
| | |
| MyDestination 2005 Fund | | |
| SCHEDULE OF INVESTMENTS | | December 31, 2008 |
| | | | | | | |
| | | Shares | | Value | |
MUTUAL FUNDS — 85.7% | | | | | | | |
GuideStone Money Market Fund (GS4 Class)¥ | | | 968,818 | | $ | 968,818 | |
GuideStone Low-Duration Bond Fund (GS4 Class)¥ | | | 670,014 | | | 8,033,469 | |
GuideStone Medium-Duration Bond Fund (GS4 Class)¥ | | | 745,987 | | | 9,071,198 | |
GuideStone Extended-Duration Bond Fund (GS4 Class)¥ | | | 51,720 | | | 670,814 | |
GuideStone Global Bond Fund (GS4 Class)¥ | | | 171,433 | | | 1,258,320 | |
GuideStone Equity Index Fund (GS4 Class)¥ | | | 103,552 | | | 1,211,560 | |
GuideStone Real Estate Securities Fund (GS4 Class)¥ | | | 396,289 | | | 2,080,517 | |
GuideStone Value Equity Fund (GS4 Class)¥ | | | 607,998 | | | 6,402,219 | |
GuideStone Growth Equity Fund (GS4 Class)¥ | | | 546,862 | | | 6,299,854 | |
GuideStone Small Cap Equity Fund (GS4 Class)¥ | | | 195,365 | | | 1,740,702 | |
GuideStone International Equity Fund (GS4 Class)¥ | | | 711,159 | | | 6,670,673 | |
| | | | | | | |
Total Mutual Funds
(Cost $62,268,775) | | | | | | 44,408,144 | |
| | | | | | | |
EXCHANGE TRADED FUND — 14.0% | | | | | | | |
iShares Lehman Treasury Inflation Protected Securities Fund
(Cost $7,525,279) | | | 73,327 | | | 7,276,971 | |
| | | | | | | |
| | |
| | | Par | | | |
U.S. TREASURY OBLIGATION — 0.3% | | | | | | | |
U.S. Treasury Bill | | | | | | | |
0.10%, 05/14/09‡‡ (Cost $149,944) | | $ | 150,000 | | | 149,967 | |
| | | | | | | |
TOTAL INVESTMENTS — 100.0%
(Cost $69,943,998) | | | | | | 51,835,082 | |
| | |
Liabilities in Excess of Other Assets — 0.0% | | | | | | (23,297 | ) |
| | | | | | | |
NET ASSETS — 100.0% | | | | | $ | 51,811,785 | |
| | | | | | | |
PORTFOLIO SUMMARY (based on net assets)
| | |
| | | % |
Bond Funds | | 36.7 |
Domestic Equity Funds | | 34.2 |
Exchange Traded Fund | | 13.9 |
International Equity Fund | | 12.9 |
Money Market Fund | | 1.9 |
Futures Contracts | | 1.8 |
U.S. Treasury Obligation | | 0.3 |
| | |
| | 101.7 |
| | |
FAS 157 DISCLOSURE
The following is a summary of the inputs used, as of December 31, 2008, in valuing the Fund’s investments carried at fair value:
| | | | | | |
Valuation Inputs | | Investments
in
Securities | | Other
Financial
Instruments*** |
Level 1 — Quoted Prices | | $ | 51,685,115 | | $ | 16,547 |
Level 2 — Other Significant Observable Inputs | | | 149,967 | | | — |
Level 3 — Significant Unobservable Inputs | | | — | | | — |
| | | | | | |
Total | | $ | 51,835,082 | | $ | 16,547 |
| | | | | | |
| *** | Other financial instruments are derivative instruments not reflected in the Schedule of Investments, such as futures, forwards and swap contracts, which are valued at the unrealized appreciation (depreciation) on the investment. |
See Notes to Financial Statements.
12
MyDestination 2015 Fund
The Fund, through its investment in underlying Select Funds and an Exchange-Traded Fund (ETF), is modestly overweight in equity securities (stocks) as compared to fixed-income securities (bonds). The fixed-income portfolio includes exposure to a wide range of bond investments across the full spectrum of maturities, including Treasury Inflation-Protected Securities (TIPS). The Fund also has an exposure to public real estate securities through the Real Estate Securities Fund. For the calendar year ending December 31, 2008, the GS4 Class of the Fund returned (29.31)%. The diversification element of the Fund provided some a modest benefit during 2008 in the midst of tumultuous capital markets and the economic uncertainty caused by the financial crisis. However, exposure to the International Equity Fund, Growth Equity Fund and Value Equity Fund contributed the most to the negative absolute return.
Please see page 15 for information regarding specific portfolio allocations. Portfolio holdings are subject to change at any time.
The MyDestination FundsTM attempt to achieve their objectives by investing in the Select Funds and other funds in which the Funds invest. By investing in these fund-of-funds, you will incur the expenses of the MyDestination FundsTM in addition to those of the underlying funds. You may invest in the Select Funds directly. The MyDestination FundsTM are also subject to the risks of the underlying funds they hold.
13
MyDestination 2015 Fund
Average Annual Total Returns as of 12/31/08
| | | | | | | | | |
| | | GS4 Class* | | | GS6 Class* | | | Benchmark** | |
One Year | | (29.31 | )% | | (29.44 | )% | | (26.11 | )% |
Since Inception | | (13.35 | )% | | (13.59 | )% | | (11.36 | )% |
Inception Date | | 12/29/06 | | | 12/29/06 | | | 12/29/06 | |
Total Fund Operating Expenses (August 5, 2008 Prospectus) | | 0.24 | % | | 2.54 | % | | | |
The performance data quoted represents past performance and does not guarantee future results. Current performance may be lower or higher. Performance data current to the most recent month-end may be obtained at www.GuideStoneFunds.org. The investment return and principal value of an investment will fluctuate so that shares, when redeemed, may be worth more or less than their original cost.
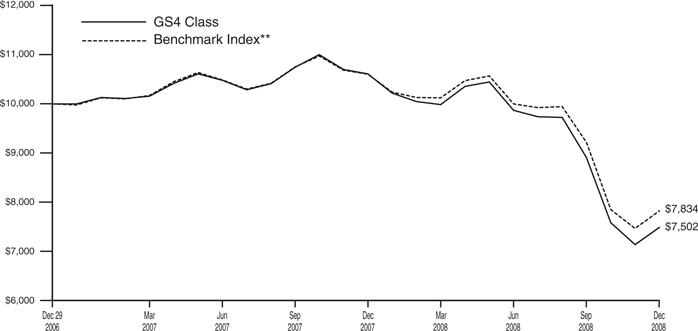
The graph illustrates the results of a hypothetical $10,000 investment in the GS4 Class of the Fund since December 29, 2006 (commencement of operations), with all dividends and capital gains reinvested, with the Fund’s composite benchmark index.
| * | These returns reflect expense waivers by the Fund’s investment adviser. Without these waivers, returns would have been lower. Returns shown do not reflect the deduction of taxes that a shareholder would pay on Fund distributions or the redemption of Fund shares. |
** | The Composite Index is provided for each MyDestination Fund to show how the Fund’s performance compares with the returns of an index of securities similar to those in which the Fund invests. The construction of the Composite Index corresponds to the percentage allocation to the underlying asset class as represented by the Fund’s investment in the Select Funds and / or the TIPS ETF. As the percentage allocation to the underlying investment changes according to the MyDestination Funds™ glide path, the percentage allocation to the Composite Index will also change. The Composite Index is derived by applying the Fund’s target allocations over time to the results of the following indices, as applicable: S&P 500® Index, Russell 1000® Value Index, Russell 1000® Growth Index, Russell 2000® Index, MSCI ACWI (All Country World Index) Ex-U.S. Index, Merrill Lynch 1-3 Year Treasury Index, Barclays Capital U.S. Aggregate Bond Index, Barclays Capital U.S. Long-Term Government Bond Index, Barclays Capital U.S. Long-Term Credit Bond Index, Barclays Capital Global Aggregate Bond Index, Barclays Capital U.S. Corporate High Yield – 2% Issuer Capped Index, Dow Jones Wilshire Real Estate Index, JPMorgan Emerging Markets Bond Index Plus and iShares Barclays TIPS Bond Fund. |
The Russell 1000® Value Index is a large-cap index consisting of those Russell 1000® securities with a less-than-average growth orientation. Companies in this index tend to exhibit lower price-to-book and price-to-earnings ratios, higher dividend yields and lower forecasted growth values than the growth universe.
The Russell 1000® Growth Index is a large-cap index consisting of those Russell 1000® securities with a greater-than-average growth orientation. Companies in this index tend to exhibit higher price-to-book and price-to-earnings ratios, lower dividend yields and higher forecasted growth values than the value universe.
Unlike a mutual fund, the performance of an index assumes no taxes, transaction costs, management fees or other expenses.
14
| | |
| MyDestination 2015 Fund | | |
| SCHEDULE OF INVESTMENTS | | December 31, 2008 |
| | | | | | | |
| | | Shares | | Value | |
MUTUAL FUNDS — 91.8% | | | | | | | |
GuideStone Money Market Fund (GS4 Class)¥ | | | 2,058,687 | | $ | 2,058,688 | |
GuideStone Low-Duration Bond Fund (GS4 Class)¥ | | | 783,454 | | | 9,393,613 | |
GuideStone Medium-Duration Bond Fund (GS4 Class)¥ | | | 1,464,820 | | | 17,812,210 | |
GuideStone Extended-Duration Bond Fund (GS4 Class)¥ | | | 530,373 | | | 6,878,936 | |
GuideStone Global Bond Fund (GS4 Class)¥ | | | 969,644 | | | 7,117,184 | |
GuideStone Equity Index Fund (GS4 Class)¥ | | | 353,678 | | | 4,138,033 | |
GuideStone Real Estate Securities Fund (GS4 Class)¥ | | | 1,690,593 | | | 8,875,612 | |
GuideStone Value Equity Fund (GS4 Class)¥ | | | 2,248,292 | | | 23,674,520 | |
GuideStone Growth Equity Fund (GS4 Class)¥ | | | 2,051,067 | | | 23,628,295 | |
GuideStone Small Cap Equity Fund (GS4 Class)¥ | | | 749,222 | | | 6,675,566 | |
GuideStone International Equity Fund (GS4 Class)¥ | | | 2,670,755 | | | 25,051,682 | |
| | | | | | | |
| | |
Total Mutual Funds
(Cost $202,327,682) | | | | | | 135,304,339 | |
| | | | | | | |
EXCHANGE TRADED FUND — 8.1% | | | | | | | |
iShares Lehman Treasury Inflation Protected Securities Fund
(Cost $12,375,530) | | | 120,873 | | | 11,995,436 | |
| | | | | | | |
| | |
| | | Par | | | |
U.S. TREASURY OBLIGATIONS — 0.2% | | | | | | | |
U.S. Treasury Bills | | | | | | | |
0.42%, 05/14/09‡‡ | | $ | 25,000 | | | 24,994 | |
0.73%, 05/14/09‡‡ | | | 275,000 | | | 274,940 | |
| | | | | | | |
Total U.S. Treasury Obligations
(Cost $299,860) | | | | | | 299,934 | |
| | | | | | | |
TOTAL INVESTMENTS — 100.1%
(Cost $215,003,072) | | | | | | 147,599,709 | |
| | |
Liabilities in Excess of Other Assets — (0.1)% | | | | | | (207,966 | ) |
| | | | | | | |
NET ASSETS — 100.0% | | | | | $ | 147,391,743 | |
| | | | | | | |
PORTFOLIO SUMMARY (based on net assets)
| | |
| | | % |
Domestic Equity Funds | | 45.5 |
Bond Funds | | 28.0 |
International Equity Fund | | 17.0 |
Exchange Traded Fund | | 8.1 |
Money Market Fund | | 1.4 |
Futures Contracts | | 1.2 |
U.S. Treasury Obligations | | 0.2 |
| | |
| | 101.4 |
| | |
FAS 157 DISCLOSURE
The following is a summary of the inputs used, as of December 31, 2008, in valuing the Fund’s investments carried at fair value:
| | | | | | |
Valuation Inputs | | Investments
in
Securities | | Other
Financial
Instruments*** |
Level 1 — Quoted Prices | | $ | 147,299,775 | | $ | 33,849 |
Level 2 — Other Significant Observable Inputs | | | 299,934 | | | — |
Level 3 — Significant Unobservable Inputs | | | — | | | — |
| | | | | | |
Total | | $ | 147,599,709 | | $ | 33,849 |
| | | | | | |
| *** | Other financial instruments are derivative instruments not reflected in the Schedule of Investments, such as futures, forwards and swap contracts, which are valued at the unrealized appreciation (depreciation) on the investment. |
See Notes to Financial Statements.
15
MyDestination 2025 Fund
The Fund, through its investment in underlying Select Funds, is significantly overweight in equity securities (stocks) as compared to fixed-income securities (bonds). The Fund also has an exposure to public real estate securities through the Real Estate Securities Fund. For the calendar year ending December 31, 2008, the GS4 Class of the Fund returned (35.00)%. The diversification element of the Fund provided a slight benefit during 2008 in the midst of tumultuous capital markets and the economic uncertainty caused by the financial crisis. However, exposure to the International Equity Fund, Growth Equity Fund and Value Equity Fund contributed the most to the negative absolute return.
Please see page 18 for information regarding specific portfolio allocations. Portfolio holdings are subject to change at any time.
The MyDestination FundsTM attempt to achieve their objectives by investing in the Select Funds and other funds in which the Funds invest. By investing in these fund-of-funds, you will incur the expenses of the MyDestination FundsTM in addition to those of the underlying funds. You may invest in the Select Funds directly. The MyDestination FundsTM are also subject to the risks of the underlying funds they hold.
16
MyDestination 2025 Fund
Average Annual Total Returns as of 12/31/08
| | | | | | | | | |
| | | GS4 Class* | | | GS6 Class* | | | Benchmark** | |
One Year | | (35.00 | )% | | (35.23 | )% | | (32.10 | )% |
Since Inception | | (17.23 | )% | | (17.48 | )% | | (15.09 | )% |
Inception Date | | 12/29/06 | | | 12/29/06 | | | 12/29/06 | |
Total Fund Operating Expenses (August 5, 2008 Prospectus) | | 0.30 | % | | 2.25 | % | | | |
The performance data quoted represents past performance and does not guarantee future results. Current performance may be lower or higher. Performance data current to the most recent month-end may be obtained at www.GuideStoneFunds.org. The investment return and principal value of an investment will fluctuate so that shares, when redeemed, may be worth more or less than their original cost.
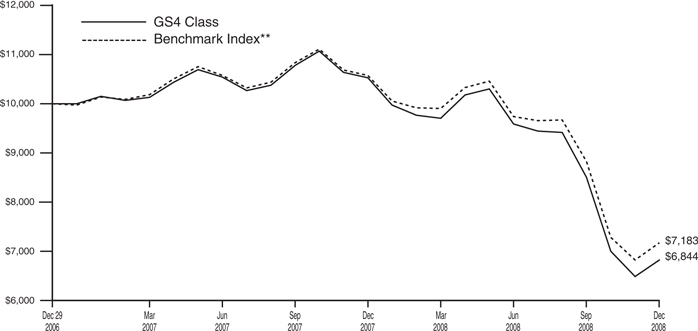
The graph illustrates the results of a hypothetical $10,000 investment in the GS4 Class of the Fund since December 29, 2006 (commencement of operations), with all dividends and capital gains reinvested, with the Fund’s composite benchmark index.
| * | These returns reflect expense waivers by the Fund’s investment adviser. Without these waivers, returns would have been lower. Returns shown do not reflect the deduction of taxes that a shareholder would pay on Fund distributions or the redemption of Fund shares. |
** | The Composite Index is provided for each MyDestination Fund to show how the Fund’s performance compares with the returns of an index of securities similar to those in which the Fund invests. The construction of the Composite Index corresponds to the percentage allocation to the underlying asset class as represented by the Fund’s investment in the Select Funds and / or the TIPS ETF. As the percentage allocation to the underlying investment changes according to the MyDestination Funds™ glide path, the percentage allocation to the Composite Index will also change. The Composite Index is derived by applying the Fund’s target allocations over time to the results of the following indices, as applicable: S&P 500® Index, Russell 1000® Value Index, Russell 1000® Growth Index, Russell 2000® Index, MSCI ACWI (All Country World Index) Ex-U.S. Index, Merrill Lynch 1-3 Year Treasury Index, Barclays Capital U.S. Aggregate Bond Index, Barclays Capital U.S. Long-Term Government Bond Index, Barclays Capital U.S. Long-Term Credit Bond Index, Barclays Capital Global Aggregate Bond Index, Barclays Capital U.S. Corporate High Yield – 2% Issuer Capped Index, Dow Jones Wilshire Real Estate Index, JPMorgan Emerging Markets Bond Index Plus and iShares Barclays TIPS Bond Fund. |
The MSCI ACWI (All Country World Index) Ex-U.S. Index is a free float-adjusted market capitalization index that is designed to measure equity market performance in the global developed (Ex-U.S.) and emerging markets. As of December 31, 2008, the MSCI ACWI Ex-U.S. Index consisted of the following developed and emerging market country indices: Argentina, Australia, Austria, Belgium, Brazil, Canada, Chile, China, Colombia, Czech Republic, Denmark, Egypt, Finland, France, Germany, Greece, Hong Kong, Hungary, India, Indonesia, Ireland, Israel, Italy, Japan, Korea, Malaysia, Mexico, Morocco, Netherlands, New Zealand, Norway, Pakistan, Peru, Philippines, Poland, Portugal, Russia, Singapore, South Africa, Spain, Sweden, Switzerland, Taiwan, Thailand, Turkey and the United Kingdom.
Unlike a mutual fund, the performance of an index assumes no taxes, transaction costs, management fees or other expenses.
17
| | |
| MyDestination 2025 Fund | | |
| SCHEDULE OF INVESTMENTS | | December 31, 2008 |
| | | | | | | |
| | | Shares | | Value | |
MUTUAL FUNDS — 100.2% | | | | | | | |
GuideStone Money Market Fund (GS4 Class)¥ | | | 1,511,269 | | $ | 1,511,269 | |
GuideStone Medium-Duration Bond Fund (GS4 Class)¥ | | | 617,624 | | | 7,510,305 | |
GuideStone Extended-Duration Bond Fund (GS4 Class)¥ | | | 525,609 | | | 6,817,149 | |
GuideStone Global Bond Fund (GS4 Class)¥ | | | 946,208 | | | 6,945,170 | |
GuideStone Equity Index Fund (GS4 Class)¥ | | | 284,201 | | | 3,325,149 | |
GuideStone Real Estate Securities Fund (GS4 Class)¥ | | | 1,290,868 | | | 6,777,056 | |
GuideStone Value Equity Fund (GS4 Class)¥ | | | 1,827,946 | | | 19,248,272 | |
GuideStone Growth Equity Fund (GS4 Class)¥ | | | 1,671,663 | | | 19,257,555 | |
GuideStone Small Cap Equity Fund (GS4 Class)¥ | | | 756,493 | | | 6,740,349 | |
GuideStone International Equity Fund (GS4 Class)¥ | | | 2,242,069 | | | 21,030,605 | |
| | | | | | | |
| | |
Total Mutual Funds
(Cost $155,393,238) | | | | | | 99,162,879 | |
| | | | | | | |
| | |
| | | Par | | | |
U.S. TREASURY OBLIGATION — 0.3% | | | | | | | |
U.S. Treasury Bill | | | | | | | |
0.10%, 05/14/09‡‡ (Cost $264,902) | | $ | 265,000 | | | 264,942 | |
| | | | | | | |
TOTAL INVESTMENTS — 100.5%
(Cost $155,658,140) | | | | | | 99,427,821 | |
| | |
Liabilities in Excess of Other Assets — (0.5)% | | | | | | (516,227 | ) |
| | | | | | | |
NET ASSETS — 100.0% | | | | | $ | 98,911,594 | |
| | | | | | | |
PORTFOLIO SUMMARY (based on net assets)
| | |
| | | % |
Domestic Equity Funds | | 56.0 |
Bond Funds | | 21.5 |
International Equity Fund | | 21.3 |
Money Market Fund | | 1.5 |
Futures Contracts | | 1.4 |
U.S. Treasury Obligation | | 0.3 |
| | |
| | 102.0 |
| | |
FAS 157 DISCLOSURE
The following is a summary of the inputs used, as of December 31, 2008, in valuing the Fund’s investments carried at fair value:
| | | | | | |
Valuation Inputs | | Investments
in
Securities | | Other
Financial
Instruments*** |
Level 1 — Quoted Prices | | $ | 99,162,879 | | $ | 26,638 |
Level 2 — Other Significant Observable Inputs | | | 264,942 | | | — |
Level 3 — Significant Unobservable Inputs | | | — | | | — |
| | | | | | |
Total | | $ | 99,427,821 | | $ | 26,638 |
| | | | | | |
| *** | Other financial instruments are derivative instruments not reflected in the Schedule of Investments, such as futures, forwards and swap contracts, which are valued at the unrealized appreciation (depreciation) on the investment. |
See Notes to Financial Statements.
18
MyDestination 2035 Fund
The Fund, through its investment in underlying Select Funds, is significantly overweight in equity securities (stocks) as compared to fixed-income securities (bonds). The Fund also has an exposure to public real estate securities through the Real Estate Securities Fund. For the calendar year ending December 31, 2008, the GS4 Class of the Fund returned (38.86)%. Exposure to the International Equity Fund, Growth Equity Fund and Value Equity Fund contributed the most to the negative absolute return.
Please see page 21 for information regarding specific portfolio allocations. Portfolio holdings are subject to change at any time.
The MyDestination FundsTM attempt to achieve their objectives by investing in the Select Funds and other funds in which the Funds invest. By investing in these fund-of-funds, you will incur the expenses of the MyDestination FundsTM in addition to those of the underlying funds. You may invest in the Select Funds directly. The MyDestination FundsTM are also subject to the risks of the underlying funds they hold.
19
MyDestination 2035 Fund
Average Annual Total Returns as of 12/31/08
| | | | | | | | | |
| | | GS4 Class* | | | GS6 Class* | | | Benchmark** | |
One Year | | (38.86 | )% | | (38.98 | )% | | (37.12 | )% |
Since Inception | | (19.76 | )% | | (19.97 | )% | | (18.31 | )% |
Inception Date | | 12/29/06 | | | 12/29/06 | | | 12/29/06 | |
Total Fund Operating Expenses (August 5, 2008 Prospectus) | | 0.64 | % | | 2.97 | % | | | |
The performance data quoted represents past performance and does not guarantee future results. Current performance may be lower or higher. Performance data current to the most recent month-end may be obtained at www.GuideStoneFunds.org. The investment return and principal value of an investment will fluctuate so that shares, when redeemed, may be worth more or less than their original cost.
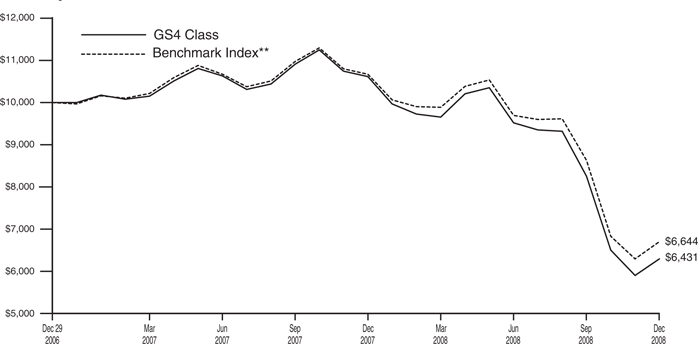
The graph illustrates the results of a hypothetical $10,000 investment in the GS4 Class of the Fund since December 29, 2006 (commencement of operations), with all dividends and capital gains reinvested, with the Fund’s composite benchmark index.
| * | These returns reflect expense waivers by the Fund’s investment adviser. Without these waivers, returns would have been lower. Returns shown do not reflect the deduction of taxes that a shareholder would pay on Fund distributions or the redemption of Fund shares. |
** | The Composite Index is provided for each MyDestination Fund to show how the Fund’s performance compares with the returns of an index of securities similar to those in which the Fund invests. The construction of the Composite Index corresponds to the percentage allocation to the underlying asset class as represented by the Fund’s investment in the Select Funds and / or the TIPS ETF. As the percentage allocation to the underlying investment changes according to the MyDestination Funds™ glide path, the percentage allocation to the Composite Index will also change. The Composite Index is derived by applying the Fund’s target allocations over time to the results of the following indices, as applicable: S&P 500® Index, Russell 1000® Value Index, Russell 1000® Growth Index, Russell 2000® Index, MSCI ACWI (All Country World Index) Ex-U.S. Index, Merrill Lynch 1-3 Year Treasury Index, Barclays Capital U.S. Aggregate Bond Index, Barclays Capital U.S. Long-Term Government Bond Index, Barclays Capital U.S. Long-Term Credit Bond Index, Barclays Capital Global Aggregate Bond Index, Barclays Capital U.S. Corporate High Yield – 2% Issuer Capped Index, Dow Jones Wilshire Real Estate Index, JPMorgan Emerging Markets Bond Index Plus and iShares Barclays TIPS Bond Fund. |
The MSCI ACWI (All Country World Index) Ex-U.S. Index is a free float-adjusted market capitalization index that is designed to measure equity market performance in the global developed (Ex-U.S.) and emerging markets. As of December 31, 2008, the MSCI ACWI Ex-U.S. Index consisted of the following developed and emerging market country indices: Argentina, Australia, Austria, Belgium, Brazil, Canada, Chile, China, Colombia, Czech Republic, Denmark, Egypt, Finland, France, Germany, Greece, Hong Kong, Hungary, India, Indonesia, Ireland, Israel, Italy, Japan, Korea, Malaysia, Mexico, Morocco, Netherlands, New Zealand, Norway, Pakistan, Peru, Philippines, Poland, Portugal, Russia, Singapore, South Africa, Spain, Sweden, Switzerland, Taiwan, Thailand, Turkey and the United Kingdom.
Unlike a mutual fund, the performance of an index assumes no taxes, transaction costs, management fees or other expenses.
20
| | |
| MyDestination 2035 Fund | | |
| SCHEDULE OF INVESTMENTS | | December 31, 2008 |
| | | | | | | |
| | | Shares | | Value | |
MUTUAL FUNDS — 100.0% | | | | | | | |
GuideStone Money Market Fund (GS4 Class)¥ | | | 799,768 | | $ | 799,768 | |
GuideStone Medium-Duration Bond Fund (GS4 Class)¥ | | | 49,506 | | | 601,992 | |
GuideStone Extended-Duration Bond Fund (GS4 Class)¥ | | | 47,258 | | | 612,942 | |
GuideStone Global Bond Fund (GS4 Class)¥ | | | 201,026 | | | 1,475,529 | |
GuideStone Equity Index Fund (GS4 Class)¥ | | | 126,380 | | | 1,478,651 | |
GuideStone Real Estate Securities Fund (GS4 Class)¥ | | | 567,754 | | | 2,980,706 | |
GuideStone Value Equity Fund (GS4 Class)¥ | | | 828,390 | | | 8,722,950 | |
GuideStone Growth Equity Fund (GS4 Class)¥ | | | 757,783 | | | 8,729,656 | |
GuideStone Small Cap Equity Fund (GS4 Class)¥ | | | 401,008 | | | 3,572,980 | |
GuideStone International Equity Fund (GS4 Class)¥ | | | 1,051,292 | | | 9,861,117 | |
| | | | | | | |
| | |
Total Mutual Funds
(Cost $61,257,250) | | | | | | 38,836,291 | |
| | | | | | | |
| | |
| | | Par | | | |
U.S. TREASURY OBLIGATIONS — 0.3% | | | | | | | |
U.S. Treasury Bills | | | | | | | |
0.27%, 05/14/09‡‡ | | $ | 25,000 | | | 24,994 | |
0.73%, 05/14/09‡‡ | | | 105,000 | | | 104,977 | |
| | | | | | | |
Total U.S. Treasury Obligations
(Cost $129,937) | | | | | | 129,971 | |
| | | | | | | |
TOTAL INVESTMENTS — 100.3%
(Cost $61,387,187) | | | | | | 38,966,262 | |
| | |
Liabilities in Excess of Other Assets — (0.3)% | | | | | | (104,913 | ) |
| | | | | | | |
NET ASSETS — 100.0% | | | | | $ | 38,861,349 | |
| | | | | | | |
PORTFOLIO SUMMARY (based on net assets)
| | |
| | | % |
Domestic Equity Funds | | 65.6 |
International Equity Fund | | 25.4 |
Bond Funds | | 6.9 |
Money Market Fund | | 2.1 |
Futures Contracts | | 1.5 |
U.S. Treasury Obligations | | 0.3 |
| | |
| | 101.8 |
| | |
FAS 157 DISCLOSURE
The following is a summary of the inputs used, as of December 31, 2008, in valuing the Fund’s investments carried at fair value:
| | | | | | |
Valuation Inputs | | Investments
in
Securities | | Other
Financial
Instruments*** |
Level 1 — Quoted Prices | | $ | 38,836,291 | | $ | 15,887 |
Level 2 — Other Significant Observable Inputs | | | 129,971 | | | — |
Level 3 — Significant Unobservable Inputs | | | — | | | — |
| | | | | | |
Total | | $ | 38,966,262 | | $ | 15,887 |
| | | | | | |
| *** | Other financial instruments are derivative instruments not reflected in the Schedule of Investments, such as futures, forwards and swap contracts, which are valued at the unrealized appreciation (depreciation) on the investment. |
See Notes to Financial Statements.
21
MyDestination 2045 Fund
The Fund, through its investment in underlying Select Funds, is significantly overweight in equity securities (stocks) as compared to fixed-income securities (bonds). The Fund also has an exposure to public real estate securities through the Real Estate Securities Fund. For the calendar year ending December 31, 2008, the GS4 Class of the Fund returned (40.29)%. Exposure to the International Equity Fund, Growth Equity Fund and Value Equity Fund contributed the most to the negative absolute return.
Please see page 24 for information regarding specific portfolio allocations. Portfolio holdings are subject to change at any time.
The MyDestination FundsTM attempt to achieve their objectives by investing in the Select Funds and other funds in which the Funds invest. By investing in these fund-of-funds, you will incur the expenses of the MyDestination FundsTM in addition to those of the underlying funds. You may invest in the Select Funds directly. The MyDestination FundsTM are also subject to the risks of the underlying funds they hold.
22
MyDestination 2045 Fund
Average Annual Total Returns as of 12/31/08
| | | | | | | | | |
| | | GS4 Class* | | | GS6 Class* | | | Benchmark** | |
One Year | | (40.29 | )% | | (40.44 | )% | | (39.22 | )% |
Since Inception | | (20.97 | )% | | (21.17 | )% | | (19.92 | )% |
Inception Date | | 12/29/06 | | | 12/29/06 | | | 12/29/06 | |
Total Fund Operating Expenses (August 5, 2008 Prospectus) | | 1.48 | % | | 3.51 | % | | | |
The performance data quoted represents past performance and does not guarantee future results. Current performance may be lower or higher. Performance data current to the most recent month-end may be obtained at www.GuideStoneFunds.org. The investment return and principal value of an investment will fluctuate so that shares, when redeemed, may be worth more or less than their original cost.
The graph illustrates the results of a hypothetical $10,000 investment in the GS4 Class of the Fund since December 29, 2006 (commencement of operations), with all dividends and capital gains reinvested, with the Fund’s composite benchmark index.
| * | These returns reflect expense waivers by the Fund’s investment adviser. Without these waivers, returns would have been lower. Returns shown do not reflect the deduction of taxes that a shareholder would pay on Fund distributions or the redemption of Fund shares. |
** | The Composite Index is provided for each MyDestination Fund to show how the Fund’s performance compares with the returns of an index of securities similar to those in which the Fund invests. The construction of the Composite Index corresponds to the percentage allocation to the underlying asset class as represented by the Fund’s investment in the Select Funds and / or the TIPS ETF. As the percentage allocation to the underlying investment changes according to the MyDestination Funds™ glide path, the percentage allocation to the Composite Index will also change. The Composite Index is derived by applying the Fund’s target allocations over time to the results of the following indices, as applicable: S&P 500® Index, Russell 1000® Value Index, Russell 1000® Growth Index, Russell 2000® Index, MSCI ACWI (All Country World Index) Ex-U.S. Index, Merrill Lynch 1-3 Year Treasury Index, Barclays Capital U.S. Aggregate Bond Index, Barclays Capital U.S. Long-Term Government Bond Index, Barclays Capital U.S. Long-Term Credit Bond Index, Barclays Capital Global Aggregate Bond Index, Barclays Capital U.S. Corporate High Yield – 2% Issuer Capped Index, Dow Jones Wilshire Real Estate Index, JPMorgan Emerging Markets Bond Index Plus and iShares Barclays TIPS Bond Fund. |
The MSCI ACWI (All Country World Index) Ex-U.S. Index is a free float-adjusted market capitalization index that is designed to measure equity market performance in the global developed (Ex-U.S.) and emerging markets. As of December 31, 2008, the MSCI ACWI Ex-U.S. Index consisted of the following developed and emerging market country indices: Argentina, Australia, Austria, Belgium, Brazil, Canada, Chile, China, Colombia, Czech Republic, Denmark, Egypt, Finland, France, Germany, Greece, Hong Kong, Hungary, India, Indonesia, Ireland, Israel, Italy, Japan, Korea, Malaysia, Mexico, Morocco, Netherlands, New Zealand, Norway, Pakistan, Peru, Philippines, Poland, Portugal, Russia, Singapore, South Africa, Spain, Sweden, Switzerland, Taiwan, Thailand, Turkey and the United Kingdom.
Unlike a mutual fund, the performance of an index assumes no taxes, transaction costs, management fees or other expenses.
23
| | | | |
| MyDestination 2045 Fund | | | | |
| SCHEDULE OF INVESTMENTS | | | | December 31, 2008 |
| | | | | | |
| | | Shares | | Value |
MUTUAL FUNDS — 99.4% | | | | | | |
GuideStone Money Market Fund (GS4 Class)¥ | | | 615,665 | | $ | 615,665 |
GuideStone Equity Index Fund (GS4 Class)¥ | | | 77,407 | | | 905,663 |
GuideStone Real Estate Securities Fund (GS4 Class)¥ | | | 346,714 | | | 1,820,248 |
GuideStone Value Equity Fund (GS4 Class)¥ | | | 414,282 | | | 4,362,388 |
GuideStone Growth Equity Fund (GS4 Class)¥ | | | 374,398 | | | 4,313,063 |
GuideStone Small Cap Equity Fund (GS4 Class)¥ | | | 208,005 | | | 1,853,328 |
GuideStone International Equity Fund (GS4 Class)¥ | | | 526,266 | | | 4,936,379 |
| | | | | | |
Total Mutual Funds
(Cost $27,515,450) | | | | | | 18,806,734 |
| | | | | | |
| | |
| | | Par | | |
U.S. TREASURY OBLIGATION — 0.5% | | | | | | |
U.S. Treasury Bill | | | | | | |
0.10%, 05/14/09‡‡ (Cost $104,961) | | $ | 105,000 | | | 104,977 |
| | | | | | |
TOTAL INVESTMENTS — 99.9%
(Cost $27,620,411) | | | | | | 18,911,711 |
| | |
Other Assets in Excess of Liabilities — 0.1% | | | | | | 16,517 |
| | | | | | |
NET ASSETS — 100.0% | | | | | $ | 18,928,228 |
| | | | | | |
PORTFOLIO SUMMARY (based on net assets)
| | |
| | | % |
Domestic Equity Funds | | 70.0 |
International Equity Fund | | 26.1 |
Money Market Fund | | 3.3 |
Futures Contracts | | 2.9 |
U.S. Treasury Obligation | | 0.5 |
| | |
| | 102.8 |
| | |
FAS 157 DISCLOSURE
The following is a summary of the inputs used, as of December 31, 2008, in valuing the Fund’s investments carried at fair value:
| | | | | | |
Valuation Inputs | | Investments
in
Securities | | Other
Financial
Instruments*** |
Level 1 — Quoted Prices | | $ | 18,806,734 | | $ | 11,635 |
Level 2 — Other Significant Observable Inputs | | | 104,977 | | | — |
Level 3 — Significant Unobservable Inputs | | | — | | | — |
| | | | | | |
Total | | $ | 18,911,711 | | $ | 11,635 |
| | | | | | |
| *** | Other financial instruments are derivative instruments not reflected in the Schedule of Investments, such as futures, forwards and swap contracts, which are valued at the unrealized appreciation (depreciation) on the investment. |
See Notes to Financial Statements.
24
STATEMENTS OF ASSETS AND LIABILITIES
December 31, 2008
| | | | | | | | | | | | | | | | | | | | |
| | | MyDestination
2005 Fund | | | MyDestination
2015 Fund | | | MyDestination
2025 Fund | | | MyDestination
2035 Fund | | | MyDestination
2045 Fund | |
Assets | | | | | | | | | | | | | | | | | | | | |
Investments in securities of affiliated issuers, at value | | $ | 44,408,144 | | | $ | 135,304,339 | | | $ | 99,162,879 | | | $ | 38,836,291 | | | $ | 18,806,734 | |
Investments in securities of unaffiliated issuers, at value | | | 7,426,938 | | | | 12,295,370 | | | | 264,942 | | | | 129,971 | | | | 104,977 | |
| | | | | | | | | | | | | | | | | | | | |
Total investments (1) | | | 51,835,082 | | | | 147,599,709 | | | | 99,427,821 | | | | 38,966,262 | | | | 18,911,711 | |
Receivables: | | | | | | | | | | | | | | | | | | | | |
Dividends | | | 1,496 | | | | 3,075 | | | | 2,601 | | | | 1,174 | | | | 928 | |
Investment securities sold | | | — | | | | 255,229 | | | | 110,567 | | | | 1,426 | | | | — | |
Fund shares sold | | | 1,961 | | | | 276,932 | | | | 39,948 | | | | 54,666 | | | | 27,979 | |
Variation margin | | | 12,215 | | | | 20,688 | | | | 26,638 | | | | 11,990 | | | | 10,787 | |
Prepaid expenses and other assets | | | 6,001 | | | | 6,331 | | | | 6,174 | | | | 6,001 | | | | 6,055 | |
| | | | | | | | | | | | | | | | | | | | |
Total Assets | | | 51,856,755 | | | | 148,161,964 | | | | 99,613,749 | | | | 39,041,519 | | | | 18,957,460 | |
| | | | | | | | | | | | | | | | | | | | |
Liabilities | | | | | | | | | | | | | | | | | | | | |
Payables: | | | | | | | | | | | | | | | | | | | | |
Investment securities purchased | | | — | | | | 720,000 | | | | 655,000 | | | | 140,000 | | | | — | |
Fund shares redeemed | | | — | | | | — | | | | — | | | | — | | | | 900 | |
Accrued expenses: | | | | | | | | | | | | | | | | | | | | |
Investment advisory fees | | | 25,594 | | | | 28,780 | | | | 26,496 | | | | 20,010 | | | | 9,811 | |
Distribution (12b-1) fees | | | 196 | | | | 218 | | | | 319 | | | | 202 | | | | 156 | |
Shareholder servicing fees | | | 98 | | | | 108 | | | | 172 | | | | 105 | | | | 80 | |
Other expenses | | | 19,082 | | | | 21,115 | | | | 20,168 | | | | 19,853 | | | | 18,285 | |
| | | | | | | | | | | | | | | | | | | | |
Total Liabilities | | | 44,970 | | | | 770,221 | | | | 702,155 | | | | 180,170 | | | | 29,232 | |
| | | | | | | | | | | | | | | | | | | | |
Net Assets | | $ | 51,811,785 | | | $ | 147,391,743 | | | $ | 98,911,594 | | | $ | 38,861,349 | | | $ | 18,928,228 | |
| | | | | | | | | | | | | | | | | | | | |
Net Assets Consist of: | | | | | | | | | | | | | | | | | | | | |
Paid-in capital | | $ | 71,000,080 | | | $ | 217,356,121 | | | $ | 155,244,481 | | | $ | 61,693,007 | | | $ | 28,291,125 | |
Undistributed net investment income | | | 101,730 | | | | 1,381,316 | | | | 608,702 | | | | 185,808 | | | | 127,784 | |
Accumulated net realized loss on investments and futures transactions | | | (1,197,656 | ) | | | (3,976,180 | ) | | | (737,908 | ) | | | (612,428 | ) | | | (793,616 | ) |
Net unrealized appreciation (depreciation) on investments and futures | | | (18,092,369 | ) | | | (67,369,514 | ) | | | (56,203,681 | ) | | | (22,405,038 | ) | | | (8,697,065 | ) |
| | | | | | | | | | | | | | | | | | | | |
Net Assets | | $ | 51,811,785 | | | $ | 147,391,743 | | | $ | 98,911,594 | | | $ | 38,861,349 | | | $ | 18,928,228 | |
| | | | | | | | | | | | | | | | | | | | |
Net Asset Value: | | | | | | | | | | | | | | | | | | | | |
$0.001 par value, unlimited shares authorized | | | | | | | | | | | | | | | | | | | | |
Net assets applicable to the GS4 Class | | $ | 50,677,588 | | | $ | 146,140,412 | | | $ | 96,826,291 | | | $ | 37,637,216 | | | $ | 17,997,650 | |
| | | | | | | | | | | | | | | | | | | | |
GS4 shares outstanding | | | 6,815,668 | | | | 21,387,988 | | | | 15,679,247 | | | | 6,428,335 | | | | 3,129,671 | |
| | | | | | | | | | | | | | | | | | | | |
Net asset value, offering and redemption price per GS4 share | | $ | 7.44 | | | $ | 6.83 | | | $ | 6.18 | | | $ | 5.85 | | | $ | 5.75 | |
| | | | | | | | | | | | | | | | | | | | |
| | | | | |
Net assets applicable to the GS6 Class | | $ | 1,134,197 | | | $ | 1,251,331 | | | $ | 2,085,303 | | | $ | 1,224,133 | | | $ | 930,578 | |
| | | | | | | | | | | | | | | | | | | | |
GS6 shares outstanding | | | 151,337 | | | | 181,674 | | | | 336,489 | | | | 207,579 | | | | 160,572 | |
| | | | | | | | | | | | | | | | | | | | |
Net asset value, offering and redemption price per GS6 share | | $ | 7.49 | | | $ | 6.89 | | | $ | 6.20 | | | $ | 5.90 | | | $ | 5.80 | |
| | | | | | | | | | | | | | | | | | | | |
(1) Investments in securities of affiliated issuers, at cost | | $ | 62,268,775 | | | $ | 202,327,682 | | | $ | 155,393,238 | | | $ | 61,257,250 | | | $ | 27,515,450 | |
Investments in securities of unaffiliated issuers, at cost | | | 7,675,223 | | | | 12,675,390 | | | | 264,902 | | | | 129,937 | | | | 104,961 | |
| | | | | | | | | | | | | | | | | | | | |
Total investments at cost | | $ | 69,943,998 | | | $ | 215,003,072 | | | $ | 155,658,140 | | | $ | 61,387,187 | | | $ | 27,620,411 | |
| | | | | | | | | | | | | | | | | | | | |
See Notes to Financial Statements.
25
STATEMENTS OF OPERATIONS
For the Year Ended December 31, 2008
| | | | | | | | | | | | | | | | | | | | |
| | | MyDestination
2005 Fund | | | MyDestination
2015 Fund | | | MyDestination
2025 Fund | | | MyDestination
2035 Fund | | | MyDestination
2045 Fund | |
Investment Income | | | | | | | | | | | | | | | | | | | | |
Income distributions received from affiliated funds | | $ | 1,518,008 | | | $ | 4,316,354 | | | $ | 2,895,863 | | | $ | 870,273 | | | $ | 341,854 | |
Dividends | | | 548,004 | | | | 874,513 | | | | — | | | | — | | | | — | |
Interest | | | 13,643 | | | | 24,080 | | | | 12,542 | | | | 3,026 | | | | 1,063 | |
| | | | | | | | | | | | | | | | | | | | |
Total Investment Income | | | 2,079,655 | | | | 5,214,947 | | | | 2,908,405 | | | | 873,299 | | | | 342,917 | |
| | | | | | | | | | | | | | | | | | | | |
Expenses | | | | | | | | | | | | | | | | | | | | |
Investment advisory fees | | | 61,527 | | | | 172,973 | | | | 110,834 | | | | 40,419 | | | | 16,647 | |
Transfer agent fees: | | | | | | | | | | | | | | | | | | | | |
GS4 | | | 18,664 | | | | 19,657 | | | | 19,863 | | | | 18,923 | | | | 18,769 | |
GS6 | | | 7,340 | | | | 7,362 | | | | 7,370 | | | | 7,369 | | | | 7,372 | |
Custodian fees | | | 12,642 | | | | 15,810 | | | | 15,401 | | | | 14,446 | | | | 12,458 | |
Distribution (12b-1) fees: | | | | | | | | | | | | | | | | | | | | |
GS6 | | | 1,423 | | | | 1,617 | | | | 2,168 | | | | 1,526 | | | | 1,145 | |
Shareholder servicing fees: | | | | | | | | | | | | | | | | | | | | |
GS6 | | | 1,562 | | | | 1,775 | | | | 2,379 | | | | 1,676 | | | | 1,256 | |
Accounting and administration fees | | | 7,802 | | | | 13,938 | | | | 10,431 | | | | 10,915 | | | | 7,102 | |
Professional fees | | | 37,208 | | | | 37,208 | | | | 37,208 | | | | 37,208 | | | | 37,208 | |
Blue sky fees: | | | | | | | | | | | | | | | | | | | | |
GS4 | | | 18,055 | | | | 17,706 | | | | 16,436 | | | | 15,608 | | | | 14,883 | |
GS6 | | | 5,210 | | | | 5,250 | | | | 5,162 | | | | 5,317 | | | | 5,705 | |
Shareholder reporting fees: | | | | | | | | | | | | | | | | | | | | |
GS4 | | | 4,263 | | | | 6,530 | | | | 6,918 | | | | 5,006 | | | | 4,677 | |
GS6 | | | — | | | | — | | | | — | | | | 143 | | | | — | |
Trustee fees | | | 521 | | | | 1,429 | | | | 903 | | | | 330 | | | | 140 | |
Line of credit facility fees | | | 303 | | | | 733 | | | | 461 | | | | 166 | | | | 66 | |
Other expenses | | | 11,893 | | | | 12,118 | | | | 11,990 | | | | 11,848 | | | | 11,797 | |
| | | | | | | | | | | | | | | | | | | | |
Total Expenses | | | 188,413 | | | | 314,106 | | | | 247,524 | | | | 170,900 | | | | 139,225 | |
Expenses waived/reimbursed net of amount recaptured(1) | | | (63,399 | ) | | | 23,186 | | | | (23,442 | ) | | | (87,225 | ) | | | (103,673 | ) |
| | | | | | | | | | | | | | | | | | | | |
Net Expenses | | | 125,014 | | | | 337,292 | | | | 224,082 | | | | 83,675 | | | | 35,552 | |
| | | | | | | | | | | | | | | | | | | | |
Net Investment Income | | | 1,954,641 | | | | 4,877,655 | | | | 2,684,323 | | | | 789,624 | | | | 307,365 | |
| | | | | | | | | | | | | | | | | | | | |
Realized and Unrealized Gain (Loss) | | | | | | | | | | | | | | | | | | | | |
Capital gain distributions received from affiliated funds | | | 536,347 | | | | 1,639,804 | | | | 1,175,568 | | | | 429,372 | | | | 189,409 | |
Net realized loss on investment securities of affiliated issuers | | | (1,333,950 | ) | | | (4,033,730 | ) | | | (923,331 | ) | | | (721,196 | ) | | | (784,569 | ) |
Net realized gain on investment securities of unaffiliated issuers | | | 15,318 | | | | 38,818 | | | | 13,123 | | | | 1,974 | | | | — | |
Net realized loss on futures transactions | | | (175,524 | ) | | | (1,124,706 | ) | | | (751,753 | ) | | | (300,491 | ) | | | (201,298 | ) |
| | | | | | | | | | | | | | | | | | | | |
Net realized loss | | | (957,809 | ) | | | (3,479,814 | ) | | | (486,393 | ) | | | (590,341 | ) | | | (796,458 | ) |
| | | | | | | | | | | | | | | | | | | | |
Change in unrealized depreciation on investment securities of affiliated issuers | | | (15,870,627 | ) | | | (58,854,417 | ) | | | (48,855,653 | ) | | | (19,548,089 | ) | | | (7,666,330 | ) |
Change in unrealized depreciation on investment securities of unaffiliated issuers | | | (720,079 | ) | | | (1,091,113 | ) | | | (2,545 | ) | | | (173 | ) | | | (16 | ) |
Change in unrealized appreciation on futures | | | 18,712 | | | | 54,085 | | | | 38,147 | | | | 21,116 | | | | 16,491 | |
| | | | | | | | | | | | | | | | | | | | |
Net change in unrealized appreciation (depreciation) | | | (16,571,994 | ) | | | (59,891,445 | ) | | | (48,820,051 | ) | | | (19,527,146 | ) | | | (7,649,855 | ) |
| | | | | | | | | | | | | | | | | | | | |
Net Realized and Unrealized Loss | | | (17,529,803 | ) | | | (63,371,259 | ) | | | (49,306,444 | ) | | | (20,117,487 | ) | | | (8,446,313 | ) |
| | | | | | | | | | | | | | | | | | | | |
Net Decrease in Net Assets Resulting from Operations | | $ | (15,575,162 | ) | | $ | (58,493,604 | ) | | $ | (46,622,121 | ) | | $ | (19,327,863 | ) | | $ | (8,138,948 | ) |
| | | | | | | | | | | | | | | | | | | | |
| (1) | See Note 3a and 3c in Notes to Financial Statements. |
See Notes to Financial Statements.
26
(This page intentionally left blank)
27
STATEMENTS OF CHANGES IN NET ASSETS
| | | | | | | | |
| | | MyDestination 2005 Fund | |
| | | For the Year Ended | |
| | | 12/31/08 | | | 12/31/07 | |
Operations: | | | | | | | | |
Net investment income | | $ | 1,954,641 | | | $ | 1,071,155 | |
Net realized gain (loss) on investment securities and futures transactions | | | (957,809 | ) | | | 2,045,019 | |
Net change in unrealized appreciation (depreciation) on investment securities and futures | | | (16,571,994 | ) | | | (1,520,375 | ) |
| | | | | | | | |
Net increase (decrease) in net assets resulting from operations | | | (15,575,162 | ) | | | 1,595,799 | |
| | | | | | | | |
Dividends and Distributions to Shareholders: | | | | | | | | |
Dividends from net investment income(1) | | | | | | | | |
GS4 shares | | | (2,047,981 | ) | | | (1,524,510 | ) |
GS6 shares | | | (31,478 | ) | | | (37,112 | ) |
Distributions from net realized capital gains | | | | | | | | |
GS4 shares | | | (1,475,258 | ) | | | (57,922 | ) |
GS6 shares | | | (33,204 | ) | | | (1,467 | ) |
| | | | | | | | |
Total dividends and distributions | | | (3,587,921 | ) | | | (1,621,011 | ) |
| | | | | | | | |
Capital Share Transactions: | | | | | | | | |
Proceeds from shares sold | | | | | | | | |
GS4 shares | | | 24,467,910 | | | | 63,731,938 | |
GS6 shares | | | 504,471 | | | | 1,384,145 | |
GS8 shares(2) | | | — | | | | 1,019,207 | |
Proceeds from exchange of GS8 shares for GS6 shares(2) | | | | | | | | |
GS6 shares | | | — | | | | 15,504 | |
GS8 shares | | | — | | | | (15,504 | ) |
Reinvestment of dividends and distributions | | | | | | | | |
GS4 shares | | | 3,523,239 | | | | 1,582,432 | |
GS6 shares | | | 64,682 | | | | 38,579 | |
| | | | | | | | |
Total proceeds from shares sold and reinvested | | | 28,560,302 | | | | 67,756,301 | |
| | | | | | | | |
Value of shares redeemed | | | | | | | | |
GS4 shares | | | (16,249,160 | ) | | | (7,563,551 | ) |
GS6 shares | | | (461,028 | ) | | | (14,703 | ) |
GS8 shares(2) | | | — | | | | (1,058,081 | ) |
| | | | | | | | |
Total value of shares redeemed | | | (16,710,188 | ) | | | (8,636,335 | ) |
| | | | | | | | |
Net increase from capital share transactions(3) | | | 11,850,114 | | | | 59,119,966 | |
| | | | | | | | |
Total increase (decrease) in net assets | | | (7,312,969 | ) | | | 59,094,754 | |
| | | | | | | | |
Net Assets: | | | | | | | | |
Beginning of Year | | | 59,124,754 | | | | 30,000 | |
| | | | | | | | |
End of Year* | | $ | 51,811,785 | | | $ | 59,124,754 | |
| | | | | | | | |
| |
* Including undistributed net investment income | | $ | 101,730 | | | $ | 357 | |
| | | | | | | | |
| (1) | Includes dividends paid from the short-term portion of capital gain distributions received from affiliated funds. |
| (2) | See Note 1 in Notes to Financial Statements. |
| (3) | See Note 7 in Notes to Financial Statements. |
See Notes to Financial Statements.
28
| | | | | | | | | | | | | | | | | | | | | | | | | | | | | | |
| MyDestination 2015 Fund | | | MyDestination 2025 Fund | | | MyDestination 2035 Fund | | | MyDestination 2045 Fund | |
| For the Year Ended | | | For the Year Ended | | | For the Year Ended | | | For the Year Ended | |
| 12/31/08 | | | 12/31/07 | | | 12/31/08 | | | 12/31/07 | | | 12/31/08 | | | 12/31/07 | | | 12/31/08 | | | 12/31/07 | |
| $ | 4,877,655 | | | $ | 2,598,220 | | | $ | 2,684,323 | | | $ | 1,380,844 | | | $ | 789,624 | | | $ | 359,894 | | | $ | 307,365 | | | $ | 108,327 | |
| | (3,479,814 | ) | | | 7,487,379 | | | | (486,393 | ) | | | 6,201,951 | | | | (590,341 | ) | | | 2,472,233 | | | | (796,458 | ) | | | 1,000,704 | |
| | (59,891,445 | ) | | | (7,478,069 | ) | | | (48,820,051 | ) | | | (7,383,630 | ) | | | (19,527,146 | ) | | | (2,877,892 | ) | | | (7,649,855 | ) | | | (1,047,210 | ) |
| | | | | | | | | | | | | | | | | | | | | | | | | | | | | | | |
| | (58,493,604 | ) | | | 2,607,530 | | | | (46,622,121 | ) | | | 199,165 | | | | (19,327,863 | ) | | | (45,765 | ) | | | (8,138,948 | ) | | | 61,821 | |
| | | | | | | | | | | | | | | | | | | | | | | | | | | | | | | |
| | | | | | | |
| | (3,988,233 | ) | | | (4,415,924 | ) | | | (2,302,358 | ) | | | (2,831,806 | ) | | | (625,387 | ) | | | (920,638 | ) | | | (180,010 | ) | | | (317,266 | ) |
| | (18,577 | ) | | | (37,265 | ) | | | (33,073 | ) | | | (52,369 | ) | | | (5,228 | ) | | | (33,623 | ) | | | (30 | ) | | | (28,833 | ) |
| | (5,474,206 | ) | | | (96,678 | ) | | | (4,533,694 | ) | | | (59,730 | ) | | | (1,798,281 | ) | | | (16,283 | ) | | | (665,336 | ) | | | (53,860 | ) |
| | (46,540 | ) | | | (881 | ) | | | (95,733 | ) | | | (1,168 | ) | | | (57,955 | ) | | | (635 | ) | | | (34,799 | ) | | | (5,636 | ) |
| | | | | | | | | | | | | | | | | | | | | | | | | | | | | | | |
| | (9,527,556 | ) | | | (4,550,748 | ) | | | (6,964,858 | ) | | | (2,945,073 | ) | | | (2,486,851 | ) | | | (971,179 | ) | | | (880,175 | ) | | | (405,595 | ) |
| | | | | | | | | | | | | | | | | | | | | | | | | | | | | | | |
| | | | | | | |
| | 55,390,960 | | | | 172,884,135 | | | | 44,588,486 | | | | 109,691,374 | | | | 24,099,520 | | | | 38,732,919 | | | | 15,130,813 | | | | 15,819,931 | |
| | 705,881 | | | | 1,378,364 | | | | 1,409,701 | | | | 1,736,960 | | | | 792,304 | | | | 1,252,606 | | | | 352,767 | | | | 1,162,386 | |
| | — | | | | 1,126,394 | | | | — | | | | 1,307,164 | | | | — | | | | 1,101,749 | | | | — | | | | 1,040,708 | |
| | — | | | | 129,470 | | | | — | | | | 295,419 | | | | — | | | | 106,056 | | | | — | | | | 37,390 | |
| | — | | | | (129,470 | ) | | | — | | | | (295,419 | ) | | | — | | | | (106,056 | ) | | | — | | | | (37,390 | ) |
| | 9,462,439 | | | | 4,512,602 | | | | 6,836,052 | | | | 2,891,536 | | | | 2,423,668 | | | | 936,921 | | | | 845,346 | | | | 371,048 | |
| | 65,117 | | | | 38,146 | | | | 128,806 | | | | 53,537 | | | | 63,183 | | | | 34,258 | | | | 34,829 | | | | 34,469 | |
| | | | | | | | | | | | | | | | | | | | | | | | | | | | | | | |
| | 65,624,397 | | | | 179,939,641 | | | | 52,963,045 | | | | 115,680,571 | | | | 27,378,675 | | | | 42,058,453 | | | | 16,363,755 | | | | 18,428,542 | |
| | | | | | | | | | | | | | | | | | | | | | | | | | | | | | | |
| | | | | | | |
| | (21,287,889 | ) | | | (5,433,303 | ) | | | (7,208,810 | ) | | | (4,692,332 | ) | | | (3,015,460 | ) | | | (3,464,770 | ) | | | (1,237,722 | ) | | | (4,122,936 | ) |
| | (406,299 | ) | | | (42,562 | ) | | | (418,340 | ) | | | (13,674 | ) | | | (191,533 | ) | | | (17,005 | ) | | | (67,470 | ) | | | (10,183 | ) |
| | — | | | | (1,067,864 | ) | | | — | | | | (1,095,979 | ) | | | — | | | | (1,085,353 | ) | | | — | | | | (1,092,861 | ) |
| | | | | | | | | | | | | | | | | | | | | | | | | | | | | | | |
| | (21,694,188 | ) | | | (6,543,729 | ) | | | (7,627,150 | ) | | | (5,801,985 | ) | | | (3,206,993 | ) | | | (4,567,128 | ) | | | (1,305,192 | ) | | | (5,225,980 | ) |
| | | | | | | | | | | | | | | | | | | | | | | | | | | | | | | |
| | 43,930,209 | | | | 173,395,912 | | | | 45,335,895 | | | | 109,878,586 | | | | 24,171,682 | | | | 37,491,325 | | | | 15,058,563 | | | | 13,202,562 | |
| | | | | | | | | | | | | | | | | | | | | | | | | | | | | | | |
| | (24,090,951 | ) | | | 171,452,694 | | | | (8,251,084 | ) | | | 107,132,678 | | | | 2,356,968 | | | | 36,474,381 | | | | 6,039,440 | | | | 12,858,788 | |
| | | | | | | | | | | | | | | | | | | | | | | | | | | | | | | |
| | | | | | | |
| | 171,482,694 | | | | 30,000 | | | | 107,162,678 | | | | 30,000 | | | | 36,504,381 | | | | 30,000 | | | | 12,888,788 | | | | 30,000 | |
| | | | | | | | | | | | | | | | | | | | | | | | | | | | | | | |
| $ | 147,391,743 | | | $ | 171,482,694 | | | $ | 98,911,594 | | | $ | 107,162,678 | | | $ | 38,861,349 | | | $ | 36,504,381 | | | $ | 18,928,228 | | | $ | 12,888,788 | |
| | | | | | | | | | | | | | | | | | | | | | | | | | | | | | | |
| $ | 1,381,316 | | | $ | 906 | | | $ | 608,702 | | | $ | 641 | | | $ | 185,808 | | | $ | — | | | $ | 127,784 | | | $ | 412 | |
| | | | | | | | | | | | | | | | | | | | | | | | | | | | | | | |
See Notes to Financial Statements.
29
FINANCIAL HIGHLIGHTS
For a Share Outstanding For the Years Ended December 31, unless otherwise indicated
| | | | | | | | | | | | | | | | | | | | | | | | | | | | | | | | | | | | | | | | | | | | | | | | | |
| | | | | | | | | | | | | | | | | | | | | | | | | | Ratios to Average Net Assets | | | | |
| | | Net Asset
Value,
Beginning
of Year | | Net Investment
Income (1) | | | Capital Gain
Distributions
Received
from
Affiliated
Funds | | Realized
and
Unrealized
Gain
(Loss) on
Investments | | | Dividends
from Net
Investment
Income | | | Distributions
from Net
Realized
Capital
Gains | | | Net Asset
Value,
End of
Year | | Total
Return | | | Net
Assets,
End of
Year
(000) | | Expenses,
Net (2) | | | Expenses,
Including
Expense
Reduction
(2) | | | Expenses,
Before
Waivers
and
Expense
Reduction
(2)(3) | | | Investment
Income,
Net (1) | | | Investment
Income/
(Loss),
Excluding
Waivers and
Expense
Reduction
(1) | | | Portfolio
Turnover
Rate | |
MyDestination 2005 Fund* | |
|
GS4 Class | |
2008 | | $ | 10.35 | | $ | 0.30 | # | | $ | 0.08 | | $ | (2.75 | ) | | $ | (0.31 | ) | | $ | (0.23 | ) | | $ | 7.44 | | (22.78 | )% | | $ | 50,678 | | 0.20 | % | | 0.20 | % | | 0.29 | % | | 3.25 | % | | 3.16 | % | | 40 | % |
2007 | | | 10.00 | | | 0.33 | # | | | 0.62 | | | (0.31 | ) | | | (0.28 | ) | | | (0.01 | ) | | | 10.35 | | 6.42 | | | | 57,667 | | 0.20 | | | 0.20 | | | 0.43 | | | 3.16 | | | 2.93 | | | 21 | |
|
GS6 Class | |
2008 | | $ | 10.33 | | $ | 0.27 | # | | $ | 0.08 | | $ | (2.75 | ) | | $ | (0.21 | ) | | $ | (0.23 | ) | | $ | 7.49 | | (23.12 | )% | | $ | 1,134 | | 0.50 | % | | 0.50 | % | | 1.31 | % | | 2.91 | % | | 2.10 | % | | 40 | % |
2007 | | | 10.00 | | | 0.26 | # | | | 0.62 | | | (0.27 | ) | | | (0.27 | ) | | | (0.01 | ) | | | 10.33 | | 6.11 | | | | 1,458 | | 0.50 | | | 0.50 | | | 2.87 | | | 2.54 | | | 0.17 | | | 21 | |
|
MyDestination 2015 Fund* | |
|
GS4 Class | |
2008 | | $ | 10.33 | | $ | 0.26 | # | | $ | 0.09 | | $ | (3.39 | ) | | $ | (0.19 | ) | | $ | (0.27 | ) | | $ | 6.83 | | (29.31 | )% | | $ | 146,140 | | 0.20 | % | | 0.20 | % | | 0.18 | % | | 2.87 | % | | 2.89 | % | | 22 | % |
2007 | | | 10.00 | | | 0.29 | # | | | 0.83 | | | (0.50 | ) | | | (0.28 | ) | | | (0.01 | ) | | | 10.33 | | 6.12 | | | | 169,953 | | 0.20 | | | 0.20 | | | 0.24 | | | 2.74 | | | 2.70 | | | 7 | |
|
GS6 Class | |
2008 | | $ | 10.31 | | $ | 0.22 | # | | $ | 0.09 | | $ | (3.36 | ) | | $ | (0.10 | ) | | $ | (0.27 | ) | | $ | 6.89 | | (29.44 | )% | | $ | 1,251 | | 0.50 | % | | 0.50 | % | | 1.14 | % | | 2.48 | % | | 1.84 | % | | 22 | % |
2007 | | | 10.00 | | | 0.22 | # | | | 0.83 | | | (0.47 | ) | | | (0.26 | ) | | | (0.01 | ) | | | 10.31 | | 5.74 | | | | 1,529 | | 0.50 | | | 0.50 | | | 2.54 | | | 2.12 | | | 0.08 | | | 7 | |
|
MyDestination 2025 Fund* | |
|
GS4 Class | |
2008 | | $ | 10.24 | | $ | 0.21 | # | | $ | 0.09 | | $ | (3.89 | ) | | $ | (0.15 | ) | | $ | (0.32 | ) | | $ | 6.18 | | (35.00 | )% | | $ | 96,826 | | 0.20 | % | | 0.20 | % | | 0.21 | % | | 2.47 | % | | 2.46 | % | | 10 | % |
2007 | | | 10.00 | | | 0.25 | # | | | 1.13 | | | (0.85 | ) | | | (0.28 | ) | | | (0.01 | ) | | | 10.24 | | 5.29 | | | | 105,102 | | 0.20 | | | 0.20 | | | 0.30 | | | 2.37 | | | 2.27 | | | 5 | |
|
GS6 Class | |
2008 | | $ | 10.23 | | $ | 0.19 | # | | $ | 0.09 | | $ | (3.89 | ) | | $ | (0.10 | ) | | $ | (0.32 | ) | | $ | 6.20 | | (35.23 | )% | | $ | 2,085 | | 0.50 | % | | 0.50 | % | | 0.96 | % | | 2.23 | % | | 1.77 | % | | 10 | % |
2007 | | | 10.00 | | | 0.19 | # | | | 1.13 | | | (0.81 | ) | | | (0.27 | ) | | | (0.01 | ) | | | 10.23 | | 5.04 | | | | 2,061 | | 0.50 | | | 0.50 | | | 2.25 | | | 1.80 | | | 0.05 | | | 5 | |
|
MyDestination 2035 Fund* | |
|
GS4 Class | |
2008 | | $ | 10.24 | | $ | 0.17 | # | | $ | 0.09 | | $ | (4.25 | ) | | $ | (0.10 | ) | | $ | (0.30 | ) | | $ | 5.85 | | (38.86 | )% | | $ | 37,637 | | 0.20 | % | | 0.20 | % | | 0.40 | % | | 2.02 | % | | 1.82 | % | | 5 | % |
2007 | | | 10.00 | | | 0.19 | # | | | 1.31 | | | (0.98 | ) | | | (0.28 | ) | | | — | † | | | 10.24 | | 5.20 | | | | 35,117 | | 0.20 | | | 0.20 | | | 0.64 | | | 1.83 | | | 1.39 | | | 2 | |
|
GS6 Class | |
2008 | | $ | 10.22 | | $ | 0.12 | # | | $ | 0.09 | | $ | (4.20 | ) | | $ | (0.03 | ) | | $ | (0.30 | ) | | $ | 5.90 | | (38.98 | )% | | $ | 1,224 | | 0.50 | % | | 0.50 | % | | 1.35 | % | | 1.45 | % | | 0.60 | % | | 5 | % |
2007 | | | 10.00 | | | 0.11 | # | | | 1.31 | | | (0.94 | ) | | | (0.26 | ) | | | — | † | | | 10.22 | | 4.82 | | | | 1,387 | | 0.50 | | | 0.50 | | | 2.97 | | | 1.09 | | | (1.38 | ) | | 2 | |
|
MyDestination 2045 Fund* | |
|
GS4 Class | |
2008 | | $ | 10.12 | | $ | 0.16 | # | | $ | 0.10 | | $ | (4.34 | ) | | $ | (0.06 | ) | | $ | (0.23 | ) | | $ | 5.75 | | (40.29 | )% | | $ | 17,998 | | 0.20 | % | | 0.20 | % | | 0.79 | % | | 1.97 | % | | 1.38 | % | | 5 | % |
2007 | | | 10.00 | | | 0.17 | # | | | 1.37 | | | (1.09 | ) | | | (0.28 | ) | | | (0.05 | ) | | | 10.12 | | 4.46 | | | | 11,659 | | 0.19 | | | 0.19 | | | 1.48 | | | 1.60 | | | 0.31 | | | 9 | |
|
GS6 Class | |
2008 | | $ | 10.13 | | $ | 0.09 | # | | $ | 0.10 | | $ | (4.29 | ) | | $ | — | † | | $ | (0.23 | ) | | $ | 5.80 | | (40.44 | )% | | $ | 931 | | 0.50 | % | | 0.50 | % | | 1.91 | % | | 1.13 | % | | (0.28 | )% | | 5 | % |
2007 | | | 10.00 | | | 0.08 | # | | | 1.37 | | | (1.03 | ) | | | (0.24 | ) | | | (0.05 | ) | | | 10.13 | | 4.20 | | | | 1,230 | | 0.50 | | | 0.50 | | | 3.51 | | | 0.79 | | | (2.22 | ) | | 9 | |
| † | Amount represents less than $0.005 per share. |
| # | Calculated using the average shares outstanding method. |
| * | Inception date was December 29, 2006. |
| (1) | Recognition of net investment income by the Fund is affected by the timing of the declaration of dividends by the underlying investment companies in which the Fund invests. |
| (2) | Does not include expenses of the investment companies in which the Fund invests. |
| (3) | The ratio also excludes previously recaptured fees. |
See Notes to Financial Statements.
30
Conservative Allocation Fund
The Fund, through investments in the Select Funds, combines a greater percentage of fixed-income securities with a smaller percentage of equity securities. The Fund has a target of, but is not limited to, an asset allocation of 75% Bond Select Funds, 17% U.S. Equity Select Funds and 8% Non-U.S. Equity Select Funds. The diversification element of the Fund provided some benefit during 2008 in the midst of tumultuous capital markets and the economic uncertainty caused by the financial crisis. The Conservative Allocation Fund GS4 Class generated a return of (13.11)% for the one-year period. Although negative, the Fund delivered the best absolute performance among the Asset Allocation Funds GS4 Class. Exposure to the International Equity Fund, Growth Equity Fund and Value Equity Fund contributed the most to the negative absolute return. The Conservative Allocation Fund trailed its composite benchmark on an annualized one-year, five-year and since-inception basis.
Please see page 33 for information regarding specific portfolio allocations. Portfolio holdings are subject to change at any time.
The Asset Allocation Funds attempt to achieve their objectives by investing in the Select Funds. By investing in these fund-of-funds, you will incur the expenses of the Asset Allocation Funds in addition to those of the underlying Funds. You may invest in the Select Funds directly. The Asset Allocation Funds are also subject to the risks of the underlying Funds they hold.
31
Conservative Allocation Fund
Average Annual Total Returns as of 12/31/08
| | | | | | | | | |
| | | GS4 Class* | | | GS6 Class* | | | Benchmark** | |
One Year | | (13.11 | )% | | (13.25 | )% | | (6.80 | )% |
Five Year | | 1.20 | % | | 0.89 | % | | 3.01 | % |
Since Inception | | 2.00 | % | | 1.72 | % | | 3.33 | % |
Inception Date | | 08/27/01 | | | 08/27/01 | | | 08/27/01 | |
Total Fund Operating Expenses (August 5, 2008 Prospectus) | | 0.15 | % | | 0.42 | % | | | |
The performance data quoted represents past performance and does not guarantee future results. Current performance may be lower or higher. Performance data current to the most recent month-end may be obtained at www.GuideStoneFunds.org. The investment return and principal value of an investment will fluctuate so that shares, when redeemed, may be worth more or less than their original cost.

The graph compares the results of a hypothetical $10,000 investment in the GS4 Class of the Fund since August 27, 2001 (commencement of operations), with all dividends and capital gains reinvested, with the Fund’s weighted composite benchmark index.
| * | These returns reflect expense waivers by the Fund’s investment adviser. Without these waivers, returns would have been lower. Returns shown do not reflect the deduction of taxes that a shareholder would pay on Fund distributions or the redemption of Fund shares. |
** | Represents a composite benchmark index consisting of the Russell 3000® Index, the MSCI ACWI (All Country World Index) Ex-U.S. Index and the Merrill Lynch 1-3 Year Treasury Index, weighted 17.5%, 7.5% and 75%, respectively. |
The Russell 3000® Index measures the performance of the 3,000 largest U.S. companies based on total market capitalization, which represents approximately 98% of the investable U.S. equity market.
The MSCI ACWI (All Country World Index) Ex-U.S. Index is a free float-adjusted market capitalization index that is designed to measure equity market performance in the global developed (Ex-U.S.) and emerging markets. As of December 31, 2008, the MSCI ACWI Ex-U.S. Index consisted of the following developed and emerging market country indices: Argentina, Australia, Austria, Belgium, Brazil, Canada, Chile, China, Colombia, Czech Republic, Denmark, Egypt, Finland, France, Germany, Greece, Hong Kong, Hungary, India, Indonesia, Ireland, Israel, Italy, Japan, Korea, Malaysia, Mexico, Morocco, Netherlands, New Zealand, Norway, Pakistan, Peru, Philippines, Poland, Portugal, Russia, Singapore, South Africa, Spain, Sweden, Switzerland, Taiwan, Thailand, Turkey and the United Kingdom.
The Merrill Lynch 1-3 Year Treasury Index is composed of all U.S. Treasury Notes and Bonds with maturities greater than or equal to one year and less than three years.
Unlike a mutual fund, the performance of an index assumes no taxes, transaction costs, management fees or other expenses.
32
| | |
| Conservative Allocation Fund | | |
| SCHEDULE OF INVESTMENTS | | December 31, 2008 |
| | | | | | | |
| | | Shares | | Value | |
MUTUAL FUNDS — 99.7% | | | | | | | |
GuideStone Money Market Fund (GS4 Class)¥ | | | 6,976,338 | | $ | 6,976,338 | |
GuideStone Low-Duration Bond Fund (GS4 Class)¥ | | | 16,002,538 | | | 191,870,436 | |
GuideStone Equity Index Fund (GS4 Class)¥ | | | 272,342 | | | 3,186,397 | |
GuideStone Value Equity Fund (GS4 Class)¥ | | | 1,554,556 | | | 16,369,472 | |
GuideStone Growth Equity Fund (GS4 Class)¥ | | | 1,378,753 | | | 15,883,235 | |
GuideStone Small Cap Equity Fund (GS4 Class)¥ | | | 379,639 | | | 3,382,582 | |
GuideStone International Equity Fund (GS4 Class)¥ | | | 1,937,202 | | | 18,170,957 | |
| | | | | | | |
Total Mutual Funds
(Cost $274,881,413) | | | | | | 255,839,417 | |
| | | | | | | |
| | |
| | | Par | | | |
U.S. TREASURY OBLIGATIONS — 0.3% | | | | | | | |
U.S. Treasury Bills | | | | | | | |
0.00%, 05/14/09‡‡ | | $ | 90,000 | | | 89,980 | |
0.01%, 05/14/09‡‡ | | | 25,000 | | | 24,995 | |
0.10%, 05/14/09‡‡ | | | 655,000 | | | 654,856 | |
0.07%, 06/11/09‡‡ | | | 55,000 | | | 54,970 | |
| | | | | | | |
Total U.S. Treasury Obligations
(Cost $824,739) | | | | | | 824,801 | |
| | | | | | | |
| | |
TOTAL INVESTMENTS — 100.0%
(Cost $275,706,152) | | | | | | 256,664,218 | |
| | |
Liabilities in Excess of Other Assets — 0.0% | | | | | | (7,958 | ) |
| | | | | | | |
NET ASSETS — 100.0% | | | | | $ | 256,656,260 | |
| | | | | | | |
PORTFOLIO SUMMARY (based on net assets)
| | |
| | | % |
Bond Fund | | 74.8 |
Domestic Equity Funds | | 15.1 |
International Equity Fund | | 7.1 |
Money Market Fund | | 2.7 |
Futures Contracts | | 2.7 |
U.S. Treasury Obligations | | 0.3 |
| | |
| | 102.7 |
| | |
FAS 157 DISCLOSURE
The following is a summary of the inputs used, as of December 31, 2008, in valuing the Fund’s investments carried at fair value:
| | | | | | |
Valuation Inputs | | Investments
in
Securities | | Other
Financial
Instruments*** |
Level 1 — Quoted Prices | | $ | 255,839,417 | | $ | 26,506 |
Level 2 — Other Significant Observable Inputs | | | 824,801 | | | — |
Level 3 — Significant Unobservable Inputs | | | — | | | — |
| | | | | | |
Total | | $ | 256,664,218 | | $ | 26,506 |
| | | | | | |
| *** | Other financial instruments are derivative instruments not reflected in the Schedule of Investments, such as futures, forwards and swap contracts, which are valued at the unrealized appreciation (depreciation) on the investment. |
See Notes to Financial Statements.
33
Balanced Allocation Fund
The Fund, through investments in the Select Funds, combines approximately equal percentages of fixed-income and equity securities. The Fund has a target of, but is not limited to, an asset allocation of 50% Bond Select Funds, 35% U.S. Equity Select Funds and 15% Non-U.S. Equity Select Funds. The diversification element of the Fund provided some benefit during 2008 in the midst of tumultuous capital markets and the economic uncertainty caused by the financial crisis. The Balanced Allocation Fund GS4 Class generated a return of (24.41)% for the one-year period. The Fund’s negative absolute return was dominated by the Fund’s exposure to the U.S. Equity Select Funds and the International Equity Fund. The Balanced Allocation Fund trailed its composite benchmark on an annualized one-year, five-year and since-inception basis.
Please see page 36 for information regarding specific portfolio allocations. Portfolio holdings are subject to change at any time.
The Asset Allocation Funds attempt to achieve their objectives by investing in the Select Funds. By investing in these fund-of-funds, you will incur the expenses of the Asset Allocation Funds in addition to those of the underlying Funds. You may invest in the Select Funds directly. The Asset Allocation Funds are also subject to the risks of the underlying Funds they hold.
34
Balanced Allocation Fund
Average Annual Total Returns as of 12/31/08
| | | | | | | | | |
| | | GS4 Class* | | | GS6 Class* | | | Benchmark** | |
One Year | | (24.41 | )% | | (24.52 | )% | | (19.63 | )% |
Five Year | | 0.61 | % | | 0.28 | % | | 2.15 | % |
Since Inception | | 1.81 | % | | 1.52 | % | | 2.97 | % |
Inception Date | | 08/27/01 | | | 08/27/01 | | | 08/27/01 | |
Total Fund Operating Expenses (August 5, 2008 Prospectus) | | 0.12 | % | | 0.40 | % | | | |
The performance data quoted represents past performance and does not guarantee future results. Current performance may be lower or higher. Performance data current to the most recent month-end may be obtained at www.GuideStoneFunds.org. The investment return and principal value of an investment will fluctuate so that shares, when redeemed, may be worth more or less than their original cost.

The graph compares the results of a hypothetical $10,000 investment in the GS4 Class of the Fund since August 27, 2001 (commencement of operations), with all dividends and capital gains reinvested, with the Fund’s weighted composite benchmark index.
| * | These returns reflect expense waivers by the Fund’s investment adviser. Without these waivers, returns would have been lower. Returns shown do not reflect the deduction of taxes that a shareholder would pay on Fund distributions or the redemption of Fund shares. |
** | Represents a composite benchmark index consisting of the Russell 3000® Index, the MSCI ACWI (All Country World Index) Ex-U.S. Index and the Barclays Capital U.S. Aggregate Bond Index, weighted 35%, 15% and 50%, respectively. |
The Russell 3000® Index measures the performance of the 3,000 largest U.S. companies based on total market capitalization, which represents approximately 98% of the investable U.S. equity market.
The MSCI ACWI (All Country World Index) Ex-U.S. Index is a free float-adjusted market capitalization index that is designed to measure equity market performance in the global developed (Ex-U.S.) and emerging markets. As of December 31, 2008, the MSCI ACWI Ex-U.S. Index consisted of the following developed and emerging market country indices: Argentina, Australia, Austria, Belgium, Brazil, Canada, Chile, China, Colombia, Czech Republic, Denmark, Egypt, Finland, France, Germany, Greece, Hong Kong, Hungary, India, Indonesia, Ireland, Israel, Italy, Japan, Korea, Malaysia, Mexico, Morocco, Netherlands, New Zealand, Norway, Pakistan, Peru, Philippines, Poland, Portugal, Russia, Singapore, South Africa, Spain, Sweden, Switzerland, Taiwan, Thailand, Turkey and the United Kingdom.
The Barclays Capital U.S. Aggregate Bond Index represents securities that are SEC-registered, taxable and dollar denominated. The index covers the U.S. investment grade bond market, with index components for government and corporate securities, mortgage pass-through securities, and asset-backed securities.
Unlike a mutual fund, the performance of an index assumes no taxes, transaction costs, management fees or other expenses.
35
| | |
| Balanced Allocation Fund | | |
| SCHEDULE OF INVESTMENTS | | December 31, 2008 |
| | | | | | |
| | | Shares | | Value |
MUTUAL FUNDS — 99.7% | | | | | | |
GuideStone Money Market Fund (GS4 Class)¥ | | | 17,075,297 | | $ | 17,075,297 |
GuideStone Low-Duration Bond Fund (GS4 Class)¥ | | | 11,334,124 | | | 135,896,147 |
GuideStone Medium-Duration Bond Fund (GS4 Class)¥ | | | 16,348,108 | | | 198,792,996 |
GuideStone Extended-Duration Bond Fund (GS4 Class)¥ | | | 7,094,305 | | | 92,013,140 |
GuideStone Global Bond Fund (GS4 Class)¥ | | | 6,105,285 | | | 44,812,789 |
GuideStone Equity Index Fund (GS4 Class)¥ | | | 2,233,696 | | | 26,134,241 |
GuideStone Value Equity Fund (GS4 Class)¥ | | | 12,011,648 | | | 126,482,650 |
GuideStone Growth Equity Fund (GS4 Class)¥ | | | 10,321,474 | | | 118,903,380 |
GuideStone Small Cap Equity Fund (GS4 Class)¥ | | | 3,391,460 | | | 30,217,906 |
GuideStone International Equity Fund (GS4 Class)¥ | | | 13,747,099 | | | 128,947,791 |
| | | | | | |
Total Mutual Funds
(Cost $1,148,797,647) | | | | | | 919,276,337 |
| | | | | | |
| | |
| | | Par | | |
U.S. TREASURY OBLIGATIONS — 0.3% | | | | | | |
U.S. Treasury Bills | | | | | | |
0.00%, 05/14/09‡‡ | | $ | 420,000 | | | 419,908 |
0.10%, 05/14/09‡‡ | | | 2,030,000 | | | 2,029,553 |
| | | | | | |
Total U.S. Treasury Obligations
(Cost $2,449,247) | | | | | | 2,449,461 |
| | | | | | |
TOTAL INVESTMENTS — 100.0%
(Cost $1,151,246,894) | | | | | | 921,725,798 |
| | |
Other Assets in Excess of Liabilities — 0.0% | | | | | | 182,766 |
| | | | | | |
NET ASSETS — 100.0% | | | | | $ | 921,908,564 |
| | | | | | |
PORTFOLIO SUMMARY (based on net assets)
| | |
| | | % |
Bond Funds | | 51.0 |
Domestic Equity Funds | | 32.7 |
International Equity Fund | | 14.0 |
Futures Contracts | | 2.1 |
Money Market Fund | | 1.9 |
U.S. Treasury Obligations | | 0.3 |
| | |
| | 102.0 |
| | |
FAS 157 DISCLOSURE
The following is a summary of the inputs used, as of December 31, 2008, in valuing the Fund’s investments carried at fair value:
| | | | | | |
Valuation Inputs | | Investments
in
Securities | | Other
Financial
Instruments*** |
Level 1 — Quoted Prices | | $ | 919,276,337 | | $ | 15,797 |
Level 2 — Other Significant Observable Inputs | | | 2,449,461 | | | — |
Level 3 — Significant Unobservable Inputs | | | — | | | — |
| | | | | | |
Total | | $ | 921,725,798 | | $ | 15,797 |
| | | | | | |
| *** | Other financial instruments are derivative instruments not reflected in the Schedule of Investments, such as futures, forwards and swap contracts, which are valued at the unrealized appreciation (depreciation) on the investment. |
See Notes to Financial Statements.
36
Growth Allocation Fund
The Fund, through investments in the Select Funds, combines a greater percentage of equity securities with a smaller percentage of fixed-income securities. The Fund has a target of, but is not limited to, an asset allocation of 52% U.S. Equity Select Funds, 25% Bond Select Funds and 23% Non-U.S. Equity Select Funds. The diversification element of the Fund provided some benefit during 2008 in the midst of tumultuous capital markets and the economic uncertainty caused by the financial crisis. The Growth Allocation Fund GS4 Class generated a return of (32.98)% for the one-year period. The Fund’s negative absolute return was primarily impacted by exposure to the U.S. Equity Select Funds and the International Equity Fund. The Growth Allocation Fund trailed its composite benchmark on an annualized one-year, five-year and since-inception basis.
Please see page 39 for information regarding specific portfolio allocations. Portfolio holdings are subject to change at any time.
The Asset Allocation Funds attempt to achieve their objectives by investing in the Select Funds. By investing in these fund-of-funds, you will incur the expenses of the Asset Allocation Funds in addition to those of the underlying Funds. You may invest in the Select Funds directly. The Asset Allocation Funds are also subject to the risks of the underlying Funds they hold.
37
Growth Allocation Fund
Average Annual Total Returns as of 12/31/08
| | | | | | | | | |
| | | GS4 Class* | | | GS6 Class* | | | Benchmark** | |
One Year | | (32.98 | )% | | (33.26 | )% | | (30.26 | )% |
Five Year | | (0.56 | )% | | (1.01 | )% | | 0.68 | % |
Since Inception | | 0.51 | % | | 0.13 | % | | 1.50 | % |
Inception Date | | 08/27/01 | | | 08/27/01 | | | 08/27/01 | |
Total Fund Operating Expenses (August 5, 2008 Prospectus) | | 0.13 | % | | 0.42 | % | | | |
The performance data quoted represents past performance and does not guarantee future results. Current performance may be lower or higher. Performance data current to the most recent month-end may be obtained at www.GuideStoneFunds.org. The investment return and principal value of an investment will fluctuate so that shares, when redeemed, may be worth more or less than their original cost.
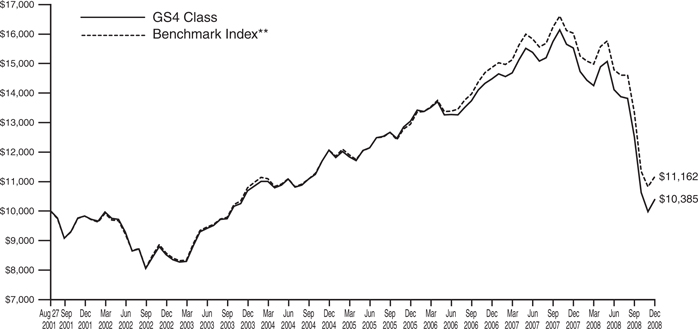
The graph compares the results of a hypothetical $10,000 investment in the GS4 Class of the Fund since August 27, 2001 (commencement of operations), with all dividends and capital gains reinvested, with the Fund’s weighted composite benchmark index.
| * | These returns reflect expense waivers by the Fund’s investment adviser. Without these waivers, returns would have been lower. Returns shown do not reflect the deduction of taxes that a shareholder would pay on Fund distributions or the redemption of Fund shares. |
** | Represents a composite benchmark index consisting of the Russell 3000® Index, the MSCI ACWI (All Country World Index) Ex-U.S. Index and the Barclays Capital U.S. Aggregate Bond Index, weighted 52.5%, 22.5% and 25%, respectively. |
The Russell 3000® Index measures the performance of the 3,000 largest U.S. companies based on total market capitalization, which represents approximately 98% of the investable U.S. equity market.
The MSCI ACWI (All Country World Index) Ex-U.S. Index is a free float-adjusted market capitalization index that is designed to measure equity market performance in the global developed (Ex-U.S.) and emerging markets. As of December 31, 2008, the MSCI ACWI Ex-U.S. Index consisted of the following developed and emerging market country indices: Argentina, Australia, Austria, Belgium, Brazil, Canada, Chile, China, Colombia, Czech Republic, Denmark, Egypt, Finland, France, Germany, Greece, Hong Kong, Hungary, India, Indonesia, Ireland, Israel, Italy, Japan, Korea, Malaysia, Mexico, Morocco, Netherlands, New Zealand, Norway, Pakistan, Peru, Philippines, Poland, Portugal, Russia, Singapore, South Africa, Spain, Sweden, Switzerland, Taiwan, Thailand, Turkey and the United Kingdom.
The Barclays U.S. Capital Aggregate Bond Index represents securities that are SEC-registered, taxable and dollar denominated. The index covers the U.S. investment grade bond market, with index components for government and corporate securities, mortgage pass-through securities and asset-backed securities.
Unlike a mutual fund, the performance of an index assumes no taxes, transaction costs, management fees or other expenses.
38
| | |
| Growth Allocation Fund | | |
| SCHEDULE OF INVESTMENTS | | December 31, 2008 |
| | | | | | |
| | | Shares | | Value |
MUTUAL FUNDS — 99.7% | | | | | | |
GuideStone Money Market Fund (GS4 Class)¥ | | | 15,860,801 | | $ | 15,860,800 |
GuideStone Low-Duration Bond Fund (GS4 Class)¥ | | | 4,266,639 | | | 51,157,003 |
GuideStone Medium-Duration Bond Fund (GS4 Class)¥ | | | 6,146,172 | | | 74,737,446 |
GuideStone Extended-Duration Bond Fund (GS4 Class)¥ | | | 2,662,813 | | | 34,536,688 |
GuideStone Global Bond Fund (GS4 Class)¥ | | | 2,245,910 | | | 16,484,979 |
GuideStone Equity Index Fund (GS4 Class)¥ | | | 2,616,469 | | | 30,612,686 |
GuideStone Value Equity Fund (GS4 Class)¥ | | | 13,493,333 | | | 142,084,796 |
GuideStone Growth Equity Fund (GS4 Class)¥ | | | 11,542,105 | | | 132,965,044 |
GuideStone Small Cap Equity Fund (GS4 Class)¥ | | | 3,651,065 | | | 32,530,991 |
GuideStone International Equity Fund (GS4 Class)¥ | | | 15,414,985 | | | 144,592,562 |
| | | | | | |
Total Mutual Funds
(Cost $896,544,572) | | | | | | 675,562,995 |
| | | | | | |
| | |
| | | Par | | |
U.S. TREASURY OBLIGATIONS — 0.3% | | | | | | |
U.S. Treasury Bills | | | | | | |
0.00%, 05/14/09‡‡ | | $ | 225,000 | | | 224,950 |
0.05%, 05/14/09‡‡ | | | 65,000 | | | 64,986 |
0.10%, 05/14/09‡‡ | | | 1,710,000 | | | 1,709,624 |
| | | | | | |
Total U.S. Treasury Obligations
(Cost $1,999,370) | | | | | | 1,999,560 |
| | | | | | |
TOTAL INVESTMENTS — 100.0%
(Cost $898,543,942) | | | | | | 677,562,555 |
| | |
Other Assets in Excess of Liabilities — 0.0% | | | | | | 314,615 |
| | | | | | |
NET ASSETS — 100.0% | | | | | $ | 677,877,170 |
| | | | | | |
PORTFOLIO SUMMARY (based on net assets)
| | |
| | | % |
Domestic Equity Funds | | 45.4 |
Bond Funds | | 30.6 |
International Equity Fund | | 21.4 |
Futures Contracts | | 2.5 |
Money Market Fund | | 2.3 |
U.S. Treasury Obligations | | 0.3 |
| | |
| | 102.5 |
| | |
FAS 157 DISCLOSURE
The following is a summary of the inputs used, as of December 31, 2008, in valuing the Fund’s investments carried at fair value:
| | | | | | |
Valuation Inputs | | Investments
in
Securities | | Other
Financial
Instruments*** |
Level 1 — Quoted Prices | | $ | 675,562,995 | | $ | 147,552 |
Level 2 — Other Significant Observable Inputs | | | 1,999,560 | | | — |
Level 3 — Significant Unobservable Inputs | | | — | | | — |
| | | | | | |
Total | | $ | 677,562,555 | | $ | 147,552 |
| | | | | | |
| *** | Other financial instruments are derivative instruments not reflected in the Schedule of Investments, such as futures, forwards and swap contracts, which are valued at the unrealized appreciation (depreciation) on the investment. |
See Notes to Financial Statements.
39
Aggressive Allocation Fund
The Fund, through investments in the Select Funds, combines a greater percentage of U.S. equity securities with a smaller percentage of international equity securities. The Fund has a target of, but is not limited to, an asset allocation of 70% U.S. Equity Select Funds and 30% Non-U.S. Equity Select Funds. The Aggressive Allocation Fund’s GS4 Class generated a return of (41.05)% for the one-year period. The Fund’s negative absolute return was driven by exposure to the International Equity Fund, the Growth Equity Fund and the Value Equity Fund. The Aggressive Allocation Fund trailed its custom benchmark on an annualized one-year, five-year and since-inception basis.
Please see page 42 for information regarding specific portfolio allocations. Portfolio holdings are subject to change at any time.
The Asset Allocation Funds attempt to achieve their objectives by investing in the Select Funds. By investing in these fund-of-funds, you will incur the expenses of the Asset Allocation Funds in addition to those of the underlying Funds. You may invest in the Select Funds directly. The Asset Allocation Funds are also subject to the risks of the underlying Funds they hold.
40
Aggressive Allocation Fund
Average Annual Total Returns as of 12/31/08
| | | | | | | | | |
| | | GS4 Class* | | | GS6 Class* | | | Benchmark** | |
One Year | | (41.05 | )% | | (41.26 | )% | | (39.79 | )% |
Five Year | | (1.95 | )% | | (2.25 | )% | | (0.91 | )% |
Since Inception | | (1.01 | )% | | (1.27 | )% | | (0.12 | )% |
Inception Date | | 08/27/01 | | | 08/27/01 | | | 08/27/01 | |
Total Fund Operating Expenses (August 5, 2008 Prospectus) | | 0.13 | % | | 0.39 | % | | | |
The performance data quoted represents past performance and does not guarantee future results. Current performance may be lower or higher. Performance data current to the most recent month-end may be obtained at www.GuideStoneFunds.org. The investment return and principal value of an investment will fluctuate so that shares, when redeemed, may be worth more or less than their original cost.
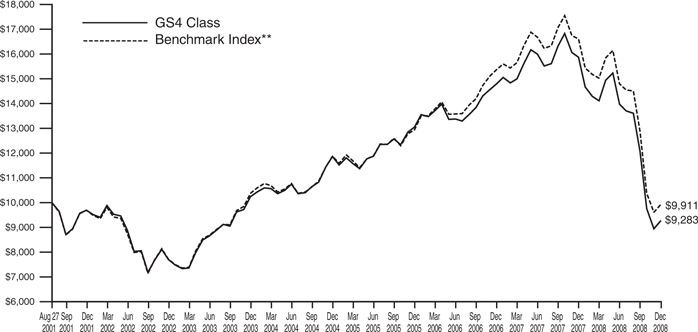
The graph compares the results of a hypothetical $10,000 investment in the GS4 Class of the Fund since August 27, 2001 (commencement of operations), with all dividends and capital gains reinvested, with the Fund’s weighted composite benchmark index.
| * | These returns reflect expense waivers by the Fund’s investment adviser. Without these waivers, returns would have been lower. Returns shown do not reflect the deduction of taxes that a shareholder would pay on Fund distributions or the redemption of Fund shares. |
** | Represents a composite benchmark index consisting of the Russell 3000® Index and the MSCI ACWI (All Country World Index) Ex-U.S. Index, weighted 70% and 30%, respectively. |
The Russell 3000® Index measures the performance of the 3,000 largest U.S. companies based on total market capitalization, which represents approximately 98% of the investable U.S. equity market.
The MSCI ACWI (All Country World Index) Ex-U.S. Index is a free float-adjusted market capitalization index that is designed to measure equity market performance in the global developed (Ex-U.S.) and emerging markets. As of December 31, 2008, the MSCI ACWI Ex-U.S. Index consisted of the following developed and emerging market country indices: Argentina, Australia, Austria, Belgium, Brazil, Canada, Chile, China, Colombia, Czech Republic, Denmark, Egypt, Finland, France, Germany, Greece, Hong Kong, Hungary, India, Indonesia, Ireland, Israel, Italy, Japan, Korea, Malaysia, Mexico, Morocco, Netherlands, New Zealand, Norway, Pakistan, Peru, Philippines, Poland, Portugal, Russia, Singapore, South Africa, Spain, Sweden, Switzerland, Taiwan, Thailand, Turkey and the United Kingdom.
Unlike a mutual fund, the performance of an index assumes no taxes, transaction costs, management fees or other expenses.
41
| | |
| Aggressive Allocation Fund | | |
| SCHEDULE OF INVESTMENTS | | December 31, 2008 |
| | | | | | | |
| | | Shares | | Value | |
MUTUAL FUNDS — 99.8% | | | | | | | |
GuideStone Money Market Fund (GS4 Class)¥ | | | 9,922,332 | | $ | 9,922,332 | |
GuideStone Equity Index Fund (GS4 Class)¥ | | | 2,969,388 | | | 34,741,840 | |
GuideStone Value Equity Fund (GS4 Class)¥ | | | 14,965,777 | | | 157,589,627 | |
GuideStone Growth Equity Fund (GS4 Class)¥ | | | 13,249,322 | | | 152,632,187 | |
GuideStone Small Cap Equity Fund (GS4 Class)¥ | | | 4,259,078 | | | 37,948,385 | |
GuideStone International Equity Fund (GS4 Class)¥ | | | 17,611,532 | | | 165,196,175 | |
| | | | | | | |
Total Mutual Funds
(Cost $797,967,964) | | | | | | 558,030,546 | |
| | | | | | | |
| | |
| | | Par | | | |
U.S. TREASURY OBLIGATIONS — 0.2% | | | | | | | |
U.S. Treasury Bills | | | | | | | |
0.01%, 05/14/09‡‡ | | $ | 60,000 | | | 59,986 | |
0.10%, 05/14/09‡‡ | | | 1,155,000 | | | 1,154,746 | |
| | | | | | | |
Total U.S. Treasury Obligations
(Cost $1,214,572) | | | | | | 1,214,732 | |
| | | | | | | |
TOTAL INVESTMENTS — 100.0%
(Cost $799,182,536) | | | | | | 559,245,278 | |
| | |
Liabilities in Excess of Other Assets — 0.0% | | | | | | (69,325 | ) |
| | | | | | | |
NET ASSETS — 100.0% | | | | | $ | 559,175,953 | |
| | | | | | | |
PORTFOLIO SUMMARY (based on net assets)
| | |
| | | % |
Domestic Equity Funds | | 68.4 |
International Equity Fund | | 29.5 |
Futures Contracts | | 1.9 |
Money Market Fund | | 1.8 |
U.S. Treasury Obligations | | 0.2 |
| | |
| | 101.8 |
| | |
FAS 157 DISCLOSURE
The following is a summary of the inputs used, as of December 31, 2008, in valuing the Fund’s investments carried at fair value:
| | | | | | |
Valuation Inputs | | Investments
in
Securities | | Other
Financial
Instruments*** |
Level 1 — Quoted Prices | | $ | 558,030,546 | | $ | 137,430 |
Level 2 — Other Significant Observable Inputs | | | 1,214,732 | | | — |
Level 3 — Significant Unobservable Inputs | | | — | | | — |
| | | | | | |
Total | | $ | 559,245,278 | | $ | 137,430 |
| | | | | | |
| *** | Other financial instruments are derivative instruments not reflected in the Schedule of Investments, such as futures, forwards and swap contracts, which are valued at the unrealized appreciation (depreciation) on the investment. |
See Notes to Financial Statements.
42
STATEMENTS OF ASSETS AND LIABILITIES
December 31, 2008
| | | | | | | | | | | | | | | | |
| | | Conservative
Allocation Fund | | | Balanced
Allocation Fund | | | Growth
Allocation Fund | | | Aggressive
Allocation Fund | |
Assets | | | | | | | | | | | | | | | | |
Investments in securities of affiliated issuers, at value | | $ | 255,839,417 | | | $ | 919,276,337 | | | $ | 675,562,995 | | | $ | 558,030,546 | |
Investments in securities of unaffiliated issuers, at value | | | 824,801 | | | | 2,449,461 | | | | 1,999,560 | | | | 1,214,732 | |
| | | | | | | | | | | | | | | | |
Total investments (1) | | | 256,664,218 | | | | 921,725,798 | | | | 677,562,555 | | | | 559,245,278 | |
Receivables: | | | | | | | | | | | | | | | | |
Dividends | | | 7,804 | | | | 21,006 | | | | 19,877 | | | | 13,044 | |
Fund shares sold | | | 50,843 | | | | 185,655 | | | | 148,305 | | | | 13,014 | |
Variation margin | | | 92,225 | | | | 255,850 | | | | 226,100 | | | | 136,850 | |
Prepaid expenses and other assets | | | 11,135 | | | | 12,982 | | | | 10,617 | | | | 10,347 | |
| | | | | | | | | | | | | | | | |
Total Assets | | | 256,826,225 | | | | 922,201,291 | | | | 677,967,454 | | | | 559,418,533 | |
| | | | | | | | | | | | | | | | |
Liabilities | | | | | | | | | | | | | | | | |
Cash overdraft | | | — | | | | 6,556 | | | | — | | | | — | |
Payables: | | | | | | | | | | | | | | | | |
Fund shares redeemed | | | 138,373 | | | | 179,475 | | | | 11,912 | | | | 174,597 | |
Accrued expenses: | | | | | | | | | | | | | | | | |
Investment Advisory fees | | | 3,238 | | | | 55,017 | | | | 35,842 | | | | 27,969 | |
Distribution (12b-1) fees | | | 1,723 | | | | 2,724 | | | | 1,740 | | | | 2,045 | |
Shareholder servicing fees | | | 893 | | | | 1,418 | | | | 882 | | | | 1,036 | |
Other expenses | | | 25,738 | | | | 47,537 | | | | 39,908 | | | | 36,933 | |
| | | | | | | | | | | | | | | | |
Total Liabilities | | | 169,965 | | | | 292,727 | | | | 90,284 | | | | 242,580 | |
| | | | | | | | | | | | | | | | |
Net Assets | | $ | 256,656,260 | | | $ | 921,908,564 | | | $ | 677,877,170 | | | $ | 559,175,953 | |
| | | | | | | | | | | | | | | | |
Net Assets Consist of: | | | | | | | | | | | | | | | | |
Paid-in-capital | | $ | 275,267,820 | | | $ | 1,147,040,507 | | | $ | 895,610,809 | | | $ | 794,546,110 | |
Undistributed net investment income | | | 6,254 | | | | — | | | | — | | | | — | |
Accumulated net realized gain on investments and futures transactions | | | 397,614 | | | | 4,373,356 | | | | 3,100,196 | | | | 4,429,671 | |
Net unrealized appreciation (depreciation) on investments and futures | | | (19,015,428 | ) | | | (229,505,299 | ) | | | (220,833,835 | ) | | | (239,799,828 | ) |
| | | | | | | | | | | | | | | | |
Net Assets | | $ | 256,656,260 | | | $ | 921,908,564 | | | $ | 677,877,170 | | | $ | 559,175,953 | |
| | | | | | | | | | | | | | | | |
Net Asset Value: | | | | | | | | | | | | | | | | |
$0.001 par value, unlimited shares authorized | | | | | | | | | | | | | | | | |
Net assets applicable to the GS4 Class | | $ | 246,616,910 | | | $ | 905,743,260 | | | $ | 667,768,501 | | | $ | 547,313,390 | |
| | | | | | | | | | | | | | | | |
GS4 shares outstanding | | | 23,883,719 | | | | 98,430,227 | | | | 75,367,103 | | | | 67,304,697 | |
| | | | | | | | | | | | | | | | |
Net asset value, offering and redemption price per GS4 share | | $ | 10.33 | | | $ | 9.20 | | | $ | 8.86 | | | $ | 8.13 | |
| | | | | | | | | | | | | | | | |
Net assets applicable to the GS6 Class | | $ | 10,039,350 | | | $ | 16,165,304 | | | $ | 10,108,669 | | | $ | 11,862,563 | |
| | | | | | | | | | | | | | | | |
GS6 shares outstanding | | | 1,540,893 | | | | 3,286,718 | | | | 2,027,993 | | | | 2,459,069 | |
| | | | | | | | | | | | | | | | |
Net asset value, offering and redemption price per GS6 share | | $ | 6.52 | | | $ | 4.92 | | | $ | 4.98 | | | $ | 4.82 | |
| | | | | | | | | | | | | | | | |
| |
(1) Investments in securities of affiliated issuers, at cost | | $ | 274,881,413 | | | $ | 1,148,797,647 | | | $ | 896,544,572 | | | $ | 797,967,964 | |
Investments in securities of unaffiliated issuers, at cost | | | 824,739 | | | | 2,449,247 | | | | 1,999,370 | | | | 1,214,572 | |
| | | | | | | | | | | | | | | | |
Total investments at cost | | $ | 275,706,152 | | | $ | 1,151,246,894 | | | $ | 898,543,942 | | | $ | 799,182,536 | |
| | | | | | | | | | | | | | | | |
See Notes to Financial Statements.
43
STATEMENTS OF OPERATIONS
For the Year Ended December 31, 2008
| | | | | | | | | | | | | | | | |
| | | Conservative
Allocation Fund | | | Balanced
Allocation Fund | | | Growth
Allocation Fund | | | Aggressive
Allocation Fund | |
Investment Income | | | | | | | | | | | | | | | | |
Income distributions received from affiliated funds | | $ | 10,605,791 | | | $ | 36,900,143 | | | $ | 20,560,236 | | | $ | 10,719,198 | |
Interest | | | 67,393 | | | | 181,942 | | | | 83,769 | | | | 20,521 | |
| | | | | | | | | | | | | | | | |
Total Investment Income | | | 10,673,184 | | | | 37,082,085 | | | | 20,644,005 | | | | 10,739,719 | |
| | | | | | | | | | | | | | | | |
Expenses | | | | | | | | | | | | | | | | |
Investment advisory fees | | | 312,467 | | | | 1,187,270 | | | | 922,479 | | | | 815,966 | |
Transfer agent fees: | | | | | | | | | | | | | | | | |
GS4 shares | | | 27,085 | | | | 55,383 | | | | 43,033 | | | | 42,247 | |
GS6 shares | | | 7,397 | | | | 7,450 | | | | 7,390 | | | | 7,425 | |
Custodian fees | | | 10,408 | | | | 26,016 | | | | 22,100 | | | | 18,817 | |
Distribution (12b-1) fees: | | | | | | | | | | | | | | | | |
GS6 shares | | | 12,870 | | | | 19,464 | | | | 13,107 | | | | 16,937 | |
Shareholder servicing fees: | | | | | | | | | | | | | | | | |
GS6 shares | | | 14,108 | | | | 21,301 | | | | 14,347 | | | | 18,533 | |
Accounting and administration fees | | | 21,995 | | | | 70,805 | | | | 55,431 | | | | 49,322 | |
Professional fees | | | 42,384 | | | | 42,385 | | | | 42,385 | | | | 42,385 | |
Blue sky fees: | | | | | | | | | | | | | | | | |
GS4 shares | | | 17,749 | | | | 19,052 | | | | 20,383 | | | | 18,418 | |
GS6 shares | | | 1,460 | | | | 1,126 | | | | 1,314 | | | | 1,346 | |
Shareholder reporting fees: | | | | | | | | | | | | | | | | |
GS4 shares | | | 21,752 | | | | 66,806 | | | | 52,193 | | | | 50,604 | |
GS6 shares | | | 117 | | | | 227 | | | | 311 | | | | 238 | |
Trustee fees | | | 3,799 | | | | 15,247 | | | | 12,003 | | | | 10,787 | |
Line of credit facility fees | | | 1,385 | | | | 5,443 | | | | 4,283 | | | | 3,837 | |
Other expenses | | | 11,158 | | | | 12,065 | | | | 11,804 | | | | 11,661 | |
| | | | | | | | | | | | | | | | |
Total Expenses | | | 506,134 | | | | 1,550,040 | | | | 1,222,563 | | | | 1,108,523 | |
Expenses waived/reimbursed net of amount recaptured(1) | | | (102,058 | ) | | | (88,095 | ) | | | (91,440 | ) | | | (98,274 | ) |
| | | | | | | | | | | | | | | | |
Net Expenses | | | 404,076 | | | | 1,461,945 | | | | 1,131,123 | | | | 1,010,249 | |
| | | | | | | | | | | | | | | | |
Net Investment Income | | | 10,269,108 | | | | 35,620,140 | | | | 19,512,882 | | | | 9,729,470 | |
| | | | | | | | | | | | | | | | |
Realized and Unrealized Loss | | | | | | | | | | | | | | | | |
Capital gain distributions received from affiliated funds | | | 756,716 | | | | 12,621,426 | | | | 8,941,967 | | | | 7,149,374 | |
Net realized gain on investment securities of affiliated issuers | | | 8,701,938 | | | | 53,384,679 | | | | 28,388,082 | | | | 22,918,908 | |
Net realized gain (loss) on investment securities of unaffiliated issuers | | | 71,045 | | | | (596,964 | ) | | | (728,559 | ) | | | — | |
Net realized loss on futures transactions | | | (705,078 | ) | | | (4,081,587 | ) | | | (3,214,311 | ) | | | (4,151,346 | ) |
| | | | | | | | | | | | | | | | |
Net realized gain | | | 8,824,621 | | | | 61,327,554 | | | | 33,387,179 | | | | 25,916,936 | |
| | | | | | | | | | | | | | | | |
Change in unrealized depreciation on investment securities of affiliated issuers | | | (60,646,618 | ) | | | (415,532,564 | ) | | | (402,470,876 | ) | | | (437,112,047 | ) |
Change in unrealized appreciation (depreciation) on investment securities of unaffiliated issuers | | | 4,794 | | | | (206,318 | ) | | | (93,902 | ) | | | (380 | ) |
Change in unrealized appreciation on futures | | | 27,094 | | | | 45,850 | | | | 176,567 | | | | 171,237 | |
| | | | | | | | | | | | | | | | |
Net change in unrealized appreciation (depreciation) | | | (60,614,730 | ) | | | (415,693,032 | ) | | | (402,388,211 | ) | | | (436,941,190 | ) |
| | | | | | | | | | | | | | | | |
Net Realized and Unrealized Loss | | | (51,790,109 | ) | | | (354,365,478 | ) | | | (369,001,032 | ) | | | (411,024,254 | ) |
| | | | | | | | | | | | | | | | |
Net Decrease in Net Assets Resulting from Operations | | $ | (41,521,001 | ) | | $ | (318,745,338 | ) | | $ | (349,488,150 | ) | | $ | (401,294,784 | ) |
| | | | | | | | | | | | | | | | |
| (1) | See Note 3a and 3c in Notes to Financial Statements. |
See Notes to Financial Statements.
44
(This page intentionally left blank)
45
STATEMENTS OF CHANGES IN NET ASSETS
| | | | | | | | | | | | | | | | |
| | | Conservative Allocation Fund | | | Balanced Allocation Fund | |
| | | For the Year Ended | | | For the Year Ended | |
| | | 12/31/08 | | | 12/31/07 | | | 12/31/08 | | | 12/31/07 | |
Operations: | | | | | | | | | | | | | | | | |
Net investment income | | $ | 10,269,108 | | | $ | 9,888,875 | | | $ | 35,620,140 | | | $ | 36,460,587 | |
Net realized gain on investment securities and futures transactions | | | 8,824,621 | | | | 13,399,627 | | | | 61,327,554 | | | | 102,089,576 | |
Net change in unrealized appreciation (depreciation) on investment securities and futures | | | (60,614,730 | ) | | | (3,540,166 | ) | | | (415,693,032 | ) | | | (45,174,455 | ) |
| | | | | | | | | | | | | | | | |
Net increase (decrease) in net assets resulting from operations | | | (41,521,001 | ) | | | 19,748,336 | | | | (318,745,338 | ) | | | 93,375,708 | |
| | | | | | | | | | | | | | | | |
Dividends and Distributions to Shareholders: | | | | | | | | | | | | | | | | |
Dividends from net investment income(1) | | | | | | | | | | | | | | | | |
GS4 shares | | | (9,693,871 | ) | | | (10,257,249 | ) | | | (40,400,725 | ) | | | (43,958,470 | ) |
GS6 shares | | | (568,343 | ) | | | (645,141 | ) | | | (1,249,223 | ) | | | (1,077,383 | ) |
Distributions from net realized capital gains | | | | | | | | | | | | | | | | |
GS4 shares | | | (11,948,499 | ) | | | (12,085,382 | ) | | | (87,603,110 | ) | | | (90,170,185 | ) |
GS6 shares | | | (724,405 | ) | | | (794,773 | ) | | | (2,600,874 | ) | | | (2,229,400 | ) |
| | | | | | | | | | | | | | | | |
Total dividends and distributions | | | (22,935,118 | ) | | | (23,782,545 | ) | | | (131,853,932 | ) | | | (137,435,438 | ) |
| | | | | | | | | | | | | | | | |
Capital Share Transactions: | | | | | | | | | | | | | | | | |
Proceeds from shares sold | | | | | | | | | | | | | | | | |
GS4 shares | | | 47,483,596 | | | | 42,265,946 | | | | 49,002,929 | | | | 65,136,033 | |
GS6 shares | | | 10,824,099 | | | | 148,296 | | | | 2,037,778 | | | | 1,397,888 | |
GS8 shares(2) | | | — | | | | 71,747 | | | | — | | | | 466,712 | |
Proceeds from exchange of GS8 shares for GS6 shares(2) | | | | | | | | | | | | | | | | |
GS6 shares | | | — | | | | 319,625 | | | | — | | | | 3,063,229 | |
GS8 shares | | | — | | | | (319,625 | ) | | | — | | | | (3,063,229 | ) |
Reinvestment of dividends and distributions | | | | | | | | | | | | | | | | |
GS4 shares | | | 21,623,391 | | | | 22,330,442 | | | | 127,987,706 | | | | 134,110,793 | |
GS6 shares | | | 1,292,748 | | | | 1,439,913 | | | | 3,850,097 | | | | 3,306,782 | |
| | | | | | | | | | | | | | | | |
Total proceeds from shares sold and reinvested | | | 81,223,834 | | | | 66,256,344 | | | | 182,878,510 | | | | 204,418,208 | |
| | | | | | | | | | | | | | | | |
Value of shares redeemed | | | | | | | | | | | | | | | | |
GS4 shares | | | (74,845,193 | ) | | | (56,005,754 | ) | | | (178,146,050 | ) | | | (208,709,539 | ) |
GS6 shares | | | (13,199,672 | ) | | | (19,909 | ) | | | (1,652,196 | ) | | | (476,452 | ) |
GS8 shares(2) | | | — | | | | (5,669,148 | ) | | | — | | | | (6,269,702 | ) |
| | | | | | | | | | | | | | | | |
Total value of shares redeemed | | | (88,044,865 | ) | | | (61,694,811 | ) | | | (179,798,246 | ) | | | (215,455,693 | ) |
| | | | | | | | | | | | | | | | |
Net increase (decrease) from capital share transactions(3) | | | (6,821,031 | ) | | | 4,561,533 | | | | 3,080,264 | | | | (11,037,485 | ) |
| | | | | | | | | | | | | | | | |
Total increase (decrease) in net assets | | | (71,277,150 | ) | | | 527,324 | | | | (447,519,006 | ) | | | (55,097,215 | ) |
| | | | | | | | | | | | | | | | |
Net Assets: | | | | | | | | | | | | | | | | |
Beginning of Year | | | 327,933,410 | | | | 327,406,086 | | | | 1,369,427,570 | | | | 1,424,524,785 | |
| | | | | | | | | | | | | | | | |
End of Year* | | $ | 256,656,260 | | | $ | 327,933,410 | | | $ | 921,908,564 | | | $ | 1,369,427,570 | |
| | | | | | | | | | | | | | | | |
| |
* Including undistributed net investment income | | $ | 6,254 | | | $ | 677 | | | $ | — | | | $ | — | |
| | | | | | | | | | | | | | | | |
| (1) | Includes dividends paid from the short-term portion of capital gain distributions received from affiliated funds. |
| (2) | See Note 1 in Notes to Financial Statements. |
| (3) | See Note 7 in Notes to Financial Statements. |
See Notes to Financial Statements.
46
| | | | | | | | | | | | | | |
| Growth Allocation Fund | | | Aggressive Allocation Fund | |
| For the Year Ended | | | For the Year Ended | |
| 12/31/08 | | | 12/31/07 | | | 12/31/08 | | | 12/31/07 | |
| $ | 19,512,882 | | | $ | 20,060,739 | | | $ | 9,729,470 | | | $ | 9,676,356 | |
| | | |
| | 33,387,179 | | | | 101,920,099 | | | | 25,916,936 | | | | 111,338,317 | |
| | | |
| | (402,388,211 | ) | | | (43,842,358 | ) | | | (436,941,190 | ) | | | (49,451,797 | ) |
| | | | | | | | | | | | | | | |
| | | |
| | (349,488,150 | ) | | | 78,138,480 | | | | (401,294,784 | ) | | | 71,562,876 | |
| | | | | | | | | | | | | | | |
| | | |
| | (21,309,114 | ) | | | (29,803,490 | ) | | | (9,439,716 | ) | | | (21,728,269 | ) |
| | (523,396 | ) | | | (586,886 | ) | | | (296,932 | ) | | | (610,351 | ) |
| | | |
| | (71,442,300 | ) | | | (91,054,947 | ) | | | (74,709,707 | ) | | | (97,810,986 | ) |
| | (1,729,302 | ) | | | (1,828,932 | ) | | | (2,468,492 | ) | | | (2,859,391 | ) |
| | | | | | | | | | | | | | | |
| | (95,004,112 | ) | | | (123,274,255 | ) | | | (86,914,847 | ) | | | (123,008,997 | ) |
| | | | | | | | | | | | | | | |
| | | |
| | 39,141,307 | | | | 52,886,509 | | | | 39,353,913 | | | | 63,137,976 | |
| | 2,441,653 | | | | 1,817,294 | | | | 1,160,837 | | | | 980,856 | |
| | — | | | | 874,231 | | | | — | | | | 743,774 | |
| | — | | | | 2,837,014 | | | | — | | | | 1,505,369 | |
| | — | | | | (2,837,014 | ) | | | — | | | | (1,505,369 | ) |
| | 92,746,748 | | | | 120,855,938 | | | | 84,148,111 | | | | 119,537,254 | |
| | 2,252,698 | | | | 2,415,818 | | | | 2,765,424 | | | | 3,469,742 | |
| | | | | | | | | | | | | | | |
| | 136,582,406 | | | | 178,849,790 | | | | 127,428,285 | | | | 187,869,602 | |
| | | | | | | | | | | | | | | |
| | | |
| | (122,227,222 | ) | | | (171,694,646 | ) | | | (100,170,087 | ) | | | (164,016,299 | ) |
| | (1,641,495 | ) | | | (192,271 | ) | | | (1,067,413 | ) | | | (149,759 | ) |
| | — | | | | (6,756,589 | ) | | | — | | | | (7,106,675 | ) |
| | | | | | | | | | | | | | | |
| | (123,868,717 | ) | | | (178,643,506 | ) | | | (101,237,500 | ) | | | (171,272,733 | ) |
| | | | | | | | | | | | | | | |
| | 12,713,689 | | | | 206,284 | | | | 26,190,785 | | | | 16,596,869 | |
| | | | | | | | | | | | | | | |
| | (431,778,573 | ) | | | (44,929,491 | ) | | | (462,018,846 | ) | | | (34,849,252 | ) |
| | | | | | | | | | | | | | | |
| | 1,109,655,743 | | | | 1,154,585,234 | | | | 1,021,194,799 | | | | 1,056,044,051 | |
| | | | | | | | | | | | | | | |
| $ | 677,877,170 | | | $ | 1,109,655,743 | | | $ | 559,175,953 | | | $ | 1,021,194,799 | |
| | | | | | | | | | | | | | | |
| $ | — | | | $ | 3,466 | | | $ | — | | | $ | 8,258 | |
| | | | | | | | | | | | | | | |
See Notes to Financial Statements.
47
FINANCIAL HIGHLIGHTS
For a Share Outstanding For the Years Ended December 31, unless otherwise indicated
| | | | | | | | | | | | | | | | | | | | | | | | | | | | | | | | | | | | | | | | | | | | | | | | | |
| | | | | | | | | | | | | | | | | | | | | | | | | | Ratios to Average Net Assets | | | | |
| | | Net Asset
Value,
Beginning
of Year | | Net
Investment
Income (1) | | | Capital Gain
Distributions
Received
from
Affiliated
Funds | | Realized
and
Unrealized
Gain
(Loss) on
Investments | | | Dividends
from Net
Investment
Income (2) | | | Distributions
from Net
Realized
Capital
Gains | | | Net
Asset
Value,
End
of
Year | | Total
Return | | | Net
Assets,
End of
Year
(000) | | Expenses,
Net (3) | | | Expenses,
Including
Expense
Reduction
(3) | | | Expenses,
Before
Waivers
and
Expense
Reduction
(3)(4) | | | Investment
Income,
Net
(1) | | | Investment
Income/
(Loss),
Excluding
Waivers and
Expense
Reduction
(1) | | | Portfolio
Turnover
Rate | |
| Conservative Allocation Fund | |
|
| GS4 Class | |
2008 | | $ | 13.02 | | $ | 0.42 | # | | $ | 0.03 | | $ | (2.17 | ) | | $ | (0.42 | ) | | $ | (0.55 | ) | | $ | 10.33 | | (13.11 | )% | | $ | 246,617 | | 0.12 | % | | 0.12 | % | | 0.15 | % | | 3.36 | % | | 3.33 | % | | 17 | % |
2007 | | | 13.15 | | | 0.43 | # | | | 0.21 | | | 0.21 | | | | (0.44 | ) | | | (0.54 | ) | | | 13.02 | | 6.48 | | | | 313,829 | | 0.13 | | | 0.13 | | | 0.16 | | | 3.13 | | | 3.10 | | | 13 | |
2006 | | | 12.94 | | | 0.40 | # | | | 0.17 | | | 0.20 | | | | (0.41 | ) | | | (0.15 | ) | | | 13.15 | | 5.99 | | | | 308,802 | | 0.13 | | | 0.13 | | | 0.18 | | | 3.08 | | | 3.03 | | | 9 | |
2005 | | | 13.18 | | | 0.33 | # | | | 0.09 | | | 0.02 | | | | (0.32 | ) | | | (0.36 | ) | | | 12.94 | | 3.31 | | | | 280,256 | | 0.13 | | | 0.13 | | | 0.19 | | | 2.51 | | | 2.45 | | | 20 | |
2004 | | | 13.00 | | | 0.21 | # | | | 0.04 | | | 0.37 | | | | (0.31 | ) | | | (0.13 | ) | | | 13.18 | | 4.76 | | | | 270,913 | | 0.13 | | | 0.13 | | | 0.17 | | | 1.60 | | | 1.56 | | | 11 | |
|
| GS6 Class | |
2008 | | $ | 8.62 | | $ | 0.25 | # | | $ | 0.03 | | $ | (1.43 | ) | | $ | (0.40 | ) | | $ | (0.55 | ) | | $ | 6.52 | | (13.25 | )% | | $ | 10,039 | | 0.40 | % | | 0.40 | % | | 0.41 | % | | 3.00 | % | | 2.99 | % | | 17 | % |
2007 | | | 9.03 | | | 0.26 | # | | | 0.21 | | | 0.07 | | | | (0.41 | ) | | | (0.54 | ) | | | 8.62 | | 6.04 | | | | 14,105 | | 0.44 | | | 0.44 | | | 0.47 | | | 2.83 | | | 2.80 | | | 13 | |
2006 | | | 9.05 | | | 0.25 | # | | | 0.17 | | | 0.09 | | | | (0.38 | ) | | | (0.15 | ) | | | 9.03 | | 5.66 | | | | 12,860 | | 0.50 | | | 0.50 | | | 0.53 | | | 2.70 | | | 2.67 | | | 9 | |
2005 | | | 9.42 | | | 0.20 | # | | | 0.09 | | | (0.02 | ) | | | (0.28 | ) | | | (0.36 | ) | | | 9.05 | | 2.90 | | | | 12,161 | | 0.50 | | | 0.50 | | | 0.56 | | | 2.10 | | | 2.04 | | | 20 | |
2004 | | | 9.41 | | | 0.11 | # | | | 0.04 | | | 0.27 | | | | (0.28 | ) | | | (0.13 | ) | | | 9.42 | | 4.52 | | | | 11,815 | | 0.36 | | | 0.36 | | | 0.45 | | | 1.14 | | | 1.05 | | | 11 | |
|
| Balanced Allocation Fund | |
|
| GS4 Class | |
2008 | | $ | 14.13 | | $ | 0.39 | # | | $ | 0.13 | | $ | (3.99 | ) | | $ | (0.43 | ) | | $ | (1.03 | ) | | $ | 9.20 | | (24.41 | )% | | $ | 905,743 | | 0.12 | % | | 0.12 | % | | 0.13 | % | | 3.05 | % | | 3.04 | % | | 19 | % |
2007 | | | 14.61 | | | 0.41 | # | | | 0.48 | | | 0.16 | | | | (0.48 | ) | | | (1.05 | ) | | | 14.13 | | 7.16 | | | | 1,348,204 | | 0.13 | | | 0.13 | | | 0.13 | | | 2.68 | | | 2.68 | | | 7 | |
2006 | | | 14.20 | | | 0.36 | # | | | 0.39 | | | 0.50 | | | | (0.40 | ) | | | (0.44 | ) | | | 14.61 | | 8.78 | | | | 1,400,001 | | 0.13 | | | 0.13 | | | 0.14 | | | 2.44 | | | 2.43 | | | 7 | |
2005 | | | 14.27 | | | 0.32 | # | | | 0.21 | | | 0.36 | | | | (0.36 | ) | | | (0.60 | ) | | | 14.20 | | 6.24 | | | | 1,273,855 | | 0.13 | | | 0.13 | | | 0.14 | | | 2.18 | | | 2.17 | | | 10 | |
2004 | | | 13.41 | | | 0.26 | # | | | 0.11 | | | 0.99 | | | | (0.30 | ) | | | (0.20 | ) | | | 14.27 | | 10.13 | | | | 1,283,982 | | 0.13 | | | 0.13 | | | 0.13 | | | 1.90 | | | 1.90 | | | 6 | |
|
| GS6 Class | |
2008 | | $ | 8.46 | | $ | 0.21 | # | | $ | 0.13 | | $ | (2.44 | ) | | $ | (0.41 | ) | | $ | (1.03 | ) | | $ | 4.92 | | (24.52 | )% | | $ | 16,165 | | 0.39 | % | | 0.39 | % | | 0.37 | % | | 2.83 | % | | 2.85 | % | | 19 | % |
2007 | | | 9.33 | | | 0.24 | # | | | 0.48 | | | (0.09 | ) | | | (0.45 | ) | | | (1.05 | ) | | | 8.46 | | 6.77 | | | | 21,224 | | 0.43 | | | 0.43 | | | 0.44 | | | 2.45 | | | 2.44 | | | 7 | |
2006 | | | 9.36 | | | 0.20 | # | | | 0.39 | | | 0.19 | | | | (0.37 | ) | | | (0.44 | ) | | | 9.33 | | 8.30 | | | | 16,080 | | 0.48 | | | 0.48 | | | 0.48 | | | 2.11 | | | 2.11 | | | 7 | |
2005 | | | 9.71 | | | 0.18 | # | | | 0.21 | | | 0.19 | | | | (0.33 | ) | | | (0.60 | ) | | | 9.36 | | 5.96 | | | | 13,888 | | 0.48 | | | 0.48 | | | 0.48 | | | 1.82 | | | 1.82 | | | 10 | |
2004 | | | 9.28 | | | 0.12 | # | | | 0.11 | | | 0.66 | | | | (0.26 | ) | | | (0.20 | ) | | | 9.71 | | 9.66 | | | | 13,118 | | 0.46 | | | 0.46 | | | 0.52 | | | 1.28 | | | 1.22 | | | 6 | |
| # | Calculated using the average shares outstanding method. |
| (1) | Recognition of net investment income by the Fund is affected by the timing of the declaration of dividends by the underlying investment companies in which the Fund invests. |
| (2) | Includes dividends paid from the short-term portion of capital gain distributions received from affiliated Funds. |
| (3) | Does not include expenses of the investment companies in which the Fund invests. |
| (4) | The ratio also excludes previously recaptured fees. |
See Notes to Financial Statements.
48
| | | | | | | | | | | | | | | | | | | | | | | | | | | | | | | | | | | | | | | | | | | | | | | | | |
| | | | | | | | | | | | | | | | | | | | | | | | | | Ratios to Average Net Assets | | | | |
| | | Net Asset
Value,
Beginning
of Year | | Net
Investment
Income (1) | | | Capital Gain
Distributions
Received
from
Affiliated
Funds | | Realized
and
Unrealized
Gain
(Loss) on
Investments | | | Dividends
from Net
Investment
Income (2) | | | Distributions
from Net
Realized
Capital
Gains | | | Net
Asset
Value,
End
of
Year | | Total
Return | | | Net
Assets,
End of
Year
(000) | | Expenses,
Net (3) | | | Expenses,
Including
Expense
Reduction
(3) | | | Expenses,
Before
Waivers
and
Expense
Reduction
(3)(4) | | | Investment
Income,
Net (1) | | | Investment
Income/
(Loss),
Excluding
Waivers and
Expense
Reduction
(1) | | | Portfolio
Turnover
Rate | |
| Growth Allocation Fund | |
|
| GS4 Class | |
2008 | | $ | 15.34 | | $ | 0.28 | # | | $ | 0.13 | | $ | (5.50 | ) | | $ | (0.29 | ) | | $ | (1.10 | ) | | $ | 8.86 | | (32.98 | )% | | $ | 667,769 | | 0.12 | % | | 0.12 | % | | 0.13 | % | | 2.15 | % | | 2.14 | % | | 13 | % |
2007 | | | 16.05 | | | 0.30 | # | | | 0.78 | | | 0.07 | | | | (0.43 | ) | | | (1.43 | ) | | | 15.34 | | 7.16 | | | | 1,095,092 | | 0.13 | | | 0.13 | | | 0.13 | | | 1.80 | | | 1.80 | | | 5 | |
2006 | | | 15.45 | | | 0.27 | # | | | 0.63 | | | 0.81 | | | | (0.35 | ) | | | (0.76 | ) | | | 16.05 | | 11.03 | | | | 1,137,039 | | 0.13 | | | 0.13 | | | 0.14 | | | 1.66 | | | 1.65 | | | 7 | |
2005 | | | 15.03 | | | 0.23 | # | | | 0.31 | | | 0.68 | | | | (0.31 | ) | | | (0.49 | ) | | | 15.45 | | 8.09 | | | | 1,046,061 | | 0.13 | | | 0.13 | | | 0.14 | | | 1.50 | | | 1.49 | | | 5 | |
2004 | | | 13.62 | | | 0.19 | # | | | 0.08 | | | 1.47 | | | | (0.21 | ) | | | (0.12 | ) | | | 15.03 | | 12.80 | | | | 1,043,625 | | 0.13 | | | 0.13 | | | 0.13 | | | 1.33 | | | 1.33 | | | 3 | |
|
| GS6 Class | |
2008 | | $ | 9.56 | | $ | 0.15 | # | | $ | 0.13 | | $ | (3.49 | ) | | $ | (0.27 | ) | | $ | (1.10 | ) | | $ | 4.98 | | (33.26 | )% | | $ | 10,109 | | 0.43 | % | | 0.43 | % | | 0.40 | % | | 1.88 | % | | 1.91 | % | | 13 | % |
2007 | | | 10.67 | | | 0.18 | # | | | 0.78 | | | (0.24 | ) | | | (0.40 | ) | | | (1.43 | ) | | | 9.56 | | 6.75 | | | | 14,564 | | 0.47 | | | 0.46 | | | 0.49 | | | 1.60 | | | 1.58 | | | 5 | |
2006 | | | 10.61 | | | 0.14 | # | | | 0.63 | | | 0.35 | | | | (0.30 | ) | | | (0.76 | ) | | | 10.67 | | 10.58 | | | | 9,448 | | 0.59 | | | 0.59 | | | 0.59 | | | 1.27 | | | 1.27 | | | 7 | |
2005 | | | 10.57 | | | 0.11 | # | | | 0.31 | | | 0.37 | | | | (0.26 | ) | | | (0.49 | ) | | | 10.61 | | 7.43 | | | | 7,571 | | 0.62 | | | 0.62 | | | 0.62 | | | 1.01 | | | 1.01 | | | 5 | |
2004 | | | 9.67 | | | 0.07 | # | | | 0.08 | | | 1.03 | | | | (0.16 | ) | | | (0.12 | ) | | | 10.57 | | 12.28 | | | | 7,042 | | 0.56 | | | 0.56 | | | 0.61 | | | 0.66 | | | 0.61 | | | 3 | |
|
| Aggressive Allocation Fund | |
|
| GS4 Class | |
2008 | | $ | 16.31 | | $ | 0.16 | # | | $ | 0.12 | | $ | (7.01 | ) | | $ | (0.14 | ) | | $ | (1.31 | ) | | $ | 8.13 | | (41.05 | )% | | $ | 547,313 | | 0.12 | % | | 0.12 | % | | 0.13 | % | | 1.21 | % | | 1.20 | % | | 7 | % |
2007 | | | 17.23 | | | 0.17 | # | | | 1.11 | | | (0.04 | ) | | | (0.36 | ) | | | (1.80 | ) | | | 16.31 | | 7.17 | | | | 1,000,850 | | 0.13 | | | 0.13 | | | 0.13 | | | 0.94 | | | 0.94 | | | 2 | |
2006 | | | 16.28 | | | 0.15 | # | | | 0.88 | | | 1.13 | | | | (0.28 | ) | | | (0.93 | ) | | | 17.23 | | 13.20 | | | | 1,031,999 | | 0.13 | | | 0.13 | | | 0.14 | | | 0.90 | | | 0.89 | | | 4 | |
2005 | | | 15.55 | | | 0.13 | # | | | 0.41 | | | 0.98 | | | | (0.23 | ) | | | (0.56 | ) | | | 16.28 | | 9.75 | | | | 940,769 | | 0.13 | | | 0.13 | | | 0.14 | | | 0.85 | | | 0.84 | | | 4 | |
2004 | | | 13.64 | | | 0.11 | # | | | 0.04 | | | 1.96 | | | | (0.12 | ) | | | (0.08 | ) | | | 15.55 | | 15.47 | | | | 936,734 | | 0.13 | | | 0.13 | | | 0.13 | | | 0.77 | | | 0.77 | | | 2 | |
|
| GS6 Class | |
2008 | | $ | 10.70 | | $ | 0.08 | # | | $ | 0.12 | | $ | (4.65 | ) | | $ | (0.12 | ) | | $ | (1.31 | ) | | $ | 4.82 | | (41.26 | )% | | $ | 11,863 | | 0.38 | % | | 0.38 | % | | 0.38 | % | | 0.96 | % | | 0.96 | % | | 7 | % |
2007 | | | 12.00 | | | 0.09 | # | | | 1.11 | | | (0.37 | ) | | | (0.33 | ) | | | (1.80 | ) | | | 10.70 | | 6.89 | | | | 20,345 | | 0.43 | | | 0.43 | | | 0.43 | | | 0.71 | | | 0.71 | | | 2 | |
2006 | | | 11.67 | | | 0.07 | # | | | 0.88 | | | 0.55 | | | | (0.24 | ) | | | (0.93 | ) | | | 12.00 | | 12.79 | | | | 16,887 | | 0.47 | | | 0.47 | | | 0.47 | | | 0.58 | | | 0.58 | | | 4 | |
2005 | | | 11.35 | | | 0.06 | # | | | 0.41 | | | 0.60 | | | | (0.19 | ) | | | (0.56 | ) | | | 11.67 | | 9.40 | | | | 14,441 | | 0.50 | | | 0.50 | | | 0.50 | | | 0.48 | | | 0.48 | | | 4 | |
2004 | | | 10.00 | | | 0.04 | # | | | 0.04 | | | 1.43 | | | | (0.08 | ) | | | (0.08 | ) | | | 11.35 | | 15.17 | | | | 13,202 | | 0.44 | | | 0.44 | | | 0.50 | | | 0.37 | | | 0.31 | | | 2 | |
| # | Calculated using the average shares outstanding method. |
| (1) | Recognition of net investment income by the Fund is affected by the timing of the declaration of dividends by the underlying investment companies in which the Fund invests. |
| (2) | Includes dividends paid from the short-term portion of capital gain distributions received from affiliated Funds. |
| (3) | Does not include expenses of the investment companies in which the Fund invests. |
| (4) | The ratio also excludes previously recaptured fees. |
See Notes to Financial Statements.
49
Conservative Allocation Fund I
The Fund, through investments in the Select Funds, combines a greater percentage of fixed-income securities with a smaller percentage of equity securities. The Fund has a target of, but is not limited to, an asset allocation of 75% Bond Select Funds, 17% U.S. Equity Select Funds and 8% Non-U.S. Equity Select Funds. The diversification element of the Fund provided some benefit during 2008 in the midst of tumultuous capital markets and the economic uncertainty caused by the financial crisis. The Conservative Allocation Fund I generated a return of (12.98)% for the one-year period. Exposure to the International Equity Fund, Growth Equity Fund and Value Equity Fund contributed the most to the negative absolute return. The Conservative Allocation Fund I trailed its composite benchmark on an annualized one-year, five-year and since-inception basis.
Please see page 52 for information regarding specific portfolio allocations. Portfolio holdings are subject to change at any time.
The Asset Allocation Funds attempt to achieve their objectives by investing in the Select Funds. By investing in these fund-of-funds, you will incur the expenses of the Asset Allocation Funds in addition to those of the underlying Funds. You may invest in the Select Funds directly. The Asset Allocation Funds are also subject to the risks of the underlying Funds they hold.
50
Conservative Allocation Fund I
| | | | | | |
| Average Annual Total Returns as of 12/31/08 | |
| | |
| | | GS2 Class* | | | Benchmark** | |
One Year | | (12.98 | )% | | (6.80 | )% |
Five Year | | 1.32 | % | | 3.01 | % |
Since Inception | | 1.99 | % | | 3.64 | % |
Inception Date | | 07/01/03 | | | 07/01/03 | |
Total Fund Operating Expenses (August 5, 2008 Prospectus) | | 0.25% | | | | |
The performance data quoted represents past performance and does not guarantee future results. Current performance may be lower or higher. Performance data current to the most recent month-end may be obtained at www.GuideStoneFunds.org. The investment return and principal value of an investment will fluctuate so that shares, when redeemed, may be worth more or less than their original cost.
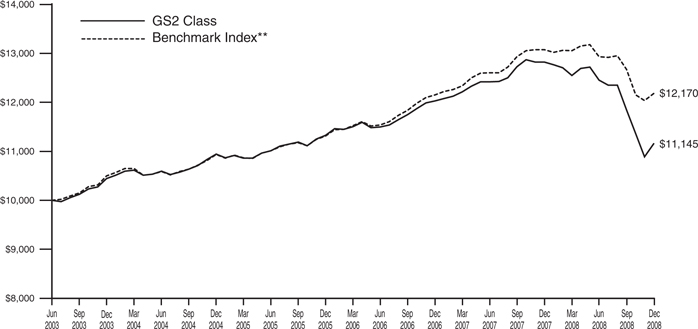
The graph compares the results of a hypothetical $10,000 investment in the GS2 Class of the Fund since July 1, 2003 (commencement of operations), with all dividends and capital gains reinvested, with the Fund’s weighted composite benchmark index.
| * | These returns reflect expense waivers by the Fund’s investment adviser. Without these waivers, returns would have been lower. Returns shown do not reflect the deduction of taxes that a shareholder would pay on Fund distributions or the redemption of Fund shares. |
** | Represents a composite benchmark index consisting of the Russell 3000® Index, the MSCI ACWI (All Country World Index) Ex-U.S. Index and the Merrill Lynch 1-3 Year Treasury Index, weighted 17.5%, 7.5% and 75%, respectively. |
The Russell 3000® Index measures the performance of the 3,000 largest U.S. companies based on total market capitalization, which represents approximately 98% of the investable U.S. equity market.
The MSCI ACWI (All Country World Index) Ex-U.S. Index is a free float-adjusted market capitalization index that is designed to measure equity market performance in the global developed (Ex-U.S.) and emerging markets. As of December 31, 2008, the MSCI ACWI Ex-U.S. Index consisted of the following developed and emerging market country indices: Argentina, Australia, Austria, Belgium, Brazil, Canada, Chile, China, Colombia, Czech Republic, Denmark, Egypt, Finland, France, Germany, Greece, Hong Kong, Hungary, India, Indonesia, Ireland, Israel, Italy, Japan, Korea, Malaysia, Mexico, Morocco, Netherlands, New Zealand, Norway, Pakistan, Peru, Philippines, Poland, Portugal, Russia, Singapore, South Africa, Spain, Sweden, Switzerland, Taiwan, Thailand, Turkey and the United Kingdom.
The Merrill Lynch 1-3 Year Treasury Index is composed of all U.S. Treasury Notes and Bonds with maturities greater than or equal to one year and less than three years.
Unlike a mutual fund, the performance of an index assumes no taxes, transaction costs, management fees or other expenses.
51
| | |
| Conservative Allocation I | | |
| SCHEDULE OF INVESTMENTS | | December 31, 2008 |
| | | | | | |
| | | Shares | | Value |
MUTUAL FUNDS — 99.7% | | | | | | |
GuideStone Money Market Fund (GS2 Class)¥ | | | 958,132 | | $ | 958,132 |
GuideStone Low-Duration Bond Fund (GS2 Class)¥ | | | 5,055,536 | | | 41,000,397 |
GuideStone Equity Index Fund (GS2 Class)¥ | | | 106,735 | | | 678,837 |
GuideStone Value Equity Fund (GS2 Class)¥ | | | 633,553 | | | 3,497,213 |
GuideStone Growth Equity Fund (GS2 Class)¥ | | | 467,090 | | | 3,391,073 |
GuideStone Small Cap Equity Fund (GS2 Class)¥ | | | 121,535 | | | 721,920 |
GuideStone International Equity Fund (GS2 Class)¥ | | | 529,761 | | | 3,877,851 |
| | | | | | |
Total Mutual Funds
(Cost $66,225,860) | | | | | | 54,125,423 |
| | | | | | |
| | |
| | | Par | | |
U.S. TREASURY OBLIGATION — 0.3% | | | | | | |
U.S. Treasury Bill 0.10%, | | | | | | |
05/14/09‡‡ (Cost $179,934) | | $ | 180,000 | | | 179,960 |
| | | | | | |
TOTAL INVESTMENTS — 100.0%
(Cost $66,405,794) | | | | | | 54,305,383 |
| | |
Other Assets in Excess of Liabilities — 0.0% | | | | | | 11,232 |
| | | | | | |
NET ASSETS — 100.0% | | | | | $ | 54,316,615 |
| | | | | | |
PORTFOLIO SUMMARY (based on net assets)
| | |
| | | % |
Bond Fund | | 75.6 |
Domestic Equity Funds | | 15.3 |
International Equity Fund | | 7.1 |
Futures Contracts | | 1.8 |
Money Market Fund | | 1.8 |
U.S. Treasury Obligation | | 0.3 |
| | |
| | 101.9 |
| | |
FAS 157 DISCLOSURE
The following is a summary of the inputs used, as of December 31, 2008, in valuing the Fund’s investments carried at fair value:
| | | | | | |
Valuation Inputs | | Investments
in
Securities | | Other
Financial
Instruments*** |
Level 1 — Quoted Prices | | $ | 54,125,423 | | $ | 12,673 |
Level 2 — Other Significant Observable Inputs | | | 179,960 | | | — |
Level 3 — Significant Unobservable Inputs | | | — | | | — |
| | | | | | |
Total | | $ | 54,305,383 | | $ | 12,673 |
| | | | | | |
| *** | Other financial instruments are derivative instruments not reflected in the Schedule of Investments, such as futures, forwards and swap contracts, which are valued at the unrealized appreciation (depreciation) on the investment. |
See Notes to Financial Statements.
52
Balanced Allocation Fund I
The Fund, through investments in the Select Funds, combines approximately equal percentages of fixed-income and equity securities. The Fund has a target of, but is not limited to, an asset allocation of 50% Bond Select Funds, 35% U.S. Equity Select Funds and 15% Non-U.S. Equity Select Funds. The diversification element of the Fund provided some benefit during 2008 in the midst of tumultuous capital markets and the economic uncertainty caused by the financial crisis. The Balanced Allocation Fund I generated a return of (24.26)% for the one-year period. The Fund’s negative absolute return was dominated by the Fund’s exposure to the U.S. Equity Select Funds and the International Equity Fund. The Balanced Allocation Fund I trailed its composite benchmark on an annualized one-year, five-year and since-inception basis.
Please see page 55 for information regarding specific portfolio allocations. Portfolio holdings are subject to change at any time.
The Asset Allocation Funds attempt to achieve their objectives by investing in the Select Funds. By investing in these fund-of-funds, you will incur the expenses of the Asset Allocation Funds in addition to those of the underlying Funds. You may invest in the Select Funds directly. The Asset Allocation Funds are also subject to the risks of the underlying Funds they hold.
53
Balanced Allocation Fund I
| | | | | | |
| Average Annual Total Returns as of 12/31/08 | |
| | |
| | | GS2 Class* | | | Benchmark** | |
One Year | | (24.26 | )% | | (19.63 | )% |
Five Year | | 0.75 | % | | 2.15 | % |
Since Inception | | 2.26 | % | | 3.63 | % |
Inception Date | | 07/01/03 | | | 07/01/03 | |
Total Fund Operating Expenses | | | | | | |
(August 5, 2008 Prospectus) | | 0.13 | % | | | |
The performance data quoted represents past performance and does not guarantee future results. Current performance may be lower or higher. Performance data current to the most recent month-end may be obtained at www.GuideStoneFunds.org. The investment return and principal value of an investment will fluctuate so that shares, when redeemed, may be worth more or less than their original cost.
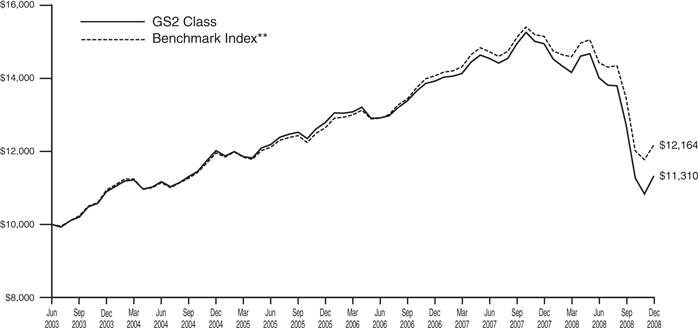
The graph compares the results of a hypothetical $10,000 investment in the GS2 Class of the Fund since July 1, 2003 (commencement of operations), with all dividends and capital gains reinvested, with the Fund’s weighted composite benchmark index.
| * | These returns reflect expense waivers by the Fund’s investment adviser. Without these waivers, returns would have been lower. Returns shown do not reflect the deduction of taxes that a shareholder would pay on Fund distributions or the redemption of Fund shares. |
** | Represents a composite benchmark index consisting of the Russell 3000® Index, the MSCI ACWI (All Country World Index) Ex-U.S. Index and the Barclays Capital U.S. Aggregate Bond Index, weighted 35%, 15% and 50%, respectively. |
The Russell 3000® Index measures the performance of the 3,000 largest U.S. companies based on total market capitalization, which represents approximately 98% of the investable U.S. equity market.
The MSCI ACWI (All Country World Index) Ex-U.S. Index is a free float-adjusted market capitalization index that is designed to measure equity market performance in the global developed (Ex-U.S.) and emerging markets. As of December 31, 2008, the MSCI ACWI Ex-U.S. Index consisted of the following developed and emerging market country indices: Argentina, Australia, Austria, Belgium, Brazil, Canada, Chile, China, Colombia, Czech Republic, Denmark, Egypt, Finland, France, Germany, Greece, Hong Kong, Hungary, India, Indonesia, Ireland, Israel, Italy, Japan, Korea, Malaysia, Mexico, Morocco, Netherlands, New Zealand, Norway, Pakistan, Peru, Philippines, Poland, Portugal, Russia, Singapore, South Africa, Spain, Sweden, Switzerland, Taiwan, Thailand, Turkey and the United Kingdom.
The Barclays Capital U.S. Aggregate Bond Index represents securities that are SEC-registered, taxable and dollar denominated. The index covers the U.S. investment grade fixed rate bond market, with index components for government and corporate securities, mortgage pass-through securities and asset-backed securities.
Unlike a mutual fund, the performance of an index assumes no taxes, transaction costs, management fees or other expenses.
54
| | |
| Balanced Allocation Fund I | | |
| SCHEDULE OF INVESTMENTS | | December 31, 2008 |
| | | | | | |
| | | Shares | | Value |
MUTUAL FUNDS — 99.6% | | | | | | |
GuideStone Money Market Fund (GS2 Class)¥ | | | 5,999,022 | | $ | 5,999,022 |
GuideStone Low-Duration Bond Fund (GS2 Class)¥ | | | 4,697,112 | | | 38,093,577 |
GuideStone Medium-Duration Bond Fund (GS2 Class)¥ | | | 7,830,390 | | | 55,830,680 |
GuideStone Extended-Duration Bond Fund (GS2 Class)¥ | | | 4,089,851 | | | 25,806,958 |
GuideStone Global Bond Fund (GS4 Class)¥ | | | 1,714,009 | | | 12,580,825 |
GuideStone Equity Index Fund (GS2 Class)¥ | | | 1,152,806 | | | 7,331,849 |
GuideStone Value Equity Fund (GS2 Class)¥ | | | 6,437,830 | | | 35,536,821 |
GuideStone Growth Equity Fund (GS2 Class)¥ | | | 4,596,290 | | | 33,369,069 |
GuideStone Small Cap Equity Fund (GS2 Class)¥ | | | 1,427,796 | | | 8,481,111 |
GuideStone International Equity Fund (GS2 Class)¥ | | | 4,944,628 | | | 36,194,674 |
| | | | | | |
Total Mutual Funds
(Cost $362,128,906) | | | | | | 259,224,586 |
| | | | | | |
| | |
| | | Par | | |
U.S. TREASURY OBLIGATIONS — 0.3% | | | | | | |
U.S. Treasury Bills | | | | | | |
0.01%, 05/14/09‡‡ | | $ | 55,000 | | | 54,988 |
0.02%, 05/14/09‡‡ | | | 35,000 | | | 34,992 |
0.10%, 05/14/09‡‡ | | | 650,000 | | | 649,857 |
| | | | | | |
Total U.S. Treasury Obligations
(Cost $739,755) | | | | | | 739,837 |
| | | | | | |
TOTAL INVESTMENTS — 99.9%
(Cost $362,868,661) | | | | | | 259,964,423 |
| | |
Other Assets in Excess of Liabilities — 0.1% | | | | | | 158,136 |
| | | | | | |
NET ASSETS — 100.0% | | | | | $ | 260,122,559 |
| | | | | | |
PORTFOLIO SUMMARY (based on net assets)
| | |
| | | % |
Bond Funds | | 50.9 |
Domestic Equity Funds | | 32.6 |
International Equity Fund | | 13.9 |
Futures Contracts | | 2.4 |
Money Market Fund | | 2.3 |
U.S. Treasury Obligations | | 0.3 |
| | |
| | 102.4 |
| | |
FAS 157 DISCLOSURE
The following is a summary of the inputs used, as of December 31, 2008, in valuing the Fund’s investments carried at fair value:
| | | | | | |
Valuation Inputs | | Investments
in
Securities | | Other
Financial
Instruments*** |
Level 1 — Quoted Prices | | $ | 259,224,586 | | $ | 43,872 |
Level 2 — Other Significant Observable Inputs | | | 739,837 | | | — |
Level 3 — Significant Unobservable Inputs | | | — | | | — |
| | | | | | |
Total | | $ | 259,964,423 | | $ | 43,872 |
| | | | | | |
| *** | Other financial instruments are derivative instruments not reflected in the Schedule of Investments, such as futures, forwards and swap contracts, which are valued at the unrealized appreciation (depreciation) on the investment. |
See Notes to Financial Statements.
55
Growth Allocation Fund I
The Fund, through investments in the Select Funds, combines a greater percentage of equity securities with a smaller percentage of fixed-income securities. The Fund has a target of, but is not limited to, an asset allocation of 52% U.S. Equity Select Funds, 25% Bond Select Funds and 23% Non-U.S. Equity Select Funds. The diversification element of the Fund provided some benefit during 2008 in the midst of tumultuous capital markets and the economic uncertainty caused by the financial crisis. The Growth Allocation Fund I generated a return of (32.82)% for the one-year period. The Fund’s negative absolute return was primarily impacted by exposure to the U.S. Equity Select Funds and the International Equity Fund. The Growth Allocation Fund I trailed its composite benchmark on an annualized one-year, five-year and since-inception basis.
Please see page 58 for information regarding specific portfolio allocations. Portfolio holdings are subject to change at any time.
The Asset Allocation Funds attempt to achieve their objectives by investing in the Select Funds. By investing in these fund-of-funds, you will incur the expenses of the Asset Allocation Funds in addition to those of the underlying Funds. You may invest in the Select Funds directly. The Asset Allocation Funds are also subject to the risks of the underlying Funds they hold.
56
Growth Allocation Fund I
Average Annual Total Returns as of 12/31/08
| | | | | | |
| | | GS2 Class* | | | Benchmark** | |
One Year | | (32.82 | )% | | (30.26 | )% |
Five Year | | (0.41 | )% | | 0.68 | % |
Since Inception | | 1.87 | % | | 3.06 | % |
Inception Date | | 07/01/03 | | | 07/01/03 | |
Total Fund Operating Expenses (August 5, 2008 Prospectus) | | 0.15 | % | | | |
The performance data quoted represents past performance and does not guarantee future results. Current performance may be lower or higher. Performance data current to the most recent month-end may be obtained at www.GuideStoneFunds.org. The investment return and principal value of an investment will fluctuate so that shares, when redeemed, may be worth more or less than their original cost.
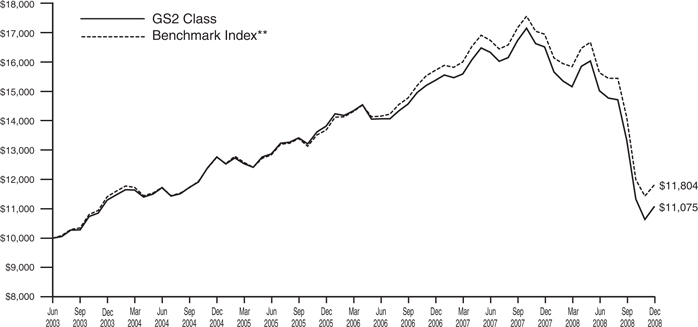
The graph compares the results of a hypothetical $10,000 investment in the GS2 Class of the Fund since July 1, 2003 (commencement of operations), with all dividends and capital gains reinvested, with the Fund’s weighted composite benchmark index.
| * | These returns reflect expense waivers by the Fund’s investment adviser. Without these waivers, returns would have been lower. Returns shown do not reflect the deduction of taxes that a shareholder would pay on Fund distributions or the redemption of Fund shares. |
** | Represents a composite benchmark index consisting of the Russell 3000® Index, the MSCI ACWI (All Country World Index) Ex-U.S. Index and the Barclays U.S. Capital Aggregate Bond Index, weighted 52.5%, 22.5% and 25%, repectively. |
The Russell 3000® Index measures the performance of the 3,000 largest U.S. companies based on total market capitalization, which represents approximately 98% of the investable U.S. equity market.
The MSCI ACWI (All Country World Index) Ex-U.S. Index is a free float-adjusted market capitalization index that is designed to measure equity market performance in the global developed (Ex-U.S.) and emerging markets. As of December 31, 2008, the MSCI ACWI Ex-U.S. Index consisted of the following developed and emerging market country indices: Argentina, Australia, Austria, Belgium, Brazil, Canada, Chile, China, Colombia, Czech Republic, Denmark, Egypt, Finland, France, Germany, Greece, Hong Kong, Hungary, India, Indonesia, Ireland, Israel, Italy, Japan, Korea, Malaysia, Mexico, Morocco, Netherlands, New Zealand, Norway, Pakistan, Peru, Philippines, Poland, Portugal, Russia, Singapore, South Africa, Spain, Sweden, Switzerland, Taiwan, Thailand, Turkey and the United Kingdom.
The Barclays U.S. Capital Aggregate Bond Index represents securities that are SEC-registered, taxable and dollar denominated. The index covers the U.S. investment grade fixed rate bond market, with index components for government and corporate securities, mortgage pass-through securities and asset-backed securities.
Unlike a mutual fund, the performance of an index assumes no taxes, transaction costs, management fees or other expenses.
57
| | |
| Growth Allocation Fund I | | |
| SCHEDULE OF INVESTMENTS | | December 31, 2008 |
| | | | | | |
| | | Shares | | Value |
MUTUAL FUNDS — 99.6% | | | | | | |
GuideStone Money Market Fund (GS2 Class)¥ | | | 3,473,075 | | $ | 3,473,075 |
GuideStone Low-Duration Bond Fund (GS2 Class)¥ | | | 1,508,811 | | | 12,236,460 |
GuideStone Medium-Duration Bond Fund (GS2 Class)¥ | | | 2,507,477 | | | 17,878,309 |
GuideStone Extended-Duration Bond Fund (GS2 Class)¥ | | | 1,308,669 | | | 8,257,704 |
GuideStone Global Bond Fund (GS4 Class)¥ | | | 539,056 | | | 3,956,674 |
GuideStone Equity Index Fund (GS2 Class)¥ | | | 1,150,523 | | | 7,317,326 |
GuideStone Value Equity Fund (GS2 Class)¥ | | | 6,162,503 | | | 34,017,017 |
GuideStone Growth Equity Fund (GS2 Class)¥ | | | 4,377,363 | | | 31,779,658 |
GuideStone Small Cap Equity Fund (GS2 Class)¥ | | | 1,309,417 | | | 7,777,936 |
GuideStone International Equity Fund (GS2 Class)¥ | | | 4,722,569 | | | 34,569,205 |
| | | | | | |
Total Mutual Funds
(Cost $248,553,030) | | | | | | 161,263,364 |
| | | | | | |
| | |
| | | Par | | |
U.S. TREASURY OBLIGATIONS — 0.3% | | | | | | |
U.S. Treasury Bills | | | | | | |
0.03%, 05/14/09‡‡ | | $ | 20,000 | | | 19,996 |
0.05%, 05/14/09‡‡ | | | 30,000 | | | 29,994 |
0.10%, 05/14/09‡‡ | | | 380,000 | | | 379,916 |
| | | | | | |
Total U.S. Treasury Obligations
(Cost $429,853) | | | | | | 429,906 |
| | | | | | |
TOTAL INVESTMENTS — 99.9%
(Cost $248,982,883) | | | | | | 161,693,270 |
| | |
Other Assets in Excess of Liabilities — 0.1% | | | | | | 121,706 |
| | | | | | |
NET ASSETS — 100.0% | | | | | $ | 161,814,976 |
| | | | | | |
PORTFOLIO SUMMARY (based on net assets)
| | |
| | | % |
Domestic Equity Funds | | 49.9 |
Bond Funds | | 26.2 |
International Equity Fund | | 21.4 |
Futures Contracts | | 2.2 |
Money Market Fund | | 2.1 |
U.S. Treasury Obligations | | 0.3 |
| | |
| | 102.1 |
| | |
FAS 157 DISCLOSURE
The following is a summary of the inputs used, as of December 31, 2008, in valuing the Fund’s investments carried at fair value:
| | | | | | |
Valuation Inputs | | Investments
in
Securities | | Other
Financial
Instruments*** |
Level 1 — Quoted Prices | | $ | 161,263,364 | | $ | 46,973 |
Level 2 — Other Significant Observable Inputs | | | 429,906 | | | — |
Level 3 — Significant Unobservable Inputs | | | — | | | — |
| | | | | | |
Total | | $ | 161,693,270 | | $ | 46,973 |
| | | | | | |
| *** | Other financial instruments are derivative instruments not reflected in the Schedule of Investments, such as futures, forwards and swap contracts, which are valued at the unrealized appreciation (depreciation) on the investment. |
See Notes to Financial Statements.
58
Aggressive Allocation Fund I
The Fund, through investments in the Select Funds, combines a greater percentage of U.S. equity securities with a smaller percentage of international equity securities. The Fund has a target of, but is not limited to, an asset allocation of 70% U.S. Equity Select Funds and 30% Non-U.S. Equity Select Funds. The Aggressive Allocation Fund I generated a return of (40.87)% for the one-year period. The Fund’s absolute negative return was driven by exposure to the International Equity Fund, the Growth Equity Fund and the Value Equity Fund. The Aggressive Allocation Fund I trailed its custom benchmark on an annualized one-year, five-year and since-inception basis.
Please see page 61 for information regarding specific portfolio allocations. Portfolio holdings are subject to change at any time.
The Asset Allocation Funds attempt to achieve their objectives by investing in the Select Funds. By investing in these fund-of-funds, you will incur the expenses of the Asset Allocation Funds in addition to those of the underlying Funds. You may invest in the Select Funds directly. The Asset Allocation Funds are also subject to the risks of the underlying Funds they hold.
59
Aggressive Allocation Fund I
Average Annual Total Returns as of 12/31/08
| | | | | | |
| | | GS2 Class* | | | Benchmark** | |
One year | | (40.87 | )% | | (39.79 | )% |
Five year | | (1.78 | )% | | (0.91 | )% |
Since Inception | | 1.25 | % | | 2.35 | % |
Inception Date | | 07/01/03 | | | 07/01/03 | |
Total Fund Operating Expenses (August 5, 2008 Prospectus) | | 0.15 | % | | | |
The performance data quoted represents past performance and does not guarantee future results. Current performance may be lower or higher. Performance data current to the most recent month-end may be obtained at www.GuideStoneFunds.org. The investment return and principal value of an investment will fluctuate so that shares, when redeemed, may be worth more or less than their original cost.
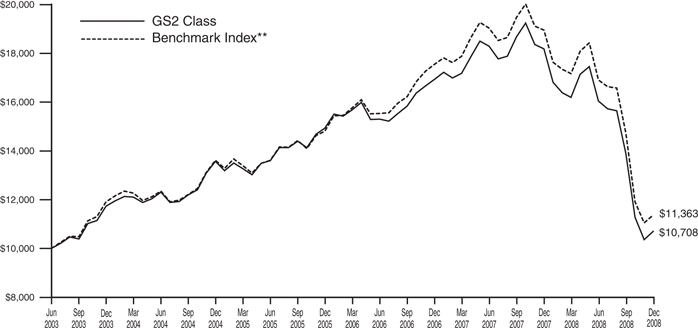
The graph compares the results of a hypothetical $10,000 investment in the GS2 Class of the Fund since July 1, 2003 (commencement of operations), with all dividends and capital gains reinvested, with the Fund’s weighted composite benchmark index.
| * | These returns reflect expense waivers by the Fund’s investment adviser. Without these waivers, returns would have been lower. Returns shown do not reflect the deduction of taxes that a shareholder would pay on Fund distributions or the redemption of Fund shares. |
** | Represents a composite benchmark index consisting of the Russell 3000® Index and the MSCI ACWI (All Country World Index) Ex-U.S. Index, weighted 70% and 30%, respectively. |
The Russell 3000® Index measures the performance of the 3,000 largest U.S. companies based on total market capitalization, which represents approximately 98% of the investable U.S. equity market.
The MSCI ACWI (All Country World Index) Ex-U.S. Index is a free float-adjusted market capitalization index that is designed to measure equity market performance in the global developed (Ex-U.S.) and emerging markets. As of December 31, 2008, the MSCI ACWI Ex-U.S. Index consisted of the following developed and emerging market country indices: Argentina, Australia, Austria, Belgium, Brazil, Canada, Chile, China, Colombia, Czech Republic, Denmark, Egypt, Finland, France, Germany, Greece, Hong Kong, Hungary, India, Indonesia, Ireland, Israel, Italy, Japan, Korea, Malaysia, Mexico, Morocco, Netherlands, New Zealand, Norway, Pakistan, Peru, Philippines, Poland, Portugal, Russia, Singapore, South Africa, Spain, Sweden, Switzerland, Taiwan, Thailand, Turkey and the United Kingdom.
Unlike a mutual fund, the performance of an index assumes no taxes, transaction costs, management fees or other expenses.
60
| | |
| Aggressive Allocation Fund I | | |
| SCHEDULE OF INVESTMENTS | | December 31, 2008 |
| | | | | | |
| | | Shares | | Value |
MUTUAL FUNDS — 99.7% | | | | | | |
GuideStone Money Market Fund (GS2 Class)¥ | | | 2,108,707 | | $ | 2,108,707 |
GuideStone Equity Index Fund (GS2 Class)¥ | | | 1,067,507 | | | 6,789,344 |
GuideStone Value Equity Fund (GS2 Class)¥ | | | 5,585,412 | | | 30,831,473 |
GuideStone Growth Equity Fund (GS2 Class)¥ | | | 4,106,294 | | | 29,811,694 |
GuideStone Small Cap Equity Fund (GS2 Class)¥ | | | 1,249,071 | | | 7,419,483 |
GuideStone International Equity Fund (GS2 Class)¥ | | | 4,408,868 | | | 32,272,915 |
| | | | | | |
Total Mutual Funds
(Cost $187,677,846) | | | | | | 109,233,616 |
| | | | | | |
| | |
| | | Par | | |
U.S. TREASURY OBLIGATIONS — 0.3% | | | | | | |
U.S. Treasury Bills | | | | | | |
0.03%, 05/14/09‡‡ | | $ | 30,000 | | | 29,993 |
0.10%, 05/14/09‡‡ | | | 245,000 | | | 244,946 |
| | | | | | |
Total U.S. Treasury Obligations
(Cost $274,907) | | | | | | 274,939 |
| | | | | | |
TOTAL INVESTMENTS — 100.0%
(Cost $187,952,753) | | | | | | 109,508,555 |
| | |
Other Assets in Excess of Liabilities — 0.0% | | | | | | 47,092 |
| | | | | | |
NET ASSETS — 100.0% | | | | | $ | 109,555,647 |
| | | | | | |
PORTFOLIO SUMMARY (based on net assets)
| | |
| | | % |
Domestic Equity Funds | | 68.3 |
International Equity Fund | | 29.5 |
Futures Contracts | | 2.0 |
Money Market Fund | | 1.9 |
U.S. Treasury Obligations | | 0.3 |
| | |
| | 102.0 |
| | |
FAS 157 DISCLOSURE
The following is a summary of the inputs used, as of December 31, 2008, in valuing the Fund’s investments carried at fair value:
| | | | | | |
Valuation Inputs | | Investments
in
Securities | | Other
Financial
Instruments*** |
Level 1 — Quoted Prices | | $ | 109,233,616 | | $ | 12,240 |
Level 2 — Other Significant Observable Inputs | | | 274,939 | | | — |
Level 3 — Significant Unobservable Inputs | | | — | | | — |
| | | | | | |
Total | | $ | 109,508,555 | | $ | 12,240 |
| | | | | | |
| *** | Other financial instruments are derivative instruments not reflected in the Schedule of Investments, such as futures, forwards and swap contracts, which are valued at the unrealized appreciation (depreciation) on the investment. |
See Notes to Financial Statements.
61
STATEMENTS OF ASSETS AND LIABILITIES
December 31, 2008
| | | | | | | | | | | | | | | | |
| | | Conservative
Allocation
Fund I | | | Balanced
Allocation
Fund I | | | Growth
Allocation
Fund I | | | Aggressive
Allocation
Fund I | |
Assets | | | | | | | | | | | | | | | | |
Investments in securities of affiliated issuers, at value | | $ | 54,125,423 | | | $ | 259,224,586 | | | $ | 161,263,364 | | | $ | 109,233,616 | |
Investments in securities of unaffiliated issuers, at value | | | 179,960 | | | | 739,837 | | | | 429,906 | | | | 274,939 | |
| | | | | | | | | | | | | | | | |
Total investments (1) | | | 54,305,383 | | | | 259,964,423 | | | | 161,693,270 | | | | 109,508,555 | |
Receivables: | | | | | | | | | | | | | | | | |
Dividends | | | 1,580 | | | | 8,680 | | | | 5,459 | | | | 3,182 | |
Fund shares sold | | | 7,528 | | | | 132,604 | | | | 90,930 | | | | 29,964 | |
Variation margin | | | 13,090 | | | | 82,497 | | | | 47,005 | | | | 29,155 | |
Prepaid expenses and other assets | | | 4,653 | | | | 4,653 | | | | 4,652 | | | | 4,653 | |
| | | | | | | | | | | | | | | | |
Total Assets | | | 54,332,234 | | | | 260,192,857 | | | | 161,841,316 | | | | 109,575,509 | |
| | | | | | | | | | | | | | | | |
Liabilities | | | | | | | | | | | | | | | | |
Cash overdraft | | | — | | | | 33,548 | | | | — | | | | — | |
Accrued expenses: | | | | | | | | | | | | | | | | |
Investment Advisory fees | | | 3,321 | | | | 21,600 | | | | 11,634 | | | | 5,998 | |
Other expenses | | | 12,298 | | | | 15,150 | | | | 14,706 | | | | 13,864 | |
| | | | | | | | | | | | | | | | |
Total Liabilities | | | 15,619 | | | | 70,298 | | | | 26,340 | | | | 19,862 | |
| | | | | | | | | | | | | | | | |
Net Assets | | $ | 54,316,615 | | | $ | 260,122,559 | | | $ | 161,814,976 | | | $ | 109,555,647 | |
| | | | | | | | | | | | | | | | |
Net Assets Consist of: | | | | | | | | | | | | | | | | |
Paid-in-capital | | $ | 68,187,447 | | | $ | 369,724,828 | | | $ | 251,344,044 | | | $ | 189,606,455 | |
Undistributed net investment income | | | 705,587 | | | | 5,275,545 | | | | 1,465,194 | | | | 3,253,345 | |
Accumulated net realized loss on investments and futures transactions | | | (2,488,681 | ) | | | (12,017,448 | ) | | | (3,751,622 | ) | | | (4,872,195 | ) |
Net unrealized appreciation (depreciation) on investments and futures | | | (12,087,738 | ) | | | (102,860,366 | ) | | | (87,242,640 | ) | | | (78,431,958 | ) |
| | | | | | | | | | | | | | | | |
Net Assets | | $ | 54,316,615 | | | $ | 260,122,559 | | | $ | 161,814,976 | | | $ | 109,555,647 | |
| | | | | | | | | | | | | | | | |
Net Asset Value: | | | | | | | | | | | | | | | | |
$0.001 par value, unlimited shares authorized | | | | | | | | | | | | | | | | |
Net assets applicable to the GS2 Class | | $ | 54,316,615 | | | $ | 260,122,559 | | | $ | 161,814,976 | | | $ | 109,555,647 | |
| | | | | | | | | | | | | | | | |
GS2 shares outstanding | | | 6,787,567 | | | | 34,522,433 | | | | 22,016,758 | | | | 15,221,920 | |
| | | | | | | | | | | | | | | | |
Net asset value, offering and redemption price per GS2 share | | $ | 8.00 | | | $ | 7.53 | | | $ | 7.35 | | | $ | 7.20 | |
| | | | | | | | | | | | | | | | |
| |
(1) Investments in securities of affiliated issuers, at cost | | $ | 66,225,860 | | | $ | 362,128,906 | | | $ | 248,553,030 | | | $ | 187,677,846 | |
Investments in securities of unaffiliated issuers, at cost | | | 179,934 | | | | 739,755 | | | | 429,853 | | | | 274,907 | |
| | | | | | | | | | | | | | | | |
Total investments at cost | | $ | 66,405,794 | | | $ | 362,868,661 | | | $ | 248,982,883 | | | $ | 187,952,753 | |
| | | | | | | | | | | | | | | | |
See Notes to Financial Statements.
62
STATEMENTS OF OPERATIONS
For the Year Ended December 31, 2008
| | | | | | | | | | | | | | | | |
| | | Conservative
Allocation
Fund I | | | Balanced
Allocation
Fund I | | | Growth
Allocation
Fund I | | | Aggressive
Allocation
Fund I | |
Investment Income | | | | | | | | | | | | | | | | |
Income distributions received from affiliated funds | | $ | 3,310,119 | | | $ | 16,611,506 | | | $ | 8,009,648 | | | $ | 3,484,102 | |
Interest | | | 13,310 | | | | 69,405 | | | | 25,684 | | | | 4,557 | |
| | | | | | | | | | | | | | | | |
Total Investment Income | | | 3,323,429 | | | | 16,680,911 | | | | 8,035,332 | | | | 3,488,659 | |
| | | | | | | | | | | | | | | | |
Expenses | | | | | | | | | | | | | | | | |
Investment advisory fees | | | 63,204 | | | | 321,148 | | | | 215,295 | | | | 159,458 | |
Transfer agent fees | | | 4,338 | | | | 4,731 | | | | 4,608 | | | | 4,682 | |
Custodian fees | | | 7,368 | | | | 12,331 | | | | 11,316 | | | | 9,051 | |
Accounting and administration fees | | | 7,731 | | | | 21,774 | | | | 16,182 | | | | 13,004 | |
Professional fees | | | 42,385 | | | | 42,385 | | | | 42,385 | | | | 42,385 | |
Shareholder reporting fees | | | 443 | | | | 685 | | | | 544 | | | | 615 | |
Trustee fees | | | 691 | | | | 3,405 | | | | 2,329 | | | | 1,693 | |
Line of credit facility fees | | | 278 | | | | 1,436 | | | | 979 | | | | 742 | |
Other expenses | | | 10,640 | | | | 12,776 | | | | 11,491 | | | | 11,985 | |
| | | | | | | | | | | | | | | | |
Total Expenses | | | 137,078 | | | | 420,671 | | | | 305,129 | | | | 243,615 | |
Expenses waived/reimbursed net of amount) recaptured(1) | | | (43,693 | ) | | | 12,577 | | | | 12,769 | | | | (7,921 | ) |
| | | | | | | | | | | | | | | | |
Net expenses | | | 93,385 | | | | 433,248 | | | | 317,898 | | | | 235,694 | |
| | | | | | | | | | | | | | | | |
Net Investment Income | | | 3,230,044 | | | | 16,247,663 | | | | 7,717,434 | | | | 3,252,965 | |
| | | | | | | | | | | | | | | | |
Realized and Unrealized Loss | | | | | | | | | | | | | | | | |
Capital gain distributions received from affiliated funds | | | 215,473 | | | | 5,417,054 | | | | 3,113,967 | | | | 1,917,503 | |
Net realized loss on investment securities of affiliated issuers | | | (1,920,965 | ) | | | (10,633,685 | ) | | | (3,800,361 | ) | | | (5,661,358 | ) |
Net realized gain (loss) on investment securities of unaffiliated issuers | | | 16,332 | | | | (124,270 | ) | | | (163,755 | ) | | | — | |
Net realized loss on futures transactions | | | (66,461 | ) | | | (1,307,277 | ) | | | (1,105,509 | ) | | | (1,152,594 | ) |
| | | | | | | | | | | | | | | | |
Net realized loss | | | (1,755,621 | ) | | | (6,648,178 | ) | | | (1,955,658 | ) | | | (4,896,449 | ) |
| | | | | | | | | | | | | | | | |
Change in unrealized depreciation on investment securities of affiliated issuers | | | (9,896,608 | ) | | | (94,580,492 | ) | | | (87,000,570 | ) | | | (76,775,261 | ) |
Change in unrealized appreciation (depreciation) on investment securities of unaffiliated issuers | | | 784 | | | | (83,695 | ) | | | (24,994 | ) | | | (79 | ) |
Change in unrealized appreciation on futures | | | 15,369 | | | | 75,601 | | | | 86,468 | | | | 43,082 | |
| | | | | | | | | | | | | | | | |
Net change in unrealized appreciation (depreciation) | | | (9,880,455 | ) | | | (94,588,586 | ) | | | (86,939,096 | ) | | | (76,732,258 | ) |
| | | | | | | | | | | | | | | | |
Net Realized and Unrealized Loss | | | (11,636,076 | ) | | | (101,236,764 | ) | | | (88,894,754 | ) | | | (81,628,707 | ) |
| | | | | | | | | | | | | | | | |
Net Decrease in Net Assets Resulting from Operations | | $ | (8,406,032 | ) | | $ | (84,989,101 | ) | | $ | (81,177,320 | ) | | $ | (78,375,742 | ) |
| | | | | | | | | | | | | | | | |
| (1) | See Note 3a and 3c in Notes to Financial Statements. |
See Notes to Financial Statements.
63
STATEMENTS OF CHANGES IN NET ASSETS
| | | | | | | | | | | | | | | | |
| | | Conservative Allocation Fund I | | | Balanced Allocation Fund I | |
| | | For the Year Ended | | | For the Year Ended | |
| | | 12/31/08 | | | 12/31/07 | | | 12/31/08 | | | 12/31/07 | |
Operations: | | | | | | | | | | | | | | | | |
Net investment income | | $ | 3,230,044 | | | $ | 3,162,674 | | | $ | 16,247,663 | | | $ | 15,686,367 | |
Net realized gain (loss) on investment securities and futures transactions | | | (1,755,621 | ) | | | 1,850,911 | | | | (6,648,178 | ) | | | 19,520,707 | |
Net change in unrealized appreciation (depreciation) on investment securities and futures | | | (9,880,455 | ) | | | (787,872 | ) | | | (94,588,586 | ) | | | (11,354,896 | ) |
| | | | | | | | | | | | | | | | |
Net increase (decrease) in net assets resulting from operations | | | (8,406,032 | ) | | | 4,225,713 | | | | (84,989,101 | ) | | | 23,852,178 | |
| | | | | | | | | | | | | | | | |
Dividends and Distributions to Shareholders: | | | | | | | | | | | | | | | | |
Dividends from net investment income(1) | | | (2,524,105 | ) | | | (3,469,288 | ) | | | (13,746,934 | ) | | | (18,895,697 | ) |
Distributions from net realized capital gains | | | (1,170,532 | ) | | | (1,941,086 | ) | | | (13,133,636 | ) | | | (14,070,859 | ) |
| | | | | | | | | | | | | | | | |
Total dividends and distributions | | | (3,694,637 | ) | | | (5,410,374 | ) | | | (26,880,570 | ) | | | (32,966,556 | ) |
| | | | | | | | | | | | | | | | |
Capital Share Transactions: | | | | | | | | | | | | | | | | |
Proceeds from GS2 shares sold | | | 8,306,973 | | | | 15,180,761 | | | | 21,418,152 | | | | 94,490,963 | |
Reinvestment of dividends and distributions into GS2 shares | | | 3,682,376 | | | | 5,410,374 | | | | 26,811,396 | | | | 32,966,555 | |
Value of GS2 shares redeemed | | | (12,802,980 | ) | | | (9,363,744 | ) | | | (30,030,801 | ) | | | (27,000,872 | ) |
| | | | | | | | | | | | | | | | |
Net increase (decrease) from capital share transactions(2) | | | (813,631 | ) | | | 11,227,391 | | | | 18,198,747 | | | | 100,456,646 | |
| | | | | | | | | | | | | | | | |
Total increase (decrease) in net assets | | | (12,914,300 | ) | | | 10,042,730 | | | | (93,670,924 | ) | | | 91,342,268 | |
| | | | | | | | | | | | | | | | |
Net Assets: | | | | | | | | | | | | | | | | |
Beginning of Year | | | 67,230,915 | | | | 57,188,185 | | | | 353,793,483 | | | | 262,451,215 | |
| | | | | | | | | | | | | | | | |
End of Year* | | $ | 54,316,615 | | | $ | 67,230,915 | | | $ | 260,122,559 | | | $ | 353,793,483 | |
| | | | | | | | | | | | | | | | |
| |
* Including undistributed net investment income | | $ | 705,587 | | | $ | 238 | | | $ | 5,275,545 | | | $ | 1,491 | |
| | | | | | | | | | | | | | | | |
(1) Includes dividends paid from the short-term portion of capital gain distributions received from affiliated funds. (2) See Note 7 in Notes to Financial Statements. | |
See Notes to Financial Statements.
64
| | | | | | | | | | | | | | |
| Growth Allocation Fund I | | | Aggressive Allocation Fund I | |
| For the Year Ended | | | For the Year Ended | |
| 12/31/08 | | | 12/31/07 | | | 12/31/08 | | | 12/31/07 | |
| $ | 7,717,434 | | | $ | 7,788,791 | | | $ | 3,252,965 | | | $ | 3,525,764 | |
| | | |
| | (1,955,658 | ) | | | 20,648,256 | | | | (4,896,449 | ) | | | 21,225,219 | |
| | | |
| | (86,939,096 | ) | | | (11,069,434 | ) | | | (76,732,258 | ) | | | (11,081,739 | ) |
| | | | | | | | | | | | | | | |
| | | |
| | (81,177,320 | ) | | | 17,367,613 | | | | (78,375,742 | ) | | | 13,669,244 | |
| | | | | | | | | | | | | | | |
| | | |
| | (7,164,765 | ) | | | (11,179,109 | ) | | | — | | | | (7,120,845 | ) |
| | (13,479,284 | ) | | | (14,541,067 | ) | | | (14,453,029 | ) | | | (13,366,408 | ) |
| | | | | | | | | | | | | | | |
| | (20,644,049 | ) | | | (25,720,176 | ) | | | (14,453,029 | ) | | | (20,487,253 | ) |
| | | | | | | | | | | | | | | |
| | | |
| | 14,603,125 | | | | 66,034,239 | | | | 9,952,658 | | | | 60,914,409 | |
| | 20,568,986 | | | | 25,720,176 | | | | 14,434,397 | | | | 20,487,253 | |
| | (23,114,496 | ) | | | (19,359,471 | ) | | | (20,849,161 | ) | | | (17,955,008 | ) |
| | | | | | | | | | | | | | | |
| | 12,057,615 | | | | 72,394,944 | | | | 3,537,894 | | | | 63,446,654 | |
| | | | | | | | | | | | | | |
| | (89,763,754 | ) | | | 64,042,381 | | | | (89,290,877 | ) | | | 56,628,645 | |
| | | | | | | | | | | | | | | |
| | | |
| | 251,578,730 | | | | 187,536,349 | | | | 198,846,524 | | | | 142,217,879 | |
| | | | | | | | | | | | | | | |
| $ | 161,814,976 | | | $ | 251,578,730 | | | $ | 109,555,647 | | | $ | 198,846,524 | |
| | | | | | | | | | | | | | | |
| $ | 1,465,194 | | | $ | 565 | | | $ | 3,253,345 | | | $ | — | |
| | | | | | | | | | | | | | | |
See Notes to Financial Statements.
65
FINANCIAL HIGHLIGHTS
For a Share Outstanding For the Years Ended December 31, unless otherwise indicated
| | | | | | | | | | | | | | | | | | | | | | | | | | | | | | | | | | | | | | | | | | | | | | | | | |
| | | | | | | | | | | | | | | | | | | | | | | | | | Ratios to Average Net Assets | | | | |
| | | Net Asset
Value,
Beginning
of Year | | Net
Investment
Income (1) | | | Capital Gain
Distributions
Received
from
Affiliated
Funds | | Realized
and
Unrealized
Gain
(Loss) on
Investments | | | Dividends
from Net
Investment
Income (2) | | | Distributions
from Net
Realized
Capital
Gains | | | Net
Asset
Value,
End
of
Year | | Total
Return | | | Net
Assets,
End of
Year
(000) | | Expenses,
Net (3) | | | Expenses,
Including
Expense
Reduction
(3) | | | Expenses,
Before Waivers/
Reimbursements
and Expense
Reduction
(3)(4) | | | Investment
Income,
Net
(1) | | | Investment
Income,
Excluding
Waivers/
Reimbursements
and Expense
Reduction
(1) | | | Portfolio
Turnover
Rate | |
Conservative Allocation Fund I | |
|
GS2 Class | |
2008 | | $ | 9.86 | | $ | 0.49 | | | $ | 0.03 | | $ | (1.81 | ) | | $ | (0.39 | ) | | $ | (0.18 | ) | | $ | 8.00 | | (12.98 | )% | | $ | 54,317 | | 0.15 | % | | 0.15 | % | | 0.22 | % | | 5.21 | % | | 5.14 | % | | 25 | % |
2007 | | | 10.05 | | | 0.50 | | | | 0.23 | | | (0.07 | ) | | | (0.54 | ) | | | (0.31 | ) | | | 9.86 | | 6.55 | | | | 67,231 | | 0.16 | | | 0.16 | | | 0.22 | | | 4.77 | | | 4.71 | | | 25 | |
2006 | | | 10.15 | | | 0.46 | | | | 0.19 | | | (0.02 | ) | | | (0.49 | ) | | | (0.24 | ) | | | 10.05 | | 6.21 | | | | 57,188 | | 0.17 | | | 0.17 | | | 0.30 | | | 4.53 | | | 4.40 | | | 16 | |
2005 | | | 10.31 | | | 0.36 | | | | 0.10 | | | (0.10 | ) | | | (0.38 | ) | | | (0.14 | ) | | | 10.15 | | 3.46 | | | | 54,231 | | 0.17 | | | 0.17 | | | 0.30 | | | 3.52 | | | 3.39 | | | 16 | |
2004 | | | 10.31 | | | 0.25 | | | | 0.05 | | | 0.19 | | | | (0.36 | ) | | | (0.13 | ) | | | 10.31 | | 4.77 | | | | 31,447 | | 0.17 | | | 0.17 | | | 0.39 | | | 2.42 | | | 2.20 | | | 23 | |
|
Balanced Allocation Fund I | |
|
GS2 Class | |
2008 | | $ | 11.07 | | $ | 0.51 | # | | $ | 0.17 | | $ | (3.38 | ) | | $ | (0.42 | ) | | $ | (0.42 | ) | | $ | 7.53 | | (24.26 | )% | | $ | 260,123 | | 0.14 | % | | 0.14 | % | | 0.14 | % | | 5.16 | % | | 5.16 | % | | 23 | % |
2007 | | | 11.35 | | | 0.55 | # | | | 0.66 | | | (0.38 | ) | | | (0.62 | ) | | | (0.49 | ) | | | 11.07 | | 7.32 | | | | 353,793 | | 0.16 | | | 0.16 | | | 0.14 | | | 4.62 | | | 4.64 | | | 12 | |
2006 | | | 11.32 | | | 0.46 | # | | | 0.45 | | | 0.09 | | | | (0.50 | ) | | | (0.47 | ) | | | 11.35 | | 8.85 | | | | 262,451 | | 0.17 | | | 0.17 | | | 0.18 | | | 3.93 | | | 3.92 | | | 13 | |
2005 | | | 11.23 | | | 0.40 | # | | | 0.25 | | | 0.07 | | | | (0.46 | ) | | | (0.17 | ) | | | 11.32 | | 6.42 | | | | 239,244 | | 0.17 | | | 0.17 | | | 0.18 | | | 3.49 | | | 3.48 | | | 11 | |
2004 | | | 10.62 | | | 0.34 | # | | | 0.14 | | | 0.60 | | | | (0.36 | ) | | | (0.11 | ) | | | 11.23 | | 10.26 | | | | 122,166 | | 0.17 | | | 0.17 | | | 0.22 | | | 3.07 | | | 3.02 | | | 10 | |
|
Growth Allocation Fund I | |
|
GS2 Class | |
2008 | | $ | 12.53 | | $ | 0.39 | # | | $ | 0.16 | | $ | (4.69 | ) | | $ | (0.34 | ) | | $ | (0.70 | ) | | $ | 7.35 | | (32.82 | )% | | $ | 161,815 | | 0.15 | % | | 0.15 | % | | 0.14 | % | | 3.65 | % | | 3.66 | % | | 18 | % |
2007 | | | 12.96 | | | 0.41 | | | | 0.92 | | | (0.37 | ) | | | (0.58 | ) | | | (0.81 | ) | | | 12.53 | | 7.40 | | | | 251,579 | | 0.16 | | | 0.16 | | | 0.15 | | | 3.20 | | | 3.21 | | | 9 | |
2006 | | | 12.62 | | | 0.34 | | | | 0.73 | | | 0.35 | | | | (0.44 | ) | | | (0.64 | ) | | | 12.96 | | 11.21 | | | | 187,536 | | 0.17 | | | 0.17 | | | 0.20 | | | 2.73 | | | 2.70 | | | 9 | |
2005 | | | 12.17 | | | 0.29 | | | | 0.38 | | | 0.33 | | | | (0.39 | ) | | | (0.16 | ) | | | 12.62 | | 8.20 | | | | 159,849 | | 0.17 | | | 0.17 | | | 0.20 | | | 2.42 | | | 2.39 | | | 8 | |
2004 | | | 11.11 | | | 0.24 | | | | 0.09 | | | 1.09 | | | | (0.26 | ) | | | (0.10 | ) | | | 12.17 | | 12.88 | | | | 70,608 | | 0.17 | | | 0.17 | | | 0.27 | | | 2.13 | | | 2.03 | | | 7 | |
|
Aggressive Allocation Fund I | |
|
GS2 Class | |
2008 | | $ | 14.07 | | $ | 0.24 | # | | $ | 0.14 | | $ | (6.15 | ) | | $ | — | | | $ | (1.10 | ) | | $ | 7.20 | | (40.87 | )% | | $ | 109,556 | | 0.15 | % | | 0.15 | % | | 0.16 | % | | 2.08 | % | | 2.07 | % | | 10 | % |
2007 | | | 14.56 | | | 0.27 | | | | 1.37 | | | (0.56 | ) | | | (0.52 | ) | | | (1.05 | ) | | | 14.07 | | 7.38 | | | | 198,847 | | 0.16 | | | 0.16 | | | 0.15 | | | 1.81 | | | 1.82 | | | 7 | |
2006 | | | 14.01 | | | 0.21 | | | | 1.09 | | | 0.57 | | | | (0.36 | ) | | | (0.96 | ) | | | 14.56 | | 13.33 | | | | 142,218 | | 0.17 | | | 0.17 | | | 0.21 | | | 1.47 | | | 1.43 | | | 8 | |
2005 | | | 13.16 | | | 0.18 | | | | 0.52 | | | 0.62 | | | | (0.31 | ) | | | (0.16 | ) | | | 14.01 | | 9.98 | | | | 125,826 | | 0.17 | | | 0.17 | | | 0.21 | | | 1.38 | | | 1.34 | | | 5 | |
2004 | | | 11.62 | | | 0.15 | | | | 0.05 | | | 1.60 | | | | (0.15 | ) | | | (0.11 | ) | | | 13.16 | | 15.48 | | | | 33,543 | | 0.17 | | | 0.17 | | | 0.41 | | | 1.29 | | | 1.05 | | | 7 | |
| # | Calculated using the average shares outstanding method. |
| (1) | Recognition of net investment income by the Fund is affected by the timing of the declaration of dividends by the underlying investment companies in which the Fund invests. |
| (2) | Includes dividends paid from the short-term portion of capital gain distributions received from affiliated Funds. |
| (3) | Does not include expenses of the investment companies in which the Fund invests. |
| (4) | The ratio also excludes previously recaptured fees. |
See Notes to Financial Statements.
66
Money Market Fund
The Money Market Fund is actively managed and invests in a broad range of high quality short-term money market instruments denominated exclusively in U.S. dollars. The Fund seeks to maintain, but does not guarantee, a stable per share price of $1.00, while paying monthly dividends based on the daily account value. The Fund generated the best performance among all GuideStone Funds for the year 2008 and represented the only Fund with positive performance for the year. The GS4 Class of the Fund returned 2.75% in 2008 and outperformed its benchmark, the Citigroup 3-Month Treasury Bill Index, by 0.95%.
Please see page 70 for information regarding specific portfolio allocations. Portfolio holdings are subject to change at any time.
An investment in the Fund is not insured or guaranteed by the Federal Deposit Insurance Corporation or any other governmental agency. Although the Fund seeks to maintain a value of $1.00 per share, it is possible to lose money.
67
Money Market Fund
Average Annual Total Returns as of 12/31/08
| | | | | | | | | | | | |
| | | GS2 Class* | | | GS4 Class* | | | GS6 Class* | | | Benchmark** | |
One Year | | 2.95 | % | | 2.75 | % | | 2.33 | % | | 1.80 | % |
Five Year | | 3.46 | % | | 3.26 | % | | 2.88 | % | | 3.10 | % |
Since Inception | | 2.83 | % | | 2.68 | % | | 2.33 | % | | 2.62 | % |
Inception Date | | 08/27/01 | | | 08/27/01 | | | 08/27/01 | | | 08/27/01 | |
Total Fund Operating Expenses (August 5, 2008 Prospectus) | | 0.19 | % | | 0.39 | % | | 0.73 | % | | | |
7-Day Annualized Yield as of 12/31/08
| | | | | | | |
| GS2 Class* | | | GS4 Class* | | | GS6 Class* | |
| 1.68 | % | | 1.47 | % | | 1.07 | % |
The performance data quoted represents past performance and does not guarantee future results. Current performance may be lower or higher. Performance data current to the most recent month-end may be obtained at www.GuideStoneFunds.org. Investment return will fluctuate so that shares, when redeemed, may be worth more or less than their original cost. The yield for the Money Market Fund represents annualization of the Fund’s declared dividends over the period indicated, excluding capital gains distributions. The 7-day annualized yield more closely reflects the current earnings of the Fund than the total return.
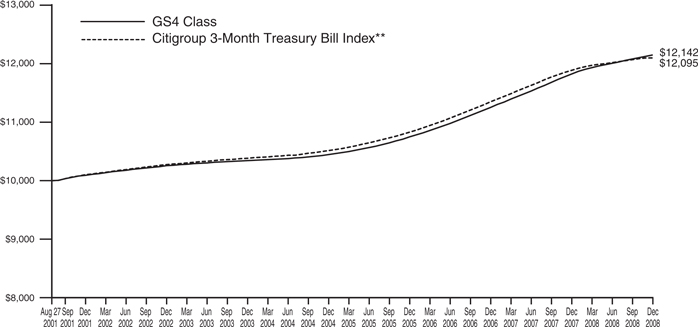
The graph compares the results of a hypothetical $10,000 investment in the GS4 Class of the Fund since August 27, 2001 (commencement of operations), with all dividends and capital gains reinvested, with the Citigroup 3-Month Treasury Bill Index.
| * | These performance figures reflect expense waivers by the Fund’s investment adviser. Without these waivers, performance would have been lower. Performance figures shown do not reflect the deduction of taxes that a shareholder would pay on Fund distributions or the redemption of Fund shares. |
| ** | The Citigroup 3-Month Treasury Bill Index is an unmanaged index that is generally representative of 3-month U.S. Treasury bills, consisting of an average of the last 3-month U.S. Treasury bill issues. |
Unlike a mutual fund, the performance of an index assumes no taxes, transaction costs, management fees or other expenses.
68
| | |
| Money Market Fund | | |
| SCHEDULE OF INVESTMENTS | | December 31, 2008 |
| | | | | | |
| | | Par | | Value |
AGENCY OBLIGATIONS — 9.5% | | | | | | |
Federal Home Loan Bank | | | | | | |
1.10%, 03/13/09† | | $ | 30,000,000 | | $ | 30,000,000 |
Federal National Mortgage Association | | | | | | |
1.15%, 05/11/09 | | | 32,000,000 | | | 31,867,111 |
2.00%, 05/14/09 | | | 4,650,000 | | | 4,615,642 |
0.28%, 05/15/09W | | | 10,000,000 | | | 9,954,589 |
1.30%, 06/22/09 | | | 8,000,000 | | | 7,950,311 |
0.35%, 07/01/09 | | | 25,835,000 | | | 25,789,537 |
| | | | | | |
Total Agency Obligations
(Cost $110,177,190) | | | | | | 110,177,190 |
| | | | | | |
CERTIFICATES OF DEPOSIT — 20.1% | | | | | | |
Banco Bilbao Vizcaya Argentaria S.A. NY | | | | | | |
2.65%, 03/10/09 | | | 7,000,000 | | | 7,000,131 |
1.93%, 03/12/09 | | | 6,000,000 | | | 6,000,116 |
2.70%, 04/14/09 | | | 2,000,000 | | | 2,000,057 |
Banco Santander NY | | | | | | |
3.36%, 02/04/09 | | | 8,000,000 | | | 8,000,075 |
3.70%, 02/24/09 | | | 10,000,000 | | | 10,000,000 |
Barclays Bank PLC NY | | | | | | |
1.85%, 02/11/09 | | | 6,701,000 | | | 6,701,000 |
BNP Paribas NY | | | | | | |
3.05%, 01/15/09 | | | 9,000,000 | | | 9,000,000 |
2.10%, 02/18/09 | | | 9,000,000 | | | 9,000,000 |
2.16%, 02/26/09 | | | 11,000,000 | | | 11,000,000 |
3.47%, 02/27/09 | | | 10,000,000 | | | 10,000,000 |
2.08%, 03/05/09 | | | 6,500,000 | | | 6,500,000 |
2.29%, 06/08/09 | | | 6,000,000 | | | 6,000,000 |
Citibank N.A. | | | | | | |
1.00%, 01/12/09 | | | 20,057,000 | | | 20,057,000 |
1.50%, 03/17/09 | | | 6,000,000 | | | 6,000,000 |
1.40%, 04/02/09 | | | 800,000 | | | 800,000 |
Intesa San Paolo SpA NY | | | | | | |
1.85%, 03/10/09 | | | 3,650,000 | | | 3,650,000 |
Lloyds TSB Bank PLC NY | | | | | | |
1.90%, 02/09/09 | | | 15,000,000 | | | 15,000,000 |
Nordea Bank Finland PLC NY | | | | | | |
3.41%, 02/24/09 | | | 10,000,000 | | | 10,000,000 |
Rabobank Nederland NV NY | | | | | | |
3.01%, 02/19/09 | | | 6,000,000 | | | 6,000,000 |
Royal Bank of Scotland NY | | | | | | |
3.14%, 03/09/09 | | | 12,820,000 | | | 12,820,000 |
Sanpaolo IMI SpA NY | | | | | | |
2.85%, 11/12/09 | | | 3,000,000 | | | 3,000,000 |
Societe Generale NY | | | | | | |
2.00%, 01/21/09 | | | 19,000,000 | | | 19,000,000 |
1.96%, 03/05/09 | | | 6,150,000 | | | 6,150,000 |
1.60%, 06/17/09 | | | 6,000,000 | | | 6,000,000 |
Svenska Handelsbanken NY | | | | | | |
1.40%, 02/12/09 | | | 1,000,000 | | | 1,000,000 |
1.95%, 03/11/09 | | | 2,000,000 | | | 2,000,000 |
Toronto Dominion Bank NY | | | | | | |
3.03%, 01/19/09 | | | 13,000,000 | | | 13,000,000 |
3.03%, 02/11/09 | | | 2,700,000 | | | 2,700,000 |
2.42%, 06/11/09 | | | 6,750,000 | | | 6,750,000 |
UBS AG NY | | | | | | |
1.40%, 03/31/09 | | | 6,000,000 | | | 6,000,000 |
| | | | | | |
| | |
Total Certificates of Deposit
(Cost $231,128,379) | | | | | | 231,128,379 |
| | | | | | |
COMMERCIAL PAPER — 66.4% | | | | | | |
Atlantis One Funding Corporation | | | | | | |
4.25%, 01/16/09 | | | 22,000,000 | | | 21,961,042 |
1.55%, 02/10/09 | | | 18,000,000 | | | 17,969,000 |
0.70%, 03/16/09 | | | 17,000,000 | | | 16,975,539 |
Barclays US Funding Corporation | | | | | | |
2.32%, 02/03/09 | | | 45,000,000 | | | 44,904,300 |
Barton Capital Corporation | | | | | | |
1.55%, 02/27/09 | | | 11,000,000 | | | 10,973,004 |
BASF SE | | | | | | |
1.85%, 01/30/09 | | | 25,000,000 | | | 24,962,743 |
CAFCO LLC | | | | | | |
1.78%, 01/28/09 | | | 6,000,000 | | | 5,991,990 |
3.10%, 02/19/09 | | | 19,000,000 | | | 18,919,831 |
Charta LLC | | | | | | |
3.55%, 02/20/09 | | | 25,000,000 | | | 24,876,736 |
Ciesco LLC | | | | | | |
0.70%, 03/19/09 | | | 54,000,000 | | | 53,919,150 |
Citigroup Funding, Inc. | | | | | | |
2.00%, 01/09/09 | | | 15,000,000 | | | 14,993,333 |
0.85%, 03/12/09 | | | 10,000,000 | | | 9,983,472 |
3.15%, 03/17/09 | | | 5,000,000 | | | 4,967,187 |
ConocoPhillips | | | | | | |
1.25%, 01/15/09 | | | 30,000,000 | | | 29,985,417 |
Enterprise Funding LLC | | | | | | |
2.25%, 02/06/09 | | | 11,000,000 | | | 10,975,250 |
Falcon Asset Securitization Co., LLC | | | | | | |
4.00%, 01/15/09 | | | 30,000,000 | | | 29,953,333 |
ING America Insurance Holdings | | | | | | |
1.02%, 02/27/09 | | | 30,329,000 | | | 30,280,019 |
JPMorgan Chase & Co. | | | | | | |
1.50%, 02/06/09 | | | 12,000,000 | | | 11,982,000 |
1.65%, 03/02/09 | | | 22,000,000 | | | 21,939,500 |
0.35%, 03/19/09 | | | 23,000,000 | | | 22,982,782 |
Jupiter Securitization Co., LLC | | | | | | |
0.70%, 03/09/09 | | | 8,000,000 | | | 7,989,578 |
Liberty Street Funding LLC | | | | | | |
3.45%, 01/30/09 | | | 10,000,000 | | | 9,972,208 |
0.65%, 03/20/09 | | | 6,000,000 | | | 5,991,550 |
MetLife Funding, Inc. | | | | | | |
0.47%, 01/28/09 | | | 30,000,000 | | | 29,989,425 |
Motiva Enterprises LLC | | | | | | |
0.05%, 01/02/09 | | | 7,200,000 | | | 7,199,990 |
NetJets, Inc. | | | | | | |
0.05%, 01/02/09 | | | 13,000,000 | | | 12,999,982 |
New York Life Capital Corporation | | | | | | |
0.75%, 01/23/09 | | | 12,700,000 | | | 12,694,179 |
Nordea North America, Inc. | | | | | | |
1.38%, 03/20/09 | | | 27,000,000 | | | 26,919,270 |
1.20%, 04/03/09 | | | 13,000,000 | | | 12,960,133 |
Old Line Funding LLC | | | | | | |
3.50%, 01/23/09 | | | 8,000,000 | | | 7,982,889 |
2.45%, 02/06/09 | | | 12,000,000 | | | 11,970,600 |
Procter & Gamble Co. | | | | | | |
1.10%, 03/09/09 | | | 50,000,000 | | | 49,897,639 |
Prudential Funding LLC | | | | | | |
0.75%, 01/12/09 | | | 16,323,000 | | | 16,319,259 |
0.50%, 01/15/09 | | | 22,000,000 | | | 21,995,722 |
See Notes to Financial Statements.
69
Money Market Fund
SCHEDULE OF INVESTMENTS (Continued)
| | | | | | | |
| | | Par | | Value | |
Toyota Motor Credit Corporation | | | | | | | |
2.40%, 01/12/09 | | $ | 10,000,000 | | $ | 9,992,667 | |
1.25%, 01/29/09 | | | 29,381,000 | | | 29,352,435 | |
1.20%, 03/20/09 | | | 18,000,000 | | | 17,953,200 | |
UBS Finance Delaware LLC | | | | | | | |
1.40%, 04/30/09 | | | 8,600,000 | | | 8,569,566 | |
Windmill Funding I Corporation | | | | | | | |
1.58%, 02/05/09 | | | 4,000,000 | | | 3,993,856 | |
Yorktown Capital LLC | | | | | | | |
3.85%, 01/20/09 | | | 30,000,000 | | | 29,939,042 | |
| | | | | | | |
Total Commercial Paper
(Cost $764,178,818) | | | | | | 764,178,818 | |
| | | | | | | |
VARIABLE RATE OBLIGATIONS — 4.6% | | | | | | | |
Bank of Montreal | | | | | | | |
2.39%, 01/07/09 144A† | | | 9,200,000 | | | 9,200,000 | |
Deutsche Bank AG | | | | | | | |
1.74%, 03/25/09† | | | 8,230,000 | | | 8,230,000 | |
General Electric Capital Corporation | | | | | | | |
0.50%, 01/26/09† | | | 5,500,000 | | | 5,500,000 | |
HSBC USA, Inc. | | | | | | | |
5.22%, 01/14/09† | | | 1,645,000 | | | 1,645,000 | |
ING Bank NV | | | | | | | |
2.47%, 02/24/09 144A† | | | 4,750,000 | | | 4,750,000 | |
ING USA Global Funding Trust | | | | | | | |
2.03%, 03/19/09† | | | 2,725,000 | | | 2,725,000 | |
Lloyds TSB Group PLC | | | | | | | |
2.81%, 02/09/09 144A† | | | 7,450,000 | | | 7,450,000 | |
Nordea Bank AB | | | | | | | |
3.89%, 01/26/09 144A† | | | 6,900,000 | | | 6,900,000 | |
Wachovia Bank NA | | | | | | | |
4.61%, 01/05/09†D | | | 6,250,000 | | | 6,250,000 | |
| | | | | | | |
Total Variable Rate Obligations
(Cost $52,650,000) | | | | | | 52,650,000 | |
| | | | | | | |
| | |
| | | Shares | | | |
MONEY MARKET FUND — 0.1% | | | | | | | |
Northern Institutional Liquid Assets Portfolio§
(Cost $1,010,000) | | | 1,010,000 | | | 1,010,000 | |
| | | | | | | |
TOTAL INVESTMENTS — 100.7%
(Cost $1,159,144,387) | | | | | | 1,159,144,387 | |
| | |
Liabilities in Excess of Other Assets — (0.7)% | | | | | | (8,452,116 | ) |
| | | | | | | |
NET ASSETS — 100.0% | | | | | $ | 1,150,692,271 | |
| | | | | | | |
PORTFOLIO SUMMARY (based on net assets)
| | |
| | | % |
Commercial Paper | | 66.4 |
Certificates of Deposit | | 20.1 |
Agency Obligations | | 9.5 |
Variable Rate Obligations | | 4.6 |
Money Market Fund | | 0.1 |
| | |
| | 100.7 |
| | |
FAS 157 DISCLOSURE
The following is a summary of the inputs used, as of December 31, 2008, in valuing the Fund’s investments carried at fair value:
| | | | | | |
Valuation Inputs | | Investments
in
Securities | | Other
Financial
Instruments*** |
Level 1 — Quoted Prices | | $ | 1,010,000 | | $ | — |
Level 2 — Other Significant Observable Inputs | | | 1,158,134,387 | | | — |
Level 3 — Significant Unobservable Inputs | | | — | | | — |
| | | | | | |
Total | | $ | 1,159,144,387 | | $ | — |
| | | | | | |
| *** | Other financial instruments are derivative instruments not reflected in the Schedule of Investments, such as futures, forwards and swap contracts, which are valued at the unrealized appreciation (depreciation) on the investment. |
See Notes to Financial Statements.
70
Low-Duration Bond Fund
The Low-Duration Bond Fund invests in a diversified portfolio composed primarily of investment grade fixed-income securities with an average dollar-weighted duration normally between one to three years. The Fund was generally positioned to capture the perceived long-term value of historically wide yield spreads but encountered a very challenging investment environment as credit spreads continued widening during the third and fourth quarters resulting in poor absolute and benchmark-relative performance for the year. The GS4 Class underperformed its all-Treasury benchmark, the Merrill Lynch 1-3 Year Treasury Index, for the one-year period ending December 31, 2008, ((2.84)% versus 6.61%). The Fund trailed its benchmark on an annualized five-year and since-inception basis.
Please see page 84 for information regarding specific portfolio allocations. Portfolio holdings are subject to change at any time.
71
Low-Duration Bond Fund
Average Annual Total Returns as of 12/31/08
| | | | | | | | | | | | |
| | | GS2 Class* | | | GS4 Class* | | | GS6 Class* | | | Benchmark** | |
One Year | | (2.76 | )% | | (2.84 | )% | | (3.16 | )% | | 6.61 | % |
Five Year | | 2.05 | % | | 1.91 | % | | 1.56 | % | | 4.06 | % |
Since Inception | | 2.76 | % | | 2.67 | % | | 2.34 | % | | 4.17 | % |
Inception Date | | 08/27/01 | | | 08/27/01 | | | 08/27/01 | | | 08/27/01 | |
Total Fund Operating Expenses (August 5, 2008 Prospectus) | | 0.41 | % | | 0.60 | % | | 1.08 | % | | | |
The performance data quoted represents past performance and does not guarantee future results. Current performance may be lower or higher. Performance data current to the most recent month-end may be obtained at www.GuideStoneFunds.org. The investment return and principal value of an investment will fluctuate so that shares, when redeemed, may be worth more or less than their original cost.
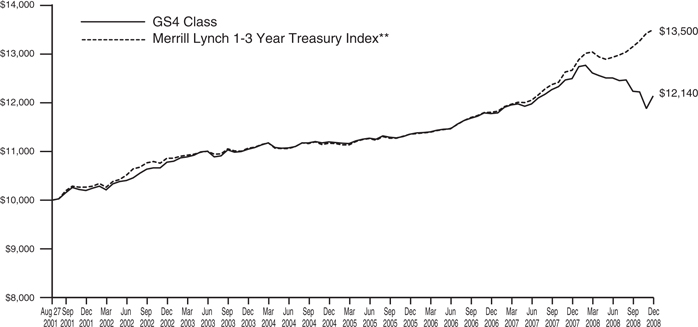
The graph compares the results of a hypothetical $10,000 investment in the GS4 Class of the Fund since August 27, 2001 (commencement of operations), with all dividends and capital gains reinvested, with the Merrill Lynch 1-3 Year Treasury Index.
| * | These returns reflect expense waivers by the Fund’s investment adviser. Without these waivers, returns would have been lower. Returns shown do not reflect the deduction of taxes that a shareholder would pay on Fund distributions or the redemption of Fund shares. |
| ** | The Merrill Lynch 1-3 Year Treasury Index is composed of all U.S. Treasury Notes and Bonds with maturities greater than or equal to one year and less than three years. |
Unlike a mutual fund, the performance of an index assumes no taxes, transaction costs, management fees or other expenses.
72
| | |
Low-Duration Bond Fund | | |
SCHEDULE OF INVESTMENTS | | December 31, 2008 |
| | | | | | |
| | | Par | | Value |
AGENCY OBLIGATIONS — 4.6% | | | | | | |
Federal Home Loan Bank | | | | | | |
0.75%, 01/14/09W‡‡ | | $ | 1,100,000 | | $ | 1,099,702 |
5.00%, 03/14/14 | | | 390,000 | | | 437,801 |
5.38%, 06/13/14 | | | 895,000 | | | 1,024,885 |
5.25%, 09/12/14 | | | 895,000 | | | 1,022,669 |
Federal Home Loan Mortgage Corporation | | | | | | |
3.25%, 02/25/11 | | | 8,000,000 | | | 8,323,288 |
3.00%, 04/01/11 | | | 4,000,000 | | | 4,020,440 |
4.63%, 10/25/12 | | | 4,360,000 | | | 4,719,931 |
Federal National Mortgage Association | | | | | | |
2.88%, 10/12/10 | | | 3,855,000 | | | 3,978,002 |
2.88%, 12/11/13 | | | 3,625,000 | | | 3,717,256 |
Small Business Administration | | | | | | |
6.95%, 11/01/16 | | | 636,509 | | | 668,137 |
| | | | | | |
Total Agency Obligations
(Cost $28,198,484) | | | | | | 29,012,111 |
| | | | | | |
ASSET-BACKED SECURITIES — 11.2% | | | | | | |
Accredited Mortgage Loan Trust | | | | | | |
0.52%, 02/25/37† | | | 1,198,550 | | | 1,058,749 |
American Express Issuance Trust | | | | | | |
4.02%, 01/18/11 | | | 2,580,000 | | | 2,479,655 |
Amresco Independence Funding, Inc. | | | | | | |
3.75%, 06/15/26 144A | | | 306,398 | | | 190,432 |
Asset-Backed Securities Corporation Home Equity | | | | | | |
0.75%, 09/25/34† | | | 100,868 | | | 79,011 |
0.52%, 11/25/36† | | | 176,694 | | | 171,511 |
Bear Stearns Asset-Backed Securities Trust | | | | | | |
0.52%, 11/25/36† | | | 585,524 | | | 521,281 |
0.66%, 02/25/37† | | | 2,165,842 | | | 1,778,861 |
1.47%, 10/25/37† | | | 1,366,917 | | | 1,119,358 |
Business Loan Express | | | | | | |
4.00%, 01/01/25 144A† | | | 208,070 | | | 153,430 |
Capital Auto Receivables Asset Trust | | | | | | |
5.32%, 03/20/10 144A | | | 2,066,830 | | | 2,044,890 |
Carmax Auto Owner Trust | | | | | | |
5.24%, 07/15/11 | | | 3,556,093 | | | 3,515,693 |
Chase Issuance Trust | | | | | | |
1.45%, 09/15/11† | | | 3,100,000 | | | 2,993,262 |
1.22%, 03/15/13† | | | 3,100,000 | | | 2,755,183 |
4.26%, 05/15/13 | | | 2,880,000 | | | 2,693,298 |
Citigroup Mortgage Loan Trust, Inc. | | | | | | |
0.53%, 07/25/45† | | | 3,053,898 | | | 2,363,461 |
Conseco Financial Corporation | | | | | | |
6.04%, 11/01/29 | | | 26,000 | | | 20,878 |
CSAB Mortgage Backed Trust | | | | | | |
5.72%, 09/25/36 STEP | | | 900,000 | | | 484,299 |
Daimler Chrysler Auto Trust | | | | | | |
2.81%, 07/08/11† | | | 1,500,000 | | | 1,449,624 |
FHLMC Structured Pass-Through Securities | | | | | | |
0.73%, 08/25/31† | | | 1,155,961 | | | 1,033,772 |
First Franklin Mortgage Loan Asset-Backed Certificates | | | | | | |
0.52%, 12/25/36† | | | 271,240 | | | 262,942 |
Ford Credit Auto Owner Trust | | | | | | |
1.22%, 12/15/09† | | | 1,399 | | | 1,397 |
5.07%, 12/15/10 | | | 2,598,000 | | | 2,551,008 |
2.10%, 01/15/11† | | | 1,500,000 | | | 1,455,607 |
1.24%, 02/15/12† | | | 2,520,000 | | | 2,252,476 |
3.96%, 04/15/12 | | | 3,585,000 | | | 3,346,584 |
Fremont Home Loan Trust | | | | | | |
0.52%, 10/25/36† | | | 152,268 | | | 138,203 |
GSAA Trust | | | | | | |
0.79%, 12/25/34† | | | 557,309 | | | 286,792 |
IFC SBA Loan-Backed Adjustable Rate Certificate | | | | | | |
3.00%, 01/15/24 144A† | | | 256,145 | | | 233,092 |
JP Morgan Mortgage Acquisition Corporation | | | | | | |
0.52%, 06/25/37† | | | 2,435,893 | | | 2,057,076 |
Long Beach Mortgage Loan Trust | | | | | | |
0.51%, 11/25/36† | | | 322,670 | | | 303,880 |
Merrill Lynch Mortgage Investors, Inc. | | | | | | |
0.50%, 06/25/37† | | | 52,144 | | | 51,406 |
Morgan Stanley ABS Capital I | | | | | | |
0.52%, 11/25/36† | | | 1,443,132 | | | 1,356,475 |
0.51%, 01/25/37† | | | 986,479 | | | 914,278 |
0.58%, 02/25/37† | | | 1,630,647 | | | 1,469,761 |
0.53%, 05/25/37† | | | 1,863,494 | | | 1,653,018 |
Option One Mortgage Loan Trust | | | | | | |
0.51%, 02/25/37† | | | 221,087 | | | 214,976 |
PG&E Energy Recovery Funding LLC | | | | | | |
4.37%, 06/25/14 | | | 350,000 | | | 342,533 |
Residential Asset Mortgage Products, Inc. | | | | | | |
0.55%, 07/25/36† | | | 88,415 | | | 87,572 |
Securitized Asset-Backed Receivables LLC Trust | | | | | | |
0.51%, 01/25/37†D | | | 1,044,102 | | | 932,903 |
SLM Student Loan Trust | | | | | | |
4.64%, 10/25/16† | | | 3,985,000 | | | 3,729,087 |
4.84%, 01/25/18† | | | 3,975,000 | | | 3,524,088 |
3.53%, 10/25/18† | | | 1,002,583 | | | 963,577 |
Soundview Home Equity Loan Trust | | | | | | |
0.59%, 01/25/37† | | | 1,129,670 | | | 992,176 |
0.53%, 08/25/37† | | | 1,308,264 | | | 1,146,613 |
Specialty Underwriting & Residential Finance | | | | | | |
0.50%, 06/25/37† | | | 24,283 | | | 23,931 |
0.52%, 11/25/37† | | | 358,037 | | | 339,317 |
Structured Asset Investment Loan Trust | | | | | | |
0.52%, 07/25/36† | | | 186,669 | | | 171,322 |
Structured Asset Securities Corporation | | | | | | |
4.90%, 04/25/35† | | | 1,312,714 | | | 643,188 |
0.52%, 10/25/36† | | | 581,607 | | | 537,606 |
Structured Asset Receivables Trust | | | | | | |
4.82%, 01/21/09 144A† | | | 622,557 | | | 547,850 |
4.92%, 04/21/11 144A† | | | 2,179,876 | | | 1,504,115 |
TXU Electric Delivery Transition Bond Co., LLC | | | | | | |
4.81%, 11/17/14 | | | 2,360,000 | | | 2,326,443 |
See Notes to Financial Statements.
73
Low-Duration Bond Fund
SCHEDULE OF INVESTMENTS (Continued)
| | | | | | |
| | | Par | | Value |
USAA Auto Owner Trust | | | | | | |
4.89%, 08/15/12 | | $ | 2,299,958 | | $ | 2,261,847 |
Wachovia Auto Loan Owner Trust | | | | | | |
5.08%, 04/20/12 144A | | | 3,000,000 | | | 2,816,559 |
Wells Fargo Home Equity Trust | | | | | | |
0.56%, 04/25/37† | | | 1,541,241 | | | 1,353,881 |
World Omni Auto Receivables Trust | | | | | | |
5.01%, 10/15/10 | | | 219,811 | | | 219,705 |
| | | | | | |
Total Asset-Backed Securities
(Cost $77,129,705) | | | | | | 69,919,932 |
| | | | | | |
CORPORATE BONDS — 18.9% | | | | | | |
3M Co. | | | | | | |
4.50%, 11/01/11 | | | 590,000 | | | 624,251 |
Abbott Laboratories | | | | | | |
5.60%, 05/15/11D | | | 750,000 | | | 792,325 |
AEP Texas Central Transition Funding LLC | | | | | | |
4.98%, 07/01/13 | | | 2,900,000 | | | 2,869,630 |
American Electric Power Co., Inc. | | | | | | |
5.25%, 06/01/15 | | | 1,600,000 | | | 1,478,733 |
American Express Co. | | | | | | |
7.00%, 03/19/18D | | | 1,400,000 | | | 1,417,984 |
American International Group, Inc. | | | | | | |
5.27%, 07/19/13(E)† | | | 400,000 | | | 330,488 |
8.25%, 08/15/18 144A@ | | | 2,700,000 | | | 1,979,097 |
Amgen, Inc. | | | | | | |
4.00%, 11/18/09D | | | 1,000,000 | | | 999,386 |
Anadarko Petroleum Corporation | | | | | | |
2.40%, 09/15/09† | | | 295,000 | | | 282,311 |
AT&T, Inc. | | | | | | |
5.50%, 02/01/18D | | | 5,600,000 | | | 5,669,530 |
Bank of America Corporation | | | | | | |
8.13%, 12/15/49† | | | 3,100,000 | | | 2,322,675 |
Bank of America NA | | | | | | |
2.84%, 05/12/10† | | | 3,100,000 | | | 3,036,586 |
2.05%, 06/23/10†D | | | 2,500,000 | | | 2,440,803 |
Bear Stearns Co., Inc. | | | | | | |
7.25%, 02/01/18 | | | 3,300,000 | | | 3,622,407 |
BellSouth Corporation | | | | | | |
4.20%, 09/15/09D | | | 2,217,000 | | | 2,226,074 |
Bottling Group LLC | | | | | | |
6.95%, 03/15/14D | | | 1,320,000 | | | 1,434,830 |
BP Capital Markets PLC | | | | | | |
5.25%, 11/07/13 | | | 525,000 | | | 548,650 |
CenterPoint Energy Transition Bond Co., LLC | | | | | | |
4.97%, 08/01/14 | | | 2,875,000 | | | 2,819,685 |
Chicago Transit Authority | | | | | | |
6.90%, 12/01/40 | | | 3,600,000 | | | 3,694,536 |
Cisco Systems, Inc. | | | | | | |
5.25%, 02/22/11 | | | 750,000 | | | 778,991 |
Citigroup Capital XXI | | | | | | |
8.30%, 12/21/57† | | | 3,100,000 | | | 2,396,229 |
Citigroup, Inc. | | | | | | |
6.13%, 05/15/18 | | | 6,400,000 | | | 6,482,624 |
8.40%, 04/30/49† | | | 3,900,000 | | | 2,580,006 |
Comcast Corporation | | | | | | |
5.12%, 07/14/09† | | | 1,735,000 | | | 1,711,522 |
ConocoPhillips Australia Funding Co. | | | | | | |
4.42%, 04/09/09† | | | 835,000 | | | 834,102 |
CVS Caremark Corporation | | | | | | |
4.00%, 09/15/09D | | | 1,085,000 | | | 1,072,022 |
2.50%, 06/01/10† | | | 1,380,000 | | | 1,270,272 |
Duke Energy Ohio, Inc. | | | | | | |
5.70%, 09/15/12 | | | 1,375,000 | | | 1,353,723 |
Florida Power Corporation | | | | | | |
6.65%, 07/15/11 | | | 600,000 | | | 630,136 |
FPL Group Capital, Inc. | | | | | | |
5.63%, 09/01/11D | | | 475,000 | | | 481,996 |
General Electric Capital Corporation | | | | | | |
4.25%, 09/13/10D | | | 2,400,000 | | | 2,409,449 |
5.00%, 12/01/10‡‡ | | | 2,225,000 | | | 2,262,302 |
6.50%, 09/15/67 144A(U)†@ | | | 1,600,000 | | | 1,497,564 |
Goldman Sachs Group, Inc. | | | | | | |
3.25%, 06/15/12D | | | 260,000 | | | 271,485 |
6.25%, 09/01/17D | | | 300,000 | | | 291,368 |
6.15%, 04/01/18 | | | 3,100,000 | | | 2,984,128 |
HSBC USA, Inc. | | | | | | |
3.13%, 12/16/11D | | | 1,266,000 | | | 1,315,674 |
John Deere Capital Corporation | | | | | | |
5.20%, 01/18/11† | | | 760,000 | | | 704,135 |
2.94%, 06/10/11† | | | 4,700,000 | | | 4,291,720 |
JPMorgan Chase & Co. | | | | | | |
3.13%, 12/01/11D | | | 340,000 | | | 353,471 |
Kraft Foods, Inc. | | | | | | |
5.63%, 08/11/10 | | | 495,000 | | | 497,398 |
6.13%, 02/01/18 | | | 600,000 | | | 588,946 |
6.88%, 02/01/38 | | | 1,100,000 | | | 1,102,681 |
Lehman Brothers Holdings, Inc. | | | | | | |
6.63%, 01/18/12# | | | 600,000 | | | 60,000 |
6.20%, 09/26/14# | | | 500,000 | | | 50,000 |
6.75%, 12/28/17# | | | 2,600,000 | | | 260 |
6.88%, 05/02/18# | | | 2,400,000 | | | 240,000 |
Midamerican Funding LLC | | | | | | |
6.75%, 03/01/11 | | | 600,000 | | | 603,992 |
Morgan Stanley | | | | | | |
2.56%, 05/07/09† | | | 300,000 | | | 295,132 |
4.23%, 05/14/10† | | | 2,200,000 | | | 2,048,554 |
2.90%, 12/01/10 | | | 630,000 | | | 646,780 |
5.95%, 12/28/17D | | | 7,600,000 | | | 6,318,237 |
Nabors Industries, Inc. | | | | | | |
6.15%, 02/15/18 | | | 3,300,000 | | | 2,843,854 |
Oracle Corporation | | | | | | |
5.00%, 01/15/11D | | | 1,040,000 | | | 1,068,569 |
Overseas Private Investment Corporation | | | | | | |
5.66%, 07/12/10W | | | 1,760,216 | | | 1,831,795 |
5.49%, 07/12/12W | | | 2,100,000 | | | 2,135,298 |
5.75%, 04/15/14 | | | 1,600,000 | | | 1,605,320 |
Procter & Gamble Co. | | | | | | |
2.37%, 03/09/10† | | | 830,000 | | | 828,309 |
4.60%, 01/15/14 | | | 535,000 | | | 561,256 |
Progress Energy, Inc. | | | | | | |
7.10%, 03/01/11 | | | 1,120,000 | | | 1,110,609 |
SLM Corporation | | | | | | |
4.00%, 01/15/09D | | | 841,000 | | | 837,165 |
Sprint Capital Corporation | | | | | | |
8.38%, 03/15/12D | | | 1,000,000 | | | 800,522 |
See Notes to Financial Statements.
74
| | | | | | |
| | | Par | | Value |
SunTrust Bank | | | | | | |
3.00%, 11/16/11 | | $ | 7,000,000 | | $ | 7,243,691 |
Time Warner Cable, Inc. | | | | | | |
5.40%, 07/02/12 | | | 1,325,000 | | | 1,238,174 |
Time Warner, Inc. | | | | | | |
2.41%, 11/13/09† | | | 6,000,000 | | | 5,776,362 |
Verizon Global Funding Corporation | | | | | | |
7.25%, 12/01/10D | | | 675,000 | | | 707,958 |
Wachovia Corporation | | | | | | |
2.12%, 03/15/11†D | | | 540,000 | | | 482,070 |
Wells Fargo & Co. | | | | | | |
7.98%, 02/28/49† | | | 400,000 | | | 341,873 |
XTO Energy, Inc. | | | | | | |
5.00%, 08/01/10 | | | 1,020,000 | | | 1,005,275 |
ZFS Finance USA Trust I | | | | | | |
5.88%, 05/09/32 144A† | | | 845,000 | | | 295,667 |
6.15%, 12/15/65 144A† | | | 845,000 | | | 473,613 |
| | | | | | |
Total Corporate Bonds
(Cost $132,438,980) | | | | | | 118,202,260 |
| | | | | | |
FOREIGN BONDS — 4.5% | | | | | | |
Australia — 0.2% | | | | | | |
National Australia Bank, Ltd. | | | | | | |
2.84%, 02/08/10 144A†@ | | | 1,600,000 | | | 1,601,589 |
| | | | | | |
Bermuda — 0.1% | | | | | | |
Ingersoll-Rand Global Holding Co., Ltd. | | | | | | |
3.68%, 08/13/10W† | | | 545,000 | | | 504,915 |
| | | | | | |
Canada — 0.5% | | | | | | |
Province of Ontario | | | | | | |
3.13%, 09/08/10D | | | 760,000 | | | 768,102 |
2.75%, 02/22/11D | | | 775,000 | | | 770,403 |
4.70%, 06/02/37(C) | | | 1,100,000 | | | 890,434 |
Toronto-Dominion Bank | | | | | | |
4.29%, 09/10/10(E)† | | | 550,000 | | | 752,567 |
| | | | | | |
| | | | | | 3,181,506 |
| | | | | | |
Cayman Islands — 0.2% | | | | | | |
Petroleum Export, Ltd. | | | | | | |
4.62%, 06/15/10 144A@ | | | 566,667 | | | 557,878 |
4.63%, 06/15/10 144A@ | | | 566,667 | | | 557,927 |
| | | | | | |
| | | | | | 1,115,805 |
| | | | | | |
France — 0.4% | | | | | | |
Caisse d’Amortissement de la Dette Sociale | | | | | | |
3.75%, 07/12/09(E) | | | 1,600,000 | | | 2,237,642 |
| | | | | | |
Germany — 0.3% | | | | | | |
Deutsche Bank AG | | | | | | |
5.00%, 10/12/10D | | | 515,000 | | | 520,870 |
Kreditanstalt fuer Wiederaufbau | | | | | | |
4.38%, 06/30/09(E) | | | 1,000,000 | | | 1,402,002 |
| | | | | | |
| | | | | | 1,922,872 |
| | | | | | |
Netherlands — 0.3% | | | | | | |
Bank Nederlandse Gemeenten | | | | | | |
4.00%, 03/02/09(E) | | | 500,000 | | | 696,031 |
| | | | | | |
Nederlandse Waterschapsbank NV | | | | | | |
4.63%, 07/25/11(E) | | | 1,000,000 | | | 1,448,239 |
| | | | | | |
| | | | | | 2,144,270 |
| | | | | | |
South Korea — 0.2% | | | | | | |
Export-Import Bank of Korea | | | | | | |
2.29%, 06/01/09† | | | 1,300,000 | | | 1,296,546 |
| | | | | | |
Supranational — 0.5% | | | | | | |
European Investment Bank | | | | | | |
4.75%, 04/15/11(E) | | | 1,500,000 | | | 2,178,249 |
International Bank for Reconstruction & Development | | | | | | |
3.13%, 11/15/11 | | | 800,000 | | | 823,922 |
| | | | | | |
| | | | | | 3,002,171 |
| | | | | | |
Switzerland — 0.8% | | | | | | |
UBS AG | | | | | | |
2.50%, 06/19/10† | | | 3,100,000 | | | 3,099,674 |
5.88%, 12/20/17 | | | 2,000,000 | | | 1,840,396 |
| | | | | | |
| | | | | | 4,940,070 |
| | | | | | |
United Kingdom — 1.0% | | | | | | |
Barclays Bank PLC | | | | | | |
4.25%, 10/27/11(E) | | | 1,000,000 | | | 1,432,416 |
HSBC Holdings PLC | | | | | | |
6.50%, 09/15/37 | | | 1,600,000 | | | 1,630,250 |
Network Rail MTN Finance PLC | | | | | | |
3.13%, 03/30/09(E) | | | 1,854,000 | | | 2,580,369 |
Vodafone Group PLC | | | | | | |
2.46%, 02/27/12† | | | 950,000 | | | 798,076 |
| | | | | | |
| | | | | | 6,441,111 |
| | | | | | |
Total Foreign Bonds
(Cost $29,528,021) | | | | | | 28,388,497 |
| | | | | | |
MORTGAGE-BACKED SECURITIES — 66.2% | | | | | | |
Adjustable Rate Mortgage Trust | | | | | | |
0.74%, 11/25/35† | | | 933,947 | | | 453,860 |
0.72%, 03/25/36† | | | 1,592,236 | | | 771,440 |
5.94%, 03/25/37† | | | 3,491,866 | | | 1,715,899 |
American Home Mortgage Investment Trust | | | | | | |
4.29%, 10/25/34† | | | 1,354,621 | | | 941,004 |
American Home Mortgage Assets | | | | | | |
0.74%, 11/25/35† | | | 886,768 | | | 327,244 |
3.18%, 11/25/46† | | | 1,476,423 | | | 518,506 |
Bank of America Commercial Mortgage, Inc. | | | | | | |
3.88%, 09/11/36 | | | 1,648,205 | | | 1,573,452 |
Bank of America Funding Corporation | | | | | | |
6.12%, 01/20/47† | | | 1,268,290 | | | 681,714 |
Bank of America Mortgage Securities, Inc. | | | | | | |
6.50%, 10/01/19 | | | 338,051 | | | 312,597 |
6.15%, 11/20/36† | | | 2,030,788 | | | 1,152,951 |
Bear Stearns Adjustable Rate Mortgage Trust | | | | | | |
4.98%, 12/01/33† | | | 535,270 | | | 381,693 |
5.18%, 01/25/34† | | | 514,038 | | | 326,994 |
4.00%, 07/25/34† | | | 1,533,186 | | | 1,070,234 |
4.13%, 03/25/35† | | | 2,279,686 | | | 1,929,569 |
Bear Stearns Alt-A Trust | | | | | | |
0.84%, 06/25/34† | | | 601,967 | | | 263,700 |
5.50%, 09/25/35† | | | 795,417 | | | 369,940 |
See Notes to Financial Statements.
75
Low-Duration Bond Fund
SCHEDULE OF INVESTMENTS (Continued)
| | | | | | |
| | | Par | | Value |
Bear Stearns Commercial Mortgage Securities | | | | | | |
1.31%, 03/15/19 144A†@ | | $ | 1,395,294 | | $ | 1,178,903 |
4.48%, 06/11/41 | | | 600,000 | | | 546,977 |
4.03%, 02/13/46 | | | 363,378 | | | 350,806 |
Chase Manhattan Bank - First Union National Bank | | | | | | |
7.44%, 08/15/31† | | | 1,869,375 | | | 1,864,796 |
Commercial Mortgage Pass-Through Certificates | | | | | | |
7.42%, 08/15/33† | | | 1,719,418 | | | 1,719,600 |
Countrywide Alternative Loan Trust | | | | | | |
6.00%, 10/25/32 | | | 218,410 | | | 194,543 |
5.50%, 05/31/35 | | | 996,209 | | | 852,573 |
Countrywide Home Loan Mortgage Pass-Through Trust | | | | | | |
5.11%, 09/25/33† | | | 1,499,283 | | | 1,006,693 |
0.74%, 01/25/35† | | | 254,240 | | | 127,772 |
Deutsche ALT-A Securities, Inc. | | | | | | |
0.55%, 03/30/36† | | | 115,264 | | | 112,051 |
5.87%, 10/25/36 STEP | | | 800,000 | | | 459,679 |
5.89%, 10/25/36 STEP | | | 800,000 | | | 403,196 |
DLJ Commercial Mortgage Corporation | | | | | | |
7.18%, 11/10/33 | | | 1,965,083 | | | 1,957,066 |
Federal Home Loan Mortgage Corporation | | | | | | |
5.88%, 03/21/11 | | | 1,260,000 | | | 1,330,392 |
15.25%, 08/01/11 | | | 880 | | | 1,016 |
5.38%, 09/15/11 | | | 3,214,276 | | | 3,288,238 |
4.00%, 08/01/15 | | | 1,289,846 | | | 1,307,393 |
5.00%, 11/15/16 | | | 1,116,176 | | | 1,134,686 |
3.50%, 12/01/18 | | | 2,751,664 | | | 2,718,083 |
10.75%, 02/01/19 | | | 67,497 | | | 72,079 |
1.43%, 02/15/19† | | | 4,681,504 | | | 4,497,026 |
6.00%, 11/01/22 | | | 1,824,215 | | | 1,891,752 |
4.25%, 06/15/24 | | | 732,702 | | | 734,696 |
5.33%, 07/01/27† | | | 25,419 | | | 25,436 |
4.10%, 06/01/28 STRIP† | | | 216,188 | | | 98,328 |
1.55%, 12/15/30† | | | 911,656 | | | 895,988 |
4.31%, 06/01/33��� | | | 2,096,925 | | | 2,080,843 |
3.97%, 04/01/34† | | | 2,180,255 | | | 2,189,440 |
4.39%, 10/01/34† | | | 729,610 | | | 718,016 |
4.36%, 08/01/35† | | | 1,445,369 | | | 1,470,348 |
4.72%, 08/01/35† | | | 2,281,573 | | | 2,269,490 |
4.89%, 10/01/35† | | | 984,505 | | | 988,041 |
5.04%, 12/01/35† | | | 4,237,952 | | | 4,304,441 |
5.84%, 04/01/36† | | | 3,074,036 | | | 3,111,810 |
71.81%, 04/15/38 IOW† | | | 11,195,071 | | | 943,621 |
6.00%, 08/01/38 | | | 1,246,816 | | | 1,290,508 |
5.50%, 01/01/39 TBA | | | 5,000,000 | | | 5,117,190 |
Federal Housing Authority | | | | | | |
7.43%, 09/01/22 | | | 1,557 | | | 1,545 |
Federal National Mortgage Association | | | | | | |
4.00%, 07/01/18 | | | 154,433 | | | 158,459 |
4.00%, 08/01/18 | | | 647,010 | | | 663,878 |
4.00%, 05/01/19 | | | 3,493,521 | | | 3,550,759 |
4.00%, 06/01/19 | | | 5,958,560 | | | 6,056,185 |
4.00%, 08/01/19 | | | 323,161 | | | 328,456 |
4.00%, 10/01/19 | | | 1,221,198 | | | 1,241,206 |
4.00%, 11/25/19 | | | 730,680 | | | 703,073 |
4.00%, 12/01/19 | | | 773,914 | | | 786,594 |
4.00%, 01/01/20 | | | 171,881 | | | 174,160 |
4.00%, 07/01/20 | | | 41,410 | | | 41,959 |
5.50%, 09/25/24 | | | 1,212,389 | | | 1,222,038 |
5.42%, 12/01/24† | | | 88,814 | | | 87,937 |
9.00%, 05/01/25 | | | 80,632 | | | 88,057 |
9.00%, 07/01/25 | | | 90,266 | | | 98,502 |
6.00%, 02/25/27 | | | 1,883,693 | | | 1,923,172 |
5.50%, 11/25/27 | | | 2,695,543 | | | 2,754,442 |
5.00%, 01/01/28 TBA | | | 2,100,000 | | | 2,143,970 |
1.07%, 05/25/30† | | | 1,752,519 | | | 1,703,427 |
1.12%, 05/25/30† | | | 1,778,676 | | | 1,728,544 |
0.72%, 09/25/30† | | | 45,126 | | | 44,702 |
5.26%, 09/01/31† | | | 72,880 | | | 73,129 |
3.31%, 03/25/32 | | | 341,516 | | | 343,544 |
5.50%, 09/25/32 | | | 2,900,000 | | | 2,963,687 |
5.38%, 04/01/33† | | | 395,400 | | | 394,748 |
4.52%, 06/01/33† | | | 125,151 | | | 126,237 |
5.50%, 06/01/33 | | | 21,416 | | | 22,006 |
5.50%, 07/01/33 | | | 19,068 | | | 19,593 |
5.18%, 10/01/33† | | | 955,048 | | | 958,117 |
5.50%, 10/01/33 | | | 107,884 | | | 110,856 |
4.76%, 12/01/33† | | | 283,863 | | | 284,728 |
4.50%, 06/01/34 | | | 62,079 | | | 63,109 |
4.50%, 09/01/34 | | | 241,270 | | | 245,122 |
4.89%, 09/01/34† | | | 892,682 | | | 895,628 |
5.09%, 09/01/34† | | | 641,248 | | | 645,879 |
4.72%, 10/01/34† | | | 973,610 | | | 973,587 |
5.07%, 10/01/34† | | | 1,118,882 | | | 1,119,761 |
4.50%, 12/01/34 | | | 76,915 | | | 78,143 |
4.50%, 02/01/35 | | | 2,731,926 | | | 2,773,836 |
4.50%, 03/01/35 | | | 1,609,778 | | | 1,634,474 |
4.50%, 04/01/35 | | | 2,609,111 | | | 2,649,137 |
4.50%, 05/01/35 | | | 781,536 | | | 793,525 |
4.50%, 06/01/35 | | | 60,821 | | | 61,754 |
5.00%, 06/01/35 | | | 39,796,947 | | | 40,687,856 |
4.50%, 08/01/35 | | | 1,640,918 | | | 1,666,091 |
4.69%, 08/01/35† | | | 4,904,183 | | | 4,909,494 |
4.41%, 09/01/35† | | | 2,336,954 | | | 2,357,582 |
4.50%, 09/01/35 | | | 1,011,418 | | | 1,026,934 |
4.64%, 09/01/35† | | | 3,081,592 | | | 3,078,417 |
7.50%, 09/01/35 | | | 1,480,817 | | | 1,567,741 |
4.50%, 10/01/35 | | | 600,647 | | | 609,861 |
5.35%, 10/01/35† | | | 2,097,805 | | | 2,134,814 |
4.50%, 11/01/35 | | | 665,214 | | | 675,419 |
4.92%, 12/01/35† | | | 200,506 | | | 203,060 |
6.00%, 02/01/36 | | | 679,670 | | | 700,620 |
6.00%, 07/01/36 | | | 1,394,034 | | | 1,436,786 |
4.13%, 10/01/36 IOW | | | 2,091,629 | | | 226,448 |
64.05%, 03/25/37 IOW† | | | 7,602,667 | | | 571,038 |
67.56%, 07/25/37 IOW† | | | 4,209,524 | | | 347,876 |
5.50%, 08/01/37 | | | 5,187,108 | | | 5,331,172 |
5.50%, 01/14/38 TBA | | | 28,000,000 | | | 28,700,000 |
5.00%, 02/12/38 TBA | | | 6,000,000 | | | 6,106,872 |
4.50%, 02/12/39 TBA | | | 16,000,000 | | | 16,144,992 |
3.68%, 07/01/44† | | | 327,761 | | | 323,277 |
6.50%, 12/31/49 | | | 1,095,000 | | | 1,106,652 |
FHLMC Structured Pass-Through Securities | | | | | | |
1.47%, 05/25/43† | | | 1,448,026 | | | 1,419,331 |
3.88%, 07/25/44† | | | 2,434,279 | | | 2,195,486 |
First Horizon Alternative Mortgage Securities | | | | | | |
4.74%, 06/25/34† | | | 809,544 | | | 447,390 |
See Notes to Financial Statements.
76
| | | | | | |
| | | Par | | Value |
General Electric Capital Commercial Mortgage Corporation | | | | | | |
4.09%, 01/10/38 | | $ | 948,082 | | $ | 922,910 |
5.56%, 06/10/38 | | | 441,249 | | | 430,245 |
GMAC Commercial Mortgage Securities, Inc. | | | | | | |
7.72%, 03/15/33† | | | 1,965,586 | | | 1,965,466 |
6.70%, 04/15/34 | | | 2,400,000 | | | 2,353,175 |
7.18%, 08/15/36† | | | 1,007,424 | | | 1,004,001 |
Government National Mortgage Association | | | | | | |
6.00%, 02/15/11 | | | 16,541 | | | 16,624 |
5.38%, 06/20/17† | | | 18,605 | | | 18,802 |
5.38%, 06/20/21† | | | 8,419 | | | 8,484 |
5.13%, 10/20/27† | | | 62,544 | | | 61,518 |
8.50%, 10/15/29 | | | 28,137 | | | 30,420 |
8.50%, 01/15/30 | | | 25,109 | | | 27,134 |
1.64%, 02/16/30† | | | 251,790 | | | 247,578 |
8.50%, 03/15/30 | | | 4,381 | | | 4,735 |
8.50%, 04/15/30 | | | 13,695 | | | 14,800 |
8.50%, 05/15/30 | | | 138,600 | | | 149,778 |
8.50%, 06/15/30 | | | 13,418 | | | 14,500 |
8.50%, 07/15/30 | | | 115,388 | | | 124,697 |
8.50%, 08/15/30 | | | 22,432 | | | 24,241 |
8.50%, 09/15/30 | | | 2,444 | | | 2,641 |
8.50%, 11/15/30 | | | 66,181 | | | 71,519 |
8.50%, 12/15/30 | | | 65,775 | | | 71,080 |
8.50%, 02/15/31 | | | 42,454 | | | 45,811 |
3.75%, 05/20/34† | | | 1,146,130 | | | 1,096,349 |
6.00%, 06/15/36 | | | 830,374 | | | 858,511 |
6.50%, 10/20/37 | | | 4,150,680 | | | 4,316,454 |
6.00%, 01/01/38 TBA | | | 26,000,000 | | | 26,820,612 |
6.00%, 07/20/38 | | | 4,357,587 | | | 4,491,690 |
6.50%, 07/20/38 | | | 4,222,615 | | | 4,392,151 |
6.50%, 08/20/38 | | | 1,004,975 | | | 1,045,325 |
6.50%, 09/20/38 | | | 2,972,613 | | | 3,091,962 |
5.00%, 01/01/39 TBA | | | 8,000,000 | | | 8,200,000 |
5.50%, 01/21/39 TBA | | | 32,300,000 | | | 33,258,922 |
6.50%, 01/21/39 TBA | | | 500,000 | | | 519,844 |
Greenpoint Mortgage Funding Trust | | | | | | |
0.65%, 01/25/37† | | | 1,266,387 | | | 526,446 |
0.74%, 11/25/45† | | | 401,770 | | | 185,027 |
GS Mortgage Securities Corporation II | | | | | | |
6.04%, 08/15/18 144A@ | | | 245,899 | | | 241,283 |
0.81%, 01/10/40 IO 144AW† | | | 22,462,822 | | | 192,232 |
GSR Mortgage Loan Trust | | | | | | |
4.35%, 06/01/34† | | | 685,983 | | | 469,752 |
4.72%, 09/25/34† | | | 832,309 | | | 537,153 |
4.54%, 09/25/35† | | | 3,861,779 | | | 2,846,644 |
4.59%, 09/25/35† | | | 1,828,439 | | | 1,403,920 |
5.28%, 10/25/35† | | | 1,118,673 | | | 654,225 |
HarborView Mortgage Loan Trust | | | | | | |
5.30%, 12/19/35† | | | 3,038,229 | | | 2,542,062 |
0.79%, 11/19/36† | | | 2,551,998 | | | 1,097,577 |
Impac Secured Assets CMN Owner Trust | | | | | | |
0.55%, 01/25/37† | | | 613,630 | | | 570,100 |
Indymac Index Mortgage Loan Trust | | | | | | |
0.74%, 06/25/37† | | | 941,617 | | | 259,648 |
0.66%, 09/25/46† | | | 1,480,074 | | | 597,867 |
JP Morgan Mortgage Trust | | | | | | |
3.88%, 08/25/34† | | | 2,547,801 | | | 1,902,494 |
5.02%, 02/25/35† | | | 975,808 | | | 732,109 |
4.74%, 07/25/35† | | | 3,166,478 | | | 2,531,115 |
LB-UBS Commercial Mortgage Trust | | | | | | |
6.16%, 07/14/16 144A | | | 1,882,733 | | | 1,850,006 |
7.95%, 05/15/25† | | | 4,327,457 | | | 4,346,160 |
6.37%, 12/15/28 | | | 1,520,000 | | | 1,478,871 |
0.90%, 04/15/37 IO 144AW† | | | 16,405,019 | | | 128,048 |
Luminent Mortgage Trust | | | | | | |
0.73%, 11/26/35† | | | 2,070,655 | | | 911,222 |
0.64%, 12/25/36† | | | 1,489,669 | | | 653,341 |
MASTR Adjustable Rate Mortgages Trust | | | | | | |
5.55%, 12/25/33† | | | 1,006,910 | | | 736,863 |
Merrill Lynch Mortgage Investors, Inc. | | | | | | |
4.23%, 08/25/34† | | | 2,308,662 | | | 1,804,225 |
MLCC Mortgage Investors, Inc. | | | | | | |
1.58%, 03/15/25 STEP | | | 320,024 | | | 227,004 |
4.71%, 12/25/34† | | | 1,676,171 | | | 1,254,950 |
5.38%, 02/25/36 STRIP† | | | 1,782,051 | | | 1,088,971 |
Morgan Stanley Capital I | | | | | | |
6.53%, 03/15/31† | | | 106,198 | | | 105,876 |
5.36%, 12/15/44 | | | 3,614,113 | | | 3,353,156 |
Opteum Mortgage Acceptance Corporation | | | | | | |
0.56%, 12/25/35† | | | 642,738 | | | 617,318 |
0.53%, 07/25/36† | | | 491,488 | | | 455,464 |
Permanent Financing PLC | | | | | | |
2.35%, 06/10/34† | | | 3,255,000 | | | 3,207,803 |
Permanent Master Issuer PLC | | | | | | |
4.80%, 01/15/16† | | | 2,195,000 | | | 2,078,935 |
PNC Mortgage Acceptance Corporation | | | | | | |
7.30%, 10/12/33† | | | 1,966,046 | | | 1,956,605 |
5.91%, 03/12/34 | | | 454,080 | | | 450,140 |
Provident Funding Mortgage Loan Trust | | | | | | |
4.30%, 04/25/34† | | | 2,125,784 | | | 2,033,713 |
Residential Accredit Loans, Inc. | | | | | | |
0.87%, 01/25/33† | | | 480,137 | | | 397,657 |
Residential Asset Securitization Trust | | | | | | |
0.77%, 05/25/35† | | | 1,276,477 | | | 945,352 |
Residential Funding Mortgage Securities I | | | | | | |
6.50%, 03/25/32 | | | 96,876 | | | 92,849 |
Structured Adjustable Rate Mortgage Loan Trust | | | | | | |
4.98%, 03/25/34† | | | 981,419 | | | 609,387 |
5.29%, 08/25/34† | | | 1,266,668 | | | 790,150 |
0.77%, 09/25/34† | | | 209,445 | | | 111,439 |
Structured Asset Mortgage Investments, Inc. | | | | | | |
6.16%, 10/19/34† | | | 583,755 | | | 303,570 |
0.75%, 05/25/35† | | | 1,105,723 | | | 525,530 |
0.83%, 07/19/35† | | | 173,202 | | | 74,964 |
0.54%, 08/25/36† | | | 488,985 | | | 460,701 |
See Notes to Financial Statements.
77
Low-Duration Bond Fund
SCHEDULE OF INVESTMENTS (Continued)
| | | | | | |
| | | Par | | Value |
Structured Asset Securities Corporation | | | | | | |
0.52%, 05/25/36† | | $ | 400,226 | | $ | 364,013 |
TBW Mortgage Backed Pass Through Certificates | | | | | | |
6.01%, 07/25/37 STEP | | | 700,000 | | | 480,819 |
Thornburg Mortgage Securities Trust | | | | | | |
0.59%, 04/25/36† | | | 1,900,000 | | | 1,881,689 |
0.59%, 07/25/36† | | | 881,471 | | | 732,771 |
1.50%, 03/25/37† | | | 1,519,519 | | | 1,252,037 |
1.53%, 06/25/37† | | | 1,506,076 | | | 1,231,094 |
TIAA Retail Commercial Trust | | | | | | |
6.68%, 06/19/31 144A† | | | 1,872,933 | | | 1,859,745 |
5.68%, 08/15/39† | | | 2,496,944 | | | 2,352,586 |
Wachovia Bank Commercial Mortgage Trust | | | | | | |
4.04%, 02/15/34 | | | 1,301,183 | | | 1,237,235 |
5.74%, 05/15/43 STRIP† | | | 1,600,000 | | | 1,273,880 |
Washington Mutual Alternative Mortgage Pass-Through Certificates | | | | | | |
0.71%, 05/04/37† | | | 2,523,229 | | | 1,020,709 |
3.10%, 05/25/47† | | | 1,124,308 | | | 357,629 |
Washington Mutual Mortgage Pass-Through Certificates | | | | | | |
1.01%, 12/25/27† | | | 2,624,899 | | | 2,173,673 |
3.92%, 06/25/34† | | | 2,194,919 | | | 1,574,394 |
4.68%, 05/25/35† | | | 3,550,000 | | | 1,663,122 |
5.71%, 02/25/37† | | | 1,369,546 | | | 747,058 |
5.35%, 03/25/37† | | | 3,045,298 | | | 1,742,338 |
5.65%, 05/25/37† | | | 1,468,644 | | | 985,630 |
5.86%, 06/25/37† | | | 3,530,114 | | | 1,874,966 |
3.66%, 06/25/42† | | | 47,507 | | | 34,687 |
0.78%, 01/25/45† | | | 1,130,407 | | | 581,412 |
0.79%, 08/25/45† | | | 554,449 | | | 299,811 |
0.76%, 10/25/45† | | | 579,167 | | | 316,327 |
3.24%, 06/25/46† | | | 2,074,195 | | | 829,647 |
3.00%, 01/25/47† | | | 1,171,866 | | | 447,183 |
Washington Mutual Mortgage Securities Corporation | | | | | | |
5.52%, 03/25/32† | | | 113,564 | | | 79,875 |
Wells Fargo Mortgage-Backed Securities Trust | | | | | | |
4.16%, 01/25/35† | | | 1,864,167 | | | 1,331,205 |
4.54%, 02/25/35† | | | 3,377,713 | | | 2,127,082 |
5.24%, 04/25/36† | | | 3,115,438 | | | 1,581,167 |
5.63%, 07/25/36† | | | 2,414,920 | | | 1,291,134 |
6.00%, 07/25/37 | | | 3,117,373 | | | 2,458,426 |
| | | | | | |
Total Mortgage-Backed Securities
(Cost $450,117,147) | | | | | | 414,976,434 |
| | | | | | |
MUNICIPAL BONDS — 0.9% | | | | | | |
New York City Municipal Water Finance Authority Series A Revenue Bond | | | | | | |
5.00%, 06/15/38 | | | 1,000,000 | | | 935,740 |
State of California General Obligation Bond | | | | | | |
5.00%, 11/01/32 | | | 3,200,000 | | | 2,774,784 |
State of Georgia General Obligation Bond | | | | | | |
5.50%, 07/01/11 | | | 1,750,000 | | | 1,901,375 |
| | | | | | |
Total Municipal Bonds
(Cost $6,083,316) | | | | | | 5,611,899 |
| | | | | | |
| | |
| | | Number of
Contracts | | |
PURCHASED OPTIONS — 1.5% | | | | | | |
Put Options — 0.0% | | | | | | |
5-Year U.S. Treasury Note Futures, Strike Price $85.00, Expires 02/20/09 | | | 180 | | | 1,406 |
| | | | | | |
| | |
| | | Notional
Amount | | |
Call Options — 0.2% | | | | | | |
30-Year Federal National Mortgage Association, Strike Price $109.50, Expires 02/05/09 | | $ | 25,000,000 | | | — |
30-Year Federal National Mortgage Association, Strike Price $94.30, Expires 02/13/09 | | | 12,000,000 | | | 862,923 |
Euro vs. U.S. Dollar, Strike Price $1.38, Expires 05/21/10 | | | 1,800,000 | | | 232,203 |
| | | | | | |
| | | | | | 1,095,126 |
| | | | | | |
Call Swaptions — 1.3% | | | | | | |
3-Month LIBOR, Strike Price $3.15, Expires 02/02/09 | | | 40,800,000 | | | 1,278,086 |
3-Month LIBOR, Strike Price $3.50, Expires 02/02/09 | | | 18,900,000 | | | 721,939 |
6-Month LIBOR, Strike Price $7.00, Expires 03/18/11 | | | 48,500,000 | | | 6,055,545 |
| | | | | | |
| | | | | | 8,055,570 |
| | | | | | |
Put Options — 0.0% | | | | | | |
30-Year Federal National Mortgage Association, Strike Price $45.00, Expires 01/06/09 | | | 22,000,000 | | | — |
30-Year Federal National Mortgage Association, Strike Price $50.00, Expires 01/06/09 | | | 8,000,000 | | | — |
30-Year Federal National Mortgage Association, Strike Price $75.00, Expires 2/05/09 | | | 1,000,000 | | | — |
30-Year Federal National Mortgage Association, Strike Price $75.50, Expires 02/09/09 | | | 14,700,000 | | | — |
30-Year Government National Mortgage Association, Strike Price $52.00, Expires 01/14/09 | | | 8,000,000 | | | — |
30-Year Government National Mortgage Association, Strike Price $55.00, Expires 01/14/09 | | | 20,000,000 | | | — |
30-Year Government National Mortgage Association, Strike Price $74.25, Expires 02/12/09 | | | 32,300,000 | | | — |
30-Year Government National Mortgage Association, Strike Price $77.25, Expires 01/12/09 | | | 13,500,000 | | | — |
30-Year Government National Mortgage Association, Strike Price $80.00, Expires 02/12/09 | | | 500,000 | | | — |
See Notes to Financial Statements.
78
| | | | | | | | |
| | | Notional
Amount | | | Value | |
| | |
Euro vs. U.S. Dollar, Strike Price $1.38, Expires 05/21/10 | | $ | 1,800,000 | | | $ | 211,199 | |
| | | | | | | | |
| | | | | | | 211,199 | |
| | | | | | | | |
Total Purchased Options
(Cost $4,897,989) | | | | | | | 9,363,301 | |
| | | | | | | | |
| | |
| | | Shares | | | | |
PREFERRED STOCK — 0.2% | | | | | | | | |
Wachovia Corporation
(Cost $970,070) | | | 1,400 | | | | 1,050,000 | |
| | | | | | | | |
MONEY MARKET FUNDS — 11.5% | | | | | | | | |
GuideStone Money Market Fund (GS4 Class)¥ | | | 20,992,945 | | | | 20,992,945 | |
Northern Institutional Liquid Assets Portfolio§ | | | 51,250,573 | | | | 51,250,573 | |
| | | | | | | | |
Total Money Market Funds
(Cost $72,243,518) | | | | | | | 72,243,518 | |
| | | | | | | | |
| | |
| | | Par | | | | |
REPURCHASE AGREEMENT — 0.6% | | | | | | | | |
JP Morgan Chase Bank NA | | | | | | | | |
0.00% (dated 12/08/08, due 01/12/09, repurchase price $3,782,500, collateralized by U.S. Treasury Note 0.000%, due 08/15/09, total market value $3,782,500)@
(Cost $3,782,500) | | $ | 3,782,500 | | | | 3,782,500 | |
| | | | | | | | |
U.S. TREASURY OBLIGATIONS — 9.3% | | | | | | | | |
U.S. Treasury Inflationary Index Bonds | | | | | | | | |
0.88%, 04/15/10 | | | 600,000 | | | | 645,081 | |
2.38%, 01/15/25 | | | 1,400,000 | | | | 1,581,911 | |
2.00%, 01/15/26D | | | 300,000 | | | | 308,553 | |
| | | | | | | | |
| | | | | | | 2,535,545 | |
| | | | | | | | |
U.S. Treasury Notes | | | | | | | | |
2.63%, 05/31/10D | | | 32,250,000 | | | | 33,233,883 | |
2.38%, 08/31/10D | | | 7,820,000 | | | | 8,059,800 | |
1.75%, 11/15/11D | | | 3,520,000 | | | | 3,601,393 | |
1.13%, 12/15/11 | | | 3,800,000 | | | | 3,818,111 | |
| | | | | | | | |
| | | | | | | 48,713,187 | |
| | | | | | | | |
U.S. Treasury STRIP | | | | | | | | |
3.99%, 05/15/21W | | | 10,600,000 | | | | 7,024,843 | |
| | | | | | | | |
Total U.S. Treasury Obligations
(Cost $56,343,019) | | | | | | | 58,273,575 | |
| | | | | | | | |
TOTAL INVESTMENTS — 129.4%
(Cost $861,732,749) | | | | | | | 810,824,027 | |
| | | | | | | | |
| | |
| | | Notional
Amount | | | Value | |
| | |
WRITTEN OPTIONS — (1.2)% | | | | | | | | |
Call Swaptions — (1.2)% | | | | | | | | |
3-Month LIBOR, Strike Price $4.25, Expires 02/02/09 | | $ | (10,900,000 | ) | | $ | (1,317,796 | ) |
3-Month LIBOR, Strike Price $4.60, Expires 02/02/09 | | | (6,300,000 | ) | | | (904,193 | ) |
6-Month LIBOR, Strike Price $7.00, Expires 03/18/09 | | | (14,900,000 | ) | | | (4,944,501 | ) |
| | | | | | | | |
| | | | | | | (7,166,490 | ) |
| | | | | | | | |
Put Swaptions — 0.0% | | | | | | | | |
3-Month LIBOR, Strike Price $2.75, Expires 05/22/09 | | | (2,000,000 | ) | | | (21,539 | ) |
3-Month LIBOR, Strike Price $2.75, Expires 05/22/09 | | | (1,000,000 | ) | | | (10,769 | ) |
3-Month LIBOR, Strike Price $2.75, Expires 05/22/09 | | | (1,900,000 | ) | | | (20,462 | ) |
| | | | | | | | |
| | | | | | | (52,770 | ) |
| | | | | | | | |
Total Written Options
(Premiums received $(3,687,541)) | | | | | | | (7,219,260 | ) |
| | | | | | | | |
| | |
| | | Par | | | | |
SECURITIES SOLD SHORT — (4.5)% | | | | | | | | |
Federal National Mortgage Association | | | | | | | | |
6.00%, 01/01/39 TBA | | | (2,000,000 | ) | | | (2,058,750 | ) |
5.50%, 01/14/38 TBA | | | (25,300,000 | ) | | | (25,932,500 | ) |
| | | | | | | | |
Total Securities Sold Short
(Cost $(27,655,906)) | | | | | | | (27,991,250 | ) |
| | | | | | | | |
Liabilities in Excess of Other Assets — (23.7)% | | | | | | | (148,771,823 | ) |
| | | | | | | | |
NET ASSETS — 100.0% | | | | | | $ | 626,841,694 | |
| | | | | | | | |
See Notes to Financial Statements.
79
Low-Duration Bond Fund
SCHEDULE OF INVESTMENTS (Continued)
Swap agreements outstanding at December 31, 2008:
| | | | | | | | |
Description | | Expiration
Date | | Notional
Amount | | Unrealized
Appreciation
(Depreciation) | |
British Pounds | | | | | | | | |
Receive variable rate payments on the six month LIBOR floating rate and pay fixed rate payments of 4.25%(k) | | 06/15/37 | | 1,200,000 | | $ | (164,753 | ) |
Receive variable rate payments on the six month LIBOR floating rate and pay fixed rate payments of 4.25%(f) | | 06/15/37 | | 3,400,000 | | | (466,801 | ) |
Receive fixed rate payments of 4.50% and pay variable rate payments on the six month LIBOR floating rate(g) | | 09/17/11 | | 30,200,000 | | | 1,739,245 | |
Receive fixed rate payments of 4.50% and pay variable rate payments on the six month LIBOR floating rate(m) | | 09/17/11 | | 6,000,000 | | | 345,545 | |
Receive fixed rate payments of 4.50% and pay variable rate payments on the six month LIBOR floating rate(b) | | 09/17/11 | | 4,800,000 | | | 276,436 | |
Receive variable rate payments on the six month LIBOR floating rate and pay fixed rate payments of 4.00%(g) | | 06/15/37 | | 3,200,000 | | | (356,053 | ) |
| | | | | | | | |
| | | | | | | 1,373,619 | |
| | | | | | | | |
Euro | | | | | | | | |
Receive fixed rate payments of 2.09% and pay variable rate payments on the France CPI Ex Tobacco(c) | | 10/15/10 | | 1,500,000 | | | 68,326 | |
Receive fixed rate payments of 4.50% and pay variable rate payments on the six month LIBOR floating rate(f) | | 03/18/14 | | 3,300,000 | | | 258,640 | |
Receive fixed rate payments of 4.50% and pay variable rate payments on the six month LIBOR floating rate(g) | | 03/18/14 | | 3,600,000 | | | 287,952 | |
Receive variable rate payments on the six month LIBOR floating rate and pay fixed rate payments of 5.00%(b) | | 09/17/38 | | 700,000 | | | (247,311 | ) |
Receive fixed rate payments of 4.50% and pay variable rate payments on the six month EURIBOR floating rate(f) | | 06/15/10 | | 12,200,000 | | | 339,610 | |
Receive variable rate payments on the six month LIBOR floating rate and pay fixed rate payments of 5.00%(m) | | 09/17/38 | | 700,000 | | | (247,311 | ) |
Receive fixed rate payments of 5.50% and pay variable rate payments on the six month LIBOR floating rate(b) | | 12/17/10 | | 1,000,000 | | | 70,020 | |
Receive fixed rate payments of 5.50% and pay variable rate payments on the six month EURIBOR floating rate(k) | | 12/17/10 | | 4,400,000 | | | 308,088 | |
Receive fixed rate payments of 5.50% and pay variable rate payments on the six month LIBOR floating rate(f) | | 09/15/10 | | 10,200,000 | | | 613,766 | |
| | | | | | | | |
| | | | | | | 1,451,780 | |
| | | | | | | | |
Japanese Yen | | | | | | | | |
Receive variable rate payments on the six month LIBOR floating rate and pay fixed rate payments of 1.50%(m) | | 06/17/18 | | 90,000,000 | | | (22,519 | ) |
Receive variable rate payments on the six month LIBOR floating rate and pay fixed rate payments of 1.50%(n) | | 06/17/18 | | 190,000,000 | | | (47,540 | ) |
| | | | | | | | |
| | | | | | | (70,059 | ) |
| | | | | | | | |
See Notes to Financial Statements.
80
| | | | | | | | | |
Description | | Expiration
Date | | Notional
Amount | | Unrealized
Appreciation
(Depreciation) | |
U.S. Dollars | | | | | | | | | |
Receive variable payments in the event of default on Citigroup, Inc. and pay fixed rate payments of 1.01%(f) | | 06/20/18 | | $ | 6,400,000 | | $ | 361,814 | |
Receive fixed rate payments of 1.10% and pay floating par in the event of default on General Electric Capital Corporation (SP) (b) | | 03/20/09 | | | 3,800,000 | | | (27,077 | ) |
Receive variable rate payments in the event of default on CDX IG 11 5y and pay fixed rate payments of 1.50%(k) | | 12/20/13 | | | 100,000 | | | 1,955 | |
Receive floating par in the event of default on Bear Stearns Cos., Inc. and pay fixed rate payments of 2.18%(c) | | 03/20/18 | | | 1,700,000 | | | (143,241 | ) |
Receive floating par in the event of default on American Electric Power and pay fixed rate payments of 0.62%(d) | | 06/20/15 | | | 1,600,000 | | | 15,097 | |
Receive variable rate payments in the event of default of Nabors Industries and pay fixed payments of 0.63%(d) | | 03/20/18 | | | 3,300,000 | | | 785,334 | |
Receive floating par in the event of default on the Dow Jones CDX HY-8 and pay fixed rate payments of 1.63%(d) | | 06/20/12 | | | 4,900,000 | | | 911,989 | |
Receive floating par in the event of default on Target Corporation, 5.88% due 03/01/12 and pay fixed rate payments of 0.11%(k) | | 06/20/12 | | | 900,000 | | | 49,773 | |
Receive floating par in the event of default on Autozone, 5.88% due 10/15/12 and pay fixed rate payments of 0.67%(m) | | 06/20/17 | | | 1,300,000 | | | 64,972 | |
Receive floating par in the event of default on Autozone, 5.88% due 10/15/12 and pay fixed rate payments of 0.64%(m) | | 06/20/17 | | | 600,000 | | | 31,249 | |
Receive floating par in the event of default on Autozone, 5.88% due 10/15/12 and pay fixed rate payments of 0.64%(m) | | 06/20/17 | | | 500,000 | | | 25,866 | |
Receive floating par in the event of default on Long Beach Mortgage Trust, 6.72% due 02/25/34 and pay fixed rate payments of 0.49%(b) | | 02/25/34 | | | 548,324 | | | 301,317 | |
Receive floating par in the event of default on Specialty Underwriting & Residential Finance, 6.62% due 02/25/35 and pay fixed rate payments of 0.59%(b) | | 02/25/35 | | | 481,777 | | | 415,681 | |
Receive floating par in the event of default on Structured Asset Investment Loan Trust, 6.14% due 02/25/35 and pay fixed rate payments of 0.61%(b) | | 02/25/35 | | | 1,137,620 | | | 1,107,665 | |
Receive floating par in the event of default on Morgan Stanley ABSD Capital I, 7.02% due 12/27/33 and pay fixed rate payments of 0.54%(k) | | 12/27/33 | | | 588,855 | | | 444,349 | |
See Notes to Financial Statements.
81
Low-Duration Bond Fund
SCHEDULE OF INVESTMENTS (Continued)
| | | | | | | | | |
Description | | Expiration
Date | | Notional
Amount | | Unrealized
Appreciation
(Depreciation) | |
Receive variable rate payments in the event of default on CDX IG9 10y and pay fixed rate payments of 0.80%(g) | | 12/20/17 | | $ | 6,929,600 | | $ | 352,204 | |
Receive variable rate payments in the event of default on CDX IG9 5y and pay fixed rate payments of 0.60%(g) | | 12/20/12 | | | 1,464,000 | | | 83,589 | |
Receive floating rate payments in the event of default on CDX IG9 10y Index and pay fixed rate payments of 0.80%(k) | | 12/20/17 | | | 5,270,400 | | | 267,874 | |
Receive variable rate payments in the event of default on CDX IG9 10y and pay fixed rate payments of 0.80%(b) | | 12/20/17 | | | 2,440,000 | | | 124,016 | |
Receive floating par in the event of default on the Dow Jones CDX HVOL7 Index and pay fixed rate payments of 0.75%(b) | | 12/20/11 | | | 9,000,000 | | | 1,040,851 | |
Receive variable rate payments in the event of default on CDX IG10 5y and pay fixed rate payments of 1.55%(p) | | 06/20/13 | | | 1,464,000 | | | 32,947 | |
Receive variable rate payments in the event of default on CDX IG9 10y and pay fixed rate payments of 0.80%(m) | | 12/20/17 | | | 2,049,600 | | | 104,173 | |
Receive variable rate payments on maturity and pay fixed rate payments of 5.50%(j) | | 05/21/09 | | | 4,300,000 | | | (724,845 | ) |
Receive variable rate payments on the three month LIBOR floating rate and pay fixed rate payments of 3.00%(m) | | 06/17/29 | | | 200,000 | | | (4,226 | ) |
Receive fixed rate payments of 4.00% and pay variable rate payments on the three month LIBOR floating rate(j) | | 06/17/14 | | | 1,500,000 | | | 121,216 | |
Receive variable rate payments on the three month LIBOR floating rate and pay fixed rate payments of 5.00%(j) | | 12/17/38 | | | 1,400,000 | | | (638,329 | ) |
Receive fixed rate payments of 4.00% and pay variable rate payments on the three month LIBOR floating rate(m) | | 06/17/14 | | | 13,100,000 | | | 1,058,621 | |
Receive variable rate payments on the three month LIBOR floating rate and pay fixed rate payments of 5.00%(f) | | 12/17/28 | | | 1,900,000 | | | (640,134 | ) |
Receive variable rate payments on the three month LIBOR floating rate and pay fixed rate payments of 4.00%(j) | | 06/17/19 | | | 1,900,000 | | | (222,928 | ) |
Receive variable rate payments on the three month LIBOR floating rate and pay fixed rate payments of 4.00%(m) | | 06/17/19 | | | 2,600,000 | | | (305,059 | ) |
Receive variable rate payments on the three month LIBOR floating rate and pay fixed rate payments of 4.00%(p) | | 06/17/19 | | | 200,000 | | | (23,466 | ) |
Receive variable rate payments on the three month LIBOR floating rate and pay fixed rate payments of 5.00%(k) | | 12/17/18 | | | 12,000,000 | | | (2,599,441 | ) |
See Notes to Financial Statements.
82
| | | | | | | | | |
| | | | | | | Unrealized | |
| | | Expiration | | Notional | | Appreciation | |
Description | | Date | | Amount | | (Depreciation) | |
Receive variable rate payments on the three month LIBOR floating rate and pay fixed rate payments of 5.00%(j) | | 12/17/23 | | $ | 2,900,000 | | $ | (788,369 | ) |
Receive variable rate payments on the three month LIBOR floating rate and pay fixed rate payments of 5.00%(b) | | 12/17/38 | | | 13,400,000 | | | (6,109,321 | ) |
Receive variable rate payments on the six month LIBOR floating rate and pay fixed rate payments of 5.00%(m) | | 12/17/28 | | | 2,400,000 | | | (808,536 | ) |
Receive variable rate payments on the six month LIBOR floating rate and pay fixed rate payments of 5.00%(j) | | 12/17/28 | | | 2,200,000 | | | (744,728 | ) |
Receive variable rate payments on the three month LIBOR floating rate and pay fixed rate payments of 5.00%(m) | | 12/17/23 | | | 9,600,000 | | | (2,609,774 | ) |
Receive variable rate payments on the three month LIBOR floating rate and pay fixed rate payments of 5.00%(b) | | 12/17/23 | | | 2,400,000 | | | (655,828 | ) |
Receive variable rate payments on the three month LIBOR floating rate and pay fixed rate payments of 5.00%(m) | | 12/17/38 | | | 1,800,000 | | | (820,655 | ) |
Receive variable rate payments on the three month LIBOR floating rate and pay fixed rate payments of 5.00%(d) | | 12/17/28 | | | 6,800,000 | | | (2,281,309 | ) |
Receive variable rate payments on the three month LIBOR floating rate and pay fixed rate payments of 5.00%(g) | | 12/17/23 | | | 4,600,000 | | | (1,257,004 | ) |
Receive fixed rate payments of 4.00% and pay variable rate payments on the six month LIBOR BBA(g) | | 12/17/13 | | | 10,700,000 | | | 950,794 | |
Receive variable rate payments on the three month LIBOR floating rate and pay fixed rate payments of 4.00%(p) | | 06/17/24 | | | 1,200,000 | | | (166,637 | ) |
Receive variable rate payments on the three month LIBOR floating rate and pay fixed rate payments of 4.00%(m) | | 06/17/24 | | | 6,600,000 | | | (916,502 | ) |
Receive fixed rate payments of 4.00% and pay variable rate payments on the three month LIBOR floating rate(m) | | 06/17/16 | | | 1,600,000 | | | 156,370 | |
Receive fixed rate payments of 4.00% and pay variable rate payments on the three month LIBOR floating rate(k) | | 06/17/14 | | | 17,300,000 | | | 1,398,026 | |
Receive fixed rate payments of 4.00% and pay variable rate payments on the three month LIBOR floating rate(b) | | 06/17/14 | | | 1,000,000 | | | 80,811 | |
Receive fixed rate payments of 4.00% and pay variable rate payments on the three month LIBOR floating rate(f) | | 06/17/14 | | | 8,500,000 | | | 686,891 | |
| | | | | | | | | |
| | | | | | | | (11,511,965 | ) |
| | | | | | | | | |
| | | | | | | $ | (8,756,625 | ) |
| | | | | | | | | |
See Notes to Financial Statements.
83
Low-Duration Bond Fund
SCHEDULE OF INVESTMENTS (Continued)
PORTFOLIO SUMMARY (based on net assets)
| | | |
| | | % | |
Mortgage-Backed Securities | | 66.2 | |
Futures Contracts | | 58.1 | |
Corporate Bonds | | 18.9 | |
Money Market Funds | | 11.5 | |
Asset-Backed Securities | | 11.2 | |
U.S. Treasury Obligations | | 9.3 | |
Agency Obligations | | 4.6 | |
Foreign Bonds | | 4.5 | |
Purchased Options | | 1.5 | |
Municipal Bonds | | 0.9 | |
Repurchase Agreement | | 0.6 | |
Preferred Stock | | 0.2 | |
Swap Agreements | | (1.4 | ) |
Written Options | | (1.2 | ) |
Forward Foreign Currency Contracts | | (2.5 | ) |
Securities Sold Short | | (4.5 | ) |
| | | |
| | 177.9 | |
| | | |
FAS 157 DISCLOSURE
The following is a summary of the inputs used, as of December 31, 2008, in valuing the Fund’s investments carried at fair value:
| | | | | | | | |
| | | Investments | | | Other | |
| | | in | | | Financial | |
Valuation Inputs | | Securities | | | Instruments*** | |
Assets: | | | | | | | | |
Level 1 — Quoted Prices | | $ | 74,601,249 | | | $ | 7,846,197 | |
Level 2 — Other Significant Observable Inputs | | | 732,482,161 | | | | — | |
Level 3 — Significant Unobservable Inputs | | | 3,740,617 | | | | — | |
| | | | | | | | |
Total Assets | | $ | 810,824,027 | | | $ | 7,846,197 | |
| | | | | | | | |
| | |
Liabilities: | | | | | | | | |
Level 1 — Quoted Prices | | $ | — | | | $ | — | |
Level 2 — Other Significant Observable Inputs | | | (35,210,510 | ) | | | (9,374,496 | ) |
Level 3 — Significant Unobservable Inputs | | | — | | | $ | — | |
| | | | | | | | |
Total Liabilities | | $ | (35,210,510 | ) | | $ | (9,374,496 | ) |
| | | | | | | | |
| *** | Other financial instruments are derivative instruments not reflected in the Schedule of Investments, such as futures, forwards and swap contracts, which are valued at the unrealized appreciation (depreciation) on the investment. |
The following is a reconciliation of assets in which significant unobservable inputs (Level 3) were used in determining fair value:
| | | | | | |
| | | Investments | | Other |
| | | in | | Financial |
| | | Securities | | Instruments |
Balance, 12/31/07 | | $ | — | | $ | — |
Accrued discounts/premiums | | | — | | | — |
Realized gain (loss) | | | — | | | — |
Change in unrealized appreciation (depreciation) | | | — | | | — |
Net purchases (sales) | | | — | | | — |
Transfers in and/or out of Level 3 | | | 3,740,617 | | | — |
| | | | | | |
Balance, 12/31/08 | | $ | 3,740,617 | | $ | — |
| | | | | | |
See Notes to Financial Statements.
84
Medium-Duration Bond Fund
The Medium-Duration Bond Fund invests in a diversified portfolio composed primarily of investment grade fixed-income securities with an average dollar-weighted duration normally between three to seven years. The Fund was generally positioned to capture the perceived long-term value of historically wide yield spreads but encountered a very challenging investment environment as credit spreads continued widening during the third and fourth quarters resulting in poor absolute and benchmark-relative performance for the year. The GS4 Class underperformed its benchmark, the Barclays Capital U.S. Aggregate Bond Index, for the one-year period ending December 31, 2008, ((3.89)% versus 5.24%). The Fund trailed its benchmark on an annualized five-year and since-inception basis.
Please see page 107 for information regarding specific portfolio allocations. Portfolio holdings are subject to change at any time.
85
Medium-Duration Bond Fund
Average Annual Total Returns as of 12/31/08
| | | | | | | | |
| | | GS2 Class* | | GS4 Class* | | GS6 Class* | | Benchmark** |
One Year | | (3.88)% | | (3.89)% | | (4.28)% | | 5.24% |
Five Year | | 2.98% | | 2.86% | | 2.48% | | 4.65% |
Since Inception | | 4.31% | | 4.27% | | 3.92% | | 5.34% |
Inception Date | | 08/27/01 | | 08/27/01 | | 08/27/01 | | 08/27/01 |
Total Fund Operating Expenses (August 5, 2008 Prospectus) | | 0.46% | | 0.65% | | 0.93% | | |
The performance data quoted represents past performance and does not guarantee future results. Current performance may be lower or higher. Performance data current to the most recent month-end may be obtained at www.GuideStoneFunds.org. The investment return and principal value of an investment will fluctuate so that shares, when redeemed, may be worth more or less than their original cost.
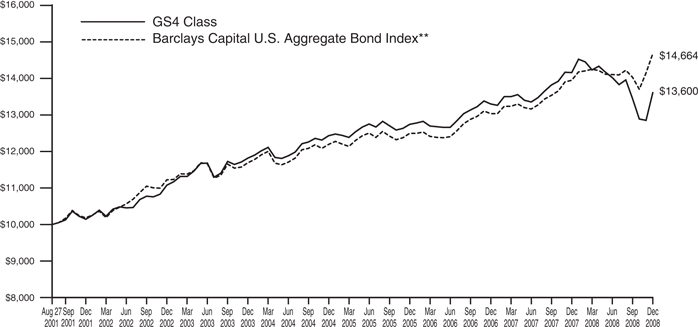
The graph compares the results of a hypothetical $10,000 investment in the GS4 Class of the Fund since August 27, 2001 (commencement of operations), with all dividends and capital gains reinvested, with the Barclays Capital U.S. Aggregate Bond Index.
| * | These returns reflect expense waivers by the Fund’s investment adviser. Without these waivers, returns would have been lower. Returns shown do not reflect the deduction of taxes that a shareholder would pay on Fund distributions or the redemption of Fund shares. |
| ** | The Barclays Capital U.S. Aggregate Bond Index represents securities that are SEC-registered, taxable and dollar denominated. The index covers the U.S. investment grade bond market, with index components for government and corporate securities, mortgage pass-through securities and asset-backed securities. |
Unlike a mutual fund, the performance of an index assumes no taxes, transaction costs, management fees or other expenses.
86
| | |
| Medium-Duration Bond Fund | | |
| SCHEDULE OF INVESTMENTS | | December 31, 2008 |
| | | | | | |
| | | Par | | Value |
AGENCY OBLIGATIONS — 0.8% | | | | | | |
Federal Farm Credit Bank | | | | | | |
5.05%, 11/06/17 | | $ | 400,000 | | $ | 460,804 |
Federal Home Loan Bank | | | | | | |
5.50%, 08/13/14 | | | 620,000 | | | 715,747 |
Federal Home Loan Mortgage Corporation | | | | | | |
5.63%, 11/23/35 | | | 1,260,000 | | | 1,313,289 |
Federal National Mortgage Association | | | | | | |
5.25%, 08/01/12 | | | 500,000 | | | 527,440 |
5.00%, 05/11/17‡‡ | | | 1,000,000 | | | 1,142,197 |
Tennessee Valley Authority | | | | | | |
5.38%, 04/01/56 | | | 1,800,000 | | | 2,291,436 |
| | | | | | |
Total Agency Obligations
(Cost $5,624,997) | | | | | | 6,450,913 |
| | | | | | |
ASSET-BACKED SECURITIES — 5.0% | | | | | | |
Access Group, Inc. | | | | | | |
4.84%, 10/27/25† | | | 1,900,000 | | | 1,747,187 |
Amortizing Residential Collateral Trust | | | | | | |
0.75%, 04/25/32† | | | 49,352 | | | 24,568 |
Argent Securities, Inc. | | | | | | |
0.52%, 10/25/36† | | | 269,044 | | | 256,724 |
Asset-Backed Securities Corporation Home Equity | | | | | | |
0.75%, 09/25/34† | | | 168,112 | | | 131,685 |
Bayview Financial Acquisition Trust | | | | | | |
1.15%, 02/28/44† | | | 660,120 | | | 539,580 |
Bear Stearns Asset-Backed Securities, Inc. | | | | | | |
6.00%, 02/01/36 | | | 3,946,104 | | | 3,118,606 |
6.50%, 02/01/36 | | | 3,666,117 | | | 3,129,947 |
Chase Issuance Trust | | | | | | |
1.85%, 11/15/11† | | | 4,400,000 | | | 4,212,229 |
CIT Mortgage Loan Trust | | | | | | |
1.92%, 09/25/24 144A†@ | | | 800,000 | | | 272,000 |
1.47%, 10/25/37 144A†@ | | | 1,165,433 | | | 949,828 |
1.72%, 10/25/37 144A†@ | | | 430,000 | | | 161,250 |
Countrywide Home Equity Loan Trust | | | | | | |
1.49%, 05/15/29† | | | 484,373 | | | 266,477 |
1.44%, 12/15/35† | | | 1,285,927 | | | 708,731 |
1.34%, 08/15/36† | | | 1,870,440 | | | 751,793 |
Daimler Chrysler Auto Trust | | | | | | |
3.36%, 09/10/12† | | | 4,300,000 | | | 3,819,549 |
EMC Mortgage Loan Trust | | | | | | |
1.02%, 11/25/41 144A† | | | 245,051 | | | 221,296 |
FBR Securitization Trust | | | | | | |
0.73%, 10/25/35† | | | 1,502,329 | | | 1,424,038 |
Ford Credit Auto Owner Trust | | | | | | |
2.40%, 12/15/10† | | | 1,678,385 | | | 1,637,583 |
2.10%, 01/15/11† | | | 3,800,000 | | | 3,687,537 |
Franklin Auto Trust | | | | | | |
2.09%, 06/20/12† | | | 700,000 | | | 630,265 |
GMAC Mortgage Corporation Loan Trust | | | | | | |
7.00%, 09/25/37 | | | 585,441 | | | 175,861 |
HFC Home Equity Loan Asset-Backed Certificates | | | | | | |
1.71%, 11/20/36† | | | 1,273,978 | | | 743,491 |
Lehman XS Trust | | | | | | |
0.77%, 11/25/35† | | | 2,450,266 | | | 1,119,108 |
0.74%, 12/25/35† | | | 290,032 | | | 133,432 |
0.74%, 02/25/36† | | | 1,418,503 | | | 639,747 |
Madison Avenue Manufactured Housing Contract | | | | | | |
0.82%, 03/25/32† | | | 761,434 | | | 668,696 |
Morgan Stanley Dean Witter Credit Corporation HELOC Trust | | | | | | |
0.66%, 07/25/17 STEP | | | 132,289 | | | 88,740 |
Nelnet Student Loan Trust | | | | | | |
5.02%, 04/25/24† | | | 780,000 | | | 631,904 |
Provident Bank Home Equity Loan Trust | | | | | | |
1.01%, 08/25/31† | | | 156,446 | | | 60,761 |
Residential Asset Mortgage Products, Inc. | | | | | | |
0.95%, 03/25/34† | | | 438,039 | | | 114,460 |
Residential Funding Securities LLC | | | | | | |
0.92%, 06/25/33 144A† | | | 421,212 | | | 316,172 |
Salomon Brothers Mortgage Securities VII | | | | | | |
0.95%, 03/25/28 STEP | | | 65,929 | | | 63,845 |
Securitized Asset-Backed Receivables LLC Trust | | | | | | |
0.70%, 02/25/37† | | | 3,681,218 | | | 1,706,504 |
SLM Student Loan Trust | | | | | | |
5.04%, 04/25/23† | | | 7,500,000 | | | 7,029,149 |
Structured Asset Securities Corporation | | | | | | |
0.77%, 04/25/31 144A† | | | 3,576,041 | | | 2,331,911 |
| | | | | | |
Total Asset-Backed Securities
(Cost $56,705,048) | | | | | | 43,514,654 |
| | | | | | |
CORPORATE BONDS — 32.8% | | | | | | |
Ace INA Holdings, Inc. | | | | | | |
5.80%, 03/15/18 | | | 575,000 | | | 518,363 |
AES Corporation | | | | | | |
8.75%, 05/15/13 144AD | | | 325,000 | | | 313,625 |
7.75%, 10/15/15 | | | 270,000 | | | 228,150 |
8.00%, 10/15/17D | | | 1,490,000 | | | 1,229,250 |
Allied Waste North America, Inc. | | | | | | |
7.13%, 05/15/16D | | | 125,000 | | | 113,908 |
Allstate Life Global Funding Trusts | | | | | | |
5.38%, 04/30/13D | | | 400,000 | | | 394,133 |
American Achievement Corporation | | | | | | |
8.25%, 04/01/12 144A | | | 30,000 | | | 23,100 |
American Electric Power Co., Inc. | | | | | | |
5.25%, 06/01/15 | | | 2,300,000 | | | 2,125,678 |
American Express Bank FSB | | | | | | |
6.00%, 09/13/17D | | | 3,100,000 | | | 2,908,045 |
American Express Co. | | | | | | |
7.00%, 03/19/18D | | | 2,500,000 | | | 2,532,115 |
6.80%, 09/01/66† | | | 1,340,000 | | | 694,502 |
American Express Credit Corporation | | | | | | |
5.88%, 05/02/13D | | | 4,300,000 | | | 4,131,750 |
American General Finance Corporation | | | | | | |
6.90%, 12/15/17 | | | 780,000 | | | 337,983 |
See Notes to Financial Statements.
87
Medium-Duration Bond Fund
SCHEDULE OF INVESTMENTS (Continued)
| | | | | | |
| | | Par | | Value |
American International Group, Inc. | | | | | | |
5.85%, 01/16/18 | | $ | 1,220,000 | | $ | 819,030 |
8.25%, 08/15/18 144A@ | | | 3,200,000 | | | 2,345,597 |
6.25%, 03/15/37 | | | 680,000 | | | 254,558 |
AmerisourceBergen Corporation | | | | | | |
5.88%, 09/15/15 | | | 130,000 | | | 113,769 |
Anadarko Petroleum Corporation | | | | | | |
2.40%, 09/15/09† | | | 1,070,000 | | | 1,023,974 |
6.45%, 09/15/36D | | | 110,000 | | | 87,014 |
ANZ Capital Trust I | | | | | | |
4.48%, 01/29/49 144A‡‡ | | | 125,000 | | | 96,636 |
ANZ Capital Trust II | | | | | | |
5.36%, 12/29/49 144A‡‡ | | | 800,000 | | | 493,800 |
Apache Corporation | | | | | | |
6.00%, 09/15/13 | | | 680,000 | | | 705,926 |
ASIF Global Financing XIX | | | | | | |
4.90%, 01/17/13 144A | | | 100,000 | | | 80,344 |
Astoria Financial Corporation | | | | | | |
5.75%, 10/15/12 | | | 450,000 | | | 368,235 |
AT&T, Inc. | | | | | | |
5.10%, 09/15/14 | | | 550,000 | | | 541,302 |
5.50%, 02/01/18D | | | 7,700,000 | | | 7,795,603 |
6.40%, 05/15/38 | | | 1,400,000 | | | 1,504,797 |
BAC Capital Trust XIV | | | | | | |
5.63%, 12/31/49†D | | | 40,000 | | | 16,036 |
Baker Hughes, Inc. | | | | | | |
7.50%, 11/15/18D | | | 870,000 | | | 966,243 |
Bank of America Corporation | | | | | | |
5.08%, 10/14/16†D | | | 1,700,000 | | | 1,217,922 |
5.75%, 12/01/17D | | | 3,130,000 | | | 3,130,510 |
5.65%, 05/01/18D | | | 5,925,000 | | | 5,970,871 |
8.13%, 12/15/49† | | | 20,000 | | | 14,985 |
8.00%, 12/29/49†D | | | 11,300,000 | | | 8,139,616 |
Bank of America NA | | | | | | |
2.84%, 05/12/10† | | | 4,100,000 | | | 4,016,130 |
Bear Stearns Co., Inc. | | | | | | |
6.95%, 08/10/12 | | | 1,900,000 | | | 1,974,849 |
5.70%, 11/15/14D | | | 1,000,000 | | | 977,501 |
6.40%, 10/02/17 | | | 1,250,000 | | | 1,301,144 |
7.25%, 02/01/18 | | | 4,360,000 | | | 4,785,968 |
BellSouth Capital Funding | | | | | | |
7.88%, 02/15/30 | | | 460,000 | | | 506,044 |
BellSouth Corporation | | | | | | |
4.75%, 11/15/12D | | | 40,000 | | | 39,277 |
6.88%, 10/15/31D | | | 10,000 | | | 10,427 |
Boardwalk Pipelines LP | | | | | | |
5.88%, 11/15/16 | | | 625,000 | | | 523,526 |
Boeing Co. | | | | | | |
6.63%, 02/15/38 | | | 210,000 | | | 226,269 |
BP Capital Markets PLC | | | | | | |
5.25%, 11/07/13 | | | 1,240,000 | | | 1,295,860 |
Caterpillar Financial Services Corporation | | | | | | |
2.22%, 06/24/11† | | | 3,800,000 | | | 3,399,438 |
6.20%, 09/30/13 | | | 980,000 | | | 1,011,329 |
CenterPoint Energy Resources Corporation | | | | | | |
5.95%, 01/15/14 | | | 525,000 | | | 480,715 |
Chesapeake Energy Corporation | | | | | | |
6.25%, 01/15/18D | | | 140,000 | | | 104,300 |
7.25%, 12/15/18D | | | 205,000 | | | 160,925 |
Chicago Transit Authority | | | | | | |
6.90%, 12/01/40 | | | 1,800,000 | | | 1,847,268 |
Chubb Corporation | �� | | | | | |
6.50%, 05/15/38 | | | 150,000 | | | 143,654 |
6.38%, 03/29/67† | | | 375,000 | | | 232,898 |
CitiFinancial, Inc. | | | | | | |
6.63%, 06/01/15 | | | 300,000 | | | 278,550 |
Citigroup, Inc. | | | | | | |
5.85%, 07/02/13 | | | 1,050,000 | | | 1,014,294 |
6.50%, 08/19/13 | | | 850,000 | | | 858,570 |
5.00%, 09/15/14 | | | 920,000 | | | 810,185 |
5.50%, 02/15/17 | | | 1,160,000 | | | 1,057,043 |
6.13%, 11/21/17 | | | 3,100,000 | | | 3,137,994 |
6.13%, 05/15/18 | | | 8,700,000 | | | 8,812,317 |
6.88%, 03/05/38 | | | 1,965,000 | | | 2,243,501 |
Clear Channel Communications, Inc. | | | | | | |
4.25%, 05/15/09 | | | 250,000 | | | 221,250 |
5.50%, 09/15/14 | | | 765,000 | | | 95,625 |
Comcast Cable Communications LLC | | | | | | |
6.75%, 01/30/11D | | | 230,000 | | | 230,984 |
Comcast Cable Communications Holdings, Inc. | | | | | | |
8.38%, 03/15/13 | | | 225,000 | | | 232,972 |
9.46%, 11/15/22 | | | 275,000 | | | 308,717 |
Comcast Corporation | | | | | | |
6.50%, 01/15/17 | | | 60,000 | | | 59,354 |
5.70%, 05/15/18 | | | 1,890,000 | | | 1,775,595 |
Comcast Holdings Corporation | | | | | | |
10.63%, 07/15/12 | | | 550,000 | | | 584,561 |
Commonwealth Edison Co. | | | | | | |
5.40%, 12/15/11 | | | 650,000 | | | 633,265 |
5.90%, 03/15/36 | | | 200,000 | | | 166,833 |
Community Health Systems, Inc. | | | | | | |
8.88%, 07/15/15D | | | 280,000 | | | 259,000 |
Complete Production Services, Inc. | | | | | | |
8.00%, 12/15/16 | | | 280,000 | | | 177,800 |
ConocoPhillips | | | | | | |
8.75%, 05/25/10 | | | 230,000 | | | 242,484 |
ConocoPhillips Holding Co. | | | | | | |
6.95%, 04/15/29 | | | 1,570,000 | | | 1,694,196 |
Countrywide Home Loans, Inc. | | | | | | |
5.63%, 07/15/09D | | | 1,900,000 | | | 1,891,885 |
4.13%, 09/15/09 | | | 475,000 | | | 469,512 |
Cox Communications, Inc. | | | | | | |
4.63%, 01/15/10D | | | 800,000 | | | 774,282 |
CSC Holdings, Inc. | | | | | | |
7.63%, 04/01/11D | | | 590,000 | | | 559,025 |
6.75%, 04/15/12 | | | 60,000 | | | 55,200 |
CVS Pass-Through Trust | | | | | | |
6.94%, 01/10/30 144A | | | 982,109 | | | 618,840 |
Daimler Finance NA LLC | | | | | | |
5.88%, 03/15/11 | | | 590,000 | | | 514,733 |
5.75%, 09/08/11 | | | 900,000 | | | 760,532 |
7.30%, 01/15/12 | | | 550,000 | | | 475,716 |
6.50%, 11/15/13D | | | 100,000 | | | 78,077 |
DaVita, Inc. | | | | | | |
6.63%, 03/15/13D | | | 310,000 | | | 296,050 |
Dean Foods Co. | | | | | | |
7.00%, 06/01/16D | | | 375,000 | | | 320,625 |
See Notes to Financial Statements.
88
| | | | | | |
| | | Par | | Value |
Delta Air Lines, Inc. | | | | | | |
6.82%, 08/10/22 | | $ | 467,468 | | $ | 296,842 |
DI Finance | | | | | | |
9.50%, 02/15/13D | | | 90,000 | | | 78,413 |
DIRECTV Holdings LLC | | | | | | |
8.38%, 03/15/13D | | | 155,000 | | | 155,000 |
Dominion Resources, Inc. | | | | | | |
5.13%, 12/15/09D | | | 230,000 | | | 229,546 |
2.92%, 06/17/10† | | | 4,000,000 | | | 3,716,708 |
4.75%, 12/15/10 | | | 70,000 | | | 69,247 |
5.70%, 09/17/12 | | | 1,230,000 | | | 1,218,923 |
6.00%, 11/30/17D | | | 3,800,000 | | | 3,654,243 |
DRS Technologies, Inc. | | | | | | |
6.63%, 02/01/16 | | | 90,000 | | | 90,450 |
Duke Energy Carolinas LLC | | | | | | |
5.63%, 11/30/12 | | | 580,000 | | | 591,189 |
Dynegy Holdings, Inc. | | | | | | |
7.75%, 06/01/19D | | | 395,000 | | | 274,525 |
Eastman Kodak Co. | | | | | | |
7.25%, 11/15/13 | | | 490,000 | | | 318,500 |
EchoStar DBS Corporation | | | | | | |
7.00%, 10/01/13D | | | 10,000 | | | 8,725 |
6.63%, 10/01/14D | | | 30,000 | | | 25,125 |
7.13%, 02/01/16D | | | 200,000 | | | 168,000 |
Edison Mission Energy | | | | | | |
7.00%, 05/15/17D | | | 240,000 | | | 210,000 |
7.20%, 05/15/19 | | | 320,000 | | | 264,000 |
7.63%, 05/15/27 | | | 120,000 | | | 93,600 |
El Paso Corporation | | | | | | |
7.00%, 06/15/17D | | | 890,000 | | | 700,968 |
7.80%, 08/01/31 | | | 750,000 | | | 492,377 |
7.75%, 01/15/32D | | | 99,000 | | | 64,758 |
El Paso Natural Gas Co. | | | | | | |
7.50%, 11/15/26 | | | 300,000 | | | 249,287 |
8.38%, 06/15/32 | | | 210,000 | | | 182,257 |
El Paso Performance-Linked Trust | | | | | | |
7.75%, 07/15/11 144A | | | 1,460,000 | | | 1,271,295 |
Electronic Data Systems Corporation | | | | | | |
7.13%, 10/15/09 | | | 1,000,000 | | | 1,016,816 |
Energy Future Holdings Corporation | | | | | | |
5.55%, 11/15/14 | | | 120,000 | | | 56,667 |
6.50%, 11/15/24 | | | 370,000 | | | 132,752 |
6.55%, 11/15/34 | | | 1,620,000 | | | 554,999 |
Energy Transfer Partners LP | | | | | | |
5.65%, 08/01/12 | | | 275,000 | | | 245,707 |
5.95%, 02/01/15 | | | 975,000 | | | 838,577 |
6.70%, 07/01/18 | | | 1,180,000 | | | 996,262 |
Enterprise Products Operating LLC | | | | | | |
8.38%, 08/01/66†D | | | 350,000 | | | 192,720 |
Enterprise Products Operating LP | | | | | | |
4.95%, 06/01/10D | | | 650,000 | | | 622,769 |
7.03%, 01/15/68†D | | | 350,000 | | | 164,711 |
Exelon Corporation | | | | | | |
5.63%, 06/15/35D | | | 675,000 | | | 427,228 |
FirstEnergy Corporation | | | | | | |
6.45%, 11/15/11 | | | 60,000 | | | 56,751 |
7.38%, 11/15/31 | | | 1,490,000 | | | 1,413,326 |
Fiserv, Inc. | | | | | | |
6.13%, 11/20/12 | | | 575,000 | | | 540,686 |
Ford Motor Co. | | | | | | |
7.45%, 07/16/31D | | | 550,000 | | | 156,750 |
Ford Motor Credit Co., LLC | | | | | | |
7.38%, 10/28/09 | | | 650,000 | | | 570,946 |
5.70%, 01/15/10D | | | 125,000 | | | 106,253 |
7.88%, 06/15/10 | | | 500,000 | | | 400,213 |
7.25%, 06/15/11† | | | 607,000 | | | 401,379 |
12.00%, 05/15/15 | | | 1,320,000 | | | 986,696 |
8.00%, 12/15/16D | | | 1,300,000 | | | 847,856 |
Forest City Enterprises, Inc. | | | | | | |
7.63%, 06/01/15 | | | 20,000 | | | 7,100 |
6.50%, 02/01/17 | | | 70,000 | | | 24,850 |
Freeport-McMoRan Copper & Gold, Inc. | | | | | | |
8.38%, 04/01/17D | | | 1,420,000 | | | 1,166,013 |
Freescale Semiconductor, Inc. | | | | | | |
8.88%, 12/15/14D | | | 75,000 | | | 33,375 |
Frontier Communications Corporation | | | | | | |
9.25%, 05/15/11D | | | 415,000 | | | 396,325 |
7.88%, 01/15/27 | | | 150,000 | | | 87,750 |
General Electric Capital Corporation | | | | | | |
5.45%, 01/15/13D | | | 150,000 | | | 151,209 |
General Electric Co. | | | | | | |
5.00%, 02/01/13 | | | 920,000 | | | 931,238 |
General Motors Acceptance Corporation LLC | | | | | | |
5.85%, 01/14/09D | | | 220,000 | | | 218,567 |
5.63%, 05/15/09D | | | 1,490,000 | | | 1,431,962 |
8.00%, 11/01/31 | | | 200,000 | | | 117,232 |
General Motors Corporation | | | | | | |
8.25%, 07/15/23(E)D | | | 210,000 | | | 35,700 |
8.38%, 07/05/33(E) | | | 170,000 | | | 40,172 |
Georgia Gulf Corporation | | | | | | |
9.50%, 10/15/14D | | | 60,000 | | | 18,300 |
Georgia Pacific Koch Forest Term Loan B | | | | | | |
1.99%, 12/20/12@ | | | 105,585 | | | 86,526 |
Georgia-Pacific Corporation LLC | | | | | | |
8.13%, 05/15/11D | | | 4,000 | | | 3,780 |
GlaxoSmithKline Capital, Inc. | | | | | | |
5.65%, 05/15/18D | | | 1,470,000 | | | 1,546,793 |
Glen Meadow Pass-Through Trust | | | | | | |
6.51%, 02/12/67 144A† | | | 600,000 | | | 268,585 |
GMAC LLC | | | | | | |
7.75%, 01/19/10 144A | | | 326,000 | | | 293,048 |
6.88%, 09/15/11 144A | | | 1,101,000 | | | 902,523 |
0.08%, 12/31/13 144A+ | | | 177,000 | | | 131,865 |
6.75%, 12/01/14D | | | 1,900,000 | | | 1,300,356 |
0.08%, 12/31/18+ | | | 65,000 | | | 33,475 |
Goldman Sachs Capital II | | | | | | |
5.79%, 12/29/49† | | | 60,000 | | | 23,079 |
Goldman Sachs Group, Inc. | | | | | | |
4.50%, 06/15/10 | | | 930,000 | | | 916,726 |
5.75%, 10/01/16D | | | 1,900,000 | | | 1,783,133 |
6.25%, 09/01/17D | | | 4,000,000 | | | 3,884,912 |
5.95%, 01/18/18D | | | 3,500,000 | | | 3,324,272 |
GrafTech Finance, Inc. | | | | | | |
10.25%, 02/15/12D | | | 37,000 | | | 33,855 |
See Notes to Financial Statements.
89
Medium-Duration Bond Fund
SCHEDULE OF INVESTMENTS (Continued)
| | | | | | |
| | | Par | | Value |
HCA, Inc. | | | | | | |
6.30%, 10/01/12 | | $ | 32,000 | | $ | 22,720 |
9.13%, 11/15/14D | | | 60,000 | | | 55,800 |
6.50%, 02/15/16D | | | 686,000 | | | 425,320 |
9.25%, 11/15/16 | | | 480,000 | | | 441,600 |
9.63%, 11/15/16 PIK | | | 466,000 | | | 364,645 |
7.69%, 06/15/25 | | | 250,000 | | | 118,613 |
Hertz Corporation | | | | | | |
8.88%, 01/01/14 | | | 115,000 | | | 71,300 |
10.50%, 01/01/16D | | | 65,000 | | | 29,981 |
Hess Corporation | | | | | | |
7.88%, 10/01/29 | | | 260,000 | | | 250,216 |
7.30%, 08/15/31 | | | 1,060,000 | | | 966,973 |
Host Hotels & Resorts LP | | | | | | |
6.75%, 06/01/16 | | | 30,000 | | | 22,050 |
HSBC Finance Corporation | | | | | | |
8.00%, 07/15/10D | | | 440,000 | | | 447,476 |
7.00%, 05/15/12 | | | 390,000 | | | 390,880 |
6.38%, 11/27/12 | | | 70,000 | | | 68,545 |
Humana, Inc. | | | | | | |
7.20%, 06/15/18 | | | 240,000 | | | 193,312 |
Idearc, Inc. | | | | | | |
8.00%, 11/15/16 | | | 340,000 | | | 27,200 |
ILFC E-Capital Trust II | | | | | | |
6.25%, 12/21/65 144A† | | | 280,000 | | | 117,060 |
International Business Machines Corporation | | | | | | |
4.10%, 07/28/11†D | | | 3,700,000 | | | 3,513,202 |
International Lease Finance Corporation | | | | | | |
4.95%, 02/01/11 | | | 300,000 | | | 216,549 |
iStar Financial, Inc. | | | | | | |
6.50%, 12/15/13 | | | 125,000 | | | 37,528 |
JC Penney Co., Inc. | | | | | | |
7.40%, 04/01/37 | | | 50,000 | | | 32,992 |
John Deere Capital Corporation | | | | | | |
2.94%, 06/10/11† | | | 6,100,000 | | | 5,570,105 |
JPMorgan Chase & Co. | | | | | | |
5.75%, 01/02/13 | | | 320,000 | | | 324,941 |
5.15%, 10/01/15 | | | 1,890,000 | | | 1,787,133 |
6.00%, 01/15/18 | | | 325,000 | | | 343,644 |
JPMorgan Chase Bank NA | | | | | | |
6.00%, 10/01/17 | | | 475,000 | | | 479,931 |
Kerr-McGee Corporation | | | | | | |
6.95%, 07/01/24 | | | 1,000,000 | | | 878,809 |
7.88%, 09/15/31 | | | 1,830,000 | | | 1,688,832 |
Kinder Morgan Energy Partners LP | | | | | | |
6.30%, 02/01/09D | | | 150,000 | | | 149,858 |
6.75%, 03/15/11D | | | 110,000 | | | 107,044 |
7.13%, 03/15/12 | | | 500,000 | | | 483,238 |
5.85%, 09/15/12D | | | 40,000 | | | 36,661 |
5.00%, 12/15/13D | | | 200,000 | | | 174,593 |
6.00%, 02/01/17 | | | 510,000 | | | 443,448 |
5.95%, 02/15/18 | | | 830,000 | | | 709,564 |
6.95%, 01/15/38 | | | 60,000 | | | 48,656 |
Kraft Foods, Inc. | | | | | | |
6.50%, 08/11/17 | | | 300,000 | | | 302,035 |
Kroger Co. | | | | | | |
6.15%, 01/15/20 | | | 500,000 | | | 494,287 |
L-3 Communications Corporation | | | | | | |
7.63%, 06/15/12 | | | 250,000 | | | 245,000 |
6.38%, 10/15/15D | | | 120,000 | | | 112,800 |
Lamar Media Corporation | | | | | | |
6.63%, 08/15/15D | | | 80,000 | | | 58,200 |
Land O’ Lakes, Inc. | | | | | | |
9.00%, 12/15/10D | | | 125,000 | | | 124,688 |
Lehman Brothers Holdings Capital Trust V | | | | | | |
5.86%, 11/29/49# | | | 2,330,000 | | | 233 |
Lehman Brothers Holdings, Inc. | | | | | | |
6.63%, 01/18/12# | | | 200,000 | | | 20,000 |
5.25%, 02/06/12# | | | 390,000 | | | 39,000 |
5.63%, 01/24/13# | | | 2,300,000 | | | 230,000 |
6.20%, 09/26/14# | | | 300,000 | | | 30,000 |
6.50%, 07/19/17# | | | 150,000 | | | 15 |
6.75%, 12/28/17# | | | 3,340,000 | | | 334 |
Liberty Media Corporation | | | | | | |
5.70%, 05/15/13 | | | 25,000 | | | 16,514 |
3.75%, 02/15/30 CONV | | | 40,000 | | | 10,800 |
Lincoln National Corporation | | | | | | |
7.00%, 05/17/66† | | | 775,000 | | | 325,856 |
Merrill Lynch & Co., Inc. | | | | | | |
3.08%, 02/05/10† | | | 1,600,000 | | | 1,518,622 |
5.45%, 02/05/13 | | | 2,645,000 | | | 2,544,778 |
5.70%, 05/02/17 | | | 400,000 | | | 354,949 |
6.40%, 08/28/17D | | | 775,000 | | | 777,723 |
MetLife Capital Trust IV | | | | | | |
7.88%, 12/15/37 144A | | | 300,000 | | | 188,583 |
MetLife Capital Trust X | | | | | | |
9.25%, 04/08/38 144A† | | | 300,000 | | | 209,665 |
MetLife, Inc. | | | | | | |
6.40%, 12/15/36 | | | 150,000 | | | 90,208 |
MidAmerican Energy Holdings Co. | | | | | | |
6.13%, 04/01/36 | | | 750,000 | | | 699,596 |
5.95%, 05/15/37 | | | 150,000 | | | 136,454 |
Morgan Stanley | | | | | | |
4.23%, 05/14/10† | | | 3,100,000 | | | 2,886,599 |
6.75%, 04/15/11D | | | 700,000 | | | 689,104 |
5.63%, 01/09/12 | | | 410,000 | | | 389,069 |
5.75%, 08/31/12D | | | 3,325,000 | | | 3,102,760 |
4.21%, 03/01/13(E)† | | | 500,000 | | | 517,038 |
4.95%, 10/18/16† | | | 340,000 | | | 234,347 |
5.75%, 10/18/16 | | | 3,700,000 | | | 3,113,657 |
5.95%, 12/28/17 | | | 450,000 | | | 374,106 |
6.63%, 04/01/18 | | | 4,775,000 | | | 4,195,979 |
Nelnet, Inc. | | | | | | |
7.40%, 09/29/36† | | | 475,000 | | | 142,488 |
Nevada Power Co. | | | | | | |
5.88%, 01/15/15 | | | 350,000 | | | 336,785 |
6.65%, 04/01/36 | | | 300,000 | | | 269,279 |
New Cingular Wireless Services, Inc. | | | | | | |
8.13%, 05/01/12D | | | 135,000 | | | 144,875 |
Nextel Communications, Inc. | | | | | | |
5.95%, 03/15/14 | | | 44,000 | | | 18,497 |
7.38%, 08/01/15 | | | 130,000 | | | 54,625 |
Nortek, Inc. | | | | | | |
8.50%, 09/01/14 | | | 62,000 | | | 14,570 |
NRG Energy, Inc. | | | | | | |
7.25%, 02/01/14 | | | 285,000 | | | 267,188 |
7.38%, 02/01/16 | | | 80,000 | | | 74,600 |
7.38%, 01/15/17 | | | 35,000 | | | 32,288 |
Occidental Petroleum Corporation | | | | | | |
7.00%, 11/01/13D | | | 1,120,000 | | | 1,223,675 |
See Notes to Financial Statements.
90
| | | | | | |
| | | Par | | Value |
Omnicom Group, Inc. | | | | | | |
5.90%, 04/15/16 | | $ | 700,000 | | $ | 569,220 |
ONEOK Partners LP | | | | | | |
6.65%, 10/01/36 | | | 375,000 | | | 291,343 |
6.85%, 10/15/37 | | | 325,000 | | | 258,630 |
Overseas Private Investment Corporation | | | | | | |
5.66%, 07/12/10W | | | 2,437,222 | | | 2,536,332 |
5.49%, 07/12/12W | | | 3,000,000 | | | 3,050,425 |
Oxford Industries, Inc. | | | | | | |
8.88%, 06/01/11 | | | 95,000 | | | 72,200 |
Pacific Energy Partners LP | | | | | | |
7.13%, 06/15/14 | | | 60,000 | | | 52,463 |
Pacific Gas & Electric Co. | | | | | | |
8.25%, 10/15/18 | | | 40,000 | | | 48,142 |
6.05%, 03/01/34 | | | 580,000 | | | 618,034 |
5.80%, 03/01/37 | | | 250,000 | | | 260,215 |
PartnerRe Finance II | | | | | | |
6.44%, 12/01/66† | | | 75,000 | | | 29,848 |
Patrons’ Legacy | | | | | | |
5.65%, 04/17/18 144A | | | 1,290,357 | | | 884,398 |
Peabody Energy Corporation | | | | | | |
6.88%, 03/15/13D | | | 145,000 | | | 138,113 |
7.88%, 11/01/26 | | | 1,500,000 | | | 1,245,000 |
Pemex Project Funding Master Trust | | | | | | |
9.13%, 10/13/10 | | | 235,000 | | | 247,925 |
6.63%, 06/15/35 | | | 159,000 | | | 134,792 |
PepsiCo, Inc. | | | | | | |
7.90%, 11/01/18 | | | 650,000 | | | 798,094 |
Phoenix Life Insurance Co. | | | | | | |
7.15%, 12/15/34 144A | | | 425,000 | | | 261,429 |
President and Fellows of Harvard College | | | | | | |
6.50%, 01/15/39 144A@ | | | 2,900,000 | | | 3,160,120 |
Pricoa Global Funding I | | | | | | |
3.57%, 01/30/12 144A†@D | | | 2,300,000 | | | 1,734,340 |
1.67%, 09/27/13 144A†@ | | | 1,700,000 | | | 1,116,331 |
Pride International, Inc. | | | | | | |
7.38%, 07/15/14D | | | 130,000 | | | 121,550 |
Private Export Funding Corporation | | | | | | |
5.45%, 09/15/17 | | | 3,200,000 | | | 3,766,378 |
Progress Energy, Inc. | | | | | | |
5.63%, 01/15/16 | | | 150,000 | | | 137,341 |
7.75%, 03/01/31 | | | 350,000 | | | 351,348 |
Prudential Financial, Inc. | | | | | | |
0.37%, 12/15/37† | | | 3,700,000 | | | 3,520,550 |
PVNGS II Funding Corporation, Inc. | | | | | | |
8.00%, 12/30/15 | | | 1,277,000 | | | 1,402,951 |
Qwest Capital Funding, Inc. | | | | | | |
7.25%, 02/15/11D | | | 200,000 | | | 169,000 |
Qwest Corporation | | | | | | |
8.88%, 03/15/12D | | | 200,000 | | | 186,000 |
7.50%, 06/15/23 | | | 500,000 | | | 352,500 |
Rabobank Capital Funding II | | | | | | |
5.26%, 12/29/13 144A† | | | 50,000 | | | 26,477 |
Rabobank Capital Funding Trust III | | | | | | |
5.25%, 10/31/49 144A† | | | 350,000 | | | 192,160 |
Regions Bank | | | | | | |
3.25%, 12/09/11 | | | 4,400,000 | | | 4,580,787 |
Reinsurance Group of America, Inc. | | | | | | |
6.75%, 12/15/65† | | | 250,000 | | | 94,591 |
RH Donnelley Corporation | | | | | | |
8.88%, 10/15/17 | | | 45,000 | | | 6,975 |
Service Corporation International | | | | | | |
7.63%, 10/01/18 | | | 90,000 | | | 67,050 |
7.50%, 04/01/27 | | | 200,000 | | | 129,000 |
Simon Property Group LP REIT | | | | | | |
6.13%, 05/30/18D | | | 1,000,000 | | | 676,777 |
SLM Corporation | | | | | | |
5.45%, 04/25/11D | | | 350,000 | | | 276,417 |
5.00%, 10/01/13 | | | 350,000 | | | 250,677 |
Sonat, Inc. | | | | | | |
7.63%, 07/15/11D | | | 460,000 | | | 421,699 |
Southern Natural Gas Co. | | | | | | |
8.00%, 03/01/32 | | | 400,000 | | | 335,307 |
Sovereign Bank | | | | | | |
4.90%, 08/01/13† | | | 525,000 | | | 374,614 |
Sprint Capital Corporation | | | | | | |
7.63%, 01/30/11 | | | 250,000 | | | 208,843 |
8.38%, 03/15/12D | | | 340,000 | | | 272,177 |
6.90%, 05/01/19 | | | 30,000 | | | 21,335 |
8.75%, 03/15/32 | | | 170,000 | | | 114,966 |
Steel Dynamics, Inc. | | | | | | |
7.38%, 11/01/12 | | | 65,000 | | | 47,775 |
6.75%, 04/01/15 | | | 225,000 | | | 156,375 |
Suburban Propane Partners LP | | | | | | |
6.88%, 12/15/13 | | | 195,000 | | | 160,875 |
SunTrust Bank | | | | | | |
3.00%, 11/16/11 | | | 4,400,000 | | | 4,553,177 |
SunTrust Preferred Capital I | | | | | | |
5.85%, 12/31/49† | | | 2,120,000 | | | 1,145,459 |
Target Corporation | | | | | | |
7.00%, 01/15/38 | | | 4,400,000 | | | 4,089,941 |
Tenet Healthcare Corporation | | | | | | |
9.88%, 07/01/14D | | | 7,000 | | | 5,670 |
9.25%, 02/01/15D | | | 1,382,000 | | | 1,119,420 |
Tennessee Gas Pipeline Co. | | | | | | |
7.00%, 10/15/28D | | | 175,000 | | | 134,774 |
7.63%, 04/01/37 | | | 50,000 | | | 39,937 |
TEPPCO Partners LP | | | | | | |
6.65%, 04/15/18 | | | 650,000 | | | 527,137 |
Terex Corporation | | | | | | |
7.38%, 01/15/14 | | | 90,000 | | | 78,750 |
Time Warner Cable, Inc. | | | | | | |
5.40%, 07/02/12 | | | 500,000 | | | 467,236 |
8.75%, 02/14/19D | | | 600,000 | | | 653,511 |
6.55%, 05/01/37 | | | 325,000 | | | 312,368 |
Time Warner, Inc. | | | | | | |
2.41%, 11/13/09† | | | 7,600,000 | | | 7,316,725 |
6.88%, 05/01/12 | | | 110,000 | | | 105,753 |
7.70%, 05/01/32 | | | 600,000 | | | 602,360 |
Time Warner Entertainment Co. LP | | | | | | |
8.38%, 07/15/33 | | | 590,000 | | | 596,938 |
Travelers Cos., Inc. | | | | | | |
6.25%, 03/15/37†D | | | 400,000 | | | 262,388 |
Unilever Capital Corporation | | | | | | |
7.13%, 11/01/10D | | | 285,000 | | | 304,920 |
Union Pacific Corporation | | | | | | |
6.65%, 01/15/11 | | | 260,000 | | | 259,214 |
See Notes to Financial Statements.
91
Medium-Duration Bond Fund
SCHEDULE OF INVESTMENTS (Continued)
| | | | | | |
| | | Par | | Value |
United Air Lines, Inc. | | | | | | |
9.21%, 01/21/17#@ | | $ | 81,379 | | $ | 472 |
9.56%, 10/19/18#@ | | | 179,895 | | | 81,403 |
United Parcel Service, Inc. | | | | | | |
4.50%, 01/15/13D | | | 1,480,000 | | | 1,528,082 |
UnitedHealth Group, Inc. | | | | | | |
4.88%, 02/15/13D | | | 370,000 | | | 345,755 |
4.88%, 04/01/13 | | | 410,000 | | | 382,398 |
Valero Energy Corporation | | | | | | |
6.63%, 06/15/37 | | | 575,000 | | | 424,023 |
Ventas Realty LP | | | | | | |
8.75%, 05/01/09 | | | 40,000 | | | 39,600 |
9.00%, 05/01/12 | | | 40,000 | | | 35,800 |
6.50%, 06/01/16 | | | 70,000 | | | 51,625 |
Verizon Communications, Inc. | | | | | | |
5.55%, 02/15/16D | | | 2,100,000 | | | 2,054,705 |
6.10%, 04/15/18 | | | 290,000 | | | 289,460 |
5.85%, 09/15/35 | | | 600,000 | | | 598,975 |
6.40%, 02/15/38D | | | 1,145,000 | | | 1,222,086 |
8.95%, 03/01/39D | | | 860,000 | | | 1,114,285 |
Verizon Global Funding Corporation | | | | | | |
7.38%, 09/01/12D | | | 290,000 | | | 303,627 |
4.38%, 06/01/13D | | | 140,000 | | | 135,383 |
Verizon Wireless Capital | | | | | | |
8.50%, 11/15/18 144A@ | | | 325,000 | | | 381,453 |
Visteon Corporation | | | | | | |
8.25%, 08/01/10 | | | 28,000 | | | 8,820 |
12.25%, 12/31/16 144A | | | 70,000 | | | 17,150 |
Wachovia Bank NA | | | | | | |
1.54%, 03/23/09† | | | 750,000 | | | 745,019 |
7.80%, 08/18/10 | | | 250,000 | | | 248,220 |
Wachovia Capital Trust III | | | | | | |
5.80%, 08/29/49† | | | 580,000 | | | 342,351 |
Wachovia Corporation | | | | | | |
5.25%, 08/01/14D | | | 1,850,000 | | | 1,725,334 |
5.63%, 10/15/16D | | | 520,000 | | | 475,745 |
5.75%, 02/01/18 | | | 600,000 | | | 602,247 |
Waste Management, Inc. | | | | | | |
7.75%, 05/15/32 | | | 980,000 | | | 878,987 |
WEA Finance LLC | | | | | | |
7.13%, 04/15/18 144A | | | 500,000 | | | 355,234 |
WellPoint, Inc. | | | | | | |
5.88%, 06/15/17 | | | 720,000 | | | 656,354 |
Wells Fargo & Co. | | | | | | |
4.38%, 01/31/13 | | | 600,000 | | | 588,070 |
7.98%, 02/28/49†D | | | 6,200,000 | | | 5,299,035 |
Wells Fargo Capital X | | | | | | |
5.95%, 12/15/36 | | | 200,000 | | | 171,944 |
Wells Fargo Capital XIII | | | | | | |
7.70%, 12/29/49†D | | | 350,000 | | | 289,104 |
Wells Fargo Capital XV | | | | | | |
9.75%, 12/29/49†D | | | 1,490,000 | | | 1,506,304 |
Westlake Chemical Corporation | | | | | | |
6.63%, 01/15/16 | | | 85,000 | | | 49,725 |
Weyerhaeuser Co. | | | | | | |
6.75%, 03/15/12 | | | 735,000 | | | 658,389 |
Williams Cos., Inc. | | | | | | |
7.50%, 01/15/31 | | | 20,000 | | | 13,428 |
7.75%, 06/15/31 | | | 200,000 | | | 137,287 |
8.75%, 03/15/32 | | | 983,000 | | | 733,822 |
Windstream Corporation | | | | | | |
8.63%, 08/01/16D | | | 630,000 | | | 560,700 |
Xerox Corporation | | | | | | |
7.13%, 06/15/10 | | | 250,000 | | | 234,733 |
6.75%, 02/01/17 | | | 70,000 | | | 50,866 |
XTO Energy, Inc. | | | | | | |
7.50%, 04/15/12 | | | 43,000 | | | 42,530 |
5.50%, 06/15/18 | | | 1,120,000 | | | 1,015,719 |
6.50%, 12/15/18D | | | 900,000 | | | 872,787 |
6.75%, 08/01/37 | | | 30,000 | | | 28,182 |
ZFS Finance USA Trust I | | | | | | |
6.15%, 12/15/65 144A† | | | 525,000 | | | 294,257 |
| | | | | | |
Total Corporate Bonds
(Cost $321,471,247) | | | | | | 284,080,552 |
| | | | | | |
FOREIGN BONDS — 6.7% | | | | | | |
Australia — 0.3% | | | | | | |
National Australia Bank, Ltd. | | | | | | |
2.84%, 02/08/10 144A†@ | | | 2,100,000 | | | 2,102,085 |
QBE Insurance Group, Ltd. | | | | | | |
5.65%, 07/01/23 144A†@ | | | 525,000 | | | 319,997 |
| | | | | | |
| | | | | | 2,422,082 |
| | | | | | |
Bermuda — 0.2% | | | | | | |
Arch Capital Group, Ltd. | | | | | | |
7.35%, 05/01/34 | | | 400,000 | | | 329,002 |
Aspen Insurance Holdings, Ltd. | | | | | | |
6.00%, 08/15/14 | | | 325,000 | | | 213,942 |
Catlin Insurance Co., Ltd. | | | | | | |
7.25%, 12/31/49 144A†@ | | | 375,000 | | | 149,314 |
Endurance Specialty Holdings, Ltd. | | | | | | |
6.15%, 10/15/15D | | | 425,000 | | | 369,023 |
Merna Reinsurance, Ltd. | | | | | | |
3.21%, 07/07/10 144A† | | | 950,000 | | | 857,755 |
| | | | | | |
| | | | | | 1,919,036 |
| | | | | | |
Canada — 0.4% | | | | | | |
Anadarko Finance Co. | | | | | | |
7.50%, 05/01/31 | | | 460,000 | | | 407,793 |
Bombardier, Inc. | | | | | | |
7.25%, 11/15/16 144A(E)@ | | | 250,000 | | | 213,720 |
Canadian Government Inflationary Index | | | | | | |
4.00%, 12/01/31(C) | | | 230,000 | | | 310,695 |
Canadian Natural Resources, Ltd. | | | | | | |
5.70%, 05/15/17 | | | 225,000 | | | 196,542 |
5.85%, 02/01/35 | | | 50,000 | | | 37,168 |
6.50%, 02/15/37 | | | 450,000 | | | 368,409 |
6.25%, 03/15/38 | | | 150,000 | | | 118,240 |
Conoco Funding Co. | | | | | | |
7.25%, 10/15/31 | | | 315,000 | | | 339,882 |
Hydro Quebec | | | | | | |
6.30%, 05/11/11 | | | 305,000 | | | 324,053 |
OPTI Canada, Inc. | | | | | | |
8.25%, 12/15/14 | | | 125,000 | | | 68,125 |
Rogers Cable, Inc. | | | | | | |
6.75%, 03/15/15 | | | 10,000 | | | 9,750 |
Rogers Communications, Inc. | | | | | | |
6.80%, 08/15/18 | | | 300,000 | | | 303,660 |
Rogers Wireless, Inc. | | | | | | |
6.38%, 03/01/14D | | | 340,000 | | | 323,550 |
Sun Media Corporation | | | | | | |
7.63%, 02/15/13 | | | 90,000 | | | 72,900 |
| | | | | | |
| | | | | | 3,094,487 |
| | | | | | |
See Notes to Financial Statements.
92
| | | | | | |
| | | Par | | Value |
Cayman Islands — 0.6% | | | | | | |
MUFG Capital Finance 1, Ltd. | | | | | | |
6.35%, 07/25/25† | | $ | 450,000 | | $ | 342,000 |
Petrobras International Finance Co. | | | | | | |
6.13%, 10/06/16 | | | 870,000 | | | 852,600 |
Petroleum Export, Ltd. | | | | | | |
4.62%, 06/15/10 144A@ | | | 300,000 | | | 295,347 |
4.63%, 06/15/10 144A@ | | | 400,000 | | | 393,831 |
Resona Preferred Global Securities Cayman, Ltd. | | | | | | |
7.19%, 07/30/49 144A†D | | | 690,000 | | | 328,826 |
Shinsei Finance Cayman, Ltd. | | | | | | |
6.42%, 07/20/49 144A† | | | 1,130,000 | | | 236,523 |
Systems 2001 Asset Trust LLC | | | | | | |
6.66%, 09/15/13 144A | | | 663,120 | | | 634,470 |
Transocean, Inc. | | | | | | |
7.50%, 04/15/31 | | | 325,000 | | | 306,404 |
6.80%, 03/15/38D | | | 450,000 | | | 402,560 |
Vale Overseas, Ltd. | | | | | | |
8.25%, 01/17/34D | | | 40,000 | | | 42,708 |
6.88%, 11/21/36 | | | 1,491,000 | | | 1,357,108 |
Willow Re, Ltd. | | | | | | |
8.55%, 06/16/10 144A† | | | 300,000 | | | 187,416 |
| | | | | | |
| | | | | | 5,379,793 |
| | | | | | |
Chile — 0.0% | | | | | | |
Codelco, Inc. | | | | | | |
4.75%, 10/15/14 144A | | | 210,000 | | | 197,719 |
| | | | | | |
France — 0.2% | | | | | | |
AXA SA | | | | | | |
6.46%, 12/14/18 144A† | | | 150,000 | | | 65,615 |
Compagnie Generale de Geophysique - Veritas | | | | | | |
7.50%, 05/15/15 | | | 200,000 | | | 125,000 |
7.75%, 05/15/17 | | | 155,000 | | | 90,675 |
French Government Bond | | | | | | |
5.75%, 10/25/32(E) | | | 500,000 | | | 886,045 |
Legrand SA | | | | | | |
8.50%, 02/15/25 | | | 250,000 | | | 219,129 |
| | | | | | |
| | | | | | 1,386,464 |
| | | | | | |
Germany — 1.2% | | | | | | |
Deutsche Bank AG | | | | | | |
6.00%, 09/01/17 | | | 3,100,000 | | | 3,294,832 |
Deutsche Bundesrepublik | | | | | | |
3.75%, 01/04/15(E) | | | 1,450,000 | | | 2,148,931 |
6.25%, 01/04/30(E) | | | 500,000 | | | 930,699 |
4.25%, 07/04/39(E) | | | 2,800,000 | | | 4,424,315 |
| | | | | | |
| | | | | | 10,798,777 |
| | | | | | |
Iceland — 0.0% | | | | | | |
Glitnir Banki HF | | | | | | |
6.33%, 07/28/11 144A# | | | 600,000 | | | 31,500 |
6.38%, 09/25/12 144A# | | | 580,000 | | | 30,450 |
6.69%, 06/15/16 144A# | | | 1,000,000 | | | 5,150 |
7.45%, 09/14/16 144A# | | | 100,000 | | | 515 |
Kaupthing Bank HF | | | | | | |
5.75%, 10/04/11 144A# | | | 250,000 | | | 16,250 |
7.63%, 02/28/15 144A#@ | | | 2,490,000 | | | 149,400 |
7.13%, 05/19/16 144A#D | | | 350,000 | | | 4,375 |
Landsbanki Islands HF | | | | | | |
6.10%, 08/25/11 144A# | | | 1,500,000 | | | 33,750 |
| | | | | | |
| | | | | | 271,390 |
| | | | | | |
India — 0.1% | | | | | | |
ICICI Bank, Ltd. | | | | | | |
6.38%, 04/30/22 144A† | | | 618,000 | | | 325,385 |
6.38%, 04/30/22† | | | 430,000 | | | 227,055 |
| | | | | | |
| | | | | | 552,440 |
| | | | | | |
Ireland — 0.1% | | | | | | |
DEPFA ACS Bank | | | | | | |
5.13%, 03/16/37 144A | | | 800,000 | | | 581,118 |
Vimpel Communications | | | | | | |
8.38%, 04/30/13 144AD | | | 850,000 | | | 548,250 |
VIP Finance Ireland Ltd. for OJSC Vimpel Communications | | | | | | |
9.13%, 04/30/18 | | | 320,000 | | | 173,466 |
| | | | | | |
| | | | | | 1,302,834 |
| | | | | | |
Italy — 0.1% | | | | | | |
Telecom Italia Capital SA | | | | | | |
6.20%, 07/18/11 | | | 150,000 | | | 133,200 |
5.25%, 11/15/13 | | | 165,000 | | | 125,939 |
4.95%, 09/30/14 | | | 260,000 | | | 198,158 |
5.25%, 10/01/15 | | | 130,000 | | | 99,094 |
| | | | | | |
| | | | | | 556,391 |
| | | | | | |
Japan — 0.1% | | | | | | |
Aiful Corporation | | | | | | |
5.00%, 08/10/10 144A | | | 600,000 | | | 329,982 |
Resona Bank, Ltd. | | | | | | |
4.13%, 06/27/38 144A(E)†@ | | | 500,000 | | | 405,546 |
5.85%, 07/15/49 144A†@ | | | 475,000 | | | 269,611 |
| | | | | | |
| | | | | | 1,005,139 |
| | | | | | |
Jersey — 0.1% | | | | | | |
HSBC Capital Funding LP | | | | | | |
4.61%, 12/29/49 144A† | | | 960,000 | | | 522,613 |
Swiss Re Capital I LP | | | | | | |
6.85%, 05/29/49 144A† | | | 650,000 | | | 206,939 |
| | | | | | |
| | | | | | 729,552 |
| | | | | | |
Luxembourg — 0.9% | | | | | | |
ArcelorMittal | | | | | | |
6.13%, 06/01/18 | | | 800,000 | | | 548,682 |
Enel Finance International SA | | | | | | |
5.70%, 01/15/13 144A@ | | | 700,000 | | | 644,998 |
Evraz Group SA | | | | | | |
8.88%, 04/24/13 144A | | | 680,000 | | | 350,200 |
FMC Finance III SA | | | | | | |
6.88%, 07/15/17D | | | 250,000 | | | 235,000 |
Gaz Capital for Gazprom | | | | | | |
6.21%, 11/22/16 144A | | | 840,000 | | | 558,600 |
6.51%, 03/07/22 144A | | | 640,000 | | | 382,400 |
Hellas Telecommunications SA | | | | | | |
8.82%, 10/15/12(E)† | | | 375,000 | | | 288,652 |
RSHB Capital SA for OJSC Russian Agricultural Bank | | | | | | |
6.30%, 05/15/17 144A | | | 1,240,000 | | | 713,000 |
TNK-BP Finance SA | | | | | | |
7.50%, 07/18/16 144A | | | 780,000 | | | 409,500 |
6.63%, 03/20/17 144A | | | 260,000 | | | 126,100 |
7.88%, 03/13/18 144A | | | 340,000 | | | 171,700 |
Tyco Electronics Group SA | | | | | | |
6.00%, 10/01/12D | | | 250,000 | | | 225,708 |
See Notes to Financial Statements.
93
Medium-Duration Bond Fund
SCHEDULE OF INVESTMENTS (Continued)
| | | | | | |
| | | Par | | Value |
Tyco International Group SA | | | | | | |
6.00%, 11/15/13 | | $ | 2,920,000 | | $ | 2,742,698 |
| | | | | | |
| | | | | | 7,397,238 |
| | | | | | |
Marshall Islands — 0.0% | | | | | | |
Teekay Shipping Corporation | | | | | | |
8.88%, 07/15/11D | | | 176,000 | | | 149,600 |
| | | | | | |
Mexico — 0.3% | | | | | | |
America Movil Sab de CV | | | | | | |
5.63%, 11/15/17 | | | 460,000 | | | 411,253 |
Kansas City Southern de Mexico SA de CV | | | | | | |
9.38%, 05/01/12 | | | 120,000 | | | 110,400 |
United Mexican States | | | | | | |
6.75%, 09/27/34 | | | 2,001,000 | | | 2,121,060 |
| | | | | | |
| | | | | | 2,642,713 |
| | | | | | |
Netherlands — 0.5% | | | | | | |
Deutsche Telekom International Finance BV | | | | | | |
5.75%, 03/23/16D | | | 510,000 | | | 488,898 |
8.75%, 06/15/30 | | | 600,000 | | | 741,874 |
HSBK Europe BV | | | | | | |
9.25%, 10/16/13 144A | | | 710,000 | | | 521,850 |
Intergas Finance BV | | | | | | |
6.38%, 05/14/17 144A | | | 980,000 | | | 573,300 |
Koninklijke KPN NV | | | | | | |
8.00%, 10/01/10 | | | 780,000 | | | 787,493 |
NXP BV | | | | | | |
7.88%, 10/15/14D | | | 30,000 | | | 11,850 |
9.50%, 10/15/15D | | | 55,000 | | | 10,587 |
TuranAlem Finance BV | | | | | | |
8.25%, 01/22/37 144A | | | 1,440,000 | | | 626,400 |
8.25%, 01/22/37D | | | 650,000 | | | 281,125 |
| | | | | | |
| | | | | | 4,043,377 |
| | | | | | |
South Korea — 0.0% | | | | | | |
Export-Import Bank of Korea | | | | | | |
5.25%, 02/10/14 144A | | | 235,000 | | | 203,951 |
| | | | | | |
Spain — 0.1% | | | | | | |
Telefonica Emisiones SAU | | | | | | |
6.42%, 06/20/16 | | | 900,000 | | | 899,752 |
| | | | | | |
Switzerland — 1.3% | | | | | | |
Credit Suisse Group | | | | | | |
5.00%, 05/15/13 | | | 6,500,000 | | | 6,261,821 |
UBS AG | | | | | | |
2.50%, 06/19/10† | | | 4,000,000 | | | 3,999,580 |
5.88%, 12/20/17D | | | 1,400,000 | | | 1,288,277 |
| | | | | | |
| | | | | | 11,549,678 |
| | | | | | |
United Kingdom — 0.2% | | | | | | |
HSBC Holdings PLC | | | | | | |
6.80%, 06/01/38 | | | 425,000 | | | 450,585 |
Inmarsat Finance PLC | | | | | | |
14.10%, 11/15/12 STEPW | | | 375,000 | | | 334,219 |
Royal Bank of Scotland Group PLC | | | | | | |
9.12%, 03/31/10 | | | 550,000 | | | 469,680 |
7.64%, 03/31/45† | | | 300,000 | | | 119,619 |
6.99%, 10/29/45 144A†D | | | 770,000 | | | 360,457 |
| | | | | | |
| | | | | | 1,734,560 |
| | | | | | |
Total Foreign Bonds
(Cost $74,922,822) | | | | | | 58,236,973 |
| | | | | | |
LOAN AGREEMENTS — 0.8% | | | | | | |
Chrysler Finance Co. Bridge Loan | | | | | | |
6.82%, 08/03/14@ | | | 8,591,114 | | | 4,412,147 |
Ford Motor Co. Tranche B | | | | | | |
5.00%, 11/29/13†@ | | | 53,364 | | | 21,446 |
Georgia Pacific Corporation | | | | | | |
2.76%, 12/20/12@ | | | 127,901 | | | 104,814 |
3.69%, 12/20/12†@ | | | 3,238,095 | | | 2,653,619 |
| | | | | | |
Total Loan Agreements
(Cost $11,654,655) | | | | | | 7,192,026 |
| | | | | | |
MORTGAGE-BACKED SECURITIES — 80.1% | | | | | | |
ABN AMRO Mortgage Corporation | | | | | | |
1.53%, 06/25/33 IOW@ | | | 461,597 | | | 43,516 |
American Home Mortgage Assets | | | | | | |
3.18%, 11/25/46† | | | 1,698,584 | | | 596,527 |
2.96%, 02/25/47† | | | 2,552,421 | | | 857,922 |
Bank of America Commercial Mortgage, Inc. | | | | | | |
5.12%, 10/10/45† | | | 3,000,000 | | | 2,445,026 |
Bank of America Funding Corporation | | | | | | |
0.59%, 07/20/36† | | | 2,072,906 | | | 1,799,984 |
Bank of America Mortgage Securities, Inc. | | | | | | |
4.52%, 07/25/34† | | | 560,882 | | | 452,937 |
Bear Stearns Adjustable Rate Mortgage Trust | | | | | | |
5.60%, 02/25/33† | | | 270,644 | | | 217,745 |
4.71%, 04/25/34† | | | 353,891 | | | 246,025 |
5.30%, 05/25/34† | | | 1,296,071 | | | 933,552 |
4.13%, 03/25/35† | | | 2,232,193 | | | 1,889,369 |
5.08%, 06/25/35† | | | 1,021,809 | | | 502,447 |
Bear Stearns Alt-A Trust | | | | | | |
1.11%, 02/25/34† | | | 135,052 | | | 71,920 |
5.37%, 05/25/35† | | | 710,809 | | | 490,975 |
5.50%, 09/25/35† | | | 1,043,985 | | | 485,547 |
Bear Stearns Structured Products, Inc. | | | | | | |
5.66%, 09/25/37† | | | 1,789,428 | | | 1,123,543 |
1.07%, 09/27/37 144A† | | | 4,608,211 | | | 4,481,393 |
Chase Mortgage Finance Corporation | | | | | | |
4.17%, 02/01/37† | | | 560,210 | | | 432,392 |
4.88%, 02/01/37† | | | 1,141,374 | | | 885,016 |
Citigroup Commercial Mortgage Trust | | | | | | |
1.27%, 11/15/36 144A†@ | | | 8,422 | | | 7,297 |
Citigroup Mortgage Loan Trust, Inc. | | | | | | |
4.90%, 12/25/35† | | | 2,502,824 | | | 1,805,458 |
See Notes to Financial Statements.
94
| | | | | | |
| | | Par | | Value |
Commerical Mortgage Asset Trust | | | | | | |
7.55%, 01/17/10† | | $ | 237,998 | | $ | 237,981 |
Countrywide Alternative Loan Trust | | | | | | |
5.50%, 10/25/33 | | | 189,670 | | | 156,478 |
0.82%, 09/25/35† | | | 2,396,072 | | | 1,080,540 |
3.76%, 09/25/35† | | | 337,475 | | | 163,313 |
0.80%, 10/25/35† | | | 1,537,644 | | | 710,147 |
0.80%, 11/20/35† | | | 2,792,962 | | | 1,396,147 |
0.81%, 11/20/35† | | | 782,164 | | | 362,986 |
0.83%, 11/20/35† | | | 1,816,768 | | | 844,097 |
0.74%, 12/25/35† | | | 851,826 | | | 400,402 |
0.77%, 12/25/35† | | | 1,617,170 | | | 714,424 |
0.74%, 02/25/36† | | | 1,745,307 | | | 793,054 |
6.00%, 08/25/37 | | | 1,651,693 | | | 999,923 |
3.64%, 04/25/43† | | | 2,867,942 | | | 1,086,584 |
0.66%, 09/25/46† | | | 1,752,541 | | | 682,876 |
Countrywide Home Loan Mortgage Pass-Through Trust | | | | | | |
5.16%, 02/19/34† | | | 1,988,540 | | | 1,417,631 |
4.54%, 11/20/34† | | | 355,427 | | | 188,378 |
4.90%, 08/20/35† | | | 1,481,706 | | | 737,046 |
0.71%, 03/25/36† | | | 598,781 | | | 255,982 |
Credit Suisse Mortgage Capital Certificates | | | | | | |
5.66%, 03/15/39 STRIP† | | | 800,000 | | | 651,284 |
5.38%, 02/15/40 | | | 4,180,000 | | | 2,508,516 |
CS First Boston Mortgage Securities Corporation | | | | | | |
4.18%, 04/25/33 IOW@ | | | 13,059 | | | 374 |
4.60%, 05/25/33 IOW@ | | | 3,543 | | | 28 |
6.99%, 06/25/33 IOW@ | | | 15,073 | | | 289 |
0.00%, 07/25/33 IOW†@ | | | 256,786 | | | — |
2.49%, 07/25/33 IOW@ | | | 661,360 | | | 69,157 |
6.18%, 08/25/33 IOW†@ | | | 314,858 | | | — |
6.53%, 06/15/34 | | | 1,500,000 | | | 1,465,671 |
Federal Home Loan Mortgage Corporation | | | | | | |
7.00%, 11/01/14 | | | 36,633 | | | 38,373 |
7.00%, 04/01/15 | | | 46,289 | | | 48,488 |
7.00%, 12/01/15 | | | 33,397 | | | 34,820 |
8.50%, 06/01/16 | | | 13,490 | | | 14,393 |
4.50%, 05/01/18 | | | 161,862 | | | 166,804 |
4.50%, 06/01/18 | | | 36,623 | | | 37,681 |
8.50%, 06/01/18 | | | 7,134 | | | 7,611 |
4.50%, 09/01/18 | | | 146,365 | | | 150,592 |
4.50%, 10/01/18 | | | 113,157 | | | 116,534 |
4.50%, 11/01/18 | | | 116,384 | | | 119,927 |
4.50%, 12/01/18 | | | 358,860 | | | 369,225 |
5.00%, 12/01/18 | | | 664,808 | | | 686,466 |
4.50%, 01/01/19 | | | 42,470 | | | 43,696 |
4.50%, 03/01/19 | | | 85,332 | | | 87,833 |
4.50%, 06/01/19 | | | 1,556,977 | | | 1,601,949 |
5.00%, 06/01/20 | | | 556,622 | | | 573,569 |
5.00%, 07/01/20 | | | 577,901 | | | 594,774 |
7.08%, 04/15/22 POW@ | | | 29,431 | | | 24,901 |
8.00%, 08/01/24 | | | 5,244 | | | 5,555 |
7.50%, 11/01/29 | | | 17,138 | | | 18,073 |
6.50%, 12/01/29 | | | 375,326 | | | 393,506 |
7.50%, 12/01/29 | | | 27,649 | | | 29,158 |
7.50%, 02/01/31 | | | 33,573 | | | 35,619 |
5.13%, 07/01/31† | | | 54,670 | | | 53,936 |
5.11%, 08/01/31† | | | 3,847 | | | 3,802 |
7.50%, 11/01/31 | | | 10,414 | | | 11,041 |
5.35%, 04/01/32† | | | 8,672 | | | 8,683 |
4.29%, 03/01/34† | | | 12,147 | | | 12,001 |
5.00%, 12/01/34 | | | 132,798 | | | 135,937 |
5.50%, 05/01/35 | | | 2,298,712 | | | 2,355,919 |
3.61%, 08/15/35W†@ | | | 133,159 | | | 126,457 |
5.00%, 11/01/35 | | | 1,831,442 | | | 1,874,158 |
5.50%, 11/01/35 | | | 708,212 | | | 725,837 |
5.00%, 12/01/35 | | | 443,364 | | | 453,705 |
6.00%, 02/01/36 | | | 1,711,348 | | | 1,764,901 |
5.00%, 03/01/36 | | | 1,371,356 | | | 1,403,341 |
5.00%, 04/01/36 | | | 1,163,613 | | | 1,190,753 |
5.00%, 06/01/36 | | | 1,967,117 | | | 2,013,190 |
6.06%, 01/01/37† | | | 2,261,956 | | | 2,323,898 |
5.68%, 04/01/37† | | | 3,811,961 | | | 3,876,654 |
3.40%, 04/15/37W†@ | | | 70,422 | | | 71,602 |
1.70%, 06/15/37† | | | 2,527,468 | | | 2,407,452 |
3.59%, 06/15/37W†@ | | | 174,324 | | | 165,889 |
5.50%, 07/01/37 | | | 638,750 | | | 654,511 |
5.63%, 09/01/37† | | | 4,499,628 | | | 4,595,447 |
5.50%, 02/12/38 TBA | | | 29,000,000 | | | 29,589,048 |
5.50%, 04/01/38 | | | 294,767 | | | 302,040 |
5.50%, 06/01/38 | | | 1,902,269 | | | 1,949,015 |
5.00%, 08/01/38 | | | 395,570 | | | 404,796 |
6.50%, 09/01/38 | | | 968,860 | | | 1,008,523 |
5.00%, 01/01/39 TBA | | | 200,000 | | | 204,375 |
5.50%, 01/01/39 TBA | | | 39,000,000 | | | 39,914,082 |
5.00%, 01/13/39 TBA | | | 5,000,000 | | | 5,109,375 |
Federal Housing Administration | | | | | | |
7.43%, 10/01/18 | | | 189,886 | | | 184,257 |
Federal National Mortgage Association | | | | | | |
4.00%, 06/01/13 | | | 61,046 | | | 61,894 |
4.00%, 07/01/13 | | | 83,100 | | | 84,561 |
4.00%, 08/01/13 | | | 116,423 | | | 118,055 |
4.00%, 09/01/13 | | | 222,701 | | | 225,866 |
4.00%, 10/01/13 | | | 467,742 | | | 474,390 |
8.00%, 06/01/15 | | | 31,002 | | | 32,746 |
8.00%, 06/15/15 | | | 11,616 | | | 12,269 |
8.00%, 07/01/15 | | | 24,043 | | | 25,396 |
8.00%, 09/01/15 | | | 47,589 | | | 49,529 |
5.00%, 12/25/15 | | | 55,709 | | | 55,826 |
7.50%, 04/01/16 | | | 15,546 | | | 16,323 |
6.00%, 05/01/16 | | | 149,216 | | | 155,463 |
6.00%, 07/01/16 | | | 15,555 | | | 16,206 |
6.00%, 01/17/17 TBA | | | 1,000,000 | | | 1,036,875 |
5.00%, 11/01/17 | | | 180,969 | | | 187,384 |
5.00%, 12/01/17 | | | 948,378 | | | 981,235 |
5.00%, 01/01/18 | | | 2,372,949 | | | 2,455,542 |
5.00%, 02/01/18 | | | 484,036 | | | 500,533 |
5.50%, 02/01/18 | | | 163,543 | | | 168,704 |
5.00%, 04/01/18 | | | 792,889 | | | 818,516 |
5.00%, 05/01/18 | | | 1,103,340 | | | 1,139,622 |
4.50%, 06/01/18 | | | 3,978,274 | | | 4,104,199 |
5.00%, 06/01/18 | | | 128,267 | | | 132,413 |
4.00%, 09/01/18 | | | 3,469,301 | | | 3,559,750 |
4.50%, 09/01/18 | | | 111,113 | | | 114,288 |
4.50%, 10/01/18 | | | 226,841 | | | 233,322 |
4.50%, 11/01/18 | | | 49,719 | | | 51,139 |
5.00%, 11/01/18 | | | 225,397 | | | 233,387 |
4.50%, 12/01/18 | | | 3,078,307 | | | 3,166,259 |
4.50%, 01/01/19 | | | 60,858 | | | 62,596 |
5.00%, 02/01/19 | | | 157,397 | | | 162,189 |
See Notes to Financial Statements.
95
Medium-Duration Bond Fund
SCHEDULE OF INVESTMENTS (Continued)
| | | | | | |
| | | Par | | Value |
4.50%, 03/01/19 | | $ | 83,825 | | $ | 86,220 |
5.00%, 03/01/19 | | | 1,148,840 | | | 1,183,818 |
5.00%, 04/01/19 | | | 1,553,796 | | | 1,602,385 |
4.00%, 05/01/19 | | | 3,764,995 | | | 3,826,680 |
4.50%, 05/01/19 | | | 328,890 | | | 337,465 |
4.50%, 06/01/19 | | | 163,612 | | | 167,878 |
4.50%, 07/01/19 | | | 52,983 | | | 54,364 |
4.50%, 08/01/19 | | | 161,657 | | | 165,871 |
5.00%, 08/01/19 | | | 567,525 | | | 584,804 |
6.00%, 09/01/19 | | | 776,282 | | | 808,782 |
5.00%, 10/01/19 | | | 244,026 | | | 251,456 |
5.00%, 11/01/19 | | | 1,029,899 | | | 1,061,256 |
4.50%, 04/01/20 | | | 519,290 | | | 534,127 |
4.50%, 08/01/20 | | | 323,370 | | | 331,397 |
4.50%, 09/01/20 | | | 255,783 | | | 262,132 |
6.00%, 12/01/20 | | | 1,461,855 | | | 1,523,058 |
4.50%, 03/01/21 | | | 344,502 | | | 352,676 |
4.50%, 08/01/21 | | | 31,482 | | | 32,229 |
10.02%, 08/25/21 IOW@ | | | 205 | | | 4,145 |
9.10%, 10/25/21 IOW@ | | | 377 | | | 8,364 |
25.52%, 01/25/22† | | | 53,524 | | | 56,364 |
4.50%, 04/01/22 | | | 290,719 | | | 297,601 |
9.50%, 05/01/22 | | | 5,259 | | | 5,783 |
4.50%, 06/01/22 | | | 1,357,294 | | | 1,389,423 |
3.95%, 07/01/22† | | | 26,983 | | | 27,173 |
6.00%, 01/01/23 | | | 145,066 | | | 150,097 |
4.50%, 04/01/23 | | | 4,146,850 | | | 4,244,597 |
4.50%, 06/01/23 | | | 3,802,413 | | | 3,892,042 |
5.00%, 07/01/23 | | | 974,043 | | | 1,001,264 |
4.50%, 12/01/23 | | | 1,000,000 | | | 1,023,060 |
5.00%, 12/01/23 | | | 1,000,000 | | | 1,027,947 |
5.00%, 01/01/24 TBA | | | 7,500,000 | | | 7,696,875 |
5.50%, 01/01/24 TBA | | | 4,600,000 | | | 4,736,565 |
4.50%, 01/20/24 TBA | | | 5,000,000 | | | 5,109,375 |
9.50%, 07/01/24 | | | 9,141 | | | 10,017 |
4.02%, 07/01/27† | | | 27,536 | | | 27,369 |
5.27%, 08/01/27† | | | 82,987 | | | 82,009 |
4.02%, 11/01/27† | | | 74,052 | | | 73,604 |
7.39%, 02/01/30† | | | 171,825 | | | 174,548 |
1.07%, 05/25/30† | | | 1,857,147 | | | 1,805,124 |
5.34%, 06/01/30† | | | 31,299 | | | 31,331 |
8.00%, 10/01/30 | | | 57,951 | | | 61,552 |
1.33%, 10/18/30† | | | 60,040 | | | 58,220 |
5.11%, 12/01/30† | | | 7,974 | | | 7,927 |
4.02%, 01/01/31† | | | 9,054 | | | 9,021 |
5.07%, 05/01/31† | | | 18,683 | | | 18,247 |
7.50%, 05/01/31 | | | 15,838 | | | 16,768 |
5.00%, 06/01/31† | | | 7,439 | | | 7,341 |
6.00%, 01/01/32 | | | 101,699 | | | 105,113 |
6.50%, 01/01/32 TBA | | | 5,000,000 | | | 5,192,190 |
6.00%, 03/01/32 | | | 288,067 | | | 297,831 |
6.50%, 03/01/32 | | | 284,092 | | | 299,062 |
6.00%, 04/01/32 | | | 653,136 | | | 674,901 |
4.02%, 06/01/32† | | | 10,230 | | | 10,200 |
3.95%, 08/01/32† | | | 38,629 | | | 38,516 |
5.59%, 02/01/33† | | | 4,283 | | | 4,256 |
5.50%, 03/01/33 | | | 117,971 | | | 121,221 |
3.95%, 05/01/33† | | | 89,634 | | | 89,403 |
5.50%, 05/01/33 | | | 189,867 | | | 195,096 |
5.50%, 06/01/33 | | | 28,414 | | | 29,196 |
5.50%, 07/01/33 | | | 365,645 | | | 375,716 |
6.01%, 07/25/33 IOW†@ | | | 379,666 | | | 8,760 |
5.50%, 01/01/34 TBA | | | 3,000,000 | | | 3,075,000 |
0.01%, 04/25/34 IOW†@ | | | 564,744 | | | 55 |
5.50%, 06/01/34 | | | 164,642 | | | 169,177 |
6.02%, 06/25/34 IOW†@ | | | 816,518 | | | 23,994 |
5.00%, 08/01/34 | | | 317,548 | | | 324,855 |
6.00%, 10/01/34 | | | 111,840 | | | 115,410 |
4.50%, 12/01/34 | | | 366,597 | | | 372,451 |
4.57%, 12/01/34† | | | 676,987 | | | 681,170 |
6.00%, 01/01/35 | | | 2,437,920 | | | 2,515,733 |
4.50%, 02/01/35 | | | 400,952 | | | 407,354 |
4.50%, 03/01/35 | | | 1,262,602 | | | 1,281,972 |
5.00%, 03/01/35 | | | 272,067 | | | 278,327 |
4.50%, 04/01/35 | | | 885,724 | | | 899,312 |
6.00%, 04/01/35 | | | 2,061,087 | | | 2,128,482 |
4.50%, 05/01/35 | | | 717,706 | | | 728,716 |
6.00%, 05/01/35 | | | 3,091,105 | | | 3,186,384 |
2.85%, 05/25/35W†@ | | | 80,752 | | | 79,557 |
5.00%, 06/01/35 | | | 2,955,600 | | | 3,023,612 |
4.50%, 07/01/35 | | | 439,788 | | | 446,535 |
6.00%, 07/01/35 | | | 1,081,992 | | | 1,115,343 |
5.00%, 08/01/35 | | | 220,573 | | | 225,511 |
4.50%, 09/01/35 | | | 114,736 | | | 116,496 |
5.00%, 09/01/35 | | | 8,332,438 | | | 8,537,199 |
5.50%, 09/01/35 | | | 682,408 | | | 700,350 |
4.50%, 10/01/35 | | | 294,956 | | | 299,481 |
6.00%, 10/01/35 | | | 264,878 | | | 273,042 |
4.02%, 11/01/35† | | | 33,148 | | | 33,084 |
4.27%, 11/01/35† | | | 457,128 | | | 461,245 |
4.42%, 11/01/35† | | | 514,826 | | | 519,426 |
4.42%, 11/01/35† | | | 464,097 | | | 468,255 |
4.43%, 11/01/35† | | | 468,436 | | | 472,633 |
4.43%, 11/01/35† | | | 468,822 | | | 473,022 |
6.00%, 11/01/35 | | | 2,219,764 | | | 2,290,060 |
5.00%, 12/01/35 | | | 6,272,394 | | | 6,416,730 |
6.00%, 03/01/36 | | | 51,194 | | | 52,764 |
5.50%, 04/01/36 | | | 699,136 | | | 702,727 |
6.00%, 04/01/36 | | | 58,176 | | | 59,960 |
6.50%, 04/01/36 | | | 852,346 | | | 886,306 |
4.42%, 05/01/36† | | | 429,875 | | | 429,221 |
6.00%, 08/01/36 | | | 49,314 | | | 50,826 |
6.50%, 08/01/36 | | | 663,602 | | | 690,043 |
5.00%, 09/01/36 | | | 860,538 | | | 879,802 |
6.00%, 09/01/36 | | | 1,272,067 | | | 1,311,078 |
6.50%, 09/01/36 | | | 1,839,668 | | | 1,912,967 |
3.68%, 09/25/36W†@ | | | 75,642 | | | 74,670 |
6.00%, 10/01/36 | | | 140,876 | | | 145,196 |
6.50%, 10/01/36 | | | 2,234,231 | | | 2,323,251 |
5.00%, 11/01/36 | | | 894,759 | | | 914,650 |
5.50%, 11/01/36 | | | 2,029,109 | | | 2,082,460 |
6.00%, 11/01/36 | | | 263,018 | | | 271,085 |
6.50%, 11/01/36 | | | 329,244 | | | 342,414 |
6.00%, 12/01/36 | | | 502,320 | | | 517,725 |
6.00%, 01/01/37 | | | 225,611 | | | 232,530 |
5.00%, 02/01/37 | | | 24,293 | | | 24,832 |
5.51%, 02/01/37† | | | 4,053,725 | | | 4,258,689 |
5.00%, 03/01/37 | | | 744,427 | | | 760,934 |
5.50%, 03/01/37 | | | 90,780 | | | 93,167 |
6.50%, 03/01/37 | | | 1,764,246 | | | 1,834,495 |
6.00%, 04/01/37 | | | 431,466 | | | 444,674 |
6.50%, 04/01/37 | | | 778,607 | | | 809,586 |
5.50%, 05/01/37 | | | 556,916 | | | 571,528 |
6.00%, 05/01/37 | | | 1,180,230 | | | 1,216,376 |
6.50%, 05/01/37 | | | 796,605 | | | 828,300 |
6.00%, 06/01/37 | | | 671,908 | | | 692,476 |
6.50%, 06/01/37 | | | 463,007 | | | 481,429 |
5.00%, 07/01/37 | | | 24,674 | | | 25,221 |
See Notes to Financial Statements.
96
| | | | | | |
| | | Par | | Value |
6.00%, 07/01/37 | | $ | 9,138,745 | | $ | 9,418,495 |
6.00%, 08/01/37 | | | 711,217 | | | 725,693 |
6.50%, 08/01/37 | | | 1,845,504 | | | 1,918,932 |
6.00%, 09/01/37 | | | 368,446 | | | 375,203 |
6.50%, 09/01/37 | | | 1,423,457 | | | 1,480,100 |
6.50%, 10/01/37 | | | 1,667,120 | | | 1,733,495 |
6.50%, 11/01/37 | | | 93,064 | | | 96,767 |
7.50%, 11/01/37 | | | 2,283,615 | | | 2,397,010 |
4.02%, 12/01/37† | | | 151,381 | | | 151,102 |
6.00%, 12/01/37 | | | 834,426 | | | 859,969 |
6.50%, 12/01/37 | | | 770,596 | | | 801,256 |
7.50%, 12/01/37 | | | 809,684 | | | 849,890 |
4.02%, 01/01/38† | | | 65,512 | | | 65,392 |
5.50%, 01/01/38 | | | 131,326 | | | 134,772 |
6.00%, 01/01/38 | | | 553,509 | | | 570,453 |
5.00%, 02/01/38 | | | 5,917,310 | | | 6,047,928 |
5.50%, 02/01/38 | | | 201,152 | | | 206,431 |
6.00%, 02/01/38 | | | 605,439 | | | 623,972 |
6.50%, 02/01/38 | | | 51,872 | | | 53,931 |
5.00%, 02/12/38 TBA | | | 22,000,000 | | | 22,391,865 |
4.50%, 03/01/38 | | | 61,089 | | | 62,007 |
5.00%, 03/01/38 | | | 1,528,747 | | | 1,562,493 |
5.50%, 03/01/38 | | | 216,994 | | | 222,672 |
6.00%, 03/01/38 | | | 68,840 | | | 70,951 |
6.50%, 03/01/38 | | | 45,386 | | | 47,187 |
4.50%, 04/01/38 | | | 1,731,196 | | | 1,757,213 |
5.00%, 04/01/38 | | | 2,379,103 | | | 2,431,619 |
5.50%, 04/01/38 | | | 417,883 | | | 428,812 |
5.00%, 05/01/38 | | | 440,688 | | | 450,459 |
5.50%, 05/01/38 | | | 183,984 | | | 188,793 |
6.00%, 05/01/38 | | | 143,386 | | | 147,761 |
5.00%, 06/01/38 | | | 7,018,309 | | | 7,173,230 |
5.50%, 06/01/38 | | | 1,203,434 | | | 1,234,888 |
6.00%, 06/01/38 | | | 131,331 | | | 133,290 |
6.50%, 06/01/38 | | | 1,903,740 | | | 1,979,302 |
5.50%, 07/01/38 | | | 828,599 | | | 850,256 |
5.50%, 08/01/38 | | | 446,137 | | | 457,798 |
6.00%, 08/01/38 | | | 2,691,744 | | | 2,773,873 |
5.00%, 09/01/38 | | | 1,859,444 | | | 1,900,489 |
5.50%, 09/01/38 | | | 606,291 | | | 622,137 |
6.00%, 09/01/38 | | | 4,098,041 | | | 4,223,078 |
6.50%, 09/01/38 | | | 932,191 | | | 969,188 |
5.50%, 10/01/38 | | | 150,623 | | | 154,691 |
6.00%, 10/01/38 | | | 896,502 | | | 923,856 |
5.50%, 11/01/38 | | | 101,832 | | | 104,493 |
6.00%, 11/01/38 | | | 1,640,905 | | | 1,690,971 |
6.00%, 12/01/38 | | | 115,922 | | | 117,909 |
6.00%, 01/01/39 TBA | | | 500,000 | | | 514,688 |
5.00%, 01/13/39 TBA | | | 37,000,000 | | | 37,774,706 |
5.50%, 01/13/39 TBA | | | 50,100,000 | | | 51,352,500 |
6.50%, 01/13/39 TBA | | | 14,200,000 | | | 14,745,820 |
5.00%, 01/14/39 TBA | | | 44,450,000 | | | 45,380,694 |
4.50%, 02/12/39 TBA | | | 2,000,000 | | | 2,018,124 |
3.88%, 06/01/40† | | | 120,474 | | | 119,289 |
3.88%, 10/01/40† | | | 363,849 | | | 360,284 |
4.02%, 11/01/40† | | | 52,334 | | | 52,239 |
FFCA Secured Lending Corporation | | | | | | |
58.17%, 07/18/20 IO 144AW†@ | | | 1,259,079 | | | 21,530 |
FHLMC Structured Pass-Through Securities | | | | | | |
3.88%, 07/25/44† | | | 2,456,304 | | | 2,215,350 |
First Horizon Alternative Mortgage Securities | | | | | | |
4.74%, 06/25/34† | | | 863,514 | | | 477,216 |
First Horizon Asset Securities, Inc. | | | | | | |
4.75%, 12/25/34† | | | 152,272 | | | 110,830 |
First Union National Bank Commercial Mortgage Trust | | | | | | |
7.20%, 10/01/32 | | | 1,436,422 | | | 1,443,115 |
General Electric Capital Commercial Mortgage Corporation | | | | | | |
5.33%, 11/10/45 STRIP† | | | 1,230,000 | | | 1,018,965 |
GMAC Commercial Mortgage Securities, Inc. | | | | | | |
6.28%, 11/15/39 | | | 2,000,000 | | | 1,927,526 |
GMAC Mortgage Corporation Loan Trust | | | | | | |
4.45%, 06/25/34† | | | 648,687 | | | 453,095 |
Government National Mortgage Association | | | | | | |
7.00%, 10/15/25 | | | 64,622 | | | 68,481 |
7.00%, 01/15/26 | | | 20,840 | | | 22,078 |
7.00%, 07/15/27 | | | 170,231 | | | 180,378 |
7.00%, 12/15/27 | | | 1,542 | | | 1,634 |
7.00%, 01/15/28 | | | 31,910 | | | 33,786 |
7.00%, 03/15/28 | | | 204,824 | | | 217,029 |
7.00%, 07/15/28 | | | 23,866 | | | 25,269 |
7.50%, 07/15/28 | | | 15,191 | | | 16,098 |
6.50%, 08/15/28 | | | 21,567 | | | 22,668 |
7.00%, 08/15/28 | | | 37,618 | | | 39,829 |
7.50%, 08/15/28 | | | 15,678 | | | 16,614 |
6.50%, 09/15/28 | | | 126,277 | | | 132,728 |
6.00%, 10/15/28 | | | 16,578 | | | 17,213 |
7.00%, 10/15/28 | | | 77,075 | | | 81,605 |
6.00%, 12/15/28 | | | 2,559 | | | 2,657 |
6.00%, 01/15/29 | | | 544 | | | 564 |
7.50%, 03/15/29 | | | 54,634 | | | 57,898 |
7.50%, 11/15/29 | | | 24,699 | | | 26,174 |
5.13%, 11/20/29† | | | 87,727 | | | 86,284 |
8.50%, 08/15/30 | | | 4,969 | | | 5,370 |
8.50%, 11/20/30 | | | 27,479 | | | 29,586 |
6.00%, 04/15/31 | | | 4,461 | | | 4,623 |
6.50%, 08/15/31 | | | 182,313 | | | 189,917 |
7.50%, 08/15/31 | | | 63,000 | | | 66,922 |
6.50%, 10/15/31 | | | 350,646 | | | 366,253 |
6.00%, 11/15/31 | | | 923,429 | | | 954,442 |
6.50%, 11/15/31 | | | 376,299 | | | 391,995 |
6.00%, 12/15/31 | | | 239,795 | | | 247,849 |
6.00%, 01/15/32 | | | 358,738 | | | 371,458 |
6.00%, 02/15/32 | | | 527,216 | | | 544,929 |
6.50%, 02/15/32 | | | 518,814 | | | 544,004 |
32.71%, 02/16/32† | | | 189,838 | | | 286,666 |
6.00%, 04/15/32 | | | 447,842 | | | 463,723 |
6.50%, 04/15/32 | | | 328,447 | | | 342,146 |
7.50%, 04/15/32 | | | 94,109 | | | 99,872 |
6.50%, 06/15/32 | | | 1,085,810 | | | 1,137,888 |
6.50%, 07/15/32 | | | 141,475 | | | 147,376 |
6.50%, 08/15/32 | | | 444,850 | | | 463,405 |
6.50%, 09/15/32 | | | 518,691 | | | 540,326 |
6.00%, 10/15/32 | | | 574,672 | | | 593,972 |
6.00%, 11/15/32 | | | 450,787 | | | 466,172 |
6.00%, 12/15/32 | | | 235,360 | | | 243,271 |
6.50%, 12/15/32 | | | 41,630 | | | 43,366 |
See Notes to Financial Statements.
97
Medium-Duration Bond Fund
SCHEDULE OF INVESTMENTS (Continued)
| | | | | | |
| | | Par | | Value |
6.00%, 01/15/33 | | $ | 256,328 | | $ | 264,936 |
6.00%, 02/15/33 | | | 182,356 | | | 188,480 |
6.50%, 03/15/33 | | | 82,479 | | | 85,920 |
5.00%, 04/15/33 | | | 243,940 | | | 251,168 |
6.50%, 04/15/33 | | | 1,292,383 | | | 1,346,289 |
5.00%, 05/15/33 | | | 2,013,708 | | | 2,069,303 |
6.00%, 05/15/33 | | | 1,271,574 | | | 1,314,280 |
5.00%, 06/15/33 | | | 264,623 | | | 272,464 |
6.00%, 06/15/33 | | | 169,624 | | | 175,320 |
5.00%, 07/15/33 | | | 628,039 | | | 646,650 |
5.00%, 08/15/33 | | | 1,219,094 | | | 1,253,612 |
5.00%, 09/15/33 | | | 885,339 | | | 909,913 |
5.00%, 10/15/33 | | | 486,480 | | | 500,271 |
6.00%, 10/15/33 | | | 854,094 | | | 882,779 |
6.50%, 10/15/33 | | | 263,960 | | | 274,970 |
5.00%, 11/15/33 | | | 59,913 | | | 61,532 |
6.00%, 12/15/33 | | | 924,013 | | | 955,046 |
5.00%, 01/15/34 | | | 394,324 | | | 405,762 |
5.00%, 03/15/34 | | | 498,139 | | | 512,588 |
5.00%, 04/15/34 | | | 195,268 | | | 200,933 |
5.00%, 05/15/34 | | | 117,150 | | | 120,548 |
5.00%, 06/15/34 | | | 750,164 | | | 771,924 |
6.00%, 06/15/34 | | | 97,355 | | | 100,670 |
5.00%, 08/15/34 | | | 499,437 | | | 513,925 |
5.00%, 11/15/34 | | | 1,130,110 | | | 1,162,891 |
5.00%, 12/15/34 | | | 1,004,721 | | | 1,033,865 |
5.00%, 01/15/35 | | | 722,051 | | | 742,544 |
6.00%, 02/15/36 | | | 14,694 | | | 15,192 |
6.00%, 06/15/36 | | | 830,374 | | | 858,511 |
6.00%, 07/15/36 | | | 102,378 | | | 105,847 |
6.00%, 08/15/36 | | | 965,735 | | | 998,576 |
5.00%, 01/01/39 TBA | | | 6,900,000 | | | 7,072,500 |
5.50%, 01/21/39 TBA | | | 20,400,000 | | | 21,005,635 |
6.50%, 01/21/39 TBA | | | 28,000,000 | | | 29,111,264 |
Greenpoint Mortgage Funding Trust | | | | | | |
0.65%, 01/25/37† | | | 1,604,090 | | | 666,832 |
0.55%, 03/25/37† | | | 3,761,311 | | | 1,899,032 |
GS Mortgage Securities Corporation II | | | | | | |
4.68%, 07/10/39 | | | 1,300,000 | | | 1,151,014 |
GSMPS Mortgage Loan Trust | | | | | | |
0.70%, 02/25/35 144A† | | | 310,688 | | | 217,528 |
0.82%, 09/25/35 144A† | | | 2,195,312 | | | 1,724,391 |
GSR Mortgage Loan Trust | | | | | | |
4.54%, 09/25/35† | | | 1,158,534 | | | 853,993 |
HarborView Mortgage Loan Trust | | | | | | |
0.89%, 11/19/35 STEP | | | 425,943 | | | 194,052 |
5.73%, 12/19/35† | | | 695,383 | | | 365,715 |
0.82%, 01/19/36 STEP | | | 255,511 | | | 118,356 |
0.83%, 01/19/36 STEP | | | 1,176,923 | | | 542,970 |
5.98%, 08/19/36† | | | 1,735,234 | | | 800,248 |
0.77%, 12/19/37† | | | 1,497,352 | | | 595,041 |
Impac CMB Trust | | | | | | |
1.19%, 10/25/34† | | | 152,904 | | | 59,370 |
0.73%, 11/25/35 STEP | | | 1,388,011 | | | 556,954 |
Impac Secured Assets CMN Owner Trust | | | | | | |
0.72%, 05/25/35† | | | 1,086,086 | | | 492,956 |
Indymac ARM Trust | | | | | | |
4.45%, 09/28/31† | | | 21,157 | | | 21,179 |
Indymac INDA Mortgage Loan Trust | | | | | | |
6.18%, 11/01/37† | | | 822,859 | | | 537,234 |
Indymac Index Mortgage Loan Trust | | | | | | |
5.32%, 08/25/35† | | | 464,334 | | | 284,124 |
5.10%, 09/25/35† | | | 588,233 | | | 282,430 |
5.40%, 09/25/35† | | | 632,508 | | | 337,494 |
0.69%, 04/25/46† | | | 1,119,925 | | | 452,482 |
0.66%, 09/25/46† | | | 1,851,817 | | | 748,030 |
JP Morgan Alternative Loan Trust | | | | | | |
0.73%, 01/25/36† | | | 893,379 | | | 401,588 |
JP Morgan Chase Commercial Mortgage Securities Corporation | | | | | | |
4.90%, 09/12/37 | | | 3,400,000 | | | 2,687,445 |
4.92%, 10/15/42† | | | 200,000 | | | 157,722 |
JP Morgan Mortgage Trust | | | | | | |
5.02%, 02/25/35† | | | 1,280,748 | | | 960,893 |
4.07%, 07/25/35† | | | 772,346 | | | 574,730 |
4.20%, 07/25/35† | | | 827,441 | | | 614,581 |
4.77%, 07/25/35† | | | 736,263 | | | 538,981 |
5.06%, 07/25/35† | | | 594,360 | | | 512,431 |
LB-UBS Commercial Mortgage Trust | | | | | | |
4.66%, 07/15/30 | | | 1,000,000 | | | 804,532 |
4.74%, 07/15/30 | | | 830,000 | | | 670,791 |
27.56%, 06/15/36 IO 144AW†@ | | | 4,244,019 | | | 71,234 |
4.95%, 09/15/40 | | | 900,000 | | | 734,672 |
Liberty Street Funding LLC | | | | | | |
5.50%, 09/01/37 | | | 151,121 | | | 155,086 |
Luminent Mortgage Trust | | | | | | |
0.66%, 07/25/36† | | | 638,061 | | | 246,913 |
0.64%, 12/25/36† | | | 4,081,286 | | | 1,789,975 |
0.67%, 02/25/46† | | | 1,127,491 | | | 457,952 |
MASTR Adjustable Rate Mortgages Trust | | | | | | |
5.19%, 05/25/34† | | | 342,179 | | | 212,694 |
5.65%, 11/25/35 144A† | | | 1,376,130 | | | 738,906 |
0.67%, 05/25/47† | | | 3,998,885 | | | 1,541,806 |
MASTR Reperforming Loan Trust | | | | | | |
7.00%, 08/25/34 144A | | | 879,434 | | | 923,800 |
Merrill Lynch-Countrywide Financial Corporation Commercial Mortgage Trust | | | | | | |
5.49%, 03/01/45† | | | 960,000 | | | 660,943 |
MLCC Mortgage Investors, Inc. | | | | | | |
3.83%, 09/25/27 STEP | | | 482,894 | | | 320,368 |
Prime Mortgage Trust | | | | | | |
5.50%, 05/25/35 144A | | | 7,179,633 | | | 4,878,747 |
6.00%, 05/25/35 144A | | | 923,155 | | | 719,664 |
6.00%, 11/25/36 144A | | | 3,804,369 | | | 2,459,317 |
RBSGC Mortgage Pass Through Certificates | | | | | | |
0.92%, 01/25/37† | | | 1,423,337 | | | 720,410 |
Residential Accredit Loans, Inc. | | | | | | |
3.26%, 01/25/46† | | | 1,088,550 | | | 468,613 |
Residential Funding Mortgage Securities I | | | | | | |
5.18%, 09/25/35† | | | 728,300 | | | 447,192 |
5.20%, 09/25/35† | | | 642,097 | | | 395,202 |
Sequoia Mortgage Trust | | | | | | |
3.41%, 07/20/33† | | | 261,052 | | | 174,826 |
3.75%, 10/20/34 STEP | | | 253,929 | | | 172,076 |
See Notes to Financial Statements.
98
| | | | | | |
| | | Par | | Value |
Structured Adjustable Rate Mortgage Loan Trust | | | | | | |
4.38%, 05/25/34† | | $ | 459,311 | | $ | 293,621 |
5.25%, 09/25/34† | | | 213,465 | | | 101,579 |
5.45%, 11/25/34† | | | 865,128 | | | 489,430 |
0.81%, 08/25/35† | | | 731,063 | | | 299,851 |
Structured Asset Mortgage Investments, Inc. | | | | | | |
0.83%, 07/19/35† | | | 227,328 | | | 98,390 |
0.78%, 12/25/35† | | | 1,031,636 | | | 485,926 |
0.70%, 02/25/36† | | | 1,091,703 | | | 422,398 |
3.98%, 11/25/37† | | | 2,576,781 | | | 1,087,174 |
Structured Asset Securities Corporation | | | | | | |
4.95%, 09/25/33† | | | 980,065 | | | 664,293 |
Thornburg Mortgage Securities Trust | | | | | | |
0.58%, 06/25/09† | | | 3,231,929 | | | 3,161,856 |
0.64%, 01/25/36† | | | 4,086,031 | | | 4,070,446 |
6.20%, 09/25/37† | | | 1,456,219 | | | 1,117,234 |
6.21%, 09/25/37† | | | 1,524,315 | | | 1,079,547 |
Wachovia Bank Commercial Mortgage Trust | | | | | | |
5.21%, 10/15/44 STRIP† | | | 3,000,000 | | | 2,449,588 |
WAMU Alternative Mortgage Pass-Through Certificates | | | | | | |
3.10%, 11/25/46† | | | 2,482,848 | | | 905,654 |
Washington Mutual Mortgage Pass-Through Certificates | | | | | | |
1.01%, 12/25/27† | | | 2,394,139 | | | 1,982,581 |
5.83%, 02/25/33† | | | 25,705 | | | 22,056 |
4.24%, 06/25/34† | | | 572,588 | | | 404,889 |
5.61%, 12/25/36† | | | 787,816 | | | 390,074 |
5.71%, 02/25/37† | | | 1,371,135 | | | 747,925 |
5.86%, 02/25/37† | | | 892,718 | | | 626,438 |
3.66%, 06/25/42† | | | 41,568 | | | 30,350 |
0.76%, 07/25/45† | | | 1,500,657 | | | 696,434 |
0.79%, 07/25/45† | | | 983,097 | | | 403,012 |
0.79%, 08/25/45† | | | 3,271,250 | | | 1,768,886 |
0.76%, 10/25/45† | | | 2,981,007 | | | 1,628,155 |
0.73%, 11/25/45† | | | 1,278,099 | | | 627,029 |
0.74%, 12/25/45† | | | 824,283 | | | 376,396 |
0.76%, 12/25/45† | | | 1,749,059 | | | 806,929 |
3.02%, 04/25/47† | | | 1,772,054 | | | 780,342 |
Wells Fargo Alternative Loan Trust | | | | | | |
6.60%, 11/01/37† | | | 2,501,528 | | | 1,136,413 |
Wells Fargo Mortgage-Backed Securities Trust | | | | | | |
3.74%, 09/25/34† | | | 2,440,000 | | | 2,392,795 |
5.03%, 04/25/35† | | | 2,064,575 | | | 1,515,835 |
5.00%, 10/25/35† | | | 836,135 | | | 633,819 |
Zuni Mortgage Loan Trust | | | | | | |
0.60%, 07/25/36† | | | 1,622,364 | | | 1,537,906 |
| | | | | | |
Total Mortgage-Backed Securities
(Cost $743,059,894) | | | | | | 692,645,150 |
| | | | | | |
MUNICIPAL BONDS — 0.6% | | | | | | |
Illinois Finance Authority | | | | | | |
5.75%, 07/01/33 | | | 1,800,000 | | | 1,834,236 |
South Carolina Transportation Infrastructure Bank, Series A Revenue Bond (AMBAC Insured) | | | | | | |
5.00%, 10/01/23 | | | 2,700,000 | | | 2,567,403 |
Virginia State Housing Development Authority, Commonwealth Mortgage, Series H Revenue Bond (MBIA Insured) 5.38%, 07/01/36 | | | 1,000,000 | | | 919,520 |
| | | | | | |
Total Municipal Bonds
(Cost $5,379,114) | | | | | | 5,321,159 |
| | | | | | |
| | |
| | | Number of
Contracts | | |
PURCHASED OPTIONS — 1.7% | | | | | | |
Call Options — 0.0% | | | | | | |
3-Month Euro-BOBL Futures, Strike Price $135.00, expires 03/20/09 | | | 10 | | | 70 |
3-Month Euro-Bund Futures, Strike Price $145.00, expires 03/20/09 | | | 56 | | | 778 |
3-Month Euro-Schatz Futures, Strike Price $120.00, expires 03/20/09 | | | 193 | | | 1,341 |
| | | | | | |
| | | | | | 2,189 |
| | | | | | |
Put Options — 0.0% | | | | | | |
10-Year U.S. Treasury Note Futures, Strike Price $80.00, Expires 03/20/09 | | | 99 | | | 1,547 |
10-Year U.S. Treasury Note Futures, Strike Price $87.00, Expires 03/27/09 | | | 190 | | | — |
5-Year U.S. Treasury Note Futures, Strike Price $85.00, Expires 03/20/09 | | | 229 | | | 1,789 |
| | | | | | |
| | | | | | 3,336 |
| | | | | | |
| | |
| | | Notional
Amount | | |
Call Options — 0.0% | | | | | | |
Euro vs. Japanese Yen, Strike Price $148.40, Expires | | | | | | |
PUR06/03/10 | | $ | 1,000,000 | | | 36,706 |
Euro vs. U.S. Dollar, Strike | | | | | | |
Price $1.38, Expires 05/21/10 | | | 1,700,000 | | | 219,306 |
| | | | | | |
| | | | | | 256,012 |
| | | | | | |
Call Swaptions — 1.6% | | | | | | |
3-Month LIBOR, Strike Price $3.15, Expires 02/02/09 | | | 51,000,000 | | | 1,597,608 |
3-Month LIBOR, Strike Price $3.50, Expires 02/02/09 | | | 23,800,000 | | | 909,108 |
3-Month LIBOR, Strike Price $4.25, Expires 07/06/09 | | | 66,400,000 | | | 3,265,574 |
3-Month LIBOR, Strike Price $7.00, Expires 03/18/09 | | | 66,000,000 | | | 8,240,535 |
| | | | | | |
| | | | | | 14,012,825 |
| | | | | | |
Put Options — 0.1% | | | | | | |
30-Year Federal National Mortgage Association, Strike Price $35.00, Expires 01/13/09 | | | 5,500,000 | | | — |
30-Year Federal National Mortgage Association, Strike Price $43.00, Expires 01/06/09 | | | 87,000,000 | | | — |
See Notes to Financial Statements.
99
Medium-Duration Bond Fund
SCHEDULE OF INVESTMENTS (Continued)
| | | | | | |
| | | Notional
Amount | | Value |
30-Year Federal National Mortgage Association, Strike Price $43.00, Expires 01/06/09 | | $ | 2,000,000 | | $ | — |
30-Year Federal National Mortgage Association, Strike Price $45.00, Expires 01/06/09 | | | 5,000,000 | | | — |
30-Year Federal National Mortgage Association, Strike Price $45.00, Expires 01/06/09 | | | 5,000,000 | | | — |
30-Year Federal National Mortgage Association, Strike Price $48.00, Expires 02/05/09 | | | 32,000,000 | | | — |
30-Year Federal National Mortgage Association, Strike Price $50.00, Expires 01/06/09 | | | 8,000,000 | | | — |
30-Year Federal National Mortgage Association, Strike Price $50.00, Expires 02/11/09 | | | 5,000,000 | | | — |
30-Year Federal National Mortgage Association, Strike Price $51.00, Expires 01/06/09 | | | 6,000,000 | | | — |
30-Year Federal National Mortgage Association, Strike Price $52.00, Expires 01/06/09 | | | 10,000,000 | | | — |
30-Year Federal National Mortgage Association, Strike Price $54.00, Expires 01/06/09 | | | 3,000,000 | | | — |
30-Year Federal National Mortgage Association, Strike Price $57.00, Expires 01/06/09 | | | 500,000 | | | — |
30-Year Federal National Mortgage Association, Strike Price $58.00, Expires 01/06/09 | | | 11,200,000 | | | — |
30-Year Federal National Mortgage Association, Strike Price $66.00, Expires 01/06/09 | | | 5,100,000 | | | — |
30-Year Federal National Mortgage Association, Strike Price $75.50, Expires 02/09/09 | | | 32,000,000 | | | — |
30-Year Federal National Mortgage Association, Strike Price $80.00, Expires 02/05/09 | | | 63,000,000 | | | — |
30-Year Government National Mortgage Association, Strike Price $50.00, Expires 01/14/09 | | | 9,800,000 | | | — |
30-Year Government National Mortgage Association, Strike Price $54.00, Expires 01/14/09 | | | 1,400,000 | | | — |
30-Year Government National Mortgage Association, Strike Price $55.00, Expires 01/14/09 | | | 21,000,000 | | | — |
30-Year Government National Mortgage Association, Strike Price $55.00, Expires 01/14/09 | | $ | 20,000,000 | | $ | — |
30-Year Government National Mortgage Association, Strike Price $57.00, Expires 01/14/09 | | | 100,000 | | | — |
30-Year Government National Mortgage Association, Strike Price $72.00, Expires 02/12/09 | | | 13,000,000 | | | — |
30-Year Government National Mortgage Association, Strike Price $74.25, Expires 02/12/09 | | | 19,000,000 | | | — |
30-Year Government National Mortgage Association, Strike Price $90.00, Expires 02/12/09 | | | 15,000,000 | | | — |
Euro vs. Japanese Yen, Strike Price $148.40, Expires 06/03/10 | | | 1,000,000 | | | 301,802 |
Euro vs. U.S. Dollar, Strike Price $1.38, Expires 05/21/10 | | | 1,700,000 | | | 199,465 |
| | | | | | |
| | | | | | 501,267 |
| | | | | | |
Total Purchased Options
(Cost $6,915,159) | | | | | | 14,775,629 |
| | | | | | |
| | | Shares | | |
PREFERRED STOCKS — 0.3% | | | | | | |
CORTS Trust for Ford Motor Co. | | | 9,100 | | | 48,230 |
Federal Home Loan Mortgage Corporation | | | 55,675 | | | 21,713 |
Federal National Mortgage Association | | | 42,050 | | | 34,809 |
General Motors Corporation CONV | | | 40,650 | | | 139,836 |
Preferred Blocker (GMAC), Inc.+ | | | 290 | | | 87,000 |
Wachovia Corporation | | | 2,400 | | | 1,800,000 |
| | | | | | |
Total Preferred Stocks
(Cost $4,877,346) | | | | | | 2,131,588 |
| | | | | | |
MONEY MARKET FUNDS — 7.7% | | | | | | |
GuideStone Money Market Fund (GS4 Class)¥ | | | 15,426,294 | | | 15,426,294 |
Northern Institutional Liquid Assets Portfolio§ | | | 51,066,761 | | | 51,066,761 |
| | | | | | |
Total Money Market Funds
(Cost $66,493,055) | | | | | | 66,493,055 |
| | | | | | |
| | |
| | | Par | | |
U.S. TREASURY OBLIGATIONS — 8.1% | | | | | | |
U.S. Treasury Bills | | | | | | |
0.28%, 01/02/09D | | $ | 280,000 | | | 280,000 |
0.75%, 01/15/09 | | | 790,000 | | | 789,997 |
0.24%, 01/29/09 | | | 280,000 | | | 280,000 |
0.03%, 03/26/09 | | | 5,010,000 | | | 5,009,549 |
| | | | | | |
| | | | | | 6,359,546 |
| | | | | | |
See Notes to Financial Statements.
100
| | | | | | | | |
| | | Par | | | Value | |
U.S. Treasury Bonds | | | | | | | | |
8.13%, 08/15/19D | | $ | 1,900,000 | | | $ | 2,808,736 | |
7.13%, 02/15/23D | | | 700,000 | | | | 1,015,766 | |
| | | | | | | | |
| | | | | | | 3,824,502 | |
| | | | | | | | |
U.S. Treasury Inflationary Index Bonds | | | | | | | | |
2.00%, 01/15/16D | | | 500,000 | | | | 522,826 | |
2.50%, 07/15/16 | | | 5,780,000 | | | | 6,153,508 | |
2.38%, 01/15/25D | | | 5,340,000 | | | | 6,033,859 | |
2.00%, 01/15/26D | | | 1,660,000 | | | | 1,707,329 | |
2.38%, 01/15/27D | | | 2,560,000 | | | | 2,763,693 | |
1.75%, 01/15/28D‡‡ | | | 3,700,000 | | | | 3,536,287 | |
3.63%, 04/15/28D | | | 2,300,000 | | | | 3,671,158 | |
3.88%, 04/15/29D‡‡ | | | 4,468,000 | | | | 7,274,117 | |
| | | | | | | | |
| | | | | | | 31,662,777 | |
| | | | | | | | |
U.S. Treasury STRIPS | | | | | | | | |
3.99%, 05/15/21W | | | 17,700,000 | | | | 11,730,162 | |
4.03%, 05/15/21WD | | | 800,000 | | | | 529,274 | |
4.06%, 08/15/21WD | | | 700,000 | | | | 457,161 | |
4.06%, 11/15/21WD | | | 8,800,000 | | | | 5,712,591 | |
4.09%, 11/15/21W | | | 3,200,000 | | | | 2,073,366 | |
4.14%, 08/15/24WD | | | 8,200,000 | | | | 4,935,711 | |
4.04%, 05/15/26WD | | | 1,500,000 | | | | 874,974 | |
4.03%, 11/15/26WD | | | 3,600,000 | | | | 2,049,138 | |
| | | | | | | | |
| | | | | | | 28,362,377 | |
| | | | | | | | |
Total U.S. Treasury Obligations
(Cost $64,535,300) | | | | | | | 70,209,202 | |
| | | | | | | | |
TOTAL INVESTMENTS — 144.6%
(Cost $1,361,638,637) | | | | | | | 1,251,050,901 | |
| | | | | | | | |
| | |
| | | Number of
Contracts | | | | |
WRITTEN OPTIONS — (1.5)% | | | | | | | | |
Call Options — 0.0% | | | | | | | | |
90-Day Eurodollar Futures, Strike Price $97.50, Expires 03/17/09 | | | (1 | ) | | | (3,625 | ) |
90-Day Eurodollar Futures, Strike Price $97.75, Expires 03/17/09 | | | (1 | ) | | | (3,013 | ) |
| | | | | | | | |
| | | | | | | (6,638 | ) |
| | | | | | | | |
Put Swaptions — 0.0% | | | | | | | | |
3-Month LIBOR, Strike Price $2.75, Expires 05/22/09 | | | (450 | ) | | | (48,462 | ) |
3-Month LIBOR, Strike Price $2.75, Expires 05/22/09 | | | (450 | ) | | | (48,462 | ) |
| | | | | | | | |
| | | | | | | (96,924 | ) |
| | | | | | | | |
| | |
| | | Notional
Amount | | | | |
Call Swaptions — (1.5)% | | | | | | | | |
3-Month LIBOR, Strike Price $4.25, Expires 02/02/09 | | $ | (13,800,000 | ) | | | (1,668,403 | ) |
3-Month LIBOR, Strike Price $4.60, Expires 02/02/09 | | | (8,000,000 | ) | | | (1,148,181 | ) |
3-Month LIBOR, Strike Price $4.90, Expires 07/06/09 | | | (22,100,000 | ) | | | (3,438,962 | ) |
3-Month LIBOR, Strike Price $7.00, Expires 03/18/09 | | | (20,300,000 | ) | | | (6,736,467 | ) |
| | | | | | | | |
| | | | | | | (12,992,013 | ) |
| | | | | | | | |
Total Written Options
(Premiums received $(5,614,864)) | | | | | | | (13,095,575 | ) |
| | | | | | | | |
| | |
| | | Par | | | Value | |
SECURITIES SOLD SHORT — (1.2)% | | | | | | | | |
Federal National Mortgage Association | | | | | | | | |
5.00%, 01/01/24 TBA | | $ | (1,000,000 | ) | | $ | (1,026,250 | ) |
4.50%, 01/20/24 TBA | | | (2,000,000 | ) | | | (2,043,750 | ) |
5.00%, 01/11/37 TBA | | | (5,000,000 | ) | | | (5,104,690 | ) |
Government National Mortgage Association | | | | | | | | |
6.00%, 01/01/38 TBA | | | (1,700,000 | ) | | | (1,753,655 | ) |
| | | | | | | | |
Total Securities Sold Short
(Cost $(9,904,133)) | | | | | | | (9,928,345 | ) |
| | | | | | | | |
Liabilities in Excess of Other Assets — (41.9)% | | | | | | | (362,660,243 | ) |
| | | | | | | | |
NET ASSETS — 100.0% | | | | | | $ | 865,366,738 | |
| | | | | | | | |
See Notes to Financial Statements.
101
Medium-Duration Bond Fund
SCHEDULE OF INVESTMENTS (Continued)
Swap agreements outstanding at December 31, 2008:
| | | | | | | | |
Description | | Expiration
Date | | Notional
Amount | | Unrealized
Appreciation
(Depreciation) | |
Brazilian Real | | | | | | | | |
Receive fixed rate payments on the three month BRL BRR CDI and pay fixed rate payments of 14.765%(j) | | 01/02/12 | | 1,000,000 | | $ | 20,236 | |
Receive fixed rate payments on the three month BRL BRR CDI and pay fixed rate payments of 10.12%(k) | | 01/02/12 | | 51,100,000 | | | (1,400,857 | ) |
Receive fixed rate payments of 13.2258% and pay variable rate payments on the BZDIOVRA Index floating rate(d) | | 12/17/15 | | 6,000,000 | | | 15,501 | |
Receive fixed rate payments of 13.22% and pay variable rate payments on the BZDIOVRA Index floating rate(f) | | 12/17/23 | | 2,000,000 | | | 5,134 | |
| | | | | | | | |
| | | | | | | (1,359,986 | ) |
| | | | | | | | |
British Pounds | | | | | | | | |
Receive fixed rate payments of 5.00% and pay variable rate payments on the six month LIBOR floating rate(d) | | 09/15/15 | | 2,500,000 | | | 345,841 | |
Receive fixed rate payments of 5.00% and pay variable rate payments on the six month LIBOR floating rate(f) | | 09/15/10 | | 4,000,000 | | | 204,681 | |
Receive fixed rate payments of 5.00% and pay variable rate payments on the six month LIBOR floating rate(b) | | 09/15/10 | | 10,200,000 | | | 521,835 | |
Receive fixed rate payments of 5.00% and pay variable rate payments on the six month LIBOR floating rate(m) | | 09/15/15 | | 400,000 | | | 54,129 | |
Pay fixed rate payments of 4.25% and receive variable rate payments on the on the six month LIBOR floating rate(k) | | 06/15/37 | | 1,600,000 | | | (219,671 | ) |
Pay fixed rate payments of 4.25% and receive variable rate payments on the on the six month LIBOR floating rate (f) | | 06/15/37 | | 4,800,000 | | | (659,013 | ) |
Receive fixed rate payments of 4.50% and pay variable rate payments on the six month LIBOR floating rate(k) | | 09/17/11 | | 15,600,000 | | $ | 898,418 | |
Receive variable rate payments on the six month LIBOR floating rate and and pay fixed rate payments of 4.00%(b) | | 06/15/37 | | 1,900,000 | | | (211,407 | ) |
| | | | | | | | |
| | | | | | | 934,813 | |
| | | | | | | | |
Euro | | | | | | | | |
Receive variable rate payments on the six month EURIBOR floating rate and and pay fixed rate payments of 5.00%(b) | | 09/17/38 | | 1,400,000 | | | (494,622 | ) |
Receive variable rate payments on the six month EURIBOR floating rate and and pay fixed rate payments of 5.00%(m) | | 09/17/38 | | 1,400,000 | | | (494,622 | ) |
Receive fixed rate payments of 4.50% and pay variable rate payments on the six month EURIBOR floating rate(f) | | 06/15/10 | | 16,900,000 | | | 490,301 | |
Receive fixed rate payments of 5.50% and pay variable rate payments on the six month EURIBOR floating rate(f) | | 09/15/10 | | 13,700,000 | | | 823,767 | |
Receive fixed rate payments of 2.15% and pay variable rate payments on the France CPI Ex Tobacco(n) | | 10/15/10 | | 300,000 | | | 15,964 | |
Receive fixed rate payments of 5.50% and pay variable rate payments on the six month EURIBOR floating rate(b) | | 12/17/10 | | 1,300,000 | | | 91,026 | |
Receive fixed rate payments of 5.50% and pay variable rate payments on the six month EURIBOR floating rate(k) | | 12/17/10 | | 5,700,000 | | | 399,114 | |
Receive fixed rate payments of 4.00% and pay variable rate payments on the six month EURIBOR floating rate(f) | | 06/15/13 | | 6,000,000 | | | 217,306 | |
See Notes to Financial Statements.
102
| | | | | | | | | |
Description | | Expiration
Date | | Notional
Amount | | Unrealized
Appreciation
(Depreciation) | |
Receive fixed rate payments of 4.50% and pay variable rate payments on the six month EURIBOR floating rate(f) | | 03/18/14 | | | 8,500,000 | | $ | 666,194 | |
| | | | | | | | | |
| | | | | | | | 1,714,428 | |
| | | | | | | | | |
Japanese Yen | | | | | | | | | |
Receive variable rate payments on the six month LIBOR rate and pay fixed rate payments of 1.50%(m) | | 06/17/18 | | | 90,000,000 | | | (22,519 | ) |
Receive variable rate payments on the six month LIBOR rate and pay fixed rate payments of 1.50%(n) | | 06/17/18 | | | 200,000,000 | | | (50,042 | ) |
| | | | | | | | | |
| | | | | | | | (72,561 | ) |
| | | | | | | | | |
Mexican Pesos | | | | | | | | | |
Receive fixed rate payments of 8.95% and pay variable rate payments on the MXIBTIIE Index floating rate(h) | | 11/19/10 | | | 13,000,000 | | | 18,382 | |
Receive fixed rate payments of 8.85% and pay variable rate payments on the MXIBTIIE Index floating rate(d) | | 11/23/10 | | | 22,300,000 | | | 2,128 | |
Receive fixed rate payments of 8.42% and pay variable rate payments on the MXIBTIIE Index floating rate(h) | | 12/01/10 | | | 21,000,000 | | | 14,811 | |
Receive fixed rate payments of 8.38% and pay variable rate payments on the MXIBTIIE Index floating rate(h) | | 12/03/10 | | | 18,000,000 | | | 12,692 | |
Receive fixed rate payments of 8.21% and pay variable rate payments on the MXIBTIIE Index floating rate(d) | | 12/08/10 | | | 46,000,000 | | | 577 | |
Receive fixed rate payments of 8.21% and pay variable rate payments on the MXIBTIIE Index floating rate(d) | | 12/09/10 | | | 39,000,000 | | | 483 | |
Receive fixed rate payments of 8.17% and pay variable rate payments on the six month MX BRR TIIE Index(j) | | 11/04/16 | | | 93,000,000 | | | (30,218 | ) |
Receive fixed rate payments of 8.91% and pay variable rate payments on the MXIBTIIE Index floating rate(f) | | 12/17/28 | | | 19,000,000 | | $ | 1,716 | |
| | | | | | | | | |
| | | | | | | | 20,571 | |
| | | | | | | | | |
U.S. Dollars | | | | | | | | | |
Receive variable rate payments on CMM Index and pay fixed rate payments of 5.50%(j) | | 02/23/09 | | $ | 5,800,000 | | | (977,697 | ) |
Receive variable rate payments on the three month LIBOR rate and pay fixed rate payments of 4.00%(b) | | 06/17/11 | | | 200,000 | | | (9,073 | ) |
Receive floating par in the event of default on DaimlerChrysler NA Holdings, 5.75% due 09/08/11 and pay fixed rate payments of 0.58%(b) | | 09/20/11 | | | 900,000 | | | 100,952 | |
Receive floating par in the event of default on the Dow Jones CDX X07 Index and pay fixed rate payments of 1.65%(h) | | 12/20/11 | | | 3,885,716 | | | 644,947 | |
Receive floating par in the event of default on the Dow Jones CDX HVOL7 Index and pay fixed rate payments of 0.75%(b) | | 12/20/11 | | | 1,700,000 | | | 196,605 | |
Receive floating par in the event of default on International Lease Finance Corporation, 5.40% due 02/15/12 and pay fixed rate payments of 0.17%(b) | | 03/20/12 | | | 400,000 | | | 91,002 | |
Receive floating par in the event of default on XL Capital PLC, 6.50% due 01/15/12, and pay fixed rate payments of 0.21%(b) | | 03/20/12 | | | 500,000 | | | 117,906 | |
Receive floating par in the event of default on Target Corporation, 5.88% due 03/01/12 and pay fixed rate payments of 0.11%(k) | | 06/20/12 | | | 1,200,000 | | | 66,365 | |
See Notes to Financial Statements.
103
Medium-Duration Bond Fund
SCHEDULE OF INVESTMENTS (Continued)
| | | | | | | | |
Description | | Expiration
Date | | Notional
Amount | | Unrealized
Appreciation
(Depreciation) | |
Receive floating par in the event of default on the Dow Jones CDX HY-8 and pay fixed rate payments of 1.60%(j) | | 06/20/12 | | 1,200,000 | | | 224,457 | |
Receive floating par in the event of default on The Dow Jones CDX HY-8 and pay fixed rate payments of 2.75%(j) | | 06/18/13 | | 1,176,000 | | $ | 198,746 | |
Receive variable rate payments on the CDX IG50 Index and pay fixed rate payments of 1.55%(f) | | 06/20/13 | | 10,000,000 | | | 231,003 | |
Receive floating par in the event of default on CDX IG 50 and pay fixed rate payments of 1.55%(f) | | 06/20/13 | | 15,000,000 | | | 346,504 | |
Receive floating par in the event of default on CDX IG 50 and pay fixed rate payments of 1.55%(f) | | 06/20/13 | | 15,000,000 | | | 346,722 | |
Receive floating par in the event of default on the CDX HY-10 Index and pay fixed rate payments of 5.00%(b) | | 06/20/13 | | 1,800,000 | | | 282,437 | |
Receive floating par in the event of default on the CDX HY-10 Index and pay fixed rate payments of 5.00%(n) | | 06/20/13 | | 1,800,000 | | | 282,437 | |
Receive variable rate payments in the event of default on CDX IG10 5Y and pay fixed rate payments of 1.55%(p) | | 06/20/13 | | 1,171,200 | | | 26,357 | |
Receive floating par in the event of default on Sealed Air Corporation, 5.63% due 07/15/13 and pay fixed rate payments of 0.58%(k) | | 09/20/13 | | 400,000 | | | 68,286 | |
Receive fixed rate payments of 4.00% and pay variable rate payments on the three month LIBOR floating rate(j) | | 12/17/13 | | 36,900,000 | | | 3,242,559 | |
Receive fixed rate payments of 4.00% and pay variable rate payments on the three month LIBOR floating rate(k) | | 12/17/13 | | 58,200,000 | | | 5,114,279 | |
Receive variable rate payments on the three month LIBOR floating rate and pay fixed rate payments of 3.25%(h) | | 06/17/14 | | 2,400,000 | | $ | (116,860 | ) |
Receive fixed rate payments of 4.00% and pay variable rate payments on the three month LIBOR floating rate(j) | | 06/17/14 | | 1,800,000 | | | 145,459 | |
Pay variable rate on the three month LIBOR rate and receive fixed rate payments of 4.00%(b) | | 06/17/14 | | 700,000 | | | 56,568 | |
Receive fixed rate payments of 4.00% and pay variable rate payments on the three month LIBOR floating rate(f) | | 06/17/14 | | 4,100,000 | | | 331,324 | |
Receive floating par in the event of default on American Electric Power and pay fixed rate payments of 6.26%(d) | | 06/20/15 | | 2,300,000 | | | 21,702 | |
Receive floating par in the event of default on CitiFinancial, 6.63% due 06/01/15 and pay fixed rate payments of 0.15%(b) | | 06/20/15 | | 300,000 | | | 28,645 | |
Receive fixed rate payments of 4.44424% and pay variable rate payments on the three month LIBOR floating rate(a) | | 11/18/15 | | 14,300,000 | | | 1,171,899 | |
Receive fixed rate payments of 3.81483% and pay variable rate payments on the three month LIBOR floating rate(a) | | 11/25/15 | | 10,400,000 | | | 551,667 | |
Receive variable rate payments on the three month LIBOR floating rate and pay fixed rate payments of 3.50%(h) | | 06/17/16 | | 3,000,000 | | | (213,918 | ) |
See Notes to Financial Statements.
104
| | | | | | | | |
Description | | Expiration
Date | | Notional
Amount | | Unrealized
Appreciation
(Depreciation) | |
Receive variable rate payments on the three month LIBOR floating rate and pay fixed rate payments of 3.50%(f) | | 06/17/16 | | 6,400,000 | | | (456,258 | ) |
Receive variable rate payments on the three month LIBOR rate and pay fixed rate payments of 4.00%(d) | | 06/17/16 | | 2,900,000 | | $ | (283,420 | ) |
Receive floating par in the event of default on Omnicon Group, Inc., 5.90% due 04/15/16 and pay fixed rate payments of 0.39%(k) | | 06/20/16 | | 700,000 | | | 109,490 | |
Receive floating par in the event of default on Bank of America, 5.62% due 10/14/16 and pay fixed rate payments of 0.17%(d) | | 12/20/16 | | 1,700,000 | | | 114,095 | |
Receive floating par in the event of default on Federal Republic of Brazil, 12.50% due 03/06/30 and pay fixed rate payments of 1.04% (SP) (f) | | 05/20/17 | | 1,000,000 | | | (143,832 | ) |
Receive floating par in the event of default on Autozone, 5.88% due 10/15/12 and pay fixed rate payments of 0.67%(m) | | 06/20/17 | | 1,700,000 | | | 84,963 | |
Receive floating par in the event of default on Autozone, 5.88% due 10/15/12 and pay fixed rate payments of 0.64%(m) | | 06/20/17 | | 900,000 | | | 46,874 | |
Receive floating par in the event of default on Autozone, 5.88% due 10/15/12 and pay fixed rate payments of 0.64%(m) | | 06/20/17 | | 600,000 | | | 31,039 | |
Receive floating par in the event of default on GMAC, LLC, 6.88% due 08/28/12 and pay fixed rate payments of 3.53% (SP)(f) | | 09/20/17 | | 8,400,000 | | | (1,969,735 | ) |
Receive floating par in the event of default on Dominion Resources, Inc. and pay fixed rate payments of 0.69%(d) | | 12/20/17 | | 3,800,000 | | | 76,977 | |
Receive floating par in the event of default on the Dow Jones CDX IG9 Index and pay fixed rate payments of 0.80%(m) | | 12/20/17 | | 7,222,400 | | | 367,086 | |
Receive floating par in the event of default on Citigroup and pay fixed rate payments of 1.01%(f) | | 06/20/18 | | 8,700,000 | | $ | 491,841 | |
Receive variable rate payments in the event of default on CDX IG10 10y and pay fixed rate payments of 1.50%(f) | | 06/20/18 | | 3,025,600 | | | 2,811 | |
Receive floating par in the event of default on the CDX IG10 Index and pay fixed rate payments of 1.50%(k) | | 06/20/18 | | 12,102,400 | | | 11,243 | |
Receive variable rate payments on the three month LIBOR floating rate and pay fixed rate payments of 5.00%(k) | | 12/17/18 | | 14,400,000 | | | (3,099,124 | ) |
Receive fixed rate payments of 3.50% and pay variable rate payments on the three month LIBOR floating rate(a) | | 06/17/19 | | 12,700,000 | | | 1,038,413 | |
Receive fixed rate payments of 3.50% and pay variable rate payments on the three month LIBOR floating rate(f) | | 06/17/19 | | 4,500,000 | | | 373,014 | |
Receive fixed rate payments of 3.50% and pay variable rate payments on the three month LIBOR floating rate(h) | | 06/17/19 | | 900,000 | | | 74,362 | |
Receive variable rate payments on the three month LIBOR floating rate and pay fixed rate payments of 4.56863%(a) | | 11/18/20 | | 8,700,000 | | | (1,267,621 | ) |
See Notes to Financial Statements.
105
Medium-Duration Bond Fund
SCHEDULE OF INVESTMENTS (Continued)
| | | | | | | | |
Description | | Expiration
Date | | Notional
Amount | | Unrealized
Appreciation
(Depreciation) | |
Receive variable rate payments on the three month LIBOR floating rate and pay fixed rate payments of 3.80667%(a) | | 11/25/20 | | 6,300,000 | | | (508,309 | ) |
Receive variable rate payments on the three month LIBOR floating rate and pay fixed rate payments of 5.00%(j) | | 12/17/23 | | 4,000,000 | | | (1,087,406 | ) |
Receive variable rate payments on the three month LIBOR floating rate and pay fixed rate payments of 5.00%(m) | | 12/17/23 | | 18,400,000 | | $ | (5,002,066 | ) |
Receive variable rate payments on the three month LIBOR floating rate and pay fixed rate payments of 5.00%(b) | | 12/17/23 | | 3,800,000 | | | (1,033,035 | ) |
Receive variable rate payments on the three month floating LIBOR rate and pay fixed rate payments of 3.50%(a) | | 06/17/24 | | 4,000,000 | | | (357,246 | ) |
Receive variable rate payments on the three month LIBOR floating rate and pay fixed rate payments of 3.50%(f) | | 06/17/24 | | 1,800,000 | | | (159,541 | ) |
Receive variable rate payments on the three month LIBOR floating rate and pay fixed rate payments of 3.50%(h) | | 06/17/24 | | 400,000 | | | (35,174 | ) |
Receive variable rate payments on the three month LIBOR floating rate and pay fixed rate payments of 3.50%(f) | | 06/17/24 | | 6,200,000 | | | (549,531 | ) |
Receive variable rate payments on the three month LIBOR floating rate and pay fixed rate payments of 3.50%(f) | | 06/17/24 | | 3,200,000 | | | (283,629 | ) |
Receive variable rate payments on the three month LIBOR rate and pay fixed rate payments of 4.00%(p) | | 06/17/24 | | 600,000 | | | (83,318 | ) |
Receive variable rate payments on the three month LIBOR rate and pay fixed rate payments of 4.00%(m) | | 06/17/24 | | 12,700,000 | | | (1,763,573 | ) |
Receive variable rate payments on the three month LIBOR and pay fixed rate payments of 5.00%(d) | | 12/17/28 | | 100,000 | | | (11,111 | ) |
Receive variable rate payments on the three month LIBOR floating rate and pay fixed rate payments of 5.00%(f) | | 12/17/28 | | 2,300,000 | | | (771,619 | ) |
Receive variable rate payments on the three month LIBOR floating rate and pay fixed rate payments of 5.00%(m) | | 12/17/28 | | 6,700,000 | | $ | (2,247,761 | ) |
Receive variable rate payments on the three month LIBOR floating rate and pay fixed rate payments of 5.00%(j) | | 12/17/28 | | 9,000,000 | | | (3,046,613 | ) |
Receive variable rate payments on the three month LIBOR floating rate and pay fixed rate payments of 5.00%(d) | | 12/17/28 | | 19,300,000 | | | (6,474,894 | ) |
Receive variable rate payments on the three month LIBOR rate and pay fixed rate payments of 3.00%(m) | | 06/17/29 | | 300,000 | | | (6,339 | ) |
Receive variable rate payments on the three month LIBOR floating rate and pay fixed rate payments of 3.50%(f) | | 06/18/29 | | 1,400,000 | | | (156,164 | ) |
Receive variable rate payments on the three month LIBOR and pay fixed rate payments of 3.50%(h) | | 06/18/29 | | 300,000 | | | (33,501 | ) |
Receive variable rate payments on the three month LIBOR floating rate and pay fixed rate payments of 3.50%(f) | | 06/18/29 | | 200,000 | | | (22,309 | ) |
Receive variable rate payments on the three month LIBOR floating rate and pay fixed rate payments of 3.50%(f) | | 06/18/29 | | 300,000 | | | (33,464 | ) |
Receive variable rate payments on the three month LIBOR floating rate and pay fixed rate payments of 3.50%(h) | | 06/18/29 | | 300,000 | | | (33,501 | ) |
See Notes to Financial Statements.
106
| | | | | | | | |
Description | | Expiration
Date | | Notional
Amount | | Unrealized
Appreciation
(Depreciation) | |
Receive variable rate payments on the three month LIBOR floating rate and pay fixed rate payments of 3.50%(h) | | 06/18/29 | | 2,500,000 | | | (279,174 | ) |
Receive floating par in the event of default on the ABX.HE.AAA .07-01 SP and pay fixed rate payments of 0.09% (SP) (p) | | 08/25/37 | | 1,000,000 | | | (604,985 | ) |
Receive variable rate payments on the three month LIBOR floating rate and pay fixed rate payments of 5.00%(j) | | 12/17/38 | | 3,700,000 | | $ | (1,681,710 | ) |
Receive variable rate payments on the three month LIBOR floating rate and pay fixed rate payments of 5.00%(m) | | 12/17/38 | | 4,700,000 | | | (2,142,815 | ) |
Receive fixed rate payments of 3.50% and pay variable rate payments on the three month LIBOR floating rate(f) | | 06/17/39 | | 2,900,000 | | | 459,043 | |
| | | | | | | | |
| | | | | | | (19,776,247 | ) |
| | | | | | | | |
| | | | | | $ | (18,538,982 | ) |
| | | | | | | | |
PORTFOLIO SUMMARY (based on net assets)
| | | |
| | | % | |
Mortgage-Backed Securities | | 80.1 | |
Futures Contracts | | 45.3 | |
Corporate Bonds | | 32.8 | |
U.S. Treasury Obligations | | 8.1 | |
Money Market Funds | | 7.7 | |
Foreign Bonds | | 6.7 | |
Asset-Backed Securities | | 5.0 | |
Purchased Options | | 1.7 | |
Loan Agreements | | 0.8 | |
Agency Obligations | | 0.8 | |
Municipal Bonds | | 0.6 | |
Preferred Stocks | | 0.3 | |
Forward Foreign Currency Contracts | | (0.6 | ) |
Securities Sold Short | | (1.2 | ) |
Written Options | | (1.5 | ) |
Swap Agreements | | (2.1 | ) |
| | | |
| | 184.5 | |
| | | |
FAS 157 DISCLOSURE
The following is a summary of the inputs used, as of December 31, 2008, in valuing the Fund’s investments carried at fair value:
| | | | | | | | |
Valuation Inputs | | Investments in
Securities | | | Other
Financial
Instruments*** | |
Assets: | | | | | | | | |
Level 1 — Quoted Prices | | $ | 69,300,447 | | | $ | 6,407,599 | |
Level 2 — Other Significant Observable Inputs | | | 1,178,195,474 | | | | — | |
Level 3 — Significant Unobservable Inputs | | | 3,554,980 | | | | — | |
| | | | | | | | |
Total Assets | | $ | 1,251,050,901 | | | $ | 6,407,599 | |
| | | | | | | | |
| | |
Liabilities: | | | | | | | | |
Level 1 — Quoted Prices | | $ | (6,638 | ) | | $ | — | |
Level 2 — Other Significant Observable Inputs | | | (23,017,282 | ) | | | (20,860,595 | ) |
Level 3 — Significant Unobservable Inputs | | | — | | | | — | |
| | | | | | | | |
Total Liabilities | | $ | (23,023,920 | ) | | $ | (20,860,595 | ) |
| | | | | | | | |
*** | Other financial instruments are derivative instruments not reflected in the Schedule of Investments, such as futures, forwards and swap contracts, which are valued at the unrealized appreciation (depreciation) on the investment. |
The following is a reconciliation of assets in which significant unobservable inputs (Level 3) were used in determining fair value:
| | | | | | | |
| | | Investments
in Securities | | | Other
Financial
Instruments |
Balance, 12/31/07 | | $ | 2,739,962 | | | $ | — |
Accrued discounts/premiums | | | — | | | | — |
Realized gain (loss) | | | — | | | | — |
Change in unrealized appreciation (depreciation)## | | | (1,356,884 | ) | | | — |
Net purchases (sales) | | | — | | | | — |
Transfers in and/or out of Level 3 | | | 2,171,902 | | | | — |
| | | | | | | |
Balance, 12/31/08 | | $ | 3,554,980 | | | $ | — |
| | | | | | | |
## | On the Statement of Operations for the year ended December 31, 2008, the amount of Net Realized and Unrealized Gain (Loss) included in Net Increase (Decrease) in Net Assets Resulting from Operations attributable to the change in unrealized appreciation (depreciation) relating to assets still held at the reporting date was $728. |
See Notes to Financial Statements.
107
Extended-Duration Bond Fund
The Extended-Duration Bond Fund invests in a diversified portfolio composed primarily of investment grade fixed-income securities with an average dollar-weighted duration normally greater than or equal to seven years. The Fund was generally positioned to capture the perceived long-term value of historically wide yield spreads but encountered a very challenging investment environment as credit spreads continued widening during the third and fourth quarters resulting in poor absolute and benchmark-relative performance for the year. The GS4 Class underperformed its benchmark with a return of (8.28)% for the one-year period, well behind its composite benchmark, 50% Barclays Capital U.S. Long-Term Government Bond Index / 50% Barclays Capital U.S. Long-Term Credit Bond Index, which returned 8.86%. The Fund lagged its benchmark on an annualized five-year and since-inception basis.
Please see page 114 for information regarding specific portfolio allocations. Portfolio holdings are subject to change at any time.
108
Extended-Duration Bond Fund
| | | | | | | | | | | | |
| | | Average Annual Total Returns as of 12/31/08 | |
| | | GS2
Class* | | | GS4
Class* | | | GS6
Class* | | | Benchmark** | |
One Year | | (8.12 | )% | | (8.28 | )% | | (8.54 | )% | | 8.86 | % |
Five Year | | 3.65 | % | | 3.50 | % | | 3.18 | % | | 6.39 | % |
Since Inception | | 5.67 | % | | 5.57 | % | | 5.22 | % | | 7.24 | % |
Inception Date | | 08/27/01 | | | 08/27/01 | | | 08/27/01 | | | 08/27/01 | |
Total Fund Operating Expenses (August 5, 2008 Prospectus) | | 0.52 | % | | 0.72 | % | | 0.97 | % | | | |
The performance data quoted represents past performance and does not guarantee future results. Current performance may be lower or higher. Performance data current to the most recent month-end may be obtained at www.GuideStoneFunds.org. The investment return and principal value of an investment will fluctuate so that shares, when redeemed, may be worth more or less than their original cost.
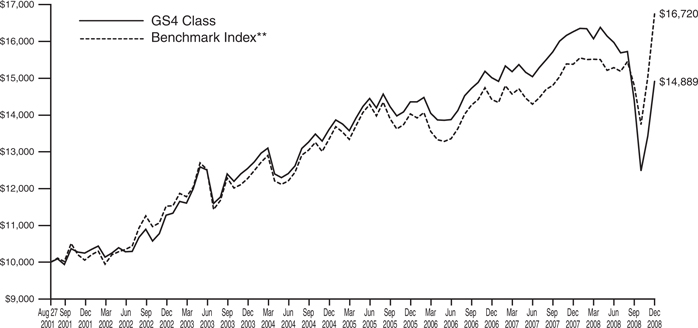
The graph compares the results of a hypothetical $10,000 investment in the GS4 Class of the Fund since August 27, 2001 (commencement of operations), with all dividends and capital gains reinvested, with the weighted composite benchmark index.
| * | These returns reflect expense waivers by the Fund’s investment adviser. Without these waivers, returns would have been lower. Returns shown do not reflect the deduction of taxes that a shareholder would pay on Fund distributions or the redemption of Fund shares. |
| ** | Represents a weighted composite benchmark index consisting of 50% Barclays Capital U.S. Long-Term Government Bond Index and 50% Barclays Capital U.S. Long-Term Credit Bond Index. |
The Barclays Capital U.S. Long-Term Government Bond Index is composed of all bonds covered by the Barclays Capital U.S. Government Bond Index with maturities of 10 years or greater.
The Barclays Capital U.S. Long-Term Credit Bond Index is composed of a subset of the Barclays Capital U.S. Credit Bond Index covering all corporate, publicly issued, fixed-rate, nonconvertible U.S. debt issues rated at least Baa with at least $50 million principal outstanding and maturity greater than 10 years.
Unlike a mutual fund, the performance of an index assumes no taxes, transaction costs, management fees or other expenses.
109
| | |
| Extended-Duration Bond Fund | | |
| SCHEDULE OF INVESTMENTS | | December 31, 2008 |
| | | | | | |
| | | Par | | Value |
ASSET-BACKED SECURITIES — 6.2% | | | | | | |
Capital One Multi-Asset Execution Trust | | | | | | |
5.75%, 07/15/20 | | $ | 12,900,000 | | $ | 9,692,063 |
Citibank Credit Card Issuance Trust | | | | | | |
6.15%, 06/15/39 | | | 12,650,000 | | | 8,713,351 |
Community Program Loan Trust | | | | | | |
4.50%, 04/01/29 | | | 1,950,000 | | | 1,806,230 |
Discover Card Master Trust | | | | | | |
5.65%, 03/16/20 | | | 9,100,000 | | | 6,891,019 |
| | | | | | |
Total Asset-Backed Securities
(Cost $36,548,527) | | | | | | 27,102,663 |
| | | | | | |
CORPORATE BONDS — 62.0% | | | | | | |
Albertson’s, Inc. | | | | | | |
7.75%, 06/15/26 | | | 800,000 | | | 492,000 |
6.63%, 06/01/28 | | | 105,000 | | | 56,175 |
7.45%, 08/01/29 | | | 985,000 | | | 586,075 |
8.00%, 05/01/31 | | | 110,000 | | | 66,550 |
American Express Co. | | | | | | |
8.15%, 03/19/38 | | | 12,446,000 | | | 14,315,539 |
American International Group, Inc. | | | | | | |
5.85%, 01/16/18 | | | 6,027,000 | | | 4,046,142 |
8.25%, 08/15/18 144A | | | 7,794,000 | | | 5,712,994 |
Anadarko Petroleum Corporation | | | | | | |
5.95%, 09/15/16 | | | 1,080,000 | | | 955,392 |
6.45%, 09/15/36 | | | 760,000 | | | 601,188 |
Apache Corporation | | | | | | |
6.00%, 01/15/37 | | | 1,640,000 | | | 1,595,558 |
Archer-Daniels-Midland Co. | | | | | | |
6.45%, 01/15/38 | | | 1,885,000 | | | 1,916,095 |
Arrow Electronics, Inc. | | | | | | |
6.88%, 07/01/13 | | | 205,000 | | | 185,532 |
ASIF Global Financing XXVII | | | | | | |
2.38%, 02/26/09 144A(G) | | | 6,700,000 | | | 3,395,392 |
AT&T Corporation | | | | | | |
6.50%, 03/15/29 | | | 125,000 | | | 121,405 |
6.50%, 09/01/37 | | | 11,130,000 | | | 12,027,345 |
Avnet, Inc. | | | | | | |
6.00%, 09/01/15 | | | 875,000 | | | 670,879 |
Bank of America Corporation | | | | | | |
8.00%, 12/29/49† | | | 11,010,000 | | | 7,930,723 |
Barclays Financial LLC | | | | | | |
4.16%, 02/22/10 144A(T) | | | 25,000,000 | | | 737,594 |
4.10%, 03/22/10 144A(T) | | | 7,000,000 | | | 196,918 |
4.06%, 09/16/10 144A(W) | | | 730,000,000 | | | 591,801 |
Borden, Inc. | | | | | | |
7.88%, 02/15/23 | | | 1,200,000 | | | 150,000 |
Bruce Mansfield Unit | | | | | | |
6.85%, 06/01/34@ | | | 1,255,000 | | | 1,069,986 |
Camden Property Trust | | | | | | |
5.70%, 05/15/17 | | | 25,000 | | | 13,414 |
Chesapeake Energy Corporation | | | | | | |
6.88%, 01/15/16D | | | 610,000 | | | 491,050 |
6.50%, 08/15/17 | | | 45,000 | | | 34,650 |
6.88%, 11/15/20D | | | 320,000 | | | 232,000 |
CIT Group Holdings, Inc. | | | | | | |
5.40%, 01/30/16 | | | 16,000 | | | 11,156 |
CIT Group, Inc. | | | | | | |
7.63%, 11/30/12D | | | 8,440,000 | | | 7,130,483 |
5.00%, 02/13/14 | | | 81,000 | | | 58,933 |
5.13%, 09/30/14 | | | 179,000 | | | 127,906 |
5.50%, 12/01/14(U) | | | 600,000 | | | 475,991 |
5.00%, 02/01/15 | | | 17,000 | | | 11,982 |
5.65%, 02/13/17 | | | 65,000 | | | 45,265 |
12.00%, 12/18/18 144A+ | | | 643,000 | | | 495,110 |
5.80%, 10/01/36 | | | 67,000 | | | 44,323 |
Citigroup Capital XXI | | | | | | |
8.30%, 12/21/57† | | | 4,312,000 | | | 3,333,077 |
Citigroup, Inc. | | | | | | |
6.63%, 06/15/32 | | | 3,128,000 | | | 2,992,226 |
5.88%, 05/29/37 | | | 4,141,000 | | | 4,152,110 |
Comcast Corporation | | | | | | |
5.50%, 03/15/11D | | | 500,000 | | | 489,667 |
5.65%, 06/15/35D | | | 660,000 | | | 588,653 |
6.50%, 11/15/35 | | | 555,000 | | | 554,101 |
6.45%, 03/15/37 | | | 2,415,000 | | | 2,410,969 |
6.95%, 08/15/37 | | | 625,000 | | | 660,258 |
Commonwealth Edison Co. | | | | | | |
4.75%, 12/01/11@ | | | 267,000 | | | 260,052 |
ConocoPhillips | | | | | | |
5.90%, 05/15/38D | | | 2,590,000 | | | 2,552,455 |
Constellation Energy Group, Inc. | | | | | | |
4.55%, 06/15/15 | | | 750,000 | | | 570,332 |
Continental Airlines, Inc. | | | | | | |
6.95%, 02/02/11 | | | 192,631 | | | 180,832 |
8.31%, 04/02/18D | | | 453,849 | | | 281,386 |
7.57%, 03/15/20 | | | 389,823 | | | 253,385 |
Corning, Inc. | | | | | | |
6.20%, 03/15/16 | | | 230,000 | | | 196,869 |
7.25%, 08/15/36 | | | 850,000 | | | 686,529 |
Cox Communications, Inc. | | | | | | |
6.75%, 03/15/11 | | | 250,000 | | | 243,476 |
CSX Corporation | | | | | | |
6.15%, 05/01/37 | | | 84,000 | | | 67,415 |
Cummins, Inc. | | | | | | |
6.75%, 02/15/27 | | | 750,000 | | | 564,126 |
7.13%, 03/01/28D | | | 425,000 | | | 331,248 |
5.65%, 03/01/98 | | | 1,520,000 | | | 677,288 |
DCP Midstream LP | | | | | | |
6.45%, 11/03/36 144A | | | 490,000 | | | 356,870 |
Dillard’s, Inc. | | | | | | |
7.75%, 07/15/26 | | | 890,000 | | | 284,800 |
7.00%, 12/01/28 | | | 500,000 | | | 165,000 |
Duke Energy Carolinas LLC | | | | | | |
6.10%, 06/01/37 | | | 1,483,000 | | | 1,563,291 |
6.00%, 01/15/38 | | | 375,000 | | | 410,006 |
Duke Realty LP | | | | | | |
5.95%, 02/15/17 | | | 70,000 | | | 35,019 |
El Paso Corporation | | | | | | |
7.00%, 05/15/11D | | | 400,000 | | | 365,914 |
Emerson Electric Co. | | | | | | |
5.25%, 10/15/18 | | | 2,900,000 | | | 2,967,680 |
First Industrial LP | | | | | | |
7.60%, 07/15/28 | | | 1,000,000 | | | 424,648 |
Foot Locker, Inc. | | | | | | |
8.50%, 01/15/22 | | | 1,000,000 | | | 765,000 |
Ford Motor Co. | | | | | | |
6.63%, 10/01/28 | | | 680,000 | | | 153,000 |
6.38%, 02/01/29 | | | 1,255,000 | | | 282,375 |
See Notes to Financial Statements.
110
| | | | | | |
| | | Par | | Value |
Ford Motor Credit Co., LLC | | | | | | |
5.70%, 01/15/10D | | $ | 135,000 | | $ | 114,753 |
7.00%, 10/01/13 | | | 315,000 | | | 217,841 |
8.00%, 12/15/16 | | | 1,000,000 | | | 652,197 |
General Electric Capital Corporation | | | | | | |
4.88%, 03/04/15 | | | 510,000 | | | 497,411 |
5.63%, 05/01/18D | | | 105,000 | | | 105,951 |
6.75%, 03/15/32D | | | 4,865,000 | | | 5,188,133 |
6.15%, 08/07/37 | | | 6,114,000 | | | 6,150,586 |
5.88%, 01/14/38 | | | 75,000 | | | 73,667 |
General Motors Acceptance Corporation LLC | | | | | | |
6.88%, 08/28/12+ | | | 158,000 | | | 121,369 |
Georgia-Pacific Corporation | | | | | | |
7.38%, 12/01/25 | | | 240,000 | | | 154,800 |
7.25%, 06/01/28 | | | 300,000 | | | 184,500 |
7.75%, 11/15/29 | | | 3,700,000 | | | 2,349,500 |
Georgia-Pacific LLC | | | | | | |
8.00%, 01/15/24 | | | 30,000 | | | 20,400 |
8.88%, 05/15/31D | | | 60,000 | | | 41,700 |
GMAC LLC | | | | | | |
8.00%, 11/01/31+ | | | 199,000 | | | 118,501 |
Goldman Sachs Group, Inc. | | | | | | |
5.15%, 01/15/14D | | | 415,000 | | | 374,162 |
5.00%, 10/01/14D | | | 815,000 | | | 729,559 |
GTE Corporation | | | | | | |
6.94%, 04/15/28 | | | 10,000 | | | 9,277 |
HCA, Inc. | | | | | | |
6.30%, 10/01/12 | | | 1,500,000 | | | 1,065,000 |
7.58%, 09/15/25 | | | 1,000,000 | | | 466,941 |
7.05%, 12/01/27 | | | 500,000 | | | 213,895 |
HCP, Inc. | | | | | | |
6.00%, 03/01/15 | | | 1,500,000 | | | 876,786 |
Highwoods Properties, Inc. | | | | | | |
7.50%, 04/15/18 | | | 1,500,000 | | | 974,770 |
Historic TW, Inc. | | | | | | |
6.63%, 05/15/29 | | | 60,000 | | | 53,348 |
Home Depot, Inc. | | | | | | |
5.88%, 12/16/36D | | | 875,000 | | | 688,137 |
HSBC Bank USA NA | | | | | | |
5.88%, 11/01/34 | | | 6,960,000 | | | 6,798,215 |
iStar Financial, Inc. | | | | | | |
8.63%, 06/01/13D | | | 635,000 | | | 196,975 |
5.95%, 10/15/13 | | | 305,000 | | | 96,149 |
5.70%, 03/01/14 | | | 1,171,000 | | | 363,311 |
JC Penney Corporation, Inc. | | | | | | |
6.38%, 10/15/36D | | | 810,000 | | | 491,436 |
JPMorgan Chase Capital XXV | | | | | | |
6.80%, 10/01/37 | | | 15,524,000 | | | 14,346,427 |
Kimberly-Clark Corporation | | | | | | |
6.63%, 08/01/37 | | | 1,424,000 | | | 1,603,151 |
Kinder Morgan Energy Partners LP | | | | | | |
5.80%, 03/15/35D | | | 280,000 | | | 195,471 |
Koninklijke Philips Electronics NV | | | | | | |
6.88%, 03/11/38 | | | 8,892,000 | | | 8,465,718 |
Kraft Foods, Inc. | | | | | | |
6.50%, 11/01/31 | | | 815,000 | | | 784,480 |
Lehman Brothers Holdings, Inc. | | | | | | |
6.00%, 05/03/32# | | | 45,000 | | | 4 |
6.88%, 07/17/37# | | | 635,000 | | | 64 |
Lennar Corporation | | | | | | |
5.60%, 05/31/15 | | | 935,000 | | | 575,025 |
6.50%, 04/15/16 | | | 625,000 | | | 384,375 |
Lowe’s Cos., Inc. | | | | | | |
6.65%, 09/15/37 | | | 3,051,000 | | | 2,917,412 |
M&T Bank Corporation | | | | | | |
6.63%, 12/04/17 | | | 9,370,000 | | | 8,732,325 |
Macy’s Retail Holdings, Inc. | | | | | | |
6.38%, 03/15/37 | | | 240,000 | | | 135,444 |
MBIA Insurance Corporation | | | | | | |
14.00%, 01/15/33 144A†D | | | 4,750,000 | | | 2,424,319 |
McDonald’s Corporation | | | | | | |
6.30%, 10/15/37 | | | 4,763,000 | | | 5,247,292 |
MetLife, Inc. | | | | | | |
6.82%, 08/15/18 | | | 3,125,000 | | | 2,981,381 |
MidAmerican Energy Holdings Co. | | | | | | |
5.88%, 10/01/12 | | | 1,000,000 | | | 998,338 |
6.50%, 09/15/37 | | | 685,000 | | | 670,797 |
Monsanto Co. | | | | | | |
5.88%, 04/15/38 | | | 2,054,000 | | | 2,210,798 |
Morgan Stanley | | | | | | |
6.75%, 04/15/11 | | | 195,000 | | | 191,965 |
5.45%, 01/09/17 | | | 5,000 | | | 4,128 |
5.95%, 12/28/17 | | | 185,000 | | | 153,799 |
6.63%, 04/01/18 | | | 170,000 | | | 149,386 |
6.25%, 08/09/26 | | | 100,000 | | | 81,522 |
Mosaic Global Holdings, Inc. | | | | | | |
7.38%, 08/01/18 | | | 500,000 | | | 370,574 |
7.30%, 01/15/28 | | | 690,000 | | | 541,146 |
Motorola, Inc. | | | | | | |
6.50%, 11/15/28 | | | 500,000 | | | 221,266 |
Nextel Communications, Inc. | | | | | | |
6.88%, 10/31/13 | | | 215,000 | | | 91,421 |
5.95%, 03/15/14 | | | 325,000 | | | 136,623 |
7.38%, 08/01/15 | | | 550,000 | | | 231,105 |
NGPL PipeCo LLC | | | | | | |
7.12%, 12/15/17 144AD | | | 640,000 | | | 577,040 |
NiSource Finance Corporation | | | | | | |
6.15%, 03/01/13D | | | 1,000,000 | | | 771,201 |
6.40%, 03/15/18 | | | 1,640,000 | | | 1,025,028 |
Nortel Networks Capital Corporation | | | | | | |
7.88%, 06/15/26# | | | 450,000 | | | 88,875 |
Nucor Corporation | | | | | | |
6.40%, 12/01/37 | | | 9,494,000 | | | 9,125,547 |
Owens Corning, Inc. | | | | | | |
6.50%, 12/01/16D | | | 240,000 | | | 174,055 |
7.00%, 12/01/36 | | | 355,000 | | | 233,322 |
PacifiCorp | | | | | | |
6.25%, 10/15/37 | | | 3,833,000 | | | 4,065,882 |
Pioneer Natural Resources Co. | | | | | | |
7.20%, 01/15/28 | | | 2,500,000 | | | 1,585,678 |
PPL Electric Utilities Corporation | | | | | | |
6.45%, 08/15/37 | | | 3,076,000 | | | 2,992,853 |
Preston Corporation | | | | | | |
7.00%, 05/01/11 CONV | | | 201,000 | | | 150,750 |
Prologis | | | | | | |
5.63%, 11/15/15 | | | 35,000 | | | 17,439 |
Pulte Homes, Inc. | | | | | | |
5.20%, 02/15/15 | | | 40,000 | | | 27,400 |
7.88%, 06/15/32 | | | 1,500,000 | | | 847,500 |
6.38%, 05/15/33 | | | 1,000,000 | | | 535,000 |
See Notes to Financial Statements.
111
Extended-Duration Bond Fund
SCHEDULE OF INVESTMENTS (Continued)
| | | | | | |
| | | Par | | Value |
Qwest Corporation | | | | | | |
7.25%, 09/15/25 | | $ | 1,000,000 | | $ | 675,000 |
6.88%, 09/15/33 | | | 2,250,000 | | | 1,350,000 |
Regions Financial Corporation | | | | | | |
7.38%, 12/10/37 | | | 11,088,000 | | | 8,177,200 |
SLM Corporation | | | | | | |
5.38%, 05/15/14 | | | 200,000 | | | 135,118 |
Southern Natural Gas Co. | | | | | | |
7.35%, 02/15/31 | | | 1,750,000 | | | 1,368,997 |
Sprint Capital Corporation | | | | | | |
6.90%, 05/01/19 | | | 75,000 | | | 53,338 |
6.88%, 11/15/28 | | | 2,350,000 | | | 1,401,089 |
Swift Energy Co. | | | | | | |
7.63%, 07/15/11 | | | 150,000 | | | 117,750 |
Target Corporation | | | | | | |
6.50%, 10/15/37 | | | 5,400,000 | | | 4,650,561 |
7.00%, 01/15/38 | | | 5,150,000 | | | 4,787,090 |
Tennessee Gas Pipeline Co. | | | | | | |
7.00%, 10/15/28D | | | 750,000 | | | 577,602 |
Time Warner, Inc. | | | | | | |
7.63%, 04/15/31 | | | 35,000 | | | 34,489 |
6.50%, 11/15/36D | | | 120,000 | | | 109,120 |
Toll Brothers Finance Corporation | | | | | | |
5.15%, 05/15/15 | | | 1,285,000 | | | 924,354 |
Toro Co. | | | | | | |
6.63%, 05/01/37@ | | | 300,000 | | | 235,974 |
Union Pacific Resources Group | | | | | | |
7.15%, 05/15/28 | | | 250,000 | | | 217,227 |
United Technologies Corporation | | | | | | |
6.13%, 07/15/38 | | | 5,948,000 | | | 6,487,180 |
Verizon Communications, Inc. | | | | | | |
6.40%, 02/15/38D | | | 2,068,000 | | | 2,207,226 |
6.90%, 04/15/38 | | | 2,570,000 | | | 2,901,602 |
8.95%, 03/01/39D | | | 105,000 | | | 136,046 |
Verizon Global Funding Corporation | | | | | | |
5.85%, 09/15/35 | | | 2,420,000 | | | 2,415,864 |
Verizon Maryland, Inc. | | | | | | |
5.13%, 06/15/33 | | | 50,000 | | | 36,510 |
Verizon New York, Inc. | | | | | | |
7.38%, 04/01/32 | | | 385,000 | | | 322,390 |
Wachovia Bank NA | | | | | | |
5.85%, 02/01/37 | | | 6,077,000 | | | 5,952,750 |
6.60%, 01/15/38 | | | 7,257,000 | | | 7,899,723 |
Wal-Mart Stores, Inc. | | | | | | |
5.25%, 09/01/35D | | | 1,822,000 | | | 1,820,570 |
6.50%, 08/15/37D | | | 4,385,000 | | | 5,224,833 |
WellPoint, Inc. | | | | | | |
6.38%, 06/15/37D | | | 2,080,000 | | | 1,938,514 |
Wells Fargo Bank NA | | | | | | |
5.95%, 08/26/36 | | | 2,638,000 | | | 2,744,781 |
Western Union Co. | | | | | | |
6.20%, 11/17/36 | | | 2,155,000 | | | 1,674,586 |
Williams Cos., Inc. | | | | | | |
7.50%, 01/15/31 | | | 1,250,000 | | | 839,265 |
Xerox Capital Trust I | | | | | | |
8.00%, 02/01/27 | | | 1,500,000 | | | 1,026,314 |
XTO Energy, Inc. | | | | | | |
6.10%, 04/01/36 | | | 50,000 | | | 41,641 |
| | | | | | |
Total Corporate Bonds
(Cost $302,281,386) | | | | | | 271,350,903 |
| | | | | | |
FOREIGN BONDS — 26.8% | | | | | | |
Australia — 1.6% | | | | | | |
General Electric Capital Australia Funding, Ltd. | | | | | | |
8.00%, 02/13/12(A) | | | 60,000 | | | 41,077 |
New South Wales Treasury Corporation | | | | | | |
7.00%, 12/01/10(A) | | | 1,125,000 | | | 826,763 |
6.00%, 05/01/12(A) | | | 60,000 | | | 43,625 |
Qantas Airways, Ltd. | | | | | | |
6.05%, 04/15/16 144A | | | 345,000 | | | 315,962 |
Queensland Treasury Corporation | | | | | | |
6.00%, 06/14/11(A) | | | 1,385,000 | | | 1,005,358 |
Rio Tinto Finance USA, Ltd. | | | | | | |
7.13%, 07/15/28D | | | 6,830,000 | | | 4,832,293 |
| | | | | | |
| | | | | | 7,065,078 |
| | | | | | |
Brazil — 1.2% | | | | | | |
Federative Republic of Brazil | | | | | | |
10.25%, 01/10/28(B) | | | 2,525,000 | | | 979,899 |
8.25%, 01/20/34 | | | 3,500,000 | | | 4,296,250 |
7.13%, 01/20/37 | | | 80,000 | | | 91,200 |
| | | | | | |
| | | | | | 5,367,349 |
| | | | | | |
Canada — 7.5% | | | | | | |
British Columbia Generic Residual | | | | | | |
3.45%, 06/09/14 STRIP(C)W | | | 7,230,000 | | | 4,887,351 |
Canada Generic Residual | | | | | | |
3.76%, 06/01/25 STRIP(C)W | | | 3,685,000 | | | 1,585,043 |
Canadian National Railway Co. | | | | | | |
6.38%, 11/15/37 | | | 6,770,000 | | | 7,451,719 |
Canadian Pacific Railway Co. NY | | | | | | |
7.13%, 10/15/31 | | | 500,000 | | | 404,191 |
CIT Group Funding Co. | | | | | | |
5.20%, 06/01/15 | | | 240,000 | | | 168,704 |
Kinder Morgan Finance Co. | | | | | | |
5.70%, 01/05/16 | | | 125,000 | | | 93,750 |
Methanex Corporation | | | | | | |
6.00%, 08/15/15 | | | 25,000 | | | 16,426 |
Ontario Generic Residual | | | | | | |
5.05%, 07/13/22 STRIP(C)W | | | 3,900,000 | | | 1,620,656 |
5.37%, 03/08/29 STRIP(C)W | | | 7,000,000 | | | 2,007,290 |
Saskatchewan Residual | | | | | | |
3.42%, 04/10/14 STRIP(C)W | | | 7,500,000 | | | 5,112,394 |
4.77%, 02/04/22 STRIP(C)W | | | 3,000,000 | | | 1,334,143 |
Talisman Energy, Inc. | | | | | | |
5.85%, 02/01/37 | | | 670,000 | | | 467,336 |
6.25%, 02/01/38 | | | 450,000 | | | 327,635 |
TransCanada Pipelines, Ltd. | | | | | | |
6.20%, 10/15/37 | | | 8,512,000 | | | 7,416,710 |
| | | | | | |
| | | | | | 32,893,348 |
| | | | | | |
Cayman Islands — 0.1% | | | | | | |
Enersis SA | | | | | | |
7.40%, 12/01/16 | | | 625,000 | | | 630,501 |
| | | | | | |
Iceland — 0.1% | | | | | | |
Glitnir Banki HF | | | | | | |
6.38%, 09/25/12 144A# | | | 6,275,000 | | | 329,438 |
| | | | | | |
See Notes to Financial Statements.
112
| | | | | | | |
| | | Par | | Value | |
Ireland — 0.0% | | | | | | | |
Elan Finance PLC | | | | | | | |
7.75%, 11/15/11 | | $ | 30,000 | | $ | 17,850 | |
8.88%, 12/01/13 | | | 85,000 | | | 44,625 | |
| | | | | | | |
| | | | | | 62,475 | |
| | | | | | | |
Luxembourg — 1.4% | | | | | | | |
Covidien International Finance SA | | | | | | | |
6.55%, 10/15/37 | | | 5,307,000 | | | 5,401,964 | |
Telecom Italia Capital SA | | | | | | | |
6.38%, 11/15/33 | | | 410,000 | | | 287,727 | |
6.00%, 09/30/34 | | | 415,000 | | | 287,109 | |
| | | | | | | |
| | | | | | 5,976,800 | |
| | | | | | | |
Malaysia — 0.1% | | | | | | | |
Telekom Malaysia BHD | | | | | | | |
7.88%, 08/01/25 144A | | | 225,000 | | | 227,642 | |
| | | | | | | |
Mexico — 0.9% | | | | | | | |
Mexican Bonos | | | | | | | |
9.00%, 12/20/12(M) | | | 23,000,000 | | | 1,739,885 | |
8.00%, 12/07/23(M) | | | 34,000,000 | | | 2,407,510 | |
| | | | | | | |
| | | | | | 4,147,395 | |
| | | | | | | |
Netherlands — 0.2% | | | | | | | |
Rabobank Nederland NV | | | | | | | |
14.00%, 01/28/09 144A(I) | | | 110,000,000 | | | 901,017 | |
| | | | | | | |
Philippines — 0.1% | | | | | | | |
Quezon Power (Philippines), Ltd. | | | | | | | |
8.86%, 06/15/17 | | | 370,000 | | | 297,850 | |
| | | | | | | |
Spain — 2.5% | | | | | | | |
Santander Perpetual SA Unipersonal | | | | | | | |
6.67%, 10/24/17 144A† | | | 11,600,000 | | | 7,388,736 | |
Telefonica Emisones SAU | | | | | | | |
7.05%, 06/20/36 | | | 3,105,000 | | | 3,399,978 | |
| | | | | | | |
| | | | | | 10,788,714 | |
| | | | | | | |
Supranational — 1.9% | | | | | | | |
Inter-American Development Bank | | | | | | | |
26.82%, 05/11/09(B)WD | | | 7,500,000 | | | 2,942,753 | |
6.00%, 12/15/17(Z) | | | 8,765,000 | | | 5,589,120 | |
| | | | | | | |
| | | | | | 8,531,873 | |
| | | | | | | |
United Kingdom — 9.2% | | | | | | | |
Barclays Bank PLC | | | | | | | |
7.70%, 10/25/49 144A† | | | 10,840,000 | | | 7,183,484 | |
HBOS PLC | | | | | | | |
6.75%, 05/21/18 144A | | | 11,684,000 | | | 10,300,159 | |
HSBC Holdings PLC | | | | | | | |
6.50%, 09/15/37 | | | 6,500,000 | | | 6,622,889 | |
Standard Chartered Bank | | | | | | | |
6.40%, 09/26/17 144A | | | 10,027,000 | | | 8,352,912 | |
Tesco PLC | | | | | | | |
6.15%, 11/15/37 144A | | | 7,550,000 | | | 6,688,937 | |
Vodafone Group PLC | | | | | | | |
6.15%, 02/27/37 | | | 1,000,000 | | | 991,708 | |
| | | | | | | |
| | | | | | 40,140,089 | |
| | | | | | | |
Total Foreign Bonds
(Cost $135,384,113) | | | | | | 117,359,569 | |
| | | | | | | |
MORTGAGE-BACKED SECURITY — 0.1% | | | | | | | |
Federal Home Loan Mortgage Corporation | | | | | | | |
5.00%, 12/01/31
(Cost $167,634) | | | 178,514 | | | 183,217 | |
| | | | | | | |
MUNICIPAL BOND — 0.8% | | | | | | | |
Dallas Area Rapid Transit | | | | | | | |
5.25%, 12/01/38
(Cost $3,371,341) | | | 3,755,000 | | | 3,580,430 | |
| | | | | | | |
| | |
U.S. TREASURY OBLIGATION — 0.9% | | | | | | | |
U.S. Treasury STRIP | | | | | | | |
2.57%, 05/15/38WD
(Cost $2,634,722) | | | 8,090,000 | | | 3,828,989 | |
| | | | | | | |
| | |
| | | Shares | | | |
PREFERRED STOCKS — 0.0% | | | | | | | |
Chesapeake Energy Corporation CONVD | | | 330 | | | 17,490 | |
El Paso Energy Capital Trust I CONV | | | 5,350 | | | 136,960 | |
Preferred Blocker (GMAC), Inc.+ | | | 82 | | | 24,600 | |
| | | | | | | |
| | |
Total Preferred Stocks
(Cost $278,115) | | | | | | 179,050 | |
| | | | | | | |
| | |
MONEY MARKET FUNDS — 4.6% | | | | | | | |
GuideStone Money Market Fund (GS4 Class)¥ | | | 6,120,643 | | | 6,120,643 | |
Northern Institutional Liquid Assets Portfolio§ | | | 14,158,534 | | | 14,158,534 | |
| | | | | | | |
Total Money Market Funds
(Cost $20,279,177) | | | | | | 20,279,177 | |
| | | | | | | |
| | |
TOTAL INVESTMENTS — 101.4%
(Cost $500,945,015) | | | | | | 443,863,998 | |
Liabilities in Excess of Other Assets — (1.4)% | | | | | | (6,259,343 | ) |
| | | | | | | |
NET ASSETS — 100.0% | | | | | $ | 437,604,655 | |
| | | | | | | |
See Notes to Financial Statements.
113
Extended-Duration Bond Fund
SCHEDULE OF INVESTMENTS (Continued)
PORTFOLIO SUMMARY (based on net assets)
| | | |
| | | % | |
Corporate Bonds | | 62.0 | |
Foreign Bonds | | 26.8 | |
Asset-Backed Securities | | 6.2 | |
Money Market Funds | | 4.6 | |
U.S. Treasury Obligation | | 0.9 | |
Municipal Bond | | 0.8 | |
Mortgage-Backed Security | | 0.1 | |
Preferred Stocks | | 0.0 | ** |
| | | |
| | 101.4 | |
| | | |
| ** | Rounds to less than 0.005%. |
FAS 157 DISCLOSURE
The following is a summary of the inputs used, as of December 31, 2008, in valuing the Fund’s assets carried at fair value:
| | | | | | |
Valuation Inputs | | Investments in
Securities | | Other
Financial
Instruments*** |
Level 1 — Quoted Prices | | $ | 20,433,627 | | $ | — |
Level 2 — Other Significant Observable Inputs | | | 422,713,743 | | | — |
Level 3 — Significant Unobservable Inputs | | | 716,628 | | | — |
| | | | | | |
Total | | $ | 443,863,998 | | $ | — |
| | | | | | |
| *** | Other financial instruments are derivative instruments not reflected in the Schedule of Investments, such as futures, forwards and swap contracts, which are valued at the unrealized appreciation (depreciation) on the investment. |
The following is a reconciliation of assets in which significant unobservable inputs (Level 3) were used in determining fair value:
| | | | | | |
| | | Investments in
Securities | | Other
Financial
Instruments |
Balance, 12/31/07 | | $ | — | | $ | — |
Accrued discounts/premiums | | | — | | | — |
Realized gain (loss) | | | — | | | — |
Changed in unrealized appreciation (depreciation) | | | — | | | — |
Net purchases (sales) | | | — | | | — |
Transfers in and/or out of Level 3 | | | 716,628 | | | — |
| | | | | | |
Balance, 12/31/08 | | $ | 716,628 | | $ | — |
| | | | | | |
See Notes to Financial Statements.
114
Global Bond Fund
The Fund is actively managed and invests in a diversified portfolio composed primarily of global fixed-income securities with an average dollar-weighted duration normally between three to ten years. The Fund was generally positioned to capture the perceived long-term value of historically wide yield spreads but encountered a very challenging investment environment as credit spreads continued widening during the third and fourth quarters resulting in poor absolute and benchmark-relative performance for the year. For the calendar year 2008, the Fund underperformed its composite benchmark, 50% Barclays Capital Global Aggregate Bond Index – Unhedged, 25% JPMorgan Emerging Markets Bond Index Plus and 25% Barclays Capital U.S. Corporate High Yield – 2% Issuer Capped Index ((20.28)% versus (7.00)%).
The Global Bond Fund invests in high yield securities, commonly known as “junk bonds.” While offering higher current yields, these securities generally are considered speculative and are subject to greater risks than higher-rated bonds. Securities of emerging countries may involve additional risks including price volatility, reduced liquidity, currency fluctuation and financial reporting requirements as well as political and economic instability.
Please see page 125 for information regarding specific portfolio allocations. Portfolio holdings are subject to change at any time.
115
Global Bond Fund
Average Annual Total Returns as of 12/31/08
| | | | | | |
| | | GS4 Class* | | | Benchmark** | |
One Year | | (20.28 | )% | | (7.00 | )% |
Since Inception | | (7.59 | )% | | 3.42 | % |
Inception Date | | 12/29/06 | | | 12/29/06 | |
Total Fund Operating Expenses (August 5, 2008 Prospectus) | | 0.88 | % | | | |
The performance data quoted represents past performance and does not guarantee future results. Current performance may be lower or higher. Performance data current to the most recent month-end may be obtained at www.GuideStoneFunds.org. The investment return and principal value of an investment will fluctuate so that shares, when redeemed, may be worth more or less than their original cost.
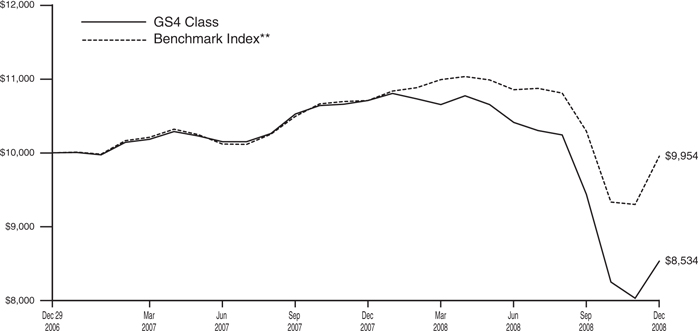
The graph compares the results of a hypothetical $10,000 investment in the GS4 Class of the Fund since December 29, 2006 (commencement of operations), with all dividends and capital gains reinvested, with the weighted composite index.
| * | These returns reflect expense waivers by the Fund’s investment adviser. Without these waivers, returns would have been lower. Returns shown do not reflect the deduction of taxes that a shareholder would pay on Fund distributions or the redemption of Fund shares. |
| ** | Represents a weighted composite benchmark index consisting of 25% JPMorgan Emerging Markets Bond Index Plus, 50% Barclays Capital Global Aggregate Bond Index — Unhedged and 25% Barclays Capital U.S. Corporate High Yield – 2% Issuer Capped Index. |
The JPMorgan Emerging Markets Bond Index Plus is a traditional, market-capitalization weighted index comprised of U.S. dollar denominated Brady bonds, Eurobonds and traded loans issued by sovereign entities.
The Barclays Capital Global Aggregate Bond Index — Unhedged provides a broad-based measure of the global investment grade fixed-rate debt markets.
The Barclays Capital U.S. Corporate High Yield -2% Issuer Capped Index is an issuer-constrained version of the Barclays Capital U.S. Corporate High Yield Index that covers the U.S.-denominated, non-investment grade, fixed-rate and taxable corporate bond market.
Unlike a mutual fund, the performance of an index assumes no taxes, transaction costs, management fees or other expenses.
116
| | |
| Global Bond Fund | | |
| SCHEDULE OF INVESTMENTS | | December 31, 2008 |
| | | | | | |
| | | Par | | Value |
AGENCY OBLIGATIONS — 0.3% | | | | | | |
Federal Home Loan Mortgage Corporation | | | | | | |
5.00%, 12/14/18 | | $ | 206,000 | | $ | 213,941 |
Federal National Mortgage Association | | | | | | |
0.25%, 05/18/09W‡‡ | | | 209,000 | | | 208,822 |
| | | | | | |
Total Agency Obligations
(Cost $385,072) | | | | | | 422,763 |
| | | | | | |
ASSET-BACKED SECURITIES — 3.1% | | | | | | |
ARG Funding Corporation | | | | | | |
2.64%, 05/20/11 144A† | | | 665,000 | | | 560,061 |
Bear Stearns Asset-Backed Securities Trust | | | | | | |
0.95%, 10/25/33 STEP | | | 140,650 | | | 119,355 |
Capital One Multi-Asset Execution Trust | | | | | | |
1.23%, 03/16/15† | | | 720,000 | | | 540,022 |
Carrington Mortgage Loan Trust | | | | | | |
0.79%, 10/25/35† | | | 102,853 | | | 88,902 |
Chase Issuance Trust | | | | | | |
1.57%, 11/15/12† | | | 1,135,000 | | | 909,732 |
1.45%, 04/15/19† | | | 760,000 | | | 234,566 |
Citibank Credit Card Issuance Trust | | | | | | |
6.30%, 06/20/14 | | | 710,000 | | | 362,322 |
Discover Card Master Trust I | | | | | | |
1.29%, 06/16/15† | | | 655,000 | | | 465,166 |
GMAC Mortgage Corporation Loan Trust | | | | | | |
0.54%, 12/25/36† | | | 1,652,273 | | | 573,691 |
Lehman XS Trust | | | | | | |
0.56%, 02/25/37† | | | 621,459 | | | 503,939 |
Morgan Stanley Mortgage Loan Trust | | | | | | |
0.59%, 10/25/36† | | | 237,612 | | | 203,358 |
Origen Manufactured Housing | | | | | | |
1.35%, 11/15/18† | | | 99,557 | | | 82,899 |
RAAC Series | | | | | | |
0.81%, 07/25/37 144A† | | | 229,354 | | | 224,909 |
Residential Asset Securities Corporation | | | | | | |
6.35%, 03/25/32 | | | 72,307 | | | 46,488 |
SACO I, Inc. | | | | | | |
0.64%, 09/25/35† | | | 123,738 | | | 35,417 |
Security National Mortgage Loan Trust | | | | | | |
0.75%, 01/25/37 144A† | | | 228,650 | | | 222,641 |
| | | | | | |
Total Asset-Backed Securities
(Cost $7,700,014) | | | | | | 5,173,468 |
| | | | | | |
CORPORATE BONDS — 43.4% | | | | | | |
Activant Solutions, Inc. | | | | | | |
9.50%, 05/01/16 | | | 65,000 | | | 30,550 |
Advanced Medical Optics, Inc. | | | | | | |
7.50%, 05/01/17D | | | 45,000 | | | 23,175 |
AES Corporation | | | | | | |
8.38%, 03/01/11(U) | | | 50,000 | | | 65,058 |
8.75%, 05/15/13 144A | | | 312,000 | | | 301,080 |
8.00%, 10/15/17 | | | 315,000 | | | 259,875 |
Affinion Group, Inc. | | | | | | |
10.13%, 10/15/13D | | | 100,000 | | | 73,500 |
11.50%, 10/15/15 | | | 105,000 | | | 63,656 |
Allegheny Energy Supply | | | | | | |
7.80%, 03/15/11 | | | 90,000 | | | 89,100 |
Allied Waste North America, Inc. | | | | | | |
7.13%, 05/15/16D | | | 225,000 | | | 205,034 |
American General Finance Corporation | | | | | | |
5.75%, 09/15/16 144A | | | 700,000 | | | 263,840 |
American International Group, Inc. | | | | | | |
5.05%, 10/01/15 | | | 100,000 | | | 67,144 |
AMH Holdings, Inc. | | | | | | |
26.95%, 03/01/14 STEPWD | | | 190,000 | | | 106,400 |
Amkor Technologies, Inc. | | | | | | |
7.75%, 05/15/13 | | | 660,000 | | | 378,675 |
Anadarko Petroleum Corporation | | | | | | |
5.95%, 09/15/16 | | | 20,000 | | | 17,692 |
Appleton Papers, Inc. | | | | | | |
8.13%, 06/15/11 | | | 40,000 | | | 27,800 |
9.75%, 06/15/14 | | | 100,000 | | | 59,000 |
Ashtead Capital, Inc. | | | | | | |
9.00%, 08/15/16 144A | | | 140,000 | | | 72,800 |
Ashton Woods USA LLC | | | | | | |
9.50%, 10/01/15# | | | 40,000 | | | 8,200 |
Associated Materials, Inc. | | | | | | |
9.75%, 04/15/12D | | | 120,000 | | | 95,100 |
AT&T Corporation | | | | | | |
6.50%, 03/15/29 | | | 580,000 | | | 563,321 |
Autonation, Inc. | | | | | | |
6.75%, 04/15/13†D | | | 200,000 | | | 138,000 |
Avis Budget Car Rental LLC | | | | | | |
4.65%, 05/15/14†D | | | 225,000 | | | 57,375 |
Baltimore Gas & Electric Co. | | | | | | |
5.20%, 06/15/33 | | | 1,125,000 | | | 797,201 |
Banca Popolare di Lodi Investors Trust III | | | | | | |
6.74%, 06/30/36(E)† | | | 260,000 | | | 190,139 |
Belden & Blake Corporation | | | | | | |
8.75%, 07/15/12D | | | 120,000 | | | 82,800 |
Biomet, Inc. | | | | | | |
10.38%, 10/15/17 PIK | | | 555,000 | | | 441,225 |
Blockbuster, Inc. | | | | | | |
9.00%, 09/01/12D | | | 110,000 | | | 53,900 |
Boeing Capital Corporation, Ltd. | | | | | | |
5.80%, 01/15/13D | | | 60,000 | | | 60,689 |
Boston Scientific Corporation | | | | | | |
7.00%, 11/15/35 | | | 215,000 | | | 160,175 |
Buffets, Inc. | | | | | | |
12.50%, 11/01/14# | | | 105,000 | | | 722 |
CCH I Holdings LLC | | | | | | |
11.00%, 10/01/15 | | | 520,000 | | | 93,600 |
CDX North America High Yield | | | | | | |
7.63%, 06/29/12 144A | | | 1,911,000 | | | 1,739,010 |
Cengage Learning Acquisitions, Inc. | | | | | | |
10.50%, 01/15/15 144A | | | 100,000 | | | 41,500 |
Ceridian Corporation | | | | | | |
12.25%, 11/15/15 PIK 144AD | | | 60,000 | | | 29,625 |
Charter Communications Holdings LLC | | | | | | |
12.13%, 01/15/12 STEP | | | 70,000 | | | 7,000 |
See Notes to Financial Statements.
117
Global Bond Fund
SCHEDULE OF INVESTMENTS (Continued)
| | | | | | |
| | | Par | | Value |
Charter Communications Operating LLC | | | | | | |
10.88%, 09/15/14 144A | | $ | 140,000 | | $ | 112,700 |
Chesapeake Energy Corporation | | | | | | |
7.50%, 09/15/13 | | | 265,000 | | | 229,225 |
6.50%, 08/15/17D | | | 1,190,000 | | | 916,300 |
6.25%, 01/15/18D | | | 30,000 | | | 22,350 |
7.25%, 12/15/18D | | | 95,000 | | | 74,575 |
Chiquita Brands International, Inc. | | | | | | |
7.50%, 11/01/14D | | | 450,000 | | | 308,250 |
CII Carbon LLC | | | | | | |
11.13%, 11/15/15 144A | | | 190,000 | | | 122,550 |
Cincinnati Bell Telephone Co. | | | | | | |
6.30%, 12/01/28 | | | 155,000 | | | 98,425 |
CIT Group Holdings, Inc. | | | | | | |
5.40%, 01/30/16 | | | 4,000 | | | 2,789 |
CIT Group, Inc. | | | | | | |
5.00%, 02/13/14 | | | 242,000 | | | 176,071 |
5.13%, 09/30/14 | | | 73,000 | | | 52,163 |
5.00%, 02/01/15 | | | 477,000 | | | 336,214 |
5.85%, 09/15/16 | | | 73,000 | | | 51,474 |
5.65%, 02/13/17 | | | 2,000 | | | 1,393 |
12.00%, 12/18/18 144A+ | | | 1,277,000 | | | 983,290 |
Clear Channel Communications, Inc. | | | | | | |
6.88%, 06/15/18 | | | 770,000 | | | 96,250 |
Clear Channel Communications, Inc. | | | | | | |
5.50%, 09/15/14 | | | 40,000 | | | 5,000 |
CMP Susquehanna Corporation | | | | | | |
9.88%, 05/15/14 | | | 80,000 | | | 3,600 |
Colorado Interstate Gas Co. | | | | | | |
5.95%, 03/15/15 | | | 20,000 | | | 16,748 |
6.80%, 11/15/15 | | | 125,000 | | | 108,312 |
Comcast Corporation | | | | | | |
6.50%, 01/15/15 | | | 60,000 | | | 59,048 |
6.50%, 01/15/17 | | | 60,000 | | | 59,354 |
Commerzbank Capital Funding Trust I | | | | | | |
5.01%, 04/12/37(E)† | | | 900,000 | | | 410,154 |
Community Health Systems, Inc. | | | | | | |
8.88%, 07/15/15D | | | 100,000 | | | 92,500 |
Complete Production Services, Inc. | | | | | | |
8.00%, 12/15/16 | | | 80,000 | | | 50,800 |
Continental Airlines, Inc. | | | | | | |
5.98%, 04/19/22 | | | 545,000 | | | 365,150 |
Countrywide Financial Corporation | | | | | | |
5.80%, 06/07/12 | | | 90,000 | | | 87,786 |
6.25%, 05/15/16 | | | 280,000 | | | 266,246 |
CSC Holdings, Inc. | | | | | | |
8.13%, 08/15/09 | | | 270,000 | | | 269,325 |
CSX Corporation | | | | | | |
6.15%, 05/01/37 | | | 138,000 | | | 110,753 |
Cummins, Inc. | | | | | | |
5.65%, 03/01/98 | | | 1,500,000 | | | 668,376 |
DAE Aviation Holdings, Inc. | | | | | | |
11.25%, 08/01/15 144A | | | 230,000 | | | 95,450 |
DaVita, Inc. | | | | | | |
6.63%, 03/15/13 | | | 140,000 | | | 133,700 |
Delhaize America, Inc. | | | | | | |
9.00%, 04/15/31 | | | 301,000 | | | 305,141 |
Deutsche Postbank Funding Trust IV | | | | | | |
5.98%, 06/29/49(E)† | | | 300,000 | | | 143,870 |
Developers Diversified Realty Corporation | | | | | | |
5.38%, 10/15/12 | | | 315,000 | | | 132,195 |
Dex Media West LLC | | | | | | |
9.88%, 08/15/13 | | | 275,000 | | | 66,000 |
Dex Media, Inc. | | | | | | |
65.79%, 11/15/13 STEPW | | | 10,000 | | | 1,900 |
DI Finance | | | | | | |
9.50%, 02/15/13D | | | 180,000 | | | 156,825 |
Dole Food Co., Inc. | | | | | | |
7.25%, 06/15/10 | | | 100,000 | | | 70,250 |
Dollar General Corporation | | | | | | |
11.88%, 07/15/17 PIK | | | 195,000 | | | 167,700 |
Dominion Resources, Inc. | | | | | | |
8.88%, 01/15/19 | | | 250,000 | | | 269,871 |
DP World, Ltd. | | | | | | |
6.85%, 07/02/37 144A | | | 1,300,000 | | | 672,148 |
DR Horton, Inc. | | | | | | |
6.50%, 04/15/16 | | | 345,000 | | | 219,075 |
Dynegy Holdings, Inc. | | | | | | |
7.50%, 06/01/15 | | | 307,000 | | | 216,435 |
7.75%, 06/01/19 | | | 746,000 | | | 518,470 |
EchoStar DBS Corporation | | | | | | |
7.00%, 10/01/13D | | | 600,000 | | | 523,500 |
Education Management LLC | | | | | | |
8.75%, 06/01/14 | | | 35,000 | | | 26,775 |
10.25%, 06/01/16D | | | 95,000 | | | 69,350 |
El Paso Corporation | | | | | | |
7.75%, 01/15/32 | | | 150,000 | | | 98,118 |
El Paso Natural Gas Co. | | | | | | |
8.63%, 01/15/22D | | | 90,000 | | | 81,542 |
8.38%, 06/15/32 | | | 75,000 | | | 65,092 |
El Pollo Loco, Inc. | | | | | | |
11.75%, 11/15/13 | | | 45,000 | | | 33,525 |
Embarq Corporation | | | | | | |
8.00%, 06/01/36D | | | 1,245,000 | | | 842,123 |
Energy Future Holdings Corporation | | | | | | |
5.55%, 11/15/14 | | | 1,370,000 | | | 646,952 |
11.25%, 11/01/17 PIK 144A | | | 890,000 | | | 436,100 |
6.50%, 11/15/24 | | | 370,000 | | | 132,752 |
6.55%, 11/15/34 | | | 300,000 | | | 102,778 |
Enterprise Products Operating LLC | | | | | | |
9.75%, 01/31/14 | | | 250,000 | | | 254,823 |
8.38%, 08/01/66†D | | | 60,000 | | | 33,038 |
Erac USA Finance Co. | | | | | | |
6.38%, 10/15/17 144A | | | 245,000 | | | 170,290 |
7.00%, 10/15/37 144A | | | 1,065,000 | | | 587,742 |
Eurohypo Capital Funding Trust 1 | | | | | | |
6.45%, 12/23/49(E)† | | | 27,000 | | | 9,946 |
EXCO Resources, Inc. | | | | | | |
7.25%, 01/15/11 | | | 125,000 | | | 98,125 |
Expedia, Inc. | | | | | | |
8.50%, 07/01/16 144AD | | | 10,000 | | | 7,500 |
FirstEnergy Corporation | | | | | | |
7.38%, 11/15/31 | | | 45,000 | | | 42,684 |
Ford Motor Co. | | | | | | |
6.63%, 10/01/28 | | | 850,000 | | | 191,250 |
7.45%, 07/16/31D | | | 2,300,000 | | | 655,500 |
See Notes to Financial Statements.
118
| | | | | | |
| | | Par | | Value |
Ford Motor Credit Co., LLC | | | | | | |
5.70%, 01/15/10D | | $ | 1,250,000 | | $ | 1,062,529 |
7.57%, 01/13/12† | | | 37,500 | | | 24,422 |
7.00%, 10/01/13D | | | 650,000 | | | 449,514 |
Freeport-McMoRan Copper & Gold, Inc. | | | | | | |
8.38%, 04/01/17 | | | 470,000 | | | 385,934 |
Freescale Semiconductor, Inc. | | | | | | |
10.13%, 12/15/16D | | | 661,000 | | | 274,315 |
Frontier Communications Corporation | | | | | | |
9.25%, 05/15/11 | | | 200,000 | | | 191,000 |
7.13%, 03/15/19 | | | 500,000 | | | 337,500 |
General Electric Capital Corporation | | | | | | |
3.49%, 03/08/12(G) | | | 200,000 | | | 125,838 |
7.63%, 12/10/14(Z)@ | | | 905,000 | | | 456,127 |
4.88%, 03/04/15 | | | 370,000 | | | 360,867 |
6.50%, 09/28/15(Z)@ | | | 255,000 | | | 118,388 |
6.75%, 09/26/16(Z)@ | | | 150,000 | | | 73,209 |
5.63%, 05/01/18 | | | 75,000 | | | 75,680 |
6.75%, 03/15/32D | | | 30,000 | | | 31,993 |
5.88%, 01/14/38D | | | 50,000 | | | 49,111 |
General Motors Corporation | | | | | | |
8.25%, 07/15/23D | | | 375,000 | | | 63,750 |
8.38%, 07/05/33(E) | | | 250,000 | | | 59,077 |
8.38%, 07/15/33D | | | 1,700,000 | | | 306,000 |
Georgia Gulf Corporation | | | | | | |
9.50%, 10/15/14D | | | 125,000 | | | 38,125 |
Georgia-Pacific LLC | | | | | | |
8.00%, 01/15/24 | | | 355,000 | | | 241,400 |
8.88%, 05/15/31 | | | 785,000 | | | 545,575 |
GMAC LLC | | | | | | |
5.75%, 05/21/10 144A+ | | | 117,000 | | | 104,130 |
5.38%, 06/06/11(E) | | | 470,000 | | | 274,395 |
6.00%, 12/15/11 144A | | | 1,016,000 | | | 822,411 |
0.08%, 12/31/13 144A+ | | | 87,000 | | | 64,815 |
6.75%, 12/01/14 | | | 399,000 | | | 274,424 |
0.08%, 12/31/18+ | | | 104,000 | | | 53,560 |
8.00%, 11/01/31 | | | 757,000 | | | 450,778 |
Goldman Sachs Group, Inc. | | | | | | |
6.65%, 05/15/09 | | | 20,000 | | | 20,069 |
5.15%, 01/15/14D | | | 300,000 | | | 270,479 |
5.00%, 10/01/14D | | | 600,000 | | | 537,098 |
Goodyear Tire & Rubber Co. | | | | | | |
7.00%, 03/15/28 | | | 690,000 | | | 348,450 |
Graham Packaging Co., Inc. | | | | | | |
8.50%, 10/15/12 | | | 25,000 | | | 17,938 |
Graphic Packaging International Corporation | | | | | | |
9.50%, 08/15/13 | | | 125,000 | | | 86,875 |
H&E Equipment Services, Inc. | | | | | | |
8.38%, 07/15/16D | | | 205,000 | | | 109,675 |
Hawaiian Telcom Communications, Inc. | | | | | | |
12.50%, 05/01/15# | | | 65,000 | | | 650 |
Hawker Beechcraft Acquisition Co., LLC | | | | | | |
8.88%, 04/01/15 PIKD | | | 280,000 | | | 96,600 |
HCA, Inc. | | | | | | |
8.75%, 11/01/10(U) | | | 140,000 | | | 179,144 |
7.88%, 02/01/11D | | | 240,000 | | | 212,400 |
6.25%, 02/15/13 | | | 480,000 | | | 302,400 |
5.75%, 03/15/14 | | | 40,000 | | | 24,400 |
6.38%, 01/15/15 | | | 870,000 | | | 535,050 |
7.19%, 11/15/15 | | | 205,000 | | | 114,571 |
6.50%, 02/15/16 | | | 220,000 | | | 136,400 |
9.25%, 11/15/16 | | | 60,000 | | | 55,200 |
9.63%, 11/15/16 PIK | | | 185,000 | | | 144,762 |
7.50%, 12/15/23 | | | 555,000 | | | 263,431 |
8.36%, 04/15/24 | | | 90,000 | | | 46,515 |
7.69%, 06/15/25 | | | 775,000 | | | 367,700 |
7.58%, 09/15/25 | | | 570,000 | | | 266,156 |
Hertz Corporation | | | | | | |
8.88%, 01/01/14 | | | 250,000 | | | 155,000 |
10.50%, 01/01/16 | | | 250,000 | | | 115,312 |
Hess Corporation | | | | | | |
6.65%, 08/15/11D | | | 60,000 | | | 60,012 |
Hexion US Finance Corporation | | | | | | |
9.75%, 11/15/14 | | | 1,170,000 | | | 339,300 |
Home Depot, Inc. | | | | | | |
5.40%, 03/01/16D | | | 270,000 | | | 241,976 |
5.88%, 12/16/36 | | | 1,515,000 | | | 1,191,460 |
Host Hotels & Resorts LP | | | | | | |
2.63%, 04/15/27 144A | | | 750,000 | | | 488,438 |
Idearc, Inc. | | | | | | |
8.00%, 11/15/16 | | | 215,000 | | | 17,200 |
International Lease Finance Corporation | | | | | | |
6.38%, 03/15/09 | | | 195,000 | | | 187,222 |
4.75%, 07/01/09 | | | 345,000 | | | 321,239 |
6.63%, 12/07/09(U) | | | 395,000 | | | 491,055 |
5.00%, 04/15/10 | | | 145,000 | | | 117,722 |
5.63%, 09/15/10 | | | 115,000 | | | 90,429 |
5.55%, 09/05/12 | | | 50,000 | | | 34,518 |
6.38%, 03/25/13D | | | 245,000 | | | 166,567 |
International Paper Co. | | | | | | |
5.50%, 01/15/14D | | | 575,000 | | | 430,330 |
7.95%, 06/15/18 | | | 635,000 | | | 502,644 |
iStar Financial, Inc. | | | | | | |
5.65%, 09/15/11 | | | 92,000 | | | 29,454 |
5.50%, 06/15/12D | | | 75,000 | | | 23,639 |
8.63%, 06/01/13 | | | 75,000 | | | 23,265 |
5.95%, 10/15/13 | | | 954,000 | | | 300,743 |
5.70%, 03/01/14 | | | 62,000 | | | 19,236 |
6.05%, 04/15/15 | | | 20,000 | | | 5,905 |
5.88%, 03/15/16D | | | 22,000 | | | 6,276 |
JC Penney Corporation, Inc. | | | | | | |
6.38%, 10/15/36 | | | 1,270,000 | | | 770,523 |
7.63%, 03/01/97 | | | 1,300,000 | | | 859,814 |
Jefferson Smurfit Corporation | | | | | | |
7.50%, 06/01/13#D | | | 625,000 | | | 112,500 |
Jones Apparel Group, Inc. | | | | | | |
6.13%, 11/15/34 | | | 135,000 | | | 56,025 |
JPMorgan Chase Bank NA | | | | | | |
9.50%, 02/11/11 144A(R) | | | 16,277,500 | | | 360,067 |
K Hovnanian Enterprises, Inc. | | | | | | |
6.38%, 12/15/14 | | | 795,000 | | | 218,625 |
Kerr-McGee Corporation | | | | | | |
6.95%, 07/01/24 | | | 30,000 | | | 26,364 |
Keystone Automotive Operations, Inc. | | | | | | |
9.75%, 11/01/13D | | | 45,000 | | | 17,325 |
See Notes to Financial Statements.
119
Global Bond Fund
SCHEDULE OF INVESTMENTS (Continued)
| | | | | | |
| | | Par | | Value |
Kinder Morgan Energy Partners LP | | | | | | |
5.95%, 02/15/18 | | $ | 1,060,000 | | $ | 906,190 |
7.40%, 03/15/31 | | | 255,000 | | | 219,177 |
6.50%, 02/01/37 | | | 75,000 | | | 57,420 |
6.95%, 01/15/38 | | | 90,000 | | | 72,985 |
Knight, Inc. | | | | | | |
5.15%, 03/01/15 | | | 150,000 | | | 112,500 |
Kraft Foods, Inc. | | | | | | |
4.13%, 11/12/09D | | | 40,000 | | | 40,069 |
6.50%, 11/01/31 | | | 1,200,000 | | | 1,155,062 |
L-3 Communications Corporation | | | | | | |
7.63%, 06/15/12 | | | 600,000 | | | 588,000 |
6.13%, 01/15/14 | | | 45,000 | | | 41,062 |
6.38%, 10/15/15 | | | 450,000 | | | 423,000 |
Lamar Media Corporation | | | | | | |
6.63%, 08/15/15 | | | 100,000 | | | 72,750 |
Lehman Brothers Holdings, Inc. | | | | | | |
5.25%, 02/06/12# | | | 130,000 | | | 13,000 |
6.00%, 05/03/32# | | | 45,000 | | | 4 |
6.88%, 07/17/37# | | | 695,000 | | | 70 |
Leiner Health Products, Inc. | | | | | | |
11.00%, 06/01/12#@ | | | 285,000 | | | 14,962 |
Lennar Corporation | | | | | | |
5.60%, 05/31/15 | | | 1,400,000 | | | 861,000 |
Level 3 Communications, Inc. | | | | | | |
3.50%, 06/15/12 | | | 195,000 | | | 69,713 |
Level 3 Financing, Inc. | | | | | | |
9.25%, 11/01/14 | | | 260,000 | | | 152,100 |
8.75%, 02/15/17D | | | 1,185,000 | | | 604,350 |
Mariner Energy, Inc. | | | | | | |
8.00%, 05/15/17 | | | 70,000 | | | 36,750 |
Marsh & McLennan Cos., Inc. | | | | | | |
5.88%, 08/01/33 | | | 1,000,000 | | | 738,733 |
Maxtor Corporation | | | | | | |
5.75%, 03/01/12@ | | | 116,000 | | | 87,580 |
MBIA Insurance Corporation | | | | | | |
14.00%, 01/15/33 144A†D | | | 435,000 | | | 222,017 |
Merrill Lynch & Co., Inc. | | | | | | |
6.11%, 01/29/37 | | | 2,000,000 | | | 1,803,520 |
Metals USA, Inc. | | | | | | |
11.13%, 12/01/15D | | | 140,000 | | | 83,300 |
MetroPCS Wireless, Inc. | | | | | | |
9.25%, 11/01/14D | | | 40,000 | | | 36,000 |
Midwest Generation LLC | | | | | | |
8.30%, 07/02/09 | | | 35,781 | | | 35,602 |
Mirant Mid-Atlantic LLC | | | | | | |
9.13%, 06/30/17 | | | 152,070 | | | 136,863 |
Morgan Stanley | | | | | | |
4.75%, 04/01/14 | | | 50,000 | | | 38,136 |
Motorola, Inc. | | | | | | |
6.50%, 09/01/25 | | | 720,000 | | | 357,001 |
6.50%, 11/15/28 | | | 155,000 | | | 68,592 |
6.63%, 11/15/37 | | | 625,000 | | | 294,283 |
Mutual of Omaha Insurance Co. | | | | | | |
6.80%, 06/15/36 144A | | | 1,200,000 | | | 1,108,638 |
Neiman-Marcus Group, Inc. | | | | | | |
9.00%, 10/15/15 PIK | | | 355,000 | | | 157,975 |
7.13%, 06/01/28 | | | 30,000 | | | 14,250 |
Nevada Power Co. | | | | | | |
8.25%, 06/01/11 | | | 290,000 | | | 297,427 |
5.88%, 01/15/15 | | | 100,000 | | | 96,224 |
NewPage Corporation | | | | | | |
9.44%, 05/01/12† | | | 265,000 | | | 102,688 |
Nextel Communications, Inc. | | | | | | |
5.95%, 03/15/14 | | | 970,000 | | | 407,768 |
7.38%, 08/01/15 | | | 1,615,000 | | | 678,608 |
Noranda Aluminium Holding Corporation | | | | | | |
8.35%, 11/15/14 PIK | | | 90,000 | | | 14,850 |
Norcraft Holdings LP | | | | | | |
9.75%, 09/01/12 STEPW | | | 195,000 | | | 146,250 |
Nortek, Inc. | | | | | | |
8.50%, 09/01/14 | | | 15,000 | | | 3,525 |
Nortel Networks Capital Corporation | | | | | | |
7.88%, 06/15/26# | | | 460,000 | | | 90,850 |
Nortel Networks Corporation | | | | | | |
2.13%, 04/15/14# | | | 2,835,000 | | | 411,075 |
NRG Energy, Inc. | | | | | | |
7.38%, 02/01/16 | | | 300,000 | | | 279,750 |
NTK Holdings, Inc. | | | | | | |
52.99%, 03/01/14WD | | | 160,000 | | | 35,200 |
Oncor Electric Delivery Co. | | | | | | |
6.38%, 01/15/15 | | | 100,000 | | | 95,904 |
Orion Power Holdings, Inc. | | | | | | |
12.00%, 05/01/10 | | | 55,000 | | | 55,275 |
Owens Corning, Inc. | | | | | | |
7.00%, 12/01/36 | | | 220,000 | | | 144,594 |
Panhandle Eastern Pipeline Co. | | | | | | |
7.00%, 06/15/18 | | | 1,100,000 | | | 879,766 |
Pemex Project Funding Master Trust | | | | | | |
6.63%, 06/15/35D | | | 1,540,000 | | | 1,305,535 |
Penhall International Corporation | | | | | | |
12.00%, 08/01/14 144A | | | 205,000 | | | 78,925 |
PetroHawk Energy Corporation | | | | | | |
9.13%, 07/15/13D | | | 70,000 | | | 57,050 |
Pioneer Natural Resources Co. | | | | | | |
5.88%, 07/15/16 | | | 900,000 | | | 628,912 |
7.20%, 01/15/28 | | | 315,000 | | | 199,795 |
Qwest Capital Funding, Inc. | | | | | | |
6.50%, 11/15/18 | | | 225,000 | | | 148,500 |
Qwest Communications International, Inc. | | | | | | |
5.65%, 02/15/09† | | | 33,000 | | | 33,000 |
7.25%, 02/15/11 | | | 35,000 | | | 30,625 |
7.50%, 02/15/14 | | | 20,000 | | | 14,400 |
Qwest Corporation | | | | | | |
7.88%, 09/01/11D | | | 100,000 | | | 92,500 |
5.25%, 06/15/13† | | | 100,000 | | | 75,000 |
7.63%, 06/15/15 | | | 300,000 | | | 247,500 |
6.50%, 06/01/17 | | | 65,000 | | | 48,425 |
7.50%, 06/15/23 | | | 125,000 | | | 88,125 |
7.25%, 09/15/25 | | | 90,000 | | | 60,750 |
6.88%, 09/15/33 | | | 3,500,000 | | | 2,100,000 |
7.25%, 10/15/35 | | | 110,000 | | | 69,300 |
Realogy Corporation | | | | | | |
12.38%, 04/15/15 | | | 235,000 | | | 32,900 |
RH Donnelley Corporation | | | | | | |
6.88%, 01/15/13D | | | 320,000 | | | 44,800 |
RH Donnelley, Inc. | | | | | | |
11.75%, 05/15/15 144A | | | 310,000 | | | 77,500 |
RSC Equipment Rental, Inc. | | | | | | |
9.50%, 12/01/14D | | | 160,000 | | | 88,800 |
See Notes to Financial Statements.
120
| | | | | | |
| | | Par | | Value |
Ryerson, Inc. | | | | | | |
12.25%, 11/01/15 144A | | $ | 160,000 | | $ | 99,600 |
Sbarro, Inc. | | | | | | |
10.38%, 02/01/15 | | | 60,000 | | | 31,800 |
Sequa Corporation | | | | | | |
11.75%, 12/01/15 144A | | | 50,000 | | | 19,250 |
13.50%, 12/01/15 PIK 144A | | | 53,431 | | | 17,365 |
Service Corporation International | | | | | | |
7.50%, 04/01/27 | | | 75,000 | | | 48,375 |
SLM Corporation | | | | | | |
6.50%, 06/15/10(Z) | | | 275,000 | | | 141,195 |
5.38%, 01/15/13 | | | 650,000 | | | 476,932 |
5.00%, 10/01/13 | | | 380,000 | | | 272,164 |
4.75%, 03/17/14(E) | | | 170,000 | | | 141,194 |
5.38%, 05/15/14 | | | 1,000,000 | | | 675,592 |
8.45%, 06/15/18 | | | 769,000 | | | 608,892 |
Smurfit-Stone Container Enterprises, Inc. | | | | | | |
8.00%, 03/15/17#D | | | 335,000 | | | 65,325 |
Sprint Capital Corporation | | | | | | |
8.38%, 03/15/12 | | | 60,000 | | | 48,031 |
6.88%, 11/15/28 | | | 755,000 | | | 450,137 |
Steel Dynamics, Inc. | | | | | | |
7.38%, 11/01/12 | | | 45,000 | | | 33,075 |
Stone Energy Corporation | | | | | | |
8.25%, 12/15/11 | | | 115,000 | | | 71,875 |
Suburban Propane Partners LP | | | | | | |
6.88%, 12/15/13 | | | 145,000 | | | 119,625 |
Sungard Data Systems, Inc. | | | | | | |
10.25%, 08/15/15 | | | 190,000 | | | 126,350 |
Swift Transportation Co., Inc. | | | | | | |
9.90%, 05/15/15 144A† | | | 50,000 | | | 4,312 |
12.50%, 05/15/17 144A | | | 180,000 | | | 17,325 |
Tenet Healthcare Corporation | | | | | | |
6.38%, 12/01/11 | | | 110,000 | | | 84,975 |
7.38%, 02/01/13 | | | 1,100,000 | | | 789,250 |
9.88%, 07/01/14D | | | 375,000 | | | 303,750 |
6.88%, 11/15/31 | | | 85,000 | | | 36,125 |
Time Warner Cable, Inc. | | | | | | |
5.85%, 05/01/17 | | | 1,200,000 | | | 1,098,017 |
8.75%, 02/14/19 | | | 190,000 | | | 206,945 |
Time Warner, Inc. | | | | | | |
6.88%, 05/01/12 | | | 90,000 | | | 86,525 |
Toledo Edison Co. | | | | | | |
6.15%, 05/15/37 | | | 125,000 | | | 100,822 |
Toys “R” Us, Inc. | | | | | | |
7.38%, 10/15/18 | | | 335,000 | | | 122,275 |
Tube City IMS Corporation | | | | | | |
9.75%, 02/01/15 | | | 80,000 | | | 28,400 |
Unicredito Italiano Capital Trust III | | | | | | |
4.03%, 10/29/49(E)† | | | 250,000 | | | 184,181 |
United Rentals, Inc. | | | | | | |
7.00%, 02/15/14 | | | 655,000 | | | 402,825 |
UnitedHealth Group, Inc. | | | | | | |
5.80%, 03/15/36 | | | 790,000 | | | 603,661 |
Universal Hospital Services, Inc. | | | | | | |
5.94%, 06/01/15† | | | 20,000 | | | 12,300 |
8.50%, 06/01/15 PIK | | | 20,000 | | | 14,300 |
US Investigations Services, Inc. | | | | | | |
10.50%, 11/01/15 144A | | | 150,000 | | | 110,250 |
US Oncology Holdings, Inc. | | | | | | |
8.33%, 03/15/12 PIK | | | 107,000 | | | 67,945 |
USG Corporation | | | | | | |
6.30%, 11/15/16 | | | 1,250,000 | | | 771,875 |
Valor Telecommunications Enterprises Finance Corporation | | | | | | |
7.75%, 02/15/15D | | | 125,000 | | | 104,462 |
Vanguard Health Holding Co. II LLC | | | | | | |
9.00%, 10/01/14 | | | 220,000 | | | 184,800 |
Ventas Realty LP | | | | | | |
9.00%, 05/01/12 | | | 305,000 | | | 272,975 |
Verizon Communications, Inc. | | | | | | |
6.40%, 02/15/38 | | | 40,000 | | | 42,693 |
6.90%, 04/15/38 | | | 234,000 | | | 264,193 |
Verizon Global Funding Corporation | | | | | | |
6.88%, 06/15/12D | | | 30,000 | | | 30,971 |
Verizon New York, Inc. | | | | | | |
7.38%, 04/01/32 | | | 205,000 | | | 171,662 |
Visteon Corporation | | | | | | |
8.25%, 08/01/10 | | | 57,000 | | | 17,955 |
12.25%, 12/31/16 144AD | | | 145,000 | | | 35,525 |
W&T Offshore, Inc. | | | | | | |
8.25%, 06/15/14 144A | | | 50,000 | | | 27,250 |
Wachovia Corporation | | | | | | |
5.25%, 08/01/14 | | | 120,000 | | | 111,914 |
Waste Management, Inc. | | | | | | |
7.38%, 08/01/10 | | | 50,000 | | | 50,688 |
7.38%, 05/15/29 | | | 50,000 | | | 42,776 |
Western Union Co. | | | | | | |
6.20%, 11/17/36 | | | 620,000 | | | 481,783 |
Westvaco Corporation | | | | | | |
8.20%, 01/15/30 | | | 150,000 | | | 114,405 |
7.95%, 02/15/31 | | | 135,000 | | | 93,210 |
Weyerhaeuser Co. | | | | | | |
6.75%, 03/15/12 | | | 120,000 | | | 107,492 |
Whiting Petroleum Corporation | | | | | | |
7.00%, 02/01/14 | | | 130,000 | | | 92,300 |
Williams Cos., Inc. | | | | | | |
7.13%, 09/01/11D | | | 525,000 | | | 483,283 |
7.50%, 01/15/31 | | | 130,000 | | | 87,284 |
Windstream Corporation | | | | | | |
8.63%, 08/01/16 | | | 650,000 | | | 578,500 |
Xerox Corporation | | | | | | |
9.75%, 01/15/09D | | | 500,000 | | | 499,500 |
XTO Energy, Inc. | | | | | | |
7.50%, 04/15/12 | | | 30,000 | | | 29,672 |
| | | | | | |
Total Corporate Bonds
(Cost $102,100,987) | | | | | | 72,633,560 |
| | | | | | |
FOREIGN BONDS — 31.2% | | | | | | |
Argentina — 0.1% | | | | | | |
Republic of Argentina | | | | | | |
7.00%, 09/12/13 | | | 488,000 | | | 166,985 |
| | | | | | |
Australia — 1.3% | | | | | | |
National Capital Instruments LLC | | | | | | |
3.97%, 12/29/49(E)† | | | 150,000 | | | 95,830 |
New South Wales Treasury Corporation | | | | | | |
7.00%, 12/01/10(A) | | | 2,825,000 | | | 2,076,094 |
| | | | | | |
| | | | | | 2,171,924 |
| | | | | | |
See Notes to Financial Statements.
121
Global Bond Fund
SCHEDULE OF INVESTMENTS (Continued)
| | | | | | |
| | | Par | | Value |
Bermuda — 0.6% | | | | | | |
White Mountains Re Group, Ltd. | | | | | | |
6.38%, 03/20/17 144A | | $ | 1,250,000 | | $ | 1,035,259 |
| | | | | | |
Brazil — 3.2% | | | | | | |
Brazil Notas do Tesouro Nacional, Series F | | | | | | |
10.00%, 07/01/10(B) | | | 2,000,000 | | | 876,274 |
10.00%, 01/01/12(B) | | | 2,000,000 | | | 847,461 |
Federative Republic of Brazil | | | | | | |
10.25%, 01/10/28(B) | | | 6,000,000 | | | 2,328,473 |
7.13%, 01/20/37 | | | 60,000 | | | 68,400 |
11.00%, 08/17/40D | | | 1,010,000 | | | 1,323,100 |
| | | | | | |
| | | | �� | | 5,443,708 |
| | | | | | |
Canada — 8.3% | | | | | | |
Bell Canada | | | | | | |
5.00%, 02/15/17 144A(C) | | | 410,000 | | | 280,557 |
6.55%, 05/01/29(C) | | | 380,000 | | | 249,329 |
7.30%, 02/23/32 144A(C) | | | 640,000 | | | 420,119 |
6.10%, 03/16/35 144A(C) | | | 380,000 | | | 236,326 |
Bombardier, Inc. | | | | | | |
7.25%, 11/15/16(E) | | | 161,000 | | | 138,184 |
Canadian Government | | | | | | |
5.25%, 06/01/12(C) | | | 10,000,000 | | | 9,101,013 |
Conoco Funding Co. | | | | | | |
6.35%, 10/15/11 | | | 70,000 | | | 73,689 |
Methanex Corporation | | | | | | |
8.75%, 08/15/12 | | | 70,000 | | | 61,687 |
Nortel Networks, Ltd. | | | | | | |
6.88%, 09/01/23# | | | 380,000 | | | 75,050 |
Novelis, Inc. | | | | | | |
7.25%, 02/15/15 | | | 115,000 | | | 67,275 |
OPTI Canada, Inc. | | | | | | |
7.88%, 12/15/14 | | | 100,000 | | | 51,500 |
8.25%, 12/15/14 | | | 70,000 | | | 38,150 |
Province of Manitoba | | | | | | |
6.38%, 09/01/15(Z) | | | 815,000 | | | 504,907 |
Province of Quebec | | | | | | |
6.75%, 11/09/15(Z) | | | 2,650,000 | | | 1,638,558 |
Rogers Cable, Inc. | | | | | | |
7.88%, 05/01/12 | | | 240,000 | | | 239,703 |
Rogers Wireless, Inc. | | | | | | |
9.63%, 05/01/11 | | | 450,000 | | | 469,808 |
Stone Container Finance | | | | | | |
7.38%, 07/15/14# | | | 650,000 | | | 123,500 |
Sun Media Corporation | | | | | | |
7.63%, 02/15/13 | | | 100,000 | | | 81,000 |
Talisman Energy, Inc. | | | | | | |
6.25%, 02/01/38 | | | 45,000 | | | 32,763 |
| | | | | | |
| | | | | | 13,883,118 |
| | | | | | |
Cayman Islands — 1.0% | | | | | | |
MUFG Capital Finance 2, Ltd. | | | | | | |
4.85%, 07/25/36(E)† | | | 500,000 | | | 408,153 |
Odebrecht Finance, Ltd. | | | | | | |
7.50%, 10/18/17 144A | | | 100,000 | | | 80,250 |
Shinsei Finance Cayman, Ltd. | | | | | | |
6.42%, 07/20/49 144A† | | | 120,000 | | | 25,117 |
SMFG Preferred Capital, Ltd. | | | | | | |
6.16%, 12/31/49(U)† | | | 350,000 | | | 317,503 |
Vale Overseas, Ltd. | | | | | | |
6.88%, 11/21/36 | | | 927,000 | | | 843,755 |
| | | | | | |
| | | | | | 1,674,778 |
| | | | | | |
Colombia — 0.2% | | | | | | |
Republic of Colombia | | | | | | |
7.38%, 09/18/37D | | | 400,000 | | | 394,000 |
| | | | | | |
Denmark — 0.3% | | | | | | |
Nordic Telephone Co. Holdings ApS | | | | | | |
8.25%, 05/01/16 | | | 200,000 | | | 186,266 |
8.88%, 05/01/16 144A(R) | | | 265,000 | | | 186,825 |
10.29%, 05/01/16(E)† | | | 111,000 | | | 104,921 |
| | | | | | |
| | | | | | 478,012 |
| | | | | | |
Finland — 0.2% | | | | | | |
M-real OYJ | | | | | | |
7.70%, 12/15/10(E)† | | | 300,000 | | | 258,549 |
| | | | | | |
France — 1.1% | | | | | | |
Akerys Holdings SA | | | | | | |
8.04%, 08/01/14 144A(E)† | | | 260,000 | | | 26,202 |
AXA SA | | | | | | |
6.21%, 10/05/49(E)† | | | 360,000 | | | 252,836 |
Banque Federative du Credit Mutuel | | | | | | |
4.47%, 10/28/35(E)† | | | 157,000 | | | 104,972 |
Compagnie Generale de Geophysique - Veritas | | | | | | |
7.50%, 05/15/15 | | | 90,000 | | | 56,250 |
Credit Agricole SA | | | | | | |
4.13%, 11/09/49(E)† | | | 500,000 | | | 469,489 |
Dexia Credit Local | | | | | | |
4.30%, 11/18/49(E)† | | | 500,000 | | | 313,838 |
Europcar Groupe SA | | | | | | |
7.75%, 05/15/13(E)† | | | 155,000 | | | 62,752 |
French Government Bond | | | | | | |
4.12%, 10/25/32(E)W | | | 1,030,000 | | | 550,679 |
| | | | | | |
| | | | | | 1,837,018 |
| | | | | | |
Germany — 0.8% | | | | | | |
ABN AMRO SA | | | | | | |
9.63%, 03/01/13 | | | 100,000 | | | 91,500 |
Bayerische Landesbank | | | | | | |
5.75%, 10/23/17(E) | | | 550,000 | | | 671,827 |
HSH Nordbank AG | | | | | | |
4.59%, 02/14/17(E)† | | | 52,000 | | | 34,155 |
HT1 Funding GmbH | | | | | | |
6.35%, 07/29/49(E)† | | | 450,000 | | | 201,199 |
Kabel Deutschland GmbH | | | | | | |
10.75%, 07/01/14(E) | | | 106,000 | | | 137,031 |
Kreditanstalt fuer Wiederaufbau | | | | | | |
10.75%, 02/01/10(I) | | | 26,800,000 | | | 211,342 |
| | | | | | |
| | | | | | 1,347,054 |
| | | | | | |
Hungary — 1.1% | | | | | | |
Hungary Government Bond | | | | | | |
6.00%, 10/24/12(H) | | | 206,970,000 | | | 966,932 |
5.50%, 02/12/14(H) | | | 210,000,000 | | | 943,515 |
| | | | | | |
| | | | | | 1,910,447 |
| | | | | | |
Iceland — 0.0% | | | | | | |
Kaupthing Bank HF | | | | | | |
5.75%, 10/04/11 144A# | | | 100,000 | | | 6,500 |
7.13%, 05/19/16 144A# | | | 150,000 | | | 1,875 |
6.13%, 10/04/16 144A# | | | 700,000 | | | 45,500 |
| | | | | | |
| | | | | | 53,875 |
| | | | | | |
See Notes to Financial Statements.
122
| | | | | | |
| | | Par | | Value |
Ireland — 0.6% | | | | | | |
Ardagh Glass Finance PLC | | | | | | |
7.13%, 06/15/17 144A(E) | | $ | 85,000 | | $ | 77,391 |
7.13%, 06/15/17(E) | | | 112,000 | | | 105,088 |
Ardagh Glass Group PLC | | | | | | |
10.75%, 03/01/15 PIK(E) | | | 85,000 | | | 41,649 |
Elan Finance PLC | | | | | | |
7.75%, 11/15/11 | | | 875,000 | | | 520,625 |
8.88%, 12/01/13 | | | 235,000 | | | 123,375 |
Vimpel Communications | | | | | | |
8.38%, 04/30/13 144A | | | 100,000 | | | 64,500 |
| | | | | | |
| | | | | | 932,628 |
| | | | | | |
Italy — 0.1% | | | | | | |
Banco Popolare SC | | | | | | |
6.16%, 06/29/49(E)† | | | 200,000 | | | 125,104 |
| | | | | | |
Japan — 1.0% | | | | | | |
Japanese 20-Year Government Bond | | | | | | |
2.10%, 03/20/27(J) | | | 30,000,000 | | | 351,177 |
Japanese 30-Year Government Bond | | | | | | |
2.30%, 12/20/36(J) | | | 29,000,000 | | | 353,233 |
Japanese Government CPI Linked Bond | | | | | | |
1.30%, 09/10/17(J) | | | 60,000,000 | | | 579,252 |
Resona Bank, Ltd. | | | | | | |
5.99%, 08/10/49(U)† | | | 300,000 | | | 339,302 |
| | | | | | |
| | | | | | 1,622,964 |
| | | | | | |
Jersey — 0.3% | | | | | | |
HSBC Capital Funding LP | | | | | | |
5.13%, 12/29/49(E)† | | | 420,000 | | | 420,000 |
RZB Finance Jersey IV, Ltd. | | | | | | |
5.17%, 05/16/16(E)† | | | 250,000 | | | 133,792 |
| | | | | | |
| | | | | | 553,792 |
| | | | | | |
Luxembourg — 1.5% | | | | | | |
Evraz Group SA | | | | | | |
8.88%, 04/24/13 144A | | | 160,000 | | | 82,400 |
8.88%, 04/24/13 | | | 100,000 | | | 52,250 |
9.50%, 04/24/18 144AD | | | 100,000 | | | 50,500 |
Fortis Hybrid Financing | | | | | | |
5.13%, 06/29/49(E)† | | | 250,000 | | | 156,456 |
Gaz Capital for Gazprom | | | | | | |
6.21%, 11/22/16 144A | | | 200,000 | | | 133,000 |
Gaz Capital SA | | | | | | |
7.29%, 08/16/37D | | | 190,000 | | | 114,180 |
HSH Nordbank Luxembourg | | | | | | |
7.41%, 06/30/49(E)† | | | 450,000 | | | 156,380 |
Kuznetski Capital for Bank of Moscow | | | | | | |
6.81%, 05/10/17† | | | 271,000 | | | 92,460 |
Lecta SA | | | | | | |
6.87%, 02/15/14(E)† | | | 200,000 | | | 148,735 |
6.87%, 02/15/14 144A(E)† | | | 102,000 | | | 75,855 |
RSHB Capital SA for OJSC Russian Agricultural Bank | | | | | | |
7.18%, 05/16/13 | | | 100,000 | | | 71,970 |
7.13%, 01/14/14 144A | | | 120,000 | | | 81,000 |
6.97%, 09/21/16† | | | 100,000 | | | 54,000 |
6.30%, 05/15/17 144A | | | 386,000 | | | 221,950 |
TNK-BP Finance SA | | | | | | |
7.50%, 07/18/16 144A | | | 250,000 | | | 131,250 |
7.88%, 03/13/18 | | | 870,000 | | | 440,133 |
Tyco International Group SA | | | | | | |
6.38%, 10/15/11 | | | 90,000 | | | 88,520 |
UBS Luxembourg SA for OJSC Vimpel Communications | | | | | | |
8.25%, 05/23/16 | | | 255,000 | | | 138,338 |
Wind Acquisition Finance SA | | | | | | |
9.75%, 12/01/15(E) | | | 53,000 | | | 60,780 |
9.75%, 12/01/15 144A(E) | | | 200,000 | | | 229,358 |
| | | | | | |
| | | | | | 2,579,515 |
| | | | | | |
Mexico — 1.7% | | | | | | |
Axtel SAB de CV | | | | | | |
7.63%, 02/01/17 | | | 20,000 | | | 13,700 |
7.63%, 02/01/17 144AD | | | 490,000 | | | 335,650 |
Kansas City Southern de Mexico SA de CV | | | | | | |
7.63%, 12/01/13 | | | 140,000 | | | 115,500 |
Mexican Bonos | | | | | | |
8.00%, 12/07/23(M) | | | 30,500,000 | | | 2,159,678 |
United Mexican States | | | | | | |
6.05%, 01/11/40D | | | 156,000 | | | 152,100 |
| | | | | | |
| | | | | | 2,776,628 |
| | | | | | |
Netherlands — 2.1% | | | | | | |
ABN Amro Bank NV | | | | | | |
4.31%, 02/10/49(E)† | | | 595,000 | | | 308,996 |
Arpeni Pratama Ocean Line Investment BV | | | | | | |
8.75%, 05/03/13 | | | 160,000 | | | 62,400 |
Carlson Wagonlit BV | | | | | | |
10.54%, 05/01/15 144A(E)† | | | 200,000 | | | 109,814 |
Clondalkin Acquisition BV | | | | | | |
5.33%, 12/15/13 144A(E)† | | | 66,000 | | | 55,505 |
Clondalkin Industries BV | | | | | | |
8.00%, 03/15/14 144A(E) | | | 150,000 | | | 85,488 |
Deutsche Telekom International Finance BV | | | | | | |
5.75%, 03/23/16 | | | 80,000 | | | 76,690 |
ELM BV for Swiss Life Insurance & Pension Group | | | | | | |
5.85%, 04/12/49(E)† | | | 300,000 | | | 146,435 |
ELM BV for Swiss Reinsurance Co. | | | | | | |
5.25%, 05/25/49(E)† | | | 400,000 | | | 189,046 |
Fresenius Finance BV | | | | | | |
5.50%, 01/31/16(E) | | | 136,000 | | | 167,306 |
Impress Holdings BV | | | | | | |
8.44%, 09/15/13 144A(E)† | | | 200,000 | | | 212,677 |
9.25%, 09/15/14 144A(E) | | | 150,000 | | | 135,530 |
KazMunaiGaz Finance Sub BV | | | | | | |
8.38%, 07/02/13 144A | | | 230,000 | | | 180,550 |
Lukoil International Finance BV | | | | | | |
6.36%, 06/07/17 | | | 650,000 | | | 416,780 |
NXP BV | | | | | | |
9.50%, 10/15/15D | | | 60,000 | | | 11,550 |
OI European Group BV | | | | | | |
6.88%, 03/31/17 144A(E) | | | 100,000 | | | 103,559 |
Shell International Finance BV | | | | | | |
6.38%, 12/15/38 | | | 170,000 | | | 193,808 |
SNS Reaal | | | | | | |
6.26%, 03/17/38(E)† | | | 260,000 | | | 152,877 |
TuranAlem Finance BV | | | | | | |
7.13%, 12/21/09(U) | | | 650,000 | | | 628,478 |
See Notes to Financial Statements.
123
Global Bond Fund
SCHEDULE OF INVESTMENTS (Continued)
| | | | | | |
| | | Par | | Value |
UPC Holding BV | | | | | | |
8.00%, 11/01/16(E) | | $ | 304,000 | | $ | 295,802 |
| | | | | | |
| | | | | | 3,533,291 |
| | | | | | |
Panama — 0.2% | | | | | | |
Panama Government International Bond | | | | | | |
7.25%, 03/15/15 | | | 51,000 | | | 52,275 |
Republic of Panama | | | | | | |
9.38%, 04/01/29 | | | 80,000 | | | 88,400 |
6.70%, 01/26/36D | | | 249,000 | | | 225,345 |
| | | | | | |
| | | | | | 366,020 |
| | | | | | |
Peru — 0.1% | | | | | | |
Republic of Peru | | | | | | |
8.38%, 05/03/16 | | | 50,000 | | | 54,125 |
7.35%, 07/21/25D | | | 40,000 | | | 40,000 |
6.55%, 03/14/37D | | | 19,000 | | | 17,053 |
| | | | | | |
| | | | | | 111,178 |
| | | | | | |
Russia — 0.5% | | | | | | |
Russian Federation | | | | | | |
7.50%, 03/31/30 STEPD | | | 889,840 | | | 784,981 |
| | | | | | |
South Africa — 0.1% | | | | | | |
Edcon Holdings Proprietary, Ltd. | | | | | | |
8.83%, 06/15/15(E)† | | | 320,000 | | | 100,084 |
Edcon Proprietary, Ltd. | | | | | | |
6.58%, 06/15/14 144A(E)† | | | 67,000 | | | 40,047 |
New Reclamation Group (Proprietary), Ltd. | | | | | | |
8.13%, 02/01/13 144A(E) | | | 153,040 | | | 77,647 |
| | | | | | |
| | | | | | 217,778 |
| | | | | | |
Supranational — 0.5% | | | | | | |
Inter-American Development Bank | | | | | | |
13.69%, 09/23/13(N)W | | | 15,900,000,000 | | | 779,829 |
| | | | | | |
Sweden — 0.1% | | | | | | |
Corral Finans AB | | | | | | |
6.82%, 04/15/10 PIK 144A(E) | | | 149,789 | | | 112,435 |
| | | | | | |
Thailand — 0.1% | | | | | | |
True Move Co., Ltd. | | | | | | |
10.75%, 12/16/13 144A | | | 461,000 | | | 172,875 |
| | | | | | |
Turkey — 1.8% | | | | | | |
Republic of Turkey | | | | | | |
14.00%, 01/19/11(L) | | | 1,380,000 | | | 857,415 |
10.00%, 02/15/12(L)W | | | 1,190,000 | | | 703,337 |
6.88%, 03/17/36 | | | 1,695,000 | | | 1,415,325 |
| | | | | | |
| | | | | | 2,976,077 |
| | | | | | |
United Kingdom — 1.7% | | | | | | |
Ashtead Holdings PLC | | | | | | |
8.63%, 08/01/15 144A | | | 160,000 | | | 84,800 |
Barclays Bank PLC | | | | | | |
6.37%, 12/15/49(U)† | | | 350,000 | | | 304,268 |
FCE Bank PLC | | | | | | |
3.99%, 09/30/09(E)† | | | 470,000 | | | 476,932 |
7.13%, 01/16/12(E) | | | 200,000 | | | 158,466 |
First Hydro Finance PLC | | | | | | |
9.00%, 07/31/21(U) | | | 100,000 | | | 120,771 |
Lloyds TSB Bank PLC | | | | | | |
4.39%, 05/12/17(E)† | | | 470,000 | | | 383,304 |
Royal Bank of Scotland Group PLC | | | | | | |
7.09%, 10/29/49(E)† | | | 500,000 | | | 293,960 |
Virgin Media Finance PLC | | | | | | |
9.75%, 04/15/14(U) | | | 450,000 | | | 465,832 |
9.13%, 08/15/16 | | | 860,000 | | | 640,700 |
| | | | | | |
| | | | | | 2,929,033 |
| | | | | | |
Venezuela — 0.3% | | | | | | |
Republic of Venezuela | | | | | | |
8.50%, 10/08/14D | | | 26,000 | | | 13,650 |
5.75%, 02/26/16D | | | 835,000 | | | 354,875 |
9.38%, 01/13/34 | | | 207,000 | | | 96,255 |
Venezuela Government Bond | | | | | | |
7.00%, 03/31/38 | | | 246,000 | | | 90,405 |
| | | | | | |
| | | | | | 555,185 |
| | | | | | |
Virgin Islands (British) — 0.3% | | | | | | |
GTL Trade Finance, Inc. | | | | | | |
7.25%, 10/20/17 | | | 320,000 | | | 282,000 |
7.25%, 10/20/17 144AD | | | 309,000 | | | 259,605 |
| | | | | | |
| | | | | | 541,605 |
| | | | | | |
Total Foreign Bonds
(Cost $73,466,189) | | | | | | 52,325,645 |
| | | | | | |
MORTGAGE-BACKED SECURITIES — 13.4% | | | | | | |
Bayview Commercial Asset Trust | | | | | | |
0.70%, 07/25/36 144A† | | | 276,084 | | | 200,258 |
Countrywide Alternative Loan Trust | | | | | | |
0.74%, 07/20/35† | | | 529,898 | | | 261,456 |
Countrywide Home Loan Mortgage Pass-Through Trust | | | | | | |
0.87%, 09/25/35 144A† | | | 677,154 | | | 519,447 |
Credit Suisse Mortgage Capital Certificates | | | | | | |
5.70%, 07/15/17† | | | 220,000 | | | 145,515 |
Federal Home Loan Mortgage Corporation | | | | | | |
5.50%, 12/17/37 | | | 2,255,348 | | | 2,311,057 |
5.00%, 03/01/38 | | | 3,379,643 | | | 3,457,413 |
Federal National Mortgage Association | | | | | | |
5.00%, 01/01/22 TBA | | | 400,000 | | | 410,500 |
5.00%, 01/01/28 TBA | | | 7,100,000 | | | 7,248,660 |
6.50%, 10/01/36 | | | 645,733 | | | 671,461 |
5.50%, 01/01/37 TBA | | | 4,400,000 | | | 4,510,000 |
Government National Mortgage Association | | | | | | |
6.00%, 01/01/38 TBA | | | 800,000 | | | 825,250 |
6.00%, 01/01/39 TBA | | | 200,000 | | | 205,750 |
JPMorgan Chase Commercial Mortgage Securities Corporation | | | | | | |
5.42%, 01/15/38 | | | 80,000 | | | 56,557 |
5.82%, 06/15/38† | | | 165,000 | | | 116,527 |
MASTR Adjustable Rate Mortgages Trust | | | | | | |
3.06%, 12/25/46† | | | 784,242 | | | 298,492 |
MASTR Reperforming Loan Trust | | | | | | |
0.82%, 05/25/35 144A† | | | 713,379 | | | 474,900 |
See Notes to Financial Statements.
124
| | | | | | | |
| | | Par | | Value | |
Thornburg Mortgage Securities Trust | | | | | | | |
0.64%, 01/25/36† | | $ | 688,924 | | $ | 686,296 | |
| | | | | | | |
Total Mortgage-Backed Securities
(Cost $23,135,525) | | | | | | 22,399,539 | |
| | | | | | | |
| | |
| | | Number of
Contracts | | | |
PURCHASED OPTION — 0.3% | | | | | | | |
Call Option — 0.3% | | | | | | | |
90-Day Sterling Futures, Strike Price $94.50, Expires 03/19/09
(Cost $177,061) | | | 67 | | | 449,738 | |
| | | | | | | |
| | |
| | | Shares | | | |
PREFERRED STOCKS — 0.7% | | | | | | | |
Bank of America Corporation CONV | | | 500 | | | 325,000 | |
CIT Group, Inc.D | | | 4,849 | | | 62,552 | |
El Paso Energy Capital Trust I CONV | | | 500 | | | 12,800 | |
Fannie Mae | | | 3,700 | | | 3,759 | |
Federal Home Loan Mortgage Corporation | | | 10,625 | | | 4,144 | |
Federal National Mortgage Association | | | 15,650 | | | 12,990 | |
Freddie Mac | | | 24,500 | | | 9,821 | |
General Motors Corporation CONV | | | 140 | | | 448 | |
Lehman Brothers Holdings, Inc.#D* | | | 6,418 | | | 347 | |
Lucent Technologies Capital Trust I CONV | | | 1,891 | | | 642,940 | |
Preferred Blocker (GMAC), Inc.+ | | | 527 | | | 158,100 | |
| | | | | | | |
Total Preferred Stocks
(Cost $3,718,139) | | | | | | 1,232,901 | |
| | | | | | | |
| | |
COMMON STOCK — 0.0% | | | | | | | |
Financial Services — 0.0% | | | | | | | |
Freddie MacD
(Cost $1,464,410) | | | 104,601 | | | 76,359 | |
| | | | | | | |
MONEY MARKET FUNDS — 16.2% | | | | | | | |
GuideStone Money Market Fund (GS4 Class)¥ | | | 12,796,567 | | | 12,796,567 | |
Northern Institutional Liquid Assets Portfolio§ | | | 14,403,133 | | | 14,403,133 | |
| | | | | | | |
Total Money Market Funds
(Cost $27,199,700) | | | | | | 27,199,700 | |
| | | | | | | |
| | |
| | | Par | | | |
U.S. TREASURY OBLIGATIONS — 3.1% | | | | | | | |
U.S. Treasury Inflationary Index Bonds | | | | | | | |
2.00%, 01/15/16D | | $ | 1,290,000 | | | 1,348,891 | |
1.38%, 07/15/18D | | | 660,000 | | | 620,338 | |
3.88%, 04/15/29D‡‡ | | | 1,260,000 | | | 2,084,994 | |
| | | | | | | |
| | | | | | 4,054,223 | |
| | | | | | | |
U.S. Treasury Notes | | | | | | | |
4.50%, 04/30/12 | | | 30,000 | | | 33,234 | |
4.50%, 05/15/17D | | | 920,000 | | | 1,079,851 | |
| | | | | | | |
| | | | | | 1,113,085 | |
| | | | | | | |
Total U.S. Treasury Obligations
(Cost $5,020,087) | | | | | | 5,167,308 | |
| | | | | | | |
| | |
TOTAL INVESTMENTS — 111.7%
(Cost $244,367,184) | | | | | | 187,080,981 | |
| | |
Liabilities in Excess of Other Assets — (11.7)% | | | | | | (19,616,205 | ) |
| | | | | | | |
NET ASSETS — 100.0% | | | | | $ | 167,464,776 | |
| | | | | | | |
PORTFOLIO SUMMARY (based on net assets)
| | | |
| | | % | |
Corporate Bonds | | 43.4 | |
Foreign Bonds | | 31.2 | |
Money Market Funds | | 16.2 | |
Mortgage-Backed Securities | | 13.4 | |
Futures Contracts | | 5.8 | |
Asset-Backed Securities | | 3.1 | |
U.S. Treasury Obligations | | 3.1 | |
Forward Foreign Currency Contracts | | 1.8 | |
Preferred Stocks | | 0.7 | |
Agency Obligations | | 0.3 | |
Purchased Option | | 0.3 | |
Common Stock | | 0.0 | ** |
| | | |
| | 119.3 | |
| | | |
| ** | Rounds to less than 0.005%. |
See Notes to Financial Statements.
125
Global Bond Fund
SCHEDULE OF INVESTMENTS (Continued)
FAS 157 DISCLOSURE
The following is a summary of the inputs used, as of December 31, 2008, in valuing the Fund’s assets carried at fair value:
| | | | | | |
Valuation Inputs | | Investments
in
Securities | | Other
Financial
Instruments*** |
Level 1 — Quoted Prices | | $ | 28,958,698 | | $ | 73,835 |
Level 2 — Other Significant Observable Inputs | | | 156,916,488 | | | 1,199,702 |
Level 3 — Significant Unobservable Inputs | | | 1,205,795 | | | — |
| | | | | | |
Total | | $ | 187,080,981 | | $ | 1,273,537 |
| | | | | | |
| *** | Other financial instruments are derivative instruments not reflected in the Schedule of Investments, such as futures, forwards and swap contracts, which are valued at the unrealized appreciation (depreciation) on the investment. |
The following is a reconciliation of assets in which significant unobservable inputs (Level 3) were used in determining fair value:
| | | | | | |
| | | Investments
in
Securities | | Other
Financial
Instruments |
Balance, 12/31/07 | | $ | — | | $ | — |
Accrued discounts/premiums | | | — | | | — |
Realized gain (loss) | | | — | | | — |
Change in unrealized appreciation (depreciation) | | | — | | | — |
Net purchases (sales) | | | — | | | — |
Transfers in and/or out of Level 3 | | | 1,205,795 | | | — |
| | | | | | |
Balance, 12/31/08 | | $ | 1,205,795 | | $ | — |
| | | | | | |
See Notes to Financial Statements.
126
Equity Index Fund
The Equity Index Fund is a passively managed fund benchmarked against the S&P 500® Index. The Fund is comprised of domestic, large-cap equity stocks with both value- and growth-style orientations. The objective of the Fund is to closely replicate the performance of the S&P 500® Index within the investment guidelines. The Fund returned (37.37)% for the GS4 Class for the one-year period ending December 31, 2008, as compared to a (37.00)% return for the S&P 500® Index. The return differential was primarily a result of social restrictions and to a lesser extent Fund expenses. The Fund’s lack of ownership of various tobacco stocks detracted about 25 basis points (0.25)% from performance for the year. On an annualized five-year and since-inception basis, the Fund has generally lagged the index by about 40 basis points a year.
Please see page 133 for information regarding specific portfolio allocations. Portfolio holdings are subject to change at any time.
127
Equity Index Fund
Average Annual Total Returns as of 12/31/08
| | | | | | | | | | | | |
| | | GS2 Class* | | | GS4 Class* | | | GS6 Class* | | | Benchmark** | |
One Year | | (37.32 | )% | | (37.37 | )% | | (37.52 | )% | | (37.00 | )% |
Five Year | | (2.46 | )% | | (2.61 | )% | | (2.86 | )% | | (2.19 | )% |
Since Inception | | (2.20 | )% | | (2.25 | )% | | (2.44 | )% | | (1.82 | )% |
Inception Date | | 08/27/01 | | | 08/27/01 | | | 08/27/01 | | | 08/27/01 | |
Total Fund Operating Expenses (August 5, 2008 Prospectus) | | 0.21 | % | | 0.41 | % | | 0.68 | % | | | |
The performance data quoted represents past performance and does not guarantee future results. Current performance may be lower or higher. Performance data current to the most recent month-end may be obtained at www.GuideStoneFunds.org. The investment return and principal value of an investment will fluctuate so that shares, when redeemed, may be worth more or less than their original cost.
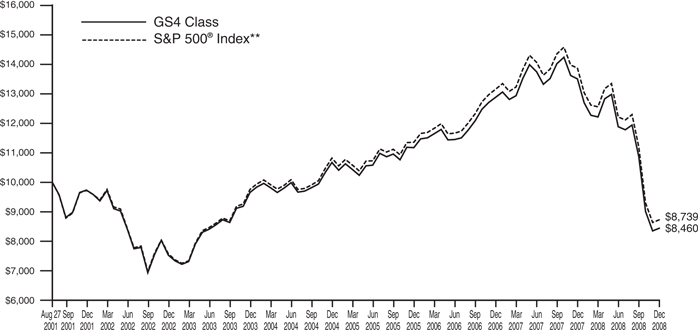
The graph compares the results of a hypothetical $10,000 investment in the GS4 Class of the Fund since August 27, 2001 (commencement of operations), with all dividends and capital gains reinvested, with the S&P 500® Index.
| * | These returns reflect expense waivers by the Fund’s investment adviser. Without these waivers, returns would have been lower. Returns shown do not reflect the deduction of taxes that a shareholder would pay on Fund distributions or the redemption of Fund shares. |
** | The S&P 500® Index is an unmanaged index (with no defined investment objective) of common stocks, includes reinvestment of dividends, and is a registered trademark of McGraw-Hill Co., Inc. The S&P 500® Index includes 500 of the largest stocks (in terms of market value) in the United States. |
Unlike a mutual fund, the performance of an index assumes no taxes, transaction costs, management fees or other expenses.
128
| | |
| Equity Index Fund | | |
| SCHEDULE OF INVESTMENTS | | December 31, 2008 |
| | | | | |
| | | Shares | | Value |
COMMON STOCKS — 95.9% | | | | | |
Auto & Transportation — 2.5% | | | | | |
Burlington Northern Santa Fe Corporation | | 10,500 | | $ | 794,955 |
CH Robinson Worldwide, Inc.D | | 6,300 | | | 346,689 |
CSX Corporation | | 14,900 | | | 483,803 |
Expeditors International Washington, Inc. | | 7,900 | | | 262,833 |
FedEx Corporation | | 11,500 | | | 737,725 |
Ford Motor Co.D* | | 87,893 | | | 201,275 |
General Motors CorporationD | | 21,900 | | | 70,080 |
Genuine Parts Co. | | 6,000 | | | 227,160 |
Goodyear Tire & Rubber Co. (The)D* | | 9,100 | | | 54,327 |
Harley-Davidson, Inc.D | | 8,800 | | | 149,336 |
Norfolk Southern CorporationD | | 13,900 | | | 653,995 |
PACCAR, Inc. | | 13,468 | | | 385,185 |
Southwest Airlines Co. | | 27,100 | | | 233,602 |
Union Pacific Corporation | | 18,800 | | | 898,640 |
United Parcel Service, Inc. Class B | | 37,300 | | | 2,057,468 |
| | | | | |
| | | | | 7,557,073 |
| | | | | |
Consumer Discretionary — 10.8% | | | | | |
Amazon.com, Inc.* | | 11,984 | | | 614,540 |
Apollo Group, Inc. Class AD* | | 3,921 | | | 300,427 |
AutoNation, Inc.D* | | 4,125 | | | 40,755 |
AutoZone, Inc.* | | 1,400 | | | 195,258 |
Avon Products, Inc.D | | 15,800 | | | 379,674 |
Bed Bath & Beyond, Inc.D* | | 9,600 | | | 244,032 |
Best Buy Co., Inc.D | | 12,625 | | | 354,889 |
Big Lots, Inc.D* | | 3,100 | | | 44,919 |
Black & Decker CorporationD | | 2,200 | | | 91,982 |
Carnival Corporation | | 16,300 | | | 396,416 |
CBS Corporation Class B | | 25,300 | | | 207,207 |
Cintas CorporationD | | 5,000 | | | 116,150 |
Coach, Inc.* | | 12,200 | | | 253,394 |
Convergys Corporation* | | 4,700 | | | 30,127 |
Costco Wholesale Corporation | | 16,100 | | | 845,250 |
Darden Restaurants, Inc.D | | 5,250 | | | 147,945 |
DIRECTV Group, Inc. (The)D* | | 20,200 | | | 462,782 |
Donnelley (R.R.) & Sons Co. | | 7,600 | | | 103,208 |
Eastman Kodak Co.D | | 9,900 | | | 65,142 |
eBay, Inc.* | | 39,900 | | | 557,004 |
Electronic Arts, Inc.* | | 11,900 | | | 190,876 |
Estee Lauder Cos., Inc. Class AD | | 4,300 | | | 133,128 |
Expedia, Inc.* | | 8,039 | | | 66,241 |
Family Dollar Stores, Inc.D | | 5,200 | | | 135,564 |
Fastenal Co.D | | 4,800 | | | 167,280 |
GameStop Corporation Class AD* | | 6,100 | | | 132,126 |
Gannett Co., Inc.D | | 8,700 | | | 69,600 |
Gap, Inc. (The) | | 17,500 | | | 234,325 |
Google, Inc.* | | 8,935 | | | 2,748,853 |
Harman International Industries, Inc. | | 2,300 | | | 38,479 |
Hasbro, Inc.D | | 4,700 | | | 137,099 |
Home Depot, Inc. (The) | | 63,420 | | | 1,459,928 |
Ingersoll-Rand Co., Ltd. Class A | | 11,895 | | | 206,378 |
International Flavors & Fragrances, Inc.D | | 2,900 | | | 86,188 |
Interpublic Group Cos., Inc.D* | | 18,048 | | | 71,470 |
Jones Apparel Group, Inc. | | 3,100 | | | 18,166 |
Kimberly-Clark Corporation | | 15,300 | | | 806,922 |
Kohl’s Corporation* | | 11,300 | | | 409,060 |
Leggett & Platt, Inc. | | 5,800 | | | 88,102 |
Limited BrandsD | | 10,100 | | | 101,404 |
Lowe’s Cos., Inc. | | 54,600 | | | 1,174,992 |
Macy’s, Inc.D | | 15,712 | | | 162,619 |
Manitowoc Co., Inc. | | 5,000 | | | 43,300 |
Marriott International, Inc. Class A | | 11,000 | | | 213,950 |
Mattel, Inc. | | 13,400 | | | 214,400 |
McDonald’s Corporation | | 41,500 | | | 2,580,885 |
McGraw-Hill Co., Inc. (The) | | 11,800 | | | 273,642 |
Meredith CorporationD | | 1,400 | | | 23,968 |
Monster Worldwide, Inc.D* | | 4,600 | | | 55,614 |
New York Times Co. Class AD | | 4,400 | | | 32,252 |
Newell Rubbermaid, Inc. | | 10,200 | | | 99,756 |
NIKE, Inc. Class B | | 14,500 | | | 739,500 |
Nordstrom, Inc.D | | 6,000 | | | 79,860 |
Office Depot, Inc.* | | 10,500 | | | 31,290 |
Omnicom Group, Inc. | | 11,800 | | | 317,656 |
Penney (JC) Co., Inc.D | | 8,200 | | | 161,540 |
Polo Ralph Lauren CorporationD | | 2,100 | | | 95,361 |
RadioShack Corporation | | 4,600 | | | 54,924 |
Republic Services, Inc.D | | 11,900 | | | 295,001 |
Robert Half International, Inc.D | | 5,800 | | | 120,756 |
Scripps Networks Interactive, Inc.D | | 3,400 | | | 74,800 |
Sears Holdings CorporationD* | | 2,089 | | | 81,200 |
Snap-On, Inc. | | 2,200 | | | 86,636 |
Stanley Works (The) | | 2,900 | | | 98,890 |
Staples, Inc. | | 26,300 | | | 471,296 |
Starbucks Corporation* | | 27,000 | | | 255,420 |
Starwood Hotels & Resorts Worldwide, Inc.D | | 6,800 | | | 121,720 |
Target CorporationD | | 27,900 | | | 963,387 |
Tiffany & Co.D | | 4,600 | | | 108,698 |
Time Warner, Inc. | | 133,000 | | | 1,337,980 |
TJX Cos., Inc. | | 15,600 | | | 320,892 |
Total System Services, Inc.D | | 7,387 | | | 103,418 |
VeriSign, Inc.D* | | 7,200 | | | 137,376 |
VF Corporation | | 3,200 | | | 175,264 |
Wal-Mart Stores, Inc.D | | 83,400 | | | 4,675,404 |
Walt Disney Co. (The) | | 68,902 | | | 1,563,386 |
Washington Post Co. | | 231 | | | 90,148 |
Waste Management, Inc. | | 18,200 | | | 603,148 |
Whirlpool Corporation | | 2,794 | | | 115,532 |
Wyndham Worldwide Corporation | | 6,780 | | | 44,409 |
Yahoo!, Inc.* | | 51,300 | | | 625,860 |
Yum! Brands, Inc.D | | 17,300 | | | 544,950 |
| | | | | |
| | | | | 32,123,370 |
| | | | | |
Consumer Staples — 7.6% | | | | | |
Campbell Soup Co. | | 7,900 | | | 237,079 |
Clorox Co. | | 5,100 | | | 283,356 |
Coca-Cola Co. (The) | | 74,000 | | | 3,349,980 |
Coca-Cola Enterprises, Inc.D | | 11,600 | | | 139,548 |
Colgate-Palmolive Co. | | 18,900 | | | 1,295,406 |
ConAgra Foods, Inc. | | 16,700 | | | 275,550 |
Dean Foods Co.D* | | 5,500 | | | 98,835 |
Dr Pepper Snapple Group, Inc.* | | 9,400 | | | 152,750 |
General Mills, Inc. | | 12,500 | | | 759,375 |
Heinz (H.J.) Co. | | 11,600 | | | 436,160 |
Hershey Co. (The) | | 6,200 | | | 215,388 |
See Notes to Financial Statements.
129
Equity Index Fund
SCHEDULE OF INVESTMENTS (Continued)
| | | | | |
| | | Shares | | Value |
J.M. Smucker Co. (The) | | 4,303 | | $ | 186,578 |
Kellogg Co. | | 9,300 | | | 407,805 |
Kraft Foods, Inc. Class A | | 54,700 | | | 1,468,695 |
Kroger Co. | | 24,200 | | | 639,122 |
McCormick & Co., Inc.D | | 4,800 | | | 152,928 |
Pepsi Bottling Group, Inc. | | 5,100 | | | 114,801 |
PepsiCo, Inc. | | 58,040 | | | 3,178,851 |
Procter & Gamble Co. | | 111,010 | | | 6,862,614 |
Safeway, Inc. | | 16,100 | | | 382,697 |
Sara Lee Corporation | | 26,300 | | | 257,477 |
SUPERVALU, Inc. | | 8,048 | | | 117,501 |
SYSCO Corporation | | 22,300 | | | 511,562 |
Tyson Foods, Inc. Class AD | | 10,900 | | | 95,484 |
Walgreen Co. | | 36,600 | | | 902,922 |
Whole Foods Market, Inc.D | | 5,300 | | | 50,032 |
| | | | | |
| | | | | 22,572,496 |
| | | | | |
Financial Services — 14.1% | | | | | |
AFLAC, Inc. | | 17,400 | | | 797,616 |
Allstate Corporation (The) | | 19,952 | | | 653,628 |
American Capital, Ltd.D | | 7,800 | | | 25,272 |
American Express Co. | | 42,900 | | | 795,795 |
American International Group, Inc. | | 100,292 | | | 157,458 |
Ameriprise Financial, Inc. | | 8,140 | | | 190,150 |
AON Corporation | | 10,300 | | | 470,504 |
Apartment Investment & Management Co. Class A REITD | | 3,732 | | | 43,105 |
Assurant, Inc. | | 4,300 | | | 129,000 |
Automatic Data Processing, Inc. | | 18,800 | | | 739,592 |
AvalonBay Communities, Inc. REITD | | 2,900 | | | 175,682 |
Bank of America CorporationD | | 186,617 | | | 2,627,567 |
Bank of New York Mellon Corporation | | 42,462 | | | 1,202,948 |
BB&T CorporationD | | 20,800 | | | 571,168 |
Block (H&R), Inc. | | 12,300 | | | 279,456 |
Boston Properties, Inc. REIT | | 4,400 | | | 242,000 |
Capital One Financial Corporation | | 14,437 | | | 460,396 |
CB Richard Ellis Group, Inc. Class A* | | 7,600 | | | 32,832 |
Chubb Corporation | | 13,200 | | | 673,200 |
CIGNA Corporation | | 10,300 | | | 173,555 |
Cincinnati Financial CorporationD | | 5,986 | | | 174,013 |
CIT Group, Inc.D | | 10,700 | | | 48,578 |
Citigroup, Inc. | | 203,330 | | | 1,364,344 |
CME Group, Inc. | | 2,455 | | | 510,910 |
Comerica, Inc.D | | 5,600 | | | 111,160 |
Developers Diversified Realty Corporation REIT | | 4,500 | | | 21,960 |
Discover Financial ServicesD | | 17,900 | | | 170,587 |
Dun & Bradstreet CorporationD | | 2,000 | | | 154,400 |
E*TRADE Financial CorporationD* | | 17,500 | | | 20,125 |
Equifax, Inc.D | | 4,800 | | | 127,296 |
Equity Residential Properties Trust REIT | | 10,100 | | | 301,182 |
Federated Investors, Inc. Class B | | 3,300 | | | 55,968 |
Fidelity National Information Services, Inc. | | 6,900 | | | 112,263 |
Fifth Third BancorpD | | 21,494 | | | 177,540 |
First Horizon National CorporationD | | 7,324 | | | 77,415 |
First Horizon National Corporation Placeholder Shares | | 89,056 | | | — |
Fiserv, Inc.D* | | 5,900 | | | 214,583 |
Franklin Resources, Inc.D | | 5,600 | | | 357,168 |
Genworth Financial, Inc. Class A | | 16,600 | | | 46,978 |
Goldman Sachs Group, Inc. | | 16,354 | | | 1,380,114 |
Hartford Financial Services Group, Inc. | | 11,200 | | | 183,904 |
HCP, Inc. REITD | | 9,296 | | | 258,150 |
Host Hotels & Resorts, Inc. REITD | | 19,200 | | | 145,344 |
Hudson City Bancorp, Inc. | | 19,200 | | | 306,432 |
Huntington Bancshares, Inc.D | | 13,600 | | | 104,176 |
IntercontinentalExchange, Inc.D* | | 2,800 | | | 230,832 |
Invesco, Ltd.D | | 14,400 | | | 207,936 |
Janus Capital Group, Inc.D | | 5,700 | | | 45,771 |
JPMorgan Chase & Co. | | 139,189 | | | 4,388,629 |
KeyCorp | | 18,400 | | | 156,768 |
Kimco Realty Corporation REITD | | 8,600 | | | 157,208 |
Legg Mason, Inc. | | 5,240 | | | 114,808 |
Leucadia National CorporationD* | | 6,600 | | | 130,680 |
Lincoln National Corporation | | 9,619 | | | 181,213 |
Loews Corporation | | 13,491 | | | 381,121 |
M&T Bank CorporationD | | 2,800 | | | 160,748 |
Marsh & McLennan Cos., Inc. | | 19,100 | | | 463,557 |
Marshall & Ilsley Corporation | | 9,800 | | | 133,672 |
Mastercard, Inc. Class AD | | 2,700 | | | 385,911 |
MBIA, Inc.D* | | 7,400 | | | 30,118 |
Merrill Lynch & Co., Inc. | | 59,980 | | | 698,167 |
MetLife, Inc.D | | 29,400 | | | 1,024,884 |
Moody’s Corporation | | 7,300 | | | 146,657 |
Morgan Stanley | | 39,500 | | | 633,580 |
NASDAQ OMX Group, Inc.D* | | 5,100 | | | 126,021 |
National City Corporation | | 78,057 | | | 141,283 |
Northern Trust Corporation | | 8,357 | | | 435,734 |
NYSE Euronext | | 9,900 | | | 271,062 |
Paychex, Inc.D | | 11,900 | | | 312,732 |
People’s United Financial, Inc.D | | 12,800 | | | 228,224 |
Plum Creek Timber Co., Inc. REITD | | 6,400 | | | 222,336 |
PNC Financial Services Group, Inc. | | 12,800 | | | 627,200 |
Principal Financial GroupD | | 9,800 | | | 221,186 |
Progressive Corporation (The) | | 24,996 | | | 370,191 |
ProLogis REITD | | 9,800 | | | 136,122 |
Prudential Financial, Inc. | | 15,800 | | | 478,108 |
Public Storage REITD | | 4,625 | | | 367,688 |
Regions Financial CorporationD | | 25,929 | | | 206,395 |
Ryder System, Inc. | | 2,100 | | | 81,438 |
Schwab (Charles) Corporation (The) | | 34,506 | | | 557,962 |
Simon Property Group, Inc. REITD | | 8,300 | | | 440,979 |
SLM Corporation* | | 17,400 | | | 154,860 |
Sovereign Bancorp, Inc.* | | 20,065 | | | 59,794 |
State Street CorporationD | | 16,000 | | | 629,280 |
SunTrust Banks, Inc.D | | 13,200 | | | 389,928 |
T. Rowe Price Group, Inc.D | | 9,600 | | | 340,224 |
Torchmark CorporationD | | 3,200 | | | 143,040 |
Travelers Cos., Inc. | | 21,756 | | | 983,371 |
Unum Group | | 12,300 | | | 228,780 |
See Notes to Financial Statements.
130
| | | | | |
| | | Shares | | Value |
US Bancorp | | 65,700 | | $ | 1,643,157 |
Vornado Realty Trust REITD | | 5,100 | | | 307,785 |
Wachovia Corporation | | 79,883 | | | 442,552 |
Wells Fargo & Co. | | 141,360 | | | 4,167,293 |
Western Union Co. | | 27,017 | | | 387,424 |
XL Capital, Ltd. Class AD | | 11,600 | | | 42,920 |
Zions BancorporationD | | 4,100 | | | 100,491 |
| | | | | |
| | | | | 41,783,334 |
| | | | | |
Healthcare — 15.0% | | | | | |
Abbott Laboratories | | 57,600 | | | 3,074,112 |
Aetna, Inc. | | 17,100 | | | 487,350 |
Allergan, Inc. | | 11,430 | | | 460,858 |
AmerisourceBergen Corporation | | 5,944 | | | 211,963 |
Amgen, Inc.* | | 39,565 | | | 2,284,879 |
Bard (C.R.), Inc. | | 3,700 | | | 311,762 |
Baxter International, Inc. | | 23,100 | | | 1,237,929 |
Becton Dickinson & Co. | | 9,000 | | | 615,510 |
Biogen Idec, Inc.* | | 10,730 | | | 511,070 |
Boston Scientific CorporationD* | | 55,500 | | | 429,570 |
Bristol-Myers Squibb Co. | | 73,200 | | | 1,701,900 |
Cardinal Health, Inc. | | 13,279 | | | 457,727 |
Celgene Corporation* | | 17,200 | | | 950,816 |
Cephalon, Inc.D* | | 2,500 | | | 192,600 |
Conventry Health Care, Inc.* | | 5,530 | | | 82,286 |
Covidien, Ltd.D | | 18,546 | | | 672,107 |
CVS Caremark Corporation | | 53,527 | | | 1,538,366 |
DaVita, Inc.D* | | 3,900 | | | 193,323 |
Dentsply International, Inc.D | | 5,600 | | | 158,144 |
Eli Lilly & Co. | | 37,100 | | | 1,494,017 |
Express Scripts, Inc.* | | 9,338 | | | 513,403 |
Forest Laboratories, Inc.* | | 11,400 | | | 290,358 |
Genzyme Corporation* | | 10,200 | | | 676,974 |
Gilead Sciences, Inc.* | | 34,200 | | | 1,748,988 |
Hospira, IncD* | | 5,950 | | | 159,579 |
Humana, Inc.* | | 6,300 | | | 234,864 |
IMS Health, Inc. | | 6,800 | | | 103,088 |
Intuitive Surgical, Inc.* | | 1,400 | | | 177,786 |
Johnson & Johnson | | 103,490 | | | 6,191,807 |
King Pharmaceuticals, Inc.* | | 9,100 | | | 96,642 |
Laboratory Corporation of America HoldingsD* | | 4,100 | | | 264,081 |
Life Technologies Corporation* | | 6,033 | | | 140,629 |
McKesson Corporation | | 10,200 | | | 395,046 |
Medco Health Solutions, Inc.* | | 18,652 | | | 781,705 |
Medtronic, Inc. | | 41,600 | | | 1,307,072 |
Merck & Co., Inc. | | 78,900 | | | 2,398,560 |
Millipore CorporationD* | | 2,100 | | | 108,192 |
Mylan Laboratories, Inc.D* | | 11,500 | | | 113,735 |
Patterson Cos., Inc.D* | | 3,400 | | | 63,750 |
Pfizer, Inc. | | 250,783 | | | 4,441,367 |
Quest Diagnostics, Inc. | | 5,800 | | | 301,078 |
Schering-Plough Corporation | | 60,200 | | | 1,025,206 |
St. Jude Medical, Inc.* | | 12,600 | | | 415,296 |
Stericycle, Inc.* | | 3,200 | | | 166,656 |
Stryker CorporationD | | 9,200 | | | 367,540 |
Tenet Healthcare CorporationD* | | 15,750 | | | 18,112 |
Thermo Fisher Scientific, Inc.* | | 15,510 | | | 528,426 |
UnitedHealth Group, Inc. | | 45,000 | | | 1,197,000 |
Varian Medical Systems, Inc.* | | 4,600 | | | 161,184 |
Watson Pharmaceuticals, Inc.D* | | 3,900 | | | 103,623 |
WellPoint, Inc.* | | 18,912 | | | 796,763 |
Wyeth | | 49,400 | | | 1,852,994 |
Zimmer Holdings, Inc.* | | 8,320 | | | 336,294 |
| | | | | |
| | | | | 44,544,087 |
| | | | | |
Integrated Oils — 9.1% | | | | | |
Chevron Corporation | | 75,741 | | | 5,602,562 |
ConocoPhillips | | 55,458 | | | 2,872,724 |
Exxon Mobil Corporation | | 189,344 | | | 15,115,332 |
Hess Corporation | | 10,600 | | | 568,584 |
Marathon Oil Corporation | | 26,084 | | | 713,658 |
Murphy Oil Corporation | | 7,100 | | | 314,885 |
Occidental Petroleum Corporation | | 30,100 | | | 1,805,699 |
| | | | | |
| | | | | 26,993,444 |
| | | | | |
Materials & Processing — 3.5% | | | | | |
Air Products & Chemicals, Inc. | | 7,800 | | | 392,106 |
AK Steel CorporationD | | 4,300 | | | 40,076 |
Alcoa, Inc. | | 29,800 | | | 335,548 |
Allegheny Technologies, Inc.D | | 3,600 | | | 91,908 |
Archer-Daniels-Midland Co. | | 23,827 | | | 686,932 |
Avery Dennison CorporationD | | 4,000 | | | 130,920 |
Ball Corporation | | 3,492 | | | 145,232 |
Bemis Co. | | 3,800 | | | 89,984 |
CF Industries Holdings, Inc. | | 2,100 | | | 103,236 |
Dow Chemical Co. (The) | | 34,200 | | | 516,078 |
Du Pont (E.I.) de Nemours & Co. | | 33,355 | | | 843,881 |
Eastman Chemical Co. | | 2,700 | | | 85,617 |
Ecolab, Inc. | | 6,300 | | | 221,445 |
Fluor Corporation | | 6,700 | | | 300,629 |
Freeport-McMoRan Copper & Gold, Inc. | | 14,062 | | | 343,675 |
International Paper Co. | | 15,935 | | | 188,033 |
Masco Corporation | | 13,500 | | | 150,255 |
MeadWestvaco Corporation | | 6,445 | | | 72,120 |
Monsanto Co. | | 20,320 | | | 1,429,512 |
Newmont Mining CorporationD | | 16,900 | | | 687,830 |
Nucor Corporation | | 11,689 | | | 540,032 |
Owens-Illinois, Inc.* | | 6,200 | | | 169,446 |
Pactiv CorporationD* | | 4,800 | | | 119,424 |
PPG Industries, Inc. | | 6,100 | | | 258,823 |
Praxair, Inc. | | 11,480 | | | 681,453 |
Precision Castparts Corporation | | 5,200 | | | 309,296 |
Rohm & Haas Co. | | 4,600 | | | 284,234 |
Sealed Air Corporation | | 6,000 | | | 89,640 |
Sherwin-Williams Co.D | | 3,700 | | | 221,075 |
Sigma-Aldrich CorporationD | | 4,600 | | | 194,304 |
Titanium Metals CorporationD | | 3,500 | | | 30,835 |
United States Steel CorporationD | | 4,300 | | | 159,960 |
Vulcan Materials Co.D | | 4,100 | | | 285,278 |
Weyerhaeuser Co.D | | 7,860 | | | 240,595 |
| | | | | |
| | | | | 10,439,412 |
| | | | | |
Other — 3.4% | | | | | |
3M Co. | | 25,800 | | | 1,484,532 |
Eaton Corporation | | 6,128 | | | 304,623 |
General Electric Co. | | 390,500 | | | 6,326,100 |
Honeywell International, Inc. | | 27,000 | | | 886,410 |
Jacobs Engineering Group, Inc.* | | 4,500 | | | 216,450 |
Johnson Controls, Inc. | | 21,976 | | | 399,084 |
Textron, Inc.D | | 9,000 | | | 124,830 |
Tyco International, Ltd. | | 17,646 | | | 381,154 |
| | | | | |
| | | | | 10,123,183 |
| | | | | |
See Notes to Financial Statements.
131
Equity Index Fund
SCHEDULE OF INVESTMENTS (Continued)
| | | | | |
| | | Shares | | Value |
Other Energy — 4.2% | | | | | |
Anadarko Petroleum Corporation | | 17,200 | | $ | 663,060 |
Apache Corporation | | 12,348 | | | 920,296 |
Baker Hughes, Inc.D | | 11,400 | | | 365,598 |
BJ Services Co.D | | 10,900 | | | 127,203 |
Cabot Oil & Gas Corporation | | 3,700 | | | 96,200 |
Cameron International Corporation* | | 8,000 | | | 164,000 |
Chesapeake Energy CorporationD | | 19,866 | | | 321,233 |
Consol Energy, Inc.D | | 6,800 | | | 194,344 |
Devon Energy Corporation | | 16,300 | | | 1,071,073 |
Dynegy, Inc. Class AD* | | 18,824 | | | 37,648 |
El Paso Corporation | | 26,400 | | | 206,712 |
ENSCO International, Inc. | | 5,300 | | | 150,467 |
EOG Resources, Inc. | | 9,200 | | | 612,536 |
Equitable Resources, Inc. | | 4,800 | | | 161,040 |
Exterran Holdings, Inc.* | | 13 | | | 277 |
FPL Group, Inc. | | 15,400 | | | 775,082 |
Halliburton Co. | | 33,175 | | | 603,122 |
Massey Energy Co. | | 3,200 | | | 44,128 |
Nabors Industries, Ltd.D* | | 10,400 | | | 124,488 |
National Oilwell Varco, Inc.* | | 15,700 | | | 383,708 |
Noble CorporationD | | 9,800 | | | 216,482 |
Noble Energy, Inc. | | 6,400 | | | 315,008 |
Peabody Energy Corporation | | 10,000 | | | 227,500 |
Pioneer Natural Resouces Co. | | 4,500 | | | 72,810 |
Range Resources CorporationD | | 5,784 | | | 198,912 |
Rowan Cos., Inc.D | | 4,200 | | | 66,780 |
Schlumberger, Ltd. | | 44,700 | | | 1,892,151 |
Smith International, Inc. | | 8,123 | | | 185,935 |
Southwestern Energy Co.* | | 12,700 | | | 367,919 |
Sunoco, Inc.D | | 4,500 | | | 195,570 |
Tesoro CorporationD | | 5,200 | | | 68,484 |
Valero Energy Corporation | | 19,400 | | | 419,816 |
Weatherford International, Ltd.* | | 25,196 | | | 272,621 |
Williams Cos., Inc. | | 21,500 | | | 311,320 |
XTO Energy, Inc. | | 21,457 | | | 756,788 |
| | | | | |
| | | | | 12,590,311 |
| | | | | |
Producer Durables — 4.6% | | | | | |
Agilent Technologies, Inc.* | | 13,200 | | | 206,316 |
American Tower Corporation Class A* | | 14,700 | | | 431,004 |
Applied Materials, Inc. | | 49,600 | | | 502,448 |
Boeing Co. (The) | | 27,300 | | | 1,164,891 |
Caterpillar, Inc. | | 22,500 | | | 1,005,075 |
Centex Corporation | | 4,800 | | | 51,072 |
Cooper Industries, Ltd. Class AD | | 6,500 | | | 189,995 |
Cummins, Inc. | | 7,600 | | | 203,148 |
Danaher Corporation | | 9,400 | | | 532,134 |
Deere & Co. | | 15,800 | | | 605,456 |
Dover Corporation | | 7,000 | | | 230,440 |
DR Horton, Inc. | | 10,200 | | | 72,114 |
Emerson Electric Co. | | 28,500 | | | 1,043,385 |
Flowserve Corporation | | 2,100 | | | 108,150 |
Goodrich Corporation | | 4,700 | | | 173,994 |
Grainger (W.W.), Inc.D | | 2,400 | | | 189,216 |
Illinois Tool Works, Inc. | | 14,600 | | | 511,730 |
ITT Industries, Inc.D | | 6,700 | | | 308,133 |
KB HomeD | | 2,900 | | | 39,498 |
KLA-Tencor Corporation | | 6,300 | | | 137,277 |
Lennar Corporation Class AD | | 5,300 | | | 45,951 |
Lexmark International, Inc.* | | 2,900 | | | 78,010 |
Lockheed Martin Corporation | | 12,300 | | | 1,034,184 |
Molex, Inc.D | | 5,250 | | | 76,073 |
Northrop Grumman Corporation | | 12,156 | | | 547,506 |
Novellus Systems, Inc.D* | | 3,700 | | | 45,658 |
Pall Corporation | | 4,400 | | | 125,092 |
Parker Hannifin Corporation | | 6,050 | | | 257,367 |
Pitney Bowes, Inc. | | 7,800 | | | 198,744 |
Pulte Homes, Inc.D | | 8,108 | | | 88,620 |
Raytheon Co. | | 15,400 | | | 786,016 |
Rockwell Collins, Inc.D | | 5,900 | | | 230,631 |
Teradyne, Inc.D* | | 6,400 | | | 27,008 |
United Technologies Corporation | | 35,400 | | | 1,897,440 |
Waters CorporationD* | | 3,700 | | | 135,605 |
Xerox CorporationD | | 32,300 | | | 257,431 |
| | | | | |
| | | | | 13,536,812 |
| | | | | |
Technology — 12.9% | | | | | |
Adobe Systems, Inc.* | | 19,600 | | | 417,284 |
Advanced Micro Devices, Inc.D* | | 23,100 | | | 49,896 |
Affiliated Computer Services, Inc. Class AD* | | 3,600 | | | 165,420 |
Akamai Technologies, Inc.* | | 6,400 | | | 96,576 |
Altera Corporation | | 11,100 | | | 185,481 |
Amphenol Corporation | | 6,700 | | | 160,666 |
Analog Devices, Inc.D | | 10,800 | | | 205,416 |
Apple, Inc.* | | 33,100 | | | 2,825,085 |
Autodesk, Inc.* | | 8,360 | | | 164,274 |
BMC Software, Inc.* | | 7,100 | | | 191,061 |
Broadcom Corporation Class A* | | 16,450 | | | 279,156 |
CA, Inc. | | 14,570 | | | 269,982 |
Ciena CorporationD* | | 3,328 | | | 22,298 |
Cisco Systems, Inc.* | | 218,000 | | | 3,553,400 |
Citrix Systems, Inc.* | | 6,700 | | | 157,919 |
Cognizant Technology Solutions Corporation Class A* | | 10,900 | | | 196,854 |
Computer Sciences Corporation* | | 5,700 | | | 200,298 |
Compuware Corporation* | | 9,600 | | | 64,800 |
Corning, Inc. | | 57,800 | | | 550,834 |
Dell, Inc.* | | 64,500 | | | 660,480 |
EMC Corporation* | | 76,600 | | | 802,002 |
FLIR Systems, Inc.* | | 5,200 | | | 159,536 |
General Dynamics Corporation | | 14,500 | | | 835,055 |
Harris Corporation | | 5,000 | | | 190,250 |
Hewlett-Packard Co. | | 91,002 | | | 3,302,463 |
Intel Corporation | | 207,100 | | | 3,036,086 |
International Business Machines Corporation | | 50,100 | | | 4,216,416 |
Intuit, Inc.D* | | 12,000 | | | 285,480 |
Jabil Circuit, Inc.D | | 8,100 | | | 54,675 |
JDS Uniphase CorporationD* | | 8,475 | | | 30,934 |
Juniper Networks, Inc.D* | | 19,600 | | | 343,196 |
L-3 Communications Holdings, Inc. | | 4,400 | | | 324,632 |
Linear Technology CorporationD | | 8,300 | | | 183,596 |
LSI CorporationD* | | 24,300 | | | 79,947 |
McAfee, Inc.* | | 5,700 | | | 197,049 |
MEMC Electronic Materials, Inc.D* | | 8,500 | | | 121,380 |
Microchip Technology, Inc. | | 6,800 | | | 132,804 |
See Notes to Financial Statements.
132
| | | | | | | |
| | | Shares | | Value | |
Micron Technology, Inc.D* | | | 29,100 | | $ | 76,824 | |
Microsoft Corporation | | | 285,330 | | | 5,546,815 | |
Motorola, Inc. | | | 83,800 | | | 371,234 | |
National Semiconductor CorporationD | | | 7,400 | | | 74,518 | |
NetApp, Inc.* | | | 12,200 | | | 170,434 | |
Novell, Inc.* | | | 13,400 | | | 52,126 | |
NVIDIA Corporation* | | | 19,950 | | | 160,996 | |
Oracle Corporation* | | | 145,500 | | | 2,579,715 | |
PerkinElmer, Inc.D | | | 4,400 | | | 61,204 | |
QLogic Corporation* | | | 4,700 | | | 63,168 | |
QUALCOMM, Inc. | | | 61,400 | | | 2,199,962 | |
Rockwell Automation, Inc.D | | | 5,300 | | | 170,872 | |
Salesforce.com, Inc.D* | | | 3,900 | | | 124,839 | |
SanDisk Corporation* | | | 8,500 | | | 81,600 | |
Sun Microsystems, Inc.D* | | | 27,500 | | | 105,050 | |
Symantec CorporationD* | | | 31,270 | | | 422,770 | |
Tellabs, Inc.* | | | 15,000 | | | 61,800 | |
Teradata CorporationD* | | | 6,700 | | | 99,361 | |
Texas Instruments, Inc. | | | 48,200 | | | 748,064 | |
Tyco Electronics, Ltd. | | | 17,046 | | | 276,316 | |
Xilinx, Inc. | | | 10,200 | | | 181,764 | |
| | | | | | | |
| | | | | | 38,342,113 | |
| | | | | | | |
Utilities — 8.2% | | | | | | | |
AES Corporation* | | | 25,100 | | | 206,824 | |
Allegheny Energy, Inc. | | | 6,200 | | | 209,932 | |
Ameren CorporationD | | | 7,800 | | | 259,428 | |
American Electric Power Co., Inc. | | | 14,900 | | | 495,872 | |
AT&T, Inc. | | | 219,072 | | | 6,243,552 | |
Centerpoint Energy, Inc. | | | 12,300 | | | 155,226 | |
CenturyTel, Inc. | | | 3,900 | | | 106,587 | |
CMS Energy CorporationD | | | 8,600 | | | 86,946 | |
Comcast Corporation Class A | | | 107,172 | | | 1,809,063 | |
Consolidated Edison, Inc.D | | | 10,100 | | | 393,193 | |
Constellation Energy Group, Inc. | | | 6,600 | | | 165,594 | |
Dominion Resources, Inc. | | | 21,440 | | | 768,410 | |
DTE Energy Co. | | | 6,100 | | | 217,587 | |
Duke Energy Corporation | | | 47,768 | | | 716,998 | |
Edison InternationalD | | | 12,000 | | | 385,440 | |
Embarq Corporation | | | 5,444 | | | 195,766 | |
Entergy Corporation | | | 7,152 | | | 594,546 | |
Exelon Corporation | | | 24,724 | | | 1,374,902 | |
FirstEnergy Corporation | | | 11,584 | | | 562,751 | |
Frontier Communications CorporationD | | | 12,000 | | | 104,880 | |
Integrys Energy Group, Inc.D | | | 2,800 | | | 120,344 | |
Nicor, Inc. | | | 1,700 | | | 59,058 | |
NiSource, Inc. | | | 10,300 | | | 112,991 | |
Pepco Holdings, Inc. | | | 7,600 | | | 134,976 | |
PG&E Corporation | | | 13,300 | | | 514,843 | |
Pinnacle West Capital Corporation | | | 3,800 | | | 122,094 | |
PPL Corporation | | | 14,300 | | | 438,867 | |
Progress Energy, Inc. | | | 9,700 | | | 386,545 | |
Public Service Enterprise Group, Inc. | | | 18,900 | | | 551,313 | |
Questar Corporation | | | 6,400 | | | 209,216 | |
Qwest Communications International, Inc.D | | | 54,900 | | | 199,836 | |
SCANA Corporation | | | 4,400 | | | 156,640 | |
Sempra EnergyD | | | 9,100 | | | 387,933 | |
Southern Co. (The) | | | 29,100 | | | 1,076,700 | |
Spectra Energy Corporation | | | 23,184 | | | 364,916 | |
Sprint Nextel Corporation* | | | 106,393 | | | 194,699 | |
TECO Energy, Inc.D | | | 8,000 | | | 98,800 | |
Verizon Communications, Inc. | | | 105,474 | | | 3,575,568 | |
Windstream CorporationD | | | 16,699 | | | 153,631 | |
Wisconsin Energy Corporation | | | 4,300 | | | 180,514 | |
Xcel Energy Inc. | | | 16,300 | | | 302,365 | |
| | | | | | | |
| | | | | | 24,395,346 | |
| | | | | | | |
Total Common Stocks
(Cost $335,673,804) | | | | | | 285,000,981 | |
| | | | | | | |
MONEY MARKET FUNDS — 9.8% | | | | | | | |
GuideStone Money Market Fund (GS4 Class)¥ | | | 8,956,628 | | | 8,956,628 | |
Northern Institutional Liquid Assets Portfolio§ | | | 20,348,261 | | | 20,348,261 | |
| | | | | | | |
Total Money Market Funds
(Cost $29,304,889) | | | | | | 29,304,889 | |
| | | | | | | |
| | |
| | | Par | | | |
U.S. TREASURY OBLIGATIONS — 0.8% | | | | | | | |
U.S. Treasury Bills | | | | | | | |
0.00%, 05/14/09‡‡ | | $ | 55,000 | | | 54,988 | |
0.04%, 05/14/09‡‡ | | | 35,000 | | | 34,992 | |
0.06%, 05/14/09‡‡ | | | 15,000 | | | 14,997 | |
0.07%, 05/14/09‡‡ | | | 60,000 | | | 59,987 | |
0.10%, 05/14/09‡‡ | | | 1,925,000 | | | 1,924,576 | |
0.20%, 05/14/09‡‡ | | | 195,000 | | | 194,957 | |
| | | | | | | |
Total U.S. Treasury Obligations
(Cost $2,284,122) | | | | | | 2,284,497 | |
| | | | | | | |
| | |
TOTAL INVESTMENTS — 106.5%
(Cost $367,262,815) | | | | | | 316,590,367 | |
| | |
Liabilities in Excess of Other Assets — (6.5)% | | | | | | (19,396,813 | ) |
| | | | | | | |
NET ASSETS — 100.0% | | | | | $ | 297,193,554 | |
| | | | | | | |
PORTFOLIO SUMMARY (based on net assets)
| | |
| | | % |
Healthcare | | 15.0 |
Financial Services | | 14.1 |
Technology | | 12.9 |
Consumer Discretionary | | 10.8 |
Money Market Funds | | 9.8 |
Integrated Oils | | 9.1 |
Utilities | | 8.2 |
Consumer Staples | | 7.6 |
Producer Durables | | 4.6 |
Other Energy | | 4.2 |
Futures Contracts | | 3.6 |
Materials & Processing | | 3.5 |
Other | | 3.4 |
Auto & Transportation | | 2.5 |
U.S. Treasury Obligations | | 0.8 |
| | |
| | 110.1 |
| | |
See Notes to Financial Statements.
133
Equity Index Fund
SCHEDULE OF INVESTMENTS (Continued)
FAS 157 DISCLOSURE
The following is a summary of the inputs used, as of December 31, 2008, in valuing the Fund’s assets carried at fair value:
| | | | | | |
Valuation Inputs | | Investments
in
Securities | | Other
Financial
Instruments*** |
Level 1 — Quoted Prices | | $ | 314,305,870 | | $ | 291,663 |
Level 2 — Other Significant Observable Inputs | | | 2,284,497 | | | — |
Level 3 — Significant Unobservable Inputs | | | — | | | — |
| | | | | | |
Total | | $ | 316,590,367 | | $ | 291,663 |
| | | | | | |
| *** | Other financial instruments are derivative instruments not reflected in the Schedule of Investments, such as futures, forwards and swap contracts, which are valued at the unrealized appreciation (depreciation) on the investment. |
See Notes to Financial Statements.
134
Real Estate Securities Fund
The Real Estate Securities Fund provides exposure to real estate by investing in public real estate securities with strong cash flow growth potential that provides the capacity for sustained dividend increases. The Fund is diversified among property sectors and geographical locations. The Fund became a registered mutual fund on December 29, 2006, but prior to that, it was offered in an unregistered fund to eligible participants beginning in January 2006. The Fund’s sub-adviser, RREEF America L.L.C., has managed assets for GuideStone Financial Resources since April 2000. Entering the fourth quarter of 2008, real estate investment trusts (REITs) were relative outperformers compared to broader equity indices. This changed abruptly as REITs fell victim to the systematic increase in risk aversion and erased their year to date relative gains. By the time the quarter was through, the Dow Jones Wilshire Real Estate Securities Index had fallen approximately 40%, by far the worst year ever for REITs. The Fund slightly underperformed its benchmark, the Dow Jones Wilshire Real Estate Securities Index, in 2008 by 52 basis points ((40.35)% versus (39.83)%). The Fund was ahead of its benchmark on an annualized basis, trailed slightly on an annualized five-year basis and remained ahead on a since-inception basis.
Please see page 137 for information regarding specific portfolio allocations. Portfolio holdings are subject to change at any time.
This Fund invests substantial assets in REITs that involve risks not associated with investing in stocks. Risks include declines in the value of real estate, general and economic conditions, changes in the value of the underlying property and defaults by borrowers. The value of assets in the real estate industry may go through cycles of relative underperformance and outperformance in comparison to equity securities markets in general.
135
Real Estate Securities Fund
Average Annual Total Returns as of 12/31/08
| | | | | | |
| | | GS4 Class* | | | Benchmark** | |
One Year | | (40.35 | )% | | (39.83 | )% |
Since Inception | | (29.07 | )% | | (29.42 | )% |
Inception Date | | 12/29/06 | | | 12/29/06 | |
Total Fund Operating Expenses (August 5, 2008 Prospectus) | | 1.18 | % | | | |
The performance data quoted represents past performance and does not guarantee future results. Current performance may be lower or higher. Performance data current to the most recent month-end may be obtained at www.GuideStoneFunds.org. The investment return and principal value of an investment will fluctuate so that shares, when redeemed, may be worth more or less than their original cost.
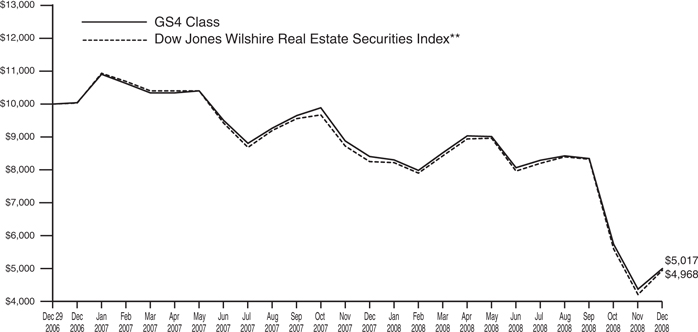
The graph compares the results of a hypothetical $10,000 investment in the GS4 Class of the Fund since December 29, 2006 (commencement of operations), with all dividends and capital gains reinvested, with the Dow Jones Wilshire Real Estate Securities Index.
| * | These returns reflect expense waivers by the Fund’s investment adviser. Without these waivers, returns would have been lower. Returns shown do not reflect the deduction of taxes that a shareholder would pay on Fund distributions or the redemption of Fund shares. |
| ** | The Dow Jones Wilshire Real Estate Securities Index is an unmanaged, broad-based, market capitalization-weighted index comprised of publicly traded REITs and real estate operating companies, not including special purpose or healthcare REITs. It is comprised of major companies engaged in the equity ownership and operation of commercial real estate. |
Unlike a mutual fund, the performance of an index assumes no taxes, transaction costs, management fees or other expenses.
136
Real Estate Securities Fund
| | | | |
| SCHEDULE OF INVESTMENTS | | December 31, 2008 |
| | | | | | | |
| | | Shares | | Value | |
COMMON STOCKS — 93.0% | | | | | | | |
Financial Services — 93.0% | | | | | | | |
AMB Property Corporation REITD | | | 45,050 | | $ | 1,055,071 | |
American Campus Communities, Inc. REIT | | | 71,600 | | | 1,466,368 | |
AvalonBay Communities, Inc. REITD | | | 83,625 | | | 5,066,003 | |
BioMed Realty Trust, Inc. REITD | | | 101,550 | | | 1,190,166 | |
Boston Properties, Inc. REITD | | | 65,500 | | | 3,602,500 | |
BRE Properties, Inc. REITD | | | 65,200 | | | 1,824,296 | |
Brookfield Properties CorporationD | | | 95,363 | | | 737,156 | |
Camden Property Trust REITD | | | 32,100 | | | 1,006,014 | |
DCT Industrial Trust, Inc. REITD | | | 146,250 | | | 740,025 | |
Digital Realty Trust, Inc. REITD | | | 90,800 | | | 2,982,780 | |
DuPont Fabros Technology, Inc. REITD | | | 53,100 | | | 109,917 | |
Equity Lifestyle Properties, Inc. REITD | | | 50,050 | | | 1,919,918 | |
Equity Residential Properties Trust REITD | | | 109,750 | | | 3,272,745 | |
Extra Space Storage, Inc. REITD | | | 104,700 | | | 1,080,504 | |
Federal Realty Investors Trust REIT | | | 46,400 | | | 2,880,512 | |
HCP, Inc. REITD | | | 7,800 | | | 216,606 | |
Hospitality Properites Trust REITD | | | 20,900 | | | 310,783 | |
Host Hotels & Resorts, Inc. REITD | | | 184,477 | | | 1,396,491 | |
Kilroy Realty Corporation REITD | | | 20,200 | | | 675,892 | |
Liberty Property Trust REITD | | | 65,800 | | | 1,502,214 | |
LTC Properties, Inc. REIT | | | 36,255 | | | 735,251 | |
Macerich Co. (The) REITD | | | 28,850 | | | 523,916 | |
Medical Properties Trust, Inc. REITD | | | 156,809 | | | 989,465 | |
Nationwide Health Properties, Inc. REITD | | | 91,810 | | | 2,636,783 | |
Omega Healthcare Investors, Inc. REITD | | | 17,800 | | | 284,266 | |
Post Properties, Inc. REITD | | | 53,125 | | | 876,562 | |
ProLogis REITD | | | 80,450 | | | 1,117,451 | |
Public Storage REITD | | | 80,680 | | | 6,414,060 | |
Regency Centers Corporation REITD | | | 91,350 | | | 4,266,045 | |
Saul Centers, Inc. REIT | | | 7,300 | | | 288,350 | |
Senior Housing Properties Trust REITD | | | 152,735 | | | 2,737,011 | |
Simon Property Group, Inc. REITD | | | 142,075 | | | 7,548,445 | |
SL Green Realty Corporation REITD | | | 43,150 | | | 1,117,585 | |
Taubman Centers, Inc. REITD | | | 34,850 | | | 887,281 | |
Ventas, Inc. REITD | | | 160,286 | | | 5,380,801 | |
Vornado Realty Trust REITD | | | 101,238 | | | 6,109,713 | |
| | | | | | | |
| | |
Total Common Stocks
(Cost $103,465,639) | | | | | | 74,948,946 | |
| | | | | | | |
MONEY MARKET FUNDS — 34.5% | | | | | | | |
GuideStone Money Market Fund (GS4 Class)¥ | | | 4,415,039 | | | 4,415,039 | |
Northern Institutional Liquid Assets Portfolio§ | | | 23,423,794 | | | 23,423,794 | |
| | | | | | | |
Total Money Market Funds
(Cost $27,838,833) | | | | | | 27,838,833 | |
| | | | | | | |
| | |
| | | Par | | | |
U.S. TREASURY OBLIGATIONS — 1.0% | | | | | | | |
U.S. Treasury Bills | | | | | | | |
0.01%, 05/14/09‡‡ | | $ | 20,000 | | | 19,996 | |
0.10%, 05/14/09‡‡ | | | 745,000 | | | 744,836 | |
| | | | | | | |
Total U.S. Treasury Obligations
(Cost $764,724) | | | | | | 764,832 | |
| | | | | | | |
| | |
TOTAL INVESTMENTS — 128.5%
(Cost $132,069,196) | | | | | | 103,552,611 | |
| | |
Liabilities in Excess of Other Assets — (28.5)% | | | | | | (22,973,362 | ) |
| | | | | | | |
NET ASSETS — 100.0% | | | | | $ | 80,579,249 | |
| | | | | | | |
| | |
PORTFOLIO SUMMARY (based on net assets) | | |
| | | % |
Financial Services | | 93.0 |
Money Market Funds | | 34.5 |
Futures Contracts | | 6.2 |
U.S. Treasury Obligations | | 1.0 |
| | |
| | 134.7 |
| | |
FAS 157 DISCLOSURE
The following is a summary of the inputs used, as of December 31, 2008, in valuing the Fund’s assets carried at fair value:
| | | | | | |
Valuation Inputs | | Investments
in
Securities | | Other
Financial
Instruments*** |
Level 1 — Quoted Prices | | $ | 102,787,779 | | $ | 238,305 |
Level 2 — Other Significant Observable Inputs | | | 764,832 | | | — |
Level 3 — Significant Unobservable Inputs | | | — | | | — |
| | | | | | |
Total | | $ | 103,552,611 | | $ | 238,305 |
| | | | | | |
| *** | Other financial instruments are derivative instruments not reflected in the Schedule of Investments, such as futures, forwards and swap contracts, which are valued at the unrealized appreciation (depreciation) on the investment. |
See Notes to Financial Statements.
137
Value Equity Fund
The Value Equity Fund invests in a diversified portfolio of large- and medium-size U.S. companies whose stocks are considered by the Fund’s investment managers to be attractive from a valuation perspective. The GS4 Class slightly trailed its benchmark, the Russell 1000® Value Index, for the one-year period ((36.95)% versus (36.85)%). Across the market capitalization spectrum, the Russell style indices indicate that value stocks fell slightly less than growth stocks for 2008, despite the preponderance of financial sector companies classified as value stocks. The Financial Services sector clearly led the market down in 2008 under the weight of a systematic crisis of the world’s banking companies. This sector within the Russell 1000® Value Index fell 52% for the year. The Value Equity Fund was meaningfully underweight to the Financial Services sector during 2008 which was a notable benefit to performance relative to the benchmark. However, the GS4 Class has underperformed its benchmark on an annualized five-year basis and since-inception basis.
Please see page 142 for information regarding specific portfolio allocations. Portfolio holdings are subject to change at any time.
138
Value Equity Fund
Average Annual Total Returns as of 12/31/08
| | | | | | | | | | | | |
| | | GS2 Class* | | | GS4 Class* | | | GS6 Class* | | | Benchmark** | |
One Year | | (36.81 | )% | | (36.95 | )% | | (37.20 | )% | | (36.85 | )% |
Five Year | | (1.26 | )% | | (1.44 | )% | | (1.76 | )% | | (0.79 | )% |
Since Inception | | (0.15 | )% | | (0.45 | )% | | (0.65 | )% | | 0.30 | % |
Inception Date | | 08/27/01 | | | 08/27/01 | | | 08/27/01 | | | 08/27/01 | |
Total Fund Operating Expenses (August 5, 2008 Prospectus) | | 0.67 | % | | 0.87 | % | | 1.13 | % | | | |
The performance data quoted represents past performance and does not guarantee future results. Current performance may be lower or higher. Performance data current to the most recent month-end may be obtained at www.GuideStoneFunds.org. The investment return and principal value of an investment will fluctuate so that shares, when redeemed, may be worth more or less than their original cost.
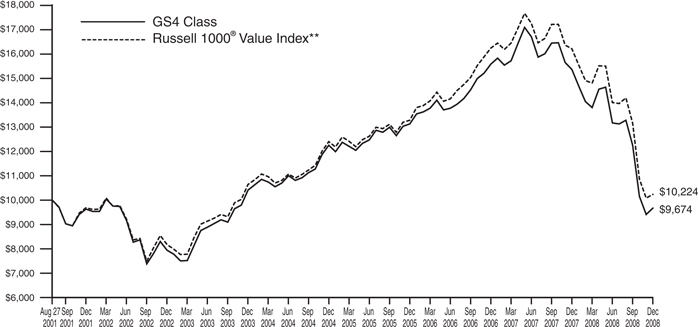
The graph compares the results of a hypothetical $10,000 investment in the GS4 Class of the Fund since August 27, 2001 (commencement of operations), with all dividends and capital gains reinvested, with the Russell 1000® Value Index.
| * | These returns reflect expense waivers by the Fund’s investment adviser. Without these waivers, returns would have been lower. Returns shown do not reflect the deduction of taxes that a shareholder would pay on Fund distributions or the redemption of Fund shares. |
** | The Russell 1000® Value Index is a large-cap index consisting of those Russell 1000® Index securities with a less-than-average growth orientation. Companies in this index tend to exhibit lower price-to-book and price-to-earnings ratios, higher dividend yields and lower forecasted growth values than the growth universe. |
Unlike a mutual fund, the performance of an index assumes no taxes, transaction costs, management fees or other expenses.
139
| | |
| Value Equity Fund | | |
| SCHEDULE OF INVESTMENTS | | December 31, 2008 |
| | | | | |
| | | Shares | | Value |
COMMON STOCKS — 96.7% | | | | | |
Auto & Transportation — 1.4% | | | | | |
Autoliv, Inc.D | | 28,300 | | $ | 607,318 |
Burlington Northern Santa Fe Corporation | | 101,500 | | | 7,684,565 |
CSX Corporation | | 30,500 | | | 990,335 |
FedEx Corporation | | 15,800 | | | 1,013,570 |
Norfolk Southern Corporation | | 37,100 | | | 1,745,555 |
Overseas Shipholding Group, Inc.D | | 27,300 | | | 1,149,603 |
Union Pacific Corporation | | 22,300 | | | 1,065,940 |
| | | | | |
| | | | | 14,256,886 |
| | | | | |
Consumer Discretionary — 10.7% | | | | | |
Aeropostale, Inc.* | | 47,900 | | | 771,190 |
Big Lots, Inc.D* | | 98,900 | | | 1,433,061 |
BJ’s Wholesale Club, Inc.D* | | 32,700 | | | 1,120,302 |
Carnival CorporationD | | 303,400 | | | 7,378,688 |
Coach, Inc.* | | 123,300 | | | 2,560,941 |
DIRECTV Group, Inc. (The)D* | | 69,300 | | | 1,587,663 |
Estee Lauder Cos., Inc. Class AD | | 43,589 | | | 1,349,515 |
Gannett Co., Inc.D | | 154,000 | | | 1,232,000 |
Gap, Inc. (The) | | 342,300 | | | 4,583,397 |
Hasbro, Inc. | | 101,300 | | | 2,954,921 |
Hewitt Associates, Inc. Class AD* | | 64,500 | | | 1,830,510 |
Home Depot, Inc. (The) | | 587,988 | | | 13,535,484 |
Interpublic Group Cos., Inc.D* | | 316,200 | | | 1,252,152 |
Kimberly-Clark Corporation | | 155,600 | | | 8,206,344 |
Lowe’s Cos., Inc. | | 70,900 | | | 1,525,768 |
Mattel, Inc. | | 311,900 | | | 4,990,400 |
McDonald’s Corporation | | 138,600 | | | 8,619,534 |
Netflix, Inc.D* | | 96,400 | | | 2,881,396 |
Omnicom Group, Inc. | | 1,200 | | | 32,304 |
Panera Bread Co.D* | | 12,100 | | | 632,104 |
Polo Ralph Lauren CorporationD | | 42,700 | | | 1,939,007 |
Shaw Communications, Inc. Class BD | | 139,500 | | | 2,466,360 |
Sony Corporation ADRD | | 143,200 | | | 3,131,784 |
Stanley Works (The)D | | 241,500 | | | 8,235,150 |
Staples, Inc.D | | 5,100 | | | 91,392 |
Target CorporationD | | 3,000 | | | 103,590 |
Time Warner Cable, Inc.D* | | 3,800 | | | 81,510 |
Time Warner, Inc. | | 1,125,800 | | | 11,325,548 |
Wal-Mart Stores, Inc.D | | 75,900 | | | 4,254,954 |
Walt Disney Co. (The) | | 86,000 | | | 1,951,340 |
Waste Management, Inc. | | 115,600 | | | 3,830,984 |
Whirlpool Corporation | | 18,500 | | | 764,975 |
| | | | | |
| | | | | 106,654,268 |
| | | | | |
Consumer Staples — 5.9% | | | | | |
Coca-Cola Co. (The) | | 35,000 | | | 1,584,450 |
Dean Foods Co.D* | | 242,000 | | | 4,348,740 |
General Mills, Inc. | | 15,600 | | | 947,700 |
Herbalife, Ltd.D | | 62,200 | | | 1,348,496 |
Kellogg Co. | | 5,400 | | | 236,790 |
Kraft Foods, Inc. Class A | | 714,100 | | | 19,173,585 |
Kroger Co. | | 146,700 | | | 3,874,347 |
NBTY, Inc.D* | | 93,000 | | | 1,455,450 |
Pepsi Bottling Group, Inc. | | 104,000 | | | 2,341,040 |
PepsiAmericas, Inc.D | | 62,800 | | | 1,278,608 |
PepsiCo, Inc. | | 4,900 | | | 268,373 |
Procter & Gamble Co. | | 219,696 | | | 13,581,607 |
Safeway, Inc. | | 68,900 | | | 1,637,753 |
Sara Lee Corporation | | 275,100 | | | 2,693,229 |
SUPERVALU, Inc. | | 86,400 | | | 1,261,440 |
SYSCO CorporationD | | 120,500 | | | 2,764,270 |
Walgreen Co. | | 3,900 | | | 96,213 |
| | | | | |
| | | | | 58,892,091 |
| | | | | |
Financial Services — 17.5% | | | | | |
Allstate Corporation (The) | | 293,800 | | | 9,624,888 |
American Express Co. | | 299,800 | | | 5,561,290 |
American Financial Group, Inc.D | | 106,700 | | | 2,441,296 |
American International Group, Inc. | | 119,300 | | | 187,301 |
Ameriprise Financial, Inc. | | 123,200 | | | 2,877,952 |
Assurant, Inc. | | 69,500 | | | 2,085,000 |
Astoria Financial CorporationD | | 37,500 | | | 618,000 |
AXIS Capital Holdings, Ltd. | | 67,500 | | | 1,965,600 |
Bank of America Corporation | | 661,100 | | | 9,308,288 |
Bank of New York Mellon Corporation | | 58,390 | | | 1,654,189 |
BB&T CorporationD | | 27,900 | | | 766,134 |
Capital One Financial CorporationD | | 309,855 | | | 9,881,276 |
Chubb Corporation | | 107,245 | | | 5,469,495 |
Citigroup, Inc. | | 629,033 | | | 4,220,811 |
CME Group, Inc. | | 1,000 | | | 208,110 |
Credicorp, Ltd. | | 58,000 | | | 2,897,680 |
Endurance Specialty Holdings, Ltd. | | 84,700 | | | 2,585,891 |
Fannie MaeD | | 55,400 | | | 42,104 |
Federated Investors, Inc. Class BD | | 61,700 | | | 1,046,432 |
Franklin Resources, Inc.D | | 41,200 | | | 2,627,736 |
Freddie MacD | | 3,000 | | | 2,190 |
Goldman Sachs Group, Inc. | | 56,365 | | | 4,756,642 |
Hartford Financial Services Group, Inc.D | | 16,204 | | | 266,070 |
Hudson City Bancorp, Inc.D | | 169,200 | | | 2,700,432 |
Invesco, Ltd. | | 73,400 | | | 1,059,896 |
JPMorgan Chase & Co. | | 731,980 | | | 23,079,330 |
Knight Capital Group, Inc. Class A* | | 74,300 | | | 1,199,945 |
Lincoln National CorporationD | | 44,500 | | | 838,380 |
Loews Corporation | | 16,048 | | | 453,356 |
Merrill Lynch & Co., Inc. | | 78,100 | | | 909,084 |
MetLife, Inc.D | | 25,800 | | | 899,388 |
Moody’s Corporation | | 101,600 | | | 2,041,144 |
Morgan StanleyD | | 53,200 | | | 853,328 |
NewAlliance Bancshares, Inc.D | | 104,800 | | | 1,380,216 |
NYSE Euronext | | 5,400 | | | 147,852 |
Platinum Underwriters Holdings, Ltd.D | | 56,100 | | | 2,024,088 |
PNC Financial Services Group, Inc. | | 17,600 | | | 862,400 |
Progressive Corporation (The)D | | 141,700 | | | 2,098,577 |
Prudential Financial, Inc. | | 18,400 | | | 556,784 |
Regions Financial CorporationD | | 274,900 | | | 2,188,204 |
See Notes to Financial Statements.
140
| | | | | |
| | | Shares | | Value |
RenaissanceRe Holdings, Ltd.D | | 32,100 | | $ | 1,655,076 |
SEI Investments Co. | | 53,400 | | | 838,914 |
SLM Corporation* | | 487,100 | | | 4,335,190 |
State Street Corporation | | 16,000 | | | 629,280 |
SunTrust Banks, Inc. | | 99,500 | | | 2,939,230 |
SVB Financial GroupD* | | 52,500 | | | 1,377,075 |
T. Rowe Price Group, Inc.D | | 32,000 | | | 1,134,080 |
Torchmark CorporationD | | 57,200 | | | 2,556,840 |
Travelers Cos., Inc. | | 476,400 | | | 21,533,280 |
US Bancorp | | 88,900 | | | 2,223,389 |
W.R. Berkley Corporation | | 97,100 | | | 3,010,100 |
Wachovia Corporation | | 110,245 | | | 610,757 |
Wells Fargo & Co. | | 574,200 | | | 16,927,416 |
XL Capital, Ltd. Class AD | | 148,400 | | | 549,080 |
| | | | | |
| | | | | 174,706,486 |
| | | | | |
Healthcare — 15.8% | | | | | |
Aetna, Inc.D | | 61,400 | | | 1,749,900 |
AmerisourceBergen CorporationD | | 85,600 | | | 3,052,496 |
Amgen, Inc.* | | 141,304 | | | 8,160,306 |
Baxter International, Inc. | | 108,700 | | | 5,825,233 |
Boston Scientific Corporation* | | 558,700 | | | 4,324,338 |
Bristol-Myers Squibb Co. | | 811,000 | | | 18,855,750 |
Cardinal Health, Inc. | | 161,600 | | | 5,570,352 |
Covidien, Ltd. | | 25,625 | | | 928,650 |
CVS Caremark Corporation | | 169,973 | | | 4,885,024 |
Eli Lilly & Co. | | 46,200 | | | 1,860,474 |
Endo Pharmaceuticals Holdings, Inc.D* | | 55,300 | | | 1,431,164 |
Forest Laboratories, Inc.D* | | 52,500 | | | 1,337,175 |
Hologic, Inc.* | | 207,700 | | | 2,714,639 |
Johnson & Johnson | | 334,900 | | | 20,037,067 |
King Pharmaceuticals, Inc.* | | 151,500 | | | 1,608,930 |
Lincare Holdings, Inc.D* | | 45,600 | | | 1,228,008 |
McKesson Corporation | | 78,000 | | | 3,020,940 |
Merck & Co., Inc. | | 78,200 | | | 2,377,280 |
Pfizer, Inc. | | 2,071,000 | | | 36,677,410 |
Tenet Healthcare CorporationD* | | 1,457,600 | | | 1,676,240 |
Thermo Fisher Scientific, Inc.D* | | 14,100 | | | 480,387 |
UnitedHealth Group, Inc. | | 383,500 | | | 10,201,100 |
Watson Pharmaceuticals, Inc.D* | | 255,300 | | | 6,783,321 |
WellPoint, Inc.* | | 238,159 | | | 10,033,639 |
Wyeth | | 68,100 | | | 2,554,431 |
Zimmer Holdings, Inc.* | | 3,900 | | | 157,638 |
| | | | | |
| | | | | 157,531,892 |
| | | | | |
Integrated Oils — 12.3% | | | | | |
Chevron Corporation | | 528,270 | | | 39,076,132 |
ConocoPhillips | | 568,800 | | | 29,463,840 |
Exxon Mobil Corporation | | 488,100 | | | 38,965,023 |
Marathon Oil Corporation | | 67,996 | | | 1,860,370 |
Murphy Oil Corporation | | 31,800 | | | 1,410,330 |
Occidental Petroleum Corporation | | 207,200 | | | 12,429,928 |
| | | | | |
| | | | | 123,205,623 |
| | | | | |
Materials & Processing — 3.2% | | | | | |
Alcoa, Inc.D | | 452,700 | | | 5,097,402 |
Archer-Daniels-Midland Co. | | 80,700 | | | 2,326,581 |
Ball CorporationD | | 35,200 | | | 1,463,968 |
Dow Chemical Co. (The) | | 121,400 | | | 1,831,926 |
Du Pont (E.I.) de Nemours & Co.D | | 259,100 | | | 6,555,230 |
Freeport-McMoRan Copper & Gold, Inc. | | 19,600 | | | 479,024 |
Granite Construction, Inc.D | | 30,200 | | | 1,326,686 |
Lennox International, Inc.D | | 30,100 | | | 971,929 |
Lubrizol CorporationD | | 69,800 | | | 2,540,022 |
MeadWestvaco Corporation | | 272,800 | | | 3,052,632 |
Methanex CorporationD | | 63,900 | | | 718,236 |
Nucor Corporation | | 12,700 | | | 586,740 |
Owens Corning* | | 44,700 | | | 773,310 |
Reliance Steel & Aluminum Co.D | | 62,100 | | | 1,238,274 |
Timken Co. | | 17,000 | | | 333,710 |
United States Steel CorporationD | | 69,300 | | | 2,577,960 |
| | | | | |
| | | | | 31,873,630 |
| | | | | |
Other — 4.6% | | | | | |
3M Co. | | 66,200 | | | 3,809,148 |
General Electric Co. | | 1,486,200 | | | 24,076,440 |
Honeywell International, Inc. | | 409,700 | | | 13,450,451 |
Johnson Controls, Inc. | | 25,700 | | | 466,712 |
Tyco International, Ltd. | | 182,700 | | | 3,946,320 |
Walter Industries, Inc.D | | 24,700 | | | 432,497 |
| | | | | |
| | | | | 46,181,568 |
| | | | | |
Other Energy — 2.5% | | | | | |
Anadarko Petroleum Corporation | | 77,600 | | | 2,991,480 |
Apache Corporation | | 17,000 | | | 1,267,010 |
Chesapeake Energy CorporationD | | 190,900 | | | 3,086,853 |
Devon Energy Corporation | | 22,800 | | | 1,498,188 |
EOG Resources, Inc. | | 3,100 | | | 206,398 |
FPL Group, Inc. | | 20,900 | | | 1,051,897 |
NRG Energy, Inc.* | | 60,500 | | | 1,411,465 |
Petro-Canada | | 72,500 | | | 1,587,025 |
Sunoco, Inc.D | | 36,100 | | | 1,568,906 |
Valero Energy Corporation | | 425,100 | | | 9,199,164 |
XTO Energy, Inc. | | 25,200 | | | 888,804 |
| | | | | |
| | | | | 24,757,190 |
| | | | | |
Producer Durables — 3.9% | | | | | |
Applied Materials, Inc. | | 375,500 | | | 3,803,815 |
Caterpillar, Inc.D | | 29,400 | | | 1,313,298 |
Cummins, Inc. | | 79,000 | | | 2,111,670 |
Danaher CorporationD | | 3,900 | | | 220,779 |
Dover Corporation | | 34,700 | | | 1,142,324 |
Emerson Electric Co. | | 220,900 | | | 8,087,149 |
Gardner Denver, Inc.* | | 45,200 | | | 1,054,968 |
Goodrich Corporation | | 43,100 | | | 1,595,562 |
Illinois Tool Works, Inc.D | | 240,900 | | | 8,443,545 |
KLA-Tencor CorporationD | | 55,400 | | | 1,207,166 |
Lennar Corporation Class AD | | 230,600 | | | 1,999,302 |
Northrop Grumman Corporation | | 85,300 | | | 3,841,912 |
Raytheon Co. | | 70,100 | | | 3,577,904 |
United Technologies Corporation | | 21,400 | | | 1,147,040 |
| | | | | |
| | | | | 39,546,434 |
| | | | | |
See Notes to Financial Statements.
141
Value Equity Fund
SCHEDULE OF INVESTMENTS (Continued)
| | | | | | | |
| | | Shares | | Value | |
Technology — 5.5% | | | | | | | |
Computer Sciences Corporation* | | | 35,800 | | $ | 1,258,012 | |
Compuware CorporationD* | | | 215,200 | | | 1,452,600 | |
Dell, Inc.* | | | 364,000 | | | 3,727,360 | |
EMC Corporation* | | | 31,900 | | | 333,993 | |
Flextronics International, Ltd.* | | | 675,338 | | | 1,728,865 | |
Garmin, Ltd.D | | | 32,800 | | | 628,776 | |
General Dynamics Corporation | | | 20,400 | | | 1,174,836 | |
Hewlett-Packard Co. | | | 194,400 | | | 7,054,776 | |
Intel Corporation | | | 276,600 | | | 4,054,956 | |
International Business Machines Corporation | | | 135,300 | | | 11,386,848 | |
L-3 Communications Holdings, Inc. | | | 38,500 | | | 2,840,530 | |
LSI CorporationD* | | | 1,044,000 | | | 3,434,760 | |
Microsoft Corporation | | | 92,900 | | | 1,805,976 | |
Motorola, Inc. | | | 636,800 | | | 2,821,024 | |
NeuStar, Inc. Class AD* | | | 121,300 | | | 2,320,469 | |
Sybase, Inc.D* | | | 19,800 | | | 490,446 | |
Symantec Corporation* | | | 292,900 | | | 3,960,008 | |
Tyco Electronics, Ltd. | | | 262,300 | | | 4,251,883 | |
| | | | | | | |
| | | | | | 54,726,118 | |
| | | | | | | |
Utilities — 13.4% | | | | | | | |
Alliant Energy CorporationD | | | 91,000 | | | 2,655,380 | |
Ameren Corporation | | | 80,400 | | | 2,674,104 | |
American Electric Power Co., Inc. | | | 204,700 | | | 6,812,416 | |
AT&T, Inc. | | | 1,377,377 | | | 39,255,244 | |
Comcast Corporation Class A | | | 517,700 | | | 8,738,776 | |
Constellation Energy Group, Inc. | | | 39,100 | | | 981,019 | |
Dominion Resources, Inc.D | | | 29,500 | | | 1,057,280 | |
DTE Energy Co.D | | | 84,500 | | | 3,014,115 | |
Duke Energy Corporation | | | 327,100 | | | 4,909,771 | |
Edison InternationalD | | | 80,500 | | | 2,585,660 | |
Entergy Corporation | | | 78,600 | | | 6,534,018 | |
Exelon Corporation | | | 16,700 | | | 928,687 | |
FirstEnergy Corporation | | | 59,552 | | | 2,893,036 | |
Nokia Corporation ADRD | | | 320,800 | | | 5,004,480 | |
NV Energy, Inc.D | | | 208,000 | | | 2,057,120 | |
OGE Energy CorporationD | | | 50,400 | | | 1,299,312 | |
Progress Energy, Inc. Contingent Value Obligation+* | | | 3,100 | | | 1,209 | |
Public Service Enterprise Group, Inc. | | | 102,800 | | | 2,998,676 | |
Qwest Communications International, Inc.D | | | 1,528,900 | | | 5,565,196 | |
Southern Co. (The) | | | 39,200 | | | 1,450,400 | |
Spectra Energy Corporation | | | 261,850 | | | 4,121,519 | |
Sprint Nextel Corporation* | | | 141,800 | | | 259,494 | |
Verizon Communications, Inc. | | | 834,924 | | | 28,303,924 | |
| | | | | | | |
| | | | | | 134,100,836 | |
| | | | | | | |
Total Common Stocks
(Cost $1,309,456,648) | | | | | | 966,433,022 | |
| | | | | | | |
FOREIGN COMMON STOCK — 0.1% | | | | | | | |
Bermuda — 0.1% | | | | | | | |
Lazard, Ltd. Class A
(Cost $571,707) | | | 19,700 | | | 585,878 | |
| | | | | | | |
MONEY MARKET FUNDS — 9.4% | | | | | | | |
GuideStone Money Market Fund (GS4 Class)¥ | | | 24,154,516 | | | 24,154,516 | |
Northern Institutional Liquid Assets Portfolio§ | | | 70,064,449 | | | 70,064,449 | |
| | | | | | | |
Total Money Market Funds
(Cost $94,218,965) | | | | | | 94,218,965 | |
| | | | | | | |
| | |
| | | Par | | | |
U.S. TREASURY OBLIGATION — 0.5% | | | | | | | |
U.S. Treasury Bill | | | | | | | |
0.10%, 05/14/09‡‡ (Cost $4,808,223) | | $ | 4,810,000 | | | 4,808,942 | |
| | | | | | | |
TOTAL INVESTMENTS — 106.7%
(Cost $1,409,055,543) | | | | | | 1,066,046,807 | |
| | |
Liabilities in Excess of Other Assets — (6.7)% | | | | | | (66,533,925 | ) |
| | | | | | | |
Net Assets — 100.0% | | | | | $ | 999,512,882 | |
| | | | | | | |
PORTFOLIO SUMMARY (based on net assets)
| | |
| | | % |
Financial Services | | 17.5 |
Healthcare | | 15.8 |
Utilities | | 13.4 |
Integrated Oils | | 12.3 |
Consumer Discretionary | | 10.7 |
Money Market Funds | | 9.4 |
Consumer Staples | | 5.9 |
Technology | | 5.5 |
Other | | 4.6 |
Producer Durables | | 3.9 |
Materials & Processing | | 3.2 |
Futures Contracts | | 3.0 |
Other Energy | | 2.5 |
Auto & Transportation | | 1.4 |
U.S. Treasury Obligation | | 0.5 |
Foreign Common Stock | | 0.1 |
| | |
| | 109.7 |
| | |
See Notes to Financial Statements.
142
FAS 157 DISCLOSURE
The following is a summary of the inputs used, as of December 31, 2008, in valuing the Fund’s assets carried at fair value:
| | | | | | |
Valuation Inputs | | Investments
in
Securities | | Other
Financial
Instruments*** |
Level 1 — Quoted Prices | | $ | 1,061,236,656 | | $ | 487,878 |
Level 2 — Other Significant Observable Inputs | | | 4,808,942 | | | — |
Level 3 — Significant Unobservable Inputs | | | 1,209 | | | — |
| | | | | | |
Total | | $ | 1,066,046,807 | | $ | 487,878 |
| | | | | | |
| *** | Other financial instruments are derivative instruments not reflected in the Schedule of Investments, such as futures, forwards and swap contracts, which are valued at the unrealized appreciation (depreciation) on the investment. |
The following is a reconciliation of assets in which significant unobservable inputs (Level 3) were used in determining fair value:
| | | | | | |
| | | Investments
in
Securities | | Other
Financial
Instruments |
Balance, 12/31/07 | | $ | — | | $ | — |
Accrued discounts/premiums | | | — | | | — |
Realized gain (loss) | | | — | | | — |
Changed in unrealized appreciation (depreciation) | | | — | | | — |
Net purchases (sales) | | | — | | | — |
Transfers in and/or out of Level 3 | | | 1,209 | | | — |
| | | | | | |
Balance, 12/31/08 | | $ | 1,209 | | $ | — |
| | | | | | |
See Notes to Financial Statements.
143
Growth Equity Fund
The Growth Equity Fund invests in a diversified portfolio of large- and medium-size U.S. companies whose stocks are considered by the Fund’s managers to have above average potential for growth in revenue and earnings. In part due to an overexposure to various oil services stocks and selected financial services stocks, the Fund’s performance (GS4 Class) materially lagged its benchmark, the Russell 1000® Growth Index, for the year 2008 ((42.92)% versus (38.44)%). The Fund has underperformed its benchmark on an annualized five-year basis and since-inception basis.
Please see page 148 for information regarding specific portfolio allocations. Portfolio holdings are subject to change at any time.
144
Growth Equity Fund
Average Annual Total Returns as of 12/31/08
| | | | | | | | | | | | |
| | | GS2 Class* | | | GS4 Class* | | | GS6 Class* | | | Benchmark** | |
One Year | | (42.84 | )% | | (42.92 | )% | | (43.08 | )% | | (38.44 | )% |
Five Year | | (4.39 | )% | | (4.51 | )% | | (4.82 | )% | | (3.42 | )% |
Since Inception | | (4.16 | )% | | (4.28 | )% | | (4.57 | )% | | (3.45 | )% |
Inception Date | | 08/27/01 | | | 08/27/01 | | | 08/27/01 | | | 08/27/01 | |
Total Fund Operating Expenses (August 5, 2008 Prospectus) | | 0.86 | % | | 1.06 | % | | 1.35 | % | | | |
The performance data quoted represents past performance and does not guarantee future results. Current performance may be lower or higher. Performance data current to the most recent month-end may be obtained at www.GuideStoneFunds.org. The investment return and principal value of an investment will fluctuate so that shares, when redeemed, may be worth more or less than their original cost.
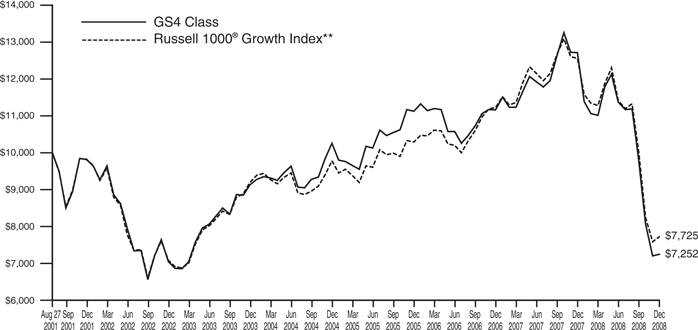
The graph compares the results of a hypothetical $10,000 investment in the GS4 Class of the Fund since August 27, 2001 (commencement of operations), with all dividends and capital gains reinvested, with the Russell 1000® Growth Index.
| * | These returns reflect expense waivers by the Fund’s investment adviser. Without these waivers, returns would have been lower. Returns shown do not reflect the deduction of taxes that a shareholder would pay on Fund distributions or the redemption of Fund shares. |
** | The Russell 1000® Growth Index is a large-cap index consisting of those Russell 1000® Index securities with greater-than-average growth orientation. Companies in this index tend to exhibit higher price-to-book and price-to-earnings-ratios, lower dividend yields and higher forecasted growth values than the value universe. |
Unlike a mutual fund, the performance of an index assumes no taxes, transaction costs, management fees or other expenses.
145
| | |
| Growth Equity Fund | | |
| SCHEDULE OF INVESTMENTS | | December 31, 2008 |
| | | | | |
| | | Shares | | Value |
COMMON STOCKS — 89.6% | | | | | |
Auto & Transportation — 2.9% | | | | | |
Delta Air Lines, Inc.* | | 482,694 | | $ | 5,531,673 |
Expeditors International Washington, Inc. | | 63,000 | | | 2,096,010 |
Norfolk Southern Corporation | | 206,692 | | | 9,724,859 |
Union Pacific Corporation | | 218,184 | | | 10,429,195 |
| | | | | |
| | | | | 27,781,737 |
| | | | | |
Consumer Discretionary — 17.7% | | | | | |
Activision Blizzard, Inc.* | | 241,500 | | | 2,086,560 |
Amazon.com, Inc.D* | | 435,663 | | | 22,340,799 |
Apollo Group, Inc. Class A* | | 14,150 | | | 1,084,173 |
Avon Products, Inc. | | 194,650 | | | 4,677,439 |
Coach, Inc.* | | 40,750 | | | 846,377 |
Costco Wholesale CorporationD | | 77,868 | | | 4,088,070 |
DIRECTV Group, Inc. (The)D* | | 269,050 | | | 6,163,936 |
GameStop Corporation Class AD* | | 71,850 | | | 1,556,271 |
Google, Inc.* | | 97,838 | | | 30,099,851 |
Iron Mountain, Inc.D* | | 168,400 | | | 4,164,532 |
Lowe’s Cos., Inc. | | 358,591 | | | 7,716,878 |
McDonald’s CorporationD | | 476,216 | | | 29,615,874 |
NIKE, Inc. Class BD | | 303,605 | | | 15,483,855 |
Omnicom Group, Inc.D | | 53,350 | | | 1,436,182 |
O’Reilly Automotive, Inc.D* | | 27,500 | | | 845,350 |
Starbucks Corporation* | | 862,300 | | | 8,157,358 |
Target CorporationD | | 77,192 | | | 2,665,440 |
TJX Cos., Inc. | | 55,600 | | | 1,143,692 |
Wal-Mart Stores, Inc. | | 325,378 | | | 18,240,691 |
Walt Disney Co. (The) | | 36,250 | | | 822,512 |
Yum! Brands, Inc.D | | 239,122 | | | 7,532,343 |
| | | | | |
| | | | | 170,768,183 |
| | | | | |
Consumer Staples — 3.9% | | | | | |
Coca-Cola Co. (The) | | 122,800 | | | 5,559,156 |
Colgate-Palmolive Co. | | 17,050 | | | 1,168,607 |
ConAgra Foods, Inc.D | | 61,750 | | | 1,018,875 |
General Mills, Inc. | | 89,000 | | | 5,406,750 |
Heinz (H.J.) Co. | | 34,800 | | | 1,308,480 |
J.M. Smucker Co. (The) | | 23,350 | | | 1,012,456 |
Kroger Co. | | 256,100 | | | 6,763,601 |
PepsiCo, Inc. | | 135,100 | | | 7,399,427 |
Procter & Gamble Co. | | 134,400 | | | 8,308,609 |
| | | | | |
| | | | | 37,945,961 |
| | | | | |
Financial Services — 14.1% | | | | | |
Abraxis Bioscience, Inc.D* | | 34,100 | | | 2,247,872 |
Affiliated Managers Group, Inc.D* | | 26,750 | | | 1,121,360 |
AFLAC, Inc. | | 36,350 | | | 1,666,284 |
Annaly Mortgage Management, Inc. REITD | | 82,150 | | | 1,303,720 |
Assurant, Inc. | | 31,100 | | | 933,000 |
Bank of America Corporation | | 55,150 | | | 776,512 |
CME Group, Inc. | | 42,900 | | | 8,927,919 |
Goldman Sachs Group, Inc. | | 79,630 | | | 6,719,976 |
IntercontinentalExchange, Inc.D* | | 201,030 | | | 16,572,916 |
JPMorgan Chase & Co.D | | 396,152 | | | 12,490,673 |
Mastercard, Inc. Class AD | | 79,999 | | | 11,434,257 |
Merrill Lynch & Co., Inc. | | 151,600 | | | 1,764,624 |
Moody’s CorporationD | | 188,200 | | | 3,780,938 |
Paychex, Inc.D | | 18,200 | | | 478,296 |
Schwab (Charles) Corporation (The) | | 334,200 | | | 5,404,014 |
State Street CorporationD | | 236,750 | | | 9,311,378 |
US BancorpD | | 235,048 | | | 5,878,550 |
Visa, Inc.D | | 527,066 | | | 27,644,611 |
Wells Fargo & Co.D | | 524,486 | | | 15,198,459 |
Western Union Co. | | 184,700 | | | 2,648,598 |
| | | | | |
| | | | | 136,303,957 |
| | | | | |
Healthcare — 17.1% | | | | | |
Abbott Laboratories | | 223,401 | | | 11,922,911 |
Aetna, Inc. | | 46,400 | | | 1,322,400 |
Allergan, Inc. | | 375,750 | | | 15,150,240 |
Amgen, Inc.* | | 79,800 | | | 4,608,450 |
Baxter International, Inc. | | 154,850 | | | 8,298,412 |
Becton Dickinson & Co. | | 35,500 | | | 2,427,845 |
Bristol-Myers Squibb Co. | | 78,000 | | | 1,813,500 |
Celgene Corporation* | | 99,200 | | | 5,483,775 |
Covidien, Ltd. | | 112,700 | | | 4,084,248 |
CVS Caremark Corporation | | 460,722 | | | 13,241,150 |
Endo Pharmaceuticals Holdings, Inc.D* | | 22,800 | | | 590,064 |
Express Scripts, Inc.* | | 143,800 | | | 7,906,125 |
Genentech, Inc.* | | 161,924 | | | 13,425,119 |
Genzyme Corporation* | | 275,395 | | | 18,277,966 |
Gilead Sciences, Inc.* | | 313,365 | | | 16,025,487 |
Hologic, Inc.D* | | 50,450 | | | 659,382 |
Intuitive Surgical, Inc.* | | 93,200 | | | 11,835,468 |
Johnson & Johnson | | 33,515 | | | 2,005,202 |
Qiagen NVD* | | 50,450 | | | 885,902 |
Schering-Plough Corporation | | 111,251 | | | 1,894,605 |
Stryker CorporationD | | 144,700 | | | 5,780,765 |
Teva Pharmaceutical Industries, Ltd. ADRD | | 150,600 | | | 6,411,042 |
Thermo Fisher Scientific, Inc.D* | | 74,700 | | | 2,545,029 |
Varian Medical Systems, Inc.D* | | 214,100 | | | 7,502,064 |
Wyeth | | 36,700 | | | 1,376,617 |
| | | | | |
| | | | | 165,473,768 |
| | | | | |
Integrated Oils — 0.7% | | | | | |
Exxon Mobil Corporation | | 87,950 | | | 7,021,048 |
| | | | | |
Materials & Processing — 5.2% | | | | | |
ABB, Ltd. ADRD | | 265,325 | | | 3,982,528 |
Air Products & Chemicals, Inc. | | 42,330 | | | 2,127,929 |
Crown Holdings, Inc.D* | | 34,550 | | | 663,360 |
Energizer Holdings, Inc.D* | | 12,900 | | | 698,406 |
Monsanto Co. | | 317,815 | | | 22,358,285 |
Mosaic Co. (The) | | 41,000 | | | 1,418,600 |
Praxair, Inc. | | 196,866 | | | 11,685,966 |
Precision Castparts Corporation | | 81,050 | | | 4,820,854 |
SPX CorporationD | | 25,400 | | | 1,029,970 |
Weyerhaeuser Co.D | | 61,600 | | | 1,885,576 |
| | | | | |
| | | | | 50,671,474 |
| | | | | |
Other — 0.6% | | | | | |
Foster Wheeler, Ltd.* | | 127,750 | | | 2,986,795 |
General Electric Co. | | 147,750 | | | 2,393,550 |
| | | | | |
| | | | | 5,380,345 |
| | | | | |
See Notes to Financial Statements.
146
| | | | | | | |
| | | Shares | | Value | |
Other Energy — 6.5% | | | | | | | |
Alpha Natural Resources, Inc.* | | | 38,800 | | $ | 628,172 | |
Cameron International Corporation* | | | 59,630 | | | 1,222,415 | |
Chesapeake Energy CorporationD | | | 113,600 | | | 1,836,912 | |
Consol Energy, Inc.D | | | 114,300 | | | 3,266,694 | |
Devon Energy Corporation | | | 161,789 | | | 10,631,155 | |
FMC Technologies, Inc.D* | | | 241,500 | | | 5,754,945 | |
National Oilwell Varco, Inc.D* | | | 533,104 | | | 13,029,062 | |
Petroleo Brasileiro SA ADR | | | 41,273 | | | 1,010,776 | |
Pioneer Natural Resouces Co.D | | | 70,000 | | | 1,132,600 | |
Schlumberger, Ltd. | | | 294,315 | | | 12,458,354 | |
Transocean, Ltd.* | | | 253,864 | | | 11,995,073 | |
| | | | | | | |
| | | | | | 62,966,158 | |
| | | | | | | |
Producer Durables — 5.4% | | | | | | | |
America Movil SA de CV ADR Series LD | | | 282,000 | | | 8,739,180 | |
American Tower Corporation Class AD* | | | 185,450 | | | 5,437,394 | |
Applied Materials, Inc. | | | 183,400 | | | 1,857,842 | |
Boeing Co. (The) | | | 40,000 | | | 1,706,800 | |
Bucyrus International, Inc. Class AD | | | 88,200 | | | 1,633,464 | |
Deere & Co. | | | 20,077 | | | 769,351 | |
Emerson Electric Co. | | | 178,850 | | | 6,547,698 | |
ITT Industries, Inc.D | | | 35,400 | | | 1,628,046 | |
Lockheed Martin CorporationD | | | 109,212 | | | 9,182,545 | |
Raytheon Co. | | | 92,250 | | | 4,708,440 | |
United Technologies Corporation | | | 183,000 | | | 9,808,801 | |
| | | | | | | |
| | | | | | 52,019,561 | |
| | | | | | | |
Technology — 14.5% | | | | | | | |
Amphenol Corporation | | | 35,400 | | | 848,892 | |
Apple, Inc.* | | | 363,627 | | | 31,035,564 | |
Autodesk, Inc.D* | | | 74,800 | | | 1,469,820 | |
Broadcom Corporation Class AD* | | | 640,850 | | | 10,875,225 | |
Cisco Systems, Inc.* | | | 705,467 | | | 11,499,112 | |
Cognizant Technology Solutions Corporation Class AD* | | | 107,600 | | | 1,943,256 | |
EMC CorporationD* | | | 645,200 | | | 6,755,244 | |
First Solar, Inc.D* | | | 21,700 | | | 2,993,732 | |
General Dynamics Corporation | | | 131,803 | | | 7,590,535 | |
Hewlett-Packard Co. | | | 362,986 | | | 13,172,761 | |
Intel Corporation | | | 340,600 | | | 4,993,196 | |
Intersil Corporation Class AD | | | 150,100 | | | 1,379,419 | |
Macrovision Solutions Corporation* | | | 7 | | | 88 | |
Microsoft Corporation | | | 246,700 | | | 4,795,848 | |
Oracle Corporation* | | | 463,842 | | | 8,223,918 | |
QUALCOMM, Inc.D | | | 611,601 | | | 21,913,664 | |
Salesforce.com, Inc.D* | | | 218,100 | | | 6,981,381 | |
Symantec CorporationD* | | | 197,300 | | | 2,667,496 | |
Trimble Navigation, Ltd.D* | | | 31,000 | | | 669,910 | |
| | | | | | | |
| | | | | | 139,809,061 | |
| | | | | | | |
Utilities — 1.0% | | | | | | | |
Allegheny Energy, Inc. | | | 57,050 | | | 1,931,713 | |
Entergy Corporation | | | 57,400 | | | 4,771,662 | |
Wisconsin Energy CorporationD | | | 39,050 | | | 1,639,319 | |
Xcel Energy Inc. | | | 95,750 | | | 1,776,162 | |
| | | | | | | |
| | | | | | 10,118,856 | |
| | | | | | | |
Total Common Stocks
(Cost $1,103,023,741) | | | | | | 866,260,109 | |
| | | | | | | |
FOREIGN COMMON STOCKS — 2.3% | | | | | | | |
Canada — 0.2% | | | | | | | |
Manulife Financial Corporation | | | 72,150 | | | 1,228,714 | |
Research In Motion, Ltd.* | | | 18,550 | | | 752,759 | |
| | | | | | | |
| | | | | | 1,981,473 | |
| | | | | | | |
China — 0.9% | | | | | | | |
Industrial & Commercial Bank of China Class HD | | | 9,796,000 | | | 5,200,862 | |
Mindray Medical International, Ltd. ADRD | | | 205,300 | | | 3,695,400 | |
| | | | | | | |
| | | | | | 8,896,262 | |
| | | | | | | |
France — 0.5% | | | | | | | |
Total SA ADRD | | | 83,550 | | | 4,620,315 | |
| | | | | | | |
Switzerland — 0.7% | | | | | | | |
Ace, Ltd. | | | 40,600 | | | 2,148,552 | |
Alcon, Inc. | | | 46,600 | | | 4,156,254 | |
| | | | | | | |
| | | | | | 6,304,806 | |
| | | | | | | |
Total Foreign Common Stocks
(Cost $30,858,120) | | | | | | 21,802,856 | |
| | | | | | | |
MONEY MARKET FUNDS — 15.3% | | | | | | | |
GuideStone Money Market Fund (GS4 Class)¥ | | | 61,323,726 | | | 61,323,726 | |
Northern Institutional Liquid Assets Portfolio§ | | | 86,712,386 | | | 86,712,386 | |
| | | | | | | |
Total Money Market Funds
(Cost $148,036,112) | | | | | | 148,036,112 | |
| | | | | | | |
| | |
| | | Par | | | |
U.S. TREASURY OBLIGATIONS — 1.2% | | | | | | | |
U.S. Treasury Bills | | | | | | | |
0.40%, 05/14/09‡‡ | | $ | 320,000 | | | 319,930 | |
0.42%, 05/14/09‡‡ | | | 225,000 | | | 224,950 | |
0.45%, 05/14/09‡‡ | | | 1,600,000 | | | 1,599,648 | |
0.46%, 05/14/09‡‡ | | | 565,000 | | | 564,876 | |
0.73%, 05/14/09‡‡ | | | 7,860,000 | | | 7,858,271 | |
0.80%, 05/14/09‡‡ | | | 300,000 | | | 299,934 | |
0.82%, 05/14/09‡‡ | | | 195,000 | | | 194,957 | |
| | | | | | | |
| | | | | | 11,062,566 | |
| | | | | | | |
| | |
Total U.S. Treasury Obligations
(Cost $11,056,220) | | | | | | 11,062,566 | |
| | | | | | | |
| | |
TOTAL INVESTMENTS — 108.4%
(Cost $1,292,974,193) | | | | | | 1,047,161,643 | |
| | |
Liabilities in Excess of Other Assets — (8.4)% | | | | | | (80,818,494 | ) |
| | | | | | | |
NET ASSETS — 100.0% | | | | | $ | 966,343,149 | |
| | | | | | | |
See Notes to Financial Statements.
147
Growth Equity Fund
SCHEDULE OF INVESTMENTS (Continued)
PORTFOLIO SUMMARY (based on net assets)
| | |
| | | % |
Consumer Discretionary | | 17.7 |
Healthcare | | 17.1 |
Money Market Funds | | 15.3 |
Technology | | 14.5 |
Financial Services | | 14.1 |
Futures Contracts | | 7.5 |
Other Energy | | 6.5 |
Producer Durables | | 5.4 |
Materials & Processing | | 5.2 |
Consumer Staples | | 3.9 |
Auto & Transportation | | 2.9 |
Foreign Common Stocks | | 2.3 |
U.S. Treasury Obligations | | 1.2 |
Utilities | | 1.0 |
Integrated Oils | | 0.7 |
Other | | 0.6 |
| | |
| | 115.9 |
| | |
FAS 157 DISCLOSURE
The following is a summary of the inputs used, as of December 31, 2008, in valuing the Fund’s assets carried at fair value:
| | | | | | |
Valuation Inputs | | Investments
in
Securities | | Other
Financial
Instruments*** |
Level 1 — Quoted Prices | | $ | 1,030,898,216 | | $ | 1,019,417 |
Level 2 — Other Significant Observable Inputs | | | 16,263,427 | | | — |
Level 3 — Significant Unobservable Inputs | | | — | | | — |
| | | | | | |
Total | | $ | 1,047,161,643 | | $ | 1,019,417 |
| | | | | | |
| *** | Other financial instruments are derivative instruments not reflected in the Schedule of Investments, such as futures, forwards and swap contracts, which are valued at the unrealized appreciation (depreciation) on the investment. |
See Notes to Financial Statements.
148
Small Cap Equity Fund
The Small Cap Equity Fund is comprised of domestic, small-cap stocks with both value and growth style orientations. In part due to an overexposure to various oil services stocks and selected financial services stocks, the Fund’s performance (GS4 Class) materially lagged its benchmark, the Russell 2000® Index, for the year 2008 ((37.19)% versus (33.79)%). The Fund has underperformed its benchmark on an annualized five-year basis and since-inception basis.
Please see page 159 for information regarding specific portfolio allocations. Portfolio holdings are subject to change at any time.
Small company stocks are generally riskier than large company stocks due to greater volatility and less liquidity.
149
Small Cap Equity Fund
Average Annual Total Returns as of 12/31/08
| | | | | | | | | | | | |
| | | GS2 Class* | | | GS4 Class* | | | GS6 Class* | | | Benchmark** | |
One Year | | (37.05 | )% | | (37.19 | )% | | (37.29 | )% | | (33.79 | )% |
Five Year | | (2.82 | )% | | (2.94 | )% | | (3.22 | )% | | (0.93 | )% |
Since Inception | | (0.02 | )% | | (0.16 | )% | | (0.43 | )% | | 1.82 | % |
Inception Date | | 08/27/01 | | | 08/27/01 | | | 08/27/01 | | | 08/27/01 | |
Total Fund Operating Expenses (August 5, 2008 Prospectus) | | 1.05 | % | | 1.25 | % | | 1.50 | % | | | |
The performance data quoted represents past performance and does not guarantee future results. Current performance may be lower or higher. Performance data current to the most recent month-end may be obtained at www.GuideStoneFunds.org. The investment return and principal value of an investment will fluctuate so that shares, when redeemed, may be worth more or less than their original cost.
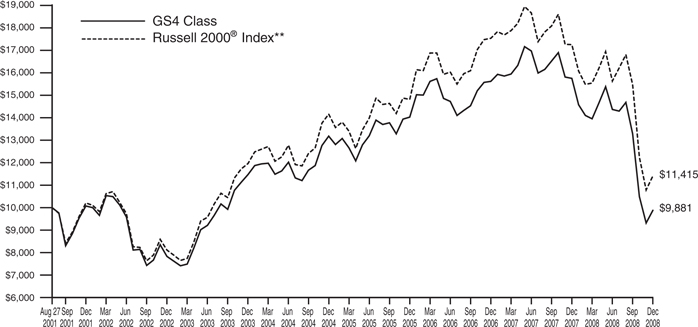
The graph compares the results of a hypothetical $10,000 investment in the GS4 Class of the Fund since August 27, 2001 (commencement of operations), with all dividends and capital gains reinvested, with the Russell 2000® Index.
| * | These returns reflect expense waivers by the Fund’s investment adviser. Without these waivers, returns would have been lower. Returns shown do not reflect the deduction of taxes that a shareholder would pay on Fund distributions or the redemption of Fund shares. |
** | The Russell 2000® Index is a small-cap equity index comprised of the 2,000 smallest companies in the Russell 3000® Index, which represents approximately 10% of the total market capitalization of the Russell 3000® Index. |
Unlike a mutual fund, the performance of an index assumes no taxes, transaction costs, management fees or other expenses.
150
| | |
| Small Cap Equity Fund | | |
| SCHEDULE OF INVESTMENTS | | December 31, 2008 |
| | | | | |
| | | Shares | | Value |
COMMON STOCKS — 73.3% | | | | | |
Auto & Transportation — 3.2% | | | | | |
American Commercial Lines, Inc.D* | | 107,100 | | $ | 524,790 |
ATC Technology Corporation* | | 24,900 | | | 364,287 |
Autoliv, Inc.D | | 37,000 | | | 794,020 |
Diana Shipping, Inc. | | 62,500 | | | 797,500 |
Heartland Express, Inc.D | | 76,900 | | | 1,211,944 |
HUB Group, Inc.* | | 28,300 | | | 750,799 |
JB Hunt Transport Services, Inc. | | 39,200 | | | 1,029,784 |
Knight Transportation, Inc.D | | 87,200 | | | 1,405,664 |
Overseas Shipholding Group, Inc.D | | 23,900 | | | 1,006,429 |
Republic Airways Holdings, Inc.* | | 58,800 | | | 627,396 |
Skywest, Inc.D | | 46,200 | | | 859,320 |
UTI Worldwide, Inc.D | | 58,100 | | | 833,154 |
WABCO Holdings, Inc.D | | 21,200 | | | 334,748 |
| | | | | |
| | | | | 10,539,835 |
| | | | | |
Consumer Discretionary — 10.1% | | | | | |
Advisory Board Co. (The)D* | | 69,100 | | | 1,540,930 |
Aeropostale, Inc.* | | 16,600 | | | 267,260 |
American Public Education, Inc.D* | | 23,700 | | | 881,403 |
AMN Healthcare Services, Inc.* | | 141,900 | | | 1,200,474 |
Arbitron, Inc. | | 13,500 | | | 179,280 |
Big Lots, Inc.* | | 29,500 | | | 427,455 |
Capella Education Co.D* | | 23,000 | | | 1,351,480 |
CEC Entertainment, Inc.D* | | 35,400 | | | 858,450 |
Chipotle Mexican Grill, Inc.D* | | 15,800 | | | 953,958 |
CKE Restaurants, Inc.D | | 78,000 | | | 677,040 |
Corinthian Colleges, Inc.D* | | 60,900 | | | 996,933 |
Corporate Executive Board Co.D | | 53,600 | | | 1,182,416 |
CoStar Group, Inc.D* | | 23,200 | | | 764,208 |
EarthLink, Inc.D* | | 123,100 | | | 832,156 |
EZCORP, Inc. Class A* | | 49,100 | | | 746,811 |
FGX International Holdings, Ltd.D* | | 35,400 | | | 486,396 |
FTI Consulting, Inc.D* | | 19,100 | | | 853,388 |
Gaylord Entertainment Co.D* | | 27,300 | | | 295,932 |
Genesco, Inc.D* | | 35,500 | | | 600,660 |
Gymboree CorporationD* | | 20,300 | | | 529,627 |
Harman International Industries, Inc. | | 44,000 | | | 736,120 |
Heckmann Corporation* | | 17,300 | | | 97,745 |
Helen of Troy, Ltd.D* | | 37,583 | | | 652,441 |
Hewitt Associates, Inc. Class AD* | | 31,800 | | | 902,484 |
Hibbett Sports, Inc.D* | | 19,900 | | | 312,629 |
Hot Topic, Inc.D* | | 50,000 | | | 463,500 |
Houston Wire & Cable Co.D | | 43,800 | | | 407,778 |
Iconix Brand Group, Inc.D* | | 37,800 | | | 369,684 |
Insight Enterprises, Inc.* | | 66,800 | | | 460,920 |
Kforce, Inc.D* | | 64,100 | | | 492,288 |
Liz Claiborne, Inc.D | | 95,200 | | | 247,520 |
MAXIMUS, Inc.D | | 18,500 | | | 649,535 |
Monro Muffler Brake, Inc.D | | 30,100 | | | 767,550 |
MPS Group, Inc.D* | | 41,000 | | | 308,730 |
Netflix, Inc.D* | | 36,700 | | | 1,096,963 |
On Assignment, Inc.D* | | 110,500 | | | 626,535 |
Orient-Express Hotels, Ltd. Class AD | | 15,200 | | | 116,432 |
Panera Bread Co.D* | | 11,200 | | | 585,088 |
Pantry, Inc.* | | 37,500 | | | 804,375 |
PetMed Express, Inc.D* | | 30,300 | | | 534,189 |
PF Chang’s China Bistro, Inc.* | | 25,600 | | | 536,064 |
Pool CorporationD | | 32,025 | | | 575,489 |
Resources Connection, Inc.D* | | 57,400 | | | 940,212 |
Robert Half International, Inc.D | | 37,900 | | | 789,078 |
Rush Enterprises, Inc. Class A* | | 59,621 | | | 510,952 |
Steven Madden, Ltd.D* | | 36,700 | | | 782,444 |
Timberland Co.D* | | 40,500 | | | 467,775 |
True Religion Apparel, Inc.D* | | 36,000 | | | 447,840 |
United Stationers, Inc.D* | | 22,800 | | | 763,572 |
Universal Electronics, Inc.* | | 49,182 | | | 797,732 |
WESCO International, Inc.D* | | 34,400 | | | 661,512 |
| | | | | |
| | | | | 33,531,433 |
| | | | | |
Consumer Staples — 2.0% | | | | | |
Diamond Foods, Inc.D | | 21,300 | | | 429,195 |
Green Mountain Coffee Roasters, Inc.D* | | 8,400 | | | 325,080 |
Hansen Natural CorporationD* | | 23,100 | | | 774,543 |
Herbalife, Ltd. | | 48,000 | | | 1,040,640 |
J & J Snack Foods Corporation | | 28,752 | | | 1,031,622 |
Nash Finch Co.D | | 19,400 | | | 870,866 |
NBTY, Inc.* | | 23,200 | | | 363,080 |
Smart Balance, Inc.D* | | 59,000 | | | 401,200 |
SUPERVALU, Inc. | | 71,600 | | | 1,045,360 |
United Natural Foods, Inc.* | | 19,300 | | | 343,926 |
| | | | | |
| | | | | 6,625,512 |
| | | | | |
Financial Services — 17.6% | | | | | |
Advance America Cash Advance Centers, Inc. | | 60,400 | | | 114,156 |
American Financial Group, Inc. | | 60,400 | | | 1,381,952 |
American Physicians Capital, Inc. | | 11,700 | | | 562,770 |
Amerisafe, Inc.* | | 27,300 | | | 560,469 |
Amtrust Financial Services, Inc. | | 48,700 | | | 564,920 |
Argo Group International Holdings, Ltd.* | | 32,952 | | | 1,117,732 |
Assured Guaranty, Ltd.D | | 27,700 | | | 315,780 |
Astoria Financial Corporation | | 64,100 | | | 1,056,368 |
AXIS Capital Holdings, Ltd. | | 18,400 | | | 535,808 |
Banco Latinoamericano de Exportaciones SAD | | 62,000 | | | 890,320 |
Bank of Florida CorporationD* | | 28,350 | | | 119,354 |
Brown & Brown, Inc.D | | 8,400 | | | 175,560 |
Cash America International, Inc. | | 28,400 | | | 776,740 |
Cathay General BancorpD | | 33,800 | | | 802,750 |
CB Richard Ellis Group, Inc. Class A* | | 63,100 | | | 272,592 |
See Notes to Financial Statements.
151
Small Cap Equity Fund
SCHEDULE OF INVESTMENTS (Continued)
| | | | | |
| | | Shares | | Value |
City Holding Co. | | 24,900 | | $ | 866,022 |
Cohen & Steers, Inc.D | | 19,200 | | | 211,008 |
Credicorp, Ltd. | | 20,500 | | | 1,024,180 |
Cybersource CorporationD* | | 27,586 | | | 330,756 |
Duff & Phelps Corporation* | | 14,500 | | | 277,240 |
Endurance Specialty Holdings, Ltd. | | 43,300 | | | 1,321,949 |
Evercore Partners, Inc. Class AD | | 33,700 | | | 420,913 |
Fair Isaac & Co., Inc.D | | 33,300 | | | 561,438 |
Federated Investors, Inc. Class B | | 45,100 | | | 764,896 |
First Bancorp Puerto RicoD | | 66,300 | | | 738,582 |
First Cash Financial Services, Inc.D* | | 40,800 | | | 777,648 |
First Potomac Realty Trust REITD | | 67,000 | | | 623,100 |
FPIC Insurance Group, Inc.D* | | 11,500 | | | 503,470 |
Global Payments, Inc.D | | 85,400 | | | 2,800,266 |
H&E Equipment Services, Inc.D* | | 48,300 | | | 372,393 |
Hanover Insurance Group, Inc. | | 29,400 | | | 1,263,318 |
HCC Insurance Holdings, Inc.D | | 86,035 | | | 2,301,436 |
Horace Mann Educators Corporation | | 102,700 | | | 943,813 |
Huron Consulting Group, Inc.D* | | 15,400 | | | 881,958 |
IBERIABANK Corporation | | 13,700 | | | 657,600 |
Infinity Property & Casualty Corporation | | 18,100 | | | 845,813 |
Interactive Brokers Group, Inc.D* | | 44,400 | | | 794,316 |
Investment Technology Group, Inc.D* | | 28,000 | | | 636,160 |
IPC Holdings, Ltd. | | 35,900 | | | 1,073,410 |
Jack Henry & Associates, Inc. | | 57,400 | | | 1,114,134 |
Jefferies Group, Inc.D | | 22,000 | | | 309,320 |
Jones Lang LaSalle, Inc. | | 10,200 | | | 282,540 |
Knight Capital Group, Inc. Class A* | | 64,500 | | | 1,041,675 |
Life Partners Holdings, Inc.D | | 7,900 | | | 344,756 |
National Financial Partners CorporationD | | 47,800 | | | 145,312 |
NewAlliance Bancshares, Inc. | | 69,600 | | | 916,632 |
Ocwen Financial CorporationD* | | 53,200 | | | 488,376 |
Odyssey Re Holdings Corporation | | 21,400 | | | 1,108,734 |
optionsXpress Holdings, Inc. | | 196,190 | | | 2,621,098 |
Pacific Capital BancorpD | | 30,600 | | | 516,528 |
Platinum Underwriters Holdings, Ltd.D | | 40,300 | | | 1,454,024 |
Portfolio Recovery Associates, Inc.D* | | 24,500 | | | 829,080 |
PrivateBancorp, Inc.D | | 37,061 | | | 1,203,000 |
Provident Financial Services, Inc. | | 66,000 | | | 1,009,800 |
RenaissanceRe Holdings, Ltd. | | 27,300 | | | 1,407,588 |
RLI CorporationD | | 17,100 | | | 1,045,836 |
Safety Insurance Group, Inc.D | | 41,800 | | | 1,590,908 |
Stancorp Financial Group, Inc. | | 29,300 | | | 1,223,861 |
Sterling Financial Corporation/WA | | 83,000 | | | 730,400 |
SVB Financial GroupD* | | 24,100 | | | 632,143 |
SWS Group, Inc.D | | 39,600 | | | 750,420 |
TNS, Inc.* | | 35,200 | | | 330,528 |
Tower Group, Inc.D | | 36,600 | | | 1,032,486 |
TradeStation Group, Inc.D* | | 65,500 | | | 422,475 |
Trustmark Corporation | | 48,400 | | | 1,044,956 |
Umpqua Holdings CorporationD | | 60,900 | | | 881,223 |
W.R. Berkley CorporationD | | 30,500 | | | 945,500 |
Webster Financial CorporationD | | 86,300 | | | 1,189,214 |
Wintrust Financial CorporationD | | 7,700 | | | 158,389 |
World Acceptance CorporationD* | | 17,400 | | | 343,824 |
Wright Express Corporation* | | 47,100 | | | 593,460 |
WSFS Financial Corporation | | 9,600 | | | 460,704 |
| | | | | |
| | | | | 58,407,880 |
| | | | | |
Healthcare — 9.4% | | | | | |
Align Technology, Inc.D* | | 53,900 | | | 471,625 |
Amedisys, Inc.D* | | 55,634 | | | 2,299,910 |
American Dental Partners, Inc.D* | | 42,600 | | | 295,644 |
AMERIGROUP Corporation* | | 37,700 | | | 1,112,904 |
AtriCure, Inc.D* | | 56,900 | | | 126,318 |
Auxilium Pharmaceuticals, Inc.* | | 4,400 | | | 125,136 |
BioMarin Pharmaceuticals, Inc.D* | | 40,400 | | | 719,120 |
Bio-Rad Laboratories, Inc. Class A* | | 15,600 | | | 1,174,836 |
Catalyst Health Solutions, Inc.D* | | 91,200 | | | 2,220,720 |
Chattem, Inc.D* | | 12,400 | | | 886,972 |
Cooper Cos., Inc. | | 58,900 | | | 965,960 |
Cubist Pharmaceuticals, Inc.D* | | 22,600 | | | 546,016 |
Endo Pharmaceuticals Holdings, Inc.D* | | 41,500 | | | 1,074,020 |
Five Star Quality Care, Inc.+ | | 2,086 | | | — |
Haemonetics CorporationD* | | 23,100 | | | 1,305,150 |
Icon PLC ADRD* | | 72,900 | | | 1,435,401 |
Immucor, Inc.* | | 43,200 | | | 1,148,256 |
King Pharmaceuticals, Inc.* | | 110,500 | | | 1,173,510 |
Lincare Holdings, Inc.D* | | 37,000 | | | 996,410 |
Magellan Health Services, Inc.D* | | 31,900 | | | 1,249,204 |
Martek Biosciences CorporationD* | | 26,800 | | | 812,308 |
MedAssets, Inc.D* | | 59,100 | | | 862,860 |
Mentor CorporationD | | 35,200 | | | 1,088,736 |
Omnicare, Inc.D | | 17,800 | | | 494,128 |
Owens & Minor, Inc. | | 20,300 | | | 764,295 |
Phase Forward, Inc.* | | 52,000 | | | 651,040 |
Psychiatric Solutions, Inc.D* | | 46,900 | | | 1,306,165 |
Stericycle, Inc.D* | | 8,900 | | | 463,512 |
STERIS CorporationD | | 22,500 | | | 537,525 |
Symmetry Medical, Inc.D* | | 98,300 | | | 783,451 |
Techne Corporation | | 19,100 | | | 1,232,332 |
VCA Antech, Inc.D* | | 74,800 | | | 1,487,024 |
See Notes to Financial Statements.
152
| | | | | |
| | | Shares | | Value |
Vital Images, Inc.D* | | 36,800 | | $ | 511,888 |
Volcano Corporation* | | 37,000 | | | 555,000 |
WellCare Health Plans, Inc.D* | | 21,900 | | | 281,634 |
| | | | | |
| | | | | 31,159,010 |
| | | | | |
Integrated Oils — 0.1% | | | | | |
Vaalco Energy, Inc.D* | | 72,100 | | | 536,424 |
| | | | | |
Materials & Processing — 6.8% | | | | | |
AAON, Inc.D | | 22,300 | | | 465,624 |
Albemarle Corporation | | 31,200 | | | 695,760 |
Ball Corporation | | 21,100 | | | 877,549 |
Beacon Roofing Supply, Inc.D* | | 101,067 | | | 1,402,810 |
Carpenter Technology Corporation | | 16,500 | | | 338,910 |
Chemtura CorporationD | | 145,000 | | | 203,000 |
Clarcor, Inc.D | | 39,400 | | | 1,307,292 |
Clean Harbors, Inc.D* | | 13,200 | | | 837,408 |
Cliffs Natural Resources, Inc.D | | 10,900 | | | 279,149 |
Cytec Industries, Inc. | | 30,900 | | | 655,698 |
Dycom Industries, Inc.D* | | 72,300 | | | 594,306 |
Ferro Corporation | | 73,200 | | | 516,060 |
Gibraltar Industries, Inc.D | | 52,900 | | | 631,626 |
Granite Construction, Inc.D | | 20,600 | | | 904,958 |
Hexcel CorporationD* | | 53,772 | | | 397,375 |
Insteel Industries, Inc.D | | 60,600 | | | 684,174 |
Interline Brands, Inc.D* | | 58,000 | | | 616,540 |
Lennox International, Inc. | | 29,600 | | | 955,784 |
Lubrizol Corporation | | 35,200 | | | 1,280,928 |
Minerals Technologies, Inc. | | 20,000 | | | 818,000 |
Mobile Mini, Inc.D* | | 52,600 | | | 758,492 |
NCI Building Systems, Inc.D* | | 26,300 | | | 428,690 |
OM Group, Inc.D* | | 25,800 | | | 544,638 |
Owens Corning* | | 6,300 | | | 108,990 |
RBC Bearings, Inc.* | | 23,500 | | | 476,580 |
Reliance Steel & Aluminum Co.D | | 64,300 | | | 1,282,142 |
Rogers Corporation* | | 16,500 | | | 458,205 |
Schulman A, Inc. | | 29,200 | | | 496,400 |
Sonoco Products Co. | | 12,400 | | | 287,184 |
Timken Co. | | 21,500 | | | 422,045 |
Watsco, Inc.D | | 55,600 | | | 2,135,040 |
Worthington Industries, Inc.D | | 56,700 | | | 624,834 |
| | | | | |
| | | | | 22,486,191 |
| | | | | |
Other — 0.2% | | | | | |
Foster Wheeler, Ltd.D* | | 18,300 | | | 427,854 |
Walter Industries, Inc. | | 10,600 | | | 185,606 |
| | | | | |
| | | | | 613,460 |
| | | | | |
Other Energy — 3.6% | | | | | |
Approach Resources, Inc.D* | | 45,400 | | | 331,874 |
Arena Resources, Inc.D* | | 72,900 | | | 2,047,761 |
Cal Dive International, Inc.D* | | 59,900 | | | 389,949 |
CARBO Ceramics, Inc.D | | 16,500 | | | 586,245 |
Comstock Resources, Inc.D* | | 40,200 | | | 1,899,450 |
Concho Resources, Inc.D* | | 43,800 | | | 999,516 |
Energy Partners, Ltd.D* | | 90,600 | | | 122,310 |
EXCO Resources, Inc.D* | | 108,800 | | | 985,728 |
Exterran Holdings, Inc.D* | | 19,400 | | | 413,220 |
NATCO Group, Inc. Class AD* | | 61,500 | | | 933,570 |
Patterson-UTI Energy, Inc.D | | 77,200 | | | 888,572 |
Quicksilver Resources, Inc.D* | | 55,900 | | | 311,363 |
Rosetta Resources, Inc.D* | | 24,700 | | | 174,876 |
SEACOR Holdings, Inc.D* | | 12,800 | | | 853,120 |
T-3 Energy Services, Inc.* | | 32,849 | | | 310,094 |
Tsakos Energy Navigation, Ltd.D | | 34,900 | | | 639,368 |
| | | | | |
| | | | | 11,887,016 |
| | | | | |
Producer Durables — 5.1% | | | | | |
A.O. Smith CorporationD | | 17,100 | | | 504,792 |
Actuant Corporation Class AD | | 76,168 | | | 1,448,715 |
Belden CDT, Inc. | | 25,400 | | | 530,352 |
Bucyrus International, Inc. Class AD | | 13,300 | | | 246,316 |
Cognex Corporation | | 35,700 | | | 528,360 |
Columbus McKinnon CorporationD* | | 40,700 | | | 555,555 |
Curtiss-Wright Corporation | | 37,100 | | | 1,238,769 |
Darling International, Inc.* | | 40,900 | | | 224,541 |
EnPro Industries, Inc.D* | | 31,900 | | | 687,126 |
Faro Technologies, Inc.D* | | 42,400 | | | 714,864 |
Gardner Denver, Inc.* | | 38,000 | | | 886,920 |
Graco, Inc.D | | 49,200 | | | 1,167,516 |
Heico CorporationD | | 17,600 | | | 683,408 |
Heico Corporation Class A | | 8,400 | | | 243,264 |
IDEX CorporationD | | 40,511 | | | 978,341 |
Ladish Co., Inc.D* | | 7,200 | | | 99,720 |
Littelfuse, Inc.D* | | 19,100 | | | 317,060 |
Measurement Specialties, Inc.* | | 55,800 | | | 387,810 |
Middleby CorporationD* | | 12,500 | | | 340,875 |
Moog, Inc. Class A* | | 14,600 | | | 533,922 |
Orbital Sciences CorporationD* | | 48,000 | | | 937,440 |
Regal-Beloit Corporation | | 37,600 | | | 1,428,424 |
SBA Communications Corporation Class AD* | | 42,600 | | | 695,232 |
TransDigm Group, Inc.D* | | 25,400 | | | 852,678 |
Triumph Group, Inc.D | | 20,900 | | | 887,414 |
| | | | | |
| | | | | 17,119,414 |
| | | | | |
Technology — 10.2% | | | | | |
Acxiom Corporation | | 116,300 | | | 943,193 |
Advanced Analogic Technologies, Inc.* | | 142,900 | | | 431,558 |
Alvarion, Ltd.D* | | 92,800 | | | 336,864 |
American Reprographics Co.* | | 111,500 | | | 769,350 |
Anixter International, Inc.D* | | 18,200 | | | 548,184 |
Atheros Communications, Inc.D* | | 24,100 | | | 344,871 |
Avnet, Inc.D* | | 23,500 | | | 427,935 |
Blackboard, Inc.D* | | 16,700 | | | 438,041 |
Coherent, Inc.* | | 18,900 | | | 405,594 |
CommVault Systems, Inc.D* | | 41,300 | | | 553,833 |
Compuware CorporationD* | | 94,600 | | | 638,550 |
Constant Contact, Inc.D* | | 33,100 | | | 438,575 |
CPI International, Inc.D* | | 57,700 | | | 499,682 |
DealerTrack Holdings, Inc.* | | 106,600 | | | 1,267,474 |
FormFactor, Inc.D* | | 42,000 | | | 613,200 |
Hittite Microwave CorporationD* | | 24,600 | | | 724,716 |
See Notes to Financial Statements.
153
Small Cap Equity Fund
SCHEDULE OF INVESTMENTS (Continued)
| | | | | | |
| | | Shares | | Value |
Informatica CorporationD* | | | 68,400 | | $ | 939,132 |
Ingram Micro, Inc. Class A* | | | 71,700 | | | 960,063 |
InterDigital, Inc.D* | | | 19,800 | | | 544,500 |
j2 Global Communications, Inc.D* | | | 100,400 | | | 2,012,016 |
Kenexa CorporationD* | | | 28,900 | | | 230,622 |
Monolithic Power Systems, Inc.* | | | 60,000 | | | 756,600 |
Monotype Imaging Holdings, Inc.* | | | 38,200 | | | 221,560 |
Netezza CorporationD* | | | 63,000 | | | 418,320 |
NeuStar, Inc. Class A* | | | 42,700 | | | 816,851 |
PerkinElmer, Inc. | | | 82,900 | | | 1,153,139 |
Power Intergrations, Inc.D | | | 90,200 | | | 1,793,176 |
QLogic CorporationD* | | | 70,800 | | | 951,552 |
Scansource, Inc.D* | | | 65,000 | | | 1,252,550 |
Silicon Image, Inc.D* | | | 109,900 | | | 461,580 |
Silicon Laboratories, Inc.D* | | | 19,500 | | | 483,210 |
SkillSoft PLC ADRD* | | | 150,300 | | | 1,073,142 |
Solera Holdings, Inc.D* | | | 151,900 | | | 3,660,790 |
SRA International, Inc. Class AD* | | | 26,800 | | | 462,300 |
Stanley, Inc.* | | | 25,000 | | | 905,500 |
Stratasys, Inc.D* | | | 30,292 | | | 325,639 |
Sybase, Inc.* | | | 10,500 | | | 260,085 |
SYKES Enterprises, Inc.D* | | | 70,100 | | | 1,340,312 |
Synaptics, Inc.D* | | | 12,150 | | | 201,204 |
Ultimate Software Group, Inc.D* | | | 41,600 | | | 607,360 |
Varian Semiconductor Equipment Associates, Inc.D* | | | 17,425 | | | 315,741 |
VeriFone Holdings, Inc.D* | | | 65,300 | | | 319,970 |
Viasat, Inc.D* | | | 45,800 | | | 1,102,864 |
Vishay Intertechnology, Inc.D* | | | 54,200 | | | 185,364 |
Websense, Inc.D* | | | 63,702 | | | 953,619 |
| | | | | | |
| | | | | | 34,090,381 |
| | | | | | |
Utilities — 5.0% | | | | | | |
Alliant Energy Corporation | | | 41,000 | | | 1,196,380 |
Centerpoint Energy, Inc. | | | 65,900 | | | 831,658 |
CenturyTel, Inc. | | | 26,600 | | | 726,978 |
Cleco CorporationD | | | 20,100 | | | 458,883 |
El Paso Electric Co.* | | | 48,200 | | | 871,938 |
Energen CorporationD | | | 19,700 | | | 577,801 |
General Communication, Inc. Class AD* | | | 79,600 | | | 643,964 |
IDACORP, Inc. | | | 24,500 | | | 721,525 |
MDU Resources Group, Inc.D | | | 31,650 | | | 683,007 |
NiSource, Inc. | | | 76,400 | | | 838,108 |
NTELOS Holdings Corporation | | | 84,700 | | | 2,088,702 |
NV Energy, Inc.D | | | 117,000 | | | 1,157,130 |
OGE Energy Corporation | | | 45,200 | | | 1,165,256 |
Oneok, Inc. | | | 43,300 | | | 1,260,896 |
Pepco Holdings, Inc. | | | 82,400 | | | 1,463,424 |
Portland General Electric Co.D | | | 42,200 | | | 821,634 |
USA Mobility, Inc.D* | | | 37,300 | | | 431,561 |
Wisconsin Energy Corporation | | | 14,400 | | | 604,512 |
| | | | | | |
| | | | | | 16,543,357 |
| | | | | | |
Total Common Stocks
(Cost $316,731,283) | | | | | | 243,539,913 |
| | | | | | |
FOREIGN COMMON STOCKS — 0.5% | | | | | | |
Israel — 0.1% | | | | | | |
RRSat Global Communications Network, Ltd.D | | | 38,900 | | | 447,739 |
| | | | | | |
Netherlands — 0.1% | | | | | | |
AerCap Holdings NV* | | | 50,600 | | | 152,306 |
| | | | | | |
Puerto Rico — 0.1% | | | | | | |
Oriental Financial Group | | | 62,700 | | | 379,335 |
| | | | | | |
Singapore — 0.2% | | | | | | |
Verigy, Ltd.D* | | | 70,600 | | | 679,172 |
| | | | | | |
Total Foreign Common Stocks
(Cost $4,220,730) | | | | | | 1,658,552 |
| | | | | | |
EXCHANGE TRADED FUND — 11.1% | | | | | | |
iShares Russell 2000 Growth Index Fund
(Cost $48,693,523) | | | 727,300 | | | 36,990,478 |
| | | | | | |
PREFERRED STOCKS — 0.0% | | | | | | |
Federal Home Loan Mortgage Corporation | | | 5,125 | | | 1,999 |
Federal National Mortgage Association | | | 3,750 | | | 3,103 |
Preferred Blocker (GMAC), Inc.+ | | | 73 | | | 21,900 |
| | | | | | |
Total Preferred Stocks
(Cost $249,415) | | | | | | 27,002 |
| | | | | | |
MONEY MARKET FUNDS — 24.8% | | | | | | |
GuideStone Money Market Fund (GS4 Class)¥ | | | 22,866,336 | | | 22,866,336 |
Northern Institutional Liquid Assets Portfolio§ | | | 59,416,171 | | | 59,416,171 |
| | | | | | |
Total Money Market Funds
(Cost $82,282,507) | | | | | | 82,282,507 |
| | | | | | |
| | |
| | | Par | | |
AGENCY OBLIGATIONS — 1.0% | | | | | | |
Federal National Mortgage Association | | | | | | |
0.25%, 05/15/09W‡‡ | | $ | 27,000 | | | 26,978 |
0.25%, 05/18/09W‡‡ | | | 3,183,000 | | | 3,180,294 |
5.25%, 08/01/12 | | | 110,000 | | | 116,037 |
| | | | | | |
Total Agency Obligations
(Cost $3,312,389) | | | | | | 3,323,309 |
| | | | | | |
ASSET-BACKED SECURITIES — 0.7% | | | | | | |
Bear Stearns Asset-Backed Securities Trust | | | | | | |
0.92%, 10/27/32† | | | 32,665 | | | 25,453 |
0.92%, 12/25/33† | | | 331,134 | | | 244,219 |
Drive Auto Receivables Trust 5.33%, | | | | | | |
04/15/14 STEP 144A | | | 400,000 | | | 351,999 |
EMC Mortgage Loan Trust 1.12%, | | | | | | |
02/25/41 STEP 144A | | | 87,048 | | | 68,681 |
GSAA Trust 0.74%, 07/25/37† | | | 200,000 | | | 14,219 |
Lehman XS Trust | | | | | | |
0.77%, 11/25/35† | | | 307,322 | | | 143,037 |
0.77%, 12/25/35† | | | 154,684 | | | 44,276 |
0.59%, 06/25/37† | | | 263,225 | | | 191,383 |
0.73%, 02/25/46† | | | 316,589 | | | 128,879 |
0.54%, 08/25/46† | | | 212,918 | | | 163,560 |
See Notes to Financial Statements.
154
| | | | | | |
| | | Par | | Value |
MASTR Specialized Loan Trust | | | | | | |
0.82%, 05/25/37 144A† | | $ | 293,839 | | $ | 152,755 |
Nelnet Student Loan Trust | | | | | | |
5.02%, 04/25/24† | | | 80,000 | | | 64,811 |
Option One Mortgage Loan Trust | | | | | | |
1.27%, 11/25/32† | | | 29,468 | | | 23,716 |
Renaissance Home Equity Loan Trust | | | | | | |
0.90%, 06/25/33† | | | 20,444 | | | 12,929 |
Securitized Asset-Backed Receivables LLC Trust | | | | | | |
0.70%, 02/25/37† | | | 300,508 | | | 139,306 |
Wachovia Asset Securitization, Inc. | | | | | | |
0.84%, 09/27/32† | | | 76,226 | | | 55,125 |
0.90%, 12/25/32† | | | 40,028 | | | 31,204 |
0.76%, 03/25/33† | | | 44,873 | | | 29,037 |
Washington Mutual Master Note Trust | | | | | | |
1.23%, 09/15/13 144A† | | | 200,000 | | | 175,075 |
Wells Fargo Financial Auto Owner Trust 2005-A | | | | | | |
4.28%, 05/15/12 | | | 138,159 | | | 134,484 |
| | | | | | |
Total Asset-Backed Securities
(Cost $3,454,982) | | | | | | 2,194,148 |
| | | | | | |
CORPORATE BONDS — 2.7% | | | | | | |
AES Corporation | | | | | | |
7.75%, 10/15/15 | | | 30,000 | | | 25,350 |
8.00%, 10/15/17 | | | 140,000 | | | 115,500 |
8.00%, 06/01/20 144A | | | 190,000 | | | 148,200 |
Alcoa, Inc. | | | | | | |
6.00%, 07/15/13 | | | 80,000 | | | 72,404 |
American Express Co. | | | | | | |
6.80%, 09/01/66† | | | 140,000 | | | 72,560 |
American International Group, Inc. | | | | | | |
5.85%, 01/16/18 | | | 190,000 | | | 127,554 |
Anadarko Petroleum Corporation | | | | | | |
5.95%, 09/15/16 | | | 20,000 | | | 17,692 |
6.45%, 09/15/36 | | | 320,000 | | | 253,132 |
Apache Corporation | | | | | | |
5.63%, 01/15/17 | | | 110,000 | | | 110,916 |
AT&T, Inc. | | | | | | |
5.50%, 02/01/18 | | | 90,000 | | | 91,117 |
BAC Capital Trust XIV | | | | | | |
5.63%, 12/31/49† | | | 10,000 | | | 4,009 |
Baker Hughes, Inc. | | | | | | |
7.50%, 11/15/18 | | | 70,000 | | | 77,744 |
Bank of America Corporation | | | | | | |
5.75%, 12/01/17 | | | 190,000 | | | 190,031 |
8.13%, 12/15/49† | | | 20,000 | | | 14,985 |
8.00%, 12/29/49† | | | 60,000 | | | 43,219 |
Bear Stearns Co., Inc. | | | | | | |
7.25%, 02/01/18 | | | 170,000 | | | 186,609 |
BP Capital Markets PLC | | | | | | |
5.25%, 11/07/13 | | | 120,000 | | | 125,406 |
Cardinal Health, Inc. | | | | | | |
5.85%, 12/15/17 | | | 60,000 | | | 54,192 |
Caterpillar Financial Services Corporation | | | | | | |
6.20%, 09/30/13 | | | 110,000 | | | 113,516 |
Chesapeake Energy Corporation | | | | | | |
6.88%, 11/15/20 | | | 100,000 | | | 72,500 |
Citigroup, Inc. | | | | | | |
6.50%, 08/19/13 | | | 140,000 | | | 141,412 |
5.00%, 09/15/14 | | | 160,000 | | | 140,902 |
6.88%, 03/05/38 | | | 130,000 | | | 148,425 |
Comcast Corporation | | | | | | |
6.50%, 01/15/17 | | | 360,000 | | | 356,125 |
Community Health Systems, Inc. | | | | | | |
8.88%, 07/15/15 | | | 30,000 | | | 27,750 |
ConocoPhillips Holding Co. | | | | | | |
6.95%, 04/15/29 | | | 180,000 | | | 194,239 |
Countrywide Financial Corporation | | | | | | |
6.25%, 05/15/16 | | | 50,000 | | | 47,544 |
CVS Pass-Through Trust | | | | | | |
6.94%, 01/10/30 144A | | | 88,390 | | | 55,696 |
DaVita, Inc. | | | | | | |
6.63%, 03/15/13 | | | 35,000 | | | 33,425 |
Devon Financing Corporation | | | | | | |
6.88%, 09/30/11 | | | 150,000 | | | 151,467 |
Dominion Resources, Inc. | | | | | | |
5.70%, 09/17/12 | | | 120,000 | | | 118,919 |
Duke Energy Carolinas LLC | | | | | | |
5.63%, 11/30/12 | | | 130,000 | | | 132,508 |
Dynegy Holdings, Inc. | | | | | | |
7.75%, 06/01/19D | | | 45,000 | | | 31,275 |
Edison Mission Energy | | | | | | |
7.20%, 05/15/19 | | | 100,000 | | | 82,500 |
Embarq Corporation | | | | | | |
6.74%, 06/01/13 | | | 150,000 | | | 126,865 |
Energy Future Holdings Corporation | | | | | | |
11.25%, 11/01/17 PIK 144A | | | 500,000 | | | 245,000 |
6.50%, 11/15/24 | | | 20,000 | | | 7,176 |
6.55%, 11/15/34 | | | 10,000 | | | 3,426 |
Energy Transfer Partners LP | | | | | | |
6.70%, 07/01/18 | | | 100,000 | | | 84,429 |
FirstEnergy Corporation | | | | | | |
7.38%, 11/15/31 | | | 110,000 | | | 104,340 |
Ford Motor Credit Co., LLC | | | | | | |
7.38%, 10/28/09 | | | 550,000 | | | 483,108 |
12.00%, 05/15/15 | | | 140,000 | | | 104,650 |
Freeport-McMoRan Copper & Gold, Inc. | | | | | | |
8.38%, 04/01/17 | | | 65,000 | | | 53,374 |
General Electric Capital Corporation | | | | | | |
6.38%, 11/15/47† | | | 130,000 | | | 81,834 |
GMAC LLC | | | | | | |
6.63%, 05/15/12 144A+ | | | 348,000 | | | 271,029 |
7.50%, 12/31/13 144A | | | 37,000 | | | 27,565 |
8.00%, 12/31/18+ | | | 32,000 | | | 16,480 |
Goldman Sachs Capital II | | | | | | |
5.79%, 12/29/49† | | | 10,000 | | | 3,847 |
Goldman Sachs Group, Inc. | | | | | | |
4.50%, 06/15/10 | | | 100,000 | | | 98,573 |
5.95%, 01/18/18 | | | 100,000 | | | 94,979 |
HCA, Inc. | | | | | | |
9.63%, 11/15/16 PIK | | | 50,000 | | | 39,125 |
Hertz Corporation | | | | | | |
8.88%, 01/01/14 | | | 10,000 | | | 6,200 |
10.50%, 01/01/16D | | | 5,000 | | | 2,306 |
See Notes to Financial Statements.
155
Small Cap Equity Fund
SCHEDULE OF INVESTMENTS (Continued)
| | | | | | |
| | | Par | | Value |
Hess Corporation | | | | | | |
7.30%, 08/15/31 | | $ | 130,000 | | $ | 118,591 |
HSBC Finance Corporation | | | | | | |
4.63%, 09/15/10 | | | 290,000 | | | 286,383 |
Humana, Inc. | | | | | | |
7.20%, 06/15/18 | | | 30,000 | | | 24,164 |
Idearc, Inc. | | | | | | |
8.00%, 11/15/16 | | | 65,000 | | | 5,200 |
JPMorgan Chase & Co. | | | | | | |
6.13%, 06/27/17 | | | 200,000 | | | 197,145 |
Kinder Morgan Energy Partners LP | | | | | | |
6.00%, 02/01/17 | | | 70,000 | | | 60,865 |
6.95%, 01/15/38 | | | 120,000 | | | 97,313 |
Kroger Co. | | | | | | |
6.15%, 01/15/20 | | | 70,000 | | | 69,200 |
L-3 Communications Corporation | | | | | | |
6.38%, 10/15/15 | | | 85,000 | | | 79,900 |
Lehman Brothers Holdings Capital Trust V | | | | | | |
5.86%, 11/29/49# | | | 10,000 | | | 1 |
Lehman Brothers Holdings E-Capital Trust I | | | | | | |
3.59%, 08/19/65# | | | 50,000 | | | 5 |
Lehman Brothers Holdings, Inc. | | | | | | |
6.50%, 07/19/17# | | | 160,000 | | | 16 |
6.75%, 12/28/17# | | | 120,000 | | | 12 |
Merrill Lynch & Co., Inc. | | | | | | |
5.45%, 02/05/13 | | | 220,000 | | | 211,664 |
MetLife, Inc. | | | | | | |
6.40%, 12/15/36 | | | 120,000 | | | 72,166 |
Morgan Stanley | | | | | | |
5.63%, 01/09/12 | | | 160,000 | | | 151,832 |
NewPage Corporation | | | | | | |
10.00%, 05/01/12 | | | 30,000 | | | 13,350 |
NRG Energy, Inc. | | | | | | |
7.25%, 02/01/14 | | | 10,000 | | | 9,375 |
7.38%, 02/01/16 | | | 30,000 | | | 27,975 |
Occidental Petroleum Corporation | | | | | | |
7.00%, 11/01/13 | | | 100,000 | | | 109,257 |
Oncor Electric Delivery Co. | | | | | | |
6.38%, 01/15/15 | | | 50,000 | | | 47,952 |
Pacific Gas & Electric Co. | | | | | | |
5.63%, 11/30/17 | | | 30,000 | | | 30,779 |
6.05%, 03/01/34 | | | 80,000 | | | 85,246 |
Pemex Project Funding Master Trust | | | | | | |
6.63%, 06/15/35 | | | 90,000 | | | 76,298 |
PepsiCo, Inc. | | | | | | |
7.90%, 11/01/18 | | | 60,000 | | | 73,670 |
Qwest Communications International, Inc. | | | | | | |
7.50%, 02/15/14 | | | 70,000 | | | 50,400 |
RH Donnelley Corporation | | | | | | |
8.88%, 10/15/17 | | | 5,000 | | | 775 |
Sonat, Inc. | | | | | | |
7.63%, 07/15/11 | | | 100,000 | | | 91,674 |
Sprint Capital Corporation | | | | | | |
6.90%, 05/01/19 | | | 100,000 | | | 71,117 |
Steel Dynamics, Inc. | | | | | | |
7.38%, 11/01/12 | | | 25,000 | | | 18,375 |
SunTrust Capital VIII | | | | | | |
6.10%, 12/15/36† | | | 100,000 | | | 70,591 |
Terex Corporation | | | | | | |
7.38%, 01/15/14 | | | 10,000 | | | 8,750 |
Time Warner Cable, Inc. | | | | | | |
6.75%, 07/01/18 | | | 110,000 | | | 106,090 |
7.30%, 07/01/38 | | | 90,000 | | | 93,787 |
Travelers Cos., Inc. | | | | | | |
6.25%, 03/15/37† | | | 100,000 | | | 65,597 |
United Parcel Service, Inc. | | | | | | |
4.50%, 01/15/13 | | | 150,000 | | | 154,873 |
UnitedHealth Group, Inc. | | | | | | |
4.88%, 02/15/13 | | | 100,000 | | | 93,447 |
Ventas Realty LP | | | | | | |
9.00%, 05/01/12 | | | 20,000 | | | 17,900 |
Verizon Communications, Inc. | | | | | | |
8.95%, 03/01/39 | | | 60,000 | | | 77,741 |
Verizon Global Funding Corporation | | | | | | |
7.38%, 09/01/12 | | | 100,000 | | | 104,699 |
Wachovia Corporation | | | | | | |
5.63%, 10/15/16 | | | 270,000 | | | 247,022 |
WellPoint, Inc. | | | | | | |
5.88%, 06/15/17 | | | 110,000 | | | 100,276 |
Weyerhaeuser Co. | | | | | | |
6.75%, 03/15/12 | | | 80,000 | | | 71,661 |
Williams Cos., Inc. | | | | | | |
7.88%, 09/01/21 | | | 50,000 | | | 38,318 |
7.50%, 01/15/31 | | | 30,000 | | | 20,142 |
7.75%, 06/15/31 | | | 50,000 | | | 34,322 |
8.75%, 03/15/32 | | | 10,000 | | | 7,465 |
Windstream Corporation | | | | | | |
8.63%, 08/01/16 | | | 20,000 | | | 17,800 |
Wyeth | | | | | | |
5.95%, 04/01/37 | | | 60,000 | | | 66,857 |
XTO Energy, Inc. | | | | | | |
7.50%, 04/15/12 | | | 110,000 | | | 108,797 |
| | | | | | |
Total Corporate Bonds
(Cost $10,602,328) | | | | | | 9,019,964 |
| | | | | | |
FOREIGN BONDS — 0.5% | | | | | | |
Canada — 0.0% | | | | | | |
OPTI Canada, Inc. | | | | | | |
7.88%, 12/15/14 | | | 30,000 | | | 15,450 |
8.25%, 12/15/14D | | | 10,000 | | | 5,450 |
| | | | | | |
| | | | | | 20,900 |
| | | | | | |
Cayman Islands — 0.1% | | | | | | |
Petrobras International Finance Co. | | | | | | |
6.13%, 10/06/16 | | | 80,000 | | | 78,400 |
Resona Preferred Global Securities Cayman, Ltd. | | | | | | |
7.19%, 07/30/49 144A† | | | 60,000 | | | 28,594 |
Shinsei Finance Cayman, Ltd. | | | | | | |
6.42%, 07/20/49 144A† | | | 100,000 | | | 20,931 |
Vale Overseas, Ltd. | | | | | | |
6.88%, 11/21/36 | | | 140,000 | | | 127,428 |
| | | | | | |
| | | | | | 255,353 |
| | | | | | |
France — 0.0% | | | | | | |
Compagnie Generale de Geophysique - Veritas | | | | | | |
7.50%, 05/15/15 | | | 50,000 | | | 31,250 |
| | | | | | |
Iceland — 0.0% | | | | | | |
Glitnir Banki HF | | | | | | |
6.69%, 06/15/16 144A# | | | 130,000 | | | 670 |
See Notes to Financial Statements.
156
| | | | | | |
| | | Par | | Value |
Kaupthing Bank HF | | | | | | |
7.63%, 02/28/15 144A#@ | | $ | 310,000 | | $ | 18,600 |
| | | | | | |
| | | | | | 19,270 |
| | | | | | |
India — 0.0% | | | | | | |
ICICI Bank, Ltd. | | | | | | |
6.38%, 04/30/22 144A† | | | 110,000 | | | 57,916 |
| | | | | | |
Ireland — 0.0% | | | | | | |
Vimpel Communications | | | | | | |
8.38%, 04/30/13 144A | | | 100,000 | | | 64,500 |
| | | | | | |
Italy — 0.0% | | | | | | |
Telecom Italia Capital SA | | | | | | |
5.25%, 10/01/15 | | | 60,000 | | | 45,736 |
| | | | | | |
Japan — 0.0% | | | | | | |
Aiful Corporation | | | | | | |
6.00%, 12/12/11 144A | | | 100,000 | | | 40,525 |
| | | | | | |
Luxembourg — 0.1% | | | | | | |
Evraz Group SA | | | | | | |
8.88%, 04/24/13 144A | | | 120,000 | | | 61,800 |
FMC Finance III SA | | | | | | |
6.88%, 07/15/17 | | | 40,000 | | | 37,600 |
Gaz Capital for Gazprom | | | | | | |
6.21%, 11/22/16 144A | | | 110,000 | | | 73,150 |
RSHB Capital SA for OJSC Russian Agricultural Bank | | | | | | |
6.30%, 05/15/17 144A | | | 110,000 | | | 63,250 |
TNK-BP Finance SA | | | | | | |
6.63%, 03/20/17 144A | | | 100,000 | | | 48,500 |
7.88%, 03/13/18 144A | | | 100,000 | | | 50,500 |
| | | | | | |
| | | | | | 334,800 |
| | | | | | |
Mexico — 0.1% | | | | | | |
America Movil Sab de CV | | | | | | |
5.63%, 11/15/17 | | | 40,000 | | | 35,761 |
Kansas City Southern de Mexico SA de CV | | | | | | |
9.38%, 05/01/12 | | | 20,000 | | | 18,400 |
United Mexican States | | | | | | |
6.75%, 09/27/34 | | | 100,000 | | | 106,000 |
| | | | | | |
| | | | | | 160,161 |
| | | | | | |
Netherlands — 0.2% | | | | | | |
Deutsche Telekom International Finance BV | | | | | | |
5.75%, 03/23/16 | | | 75,000 | | | 71,897 |
HSBK Europe BV | | | | | | |
9.25%, 10/16/13 144A | | | 100,000 | | | 73,500 |
Intergas Finance BV | | | | | | |
6.38%, 05/14/17 144A | | | 110,000 | | | 64,350 |
KazMunaiGaz Finance Sub BV | | | | | | |
8.38%, 07/02/13 144A | | | 120,000 | | | 94,200 |
Koninklijke KPN NV | | | | | | |
8.00%, 10/01/10 | | | 110,000 | | | 111,056 |
TuranAlem Finance BV | | | | | | |
8.25%, 01/22/37 144A | | | 210,000 | | | 91,350 |
| | | | | | |
| | | | | | 506,353 |
| | | | | | |
Russia — 0.0% | | | | | | |
Russian Federation | | | | | | |
7.50%, 03/31/30 STEP | | | 12,740 | | | 11,239 |
| | | | | | |
United Kingdom — 0.0% | | | | | | |
Vedanta Resources PLC | | | | | | |
8.75%, 01/15/14 144A | | | 100,000 | | | 60,500 |
| | | | | | |
Total Foreign Bonds
(Cost $2,741,096) | | | | | | 1,608,503 |
| | | | | | |
MORTGAGE-BACKED SECURITIES — 5.0% | | | | | | |
American Home Mortgage Investment Trust | | | | | | |
0.82%, 04/25/44 STEP | | | 38,965 | | | 27,493 |
0.76%, 11/25/45† | | | 274,749 | | | 131,579 |
Bear Stearns Adjustable Rate Mortgage Trust | | | | | | |
6.19%, 02/25/35† | | | 117,692 | | | 76,717 |
4.87%, 08/25/35† | | | 280,845 | | | 135,166 |
Bear Stearns Mortgage Funding Trust | | | | | | |
0.68%, 12/25/36† | | | 261,995 | | | 74,743 |
Bear Stearns Structured Products, Inc. | | | | | | |
1.07%, 09/27/37 144A† | | | 754,404 | | | 733,643 |
Commercial Mortgage Lease-Backed Certificates | | | | | | |
6.75%, 06/20/31 144A | | | 307,717 | | | 293,718 |
Countrywide Alternative Loan Trust | | | | | | |
0.71%, 07/25/35† | | | 233,204 | | | 106,277 |
0.73%, 07/25/35† | | | 308,749 | | | 141,242 |
0.72%, 06/25/37† | | | 143,317 | | | 54,155 |
0.66%, 09/25/46† | | | 339,366 | | | 118,769 |
Credit Suisse Mortgage Capital Certificates | | | | | | |
5.47%, 09/15/39 | | | 390,000 | | | 286,948 |
CS First Boston Mortgage Securities Corporation | | | | | | |
6.00%, 10/25/35 | | | 131,889 | | | 83,008 |
Federal Home Loan Mortgage Corporation | | | | | | |
6.00%, 05/01/37† | | | 68,208 | | | 70,075 |
6.20%, 09/01/37† | | | 61,672 | | | 63,397 |
5.50%, 01/01/39 TBA | | | 100,000 | | | 102,344 |
6.00%, 01/01/39 TBA | | | 300,000 | | | 309,000 |
Federal National Mortgage Association | | | | | | |
5.00%, 01/01/28 TBA | | | 8,500,000 | | | 8,677,973 |
4.95%, 09/01/35† | | | 137,212 | | | 137,707 |
6.00%, 01/01/39 TBA | | | 100,000 | | | 102,937 |
First Horizon Alternative Mortgage Securities | | | | | | |
5.55%, 02/25/36† | | | 173,997 | | | 83,891 |
0.84%, 02/25/37† | | | 108,799 | | | 32,562 |
General Electric Capital Commercial Mortgage Corporation | | | | | | |
5.34%, 03/10/44† | | | 300,000 | | | 240,280 |
GMAC Commercial Mortgage Securities, Inc. | | | | | | |
5.24%, 11/10/45† | | | 100,000 | | | 79,688 |
Government National Mortgage Association | | | | | | |
5.50%, 01/01/38 TBA | | | 400,000 | | | 410,627 |
6.00%, 01/01/38 TBA | | | 400,000 | | | 412,625 |
5.00%, 01/01/39 TBA | | | 500,000 | | | 512,500 |
6.00%, 01/01/39 TBA | | | 200,000 | | | 205,750 |
See Notes to Financial Statements.
157
Small Cap Equity Fund
SCHEDULE OF INVESTMENTS (Continued)
| | | | | | | | |
| | | Par | | | Value | |
Greenpoint Mortgage Funding Trust | | | | | | | | |
0.73%, 10/25/45† | | $ | 79,931 | | | $ | 35,948 | |
Harborview Mortgage Loan Trust | | | | | | | | |
0.82%, 06/19/35† | | | 290,682 | | | | 133,708 | |
Homestar Mortgage Acceptance Corporation | | | | | | | | |
0.92%, 07/25/34† | | | 127,448 | | | | 66,980 | |
Impac CMB Trust | | | | | | | | |
1.27%, 03/25/33† | | | 22,133 | | | | 10,923 | |
Indymac INDA Mortgage Loan Trust | | | | | | | | |
6.18%, 11/01/37† | | | 180,245 | | | | 117,680 | |
MASTR Adjustable Rate Mortgages Trust | | | | | | | | |
3.79%, 11/21/34† | | | 200,000 | | | | 128,004 | |
3.06%, 12/25/46† | | | 313,697 | | | | 119,397 | |
Merrill Lynch Mortgage Investors, Inc. | | | | | | | | |
5.04%, 05/25/34† | | | 57,663 | | | | 41,836 | |
4.49%, 02/25/35† | | | 309,096 | | | | 187,890 | |
Morgan Stanley Capital I | | | | | | | | |
5.69%, 04/15/49† | | | 270,000 | | | | 202,622 | |
Residential Accredit Loans, Inc. | | | | | | | | |
5.53%, 12/26/34† | | | 315,297 | | | | 153,467 | |
0.87%, 10/25/45† | | | 196,775 | | | | 90,456 | |
Structured Adjustable Rate Mortgage Loan Trust | | | | | | | | |
5.14%, 11/25/34† | | | 96,288 | | | | 49,482 | |
Structured Asset Mortgage Investments, Inc. | | | | | | | | |
0.68%, 08/25/36† | | | 297,061 | | | | 118,018 | |
0.65%, 09/25/37† | | | 361,443 | | | | 111,429 | |
Terwin Mortgage Trust | | | | | | | | |
0.55%, 10/25/37† | | | 170,208 | | | | 149,358 | |
Washington Mutual Alternative Mortgage Pass-Through Certificates | | | | | | | | |
3.10%, 05/25/47† | | | 345,941 | | | | 110,040 | |
Washington Mutual, Inc. | | | | | | | | |
5.63%, 11/25/36† | | | 266,871 | | | | 141,000 | |
Wells Fargo Mortgage-Backed Securities Trust | | | | | | | | |
0.87%, 05/25/33† | | | 324,544 | | | | 294,640 | |
3.74%, 09/25/34† | | | 400,000 | | | | 392,261 | |
5.24%, 04/25/36† | | | 281,166 | | | | 203,634 | |
| | | | | | | | |
Total Mortgage-Backed Securities
(Cost $19,894,116) | | | | | | | 16,563,587 | |
| | | | | | | | |
U.S. TREASURY OBLIGATIONS — 1.2% | | | | | | | | |
U.S. Treasury Bills | | | | | | | | |
0.00%, 05/14/09‡‡ | | | 55,000 | | | | 54,988 | |
0.10%, 05/14/09‡‡ | | | 1,890,000 | | | | 1,889,584 | |
| | | | | | | | |
| | | | | | | 1,944,572 | |
| | | | | | | | |
U.S. Treasury Bond | | | | | | | | |
5.50%, 08/15/28 | | | 780,000 | | | | 1,054,462 | |
| | | | | | | | |
U.S. Treasury Inflationary Index Bonds | | | | | | | | |
2.50%, 07/15/16‡‡ | | | 90,000 | | | | 95,816 | |
2.63%, 07/15/17‡‡ | | | 120,000 | | | | 128,582 | |
2.38%, 01/15/27‡‡ | | | 295,000 | | | | 318,472 | |
1.75%, 01/15/28‡‡ | | | 350,000 | | | | 334,514 | |
| | | | | | | | |
| | | | | | | 877,384 | |
| | | | | | | | |
Total U.S. Treasury Obligations
(Cost $3,815,530) | | | | | | | 3,876,418 | |
| | | | | | | | |
| | |
TOTAL INVESTMENTS — 120.8%
(Cost $495,997,899) | | | | | | | 401,084,381 | |
| | | | | | | | |
| | |
| | | Number of
Contracts | | | | |
WRITTEN OPTIONS — (0.1)% | | | | | | | | |
Call Options — (0.1)% | | | | | | | | |
10-Year U.S. Treasury Note Futures, Strike Price $118.00, Expires 02/21/09 | | | (17 | ) | | | (139,453 | ) |
90-Day Eurodollar Futures, Strike Price $98.25, Expires 03/17/09 | | | (37 | ) | | | (67,063 | ) |
| | | | | | | | |
| | | | | | | (206,516 | ) |
| | | | | | | | |
Put Options — 0.0% | | | | | | | | |
10-Year U.S. Treasury Note Futures, Strike Price $110.00, Expires 02/20/09 | | | (16 | ) | | | (2,000 | ) |
10-Year U.S. Treasury Note Futures, Strike Price $111.00, Expires 02/20/09 | | | (4 | ) | | | (562 | ) |
90-Day Eurodollar Futures, Strike Price $96.75, Expires 03/17/09 | | | (15 | ) | | | (94 | ) |
| | | | | | | | |
| | | | | | | (2,656 | ) |
| | | | | | | | |
Total Written Options
(Premiums received $(81,114)) | | | | | | | (209,172 | ) |
| | | | | | | | |
Liabilities in Excess of Other Assets — (20.7)% | | | | | | | (68,793,611 | ) |
| | | | | | | | |
| | |
NET ASSETS — 100.0% | | | | | | $ | 332,081,598 | |
| | | | | | | | |
See Notes to Financial Statements.
158
PORTFOLIO SUMMARY (based on net assets)
| | | |
| | | % | |
Money Market Funds | | 24.8 | |
Futures Contracts | | 19.6 | |
Financial Services | | 17.6 | |
Exchange Traded Fund | | 11.1 | |
Technology | | 10.2 | |
Consumer Discretionary | | 10.1 | |
Healthcare | | 9.4 | |
Materials & Processing | | 6.8 | |
Producer Durables | | 5.1 | |
Mortgage-Backed Securities | | 5.0 | |
Utilities | | 5.0 | |
Other Energy | | 3.6 | |
Auto & Transportation | | 3.2 | |
Corporate Bonds | | 2.7 | |
Consumer Staples | | 2.0 | |
U.S. Treasury Obligations | | 1.2 | |
Agency Obligations | | 1.0 | |
Asset-Backed Securities | | 0.7 | |
Foreign Bonds | | 0.5 | |
Foreign Common Stocks | | 0.5 | |
Other | | 0.2 | |
Integrated Oils | | 0.1 | |
Preferred Stocks | | 0.0 | ** |
Purchased Options | | 0.0 | ** |
Forward Foreign Currency Contracts | | (0.1 | ) |
Written Options | | (0.1 | ) |
| | | |
| | 140.2 | |
| | | |
| ** | Rounds to less than 0.005%. |
FAS 157 DISCLOSURE
The following is a summary of the inputs used, as of December 31, 2008, in valuing the Fund’s assets carried at fair value:
| | | | | | | | |
Valuation Inputs | | Investments
in
Securities | | | Other
Financial
Instruments*** | |
Assets: | | | | | | | | |
Level 1 — Quoted Prices | | $ | 364,476,552 | | | $ | 2,762,017 | |
Level 2 — Other Significant Observable Inputs | | | 36,541,884 | | | | — | |
Level 3 — Significant Unobservable Inputs | | | 65,945 | | | | — | |
| | | | | | | | |
Total Assets | | $ | 401,084,381 | | | $ | 2,762,017 | |
| | | | | | | | |
| | |
Liabilities: | | | | | | | | |
Level 1 — Quoted Prices | | $ | (209,172 | ) | | $ | — | |
Level 2 — Other Significant Observable Inputs | | | — | | | | (7,828 | ) |
Level 3 — Significant Unobservable Inputs | | | — | | | | — | |
| | | | | | | | |
Total Liabilities | | $ | (209,172 | ) | | $ | (7,828 | ) |
| | | | | | | | |
| *** | Other financial instruments are derivative instruments not reflected in the Schedule of Investments, such as futures, forwards and swap contracts, which are valued at the unrealized appreciation (depreciation) on the investment. |
The following is a reconciliation of assets in which significant unobservable inputs (Level 3) were used in determining fair value:
| | | | | | |
| | | Investments
in
Securities | | Other
Financial
Instruments |
Balance, 12/31/07 | | $ | — | | $ | — |
Accrued discounts/premiums | | | — | | | — |
Realized gain (loss) | | | — | | | — |
Changed in unrealized appreciation (depreciation) | | | — | | | — |
Net purchases (sales) | | | — | | | — |
Transfers in and/or out of Level 3 | | | 65,945 | | | — |
| | | | | | |
Balance, 12/31/08 | | $ | 65,945 | | $ | — |
| | | | | | |
See Notes to Financial Statements.
159
International Equity Fund
The International Equity Fund is primarily comprised of international stocks located in developed countries, and to a lesser extent, in international stocks located in emerging markets. The year 2008 was characterized by unprecedented declines across every global equity market. The Fund generated the worst absolute return among all Funds during the year but still managed to outperform its benchmark, the MSCI ACWI (All Country World Index) Ex-U.S. Index, by 72 basis points ((44.81)% versus (45.53)%). The Fund lagged its benchmark on an annualized five-year and since-inception basis.
Please see page 174 for information regarding specific portfolio allocations. Portfolio holdings are subject to change at any time.
Foreign securities may involve additional risks, social and political instability, reduced market liquidity and currency volatility.
160
International Equity Fund
Average Annual Total Returns as of 12/31/08
| | | | | | | | | | | | |
| | | GS2 Class* | | | GS4 Class* | | | GS6 Class* | | | Benchmark** | |
One Year | | (44.72 | )% | | (44.81 | )% | | (44.97 | )% | | (45.53 | )% |
Five Year | | 1.62 | % | | 1.45 | % | | 1.18 | % | | 2.56 | % |
Since Inception | | 2.98 | % | | 2.81 | % | | 2.43 | % | | 3.44 | % |
Inception Date | | 08/27/01 | | | 08/27/01 | | | 08/27/01 | | | 08/27/01 | |
Total Fund Operating Expenses (August 5, 2008 Prospectus) | | 1.07 | % | | 1.26 | % | | 1.51 | % | | | |
The performance data quoted represents past performance and does not guarantee future results. Current performance may be lower or higher. Performance data current to the most recent month-end may be obtained at www.GuideStoneFunds.org. The investment return and principal value of an investment will fluctuate so that shares, when redeemed, may be worth more or less than their original cost.

The graph compares the results of a hypothetical $10,000 investment in the GS4 Class of the Fund since August 27, 2001 (commencement of operations), with all dividends and capital gains reinvested, with the MSCI ACWI (All Country World Index) Ex-U.S. Index.
| * | These returns reflect expense waivers by the Fund’s investment adviser. Without these waivers, returns would have been lower. Returns shown do not reflect the deduction of taxes that a shareholder would pay on Fund distributions or the redemption of Fund shares. |
| ** | The MSCI ACWI (All Country World Index) Ex-U.S. Index is a free float-adjusted market capitalization index that is designed to measure equity market performance in the global developed (Ex-U.S.) and emerging markets. As of December 31, 2008, the MSCI ACWI Ex-U.S. Index consisted of the following developed and emerging market country indices: Argentina, Australia, Austria, Belgium, Brazil, Canada, Chile, China, Colombia, Czech Republic, Denmark, Egypt, Finland, France, Germany, Greece, Hong Kong, Hungary, India, Indonesia, Ireland, Israel, Italy, Japan, Korea, Malaysia, Mexico, Morocco, Netherlands, New Zealand, Norway, Pakistan, Peru, Philippines, Poland, Portugal, Russia, Singapore, South Africa, Spain, Sweden, Switzerland, Taiwan, Thailand, Turkey and the United Kingdom. |
Unlike a mutual fund, the performance of an index assumes no taxes, transaction costs, management fees or other expenses.
161
| | |
| International Equity Fund | | |
| SCHEDULE OF INVESTMENTS | | December 31, 2008 |
| | | | | |
| | | Shares | | Value |
FOREIGN COMMON STOCKS — 97.8% | | | | | |
Argentina — 0.0% | | | | | |
Banco Macro SA ADRD | | 21,400 | | $ | 231,548 |
| | | | | |
Australia — 4.2% | | | | | |
ABC Learning Centres, Ltd.+ | | 2,281 | | | 859 |
AGL Energy, Ltd. | | 15,492 | | | 165,170 |
Allco Finance Group, Ltd.+* | | 147,022 | | | 7,432 |
Amcor, Ltd. | | 902,004 | | | 3,665,566 |
AMP, Ltd. | | 250,947 | | | 956,807 |
Ansell, Ltd. | | 68,372 | | | 598,641 |
APN News & Media, Ltd. | | 29,616 | | | 51,405 |
Austereo Group, Ltd. | | 4,609 | | | 4,026 |
Australand Property Group REIT | | 49,418 | | | 8,782 |
Australia and New Zealand Banking Group, Ltd. | | 10,601 | | | 114,450 |
AWB, Ltd. | | 21,422 | | | 38,184 |
AXA Asia Pacific Holdings, Ltd. | | 7,828 | | | 27,209 |
BHP Billiton, Ltd. | | 198,006 | | | 4,206,471 |
BlueScope Steel, Ltd. | | 25,908 | | | 63,653 |
Boart Longyear Group | | 244,286 | | | 34,424 |
Brambles, Ltd. | | 337,333 | | | 1,752,628 |
Caltex Australia, Ltd. | | 3,502 | | | 17,697 |
CFS Retail Property Trust REIT | | 16,818 | | | 22,107 |
Coca-Cola Amatil, Ltd. | | 1,167,750 | | | 7,504,075 |
Commonwealth Bank of Australia | | 12,300 | | | 253,078 |
CSL, Ltd. | | 165,304 | | | 3,898,170 |
Dexus Property Group REIT | | 16,883 | | | 9,668 |
Downer EDI, Ltd. | | 15,384 | | | 41,280 |
Energy Resources of Australia, Ltd. | | 736 | | | 9,838 |
Felix Resources, Ltd. | | 7,297 | | | 45,383 |
Flight Centre, Ltd. | | 11,391 | | | 62,194 |
Goodman Group REIT | | 12,883 | | | 6,634 |
GPT Group REIT | | 30,485 | | | 19,878 |
Iluka Resources, Ltd.* | | 9,978 | | | 32,444 |
Incitec Pivot, Ltd.D | | 231,200 | | | 405,261 |
Insurance Australia Group, Ltd. | | 7,055 | | | 19,227 |
Leighton Holdings, Ltd. | | 667 | | | 12,960 |
MacArthur Coal, Ltd. | | 4,314 | | | 9,232 |
Macquarie Airports | | 10,391 | | | 17,491 |
Macquarie Group, Ltd.D | | 43,100 | | | 874,729 |
Macquarie Infrastructure Group | | 22,008 | | | 26,381 |
Metcash Ltd. | | 17,680 | | | 54,132 |
Minara Resources, Ltd. | | 88,915 | | | 17,898 |
Mineral Deposits, Ltd.* | | 138,300 | | | 67,755 |
Mirvac Group REIT | | 9,451 | | | 8,458 |
National Australia Bank, Ltd. | | 427,974 | | | 6,291,922 |
New Hope Corporation, Ltd. | | 4,189 | | | 10,130 |
Newcrest Mining, Ltd. | | 3,610 | | | 85,928 |
OneSteel, Ltd. | | 14,714 | | | 25,444 |
Orica, Ltd. | | 2,094 | | | 20,549 |
Origin Energy, Ltd. | | 6,520 | | | 73,536 |
QBE Insurance Group, Ltd. | | 56,645 | | | 1,023,762 |
Quantas Airways, Ltd. | | 272,162 | | | 501,405 |
Rio Tinto, Ltd.D | | 17,435 | | | 467,219 |
Santos, Ltd. | | 7,643 | | | 80,083 |
Sigma Pharmaceuticals, Ltd. | | 24,331 | | | 18,391 |
SP AusNet | | 16,928 | | | 11,236 |
Spotless Group, Ltd. | | 26,645 | | | 52,705 |
Stockland REIT | | 10,657 | | | 30,316 |
Suncorp-Metway, Ltd. | | 205,391 | | | 1,210,638 |
Telstra Corporation, Ltd. | | 2,685,830 | | | 7,190,063 |
Ten Network Holdings, Ltd. | | 13,995 | | | 11,445 |
Transurban Group | | 5,476 | | | 20,714 |
Wesfarmers, Ltd. | | 199,665 | | | 2,520,128 |
West Australian Newspapers Holdings, Ltd. | | 1,060 | | | 4,115 |
Westfield Group REIT | | 12,979 | | | 117,833 |
Westpac Banking Corporation | | 29,617 | | | 355,215 |
Woodside Petroleum, Ltd. | | 1,999 | | | 51,729 |
| | | | | |
| | | | | 45,306,183 |
| | | | | |
Austria — 0.3% | | | | | |
Erste Bank Der Oesterreichischen Sparkassen AGD | | 91,858 | | | 2,138,810 |
Raiffeisen International Bank Holding AGD | | 160 | | | 4,448 |
Verbund AG | | 9,429 | | | 435,974 |
Wienerberger AG | | 16,158 | | | 275,625 |
| | | | | |
| | | | | 2,854,857 |
| | | | | |
Belgium — 0.4% | | | | | |
Bekaert SA | | 2,922 | | | 197,603 |
Colruyt SA | | 3,772 | | | 810,553 |
Delhaize Group | | 10,916 | | | 674,790 |
Fortis | | 354,732 | | | 467,161 |
KBC Groep NV | | 431 | | | 12,952 |
Mobistar SA | | 10,602 | | | 764,771 |
Nationale A Portefeuille | | 1,101 | | | 53,694 |
Omega Pharma SA | | 200 | | | 7,563 |
Tessenderlo Chemie NV | | 17,642 | | | 534,102 |
Umicore | | 10,852 | | | 214,441 |
| | | | | |
| | | | | 3,737,630 |
| | | | | |
Bermuda — 0.1% | | | | | |
Catlin Group, Ltd. | | 13,855 | | | 87,211 |
Credicorp, Ltd. | | 8,271 | | | 413,219 |
Hiscox, Ltd. | | 6,878 | | | 34,229 |
| | | | | |
| | | | | 534,659 |
| | | | | |
Brazil — 1.5% | | | | | |
Amil Participacoes SA | | 132,937 | | | 410,440 |
Banco do Brasil SA | | 173,161 | | | 1,090,053 |
Banco Itau Holding Financeira SA ADRD | | 13,366 | | | 155,046 |
BR Malls Participacoes SA* | | 36,100 | | | 140,871 |
Brasil Telecom Participacoes SA | | 6,900 | | | 174,275 |
Brasil Telecom Participacoes SA ADRD | | 30,159 | | | 1,165,042 |
Companhia Brasileira de Distribuicao Grupo Pao de Acucar ADRD | | 20,180 | | | 556,161 |
Companhia Vale do Rio Doce ADRD | | 154,100 | | | 1,641,165 |
Gerdau SA ADRD | | 49,800 | | | 328,680 |
Global Village Telecom Holding SA* | | 31,700 | | | 344,867 |
Hypermarcas SA* | | 17,300 | | | 98,815 |
Localiza Rent A Car SA | | 16,500 | | | 50,236 |
Lojas Renner SA | | 20,208 | | | 135,789 |
Marfrig Frigorificos e Comercio de Alimentos SA* | | 120,437 | | | 387,340 |
OGX Petroleo e Gas Participacoes SA* | | 1,249 | | | 281,727 |
Perdigao SA | | 7,000 | | | 89,271 |
Petroleo Brasileiro SA ADR | | 265,210 | | | 6,070,265 |
Tegma Gestao Logistica SA | | 31,778 | | | 61,321 |
See Notes to Financial Statements.
162
| | | | | |
| | | Shares | | Value |
Tele Norte Leste Participacoes SA ADRD | | 86,686 | | $ | 1,206,669 |
Terna Participacoes SA | | 35,600 | | | 335,696 |
Totvs SA | | 11,868 | | | 188,249 |
Triunfo Participacoes e Investimentos SA* | | 50,300 | | | 21,569 |
Unibanco GDR | | 15,373 | | | 993,403 |
Usinas Siderurgicas de Minas Gerais SA | | 7,500 | | | 83,137 |
| | | | | |
| | | | | 16,010,087 |
| | | | | |
Canada — 1.4% | | | | | |
Canadian National Railway Co. | | 42,640 | | | 1,546,715 |
Encana Corporation | | 65,000 | | | 3,021,200 |
Falcon Oil & Gas, Ltd.* | | 335,000 | | | 75,982 |
First Quantum Minerals, Ltd. | | 60,857 | | | 868,118 |
Goldcorp, Inc. | | 108,190 | | | 3,411,231 |
Research In Motion, Ltd.* | | 22,110 | | | 897,224 |
Rogers Communications, Inc. Class B | | 92,293 | | | 2,735,521 |
Talisman Energy, Inc. | | 210,500 | | | 2,076,865 |
Teck Cominco, Ltd. Class B | | 67,900 | | | 331,112 |
| | | | | |
| | | | | 14,963,968 |
| | | | | |
Chile — 0.2% | | | | | |
Banco de Credito e Inversiones | | 13,765 | | | 234,367 |
Banco Santander Chile SA ADRD | | 6,500 | | | 227,695 |
Centros Comerciales Sudamericanos SA | | 83,209 | | | 118,172 |
Embotelladora Andina SA ADR Class A | | 20,000 | | | 210,000 |
Embotelladora Andina SA ADR Class B@D | | 40,400 | | | 545,400 |
Enersis SA ADRD | | 46,300 | | | 589,862 |
Multiexport Foods SA* | | 115,516 | | | 7,704 |
S.A.C.I. Falabella SA | | 133,155 | | | 351,040 |
| | | | | |
| | | | | 2,284,240 |
| | | | | |
China — 2.0% | | | | | |
Anhui Conch Cement Co., Ltd.D* | | 121,821 | | | 566,563 |
Asia Cement China Holdings Corporation* | | 374,800 | | | 189,981 |
Bank of Communications Co., Ltd.D | | 2,206,000 | | | 1,603,385 |
China Construction Bank Class HD | | 1,172,000 | | | 652,068 |
China COSCO Holdings Co., Ltd.D | | 1,194,500 | | | 841,536 |
China Life Insurance Co., Ltd. Class H | | 900,000 | | | 2,765,233 |
China Medical Technologies, Inc. ADRD | | 36,200 | | | 733,412 |
China Petroleum & Chemical Corporation Class H | | 3,583,000 | | | 2,202,339 |
China Railway Group, Ltd.* | | 889,000 | | | 621,309 |
China Shenhua Energy Co., Ltd. Class HD | | 1,166,655 | | | 2,501,143 |
China Shipping Development Co., Ltd.D | | 232,000 | | | 233,790 |
China Yurun Food Group, Ltd. | | 1,197,000 | | | 1,415,873 |
Golden Eagle Retail Group, Ltd.D | | 557,333 | | | 392,230 |
Great Wall Motor Co., Ltd. | | 392,000 | | | 137,427 |
Industrial & Commercial Bank of China Class HD | | 4,824,000 | | | 2,561,143 |
New Oriental Education & Technology Group ADRD* | | 4,200 | | | 230,622 |
New World Department Store China, Ltd.D | | 533,337 | | | 293,861 |
Parkson Retail Group, Ltd.D | | 1,152,694 | | | 1,319,644 |
Shanda Interactive Entertainment, Ltd. ADRD* | | 8,300 | | | 268,588 |
Shandong Weigao Group Medical Polymer Co., Ltd. | | 216,000 | | | 328,772 |
Simcere Pharmaceutical Group ADRD* | | 39,800 | | | 285,366 |
Tencent Holdings, Ltd.D | | 66,800 | | | 434,048 |
Xinao Gas Holdings, Ltd. | | 281,553 | | | 298,671 |
ZTE Corporation Class H | | 101,000 | | | 266,831 |
| | | | | |
| | | | | 21,143,835 |
| | | | | |
Colombia — 0.1% | | | | | |
BanColombia SA | | 76,200 | | | 441,222 |
BanColombia SA ADR | | 13,000 | | | 303,550 |
| | | | | |
| | | | | 744,772 |
| | | | | |
Czech Republic — 0.3% | | | | | |
CEZ AS | | 83,135 | | | 3,536,746 |
| | | | | |
Denmark — 1.2% | | | | | |
A P Moller - Maersk A/S | | 84 | | | 452,047 |
D/S Norden | | 4,822 | | | 170,125 |
Danske Bank A/SD | | 132,400 | | | 1,333,797 |
East Asiatic Co., Ltd. A/S | | 170 | | | 5,789 |
H Lundbeck A/S | | 126,649 | | | 2,648,784 |
Novo-Nordisk A/S Class B | | 126,775 | | | 6,539,547 |
Sydbank A/S | | 271 | | | 3,335 |
TDC A/S | | 113 | | | 4,917 |
Vestas Wind Systems A/S* | | 32,817 | | | 1,931,175 |
| | | | | |
| | | | | 13,089,516 |
| | | | | |
Egypt — 0.2% | | | | | |
El Sewedy Cables Holding Co.* | | 55,835 | | | 743,926 |
Orascom Construction Industries | | 55,194 | | | 1,405,113 |
Orascom Construction Industries GDRD | | 1,828 | | | 93,110 |
Orascom Construction Industries GDR 144A | | 1,576 | | | 80,275 |
| | | | | |
| | | | | 2,322,424 |
| | | | | |
Estonia — 0.0% | | | | | |
Tallink Group, Ltd.* | | 746,660 | | | 400,949 |
| | | | | |
Finland — 1.0% | | | | | |
Fortum OYJ | | 36,673 | | | 797,099 |
Konecranes OYJ | | 6,980 | | | 121,511 |
Nokia Corporation ADRD | | 145,400 | | | 2,268,240 |
Nokia OYJ ADRD | | 274,211 | | | 4,303,020 |
Orion OYJ | | 268 | | | 4,558 |
Outokumpu OYJ | | 55,034 | | | 654,852 |
Tietoenator OYJ | | 10,982 | | | 120,818 |
UPM-Kymmene OYJD | | 233,934 | | | 2,998,737 |
| | | | | |
| | | | | 11,268,835 |
| | | | | |
France — 9.1% | | | | | |
Air Liquide SA | | 18,402 | | | 1,685,243 |
Alcatel-Lucent* | | 6,706 | | | 14,516 |
Alstom | | 10,234 | | | 609,891 |
AXA SA | | 231,437 | | | 5,194,740 |
BNP Paribas SA | | 73,949 | | | 3,191,968 |
Bouygues SA | | 13,465 | | | 571,232 |
Cap Gemini SA | | 1,701 | | | 65,772 |
See Notes to Financial Statements.
163
International Equity Fund
SCHEDULE OF INVESTMENTS (Continued)
| | | | | |
| | | Shares | | Value |
Carrefour SA | | 161,488 | | $ | 6,242,220 |
Casino Guichard Perrachon SA | | 20,560 | | | 1,566,967 |
Christian Dior SA | | 39,575 | | | 2,237,539 |
Ciments Francais SA | | 1,054 | | | 89,154 |
CNP Assurances | | 3,095 | | | 224,878 |
Compagnie de Saint-GobainD | | 159,336 | | | 7,528,657 |
Compagnie Generale des Etablissements Michelin Class B | | 218 | | | 11,518 |
Compagnie Generale d’Optique Essilor International SAD | | 22,661 | | | 1,064,499 |
Credit Agricole SA | | 133,289 | | | 1,497,118 |
Eramet | | 808 | | | 157,615 |
France Telecom SA | | 394,597 | | | 10,998,471 |
Gaz de France SA | | 150,600 | | | 7,475,338 |
Gecina SA REIT | | 43 | | | 2,990 |
Groupe Danone | | 26,269 | | | 1,587,167 |
IPSOS | | 2,887 | | | 77,885 |
Lafarge SAD | | 14,822 | | | 906,534 |
Lagardere SCA | | 1,379 | | | 56,026 |
Nexans SA | | 2,390 | | | 143,118 |
Peugeot SA | | 1,710 | | | 29,235 |
Publicis Groupe | | 4,538 | | | 117,116 |
Renault SA | | 79,730 | | | 2,080,637 |
Safran SA | | 1,138 | | | 15,365 |
Sanofi-Aventis | | 53,440 | | | 3,418,189 |
Schneider Electric SAD | | 23,052 | | | 1,716,308 |
Societe BIC SAD | | 27,960 | | | 1,608,662 |
Societe Generale Class A | | 87,305 | | | 4,429,237 |
Societe Television Francaise 1D | | 42,886 | | | 628,343 |
Sodexo | | 7,337 | | | 407,767 |
Suez Environnement SA* | | 76,432 | | | 1,290,832 |
Teleperformance | | 5,289 | | | 148,043 |
Thales SA | | 4,802 | | | 201,123 |
Total SA | | 438,249 | | | 24,094,547 |
Total SA ADR | | 44,400 | | | 2,455,320 |
UBISOFT Entertainment* | | 8,831 | | | 173,261 |
Unibail-Rodamco REIT | | 149 | | | 22,260 |
Valeo SAD | | 81,898 | | | 1,220,031 |
Vallourec | | 1,050 | | | 119,385 |
Veolia Environnement SA | | 12,208 | | | 385,076 |
Vivendi SA | | 31,773 | | | 1,035,609 |
| | | | | |
| | | | | 98,797,402 |
| | | | | |
Germany — 7.2% | | | | | |
Adidas-Salomon AG | | 19,288 | | | 735,251 |
Allianz AG | | 41,361 | | | 4,400,836 |
AMB Generali Holding AG | | 519 | | | 52,738 |
BASF AGD | | 114,954 | | | 4,466,379 |
Bayer AG | | 110,581 | | | 6,443,379 |
Celesio AG | | 272 | | | 7,360 |
Commerzbank AG | | 132,341 | | | 1,257,386 |
Daimler AG | | 20,406 | | | 777,506 |
Demag Cranes AG | | 19,142 | | | 523,056 |
Deutsche Bank AGD | | 28,213 | | | 1,115,716 |
Deutsche Boerse AGD | | 30,572 | | | 2,211,852 |
Deutsche Lufthansa AGD | | 172,043 | | | 2,829,048 |
Deutsche Telekom AG | | 453,654 | | | 6,858,927 |
E.ON AG | | 150,975 | | | 5,928,360 |
Fielmann AG | | 1,479 | | | 97,179 |
Fresenius Medical Care AG & Co. KGaA | | 56,105 | | | 2,579,243 |
Hannover Rueckversicherung AGD | | 87,066 | | | 2,768,765 |
Infineon Technologies AG* | | 18,604 | | | 25,039 |
Lanxess AGD | | 38,732 | | | 755,273 |
Linde AG | | 25,393 | | | 2,131,195 |
MAN AG | | 2,669 | | | 149,714 |
Merck KGaA | | 19,736 | | | 1,765,587 |
Metro AG | | 6,497 | | | 258,376 |
MTU Aero Engines Holding AG | | 5,642 | | | 156,070 |
Muenchener Rueckver-sicherungs AG | | 7,686 | | | 1,193,233 |
RWE AGD | | 176,629 | | | 15,682,367 |
Salzgitter AG | | 757 | | | 58,830 |
SAP AGD | | 139,123 | | | 5,048,359 |
Siemens AGD | | 37,266 | | | 2,805,509 |
SolarWorld AGD | | 9,510 | | | 212,834 |
Stada Arzneimittel AG | | 6,585 | | | 189,148 |
Symrise AGD | | 109,960 | | | 1,539,268 |
ThyssenKrupp AGD | | 30,044 | | | 836,367 |
Tognum AG | | 34,553 | | | 447,807 |
TUI AG | | 1,175 | | | 13,959 |
United Internet AGD | | 55,419 | | | 501,318 |
Volkswagen AG | | 521 | | | 181,210 |
Wacker Chemie AG | | 974 | | | 104,299 |
Wincor Nixdorf AGD | | 11,370 | | | 542,037 |
| | | | | |
| | | | | 77,650,780 |
| | | | | |
Greece — 0.4% | | | | | |
Coca Cola Hellenic Bottling Co. SA | | 108,744 | | | 1,581,209 |
National Bank of Greece SA | | 47,028 | | | 873,332 |
Public Power Corporation | | 116,254 | | | 1,868,346 |
| | | | | |
| | | | | 4,322,887 |
| | | | | |
Hong Kong — 3.1% | | | | | |
AAC Acoustic Technology Holdings, Inc.* | | 594,000 | | | 267,820 |
Beijing Enterprises Holdings, Ltd. | | 36,000 | | | 147,407 |
BOC Hong Kong Holdings, Ltd. | | 432,500 | | | 495,034 |
Cheung Kong Holdings, Ltd. | | 8,000 | | | 76,317 |
Cheung Kong Infrastructure Holdings, Ltd. | | 1,000 | | | 3,776 |
China Mobile, Ltd. | | 661,882 | | | 6,715,532 |
China Overseas Land & Investment, Ltd.D | | 2,201,000 | | | 3,090,508 |
China Power International Development, Ltd. | | 50,000 | | | 10,385 |
China Resources Power Holdings Co. | | 116,000 | | | 225,543 |
Chinese Estates Holdings, Ltd. | | 8,000 | | | 9,153 |
CLP Holdings, Ltd. | | 12,500 | | | 84,984 |
CNOOC, Ltd. | | 1,056,000 | | | 1,004,441 |
Dairy Farm International Holdings, Ltd. | | 296,100 | | | 1,264,347 |
Esprit Holdings, Ltd. | | 2,900 | | | 16,525 |
Giordano International, Ltd. | | 8,000 | | | 2,018 |
Great Eagle Holdings, Ltd. | | 3,000 | | | 3,357 |
Hang Lung Group, Ltd. | | 5,000 | | | 15,274 |
Hang Lung Properties, Ltd. | | 1,000 | | | 2,196 |
Hang Seng Bank, Ltd. | | 4,200 | | | 55,451 |
Henderson Land Development Co., Ltd. | | 3,000 | | | 11,220 |
Hengan International Group Co., Ltd.D | | 462,000 | | | 1,490,802 |
Hong Kong Electric Holdings, Ltd.D | | 691,000 | | | 3,890,324 |
Hong Kong Exchanges and Clearing, Ltd. | | 5,700 | | | 54,725 |
See Notes to Financial Statements.
164
| | | | | |
| | | Shares | | Value |
Hongkong Land Holdings, Ltd. | | 423,000 | | $ | 1,049,040 |
Hopewell Holdings | | 12,000 | | | 39,812 |
Hutchison Telecommunications International, Ltd.* | | 85,000 | | | 22,922 |
Hutchison Whampoa, Ltd. | | 400,600 | | | 2,022,316 |
Hysan Development Co., Ltd. | | 496,000 | | | 806,465 |
Industrial and Commercial Bank of China Asia, Ltd. | | 2,000 | | | 2,153 |
Jardine Matheson Holdings, Ltd. | | 124,000 | | | 2,299,276 |
Li & Fung, Ltd.D | | 804,000 | | | 1,389,470 |
Link REIT | | 11,000 | | | 18,299 |
Midland Holdings, Ltd. | | 10,000 | | | 3,601 |
Mongolia Energy Co., Ltd.* | | 17,000 | | | 5,288 |
New World Development, Ltd. | | 13,000 | | | 13,311 |
Noble Group, Ltd. | | 1,387,000 | | | 993,455 |
Orient Overseas International, Ltd. | | 3,000 | | | 6,727 |
Pacific Basin Shipping, Ltd.D | | 432,000 | | | 198,866 |
PCCW, Ltd. | | 14,000 | | | 6,721 |
Shenzhen International Holdings | | 7,500 | | | 326 |
Shui On Land, Ltd. | | 1,464,223 | | | 466,629 |
Sun Hung Kai Properties, Ltd. | | 185,000 | | | 1,556,690 |
Swire Pacific, Ltd. Class A | | 8,000 | | | 55,418 |
Television Broadcasts, Ltd. | | 1,000 | | | 3,278 |
Texwinca Holdings, Ltd. | | 32,000 | | | 13,645 |
VTech Holdings, Ltd. | | 4,000 | | | 16,946 |
Wharf Holdings, Ltd. | | 1,092,250 | | | 3,023,520 |
Wheelock & Co., Ltd. | | 22,000 | | | 48,482 |
Wing Hang Bank, Ltd. | | 1,500 | | | 8,726 |
WM Morrison Supermarkets PLC | | 68,815 | | | 278,931 |
| | | | | |
| | | | | 33,287,452 |
| | | | | |
Hungary — 0.1% | | | | | |
MOL Hungarian Oil and Gas PLC | | 13,272 | | | 689,983 |
MOL Hungarian Oil and Gas PLC ADRD | | 7,460 | | | 197,019 |
| | | | | |
| | | | | 887,002 |
| | | | | |
India — 1.3% | | | | | |
Ambuja Cements, Ltd. | | 587,628 | | | 852,737 |
Andhra Bank, Ltd. | | 685,968 | | | 779,478 |
Asian Paints, Ltd. | | 37,948 | | | 699,658 |
Bharat Heavy Electricals, Ltd. | | 5,640 | | | 158,598 |
Bharti Airtel, Ltd.* | | 71,089 | | | 1,047,910 |
Container Corporation of India, Ltd. | | 40,563 | | | 516,692 |
Hindustan Unilever, Ltd. | | 131,574 | | | 680,273 |
Housing Development Finance Corporation | | 98,305 | | | 3,008,318 |
Indraprastha Gas, Ltd. | | 93,800 | | | 196,508 |
Infosys Technologies, Ltd. | | 76,662 | | | 1,776,731 |
Infosys Technologies, Ltd. ADRD | | 107,220 | | | 2,634,395 |
NTPC, Ltd. | | 70,658 | | | 262,788 |
Phoenix Mills, Ltd. | | 11,389 | | | 17,789 |
Rural Electrification Corporation, Ltd. | | 175,346 | | | 264,849 |
Shriram Transport Finance Co., Ltd. | | 25,860 | | | 104,367 |
Sun Pharmaceuticals Industries, Ltd. | | 48,844 | | | 1,074,510 |
Welspun-Gujarat Stahl, Ltd. | | 108,472 | | | 245,784 |
| | | | | |
| | | | | 14,321,385 |
| | | | | |
Indonesia — 0.6% | | | | | |
Bank Danamon Indonesia TBK | | 458,165 | | | 132,891 |
Bank Rakyat Indonesia | | 8,001,300 | | | 3,402,564 |
PT Panin Life TBK@* | | 26,999,000 | | | 208,921 |
PT Ramayana Lestari Sentosa TBK@ | | 3,484,500 | | | 161,069 |
PT Telekomunikasi Indonesia TBK | | 4,712,196 | | | 3,011,669 |
| | | | | |
| | | | | 6,917,114 |
| | | | | |
Ireland — 0.2% | | | | | |
CRH PLCD | | 85,113 | | | 2,181,479 |
Experian PLC | | 7,388 | | | 46,581 |
| | | | | |
| | | | | 2,228,060 |
| | | | | |
Israel — 0.7% | | | | | |
Israel Chemicals, Ltd. | | 47,247 | | | 330,518 |
Syneron Medical, Ltd.D* | | 3,335 | | | 27,814 |
Teva Pharmaceutical Industries, Ltd. ADRD | | 174,470 | | | 7,427,188 |
| | | | | |
| | | | | 7,785,520 |
| | | | | |
Italy — 2.1% | | | | | |
Buzzi Unicem SpA | | 6,422 | | | 107,987 |
Edison SpA | | 1,959 | | | 2,495 |
Enel SpA | | 221,434 | | | 1,426,387 |
ENI SpA | | 148,681 | | | 3,577,805 |
Fiat SpAD | | 71,620 | | | 479,434 |
Finmeccanica SpA | | 3,549 | | | 54,970 |
Intesa Sanpaolo SpA | | 1,812,598 | | | 6,584,598 |
Mediaset SpAD | | 538,710 | | | 3,104,055 |
Pirelli & C SpA | | 279,264 | | | 105,471 |
Saipem SpA | | 87,820 | | | 1,497,820 |
UniCredito Italiano SpA | | 2,283,111 | | | 5,804,862 |
Unione di Banche Italiane SCPA | | 1,424 | | | 20,885 |
| | | | | |
| | | | | 22,766,769 |
| | | | | |
Japan — 20.1% | | | | | |
77 Bank, Ltd. (The) | | 88,000 | | | 478,996 |
Acom Co., Ltd. | | 20 | | | 845 |
Advantest Corporation | | 3,800 | | | 61,944 |
Aeon Credit Service Co., Ltd.D | | 161,500 | | | 1,702,752 |
Aiful Corporation | | 6,800 | | | 19,573 |
Aioi Insurance Co., Ltd. | | 11,000 | | | 57,543 |
Aisin Seiki Co., Ltd. | | 49,900 | | | 714,702 |
Alps Electric Co., Ltd. | | 7,500 | | | 36,990 |
Amada Co., Ltd. | | 12,000 | | | 58,364 |
Aoyama Trading Co., Ltd. | | 2,500 | | | 39,826 |
Asahi Glass Co., Ltd. | | 12,000 | | | 68,404 |
Astellas Pharma, Inc. | | 256,600 | | | 10,503,229 |
Autobacs Seven Co., Ltd. | | 1,900 | | | 44,007 |
Bridgestone Corporation | | 300 | | | 4,500 |
Brother Industries, Ltd. | | 12,900 | | | 76,957 |
Calsonic Kansei Corporation | | 14,000 | | | 20,002 |
Canon Marketing Japan, Inc. | | 8,300 | | | 133,655 |
Canon, Inc. | | 348,150 | | | 11,030,985 |
Casio Computer Co., Ltd. | | 14,200 | | | 89,607 |
Central Japan Railway Co. | | 112 | | | 971,337 |
Chiyoda Corporation | | 10,000 | | | 55,699 |
Chubu Electric Power Co., Inc. | | 34,500 | | | 1,050,795 |
Chuo Mitsui Trust Holdings, Inc. | | 5,000 | | | 24,584 |
See Notes to Financial Statements.
165
International Equity Fund
SCHEDULE OF INVESTMENTS (Continued)
| | | | | |
| | | Shares | | Value |
Circle K Sunkus Co., Ltd. | | 5,300 | | $ | 95,887 |
Coca-Cola West Holdings Co., Ltd. | | 1,600 | | | 34,594 |
Credit Saison Co., Ltd. | | 200 | | | 2,776 |
Dai Nippon Printing Co., Ltd. | | 14,000 | | | 154,764 |
Daiei, Inc. (The)* | | 7,000 | | | 44,948 |
Daiichi Sankyo Co., Ltd. | | 5,600 | | | 132,431 |
Daishi Bank, Ltd. | | 19,000 | | | 84,489 |
Daito Trust Construction Co., Ltd. | | 39,100 | | | 2,052,530 |
Daiwa Securities Group, Inc. | | 209,000 | | | 1,254,694 |
Denso CorporationD | | 29,000 | | | 491,387 |
DIC Corporation | | 11,000 | | | 23,207 |
Doutor Nichires Holdings Co., Ltd. | | 1,300 | | | 28,464 |
East Japan Railway Co. | | 419 | | | 3,184,677 |
Ebara Corporation | | 35,000 | | | 81,439 |
FamilyMart Co., Ltd. | | 31,800 | | | 1,381,025 |
Fancl Corporation | | 200 | | | 2,664 |
Fanuc, Ltd.D | | 10,900 | | | 781,223 |
Fast Retailing Co., Ltd. | | 12,800 | | | 1,878,181 |
Fuji Fire & Marine Insurance Co., Ltd. (The) | | 6,000 | | | 9,008 |
Fuji Heavy Industries, Ltd. | | 121,000 | | | 332,523 |
FUJIFILM Holdings Corporation | | 4,800 | | | 107,156 |
Fujitsu, Ltd. | | 128,000 | | | 622,336 |
Funai Electric Co., Ltd. | | 2,500 | | | 51,678 |
Furukawa Electric Co., Ltd. | | 183,000 | | | 893,059 |
Glory, Ltd. | | 5,100 | | | 98,968 |
Gunma Bank, Ltd.D | | 107,000 | | | 684,977 |
Gunze, Ltd. | | 16,000 | | | 52,757 |
H2O Retailing Corporation | | 10,000 | | | 75,443 |
Hakuhodo DY Holdings, Inc. | | 960 | | | 52,374 |
Haseko Corporation | | 15,000 | | | 15,993 |
Higo Bank, Ltd. | | 8,000 | | | 50,495 |
Hino Motors, Ltd. | | 7,000 | | | 14,428 |
Hirose Electric Co., Ltd.D | | 12,600 | | | 1,274,882 |
Hisamitsu Pharmaceutical Co., Inc. | | 26,800 | | | 1,095,524 |
Hitachi Cable, Ltd. | | 38,000 | | | 85,316 |
Hitachi Capital Corporation | | 59,900 | | | 749,366 |
Hitachi Construction Machinery Co., Ltd.D | | 126,800 | | | 1,516,186 |
Hitachi High-Technologies Corporation | | 500 | | | 8,007 |
Hitachi Metals, Ltd. | | 1,000 | | | 4,651 |
Hitachi Software Engineering Co., Ltd. | | 1,300 | | | 20,174 |
Hitachi Transport System, Ltd. | | 5,300 | | | 79,748 |
Hitachi, Ltd. | | 21,000 | | | 81,499 |
Hokkoku Bank, Ltd. | | 23,000 | | | 80,617 |
Hokuhoku Financial Group, Inc. | | 132,000 | | | 312,475 |
Honda Motor Co., Ltd. | | 41,800 | | | 890,285 |
Hosiden CorporationD | | 53,300 | | | 842,377 |
Hoya CorporationD | | 60,500 | | | 1,056,704 |
Hyakugo Bank, Ltd. | | 13,000 | | | 78,675 |
Hyakujushi Bank, Ltd. | | 20,000 | | | 113,843 |
Ibiden Co., Ltd. | | 93,900 | | | 1,946,913 |
IHI Corporation | | 8,000 | | | 10,205 |
Inpex Holdings, Inc. | | 739 | | | 5,891,353 |
Isuzu Motors, Ltd. | | 52,000 | | | 67,192 |
Itochu Corporation | | 143,000 | | | 721,448 |
Itoham Foods, Inc. | | 36,000 | | | 130,750 |
Japan Steel Works, Ltd.D | | 290,000 | | | 4,060,241 |
JFE Holdings, Inc. | | 121,400 | | | 3,226,301 |
JGC Corporation | | 9,000 | | | 134,694 |
JSR Corporation | | 10,300 | | | 115,878 |
JTEKT Corporation | | 3,000 | | | 23,380 |
Jupiter Telecommunications Co., Ltd. | | 851 | | | 885,756 |
Kagoshima Bank, Ltd. | | 7,000 | | | 58,487 |
Kaken Pharmaceutical Co., Ltd. | | 17,000 | | | 187,183 |
Kamigumi Co., Ltd. | | 30,000 | | | 266,543 |
Kandenko Co., Ltd. | | 12,000 | | | 94,840 |
Kaneka Corporation | | 21,000 | | | 134,142 |
Kansai Paint Co., Ltd. | | 33,000 | | | 169,542 |
Kanto Auto Works, Ltd. | | 8,300 | | | 95,152 |
Kao Corporation | | 399,000 | | | 12,119,762 |
KDDI Corporation | | 1,636 | | | 11,681,527 |
Keyence CorporationD | | 7,800 | | | 1,602,993 |
Kinden Corporation | | 9,000 | | | 81,402 |
Kobayashi Pharmaceutical Co., Ltd. | | 500 | | | 21,375 |
Komatsu, Ltd.D | | 44,800 | | | 571,492 |
Kose Corporation | | 4,400 | | | 110,600 |
Kubota Corporation | | 2,000 | | | 14,481 |
Kuraray Co., Ltd. | | 304,500 | | | 2,385,737 |
Kureha Corporation | | 89,000 | | | 445,272 |
Kurita Water Industries, Ltd.D | | 31,500 | | | 851,561 |
Kyocera Corporation | | 2,300 | | | 166,515 |
Lawson, Inc.D | | 60,400 | | | 3,483,348 |
Leopalace21 Corporation | | 4,700 | | | 47,622 |
Lintec Corporation | | 7,600 | | | 105,871 |
Makita Corporation | | 1,200 | | | 26,849 |
Matsumotokiyoshi Holdings Co., Ltd. | | 4,600 | | | 95,475 |
Matsushita Electric Industrial Co., Ltd. | | 13,000 | | | 159,799 |
Mediceo Paltac Holdings Co., Ltd. | | 1,800 | | | 21,651 |
Meiji Dairies Corporation | | 2,000 | | | 10,767 |
Meitec Corporation | | 500 | | | 8,640 |
Millea Holdings, Inc. | | 242,900 | | | 7,196,989 |
Miraca Holdings, Inc. | | 1,700 | | | 36,831 |
Mitsubishi Chemical Holdings Corporation | | 500 | | | 2,216 |
Mitsubishi Corporation | | 196,100 | | | 2,777,572 |
Mitsubishi Electric Corporaiton | | 7,000 | | | 43,867 |
Mitsubishi Estate Co., Ltd. | | 7,000 | | | 115,632 |
Mitsubishi Gas Chemical Co., Inc. | | 444,000 | | | 1,821,825 |
Mitsubishi Logistics Corporation | | 1,000 | | | 12,678 |
Mitsubishi Materials Corporation | | 14,000 | | | 35,435 |
Mitsubishi UFJ Financial Group, Inc. | | 666,900 | | | 4,191,566 |
Mitsubishi UFJ Lease & Finance Co., Ltd. | | 4,950 | | | 126,156 |
Mitsui & Co., Ltd. | | 20,000 | | | 205,607 |
Mitsui Fudosan Co., Ltd. | | 48,000 | | | 800,267 |
Mitsui OSK Lines, Ltd. | | 48,000 | | | 296,654 |
Mitsui Sumitomo Insurance Group Holdings, Inc. | | 2,500 | | | 79,503 |
Mizuho Financial Group, Inc.D | | 311 | | | 884,111 |
Morinaga Milk Industry Co., Ltd. | | 5,000 | | | 19,452 |
Musashino Bank, Ltd. (The) | | 2,300 | | | 89,910 |
Nabtesco Corporation | | 9,000 | | | 60,467 |
Namco Bandai Holdings, Inc. | | 4,300 | | | 47,130 |
See Notes to Financial Statements.
166
| | | | | |
| | | Shares | | Value |
Nanto Bank, Ltd. | | 2,000 | | $ | 11,608 |
NEC Corporation | | 22,000 | | | 74,430 |
NEC Electronics Corporation* | | 7,800 | | | 73,856 |
NGK Insulators, Ltd. | | 2,000 | | | 22,663 |
Nichirei Corporation | | 15,000 | | | 71,919 |
Nihon Parkerizing Co., Ltd. | | 8,000 | | | 69,327 |
Nikon Corporation | | 3,000 | | | 36,008 |
Nintendo Co., Ltd. | | 22,157 | | | 8,467,335 |
Nippon Denko Co., Ltd.D | | 64,000 | | | 331,606 |
Nippon Electric Glass Co., Ltd. | | 131,000 | | | 691,498 |
Nippon Express Co., Ltd. | | 238,000 | | | 1,003,197 |
Nippon Konpo Unyu Soko Co., Ltd. | | 4,000 | | | 44,143 |
Nippon Mining Holdings, Inc. | | 6,000 | | | 26,035 |
Nippon Oil Corporation | | 11,000 | | | 55,774 |
Nippon Shinyaku Co., Ltd. | | 7,000 | | | 83,571 |
Nippon Steel Corporation | | 26,000 | | | 85,443 |
Nippon Telegraph & Telephone Corporation | | 1,667 | | | 8,606,244 |
Nippon Yusen Kabushiki KaishaD | | 115,000 | | | 708,945 |
Nishi-Nippon City Bank, Ltd. (The) | | 14,000 | | | 40,720 |
Nissan Motor Co., Ltd. | | 50,600 | | | 182,040 |
Nissan Shatai Co., Ltd. | | 15,000 | | | 91,322 |
Nissay Dowa General Insurance Co., Ltd. | | 1,000 | | | 6,219 |
Nissha Printing Co., Ltd.D | | 9,600 | | | 382,023 |
Nisshin Seifun Group, Inc. | | 9,500 | | | 125,459 |
Nitto Denko CorporationD | | 193,800 | | | 3,710,070 |
NOF Corporation | | 3,000 | | | 11,932 |
Nomura Holdings, Inc. | | 92,700 | | | 771,850 |
Nomura Real Estate Holdings, Inc. | | 1,000 | | | 19,951 |
NSK, Ltd. | | 79,000 | | | 298,354 |
NTN Corporation | | 8,000 | | | 24,174 |
NTT Data Corporation | | 471 | | | 1,897,690 |
NTT DoCoMo, Inc. | | 383 | | | 753,865 |
Ogaki Kyoritsu Bank, Ltd. | | 8,000 | | | 37,606 |
Okinawa Electric Power Co., Inc. | | 6,400 | | | 475,325 |
OKUMA Corporation | | 6,000 | | | 22,642 |
Okumura Corporation | | 6,000 | | | 30,357 |
Omron Corporation | | 7,200 | | | 96,738 |
Onward Holdings Co., Ltd. | | 3,000 | | | 23,912 |
ORIX Corporation | | 9,680 | | | 552,737 |
Osaka Gas Co., Ltd. | | 33,000 | | | 152,600 |
Pacific Metals Co., Ltd. | | 3,000 | | | 15,110 |
Promise Co., Ltd. | | 3,150 | | | 79,900 |
QP Corporation | | 10,600 | | | 145,049 |
Rakuten, Inc.D | | 4,519 | | | 2,877,221 |
Ricoh Co., Ltd. | | 169,000 | | | 2,166,026 |
Rinnai Corporation | | 1,500 | | | 58,847 |
Rohm Co., Ltd. | | 3,000 | | | 151,461 |
Rohto Pharmaceutical Co., Ltd. | | 1,000 | | | 13,848 |
San-in Godo Bank, Ltd. (The) | | 10,000 | | | 81,091 |
Sankyo Co., Ltd. | | 1,900 | | | 95,852 |
Sanwa Holdings Corporation | | 27,000 | | | 103,849 |
Sapporo Hokuyo Holdings, Inc. | | 7 | | | 26,950 |
SBI Holdings, Inc. | | 176 | | | 27,171 |
Secom Co., Ltd. | | 600 | | | 30,961 |
Seiko Epson Corporation | | 5,300 | | | 84,333 |
Seino Holdings Corporation | | 11,000 | | | 61,396 |
Sekisui House, Ltd.D | | 300,000 | | | 2,646,736 |
Seven & Holdings Co., Ltd. | | 309,300 | | | 10,631,133 |
Sharp Corporation | | 6,000 | | | 43,251 |
Shima Seiki Manufacturing, Ltd. | | 4,400 | | | 87,117 |
Shimano, Inc. | | 1,000 | | | 39,367 |
Shin-Etsu Chemical Co., Ltd. | | 113,600 | | | 5,242,818 |
Shinsei Bank, Ltd. | | 37,000 | | | 58,561 |
Shionogi & Co., Ltd. | | 40,000 | | | 1,033,003 |
Shiseido Co., Ltd.D | | 65,000 | | | 1,336,717 |
Showa Shell Sekiyu KK | | 6,300 | | | 62,433 |
Snow Brand Milk Products Co., Ltd. | | 7,000 | | | 26,648 |
Softbank Corporation | | 2,400 | | | 43,587 |
Sompo Japan Insurance, Inc. | | 2,000 | | | 14,809 |
Sony Corporation | | 26,700 | | | 583,980 |
Stanley Electric Co., Ltd. | | 31,100 | | | 328,377 |
Sumco Corporation | | 1,300 | | | 16,516 |
Sumitomo Bakelite Co., Ltd. | | 21,000 | | | 84,766 |
Sumitomo CorporationD | | 58,800 | | | 521,514 |
Sumitomo Electric Industries, Ltd. | | 177,100 | | | 1,370,967 |
Sumitomo Forestry Co., Ltd. | | 21,500 | | | 174,194 |
Sumitomo Metal Mining Co., Ltd. | | 4,000 | | | 42,790 |
Sumitomo Metal Industries, Ltd. | | 3,000 | | | 7,410 |
Sumitomo Mitsui Financial Group, Inc.D | | 170 | | | 705,130 |
Sumitomo Realty & Development Co., Ltd. | | 2,000 | | | 30,064 |
Sumitomo Trust & Banking Co., Ltd. | | 15,000 | | | 88,669 |
Suzuken Co., Ltd. | | 4,600 | | | 137,136 |
Taisho Pharmaceutical Co., Ltd. | | 5,000 | | | 106,511 |
Takata Corporation | | 7,000 | | | 49,610 |
Takeda Pharmaceutical Co., Ltd. | | 220,800 | | | 11,508,606 |
Takefuji CorporationD | | 61,450 | | | 504,164 |
TDK Corporation | | 1,800 | | | 66,504 |
THK Co., Ltd. | | 4,900 | | | 51,567 |
Toho Co., Ltd. | | 100 | | | 2,152 |
Toho Gas Co., Ltd. | | 139,000 | | | 917,207 |
Tohoku Electric Power Co., Inc. | | 600 | | | 16,231 |
Tokai Rika Co., Ltd. | | 10,400 | | | 91,056 |
Tokai Rubber Industries, Inc. | | 10,400 | | | 85,772 |
Tokuyama Corporation | | 72,000 | | | 610,443 |
Tokyo Electric Power Co., Inc. | | 87,000 | | | 2,904,212 |
Tokyo Electron, Ltd. | | 3,500 | | | 123,213 |
Tokyo Gas Co., Ltd. | | 82,000 | | | 415,648 |
Tokyo Steel Manufacturing Co., Ltd. | | 12,100 | | | 126,958 |
Tokyo Style Co., Ltd. | | 1,000 | | | 7,257 |
Tokyu Land Corporation | | 179,000 | | | 686,120 |
Toppan Forms Co., Ltd. | | 2,200 | | | 28,311 |
Toppan Printing Co., Ltd. | | 9,000 | | | 69,528 |
Toshiba TEC Corporation | | 21,000 | | | 63,308 |
Tosoh Corporation | | 4,000 | | | 9,873 |
Toyo Seikan Kaisha, Ltd. | | 8,900 | | | 154,272 |
Toyo Suisan Kaisha, Ltd. | | 5,000 | | | 144,082 |
Toyoda Gosei Co., Ltd. | | 1,700 | | | 20,017 |
Toyota Auto Body Co., Ltd. | | 7,500 | | | 109,899 |
Toyota Boshoku Corporation | | 2,000 | | | 16,296 |
Toyota Motor Corporation | | 275,740 | | | 9,115,503 |
Toyota Tsusho Corporation | | 2,300 | | | 24,761 |
Tsuruha Holdings, Inc. | | 500 | | | 19,385 |
TV Asahi Corporation | | 17 | | | 22,837 |
Ube Industries, Ltd. | | 6,000 | | | 16,855 |
Uni-Charm Corporation | �� | 18,300 | | | 1,376,740 |
See Notes to Financial Statements.
167
International Equity Fund
SCHEDULE OF INVESTMENTS (Continued)
| | | | | |
| | | Shares | | Value |
UNY Co., Ltd. | | 109,000 | | $ | 1,206,207 |
Urban Corporation+ | | 4,300 | | | — |
USS Co., Ltd. | | 650 | | | 34,492 |
West Japan Railway Co. | | 753 | | | 3,430,993 |
Xebio Co., Ltd. | | 800 | | | 15,602 |
Yamaguchi Financial Group, Inc. | | 2,000 | | | 22,493 |
Yamaha Corporation | | 3,000 | | | 27,891 |
Yamato Holdings Co., Ltd. | | 8,000 | | | 104,614 |
Yamato Kogyo Co., Ltd. | | 2,300 | | | 62,248 |
Yamazaki Baking Co., Ltd.D | | 40,000 | | | 615,347 |
| | | | | |
| | | | | 217,915,538 |
| | | | | |
Kazakhstan — 0.0% | | | | | |
Eurasian Natural Resources Corporation | | 27,494 | | | 131,554 |
KazakhGold Group, Ltd. GDR* | | 26,174 | | | 103,387 |
| | | | | |
| | | | | 234,941 |
| | | | | |
Luxembourg — 0.1% | | | | | |
Arcelor | | 15,564 | | | 377,261 |
Oriflame Cosmetics SA ADR | | 1,237 | | | 36,135 |
Reinet Investments SCA* | | 704 | | | 6,849 |
SES | | 42,248 | | | 818,786 |
Tenaris SA | | 7,715 | | | 80,186 |
Tenaris SA ADR | | 8,800 | | | 184,624 |
| | | | | |
| | | | | 1,503,841 |
| | | | | |
Malaysia — 0.2% | | | | | |
AirAsia BHD* | | 1,471,200 | | | 368,878 |
Astro All Asia Networks PLC | | 125,541 | | | 80,411 |
Bumiputra-Commerce Holdings BHD | | 826,641 | | | 1,400,466 |
KNM Group BHD | | 627,300 | | | 74,099 |
| | | | | |
| | | | | 1,923,854 |
| | | | | |
Mexico — 1.0% | | | | | |
America Movil SA de CV ADR Series L | | 176,193 | | | 5,460,221 |
Cemex SA de CV* | | 1,336,757 | | | 1,210,451 |
Corporacion Moctezuma SA de CV | | 181,059 | | | 281,097 |
Grupo Financiero Inbursa SAD | | 293,599 | | | 689,025 |
Grupo Televisa SA ADR | | 84,606 | | | 1,264,014 |
Megacable Holdings SAB de CV* | | 363,562 | | | 484,364 |
Urbi Desarrollos Urbanos SA* | | 125,700 | | | 171,551 |
Wal-Mart de Mexico SAB de CV Series VD | | 286,159 | | | 764,551 |
| | | | | |
| | | | | 10,325,274 |
| | | | | |
Netherlands — 3.8% | | | | | |
Aegon NV | | 267,889 | | | 1,691,082 |
Akzo Nobel NV | | 79,272 | | | 3,269,793 |
CSM | | 12,236 | | | 197,002 |
European Aeronautic Defence and Space Co., NVD | | 55,109 | | | 933,291 |
Fugro NV | | 17,103 | | | 491,591 |
Imtech NV | | 4,497 | | | 75,888 |
ING Groep NV | | 456,861 | | | 5,028,177 |
James Hardie Industries NV | | 29,784 | | | 97,544 |
Koninklijke Ahold NV | | 200,870 | | | 2,475,301 |
Koninklijke BAM Groep NV | | 3,707 | | | 33,431 |
Koninklijke Boskalis Westminster NV | | 11,534 | | | 269,092 |
Koninklijke Philips Electronics NV ADRD | | 100,223 | | | 1,988,113 |
Reed Elsevier NV | | 471,939 | | | 5,611,068 |
Royal Dutch Shell PLC | | 22,447 | | | 589,753 |
Royal Dutch Shell PLC Class A | | 306,365 | | | 8,101,500 |
Royal Dutch Shell PLC Class B | | 161,427 | | | 4,091,925 |
Royal KPN NV | | 8,007 | | | 116,409 |
SNS Reaal | | 34,919 | | | 191,929 |
TNT NV | | 117,849 | | | 2,289,259 |
Unilever NV | | 115,134 | | | 2,790,613 |
Vastned Retail NV REIT | | 11,361 | | | 572,081 |
| | | | | |
| | | | | 40,904,842 |
| | | | | |
New Zealand — 0.1% | | | | | |
Telecom Corporation of New Zealand, Ltd. | | 1,060,562 | | | 1,425,425 |
| | | | | |
Nigeria — 0.1% | | | | | |
First City Monument Bank PLC | | 7,843,902 | | | 336,724 |
Guaranty Trust Bank GDR@ | | 90,245 | | | 314,053 |
United Bank for Africa PLC | | 4,284,006 | | | 402,843 |
| | | | | |
| | | | | 1,053,620 |
| | | | | |
Norway — 0.7% | | | | | |
DnB NOR ASA | | 229,000 | | | 908,590 |
Norsk Hydro ASA | | 94,000 | | | 382,994 |
Petroleum Geo-Services ASAD* | | 84,350 | | | 344,276 |
StatoilHydro ASA | | 135,487 | | | 2,265,992 |
Tandberg ASAD | | 26,200 | | | 288,735 |
Telenor ASA | | 495,700 | | | 3,344,185 |
Yara International ASAD | | 16,950 | | | 372,845 |
| | | | | |
| | | | | 7,907,617 |
| | | | | |
Papua New Guinea — 0.0% | | | | | |
Oil Search, Ltd. | | 8,885 | | | 29,094 |
| | | | | |
Peru — 0.0% | | | | | |
Compania de Minas | | | | | |
Buenaventura SA ADRD | | 7,101 | | | 141,452 |
| | | | | |
Philippines — 0.0% | | | | | |
International Container Terminal Services, Inc. | | 1,246,288 | | | 343,706 |
| | | | | |
Poland — 0.1% | | | | | |
Powszechna Kasa Oszczednosci | | | | | |
Bank Polski SA | | 43,586 | | | 526,338 |
Telekomunikacja Polska SA | | 22,335 | | | 145,064 |
| | | | | |
| | | | | 671,402 |
| | | | | |
Russia — 1.1% | | | | | |
Gazprom OAO ADRD | | 157,136 | | | 2,239,188 |
Kalina ADR@ | | 7,200 | | | 39,960 |
LSR Group GDR* | | 77,900 | | | 59,204 |
LUKOIL ADRD | | 74,323 | | | 2,460,091 |
Magnit OAO@* | | 37,405 | | | 601,801 |
Mobile Telesystems ADRD | | 45,840 | | | 1,223,011 |
NovaTek OAO GDRD | | 26,723 | | | 511,745 |
Novorossiysk Commercial Sea Port GDR | | 117,095 | | | 790,391 |
Pharmstandard GDR* | | 17,816 | | | 188,850 |
Raspadskaya@ | | 279,672 | | | 279,672 |
Sberbank | | 1,169,378 | | | 865,340 |
Seventh Continent@* | | 24,176 | | | 145,056 |
Vimpel-Communications ADRD | | 49,300 | | | 352,988 |
VTB Bank OJSC GDRD | | 484,093 | | | 1,059,289 |
VTB Bank OJSC GDR * | | 19,000 | | | 39,140 |
X 5 Retail Group NV GDRD* | | 92,644 | | | 801,986 |
| | | | | |
| | | | | 11,657,712 |
| | | | | |
See Notes to Financial Statements.
168
| | | | | |
| | | Shares | | Value |
Singapore — 1.0% | | | | | |
Ascendas, Ltd. REIT | | 3,000 | | $ | 2,886 |
CapitaCommercial Trust REIT | | 4,000 | | | 2,516 |
CapitaMall Trust REIT | | 4,000 | | | 4,451 |
ComfortDelgro Corporation, Ltd. | | 10,000 | | | 10,130 |
Cosco Corporation Singapore, Ltd. | | 1,257,000 | | | 840,311 |
DBS Group Holdings, Ltd. | | 8,000 | | | 47,123 |
Golden Agri-Resources, Ltd. | | 93,000 | | | 15,325 |
Haw Par Corporation, Ltd. | | 4,000 | | | 10,132 |
Indofood Agri Resources, Ltd.* | | 42,000 | | | 15,620 |
Jardine Cycle & Carriage, Ltd. | | 4,000 | | | 26,602 |
Keppel Corporation, Ltd. | | 8,000 | | | 24,289 |
Neptune Orient Lines, Ltd. | | 24,000 | | | 18,860 |
Oversea-Chinese Banking Corporation | | 656,800 | | | 2,283,749 |
Parkway Holdings, Ltd. | | 1,000 | | | 867 |
SembCorp Industries, Ltd. | | 664,000 | | | 1,083,200 |
Singapore Airlines, Ltd. | | 7,000 | | | 55,055 |
Singapore Exchange, Ltd. | | 4,000 | | | 14,249 |
Singapore Petroleum Co., Ltd. | | 10,000 | | | 15,852 |
Singapore Technologies Engineering, Ltd. | | 6,000 | | | 9,936 |
Singapore Telecommunications, Ltd. | | 2,842,000 | | | 5,064,599 |
United Overseas Bank, Ltd. | | 150,000 | | | 1,355,555 |
United Overseas Land, Ltd. | | 5,000 | | | 7,782 |
Venture Corporation, Ltd. | | 2,000 | | | 6,117 |
Wing Tai Holdings, Ltd. | | 7,000 | | | 4,069 |
| | | | | |
| | | | | 10,919,275 |
| | | | | |
South Africa — 1.1% | | | | | |
ABSA Group, Ltd. | | 9,928 | | | 116,816 |
Bidvest Group, Ltd. | | 189,902 | | | 2,162,495 |
MTN Group, Ltd. | | 175,917 | | | 2,074,088 |
Murray & Roberts Holdings, Ltd. | | 50,956 | | | 266,435 |
Naspers, Ltd. | | 22,356 | | | 404,426 |
Pick’n Pay Stores, Ltd. | | 86,790 | | | 337,886 |
Sasol, Ltd. | | 138,673 | | | 4,217,284 |
Standard Bank Group, Ltd. | | 308,407 | | | 2,782,633 |
| | | | | |
| | | | | 12,362,063 |
| | | | | |
South Korea — 1.2% | | | | | |
Amorepacific Corporation* | | 1,783 | | | 932,419 |
Hyundai Mobis* | | 4,669 | | | 238,130 |
KB Financial Group, Inc.* | | 35,703 | | | 955,255 |
Korea Electric Power Corporation* | | 71,320 | | | 1,662,778 |
KTBNetwork* | | 22,929 | | | 60,067 |
LG Electronics, Inc.* | | 5,560 | | | 337,620 |
LG Household & Health Care, Ltd.* | | 5,470 | | | 833,611 |
LG Telecom, Ltd.* | | 52,100 | | | 414,666 |
POSCO | | 1,820 | | | 552,682 |
Samsung Electronics Co., Ltd. | | 12,630 | | | 4,604,776 |
Samsung Electronics Co., Ltd. (Non-Voting Shares) GDR 144AD | | 6,007 | | | 615,222 |
Samsung Fire & Marine Insurance Co., Ltd. | | 3,168 | | | 481,408 |
Shinhan Financial Group Co., Ltd.* | | 37,631 | | | 895,405 |
| | | | | |
| | | | | 12,584,039 |
| | | | | |
Spain — 4.7% | | | | | |
Banco Bilbao Vizcaya | | | | | |
Argentaria SA | | 109,737 | | | 1,359,682 |
Banco Santander SA | | 1,212,557 | | | 11,713,939 |
Construcciones y Auxiliar de Ferrocarriles SA | | 280 | | | 99,560 |
Criteria CaixaCorporation SA | | 16,260 | | | 64,867 |
Endesa SA | | 3,226 | | | 131,386 |
Gamesa Corporation Tecnologica SA | | 18,805 | | | 342,875 |
Gas Natural SDG SA | | 12,627 | | | 343,571 |
Iberdrola SA | | 1,062,698 | | | 9,906,137 |
Iberia Lineas Aereas de Espana | | 1,461 | | | 4,121 |
Inditex SA | | 43,399 | | | 1,932,592 |
Prosegur Cia de Seguridad SA | | 2,171 | | | 72,255 |
Red Electrica de Espana | | 27,189 | | | 1,386,006 |
Repsol YPF SA | | 11,122 | | | 237,457 |
Tecnicas Reunidas SAD | | 8,677 | | | 229,217 |
Telefonica SA | | 989,007 | | | 22,323,532 |
Union Fenosa SA | | 2,441 | | | 61,160 |
Viscofan SA | | 5,334 | | | 106,060 |
| | | | | |
| | | | | 50,314,417 |
| | | | | |
Sri Lanka — 0.0% | | | | | |
Dialog Telekom, Ltd.@ | | 2,196,610 | | | 117,277 |
| | | | | |
Sweden — 0.7% | | | | | |
Alfa Laval ABD | | 47,400 | | | 423,167 |
Assa Abloy AB Class BD | | 184,000 | | | 2,139,750 |
Electrolux AB | | 3,088 | | | 27,020 |
Elekta AB | | 2,321 | | | 23,356 |
Hennes & Mauritz AB Class B | | 10,851 | | | 431,600 |
Industrivarden AB | | 9,952 | | | 74,596 |
Investor AB | | 776 | | | 11,836 |
Loomis AB* | | 1,324 | | | 8,205 |
NCC AB | | 2,344 | | | 15,302 |
Nordea Bank AB* | | 179,242 | | | 1,290,103 |
Scania AB | | 16,102 | | | 163,843 |
Securitas AB | | 6,422 | | | 54,066 |
Skanska AB | | 30,937 | | | 317,312 |
SKF AB | | 114,600 | | | 1,166,183 |
Svenska Cellulosa AB | | 36,214 | | | 314,426 |
Svenska Handelsbanken AB | | 32,057 | | | 530,102 |
Tele2 AB | | 62,132 | | | 562,258 |
Telefonaktiebolaget LM Ericsson Class B | | 38,220 | | | 297,959 |
TeliaSonera AB | | 14,479 | | | 72,917 |
Volvo AB | | 2,134 | | | 12,144 |
West Siberian Resources, Ltd. GDR* | | 34,476 | | | 11,483 |
| | | | | |
| | | | | 7,947,628 |
| | | | | |
Switzerland — 7.9% | | | | | |
ABB, Ltd.* | | 10,861 | | | 165,632 |
Actelion, Ltd.* | | 28,287 | | | 1,600,238 |
Alcon, Inc. | | 7,900 | | | 704,601 |
Baloise Holding AG | | 5,038 | | | 380,461 |
Clariant AG* | | 2,536 | | | 17,429 |
Compagnie Financiere Richemont SAD | | 55,911 | | | 1,065,322 |
Credit Suisse Group | | 20,088 | | | 562,958 |
Geberit AG | | 3,225 | | | 348,785 |
Helvetia Holding AG | | 7 | | | 1,540 |
Holcim, Ltd. | | 325 | | | 18,811 |
Julius Baer Holding AG | | 78,771 | | | 3,052,953 |
Lonza Group AGD | | 5,436 | | | 503,979 |
Nestle SA | | 536,201 | | | 21,232,564 |
See Notes to Financial Statements.
169
International Equity Fund
SCHEDULE OF INVESTMENTS (Continued)
| | | | | |
| | | Shares | | Value |
Novartis AG | | 415,862 | | $ | 20,826,973 |
Roche Holding AG | | 91,920 | | | 14,230,789 |
Sonova Holding AG | | 16,162 | | | 982,285 |
STMicroelectronics NV | | 7,032 | | | 47,161 |
Swatch Group AG | | 41,226 | | | 2,020,118 |
Swiss Reinsurance | | 71,747 | | | 3,513,136 |
Syngenta AG | | 24,326 | | | 4,725,704 |
Synthes Inc | | 16,698 | | | 2,117,406 |
Zurich Financial Services AG | | 34,723 | | | 7,586,315 |
| | | | | |
| | | | | 85,705,160 |
| | | | | |
Taiwan — 1.1% | | | | | |
AU Optronics Corporation | | 149,949 | | | 113,674 |
Cathay Financial Holding Co., Ltd. | | 145,836 | | | 164,308 |
Chunghwa Telecom Co., Ltd. | | 1,736,750 | | | 2,797,562 |
High Tech Computer Corporation | | 25,300 | | | 253,958 |
MediaTek, Inc. | | 121,290 | | | 820,346 |
Novatek Microelectronics Corporation, Ltd. | | 380,503 | | | 363,418 |
Quanta Computer, Inc. | | 436,890 | | | 463,518 |
Silicon Motion Technology Corporation ADRD* | | 11,700 | | | 26,793 |
Taiwan Semiconductor Manufacturing Co., Ltd. | | 3,206,094 | | | 4,374,651 |
Taiwan Semiconductor Manufacturing Co., Ltd. ADRD | | 288,085 | | | 2,275,871 |
Vanguard International Semiconductor Corporation | | 630,547 | | | 143,846 |
Yuanta Financial Holding Co., Ltd. | | 468,000 | | | 213,084 |
| | | | | |
| | | | | 12,011,029 |
| | | | | |
Thailand — 0.1% | | | | | |
Central Pattana PCL ADRD | | 1,063,400 | | | 440,879 |
CP ALL PCL@ | | 687,052 | | | 242,977 |
Siam Commercial Bank Public Co., Ltd. | | 271,600 | | | 382,645 |
| | | | | |
| | | | | 1,066,501 |
| | | | | |
Turkey — 0.3% | | | | | |
Coca-Cola Icecek Uretim AS | | 81,653 | | | 339,431 |
Türkiye Garanti Bankasi AS* | | 1,031,791 | | | 1,775,989 |
Yapi ve Kredi Bankasi* | | 888,585 | | | 1,226,027 |
| | | | | |
| | | | | 3,341,447 |
| | | | | |
United Kingdom — 14.7% | | | | | |
Admiral Group PLC | | 59,707 | | | 788,128 |
Aegis Group PLC | | 257,957 | | | 279,759 |
Aggreko PLC | | 41,832 | | | 273,095 |
AMEC PLC | | 293,245 | | | 2,116,992 |
Anglo American PLC | | 278,229 | | | 6,421,364 |
Antofagasta PLC | | 1,916 | | | 12,002 |
Arriva PLC | | 404 | | | 3,518 |
AstraZeneca PLC | | 106,467 | | | 4,355,613 |
Atkins WS PLC | | 12 | | | 118 |
Autonomy Corporation PLC* | | 168,239 | | | 2,341,071 |
Aveva Group PLC | | 6,413 | | | 53,402 |
Aviva PLC | | 654,616 | | | 3,709,378 |
BAE Systems PLC | | 398,912 | | | 2,170,936 |
Barclays PLCD | | 251,883 | | | 572,502 |
BBA Aviation PLC | | 20,628 | | | 20,612 |
BG Group PLC | | 579,039 | | | 8,014,820 |
BHP Billiton PLC | | 489,596 | | | 9,495,571 |
BP PLC | | 2,093,134 | | | 16,157,825 |
Bradford & Bingley PLC+D* | | 28,672 | | | — |
Brit Insurance Holdings PLC | | 2,270 | | | 7,268 |
British Energy Group PLC | | 6,961 | | | 78,005 |
British Land Co. PLC REIT | | 38,070 | | | 305,027 |
BT Group PLC | | 1,807,072 | | | 3,634,216 |
Burberry Group PLC | | 343,129 | | | 1,110,955 |
Cable & Wireless PLC | | 71,824 | | | 162,432 |
Capita Group PLC (The) | | 149,526 | | | 1,603,959 |
Carnival PLC | | 32,262 | | | 712,477 |
Centrica PLC | | 394,981 | | | 1,520,601 |
Close Brothers Group PLC | | 17,378 | | | 133,882 |
Compass Group PLC | | 1,158,143 | | | 5,776,457 |
CSR PLCD* | | 84,084 | | | 210,114 |
De La Rue PLC | | 1 | | | 10 |
Drax Group PLC | | 84,795 | | | 688,347 |
Friends Provident PLC | | 7,512 | | | 9,602 |
Game Group PLC | | 277,905 | | | 514,921 |
GKN PLC | | 579,751 | | | 807,209 |
GlaxoSmithKline PLC | | 766,497 | | | 14,255,127 |
Hays PLC | | 193,907 | | | 195,937 |
HBOS PLC | | 816,097 | | | 844,803 |
Hikma Pharmaceuticals PLC | | 44,290 | | | 225,440 |
HMV Group PLC | | 107,881 | | | 170,583 |
Home Retail Group PLC | | 36,808 | | | 113,605 |
HSBC Holdings PLC | | 538,839 | | | 5,273,724 |
IG Group Holdings PLC | | 232,645 | | | 873,203 |
Intermediate Capital Group PLC | | 9,102 | | | 85,198 |
International Power PLC | | 232,360 | | | 809,710 |
Intertek Group PLC | | 102,389 | | | 1,169,227 |
J Sainsbury PLC | | 11,974 | | | 57,140 |
John Wood Group PLC | | 56,728 | | | 154,802 |
Kesa Electricals PLC | | 111,791 | | | 143,756 |
Land Securities Group PLC REIT | | 3,379 | | | 45,428 |
Legal & General Group PLC | | 234,595 | | | 262,212 |
Lloyds TSB Group PLC | | 1,095,234 | | | 2,072,974 |
Man Group PLC | | 177,903 | | | 612,014 |
Marks & Spencer Group PLC | | 496,900 | | | 1,557,554 |
Michael Page International PLC | | 358,200 | | | 1,125,641 |
Micro Focus International PLC | | 100,919 | | | 414,222 |
Mondi PLC | | 90,110 | | | 268,225 |
National Express Group PLC | | 244,575 | | | 1,758,702 |
Next PLC | | 56,181 | | | 882,836 |
Old Mutual PLC | | 320,349 | | | 257,479 |
Persimmon PLCD | | 231,600 | | | 774,321 |
Petrofac, Ltd. | | 272,275 | | | 1,362,934 |
Prudential PLC | | 443,888 | | | 2,694,507 |
Reckitt Benckiser Group PLC | | 182,312 | | | 6,831,408 |
Reed Elsevier PLC | | 180,494 | | | 1,325,158 |
Regus PLC | | 23,124 | | | 16,457 |
Restaurant Group PLC | | 330,324 | | | 508,647 |
Rexam PLC | | 258,209 | | | 1,321,591 |
Rio Tinto PLC | | 48,430 | | | 1,076,434 |
Rolls-Royce Group PLC* | | 488,139 | | | 2,387,932 |
Royal Bank of Scotland Group PLCD | | 1,372,927 | | | 1,010,650 |
Segro PLC REIT | | 1,693 | | | 6,036 |
Signet Jewelers, Ltd. | | 61,112 | | | 508,776 |
Spirax-Sarco Engineering PLC | | 36,480 | | | 483,221 |
Stagecoach Group PLC | | 59,587 | | | 122,568 |
Standard Chartered PLC | | 179,093 | | | 2,291,684 |
Standard Life PLC | | 10,390 | | | 30,331 |
Tate & Lyle PLC | | 212,838 | | | 1,240,142 |
Tesco PLC | | 984,592 | | | 5,126,802 |
See Notes to Financial Statements.
170
| | | | | | | |
| | | Shares | | | Value | |
Thomas Cook Group PLC | | 16,792 | | | $ | 42,940 | |
Tomkins PLC | | 145,579 | | | | 262,109 | |
Travis Perkins PLC | | 120,294 | | | | 598,157 | |
Trinity Mirror PLC | | 20,862 | | | | 17,071 | |
Tullett Prebon PLC | | 2,466 | | | | 4,947 | |
Tullow Oil PLC | | 242,986 | | | | 2,326,399 | |
Unilever PLC | | 384,678 | | | | 8,835,981 | |
United Utilities Group PLC | | 14,311 | | | | 129,944 | |
Vedanta Resources PLCD | | 44,941 | | | | 403,554 | |
Vodafone Group PLC | | 2,422,227 | | | | 4,959,882 | |
WH Smith PLC | | 90,069 | | | | 469,593 | |
WPP PLC | | 655,914 | | | | 3,835,352 | |
| | | | | | | |
| | | | | | 158,697,258 | |
| | | | | | | |
Total Foreign Common Stocks
(Cost $1,414,479,277) | | | | | | 1,058,499,032 | |
| | | | | | | |
FOREIGN PREFERRED STOCKS — 0.5% | | | | | | | |
Belgium — 0.0% | | | | | | | |
Fortis* | | 106,120 | | | | 148 | |
| | | | | | | |
Brazil — 0.3% | | | | | | | |
Banco Bradesco SA | | 148,450 | | | | 1,438,030 | |
Eletropaulo Metropolitana de Sao Paulo SA Class B | | 64,867 | | | | 709,309 | |
Investimentos Itau SA | | 487,058 | | | | 1,672,956 | |
Usinas Siderurgicas de Minas Gerais SA | | 1,400 | | | | 15,921 | |
| | | | | | | |
| | | | | | 3,836,216 | |
| | | | | | | |
Chile — 0.0% | | | | | | | |
Embotelladora Andina SA | | 66,700 | | | | 134,245 | |
| | | | | | | |
Germany — 0.1% | | | | | | | |
Fresenius AG | | 4,178 | | | | 245,186 | |
Porsche AGD | | 4,826 | | | | 377,754 | |
Volkswagen AG | | 848 | | | | 45,710 | |
| | | | | | | |
| | | | | | 668,650 | |
| | | | | | | |
Russia — 0.0% | | | | | | | |
URSA Bank | | 860,100 | | | | 172,020 | |
| | | | | | | |
Singapore — 0.0% | | | | | | | |
DBS Group Holdings, Ltd.+* | | 4,000 | | | | 8,948 | |
| | | | | | | |
South Korea — 0.1% | | | | | | | |
Samsung Electronics Co., Ltd. | | 5,343 | | | | 1,110,265 | |
| | | | | | | |
Total Foreign Preferred Stocks
(Cost $10,736,736) | | | | | | 5,930,492 | |
| | | | | | | |
RIGHTS — 0.0% | | | | | | | |
China Overseas Land & Investment, Ltd.+ | | 88,040 | | | | 31,580 | |
Fortis+ | | 355,003 | | | | — | |
HBOS PLC+ | | 1,129,397 | | | | — | |
Rolls-Royce Group PLC+ | | 27,529,159 | | | | 39,580 | |
| | | | | | | |
Total Rights
(Cost $44,888) | | | | | | 71,160 | |
| | | | | | | |
MONEY MARKET FUNDS — 11.2% | | | | | | | |
GuideStone Money Market Fund (GS4 Class)¥ | | 22,560,582 | | | | 22,560,582 | |
Northern Institutional Liquid Assets Portfolio§ | | 98,556,925 | | | | 98,556,925 | |
| | | | | | | |
Total Money Market Funds
(Cost $121,117,507) | | | | | | 121,117,507 | |
| | | | | | | |
TOTAL INVESTMENTS — 109.5%
(Cost $1,546,378,408) | | | | | | 1,185,618,191 | |
| | | | | | | |
SECURITIES SOLD SHORT — (1.8)% | | | | | | | |
Australia — (0.1)% | | | | | | | |
Adelaide Brighton, Ltd. | | (20,446 | ) | | | (30,096 | ) |
Alumina, Ltd. | | (63,773 | ) | | | (64,250 | ) |
Asciano Group | | (7,203 | ) | | | (7,668 | ) |
Billabong International, Ltd. | | (4,338 | ) | | | (23,823 | ) |
Boral, Ltd. | | (7,403 | ) | | | (23,976 | ) |
Cochlear, Ltd. | | (2,310 | ) | | | (89,488 | ) |
Computershare, Ltd. | | (13,937 | ) | | | (76,154 | ) |
Fortescue Metals Group, Ltd.* | | (15,062 | ) | | | (20,538 | ) |
Goodman Fielder, Ltd. | | (36,253 | ) | | | (33,701 | ) |
GWA International, Ltd. | | (59,877 | ) | | | (121,908 | ) |
Harvey Norman Holdings, Ltd. | | (47,368 | ) | | | (87,907 | ) |
Incitec Pivot, Ltd. | | (10,630 | ) | | | (18,633 | ) |
Nufarm, Ltd. | | (2,999 | ) | | | (22,112 | ) |
Paladin Energy, Ltd. | | (27,708 | ) | | | (48,693 | ) |
PaperlinX, Ltd. | | (42,590 | ) | | | (20,906 | ) |
Ramsay Health Care, Ltd. | | (11,807 | ) | | | (85,801 | ) |
Sims Metal Management, Ltd. | | (1,756 | ) | | | (21,492 | ) |
Sonic Healthcare, Ltd. | | (6,871 | ) | | | (70,002 | ) |
Toll Holdings, Ltd. | | (11,334 | ) | | | (48,969 | ) |
United Group, Ltd. | | (6,395 | ) | | | (37,041 | ) |
WorleyParsons, Ltd. | | (2,879 | ) | | | (28,721 | ) |
| | | | | | | |
| | | | | | (981,879 | ) |
| | | | | | | |
Belgium — 0.0% | | | | | | | |
Telenet Group Holding NV | | (9,217 | ) | | | (158,742 | ) |
| | | | | | | |
Denmark — (0.1)% | | | | | | | |
Coloplast A/S | | (697 | ) | | | (48,199 | ) |
D/S Torm A/S | | (7,908 | ) | | | (86,858 | ) |
Danisco A/S | | (530 | ) | | | (21,646 | ) |
FLSmidth & Co. A/S | | (8,146 | ) | | | (285,929 | ) |
Topdanmark A/S* | | (1,772 | ) | | | (232,066 | ) |
TrygVesta AS | | (5,902 | ) | | | (371,942 | ) |
| | | | | | | |
| | | | | | (1,046,640 | ) |
| | | | | | | |
Finland — (0.1)% | | | | | | | |
Kemira OYJ | | (22,150 | ) | | | (186,132 | ) |
Kesko OYJ | | (12,539 | ) | | | (315,949 | ) |
Nokian Renkaat OYJ | | (9,264 | ) | | | (105,255 | ) |
| | | | | | | |
| | | | | | (607,336 | ) |
| | | | | | | |
France — (0.2)% | | | | | | | |
Alten, Ltd. | | (2,968 | ) | | | (63,306 | ) |
Bureau Veritas SA | | (5,216 | ) | | | (209,704 | ) |
EDF Energies Nouvelles SA | | (17,878 | ) | | | (633,351 | ) |
Eiffage SA | | (133 | ) | | | (6,973 | ) |
Electricite de France | | (1,530 | ) | | | (88,988 | ) |
Eutelsat Communications* | | (2,406 | ) | | | (56,827 | ) |
JC Decaux SA | | (18,752 | ) | | | (324,337 | ) |
Mercialys SA REIT | | (170 | ) | | | (5,369 | ) |
Neopost SA | | (808 | ) | | | (73,316 | ) |
Orpea | | (9,092 | ) | | | (329,206 | ) |
Rallye SA | | (4,922 | ) | | | (111,543 | ) |
Renault SA | | (7,229 | ) | | | (188,648 | ) |
Societe Television Francaise 1 | | (7,268 | ) | | | (106,487 | ) |
| | | | | | | |
| | | | | | (2,198,055 | ) |
| | | | | | | |
Germany — (0.2)% | | | | | | | |
Altana AG | | (2,864 | ) | | | (52,392 | ) |
Arcandor AG | | (1,513 | ) | | | (6,664 | ) |
Beiersdorf AG | | (310 | ) | | | (18,362 | ) |
Biotest AG | | (2,204 | ) | | | (145,439 | ) |
Demag Cranes AG | | (25 | ) | | | (683 | ) |
Fraport AG Frankfurt Airport Services Worldwide | | (5,171 | ) | | | (233,983 | ) |
See Notes to Financial Statements.
171
International Equity Fund
SCHEDULE OF INVESTMENTS (Continued)
| | | | | | | |
| | | Shares | | | Value | |
Gildemeister AG | | (319 | ) | | $ | (3,664) | |
Hamburger Hafen und Logistik AG | | (319 | ) | | | (10,680 | ) |
Krones AG | | (2,284 | ) | | | (99,946 | ) |
Norddeutsche Affinerie AG | | (1,619 | ) | | | (63,736 | ) |
Porsche Automobil Holding Se | | (1,583 | ) | | | (123,909 | ) |
SGL Carbon AG* | | (5,338 | ) | | | (179,097 | ) |
Solarworld AG | | (16,924 | ) | | | (378,759 | ) |
Stada Arzneimittel AG | | (2,761 | ) | | | (79,307 | ) |
Symrise AG | | (23,387 | ) | | | (327,382 | ) |
United Internet AG | | (7,906 | ) | | | (71,517 | ) |
Vossloh AG | | (606 | ) | | | (67,842 | ) |
| | | | | | | |
| | | | | | (1,863,362 | ) |
| | | | | | | |
Japan — (0.4)% | | | | | | | |
ABC-Mart, Inc. | | (1,000 | ) | | | (36,568 | ) |
Aeon Credit Service Co., Ltd. | | (2,900 | ) | | | (30,576 | ) |
Air Water, Inc. | | (4,000 | ) | | | (35,661 | ) |
Aozora Bank, Ltd. | | (37,000 | ) | | | (34,761 | ) |
Asahi Kasei Corporation | | (2,000 | ) | | | (8,828 | ) |
Asics Corporation | | (5,000 | ) | | | (40,515 | ) |
Bank of Yokohama, Ltd. | | (8,000 | ) | | | (47,190 | ) |
Capcom Co., Ltd. | | (4,900 | ) | | | (110,853 | ) |
Chiba Bank, Ltd. | | (10,000 | ) | | | (62,538 | ) |
Citizen Holdings Co., Ltd. | | (6,800 | ) | | | (24,512 | ) |
Daido Steel Co., Ltd. | | (10,000 | ) | | | (30,335 | ) |
Daikin Industries, Ltd. | | (800 | ) | | | (21,039 | ) |
Denki Kagaku Kogyo KK | | (26,000 | ) | | | (64,026 | ) |
Don Quijote Co., Ltd. | | (4,400 | ) | | | (87,722 | ) |
Eisai Co., Ltd. | | (3,100 | ) | | | (129,362 | ) |
Electric Power Development Co., Ltd. | | (1,300 | ) | | | (51,098 | ) |
Fuji Electric Holdings Co., Ltd. | | (62,000 | ) | | | (93,412 | ) |
Fujikura, Ltd. | | (10,000 | ) | | | (33,135 | ) |
Fukuyama Transporting Co., Ltd. | | (16,000 | ) | | | (79,493 | ) |
Hikari Tsushin, Inc. | | (800 | ) | | | (15,206 | ) |
Hokuetsu Paper Mills, Ltd. | | (7,000 | ) | | | (43,014 | ) |
Hosiden Corporation | | (1,800 | ) | | | (28,448 | ) |
Idemitsu Kosan Co., Ltd. | | (600 | ) | | | (38,641 | ) |
IT Holdings Corporation | | (1,700 | ) | | | (26,645 | ) |
Itochu Corporation | | (12,000 | ) | | | (60,541 | ) |
Jafco Co., Ltd. | | (3,000 | ) | | | (76,668 | ) |
Joyo Bank, Ltd. | | (24,000 | ) | | | (136,491 | ) |
Kawasaki Kisen Kaisha, Ltd. | | (10,000 | ) | | | (46,901 | ) |
Konami Corporation | | (1,800 | ) | | | (46,665 | ) |
K’s Holdings Corporation | | (4,000 | ) | | | (67,488 | ) |
Kurita Water Industries, Ltd. | | (3,400 | ) | | | (91,915 | ) |
Kyowa Exeo Corporation | | (7,000 | ) | | | (75,267 | ) |
Marubeni Corporation | | (4,000 | ) | | | (15,314 | ) |
McDonald’s Holdings Co. Japan, Ltd. | | (600 | ) | | | (12,008 | ) |
Mitsui Chemicals, Inc. | | (7,000 | ) | | | (26,012 | ) |
Mitsui Engineering & Shipbuilding Co., Ltd. | | (38,000 | ) | | | (64,012 | ) |
Mizuho Trust & Banking Co., Ltd. | | (84,000 | ) | | | (106,572 | ) |
Nagoya Railroad Co., Ltd. | | (5,000 | ) | | | (16,013 | ) |
NET One Systems Co., Ltd. | | (6 | ) | | | (12,063 | ) |
NGK Spark Plug Co., Ltd. | | (16,000 | ) | | | (128,545 | ) |
Nihon Unisys, Ltd. | | (4,200 | ) | | | (34,447 | ) |
Nippon Paper Group, Inc. | | (13 | ) | | | (51,340 | ) |
Nippon Shokubai Co., Ltd. | | (5,000 | ) | | | (38,530 | ) |
Nipponkoa Insurance Co., Ltd. | | (35,000 | ) | | | (272,293 | ) |
Nipro Corporation | | (2,000 | ) | | | (35,188 | ) |
Nissan Chemical Industries, Ltd. | | (12,000 | ) | | | (116,318 | ) |
Nisshin Steel Co., Ltd. | | (24,000 | ) | | | (49,464 | ) |
Nomura Research Institute, Ltd. | | (5,900 | ) | | | (112,549 | ) |
NSK, Ltd. | | (11,000 | ) | | | (41,543 | ) |
NTT Data Corporation | | (12 | ) | | | (48,349 | ) |
Olympus Corporation | | (5,000 | ) | | | (100,093 | ) |
Osaka Securities Exchange Co., Ltd. | | (58 | ) | | | (258,871 | ) |
Otsuka Corporation | | (1,100 | ) | | | (50,101 | ) |
Point, Inc. | | (2,400 | ) | | | (132,288 | ) |
Rakuten, Inc. | | (94 | ) | | | (59,849 | ) |
Saizeriya Co., Ltd. | | (3,700 | ) | | | (51,918 | ) |
Sankyu, Inc. | | (10,000 | ) | | | (36,870 | ) |
Sega Sammy Holdings, Inc. | | (4,400 | ) | | | (51,308 | ) |
Shimamura Co., Ltd. | | (1,000 | ) | | | (77,205 | ) |
Shimizu Corporation | | (10,000 | ) | | | (58,704 | ) |
Showa Denko KK | | (44,000 | ) | | | (63,729 | ) |
Square Enix Co., Ltd. | | (400 | ) | | | (12,907 | ) |
Sumitomo Heavy Industries, Ltd. | | (17,000 | ) | | | (68,005 | ) |
Sumitomo Rubber Industries, Inc. | | (11,600 | ) | | | (100,969 | ) |
Suruga Bank, Ltd. | | (1,000 | ) | | | (9,935 | ) |
Sysmex Corporation | | (1,300 | ) | | | (47,376 | ) |
Taiyo Nippon Sanso Corporation | | (4,000 | ) | | | (30,876 | ) |
Teijin, Ltd. | | (1,000 | ) | | | (2,841 | ) |
Toda Corporation | | (29,000 | ) | | | (106,009 | ) |
Toray Industries, Inc. | | (10,000 | ) | | | (50,892 | ) |
Toshiba Corporation | | (34,000 | ) | | | (139,903 | ) |
Tsumura & Co. | | (1,600 | ) | | | (59,389 | ) |
Yahoo! Japan Corporation | | (428 | ) | | | (175,614 | ) |
Yamada Denki Co., Ltd. | | (770 | ) | | | (53,824 | ) |
Yamatake Corporation | | (800 | ) | | | (19,345 | ) |
Yokohama Rubber Co., Ltd. | | (6,000 | ) | | | (30,110 | ) |
| | | | | | | |
| | | | | | (4,805,005 | ) |
| | | | | | | |
Mexico — (0.1)% | | | | | | | |
Fresnillo PLC | | (199,958 | ) | | | (670,298 | ) |
| | | | | | | |
Netherlands — (0.1)% | | | | | | | |
Aalberts Industries NV | | (12,496 | ) | | | (88,761 | ) |
ASML Holding NV | | (23,256 | ) | | | (419,239 | ) |
Fugro NV | | (1,490 | ) | | | (42,827 | ) |
OPG Groep NV | | (12,392 | ) | | | (160,898 | ) |
Qiagen NV | | (10,543 | ) | | | (186,469 | ) |
Randstad Holding NV | | (12,421 | ) | | | (253,485 | ) |
SBM Offshore NV | | (15,662 | ) | | | (205,764 | ) |
| | | | | | | |
| | | | | | (1,357,443 | ) |
| | | | | | | |
Spain — (0.1)% | | | | | | | |
Acciona SA | | (4,603 | ) | | | (585,279 | ) |
Laboratorios Almirall SA | | (452 | ) | | | (3,554 | ) |
| | | | | | | |
| | | | | | (588,833 | ) |
| | | | | | | |
Sweden — (0.1)% | | | | | | | |
Atlas Copco AB Class A | | (7,273 | ) | | | (63,991 | ) |
Boliden AB | | (21,264 | ) | | | (49,804 | ) |
Hexagon AB | | (33,889 | ) | | | (169,196 | ) |
Modern Times Group AB | | (3,620 | ) | | | (79,252 | ) |
Sandvik AB | | (11,364 | ) | | | (72,995 | ) |
Ssab Svenskt Stal AB | | (48,618 | ) | | | (431,150 | ) |
| | | | | | | |
| | | | | | (866,388 | ) |
| | | | | | | |
Switzerland — 0.0% | | | | | | | |
Givaudan SA | | (409 | ) | | | (323,190 | ) |
See Notes to Financial Statements.
172
| | | | | | | |
| | | Shares | | | Value | |
Kuehne + Nagel International AG | | (382 | ) | | $ | (24,741) | |
Logitech International SA* | | (9,642 | ) | | | (151,317 | ) |
Lonza Group AG | | (168 | ) | | | (15,575 | ) |
OC Oerlikon Corporation AG | | (242 | ) | | | (16,184 | ) |
| | | | | | | |
| | | | | | (531,007 | ) |
| | | | | | | |
United Kingdom — (0.3)% | | | | | | | |
Amlin PLC | | (61,390 | ) | | | (319,100 | ) |
ARM Holdings PLC | | (6,113 | ) | | | (7,739 | ) |
Associated British Foods PLC | | (4,565 | ) | | | (48,057 | ) |
Autonomy Corp PLC | | (25,654 | ) | | | (356,979 | ) |
Bellway PLC | | (26,131 | ) | | | (228,317 | ) |
British Sky Broadcasting Group PLC | | (36,263 | ) | | | (256,087 | ) |
Burberry Group PLC | | (26,378 | ) | | | (85,404 | ) |
Cairn Energy PLC* | | (2,039 | ) | | | (59,719 | ) |
Charter International PLC | | (7,042 | ) | | | (33,411 | ) |
Firstgroup PLC | | (14,192 | ) | | | (89,751 | ) |
ICAP PLC | | (1,356 | ) | | | (5,724 | ) |
Inmarsat PLC | | (11,617 | ) | | | (79,792 | ) |
International Power PLC | | (31,570 | ) | | | (110,013 | ) |
Intertek Group PLC | | (11,395 | ) | | | (130,125 | ) |
Kazakhmys PLC | | (1,451 | ) | | | (4,953 | ) |
London Stock Exchange Group PLC | | (54,356 | ) | | | (407,725 | ) |
Lonmin PLC | | (7,211 | ) | | | (96,113 | ) |
Marks & Spencer Group PLC | | (5,338 | ) | | | (16,732 | ) |
Meggitt PLC | | (74,261 | ) | | | (172,422 | ) |
Northumbrian Water Group PLC | | (28,724 | ) | | | (98,317 | ) |
Pennon Group PLC | | (1,688 | ) | | | (12,220 | ) |
Premier Oil PLC* | | (1,151 | ) | | | (16,510 | ) |
Rentokil Initial PLC | | (38,305 | ) | | | (24,490 | ) |
Sage Group PLC | | (55,384 | ) | | | (137,140 | ) |
Serco Group PLC | | (3,395 | ) | | | (22,224 | ) |
Smiths Group PLC | | (9,775 | ) | | | (125,608 | ) |
Tullow Oil PLC | | (26,915 | ) | | | (257,690 | ) |
VT Group PLC | | (4,874 | ) | | | (39,380 | ) |
Weir Group PLC (The) | | (45,008 | ) | | | (203,630 | ) |
Wellstream Holdings PLC | | (41,062 | ) | | | (211,385 | ) |
| | | | | | | |
| | | | | | (3,656,757 | ) |
| | | | | | | |
Total Securities Sold Short
(Cost $(16,099,775)) | | | | | | (19,331,745 | ) |
| | | | | | | |
Liabilities in Excess of Other Assets — (7.7)% | | | | | | (83,804,612 | ) |
| | | | | | | |
NET ASSETS — 100.0% | | | | | $ | 1,082,481,834 | |
| | | | | | | |
Swap agreements outstanding at December 31, 2008:
| | | | | | | | |
Description | | Expiration
Date | | Notional
Amount | | | Unrealized
Appreciation
(Depreciation) |
Euro | | | | | | | | |
MSCI NDDLAT Index(u) | | 03/18/09 | | (948,733 | ) | | $ | 44,401 |
MSCI NDDLBE Index(u) | | 03/18/09 | | (1,386,305 | ) | | | 24,784 |
| | | | | | | | |
| | | | | | | | 69,185 |
| | | | | | | | |
Norwegian Kroner | | | | | | | | |
MSCI NDDLNO Index(u) | | 03/18/09 | | (4,083,411 | ) | | | 49,494 |
| | | | | | | | |
| | | | | | | $ | 118,679 |
| | | | | | | | |
See Notes to Financial Statements.
173
International Equity Fund
SCHEDULE OF INVESTMENTS (Continued)
| | | |
| PORTFOLIO SUMMARY (based on net assets) | | | |
| |
| | | % | |
Foreign Common Stocks | | | |
Japan | | 20.1 | |
United Kingdom | | 14.6 | |
France | | 9.1 | |
Switzerland | | 7.9 | |
Germany | | 7.2 | |
Spain | | 4.7 | |
Australia | | 4.2 | |
Netherlands | | 3.8 | |
Hong Kong | | 3.1 | |
Italy | | 2.1 | |
China | | 2.0 | |
Brazil | | 1.5 | |
Canada | | 1.4 | |
India | | 1.3 | |
Denmark | | 1.2 | |
South Korea | | 1.2 | |
South Africa | | 1.1 | |
Russia | | 1.1 | |
Taiwan | | 1.1 | |
Finland | | 1.0 | |
Mexico | | 1.0 | |
Singapore | | 1.0 | |
Israel | | 0.7 | |
Norway | | 0.7 | |
Sweden | | 0.7 | |
Indonesia | | 0.6 | |
Belgium | | 0.4 | |
Greece | | 0.4 | |
Austria | | 0.3 | |
Czech Republic | | 0.3 | |
Turkey | | 0.3 | |
Chile | | 0.2 | |
Egypt | | 0.2 | |
Ireland | | 0.2 | |
Malaysia | | 0.2 | |
Bermuda | | 0.1 | |
Colombia | | 0.1 | |
Hungary | | 0.1 | |
Luxembourg | | 0.1 | |
New Zealand | | 0.1 | |
Nigeria | | 0.1 | |
Poland | | 0.1 | |
Thailand | | 0.1 | |
Argentina | | — | ** |
Estonia | | — | ** |
Kazakhstan | | — | ** |
Papua New Guinea | | — | ** |
Peru | | — | ** |
Philippines | | — | ** |
Sri Lanka | | — | ** |
| | | |
Total Foreign Common Stocks | | 97.7 | |
| | | |
Total Money Market Funds | | 11.2 | |
| | | |
Total Futures Contracts | | 2.6 | |
| | | |
Total Foreign Preferred Stocks | | 0.5 | |
| | | |
Total Rights | | 0.1 | |
| | | |
Total Forward Foreign Currency Contracts | | 0.1 | |
| | | |
Swap Agreements | | — | ** |
| | | |
Total Securities Sold Short | | (1.8 | ) |
| | | |
Total Investments | | 110.4 | |
| | | |
| ** | Rounds to less than 0.005%. |
FAS 157 DISCLOSURE
The following is a summary of the inputs used, as of December 31, 2008, in valuing the Fund’s assets carried at fair value:
| | | | | | | |
| Valuation Inputs | | Investments
in
Securities | | | Other
Financial
Instruments*** |
Assets: | | | | | | | |
Level 1 — Quoted Prices | | $ | 220,408,126 | | | $ | 659,387 |
Level 2 — Other Significant Observable Inputs | | | 965,178,485 | | | | 446,978 |
Level 3 — Significant Unobservable Inputs | | | 31,580 | | | | — |
| | | | | | | |
Total Assets | | $ | 1,185,618,191 | | | $ | 1,106,365 |
| | | | | | | |
| | |
Liabilities: | | | | | | | |
Level 1 — Quoted Prices | | $ | (136,670 | ) | | $ | — |
Level 2 — Other Significant Observable Inputs | | | (19,195,075 | ) | | | — |
Level 3 — Significant Unobservable Inputs | | | — | | | | — |
| | | | | | | |
Total Liabilities | | $ | (19,331,745 | ) | | $ | — |
| | | | | | | |
| *** | Other financial instruments are derivative instruments not reflected in the Schedule of Investments, such as futures, forwards and swap contracts, which are valued at the unrealized appreciation (depreciation) on the investment. |
The following is a reconciliation of assets in which significant unobservable inputs (Level 3) were used in determining fair value:
| | | | | | |
| | | Investments
in
Securities | | Other
Financial
Instruments |
Balance, 12/31/07 | | $ | — | | $ | — |
Accrued discounts/premiums | | | — | | | — |
Realized gain (loss) | | | — | | | — |
Changed in unrealized appreciation (depreciation) | | | — | | | — |
Net purchases (sales) | | | — | | | — |
Transfers in and/or out of Level 3 | | | 31,580 | | | — |
| | | | | | |
Balance, 12/31/08 | | $ | 31,580 | | $ | — |
| | | | | | |
See Notes to Financial Statements.
174
SCHEDULE OF INVESTMENTS – ABBREVIATIONS AND FOOTNOTES
| | | | |
| INVESTMENT ABBREVIATIONS: |
| | |
| ADR | | — | | American Depository Receipt |
| CONV | | — | | Convertible |
| GDR | | — | | Global Depository Receipt |
| IO | | — | | Interest Only (Principal amount shown is notional) |
| PIK | | — | | Payment-in-Kind Bonds |
| PO | | — | | Principal Only |
| REIT | | — | | Real Estate Investment Trust |
| STEP | | — | | Stepped Coupon Bonds (1) |
| STRIP | | — | | Stripped Security |
| TBA | | — | | To be announced. |
| 144A | | — | | Security was purchased pursuant to Rule 144A under the Securities Act of 1933 and may not be resold subject to that rule except to qualified institutional buyers. As of December 31, 2008, the total market values and percentages of net assets for 144A securities by fund were as follows: |
| | | | | | |
Fund | | Value of
144A Securities | | Percentage of
144A Securities | |
Money Market | | $ | 28,300,000 | | 2.46 | % |
Low-Duration Bond | | | 19,903,920 | | 3.18 | |
Medium-Duration Bond | | | 51,360,087 | | 5.94 | |
Extended-Duration Bond | | | 56,176,325 | | 12.84 | |
Global Bond | | | 16,953,575 | | 10.12 | |
Small Cap Equity | | | 3,436,197 | | 1.03 | |
International Equity | | | 695,497 | | 0.06 | |
| | | | |
| INVESTMENT FOOTNOTES: |
| | |
| ‡‡ | | — | | All or a portion of the security was held as collateral for open futures, options and/or swap contracts. |
| @ | | — | | Illiquid. |
| * | | — | | Non-income producing security. |
| # | | — | | Security in default. |
| + | | — | | Security is valued at fair value (2). |
| § | | — | | Security purchased with the cash proceeds from securities loaned. |
| † | | — | | Variable rate security (1). |
| W | | — | | Interest rates shown reflect the effective yields as of December 31, 2008. |
| ¥ | | — | | Affiliated fund. |
| D | | — | | Security either partially or fully on loan. |
| (1) | | Interest rates shown reflect the rates currently in effect. Maturity date for money market instruments is the date of the next interest rate reset. |
| (2) | | Fair valued securities were held in the Medium-Duration Bond Fund, Extended Duration Bond Fund, Global Bond Fund, Value Equity Fund, Small Cap Equity Fund and International Equity Fund at an aggregate market value of $252,340, $759,580, $1,363,895, $1,209, $309,409 and $88,399, respectively, which amounted to 0.03%, 0.17%, 0.81%, 0.00%, 0.09% and 0.01% of each of those funds, respectively. |
| | | | |
| FOREIGN BOND FOOTNOTES: |
| | |
| (A) | | — | | Par is denominated in Australian Dollars. |
| (B) | | — | | Par is denominated in Brazilian Real. |
| (C) | | — | | Par is denominated in Canadian Dollars. |
| (E) | | — | | Par is denominated in Euro. |
| (G) | | — | | Par is denominated in Singapore Dollars. |
| (H) | | — | | Par is denominated in Hungarian Forint. |
| (I) | | — | | Par is denominated in Iceland Kronur. |
| (J) | | — | | Par is denominated in Japanese Yen. |
| (L) | | — | | Par is denominated in Turkish Lira. |
| (M) | | — | | Par is denominated in Mexican Pesos. |
| (N) | | — | | Par is denominated in Indonesia Rupiahs. |
| (R) | | — | | Par is denominated in Russian Rubles. |
| (T) | | — | | Par is denominated in Thailand Baht. |
| (U) | | — | | Par is denominated in British Pounds. |
| (W) | | — | | Par is denominated in South Korean Won. |
| (Z) | | — | | Par is denominated in New Zealand Dollars. |
| | | | |
| SWAP AGREEMENT FOOTNOTES: |
| | |
| (a) | | — | | Counterparty to contract is Bank of America. |
| (b) | | — | | Counterparty to contract is Barclays Capital. |
| (c) | | — | | Counterparty to contract is BNP Paribas. |
| (d) | | — | | Counterparty to contract is Citibank NA London. |
| (f) | | — | | Counterparty to contract is Deutsche Bank AG. |
| (g) | | — | | Counterparty to contract is Goldman Sachs Capital Markets, LP. |
| (h) | | — | | Counterparty to contract is JPMorgan Chase Bank. |
| (j) | | — | | Counterparty to contract is Merrill Lynch Capital Services, Inc. |
| (k) | | — | | Counterparty to contract is Morgan Stanley Capital Services. |
| (m) | | — | | Counterparty to contract is Royal Bank of Scotland. |
| (n) | | — | | Counterparty to contract is UBS AG. |
| (p) | | — | | Counterparty to contract is Credit Suisse International. |
| (u) | | — | | The Fund receives monthly payments based on any positive monthly duration adjusted return of the respective Index. The Fund makes payments on any such negative monthly duration adjusted return of such index. |
| (SP) | | — | | Seller of Protection. See Note 2c in Notes to Financial Statements. |
175
STATEMENTS OF ASSETS AND LIABILITIES
December 31, 2008
| | | | | | | | | | | |
| | | Money
Market Fund | | Low-Duration
Bond Fund | | | Medium-Duration
Bond Fund | |
Assets | | | | | | | | | | | |
Investments in securities of unaffiliated issuers, at value | | $ | 1,159,144,387 | | $ | 789,831,082 | | | $ | 1,235,624,607 | |
Investments in securities of affiliated issuers, at value | | | — | | | 20,992,945 | | | | 15,426,294 | |
Total investments (1)(2) | | | 1,159,144,387 | | | 810,824,027 | | | | 1,251,050,901 | |
Cash | | | 160 | | | 1,865,792 | | | | 12,954,973 | |
Cash collateral for futures and swaps | | | — | | | 2,458,200 | | | | 4,670,877 | |
Foreign currency (3) | | | — | | | 4,932,904 | | | | 3,939,177 | |
Receivables: | | | | | | | | | | | |
Dividends and reclaims | | | — | | | 32,750 | | | | 24,454 | |
Interest | | | 1,377,288 | | | 3,991,147 | | | | 7,781,981 | |
Securities lending | | | 775 | | | 43,275 | | | | 33,881 | |
Investment securities sold | | | — | | | 171,586,080 | | | | 357,776,296 | |
Maturities | | | — | | | 92,226 | | | | 30,933 | |
Fund shares sold | | | 1,922,694 | | | 164,055 | | | | 43,480 | |
Variation margin | | | — | | | 45,620 | | | | 255,537 | |
Other receivables | | | — | | | 126,983 | | | | 125,340 | |
Unrealized appreciation on foreign currency exchange contracts | | | — | | | 564,153 | | | | 643,481 | |
Unrealized appreciation on swap agreements | | | — | | | 16,030,718 | | | | 21,990,315 | |
Prepaid expenses and other assets | | | 207,498 | | | 24,067 | | | | 31,445 | |
| | | | | | | | | | | |
Total Assets | | | 1,162,652,802 | | | 1,012,781,997 | | | | 1,661,353,071 | |
| | | | | | | | | | | |
Liabilities | | | | | | | | | | | |
Securities sold short, at value (5) | | | — | | | 27,991,250 | | | | 9,928,345 | |
Options written at value (4) | | | — | | | 7,219,260 | | | | 13,095,575 | |
Unrealized depreciation on foreign currency exchange contracts | | | — | | | 1,182,024 | | | | 2,965,094 | |
Unrealized depreciation on swap agreements | | | — | | | 24,787,343 | | | | 40,529,297 | |
Collateral held for securities on loan at value | | | 1,010,000 | | | 51,250,573 | | | | 51,066,761 | |
Collateral held for swap agreements | | | — | | | 1,690,000 | | | | 2,500,000 | |
Payables: | | | | | | | | | | | |
Investment securities purchased | | | 8,569,566 | | | 271,152,991 | | | | 674,670,719 | |
Fund shares redeemed | | | 1,554,557 | | | — | | | | 66,381 | |
Variation margin | | | — | | | 369,714 | | | | 677,470 | |
Distributions | | | 479,333 | | | — | | | | — | |
Securities lending | | | 155 | | | 8,655 | | | | 6,776 | |
Deferred foreign capital gains taxes | | | — | | | — | | | | — | |
Accrued expenses | | | | | | | | | | | |
Advisory fees | | | 151,923 | | | 127,626 | | | | 234,182 | |
Distribution (12b-1) fees | | | 1,552 | | | 973 | | | | 2,377 | |
Shareholder servicing fees | | | 157,209 | | | 84,318 | | | | 120,850 | |
Other expenses | | | 36,236 | | | 75,576 | | | | 122,506 | |
| | | | | | | | | | | |
Total Liabilities | | | 11,960,531 | | | 385,940,303 | | | | 795,986,333 | |
| | | | | | | | | | | |
Net Assets | | $ | 1,150,692,271 | | $ | 626,841,694 | | | $ | 865,366,738 | |
| | | | | | | | | | | |
Net Assets Consist of: | | | | | | | | | | | |
Paid-in-capital | | $ | 1,150,607,769 | | $ | 692,333,433 | | | $ | 986,312,718 | |
Undistributed (distributions in excess of) net investment income | | | 84,502 | | | 2,004,153 | | | | 3,256,156 | |
Undistributed (accumulated) net realized gain (loss) on investments, foreign currency transactions and derivative transactions | | | — | | | (13,081,906 | ) | | | (873,732 | ) |
Net unrealized appreciation (depreciation) on investments, foreign currency translations and derivative transactions | | | — | | | (54,413,986 | ) | | | (123,328,404 | ) |
| | | | | | | | | | | |
Net Assets | | $ | 1,150,692,271 | | $ | 626,841,694 | | | $ | 865,366,738 | |
| | | | | | | | | | | |
Net Asset Value: | | | | | | | | | | | |
$0.001 par value, unlimited shares authorized Net assets applicable to the GS2 Class | | $ | 171,738,956 | | $ | 105,222,559 | | | $ | 112,240,385 | |
| | | | | | | | | | | |
GS2 shares outstanding | | | 171,729,524 | | | 12,966,672 | | | | 15,739,166 | |
| | | | | | | | | | | |
Net asset value, offering and redemption price per GS2 share | | $ | 1.00 | | $ | 8.11 | | | $ | 7.13 | |
| | | | | | | | | | | |
Net assets applicable to the GS4 Class | | $ | 970,146,416 | | $ | 515,996,130 | | | $ | 738,609,508 | |
| | | | | | | | | | | |
GS4 shares outstanding | | | 970,035,039 | | | 43,045,388 | | | | 60,750,902 | |
| | | | | | | | | | | |
Net asset value, offering and redemption price per GS4 share | | $ | 1.00 | | $ | 11.99 | | | $ | 12.16 | |
| | | | | | | | | | | |
Net assets applicable to the GS6 class | | $ | 8,806,899 | | $ | 5,623,005 | | | $ | 14,516,845 | |
| | | | | | | | | | | |
GS6 shares outstanding | | | 8,808,558 | | | 689,505 | | | | 2,016,190 | |
| | | | | | | | | | | |
Net asset value, offering and redemption price per GS6 share | | $ | 1.00 | | $ | 8.16 | | | $ | 7.20 | |
| | | | | | | | | | | |
| |
(1) Investments in securities of unaffiliated issuers, at cost | | $ | 1,159,144,387 | | $ | 840,739,804 | | | $ | 1,346,212,343 | |
Investments in securities of affiliated issuers, at cost | | | — | | | 20,992,945 | | | | 15,426,294 | |
| | | | | | | | | | | |
Total investments at cost | | $ | 1,159,144,387 | | $ | 861,732,749 | | | $ | 1,361,638,637 | |
| | | | | | | | | | | |
(2) Includes securities loaned of: | | $ | 993,578 | | $ | 50,259,820 | | | $ | 49,671,546 | |
| | | | | | | | | | | |
(3) Foreign currency at cost | | $ | — | | $ | 5,067,143 | | | $ | 4,155,209 | |
| | | | | | | | | | | |
(4) Premiums received on options written | | $ | — | | $ | (3,687,541 | ) | | $ | (5,614,864 | ) |
| | | | | | | | | | | |
(5) Securities Sold Short at cost | | $ | — | | $ | (27,655,906 | ) | | $ | (9,904,133 | ) |
| | | | | | | | | | | |
(6) Net of ($10,402) accrued foreign capital gains taxes on appreciated securities | | | | | | | | | | | |
See Notes to Financial Statements.
176
| | | | | | | | | | | | | | | | | | | | | | | | | | | | | |
Extended-Duration
Bond Fund | | Global Bond
Fund | | | Equity Index
Fund | | | Real Estate
Securities Fund | | | Value
Equity Fund | | | Growth Equity
Fund | | | Small Cap
Equity Fund | | | International
Equity Fund | |
| $ | 437,743,355 | | $ | 174,284,414 | | | $ | 307,633,739 | | | $ | 99,137,572 | | | $ | 1,041,892,291 | | | $ | 985,837,917 | | | $ | 378,218,045 | | | $ | 1,163,057,609 | |
| | 6,120,643 | | | 12,796,567 | | | | 8,956,628 | | | | 4,415,039 | | | | 24,154,516 | | | | 61,323,726 | | | | 22,866,336 | | | | 22,560,582 | |
| | | | | | | | | | | | | | | | | | | | | | | | | | | | | | |
| | 443,863,998 | | | 187,080,981 | | | | 316,590,367 | | | | 103,552,611 | | | | 1,066,046,807 | | | | 1,047,161,643 | | | | 401,084,381 | | | | 1,185,618,191 | |
| | 429,781 | | | 1,343,103 | | | | 473,579 | | | | — | | | | 538,950 | | | | 403,206 | | | | 112,971 | | | | 4,218 | |
| | — | | | — | | | | — | | | | — | | | | — | | | | — | | | | — | | | | 10,679,130 | |
| | 173,904 | | | 2,375,595 | | | | — | | | | — | | | | — | | | | 2,323 | | | | 309,527 | | | | 1,352,502 | |
| | 10,280 | | | 31,162 | | | | 603,691 | | | | 593,492 | | | | 2,134,099 | | | | 1,101,939 | | | | 156,263 | | | | 2,285,639 | |
| | 7,600,997 | | | 3,370,841 | | | | — | | | | — | | | | — | | | | — | | | | 272,489 | | | | — | |
| | 6,956 | | | 8,487 | | | | 15,098 | | | | 5,650 | | | | 36,202 | | | | 38,707 | | | | 60,611 | | | | 90,593 | |
| | — | | | — | | | | 5,892 | | | | 1,830,916 | | | | 1,512,982 | | | | 4,682,739 | | | | 196,428 | | | | 1,197,183 | |
| | — | | | — | | | | — | | | | — | | | | — | | | | — | | | | 1,831 | | | | — | |
| | 265,769 | | | 547 | | | | 372,262 | | | | 100,598 | | | | 217,622 | | | | 733,577 | | | | 279,414 | | | | 56,491 | |
| | — | | | 20,109 | | | | 139,825 | | | | 143,000 | | | | 398,473 | | | | 948,891 | | | | 1,439,350 | | | | 176,148 | |
| | — | | | — | | | | — | | | | — | | | | — | | | | — | | | | — | | | | — | |
| | — | | | 3,043,435 | | | | — | | | | — | | | | — | | | | — | | | | — | | | | 1,394,960 | |
| | — | | | — | | | | — | | | | — | | | | — | | | | — | | | | — | | | | 118,679 | |
| | 20,624 | | | 10,422 | | | | 17,621 | | | | 9,237 | | | | 31,973 | | | | 35,778 | | | | 18,981 | | | | 33,922 | |
| | | | | | | | | | | | | | | | | | | | | | | | | | | | | | |
| | 452,372,309 | | | 197,284,682 | | | | 318,218,335 | | | | 106,235,504 | | | | 1,070,917,108 | | | | 1,055,108,803 | | | | 403,932,246 | | | | 1,203,007,656 | |
| | | | | | | | | | | | | | | | | | | | | | | | | | | | | | |
| | — | | | — | | | | — | | | | — | | | | — | | | | — | | | | — | | | | 19,331,745 | |
| | — | | | — | | | | — | | | | — | | | | — | | | | — | | | | 209,172 | | | | — | |
| | — | | | 1,843,733 | | | | — | | | | — | | | | — | | | | — | | | | 7,828 | | | | 1,066,661 | |
| | — | | | — | | | | — | | | | — | | | | — | | | | — | | | | — | | | | — | |
| | 14,158,534 | | | 14,403,133 | | | | 20,348,261 | | | | 23,423,794 | | | | 70,064,449 | | | | 86,712,386 | | | | 59,416,171 | | | | 98,556,925 | |
| | — | | | — | | | | — | | | | — | | | | — | | | | — | | | | — | | | | — | |
| | — | | | 13,023,355 | | | | 485,560 | | | | 2,116,687 | | | | 578,891 | | | | 1,213,212 | | | | 11,798,158 | | | | 231,075 | |
| | 350,000 | | | — | | | | 1,925 | | | | — | | | | 22,203 | | | | 38,549 | | | | 43,660 | | | | — | |
| | — | | | 420,150 | | | | — | | | | — | | | | — | | | | — | | | | 20,219 | | | | 160,508 | |
| | — | | | — | | | | — | | | | — | | | | — | | | | — | | | | — | | | | 27,262 | |
| | 1,391 | | | 1,697 | | | | 3,020 | | | | 1,133 | | | | 7,242 | | | | 13,824 | | | | 12,124 | | | | 18,112 | |
| | — | | | — | | | | — | | | | — | | | | — | | | | — | | | | — | | | | 10,402 | |
| | 152,433 | | | 61,822 | | | | 40,224 | | | | 76,555 | | | | 523,204 | | | | 595,319 | | | | 219,325 | | | | 617,192 | |
| | 2,463 | | | — | | | | 147 | | | | — | | | | 1,963 | | | | 1,397 | | | | 1,896 | | | | 2,635 | |
| | 58,985 | | | 25,951 | | | | 38,542 | | | | 11,736 | | | | 133,566 | | | | 129,477 | | | | 43,465 | | | | 135,728 | |
| | 43,848 | | | 40,065 | | | | 107,102 | | | | 26,350 | | | | 72,708 | | | | 61,490 | | | | 78,630 | | | | 367,577 | |
| | | | | | | | | | | | | | | | | | | | | | | | | | | | | | |
| | 14,767,654 | | | 29,819,906 | | | | 21,024,781 | | | | 25,656,255 | | | | 71,404,226 | | | | 88,765,654 | | | | 71,850,648 | | | | 120,525,822 | |
| | | | | | | | | | | | | | | | | | | | | | | | | | | | | | |
| $ | 437,604,655 | | $ | 167,464,776 | | | $ | 297,193,554 | | | $ | 80,579,249 | | | $ | 999,512,882 | | | $ | 966,343,149 | | | $ | 332,081,598 | | | $ | 1,082,481,834 | |
| | | | | | | | | | | | | | | | | | | | | | | | | | | | | | |
| | | | | | | | | | | | | | | | | | | | | | | | | | | | | |
| $ | 494,917,519 | | $ | 226,511,000 | | | $ | 353,006,858 | | | $ | 155,988,539 | | | $ | 1,470,397,877 | | | $ | 1,354,122,872 | | | $ | 517,154,562 | | | $ | 1,557,922,638 | |
| | (55,475) | | | (16,036 | ) | | | 1,622,559 | | | | — | | | | 7,752,269 | | | | 38,545 | | | | (21,274 | ) | | | 506,726 | |
| | (115,255) | | | (2,942,929 | ) | | | (7,055,078 | ) | | | (47,131,010 | ) | | | (136,116,406 | ) | | | (143,025,137 | ) | | | (92,736,461 | ) | | | (113,003,870 | ) |
| | (57,142,134) | | | (56,087,259 | ) | | | (50,380,785 | ) | | | (28,278,280 | ) | | | (342,520,858 | ) | | | (244,793,131 | ) | | | (92,315,229 | ) | | | (362,943,660 | )(6) |
| | | | | | | | | | | | | | | | | | | | | | | | | | | | | | |
| $ | 437,604,655 | | $ | 167,464,776 | | | $ | 297,193,554 | | | $ | 80,579,249 | | | $ | 999,512,882 | | | $ | 966,343,149 | | | $ | 332,081,598 | | | $ | 1,082,481,834 | |
| | | | | | | | | | | | | | | | | | | | | | | | | | | | | | |
| $ | 64,833,663 | | | N/A | | | $ | 49,472,407 | | | | N/A | | | $ | 143,506,453 | | | $ | 141,137,903 | | | $ | 48,158,699 | | | $ | 193,281,364 | |
| | | | | | | | | | | | | | | | | | | | | | | | | | | | | | |
| | 10,271,460 | | | N/A | | | | 7,779,279 | | | | N/A | | | | 26,016,878 | | | | 19,442,332 | | | | 8,112,319 | | | | 26,397,260 | |
| | | | | | | | | | | | | | | | | | | | | | | | | | | | | | |
| $ | 6.31 | | | N/A | | | $ | 6.36 | | | | N/A | | | $ | 5.52 | | | $ | 7.26 | | | $ | 5.94 | | | $ | 7.32 | |
| | | | | | | | | | | | | | | | | | | | | | | | | | | | | | |
| $ | 357,072,623 | | $ | 167,464,776 | | | $ | 247,076,678 | | | $ | 80,579,249 | | | $ | 844,459,208 | | | $ | 817,314,504 | | | $ | 272,588,439 | | | $ | 873,618,076 | |
| | | | | | | | | | | | | | | | | | | | | | | | | | | | | | |
| | 27,533,189 | | | 22,825,882 | | | | 21,123,528 | | | | 15,344,199 | | | | 80,215,516 | | | | 70,959,693 | | | | 30,610,582 | | | | 93,113,493 | |
| | | | | | | | | | | | | | | | | | | | | | | | | | | | | | |
| $ | 12.97 | | $ | 7.34 | | | $ | 11.70 | | | $ | 5.25 | | | $ | 10.53 | | | $ | 11.52 | | | $ | 8.91 | | | $ | 9.38 | |
| | | | | | | | | | | | | | | | | | | | | | | | | | | | | | |
| $ | 15,698,369 | | | N/A | | | $ | 644,469 | | | | N/A | | | $ | 11,547,221 | | | $ | 7,890,742 | | | $ | 11,334,460 | | | $ | 15,582,394 | |
| | | | | | | | | | | | | | | | | | | | | | | | | | | | | | |
| | 2,488,602 | | | N/A | | | | 99,642 | | | | N/A | | | | 2,109,872 | | | | 1,113,139 | | | | 1,978,072 | | | | 2,166,570 | |
| | | | | | | | | | | | | | | | | | | | | | | | | | | | | | |
| $ | 6.31 | | | N/A | | | $ | 6.47 | | | | N/A | | | $ | 5.47 | | | $ | 7.09 | | | $ | 5.73 | | | $ | 7.19 | |
| | | | | | | | | | | | | | | | | | | | | | | | | | | | | | |
| $ | 494,824,372 | | $ | 231,570,617 | | | $ | 358,306,187 | | | $ | 127,654,157 | | | $ | 1,384,901,027 | | | $ | 1,231,650,467 | | | $ | 473,131,563 | | | $ | 1,523,817,826 | |
| | 6,120,643 | | | 12,796,567 | | | | 8,956,628 | | | | 4,415,039 | | | | 24,154,516 | | | | 61,323,726 | | | | 22,866,336 | | | | 22,560,582 | |
| | | | | | | | | | | | | | | | | | | | | | | | | | | | | | |
| $ | 500,945,015 | | $ | 244,367,184 | | | $ | 367,262,815 | | | $ | 132,069,196 | | | $ | 1,409,055,543 | | | $ | 1,292,974,193 | | | $ | 495,997,899 | | | $ | 1,546,378,408 | |
| | | | | | | | | | | | | | | | | | | | | | | | | | | | | | |
| $ | 13,938,149 | | $ | 14,019,040 | | | $ | 20,286,313 | | | $ | 22,761,622 | | | $ | 69,422,644 | | | $ | 85,793,222 | | | $ | 59,757,324 | | | $ | 95,238,971 | |
| | | | | | | | | | | | | | | | | | | | | | | | | | | | | | |
| $ | 173,904 | | $ | 2,360,313 | | | $ | — | | | $ | — | | | $ | — | | | $ | 2,321 | | | $ | 337,294 | | | $ | 1,366,100 | |
| | | | | | | | | | | | | | | | | | | | | | | | | | | | | | |
| $ | — | | $ | — | | | $ | — | | | $ | — | | | $ | — | | | $ | — | | | $ | (81,114 | ) | | $ | — | |
| | | | | | | | | | | | | | | | | | | | | | | | | | | | | | |
| $ | — | | $ | — | | | $ | — | | | $ | — | | | $ | — | | | $ | — | | | $ | — | | | $ | (16,099,775 | ) |
| | | | | | | | | | | | | | | | | | | | | | | | | | | | | | |
See Notes to Financial Statements.
177
STATEMENTS OF OPERATIONS
For the Year Ended December 31, 2008
| | | | | | | | | | | |
| | | Money
Market Fund | | Low-Duration
Bond Fund | | | Medium-Duration
Bond Fund | |
Investment Income | | | | | | | | | | | |
Dividends | | $ | — | | $ | 25,578 | | | $ | 324,687 | |
Income distributions received from affiliated funds | | | 3,255 | | | 922,649 | | | | 1,885,842 | |
Interest | | | 34,691,816 | | | 33,033,067 | | | | 58,272,102 | |
Securities lending | | | 6,096 | | | 480,399 | | | | 475,917 | |
Less foreign taxes withheld | | | — | | | — | | | | — | |
| | | | | | | | | | | |
Total Investment Income | | | 34,701,167 | | | 34,461,693 | | | | 60,958,548 | |
| | | | | | | | | | | |
Expenses | | | | | | | | | | | |
Investment advisory fees | | | 1,727,716 | | | 2,580,715 | | | | 4,503,919 | |
Transfer agent fees: | | | | | | | | | | | |
GS2 shares | | | 3,574 | | | 3,905 | | | | 3,974 | |
GS4 shares | | | 34,221 | | | 20,937 | | | | 23,569 | |
GS6 shares | | | 5,814 | | | 7,307 | | | | 7,345 | |
Custodian fees | | | 12,677 | | | 139,102 | | | | 209,054 | |
Distribution (12b-1) fees: | | | | | | | | | | | |
GS6 shares | | | 6,893 | | | 5,666 | | | | 14,656 | |
Shareholder servicing fees: | | | | | | | | | | | |
GS4 shares | | | 1,860,722 | | | 1,190,604 | | | | 1,787,221 | |
GS6 shares | | | 20,629 | | | 16,964 | | | | 43,872 | |
Accounting and administration fees | | | 239,741 | | | 260,343 | | | | 402,521 | |
Professional fees | | | 43,213 | | | 59,916 | | | | 59,975 | |
Blue sky fees: | | | | | | | | | | | |
GS2 shares | | | 1,894 | | | 1,654 | | | | 1,654 | |
GS4 shares | | | 28,839 | | | 17,171 | | | | 18,497 | |
GS6 shares | | | 2,597 | | | 1,205 | | | | 1,118 | |
Shareholder reporting fees: | | | | | | | | | | | |
GS2 shares | | | 83 | | | 468 | | | | 377 | |
GS4 shares | | | 42,664 | | | 9,467 | | | | 14,575 | |
GS6 shares | | | 454 | | | 190 | | | | 457 | |
Trustee fees | | | 12,500 | | | 9,244 | | | | 14,288 | |
Line of credit facility fees | | | 4,820 | | | 3,407 | | | | 5,214 | |
Dividend expense on securities sold short | | | — | | | — | | | | — | |
Other expenses | | | 147,048 | | | 37,592 | | | | 71,513 | |
| | | | | | | | | | | |
Total expenses | | | 4,196,099 | | | 4,365,857 | | | | 7,183,799 | |
Expenses waived/reimbursed net of amount recaptured(1) | | | 5,760 | | | (606,659 | ) | | | (905,658 | ) |
Fees paid indirectly | | | — | | | — | | | | — | |
| | | | | | | | | | | |
Net expenses | | | 4,201,859 | | | 3,759,198 | | | | 6,278,141 | |
| | | | | | | | | | | |
Net Investment Income | | | 30,499,308 | | | 30,702,495 | | | | 54,680,407 | |
| | | | | | | | | | | |
Realized and Unrealized Gain (Loss) | | | | | | | | | | | |
Net realized gain (loss) from: | | | | | | | | | | | |
Investment securities (net of capital gains taxes of $122,209 for International Equity) | | | 87,123 | | | (1,417,543 | ) | | | 16,540,427 | |
Futures transactions | | | — | | | 838,604 | | | | 6,138,178 | |
Swap agreements | | | — | | | 1,033,764 | | | | (4,631,201 | ) |
Option contracts written | | | — | | | (11,760,654 | ) | | | (13,409,224 | ) |
Option contracts purchased | | | — | | | 18,585,931 | | | | 17,338,130 | |
Foreign currency transactions | | | — | | | 2,968,228 | | | | 3,933,948 | |
| | | | | | | | | | | |
Net realized gain (loss) | | | 87,123 | | | 10,248,330 | | | | 25,910,258 | |
| | | | | | | | | | | |
Net change in unrealized appreciation (depreciation) on: | | | | | | | | | | | |
Investment securities (net of estimated capital gains taxes of $190,597 for International Equity) | | | — | | | (56,891,084 | ) | | | (122,481,056 | ) |
Futures | | | — | | | 5,027,161 | | | | 5,176,828 | |
Swap agreements | | | — | | | (8,303,705 | ) | | | (6,167,224 | ) |
Option contracts written | | | — | | | 147,706 | | | | (3,915,982 | ) |
Option contracts purchased | | | — | | | (1,223,800 | ) | | | 808,818 | |
Foreign currency translations | | | — | | | (913,969 | ) | | | (2,906,651 | ) |
| | | | | | | | | | | |
Net change in unrealized appreciation (depreciation) | | | — | | | (62,157,691 | ) | | | (129,485,267 | ) |
| | | | | | | | | | | |
Net Realized and Unrealized Gain (Loss) | | | 87,123 | | | (51,909,361 | ) | | | (103,575,009 | ) |
| | | | | | | | | | | |
Net Increase (Decrease) in Net Assets Resulting from Operations | | $ | 30,586,431 | | $ | (21,206,866 | ) | | $ | (48,894,602 | ) |
| | | | | | | | | | | |
| (1) | See Note 3a and 3c in Notes to Financial Statements. |
See Notes to Financial Statements.
178
| | | | | | | | | | | | | | | | | | | | | | | | | | | | | | |
Extended-Duration
Bond Fund | | | Global Bond
Fund | | | Equity Index
Fund | | | Real Estate
Securities Fund | | | Value Equity
Fund | | | Growth Equity
Fund | | | Small Cap
Equity Fund | | | International
Equity Fund | |
| $ | 7,982 | | | $ | 113,796 | | | $ | 9,049,222 | | | $ | 3,440,130 | | | $ | 37,983,502 | | | $ | 12,961,049 | | | $ | 3,946,568 | | | $ | 58,523,593 | |
| | 296,497 | | | | 402,773 | | | | 232,249 | | | | 124,556 | | | | 1,065,539 | | | | 1,974,116 | | | | 675,713 | | | | 1,281,618 | |
| | 35,913,780 | | | | 12,517,955 | | | | 35,970 | | | | 15,991 | | | | 113,154 | | | | 185,952 | | | | 1,970,688 | | | | 87,913 | |
| | 105,472 | | | | 77,918 | | | | 146,256 | | | | 83,371 | | | | 585,322 | | | | 461,717 | | | | 1,118,187 | | | | 2,037,121 | |
| | — | | | | (4,266 | ) | | | — | | | | (3,279 | ) | | | (65,660 | ) | | | (48,832 | ) | | | (9,693 | ) | | | (4,866,534 | ) |
| | | | | | | | | | | | | | | | | | | | | | | | | | | | | | | |
| | 36,323,731 | | | | 13,108,176 | | | | 9,463,697 | | | | 3,660,769 | | | | 39,681,857 | | | | 15,534,002 | | | | 7,701,463 | | | | 57,063,711 | |
| | | | | | | | | | | | | | | | | | | | | | | | | | | | | | | |
| | 2,342,410 | | | | 737,407 | | | | 613,523 | | | | 942,460 | | | | 8,489,976 | | | | 11,530,020 | | | | 4,336,296 | | | | 13,879,861 | |
| | 3,905 | | | | — | | | | 3,916 | | | | — | | | | 3,981 | | | | 3,945 | | | | 4,022 | | | | 4,190 | |
| | 23,774 | | | | 4,025 | | | | 25,776 | | | | 21,712 | | | | 31,305 | | | | 27,443 | | | | 29,688 | | | | 38,677 | |
| | 7,323 | | | | — | | | | 7,321 | | | | — | | | | 7,413 | | | | 7,387 | | | | 7,359 | | | | 7,356 | |
| | 35,208 | | | | 71,064 | | | | 35,779 | | | | 22,262 | | | | 64,698 | | | | 66,536 | | | | 129,386 | | | | 1,345,710 | |
| | 16,196 | | | | — | | | | 614 | | | | — | | | | 15,160 | | | | 11,220 | | | | 15,189 | | | | 22,577 | |
| | 799,974 | | | | 312,622 | | | | 647,630 | | | | 200,218 | | | | 2,178,136 | | | | 2,227,757 | | | | 704,066 | | | | 2,257,950 | |
| | 48,472 | | | | — | | | | 2,053 | | | | — | | | | 45,293 | | | | 33,580 | | | | 45,327 | | | | 67,338 | |
| | 131,726 | | | | 85,844 | | | | 105,029 | | | | 31,015 | | | | 296,827 | | | | 301,641 | | | | 156,758 | | | | 542,909 | |
| | 53,698 | | | | 48,078 | | | | 65,922 | | | | 53,905 | | | | 65,923 | | | | 52,135 | | | | 52,164 | | | | 52,980 | |
| | 1,654 | | | | — | | | | 1,654 | | | | — | | | | 1,654 | | | | 1,654 | | | | 1,654 | | | | 1,654 | |
| | 17,165 | | | | 16,249 | | | | 15,171 | | | | 18,106 | | | | 19,561 | | | | 12,203 | | | | 15,389 | | | | 19,848 | |
| | 1,297 | | | | — | | | | 1,205 | | | | — | | | | 1,150 | | | | 1,147 | | | | 1,323 | | | | 1,362 | |
| | 98 | | | | — | | | | 266 | | | | — | | | | 372 | | | | 319 | | | | 745 | | | | 426 | |
| | 15,444 | | | | 5,320 | | | | 19,212 | | | | 12,436 | | | | 29,453 | | | | 19,306 | | | | 27,567 | | | | 49,264 | |
| | 66 | | | | — | | | | 223 | | | | — | | | | 571 | | | | 549 | | | | — | | | | 362 | |
| | 6,575 | | | | 1,565 | | | | 5,434 | | | | 1,002 | | | | 17,248 | | | | 17,648 | | | | 5,721 | | | | 17,533 | |
| | 2,394 | | | | 613 | | | | 1,407 | | | | 450 | | | | 6,402 | | | | 6,567 | | | | 2,174 | | | | 6,788 | |
| | — | | | | — | | | | — | | | | — | | | | — | | | | — | | | | — | | | | 27,812 | |
| | 20,389 | | | | 35,342 | | | | 36,861 | | | | 12,222 | | | | 47,067 | | | | 44,385 | | | | 37,534 | | | | 185,374 | |
| | | | | | | | | | | | | | | | | | | | | | | | | | | | | | | |
| | 3,527,768 | | | | 1,318,129 | | | | 1,588,996 | | | | 1,315,788 | | | | 11,322,190 | | | | 14,365,442 | | | | 5,572,362 | | | | 18,529,971 | |
| | (100,954 | ) | | | (30,442 | ) | | | (179,764 | ) | | | 16,763 | | | | (144,307 | ) | | | (1,118,630 | ) | | | (360,040 | ) | | | (2,343,428 | ) |
| | — | | | | — | | | | — | | | | — | | | | (176,335 | ) | | | (151,169 | ) | | | (60,677 | ) | | | (103,181 | ) |
| | | | | | | | | | | | | | | | | | | | | | | | | | | | | | | |
| | 3,426,814 | | | | 1,287,687 | | | | 1,409,232 | | | | 1,332,551 | | | | 11,001,548 | | | | 13,095,643 | | | | 5,151,645 | | | | 16,083,362 | |
| | | | | | | | | | | | | | | | | | | | | | | | | | | | | | | |
| | 32,896,917 | | | | 11,820,489 | | | | 8,054,465 | | | | 2,328,218 | | | | 28,680,309 | | | | 2,438,359 | | | | 2,549,818 | | | | 40,980,349 | |
| | | | | | | | | | | | | | | | | | | | | | | | | | | | | | | |
| | 2,208,080 | | | | (3,517,688 | ) | | | 961,646 | | | | (42,284,244 | ) | | | (93,471,290 | ) | | | (51,355,971 | ) | | | (59,839,487 | ) | | | (69,310,400 | ) |
| | — | | | | 1,091,187 | | | | (4,797,621 | ) | | | (2,209,816 | ) | | | (24,828,270 | ) | | | (26,527,103 | ) | | | (28,946,183 | ) | | | (20,900,214 | ) |
| | — | | | | — | | | | — | | | | — | | | | — | | | | — | | | | — | | | | 111,298 | |
| | — | | | | — | | | | — | | | | — | | | | — | | | | — | | | | (7,590 | ) | | | — | |
| | — | | | | (327,030 | ) | | | — | | | | — | | | | — | | | | — | | | | 59,251 | | | | — | |
| | 1,328,656 | | | | 1,982,382 | | | | — | | | | — | | | | — | | | | 3,395 | | | | 9,779 | | | | 2,827,897 | |
| | | | | | | | | | | | | | | | | | | | | | | | | | | | | | | |
| | 3,536,736 | | | | (771,149 | ) | | | (3,835,975 | ) | | | (44,494,060 | ) | | | (118,299,560 | ) | | | (77,879,679 | ) | | | (88,724,230 | ) | | | (87,271,419 | ) |
| | | | | | | | | | | | | | | | | | | | | | | | | | | | | | | |
| | (81,908,489 | ) | | | (57,221,141 | ) | | | (186,771,307 | ) | | | (8,778,841 | ) | | | (510,162,489 | ) | | | (642,159,009 | ) | | | (115,891,794 | ) | | | (776,496,385 | ) |
| | — | | | | (222,462 | ) | | | 304,857 | | | | 216,722 | | | | 503,650 | | | | 1,081,730 | | | | 2,609,053 | | | | 264,415 | |
| | — | | | | — | | | | — | | | | — | | | | — | | | | — | | | | — | | | | (116,543 | ) |
| | — | | | | — | | | | — | | | | — | | | | — | | | | — | | | | (135,262 | ) | | | — | |
| | — | | | | 134,869 | | | | — | | | | — | | | | — | | | | — | | | | — | | | | — | |
| | (67,353 | ) | | | 1,118,891 | | | | — | | | | — | | | | — | | | | 2 | | | | (23,345 | ) | | | (422,997 | ) |
| | | | | | | | | | | | | | | | | | | | | | | | | | | | | | | |
| | (81,975,842 | ) | | | (56,189,843 | ) | | | (186,466,450 | ) | | | (8,562,119 | ) | | | (509,658,839 | ) | | | (641,077,277 | ) | | | (113,441,348 | ) | | | (776,771,510 | ) |
| | | | | | | | | | | | | | | | | | | | | | | | | | | | | | | |
| | (78,439,106 | ) | | | (56,960,992 | ) | | | (190,302,425 | ) | | | (53,056,179 | ) | | | (627,958,399 | ) | | | (718,956,956 | ) | | | (202,165,578 | ) | | | (864,042,929 | ) |
| | | | | | | | | | | | | | | | | | | | | | | | | | | | | | | |
| $ | (45,542,189 | ) | | $ | (45,140,503 | ) | | $ | (182,247,960 | ) | | $ | (50,727,961 | ) | | $ | (599,278,090 | ) | | $ | (716,518,597 | ) | | $ | (199,615,760 | ) | | $ | (823,062,580 | ) |
| | | | | | | | | | | | | | | | | | | | | | | | | | | | | | | |
See Notes to Financial Statements.
179
STATEMENTS OF CHANGES IN NET ASSETS
| | | | | | | | |
| | | Money Market Fund | |
| | | For the Year Ended | |
| | | 12/31/08 | | | 12/31/07 | |
Operations: | | | | | | | | |
Net investment income | | $ | 30,499,308 | | | $ | 53,685,126 | |
Net realized gain (loss) on investment securities, foreign currency transactions and derivative transactions | | | 87,123 | | | | 6,543 | |
Net change in unrealized appreciation (depreciation) on investment securities, foreign currency translations and derivative transactions | | | — | | | | — | |
| | | | | | | | |
Net increase (decrease) in net assets resulting from operations | | | 30,586,431 | | | | 53,691,669 | |
| | | | | | | | |
Dividends and Distributions to Shareholders: | | | | | | | | |
Dividends from net investment income | | | | | | | | |
GS2 shares | | | (3,742,477 | ) | | | (5,538,291 | ) |
GS4 shares | | | (26,602,255 | ) | | | (47,809,133 | ) |
GS6 shares | | | (154,576 | ) | | | (238,657 | ) |
GS8 shares(1) | | | — | | | | (99,045 | ) |
Distributions from net realized capital gains | | | | | | | | |
GS2 shares | | | — | | | | — | |
GS4 shares | | | — | | | | — | |
GS6 shares | | | — | | | | — | |
GS8 shares(1) | | | — | | | | — | |
| | | | | | | | |
Total dividends and distributions | | | (30,499,308 | ) | | | (53,685,126 | ) |
| | | | | | | | |
Capital Share Transactions: | | | | | | | | |
Proceeds from shares sold | | | | | | | | |
GS2 shares | | | 174,901,124 | | | | 178,932,360 | |
GS4 shares | | | 4,070,538,346 | | | | 3,334,006,987 | |
GS6 shares | | | 3,546,544 | | | | 2,164,993 | |
GS8 shares(1) | | | — | | | | 214,065 | |
Proceeds from exchange of GS8 shares for GS6 shares(1) | | | | | | | | |
GS6 shares | | | — | | | | 301,818 | |
GS8 shares | | | — | | | | (301,818 | ) |
Reinvestment of dividends and distributions | | | | | | | | |
GS2 shares | | | 3,367,839 | | | | 4,895,984 | |
GS4 shares | | | 16,558,471 | | | | 24,364,936 | |
GS6 shares | | | 154,558 | | | | 238,657 | |
GS8 shares(1) | | | — | | | | 96,906 | |
| | | | | | | | |
Total proceeds from shares sold and reinvested | | | 4,269,066,882 | | | | 3,544,914,888 | |
| | | | | | | | |
Value of shares redeemed | | | | | | | | |
GS2 shares | | | (119,120,727 | ) | | | (171,806,826 | ) |
GS4 shares | | | (4,056,623,451 | ) | | | (3,349,363,902 | ) |
GS6 shares | | | (873,423 | ) | | | (1,510,697 | ) |
GS8 shares(1) | | | — | | | | (5,466,591 | ) |
| | | | | | | | |
Total value of shares redeemed | | | (4,176,617,601 | ) | | | (3,528,148,016 | ) |
| | | | | | | | |
Net increase (decrease) from capital share transactions(2) | | | 92,449,281 | | | | 16,766,872 | |
| | | | | | | | |
Total increase (decrease) in net assets | | | 92,536,404 | | | | 16,773,415 | |
| | | | | | | | |
Net Assets: | | | | | | | | |
Beginning of Year | | | 1,058,155,867 | | | | 1,041,382,452 | |
| | | | | | | | |
End of Year* | | $ | 1,150,692,271 | | | $ | 1,058,155,867 | |
| | | | | | | | |
| | | | | | | | |
* Including undistributed (distributions in excess of) net investment income | | $ | 84,502 | | | $ | — | |
| | | | | | | | |
| (1) | See Note 1 in Notes to Financial Statements. |
| (2) | See Note 7 in Notes to Financial Statements. |
See Notes to Financial Statements.
180
| | | | | | | | | | | | | | | | | | | | | | | | | | | | | | |
| Low-Duration Bond Fund | | | Medium-Duration Bond Fund | | | Extended-Duration Bond Fund | | | Global Bond Fund | |
| For the Year Ended | | | For the Year Ended | | | For the Year Ended | | | For the Year Ended | |
| 12/31/08 | | | 12/31/07 | | | 12/31/08 | | | 12/31/07 | | | 12/31/08 | | | 12/31/07 | | | 12/31/08 | | | 12/31/07 | |
| | | | | | | | | | | | | | | | | | | | | | | | | | | | | | |
| $ | 30,702,495 | | | $ | 36,001,977 | | | $ | 54,680,407 | | | $ | 59,912,304 | | | $ | 32,896,917 | | | $ | 28,299,838 | | | $ | 11,820,489 | | | $ | 7,087,278 | |
| 10,248,330 | | | | 361,395 | | | | 25,910,258 | | | | 12,982,749 | | | | 3,536,736 | | | | 6,718,044 | | | | (771,149 | ) | | | 1,363,429 | |
| (62,157,691 | ) | | | 11,142,622 | | | | (129,485,267 | ) | | | 5,195,793 | | | | (81,975,842 | ) | | | 10,327,793 | | | | (56,189,843 | ) | | | (441,595 | ) |
| | | | | | | | | | | | | | | | | | | | | | | | | | | | | | | |
| | (21,206,866 | ) | | | 47,505,994 | | | | (48,894,602 | ) | | | 78,090,846 | | | | (45,542,189 | ) | | | 45,345,675 | | | | (45,140,503 | ) | | | 8,009,112 | |
| | | | | | | | | | | | | | | | | | | | | | | | | | | | | | | |
| | | | | | | | | | | | | | | | | | | | | | | | | | | | | | |
| | | | | | | | | | | | | | | | | | | | | | | | | | | | | | |
| | (7,859,812 | ) | | | (7,672,524 | ) | | | (11,645,709 | ) | | | (10,666,648 | ) | | | (8,411,202 | ) | | | (6,092,828 | ) | | | — | | | | — | |
| | (25,918,642 | ) | | | (26,263,698 | ) | | | (44,817,988 | ) | | | (49,428,227 | ) | | | (24,338,771 | ) | | | (21,342,760 | ) | | | (13,354,129 | ) | | | (7,440,952 | ) |
| | (331,598 | ) | | | (283,996 | ) | | | (1,129,043 | ) | | | (987,213 | ) | | | (1,871,633 | ) | | | (1,340,200 | ) | | | — | | | | — | |
| | — | | | | (97,187 | ) | | | — | | | | (131,335 | ) | | | — | | | | (148,346 | ) | | | — | | | | — | |
| | | | | | | | | | | | | | | | | | | | | | | | | | | | | | |
| | — | | | | — | | | | (5,325,358 | ) | | | (57,748 | ) | | | (1,551,879 | ) | | | (1,089,726 | ) | | | — | | | | — | |
| | — | | | | — | | | | (20,940,453 | ) | | | (261,757 | ) | | | (4,629,238 | ) | | | (4,016,550 | ) | | | (1,286,826 | ) | | | (362,235 | ) |
| | — | | | | — | | | | (605,256 | ) | | | (5,694 | ) | | | (351,828 | ) | | | (250,814 | ) | | | — | | | | — | |
| | — | | | | — | | | | — | | | | — | | | | — | | | | (88,500 | ) | | | — | | | | — | |
| | | | | | | | | | | | | | | | | | | | | | | | | | | | | | | |
| | (34,110,052 | ) | | | (34,317,405 | ) | | | (84,463,807 | ) | | | (61,538,622 | ) | | | (41,154,551 | ) | | | (34,369,724 | ) | | | (14,640,955 | ) | | | (7,803,187 | ) |
| | | | | | | | | | | | | | | | | | | | | | | | | | | | | | | |
| | | | | | | | | | | | | | | | | | | | | | | | | | | | | | |
| | | | | | | | | | | | | | | | | | | | | | | | | | | | | | |
| | 13,419,447 | | | | 31,333,771 | | | | 26,755,295 | | | | 39,644,411 | | | | 12,386,781 | | | | 21,710,537 | | | | | | | | — | |
| | 74,611,719 | | | | 66,354,406 | | | | 94,933,988 | | | | 101,252,003 | | | | 27,666,880 | | | | 59,533,256 | | | | 122,278,692 | | | | 20,015,199 | |
| | 598,495 | | | | 62,248 | | | | 708,473 | | | | 1,034,684 | | | | 170,965 | | | | 154,752 | | | | | | | | — | |
| | — | | | | 3,014 | | | | — | | | | 22,979 | | | | — | | | | 4,960 | | | | — | | | | — | |
| | | | | | | | | | | | | | | | | | | | | | | | | | | | | | |
| | — | | | | 32,919 | | | | — | | | | 62,954 | | | | — | | | | 14,692 | | | | — | | | | — | |
| | — | | | | (32,919 | ) | | | — | | | | (62,954 | ) | | | — | | | | (14,692 | ) | | | — | | | | — | |
| | | | | | | | | | | | | | | | | | | | | | | | | | | | | | |
| | 7,855,439 | | | | 7,645,639 | | | | 16,454,325 | | | | 10,671,347 | | | | 9,955,235 | | | | 7,157,871 | | | | — | | | | — | |
| | 25,915,895 | | | | 26,261,575 | | | | 65,754,384 | | | | 49,687,483 | | | | 28,967,078 | | | | 25,352,570 | | | | 14,640,955 | | | | 7,803,187 | |
| | 331,598 | | | | 283,996 | | | | 1,734,299 | | | | 992,907 | | | | 2,223,461 | | | | 1,591,014 | | | | — | | | | — | |
| | — | | | | 97,187 | | | | — | | | | 131,335 | | | | — | | | | 236,846 | | | | — | | | | — | |
| | | | | | | | | | | | | | | | | | | | | | | | | | | | | | | |
| | 122,732,593 | | | | 132,041,836 | | | | 206,340,764 | | | | 203,437,149 | | | | 81,370,400 | | | | 115,741,806 | | | | 136,919,647 | | | | 27,818,386 | |
| | | | | | | | | | | | | | | | | | | | | | | | | | | | | | | |
| | | | | | | | | | | | | | | | | | | | | | | | | | | | | | |
| | (38,248,100 | ) | | | (11,842,391 | ) | | | (58,514,727 | ) | | | (10,331,020 | ) | | | (17,257,194 | ) | | | (11,480,654 | ) | | | — | | | | — | |
| | (206,206,149 | ) | | | (137,993,498 | ) | | | (394,054,838 | ) | | | (199,257,167 | ) | | | (132,897,070 | ) | | | (65,500,790 | ) | | | (35,006,076 | ) | | | (7,326,950 | ) |
| | (311,460 | ) | | | (25,141 | ) | | | (200,010 | ) | | | (996,214 | ) | | | (165,272 | ) | | | (559 | ) | | | — | | | | — | |
| | — | | | | (5,027,787 | ) | | | — | | | | (5,325,871 | ) | | | | | | | (5,555,877 | ) | | | — | | | | — | |
| | | | | | | | | | | | | | | | | | | | | | | | | | | | | | | |
| | (244,765,709 | ) | | | (154,888,817 | ) | | | (452,769,575 | ) | | | (215,910,272 | ) | | | (150,319,536 | ) | | | (82,537,880 | ) | | | (35,006,076 | ) | | | (7,326,950 | ) |
| | | | | | | | | | | | | | | | | | | | | | | | | | | | | | | |
| | (122,033,116 | ) | | | (22,846,981 | ) | | | (246,428,811 | ) | | | (12,473,123 | ) | | | (68,949,136 | ) | | | 33,203,926 | | | | 101,913,571 | | | | 20,491,436 | |
| | | | | | | | | | | | | | | | | | | | | | | | | | | | | | | |
| | (177,350,034 | ) | | | (9,658,392 | ) | | | (379,787,220 | ) | | | 4,079,101 | | | | (155,645,876 | ) | | | 44,179,877 | | | | 42,132,113 | | | | 20,697,361 | |
| | | | | | | | | | | | | | | | | | | | | | | | | | | | | | | |
| | | | | | | | | | | | | | | | | | | | | | | | | | | | | | |
| | 804,191,728 | | | | 813,850,120 | | | | 1,245,153,958 | | | | 1,241,074,857 | | | | 593,250,531 | | | | 549,070,654 | | | | 125,332,663 | | | | 104,635,302 | |
| | | | | | | | | | | | | | | | | | | | | | | | | | | | | | | |
| $ | 626,841,694 | | | $ | 804,191,728 | | | $ | 865,366,738 | | | $ | 1,245,153,958 | | | $ | 437,604,655 | | | $ | 593,250,531 | | | $ | 167,464,776 | | | $ | 125,332,663 | |
| | | | | | | | | | | | | | | | | | | | | | | | | | | | | | | |
| | | | | | | | | | | | | | | | | | | | | | | | | | | | | | |
| $ | 2,004,153 | | | $ | 1,439,714 | | | $ | 3,256,156 | | | $ | 681,069 | | | $ | (55,475 | ) | | $ | 416,968 | | | $ | (16,036 | ) | | $ | 1,642 | |
| | | | | | | | | | | | | | | | | | | | | | | | | | | | | | | |
See Notes to Financial Statements.
181
STATEMENTS OF CHANGES IN NET ASSETS
| | | | | | | | | | | | | | | | |
| | | Equity Index Fund | | | Real Estate Securities Fund | |
| | | For the Year Ended | | | For the Year Ended | |
| | | 12/31/08 | | | 12/31/07 | | | 12/31/08 | | | 12/31/07 | |
Operations: | | | | | | | | | | | | | | | | |
Net investment income | | $ | 8,054,465 | | | $ | 8,787,369 | | | $ | 2,328,218 | | | $ | 1,174,244 | |
Net realized gain (loss) on investment securities, foreign currency transactions and derivative transactions | | | (3,835,975 | ) | | | 25,461,196 | | | | (44,494,060 | ) | | | 9,946,333 | |
Net change in unrealized appreciation (depreciation) on investment securities, foreign currency translations and derivative transactions | | | (186,466,450 | ) | | | (7,317,962 | ) | | | (8,562,119 | ) | | | (33,430,076 | ) |
| | | | | | | | | | | | | | | | |
Net increase (decrease) in net assets resulting from operations | | | (182,247,960 | ) | | | 26,930,603 | | | | (50,727,961 | ) | | | (22,309,499 | ) |
| | | | | | | | | | | | | | | | |
Dividends and Distributions to Shareholders: | | | | | | | | | | | | | | | | |
Dividends from net investment income | | | | | | | | | | | | | | | | |
GS2 shares | | | (1,831,863 | ) | | | (2,396,727 | ) | | | — | | | | — | |
GS4 shares | | | (4,586,589 | ) | | | (6,279,342 | ) | | | (2,388,143 | ) | | | (1,114,099 | ) |
GS6 shares | | | (18,532 | ) | | | (143,849 | ) | | | — | | | | — | |
Distributions from net realized capital gains | | | | | | | | | | | | | | | | |
GS2 shares | | | (695,874 | ) | | | (5,483,594 | ) | | | — | | | | — | |
GS4 shares | | | (1,977,420 | ) | | | (16,735,167 | ) | | | — | | | | (12,550,773 | ) |
GS6 shares | | | (7,511 | ) | | | (42,505 | ) | | | — | | | | — | |
Return of Capital | | | | | | | | | | | | | | | | |
GS2 shares | | | — | | | | — | | | | — | | | | — | |
GS4 shares | | | — | | | | — | | | | (99,004 | ) | | | — | |
GS6 shares | | | — | | | | — | | | | — | | | | — | |
| | | | | | | | | | | | | | | | |
Total dividends and distributions | | | (9,117,789 | ) | | | (31,081,184 | ) | | | (2,487,147 | ) | | | (13,664,872 | ) |
| | | | | | | | | | | | | | | | |
Capital Share Transactions: | | | | | | | | | | | | | | | | |
Proceeds from shares sold | | | | | | | | | | | | | | | | |
GS2 shares | | | 7,040,123 | | | | 17,318,452 | | | | — | | | | — | |
GS4 shares | | | 22,884,918 | | | | 42,486,377 | | | | 84,159,228 | | | | 111,957,141 | |
GS6 shares | | | 524,851 | | | | 310,469 | | | | — | | | | — | |
GS8 shares(1) | | | — | | | | 80,168 | | | | — | | | | — | |
Proceeds from exchange of GS8 shares for GS6 shares(1) | | | | | | | | | | | | | | | | |
GS6 shares | | | — | | | | 129,566 | | | | — | | | | — | |
GS8 shares | | | — | | | | (129,566 | ) | | | — | | | | — | |
Reinvestment of dividends and distributions | | | | | | | | | | | | | | | | |
GS2 shares | | | 2,524,043 | | | | 7,880,321 | | | | — | | | | — | |
GS4 shares | | | 6,563,344 | | | | 23,014,028 | | | | 2,446,782 | | | | 13,663,336 | |
GS6 shares | | | 26,043 | | | | 186,354 | | | | — | | | | — | |
| | | | | | | | | | | | | | | | |
Total proceeds from shares sold and reinvested | | | 39,563,322 | | | | 91,276,169 | | | | 86,606,010 | | | | 125,620,477 | |
| | | | | | | | | | | | | | | | |
Value of shares redeemed | | | | | | | | | | | | | | | | |
GS2 shares | | | (8,877,183 | ) | | | (15,312,753 | ) | | | — | | | | — | |
GS4 shares | | | (53,088,621 | ) | | | (100,650,924 | ) | | | (49,586,856 | ) | | | (99,906,353 | ) |
GS6 shares | | | (197,779 | ) | | | (14,837,734 | ) | | | — | | | | — | |
GS8 shares(1) | | | — | | | | (6,709,689 | ) | | | — | | | | — | |
| | | | | | | | | | | | | | | | |
Total value of shares redeemed | | | (62,163,583 | ) | | | (137,511,100 | ) | | | (49,586,856 | ) | | | (99,906,353 | ) |
| | | | | | | | | | | | | | | | |
Net increase (decrease) from capital share transactions(2) | | | (22,600,261 | ) | | | (46,234,931 | ) | | | 37,019,154 | | | | 25,714,124 | |
| | | | | | | | | | | | | | | | |
Total increase (decrease) in net assets | | | (213,966,010 | ) | | | (50,385,512 | ) | | | (16,195,954 | ) | | | (10,260,247 | ) |
| | | | | | | | | | | | | | | | |
Net Assets: | | | | | | | | | | | | | | | | |
Beginning of Year | | | 511,159,564 | | | | 561,545,076 | | | | 96,775,203 | | | | 107,035,450 | |
| | | | | | | | | | | | | | | | |
End of Year* | | $ | 297,193,554 | | | $ | 511,159,564 | | | $ | 80,579,249 | | | $ | 96,775,203 | |
| | | | | | | | | | | | | | | | |
| | | | | | | | | | | | | | | | |
* Including undistributed (distributions in excess of) net investment income | | $ | 1,622,559 | | | $ | 7,144 | | | $ | — | | | $ | 59,925 | |
| | | | | | | | | | | | | | | | |
(1) | See Note 1 in Notes to Financial Statements. |
(2) | See Note 7 in Notes to Financial Statements. |
See Notes to Financial Statements.
182
| | | | | | | | | | | | | | | | | | | | | | | | | | | | | | |
| Value Equity Fund | | | Growth Equity Fund | | | Small Cap Equity Fund | | | International Equity Fund | |
| For the Year Ended | | | For the Year Ended | | | For the Year Ended | | | For the Year Ended | |
| 12/31/08 | | | 12/31/07 | | | 12/31/08 | | | 12/31/07 | | | 12/31/08 | | | 12/31/07 | | | 12/31/08 | | | 12/31/07 | |
| | | | | | | | | | | | | | | | | | | | | | | | | | | | | | |
| $ | 28,680,309 | | | $ | 25,750,914 | | | $ | 2,438,359 | | | $ | 2,291,785 | | | $ | 2,549,818 | | | $ | 2,031,110 | | | $ | 40,980,349 | | | $ | 22,903,965 | |
| (118,299,560 | ) | | | 109,509,564 | | | | (77,879,679 | ) | | | 101,225,925 | | | | (88,724,230 | ) | | | 53,354,323 | | | | (87,271,419 | ) | | | 251,442,073 | |
| (509,658,839 | ) | | | (156,542,760 | ) | | | (641,077,277 | ) | | | 109,546,540 | | | | (113,441,348 | ) | | | (50,321,205 | ) | | | (776,771,510 | ) | | | (80,256,374 | ) |
| | | | | | | | | | | | | | | | | | | | | | | | | | | | | | | |
| | (599,278,090 | ) | | | (21,282,282 | ) | | | (716,518,597 | ) | | | 213,064,250 | | | | (199,615,760 | ) | | | 5,064,228 | | | | (823,062,580 | ) | | | 194,089,664 | |
| | | | | | | | | | | | | | | | | | | | | | | | | | | | | | | |
| | | | | | | | | | | | | | | | | | | | | | | | | | | | | | |
| | | | | | | | | | | | | | | | | | | | | | | | | | | | | | |
| | (5,427,637 | ) | | | (6,198,596 | ) | | | (760,505 | ) | | | (764,503 | ) | | | (614,201 | ) | | | (513,194 | ) | | | (9,679,437 | ) | | | (4,950,877 | ) |
| | (15,120,026 | ) | | | (19,213,656 | ) | | | (1,656,101 | ) | | | (1,487,807 | ) | | | (1,982,895 | ) | | | (1,456,206 | ) | | | (32,423,305 | ) | | | (17,856,534 | ) |
| | (371,566 | ) | | | (432,944 | ) | | | (2,559 | ) | | | — | | | | (103,815 | ) | | | (43,468 | ) | | | (701,696 | ) | | | (395,926 | ) |
| | | | | | | | | | | | | | | | | | | | | | | | | | | | | | |
| | (1,791,283 | ) | | | (24,783,302 | ) | | | — | | | | — | | | | — | | | | (11,936,809 | ) | | | (8,347,976 | ) | | | (45,519,702 | ) |
| | (5,776,508 | ) | | | (88,434,175 | ) | | | — | | | | — | | | | — | | | | (52,445,036 | ) | | | (30,093,735 | ) | | | (192,888,593 | ) |
| | (145,613 | ) | | | (2,026,807 | ) | | | — | | | | — | | | | — | | | | (2,922,577 | ) | | | (687,438 | ) | | | (4,700,995 | ) |
| | | | | | | | | | | | | | | | | | | | | | | | | | | | | | |
| | — | | | | — | | | | — | | | | — | | | | (168,554 | ) | | | — | | | | — | | | | — | |
| | — | | | | — | | | | — | | | | — | | | | (544,164 | ) | | | — | | | | — | | | | — | |
| | — | | | | — | | | | — | | | | — | | | | (28,490 | ) | | | — | | | | — | | | | — | |
| | | | | | | | | | | | | | | | | | | | | | | | | | | | | | | |
| | (28,632,633 | ) | | | (141,089,480 | ) | | | (2,419,165 | ) | | | (2,252,310 | ) | | | (3,442,119 | ) | | | (69,317,290 | ) | | | (81,933,587 | ) | | | (266,312,627 | ) |
| | | | | | | | | | | | | | | | | | | | | | | | | | | | | | | |
| | | | | | | | | | | | | | | | | | | | | | | | | | | | | | |
| | | | | | | | | | | | | | | | | | | | | | | | | | | | | | |
| | 26,364,928 | | | | 69,148,249 | | | | 28,172,361 | | | | 54,095,628 | | | | 20,033,750 | | | | 17,551,589 | | | | 104,596,517 | | | | 76,072,933 | |
| | 119,844,786 | | | | 181,185,102 | | | | 122,481,304 | | | | 135,306,396 | | | | 38,592,188 | | | | 56,487,534 | | | | 275,354,383 | | | | 194,576,950 | |
| | 384,635 | | | | 2,030,826 | | | | 295,093 | | | | 2,907,748 | | | | 274,544 | | | | 1,233,647 | | | | 699,797 | | | | 1,761,039 | |
| | — | | | | 176,742 | | | | 1,150,180 | | | | 80,594 | | | | — | | | | 66,601 | | | | — | | | | 179,320 | |
| | | | | | | | | | | | | | | | | | | | | | | | | | | | | | |
| | — | | | | 445,015 | | | | — | | | | 181,274 | | | | — | | | | 174,140 | | | | — | | | | 333,450 | |
| | — | | | | (445,015 | ) | | | — | | | | (181,274 | ) | | | — | | | | (174,140 | ) | | | — | | | | (333,450 | ) |
| | | | | | | | | | | | | | | | | | | | | | | | | | | | | | |
| | 7,209,480 | | | | 30,977,959 | | | | 759,609 | | | | 764,503 | | | | 781,539 | | | | 12,450,002 | | | | 17,999,891 | | | | 50,460,024 | |
| | 20,894,776 | | | | 107,637,522 | | | | 1,656,068 | | | | 1,487,784 | | | | 2,526,659 | | | | 53,895,325 | | | | 62,512,863 | | | | 210,719,957 | |
| | 517,179 | | | | 2,459,750 | | | | 2,559 | | | | — | | | | 132,305 | | | | 2,966,045 | | | | 1,389,134 | | | | 5,096,921 | |
| | | | | | | | | | | | | | | | | | | | | | | | | | | | | | | |
| | 175,215,784 | | | | 393,616,150 | | | | 154,517,174 | | | | 194,642,653 | | | | 62,340,985 | | | | 144,650,743 | | | | 462,552,585 | | | | 538,867,144 | |
| | | | | | | | | | | | | | | | | | | | | | | | | | | | | | | |
| | | | | | | | | | | | | | | | | | | | | | | | | | | | | | |
| | (28,656,106 | ) | | | (18,557,205 | ) | | | (26,886,067 | ) | | | (20,464,151 | ) | | | (16,975,850 | ) | | | (8,315,547 | ) | | | (38,548,254 | ) | | | (27,617,520 | ) |
| | (175,032,062 | ) | | | (188,885,419 | ) | | | (186,516,510 | ) | | | (172,307,927 | ) | | | (71,310,720 | ) | | | (79,779,484 | ) | | | (144,223,290 | ) | | | (207,849,507 | ) |
| | (127,031 | ) | | | (1,867,609 | ) | | | (149,108 | ) | | | (2,710,726 | ) | | | (74,701 | ) | | | (1,121,796 | ) | | | (300,712 | ) | | | (1,211,740 | ) |
| | — | | | | (7,266,923 | ) | | | — | | | | (6,136,980 | ) | | | — | | | | (6,946,803 | ) | | | — | | | | (8,483,456 | ) |
| | | | | | | | | | | | | | | | | | | | | | | | | | | | | | | |
| | (203,815,199 | ) | | | (216,577,156 | ) | | | (213,551,685 | ) | | | (201,619,784 | ) | | | (88,361,271 | ) | | | (96,163,630 | ) | | | (183,072,256 | ) | | | (245,162,223 | ) |
| | | | | | | | | | | | | | | | | | | | | | | | | | | | | | | |
| | (28,599,415 | ) | | | 177,038,994 | | | | (59,034,511 | ) | | | (6,977,131 | ) | | | (26,020,286 | ) | | | 48,487,113 | | | | 279,480,329 | | | | 293,704,921 | |
| | | | | | | | | | | | | | | | | | | | | | | | | | | | | | | |
| | (656,510,138 | ) | | | 14,667,232 | | | | (777,972,273 | ) | | | 203,834,809 | | | | (229,078,165 | ) | | | (15,765,949 | ) | | | (625,515,838 | ) | | | 221,481,958 | |
| | | | | | | | | | | | | | | | | | | | | | | | | | | | | | | |
| | | | | | | | | | | | | | | | | | | | | | | | | | | | | | |
| | 1,656,023,020 | | | | 1,641,355,788 | | | | 1,744,315,422 | | | | 1,540,480,613 | | | | 561,159,763 | | | | 576,925,712 | | | | 1,707,997,672 | | | | 1,486,515,714 | |
| | | | | | | | | | | | | | | | | | | | | | | | | | | | | | | |
| $ | 999,512,882 | | | $ | 1,656,023,020 | | | $ | 966,343,149 | | | $ | 1,744,315,422 | | | $ | 332,081,598 | | | $ | 561,159,763 | | | $ | 1,082,481,834 | | | $ | 1,707,997,672 | |
| | | | | | | | | | | | | | | | | | | | | | | | | | | | | | | |
| | | | | | | | | | | | | | | | | | | | | | | | | | | | | | |
$ | 7,752,269 | | | $ | — | | | $ | 38,545 | | | $ | 15,956 | | | $ | (21,274 | ) | | $ | 95,372 | | | $ | 506,726 | | | $ | (3,124,565 | ) |
| | | | | | | | | | | | | | | | | | | | | | | | | | | | | | | |
See Notes to Financial Statements.
183
FINANCIAL HIGHLIGHTS
For a Share Outstanding For the Years Ended December 31, unless otherwise indicated
| | | | | | | | | | | | | | | | | | | | | | | | | | | | | | | | | | | | | | | | | | | | | | |
| | | Ratios to Average Net Assets | | | | |
| | | Net Asset
Value,
Beginning
of Year | | Net Investment
Income | | | Realized
and
Unrealized
Gain
(Loss) on
Investments | | | Dividends
from Net
Investment
Income | | | Distributions
from Net
Realized
Capital
Gains | | | Net Asset
Value,
End of
Year | | Total
Return | | | Net Assets,
End of Year
(000) | | Expenses,
Net | | | Expenses,
Including
Expense
Reduction | | | Expenses,
Before
Waivers and
Expense
Reduction(1) | | | Investment
Income,
Net | | | Investment
Income/
(Loss),
Excluding
Waivers and
Expense
Reduction | | | Portfolio
Turnover
Rate | |
Money Market Fund | |
GS2 Class | | | | | | | | | | | | | | | | | | | | | | | | | | | | | | | | | | | | | | | | | | | | | | |
2008 | | $ | 1.00 | | $ | 0.03 | | | $ | — | † | | $ | (0.03 | ) | | $ | — | | | $ | 1.00 | | 2.95 | % | | $ | 171,739 | | 0.20 | % | | 0.20 | % | | 0.20 | % | | 2.86 | % | | 2.86 | % | | N/A | |
2007 | | | 1.00 | | | 0.05 | | | | — | † | | | (0.05 | ) | | | — | | | | 1.00 | | 5.23 | | | | 112,581 | | 0.23 | | | 0.23 | | | 0.23 | | | 5.11 | | | 5.11 | | | N/A | |
2006 | | | 1.00 | | | 0.05 | | | | — | † | | | (0.05 | ) | | | — | | | | 1.00 | | 4.92 | | | | 100,559 | | 0.26 | | | 0.26 | | | 0.26 | | | 4.82 | | | 4.82 | | | N/A | |
2005 | | | 1.00 | | | 0.03 | | | | — | † | | | (0.03 | ) | | | — | | | | 1.00 | | 3.07 | | | | 93,103 | | 0.27 | | | 0.27 | | | 0.26 | | | 3.03 | | | 3.04 | | | N/A | |
2004 | | | 1.00 | | | 0.01 | | | | — | † | | | (0.01 | ) | | | — | | | | 1.00 | | 1.19 | | | | 61,374 | | 0.27 | | | 0.27 | | | 0.27 | | | 1.17 | | | 1.17 | | | N/A | |
GS4 Class | | | | | | | | | | | | | | | | | | | | | | | | | | | | | | | | | | | | | | | | | | | | | | |
2008 | | $ | 1.00 | | $ | 0.03 | | | $ | — | † | | $ | (0.03 | ) | | $ | — | | | $ | 1.00 | | 2.75 | % | | $ | 970,146 | | 0.40 | %(2) | | 0.40 | %(2) | | 0.40 | %(2) | | 2.72 | % | | 2.72 | % | | N/A | |
2007 | | | 1.00 | | | 0.05 | | | | — | † | | | (0.05 | ) | | | — | | | | 1.00 | | 5.03 | | | | 939,596 | | 0.43 | | | 0.43 | | | 0.43 | | | 4.92 | | | 4.92 | | | N/A | |
2006 | | | 1.00 | | | 0.05 | | | | — | † | | | (0.05 | ) | | | — | | | | 1.00 | | 4.72 | | | | 930,582 | | 0.46 | | | 0.46 | | | 0.46 | | | 4.64 | | | 4.64 | | | N/A | |
2005 | | | 1.00 | | | 0.03 | | | | — | † | | | (0.03 | ) | | | — | | | | 1.00 | | 2.88 | | | | 766,322 | | 0.46 | | | 0.46 | | | 0.46 | | | 2.84 | | | 2.84 | | | N/A | |
2004 | | | 1.00 | | | 0.01 | | | | — | † | | | (0.01 | ) | | | — | | | | 1.00 | | 0.99 | | | | 838,087 | | 0.46 | | | 0.46 | | | 0.45 | | | 0.98 | | | 0.99 | | | N/A | |
GS6 Class | | | | | | | | | | | | | | | | | | | | | | | | | | | | | | | | | | | | | | | | | | | | | | |
2008 | | $ | 1.00 | | $ | 0.02 | | | $ | — | † | | $ | (0.02 | ) | | $ | — | | | $ | 1.00 | | 2.33 | % | | $ | 8,807 | | 0.81 | %(2) | | 0.81 | %(2) | | 0.73 | % | | 2.25 | % | | 2.33 | % | | N/A | |
2007 | | | 1.00 | | | 0.04 | | | | — | † | | | (0.04 | ) | | | — | | | | 1.00 | | 4.59 | | | | 5,979 | | 0.85 | | | 0.85 | | | 0.92 | | | 4.49 | | | 4.42 | | | N/A | |
2006 | | | 1.00 | | | 0.04 | | | | — | † | | | (0.04 | ) | | | — | | | | 1.00 | | 4.29 | | | | 4,784 | | 0.87 | | | 0.87 | | | 1.09 | | | 4.21 | | | 3.99 | | | N/A | |
2005 | | | 1.00 | | | 0.02 | | | | — | † | | | (0.02 | ) | | | — | | | | 1.00 | | 2.50 | | | | 4,587 | | 0.83 | | | 0.83 | | | 1.43 | | | 2.47 | | | 1.87 | | | N/A | |
2004 | | | 1.00 | | | 0.01 | | | | — | † | | | (0.01 | ) | | | — | | | | 1.00 | | 0.73 | | | | 4,476 | | 0.72 | | | 0.72 | | | 1.09 | | | 0.68 | | | 0.31 | | | N/A | |
|
Low-Duration Bond Fund | |
GS2 Class | | | | | | | | | | | | | | | | | | | | | | | | | | | | | | | | | | | | | | | | | | | | | | |
2008 | | $ | 8.90 | | $ | 0.36 | # | | $ | (0.60 | ) | | $ | (0.55 | ) | | $ | — | | | $ | 8.11 | | (2.76 | )% | | $ | 105,223 | | 0.36 | % | | 0.36 | % | | 0.41 | % | | 4.19 | % | | 4.14 | % | | 427 | % |
2007 | | | 8.89 | | | 0.42 | # | | | 0.12 | | | | (0.53 | ) | | | — | | | | 8.90 | | 6.22 | | | | 133,374 | | 0.42 | | | 0.42 | | | 0.45 | | | 4.71 | | | 4.68 | | | 248 | |
2006 | | | 9.06 | | | 0.38 | # | | | (0.03 | ) | | | (0.52 | ) | | | — | | | | 8.89 | | 3.94 | | | | 105,991 | | 0.45 | | | 0.45 | | | 0.47 | | | 4.22 | | | 4.20 | | | 168 | |
2005 | | | 9.32 | | | 0.30 | # | | | (0.15 | ) | | | (0.41 | ) | | | — | † | | | 9.06 | | 1.60 | | | | 104,681 | | 0.45 | | | 0.45 | | | 0.48 | | | 3.30 | | | 3.27 | | | 196 | |
2004 | | | 9.51 | | | 0.21 | # | | | (0.07 | ) | | | (0.28 | ) | | | (0.05 | ) | | | 9.32 | | 1.47 | | | | 59,777 | | 0.45 | | | 0.45 | | | 0.49 | | | 2.22 | | | 2.18 | | | 289 | |
GS4 Class | | | | | | | | | | | | | | | | | | | | | | | | | | | | | | | | | | | | | | | | | | | | | | |
2008 | | $ | 12.88 | | $ | 0.51 | # | | $ | (0.87 | ) | | $ | (0.53 | ) | | $ | — | | | $ | 11.99 | | (2.84 | )% | | $ | 515,996 | | 0.52 | % | | 0.52 | % | | 0.61 | % | | 4.03 | % | | 3.94 | % | | 427 | % |
2007 | | | 12.63 | | | 0.58 | # | | | 0.17 | | | | (0.50 | ) | | | — | | | | 12.88 | | 6.11 | | | | 665,292 | | 0.58 | | | 0.58 | | | 0.64 | | | 4.54 | | | 4.48 | | | 248 | |
2006 | | | 12.66 | | | 0.58 | # | | | (0.11 | ) | | | (0.50 | ) | | | — | | | | 12.63 | | 3.75 | | | | 697,687 | | 0.61 | | | 0.61 | | | 0.66 | | | 4.05 | | | 4.00 | | | 168 | |
2005 | | | 12.87 | | | 0.40 | # | | | (0.22 | ) | | | (0.39 | ) | | | — | † | | | 12.66 | | 1.39 | | | | 789,077 | | 0.61 | | | 0.61 | | | 0.67 | | | 3.13 | | | 3.07 | | | 196 | |
2004 | | | 13.00 | | | 0.27 | # | | | (0.09 | ) | | | (0.26 | ) | | | (0.05 | ) | | | 12.87 | | 1.38 | | | | 789,866 | | 0.61 | | | 0.61 | | | 0.67 | | | 2.06 | | | 2.00 | | | 289 | |
GS6 Class | | | | | | | | | | | | | | | | | | | | | | | | | | | | | | | | | | | | | | | | | | | | | | |
2008 | | $ | 8.95 | | $ | 0.32 | # | | $ | (0.60 | ) | | $ | (0.51 | ) | | $ | — | | | $ | 8.16 | | (3.16 | )% | | $ | 5,623 | | 0.91 | % | | 0.91 | % | | 0.96 | % | | 3.66 | % | | 3.61 | % | | 427 | % |
2007 | | | 8.93 | | | 0.37 | # | | | 0.13 | | | | (0.48 | ) | | | — | | | | 8.95 | | 5.72 | | | | 5,526 | | 0.97 | | | 0.97 | | | 1.57 | | | 4.15 | | | 3.55 | | | 248 | |
2006 | | | 9.09 | | | 0.60 | # | | | (0.30 | ) | | | (0.46 | ) | | | — | | | | 8.93 | | 3.43 | | | | 5,159 | | 1.00 | | | 1.00 | | | 1.05 | | | 3.63 | | | 3.58 | | | 168 | |
2005 | | | 9.36 | | | 0.25 | # | | | (0.16 | ) | | | (0.36 | ) | | | — | † | | | 9.09 | | 0.96 | | | | 11,380 | | 0.94 | | | 0.94 | | | 1.05 | | | 2.74 | | | 2.63 | | | 196 | |
2004 | | | 9.54 | | | 0.17 | # | | | (0.06 | ) | | | (0.24 | ) | | | (0.05 | ) | | | 9.36 | | 1.17 | | | | 16,087 | | 0.85 | | | 0.85 | | | 0.90 | | | 1.82 | | | 1.77 | | | 289 | |
| † | Amount represents less than $0.005 per share. |
| # | Calculated using the average shares outstanding method. |
| (1) | The ratio also excludes previously recaptured fees. |
| (2) | See Note 11 in Notes to Financial Statements. |
See Notes to Financial Statements.
184
| | | | | | | | | | | | | | | | | | | | | | | | | | | | | | | | | | | | | | | | | | | | | | | | | | |
| | | | | | | | | | | | | | | | | | | | | | | | | | | Ratios to Average Net Assets | | | | |
| | | Net Asset
Value,
Beginning
of Year | | Net Investment
Income | | | Realized
and
Unrealized
Gain
(Loss) on
Investments | | | Dividends
from Net
Investment
Income | | | Distributions
from Net
Realized
Capital
Gains | | | Return
of
Capital | | | Net Asset
Value,
End of
Year | | Total
Return | | | Net Assets,
End of Year
(000) | | Expenses,
Net | | | Expenses,
Including
Expense
Reduction | | | Expenses,
Before
Waivers
and
Expense
Reduction(1) | | | Investment
Income,
Net | | | Investment
Income/
(Loss),
Excluding
Waivers and
Expense
Reduction | | | Portfolio
Turnover
Rate | |
Medium-Duration Bond Fund | | | | | | | | | | | | | | | | | | | | | | | | | | | | | | | | | | | | |
| | | | | | | | | | | | | | |
GS2 Class | | | | | | | | | | | | | | | | | | | | | | | | | | | | | | | | | | | | | | | | | | | | | | | |
2008 | | $ | 8.42 | | $ | 0.40 | # | | $ | (0.72 | ) | | $ | (0.65 | ) | | $ | (0.32 | ) | | $ | — | | | $ | 7.13 | | (3.88 | )% | | $ | 112,240 | | 0.47 | % | | 0.47 | % | | 0.48 | % | | 5.07 | % | | 5.06 | % | | 566 | % |
2007 | | | 8.52 | | | 0.42 | # | | | 0.12 | | | | (0.64 | ) | | $ | — | † | | | — | | | | 8.42 | | 6.65 | | | | 151,466 | | 0.48 | | | 0.48 | | | 0.49 | | | 5.02 | | | 5.01 | | | 428 | |
2006 | | | 8.71 | | | 0.39 | # | | | (0.01 | ) | | | (0.57 | ) | | | — | | | | — | | | | 8.52 | | 4.50 | | | | 113,051 | | 0.50 | | | 0.50 | | | 0.50 | | | 4.60 | | | 4.60 | | | 440 | |
2005 | | | 9.06 | | | 0.34 | # | | | (0.10 | ) | | | (0.53 | ) | | | (0.06 | ) | | | — | | | | 8.71 | | 2.62 | | | | 100,800 | | 0.50 | | | 0.50 | | | 0.53 | | | 3.84 | | | 3.81 | | | 465 | |
2004 | | | 9.24 | | | 0.28 | # | | | 0.21 | | | | (0.45 | ) | | | (0.22 | ) | | | — | | | | 9.06 | | 5.34 | | | | 52,865 | | 0.50 | | | 0.50 | | | 0.53 | | | 2.97 | | | 2.94 | | | 372 | |
GS4 Class | | | | | | | | | | | | | | | | | | | | | | | | | | | | | | | | | | | | | | | | | | | | | | | |
2008 | | $ | 13.64 | | $ | 0.65 | # | | $ | (1.18 | ) | | $ | (0.63 | ) | | $ | (0.32 | ) | | $ | — | | | $ | 12.16 | | (3.89 | )% | | $ | 738,610 | | 0.58 | % | | 0.58 | % | | 0.67 | % | | 4.96 | % | | 4.87 | % | | 566 | % |
2007 | | | 13.42 | | | 0.66 | # | | | 0.18 | | | | (0.62 | ) | | | — | † | | | — | | | | 13.64 | | 6.46 | | | | 1,079,034 | | 0.61 | | | 0.61 | | | 0.68 | | | 4.88 | | | 4.81 | | | 428 | |
2006 | | | 13.40 | | | 0.60 | # | | | (0.03 | ) | | | (0.55 | ) | | | — | | | | — | | | | 13.42 | | 4.37 | | | | 1,108,958 | | 0.62 | | | 0.62 | | | 0.69 | | | 4.48 | | | 4.41 | | | 440 | |
2005 | | | 13.63 | | | 0.50 | # | | | (0.16 | ) | | | (0.51 | ) | | | (0.06 | ) | | | — | | | | 13.40 | | 2.50 | | | | 981,935 | | 0.62 | | | 0.62 | | | 0.71 | | | 3.71 | | | 3.62 | | | 465 | |
2004 | | | 13.58 | | | 0.39 | # | | | 0.31 | | | | (0.43 | ) | | | (0.22 | ) | | | — | | | | 13.63 | | 5.20 | | | | 853,377 | | 0.62 | | | 0.62 | | | 0.72 | | | 2.85 | | | 2.75 | | | 372 | |
GS6 Class | | | | | | | | | | | | | | | | | | | | | | | | | | | | | | | | | | | | | | | | | | | | | | | |
2008 | | $ | 8.49 | | $ | 0.37 | # | | $ | (0.73 | ) | | $ | (0.61 | ) | | $ | (0.32 | ) | | $ | — | | | $ | 7.20 | | (4.28 | )% | | $ | 14,517 | | 0.93 | % | | 0.93 | % | | 0.94 | % | | 4.68 | % | | 4.67 | % | | 566 | % |
2007 | | | 8.59 | | | 0.38 | # | | | 0.12 | | | | (0.60 | ) | | | — | † | | | — | | | | 8.49 | | 6.08 | | | | 14,654 | | 0.97 | | | 0.97 | | | 1.00 | | | 4.52 | | | 4.49 | | | 428 | |
2006 | | | 8.78 | | | 0.35 | # | | | (0.02 | ) | | | (0.52 | ) | | | — | | | | — | | | | 8.59 | | 3.89 | | | | 13,709 | | 1.05 | | | 1.05 | | | 1.05 | | | 4.05 | | | 4.05 | | | 440 | |
2005 | | | 9.12 | | | 0.29 | # | | | (0.09 | ) | | | (0.48 | ) | | | (0.06 | ) | | | — | | | | 8.78 | | 2.18 | | | | 13,195 | | 1.00 | | | 1.00 | | | 1.06 | | | 3.29 | | | 3.21 | | | 465 | |
2004 | | | 9.30 | | | 0.24 | # | | | 0.21 | | | | (0.41 | ) | | | (0.22 | ) | | | — | | | | 9.12 | | 4.88 | | | | 16,524 | | 0.90 | | | 0.90 | | | 0.95 | | | 2.61 | | | 2.56 | | | 372 | |
| | | | | | | | | | | |
Extended-Duration Bond Fund | | | | | | | | | | | | | | | | | | | | | | | | | | | | | | | | | | | | |
| | | | | | | | | | | | | | |
GS2 Class | | | | | | | | | | | | | | | | | | | | | | | | | | | | | | | | | | | | | | | | | | | | | | | |
2008 | | $ | 7.95 | | $ | 0.47 | # | | $ | (1.11 | ) | | $ | (0.85 | ) | | $ | (0.15 | ) | | $ | — | | | $ | 6.31 | | (8.12 | )% | | $ | 64,834 | | 0.52 | % | | 0.52 | % | | 0.52 | % | | 6.66 | % | | 6.66 | % | | 40 | % |
2007 | | | 8.13 | | | 0.41 | # | | | 0.23 | | | | (0.69 | ) | | | (0.13 | ) | | | — | | | | 7.95 | | 8.45 | | | | 75,841 | | 0.53 | | | 0.53 | | | 0.53 | | | 5.21 | | | 5.21 | | | 101 | |
2006 | | | 8.44 | | | 0.40 | # | | | (0.03 | ) | | | (0.65 | ) | | | (0.03 | ) | | | — | | | | 8.13 | | 4.75 | | | | 59,916 | | 0.57 | | | 0.57 | | | 0.57 | | | 4.91 | | | 4.91 | | | 100 | |
2005 | | | 8.90 | | | 0.44 | # | | | 0.04 | | | | (0.68 | ) | | | (0.26 | ) | | | — | | | | 8.44 | | 5.65 | | | | 57,372 | | 0.56 | | | 0.56 | | | 0.57 | | | 4.90 | | | 4.89 | | | 38 | |
2004 | | | 9.23 | | | 0.47 | # | | | 0.27 | | | | (0.76 | ) | | | (0.31 | ) | | | — | | | | 8.90 | | 8.49 | | | | 32,309 | | 0.57 | | | 0.57 | | | 0.57 | | | 5.17 | | | 5.17 | | | 66 | |
GS4 Class | | | | | | | | | | | | | | | | | | | | | | | | | | | | | | | | | | | | | | | | | | | | | | | |
2008 | | $ | 15.20 | | $ | 0.90 | # | | $ | (2.15 | ) | | $ | (0.83 | ) | | $ | (0.15 | ) | | $ | — | | | $ | 12.97 | | (8.28 | )% | | $ | 357,073 | | 0.69 | % | | 0.69 | % | | 0.71 | % | | 6.45 | % | | 6.43 | % | | 40 | % |
2007 | | | 14.81 | | | 0.74 | # | | | 0.44 | | | | (0.66 | ) | | | (0.13 | ) | | | — | | | | 15.20 | | 8.29 | | | | 500,252 | | 0.72 | | | 0.72 | | | 0.72 | | | 5.02 | | | 5.02 | | | 101 | |
2006 | | | 14.82 | | | 0.69 | # | | | (0.04 | ) | | | (0.63 | ) | | | (0.03 | ) | | | — | | | | 14.81 | | 4.56 | | | | 467,877 | | 0.73 | | | 0.73 | | | 0.76 | | | 4.75 | | | 4.72 | | | 100 | |
2005 | | | 14.93 | | | 0.71 | # | | | 0.10 | | | | (0.66 | ) | | | (0.26 | ) | | | — | | | | 14.82 | | 5.54 | | | | 393,851 | | 0.73 | | | 0.73 | | | 0.76 | | | 4.72 | | | 4.69 | | | 38 | |
2004 | | | 14.78 | | | 0.75 | # | | | 0.45 | | | | (0.74 | ) | | | (0.31 | ) | | | — | | | | 14.93 | | 8.37 | | | | 399,459 | | 0.73 | | | 0.73 | | | 0.75 | | | 5.01 | | | 4.99 | | | 66 | |
GS6 Class | | | | | | | | | | | | | | | | | | | | | | | | | | | | | | | | | | | | | | | | | | | | | | | |
2008 | | $ | 7.95 | | $ | 0.44 | # | | $ | (1.11 | ) | | $ | (0.82 | ) | | $ | (0.15 | ) | | $ | — | | | $ | 6.31 | | (8.54 | )% | | $ | 15,698 | | 0.97 | % | | 0.97 | % | | 0.97 | % | | 6.24 | % | | 6.24 | % | | 40 | % |
2007 | | | 8.13 | | | 0.38 | # | | | 0.23 | | | | (0.66 | ) | | | (0.13 | ) | | | — | | | | 7.95 | | 7.96 | | | | 17,157 | | 0.99 | | | 0.99 | | | 1.01 | | | 4.74 | | | 4.72 | | | 101 | |
2006 | | | 8.44 | | | 0.36 | # | | | (0.03 | ) | | | (0.61 | ) | | | (0.03 | ) | | | — | | | | 8.13 | | 4.09 | | | | 15,730 | | 1.08 | | | 1.08 | | | 1.08 | | | 4.39 | | | 4.39 | | | 100 | |
2005 | | | 8.89 | | | 0.39 | # | | | 0.05 | | | | (0.63 | ) | | | (0.26 | ) | | | — | | | | 8.44 | | 5.19 | | | | 15,100 | | 1.09 | | | 1.09 | | | 1.09 | | | 4.37 | | | 4.37 | | | 38 | |
2004 | | | 9.22 | | | 0.44 | # | | | 0.27 | | | | (0.73 | ) | | | (0.31 | ) | | | — | | | | 8.89 | | 8.05 | | | | 24,043 | | 0.98 | | | 0.98 | | | 0.96 | | | 4.76 | | | 4.78 | | | 66 | |
| | | | | | | | | | | |
Global Bond Fund | | | | | | | | | | | | | | | | | | | | | | | | | | | | | | | | | | | | |
| | | | | | | | | | | | | | |
GS4 Class | | | | | | | | | | | | | | | | | | | | | | | | | | | | | | | | | | | | | | | | | | | | | | | |
2008 | | $ | 10.14 | | $ | 0.64 | # | | $ | (2.59 | ) | | $ | (0.75 | ) | | $ | (0.10 | ) | | $ | — | | | $ | 7.34 | | (20.28 | )% | | $ | 167,465 | | 0.78 | % | | 0.78 | % | | 0.80 | % | | 7.20 | % | | 7.18 | % | | 176 | % |
2007 | | | 10.12 | | | 0.61 | | | | 0.08 | | | | (0.64 | ) | | | (0.03 | ) | | | — | | | | 10.14 | | 7.00 | | | | 125,333 | | 0.79 | | | 0.79 | | | 0.80 | | | 6.07 | | | 6.06 | | | 255 | |
2006(2)(3) | | | 10.12 | | | — | † | | | — | † | | | — | † | | | — | | | | — | † | | | 10.12 | | 0.04 | | | | 104,635 | | 1.04 | | | 1.04 | | | 1.42 | | | 4.32 | | | 3.94 | | | — | |
| † | Amount represents less than $0.005 per share. |
| # | Calculated using the average shares outstanding method. |
| (1) | The ratio also excludes previously recaptured fees. |
| (2) | Inception date was December 29, 2006. |
| (3) | Total return is not annualized. Ratios are annualized. |
See Notes to Financial Statements.
185
FINANCIAL HIGHLIGHTS (Continued)
For a Share Outstanding For the Years Ended December 31, unless otherwise indicated
| | | | | | | | | | | | | | | | | | | | | | | | | | | | | | | | | | | | | | | | | | | | | | | | | | |
| | | | | | | | | | | | | | | | | | | | | | | | | | | Ratios to Average Net Assets | | | | |
| | | Net Asset
Value,
Beginning
of Year | | Net Investment
Income | | | Realized
and
Unrealized
Gain
(Loss) on
Investments | | | Dividends
from Net
Investment
Income | | | Distributions
from Net
Realized
Capital
Gains | | | Excess
Distribution/
Return of
Capital | | | Net Asset
Value,
End of
Year | | Total
Return | | | Net Assets,
End of Year
(000) | | Expenses,
Net | | | Expenses,
Including
Expense
Reduction | | | Expenses,
Before
Waivers
and
Expense
Reduction(1) | | | Investment
Income/
(Loss),
Net | | | Investment
Income/
(Loss),
Excluding
Waivers and
Expense
Reduction | | | Portfolio
Turnover
Rate | |
Equity Index Fund | | | | | | | | | | | | | | | | | | | | | | | | | | | | | | | | | | | | | | | | |
| | | | | | | | | | | | | | |
GS2 Class | | | | | | | | | | | | | | | | | | | | | | | | | | | | | | | | | | | | | | | | | | | | | | | |
2008 | | $ | 10.57 | | $ | 0.18 | # | | $ | (4.06 | ) | | $ | (0.24 | ) | | $ | (0.09 | ) | | $ | — | | | $ | 6.36 | | (37.32 | )% | | $ | 49,472 | | 0.21 | % | | 0.21 | % | | 0.22 | % | | 2.11 | % | | 2.10 | % | | 5 | % |
2007 | | | 11.08 | | | 0.20 | # | | | 0.39 | | | | (0.32 | ) | | | (0.78 | ) | | | — | | | | 10.57 | | 5.19 | | | | 81,104 | | 0.22 | | | 0.22 | | | 0.22 | | | 1.77 | | | 1.77 | | | 5 | |
2006 | | | 9.96 | | | 0.18 | # | | | 1.33 | | | | (0.28 | ) | | | (0.11 | ) | | | — | | | | 11.08 | | 15.37 | | | | 74,634 | | 0.23 | | | 0.23 | | | 0.23 | | | 1.74 | | | 1.74 | | | 5 | |
2005 | | | 9.78 | | | 0.16 | # | | | 0.30 | | | | (0.24 | ) | | | (0.04 | ) | | | — | | | | 9.96 | | 4.80 | | | | 62,214 | | 0.23 | | | 0.23 | | | 0.24 | | | 1.63 | | | 1.62 | | | 6 | |
2004 | | | 9.08 | | | 0.16 | # | | | 0.81 | | | | (0.27 | ) | | | — | | | | — | † | | | 9.78 | | 10.77 | | | | 36,148 | | 0.25 | | | 0.25 | | | 0.23 | | | 1.75 | | | 1.77 | | | 2 | |
GS4 Class | | | | | | | | | | | | | | | | | | | | | | | | | | | | | | | | | | | | | | | | | | | | | | | |
2008 | | $ | 19.07 | | $ | 0.31 | # | | $ | (7.37 | ) | | $ | (0.22 | ) | | $ | (0.09 | ) | | $ | — | | | $ | 11.70 | | (37.37 | )% | | $ | 247,077 | | 0.37 | % | | 0.37 | % | | 0.42 | % | | 1.95 | % | | 1.90 | % | | 5 | % |
2007 | | | 19.17 | | | 0.32 | # | | | 0.64 | | | | (0.28 | ) | | | (0.78 | ) | | | — | | | | 19.07 | | 4.95 | | | | 429,423 | | 0.39 | | | 0.39 | | | 0.42 | | | 1.59 | | | 1.56 | | | 5 | |
2006 | | | 16.97 | | | 0.28 | # | | | 2.28 | | | | (0.25 | ) | | | (0.11 | ) | | | — | | | | 19.17 | | 15.19 | | | | 466,429 | | 0.40 | | | 0.40 | | | 0.43 | | | 1.57 | | | 1.54 | | | 5 | |
2005 | | | 16.47 | | | 0.24 | # | | | 0.51 | | | | (0.21 | ) | | | (0.04 | ) | | | — | | | | 16.97 | | 4.61 | | | | 402,865 | | 0.40 | | | 0.40 | | | 0.43 | | | 1.46 | | | 1.43 | | | 6 | |
2004 | | | 15.12 | | | 0.25 | # | | | 1.35 | | | | (0.25 | ) | | | — | | | | — | | | | 16.47 | | 10.60 | | | | 417,962 | | 0.40 | | | 0.40 | | | 0.41 | | | 1.60 | | | 1.59 | | | 2 | |
GS6 Class | | | | | | | | | | | | | | | | | | | | | | | | | | | | | | | | | | | | | | | | | | | | | | | |
2008 | | $ | 10.74 | | $ | 0.15 | # | | $ | (4.12 | ) | | $ | (0.21 | ) | | $ | (0.09 | ) | | $ | — | | | $ | 6.47 | | (37.52 | )% | | $ | 644 | | 0.60 | % | | 0.60 | % | | 1.88 | % | | 1.76 | % | | 0.48 | % | | 5 | % |
2007 | | | 11.15 | | | 0.15 | # | | | 0.35 | | | | (0.13 | ) | | | (0.78 | ) | | | — | | | | 10.74 | | 4.38 | | | | 633 | | 0.60 | | | 0.60 | | | 0.75 | | | 1.33 | | | 1.18 | | | 5 | |
2006 | | | 10.02 | | | 0.14 | # | | | 1.34 | | | | (0.24 | ) | | | (0.11 | ) | | | — | | | | 11.15 | | 14.97 | | | | 14,233 | | 0.60 | | | 0.60 | | | 0.78 | | | 1.37 | | | 1.19 | | | 5 | |
2005 | | | 9.83 | | | 0.13 | # | | | 0.31 | | | | (0.21 | ) | | | (0.04 | ) | | | — | | | | 10.02 | | 4.54 | | | | 12,019 | | 0.56 | | | 0.56 | | | 0.82 | | | 1.30 | | | 1.04 | | | 6 | |
2004 | | | 9.14 | | | 0.13 | # | | | 0.81 | | | | (0.25 | ) | | | — | | | | — | | | | 9.83 | | 10.37 | | | | 11,502 | | 0.45 | | | 0.45 | | | 0.72 | | | 1.41 | | | 1.14 | | | 2 | |
| | | | | | | | | | | | |
Real Estate Securities Fund | | | | | | | | | | | | | | | | | | | | | | | | | | | | | | | | | | | | | | | | |
| | | | | | | | | | | | | | |
GS4 Class | | | | | | | | | | | | | | | | | | | | | | | | | | | | | | | | | | | | | | | | | | | | | | | |
2008 | | $ | 9.04 | | $ | 0.18 | # | | $ | (3.80 | ) | | $ | (0.16 | ) | | $ | — | | | $ | (0.01 | ) | | $ | 5.25 | | (40.35 | )% | | $ | 80,579 | | 1.26 | % | | 1.26 | % | | 1.25 | % | | 2.21 | % | | 2.22 | % | | 94 | % |
2007 | | | 12.55 | | | 0.11 | # | | | (2.12 | ) | | | (0.11 | ) | | | (1.39 | ) | | | — | | | | 9.04 | | (16.23 | ) | | | 96,775 | | 1.20 | | | 1.20 | | | 1.22 | | | 0.94 | | | 0.92 | | | 119 | |
2006(2)(3) | | | 12.50 | | | — | † | | | 0.05 | | | | — | | | | — | | | | — | | | | 12.55 | | 0.40 | | | | 107,035 | | 1.33 | | | 1.33 | | | 1.88 | | | (1.16 | ) | | (1.71 | ) | | — | |
| | | | | | | | | | | | |
Value Equity Fund | | | | | | | | | | | | | | | | | | | | | | | | | | | | | | | | | | | | | | | | |
| | | | | | | | | | | | | | |
GS2 Class | | | | | | | | | | | | | | | | | | | | | | | | | | | | | | | | | | | | | | | | | | | | | | | |
2008 | | $ | 9.10 | | $ | 0.17 | # | | $ | (3.46 | ) | | $ | (0.22 | ) | | $ | (0.07 | ) | | $ | — | | | $ | 5.52 | | (36.81 | )% | | $ | 143,506 | | 0.66 | % | | 0.65 | % | | 0.67 | % | | 2.29 | % | | 2.27 | % | | 52 | % |
2007 | | | 10.62 | | | 0.18 | # | | | (0.27 | ) | | | (0.28 | ) | | | (1.15 | ) | | | — | | | | 9.10 | | (1.18 | ) | | | 230,436 | | 0.69 | | | 0.69 | | | 0.69 | | | 1.70 | | | 1.70 | | | 45 | |
2006 | | | 10.75 | | | 0.18 | # | | | 1.78 | | | | (0.28 | ) | | | (1.81 | ) | | | — | | | | 10.62 | | 18.76 | | | | 181,940 | | 0.72 | | | 0.71 | | | 0.72 | | | 1.70 | | | 1.69 | | | 76 | |
2005 | | | 11.44 | | | 0.20 | # | | | 0.65 | | | | (0.28 | ) | | | (1.26 | ) | | | — | | | | 10.75 | | 7.40 | | | | 156,279 | | 0.73 | | | 0.72 | | | 0.73 | | | 1.72 | | | 1.71 | | | 54 | |
2004 | | | 9.94 | | | 0.17 | # | | | 1.59 | | | | (0.26 | ) | | | — | † | | | — | | | | 11.44 | | 17.83 | | | | 75,123 | | 0.75 | | | 0.74 | | | 0.74 | | | 1.64 | | | 1.64 | | | 56 | |
GS4 Class | | | | | | | | | | | | | | | | | | | | | | | | | | | | | | | | | | | | | | | | | | | | | | | |
2008 | | $ | 17.03 | | $ | 0.30 | # | | $ | (6.54 | ) | | $ | (0.19 | ) | | $ | (0.07 | ) | | $ | — | | | $ | 10.53 | | (36.95 | )% | | $ | 844,459 | | 0.85 | % | | 0.84 | % | | 0.86 | % | | 2.09 | % | | 2.07 | % | | 52 | % |
2007 | | | 18.65 | | | 0.29 | # | | | (0.52 | ) | | | (0.24 | ) | | | (1.15 | ) | | | — | | | | 17.03 | | (1.39 | ) | | | 1,407,534 | | 0.88 | | | 0.88 | | | 0.88 | | | 1.50 | | | 1.50 | | | 45 | |
2006 | | | 17.50 | | | 0.28 | # | | | 2.93 | | | | (0.25 | ) | | | (1.81 | ) | | | — | | | | 18.65 | | 18.64 | | | | 1,434,773 | | 0.90 | | | 0.89 | | | 0.91 | | | 1.52 | | | 1.50 | | | 76 | |
2005 | | | 17.74 | | | 0.28 | # | | | 0.99 | | | | (0.25 | ) | | | (1.26 | ) | | | — | | | | 17.50 | | 7.13 | | | | 1,279,940 | | 0.90 | | | 0.89 | | | 0.93 | | | 1.53 | | | 1.49 | | | 54 | |
2004 | | | 15.28 | | | 0.24 | # | | | 2.45 | | | | (0.23 | ) | | | — | | | | — | | | | 17.74 | | 17.71 | | | | 1,305,669 | | 0.90 | | | 0.89 | | | 0.92 | | | 1.49 | | | 1.46 | | | 56 | |
GS6 Class | | | | | | | | | | | | | | | | | | | | | | | | | | | | | | | | | | | | | | | | | | | | | | | |
2008 | | $ | 9.03 | | $ | 0.14 | # | | $ | (3.45 | ) | | $ | (0.18 | ) | | $ | (0.07 | ) | | $ | — | | | $ | 5.47 | | (37.20 | )% | | $ | 11,547 | | 1.12 | % | | 1.11 | % | | 1.13 | % | | 1.83 | % | | 1.81 | % | | 52 | % |
2007 | | | 10.55 | | | 0.13 | # | | | (0.27 | ) | | | (0.23 | ) | | | (1.15 | ) | | | — | | | | 9.03 | | (1.61 | ) | | | 18,053 | | 1.16 | | | 1.16 | | | 1.18 | | | 1.23 | | | 1.21 | | | 45 | |
2006 | | | 10.69 | | | 0.12 | # | | | 1.78 | | | | (0.23 | ) | | | (1.81 | ) | | | — | | | | 10.55 | | 18.21 | | | | 17,798 | | 1.24 | | | 1.23 | | | 1.24 | | | 1.18 | | | 1.17 | | | 76 | |
2005 | | | 11.39 | | | 0.14 | # | | | 0.64 | | | | (0.22 | ) | | | (1.26 | ) | | | — | | | | 10.69 | | 6.78 | | | | 15,003 | | 1.25 | | | 1.24 | | | 1.27 | | | 1.17 | | | 1.14 | | | 54 | |
2004 | | | 9.90 | | | 0.12 | # | | | 1.59 | | | | (0.22 | ) | | | — | | | | — | | | | 11.39 | | 17.35 | | | | 17,968 | | 1.15 | | | 1.14 | | | 1.22 | | | 1.20 | | | 1.12 | | | 56 | |
| † | Amount represents less than $0.005 per share. |
| # | Calculated using the average shares outstanding method. |
| (1) | The ratio also excludes previously recaptured fees. |
| (2) | Inception date was December 29, 2006. |
| (3) | Total return is not annualized. Ratios are annualized. |
See Notes to Financial Statements.
186
| | | | | | | | | | | | | | | | | | | | | | | | | | | | | | | | | | | | | | | | | | | | | | | | | | |
| | | | | | | | | | | | | | | | | | | | | | | | | | | Ratios to Average Net Assets | | | | |
| | | Net Asset
Value,
Beginning
of Year | | Net
Investment
Income/
(Loss) | | | Realized
and
Unrealized
Gain
(Loss) on
Investments | | | Dividends
from Net
Investment
Income | | | Distributions
from Net
Realized
Capital
Gains | | | Excess
Distribution/
Return of
Capital | | | Net Asset
Value,
End of
Year | | Total
Return | | | Net Assets,
End of Year
(000) | | Expenses,
Net | | | Expenses,
Including
Expense
Reduction | | | Expenses,
Before Waivers/
Reimbursements
and
Expense
Reduction(1) | | | Investment
Income/
(Loss),
Net | | | Investment
Income/(Loss),
Excluding
Waivers/
Reimbursements
and
Expense
Reduction | | | Portfolio
Turnover
Rate | |
Growth Equity Fund | | | | | | | | | | | | | | | | | | | | | | | | | | | | | | | | | | | | | | | | |
| | | | | | | | | | | | | | |
GS2 Class | | | | | | | | | | | | | | | | | | | | | | | | | | | | | | | | | | | | | | | | | | | | | | | |
2008 | | $ | 12.76 | | $ | 0.03 | | | $ | (5.49 | ) | | $ | (0.04 | ) | | $ | — | | | $ | — | | | $ | 7.26 | | (42.84 | )% | | $ | 141,138 | | 0.87 | % | | 0.86 | % | | 0.87 | % | | 0.26 | % | | 0.25 | % | | 99 | % |
2007 | | | 11.23 | | | 0.02 | | | | 1.55 | | | | (0.04 | ) | | | — | | | | — | | | | 12.76 | | 13.99 | | | | 242,557 | | 0.89 | | | 0.89 | | | 0.88 | | | 0.24 | | | 0.25 | | | 51 | |
2006 | | | 11.18 | | | — | † | | | 0.05 | | | | — | | | | — | | | | — | | | | 11.23 | | 0.45 | | | | 179,852 | | 0.89 | | | 0.88 | | | 0.90 | | | 0.00 | | | (0.02 | ) | | 48 | |
2005 | | | 10.29 | | | (0.03 | ) | | | 0.92 | | | | — | | | | — | | | | — | | | | 11.18 | | 8.65 | | | | 172,118 | | 0.87 | | | 0.86 | | | 0.89 | | | (0.10 | ) | | (0.13 | ) | | 49 | |
2004 | | | 9.16 | | | — | † | | | 1.13 | | | | — | | | | — | | | | — | | | | 10.29 | | 12.34 | | | | 84,177 | | 0.87 | | | 0.86 | | | 0.89 | | | 0.01 | | | (0.02 | ) | | 56 | |
GS4 Class | | | | | | | | | | | | | | | | | | | | | | | | | | | | | | | | | | | | | | | | | | | | | | | |
2008 | | $ | 20.22 | | $ | 0.02 | | | $ | (8.70 | ) | | $ | (0.02 | ) | | $ | — | | | $ | — | | | $ | 11.52 | | (42.92 | )% | | $ | 817,315 | | 0.97 | % | | 0.96 | % | | 1.06 | % | | 0.16 | % | | 0.06 | % | | 99 | % |
2007 | | | 17.77 | | | 0.02 | | | | 2.45 | | | | (0.02 | ) | | | — | | | | — | | | | 20.22 | | 13.90 | | | | 1,488,091 | | 1.00 | | | 1.00 | | | 1.07 | | | 0.13 | | | 0.06 | | | 51 | |
2006 | | | 17.71 | | | (0.02 | ) | | | 0.08 | | | | — | | | | — | | | | — | | | | 17.77 | | 0.34 | | | | 1,343,147 | | 1.01 | | | 1.00 | | | 1.09 | | | (0.12 | ) | | (0.21 | ) | | 48 | |
2005 | | | 16.33 | | | (0.04 | ) | | | 1.42 | | | | — | | | | — | | | | — | | | | 17.71 | | 8.45 | | | | 1,362,599 | | 0.99 | | | 0.98 | | | 1.08 | | | (0.22 | ) | | (0.32 | ) | | 49 | |
2004 | | | 14.55 | | | (0.02 | ) | | | 1.80 | | | | — | | | | — | | | | — | | | | 16.33 | | 12.23 | | | | 1,405,754 | | 0.99 | | | 0.98 | | | 1.08 | | | (0.11 | ) | | (0.21 | ) | | 56 | |
GS6 Class | | | | | | | | | | | | | | | | | | | | | | | | | | | | | | | | | | | | | | | | | | | | | | | |
2008 | | $ | 12.46 | | $ | (0.01 | ) | | $ | (5.36 | ) | | $ | — | † | | $ | — | | | $ | — | | | $ | 7.09 | | (43.08 | )% | | $ | 7,891 | | 1.29 | % | | 1.28 | % | | 1.35 | % | | (0.15 | )% | | (0.22 | )% | | 99 | % |
2007 | | | 10.99 | | | (0.02 | ) | | | 1.49 | | | | — | | | | — | | | | — | | | | 12.46 | | 13.38 | | | | 13,668 | | 1.36 | | | 1.36 | | | 1.41 | | | (0.23 | ) | | (0.28 | ) | | 51 | |
2006 | | | 10.99 | | | (0.05 | ) | | | 0.05 | | | | — | | | | — | | | | — | | | | 10.99 | | — | | | | 11,706 | | 1.41 | | | 1.40 | | | 1.48 | | | (0.52 | ) | | (0.60 | ) | | 48 | |
2005 | | | 10.17 | | | (0.09 | ) | | | 0.91 | | | | — | | | | — | | | | — | | | | 10.99 | | 8.06 | | | | 11,406 | | 1.34 | | | 1.33 | | | 1.47 | | | (0.57 | ) | | (0.71 | ) | | 49 | |
2004 | | | 9.08 | | | (0.07 | ) | | | 1.16 | | | | — | | | | — | | | | — | | | | 10.17 | | 12.00 | | | | 13,780 | | 1.24 | | | 1.23 | | | 1.44 | | | (0.42 | ) | | (0.63 | ) | | 56 | |
| | | | | | | | | | | | |
Small Cap Equity Fund | | | | | | | | | | | | | | | | | | | | | | | | | | | | | | | | | | | | | | | | |
| | | | | | | | | | | | | | |
GS2 Class | | | | | | | | | | | | | | | | | | | | | | | | | | | | | | | | | | | | | | | | | | | | | | | |
2008 | | $ | 9.60 | | $ | 0.05 | # | | $ | (3.61 | ) | | $ | (0.08 | ) | | $ | — | | | $ | (0.02 | ) | | $ | 5.94 | | (37.05 | )% | | $ | 48,159 | | 1.03 | % | | 1.02 | % | | 1.04 | % | | 0.66 | % | | 0.64 | % | | 147 | % |
2007 | | | 11.33 | | | 0.06 | # | | | 0.09 | | | | (0.07 | ) | | | (1.81 | ) | | | — | | | | 9.60 | | 1.05 | | | | 76,792 | | 1.05 | | | 1.05 | | | 1.05 | | | 0.48 | | | 0.48 | | | 119 | |
2006 | | | 11.40 | | | (0.01 | )# | | | 1.32 | | | | — | | | | (1.38 | ) | | | — | | | | 11.33 | | 11.40 | | | | 66,695 | | 1.06 | | | 1.05 | | | 1.06 | | | (0.05 | ) | | (0.06 | ) | | 86 | |
2005 | | | 12.51 | | | (0.01 | )# | | | 0.84 | | | | — | | | | (1.94 | ) | | | — | | | | 11.40 | | 6.48 | | | | 62,009 | | 1.10 | | | 1.09 | | | 1.07 | | | (0.06 | ) | | (0.04 | ) | | 97 | |
2004 | | | 11.52 | | | (0.01 | ) | | | 1.74 | | | | — | | | | (0.74 | ) | | | — | | | | 12.51 | | 15.04 | | | | 28,639 | | 1.18 | | | 1.15 | | | 1.20 | | | (0.10 | ) | | (0.15 | ) | | 148 | |
GS4 Class | | | | | | | | | | | | | | | | | | | | | | | | | | | | | | | | | | | | | | | | | | | | | | | |
2008 | | $ | 14.31 | | $ | 0.07 | # | | $ | (5.39 | ) | | $ | (0.06 | ) | | $ | — | | | $ | (0.02 | ) | | $ | 8.91 | | (37.19 | )% | | $ | 272,588 | | 1.15 | % | | 1.13 | % | | 1.24 | % | | 0.55 | % | | 0.44 | % | | 147 | % |
2007 | | | 16.00 | | | 0.06 | # | | | 0.11 | | | | (0.05 | ) | | | (1.81 | ) | | | — | | | | 14.31 | | 0.87 | | | | 466,522 | | 1.18 | | | 1.18 | | | 1.25 | | | 0.34 | | | 0.27 | | | 119 | |
2006 | | | 15.61 | | | (0.03 | )# | | | 1.80 | | | | — | | | | (1.38 | ) | | | — | | | | 16.00 | | 11.27 | | | | 486,358 | | 1.21 | | | 1.20 | | | 1.25 | | | (0.20 | ) | | (0.25 | ) | | 86 | |
2005 | | | 16.48 | | | (0.03 | )# | | | 1.10 | | | | — | | | | (1.94 | ) | | | — | | | | 15.61 | | 6.37 | | | | 463,367 | | 1.22 | | | 1.21 | | | 1.27 | | | (0.19 | ) | | (0.26 | ) | | 97 | |
2004 | | | 14.99 | | | (0.02 | ) | | | 2.25 | | | | — | | | | (0.74 | ) | | | — | | | | 16.48 | | 14.89 | | | | 432,763 | | 1.25 | | | 1.22 | | | 1.37 | | | (0.16 | ) | | (0.31 | ) | | 148 | |
GS6 Class | | | | | | | | | | | | | | | | | | | | | | | | | | | | | | | | | | | | | | | | | | | | | | | |
2008 | | $ | 9.25 | | $ | 0.02 | # | | $ | (3.47 | ) | | $ | (0.06 | ) | | $ | — | | | $ | (0.01 | ) | | $ | 5.73 | | (37.29 | )% | | $ | 11,334 | | 1.43 | % | | 1.42 | % | | 1.49 | % | | 0.27 | % | | 0.20 | % | | 147 | % |
2007 | | | 11.00 | | | — | †# | | | 0.08 | | | | (0.02 | ) | | | (1.81 | ) | | | — | | | | 9.25 | | 0.50 | | | | 17,846 | | 1.50 | | | 1.50 | | | 1.54 | | | 0.03 | | | (0.01 | ) | | 119 | |
2006 | | | 11.16 | | | (0.07 | )# | | | 1.29 | | | | — | | | | (1.38 | ) | | | — | | | | 11.00 | | 10.84 | | | | 17,483 | | 1.58 | | | 1.57 | | | 1.57 | | | (0.57 | ) | | (0.57 | ) | | 86 | |
2005 | | | 12.34 | | | (0.06 | )# | | | 0.82 | | | | — | | | | (1.94 | ) | | | — | | | | 11.16 | | 6.00 | | | | 15,577 | | 1.57 | | | 1.56 | | | 1.59 | | | (0.53 | ) | | (0.56 | ) | | 97 | |
2004 | | | 11.41 | | | (0.08 | ) | | | 1.75 | | | | — | | | | (0.74 | ) | | | — | | | | 12.34 | | 14.66 | | | | 17,875 | | 1.50 | | | 1.47 | | | 1.69 | | | (0.43 | ) | | (0.65 | ) | | 148 | |
| † | Amount represents less than $0.005 per share. |
| # | Calculated using the average shares outstanding method. |
| (1) | The ratio also excludes previously recaptured fees. |
187
FINANCIAL HIGHLIGHTS (Continued)
For a Share Outstanding For the Years Ended December 31, unless otherwise indicated
| | | | | | | | | | | | | | | | | | | | | | | | | | | | | | | | | | | | | | | | | | | | | | | | | |
| | | | | | | | | | | | | | | | | | | | | | | | | | Ratios to Average Net Assets | | | | |
| | | Net Asset
Value,
Beginning
of Year | | Net Investment
Income | | | Realized
and
Unrealized
Gain
(Loss) on
Investments | | | Dividends
from Net
Investment
Income | | | Distributions
from Net
Realized
Capital
Gains | | | Return
of
Capital | | Net Asset
Value,
End of
Year | | Total
Return | | | Net Assets,
End of Year
(000) | | Expenses,
Net | | | Expenses,
Including
Expense
Reduction | | | Expenses,
Before
Waivers
and
Expense
Reduction(1) | | | Investment
Income,
Net | | | Investment
Income/
(Loss),
Excluding
Waivers and
Expense
Reduction | | | Portfolio
Turnover
Rate | |
International Equity Fund | | | | | | | | | | | | | | | | | | | | | | | | | | | | | | | | | | | | | | | |
| | | | | | | | | | | | | | |
GS2 Class | | | | | | | | | | | | | | | | | | | | | | | | | | | | | | | | | | | | | | | | | | | | | | |
2008 | | $ | 14.61 | | $ | 0.34 | # | | $ | (6.89 | ) | | $ | (0.39 | ) | | $ | (0.35 | ) | | $ | — | | $ | 7.32 | | (44.72 | )% | | $ | 193,281 | | 0.94 | % | | 0.93 | % | | 1.08 | % | | 2.92 | % | | 2.77 | % | | 88 | % |
2007 | | | 15.80 | | | 0.26 | # | | | 1.79 | | | | (0.27 | ) | | | (2.97 | ) | | | — | | | 14.61 | | 13.21 | | | | 279,652 | | 0.96 | | | 0.96 | | | 1.07 | | | 1.55 | | | 1.44 | | | 66 | |
2006 | | | 14.71 | | | 0.25 | | | | 3.23 | | | | (0.35 | ) | | | (2.04 | ) | | | — | | | 15.80 | | 23.78 | | | | 199,989 | | 0.97 | | | 0.96 | | | 1.10 | | | 1.60 | | | 1.46 | | | 26 | |
2005 | | | 12.93 | | | 0.29 | | | | 1.99 | | | | (0.30 | ) | | | (0.20 | ) | | | — | | | 14.71 | | 17.66 | | | | 176,819 | | 0.97 | | | 0.95 | | | 1.12 | | | 1.59 | | | 1.43 | | | 30 | |
2004 | | | 11.06 | | | 0.16 | | | | 1.93 | | | | (0.22 | ) | | | — | | | | — | | | 12.93 | | 18.93 | | | | 87,300 | | 0.97 | | | 0.95 | | | 1.13 | | | 1.32 | | | 1.14 | | | 33 | |
GS4 Class | | | | | | | | | | | | | | | | | | | | | | | | | | | | | | | | | | | | | | | | | | | | | | |
2008 | | $ | 18.32 | | $ | 0.40 | # | | $ | (8.63 | ) | | $ | (0.36 | ) | | $ | (0.35 | ) | | $ | — | | $ | 9.38 | | (44.81 | )% | | $ | 873,618 | | 1.12 | % | | 1.11 | % | | 1.28 | % | | 2.73 | % | | 2.56 | % | | 88 | % |
2007 | | | 19.09 | | | 0.28 | # | | | 2.16 | | | | (0.24 | ) | | | (2.97 | ) | | | — | | | 18.32 | | 12.96 | | | | 1,400,548 | | 1.14 | | | 1.14 | | | 1.27 | | | 1.38 | | | 1.25 | | | 66 | |
2006 | | | 17.37 | | | 0.26 | | | | 3.82 | | | | (0.32 | ) | | | (2.04 | ) | | | — | | | 19.09 | | 23.58 | | | | 1,254,839 | | 1.15 | | | 1.14 | | | 1.29 | | | 1.43 | | | 1.28 | | | 26 | |
2005 | | | 15.20 | | | 0.23 | | | | 2.41 | | | | (0.27 | ) | | | (0.20 | ) | | | — | | | 17.37 | | 17.39 | | | | 1,120,234 | | 1.15 | | | 1.13 | | | 1.31 | | | 1.42 | | | 1.24 | | | 30 | |
2004 | | | 12.96 | | | 0.17 | | | | 2.26 | | | | (0.19 | ) | | | — | | | | — | | | 15.20 | | 18.80 | | | | 1,072,556 | | 1.15 | | | 1.13 | | | 1.31 | | | 1.22 | | | 1.04 | | | 33 | |
GS6 Class | | | | | | | | | | | | | | | | | | | | | | | | | | | | | | | | | | | | | | | | | | | | | | |
2008 | | $ | 14.35 | | $ | 0.28 | # | | $ | (6.75 | ) | | $ | (0.34 | ) | | $ | (0.35 | ) | | $ | — | | $ | 7.19 | | (44.97 | )% | | $ | 15,582 | | 1.37 | % | | 1.36 | % | | 1.52 | % | | 2.46 | % | | 2.30 | % | | 88 | % |
2007 | | | 15.59 | | | 0.19 | # | | | 1.75 | | | | (0.21 | ) | | | (2.97 | ) | | | — | | | 14.35 | | 12.68 | | | | 27,798 | | 1.40 | | | 1.40 | | | 1.54 | | | 1.11 | | | 0.97 | | | 66 | |
2006 | | | 14.56 | | | 0.18 | | | | 3.17 | | | | (0.28 | ) | | | (2.04 | ) | | | — | | | 15.59 | | 23.14 | | | | 23,877 | | 1.47 | | | 1.46 | | | 1.60 | | | 1.10 | | | 0.96 | | | 26 | |
2005 | | | 12.80 | | | 0.13 | | | | 2.06 | | | | (0.23 | ) | | | (0.20 | ) | | | — | | | 14.56 | | 17.15 | | | | 19,123 | | 1.45 | | | 1.43 | | | 1.64 | | | 1.11 | | | 0.91 | | | 30 | |
2004 | | | 10.95 | | | 0.12 | | | | 1.90 | | | | (0.17 | ) | | | — | | | | — | | | 12.80 | | 18.52 | | | | 19,551 | | 1.35 | | | 1.33 | | | 1.58 | | | 1.06 | | | 0.81 | | | 33 | |
| # | Calculated using the average shares outstanding method. |
| (1) | The ratio also excludes previously recaptured fees. |
See Notes to Financial Statements.
188
NOTES TO FINANCIAL STATEMENTS
1. DESCRIPTION OF THE FUNDS
GuideStone Funds (the “Trust”) was organized as a Delaware statutory trust on March 2, 2000. The Trust has established twenty-four series (each, a “Fund” and together, the “Funds”). Each Fund is a diversified, open-end management investment company, registered under the Investment Company Act of 1940, as amended (the “1940 Act”). The MyDestination 2005, MyDestination 2015, MyDestination 2025, MyDestination 2035 and MyDestination 2045 Funds, each referred to as a “Date Target Fund” and together as the “Date Target Funds,” commenced operations on December 29, 2006. Effective June 1, 2008, the Blended Funds were renamed to provide shareholders with a more accurate depiction of their investment strategies and risk tolerance. All references to the Blended Funds category have been replaced with “Asset Allocation Funds.” The Conservative Allocation Fund (formerly Flexible Income Fund), Balanced Allocation Fund (formerly Growth & Income Fund), Growth Allocation Fund (formerly Capital Opportunities Fund), Aggressive Allocation Fund (formerly Global Equity Fund), Conservative Allocation Fund I (formerly Flexible Income Fund I), Balanced Allocation Fund I (formerly Growth & Income Fund I), Growth Allocation Fund I (formerly Capital Opportunities Fund I) and Aggressive Allocation Fund I (formerly Global Equity Fund I) are each referred to as an “Asset Allocation Fund” and together are referred to as the “Asset Allocation Funds.” The remaining Funds are each referred to as a “Select Fund” and are together referred to as the “Select Funds.” The Low-Duration Bond Fund, Medium-Duration Bond Fund, Extended-Duration Bond Fund and Global Bond Fund are together referred to as the “Bond Funds.” The Equity Index Fund, Real Estate Securities Fund, Value Equity Fund, Growth Equity Fund, Small Cap Equity Fund and International Equity Fund are together referred to as the “Equity Funds.” The Money Market Fund is referred to as the “Money Market Fund.”
There are three classes of shares issued by the Funds — the GS2 Class, the GS4 Class and the GS6 Class (each, a “Class” and together the “Classes”), except for the Global Bond Fund and the Real Estate Securities Fund, which issued the GS4 Class only, and the Date Target Funds, which issued the GS4 Class and the GS6 Class only. The Conservative Allocation Fund I, Balanced Allocation Fund I, Growth Allocation Fund I and Aggressive Allocation Fund I issued the GS2 Class only. All Classes of shares have identical voting, dividend and liquidation rights. The distribution fee (class specific expense) differs among Classes. Income, expenses (other than class specific expenses) and realized and unrealized gains or losses on investments are allocated to each Class of shares based upon its relative net assets.
Prior to June 1, 2007, GS8 Class shares of the Funds were also available. On June 1, 2007, shares of the GS8 Class of each Fund were exchanged at each Fund’s applicable net asset value for equivalent shares of the GS6 Class of the same Fund, and the GS8 Class was terminated.
Each Fund is a separate mutual fund with its own investment objective, strategies and risks. The Select Funds invest directly in particular types of fixed-income obligations, stocks and other investments. The Asset Allocation and Date Target Funds primarily invest in a different mix of the Select Funds to meet a specified investment strategy. The Asset Allocation and Date Target Funds are commonly referred to as “Fund of Funds”.
2. SIGNIFICANT ACCOUNTING POLICIES
The following significant accounting policies are in conformity with generally accepted accounting principles (“GAAP”) in the United States of America which require management to make estimates and assumptions that affect the reported amounts of assets, liabilities, disclosures of contingent assets and liabilities at the date of the financial statements and the reported amounts of income and expenses during the reporting period. Actual results could differ from those estimates.
189
a. Valuation of Securities
The Funds (except the Money Market Fund) each value securities traded on national securities exchanges or included in national market systems at the last quoted sale price, or official close price, on the principal exchange on which they were traded, or, in the absence of any sale or official close price, at the closing bid price. Securities which are primarily traded on foreign exchanges are generally valued at the closing values of such securities on their respective exchanges, except that when an occurrence subsequent to the time when the foreign security is valued is likely to have changed such value, then the fair value of those securities will be determined through procedures established by or under the direction of the Board of Trustees of the Trust (the “Board of Trustees”). Non-exchange traded securities for which an over-the-counter quotation is readily available are valued at the last quoted bid price. Debt securities, excluding asset-backed and mortgage-backed securities, are valued at the mean of the last bid and asked prices available. Asset-backed and mortgage-backed securities are valued at the last bid price. Options and warrants for which the primary market is a national securities exchange are valued at the last sale price on the exchange on which they are traded, or, in the absence of any sale, at the closing bid price. Options and warrants not traded on a national securities exchange are valued at the last quoted bid price. Short-term securities maturing in more than 60 days from the valuation date are valued at the mean of the last bid and asked prices; those maturing in 60 days or less are valued at amortized cost. Futures contracts are valued at the closing settlement price on the exchange on which they are primarily traded. Forward foreign exchange contracts are valued based upon closing exchange rates from each respective foreign market. Swap agreements are valued daily based upon the terms specific to each agreement with its counterparty. To the extent available, valuations of portfolio securities are provided by independent pricing services approved by the Board of Trustees. Debt securities are valued on the basis of broker quotations or valuations provided by a pricing service which may use a matrix, formula or other objective method that takes into consideration market indices, matrices, yield curves and other specific adjustments. Certain fixed-income securities are valued by the sub-adviser using various methodologies. Due to excessive volatility in the current market, valuations developed through pricing techniques may materially vary from the actual amounts realized upon sale of the securities. Securities for which market quotations are not readily available are valued at fair value according to methods established in good faith by the Board of Trustees.
For securities that principally trade on a foreign market or exchange, a significant gap in time can exist between the time of a particular security’s last trade and the time at which a Fund calculates its net asset value. The closing prices of such securities may no longer reflect their market value at the time the Fund calculates its net asset value if an event that could materially affect the value of those securities (a “Significant Event”) has occurred between the time of the security’s last close and the time that the Fund calculates its net asset value. A Significant Event may relate to a single issuer or to an entire market sector. If a Fund becomes aware of a Significant Event that has occurred with respect to a security or group of securities after the closing of the exchange or market on which the security or securities principally trade, but before the time at which the Fund calculates its net asset value, a Valuation Committee meeting may be called. The Trust uses Interactive Data (“ID”) as a third party fair valuation vendor. ID provides a fair value for foreign equity securities held by the Trust based on certain factors and methodologies applied by ID in the event that there is movement in the U.S. market that exceeds a specific threshold established by the Valuation Committee in consultation with, and approved by, the Trustees. Such methodologies generally involve tracking valuation correlations between the U.S. market and each non-U.S. security. As part of the valuation procedures, a “confidence interval” is used, when the threshold is exceeded, to determine the level of correlation between the value of a foreign equity security and movements in the U.S. market before a particular security will be fair valued. In the event that the threshold established by the Valuation Committee is exceeded on a specific day, the Trust will typically value non-U.S. equity securities in its portfolio that exceed the applicable confidence interval based upon the fair values provided by ID. On December 31, 2008, the International Equity Fund utilized fair value pricing for its foreign common stocks.
190
The Money Market Fund uses the amortized cost method, which approximates market value, to determine the value of its portfolio securities.
The Asset Allocation and Date Target Funds value their investments in the underlying Select Funds daily at the closing net asset value of each respective Select Fund.
The Funds have adopted the provisions of the Statement of Financial Accounting Standards No. 157 (“FAS 157”). FAS 157 defines fair value as the price that a fund would receive to sell an asset or pay to transfer a liability in an orderly transaction between market participants at the measurement date. It establishes and requires disclosure of a fair value hierarchy, separately for each major category of assets and liabilities, that segregates fair value measurements into levels (Levels 1, 2, and 3). Categorization of fair value measurements is determined by the nature of the inputs as follows:
| | |
| Level 1 – | | quoted prices in active markets for identical securities. |
| |
| Level 2 – | | prices determined using other significant observable inputs (including quoted prices for similar securities, interest rates, prepayment speeds, credit risk, etc.). |
| |
| Level 3 – | | prices determined using significant unobservable inputs (including the Fund’s own assumptions in determining the fair value of investments). |
Valuation levels are not necessarily an indication of the risk associated with investing in those securities. For fair valuations using significant unobservable inputs, FAS 157 requires a reconciliation of the beginning to ending balances for reported market values that presents changes attributable to total realized and unrealized gains or losses, purchases and sales, and transfers in/out of the Level 3 category during the period. In accordance with the requirements of FAS 157, a fair value hierarchy and Level 3 reconciliation have been included in the Schedules of Investments for each respective fund.
b. Repurchase Agreements
Each Fund may agree to purchase securities from financial institutions subject to the seller’s agreement to repurchase them at a mutually agreed upon date and price. It is the Fund’s policy that repurchase agreements are fully collateralized by U.S. Treasury and Government Agency securities. All collateral is held by the Fund’s custodian bank or a bank with which the custodian bank has entered into a subcustodian agreement, or is segregated in the Federal Reserve Book Entry System. In connection with transactions in repurchase agreements, if the seller defaults and the value of the collateral declines, or if the seller enters an insolvency proceeding, realization of the collateral by the Fund may be delayed or limited.
c. Derivative Financial Instruments
The Funds may engage in various portfolio strategies to seek to increase its return by hedging its portfolio against adverse movements in the equity, debt and currency markets. Losses may arise due to changes in the value of the contract if the counterparty does not perform under the contract. The Funds, in their normal course of business, may enter into contracts that contain a variety of representations and warranties, and which provide general indemnifications. The Funds’ exposure may include future claims that may be made against the Funds that have not yet occurred. However, based on experience, the Funds expect the risk of loss to be remote.
Financial Futures Contracts — The Funds (except the Money Market Fund) may purchase or sell financial futures contracts and the options on such futures contracts for the purpose of hedging risk on existing securities, demonstrating purchase of securities or gaining market exposure on cash balances. Financial futures contracts are contracts for the
delivery of securities at a specified future date at an agreed upon price or yield. Upon entering into a contract, the Funds deposit and maintain as collateral such initial margin as required by the exchange on which the transaction is effected.
191
Pursuant to the contract, the Funds agree to pay to or receive from the broker an amount of cash equal to the daily fluctuation in the value of the contract. Such payments or receipts are known as variation margin and are recorded by the Funds as unrealized gains or losses until the contract is closed or settled.
Risks of entering into futures contracts include the possibility that there will be an imperfect price correlation between the futures and the underlying securities. Second, it is possible that a lack of liquidity for futures contracts could exist in the secondary market, resulting in an inability to close a futures position prior to its maturity date. Third, the purchase of a futures contract involves the risk that a Fund could lose more than the original margin deposit required to initiate a futures transaction.
Options — Certain Funds are authorized to write and purchase put and call options. The risk in writing a call option is that the Funds give up the opportunity for profit if the market price of the security increases. The risk in writing a put option is that the Funds may incur a loss if the market price of the security decreases and the option is exercised. The risk in purchasing an option is that the Funds pay a premium whether or not the option is exercised. The Funds also have the additional risk of being unable to enter into a closing transaction at an acceptable price if a liquid secondary market does not exist. The Funds also may write over-the-counter options where completing the obligation depends upon the credit standing of the other party and that party’s ability to perform. Option contracts also involve the risk that they may not work as intended due to unanticipated developments in market conditions or other causes.
Options purchased are recorded as an asset, and written options are recorded as liabilities to the extent of premiums paid or received. Each Fund will realize a gain or loss when the option transaction expires or closes. When an option is exercised, the proceeds on sales for a written call option, the purchase cost for a written put option or the cost of a security for a purchased put or call option is adjusted by the amount of the premium received or paid.
Certain Funds may write swaption contracts to manage exposure to fluctuations in interest rates and to enhance portfolio yield. Swaption contracts written by the Funds represent an option that gives the purchaser the right, but not the obligation, to enter into a previously agreed upon swap contract on a future date. If a written call swaption is exercised, the writer will enter a swap and is obligated to pay the fixed-rate and receive a floating rate in exchange. If a written put swaption is exercised, the writer will enter a swap and is obligated to pay the floating rate and receive a fixed rate in exchange. Swaptions are marked-to-market daily based upon quotations from market makers. When a Fund writes a swaption, the premium received is recorded as a liability and is subsequently adjusted to the current market value of the swaption.
Entering into a swaption contract involves, to varying degrees, the elements of credit, market and interest rate risk in excess of the amounts reported in the Statement of Assets and Liabilities, associated with both option contracts and swap contracts. The Funds bear the market risk arising from any change in index values or interest rates.
Forward Foreign Exchange Contracts — Certain Funds may enter into forward foreign currency exchange contracts to hedge against adverse exchange rate fluctuation to the U.S. dollar or between different foreign currencies in connection with either specific security transactions or portfolio positions. Each contract is valued daily and the change in value is recorded as an unrealized gain or loss. When the contract is closed, a realized gain or loss is recorded equal to the difference between the opening value and the closing value of the contract. The Funds could be exposed to risk if the counterparties to the contracts are unable to meet the terms of the contract and from unanticipated movements in the value of a foreign currency relative to the U.S. dollar.
192
Foreign Currency Options and Futures — The International Equity Fund, Small Cap Equity Fund and the Bond Funds may also enter into futures contracts on foreign currencies and related options on transactions as a short or long hedge against possible variations in foreign exchange rates.
TBAs — The Bond Funds and the Small Cap Equity Fund may enter into “TBA” (to be announced) purchase commitments to purchase securities for a fixed price at a future date, typically not exceeding 45 days. TBAs may be considered securities in themselves and involve a risk of loss if the value of the security to be purchased declines prior to settlement date. This risk is in addition to the risk of decline in each Fund’s other assets. Unsettled TBAs are valued at the current market value of the underlying securities, according to the procedures described in the section entitled “Valuation of Securities”.
Mortgage-Backed Securities — Investments in securities collateralized by residential real estate mortgages are subject to certain credit and liquidity risks. When market conditions result in an increase in default rates of the underlying mortgages and the foreclosure values of underlying real estate properties are materially below the outstanding amount of these underlying mortgages, collection of the full amount of accrued interest and principal on these investments may be difficult. Such market conditions may significantly impair the value of these investments resulting in a lack of correlation between their credit ratings and values.
Dollar Rolls — During the period ended December 31, 2008, the Trust entered into dollar roll transactions, pursuant to which they sell a mortgage-backed TBA or security and simultaneously purchase a similar, but not identical, TBA with the same issuer, rate and terms. The Funds may execute a “roll” to obtain better underlying mortgage securities or to increase yield. The Funds account for dollar roll transactions as purchases and sales, which has the effect of increasing their portfolio turnover rates. Risks associated with dollar rolls are that actual mortgages received by the Funds may be less favorable than those anticipated or that counterparties may fail to perform under the terms of the contracts.
Swap Agreements — Each Select Fund may enter into swap agreements. The Equity Funds may enter into equity swap contracts and the Bond Funds and the Small Cap Equity Fund may enter into interest rate and credit default swaps. The Bond Funds and International Equity Fund may enter into cross-currency swaps, and each Select Fund may enter into total return swaps.
Swap agreements are privately negotiated agreements between a Fund and a counterparty to exchange or swap investment cash flows, assets, foreign currencies or market-linked returns at specified, future intervals. A swap may be entered into in order to, among other things, change the maturity of a Fund’s portfolio, to protect a Fund’s value from changes in interest rates, to expose a Fund to a different security or market, or to help a Fund achieve a strategy relative to an index or other benchmark. By entering into a swap agreement, a Fund is exposed to the risk of unanticipated movements in interest rates or in the value of an underlying security or index (or the risk that the counterparty will not fulfill its obligation under the agreement). Credit default swaps involve the payment of amounts based on a specified rate multiplied by a notional amount as well as upon an event of default. In connection with these agreements, securities are set aside as collateral by the Fund’s custodian.
Swaps are marked-to-market daily based upon values from third party vendors or quotations from market makers to the extent available and the change in value, if any, is recorded as an unrealized gain or loss on the Statements of Assets and
193
Liabilities. In the event that market quotations are not readily available or deemed reliable, certain swap agreements may be valued pursuant to guidelines established by the Board of Trustees. In the event that market quotes are not readily available and the swap cannot be valued pursuant to one of the valuation methods, the value of the swap will be determined in good faith by the Valuation Committee of the Board of Trustees, generally based upon recommendations provided by the Fund’s sub-adviser.
Payments received or made at the beginning of the measurement period are reflected as such on the Statements of Assets and Liabilities and represent payments made or received upon entering into the swap agreement to compensate for differences between the stated terms of the swap agreement and prevailing market conditions (credit spreads, currency exchange rates, interest rates, and other relevant factors). These upfront payments are recorded as realized gains or losses on the Statements of Operations upon termination or maturity of the swap. A liquidation payment received or made at the termination of the swap is recorded as realized gain or loss on the Statements of Operations. Net periodic payments received or paid by a Fund are included as part of realized gains or losses on the Statements of Operations.
Certain of the Fund’s derivative agreements contain provisions that require the Fund to maintain a predetermined level of net assets, and/or provide limits regarding the decline of the Fund’s NAV over one- month, three-month and 12-month periods. If the Fund were to violate such provisions, the counterparties to the derivative instruments could request immediate payment or demand immediate collateralization on derivative instruments in net liability positions. For the fiscal year ending December 31, 2008, the Fund did maintain the required level of net assets and/or the NAV of the Fund did not decline below the limits set forth in the derivative agreements.
Entering into these agreements involves, to varying degrees, elements of credit, market and documentation risk in excess of the amounts recognized on the Statements of Assets and Liabilities. Such risks involve the possibility that there will be no liquid market for these agreements, that the counterparty to the agreements may default on its obligation to perform or disagree as to the meaning of contractual terms in the agreements and that there may be unfavorable changes in interest rates.
Credit Default Swaps — Credit default swap agreements involve one party making a stream of payments (referred to as the buyer of protection) to another party (the seller of protection) in exchange for the right to receive a specified return in the event of a default or other credit event for the referenced entity, obligation or index. As a seller of protection on credit default swap agreements, a Fund will generally receive from the buyer of protection a fixed rate of income throughout the term of the swap provided that there is no credit event. As the seller, a Fund would effectively add leverage to its portfolio because, in addition to its total net assets, a Fund would be subject to investment exposure on the notional amount of the swap.
Any upfront payments made or received upon entering a credit default swap contract is treated as part of the cost and is reflected as part of the unrealized gain (loss) on valuation. Upon termination of the swap contract, the amount included in the cost is reversed and becomes part of the swap’s realized gain (loss).
Credit default swaps are carried at their estimated fair value, as determined in good faith by the Board of Trustees. In determining fair value, the Board of Trustees considers the value provided by the counterparty as well as the use of a proprietary model. In addition to credit quality, the sub-advisors monitor a variety of factors including cash flow assumptions, market activity, market sentiment and valuation as part of its ongoing process of assessing payment and performance risk. As payment and performance risk increases, the value of a credit default swap increases, resulting in recognition of unrealized gains for long positions and unrealized losses for short positions. Conversely, as payment and
194
performance risk decreases, unrealized gains are recognized for short positions and unrealized losses are recognized for long positions. Any current or future declines in the fair value of the swap may be partially offset by upfront payments received by the Fund as a seller of protection if applicable. The change in value is recorded within unrealized appreciation (depreciation) until the occurrence of a credit event or the termination of the swap, at which time a realized gain (loss) is recorded.
If a Fund is a seller of protection and a credit event occurs, as defined under the terms of that particular swap agreement, a Fund will either (i) pay to the buyer of protection an amount equal to the notional amount of the swap and take delivery of the referenced obligation, other deliverable obligations or underlying securities comprising the referenced index or (ii) pay a net settlement amount in the form of cash or securities equal to the notional amount of the swap less the recovery value of the referenced obligation or underlying securities comprising the referenced index. If a Fund is a buyer of protection and a credit event occurs, as defined under the terms of that particular swap agreement, a Fund will either (i) receive from the seller of protection an amount equal to the notional amount of the swap and deliver the referenced obligation, other deliverable obligations or underlying securities comprising the referenced index or (ii) receive a net settlement amount in the form of cash or securities equal to the notional amount of the swap less the recovery value of the referenced obligation or underlying securities comprising the referenced index. Recovery values are assumed by market makers considering either industry standard recovery rates or entity specific factors and considerations until a credit event occurs. If a credit event has occurred, the recovery value is determined by a facilitated auction whereby a minimum number of allowable broker bids, together with a specified valuation method, are used to calculate the settlement value.
Credit default swap agreements on corporate issues or sovereign issues of an emerging country involve one party making a stream of payments to another party in exchange for the right to receive a specified return in the event of a default or other credit event. If a credit event occurs and cash settlement is not elected, a variety of other deliverable obligations may be delivered in lieu of the specific referenced obligation. The ability to deliver other obligations may result in a cheapest-to-deliver option (the buyer of protection’s right to choose the deliverable obligation with the lowest value following a credit event). A Fund may use credit default swaps on corporate issues or sovereign issues of an emerging country to provide a measure of protection against defaults of the issuers (i.e., to reduce risk where a Fund owns or has exposure to the referenced obligation) or to take an active long or short position with respect to the likelihood of a particular issuer’s default.
Credit default swap agreements on asset-backed securities involve one party making a stream of payments to another party in exchange for the right to receive a specified return in the event of a default or other credit event. Unlike credit default swaps on corporate issues or sovereign issues of an emerging country, deliverable obligations in most instances would be limited to the specific referenced obligation as performance for asset-backed securities can vary across deals. Prepayments, principal paydowns, and other write down or loss events on the underlying mortgage loans will reduce the outstanding principal balance of the referenced obligation. These reductions may be temporary or permanent as defined under the terms of the swap agreement and the notional amount for the swap agreement will be adjusted by corresponding amounts. A Fund may use credit default swaps on asset-backed securities to provide a measure of protection against defaults of the referenced obligation or to take an active long or short position with respect to the likelihood of a particular referenced obligation’s default.
Credit default swap agreements on credit indices involve one party making a stream of payments to another party in exchange for the right to receive a specified return in the event of a write-down, principal shortfall, interest shortfall or default of all or part of the referenced entities comprising the credit index. A credit index is a list of a basket of credit
195
instruments or exposures designed to be representative of some part of the credit market as a whole. These indices are made up of reference credits that are judged by a poll of dealers to be the most liquid entities in the credit default swap market based on the sector of the index. Components of the indices may include, but are not limited to, investment grade securities, high yield securities, asset backed securities, emerging markets, and/or various credit ratings within each sector. Credit indices are traded using credit default swaps with standardized terms including a fixed spread and standard maturity dates. An index credit default swap references all the names in the index, and if there is a default, the credit event is settled based on that name’s weight in the index. The composition of the indices changes periodically, usually every six months, and for most indices, each name has an equal weight in the index. A Fund may use credit default swaps on credit indices to hedge a portfolio of credit default swaps or bonds with a credit default swap on indices which is less expensive than it would be to buy many credit default swap to achieve a similar effect. Credit-default swap on indices are benchmarks for protecting investors owning bonds against default, and traders use them to speculate on changes in credit quality.
Implied credit spreads, represented in absolute terms, utilized in determining the market value of credit default swap agreements on corporate issues or sovereign issues of an emerging country as of period end are disclosed in the footnotes to the Schedules of Investments and serve as an indicator of the current status of the payment/performance risk and represent the likelihood or risk of default for the credit derivative. The implied credit spread of a particular referenced entity reflects the cost of buying/selling protection and may include upfront payments required to be made to enter into the agreement. For credit default swap agreements on asset-backed securities and credit indices, the quoted market prices and resulting values serve as the indicator of the current status of the payment/performance risk. Wider credit spreads and increasing market values, in absolute terms when compared to the notional amount of the swap, represent a deterioration of the referenced entity’s credit soundness and a greater likelihood or risk of default or other credit event occurring as defined under the terms of the agreement.
The maximum potential amount of future payments (undiscounted) that a Fund as a seller of protection could be required to make under a credit default swap agreement would be an amount equal to the notional amount of the agreement. These potential amounts would be partially offset by any recovery values of the respective referenced obligations, upfront payments received upon entering into the agreement, or net amounts received from the settlement of buy protection credit default swap agreements entered into by a Fund for the same referenced entity or entities.
Credit default swaps involve greater risks than if the Funds had invested in the reference obligation directly. In addition to general market risks, credit default swaps are subject to liquidity risk and counterparty credit risk. The Funds enter into credit default swaps with counterparties meeting defined criteria for financial strength. A buyer also may lose its investment and recover nothing should a credit event not occur. If a credit event did occur, the value of the reference obligation received by the seller, coupled with the periodic payments previously received, may be less than the full notional value it pays to the buyer, resulting in a loss of value.
Cross-Currency Swap Agreements — Cross-currency swap agreements involve two parties exchanging two different currencies with an agreement to reverse the exchange at a later date at specified exchange rates. The exchange of currencies at the inception date of the contract takes place at the current spot rate. The re-exchange at maturity may take place at the same exchange rate, a specified rate, or the then current spot rate. Interest payments, if applicable, are made between the parties based on interest rates available in the two currencies at the inception of the contract. The terms of cross currency swap contracts may extend for many years. Cross-currency swaps are usually negotiated with commercial and investment banks. Some cross currency swaps may not provide for exchanging principal cash flows, but only for exchanging interest cash flows.
196
Interest Rate Swap Agreements — Interest rate swap agreements involve the exchange by a Fund with another party of their respective commitments to pay or receive interest with respect to the notional amount of principal. Certain forms of interest rate swap agreements may include: (i) interest rate caps, under which, in return for a premium, one party agrees to make payments to the other to the extent that interest rates exceed a specified rate, or “cap”, (ii) interest rate floors, under which, in return for a premium, one party agrees to make payments to the other to the extent that interest rates fall below a specified rate, or “floor”, (iii) interest rate collars, under which a party sells a cap and purchases a floor or vice versa in an attempt to protect itself against interest rate movements exceeding given minimum or maximum levels, (iv) callable interest rate swaps, under which the counterparty may terminate the swap transaction in whole at zero cost by a predetermined date and time prior to the maturity date, (v) spread locks, which allow the interest rate swap users to lock in the forward differential (or spread) between the interest rate swap rate and a specified benchmark, or (vi) basis swap, under which two parties can exchange variable interest rates based on different money markets.
Total Return Swap Agreements — Total return swap agreements on commodities involve commitments where exchanged cash flows based on the price of a commodity and in return receives either fixed or determined by floating price or rate. One party would receive payments based on the market value of the commodity involved and pay a fixed amount. Total return swap agreements on indices involve commitments to pay interest in exchange for a market-linked return. One counterparty pays out the total return of a specific reference asset, which may be an equity, index, or bond, and in return receives a regular stream of payments. To the extent the total return of the security or index underlying the transaction exceeds or falls short of the offsetting interest rate obligation, a Fund will receive a payment from or make a payment to the counterparty.
FASB Staff Position No. FAS 133-1 and FIN 45-4, “Disclosures about Credit Derivatives and Certain Guarantees: An Amendment of FASB Statement No. 133 and FASB Interpretation No. 45” (the “Position”). The Position amends FASB Statement No. 133 (“FAS 133”), Accounting for Derivative Instruments and Hedging Activities, and also amends FASB Interpretation No. 45 (“FIN 45”), Guarantor’s Accounting and Disclosure Requirements for Guarantees, Including Indirect Guarantees of Indebtedness of Others. The amendments to FAS 133 include required disclosure for (i) the nature and terms of the credit derivative, reasons for entering into the credit derivative, the events or circumstances that would require the seller to perform under the credit derivative, and the current status of the payment/performance risk of the credit derivative, (ii) the maximum potential amount of future payments (undiscounted) the seller could be required to make under the credit derivative, (iii) the fair value of the credit derivative, and (iv) the nature of any recourse provisions and assets held either as collateral or by third parties. The amendments to FIN 45 require additional disclosures about the current status of the payment/performance risk of a guarantee. All changes to accounting policies have been made in accordance with the Position and incorporated for the current period as part of the Notes to the Schedules of Investments and disclosures within Footnote 2(c), Swap Agreements.
197
As of December 31, 2008, the Low-Duration Bond Fund and the Medium-Duration Bond Fund are the buyer (“receiving protection”) on a total notional amount of $52,674,176 and $99,183,316, respectively, and are the seller (“providing protection”) on a total notional amount of $3,800,000 and $10,400,000, respectively. The notional amounts of the swaps are not recorded in the financial statements; however the notional amount does approximate the maximum potential amount of future payments that the Funds could be required to make if the Funds were the seller of protection and a credit event were to occur. Those credit default swaps for which the Funds are providing protection at balance sheet date are summarized as follows:
| | | | | | | | | | | | | | | | | | | |
| Written Credit Derivative Contracts | | Single Name
Credit Default Swaps | | | Credit Default
Swap Index | | | |
| Reference Asset | | Corporate
Debt | | | Sovereign
Debt | | | Asset-Backed
Securities | | | Corporate
Debt | | Total | |
Low-Duration Bond Fund | | | | | | | | | | | | | | | | | | | |
Fair value of written credit derivatives | | $ | (27,077 | ) | | $ | — | | | $ | — | | | $ | — | | $ | (27,077 | ) |
Maximum potential amount of future payments | | | (3,800,000 | ) | | | — | | | | — | | | | — | | | (3,800,000 | ) |
Recourse provisions with third parties to recover any amounts paid under the credit derivative (including any purchased credit protection) | | | — | | | | — | | | | — | | | | — | | | — | |
Collateral held by the Funds or other third parties which the Funds can obtain upon occurrence of triggering event | | | — | | | | — | | | | — | | | | — | | | — | |
| | | | | |
Medium-Duration Bond | | | | | | | | | | | | | | | | | | | |
Fair value of written credit derivatives | | $ | (1,969,734 | ) | | $ | (143,832 | ) | | $ | (604,985 | ) | | $ | — | | $ | (2,718,551 | ) |
Maximum potential amount of future payments | | | (8,400,000 | ) | | | (1,000,000 | ) | | | (1,000,000 | ) | | | — | | | (10,400,000 | ) |
Recourse provisions with third parties to recover any amounts paid under the credit derivative (including any purchased credit protection) | | | — | | | | — | | | | — | | | | — | | | — | |
Collateral held by the Funds or other third parties which the Funds can obtain upon occurrence of triggering event | | | — | | | | — | | | | — | | | | — | | | — | |
The credit spread disclosed below for each referenced obligation where the Funds are the seller of protection is a representation of the current payment/performance risk of the swap.
| | | | | | | | | | | | | | | | | | |
| | | Maximum Potential Amount of Futures Payments by Contract Term |
Current credit spread on underlying (in basis points) | | 0-6
Months | | 6-12
Months | | 1-5
Years | | 5-10
Years | | More Than
10 Years | | Total |
Low-Duration Bond Fund | | | | | | | | | | | | | | | | | | |
0 - 100 | | $ | — | | $ | — | | $ | — | | $ | — | | $ | — | | $ | — |
101 - 250 | | | — | | | — | | | — | | | — | | | — | | | — |
251 - 500 | | | 3,800,000 | | | — | | | — | | | — | | | — | | | 3,800,000 |
501 - 1,000 | | | — | | | — | | | — | | | — | | | — | | | — |
Greater than 1,000 | | | — | | | — | | | — | | | — | | | — | | | — |
| | | | | | | | | | | | | | | | | | |
Total | | $ | 3,800,000 | | $ | — | | $ | — | | $ | — | | $ | — | | $ | 3,800,000 |
| | | | | | | | | | | | | | | | | | |
| | | | | | |
Medium-Duration Bond Fund | | | | | | | | | | | | | | | | | | |
0 - 100 | | $ | — | | $ | — | | $ | — | | $ | — | | $ | — | | $ | — |
101 - 250 | | | — | | | — | | | — | | | — | | | — | | | — |
251 - 500 | | | — | | | — | | | — | | | 1,000,000 | | | 1,000,000 | | | 2,000,000 |
501 - 1,000 | | | — | | | — | | | — | | | 8,400,000 | | | — | | | 8,400,000 |
Greater than 1,000 | | | — | | | — | | | — | | | — | | | — | | | — |
| | | | | | | | | | | | | | | | | | |
Total | | $ | — | | $ | — | | $ | — | | $ | 9,400,000 | | $ | 1,000,000 | | $ | 10,400,000 |
| | | | | | | | | | | | | | | | | | |
d. Foreign Currency Translations
Securities and other assets and liabilities denominated in foreign currencies are translated daily into U.S. dollars. Foreign currency amounts related to the purchase or sale of securities and income and expenses are translated at the exchange rate on the transaction date. The effect of changes in foreign exchange rates on realized and unrealized security gains or losses is reflected as a component of such gains or losses. In the statement of operations, net realized gains or losses from foreign currency transactions, if any, may arise from sales of foreign currency, closed forward contracts, exchange gains or losses realized between the trade date and settlement date on securities transactions, and other translation gains or losses on dividends, interest income and foreign withholding taxes.
198
e. Dividends and Distributions to Shareholders
Dividends from net investment income for the Money Market Fund are declared daily and paid monthly. Dividends from net investment income for the Bond Funds are declared and paid monthly. Dividends from net investment income, if any, for the Equity Index Fund, Real Estate Securities Fund, Value Equity Fund and Growth Equity Fund are declared and paid semi-annually. Dividends from net investment income, if any, for the Small Cap Equity Fund, International Equity Fund, the Asset Allocation Funds and the Date Target Funds are declared and paid annually. Net realized capital gains, if any, will be distributed at least annually by each of the Funds. Dividends and distributions to shareholders are recorded on the ex-dividend date.
f. Security Transactions, Income and Realized Gains and Losses
Security transactions are accounted for on the date securities are purchased or sold (the trade date). Dividend income is recognized on the ex-dividend date and interest income is accrued daily, including the amortization of market premium and the accretion of market discount. Realized gains and losses from security transactions are on an identified cost basis.
g. Expenses
Expenses arising in connection with a Fund are charged directly to that Fund. Expenses common to all Funds are generally allocated to each Fund in proportion to their relative net assets. Each Class of shares bears its pro-rata portion of expenses attributable to its Class, except that each Class separately bears expenses related specifically to that Class, such as printing, registration, transfer agent, shareholder servicing and distribution fees.
h. REITs
The Real Estate Securities Fund invests substantial assets in real estate investment trusts (“REITS”) that involve risks not associated with investing in stocks. Risks include declines in the value of real estate, general and economic conditions, changes in the value of the underlying property and defaults by borrowers. The value of assets in the real estate industry may go through cycles of relative underperformance and outperformance in comparison to equity securities markets in general.
Dividend income is recorded using management’s estimate of the income included in distributions received from REIT investments. The actual amounts of income, return of capital and capital gains are only determined by each REIT after its fiscal year-end, and may differ from the estimated amount. Estimates of income are adjusted in the Funds to the actual amounts when the amounts are determined.
i. Short Sales
A short sale is a transaction in which a Fund sells a security it does not own. The Fund’s obligation to replace the security borrowed and sold short will be fully collateralized at all times by cash equivalents deposited in an account with the Fund’s custodian. If the price of the security sold short increases between the time of the short sale and the time the Fund replaces the borrowed security, the Fund will realize a loss, and if the price declines during the period, the Fund will realize a gain. Any realized gain will be decreased, and any realized loss increased, by the amount of transaction costs.
The Equity Funds may sell short exchange-listed equity futures contracts to reduce market exposure. The Date Target Funds, Asset Allocation Funds, Bond Funds and Small Cap Equity Fund may sell short U.S. Treasury securities and exchange-listed U.S. Treasury futures contracts to reduce market exposure. The Low-Duration Bond, Medium-Duration Bond and Small Cap Equity Funds will occasionally enter into a short sale to initiate a dollar roll transaction. The International Equity Fund may establish short positions in stocks of foreign companies with a market value of up to 5% of the Fund’s assets.
199
At December 31, 2008, the value of securities sold short in the Low-Duration Bond Fund, the Medium-Duration Bond Fund and the International Equity Fund amounted to $27,991,250, $9,928,345 and $19,331,745, respectively.
j. Loan Participations
Loan participations typically represent direct participation in a loan to a corporate borrower, and generally are offered by banks or other financial institutions or lending syndicates. The Bond Funds and the Small Cap Equity Fund may participate in such syndications, or can buy part of a loan, becoming a part lender. When purchasing loan participations, a Fund assumes the credit risk associated with the corporate borrower and may assume the credit risk associated with an interposed bank or other financial intermediary.
The Bond Funds and the Small Cap Equity Fund invest in loan participations with credit quality comparable to that of issuers of its securities investments. Indebtedness of companies whose creditworthiness is poor involves substantially greater risks, and may be highly speculative.
3. FEES AND OTHER TRANSACTIONS WITH AFFILIATES
a. Investment Advisory Fees
Pursuant to a separate investment advisory agreement, GuideStone Capital Management (“GSCM” or “Adviser”) acts as the Adviser to the Funds. As Adviser, it supervises the investments of the Funds and for such services is paid a fee. GSCM and the Trust have entered into sub-advisory agreements with various sub-advisers to manage each Select Fund’s investments. Under the general supervision of GSCM, the sub-advisers make the day-to-day investment decisions for the Select Funds, and for such services, each sub-adviser receives a fee from the Funds.
The advisory fees paid to GSCM and aggregate sub-advisory fees paid to the sub-advisers, listed at the end of this report, are computed daily based upon the net assets of each Fund. The actual advisory fees accrued and the sub-advisory fees accrued during the year ended December 31, 2008, based upon average daily net assets, were as follows:
| | | | | | |
Fund | | Advisory
Fees | | | Sub-Adviser
Fees | |
MyDestination 2005 | | 0.10 | % | | — | |
MyDestination 2015 | | 0.10 | % | | — | |
MyDestination 2025 | | 0.10 | % | | — | |
MyDestination 2035 | | 0.10 | % | | — | |
MyDestination 2045 | | 0.10 | % | | — | |
Conservative Allocation | | 0.10 | % | | — | |
Balanced Allocation | | 0.10 | % | | — | |
Growth Allocation | | 0.10 | % | | — | |
Aggressive Allocation | | 0.10 | % | | — | |
Conservative Allocation I | | 0.10 | % | | — | |
Balanced Allocation I | | 0.10 | % | | — | |
Growth Allocation I | | 0.10 | % | | — | |
Aggressive Allocation I | | 0.10 | % | | — | |
Money Market | | 0.09 | % | | 0.07 | % |
Low-Duration Bond | | 0.13 | % | | 0.21 | % |
Medium-Duration Bond | | 0.21 | % | | 0.20 | % |
Extended-Duration Bond | | 0.25 | % | | 0.21 | % |
Global Bond | | 0.21 | % | | 0.24 | % |
200
| | | | | | |
Fund | | Advisory
Fees | | | Sub-Adviser
Fees | |
Equity Index | | 0.13 | % | | 0.02 | % |
Real Estate Securities | | 0.28 | % | | 0.61 | % |
Value Equity | | 0.40 | % | | 0.23 | % |
Growth Equity | | 0.45 | % | | 0.39 | % |
Small Cap Equity | | 0.27 | % | | 0.68 | % |
International Equity | | 0.47 | % | | 0.47 | % |
For the year ended December 31, 2008, advisory fees (excluding sub-advisory fees) and waivers for each Fund were as follows:
| | | | | | | | | | | |
| | | Gross
Advisory Fee | | Waiver/
Reimbursements | | | Net Advisory Fee
(Reimbursement) | |
MyDestination 2005 | | $ | 60,377 | | $ | (63,399 | ) | | $ | (3,022 | ) |
MyDestination 2015 | | | 170,214 | | | 23,186 | | | | 193,400 | |
MyDestination 2025 | | | 108,798 | | | (23,442 | ) | | | 85,356 | |
MyDestination 2035 | | | 39,552 | | | (87,225 | ) | | | (47,673 | ) |
MyDestination 2045 | | | 16,063 | | | (103,673 | ) | | | (87,610 | ) |
Conservative Allocation | | | 306,802 | | | (102,058 | ) | | | 204,744 | |
Balanced Allocation | | | 1,170,757 | | | (88,095 | ) | | | 1,082,662 | |
Growth Allocation | | | 909,446 | | | (91,440 | ) | | | 818,006 | |
Aggressive Allocation | | | 804,734 | | | (98,274 | ) | | | 706,460 | |
Conservative Allocation I | | | 62,037 | | | (43,693 | ) | | | 18,344 | |
Balanced Allocation I | | | 315,156 | | | 12,577 | | | | 327,733 | |
Growth Allocation I | | | 211,387 | | | 12,769 | | | | 224,156 | |
Aggressive Allocation I | | | 156,704 | | | (7,921 | ) | | | 148,783 | |
Money Market | | | 1,003,190 | | | 5,760 | | | | 1,008,950 | |
Low-Duration Bond | | | 984,202 | | | (606,659 | ) | | | 377,543 | |
Medium-Duration Bond | | | 2,309,580 | | | (905,658 | ) | | | 1,403,922 | |
Extended-Duration Bond | | | 1,269,976 | | | (100,954 | ) | | | 1,169,022 | |
Global Bond | | | 345,530 | | | (30,442 | ) | | | 315,088 | |
Equity Index | | | 530,325 | | | (179,764 | ) | | | 350,561 | |
Real Estate Securities | | | 295,058 | | | 16,763 | | | | 311,821 | |
Value Equity | | | 5,408,811 | | | (144,307 | ) | | | 5,264,504 | |
Growth Equity | | | 6,217,376 | | | (1,118,630 | ) | | | 5,098,746 | |
Small Cap Equity | | | 1,233,060 | | | (360,040 | ) | | | 873,020 | |
International Equity | | | 6,961,552 | | | (2,343,428 | ) | | | 4,618,124 | |
b. Distribution and Shareholder Servicing Fees
The Board of Trustees has adopted Shareholder Service Plans for the GS4 Class and GS6 Class of each Select Fund and the GS6 Class of each Asset Allocation and Date Target Fund (“Service Plans”) and a separate Plan of Distribution for the GS6 Class of each Select Fund, Asset Allocation Fund and Date Target Fund pursuant to Rule 12b-1 under the 1940 Act (“12b-1 Plan”).
Under the Service Plans, the GS4 Class and GS6 Class of each Select Fund and the GS6 Class of each applicable Asset Allocation and Date Target Fund are authorized to pay fees to parties that provide services for and maintain shareholder accounts. The GS4 Class and GS6 Class of each Select Fund are authorized to pay service fees of 0.19% and 0.30% of average daily net assets, respectively. The GS6 Class of each applicable Asset Allocation and Date Target Fund is authorized to pay shareholder servicing fees of 0.11% of average daily net assets.
Under the 12b-1 Plan, the assets of each Select Fund, Asset Allocation Fund and Date Target Fund may be used to compensate GuideStone Financial Resources, the Underwriter or others for certain expenses relating to the distribution of shares of the Funds to investors. Under the 12b-1 Plan, the maximum amount payable as a percentage of average daily net assets on an annual basis is 0.10% by the GS6 Class of each Select Fund, Asset Allocation Fund and Date Target Fund.
201
c. Expense Limitation
GSCM has agreed, through April 30, 2009, to waive fees and reimburse expenses of the GS2 Class, GS4 Class and GS6 Class of each Fund (excluding interest, taxes, brokerage commissions and extraordinary expenses) which exceed, in the aggregate, the annual percentage rate of each Class’s average daily net assets as follows:
| | | | | | | | | |
Fund | | GS2
Class | | | GS4
Class | | | GS6
Class | |
MyDestination 2005 | | NA | | | 0.20 | % | | 0.50 | % |
MyDestination 2015 | | NA | | | 0.20 | % | | 0.50 | % |
MyDestination 2025 | | NA | | | 0.20 | % | | 0.50 | % |
MyDestination 2035 | | NA | | | 0.20 | % | | 0.50 | % |
MyDestination 2045 | | NA | | | 0.20 | % | | 0.50 | % |
Conservative Allocation | | NA | | | 0.12 | % | | 0.45 | % |
Balanced Allocation | | NA | | | 0.12 | % | | 0.45 | % |
Growth Allocation | | NA | | | 0.12 | % | | 0.45 | % |
Aggressive Allocation | | NA | | | 0.12 | % | | 0.45 | % |
Conservative Allocation I | | 0.15 | % | | NA | | | NA | |
Balanced Allocation I | | 0.15 | % | | NA | | | NA | |
Growth Allocation I | | 0.15 | % | | NA | | | NA | |
Aggressive Allocation I | | 0.15 | % | | NA | | | NA | |
Money Market | | 0.20 | % | | 0.39 | % | | 0.80 | % |
Low-Duration Bond | | 0.36 | % | | 0.52 | % | | 0.91 | % |
Medium-Duration Bond | | 0.48 | % | | 0.58 | % | | 0.93 | % |
Extended-Duration Bond | | 0.63 | % | | 0.69 | % | | 0.97 | % |
Global Bond | | NA | | | 1.02 | % | | NA | |
Equity Index | | 0.23 | % | | 0.37 | % | | 0.60 | % |
Real Estate Securities | | NA | | | 1.29 | % | | NA | |
Value Equity | | 0.74 | % | | 0.85 | % | | 1.14 | % |
Growth Equity | | 0.88 | % | | 0.97 | % | | 1.29 | % |
Small Cap Equity | | 1.12 | % | | 1.15 | % | | 1.43 | % |
International Equity | | 0.94 | % | | 1.12 | % | | 1.37 | % |
Each Fund in turn agrees to reimburse GSCM for any operating expenses in excess of the expense limitation paid, waived or assumed by GSCM for that Fund during the limitation period, provided GSCM would not be entitled to reimbursement for any amount that would cause operating expenses to exceed the expense limitation during the year in which the reimbursement would be made, and provided further that no amount will be reimbursed by the Fund more than three years after the year in which it was incurred or waived by GSCM.
At December 31, 2008, the amounts subject to possible future reimbursement under the expense limitation agreement are as follows:
| | | | | | | | | |
| | | GS2
Class | | GS4
Class | | GS6
Class |
MyDestination 2005 | | | NA | | $ | 125,492 | | $ | 38,120 |
MyDestination 2015 | | | NA | | | — | | | 34,080 |
MyDestination 2025 | | | NA | | | 73,421 | | | 34,851 |
MyDestination 2035 | | | NA | | | 158,080 | | | 40,739 |
MyDestination 2045 | | | NA | | | 169,281 | | | 48,785 |
Conservative Allocation | | | NA | | | 361,889 | | | 9,160 |
Balanced Allocation | | | NA | | | 238,668 | | | — |
Growth Allocation | | | NA | | | 246,616 | | | — |
Aggressive Allocation | | | NA | | | 264,614 | | | — |
Conservative Allocation I | | $ | 158,726 | | | NA | | | NA |
Growth Allocation I | | | 31,667 | | | NA | | | NA |
Aggressive Allocation I | | | 56,462 | | | NA | | | NA |
202
| | | | | | | | | |
| | | GS2
Class | | GS4
Class | | GS6
Class |
Money Market | | $ | — | | $ | — | | $ | 14,640 |
Low-Duration Bond | | | 120,720 | | | 1,333,597 | | | 40,326 |
Medium-Duration Bond | | | — | | | 2,112,192 | | | 2,850 |
Extended-Duration Bond | | | — | | | 229,219 | | | 1,846 |
Equity Index | | | — | | | 396,733 | | | 50,575 |
Value Equity | | | — | | | 267,824 | | | 2,711 |
Growth Equity | | | — | | | 3,078,942 | | | 20,748 |
Small Cap Equity | | | — | | | 869,422 | | | 15,051 |
International Equity | | | 917,431 | | | 5,340,638 | | | 95,659 |
During the period ended December 31, 2008, GSCM recaptured the following amounts:
| | | | | | | | | |
| | | GS2
Class | | GS4
Class | | GS6
Class |
MyDestination 2015 | | | NA | | $ | 33,536 | | | NA |
Balanced Allocation | | | NA | | | NA | | $ | 2,992 |
Growth Allocation | | | NA | | | NA | | | 3,551 |
Aggressive Allocation | | | NA | | | NA | | | 339 |
Balanced Allocation I | | $ | 12,577 | | | NA | | | NA |
Growth Allocation I | | | 12,769 | | | NA | | | NA |
Money Market | | | NA | | | NA | | | 5,760 |
Extended-Duration Bond | | | NA | | | NA | | | 1,216 |
Real Estate Securities | | | NA | | | 25,165 | | | NA |
Value Equity | | | NA | | | NA | | | 467 |
Growth Equity | | | 19,056 | | | NA | | | NA |
d. Brokerage Service and Other Arrangements
The Adviser directs the sub-advisers to place security trades with designated brokers who have agreed to pay certain custody, transfer agency or other operating expenses through the use of Brokerage Service Arrangements on behalf of the Equity Funds.
| | | |
Fund | | Expenses Paid
Through Brokerage
Service Arrangements |
Value Equity | | $ | 176,335 |
Growth Equity | | | 151,169 |
Small Cap Equity | | | 60,677 |
International Equity | | | 103,181 |
e. Administrator, Transfer Agent and Distributor
Certain employees of PNC Global Investment Servicing (U.S.), Inc. (“PNC”), an indirect, wholly-owned subsidiary of The PNC Financial Services Group, Inc., are officers of the Funds. PNC serves as Administrator and Transfer Agent of the Funds.
For its services as Administrator, PNC is entitled to receive fees, computed daily and paid monthly, based upon the average daily net assets of each Fund. The fees, excluding out of pocket expenses, currently range between 0.004% and 0.02% of average daily net assets. For its services as Transfer Agent, PNC receives a fee based mainly upon the number of accounts serviced. Certain minimum fees and transaction charges may apply. For the year ended December 31, 2008, PNC received $3,206,305 in aggregate fees and expenses for services rendered under the various agreements described above.
PFPC Distributors, Inc. (“PDI”), also an indirect, wholly-owned subsidiary of The PNC Financial Services Group, Inc., serves as the Underwriter for the Funds. The Funds do not pay any fees to PDI in its capacity as Underwriter. The fees are paid by GSCM.
203
4. SECURITIES LENDING
Through an agreement with The Northern Trust Company (“Northern Trust”) (the Funds’ custodian) the Select Funds may lend portfolio securities to certain brokers, dealers and other financial institutions that pay the Select Funds a negotiated fee. The Select Funds receive cash or U.S. government securities as collateral against the loaned securities in an amount at least equal to the market value of the loaned securities. The Funds continue to own the loaned securities and the securities remain in the investment portfolio. However, in the event of default or bankruptcy by the other party to the agreement, realization and/or retention of the collateral may be subject to legal proceedings. Cash collateral has been invested in a short-term money market fund of Northern Trust, an affiliate of the Funds, that invests in securities that satisfy the quality requirements of Rule 2a-7 and have short maturities. At December 31, 2008, the market values of loaned securities and collateral received were as follows:
| | | | | | | | | | | | |
Fund | | Value of
Securities
Loaned | | Value of
Cash
Collateral | | Value of
Non-cash
Collateral | | Total
Value of
Collateral |
Money Market | | $ | 993,578 | | $ | 1,010,000 | | $ | — | | $ | 1,010,000 |
Low-Duration Bond | | | 50,259,820 | | | 51,250,573 | | | — | | | 51,250,573 |
Medium-Duration Bond | | | 49,671,546 | | | 51,066,761 | | | — | | | 51,066,761 |
Extended-Duration Bond | | | 13,938,149 | | | 14,158,534 | | | — | | | 14,158,534 |
Global Bond | | | 14,019,040 | | | 14,403,133 | | | — | | | 14,403,133 |
Equity Index | | | 20,286,313 | | | 20,348,261 | | | — | | | 20,348,261 |
Real Estate Securities | | | 22,761,622 | | | 23,423,794 | | | — | | | 23,423,794 |
Value Equity | | | 69,422,644 | | | 70,064,449 | | | — | | | 70,064,449 |
Growth Equity | | | 85,793,222 | | | 86,712,386 | | | — | | | 86,712,386 |
Small Cap Equity | | | 59,757,324 | | | 59,416,171 | | | 371,857 | | | 59,788,028 |
International Equity | | | 95,238,971 | | | 98,556,925 | | | 2,441,543 | | | 100,998,468 |
As of the close of business on September 18, 2008, Lehman Brothers Holding Inc. was in default of the security lending agreements with the Medium-Duration Bond Fund, Extended-Duration Bond Fund, Growth Equity Fund, Small Cap Equity Fund and International Equity Fund (the “Funds”). As a result, Northern Trust as Securities Lending Agent took possession of the collateral and repurchased the securities in the Funds through open market purchases. Under Statement of Financial Accounting Standards No. 140, Accounting for Transfers and Servicing of Financial Assets and Extinguishments of Liabilities (“SFAS 140”), the criteria for sales accounting have been met.
5. 10% SHAREHOLDERS
The Date Target and Asset Allocation Funds do not invest in the underlying Select Funds for the purpose of exercising management or control; however, investments made by each Date Target and Asset Allocation Fund within each of its principal investment strategies may represent a significant portion of an underlying Select Fund’s net assets. At December 31, 2008, the Asset Allocation Funds were the owner of record of the following approximate percentages of the total outstanding shares of the underlying Select Funds as detailed below:
| | | | | | | | | | | | | | | | | | | | | | | | | | | | | | |
Fund | | Low-
Duration
Bond | | | Medium-
Duration
Bond | | | Extended-
Duration
Bond | | | Global
Bond | | | Equity
Index | | | Real
Estate
Securities | | | Value
Equity | | | Growth
Equity | | | Small
Cap
Equity | | | International
Equity | |
MyDestination 2005 | | 1.18 | % | | 0.95 | % | | 0.13 | % | | 0.75 | % | | 0.36 | % | | 2.58 | % | | 0.56 | % | | 0.60 | % | | 0.48 | % | | 0.58 | % |
MyDestination 2015 | | 1.38 | | | 1.87 | | | 1.32 | | | 4.25 | | | 1.22 | | | 11.02 | | | 2.08 | | | 2.24 | | | 1.84 | | | 2.19 | |
MyDestination 2025 | | — | | | 0.79 | | | 1.30 | | | 4.15 | | | 0.98 | | | 8.41 | | | 1.69 | | | 1.83 | | | 1.86 | | | 1.84 | |
MyDestination 2035 | | — | | | 0.06 | | | 0.12 | | | 0.88 | | | 0.44 | | | 3.70 | | | 0.76 | | | 0.83 | | | 0.99 | | | 0.86 | |
MyDestination 2045 | | — | | | — | | | — | | | — | | | 0.27 | | | 2.26 | | | 0.38 | | | 0.41 | | | 0.51 | | | 0.43 | |
Conservative Allocation | | 28.22 | | | — | | | — | | | — | | | 0.94 | | | — | | | 1.43 | | | 1.51 | | | 0.93 | | | 1.59 | |
Balanced Allocation | | 19.99 | | | 20.82 | | | 17.61 | | | 26.75 | | | 7.70 | | | — | | | 11.09 | | | 11.28 | | | 8.33 | | | 11.30 | |
Growth Allocation | | 7.52 | | | 7.83 | | | 6.61 | | | 9.84 | | | 9.02 | | | — | | | 12.45 | | | 12.61 | | | 8.97 | | | 12.67 | |
Aggressive Allocation | | — | % | | — | % | | — | % | | — | % | | 10.24 | % | | — | % | | 13.81 | % | | 14.48 | % | | 10.46 | % | | 14.47 | % |
204
| | | | | | | | | | | | | | | | | | | | |
Fund | | Low-
Duration
Bond | | Medium-
Duration
Bond | | Extended-
Duration
Bond | | Global
Bond | | Equity
Index | | Real
Estate
Securities | | Value
Equity | | Growth
Equity | | Small
Cap
Equity | | International
Equity |
Conservative Allocation I | | 8.92 | | — | | — | | — | | 0.37 | | — | | 0.58 | | 0.51 | | 0.30 | | 0.44 |
Balanced Allocation I | | 8.28 | | 9.97 | | 10.15 | | 7.51 | | 3.97 | | — | | 5.94 | | 5.02 | | 3.51 | | 4.06 |
Growth Allocation I | | 2.66 | | 3.19 | | 3.25 | | 2.36 | | 3.97 | | — | | 5.69 | | 4.78 | | 3.22 | | 3.88 |
Aggressive Allocation I | | — | | — | | — | | — | | 3.68 | | — | | 5.16 | | 4.49 | | 3.07 | | 3.62 |
6. INVESTMENT TRANSACTIONS
For the period ended December 31, 2008, the cost of purchases and proceeds from sales and maturities for each Fund were as follows:
| | | | | | | | | | | | |
| | | Cost of Purchases and
Proceeds from Sales and Maturities
of Long-Term Securities
(other than U.S. Government Obligations) | | Cost of Purchases and
Proceeds from Sales and Maturities
of Long-Term U.S. Government Obligations |
| | | Purchases | | Sale and Maturity
Proceeds | | Purchases | | Sale and Maturity
Proceeds |
MyDestination 2005 | | $ | 22,446,014 | | $ | 13,663,838 | | $ | 9,762,667 | | $ | 10,216,524 |
MyDestination 2015 | | | 58,902,144 | | | 22,449,448 | | | 12,766,450 | | | 13,957,027 |
MyDestination 2025 | | | 43,642,000 | | | 5,158,500 | | | 5,296,321 | | | 5,607,638 |
MyDestination 2035 | | | 22,817,284 | | | 1,196,000 | | | 669,338 | | | 711,165 |
MyDestination 2045 | | | 14,408,413 | | | 790,500 | | | — | | | — |
Conservative Allocation | | | 26,600,000 | | | 58,050,000 | | | 24,126,783 | | | 27,818,280 |
Balanced Allocation | | | 167,900,000 | | | 299,050,000 | | | 55,699,241 | | | 63,916,552 |
Growth Allocation | | | 99,250,000 | | | 185,600,000 | | | 16,590,117 | | | 19,993,770 |
Aggressive Allocation | | | 53,500,000 | | | 115,700,000 | | | — | | | — |
Conservative Allocation I | | | 8,018,000 | | | 12,376,000 | | | 7,489,815 | | | 8,260,229 |
Balanced Allocation I | | | 62,488,000 | | | 71,658,000 | | | 9,721,366 | | | 12,682,878 |
Growth Allocation I | | | 34,706,000 | | | 42,276,000 | | | 3,882,856 | | | 5,139,495 |
Aggressive Allocation I | | | 15,645,000 | | | 26,604,000 | | | — | | | — |
Low-Duration Bond | | | 280,931,656 | | | 105,397,306 | | | 3,169,158,101 | | | 3,113,916,770 |
Medium-Duration Bond | | | 299,395,629 | | | 163,583,881 | | | 7,311,089,926 | | | 7,466,263,881 |
Extended-Duration Bond | | | 186,567,744 | | | 239,379,782 | | | 10,769,187 | | | 29,887,058 |
Global Bond | | | 140,738,593 | | | 41,754,377 | | | 229,393,644 | | | 233,836,701 |
Equity Index | | | 19,130,565 | | | 43,720,056 | | | — | | | — |
Real Estate Securities | | | 132,694,809 | | | 94,100,513 | | | — | | | — |
Value Equity | | | 693,955,511 | | | 714,936,316 | | | — | | | — |
Growth Equity | | | 1,310,592,201 | | | 1,371,754,365 | | | — | | | — |
Small Cap Equity | | | 394,828,903 | | | 431,504,309 | | | 260,494,234 | | | 279,573,491 |
International Equity | | | 1,514,457,955 | | | 1,268,191,642 | | | — | | | — |
Futures Contracts
Investments as of December 31, 2008, included cash and securities that were valued and pledged as collateral to cover initial margin deposits. The market value of the open futures contracts is as follows:
| | | | | | | | |
| | | Open Long
(Short) Contracts | | Market Value
of Contracts | | Net Unrealized
Appreciation
(Depreciation)
on Futures |
MyDestination 2005 | | | | | | | | |
March 2009 S&P 500® E-Mini | | 21 | | $ | 945,105 | | $ | 16,547 |
| | | | | | | | |
MyDestination 2015 | | | | | | | | |
March 2009 S&P 500® E-Mini | | 39 | | $ | 1,755,195 | | $ | 33,849 |
| | | | | | | | |
MyDestination 2025 | | | | | | | | |
March 2009 S&P 500® E-Mini | | 31 | | $ | 1,395,155 | | $ | 26,638 |
| | | | | | | | |
205
| | | | | | | | | | | |
| | | Open Long
(Short) Contracts | | | Market Value
of Contracts | | | Net Unrealized
Appreciation
(Depreciation)
on Futures | |
MyDestination 2035 | | | | | | | | | | | |
March 2009 S&P 500® E-Mini | | 13 | | | $ | 585,065 | | | $ | 15,887 | |
| | | | | | | | | | | |
MyDestination 2045 | | | | | | | | | | | |
March 2009 S&P 500® E-Mini | | 12 | | | $ | 540,060 | | | $ | 11,635 | |
| | | | | | | | | | | |
Conservative Allocation Fund | | | | | | | | | | | |
March 2009 S&P 500® | | 31 | | | $ | 6,975,775 | | | $ | 26,506 | |
| | | | | | | | | | | |
Balanced Allocation Fund | | | | | | | | | | | |
March 2009 S&P 500® | | 86 | | | $ | 19,352,150 | | | $ | 15,797 | |
| | | | | | | | | | | |
Growth Allocation Fund | | | | | | | | | | | |
March 2009 S&P 500® | | 76 | | | $ | 17,101,900 | | | $ | 147,552 | |
| | | | | | | | | | | |
Aggressive Allocation Fund | | | | | | | | | | | |
March 2009 S&P 500® | | 46 | | | $ | 10,351,150 | | | $ | 137,430 | |
| | | | | | | | | | | |
Conservative Allocation Fund I | | | | | | | | | | | |
March 2009 S&P 500® E-Mini | | 22 | | | $ | 990,110 | | | $ | 12,673 | |
| | | | | | | | | | | |
Balanced Allocation Fund I | | | | | | | | | | | |
March 2009 S&P 500® E-Mini | | 141 | | | $ | 6,345,705 | | | $ | 43,872 | |
| | | | | | | | | | | |
Growth Allocation Fund I | | | | | | | | | | | |
March 2009 S&P 500® E-Mini | | 79 | | | $ | 3,555,395 | | | $ | 46,973 | |
| | | | | | | | | | | |
Aggressive Allocation Fund I | | | | | | | | | | | |
March 2009 S&P 500® E-Mini | | 49 | | | $ | 2,205,245 | | | $ | 12,240 | |
| | | | | | | | | | | |
Low-Duration Bond Fund | | | | | | | | | | | |
December 2009 90-Day Euro | | (12 | ) | | $ | (2,957,550 | ) | | $ | (72,437 | ) |
December 2009 90-Day Sterling | | 104 | | | | 18,295,479 | | | | 670,802 | |
December 2010 90-Day Euro | | (9 | ) | | | (2,202,300 | ) | | | (50,127 | ) |
June 2009 90-Day Euro | | 35 | | | | 8,651,125 | | | | 162,201 | |
June 2009 90-Day Sterling | | 136 | | | | 24,043,400 | | | | 1,021,020 | |
June 2010 90-Day Euro | | (9 | ) | | | (2,210,850 | ) | | | (52,752 | ) |
March 2009 10-Year U.S. Treasury Note | | 46 | | | | 5,784,500 | | | | 55,441 | |
March 2009 2-Year U.S. Treasury Note | | 354 | | | | 77,194,125 | | | | 567,270 | |
March 2009 5-Year U.S. Treasury Note | | 376 | | | | 44,764,562 | | | | 940,984 | |
March 2009 90-Day EURIBOR | | 192 | | | | 65,234,362 | | | | 1,735,419 | |
March 2009 90-Day Euro | | (15 | ) | | | (3,710,250 | ) | | | (81,421 | ) |
March 2009 90-Day Sterling | | 66 | | | | 11,652,107 | | | | 111,875 | |
March 2009 Euro-BOBL | | 1 | | | | 161,537 | | | | 833 | |
March 2009 Euro-Bund | | 7 | | | | 1,214,734 | | | | 17,499 | |
March 2009 Euro-Schatz | | 15 | | | | 2,240,826 | | | | (400 | ) |
March 2009 Long Gilt | | 9 | | | | 1,597,674 | | | | 147,623 | |
March 2010 90-Day Euro | | 185 | | | | 45,542,375 | | | | 865,076 | |
March 2011 90-Day Euro | | (9 | ) | | | (2,199,600 | ) | | | (49,265 | ) |
September 2009 90-Day Euro | | 238 | | | | 58,753,275 | | | | 1,331,242 | |
September 2009 90-Day Sterling | | 81 | | | | 14,303,225 | | | | 576,979 | |
September 2010 90-Day Euro | | (9 | ) | | | (2,206,688 | ) | | | (51,665 | ) |
| | | | | | | | | | | |
| | | | | | | | | $ | 7,846,197 | |
| | | | | | | | | | | |
206
| | | | | | | | | | | |
| | | Open Long
(Short) Contracts | | | Market Value
of Contracts | | | Net Unrealized
Appreciation
(Depreciation)
on Futures | |
Medium-Duration Bond Fund | | | | | | | | | | | |
December 2009 90-Day Sterling | | 290 | | | $ | 51,016,239 | | | $ | 1,540,791 | |
June 2009 90-Day Euro | | 441 | | | | 109,004,175 | | | | 237,420 | |
March 2009 10-Year U.S. Treasury Note | | (131 | ) | | | (16,473,250 | ) | | | (627,053 | ) |
March 2009 2-Year U.S. Treasury Note | | 20 | | | | 4,361,250 | | | | 16,214 | |
March 2009 5-Year U.S. Treasury Note | | 364 | | | | 43,335,906 | | | | 711,804 | |
March 2009 90-Day EURIBOR | | 244 | | | | 82,902,002 | | | | 2,205,427 | |
March 2009 90-Day Euro | | 116 | | | | 28,692,600 | | | | 271,237 | |
March 2009 90-Day Sterling | | 74 | | | | 13,064,484 | | | | 239,729 | |
March 2009 Euro-BOBL | | (10 | ) | | | (1,615,374 | ) | | | (11,329 | ) |
March 2009 Euro-Bund | | (27 | ) | | | (4,685,405 | ) | | | (39,655 | ) |
March 2009 Euro-Schatz | | (145 | ) | | | (21,661,315 | ) | | | (76,658 | ) |
March 2009 Long Gilt | | (35 | ) | | | (6,213,178 | ) | | | (227,085 | ) |
March 2009 U.S. Long Treasury Bond | | 91 | | | | 12,562,266 | | | | 227,377 | |
March 2010 90-Day Euro | | 283 | | | | 69,667,525 | | | | 1,364,288 | |
September 2009 90-Day Euro | | 92 | | | | 22,711,350 | | | | 416,912 | |
September 2009 90-Day Sterling | | 29 | | | | 5,120,908 | | | | 158,180 | |
| | | | | | | | | | | |
| | | | | | | | | $ | 6,407,599 | |
| | | | | | | | | | | |
Global Bond Fund | | | | | | | | | | | |
March 2009 10-Year U.S. Treasury Note | | (13 | ) | | $ | (1,634,750 | ) | | $ | (124,276 | ) |
March 2009 5-Year U.S. Treasury Note | | 45 | | | | 5,357,461 | | | | 158,689 | |
March 2009 Euro-BOBL | | 27 | | | | 4,361,510 | | | | 33,938 | |
March 2009 Euro-Bund | | 9 | | | | 1,561,802 | | | | 5,484 | |
| | | | | | | | | | | |
| | | | | | | | | $ | 73,835 | |
| | | | | | | | | | | |
Equity Index Fund | | | | | | | | | | | |
March 2009 S&P 500® | | 47 | | | $ | 10,576,175 | | | $ | 291,663 | |
| | | | | | | | | | | |
Real Estate Securities Fund | | | | | | | | | | | |
March 2009 Russell 2000® IMM-Mini | | 100 | | | $ | 4,979,000 | | | $ | 238,305 | |
| | | | | | | | | | | |
Value Equity Fund | | | | | | | | | | | |
March 2009 S&P 500® | | 130 | | | $ | 29,253,250 | | | $ | 450,429 | |
March 2009 S&P 500® E-Mini | | 26 | | | | 1,170,130 | | | | 37,449 | |
| | | | | | | | | | | |
| | | | | | | | | $ | 487,878 | |
| | | | | | | | | | | |
Growth Equity Fund | | | | | | | | | | | |
March 2009 S&P 500® | | 324 | | | $ | 72,908,100 | | | $ | 1,019,417 | |
| | | | | | | | | | | |
Small Cap Equity Fund | | | | | | | | | | | |
March 2009 2-Year U.S. Treasury Note | | 7 | | | $ | 1,526,438 | | | $ | 21,637 | |
March 2009 5-Year U.S. Treasury Note | | 28 | | | | 3,333,531 | | | | 88,219 | |
March 2009 90-Day Euro | | 50 | | | | 12,367,500 | | | | 283,038 | |
March 2009 Euro-Bund | | 9 | | | | 1,561,802 | | | | (2,189 | ) |
March 2009 Russell 2000® EMM-Mini | | 992 | | | | 49,391,680 | | | | 2,486,355 | |
207
| | | | | | | | | | | |
| | | Open Long
(Short) Contracts | | | Market Value
of Contracts | | | Net Unrealized
Appreciation
(Depreciation)
on Futures | |
March 2009 U.S. Long Treasury Bond | | 2 | | | $ | 276,094 | | | $ | 38,240 | |
March 2009 10-Year U.S. Treasury Note | | (27 | ) | | | (3,395,250 | ) | | | (153,283 | ) |
| | | | | | | | | | | |
| | | | | | | | | $ | 2,762,017 | |
| | | | | | | | | | | |
International Equity Fund | | | | | | | | | | | |
January 2009 CAC40 Index | | 52 | | | $ | 2,328,218 | | | $ | (10,151 | ) |
January 2009 AEX Index | | 28 | | | | 1,917,654 | | | | (13,175 | ) |
January 2009 Hang Seng Index | | (10 | ) | | | (929,331 | ) | | | 31,087 | |
January 2009 IBEX 35 | | (8 | ) | | | (1,013,400 | ) | | | 524 | |
January 2009 MSCI Singapore Index | | 3 | | | | 91,119 | | | | 2,798 | |
January 2009 OMXS30 Index Future | | (19 | ) | | | (158,334 | ) | | | 1,605 | |
March 2009 DAX Index Future | | (13 | ) | | | (2,184,060 | ) | | | (47,843 | ) |
March 2009 FTSE 100 Index® | | 177 | | | | 11,171,772 | | | | 320,895 | |
March 2009 S&P /TSE 60 Index | | (6 | ) | | | (524,812 | ) | | | (24,972 | ) |
March 2009 S&P MIB Index | | 20 | | | | 2,699,750 | | | | 17,061 | |
March 2009 SPI 200® | | (10 | ) | | | (652,927 | ) | | | (36,179 | ) |
March 2009 TOPIX Index® | | 63 | | | | 5,990,734 | | | | 261,427 | |
March 2009 DJ Euro Stoxx 50® | | 348 | | | | 11,851,543 | | | | 146,329 | |
March 2009 Swiss Synthetic Future | | (52 | ) | | | (2,663,147 | ) | | | 9,981 | |
| | | | | | | | | | | |
| | | | | | | | | $ | 659,387 | |
| | | | | | | | | | | |
Forward Foreign Currency Contracts
As of December 31, 2008, the following Funds have forward foreign currency exchange contracts that obligate it to deliver currencies at specified future dates. The unrealized appreciation and/or depreciation on these contracts is included in the accompanying financial statements. The terms of the open contracts are as follows:
| | | | | | | | | | | | |
Fund/Expiration Date | | Currency to be
Delivered | | Amount of Currency
to be Delivered | | Currency to be
Received | | Amount of Currency
to be Received | | Net Unrealized
Appreciation
(Depreciation) | |
Low-Duration Bond Fund | | | | | | | | | | |
01/08/09 | | Japanese Yen | | 8,943,000 | | U.S. Dollars | | 97,698 | | $ | (973 | ) |
01/08/09 | | U.S. Dollars | | 20,256 | | Japanese Yen | | 1,954,000 | | | 1,303 | |
01/08/09 | | U.S. Dollars | | 25,535 | | Japanese Yen | | 2,433,000 | | | 1,309 | |
01/08/09 | | U.S. Dollars | | 50,126 | | Japanese Yen | | 4,777,000 | | | 2,580 | |
01/08/09 | | U.S. Dollars | | 24,849 | | Japanese Yen | | 2,361,000 | | | 1,201 | |
01/12/09 | | Euro | | 4,340,000 | | U.S. Dollars | | 5,491,315 | | | (538,141 | ) |
01/12/09 | | Euro | | 4,951,000 | | U.S. Dollars | | 6,394,365 | | | (483,939 | ) |
01/13/09 | | Euro | | 247,000 | | U.S. Dollars | | 329,407 | | | (13,729 | ) |
01/13/09 | | U.S. Dollars | | 3,753 | | Euro | | 3,000 | | | 415 | |
01/13/09 | | U.S. Dollars | | 1,630,585 | | Euro | | 1,291,000 | | | 162,887 | |
01/13/09 | | U.S. Dollars | | 87,373 | | Euro | | 69,000 | | | 8,483 | |
01/13/09 | | U.S. Dollars | | 237,550 | | Euro | | 171,000 | | | 5 | |
01/13/09 | | U.S. Dollars | | 394,423 | | Euro | | 286,000 | | | 2,892 | |
01/13/09 | | British Pounds | | 1,082,000 | | U.S. Dollars | | 1,666,516 | | | 111,458 | |
01/13/09 | | British Pounds | | 760,000 | | U.S. Dollars | | 1,125,712 | | | 33,435 | |
01/13/09 | | British Pounds | | 824,000 | | U.S. Dollars | | 1,221,465 | | | 37,206 | |
01/13/09 | | British Pounds | | 731,000 | | U.S. Dollars | | 1,083,985 | | | 33,387 | |
01/13/09 | | British Pounds | | 343,000 | | U.S. Dollars | | 525,440 | | | 32,478 | |
208
| | | | | | | | | | | | |
Fund/Expiration Date | | Currency to be
Delivered | | Amount of Currency
to be Delivered | | Currency to be
Received | | Amount of Currency
to be Received | | Net Unrealized
Appreciation
(Depreciation) | |
01/13/09 | | British Pounds | | 1,082,000 | | U.S. Dollars | | 1,668,920 | | $ | 113,862 | |
01/13/09 | | U.S. Dollars | | 731,891 | | British Pounds | | 489,000 | | | (29,097 | ) |
01/14/09 | | U.S. Dollars | | 218,193 | | Canadian Dollars | | 275,000 | | | 4,515 | |
01/21/09 | | British Pounds | | 170,000 | | U.S. Dollars | | 253,235 | | | 8,967 | |
05/06/09 | | U.S. Dollars | | 3,277,178 | | Chinese Yuan | | 22,684,625 | | | (3,026 | ) |
07/15/09 | | Chinese Yuan | | 3,490,000 | | U.S. Dollars | | 500,000 | | | (2,411 | ) |
07/15/09 | | Chinese Yuan | | 9,814,000 | | U.S. Dollars | | 1,400,000 | | | (12,796 | ) |
07/15/09 | | Chinese Yuan | | 11,131,090 | | U.S. Dollars | | 1,597,000 | | | (5,400 | ) |
07/15/09 | | Chinese Yuan | | 2,467,970 | | U.S. Dollars | | 356,000 | | | 718 | |
07/15/09 | | Chinese Yuan | | 2,376,990 | | U.S. Dollars | | 343,000 | | | 815 | |
07/15/09 | | Chinese Yuan | | 7,018,220 | | U.S. Dollars | | 1,012,000 | | | 1,677 | |
07/15/09 | | Chinese Yuan | | 5,462,810 | | U.S. Dollars | | 788,000 | | | 1,589 | |
07/15/09 | | Chinese Yuan | | 7,008,758 | | U.S. Dollars | | 1,011,000 | | | 2,039 | |
07/15/09 | | Chinese Yuan | | 2,716,560 | | U.S. Dollars | | 392,000 | | | 932 | |
07/15/09 | | U.S. Dollars | | 1,025,000 | | Chinese Yuan | | 6,970,000 | | | (21,618 | ) |
07/15/09 | | U.S. Dollars | | 3,047,815 | | Chinese Yuan | | 20,780,000 | | | (56,384 | ) |
09/08/09 | | U.S. Dollars | | 1,610,000 | | Chinese Yuan | | 11,100,145 | | | (14,510 | ) |
| | | | | | | | | | | | |
| | | | | | | | | | $ | (617,871 | ) |
| | | | | | | | | | | | |
Medium-Duration Bond Fund | | | | | | | | | | |
01/08/09 | | Japanese Yen | | 32,409,000 | | U.S. Dollars | | 340,145 | | $ | (17,433 | ) |
01/08/09 | | Japanese Yen | | 32,600,000 | | U.S. Dollars | | 343,104 | | | (16,582 | ) |
01/08/09 | | Japanese Yen | | 60,397,740 | | U.S. Dollars | | 633,764 | | | (32,622 | ) |
01/08/09 | | Japanese Yen | | 9,413,000 | | U.S. Dollars | | 102,833 | | | (1,024 | ) |
01/13/09 | | Euro | | 829,072 | | U.S. Dollars | | 1,071,990 | | | (73,379 | ) |
01/13/09 | | Euro | | 324,000 | | U.S. Dollars | | 432,096 | | | (18,008 | ) |
01/13/09 | | Euro | | 2,850,000 | | U.S. Dollars | | 3,599,664 | | | (359,588 | ) |
01/13/09 | | U.S. Dollars | | 541,986 | | Euro | | 393,000 | | | 3,973 | |
01/13/09 | | U.S. Dollars | | 219,490 | | Euro | | 158,000 | | | 5 | |
01/13/09 | | British Pounds | | 533,000 | | U.S. Dollars | | 790,375 | | | 24,344 | |
01/13/09 | | British Pounds | | 164,000 | | U.S. Dollars | | 251,231 | | | 15,529 | |
01/13/09 | | British Pounds | | 519,000 | | U.S. Dollars | | 800,526 | | | 54,616 | |
01/13/09 | | British Pounds | | 519,000 | | U.S. Dollars | | 799,373 | | | 53,463 | |
01/13/09 | | British Pounds | | 601,000 | | U.S. Dollars | | 890,898 | | | 27,137 | |
01/13/09 | | British Pounds | | 554,000 | | U.S. Dollars | | 820,585 | | | 24,372 | |
01/16/09 | | Hungarian Forint | | 128,389,890 | | U.S. Dollars | | 703,506 | | | 34,031 | |
01/16/09 | | U.S. Dollars | | 104,785 | | Hungarian Forint | | 21,072,333 | | | 5,094 | |
01/16/09 | | U.S. Dollars | | 60,562 | | Hungarian Forint | | 13,647,626 | | | 10,602 | |
01/16/09 | | U.S. Dollars | | 158,918 | | Hungarian Forint | | 33,833,680 | | | 17,504 | |
01/16/09 | | U.S. Dollars | | 48,665 | | Hungarian Forint | | 9,694,086 | | | 1,884 | |
01/16/09 | | U.S. Dollars | | 231,925 | | Hungarian Forint | | 50,142,165 | | | 29,536 | |
02/03/09 | | U.S. Dollars | | 2,694,007 | | Brazilian Real | | 5,911,998 | | | (193,867 | ) |
02/03/09 | | Canadian Dollars | | 1,842,980 | | U.S. Dollars | | 1,533,899 | | | 41,683 | |
02/03/09 | | U.S. Dollars | | 979,336 | | Canadian Dollar | | 1,175,203 | | | (27,802 | ) |
02/03/09 | | Euro | | 1,448,485 | | U.S. Dollars | | 1,922,546 | | | (87,903 | ) |
02/12/09 | | U.S. Dollars | | 80,000 | | Malaysian Ringits | | 282,780 | | | 1,612 | |
02/12/09 | | U.S. Dollars | | 200,000 | | Malaysian Ringits | | 718,350 | | | 7,319 | |
02/12/09 | | U.S. Dollars | | 98,821 | | Malaysian Ringits | | 349,825 | | | 2,140 | |
02/12/09 | | U.S. Dollars | | 226,458 | | Malaysian Ringits | | 790,000 | | | 1,539 | |
02/12/09 | | U.S. Dollars | | 80,000 | | Malaysian Ringits | | 280,520 | | | 959 | |
04/14/09 | | U.S. Dollars | | 80,000 | | Malaysian Ringits | | 280,280 | | | 870 | |
04/14/09 | | U.S. Dollars | | 80,000 | | Malaysian Ringits | | 279,640 | | | 686 | |
209
| | | | | | | | | | | | |
Fund/Expiration Date | | Currency to be
Delivered | | Amount of Currency
to be Delivered | | Currency to be
Received | | Amount of Currency
to be Received | | Net Unrealized
Appreciation
(Depreciation) | |
04/14/09 | | U.S. Dollars | | 170,000 | | Malaysian Ringits | | 597,720 | | $ | 2,462 | |
04/14/09 | | U.S. Dollars | | 20,000 | | Malaysian Ringits | | 70,220 | | | 261 | |
04/14/09 | | U.S. Dollars | | 90,000 | | Malaysian Ringits | | 316,530 | | | 1,330 | |
04/14/09 | | U.S. Dollars | | 100,000 | | Malaysian Ringits | | 360,450 | | | 4,002 | |
05/06/09 | | U.S. Dollars | | 3,793,266 | | Chinese Yuan | | 26,256,986 | | | (3,502 | ) |
05/06/09 | | Russian Rubles | | 64,187,950 | | U.S. Dollars | | 1,916,058 | | | 54,639 | |
05/06/09 | | Russian Rubles | | 6,300,000 | | U.S. Dollars | | 200,000 | | | 17,303 | |
05/06/09 | | Russian Rubles | | 38,812,580 | | U.S. Dollars | | 1,202,000 | | | 76,455 | |
05/06/09 | | Russian Rubles | | 18,543,750 | | U.S. Dollars | | 575,000 | | | 37,241 | |
05/06/09 | | Russian Rubles | | 21,156,900 | | U.S. Dollars | | 654,000 | | | 40,460 | |
05/06/09 | | Russian Rubles | | 12,691,140 | | U.S. Dollars | | 402,000 | | | 33,963 | |
05/06/09 | | Russian Rubles | | 6,571,125 | | U.S. Dollars | | 197,925 | | | 7,366 | |
05/06/09 | | U.S. Dollars | | 6,895,336 | | Russian Rubles | | 168,263,445 | | | (2,015,779 | ) |
05/19/09 | | U.S. Dollars | | 4,292 | | Mexican Pesos | | 46,864 | | | (1,028 | ) |
07/15/09 | | Chinese Yuan | | 1,994,940 | | U.S. Dollars | | 284,585 | | | (2,601 | ) |
07/15/09 | | Chinese Yuan | | 4,865,060 | | U.S. Dollars | | 698,000 | | | (2,360 | ) |
07/15/09 | | U.S. Dollars | | 1,008,824 | | Chinese Yuan | | 6,860,000 | | | (21,277 | ) |
07/15/09 | | Chinese Yuan | | 2,185,690 | | U.S. Dollars | | 315,282 | | | 636 | |
07/15/09 | | Chinese Yuan | | 8,208,080 | | U.S. Dollars | | 1,184,000 | | | 2,388 | |
07/15/09 | | Chinese Yuan | | 3,180,870 | | U.S. Dollars | | 459,000 | | | 1,091 | |
07/15/09 | | Chinese Yuan | | 2,883,920 | | U.S. Dollars | | 416,000 | | | 839 | |
07/15/09 | | Chinese Yuan | | 2,785,860 | | U.S. Dollars | | 402,000 | | | 955 | |
07/15/09 | | Chinese Yuan | | 8,217,975 | | U.S. Dollars | | 1,185,000 | | | 1,964 | |
07/15/09 | | Chinese Yuan | | 11,324,060 | | U.S. Dollars | | 1,615,415 | | | (14,765 | ) |
07/15/09 | | Chinese Yuan | | 4,886,000 | | U.S. Dollars | | 700,000 | | | (3,375 | ) |
07/15/09 | | Chinese Yuan | | 4,219,940 | | U.S. Dollars | | 608,718 | | | 1,228 | |
07/15/09 | | U.S. Dollars | | 2,996,480 | | Chinese Yuan | | 20,430,000 | | | (55,435 | ) |
09/08/09 | | U.S. Dollars | | 1,860,000 | | Chinese Yuan | | 12,823,770 | | | (16,764 | ) |
| | | | | | | | | | | | |
| | | | | | | | | | $ | (2,321,613 | ) |
| | | | | | | | | | | | |
Global Bond Fund | | | | | | | | | | | | |
02/03/09 | | Australian Dollars | | 720,000 | | Euro | | 371,517 | | $ | 15,581 | |
02/03/09 | | Japanese Yen | | 78,798,900 | | Euro | | 620,000 | | | (9,342 | ) |
02/03/09 | | Japanese Yen | | 40,112,000 | | Euro | | 320,000 | | | 1,342 | |
02/03/09 | | Australian Dollars | | 603,028 | | U.S. Dollars | | 411,024 | | | (7,806 | ) |
02/03/09 | | Australian Dollars | | 250,000 | | U.S. Dollars | | 170,125 | | | (3,511 | ) |
02/03/09 | | Australian Dollars | | 631,336 | | U.S. Dollars | | 431,278 | | | (7,213 | ) |
02/03/09 | | U.S. Dollars | | 400,779 | | Australian Dollars | | 587,221 | | | 7,073 | |
02/03/09 | | U.S. Dollars | | 424,080 | | Australian Dollars | | 620,000 | | | 6,538 | |
02/03/09 | | U.S. Dollars | | 824,691 | | Australian Dollars | | 1,348,637 | | | 111,997 | |
02/03/09 | | U.S. Dollars | | 1,366,840 | | Canandian Dollars | | 1,640,208 | | | (38,803 | ) |
02/03/09 | | Euro | | 779,420 | | U.S. Dollars | | 1,041,695 | | | (40,114 | ) |
02/03/09 | | Euro | | 808,255 | | U.S. Dollars | | 1,070,453 | | | (51,377 | ) |
02/03/09 | | Euro | | 4,967,336 | | U.S. Dollars | | 6,593,046 | | | (301,447 | ) |
02/03/09 | | Euro | | 3,126,684 | | U.S. Dollars | | 4,139,105 | | | (200,626 | ) |
02/03/09 | | Euro | | 490,000 | | U.S. Dollars | | 632,345 | | | (47,758 | ) |
02/03/09 | | U.S. Dollars | | 3,264,896 | | Euro | | 2,470,000 | | | 163,380 | |
02/03/09 | | U.S. Dollars | | 1,323,350 | | Euro | | 1,000,000 | | | 64,616 | |
02/03/09 | | U.S. Dollars | | 2,532,668 | | Euro | | 1,916,003 | | | 126,679 | |
02/03/09 | | U.S. Dollars | | 269,100 | | Euro | | 214,938 | | | 29,227 | |
02/03/09 | | U.S. Dollars | | 399,968 | | Euro | | 320,000 | | | 44,181 | |
02/03/09 | | British Pounds | | 200,000 | | U.S. Dollars | | 345,760 | | | 58,484 | |
210
| | | | | | | | | | | | |
Fund/Expiration Date | | Currency to be
Delivered | | Amount of Currency
to be Delivered | | Currency to be
Received | | Amount of Currency
to be Received | | Net Unrealized
Appreciation
(Depreciation) | |
02/03/09 | | British Pounds | | 258,677 | | U.S. Dollars | | 439,750 | | $ | 68,192 | |
02/03/09 | | British Pounds | | 650,000 | | U.S. Dollars | | 1,099,124 | | | 165,476 | |
02/03/09 | | British Pounds | | 500,000 | | U.S. Dollars | | 847,925 | | | 129,734 | |
02/03/09 | | U.S. Dollars | | 1,100,000 | | British Pounds | | 743,846 | | | (31,553 | ) |
02/03/09 | | U.S. Dollars | | 403,623 | | British Pounds | | 270,000 | | | (15,800 | ) |
02/03/09 | | Hungarian Forint | | 359,036,188 | | U.S. Dollars | | 1,713,777 | | | (153,026 | ) |
02/03/09 | | Japanese Yen | | 321,274,100 | | U.S. Dollars | | 3,196,757 | | | (349,869 | ) |
02/03/09 | | Japanese Yen | | 128,025,470 | | U.S. Dollars | | 1,271,658 | | | (141,647 | ) |
02/03/09 | | Japanese Yen | | 235,608,000 | | U.S. Dollars | | 2,400,000 | | | (200,936 | ) |
02/03/09 | | U.S. Dollars | | 9,992,762 | | Japanese Yen | | 1,011,467,400 | | | 1,173,081 | |
02/03/09 | | U.S. Dollars | | 5,970,327 | | Japanese Yen | | 600,226,840 | | | 655,728 | |
02/03/09 | | U.S. Dollars | | 1,485,519 | | Japanese Yen | | 142,800,000 | | | 90,886 | |
02/03/09 | | Mexican Pesos | | 7,853,760 | | U.S. Dollars | | 605,533 | | | 45,122 | |
02/03/09 | | U.S. Dollars | | 959,197 | | Mexican Pesos | | 12,504,035 | | | (66,962 | ) |
02/03/09 | | Turkish Lira | | 4,541,944 | | U.S. Dollars | | 2,787,324 | | | (116,059 | ) |
02/03/09 | | U.S. Dollars | | 1,157,557 | | Turkish Lira | | 1,846,304 | | | 22,670 | |
02/03/09 | | U.S. Dollars | | 95,729 | | South African Rand | | 988,065 | | | 10,030 | |
02/10/09 | | U.S. Dollars | | 529,501 | | South Korean Won | | 700,000,000 | | | 28,024 | |
02/10/09 | | Malaysian Ringits | | 3,987,838 | | U.S. Dollars | | 1,091,064 | | | (59,884 | ) |
02/10/09 | | U.S. Dollars | | 1,125,554 | | Malaysian Ringits | | 3,987,838 | | | 25,394 | |
| | | | | | | | | | | | |
| | | | | | | | | | $ | 1,199,702 | |
| | | | | | | | | | | | |
Small Cap Equity Fund | | | | | | | | | | |
02/03/09 | | Euro | | 128,994 | | U.S. Dollars | | 171,212 | | $ | (7,828 | ) |
| | | | | | | | | | | | |
| | | | |
International Equity Fund | | | | | | | | | | |
03/18/09 | | Australian Dollars | | 242,000 | | U.S. Dollars | | 148,770 | | $ | (18,730 | ) |
03/18/09 | | Australian Dollars | | 193,000 | | U.S. Dollars | | 125,336 | | | (8,249 | ) |
03/18/09 | | Australian Dollars | | 249,000 | | U.S. Dollars | | 159,953 | | | (12,393 | ) |
03/18/09 | | U.S. Dollars | | 149,063 | | Australian Dollars | | 230,000 | | | 10,131 | |
03/18/09 | | U.S. Dollars | | 229,936 | | Australian Dollars | | 358,000 | | | 17,854 | |
03/18/09 | | U.S. Dollars | | 6,422 | | Australian Dollars | | 10,000 | | | 499 | |
03/18/09 | | U.S. Dollars | | 725,143 | | Australian Dollars | | 1,089,000 | | | 28,608 | |
03/18/09 | | U.S. Dollars | | 548,229 | | Australian Dollars | | 800,000 | | | 5,491 | |
03/18/09 | | Canadian Dollars | | 798,000 | | U.S. Dollars | | 650,534 | | | 3,961 | |
03/18/09 | | Canadian Dollars | | 2,765,000 | | U.S. Dollars | | 2,219,395 | | | (20,924 | ) |
03/18/09 | | Canadian Dollars | | 1,006,000 | | U.S. Dollars | | 822,995 | | | 7,891 | |
03/18/09 | | Swiss Francs | | 746,000 | | U.S. Dollars | | 626,671 | | | (74,797 | ) |
03/18/09 | | Swiss Francs | | 1,381,000 | | U.S. Dollars | | 1,119,652 | | | (178,910 | ) |
03/18/09 | | Swiss Francs | | 357,000 | | U.S. Dollars | | 330,980 | | | (4,709 | ) |
03/18/09 | | U.S. Dollars | | 1,729,576 | | Swiss Francs | | 2,062,000 | | | 209,334 | |
03/18/09 | | U.S. Dollars | | 343,265 | | Swiss Francs | | 406,000 | | | 38,499 | |
03/18/09 | | U.S. Dollars | | 213,574 | | Swiss Francs | | 254,000 | | | 25,264 | |
03/18/09 | | Danish Kroner | | 1,778,000 | | U.S. Dollars | | 300,956 | | | (29,526 | ) |
03/18/09 | | Danish Kroner | | 84,000 | | U.S. Dollars | | 14,897 | | | (716 | ) |
03/18/09 | | Danish Kroner | | 200,000 | | U.S. Dollars | | 37,602 | | | 427 | |
03/18/09 | | U.S. Dollars | | 46,419 | | Danish Kroner | | 267,000 | | | 3,209 | |
03/18/09 | | U.S. Dollars | | 186,965 | | Danish Kroner | | 1,120,000 | | | 21,213 | |
03/18/09 | | U.S. Dollars | | 265,618 | | Danish Kroner | | 1,537,000 | | | 20,068 | |
03/18/09 | | U.S. Dollars | | 191,434 | | Danish Kroner | | 1,119,000 | | | 16,558 | |
03/18/09 | | Euro | | 1,016,000 | | U.S. Dollars | | 1,316,617 | | | (91,982 | ) |
03/18/09 | | Euro | | 852,000 | | U.S. Dollars | | 1,064,421 | | | (116,806 | ) |
03/18/09 | | Euro | | 589,000 | | U.S. Dollars | | 760,356 | | | (56,243 | ) |
211
| | | | | | | | | | | | |
Fund/Expiration Date | | Currency to be
Delivered | | Amount of Currency
to be Delivered | | Currency to be
Received | | Amount of Currency
to be Received | | Net Unrealized
Appreciation
(Depreciation) | |
03/18/09 | | Euro | | 44,000 | | U.S. Dollars | | 57,237 | | $ | (3,766 | ) |
03/18/09 | | Euro | | 1,671,000 | | U.S. Dollars | | 2,380,840 | | | 64,138 | |
03/18/09 | | Euro | | 451,000 | | U.S. Dollars | | 568,930 | | | (56,343 | ) |
03/18/09 | | U.S. Dollars | | 1,269 | | Euro | | 1,000 | | | 117 | |
03/18/09 | | U.S. Dollars | | 1,592,660 | | Euro | | 1,246,000 | | | 134,815 | |
03/18/09 | | U.S. Dollars | | 2,433,984 | | Euro | | 1,931,000 | | | 243,186 | |
03/18/09 | | British Pounds | | 366,000 | | U.S. Dollars | | 541,441 | | | 16,053 | |
03/18/09 | | British Pounds | | 242,000 | | U.S. Dollars | | 367,197 | | | 19,809 | |
03/18/09 | | British Pounds | | 280,000 | | U.S. Dollars | | 399,437 | | | (2,499 | ) |
03/18/09 | | U.S. Dollars | | 1,502 | | British Pounds | | 1,000 | | | (66 | ) |
03/18/09 | | U.S. Dollars | | 1,497 | | British Pounds | | 1,000 | | | (62 | ) |
03/18/09 | | U.S. Dollars | | 184,560 | | British Pounds | | 123,000 | | | (7,995 | ) |
03/18/09 | | U.S. Dollars | | 293,433 | | British Pounds | | 191,000 | | | (19,255 | ) |
03/18/09 | | U.S. Dollars | | 1,061,009 | | British Pounds | | 719,000 | | | (28,893 | ) |
03/18/09 | | U.S. Dollars | | 1,481 | | British Pounds | | 1,000 | | | (46 | ) |
03/18/09 | | U.S. Dollars | | 1,490 | | British Pounds | | 1,000 | | | (55 | ) |
03/18/09 | | U.S. Dollars | | 1,416,272 | | British Pounds | | 936,000 | | | (72,656 | ) |
03/18/09 | | U.S. Dollars | | 10,423 | | British Pounds | | 7,000 | | | (375 | ) |
03/18/09 | | Hong Kong Dollars | | 7,000 | | U.S. Dollars | | 904 | | | (1 | ) |
03/18/09 | | Hong Kong Dollars | | 16,000 | | U.S. Dollars | | 2,067 | | | 1 | |
03/18/09 | | Hong Kong Dollars | | 18,000 | | U.S. Dollars | | 2,325 | | | 1 | |
03/18/09 | | Hong Kong Dollars | | 243,000 | | U.S. Dollars | | 31,376 | | | 6 | |
03/18/09 | | U.S. Dollars | | 8,393 | | Hong Kong Dollars | | 65,000 | | | (2 | ) |
03/18/09 | | U.S. Dollars | | 123,116 | | Hong Kong Dollars | | 954,000 | | | 40 | |
03/18/09 | | U.S. Dollars | | 3,484 | | Hong Kong Dollars | | 27,000 | | | 1 | |
03/18/09 | | U.S. Dollars | | 44,920 | | Hong Kong Dollars | | 348,000 | | | 5 | |
03/18/09 | | Japanese Yen | | 81,742,000 | | U.S. Dollars | | 859,367 | | | (43,839 | ) |
03/18/09 | | Japanese Yen | | 24,924,000 | | U.S. Dollars | | 279,252 | | | 3,855 | |
03/18/09 | | Japanese Yen | | 77,643,000 | | U.S. Dollars | | 819,769 | | | (38,145 | ) |
03/18/09 | | U.S. Dollars | | 477,534 | | Japanese Yen | | 45,183,000 | | | 21,714 | |
03/18/09 | | U.S. Dollars | | 1,156,198 | | Japanese Yen | | 106,467,000 | | | 20,205 | |
03/18/09 | | U.S. Dollars | | 24,851 | | Japanese Yen | | 2,307,000 | | | 640 | |
03/18/09 | | U.S. Dollars | | 64,597 | | Japanese Yen | | 6,154,000 | | | 3,401 | |
03/18/09 | | U.S. Dollars | | 1,028,316 | | Japanese Yen | | 94,054,000 | | | 10,931 | |
03/18/09 | | U.S. Dollars | | 3,547,830 | | Japanese Yen | | 341,504,000 | | | 225,606 | |
03/18/09 | | Norwegian Kroner | | 5,996,000 | | U.S. Dollars | | 824,737 | | | (27,510 | ) |
03/18/09 | | Norwegian Kroner | | 7,616,000 | | U.S. Dollars | | 1,092,952 | | | 10,445 | |
03/18/09 | | U.S. Dollars | | 565,445 | | Norwegian Kroner | | 3,999,000 | | | 2,956 | |
03/18/09 | | U.S. Dollars | | 713,442 | | Norwegian Kroner | | 5,011,000 | | | (1,199 | ) |
03/18/09 | | U.S. Dollars | | 996,865 | | New Zealand Dollars | | 1,811,000 | | | 52,105 | |
03/18/09 | | U.S. Dollars | | 2,160,195 | | New Zealand Dollars | | 3,977,000 | | | 143,369 | |
03/18/09 | | Swedish Kronor | | 7,460,000 | | U.S. Dollars | | 930,808 | | | (11,674 | ) |
03/18/09 | | Swedish Kronor | | 1,844,000 | | U.S. Dollars | | 217,306 | | | (15,662 | ) |
03/18/09 | | Swedish Kronor | | 2,078,000 | | U.S. Dollars | | 261,189 | | | (1,341 | ) |
03/18/09 | | Swedish Kronor | | 2,316,000 | | U.S. Dollars | | 291,297 | | | (1,302 | ) |
03/18/09 | | Swedish Kronor | | 4,167,000 | | U.S. Dollars | | 496,599 | | | (29,852 | ) |
03/18/09 | | U.S. Dollars | | 186,886 | | Swedish Kronor | | 1,535,000 | | | 7,043 | |
03/18/09 | | U.S. Dollars | | 290,103 | | Swedish Kronor | | 2,229,000 | | | (8,496 | ) |
03/18/09 | | U.S. Dollars | | 52,278 | | Swedish Kronor | | 426,000 | | | 1,542 | |
03/18/09 | | Singapore Dollar | | 2,000 | | U.S. Dollars | | 1,355 | | | (32 | ) |
03/18/09 | | Singapore Dollar | | 1,000 | | U.S. Dollars | | 697 | | | 4 | |
03/18/09 | | Singapore Dollar | | 11,000 | | U.S. Dollars | | 7,434 | | | (190 | ) |
212
| | | | | | | | | | | | |
Fund/Expiration Date | | Currency to be
Delivered | | Amount of Currency
to be Delivered | | Currency to be
Received | | Amount of Currency
to be Received | | Net Unrealized
Appreciation
(Depreciation) | |
03/18/09 | | Singapore Dollar | | 14,000 | | U.S. Dollars | | 9,719 | | $ | 16 | |
03/18/09 | | U.S. Dollars | | 84,145 | | Singapore Dollar | | 127,000 | | | 3,875 | |
03/18/09 | | U.S. Dollars | | 664 | | Singapore Dollar | | 1,000 | | | 29 | |
03/18/09 | | U.S. Dollars | | 4,114 | | Singapore Dollar | | 6,000 | | | 45 | |
03/19/09 | | Swiss Francs | | 683,000 | | U.S. Dollars | | 560,815 | | | (81,420 | ) |
| | | | | | | | | | | | |
| | | | | | | | | | $ | 328,299 | |
| | | | | | | | | | | | |
Options Written
Transactions in options written during the period ended December 31, 2008 were as follows:
| | | | | | | | | | | |
Low-Duration Bond Fund | | Number of
Contracts | | | Notional
Amount | | | Premiums
Received | |
Options written, 12/31/07 | | — | | | $ | 917,600,000 | | | $ | 4,422,364 | |
Options written | | 1,157 | | | | 149,400,000 | | | | 6,580,360 | |
Options expired | | (1,092 | ) | | | (685,800,000 | ) | | | (586,984 | ) |
Options closed | | (65 | ) | | | (344,200,000 | ) | | | (6,728,199 | ) |
| | | | | | | | | | | |
Options written, 12/31/08 | | — | | | $ | 37,000,000 | | | $ | 3,687,541 | |
| | | | | | | | | | | |
| | | |
Medium-Duration Bond Fund | | Number of
Contracts | | | Notional
Amount | | | Premiums
Received | |
Options written, 12/31/07 | | 108 | | | $ | 1,224,600,000 | | | $ | 5,592,094 | |
Options written | | 202 | | | | 130,500,000 | | | | 6,877,280 | |
Options expired | | (308 | ) | | | (935,800,000 | ) | | | (439,586 | ) |
Options closed | | — | | | | (346,100,000 | ) | | | (6,414,924 | ) |
| | | | | | | | | | | |
Options written, 12/31/08 | | 2 | | | $ | 73,200,000 | | | $ | 5,614,864 | |
| | | | | | | | | | | |
| | | |
Small Cap Equity Fund | | Number of
Contracts | | | Notional
Amount | | | Premiums
Received | |
Options written, 12/31/07 | | 33 | | | $ | — | | | $ | 25,110 | |
Options written | | 216 | | | | — | | | | 167,479 | |
Options expired | | — | | | | — | | | | — | |
Options closed | | (160 | ) | | | — | | | | (111,475 | ) |
| | | | | | | | | | | |
Options written, 12/31/08 | | 89 | | | $ | — | | | $ | 81,114 | |
| | | | | | | | | | | |
213
7. CAPITAL SHARE TRANSACTIONS
Transactions in shares of capital stock were as follows:
| | | | | | | | | | | | | | | |
| | | Year Ended December 31, 2008 | | | Year Ended December 31, 2007 | |
| | | GS4 | | | GS6 | | | GS4 | | | GS6 | | | GS8 | |
MyDestination 2005 | | | | | | | | | | | | | | | |
Shares sold | | 2,578,136 | | | 56,867 | | | 6,148,997 | | | 136,448 | | | 101,780 | |
Shares exchanged | | — | | | — | | | — | | | 1,482 | | | (1,484 | ) |
Shares reinvested | | 470,720 | | | 8,600 | | | 152,755 | | | 3,735 | | | — | |
Shares redeemed | | (1,805,238 | ) | | (55,337 | ) | | (730,702 | ) | | (1,458 | ) | | (101,296 | ) |
| | | | | | | | | | | | | | | |
Net increase (decrease) | | 1,243,618 | | | 10,130 | | | 5,571,050 | | | 140,207 | | | (1,000 | ) |
| | | | | | | | | | | | | | | |
MyDestination 2015 | | | | | | | | | | | | | | | |
Shares sold | | 6,021,065 | | | 80,777 | | | 16,541,145 | | | 135,535 | | | 112,014 | |
Shares exchanged | | — | | | — | | | — | | | 12,203 | | | (12,214 | ) |
Shares reinvested | | 1,381,039 | | | 9,488 | | | 436,184 | | | 3,694 | | | — | |
Shares redeemed | | (2,468,448 | ) | | (56,916 | ) | | (523,997 | ) | | (4,107 | ) | | (100,800 | ) |
| | | | | | | | | | | | | | | |
Net increase (decrease) | | 4,933,656 | | | 33,349 | | | 16,453,332 | | | 147,325 | | | (1,000 | ) |
| | | | | | | | | | | | | | | |
MyDestination 2025 | | | | | | | | | | | | | | | |
Shares sold | | 5,197,306 | | | 175,155 | | | 10,440,156 | | | 169,074 | | | 129,123 | |
Shares exchanged | | — | | | — | | | — | | | 27,558 | | | (27,583 | ) |
Shares reinvested | | 1,107,495 | | | 20,895 | | | 281,677 | | | 5,220 | | | — | |
Shares redeemed | | (892,400 | ) | | (61,065 | ) | | (455,987 | ) | | (1,348 | ) | | (102,540 | ) |
| | | | | | | | | | | | | | | |
Net increase (decrease) | | 5,412,401 | | | 134,985 | | | 10,265,846 | | | 200,504 | | | (1,000 | ) |
| | | | | | | | | | | | | | | |
MyDestination 2035 | | | | | | | | | | | | | | | |
Shares sold | | 2,939,696 | | | 92,123 | | | 3,675,043 | | | 123,285 | | | 109,187 | |
Shares exchanged | | — | | | — | | | — | | | 9,784 | | | (9,802 | ) |
Shares reinvested | | 416,311 | | | 10,875 | | | 91,100 | | | 3,341 | | | — | |
Shares redeemed | | (356,667 | ) | | (31,178 | ) | | (338,148 | ) | | (1,651 | ) | | (100,385 | ) |
| | | | | | | | | | | | | | | |
Net increase (decrease) | | 2,999,340 | | | 71,820 | | | 3,427,995 | | | 134,759 | | | (1,000 | ) |
| | | | | | | | | | | | | | | |
MyDestination 2045 | | | | | | | | | | | | | | | |
Shares sold | | 1,972,366 | | | 43,400 | | | 1,514,661 | | | 114,644 | | | 103,251 | |
Shares exchanged | | — | | | — | | | — | | | 3,443 | | | (3,446 | ) |
Shares reinvested | | 148,529 | | | 6,121 | | | 36,409 | | | 3,379 | | | — | |
Shares redeemed | | (143,582 | ) | | (10,397 | ) | | (399,712 | ) | | (1,018 | ) | | (100,805 | ) |
| | | | | | | | | | | | | | | |
Net increase (decrease) | | 1,977,313 | | | 39,124 | | | 1,151,358 | | | 120,448 | | | (1,000 | ) |
| | | | | | | | | | | | | | | |
214
| | | | | | | | | | | | | | | |
| | | Year Ended December 31, 2008 | | | Year Ended December 31, 2007 | |
| | | GS4 | | | GS6 | | | GS4 | | | GS6 | | | GS8 | |
Conservative Allocation Fund | | | | | | | | | | | | | | | |
Shares sold | | 3,830,825 | | | 1,335,856 | | | 3,101,631 | | | 15,787 | | | 8,171 | |
Shares exchanged | | — | | | — | | | — | | | 34,331 | | | (34,405 | ) |
Shares reinvested | | 2,072,716 | | | 194,313 | | | 1,689,255 | | | 163,129 | | | — | |
Shares redeemed | | (6,132,632 | ) | | (1,625,132 | ) | | (4,161,710 | ) | | (2,128 | ) | | (610,247 | ) |
| | | | | | | | | | | | | | | |
Net increase (decrease) | | (229,091 | ) | | (94,963 | ) | | 629,176 | | | 211,119 | | | (636,481 | ) |
| | | | | | | | | | | | | | | |
Balanced Allocation Fund | | | | | | | | | | | | | | | |
Shares sold | | 3,881,710 | | | 277,834 | | | 4,276,596 | | | 142,844 | | | 49,264 | |
Shares exchanged | | — | | | — | | | — | | | 312,574 | | | (313,534 | ) |
Shares reinvested | | 13,664,245 | | | 751,815 | | | 9,292,073 | | | 377,694 | | | — | |
Shares redeemed | | (14,547,876 | ) | | (250,354 | ) | | (13,938,640 | ) | | (48,496 | ) | | (642,064 | ) |
| | | | | | | | | | | | | | | |
Net increase (decrease) | | 2,998,079 | | | 779,295 | | | (369,971 | ) | | 784,616 | | | (906,334 | ) |
| | | | | | | | | | | | | | | |
Growth Allocation Fund | | | | | | | | | | | | | | | |
Shares sold | | 3,068,016 | | | 311,761 | | | 3,127,389 | | | 161,689 | | | 80,894 | |
Shares exchanged | | — | | | — | | | — | | | 247,991 | | | (248,643 | ) |
Shares reinvested | | 10,412,402 | | | 442,625 | | | 7,709,244 | | | 244,649 | | | — | |
Shares redeemed | | (9,482,818 | ) | | (249,371 | ) | | (10,322,926 | ) | | (17,198 | ) | | (592,647 | ) |
| | | | | | | | | | | | | | | |
Net increase (decrease) | | 3,997,600 | | | 505,015 | | | 513,707 | | | 637,131 | | | (760,396 | ) |
| | | | | | | | | | | | | | | |
Aggressive Allocation Fund | | | | | | | | | | | | | | | |
Shares sold | | 3,141,389 | | | 134,125 | | | 3,459,912 | | | 76,547 | | | 60,068 | |
Shares exchanged | | — | | | — | | | — | | | 114,564 | | | (114,914 | ) |
Shares reinvested | | 10,394,753 | | | 571,773 | | | 7,170,968 | | | 315,184 | | | — | |
Shares redeemed | | (7,577,349 | ) | | (148,560 | ) | | (9,170,824 | ) | | (11,888 | ) | | (542,557 | ) |
| | | | | | | | | | | | | | | |
Net increase (decrease) | | 5,958,793 | | | 557,338 | | | 1,460,056 | | | 494,407 | | | (597,403 | ) |
| | | | | | | | | | | | | | | |
| | | | | |
| | | GS2 | | | | | | GS2 | | | | | | | |
Conservative Allocation Fund I | | | | | | | | | | | | | | | |
Shares sold | | 898,141 | | | | | | 1,491,042 | | | | | | | |
Shares reinvested | | 458,199 | | | | | | 539,752 | | | | | | | |
Shares redeemed | | (1,390,576 | ) | | | | | (901,269 | ) | | | | | | |
| | | | | | | | | | | | | | | |
Net increase (decrease) | | (34,236 | ) | | | | | 1,129,525 | | | | | | | |
| | | | | | | | | | | | | | | |
Balanced Allocation Fund I | | | | | | | | | | | | | | | |
Shares sold | | 2,176,193 | | | | | | 8,238,644 | | | | | | | |
Shares reinvested | | 3,505,813 | | | | | | 2,911,117 | | | | | | | |
Shares redeemed | | (3,132,150 | ) | | | | | (2,301,545 | ) | | | | | | |
| | | | | | | | | | | | | | | |
Net increase | | 2,549,856 | | | | | | 8,848,216 | | | | | | | |
| | | | | | | | | | | | | | | |
Growth Allocation Fund I | | | | | | | | | | | | | | | |
Shares sold | | 1,391,073 | | | | | | 5,024,682 | | | | | | | |
Shares reinvested | | 2,776,308 | | | | | | 2,000,500 | | | | | | | |
Shares redeemed | | (2,236,325 | ) | | | | | (1,414,424 | ) | | | | | | |
| | | | | | | | | | | | | | | |
Net increase | | 1,931,056 | | | | | | 5,610,758 | | | | | | | |
| | | | | | | | | | | | | | | |
Aggressive Allocation Fund I | | | | | | | | | | | | | | | |
Shares sold | | 881,962 | | | | | | 4,117,743 | | | | | | | |
Shares reinvested | | 2,044,532 | | | | | | 1,417,048 | | | | | | | |
Shares redeemed | | (1,840,613 | ) | | | | | (1,167,436 | ) | | | | | | |
| | | | | | | | | | | | | | | |
Net increase | | 1,085,881 | | | | | | 4,367,355 | | | | | | | |
| | | | | | | | | | | | | | | |
215
| | | | | | | | | | | | | | | | | | | | | |
| | | Year Ended December 31, 2008 | | | Year Ended December 31, 2007 | |
| | | GS2 | | | GS4 | | | GS6 | | | GS2 | | | GS4 | | | GS6 | | | GS8 | |
Money Market Fund | | | | | | | | | | | | | | | | | | | | | |
Shares sold | | 174,901,124 | | | 4,070,538,152 | | | 3,546,545 | | | 178,932,360 | | | 3,334,006,987 | | | 2,164,993 | | | 214,065 | |
Shares exchanged | | — | | | — | | | — | | | — | | | — | | | 301,818 | | | (301,818 | ) |
Shares reinvested | | 3,367,839 | | | 16,558,522 | | | 154,558 | | | 4,895,984 | | | 24,364,936 | | | 238,657 | | | 96,906 | |
Shares redeemed | | (119,120,727 | ) | | (4,056,623,451 | ) | | (873,423 | ) | | (171,806,826 | ) | | (3,349,363,902 | ) | | (1,510,697 | ) | | (5,466,591 | ) |
| | | | | | | | | | | | | | | | | | | | | |
Net increase (decrease) | | 59,148,236 | | | 30,473,223 | | | 2,827,680 | | | 12,021,518 | | | 9,008,021 | | | 1,194,771 | | | (5,457,438 | ) |
| | | | | | | | | | | | | | | | | | | | | |
Low-Duration Bond Fund | | | | | | | | | | | | | | | | | | | |
Shares sold | | 1,544,065 | | | 5,832,714 | | | 68,587 | | | 3,526,093 | | | 5,216,637 | | | 6,980 | | | 299 | |
Shares exchanged | | — | | | — | | | — | | | — | | | — | | | 3,724 | | | (3,724 | ) |
Shares reinvested | | 924,880 | | | 2,084,429 | | | 38,993 | | | 863,634 | | | 2,066,787 | | | 31,928 | | | 10,905 | |
Shares redeemed | | (4,482,124 | ) | | (16,505,332 | ) | | (35,787 | ) | | (1,333,936 | ) | | (10,869,252 | ) | | (2,816 | ) | | (568,754 | ) |
| | | | | | | | | | | | | | | | | | | | | |
Net increase (decrease) | | (2,013,179 | ) | | (8,588,189 | ) | | 71,793 | | | 3,055,791 | | | (3,585,828 | ) | | 39,816 | | | (561,274 | ) |
| | | | | | | | | | | | | | | | | | | | | |
Medium-Duration Bond Fund | | | | | | | | | | | | | | | | | | | |
Shares sold | | 3,207,707 | | | 7,021,197 | | | 87,296 | | | 4,677,595 | | | 7,532,324 | | | 121,884 | | | 2,619 | |
Shares exchanged | | — | | | — | | | — | | | — | | | — | | | 7,495 | | | (7,495 | ) |
Shares reinvested | | 2,156,956 | | | 5,171,411 | | | 227,556 | | | 1,272,358 | | | 3,701,683 | | | 117,394 | | | 15,364 | |
Shares redeemed | | (7,621,389 | ) | | (30,536,247 | ) | | (25,004 | ) | | (1,226,651 | ) | | (14,782,322 | ) | | (117,212 | ) | | (634,032 | ) |
| | | | | | | | | | | | | | | | | | | | | |
Net increase (decrease) | | (2,256,726 | ) | | (18,343,639 | ) | | 289,848 | | | 4,723,302 | | | (3,548,315 | ) | | 129,561 | | | (623,544 | ) |
| | | | | | | | | | | | | | | | | | | | | |
Extended-Duration Bond Fund | | | | | | | | | | | | | | | | | | | |
Shares sold | | 1,689,108 | | | 1,932,832 | | | 24,149 | | | 2,707,881 | | | 4,015,105 | | | 19,397 | | | 636 | |
Shares exchanged | | — | | | — | | | — | | | — | | | — | | | 1,879 | | | (1,881 | ) |
Shares reinvested | | 1,461,454 | | | 2,130,785 | | | 328,365 | | | 907,747 | | | 1,718,398 | | | 201,887 | | | 29,671 | |
Shares redeemed | | (2,415,249 | ) | | (9,446,049 | ) | | (22,623 | ) | | (1,448,373 | ) | | (4,410,805 | ) | | (71 | ) | | (711,380 | ) |
| | | | | | | | | | | | | | | | | | | | | |
Net increase (decrease) | | 735,313 | | | (5,382,432 | ) | | 329,891 | | | 2,167,255 | | | 1,322,698 | | | 223,092 | | | (682,954 | ) |
| | | | | | | | | | | | | | | | | | | | | |
Global Bond Fund | | | | | | | | | | | | | | | | | | | | | |
Shares sold | | | | | 12,869,898 | | | | | | | | | 1,970,318 | | | | | | | |
Shares reinvested | | | | | 1,740,619 | | | | | | | | | 772,252 | | | | | | | |
Shares redeemed | | | | | (4,150,771 | ) | | | | | | | | (719,165 | ) | | | | | | |
| | | | | | | | | | | | | | | | | | | | | |
Net increase | | | | | 10,459,746 | | | | | | | | | 2,023,405 | | | | | | | |
| | | | | | | | | | | | | | | | | | | | | |
Equity Index Fund | | | | | | | | | | | | | | | | | | | | | |
Shares sold | | 820,528 | | | 1,486,319 | | | 59,695 | | | 1,533,810 | | | 2,103,745 | | | 26,070 | | | 7,212 | |
Shares exchanged | | — | | | — | | | — | | | — | | | — | | | 10,673 | | | (10,690 | ) |
Shares reinvested | | 311,273 | | | 437,304 | | | 3,175 | | | 720,035 | | | 1,178,005 | | | 16,160 | | | — | |
Shares redeemed | | (1,027,162 | ) | | (3,313,360 | ) | | (22,137 | ) | | (1,314,474 | ) | | (5,101,066 | ) | | (1,270,974 | ) | | (557,038 | ) |
| | | | | | | | | | | | | | | | | | | | | |
Net increase (decrease) | | 104,639 | | | (1,389,737 | ) | | 40,733 | | | 939,371 | | | (1,819,316 | ) | | (1,218,071 | ) | | (560,516 | ) |
| | | | | | | | | | | | | | | | | | | | | |
216
| | | | | | | | | | | | | | | | | | | | | |
| | | Year Ended December 31, 2008 | | | Year Ended December 31, 2007 | |
| | | GS2 | | | GS4 | | | GS6 | | | GS2 | | | GS4 | | | GS6 | | | GS8 | |
Real Estate Securities Fund | | | | | | | | | | | | | | | | | | | | | |
Shares sold | | | | | 10,637,842 | | | | | | | | | 8,779,566 | | | | | | | |
Shares reinvested | | | | | 386,418 | | | | | | | | | 1,474,799 | | | | | | | |
Shares redeemed | | | | | (6,384,635 | ) | | | | | | | | (8,076,816 | ) | | | | | | |
| | | | | | | | | | | | | | | | | | | | | |
Net increase | | | | | 4,639,625 | | | | | | | | | 2,177,549 | | | | | | | |
| | | | | | | | | | | | | | | | | | | | | |
Value Equity Fund | | | | | | | | | | | | | | | | | | | | | |
Shares sold | | 3,486,962 | | | 8,453,832 | | | 52,086 | | | 6,634,605 | | | 9,488,670 | | | 184,049 | | | 16,806 | |
Shares exchanged | | — | | | — | | | — | | | — | | | — | | | 38,330 | | | (38,463 | ) |
Shares reinvested | | 1,038,380 | | | 1,565,141 | | | 74,232 | | | 3,241,859 | | | 6,099,780 | | | 260,082 | | | — | |
Shares redeemed | | (3,826,610 | ) | | (12,449,297 | ) | | (16,490 | ) | | (1,686,305 | ) | | (9,883,557 | ) | | (169,598 | ) | | (628,190 | ) |
| | | | | | | | | | | | | | | | | | | | | |
Net increase (decrease) | | 698,732 | | | (2,430,324 | ) | | 109,828 | | | 8,190,159 | | | 5,704,893 | | | 312,863 | | | (649,847 | ) |
| | | | | | | | | | | | | | | | | | | | | |
Growth Equity Fund | | | | | | | | | | | | | | | | | | | | | |
Shares sold | | 2,871,383 | | | 8,033,364 | | | 30,730 | | | 4,615,624 | | | 7,073,383 | | | 232,706 | | | 7,396 | |
Shares exchanged | | — | | | — | | | — | | | — | | | — | | | 15,272 | | | (15,401 | ) |
Shares reinvested | | 89,784 | | | 126,685 | | | 372 | | | 58,763 | | | 72,223 | | | — | | | — | |
Shares redeemed | | (2,524,921 | ) | | (10,808,932 | ) | | (14,792 | ) | | (1,680,960 | ) | | (9,107,022 | ) | | (216,686 | ) | | (521,411 | ) |
| | | | | | | | | | | | | | | | | | | | | |
Net increase (decrease) | | 436,246 | | | (2,648,883 | ) | | 16,310 | | | 2,993,427 | | | (1,961,416 | ) | | 31,292 | | | (529,416 | ) |
| | | | | | | | | | | | | | | | | | | | | |
Small Cap Equity Fund | | | | | | | | | | | | | | | | | | | | | |
Shares sold | | 2,366,155 | | | 3,557,451 | | | 35,880 | | | 1,552,429 | | | 3,352,291 | | | 104,506 | | | 5,878 | |
Shares exchanged | | — | | | — | | | — | | | — | | | — | | | 14,321 | | | (14,475 | ) |
Shares reinvested | | 138,470 | | | 298,452 | | | 24,255 | | | 1,268,795 | | | 3,698,109 | | | 314,823 | | | — | |
Shares redeemed | | (2,394,207 | ) | | (5,853,574 | ) | | (10,548 | ) | | (704,104 | ) | | (4,839,342 | ) | | (94,262 | ) | | (577,495 | ) |
| | | | | | | | | | | | | | | | | | | | | |
Net increase (decrease) | | 110,418 | | | (1,997,671 | ) | | 49,587 | | | 2,117,120 | | | 2,211,058 | | | 339,388 | | | (586,092 | ) |
| | | | | | | | | | | | | | | | | | | | | |
International Equity Fund | | | | | | | | | | | | | | | | | | | | | |
Shares sold | | 8,764,143 | | | 19,289,876 | | | 62,220 | | | 4,671,748 | | | 9,531,264 | | | 100,030 | | | 10,936 | |
Shares exchanged | | — | | | — | | | — | | | — | | | — | | | 19,330 | | | (19,398 | ) |
Shares reinvested | | 2,467,529 | | | 6,721,576 | | | 193,967 | | | 3,434,905 | | | 11,491,189 | | | 354,520 | | | — | |
Shares redeemed | | (3,979,501 | ) | | (9,340,113 | ) | | (27,121 | ) | | (1,616,635 | ) | | (10,308,303 | ) | | (67,938 | ) | | (493,635 | ) |
| | | | | | | | | | | | | | | | | | | | | |
Net increase (decrease) | | 7,252,171 | | | 16,671,339 | | | 229,066 | | | 6,490,018 | | | 10,714,150 | | | 405,942 | | | (502,097 | ) |
| | | | | | | | | | | | | | | | | | | | | |
8. BANK BORROWINGS
The Trust, on behalf of and for the benefit of the Funds, has a credit agreement with Bank of America, N.A., dated December 3, 2007 through December 3, 2008, whereby each Fund is permitted to have bank borrowings for temporary or emergency purposes to fund shareholder redemptions. The agreement permits up to $50 million, collectively. Interest is charged to each Fund based on its borrowings at a rate equal to the Bank prime rate minus two percent or the Wall Street Journal LIBOR One Month Floating Rate plus 0.50%. Each Fund also pays a facility fee equal to its pro rata share of the amount of the credit facility at a rate of 0.12% per annum.
217
On October 30, 2008, the Board of Trustees approved a credit agreement with Bank of America, N.A. dated December 3, 2008 through December 2, 2009. The agreement permits up to $50 million, collectively. Interest is charged to each Fund based on its borrowings at a rate equal to the Bank prime plus 0.60% or the Wall Street Journal LIBOR One Month Floating Rate plus 1.00%. Each Fund also pays a facility fee equal to its pro rata share of the amount of the credit facility at a rate of 0.30% per annum.
On July 17, 2008, the MyDestination 2005 Fund borrowed $500,000 at a rate of 2.96%. The Fund repaid the loan in the amount of $500,041, which represents principal and one day of accrued interest, on July 18, 2008. On November 25, 2008, the Medium-Duration Bond and Small Cap Equity Funds borrowed $2,000,000 at a rate of 1.90%. The Funds repaid the loan in the amount of $2,000,105, which represents principal and one day of accrued interest, on November 26, 2008. No other Funds borrowed for the year ended December 31, 2008, and there were no outstanding loans at December 31, 2008.
9. FEDERAL INCOME TAXES
Each Fund’s policy is to comply with all sections of the Internal Revenue Code of 1986, as amended, that apply to regulated investment companies and to distribute substantially all of its taxable income to shareholders. No provision for income or excise taxes is thus required. Each Fund is treated as a separate entity for federal income tax purposes.
Net investment income (loss) and net realized gains (losses) may differ for financial statements and tax purposes primarily because of deferred losses on certain futures contracts and losses deferred due to “wash sale” transactions. The character of distributions made during the year from net investment income or net realized gains may differ from their ultimate characterization for federal income tax purposes. Also, due to the timing of dividend distributions, the fiscal year in which amounts are distributed may differ from the year that the income or realized gains (losses) were recorded by the Funds. Income dividends and capital gain distributions are determined in accordance with federal income tax regulations, which may differ from GAAP. These differences are primarily due to differing treatments for futures and options transactions, foreign currency transactions, paydowns, losses deferred due to wash sales and investments in Passive Foreign Investment Companies (“PFIC’s”). Distributions during the year ended December 31, 2008 and the period ended December 31, 2007 were characterized as follows for tax purposes:
| | | | | | | | | | | |
Fund | | | | Ordinary
Income | | Long-Term
Capital Gain | | Return
of Capital |
MyDestination 2005 | | 2008 | | $ | 2,083,566 | | $ | 1,504,355 | | $ | — |
| | 2007 | | | 1,613,240 | | | 7,771 | | | — |
MyDestination 2015 | | 2008 | | | 4,008,790 | | | 5,518,766 | | | — |
| | 2007 | | | 4,521,960 | | | 28,788 | | | — |
MyDestination 2025 | | 2008 | | | 2,335,600 | | | 4,629,258 | | | — |
| | 2007 | | | 2,919,699 | | | 25,374 | | | — |
MyDestination 2035 | | 2008 | | | 630,615 | | | 1,856,236 | | | — |
| | 2007 | | | 963,562 | | | 7,617 | | | — |
MyDestination 2045 | | 2008 | | | 180,040 | | | 700,135 | | | — |
| | 2007 | | | 395,513 | | | 10,082 | | | — |
Conservative Allocation | | 2008 | | | 10,292,290 | | | 12,642,828 | | | — |
| | 2007 | | | 10,983,286 | | | 12,799,259 | | | — |
Balanced Allocation | | 2008 | | | 41,644,877 | | | 90,209,055 | | | — |
| | 2007 | | | 45,528,937 | | | 91,906,501 | | | — |
Growth Allocation | | 2008 | | | 21,830,650 | | | 73,173,462 | | | — |
| | 2007 | | | 30,965,170 | | | 92,309,085 | | | — |
Aggressive Allocation | | 2008 | | | 9,741,630 | | | 77,173,217 | | | — |
| | 2007 | | | 22,723,860 | | | 100,285,137 | | | — |
218
| | | | | | | | | | | |
Fund | | | | Ordinary
Income | | Long-Term
Capital Gain | | Return
of Capital |
Conservative Allocation I | | 2008 | | $ | 2,530,981 | | $ | 1,163,656 | | $ | — |
| | 2007 | | | 3,488,023 | | | 1,922,351 | | | — |
Balanced Allocation I | | 2008 | | | 13,748,251 | | | 13,132,319 | | | — |
| | 2007 | | | 19,049,303 | | | 13,917,253 | | | — |
Growth Allocation I | | 2008 | | | 7,165,766 | | | 13,478,283 | | | — |
| | 2007 | | | 11,337,811 | | | 14,382,365 | | | — |
Aggressive Allocation I | | 2008 | | | 20 | | | 14,453,009 | | | — |
| | 2007 | | | 7,242,215 | | | 13,245,038 | | | — |
Money Market | | 2008 | | | 30,499,308 | | | — | | | — |
| | 2007 | | | 53,685,126 | | | — | | | — |
Low-Duration Bond | | 2008 | | | 34,110,052 | | | — | | | — |
| | 2007 | | | 34,317,405 | | | — | | | — |
Medium-Duration Bond | | 2008 | | | 81,631,018 | | | 2,832,789 | | | — |
| | 2007 | | | 61,213,423 | | | 325,199 | | | — |
Extended-Duration Bond | | 2008 | | | 38,263,627 | | | 2,890,924 | | | — |
| | 2007 | | | 29,148,913 | | | 5,220,811 | | | — |
Global Bond | | 2008 | | | 14,374,673 | | | 266,282 | | | — |
| | 2007 | | | 7,590,035 | | | 213,152 | | | — |
Equity Index | | 2008 | | | 6,439,050 | | | 2,678,739 | | | — |
| | 2007 | | | 9,377,214 | | | 21,703,970 | | | — |
Real Estate Securities | | 2008 | | | 2,388,143 | | | — | | | 99,004 |
| | 2007 | | | 6,816,862 | | | 6,848,010 | | | — |
Value Equity | | 2008 | | | 20,928,040 | | | 7,704,593 | | | — |
| | 2007 | | | 57,448,170 | | | 83,641,310 | | | — |
Growth Equity | | 2008 | | | 2,419,165 | | | — | | | — |
| | 2007 | | | 2,252,310 | | | — | | | — |
Small Cap Equity | | 2008 | | | 2,699,065 | | | 1,846 | | | 741,208 |
| | 2007 | | | 26,496,997 | | | 42,820,293 | | | — |
International Equity | | 2008 | | | 42,815,653 | | | 39,117,934 | | | — |
| | 2007 | | | 57,208,698 | | | 209,103,929 | | | — |
At December 31, 2008, the components of distributable earnings on a tax basis were as follows:
| | | | | | | | | | | | | | | |
Fund | | Undistributed
Ordinary
Income | | Undistributed
Long-Term
Capital
Gain/ (Capital
Loss
Carryforward) | | | Post-October
Loss Deferral | | | Net
Unrealized
Appreciation
(Depreciation)
on Investments | |
MyDestination 2005 | | $ | 101,730 | | $ | (42,414 | ) | | $ | — | | | $ | (19,247,610 | ) |
MyDestination 2015 | | | 1,381,316 | | | (889,637 | ) | | | — | | | | (70,456,057 | ) |
MyDestination 2025 | | | 608,702 | | | (31,687 | ) | | | — | | | | (56,909,902 | ) |
MyDestination 2035 | | | 185,808 | | | 124,488 | | | | — | | | | (23,141,954 | ) |
MyDestination 2045 | | | 127,784 | | | 4,334 | | | | — | | | | (9,495,015 | ) |
Conservative Allocation | | | 6,254 | | | 1,080,889 | | | | — | | | | (19,698,703 | ) |
Balanced Allocation | | | — | | | 6,797,379 | | | | — | | | | (231,929,322 | ) |
Growth Allocation | | | — | | | 3,868,509 | | | | — | | | | (221,602,148 | ) |
Aggressive Allocation | | | — | | | 4,784,388 | | | | — | | | | (240,154,545 | ) |
Conservative Allocation I | | | 705,587 | | | (650,405 | ) | | | — | | | | (13,926,014 | ) |
Balanced Allocation I | | | 5,275,545 | | | (4,262,186 | ) | | | — | | | | (110,615,628 | ) |
Growth Allocation I | | | 1,465,194 | | | (412,556 | ) | | | — | | | | (90,581,706 | ) |
Aggressive Allocation I | | | 3,253,345 | | | (3,489,043 | ) | | | — | | | | (79,815,110 | ) |
Money Market | | | 84,502 | | | — | | | | — | | | | — | |
Low-Duration Bond | | | 1,544,710 | | | (7,356,071 | ) | | | (1,971,733 | ) | | | (57,708,645 | ) |
Medium-Duration Bond | | | 7,822,937 | | | — | | | | (3,952,447 | ) | | | (124,816,470 | ) |
219
| | | | | | | | | | | | | | | |
Fund | | Undistributed
Ordinary
Income | | Undistributed
Long-Term
Capital
Gain/ (Capital
Loss
Carryforward) | | | Post-October
Loss
Deferral | | | Net
Unrealized
Appreciation
(Depreciation)
on Investments | |
Extended-Duration Bond | | $ | — | | $ | 651,104 | | | $ | (324,537) | | | $ | (57,639,431 | ) |
Global Bond | | | 1,495,654 | | | (705,051 | ) | | | (1,784,324 | ) | | | (58,052,503 | ) |
Equity Index | | | 1,622,559 | | | (1,612,695 | ) | | | (1,178,253 | ) | | | (54,644,915 | ) |
Real Estate Securities | | | — | | | (12,320,254 | ) | | | (23,080,864 | ) | | | (40,008,172 | ) |
Value Equity | | | 7,752,269 | | | (73,270,784 | ) | | | (45,682,715 | ) | | | (359,683,765 | ) |
Growth Equity | | | 49,558 | | | (45,483,748 | ) | | | (57,189,899 | ) | | | (285,155,634 | ) |
Small Cap Equity | | | — | | | (69,003,843 | ) | | | (18,488,881 | ) | | | (97,580,240 | ) |
International Equity | | | 1,194,012 | | | 5,380 | | | | (61,018,376 | ) | | | (415,621,820 | ) |
Post-October loss deferrals have been included in undistributed ordinary income and undistributed long-term capital gains, depending upon the character of the loss deferral.
For federal income tax purposes, capital loss carryovers and their expiration dates, were as follows as of December 31, 2008:
| | | | | | | | | | | | |
| Expiring December 31, | | 2011 | | 2014 | | 2016 | | Total |
MyDestination 2005 | | $ | — | | $ | — | | $ | 42,414 | | $ | 42,414 |
MyDestination 2015 | | | — | | | — | | | 889,637 | | | 889,637 |
MyDestination 2025 | | | — | | | — | | | 31,687 | | | 31,687 |
Conservative Allocation I | | | — | | | — | | | 650,405 | | | 650,405 |
Balanced Allocation I | | | — | | | — | | | 4,262,186 | | | 4,262,186 |
Growth Allocation I | | | — | | | — | | | 412,556 | | | 412,556 |
Aggressive Allocation I | | | — | | | — | | | 3,489,043 | | | 3,489,043 |
Low-Duration Bond | | | — | | | 7,356,071 | | | — | | | 7,356,071 |
Global Bond | | | — | | | — | | | 705,051 | | | 705,051 |
Equity Index | | | — | | | — | | | 1,612,695 | | | 1,612,695 |
Real Estate Securities | | | — | | | — | | | 12,320,254 | | | 12,320,254 |
Value Equity | | | — | | | — | | | 73,270,784 | | | 73,270,784 |
Growth Equity | | | 45,483,748 | | | — | | | — | | | 45,483,748 |
Small Cap Equity | | | — | | | — | | | 69,003,843 | | | 69,003,843 |
For federal income tax purposes, post-October loss deferrals, which will reverse in 2009, were as follows as of December 31, 2008:
| | | | | | | | | |
| | | Capital | | FX | | Total |
Low-Duration Bond | | $ | 1,971,733 | | $ | — | | $ | 1,971,733 |
Medium-Duration Bond | | | 3,641,503 | | | 310,944 | | | 3,952,447 |
Extended-Duration Bond | | | 269,062 | | | 55,475 | | | 324,537 |
Global Bond | | | 1,784,324 | | | — | | | 1,784,324 |
Equity Index | | | 1,178,253 | | | — | | | 1,178,253 |
Real Estate Securities | | | 23,080,864 | | | — | | | 23,080,864 |
Value Equity | | | 45,682,715 | | | — | | | 45,682,715 |
Growth Equity | | | 57,178,886 | | | 11,013 | | | 57,189,899 |
Small Cap Equity | | | 18,459,779 | | | 29,102 | | | 18,488,881 |
International Equity | | | 61,018,376 | | | — | | | 61,018,376 |
At December 31, 2008, the aggregate cost of investment securities for federal income tax purposes (excluding foreign currency, securities sold short and derivative related items) and the net unrealized appreciation from investments for those securities having an excess of value over cost and net unrealized depreciation from investments for those securities having an excess of cost over value (based on cost for federal income tax purposes) were as follows:
220
| | | | | | | | | | | | | | |
Fund | | Federal Tax Cost | | Net Unrealized
Appreciation
(Depreciation) | | | Appreciated
Securities | | Depreciated
Securities | |
MyDestination 2005 | | $ | 71,082,692 | | $ | (19,247,610 | ) | | $ | 22 | | $ | (19,247,632 | ) |
MyDestination 2015 | | | 218,055,766 | | | (70,456,057 | ) | | | 74 | | | (70,456,131 | ) |
MyDestination 2025 | | | 156,337,723 | | | (56,909,902 | ) | | | 40 | | | (56,909,942 | ) |
MyDestination 2035 | | | 62,108,216 | | | (23,141,954 | ) | | | 35 | | | (23,141,989 | ) |
MyDestination 2045 | | | 28,406,727 | | | (9,495,016 | ) | | | 16 | | | (9,495,032 | ) |
Conservative Allocation | | | 276,362,921 | | | (19,698,703 | ) | | | 3,930,379 | | | (23,629,082 | ) |
Balanced Allocation | | | 1,153,655,120 | | | (231,929,322 | ) | | | 437 | | | (231,929,759 | ) |
Growth Allocation | | | 899,164,703 | | | (221,602,148 | ) | | | 407 | | | (221,602,555 | ) |
Aggressive Allocation | | | 799,399,823 | | | (240,154,545 | ) | | | 388 | | | (240,154,933 | ) |
Conservative Allocation I | | | 68,231,397 | | | (13,926,014 | ) | | | 30 | | | (13,926,044 | ) |
Balanced Allocation I | | | 370,580,051 | | | (110,615,628 | ) | | | 114 | | | (110,615,742 | ) |
Growth Allocation I | | | 252,274,976 | | | (90,581,706 | ) | | | 78 | | | (90,581,784 | ) |
Aggressive Allocation I | | | 189,323,665 | | | (79,815,110 | ) | | | 60 | | | (79,815,170 | ) |
Money Market | | | 1,159,144,387 | | | — | | | | — | | | — | |
Low-Duration Bond | | | 862,082,589 | | | (51,258,562 | ) | | | 10,846,477 | | | (62,105,039 | ) |
Medium-Duration Bond | | | 1,362,861,108 | | | (111,810,207 | ) | | | 30,848,862 | | | (142,659,069 | ) |
Extended-Duration Bond | | | 501,442,312 | | | (57,578,314 | ) | | | 21,118,481 | | | (78,696,795 | ) |
Global Bond | | | 244,970,434 | | | (57,889,453 | ) | | | 2,956,581 | | | (60,846,034 | ) |
Equity Index | | | 371,235,282 | | | (54,644,915 | ) | | | 54,724,647 | | | (109,369,562 | ) |
Real Estate Securities | | | 143,560,783 | | | (40,008,172 | ) | | | 315,914 | | | (40,324,086 | ) |
Value Equity | | | 1,425,730,572 | | | (359,683,765 | ) | | | 47,772,157 | | | (407,455,922 | ) |
Growth Equity | | | 1,332,317,279 | | | (285,155,636 | ) | | | 22,091,776 | | | (307,247,412 | ) |
Small Cap Equity | | | 498,634,591 | | | (97,550,210 | ) | | | 12,743,757 | | | (110,293,967 | ) |
International Equity | | | 1,598,746,239 | | | (413,128,048 | ) | | | 49,240,491 | | | (462,368,539 | ) |
The differences between book basis and tax-basis unrealized appreciation is attributable primarily to the tax deferral of losses on wash sales and on investments in PFIC’s.
At December 31, 2008, capital contributions, accumulated undistributed net investment income and accumulated net realized gain (loss) from investments have been adjusted for current period permanent book/tax differences which arose principally from differing book/tax treatments of paydown gains, net operating losses and foreign currency transactions. The following amounts were reclassified within the capital accounts:
| | | | | | | | | | | |
Fund | | Paid in
Capital | | Accumulated
Undistributed
Income | | | Accumulated Net
Realized
Gain (Loss) on
Investments,
Currency Translations
and Derivative
Transactions | |
MyDestination 2005 | | $ | — | | $ | 226,191 | | | $ | (226,191) | |
MyDestination 2015 | | | — | | | 509,565 | | | | (509,565 | ) |
MyDestination 2025 | | | — | | | 259,169 | | | | (259,169 | ) |
MyDestination 2035 | | | — | | | 26,799 | | | | (26,799 | ) |
MyDestination 2045 | | | — | | | 47 | | | | (47 | ) |
Conservative Allocation | | | — | | | (1,317 | ) | | | 1,317 | |
Balanced Allocation | | | — | | | 6,029,808 | | | | (6,029,808 | ) |
Growth Allocation | | | — | | | 2,316,162 | | | | (2,316,162 | ) |
Aggressive Allocation | | | — | | | (1,080 | ) | | | 1,080 | |
Conservative Allocation I | | | — | | | (590 | ) | | | 590 | |
Balanced Allocation I | | | — | | | 2,773,325 | | | | (2,773,325 | ) |
Growth Allocation I | | | — | | | 911,960 | | | | (911,960 | ) |
Aggressive Allocation I | | | — | | | 380 | | | | (380 | ) |
Money Market | | | — | | | 84,502 | | | | (84,502 | ) |
Low-Duration Bond | | | — | | | 3,971,996 | | | | (3,971,996 | ) |
221
| | | | | | | | | | | |
Fund | | Paid in
Capital | | Accumulated
Undistributed
Income | | | Accumulated
Net Realized
Gain (Loss) on
Investments,
Currency Translations
and Derivative
Transactions | |
Medium-Duration Bond | | $ | — | | $ | 5,487,420 | | | $ | (5,487,420 | ) |
Extended-Duration Bond | | | — | | | 1,252,246 | | | | (1,252,246 | ) |
Global Bond | | | — | | | 1,515,962 | | | | (1,515,962 | ) |
Equity Index | | | — | | | (2,066 | ) | | | 2,066 | |
Real Estate Securities | | | — | | | — | | | | — | |
Value Equity | | | — | | | (8,811 | ) | | | 8,811 | |
Growth Equity | | | — | | | 3,395 | | | | (3,395 | ) |
Small Cap Equity | | | — | | | 34,447 | | | | (34,447 | ) |
International Equity | | | — | | | 5,455,380 | | | | (5,455,380 | ) |
Net investment income, net realized gain (loss) on investments and net assets were not affected by these reclassifications.
The Financial Accounting Standards Board (“FASB”) Interpretation No. 48, (“FIN 48”) Accounting for Uncertainty in Income Taxes, sets forth a minimum threshold for financial statement recognition of the benefit of a tax position taken or expected to be taken in a tax return. Management has analyzed the Funds’ tax positions and has concluded that no provision for income tax is required in the Funds’ financial statements. The Funds are not aware of any tax positions for which it is reasonably possible that the total amounts of unrecognized tax benefits will significantly change in the next twelve months. However, management’s conclusions regarding the adoption of FIN 48 may be subject to review and adjustment at a later date based on factors including, but not limited to, further implementation guidance from the FASB, new tax laws, regulations and administrative interpretations (including court decisions). Each of the Funds’ federal tax returns for the prior three fiscal years remains subject to examination by the Internal Revenue Service.
10. LEHMAN BROTHERS HOLDINGS, INC.
On September 15, 2008, Lehman Brothers Holdings Inc. filed for protection under Chapter 11 of the United States Bankruptcy Code. On September 19, 2008, a proceeding under the Securities Investor Protection Act (SIPA) was commenced with respect to Lehman Brothers Inc., a broker-dealer. A trustee appointed under SIPA is administering the bankruptcy estate of Lehman Brothers Inc. Lehman Brothers International (Europe) was placed in administration under the UK Insolvency Act on September 15, 2008. Lehman Brothers Special Financing Inc. filed for protection under Chapter 11 of the United States Bankruptcy Code on October 3, 2008. In connection with these filings, the Lehman Brothers group of companies (collectively “Lehman Brothers”) will be reorganized and/or liquidated in an orderly fashion, subject to court approval. Each Lehman Brothers entity is a separate legal entity that is subject to its own bankruptcy proceeding.
The Low-Duration Bond and Medium-Duration Bond Funds had select holdings, credit default swap agreements, and securities and derivatives transactions outstanding with Lehman Brothers entities as issuer, referenced entity, counterparty or guarantor at the time the relevant Lehman Brothers entity filed for protection or was placed in administration. The security holdings, credit default swap agreements, and securities and derivatives transactions associated with Lehman Brothers have been written down to their estimated recoverable values. Anticipated losses for securities and derivatives transactions associated with Lehman Brothers have been incorporated as components of other receivables on the Statement of Assets and Liabilities and net changes in unrealized appreciation (depreciation) on the Statement of Operations. A facilitated auction occurred on October 10, 2008 comprising multiple pre-approved brokerage agencies to determine the estimated recovery rate for holdings and credit default swap agreements with Lehman Brothers Holdings Inc. as referenced entity. These recovery rates have been utilized in determining estimated recovery values.
222
The Funds’ Sub-Advisers, on behalf of GSCM, have delivered notices of default to the relevant Lehman Brothers entities in accordance with the terms of the applicable agreements. For transactions with Lehman Brothers counterparties, the Sub-Advisers have terminated the trades, has obtained quotations from brokers for replacement trades and, where deemed appropriate, has re-opened positions with new counterparties.
11. U.S. TREASURY DEPARTMENT TEMPORARY GUARANTEE PROGRAM
The Money Market Fund participates in the U.S. Department of the Treasury (the “Treasury”) Temporary Guarantee Program for Money Market Funds (the “Program”). Under the Program, the Treasury will guarantee the share price of the shares of the Fund held by shareholders as of the close of business on September 19, 2008, at $1.00 for each share of the Fund, if the Fund’s net asset value per share falls below $0.995 (a “Guarantee Event”) and the Fund liquidates. Shareholders who held shares of the Fund on September 19, 2008, are provided a guarantee for the lesser of: (a) the number of shares owned by the shareholder at the close of September 19, 2008; or (b) the number of shares owned by the shareholder on the date of a Guarantee Event. The Program does not apply to shareholders who were not shareholders of the Fund as of the close of business on September 19, 2008. The Fund will bear the expense of its participation in the program without regard to any expense limitation currently in effect.
12. NEW ACCOUNTING PRONOUNCEMENTS
In March 2008, FASB issued Statement No. 161, “Disclosures about Derivative Instruments and Hedging Activities” (“FAS 161”), an amendment to FASB Statement No. 133. FAS 161 is intended to improve financial reporting for derivative instruments by requiring enhanced disclosure that enables investors to understand how and why an entity uses derivatives, how derivatives are accounted for, and how derivative instruments affect an entity’s results of operations and financial position. FAS 161 is effective for financial statements issued for fiscal years and interim periods beginning after November 15, 2008. Management is currently evaluating the implications of FAS 161. The impact on the Funds’ financial statement disclosures, if any, is currently being assessed.
223
REPORT OF INDEPENDENT REGISTERED PUBLIC ACCOUNTING FIRM
To the Board of Trustees and
Shareholders of GuideStone Funds:
In our opinion, the accompanying statements of assets and liabilities, including the schedules of investments, and the related statements of operations and of changes in net assets and the financial highlights, present fairly, in all material respects, the financial position of MyDestination 2005 Fund, MyDestination 2015 Fund, MyDestination 2025 Fund, MyDestination 2035 Fund, MyDestination 2045 Fund, Conservative Allocation Fund (formerly Flexible Income Fund), Balanced Allocation Fund (formerly Growth & Income Fund), Growth Allocation Fund (formerly Capital Opportunities Fund), Aggressive Allocation Fund (formerly Global Equity Fund), Conservative Allocation Fund I (formerly Flexible Income Fund I), Balanced Allocation Fund I (formerly Growth & Income Fund I), Growth Allocation Fund I (formerly Capital Opportunities Fund I), Aggressive Allocation Fund I (formerly Global Equity Fund I), Money Market Fund, Low-Duration Bond Fund, Medium-Duration Bond Fund, Extended-Duration Bond Fund, Global Bond Fund, Equity Index Fund, Real Estate Securities Fund, Value Equity Fund, Growth Equity Fund, Small Cap Equity Fund, and International Equity Fund (constituting GuideStone Funds, hereafter referred to as the “Trust”) at December 31, 2008, and the results of their operations, the changes in their net assets and their financial highlights for each of the periods indicated, in conformity with accounting principles generally accepted in the United States of America. These financial statements and financial highlights (hereafter referred to as “financial statements”) are the responsibility of the Trust’s management; our responsibility is to express an opinion on these financial statements based on our audits. We conducted our audits of these financial statements in accordance with the standards of the Public Company Accounting Oversight Board (United States). Those standards require that we plan and perform the audit to obtain reasonable assurance about whether the financial statements are free of material misstatement. An audit includes examining, on a test basis, evidence supporting the amounts and disclosures in the financial statements, assessing the accounting principles used and significant estimates made by management, and evaluating the overall financial statement presentation. We believe that our audits, which included confirmation of securities at December 31, 2008 by correspondence with the custodian and brokers, provide a reasonable basis for our opinion.
|
 |
|
| Philadelphia, Pennsylvania |
| February 26, 2009 |
224
NOTICE TO SHAREHOLDERS (Unaudited)
Each Fund is required by Subchapter M of the Internal Revenue Code of 1986, as amended, to advise its shareholders within 60 days of the Fund’s year end as of the federal tax status of distributions received by each Fund’s shareholders. During the year ended December 31, 2008, the Funds hereby designate the following dividends and distributions paid by each of the Funds:
| | | | | | | | | |
Fund | | Ordinary
Income | | Long-Term
Capital Gain | | Return of
Capital |
MyDestination 2005 | | $ | 2,083,566 | | $ | 1,504,355 | | $ | — |
MyDestination 2015 | | | 4,008,790 | | | 5,518,766 | | | — |
MyDestination 2025 | | | 2,335,600 | | | 4,629,258 | | | — |
MyDestination 2035 | | | 630,615 | | | 1,856,236 | | | — |
MyDestination 2045 | | | 180,040 | | | 700,135 | | | — |
Conservative Allocation | | | 10,292,290 | | | 12,642,828 | | | — |
Balanced Allocation | | | 41,644,877 | | | 90,209,055 | | | — |
Growth Allocation | | | 21,830,650 | | | 73,173,462 | | | — |
Aggressive Allocation | | | 9,741,630 | | | 77,173,217 | | | — |
Conservative Allocation I | | | 2,530,981 | | | 1,163,656 | | | — |
Balanced Allocation I | | | 13,748,251 | | | 13,132,319 | | | — |
Growth Allocation I | | | 7,165,766 | | | 13,478,283 | | | — |
Aggressive Allocation I | | | 20 | | | 14,453,009 | | | — |
Money Market | | | 30,499,308 | | | — | | | — |
Low-Duration Bond | | | 34,110,052 | | | — | | | — |
Medium-Duration Bond | | | 81,631,018 | | | 2,832,789 | | | — |
Extended-Duration Bond | | | 38,263,627 | | | 2,890,924 | | | — |
Global Bond | | | 14,374,673 | | | 266,282 | | | — |
Equity Index | | | 6,439,050 | | | 2,678,739 | | | — |
Real Estate Securities | | | 2,388,143 | | | — | | | 99,004 |
Value Equity | | | 20,928,040 | | | 7,704,593 | | | — |
Growth Equity | | | 2,419,165 | | | — | | | — |
Small Cap Equity | | | 2,699,065 | | | 1,846 | | | 741,208 |
International Equity | | | 42,815,653 | | | 39,117,934 | | | — |
Dividends from net investment income and short-term capital gains are treated as ordinary income dividends for federal income tax purposes. Long-term capital gain distributions are taxable as capital gain dividends.
The following percentages of ordinary income dividends paid for the year ended December 31, 2008 have been designated as qualified for the reduced tax rate under The Job and Growth Tax Relief Reconciliation Act of 2003.
| | | |
Fund | | | |
MyDestination 2005 | | 13.37 | % |
MyDestination 2015 | | 25.81 | % |
MyDestination 2025 | | 36.04 | % |
MyDestination 2035 | | 60.05 | % |
MyDestination 2045 | | 92.92 | % |
Conservative Allocation | | 7.24 | % |
Balanced Allocation | | 13.49 | % |
Growth Allocation | | 29.44 | % |
Aggressive Allocation | | 77.40 | % |
Conservative Allocation I | | 10.65 | % |
Balanced Allocation I | | 19.78 | % |
Growth Allocation I | | 37.58 | % |
Equity Index | | 100.00 | % |
Value Equity | | 100.00 | % |
Growth Equity | | 100.00 | % |
Small Cap Equity | | 59.40 | % |
International Equity | | 57.12 | % |
All above designations are based on financial information available as of the date of this annual report, and accordingly, are subject to change. It is the intention of the Funds to designate the maximum amount permitted under the Internal Revenue Code and the regulations thereunder. Shareholders are advised to consult their own tax advisers with respect to the tax consequences of their investment in the Funds.
225
FUND MANAGEMENT (Unaudited)
Information pertaining to the Trustees and officers of the Trust is set forth below. The statement of additional information (SAI) includes additional information about the Trustees and is available without charge, upon request, by calling 1-888-98-GUIDE.
| | | | | | | | |
Name, (DOB), Address and Position(s) with Trust | | Term of Office and
Length of Time
Served1 | | Principal Occupation(s) During Past 5 Years | | Number of
Portfolios
in Fund
Complex
Overseen
by Trustee | | Other Trusteeships/ Directorships Held by Trusteee |
DISINTERESTED TRUSTEES |
| | | | |
Michael R. Buster (1957) 2401 Cedar Springs Road Dallas, TX 75201-1407 Trustee | | Since 2002 | | Executive Pastor, Prestonwood Baptist Church, 1989 - present. | | 24 | | None |
| | | | |
William Craig George (1958) 2401 Cedar Springs Road Dallas, TX 75201-1407 Trustee | | Since 2004 | | Regional loan administrator, SunTrust Bank, 1995 - present. | | 24 | | None |
| | | | |
Joseph A. Mack (1939) 2401 Cedar Springs Road Dallas, TX 75201-1407 Trustee | | Since 2002 | | Director, Office of Public Policy, South Carolina Baptist Convention, 1999 - Present, | | 24 | | None |
| | | | |
Julie P. Fry (1956) 2401 Cedar Springs Road Dallas, TX 75201-1407 Trustee | | Since 2007 | | Chief Operating Officer, Salmon, Sims, Thomas & Associates, PLLC, 1996 - Present | | 24 | | National Charity League, DFW Metroport Chapter - past President |
| | | | |
Franklin Raymond Morgan (1943) 2401 Cedar Springs Road Dallas, TX 75201-1407 Trustee | | Since 2005 | | Retired - Senior Vice President, Director of International Administration, Prudential Securities, Inc., January 1962 - May 2003. | | 24 | | None |
| | | | |
Peter L. Chamberlain, Ph.D. (1951) 2401 Cedar Springs Road Dallas, TX 75201-1407 Trustee (Effective 07/26/08) | | Since 2008 | | Senior Financial Analyst, Summit Wealth Management, Inc., 2006 to Present; President, B.R. Chamberlain & Sons, Inc., 1990 - 2006 Registered Investment Adviser. | | 24 | | First Baptist Church of Orlando - Board of Trusteee Member and Strategy Team; Rollins College Board of Overseers/Corporate Council - Member; The B.R. Chamberlain Foundation for Public Entertainment - President |
|
| INTERESTED TRUSTEES2 |
| | | | |
Barry Hartis (1945) 2401 Cedar Springs Road Dallas, TX 75201-1407 Trustee | | Since 2005 | | Certified Public Accountant,1976 - Present; Vice President of Business and Finance, Greensboro College, January 1998 - June 30, 2005. | | 24 | | None |
| | | | |
Gerald B. Jones (1932) 2401 Cedar Springs Road Dallas, TX 75201-1407 Trustee | | Since 2000 | | President, Flying Investments, November 2006 - present. Owner Jones Motorcars, Inc. 1957 - October 2006. | | 24 | | Bank of Arkansas — Director |
|
| OFFICERS WHO ARE NOT TRUSTEES |
| | | | |
Jeffrey P. Billinger (1946) 2401 Cedar Springs Road Dallas, TX 75201-1407 Vice President and Treasurer | | Since 2000 | | Executive Officer and Treasurer, GuideStone Financial Resources of the Southern Baptist Convention, 1995 - present. | | N/A | | N/A |
226
FUND MANAGEMENT (Continued)
| | | | | | | | |
Name, (DOB), Address and Position(s) with Trust | | Term of Office and Length of Time Served1 | | Principal Occupation(s) During Past 5 Years | | Number of
Portfolios
in Fund
Complex
Overseen
by Trustee | | Other Trusteeships/ Directorships Held by Trusteee |
Rodric E. Cummins (1957) 2401 Cedar Springs Road Dallas, TX 75201-1407 Vice President and Investment Officer | | Since 2000 | | Executive Officer and Chief Investment Officer, GuideStone Financial Resources of the Southern Baptist Convention, 1998 - present. | | N/A | | N/A |
| | | | |
John R. Jones (1953) 2401 Cedar Springs Road Dallas, TX 75201-1407 President | | Since 2000 | | Executive Vice President and Chief Operating Officer, GuideStone Financial Resources of the Southern Baptist Convention, 1995 - present. | | N/A | | N/A |
| | | | |
Rodney R. Miller (1953) 2401 Cedar Springs Road Dallas, TX 75201-1407 Vice President, Secretary and Chief Legal Officer | | Since 2000 | | General Counsel, Legal and Compliance, GuideStone Financial Resources of the Southern Baptist Convention, 1995 - present. | | N/A | | N/A |
| | | | |
Curtis D. Sharp (1947) 2401 Cedar Springs Road Dallas, TX 75201-1407 Chief Compliance Officer and AML Officer | | Since 2006 | | Executive Officer, Denominational and Public Relations Services, GuideStone Financial Resources of the Southern Baptist Convention, 1985 - present. | | N/A | | N/A |
| | | | |
Patricia A. Weiland (1959) 2401 Cedar Springs Road Dallas, TX 75201-1407 Vice President — Fund Operations and Sales | | Since 2000 | | Executive Officer, Financial Solutions and Services, GuideStone Financial Resources of the Southern Baptist Convention, 2006 - present; Director, Mutual Funds, GuideStone Financial Resources of the Southern Baptist Convention, 2000 - 2006. | | N/A | | N/A |
1 | Each Trustee and officer serves for an indefinite term, until his/her successor is elected. Officers serve at the pleasure of the Board of Trustees. |
2 | Messrs. Gerald Jones and Hartis serve as trustees and are to be “interested persons” of the Trust as the term is defined in the Investment Company Act of 1940, due to their positions on the Board of Trustees of GuideStone Financial Resources of the Southern Baptist Convention. |
PROXY VOTING
A description of the policies and procedures that the Trust uses to determine how to vote proxies relating to their portfolio securities as well as information regarding how the Trust voted proxies during the most recent 12-month period ended June 30 is available without charge by calling 1-888-98-GUIDE, by visiting our Web site at www.GuideStoneFunds.org or by visiting the U.S. Securities and Exchange Commission’s Web site at www.sec.gov.
QUARTERLY SCHEDULES OF INVESTMENTS
In addition to the semi-annual and annual reports that the Trust delivers to shareholders and makes available through its Web site, the Trust files a complete schedule of portfolio holdings with the SEC for each Fund’s first and third fiscal quarters on Form N-Q. GuideStone Funds does not deliver the schedule for the first and third fiscal quarters to shareholders; however, the schedule is posted to our Web site, www.GuideStoneFunds.org. You may also obtain the Form N-Q filings by accessing the SEC’s Web site at www.sec.gov or copy them at the SEC’s Public Reference Room in Washington, DC. Information on the operation of the SEC’s Public Reference Room may be obtained by calling the SEC at (800) 732-0330. You can also request copies of this information, upon payment of a fee for duplication, at the SEC’s email address (publicinfo@sec.gov) or by writing the Public Reference section of the SEC, Washington, DC 20549-0102.
227
BOARD REVIEW OF ADVISORY AGREEMENTS (UNAUDITED)
As required by the Investment Company Act of 1940, as amended (the “1940 Act”), the Board of Trustees (the “Board”) of GuideStone Funds (the “Trust”), including all of the Trustees who are not “interested persons” of the Trust, as that term is defined in the 1940 Act (the “Independent Trustees”), recently considered the renewal of (i) the investment advisory agreement between GuideStone Capital Management (the “Adviser” or “GSCM”) and the Trust on behalf of the Date Target, Asset Allocation and Select Funds (each a “Fund” and together the “Funds”) of the Trust (the “Advisory Agreement”); and (ii) the sub-advisory agreements among the Adviser, each sub-adviser, with the exception of Provident Investment Counsel, LLC, and the Trust on behalf of each Select Fund (the “Sub-Advisory Agreements”). It was noted that certain Sub-Advisory Agreements with respect to the Global Bond, Growth Equity and International Equity Funds were not presented for renewal because they had been approved recently for an initial two-year term in accordance with Section 15(a) of the 1940 Act. The Advisory Agreement and each Sub-Advisory Agreement presented for renewal (the “Agreements”) were approved for an additional one-year term at a meeting of the Board held on September 11, 2008. The Board’s decision to approve the Agreements reflects the exercise of its business judgment to continue each existing arrangement. In approving the Agreements, the Board considered information provided by the Adviser, each sub-adviser and a consulting firm engaged by the Adviser with the assistance and advice of counsel to the Independent Trustees and counsel to the Trust.
The Board’s consideration of various factors and its conclusions with respect to such factors formed the basis for the Board’s determination to continue the Agreements. The factors considered by the Board included, but were not limited to: (i) the resources of the Adviser or sub-adviser; (ii) the experience and expertise of the Adviser or sub-adviser; (iii) the financial capability of the Adviser or sub-adviser; (iv) the compliance procedures and history of the Adviser or sub-adviser; (v) the performance of the Fund in comparison to relevant benchmarks, similarly managed funds and the Adviser’s or sub-adviser’s other clients; (vi) the amount of the contractual advisory fee in comparison to similarly managed funds and the Adviser’s or sub-adviser’s other clients and the effect of any fee waiver and expense reimbursement arrangement; (vii) the total expenses of the Fund in comparison to similarly managed funds and the use of past and anticipated expense caps; (viii) the profitability of the Adviser or sub-adviser with respect to the Fund and its overall business; (ix) the extent of any economies of scale and whether the fee structure reflects such economies of scale; (x) the existence of any collateral benefits realized by the Adviser or sub-adviser; and (xi) the existence of any collateral benefits realized by the Fund. In its decision to renew each Agreement, the Board was also mindful of the potential disruptions of the Trust’s operations and various risks, uncertainties and other effects that could occur as a result of a decision to terminate or not renew an Agreement. No one factor was determinative in the Board’s consideration of the Agreements.
The Board undertook a review of the terms of the Agreements and the nature and quality of the services provided by the Adviser and each sub-adviser. The Board conducted its analysis on a fund-by-fund basis with respect to the Adviser and each sub-adviser. The Adviser provided the Board with substantial detailed information in the form of reports about each Date Target Fund, Asset Allocation Fund, Select Fund, sub-advisory firm and the Adviser prior to and during the meeting, which addressed most, if not all, of the factors listed above. The Adviser also provided additional information about the Adviser and each sub-adviser in presentations made during the meeting and responded to questions from the Trustees. In addition, the Independent Trustees met separately in executive session with counsel to the Independent Trustees to discuss and consider information presented in connection with the continuation of the Agreements as well as the Trustees’ responsibilities and duties in approving the Agreements.
APPROVAL OF CONTINUATION OF INVESTMENT ADVISORY AGREEMENT
In considering the renewal of the existing Advisory Agreement with GSCM, the Trustees took into account all the materials provided prior to and during the meeting, the presentations made during the meeting and the extensive discussions during the meeting, including the discussions the Independent Trustees had during their executive session with independent legal counsel. More specifically, Trustees examined the nature, extent and quality of the services to be provided by the Adviser to the Funds. The Trustees evaluated the Adviser’s experience in serving as an investment adviser, including overseeing and managing the allocation of Fund assets among the sub-advisers. The Trustees noted the experience of key personnel at the Adviser in
228
providing investment management and administrative services and the systems used by such persons and the ability of the Adviser to attract and retain capable personnel. The Trustees noted the reputation, compliance history, compliance program and financial condition of the Adviser. The Trustees also noted the terms of the Advisory Agreement and the responsibilities that the Adviser has as investment adviser to the Funds, including oversight of sub-adviser compliance with each Fund’s policies and objectives, oversight of general Fund compliance, including compliance with social restrictions, and the implementation of Board directives as they relate to the Funds. The Trustees concluded that each Fund is likely to benefit from the extent and quality of these services as a result of the Adviser’s experience, personnel, operations and resources.
The Trustees also reviewed a memorandum prepared by a consulting firm engaged by the Adviser for, among other things, supplying research on expense comparisons and investment performance of other similar funds. The memorandum compared each Select Fund with other funds having the same investment style or objective, based primarily on Morningstar’s style-based investment categories, and compared the share class of each Fund with other funds in the same distribution channel. The Board analyzed the comparative expense and performance information in the memorandum, including comparative expense information for each Fund based on a sampling of funds similar in asset size. The Trustees considered the comparative performance, fee and expense information that had been provided in their evaluation of the management fees charged to each Select Fund. The Board evaluated the annualized performance results comparing the Funds against their peers, noting that most of the Funds provided above average returns with below average net expenses.
The Trustees examined fee and expense information for the Select Funds, as compared to other funds in the Funds’ asset-stratified peer groups for the GS4 Class, as of June 30, 2008. The Trustees determined that the management fees (combined advisory and sub-advisory fees) for each Select Fund were lower than the median management fees for other mutual funds in each respective Fund’s asset-stratified peer group, except for the Real Estate Securities, Growth Equity, Small Cap Equity and International Equity Funds. The Trustees noted that the management fees (combined advisory and sub-advisory fees) net of any fee waiver or expense reimbursement for each Select Fund were lower than the median management fees for other mutual funds in the Fund’s asset-stratified peer group, except for the Real Estate Securities, Growth Equity, Small Cap Equity and International Equity Funds. The Trustees then noted that the management fees net of any fee waiver and expense reimbursement for the Global Bond Fund ranked in the first quartile among similar funds at the same asset levels. The Trustees also noted that the management fees net of any fee waiver or expense reimbursement for the Low-Duration Bond, Medium-Duration Bond, Extended-Duration Bond, Equity Index and Value Equity Funds ranked in the second quartile among other similar funds at the same asset levels. The Trustees then noted that the management fees net of any fee waiver or expense reimbursement for the Real Estate Securities and International Equity Funds ranked in the third quartile among other similar funds at the same asset levels, and the Growth Equity and Small Cap Equity Funds ranked in the fourth quartile. The Trustees also evaluated the expense ratios for other funds in the Funds’ asset-stratified peer groups and determined that each Fund’s expense ratio was significantly lower than the median expense ratio for such other funds. The Trustees concluded that the level of each Fund’s management fees was reasonable and compared fairly to that of comparable mutual funds.
The Trustees examined the performance information for the GS4 Class of the Select Funds compared to Morningstar peers for the one- and three-year periods ended June 30, 2008. The Trustees noted that the average annual total returns for the Money Market and Extended-Duration Bond Funds ranked in the first quartile among their Morningstar peers, and the average annual total return for the Low-Duration Bond, Medium-Duration Bond, Real Estate Securities, Growth Equity, Small Cap Equity and International Equity Funds ranked in the second quartile among the Morningstar peers for the one-year period ended June 30, 2008. The Trustees noted that the average annual total returns for the Low-Duration Bond, Medium-Duration Bond, Value Equity and Small Cap Equity Funds ranked in the third quartile among the Morningstar peers for the three-year period ended June 30, 2008. They also noted that the average annual total returns for the Global Bond and Value Equity Funds for the one-year period ended June 30, 2008 and the Growth Equity Fund for the three-year period ended June 30, 2008 were each ranked in the fourth quartile.
The Trustees considered the costs to GSCM of serving as the Adviser to the Funds, including the costs associated with the personnel, systems and equipment necessary to manage the Funds in accordance with the existing Advisory Agreement. The
229
Trustees considered the revenues that GSCM expected to receive for serving as the Adviser to the Funds, the fact that any profit realized by the Adviser is forwarded to GuideStone Financial Resources, which historically has operated at a deficit with respect to the Trust, and that recently the investment advisory fee for certain Select Funds had been reduced. The Trustees also considered the profitability estimates for the Adviser, one without taking into account sub-advisory fee expenses borne by the Fund and one taking into account sub-advisory fee expenses. The Trustees then considered whether any direct or indirect collateral benefits inured to either the Adviser or the Trust as a result of their affiliation with one another. In light of these considerations, the Trustees concluded that any profits realized in connection with the Adviser’s services appeared reasonable.
The Trustees considered the extent to which the advisory fee to be paid to the Adviser reflected economies of scale. The Trustees again noted that the management fees for each Fund net of any fee waiver and expense reimbursement were below the median fee for other similar funds at the same asset levels, except for the Real Estate Securities, Growth Equity, Small Cap Equity and International Equity Funds.
Based on all of the information presented to the Board and its consideration of relevant factors, the Board concluded that the fee paid to the Adviser by each Fund was reasonable, and in the exercise of its business judgment, determined to approve the continuation of the Advisory Agreement for each Fund.
APPROVAL OF CONTINUATION OF SUB-ADVISORY AGREEMENTS
In considering the existing Sub-Advisory Agreements with each sub-adviser, the Trustees took into account the materials provided prior to and during the meeting, the presentations made during the meeting and the extensive discussions during the meeting, including the discussions the Independent Trustees had during their executive session with independent legal counsel. More specifically, the Trustees examined the nature, extent and quality of the services being provided by each of the sub-advisers to the Select Funds. The Trustees evaluated each sub-adviser’s experience in serving as a sub-adviser to a Select Fund and noted that each sub-adviser currently provides investment advice to various clients, including, in some cases, other pooled investment vehicles. The Trustees noted the experience of key personnel at each sub-adviser in providing investment management services and the systems used by such persons, and the ability of each sub-adviser to attract and retain capable personnel. The Trustees noted the reputation, compliance history, compliance program and financial condition of each sub-adviser. The Trustees also noted the terms of the existing Sub-Advisory Agreements and the responsibilities that each sub-adviser has for a Select Fund, including the responsibility of the day-to-day management of the investment portfolio of each Fund, compliance with each Fund’s policies and objectives and the implementation of the Board directives as related to the Funds. The Trustees concluded that each Fund is likely to benefit from the extent and quality of these services as a result of each sub-adviser’s experience, personnel, operations and resources.
The Trustees examined performance information for each segment of a Select Fund managed by a sub-adviser. The Trustees noted that, for the majority of sub-advisers, the performance record of the segment of the Select Fund managed by the sub-adviser compared favorably to the relevant Fund benchmark, the composite performance for the sub-adviser’s clients (on a gross fee basis) and the peer universe of similarly managed funds for the period of time the sub-adviser performed advisory services on behalf of the Select Fund.
The Trustees then noted that, in certain cases, market trends, changes in personnel and a short history of managing Fund assets may have contributed to the underperformance of certain sub-advisers. The Trustees also noted each such sub-adviser had or was in the process of taking action to address any such underperformance and that each sub-adviser fulfilled a particular investment mandate for the Select Fund it advised. The Trustees concluded that, although past performance is no guarantee of future performance, the performance of each Select Fund was satisfactory and the Funds were likely to benefit from each sub-adviser continuing to serve as sub-adviser to the Fund.
The Trustees examined the fee schedule for each sub-adviser, noting how the fee levels charged to the Trust compared with available information about fees charged by the sub-advisers to their other similarly situated clients, as well as how the sub-adviser fee levels for each Select Fund compared to the median sub-advisory fee for the peer universe of similarly managed funds.
230
The Trustees also took into account the profitability and the financial capability of each sub-adviser in light of information presented at the meeting. The Trustees noted that the profitability estimates provided by each sub-adviser who completed a profitability questionnaire fell within industry norms, except for one sub-adviser. The Trustees considered that although the profitability may have been slightly higher, it was noted that the sub-adviser had consistently outperformed the relevant benchmark for the Fund and the median for the peer universe of similarly managed funds. In light of these considerations, the Trustees concluded that profits realized by each sub-adviser who completed a profitability questionnaire appeared reasonable. For those sub-advisers that did not provide profitability information, the Trustees relied upon other relevant information, particularly the independent negotiation of the fee schedules, the level of the fees and the sub-adviser’s performance history. The Trustees noted that, based on the Adviser’s representations, the financial statements of the sub-advisers did not appear to raise any concerns regarding the financial capability of those sub-advisers. The Trustees also considered the Adviser’s representations that no sub-adviser experienced any material change in its financial condition since the date of its most recent audited financial statements.
The Trustees considered the extent to which sub-adviser fees to be paid to each sub-adviser reflected economies of scale. The Trustees noted that each sub-adviser fee schedule either reflected economies of scale by reducing the fee on assets in excess of certain stated breakpoints, or the fee level negotiated was below or on par with the standard fee level for the sub-adviser.
In evaluating the benefits that are expected to accrue to each sub-adviser through its relationship as sub-adviser to a Select Fund, the Trustees noted that certain sub-advisers allocate portfolio brokerage to affiliated broker-dealers that receive commissions from the execution of Fund trades. The Trustees also noted that certain sub-advisers expect to benefit from “soft dollar” arrangements by which brokers will provide research and other services to the sub-adviser in exchange for commissions on trades of the portfolio securities of the Select Fund. The Trustees considered whether any direct or indirect collateral benefits inured to the Trust as a result of its affiliation with each sub-adviser.
Based on all of the information presented to the Board and its consideration of relevant factors, the Board, in the exercise of its reasonable business judgment, determined to approve the continuation of each Sub-Advisory Agreement.
BOARD REVIEW OF NEW SUB-ADVISORY AGREEMENTS FOR GROWTH EQUITY FUND
As required by the 1940 Act, the Board, including all of the Independent Trustees, considered the approval of new Sub-Advisory Agreements among: (1) GSCM, Columbus Circle Investors (“CCI”) and the Trust; and (2) GSCM, Rainier Investment Management, Inc.® (“Rainier”) and the Trust on behalf of the Growth Equity Fund (the “Growth Equity Sub-Advisory Agreements”). The Growth Equity Sub-Advisory Agreements were approved for an initial two-year term at the meeting of the Board held on July 24, 2008. The Board’s decision to approve the Growth Equity Sub-Advisory Agreements reflects the exercise of its business judgment to enter into new sub-advisory arrangements. In approving the Growth Equity Sub-Advisory Agreements, the Board considered information provided by the Adviser and CCI and Rainier (the “New Sub-Advisers”) with the assistance and advice of counsel to the Independent Trustees and counsel to the Trust.
The Board’s consideration of various factors and its conclusions with respect to such factors formed the basis for the Board’s determination to approve the Growth Equity Sub-Advisory Agreements. The factors considered by the Board included, but were not limited to: (i) the resources of the New Sub-Advisers; (ii) the experience and expertise of the New Sub-Advisers; (iii) the financial capability of the New Sub-Advisers; (iv) the compliance procedures and history of the New Sub-Advisers; (v) the performance of similarly managed funds and accounts in comparison to relevant benchmarks for the Growth Equity Fund; (vi) the amount of the contractual sub-advisory fee in comparison to similarly managed funds and the New Sub-Advisers’ other clients and the effect of any fee waiver and expense reimbursement arrangement; (vii) the total expenses of the Growth Equity Fund in comparison to similarly managed funds and the use of past and anticipated expense caps; (viii) the anticipated profitability of the New Sub-Advisers with respect to the Growth Equity Fund and its overall business; (ix) the extent of any anticipated economies of scale and whether the fee structure reflects such economies of scale; (x) the existence of any collateral benefits to be realized by the New Sub-Advisers; and (xi) the existence of any collateral benefits to be realized by the Growth Equity Fund. No one factor was determinative in the Board’s consideration of the Growth Equity Sub-Advisory Agreements.
231
The Board undertook a review of the terms of the Growth Equity Sub-Advisory Agreements and the nature and quality of the services to be provided by the New Sub-Advisers. The Adviser provided the Board with substantial detailed information in the form of reports about the New Sub-Advisers prior to the meetings which addressed most, if not all, of the factors listed previously. The Adviser also provided additional information about the New Sub-Advisers in a presentation made during the meeting, discussed the comprehensive screening process used to recommend the New Sub-Advisers and responded to questions from the Board. In addition, the Independent Trustees met separately in executive session with counsel to the Independent Trustees to discuss and consider information presented in connection with the approval of the Growth Equity Sub-Advisory Agreements as well as the Board’s responsibilities and duties in approving each agreement.
APPROVAL OF NEW SUB-ADVISORY AGREEMENTS FOR GROWTH EQUITY FUND
In considering the approval of the Growth Equity Sub-Advisory Agreements, the Board took into account the materials provided prior to and during the meetings and the extensive discussions during the meetings, including the discussions the Independent Trustees had during their executive sessions with independent legal counsel. More specifically, the Board examined the nature, extent and quality of services to be provided by the New Sub-Advisers to the Growth Equity Fund. The Board considered a number of factors, including the past performance records of similar accounts managed by personnel of the New Sub-Advisers who would be managing the portfolio of the Growth Equity Fund, fees charged to comparable clients, information regarding each New Sub-Adviser’s ownership structure, investment management experience, personnel, clients, assets under management, compliance policies and procedures, brokerage and soft dollar practices and investment philosophies and processes. The Board also reviewed presentations by the Adviser regarding the comprehensive screening process it used to recommend the New Sub-Advisers. The Board received and considered information about the potential of each New Sub-Adviser to contribute economies of scale as the Growth Equity Fund grows in size. The Board considered that the Adviser had been able to negotiate fees that were very favorable compared to each New Sub-Adviser’s stated fee schedule. The Board noted that each New Sub-Adviser’s fee schedule incorporated fee breakpoints, but given the proposed allocation of assets to each New Sub-Adviser, no future breakpoints would be available to the Growth Equity Fund as assets increase in market value. Because the engagement of the New Sub-Advisers is new, there was no historical profitability information with regard to their arrangements with the Growth Equity Fund presented to the Board. The Board did note, however, that CCI provided an estimate of its overall profitability as an investment advisory firm. Due to the Adviser’s fee negotiations with the New Sub-Advisers, it was noted that the Growth Equity Fund’s aggregate sub-advisory fees were expected to remain the same. The Board noted that the Growth Equity Fund, and not the Adviser, pays fees to sub-advisers directly; therefore, the Growth Equity Fund’s sub-adviser terminations and appointments were not expected to affect the Adviser’s profitability. The Board noted that the management fee for the Growth Equity Fund, which would remain unchanged, would continue to be competitive with fees paid by other mutual funds to other advisers.
The Board considered potential “fall-out” or ancillary benefits anticipated to be received by the New Sub-Advisers and their affiliates as a result of their arrangements with the Growth Equity Fund. The Board concluded that any potential benefits to be derived by the New Sub-Advisers included potential access to additional research resources, larger assets under management and reputational benefits, which were consistent with those generally derived by sub-advisers to mutual funds.
The Board considered the investment strategies proposed to be implemented by the New Sub-Advisers. With respect to CCI, the Board considered the Adviser’s assessment that the strategy would enhance the Fund’s core and high growth oriented exposure and offer the potential for increased returns. The Board noted that the proposed investment strategy outperformed its benchmark over the one-, three-, five-, seven- and ten-year periods ended March 31, 2008. The Board further noted that the proposed investment strategy was ranked in the top quartile among its peer universe during the one-, three- and five-year periods ended March 31, 2008, and fell just below the top quartile for the seven- and ten-year periods ended March 31, 2008. The Board also considered two separate and complementary investment strategies proposed to be implemented by Rainier, and the Adviser’s assessment that the strategies, which are focused on large capitalization growth stocks, would provide relative growth oriented exposure and core oriented growth exposure, respectively, to the Fund and offer the potential for increased returns. The Board noted that the proposed large cap equity investment strategy outperformed its benchmark indices over the one-, three-, five-, seven- and ten-year periods ended March 31, 2008, and was ranked in the second quartile for the ten-year period ended March 31, 2008. The Board noted that the proposed large cap growth investment strategy outperformed its benchmark index over the
232
one-, three-, five- and seven-year periods ended March 31, 2008. The Board further noted that the proposed large cap growth investment strategy was in the top quartile among its peer universe during the one-, three-, five- and seven-year periods ended March 31, 2008.
The Trustees also considered the Adviser’s assessment of the financial condition of the New Sub-Advisers. The Trustees noted that the Adviser, after reviewing certain financial information provided by the New Sub-Advisers, felt comfortable that the New Sub-Advisers were financially solid.
Based on all of the information presented to the Board and its consideration of relevant factors, the Board, in the exercise of its reasonable business judgment, determined to approve the Growth Equity Sub-Advisory Agreements.
233
| | | | | | | | |
 | | 2401 Cedar Springs Road, Dallas, TX 75201-1498 | | Funds distributed by PFPC Distributors, Inc. |
| | 1-888-98-GUIDE | | • | | www.GuideStoneFunds.org | | 760 Moore Road, King of Prussia, PA 19406 |
There have been no amendments or waivers, during the period covered by this report, to a provision of the code of ethics that applies to the registrant’s principal executive officer, principal financial officer, principal accounting officer or controller, or persons performing similar functions, regardless of whether these individuals are employed by the registrant or a third party, and that relates to any element of the code of ethics description.
| Item 3. | Audit Committee Financial Expert. |
As of the end of the period covered by the report, the registrant’s board of directors has determined that Julie P. Fry is qualified to serve as an audit committee financial expert serving on its audit committee and that she is “independent,” as defined by Item 3 of Form N-CSR.
| Item 4. | Principal Accountant Fees and Services. |
Audit Fees
| | (a) | The aggregate fees billed for each of the last two fiscal years for professional services rendered by the principal accountant for the audit of the registrant’s annual financial statements or services that are normally provided by the accountant in connection with statutory and regulatory filings or engagements for those fiscal years are $418,320 and $460,152 for 2007 and 2008, respectively. |
Audit-Related Fees
| | (b) | The aggregate fees billed in each of the last two fiscal years for assurance and related services by the principal accountant that are reasonably related to the performance of the audit of the registrant’s financial statements and are not reported under paragraph (a) of this Item are $33,400 and $36,740 for 2007 and 2008, respectively. Audit-related fees are related to procedures performed and the issuance of the auditors’ reports in connection with the Funds’ 17F-2 security counts. |
Tax Fees
| | (c) | The aggregate fees billed in each of the last two fiscal years for professional services rendered by the principal accountant for tax compliance, tax advice, and tax planning are $86,90 and $91,000 for 2007 and 2008, respectively. Tax fees are related to tax services in connection with Funds’ excise tax calculations and review of the Funds’ applicable tax returns. |
All Other Fees
| | (d) | The aggregate fees billed in each of the last two fiscal years for products and services provided by the principal accountant, other than the services reported in paragraphs (a) through (c) of this Item are $0 and $0 for 2007 and 2008, respectively |
| | (e)(1) | Disclose the audit committee’s pre-approval policies and procedures described in paragraph (c)(7) of Rule 2-01 of Regulation S-X. |
GuideStone
Non-Audit Services Provided to the Company, Advisor, and Others
The Audit Committee shall pre-approve all permissible non-audit services (e.g., tax services) to be provided to the Company by the Auditors, including the fees therefor;
provided, that if the Committee chooses to delegate the authority to grant pre-approvals to one or more Committee members, each acting on behalf of the Committee, then the Committee shall adopt policies and procedures detailed as to the particular service and designed to safeguard the continued independence of the auditors, consistent with the requirements of the Sarbanes-Oxley Act of 2002 (the “S-O Act”) and related SEC regulations, which shall then be used in making such pre-approvals; and,
further provided, that each delegated pre-approval shall be reported to the Committee during its next regularly scheduled meeting.
The pre-approval requirement for a permitted non-audit service may be waived if:
| | (1) | the aggregate amount of all such non-audit services provided constitutes not more than 5% of the total revenues paid by the Company to the Auditors in the fiscal year in which the non-audit services are provided; |
| | (2) | such services were not recognized by the Company at the time of the engagement to be non-audit services; and |
| | (3) | such services are promptly brought to the attention of, and approved by, the Audit Committee or by a member of the Audit Committee to whom the Committee has delegated the authority to grant such approvals, if any, prior to the Auditors’ completion of the Company’s audit. |
Additionally, if the Auditors’ engagement relates directly to the operations and financial reporting of the Company, to the extent required by Rule 2-01 of Regulation S-X, the Audit Committee shall pre-approve their engagements for non-audit services with:
| | (1) | the Advisor (excluding any subadviser whose role is primarily portfolio management and is sub-contracted or overseen by the Advisor), and |
| | (2) | any entity controlling, controlled by, or under common control with such Advisor that provides ongoing services to the Company (each, a “Control Entity”) |
in accordance with the foregoing paragraph, unless the aggregate amount of all services provided constitutes no more than 5% of the total amount of revenues paid to the Auditors by the Company, the Advisor and any such Control Entity during the fiscal year in which the services are provided that would have to be pre-approved by the Audit Committee pursuant to this paragraph (in the absence of this exception). The Auditors may not perform contemporaneously any prohibited non-audit services for the Company, which currently include the following:
| | 1. | bookkeeping or other services related to the accounting records or financial statements of the Company; |
| | 2. | financial information systems design and implementation; |
| | 3. | appraisal or valuation services, fairness opinions, or contribution-in-kind reports; |
| | 5. | internal audit outsourcing services; |
| | 6. | management functions or human resources; |
| | 7. | broker or dealer, investment adviser, or investment banking services; |
| | 8. | legal services and expert services unrelated to the audit; and |
| | 9. | any other service that the Public Company Accounting Oversight Board determines, by regulation, is impermissible. |
| | (e)(2) | The percentage of services described in each of paragraphs (b) through (d) of this Item that were approved by the audit committee pursuant to paragraph (c)(7)(i)(C) of Rule 2-01 of Regulation S-X are as follows: |
| | (f) | The percentage of hours expended on the principal accountant’s engagement to audit the registrant’s financial statements for the most recent fiscal year that were attributed to work performed by persons other than the principal accountant’s full-time, permanent employees was 0%. |
| | (g) | The aggregate non-audit fees billed by the registrant’s accountant for services rendered to the registrant, and rendered to the registrant’s investment adviser (not including any sub-adviser whose role is primarily portfolio management and is subcontracted with or overseen by another investment adviser), and any entity controlling, controlled by, or under common control with the adviser that provides ongoing services to the registrant for each of the last two fiscal years of the registrant was $0 and $0 for 2007 and 2008, respectively. |
| | (h) | The registrant’s audit committee of the board of directors has considered whether the provision of non-audit services that were rendered to the registrant’s investment adviser (not including any sub-adviser whose role is primarily portfolio management and is subcontracted with or overseen by another investment adviser), and any entity controlling, controlled by, or under common control with the investment adviser that provides ongoing services to the registrant that were not pre-approved pursuant to paragraph (c)(7)(ii) of Rule 2-01 of Regulation S-X is compatible with maintaining the principal accountant’s independence. |
| Item 5. | Audit Committee of Listed registrants. |
Not applicable.
| (a) | Schedule of Investments in securities of unaffiliated issuers as of the close of the reporting period is included as part of the report to shareholders filed under Item 1 of this form. |
| Item 7. | Disclosure of Proxy Voting Policies and Procedures for Closed-End Management Investment Companies. |
Not applicable.
| Item 8. | Portfolio Managers of Closed-End Management Investment Companies. |
Not applicable.
| Item 9. | Purchases of Equity Securities by Closed-End Management Investment Company and Affiliated Purchasers. |
Not applicable.
| Item 10. | Submission of Matters to a Vote of Security Holders. |
Not applicable.
| Item 11. | Controls and Procedures. |
| | (a) | The registrant’s principal executive and principal financial officers, or persons performing similar functions, have concluded that the registrant’s disclosure controls and procedures (as defined in Rule 30a-3(c) under the Investment Company Act of 1940, as amended (the “1940 Act”) (17 CFR 270.30a-3(c))) are effective, as of a date within 90 days of the filing date of the report that includes the disclosure required by this paragraph, based on their evaluation of these controls and procedures required by Rule 30a-3(b) under the 1940 Act (17 CFR 270.30a-3(b)) and Rules 13a-15(b) or 15d-15(b) under the Securities Exchange Act of 1934, as amended (17 CFR 240.13a-15(b) or 240.15d-15(b)). |
| | (b) | There were no changes in the registrant’s internal control over financial reporting (as defined in Rule 30a-3(d) under the 1940 Act (17 CFR 270.30a-3(d)) that occurred during the registrant’s second fiscal quarter of the period covered by this report that has materially affected, or is reasonably likely to materially affect, the registrant’s internal control over financial reporting. |
| | (a)(1) | Code of ethics, or any amendment thereto, that is the subject of disclosure required by Item 2 is attached hereto. |
| | (a)(2) | Certifications pursuant to Rule 30a-2(a) under the 1940 Act and Section 302 of the Sarbanes-Oxley Act of 2002 are attached hereto. |
| | (b) | Certifications pursuant to Rule 30a-2(b) under the 1940 Act and Section 906 of the Sarbanes-Oxley Act of 2002 are attached hereto. |
SIGNATURES
Pursuant to the requirements of the Securities Exchange Act of 1934 and the Investment Company Act of 1940, the registrant has duly caused this report to be signed on its behalf by the undersigned, thereunto duly authorized.
| | |
| (registrant) | | GuideStone Funds |
| |
| By (Signature and Title)* | | /s/ John R. Jones |
| | John R. Jones, President |
| | (principal executive officer) |
| |
| Date | | 2/25/2009 |
Pursuant to the requirements of the Securities Exchange Act of 1934 and the Investment Company Act of 1940, this report has been signed below by the following persons on behalf of the registrant and in the capacities and on the dates indicated.
| | |
| By (Signature and Title)* | | /s/ John R. Jones |
| | John R. Jones, President |
| | (principal executive officer) |
| |
| Date | | 2/25/2009 |
| |
| By (Signature and Title)* | | /s/ Jeffrey P. Billinger |
| | Jeffrey P. Billinger, Vice President and Treasurer |
| | (principal financial officer) |
| |
| Date | | 2/25/2009 |
* | Print the name and title of each signing officer under his or her signature. |