UNITED STATES
SECURITIES AND EXCHANGE COMMISSION
Washington, D.C. 20549
FORM N-CSR
CERTIFIED SHAREHOLDER REPORT OF REGISTERED
MANAGEMENT INVESTMENT COMPANIES
Investment Company Act file number 811-10263
GuideStone Funds
(Exact name of registrant as specified in charter)
2401 Cedar Springs Road
Dallas, TX 75201-1407
(Address of principal executive offices) (Zip code)
Rodney R. Miller, Esq.
GuideStone Financial Resources of the Southern Baptist Convention
2401 Cedar Springs Road
Dallas, TX 75201-1407
(Name and address of agent for service)
Registrant’s telephone number, including area code: 214-720-2142
Date of fiscal year end: December 31
Date of reporting period: December 31, 2011
Form N-CSR is to be used by management investment companies to file reports with the Commission not later than 10 days after the transmission to stockholders of any report that is required to be transmitted to stockholders under Rule 30e-1 under the Investment Company Act of 1940 (17 CFR 270.30e-1). The Commission may use the information provided on Form N-CSR in its regulatory, disclosure review, inspection, and policymaking roles.
A registrant is required to disclose the information specified by Form N-CSR, and the Commission will make this information public. A registrant is not required to respond to the collection of information contained in Form N-CSR unless the Form displays a currently valid Office of Management and Budget (“OMB”) control number. Please direct comments concerning the accuracy of the information collection burden estimate and any suggestions for reducing the burden to Secretary, Securities and Exchange Commission, 100 F Street, NE, Washington, DC 20549. The OMB has reviewed this collection of information under the clearance requirements of 44 U.S.C. § 3507.
Item 1. Reports to Stockholders.
The Report to Shareholders is attached herewith.
GuideStone Funds
Privacy Notice
NOTICE CONCERNING YOUR PRIVACY RIGHTS
This notice will provide you with information concerning our policies with respect to nonpublic personal information that we collect about you in connection with the following financial products and services provided and/or serviced by the entities listed below: individual retirement accounts (“IRAs”) and/or personal mutual fund accounts.
The confidentiality of your information is important to us as we recognize that you depend on us to keep your information confidential, as described in this notice.
We collect nonpublic personal information about you with regard to your IRA and/or personal mutual fund accounts from the following sources:
| | • | | Information we receive from you on applications or other forms; |
| | • | | Information about your transactions with us, our affiliates or others (including our third party service providers); |
| | • | | Information we receive from others such as service providers, broker-dealers and your personal agents or representatives; and |
| | • | | Information you and others provide to us in correspondence sent to us, whether written, electronic or by telephone. |
We may disclose such nonpublic personal financial information about you to one or more of our affiliates as permitted by law. An affiliate of an organization means any entity that controls, is controlled by or is under common control with that organization. GuideStone Funds, GuideStone Financial Resources of the Southern Baptist Convention (“GuideStone Financial Resources”), GuideStone Capital Management (“GSCM”), GuideStone Trust Services (“GSTS”), GuideStone Financial Services (“GFS”) and GuideStone Advisors (“GA”) are affiliates of one another. GuideStone Funds, GuideStone Financial Resources, GSCM, GSTS, GFS, GA and BNY Mellon Distributors Inc. do not sell your personal information to nonaffiliated third parties.
We may also disclose any of the personal information that we collect about you to nonaffiliated third parties as permitted by law. For example, we may provide your information to nonaffiliated companies that provide account services or that perform marketing services on our behalf and to other financial institutions with whom we have joint marketing agreements. We restrict access to nonpublic personal information about you to those of our employees who need to know that information in order for us to provide and/or service products or services to you. We also maintain physical, electronic and procedural safeguards to guard your personal information.
These procedures will continue to remain in effect after you cease to receive financial products and services from us.
If you have any questions concerning our customer information policy, please contact a customer relations specialist at 1-888-98-GUIDE (1-888-984-8433).
TABLE OF CONTENTS
This report has been prepared for shareholders of GuideStone Funds. It is not authorized for distribution to prospective investors unless accompanied or preceded by a current prospectus, which contains more complete information about the Funds. Investors are reminded to read the prospectus carefully before investing. Past performance is no guarantee of future results. Share prices will fluctuate and there may be a gain or loss when shares are redeemed. Fund shares are distributed by BNY Mellon Distributors Inc., 760 Moore Rd., King of Prussia, PA 19406.
1
LETTER FROM THE PRESIDENT

Dear Shareholder:
We are pleased to present you with the 2011 GuideStone Funds Annual Report. This report reflects our unwavering commitment to integrity in financial reporting so that you may stay fully informed of your investments. We hope that you will find this information valuable when making investment decisions.
Recently, GuideStone Funds celebrated 10 years of delivering investment performance guided by Christian values. Since the inception of GuideStone Funds in 2001, we have worked diligently to enhance the products and services delivered to our shareholders. Several examples of our ongoing commitment are noted below:
| • | | Defensive Market Strategies Fund added in September. This Fund seeks to provide long-term capital appreciation with reduced volatility compared to the equity markets. This Fund may be suitable for investors who have a medium- to long-term investment horizon, possess a moderate tolerance for risk and seek to participate in the return potential of equities at a slightly lower risk level than an all equity portfolio. |
| • | | MyDestination 2055 Fund launched. This new Date Target Fund was launched on January 1, 2012. This Fund may be suitable for investors who want a simplified “one choice” investment approach and plan to retire near the year 2055. (The retirement year of 2055 assumes that an investor retired at age 65.) |
| • | | Enhancing investors’ experience. In 2011, we enriched our investors’ online experience by launching the MyGuideStone™ application for iPhone ® and iPod touch ® users, augmenting our retirement plan enrollment capabilities and increasing options available through MyGuideStone™. For 2012, online enhancements will continue as we roll out paperless, online enrollment for retail accounts, GuideStone Funds Personal Investment Accounts or RightChoice IRAs™. |
We invite you to learn more about the new products and services offered by GuideStone Funds. Please visit our website at www.GuidestoneFunds.org or contact us at 1-888-98-GUIDE (1-888-984-8433). Thank you for entrusting GuideStone Funds with your investment assets, and we look forward to continuing to serve you.
|
| Sincerely, |
|
 |
|
| John R. Jones, CFA |
| President |
2
FROM THE CHIEF INVESTMENT OFFICER
| | |

Rodric E. Cummins, CFA | | Surprisingly good economic data in the fourth quarter rescued the U.S. stock market from what was otherwise shaping up to be a very disappointing year for investors. Macro-economic and political uncertainties drove the capital markets, obscuring the very positive bottom-up results of individual companies and dampening investors’ appetite for risky assets. The high levels of volatility that we’ve experienced since the beginning of the financial crisis have continued. In fact, when you tally the most volatile days in the U.S. stock market over the past 50 years, 37% of those days have occurred since the beginning of 2007. With performance concentrated in short bursts of returns, investors needed to be fully invested in well-diversified portfolios in 2011 to make money. Those that did avoided the possibility of very damaging results from attempts at market timing. |
Bond investments played an important role in diversified portfolios in 2011 as interest rates fell sharply. Bonds led all major asset classes with a return of 7.84%, as measured by the Barclays Capital Aggregate Bond Index. Investments considered being safe havens did exceptionally well as evidenced by the 30-year U.S. Treasury bond that returned 35.60% for the year. The S&P 500® Index, after gaining nearly 12% in the final quarter, ended the year almost exactly where it started. With the dividend yield, the index returned 2.11% in 2011, well below what most had hoped for after an exceptional year in 2010. U.S. stock returns were meager, but they were significantly better than those abroad as foreign stock markets fell under the pressures of the debt crisis in Europe; China’s effort to slow economic growth; and the concerns that a slow global economy could threaten export-driven emerging market economies. Stocks in international markets returned -13.71% for the year (MSCI ACWI (All Country World Index) Ex- U.S.).
For four years running, the central economic and political story has remained global deleveraging. This deleveraging is the unwinding of excessive debt amassed across decades of overspending by individuals, companies and governments. Debt reduction is achieved in the opposite manner in which it is acquired, typically leading to long periods of reduced spending (or slow growth) as financial resources are directed to reducing debt levels. As we have stated before, we believe we are in an extended period constrained by deleveraging and one marked by slow, below-capacity, economic growth.
Households and corporations are coping well with the forces of deleveraging. While household debt still remains high, it is trending down, and the financial strength of U.S. corporations has rarely been as strong as it is today. Households and corporations are on the path to building a foundation that makes for a much more sustainable long-term economic recovery. Unfortunately, the government sector has not been as responsive. The limitation of central governments to match the demands of the capital markets with timely solutions has been painfully exposed through political impasses in the United States and Europe. This lack of resolve has created noticeable apprehension among investors, and rightfully so. Risk assets such as stocks are highly dependent on the future growth of the economy, so investors are keenly focused on the global economy’s well-being and policymakers’ ability to navigate debt reduction while smartly managing normal business cycles.
In the face of these challenges, it’s important to recognize that the U.S. and global economies are massive, diverse and very adaptive. The U.S. economy is maintaining a slow but growing trajectory, as job conditions are slowly improving; corporate earnings are at record levels; and corporate success stories abound across virtually all non-financial sectors. The resiliency of the capital markets has been impressive, especially considering the challenging environment over the past 12 months that has included natural disasters, supply disruptions, oil price shocks, sovereign debt downgrades and political impasses. Even in the midst of these headwinds, the U.S. equity markets posted a third consecutive year of positive capital market returns in 2011.
As we move into a new year, the dominant theme remains the economic and political uncertainties which make for a very fragile market environment. With economic growth highly dependent on the actions of policymakers, particularly in Europe, central government’s decision-making is key and election year results are important. These conditions will almost surely result in higher than normal market volatility and a wider range of possible outcomes for investors.
Investors can prepare for this market environment by being mindful of three simple principles:
First, investors should focus on long-term objectives while expecting continued high levels of volatility. A well-diversified global portfolio that is properly aligned with your investment objectives, your risk tolerance and your time horizon provides the confidence that you need to stay with your financial plans in turbulent times.
3
Secondly, in a market environment with a wide range of possible outcomes, that well-constructed portfolio should contain strategies designed for both upside capture and downside protection. This likely means a diversified mix of stocks and bonds, again within the context of your personal objectives, risk tolerance and time horizon.
Finally, investors need realistic expectations about expected returns. As deleveraging likely constrains economic growth, investors should be prepared for an extended period of below normal returns. This may require increasing savings rates to offset lower future capital market returns.
| * | This report may include statements that constitute “forward-looking statements” under the U.S. securities laws. Forward-looking statements include, among other things, projections, estimates, and information about possible or future results related to GuideStone Funds, market or regulatory developments. The views expressed are not guarantees of future performance or economic results and involve certain risks, uncertainties and assumptions that could cause actual outcomes and results to differ materially from the views expressed herein. The views expressed are subject to change at any time based upon economic, market, or other conditions and GuideStone Funds undertakes no obligation to update the views expressed herein. Any discussions of specific securities should not be considered a recommendation to buy or sell those securities. The views expressed (including any forward-looking statement) may not be relied upon as investment advice or as an indication of GuideStone Funds’ trading intent. |
Asset Class Performance Comparison
The following graph illustrates the performance of the major assets classes during 2011.

| 1 | The Barclays Capital U.S. Aggregate Bond Index represents securities that are SEC-registered, taxable and dollar denominated. The index covers the U.S. investment grade bond market, with index components for government and corporate securities, mortgage pass-through securities and asset-backed securities. |
| 2 | The MSCI ACWI (All Country World Index) Ex-U.S. Index is a free float-adjusted market capitalization index that is designed to measure equity market performance in the global developed (excluding the United States) and emerging markets. |
| 3 | The Russell 2000® Index is a small-cap index consisting of the smallest 2,000 companies in the Russell 3000® Index, representing approximately 10% of the Russell 3000® Index total market capitalization. |
| 4 | The S&P 500® Index is an unmanaged index (with no defined investment objective) of common stocks, includes reinvestment of dividends and is a registered trademark of McGraw-Hill Co., Inc. The S&P 500® Index includes 500 of the largest stocks (in terms of market value) in the United States. |
4
U.S. Economy — Real Gross Domestic Product
At the end of year 2010, the monetary and fiscal stimulus injected into the U.S. economy supported an increasingly bullish view on U.S. growth prospects as investors entered the new year. As the year 2011 began to unfold, the U.S. encountered a succession of external events which conspired to squelch domestic economic growth early in the year as GDP growth was up 0.4% in the first quarter of 2011. There was a significant disruption to the global supply chain which impacted output due to the Japanese and Thailand natural disasters, primarily impacting the auto and technology sectors. Also, there was a rapid increase in energy prices early in the year resulting from the political revolutions and uncertainty occurring in the Middle East. As these situations stabilized and subsided, the U.S. growth rates began to improve gradually, up 1.3% in the second quarter and up 1.8% in the third quarter, as production growth in the form of business fixed investment improved due to inventory rebuilding. However, most of the improvement in the GDP growth towards the end of the year came from a spurt in household spending as household savings rates began to decline.
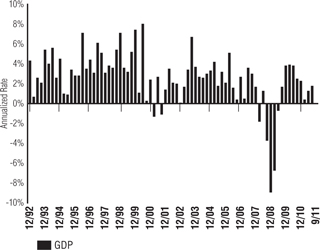
Real Gross Domestic Product (“GDP”) is one of the most widely used economic measures for the overall U.S. economy. GDP measures the output of all goods and services produced by labor and property within the United States during a specific period. The output is usually expressed as an annualized rate for a quarter. Generally, it is viewed as positive for the equity markets when GDP expands reflecting an environment of economic growth and profitability. The converse is true when GDP is contracting.
Data Source: Bloomberg, Bureau of Economic Analysis
S&P 500® Index Returns
The U.S. large cap equity market, as represented by the S&P 500® Index, posted a positive annual return of 2.11%. This is the third consecutive year of positive results after a very disappointing year for stocks in 2008. This index has generated positive results in eight of the last nine years. The beginning of the year was generally positive, peaking in late April, up about 9% year to date at that time. However, the large cap market pulled back sharply from August until reaching the low point for the year in early October, down over 18% during this short period. From this point until year-end, this index rallied by approximately 15% to finish the year. The best performing sectors this year in this index were Utilities, Consumer Staples, and Health Care. The sectors in the index that lagged the most this year were Financials, Materials & Processing, and Industrials. Factors such as lower beta, positive earnings growth and larger market cap stocks made the largest contributions to performance this year.
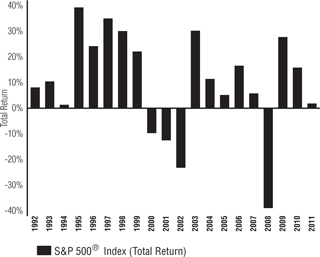
The S&P 500® Index includes 500 leading companies in major industries of the U.S. economy. The index represents about 75% of U.S. equity market capitalization. It is a capitalization-weighted index calculated on a total return basis with dividends reinvested. Constituents are selected by a team of Standard & Poor’s economists and analysts.
Data Source: Standard & Poor’s®
5
Russell 2000® Index Return
The U.S. small cap equity market, as represented by the Russell 2000® Index, posted a negative return of -4.18% for the year. This was a volatile year with the index getting off to a good start, peaking in late April, up over 10% year to date at that time. However, the small cap market pulled back noticeably beginning in August and bottomed in early October, down approximately 29% over this short period. From this point until year-end, this index rallied by about 22% to finish the year. Cross-sectional volatility was very evident this year with only three sectors recording positive results. The best performing sectors this year in this index were Utilities, Consumer Staples, and Health Care. The sectors in the index that lagged the most this year were Materials & Processing, Technology, and Consumer Discretionary. Factors such as lower beta and positive earnings growth made the largest contributions to performance this year.
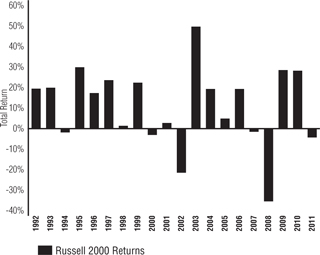
The Russell 2000® Index measures the performance of the small-cap segment of the U.S. equity universe. The Russell 2000® Index is a subset of the Russell 3000® Index representing approximately 8% of the total market capitalization of that index. It includes approximately 2,000 of the smallest securities based on a combination of their market cap and current index membership. The Russell 2000® is constructed to provide a comprehensive and unbiased small-cap barometer and is completely reconstituted annually to ensure larger stocks do not distort the performance and characteristics of the true small-cap opportunity set.
Data Source: Russell Investments
The Conference Board Consumer Confidence Index
U.S. consumer confidence, as measured by the Conference Board’s index, reflects current appraisals and expectations of business and employment conditions as well as expectations related to future family income. In 2011, this measure of consumer confidence was more volatile than in the prior year. This index reached its highest point of the year in February at 72.0 then proceeded to pull back over the next eight months due to several factors including rising energy prices stemming from increased political instability in the Middle East, the global supply chain disruption ignited by the natural disasters in Japan and Thailand impacting the auto and technology sectors, and the U.S. debt ceiling crisis. Economic data continued to indicate a positive yet fragile growth environment. Additionally weighing on the minds of consumers was the renewed fiscal crisis in the euro zone which gained much greater attention from the summer through year-end. In October, the confidence level was down to 40.9, which is the lowest reading since April 2009. Over the final two months of 2011 this index moved upward, as employment figures started showing improvement, to finish at a level of 64.5.
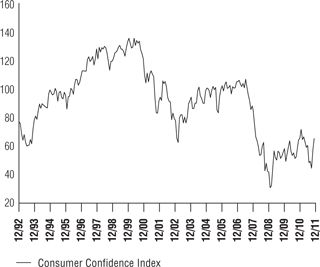
The Conference Board Consumer Confidence Index is based on a monthly survey of a sample of 5,000 U.S. households for the purpose of measuring consumer sentiment. The trend in this economic measure is closely monitored, given consumers comprise approximately two-thirds of the U.S. Economy. Generally, it is viewed as positive to the economy and equity markets when the index increases. This reflects the fact that consumers are positive regarding their economic outlook and that they are more willing to spend money providing further economic stimulus.
Data Source: Bloomberg, The Conference Board
6
Federal Reserve
The Federal Reserve (“Fed”) maintained the same targeted Fed Funds level of 0-0.25% throughout 2011. Although the Fed formally met to review this rate level on eight separate occasions during the year, no meaningful action was taken. The last time an action was taken was December 2008 when the Fed cut rates to their current levels. This year, the Fed elected to complete its previously announced measure of quantitative easing by mid-year. On August 9th, the Fed admitted that the growth of the economy was “considerably slower“ than expected and announced it would keep the federal funds rate ”exceptionally low“ until the middle of 2013 at a minimum. The Fed had previously only said that it would keep it low for ”an extended period.“ On September 21, the Fed announced a new maturity extension program, called “Operation Twist” to further support conditions in mortgage markets and put downward pressure on longer-term interest rates. The Fed intends to sell $400 billion of shorter-term U.S. Treasury securities by the end of June 2012 and use the proceeds to buy longer-term U.S. Treasury securities. This will extend the average maturity of the securities in the Federal Reserve’s portfolio. The reduction in longer-term interest rates, in turn, will hopefully contribute to a broad easing in financial market conditions that will provide additional stimulus to support the economic recovery. The Fed continues to carefully monitor the risks from these additional U.S. Treasury security purchases and the related impact that this continued high level of monetary accommodation may have on the future.
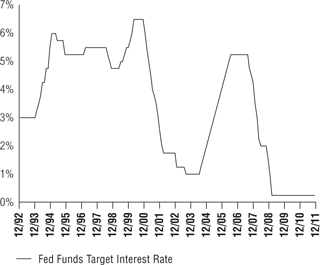
The Federal Reserve (“Fed”) is the central bank of the United States. It was created by Congress to provide the nation with a safer, more flexible, and more stable monetary and financial system. The Federal Funds Rate is the interest rate at which depository institutions lend balances at the Fed to other depository institutions overnight. The rate is one tool the Fed can use in their efforts of controlling the supply of money. Changes in the Federal Funds Rate trigger a chain of events that affect other short-term interest rates, foreign exchange rates, long-term interest rates, the amount of money and credit, and, ultimately, a range of economic variables, including employment, output, and prices of goods and services.
Data Source: Bloomberg
U.S. Unemployment
Job growth remained rather stagnant for most of this year. The employment situation is extremely important for macroeconomic analysis, so the financial markets track this as one of their employment indicators. Initial jobless claims started the year at a level above 400,000. As the year began there were positive signs that the U.S. economy was improving, and initial jobless claims dropped slightly below 400,000 in February and March. Unfortunately, the global supply chain disruption triggered by the natural disasters in Japan and Thailand had a negative impact on the U.S. economy and unemployment figures experienced a slight uptick from its March level but soon stabilized for the next several months. In November, job growth began to pick up again and initial jobless claims once again fell below the 400,000 mark for the final two months on this year. At year-end, the unemployment rate was at 8.5%, which is the lowest level for the U.S. since February 2009.
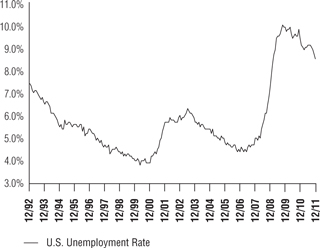
The U.S. unemployment rate measures the numbers of persons unemployed as a percentage of the labor force. Typically, unemployment tends to increase during difficult economic periods and declines during expansionary economic times. Additionally, very low unemployment can place inflationary pressure on the economy as labor markets become very competitive and expensive.
Data Source: Bloomberg, Bureau of Labor Statistics
7
U.S. Treasury Yield Curve
Short-term rates remained at historically low levels as the Federal Reserve (the “Fed”), through its aggressive monetary policy, maintained the target federal funds rate at 0-0.25% in an effort to stimulate economic growth all year long. The very short end of the curve where the maturity is less than two years stayed basically unchanged. Starting at the 2-year maturity level and longer, there was some reduction in yield levels as the yield curve flattened compared to the end of 2010. The mid-to-long end of the yield curve, which is much more heavily influenced by market forces and inflation expectations, experienced a larger decline in yields primarily due to investor demand as well as concerns related to economic growth and the European debt crisis. Although the U.S. Treasury credit rating was dropped from AAA to AA+ by Standard & Poor’s in early August, investor demand was exceptionally strong for U.S. Treasury securities and actually moved interest rates lower in spite of the credit downgrade. Overall for the year, there was a larger drop in yields in the 5-year to 30-year area of the yield curve than there was observed in the shorter part of the curve, in the less than 3-year maturity area. At year-end 2011, yields on the 2-year, 10-year, and 30-year U.S. Treasury securities were 0.24%, 1.88%, and 2.89%, respectively.
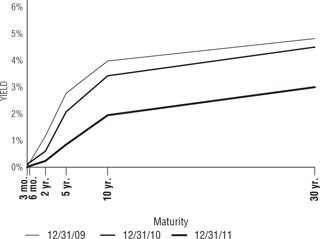
The Treasury yield curve illustrates the relationship between yields on short-term, intermediate-term and long-term Treasury securities. Normally, the shape of the yield curve is upward sloping with rates increasing from the short end of the curve moving higher to the long end. The short end of the curve is impacted more by monetary policy (demand for money) while inflationary expectations and market forces impact the long end of the curve.
Data Source: Bloomberg
8
About Your Expenses (Unaudited)
As a shareholder of the Funds, you incur ongoing costs, including advisory fees and to the extent applicable, shareholder services fees, as well as other Fund expenses. This example is intended to help you to understand your ongoing costs (in dollars) of investing in the Funds and to compare these costs with the ongoing costs of investing in other mutual funds. It is based on an investment of $1,000 invested at the beginning of the period and held for the entire period from July 1, 2011 to December 31, 2011.
Actual Expenses
The first section of the table below provides information about actual account values and actual expenses. You may use the information in this section, together with the amount you invested, to estimate the expenses that you incurred over the period. Simply divide your account value by $1,000 (for example, an $8,600 account value divided by $1,000 = 8.6), then multiply the result by the number in the first section under the heading entitled “Expenses Paid During Period” to estimate the expenses attributable to your investment during this period.
Hypothetical Example for Comparison Purposes
The second section of the table below provides information about hypothetical account values and hypothetical expenses based on the Fund’s actual expense ratio and an assumed rate of return of 5% per year before expenses, which is not the Fund’s actual return. Thus, you should not use the hypothetical account values and expenses to estimate the actual ending account balance or your expenses for the period. Rather, these figures are provided to enable you to compare the ongoing costs of investing in the Fund and other funds. To do so, compare this 5% hypothetical example with the 5% hypothetical examples that appear in the shareholder reports of the other funds. Please note that the expenses shown in the table are meant to highlight your ongoing costs only. Therefore, the second section of the table is useful in comparing ongoing costs only and will not help you determine the relative total costs of owning different funds.
| | | | | | | | | | | | | | | | | | | | |
ACTUAL | |
Fund | | Class | | | Beginning
Account
Value
07/01/11 | | | Ending
Account
Value
12/31/11 | | | Annualized
Expense
Ratio (1) | | | Expenses
Paid
During
Period (2) | |
MyDestination 2005 | | | GS4 | | | $ | 1,000.00 | | | $ | 983.88 | | | | 0.20 | % | | $ | 1.00 | |
MyDestination 2015 | | | GS4 | | | | 1,000.00 | | | | 967.77 | | | | 0.18 | | | | 0.90 | |
MyDestination 2025 | | | GS4 | | | | 1,000.00 | | | | 944.29 | | | | 0.18 | | | | 0.90 | |
MyDestination 2035 | | | GS4 | | | | 1,000.00 | | | | 911.92 | | | | 0.20 | | | | 0.96 | |
MyDestination 2045 | | | GS4 | | | | 1,000.00 | | | | 902.25 | | | | 0.20 | | | | 0.96 | |
Conservative Allocation | | | GS4 | | | | 1,000.00 | | | | 987.97 | | | | 0.12 | | | | 0.60 | |
Balanced Allocation | | | GS4 | | | | 1,000.00 | | | | 967.01 | | | | 0.12 | | | | 0.59 | |
Growth Allocation | | | GS4 | | | | 1,000.00 | | | | 926.28 | | | | 0.12 | | | | 0.58 | |
Aggressive Allocation | | | GS4 | | | | 1,000.00 | | | | 893.25 | | | | 0.12 | | | | 0.57 | |
Conservative Allocation I | | | GS2 | | | | 1,000.00 | | | | 990.75 | | | | 0.15 | | | | 0.75 | |
Balanced Allocation I | | | GS2 | | | | 1,000.00 | | | | 968.23 | | | | 0.15 | | | | 0.73 | |
Growth Allocation I | | | GS2 | | | | 1,000.00 | | | | 927.34 | | | | 0.16 | | | | 0.78 | |
Aggressive Allocation I | | | GS2 | | | | 1,000.00 | | | | 894.96 | | | | 0.15 | | | | 0.70 | |
Money Market | | | GS2 | | | | 1,000.00 | | | | 1,000.33 | | | | 0.19 | | | | 0.94 | |
| | | GS4 | | | | 1,000.00 | | | | 1,000.07 | | | | 0.24 | | | | 1.20 | |
Low-Duration Bond | | | GS2 | | | | 1,000.00 | | | | 1,004.53 | | | | 0.36 | | | | 1.82 | |
| | | GS4 | | | | 1,000.00 | | | | 1,003.31 | | | | 0.57 | | | | 2.88 | |
Medium-Duration Bond | | | GS2 | | | | 1,000.00 | | | | 1,035.25 | | | | 0.48 | | | | 2.46 | |
| | | GS4 | | | | 1,000.00 | | | | 1,034.95 | | | | 0.63 | | | | 3.23 | |
9
About Your Expenses (Unaudited) (Continued)
| | | | | | | | | | | | | | | | | | | | |
ACTUAL | |
Fund | | Class | | | Beginning
Account
Value
07/01/11 | | | Ending
Account
Value
12/31/11 | | | Annualized
Expense
Ratio (1) | | | Expenses
Paid
During
Period (2) | |
Extended-Duration Bond | | | GS2 | | | $ | 1,000.00 | | | $ | 1,091.05 | | | | 0.53 | % | | $ | 2.81 | |
| | | GS4 | | | | 1,000.00 | | | | 1,090.95 | | | | 0.75 | | | | 3.95 | |
Inflation Protected Bond | | | GS4 | | | | 1,000.00 | | | | 1,070.29 | | | | 0.68 | | | | 3.53 | |
Global Bond | | | GS4 | | | | 1,000.00 | | | | 991.71 | | | | 0.88 | | | | 4.44 | |
Defensive Market Strategies (3)(4) | | | GS2 | | | | 1,000.00 | | | | 1,025.08 | | | | 1.03 | | | | 3.50 | |
| | | GS4 | | | | 1,000.00 | | | | 1,024.26 | | | | 1.29 | | | | 4.38 | |
Equity Index | | | GS2 | | | | 1,000.00 | | | | 971.98 | | | | 0.27 | | | | 1.32 | |
| | | GS4 | | | | 1,000.00 | | | | 970.11 | | | | 0.38 | | | | 1.89 | |
Real Estate Securities | | | GS4 | | | | 1,000.00 | | | | 971.84 | | | | 1.12 | | | | 5.57 | |
Value Equity | | | GS2 | | | | 1,000.00 | | | | 938.15 | | | | 0.68 | | | | 3.30 | |
| | | GS4 | | | | 1,000.00 | | | | 936.22 | | | | 0.92 | | | | 4.50 | |
Growth Equity | | | GS2 | | | | 1,000.00 | | | | 933.33 | | | | 0.87 | | | | 4.24 | |
| | | GS4 | | | | 1,000.00 | | | | 931.97 | | | | 1.05 | | | | 5.11 | |
Small Cap Equity | | | GS2 | | | | 1,000.00 | | | | 911.58 | | | | 1.01 | | | | 4.85 | |
| | | GS4 | | | | 1,000.00 | | | | 910.24 | | | | 1.18 | | | | 5.67 | |
International Equity (4) | | | GS2 | | | | 1,000.00 | | | | 821.68 | | | | 1.04 | | | | 4.76 | |
| | | GS4 | | | | 1,000.00 | | | | 820.76 | | | | 1.28 | | | | 5.86 | |
|
HYPOTHETICAL (assuming a 5% return before expenses) | |
Fund | | Class | | | Beginning
Account
Value
07/01/11 | | | Ending
Account
Value
12/31/11 | | | Annualized
Expense
Ratio (1) | | | Expenses
Paid
During
Period (2) | |
MyDestination 2005 | | | GS4 | | | $ | 1,000.00 | | | $ | 1,024.20 | | | | 0.20 | % | | $ | 1.02 | |
MyDestination 2015 | | | GS4 | | | | 1,000.00 | | | | 1,024.29 | | | | 0.18 | | | | 0.92 | |
MyDestination 2025 | | | GS4 | | | | 1,000.00 | | | | 1,024.28 | | | | 0.18 | | | | 0.93 | |
MyDestination 2035 | | | GS4 | | | | 1,000.00 | | | | 1,024.20 | | | | 0.20 | | | | 1.02 | |
MyDestination 2045 | | | GS4 | | | | 1,000.00 | | | | 1,024.20 | | | | 0.20 | | | | 1.02 | |
Conservative Allocation | | | GS4 | | | | 1,000.00 | | | | 1,024.60 | | | | 0.12 | | | | 0.61 | |
Balanced Allocation | | | GS4 | | | | 1,000.00 | | | | 1,024.60 | | | | 0.12 | | | | 0.61 | |
Growth Allocation | | | GS4 | | | | 1,000.00 | | | | 1,024.60 | | | | 0.12 | | | | 0.61 | |
Aggressive Allocation | | | GS4 | | | | 1,000.00 | | | | 1,024.60 | | | | 0.12 | | | | 0.61 | |
Conservative Allocation I | | | GS2 | | | | 1,000.00 | | | | 1,024.45 | | | | 0.15 | | | | 0.77 | |
Balanced Allocation I | | | GS2 | | | | 1,000.00 | | | | 1,024.46 | | | | 0.15 | | | | 0.76 | |
Growth Allocation I | | | GS2 | | | | 1,000.00 | | | | 1,024.39 | | | | 0.16 | | | | 0.82 | |
Aggressive Allocation I | | | GS2 | | | | 1,000.00 | | | | 1,024.47 | | | | 0.15 | | | | 0.75 | |
Money Market | | | GS2 | | | | 1,000.00 | | | | 1,024.26 | | | | 0.19 | | | | 0.95 | |
| | | GS4 | | | | 1,000.00 | | | | 1,024.00 | | | | 0.24 | | | | 1.22 | |
Low-Duration Bond | | | GS2 | | | | 1,000.00 | | | | 1,023.39 | | | | 0.36 | | | | 1.84 | |
| | | GS4 | | | | 1,000.00 | | | | 1,022.33 | | | | 0.57 | | | | 2.91 | |
Medium-Duration Bond | | | GS2 | | | | 1,000.00 | | | | 1,022.79 | | | | 0.48 | | | | 2.45 | |
| | | GS4 | | | | 1,000.00 | | | | 1,022.03 | | | | 0.63 | | | | 3.21 | |
Extended-Duration Bond | | | GS2 | | | | 1,000.00 | | | | 1,022.51 | | | | 0.53 | | | | 2.72 | |
| | | GS4 | | | | 1,000.00 | | | | 1,021.42 | | | | 0.75 | | | | 3.82 | |
Inflation Protected Fund | | | GS4 | | | | 1,000.00 | | | | 1,021.80 | | | | 0.68 | | | | 3.44 | |
10
| | | | | | | | | | | | | | | | | | | | |
HYPOTHETICAL (assuming a 5% return before expenses) | |
Fund | | Class | | | Beginning
Account
Value
07/01/11 | | | Ending
Account
Value
12/31/11 | | | Annualized
Expense
Ratio (1) | | | Expenses
Paid
During
Period (2) | |
Global Bond | | | GS4 | | | $ | 1,000.00 | | | $ | 1,020.75 | | | | 0.88 | % | | $ | 4.50 | |
Defensive Market Strategies (3)(4) | | | GS2 | | | | 1,000.00 | | | | 1,019.99 | | | | 1.03 | | | | 5.26 | |
| | | GS4 | | | | 1,000.00 | | | | 1,018.68 | | | | 1.29 | | | | 6.58 | |
Equity Index | | | GS2 | | | | 1,000.00 | | | | 1,023.86 | | | | 0.27 | | | | 1.36 | |
| | | GS4 | | | | 1,000.00 | | | | 1,023.29 | | | | 0.38 | | | | 1.94 | |
Real Estate Securities Fund | | | GS4 | | | | 1,000.00 | | | | 1,019.55 | | | | 1.12 | | | | 5.71 | |
Value Equity | | | GS2 | | | | 1,000.00 | | | | 1,021.80 | | | | 0.68 | | | | 3.44 | |
| | | GS4 | | | | 1,000.00 | | | | 1,020.56 | | | | 0.92 | | | | 4.70 | |
Growth Equity | | | GS2 | | | | 1,000.00 | | | | 1,020.82 | | | | 0.87 | | | | 4.43 | |
| | | GS4 | | | | 1,000.00 | | | | 1,019.92 | | | | 1.05 | | | | 5.34 | |
Small Cap Equity | | | GS2 | | | | 1,000.00 | | | | 1,020.13 | | | | 1.01 | | | | 5.12 | |
| | | GS4 | | | | 1,000.00 | | | | 1,019.27 | | | | 1.18 | | | | 5.99 | |
International Equity (4) | | | GS2 | | | | 1,000.00 | | | | 1,019.98 | | | | 1.04 | | | | 5.27 | |
| | | GS4 | | | | 1,000.00 | | | | 1,018.77 | | | | 1.28 | | | | 6.49 | |
| (1) | Expenses include the effect of contractual waivers by GuideStone Capital Management. The Date Target Funds’ and Asset Allocation Funds’ proportionate share of the operating expenses of the Select Funds is not reflected in the tables above. |
| (2) | Expenses are equal to the Fund’s annualized expense ratios for the period July 1, 2011 through December 31, 2011, multiplied by the average account value over the period, multiplied by 184/365 (to reflect the one-half year period). |
| (3) | The Defensive Market Strategies Fund commenced operations on September 1, 2011. The expense figures shown reflect the expenses that would have been paid over the time period July 1, 2011 through December 31, 2011, assuming the Fund was in operation throughout the entire period. |
| (4) | The expense ratios for the Defensive Market Strategies Fund and the International Equity Fund include the impact of dividend expense on securities sold short. |
11
MyDestination 2005 Fund
The Fund, through investments in the underlying Select Funds, combines a greater percentage of exposure to fixed income securities with a smaller percentage to equity securities. While the Fund follows an allocation glide path that becomes more conservative over time, the December 2011 targeted allocations were approximately 45% Fixed Income Select Funds, 30% U.S. Equity Select Funds, 8% Non-U.S. Equity Select Fund and 17% Real Return Select Funds.
The Fund is a fund of funds, and its performance is based on the performance of the underlying Select Funds. The Fund generated a positive return of 2.52% for the one-year period ended December 31, 2011, benefiting from positive absolute performance from all of the Fixed Income Select Funds and Real Return Select Funds. Overall exposure to Equity Select Funds was a detractor to the Fund’s performance due to negative investment results for the Growth Equity Fund and International Equity Fund. The Fund’s absolute return was most positively influenced by its exposure to the Real Return Select Funds, with the Inflation Protected Bond Fund, which returned 12.00% for 2011, contributing most.
U.S. equity exposure contributed to the positive performance of the Fund. From a price perspective, the domestic equity market ended the year almost exactly where it started, as measured by level of the S&P 500® Index, with all positive performance for investors generated solely through reinvested dividends. However, the domestic equity market was anything but “flat”, as investors endured extreme market volatility throughout a year where uncertainty reigned and political or macro-economic headlines could send the “risk-on, risk-off ” market up or down several percentage points in a single day. Despite a volatile year and a brutal double-digit third quarter sell-off, the domestic equity market showed its resilience in the fourth quarter and, after a double-digit bounce, managed to deliver a positive investment return for the year.
Non-U.S. equity exposure was the largest absolute detractor to Fund performance, as the International Equity Fund returned -14.01% for the one-year period ended December 31, 2011. While U.S. equity market returns were meager, they were significantly better than those abroad as foreign equity markets fell under the pressures of the debt crisis in Europe, China’s effort to slow economic growth and the concerns that a slow global economy could threaten export-driven emerging market economies.
The Fund’s majority allocation to fixed income holdings contributed meaningfully to absolute performance, as fixed income outpaced equities on a broad measure basis by 5.73%, as represented by the Barclays Capital U.S. Aggregate Bond Index which returned 7.84% compared to the S&P 500® Index which returned 2.11% in 2011, respectively. The bond market benefited from the economic uncertainty and overall risk aversion during a turbulent 2011, with all major bond market sectors posting positive returns for the year, led by the U.S. Treasury sector.
The Fund underperformed its composite benchmark by 0.87% in 2011. The largest detractors to relative performance were the Medium-Duration Bond Fund, Inflation Protected Bond Fund and Growth Equity Fund, as a result of underweight exposure to U.S. Treasuries, duration and yield curve strategies and security selection, respectively. The Fund’s relative performance was most positively impacted by exposure to the Small Cap Equity Fund which benefited almost entirely from security selection, leading it to outperform its respective benchmark.
The Fund attempts to achieve its objective by investing in the Select Funds. The Fund is managed to a retirement date (“target date”) by adjusting the percentage of fixed income securities and equity securities to become more conservative each year until reaching the retirement year and then approximately 15 years thereafter. The target date in the name of the Fund is the approximate date when an investor plans to start withdrawing money. This Fund may be suitable for investors who want a simplified “one fund” retirement solution, are willing to pay slightly higher fees to get a diversified mix of investments that becomes more conservative over time and plan to retire at an age that is near the year 2005. The Fund’s value will fluctuate due to changes in interest rates. There is a risk that the issuer of a fixed-income investment may fail to pay interest or even principal due in a timely manner or at all. The Fund’s value will fluctuate due to business developments concerning a particular issuer, industry or country, as well as general market and economic conditions. The Fund is subject to risks presented by investments in foreign issuers and changes in currency exchange rates relative to the U.S. dollar may negatively affect the values of foreign investments held by the Select Funds. By investing in this Fund, you will incur the expenses of the Fund, in addition to those of the underlying Select Funds. The principal risks of the Fund will change depending on the asset mix of the Select Funds in which it invests. You may directly invest in the Select Funds. The Fund’s value will go up and down in response to changes in the share prices of the investments that it owns. The amount invested in the Fund is not guaranteed to increase, is not guaranteed against loss, nor is the amount of the original investment guaranteed at the target date. It is possible to lose money by investing in the Fund.
Please see page 14 for information regarding specific portfolio allocations. Portfolio holdings are subject to change and risk at any time.
12
MyDestination 2005 Fund
| | | | | | | | |
Average Annual Total Returns as of 12/31/11 | |
| | | GS4
Class* | | | Benchmark** | |
One Year | | | 2.52 | % | | | 3.39 | % |
Five Year | | | 2.56 | % | | | 3.09 | % |
Since Inception | | | 2.56 | % | | | 3.09 | % |
Inception Date | | | 12/29/06 | | | | | |
Total Fund Operating Expenses (April 30, 2011 Prospectus, as amended on September 1, 2011)(1) | | | 1.11 | % | | | | |
| (1) | The Fund’s shareholders indirectly bear the expenses of the GS4 Class shares of the Select Funds in which the Fund invests. Current information regarding the Fund’s Operating Expenses can be found in the Financial Highlights. |
The performance data quoted represents past performance and does not guarantee future results. Current performance may be lower or higher. Performance data current to the most recent month-end may be obtained at www.GuideStoneFunds.org. The investment return and principal value of an investment will fluctuate so that shares, when redeemed, may be worth more or less than their original cost.
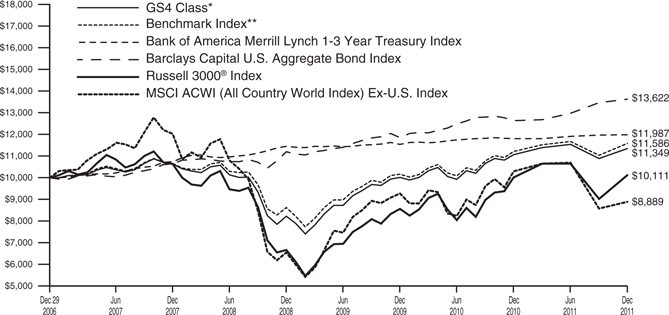
The graph illustrates the results of a hypothetical $10,000 investment in the GS4 Class of the Fund since December 29, 2006 (commencement of operations), with all dividends and capital gains reinvested, with the Fund’s composite benchmark index.
| * | These returns reflect expense waivers by the Fund’s investment adviser. Without these waivers, returns would have been lower. Returns shown do not reflect the deduction of taxes that a shareholder would pay on Fund distributions or the redemption of Fund shares. |
| ** | Represents a composite index as of December 2011, consisting of 26.25% of the Bank of America Merrill Lynch 1-3 Year Treasury Index, 18.00% of the Barclays Capital U.S. Aggregate Bond Index, 15.00% of the Barclays Capital U.S. TIPS Index, 14.00% of the S&P 500® Index, 2.50% of the Dow Jones U.S. Select Real Estate Securities IndexSM, 7.01% of the Russell 1000® Value Index, 7.01% of the Russell 1000® Growth Index, 1.75% of the Russell 2000® Index and 8.48% of the MSCI ACWI (All Country World Index) Ex-U.S. Index. |
The construction of the composite index corresponds to the target percentage allocations to the underlying asset classes as represented by the Fund’s investment in the Select Funds. As the target percentage allocations to the underlying investments change according to the MyDestination Funds® glide path, the target percentage allocations to the composite index also change.
Unlike a mutual fund, the performance of an index assumes no taxes, transaction costs, management fees or other expenses.
13
| | |
| MYDESTINATION 2005 FUND | | |
| SCHEDULE OF INVESTMENTS | | December 31, 2011 |
| | | | | | | | |
| | | Shares | | | Value | |
MUTUAL FUNDS — 99.9% | |
GuideStone Money Market Fund (GS4 Class)¥ | | | 1,386,612 | | | $ | 1,386,612 | |
GuideStone Low-Duration Bond Fund (GS4 Class)¥ | | | 1,229,952 | | | | 16,235,367 | |
GuideStone Medium-Duration Bond Fund (GS4 Class)¥ | | | 803,704 | | | | 11,308,110 | |
GuideStone Inflation Protected Bond Fund (GS4 Class)¥ | | | 840,254 | | | | 9,377,236 | |
GuideStone Global Bond Fund (GS4 Class)¥ | | | 5,437 | | | | 52,899 | |
GuideStone Defensive Market Strategies Fund (GS4 Class)¥ | | | 886,151 | | | | 9,038,741 | |
GuideStone Real Estate Securities Fund (GS4 Class)¥ | | | 185,407 | | | | 1,702,039 | |
GuideStone Value Equity Fund (GS4 Class)¥ | | | 324,417 | | | | 4,541,842 | |
GuideStone Growth Equity Fund (GS4 Class)¥ | | | 237,884 | | | | 4,431,783 | |
GuideStone Small Cap Equity Fund (GS4 Class)¥ | | | 77,070 | | | | 1,126,770 | |
GuideStone International Equity Fund (GS4 Class)¥ | | | 471,450 | | | | 5,341,531 | |
| | | | | | | | |
Total Mutual Funds
(Cost $60,887,192) | | | | 64,542,930 | |
| | | | | | | | |
TOTAL INVESTMENTS — 99.9%
(Cost $60,887,192) | | | | 64,542,930 | |
Other Assets in Excess of Liabilities — 0.1% | | | | | | | 64,927 | |
| | | | | | | | |
NET ASSETS — 100.0% | | | $ | 64,607,857 | |
| | | | | | | | |
Please see abbreviation and footnote definitions beginning on page 200.
PORTFOLIO SUMMARY (based on net assets)
| | | | |
| | | % | |
Bond Funds | | | 57.2 | |
Domestic Equity Funds | | | 32.3 | |
International Equity Fund | | | 8.3 | |
Futures Contracts | | | 2.2 | |
Money Market Fund | | | 2.1 | |
| | | | |
| | | 102.1 | |
| | | | |
VALUATION HIERARCHY
The following is a summary of the inputs used, as of December 31, 2011, in valuing the Fund’s investments carried at fair value:
| | | | | | | | | | | | | | | | |
| | | Total Value | | | Level 1
Quoted Prices | | | Level 2
Other
Significant
Observable
Inputs | | | Level 3
Significant
Unobservable
Inputs | |
Assets: | | | | | | | | | | | | | | | | |
Investments in Securities: | | | | | | | | | | | | | | | | |
Mutual Funds | | $ | 64,542,930 | | | $ | 64,542,930 | | | $ | — | | | $ | — | |
| | | | | | | | | | | | | | | | |
Total Assets — Investments in Securities | | $ | 64,542,930 | | | $ | 64,542,930 | | | $ | — | | | $ | — | |
| | | | | | | | | | | | | | | | |
| | | | |
Other Financial Instruments*** | | | | | | | | | | | | | | | | |
Futures Contracts | | $ | 5,027 | | | $ | 5,027 | | | $ | — | | | $ | — | |
| | | | | | | | | | | | | | | | |
Total Assets — Other Financial Instruments | | $ | 5,027 | | | $ | 5,027 | | | $ | — | | | $ | — | |
| | | | | | | | | | | | | | | | |
| *** | Other financial instruments are derivative instruments not reflected in the Schedule of Investments, such as futures, forwards and swap contracts, which are valued at the unrealized appreciation (depreciation) on the investment. Details of these investments can be found in the Financial Statements. |
|
| See Notes to Financial Statements. |
14 |
MyDestination 2015 Fund
The Fund, through investments in the underlying Select Funds, combines a greater percentage of exposure to equity securities with a smaller percentage to fixed income securities. While the Fund follows an allocation glide path that becomes more conservative over time, the December 2011 targeted allocations were approximately 29% Fixed income Select Funds, 42% U.S. Equity Select Funds, 11% Non-U.S. Equity Select Fund and 18% Real Return Select Funds.
The Fund is a fund of funds, and its performance is based on the performance of the underlying Select Funds. The Fund generated a modest return of 1.84% for the one-year period ended December 31, 2011, benefiting from positive absolute performance from all of the Fixed Income Select Funds and Real Return Select Funds. Overall exposure to the Equity Select Funds was a detractor to the Fund’s performance due to negative investment results for the Growth Equity Fund and International Equity Fund. The Fund’s absolute return was most positively influenced by its exposure to the Real Return Select Funds, with its allocation to Inflation Protected Bond Fund, which was up 12.00% for 2011, contributing most.
U.S. equity exposure contributed to the positive performance of the Fund. From a price perspective, the domestic equity market ended the year almost exactly where it started, as measured by level of the S&P 500® Index, with all positive performance for investors generated solely through reinvested dividends. However, the domestic equity markets were anything but “flat”, as investors endured extreme market volatility throughout a year where uncertainty reigned and political or macro-economic headlines could send the “risk-on, risk-off ” market up or down several percentage points in a single day. Despite a volatile year and a brutal double-digit third quarter sell-off, the domestic equity market showed its resilience in the fourth quarter and, after a double-digit bounce, managed to deliver a positive investment return for the year.
Non-U.S. equity exposure was the largest absolute detractor to Fund performance, as the International Equity Fund returned -14.01% for the one-year period ended December 31, 2011. While U.S. equity market returns were meager, they were significantly better than those abroad as foreign equity markets fell under the pressures of the debt crisis in Europe, China’s effort to slow economic growth and the concerns that a slow global economy could threaten export-driven emerging market economies.
The Fund’s allocation to fixed income holdings contributed to absolute performance, as fixed income outpaced equities on a broad measure basis, as represented by the Barclays Capital U.S. Aggregate Bond Index which returned 7.84% compared to the S&P 500® Index which returned 2.11% in 2011, respectively. The bond market benefited from the economic uncertainty and overall risk aversion during a turbulent 2011, with all major bond market sectors posting positive returns for the year, led by the U.S. Treasury sector.
The Fund underperformed its composite benchmark by 1.32% for 2011, with its exposure to both Fixed Income Select Funds and Equity Select Funds detracting from relative performance. The largest detractor to relative performance from Fixed Income Select Fund holdings was the Extended-Duration Bond Fund, which underperformed its benchmark due to an underweight in the longer-duration U.S. Treasury sector. The largest detractor to the Fund’s relative performance was attributed to exposure to the Growth Equity Fund, which trailed its respective benchmark as a result of security selection. The Fund’s relative performance was most positively impacted by exposure to the Small Cap Equity Fund, which benefited almost entirely from security selection, leading it to outperform its respective benchmark.
The Fund attempts to achieve its objective by investing in the Select Funds. The Fund is managed to a retirement date (“target date”) by adjusting the percentage of fixed income securities and equity securities to become more conservative each year until reaching the retirement year and then approximately 15 years thereafter. The target date in the name of the Fund is the approximate date when an investor plans to start withdrawing money. This Fund may be suitable for investors who want a simplified “one fund” retirement solution, are willing to pay slightly higher fees to get a diversified mix of investments that becomes more conservative over time and plan to retire at an age that is near the year 2015. The Fund’s value will fluctuate due to changes in interest rates. There is a risk that the issuer of a fixed-income investment may fail to pay interest or even principal due in a timely manner or at all. The Fund’s value will fluctuate due to business developments concerning a particular issuer, industry or country, as well as general market and economic conditions. The Fund is subject to risks presented by investments in foreign issuers and changes in currency exchange rates relative to the U.S. dollar may negatively affect the values of foreign investments held by the Select Funds. By investing in this Fund, you will incur the expenses of the Fund, in addition to those of the underlying Select Funds. The principal risks of the Fund will change depending on the asset mix of the Select Funds in which it invests. You may directly invest in the Select Funds. The Fund’s value will go up and down in response to changes in the share prices of the investments that it owns. The amount invested in the Fund is not guaranteed to increase, is not guaranteed against loss, nor is the amount of the original investment guaranteed at the target date. It is possible to lose money by investing in the Fund.
Please see page 17 for information regarding specific portfolio allocations. Portfolio holdings are subject to change and risk at any time.
15
MyDestination 2015 Fund
| | | | | | | | |
Average Annual Total Returns as of 12/31/11 | |
| | | GS4
Class* | | | Benchmark** | |
One Year | | | 1.84 | % | | | 3.16 | % |
Five Year | | | 1.84 | % | | | 2.51 | % |
Since Inception | | | 1.84 | % | | | 2.51 | % |
Inception Date | | | 12/29/06 | | | | | |
Total Fund Operating Expenses (April 30, 2011 Prospectus, as amended on September 1, 2011)(1) | | | 1.14 | % | | | | |
| (1) | The Fund’s shareholders indirectly bear the expenses of the GS4 Class shares of the Select Funds in which the Fund invests. Current information regarding the Fund’s Operating Expenses can be found in the Financial Highlights. |
The performance data quoted represents past performance and does not guarantee future results. Current performance may be lower or higher. Performance data current to the most recent month-end may be obtained at www.GuideStoneFunds.org. The investment return and principal value of an investment will fluctuate so that shares, when redeemed, may be worth more or less than their original cost.
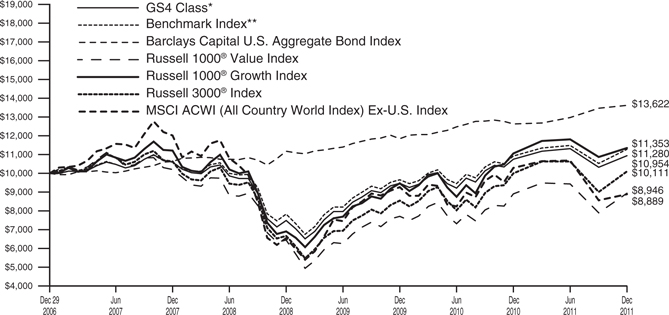
The graph illustrates the results of a hypothetical $10,000 investment in the GS4 Class of the Fund since December 29, 2006 (commencement of operations), with all dividends and capital gains reinvested, with the Fund’s composite benchmark index.
| * | These returns reflect expense waivers by the Fund’s investment adviser. Without these waivers, returns would have been lower. Returns shown do not reflect the deduction of taxes that a shareholder would pay on Fund distributions or the redemption of Fund shares. |
| ** | Represents a composite index as of December 2011, consisting of 8.00% of the Bank of America Merrill Lynch 1-3 Year Treasury Index, 12.25% of the Barclays Capital U.S. Aggregate Bond Index, 2.00% of the Barclays Capital U.S. Long-Term Government Bond, 2.00% of the Barclays Capital U.S. Long-Term Credit Bond Index, 12.00% of the Barclays Capital U.S. TIPS Index, 2.13% of the Barclays Capital Global Aggregate Bond Index — Unhedged, 1.06% of the Barclays U.S. Corporate High Yield — 2% Issuer Capped Index, 1.06% of the J.P. Morgan Emerging Markets Bond Index Plus, 20.00% of the S&P 500® Index, 5.50% of the Dow Jones U.S. Select Real Estate Securities IndexSM, 9.81% of the Russell 1000® Value Index, 9.81% of the Russell 1000® Growth Index, 2.48% of the Russell 2000® Index and 11.90% of the MSCI ACWI (All Country World Index) Ex-U.S. Index. |
The construction of the composite index corresponds to the target percentage allocations to the underlying asset classes as represented by the Fund’s investment in the Select Funds. As the target percentage allocations to the underlying investments change according to the MyDestination Funds® glide path, the target percentage allocations to the composite index also change.
Unlike a mutual fund, the performance of an index assumes no taxes, transaction costs, management fees or other expenses.
16
| | |
| MYDESTINATION 2015 FUND | | |
SCHEDULE OF INVESTMENTS | | December 31, 2011 |
| | | | | | | | |
| | | Shares | | | Value | |
MUTUAL FUNDS — 99.9% | |
GuideStone Money Market Fund (GS4 Class)¥ | | | 4,844,410 | | | $ | 4,844,410 | |
GuideStone Low-Duration Bond Fund (GS4 Class)¥ | | | 1,596,327 | | | | 21,071,512 | |
GuideStone Medium-Duration Bond Fund (GS4 Class)¥ | | | 2,307,019 | | | | 32,459,757 | |
GuideStone Extended-Duration Bond Fund (GS4 Class)¥ | | | 651,480 | | | | 11,127,277 | |
GuideStone Inflation Protected Bond Fund (GS4 Class)¥ | | | 2,842,830 | | | | 31,725,979 | |
GuideStone Global Bond Fund (GS4 Class)¥ | | | 1,182,345 | | | | 11,504,217 | |
GuideStone Defensive Market Strategies Fund (GS4 Class)¥ | | | 5,180,087 | | | | 52,836,889 | |
GuideStone Real Estate Securities Fund (GS4 Class)¥ | | | 1,683,366 | | | | 15,453,303 | |
GuideStone Value Equity Fund (GS4 Class)¥ | | | 1,978,757 | | | | 27,702,598 | |
GuideStone Growth Equity Fund (GS4 Class)¥ | | | 1,428,391 | | | | 26,610,921 | |
GuideStone Small Cap Equity Fund (GS4 Class)¥ | | | 486,821 | | | | 7,117,321 | |
GuideStone International Equity Fund (GS4 Class)¥ | | | 2,773,281 | | | | 31,421,274 | |
| | | | | | | | |
Total Mutual Funds
(Cost $255,829,390) | | | | 273,875,458 | |
| | | | | | | | |
TOTAL INVESTMENTS — 99.9%
(Cost $255,829,390) | | | | 273,875,458 | |
Other Assets in Excess of Liabilities — 0.1% | | | | | | | 220,635 | |
| | | | | | | | |
NET ASSETS — 100.0% | | | $ | 274,096,093 | |
| | | | | | | | |
Please see abbreviation and footnote definitions beginning on page 200.
PORTFOLIO SUMMARY (based on net assets)
| | | | |
| | | % | |
Domestic Equity Funds | | | 47.3 | |
Bond Funds | | | 39.4 | |
International Equity Fund | | | 11.4 | |
Futures Contracts | | | 1.8 | |
Money Market Fund | | | 1.8 | |
| | | | |
| | | 101.7 | |
| | | | |
VALUATION HIERARCHY
The following is a summary of the inputs used, as of December 31, 2011, in valuing the Fund’s investments carried at fair value:
| | | | | | | | | | | | | | | | |
| | | Total Value | | | Level 1
Quoted Prices | | | Level 2
Other
Significant
Observable
Inputs | | | Level 3
Significant
Unobservable
Inputs | |
Assets: | | | | | | | | | | | | | | | | |
Investments in Securities: | | | | | | | | | | | | | | | | |
Mutual Funds | | $ | 273,875,458 | | | $ | 273,875,458 | | | $ | — | | | $ | — | |
| | | | | | | | | | | | | | | | |
Total Assets — Investments in Securities | | $ | 273,875,458 | | | $ | 273,875,458 | | | $ | — | | | $ | — | |
| | | | | | | | | | | | | | | | |
| | | | |
Other Financial Instruments*** | | | | | | | | | | | | | | | | |
Futures Contracts | | $ | 27,567 | | | $ | 27,567 | | | $ | — | | | $ | — | |
| | | | | | | | | | | | | | | | |
Total Assets — Other Financial Instruments | | $ | 27,567 | | | $ | 27,567 | | | $ | — | | | $ | — | |
| | | | | | | | | | | | | | | | |
| *** | Other financial instruments are derivative instruments not reflected in the Schedule of Investments, such as futures, forwards and swap contracts, which are valued at the unrealized appreciation (depreciation) on the investment. Details of these investments can be found in the Financial Statements. |
|
| See Notes to Financial Statements. |
17 |
MyDestination 2025 Fund
The Fund, through investments in the underlying Select Funds, combines a greater percentage of exposure to equity securities with a much smaller percentage to fixed income securities. While the Fund follows an allocation glide path that becomes more conservative over time, the year-end targeted allocations were approximately 23% Fixed Income Select Funds, 50% U.S. Equity Select Funds 18% Non-U.S. Equity Select Fund and 9% Real Return Select Funds.
The Fund is a fund of funds, and its performance is based on the performance of the underlying Select Funds. The Fund generated a return of 0.03% for the one-year period ended December 31, 2011. The Fund’s absolute return was mostly positive influenced by its exposure to the Fixed Income Select Funds, particularly the Extended-Duration Bond Fund, which was the highest performing Select Fund for the year returning 13.14%.
U.S. equity exposure contributed to the positive performance of the Fund. From a price perspective, the domestic equity market ended the year almost exactly where it started, as measured by level of the S&P 500® Index, with all positive performance for investors generated solely through reinvested dividends. However, the domestic equity market was anything but “flat”, as investors endured extreme market volatility throughout a year where uncertainty reigned and political or macro-economic headlines could send the “risk-on, risk-off ” market up or down several percentage points in a single day. Despite a volatile year and a brutal double-digit third quarter sell-off, the domestic equity market showed its resilience in the fourth quarter and, after a double-digit bounce, managed to deliver a positive investment return for the year.
Non-U.S. equity exposure was the largest absolute detractor to Fund performance, as the International Equity Fund returned -14.01% for the one-year period ended December 31, 2011. While U.S. equity market returns were meager, they were significantly better than those abroad as foreign equity markets fell under the pressures of the debt crisis in Europe, China’s effort to slow economic growth and the concerns that a slow global economy could threaten export-driven emerging market economies.
The Fund’s allocation to fixed income holdings contributed to absolute performance, as fixed income outpaced equities on a broad measure basis, as represented by the Barclays Capital U.S. Aggregate Bond Index which returned 7.84% compared to the S&P 500® Index which returned 2.11% in 2011, respectively. The bond market benefited from the economic uncertainty and overall risk aversion during a turbulent 2011, with all major bond market sectors posting positive returns for the year, led by the U.S. Treasury sector.
The Fund underperformed its composite benchmark by 1.36% in 2011. The Fund’s largest contributor to absolute performance, the Extended-Duration Bond Fund, was also one of its largest detractors to relative underperformance. The Extended-Duration Bond Fund’s benchmark-relative performance was negatively impacted by the Fund’s underweight to the longer-duration U.S. Treasury sector. The Growth Equity Fund was the Fund’s other significant detractor to relative performance, with it trailing its respective benchmark for the year as a result of security selection. The Fund’s relative performance was most positively impacted by exposure to the Small Cap Equity Fund, which benefited almost entirely from security selection, leading it to outperform its respective benchmark.
The Fund attempts to achieve its objective by investing in the Select Funds. The Fund is managed to a retirement date (“target date”) by adjusting the percentage of fixed income securities and equity securities to become more conservative each year until reaching the retirement year and then approximately 15 years thereafter. The target date in the name of the Fund is the approximate date when an investor plans to start withdrawing money. This Fund may be suitable for investors who want a simplified “one fund” retirement solution, are willing to pay slightly higher fees to get a diversified mix of investments that becomes more conservative over time and plan to retire at an age that is near the year 2025. The Fund’s value will fluctuate due to changes in interest rates. There is a risk that the issuer of a fixed-income investment may fail to pay interest or even principal due in a timely manner or at all. The Fund’s value will fluctuate due to business developments concerning a particular issuer, industry or country, as well as general market and economic conditions. The Fund is subject to risks presented by investments in foreign issuers and changes in currency exchange rates relative to the U.S. dollar may negatively affect the values of foreign investments held by the Select Funds. By investing in this Fund, you will incur the expenses of the Fund, in addition to those of the underlying Select Funds. The principal risks of the Fund will change depending on the asset mix of the Select Funds in which it invests. You may directly invest in the Select Funds. The Fund’s value will go up and down in response to changes in the share prices of the investments that it owns. The amount invested in the Fund is not guaranteed to increase, is not guaranteed against loss, nor is the amount of the original investment guaranteed at the target date. It is possible to lose money by investing in the Fund.
Please see page 20 for information regarding specific portfolio allocations. Portfolio holdings are subject to change and risk at any time.
18
MyDestination 2025 Fund
| | | | | | | | |
Average Annual Total Returns as of 12/31/11 | |
| | | GS4
Class* | | | Benchmark** | |
One Year | | | 0.03 | % | | | 1.39 | % |
Five Year | | | 0.54 | % | | | 1.40 | % |
Since Inception | | | 0.54 | % | | | 1.40 | % |
Inception Date | | | 12/29/06 | | | | | |
Total Fund Operating Expenses (April 30, 2011 Prospectus, as amended on September 1, 2011)(1) | | | 1.21 | % | | | | |
| (1) | The Fund’s shareholders indirectly bear the expenses of the GS4 Class shares of the Select Funds in which the Fund invests. Current information regarding the Fund’s Operating Expenses can be found in the Financial Highlights. |
The performance data quoted represents past performance and does not guarantee future results. Current performance may be lower or higher. Performance data current to the most recent month-end may be obtained at www.GuideStoneFunds.org. The investment return and principal value of an investment will fluctuate so that shares, when redeemed, may be worth more or less than their original cost.
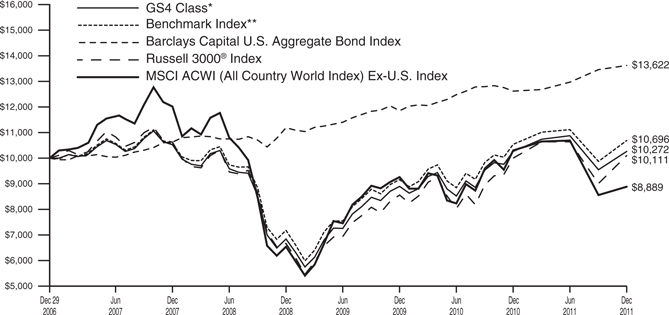
The graph illustrates the results of a hypothetical $10,000 investment in the GS4 Class of the Fund since December 29, 2006 (commencement of operations), with all dividends and capital gains reinvested, with the Fund’s composite benchmark index.
| * | These returns reflect expense waivers by the Fund’s investment adviser. Without these waivers, returns would have been lower. Returns shown do not reflect the deduction of taxes that a shareholder would pay on Fund distributions or the redemption of Fund shares. |
| ** | Represents a composite benchmark index as of December 2011, consisting of 1.50% of the Bank of America Merrill Lynch 1-3 Year Treasury Index, 8.50% of the Barclays Capital U.S. Aggregate Bond Index, 3.38% of the Barclays Capital U.S. Long-Term Government Bond, 3.38% of the Barclays Capital U.S. Long-Term Credit Bond Index, 2.00% of the Barclays Capital U.S. TIPS Index, 3.38% of the Barclays Capital Global Aggregate Bond Index — Unhedged, 1.68% of the Barclays U.S. Corporate High Yield — 2% Issuer Capped Index, 1.68% of the J.P. Morgan Emerging Markets Bond Index Plus, 16.00% of the S&P 500® Index, 6.50% of the Dow Jones U.S. Select Real Estate Securities IndexSM, 14.60% of the Russell 1000® Value Index, 14.60% of the Russell 1000® Growth Index, 4.60% of the Russell 2000® Index and 18.20% of the MSCI ACWI (All Country World Index) Ex-U.S. Index. |
The construction of the composite index corresponds to the target percentage allocations to the underlying asset classes as represented by the Fund’s investment in the Select Funds. As the target percentage allocations to the underlying investments change according to the MyDestination Funds® glide path, the target percentage allocations to the composite index also change.
Unlike a mutual fund, the performance of an index assumes no taxes, transaction costs, management fees or other expenses.
19
| | |
| MYDESTINATION 2025 FUND | | |
| SCHEDULE OF INVESTMENTS | | December 31, 2011 |
| | | | | | | | |
| | | Shares | | | Value | |
MUTUAL FUNDS — 99.8% | |
GuideStone Money Market Fund (GS4 Class)¥ | | | 4,563,617 | | | $ | 4,563,617 | |
GuideStone Low-Duration Bond Fund (GS4 Class)¥ | | | 296,027 | | | | 3,907,553 | |
GuideStone Medium-Duration Bond Fund (GS4 Class)¥ | | | 1,618,735 | | | | 22,775,602 | |
GuideStone Extended-Duration Bond Fund (GS4 Class)¥ | | | 1,108,466 | | | | 18,932,605 | |
GuideStone Inflation Protected Bond Fund (GS4 Class)¥ | | | 459,417 | | | | 5,127,095 | |
GuideStone Global Bond Fund (GS4 Class)¥ | | | 1,888,517 | | | | 18,375,272 | |
GuideStone Defensive Market Strategies Fund (GS4 Class)¥ | | | 4,142,518 | | | | 42,253,683 | |
GuideStone Real Estate Securities Fund (GS4 Class)¥ | | | 2,011,290 | | | | 18,463,641 | |
GuideStone Value Equity Fund (GS4 Class)¥ | | | 2,930,009 | | | | 41,020,132 | |
GuideStone Growth Equity Fund (GS4 Class)¥ | | | 2,134,391 | | | | 39,763,711 | |
GuideStone Small Cap Equity Fund (GS4 Class)¥ | | | 888,358 | | | | 12,987,798 | |
GuideStone International Equity Fund (GS4 Class)¥ | | | 4,377,351 | | | | 49,595,383 | |
| | | | | | | | |
Total Mutual Funds
(Cost $267,862,993) | | | | 277,766,092 | |
| | | | | | | | |
TOTAL INVESTMENTS — 99.8%
(Cost $267,862,993) | | | | 277,766,092 | |
Other Assets in Excess of Liabilities — 0.2% | | | | | | | 473,263 | |
| | | | | | | | |
NET ASSETS — 100.0% | | | $ | 278,239,355 | |
| | | | | | | | |
Please see abbreviation and footnote definitions beginning on page 200.
PORTFOLIO SUMMARY (based on net assets)
| | | | |
| | | % | |
Domestic Equity Funds | | | 55.5 | |
Bond Funds | | | 24.8 | |
International Equity Fund | | | 17.8 | |
Futures Contracts | | | 1.7 | |
Money Market Fund | | | 1.7 | |
| | | | |
| | | 101.5 | |
| | | | |
VALUATION HIERARCHY
The following is a summary of the inputs used, as of December 31, 2011, in valuing the Fund’s investments carried at fair value:
| | | | | | | | | | | | | | | | |
| | | Total Value | | | Level 1
Quoted Prices | | | Level 2
Other
Significant
Observable
Inputs | | | Level 3
Significant
Unobservable
Inputs | |
Assets: | | | | | | | | | | | | | | | | |
Investments in Securities: | | | | | | | | | | | | | | | | |
Mutual Funds | | $ | 277,766,092 | | | $ | 277,766,092 | | | $ | — | | | $ | — | |
| | | | | | | | | | | | | | | | |
Total Assets — Investments in Securities | | $ | 277,766,092 | | | $ | 277,766,092 | | | $ | — | | | $ | — | |
| | | | | | | | | | | | | | | | |
| | | | |
Other Financial Instruments*** | | | | | | | | | | | | | | | | |
Futures Contracts | | $ | 44,511 | | | $ | 44,511 | | | $ | — | | | $ | — | |
| | | | | | | | | | | | | | | | |
Total Assets — Other Financial Instruments | | $ | 44,511 | | | $ | 44,511 | | | $ | — | | | $ | — | |
| | | | | | | | | | | | | | | | |
| *** | Other financial instruments are derivative instruments not reflected in the Schedule of Investments, such as futures, forwards and swap contracts, which are valued at the unrealized appreciation (depreciation) on the investment. Details of these investments can be found in the Financial Statements. |
|
| See Notes to Financial Statements. |
20 |
MyDestination 2035 Fund
The Fund, through investments in the underlying Select Funds, combines a high percentage of exposure to equity securities with only a modest percentage to fixed income securities. While the Fund follows an allocation glide path that becomes more conservative over time, the year-end targeted allocations were approximately 11% Fixed Income Select Funds, 53% U.S. Equity Select Funds, 29% Non-U.S. Equity Select Fund and 7% Real Return Select Fund.
Equity exposure represented approximately 82% of the Fund and, therefore, contributed most all of the Fund’s return. The Fund is a fund of funds, and its performance is based on the performance of the underlying Select Funds. The Fund generated a return of -2.99% for the one-year period ended December 31, 2011, with the loss mostly attributable to its exposure to the non-U.S. equity market. The International Equity Fund returned -14.01% in 2011, just slightly less than the MSCI ACWI (All Country World Index) Ex-U.S. Index, which is a broad measure of international equity market returns, at -13.71% for 2011. The Fund’s overall performance was most positively impacted by its exposure to the Real Estate Securities Fund, as U.S. property stocks, supported by well capitalized balance sheets, limited supply and relatively attractive dividend yields, outperformed the broader equity market in 2011.
U.S. equity exposure was a positive contributor to absolute performance. From a price perspective, the domestic equity market ended the year almost exactly where it started, as measured by level of the S&P 500® Index, with all positive performance for investors generated solely through reinvested dividends. However, the domestic equity market was anything but “flat”, as investors endured extreme market volatility throughout a year where uncertainty reigned and political or macro-economic headlines could send the “risk-on, risk-off ” market up or down several percentage points in a single day. Despite a volatile year and a brutal double-digit third quarter sell-off, the domestic equity market showed its resilience in the fourth quarter and, after a double-digit bounce, managed to deliver a positive investment return for the year.
Non-U.S. equity exposure was the largest absolute detractor to Fund performance. While U.S. equity market returns were meager, they were significantly better than those abroad as foreign equity markets fell under the pressures of the debt crisis in Europe, China’s effort to slow economic growth and the concerns that a slow global economy could threaten export-driven emerging market economies.
The Fund’s modest allocation to fixed income holdings contributed modestly to absolute performance, as fixed income outpaced equities on a broad measure basis, as represented by the Barclays Capital U.S. Aggregate Bond Index which returned 7.84% compared to the S&P 500® Index which returned 2.11% in 2011, respectively. The bond market benefited from the economic uncertainty and overall risk aversion during a turbulent 2011, with all major bond market sectors posting positive returns for the year, led by the U.S. Treasury sector.
The Fund underperformed its composite benchmark by 1.15% in 2011, with relative underperformance dominated by its exposure to the Growth Equity Fund. The Growth Equity Fund underperformed its benchmark index primarily due to security selection. The Fund’s relative performance was most positively impacted by exposure to the Small Cap Equity Fund, which benefited almost entirely from security selection, leading it to outperform its respective benchmark.
The Fund attempts to achieve its objective by investing in the Select Funds. The Fund is managed to a retirement date (“target date”) by adjusting the percentage of fixed income securities and equity securities to become more conservative each year until reaching the retirement year and then approximately 15 years thereafter. The target date in the name of the Fund is the approximate date when an investor plans to start withdrawing money. This Fund may be suitable for investors who want a simplified “one fund” retirement solution, are willing to pay slightly higher fees to get a diversified mix of investments that becomes more conservative over time and plan to retire at an age that is near the year 2035. The Fund’s value will fluctuate due to changes in interest rates. There is a risk that the issuer of a fixed-income investment may fail to pay interest or even principal due in a timely manner or at all. The Fund’s value will fluctuate due to business developments concerning a particular issuer, industry or country, as well as general market and economic conditions. The Fund is subject to risks presented by investments in foreign issuers and changes in currency exchange rates relative to the U.S. dollar may negatively affect the values of foreign investments held by the Select Funds. By investing in this Fund, you will incur the expenses of the Fund, in addition to those of the underlying Select Funds. The principal risks of the Fund will change depending on the asset mix of the Select Funds in which it invests. You may directly invest in the Select Funds. The Fund’s value will go up and down in response to changes in the share prices of the investments that it owns. The amount invested in the Fund is not guaranteed to increase, is not guaranteed against loss, nor is the amount of the original investment guaranteed at the target date. It is possible to lose money by investing in the Fund.
Please see page 23 for information regarding specific portfolio allocations. Portfolio holdings are subject to change and risk at any time.
21
MyDestination 2035 Fund
| | | | | | | | |
Average Annual Total Returns as of 12/31/11 | |
| | | GS4
Class* | | | Benchmark** | |
One Year | | | -2.99 | % | | | -1.84 | % |
Five Year | | | -1.06 | % | | | -0.13 | % |
Since Inception | | | -1.06 | % | | | -0.13 | % |
Inception Date | | | 12/29/06 | | | | | |
Total Fund Operating Expenses (April 30, 2011 Prospectus, as amended on September 1, 2011)(1) | | | 1.33 | % | | | | |
| (1) | The Fund’s shareholders indirectly bear the expenses of the GS4 Class shares of the Select Funds in which the Fund invests. Current information regarding the Fund’s Operating Expenses can be found in the Financial Highlights. |
The performance data quoted represents past performance and does not guarantee future results. Current performance may be lower or higher. Performance data current to the most recent month-end may be obtained at www.GuideStoneFunds.org. The investment return and principal value of an investment will fluctuate so that shares, when redeemed, may be worth more or less than their original cost.
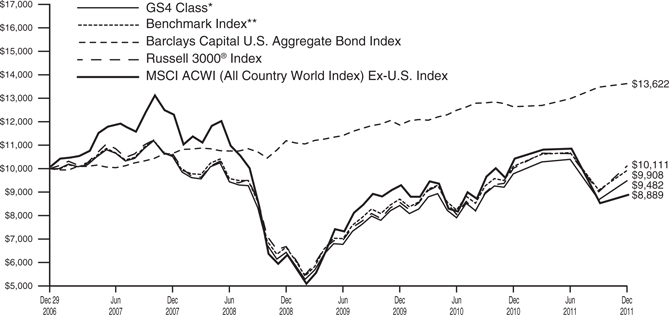
The graph illustrates the results of a hypothetical $10,000 investment in the GS4 Class of the Fund since December 29, 2006 (commencement of operations), with all dividends and capital gains reinvested, with the Fund’s composite benchmark index.
| * | These returns reflect expense waivers by the Fund’s investment adviser. Without these waivers, returns would have been lower. Returns shown do not reflect the deduction of taxes that a shareholder would pay on Fund distributions or the redemption of Fund shares. |
| ** | Represents a composite benchmark index as of December 2011, consisting of 2.25% of the Barclays Capital U.S. Aggregate Bond Index, 1.13% of the Barclays Capital U.S. Long-Term Government Bond, 1.13% of the Barclays Capital U.S. Long-Term Credit Bond Index, 3.25% of the Barclays Capital Global Aggregate Bond Index — Unhedged, 1.62% of the Barclays U.S. Corporate High Yield — 2% Issuer Capped Index, 1.62% of the J.P. Morgan Emerging Markets Bond Index Plus, 7.00% of the Dow Jones U.S. Select Real Estate Securities IndexSM, 22.59% of the Russell 1000® Value Index, 22.59% of the Russell 1000® Growth Index, 8.12% of the Russell 2000® Index and 28.70% of the MSCI ACWI (All Country World Index) Ex-U.S. Index. |
The construction of the composite index corresponds to the target percentage allocations to the underlying asset classes as represented by the Fund’s investment in the Select Funds. As the target percentage allocations to the underlying investments change according to the MyDestination Funds® glide path, the target percentage allocations to the composite index also change.
Unlike a mutual fund, the performance of an index assumes no taxes, transaction costs, management fees or other expenses.
22
| | |
| MYDESTINATION 2035 FUND | | |
| SCHEDULE OF INVESTMENTS | | December 31, 2011 |
| | | | | | | | |
| | | Shares | | | Value | |
MUTUAL FUNDS — 99.7% | |
GuideStone Money Market Fund (GS4 Class)¥ | | | 3,087,962 | | | $ | 3,087,962 | |
GuideStone Medium-Duration Bond Fund (GS4 Class)¥ | | | 196,575 | | | | 2,765,813 | |
GuideStone Extended-Duration Bond Fund (GS4 Class)¥ | | | 170,008 | | | | 2,903,731 | |
GuideStone Global Bond Fund (GS4 Class)¥ | | | 836,270 | | | | 8,136,904 | |
GuideStone Real Estate Securities Fund (GS4 Class)¥ | | | 1,020,690 | | | | 9,369,933 | |
GuideStone Value Equity Fund (GS4 Class)¥ | | | 2,090,263 | | | | 29,263,689 | |
GuideStone Growth Equity Fund (GS4 Class)¥ | | | 1,538,053 | | | | 28,653,926 | |
GuideStone Small Cap Equity Fund (GS4 Class)¥ | | | 715,589 | | | | 10,461,907 | |
GuideStone International Equity Fund (GS4 Class)¥ | | | 3,213,343 | | | | 36,407,178 | |
| | | | | | | | |
Total Mutual Funds
(Cost $129,173,429) | | | | 131,051,043 | |
| | | | | | | | |
TOTAL INVESTMENTS — 99.7%
(Cost $129,173,429) | | | | 131,051,043 | |
Other Assets in Excess of Liabilities — 0.3% | | | | | | | 394,999 | |
| | | | | | | | |
NET ASSETS — 100.0% | | | $ | 131,446,042 | |
| | | | | | | | |
Please see abbreviation and footnote definitions beginning on page 200.
PORTFOLIO SUMMARY (based on net assets)
| | | | |
| | | % | |
Domestic Equity Funds | | | 59.1 | |
International Equity Fund | | | 27.7 | |
Bond Funds | | | 10.5 | |
Futures Contracts | | | 2.4 | |
Money Market | | | 2.4 | |
| | | | |
| | | 102.1 | |
| | | | |
VALUATION HIERARCHY
The following is a summary of the inputs used, as of December 31, 2011, in valuing the Fund’s investments carried at fair value:
| | | | | | | | | | | | | | | | |
| | | Total Value | | | Level 1
Quoted Prices | | | Level 2
Other
Significant
Observable
Inputs | | | Level 3
Significant
Unobservable
Inputs | |
Assets: | | | | | | | | | | | | | | | | |
Investments in Securities: | | | | | | | | | | | | | | | | |
Mutual Funds | | $ | 131,051,043 | | | $ | 131,051,043 | | | $ | — | | | $ | — | |
| | | | | | | | | | | | | | | | |
Total Assets — Investments in Securities | | $ | 131,051,043 | | | $ | 131,051,043 | | | $ | — | | | $ | — | |
| | | | | | | | | | | | | | | | |
| | | | |
Other Financial Instruments*** | | | | | | | | | | | | | | | | |
Futures Contracts | | $ | 26,203 | | | $ | 26,203 | | | $ | — | | | $ | — | |
| | | | | | | | | | | | | | | | |
Total Assets — Other Financial Instruments | | $ | 26,203 | | | $ | 26,203 | | | $ | — | | | $ | — | |
| | | | | | | | | | | | | | | | |
| *** | Other financial instruments are derivative instruments not reflected in the Schedule of Investments, such as futures, forwards and swap contracts, which are valued at the unrealized appreciation (depreciation) on the investment. Details of these investments can be found in the Financial Statements. |
|
| See Notes to Financial Statements. |
23 |
MyDestination 2045 Fund
The Fund, through investments in the underlying Select Funds, combines a high percentage of exposure to equity securities with only a modest percentage to fixed income securities. While the Fund follows an allocation glide path that becomes more conservative over time, the year-end targeted allocations were approximately 6% Fixed Income Select Funds, 55% U.S. Equity Select Funds, 30% Non-U.S. Equity Select Fund and 9% Real Return Select Fund.
Equity exposure represented approximately 94% of the Fund and, therefore, contributed most all of the Fund’s returns. The Fund is a fund of funds, and its performance is based on the performance of the underlying Select Funds. The Fund returned -3.63% for the one-year period ended December 31, 2011, with the loss mostly attributable to its exposure to the International Equity Fund. The International Equity Fund returned -14.01% in 2011, just slightly less than the MSCI ACWI (All Country World Index) Ex-U.S. Index, which is a broad measure of international equity market returns, at -13.71% for 2011. The Fund’s overall performance was most positively impacted by its exposure to the Real Estate Securities Fund, as U.S. property stocks, supported by well capitalized balance sheets, limited supply and relatively attractive dividend yields, outperformed the broader equity market in 2011.
U.S. equity exposure was a positive contributor to absolute performance. From a price perspective, the domestic equity market ended the year almost exactly where it started, as measured by level of the S&P 500® Index, with all positive performance for investors generated solely through reinvested dividends. However, the domestic equity market was anything but “flat”, as investors endured extreme market volatility throughout a year where uncertainty reigned and political or macro-economic headlines could send the “risk-on, risk-off ” market up or down several percentage points in a single day. Despite a volatile year and a brutal double-digit third quarter sell-off, the domestic equity market showed its resilience in the fourth quarter and, after a double-digit bounce, managed to deliver a positive investment return for the year.
Non-U.S. equity exposure was the largest absolute detractor to Fund performance. While U.S. equity market returns were meager, they were significantly better than those abroad as foreign equity markets fell under the pressures of the debt crisis in Europe, China’s effort to slow economic growth and the concerns that a slow global economy could threaten export-driven emerging market economies.
The Fund’s allocation to fixed income holdings contributed modestly to absolute performance, as fixed income outpaced equities on a broad measure basis, as represented by the Barclays Capital U.S. Aggregate Bond Index which returned 7.84% compared to the S&P 500® Index which returned 2.11% in 2011, respectively. The bond market benefited from the economic uncertainty and overall risk aversion during a turbulent 2011, with all major bond market sectors posting positive returns for the year, led by the U.S. Treasury sector.
The Fund underperformed its composite benchmark by 0.68% in 2011. Relative underperformance was driven by the Fund’s exposure to the Growth Equity Fund, which underperformed its benchmark index due to security selection. The Fund’s relative performance was most positively impacted by exposure to the Small Cap Equity Fund, which benefited almost entirely from security selection, leading it to outperform its respective benchmark.
The Fund attempts to achieve its objective by investing in the Select Funds. The Fund is managed to a retirement date (“target date”) by adjusting the percentage of fixed income securities and equity securities to become more conservative each year until reaching the retirement year and then approximately 15 years thereafter. The target date in the name of the Fund is the approximate date when an investor plans to start withdrawing money. This Fund may be suitable for investors who want a simplified “one fund” retirement solution, are willing to pay slightly higher fees to get a diversified mix of investments that becomes more conservative over time and plan to retire at an age that is near the year 2045. The Fund’s value will fluctuate due to changes in interest rates. There is a risk that the issuer of a fixed-income investment may fail to pay interest or even principal due in a timely manner or at all. The Fund’s value will fluctuate due to business developments concerning a particular issuer, industry or country, as well as general market and economic conditions. The Fund is subject to risks presented by investments in foreign issuers and changes in currency exchange rates relative to the U.S. dollar may negatively affect the values of foreign investments held by the Select Funds. By investing in this Fund, you will incur the expenses of the Fund, in addition to those of the underlying Select Funds. The principal risks of the Fund will change depending on the asset mix of the Select Funds in which it invests. You may directly invest in the Select Funds. The Fund’s value will go up and down in response to changes in the share prices of the investments that it owns. The amount invested in the Fund is not guaranteed to increase, is not guaranteed against loss, nor is the amount of the original investment guaranteed at the target date. It is possible to lose money by investing in the Fund.
Please see page 26 for information regarding specific portfolio allocations. Portfolio holdings are subject to change and risk at any time.
24
MyDestination 2045 Fund
| | | | | | | | |
Average Annual Total Returns as of 12/31/11 | |
| | | GS4
Class* | | | Benchmark** | |
One Year | | | -3.63 | % | | | -2.95 | % |
Five Year | | | -1.70 | % | | | -0.77 | % |
Since Inception | | | -1.70 | % | | | -0.77 | % |
Inception Date | | | 12/29/06 | | | | | |
Total Fund Operating Expenses (April 30, 2011 Prospectus, as amended on September 1, 2011)(1) | | | 1.42 | % | | | | |
| (1) | The Fund’s shareholders indirectly bear the expenses of the GS4 Class shares of the Select Funds in which the Fund invests. Current information regarding the Fund’s Operating Expenses can be found in the Financial Highlights. |
The performance data quoted represents past performance and does not guarantee future results. Current performance may be lower or higher. Performance data current to the most recent month-end may be obtained at www.GuideStoneFunds.org. The investment return and principal value of an investment will fluctuate so that shares, when redeemed, may be worth more or less than their original cost.
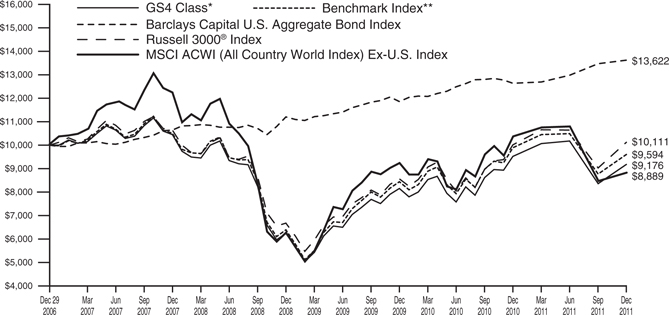
The graph illustrates the results of a hypothetical $10,000 investment in the GS4 Class of the Fund since December 29, 2006 (commencement of operations), with all dividends and capital gains reinvested, with the Fund’s composite benchmark index.
| * | These returns reflect expense waivers by the Fund’s investment adviser. Without these waivers, returns would have been lower. Returns shown do not reflect the deduction of taxes that a shareholder would pay on Fund distributions or the redemption of Fund shares. |
| ** | Represents a composite benchmark index as of December 2011, consisting of 0.50% of the Barclays Capital U.S. Long-Term Government Bond, 0.50% of the Barclays Capital U.S. Long-Term Credit Bond Index, 2.50% of the Barclays Capital Global Aggregate Bond Index — Unhedged, 1.25% of the Barclays U.S. Corporate High Yield — 2% Issuer Capped Index, 1.25% of the J.P. Morgan Emerging Markets Bond Index Plus, 9.00% of the Dow Jones U.S. Select Real Estate Securities IndexSM, 23.24% of the Russell 1000® Value Index, 23.24% of the Russell 1000® Growth Index, 8.77% of the Russell 2000® Index and 29.75% of the MSCI ACWI (All Country World Index) Ex-U.S. Index. |
The construction of the composite index corresponds to the target percentage allocations to the underlying asset classes as represented by the Fund’s investment in the Select Funds. As the target percentage allocations to the underlying investments change according to the MyDestination Funds® glide path, the target percentage allocations to the composite index also change.
Unlike a mutual fund, the performance of an index assumes no taxes, transaction costs, management fees or other expenses.
25
| | |
| MYDESTINATION 2045 FUND | | |
| SCHEDULE OF INVESTMENTS | | December 31, 2011 |
| | | | | | | | |
| | | Shares | | | Value | |
MUTUAL FUNDS — 99.6% | | | | | | | | |
GuideStone Money Market Fund (GS4 Class)¥ | | | 2,134,540 | | | $ | 2,134,540 | |
GuideStone Extended-Duration Bond Fund (GS4 Class)¥ | | | 48,205 | | | | 823,344 | |
GuideStone Global Bond Fund (GS4 Class)¥ | | | 453,662 | | | | 4,414,133 | |
GuideStone Real Estate Securities Fund (GS4 Class)¥ | | | 867,620 | | | | 7,964,747 | |
GuideStone Value Equity Fund (GS4 Class)¥ | | | 1,455,377 | | | | 20,375,280 | |
GuideStone Growth Equity Fund (GS4 Class)¥ | | | 1,074,764 | | | | 20,022,846 | |
GuideStone Small Cap Equity Fund (GS4 Class)¥ | | | 527,181 | | | | 7,707,387 | |
GuideStone International Equity Fund (GS4 Class)¥ | | | 2,306,838 | | | | 26,136,474 | |
| | | | | | | | |
Total Mutual Funds
(Cost $83,364,328) | | | | 89,578,751 | |
| | | | | | | | |
TOTAL INVESTMENTS — 99.6%
(Cost $83,364,328) | | | | 89,578,751 | |
Other Assets in Excess of Liabilities — 0.4% | | | | | | | 375,155 | |
| | | | | | | | |
NET ASSETS — 100.0% | | | $ | 89,953,906 | |
| | | | | | | | |
Please see abbreviation and footnote definitions beginning on page 200.
PORTFOLIO SUMMARY (based on net assets)
| | | | |
| | | % | |
Domestic Equity Funds | | | 62.3 | |
International Equity Fund | | | 29.1 | |
Bond Funds | | | 5.8 | |
Futures Contracts | | | 2.4 | |
Money Market Fund | | | 2.4 | |
| | | | |
| | | 102.0 | |
| | | | |
VALUATION HIERARCHY
The following is a summary of the inputs used, as of December 31, 2011, in valuing the Fund’s investments carried at fair value:
| | | | | | | | | | | | | | | | |
| | | Total Value | | | Level 1
Quoted Prices | | | Level 2
Other
Significant
Observable
Inputs | | | Level 3
Significant
Unobservable
Inputs | |
Assets: | | | | | | | | | | | | | | | | |
Investments in Securities: | | | | | | | | | | | | | | | | |
Mutual Funds | | $ | 89,578,751 | | | $ | 89,578,751 | | | $ | — | | | $ | — | |
| | | | | | | | | | | | | | | | |
Total Assets — Investments in Securities | | $ | 89,578,751 | | | $ | 89,578,751 | | | $ | — | | | $ | — | |
| | | | | | | | | | | | | | | | |
Other Financial Instruments*** | | | | | | | | | | | | | | | | |
Futures Contracts | | $ | 12,721 | | | $ | 12,721 | | | $ | — | | | $ | — | |
| | | | | | | | | | | | | | | | |
Total Assets — Other Financial Instruments | | $ | 12,721 | | | $ | 12,721 | | | $ | — | | | $ | — | |
| | | | | | | | | | | | | | | | |
| *** | Other financial instruments are derivative instruments not reflected in the Schedule of Investments, such as futures, forwards and swap contracts, which are valued at the unrealized appreciation (depreciation) on the investment. Details of these investments can be found in the Financial Statements. |
|
| See Notes to Financial Statements. |
26 |
| | |
| STATEMENTS OF ASSETS AND LIABILITIES | | December 31, 2011 |
| | | | | | | | | | | | | | | | | | | | |
| | | MyDestination
2005 Fund | | | MyDestination
2015 Fund | | | MyDestination
2025 Fund | | | MyDestination
2035 Fund | | | MyDestination
2045 Fund | |
Assets | | | | | | | | | | | | | | | | | | | | |
Investments in securities of affiliated issuers, at value(1) | | $ | 64,542,930 | | | $ | 273,875,458 | | | $ | 277,766,092 | | | $ | 131,051,043 | | | $ | 89,578,751 | |
Cash collateral for derivatives | | | 77,200 | | | | 268,000 | | | | 312,300 | | | | 243,000 | | | | 164,500 | |
Receivables: | | | | | | | | | | | | | | | | | | | | |
Dividends | | | 12 | | | | 36 | | | | 36 | | | | 22 | | | | 15 | |
Fund shares sold | | | 5,831 | | | | 86,670 | | | | 198,453 | | | | 174,784 | | | | 240,164 | |
Variation margin | | | 618 | | | | 74 | | | | — | | | | — | | | | — | |
Receivable from advisor | | | 4,466 | | | | — | | | | — | | | | — | | | | — | |
Prepaid expenses and other assets | | | 14,883 | | | | 16,630 | | | | 15,210 | | | | 14,919 | | | | 14,419 | |
| | | | | | | | | | | | | | | | | | | | |
Total Assets | | | 64,645,940 | | | | 274,246,868 | | | | 278,292,091 | | | | 131,483,768 | | | | 89,997,849 | |
| | | | | | | | | | | | | | | | | | | | |
Liabilities | | | | | | | | | | | | | | | | | | | | |
Payables: | | | | | | | | | | | | | | | | | | | | |
Investment securities purchased | | | — | | | | — | | | | 36 | | | | 36 | | | | 36 | |
Fund shares redeemed | | | 15,003 | | | | 100,205 | | | | — | | | | — | | | | 14,752 | |
Variation margin | | | — | | | | — | | | | 1,342 | | | | 2,591 | | | | 1,504 | |
Accrued expenses: | | | | | | | | | | | | | | | | | | | | |
Investment advisory fees | | | — | | | | 23,421 | | | | 23,650 | | | | 9,161 | | | | 2,738 | |
Other expenses | | | 23,080 | | | | 27,149 | | | | 27,708 | | | | 25,938 | | | | 24,913 | |
| | | | | | | | | | | | | | | | | | | | |
Total Liabilities | | | 38,083 | | | | 150,775 | | | | 52,736 | | | | 37,726 | | | | 43,943 | |
| | | | | | | | | | | | | | | | | | | | |
Net Assets | | $ | 64,607,857 | | | $ | 274,096,093 | | | $ | 278,239,355 | | | $ | 131,446,042 | | | $ | 89,953,906 | |
| | | | | | | | | | | | | | | | | | | | |
Net Assets Consist of: | | | | | | | | | | | | | | | | | | | | |
Paid-in capital | | $ | 69,054,399 | | | $ | 281,477,484 | | | $ | 280,924,660 | | | $ | 132,624,725 | | | $ | 87,060,509 | |
Undistributed net investment income | | | 101,776 | | | | 1,380,630 | | | | 607,362 | | | | — | | | | — | |
Accumulated net realized loss on investments and futures transactions | | | (8,209,083 | ) | | | (26,835,656 | ) | | | (13,240,277 | ) | | | (3,082,500 | ) | | | (3,333,747 | ) |
Net unrealized appreciation on investments and futures | | | 3,660,765 | | | | 18,073,635 | | | | 9,947,610 | | | | 1,903,817 | | | | 6,227,144 | |
| | | | | | | | | | | | | | | | | | | | |
Net Assets | | $ | 64,607,857 | | | $ | 274,096,093 | | | $ | 278,239,355 | | | $ | 131,446,042 | | | $ | 89,953,906 | |
| | | | | | | | | | | | | | | | | | | | |
Net Asset Value: | | | | | | | | | | | | | | | | | | | | |
$0.001 par value, unlimited shares authorized | | | | | | | | | | | | | | | | | | | | |
Net assets applicable to the GS4 Class | | $ | 64,607,857 | | | $ | 274,096,093 | | | $ | 278,239,355 | | | $ | 131,446,042 | | | $ | 89,953,906 | |
| | | | | | | | | | | | | | | | | | | | |
GS4 shares outstanding | | | 6,731,142 | | | | 29,255,030 | | | | 31,565,579 | | | | 15,989,184 | | | | 11,302,234 | |
| | | | | | | | | | | | | | | | | | | | |
Net asset value, offering and redemption price per GS4 share | | $ | 9.60 | | | $ | 9.37 | | | $ | 8.81 | | | $ | 8.22 | | | $ | 7.96 | |
| | | | | | | | | | | | | | | | | | | | |
(1) Investments in securities of affiliated issuers, at cost | | $ | 60,887,192 | | | $ | 255,829,390 | | | $ | 267,862,993 | | | $ | 129,173,429 | | | $ | 83,364,328 | |
| | | | | | | | | | | | | | | | | | | | |
|
| See Notes to Financial Statements. |
27 |
| | |
| STATEMENTS OF OPERATIONS | | For the Year Ended December 31, 2011 |
| | | | | | | | | | | | | | | | | | | | |
| | | MyDestination
2005 Fund | | | MyDestination
2015 Fund | | | MyDestination
2025 Fund | | | MyDestination
2035 Fund | | | MyDestination
2045 Fund | |
Investment Income | | | | | | | | | | | | | | | | | | | | |
Income dividends received from affiliated funds | | $ | 970,616 | | | $ | 4,300,361 | | | $ | 4,168,470 | | | $ | 1,646,239 | | | $ | 892,346 | |
Interest | | | — | | | | 12,552 | | | | 8,614 | | | | 1,965 | | | | 194 | |
| | | | | | | | | | | | | | | | | | | | |
Total Investment Income | | | 970,616 | | | | 4,312,913 | | | | 4,177,084 | | | | 1,648,204 | | | | 892,540 | |
| | | | | | | | | | | | | | | | | | | | |
Expenses | | | | | | | | | | | | | | | | | | | | |
Investment advisory fees | | | 61,222 | | | | 274,345 | | | | 271,901 | | | | 126,456 | | | | 85,531 | |
Transfer agent fees: | | | | | | | | | | | | | | | | | | | | |
GS4 Shares | | | 19,083 | | | | 21,219 | | | | 21,357 | | | | 20,180 | | | | 20,136 | |
Custodian fees | | | 9,664 | | | | 17,172 | | | | 18,015 | | | | 13,994 | | | | 12,376 | |
Accounting and administration fees | | | 10,249 | | | | 21,895 | | | | 22,251 | | | | 14,231 | | | | 12,003 | |
Professional fees | | | 56,598 | | | | 57,115 | | | | 57,167 | | | | 56,869 | | | | 56,763 | |
Blue sky fees: | | | | | | | | | | | | | | | | | | | | |
GS4 Shares | | | 33,019 | | | | 34,263 | | | | 34,951 | | | | 33,264 | | | | 32,112 | |
Shareholder reporting fees: | | | | | | | | | | | | | | | | | | | | |
GS4 Shares | | | 4,981 | | | | 9,877 | | | | 10,368 | | | | 7,490 | | | | 7,328 | |
Trustee expenses | | | 350 | | | | 1,562 | | | | 1,582 | | | | 742 | | | | 500 | |
Line of credit facility fees | | | 678 | | | | 2,847 | | | | 2,816 | | | | 1,320 | | | | 865 | |
Other expenses | | | 14,146 | | | | 13,558 | | | | 13,410 | | | | 13,409 | | | | 13,402 | |
| | | | | | | | | | | | | | | | | | | | |
Total Expenses | | | 209,990 | | | | 453,853 | | | | 453,818 | | | | 287,955 | | | | 241,016 | |
Expenses waived/reimbursed net of amount recaptured(1) | | | (91,223 | ) | | | — | | | | — | | | | (40,727 | ) | | | (74,220 | ) |
| | | | | | | | | | | | | | | | | | | | |
Net Expenses | | | 118,767 | | | | 453,853 | | | | 453,818 | | | | 247,228 | | | | 166,796 | |
| | | | | | | | | | | | | | | | | | | | |
Net investment income | | | 851,849 | | | | 3,859,060 | | | | 3,723,266 | | | | 1,400,976 | | | | 725,744 | |
| | | | | | | | | | | | | | | | | | | | |
Realized and Unrealized Gain (Loss) | | | | | | | | | | | | | | | | | | | | |
Capital gain distributions received from affiliated funds | | | 306,340 | | | | 1,288,463 | | | | 974,079 | | | | 142,093 | | | | 42,882 | |
Net realized gain (loss) on investment securities of affiliated issuers | | | 2,262,537 | | | | (8,058,170 | ) | | | (6,802,668 | ) | | | 108,979 | | | | (16,957 | ) |
Net realized gain (loss) on investment securities of unaffiliated issuers | | | — | | | | (14,767 | ) | | | 14,802 | | | | 2,814 | | | | 2 | |
Net realized gain (loss) on futures transactions | | | (51,199 | ) | | | 171,780 | | | | 523,880 | | | | (63,635 | ) | | | 147 | |
| | | | | | | | | | | | | | | | | | | | |
Net realized gain (loss) | | | 2,517,678 | | | | (6,612,694 | ) | | | (5,289,907 | ) | | | 190,251 | | | | 26,074 | |
| | | | | | | | | | | | | | | | | | | | |
Change in unrealized appreciation (depreciation) on investment securities of affiliated issuers | | | (2,030,579 | ) | | | 7,195,928 | | | | 902,050 | | | | (5,712,404 | ) | | | (4,102,333 | ) |
Change in unrealized appreciation (depreciation) on investment securities of unaffiliated issuers | | | — | | | | 22,455 | | | | (5,450 | ) | | | (941 | ) | | | (22 | ) |
Change in unrealized appreciation (depreciation) on futures | | | 5,027 | | | | (75,155 | ) | | | (18,636 | ) | | | (5,743 | ) | | | (23,615 | ) |
| | | | | | | | | | | | | | | | | | | | |
Net change in unrealized appreciation (depreciation) | | | (2,025,552 | ) | | | 7,143,228 | | | | 877,964 | | | | (5,719,088 | ) | | | (4,125,970 | ) |
| | | | | | | | | | | | | | | | | | | | |
Net Realized and Unrealized Gain (Loss) | | | 492,126 | | | | 530,534 | | | | (4,411,943 | ) | | | (5,528,837 | ) | | | (4,099,896 | ) |
| | | | | | | | | | | | | | | | | | | | |
Net Increase (Decrease) in Net Assets Resulting from Operations | | $ | 1,343,975 | | | $ | 4,389,594 | | | $ | (688,677 | ) | | $ | (4,127,861 | ) | | $ | (3,374,152 | ) |
| | | | | | | | | | | | | | | | | | | | |
| (1) | See Note 3a and 3c in Notes to Financial Statements. |
|
| See Notes to Financial Statements. |
28 |
STATEMENTS OF CHANGES IN NET ASSETS
| | | | | | | | |
| | | MyDestination 2005 Fund | |
| | | For the Year Ended | |
| | | 12/31/11 | | | 12/31/10 | |
Operations: | | | | | | | | |
Net investment income | | $ | 851,849 | | | $ | 957,660 | |
Net realized gain (loss) on investment securities and futures transactions | | | 2,517,678 | | | | (2,591,615 | ) |
Net change in unrealized appreciation (depreciation) on investment securities and futures | | | (2,025,552 | ) | | | 7,862,555 | |
| | | | | | | | |
Net increase (decrease) in net assets resulting from operations | | | 1,343,975 | | | | 6,228,600 | |
| | | | | | | | |
Dividends and Distributions to Shareholders: | | | | | | | | |
Dividends from net investment income(1) | | | (1,118,885 | ) | | | (1,382,009 | ) |
Distributions from net realized capital gains | | | — | | | | — | |
| | | | | | | | |
Total dividends and distributions | | | (1,118,885 | ) | | | (1,382,009 | ) |
| | | | | | | | |
Capital Share Transactions: | | | | | | | | |
Proceeds from GS4 shares sold | | | 25,225,989 | | | | 16,345,475 | |
Reinvestment of dividends and distributions into GS4 shares | | | 1,118,483 | | | | 1,381,875 | |
Value of GS4 shares redeemed | | | (16,644,614 | ) | | | (34,721,138 | ) |
| | | | | | | | |
Net increase (decrease) from capital share transactions(2) | | | 9,699,858 | | | | (16,993,788 | ) |
| | | | | | | | |
Total increase (decrease) in net assets | | | 9,924,948 | | | | (12,147,197 | ) |
| | | | | | | | |
Net Assets: | | | | | | | | |
Beginning of Year | | | 54,682,909 | | | | 66,830,106 | |
| | | | | | | | |
End of Year* | | $ | 64,607,857 | | | $ | 54,682,909 | |
| | | | | | | | |
* Including undistributed net investment income | | $ | 101,776 | | | $ | 149,327 | |
| | | | | | | | |
| (1) | Includes dividends paid from the short-term portion of capital gain distributions received from affiliated funds. |
| (2) | See Note 7 in Notes to Financial Statements. |
|
| See Notes to Financial Statements. |
29 |
| | | | | | | | | | | | | | | | | | | | | | | | | | | | | | |
| MyDestination 2015 Fund | | | MyDestination 2025 Fund | | | MyDestination 2035 Fund | | | MyDestination 2045 Fund | |
| For the Year Ended | | | For the Year Ended | | | For the Year Ended | | | For the Year Ended | |
| 12/31/11 | | | 12/31/10 | | | 12/31/11 | | | 12/31/10 | | | 12/31/11 | | | 12/31/10 | | | 12/31/11 | | | 12/31/10 | |
| | | | | | | | | | | | | | | | | | | | | | | | | | | | | | | |
| $ | 3,859,060 | | | $ | 3,914,330 | | | $ | 3,723,266 | | | $ | 3,326,828 | | | $ | 1,400,976 | | | $ | 1,149,458 | | | $ | 725,744 | | | $ | 605,319 | |
| | (6,612,694 | ) | | | (6,101,491 | ) | | | (5,289,907 | ) | | | (705,885 | ) | | | 190,251 | | | | (925,478 | ) | | | 26,074 | | | | 443,618 | |
| | 7,143,228 | | | | 32,497,322 | | | | 877,964 | | | | 26,572,953 | | | | (5,719,088 | ) | | | 13,928,400 | | | | (4,125,970 | ) | | | 8,943,961 | |
| | | | | | | | | | | | | | | | | | | | | | | | | | | | | | |
| | 4,389,594 | | | | 30,310,161 | | | | (688,677 | ) | | | 29,193,896 | | | | (4,127,861 | ) | | | 14,152,380 | | | | (3,374,152 | ) | | | 9,992,898 | |
| | | | | | | | | | | | | | | | | | | | | | | | | | | | | | |
| | | | | | | | | | | | | | | | | | | | | | | | | | | | | | | |
| | (4,639,060 | ) | | | (5,104,591 | ) | | | (4,085,427 | ) | | | (3,787,639 | ) | | | (1,436,957 | ) | | | (1,213,587 | ) | | | (728,739 | ) | | | (603,947 | ) |
| | — | | | | — | | | | — | | | | — | | | | (762,677 | ) | | | (98,451 | ) | | | (1,952,225 | ) | | | (257,097 | ) |
| | | | | | | | | | | | | | | | | | | | | | | | | | | | | | |
| | (4,639,060 | ) | | | (5,104,591 | ) | | | (4,085,427 | ) | | | (3,787,639 | ) | | | (2,199,634 | ) | | | (1,312,038 | ) | | | (2,680,964 | ) | | | (861,044 | ) |
| | | | | | | | | | | | | | | | | | | | | | | | | | | | | | |
| | | | | | | | | | | | | | | | | | | | | | | | | | | | | | | |
| | 54,743,331 | | | | 47,065,643 | | | | 59,628,488 | | | | 50,705,586 | | | | 33,005,073 | | | | 28,363,630 | | | | 27,357,501 | | | | 25,499,963 | |
| | 4,639,060 | | | | 5,104,589 | | | | 4,085,427 | | | | 3,787,605 | | | | 2,199,634 | | | | 1,312,038 | | | | 2,680,965 | | | | 861,044 | |
| | (30,708,423 | ) | | | (50,968,664 | ) | | | (17,202,341 | ) | | | (12,960,593 | ) | | | (7,637,385 | ) | | | (7,729,184 | ) | | | (9,832,010 | ) | | | (3,849,382 | ) |
| | | | | | | | | | | | | | | | | | | | | | | | | | | | | | |
| | 28,673,968 | | | | 1,201,568 | | | | 46,511,574 | | | | 41,532,598 | | | | 27,567,322 | | | | 21,946,484 | | | | 20,206,456 | | | | 22,511,625 | |
| | | | | | | | | | | | | | | | | | | | | | | | | | | | | | |
| | 28,424,502 | | | | 26,407,138 | | | | 41,737,470 | | | | 66,938,855 | | | | 21,239,827 | | | | 34,786,826 | | | | 14,151,340 | | | | 31,643,479 | |
| | | | | | | | | | | | | | | | | | | | | | | | | | | | | | |
| | | | | | | | | | | | | | | | | | | | | | | | | | | | | | | |
| | 245,671,591 | | | | 219,264,453 | | | | 236,501,885 | | | | 169,563,030 | | | | 110,206,215 | | | | 75,419,389 | | | | 75,802,566 | | | | 44,159,087 | |
| | | | | | | | | | | | | | | | | | | | | | | | | | | | | | |
| $ | 274,096,093 | | | $ | 245,671,591 | | | $ | 278,239,355 | | | $ | 236,501,885 | | | $ | 131,446,042 | | | $ | 110,206,215 | | | $ | 89,953,906 | | | $ | 75,802,566 | |
| | | | | | | | | | | | | | | | | | | | | | | | | | | | | | |
| $ | 1,380,630 | | | $ | 1,490,826 | | | $ | 607,362 | | | $ | 642,853 | | | $ | — | | | $ | 4,948 | | | $ | — | | | $ | 1,491 | |
| | | | | | | | | | | | | | | | | | | | | | | | | | | | | | |
See Notes to Financial Statements.
30
FINANCIAL HIGHLIGHTS
For a Share Outstanding For the Years Ending December 31, unless otherwise indicated
| | | | | | | | | | | | | | | | | | | | | | | | | | | | | | | | | | | | | | | | | | | | | | | | | | | | |
| | | | Ratios to Average Net Assets | | | | |
| | | Net Asset
Value,
Beginning
of Year | | | Net
Investment
Income (1) | | | Capital Gain
Distributions
Received
from
Affiliated
Funds | | | Realized
and
Unrealized
Gain (Loss)
on
Investments | | | Dividends
from Net
Investment
Income (2) | | | Distributions
from Net
Realized
Capital
Gains | | | Net
Asset
Value,
End of
Year | | | Total
Return | | | Net Assets,
End of
Year (000) | | | Expenses,
Net(3) | | | Expenses,
Gross(3)(4) | | | Investment
Income,
Net (1)(5) | | | Portfolio
Turnover
Rate | |
MyDestination 2005 Fund | |
|
GS4 Class | |
2011 | | $ | 9.53 | | | $ | 0.14 | # | | $ | 0.05 | | | $ | 0.05 | | | $ | (0.17 | ) | | $ | — | | | $ | 9.60 | | | | 2.52 | % | | $ | 64,608 | | | | 0.20 | % | | | 0.35 | % | | | 1.43 | % | | | 31 | % |
2010 | | | 8.84 | | | | 0.14 | # | | | 0.09 | | | | 0.70 | | | | (0.24 | ) | | | — | | | | 9.53 | | | | 10.56 | | | | 54,683 | | | | 0.20 | | | | 0.26 | | | | 1.50 | | | | 19 | |
2009 | | | 7.44 | | | | 0.18 | # | | | 0.04 | | | | 1.40 | | | | (0.22 | ) | | | — | | | | 8.84 | | | | 21.84 | | | | 66,830 | | | | 0.20 | | | | 0.26 | | | | 2.31 | | | | 57 | |
2008 | | | 10.35 | | | | 0.30 | # | | | 0.08 | | | | (2.75 | ) | | | (0.31 | ) | | | (0.23 | ) | | | 7.44 | | | | (22.78 | ) | | | 50,678 | | | | 0.20 | | | | 0.29 | | | | 3.25 | | | | 40 | |
2007 | | | 10.00 | | | | 0.33 | # | | | 0.62 | | | | (0.31 | ) | | | (0.28 | ) | | | (0.01 | ) | | | 10.35 | | | | 6.42 | | | | 57,667 | | | | 0.20 | | | | 0.43 | | | | 3.16 | | | | 21 | |
|
MyDestination 2015 Fund | |
|
GS4 Class | |
2011 | | $ | 9.36 | | | $ | 0.14 | # | | $ | 0.05 | | | $ | (0.02 | ) | | $ | (0.16 | ) | | $ | — | | | $ | 9.37 | | | | 1.84 | % | | $ | 274,096 | | | | 0.17 | % | | | 0.17 | % | | | 1.46 | % | | | 33 | % |
2010 | | | 8.42 | | | | 0.14 | # | | | 0.06 | | | | 0.94 | | | | (0.20 | ) | | | — | | | | 9.36 | | | | 13.54 | | | | 245,672 | | | | 0.16 | | | | 0.16 | | | | 1.65 | | | | 28 | |
2009 | | | 6.83 | | | | 0.17 | # | | | 0.02 | | | | 1.58 | | | | (0.18 | ) | | | — | | | | 8.42 | | | | 26.27 | | | | 219,264 | | | | 0.16 | | | | 0.16 | | | | 2.25 | | | | 25 | |
2008 | | | 10.33 | | | | 0.26 | # | | | 0.09 | | | | (3.39 | ) | | | (0.19 | ) | | | (0.27 | ) | | | 6.83 | | | | (29.31 | ) | | | 146,140 | | | | 0.20 | | | | 0.18 | | | | 2.87 | | | | 22 | |
2007 | | | 10.00 | | | | 0.29 | # | | | 0.83 | | | | (0.50 | ) | | | (0.28 | ) | | | (0.01 | ) | | | 10.33 | | | | 6.12 | | | | 169,953 | | | | 0.20 | | | | 0.24 | | | | 2.74 | | | | 7 | |
|
MyDestination 2025 Fund | |
|
GS4 Class | |
2011 | | $ | 8.94 | | | $ | 0.13 | # | | $ | 0.03 | | | $ | (0.16 | ) | | $ | (0.13 | ) | | $ | — | | | $ | 8.81 | | | | 0.03 | % | | $ | 278,239 | | | | 0.17 | % | | | 0.17 | % | | | 1.42 | % | | | 24 | % |
2010 | | | 7.88 | | | | 0.14 | # | | | 0.03 | | | | 1.04 | | | | (0.15 | ) | | | — | | | | 8.94 | | | | 15.32 | | | | 236,502 | | | | 0.20 | | | | 0.17 | | | | 1.72 | | | | 15 | |
2009 | | | 6.18 | | | | 0.14 | # | | | 0.01 | | | | 1.69 | | | | (0.14 | ) | | | — | | | | 7.88 | | | | 30.12 | | | | 169,563 | | | | 0.20 | | | | 0.19 | | | | 2.11 | | | | 13 | |
2008 | | | 10.24 | | | | 0.21 | # | | | 0.09 | | | | (3.89 | ) | | | (0.15 | ) | | | (0.32 | ) | | | 6.18 | | | | (35.00 | ) | | | 96,826 | | | | 0.20 | | | | 0.21 | | | | 2.47 | | | | 10 | |
2007 | | | 10.00 | | | | 0.25 | # | | | 1.13 | | | | (0.85 | ) | | | (0.28 | ) | | | (0.01 | ) | | | 10.24 | | | | 5.29 | | | | 105,102 | | | | 0.20 | | | | 0.30 | | | | 2.37 | | | | 5 | |
|
MyDestination 2035 Fund | |
|
GS4 Class | |
2011 | | $ | 8.62 | | | $ | 0.10 | # | | $ | 0.01 | | | $ | (0.37 | ) | | $ | (0.09 | ) | | $ | (0.05 | ) | | $ | 8.22 | | | | (2.99 | )% | | $ | 131,446 | | | | 0.20 | % | | | 0.23 | % | | | 1.13 | % | | | 10 | % |
2010 | | | 7.52 | | | | 0.10 | # | | | 0.01 | | | | 1.10 | | | | (0.10 | ) | | | (0.01 | ) | | | 8.62 | | | | 16.02 | | | | 110,206 | | | | 0.20 | | | | 0.23 | | | | 1.32 | | | | 9 | |
2009 | | | 5.85 | | | | 0.10 | # | | | — | † | | | 1.70 | | | | (0.11 | ) | | | (0.02 | ) | | | 7.52 | | | | 30.99 | | | | 75,419 | | | | 0.20 | | | | 0.28 | | | | 1.57 | | | | 4 | |
2008 | | | 10.24 | | | | 0.17 | # | | | 0.09 | | | | (4.25 | ) | | | (0.10 | ) | | | (0.30 | ) | | | 5.85 | | | | (38.86 | ) | | | 37,637 | | | | 0.20 | | | | 0.40 | | | | 2.02 | | | | 5 | |
2007 | | | 10.00 | | | | 0.19 | # | | | 1.31 | | | | (0.98 | ) | | | (0.28 | ) | | | — | † | | | 10.24 | | | | 5.20 | | | | 35,117 | | | | 0.20 | | | | 0.64 | | | | 1.83 | | | | 2 | |
|
MyDestination 2045 Fund | |
|
GS4 Class | |
2011 | | $ | 8.52 | | | $ | 0.07 | # | | $ | — | † | | $ | (0.38 | ) | | $ | (0.07 | ) | | $ | (0.18 | ) | | $ | 7.96 | | | | (3.63 | )% | | $ | 89,954 | | | | 0.20 | % | | | 0.29 | % | | | 0.87 | % | | | 25 | % |
2010 | | | 7.38 | | | | 0.08 | # | | | — | † | | | 1.16 | | | | (0.07 | ) | | | (0.03 | ) | | | 8.52 | | | | 16.80 | | | | 75,803 | | | | 0.20 | | | | 0.30 | | | | 1.08 | | | | 1 | |
2009 | | | 5.75 | | | | 0.08 | # | | | — | † | | | 1.67 | | | | (0.09 | ) | | | (0.03 | ) | | | 7.38 | | | | 30.71 | | | | 44,159 | | | | 0.20 | | | | 0.41 | | | | 1.23 | | | | 7 | |
2008 | | | 10.12 | | | | 0.16 | # | | | 0.10 | | | | (4.34 | ) | | | (0.06 | ) | | | (0.23 | ) | | | 5.75 | | | | (40.29 | ) | | | 17,998 | | | | 0.20 | | | | 0.79 | | | | 1.97 | | | | 5 | |
2007 | | | 10.00 | | | | 0.17 | # | | | 1.37 | | | | (1.09 | ) | | | (0.28 | ) | | | (0.05 | ) | | | 10.12 | | | | 4.46 | | | | 11,659 | | | | 0.19 | | | | 1.48 | | | | 1.60 | | | | 9 | |
| † | Amount represents less than $0.005 per share. |
| # | Calculated using the average shares outstanding method. |
| (1) | Recognition of net investment income by the Fund is affected by the timing of the declaration of dividends by the underlying investment companies in which the Fund invests. |
| (2) | Includes dividends paid from the short-term portion of capital gain distributions received from affiliated Funds. |
| (3) | Does not include expenses of the investment companies in which the Fund invests. |
| (4) | The ratio excludes expenses waived/reimbursed net of amount recaptured. |
| (5) | The ratio includes expenses waived/reimbursed net of amount recaptured and fees paid indirectly, where applicable; if expenses waived/reimbursed net of amount recaptured and fees paid indirectly were excluded, the ratio would have been lower than the ratio shown. |
See Notes to Financial Statements.
31
Conservative Allocation Fund
The Fund, through investments in the underlying Select Funds, combines a greater percentage of exposure to fixed income securities with a smaller percentage to equity securities. The Fund has a target of, but is not limited to, an asset allocation of 60% Fixed Income Select Funds, 19% U.S. Equity Select Funds, 6% Non-U.S. Equity Select Fund and 15% Real Return Select Fund.
The Fund is a fund of funds, and its performance is based on the performance of the underlying Select Funds. The Fund generated a positive absolute return of 1.71% for the one-year period ended December 31, 2011, benefiting from the positive performance of the underlying Fixed Income Select Funds and Real Return Select Fund. The Fund’s absolute return was most positively influenced by its exposure to the Inflation Protected Bond Fund and followed by exposure to the Low-Duration Bond Fund and Small Cap Equity Fund.
Sluggish U.S. growth forecasts, coupled with the Federal Reserve’s low interest rate policy provided an ideal environment for bonds, which contributed a modest absolute benefit to performance. Bonds outpaced U.S. equities on a broad measure by 5.73%, as represented by the Barclays Capital U.S. Aggregate Bond Index which returned 7.84% compared to the S&P 500® Index which returned 2.11% in 2011, respectively. Representing the preferred safe haven for investors, long-term U.S. government bonds dominated in asset performance for 2011. Leading into the fourth quarter, reports of improvement in economic data resulted in an optimistic shift in investor sentiment. Consequently, U.S. equities advanced and produced impressive double-digit results for the fourth quarter; however, the positive performance only helped to offset losses suffered during the third quarter of 2011.
Continued concerns over the Eurozone sovereign debt crisis and inflationary worries within China’s economy contributed to investor pessimism and a reduced appetite for markets with a higher perception of risk. Both international developed and emerging markets suffered a crushing third quarter correction which led to double-digit losses for the year, as represented by the MSCI EAFE Index (Net) which returned -12.14% and the MSCI Emerging Markets Index (Net) which returned -18.42%, both for the one-year period ended December 31, 2011, respectively. Elevated levels of volatility and asset class correlation were clearly evident throughout the year as macro-economic developments dictated market performance.
The Fund underperformed its composite benchmark by 0.67% in 2011. While the Inflation Protected Bond Fund was the largest contributor to the Fund’s absolute return, it served as the leading driver in the Fund’s relative underperformance during the year. At a target weight of 58%, the Low-Duration Bond Fund finished flat relative to its benchmark for 2011. The contribution to relative performance was negative overall for Equity Select Funds, with the Growth Equity Fund being the largest single detractor to relative performance. The Small Cap Equity Fund provided benefit by contributing a marginal offset to the Fund’s underperformance.
The Fund attempts to achieve its objective by investing in the Select Funds. By investing in the Fund you will also incur the expenses and risks of the underlying Select Funds. The principal risks of the Fund will change depending on the asset mix of the Select Funds in which it invests. You may directly invest in the Select Funds. The Fund’s value will go up and down in response to changes in the share prices of the investments that it owns. It is possible to lose money by investing in the Fund. The Fund may be suitable for investors who have a short- to medium-time investment horizon, possess a relatively low tolerance for risk and want some exposure to the growth potential of the stock market tempered by a larger allocation to short-term, fixed-income securities. This Fund is subject to interest rate risk. Meaning, when interest rates rise, the value of the existing bonds decrease and vice versa. Changes in interest rates have a bigger impact on long duration holdings than on short duration holdings.
Please see page 35 for information regarding specific portfolio allocations. Portfolio holdings are subject to change and risk at any time.
32
Conservative Allocation Fund
| | | | | | | | |
Average Annual Total Returns as of 12/31/11 | |
| | | GS4
Class* | | | Benchmark** | |
One Year | | | 1.71 | % | | | 2.38 | % |
Five Year | | | 3.29 | % | | | 3.61 | % |
Ten Year | | | 3.84 | % | | | 4.10 | % |
Since Inception | | | 3.79 | % | | | 4.10 | % |
Inception Date | | | 08/27/01 | | | | | |
Total Fund Operating Expenses (April 30, 2011 Prospectus, as amended on September 1, 2011)(1) | | | 0.90 | % | | | | |
| (1) | The Fund’s shareholders indirectly bear the expenses of the GS4 Class shares of the Select Funds in which the Fund invests. Current information regarding the Fund’s Operating Expenses can be found in the Financial Highlights. |
The performance data quoted represents past performance and does not guarantee future results. Current performance may be lower or higher. Performance data current to the most recent month-end may be obtained at www.GuideStoneFunds.org. The investment return and principal value of an investment will fluctuate so that shares, when redeemed, may be worth more or less than their original cost.
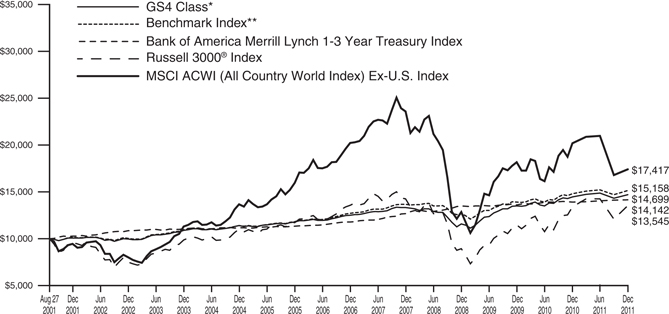
The graph compares the results of a hypothetical $10,000 investment in the GS4 Class of the Fund since August 27, 2001 (commencement of operations), with all dividends and capital gains reinvested, with the Fund’s weighted composite benchmark index.
| * | These returns reflect expense waivers by the Fund’s investment adviser. Without these waivers, returns would have been lower. Returns shown do not reflect the deduction of taxes that a shareholder would pay on Fund distributions or the redemption of Fund shares. |
| ** | Represents a composite index consisting of the Bank of America Merrill Lynch 1-3 Year Treasury Index, the Barclays Capital U.S. TIPS Index, the Russell 3000® Index and the MSCI ACWI (All Country World Index) Ex-U.S. Index, weighted 60.00%, 15.00%, 18.88% and 6.12%, respectively. |
The Bank of America Merrill Lynch 1-3 Year Treasury Index is composed of all U.S. Treasury notes and bonds with maturities greater than or equal to one year and less than three years.
The Barclays Capital U.S. TIPS Index measures the performance of the U.S. Treasury Inflation Protected Securities (“TIPS”) market and includes TIPS with one or more years remaining until maturity with total outstanding issue size of $500 million or more.
The Russell 3000® Index measures the performance of the 3,000 largest U.S. companies based on total market capitalization, which represents approximately 98% of the investable U.S. equity market.
The MSCI ACWI (All Country World Index) Ex-U.S. Index is a free float-adjusted market capitalization index that is designed to measure equity market performance in the global developed (excluding U.S.) and emerging markets.
Unlike a mutual fund, the performance of an index assumes no taxes, transaction costs, management fees or other expenses.
33
| | |
| CONSERVATIVE ALLOCATION FUND | | |
| SCHEDULE OF INVESTMENTS | | December 31, 2011 |
| | | | | | | | |
| | | Shares | | | Value | |
MUTUAL FUNDS — 100.0% | | | | | | | | |
GuideStone Money Market Fund (GS4 Class)¥ | | | 6,146,479 | | | $ | 6,146,479 | |
GuideStone Low-Duration Bond Fund (GS4 Class)¥ | | | 12,965,211 | | | | 171,140,785 | |
GuideStone Inflation Protected Bond Fund (GS4 Class)¥ | | | 3,806,254 | | | | 42,477,796 | |
GuideStone Defensive Market Strategies Fund (GS4 Class)¥ | | | 2,126,153 | | | | 21,686,756 | |
GuideStone Value Equity Fund (GS4 Class)¥ | | | 1,129,227 | | | | 15,809,176 | |
GuideStone Growth Equity Fund (GS4 Class)¥ | | | 806,478 | | | | 15,024,688 | |
GuideStone Small Cap Equity Fund (GS4 Class)¥ | | | 245,868 | | | | 3,594,583 | |
GuideStone International Equity Fund (GS4 Class)¥ | | | 1,529,074 | | | | 17,324,412 | |
| | | | | | | | |
Total Mutual Funds
(Cost $276,433,930) | | | | | | | 293,204,675 | |
| | | | | | | | |
TOTAL INVESTMENTS — 100.0%
(Cost $276,433,930) | | | | 293,204,675 | |
| | |
Other Assets in Excess of Liabilities — 0.0% | | | | | | | 31,329 | |
| | | | | | | | |
NET ASSETS — 100.0% | | | | | | $ | 293,236,004 | |
| | | | | | | | |
Please see abbreviation and footnote definitions beginning on page 200.
| | | | |
| PORTFOLIO SUMMARY (based on net assets) | |
| | | % | |
Bond Funds | | | 72.9 | |
Domestic Equity Funds | | | 19.1 | |
International Equity Fund | | | 5.9 | |
Futures Contracts | | | 2.1 | |
Money Market Fund | | | 2.1 | |
| | | | |
| | | 102.1 | |
| | | | |
VALUATION HIERARCHY
The following is a summary of the inputs used, as of December 31, 2011, in valuing the Fund’s investments carried at fair value:
| | | | | | | | | | | | | | | | |
| | | Total Value | | | Level 1
Quoted Prices | | | Level 2
Other
Significant
Observable
Inputs | | | Level 3
Significant
Unobservable
Inputs | |
Assets: | | | | | | | | | | | | | | | | |
Investments in Securities: | | | | | | | | | | | | | | | | |
Mutual Funds | | $ | 293,204,675 | | | $ | 293,204,675 | | | $ | — | | | $ | — | |
| | | | | | | | | | | | | | | | |
Total Assets — Investments in Securities | | $ | 293,204,675 | | | $ | 293,204,675 | | | $ | — | | | $ | — | |
| | | | | | | | | | | | | | | | |
| | | | |
Other Financial Instruments*** | | | | | | | | | | | | | | | | |
Futures Contracts | | $ | 11,485 | | | $ | 11,485 | | | $ | — | | | $ | — | |
| | | | | | | | | | | | | | | | |
Total Assets — Other Financial Instruments | | $ | 11,485 | | | $ | 11,485 | | | $ | — | | | $ | — | |
| | | | | | | | | | | | | | | | |
| *** | Other financial instruments are derivative instruments not reflected in the Schedule of Investments, such as futures, forwards and swap contracts, which are valued at the unrealized appreciation (depreciation) on the investment. Details of these investments can be found in the Financial Statements. |
|
| See Notes to Financial Statements. |
34 |
Balanced Allocation Fund
The Fund, through investments in the underlying Select Funds, combines approximately equal percentages to equity securities and fixed income securities. The Fund has a target of, but is not limited to, an asset allocation of 50% Fixed Income Select Funds, 36% U.S. Equity Select Funds and 14% Non-U.S. Equity Select Fund.
The Fund is a fund of funds, and its performance is based on the performance of the underlying Select Funds. The Fund generated a modest return of 1.01% for the one-year period ended December 31, 2011, benefiting from positive absolute performance from all of the underlying Fixed Income Select Funds. The Fund’s absolute return was most positively influenced by its exposure to the Medium-Duration Bond Fund and Extended-Duration Bond Fund, which represented over half of the overall fixed income allocation.
Sluggish U.S. growth forecasts, coupled with the Federal Reserve’s low interest rate policy provided an ideal environment for bonds, which contributed a modest absolute benefit to performance. Bonds outpaced equities on a broad measure by 5.73%, as represented by the Barclays Capital U.S. Aggregate Bond Index which returned 7.84% and the S&P 500® Index which returned 2.11% in 2011, respectively. Representing the preferred safe haven for investors, long-term U.S. government bonds dominated in asset performance for 2011. Leading into the fourth quarter, reports of improvement in economic data resulted in an optimistic shift in investor sentiment. Consequently, U.S. equities advanced and produced impressive double-digit results for the fourth quarter; however, the positive performance only helped to offset losses suffered during the third quarter of 2011.
Continued concerns over the Eurozone sovereign debt crisis and inflationary worries within China’s economy contributed to investor pessimism and a reduced appetite for markets with a higher perception of risk. Both international developed and emerging markets suffered a crushing third quarter correction which led to double-digit losses for the year, as represented by the MSCI EAFE Index (Net) which returned -12.14% and the MSCI Emerging Markets Index (Net) which returned -18.42%, both for the one-year period ended December 31, 2011, respectively. Elevated levels of volatility and asset class correlation were clearly evident throughout the year as macro-economic developments dictated market performance.
The Fund underperformed its composite benchmark by 1.49% in 2011, suffering the most from its overall exposure to the Fixed Income Select Funds. Notably, the primary source of underperformance came from the Extended–Duration Bond Fund allocation. Within the U.S. Equity Select Funds, the Growth Equity Fund was a detractor as its performance trailed due to security selection. The Small Cap Equity Fund substantially outperformed its benchmark and provided the Fund’s largest relative benefit during the year.
The Fund attempts to achieve its objective by investing in the Select Funds. By investing in the Fund you will also incur the expenses and risks of the underlying Select Funds. The principal risks of the Fund will change depending on the asset mix of the Select Funds in which it invests. You may directly invest in the Select Funds. The Fund’s value will go up and down in response to changes in the share prices of the investments that it owns. It is possible to lose money by investing in the Fund. This Fund may be suitable for investors who have a medium- to long-term investment horizon, possess a moderate tolerance for risk, and seek to participate in the return potential of stocks but want to achieve this result more slowly and with less volatility through a balanced allocation of fixed-income and equity investments.
Please see page 38 for information regarding specific portfolio allocations. Portfolio holdings are subject to change and risk at any time.
35
Balanced Allocation Fund
| | | | | | | | |
Average Annual Total Returns as of 12/31/11 | |
| | | GS4
Class* | | | Benchmark** | |
One Year | | | 1.01 | % | | | 2.50 | % |
Five Year | | | 2.74 | % | | | 3.31 | % |
Ten Year | | | 4.95 | % | | | 5.41 | % |
Since Inception | | | 4.73 | % | | | 5.18 | % |
Inception Date | | | 08/27/01 | | | | | |
Total Fund Operating Expenses (April 30, 2011 Prospectus, as amended on September 1, 2011)(1) | | | 1.02 | % | | | | |
| (1) | The Fund’s shareholders indirectly bear the expenses of the GS4 Class shares of the Select Funds in which the Fund invests. Current information regarding the Fund’s Operating Expenses can be found in the Financial Highlights. |
The performance data quoted represents past performance and does not guarantee future results. Current performance may be lower or higher. Performance data current to the most recent month-end may be obtained at www.GuideStoneFunds.org. The investment return and principal value of an investment will fluctuate so that shares, when redeemed, may be worth more or less than their original cost.
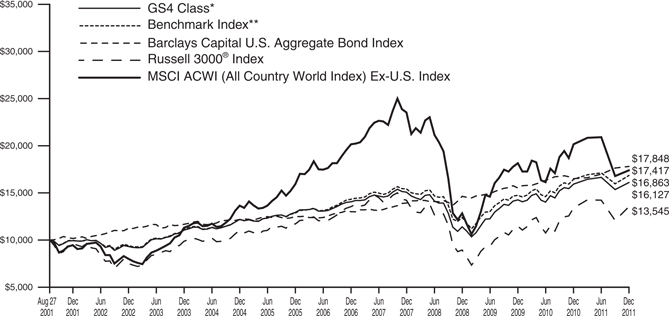
The graph compares the results of a hypothetical $10,000 investment in the GS4 Class of the Fund since August 27, 2001 (commencement of operations), with all dividends and capital gains reinvested, with the Fund’s weighted composite benchmark index.
| * | These returns reflect expense waivers by the Fund’s investment adviser. Without these waivers, returns would have been lower. Returns shown do not reflect the deduction of taxes that a shareholder would pay on Fund distributions or the redemption of Fund shares. |
| **** | Represents a composite index consisting of the Barclays Capital U.S. Aggregate Bond Index, the Russell 3000® Index and the MSCI ACWI (All Country World Index) Ex-U.S. Index, weighted 50%, 36% and 14%, respectively. |
The Barclays Capital U.S. Aggregate Bond Index represents securities that are SEC-registered, taxable and dollar denominated. The index covers the U.S. investment grade fixed-rate bond market, with index components for government and corporate securities, mortgage pass-through securities, and asset-backed securities.
The Russell 3000® Index measures the performance of the 3,000 largest U.S. companies based on total market capitalization, which represents approximately 98% of the investable U.S. equity market.
The MSCI ACWI (All Country World Index) Ex-U.S. Index is a free float-adjusted market capitalization index that is designed to measure equity market performance in the global developed (excluding U.S.) and emerging markets.
Unlike a mutual fund, the performance of an index assumes no taxes, transaction costs, management fees or other expenses.
36
| | |
| BALANCED ALLOCATION FUND | | |
| SCHEDULE OF INVESTMENTS | | December 31, 2011 |
| | | | | | | | |
| | | Shares | | | Value | |
MUTUAL FUNDS — 99.9% | | | | | | | | |
GuideStone Money Market Fund (GS4 Class)¥ | | | 27,644,304 | | | $ | 27,644,304 | |
GuideStone Low-Duration Bond Fund (GS4 Class)¥ | | | 11,978,745 | | | | 158,119,436 | |
GuideStone Medium-Duration Bond Fund (GS4 Class)¥ | | | 15,975,507 | | | | 224,775,387 | |
GuideStone Extended-Duration Bond Fund (GS4 Class)¥ | | | 5,368,099 | | | | 91,687,129 | |
GuideStone Global Bond Fund (GS4 Class)¥ | | | 5,434,870 | | | | 52,881,287 | |
GuideStone Defensive Market Strategies Fund (GS4 Class)¥ | | | 10,611,577 | | | | 108,238,087 | |
GuideStone Value Equity Fund (GS4 Class)¥ | | | 9,347,964 | | | | 130,871,501 | |
GuideStone Growth Equity Fund (GS4 Class)¥ | | | 6,802,426 | | | | 126,729,193 | |
GuideStone Small Cap Equity Fund (GS4 Class)¥ | | | 2,006,225 | | | | 29,331,011 | |
GuideStone International Equity Fund (GS4 Class)¥ | | | 12,891,706 | | | | 146,063,033 | |
| | | | | | | | |
Total Mutual Funds
(Cost $1,062,122,860) | | | | | | | 1,096,340,368 | |
| | | | | | | | |
| |
TOTAL INVESTMENTS — 99.9%
(Cost $1,062,122,860) | | | | 1,096,340,368 | |
| | |
Other Assets in Excess of Liabilities — 0.1% | | | | | | | 934,631 | |
| | | | | | | | |
NET ASSETS — 100.0% | | | | | | $ | 1,097,274,999 | |
| | | | | | | | |
Please see abbreviation and footnote definitions beginning on page 200.
PORTFOLIO SUMMARY (based on net assets)
| | | | |
| | | % | |
Bond Funds | | | 48.1 | |
Domestic Equity Funds | | | 36.0 | |
International Equity Fund | | | 13.3 | |
Money Market Fund | | | 2.5 | |
Futures Contracts | | | 2.3 | |
| | | | |
| | | 102.2 | |
| | | | |
VALUATION HIERARCHY
The following is a summary of the inputs used, as of December 31, 2011, in valuing the Fund’s investments carried at fair value:
| | | | | | | | | | | | | | | | |
| | | Total Value | | | Level 1
Quoted Prices | | | Level 2
Other
Significant
Observable
Inputs | | | Level 3
Significant
Unobservable
Inputs | |
Assets: | | | | | | | | | | | | | | | | |
Investments in Securities: | | | | | | | | | | | | | | | | |
Mutual Funds | | $ | 1,096,340,368 | | | $ | 1,096,340,368 | | | $ | — | | | $ | — | |
| | | | | | | | | | | | | | | | |
Total Assets — Investments in Securities | | $ | 1,096,340,368 | | | $ | 1,096,340,368 | | | $ | — | | | $ | — | |
| | | | | | | | | | | | | | | | |
| | | | |
Other Financial Instruments*** | | | | | | | | | | | | | | | | |
Futures Contracts | | $ | 209,166 | | | $ | 209,166 | | | $ | — | | | $ | — | |
| | | | | | | | | | | | | | | | |
Total Assets — Other Financial Instruments | | $ | 209,166 | | | $ | 209,166 | | | $ | — | | | $ | — | |
| | | | | | | | | | | | | | | | |
| *** | Other financial instruments are derivative instruments not reflected in the Schedule of Investments, such as futures, forwards and swap contracts, which are valued at the unrealized appreciation (depreciation) on the investment. Details of these investments can be found in the Financial Statements. |
|
| See Notes to Financial Statements. |
37 |
Growth Allocation Fund
The Fund, through investments in the underlying Select Funds, combines a greater percentage of exposure to equity securities with a smaller percentage to fixed income securities. The Fund has a target of, but is not limited to, an asset allocation of 25% Fixed Income Select Funds, 49% U.S. Equity Select Funds and 26% Non-U.S. Equity Select Fund.
The Fund is a fund of funds, and its performance is based on the performance of the underlying Select Funds. The Fund generated a return of -2.39% for the one-year period ended December 31, 2011, as all detraction from absolute performance came from the underlying Equity Select Funds. The Fund’s absolute returns were primarily influenced by its exposure to the Growth Equity Fund and International Equity Fund, which represented roughly two-thirds of the overall equity allocation.
Despite strong fourth quarter performance, equities accounted for the Fund’s total shortfall in absolute performance during the year. Sluggish U.S. growth forecasts, coupled with the Federal Reserve’s low interest rate policy provided an ideal environment for bonds which contributed a modest absolute benefit to performance, outpacing U.S. equities on a broad measure by 5.73%, as represented by the Barclays Capital U.S. Aggregate Bond Index which returned 7.84% and the S&P 500® Index which returned 2.11% in 2011, respectively. Representing the preferred safe haven for investors, long-term U.S. government bonds dominated in asset performance for 2011. Leading into the fourth quarter, reports of improvement in economic data resulted in an optimistic shift in investor sentiment. Consequently, U.S. equities advanced and produced impressive double-digit results for the fourth quarter; however, the positive performance only helped to offset losses suffered during the third quarter of 2011.
Continued concerns over the Eurozone sovereign debt crisis and inflationary worries within China’s economy contributed to investor pessimism and a reduced appetite for markets with a higher perception of risk. Both international developed and emerging International markets suffered a crushing third quarter correction which led to double-digit losses for the year, as represented by the MSCI EAFE Index (Net) which returned -12.14% and the MSCI Emerging Markets Index (Net) which returned -18.42%, both for the one-year period ended December 31, 2011, respectively. Elevated levels of volatility and asset class correlation were clearly evident throughout the year as macro-economic developments dictated market performance.
The Fund underperformed its composite benchmark by 1.43% in 2011. The largest detractor to the Fund’s relative performance was attributed to exposure to the Growth Equity Fund, which trailed its respective benchmark due to security selection. The Fund’s relative performance was positively impacted by exposure to the Small Cap Equity Fund, which benefited almost entirely from security selection, leading the Fund to outperform its respective benchmark.
The Fund attempts to achieve its objective by investing in the Select Funds. By investing in the Fund you will also incur the expenses and risks of the underlying Select Funds. The principal risks of the Fund will change depending on the asset mix of the Select Funds in which it invests. You may directly invest in the Select Funds. The Fund’s value will go up and down in response to changes in the share prices of the investments that it owns. It is possible to lose money by investing in the Fund. This Fund may be suitable for investors who have a long-term investment horizon, possess a relatively high tolerance for risk and seek to participate in the return potential of stocks at a slightly lower risk level than an all stock portfolio. Foreign securities may be subject to greater risk than domestic securities due to currency volatility, reduced market liquidity and political and economic instability. Small company stocks are subject to greater risk than large company stocks due to more volatility and less liquidity. This Fund is subject to interest rate risk. Meaning, when interest rates rise, the value of the existing bonds decrease and vice versa. Changes in interest rates have a bigger impact on long duration holdings than on short duration holdings.
Please see page 41 for information regarding specific portfolio allocations. Portfolio holdings are subject to change and risk at any time.
38
Growth Allocation Fund
| | | | | | | | |
Average Annual Total Returns as of 12/31/11 | |
| | | GS4
Class* | | | Benchmark** | |
One Year | | | -2.39 | % | | | -0.96 | % |
Five Year | | | 0.38 | % | | | 1.22 | % |
Ten Year | | | 4.13 | % | | | 4.84 | % |
Since Inception | | | 3.82 | % | | | 4.50 | % |
Inception Date | | | 08/27/01 | | | | | |
Total Fund Operating Expenses (April 30, 2011 Prospectus, as amended on September 1, 2011)(1) | | | 1.11 | % | | | | |
| (1) | The Fund’s shareholders indirectly bear the expenses of the GS4 Class shares of the Select Funds in which the Fund invests. Current information regarding the Fund’s Operating Expenses can be found in the Financial Highlights. |
The performance data quoted represents past performance and does not guarantee future results. Current performance may be lower or higher. Performance data current to the most recent month-end may be obtained at www.GuideStoneFunds.org. The investment return and principal value of an investment will fluctuate so that shares, when redeemed, may be worth more or less than their original cost.
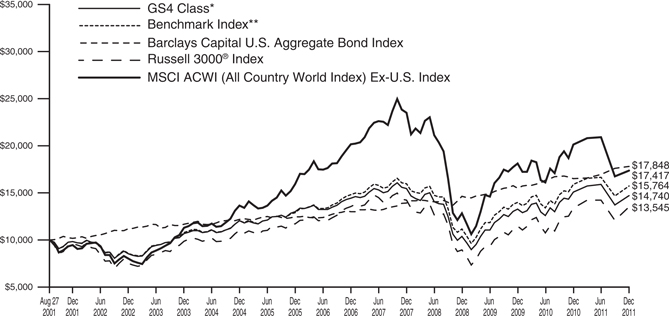
The graph compares the results of a hypothetical $10,000 investment in the GS4 Class of the Fund since August 27, 2001 (commencement of operations), with all dividends and capital gains reinvested, with the Fund’s weighted composite benchmark index.
| * | These returns reflect expense waivers by the Fund’s investment adviser. Without these waivers, returns would have been lower. Returns shown do not reflect the deduction of taxes that a shareholder would pay on Fund distributions or the redemption of Fund shares. |
| ** | Represents a composite index consisting of the Barclays Capital U.S. Aggregate Bond Index, the Russell 3000® Index, and the MSCI ACWI (All Country World Index) Ex-U.S. Index, weighted 25.00%, 48.75% and 26.25%, respectively. |
The Barclays U.S. Capital Aggregate Bond Index represents securities that are SEC-registered, taxable and dollar denominated. The index covers the U.S. investment grade fixed-rate bond market, with index components for government and corporate securities, mortgage pass-through securities and asset-backed securities.
The Russell 3000® Index measures the performance of the 3,000 largest U.S. companies based on total market capitalization, which represents approximately 98% of the investable U.S. equity market.
The MSCI ACWI (All Country World Index) Ex-U.S. Index is a free float-adjusted market capitalization index that is designed to measure equity market performance in the global developed (excluding U.S.) and emerging markets.
Unlike a mutual fund, the performance of an index assumes no taxes, transaction costs, management fees or other expenses.
39
| | |
| GROWTH ALLOCATION FUND | | |
| SCHEDULE OF INVESTMENTS | | December 31, 2011 |
| | | | | | | | |
| | | Shares | | | Value | |
MUTUAL FUNDS — 99.8% | | | | | | | | |
GuideStone Money Market Fund (GS4 Class)¥ | | | 19,900,650 | | | $ | 19,900,650 | |
GuideStone Low-Duration Bond Fund (GS4 Class)¥ | | | 4,246,343 | | | | 56,051,733 | |
GuideStone Medium-Duration Bond Fund (GS4 Class)¥ | | | 5,669,799 | | | | 79,774,068 | |
GuideStone Extended-Duration Bond Fund (GS4 Class)¥ | | | 1,825,043 | | | | 31,171,733 | |
GuideStone Global Bond Fund (GS4 Class)¥ | | | 1,951,009 | | | | 18,983,314 | |
GuideStone Value Equity Fund (GS4 Class)¥ | | | 12,373,714 | | | | 173,231,995 | |
GuideStone Growth Equity Fund (GS4 Class)¥ | | | 8,996,932 | | | | 167,612,841 | |
GuideStone Small Cap Equity Fund (GS4 Class)¥ | | | 2,718,084 | | | | 39,738,385 | |
GuideStone International Equity Fund (GS4 Class)¥ | | | 17,271,832 | | | | 195,689,851 | |
| | | | | | | | |
Total Mutual Funds
(Cost $794,081,598) | | | | | | | 782,154,570 | |
| | | | | | | | |
| |
TOTAL INVESTMENTS — 99.8%
(Cost $794,081,598) | | | | 782,154,570 | |
| | |
Other Assets in Excess of Liabilities — 0.2% | | | | | | | 1,189,466 | |
| | | | | | | | |
NET ASSETS — 100.0% | | | | | | $ | 783,344,036 | |
| | | | | | | | |
Please see abbreviation and footnote definitions beginning on page 200.
PORTFOLIO SUMMARY (based on net assets)
| | | | |
| | | % | |
Domestic Equity Funds | | | 48.6 | |
International Equity Fund | | | 25.0 | |
Bond Funds | | | 23.7 | |
Futures Contracts | | | 2.5 | |
Money Market Fund | | | 2.5 | |
| | | | |
| | | 102.3 | |
| | | | |
VALUATION HIERARCHY
The following is a summary of the inputs used, as of December 31, 2011, in valuing the Fund’s investments carried at fair value:
| | | | | | | | | | | | | | | | |
| | | Total Value | | | Level 1
Quoted Prices | | | Level 2
Other
Significant
Observable
Inputs | | | Level 3
Significant
Unobservable
Inputs | |
Assets: | | | | | | | | | | | | | | | | |
Investments in Securities: | | | | | | | | | | | | | | | | |
Mutual Funds | | $ | 782,154,570 | | | $ | 782,154,570 | | | $ | — | | | $ | — | |
| | | | | | | | | | | | | | | | |
Total Assets — Investments in Securities | | $ | 782,154,570 | | | $ | 782,154,570 | | | $ | — | | | $ | — | |
| | | | | | | | | | | | | | | | |
| | | | |
Other Financial Instruments*** | | | | | | | | | | | | | | | | |
Futures Contracts | | $ | 277,548 | | | $ | 277,548 | | | $ | — | | | $ | — | |
| | | | | | | | | | | | | | | | |
Total Assets — Other Financial Instruments | | $ | 277,548 | | | $ | 277,548 | | | $ | — | | | $ | — | |
| | | | | | | | | | | | | | | | |
| *** | Other financial instruments are derivative instruments not reflected in the Schedule of Investments, such as futures, forwards and swap contracts, which are valued at the unrealized appreciation (depreciation) on the investment. Details of these investments can be found in the Financial Statements. |
|
| See Notes to Financial Statements. |
40 |
Aggressive Allocation Fund
The Fund, through investments in the underlying Select Funds, combines a greater percentage of exposure to U.S. equity securities with a smaller percentage to non-U.S. equity securities. The Fund has a target of, but is not limited to, an asset allocation of 63% U.S. Equity Select Funds and 35% Non-U.S. Select Fund, with a small allocation of 2% to Fixed Income Select Fund.
The Fund is a fund of funds, and its performance is based on the performance of the underlying Select Funds. The Fund generated a return of -5.14% for the one-year period ended December 31, 2011, as absolute performance was almost entirely attributable to exposure to the International Equity Fund, which represented a target weight of 35% of the Fund.
Despite strong fourth quarter performance, equities accounted for the Fund’s total performance shortfall during the year. Leading into the fourth quarter, reports of improvement in economic data resulted in an optimistic shift in investor sentiment. Consequently, U.S. equities advanced and produced impressive double-digit results for the fourth quarter; however, the positive performance only helped to offset losses suffered during the third quarter of 2011. Overall, the U.S. equity market returned 2.11%, as represented for the S&P 500® Index for 2011.
Continued concerns over the Eurozone sovereign debt crisis and inflationary worries within China’s economy contributed to investor pessimism and a reduced appetite for markets with a higher perception of risk. Both international developed and emerging markets suffered a crushing third quarter correction which led to double-digit losses for the year, as represented by the MSCI EAFE Index (Net) which returned -12.14% and the MSCI Emerging Markets Index (Net) which returned -18.42%, both for the one-year period ended December 31, 2011, respectively. Elevated levels of volatility and asset class correlation were clearly evident throughout the year as macro-economic developments dictated market performance.
The Fund underperformed its composite benchmark by 1.01% in 2011. The Growth Equity Fund and International Equity Fund served as key drivers in the Fund’s relative underperformance for the year. The Growth Equity Fund, the largest detractor to relative performance, suffered the most due to security selection. Relative benefit was produced by the Small Cap Equity Fund, which outperformed its respective benchmark.
The Fund attempts to achieve its objective by investing in the Select Funds. By investing in the Fund you will also incur the expenses and risks of the underlying Select Funds. The principal risks of the Fund will change depending on the asset mix of the Select Funds in which it invests. You may directly invest in the Select Funds. The Fund’s value will go up and down in response to changes in the share prices of the investments that it owns. It is possible to lose money by investing in the Fund. This Fund may be suitable for investors who have a long-term investment horizon, possess a relatively high tolerance for risk and want to diversify by adding an aggressive investment option that combines U.S. and international stocks. Foreign securities may be subject to greater risk than domestic securities due to currency volatility, reduced market liquidity and political and economic instability. Small company stocks are subject to greater risk than large company stocks due to more volatility and less liquidity.
Please see page 44 for information regarding specific portfolio allocations. Portfolio holdings are subject to change and risk at any time.
41
Aggressive Allocation Fund
| | | | | | | | |
Average Annual Total Returns as of 12/31/11 | |
| | | GS4
Class* | | | Benchmark** | |
One Year | | | -5.14 | % | | | -4.13 | % |
Five Year | | | -2.02 | % | | | -1.02 | % |
Ten Year | | | 3.18 | % | | | 4.10 | % |
Since Inception | | | 2.77 | % | | | 3.64 | % |
Inception Date | | | 08/27/01 | | | | | |
Total Fund Operating Expenses (April 30, 2011 Prospectus, as amended on September 1, 2011)(1) | | | 1.21 | % | | | | |
| (1) | The Fund’s shareholders indirectly bear the expenses of the GS4 Class shares of the Select Funds in which the Fund invests. Current information regarding the Fund’s Operating Expenses can be found in the Financial Highlights. |
The performance data quoted represents past performance and does not guarantee future results. Current performance may be lower or higher. Performance data current to the most recent month-end may be obtained at www.GuideStoneFunds.org. The investment return and principal value of an investment will fluctuate so that shares, when redeemed, may be worth more or less than their original cost.
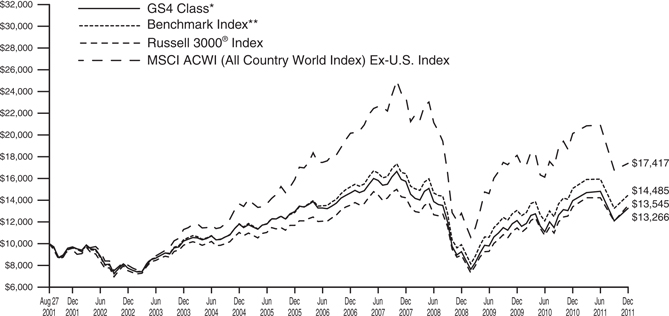
The graph compares the results of a hypothetical $10,000 investment in the GS4 Class of the Fund since August 27, 2001 (commencement of operations), with all dividends and capital gains reinvested, with the Fund’s weighted composite benchmark index.
| * | These returns reflect expense waivers by the Fund’s investment adviser. Without these waivers, returns would have been lower. Returns shown do not reflect the deduction of taxes that a shareholder would pay on Fund distributions or the redemption of Fund shares. |
| ** | Represents a composite index consisting of the Russell 3000® Index and the MSCI ACWI (All Country World Index) Ex-U.S. Index, weighted 65% and 35%, respectively. |
The Russell 3000® Index measures the performance of the 3,000 largest U.S. companies based on total market capitalization, which represents approximately 98% of the investable U.S. equity market.
The MSCI ACWI (All Country World Index) Ex-U.S. Index is a free float-adjusted market capitalization index that is designed to measure equity market performance in the global developed (excluding U.S.) and emerging markets.
Unlike a mutual fund, the performance of an index assumes no taxes, transaction costs, management fees or other expenses.
42
| | |
| AGGRESSIVE ALLOCATION FUND | | |
| SCHEDULE OF INVESTMENTS | | December 31, 2011 |
| | | | | | | | |
| | | Shares | | | Value | |
MUTUAL FUNDS — 100.2% | |
GuideStone Money Market Fund (GS4 Class)¥ | | | 16,535,540 | | | $ | 16,535,540 | |
GuideStone Value Equity Fund (GS4 Class)¥ | | | 14,080,313 | | | | 197,124,381 | |
GuideStone Growth Equity Fund (GS4 Class)¥ | | | 10,353,641 | | | | 192,888,334 | |
GuideStone Small Cap Equity Fund (GS4 Class)¥ | | | 3,025,235 | | | | 44,228,930 | |
GuideStone International Equity Fund (GS4 Class)¥ | | | 19,916,436 | | | | 225,653,215 | |
Total Mutual Funds
(Cost $718,507,624) | | | | | | | 676,430,400 | |
| |
TOTAL INVESTMENTS — 100.2%
(Cost $718,507,624) | | | | 676,430,400 | |
| | |
Liabilities in Excess of Other Assets — (0.2)% | | | | | | | (1,640,613 | ) |
NET ASSETS — 100.0% | | | | | | $ | 674,789,787 | |
| | | | | | | | |
Please see abbreviation and footnote definitions beginning on page 200.
PORTFOLIO SUMMARY (based on net assets)
| | | | |
| | | % | |
Domestic Equity Funds | | | 64.4 | |
International Equity Fund | | | 33.4 | |
Money Market Fund | | | 2.4 | |
Futures Contracts | | | 2.2 | |
| | | | |
| | | 102.4 | |
| | | | |
VALUATION HIERARCHY
The following is a summary of the inputs used, as of December 31, 2011, in valuing the Fund’s investments carried at fair value:
| | | | | | | | | | | | | | | | |
| | | Total Value | | | Level 1
Quoted Prices | | | Level 2
Other
Significant
Observable
Inputs | | | Level 3
Significant
Unobservable
Inputs | |
Assets: | | | | | | | | | | | | | | | | |
Investments in Securities: | | | | | | | | | | | | | | | | |
Mutual Funds | | $ | 676,430,400 | | | $ | 676,430,400 | | | $ | — | | | $ | — | |
| | | | | | | | | | | | | | | | |
Total Assets — Investments in Securities | | $ | 676,430,400 | | | $ | 676,430,400 | | | $ | — | | | $ | — | |
| | | | | | | | | | | | | | | | |
| | | | |
Other Financial Instruments*** | | | | | | | | | | | | | | | | |
Futures Contracts | | $ | 389,119 | | | $ | 389,119 | | | $ | — | | | $ | — | |
| | | | | | | | | | | | | | | | |
Total Assets — Other Financial Instruments | | $ | 389,119 | | | $ | 389,119 | | | $ | — | | | $ | — | |
| | | | | | | | | | | | | | | | |
| *** | Other financial instruments are derivative instruments not reflected in the Schedule of Investments, such as futures, forwards and swap contracts, which are valued at the unrealized appreciation (depreciation) on the investment. Details of these investments can be found in the Financial Statements. |
|
| See Notes to Financial Statements. |
43 |
| | |
| STATEMENTS OF ASSETS AND LIABILITIES | | December 31, 2011 |
| | | | | | | | | | | | | | | | |
| | | Conservative
Allocation
Fund | | | Balanced
Allocation
Fund | | | Growth
Allocation
Fund | | | Aggressive
Allocation
Fund | |
Assets | | | | | | | | | | | | | | | | |
Investments in securities of affiliated issuers, at value (1) | | $ | 293,204,675 | | | $ | 1,096,340,368 | | | $ | 782,154,570 | | | $ | 676,430,400 | |
Cash collateral for derivatives | | | 153,200 | | | | 1,170,600 | | | | 1,261,400 | | | | 1,453,000 | |
Receivables: | | | | | | | | | | | | | | | | |
Dividends | | | 55 | | | | 203 | | | | 128 | | | | 100 | |
Investment securities sold | | | — | | | | — | | | | — | | | | 5,855 | |
Fund shares sold | | | 39,263 | | | | 16,236 | | | | 53,018 | | | | 38,448 | |
Variation margin on financial futures contracts | | | 13 | | | | 4,321 | | | | — | | | | — | |
Prepaid expenses and other assets | | | 10,125 | | | | 11,798 | | | | 10,442 | | | | 11,110 | |
| | | | | | | | | | | | | | | | |
Total Assets | | | 293,407,331 | | | | 1,097,543,526 | | | | 783,479,558 | | | | 677,938,913 | |
| | | | | | | | | | | | | | | | |
Liabilities | | | | | | | | | | | | | | | | |
Payables: | | | | | | | | | | | | | | | | |
Investment securities purchased | | | — | | | | — | | | | 108 | | | | 9,727 | |
Fund shares redeemed | | | 128,637 | | | | 137,898 | | | | 31,168 | | | | 3,041,705 | |
Variation margin on financial futures contracts | | | — | | | | — | | | | 6,289 | | | | 13,095 | |
Accrued expenses: | | | | | | | | | | | | | | | | |
Investment advisory fees | | | 8,474 | | | | 73,723 | | | | 52,187 | | | | 44,402 | |
Other expenses | | | 34,216 | | | | 56,906 | | | | 45,770 | | | | 40,197 | |
| | | | | | | | | | | | | | | | |
Total Liabilities | | | 171,327 | | | | 268,527 | | | | 135,522 | | | | 3,149,126 | |
| | | | | | | | | | | | | | | | |
Net Assets | | $ | 293,236,004 | | | $ | 1,097,274,999 | | | $ | 783,344,036 | | | $ | 674,789,787 | |
| | | | | | | | | | | | | | | | |
Net Assets Consist of: | | | | | | | | | | | | | | | | |
Paid-in-capital | | $ | 279,004,988 | | | $ | 1,067,696,296 | | | $ | 796,492,515 | | | $ | 715,737,871 | |
Undistributed net investment income | | | — | | | | 3,269 | | | | — | | | | 1,962 | |
Undistributed (accumulated) net realized gain (loss) on investments and futures transactions | | | (2,551,214 | ) | | | (4,851,240 | ) | | | (1,498,999 | ) | | | 738,059 | |
Net unrealized appreciation (depreciation) on investments and futures | | | 16,782,230 | | | | 34,426,674 | | | | (11,649,480 | ) | | | (41,688,105 | ) |
| | | | | | | | | | | | | | | | |
Net Assets | | $ | 293,236,004 | | | $ | 1,097,274,999 | | | $ | 783,344,036 | | | $ | 674,789,787 | |
| | | | | | | | | | | | | | | | |
Net Asset Value: | | | | | | | | | | | | | | | | |
$0.001 par value, unlimited shares authorized | | | | | | | | | | | | | | | | |
Net assets applicable to the GS4 Class | | $ | 293,236,004 | | | $ | 1,097,274,999 | | | $ | 783,344,036 | | | $ | 674,789,787 | |
| | | | | | | | | | | | | | | | |
GS4 shares outstanding | | | 25,053,908 | | | | 93,211,369 | | | | 67,517,434 | | | | 61,951,514 | |
| | | | | | | | | | | | | | | | |
Net asset value, offering and redemption price per GS4 share | | $ | 11.70 | | | $ | 11.77 | | | $ | 11.60 | | | $ | 10.89 | |
| | | | | | | | | | | | | | | | |
(1) Investments in securities of affiliated issuers, at cost | | $ | 276,433,930 | | | $ | 1,062,122,860 | | | $ | 794,081,598 | | | $ | 718,507,624 | |
| | | | | | | | | | | | | | | | |
See Notes to Financial Statements.
44
| | |
| STATEMENTS OF OPERATIONS | | For the Year Ended December 31, 2011 |
| | | | | | | | | | | | | | | | |
| | | Conservative
Allocation
Fund | | | Balanced
Allocation
Fund | | | Growth
Allocation
Fund | | | Aggressive
Allocation
Fund | |
Investment Income | | | | | | | | | | | | | | | | |
Income dividends received from affiliated funds | | $ | 4,398,734 | | | $ | 19,803,468 | | | $ | 11,387,546 | | | $ | 6,940,125 | |
Interest | | | 187 | | | | 101,817 | | | | 36,579 | | | | 1,301 | |
| | | | | | | | | | | | | | | | |
Total Investment Income | | | 4,398,921 | | | | 19,905,285 | | | | 11,424,125 | | | | 6,941,426 | |
| | | | | | | | | | | | | | | | |
Expenses | | | | | | | | | | | | | | | | |
Investment advisory fees | | | 284,603 | | | | 1,158,977 | | | | 845,984 | | | | 745,178 | |
Transfer agent fees: | | | | | | | | | | | | | | | | |
GS4 shares | | | 29,059 | | | | 53,036 | | | | 38,742 | | | | 35,237 | |
Custodian fees | | | 14,929 | | | | 33,325 | | | | 27,749 | | | | 22,557 | |
Accounting and administration fees | | | 23,192 | | | | 68,085 | | | | 52,653 | | | | 47,002 | |
Professional fees | | | 57,459 | | | | 57,457 | | | | 57,457 | | | | 57,797 | |
Blue sky fees: | | | | | | | | | | | | | | | | |
GS4 shares | | | 28,048 | | | | 38,438 | | | | 31,551 | | | | 28,588 | |
Shareholder reporting fees: | | | | | | | | | | | | | | | | |
GS4 shares | | | 26,207 | | | | 62,026 | | | | 45,306 | | | | 40,724 | |
Trustee expenses | | | 1,663 | | | | 6,534 | | | | 4,738 | | | | 4,101 | |
Line of credit facility fees | | | 3,226 | | | | 12,962 | | | | 9,637 | | | | 8,646 | |
Other expenses | | | 13,628 | | | | 14,725 | | | | 14,953 | | | | 14,199 | |
| | | | | | | | | | | | | | | | |
Total Expenses | | | 482,014 | | | | 1,505,565 | | | | 1,128,770 | | | | 1,004,029 | |
Expenses waived/reimbursed(1) | | | (148,927 | ) | | | (157,363 | ) | | | (133,967 | ) | | | (129,580 | ) |
| | | | | | | | | | | | | | | | |
Net Expenses | | | 333,087 | | | | 1,348,202 | | | | 994,803 | | | | 874,449 | |
| | | | | | | | | | | | | | | | |
Net investment income | | | 4,065,834 | | | | 18,557,083 | | | | 10,429,322 | | | | 6,066,977 | |
| | | | | | | | | | | | | | | | |
Realized and Unrealized Gain (Loss) | | | | | | | | | | | | | | | | |
Capital gain distributions received from affiliated funds | | | 1,107,068 | | | | 5,645,693 | | | | 2,075,526 | | | | 214,110 | |
Net realized gain (loss) on investment securities of affiliated issuers | | | (530,439 | ) | | | 11,536,671 | | | | 7,196,866 | | | | 6,621,505 | |
Net realized gain on investment securities of unaffiliated issuers | | | 16 | | | | 128,932 | | | | 54,256 | | | | 96 | |
Net realized gain (loss) on futures transactions | | | (474,091 | ) | | | 2,409,288 | | | | 798,906 | | | | 718,908 | |
| | | | | | | | | | | | | | | | |
Net realized gain | | | 102,554 | | | | 19,720,584 | | | | 10,125,554 | | | | 7,554,619 | |
| | | | | | | | | | | | | | | | |
Change in unrealized appreciation (depreciation) on investment securities of affiliated issuers | | | 283,227 | | | | (26,511,727 | ) | | | (39,273,899 | ) | | | (49,074,296 | ) |
Change in unrealized depreciation on investment securities of unaffiliated issuers | | | (38 | ) | | | (66,003 | ) | | | (20,061 | ) | | | (403 | ) |
Change in unrealized depreciation on futures | | | (47,086 | ) | | | (246,347 | ) | | | (130,695 | ) | | | (96,556 | ) |
| | | | | | | | | | | | | | | | |
Net change in unrealized appreciation (depreciation) | | | 236,103 | | | | (26,824,077 | ) | | | (39,424,655 | ) | | | (49,171,255 | ) |
| | | | | | | | | | | | | | | | |
Net Realized and Unrealized Gain (Loss) | | | 338,657 | | | | (7,103,493 | ) | | | (29,299,101 | ) | | | (41,616,636 | ) |
| | | | | | | | | | | | | | | | |
Net Increase (Decrease) in Net Assets Resulting from Operations | | $ | 4,404,491 | | | $ | 11,453,590 | | | $ | (18,869,779 | ) | | $ | (35,549,659 | ) |
| | | | | | | | | | | | | | | | |
| (1) | See Note 3a and 3c in Notes to Financial Statements. |
See Notes to Financial Statements.
45
STATEMENTS OF CHANGES IN NET ASSETS
| | | | | | | | | | | | | | | | |
| | | Conservative Allocation Fund | | | Balanced Allocation Fund | |
| | | For the Year Ended | | | For the Year Ended | |
| | | 12/31/11 | | | 12/31/10 | | | 12/31/11 | | | 12/31/10 | |
Operations: | | | | | | | | | | | | | | | | |
Net investment income | | $ | 4,065,834 | | | $ | 4,501,021 | | | $ | 18,557,083 | | | $ | 22,182,168 | |
Net realized gain on investment securities and futures transactions | | | 102,554 | | | | 6,404,018 | | | | 19,720,584 | | | | 10,625,849 | |
Net change in unrealized appreciation (depreciation) on investment securities and futures | | | 236,103 | | | | 9,213,337 | | | | (26,824,077 | ) | | | 94,062,971 | |
| | | | | | | | | | | | | | | | |
Net increase (decrease) in net assets resulting from operations | | | 4,404,491 | | | | 20,118,376 | | | | 11,453,590 | | | | 126,870,988 | |
| | | | | | | | | | | | | | | | |
Dividends and Distributions to Shareholders: | | | | | | | | | | | | | | | | |
Dividends from net investment income(1) | | | (4,792,770 | ) | | | (5,905,990 | ) | | | (23,283,553 | ) | | | (30,794,116 | ) |
Distributions from net realized capital gains | | | (4,309,760 | ) | | | (1,420,226 | ) | | | (19,005,488 | ) | | | — | |
| | | | | | | | | | | | | | | | |
Total dividends and distributions | | | (9,102,530 | ) | | | (7,326,216 | ) | | | (42,289,041 | ) | | | (30,794,116 | ) |
| | | | | | | | | | | | | | | | |
Capital Share Transactions: | | | | | | | | | | | | | | | | |
Proceeds from GS4 shares sold | | | 57,204,012 | | | | 37,177,857 | | | | 60,590,265 | | | | 44,223,390 | |
Reinvestment of dividends and distributions into GS4 shares | | | 9,098,316 | | | | 7,320,019 | | | | 42,263,421 | | | | 30,789,666 | |
Value of GS4 shares redeemed | | | (30,360,939 | ) | | | (80,047,873 | ) | | | (95,724,099 | ) | | | (183,100,371 | ) |
| | | | | | | | | | | | | | | | |
Net increase (decrease) from capital share transactions(2) | | | 35,941,389 | | | | (35,549,997 | ) | | | 7,129,587 | | | | (108,087,315 | ) |
| | | | | | | | | | | | | | | | |
Total increase (decrease) in net assets | | | 31,243,350 | | | | (22,757,837 | ) | | | (23,705,864 | ) | | | (12,010,443 | ) |
| | | | | | | | | | | | | | | | |
Net Assets: | | | | | | | | | | | | | | | | |
Beginning of Year | | | 261,992,654 | | | | 284,750,491 | | | | 1,120,980,863 | | | | 1,132,991,306 | |
| | | | | | | | | | | | | | | | |
End of Year* | | $ | 293,236,004 | | | $ | 261,992,654 | | | $ | 1,097,274,999 | | | $ | 1,120,980,863 | |
| | | | | | | | | | | | | | | | |
* Including undistributed net investment income | | $ | — | | | $ | 83,018 | | | $ | 3,269 | | | $ | 2,195,907 | |
| | | | | | | | | | | | | | | | |
| (1) | Includes dividends paid from the short-term portion of capital gain distributions received from affiliated funds. |
| (2) | See Note 7 in Notes to Financial Statements. |
See Notes to Financial Statements.
46
| | | | | | | | | | | | | | |
| Growth Allocation Fund | | | Aggressive Allocation Fund | |
| For the Year Ended | | | For the Year Ended | |
| 12/31/11 | | | 12/31/10 | | | 12/31/11 | | | 12/31/10 | |
| | | | | | | | | | | | | | | |
| $ | 10,429,322 | | | $ | 11,875,862 | | | $ | 6,066,977 | | | $ | 6,606,095 | |
| | 10,125,554 | | | | 14,704,282 | | | | 7,554,619 | | | | 10,815,244 | |
| | (39,424,655 | ) | | | 78,912,409 | | | | (49,171,255 | ) | | | 85,563,361 | |
| | | | | | | | | | | | | | |
| | (18,869,779 | ) | | | 105,492,553 | | | | (35,549,659 | ) | | | 102,984,700 | |
| | | | | | | | | | | | | | |
| | | | | | | | | | | | | | | |
| | (11,523,090 | ) | | | (17,932,584 | ) | | | (6,067,329 | ) | | | (6,611,145 | ) |
| | (13,505,147 | ) | | | (5,229,092 | ) | | | (11,387,493 | ) | | | (7,518,944 | ) |
| | | | | | | | | | | | | | |
| | (25,028,237 | ) | | | (23,161,676 | ) | | | (17,454,822 | ) | | | (14,130,089 | ) |
| | | | | | | | | | | | | | |
| | | | | | | | | | | | | | | |
| | 33,158,753 | | | | 28,291,186 | | | | 31,839,557 | | | | 34,506,419 | |
| | 25,025,796 | | | | 23,159,991 | | | | 17,454,013 | | | | 14,129,316 | |
| | (72,868,581 | ) | | | (132,666,304 | ) | | | (66,992,296 | ) | | | (121,731,738 | ) |
| | | | | | | | | | | | | | |
| | (14,684,032 | ) | | | (81,215,127 | ) | | | (17,698,726 | ) | | | (73,096,003 | ) |
| | | | | | | | | | | | | | |
| | (58,582,048 | ) | | | 1,115,750 | | | | (70,703,207 | ) | | | 15,758,608 | |
| | | | | | | | | | | | | | |
| | | | | | | | | | | | | | | |
| | 841,926,084 | | | | 840,810,334 | | | | 745,492,994 | | | | 729,734,386 | |
| | | | | | | | | | | | | | |
| $ | 783,344,036 | | | $ | 841,926,084 | | | $ | 674,789,787 | | | $ | 745,492,994 | |
| | | | | | | | | | | | | | |
| $ | — | | | $ | 218,423 | | | $ | 1,962 | | | $ | 2,220 | |
| | | | | | | | | | | | | | |
See Notes to Financial Statements.
47
FINANCIAL HIGHLIGHTS
For a Share Outstanding For the Years Ending December 31, unless otherwise indicated
| | | | | | | | | | | | | | | | | | | | | | | | | | | | | | | | | | | | | | | | | | | | | | | | | | | | |
| | | | | | | | | | | | | | | | Ratios to Average Net Assets | | | | |
| | | Net Asset
Value,
Beginning
of Year | | | Net
Investment
Income (1) | | | Capital Gain
Distributions
Received
from
Affiliated
Funds | | | Realized
and
Unrealized
Gain (Loss)
on
Investments | | | Dividends
from Net
Investment
Income (2) | | | Distributions
from Net
Realized
Capital
Gains | | | Net
Asset
Value,
End of
Year | | | Total
Return | | | Net Assets,
End of Year
(000) | | | Expenses,
Net(3) | | | Expenses,
Gross(3)(4) | | | Investment
Income,
Net (1)(5) | | | Portfolio
Turnover
Rate | |
Conservative Allocation Fund | |
|
GS4 Class | |
2011 | | $ | 11.87 | | | $ | 0.18 | # | | $ | 0.05 | | | $ | (0.03 | ) | | $ | (0.19 | ) | | $ | (0.18 | ) | | $ | 11.70 | | | | 1.71 | % | | $ | 293,236 | | | | 0.12 | % | | | 0.17 | % | | | 1.47 | % | | | 9 | % |
2010 | | | 11.39 | | | | 0.18 | # | | | 0.08 | | | | 0.56 | | | | (0.27 | ) | | | (0.07 | ) | | | 11.87 | | | | 7.19 | | | | 261,993 | | | | 0.12 | | | | 0.15 | | | | 1.57 | | | | 19 | |
2009 | | | 10.33 | | | | 0.26 | # | | | — | † | | | 1.44 | | | | (0.26 | ) | | | (0.38 | ) | | | 11.39 | | | | 16.58 | | | | 284,750 | | | | 0.12 | | | | 0.16 | | | | 2.37 | | | | 32 | |
2008 | | | 13.02 | | | | 0.42 | # | | | 0.03 | | | | (2.17 | ) | | | (0.42 | ) | | | (0.55 | ) | | | 10.33 | | | | (13.11 | ) | | | 246,617 | | | | 0.12 | | | | 0.15 | | | | 3.36 | | | | 17 | |
2007 | | | 13.15 | | | | 0.43 | # | | | 0.21 | | | | 0.21 | | | | (0.44 | ) | | | (0.54 | ) | | | 13.02 | | | | 6.48 | | | | 313,829 | | | | 0.13 | | | | 0.16 | | | | 3.13 | | | | 13 | |
|
Balanced Allocation Fund | |
|
GS4 Class | |
2011 | | $ | 12.12 | | | $ | 0.20 | # | | $ | 0.06 | | | $ | (0.14 | ) | | $ | (0.26 | ) | | $ | (0.21 | ) | | $ | 11.77 | | | | 1.01 | % | | $ | 1,097,275 | | | | 0.12 | % | | | 0.13 | % | | | 1.65 | % | | | 16 | % |
2010 | | | 11.14 | | | | 0.23 | # | | | 0.09 | | | | 1.00 | | | | (0.34 | ) | | | — | | | | 12.12 | | | | 11.87 | | | | 1,120,981 | | | | 0.12 | | | | 0.12 | | | | 1.95 | | | | 17 | |
2009 | | | 9.20 | | | | 0.26 | # | | | 0.05 | | | | 1.97 | | | | (0.27 | ) | | | (0.07 | ) | | | 11.14 | | | | 25.05 | | | | 1,132,991 | | | | 0.12 | | | | 0.13 | | | | 2.58 | | | | 19 | |
2008 | | | 14.13 | | | | 0.39 | # | | | 0.13 | | | | (3.99 | ) | | | (0.43 | ) | | | (1.03 | ) | | | 9.20 | | | | (24.41 | ) | | | 905,743 | | | | 0.12 | | | | 0.13 | | | | 3.05 | | | | 19 | |
2007 | | | 14.61 | | | | 0.41 | # | | | 0.48 | | | | 0.16 | | | | (0.48 | ) | | | (1.05 | ) | | | 14.13 | | | | 7.16 | | | | 1,348,204 | | | | 0.13 | | | | 0.13 | | | | 2.68 | | | | 7 | |
|
Growth Allocation Fund | |
|
GS4 Class | |
2011 | | $ | 12.28 | | | $ | 0.16 | # | | $ | 0.03 | | | $ | (0.49 | ) | | $ | (0.17 | ) | | $ | (0.21 | ) | | $ | 11.60 | | | | (2.39 | )% | | $ | 783,344 | | | | 0.12 | % | | | 0.14 | % | | | 1.26 | % | | | 10 | % |
2010 | | | 11.11 | | | | 0.16 | # | | | 0.05 | | | | 1.31 | | | | (0.27 | ) | | | (0.08 | ) | | | 12.28 | | | | 13.65 | | | | 841,926 | | | | 0.12 | | | | 0.13 | | | | 1.43 | | | | 8 | |
2009 | | | 8.86 | | | | 0.18 | # | | | 0.02 | | | | 2.25 | | | | (0.15 | ) | | | (0.05 | ) | | | 11.11 | | | | 27.96 | | | | 840,810 | | | | 0.12 | | | | 0.13 | | | | 1.88 | | | | 11 | |
2008 | | | 15.34 | | | | 0.28 | # | | | 0.13 | | | | (5.50 | ) | | | (0.29 | ) | | | (1.10 | ) | | | 8.86 | | | | (32.98 | ) | | | 667,769 | | | | 0.12 | | | | 0.13 | | | | 2.15 | | | | 13 | |
2007 | | | 16.05 | | | | 0.30 | # | | | 0.78 | | | | 0.07 | | | | (0.43 | ) | | | (1.43 | ) | | | 15.34 | | | | 7.16 | | | | 1,095,092 | | | | 0.13 | | | | 0.13 | | | | 1.80 | | | | 5 | |
|
Aggressive Allocation Fund | |
|
GS4 Class | |
2011 | | $ | 11.79 | | | $ | 0.10 | # | | $ | — | † | | $ | (0.71 | ) | | $ | (0.10 | ) | | $ | (0.19 | ) | | $ | 10.89 | | | | (5.14 | )% | | $ | 674,790 | | | | 0.12 | % | | | 0.14 | % | | | 0.83 | % | | | 9 | % |
2010 | | | 10.43 | | | | 0.10 | # | | | — | † | | | 1.48 | | | | (0.10 | ) | | | (0.12 | ) | | | 11.79 | | | | 15.16 | | | | 745,493 | | | | 0.12 | | | | 0.13 | | | | 0.91 | | | | 1 | |
2009 | | | 8.13 | | | | 0.10 | # | | | — | † | | | 2.38 | | | | (0.10 | ) | | | (0.08 | ) | | | 10.43 | | | | 30.82 | | | | 729,734 | | | | 0.12 | | | | 0.14 | | | | 1.17 | | | | 3 | |
2008 | | | 16.31 | | | | 0.16 | # | | | 0.12 | | | | (7.01 | ) | | | (0.14 | ) | | | (1.31 | ) | | | 8.13 | | | | (41.05 | ) | | | 547,313 | | | | 0.12 | | | | 0.13 | | | | 1.21 | | | | 7 | |
2007 | | | 17.23 | | | | 0.17 | # | | | 1.11 | | | | (0.04 | ) | | | (0.36 | ) | | | (1.80 | ) | | | 16.31 | | | | 7.17 | | | | 1,000,850 | | | | 0.13 | | | | 0.13 | | | | 0.94 | | | | 2 | |
| † | Amount represents less than $0.005 per share. |
| # | Calculated using the average shares outstanding method. |
| (1) | Recognition of net investment income by the Fund is affected by the timing of the declaration of dividends by the underlying investment companies in which the Fund invests. |
| (2) | Includes dividends paid from the short-term portion of capital gain distributions received from affiliated Funds. |
| (3) | Does not include expenses of the investment companies in which the Fund invests. |
| (4) | The ratio excludes expenses waived/reimbursed net of amount recaptured. |
| (5) | The ratio includes expenses waived/reimbursed net of amount recaptured and fees paid indirectly, where applicable; if expenses waived/reimbursed net of amount recaptured and fees paid indirectly were excluded, the ratio would have been lower than the ratio shown. |
|
| See Notes to Financial Statements. |
48 |
Conservative Allocation Fund I
The Fund, through investments in the underlying Select Funds, combines a greater percentage of exposure to fixed income securities with a smaller percentage to equity securities. The Fund has a target of, but is not limited to, an asset allocation of 60% Fixed Income Select Funds, 19% U.S. Equity Select Funds, 6% Non-U.S. Equity Select Fund and 15% Real Return Select Fund.
The Fund is a fund of funds, and its performance is based on the performance of the underlying Select Funds. The Fund generated a positive absolute return of 1.92% for the one-year period ended 2011, benefiting from the positive performance of the underlying Fixed Income Select Funds and Real Return Select Fund. The Fund’s absolute return was most positively influenced by its exposure to the Inflation Protected Bond Fund and followed by exposure to the Low–Duration Bond Fund and Small Cap Equity Fund.
Sluggish U.S. growth forecasts, coupled with the Federal Reserve’s low interest rate policy provided an ideal environment for bonds, which contributed a modest absolute benefit to performance, outpacing equities on a broad measure by 5.73%, as represented by the Barclays Capital U.S. Aggregate Bond Index which returned 7.84% and the S&P 500® Index which returned 2.11% in 2011, respectively. Representing the preferred safe haven for investors, long-term U.S. government bonds dominated in asset performance for 2011. Leading into the fourth quarter, reports of improvement in economic data resulted in an optimistic shift in investor sentiment. Consequently, U.S. equities advanced and produced impressive double-digit results for the fourth quarter; however, the positive performance only helped to offset losses suffered during the third quarter of 2011.
Continued concerns over the Eurozone sovereign debt crisis and inflationary worries within China’s economy contributed to investor pessimism and a reduced appetite for markets with a higher perception of risk. Both international developed and emerging markets suffered a crushing third quarter correction which led to double-digit losses for the year, as represented by the MSCI EAFE Index (Net) which returned -12.14% and the MSCI Emerging Markets Index (Net) which returned -18.42%, both for the one-year period ended December 31, 2011, respectively. Elevated levels of volatility and asset class correlation were clearly evident throughout the year as macro-economic developments dictated market performance.
The Fund underperformed its composite benchmark by 0.46% in 2011. While the Inflation Protected Bond Fund was the largest contributor to the Fund’s absolute return, it served as the leading driver in the Fund’s relative underperformance during the year. At a target weight of 58%, the Low-Duration Bond Fund finished flat relative to its benchmark over the period. The contribution to relative performance was negative overall for Equity Select Funds, with the Growth Equity Fund being the largest single detractor to relative performance. The Small Cap Equity Fund provided benefit by contributing a marginal offset to the Fund’s underperformance.
The Fund attempts to achieve its objective by investing in the Select Funds. By investing in the Fund you will also incur the expenses and risks of the underlying Select Funds. The principal risks of the Fund will change depending on the asset mix of the Select Funds in which it invests. You may directly invest in the Select Funds. The Fund’s value will go up and down in response to changes in the share prices of the investments that it owns. It is possible to lose money by investing in the Fund. The Fund may be suitable for investors who have a short- to medium-time investment horizon, possess a relatively low tolerance for risk and want some exposure to the growth potential of the stock market tempered by a larger allocation to short-term, fixed-income securities. This Fund is subject to interest rate risk. Meaning, when interest rates rise, the value of the existing bonds decrease and vice versa. Changes in interest rates have a bigger impact on long duration holdings than on short duration holdings.
Please see page 53 for information regarding specific portfolio allocations. Portfolio holdings are subject to change and risk at any time.
49
Conservative Allocation Fund I
| | | | | | | | |
Average Annual Total Returns as of 12/31/11 | |
| | | GS2
Class* | | | Benchmark** | |
One Year | | | 1.92 | % | | | 2.38 | % |
Five Year | | | 3.49 | % | | | 3.61 | % |
Since Inception | | | 4.27 | % | | | 4.47 | % |
Inception Date | | | 07/01/03 | | | | | |
Total Fund Operating Expenses (April 30, 2011 Prospectus, as amended on September 1, 2011)(1) | | | 0.76 | % | | | | |
| (1) | The Fund’s shareholders indirectly bear the expenses of the shares of the Select Funds in which the Fund invests. Current information regarding the Fund’s Operating Expenses can be found in the Financial Highlights. |
The performance data quoted represents past performance and does not guarantee future results. Current performance may be lower or higher. Performance data current to the most recent month-end may be obtained at www.GuideStoneFunds.org. The investment return and principal value of an investment will fluctuate so that shares, when redeemed, may be worth more or less than their original cost.
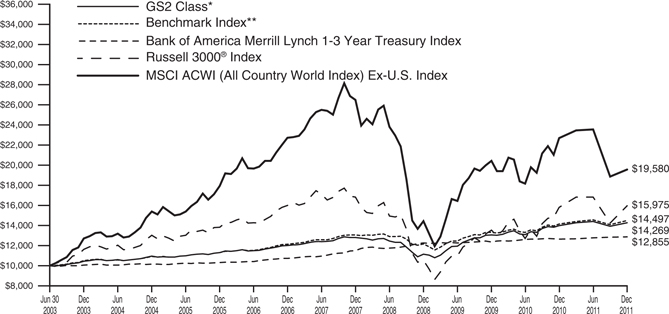
The graph compares the results of a hypothetical $10,000 investment in the GS2 Class of the Fund since July 1, 2003 (commencement of operations), with all dividends and capital gains reinvested, with the Fund’s weighted composite benchmark index.
| * | These returns reflect expense waivers by the Fund’s investment adviser. Without these waivers, returns would have been lower. Returns shown do not reflect the deduction of taxes that a shareholder would pay on Fund distributions or the redemption of Fund shares. |
| ** | Represents a composite index consisting of the Bank of America Merrill Lynch 1-3 Year Treasury Index, the Barclays Capital U.S. TIPS Index, the Russell 3000® Index and the MSCI ACWI (All Country World Index) Ex-U.S. Index weighted 60.00%, 15.00%, 18.88%, and 6.12%, respectively. |
The Bank of America Merrill Lynch 1-3 Year Treasury Index is composed of all U.S. Treasury notes and bonds with maturities greater than or equal to one year and less than three years.
The Barclays Capital U.S. TIPS Index measures the performance of the U.S. Treasury Inflation Protected Securities (“TIPS”) market and includes TIPS with one or more years remaining until maturity with total outstanding issue size of $500 million or more.
The Russell 3000® Index measures the performance of the 3,000 largest U.S. companies based on total market capitalization, which represents approximately 98% of the investable U.S. equity market.
The MSCI ACWI (All Country World Index) Ex-U.S. Index is a free float-adjusted market capitalization index that is designed to measure equity market performance in the global developed (excluding U.S.) and emerging markets.
Unlike a mutual fund, the performance of an index assumes no taxes, transaction costs, management fees or other expenses.
50
| | |
| CONSERVATIVE ALLOCATION FUND I | | |
| SCHEDULE OF INVESTMENTS | | December 31, 2011 |
| | | | | | | | |
| | | Shares | | | Value | |
MUTUAL FUNDS — 99.7% | | | | | | | | |
GuideStone Money Market Fund (GS2 Class)¥ | | | 859,133 | | | $ | 859,133 | |
GuideStone Low-Duration Bond Fund (GS2 Class)¥ | | | 5,070,949 | | | | 43,559,455 | |
GuideStone Inflation Protected Bond Fund (GS4 Class)¥ | | | 968,432 | | | | 10,807,705 | |
GuideStone Defensive Market Strategies Fund (GS2 Class)¥ | | | 540,780 | | | | 5,515,960 | |
GuideStone Value Equity Fund (GS2 Class)¥ | | | 571,507 | | | | 4,017,696 | |
GuideStone Growth Equity Fund (GS2 Class)¥ | | | 324,772 | | | | 3,819,314 | |
GuideStone Small Cap Equity Fund (GS2 Class)¥ | | | 93,996 | | | | 911,766 | |
GuideStone International Equity Fund (GS2 Class)¥ | | | 508,277 | | | | 4,406,763 | |
| | | | | | | | |
Total Mutual Funds
(Cost $72,053,542) | | | | | | | 73,897,792 | |
| | | | | | | | |
| |
TOTAL INVESTMENTS — 99.7%
(Cost $72,053,542) | | | | 73,897,792 | |
| | |
Other Assets in Excess of Liabilities — 0.3% | | | | | | | 243,067 | |
| | | | | | | | |
NET ASSETS — 100.0% | | | | | | $ | 74,140,859 | |
| | | | | | | | |
Please see abbreviation and footnote definitions beginning on page 200.
PORTFOLIO SUMMARY (based on net assets)
| | | | |
| | | % | |
Bond Funds | | | 73.4 | |
Domestic Equity Funds | | | 19.2 | |
International Equity Fund | | | 5.9 | |
Money Market Fund | | | 1.2 | |
Futures Contracts | | | 1.1 | |
| | | | |
| | | 100.8 | |
| | | | |
VALUATION HIERARCHY
The following is a summary of the inputs used, as of December 31, 2011, in valuing the Fund’s investments carried at fair value:
| | | | | | | | | | | | | | | | |
| | | Total Value | | | Level 1
Quoted Prices | | | Level 2
Other
Significant
Observable
Inputs | | | Level 3
Significant
Unobservable
Inputs | |
| | | | |
Assets: | | | | | | | | | | | | | | | | |
Investments in Securities: | | | | | | | | | | | | | | | | |
Mutual Funds | | $ | 73,897,792 | | | $ | 73,897,792 | | | $ | — | | | $ | — | |
| | | | | | | | | | | | | | | | |
Total Assets — Investments in Securities | | $ | 73,897,792 | | | $ | 73,897,792 | | | $ | — | | | $ | — | |
| | | | | | | | | | | | | | | | |
| | | | |
Other Financial Instruments*** | | | | | | | | | | | | | | | | |
Futures Contracts | | $ | 4,197 | | | $ | 4,197 | | | $ | — | | | $ | — | |
| | | | | | | | | | | | | | | | |
Total Assets — Other Financial Instruments | | $ | 4,197 | | | $ | 4,197 | | | $ | — | | | $ | — | |
| | | | | | | | | | | | | | | | |
| *** | Other financial instruments are derivative instruments not reflected in the Schedule of Investments, such as futures, forwards and swap contracts, which are valued at the unrealized appreciation (depreciation) on the investment. Details of these investments can be found in the Financial Statements. |
|
| See Notes to Financial Statements. |
51 |
Balanced Allocation Fund I
The Fund, through investments in the underlying Select Funds, combines approximately equal percentages to equity securities and fixed income securities. The Fund has a target of, but is not limited to, an asset allocation of 50% Fixed Income Select Funds, 36% U.S. Equity Select Funds and 14% Non-U.S. Equity Select Fund.
The Fund is a fund of funds, and its performance is based on the performance of the underlying Select Funds. The Fund generated a modest return of 1.14% during 2011, benefiting from positive absolute performance from all of the underlying Fixed Income Select Funds. The Fund’s absolute return was most positively influenced by its exposure to the Medium-Duration Bond Fund and Extended-Duration Bond Fund, which represented over half of the overall fixed income allocation.
Sluggish U.S. growth forecasts, coupled with the Federal Reserve’s low interest rate policy provided an ideal environment for bonds which contributed a modest absolute benefit to performance, outpacing equities on a broad measure by 5.73%, as represented by the Barclays Capital U.S. Aggregate Bond Index which returned 7.84% and S&P 500® Index which returned 2.11% for 2011, respectively. Representing the preferred safe haven for investors, long-term U.S. government bonds dominated in asset performance for 2011. Leading into the fourth quarter, reports of improvement in economic data resulted in an optimistic shift in investor sentiment. Consequently, U.S. equities advanced and produced impressive double-digit results in the fourth quarter; however, the positive performance only helped to offset losses suffered during the third quarter.
Continued concerns over the Eurozone sovereign debt crisis and inflationary worries within China’s economy contributed to investor pessimism and a reduced appetite for markets with a higher perception of risk. Both international developed and emerging markets suffered a crushing third quarter correction which led to double-digit losses for the year, as represented by the MSCI EAFE Index (Net) which returned -12.14% and the MSCI Emerging Markets Index (Net) which returned -18.42%, both for the one-year period ended December 31, 2011, respectively. Elevated levels of volatility and asset class correlation were clearly evident throughout the year as macro-economic developments dictated market performance.
The Fund underperformed its composite benchmark by 1.36%, suffering the most from its overall exposure to the Fixed Income Select Funds. Notably, the primary source of underperformance came from the Extended-Duration Bond Fund allocation. Within the U.S. Equity Select Funds, the Growth Equity Fund was a detractor as performance trailed due to security selection. The Small Cap Equity Fund substantially outperformed its benchmark and provided the Fund’s largest relative benefit during the year.
The Fund attempts to achieve its objective by investing in the Select Funds. By investing in the Fund you will also incur the expenses and risks of the underlying Select Funds. The principal risks of the Fund will change depending on the asset mix of the Select Funds in which it invests. You may directly invest in the Select Funds. The Fund’s value will go up and down in response to changes in the share prices of the investments that it owns. It is possible to lose money by investing in the Fund. This Fund may be suitable for investors who have a medium- to long-term investment horizon, possess a moderate tolerance for risk, and seek to participate in the return potential of stocks but want to achieve this result more slowly and with less volatility through a balanced allocation of fixed-income and equity investments.
Please see page 56 for information regarding specific portfolio allocations. Portfolio holdings are subject to change and risk at any time.
52
Balanced Allocation Fund I
| | | | | | | | |
Average Annual Total Returns as of 12/31/11 | |
| | | GS2
Class* | | | Benchmark** | |
One Year | | | 1.14 | % | | | 2.50 | % |
Five Year | | | 2.91 | % | | | 3.31 | % |
Since Inception | | | 5.73 | % | | | 6.10 | % |
Inception Date | | | 07/01/03 | | | | | |
Total Fund Operating Expenses (April 30, 2011 Prospectus, as amended on September 1, 2011)(1) | | | 0.83 | % | | | | |
| (1) | The Fund’s shareholders indirectly bear the expenses of the shares of the Select Funds in which the Fund invests. Current information regarding the Fund’s Operating Expenses can be found in the Financial Highlights. |
The performance data quoted represents past performance and does not guarantee future results. Current performance may be lower or higher. Performance data current to the most recent month-end may be obtained at www.GuideStoneFunds.org. The investment return and principal value of an investment will fluctuate so that shares, when redeemed, may be worth more or less than their original cost.
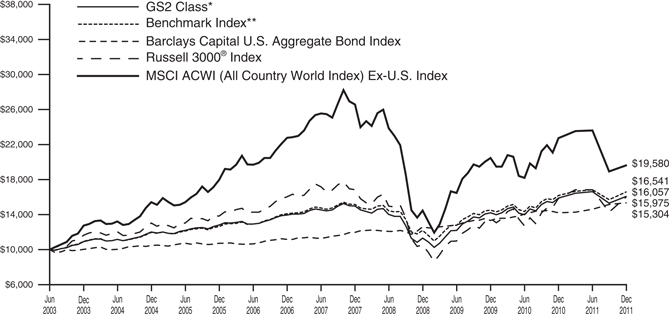
The graph compares the results of a hypothetical $10,000 investment in the GS2 Class of the Fund since July 1, 2003 (commencement of operations), with all dividends and capital gains reinvested, with the Fund’s weighted composite benchmark index.
| * | These returns reflect expense waivers by the Fund’s investment adviser. Without these waivers, returns would have been lower. Returns shown do not reflect the deduction of taxes that a shareholder would pay on Fund distributions or the redemption of Fund shares. |
| ** | Represents a composite index consisting of the Barclays Capital U.S. Aggregate Bond Index, the Russell 3000® Index and the MSCI ACWI (All Country World Index) Ex-U.S. Index, weighted 50%, 36% and 14%, respectively. |
The Barclays Capital U.S. Aggregate Bond Index represents securities that are SEC-registered, taxable and dollar denominated. The index covers the U.S. investment grade fixed rate bond market, with index components for government and corporate securities, mortgage pass-through securities and asset-backed securities.
The Russell 3000® Index measures the performance of the 3,000 largest U.S. companies based on total market capitalization, which represents approximately 98% of the investable U.S. equity market.
The MSCI ACWI (All Country World Index) Ex-U.S. Index is a free float-adjusted market capitalization index that is designed to measure equity market performance in the global developed (excluding U.S.) and emerging markets.
Unlike a mutual fund, the performance of an index assumes no taxes, transaction costs, management fees or other expenses.
53
| | |
| BALANCED ALLOCATION FUND I | | |
| SCHEDULE OF INVESTMENTS | | December 31, 2011 |
| | | | | | | | |
| | | Shares | | | Value | |
MUTUAL FUNDS — 99.8% | | | | | | | | |
GuideStone Money Market Fund (GS2 Class)¥ | | | 7,010,111 | | | $ | 7,010,111 | |
GuideStone Low-Duration Bond Fund (GS2 Class)¥ | | | 5,214,420 | | | | 44,791,872 | |
GuideStone Medium-Duration Bond Fund (GS2 Class)¥ | | | 8,787,757 | | | | 63,623,363 | |
GuideStone Extended-Duration Bond Fund (GS2 Class)¥ | | | 4,005,294 | | | | 25,954,308 | |
GuideStone Global Bond Fund (GS4 Class)¥ | | | 1,539,778 | | | | 14,982,036 | |
GuideStone Defensive Market Strategies Fund (GS2 Class)¥ | | | 3,005,426 | | | | 30,655,348 | |
GuideStone Value Equity Fund (GS2 Class)¥ | | | 5,274,121 | | | | 37,077,070 | |
GuideStone Growth Equity Fund (GS2 Class)¥ | | | 3,054,720 | | | | 35,923,504 | |
GuideStone Small Cap Equity Fund (GS2 Class)¥ | | | 857,821 | | | | 8,320,866 | |
GuideStone International Equity Fund (GS2 Class)¥ | | | 4,768,549 | | | | 41,343,318 | |
| | | | | | | | |
Total Mutual Funds
(Cost $313,727,663) | | | | 309,681,796 | |
| | | | | | | | |
| |
TOTAL INVESTMENTS — 99.8%
(Cost $313,727,663) | | | | 309,681,796 | |
| | |
Other Assets in Excess of Liabilities — 0.2% | | | | | | | 584,832 | |
| | | | | | | | |
NET ASSETS — 100.0% | | | | | | $ | 310,266,628 | |
| | | | | | | | |
Please see abbreviation and footnote definitions beginning on page 200.
PORTFOLIO SUMMARY (based on net assets)
| | | | |
| | | % | |
Bond Funds | | | 48.1 | |
Domestic Equity Funds | | | 36.1 | |
International Equity Fund | | | 13.3 | |
Money Market Fund | | | 2.3 | |
Futures Contracts | | | 2.0 | |
| | | | |
| | | 101.8 | |
| | | | |
VALUATION HIERARCHY
The following is a summary of the inputs used, as of December 31, 2011, in valuing the Fund’s investments carried at fair value:
| | | | | | | | | | | | | | | | |
| | | Total Value | | | Level 1
Quoted Prices | | | Level 2
Other
Significant
Observable
Inputs | | | Level 3
Significant
Unobservable
Inputs | |
Assets: | | | | | | | | | | | | | | | | |
Investments in Securities: | | | | | | | | | | | | | | | | |
Mutual Funds | | $ | 309,681,796 | | | $ | 309,681,796 | | | $ | — | | | $ | — | |
| | | | | | | | | | | | | | | | |
Total Assets — Investments in Securities | | $ | 309,681,796 | | | $ | 309,681,796 | | | $ | — | | | $ | — | |
| | | | | | | | | | | | | | | | |
| | | | |
Other Financial Instruments*** | | | | | | | | | | | | | | | | |
Futures Contracts | | $ | 110,360 | | | $ | 110,360 | | | $ | — | | | $ | — | |
| | | | | | | | | | | | | | | | |
Total Assets — Other Financial Instruments | | $ | 110,360 | | | $ | 110,360 | | | $ | — | | | $ | — | |
| | | | | | | | | | | | | | | | |
| *** | Other financial instruments are derivative instruments not reflected in the Schedule of Investments, such as futures, forwards and swap contracts, which are valued at the unrealized appreciation (depreciation) on the investment. Details of these investments can be found in the Financial Statements. |
|
| See Notes to Financial Statements. |
54 |
Growth Allocation Fund I
The Fund, through investments in the underlying Select Funds, combines a greater percentage of exposure to equity securities with a smaller percentage to fixed income securities. The Fund has a target of, but is not limited to, an asset allocation of 25% Fixed Income Select Funds, 49% U.S. Equity Select Funds and 26% Non-U.S. Equity Select Fund.
The Fund is a fund of funds, and its performance is based on the performance of the underlying Select Funds. The Fund generated a return of -2.21% for the one-year period ended December 31, 2011, as all detraction from absolute performance came from the underlying Equity Select Funds. The Fund’s absolute return was primarily influenced by its exposure to the Growth Equity Fund and International Equity Fund, which represents roughly two-thirds of the overall equity allocation.
Despite strong fourth quarter performance, equities accounted for the Fund’s total shortfall in absolute performance during the year. Sluggish U.S. growth forecasts, coupled with the Federal Reserve’s low interest rate policy provided an ideal environment for bonds which contributed a modest absolute benefit to performance, outpacing equities on a broad measure by 5.73%, as represented by the Barclays Capital U.S. Aggregate Bond Index which returned 7.84% and the S&P 500® Fund which returned 2.11% for 2011, respectively. Representing the preferred safe haven for investors, long-term U.S. government bonds dominated in asset performance for 2011. Leading into the fourth quarter, reports of improvement in economic data resulted in an optimistic shift in investor sentiment. Consequently, U.S. equities advanced and produced impressive double-digit results for the fourth quarter; however, the positive performance only helped to offset losses suffered during the third quarter.
Continued concerns over the Eurozone sovereign debt crisis and inflationary worries within China’s economy contributed to investor pessimism and a reduced appetite for markets with a higher perception of risk. Both international developed and emerging markets suffered a crushing third quarter correction which led to double-digit losses for the year, as represented by the MSCI EAFE Index (Net) which returned -12.14% and the MSCI Emerging Markets Index (Net) which returned -18.42%, both for the one-year period ended December 31, 2011, respectively. Elevated levels of volatility and asset class correlation were clearly evident throughout the year as macro-economic developments dictated market performance.
The Fund underperformed its composite benchmark by 1.25%. The largest detractor to the Fund’s relative performance was attributed to exposure to the Growth Equity Fund, which trailed its respective benchmark due to security selection. The Fund’s relative performance was positively impacted by exposure to the Small Cap Equity Fund, which benefited almost entirely from security selection, leading the Fund to outperform its respective benchmark.
The Fund attempts to achieve its objective by investing in the Select Funds. By investing in the Fund you will also incur the expenses and risks of the underlying Select Funds. The principal risks of the Fund will change depending on the asset mix of the Select Funds in which it invests. You may directly invest in the Select Funds. The Fund’s value will go up and down in response to changes in the share prices of the investments that it owns. It is possible to lose money by investing in the Fund. This Fund may be suitable for investors who have a long-term investment horizon, possess a relatively high tolerance for risk and seek to participate in the return potential of stocks at a slightly lower risk level than an all stock portfolio. Foreign securities may be subject to greater risk than domestic securities due to currency volatility, reduced market liquidity and political and economic instability. Small company stocks are subject to greater risk than large company stocks due to more volatility and less liquidity. This Fund is subject to interest rate risk. Meaning, when interest rates rise, the value of the existing bonds decrease and vice versa. Changes in interest rates have a bigger impact on long duration holdings than on short duration holdings.
Please see page 59 for information regarding specific portfolio allocations. Portfolio holdings are subject to change and risk at any time.
55
Growth Allocation Fund I
| | | | | | | | |
Average Annual Total Returns as of 12/31/11 | |
| | | GS2
Class* | | | Benchmark** | |
One Year | | | -2.21 | % | | | -0.96 | % |
Five Year | | | 0.56 | % | | | 1.22 | % |
Since Inception | | | 5.52 | % | | | 6.20 | % |
Inception Date | | | 07/01/03 | | | | | |
Total Fund Operating Expenses (April 30, 2011 Prospectus, as amended on September 1, 2011)(1) | | | 0.92 | % | | | | |
| (1) | The Fund’s shareholders indirectly bear the expenses of the shares of the Select Funds in which the Fund invests. Current information regarding the Fund’s Operating Expenses can be found in the Financial Highlights. |
The performance data quoted represents past performance and does not guarantee future results. Current performance may be lower or higher. Performance data current to the most recent month-end may be obtained at www.GuideStoneFunds.org. The investment return and principal value of an investment will fluctuate so that shares, when redeemed, may be worth more or less than their original cost.
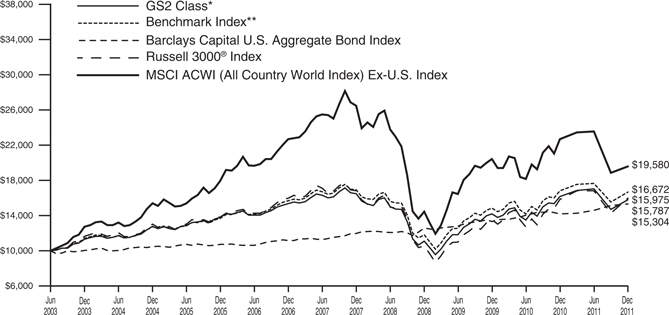
The graph compares the results of a hypothetical $10,000 investment in the GS2 Class of the Fund since July 1, 2003 (commencement of operations), with all dividends and capital gains reinvested, with the Fund’s weighted composite benchmark index.
| * | These returns reflect expense waivers by the Fund’s investment adviser. Without these waivers, returns would have been lower. Returns shown do not reflect the deduction of taxes that a shareholder would pay on Fund distributions or the redemption of Fund shares. |
| **** | Represents a composite index consisting of the Barclays Capital U.S. Aggregate Bond Index, the Russell 3000® Index, and the MSCI ACWI (All Country World Index) Ex-U.S. Index, weighted 25.00%, 48.75% and 26.25%, respectively. |
The Barclays U.S. Capital Aggregate Bond Index represents securities that are SEC-registered, taxable and dollar denominated. The index covers the U.S. investment grade fixed-rate bond market, with index components for government and corporate securities, mortgage pass-through securities and asset-backed securities.
The Russell 3000® Index measures the performance of the 3,000 largest U.S. companies based on total market capitalization, which represents approximately 98% of the investable U.S. equity market.
The MSCI ACWI (All Country World Index) Ex-U.S. Index is a free float-adjusted market capitalization index that is designed to measure equity market performance in the global developed (excluding U.S.) and emerging markets.
Unlike a mutual fund, the performance of an index assumes no taxes, transaction costs, management fees or other expenses.
56
| | |
| GROWTH ALLOCATION FUND I | | |
| SCHEDULE OF INVESTMENTS | | December 31, 2011 |
| | | | | | | | |
| | | Shares | | | Value | |
MUTUAL FUNDS — 99.8% | |
GuideStone Money Market Fund (GS2 Class)¥ | | | 3,847,733 | | | $ | 3,847,733 | |
GuideStone Low-Duration Bond Fund (GS2 Class)¥ | | | 1,657,628 | | | | 14,239,026 | |
GuideStone Medium-Duration Bond Fund (GS2 Class)¥ | | | 2,796,294 | | | | 20,245,166 | |
GuideStone Extended-Duration Bond Fund (GS2 Class)¥ | | | 1,221,699 | | | | 7,916,608 | |
GuideStone Global Bond Fund (GS4 Class)¥ | | | 495,542 | | | | 4,821,627 | |
GuideStone Value Equity Fund (GS2 Class)¥ | | | 6,258,987 | | | | 44,000,680 | |
GuideStone Growth Equity Fund (GS2 Class)¥ | | | 3,619,528 | | | | 42,565,649 | |
GuideStone Small Cap Equity Fund (GS2 Class)¥ | | | 1,040,102 | | | | 10,088,993 | |
GuideStone International Equity Fund (GS2 Class)¥ | | | 5,728,943 | | | | 49,669,938 | |
| | | | | | | | |
Total Mutual Funds
(Cost $215,039,904) | | | | 197,395,420 | |
| | | | | | | | |
| |
TOTAL INVESTMENTS — 99.8%
(Cost $215,039,904) | | | | 197,395,420 | |
| | |
Other Assets in Excess of Liabilities — 0.2% | | | | | | | 487,642 | |
| | | | | | | | |
NET ASSETS — 100.0% | | | $ | 197,883,062 | |
| | | | | | | | |
Please see abbreviation and footnote definitions beginning on page 200.
PORTFOLIO SUMMARY (based on net assets)
| | | | |
| | | % | |
Domestic Equity Funds | | | 48.9 | |
International Equity Fund | | | 25.1 | |
Bond Funds | | | 23.9 | |
Futures Contracts | | | 2.0 | |
Money Market Fund | | | 1.9 | |
| | | | |
| | | 101.8 | |
| | | | |
VALUATION HIERARCHY
The following is a summary of the inputs used, as of December 31, 2011, in valuing the Fund’s investments carried at fair value:
| | | | | | | | | | | | | | | | |
| | | Total Value | | | Level 1
Quoted Prices | | | Level 2
Other
Significant
Observable
Inputs | | | Level 3
Significant
Unobservable
Inputs | |
Assets: | | | | | | | | | | | | | | | | |
Investments in Securities: | | | | | | | | | | | | | | | | |
Mutual Funds | | $ | 197,395,420 | | | $ | 197,395,420 | | | $ | — | | | $ | — | |
| | | | | | | | | | | | | | | | |
Total Assets — Investments in Securities | | $ | 197,395,420 | | | $ | 197,395,420 | | | $ | — | | | $ | — | |
| | | | | | | | | | | | | | | | |
| | | | |
Other Financial Instruments*** | | | | | | | | | | | | | | | | |
Futures Contracts | | $ | 95,350 | | | $ | 95,350 | | | $ | — | | | $ | — | |
| | | | | | | | | | | | | | | | |
Total Assets — Other Financial Instruments | | $ | 95,350 | | | $ | 95,350 | | | $ | — | | | $ | — | |
| | | | | | | | | | | | | | | | |
| *** | Other financial instruments are derivative instruments not reflected in the Schedule of Investments, such as futures, forwards and swap contracts, which are valued at the unrealized appreciation (depreciation) on the investment. Details of these investments can be found in the Financial Statements. |
|
| See Notes to Financial Statements. |
57 |
Aggressive Allocation Fund I
The Fund, through investments in the underlying Select Funds, combines a greater percentage of exposure to U.S. equity securities with a smaller percentage to non-U.S. equity securities. The Fund has a target of, but is not limited to, an asset allocation of 63% U.S. Equity Select Funds and 35% Non-U.S. Select Funds, with a small allocation of 2% to Fixed Income Select Fund.
The Fund is a fund of funds, and its performance is based on the performance of the underlying Select Funds. The Fund generated a return of -4.93% for the one-year period ended December 31, 2011, as absolute performance was almost entirely attributable to exposure to the International Equity Fund, which represented a target weight of 35% of the Fund.
Despite strong fourth quarter performance, equities accounted for the Fund’s total performance shortfall during the year. Leading into the fourth quarter, reports of improvement in economic data resulted in an optimistic shift in investor sentiment. Consequently, U.S. equities advanced and produced impressive double-digit results for the fourth quarter; however, the positive performance only helped to offset losses suffered during the third quarter of 2011. Overall, the U.S. equity market returned 2.11%, as represented for the S&P 500® Index for 2011.
Continued concerns over the Eurozone sovereign debt crisis and inflationary worries within China’s economy contributed to investor pessimism and a reduced appetite for markets with a higher perception of risk. Both international developed and emerging markets suffered a crushing third quarter correction which led to double-digit losses for the year, as represented by the MSCI EAFE Index (Net) which returned -12.14% and the MSCI Emerging Markets Index (Net) which returned -18.42%, both for the one-year period ended December 31, 2011, respectively. Elevated levels of volatility and asset class correlation were clearly evident throughout the year as macro-economic developments dictated market performance.
The Fund underperformed its composite benchmark during the year by 0.80%. The Growth Equity Fund and International Equity Fund served as key drivers in the Fund’s relative underperformance for the year. The Growth Equity Fund, the largest detractor to relative performance, suffered the most due to security selection. Relative benefit was produced by the Small Cap Equity Fund, which outperformed its respective benchmark.
The Fund attempts to achieve its objective by investing in the Select Funds. By investing in the Fund you will also incur the expenses and risks of the underlying Select Funds. The principal risks of the Fund will change depending on the asset mix of the Select Funds in which it invests. You may directly invest in the Select Funds. The Fund’s value will go up and down in response to changes in the share prices of the investments that it owns. It is possible to lose money by investing in the Fund. This Fund may be suitable for investors who have a long-term investment horizon, possess a relatively high tolerance for risk and want to diversify by adding an aggressive investment option that combines U.S. and international stocks. Foreign securities may be subject to greater risk than domestic securities due to currency volatility, reduced market liquidity and political and economic instability. Small company stocks are subject to greater risk than large company stocks due to more volatility and less liquidity.
Please see page 62 for information regarding specific portfolio allocations. Portfolio holdings are subject to change and risk at any time.
58
Aggressive Allocation Fund I
| | | | | | | | |
Average Annual Total Returns as of 12/31/11 | |
| | | GS2
Class* | | | Benchmark** | |
One year | | | -4.93 | % | | | -4.13 | % |
Five year | | | -1.86 | % | | | -1.02 | % |
Since Inception | | | 5.17 | % | | | 6.15 | % |
Inception Date | | | 07/01/03 | | | | | |
Total Fund Operating Expenses (April 30, 2011 Prospectus, as amended on September 1, 2011)(1) | | | 1.03 | % | | | | |
| (1) | The Fund’s shareholders indirectly bear the expenses of the GS2 Class shares of the Select Funds in which the Fund invests. Current information regarding the Fund’s Operating Expenses can be found in the Financial Highlights. |
The performance data quoted represents past performance and does not guarantee future results. Current performance may be lower or higher. Performance data current to the most recent month-end may be obtained at www.GuideStoneFunds.org. The investment return and principal value of an investment will fluctuate so that shares, when redeemed, may be worth more or less than their original cost.
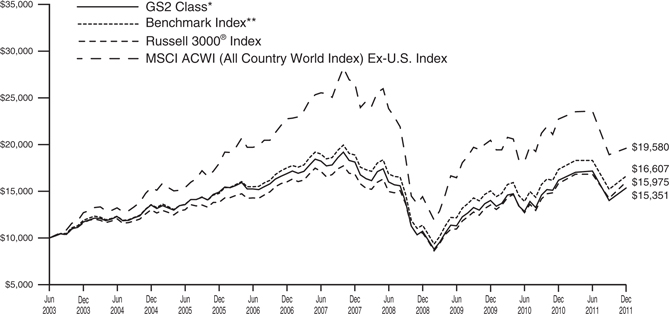
The graph compares the results of a hypothetical $10,000 investment in the GS2 Class of the Fund since July 1, 2003 (commencement of operations), with all dividends and capital gains reinvested, with the Fund’s weighted composite benchmark index.
| * | These returns reflect expense waivers by the Fund’s investment adviser. Without these waivers, returns would have been lower. Returns shown do not reflect the deduction of taxes that a shareholder would pay on Fund distributions or the redemption of Fund shares. |
| ** | Represents a composite index consisting of the Russell 3000® Index and the MSCI ACWI (All Country World Index) Ex-U.S. Index, weighted 65% and 35%, respectively. |
The Russell 3000® Index measures the performance of the 3,000 largest U.S. companies based on total market capitalization, which represents approximately 98% of the investable U.S. equity market.
The MSCI ACWI (All Country World Index) Ex-U.S. Index is a free float-adjusted market capitalization index that is designed to measure equity market performance in the global developed (excluding U.S.) and emerging markets.
Unlike a mutual fund, the performance of an index assumes no taxes, transaction costs, management fees or other expenses.
59
| | |
| AGGRESSIVE ALLOCATION FUND I | | |
| SCHEDULE OF INVESTMENTS | | December 31, 2011 |
| | | | | | | | |
| | | Shares | | | Value | |
MUTUAL FUNDS — 99.8% | |
GuideStone Money Market Fund (GS2 Class)¥ | | | 2,463,786 | | | $ | 2,463,786 | |
GuideStone Value Equity Fund (GS2 Class)¥ | | | 5,389,658 | | | | 37,889,295 | |
GuideStone Growth Equity Fund (GS2 Class)¥ | | | 3,152,062 | | | | 37,068,247 | |
GuideStone Small Cap Equity Fund (GS2 Class)¥ | | | 875,856 | | | | 8,495,806 | |
GuideStone International Equity Fund (GS2 Class)¥ | | | 4,999,394 | | | | 43,344,744 | |
| | | | | | | | |
Total Mutual Funds
(Cost $151,744,305) | | | | 129,261,878 | |
| | | | | | | | |
| |
TOTAL INVESTMENTS — 99.8%
(Cost $151,744,305) | | | | 129,261,878 | |
| | |
Other Assets in Excess of Liabilities — 0.2% | | | | | | | 204,254 | |
| | | | | | | | |
NET ASSETS — 100.0% | | | $ | 129,466,132 | |
| | | | | | | | |
Please see abbreviation and footnote definitions beginning on page 200.
PORTFOLIO SUMMARY (based on net assets)
| | | | |
| | | % | |
Domestic Equity Funds | | | 64.4 | |
International Equity Fund | | | 33.5 | |
Futures Contracts | | | 2.0 | |
Money Market Fund | | | 1.9 | |
| | | | |
| | | 101.8 | |
| | | | |
VALUATION HIERARCHY
The following is a summary of the inputs used, as of December 31, 2011, in valuing the Fund’s investments carried at fair value:
| | | | | | | | | | | | | | | | |
| | | Total Value | | | Level 1
Quoted Prices | | | Level 2
Other
Significant
Observable
Inputs | | | Level 3
Significant
Unobservable
Inputs | |
Assets: | | | | | | | | | | | | | | | | |
Investments in Securities: | | | | | | | | | | | | | | | | |
Mutual Funds | | $ | 129,261,878 | | | $ | 129,261,878 | | | $ | — | | | $ | — | |
| | | | | | | | | | | | | | | | |
Total Assets — Investments in Securities | | $ | 129,261,878 | | | $ | 129,261,878 | | | $ | — | | | $ | — | |
| | | | | | | | | | | | | | | | |
| | | | |
Other Financial Instruments*** | | | | | | | | | | | | | | | | |
Futures Contracts | | $ | 79,143 | | | $ | 79,143 | | | $ | — | | | $ | — | |
| | | | | | | | | | | | | | | | |
Total Assets — Other Financial Instruments | | $ | 79,143 | | | $ | 79,143 | | | $ | — | | | $ | — | |
| | | | | | | | | | | | | | | | |
| *** | Other financial instruments are derivative instruments not reflected in the Schedule of Investments, such as futures, forwards and swap contracts, which are valued at the unrealized appreciation (depreciation) on the investment. Details of these investments can be found in the Financial Statements. |
|
| See Notes to Financial Statements. |
60 |
| | |
| STATEMENTS OF ASSETS AND LIABILITIES | | December 31, 2011 |
| | | | | | | | | | | | | | | | |
| | | Conservative
Allocation
Fund I | | | Balanced
Allocation
Fund I | | | Growth
Allocation
Fund I | | | Aggressive
Allocation
Fund I | |
Assets | | | | | | | | | | | | | | | | |
Investments in securities of affiliated issuers, at value (1) | | $ | 73,897,792 | | | $ | 309,681,796 | | | $ | 197,395,420 | | | $ | 129,261,878 | |
Cash collateral for derivatives | | | 50,400 | | | | 339,550 | | | | 299,950 | | | | 256,000 | |
Receivables: | | | | | | | | | | | | | | | | |
Dividends | | | 130 | | | | 370 | | | | 234 | | | | 141 | |
Investment securities sold | | | 217 | | | | — | | | | 315 | | | | — | |
Fund shares sold | | | 202,209 | | | | 288,169 | | | | 221,621 | | | | 270 | |
Variation margin on financial futures contracts | | | 339 | | | | 1,476 | | | | — | | | | — | |
Receivable from advisor | | | 4,684 | | | | — | | | | — | | | | — | |
Prepaid expenses and other assets | | | 4,238 | | | | 4,237 | | | | 4,237 | | | | 4,237 | |
| | | | | | | | | | | | | | | | |
Total Assets | | | 74,160,009 | | | | 310,315,598 | | | | 197,921,777 | | | | 129,522,526 | |
| | | | | | | | | | | | | | | | |
Liabilities | | | | | | | | | | | | | | | | |
Payables: | | | | | | | | | | | | | | | | |
Fund shares redeemed | | | — | | | | — | | | | — | | | | 31,781 | |
Variation margin on financial futures contracts | | | — | | | | — | | | | 1,262 | | | | 2,145 | |
Accrued expenses: | | | | | | | | | | | | | | | | |
Investment advisory fees | | | — | | | | 27,849 | | | | 17,048 | | | | 2,114 | |
Other expenses | | | 19,150 | | | | 21,121 | | | | 20,405 | | | | 20,354 | |
| | | | | | | | | | | | | | | | |
Total Liabilities | | | 19,150 | | | | 48,970 | | | | 38,715 | | | | 56,394 | |
| | | | | | | | | | | | | | | | |
Net Assets | | $ | 74,140,859 | | | $ | 310,266,628 | | | $ | 197,883,062 | | | $ | 129,466,132 | |
| | | | | | | | | | | | | | | | |
Net Assets Consist of: | | | | | | | | | | | | | | | | |
Paid-in-capital | | $ | 79,008,944 | | | $ | 357,008,433 | | | $ | 238,527,833 | | | $ | 170,634,974 | |
Undistributed net investment income | | | 710,653 | | | | 5,272,598 | | | | 1,464,387 | | | | 2,287,519 | |
Accumulated net realized loss on investments and futures transactions | | | (7,427,185 | ) | | | (48,078,896 | ) | | | (24,560,024 | ) | | | (21,053,077 | ) |
Net unrealized appreciation (depreciation) on investments and futures | | | 1,848,447 | | | | (3,935,507 | ) | | | (17,549,134 | ) | | | (22,403,284 | ) |
| | | | | | | | | | | | | | | | |
Net Assets | | $ | 74,140,859 | | | $ | 310,266,628 | | | $ | 197,883,062 | | | $ | 129,466,132 | |
| | | | | | | | | | | | | | | | |
Net Asset Value: | | | | | | | | | | | | | | | | |
$0.001 par value, unlimited shares authorized | | | | | | | | | | | | | | | | |
Net assets applicable to the GS2 Class | | $ | 74,140,859 | | | $ | 310,266,628 | | | $ | 197,883,062 | | | $ | 129,466,132 | |
| | | | | | | | | | | | | | | | |
GS2 shares outstanding | | | 7,931,423 | | | | 33,189,321 | | | | 20,703,673 | | | | 13,295,524 | |
| | | | | | | | | | | | | | | | |
Net asset value, offering and redemption price per GS2 share | | $ | 9.35 | | | $ | 9.35 | | | $ | 9.56 | | | $ | 9.74 | |
| | | | | | | | | | | | | | | | |
(1) Investments in securities of affiliated issuers, at cost | | $ | 72,053,542 | | | $ | 313,727,663 | | | $ | 215,039,904 | | | $ | 151,744,305 | |
| | | | | | | | | | | | | | | | |
|
| See Notes to Financial Statements. |
61 |
| | |
| STATEMENTS OF OPERATIONS | | For the Year Ended December 31, 2011 |
| | | | | | | | | | | | | | | | |
| | | Conservative
Allocation
Fund I | | | Balanced
Allocation
Fund I | | | Growth
Allocation
Fund I | | | Aggressive
Allocation
Fund I | |
Investment Income | | | | | | | | | | | | | | | | |
Income dividends received from affiliated funds | | $ | 1,814,350 | | | $ | 11,325,370 | | | $ | 5,706,219 | | | $ | 2,514,703 | |
Interest | | | — | | | | 25,028 | | | | 8,390 | | | | 165 | |
| | | | | | | | | | | | | | | | |
Total Investment Income | | | 1,814,350 | | | | 11,350,398 | | | | 5,714,609 | | | | 2,514,868 | |
| | | | | | | | | | | | | | | | |
Expenses | | | | | | | | | | | | | | | | |
Investment advisory fees | | | 76,901 | | | | 355,102 | | | | 233,520 | | | | 154,391 | |
Transfer agent fees: | | | | | | | | | | | | | | | | |
GS2 Shares | | | 3,931 | | | | 4,007 | | | | 3,879 | | | | 3,866 | |
Custodian fees | | | 9,500 | | | | 21,687 | | | | 17,222 | | | | 13,080 | |
Accounting and administration fees | | | 12,093 | | | | 26,765 | | | | 20,465 | | | | 16,053 | |
Professional fees | | | 57,549 | | | | 58,046 | | | | 57,731 | | | | 57,567 | |
Blue sky fees: | | | | | | | | | | | | | | | | |
GS2 Shares | | | 3,616 | | | | 3,616 | | | | 3,616 | | | | 3,616 | |
Shareholder reporting fees | | | 550 | | | | 699 | | | | 447 | | | | 457 | |
Trustee expenses | | | 453 | | | | 2,010 | | | | 1,323 | | | | 855 | |
Line of credit facility fees | | | 854 | | | | 3,953 | | | | 2,619 | | | | 1,719 | |
Other expenses | | | 13,688 | | | | 14,224 | | | | 13,613 | | | | 13,687 | |
| | | | | | | | | | | | | | | | |
Total Expenses | | | 179,135 | | | | 490,109 | | | | 354,435 | | | | 265,291 | |
Expenses waived/reimbursed net of amount recaptured(1) | | | (66,248 | ) | | | — | | | | (2,458 | ) | | | (38,072 | ) |
| | | | | | | | | | | | | | | | |
Net expenses | | | 112,887 | | | | 490,109 | | | | 351,977 | | | | 227,219 | |
| | | | | | | | | | | | | | | | |
Net Investment Income | | | 1,701,463 | | | | 10,860,289 | | | | 5,362,632 | | | | 2,287,649 | |
| | | | | | | | | | | | | | | | |
Realized and Unrealized Gain (Loss) | | | | | | | | | | | | | | | | |
Capital gain distributions received from affiliated funds | | | 359,023 | | | | 3,763,881 | | | | 1,238,595 | | | | 85,481 | |
Net realized loss on investment securities of affiliated issuers | | | (244,539 | ) | | | (19,468,890 | ) | | | (13,718,234 | ) | | | (9,170,716 | ) |
Net realized gain on investment securities of unaffiliated issuers | | | — | | | | 43,854 | | | | 9,332 | | | | 2 | |
Net realized gain (loss) on futures transactions | | | (166,463 | ) | | | 433,480 | | | | 129,814 | | | | (25,826 | ) |
| | | | | | | | | | | | | | | | |
Net realized loss | | | (51,979 | ) | | | (15,227,675 | ) | | | (12,340,493 | ) | | | (9,111,059 | ) |
| | | | | | | | | | | | | | | | |
Change in unrealized appreciation (depreciation) on investment securities of affiliated issuers | | | (321,081 | ) | | | 7,825,505 | | | | 1,428,709 | | | | (863,950 | ) |
Change in unrealized depreciation on investment securities of unaffiliated issuers | | | — | | | | (11,599 | ) | | | (3,886 | ) | | | (35 | ) |
Change in unrealized appreciation on futures | | | 4,197 | | | | 52,372 | | | | 44,662 | | | | 17,799 | |
| | | | | | | | | | | | | | | | |
Net change in unrealized appreciation (depreciation) | | | (316,884 | ) | | | 7,866,278 | | | | 1,469,485 | | | | (846,186 | ) |
| | | | | | | | | | | | | | | | |
Net Realized and Unrealized Loss | | | (368,863 | ) | | | (7,361,397 | ) | | | (10,871,008 | ) | | | (9,957,245 | ) |
| | | | | | | | | | | | | | | | |
Net Increase (Decrease) in Net Assets Resulting from Operations | | $ | 1,332,600 | | | $ | 3,498,892 | | | $ | (5,508,376 | ) | | $ | (7,669,596 | ) |
| | | | | | | | | | | | | | | | |
| (1) | See Note 3a and 3c in Notes to Financial Statements. |
|
| See Notes to Financial Statements. |
62 |
STATEMENTS OF CHANGES IN NET ASSETS
| | | | | | | | | | | | | | | | |
| | | Conservative Allocation Fund I | | | Balanced Allocation Fund I | |
| | | For the Year Ended | | | For the Year Ended | |
| | | 12/31/11 | | | 12/31/10 | | | 12/31/11 | | | 12/31/10 | |
Operations: | | | | | | | | | | | | | | | | |
Net investment income | | $ | 1,701,463 | | | $ | 1,702,970 | | | $ | 10,860,289 | | | $ | 11,905,320 | |
Net realized loss on investment securities and futures transactions | | | (51,979 | ) | | | (676,355 | ) | | | (15,227,675 | ) | | | (3,548,295 | ) |
Net change in unrealized appreciation (depreciation) on investment securities and futures | | | (316,884 | ) | | | 3,826,228 | | | | 7,866,278 | | | | 30,022,672 | |
| | | | | | | | | | | | | | | | |
Net increase (decrease) in net assets resulting from operations | | | 1,332,600 | | | | 4,852,843 | | | | 3,498,892 | | | | 38,379,697 | |
| | | | | | | | | | | | | | | | |
Dividends to Shareholders: | | | | | | | | | | | | | | | | |
Dividends from net investment income(1) | | | (1,925,326 | ) | | | (2,200,764 | ) | | | (12,643,249 | ) | | | (15,332,084 | ) |
| | | | | | | | | | | | | | | | |
Total dividends | | | (1,925,326 | ) | | | (2,200,764 | ) | | | (12,643,249 | ) | | | (15,332,084 | ) |
| | | | | | | | | | | | | | | | |
Capital Share Transactions: | | | | | | | | | | | | | | | | |
Proceeds from GS2 shares sold | | | 18,399,863 | | | | 11,578,089 | | | | 20,439,001 | | | | 20,143,207 | |
Reinvestment of dividends and distributions into GS2 shares | | | 1,921,753 | | | | 2,196,344 | | | | 12,613,592 | | | | 15,298,336 | |
Value of GS2 shares redeemed | | | (17,513,547 | ) | | | (8,731,188 | ) | | | (61,130,637 | ) | | | (37,676,116 | ) |
| | | | | | | | | | | | | | | | |
Net increase (decrease) from capital share transactions(2) | | | 2,808,069 | | | | 5,043,245 | | | | (28,078,044 | ) | | | (2,234,573 | ) |
| | | | | | | | | | | | | | | | |
Total increase (decrease) in net assets | | | 2,215,343 | | | | 7,695,324 | | | | (37,222,401 | ) | | | 20,813,040 | |
| | | | | | | | | | | | | | | | |
Net Assets: | | | | | | | | | | | | | | | | |
Beginning of Year | | | 71,925,516 | | | | 64,230,192 | | | | 347,489,029 | | | | 326,675,989 | |
| | | | | | | | | | | | | | | | |
End of Year* | | $ | 74,140,859 | | | $ | 71,925,516 | | | $ | 310,266,628 | | | $ | 347,489,029 | |
| | | | | | | | | | | | | | | | |
* Including undistributed net investment income | | $ | 710,653 | | | $ | 724,828 | | | $ | 5,272,598 | | | $ | 5,589,325 | |
| | | | | | | | | | | | | | | | |
| (1) | Includes dividends paid from the short-term portion of capital gain distributions received from affiliated funds. |
| (2) | See Note 7 in Notes to Financial Statements. |
|
| See Notes to Financial Statements. |
63 |
| | | | | | | | | | | | | | |
| Growth Allocation Fund I | | | Aggressive Allocation Fund I | |
| For the Year Ended | | | For the Year Ended | |
| 12/31/11 | | | 12/31/10 | | | 12/31/11 | | | 12/31/10 | |
| | | | | | | | | | | | | | | |
| $ | 5,362,632 | | | $ | 5,592,851 | | | $ | 2,287,649 | | | $ | 2,390,609 | |
| | (12,340,493 | ) | | | (2,107,102 | ) | | | (9,111,059 | ) | | | (3,843,054 | ) |
| | 1,469,485 | | | | 24,894,782 | | | | (846,186 | ) | | | 22,255,533 | |
| | | | | | | | | | | | | | |
| | (5,508,376 | ) | | | 28,380,531 | | | | (7,669,596 | ) | | | 20,803,088 | |
| | | | | | | | | | | | | | |
| | | | | | | | | | | | | | | |
| | (5,922,267 | ) | | | (6,706,135 | ) | | | (2,389,446 | ) | | | (2,510,802 | ) |
| | | | | | | | | | | | | | |
| | (5,922,267 | ) | | | (6,706,135 | ) | | | (2,389,446 | ) | | | (2,510,802 | ) |
| | | | | | | | | | | | | | |
| | | | | | | | | | | | | | | |
| | 10,889,257 | | | | 12,756,146 | | | | 7,071,127 | | | | 8,533,321 | |
| | 5,901,738 | | | | 6,685,451 | | | | 2,387,924 | | | | 2,509,149 | |
| | (41,034,407 | ) | | | (16,618,041 | ) | | | (27,243,948 | ) | | | (15,288,566 | ) |
| | | | | | | | | | | | | | |
| | (24,243,412 | ) | | | 2,823,556 | | | | (17,784,897 | ) | | | (4,246,096 | ) |
| | | | | | | | | | | | | | |
| | (35,674,055 | ) | | | 24,497,952 | | | | (27,843,939 | ) | | | 14,046,190 | |
| | | | | | | | | | | | | | |
| | | | | | | | | | | | | | | |
| | 233,557,117 | | | | 209,059,165 | | | | 157,310,071 | | | | 143,263,881 | |
| | | | | | | | | | | | | | |
| $ | 197,883,062 | | | $ | 233,557,117 | | | $ | 129,466,132 | | | $ | 157,310,071 | |
| | | | | | | | | | | | | | |
| $ | 1,464,387 | | | $ | 1,563,564 | | | $ | 2,287,519 | | | $ | 2,389,297 | |
| | | | | | | | | | | | | | |
|
| See Notes to Financial Statements. |
64 |
FINANCIAL HIGHLIGHTS
For a Share Outstanding For the Years Ending December 31, unless otherwise indicated
| | | | | | | | | | | | | | | | | | | | | | | | | | | | | | | | | | | | | | | | | | | | | | | | | | | | |
| | | | Ratios to Average Net Assets | | | | |
| | | Net
Asset
Value,
Beginning
of Year | | | Net
Investment
Income (1) | | | Capital
Gain
Distributions
Received
from
Affiliated
Funds | | | Realized
and
Unrealized
Gain (Loss)
on
Investments | | | Dividends
from Net
Investment
Income (2) | | | Distributions
from Net
Realized
Capital
Gains | | | Net
Asset
Value,
End of
Year | | | Total
Return | | | Net Assets,
End of
Year (000) | | | Expenses,
Net(3) | | | Expenses,
Gross(3)(4) | | | Investment
Income,
Net
(1)(5) | | | Portfolio
Turnover
Rate | |
Conservative Allocation Fund I | |
|
GS2 Class | |
2011 | | $ | 9.42 | | | $ | 0.22 | # | | $ | 0.05 | | | $ | (0.09 | ) | | $ | (0.25 | ) | | $ | — | | | $ | 9.35 | | | | 1.92 | % | | $ | 74,141 | | | | 0.15 | % | | | 0.24 | % | | | 2.26 | % | | | 26 | % |
2010 | | | 9.06 | | | | 0.23 | # | | | 0.10 | | | | 0.33 | | | | (0.30 | ) | | | — | | | | 9.42 | | | | 7.25 | | | | 71,926 | | | | 0.15 | | | | 0.20 | | | | 2.50 | | | | 12 | |
2009 | | | 8.00 | | | | 0.32 | # | | | — | † | | | 1.05 | | | | (0.31 | ) | | | — | | | | 9.06 | | | | 17.13 | | | | 64,230 | | | | 0.15 | | | | 0.23 | | | | 3.70 | | | | 35 | |
2008 | | | 9.86 | | | | 0.49 | | | | 0.03 | | | | (1.81 | ) | | | (0.39 | ) | | | (0.18 | ) | | | 8.00 | | | | (12.98 | ) | | | 54,317 | | | | 0.15 | | | | 0.22 | | | | 5.21 | | | | 25 | |
2007 | | | 10.05 | | | | 0.50 | | | | 0.23 | | | | (0.07 | ) | | | (0.54 | ) | | | (0.31 | ) | | | 9.86 | | | | 6.55 | | | | 67,231 | | | | 0.16 | | | | 0.22 | | | | 4.77 | | | | 25 | |
|
Balanced Allocation Fund I | |
|
GS2 Class | |
2011 | | $ | 9.64 | | | $ | 0.31 | # | | $ | 0.11 | | | $ | (0.31 | ) | | $ | (0.40 | ) | | $ | — | | | $ | 9.35 | | | | 1.14 | % | | $ | 310,267 | | | | 0.14 | % | | | 0.14 | % | | | 3.14 | % | | | 18 | % |
2010 | | | 9.00 | | | | 0.33 | # | | | 0.15 | | | | 0.60 | | | | (0.44 | ) | | | — | | | | 9.64 | | | | 12.04 | | | | 347,489 | | | | 0.13 | | | | 0.13 | | | | 3.56 | | | | 19 | |
2009 | | | 7.53 | | | | 0.37 | # | | | 0.08 | | | | 1.46 | | | | (0.44 | ) | | | — | | | | 9.00 | | | | 25.28 | | | | 326,676 | | | | 0.14 | | | | 0.14 | | | | 4.46 | | | | 20 | |
2008 | | | 11.07 | | | | 0.51 | # | | | 0.17 | | | | (3.38 | ) | | | (0.42 | ) | | | (0.42 | ) | | | 7.53 | | | | (24.26 | ) | | | 260,123 | | | | 0.14 | | | | 0.14 | | | | 5.16 | | | | 23 | |
2007 | | | 11.35 | | | | 0.55 | # | | | 0.66 | | | | (0.38 | ) | | | (0.62 | ) | | | (0.49 | ) | | | 11.07 | | | | 7.32 | | | | 353,793 | | | | 0.16 | | | | 0.14 | | | | 4.62 | | | | 12 | |
|
Growth Allocation Fund I | |
|
GS2 Class | |
2011 | | $ | 10.08 | | | $ | 0.24 | # | | $ | 0.05 | | | $ | (0.51 | ) | | $ | (0.30 | ) | | $ | — | | | $ | 9.56 | | | | (2.21 | )% | | $ | 197,883 | | | | 0.15 | % | | | 0.15 | % | | | 2.34 | % | | | 13 | % |
2010 | | | 9.13 | | | | 0.24 | # | | | 0.07 | | | | 0.94 | | | | (0.30 | ) | | | — | | | | 10.08 | | | | 13.68 | | | | 233,557 | | | | 0.14 | | | | 0.14 | | | | 2.60 | | | | 13 | |
2009 | | | 7.35 | | | | 0.26 | # | | | 0.04 | | | | 1.78 | | | | (0.30 | ) | | | — | | | | 9.13 | | | | 28.22 | | | | 209,059 | | | | 0.15 | | | | 0.15 | | | | 3.28 | | | | 13 | |
2008 | | | 12.53 | | | | 0.39 | # | | | 0.16 | | | | (4.69 | ) | | | (0.34 | ) | | | (0.70 | ) | | | 7.35 | | | | (32.82 | ) | | | 161,815 | | | | 0.15 | | | | 0.14 | | | | 3.65 | | | | 18 | |
2007 | | | 12.96 | | | | 0.41 | | | | 0.92 | | | | (0.37 | ) | | | (0.58 | ) | | | (0.81 | ) | | | 12.53 | | | | 7.40 | | | | 251,579 | | | | 0.16 | | | | 0.15 | | | | 3.20 | | | | 9 | |
|
Aggressive Allocation Fund I | |
|
GS2 Class | |
2011 | | $ | 10.44 | | | $ | 0.16 | # | | $ | 0.01 | | | $ | (0.69 | ) | | $ | (0.18 | ) | | $ | — | | | $ | 9.74 | | | | (4.93 | )% | | $ | 129,466 | | | | 0.15 | % | | | 0.18 | % | | | 1.51 | % | | | 9 | % |
2010 | | | 9.21 | | | | 0.16 | # | | | — | † | | | 1.24 | | | | (0.17 | ) | | | — | | | | 10.44 | | | | 15.23 | | | | 157,310 | | | | 0.15 | | | | 0.16 | | | | 1.67 | | | | 5 | |
2009 | | | 7.20 | | | | 0.16 | # | | | — | † | | | 2.06 | | | | (0.21 | ) | | | — | | | | 9.21 | | | | 30.87 | | | | 143,264 | | | | 0.15 | | | | 0.17 | | | | 2.10 | | | | 5 | |
2008 | | | 14.07 | | | | 0.24 | # | | | 0.14 | | | | (6.15 | ) | | | — | | | | (1.10 | ) | | | 7.20 | | | | (40.87 | ) | | | 109,556 | | | | 0.15 | | | | 0.16 | | | | 2.08 | | | | 10 | |
2007 | | | 14.56 | | | | 0.27 | | | | 1.37 | | | | (0.56 | ) | | | (0.52 | ) | | | (1.05 | ) | | | 14.07 | | | | 7.38 | | | | 198,847 | | | | 0.16 | | | | 0.15 | | | | 1.81 | | | | 7 | |
| † | Amount represents less than $0.005 per share. |
| # | Calculated using the average shares outstanding method. |
| (1) | Recognition of net investment income by the Fund is affected by the timing of the declaration of dividends by the underlying investment companies in which the Fund invests. |
| (2) | Includes dividends paid from the short-term portion of capital gain distributions received from affiliated Funds. |
| (3) | Does not include expenses of the investment companies in which the Fund invests. |
| (4) | The ratio excludes expenses waived/reimbursed net of amount recaptured. |
| (5) | The ratio includes expenses waived/reimbursed net of amount recaptured and fees paid indirectly, where applicable; if expenses waived/reimbursed net of amount recaptured and fees paid indirectly were excluded, the ratio would have been lower than the ratio shown. |
|
| See Notes to Financial Statements. |
65 |
Money Market Fund
During 2011, the Federal Reserve remained persistent in maintaining its near zero percent interest rate policy to keep borrowing costs low in a concerted effort to stimulate economic growth, thus keeping short-term rates fell even further from historically low levels. The Federal Reserve also introduced unconventional means to stimulate the domestic economy, including “Operation Twist”, a program designed to reduce long-term rates and keep shorter-term rates at current or higher levels. The U.S. central bank had committed to holding the federal funds rate target between the range of 0.00% to 0.25% until mid-2013.
Given the environment of historically low interest rates and funds’ constrained investment universe stemming from new Rule 2a-7 regulations, money market funds (which are lenders to borrowers at short-term interest rates) experienced another year of historically low returns. At the end of 2011, 90-day U.S. Treasury bills were yielding a very modest 0.01%, compared to 0.12% a year ago. Low-yields made it extraordinarily difficult for money market funds across the mutual fund industry to post positive returns after covering expenses.
The Fund is actively managed and invests in a broad range of high quality, short-term money market instruments denominated exclusively in U.S. dollars. The Fund seeks to maintain, but does not guarantee, a stable per share price of $1.00, while paying monthly dividends based on the daily account value. The GS4 Class of the Fund returned 0.01% for the one-year period ended December 31, 2011, as compared to a 0.08% return for the Citigroup 3-Month Treasury Bill Index (benchmark index). The Fund’s underperformance was due to the impact of Fund expenses as the low-rate environment provided little opportunity to generate returns sufficient to cover expenses and outpace the benchmark index. Despite the difficult interest rate environment, the management of the Fund remained true to its primary objectives of preservation of capital and liquidity versus sacrificing quality in an effort to “stretch for incremental yield.” As evidence, exposure to the European bank sector was materially reduced or eliminated during the year while giving up higher yields in an effort to reduce credit risk and exposure to this problematic region/sector. Throughout the year, the Fund remained well diversified among many sectors including floating rate notes, certificates of deposits, time deposits, commercial paper, U.S. Treasuries and agency obligations. At year-end, the Fund’s weighted average maturity was 32 days.
This Fund may be suitable for investors who have a short-term investment horizon, seek to maintain a stable dollar value for their investment and can accept a long-term rate of return that may be lower than other fixed income and stock investments.
An investment in the Fund is not insured or guaranteed by the Federal Depository Insurance Corporation or any other governmental agency. Although the Fund seeks to maintain a value of $1.00 per share, it is possible to lose money.
Please see page 73 for information regarding specific portfolio allocations. Portfolio holdings are subject to change and risk at any time.
66
Money Market Fund
| | | | | | | | | | | | |
Average Annual Total Returns as of 12/31/11 | |
| | | GS2
Class* | | | GS4
Class* | | | Benchmark** | |
One Year | | | 0.10 | % | | | 0.01 | % | | | 0.08 | % |
Five Year | | | 1.76 | % | | | 1.60 | % | | | 1.36 | % |
Ten Year | | | 2.08 | % | | | 1.90 | % | | | 1.85 | % |
Since Inception | | | 2.07 | % | | | 1.92 | % | | | 1.89 | % |
Inception Date | | | 08/27/01 | | | | 08/27/01 | | | | | |
Total Fund Operating Expenses (April 30, 2011 Prospectus, as amended on September 1, 2011)(1) | | | 0.18 | % | | | 0.42 | % | | | | |
| | | | | | | | |
Yield as of 12/31/11(2) | |
| | | GS2
Class* | | | GS4
Class* | |
7-Day Annualized Yield (Net) | | | 0.07 | % | | | 0.00 | % |
7-Day Annualized Yield (Gross) | | | 0.25 | % | | | 0.25 | % |
| (1) | Current information regarding the Fund’s Operating Expenses can be found in the Financial Highlights. |
| (2) | Yield for the Money Market Fund represents the annualization of the Fund’s declared dividends over the period indicated, excluding capital gains distributions. The yield more closely reflects the current earnings of the Fund than the total return. Gross Yield reflects the yield without fee waivers in effect. |
The performance data quoted represents past performance and does not guarantee future results. Current performance may be lower or higher. Performance data current to the most recent month-end may be obtained at www.GuideStoneFunds.org. Investment return will fluctuate so that shares, when redeemed, may be worth more or less than their original cost. The yield for the Money Market Fund represents annualization of the Fund’s declared dividends over the period indicated, excluding capital gains distributions. The 7-day annualized yield more closely reflects the current earnings of the Fund than the total return.
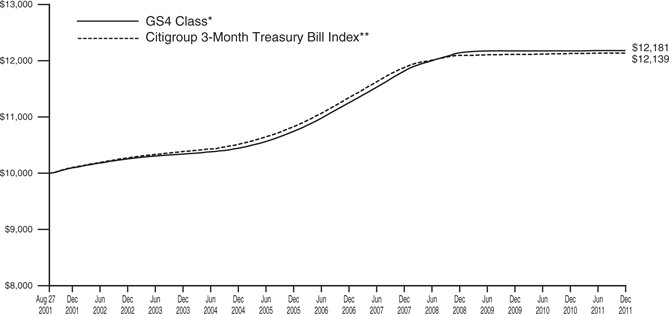
The graph compares the results of a hypothetical $10,000 investment in the GS4 Class of the Fund since August 27, 2001 (commencement of operations), with all dividends and capital gains reinvested, with the Citigroup 3-Month Treasury Bill Index.
| * | These performance figures reflect expense waivers by the Fund’s investment adviser. Without these waivers, performance would have been lower. Performance figures shown do not reflect the deduction of taxes that a shareholder would pay on Fund distributions or the redemption of Fund shares. |
| ** | The Citigroup 3-Month Treasury Bill Index is an unmanaged index that is generally representative of 3-month U.S. Treasury bills, consisting of an average of the last 3-month U.S. Treasury bill issues. |
Unlike a mutual fund, the performance of an index assumes no taxes, transaction costs, management fees or other expenses.
67
| | |
| MONEY MARKET FUND | | |
| SCHEDULE OF INVESTMENTS | | December 31, 2011 |
| | | | | | | | |
| | | Par | | | Value | |
AGENCY OBLIGATIONS — 11.6% | | | | | |
Federal Home Loan Mortgage Corporation | | | | | | | | |
0.15%, 02/15/12 | | $ | 15,000,000 | | | $ | 14,997,188 | |
0.24%, 02/16/12† | | | 6,000,000 | | | | 5,999,695 | |
0.15%, 04/03/12 | | | 13,000,000 | | | | 12,994,963 | |
0.24%, 04/03/12† | | | 10,000,000 | | | | 9,998,966 | |
0.15%, 04/04/12 | | | 15,000,000 | | | | 14,994,125 | |
1.13%, 04/25/12 | | | 9,000,000 | | | | 9,026,906 | |
0.21%, 11/02/12† | | | 10,000,000 | | | | 9,994,922 | |
0.30%, 09/03/13† | | | 15,500,000 | | | | 15,494,765 | |
0.22%, 09/13/13† | | | 36,800,000 | | | | 36,762,047 | |
Federal National Mortgage Association | | | | | | | | |
0.28%, 07/26/12† | | | 11,000,000 | | | | 10,998,754 | |
0.31%, 12/20/12† | | | 7,000,000 | | | | 6,998,626 | |
| | | | | | | | |
Total Agency Obligations
(Cost $148,260,957) | | | | | | | 148,260,957 | |
| | | | | | | | |
CERTIFICATES OF DEPOSIT — 22.8% | |
Bank of Montreal CHI | | | | | | | | |
0.37%, 01/25/12† | | | 14,000,000 | | | | 14,000,000 | |
Bank of Nova Scotia Houston | | | | | | | | |
0.30%, 01/13/12 | | | 10,000,000 | | | | 10,000,000 | |
Bank of Tokyo Mitsubishi UFJ, Ltd. | | | | | | | | |
0.41%, 02/10/12 | | | 10,000,000 | | | | 10,000,000 | |
Credit Suisse NY | | | | | | | | |
0.40%, 01/26/12 | | | 10,000,000 | | | | 10,000,000 | |
National Australia Bank NY | | | | | | | | |
0.32%, 01/19/12 | | | 10,000,000 | | | | 10,000,000 | |
0.37%, 02/10/12† | | | 20,000,000 | | | | 20,000,000 | |
0.32%, 02/21/12 | | | 15,000,000 | | | | 15,000,000 | |
Norinchukin Bank NY | | | | | | | | |
0.18%, 01/03/12 | | | 30,000,000 | | | | 30,000,000 | |
0.18%, 01/04/12 | | | 10,000,000 | | | | 10,000,000 | |
Royal Bank of Canada NY | | | | | | | | |
0.52%, 02/29/12† | | | 13,000,000 | | | | 13,000,000 | |
0.40%, 04/10/12† | | | 5,000,000 | | | | 5,000,000 | |
0.40%, 07/09/12† | | | 4,000,000 | | | | 4,000,000 | |
Sumitomo Mitsui Banking Corporation NY | | | | | | | | |
0.23%, 01/06/12 | | | 30,000,000 | | | | 30,000,000 | |
0.35%, 01/12/12 | | | 20,000,000 | | | | 20,000,000 | |
0.40%, 02/09/12 | | | 10,000,000 | | | | 10,000,000 | |
Svenska Handelsbanken NY | | | | | | | | |
0.33%, 01/09/12 | | | 18,000,000 | | | | 18,000,000 | |
0.50%, 03/29/12 | | | 5,500,000 | | | | 5,500,000 | |
Toronto Dominion Bank NY | | | | | | | | |
0.36%, 01/12/12† | | | 6,500,000 | | | | 6,500,000 | |
0.37%, 04/17/12 | | | 18,000,000 | | | | 18,000,000 | |
Westpac Banking Corporation NY | | | | | | | | |
0.42%, 01/18/12† | | | 22,000,000 | | | | 22,000,000 | |
0.37%, 04/04/12† | | | 10,000,000 | | | | 9,999,896 | |
| | | | | | | | |
Total Certificates of Deposit
(Cost $290,999,896) | | | | 290,999,896 | |
| | | | | | | | |
COMMERCIAL PAPER — 45.9% | | | | | |
Barclays US Funding LLC | | | | | | | | |
0.09%, 01/03/12 | | | 45,000,000 | | | | 44,999,775 | |
Cancara Asset Securitization LLC | | | | | | | | |
0.26%, 01/24/12 | | | 19,000,000 | | | | 18,996,844 | |
| | | | | | | | |
| | | Par | | | Value | |
Commonwealth Bank of Australia | | | | | | | | |
0.34%, 02/15/12 | | $ | 25,000,000 | | | $ | 24,989,375 | |
Deutsche Bank Financial LLC | | | | | | | | |
0.25%, 01/05/12 | | | 10,000,000 | | | | 9,999,722 | |
0.44%, 01/10/12 | | | 15,000,000 | | | | 14,998,350 | |
Fairway Finance Co. LLC | | | | | | | | |
0.31%, 03/09/12 | | | 18,500,000 | | | | 18,500,000 | |
0.31%, 05/04/12 | | | 23,000,000 | | | | 23,000,000 | |
ING US Funding LLC | | | | | | | | |
0.26%, 01/18/12 | | | 30,000,000 | | | | 29,996,317 | |
Kells Funding LLC | | | | | | | | |
0.48%, 02/10/12 | | | 13,000,000 | | | | 13,000,000 | |
0.57%, 03/01/12 | | | 10,000,000 | | | | 10,000,000 | |
0.57%, 03/08/12 | | | 10,000,000 | | | | 10,000,000 | |
Metlife Short Term Funding LLC | | | | | | | | |
0.34%, 01/17/12 | | | 20,000,000 | | | | 19,996,978 | |
0.25%, 03/02/12 | | | 15,000,000 | | | | 14,993,646 | |
National Australia Bank, Ltd. NY | | | | | | | | |
0.49%, 06/18/12 | | | 10,000,000 | | | | 9,976,997 | |
Nordea North America, Inc. | | | | | | | | |
0.38%, 01/20/12 | | | 20,000,000 | | | | 19,995,989 | |
0.36%, 02/03/12 | | | 20,000,000 | | | | 19,993,400 | |
0.44%, 02/16/12 | | | 15,000,000 | | | | 14,991,567 | |
Regency Markets No. 1 LLC | | | | | | | | |
0.36%, 01/17/12 | | | 15,608,000 | | | | 15,605,503 | |
0.25%, 01/25/12 | | | 15,000,000 | | | | 14,997,500 | |
Sheffield Receivables Corporation | | | | | | | | |
0.30%, 01/25/12 | | | 15,000,000 | | | | 14,997,000 | |
Solitaire Funding LLC | | | | | | | | |
0.39%, 01/17/12 | | | 20,000,000 | | | | 19,996,533 | |
0.40%, 01/23/12 | | | 10,000,000 | | | | 9,997,555 | |
State Street Corporation | | | | | | | | |
0.22%, 03/05/12 | | | 20,000,000 | | | | 19,992,178 | |
Sumitomo Mitsui Banking Corporation | | | | | | | | |
0.40%, 02/10/12 | | | 20,000,000 | | | | 19,991,111 | |
Svenska Handelsbanken, Inc. | | | | | | | | |
0.36%, 01/19/12 | | | 20,000,000 | | | | 19,996,400 | |
Sydney Capital Corporation | | | | | | | | |
0.38%, 02/16/12 | | | 19,122,000 | | | | 19,112,715 | |
Thames Asset Global Securitization | | | | | | | | |
0.32%, 01/06/12 | | | 20,000,000 | | | | 19,999,111 | |
0.32%, 01/12/12 | | | 15,000,000 | | | | 14,998,533 | |
UBS Finance Delaware LLC | | | | | | | | |
0.38%, 01/09/12 | | | 25,000,000 | | | | 24,997,889 | |
Victory Receivables Corporation | | | | | | | | |
0.35%, 01/04/12 | | | 18,000,000 | | | | 17,999,475 | |
0.35%, 01/06/12 | | | 15,000,000 | | | | 14,999,271 | |
0.37%, 01/18/12 | | | 20,000,000 | | | | 19,996,506 | |
| | | | | | | | |
Total Commercial Paper
(Cost $586,106,240) | | | | 586,106,240 | |
| | | | | | | | |
|
| See Notes to Financial Statements. |
68 |
MONEY MARKET FUND
SCHEDULE OF INVESTMENTS (Continued)
| | | | | | | | |
| | | Par | | | Value | |
MUNICIPAL BONDS — 15.6% | | | | | |
California Housing Finance Agency, Revenue Bond, Series D | | | | | | | | |
0.07%, 01/06/12† | | $ | 12,900,000 | | | $ | 12,900,000 | |
California Housing Finance Agency, Multi-Family III, Revenue Bond, Series E (LOC-Fannie Mae, Freddie Mac) | | | | | | | | |
0.08%, 01/06/12† | | | 10,800,000 | | | | 10,800,000 | |
California Pollution Control Financing Authority, Pollution Control Revenue Bonds, Series E (LOC-JP Morgan Chase Bank) | | | | | | | | |
0.04%, 01/03/12† | | | 5,800,000 | | | | 5,800,000 | |
California Statewide Communities Development Authority, Hallmark House Apartments, Revenue Bond, Series ZZ | | | | | | | | |
0.10%, 01/06/12† | | | 6,420,000 | | | | 6,420,000 | |
California Statewide Communities Development Authority, Kimberly Woods Apartments, Revenue Bond, Series B | | | | | | | | |
0.10%, 01/06/12† | | | 17,100,000 | | | | 17,100,000 | |
Connecticut State Health & Educational Facilities Authority, Yale-New Haven Hospital, Revenue Bond, Series K2 (LOC-JPMorgan Chase Bank) | | | | | | | | |
0.06%, 01/06/12† | | | 12,420,000 | | | | 12,420,000 | |
Los Angeles Community Redevelopment Agency, Hollywood & Vine Apartments, Revenue Bond, Series A | | | | | | | | |
0.09%, 01/06/12† | | | 10,000,000 | | | | 10,000,000 | |
Los Angeles County Housing Authority, Malibu Meadows II, Revenue Bond, Series C | | | | | | | | |
0.06%, 01/06/12† | | | 5,799,000 | | | | 5,799,000 | |
Maryland Department of Housing and Community Development Administration, Multifamily Barrington Apartments Project, Revenue Bond, Series A | | | | | | | | |
0.09%, 01/06/12† | | | 27,575,000 | | | | 27,575,000 | |
New York City Housing Development Corporation, Multi-Family Housing (155 West 21st Street), Revenue Bond, Series A | | | | | | | | |
0.09%, 01/06/12† | | | 3,100,000 | | | | 3,100,000 | |
New York City Housing Development Corporation, Multi-Family Housing (90 West Street), Revenue Bond, Series A | | | | | | | | |
0.09%, 01/06/12† | | | 6,000,000 | | | | 6,000,000 | |
| | | | | | | | |
| | | Par | | | Value | |
New York City Housing Development Corporation, Multi-Family Housing (West 61st Street Apartments), Revenue Bond, Series A | | | | | | | | |
0.09%, 01/06/12† | | $ | 3,000,000 | | | $ | 3,000,000 | |
New York City Industrial Development Agency, New York Law School Project, Revenue Bond, Series A (LOC-JPMorgan Chase Bank) | | | | | | | | |
0.06%, 01/06/12† | | | 7,800,000 | | | | 7,800,000 | |
New York City Municipal Water Finance Authority, Water and Sewer System, Revenue Bond, Sub Series B-1 | | | | | | | | |
0.05%, 01/06/12† | | | 6,800,000 | | | | 6,800,000 | |
New York Housing Finance Agency, 10 Barclay Street Housing, Revenue Bond, Series A (LOC-Fannie Mae) | | | | | | | | |
0.09%, 01/06/12† | | | 10,000,000 | | | | 10,000,000 | |
New York Housing Finance Agency, Biltmore Tower Housing Project, Revenue Bond, Series A | | | | | | | | |
0.09%, 01/06/12† | | | 4,000,000 | | | | 4,000,000 | |
New York Housing Finance Agency, The Victory Housing, Revenue Bond, Series 2001-A | | | | | | | | |
0.09%, 01/06/12† | | | 2,700,000 | | | | 2,700,000 | |
New York, General Obligation, Sub Series A-3 (LOC - Morgan Stanley) | | | | | | | | |
0.10%, 01/06/12† | | | 10,100,000 | | | | 10,100,000 | |
Pennsylvania Higher Educational Facilities Authority, Thomas Jefferson University, Revenue Bond, Series B (LOC-JP Morgan Chase Bank) | | | | | | | | |
0.07%, 01/06/12† | | | 4,900,000 | | | | 4,900,000 | |
Sacramento Housing Authority, Multifamily Housing The Lofts at Natomas Apartments, Revenue Bond, Series F | | | | | | | | |
0.10%, 01/06/12† | | | 10,190,000 | | | | 10,190,000 | |
Santa Clara County Housing Authority, Benton Park Century Apartments, Revenue Bond, Series A (LOC-Fannie Mae) | | | | | | | | |
0.06%, 01/06/12† | | | 5,900,000 | | | | 5,900,000 | |
State of Texas, Veterans’ Housing Assistance Program, General Obligation Bond, Series A-2 | | | | | | | | |
0.17%, 01/06/12† | | | 7,700,000 | | | | 7,700,000 | |
See Notes to Financial Statements.
69
| | | | | | | | |
| | | Par | | | Value | |
Wisconsin Housing & Economic Development Authority, Revenue Bond, Series B (LOC-Fannie Mae, Freddie Mac) | | | | | | | | |
0.09%, 01/06/12† | | $ | 7,900,000 | | | $ | 7,900,000 | |
| | | | | | | | |
Total Municipal Bonds
(Cost $198,904,000) | | | | 198,904,000 | |
| | | | | | | | |
TIME DEPOSIT — 1.0% | |
Citibank NA | | | | | | | | |
0.06%, 01/03/12 | | | | | | | | |
(Cost $13,377,000) | | | 13,377,000 | | | | 13,377,000 | |
| | | | | | | | |
U.S. TREASURY OBLIGATION — 3.1% | |
U.S. Treasury Note | | | | | | | | |
0.38%, 08/31/12D | | | 40,000,000 | | | | 40,062,641 | |
| | | | | | | | |
Total U.S. Treasury Obligation
(Cost $40,062,641) | | | | 40,062,641 | |
| | | | | | | | |
| |
TOTAL INVESTMENTS — 100.0%
(Cost $1,277,710,734) | | | | 1,277,710,734 | |
Other Assets in Excess of Liabilities — 0.0% | | | | | | | 216,978 | |
| | | | | | | | |
NET ASSETS — 100.0% | | | $ | 1,277,927,712 | |
| | | | | | | | |
Please see abbreviation and footnote definitions beginning on page 200.
PORTFOLIO SUMMARY (based on net assets)
| | | | |
| | | % | |
Commercial Paper | | | 45.9 | |
Certificates of Deposit | | | 22.8 | |
Municipal Bonds | | | 15.6 | |
Agency Obligations | | | 11.6 | |
U.S. Treasury Obligation | | | 3.1 | |
Time Deposit | | | 1.0 | |
| | | | |
| | | 100.0 | |
| | | | |
VALUATION HIERARCHY
The following is a summary of the inputs used, as of December 31, 2011, in valuing the Fund’s investments carried at fair value:
| | | | | | | | | | | | | | | | |
| | | Total Value | | | Level 1
Quoted
Prices | | | Level 2
Other Significant
Observable
Inputs | | | Level 3
Significant
Unobservable
Inputs | |
Assets: | | | | | | | | | | | | | | | | |
Investments in Securities: | | | | | | | | | | | | | | | | |
Agency Obligations | | $ | 148,260,957 | | | $ | — | | | $ | 148,260,957 | | | $ | — | |
Certificates of Deposit | | | 290,999,896 | | | | — | | | | 290,999,896 | | | | — | |
Commercial Paper | | | 586,106,240 | | | | — | | | | 586,106,240 | | | | — | |
Municipal Bonds | | | 198,904,000 | | | | — | | | | 198,904,000 | | | | — | |
Time Deposit | | | 13,377,000 | | | | — | | | | 13,377,000 | | | | — | |
U.S. Treasury Obligation | | | 40,062,641 | | | | — | | | | 40,062,641 | | | | — | |
| | | | | | | | | | | | | | | | |
Total Assets — Investments in Securities | | $ | 1,277,710,734 | | | $ | — | | | $ | 1,277,710,734 | | | $ | — | |
| | | | | | | | | | | | | | | | |
|
| See Notes to Financial Statements. |
70 |
Low-Duration Bond Fund
The year of 2011 was turbulent and was impacted by numerous macro-economic and political events that pushed and pulled on the capital markets. Although corporate fundamentals were improving, the potential outcome of such macro events were difficult to accurately predict, which fueled investors’ fears, led to extreme uncertainty and capital market volatility. The bond market benefited from this economic uncertainty and overall risk aversion. During 2011, the broad domestic bond market, as measured by the Barclay’s Capital U.S. Aggregate Bond Index, posted an annual return of 7.84%, compared to the U.S. stock market which generated a return of 2.11%, as measured by the S&P 500® Index. Despite the macro-economic headwinds, all major bond market sectors posted positive returns for the year, led by the U.S. Treasury sector. Throughout the year, U.S. Treasury yields fell, from their already low levels, in response to the Federal Reserve’s maintaining its commitment to a near zero federal funds rate for the foreseeable future and the implementation of “Operation Twist.” Treasuries also benefitted from high demand, as global investors often sought the “safe haven” assets when implementing “risk-off ” trades. As a sector, U.S. Treasuries posted an annual return of 9.81%, with longer-dated Treasuries posting higher returns. Shorter-term U.S. Treasuries, as measured by the Bank of America Merrill Lynch 1-3 Year Treasury Index, generated a one-year return of 1.55%. The year ended at remarkably low levels with the yield on the 10-year U.S. Treasury bond at 1.88% and the 30-year U.S. Treasury bond at 2.89%. Non-U.S. Treasury bonds, “spread sectors”, also performed well in this risk aversion environment. As evidence, the investment grade corporate bond sector and mortgage-backed securities sector posted annual returns of 8.15% and 6.23%, respectively. Overall, higher-quality bonds generally outpaced lower-quality bonds while longer-maturity bonds typically outperformed shorter-maturity bonds. Non-benchmark sectors posted varied returns based on risk and correlations to the equity markets. High yield bonds (below investment grade corporate bonds), considered higher risk and more correlated to the equity market, posted an annual return of 4.98% while emerging market bonds generated an annual return 8.47%. U.S. Treasury inflation protected securities (“TIPS”) benefited from strong demand and inflationary concerns, posting an annual return of 13.56% as measured by the Barclays Capital U.S. TIPS Index.
The Fund invests in a diversified portfolio composed primarily of investment grade fixed income securities with an average dollar-weighted duration (a measure of bond prices’ sensitivity to changes in interest rates) normally between one to three years. The GS4 Class of the Fund outpaced its all-U.S. Treasury benchmark index, the Bank of America Merrill Lynch 1-3 Year Treasury Index, for the one-year period ended December 31, 2011 (1.58% versus 1.55%). In an effort to outperform its benchmark index during the low-interest rate environment, the Fund tactically utilized spread sectors that trade at a yield premium relative to their U.S. Treasury counterparts. During the year, the Fund maintained diversified exposure to multiple spread sectors including, but not limited to, corporate bonds, mortgaged-backed securities, Yankee bonds and non-U.S. bonds. While spread sectors generally underperformed U.S. Treasuries, certain securities within these sectors maintained a higher yield orientation compared to the U.S. Treasury sector which added value relative to the benchmark.
Other strategies involving derivatives were utilized during the year resulting in a modest impact to performance. U.S. Treasury futures contracts were used for the purpose of shortening the Fund’s overall duration position making it less sensitive to interest rate changes. This strategy detracted slightly from relative performance during the year as interest rates continued to fall from already historically low levels. Along with U.S. Treasury futures contracts, currency forward contracts were utilized in an effort to hedge foreign currency risk and to add exposure to rising currencies. Hedging out of the declining euro while gaining long exposure to both the Norwegian krone and Singapore dollar added very modest value relative to the benchmark index.
Security selection provided the primary source of excess return relative to the benchmark index. During the year, the Fund remained true to its overall objective of seeking current income consistent with conservation of capital.
This Fund may be suitable for investors who have a short-term investment horizon, seek an investment return that is relatively stable and want to diversify their portfolio with a fixed income investment option. This Fund is subject to interest rate risk. Meaning, when interest rates rise, the value of the existing bonds decrease and vice versa. Changes in interest rates have a bigger impact on long duration holdings than on short duration holdings. To the extent that the investment advisor misjudges current market conditions, the Fund’s volatility may be amplified by its use of short sales and derivatives and by its ability to select sub-advisers to allocate assets. Short sales by a fund theoretically involve unlimited loss potential since the market price of securities sold short may continuously increase. Leverage may increase the risk of loss and cause fluctuations in the market value of the Fund’s portfolio to have disproportionately large effects or cause the NAV of the Fund generally to decline faster than it would otherwise.
Please see page 85 for information regarding specific portfolio allocations. Portfolio holdings are subject to change and risk at any time.
71
Low-Duration Bond Fund
| | | | | | | | | | | | |
Average Annual Total Returns as of 12/31/11 | |
| | | GS2
Class* | | | GS4
Class* | | | Benchmark** | |
One Year | | | 1.77 | % | | | 1.58 | % | | | 1.55 | % |
Five Year | | | 4.26 | % | | | 4.09 | % | | | 3.69 | % |
Ten Year | | | 3.67 | % | | | 3.50 | % | | | 3.25 | % |
Since Inception | | | 3.70 | % | | | 3.58 | % | | | 3.40 | % |
Inception Date | | | 08/27/01 | | | | 08/27/01 | | | | | |
Total Fund Operating Expenses (April 30, 2011 Prospectus, as amended on September 1, 2011)(1) | | | 0.42 | % | | | 0.67 | % | | | | |
| (1) | Current information regarding the Fund’s Operating Expenses can be found in the Financial Highlights. |
The performance data quoted represents past performance and does not guarantee future results. Current performance may be lower or higher. Performance data current to the most recent month-end may be obtained at www.GuideStoneFunds.org. The investment return and principal value of an investment will fluctuate so that shares, when redeemed, may be worth more or less than their original cost.
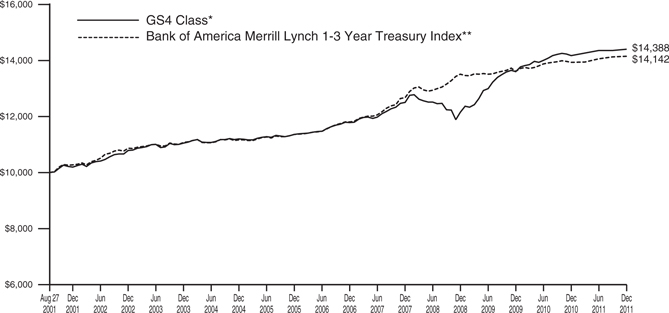
The graph compares the results of a hypothetical $10,000 investment in the GS4 Class of the Fund since August 27, 2001 (commencement of operations), with all dividends and capital gains reinvested, with the Bank of America Merrill Lynch 1-3 Year Treasury Index.
| * | These returns reflect expense waivers by the Fund’s investment adviser. Without these waivers, returns would have been lower. Returns shown do not reflect the deduction of taxes that a shareholder would pay on Fund distributions or the redemption of Fund shares. |
| ** | The Bank of America Merrill Lynch 1-3 Year Treasury Index is composed of all U.S. Treasury Notes and Bonds with maturities greater than or equal to one year and less than three years. |
Unlike a mutual fund, the performance of an index assumes no taxes, transaction costs, management fees or other expenses.
72
| | |
| LOW-DURATION BOND FUND | | |
| SCHEDULE OF INVESTMENTS | | December 31, 2011 |
| | | | | | | | |
| | | Par | | | Value | |
AGENCY OBLIGATIONS — 1.2% | |
Federal Farm Credit Bank | | | | | | | | |
1.38%, 06/25/13 | | $ | 1,150,000 | | | $ | 1,169,194 | |
Federal Home Loan Bank | | | | | | | | |
5.38%, 06/13/14 | | | 895,000 | | | | 999,620 | |
Federal National Mortgage Association | | | | | | | | |
5.25%, 08/01/12 | | | 1,580,000 | | | | 1,623,930 | |
0.75%, 12/19/14 | | | 5,000,000 | | | | 5,016,027 | |
Small Business Administration | | | | | | | | |
6.95%, 11/01/16 | | | 264,623 | | | | 287,082 | |
| | | | | | | | |
Total Agency Obligations
(Cost $8,916,941) | | | | 9,095,853 | |
| | | | | | | | |
ASSET-BACKED SECURITIES — 6.1% | |
AmeriCredit Automobile Receivables Trust | | | | | | | | |
1.39%, 09/18/15 | | | 500,000 | | | | 499,585 | |
2.33%, 03/08/16 | | | 580,000 | | | | 581,166 | |
Asset-Backed Securities Corporation Home Equity | | | | | | | | |
0.57%, 09/25/34† | | | 100,868 | | | | 89,053 | |
Bank of America Auto Trust | | | | | | | | |
2.67%, 07/15/13 144A | | | 154,682 | | | | 155,024 | |
Bear Stearns Asset-Backed Securities Trust | | | | | | | | |
0.34%, 11/25/36† | | | 80,244 | | | | 77,662 | |
1.29%, 10/25/37† | | | 971,928 | | | | 536,540 | |
0.48%, 01/25/47† | | | 761,425 | | | | 724,615 | |
BNC Mortgage Loan Trust | | | | | | | | |
0.41%, 11/25/36† | | | 689,026 | | | | 660,964 | |
0.35%, 03/25/37† | | | 643,098 | | | | 598,707 | |
Cars Alliance Funding PLC | | | | | | | | |
1.24%, 10/25/20(E)† | | | 79,160 | | | | 102,376 | |
1.44%, 10/08/23(E)† | | | 172,167 | | | | 222,571 | |
CenterPoint Energy Transition Bond Co., LLC | | | | | | | | |
4.97%, 08/01/14 | | | 691,699 | | | | 697,057 | |
Citibank Omni Master Trust | | | | | | | | |
2.38%, 05/16/16 144A† | | | 2,875,000 | | | | 2,892,658 | |
Conseco Financial Corporation | | | | | | | | |
6.04%, 11/01/29 | | | 14,961 | | | | 15,191 | |
Credit Acceptance Auto Loan Trust | | | | | | | | |
2.61%, 03/15/19 144A | | | 1,120,000 | | | | 1,117,235 | |
CSAB Mortgage Backed Trust | | | | | | | | |
5.72%, 09/25/36 STEP | | | 742,063 | | | | 469,219 | |
Daimler Chrysler Auto Trust | | | | | | | | |
5.28%, 03/08/13 | | | 450,666 | | | | 451,106 | |
FHLMC Structured Pass-Through Securities | | | | | | | | |
0.55%, 08/25/31† | | | 808,743 | | | | 785,896 | |
First Investors Auto Owner Trust | | | | | | | | |
3.40%, 03/15/16 144A | | | 700,000 | | | | 707,897 | |
Ford Credit Auto Owner Trust | | | | | | | | |
2.17%, 10/15/13 | | | 926,705 | | | | 931,440 | |
2.98%, 08/15/14 | | | 1,255,000 | | | | 1,282,507 | |
Globaldrive BV | | | | | | | | |
4.00%, 10/20/16(E) | | | 723,572 | | | | 942,460 | |
1.89%, 04/20/19 144A(E)† | | | 683,201 | | | | 884,143 | |
Hyundai Capital Auto Funding, Ltd. | | | | | | | | |
1.28%, 09/20/16 144A† | | | 1,460,000 | | | | 1,468,015 | |
| | | | | | | | |
| | | Par | | | Value | |
IFC SBA Loan-Backed Adjustable Rate Certificate | | | | | | | | |
1.25%, 01/15/24 144A† | | $ | 157,836 | | | $ | 126,268 | |
LA Arena Funding LLC | | | | | | | | |
7.66%, 12/15/26 144A | | | 426,694 | | | | 428,545 | |
Magnolia Funding, Ltd. | | | | | | | | |
3.00%, 04/20/17 144A(E) | | | 518,593 | | | | 667,741 | |
MMAF Equipment Finance LLC | | | | | | | | |
1.27%, 09/15/15 144A | | | 1,070,000 | | | | 1,066,654 | |
Oncor Electric Delivery Transition Bond Co., LLC | | | | | | | | |
4.81%, 11/17/14 | | | 672,622 | | | | 689,275 | |
Penarth Master Issuer PLC | | | | | | | | |
0.94%, 05/18/15 144A† | | | 610,000 | | | | 610,253 | |
PG&E Energy Recovery Funding LLC | | | | | | | | |
4.37%, 06/25/14 | | | 72,514 | | | | 73,348 | |
Residential Asset Mortgage Products, Inc. | | | | | | | | |
0.41%, 12/25/36† | | | 261,359 | | | | 257,880 | |
Santander Consumer Acquired Receivables Trust | | | | | | | | |
1.40%, 10/15/14 144A | | | 1,980,000 | | | | 1,982,676 | |
1.66%, 08/15/16 144A | | | 786,657 | | | | 777,652 | |
2.01%, 08/15/16 144A | | | 692,488 | | | | 684,472 | |
Santander Drive Auto Receivables Trust | | | | | | | | |
1.01%, 07/15/13 144A | | | 417,042 | | | | 416,912 | |
1.37%, 08/15/13 144A | | | 665,781 | | | | 666,306 | |
1.37%, 03/16/15 | | | 1,075,000 | | | | 1,074,159 | |
3.10%, 05/15/17 144A | | | 785,793 | | | | 778,917 | |
2.06%, 06/15/17 144A | | | 317,013 | | | | 316,183 | |
2.86%, 06/15/17 144A | | | 326,951 | | | | 326,125 | |
3.35%, 06/15/17 144A | | | 470,991 | | | | 469,921 | |
SLC Student Loan Trust | | | | | | | | |
0.52%, 01/15/19† | | | 697,948 | | | | 684,395 | |
SLM Student Loan Trust | | | | | | | | |
0.42%, 07/25/17† | | | 929,380 | | | | 921,595 | |
1.93%, 12/15/17 144A† | | | 756,353 | | | | 758,622 | |
1.72%, 01/25/18† | | | 3,975,000 | | | | 4,037,097 | |
0.75%, 06/15/21† | | | 1,204,075 | | | | 1,153,728 | |
0.95%, 03/15/22† | | | 823,219 | | | | 792,756 | |
0.53%, 10/25/24† | | | 750,000 | | | | 726,181 | |
3.50%, 08/17/43 144A† | | | 3,709,946 | | | | 3,654,554 | |
3.53%, 05/16/44 144A† | | | 1,890,810 | | | | 1,927,681 | |
Soundview Home Equity Loan Trust | | | | | | | | |
1.14%, 08/25/31† | | | 460,025 | | | | 448,846 | |
Structured Asset Securities Corporation | | | | | | | | |
1.76%, 04/25/35† | | | 909,067 | | | | 694,160 | |
Turbo Finance | | | | | | | | |
2.62%, 01/20/19(U)† | | | 601,704 | | | | 935,440 | |
Wells Fargo Home Equity Trust | | | | | | | | |
0.38%, 04/25/37† | | | 437,006 | | | | 422,363 | |
| | | | | | | | |
Total Asset-Backed Securities
(Cost $46,616,132) | | | | | | | 45,463,792 | |
| | | | | | | | |
|
CORPORATE BONDS — 22.5% | |
3M Co. | | | | | | | | |
1.38%, 09/29/16D | | | 690,000 | | | | 696,719 | |
AEP Texas Central Transition Funding LLC | | | | | | | | |
4.98%, 07/01/15 | | | 1,560,715 | | | | 1,598,098 | |
|
| See Notes to Financial Statements. |
73 |
| | | | | | | | |
| | | Par | | | Value | |
AES Corporation | | | | | | | | |
7.75%, 03/01/14D | | $ | 375,000 | | | $ | 406,875 | |
Agilent Technologies, Inc. | | | | | | | | |
4.45%, 09/14/12 | | | 610,000 | | | | 622,048 | |
2.50%, 07/15/13 | | | 810,000 | | | | 817,956 | |
5.50%, 09/14/15 | | | 310,000 | | | | 342,001 | |
Airgas, Inc. | | | | | | | | |
2.85%, 10/01/13 | | | 1,440,000 | | | | 1,467,631 | |
Allied Waste North America, Inc. | | | | | | | | |
6.88%, 06/01/17 | | | 1,360,000 | | | | 1,439,822 | |
Allstate Corporation | | | | | | | | |
6.20%, 05/16/14 | | | 300,000 | | | | 334,765 | |
American Express Credit Corporation | | | | | | | | |
1.42%, 06/24/14† | | | 920,000 | | | | 902,982 | |
American Honda Finance Corporation | | | | | | | | |
2.38%, 03/18/13 144A | | | 300,000 | | | | 304,291 | |
American International Group, Inc. | | | | | | | | |
1.75%, 07/19/13(E)† | | | 400,000 | | | | 485,358 | |
3.75%, 11/30/13 144A | | | 400,000 | | | | 392,688 | |
3.65%, 01/15/14D | | | 1,020,000 | | | | 991,124 | |
8.25%, 08/15/18 144A | | | 1,350,000 | | | | 1,429,651 | |
AmeriGas Partners LP | | | | | | | | |
6.25%, 08/20/19 | | | 500,000 | | | | 500,000 | |
Amgen, Inc. | | | | | | | | |
1.88%, 11/15/14D | | | 1,513,000 | | | | 1,533,649 | |
Amsouth Bank | | | | | | | | |
5.20%, 04/01/15 | | | 1,250,000 | | | | 1,175,000 | |
AvalonBay Communities, Inc. | | | | | | | | |
6.13%, 11/01/12D | | | 317,000 | | | | 327,975 | |
Bank of America Corporation | | | | | | | | |
5.38%, 09/11/12D | | | 800,000 | | | | 809,957 | |
4.90%, 05/01/13 | | | 400,000 | | | | 400,451 | |
5.65%, 05/01/18 | | | 1,200,000 | | | | 1,144,794 | |
Bank of New York Mellon Corporation | | | | | | | | |
4.30%, 05/15/14 | | | 790,000 | | | | 848,109 | |
BB&T Corporation | | | | | | | | |
3.38%, 09/25/13D | | | 400,000 | | | | 413,926 | |
1.13%, 04/28/14† | | | 310,000 | | | | 306,356 | |
Berkshire Hathaway Finance Corporation | | | | | | | | |
4.00%, 04/15/12 | | | 500,000 | | | | 505,050 | |
Berkshire Hathaway, Inc. | | | | | | | | |
3.75%, 08/15/21D | | | 2,200,000 | | | | 2,290,515 | |
BMW US Capital LLC | | | | | | | | |
1.01%, 12/21/12† | | | 3,000,000 | | | | 3,000,030 | |
Broadcom Corporation | | | | | | | | |
1.50%, 11/01/13 | | | 520,000 | | | | 525,860 | |
Brocade Communications Systems Inc | | | | | | | | |
6.63%, 01/15/18 | | | 1,055,000 | | | | 1,102,475 | |
Capital One Financial Corporation | | | | | | | | |
6.25%, 11/15/13 | | | 1,210,000 | | | | 1,291,492 | |
2.13%, 07/15/14 | | | 600,000 | | | | 592,670 | |
CareFusion Corporation | | | | | | | | |
4.13%, 08/01/12 | | | 1,720,000 | | | | 1,746,383 | |
Caterpillar Financial Services Corporation | | | | | | | | |
5.75%, 02/15/12 | | | 575,000 | | | | 578,692 | |
2.00%, 04/05/13D | | | 540,000 | | | | 549,605 | |
| | | | | | | | |
| | | Par | | | Value | |
Cellco Partnership/Verizon Wireless Capital LLC | | | | | | | | |
5.55%, 02/01/14 | | $ | 400,000 | | | $ | 434,800 | |
CenterPoint Energy, Inc. | | | | | | | | |
6.85%, 06/01/15 | | | 710,000 | | | | 806,225 | |
CenturyLink, Inc. | | | | | | | | |
5.50%, 04/01/13 | | | 790,000 | | | | 806,802 | |
Chesapeake Energy Corporation | | | | | | | | |
7.63%, 07/15/13D | | | 1,100,000 | | | | 1,168,750 | |
Cisco Systems, Inc. | | | | | | | | |
1.63%, 03/14/14D | | | 1,070,000 | | | | 1,090,641 | |
Citigroup, Inc. | | | | | | | | |
5.30%, 10/17/12 | | | 275,000 | | | | 279,522 | |
1.31%, 02/15/13† | | | 730,000 | | | | 716,631 | |
5.50%, 04/11/13 | | | 1,230,000 | | | | 1,256,119 | |
2.45%, 08/13/13† | | | 700,000 | | | | 687,391 | |
6.00%, 12/13/13 | | | 300,000 | | | | 310,570 | |
Coca-Cola Enterprises, Inc. | | | | | | | | |
1.13%, 11/12/13 | | | 780,000 | | | | 782,847 | |
ConocoPhillips | | | | | | | | |
4.75%, 10/15/12 | | | 1,000,000 | | | | 1,030,057 | |
4.75%, 02/01/14 | | | 400,000 | | | | 432,223 | |
Constellation Energy Group, Inc. | | | | | | | | |
4.55%, 06/15/15D | | | 582,000 | | | | 614,984 | |
Consumers Energy Co. | | | | | | | | |
5.38%, 04/15/13 | | | 475,000 | | | | 499,954 | |
Corn Products International, Inc. | | | | | | | | |
3.20%, 11/01/15 | | | 200,000 | | | | 206,826 | |
COX Communications, Inc. | | | | | | | | |
7.13%, 10/01/12 | | | 420,000 | | | | 439,843 | |
Credit Suisse Group Finance US, Inc. | | | | | | | | |
3.13%, 09/14/12(E) | | | 925,000 | | | | 1,206,591 | |
Crown Castle Towers LLC | | | | | | | | |
4.52%, 01/15/35 144AD | | | 1,300,000 | | | | 1,356,785 | |
CSX Corporation | | | | | | | | |
5.75%, 03/15/13D | | | 1,225,000 | | | | 1,289,885 | |
Daimler Finance NA LLC | | | | | | | | |
7.30%, 01/15/12 | | | 350,000 | | | | 350,654 | |
1.18%, 03/28/14 144A† | | | 2,600,000 | | | | 2,510,794 | |
1.95%, 03/28/14 144AD | | | 1,120,000 | | | | 1,117,384 | |
Danaher Corporation | | | | | | | | |
1.30%, 06/23/14D | | | 300,000 | | | | 304,495 | |
DENTSPLY International, Inc. | | | | | | | | |
1.96%, 08/15/13† | | | 590,000 | | | | 594,277 | |
DIRECTV Holdings LLC | | | | | | | | |
4.75%, 10/01/14 | | | 680,000 | | | | 734,988 | |
Domtar Corporation | | | | | | | | |
7.13%, 08/15/15D | | | 350,000 | | | | 386,750 | |
DTE Energy Co. | | | | | | | | |
1.23%, 06/03/13† | | | 630,000 | | | | 629,620 | |
eBay, Inc. | | | | | | | | |
0.88%, 10/15/13D | | | 330,000 | | | | 331,160 | |
Ecolab, Inc. | | | | | | | | |
2.38%, 12/08/14D | | | 270,000 | | | | 275,439 | |
Eli Lilly & Co. | | | | | | | | |
3.55%, 03/06/12 | | | 200,000 | | | | 201,053 | |
Enterprise Products Operating LLC | | | | | | | | |
6.13%, 02/01/13 | | | 1,005,000 | | | | 1,049,207 | |
6.38%, 02/01/13 | | | 750,000 | | | | 785,303 | |
5.65%, 04/01/13 | | | 1,030,000 | | | | 1,078,757 | |
|
| See Notes to Financial Statements. |
74 |
LOW-DURATION BOND FUND
SCHEDULE OF INVESTMENTS (Continued)
| | | | | | | | |
| | | Par | | | Value | |
EOG Resources, Inc. | | | | | | | | |
1.18%, 02/03/14† | | $ | 2,900,000 | | | $ | 2,910,127 | |
Equifax, Inc. | | | | | | | | |
4.45%, 12/01/14 | | | 140,000 | | | | 147,662 | |
ERAC USA Finance LLC | | | | | | | | |
2.75%, 07/01/13 144A | | | 370,000 | | | | 376,379 | |
2.25%, 01/10/14 144A | | | 330,000 | | | | 328,792 | |
Exelon Generation Co., LLC | | | | | | | | |
5.35%, 01/15/14 | | | 808,000 | | | | 863,480 | |
Express Scripts, Inc. | | | | | | | | |
5.25%, 06/15/12 | | | 550,000 | | | | 560,460 | |
FDIC Structured Sale Guaranteed Notes | | | | | | | | |
0.32%, 10/25/12 144AW | | | 1,700,000 | | | | 1,686,891 | |
0.65%, 10/25/13 144AW | | | 2,300,000 | | | | 2,274,182 | |
Ford Motor Credit Co., LLC | | | | | | | | |
3.88%, 01/15/15 | | | 1,271,000 | | | | 1,267,154 | |
Ford Motor Credit Co., LLC | | | | | | | | |
7.50%, 08/01/12D | | | 3,000,000 | | | | 3,098,118 | |
Freeport-McMoRan Copper & Gold, Inc. | | | | | | | | |
8.38%, 04/01/17 | | | 1,512,000 | | | | 1,608,203 | |
Frontier Communications Corporation | | | | | | | | |
6.25%, 01/15/13 | | | 830,000 | | | | 850,750 | |
General Electric Capital Corporation | | | | | | | | |
1.25%, 01/15/13†D | | | 700,000 | | | | 704,752 | |
1.88%, 09/16/13D | | | 200,000 | | | | 202,548 | |
1.23%, 01/07/14† | | | 500,000 | | | | 492,930 | |
5.90%, 05/13/14 | | | 460,000 | | | | 504,050 | |
3.75%, 11/14/14D | | | 660,000 | | | | 696,158 | |
6.50%, 09/15/67 144A(U)† | | | 200,000 | | | | 270,220 | |
Genzyme Corporation | | | | | | | | |
3.63%, 06/15/15 | | | 395,000 | | | | 422,084 | |
Georgia Power Co. | | | | | | | | |
1.30%, 09/15/13 | | | 720,000 | | | | 726,957 | |
Georgia-Pacific LLC | | | | | | | | |
8.25%, 05/01/16 144A | | | 1,535,000 | | | | 1,705,865 | |
Gilead Sciences, Inc. | | | | | | | | |
2.40%, 12/01/14 | | | 280,000 | | | | 285,242 | |
Goldman Sachs Group, Inc. | | | | | | | | |
1.44%, 02/07/14† | | | 910,000 | | | | 851,097 | |
1.82%, 05/23/16(E)† | | | 2,900,000 | | | | 3,137,281 | |
Hartford Financial Services Group, Inc. | | | | | | | | |
4.00%, 03/30/15D | | | 320,000 | | | | 321,792 | |
Hartford Life Institutional Funding | | | | | | | | |
5.38%, 01/17/12(U) | | | 900,000 | | | | 1,412,962 | |
HCP, Inc. | | | | | | | | |
2.70%, 02/01/14 | | | 210,000 | | | | 209,800 | |
Health Care REIT, Inc. | | | | | | | | |
6.00%, 11/15/13 | | | 540,000 | | | | 566,862 | |
Hewlett-Packard Co. | | | | | | | | |
4.25%, 02/24/12 | | | 486,000 | | | | 488,205 | |
0.79%, 05/24/13† | | | 2,900,000 | | | | 2,872,641 | |
2.63%, 12/09/14D | | | 520,000 | | | | 524,950 | |
2.35%, 03/15/15 | | | 800,000 | | | | 796,736 | |
Hyundai Capital America | | | | | | | | |
3.75%, 04/06/16 144A | | | 190,000 | | | | 189,529 | |
Intel Corporation | | | | | | | | |
1.95%, 10/01/16 | | | 560,000 | | | | 576,341 | |
| | | | | | | | |
| | | Par | | | Value | |
International Business Machines Corporation | | | | | | | | |
2.10%, 05/06/13 | | $ | 1,250,000 | | | $ | 1,276,212 | |
1.00%, 08/05/13 | | | 700,000 | | | | 705,788 | |
Interpublic Group of Cos., Inc. | | | | | | | | |
6.25%, 11/15/14 | | | 700,000 | | | | 747,250 | |
10.00%, 07/15/17 | | | 313,000 | | | | 359,167 | |
Jabil Circuit, Inc. | | | | | | | | |
7.75%, 07/15/16 | | | 295,000 | | | | 330,400 | |
JB Hunt Transport Services, Inc. | | | | | | | | |
3.38%, 09/15/15 | | | 550,000 | | | | 557,864 | |
John Hancock Global Funding II | | | | | | | | |
1.75%, 06/25/12(E)† | | | 600,000 | | | | 771,700 | |
JPMorgan Chase & Co. | | | | | | | | |
5.38%, 10/01/12 | | | 300,000 | | | | 310,218 | |
4.75%, 05/01/13D | | | 325,000 | | | | 339,870 | |
Kansas City Southern Railway | | | | | | | | |
8.00%, 06/01/15 | | | 675,000 | | | | 719,719 | |
KeyCorp | | | | | | | | |
3.75%, 08/13/15D | | | 360,000 | | | | 373,622 | |
Kraft Foods, Inc. | | | | | | | | |
2.63%, 05/08/13 | | | 230,000 | | | | 235,052 | |
5.25%, 10/01/13 | | | 230,000 | | | | 245,442 | |
Lehman Brothers Holdings, Inc. | | | | | | | | |
6.63%, 01/18/12# | | | 600,000 | | | | 156,750 | |
6.75%, 12/28/17# | | | 2,600,000 | | | | 2,860 | |
6.88%, 05/02/18# | | | 2,400,000 | | | | 648,000 | |
Life Technologies Corporation | | | | | | | | |
4.40%, 03/01/15 | | | 600,000 | | | | 623,953 | |
3.50%, 01/15/16 | | | 800,000 | | | | 804,092 | |
Lincoln National Corporation | | | | | | | | |
4.30%, 06/15/15 | | | 1,210,000 | | | | 1,254,132 | |
Merrill Lynch & Co., Inc. | | | | | | | | |
6.05%, 08/15/12D | | | 400,000 | | | | 405,837 | |
5.45%, 02/05/13 | | | 1,500,000 | | | | 1,511,299 | |
5.00%, 01/15/15D | | | 2,700,000 | | | | 2,602,811 | |
MetLife, Inc. | | | | | | | | |
2.38%, 02/06/14D | | | 290,000 | | | | 294,196 | |
Metropolitan Life Global Funding I | | | | | | | | |
2.88%, 09/17/12 144AD | | | 2,225,000 | | | | 2,254,479 | |
1.33%, 01/10/14 144A† | | | 1,000,000 | | | | 999,548 | |
Microsoft Corporation | | | | | | | | |
2.95%, 06/01/14 | | | 900,000 | | | | 956,605 | |
MidAmerican Energy Co. | | | | | | | | |
5.13%, 01/15/13 | | | 515,000 | | | | 537,127 | |
MidAmerican Energy Holdings Co. | | | | | | | | |
5.88%, 10/01/12 | | | 550,000 | | | | 569,450 | |
Morgan Stanley | | | | | | | | |
6.60%, 04/01/12D | | | 885,000 | | | | 892,415 | |
5.30%, 03/01/13D | | | 125,000 | | | | 126,565 | |
1.41%, 04/29/13† | | | 1,010,000 | | | | 952,173 | |
Nabors Industries, Inc. | | | | | | | | |
6.15%, 02/15/18D | | | 1,650,000 | | | | 1,845,570 | |
9.25%, 01/15/19 | | | 2,300,000 | | | | 2,897,068 | |
National Rural Utilities Cooperative Finance Corporation | | | | | | | | |
1.13%, 11/01/13 | | | 330,000 | | | | 330,290 | |
NBCUniversal Media LLC | | | | | | | | |
3.65%, 04/30/15D | | | 550,000 | | | | 580,963 | |
See Notes to Financial Statements.
75
| | | | | | | | |
| | | Par | | | Value | |
NCUA Guaranteed Notes | | | | | | | | |
1.40%, 06/12/15 | | $ | 1,180,000 | | | $ | 1,195,328 | |
New York Life Global Funding | | | | | | | | |
0.84%, 04/04/14 144A† | | | 1,600,000 | | | | 1,580,189 | |
NextEra Energy Capital Holdings, Inc. | | | | | | | | |
2.55%, 11/15/13 | | | 750,000 | | | | 763,358 | |
Nissan Motor Acceptance Corporation | | | | | | | | |
3.25%, 01/30/13 144AD | | | 580,000 | | | | 587,634 | |
Novartis Capital Corporation | | | | | | | | |
4.13%, 02/10/14 | | | 210,000 | | | | 224,798 | |
Oracle Corporation | | | | | | | | |
3.75%, 07/08/14 | | | 970,000 | | | | 1,043,841 | |
Overseas Private Investment Corporation | | | | | | | | |
0.00%, 04/15/16W@ | | | 1,600,000 | | | | 2,099,392 | |
0.75%, 07/12/16W@ | | | 2,100,000 | | | | 2,552,430 | |
PACCAR Financial Corporation | | | | | | | | |
0.74%, 04/05/13† | | | 550,000 | | | | 549,656 | |
1.55%, 09/29/14 | | | 470,000 | | | | 475,848 | |
Pacific Life Global Funding | | | | | | | | |
5.15%, 04/15/13 144A | | | 460,000 | | | | 480,630 | |
Pfizer, Inc. | | | | | | | | |
3.63%, 06/03/13(E) | | | 100,000 | | | | 133,625 | |
Praxair, Inc. | | | | | | | | |
1.75%, 11/15/12 | | | 330,000 | | | | 332,886 | |
Procter & Gamble Co. | | | | | | | | |
3.50%, 02/15/15D | | | 200,000 | | | | 215,527 | |
Prudential Financial, Inc. | | | | | | | | |
3.63%, 09/17/12 | | | 945,000 | | | | 959,817 | |
2.75%, 01/14/13D | | | 650,000 | | | | 655,766 | |
Raytheon Co. | | | | | | | | |
1.40%, 12/15/14 | | | 320,000 | | | | 321,782 | |
Regions Financial Corporation | | | | | | | | |
4.88%, 04/26/13D | | | 649,000 | | | | 640,887 | |
Reynolds Group Issuer, Inc. | | | | | | | | |
8.75%, 10/15/16 144AD | | | 1,250,000 | | | | 1,321,875 | |
Rohm & Haas Co. | | | | | | | | |
3.50%, 09/19/12(E) | | | 990,000 | | | | 1,287,106 | |
SBA Tower Trust | | | | | | | | |
4.25%, 04/15/15 144AD | | | 510,000 | | | | 525,691 | |
Simon Property Group LP REIT | | | | | | | | |
4.20%, 02/01/15 | | | 140,000 | | | | 148,567 | |
SLM Corporation | | | | | | | | |
5.00%, 10/01/13 | | | 175,000 | | | | 175,437 | |
Southeast Supply Header LLC | | | | | | | | |
4.85%, 08/15/14 144A | | | 945,000 | | | | 1,007,582 | |
Steel Dynamics, Inc. | | | | | | | | |
6.75%, 04/01/15D | | | 1,250,000 | | | | 1,284,375 | |
SteelRiver Transmission Co., LLC | | | | | | | | |
4.71%, 06/30/17 144A | | | 613,192 | | | | 626,087 | |
Stryker Corporation | | | | | | | | |
3.00%, 01/15/15D | | | 450,000 | | | | 474,544 | |
2.00%, 09/30/16 | | | 850,000 | | | | 870,814 | |
Suntrust Bank | | | | | | | | |
1.05%, 06/22/12(U) | | | 560,000 | | | | 860,836 | |
TD Ameritrade Holding Corporation | | | | | | | | |
4.15%, 12/01/14 | | | 660,000 | | | | 698,026 | |
Tesoro Corporation | | | | | | | | |
6.63%, 11/01/15D | | | 860,000 | | | | 879,350 | |
| | | | | | | | |
| | | Par | | | Value | |
Teva Pharmaceutical Finance III LLC | | | | | | | | |
1.50%, 06/15/12 | | $ | 800,000 | | | $ | 803,125 | |
Teva Pharmaceutical Finance IV LLC | | | | | | | | |
1.70%, 11/10/14D | | | 1,320,000 | | | | 1,331,129 | |
Texas Instruments, Inc. | | | | | | | | |
0.88%, 05/15/13 | | | 680,000 | | | | 682,018 | |
Thermo Fisher Scientific, Inc. | | | | | | | | |
2.15%, 12/28/12 | | | 370,000 | | | | 374,532 | |
Time Warner Cable, Inc. | | | | | | | | |
7.50%, 04/01/14 | | | 350,000 | | | | 392,085 | |
Time Warner, Inc. | | | | | | | | |
3.15%, 07/15/15 | | | 290,000 | | | | 301,887 | |
Toyota Motor Credit Corporation | | | | | | | | |
2.00%, 09/15/16 | | | 750,000 | | | | 758,310 | |
Union Bank NA | | | | | | | | |
2.13%, 12/16/13D | | | 790,000 | | | | 799,359 | |
1.48%, 06/06/14† | | | 3,000,000 | | | | 2,958,021 | |
United Air Lines, Inc. | | | | | | | | |
9.75%, 01/15/17 | | | 818,195 | | | | 883,650 | |
10.40%, 05/01/18D | | | 741,749 | | | | 820,523 | |
Universal City Development Partners, Ltd. UCDP Finance Inc. | | | | | | | | |
8.88%, 11/15/15 | | | 1,014,000 | | | | 1,128,075 | |
US Bancorp | | | | | | | | |
1.38%, 09/13/13 | | | 720,000 | | | | 724,684 | |
Verizon Communications, Inc. | | | | | | | | |
1.25%, 11/03/14 | | | 1,250,000 | | | | 1,257,055 | |
Vornado Realty LP REIT | | | | | | | | |
4.25%, 04/01/15 | | | 700,000 | | | | 724,989 | |
Wachovia Bank NA | | | | | | | | |
4.80%, 11/01/14 | | | 360,000 | | | | 378,541 | |
Wachovia Corporation | | | | | | | | |
5.50%, 05/01/13 | | | 3,100,000 | | | | 3,271,861 | |
WellPoint, Inc. | | | | | | | | |
2.38%, 02/15/17 | | | 1,060,000 | | | | 1,058,060 | |
Western Corporate Federal Credit Union | | | | | | | | |
1.75%, 11/02/12 | | | 1,875,000 | | | | 1,898,876 | |
WM Wrigley Jr Co. | | | | | | | | |
3.70%, 06/30/14 144A | | | 1,420,000 | | | | 1,464,791 | |
XTO Energy, Inc. | | | | | | | | |
6.25%, 04/15/13 | | | 600,000 | | | | 642,148 | |
| | | | | | | | |
Total Corporate Bonds
(Cost $171,358,899) | | | | 167,419,415 | |
| | | | | | | | |
FOREIGN BONDS — 20.2% | |
Australia — 2.1% | |
Asciano Finance, Ltd. | | | | | | | | |
3.13%, 09/23/15 144A | | | 620,000 | | | | 600,087 | |
Australia & New Zealand Banking Group, Ltd. | | | | | | | | |
0.84%, 06/18/12 144A† | | | 1,575,000 | | | | 1,574,992 | |
Australia Government Bond | | | | | | | | |
5.50%, 12/15/13(A) | | | 3,200,000 | | | | 3,417,399 | |
5.50%, 01/21/18(A) | | | 4,300,000 | | | | 4,900,322 | |
5.25%, 03/15/19(A) | | | 400,000 | | | | 454,831 | |
5.75%, 07/15/22(A) | | | 1,000,000 | | | | 1,195,893 | |
Commonwealth Bank of Australia | | | | | | | | |
2.13%, 03/17/14 144A | | | 850,000 | | | | 853,473 | |
|
| See Notes to Financial Statements. |
76 |
LOW-DURATION BOND FUND
SCHEDULE OF INVESTMENTS (Continued)
| | | | | | | | |
| | | Par | | | Value | |
National Australia Bank, Ltd. | | | | | | | | |
1.06%, 01/08/13 144A† | | $ | 930,000 | | | $ | 930,994 | |
Westfield Capital | | | | | | | | |
5.13%, 11/15/14 144AD | | | 730,000 | | | | 765,339 | |
Westpac Banking Corporation | | | | | | | | |
2.25%, 11/19/12 | | | 620,000 | | | | 626,299 | |
Woodside Finance, Ltd. | | | | | | | | |
4.50%, 11/10/14 144A | | | 490,000 | | | | 516,271 | |
| | | | | | | | |
| | | | | | | 15,835,900 | |
| | | | | | | | |
Bermuda — 0.2% | |
Ingersoll-Rand Global Holding Co., Ltd. | | | | | | | | |
9.50%, 04/15/14 | | | 880,000 | | | | 1,023,423 | |
Qtel International Finance, Ltd. | | | | | | | | |
6.50%, 06/10/14 144A | | | 660,000 | | | | 721,710 | |
| | | | | | | | |
| | | | | | | 1,745,133 | |
| | | | | | | | |
Brazil — 0.4% | |
Banco Bradesco SA | | | | | | | | |
2.56%, 05/16/14 144A† | | | 520,000 | | | | 510,746 | |
Banco do Brasil SA | | | | | | | | |
4.50%, 01/22/15 144A | | | 680,000 | | | | 706,520 | |
Banco do Nordeste do Brasil SA | | | | | | | | |
3.63%, 11/09/15 144AD | | | 710,000 | | | | 711,775 | |
Cia de Eletricidade do Estado da Bahia | | | | | | | | |
11.75%, 04/27/16 144A(B) | | | 1,200,000 | | | | 672,296 | |
| | | | | | | | |
| | | | | | | 2,601,337 | |
| | | | | | | | |
Canada — 5.9% | |
Barrick Gold Corporation | | | | | | | | |
1.75%, 05/30/14 | | | 340,000 | | | | 343,554 | |
Caisse Centrale Desjardins du Quebec | | | | | | | | |
1.70%, 09/16/13 144A | | | 1,320,000 | | | | 1,322,725 | |
Canadian Government Bond | | | | | | | | |
1.50%, 03/01/12(C) | | | 15,500,000 | | | | 15,229,482 | |
2.50%, 09/01/13(C) | | | 6,700,000 | | | | 6,743,472 | |
2.25%, 08/01/14(C) | | | 5,200,000 | | | | 5,266,713 | |
Canadian Imperial Bank of Commerce | | | | | | | | |
2.00%, 02/04/13 144A | | | 6,560,000 | | | | 6,634,823 | |
CDP Financial, Inc. | | | | | | | | |
3.00%, 11/25/14 144A | | | 735,000 | | | | 764,868 | |
Manulife Financial Corporation | | | | | | | | |
3.40%, 09/17/15 | | | 5,000 | | | | 5,032 | |
Nova Chemicals Corporation | | | | | | | | |
8.38%, 11/01/16 | | | 1,250,000 | | | | 1,368,750 | |
Province of British Columbia Canada | | | | | | | | |
2.65%, 09/22/21D | | | 500,000 | | | | 510,743 | |
Province of Manitoba | | | | | | | | |
1.38%, 04/28/14D | | | 1,000,000 | | | | 1,016,942 | |
Province of Ontario Canada | | | | | | | | |
2.95%, 02/05/15 | | | 800,000 | | | | 842,486 | |
Rogers Communications, Inc. | | | | | | | | |
6.25%, 06/15/13 | | | 1,300,000 | | | | 1,392,028 | |
6.38%, 03/01/14 | | | 320,000 | | | | 353,022 | |
Teck Resources, Ltd. | | | | | | | | |
3.15%, 01/15/17 | | | 346,000 | | | | 353,882 | |
Toronto-Dominion Bank | | | | | | | | |
1.38%, 07/14/14D | | | 670,000 | | | | 675,671 | |
| | | | | | | | |
| | | Par | | | Value | |
TransCanada PipeLines, Ltd. | | | | | | | | |
3.40%, 06/01/15D | | $ | 360,000 | | | $ | 381,617 | |
Xstrata Canada Financial Corporation | | | | | | | | |
2.85%, 11/10/14 144A | | | 540,000 | | | | 543,128 | |
| | | | | | | | |
| | | | | | | 43,748,938 | |
| | | | | | | | |
Cayman Islands — 0.4% | |
China Resources Land, Ltd. | | | | | | | | |
4.63%, 05/19/16 144A | | | 420,000 | | | | 413,168 | |
IPIC GMTN, Ltd. | | | | | | | | |
3.13%, 11/15/15 144A | | | 330,000 | | | | 330,825 | |
Petrobras International Finance Co. | | | | | | | | |
3.88%, 01/27/16D | | | 590,000 | | | | 610,774 | |
Thames Water Utilities Cayman Finance, Ltd. | | | | | | | | |
6.13%, 02/04/13(E) | | | 1,000,000 | | | | 1,354,880 | |
Transocean, Inc. | | | | | | | | |
4.95%, 11/15/15 | | | 595,000 | | | | 608,114 | |
| | | | | | | | |
| | | | | | | 3,317,761 | |
| | | | | | | | |
Chile — 0.6% | |
Banco Santander Chile | | | | | | | | |
2.01%, 01/19/16 144A† | | | 2,500,000 | | | | 2,414,429 | |
Celulosa Arauco y Constitucion SA | | | | | | | | |
5.63%, 04/20/15D | | | 1,260,000 | | | | 1,371,810 | |
Corp Nacional del Cobre de Chile | | | | | | | | |
4.75%, 10/15/14 144A | | | 960,000 | | | | 1,034,454 | |
| | | | | | | | |
| | | | | | | 4,820,693 | |
| | | | | | | | |
Denmark — 0.2% | |
Danske Bank A/S | | | | | | | | |
1.45%, 04/14/14 144A†D | | | 950,000 | | | | 916,264 | |
FIH Erhvervsbank A/S | | | | | | | | |
2.45%, 08/17/12 144A | | | 450,000 | | | | 454,648 | |
| | | | | | | | |
| | | | | | | 1,370,912 | |
| | | | | | | | |
France — 2.2% | |
Banque PSA Finance SA | | | | | | | | |
3.50%, 01/17/14(E) | | | 550,000 | | | | 690,895 | |
2.48%, 04/04/14 144A† | | | 2,000,000 | | | | 1,853,256 | |
BPCE SA | | | | | | | | |
2.19%, 02/07/14 144A† | | | 2,300,000 | | | | 2,188,774 | |
Cie de Financement Foncier | | | | | | | | |
2.13%, 04/22/13 144A | | | 3,000,000 | | | | 2,968,728 | |
Dexia Credit Local | | | | | | | | |
0.91%, 04/29/14 144A† | | | 2,300,000 | | | | 2,087,982 | |
2.75%, 04/29/14 144AD | | | 1,400,000 | | | | 1,273,554 | |
RCI Banque SA | | | | | | | | |
2.20%, 04/07/15(E)† | | | 900,000 | | | | 1,015,831 | |
Sanofi SA | | | | | | | | |
1.63%, 03/28/14 | | | 510,000 | | | | 519,213 | |
Total Capital SA | | | | | | | | |
3.00%, 06/24/15D | | | 2,800,000 | | | | 2,961,770 | |
Veolia Environnement SA | | | | | | | | |
5.25%, 06/03/13 | | | 520,000 | | | | 547,353 | |
| | | | | | | | |
| | | | | | | 16,107,356 | |
| | | | | | | | |
See Notes to Financial Statements.
77
| | | | | | | | |
| | | Par | | | Value | |
Germany — 0.5% | |
Deutsche Bank AG | | | | | | | | |
5.38%, 10/12/12D | | $ | 3,855,000 | | | $ | 3,933,430 | |
| | | | | | | | |
India — 0.1% | |
ICICI Bank, Ltd. | | | | | | | | |
5.50%, 03/25/15 144A | | | 395,000 | | | | 395,391 | |
| | | | | | | | |
Ireland — 0.4% | |
DanFin Funding, Ltd. | | | | | | | | |
1.10%, 07/16/13 144A† | | | 2,800,000 | | | | 2,800,162 | |
| | | | | | | | |
Italy — 0.7% | |
Intesa Sanpaolo SpA | | | | | | | | |
0.91%, 01/19/12† | | | 760,000 | | | | 759,803 | |
2.38%, 12/21/12 | | | 720,000 | | | | 669,917 | |
2.91%, 02/24/14 144A†D | | | 2,900,000 | | | | 2,554,848 | |
Telecom Italia SpA | | | | | | | | |
2.00%, 12/06/12(E)† | | | 900,000 | | | | 1,122,289 | |
| | | | | | | | |
| | | | | | | 5,106,857 | |
| | | | | | | | |
Jersey — 0.1% | |
BAA Funding, Ltd. | | | | | | | | |
3.98%, 02/15/12(E) | | | 600,000 | | | | 778,706 | |
| | | | | | | | |
Luxembourg — 0.4% | |
Covidien International Finance SA | | | | | | | | |
1.88%, 06/15/13 | | | 570,000 | | | | 575,617 | |
Gazprom OAO Via Gaz Capital SA | | | | | | | | |
9.25%, 04/23/19D | | | 2,300,000 | | | | 2,745,970 | |
| | | | | | | | |
| | | | | | | 3,321,587 | |
| | | | | | | | |
Mexico — 0.5% | |
America Movil SAB de CV | | | | | | | | |
3.63%, 03/30/15 | | | 200,000 | | | | 210,574 | |
2.38%, 09/08/16D | | | 380,000 | | | | 380,841 | |
Petroleos Mexicanos | | | | | | | | |
4.88%, 03/15/15D | | | 1,250,000 | | | | 1,335,938 | |
5.50%, 01/21/21 | | | 1,400,000 | | | | 1,526,000 | |
| | | | | | | | |
| | | | | | | 3,453,353 | |
| | | | | | | | |
Netherlands — 0.7% | |
Achmea Hypotheekbank NV | | | | | | | | |
3.20%, 11/03/14 144A | | | 912,000 | | | | 957,745 | |
ING Bank NV | | | | | | | | |
1.60%, 03/15/13 144A†D | | | 880,000 | | | | 859,811 | |
Shell International Finance BV | | | | | | | | |
1.88%, 03/25/13 | | | 400,000 | | | | 407,568 | |
Volkswagen International Finance NV | | | | | | | | |
1.03%, 10/01/12 144A† | | | 1,700,000 | | | | 1,698,652 | |
1.19%, 04/01/14 144A† | | | 1,200,000 | | | | 1,176,673 | |
| | | | | | | | |
| | | | | | | 5,100,449 | |
| | | | | | | | |
Netherlands Antilles — 0.0% | |
Teva Pharmaceutical Finance III BV | | | | | | | | |
1.70%, 03/21/14D | | | 300,000 | | | | 301,711 | |
| | | | | | | | |
Norway — 0.3% | |
Eksportfinans ASA | | | | | | | | |
5.00%, 02/14/12 | | | 1,125,000 | | | | 1,118,875 | |
Sparebank 1 Boligkreditt AS | | | | | | | | |
1.25%, 10/25/14 144A | | | 370,000 | | | | 367,531 | |
| | | | | | | | |
| | | Par | | | Value | |
Statoil ASA | | | | | | | | |
2.90%, 10/15/14 | | $ | 650,000 | | | $ | 682,551 | |
| | | | | | | | |
| | | | | | | 2,168,957 | |
| | | | | | | | |
Panama — 0.1% | |
Banco de Credito del Peru/Panama | | | | | | | | |
4.75%, 03/16/16 144AD | | | 480,000 | | | | 483,600 | |
Panama Government International Bond | | | | | | | | |
7.25%, 03/15/15 | | | 530,000 | | | | 613,475 | |
| | | | | | | | |
| | | | | | | 1,097,075 | |
| | | | | | | | |
Portugal — 0.3% | |
Obrigacoes do Tesouro | | | | | | | | |
2.62%, 05/16/47(E) | | | 1,563,436 | | | | 2,015,882 | |
| | | | | | | | |
Qatar — 0.1% | |
Qatar Government International Bond | | | | | | | | |
3.13%, 01/20/17 | | | 580,000 | | | | 586,496 | |
| | | | | | | | |
South Africa — 0.1% | |
South Africa Government International Bond | | | | | | | | |
7.38%, 04/25/12 | | | 600,000 | | | | 611,280 | |
| | | | | | | | |
South Korea — 0.5% | |
Hyundai Capital Services, Inc. | | | | | | | | |
4.38%, 07/27/16 144A | | | 2,900,000 | | | | 2,960,633 | |
Korea National Oil Corporation | | | | | | | | |
2.88%, 11/09/15 | | | 770,000 | | | | 772,081 | |
| | | | | | | | |
| | | | | | | 3,732,714 | |
| | | | | | | | |
Spain — 0.2% | |
Santander US Debt SAU | | | | | | | | |
1.38%, 03/30/12 144A† | | | 800,000 | | | | 798,627 | |
Telefonica Emisiones SAU | | | | | | | | |
2.58%, 04/26/13D | | | 710,000 | | | | 693,036 | |
| | | | | | | | |
| | | | | | | 1,491,663 | |
| | | | | | | | |
Supranational — 0.1% | |
Asian Development Bank | | | | | | | | |
3.38%, 05/20/14(K) | | | 6,400,000 | | | | 1,100,965 | |
| | | | | | | | |
Sweden — 0.8% | |
Nordea Bank AB | | | | | | | | |
1.47%, 01/14/14 144A† | | | 2,900,000 | | | | 2,809,459 | |
Stadshypotek AB | | | | | | | | |
1.45%, 09/30/13 144A | | | 2,900,000 | | | | 2,896,146 | |
| | | | | | | | |
| | | | | | | 5,705,605 | |
| | | | | | | | |
Switzerland — 0.2% | |
Credit Suisse NY | | | | | | | | |
1.36%, 01/14/14† | | | 1,200,000 | | | | 1,162,098 | |
| | | | | | | | |
United Kingdom — 2.1% | |
Anglo American Capital PLC | | | | | | | | |
2.15%, 09/27/13 144AD | | | 360,000 | | | | 360,751 | |
Barclays Bank PLC | | | | | | | | |
2.50%, 01/23/13 | | | 1,700,000 | | | | 1,693,185 | |
1.62%, 01/13/14† | | | 580,000 | | | | 562,506 | |
2.38%, 01/13/14D | | | 2,900,000 | | | | 2,839,834 | |
BP Capital Markets PLC | | | | | | | | |
5.25%, 11/07/13 | | | 1,047,000 | | | | 1,123,473 | |
HSBC Bank PLC | | | | | | | | |
1.63%, 07/07/14 144AD | | | 650,000 | | | | 642,852 | |
Kingfisher PLC | | | | | | | | |
4.13%, 11/23/12(E) | | | 380,000 | | | | 503,018 | |
|
| See Notes to Financial Statements. |
78 |
LOW-DURATION BOND FUND
SCHEDULE OF INVESTMENTS (Continued)
| | | | | | | | |
| | | Par | | | Value | |
Lloyds TSB Bank PLC | | | | | | | | |
2.77%, 01/24/14† | | $ | 3,240,000 | | | $ | 3,066,741 | |
National Grid PLC | | | | | | | | |
1.92%, 01/18/12(E)† | | | 850,000 | | | | 1,100,317 | |
Royal Bank of Scotland PLC | | | | | | | | |
3.25%, 01/11/14 | | | 780,000 | | | | 747,781 | |
United Kingdom Gilt | | | | | | | | |
4.25%, 03/07/36(U) | | | 200,000 | | | | 381,440 | |
4.25%, 09/07/39(U) | | | 200,000 | | | | 382,856 | |
4.25%, 12/07/40(U) | | | 200,000 | | | | 383,236 | |
Vedanta Resources PLC | | | | | | | | |
6.75%, 06/07/16 144AD | | | 750,000 | | | | 645,000 | |
Vodafone Group PLC | | | | | | | | |
0.79%, 02/27/12†D | | | 950,000 | | | | 950,132 | |
| | | | | | | | |
| | | | | | | 15,383,122 | |
| | | | | | | | |
Total Foreign Bonds
(Cost $151,165,715) | | | | 149,795,533 | |
| | | | | | | | |
MORTGAGE-BACKED SECURITIES — 27.8% | |
Adjustable Rate Mortgage Trust | | | | | | | | |
3.64%, 03/25/37† | | | 2,604,288 | | | | 1,122,417 | |
American Home Mortgage Investment Trust | | | | | | | | |
2.43%, 10/25/34† | | | 697,768 | | | | 591,306 | |
American Home Mortgage Assets | | | | | | | | |
1.14%, 11/25/46† | | | 1,122,796 | | | | 410,705 | |
Arkle Master Issuer PLC | | | | | | | | |
1.56%, 02/17/52(E)† | | | 1,080,000 | | | | 1,392,003 | |
1.62%, 05/17/60 144A† | | | 4,260,000 | | | | 4,245,110 | |
Arran Residential Mortgages Funding PLC | | | | | | | | |
1.66%, 05/16/47 144A† | | | 1,068,348 | | | | 1,066,340 | |
0.62%, 09/16/56 144A† | | | 726,161 | | | | 722,079 | |
1.13%, 09/16/56(U)† | | | 710,645 | | | | 1,096,140 | |
1.49%, 09/16/56(E)† | | | 1,427,496 | | | | 1,836,495 | |
Banc of America Funding Corporation | | | | | | | | |
5.74%, 01/20/47† | | | 870,758 | | | | 549,509 | |
Banc of America Merrill Lynch Commercial Mortgage, Inc. | | | | | | | | |
3.88%, 09/11/36 | | | 148,987 | | | | 148,981 | |
4.76%, 11/10/39 | | | 615,000 | | | | 645,684 | |
5.45%, 01/15/49 | | | 1,990,000 | | | | 2,094,021 | |
5.84%, 06/10/49† | | | 959,475 | | | | 969,102 | |
Banc of America Mortgage Securities, Inc. | | | | | | | | |
6.50%, 10/25/31 | | | 139,978 | | | | 141,449 | |
Bear Stearns Adjustable Rate Mortgage Trust | | | | | | | | |
2.85%, 01/25/34† | | | 373,487 | | | | 345,176 | |
3.12%, 07/25/34† | | | 634,523 | | | | 560,540 | |
2.78%, 10/25/34† | | | 316,142 | | | | 277,162 | |
2.71%, 03/25/35† | | | 1,150,619 | | | | 1,067,015 | |
Bear Stearns Alt-A Trust | | | | | | | | |
1.03%, 11/25/34† | | | 358,084 | | | | 310,848 | |
2.77%, 09/25/35† | | | 589,860 | | | | 371,605 | |
Bear Stearns Commercial Mortgage Securities | | | | | | | | |
5.74%, 06/11/50 | | | 895,000 | | | | 939,892 | |
Commercial Mortgage Pass-Through Certificates | | | | | | | | |
6.10%, 07/16/34 144A | | | 32,271 | | | | 32,356 | |
| | | | | | | | |
| | | Par | | | Value | |
Countrywide Alternative Loan Trust | | | | | | | | |
6.00%, 10/25/32 | | $ | 54,364 | | | $ | 56,755 | |
Countrywide Home Loan Mortgage Pass-Through Trust | | | | | | | | |
0.83%, 02/25/35† | | | 208,073 | | | | 167,126 | |
Credit Suisse Mortgage Capital Certificates | | | | | | | | |
5.80%, 09/15/39† | | | 1,155,000 | | | | 1,203,622 | |
5.62%, 09/15/40† | | | 850,000 | | | | 901,073 | |
6.21%, 02/15/41† | | | 1,390,000 | | | | 1,437,619 | |
Deutsche ALT-A Securities, Inc. | | | | | | | | |
5.87%, 10/25/36 STEP | | | 662,301 | | | | 334,062 | |
5.89%, 10/25/36 STEP | | | 662,301 | | | | 359,820 | |
Extended Stay America Trust | | | | | | | | |
2.95%, 11/05/27 144A | | | 3,542,604 | | | | 3,549,201 | |
Fannie Mae Grantor Trust | | | | | | | | |
3.31%, 02/25/32 | | | 182,634 | | | | 190,602 | |
FDIC Structured Sale Guaranteed Notes | | | | | | | | |
3.00%, 09/30/19 144A | | | 1,002,112 | | | | 1,008,300 | |
0.99%, 12/04/20 144A† | | | 2,209,216 | | | | 2,216,153 | |
3.25%, 04/25/38 144A | | | 737,850 | | | | 754,991 | |
0.85%, 02/25/48 144A† | | | 595,841 | | | | 594,682 | |
FDIC Trust | | | | | | | | |
2.18%, 05/25/50 144A | | | 1,372,782 | | | | 1,371,171 | |
Federal Home Loan Mortgage Corporation | | | | | | | | |
5.00%, 01/01/19 | | | 413,030 | | | | 442,275 | |
5.00%, 02/01/19 | | | 433,173 | | | | 463,886 | |
10.75%, 02/01/19 | | | 45,496 | | | | 46,913 | |
5.00%, 12/01/19 | | | 858,334 | | | | 925,202 | |
5.50%, 05/01/22 | | | 2,799,550 | | | | 3,025,482 | |
2.59%, 07/01/27† | | | 15,339 | | | | 16,267 | |
2.28%, 06/01/33† | | | 1,342,220 | | | | 1,395,370 | |
2.38%, 10/01/34† | | | 347,597 | | | | 364,325 | |
2.50%, 08/01/35† | | | 1,102,197 | | | | 1,159,398 | |
2.38%, 10/01/35† | | | 886,677 | | | | 937,308 | |
2.34%, 04/01/36† | | | 839,100 | | | | 883,809 | |
5.50%, 12/01/37 | | | 1,036,964 | | | | 1,126,601 | |
5.50%, 05/01/38 | | | 2,515,796 | | | | 2,733,265 | |
5.50%, 02/01/40 | | | 739,332 | | | | 803,241 | |
Federal Home Loan Mortgage Corporation REMIC | | | | | | | | |
0.63%, 12/15/30† | | | 140,245 | | | | 140,232 | |
4.50%, 11/15/41 | | | 1,489,304 | | | | 1,620,536 | |
Federal Housing Authority | | | | | | | | |
7.43%, 09/01/22 | | | 1,296 | | | | 1,257 | |
Federal National Mortgage Association | | | | | | | | |
0.62%, 07/01/16† | | | 1,900,000 | | | | 1,917,335 | |
5.00%, 01/01/18 | | | 1,005,225 | | | | 1,085,735 | |
5.50%, 12/01/18 | | | 414,971 | | | | 450,801 | |
5.00%, 07/01/19 | | | 192,202 | | | | 207,626 | |
5.00%, 05/01/21 | | | 1,758,312 | | | | 1,899,138 | |
5.00%, 11/01/21 | | | 735,094 | | | | 793,969 | |
2.39%, 12/01/24† | | | 50,184 | | | | 50,951 | |
9.00%, 05/01/25 | | | 13,882 | | | | 13,932 | |
9.00%, 07/01/25 | | | 62,367 | | | | 65,535 | |
3.50%, 01/01/26 TBA | | | 6,000,000 | | | | 6,273,750 | |
3.00%, 02/01/26 TBA | | | 28,600,000 | | | | 29,444,592 | |
5.00%, 03/01/26 | | | 2,815,745 | | | | 3,041,263 | |
2.41%, 09/01/31† | | | 53,742 | | | | 56,714 | |
5.50%, 10/01/32 | | | 829,274 | | | | 912,489 | |
2.10%, 04/01/33† | | | 229,971 | | | | 242,125 | |
|
See Notes to Financial Statements. 79 |
| | | | | | | | |
| | | Par | | | Value | |
2.16%, 06/01/33† | | $ | 212,282 | | | $ | 220,630 | |
2.67%, 10/01/33† | | | 486,358 | | | | 514,746 | |
2.54%, 12/01/33† | | | 161,293 | | | | 169,665 | |
2.17%, 09/01/34† | | | 301,423 | | | | 313,217 | |
2.19%, 09/01/34† | | | 371,996 | | | | 386,526 | |
2.06%, 10/01/34† | | | 377,953 | | | | 393,610 | |
2.24%, 10/01/34† | | | 491,438 | | | | 514,886 | |
5.00%, 07/01/35 | | | 3,539,641 | | | | 3,827,915 | |
2.41%, 09/01/35† | | | 1,007,094 | | | | 1,063,736 | |
2.61%, 12/01/35† | | | 49,372 | | | | 51,368 | |
4.00%, 11/01/40 | | | 1,056,713 | | | | 1,111,062 | |
3.50%, 01/01/41 TBA | | | 21,200,000 | | | | 21,802,875 | |
4.00%, 09/01/41 | | | 1,665,942 | | | | 1,752,145 | |
1.42%, 07/01/44† | | | 168,105 | | | | 169,248 | |
Federal National Mortgage Association REMIC | | | | | | | | |
4.00%, 11/25/19 | | | 361,511 | | | | 378,818 | |
0.89%, 05/25/30† | | | 869,156 | | | | 868,632 | |
0.94%, 05/25/30† | | | 687,240 | | | | 686,688 | |
0.00%, 10/25/40 IOW | | | 5,328,018 | | | | 808,509 | |
4.50%, 07/25/41 | | | 1,061,109 | | | | 1,140,067 | |
0.84%, 09/25/41† | | | 5,889,881 | | | | 5,866,347 | |
FHLMC Multifamily Structured Pass-Through Certificates | | | | | | | | |
2.23%, 07/25/13 | | | 665,490 | | | | 669,613 | |
3.61%, 06/25/14 | | | 1,095,000 | | | | 1,136,417 | |
FHLMC Multifamily VRD Certificates | | | | | | | | |
5.50%, 08/15/51 STEP | | | 3,000,000 | | | | 3,353,096 | |
FHLMC Structured Pass-Through Securities | | | | | | | | |
1.29%, 05/25/43† | | | 1,065,661 | | | | 1,092,904 | |
1.62%, 07/25/44† | | | 1,688,025 | | | | 1,716,246 | |
First Horizon Alternative Mortgage Securities | | | | | | | | |
2.32%, 06/25/34† | | | 609,998 | | | | 510,819 | |
GMAC Commercial Mortgage Securities, Inc. | | | | | | | | |
6.70%, 04/15/34 | | | 100,438 | | | | 100,451 | |
Government National Mortgage Association | | | | | | | | |
2.38%, 06/20/17† | | | 8,423 | | | | 8,717 | |
2.38%, 06/20/21† | | | 5,247 | | | | 5,431 | |
2.13%, 10/20/27† | | | 41,618 | | | | 42,903 | |
8.50%, 10/15/29 | | | 26,500 | | | | 27,624 | |
0.88%, 02/16/30† | | | 157,370 | | | | 158,103 | |
8.50%, 03/15/30 | | | 1,054 | | | | 1,058 | |
8.50%, 04/15/30 | | | 5,583 | | | | 5,800 | |
8.50%, 05/15/30 | | | 131,151 | | | | 143,750 | |
8.50%, 06/15/30 | | | 6,730 | | | | 6,935 | |
8.50%, 07/15/30 | | | 59,642 | | | | 66,599 | |
8.50%, 08/15/30 | | | 17,126 | | | | 19,551 | |
8.50%, 09/15/30 | | | 2,069 | | | | 2,106 | |
8.50%, 11/15/30 | | | 14,493 | | | | 16,923 | |
8.50%, 12/15/30 | | | 31,675 | | | | 38,040 | |
8.50%, 02/15/31 | | | 18,453 | | | | 19,852 | |
5.16%, 06/16/31† | | | 1,155,000 | | | | 1,177,756 | |
0.59%, 03/20/37† | | | 1,999,606 | | | | 1,997,409 | |
0.59%, 05/20/37† | | | 842,176 | | | | 841,249 | |
0.00%, 06/20/41 IOW† | | | 3,884,781 | | | | 537,284 | |
Gracechurch Mortgage Financing PLC | | | | | | | | |
0.56%, 11/20/56 144A† | | | 3,103,649 | | | | 3,087,573 | |
Granite Mortgages PLC | | | | | | | | |
1.96%, 01/20/44(E)† | | | 317,587 | | | | 394,368 | |
| | | | | | | | |
| | | Par | | | Value | |
Greenpoint Mortgage Funding Trust | | | | | | | | |
0.47%, 01/25/37† | | $ | 896,346 | | | $ | 419,006 | |
0.56%, 11/25/45† | | | 253,884 | | | | 135,508 | |
GSR Mortgage Loan Trust | | | | | | | | |
2.76%, 09/25/34† | | | 610,910 | | | | 537,406 | |
2.71%, 09/25/35† | | | 2,242,165 | | | | 1,950,988 | |
HarborView Mortgage Loan Trust | | | | | | | | |
2.75%, 12/19/35† | | | 1,566,493 | | | | 966,114 | |
0.50%, 11/19/36† | | | 1,870,080 | | | | 1,023,044 | |
Holmes Master Issuer PLC | | | | | | | | |
0.50%, 07/15/20† | | | 1,785,000 | | | | 1,777,186 | |
Indymac Index Mortgage Loan Trust | | | | | | | | |
0.56%, 06/25/37† | | | 683,762 | | | | 91,360 | |
0.48%, 09/25/46† | | | 1,020,481 | | | | 526,358 | |
JP Morgan Chase Commercial Mortgage Securities Corporation | | | | | | | | |
2.18%, 11/15/28 144A†@ | | | 4,500,000 | | | | 4,463,888 | |
5.12%, 07/15/41 | | | 955,000 | | | | 1,009,641 | |
JP Morgan Mortgage Trust | | | | | | | | |
5.02%, 02/25/35† | | | 321,144 | | | | 311,504 | |
Luminent Mortgage Trust | | | | | | | | |
0.46%, 12/25/36† | | | 1,090,097 | | | | 599,776 | |
MASTR Adjustable Rate Mortgages Trust | | | | | | | | |
2.87%, 12/25/33† | | | 467,370 | | | | 390,227 | |
Merrill Lynch Floating Trust | | | | | | | | |
0.83%, 07/09/21 144A† | | | 199,959 | | | | 185,259 | |
Merrill Lynch Mortgage Trust | | | | | | | | |
5.24%, 11/12/35† | | | 1,260,000 | | | | 1,328,921 | |
MLCC Mortgage Investors, Inc. | | | | | | | | |
2.08%, 12/25/34† | | | 836,651 | | | | 787,929 | |
1.96%, 02/25/36† | | | 940,852 | | | | 787,851 | |
Morgan Stanley Capital I | | | | | | | | |
5.36%, 12/15/44 | | | 1,136,425 | | | | 1,141,482 | |
Morgan Stanley Reremic Trust | | | | | | | | |
2.50%, 03/23/51 144A | | | 1,113,129 | | | | 1,111,389 | |
NCUA Guaranteed Notes | | | | | | | | |
0.64%, 11/06/17† | | | 1,166,481 | | | | 1,166,481 | |
1.84%, 10/07/20 | | | 281,645 | | | | 283,406 | |
2.90%, 10/29/20 | | | 730,000 | | | | 770,743 | |
0.83%, 12/08/20† | | | 3,962,001 | | | | 3,976,859 | |
0.80%, 03/09/21† | | | 3,326,955 | | | | 3,332,677 | |
Opteum Mortgage Acceptance Corporation | | | | | | | | |
0.57%, 11/25/35† | | | 459,652 | | | | 405,602 | |
Permanent Master Issuer PLC | | | | | | | | |
1.82%, 04/15/14(U)† | | | 2,095,000 | | | | 3,252,697 | |
1.09%, 04/15/20(U)† | | | 2,060,000 | | | | 3,132,712 | |
0.51%, 07/15/33† | | | 830,000 | | | | 822,158 | |
Provident Funding Mortgage Loan Trust | | | | | | | | |
2.62%, 04/25/34† | | | 981,826 | | | | 915,893 | |
Residential Accredit Loans, Inc. | | | | | | | | |
0.69%, 01/25/33† | | | 239,441 | | | | 224,694 | |
Residential Asset Securitization Trust | | | | | | | | |
0.59%, 05/25/35† | | | 517,221 | | | | 395,266 | |
Residential Funding Mortgage Securities I | | | | | | | | |
6.50%, 03/25/32 | | | 29,253 | | | | 30,324 | |
|
| See Notes to Financial Statements. |
80 |
LOW-DURATION BOND FUND
SCHEDULE OF INVESTMENTS (Continued)
| | | | | | | | |
| | | Par | | | Value | |
Structured Adjustable Rate Mortgage Loan Trust | | | | | | | | |
2.50%, 08/25/34† | | $ | 962,255 | | | $ | 754,653 | |
0.59%, 09/25/34† | | | 177,957 | | | | 126,211 | |
Structured Asset Mortgage Investments, Inc. | | | | | | | | |
2.17%, 10/19/34† | | | 556,973 | | | | 299,718 | |
0.54%, 07/19/35† | | | 154,051 | | | | 94,094 | |
0.57%, 02/25/36† | | | 844,659 | | | | 407,996 | |
Superannuation Members Home Loans Global Fund | | | | | | | | |
1.55%, 06/12/40(E)† | | | 822,126 | | | | 1,033,811 | |
TBW Mortgage Backed Pass-Through Certificates | | | | | | | | |
6.02%, 07/25/37 STEP | | | 555,997 | | | | 339,334 | |
Thornburg Mortgage Securities Trust | | | | | | | | |
0.39%, 03/25/37† | | | 1,477,815 | | | | 1,462,364 | |
0.42%, 06/25/37† | | | 702,458 | | | | 697,627 | |
Washington Mutual Alternative Mortgage Pass-Through Certificates | | | | | | | | |
1.06%, 05/25/47† | | | 897,947 | | | | 166,706 | |
Washington Mutual Mortgage Pass-Through Certificates | | | | | | | | |
5.06%, 02/25/37† | | | 871,088 | | | | 541,551 | |
5.22%, 05/25/37† | | | 1,063,718 | | | | 734,026 | |
5.24%, 07/25/37† | | | 2,461,828 | | | | 1,344,825 | |
1.62%, 06/25/42† | | | 28,024 | | | | 20,396 | |
0.60%, 01/25/45† | | | 997,355 | | | | 740,848 | |
0.61%, 08/25/45† | | | 407,993 | | | | 297,376 | |
0.58%, 10/25/45† | | | 423,717 | | | | 304,009 | |
1.19%, 06/25/46† | | | 1,580,064 | | | | 990,441 | |
0.96%, 01/25/47† | | | 896,918 | | | | 440,472 | |
Wells Fargo Mortgage-Backed Securities Trust | | | | | | | | |
2.71%, 12/25/34† | | | 943,687 | | | | 885,461 | |
| | | | | | | | |
Total Mortgage-Backed Securities
(Cost $216,221,469) | | | | 206,777,969 | |
| | | | | | | | |
MUNICIPAL BONDS — 2.7% | |
California State Public Works Board, California State University Projects, Revenue Bond, Series B-2 | | | | | | | | |
7.80%, 03/01/35 | | | 800,000 | | | | 894,256 | |
Chicago Transit Authority, Revenue Bond | | | | | | | | |
6.90%, 12/01/40 | | | 1,300,000 | | | | 1,518,517 | |
Dallas County Hospital District, General Obligation, Series B | | | | | | | | |
6.17%, 08/15/34 | | | 1,300,000 | | | | 1,430,702 | |
Irvine Ranch Water District Joint Powers Agency, Revenue Bond, Escrowed to Maturity | | | | | | | | |
2.61%, 03/15/14 | | | 2,800,000 | | | | 2,915,304 | |
Kentucky Asset/Liability Commission, Revenue Bond | | | | | | | | |
3.17%, 04/01/18 | | | 700,000 | | | | 720,342 | |
North Texas Higher Education Authority, Taxable Student Loan Revenue Bond, Series 1 | | | | | | | | |
1.47%, 04/01/40† | | | 468,204 | | | | 457,084 | |
State of California, General Obligation | | | | | | | | |
5.10%, 08/01/14 | | | 170,000 | | | | 176,756 | |
| | | | | | | | |
| | | Par | | | Value | |
5.00%, 11/01/32 | | $ | 1,300,000 | | | $ | 1,351,779 | |
7.50%, 04/01/34 | | | 1,600,000 | | | | 1,921,360 | |
5.65%, 04/01/39† | | | 1,340,000 | | | | 1,405,928 | |
State of Illinois, General Obligation | | | | | | | | |
2.77%, 01/01/12 | | | 1,820,000 | | | | 1,820,000 | |
3.32%, 01/01/13 | | | 5,500,000 | | | | 5,597,955 | |
| | | | | | | | |
Total Municipal Bonds
(Cost $19,138,559) | | | | 20,209,983 | |
| | | | | | | | |
U.S. TREASURY OBLIGATIONS — 14.2% | |
U.S. Treasury Bills | | | | | | | | |
0.05%, 03/15/12‡‡ | | | 1,600,000 | | | | 1,599,944 | |
0.04%, 03/29/12D‡‡ | | | 7,500,000 | | | | 7,499,685 | |
0.04%, 06/21/12 | | | 400,000 | | | | 399,902 | |
| | | | | | | | |
| | | | | | | 9,499,531 | |
| | | | | | | | |
U.S. Treasury Bonds | | | | | | | | |
8.13%, 05/15/21 | | | 41,000 | | | | 63,800 | |
7.25%, 08/15/22 | | | 51,000 | | | | 77,201 | |
7.63%, 11/15/22‡‡ | | | 117,000 | | | | 182,173 | |
| | | | | | | | |
| | | | | | | 323,174 | |
| | | | | | | | |
U.S. Treasury Inflationary Index Bonds | | | | | | | | |
1.13%, 01/15/21‡‡ | | | 1,700,000 | | | | 1,964,265 | |
| | | | | | | | |
U.S. Treasury Notes | | | | | | | | |
0.63%, 12/31/12 | | | 13,450,000 | | | | 13,515,152 | |
0.38%, 06/30/13D | | | 6,000,000 | | | | 6,015,234 | |
0.75%, 09/15/13 | | | 1,480,000 | | | | 1,492,892 | |
0.13%, 09/30/13 | | | 3,090,000 | | | | 3,084,327 | |
0.25%, 10/31/13D | | | 40,085,000 | | | | 40,097,547 | |
1.25%, 02/15/14‡‡ | | | 867,000 | | | | 884,949 | |
0.38%, 11/15/14D | | | 6,750,000 | | | | 6,755,272 | |
2.13%, 02/29/16‡‡ | | | 772,000 | | | | 819,165 | |
3.38%, 11/15/19‡‡ | | | 167,000 | | | | 190,393 | |
3.13%, 05/15/21D | | | 16,400,000 | | | | 18,314,192 | |
2.13%, 08/15/21D | | | 1,500,000 | | | | 1,538,671 | |
2.00%, 11/15/21D | | | 1,300,000 | | | | 1,315,032 | |
| | | | | | | | |
| | | | | | | 94,022,826 | |
| | | | | | | | |
Total U.S. Treasury Obligations
(Cost $105,047,052) | | | | 105,809,796 | |
| | | | | | | | |
| | | | | | | | |
| | | Shares | | | | |
MONEY MARKET FUNDS — 16.2% | |
GuideStone Money Market Fund (GS4 Class)¥ | | | 36,527,243 | | | | 36,527,243 | |
Northern Institutional Liquid Assets Portfolio§ | | | 84,233,733 | | | | 84,233,733 | |
| | | | | | | | |
Total Money Market Funds
(Cost $120,760,976) | | | | | | | 120,760,976 | |
| | | | | | | | |
| | | | | | | | |
| | | Par | | | | |
REPURCHASE AGREEMENTS — 14.3% | |
J.P. Morgan Securities LLC | | | | | | | | |
0.07% (dated 12/30/11, due 01/03/12, repurchase price $8,600,067, collateralized by Federal National Mortgage Association, 0.950%, due 10/27/14, total market value $8,771,590) | | $ | 8,600,000 | | | | 8,600,000 | |
|
See Notes to Financial Statements. 81 |
| | | | | | | | |
| | | Par | | | Value | |
Morgan Stanley & Co., Inc. | | | | | | | | |
0.07% (dated 12/30/11, due 01/03/12, repurchase price $44,600,347, collateralized by Federal Home Loan Bank, 0.300%, due 05/16/2013, total market value $45,528,711) | | $ | 44,600,000 | | | $ | 44,600,000 | |
0.11% (dated 01/03/2012, due 01/04/2012, repurchase price $30,110,092, collateralized by Federal Home Loan Bank, 0.300%, due 05/16/2013, total market value $30,726,230) | | | 30,110,000 | | | | 30,110,000 | |
0.11% (dated 01/03/2012, due 01/04/2012, repurchase price $23,190,071, collateralized by Federal Home Loan Bank, 0.310%, due 05/16/2013, total market value $23,646,069) | | | 23,190,000 | | | | 23,190,000 | |
| | | | | | | | |
Total Repurchase Agreements
(Cost $106,500,000) | | | | 106,500,000 | |
| | | | | | | | |
TOTAL INVESTMENTS — 125.2%
(Cost $945,725,743) | | | | 931,833,317 | |
| | | | | | | | |
| | | $0000000000 | | | | $0000000000 | |
| | | Notional
Amount | | | | |
WRITTEN OPTIONS — 0.0% | |
Put Swaptions — 0.0% | |
3-Month LIBOR, Strike Price $10.00, Expires 07/10/12 (BAR) | | $ | (200,000 | ) | | | — | |
3-Month LIBOR, Strike Price $10.00, Expires 07/10/12 (CS) | | | (100,000 | ) | | | — | |
3-Month LIBOR, Strike Price $10.00, Expires 07/10/12 (MSCS) | | | (3,800,000 | ) | | | — | |
3-Month LIBOR, Strike Price $10.00, Expires 07/10/12 (RBS) | | | (300,000 | ) | | | — | |
3-Month LIBOR, Strike Price $2.25, Expires 09/24/12 (CITI) | | | (600,000 | ) | | | (243 | ) |
3-Month LIBOR, Strike Price $2.25, Expires 09/24/12 (UBS) | | | (300,000 | ) | | | (122 | ) |
| | | | | | | | |
Total Written Options
(Premiums received $(32,965)) | | | | (365 | ) |
| | | | | | | | |
| | | | | | | | |
| | | Par | | | Value | |
TBA SALE COMMITMENTS — (2.2)% | |
Federal Home Loan Mortgage Corporation | | | | | | | | |
5.50%, 01/01/39 TBA | | $ | (4,000,000 | ) | | $ | (4,340,000 | ) |
Federal National Mortgage Association | | | | | | | | |
4.00%, 01/01/41 TBA | | | (4,000,000 | ) | | | (4,201,875 | ) |
5.50%, 01/01/40 TBA | | | (7,000,000 | ) | | | (7,622,344 | ) |
| | | | | | | | |
Total TBA Sale Commitments
(Cost $(16,011,563)) | | | | (16,164,219 | ) |
| | | | | | | | |
Liabilities in Excess of Other Assets — (23.0)% | | | | | | | (171,493,590 | ) |
| | | | | | | | |
NET ASSETS — 100.0% | | | $ | 744,175,143 | |
| | | | | | | | |
Please see abbreviation and footnote definitions beginning on page 200.
PORTFOLIO SUMMARY (based on net assets)
| | | | |
| | | % | |
Mortgage-Backed Securities | | | 27.8 | |
Corporate Bonds | | | 22.5 | |
Foreign Bonds | | | 20.2 | |
Money Market Funds | | | 16.2 | |
Repurchase Agreements | | | 14.3 | |
U.S. Treasury Obligations | | | 14.2 | |
Futures Contracts | | | 13.7 | |
Asset-Backed Securities | | | 6.1 | |
Municipal Bonds | | | 2.7 | |
Agency Obligations | | | 1.2 | |
Swap Agreements | | | 0.4 | |
Written Options | | | — | ** |
TBA Sale Commitments | | | (2.2 | ) |
Forward Foreign Currency Contracts | | | (9.4 | ) |
| | | | |
| | | 127.7 | |
| | | | |
| ** | Rounds to less than 0.005%. |
|
| See Notes to Financial Statements. |
82 |
LOW-DURATION BOND FUND
SCHEDULE OF INVESTMENTS (Continued)
Swap agreements outstanding at December 31, 2011:
| | | | | | | | | | | | | | | | | | | | | | | | | | | | | | | | |
Reference Obligation | | Fixed
Deal
(Pay)
Rate | | | Maturity
Date | | | Counterparty | | | Currency | | | Notional
Amount | | | Market
Value | | | Upfront
Premiums
Paid/
(Received) | | | Unrealized
Appreciation
(Depreciation) | |
Credit Default Swaps on Corporate Issues — Buy Protection | |
Nabors Industries, 6.15% due 02/15/18 | | | (0.63 | )% | | | 03/20/18 | | | | CITI | | | | USD | | | $ | 3,300,000 | | | $ | 277,559 | | | $ | — | | | $ | 277,559 | |
Nabors Industries, 5.375% due 08/15/12 | | | (1.00 | )% | | | 03/20/19 | | | | BNP | | | | USD | | | | 2,700,000 | | | | 203,132 | | | | 8,660 | | | | 194,472 | |
Morgan Stanley ABS Capital I, 7.02% due 12/27/33 | | | (0.54 | )% | | | 12/27/33 | | | | MSCS | | | | USD | | | | 368,596 | | | | 151,694 | | | | — | | | | 151,694 | |
Long Beach Mortgage Trust, 6.72%, due 02/25/34 | | | (0.49 | )% | | | 02/25/34 | | | | BAR | | | | USD | | | | 381,820 | | | | 168,130 | | | | — | | | | 168,130 | |
Specialty Underwriting & Residential Finance, 6.62% due 02/25/35 | | | (0.59 | )% | | | 02/25/35 | | | | BAR | | | | USD | | | | 384,485 | | | | 236,886 | | | | — | | | | 236,886 | |
| | | | | | | | | | | | | | | | | | | | | | | | | | | | | | | | |
| | | | | | | | | | | | | | | | | | $ | 7,134,901 | | | $ | 1,037,401 | | | $ | 8,660 | | | $ | 1,028,741 | |
| | | | | | | | | | | | | | | | | | | | | | | | | | | | | | | | |
| | | | | | | | | | | | | | | | | | | | | | | | | | | | | | | | | | | | |
Reference Obligation | | Implied
Credit
Spread | | | Fixed
Deal
(Pay)
Rate | | | Maturity
Date | | | Counterparty | | | Currency | | | Notional
Amount | | | Market
Value | | | Upfront
Premiums
Paid/
(Received) | | | Unrealized
Appreciation
(Depreciation) | |
Credit Default Swaps on Corporate Issues — Sell Protection | |
General Electric Capital Corporation, 5.625% due 09/15/17 | | | 1.82 | % | | | 1.00 | % | | | 09/20/13 | | | | UBS | | | | USD | | | $ | 700,000 | | | $ | (10,232 | ) | | $ | (17,530 | ) | | $ | 7,298 | |
| | | | | | | | | | | | | | | | | | | | | | | | | | | | | | | | | | | | |
| | | | | | | | | | | | | | | | | | | | | | | | | | | | | | | | |
Reference Obligation | | Fixed
Deal
(Pay)
Rate | | | Maturity
Date | | | Counterparty | | | Currency | | | Notional
Amount | | | Market
Value | | | Upfront
Premiums
Paid/
(Received) | | | Unrealized
Appreciation
(Depreciation) | |
Credit Default Swaps on Credit Indices — Buy Protection | |
Dow Jones CDX HY-8 Index | | | (1.63 | )% | | | 06/20/12 | | | | CITI | | | | USD | | | $ | 4,900,000 | | | $ | (25,629 | ) | | $ | — | | | $ | (25,629 | ) |
Dow Jones CDX IG14 Index | | | (1.00 | )% | | | 06/20/15 | | | | BAR | | | | USD | | | | 7,900,000 | | | | (9,484 | ) | | | 6,638 | | | | (16,122 | ) |
Dow Jones CDX IG15 Index | | | (1.00 | )% | | | 12/20/15 | | | | CS | | | | USD | | | | 1,800,000 | | | | 3,035 | | | | 11,627 | | | | (8,592 | ) |
Dow Jones CDX IG16 Index | | | (1.00 | )% | | | 06/20/16 | | | | CS | | | | USD | | | | 400,000 | | | | 2,763 | | | | 5,268 | | | | (2,505 | ) |
Dow Jones CDX IG9 Index | | | (0.80 | )% | | | 12/20/17 | | | | BAR | | | | USD | | | | 16,552,800 | | | | 618,023 | | | | 706,533 | | | | (88,510 | ) |
CMBX.NA.AAA.4 Index | | | (0.35 | )% | | | 02/17/39 | | | | GSC | | | | USD | | | | 5,700,000 | | | | 572,419 | | | | 809,639 | | | | (237,220 | ) |
| | | | | | | | | | | | | | | | | | | | | | | | | | | | | | | | |
| | | | | | | | | | | | | | | | | | $ | 37,252,800 | | | $ | 1,161,127 | | | $ | 1,539,705 | | | $ | (378,578 | ) |
| | | | | | | | | | | | | | | | | | | | | | | | | | | | | | | | |
| | | | | | | | | | | | | | | | | | | | | | | | | | | | | | | | |
Reference Obligation | | Fixed
Deal
(Pay)
Rate | | | Maturity
Date | | | Counterparty | | | Currency | | | Notional
Amount | | | Market
Value | | | Upfront
Premiums
Paid/
(Received) | | | Unrealized
Appreciation
(Depreciation) | |
Interest Rate Swaps | |
Brazil Cetip Interbank Deposit | | | 10.77 | % | | | 01/02/14 | | | | UBS | | | | BRL | | | $ | 400,000 | | | $ | 1,139 | | | $ | 1,041 | | | $ | 98 | |
Brazil Cetip Interbank Deposit | | | 11.94 | % | | | 01/02/14 | | | | HSBC | | | | BRL | | | | 10,400,000 | | | | 167,951 | | | | 12,045 | | | | 155,906 | |
Brazil Cetip Interbank Deposit | | | 11.96 | % | | | 01/02/14 | | | | GSC | | | | BRL | | | | 5,900,000 | | | | 118,124 | | | | (5,553 | ) | | | 123,677 | |
Brazil Cetip Interbank Deposit | | | 10.58 | % | | | 01/02/14 | | | | MSCS | | | | BRL | | | | 1,200,000 | | | | 1,244 | | | | 1,273 | | | | (29 | ) |
Brazil Cetip Interbank Deposit | | | 12.56 | % | | | 01/02/14 | | | | HSBC | | | | BRL | | | | 800,000 | | | | 15,365 | | | | 1,051 | | | | 14,314 | |
Brazil Cetip Interbank Deposit | | | 12.51 | % | | | 01/02/14 | | | | BAR | | | | BRL | | | | 1,000,000 | | | | 18,757 | | | | 839 | | | | 17,918 | |
|
See Notes to Financial Statements. 83 |
| | | | | | | | | | | | | | | | | | | | | | | | | | | | | | | | |
Reference Obligation | | Fixed
Deal
(Pay)
Rate | | | Maturity
Date | | | Counterparty | | | Currency | | | Notional
Amount | | | Market
Value | | | Upfront
Premiums
Paid/
(Received) | | | Unrealized
Appreciation
(Depreciation) | |
6-Month LIBOR | | | 1.80 | % | | | 10/13/16 | | | | CS | | | | USD | | | $ | 3,400,000 | | | $ | (108,232 | ) | | $ | (62,883 | ) | | $ | (45,349 | ) |
6-Month EURIBOR | | | 2.00 | % | | | 03/21/17 | | | | BAR | | | | EUR | | | | 2,900,000 | | | | 44,363 | | | | (17,315 | ) | | | 61,678 | |
6-Month LIBOR | | | 2.00 | % | | | 03/21/17 | | | | BAR | | | | EUR | | | | 4,900,000 | | | | 74,958 | | | | (31,495 | ) | | | 106,453 | |
6-Month BBR BBSW Index | | | (5.50 | )% | | | 12/15/17 | | | | BAR | | | | AUD | | | | 1,500,000 | | | | 90,012 | | | | (6,134 | ) | | | 96,146 | |
6-Month BBR BBSW Index | | | (5.50 | )% | | | 12/15/17 | | | | DEUT | | | | AUD | | | | 1,000,000 | | | | 57,603 | | | | (3,654 | ) | | | 61,257 | |
MXN-TIIE-Banxico | | | 7.50 | % | | | 06/02/21 | | | | UBS | | | | MXN | | | | 300,000 | | | | 1,254 | | | | 932 | | | | 322 | |
| | | | | | | | | | | | | | | | | | | | | | | | | | | | | | | | |
| | | | | | | | | | | | | | | | | | $ | 33,700,000 | | | $ | 482,538 | | | $ | (109,853 | ) | | $ | 592,391 | |
| | | | | | | | | | | | | | | | | | | | | | | | | | | | | | | | |
Total Swap agreements outstanding at December 31, 2011 | | | | | | | | | | | $ | 2,670,834 | | | $ | 1,420,982 | | | $ | 1,249,852 | |
| | | | | | | | | | | | | | | | | | | | | | | | | | | | | | | | |
Please see abbreviation and footnote definitions beginning on page 200.
|
| See Notes to Financial Statements. |
84 |
LOW-DURATION BOND FUND
SCHEDULE OF INVESTMENTS (Continued)
VALUATION HIERARCHY
The following is a summary of the inputs used, as of December 31, 2011, in valuing the Fund’s investments carried at fair value:
| | | | | | | | | | | | | | | | |
| | | Total Value | | | Level 1
Quoted Prices | | | Level 2
Other
Significant
Observable
Inputs | | | Level 3
Significant
Unobservable
Inputs | |
Assets: | | | | | | | | | | | | | | | | |
Investments in Securities: | | | | | | | | | | | | | | | | |
Agency Obligations | | $ | 9,095,853 | | | $ | — | | | $ | 9,095,853 | | | $ | — | |
Asset-Backed Securities | | | 45,463,792 | | | | — | | | | 44,579,649 | | | | 884,143 | |
Corporate Bonds | | | 167,419,415 | | | | — | | | | 166,224,087 | | | | 1,195,328 | |
Foreign Bonds | | | 149,795,533 | | | | — | | | | 149,795,533 | | | | — | |
Money Market Funds | | | 120,760,976 | | | | 120,760,976 | | | | — | | | | — | |
Mortgage-Backed Securities | | | 206,777,969 | | | | — | | | | 206,776,712 | | | | 1,257 | |
Municipal Bonds | | | 20,209,983 | | | | — | | | | 20,209,983 | | | | — | |
Repurchase Agreements | | | 106,500,000 | | | | — | | | | 106,500,000 | | | | — | |
U.S. Treasury Obligations | | | 105,809,796 | | | | — | | | | 105,809,796 | | | | — | |
| | | | | | | | | | | | | | | | |
Total Assets — Investments in Securities | | $ | 931,833,317 | | | $ | 120,760,976 | | | $ | 808,991,613 | | | $ | 2,080,728 | |
| | | | | | | | | | | | | | | | |
Other Financial Instruments*** | | | | | | | | | | | | | | | | |
Forward Foreign Currency Contracts | | $ | 917,514 | | | $ | — | | | $ | 917,514 | | | $ | — | |
Futures Contracts | | | 40,120 | | | | 40,120 | | | | — | | | | — | |
Swap Agreements | | | 2,670,834 | | | | — | | | | 2,670,834 | | | | — | |
| | | | | | | | | | | | | | | | |
Total Assets — Other Financial Instruments | | $ | 3,628,468 | | | $ | 40,120 | | | $ | 3,588,348 | | | $ | — | |
| | | | | | | | | | | | | | | | |
Liabilities: | | | | | | | | | | | | | | | | |
Investments in Securities: | | | | | | | | | | | | | | | | |
TBA Sale Commitments | | $ | (16,164,219 | ) | | $ | — | | | $ | (16,164,219 | ) | | $ | — | |
Written Options | | | (365 | ) | | | — | | | | (365 | ) | | | — | |
| | | | | | | | | | | | | | | | |
Total Liabilities — Investments in Securities | | $ | (16,164,584 | ) | | $ | — | | | $ | (16,164,584 | ) | | $ | — | |
| | | | | | | | | | | | | | | | |
| *** | Other financial instruments are derivative instruments not reflected in the Schedule of Investments, such as futures, forwards and swap contracts, which are valued at the unrealized appreciation (depreciation) on the investment. Details of these investments can be found in the Notes to Schedules of Investments. |
See Notes to Financial Statements.
85
The following is a reconciliation of assets in which significant unobservable inputs (Level 3) were used in determining fair value:
| | | | | | | | | | | | | | | | |
| | | Total Value | | | Asset-Backed
Securities | | | Corporate
Bond | | | Mortgage-
Backed
Securities | |
Balance, 12/31/10 | | $ | 110,903 | | | $ | — | | | $ | 110,903 | | | $ | — | |
Accrued discounts/premiums | | | 217 | | | | — | | | | 217 | | | | — | |
Realized gain (loss)(1) | | | (9,801 | ) | | | (9,801 | ) | | | — | | | | — | |
Change in unrealized appreciation (depreciation)(2) | | | (97,063 | ) | | | (113,814 | ) | | | 16,751 | | | | — | |
Purchases | | | 2,332,319 | | | | 1,153,959 | | | | 1,178,360 | | | | — | |
Sales | | | (257,104 | ) | | | (146,201 | ) | | | — | | | | (110,903 | ) |
Transfers in and/or out of Level 3(3)(4) | | | 1,257 | | | | | | | | (110,903 | ) | | | 112,160 | |
| | | | | | | | | | | | | | | | |
Balance, 12/31/11 | | $ | 2,080,728 | | | $ | 884,143 | | | $ | 1,195,328 | | | $ | 1,257 | |
| | | | | | | | | | | | | | | | |
| (1) | Realized gain (loss) from the sale of Level 3 securities can be found on the Statement of Operations in Net Realized Gain (loss) from Investment securities and securities sold short. |
| (2) | Change in unrealized appreciation (depreciation) can be found on the Statement of Operations in Net change in unrealized appreciation (depreciation) on Investment securities and securities sold short. |
| (3) | The Fund had a security valued at $1,390 as of December 31, 2010 that was transferred from Level 2 to Level 3 of the fair value hierarchy. The security that transferred from Level 2 to Level 3 during the year ended December 31, 2011 did so as a result of the inability of the Fund to obtain a price which was determined using observable inputs. The value of the securities as of December 31, 2011 is $1,257. |
| (4) | Transfers in and/or out of Level 3 reflect the re-classification of a balance from December 31, 2010 in the amount of $110,903. |
|
| See Notes to Financial Statements. |
86 |
Medium-Duration Bond Fund
The year of 2011 was turbulent and was impacted by numerous macro-economic and political events that pushed and pulled on the capital markets. Although corporate fundamentals were improving, the potential outcome of such macro events were difficult to accurately predict, which fueled investors’ fears, led to extreme uncertainty and capital market volatility. The bond market benefited from this economic uncertainty and overall risk aversion. During 2011, the broad domestic bond market, as measured by the Barclay’s Capital U.S. Aggregate Bond Index, posted an annual return of 7.84%, compared to the U.S. stock market which generated a return of 2.11%, as measured by the S&P 500® Index. Despite the macro-economic headwinds, all major bond market sectors posted positive returns for the year, led by the U.S. Treasury sector. Throughout the year, U.S. Treasury yields fell, from their already low levels, in response to the Federal Reserve maintaining its commitment to a near zero federal funds rate for the foreseeable future and the implementation of “Operation Twist.” Treasuries also benefitted from high demand, as global investors often sought the “safe haven” assets when implementing “risk-off ” trades. As a sector, U.S. Treasuries posted an annual return of 9.81%, with longer-dated Treasuries posting the highest returns in the bond market. Shorter-term U.S. Treasuries, as measured by the Bank of America Merrill Lynch 1-3 Year Treasury Index, generated a one-year return of 1.55%. The year ended at remarkably low levels with the yield on the 10-year U.S. Treasury bond at 1.88% and the 30-year U.S. Treasury bond at 2.89%. Non-U.S. Treasury bonds, “spread sectors”, performed well in this risk aversion environment. The investment grade corporate bond sector and mortgage-backed securities sector posted annual returns of 8.15% and 6.23%, respectively. Overall, higher-quality bonds generally outpaced lower-quality bonds while longer-maturity bonds typically outperformed shorter-maturity bonds. Non-benchmark sectors posted varied returns based on risk and correlations to the equity markets. High yield bonds (below investment grade corporate bonds), considered higher risk and more correlated to the equity market, posted an annual return of 4.98% while emerging market bonds generated an annual return 8.47%. U.S. Treasury inflation protected securities (“TIPS”) benefited from strong demand and inflationary concerns, posting an annual return of 13.56% as measured by the Barclays Capital U.S. TIPS Index.
The Fund invests in a diversified portfolio composed of investment grade fixed income securities with an average dollar-weighted duration (a measure of bond prices’ sensitivity to changes in interest rates) normally between three to seven years. The GS4 Class of the Fund underperformed its benchmark index, the Barclays Capital U.S. Aggregate Bond Index, for the one-year period ended December 31, 2011 (6.49% versus 7.84%). The Fund’s benchmark relative underperformance was largely attributable to the Fund’s underweight to the U.S. Treasury sector. The Fund underweighted U.S. Treasuries in favor of spread sectors, which underperformed U.S. Treasuries for the year. During this historically low interest rate environment, U.S. Treasuries appeared expensive relative to the more attractively valued spread sectors that were demonstrating improving fundamentals while offering a higher yield orientation. Additionally, the Fund’s duration was at times shorter relative to the benchmark’s duration, which had a negative relative performance impact as interest rates declined. During the year, the Fund remained diversified across multiple spread sectors including, but not limited to, corporate bonds, mortgaged-backed securities, Yankee bonds and non-U.S. bonds. High yield and emerging markets bonds were also utilized on a tactical basis.
Other strategies involving derivatives were utilized during the year. U.S. Treasury futures contracts were used for the purpose of managing the Fund’s overall duration position. Throughout the year, this strategy detracted slightly from relative performance as interest rates continued to fall from already historically low levels. Along with U.S. Treasury futures contracts, currency forward contracts were utilized in an effort to hedge foreign currency risk and to add exposure to rising currencies. These currency strategies resulted in a minimal positive impact to the Fund’s performance. In an effort to hedge or take advantage of interest rate and credit quality viewpoints during the year, certain derivative instruments were also used including interest rate swaps, credit default swaps and options on U.S. Treasuries. These strategies had minimal impact, positively or negatively, on the Fund’s performance. During the year, the Fund remained focused on its objective of seeking maximum total return consistent with preservation of capital.
This Fund may be suitable for investors who have a short- to medium-term investment horizon, seek higher returns than those offered by a shorter maturity bond fund, can accept some short-term fluctuations in account value and want to diversify their portfolio with a fixed income investment option. This Fund is subject to interest rate risk. Meaning, when interest rates rise, the value of the existing bonds decrease and vice versa. Changes in interest rates have a bigger impact on long duration holdings than on short duration holdings. To the extent that the investment advisor misjudges current market conditions, the Fund’s volatility may be amplified by its use of short sales and derivatives and by its ability to select sub-advisers to allocate assets. Short sales by a fund theoretically involve unlimited loss potential since the market price of securities sold short may continuously increase. Leverage may increase the risk of loss and cause fluctuations in the market value of the Fund’s portfolio to have disproportionately large effects or cause the NAV of the Fund generally to decline faster than it would otherwise.
Please see page 106 for information regarding specific portfolio allocations. Portfolio holdings are subject to change and risk at any time.
87
Medium-Duration Bond Fund
| | | | | | | | | | | | |
Average Annual Total Returns as of 12/31/11 | |
| | | GS2
Class* | | | GS4
Class* | | | Benchmark** | |
One Year | | | 6.56 | % | | | 6.49 | % | | | 7.84 | % |
Five Year | | | 6.87 | % | | | 6.74 | % | | | 6.50 | % |
Ten Year | | | 6.26 | % | | | 6.13 | % | | | 5.78 | % |
Since Inception | | | 6.13 | % | | | 6.07 | % | | | 5.76 | % |
Inception Date | | | 08/27/01 | | | | 08/27/01 | | | | | |
Total Fund Operating Expenses (April 30, 2011 Prospectus, as amended on September 1, 2011)(1) | | | 0.50 | % | | | 0.74 | % | | | | |
| (1) | Current information regarding the Fund’s Operating Expenses can be found in the Financial Highlights. |
The performance data quoted represents past performance and does not guarantee future results. Current performance may be lower or higher. Performance data current to the most recent month-end may be obtained at www.GuideStoneFunds.org. The investment return and principal value of an investment will fluctuate so that shares, when redeemed, may be worth more or less than their original cost.
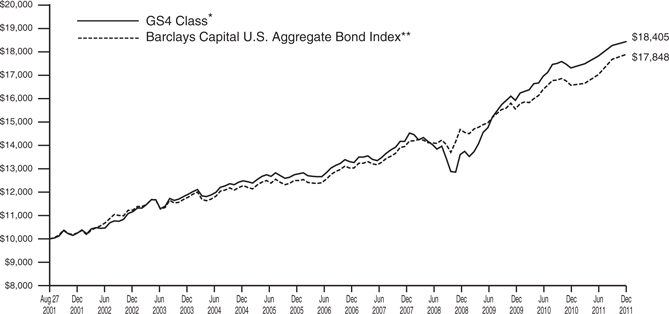
The graph compares the results of a hypothetical $10,000 investment in the GS4 Class of the Fund since August 27, 2001 (commencement of operations), with all dividends and capital gains reinvested, with the Barclays Capital U.S. Aggregate Bond Index.
| * | These returns reflect expense waivers by the Fund’s investment adviser. Without these waivers, returns would have been lower. Returns shown do not reflect the deduction of taxes that a shareholder would pay on Fund distributions or the redemption of Fund shares. |
| ** | The Barclays Capital U.S. Aggregate Bond Index represents securities that are SEC-registered, taxable and dollar denominated. The index covers the U.S. investment grade fixed-rate bond market, with index components for government and corporate securities, mortgage pass-through securities and asset-backed securities. |
Unlike a mutual fund, the performance of an index assumes no taxes, transaction costs, management fees or other expenses.
88
| | |
| MEDIUM-DURATION BOND FUND | | |
| SCHEDULE OF INVESTMENTS | | December 31, 2011 |
| | | | | | | | |
| | | Par | | | Value | |
AGENCY OBLIGATIONS — 5.0% | |
Federal Farm Credit Bank | | | | | | | | |
5.05%, 11/06/17 | | $ | 400,000 | | | $ | 476,737 | |
Federal Home Loan Bank | | | | | | | | |
0.40%, 08/17/12 | | | 2,200,000 | | | | 2,200,471 | |
0.21%, 01/04/13 | | | 1,600,000 | | | | 1,599,395 | |
5.63%, 06/11/21 | | | 700,000 | | | | 893,314 | |
Federal Home Loan Mortgage Corporation | | | | | | | | |
0.11%, 01/10/12W‡‡ | | | 204,000 | | | | 203,999 | |
0.10%, 02/10/12 | | | 5,100,000 | | | | 5,099,943 | |
0.05%, 05/02/12 | | | 9,000,000 | | | | 8,999,703 | |
0.08%, 07/11/12 | | | 9,000,000 | | | | 8,998,101 | |
0.70%, 11/04/13 | | | 1,100,000 | | | | 1,100,728 | |
0.63%, 12/29/14 | | | 1,700,000 | | | | 1,700,010 | |
Federal National Mortgage Association | | | | | | | | |
0.09%, 01/04/12W | | | 5,100,000 | | | | 5,099,989 | |
5.25%, 08/01/12 | | | 2,400,000 | | | | 2,466,730 | |
0.60%, 09/12/13 | | | 920,000 | | | | 920,227 | |
4.38%, 10/15/15 | | | 510,000 | | | | 576,803 | |
1.38%, 11/15/16D | | | 480,000 | | | | 485,518 | |
5.34%, 10/09/19 | | | 150,000 | | | | 115,550 | |
6.63%, 11/15/30 | | | 820,000 | | | | 1,218,288 | |
5.63%, 07/15/37 | | | 300,000 | | | | 413,286 | |
Tennessee Valley Authority | | | | | | | | |
5.25%, 09/15/39 | | | 350,000 | | | | 448,581 | |
4.63%, 09/15/60 | | | 200,000 | | | | 240,096 | |
| | | | | | | | |
Total Agency Obligations
(Cost $42,618,604) | | | | 43,257,469 | |
| | | | | | | | |
ASSET-BACKED SECURITIES — 3.5% | |
Access Group, Inc. | | | | | | | | |
1.72%, 10/27/25† | | | 1,379,617 | | | | 1,382,862 | |
Amortizing Residential Collateral Trust | | | | | | | | |
0.57%, 01/01/32† | | | 35,188 | | | | 22,232 | |
Asset-Backed Securities Corporation Home Equity | | | | | | | | |
0.57%, 09/25/34† | | | 168,112 | | | | 148,422 | |
Avis Budget Rental Car Funding AESOP LLC | | | | | | | | |
4.64%, 05/20/16 144A | | | 200,000 | | | | 212,798 | |
3.15%, 03/20/17 144A | | | 160,000 | | | | 161,812 | |
Bayview Financial Acquisition Trust | | | | | | | | |
0.97%, 02/28/44† | | | 396,615 | | | | 354,830 | |
Bear Stearns Asset-Backed Securities, Inc. | | | | | | | | |
6.00%, 10/25/36 | | | 2,438,504 | | | | 1,683,146 | |
6.50%, 10/25/36 | | | 2,989,490 | | | | 2,163,288 | |
Brazos Higher Education Authority | | | | | | | | |
0.68%, 09/25/23† | | | 573,823 | | | | 561,733 | |
1.41%, 05/25/29† | | | 436,056 | | | | 430,395 | |
1.27%, 07/25/29† | | | 1,100,000 | | | | 1,069,554 | |
1.31%, 02/25/30† | | | 1,100,000 | | | | 1,069,432 | |
CIT Mortgage Loan Trust | | | | | | | | |
1.29%, 10/25/37 144A†@ | | | 135,170 | | | | 132,142 | |
1.54%, 10/25/37 144A†@ | | | 430,000 | | | | 318,375 | |
1.74%, 10/25/37 144A†@ | | | 800,000 | | | | 325,394 | |
College Loan Corporation Trust | | | | | | | | |
0.51%, 10/25/25† | | | 1,000,000 | | | | 984,986 | |
Countrywide Home Equity Loan Trust | | | | | | | | |
0.57%, 02/15/34† | | | 318,978 | | | | 208,059 | |
| | | | | | | | |
| | | Par | | | Value | |
0.52%, 12/15/35† | | $ | 838,483 | | | $ | 398,094 | |
0.42%, 07/15/36† | | | 876,708 | | | | 526,735 | |
Education Funding Capital Trust I | | | | | | | | |
1.45%, 06/15/43† | | | 200,000 | | | | 183,992 | |
EMC Mortgage Loan Trust | | | | | | | | |
0.84%, 11/25/41 144A† | | | 105,919 | | | | 93,376 | |
GCO Education Loan Funding Trust | | | | | | | | |
0.70%, 02/27/28† | | | 100,000 | | | | 85,414 | |
0.74%, 05/25/36† | | | 150,000 | | | | 123,924 | |
GMAC Mortgage Corporation Loan Trust | | | | | | | | |
7.00%, 09/25/37 | | | 352,358 | | | | 251,362 | |
Goal Capital Funding Trust | | | | | | | | |
1.21%, 08/25/48 144A† | | | 388,562 | | | | 363,025 | |
Greenpoint Manufactured Housing | | | | | | | | |
2.25%, 11/22/31† | | | 325,000 | | | | 275,711 | |
Hertz Vehicle Financing LLC | | | | | | | | |
5.29%, 03/25/16 144A | | | 400,000 | | | | 433,043 | |
HSBC Home Equity Loan Trust | | | | | | | | |
1.49%, 11/20/36† | | | 759,253 | | | | 672,010 | |
Iowa Student Loan Liquidity Corporation | | | | | | | | |
1.82%, 06/25/42† | | | 300,000 | | | | 283,338 | |
Keycorp Student Loan Trust | | | | | | | | |
0.70%, 08/27/31† | | | 678,143 | | | | 605,695 | |
Knowledgeworks Foundation | | | | | | | | |
1.46%, 02/25/42† | | | 271,276 | | | | 261,912 | |
Lehman XS Trust | | | | | | | | |
0.59%, 11/25/35† | | | 774,289 | | | | 536,686 | |
0.56%, 02/25/36† | | | 916,151 | | | | 471,772 | |
Magnolia Funding, Ltd. | | | | | | | | |
3.00%, 04/20/17(E) | | | 1,414,345 | | | | 1,821,111 | |
Missouri Higher Education Loan Authority | | | | | | | | |
1.46%, 11/26/32† | | | 779,174 | | | | 755,443 | |
Nelnet Education Loan Funding, Inc. | | | | | | | | |
1.09%, 02/25/39† | | | 800,000 | | | | 697,440 | |
Panhandle-Plains Higher Education Authority, Inc. | | | | | | | | |
1.71%, 10/01/35† | | | 854,167 | | | | 843,035 | |
Provident Bank Home Equity Loan Trust | | | | | | | | |
0.83%, 08/25/31† | | | 108,540 | | | | 53,407 | |
Residential Asset Mortgage Products, Inc. | | | | | | | | |
0.77%, 03/25/34† | | | 346,463 | | | | 230,404 | |
Residential Funding Securities LLC | | | | | | | | |
0.74%, 06/25/33 144A† | | | 258,027 | | | | 245,013 | |
Salomon Brothers Mortgage Securities VII, Inc. | | | | | | | | |
0.77%, 03/25/28† | | | 39,130 | | | | 36,051 | |
SLM Student Loan Trust | | | | | | | | |
1.92%, 04/25/23† | | | 5,656,710 | | | | 5,786,947 | |
0.84%, 12/15/25 144A† | | | 400,000 | | | | 372,265 | |
3.50%, 08/17/43 144A† | | | 1,357,297 | | | | 1,337,032 | |
3.53%, 05/16/44 144A† | | | 1,350,579 | | | | 1,376,915 | |
| | | | | | | | |
Total Asset-Backed Securities
(Cost $34,641,371) | | | | 30,350,612 | |
| | | | | | | | |
|
| See Notes to Financial Statements. |
89 |
| | | | | | | | |
| | | Par | | | Value | |
CORPORATE BONDS — 22.3% | |
ACCO Brands Corporation | | | | | | | | |
10.63%, 03/15/15 | | $ | 175,000 | | | $ | 195,562 | |
AES Corporation | | | | | | | | |
8.00%, 10/15/17D | | | 350,000 | | | | 386,750 | |
Ally Financial, Inc. | | | | | | | | |
6.25%, 12/01/17D | | | 606,000 | | | | 586,820 | |
8.00%, 03/15/20 | | | 450,000 | | | | 462,375 | |
American Express Bank FSB | | | | | | | | |
6.00%, 09/13/17 | | | 1,100,000 | | | | 1,247,841 | |
American Express Co. | | | | | | | | |
6.80%, 09/01/66† | | | 1,400,000 | | | | 1,398,250 | |
American Express Credit Corporation | | | | | | | | |
5.13%, 08/25/14D | | | 160,000 | | | | 171,998 | |
American International Group, Inc. | | | | | | | | |
3.75%, 11/30/13 144A | | | 200,000 | | | | 196,344 | |
5.60%, 10/18/16 | | | 600,000 | | | | 578,903 | |
5.85%, 01/16/18 | | | 180,000 | | | | 176,484 | |
8.25%, 08/15/18 144A | | | 3,200,000 | | | | 3,388,803 | |
6.40%, 12/15/20 | | | 110,000 | | | | 111,203 | |
6.25%, 03/15/37 | | | 680,000 | | | | 495,550 | |
Amgen, Inc. | | | | | | | | |
3.88%, 11/15/21D | | | 500,000 | | | | 505,586 | |
Anadarko Petroleum Corporation | | | | | | | | |
6.38%, 09/15/17 | | | 565,000 | | | | 655,707 | |
8.70%, 03/15/19 | | | 175,000 | | | | 223,736 | |
ANZ Capital Trust II | | | | | | | | |
5.36%, 11/29/49 144A | | | 800,000 | | | | 794,000 | |
Apache Corporation | | | | | | | | |
6.00%, 09/15/13D | | | 680,000 | | | | 741,104 | |
Arch Coal, Inc. | | | | | | | | |
7.25%, 06/15/21 144AD | | | 500,000 | | | | 516,250 | |
Aristotle Holding, Inc. | | | | | | | | |
3.50%, 11/15/16 144A | | | 1,020,000 | | | | 1,039,981 | |
Arizona Public Service Co. | | | | | | | | |
8.75%, 03/01/19 | | | 525,000 | | | | 671,394 | |
Ashtead Capital, Inc. | | | | | | | | |
9.00%, 08/15/16 144AD | | | 400,000 | | | | 419,000 | |
ASIF Global Financing XIX | | | | | | | | |
4.90%, 01/17/13 144A | | | 100,000 | | | | 100,911 | |
Astoria Financial Corporation | | | | | | | | |
5.75%, 10/15/12 | | | 450,000 | | | | 458,913 | |
AT&T, Inc. | | | | | | | | |
5.10%, 09/15/14D | | | 550,000 | | | | 606,180 | |
2.95%, 05/15/16D | | | 825,000 | | | | 860,643 | |
3.88%, 08/15/21D | | | 120,000 | | | | 127,185 | |
6.55%, 02/15/39 | | | 130,000 | | | | 165,954 | |
5.35%, 09/01/40 | | | 70,000 | | | | 79,047 | |
5.55%, 08/15/41D | | | 160,000 | | | | 189,125 | |
Baker Hughes, Inc. | | | | | | | | |
7.50%, 11/15/18 | | | 710,000 | | | | 937,968 | |
Bank of America Corporation | | | | | | | | |
1.85%, 01/30/14† | | | 900,000 | | | | 813,027 | |
6.50%, 08/01/16 | | | 25,000 | | | | 25,201 | |
0.83%, 10/14/16†D | | | 1,700,000 | | | | 1,337,495 | |
5.75%, 12/01/17 | | | 2,290,000 | | | | 2,165,603 | |
5.65%, 05/01/18 | | | 2,700,000 | | | | 2,575,787 | |
5.00%, 05/13/21 | | | 360,000 | | | | 328,496 | |
Barrick North America Finance LLC | | | | | | | | |
4.40%, 05/30/21D | | | 610,000 | | | | 661,909 | |
| | | | | | | | |
| | | Par | | | Value | |
BB&T Corporation | | | | | | | | |
3.20%, 03/15/16D | | $ | 475,000 | | | $ | 495,633 | |
Bear Stearns Cos. LLC | | | | | | | | |
5.70%, 11/15/14D | | | 1,000,000 | | | | 1,088,253 | |
6.40%, 10/02/17 | | | 1,200,000 | | | | 1,342,302 | |
7.25%, 02/01/18 | | | 1,825,000 | | | | 2,142,223 | |
BellSouth Capital Funding Corporation | | | | | | | | |
7.88%, 02/15/30 | | | 210,000 | | | | 283,233 | |
BellSouth Corporation | | | | | | | | |
4.75%, 11/15/12D | | | 40,000 | | | | 41,348 | |
6.88%, 10/15/31 | | | 10,000 | | | | 12,499 | |
Berkshire Hathaway, Inc. | | | | | | | | |
3.20%, 02/11/15D | | | 280,000 | | | | 297,065 | |
BMW US Capital LLC | | | | | | | | |
1.01%, 12/21/12† | | | 3,400,000 | | | | 3,400,034 | |
Boeing Capital Corporation | | | | | | | | |
4.70%, 10/27/19 | | | 230,000 | | | | 262,237 | |
Boeing Co. | | | | | | | | |
4.88%, 02/15/20D | | | 300,000 | | | | 350,872 | |
6.63%, 02/15/38 | | | 210,000 | | | | 292,847 | |
Brandywine Operating Partnership LP | | | | | | | | |
4.95%, 04/15/18D | | | 400,000 | | | | 394,276 | |
Calpine Corporation | | | | | | | | |
7.88%, 01/15/23 144AD | | | 700,000 | | | | 756,000 | |
Capital One Capital III | | | | | | | | |
7.69%, 08/15/36 | | | 325,000 | | | | 325,406 | |
Casella Waste Systems, Inc. | | | | | | | | |
11.00%, 07/15/14 | | | 375,000 | | | | 408,750 | |
Caterpillar Financial Services Corporation | | | | | | | | |
6.20%, 09/30/13D | | | 450,000 | | | | 490,755 | |
Caterpillar, Inc. | | | | | | | | |
3.90%, 05/27/21D | | | 240,000 | | | | 264,009 | |
Cellco Partnership/Verizon Wireless Capital LLC | | | | | | | | |
8.50%, 11/15/18 | | | 710,000 | | | | 959,607 | |
CenterPoint Energy Resources Corporation | | | | | | | | |
5.95%, 01/15/14D | | | 525,000 | | | | 570,038 | |
Charter Communications Operating LLC | | | | | | | | |
10.88%, 09/15/14 144A | | | 200,000 | | | | 215,750 | |
Chesapeake Midstream Partners LP | | | | | | | | |
5.88%, 04/15/21 144AD | | | 330,000 | | | | 331,650 | |
Chubb Corporation | | | | | | | | |
6.38%, 03/29/67† | | | 375,000 | | | | 372,188 | |
Cigna Corporation | | | | | | | | |
2.75%, 11/15/16 | | | 225,000 | | | | 224,761 | |
Cimarex Energy Co. | | | | | | | | |
7.13%, 05/01/17 | | | 70,000 | | | | 73,325 | |
CitiFinancial, Inc. | | | | | | | | |
6.63%, 06/01/15 | | | 300,000 | | | | 315,921 | |
Citigroup Capital XXI | | | | | | | | |
8.30%, 12/21/57† | | | 274,000 | | | | 274,342 | |
Citigroup, Inc. | | | | | | | | |
6.50%, 08/19/13D | | | 110,000 | | | | 114,550 | |
6.00%, 12/13/13D | | | 980,000 | | | | 1,014,527 | |
5.00%, 09/15/14 | | | 1,720,000 | | | | 1,703,359 | |
6.01%, 01/15/15D | | | 150,000 | | | | 156,814 | |
5.50%, 02/15/17D | | | 1,160,000 | | | | 1,170,046 | |
6.13%, 11/21/17 | | | 1,205,000 | | | | 1,287,603 | |
6.13%, 05/15/18D | | | 4,800,000 | | | | 5,115,653 | |
|
| See Notes to Financial Statements. |
90 |
MEDIUM-DURATION BOND FUND
SCHEDULE OF INVESTMENTS (Continued)
| | | | | | | | |
| | | Par | | | Value | |
5.38%, 08/09/20 | | $ | 20,000 | | | $ | 20,601 | |
6.88%, 03/05/38 | | | 810,000 | | | | 892,705 | |
Comcast Cable Communications Holdings, Inc. | | | | | | | | |
8.38%, 03/15/13 | | | 83,000 | | | | 90,290 | |
Comcast Corporation | | | | | | | | |
5.88%, 02/15/18 | | | 200,000 | | | | 231,555 | |
5.70%, 05/15/18D | | | 1,250,000 | | | | 1,440,399 | |
6.95%, 08/15/37 | | | 40,000 | | | | 51,063 | |
6.40%, 03/01/40 | | | 140,000 | | | | 174,661 | |
Comcast Holdings Corporation | | | | | | | | |
10.63%, 07/15/12D | | | 550,000 | | | | 573,622 | |
Complete Production Services, Inc. | | | | | | | | |
8.00%, 12/15/16 | | | 280,000 | | | | 292,600 | |
ConocoPhillips Holding Co. | | | | | | | | |
6.95%, 04/15/29 | | | 580,000 | | | | 792,919 | |
Continental Airlines 1998-1 Class A Pass Through Trust | | | | | | | | |
6.65%, 09/15/17 | | | 278,986 | | | | 284,901 | |
COX Communications, Inc. | | | | | | | | |
5.45%, 12/15/14 | | | 210,000 | | | | 233,266 | |
CVS Caremark Corporation | | | | | | | | |
6.60%, 03/15/19 | | | 590,000 | | | | 720,218 | |
CVS Pass-Through Trust | | | | | | | | |
6.94%, 01/10/30 | | | 812,955 | | | | 903,472 | |
Daimler Finance NA LLC | | | | | | | | |
7.30%, 01/15/12 | | | 550,000 | | | | 551,028 | |
6.50%, 11/15/13D | | | 100,000 | | | | 108,968 | |
1.18%, 03/28/14 144A† | | | 3,400,000 | | | | 3,283,346 | |
DCP Midstream LLC | | | | | | | | |
9.75%, 03/15/19 144A | | | 200,000 | | | | 261,074 | |
Delta Air Lines 2007-1 Class A Pass Through Trust | | | | | | | | |
6.82%, 08/10/22 | | | 378,170 | | | | 394,696 | |
Devon Energy Corporation | | | | | | | | |
5.60%, 07/15/41 | | | 590,000 | | | | 712,141 | |
DIRECTV Holdings LLC | | | | | | | | |
3.50%, 03/01/16D | | | 525,000 | | | | 541,758 | |
Discover Bank | | | | | | | | |
8.70%, 11/18/19 | | | 425,000 | | | | 485,284 | |
DISH DBS Corporation | | | | | | | | |
7.00%, 10/01/13 | | | 10,000 | | | | 10,725 | |
6.63%, 10/01/14 | | | 30,000 | | | | 32,175 | |
7.75%, 05/31/15D | | | 200,000 | | | | 221,000 | |
DJO Finance LLC | | | | | | | | |
10.88%, 11/15/14 | | | 240,000 | | | | 225,000 | |
Dominion Resources, Inc. | | | | | | | | |
5.70%, 09/17/12 | | | 1,230,000 | | | | 1,271,462 | |
Dow Chemical Co. | | | | | | | | |
7.60%, 05/15/14 | | | 650,000 | | | | 735,436 | |
Duke Energy Carolinas LLC | | | | | | | | |
5.63%, 11/30/12 | | | 580,000 | | | | 604,515 | |
Duke Realty LP REIT | | | | | | | | |
6.75%, 03/15/20 | | | 325,000 | | | | 357,149 | |
Ecolab, Inc. | | | | | | | | |
3.00%, 12/08/16 | | | 500,000 | | | | 517,797 | |
4.35%, 12/08/21D | | | 585,000 | | | | 625,980 | |
El Paso Corporation | | | | | | | | |
7.00%, 06/15/17D | | | 710,000 | | | | 781,463 | |
7.80%, 08/01/31D | | | 750,000 | | | | 868,125 | |
El Paso Natural Gas Co. | | | | | | | | |
7.50%, 11/15/26 | | | 300,000 | | | | 370,500 | |
| | | | | | | | |
| | | Par | | | Value | |
Energy Transfer Partners LP | | | | | | | | |
5.95%, 02/01/15 | | $ | 500,000 | | | $ | 540,818 | |
6.70%, 07/01/18 | | | 570,000 | | | | 633,212 | |
Enterprise Products Operating LLC | | | | | | | | |
4.05%, 02/15/22 | | | 1,020,000 | | | | 1,041,390 | |
5.70%, 02/15/42 | | | 430,000 | | | | 470,236 | |
7.03%, 01/15/68† | | | 350,000 | | | | 364,445 | |
EOG Resources, Inc. | | | | | | | | |
1.18%, 02/03/14† | | | 3,500,000 | | | | 3,512,222 | |
ERP Operating LP | | | | | | | | |
4.63%, 12/15/21 | | | 375,000 | | | | 383,152 | |
Exelon Corporation | | | | | | | | |
5.63%, 06/15/35 | | | 655,000 | | | | 707,435 | |
Fifth Third Bancorp | | | | | | | | |
3.63%, 01/25/16 | | | 175,000 | | | | 177,720 | |
Fifth Third Bank Ohio | | | | | | | | |
0.58%, 05/17/13† | | | 400,000 | | | | 392,653 | |
First Niagara Financial Group, Inc. | | | | | | | | |
6.75%, 03/19/20 | | | 250,000 | | | | 263,673 | |
FirstEnergy Corporation | | | | | | | | |
7.38%, 11/15/31 | | | 1,080,000 | | | | 1,331,924 | |
Ford Motor Credit Co., LLC | | | | | | | | |
5.63%, 09/15/15D | | | 3,100,000 | | | | 3,216,092 | |
8.00%, 12/15/16D | | | 1,300,000 | | | | 1,478,242 | |
Freeport-McMoRan Copper & Gold, Inc. | | | | | | | | |
8.38%, 04/01/17D | | | 1,995,000 | | | | 2,121,934 | |
Fresenius Medical Care US Finance, Inc. | | | | | | | | |
6.88%, 07/15/17D | | | 250,000 | | | | 267,188 | |
GE Capital Trust I | | | | | | | | |
6.38%, 11/15/67†D | | | 321,000 | | | | 316,185 | |
General Electric Capital Corporation | | | | | | | | |
5.45%, 01/15/13 | | | 150,000 | | | | 156,979 | |
1.23%, 01/07/14† | | | 2,000,000 | | | | 1,971,722 | |
6.00%, 08/07/19 | | | 1,850,000 | | | | 2,128,258 | |
4.38%, 09/16/20D | | | 330,000 | | | | 337,830 | |
5.30%, 02/11/21 | | | 60,000 | | | | 64,253 | |
General Electric Co. | | | | | | | | |
5.00%, 02/01/13D | | | 840,000 | | | | 875,591 | |
GlaxoSmithKline Capital, Inc. | | | | | | | | |
5.65%, 05/15/18D | | | 380,000 | | | | 457,997 | |
Goldman Sachs Capital II | | | | | | | | |
5.79%, 06/01/43† | | | 60,000 | | | | 37,200 | |
Goldman Sachs Group, Inc. | | | | | | | | |
6.60%, 01/15/12 | | | 70,000 | | | | 70,093 | |
5.30%, 02/14/12D | | | 30,000 | | | | 30,102 | |
3.63%, 08/01/12D | | | 110,000 | | | | 110,678 | |
5.45%, 11/01/12 | | | 190,000 | | | | 193,265 | |
4.75%, 07/15/13 | | | 20,000 | | | | 20,272 | |
5.25%, 10/15/13 | | | 160,000 | | | | 163,322 | |
5.75%, 10/01/16D | | | 1,900,000 | | | | 1,972,071 | |
6.25%, 09/01/17 | | | 1,700,000 | | | | 1,779,354 | |
5.95%, 01/18/18D | | | 2,300,000 | | | | 2,358,678 | |
5.38%, 03/15/20D | | | 250,000 | | | | 247,160 | |
6.00%, 06/15/20 | | | 460,000 | | | | 471,983 | |
5.25%, 07/27/21 | | | 110,000 | | | | 107,508 | |
6.25%, 02/01/41 | | | 800,000 | | | | 787,418 | |
HCA, Inc. | | | | | | | | |
6.50%, 02/15/16D | | | 686,000 | | | | 699,720 | |
7.88%, 02/15/20 | | | 125,000 | | | | 135,625 | |
|
See Notes to Financial Statements. 91 |
| | | | | | | | |
| | | Par | | | Value | |
7.69%, 06/15/25 | | $ | 250,000 | | | $ | 222,500 | |
HCP, Inc. REIT | | | | | | | | |
6.00%, 01/30/17 | | | 300,000 | | | | 324,955 | |
5.38%, 02/01/21 | | | 200,000 | | | | 210,054 | |
Hess Corporation | | | | | | | | |
8.13%, 02/15/19D | | | 330,000 | | | | 424,208 | |
7.88%, 10/01/29 | | | 260,000 | | | | 350,238 | |
7.30%, 08/15/31 | | | 110,000 | | | | 141,562 | |
Hewlett-Packard Co. | | | | | | | | |
0.79%, 05/24/13† | | | 3,000,000 | | | | 2,971,698 | |
3.00%, 09/15/16D | | | 300,000 | | | | 302,445 | |
HSBC Finance Corporation | | | | | | | | |
7.00%, 05/15/12 | | | 390,000 | | | | 397,308 | |
6.38%, 11/27/12 | | | 70,000 | | | | 72,014 | |
6.68%, 01/15/21D | | | 90,000 | | | | 93,253 | |
Humana, Inc. | | | | | | | | |
7.20%, 06/15/18D | | | 480,000 | | | | 560,640 | |
ILFC E-Capital Trust II | | | | | | | | |
6.25%, 12/21/65 144A†D | | | 280,000 | | | | 190,400 | |
International Lease Finance Corporation | | | | | | | | |
6.50%, 09/01/14 144AD | | | 240,000 | | | | 246,600 | |
6.75%, 09/01/16 144A | | | 880,000 | | | | 906,400 | |
8.63%, 01/15/22D | | | 250,000 | | | | 254,152 | |
JPMorgan Chase & Co. | | | | | | | | |
5.75%, 01/02/13D | | | 320,000 | | | | 332,029 | |
5.15%, 10/01/15D | | | 1,890,000 | | | | 2,007,717 | |
6.30%, 04/23/19D | | | 800,000 | | | | 907,455 | |
4.95%, 03/25/20D | | | 800,000 | | | | 851,736 | |
4.40%, 07/22/20 | | | 230,000 | | | | 235,296 | |
4.35%, 08/15/21D | | | 70,000 | | | | 70,832 | |
JPMorgan Chase Capital XXV | | | | | | | | |
6.80%, 10/01/37D | | | 375,000 | | | | 380,156 | |
Kerr-McGee Corporation | | | | | | | | |
6.95%, 07/01/24 | | | 420,000 | | | | 501,997 | |
7.88%, 09/15/31 | | | 690,000 | | | | 867,221 | |
Kinder Morgan Energy Partners LP | | | | | | | | |
7.13%, 03/15/12 | | | 410,000 | | | | 414,706 | |
5.85%, 09/15/12 | | | 40,000 | | | | 41,297 | |
5.00%, 12/15/13 | | | 200,000 | | | | 212,088 | |
6.00%, 02/01/17D | | | 250,000 | | | | 283,257 | |
Kraft Foods, Inc. | | | | | | | | |
6.13%, 08/23/18 | | | 350,000 | | | | 413,555 | |
5.38%, 02/10/20 | | | 730,000 | | | | 843,720 | |
6.50%, 02/09/40 | | | 300,000 | | | | 391,716 | |
Kroger Co. | | | | | | | | |
6.15%, 01/15/20D | | | 360,000 | | | | 437,581 | |
L-3 Communications Corporation | | | | | | | | |
6.38%, 10/15/15 | | | 250,000 | | | | 256,875 | |
Lehman Brothers Holdings Capital Trust VII | | | | | | | | |
5.86%, 11/29/49# | | | 2,330,000 | | | | 1,398 | |
Lehman Brothers Holdings, Inc. | | | | | | | | |
6.63%, 01/18/12# | | | 200,000 | | | | 52,250 | |
5.63%, 01/24/13# | | | 2,300,000 | | | | 615,250 | |
6.50%, 07/19/17# | | | 150,000 | | | | 165 | |
6.75%, 12/28/17# | | | 3,340,000 | | | | 3,674 | |
Liberty Property LP | | | | | | | | |
4.75%, 10/01/20 | | | 575,000 | | | | 585,340 | |
Lyondell Chemical Co. | | | | | | | | |
11.00%, 05/01/18D | | | 249,550 | | | | 273,881 | |
| | | | | | | | |
| | | Par | | | Value | |
MarkWest Energy Partners LP | | | | | | | | |
6.25%, 06/15/22 | | $ | 290,000 | | | $ | 304,500 | |
Medtronic, Inc. | | | | | | | | |
4.45%, 03/15/20D | | | 300,000 | | | | 339,118 | |
Merrill Lynch & Co., Inc. | | | | | | | | |
5.45%, 02/05/13 | | | 3,850,000 | | | | 3,879,002 | |
6.05%, 05/16/16 | | | 275,000 | | | | 259,447 | |
5.70%, 05/02/17 | | | 400,000 | | | | 367,766 | |
6.40%, 08/28/17D | | | 2,300,000 | | | | 2,229,691 | |
MetLife Capital Trust IV | | | | | | | | |
7.88%, 12/15/37 144A | | | 300,000 | | | | 312,750 | |
MetLife Capital Trust X | | | | | | | | |
9.25%, 04/08/38 144A | | | 300,000 | | | | 344,250 | |
MetLife, Inc. | | | | | | | | |
4.75%, 02/08/21D | | | 620,000 | | | | 671,958 | |
6.40%, 12/15/66D | | | 150,000 | | | | 142,688 | |
Morgan Stanley | | | | | | | | |
1.81%, 03/01/13(E)† | | | 500,000 | | | | 614,345 | |
0.86%, 10/18/16† | | | 340,000 | | | | 273,139 | |
6.63%, 04/01/18 | | | 1,675,000 | | | | 1,656,051 | |
Nabors Industries, Inc. | | | | | | | | |
9.25%, 01/15/19 | | | 3,300,000 | | | | 4,156,664 | |
Nationwide Financial Services | | | | | | | | |
5.38%, 03/25/21 144A | | | 575,000 | | | | 565,806 | |
NCUA Guaranteed Notes | | | | | | | | |
3.00%, 06/12/19 | | | 600,000 | | | | 638,574 | |
Newfield Exploration Co. | | | | | | | | |
7.13%, 05/15/18 | | | 100,000 | | | | 107,250 | |
5.75%, 01/30/22 | | | 50,000 | | | | 54,250 | |
News America, Inc. | | | | | | | | |
6.15%, 02/15/41 | | | 450,000 | | | | 520,552 | |
Noble Energy, Inc. | | | | | | | | |
4.15%, 12/15/21 | | | 620,000 | | | | 642,664 | |
Northwestern Mutual Life Insurance | | | | | | | | |
6.06%, 03/30/40 144A | | | 500,000 | | | | 602,429 | |
Occidental Petroleum Corporation | | | | | | | | |
3.13%, 02/15/22 | | | 310,000 | | | | 318,686 | |
Overseas Private Investment Corporation | | | | | | | | |
0.90%, 11/18/13W@ | | | 3,500,000 | | | | 3,504,308 | |
0.75%, 07/12/16W@ | | | 3,000,000 | | | | 3,646,329 | |
Pacific Gas & Electric Co. | | | | | | | | |
8.25%, 10/15/18D | | | 40,000 | | | | 52,801 | |
6.05%, 03/01/34D | | | 110,000 | | | | 136,613 | |
5.80%, 03/01/37D | | | 250,000 | | | | 305,574 | |
Patrons’ Legacy | | | | | | | | |
5.65%, 11/17/18 144A | | | 1,290,357 | | | | 1,244,214 | |
Peabody Energy Corporation | | | | | | | | |
7.88%, 11/01/26 | | | 1,100,000 | | | | 1,185,250 | |
Pemex Project Funding Master Trust | | | | | | | | |
6.63%, 06/15/35 | | | 159,000 | | | | 181,856 | |
PepsiCo, Inc. | | | | | | | | |
7.90%, 11/01/18D | | | 140,000 | | | | 189,272 | |
Pfizer, Inc. | | | | | | | | |
7.20%, 03/15/39 | | | 600,000 | | | | 888,978 | |
Plains Exploration & Production Co. | | | | | | | | |
10.00%, 03/01/16 | | | 500,000 | | | | 556,250 | |
Plastipak Holdings, Inc. | | | | | | | | |
8.50%, 12/15/15 144A | | | 200,000 | | | | 205,000 | |
Pricoa Global Funding I | | | | | | | | |
0.56%, 09/27/13 144A† | | | 1,700,000 | | | | 1,683,309 | |
|
| See Notes to Financial Statements. |
92 |
MEDIUM-DURATION BOND FUND
SCHEDULE OF INVESTMENTS (Continued)
| | | | | | | | |
| | | Par | | | Value | |
Private Export Funding Corporation | | | | | | | | |
5.45%, 09/15/17 | | $ | 1,600,000 | | | $ | 1,940,930 | |
Progress Energy, Inc. | | | | | | | | |
7.75%, 03/01/31 | | | 350,000 | | | | 498,454 | |
ProLogis LP | | | | | | | | |
1.88%, 11/15/37 | | | 350,000 | | | | 344,750 | |
Prudential Financial, Inc. | | | | | | | | |
4.50%, 11/15/20D | | | 900,000 | | | | 906,635 | |
PVNGS II Funding Corporation, Inc. | | | | | | | | |
8.00%, 12/30/15 | | | 715,000 | | | | 782,014 | |
Raytheon Co. | | | | | | | | |
3.13%, 10/15/20 | | | 200,000 | | | | 201,942 | |
Reed Elsevier Capital, Inc. | | | | | | | | |
8.63%, 01/15/19 | | | 410,000 | | | | 512,417 | |
Reinsurance Group of America, Inc. | | | | | | | | |
6.75%, 12/15/65† | | | 475,000 | | | | 412,129 | |
Rensselaer Polytechnic Institute | | | | | | | | |
5.60%, 09/01/20 | | | 675,000 | | | | 759,652 | |
Reynolds Group Issuer, Inc. | | | | | | | | |
7.13%, 04/15/19 144A | | | 500,000 | | | | 511,250 | |
Roche Holdings, Inc. | | | | | | | | |
6.00%, 03/01/19 144A | | | 430,000 | | | | 523,409 | |
Rock-Tenn Co. | | | | | | | | |
5.63%, 03/15/13 | | | 50,000 | | | | 51,750 | |
Safeway, Inc. | | | | | | | | |
3.95%, 08/15/20D | | | 150,000 | | | | 148,397 | |
4.75%, 12/01/21 | | | 290,000 | | | | 297,650 | |
Service Corporation International | | | | | | | | |
7.63%, 10/01/18 | | | 90,000 | | | | 100,575 | |
7.50%, 04/01/27 | | | 200,000 | | | | 193,000 | |
SESI LLC | | | | | | | | |
7.13%, 12/15/21 144AD | | | 80,000 | | | | 84,200 | |
Simon Property Group LP | | | | | | | | |
10.35%, 04/01/19 | | | 750,000 | | | | 1,030,935 | |
SLM Corporation | | | | | | | | |
6.25%, 01/25/16 | | | 375,000 | | | | 365,000 | |
Southern Natural Gas Co. | | | | | | | | |
8.00%, 03/01/32D | | | 400,000 | | | | 496,737 | |
Sprint Capital Corporation | | | | | | | | |
6.90%, 05/01/19D | | | 30,000 | | | | 24,825 | |
6.88%, 11/15/28 | | | 50,000 | | | | 35,938 | |
8.75%, 03/15/32 | | | 120,000 | | | | 97,650 | |
Sprint Nextel Corporation | | | | | | | | |
9.00%, 11/15/18 144A | | | 80,000 | | | | 84,200 | |
SSIF Nevada LP | | | | | | | | |
1.10%, 04/14/14 144A† | | | 3,400,000 | | | | 3,348,327 | |
State Street Corporation | | | | | | | | |
4.96%, 03/15/18 | | | 530,000 | | | | 551,627 | |
Steel Dynamics, Inc. | | | | | | | | |
6.75%, 04/01/15 | | | 225,000 | | | | 231,188 | |
7.75%, 04/15/16 | | | 500,000 | | | | 523,750 | |
SunTrust Banks, Inc. | | | | | | | | |
3.60%, 04/15/16D | | | 300,000 | | | | 305,803 | |
SunTrust Preferred Capital I | | | | | | | | |
4.00%, 06/29/49† | | | 357,000 | | | | 243,206 | |
Teachers Insurance & Annuity Association of America | | | | | | | | |
6.85%, 12/16/39 144AD | | | 540,000 | | | | 695,488 | |
Tenet Healthcare Corporation | | | | | | | | |
9.25%, 02/01/15D | | | 1,262,000 | | | | 1,332,988 | |
| | | | | | | | |
| | | Par | | | Value | |
Tennessee Gas Pipeline Co. | | | | | | | | |
7.50%, 04/01/17 | | $ | 250,000 | | | $ | 298,900 | |
7.63%, 04/01/37 | | | 50,000 | | | | 59,898 | |
Terex Corporation | | | | | | | | |
10.88%, 06/01/16 | | | 250,000 | | | | 277,500 | |
Thermo Fisher Scientific, Inc. | | | | | | | | |
3.60%, 08/15/21D | | | 160,000 | | | | 167,444 | |
Time Warner Cable, Inc. | | | | | | | | |
8.75%, 02/14/19D | | | 650,000 | | | | 831,155 | |
4.13%, 02/15/21D | | | 70,000 | | | | 72,019 | |
5.88%, 11/15/40 | | | 460,000 | | | | 499,636 | |
Time Warner, Inc. | | | | | | | | |
4.70%, 01/15/21 | | | 10,000 | | | | 10,787 | |
6.10%, 07/15/40 | | | 140,000 | | | | 164,726 | |
6.25%, 03/29/41 | | | 40,000 | | | | 48,134 | |
Time Warner Entertainment Co. LP | | | | | | | | |
8.38%, 07/15/33 | | | 590,000 | | | | 775,521 | |
Transatlantic Holdings, Inc. | | | | | | | | |
8.00%, 11/30/39 | | | 300,000 | | | | 341,547 | |
UAL 1993 Pass Through Trust A | | | | | | | | |
9.21%, 01/21/17+ | | | 81,116 | | | | — | |
UAL 1995 Pass Through Trust A | | | | | | | | |
9.56%, 10/19/18@ | | | 135,404 | | | | 36,220 | |
Union Bank NA | | | | | | | | |
1.48%, 06/06/14† | | | 2,600,000 | | | | 2,563,618 | |
United Parcel Service, Inc. | | | | | | | | |
4.50%, 01/15/13D | | | 770,000 | | | | 801,913 | |
UnitedHealth Group, Inc. | | | | | | | | |
4.88%, 02/15/13D | | | 370,000 | | | | 385,392 | |
4.88%, 04/01/13 | | | 410,000 | | | | 428,506 | |
Verizon Communications, Inc. | | | | | | | | |
6.10%, 04/15/18 | | | 290,000 | | | | 348,862 | |
3.50%, 11/01/21D | | | 735,000 | | | | 766,816 | |
6.00%, 04/01/41D | | | 40,000 | | | | 49,785 | |
Verizon Global Funding Corporation | | | | | | | | |
4.38%, 06/01/13 | | | 140,000 | | | | 146,740 | |
Wachovia Bank NA | | | | | | | | |
6.60%, 01/15/38 | | | 275,000 | | | | 312,891 | |
Wachovia Capital Trust III | | | | | | | | |
5.57%, 03/29/49† | | | 960,000 | | | | 807,600 | |
Wachovia Corporation | | | | | | | | |
5.25%, 08/01/14D | | | 1,850,000 | | | | 1,952,507 | |
5.63%, 10/15/16 | | | 250,000 | | | | 272,461 | |
Waste Management, Inc. | | | | | | | | |
7.38%, 05/15/29 | | | 140,000 | | | | 178,486 | |
WEA Finance LLC | | | | | | | | |
7.13%, 04/15/18 144A | | | 400,000 | | | | 447,622 | |
WellPoint, Inc. | | | | | | | | |
5.88%, 06/15/17 | | | 720,000 | | | | 830,611 | |
Wells Fargo & Co. | | | | | | | | |
4.38%, 01/31/13 | | | 600,000 | | | | 620,264 | |
3.68%, 06/15/16 | | | 290,000 | | | | 303,360 | |
4.60%, 04/01/21D | | | 70,000 | | | | 76,914 | |
7.98%, 03/29/49†D | | | 2,600,000 | | | | 2,798,250 | |
Wells Fargo Capital X | | | | | | | | |
5.95%, 12/15/36 | | | 200,000 | | | | 202,250 | |
Williams Cos., Inc. | | | | | | | | |
7.50%, 01/15/31 | | | 10,000 | | | | 12,221 | |
7.75%, 06/15/31 | | | 25,000 | | | | 31,184 | |
8.75%, 03/15/32 | | | 451,000 | | | | 592,512 | |
|
See Notes to Financial Statements. 93 |
| | | | | | | | |
| | | Par | | | Value | |
WPX Energy, Inc. | | | | | | | | |
6.00%, 01/15/22 144AD | | $ | 160,000 | | | $ | 164,600 | |
Xylem, Inc. | | | | | | | | |
3.55%, 09/20/16 144A | | | 350,000 | | | | 360,131 | |
| | | | | | | | |
Total Corporate Bonds
(Cost $192,176,278) | | | | 193,109,207 | |
| | | | | | | | |
FOREIGN BONDS — 18.8% | |
Australia — 3.8% | |
Australia Government Bond | | | | | | | | |
5.50%, 12/15/13(A) | | | 400,000 | | | | 427,175 | |
4.75%, 06/15/16(A) | | | 7,800,000 | | | | 8,467,862 | |
6.00%, 02/15/17(A) | | | 2,400,000 | | | | 2,765,067 | |
5.50%, 01/21/18(A) | | | 5,100,000 | | | | 5,812,010 | |
5.75%, 07/15/22(A) | | | 6,500,000 | | | | 7,773,306 | |
BHP Billiton Finance (USA) Ltd. | | | | | | | | |
3.25%, 11/21/21D | | | 960,000 | | | | 990,502 | |
Commonwealth Bank of Australia | | | | | | | | |
3.75%, 10/15/14 144AD | | | 440,000 | | | | 453,631 | |
5.00%, 10/15/19 144AD | | | 190,000 | | | | 201,828 | |
National Australia Bank, Ltd. | | | | | | | | |
1.30%, 04/11/14 144A†D | | | 2,000,000 | | | | 1,981,230 | |
Newcrest Finance Pty, Ltd. | | | | | | | | |
4.45%, 11/15/21 144A | | | 400,000 | | | | 394,548 | |
QBE Insurance Group, Ltd. | | | | | | | | |
5.65%, 07/01/23 144A†@ | | | 525,000 | | | | 470,246 | |
Rio Tinto Finance USA, Ltd. | | | | | | | | |
2.50%, 05/20/16 | | | 30,000 | | | | 30,634 | |
3.50%, 11/02/20 | | | 1,180,000 | | | | 1,208,367 | |
4.13%, 05/20/21 | | | 140,000 | | | | 150,792 | |
3.75%, 09/20/21D | | | 110,000 | | | | 115,500 | |
Westpac Banking Corporation | | | | | | | | |
1.90%, 12/14/12 144A | | | 1,500,000 | | | | 1,514,162 | |
| | | | | | | | |
| | | | | | | 32,756,860 | |
| | | | | | | | |
Austria — 0.1% | |
PE Paper Escrow GmbH | | | | | | | | |
12.00%, 08/01/14 144A | | | 450,000 | | | | 481,500 | |
| | | | | | | | |
Bermuda — 0.1% | |
Arch Capital Group, Ltd. | | | | | | | | |
7.35%, 05/01/34 | | | 175,000 | | | | 207,000 | |
Endurance Specialty Holdings, Ltd. | | | | | | | | |
6.15%, 10/15/15 | | | 200,000 | | | | 209,970 | |
Weatherford International, Ltd. | | | | | | | | |
9.63%, 03/01/19@D | | | 325,000 | | | | 420,893 | |
| | | | | | | | |
| | | | | | | 837,863 | |
| | | | | | | | |
Brazil — 0.1% | |
Brazilian Government International Bond | | | | | | | | |
8.25%, 01/20/34D | | | 600,000 | | | | 907,500 | |
| | | | | | | | |
Canada — 1.1% | |
Canadian Government Bond | | | | | | | | |
1.50%, 03/01/12(C) | | | 4,400,000 | | | | 4,323,207 | |
2.25%, 08/01/14(C) | | | 3,000,000 | | | | 3,039,047 | |
Canadian Imperial Bank of Commerce | | | | | | | | |
1.50%, 12/12/14 144A | | | 400,000 | | | | 400,836 | |
Nexen, Inc. | | | | | | | | |
6.40%, 05/15/37 | | | 40,000 | | | | 42,507 | |
7.50%, 07/30/39 | | | 250,000 | | | | 300,662 | |
| | | | | | | | |
| | | Par | | | Value | |
Potash Corporation of Saskatchewan, Inc. | | | | | | | | |
4.88%, 03/30/20D | | $ | 110,000 | | | $ | 126,528 | |
PTTEP Canada International Finance, Ltd. | | | | | | | | |
5.69%, 04/05/21 144A | | | 320,000 | | | | 335,617 | |
Rogers Communications, Inc. | | | | | | | | |
6.38%, 03/01/14 | | | 90,000 | | | | 99,287 | |
6.75%, 03/15/15 | | | 10,000 | | | | 11,510 | |
Teck Resources, Ltd. | | | | | | | | |
10.75%, 05/15/19 | | | 400,000 | | | | 488,648 | |
TransCanada PipeLines, Ltd. | | | | | | | | |
6.35%, 05/15/67† | | | 400,000 | | | | 401,797 | |
| | | | | | | | |
| | | | | | | 9,569,646 | |
| | | | | | | | |
Cayman Islands — 0.6% | |
MUFG Capital Finance 1, Ltd. | | | | | | | | |
6.35%, 07/29/49† | | | 450,000 | | | | 457,486 | |
Petrobras International Finance Co. | | | | | | | | |
3.88%, 01/27/16 | | | 250,000 | | | | 258,803 | |
6.13%, 10/06/16 | | | 271,000 | | | | 301,776 | |
5.75%, 01/20/20 | | | 285,000 | | | | 306,409 | |
5.38%, 01/27/21D | | | 1,130,000 | | | | 1,192,829 | |
Resona Preferred Global Securities Cayman, Ltd. | | | | | | | | |
7.19%, 12/29/49 144A†D | | | 1,015,000 | | | | 1,004,442 | |
Transocean, Inc. | | | | | | | | |
6.00%, 03/15/18D | | | 425,000 | | | | 434,917 | |
6.50%, 11/15/20D | | | 275,000 | | | | 284,550 | |
6.38%, 12/15/21 | | | 475,000 | | | | 505,804 | |
Vale Overseas, Ltd. | | | | | | | | |
8.25%, 01/17/34 | | | 80,000 | | | | 103,531 | |
6.88%, 11/21/36D | | | 511,000 | | | | 584,354 | |
| | | | | | | | |
| | | | | | | 5,434,901 | |
| | | | | | | | |
Chile — 0.0% | |
Corp Nacional del Cobre de Chile | | | | | | | | |
4.75%, 10/15/14 144A | | | 210,000 | | | | 226,287 | |
| | | | | | | | |
Colombia — 0.1% | |
Colombia Government International Bond | | | | | | | | |
4.38%, 07/12/21 | | | 880,000 | | | | 950,400 | |
| | | | | | | | |
Denmark — 0.3% | |
BRFkredit A/S | | | | | | | | |
2.05%, 04/15/13 144A | | | 1,200,000 | | | | 1,222,530 | |
Danske Bank A/S | | | | | | | | |
2.50%, 05/10/12 144A | | | 600,000 | | | | 603,827 | |
FIH Erhvervsbank A/S | | | | | | | | |
2.00%, 06/12/13 144AD | | | 1,000,000 | | | | 1,014,606 | |
| | | | | | | | |
| | | | | | | 2,840,963 | |
| | | | | | | | |
France — 1.4% | |
Banque PSA Finance SA | | | | | | | | |
2.48%, 04/04/14 144A† | | | 1,500,000 | | | | 1,389,942 | |
Cie de Financement Foncier | | | | | | | | |
2.13%, 04/22/13 144A | | | 3,600,000 | | | | 3,562,474 | |
Compagnie Generale de Geophysique - Veritas | | | | | | | | |
9.50%, 05/15/16 | | | 250,000 | | | | 271,250 | |
7.75%, 05/15/17D | | | 155,000 | | | | 157,712 | |
Credit Agricole SA | | | | | | | | |
2.63%, 01/21/14 144A | | | 310,000 | | | | 291,893 | |
8.38%, 10/29/49 144A†D | | | 980,000 | | | | 739,900 | |
|
| See Notes to Financial Statements. |
94 |
MEDIUM-DURATION BOND FUND
SCHEDULE OF INVESTMENTS (Continued)
| | | | | | | | |
| | | Par | | | Value | |
Dexia Credit Local | | | | | | | | |
2.75%, 01/10/14 144A | | $ | 5,900,000 | | | $ | 5,469,861 | |
Legrand France SA | | | | | | | | |
8.50%, 02/15/25 | | | 250,000 | | | | 306,213 | |
| | | | | | | | |
| | | | | | | 12,189,245 | |
| | | | | | | | |
Iceland — 0.1% | |
Glitnir Banki HF | | | | | | | | |
6.33%, 07/28/11 144A#@ | | | 600,000 | | | | 159,000 | |
6.38%, 09/25/12 144A#@ | | | 580,000 | | | | 153,700 | |
6.69%, 06/15/16+ 144A#D | | | 1,000,000 | | | | 10 | |
7.45%, 03/29/49+ 144A# | | | 100,000 | | | | 1 | |
Kaupthing Bank HF | | | | | | | | |
5.75%, 10/04/11 144A#@ | | | 250,000 | | | | 63,125 | |
7.63%, 02/28/15 144A#@ | | | 2,490,000 | | | | 628,725 | |
7.13%, 05/19/16+ 144A# | | | 350,000 | | | | 3 | |
Landsbanki Islands HF | | | | | | | | |
6.10%, 08/25/11 144A#@ | | | 1,500,000 | | | | 60,000 | |
| | | | | | | | |
| | | | | | | 1,064,564 | |
| | | | | | | | |
India — 0.4% | |
ICICI Bank, Ltd. | | | | | | | | |
2.26%, 02/24/14 144A† | | | 3,400,000 | | | | 3,230,384 | |
6.38%, 04/30/22 144A† | | | 418,000 | | | | 369,930 | |
6.38%, 04/30/22† | | | 110,000 | | | | 97,350 | |
| | | | | | | | |
| | | | | | | 3,697,664 | |
| | | | | | | | |
Ireland — 0.1% | |
Bank of Ireland | | | | | | | | |
6.75%, 01/30/12(U) | | | 50,000 | | | | 77,455 | |
2.75%, 03/02/12 | | | 380,000 | | | | 376,713 | |
VIP Finance Ireland Ltd. for OJSC Vimpel Communications | | | | | | | | |
8.38%, 04/30/13 144A | | | 120,000 | | | | 125,400 | |
6.49%, 02/02/16 144A | | | 230,000 | | | | 217,638 | |
7.75%, 02/02/21 144A | | | 200,000 | | | | 172,000 | |
| | | | | | | | |
| | | | | | | 969,206 | |
| | | | | | | | |
Italy — 0.4% | |
Intesa Sanpaolo SpA | | | | | | | | |
2.91%, 02/24/14 144A†D | | | 3,400,000 | | | | 2,995,339 | |
3.63%, 08/12/15 144A | | | 290,000 | | | | 240,425 | |
| | | | | | | | |
| | | | | | | 3,235,764 | |
| | | | | | | | |
Japan — 0.2% | |
Bank of Tokyo-Mitsubishi UFJ, Ltd. | | | | | | | | |
3.85%, 01/22/15 144A | | | 330,000 | | | | 350,361 | |
Resona Bank, Ltd. | | | | | | | | |
5.85%, 09/29/49 144A†@ | | | 250,000 | | | | 248,613 | |
Sumitomo Mitsui Banking Corporation | | | | | | | | |
3.15%, 07/22/15 144A | | | 640,000 | | | | 668,389 | |
| | | | | | | | |
| | | | | | | 1,267,363 | |
| | | | | | | | |
Jersey — 0.2% | |
HSBC Capital Funding LP | | | | | | | | |
4.61%, 12/29/49 144A†D | | | 800,000 | | | | 737,593 | |
4.61%, 12/29/49 | | | 160,000 | | | | 147,519 | |
QBE Capital Funding III, Ltd. | | | | | | | | |
7.25%, 05/24/41 144A† | | | 200,000 | | | | 176,000 | |
UBM PLC | | | | | | | | |
5.75%, 11/03/20 144A | | | 260,000 | | | | 262,701 | |
| | | | | | | | |
| | | | | | | 1,323,813 | |
| | | | | | | | |
| | | | | | | | |
| | | Par | | | Value | |
Luxembourg — 0.7% | |
Fiat Finance & Trade, Ltd. SA | | | | | | | | |
9.00%, 07/30/12(E) | | $ | 700,000 | | | $ | 925,225 | |
Gazprom OAO Via Gaz Capital SA | | | | | | | | |
9.25%, 04/23/19D | | | 290,000 | | | | 346,231 | |
Gazprom Via Gaz Capital SA | | | | | | | | |
6.51%, 03/07/22 144AD | | | 3,200,000 | | | | 3,264,000 | |
Intelsat Jackson Holdings SA | | | | | | | | |
7.50%, 04/01/21 144A | | | 500,000 | | | | 506,875 | |
Russian Capital SA for OJSC Russian Agricultural Bank | | | | | | | | |
6.30%, 05/15/17 144A | | | 300,000 | | | | 300,000 | |
TNK-BP Finance SA | | | | | | | | |
7.50%, 07/18/16 144A | | | 110,000 | | | | 116,325 | |
7.50%, 07/18/16 | | | 190,000 | | | | 200,925 | |
| | | | | | | | |
| | | | | | | 5,659,581 | |
| | | | | | | | |
Malaysia — 0.2% | |
Malaysia Government Bond | | | | | | | | |
3.43%, 08/15/14(R) | | | 1,620,000 | | | | 516,230 | |
3.84%, 08/12/15(R) | | | 2,280,000 | | | | 736,003 | |
4.26%, 09/15/16(R)D | | | 650,000 | | | | 213,489 | |
| | | | | | | | |
| | | | | | | 1,465,722 | |
| | | | | | | | |
Mexico — 0.7% | |
America Movil SAB de CV | | | | | | | | |
5.63%, 11/15/17 | | | 270,000 | | | | 313,076 | |
5.00%, 03/30/20 | | | 240,000 | | | | 266,345 | |
BBVA Bancomer SA | | | | | | | | |
7.25%, 04/22/20 144AD | | | 625,000 | | | | 628,125 | |
Mexican Bonos | | | | | | | | |
8.00%, 06/11/20(M) | | | 32,757,000 | | | | 2,613,858 | |
10.00%, 12/05/24(M) | | | 3,487,200 | | | | 322,068 | |
Mexico Cetes | | | | | | | | |
4.48%, 01/12/12(M)W | | | 112,448,200 | | | | 804,560 | |
Mexico Government International Bond | | | | | | | | |
6.75%, 09/27/34 | | | 601,000 | | | | 785,807 | |
6.05%, 01/11/40D | | | 134,000 | | | | 164,485 | |
Petroleos Mexicanos | | | | | | | | |
5.50%, 01/21/21 | | | 370,000 | | | | 403,300 | |
| | | | | | | | |
| | | | | | | 6,301,624 | |
| | | | | | | | |
Netherlands — 1.6% | |
Achmea Hypotheekbank NV | | | | | | | | |
3.20%, 11/03/14 144A | | | 1,216,000 | | | | 1,276,993 | |
Cooperatieve Centrale Raiffeisen-Boerenleenbank BA | | | | | | | | |
4.50%, 01/11/21D | | | 4,000,000 | | | | 4,163,076 | |
11.00%, 12/29/49 144A† | | | 687,000 | | | | 807,305 | |
Deutsche Telekom International Finance BV | | | | | | | | |
5.75%, 03/23/16 | | | 510,000 | | | | 568,104 | |
ING Bank NV | | | | | | | | |
3.90%, 03/19/14 144A | | | 500,000 | | | | 527,787 | |
2.38%, 06/09/14 144A | | | 550,000 | | | | 536,484 | |
2.50%, 01/14/16 144AD | | | 600,000 | | | | 589,747 | |
LeasePlan Corporation NV | | | | | | | | |
3.00%, 05/07/12 144A | | | 1,200,000 | | | | 1,209,269 | |
Shell International Finance BV | | | | | | | | |
4.38%, 03/25/20D | | | 700,000 | | | | 818,663 | |
|
See Notes to Financial Statements. 95 |
| | | | | | | | |
| | | Par | | | Value | |
Volkswagen International Finance NV | | | | | | | | |
1.03%, 10/01/12 144A† | | $ | 1,900,000 | | | $ | 1,898,493 | |
1.19%, 04/01/14 144A† | | | 1,500,000 | | | | 1,470,842 | |
| | | | | | | | |
| | | | | | | 13,866,763 | |
| | | | | | | | |
New Zealand — 0.0% | |
Westpac Securities NZ, Ltd. | | | | | | | | |
2.50%, 05/25/12 144A | | | 200,000 | | | | 201,243 | |
| | | | | | | | |
Norway — 1.3% | |
DnB NOR Boligkreditt | | | | | | | | |
2.10%, 10/14/15 144AD | | | 1,700,000 | | | | 1,688,659 | |
2.90%, 03/29/16 144A | | | 4,300,000 | | | | 4,375,702 | |
Nordea Eiendomskreditt AS | | | | | | | | |
1.88%, 04/07/14 144A | | | 1,500,000 | | | | 1,502,540 | |
Sparebank 1 Boligkreditt AS | | | | | | | | |
1.25%, 10/25/14 144AD | | | 1,900,000 | | | | 1,887,319 | |
2.63%, 05/27/16 144A | | | 1,600,000 | | | | 1,599,821 | |
| | | | | | | | |
| | | | | | | 11,054,041 | |
| | | | | | | | |
Portugal — 0.3% | |
Obrigacoes do Tesouro | | | | | | | | |
2.62%, 05/16/47(E) | | | 1,954,296 | | | | 2,519,853 | |
| | | | | | | | |
Qatar — 0.0% | |
Ras Laffan Liquefied Natural Gas Co., Ltd. III | | | | | | | | |
6.75%, 09/30/19 144A | | | 250,000 | | | | 296,938 | |
| | | | | | | | |
South Africa — 0.3% | |
South Africa Government Bond | | | | | | | | |
7.25%, 01/15/20(S) | | | 620,000 | | | | 73,957 | |
6.75%, 03/31/21(S)D | | | 5,110,000 | | | | 584,661 | |
10.50%, 12/21/26(S) | | | 10,270,000 | | | | 1,489,393 | |
Transnet, Ltd. | | | | | | | | |
4.50%, 02/10/16 144AD | | | 500,000 | | | | 506,821 | |
| | | | | | | | |
| | | | | | | 2,654,832 | |
| | | | | | | | |
South Korea — 0.4% | |
Export-Import Bank of Korea | | | | | | | | |
5.25%, 02/10/14 | | | 235,000 | | | | 247,827 | |
Hyundai Capital Services, Inc. | | | | | | | | |
4.38%, 07/27/16 144AD | | | 3,400,000 | | | | 3,471,087 | |
| | | | | | | | |
| | | | | | | 3,718,914 | |
| | | | | | | | |
Spain — 0.2% | |
BBVA US Senior SAU | | | | | | | | |
3.25%, 05/16/14D | | | 800,000 | | | | 758,203 | |
Santander US Debt SA Unipersonal | | | | | | | | |
3.72%, 01/20/15 144A | | | 700,000 | | | | 636,055 | |
3.78%, 10/07/15 144AD | | | 100,000 | | | | 90,703 | |
Telefonica Emisiones SAU | | | | | | | | |
5.88%, 07/15/19D | | | 80,000 | | | | 79,180 | |
5.13%, 04/27/20D | | | 290,000 | | | | 272,853 | |
5.46%, 02/16/21D | | | 60,000 | | | | 57,357 | |
| | | | | | | | |
| | | | | | | 1,894,351 | |
| | | | | | | | |
Sweden — 1.1% | |
Nordea Bank AB | | | | | | | | |
1.47%, 01/14/14 144A† | | | 3,400,000 | | | | 3,293,849 | |
3.70%, 11/13/14 144A | | | 390,000 | | | | 396,482 | |
4.88%, 01/27/20 144A | | | 110,000 | | | | 113,150 | |
4.88%, 05/13/21 144A | | | 640,000 | | | | 541,906 | |
Stadshypotek AB | | | | | | | | |
1.45%, 09/30/13 144AD | | | 4,850,000 | | | | 4,843,554 | |
| | | | | | | | |
| | | Par | | | Value | |
Swedbank Hypotek AB | | | | | | | | |
1.02%, 03/28/14 144A† | | $ | 200,000 | | | $ | 196,813 | |
| | | | | | | | |
| | | | | | | 9,385,754 | |
| | | | | | | | |
Switzerland — 0.1% | |
Credit Suisse | | | | | | | | |
6.00%, 02/15/18D | | | 100,000 | | | | 98,747 | |
UBS AG | | | | | | | | |
2.25%, 01/28/14 | | | 710,000 | | | | 691,258 | |
3.88%, 01/15/15 | | | 280,000 | | | | 279,428 | |
4.88%, 08/04/20 | | | 180,000 | | | | 179,083 | |
| | | | | | | | |
| | | | | | | 1,248,516 | |
| | | | | | | | |
United Arab Emirates — 0.0% | |
Dolphin Energy, Ltd. | | | | | | | | |
5.89%, 06/15/19 144A | | | 236,012 | | | | 256,958 | |
| | | | | | | | |
United Kingdom — 2.4% | |
Abbey National Treasury Services PLC | | | | | | | | |
3.88%, 11/10/14 144A | | | 2,900,000 | | | | 2,723,465 | |
Bank of Scotland PLC | | | | | | | | |
5.25%, 02/21/17 144A | | | 400,000 | | | | 423,875 | |
Barclays Bank PLC | | | | | | | | |
1.62%, 01/13/14†D | | | 3,400,000 | | | | 3,297,446 | |
6.05%, 12/04/17 144A | | | 230,000 | | | | 208,983 | |
BP Capital Markets PLC | | | | | | | | |
5.25%, 11/07/13 | | | 940,000 | | | | 1,008,658 | |
3.88%, 03/10/15 | | | 310,000 | | | | 331,269 | |
3.20%, 03/11/16 | | | 275,000 | | | | 288,489 | |
4.50%, 10/01/20 | | | 725,000 | | | | 799,950 | |
3.56%, 11/01/21 | | | 50,000 | | | | 51,911 | |
HSBC Holdings PLC | | | | | | | | |
6.80%, 06/01/38 | | | 250,000 | | | | 259,743 | |
Lloyds TSB Bank PLC | | | | | | | | |
2.77%, 01/24/14†D | | | 3,400,000 | | | | 3,218,185 | |
6.38%, 01/21/21 | | | 550,000 | | | | 552,112 | |
12.00%, 12/29/49 144A† | | | 3,200,000 | | | | 2,946,575 | |
Royal Bank of Scotland PLC | | | | | | | | |
1.50%, 03/30/12 144A | | | 2,400,000 | | | | 2,404,414 | |
4.88%, 08/25/14 144A | | | 425,000 | | | | 416,107 | |
3.95%, 09/21/15D | | | 700,000 | | | | 656,948 | |
Royal Bank of Scotland Group PLC | | | | | | | | |
5.00%, 10/01/14 | | | 100,000 | | | | 82,596 | |
5.05%, 01/08/15 | | | 100,000 | | | | 81,598 | |
6.40%, 10/21/19D | | | 530,000 | | | | 496,922 | |
7.64%, 03/29/49 | | | 200,000 | | | | 108,250 | |
WPP Finance UK | | | | | | | | |
8.00%, 09/15/14 | | | 226,000 | | | | 251,898 | |
| | | | | | | | |
| | | | | | | 20,609,394 | |
| | | | | | | | |
Virgin Islands (British) — 0.5% | |
Gerdau Trade, Inc. | | | | | | | | |
5.75%, 01/30/21 144AD | | | 4,000,000 | | | | 3,990,000 | |
| | | | | | | | |
Total Foreign Bonds
(Cost $167,480,948) | | | | 162,878,023 | |
| | | | | | | | |
|
| See Notes to Financial Statements. |
96 |
MEDIUM-DURATION BOND FUND
SCHEDULE OF INVESTMENTS (Continued)
| | | | | | | | |
| | | Par | | | Value | |
MORTGAGE-BACKED SECURITIES — 46.3% | |
ABN Amro Mortgage Corporation | | | | | | | | |
5.64%, 06/25/33 IOW@ | | $ | 19,288 | | | $ | 1,029 | |
American Home Mortgage Assets | | | | | | | | |
1.14%, 11/25/46† | | | 1,291,745 | | | | 472,505 | |
Banc of America Large Loan, Inc. | | | | | | | | |
5.67%, 02/17/51 144A† | | | 100,000 | | | | 109,296 | |
Banc of America Merrill Lynch Commercial Mortgage, Inc. | | | | | | | | |
5.92%, 05/10/45† | | | 420,000 | | | | 470,149 | |
Bank of America Mortgage Securities, Inc. | | | | | | | | |
2.75%, 07/25/34† | | | 281,943 | | | | 248,389 | |
Bear Stearns Adjustable Rate Mortgage Trust | | | | | | | | |
5.68%, 02/25/33† | | | 62,444 | | | | 59,107 | |
5.30%, 05/25/34† | | | 280,444 | | | | 249,496 | |
2.71%, 03/25/35† | | | 1,126,648 | | | | 1,044,786 | |
Bear Stearns Alt-A Trust | | | | | | | | |
0.93%, 04/25/34† | | | 89,633 | | | | 64,985 | |
2.59%, 05/25/35† | | | 521,920 | | | | 406,372 | |
2.77%, 09/25/35† | | | 774,191 | | | | 487,732 | |
Bear Stearns Structured Products, Inc. | | | | | | | | |
2.56%, 01/26/36† | | | 1,314,784 | | | | 767,037 | |
Chase Mortgage Finance Corporation | | | | | | | | |
2.74%, 02/25/37† | | | 228,835 | | | | 206,862 | |
Countrywide Alternative Loan Trust | | | | | | | | |
5.50%, 10/25/33 | | | 126,490 | | | | 132,754 | |
0.64%, 09/25/35† | | | 1,067,712 | | | | 506,304 | |
1.72%, 09/25/35† | | | 260,418 | | | | 148,866 | |
0.62%, 10/25/35† | | | 1,226,661 | | | | 574,553 | |
0.59%, 11/20/35† | | | 1,834,502 | | | | 925,763 | |
0.61%, 11/20/35† | | | 969,550 | | | | 488,672 | |
0.56%, 01/25/36† | | | 585,880 | | | | 344,502 | |
0.56%, 02/25/36† | | | 1,426,704 | | | | 695,311 | |
6.00%, 08/25/37 | | | 1,128,825 | | | | 842,193 | |
0.48%, 09/25/46† | | | 1,316,098 | | | | 607,355 | |
Countrywide Home Loan Mortgage Pass-Through Trust | | | | | | | | |
2.84%, 02/19/34† | | | 1,119,757 | | | | 998,898 | |
2.72%, 11/20/34† | | | 230,567 | | | | 170,984 | |
0.71%, 11/25/34 144A† | | | 22,232 | | | | 18,274 | |
0.65%, 03/25/35 144A† | | | 89,053 | | | | 68,940 | |
0.53%, 03/25/36† | | | 396,601 | | | | 216,397 | |
Credit Suisse Mortgage Capital Certificates | | | | | | | | |
5.38%, 02/15/40 | | | 1,550,000 | | | | 1,566,078 | |
CS First Boston Mortgage Securities Corporation | | | | | | | | |
0.01%, 07/25/33 IOW†@ | | | 138,414 | | | | — | |
5.38%, 07/25/33 IOW@ | | | 52,373 | | | | 5,093 | |
0.01%, 08/25/33 IOW†@ | | | 181,775 | | | | 3 | |
DBUBS Mortgage Trust | | | | | | | | |
9.05%, 08/10/44 144AW† | | | 1,315,782 | | | | 73,538 | |
Federal Home Loan Mortgage Corporation | | | | | | | | |
7.00%, 11/01/14 | | | 5,787 | | | | 6,162 | |
7.00%, 04/01/15 | | | 7,938 | | | | 8,453 | |
7.00%, 12/01/15 | | | 13,012 | | | | 13,583 | |
| | | | | | | | |
| | | Par | | | Value | |
8.50%, 06/01/16 | | $ | 8,845 | | | $ | 8,863 | |
8.50%, 06/01/18 | | | 3,825 | | | | 4,293 | |
4.50%, 09/01/18 | | | 14,516 | | | | 15,675 | |
8.00%, 08/01/24 | | | 2,192 | | | | 2,598 | |
7.50%, 11/01/29 | | | 9,355 | | | | 11,166 | |
7.50%, 12/01/29 | | | 15,524 | | | | 18,516 | |
7.50%, 02/01/31 | | | 28,341 | | | | 32,946 | |
2.41%, 07/01/31† | | | 27,374 | | | | 27,862 | |
2.36%, 08/01/31† | | | 3,505 | | | | 3,683 | |
7.50%, 11/01/31 | | | 9,857 | | | | 10,025 | |
2.73%, 04/01/32† | | | 3,044 | | | | 3,219 | |
2.59%, 03/01/34† | | | 5,451 | | | | 5,708 | |
5.00%, 12/01/34 | | | 61,716 | | | | 66,404 | |
5.50%, 05/01/35 | | | 1,000,183 | | | | 1,090,703 | |
5.00%, 11/01/35 | | | 923,573 | | | | 993,740 | |
5.50%, 11/01/35 | | | 258,276 | | | | 281,166 | |
5.00%, 12/01/35 | | | 65,200 | | | | 71,376 | |
5.50%, 01/01/36 | | | 156,342 | | | | 171,078 | |
6.00%, 02/01/36 | | | 817,574 | | | | 902,809 | |
4.97%, 01/01/37† | | | 702,314 | | | | 742,554 | |
6.00%, 04/01/37 | | | 7,758 | | | | 8,667 | |
5.50%, 07/01/37 | | | 279,080 | | | | 305,385 | |
6.00%, 07/01/37 | | | 2,103 | | | | 2,350 | |
5.67%, 09/01/37† | | | 348,858 | | | | 372,437 | |
6.00%, 09/01/37 | | | 92,630 | | | | 103,474 | |
5.50%, 02/01/38 | | | 941,948 | | | | 1,023,372 | |
5.50%, 04/01/38 | | | 269,768 | | | | 293,087 | |
6.00%, 07/01/38 | | | 35,458 | | | | 39,609 | |
5.50%, 08/01/38 | | | 932,094 | | | | 1,013,685 | |
5.50%, 12/01/38 | | | 470,666 | | | | 511,351 | |
6.00%, 12/01/38 | | | 96,144 | | | | 107,399 | |
6.00%, 01/01/39 | | | 48,330 | | | | 53,892 | |
5.50%, 02/01/39 | | | 104,426 | | | | 113,453 | |
4.50%, 07/01/39 | | | 12,206 | | | | 12,945 | |
4.50%, 09/01/39 | | | 1,324,882 | | | | 1,423,002 | |
6.50%, 09/01/39 | | | 276,002 | | | | 312,108 | |
4.50%, 10/01/39 | | | 991,161 | | | | 1,051,185 | |
4.50%, 11/01/39 | | | 444,640 | | | | 471,567 | |
4.50%, 12/01/39 | | | 1,380,901 | | | | 1,464,527 | |
4.50%, 01/01/40 | | | 47,273 | | | | 50,136 | |
4.50%, 01/01/40 TBA | | | 41,500,000 | | | | 43,970,546 | |
5.50%, 01/01/40 | | | 683,053 | | | | 742,097 | |
4.50%, 04/01/40 | | | 68,425 | | | | 72,548 | |
4.50%, 05/01/40 | | | 10,959 | | | | 11,620 | |
4.50%, 06/01/40 | | | 10,732 | | | | 11,378 | |
4.50%, 07/01/40 | | | 163,044 | | | | 172,867 | |
4.00%, 09/01/40 | | | 30,314 | | | | 32,110 | |
4.00%, 11/01/40 | | | 34,278 | | | | 36,309 | |
4.00%, 12/01/40 | | | 606,545 | | | | 642,479 | |
4.00%, 01/01/41 TBA | | | 100,000 | | | | 104,875 | |
4.50%, 02/01/41 | | | 9,827 | | | | 10,416 | |
4.50%, 03/01/41 | | | 13,426 | | | | 14,231 | |
4.50%, 04/01/41 | | | 29,650 | | | | 31,429 | |
4.50%, 05/01/41 | | | 25,606 | | | | 27,143 | |
4.50%, 06/01/41 | | | 134,300 | | | | 142,359 | |
4.50%, 09/01/41 | | | 21,300 | | | | 22,578 | |
4.00%, 10/01/41 | | | 996,023 | | | | 1,049,740 | |
4.50%, 10/01/41 | | | 12,960 | | | | 13,738 | |
3.50%, 01/12/42 TBA | | | 1,400,000 | | | | 1,437,406 | |
Federal Home Loan Mortgage Corporation REMIC | | | | | | | | |
8.00%, 09/25/21 | | | 1,450,000 | | | | 161,780 | |
1.62%, 04/15/22 POW | | | 13,738 | | | | 13,195 | |
0.78%, 06/15/37† | | | 1,156,757 | | | | 1,153,776 | |
|
See Notes to Financial Statements. 97 |
| | | | | | | | |
| | | Par | | | Value | |
Federal Housing Administration | | | | | | | | |
8.70%, 10/01/18@ | | $ | 111,004 | | | $ | 116,305 | |
Federal National Mortgage Association | | | | | | | | |
8.00%, 06/01/15 | | | 17,517 | | | | 18,417 | |
8.00%, 07/01/15 | | | 8,339 | | | | 8,474 | |
8.00%, 09/01/15 | | | 17,701 | | | | 19,048 | |
3.07%, 12/01/17 | | | 984,137 | | | | 1,029,378 | |
5.00%, 12/01/17 | | | 39,118 | | | | 42,177 | |
2.80%, 03/01/18 | | | 591,490 | | | | 613,201 | |
3.74%, 05/01/18 | | | 1,389,437 | | | | 1,499,367 | |
3.84%, 05/01/18 | | | 420,000 | | | | 455,009 | |
4.51%, 06/01/19 | | | 1,000,000 | | | | 1,111,484 | |
3.42%, 10/01/20 | | | 296,622 | | | | 314,316 | |
3.63%, 12/01/20 | | | 197,818 | | | | 212,151 | |
3.76%, 12/01/20 | | | 1,285,646 | | | | 1,388,184 | |
9.50%, 05/01/22 | | | 2,112 | | | | 2,438 | |
2.60%, 07/01/22† | | | 8,669 | | | | 8,724 | |
5.50%, 09/01/23 | | | 295,657 | | | | 323,330 | |
5.50%, 10/01/23 | | | 51,518 | | | | 56,626 | |
9.50%, 07/01/24 | | | 4,241 | | | | 4,908 | |
5.50%, 05/01/25 | | | 1,786,787 | | | | 1,942,179 | |
3.00%, 01/01/26 TBA | | | 16,900,000 | | | | 17,451,890 | |
3.50%, 01/01/26 TBA | | | 1,000,000 | | | | 1,045,625 | |
4.50%, 01/19/26 TBA | | | 16,000,000 | | | | 17,055,000 | |
3.50%, 09/18/26 TBA | | | 13,000,000 | | | | 13,593,125 | |
2.53%, 07/01/27† | | | 23,138 | | | | 23,531 | |
2.35%, 08/01/27† | | | 56,316 | | | | 59,390 | |
2.53%, 11/01/27† | | | 39,126 | | | | 40,130 | |
6.50%, 01/14/28 TBA | | | 1,000,000 | | | | 1,112,656 | |
5.50%, 04/01/29 | | | 199 | | | | 218 | |
2.76%, 02/01/30† | | | 149,271 | | | | 158,639 | |
2.51%, 06/01/30† | | | 19,552 | | | | 19,708 | |
8.00%, 10/01/30 | | | 37,843 | | | | 45,732 | |
2.63%, 12/01/30† | | | 7,085 | | | | 7,522 | |
6.50%, 12/01/30 | | | 439,590 | | | | 502,522 | |
2.53%, 01/01/31† | | | 7,800 | | | | 8,006 | |
4.50%, 04/01/31 | | | 273,802 | | | | 292,834 | |
2.45%, 05/01/31† | | | 16,720 | | | | 16,839 | |
4.50%, 05/01/31 | | | 919,158 | | | | 983,049 | |
4.50%, 06/01/31 | | | 275,897 | | | | 295,075 | |
6.00%, 11/01/31 | | | 11,389 | | | | 12,696 | |
6.00%, 01/01/32 | | | 70,108 | | | | 78,151 | |
6.00%, 03/01/32 | | | 52,200 | | | | 58,188 | |
6.00%, 04/01/32 | | | 446,881 | | | | 499,223 | |
2.53%, 06/01/32† | | | 9,256 | | | | 9,428 | |
2.60%, 08/01/32† | | | 22,651 | | | | 23,497 | |
2.38%, 02/01/33† | | | 3,071 | | | | 3,114 | |
5.50%, 02/01/33 | | | 95,072 | | | | 103,929 | |
2.60%, 05/01/33† | | | 63,717 | | | | 66,427 | |
6.00%, 05/01/33 | | | 5,171 | | | | 5,764 | |
5.00%, 08/01/33 | | | 17,476 | | | | 19,056 | |
5.50%, 09/01/33 | | | 5,719 | | | | 6,280 | |
6.00%, 12/01/33 | | | 2,956 | | | | 3,295 | |
5.50%, 02/01/34 | | | 7,289 | | | | 8,004 | |
5.50%, 03/01/34 | | | 377,643 | | | | 412,824 | |
5.50%, 04/01/34 | | | 1,233 | | | | 1,364 | |
5.50%, 08/01/34 | | | 10,940 | | | | 12,106 | |
5.50%, 10/01/34 | | | 604 | | | | 669 | |
6.00%, 10/01/34 | | | 69,224 | | | | 77,155 | |
5.50%, 11/01/34 | | | 76,786 | | | | 83,940 | |
2.19%, 12/01/34† | | | 351,599 | | | | 363,804 | |
5.50%, 12/01/34 | | | 71,468 | | | | 78,483 | |
| | | | | | | | |
| | | Par | | | Value | |
6.00%, 12/01/34 | | $ | 1,061 | | | $ | 1,179 | |
6.00%, 01/01/35 | | | 728,071 | | | | 808,202 | |
6.00%, 05/01/35 | | | 2,253,632 | | | | 2,492,456 | |
5.00%, 07/01/35 | | | 3,903,420 | | | | 4,221,321 | |
5.50%, 07/01/35 | | | 526 | | | | 582 | |
6.00%, 07/01/35 | | | 448,832 | | | | 496,396 | |
5.50%, 08/01/35 | | | 1,185 | | | | 1,311 | |
6.00%, 08/01/35 | | | 435 | | | | 481 | |
5.50%, 09/01/35 | | | 289,798 | | | | 317,217 | |
6.00%, 10/01/35 | | | 111,211 | | | | 123,329 | |
2.15%, 11/01/35† | | | 149,858 | | | | 155,886 | |
2.16%, 11/01/35† | | | 171,529 | | | | 178,449 | |
2.17%, 11/01/35† | | | 138,613 | | | | 143,902 | |
2.17%, 11/01/35† | | | 316,913 | | | | 329,613 | |
2.53%, 11/01/35† | | | 19,815 | | | | 20,330 | |
6.00%, 11/01/35 | | | 1,065,341 | | | | 1,185,051 | |
5.50%, 12/01/35 | | | 5,407 | | | | 5,983 | |
6.00%, 12/01/35 | | | 24,277 | | | | 26,933 | |
6.00%, 02/01/36 | | | 15,351 | | | | 17,031 | |
6.00%, 03/01/36 | | | 21,144 | | | | 23,457 | |
5.50%, 04/01/36 | | | 279,405 | | | | 300,720 | |
6.00%, 04/01/36 | | | 21,899 | | | | 24,295 | |
3.99%, 05/01/36† | | | 249,767 | | | | 266,016 | |
5.50%, 09/01/36 | | | 1,014,473 | | | | 1,108,981 | |
6.00%, 10/01/36 | | | 2,804 | | | | 3,093 | |
6.50%, 10/01/36 | | | 180,499 | | | | 202,729 | |
5.50%, 11/01/36 | | | 754,808 | | | | 823,475 | |
6.00%, 11/01/36 | | | 71,314 | | | | 78,671 | |
6.50%, 11/01/36 | | | 91,061 | | | | 102,732 | |
6.00%, 12/01/36 | | | 291 | | | | 321 | |
6.00%, 01/01/37 | | | 73,766 | | | | 81,370 | |
5.10%, 02/01/37† | | | 928,635 | | | | 982,673 | |
5.50%, 02/01/37 | | | 927 | | | | 1,018 | |
5.50%, 03/01/37 | | | 38,710 | | | | 42,268 | |
5.50%, 04/01/37 | | | 1,390 | | | | 1,526 | |
6.00%, 04/01/37 | | | 10,942 | | | | 12,061 | |
5.50%, 05/01/37 | | | 1,762 | | | | 1,935 | |
6.00%, 05/01/37 | | | 37,572 | | | | 41,413 | |
5.50%, 06/01/37 | | | 679 | | | | 746 | |
6.00%, 06/01/37 | | | 415 | | | | 458 | |
6.00%, 07/01/37 | | | 4,526,960 | | | | 5,022,207 | |
5.50%, 08/01/37 | | | 473,113 | | | | 517,189 | |
6.50%, 10/01/37 | | | 299,138 | | | | 335,368 | |
6.00%, 11/01/37 | | | 5,200 | | | | 5,732 | |
2.53%, 12/01/37† | | | 104,924 | | | | 109,284 | |
6.00%, 12/01/37 | | | 1,257 | | | | 1,385 | |
2.53%, 01/01/38† | | | 48,480 | | | | 50,449 | |
6.00%, 01/01/38 | | | 7,636 | | | | 8,416 | |
5.50%, 02/01/38 | | | 806 | | | | 885 | |
6.00%, 02/01/38 | | | 30,141 | | | | 33,212 | |
4.50%, 03/01/38 | | | 43,765 | | | | 46,609 | |
5.50%, 03/01/38 | | | 2,206 | | | | 2,423 | |
6.00%, 03/01/38 | | | 3,883 | | | | 4,283 | |
4.50%, 04/01/38 | | | 1,365,925 | | | | 1,454,682 | |
6.00%, 04/01/38 | | | 1,528 | | | | 1,684 | |
5.50%, 05/01/38 | | | 576 | | | | 632 | |
6.00%, 05/01/38 | | | 30,516 | | | | 33,748 | |
5.50%, 06/01/38 | | | 2,766 | | | | 3,037 | |
5.50%, 07/01/38 | | | 326,323 | | | | 358,355 | |
5.50%, 08/01/38 | | | 449,671 | | | | 493,809 | |
5.50%, 09/01/38 | | | 1,351 | | | | 1,478 | |
6.50%, 10/01/38 | | | 94,441 | | | | 105,660 | |
6.00%, 11/01/38 | | | 376,349 | | | | 414,820 | |
5.50%, 12/01/38 | | | 497,051 | | | | 543,361 | |
|
| See Notes to Financial Statements. |
98 |
MEDIUM-DURATION BOND FUND
SCHEDULE OF INVESTMENTS (Continued)
| | | | | | | | |
| | | Par | | | Value | |
6.00%, 01/01/39 TBA | | $ | 5,500,000 | | | $ | 6,056,016 | |
5.00%, 01/13/39 TBA | | | 3,700,000 | | | | 3,997,156 | |
6.50%, 06/01/39 | | | 94,227 | | | | 105,111 | |
5.00%, 07/01/39 | | | 63,102 | | | | 68,202 | |
4.50%, 08/01/39 | | | 217,136 | | | | 235,995 | |
5.50%, 08/01/39 | | | 148,708 | | | | 162,051 | |
4.50%, 09/01/39 | | | 174,733 | | | | 189,910 | |
4.50%, 10/01/39 | | | 85,782 | | | | 93,233 | |
6.50%, 10/01/39 | | | 800,000 | | | | 889,156 | |
4.50%, 12/01/39 | | | 162,634 | | | | 176,759 | |
6.00%, 12/01/39 | | | 3,028,762 | | | | 3,338,371 | |
4.00%, 01/01/40 TBA | | | 29,000,000 | | | | 30,581,405 | |
5.50%, 01/01/40 TBA | | | 4,200,000 | | | | 4,573,406 | |
1.62%, 06/01/40† | | | 80,408 | | | | 82,190 | |
6.50%, 06/01/40 | | | 1,317,860 | | | | 1,468,848 | |
4.00%, 09/01/40 | | | 1,089,738 | | | | 1,145,785 | |
1.62%, 10/01/40† | | | 250,744 | | | | 256,330 | |
2.53%, 11/01/40† | | | 45,121 | | | | 47,185 | |
4.00%, 11/01/40 | | | 1,415,692 | | | | 1,488,503 | |
4.00%, 12/01/40 | | | 1,331,969 | | | | 1,400,474 | |
4.50%, 12/01/40 | | | 886,221 | | | | 943,807 | |
3.50%, 01/01/41 TBA | | | 8,600,000 | | | | 8,844,562 | |
4.00%, 01/01/41 | | | 1,734,170 | | | | 1,823,361 | |
4.00%, 01/13/41 TBA | | | 23,000,000 | | | | 24,160,782 | |
5.00%, 02/01/41 | | | 588,881 | | | | 636,841 | |
4.00%, 04/01/41 | | | 4,907,286 | | | | 5,159,733 | |
5.00%, 04/01/41 | | | 240,041 | | | | 259,440 | |
5.00%, 05/01/41 | | | 507,205 | | | | 548,196 | |
5.00%, 06/01/41 | | | 73,530 | | | | 79,472 | |
4.50%, 07/01/41 | | | 338,302 | | | | 360,285 | |
4.50%, 08/01/41 | | | 221,797 | | | | 236,209 | |
4.50%, 09/01/41 | | | 978,034 | | | | 1,041,586 | |
4.00%, 10/01/41 | | | 3,970,229 | | | | 4,175,665 | |
4.50%, 10/01/41 | | | 336,044 | | | | 357,880 | |
5.00%, 10/01/41 | | | 3,403,526 | | | | 3,686,033 | |
4.00%, 11/01/41 | | | 2,792,578 | | | | 2,940,977 | |
4.50%, 11/01/41 | | | 998,532 | | | | 1,063,416 | |
4.00%, 01/01/42 TBA | | | 5,200,000 | | | | 5,462,438 | |
4.50%, 01/01/42 TBA | | | 4,650,000 | | | | 4,947,891 | |
3.50%, 01/12/42 TBA | | | 31,000,000 | | | | 31,881,562 | |
Federal National Mortgage Association REMIC | | | | | | | | |
13.20%, 08/25/21 IOW | | | 130 | | | | 2,819 | |
5.64%, 10/25/21 IOW | | | 192 | | | | 3,716 | |
0.89%, 05/25/30† | | | 717,559 | | | | 717,127 | |
0.73%, 10/18/30† | | | 35,325 | | | | 35,418 | |
0.01%, 07/25/33 IOW†@ | | | 146,856 | | | | 511 | |
0.01%, 04/25/34 IOW†@ | | | 253,526 | | | | 3,679 | |
0.01%, 06/25/34 IOW†@ | | | 363,139 | | | | 1,223 | |
11.06%, 10/25/40 IOW† | | | 668,550 | | | | 94,570 | |
9.09%, 12/25/40 IOW† | | | 550,900 | | | | 71,098 | |
5.50%, 07/25/41 | | | 818,502 | | | | 957,703 | |
12.35%, 07/25/41 IOW† | | | 874,316 | | | | 112,283 | |
0.84%, 09/25/41† | | | 6,969,692 | | | | 6,941,844 | |
6.68%, 10/25/41 IOW† | | | 1,817,185 | | | | 316,368 | |
FFCA Secured Lending Corporation | | | | | | | | |
8.00%, 09/18/27 144AW†@ | | | 741,327 | | | | 31,709 | |
FHLMC Multifamily Structured Pass Through Certificates | | | | | | | | |
6.94%, 02/25/18 IOW† | | | 5,517,682 | | | | 416,228 | |
2.70%, 05/25/18 IO | | | 800,000 | | | | 826,236 | |
6.36%, 08/25/18 IOW† | | | 760,000 | | | | 79,179 | |
| | | | | | | | |
| | | Par | | | Value | |
6.39%, 08/25/18 IOW† | | $ | 1,974,277 | | | $ | 208,379 | |
6.09%, 01/25/20 IOW† | | | 3,891,919 | | | | 243,715 | |
13.67%, 04/25/20 IOW† | | | 1,112,630 | | | | 78,583 | |
6.17%, 06/25/20 IOW† | | | 1,176,770 | | | | 116,442 | |
6.58%, 08/25/20 IOW† | | | 1,295,531 | | | | 111,730 | |
8.00%, 04/25/21 IOW† | | | 867,221 | | | | 72,473 | |
6.24%, 10/25/21 IOW† | | | 913,000 | | | | 99,355 | |
FHLMC Multifamily VRD Certificates | | | | | | | | |
5.50%, 08/15/51 STEP | | | 3,500,000 | | | | 3,911,945 | |
FHLMC Structured Pass-Through Securities | | | | | | | | |
1.62%, 07/25/44† | | | 1,703,096 | | | | 1,731,570 | |
First Horizon Alternative Mortgage Securities | | | | | | | | |
2.32%, 06/25/34† | | | 813,332 | | | | 681,093 | |
GMAC Mortgage Corporation Loan Trust | | | | | | | | |
3.10%, 06/25/34† | | | 300,118 | | | | 277,557 | |
Government National Mortgage Association | | | | | | | | |
3.95%, 07/15/25 | | | 186,528 | | | | 204,279 | |
7.00%, 10/15/25 | | | 53,752 | | | | 62,169 | |
7.00%, 01/15/26 | | | 11,697 | | | | 13,565 | |
7.00%, 07/15/27 | | | 102,491 | | | | 118,574 | |
7.00%, 12/15/27 | | | 1,418 | | | | 1,649 | |
7.00%, 01/15/28 | | | 17,010 | | | | 19,819 | |
7.00%, 03/15/28 | | | 131,156 | | | | 152,073 | |
7.00%, 07/15/28 | | | 18,662 | | | | 21,744 | |
7.50%, 07/15/28 | | | 14,101 | | | | 14,644 | |
6.50%, 08/15/28 | | | 11,632 | | | | 13,486 | |
7.00%, 08/15/28 | | | 29,759 | | | | 34,673 | |
7.50%, 08/15/28 | | | 11,546 | | | | 13,737 | |
6.50%, 09/15/28 | | | 45,961 | | | | 53,285 | |
7.00%, 10/15/28 | | | 41,979 | | | | 48,911 | |
7.50%, 03/15/29 | | | 35,078 | | | | 40,971 | |
7.50%, 11/15/29 | | | 22,790 | | | | 23,984 | |
2.13%, 11/20/29† | | | 58,352 | | | | 60,153 | |
8.50%, 08/15/30 | | | 2,272 | | | | 2,782 | |
8.50%, 11/20/30 | | | 16,707 | | | | 20,451 | |
6.50%, 08/15/31 | | | 97,555 | | | | 111,148 | |
7.50%, 08/15/31 | | | 19,389 | | | | 22,725 | |
6.50%, 10/15/31 | | | 174,419 | | | | 199,532 | |
6.00%, 11/15/31 | | | 499,120 | | | | 565,690 | |
6.50%, 11/15/31 | | | 216,842 | | | | 247,058 | |
6.00%, 12/15/31 | | | 116,394 | | | | 131,918 | |
6.00%, 01/15/32 | | | 174,608 | | | | 198,730 | |
6.00%, 02/15/32 | | | 272,802 | | | | 309,187 | |
6.50%, 02/15/32 | | | 319,185 | | | | 368,084 | |
6.00%, 04/15/32 | | | 145,663 | | | | 165,773 | |
7.50%, 04/15/32 | | | 80,183 | | | | 84,170 | |
6.50%, 06/15/32 | | | 167,807 | | | | 191,190 | |
6.50%, 07/15/32 | | | 3,790 | | | | 4,318 | |
6.50%, 08/15/32 | | | 321,170 | | | | 365,923 | |
6.50%, 09/15/32 | | | 325,744 | | | | 371,135 | |
6.00%, 10/15/32 | | | 270,640 | | | | 306,736 | |
6.00%, 11/15/32 | | | 234,579 | | | | 266,144 | |
6.00%, 12/15/32 | | | 108,687 | | | | 123,183 | |
6.50%, 12/15/32 | | | 23,949 | | | | 27,286 | |
15.93%, 12/20/32 IOW† | | | 273,169 | | | | 37,736 | |
6.00%, 01/15/33 | | | 119,038 | | | | 134,914 | |
6.00%, 02/15/33 | | | 97,782 | | | | 110,824 | |
6.50%, 03/15/33 | | | 44,535 | | | | 50,741 | |
6.50%, 04/15/33 | | | 711,762 | | | | 810,942 | |
|
See Notes to Financial Statements. 99 |
| | | | | | | | |
| | | Par | | | Value | |
6.00%, 05/15/33 | | $ | 520,731 | | | $ | 590,183 | |
6.00%, 06/15/33 | | | 68,441 | | | | 77,569 | |
6.00%, 10/15/33 | | | 345,496 | | | | 391,577 | |
6.50%, 10/15/33 | | | 189,438 | | | | 215,835 | |
6.00%, 12/15/33 | | | 393,405 | | | | 445,875 | |
15.82%, 07/20/34 IOW† | | | 225,689 | | | | 31,746 | |
6.50%, 08/15/34 | | | 627,769 | | | | 727,778 | |
8.59%, 02/20/35 IOW† | | | 197,547 | | | | 36,367 | |
9.36%, 02/20/35 IOW† | | | 251,240 | | | | 45,032 | |
9.54%, 07/20/35 IOW† | | | 466,464 | | | | 76,302 | |
8.00%, 08/20/35 IOW† | | | 599,941 | | | | 81,157 | |
10.17%, 11/16/35 IOW† | | | 584,892 | | | | 102,704 | |
1.00%, 02/16/36 IOW† | | | 1,181,331 | | | | 157,402 | |
10.02%, 08/16/36 IOW† | | | 615,817 | | | | 117,862 | |
0.94%, 12/16/36 IOW† | | | 370,810 | | | | 58,765 | |
0.59%, 03/20/37† | | | 2,025,916 | | | | 2,023,690 | |
11.62%, 05/16/37 IOW† | | | 549,090 | | | | 71,240 | |
0.59%, 05/20/37† | | | 869,343 | | | | 868,386 | |
14.09%, 05/20/37 IOW† | | | 824,231 | | | | 118,834 | |
9.19%, 11/16/37 IOW† | | | 386,672 | | | | 61,483 | |
1.74%, 02/20/38 IOW† | | | 273,386 | | | | 37,950 | |
1.00%, 10/20/38 IOW† | | | 468,345 | | | | 74,111 | |
4.65%, 11/20/38 IOW† | | | 446,298 | | | | 68,508 | |
5.09%, 11/20/38 IOW† | | | 100,000 | | | | 13,340 | |
6.00%, 01/01/39 TBA | | | 200,000 | | | | 225,875 | |
6.56%, 03/20/39 IOW† | | | 250,972 | | | | 37,612 | |
14.58%, 04/16/39 IOW† | | | 157,098 | | | | 21,920 | |
19.28%, 04/16/39 IOW† | | | 243,044 | | | | 28,276 | |
22.98%, 08/20/39 IOW† | | | 768,998 | | | | 98,243 | |
6.52%, 10/20/39 IOW† | | | 1,291,043 | | | | 197,053 | |
4.00%, 01/01/40 TBA | | | 3,000,000 | | | | 3,217,969 | |
5.00%, 01/01/40 TBA | | | 200,000 | | | | 221,125 | |
12.89%, 01/20/40 IOW† | | | 303,367 | | | | 44,448 | |
8.06%, 02/16/40 IOW† | | | 282,861 | | | | 50,569 | |
4.50%, 03/15/40 | | | 597,175 | | | | 651,424 | |
4.72%, 06/20/40 IOW† | | | 892,766 | | | | 150,698 | |
16.20%, 07/16/40 IOW† | | | 748,263 | | | | 105,812 | |
5.00%, 07/20/40 | | | 84,043 | | | | 93,030 | |
8.73%, 07/20/40 IOW† | | | 446,314 | | | | 65,210 | |
5.00%, 08/20/40 | | | 1,193,870 | | | | 1,321,539 | |
5.00%, 09/20/40 | | | 330,630 | | | | 365,986 | |
6.00%, 10/20/40 | | | 174,138 | | | | 197,516 | |
4.00%, 01/01/41 TBA | | | 2,700,000 | | | | 2,896,172 | |
4.50%, 01/01/41 TBA | | | 300,000 | | | | 326,719 | |
5.50%, 01/01/41 TBA | | | 800,000 | | | | 896,875 | |
6.00%, 01/20/41 | | | 174,321 | | | | 197,723 | |
8.07%, 02/20/41 IOW† | | | 277,682 | | | | 50,450 | |
11.72%, 03/16/41 IOW† | | | 177,065 | | | | 24,606 | |
11.50%, 10/16/41 IOW† | | | 481,748 | | | | 83,215 | |
4.50%, 01/01/42 TBA | | | 6,100,000 | | | | 6,646,140 | |
0.65%, 12/20/60† | | | 520,672 | | | | 510,519 | |
0.75%, 03/20/61† | | | 391,478 | | | | 387,704 | |
0.77%, 03/20/61† | | | 588,285 | | | | 584,008 | |
Granite Mortgages PLC | | | | | | | | |
1.96%, 01/20/44(E)† | | | 264,656 | | | | 328,640 | |
1.39%, 06/20/44(U)† | | | 50,932 | | | | 75,296 | |
Greenpoint Mortgage Funding Trust | | | | | | | | |
0.47%, 01/25/37† | | | 1,135,372 | | | | 530,741 | |
GS Mortgage Securities Corporation II | | | | | | | | |
4.68%, 07/10/39 | | | 191,143 | | | | 193,674 | |
GS Mortgage Securities Trust | | | | | | | | |
8.00%, 08/12/44 | | | 1,307,203 | | | | 119,731 | |
| | | | | | | | |
| | | Par | | | Value | |
GSMPS Mortgage Loan Trust | | | | | | | | |
0.52%, 02/25/35 144A† | | $ | 168,636 | | | $ | 144,072 | |
0.64%, 09/25/35 144A† | | | 1,809,873 | | | | 1,412,870 | |
GSR Mortgage Loan Trust | | | | | | | | |
2.71%, 09/25/35† | | | 672,649 | | | | 585,296 | |
Impac CMB Trust | | | | | | | | |
1.01%, 10/25/34†@ | | | 100,006 | | | | 59,190 | |
0.55%, 11/25/35† | | | 975,488 | | | | 483,362 | |
Indymac ARM Trust | | | | | | | | |
1.72%, 01/25/32† | | | 14,717 | | | | 11,649 | |
Indymac INDA Mortgage Loan Trust | | | | | | | | |
5.74%, 11/25/37† | | | 445,668 | | | | 319,235 | |
Indymac Index Mortgage Loan Trust | | | | | | | | |
0.59%, 07/25/35† | | | 1,795,967 | | | | 1,005,637 | |
0.51%, 04/25/46† | | | 740,877 | | | | 334,270 | |
0.48%, 09/25/46† | | | 1,276,769 | | | | 658,550 | |
JP Morgan Alternative Loan Trust | | | | | | | | |
0.55%, 01/25/36† | | | 562,288 | | | | 355,510 | |
JP Morgan Chase Commercial Mortgage Securities Corporation | | | | | | | | |
4.90%, 09/12/37 | | | 700,000 | | | | 763,574 | |
5.34%, 05/15/47 | | | 155,000 | | | | 164,378 | |
JP Morgan Mortgage Trust | | | | | | | | |
5.02%, 02/25/35† | | | 421,502 | | | | 408,850 | |
2.78%, 07/25/35† | | | 380,275 | | | | 332,903 | |
2.79%, 07/25/35† | | | 360,562 | | | | 282,383 | |
2.81%, 07/25/35† | | | 398,294 | | | | 355,505 | |
LB-UBS Commercial Mortgage Trust | | | | | | | | |
4.66%, 07/15/30 | | | 388,105 | | | | 393,908 | |
4.95%, 09/15/30 | | | 400,000 | | | | 436,657 | |
8.00%, 06/15/36 144AW†@ | | | 703,821 | | | | 621 | |
5.42%, 02/15/40 | | | 29,000 | | | | 31,599 | |
Luminent Mortgage Trust | | | | | | | | |
0.46%, 12/25/36† | | | 2,986,568 | | | | 1,643,221 | |
0.49%, 02/25/46† | | | 887,710 | | | | 421,637 | |
MASTR Adjustable Rate Mortgages Trust | | | | | | | | |
2.46%, 05/25/34† | | | 267,972 | | | | 216,506 | |
2.57%, 11/25/35 144A† | | | 1,027,840 | | | | 529,435 | |
0.49%, 05/25/47† | | | 2,768,531 | | | | 1,346,622 | |
MASTR Reperforming Loan Trust | | | | | | | | |
7.00%, 08/25/34 144A | | | 646,735 | | | | 661,743 | |
Merrill Lynch/Countrywide Commercial Mortgage Trust | | | | | | | | |
6.16%, 08/12/49† | | | 150,000 | | | | 162,793 | |
MLCC Mortgage Investors, Inc. | | | | | | | | |
0.90%, 11/25/29† | | | 382,523 | | | | 345,406 | |
Nomura Asset Acceptance Corporation | | | | | | | | |
6.50%, 03/25/34 144A | | | 109,888 | | | | 111,241 | |
6.50%, 10/25/34 144A† | | | 111,822 | | | | 112,564 | |
Permanent Master Issuer PLC | | | | | | | | |
1.97%, 07/15/42 144A† | | | 1,000,000 | | | | 995,982 | |
Prime Mortgage Trust | | | | | | | | |
5.50%, 05/25/35 144A | | | 5,047,125 | | | | 4,481,956 | |
6.00%, 05/25/35 144A | | | 3,417,602 | | | | 3,030,772 | |
Sequoia Mortgage Trust | | | | | | | | |
0.75%, 07/20/33† | | | 224,760 | | | | 176,434 | |
|
| See Notes to Financial Statements. |
100 |
MEDIUM-DURATION BOND FUND
SCHEDULE OF INVESTMENTS (Continued)
| | | | | | | | |
| | | Par | | | Value | |
Structured Adjustable Rate Mortgage Loan Trust | | | | | | | | |
0.63%, 08/25/35† | | $ | 429,384 | | | $ | 313,601 | |
Structured Asset Mortgage Investments, Inc. | | | | | | | | |
0.54%, 07/19/35† | | | 202,192 | | | | 123,498 | |
Structured Asset Securities Corporation | | | | | | | | |
0.64%, 06/25/35 144A† | | | 222,856 | | | | 166,496 | |
Wachovia Bank Commercial Mortgage Trust | | | | | | | | |
5.31%, 11/15/48 | | | 105,000 | | | | 115,059 | |
Washington Mutual Mortgage Pass-Through Certificates | | | | | | | | |
2.58%, 02/25/33† | | | 15,913 | | | | 12,927 | |
2.56%, 12/25/36† | | | 581,057 | | | | 373,142 | |
5.06%, 02/25/37† | | | 872,098 | | | | 542,179 | |
5.45%, 02/25/37† | | | 592,099 | | | | 393,906 | |
1.62%, 06/25/42† | | | 33,279 | | | | 24,221 | |
0.58%, 07/25/45† | | | 357,877 | | | | 261,299 | |
0.61%, 07/25/45† | | | 651,372 | | | | 477,132 | |
0.58%, 10/25/45† | | | 1,308,539 | | | | 938,853 | |
0.98%, 04/25/47† | | | 1,340,218 | | | | 843,664 | |
Wells Fargo Alternative Loan Trust | | | | | | | | |
5.98%, 12/28/37† | | | 1,666,400 | | | | 1,012,952 | |
Wells Fargo Mortgage-Backed Securities Trust | | | | | | | | |
2.74%, 08/25/33† | | | 495,059 | | | | 493,157 | |
WF-RBS Commercial Mortgage Trust | | | | | | | | |
6.61%, 02/15/44 144AW† | | | 1,584,052 | | | | 87,116 | |
4.38%, 03/15/44 144A | | | 150,000 | | | | 159,720 | |
4.90%, 06/15/44 144A† | | | 220,000 | | | | 245,022 | |
3.67%, 11/15/44 | | | 116,000 | | | | 118,170 | |
| | | | | | | | |
Total Mortgage-Backed Securities
(Cost $408,543,878) | | | | 400,207,448 | |
| | | | | | | | |
MUNICIPAL BONDS — 2.4% | |
American Municipal Power, Inc., Revenue Bond, Series E | | | | | | | | |
6.27%, 02/15/50 | | | 250,000 | | | | 281,997 | |
Birmingham Commercial Development Authority, Civic Center Improvements Project, Revenue Bond, Series A | | | | | | | | |
5.50%, 04/01/41 | | | 30,000 | | | | 32,123 | |
Chicago O’Hare International Airport, Revenue Bond, Series A | | | | | | | | |
5.63%, 01/01/35 | | | 40,000 | | | | 43,730 | |
Chicago O’Hare International Airport, Revenue Bond, Series C | | | | | | | | |
5.50%, 01/01/31 | | | 80,000 | | | | 87,845 | |
Chicago Transit Authority, Revenue Bond, Series A | | | | | | | | |
6.90%, 12/01/40 | | | 1,800,000 | | | | 2,102,562 | |
Clark County Nevada, Las-Vegas-McCarran International Airport, Revenue Bond, Series A (AGM Insured) | | | | | | | | |
5.25%, 07/01/39 | | | 50,000 | | | | 52,050 | |
| | | | | | | | |
| | | Par | | | Value | |
Department of Airports of the City of Los Angeles, California, Revenue Bond, Series A | | | | | | | | |
5.00%, 05/15/35 | | $ | 70,000 | | | $ | 74,571 | |
5.25%, 05/15/39 | | | 50,000 | | | | 54,015 | |
Illinois Finance Authority, Revenue Bond, Series B | | | | | | | | |
5.75%, 07/01/33 | | | 1,800,000 | | | | 2,036,610 | |
Los Angeles Department of Water & Power, Revenue Bond | | | | | | | | |
6.57%, 07/01/45 | | | 200,000 | | | | 254,108 | |
Metropolitan Atlanta Rapid Transit Authority, Revenue Bond, Series A-3 | | | | | | | | |
5.00%, 07/01/39 | | | 50,000 | | | | 53,274 | |
Municipal Electric Authority of Georgia, Revenue Bond, Series B | | | | | | | | |
6.64%, 04/01/57 | | | 230,000 | | | | 239,301 | |
6.66%, 04/01/57 | | | 130,000 | | | | 133,765 | |
New York Liberty Development Corporation, Goldman Sachs Headquarters, Revenue Bond, Series 2005 | | | | | | | | |
5.25%, 10/01/35 | | | 100,000 | | | | 103,302 | |
Pennsylvania Higher Education Assistance Agency, Student Loan, Revenue Bond, Sub-Series HH-10 | | | | | | | | |
2.20%, 05/01/46† | | | 2,200,000 | | | | 2,033,944 | |
San Mateo County Community College District, Election 2005, General Obligation, Series B | | | | | | | | |
5.00%, 09/01/38 | | | 20,000 | | | | 20,738 | |
Santa Clara Valley Transportation Authority, Revenue Bond | | | | | | | | |
5.88%, 04/01/32 | | | 310,000 | | | | 364,247 | |
South Carolina Transportation Infrastructure Bank, Revenue Bond, Series A (AMBAC Insured) | | | | | | | | |
5.00%, 10/01/23 | | | 2,700,000 | | | | 2,704,509 | |
State of California, General Obligation | | | | | | | | |
7.95%, 03/01/36 | | | 165,000 | | | | 186,744 | |
7.55%, 04/01/39 | | | 85,000 | | | | 104,016 | |
7.30%, 10/01/39 | | | 360,000 | | | | 426,035 | |
State of Illinois, General Obligation | | | | | | | | |
3.32%, 01/01/13 | | | 6,500,000 | | | | 6,615,765 | |
4.42%, 01/01/15 | | | 1,400,000 | | | | 1,453,214 | |
5.67%, 03/01/18 | | | 300,000 | | | | 319,584 | |
5.88%, 03/01/19 | | | 310,000 | | | | 334,078 | |
7.35%, 07/01/35 | | | 375,000 | | | | 414,045 | |
| | | | | | | | |
Total Municipal Bonds
(Cost $19,306,278) | | | | 20,526,172 | |
| | | | | | | | |
|
See Notes to Financial Statements. 101 |
| | | | | | | | |
| | | Notional
Amount | | | Value | |
PURCHASED OPTIONS — 0.0% | |
Put Options — 0.0% | |
30-Year Federal National Mortgage Association, Strike Price $100.00, Expires 02/09/12 (CITI) | | $ | 16,000,000 | | | $ | — | |
30-Year Federal National Mortgage Association, Strike Price $87.00, Expires 03/05/12 (CS) | | | 20,000,000 | | | | — | |
30-Year Federal National Mortgage Association, Strike Price $88.00, Expires 03/05/12 (CS) | | | 16,000,000 | | | | — | |
| | | | | | | | |
Total Purchased Options
(Cost $6,094) | | | | — | |
| | | | | | | | |
| | |
| | | Par | | | | |
U.S. TREASURY OBLIGATIONS — 16.2% | |
U.S. Treasury Bill | | | | | | | | |
0.04%, 03/29/12D‡‡ | | $ | 2,700,000 | | | | 2,699,886 | |
| | | | | | | | |
U.S. Treasury Bonds | | | | | | | | |
7.50%, 11/15/24D | | | 800,000 | | | | 1,276,875 | |
6.63%, 02/15/27 | | | 100,000 | | | | 153,891 | |
6.13%, 11/15/27 | | | 200,000 | | | | 297,281 | |
4.38%, 02/15/38D | | | 400,000 | | | | 517,188 | |
4.38%, 11/15/39 | | | 7,940,000 | | | | 10,309,598 | |
4.38%, 05/15/40D | | | 1,490,000 | | | | 1,935,836 | |
3.88%, 08/15/40D | | | 2,400,000 | | | | 2,877,374 | |
4.25%, 11/15/40D | | | 100,000 | | | | 127,547 | |
4.75%, 02/15/41D | | | 5,670,000 | | | | 7,814,853 | |
4.38%, 05/15/41 | | | 6,490,000 | | | | 8,457,281 | |
3.75%, 08/15/41D | | | 2,900,000 | | | | 3,411,125 | |
3.13%, 11/15/41D | | | 1,300,000 | | | | 1,362,157 | |
| | | | | | | | |
| | | | | | | 38,541,006 | |
| | | | | | | | |
U.S. Treasury Inflationary Index Bonds | | | | | | | | |
2.00%, 04/15/12 | | | 1,740,000 | | | | 1,951,479 | |
3.00%, 07/15/12 | | | 800,000 | | | | 1,029,844 | |
1.88%, 07/15/13 | | | 100,000 | | | | 129,008 | |
1.13%, 01/15/21‡‡ | | | 4,700,000 | | | | 5,430,616 | |
2.38%, 01/15/25‡‡ | | | 850,000 | | | | 1,299,570 | |
2.38%, 01/15/27‡‡ | | | 1,480,000 | | | | 2,148,403 | |
3.88%, 04/15/29‡‡ | | | 808,000 | | | | 1,737,442 | |
2.13%, 02/15/41 | | | 2,150,000 | | | | 3,008,509 | |
| | | | | | | | |
| | | | | | | 16,734,871 | |
| | | | | | | | |
U.S. Treasury Notes | | | | | | | | |
1.38%, 02/15/13 | | | 70,000 | | | | 70,943 | |
0.50%, 05/31/13 | | | 40,000 | | | | 40,175 | |
0.38%, 07/31/13‡‡ | | | 9,300,000 | | | | 9,323,613 | |
0.13%, 08/31/13 | | | 140,000 | | | | 139,776 | |
0.25%, 11/30/13D | | | 8,800,000 | | | | 8,802,411 | |
1.88%, 02/28/14 | | | 370,000 | | | | 382,661 | |
0.38%, 11/15/14D | | | 6,000,000 | | | | 6,004,686 | |
0.25%, 12/15/14D | | | 3,600,000 | | | | 3,588,750 | |
1.50%, 06/30/16 | | | 410,000 | | | | 424,062 | |
1.00%, 08/31/16D | | | 1,770,000 | | | | 1,789,636 | |
1.00%, 09/30/16 | | | 400,000 | | | | 404,188 | |
1.00%, 10/31/16D | | | 500,000 | | | | 504,922 | |
0.88%, 11/30/16D | | | 500,000 | | | | 501,602 | |
2.88%, 03/31/18D | | | 1,000,000 | | | | 1,104,531 | |
2.25%, 07/31/18 | | | 4,100,000 | | | | 4,361,375 | |
| | | | | | | | |
| | | Par | | | Value | |
1.75%, 10/31/18 | | $ | 2,070,000 | | | $ | 2,130,806 | |
1.38%, 11/30/18 | | | 3,730,000 | | | | 3,743,406 | |
2.63%, 08/15/20 | | | 5,500,000 | | | | 5,932,696 | |
2.63%, 11/15/20 | | | 1,500,000 | | | | 1,615,078 | |
3.13%, 05/15/21D | | | 13,220,000 | | | | 14,763,025 | |
2.13%, 08/15/21D | | | 7,100,000 | | | | 7,283,045 | |
2.00%, 11/15/21D | | | 8,900,000 | | | | 9,002,911 | |
| | | | | | | | |
| | | | | | | 81,914,298 | |
| | | | | | | | |
Total U.S. Treasury Obligations
(Cost $129,635,956) | | | | 139,890,061 | |
| | | | | | | | |
| | |
| | | Shares | | | | |
PREFERRED STOCK — 0.3% | |
Wells Fargo & Co.*
(Cost $1,420,633) | | | 2,400 | | | | 2,529,600 | |
| | | | | | | | |
| | |
| | | Par | | | | |
REPURCHASE AGREEMENTS — 13.3% | |
J.P. Morgan Securities LLC | | | | | | | | |
0.07% (dated 12/30/11, due 01/03/12, repurchase price $6,000,047, collateralized by Federal National Mortgage Association, 0.950%, due 10/27/14, total market value $6,118,084) | | $ | 6,000,000 | | | | 6,000,000 | |
Morgan Stanley & Co., Inc. | | | | | | | | |
0.07% (dated 12/30/11, due 01/03/12, repurchase price $48,610,378, collateralized by Federal Home Loan Bank, 0.300%, due 05/16/2013, total market value $49,607,768) | | | 48,610,000 | | | | 48,610,000 | |
0.07% (dated 12/30/11, due 01/03/12, repurchase price $2,590,020, collateralized by Federal Home Loan Bank, 0.310%, due 05/16/2013, total market value $2,639,176) | | | 2,590,000 | | | | 2,590,000 | |
0.11% (dated 01/03/2012, due 01/04/2012, repurchase price $49,059,979, collateralized by Federal Home Loan Bank, 0.310%, due 05/16/2013, total market value $49,984,402) | | | 49,059,829 | | | | 49,059,829 | |
0.11% (dated 01/03/2012, due 01/04/2012, repurchase price $8,340,196, collateralized by Federal Home Loan Bank, 0.310%, due 05/16/2013, total market value $8,497,348) | | | 8,340,171 | | | | 8,340,171 | |
| | | | | | | | |
Total Repurchase Agreements
(Cost $114,600,000) | | | | 114,600,000 | |
| | | | | | | | |
|
| See Notes to Financial Statements. |
102 |
MEDIUM-DURATION BOND FUND
SCHEDULE OF INVESTMENTS (Continued)
| | | | | | | | |
| | | Shares | | | Value | |
MONEY MARKET FUNDS — 17.4% | |
GuideStone Money Market Fund (GS4 Class)¥ | | | 38,777,740 | | | $ | 38,777,740 | |
Northern Institutional Liquid Assets Portfolio§ | | | 111,295,148 | | | | 111,295,148 | |
| | | | | | | | |
Total Money Market Funds
(Cost $150,072,888) | | | | 150,072,888 | |
| | | | | | | | |
TOTAL INVESTMENTS — 145.5%
(Cost $1,260,502,928) | | | | 1,257,421,480 | |
| | | | | | | | |
| | |
| | | Notional
Amount | | | | |
WRITTEN OPTIONS — 0.0% | |
Put Swaptions — 0.0% | |
3-Month LIBOR, Strike Price $10.00, Expires 07/10/12 (BAR) | | $ | (300,000 | ) | | | — | |
3-Month LIBOR, Strike Price $10.00, Expires 07/10/12 (CS) | | | (100,000 | ) | | | — | |
3-Month LIBOR, Strike Price $10.00, Expires 07/10/12 (DEUT) | | | (500,000 | ) | | | — | |
3-Month LIBOR, Strike Price $10.00, Expires 07/10/12 (MSCS) | | | (5,600,000 | ) | | | (1 | ) |
3-Month LIBOR, Strike Price $2.25, Expires 09/24/12 (CITI) | | | (900,000 | ) | | | (364 | ) |
3-Month LIBOR, Strike Price $2.25, Expires 09/24/12 (UBS) | | | (400,000 | ) | | | (162 | ) |
| | | | | | | | |
Total Written Options
(Premiums received $(48,601)) | | | | (527 | ) |
| | | | | | | | |
| | |
| | | Par | | | | |
TBA SALE COMMITMENTS — (2.0)% | |
Federal Home Loan Mortgage Corporation | | | | | | | | |
5.50%, 01/01/39 TBA | | $ | (3,000,000 | ) | | | (3,255,000 | ) |
Federal National Mortgage Association | | | | | | | | |
5.00%, 02/12/38 TBA | | | (3,000,000 | ) | | | (3,234,375 | ) |
4.50%, 01/01/40 TBA | | | (2,000,000 | ) | | | (2,128,125 | ) |
5.00%, 01/01/40 TBA | | | (4,000,000 | ) | | | (4,321,250 | ) |
4.00%, 01/01/41 TBA | | | (4,000,000 | ) | | | (4,201,875 | ) |
| | | | | | | | |
Total TBA Sale Commitments
(Cost $(17,081,016)) | | | | (17,140,625 | ) |
| | | | | | | | |
| | |
Liabilities in Excess of Other Assets — (43.5)% | | | | | | | (376,038,674 | ) |
| | | | | | | | |
NET ASSETS — 100.0% | | | $ | 864,241,654 | |
| | | | | | | | |
Please see abbreviation and footnote definitions beginning on page 200.
PORTFOLIO SUMMARY (based on net assets)
| | | | |
| | | % | |
Mortgage-Backed Securities | | | 46.3 | |
Corporate Bonds | | | 22.3 | |
Foreign Bonds | | | 18.8 | |
Money Market Funds | | | 17.4 | |
U.S. Treasury Obligations | | | 16.2 | |
Repurchase Agreements | | | 13.3 | |
Agency Obligations | | | 5.0 | |
Asset-Backed Securities | | | 3.5 | |
Municipal Bonds | | | 2.4 | |
Preferred Stock | | | 0.3 | |
Swap Agreements | | | 0.2 | |
Purchased Options | | | — | ** |
Written Options | | | — | ** |
TBA Sale Commitments | | | (2.0 | ) |
Futures Contracts | | | (2.2 | ) |
Forward Foreign Currency Contracts | | | (4.9 | ) |
| | | | |
| | | 136.6 | |
| | | | |
| ** | Rounds to less than 0.005%. |
See Notes to Financial Statements.
103
Swap agreements outstanding at December 31, 2011:
| | | | | | | | | | | | | | | | | | | | | | | | | | | | | | | | |
Reference Obligation | | Fixed
Deal
(Pay)
Rate | | | Maturity
Date | | | Counterparty | | | Currency | | | Notional
Amount | | | Market
Value | | | Upfront
Premiums
Paid/
Received | | | Unrealized
Appreciation
(Depreciation) | |
Credit Default Swaps on Corporate Issues — Buy Protection | | | | | |
Target Corporation, 5.88% due 03/01/12 | | | (0.11 | )% | | | 06/20/12 | | | | MSCS | | | | USD | | | $ | 1,200,000 | | | $ | 15 | | | $ | — | | | $ | 15 | |
CitiFinancial, 6.63% due 06/01/15 | | | (0.15 | )% | | | 06/20/15 | | | | BAR | | | | USD | | | | 300,000 | | | | 23,353 | | | | — | | | | 23,353 | |
Nabors Industries, 5.375% due 05/15/12 | | | (1.00 | )% | | | 03/20/19 | | | | BNP | | | | USD | | | | 3,900,000 | | | | 293,305 | | | | 9,683 | | | | 283,622 | |
Credit Suisse, Inc., 6.50%, due 01/15/12 | | | (1.00 | )% | | | 09/20/20 | | | | GSC | | | | USD | | | | 300,000 | | | | (1,269 | ) | | | 6,743 | | | | (8,012 | ) |
| | | | | | | | | | | | | | | | | | | | | | | | | | | | | | | | |
| | | | | | | | | | | | | | | | | | $ | 5,700,000 | | | $ | 315,404 | | | $ | 16,426 | | | $ | 298,978 | |
| | | | | | | | | | | | | | | | | | | | | | | | | | | | | | | | |
| | | | | | | | | | | | | | | | | | | | | | | | | | | | | | | | | | | | |
Reference Obligation | | Implied
Credit
Spread | | | Fixed
Deal
(Pay)
Rate | | | Maturity
Date | | | Counterparty | | | Currency | | | Notional
Amount | | | Market
Value | | | Upfront
Premiums
Paid/
(Received) | | | Unrealized
Appreciation
(Depreciation) | |
Credit Default Swaps on Corporate Issues — Sell Protection | |
General Electric Capital Corporation, 5.625% due 09/15/17 | | | 1.82 | % | | | 1.00 | % | | | 09/20/13 | | | | UBS | | | | USD | | | $ | 900,000 | | | $ | (13,155 | ) | | $ | (22,539 | ) | | $ | 9,384 | |
Federated Republic of Brazil, 12.25% due 03/06/30 | | | 1.63 | % | | | (1.04 | )% | | | 05/20/17 | | | | DEUT | | | | USD | | | | 1,000,000 | | | | (27,385 | ) | | | — | | | | (27,385 | ) |
GMAC LLC, 6.88% due 08/28/12 | | | 6.62 | % | | | (3.53 | )% | | | 09/20/17 | | | | DEUT | | | | USD | | | | 4,100,000 | | | | (502,315 | ) | | | — | | | | (502,315 | ) |
| | | | | | | | | | | | | | | | | | | | | | | | | | | | | | | | | | | | |
| | | | | | | | | | | | | | | | | | | | | | $ | 6,000,000 | | | $ | (542,855 | ) | | $ | (22,539 | ) | | $ | (520,316 | ) |
| | | | | | | | | | | | | | | | | | | | | | | | | | | | | | | | | | | | |
| | | | | | | | | | | | | | | | | | | | | | | | | | | | | | | | |
Reference Obligation | | Fixed
Deal
(Pay)
Rate | | | Maturity
Date | | | Counterparty | | | Currency | | | Notional
Amount | | | Market
Value | | | Upfront
Premiums
Paid/
(Received) | | | Unrealized
Appreciation
(Depreciation) | |
Credit Default Swaps on Credit Indices — Buy Protection | | | | | |
Dow Jones CDX HY-8 Index | | | 1.60 | % | | | 06/20/12 | | | | MLCS | | | | USD | | | $ | 1,200,000 | | | $ | (6,081 | ) | | $ | — | | | $ | (6,081 | ) |
Dow Jones CDX IG16 Index | | | 1.00 | % | | | 06/20/14 | | | | BOA | | | | USD | | | | 5,200,000 | | | | (8,406 | ) | | | (50,884 | ) | | | 42,478 | |
Dow Jones CDX IG16 Index | | | 1.00 | % | | | 06/20/14 | | | | JPM | | | | USD | | | | 5,600,000 | | | | (12,745 | ) | | | (56,905 | ) | | | 44,160 | |
Dow Jones CDX IG16 Index | | | 1.00 | % | | | 06/20/14 | | | | DEUT | | | | USD | | | | 4,100,000 | | | | (9,331 | ) | | | (43,078 | ) | | | 33,747 | |
Dow Jones CDX IG16 Index | | | 1.00 | % | | | 06/20/14 | | | | JPM | | | | USD | | | | 5,300,000 | | | | (12,062 | ) | | | (57,631 | ) | | | 45,569 | |
Dow Jones CDX IG14 Index | | | (1.00 | )% | | | 06/20/15 | | | | UBS | | | | USD | | | | 3,900,000 | | | | 5,393 | | | | 3,932 | | | | 1,461 | |
Dow Jones CDX HY15 Index | | | 5.00 | % | | | 12/20/15 | | | | CITI | | | | USD | | | | 2,156,000 | | | | 68,013 | | | | (62,285 | ) | | | 130,298 | |
Dow Jones CDX IG16 Index | | | (1.00 | )% | | | 12/20/15 | | | | CS | | | | USD | | | | 1,200,000 | | | | 5,090 | | | | 7,751 | | | | (2,661 | ) |
Dow Jones CDX IG16 Index | | | (1.00 | )% | | | 06/20/16 | | | | CS | | | | USD | | | | 4,000,000 | | | | 27,631 | | | | 61,527 | | | | (33,896 | ) |
Dow Jones CDX.NA.NY 17 Index | | | (5.00 | )% | | | 12/20/16 | | | | CITI | | | | USD | | | | 2,325,000 | | | | 159,523 | | | | 183,981 | | | | (24,458 | ) |
Dow Jones CDX.NA.NY 17 Index | | | (5.00 | )% | | | 12/20/16 | | | | JPM | | | | USD | | | | 775,000 | | | | 53,174 | | | | 65,139 | | | | (11,965 | ) |
Dow Jones CDX.NA.NY 17 Index | | | (5.00 | )% | | | 12/20/16 | | | | DEUT | | | | USD | | | | 1,525,000 | | | | 104,633 | | | | 132,825 | | | | (28,192 | ) |
Dow Jones CDX.NA.NY 17 Index | | | (5.00 | )% | | | 12/20/16 | | | | DEUT | | | | USD | | | | 300,000 | | | | 20,584 | | | | 27,227 | | | | 6,643 | ) |
Dow Jones CDX.NA.NY 17 Index | | | (1.00 | )% | | | 12/20/16 | | | | DEUT | | | | USD | | | | 8,000,000 | | | | 70,460 | | | | 119,752 | | | | (49,292 | ) |
|
| See Notes to Financial Statements. |
104 |
MEDIUM-DURATION BOND FUND
SCHEDULE OF INVESTMENTS (Continued)
| | | | | | | | | | | | | | | | | | | | | | | | | | | | | | | | |
Reference Obligation | | Fixed
Deal
(Pay)
Rate | | | Maturity
Date | | | Counterparty | | | Currency | | | Notional
Amount | | | Market
Value | | | Upfront
Premiums
Paid/
(Received) | | | Unrealized
Appreciation
(Depreciation) | |
Dow Jones CDX IG9 Index | | | (0.80 | )% | | | 12/20/17 | | | | BAR | | | | USD | | | $ | 7,163,200 | | | $ | 267,470 | | | $ | 305,751 | | | $ | (38,281 | ) |
Dow Jones CDX IG10 Index | | | (1.50 | )% | | | 06/20/18 | | | | CS | | | | USD | | | | 7,356,800 | | | | (723 | ) | | | 63,728 | | | | (64,451 | ) |
| | | | | | | | | | | | | | | | | | | | | | | | | | | | | | | | |
| | | | | | | | | | | | | | | | | | $ | 60,101,000 | | | $ | 732,623 | | | $ | 700,830 | | | $ | 31,793 | |
| | | | | | | | | | | | | | | | | | | | | | | | | | | | | | | | |
| | | | | | | | | | | | | | | | | | | | | | | | | | | | | | | | | | | | |
Reference Obligation | | Implied
Credit
Spread | | | Fixed
Deal
(Pay)
Rate | | | Maturity
Date | | | Counterparty | | | Currency | | | Notional
Amount | | | Market
Value | | | Upfront
Premiums
Paid/
(Received) | | | Unrealized
Appreciation
(Depreciation) | |
Credit Default Swaps on Credit Indices — Sell Protection | |
Dow Jones CDX IG16 Index | | | 0.97 | % | | | 1.00 | % | | | 06/20/16 | | | | BOA | | | | USD | | | $ | 5,200,000 | | | $ | (39,369 | ) | | $ | 10,568 | | | $ | (49,937 | ) |
Dow Jones CDX IG16 Index | | | 0.94 | % | | | 1.00 | % | | | 06/20/16 | | | | DEUT | | | | USD | | | | 2,125,000 | | | | (14,687 | ) | | | 7,796 | | | | (22,483 | ) |
Dow Jones CDX IG16 Index | | | 0.94 | % | | | 1.00 | % | | | 06/20/16 | | | | JPM | | | | USD | | | | 4,825,000 | | | | (33,348 | ) | | | 18,108 | | | | (51,456 | ) |
| | | | | | | | | | | | | | | | | | | | | | | | | | | | | | | | | | | | |
| | | | | | | | | | | | | | | | | | | | | | $ | 12,150,000 | | | $ | (87,404 | ) | | $ | 36,472 | | | $ | (123,876 | ) |
| | | | | | | | | | | | | | | | | | | | | | | | | | | | | | | | | | | | |
| | | | | | | | | | | | | | | | | | | | | | | | | | | | | | | | |
Reference Obligation | | Fixed
Deal
(Pay)
Rate | | | Maturity
Date | | | Counterparty | | | Currency | | | Notional
Amount | | | Market
Value | | | Upfront
Premiums
Paid/
(Received) | | | Unrealized
Appreciation
(Depreciation) | |
Interest Rate Swaps | |
MXN-TIIE-Banxico | | | 6.50 | % | | | 03/05/13 | | | | MSCS | | | | MXN | | | $ | 15,600,000 | | | $ | 15,817 | | | $ | (611 | ) | | $ | 16,428 | |
3-Month LIBOR | | | 0.50 | % | | | 09/30/13 | | | | DEUT | | | | USD | | | | 9,200,000 | | | | (20,821 | ) | | | (7,849 | ) | | | (12,972 | ) |
6-Month LIBOR | | | (0.50 | )% | | | 09/30/13 | | | | DEUT | | | | USD | | | | 9,200,000 | | | | 34,481 | | | | 38,490 | | | | (4,009 | ) |
Brazil CETIP Interbank Deposit | | | 10.65 | % | | | 01/02/14 | | | | MSCS | | | | BRL | | | | 12,300,000 | | | | 12,754 | | | | 20,978 | | | | (8,224 | ) |
Brazil CETIP Interbank Deposit | | | 10.53 | % | | | 01/02/14 | | | | HSBC | | | | BRL | | | | 5,000,000 | | | | 2,673 | | | | 7,308 | | | | (4,635 | ) |
Brazil CETIP Interbank Deposit | | | 10.38 | % | | | 01/02/14 | | | | UBS | | | | BRL | | | | 1,200,000 | | | | 53 | | | | 3,365 | | | | (3,312 | ) |
Brazil CETIP Interbank Deposit | | | 10.77 | % | | | 01/02/14 | | | | UBS | | | | BRL | | | | 6,500,000 | | | | 18,509 | | | | 19,393 | | | | (884 | ) |
Brazil CETIP Interbank Deposit | | | 11.99 | % | | | 01/02/14 | | | | BAR | | | | BRL | | | | 1,700,000 | | | | 34,679 | | | | 285 | | | | 34,394 | |
Brazil CETIP Interbank Deposit | | | 11.94 | % | | | 01/02/14 | | | | HSBC | | | | BRL | | | | 14,400,000 | | | | 232,547 | | | | 36,983 | | | | 195,564 | |
Brazil CETIP Interbank Deposit | | | 12.56 | % | | | 01/02/14 | | | | HSBC | | | | BRL | | | | 5,800,000 | | | | 111,395 | | | | 7,604 | | | | 103,791 | |
Brazil CETIP Interbank Deposit | | | 12.51 | % | | | 01/02/14 | | | | BAR | | | | BRL | | | | 6,100,000 | | | | 114,420 | | | | 5,116 | | | | 109,304 | |
Brazil CETIP Interbank Deposit | | | 12.12 | % | | | 01/02/14 | | | | HSBC | | | | BRL | | | | 15,600,000 | | | | 355,324 | | | | 18,054 | | | | 337,270 | |
6-Month EURIBOR | | | 2.00 | % | | | 03/21/17 | | | | MSCS | | | | EUR | | | | 5,600,000 | | | | 85,666 | | | | (33,028 | ) | | | 118,694 | |
6-Month EURIBOR | | | 2.00 | % | | | 03/21/17 | | | | BAR | | | | EUR | | | | 5,600,000 | | | | 113,976 | | | | (35,994 | ) | | | 149,970 | |
|
See Notes to Financial Statements. 105 |
| | | | | | | | | | | | | | | | | | | | | | | | | | | | | | | | |
Reference Obligation | | Fixed
Deal
(Pay)
Rate | | | Maturity
Date | | | Counterparty | | | Currency | | | Notional
Amount | | | Market
Value | | | Upfront
Premiums
Paid/
(Received) | | | Unrealized
Appreciation
(Depreciation) | |
6-Month LIBOR | | | (1.75 | )% | | | 06/20/17 | | | | JPM | | | | USD | | | $ | 1,000,000 | | | $ | (16,826 | ) | | $ | (14,276 | ) | | $ | (2,550 | ) |
6-Month BBR BBSW Index | | | 5.50 | % | | | 12/15/17 | | | | BAR | | | | AUD | | | | 2,200,000 | | | | 131,503 | | | | (8,996 | ) | | | 140,499 | |
6-Month BBR BBSW Index | | | 5.50 | % | | | 12/15/17 | | | | DEUT | | | | AUD | | | | 1,300,000 | | | | 78,002 | | | | (4,749 | ) | | | 82,751 | |
6-Month LIBOR | | | (2.00 | )% | | | 06/20/19 | | | | JPM | | | | USD | | | | 5,400,000 | | | | (73,493 | ) | | | (50,754 | ) | | | (22,739 | ) |
3-Month LIBOR | | | 2.56 | % | | | 10/20/20 | | | | DEUT | | | | USD | | | | 2,800,000 | | | | 165,274 | | | | — | | | | 165,274 | |
3-Month LIBOR | | | (2.50 | )% | | | 06/20/22 | | | | DEUT | | | | USD | | | | 1,700,000 | | | | (53,364 | ) | | | (24,902 | ) | | | (28,462 | ) |
3-Month LIBOR | | | (2.50 | )% | | | 06/20/22 | | | | DEUT | | | | USD | | | | 1,100,000 | | | | (34,530 | ) | | | (16,082 | ) | | | (18,448 | ) |
6-Month LIBOR | | | (2.50 | )% | | | 06/20/22 | | | | DEUT | | | | USD | | | | 3,800,000 | | | | (119,286 | ) | | | (63,765 | ) | | | (55,521 | ) |
6-Month LIBOR | | | 2.50 | % | | | 06/20/22 | | | | JPM | | | | USD | | | | 1,200,000 | | | | 37,669 | | | | 36,325 | | | | 1,344 | |
6-Month LIBOR | | | 2.75 | % | | | 06/20/22 | | | | JPM | | | | USD | | | | 1,200,000 | | | | 37,669 | | | | 36,153 | | | | 1,516 | |
6-Month LIBOR | | | 2.75 | % | | | 06/20/27 | | | | JPM | | | | USD | | | | 800,000 | | | | 28,317 | | | | 14,323 | | | | 13,994 | |
6-Month LIBOR | | | (2.75 | )% | | | 06/20/42 | | | | JPM | | | | USD | | | | 600,000 | | | | (12,665 | ) | | | (5,446 | ) | | | (7,219 | ) |
| | | | | | | | | | | | | | | | | | | | | | | | | | | | | | | | |
| | | | | | | | | | | | | | | | | | $ | 136,900,000 | | | $ | 1,279,743 | | | $ | (22,075 | ) | | $ | 1,301,818 | |
| | | | | | | | | | | | | | | | | | | | | | | | | | | | | | | | |
Total Swap agreements outstanding at December 31, 2011 | | | | | | | | | | | $ | 1,697,511 | | | $ | 709,114 | | | $ | 988,397 | |
| | | | | | | | | | | | | | | | | | | | | | | | | | | | | | | | |
Please see abbreviation and footnote definitions beginning on page 200.
|
| See Notes to Financial Statements. |
106 |
MEDIUM-DURATION BOND FUND
SCHEDULE OF INVESTMENTS (Continued)
VALUATION HIERARCHY
The following is a summary of the inputs used, as of December 31, 2011, in valuing the Fund’s investments carried at fair value:
| | | | | | | | | | | | | | | | |
| | | Total Value | | | Level 1
Quoted Prices | | | Level 2
Other Significant
Observable Inputs | | | Level 3
Significant
Unobservable
Inputs | |
Assets: | | | | | | | | | | | | | | | | |
Investments in Securities: | | | | | | | | | | | | | | | | |
Agency Obligations | | $ | 43,257,469 | | | $ | — | | | $ | 43,257,469 | | | $ | — | |
Asset-Backed Securities | | | 30,350,612 | | | | — | | | | 30,166,620 | | | | 183,992 | |
Corporate Bonds | | | 193,109,207 | | | | — | | | | 191,864,993 | | | | 1,244,214 | |
Foreign Bonds | | | 162,878,023 | | | | — | | | | 162,878,009 | | | | 14 | |
Money Market Funds | | | 150,072,888 | | | | 150,072,888 | | | | — | | | | — | |
Mortgage-Backed Securities | | | 400,207,448 | | | | — | | | | 400,091,140 | | | | 116,308 | |
Municipal Bonds | | | 20,526,172 | | | | — | | | | 20,526,172 | | | | — | |
Preferred Stock | | | 2,529,600 | | | | 2,529,600 | | | | — | | | | — | |
Purchased Options | | | — | | | | — | | | | — | | | | — | |
Repurchase Agreements | | | 114,600,000 | | | | — | | | | 114,600,000 | | | | — | |
U.S. Treasury Obligations | | | 139,890,061 | | | | — | | | | 139,890,061 | | | | — | |
| | | | | | | | | | | | | | | | |
Total Assets — Investments in Securities | | $ | 1,257,421,480 | | | $ | 152,602,488 | | | $ | 1,103,274,464 | | | $ | 1,544,528 | |
| | | | | | | | | | | | | | | | |
Other Financial Instruments*** | | | | | | | | | | | | | | | | |
Futures Contracts | | $ | 158,300 | | | $ | 158,300 | | | $ | — | | | $ | — | |
Swap Agreements | | | 1,697,511 | | | | — | | | | 1,697,511 | | | | — | |
| | | | | | | | | | | | | | | | |
Total Assets — Other Financial Instruments | | $ | 1,855,811 | | | $ | 158,300 | | | $ | 1,697,511 | | | $ | — | |
| | | | | | | | | | | | | | | | |
Liabilities: | | | | | | | | | | | | | | | | |
Investments in Securities: | | | | | | | | | | | | | | | | |
TBA Sale Commitments | | $ | (17,140,625 | ) | | $ | — | | | $ | (17,140,625 | ) | | $ | — | |
Written Options | | | (527 | ) | | | — | | | | (527 | ) | | | — | |
| | | | | | | | | | | | | | | | |
Total Liabilities — Investments in Securities | | $ | (17,141,152 | ) | | $ | — | | | $ | (17,141,152 | ) | | $ | — | |
| | | | | | | | | | | | | | | | |
Other Financial Instruments*** | | | | | | | | | | | | | | | | |
Forward Foreign Currency Contracts | | $ | (539,494 | ) | | $ | — | | | $ | (539,494 | ) | | $ | — | |
| | | | | | | | | | | | | | | | |
Total Liabilities — Other Financial Instruments | | $ | (539,494 | ) | | $ | — | | �� | $ | (539,494 | ) | | $ | — | |
| | | | | | | | | | | | | | | | |
| *** | Other financial instruments are derivative instruments not reflected in the Schedule of Investments, such as futures, forwards and swap contracts, which are valued at the unrealized appreciation (depreciation) on the investment. Details of these investments can be found in the Notes to Schedules of Investments. |
See Notes to Financial Statements.
107
The following is a reconciliation of assets in which significant unobservable inputs (Level 3) were used in determining fair value:
| | | | | | | | | | | | | | | | | | | | | | | | |
| | | Total Value | | | Asset-
Backed
Securities | | | Common
Stocks | | | Corporate
Bonds | | | Foreign
Bonds | | | Mortgage-
Backed
Securities | |
| | | | | | |
Balance, 12/31/10 | | $ | 369,013 | | | $ | — | | | $ | 369,013 | | | $ | — | | | $ | — | | | $ | — | |
Accrued discounts/premiums | | | — | | | | — | | | | — | | | | — | | | | — | | | | — | |
Realized gain (loss)(1) | | | (540,758 | ) | | | — | | | | (540,758 | ) | | | — | | | | — | | | | — | |
Change in unrealized appreciation (depreciation)(2) | | | 446,039 | | | | — | | | | 446,036 | | | | — | | | | — | | | | 3 | |
Purchases | | | — | | | | — | | | | — | | | | — | | | | — | | | | — | |
Sales | | | (274,291 | ) | | | — | | | | (173,138 | ) | | | — | | | | — | | | | (101,153 | ) |
Transfers in and/or out of Level 3(3)(4) | | | 1,544,525 | | | | 183,992 | | | | (101,153 | ) | | | 1,244,214 | | | | 14 | | | | 217,458 | |
| | | | | | | | | | | | | | | | | | | | | | | | |
Balance, 12/31/11 | | $ | 1,544,528 | | | $ | 183,992 | | | $ | — | | | $ | 1,244,214 | | | $ | 14 | | | $ | 116,308 | |
| | | | | | | | | | | | | | | | | | | | | | | | |
| (1) | Realized gain (loss) from the sale of Level 3 securities can be found on the Statement of Operations in Net realized gain (loss) from Investment securities and securities sold short. |
| (2) | Change in unrealized appreciation (depreciation) can be found on the Statement of Operations in Net change in unrealized appreciation (depreciation) on Investment securities and securities sold short. |
| (3) | The Fund had securities valued at $1,580,983 as of December 31, 2010 that were transferred from Level 2 to Level 3 of the fair value hierarchy. The securities that transferred from Level 2 to Level 3 during the year ended December 31, 2011 did so as a result of the inability of the Fund to obtain a price which was determined using observable inputs. The value of the securities as of December 31, 2011 is $1,544,525. |
| (4) | Transfers in and/or out of Level 3 of $101,153 between Common Stocks and Mortgage-Backed Securities reflect the re-classification of a balance from December 31, 2010. |
|
| See Notes to Financial Statements. |
108 |
Extended-Duration Bond Fund
The year of 2011 was turbulent and was impacted by numerous macro-economic and political events that pushed and pulled on the capital markets. Although corporate fundamentals were improving, the potential outcome of such macro events were difficult to accurately predict, which fueled investors’ fears, led to extreme uncertainty and capital market volatility. The bond market benefited from this economic uncertainty and overall risk aversion. During 2011, the broad domestic bond market, as measured by the Barclay’s Capital U.S. Aggregate Bond Index, posted an annual return of 7.84%, compared to the U.S. stock market which generated a return of 2.11%, as measured by the S&P 500® Index. Despite the macro-economic headwinds, all major bond market sectors posted positive returns for the year, led by the U.S. Treasury sector. Throughout the year, U.S. Treasury yields fell, from their already low levels, in response to the Federal Reserve maintaining its commitment to a near zero federal funds rate for the foreseeable future and the implementation of “Operation Twist.” Treasuries also benefitted from high demand, as global investors often sought the “safe haven” assets when implementing “risk-off” trades. As a sector, U.S. Treasuries posted an annual return of 9.81%, with longer-dated Treasuries posting the highest returns in the bond market. The year ended at remarkably low levels with the yield on the 10-year U.S. Treasury bond at 1.88% and the 30-year U.S. Treasury bond at 2.89%. Non-U.S. Treasury, “spread sectors”, also performed well in this risk aversion environment. The investment grade corporate bond sector and mortgage-backed securities sector posted annual returns of 8.15% and 6.23%, respectively. Overall, higher-quality bonds generally outpaced lower-quality bonds while longer-maturity bonds typically outperformed shorter-maturity bonds. Within the longer-maturity space, long-term credit bonds posted an annual return of 17.13%, as measured by the Barclays Capital U.S. Long-Term Credit Index, compared to long-term government bonds which generated an annual return of 29.15%, as measured by the Barclays Capital U.S. Long-Term Government Index, for the one-year period ended December 31, 2011. Other sectors posted varied returns based on risk and correlations to the equity markets. High yield bonds (below investment grade corporate bonds), considered higher risk and more correlated to the equity market, posted an annual return of 4.98% while emerging market bonds generated an annual return 8.47%. U.S. Treasury inflation protected securities (“TIPS”) benefited from strong demand and inflationary concerns, posting an annual return of 13.56% as measured by the Barclays Capital U.S. TIPS Index.
The Fund invests in a diversified portfolio composed primarily of investment grade fixed income securities with an average dollar-weighted duration (a measure of bond prices’ sensitivity to changes in interest rates) normally greater than or equal to seven years. The GS4 Class of the Fund underperformed its composite benchmark index, 50% Barclays Capital U.S. Long-Term Government Index and 50% Barclays Capital U.S. Long-Term Credit Index, for the one-year period ended December 31, 2011 (13.14% versus 23.22%). The Fund’s benchmark-relative performance was negatively impacted by the Fund’s significant underweight to the U.S. Treasury sector. Throughout the year, the Fund underweighted lower yielding U.S. Treasury securities in favor of higher yielding corporate bonds, non-U.S. bonds and high yield bonds. These sectors, which traded at a yield premium to U.S. Treasuries, appeared attractive on a valuation basis. A by-product of underweighting U.S. Treasuries was the Fund’s higher-than-benchmark yield, which provided incremental interest income. The Fund’s relative performance was also negatively impacted by maintaining a duration position somewhat shorter than its composite benchmarks during a period when longer-duration bonds outperformed. During the year, the Fund remained focused on its objective of seeking maximum total return consistent with preservation of capital.
This Fund may be suitable for investors who are seeking higher returns without investing in stocks, can accept short-term fluctuations in account value and want to diversify their portfolio with a fixed income investment option. This Fund is subject to interest rate risk. Meaning, when interest rates rise, the value of the existing bonds decrease and vice versa. Changes in interest rates have a bigger impact on long duration holdings than on short duration holdings. To the extent that the investment advisor misjudges current market conditions, the Fund’s volatility may be amplified by its use of short sales and derivatives and by its ability to select sub-advisers to allocate assets. Short sales by a fund theoretically involve unlimited loss potential since the market price of securities sold short may continuously increase. Leverage may increase the risk of loss and cause fluctuations in the market value of the Fund’s portfolio to have disproportionately large effects or cause the NAV of the Fund generally to decline faster than it would otherwise.
Please see page 118 for information regarding specific portfolio allocations. Portfolio holdings are subject to change and risk at any time.
109
Extended-Duration Bond Fund
| | | | | | | | | | | | |
Average Annual Total Returns as of 12/31/11 | |
| | | GS2
Class* | | | GS4
Class* | | | Benchmark** | |
One Year | | | 13.33 | % | | | 13.14 | % | | | 23.22 | % |
Five Year | | | 9.69 | % | | | 9.51 | % | | | 9.85 | % |
Ten Year | | | 8.87 | % | | | 8.69 | % | | | 8.64 | % |
Since Inception | | | 8.79 | % | | | 8.65 | % | | | 8.40 | % |
Inception Date | | | 08/27/01 | | | | 08/27/01 | | | | | |
Total Fund Operating Expenses (April 30, 2011 Prospectus, as amended on September 1, 2011)(1) | | | 0.53 | % | | | 0.77 | % | | | | |
| (1) | Current information regarding the Fund’s Operating Expenses can be found in the Financial Highlights. |
The performance data quoted represents past performance and does not guarantee future results. Current performance may be lower or higher. Performance data current to the most recent month-end may be obtained at www.GuideStoneFunds.org. The investment return and principal value of an investment will fluctuate so that shares, when redeemed, may be worth more or less than their original cost.
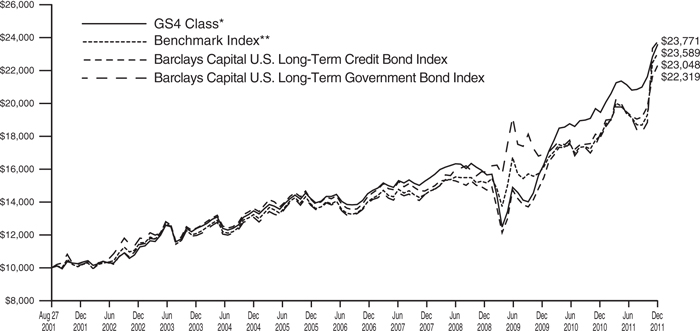
The graph compares the results of a hypothetical $10,000 investment in the GS4 Class of the Fund since August 27, 2001 (commencement of operations), with all dividends and capital gains reinvested, with the weighted composite benchmark index.
| * | These returns reflect expense waivers by the Fund’s investment adviser. Without these waivers, returns would have been lower. Returns shown do not reflect the deduction of taxes that a shareholder would pay on Fund distributions or the redemption of Fund shares. |
| ** | Represents a weighted composite benchmark index consisting of 50% Barclays Capital U.S. Long-Term Government Bond Index and 50% Barclays Capital U.S. Long-Term Credit Bond Index. |
The Barclays Capital U.S. Long-Term Government Bond Index is composed of all bonds covered by the Barclays Capital U.S. Government Bond Index with maturities of 10 years or greater.
The Barclays Capital U.S. Long-Term Credit Bond Index is composed of a subset of the Barclays Capital U.S. Credit Bond Index covering all corporate, publicly issued, fixed-rate, nonconvertible U.S. debt issues rated at least Baa with at least $50 million principal outstanding and maturity greater than 10 years.
Unlike a mutual fund, the performance of an index assumes no taxes, transaction costs, management fees or other expenses.
110
| | |
| EXTENDED-DURATION BOND FUND | | |
| SCHEDULE OF INVESTMENTS | | December 31, 2011 |
| | | | | | | | |
| | | Par | | | Value | |
CORPORATE BONDS — 58.0% | |
Aflac, Inc. | | | | | | | | |
6.90%, 12/17/39 | | $ | 2,669,000 | | | $ | 2,977,280 | |
6.45%, 08/15/40D | | | 5,705,000 | | | | 6,062,510 | |
Alcoa, Inc. | | | | | | | | |
5.87%, 02/23/22D | | | 10,000 | | | | 10,092 | |
6.75%, 01/15/28D | | | 235,000 | | | | 242,234 | |
5.95%, 02/01/37D | | | 5,326,000 | | | | 5,067,199 | |
Ally Financial, Inc. | | | | | | | | |
8.00%, 11/01/31 | | | 199,000 | | | | 193,030 | |
Alta Wind Holdings LLC | | | | | | | | |
7.00%, 06/30/35 144A | | | 566,719 | | | | 624,867 | |
American Express Co. | | | | | | | | |
8.15%, 03/19/38 | | | 3,752,000 | | | | 5,585,561 | |
American International Group, Inc. | | | | | | | | |
5.45%, 05/18/17 | | | 30,000 | | | | 28,735 | |
Andarko Petroleum Corporation | | | | | | | | |
7.15%, 05/15/28 | | | 250,000 | | | | 290,000 | |
AT&T Corporation | | | | | | | | |
6.50%, 03/15/29 | | | 125,000 | | | | 149,858 | |
6.50%, 09/01/37 | | | 8,530,000 | | | | 10,657,263 | |
Bank of America Corporation | | | | | | | | |
5.49%, 03/15/19D | | | 300,000 | | | | 258,943 | |
7.63%, 06/01/19 | | | 970,000 | | | | 1,004,604 | |
5.00%, 05/13/21D | | | 140,000 | | | | 127,749 | |
6.50%, 09/15/37D | | | 100,000 | | | | 82,123 | |
Bank of America NA | | | | | | | | |
6.00%, 10/15/36 | | | 8,152,000 | | | | 6,800,129 | |
Barrick North America Finance LLC | | | | | | | | |
5.70%, 05/30/41 | | | 1,634,000 | | | | 1,943,194 | |
Bell South Tele-communications, Inc. | | | | | | | | |
7.00%, 12/01/95 | | | 1,000,000 | | | | 1,261,002 | |
Bruce Mansfield Unit | | | | | | | | |
6.85%, 06/01/34 | | | 1,216,973 | | | | 1,326,244 | |
California Institute of Technology | | | | | | | | |
4.70%, 11/01/11 | | | 2,880,000 | | | | 2,990,391 | |
Camden Property Trust | | | | | | | | |
5.70%, 05/15/17D | | | 25,000 | | | | 27,406 | |
CenturyLink, Inc. | | | | | | | | |
6.45%, 06/15/21 | | | 260,000 | | | | 260,935 | |
6.88%, 01/15/28D | | | 65,000 | | | | 60,735 | |
7.60%, 09/15/39 | | | 755,000 | | | | 742,965 | |
Chesapeake Energy Corporation | | | | | | | | |
2.50%, 05/15/37 | | | 100,000 | | | | 89,625 | |
2.25%, 12/15/38 | | | 50,000 | | | | 41,500 | |
CIT Group, Inc. | | | | | | | | |
7.00%, 05/01/15 | | | 153,940 | | | | 154,440 | |
7.00%, 05/01/17 | | | 359,197 | | | | 359,646 | |
Citigroup, Inc. | | | | | | | | |
6.88%, 06/01/25 | | | 2,441,000 | | | | 2,578,409 | |
5.88%, 05/29/37D | | | 1,141,000 | | | | 1,143,322 | |
8.13%, 07/15/39 | | | 4,174,000 | | | | 5,126,173 | |
Comcast Corporation | | | | | | | | |
5.65%, 06/15/35 | | | 660,000 | | | | 731,577 | |
6.50%, 11/15/35D | | | 555,000 | | | | 671,187 | |
6.45%, 03/15/37 | | | 2,415,000 | | | | 2,937,509 | |
6.95%, 08/15/37 | | | 625,000 | | | | 797,864 | |
Continental Airlines, Inc. | | | | | | | | |
9.00%, 01/08/18 | | | 1,824,127 | | | | 2,006,539 | |
| | | | | | | | |
| | | Par | | | Value | |
8.31%, 04/02/18 | | $ | 183,523 | | | $ | 179,394 | |
7.57%, 03/15/20 | | | 157,704 | | | | 155,527 | |
Corning, Inc. | | | | | | | | |
7.25%, 08/15/36 | | | 850,000 | | | | 1,027,847 | |
Cummins, Inc. | | | | | | | | |
6.75%, 02/15/27 | | | 1,000,000 | | | | 1,221,313 | |
5.65%, 03/01/98D | | | 2,520,000 | | | | 2,481,000 | |
Darden Restaurants, Inc. | | | | | | | | |
6.00%, 08/15/35 | | | 990,000 | | | | 1,016,632 | |
DCP Midstream LLP | | | | | | | | |
6.45%, 11/03/36 144A | | | 490,000 | | | | 560,665 | |
Dillard’s, Inc. | | | | | | | | |
7.75%, 07/15/26D | | | 890,000 | | | | 841,050 | |
7.00%, 12/01/28D | | | 500,000 | | | | 462,500 | |
Dow Chemical Co. | | | | | | | | |
9.40%, 05/15/39 | | | 920,000 | | | | 1,387,208 | |
Duke Realty LP | | | | | | | | |
5.95%, 02/15/17 | | | 70,000 | | | | 75,342 | |
First Industrial LP | | | | | | | | |
7.60%, 07/15/28 | | | 1,000,000 | | | | 933,753 | |
Foot Locker, Inc. | | | | | | | | |
8.50%, 01/15/22 | | | 1,000,000 | | | | 1,035,000 | |
Ford Motor Co. | | | | | | | | |
4.25%, 11/15/16 | | | 175,000 | | | | 251,781 | |
6.63%, 10/01/28D | | | 680,000 | | | | 719,413 | |
6.38%, 02/01/29 | | | 1,255,000 | | | | 1,295,614 | |
General Electric Capital Corporation | | | | | | | | |
4.88%, 03/04/15D | | | 510,000 | | | | 553,730 | |
6.75%, 03/15/32 | | | 3,000,000 | | | | 3,523,107 | |
6.15%, 08/07/37 | | | 6,114,000 | | | | 6,710,445 | |
5.88%, 01/14/38 | | | 150,000 | | | | 159,480 | |
Goldman Sachs Group, Inc. | | | | | | | | |
5.38%, 03/15/20 | | | 415,000 | | | | 410,286 | |
6.75%, 10/01/37 | | | 65,000 | | | | 60,660 | |
Halliburton Co. | | | | | | | | |
7.45%, 09/15/39D | | | 870,000 | | | | 1,261,519 | |
4.50%, 11/15/41 | | | 1,150,000 | | | | 1,184,394 | |
HCA, Inc. | | | | | | | | |
7.58%, 09/15/25 | | | 1,000,000 | | | | 890,000 | |
7.05%, 12/01/27 | | | 500,000 | | | | 421,875 | |
Hewlett-Packard Co. | | | | | | | | |
6.00%, 09/15/41 | | | 2,810,000 | | | | 3,120,946 | |
Home Depot, Inc. | | | | | | | | |
5.88%, 12/16/36 | | | 875,000 | | | | 1,101,967 | |
HSBC Bank USA NA | | | | | | | | |
7.00%, 01/15/39 | | | 5,948,000 | | | | 6,469,556 | |
Intel Corporation | | | | | | | | |
3.25%, 08/01/39 | | | 1,155,000 | | | | 1,452,413 | |
International Lease Finance Corporation | | | | | | | | |
5.65%, 06/01/14 | | | 105,000 | | | | 100,800 | |
8.63%, 09/15/15 | | | 5,000 | | | | 5,144 | |
International Paper Co. | | | | | | | | |
8.70%, 06/15/38 | | | 2,643,000 | | | | 3,596,851 | |
iStar Financial, Inc. | | | | | | | | |
8.63%, 06/01/13D | | | 635,000 | | | | 593,725 | |
5.95%, 10/15/13 | | | 305,000 | | | | 264,588 | |
5.70%, 03/01/14 | | | 1,171,000 | | | | 986,568 | |
JC Penney Corporation, Inc. | | | | | | | | |
6.38%, 10/15/36 | | | 414,000 | | | | 348,278 | |
JPMorgan Chase & Co. | | | | | | | | |
5.60%, 07/15/41 | | | 6,827,000 | | | | 7,173,969 | |
|
| See Notes to Financial Statements. |
111 |
| | | | | | | | |
| | | Par | | | Value | |
Kinder Morgan Energy Partners LP | | | | | | | | |
5.80%, 03/15/35D | | $ | 280,000 | | | $ | 289,453 | |
Kraft Foods, Inc. | | | | | | | | |
6.50%, 11/01/31 | | | 815,000 | | | | 1,016,266 | |
7.00%, 08/11/37D | | | 525,000 | | | | 703,771 | |
6.88%, 02/01/38 | | | 3,243,000 | | | | 4,309,188 | |
6.50%, 02/09/40 | | | 3,013,000 | | | | 3,934,131 | |
Lennar Corporation | | | | | | | | |
6.50%, 04/15/16D | | | 625,000 | | | | 621,875 | |
Liberty Mutual Group, Inc. | | | | | | | | |
6.50%, 03/15/35 144A | | | 1,400,000 | | | | 1,368,861 | |
Macy’s Retail Holdings, Inc. | | | | | | | | |
6.38%, 03/15/37D | | | 240,000 | | | | 279,744 | |
Masco Corporation | | | | | | | | |
7.13%, 03/15/20 | | | 175,000 | | | | 176,886 | |
7.75%, 08/01/29 | | | 100,000 | | | | 97,295 | |
Massachusetts Institute of Technology | | | | | | | | |
5.60%, 07/01/11 | | | 1,927,000 | | | | 2,666,739 | |
Mead Corporation | | | | | | | | |
7.55%, 03/01/47 | | | 515,000 | | | | 503,214 | |
Merrill Lynch & Co., Inc. | | | | | | | | |
6.05%, 05/16/16 | | | 200,000 | | | | 188,688 | |
6.22%, 09/15/26 | | | 400,000 | | | | 330,684 | |
6.11%, 01/29/37 | | | 500,000 | | | | 386,538 | |
MetLife, Inc. | | | | | | | | |
6.40%, 12/15/36 | | | 310,000 | | | | 294,888 | |
5.88%, 02/06/41D | | | 6,373,000 | | | | 7,486,695 | |
Micron Technology, Inc. | | | | | | | | |
1.88%, 06/01/14D | | | 20,000 | | | | 19,200 | |
Morgan Stanley | | | | | | | | |
5.45%, 01/09/17 | | | 5,000 | | | | 4,819 | |
6.63%, 04/01/18 | | | 70,000 | | | | 69,208 | |
5.63%, 09/23/19 | | | 195,000 | | | | 180,861 | |
5.50%, 01/26/20 | | | 100,000 | | | | 91,171 | |
5.50%, 07/24/20 | | | 300,000 | | | | 273,220 | |
5.75%, 01/25/21 | | | 300,000 | | | | 280,323 | |
6.25%, 08/09/26D | | | 100,000 | | | | 92,275 | |
Motorola Solutions, Inc. | | | | | | | | |
6.63%, 11/15/37 | | | 46,000 | | | | 47,658 | |
Mutual of Omaha Insurance Co. | | | | | | | | |
6.80%, 06/15/36 144A | | | 100,000 | | | | 106,984 | |
Nationwide Mutual Insurance Co. | | | | | | | | |
6.60%, 04/15/34 144A | | | 150,000 | | | | 137,905 | |
Nortel Networks Capital Corporation | | | | | | | | |
7.88%, 06/15/26# | | | 445,000 | | | | 473,925 | |
Old Republic International Corporation | | | | | | | | |
3.75%, 03/15/18D | | | 1,980,000 | | | | 1,749,825 | |
Owens Corning | | | | | | | | |
7.00%, 12/01/36 | | | 3,940,000 | | | | 4,038,898 | |
Owens Corning, Inc. | | | | | | | | |
6.50%, 12/01/16 | | | 240,000 | | | | 262,208 | |
Penn Mutual Life Insurance Co. | | | | | | | | |
7.63%, 06/15/40 144A | | | 1,750,000 | | | | 2,152,706 | |
Pioneer Natural Resources Co. | | | | | | | | |
7.20%, 01/15/28 | | | 2,500,000 | | | | 2,870,590 | |
ProLogis LP | | | | | | | | |
5.63%, 11/15/15 | | | 35,000 | | | | 37,257 | |
Prudential Financial, Inc. | | | | | | | | |
6.63%, 06/21/40 | | | 5,412,000 | | | | 5,998,774 | |
5.63%, 05/12/41 | | | 987,000 | | | | 973,796 | |
| | | | | | | | |
| | | Par | | | Value | |
Pulte Group, Inc. | | | | | | | | |
5.20%, 02/15/15D | | $ | 38,000 | | | $ | 35,720 | |
7.88%, 06/15/32 | | | 1,500,000 | | | | 1,215,000 | |
6.38%, 05/15/33 | | | 1,000,000 | | | | 697,500 | |
Qwest Corporation | | | | | | | | |
7.25%, 09/15/25D | | | 1,000,000 | | | | 1,099,579 | |
6.88%, 09/15/33 | | | 2,250,000 | | | | 2,246,153 | |
Sempra Energy | | | | | | | | |
6.00%, 10/15/39 | | | 3,018,000 | | | | 3,737,657 | |
SLM Corporation | | | | | | | | |
5.00%, 10/01/13 | | | 250,000 | | | | 250,625 | |
5.38%, 05/15/14D | | | 200,000 | | | | 200,250 | |
Southern Natural Gas Co. | | | | | | | | |
7.35%, 02/15/31 | | | 1,750,000 | | | | 2,066,320 | |
Sprint Capital Corporation | | | | | | | | |
6.90%, 05/01/19 | | | 55,000 | | | | 45,512 | |
6.88%, 11/15/28 | | | 2,350,000 | | | | 1,689,062 | |
8.75%, 03/15/32 | | | 20,000 | | | | 16,275 | |
Target Corporation | | | | | | | | |
7.00%, 01/15/38 | | | 2,330,000 | | | | 3,268,354 | |
Tennessee Gas Pipeline Co. | | | | | | | | |
7.00%, 10/15/28 | | | 750,000 | | | | 865,699 | |
Textron, Inc. | | | | | | | | |
6.63%, 04/07/20(U) | | | 160,000 | | | | 272,476 | |
Time Warner Cable, Inc. | | | | | | | | |
6.55%, 05/01/37 | | | 1,049,000 | | | | 1,197,062 | |
6.75%, 06/15/39 | | | 2,995,000 | | | | 3,551,276 | |
5.88%, 11/15/40 | | | 1,700,000 | | | | 1,846,480 | |
Time Warner Entertainment Co. LP | | | | | | | | |
8.38%, 07/15/33 | | | 1,049,000 | | | | 1,378,851 | |
Toro Co. | | | | | | | | |
6.63%, 05/01/37@ | | | 300,000 | | | | 314,610 | |
Travelers Cos., Inc. | | | | | | | | |
6.25%, 06/15/37 | | | 4,825,000 | | | | 6,020,804 | |
UnitedHealth Group, Inc. | | | | | | | | |
5.80%, 03/15/36 | | | 920,000 | | | | 1,104,508 | |
6.50%, 06/15/37 | | | 767,000 | | | | 978,883 | |
6.63%, 11/15/37 | | | 2,526,000 | | | | 3,254,231 | |
5.70%, 10/15/40 | | | 1,210,000 | | | | 1,454,251 | |
University of Southern California | | | | | | | | |
5.25%, 10/01/11 | | | 3,014,000 | | | | 3,803,858 | |
Verizon Communications, Inc. | | | | | | | | |
5.85%, 09/15/35 | | | 2,420,000 | | | | 2,901,265 | |
6.40%, 02/15/38 | | | 968,000 | | | | 1,233,130 | |
6.90%, 04/15/38 | | | 1,000,000 | | | | 1,341,259 | |
8.95%, 03/01/39 | | | 105,000 | | | | 168,714 | |
7.35%, 04/01/39 | | | 979,000 | | | | 1,373,447 | |
6.00%, 04/01/41 | | | 2,770,000 | | | | 3,447,578 | |
Verizon Maryland, Inc. | | | | | | | | |
5.13%, 06/15/33 | | | 150,000 | | | | 157,325 | |
Wachovia Bank NA | | | | | | | | |
5.85%, 02/01/37D | | | 4,577,000 | | | | 4,806,157 | |
6.60%, 01/15/38 | | | 3,757,000 | | | | 4,274,666 | |
WellPoint, Inc. | | | | | | | | |
5.95%, 12/15/34 | | | 846,000 | | | | 1,002,925 | |
6.38%, 06/15/37 | | | 2,766,000 | | | | 3,503,106 | |
Western Union Co. | | | | | | | | |
6.20%, 11/17/36 | | | 3,125,000 | | | | 3,335,872 | |
6.20%, 06/21/40 | | | 20,000 | | | | 21,491 | |
Weyerhaeuser Co. | | | | | | | | |
8.50%, 01/15/25 | | | 520,000 | | | | 598,131 | |
6.88%, 12/15/33 | | | 580,000 | | | | 572,602 | |
|
| See Notes to Financial Statements. |
112 |
EXTENDED-DURATION BOND FUND
SCHEDULE OF INVESTMENTS (Continued)
| | | | | | | | |
| | | Par | | | Value | |
Wyndham Worldwide Corporation | | | | | | | | |
5.75%, 02/01/18 | | $ | 50,000 | | | $ | 52,999 | |
| | | | | | | | |
Total Corporate Bonds
(Cost $208,953,513) | | | | 235,365,362 | |
| | | | | | | | |
FOREIGN BONDS — 22.7% | |
Australia — 2.0% | |
Barrick PD Australia Finance Pty, Ltd. | | | | | | | | |
5.95%, 10/15/39 | | | 2,870,000 | | | | 3,334,642 | |
General Electric Capital Australia Funding, Ltd. | | | | | | | | |
8.00%, 02/13/12(A) | | | 60,000 | | | | 61,527 | |
New South Wales Treasury Corporation | | | | | | | | |
6.00%, 05/01/12(A) | | | 845,000 | | | | 869,504 | |
Qantas Airways, Ltd. | | | | | | | | |
6.05%, 04/15/16 144A | | | 345,000 | | | | 356,586 | |
Rio Tinto Finance USA, Ltd. | | | | | | | | |
5.20%, 11/02/40 | | | 3,186,000 | | | | 3,663,400 | |
| | | | | | | | |
| | | | | | | 8,285,659 | |
| | | | | | | | |
Brazil — 0.4% | |
Brazilian Government International Bond | | | | | | | | |
10.25%, 01/10/28(B) | | | 2,525,000 | | | | 1,549,993 | |
| | | | | | | | |
Canada — 4.8% | |
Canada Generic Residual STRIP | | | | | | | | |
0.00%, 06/01/25(C)W | | | 3,685,000 | | | | 2,644,121 | |
Methanex Corporation | | | | | | | | |
6.00%, 08/15/15 | | | 25,000 | | | | 25,763 | |
Ontario Generic Residual STRIP | | | | | | | | |
0.00%, 07/13/22(C)W | | | 3,025,000 | | | | 2,055,456 | |
0.00%, 03/08/29(C)W | | | 7,000,000 | | | | 3,747,328 | |
Saskatchewan Residual STRIP | | | | | | | | |
0.00%, 04/10/14(C)W | | | 3,535,000 | | | | 3,365,925 | |
0.00%, 02/04/22(C)W | | | 3,000,000 | | | | 2,090,770 | |
Talisman Energy, Inc. | | | | | | | | |
6.25%, 02/01/38 | | | 450,000 | | | | 543,477 | |
TransCanada PipeLines, Ltd. | | | | | | | | |
6.20%, 10/15/37 | | | 3,541,000 | | | | 4,429,097 | |
Xstrata Canada Financial Corporation | | | | | | | | |
6.00%, 11/15/41 144A | | | 737,000 | | | | 758,901 | |
| | | | | | | | |
| | | | | | | 19,660,838 | |
| | | | | | | | |
Cayman Islands — 0.2% | |
Enersis SA | | | | | | | | |
7.40%, 12/01/16 | | | 625,000 | | | | 745,273 | |
| | | | | | | | |
Finland — 1.0% | |
Nokia OYJ | | | | | | | | |
6.63%, 05/15/39 | | | 4,410,000 | | | | 4,240,810 | |
| | | | | | | | |
Ireland — 1.2% | |
Ireland Government Bond | | | | | | | | |
4.50%, 10/18/18(E) | | | 1,150,000 | | | | 1,187,701 | |
5.00%, 10/18/20(E) | | | 75,000 | | | | 80,298 | |
5.40%, 03/13/25(E) | | | 1,300,000 | | | | 1,354,043 | |
XL Capital, Ltd. | | | | | | | | |
6.38%, 11/15/24 | | | 585,000 | | | | 616,342 | |
| | | | | | | | |
| | | Par | | | Value | |
XL Group PLC | | | | | | | | |
6.25%, 05/15/27D | | $ | 1,530,000 | | | $ | 1,554,217 | |
| | | | | | | | |
| | | | | | | 4,792,601 | |
| | | | | | | | |
Italy — 0.3% | |
Italy Buoni Poliennali Del Tesoro | | | | | | | | |
5.25%, 11/01/29(E) | | | 25,000 | | | | 26,951 | |
5.75%, 02/01/33(E) | | | 25,000 | | | | 27,938 | |
5.00%, 08/01/34(E) | | | 25,000 | | | | 25,750 | |
Telecom Italia Capital SA | | | | | | | | |
6.38%, 11/15/33 | | | 525,000 | | | | 398,621 | |
6.00%, 09/30/34 | | | 740,000 | | | | 549,780 | |
| | | | | | | | |
| | | | | | | 1,029,040 | |
| | | | | | | | |
Luxembourg — 2.1% | |
ArcelorMittal | | | | | | | | |
6.13%, 06/01/18D | | | 435,000 | | | | 430,151 | |
5.50%, 03/01/21 | | | 45,000 | | | | 41,378 | |
7.00%, 10/15/39 | | | 4,682,000 | | | | 4,363,755 | |
6.75%, 03/01/41D | | | 2,463,000 | | | | 2,221,399 | |
Enel Finance International NV | | | | | | | | |
6.00%, 10/07/39 144A | | | 1,710,000 | | | | 1,380,391 | |
| | | | | | | | |
| | | | | | | 8,437,074 | |
| | | | | | | | |
Malaysia — 0.1% | |
Telekom Malaysia BhD | | | | | | | | |
7.88%, 08/01/25 144A | | | 225,000 | | | | 300,405 | |
| | | | | | | | |
Mexico — 0.7% | |
Mexican Bonos | | | | | | | | |
8.00%, 12/07/23(M) | | | 34,000,000 | | | | 2,734,758 | |
| | | | | | | | |
Netherlands — 1.2% | |
EDP Finance BV | | | | | | | | |
6.00%, 02/02/18 144AD | | | 600,000 | | | | 505,323 | |
4.90%, 10/01/19 144A | | | 600,000 | | | | 463,680 | |
Koninklijke Philips Electronics NV | | | | | | | | |
6.88%, 03/11/38 | | | 3,250,000 | | | | 4,112,137 | |
| | | | | | | | |
| | | | | | | 5,081,140 | |
| | | | | | | | |
Norway — 0.6% | |
Norway Government Bond | | | | | | | | |
5.00%, 05/15/15(K)D | | | 540,000 | | | | 100,378 | |
4.25%, 05/19/17(K) | | | 11,940,000 | | | | 2,229,115 | |
| | | | | | | | |
| | | | | | | 2,329,493 | |
| | | | | | | | |
Portugal — 0.1% | |
Portugal Obrigacoesdo Tesouro OT | | | | | | | | |
4.80%, 06/15/20(E) | | | 75,000 | | | | 53,579 | |
3.85%, 04/15/21(E) | | | 250,000 | | | | 169,773 | |
| | | | | | | | |
| | | | | | | 223,352 | |
| | | | | | | | |
Spain — 0.4% | |
Telefonica Emisones SAU | | | | | | | | |
7.05%, 06/20/36 | | | 1,495,000 | | | | 1,461,904 | |
| | | | | | | | |
Supranational — 1.8% | |
Inter-American Development Bank | | | | | | | | |
6.00%, 12/15/17(Z) | | | 6,365,000 | | | | 5,468,310 | |
|
See Notes to Financial Statements. 113 |
| | | | | | | | |
| | | Par | | | Value | |
International Bank For Reconstruction & Development | | | | | | | | |
1.43%, 03/05/14(G) | | $ | 2,470,000 | | | $ | 1,935,916 | |
| | | | | | | 7,404,226 | |
United Kingdom — 5.8% | |
Barclays Bank PLC | | | | | | | | |
3.68%, 08/20/15(W) | | | 740,000,000 | | | | 647,796 | |
10.18%, 06/12/21 144A | | | 7,312,000 | | | | 7,766,368 | |
BG Energy Capital PLC | | | | | | | | |
5.13%, 10/15/41 144AD | | | 1,785,000 | | | | 1,939,367 | |
HBOS PLC | | | | | | | | |
6.00%, 11/01/33 144A | | | 590,000 | | | | 361,780 | |
HSBC Holdings PLC | | | | | | | | |
6.80%, 06/01/38 | | | 2,000,000 | | | | 2,077,942 | |
Lloyds TSB Bank PLC | | | | | | | | |
5.80%, 01/13/20 144A | | | 6,830,000 | | | | 6,494,435 | |
6.38%, 01/21/21 | | | 1,749,000 | | | | 1,755,716 | |
Royal Bank of Scotland PLC | | | | | | | | |
6.13%, 01/11/21D | | | 1,988,000 | | | | 1,964,571 | |
Standard Chartered Bank | | | | | | | | |
6.40%, 09/26/17 144A | | | 650,000 | | | | 670,094 | |
| | | | | | | 23,678,069 | |
Total Foreign Bonds
(Cost $86,098,314) | | | | 91,954,635 | |
| | | | | | | | |
MORTGAGE-BACKED SECURITIES — 0.5% | |
Community Program Loan Trust | | | | | | | | |
4.50%, 04/01/29 | | | 1,950,000 | | | | 1,875,931 | |
Federal Home Loan Mortgage Corporation | | | | | | | | |
5.00%, 12/01/31 | | | 89,766 | | | | 96,775 | |
Total Mortgage-Backed Securities
(Cost $1,810,994) | | | | 1,972,706 | |
MUNICIPAL BONDS — 12.4% | |
California Educational Facilities Authority, Stanford University, Revenue Bond | | | | | | | | |
5.25%, 04/01/40 | | | 4,690,000 | | | | 6,298,295 | |
Dallas Area Rapid Transit, Revenue Bond | | | | | | | | |
5.25%, 12/01/43 | | | 325,000 | | | | 349,086 | |
5.25%, 12/01/48 | | | 1,495,000 | | | | 1,592,803 | |
Escondido Union High School District, CABS-Election 2008, General Obligation Bond, Series C | | | | | | | | |
6.34%, 08/01/51W | | | 1,725,000 | | | | 153,387 | |
Foothill-De Anza Community College District, California Community College, General Obligation Bond, Series C | | | | | | | | |
5.00%, 08/01/40 | | | 1,110,000 | | | | 1,193,871 | |
Houston Combined Utility System, First Lien Revenue Bond, Series D | | | | | | | | |
5.00%, 11/15/40 | | | 930,000 | | | | 998,067 | |
Imperial Irrigation District, Revenue Bond, Series C | | | | | | | | |
5.00%, 11/01/41 | | | 1,035,000 | | | | 1,066,195 | |
| | | | | | | | |
| | | Par | | | Value | |
King County Sewer, Revenue Bond | | | | | | | | |
5.00%, 01/01/39 | | $ | 405,000 | | | $ | 432,532 | |
5.00%, 01/01/45 | | | 2,270,000 | | | | 2,428,650 | |
Massachusetts Development Finance Agency, Harvard University, Revenue Bond, Series B-1 | | | | | | | | |
5.00%, 10/15/40 | | | 1,230,000 | | | | 1,383,172 | |
Metropolitan Pier & Exposition Authority, McCormick Place Expansion Project, Revenue Bond (AGM) | | | | | | | | |
6.14%, 06/15/45W | | | 9,800,000 | | | | 1,343,776 | |
Metropolitan Pier & Exposition Authority, McCormick Place Expansion Project, Revenue Bond, Series B (AGM) | | | | | | | | |
6.15%, 06/15/46W | | | 1,240,000 | | | | 159,687 | |
6.16%, 06/15/47W | | | 400,000 | | | | 48,536 | |
Metropolitan Transportation Authority, Revenue Bond, Series E | | | | | | | | |
6.81%, 11/15/40 | | | 1,020,000 | | | | 1,280,753 | |
New Jersey Transportation Trust Fund Authority, Revenue Bond, Series A | | | | | | | | |
5.50%, 06/15/41 | | | 3,335,000 | | | | 3,626,679 | |
New York City Municipal Water Finance Authority, Second General Resolution, Revenue Bond, Series EE | | | | | | | | |
5.38%, 06/15/43 | | | 830,000 | | | | 921,018 | |
New York City Municipal Water Finance Authority, Revenue Bond, Series GG | | | | | | | | |
5.00%, 06/15/43 | | | 2,575,000 | | | | 2,775,824 | |
New York State Dormitory Authority, Revenue Bond, Series C | | | | | | | | |
5.00%, 03/15/41 | | | 4,585,000 | | | | 4,952,900 | |
Ohio State University, Revenue Bond, Series A | | | | | | | | |
4.80%, 06/01/11 | | | 1,470,000 | | | | 1,523,346 | |
Placentia-Yorba Linda Unified School District, General Obligation Bond, Series D | | | | | | | | |
6.08%, 08/01/42W | | | 905,000 | | | | 153,425 | |
San Bernardino Community College District, General Obligation, Series B | | | | | | | | |
6.37%, 08/01/48W | | | 2,845,000 | | | | 294,372 | |
San Francisco Public Utilities Commission, Revenue Bond, Sub-Series A | | | | | | | | |
5.00%, 11/01/41 | | | 1,170,000 | | | | 1,250,461 | |
Santa Barbara Secondary High School District, General Obligation, Series A | | | | | | | | |
6.08%, 08/01/40W | | | 1,500,000 | | | | 271,695 | |
Santa Barbara Unified School District, General Obligation, Series A | | | | | | | | |
6.08%, 08/01/41W | | | 705,000 | | | | 119,942 | |
Santa Clara, Election of 2008, General Obligation, Series A | | | | | | | | |
5.00%, 08/01/34 | | | 1,625,000 | | | | 1,750,011 | |
|
| See Notes to Financial Statements. |
114 |
EXTENDED-DURATION BOND FUND
SCHEDULE OF INVESTMENTS (Continued)
| | | | | | | | |
| | | Par | | | Value | |
Southwestern Community College District, General Obligation, Series C | | | | | | | | |
6.35%, 08/01/46W | | $ | 3,975,000 | | | $ | 479,862 | |
State of California, General Obligation | | | | | | | | |
7.50%, 04/01/34 | | | 2,135,000 | | | | 2,563,815 | |
7.55%, 04/01/39 | | | 1,190,000 | | | | 1,456,227 | |
5.50%, 03/01/40 | | | 1,985,000 | | | | 2,140,207 | |
State of Illinois, General Obligation | | | | | | | | |
5.10%, 06/01/33 | | | 635,000 | | | | 576,986 | |
State of Louisiana, Revenue Bond, Series B | | | | | | | | |
5.00%, 05/01/45 | | | 1,185,000 | | | | 1,262,937 | |
State of Washington, General Obligation, Series B-1 | | | | | | | | |
5.00%, 08/01/40 | | | 1,075,000 | | | | 1,166,891 | |
Turlock Irrigation District, Revenue Bond | | | | | | | | |
5.50%, 01/01/41 | | | 3,770,000 | | | | 4,104,324 | |
| | | | | | | | |
Total Municipal Bonds
(Cost $45,576,051) | | | | 50,119,732 | |
| | | | | | | | |
U.S. TREASURY OBLIGATIONS — 3.4% | |
U.S. Treasury STRIPS | | | | | | | | |
3.08%, 05/15/40W | | | 14,975,000 | | | | 6,366,172 | |
3.09%, 02/15/41WD | | | 18,427,000 | | | | 7,625,645 | |
| | | | | | | | |
| | | | | | | 13,991,817 | |
| | | | | | | | |
Total U.S. Treasury Obligations
(Cost $10,127,821) | | | | 13,991,817 | |
| | | | | | | | |
| | |
| | | Shares | | | | |
PREFERRED STOCKS — 0.1% | |
Chesapeake Energy Corporation | | | 330 | | | | 27,522 | |
El Paso Energy Capital Trust I | | | 5,350 | | | | 246,314 | |
Preferred Blocker (GMAC), Inc. 144A | | | 82 | | | | 58,781 | |
| | | | | | | | |
Total Preferred Stocks
(Cost $272,390) | | | | 332,617 | |
| | | | | | | | |
MONEY MARKET FUNDS — 7.4% | | | | | |
GuideStone Money Market Fund (GS4 Class)¥ | | | 6,426,729 | | | | 6,426,729 | |
Northern Institutional Liquid Assets Portfolio§ | | | 23,397,891 | | | | 23,397,891 | |
| | | | | | | | |
Total Money Market Funds
(Cost $29,824,620) | | | | | | | 29,824,620 | |
| | | | | | | | |
| |
TOTAL INVESTMENTS — 104.5%
(Cost $382,663,703) | | | | 423,561,489 | |
| | |
Liabilities in Excess of Other Assets — (4.5)% | | | | | | | (18,091,881 | ) |
| | | | | | | | |
NET ASSETS — 100.0% | | | $ | 405,469,608 | |
| | | | | | | | |
Please see abbreviation and footnote definitions beginning on page 200.
PORTFOLIO SUMMARY (based on net assets)
| | | | |
| | | % | |
Corporate Bonds | | | 58.0 | |
Foreign Bonds | | | 22.7 | |
Municipal Bonds | | | 12.4 | |
Money Market Funds | | | 7.4 | |
U.S. Treasury Obligations | | | 3.4 | |
Mortgage-Backed Securities | | | 0.5 | |
Preferred Stocks | | | 0.1 | |
| | | | |
| | | 104.5 | |
| | | | |
|
See Notes to Financial Statements. 115 |
VALUATION HIERARCHY
The following is a summary of the inputs used, as of December 31, 2011, in valuing the Fund’s investments carried at fair value:
| | | | | | | | | | | | | | | | |
| | | Total Value | | | Level 1
Quoted Prices | | | Level 2
Other
Significant
Observable
Inputs | | | Level 3
Significant
Unobservable
Inputs | |
Assets: | | | | | | | | | | | | | | | | |
Investments in Securities: | | | | | | | | | | | | | | | | |
Corporate Bonds | | $ | 235,365,362 | | | $ | — | | | $ | 235,365,362 | | | $ | — | |
Foreign Bonds | | | 91,954,635 | | | | — | | | | 91,954,635 | | | | — | |
Money Market Funds | | | 29,824,620 | | | | 29,824,620 | | | | — | | | | — | |
Mortgage-Backed Securities | | | 1,972,706 | | | | — | | | | 1,972,706 | | | | — | |
Municipal Bonds | | | 50,119,732 | | | | — | | | | 50,119,732 | | | | — | |
Preferred Stocks | | | 332,617 | | | | 332,617 | | | | — | | | | — | |
U.S. Treasury Obligations | | | 13,991,817 | | | | — | | | | 13,991,817 | | | | — | |
| | | | | | | | | | | | | | | | |
Total Assets — Investments in Securities | | $ | 423,561,489 | | | $ | 30,157,237 | | | $ | 393,404,252 | | | $ | — | |
| | | | | | | | | | | | | | | | |
|
| See Notes to Financial Statements. |
116 |
Inflation Protected Bond Fund
The year of 2011 was turbulent and was impacted by numerous macro-economic and political events that pushed and pulled on the capital markets. Although corporate fundamentals were improving, the potential outcome of such macro events were difficult to accurately predict, which fueled investors’ fears, led to extreme uncertainty and capital market volatility. The bond market benefited from this economic uncertainty and overall risk aversion. During 2011, the broad domestic bond market, as measured by the Barclay’s Capital U.S. Aggregate Bond Index, posted an annual return of 7.84%, compared to the U.S. stock market which generated a return of 2.11%, as measured by the S&P 500® Index. Despite the macro-economic headwinds, all major bond market sectors posted positive returns for the year, led by the U.S. Treasury sector. Throughout the year, U.S. Treasury yields fell, from their already low levels, in response to the Federal Reserve maintaining its commitment to a near zero federal funds rate for the foreseeable future and the implementation of “Operation Twist.” Treasuries also benefitted from high demand, as global investors often sought the “safe haven” assets when implementing “risk-off” trades. As a sector, U.S. Treasuries posted an annual return of 9.81%, with longer-dated Treasuries posting the highest returns in the bond market. Shorter-term U.S. Treasuries, as measured by the Bank of America Merrill Lynch 1-3 Year Treasury Index, generated a one-year return of 1.55%. The year ended at remarkably low levels with the yield on the 10-year U.S. Treasury bond at 1.88% and the 30-year U.S. Treasury bond at 2.89%. Non-U.S. Treasury, “spread sectors”, also performed well in this risk aversion environment. The investment grade corporate bond sector and mortgage-backed securities sector posted annual returns of 8.15% and 6.23%, respectively. Overall, higher-quality bonds generally outpaced lower-quality bonds while longer-maturity bonds typically outperformed shorter-maturity bonds. Other sectors posted varied returns based on risk and correlations to the equity markets. High yield bonds (below investment grade corporate bonds), considered higher risk and more correlated to the equity market, posted an annual return of 4.98% while emerging market bonds generated an annual return 8.47%. U.S. Treasury inflation protected securities (“TIPS”) benefited from strong demand and inflationary concerns, posting an annual return of 13.56% as measured by the Barclays Capital U.S. TIPS Index.
The Fund is actively managed and is primarily comprised of inflation-indexed debt securities with an average dollar-weighted duration (a measure of bond prices’ sensitivity to changes in interest rates) normally between four and 10 years. The Fund underperformed its benchmark index, the Barclay’s Capital U.S. TIPS Index, for the period ended December 31, 2011 (12.00% versus 13.56%). The main source of the benchmark-relative underperformance was the Fund’s shorter-than-benchmark nominal duration position, making the Fund less sensitive to interest rate changes. The portfolio was positioned for moderate economic growth in the second half of the year. Although a modest rebound in economic growth did occur as expected, headline risks in the United States and Europe overwhelmed fundamental valuations. As a result, both nominal and real yields declined somewhat consistently into year-end which proved negative for the Fund’s duration positioning. Additionally, yield curve strategies for both flattening and steepening scenarios were implemented throughout the year, adding modest value. Derivatives were utilized in the portfolio consistent with the investment objectives of the Fund and contributed to the Fund’s overall strong performance in 2011. U.S. Treasury futures were utilized for yield curve positioning and to shorten the portfolio’s duration, both strategies contributed to the Fund’s underperformance relative to the benchmark.
The Fund was consistently managed to provide inflation protection and income consistent with investment in inflation-indexed securities. During the year, the Fund did not contradict its primary objective in an effort to stretch for additional yield by investing in nominal bonds with credit risk. The Fund’s average modified duration ranged between 7.0 and 8.4 years.
This Fund may be suitable for investors who have a long-term investment horizon, want protection from inflation, can accept short-term fluctuations in account value and want to diversify their portfolio with a fixed income investment option. This Fund is subject to interest rate risk. Meaning, when interest rates rise, the value of the existing bonds decrease and vice versa. Changes in interest rates have a bigger impact on long duration holdings than on short duration holdings. To the extent that the investment advisor misjudges current market conditions, the Fund’s volatility may be amplified by its use of short sales and derivatives and by its ability to select sub-advisers to allocate assets. Short sales by a fund theoretically involve unlimited loss potential since the market price of securities sold short may continuously increase. Leverage may increase the risk of loss and cause fluctuations in the market value of the Fund’s portfolio to have disproportionately large effects or cause the NAV of the Fund generally to decline faster than it would otherwise.
Please see page 122 for information regarding specific portfolio allocations. Portfolio holdings are subject to change and risk at any time.
117
Inflation Protected Bond Fund
| | | | | | | | |
Average Annual Total Returns as of 12/31/11 | |
| | | GS4
Class* | | | Benchmark** | |
One Year | | | 12.00 | % | | | 13.56 | % |
Since Inception | | | 9.12 | % | | | 10.21 | % |
Inception Date | | | 06/25/09 | | | | | |
Total Fund Operating Expenses (April 30, 2011 Prospectus, as amended on September 1, 2011)(1) | | | 0.72 | % | | | | |
| (1) | Current information regarding the Fund’s Operating Expenses can be found in the Financial Highlights. |
The performance data quoted represents past performance and does not guarantee future results. Current performance may be lower or higher. Performance data current to the most recent month-end may be obtained at www.GuideStoneFunds.org. The investment return and principal value of an investment will fluctuate so that shares, when redeemed, may be worth more or less than their original cost.
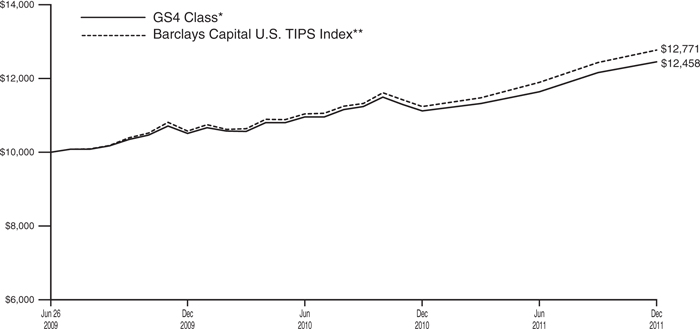
The graph compares the results of a hypothetical $10,000 investment in the GS4 Class of the Fund since June 25, 2009 (commencement of operations), with all dividends and capital gains reinvested, with the Barclays Capital U.S. TIPS Index.
| * | These returns reflect expense waivers by the Fund’s investment adviser. Without these waivers, returns would have been lower. Returns shown do not reflect the deduction of taxes that a shareholder would pay on Fund distributions or the redemption of Fund shares. |
| ** | The Barclays Capital U.S. TIPS Index measures the performance of the U.S. Treasury Inflation Protected Securities (“TIPS”) market and includes TIPS with one or more years remaining maturity with total outstanding issue size of $500 million or more. |
Unlike a mutual fund, the performance of an index assumes no taxes, transaction costs, management fees or other expenses.
118
| | |
| INFLATION PROTECTED BOND FUND | | |
| SCHEDULE OF INVESTMENTS | | December 31, 2011 |
| | | | | | | | |
| | | Par | | | Value | |
U.S. TREASURY OBLIGATIONS — 91.2% | |
U.S. Treasury Bonds | | | | | | | | |
4.38%, 05/15/40D‡‡ | | $ | 240,000 | | | $ | 311,812 | |
3.88%, 08/15/40D‡‡ | | | 160,000 | | | | 191,825 | |
3.75%, 08/15/41D | | | 995,000 | | | | 1,170,369 | |
| | | | | | | | |
| | | | | | | 1,674,006 | |
| | | | | | | | |
U.S. Treasury Inflationary Index Bonds | | | | | | | | |
3.38%, 01/15/12D | | | 2,970,000 | | | | 3,791,253 | |
2.00%, 04/15/12D | | | 6,587,300 | | | | 7,387,919 | |
3.00%, 07/15/12 | | | 275,000 | | | | 354,009 | |
0.63%, 04/15/13D | | | 2,590,000 | | | | 2,823,408 | |
1.88%, 07/15/13D | | | 3,190,000 | | | | 4,115,357 | |
2.00%, 01/15/14D | | | 3,290,000 | | | | 4,272,441 | |
1.25%, 04/15/14D | | | 1,255,000 | | | | 1,408,026 | |
2.00%, 07/15/14D‡‡ | | | 3,908,200 | | | | 5,061,556 | |
1.63%, 01/15/15D | | | 735,000 | | | | 940,658 | |
0.50%, 04/15/15D | | | 6,826,900 | | | | 7,468,650 | |
1.88%, 07/15/15 | | | 2,683,700 | | | | 3,447,601 | |
2.00%, 01/15/16D | | | 2,335,000 | | | | 2,979,414 | |
0.13%, 04/15/16D | | | 12,040,300 | | | | 12,885,081 | |
2.50%, 07/15/16 | | | 1,477,200 | | | | 1,916,765 | |
2.38%, 01/15/17 | | | 4,045,000 | | | | 5,275,305 | |
2.63%, 07/15/17 | | | 980,000 | | | | 1,275,290 | |
1.63%, 01/15/18D | | | 2,220,000 | | | | 2,735,243 | |
1.38%, 07/15/18 | | | 290,000 | | | | 345,130 | |
2.13%, 01/15/19 | | | 380,900 | | | | 477,953 | |
1.88%, 07/15/19 | | | 1,365,000 | | | | 1,707,242 | |
1.38%, 01/15/20D | | | 2,753,900 | | | | 3,286,244 | |
1.13%, 01/15/21 | | | 4,975,000 | | | | 5,748,364 | |
0.63%, 07/15/21D | | | 7,290,000 | | | | 7,842,423 | |
2.38%, 01/15/25D‡‡ | | | 6,705,200 | | | | 10,251,616 | |
2.00%, 01/15/26D | | | 2,275,000 | | | | 3,193,853 | |
2.38%, 01/15/27D | | | 1,990,000 | | | | 2,888,732 | |
1.75%, 01/15/28D | | | 4,305,000 | | | | 5,601,898 | |
3.63%, 04/15/28D | | | 2,550,000 | | | | 5,312,948 | |
2.50%, 01/15/29D | | | 3,900,000 | | | | 5,496,914 | |
3.88%, 04/15/29 | | | 3,030,000 | | | | 6,515,408 | |
3.38%, 04/15/32D | | | 307,100 | | | | 604,553 | |
2.13%, 02/15/40D | | | 5,852,600 | | | | 8,243,954 | |
2.13%, 02/15/41D | | | 7,773,900 | | | | 10,878,070 | |
| | | | | | | | |
| | | | | | | 146,533,278 | |
| | | | | | | | |
U.S. Treasury Note | | | | | | | | |
1.00%, 10/31/16D | | | 585,000 | | | | 590,759 | |
| | | | | | | | |
Total U.S. Treasury Obligations
(Cost $138,416,391) | | | | 148,798,043 | |
| | | | | | | | |
| | | | | | | | |
| | | Shares | | | Value | |
MONEY MARKET FUNDS — 16.2% | |
GuideStone Money Market Fund (GS4 Class)¥ | | | 17,068,521 | | | $ | 17,068,521 | |
Northern Institutional Liquid Assets Portfolio§ | | | 9,341,031 | | | | 9,341,031 | |
| | | | | | | | |
Total Money Market Funds
(Cost $26,409,552) | | | | 26,409,552 | |
| | | | | | | | |
TOTAL INVESTMENTS — 107.4%
(Cost $164,825,943) | | | | 175,207,595 | |
Liabilities in Excess of Other Assets — (7.4)% | | | | | | | (12,051,866 | ) |
| | | | | | | | |
NET ASSETS — 100.0% | | | $ | 163,155,729 | |
| | | | | | | | |
Please see abbreviation and footnote definitions beginning on page 200.
PORTFOLIO SUMMARY (based on net assets)
| | | | |
| | | % | |
U.S. Treasury Obligations | | | 91.2 | |
Money Market Funds | | | 16.2 | |
Futures Contracts | | | 3.3 | |
| | | | |
| | | 110.7 | |
| | | | |
|
| See Notes to Financial Statements. |
119 |
VALUATION HIERARCHY
The following is a summary of the inputs used, as of December 31, 2011, in valuing the Fund’s investments carried at fair value:
| | | | | | | | | | | | | | | | |
| | | Total Value | | | Level 1
Quoted Prices | | | Level 2
Other
Significant
Observable
Inputs | | | Level 3
Significant
Unobservable
Inputs | |
Assets: | | | | | | | | | | | | | | | | |
Investments in Securities: | | | | | | | | | | | | | | | | |
Money Market Funds | | $ | 26,409,552 | | | $ | 26,409,552 | | | $ | — | | | $ | — | |
U.S. Treasury Obligations | | | 148,798,043 | | | | — | | | | 148,798,043 | | | | — | |
| | | | | | | | | | | | | | | | |
Total Assets — Investments in Securities | | $ | 175,207,595 | | | $ | 26,409,552 | | | $ | 148,798,043 | | | $ | — | |
| | | | | | | | | | | | | | | | |
| | | | |
Liabilities: | | | | | | | | | | | | | | | | |
Other Financial Instruments*** | | | | | | | | | | | | | | | | |
Futures Contracts | | $ | (37,770 | ) | | $ | (37,770 | ) | | $ | — | | | $ | — | |
| | | | | | | | | | | | | | | | |
Total Liabilities — Other Financial Instruments | | $ | (37,770 | ) | | $ | (37,770 | ) | | $ | — | | | $ | — | |
| | | | | | | | | | | | | | | | |
| *** | Other financial instruments are derivative instruments not reflected in the Schedule of Investments, such as futures, forwards and swap contracts, which are valued at the unrealized appreciation (depreciation) on the investment. Details of these investments can be found in the Notes to Schedule of Investments. |
|
| See Notes to Financial Statements. |
120 |
Global Bond Fund
The year of 2011 was turbulent and was impacted by numerous macro-economic and political events that pushed and pulled on the capital markets. Although corporate fundamentals were improving, the potential outcome of such macro events were difficult to accurately predict, which fueled investors’ fears, led to extreme uncertainty and capital market volatility. The bond market benefited from this economic uncertainty and overall risk aversion. During 2011, the broad domestic bond market, as measured by the Barclay’s Capital U.S. Aggregate Bond Index, posted an annual return of 7.84%, compared to the U.S. stock market which generated a return of 2.11%, as measured by the S&P 500® Index. Despite the macro-economic headwinds, all major bond market sectors posted positive returns for the year, led by the U.S. Treasury sector. Throughout the year, U.S. Treasury yields fell, from their already low levels, in response to the Federal Reserve maintaining its commitment to a near zero federal funds rate for the foreseeable future and the implementation of “Operation Twist.” Treasuries also benefitted from high demand, as global investors often sought the “safe haven” assets when implementing “risk-off” trades. As a sector, U.S. Treasuries posted an annual return of 9.81%, with longer-dated Treasuries posting the highest returns in the bond market. Shorter-term U.S. Treasuries, as measured by the Merrill Lynch 1-3 Year Treasury Index, generated a one-year return of 1.58%. The year ended at remarkably low levels with the yield on the 10-year U.S. Treasury bond at 1.88% and the 30-year U.S. Treasury bond at 2.89%. Non-U.S. Treasury, “spread sectors”, also performed well in this risk aversion environment. The investment grade corporate bond sector and mortgage-backed securities sector posted annual returns of 8.15% and 6.23%, respectively. Overall, higher-quality bonds generally outpaced lower-quality bonds while longer-maturity bonds typically outperformed shorter-maturity bonds. Other sectors posted varied returns based on risk and correlations to the equity markets. U.S. Treasury inflation protected securities (“TIPS”) benefited from strong demand and inflationary concerns, posting an annual return of 13.56% as measured by the Barclays Capital U.S. TIPS Index. High yield bonds (below investment grade corporate bonds), considered higher risk and more correlated to the equity market, posted an annual return of 4.98%. Austerity measures and deteriorating economic conditions in many areas of the world, especially Europe, caused the global bond market in aggregate to underperform the U.S. market for the year. In addition to the United States, several other government yields plunged to historical lows due to risk aversion. The yield on the German 10-year issue fell 113 basis points while U.K. government bond yields fell 150 basis points. The intensity of the European crisis was reflected in the government bond yields of the Eurozone’s peripheral countries. As evidence, the yield on the Italian 10-year issue rose by 229 basis points. Emerging markets outperformed their developed market counterparts, generating an annual return 8.47%. The Barclay’s Capital Global Aggregate Bond Index generated an annual return of 5.64%.
The Fund is actively managed and invests in a diversified portfolio composed primarily of global fixed income securities with an average dollar-weighted duration (a measure of bond prices’ sensitivity to changes in interest rates) normally between three to 10 years. The Fund maintained its global focus, seeking investment opportunities across a wide array of economies, credits, yield curves and currencies. For the one-year period ended December 31, 2011, the Fund underperformed its composite benchmark, 50% Barclays Capital Global Aggregate Bond Index — Unhedged, 25% JPMorgan Emerging Markets Index Plus and 25% Barclays Capital U.S. Corporate High Yield Index — 2% Issuer Capped (4.35% versus 6.42%). The underperformance was primarily generated during the second and third quarters. The Fund’s benchmark-relative underperformance was attributable to several factors: its underweight to the U.S. Treasury sector; security selection within the corporate bond; and emerging market bond sectors and exposure to convertible bonds. During the year, the Fund utilized government futures and options to manage duration and implement yield curve strategies. These strategies, in aggregate, added modest value to the Fund’s performance. Additionally, the Fund used currency forward contracts for hedging purposes which slightly detracted from performance.
This Fund may be suitable for investors who have a medium to long-term investment horizon, seek higher returns than those offered by a shorter maturity bond fund, can accept short-term fluctuations in account value and want to diversify their portfolio with a globally diversified fixed-income investment option. This Fund may invest, to a large extent, in high yield securities, commonly known as junk bonds. While offering higher current yields, these securities may be considered speculative and are subject to greater risks than higher-rated bonds. Securities of emerging countries may involve additional risks including price volatility, reduced liquidity, currency fluctuation and financial reporting requirements as well as political and economic instability. This Fund is subject to interest rate risk. Meaning, when interest rates rise, the value of the existing bonds decrease and vice versa. Changes in interest rates have a bigger impact on long duration holdings than on short duration holdings. To the extent that the investment advisor misjudges current market conditions, the Fund’s volatility may be amplified by its use of short sales and derivatives and by its ability to select sub-advisers to allocate assets. Short sales by a fund theoretically involve unlimited loss potential since the market price of securities sold short may continuously increase. Leverage may increase the risk of loss and cause fluctuations in the market value of the Fund’s portfolio to have disproportionately large effects or cause the NAV of the Fund generally to decline faster than it would otherwise.
Please see page 133 for information regarding specific portfolio allocations. Portfolio holdings are subject to change and risk at any time.
121
Global Bond Fund
| | | | | | | | |
Average Annual Total Returns as of 12/31/11 | |
| | | GS4
Class* | | | Benchmark** | |
One Year | | | 4.35 | % | | | 6.42 | % |
Five Year | | | 6.35 | % | | | 7.39 | % |
Since Inception | | | 6.35 | % | | | 7.40 | % |
Inception Date | | | 12/29/06 | | | | | |
Total Fund Operating Expenses (April 30, 2011 Prospectus, as amended on September 1, 2011)(1) | | | 0.90 | % | | | | |
| (1) | Current information regarding the Fund’s Operating Expenses can be found in the Financial Highlights. |
The performance data quoted represents past performance and does not guarantee future results. Current performance may be lower or higher. Performance data current to the most recent month-end may be obtained at www.GuideStoneFunds.org. The investment return and principal value of an investment will fluctuate so that shares, when redeemed, may be worth more or less than their original cost.
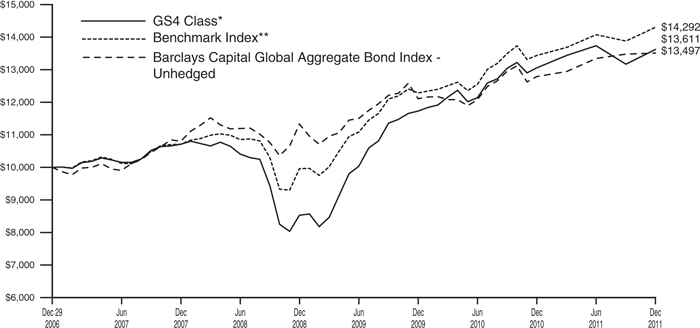
The graph compares the results of a hypothetical $10,000 investment in the GS4 Class of the Fund since December 29, 2006 (commencement of operations), with all dividends and capital gains reinvested, with the weighted composite index.
| * | These returns reflect expense waivers by the Fund’s investment adviser. Without these waivers, returns would have been lower. Returns shown do not reflect the deduction of taxes that a shareholder would pay on Fund distributions or the redemption of Fund shares. |
| ** | Represents a weighted composite benchmark index consisting of 25% JPMorgan Emerging Markets Bond Index Plus, 50% Barclays Capital Global Aggregate Bond Index — Unhedged and 25% Barclays Capital U.S. Corporate High Yield — 2% Issuer Capped Index. |
The JPMorgan Emerging Markets Bond Index Plus is a traditional, market-capitalization weighted index comprised of U.S. dollar denominated Brady bonds, Eurobonds and traded loans issued by sovereign entities.
The Barclays Capital Global Aggregate Bond Index — Unhedged provides a broad-based measure of the global investment grade fixed-rate debt markets.
The Barclays Capital U.S. Corporate High Yield — 2% Issuer Capped Index is an issuer-constrained version of the Barclays Capital U.S. Corporate High Yield Index that covers the U.S.-denominated, non-investment grade, fixed-rate and taxable corporate bond market.
Unlike a mutual fund, the performance of an index assumes no taxes, transaction costs, management fees or other expenses.
122
| | |
| GLOBAL BOND FUND | | |
| SCHEDULE OF INVESTMENTS | | December 31, 2011 |
| | | | | | | | |
| | | Par | | | Value | |
AGENCY OBLIGATIONS — 0.0% | |
Federal National Mortgage Association | | | | | | | | |
0.10%, 01/10/12‡‡ | | $ | 16,000 | | | $ | 16,000 | |
0.14%, 01/11/12†‡‡ | | | 17,000 | | | | 17,000 | |
| | | | | | | | |
Total Agency Obligations
(Cost $32,999) | | | | 33,000 | |
| | | | | | | | |
CORPORATE BONDS — 42.5% | |
Acadia Healthcare Co., Inc. | | | | | | | | |
12.88%, 11/01/18 144A | | | 160,000 | | | | 159,200 | |
AES Corporation | | | | | | | | |
8.00%, 06/01/20 | | | 350,000 | | | | 386,750 | |
Alcoa, Inc. | | | | | | | | |
5.87%, 02/23/22D | | | 5,000 | | | | 5,046 | |
6.75%, 01/15/28 | | | 185,000 | | | | 190,694 | |
5.95%, 02/01/37D | | | 65,000 | | | | 61,842 | |
Ally Financial, Inc. | | | | | | | | |
7.50%, 12/31/13 | | | 87,000 | | | | 90,262 | |
6.75%, 12/01/14D | | | 399,000 | | | | 402,990 | |
8.00%, 12/31/18 | | | 104,000 | | | | 102,700 | |
8.00%, 03/15/20D | | | 200,000 | | | | 205,500 | |
7.50%, 09/15/20 | | | 415,000 | | | | 420,706 | |
8.00%, 11/01/31 | | | 389,000 | | | | 377,330 | |
Altegrity, Inc. | | | | | | | | |
10.50%, 11/01/15 144A | | | 150,000 | | | | 135,750 | |
American Express Credit Corporation | | | | | | | | |
5.13%, 08/25/14 | | | 100,000 | | | | 107,499 | |
American International Group, Inc. | | | | | | | | |
5.45%, 05/18/17 | | | 25,000 | | | | 23,946 | |
Anadarko Petroleum Corporation | | | | | | | | |
5.95%, 09/15/16 | | | 10,000 | | | | 11,347 | |
6.38%, 09/15/17 | | | 120,000 | | | | 139,265 | |
Appleton Papers, Inc. | | | | | | | | |
11.25%, 12/15/15 | | | 102,000 | | | | 92,310 | |
Ashtead Capital, Inc. | | | | | | | | |
9.00%, 08/15/16 144AD | | | 250,000 | | | | 261,875 | |
Ashton Woods USA LLC | | | | | | | | |
20.16%, 06/30/15 STEP 144AW@ | | | 20,800 | | | | 15,912 | |
Astoria Depositor Corporation | | | | | | | | |
8.14%, 05/01/21 144A | | | 130,000 | | | | 114,400 | |
AT&T, Inc. | | | | | | | | |
3.88%, 08/15/21 | | | 60,000 | | | | 63,592 | |
6.55%, 02/15/39 | | | 220,000 | | | | 280,845 | |
Ball Corporation | | | | | | | | |
5.75%, 05/15/21D | | | 380,000 | | | | 399,950 | |
Baltimore Gas & Electric Co. | | | | | | | | |
5.20%, 06/15/33 | | | 1,125,000 | | | | 1,234,389 | |
Bank of America Corporation | | | | | | | | |
4.63%, 08/07/17(E) | | | 300,000 | | | | 348,954 | |
5.49%, 03/15/19 | | | 100,000 | | | | 86,314 | |
5.00%, 05/13/21D | | | 100,000 | | | | 91,249 | |
Berry Petroleum Co. | | | | | | | | |
10.25%, 06/01/14 | | | 80,000 | | | | 90,900 | |
Biomet, Inc. | | | | | | | | |
10.00%, 10/15/17D | | | 10,000 | | | | 10,850 | |
10.38%, 10/15/17 PIK | | | 545,000 | | | | 592,688 | |
Boston Scientific Corporation | | | | | | | | |
7.00%, 11/15/35D | | | 215,000 | | | | 248,432 | |
| | | | | | | | |
| | | Par | | | Value | |
Buffets Restaurants Holdings, Inc. Escrow | | | | | | | | |
12.50%, 11/01/14@ | | $ | 105,000 | | | $ | 10 | |
Calpine Corporation | | | | | | | | |
7.50%, 02/15/21 144A | | | 460,000 | | | | 494,500 | |
7.88%, 01/15/23 144AD | | | 400,000 | | | | 432,000 | |
CCO Holdings LLC | | | | | | | | |
7.00%, 01/15/19 | | | 230,000 | | | | 240,925 | |
Cellco Partnership/Verizon Wireless Capital LLC | | | | | | | | |
8.50%, 11/15/18 | | | 260,000 | | | | 351,405 | |
Cengage Learning Acquisitions, Inc. | | | | | | | | |
10.50%, 01/15/15 144AD | | | 100,000 | | | | 72,250 | |
Chesapeake Energy Corporation | | | | | | | | |
7.25%, 12/15/18D | | | 110,000 | | | | 122,100 | |
6.63%, 08/15/20D | | | 530,000 | | | | 571,075 | |
2.50%, 05/15/37D | | | 65,000 | | | | 58,256 | |
2.25%, 12/15/38 | | | 25,000 | | | | 20,750 | |
Chiquita Brands International, Inc. | | | | | | | | |
7.50%, 11/01/14D | | | 450,000 | | | | 455,625 | |
Ciena Corporation | | | | | | | | |
0.88%, 06/15/17D | | | 135,000 | | | | 102,938 | |
3.75%, 10/15/18 144A | | | 410,000 | | | | 387,450 | |
Cincinnati Bell Telephone Co. LLC | | | | | | | | |
6.30%, 12/01/28 | | | 155,000 | | | | 118,575 | |
CIT Group, Inc. | | | | | | | | |
7.00%, 05/01/15 | | | 92,453 | | | | 92,753 | |
7.00%, 05/01/16 | | | 154,090 | | | | 154,283 | |
7.00%, 05/01/17D | | | 215,726 | | | | 215,996 | |
Citigroup, Inc. | | | | | | | | |
6.38%, 08/12/14 | | | 150,000 | | | | 157,522 | |
7.38%, 09/04/19(E) | | | 380,000 | | | | 554,469 | |
Colorado Interstate Gas Co. | | | | | | | | |
5.95%, 03/15/15 | | | 20,000 | | | | 21,671 | |
6.80%, 11/15/15 | | | 125,000 | | | | 144,116 | |
Comcast Corporation | | | | | | | | |
5.15%, 03/01/20D | | | 170,000 | | | | 193,656 | |
Community Health Systems, Inc. | | | | | | | | |
8.88%, 07/15/15D | | | 100,000 | | | | 103,500 | |
Complete Production Services, Inc. | | | | | | | | |
8.00%, 12/15/16 | | | 80,000 | | | | 83,600 | |
ConocoPhillips | | | | | | | | |
6.50%, 02/01/39 | | | 30,000 | | | | 41,652 | |
Consol Energy, Inc. | | | | | | | | |
8.25%, 04/01/20 | | | 210,000 | | | | 233,100 | |
Continental Airlines, Inc. | | | | | | | | |
9.00%, 01/08/18 | | | 1,140,079 | | | | 1,254,087 | |
5.98%, 10/19/23D | | | 506,565 | | | | 527,436 | |
Countrywide Financial Corporation | | | | | | | | |
6.25%, 05/15/16D | | | 280,000 | | | | 264,043 | |
Cricket Communications, Inc. | | | | | | | | |
7.75%, 05/15/16 | | | 150,000 | | | | 155,625 | |
Cummins, Inc. | | | | | | | | |
5.65%, 03/01/98 | | | 1,500,000 | | | | 1,476,786 | |
DAE Aviation Holdings, Inc. | | | | | | | | |
11.25%, 08/01/15 144A | | | 130,000 | | | | 135,850 | |
Delta Air Lines, Inc. | | | | | | | | |
9.50%, 09/15/14 144AD | | | 36,000 | | | | 37,260 | |
|
| See Notes to Schedule of Investments. |
123 |
| | | | | | | | |
| | | Par | | | Value | |
8.02%, 02/10/24 | | $ | 86,045 | | | $ | 84,428 | |
DISH DBS Corporation | | | | | | | | |
7.00%, 10/01/13 | | | 600,000 | | | | 643,500 | |
Dynegy Holdings LLC | | | | | | | | |
7.75%, 06/01/19#D | | | 893,000 | | | | 589,380 | |
El Paso Corporation | | | | | | | | |
7.75%, 01/15/32 | | | 50,000 | | | | 58,000 | |
El Paso Natural Gas Co. | | | | | | | | |
8.63%, 01/15/22 | | | 90,000 | | | | 114,523 | |
8.38%, 06/15/32 | | | 75,000 | | | | 95,527 | |
El Pollo Loco, Inc. | | | | | | | | |
1.41%, 07/14/17W† | | | 29,850 | | | | 26,566 | |
17.00%, 01/01/18 144A | | | 170,000 | | | | 144,712 | |
Embarq Corporation | | | | | | | | |
8.00%, 06/01/36 | | | 995,000 | | | | 1,033,819 | |
Enterprise Products Operating LLC | | | | | | | | |
9.75%, 01/31/14 | | | 100,000 | | | | 115,570 | |
8.38%, 08/01/66†D | | | 60,000 | | | | 64,261 | |
ERAC USA Finance LLC | | | | | | | | |
7.00%, 10/15/37 144A | | | 1,065,000 | | | | 1,285,464 | |
Escrow GCB US Oncology | | | | | | | | |
9.12%, 08/15/17+ 144A | | | 155,000 | | | | — | |
EXCO Resources, Inc. | | | | | | | | |
7.50%, 09/15/18 | | | 200,000 | | | | 190,000 | |
FirstEnergy Corporation | | | | | | | | |
7.38%, 11/15/31 | | | 325,000 | | | | 400,810 | |
Ford Motor Co. | | | | | | | | |
4.25%, 11/15/16 | | | 830,000 | | | | 1,194,162 | |
6.63%, 10/01/28 | | | 850,000 | | | | 899,266 | |
Ford Motor Credit Co., LLC | | | | | | | | |
3.15%, 01/13/12†D | | | 37,500 | | | | 37,569 | |
7.50%, 08/01/12 | | | 500,000 | | | | 516,353 | |
12.00%, 05/15/15 | | | 100,000 | | | | 123,249 | |
Freeport-McMoRan Copper & Gold, Inc. | | | | | | | | |
8.38%, 04/01/17 | | | 150,000 | | | | 159,544 | |
Freescale Semiconductor, Inc. | | | | | | | | |
10.13%, 12/15/16D | | | 130,000 | | | | 137,475 | |
Fresenius Medical Care US Finance, Inc. | | | | | | | | |
6.88%, 07/15/17D | | | 75,000 | | | | 80,156 | |
Fresenius US Finance II, Inc. | | | | | | | | |
8.75%, 07/15/15 144A(E) | | | 30,000 | | | | 44,991 | |
Frontier Communications Corporation | | | | | | | | |
7.88%, 01/15/27D | | | 405,000 | | | | 346,275 | |
General Electric Capital Corporation | | | | | | | | |
3.49%, 03/08/12(G) | | | 200,000 | | | | 154,712 | |
7.63%, 12/10/14(Z) | | | 1,025,000 | | | | 876,788 | |
4.88%, 03/04/15 | | | 370,000 | | | | 401,726 | |
6.50%, 09/28/15(Z) | | | 255,000 | | | | 209,655 | |
6.75%, 09/26/16(Z) | | | 150,000 | | | | 125,289 | |
6.75%, 03/15/32 | | | 30,000 | | | | 35,231 | |
Georgia-Pacific LLC | | | | | | | | |
8.88%, 05/15/31 | | | 785,000 | | | | 1,081,916 | |
Gerdau Holdings, Inc. | | | | | | | | |
7.00%, 01/20/20 | | | 100,000 | | | | 106,000 | |
Goldman Sachs Group, Inc. | | | | | | | | |
5.13%, 10/23/19(E) | | | 500,000 | | | | 615,022 | |
4.75%, 10/12/21(E)D | | | 300,000 | | | | 298,662 | |
6.75%, 10/01/37 | | | 45,000 | | | | 41,996 | |
| | | | | | | | |
| | | Par | | | Value | |
Goodyear Tire & Rubber Co. | | | | | | | | |
7.00%, 03/15/28D | | $ | 690,000 | | | $ | 672,750 | |
Grifols, Inc. | | | | | | | | |
8.25%, 02/01/18D | | | 220,000 | | | | 232,100 | |
H&E Equipment Services, Inc. | | | | | | | | |
8.38%, 07/15/16 | | | 370,000 | | | | 380,175 | |
Hanover Insurance Group, Inc. | | | | | | | | |
7.50%, 03/01/20 | | | 385,000 | | | | 441,903 | |
HCA, Inc. | | | | | | | | |
6.38%, 01/15/15 | | | 150,000 | | | | 153,562 | |
7.19%, 11/15/15 | | | 205,000 | | | | 206,025 | |
7.50%, 12/15/23 | | | 555,000 | | | | 499,500 | |
8.36%, 04/15/24 | | | 90,000 | | | | 85,500 | |
7.69%, 06/15/25 | | | 775,000 | | | | 689,750 | |
7.58%, 09/15/25 | | | 570,000 | | | | 507,300 | |
Hercules Offshore, Inc. | | | | | | | | |
10.50%, 10/15/17 144AD | | | 80,000 | | | | 78,200 | |
Hertz Corporation | | | | | | | | |
8.88%, 01/01/14D | | | 55,000 | | | | 55,550 | |
Human Genome Sciences, Inc. | | | | | | | | |
3.00%, 11/15/18 | | | 510,000 | | | | 457,725 | |
Idearc, Inc. Escrow | | | | | | | | |
0.00%, 11/15/16+W | | | 185,000 | | | | — | |
ING Capital Funding Trust III | | | | | | | | |
3.97%, 12/29/49† | | | 200,000 | | | | 157,983 | |
Intel Corporation | | | | | | | | |
2.95%, 12/15/35 | | | 580,000 | | | | 606,825 | |
3.25%, 08/01/39 | | | 460,000 | | | | 578,450 | |
International Lease Finance Corporation | | | | | | | | |
5.65%, 06/01/14 | | | 90,000 | | | | 86,400 | |
8.63%, 09/15/15D | | | 215,000 | | | | 221,181 | |
6.25%, 05/15/19 | | | 440,000 | | | | 407,051 | |
iStar Financial, Inc. | | | | | | | | |
5.70%, 03/01/14 | | | 62,000 | | | | 52,235 | |
6.05%, 04/15/15 | | | 20,000 | | | | 16,550 | |
5.88%, 03/15/16 | | | 22,000 | | | | 18,040 | |
JC Penney Corporation, Inc. | | | | | | | | |
6.38%, 10/15/36D | | | 650,000 | | | | 546,812 | |
7.63%, 03/01/97D | | | 1,300,000 | | | | 1,170,000 | |
Jones Group, Inc. | | | | | | | | |
6.13%, 11/15/34D | | | 135,000 | | | | 93,825 | |
JPMorgan Chase Bank NA | | | | | | | | |
4.38%, 11/30/21(E)† | | | 350,000 | | | | 378,398 | |
K Hovnanian Enterprises, Inc. | | | | | | | | |
5.00%, 11/01/21D | | | 795,000 | | | | 445,200 | |
Key Energy Services, Inc. | | | | | | | | |
6.75%, 03/01/21 | | | 170,000 | | | | 170,850 | |
Kinder Morgan Energy Partners LP | | | | | | | | |
6.50%, 02/01/37 | | | 75,000 | | | | 82,854 | |
6.95%, 01/15/38 | | | 90,000 | | | | 101,979 | |
Lennar Corporation | | | | | | | | |
5.60%, 05/31/15D | | | 1,400,000 | | | | 1,386,000 | |
Level 3 Financing, Inc. | | | | | | | | |
8.75%, 02/15/17D | | | 1,285,000 | | | | 1,313,912 | |
9.38%, 04/01/19 | | | 20,000 | | | | 20,975 | |
Marsh & McLennan Cos., Inc. | | | | | | | | |
5.88%, 08/01/33 | | | 1,000,000 | | | | 1,102,173 | |
Masco Corporation | | | | | | | | |
5.85%, 03/15/17 | | | 90,000 | | | | 89,939 | |
7.13%, 03/15/20 | | | 150,000 | | | | 151,616 | |
7.75%, 08/01/29 | | | 100,000 | | | | 97,295 | |
|
| See Notes to Schedule of Investments. |
124 |
GLOBAL BOND FUND
SCHEDULE OF INVESTMENTS (Continued)
| | | | | | | | |
| | | Par | | | Value | |
6.50%, 08/15/32D | | $ | 145,000 | | | $ | 130,043 | |
MBIA Insurance Corporation | | | | | | | | |
14.00%, 01/15/33 144A† | | | 435,000 | | | | 247,950 | |
Merrill Lynch & Co., Inc. | | | | | | | | |
6.05%, 06/01/34 | | | 700,000 | | | | 538,590 | |
6.11%, 01/29/37 | | | 1,300,000 | | | | 1,005,000 | |
Mirant Mid Atlantic Pass Through Trust | | | | | | | | |
10.06%, 12/30/28 | | | 165,630 | | | | 171,427 | |
Morgan Stanley | | | | | | | | |
4.75%, 04/01/14D | | | 40,000 | | | | 39,424 | |
5.75%, 01/25/21 | | | 700,000 | | | | 654,088 | |
Motorola Solutions, Inc. | | | | | | | | |
6.63%, 11/15/37 | | | 105,000 | | | | 108,784 | |
Mutual of Omaha Insurance Co. | | | | | | | | |
6.80%, 06/15/36 144A | | | 1,200,000 | | | | 1,283,814 | |
Nalco Co. | | | | | | | | |
6.88%, 01/15/19 144A(E) | | | 100,000 | | | | 146,266 | |
NetFlix, Inc. | | | | | | | | |
8.50%, 11/15/17 | | | 150,000 | | | | 155,625 | |
NewPage Corporation | | | | | | | | |
11.38%, 12/31/14 144AD | | | 285,000 | | | | 211,969 | |
Nextel Communications, Inc. | | | | | | | | |
5.95%, 03/15/14D | | | 970,000 | | | | 940,900 | |
7.38%, 08/01/15 | | | 1,615,000 | | | | 1,485,800 | |
Nielsen Finance LLC | | | | | | | | |
11.50%, 05/01/16 | | | 250,000 | | | | 287,500 | |
Old Republic International Corporation | | | | | | | | |
3.75%, 03/15/18D | | | 1,395,000 | | | | 1,232,831 | |
Owens Corning | | | | | | | | |
7.00%, 12/01/36D | | | 220,000 | | | | 225,522 | |
Owens-Brockway Glass Container, Inc. | | | | | | | | |
3.00%, 06/01/15 144AD | | | 840,000 | | | | 785,400 | |
Oxford Industries, Inc. | | | | | | | | |
11.38%, 07/15/15 | | | 135,000 | | | | 148,500 | |
Pemex Project Funding Master Trust | | | | | | | | |
6.63%, 06/15/35 | | | 516,000 | | | | 590,175 | |
Penn Mutual Life Insurance Co. | | | | | | | | |
7.63%, 06/15/40 144A | | | 685,000 | | | | 842,631 | |
Pioneer Natural Resources Co. | | | | | | | | |
5.88%, 07/15/16 | | | 900,000 | | | | 983,964 | |
7.20%, 01/15/28 | | | 315,000 | | | | 361,694 | |
Plains Exploration & Production Co. | | | | | | | | |
8.63%, 10/15/19 | | | 55,000 | | | | 60,706 | |
ProLogis LP | | | | | | | | |
6.63%, 05/15/18D | | | 15,000 | | | | 16,312 | |
QEP Resources, Inc. | | | | | | | | |
6.88%, 03/01/21 | | | 290,000 | | | | 313,925 | |
Quicksilver Resources, Inc. | | | | | | | | |
11.75%, 01/01/16 | | | 95,000 | | | | 108,300 | |
Qwest Capital Funding, Inc. | | | | | | | | |
6.50%, 11/15/18 | | | 225,000 | | | | 223,209 | |
Qwest Corporation | | | | | | | | |
3.80%, 06/15/13†D | | | 100,000 | | | | 100,781 | |
7.63%, 06/15/15 | | | 300,000 | | | | 333,934 | |
7.50%, 06/15/23D | | | 110,000 | | | | 110,583 | |
7.25%, 09/15/25 | | | 105,000 | | | | 115,456 | |
6.88%, 09/15/33D | | | 2,500,000 | | | | 2,495,725 | |
7.25%, 10/15/35D | | | 110,000 | | | | 110,236 | |
Range Resources Corporation | | | | | | | | |
6.75%, 08/01/20 | | | 510,000 | | | | 568,650 | |
| | | | | | | | |
| | | Par | | | Value | |
Regency Energy Partners LP | | | | | | | | |
6.88%, 12/01/18 | | $ | 450,000 | | | $ | 480,375 | |
Reliance Holdings USA, Inc. | | | | | | | | |
4.50%, 10/19/20 144AD | | | 290,000 | | | | 263,961 | |
Republic Services, Inc. | | | | | | | | |
4.75%, 05/15/23 | | | 90,000 | | | | 98,541 | |
RSC Equipment Rental, Inc. | | | | | | | | |
10.00%, 07/15/17 144A | | | 180,000 | | | | 210,600 | |
Service Corporation International | | | | | | | | |
7.50%, 04/01/27 | | | 75,000 | | | | 72,375 | |
Simon Property Group LP | | | | | | | | |
5.75%, 12/01/15 | | | 25,000 | | | | 27,994 | |
SLM Corporation | | | | | | | | |
5.38%, 01/15/13D | | | 650,000 | | | | 654,648 | |
5.38%, 05/15/14D | | | 1,000,000 | | | | 1,001,250 | |
8.45%, 06/15/18 | | | 769,000 | | | | 795,915 | |
8.00%, 03/25/20 | | | 10,000 | | | | 10,125 | |
Southern Copper Corporation | | | | | | | | |
5.38%, 04/16/20D | | | 70,000 | | | | 74,530 | |
6.75%, 04/16/40 | | | 350,000 | | | | 353,716 | |
Springleaf Finance Corporation | | | | | | | | |
5.75%, 09/15/16 | | | 700,000 | | | | 495,250 | |
6.50%, 09/15/17 | | | 400,000 | | | | 280,000 | |
6.90%, 12/15/17D | | | 200,000 | | | | 145,000 | |
Sprint Capital Corporation | | | | | | | | |
6.88%, 11/15/28 | | | 210,000 | | | | 150,937 | |
8.75%, 03/15/32 | | | 745,000 | | | | 606,244 | |
Steel Dynamics, Inc. | | | | | | | | |
7.38%, 11/01/12 | | | 45,000 | | | | 46,969 | |
7.75%, 04/15/16 | | | 280,000 | | | | 293,300 | |
7.63%, 03/15/20D | | | 100,000 | | | | 106,000 | |
Teachers Insurance & Annuity Association of America | | | | | | | | |
6.85%, 12/16/39 144A | | | 100,000 | | | | 128,794 | |
Tenet Healthcare Corporation | | | | | | | | |
10.00%, 05/01/18 | | | 55,000 | | | | 63,112 | |
8.88%, 07/01/19D | | | 462,000 | | | | 520,905 | |
6.88%, 11/15/31D | | | 85,000 | | | | 70,125 | |
Textron Financial Corporation | | | | | | | | |
5.13%, 08/15/14 | | | 30,000 | | | | 31,076 | |
Textron, Inc. | | | | | | | | |
6.63%, 04/07/20(U) | | | 130,000 | | | | 221,387 | |
Time Warner Cable, Inc. | | | | | | | | |
8.75%, 02/14/19 | | | 190,000 | | | | 242,953 | |
8.25%, 04/01/19 | | | 40,000 | | | | 50,312 | |
Time Warner, Inc. | | | | | | | | |
4.00%, 01/15/22D | | | 100,000 | | | | 103,360 | |
Toys “R” Us, Inc. | | | | | | | | |
7.38%, 10/15/18D | | | 335,000 | | | | 302,338 | |
United Air Lines, Inc. | | | | | | | | |
10.40%, 05/01/18 | | | 610,446 | | | | 675,275 | |
6.64%, 01/02/24 | | | 252,230 | | | | 252,230 | |
Universal Hospital Services, Inc. | | | | | | | | |
8.50%, 06/01/15 PIK | | | 20,000 | | | | 20,300 | |
Univision Communications, Inc. | | | | | | | | |
7.88%, 11/01/20 144AD | | | 150,000 | | | | 153,000 | |
USG Corporation | | | | | | | | |
6.30%, 11/15/16D | | | 1,250,000 | | | | 981,250 | |
Vanguard Health Holding Co. II LLC | | | | | | | | |
8.00%, 02/01/18D | | | 105,000 | | | | 104,738 | |
|
See Notes to Schedule of Investments. 125 |
| | | | | | | | |
| | | Par | | | Value | |
Verizon Maryland, Inc. | | | | | | | | |
5.13%, 06/15/33 | | $ | 85,000 | | | $ | 89,151 | |
Verizon Pennsylvania, Inc. | | | | | | | | |
6.00%, 12/01/28 | | | 90,000 | | | | 96,566 | |
Wachovia Corporation | | | | | | | | |
5.25%, 08/01/14 | | | 120,000 | | | | 126,649 | |
WellPoint, Inc. | | | | | | | | |
7.00%, 02/15/19 | | | 80,000 | | | | 96,665 | |
Western Union Co. | | | | | | | | |
6.20%, 11/17/36 | | | 40,000 | | | | 42,699 | |
6.20%, 06/21/40 | | | 5,000 | | | | 5,373 | |
Westvaco Corporation | | | | | | | | |
8.20%, 01/15/30 | | | 150,000 | | | | 170,966 | |
7.95%, 02/15/31 | | | 135,000 | | | | 150,079 | |
Weyerhaeuser Co. | | | | | | | | |
8.50%, 01/15/25 | | | 405,000 | | | | 465,852 | |
6.95%, 10/01/27 | | | 55,000 | | | | 54,530 | |
7.38%, 03/15/32 | | | 370,000 | | | | 389,401 | |
6.88%, 12/15/33 | | | 490,000 | | | | 483,750 | |
Whiting Petroleum Corporation | | | | | | | | |
7.00%, 02/01/14 | | | 130,000 | | | | 139,100 | |
Williams Cos., Inc. | | | | | | | | |
7.50%, 01/15/31 | | | 60,000 | | | | 73,327 | |
WPX Energy, Inc. | | | | | | | | |
6.00%, 01/15/22 144A | | | 150,000 | | | | 154,312 | |
Wyndham Worldwide Corporation | | | | | | | | |
7.38%, 03/01/20D | | | 380,000 | | | | 434,401 | |
| | | | | | | | |
Total Corporate Bonds
(Cost $66,217,179) | | | | 72,315,351 | |
| | | | | | | | |
FOREIGN BONDS — 38.3% | |
Argentina — 0.4% | |
Argentina Bonos | | | | | | | | |
7.00%, 10/03/15D | | | 262,000 | | | | 243,005 | |
Argentine Republic Government International Bond | | | | | | | | |
8.75%, 06/02/17 | | | 93,000 | | | | 85,727 | |
Pan American Energy LLC | | | | | | | | |
7.88%, 05/07/21 144AD | | | 100,000 | | | | 101,500 | |
7.88%, 05/07/21D | | | 176,000 | | | | 178,640 | |
| | | | | | | | |
| | | | | | | 608,872 | |
| | | | | | | | |
Australia — 2.1% | |
New South Wales Treasury Corporation | | | | | | | | |
6.00%, 05/01/12(A) | | | 2,825,000 | | | | 2,907,047 | |
Queensland Treasury Corporation | | | | | | | | |
7.13%, 09/18/17(Z) | | | 275,000 | | | | 247,365 | |
Rio Tinto Finance USA, Ltd. | | | | | | | | |
9.00%, 05/01/19 | | | 260,000 | | | | 355,348 | |
| | | | | | | | |
| | | | | | | 3,509,760 | |
| | | | | | | | |
Belgium — 0.0% | |
Ontex IV SA | | | | | | | | |
9.00%, 04/15/19(E) | | | 100,000 | | | | 89,303 | |
| | | | | | | | |
Bermuda — 0.9% | |
Qtel International Finance, Ltd. | | | | | | | | |
4.75%, 02/16/21 144A | | | 200,000 | | | | 202,500 | |
Sirius International Group, Ltd. | | | | | | | | |
6.38%, 03/20/17 144A | | | 1,250,000 | | | | 1,312,511 | |
| | | | | | | | |
| | | | | | | 1,515,011 | |
| | | | | | | | |
| | | | | | | | |
| | | Par | | | Value | |
Brazil — 3.6% | |
Brazil Notas do Tesouro Nacional | | | | | | | | |
10.00%, 01/01/14(B) | | $ | 131,000 | | | $ | 69,577 | |
10.00%, 01/01/17(B) | | | 4,207,000 | | | | 2,168,333 | |
Brazilian Government International Bond | | | | | | | | |
4.88%, 01/22/21D | | | 120,000 | | | | 134,700 | |
10.25%, 01/10/28(B) | | | 5,250,000 | | | | 3,222,758 | |
11.00%, 08/17/40 | | | 115,000 | | | | 152,375 | |
Hypermarcas SA | | | | | | | | |
6.50%, 04/20/21 144AD | | | 150,000 | | | | 134,625 | |
Telemar Norte Leste SA | | | | | | | | |
5.50%, 10/23/20 144A | | | 110,000 | | | | 108,900 | |
5.50%, 10/23/20 | | | 100,000 | | | | 99,000 | |
| | | | | | | | |
| | | | | | | 6,090,268 | |
| | | | | | | | |
Canada — 4.7% | |
Atlantic Power Corporation | | | | | | | | |
9.00%, 11/15/18 | | | 310,000 | | | | 312,325 | |
Canadian Government Bond | | | | | | | | |
5.25%, 06/01/12(C) | | | 4,720,000 | | | | 4,713,977 | |
Province of Manitoba | | | | | | | | |
6.38%, 09/01/15(Z) | | | 815,000 | | | | 691,953 | |
Province of Quebec | | | | | | | | |
6.75%, 11/09/15(Z) | | | 2,650,000 | | | | 2,285,198 | |
Stone Container Finance Company of Canada II | | | | | | | | |
0.00%, 07/15/14+W | | | 330,000 | | | | 8,250 | |
Teck Resources, Ltd. | | | | | | | | |
9.75%, 05/15/14 144AD | | | 21,000 | | | | 24,692 | |
10.25%, 05/15/16 144A | | | 29,000 | | | | 33,380 | |
| | | | | | | | |
| | | | | | | 8,069,775 | |
| | | | | | | | |
Cayman Islands — 1.5% | |
Braskem Finance, Ltd. | | | | | | | | |
7.00%, 05/07/20 | | | 180,000 | | | | 193,950 | |
Fibria Overseas Finance, Ltd. | | | | | | | | |
7.50%, 05/04/20D | | | 190,000 | | | | 186,675 | |
6.75%, 03/03/21 144A | | | 200,000 | | | | 184,500 | |
Odebrecht Finance, Ltd. | | | | | | | | |
7.00%, 04/21/20 144A | | | 300,000 | | | | 322,500 | |
6.00%, 04/05/23 144A | | | 220,000 | | | | 221,650 | |
Petrobras International Finance Co. | | | | | | | | |
6.88%, 01/20/40 | | | 390,000 | | | | 453,473 | |
6.75%, 01/27/41D | | | 160,000 | | | | 184,661 | |
Suzano Trading, Ltd. | | | | | | | | |
5.88%, 01/23/21 144A | | | 250,000 | | | | 232,500 | |
TGI International, Ltd. | | | | | | | | |
9.50%, 10/03/17 | | | 130,000 | | | | 139,912 | |
Vale Overseas, Ltd. | | | | | | | | |
6.88%, 11/21/36 | | | 462,000 | | | | 528,321 | |
| | | | | | | | |
| | | | | | | 2,648,142 | |
| | | | | | | | |
Chile — 0.5% | |
AES Gener SA | | | | | | | | |
5.25%, 08/15/21 144A | | | 120,000 | | | | 121,200 | |
Celulosa Arauco y Constitucion SA | | | | | | | | |
7.25%, 07/29/19 | | | 120,000 | | | | 142,640 | |
Colbun SA | | | | | | | | |
6.00%, 01/21/20 144A | | | 110,000 | | | | 116,992 | |
6.00%, 01/21/20 | | | 100,000 | | | | 106,356 | |
|
| See Notes to Schedule of Investments. |
126 |
GLOBAL BOND FUND
SCHEDULE OF INVESTMENTS (Continued)
| | | | | | | | |
| | | Par | | | Value | |
Corporation Nacional del Cobre de Chile | | | | | | | | |
3.88%, 11/03/21 144A | | $ | 220,000 | | | $ | 225,095 | |
Inversiones CMPC SA | | | | | | | | |
4.75%, 01/19/18 144AD | | | 200,000 | | | | 209,653 | |
| | | | | | | | |
| | | | | | | 921,936 | |
| | | | | | | | |
Colombia — 0.9% | |
Colombia Government International Bond | | | | | | | | |
7.38%, 03/18/19 | | | 200,000 | | | | 253,000 | |
7.38%, 09/18/37 | | | 160,000 | | | | 226,000 | |
6.13%, 01/18/41D | | | 140,000 | | | | 173,600 | |
Ecopetrol SA | | | | | | | | |
7.63%, 07/23/19D | | | 440,000 | | | | 534,621 | |
Empresa de Energia de Bogota SA | | | | | | | | |
6.13%, 11/10/21 144A | | | 250,000 | | | | 252,500 | |
Empresas Publicas de Medellin ESP | | | | | | | | |
7.63%, 07/29/19 144A | | | 120,000 | | | | 139,800 | |
| | | | | | | | |
| | | | | | | 1,579,521 | |
| | | | | | | | |
France — 0.6% | |
AXA SA | | | | | | | | |
6.21%, 10/29/49(E)† | | | 210,000 | | | | 189,901 | |
Compagnie Generale de Geophysique - Veritas | | | | | | | | |
9.50%, 05/15/16D | | | 650,000 | | | | 705,250 | |
Europcar Groupe SA | | | | | | | | |
9.38%, 04/15/18 144A(E) | | | 145,000 | | | | 99,463 | |
| | | | | | | | |
| | | | | | | 994,614 | |
| | | | | | | | |
Germany — 5.3% | |
Bundesobligation | | | | | | | | |
2.00%, 02/26/16(E) | | | 910,000 | | | | 1,245,311 | |
Bundesrepublik Deutschland | | | | | | | | |
4.00%, 07/04/16(E)D | | | 2,000 | | | | 2,967 | |
3.75%, 01/04/19(E) | | | 770,000 | | | | 1,155,387 | |
3.25%, 01/04/20(E)D | | | 4,240,000 | | | | 6,199,240 | |
Kabel Deutschland Vertrieb und Service GmbH | | | | | | | | |
6.50%, 06/29/18 144A(E) | | | 160,000 | | | | 211,802 | |
Rearden G Holdings EINS GmbH | | | | | | | | |
7.88%, 03/30/20 144A | | | 100,000 | | | | 100,750 | |
Unitymedia NRW GmbH | | | | | | | | |
8.13%, 12/01/17 144A | | | 100,000 | | | | 106,125 | |
| | | | | | | | |
| | | | | | | 9,021,582 | |
| | | | | | | | |
Iceland — 0.0% | |
Kaupthing Bank HF | | | | | | | | |
7.13%, 05/19/16+ 144A# | | | 150,000 | | | | 2 | |
| | | | | | | | |
Indonesia — 0.3% | |
Indonesia Government International Bond | | | | | | | | |
6.63%, 02/17/37D | | | 225,000 | | | | 274,500 | |
Pertamina Persero PT | | | | | | | | |
5.25%, 05/23/21 144AD | | | 200,000 | | | | 206,700 | |
| | | | | | | | |
| | | | | | | 481,200 | |
| | | | | | | | |
Ireland — 1.6% | |
Ardagh Glass Finance PLC | | | | | | | | |
7.13%, 06/15/17 144A(E) | | | 112,000 | | | | 127,561 | |
Ireland Government Bond | | | | | | | | |
4.50%, 10/18/18(E) | | | 900,000 | | | | 929,505 | |
| | | | | | | | |
| | | Par | | | Value | |
5.00%, 10/18/20(E) | | $ | 50,000 | | | $ | 53,532 | |
5.40%, 03/13/25(E) | | | 750,000 | | | | 781,178 | |
Novatek Finance, Ltd. | | | | | | | | |
6.60%, 02/03/21 144AD | | | 200,000 | | | | 202,500 | |
XL Group PLC | | | | | | | | |
6.25%, 05/15/27D | | | 640,000 | | | | 650,130 | |
| | | | | | | | |
| | | | | | | 2,744,406 | |
| | | | | | | | |
Italy — 0.5% | |
Italy Buoni Poliennali Del Tesoro | | | | | | | | |
5.25%, 11/01/29(E) | | | 20,000 | | | | 21,561 | |
5.75%, 02/01/33(E) | | | 20,000 | | | | 22,350 | |
5.00%, 08/01/34(E) | | | 20,000 | | | | 20,600 | |
Seat Pagine Gialle SpA | | | | | | | | |
10.50%, 01/31/17(E) | | | 129,000 | | | | 95,166 | |
Telecom Italia Capital SA | | | | | | | | |
6.38%, 11/15/33 | | | 790,000 | | | | 599,830 | |
6.00%, 09/30/34 | | | 85,000 | | | | 63,150 | |
| | | | | | | | |
| | | | | | | 822,657 | |
| | | | | | | | |
Luxembourg — 1.9% | |
ArcelorMittal | | | | | | | | |
6.13%, 06/01/18D | | | 305,000 | | | | 301,600 | |
5.50%, 03/01/21 | | | 30,000 | | | | 27,585 | |
7.00%, 10/15/39 | | | 190,000 | | | | 177,085 | |
6.75%, 03/01/41 | | | 675,000 | | | | 608,788 | |
ConvaTec Healthcare E SA | | | | | | | | |
10.88%, 12/15/18(E) | | | 100,000 | | | | 112,599 | |
CSN Resources SA | | | | | | | | |
6.50%, 07/21/20 144AD | | | 150,000 | | | | 157,500 | |
6.50%, 07/21/20 | | | 100,000 | | | | 105,000 | |
Evraz Group SA | | | | | | | | |
9.50%, 04/24/18 | | | 160,000 | | | | 164,600 | |
6.75%, 04/27/18 144A | | | 240,000 | | | | 216,000 | |
Greif Luxembourg Finance SCA | | | | | | | | |
7.38%, 07/15/21 144A(E) | | | 150,000 | | | | 187,828 | |
Hannover Finance Luxembourg SA | | | | | | | | |
5.75%, 09/14/40(E)† | | | 50,000 | | | | 60,156 | |
Lecta SA | | | | | | | | |
5.46%, 02/15/14(E)† | | | 240,000 | | | | 285,770 | |
TNK-BP Finance SA | | | | | | | | |
7.88%, 03/13/18 | | | 290,000 | | | | 312,838 | |
Vimpel Communications OJSC Via UBS Luxembourg SA | | | | | | | | |
8.25%, 05/23/16 | | | 255,000 | | | | 254,363 | |
Wind Acquisition Finance SA | | | | | | | | |
7.25%, 02/15/18 144AD | | | 200,000 | | | | 182,500 | |
Wind Acquisition Holdings Finance SA | | | | | | | | |
12.25%, 07/15/17 PIK(E) | | | 7,800 | | | | 7,369 | |
| | | | | | | | |
| | | | | | | 3,161,581 | |
| | | | | | | | |
Malaysia — 0.7% | |
Malaysia Government Bond | | | | | | | | |
3.84%, 08/12/15(R) | | | 3,365,000 | | | | 1,086,250 | |
4.26%, 09/15/16(R)D | | | 140,000 | | | | 45,982 | |
| | | | | | | | |
| | | | | | | 1,132,232 | |
| | | | | | | | |
Marshall Islands — 0.1% | |
Teekay Corporation | | | | | | | | |
8.50%, 01/15/20D | | | 150,000 | | | | 145,125 | |
| | | | | | | | |
|
See Notes to Schedule of Investments. 127 |
| | | | | | | | |
| | | Par | | | Value | |
Mexico — 3.0% | |
America Movil Sab de CV | | | | | | | | |
5.63%, 11/15/17 | | $ | 98,000 | | | $ | 113,635 | |
Axtel SAB de CV | | | | | | | | |
7.63%, 02/01/17 144A | | | 170,000 | | | | 124,950 | |
7.63%, 02/01/17 | | | 20,000 | | | | 14,700 | |
9.00%, 09/22/19 | | | 58,000 | | | | 44,660 | |
Grupo Televisa SAB | | | | | | | | |
6.63%, 03/18/25D | | | 100,000 | | | | 116,581 | |
6.63%, 01/15/40D | | | 270,000 | | | | 307,158 | |
Kansas City Southern de Mexico SA de CV | | | | | | | | |
12.50%, 04/01/16 | | | 60,000 | | | | 70,200 | |
8.00%, 02/01/18D | | | 500,000 | | | | 552,500 | |
Mexican Bonos | | | | | | | | |
8.00%, 06/11/20(M) | | | 19,619,000 | | | | 1,565,506 | |
8.00%, 12/07/23(M) | | | 26,500,000 | | | | 2,131,502 | |
Petroleos Mexicanos | | | | | | | | |
6.50%, 06/02/41 144AD | | | 135,000 | | | | 152,550 | |
| | | | | | | | |
| | | | | | | 5,193,942 | |
| | | | | | | | |
Netherlands — 1.6% | |
Clondalkin Acquisition BV | | | | | | | | |
3.43%, 12/15/13 144A(E)† | | | 66,000 | | | | 77,732 | |
Clondalkin Industries BV | | | | | | | | |
8.00%, 03/15/14 144A(E) | | | 150,000 | | | | 144,632 | |
EDP Finance BV | | | | | | | | |
6.00%, 02/02/18 144A | | | 200,000 | | | | 168,441 | |
4.90%, 10/01/19 144A | | | 300,000 | | | | 231,840 | |
Indosat Palapa Co. BV | | | | | | | | |
7.38%, 07/29/20 144AD | | | 100,000 | | | | 111,250 | |
7.38%, 07/29/20 | | | 100,000 | | | | 110,688 | |
Lukoil International Finance BV | | | | | | | | |
6.36%, 06/07/17 | | | 200,000 | | | | 204,000 | |
6.66%, 06/07/22D | | | 100,000 | | | | 100,250 | |
LyondellBasell Industries NV | | | | | | | | |
6.00%, 11/15/21 144AD | | | 160,000 | | | | 166,800 | |
OI European Group BV | | | | | | | | |
6.88%, 03/31/17 144A(E) | | | 100,000 | | | | 130,719 | |
Polish Television Holding BV | | | | | | | | |
11.25%, 05/15/17(E) | | | 125,000 | | | | 164,208 | |
Swiss Reinsurance Co. Via ELM BV | | | | | | | | |
5.25%, 05/25/49(E)† | | | 400,000 | | | | 411,571 | |
UPC Holding BV | | | | | | | | |
8.00%, 11/01/16(E) | | | 154,000 | | | | 199,314 | |
VimpelCom Holdings BV | | | | | | | | |
7.50%, 03/01/22 144A | | | 200,000 | | | | 169,000 | |
Ziggo Bond Co. BV | | | | | | | | |
8.00%, 05/15/18 144A(E) | | | 250,000 | | | | 328,415 | |
| | | | | | | | |
| | | | | | | 2,718,860 | |
| | | | | | | | |
Norway — 0.9% | |
Norway Government Bond | | | | | | | | |
5.00%, 05/15/15(K)D | | | 355,000 | | | | 65,989 | |
4.25%, 05/19/17(K) | | | 8,060,000 | | | | 1,504,746 | |
Trico Shipping AS | | | | | | | | |
1.00%, 05/13/14W@ | | | 18,802 | | | | 18,708 | |
| | | | | | | | |
| | | | | | | 1,589,443 | |
| | | | | | | | |
| | | | | | | | |
| | | Par | | | Value | |
Panama — 0.3% | |
AES El Salvador Trust | | | | | | | | |
6.75%, 02/01/16 | | $ | 100,000 | | | $ | 98,000 | |
Panama Government International Bond | | | | | | | | |
7.25%, 03/15/15 | | | 1,000 | | | | 1,158 | |
6.70%, 01/26/36D | | | 296,000 | | | | 387,760 | |
| | | | | | | | |
| | | | | | | 486,918 | |
| | | | | | | | |
Peru — 0.7% | |
Peru Government Bond | | | | | | | | |
7.84%, 08/12/20(P) | | | 1,864,000 | | | | 789,910 | |
Peruvian Government International Bond | | | | | | | | |
7.35%, 07/21/25D | | | 40,000 | | | | 53,200 | |
8.75%, 11/21/33 | | | 239,000 | | | | 365,670 | |
6.55%, 03/14/37 | | | 8,000 | | | | 10,200 | |
| | | | | | | | |
| | | | | | | 1,218,980 | |
| | | | | | | | |
Portugal — 0.1% | |
Portugal Obrigacoes do Tesouro OT | | | | | | | | |
4.80%, 06/15/20(E) | | | 50,000 | | | | 35,720 | |
3.85%, 04/15/21(E) | | | 200,000 | | | | 135,818 | |
| | | | | | | | |
| | | | | | | 171,538 | |
| | | | | | | | |
Russia — 0.6% | |
Russian Federation | | | | | | | | |
7.50%, 03/31/30 STEP | | | 854,205 | | | | 994,081 | |
| | | | | | | | |
South Africa — 0.2% | |
Edcon Proprietary, Ltd. | | | | | | | | |
4.68%, 06/15/14(E)† | | | 320,000 | | | | 307,513 | |
| | | | | | | | |
Supranational — 0.9% | |
Inter-American Development Bank | | | | | | | | |
0.00%, 09/23/13(N)W | | | 15,900,000,000 | | | | 1,555,719 | |
| | | | | | | | |
Sweden — 0.2% | |
Corral Petroleum Holdings AB | | | | | | | | |
15.00%, 12/31/17 PIK 144A(E) | | | 141,933 | | | | 146,957 | |
Nordea Bank AB | | | | | | | | |
4.88%, 01/27/20 144A | | | 160,000 | | | | 164,582 | |
| | | | | | | | |
| | | | | | | 311,539 | |
| | | | | | | | |
Trinidad And Tobago — 0.2% | |
Petroleum Co. of Trinidad & Tobago, Ltd. | | | | | | | | |
9.75%, 08/14/19 144A | | | 240,000 | | | | 285,600 | |
| | | | | | | | |
Turkey — 0.2% | |
Turkey Government International Bond | | | | | | | | |
7.50%, 07/14/17 | | | 100,000 | | | | 113,125 | |
7.00%, 03/11/19 | | | 100,000 | | | | 111,250 | |
6.88%, 03/17/36D | | | 73,000 | | | | 76,468 | |
| | | | | | | | |
| | | | | | | 300,843 | |
| | | | | | | | |
United Arab Emirates — 0.8% | |
DP World, Ltd. | | | | | | | | |
6.85%, 07/02/37 144A | | | 1,500,000 | | | | 1,365,000 | |
| | | | | | | | |
United Kingdom — 2.1% | |
Barclays Bank PLC | | | | | | | | |
6.00%, 01/23/18(E)D | | | 450,000 | | | | 525,478 | |
Boparan Holdings, Ltd. | | | | | | | | |
9.88%, 04/30/18 144A(U) | | | 100,000 | | | | 125,016 | |
|
| See Notes to Schedule of Investments. |
128 |
GLOBAL BOND FUND
SCHEDULE OF INVESTMENTS (Continued)
| | | | | | | | |
| | | Par | | | Value | |
DFS Furniture Holdings PLC | | | | | | | | |
9.75%, 07/15/17 144A(U) | | $ | 54,000 | | | $ | 68,766 | |
HSBC Holdings PLC | | | | | | | | |
6.00%, 06/10/19(E) | | | 270,000 | | | | 355,406 | |
Ineos Group Holdings, Ltd. | | | | | | | | |
7.88%, 02/15/16(E) | | | 160,000 | | | | 154,274 | |
Inmarsat Finance PLC | | | | | | | | |
7.38%, 12/01/17 144AD | | | 290,000 | | | | 304,500 | |
ISS A/S | | | | | | | | |
11.00%, 06/15/14(E) | | | 212,000 | | | | 290,157 | |
Lloyds TSB Bank PLC | | | | | | | | |
6.50%, 03/24/20(E)D | | | 326,000 | | | | 332,944 | |
Phones4u Finance PLC | | | | | | | | |
9.50%, 04/01/18 144A(U) | | | 130,000 | | | | 162,520 | |
Priory Group No. 3 PLC | | | | | | | | |
8.88%, 02/15/19(U)D | | | 100,000 | | | | 124,239 | |
Royal Bank of Scotland PLC | | | | | | | | |
4.88%, 01/20/17(E) | | | 580,000 | | | | 710,645 | |
Vedanta Resources PLC | | | | | | | | |
8.75%, 01/15/14D | | | 210,000 | | | | 205,800 | |
6.75%, 06/07/16 144AD | | | 200,000 | | | | 172,000 | |
| | | | | | | | |
| | | | | | | 3,531,745 | |
| | | | | | | | |
Venezuela — 0.8% | |
Venezuela Government International Bond | | | | | | | | |
8.50%, 10/08/14D | | | 26,000 | | | | 24,342 | |
5.75%, 02/26/16D | | | 1,153,000 | | | | 907,988 | |
7.75%, 10/13/19D | | | 360,000 | | | | 259,200 | |
9.38%, 01/13/34D | | | 207,000 | | | | 143,865 | |
| | | | | | | | |
| | | | | | | 1,335,395 | |
| | | | | | | | |
Virgin Islands (British) — 0.1% | |
GTL Trade Finance, Inc. | | | | | | | | |
7.25%, 10/20/17 144A | | | 189,000 | | | | 205,065 | |
| | | | | | | | |
Total Foreign Bonds
(Cost $64,868,377) | | | | | | | 65,108,168 | |
| | | | | | | | |
MORTGAGE-BACKED SECURITIES — 0.4% | |
Bayview Commercial Asset Trust | | | | | | | | |
0.52%, 07/25/36 144A† | | | 188,377 | | | | 138,937 | |
Credit Suisse Mortgage Capital Certificates | | | | | | | | |
5.70%, 09/15/40† | | | 220,000 | | | | 229,534 | |
Federal National Mortgage Association | | | | | | | | |
3.00%, 01/01/26 TBA | | | 200,000 | | | | 206,531 | |
Government National Mortgage Association | | | | | | | | |
4.50%, 01/01/41 TBA | | | 100,000 | | | | 108,906 | |
| | | | | | | | |
Total Mortgage-Backed Securities
(Cost $623,489) | | | | 683,908 | |
| | | | | | | | |
MUNICIPAL BOND — 0.2% | |
State of Illinois, General Obligation | | | | | | | | |
5.10%, 06/01/33 | | | | | | | | |
(Cost $329,176) | | | 435,000 | | | | 395,258 | |
| | | | | | | | |
| | | | | | | | |
| | | Par | | | Value | |
U.S. TREASURY OBLIGATIONS — 4.2% | |
U.S. Treasury Bonds | | | | | | | | |
3.50%, 02/15/39‡‡ | | $ | 3,700,000 | | | $ | 4,162,500 | |
4.25%, 05/15/39D | | | 40,000 | | | | 50,894 | |
4.63%, 02/15/40D | | | 140,000 | | | | 188,847 | |
3.88%, 08/15/40D | | | 30,000 | | | | 35,967 | |
| | | | | | | | |
| | | | | | | 4,438,208 | |
| | | | | | | | |
U.S. Treasury Notes | | | | | | | | |
4.50%, 04/30/12 | | | 30,000 | | | | 30,437 | |
1.00%, 05/15/14 | | | 10,000 | | | | 10,167 | |
2.63%, 07/31/14 | | | 50,000 | | | | 52,941 | |
2.38%, 09/30/14 | | | 110,000 | | | | 116,076 | |
1.75%, 07/31/15 | | | 90,000 | | | | 93,952 | |
1.25%, 08/31/15D | | | 90,000 | | | | 92,405 | |
1.25%, 09/30/15D | | | 90,000 | | | | 92,348 | |
2.00%, 01/31/16 | | | 170,000 | | | | 179,377 | |
1.88%, 10/31/17 | | | 10,000 | | | | 10,457 | |
3.38%, 11/15/19D | | | 40,000 | | | | 45,603 | |
3.63%, 02/15/20 | | | 20,000 | | | | 23,198 | |
2.63%, 08/15/20 | | | 340,000 | | | | 366,749 | |
2.63%, 11/15/20D | | | 1,300,000 | | | | 1,399,735 | |
3.63%, 02/15/21D | | | 90,000 | | | | 104,505 | |
2.13%, 08/15/21D | | | 100,000 | | | | 102,578 | |
| | | | | | | | |
| | | | | | | 2,720,528 | |
| | | | | | | | |
Total U.S. Treasury Obligations
(Cost $6,231,404) | | | | | | | 7,158,736 | |
| | | | | | | | |
| | |
| | | Shares | | | | |
COMMON STOCKS — 0.6% | |
Consumer Discretionary — 0.0% | |
General Motors Co.D* | | | 69 | | | | 1,398 | |
| | | | | | | | |
Healthcare — 0.3% | | | | | | | | |
Bristol-Myers Squibb Co.D | | | 15,400 | | | | 542,696 | |
| | | | | | | | |
Materials & Processing — 0.3% | |
Georgia Gulf Corporation | | | 3,161 | | | | 61,608 | |
PPG Industries, Inc. | | | 5,751 | | | | 480,151 | |
Rock-Tenn Co. Class A | | | 133 | | | | 7,674 | |
| | | | | | | | |
| | | | | | | 549,433 | |
| | | | | | | | |
Media — 0.0% | |
Dex One CorporationD | | | 1,433 | | | | 2,379 | |
| | | | | | | | |
Producer Durables — 0.0% | |
Nortek, Inc. | | | 179 | | | | 4,683 | |
| | | | | | | | |
Total Common Stocks
(Cost $892,083) | | | | | | | 1,100,589 | |
| | | | | | | | |
FOREIGN COMMON STOCKS — 0.9% | |
Netherlands — 0.3% | |
Royal Dutch Shell PLC ADRD | | | 6,443 | | | | 470,919 | |
| | | | | | | | |
Norway — 0.1% | |
Deep Ocean Group Holding+@ | | | 8,860 | | | | 130,685 | |
| | | | | | | | |
Spain — 0.5% | |
Repsol YPF SA ADRD | | | 15,133 | | | | 461,708 | |
Telefonica SA ADRD | | | 22,180 | | | | 381,274 | |
| | | | | | | | |
| | | | | | | 842,982 | |
| | | | | | | | |
Total Foreign Common Stocks
(Cost $1,273,319) | | | | | | | 1,444,586 | |
| | | | | | | | |
|
See Notes to Schedule of Investments. 129 |
| | | | | | | | |
| | | Shares | | | Value | |
PREFERRED STOCKS — 1.3% | |
Bank of America Corporation CONV* | | | 602 | | | $ | 474,388 | |
Citigroup Capital XII | | | 12,325 | | | | 310,097 | |
El Paso Energy Capital Trust I | | | 500 | | | | 23,020 | |
Lucent Technologies Capital Trust I CONVD* | | | 1,891 | | | | 1,161,074 | |
Preferred Blocker (GMAC), Inc. | | | 400 | | | | 286,738 | |
| | | | | | | | |
Total Preferred Stocks
(Cost $2,410,358) | | | | 2,255,317 | |
| | | | | | | | |
RIGHTS/WARRANTS — 0.0% | |
Buffets Restaurants Holdings, Inc. | | | 89 | | | | 1 | |
Charter Communications, Inc. | | | 110 | | | | 1,563 | |
CMP Susquehanna Radio Holdings Corporation@ | | | 1,706 | | | | 8,815 | |
General Motors Co. | | | 122 | | | | 1,192 | |
Nortek, Inc.@ | | | 184 | | | | 230 | |
| | | | | | | | |
Total Rights/Warrants
(Cost $50,348) | | | | 11,801 | |
| | | | | | | | |
MONEY MARKET FUNDS — 26.4% | |
GuideStone Money Market Fund (GS4 Class)¥ | | | 15,259,602 | | | | 15,259,602 | |
Northern Institutional Liquid Assets Portfolio§ | | | 29,584,211 | | | | 29,584,211 | |
| | | | | | | | |
Total Money Market Funds
(Cost $44,843,813) | | | | 44,843,813 | |
| | | | | | | | |
TOTAL INVESTMENTS — 114.8%
(Cost $187,772,545) | | | | 195,350,527 | |
| | |
Liabilities in Excess of Other Assets — (14.8)% | | | | | | | (25,183,297 | ) |
| | | | | | | | |
NET ASSETS — 100.0% | | | $ | 170,167,230 | |
| | | | | | | | |
Please see abbreviation and footnote definitions beginning on page 200.
PORTFOLIO SUMMARY (based on net assets)
| | | | |
| | | % | |
Corporate Bonds | | | 42.5 | |
Foreign Bonds | | | 38.3 | |
Money Market Funds | | | 26.4 | |
U.S. Treasury Obligations | | | 4.2 | |
Preferred Stocks | | | 1.3 | |
Foreign Common Stocks | | | 0.9 | |
Common Stocks | | | 0.6 | |
Mortgage-Backed Securities | | | 0.4 | |
Forward Foreign Currency Contracts | | | 0.3 | |
Municipal Bond | | | 0.2 | |
Agency Obligations | | | — | ** |
Rights/Warrants | | | — | ** |
Futures Contracts | | | (0.9 | ) |
| | | | |
| | | 114.2 | |
| | | | |
| ** | Rounds to less than 0.005%. |
|
| See Notes to Schedule of Investments. |
130 |
GLOBAL BOND FUND
SCHEDULE OF INVESTMENTS (Continued)
VALUATION HIERARCHY
The following is a summary of the inputs used, as of December 31, 2011, in valuing the Fund’s investments carried at fair value:
| | | | | | | | | | | | | | | | |
| | | Total Value | | | Level 1
Quoted Prices | | | Level 2
Other
Significant
Observable
Inputs | | | Level 3
Significant
Unobservable
Inputs | |
Assets: | | | | | | | | | | | | | | | | |
Investments in Securities: | | | | | | | | | | | | | | | | |
Agency Obligations | | $ | 33,000 | | | $ | — | | | $ | 33,000 | | | $ | — | |
Common Stocks | | | 1,100,589 | | | | 1,100,589 | | | | — | | | | — | |
Corporate Bonds | | | 72,315,351 | | | | — | | | | 72,315,351 | | | | — | |
Foreign Bonds | | | 65,108,168 | | | | — | | | | 65,099,916 | | | | 8,252 | |
Foreign Common Stocks | | | 1,444,586 | | | | 1,313,901 | | | | — | | | | 130,685 | |
Money Market Funds | | | 44,843,813 | | | | 44,843,813 | | | | — | | | | — | |
Mortgage-Backed Securities | | | 683,908 | | | | — | | | | 683,908 | | | | — | |
Municipal Bond | | | 395,258 | | | | — | | | | 395,258 | | | | — | |
Preferred Stocks | | | 2,255,317 | | | | 2,255,317 | | | | — | | | | — | |
Rights/Warrants | | | 11,801 | | | | 2,985 | | | | 1 | | | | 8,815 | |
U.S. Treasury Obligations | | | 7,158,736 | | | | — | | | | 7,158,736 | | | | — | |
| | | | | | | | | | | | | | | | |
Total Assets — Investments in Securities | | $ | 195,350,527 | | | $ | 49,516,605 | | | $ | 145,686,170 | | | $ | 147,752 | |
| | | | | | | | | | | | | | | | |
Other Financial Instruments*** | | | | | | | | | | | | | | | | |
Forward Foreign Currency Contracts | | $ | 804,377 | | | $ | — | | | $ | 804,377 | | | $ | — | |
Futures Contracts | | | 9,027 | | | | 9,027 | | | | — | | | | — | |
| | | | | | | | | | | | | | | | |
Total Assets — Other Financial Instruments | | $ | 813,404 | | | $ | 9,027 | | | $ | 804,377 | | | $ | — | |
| | | | | | | | | | | | | | | | |
| | | | |
| Other Financial Instruments*** | | | | | | | | | | | | | | | | |
| *** | Other financial instruments are derivative instruments not reflected in the Schedule of Investments, such as futures, forwards and swap contracts, which are valued at the unrealized appreciation (depreciation) on the investment. Details of these investments can be found in the Notes to Schedules of Investments. |
The following is a reconciliation of assets in which significant unobservable inputs (Level 3) were used in determining fair value:
| | | | | | | | | | | | | | | | | | | | |
| | | Total
Value | | | Common
Stocks | | | Foreign
Bonds | | | Foreign
Common
Stocks | | | Warrants | |
Balance, 12/31/10 | | $ | 11,550 | | | $ | 11,550 | | | $ | — | | | $ | — | | | $ | — | |
Accrued discounts/premiums | | | — | | | | — | | | | — | | | | — | | | | — | |
Realized gain (loss) | | | — | | | | — | | | | — | | | | — | | | | — | |
Change in unrealized appreciation (depreciation)(1) | | | 23,280 | | | | — | | | | (3,300 | ) | | | 26,580 | | | | — | |
Purchases | | | 104,105 | | | | — | | | | — | | | | 104,105 | | | | — | |
Sales | | | — | | | | — | | | | — | | | | — | | | | — | |
Transfers in and/or out of Level 3(2)(3) | | | 8,817 | | | | (11,550 | ) | | | 11,552 | | | | — | | | | 8,815 | |
| | | | | | | | | | | | | | | | | | | | |
Balance, 12/31/11 | | $ | 147,752 | | | $ | — | | | $ | 8,252 | | | $ | 130,685 | | | $ | 8,815 | |
| | | | | | | | | | | | | | | | | | | | |
| (1) | Change in unrealized appreciation (depreciation) can be found on the Statement of Operations in Net change in unrealized appreciation (depreciation) on Investment securities and securities sold short. |
| (2) | The Fund had a security valued at $2 as of December 31, 2010 that was transferred from Level 2 to Level 3 of the fair value hierarchy. The securities that transferred from Level 2 to Level 3 during the year ended December 31, 2011 did so as a result of the inability of the Fund to obtain a price which was determined using observable inputs. The value of the securities as of December 31, 2011 is $8,817. |
| (3) | Transfers in and/or out of Level 3 reflect the re-classification of a balance from December 31, 2010 in the amount of $11,550. |
See Notes to Schedule of Investments.
131
Defensive Market Strategies Fund
The Defensive Market Strategies Fund was launched September 1, 2011. The Fund combines multiple strategies that in aggregate seek to provide long-term capital appreciation with reduced volatility compared to the equity markets.
The Fund met its investment objectives during the very volatile four month period, one characterized by a strong sell off in equity markets in the month of September followed by a powerful fourth quarter rally. The Fund provides lower sensitivity to market movements, thus reducing Fund volatility and helping ensure that the Fund experiences less significant drawdowns during significant equity market corrections like those experienced in September. Contrastingly, due to the Fund’s defensive posture, it is expected to participate to a lesser degree in strong market rallies, as was the case in the final quarter. Overall, the Fund posted a return of 2.43% for 2011.
The September equity market sell-off reflected a continuation of fears surrounding a slowing global economy, government fiscal policies and the European debt crisis. The Fund performed as expected in response to the adverse market conditions. The sharp downturn in equity markets in September benefited the relative performance of the Fund due to its defensive characteristics. For the month of September, the S&P 500® Index returned -7.09% while the Fund posted a return of -3.40%, or 3.69% better than its benchmark. This relative outperformance was primarily due to the defensively positioned portfolio that has significantly less market sensitivity (beta). Additionally, the higher quality, lower beta holdings in the Fund significantly outperformed the rest of the market in September.
The equity markets showed resilience in the fourth quarter and quickly erased a large portion of their previous losses suffered from prior months as markets cheered better economic news domestically. The sharp snap back in performance came primarily from October’s double-digit gains in stock markets both in the United States and abroad. During the fourth quarter, lower quality, higher beta stocks performed best. As expected, the Fund lagged the sharply rising equity markets, underperforming the S&P 500® Index by 5.78% in the fourth quarter to end the year with relative underperformance of 1.53% to the S&P 500® Index over its first four months of history.
The Fund’s investment in lower volatility and higher dividend stocks contributed to positive absolute and benchmark relative performance in 2011. The more conservatively positioned convertible bonds and long/short equity strategies detracted from both absolute and relative performance.
Some of the strategies utilized derivative instruments during the year. Currency forwards were utilized in an effort to hedge foreign currency risk associated with non-U.S. dollar investments. Overall these positions contributed positively, although marginally, to absolute and relative performance. In addition, some call and put options were utilized (all options being fully covered), to more efficiently implement desired position exposures in the portfolio or to reduce the risk associated with long-only equity positions. These positions had negligible positive and negative impacts on the Fund’s performance.
This Fund may be suitable for investors who have a medium to long-term investment horizon, possess a moderate tolerance for risk and seek to participate in the return potential of stocks at a slightly lower risk level than an all stock portfolio. Convertible securities valuations generally are more closely aligned with a company’s bonds than common stock. This Fund is subject to interest rate risk. Meaning, when interest rates rise, the value of the existing bonds decrease and vice versa. Foreign securities may be subject to greater risk than domestic securities due to currency volatility, reduced market liquidity and political and economic instability. To the extent that the investment advisor misjudges current market conditions, the Fund’s volatility may be amplified by its use of short sales and derivatives and by its ability to select sub-advisers to allocate assets. Short sales by a fund theoretically involve unlimited loss potential since the market price of securities sold short may continuously increase. Leverage may increase the risk of loss and cause fluctuations in the market value of the Fund’s portfolio to have disproportionately large effects or cause the NAV of the Fund generally to decline faster than it would otherwise.
Please see page 145 for information regarding specific portfolio allocations. Portfolio holdings are subject to change and risk at any time.
132
| | |
| DEFENSIVE MARKET STRATEGIES FUND | | |
| SCHEDULE OF INVESTMENTS | | December 31, 2011 |
| | | | | | | | |
| | | Shares | | | Value | |
COMMON STOCKS — 54.1% | | | | | | | | |
Consumer Discretionary — 7.1% | | | | | | | | |
Advance Auto Parts, Inc. | | | 1,500 | | | $ | 104,445 | |
Aeropostale, Inc.* | | | 7,610 | | | | 116,053 | |
Amazon.com, Inc.* | | | 3,300 | | | | 571,230 | |
American Eagle Outfitters, Inc. | | | 9,930 | | | | 151,830 | |
Ancestry.com, Inc.* | | | 5,630 | | | | 129,265 | |
Asbury Automotive Group, Inc.* | | | 6,260 | | | | 134,966 | |
AutoZone, Inc.* | | | 1,700 | | | | 552,449 | |
Avon Products, Inc. | | | 2,600 | | | | 45,422 | |
Bed Bath & Beyond, Inc.* | | | 8,550 | | | | 495,644 | |
Big Lots, Inc.* | | | 2,300 | | | | 86,848 | |
BorgWarner, Inc.* | | | 2,270 | | | | 144,690 | |
CBS Corporation Class B | | | 13,540 | | | | 367,476 | |
Chipotle Mexican Grill, Inc.* | | | 3,000 | | | | 1,013,220 | |
Coach, Inc. | | | 6,670 | | | | 407,137 | |
Coldwater Creek, Inc.* | | | 72,620 | | | | 85,692 | |
Costco Wholesale Corporation | | | 12,000 | | | | 999,840 | |
CROCS, Inc.* | | | 9,310 | | | | 137,509 | |
Crumbs Bake Shop, Inc.* | | | 10,060 | | | | 40,240 | |
Deckers Outdoor Corporation* | | | 1,230 | | | | 92,951 | |
Dollar Tree, Inc.* | | | 5,300 | | | | 440,483 | |
eBay, Inc.* | | | 23,160 | | | | 702,443 | |
Estee Lauder Cos., Inc. (The) Class A | | | 3,840 | | | | 431,309 | |
Expedia, Inc.* | | | 800 | | | | 23,216 | |
Express, Inc.* | | | 4,980 | | | | 99,301 | |
Family Dollar Stores, Inc. | | | 10,280 | | | | 592,745 | |
GameStop Corporation Class A* | | | 13,180 | | | | 318,033 | |
Gap, Inc. (The) | | | 13,900 | | | | 257,845 | |
Genuine Parts Co. | | | 6,600 | | | | 403,920 | |
Guess ?, Inc. | | | 1,200 | | | | 35,784 | |
Hasbro, Inc. | | | 8,300 | | | | 264,687 | |
Home Depot, Inc. (The) | | | 5,700 | | | | 239,628 | |
J.C. Penney Co., Inc. | | | 1,200 | | | | 42,180 | |
Jack in the Box, Inc.* | | | 5,350 | | | | 111,815 | |
Kohl’s Corporation | | | 6,500 | | | | 320,775 | |
Lowe’s Cos., Inc. | | | 61,100 | | | | 1,550,718 | |
Lumber Liquidators Holdings, Inc.* | | | 18,400 | | | | 324,944 | |
Marriott International, Inc. Class A | | | 2,100 | | | | 61,257 | |
McDonald’s Corporation | | | 11,140 | | | | 1,117,676 | |
NIKE, Inc. Class B | | | 2,700 | | | | 260,199 | |
Nordstrom, Inc. | | | 2,290 | | | | 113,836 | |
Omnicom Group, Inc. | | | 5,500 | | | | 245,190 | |
O’Reilly Automotive, Inc.* | | | 2,600 | | | | 207,870 | |
P.F. Chang’s China Bistro, Inc. | | | 2,550 | | | | 78,820 | |
Panera Bread Co.* | | | 4,600 | | | | 650,670 | |
PetSmart, Inc. | | | 3,900 | | | | 200,031 | |
Polaris Industries, Inc. | | | 1,600 | | | | 89,568 | |
priceline.com, Inc.* | | | 700 | | | | 327,397 | |
RadioShack Corporation | | | 4,960 | | | | 48,161 | |
Ralph Lauren Corporation | | | 2,810 | | | | 388,005 | |
Scripps Networks Interactive, Inc. Class A | | | 6,500 | | | | 275,730 | |
Stanley Black & Decker, Inc. | | | 3,030 | | | | 204,828 | |
Starbucks Corporation | | | 6,540 | | | | 300,905 | |
Starwood Hotels & Resorts Worldwide, Inc. | | | 5,850 | | | | 280,624 | |
Steven Madden, Ltd.* | | | 6,530 | | | | 225,285 | |
Target Corporation | | | 11,000 | | | | 563,420 | |
Teavana Holdings, Inc.* | | | 5,700 | | | | 107,046 | |
| | | | | | | | |
| | | Shares | | | Value | |
Tempur-Pedic International, Inc.* | | | 3,230 | | | $ | 169,672 | |
Time Warner, Inc. | | | 17,900 | | | | 646,906 | |
TJX Cos., Inc. | | | 3,100 | | | | 200,105 | |
TripAdvisor, Inc.* | | | 3,240 | | | | 81,680 | |
Tupperware Brands Corporation | | | 2,400 | | | | 134,328 | |
Under Armour, Inc. Class A* | | | 1,620 | | | | 116,300 | |
Urban Outfitters, Inc.* | | | 3,510 | | | | 96,736 | |
Vera Bradley, Inc.* | | | 3,880 | | | | 125,130 | |
Vitamin Shoppe, Inc.* | | | 3,160 | | | | 126,021 | |
Wal-Mart Stores, Inc. | | | 28,600 | | | | 1,709,136 | |
Whirlpool Corporation | | | 11,900 | | | | 564,655 | |
Williams-Sonoma, Inc. | | | 3,730 | | | | 143,605 | |
Yum! Brands, Inc. | | | 11,600 | | | | 684,516 | |
| | | | | | | | |
| | | | | | | 22,382,041 | |
| | | | | | | | |
Consumer Staples — 6.1% | | | | | | | | |
Campbell Soup Co. | | | 9,700 | | | | 322,428 | |
Church & Dwight Co., Inc. | | | 16,900 | | | | 773,344 | |
Clorox Co. (The) | | | 20,900 | | | | 1,391,104 | |
Coca-Cola Co. (The) | | | 11,500 | | | | 804,655 | |
Colgate-Palmolive Co. | | | 11,790 | | | | 1,089,278 | |
Dr. Pepper Snapple Group, Inc. | | | 44,700 | | | | 1,764,756 | |
General Mills, Inc. | | | 9,300 | | | | 375,813 | |
H.J. Heinz Co. | | | 9,900 | | | | 534,996 | |
Hansen Natural Corporation* | | | 1,150 | | | | 105,961 | |
Hershey Co. (The) | | | 13,910 | | | | 859,360 | |
Hormel Foods Corporation | | | 6,800 | | | | 199,172 | |
Kellogg Co. | | | 13,200 | | | | 667,524 | |
Kimberly-Clark Corporation | | | 22,200 | | | | 1,633,032 | |
Kraft Foods, Inc. Class A | | | 1,100 | | | | 41,096 | |
Kroger Co. (The) | | | 26,000 | | | | 629,720 | |
McCormick & Co., Inc. | | | 8,400 | | | | 423,528 | |
PepsiCo, Inc. | | | 8,200 | | | | 544,070 | |
Procter & Gamble Co. (The) | | | 64,720 | | | | 4,317,471 | |
Safeway, Inc. | | | 45,900 | | | | 965,736 | |
Sysco Corporation | | | 21,500 | | | | 630,595 | |
Tyson Foods, Inc. Class A | | | 7,250 | | | | 149,640 | |
Walgreen Co. | | | 7,400 | | | | 244,644 | |
Whole Foods Market, Inc. | | | 9,670 | | | | 672,839 | |
| | | | | | | | |
| | | | | | | 19,140,762 | |
| | | | | | | | |
Energy — 3.3% | | | | | | | | |
Alpha Natural Resources, Inc.* | | | 9,280 | | | | 189,590 | |
Anadarko Petroleum Corporation | | | 7,820 | | | | 596,901 | |
Baker Hughes, Inc. | | | 2,890 | | | | 140,570 | |
Basic Energy Services, Inc.* | | | 11,020 | | | | 217,094 | |
Berry Petroleum Co. | | | 9,050 | | | | 380,281 | |
Cabot Oil & Gas Corporation | | | 4,940 | | | | 374,946 | |
Chevron Corporation | | | 17,700 | | | | 1,883,280 | |
Cobalt International Energy, Inc.* | | | 8,080 | | | | 125,402 | |
Concho Resources, Inc.* | | | 5,510 | | | | 516,562 | |
Consol Energy, Inc. | | | 2,830 | | | | 103,861 | |
CVR Energy, Inc. | | | 4,570 | | | | 85,596 | |
Dawson Geophysical Co.* | | | 1,490 | | | | 58,900 | |
EQT Corporation | | | 6,350 | | | | 347,916 | |
Exxon Mobil Corporation | | | 42,800 | | | | 3,627,728 | |
Gulfport Energy Corporation* | | | 5,020 | | | | 147,839 | |
Hercules Offshore, Inc.* | | | 16,790 | | | | 74,548 | |
Key Energy Services, Inc.* | | | 19,660 | | | | 304,140 | |
Laredo Petroleum Holdings, Inc.* | | | 2,470 | | | | 55,081 | |
McMoRan Exploration Co.* | | | 7,880 | | | | 114,654 | |
National Oilwell Varco, Inc. | | | 1,200 | | | | 81,588 | |
|
| See Notes to Financial Statements. |
133 |
| | | | | | | | |
| | | Shares | | | Value | |
Noble Energy, Inc. | | | 450 | | | $ | 42,476 | |
Northern Oil and Gas, Inc.* | | | 7,180 | | | | 172,176 | |
Pioneer Natural Resources Co. | | | 730 | | | | 65,320 | |
Plains Exploration & Production Co.* | | | 4,220 | | | | 154,958 | |
RAM Energy Resources, Inc.* | | | 490 | | | | 1,534 | |
Range Resources Corporation | | | 630 | | | | 39,022 | |
Rex Energy Corporation* | | | 4,830 | | | | 71,291 | |
Rowan Cos., Inc.* | | | 2,940 | | | | 89,170 | |
SandRidge Energy, Inc.* | | | 3,110 | | | | 25,378 | |
Schlumberger, Ltd. | | | 980 | | | | 66,944 | |
Spectra Energy Corporation | | | 3,100 | | | | 95,325 | |
Swift Energy Co.* | | | 1,870 | | | | 55,576 | |
Valero Energy Corporation | | | 4,200 | | | | 88,410 | |
Walter Energy, Inc. | | | 1,960 | | | | 118,698 | |
| | | | | | | | |
| | | | | | | 10,512,755 | |
| | | | | | | | |
Financial Services — 8.9% | | | | | | | | |
Affiliated Managers Group, Inc.* | | | 3,390 | | | | 325,270 | |
Allstate Corporation (The) | | | 9,700 | | | | 265,877 | |
Ameriprise Financial, Inc. | | | 8,200 | | | | 407,048 | |
Aon Corporation | | | 15,270 | | | | 714,636 | |
Bank of Hawaii Corporation | | | 16,500 | | | | 734,085 | |
Brown & Brown, Inc. | | | 7,880 | | | | 178,324 | |
Capitol Federal Financial, Inc. | | | 237,200 | | | | 2,737,288 | |
CBRE Group, Inc.* | | | 12,860 | | | | 195,729 | |
Chubb Corporation (The) | | | 41,070 | | | | 2,842,865 | |
City National Corporation | | | 3,800 | | | | 167,884 | |
Comerica, Inc. | | | 28,440 | | | | 733,752 | |
Commerce Bancshares, Inc. | | | 35,510 | | | | 1,353,641 | |
Cullen/Frost Bankers, Inc. | | | 13,400 | | | | 708,994 | |
Discover Financial Services | | | 3,600 | | | | 86,400 | |
Duke Realty Corporation REIT | | | 26,120 | | | | 314,746 | |
Dun & Bradstreet Corporation (The) | | | 5,400 | | | | 404,082 | |
Equifax, Inc. | | | 14,670 | | | | 568,316 | |
Extra Space Storage, Inc. REIT | | | 3,480 | | | | 84,320 | |
Factset Research Systems, Inc. | | | 4,100 | | | | 357,848 | |
First Commonwealth Financial Corporation | | | 7,780 | | | | 40,923 | |
First Horizon National Corporation | | | 6,380 | | | | 51,040 | |
First Niagara Financial Group, Inc. | | | 31,000 | | | | 267,530 | |
Fiserv, Inc.* | | | 2,790 | | | | 163,885 | |
Fortegra Financial Corporation* | | | 16,110 | | | | 107,615 | |
Goldman Sachs Group, Inc. (The) | | | 2,263 | | | | 204,643 | |
Invesco, Ltd. | | | 12,190 | | | | 244,897 | |
JPMorgan Chase & Co. | | | 27,956 | | | | 929,537 | |
M&T Bank Corporation | | | 5,900 | | | | 450,406 | |
Manning & Napier, Inc.* | | | 5,360 | | | | 66,946 | |
MarketAxess Holdings, Inc. | | | 7,450 | | | | 224,320 | |
Marsh & McLennan Cos., Inc. | | | 107,100 | | | | 3,386,502 | |
Mastercard, Inc. Class A | | | 1,330 | | | | 495,851 | |
MSCI, Inc.* | | | 4,470 | | | | 147,197 | |
New York Community Bancorp, Inc. | | | 1,700 | | | | 21,029 | |
Northern Trust Corporation | | | 85,000 | | | | 3,371,100 | |
Ocwen Financial Corporation* | | | 20,620 | | | | 298,578 | |
Oritani Financial Corporation | | | 8,490 | | | | 108,417 | |
People’s United Financial, Inc. | | | 94,600 | | | | 1,215,610 | |
Piedmont Office Realty Trust, Inc. REIT | | | 30,000 | | | | 511,200 | |
| | | | | | | | |
| | | Shares | | | Value | |
Plum Creek Timber Co., Inc. REIT | | | 2,910 | | | $ | 106,390 | |
PNC Financial Services Group, Inc. | | | 6,800 | | | | 392,156 | |
ProAssurance Corporation | | | 1,600 | | | | 127,712 | |
Progressive Corporation (The) | | | 1,000 | | | | 19,510 | |
Signature Bank* | | | 1,540 | | | | 92,385 | |
SunTrust Banks, Inc. | | | 20,800 | | | | 368,160 | |
SVB Financial Group* | | | 400 | | | | 19,076 | |
T Rowe Price Group, Inc. | | | 3,700 | | | | 210,715 | |
Texas Capital Bancshares, Inc.* | | | 3,770 | | | | 115,400 | |
Total System Services, Inc. | | | 2,100 | | | | 41,076 | |
Travelers Cos., Inc. (The) | | | 3,200 | | | | 189,344 | |
Visa, Inc. Class A | | | 1,100 | | | | 111,683 | |
W.R. Berkley Corporation | | | 700 | | | | 24,073 | |
Wells Fargo & Co. | | | 13,030 | | | | 359,107 | |
Western Union Co. (The) | | | 11,490 | | | | 209,807 | |
WisdomTree Investments, Inc.* | | | 14,193 | | | | 85,868 | |
| | | | | | | | |
| | | | | | | 27,960,793 | |
| | | | | | | | |
Healthcare — 9.2% | | | | | | | | |
Abbott Laboratories | | | 41,500 | | | | 2,333,545 | |
Acadia Healthcare Co., Inc.* | | | 1,970 | | | | 19,641 | |
Achillion Pharmaceuticals, Inc.* | | | 14,750 | | | | 112,393 | |
Aetna, Inc. | | | 8,390 | | | | 353,974 | |
Air Methods Corporation* | | | 1,880 | | | | 158,766 | |
Akorn, Inc.* | | | 8,960 | | | | 99,635 | |
Alexion Pharmaceuticals, Inc.* | | | 8,490 | | | | 607,035 | |
Align Technology, Inc.* | | | 1,590 | | | | 37,723 | |
Allergan, Inc. | | | 7,880 | | | | 691,391 | |
AMERIGROUP Corporation* | | | 1,490 | | | | 88,029 | |
AmerisourceBergen Corporation | | | 19,890 | | | | 739,709 | |
Amgen, Inc. | | | 11,678 | | | | 749,844 | |
Analogic Corporation | | | 1,170 | | | | 67,064 | |
Ariad Pharmaceuticals, Inc.* | | | 6,150 | | | | 75,338 | |
Arthrocare Corporation* | | | 12,910 | | | | 408,989 | |
Baxter International, Inc. | | | 6,100 | | | | 301,828 | |
Becton, Dickinson and Co. | | | 8,700 | | | | 650,064 | |
Biogen Idec, Inc.* | | | 7,300 | | | | 803,365 | |
BioMarin Pharmaceuticals, Inc.* | | | 3,820 | | | | 131,332 | |
Bristol-Myers Squibb Co. | | | 51,400 | | | | 1,811,336 | |
C.R. Bard, Inc. | | | 4,800 | | | | 410,400 | |
Cardinal Health, Inc. | | | 3,200 | | | | 129,952 | |
CareFusion Corporation* | | | 6,060 | | | | 153,985 | |
Celgene Corporation* | | | 3,400 | | | | 229,840 | |
Cepheid, Inc.* | | | 1,730 | | | | 59,529 | |
Cerner Corporation* | | | 1,770 | | | | 108,412 | |
Computer Programs & Systems, Inc. | | | 1,240 | | | | 63,376 | |
Conventry Health Care, Inc.* | | | 1,190 | | | | 36,140 | |
Covance, Inc.* | | | 500 | | | | 22,860 | |
Cubist Pharmaceuticals, Inc.* | | | 3,140 | | | | 124,407 | |
Cyberonics, Inc.* | | | 2,620 | | | | 87,770 | |
DaVita, Inc.* | | | 200 | | | | 15,162 | |
DENTSPLY International, Inc. | | | 1,700 | | | | 59,483 | |
Edwards Lifesciences Corporation* | | | 600 | | | | 42,420 | |
Eli Lilly & Co. | | | 32,800 | | | | 1,363,168 | |
Express Scripts, Inc.* | | | 22,970 | | | | 1,026,529 | |
Gilead Sciences, Inc.* | | | 8,100 | | | | 331,533 | |
Health Management Associates, Inc. Class A* | | | 3,650 | | | | 26,900 | |
Healthspring, Inc.* | | | 3,430 | | | | 187,072 | |
|
| See Notes to Financial Statements. |
134 |
DEFENSIVE MARKET STRATEGIES FUND
SCHEDULE OF INVESTMENTS (Continued)
| | | | | | | | |
| | | Shares | | | Value | |
Henry Schein, Inc.* | | | 500 | | | $ | 32,215 | |
Humana, Inc. | | | 600 | | | | 52,566 | |
Idenix Pharmaceuticals, Inc.* | | | 1,830 | | | | 13,624 | |
IDEXX Laboratories, Inc.* | | | 2,700 | | | | 207,792 | |
Infinity Pharmaceuticals, Inc.* | | | 2,160 | | | | 19,094 | |
Intuitive Surgical, Inc.* | | | 90 | | | | 41,671 | |
Johnson & Johnson | | | 39,700 | | | | 2,603,526 | |
Laboratory Corporation of America Holdings* | | | 6,100 | | | | 524,417 | |
McKesson Corporation | | | 6,500 | | | | 506,415 | |
Medicis Pharmaceutical Corporation Class A | | | 3,900 | | | | 129,675 | |
Medtronic, Inc. | | | 4,060 | | | | 155,295 | |
Merck & Co., Inc. | | | 100,720 | | | | 3,797,144 | |
Myriad Genetics, Inc.* | | | 15,300 | | | | 320,382 | |
Onyx Pharmaceuticals, Inc.* | | | 9,640 | | | | 423,678 | |
PAREXEL International Corporation* | | | 3,490 | | | | 72,383 | |
Patterson Cos., Inc. | | | 3,800 | | | | 112,176 | |
Perrigo Co. | | | 900 | | | | 87,570 | |
Pfizer, Inc. | | | 126,700 | | | | 2,741,788 | |
Quest Diagnostics, Inc. | | | 1,900 | | | | 110,314 | |
Questcor Pharmaceuticals, Inc.* | | | 3,420 | | | | 142,204 | |
Salix Pharmaceuticals, Ltd.* | | | 1,060 | | | | 50,721 | |
Stryker Corporation | | | 4,560 | | | | 226,678 | |
SXC Health Solutions Corporation* | | | 1,450 | | | | 81,896 | |
United Therapeutics Corporation* | | | 11,110 | | | | 524,948 | |
UnitedHealth Group, Inc. | | | 10,200 | | | | 516,936 | |
Universal American Corporation | | | 4,490 | | | | 57,068 | |
Varian Medical Systems, Inc.* | | | 400 | | | | 26,852 | |
Watson Pharmaceuticals, Inc.* | | | 4,950 | | | | 298,683 | |
WellCare Health Plans, Inc.* | | | 5,370 | | | | 281,925 | |
WellPoint, Inc. | | | 700 | | | | 46,375 | |
XenoPort, Inc.* | | | 3,450 | | | | 13,145 | |
Zimmer Holdings, Inc. | | | 300 | | | | 16,026 | |
| | | | | | | | |
| | | | | | | 28,955,121 | |
| | | | | | | | |
Materials & Processing — 1.6% | | | | | | | | |
Allegheny Technologies, Inc. | | | 1,660 | | | | 79,348 | |
Bemis Co., Inc. | | | 500 | | | | 15,040 | |
Boise, Inc. | | | 13,600 | | | | 96,832 | |
Celanese Corporation Class A | | | 5,280 | | | | 233,746 | |
CF Industries Holdings, Inc. | | | 370 | | | | 53,643 | |
Ecolab, Inc. | | | 3,500 | | | | 202,335 | |
EI du Pont de Nemours & Co. | | | 36,200 | | | | 1,657,236 | |
Fastenal Co. | | | 4,800 | | | | 209,328 | |
Freeport-McMoRan Copper & Gold, Inc. | | | 7,100 | | | | 261,209 | |
LSB Industries, Inc.* | | | 3,650 | | | | 102,309 | |
Monsanto Co. | | | 1,480 | | | | 103,704 | |
Mosaic Co. (The) | | | 1,150 | | | | 57,994 | |
Newmont Mining Corporation | | | 4,100 | | | | 246,041 | |
Owens Corning* | | | 11,560 | | | | 332,003 | |
Owens-Illinois, Inc.* | | | 12,130 | | | | 235,079 | |
Praxair, Inc. | | | 500 | | | | 53,450 | |
Senomyx, Inc.* | | | 10,000 | | | | 34,800 | |
Sherwin-Williams Co. (The) | | | 3,000 | | | | 267,810 | |
Tronox, Inc.* | | | 780 | | | | 93,600 | |
United States Steel Corporation | | | 17,910 | | | | 473,899 | |
Vulcan Materials Co. | | | 3,310 | | | | 130,248 | |
| | | | | | | | |
| | | | | | | 4,939,654 | |
| | | | | | | | |
| | | | | | | | |
| | | Shares | | | Value | |
Producer Durables — 5.8% | | | | | | | | |
3M Co. | | | 4,200 | | | $ | 343,266 | |
AMETEK, Inc. | | | 2,050 | | | | 86,305 | |
Automatic Data Processing, Inc. | | | 19,300 | | | | 1,042,393 | |
BE Aerospace, Inc.* | | | 2,690 | | | | 104,130 | |
Boeing Co. (The) | | | 1,400 | | | | 102,690 | |
C.H. Robinson Worldwide, Inc. | | | 5,100 | | | | 355,878 | |
Caterpillar, Inc. | | | 2,230 | | | | 202,038 | |
Clean Harbors, Inc.* | | | 10,840 | | | | 690,833 | |
Cummins, Inc. | | | 1,870 | | | | 164,597 | |
Danaher Corporation | | | 3,600 | | | | 169,344 | |
Delta Air Lines, Inc.* | | | 15,680 | | | | 126,851 | |
Emerson Electric Co. | | | 6,300 | | | | 293,517 | |
FedEx Corporation | | | 1,200 | | | | 100,212 | |
General Dynamics Corporation | | | 2,700 | | | | 179,307 | |
General Electric Co. | | | 56,610 | | | | 1,013,885 | |
Genesee & Wyoming, Inc. Class A* | | | 1,590 | | | | 96,322 | |
JB Hunt Transport Services, Inc. | | | 2,270 | | | | 102,309 | |
KBR, Inc. | | | 3,400 | | | | 94,758 | |
Knight Transportation, Inc. | | | 23,900 | | | | 373,796 | |
Lockheed Martin Corporation | | | 5,800 | | | | 469,220 | |
Molex, Inc. | | | 83,000 | | | | 1,641,740 | |
MSC Industrial Direct Co., Inc. Class A | | | 1,100 | | | | 78,705 | |
Northrop Grumman Corporation | | | 2,300 | | | | 134,504 | |
Paychex, Inc. | | | 23,500 | | | | 707,585 | |
Raytheon Co. | | | 13,100 | | | | 633,778 | |
Republic Services, Inc. | | | 43,600 | | | | 1,201,180 | |
Robbins & Myers, Inc. | | | 2,010 | | | | 97,586 | |
Rockwell Automation, Inc. | | | 8,800 | | | | 645,656 | |
SPX Corporation | | | 3,240 | | | | 195,275 | |
Stericycle, Inc.* | | | 7,800 | | | | 607,776 | |
Synopsys, Inc.* | | | 5,500 | | | | 149,600 | |
Triumph Group, Inc. | | | 580 | | | | 33,901 | |
Union Pacific Corporation | | | 6,860 | | | | 726,748 | |
United Parcel Service, Inc. Class B | | | 33,900 | | | | 2,481,141 | |
United Technologies Corporation | | | 300 | | | | 21,927 | |
Verisk Analytics, Inc. Class A* | | | 2,230 | | | | 89,490 | |
Waste Management, Inc. | | | 83,100 | | | | 2,718,201 | |
WESCO International, Inc.* | | | 2,970 | | | | 157,440 | |
| | | | | | | | |
| | | | | | | 18,433,884 | |
| | | | | | | | |
Technology — 4.5% | | | | | | | | |
Active Network, Inc. (The)* | | | 7,810 | | | | 106,216 | |
Altera Corporation | | | 4,000 | | | | 148,400 | |
American Tower Corporation Class A | | | 20,500 | | | | 1,230,205 | |
Anaren, Inc.* | | | 4,270 | | | | 70,967 | |
Apple, Inc.* | | | 2,930 | | | | 1,186,650 | |
Applied Materials, Inc. | | | 126,800 | | | | 1,358,028 | |
Ariba, Inc.* | | | 4,090 | | | | 114,847 | |
Aruba Networks, Inc.* | | | 7,050 | | | | 130,566 | |
Bankrate, Inc.* | | | 4,860 | | | | 104,490 | |
Broadcom Corporation Class A* | | | 20,550 | | | | 603,348 | |
BroadSoft, Inc.* | | | 2,420 | | | | 73,084 | |
Ceva, Inc.* | | | 10,030 | | | | 303,508 | |
Cirrus Logic, Inc.* | | | 6,380 | | | | 101,123 | |
Cisco Systems, Inc. | | | 5,880 | | | | 106,310 | |
See Notes to Financial Statements.
135
| | | | | | | | |
| | | Shares | | | Value | |
Citrix Systems, Inc.* | | | 4,710 | | | $ | 285,991 | |
Cognizant Technology Solutions Corporation Class A* | | | 4,190 | | | | 269,459 | |
Coherent, Inc.* | | | 860 | | | | 44,952 | |
Digimarc Corporation* | | | 6,430 | | | | 153,613 | |
Diodes, Inc.* | | | 5,890 | | | | 125,457 | |
F5 Networks, Inc.* | | | 3,550 | | | | 376,726 | |
Google, Inc. Class A* | | | 1,710 | | | | 1,104,489 | |
GSI Group, Inc.* | | | 10,050 | | | | 102,812 | |
HSW International, Inc.* | | | 13,350 | | | | 45,924 | |
IAC/InterActiveCorp | | | 12,100 | | | | 515,460 | |
Informatica Corporation* | | | 200 | | | | 7,386 | |
Intel Corporation | | | 21,200 | | | | 514,100 | |
International Business Machines Corporation | | | 5,300 | | | | 974,564 | |
Intuit, Inc. | | | 8,620 | | | | 453,326 | |
LAM Research Corporation* | | | 2,830 | | | | 104,767 | |
LinkedIn Corporation* | | | 3,700 | | | | 233,137 | |
Microsoft Corporation | | | 32,200 | | | | 835,912 | |
NetApp, Inc.* | | | 2,370 | | | | 85,960 | |
NETGEAR, Inc.* | | | 2,050 | | | | 68,819 | |
ON Semiconductor Corporation* | | | 15,430 | | | | 119,120 | |
Plexus Corporation* | | | 2,910 | | | | 79,676 | |
QUALCOMM, Inc. | | | 4,090 | | | | 223,723 | |
Red Hat, Inc.* | | | 900 | | | | 37,161 | |
SanDisk Corporation* | | | 9,210 | | | | 453,224 | |
Synchronoss Technologies, Inc.* | | | 2,230 | | | | 67,368 | |
Taleo Corporation Class A* | | | 4,530 | | | | 175,266 | |
Teradata Corporation* | | | 3,500 | | | | 169,785 | |
Teradyne, Inc.* | | | 9,510 | | | | 129,621 | |
Texas Instruments, Inc. | | | 2,300 | | | | 66,953 | |
VeriFone Systems, Inc.* | | | 5,110 | | | | 181,507 | |
VeriSign, Inc.* | | | 3,300 | | | | 117,876 | |
VMware, Inc.* | | | 1,360 | | | | 113,138 | |
Xilinx, Inc. | | | 6,200 | | | | 198,772 | |
| | | | | | | | |
| | | | | | | 14,073,786 | |
| | | | | | | | |
Utilities — 7.6% | |
AGL Resources, Inc. | | | 52,956 | | | | 2,237,921 | |
American Electric Power Co., Inc. | | | 11,600 | | | | 479,196 | |
American Water Works Co., Inc. | | | 900 | | | | 28,674 | |
AT&T, Inc. | | | 127,700 | | | | 3,861,648 | |
CenterPoint Energy, Inc. | | | 10,800 | | | | 216,972 | |
CenturyLink, Inc. | | | 73,000 | | | | 2,715,600 | |
Consolidated Edison, Inc. | | | 37,600 | | | | 2,332,328 | |
Dominion Resources, Inc. | | | 3,800 | | | | 201,704 | |
DTE Energy Co. | | | 3,400 | | | | 185,130 | |
Duke Energy Corporation | | | 2,400 | | | | 52,800 | |
Exelon Corporation | | | 10,700 | | | | 464,059 | |
ITC Holdings Corporation | | | 1,030 | | | | 78,156 | |
NextEra Energy, Inc. | | | 1,700 | | | | 103,496 | |
NiSource, Inc. | | | 5,100 | | | | 121,431 | |
ONEOK, Inc. | | | 3,900 | | | | 338,091 | |
PG&E Corporation | | | 12,800 | | | | 527,616 | |
Piedmont Natural Gas Co., Inc. | | | 21,300 | | | | 723,774 | |
Pinnacle West Capital Corporation | | | 5,200 | | | | 250,536 | |
Portland General Electric Co. | | | 35,200 | | | | 890,208 | |
Public Service Enterprise | | | | | | | | |
Group, Inc. | | | 13,200 | | | | 435,732 | |
Questar Corporation | | | 26,600 | | | | 528,276 | |
Sempra Energy | | | 18,800 | | | | 1,034,000 | |
| | | | | | | | |
| | | Shares | | | Value | |
Southern Co. (The) | | | 22,200 | | | $ | 1,027,638 | |
tw telecom, Inc.* | | | 20,800 | | | | 403,104 | |
UGI Corporation | | | 17,800 | | | | 523,320 | |
Verizon Communications, Inc. | | | 25,800 | | | | 1,035,096 | |
WGL Holdings, Inc. | | | 64,600 | | | | 2,856,612 | |
Wisconsin Energy Corporation | | | 2,600 | | | | 90,896 | |
Xcel Energy, Inc. | | | 8,500 | | | | 234,940 | |
| | | | | | | | |
| | | | | | | 23,978,954 | |
| | | | | | | | |
Total Common Stocks
(Cost $161,562,034) | | | | 170,377,750 | |
| | | | | | | | |
EQUITY LINKED SECURITIES — 0.7% | |
Credit Suisse NY | | | 4,900 | | | | 459,228 | |
Deutsche Bank AG@ | | | 46,000 | | | | 514,970 | |
Goldman Sachs Group, Inc. | | | 63,300 | | | | 728,899 | |
UBS AG | | | 5,400 | | | | 353,106 | |
| | | | | | | | |
Total Equity Linked Securities
(Cost $2,102,996) | | | | 2,056,203 | |
| | | | | | | | |
FOREIGN COMMON STOCKS — 3.3% | |
Argentina — 0.0% | | | | | | | | |
Arcos Dorados Holdings, Inc. | | | 5,760 | | | | 118,253 | |
| | | | | | | | |
Bermuda — 0.3% | |
AXIS Capital Holdings, Ltd. | | | 1,400 | | | | 44,744 | |
Energy XXI Bermuda, Ltd.* | | | 2,540 | | | | 80,975 | |
Everest Re Group, Ltd. | | | 6,100 | | | | 512,949 | |
Renaissance Re Holdings, Ltd. | | | 4,110 | | | | 305,661 | |
Validus Holdings, Ltd. | | | 2,170 | | | | 68,355 | |
| | | | | | | | |
| | | | | | | 1,012,684 | |
| | | | | | | | |
Canada — 0.3% | |
CGX Energy, Inc.* | | | 22,726 | | | | 23,423 | |
Eastern Platinum, Ltd.* | | | 27,310 | | | | 14,476 | |
Goldcorp, Inc. | | | 2,860 | | | | 126,555 | |
Grande Cache Coal Corporation* | | | 5,160 | | | | 50,194 | |
Inmet Mining Corporation | | | 1,760 | | | | 113,158 | |
Lululemon Athletica, Inc.* | | | 3,060 | | | | 142,780 | |
New Gold, Inc.* | | | 9,850 | | | | 99,288 | |
Poseidon Concepts Corporation | | | 2,810 | | | | 34,341 | |
QLT, Inc.* | | | 5,860 | | | | 42,192 | |
Rubicon Minerals Corporation* | | | 3,690 | | | | 13,948 | |
SEMAFO, Inc. | | | 3,881 | | | | 25,143 | |
Silvercrest Mines, Inc.* | | | 10,955 | | | | 20,647 | |
Thompson Creek | | | | | | | | |
Metals Co., Inc.* | | | 12,790 | | | | 89,018 | |
| | | | | | | | |
| | | | | | | 795,163 | |
| | | | | | | | |
China — 0.2% | |
PetroChina Co., Ltd. ADR | | | 2,390 | | | | 297,101 | |
Ping An Insurance Group Co. | | | 16,240 | | | | 107,059 | |
Sina Corporation* | | | 1,970 | | | | 102,440 | |
Sohu.com, Inc.* | | | 1,600 | | | | 80,000 | |
| | | | | | | | |
| | | | | | | 586,600 | |
| | | | | | | | |
France — 0.5% | |
Total SA | | | 28,100 | | | | 1,436,550 | |
| | | | | | | | |
Germany — 0.2% | |
Siemens AG | | | 5,500 | | | | 526,332 | |
| | | | | | | | |
Hong Kong — 0.1% | |
AIA Group, Ltd. | | | 61,695 | | | | 192,633 | |
Sparkle Roll Group, Ltd. | | | 682,531 | | | | 65,910 | |
| | | | | | | | |
| | | | | | | 258,543 | |
| | | | | | | | |
See Notes to Financial Statements.
136
DEFENSIVE MARKET STRATEGIES FUND
SCHEDULE OF INVESTMENTS (Continued)
| | | | | | | | |
| | | Shares | | | Value | |
Ireland — 0.4% | | | | | | | | |
Accenture PLC, Class A | | | 6,000 | | | $ | 319,380 | |
Experian PLC | | | 14,238 | | | | 193,586 | |
Shire PLC | | | 3,950 | | | | 137,592 | |
Shire PLC ADR | | | 4,940 | | | | 513,266 | |
| | | | | | | | |
| | | | | | | 1,163,824 | |
| | | | | | | | |
Israel — 0.0% | | | | | | | | |
Mellanox Technologies, Ltd.* | | | 3,100 | | | | 100,719 | |
| | | | | | | | |
Japan — 0.1% | | | | | | | | |
Honda Motor Co., Ltd. | | | 8,200 | | | | 250,144 | |
| | | | | | | | |
Luxembourg — 0.0% | | | | | | | | |
Pacific Drilling SA* | | | 9,790 | | | | 91,047 | |
| | | | | | | | |
Netherlands — 0.1% | | | | | | | | |
ASML Holding N.V. | | | 2,290 | | | | 95,699 | |
Koninklijke Philips Electronics NV | | | 5,000 | | | | 105,352 | |
NXP Semiconductor NV* | | | 5,040 | | | | 77,465 | |
| | | | | | | | |
| | | | | | | 278,516 | |
| | | | | | | | |
Norway — 0.0% | | | | | | | | |
Petroleum Geo-Services ASA* | | | 8,960 | | | | 98,052 | |
| | | | | | | | |
Panama — 0.0% | | | | | | | | |
Banco Latinoamericano de Commercio Exterior SA, Class E | | | 2,740 | | | | 43,977 | |
| | | | | | | | |
Spain — 0.0% | | | | | | | | |
Grifols SA ADR* | | | 280 | | | | 1,548 | |
| | | | | | | | |
Sweden — 0.1% | | | | | | | | |
Atlas Copco AB, Class A | | | 8,600 | | | | 163,451 | |
Svenska Handelsbanken AB | | | 1,641 | | | | 43,159 | |
| | | | | | | | |
| | | | | | | 206,610 | |
| | | | | | | | |
Switzerland — 0.8% | | | | | | | | |
ABB, Ltd. | | | 6,500 | | | | 122,346 | |
ACE, Ltd. | | | 2,400 | | | | 168,288 | |
Noble Corporation | | | 8,530 | | | | 257,777 | |
Transocean, Ltd. | | | 10,520 | | | | 403,863 | |
Tyco International, Ltd. | | | 34,800 | | | | 1,625,508 | |
Wolseley PLC ADR | | | 19,170 | | | | 62,302 | |
| | | | | | | | |
| | | | | | | 2,640,084 | |
| | | | | | | | |
United Kingdom — 0.2% | | | | | | | | |
ARM Holdings PLC ADR | | | 6,390 | | | | 176,811 | |
Imagination Technologies Group PLC* | | | 9,850 | | | | 83,980 | |
Ophir Energy PLC* | | | 10,269 | | | | 46,057 | |
Vodafone Group PLC | | | 168,300 | | | | 467,587 | |
| | | | | | | | |
| | | | | | | 774,435 | |
| | | | | | | | |
Total Foreign Common Stocks
(Cost $10,041,413) | | | | | | | 10,383,081 | |
| | | | | | | | |
EXCHANGE TRADED FUNDS — 0.2% | |
iShares Dow Jones U.S. Real Estate Index Fund | | | 3,480 | | | | 197,629 | |
Market Vectors Semiconductor | | | 4,240 | | | | 129,023 | |
ProShares Short Russell2000 | | | 5,880 | | | | 174,519 | |
SPDR S&P Homebuilders ETF | | | 4,930 | | | | 84,303 | |
| | | | | | | | |
| | | | | | | 585,474 | |
| | | | | | | | |
Total Exchange Traded Funds
(Cost $579,092) | | | | | | | 585,474 | |
| | | | | | | | |
| | | | | | | | |
| | | | | | | | |
| | | Shares | | | Value | |
EXCHANGE TRADED NOTE — 0.0% | |
iPath S&P 500 VIX Short-Term Futures ETN* | | | | | | | | |
(Cost $25,487) | | | 590 | | | $ | 20,963 | |
| | | | | | | | |
PREFERRED STOCKS — 4.0% | |
Apache Corporation* | | | 15,322 | | | | 831,678 | |
Bank of America Corporation* | | | 200 | | | | 157,604 | |
Health Care REIT, Inc.* | | | 1,000 | | | | 51,170 | |
Lucent Technologies Capital Trust I* | | | 1,600 | | | | 982,400 | |
MetLife, Inc.* | | | 8,500 | | | | 523,770 | |
National City Capital Trust III* | | | 39,900 | | | | 1,021,041 | |
National City Capital Trust IV* | | | 31,900 | | | | 814,407 | |
Stanley Black & Decker, Inc.* | | | 26,200 | | | | 3,071,950 | |
Wells Fargo & Co.* | | | 5,000 | | | | 5,270,000 | |
| | | | | | | | |
Total Preferred Stocks
(Cost $13,006,463) | | | | | | | 12,724,020 | |
| | | | | | | | |
|
MASTER LIMITED PARTNERSHIPS — 0.9% | |
El Paso Pipeline Partners LP | | | 15,200 | | | | 526,224 | |
Spectra Energy Partners LP | | | 74,400 | | | | 2,377,824 | |
| | | | | | | | |
Total Master Limited Partnerships
(Cost $2,768,962) | | | | 2,904,048 | |
| | | | | | | | |
MONEY MARKET FUND — 6.6% | |
GuideStone Money Market Fund (GS4 Class)¥ | | | | | | | | |
(Cost $20,872,320) | | | 20,872,320 | | | | 20,872,320 | |
| | | | | | | | |
| | |
| | | Par | | | | |
CORPORATE BONDS — 25.5% | |
Advanced Micro Devices, Inc. | | | | | | | | |
6.00%, 05/01/15 | | $ | 1,700,000 | | | | 1,668,125 | |
Affiliated Managers Group, Inc. | | | | | | | | |
3.95%, 08/15/38 | | | 1,500,000 | | | | 1,635,000 | |
Alaska Communications Systems Group, Inc. | | | | | | | | |
6.25%, 05/01/18 144A | | | 500,000 | | | | 320,625 | |
Alere, Inc. | | | | | | | | |
3.00%, 05/15/16 | | | 1,000,000 | | | | 952,500 | |
Alexandria Real Estate Equities, Inc. | | | | | | | | |
3.70%, 01/15/27 144A | | | 1,200,000 | | | | 1,204,500 | |
Amgen, Inc. | | | | | | | | |
0.38%, 02/01/13 | | | 1,000,000 | | | | 1,008,750 | |
Annaly Capital Management, Inc. | | | | | | | | |
4.00%, 02/15/15 | | | 87,000 | | | | 98,854 | |
ARAMARK Corporation | | | | | | | | |
8.50%, 02/01/15 | | | 500,000 | | | | 515,000 | |
Archer-Daniels-Midland Co. | | | | | | | | |
0.88%, 02/15/14 | | | 1,000,000 | | | | 1,010,000 | |
Arris Group, Inc. | | | | | | | | |
2.00%, 11/15/26 | | | 1,250,000 | | | | 1,259,375 | |
Avis Budget Group, Inc. | | | | | | | | |
3.50%, 10/01/14 | | | 1,250,000 | | | | 1,281,250 | |
Best Buy Co., Inc. | | | | | | | | |
2.25%, 01/15/22 | | | 232,000 | | | | 232,580 | |
Bill Barrett Corporation | | | | | | | | |
5.00%, 03/15/28 | | | 1,500,000 | | | | 1,509,375 | |
Boston Properties LP | | | | | | | | |
2.88%, 02/15/37 | | | 234,000 | | | | 235,170 | |
Bristow Group, Inc. | | | | | | | | |
3.00%, 06/15/38 | | | 1,500,000 | | | | 1,539,375 | |
|
See Notes to Financial Statements. 137 |
| | | | | | | | |
| | | Par | | | Value | |
Charles River Laboratories International, Inc. | | | | | | | | |
2.25%, 06/15/13 | | $ | 1,500,000 | | | $ | 1,460,625 | |
Chesapeake Energy Corporation | | | | | | | | |
2.50%, 05/15/37 | | | 1,750,000 | | | | 1,568,437 | |
CIT Group, Inc. | | | | | | | | |
7.00%, 05/01/15 | | | 500,000 | | | | 501,625 | |
Covanta Holding Corporation | | | | | | | | |
3.25%, 06/01/14 | | | 500,000 | | | | 523,750 | |
DaVita, Inc. | | | | | | | | |
6.63%, 11/01/20 | | | 500,000 | | | | 516,250 | |
Equinix, Inc. | | | | | | | | |
2.50%, 04/15/12 | | | 1,250,000 | | | | 1,296,875 | |
Euronet Worldwide, Inc. | | | | | | | | |
3.50%, 10/15/25 | | | 1,000,000 | | | | 995,000 | |
Exterran Holdings, Inc. | | | | | | | | |
4.25%, 06/15/14 | | | 1,750,000 | | | | 1,561,875 | |
Frontier Communications Corporation | | | | | | | | |
7.88%, 04/15/15 | | | 50,000 | | | | 50,938 | |
8.50%, 04/15/20 | | | 450,000 | | | | 462,938 | |
General Cable Corporation | | | | | | | | |
0.88%, 11/15/13 | | | 1,500,000 | | | | 1,387,500 | |
Gilead Sciences, Inc. | | | | | | | | |
1.00%, 05/01/14 | | | 1,250,000 | | | | 1,375,000 | |
Goodrich Petroleum Corporation | | | | | | | | |
5.00%, 10/01/29 | | | 1,500,000 | | | | 1,396,875 | |
Group 1 Automotive, Inc. | | | | | | | | |
2.25%, 06/15/36 STEP | | | 1,250,000 | | | | 1,320,312 | |
Hanesbrands, Inc. | | | | | | | | |
6.38%, 12/15/20 | | | 500,000 | | | | 510,000 | |
Health Care REIT, Inc. | | | | | | | | |
3.00%, 12/01/29 | | | 1,000,000 | | | | 1,148,750 | |
Helix Energy Solutions Group, Inc. | | | | | | | | |
3.25%, 12/15/25 | | | 1,250,000 | | | | 1,259,375 | |
Hercules Offshore, Inc. | | | | | | | | |
3.38%, 06/01/38 STEP | | | 1,000,000 | | | | 901,250 | |
Hologic, Inc. | | | | | | | | |
2.00%, 12/15/37 STEP | | | 1,250,000 | | | | 1,198,438 | |
Hornbeck Offshore Services, Inc. | | | | | | | | |
1.63%, 11/15/26 STEP | | | 1,500,000 | | | | 1,507,500 | |
Host Hotels & Resorts LP | | | | | | | | |
3.25%, 04/15/24 144A@ | | | 2,776,000 | | | | 3,011,960 | |
2.63%, 04/15/27 144A@ | | | 1,270,000 | | | | 1,279,525 | |
2.50%, 10/15/29 144A@ | | | 229,000 | | | | 284,819 | |
Iconix Brand Group, Inc. | | | | | | | | |
1.88%, 06/30/12 | | | 250,000 | | | | 247,500 | |
2.50%, 06/01/16 144A | | | 1,000,000 | | | | 951,250 | |
Integra LifeSciences Holdings Corporation | | | | | | | | |
2.38%, 06/01/12 144A | | | 125,000 | | | | 124,375 | |
1.63%, 12/15/16 144A | | | 875,000 | | | | 752,500 | |
Intel Corporation | | | | | | | | |
2.95%, 12/15/35 | | | 716,000 | | | | 749,115 | |
Interpublic Group of Cos., Inc. | | | | | | | | |
4.25%, 03/15/23 | | | 1,500,000 | | | | 1,524,375 | |
Janus Capital Group, Inc. | | | | | | | | |
3.25%, 07/15/14 | | | 1,501,000 | | | | 1,482,237 | |
Jarden Corporation | | | | | | | | |
7.50%, 05/01/17 | | | 500,000 | | | | 532,500 | |
| | | | | | | | |
| | | Par | | | Value | |
Leap Wireless International, Inc. | | | | | | | | |
4.50%, 07/15/14 | | $ | 2,000,000 | | | $ | 1,750,000 | |
Lennar Corporation | | | | | | | | |
2.00%, 12/01/20 144A | | | 1,500,000 | | | | 1,515,000 | |
Liberty Interactive LLC | | | | | | | | |
3.13%, 03/30/23 | | | 500,000 | | | | 561,875 | |
Life Technologies Corporation | | | | | | | | |
1.50%, 02/15/24 | | | 478,000 | | | | 480,390 | |
LifePoint Hospitals, Inc. | | | | | | | | |
3.50%, 05/15/14 | | | 4,778,000 | | | | 4,909,395 | |
Lincare Holdings, Inc. | | | | | | | | |
2.75%, 11/01/37 | | | 251,000 | | | | 256,648 | |
Linear Technology Corporation | | | | | | | | |
3.00%, 05/01/27 | | | 1,250,000 | | | | 1,282,812 | |
Medtronic, Inc. | | | | | | | | |
1.63%, 04/15/13 | | | 1,000,000 | | | | 1,012,500 | |
Meritor, Inc. | | | | | | | | |
4.63%, 03/01/26 STEP | | | 1,250,000 | | | | 928,125 | |
Microchip Technology, Inc. | | | | | | | | |
2.13%, 12/15/37 | | | 121,000 | | | | 163,955 | |
Micron Technology, Inc. | | | | | | | | |
1.88%, 06/01/14 | | | 1,250,000 | | | | 1,200,000 | |
Mylan, Inc. | | | | | | | | |
1.25%, 03/15/12 | | | 1,150,000 | | | | 1,158,625 | |
NBTY, Inc. | | | | | | | | |
9.00%, 10/01/18 | | | 500,000 | | | | 552,500 | |
Newmont Mining Corporation | | | | | | | | |
3.00%, 02/15/12 | | | 413,000 | | | | 544,644 | |
NuVasive, Inc. | | | | | | | | |
2.75%, 07/01/17 | | | 1,000,000 | | | | 733,750 | |
Omnicare, Inc. | | | | | | | | |
3.25%, 12/15/35 | | | 110,000 | | | | 101,475 | |
Owens-Brockway Glass Container, Inc. | | | | | | | | |
3.00%, 06/01/15 144A | | | 1,740,000 | | | | 1,626,900 | |
Pantry, Inc. | | | | | | | | |
3.00%, 11/15/12 | | | 500,000 | | | | 491,250 | |
Patriot Coal Corporation | | | | | | | | |
3.25%, 05/31/13 | | | 1,750,000 | | | | 1,605,625 | |
Peabody Energy Corporation | | | | | | | | |
4.75%, 12/15/41 | | | 2,320,000 | | | | 2,378,000 | |
ProLogis LP | | | | | | | | |
3.25%, 03/15/15 | | | 1,250,000 | | | | 1,295,312 | |
RadioShack Corporation | | | | | | | | |
2.50%, 08/01/13 144A | | | 1,250,000 | | | | 1,201,562 | |
Rayonier TRS Holdings, Inc. | | | | | | | | |
3.75%, 10/15/12 | | | 552,000 | | | | 690,000 | |
SanDisk Corporation | | | | | | | | |
1.00%, 05/15/13 | | | 1,100,000 | | | | 1,076,625 | |
SBA Communications Corporation | | | | | | | | |
1.88%, 05/01/13 | | | 750,000 | | | | 850,312 | |
Teva Pharmaceutical Finance Co. LLC | | | | | | | | |
0.25%, 02/01/26 | | | 1,000,000 | | | | 1,038,750 | |
Trinity Industries, Inc. | | | | | | | | |
3.88%, 06/01/36 | | | 2,000,000 | | | | 1,965,000 | |
tw telecom, Inc. | | | | | | | | |
2.38%, 04/01/26 | | | 975,000 | | | | 1,152,938 | |
WebMD Health Corporation | | | | | | | | |
2.25%, 03/31/16 144A | | | 500,000 | | | | 482,500 | |
2.50%, 01/31/18 144A | | | 750,000 | | | | 702,188 | |
|
| See Notes to Financial Statements. |
138 |
DEFENSIVE MARKET STRATEGIES FUND
SCHEDULE OF INVESTMENTS (Continued)
| | | | | | | | |
| | | Par | | | Value | |
Xm Satellite Radio, Inc. | | | | | | | | |
7.00%, 12/01/14 144A | | $ | 300,000 | | | $ | 389,250 | |
| | | | | | | | |
Total Corporate Bonds
(Cost $80,347,258) | | | | 80,451,854 | |
| | | | | | | | |
| | |
| | | Number of
Contracts | | | | |
PURCHASED OPTIONS — 0.0% | |
Alpha Natural Resources, Inc., Strike Price $24.00, Expires 01/21/12 (KS) | | | 337 | | | | 9,099 | |
Alpha Natural Resources, Inc., Strike Price $27.00, Expires 01/21/12 (KS) | | | 84 | | | | 672 | |
Century Aluminum Co., Strike Price $10.00, Expires 01/21/12 (KS) | | | 212 | | | | 2,120 | |
Cobalt International Energy, Inc., Strike Price $10.00, Expires 01/21/12 (KS) | | | 168 | | | | 840 | |
| | | | | | | | |
Total Purchased Options
(Cost $43,856) | | | | 12,731 | |
| | | | | | | | |
TOTAL INVESTMENTS — 95.3%
(Cost $291,349,881) | | | | 300,388,444 | |
| | | | | | | | |
| | |
| | | Shares | | | | |
COMMON STOCKS SOLD SHORT — (7.8)% | |
Consumer Discretionary — (1.4)% | |
AutoNation, Inc.* | | | (2,400 | ) | | | (88,488 | ) |
Buckle, Inc. (The) | | | (2,310 | ) | | | (94,410 | ) |
Cabela’s, Inc.* | | | (3,090 | ) | | | (78,548 | ) |
CarMax, Inc.* | | | (1,980 | ) | | | (60,350 | ) |
Cheesecake Factory, Inc. (The)* | | | (2,840 | ) | | | (83,354 | ) |
Darden Restaurants, Inc. | | | (2,760 | ) | | | (125,801 | ) |
Dick’s Sporting Goods, Inc. | | | (9,570 | ) | | | (352,942 | ) |
Ethan Allen Interiors, Inc. | | | (10,470 | ) | | | (248,244 | ) |
Francesca’s Holdings | | | | | | | | |
Corporation* | | | (6,410 | ) | | | (110,893 | ) |
Genesco, Inc.* | | | (1,390 | ) | | | (85,819 | ) |
Hyatt Hotels Corporation* | | | (2,120 | ) | | | (79,797 | ) |
Iconix Brand Group, Inc.* | | | (5,390 | ) | | | (87,803 | ) |
J.C. Penney Co., Inc. | | | (9,430 | ) | | | (331,464 | ) |
Kohl’s Corporation | | | (2,000 | ) | | | (98,700 | ) |
Lear Corporation | | | (2,210 | ) | | | (87,958 | ) |
Limited Brands, Inc. | | | (2,530 | ) | | | (102,085 | ) |
Liz Claiborne, Inc.* | | | (10,870 | ) | | | (93,808 | ) |
Lowes Cos., Inc. | | | (11,440 | ) | | | (290,347 | ) |
Mattel, Inc. | | | (12,410 | ) | | | (344,502 | ) |
Newell Rubbermaid, Inc. | | | (3,970 | ) | | | (64,115 | ) |
Pier 1 Imports, Inc.* | | | (6,100 | ) | | | (84,973 | ) |
priceline.com, Inc.* | | | (130 | ) | | | (60,802 | ) |
PVH Corporation | | | (2,360 | ) | | | (166,356 | ) |
Snap-on, Inc. | | | (4,060 | ) | | | (205,517 | ) |
Tiffany & Co. | | | (3,860 | ) | | | (255,764 | ) |
Time Warner, Inc. | | | (2,630 | ) | | | (95,048 | ) |
Tractor Supply Co. | | | (1,520 | ) | | | (106,628 | ) |
VF Corporation | | | (4,040 | ) | | | (513,040 | ) |
Zumiez, Inc.* | | | (3,710 | ) | | | (102,990 | ) |
| | | | | | | | |
| | | | | | | (4,500,546 | ) |
| | | | | | | | |
Consumer Staples — (0.4)% | |
Campbell Soup Co. | | | (7,470 | ) | | | (248,303 | ) |
CVS Caremark Corporation | | | (15,410 | ) | | | (628,420 | ) |
Dr. Pepper Snapple Group, Inc. | | | (4,250 | ) | | | (167,790 | ) |
H.J. Hienz Co. | | | (4,140 | ) | | | (223,725 | ) |
| | | | | | | | |
| | | Shares | | | Value | |
Peet’s Coffee & Tea, Inc.* | | | (910 | ) | | $ | (57,039 | ) |
Sanderson Farms, Inc. | | | (1,730 | ) | | | (86,725 | ) |
| | | | | | | | |
| | | | | | | (1,412,002 | ) |
| | | | | | | | |
Energy — (0.9)% | |
Apache Corporation | | | (4,790 | ) | | | (433,878 | ) |
Atwood Oceanics, Inc.* | | | (1,520 | ) | | | (60,481 | ) |
Cimarex Energy Co. | | | (10,020 | ) | | | (620,238 | ) |
Cloud Peak Energy, Inc.* | | | (4,060 | ) | | | (78,439 | ) |
Continental Resources, Inc.* | | | (4,790 | ) | | | (319,541 | ) |
Diamond Offshore | | | | | | | | |
Drilling, Inc. | | | (4,750 | ) | | | (262,485 | ) |
EOG Resources, Inc. | | | (580 | ) | | | (57,136 | ) |
EXCO Resources, Inc. | | | (14,850 | ) | | | (155,182 | ) |
Halliburton Co. | | | (5,680 | ) | | | (196,017 | ) |
Hess Corporation | | | (1,040 | ) | | | (59,072 | ) |
Patterson-UTI Energy, Inc. | | | (5,050 | ) | | | (100,899 | ) |
Rosetta Resources, Inc.* | | | (1,240 | ) | | | (53,940 | ) |
Sanchez Energy Corporation* | | | (2,380 | ) | | | (41,079 | ) |
Southwestern Energy Co.* | | | (3,120 | ) | | | (99,653 | ) |
Ultra Petroleum Corporation* | | | (10,740 | ) | | | (318,226 | ) |
Whiting Petroleum Corporation* | | | (2,640 | ) | | | (123,261 | ) |
| | | | | | | | |
| | | | | | | (2,979,527 | ) |
| | | | | | | | |
Financial Services — (1.7)% | |
Apartment Investment & Management Co. Class A REIT | | | (12,400 | ) | | | (284,084 | ) |
Arthur J. Gallagher & Co. | | | (6,010 | ) | | | (200,974 | ) |
BOK Financial Corporation | | | (1,690 | ) | | | (92,832 | ) |
BRE Properties, Inc. REIT | | | (1,750 | ) | | | (88,340 | ) |
City National Corporation | | | (6,500 | ) | | | (287,170 | ) |
Corporationorate Office Properties Trust REIT | | | (4,030 | ) | | | (85,678 | ) |
Cullen/Frost Bankers, Inc. | | | (5,580 | ) | | | (295,238 | ) |
DFC Global Corporation* | | | (6,010 | ) | | | (108,541 | ) |
Eaton Vance Corporation | | | (5,430 | ) | | | (128,365 | ) |
Factset Research Systems, Inc. | | | (3,570 | ) | | | (311,590 | ) |
Fair Isaac Corporation | | | (10,480 | ) | | | (375,603 | ) |
Fidelity National Information Services, Inc. | | | (4,280 | ) | | | (113,805 | ) |
Franklin Resources, Inc. | | | (4,820 | ) | | | (463,009 | ) |
Global Payments, Inc. | | | (2,830 | ) | | | (134,085 | ) |
IntercontinentalExchange, Inc.* | | | (1,070 | ) | | | (128,988 | ) |
Jefferies Group, Inc. | | | (3,120 | ) | | | (42,900 | ) |
Legg Mason, Inc. | | | (11,840 | ) | | | (284,752 | ) |
LPL Investment Holdings, Inc.* | | | (4,120 | ) | | | (125,825 | ) |
Markel Corporation* | | | (255 | ) | | | (105,741 | ) |
Marsh & McLennan Cos., Inc. | | | (9,850 | ) | | | (311,457 | ) |
National Penn Bancshares, Inc. | | | (14,290 | ) | | | (120,608 | ) |
Northern Trust Corporation | | | (3,960 | ) | | | (157,054 | ) |
Public Storage REIT | | | (670 | ) | | | (90,088 | ) |
RLI Corporation | | | (2,620 | ) | | | (190,893 | ) |
SL Green Realty Corporation REIT | | | (1,450 | ) | | | (96,628 | ) |
T. Rowe Price Group, Inc. | | | (1,900 | ) | | | (108,205 | ) |
Taubman Centers, Inc. REIT | | | (5,060 | ) | | | (314,226 | ) |
Thomson Reuters Corporation | | | (3,790 | ) | | | (101,079 | ) |
Torchmark Corporation | | | (2,980 | ) | | | (129,302 | ) |
Travelers Cos., Inc. (The) | | | (2,900 | ) | | | (171,593 | ) |
| | | | | | | | |
| | | | | | | (5,448,653 | ) |
| | | | | | | | |
Healthcare — (1.2)% | |
Abbott Laboratories | | | (5,630 | ) | | | (316,575 | ) |
|
See Notes to Financial Statements. 139 |
| | | | | | | | |
| | | Shares | | | Value | |
Allscripts Healthcare Solutions, Inc.* | | | (3,350 | ) | | $ | (63,449 | ) |
Amgen, Inc. | | | (4,850 | ) | | | (311,419 | ) |
athenahealth, Inc.* | | | (1,640 | ) | | | (80,557 | ) |
Baxter International, Inc. | | | (5,010 | ) | | | (247,895 | ) |
Becton Dickenson and Co. | | | (1,610 | ) | | | (120,299 | ) |
Celgene Corporation | | | (6,770 | ) | | | (457,652 | ) |
Chemed Corporation | | | (1,000 | ) | | | (51,210 | ) |
Covance, Inc.* | | | (1,300 | ) | | | (59,436 | ) |
DENTSPLY International, Inc. | | | (2,960 | ) | | | (103,571 | ) |
Edwards Lifesciences Corporation | | | (2,520 | ) | | | (178,164 | ) |
Hospira, Inc.* | | | (2,230 | ) | | | (67,725 | ) |
IDEXX Laboratories, Inc.* | | | (3,300 | ) | | | (253,968 | ) |
Immunogen, Inc.* | | | (3,640 | ) | | | (42,151 | ) |
Insulet Corporation* | | | (4,940 | ) | | | (93,020 | ) |
Johnson & Johnson | | | (6,860 | ) | | | (449,879 | ) |
Laboratory Corporation of America Holdings* | | | (1,000 | ) | | | (85,970 | ) |
MAKO Surgical Corporation* | | | (1,840 | ) | | | (46,386 | ) |
Masimo Corporation* | | | (3,250 | ) | | | (60,726 | ) |
Regeneron Pharmaceuticals, Inc.* | | | (1,210 | ) | | | (67,070 | ) |
Spectrum Pharmaceuticals, Inc.* | | | (2,570 | ) | | | (37,599 | ) |
St. Jude Medical, Inc. | | | (2,890 | ) | | | (99,127 | ) |
Thermo Fisher Scientific, Inc.* | | | (1,840 | ) | | | (82,745 | ) |
WellPoint, Inc. | | | (1,230 | ) | | | (81,488 | ) |
Zeltiq Aesthetics, Inc.* | | | (2,940 | ) | | | (33,398 | ) |
Zimmer Holdings, Inc. | | | (2,360 | ) | | | (126,071 | ) |
| | | | | | | | |
| | | | | | | (3,617,550 | ) |
| | | | | | | | |
Materials & Processing — (0.6)% | |
Alcoa, Inc. | | | (40,890 | ) | | | (353,698 | ) |
Bemis Co., Inc. | | | (8,360 | ) | | | (251,469 | ) |
Carpenter Technology Corporation | | | (2,055 | ) | | | (105,791 | ) |
Dow Chemical Co. (The) | | | (2,580 | ) | | | (74,201 | ) |
Fastenal Co. | | | (5,930 | ) | | | (258,607 | ) |
Martin Marietta Materials, Inc. | | | (1,460 | ) | | | (110,099 | ) |
Masco Corporation | | | (26,940 | ) | | | (282,331 | ) |
MolyCorp, Inc.* | | | (1,420 | ) | | | (34,052 | ) |
NewMarket Corporation | | | (210 | ) | | | (41,603 | ) |
Newmont Mining Corporation | | | (1,970 | ) | | | (118,220 | ) |
Nucor Corporation | | | (3,570 | ) | | | (141,265 | ) |
Valmont Industries, Inc. | | | (730 | ) | | | (66,277 | ) |
| | | | | | | | |
| | | | | | | (1,837,613 | ) |
| | | | | | | | |
Producer Durables — (0.6)% | |
3M Co. | | | (5,290 | ) | | | (432,352 | ) |
Actuant Corporation, Class A | | | (2,730 | ) | | | (61,944 | ) |
Dover Corporation | | | (1,770 | ) | | | (102,748 | ) |
Emerson Electric Co. | | | (7,020 | ) | | | (327,062 | ) |
Graco, Inc. | | | (3,860 | ) | | | (157,835 | ) |
PACCAR, Inc. | | | (4,490 | ) | | | (168,240 | ) |
Parker Hannifin Corporation | | | (920 | ) | | | (70,150 | ) |
Paychex Inc | | | (2,870 | ) | | | (86,416 | ) |
Rockwell Collins, Inc. | | | (1,910 | ) | | | (105,757 | ) |
Southwest Airlines Co. | | | (10,360 | ) | | | (88,681 | ) |
Stericycle, Inc.* | | | (1,070 | ) | | | (83,374 | ) |
Tidewater, Inc. | | | (1,340 | ) | | | (66,062 | ) |
W.W. Grainger, Inc. | | | (440 | ) | | | (82,364 | ) |
| | | | | | | | |
| | | | | | | (1,832,985 | ) |
| | | | | | | | |
Technology — (0.9)% | |
Adobe Systems, Inc.* | | | (16,400 | ) | | | (463,628 | ) |
| | | | | | | | |
| | | Shares | | | Value | |
Amphenol Corporation Class A | | | (5,760 | ) | | $ | (261,446 | ) |
Autodesk, Inc.* | | | (12,500 | ) | | | (379,125 | ) |
Dell, Inc.* | | | (9,050 | ) | | | (132,402 | ) |
Groupon, Inc.* | | | (8,590 | ) | | | (177,212 | ) |
Intel Corporation | | | (17,090 | ) | | | (414,432 | ) |
KLA-Tencor Corporation | | | (2,570 | ) | | | (124,002 | ) |
Linear Technology Corporation | | | (4,010 | ) | | | (120,420 | ) |
Mitek Systems, Inc.* | | | (2,440 | ) | | | (17,690 | ) |
NetSuite, Inc.* | | | (2,020 | ) | | | (81,911 | ) |
QLogic Corporation* | | | (4,140 | ) | | | (62,100 | ) |
Red Hat, Inc.* | | | (3,950 | ) | | | (163,096 | ) |
Riverbed Technology, Inc.* | | | (4,900 | ) | | | (115,150 | ) |
Semiconductor Holders Trust | | | (4,240 | ) | | | (127,327 | ) |
Synaptics, Inc.* | | | (1,330 | ) | | | (40,100 | ) |
Tech Data Corporation* | | | (4,160 | ) | | | (205,546 | ) |
| | | | | | | | |
| | | | | | | (2,885,587 | ) |
| | | | | | | | |
Utilities — (0.1)% | |
j2 Global Communications, Inc. | | | (5,670 | ) | | | (159,554 | ) |
| | | | | | | | |
Total Common Stocks Sold Short
(Cost $(24,416,330)) | | | | (24,674,017 | ) |
| | | | | | | | |
FOREIGN COMMON STOCKS SOLD SHORT — (1.2)% | |
Austria — 0.0% | |
Erste Group Bank AG | | | (4,932 | ) | | | (86,716 | ) |
| | | | | | | | |
Bermuda — (0.1)% | |
Nabors Industries, Ltd.* | | | (5,920 | ) | | | (102,653 | ) |
Seadrill, Ltd. | | | (2,310 | ) | | | (76,646 | ) |
| | | | | | | | |
| | | | | | | (179,299 | ) |
| | | | | | | | |
Brazil — 0.0% | |
Fibria Celulose SA ADR | | | (10,980 | ) | | | (85,315 | ) |
| | | | | | | | |
Canada — (0.2)% | |
Celestica, Inc.* | | | (8,520 | ) | | | (62,452 | ) |
Eldorado Gold Corporation | | | (4,360 | ) | | | (59,776 | ) |
EnCana Corporation | | | (8,660 | ) | | | (160,470 | ) |
Kinross Gold Corporation | | | (4,830 | ) | | | (55,062 | ) |
Pan American Silver Corporation | | | (3,450 | ) | | | (75,244 | ) |
Taseko Mines, Ltd.* | | | (10,570 | ) | | | (28,856 | ) |
Tim Hortons, Inc. | | | (2,160 | ) | | | (104,587 | ) |
| | | | | | | | |
| | | | | | | (546,447 | ) |
| | | | | | | | |
Cayman Islands — 0.0% | |
Herbalife, Ltd. | | | (1,440 | ) | | | (74,405 | ) |
| | | | | | | | |
China — (0.2)% | |
Baidu, Inc. ADR* | | | (890 | ) | | | (103,658 | ) |
China Petroleum & Chemical Corporation ADR | | | (2,820 | ) | | | (296,241 | ) |
Feihe International, Inc.* | | | (3,100 | ) | | | (8,029 | ) |
Home Inns & Hotels Management, Inc. ADR* | | | (1,750 | ) | | | (45,150 | ) |
| | | | | | | | |
| | | | | | | (453,078 | ) |
| | | | | | | | |
Colombia — 0.0% | |
BanColombia SA ADR | | | (1,420 | ) | | | (84,575 | ) |
| | | | | | | | |
France — 0.0% | |
Technip SA | | | (630 | ) | | | (59,212 | ) |
| | | | | | | | |
Hong Kong — (0.1)% | |
BOC Hong Kong Holdings, Ltd. | | | (61,410 | ) | | | (145,488 | ) |
|
| See Notes to Financial Statements. |
140 |
DEFENSIVE MARKET STRATEGIES FUND
SCHEDULE OF INVESTMENTS (Continued)
| | | | | | | | |
| | | Shares | | | Value | |
Hang Seng Bank, Ltd. | | | (12,650 | ) | | $ | (150,091 | ) |
| | | | | | | | |
| | | | | | | (295,579 | ) |
| | | | | | | | |
India — (0.1)% | | | | | | | | |
Infosys, Ltd. ADR | | | (3,790 | ) | | | (194,730 | ) |
| | | | | | | | |
Ireland — 0.0% | | | | | | | | |
Accenture PLC Class A | | | (1,530 | ) | | | (81,442 | ) |
Alkermes PLC | | | (2,990 | ) | | | (51,906 | ) |
| | | | | | | | |
| | | | | | | (133,348 | ) |
| | | | | | | | |
Mexico — 0.0% | | | | | | | | |
America Movil SAB de CV ADR | | | (2,340 | ) | | | (52,884 | ) |
| | | | | | | | |
Netherlands — (0.1)% | | | | | | | | |
LyondellBasell Industries N.V. Class A | | | (5,340 | ) | | | (173,497 | ) |
Sensata Technologies Holding N.V.* | | | (3,600 | ) | | | (94,608 | ) |
Tornier NV* | | | (1,780 | ) | | | (32,040 | ) |
| | | | | | | | |
| | | | | | | (300,145 | ) |
| | | | | | | | |
Norway — (0.1)% | | | | | | | | |
Algeta ASA* | | | (2,500 | ) | | | (63,954 | ) |
Yara International ASA | | | (2,280 | ) | | | (91,492 | ) |
| | | | | | | | |
| | | | | | | (155,446 | ) |
| | | | | | | | |
Peru — 0.0% | | | | | | | | |
Credicorp, Ltd. | | | (790 | ) | | | (86,481 | ) |
| | | | | | | | |
South Africa — 0.0% | | | | | | | | |
Gold Fields, Ltd. ADR | | | (6,960 | ) | | | (106,140 | ) |
| | | | | | | | |
South Korea — 0.0% | | | | | | | | |
POSCO ADR | | | (940 | ) | | | (77,174 | ) |
| | | | | | | | |
Sweden — (0.1)% | | | | | | | | |
Hennes & Mauritz AB Class B | | | (3,770 | ) | | | (121,229 | ) |
Telefonaktiebolaget LM Ericsson ADR | | | (18,780 | ) | | | (190,241 | ) |
| | | | | | | | |
| | | | | | | (311,470 | ) |
| | | | | | | | |
Switzerland — (0.1)% | | | | | | | | |
Ace, Ltd. | | | (1,230 | ) | | | (86,248 | ) |
STMicroelectronics NV | | | (17,470 | ) | | | (103,597 | ) |
| | | | | | | | |
| | | | | | | (189,845 | ) |
| | | | | | | | |
United Kingdom — (0.1)% | | | | | | | | |
Antofagasta PLC | | | (3,210 | ) | | | (60,569 | ) |
Ensco PLC ADR | | | (5,820 | ) | | | (273,074 | ) |
Smith & Nephew PLC ADR | | | (1,250 | ) | | | (60,188 | ) |
| | | | | | | | |
| | | | | | | (393,831 | ) |
| | | | | | | | |
Total Foreign Common Stocks Sold Short
(Cost $(3,950,184)) | | | | (3,866,120 | ) |
| | | | | | | | |
|
EXCHANGE TRADED FUNDS SOLD SHORT — (1.3)% | |
|
iShares Dow Jones US Oil Equipment & Services Index Fund | | | (6,560 | ) | | | (340,621 | ) |
iShares Nasdaq Biotechnology Index Fund | | | (2,450 | ) | | | (255,657 | ) |
iShares S&P 500 Index Fund | | | (3,220 | ) | | | (405,591 | ) |
iShares S&P North American Technology-Software Index Fund | | | (1,930 | ) | | | (104,452 | ) |
iShares S&P SmallCap 600 Index Fund | | | (3,560 | ) | | | (243,077 | ) |
iShares Silver Trust* | | | (5,800 | ) | | | (156,252 | ) |
| | | | | | | | |
| | | Shares | | | Value | |
Materials Select Sector SPDR Fund | | | (5,040 | ) | | $ | (168,840 | ) |
SPDR S&P 500 ETF Trust | | | (3,900 | ) | | | (489,450 | ) |
SPDR S&P Metals & Mining ETF | | | (8,240 | ) | | | (403,678 | ) |
SPDR S&P MidCap 400 ETF Trust | | | (630 | ) | | | (100,510 | ) |
SPDR S&P Oil & Gas Equipment & Services ETF | | | (3,500 | ) | | | (121,310 | ) |
SPDR S&P Oil & Gas Exploration & Production ETF | | | (5,770 | ) | | | (304,021 | ) |
SPDR S&P Retail ETF | | | (8,680 | ) | | | (456,134 | ) |
Vanguard Small-Cap Growth ETF | | | (1,390 | ) | | | (106,196 | ) |
Vanguard Total Stock Market ETF | | | (4,280 | ) | | | (275,204 | ) |
| | | | | | | | |
Total Exchange Traded Funds Sold Short
(Cost $(3,897,004)) | | | | (3,930,993 | ) |
| | | | | | | | |
TOTAL SECURITIES SOLD SHORT — (10.3)%
(Cost $(32,263,518)) | | | | (32,471,130 | ) |
| | | | | | | | |
| | |
| | | Number
of
Contracts | | | | |
WRITTEN OPTION — 0.0% | | | | | | | | |
Call Option — 0.0% | | | | | | | | |
Cobalt International Energy, Inc., Strike Price $7.50, Expires 01/21/12 (KS) | | | | | | | | |
(Premiums received $(4,032)) | | | | | | | (840 | ) |
| | | | | | | | |
| | |
Other Assets in Excess of Liabilities — 15.0% | | | | | | | 47,128,674 | |
| | | | | | | | |
NET ASSETS — 100.0% | | | $ | 315,045,148 | |
| | | | | | | | |
Please see abbreviation and footnote definitions beginning on page 200.
|
See Notes to Financial Statements. 141 |
PORTFOLIO SUMMARY (based on net assets)
| | | | |
| | | % | |
Corporate Bonds | | | 25.5 | |
Healthcare | | | 9.2 | |
Financial Services | | | 8.9 | |
Utilities | | | 7.6 | |
Consumer Discretionary | | | 7.1 | |
Money Market Fund | | | 6.6 | |
Consumer Staples | | | 6.1 | |
Producer Durables | | | 5.8 | |
Technology | | | 4.5 | |
Preferred Stocks | | | 4.0 | |
Energy | | | 3.3 | |
Foreign Common Stocks | | | 3.3 | |
Futures Contracts | | | 1.6 | |
Materials & Processsing | | | 1.6 | |
Master Limited Partnerships | | | 0.9 | |
Equity Linked Securities | | | 0.7 | |
Exchange Traded Funds | | | 0.2 | |
Exchange Traded Note | | | — | ** |
Purchased Options | | | — | ** |
Written Option | | | — | ** |
Forward Foreign Currency Contracts | | | (0.8 | ) |
Foreign Common Stocks Sold Short | | | (1.2 | ) |
Exchange Traded Funds Sold Short | | | (1.3 | ) |
Common Stocks Sold Short | | | (7.8 | ) |
| | | | |
| | | 85.8 | |
| | | | |
| ** | Rounds to less than 0.005%. |
|
| See Notes to Financial Statements. |
142 |
DEFENSIVE MARKET STRATEGIES FUND
SCHEDULE OF INVESTMENTS (Continued)
VALUATION HIERARCHY
The following is a summary of the inputs used, as of December 31, 2011, in valuing the Fund’s investments carried at fair value:
| | | | | | | | | | | | | | | | |
| | | Total Value | | | Level 1
Quoted Prices | | | Level 2
Other
Significant
Observable
Inputs | | | Level 3
Significant
Unobservable
Inputs | |
Assets: | | | | | | | | | | | | | | | | |
Investments in Securities: | | | | | | | | | | | | | | | | |
Common Stocks | | $ | 170,377,750 | | | $ | 170,377,750 | | | $ | — | | | $ | — | |
Corporate Bonds | | | 80,451,854 | | | | — | | | | 80,451,854 | | | | — | |
Equity Linked Securities | | | 2,056,203 | | | | — | | | | 2,056,203 | | | | | |
Exchange Traded Funds | | | 585,474 | | | | 585,474 | | | | — | | | | — | |
Exchange Traded Note | | | 20,963 | | | | 20,963 | | | | — | | | | — | |
Foreign Common Stocks | | | 10,383,081 | | | | 10,383,081 | | | | — | | | | — | |
Master Limited Partnerships | | | 2,904,048 | | | | 2,904,048 | | | | — | | | | — | |
Money Market Fund | | | 20,872,320 | | | | 20,872,320 | | | | — | | | | — | |
Preferred Stocks | | | 12,724,020 | | | | 12,724,020 | | | | — | | | | — | |
Purchased Options | | | 12,731 | | | | 10,611 | | | | 2,120 | | | | — | |
| | | | | | | | | | | | | | | | |
Total Assets — Investments in Securities | | $ | 300,388,444 | | | $ | 217,878,267 | | | $ | 82,510,177 | | | $ | — | |
| | | | | | | | | | | | | | | | |
Other Financial Instruments*** | | | | | | | | | | | | | | | | |
Forward Foreign Currency Contracts | | $ | 17,895 | | | | — | | | $ | 17,895 | | | $ | — | |
Futures Contracts | | | 113,467 | | | | 113,467 | | | | — | | | | — | |
| | | | | | | | | | | | | | | | |
Total Assets — Other Financial Instruments | | $ | 131,362 | | | $ | 113,467 | | | $ | 17,895 | | | $ | — | |
| | | | | | | | | | | | | | | | |
Liabilities: | | | | | | | | | | | | | | | | |
Investments in Securities: | | | | | | | | | | | | | | | | |
Common Stocks Sold Short | | $ | (24,674,017 | ) | | $ | (24,674,017 | ) | | $ | — | | | $ | — | |
Exchange Traded Funds Sold Short | | | (3,930,993 | ) | | | (3,930,993 | ) | | | — | | | | — | |
Foreign Common Stocks Sold Short | | | (3,866,120 | ) | | | (3,866,120 | ) | | | — | | | | — | |
Written Option | | | (840 | ) | | | (840 | ) | | | — | | | | — | |
| | | | | | | | | | | | | | | | |
Total Liabilities — Investments in Securities | | $ | (32,471,970 | ) | | $ | (32,471,970 | ) | | $ | — | | | $ | — | |
| | | | | | | | | | | | | | | | |
See Notes to Financial Statements.
143
Equity Index Fund
Familiar themes such as the sovereign debt crisis in Europe, recession fears and moderating growth expectations in China continued to dominate headlines during 2011. The U.S. equity market showed resilience in the final quarter of the year as it overcame a dismal third quarter and ended the year in positive territory. The S&P 500® Index posted a fourth quarter return of 11.82%, bringing the return to a positive 2.11% for the one-year period ended December 31, 2011. The broader U.S. market, as measured by the Russell 3000® Index, gained 12.12% for the fourth quarter and 1.03% for the calendar year of 2011.
From a sector perspective, performance was mixed as five of the nine sectors within the Russell 3000® Index advanced during a year in which volatility prevailed. Defensive sectors such as utilities, consumer staples and healthcare were the best performers and experienced double-digit gains; whereas, the weakest performer was the financial services sector, which posted a double-digit loss for the year.
In terms of the underlying dynamics of equity market performance, low beta (or lower risk), high quality stocks generally outperformed during the year. Regarding market capitalization, large-cap companies outperformed their small-cap counterparts as the Russell 1000® Index posted a one-year return of 1.50%, while the Russell 2000® Index returned -4.18%. Style differentiation was evident as growth-oriented stocks outperformed value-oriented stocks across most market capitalization segments. In the large capitalization segment, the Russell 1000® Growth Index outpaced the Russell 1000® Value Index and posted one-year returns of 2.64% and 0.39%, respectively.
The Fund is passively managed and benchmarked against the S&P 500® Index. The Fund is comprised of domestic, large-cap equity stocks with both value- and growth-style orientations. The objective of the Fund is to provide investment results approximating the aggregate price and dividend performance of the securities included in the S&P 500® Index. The GS4 Class of the Fund returned 2.75% for the one-year period ended December 31, 2011, as compared to a 2.11% return for the S&P 500® Index. The return differential was primarily a result of socially responsible investment restrictions and expenses of the Fund.
This Fund may be suitable for investors who seek higher, long-term rates of return, can accept significant short-term fluctuations in account value and want to diversify their portfolio by adding a potentially higher return, higher risk option of stocks.
Please see page 154 for information regarding specific portfolio allocations. Portfolio holdings are subject to change and risk at any time.
144
Equity Index Fund
| | | | | | | | | | | | |
Average Annual Total Returns as of 12/31/11 | |
| | | GS2
Class* | | | GS4
Class* | | | Benchmark** | |
One Year | | | 3.00 | % | | | 2.75 | % | | | 2.11 | % |
Five Year | | | -0.33 | % | | | -0.51 | % | | | -0.25 | % |
Ten Year | | | 2.71 | % | | | 2.56 | % | | | 2.92 | % |
Since Inception | | | 2.31 | % | | | 2.22 | % | | | 2.56 | % |
Inception Date | | | 08/27/01 | | | | 08/27/01 | | | | | |
Total Fund Operating Expenses (April 30, 2011 Prospectus, as amended on September 1, 2011)(1) | | | 0.27 | % | | | 0.52 | % | | | | |
| (1) | Current information regarding the Fund’s Operating Expenses can be found in the Financial Highlights. |
The performance data quoted represents past performance and does not guarantee future results. Current performance may be lower or higher. Performance data current to the most recent month-end may be obtained at www.GuideStoneFunds.org. The investment return and principal value of an investment will fluctuate so that shares, when redeemed, may be worth more or less than their original cost.
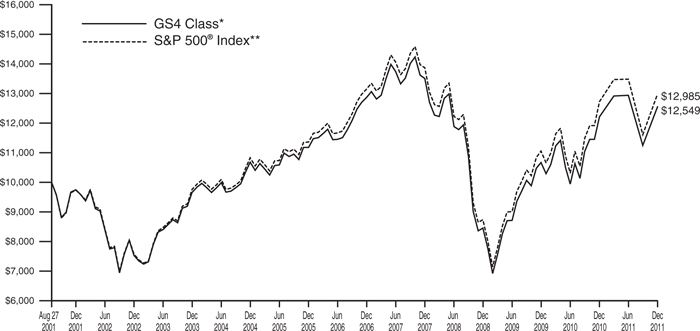
The graph compares the results of a hypothetical $10,000 investment in the GS4 Class of the Fund since August 27, 2001 (commencement of operations), with all dividends and capital gains reinvested, with the S&P 500® Index.
| * | These returns reflect expense waivers by the Fund’s investment adviser. Without these waivers, returns would have been lower. Returns shown do not reflect the deduction of taxes that a shareholder would pay on Fund distributions or the redemption of Fund shares. |
| ** | The S&P 500® Index is an unmanaged index (with no defined investment objective) of common stocks, includes reinvestment of dividends, and is a registered trademark of McGraw-Hill Co., Inc. The S&P 500® Index includes 500 of the largest stocks (in terms of market value) in the United States. |
Unlike a mutual fund, the performance of an index assumes no taxes, transaction costs, management fees or other expenses.
145
| | |
EQUITY INDEX FUND SCHEDULE OF INVESTMENTS | | December 31, 2011 |
| | | | | | | | |
| | | Shares | | | Value | |
COMMON STOCKS — 94.7% | |
Consumer Discretionary — 11.9% | |
Amazon.com, Inc.* | | | 6,962 | | | $ | 1,205,122 | |
Apollo Group, Inc. Class A* | | | 2,129 | | | | 114,689 | |
AutoNation, Inc.D* | | | 973 | | | | 35,874 | |
AutoZone, Inc.* | | | 550 | | | | 178,733 | |
Avon Products, Inc. | | | 8,252 | | | | 144,162 | |
Bed Bath & Beyond, Inc.* | | | 4,613 | | | | 267,416 | |
Best Buy Co., Inc.D | | | 5,770 | | | | 134,845 | |
Big Lots, Inc.* | | | 1,121 | | | | 42,329 | |
BorgWarner, Inc.D* | | | 2,000 | | | | 127,480 | |
Cablevision Systems Corporation | | | 4,428 | | | | 62,966 | |
CarMax, Inc.* | | | 4,332 | | | | 132,039 | |
Carnival CorporationD | | | 8,611 | | | | 281,063 | |
CBS Corporation Class B | | | 12,459 | | | | 338,137 | |
Chipotle Mexican Grill, Inc.* | | | 598 | | | | 201,969 | |
Coach, Inc. | | | 5,670 | | | | 346,097 | |
Comcast Corporation Class A | | | 51,638 | | | | 1,224,337 | |
Costco Wholesale Corporation | | | 8,265 | | | | 688,640 | |
Darden Restaurants, Inc.D | | | 2,320 | | | | 105,746 | |
DeVry, Inc. | | | 1,239 | | | | 47,652 | |
DIRECTV, Class A* | | | 13,360 | | | | 571,274 | |
Discovery Communications, Inc.* | | | 5,118 | | | | 209,684 | |
Dollar Tree, Inc.* | | | 2,300 | | | | 191,153 | |
DR Horton, Inc.D | | | 4,858 | | | | 61,259 | |
eBay, Inc.* | | | 21,908 | | | | 664,470 | |
Estee Lauder Cos., Inc. (The) Class A | | | 2,096 | | | | 235,423 | |
Expedia, Inc.D* | | | 1,716 | | | | 49,784 | |
Family Dollar Stores, Inc. | | | 2,145 | | | | 123,681 | |
Ford Motor Co.D | | | 72,774 | | | | 783,048 | |
GameStop Corporation Class AD* | | | 2,459 | | | | 59,336 | |
Gannett Co., Inc. | | | 4,704 | | | | 62,892 | |
Gap, Inc. (The)D | | | 6,744 | | | | 125,101 | |
Genuine Parts Co.D | | | 2,997 | | | | 183,416 | |
Goodyear Tire & Rubber Co. (The)* | | | 4,943 | | | | 70,042 | |
H&R Block, Inc.D | | | 5,850 | | | | 95,530 | |
Harley-Davidson, Inc. | | | 4,541 | | | | 176,509 | |
Harman International Industries, Inc. | | | 1,346 | | | | 51,202 | |
Hasbro, Inc.D | | | 2,303 | | | | 73,443 | |
Home Depot, Inc. (The) | | | 29,314 | | | | 1,232,361 | |
Interpublic Group of Companies, Inc. (The) | | | 8,293 | | | | 80,691 | |
J.C. Penney Co., Inc.D | | | 2,818 | | | | 99,053 | |
Johnson Controls, Inc. | | | 12,987 | | | | 405,974 | |
Kohl’s Corporation | | | 4,797 | | | | 236,732 | |
Leggett & Platt, Inc.D | | | 2,803 | | | | 64,581 | |
Lennar Corporation Class AD | | | 3,110 | | | | 61,111 | |
Limited Brands, Inc. | | | 4,599 | | | | 185,570 | |
Lowe’s Cos., Inc. | | | 23,800 | | | | 604,044 | |
Macy’s, Inc. | | | 7,898 | | | | 254,158 | |
Marriott International, Inc. Class A | | | 5,050 | | | | 147,308 | |
Marriott International, Ltd. Placeholder Shares+ | | | 82,125 | | | | — | |
Mattel, Inc.D | | | 6,308 | | | | 175,110 | |
McDonald’s Corporation | | | 19,519 | | | | 1,958,341 | |
McGraw-Hill Co., Inc. (The)D | | | 5,610 | | | | 252,282 | |
Netflix, Inc.D* | | | 1,014 | | | | 70,260 | |
| | | | | | | | |
| | | Shares | | | Value | |
Newell Rubbermaid, Inc. | | | 5,589 | | | $ | 90,262 | |
News Corporation | | | 41,671 | | | | 743,411 | |
NIKE, Inc. Class B | | | 6,981 | | | | 672,759 | |
Nordstrom, Inc. | | | 3,020 | | | | 150,124 | |
Omnicom Group, Inc. | | | 5,159 | | | | 229,988 | |
Orchard Supply Hardware Stores Corporation, Class A+* | | | 30 | | | | — | |
O’Reilly Automotive, Inc.* | | | 2,424 | | | | 193,799 | |
priceline.com, Inc.* | | | 931 | | | | 435,438 | |
PulteGroup, Inc.* | | | 6,461 | | | | 40,769 | |
Ralph Lauren Corporation | | | 1,237 | | | | 170,805 | |
Ross Stores, Inc. | | | 4,284 | | | | 203,619 | |
Scripps Networks Interactive, Inc. Class A | | | 1,906 | | | | 80,853 | |
Sears Holdings CorporationD* | | | 673 | | | | 21,388 | |
Snap-on, Inc. | | | 1,158 | | | | 58,618 | |
Stanley Black & Decker, Inc. | | | 3,226 | | | | 218,078 | |
Staples, Inc. | | | 12,983 | | | | 180,334 | |
Starbucks Corporation | | | 14,260 | | | | 656,103 | |
Starwood Hotels & Resorts Worldwide, Inc. | | | 3,729 | | | | 178,880 | |
Target Corporation | | | 12,756 | | | | 653,362 | |
Tiffany & Co.D | | | 2,450 | | | | 162,337 | |
Time Warner Cable, Inc. | | | 6,093 | | | | 387,332 | |
Time Warner, Inc. | | | 18,870 | | | | 681,962 | |
TJX Cos., Inc. | | | 7,233 | | | | 466,890 | |
TripAdvisor, Inc.* | | | 1,716 | | | | 43,248 | |
Urban Outfitters, Inc.D* | | | 2,249 | | | | 61,982 | |
VF Corporation | | | 1,705 | | | | 216,518 | |
Wal-Mart Stores, Inc. | | | 33,281 | | | | 1,988,873 | |
Walt Disney Co. (The) | | | 34,103 | | | | 1,278,862 | |
Washington Post Co. (The)D | | | 98 | | | | 36,927 | |
Whirlpool CorporationD | | | 1,462 | | | | 69,372 | |
Wyndham Worldwide Corporation | | | 2,882 | | | | 109,026 | |
Yum! Brands, Inc. | | | 8,750 | | | | 516,337 | |
| | | | | | | | |
| | | | | | | 26,292,375 | |
| | | | | | | | |
Consumer Staples — 7.8% | |
Archer-Daniels-Midland Co. | | | 12,738 | | | | 364,307 | |
Campbell Soup Co.D | | | 3,495 | | | | 116,174 | |
Clorox Co. (The) | | | 2,608 | | | | 173,589 | |
Coca-Cola Co. (The) | | | 43,255 | | | | 3,026,552 | |
Coca-Cola Enterprises, Inc. | | | 5,844 | | | | 150,658 | |
Colgate-Palmolive Co. | | | 9,233 | | | | 853,037 | |
ConAgra Foods, Inc. | | | 7,857 | | | | 207,425 | |
CVS Caremark Corporation | | | 24,788 | | | | 1,010,855 | |
Dean Foods Co.* | | | 3,527 | | | | 39,502 | |
Dr. Pepper Snapple Group, Inc. | | | 3,989 | | | | 157,486 | |
General Mills, Inc. | | | 12,261 | | | | 495,467 | |
H.J. Heinz Co.D | | | 5,987 | | | | 323,537 | |
Hershey Co. (The) | | | 2,946 | | | | 182,004 | |
Hormel Foods CorporationD | | | 2,583 | | | | 75,656 | |
J.M. Smucker Co. (The) | | | 2,097 | | | | 163,923 | |
Kellogg Co. | | | 4,604 | | | | 232,824 | |
Kimberly-Clark Corporation | | | 7,497 | | | | 551,479 | |
Kraft Foods, Inc. Class A | | | 33,744 | | | | 1,260,676 | |
Kroger Co. (The) | | | 11,220 | | | | 271,748 | |
McCormick & Co., Inc. | | | 2,535 | | | | 127,815 | |
Mead Johnson Nutrition Co. | | | 3,925 | | | | 269,765 | |
PepsiCo, Inc. | | | 29,754 | | | | 1,974,178 | |
Procter & Gamble Co. (The) | | | 52,322 | | | | 3,490,401 | |
Safeway, Inc.D | | | 6,303 | | | | 132,615 | |
Sara Lee Corporation | | | 11,248 | | | | 212,812 | |
|
| See Notes to Financial Statements. |
146 |
EQUITY INDEX FUND
SCHEDULE OF INVESTMENTS (Continued)
| | | | | | | | |
| | | Shares | | | Value | |
SUPERVALU, Inc.D | | | 4,104 | | | $ | 33,325 | |
Sysco CorporationD | | | 11,174 | | | | 327,733 | |
Tyson Foods, Inc. Class A | | | 5,763 | | | | 118,948 | |
Walgreen Co. | | | 16,816 | | | | 555,937 | |
Whole Foods Market, Inc. | | | 3,047 | | | | 212,010 | |
| | | | | | | | |
| | | | | | | 17,112,438 | |
| | | | | | | | |
| | |
Energy — 12.0% | | | | | | | | |
Alpha Natural Resources, Inc.* | | | 4,345 | | | | 88,768 | |
Anadarko Petroleum Corporation | | | 9,424 | | | | 719,334 | |
Apache Corporation | | | 7,252 | | | | 656,886 | |
Baker Hughes, Inc. | | | 8,341 | | | | 405,706 | |
Cabot Oil & Gas Corporation | | | 2,007 | | | | 152,331 | |
Cameron International Corporation* | | | 4,706 | | | | 231,488 | |
Chesapeake Energy Corporation | | | 12,636 | | | | 281,656 | |
Chevron Corporation | | | 37,814 | | | | 4,023,410 | |
ConocoPhillips | | | 25,319 | | | | 1,844,996 | |
Consol Energy, Inc. | | | 4,348 | | | | 159,572 | |
Denbury Resources, Inc.* | | | 7,628 | | | | 115,183 | |
Devon Energy Corporation | | | 7,668 | | | | 475,416 | |
Diamond Offshore Drilling, Inc.D | | | 1,330 | | | | 73,496 | |
El Paso Corporation | | | 14,772 | | | | 392,492 | |
EOG Resources, Inc. | | | 5,053 | | | | 497,771 | |
EQT Corporation | | | 2,869 | | | | 157,193 | |
Exterran Holdings, Inc.* | | | 13 | | | | 118 | |
Exxon Mobil Corporation | | | 91,177 | | | | 7,728,163 | |
First Solar, Inc.D* | | | 1,151 | | | | 38,858 | |
FMC Technologies, Inc.D* | | | 4,610 | | | | 240,780 | |
Halliburton Co. | | | 17,358 | | | | 599,025 | |
Helmerich & Payne, Inc. | | | 2,051 | | | | 119,696 | |
Hess Corporation | | | 5,627 | | | | 319,614 | |
Marathon Oil Corporation | | | 13,309 | | | | 389,554 | |
Marathon Petroleum Corporation | | | 6,842 | | | | 227,770 | |
Murphy Oil Corporation | | | 3,710 | | | | 206,795 | |
National Oilwell Varco, Inc. | | | 7,980 | | | | 542,560 | |
Newfield Exploration Co.* | | | 2,539 | | | | 95,796 | |
Noble Energy, Inc. | | | 3,378 | | | | 318,849 | |
Occidental Petroleum Corporation | | | 15,380 | | | | 1,441,106 | |
Peabody Energy Corporation | | | 5,193 | | | | 171,940 | |
Pioneer Natural Resources Co. | | | 2,343 | | | | 209,652 | |
QEP Resources, Inc. | | | 3,403 | | | | 99,708 | |
Range Resources Corporation | | | 2,888 | | | | 178,883 | |
Rowan Cos., Inc.D* | | | 2,445 | | | | 74,157 | |
Schlumberger, Ltd. | | | 25,518 | | | | 1,743,135 | |
Southwestern Energy Co.* | | | 6,691 | | | | 213,711 | |
Spectra Energy Corporation | | | 12,446 | | | | 382,714 | |
Sunoco, Inc.D | | | 1,977 | | | | 81,097 | |
Tesoro Corporation* | | | 2,765 | | | | 64,590 | |
Valero Energy Corporation | | | 10,458 | | | | 220,141 | |
Williams Cos., Inc. (The) | | | 11,287 | | | | 372,697 | |
| | | | | | | | |
| | | | | | | 26,356,807 | |
| | | | | | | | |
| |
Financial Services — 14.1% | | | | | |
Aflac, Inc. | | | 8,950 | | | | 387,177 | |
Allstate Corporation (The) | | | 9,659 | | | | 264,753 | |
American Express Co. | | | 19,177 | | | | 904,579 | |
American International Group, Inc.D* | | | 8,387 | | | | 194,578 | |
Ameriprise Financial, Inc. | | | 4,135 | | | | 205,261 | |
| | | | | | | | |
| | | Shares | | | Value | |
Aon Corporation | | | 6,122 | | | $ | 286,510 | |
Apartment Investment & Management Co. Class A REIT | | | 2,314 | | | | 53,014 | |
Assurant, Inc. | | | 1,697 | | | | 69,679 | |
AvalonBay Communities, Inc. REITD | | | 1,762 | | | | 230,117 | |
Bank of America Corporation | | | 193,377 | | | | 1,075,176 | |
Bank of New York Mellon Corporation (The)D | | | 23,260 | | | | 463,107 | |
BB&T Corporation | | | 13,288 | | | | 334,459 | |
Berkshire Hathaway, Inc.* | | | 33,415 | | | | 2,549,564 | |
BlackRock, Inc. | | | 1,967 | | | | 350,598 | |
Boston Properties, Inc. REIT | | | 2,793 | | | | 278,183 | |
Capital One Financial Corporation | | | 8,788 | | | | 371,644 | |
CBRE Group, Inc.* | | | 6,321 | | | | 96,206 | |
Charles Schwab Corporation (The) | | | 20,892 | | | | 235,244 | |
Chubb Corporation (The) | | | 5,228 | | | | 361,882 | |
Cincinnati Financial CorporationD | | | 3,141 | | | | 95,675 | |
Citigroup, Inc. | | | 55,534 | | | | 1,461,100 | |
CME Group, Inc. | | | 1,247 | | | | 303,856 | |
Comerica, Inc. | | | 3,797 | | | | 97,963 | |
Discover Financial Services | | | 10,474 | | | | 251,376 | |
Dun & Bradstreet Corporation (The) | | | 881 | | | | 65,925 | |
E*TRADE Financial Corporation* | | | 4,860 | | | | 38,686 | |
Equifax, Inc. | | | 2,346 | | | | 90,884 | |
Equity Residential REIT | | | 5,667 | | | | 323,189 | |
Federated Investors, Inc. Class BD | | | 1,746 | | | | 26,452 | |
Fidelity National Information Services, Inc. | | | 4,773 | | | | 126,914 | |
Fifth Third Bancorp | | | 17,546 | | | | 223,185 | |
First Horizon National Corporation | | | 5,011 | | | | 40,088 | |
First Horizon National Corporation Placeholder Shares+ | | | 271,852 | | | | — | |
Fiserv, Inc.D* | | | 2,749 | | | | 161,476 | |
Franklin Resources, Inc. | | | 2,768 | | | | 265,894 | |
Genworth Financial, Inc. Class A* | | | 8,940 | | | | 58,557 | |
Goldman Sachs Group, Inc. (The) | | | 9,281 | | | | 839,281 | |
Hartford Financial Services Group, Inc. | | | 8,562 | | | | 139,132 | |
HCP, Inc. REIT | | | 7,837 | | | | 324,687 | |
Health Care REIT, Inc.D | | | 3,611 | | | | 196,908 | |
Host Hotels & Resorts, Inc. REIT | | | 13,174 | | | | 194,580 | |
Hudson City Bancorp, Inc.D | | | 9,311 | | | | 58,194 | |
Huntington Bancshares, Inc. | | | 16,431 | | | | 90,206 | |
IntercontinentalExchange, Inc.* | | | 1,413 | | | | 170,337 | |
Invesco, Ltd. | | | 8,362 | | | | 167,993 | |
JPMorgan Chase & Co. | | | 72,068 | | | | 2,396,261 | |
KeyCorp | | | 18,137 | | | | 139,474 | |
Kimco Realty Corporation REIT | | | 7,829 | | | | 127,143 | |
Legg Mason, Inc.D | | | 2,496 | | | | 60,029 | |
Leucadia National Corporation | | | 3,799 | | | | 86,389 | |
Lincoln National Corporation | | | 5,427 | | | | 105,392 | |
Loews Corporation | | | 5,666 | | | | 213,325 | |
M&T Bank Corporation | | | 2,358 | | | | 180,010 | |
|
See Notes to Financial Statements. 147 |
| | | | | | | | |
| | | Shares | | | Value | |
Marsh & McLennan Cos., Inc. | | | 10,196 | | | $ | 322,398 | |
Mastercard, Inc. Class A | | | 2,023 | | | | 754,215 | |
MetLife, Inc. | | | 20,277 | | | | 632,237 | |
Moody’s Corporation | | | 3,806 | | | | 128,186 | |
Morgan Stanley | | | 28,601 | | | | 432,733 | |
NASDAQ OMX Group, Inc. (The)* | | | 2,495 | | | | 61,152 | |
Northern Trust Corporation | | | 4,698 | | | | 186,323 | |
NYSE Euronext | | | 5,035 | | | | 131,413 | |
People’s United Financial, Inc. | | | 7,109 | | | | 91,351 | |
Plum Creek Timber Co., Inc. REITD | | | 3,098 | | | | 113,263 | |
PNC Financial Services Group, Inc. | | | 10,085 | | | | 581,602 | |
Principal Financial Group, Inc. | | | 5,746 | | | | 141,352 | |
Progressive Corporation (The) | | | 11,960 | | | | 233,340 | |
ProLogis, Inc. REIT | | | 8,739 | | | | 249,848 | |
Prudential Financial, Inc. | | | 8,867 | | | | 444,414 | |
Public Storage REIT | | | 2,679 | | | | 360,218 | |
Regions Financial Corporation | | | 24,058 | | | | 103,449 | |
Simon Property Group, Inc. REIT | | | 5,649 | | | | 728,382 | |
SLM Corporation | | | 9,357 | | | | 125,384 | |
State Street Corporation | | | 9,427 | | | | 380,002 | |
SunTrust Banks, Inc. | | | 10,272 | | | | 181,814 | |
T. Rowe Price Group, Inc.D | | | 4,807 | | | | 273,759 | |
Torchmark Corporation | | | 2,017 | | | | 87,518 | |
Total System Services, Inc. | | | 3,083 | | | | 60,303 | |
Travelers Cos., Inc. (The) | | | 7,851 | | | | 464,544 | |
Unum Group | | | 5,230 | | | | 110,196 | |
US Bancorp | | | 36,385 | | | | 984,214 | |
Ventas, Inc. REIT | | | 5,518 | | | | 304,207 | |
Visa, Inc. Class A | | | 9,692 | | | | 984,029 | |
Vornado Realty Trust REIT | | | 3,431 | | | | 263,707 | |
Wells Fargo & Co. | | | 100,247 | | | | 2,762,807 | |
Western Union Co. (The) | | | 11,561 | | | | 211,104 | |
Weyerhaeuser Co. REIT | | | 10,357 | | | | 193,365 | |
Zions BancorporationD | | | 3,140 | | | | 51,119 | |
| | | | | | | | |
| | | | | | | 30,966,240 | |
| | | | | | | | |
Healthcare — 11.3% | |
Abbott Laboratories | | | 29,696 | | | | 1,669,806 | |
Aetna, Inc. | | | 6,732 | | | | 284,023 | |
Allergan, Inc. | | | 5,821 | | | | 510,735 | |
AmerisourceBergen Corporation | | | 4,982 | | | | 185,281 | |
Amgen, Inc.D | | | 15,028 | | | | 964,948 | |
Baxter International, Inc. | | | 10,750 | | | | 531,910 | |
Becton, Dickinson and Co. | | | 4,060 | | | | 303,363 | |
Biogen Idec, Inc.* | | | 4,649 | | | | 511,622 | |
Boston Scientific Corporation* | | | 27,489 | | | | 146,791 | |
Bristol-Myers Squibb Co. | | | 32,276 | | | | 1,137,406 | |
C.R. Bard, Inc. | | | 1,644 | | | | 140,562 | |
Cardinal Health, Inc. | | | 6,489 | | | | 263,518 | |
CareFusion Corporation* | | | 4,289 | | | | 108,983 | |
Celgene Corporation* | | | 8,463 | | | | 572,099 | |
Cerner Corporation* | | | 2,776 | | | | 170,030 | |
CIGNA Corporation | | | 5,494 | | | | 230,748 | |
Conventry Health Care, Inc.* | | | 2,845 | | | | 86,403 | |
DaVita, Inc.* | | | 1,794 | | | | 136,003 | |
DENTSPLY International, Inc.D | | | 2,702 | | | | 94,543 | |
Edwards Lifesciences Corporation* | | | 2,204 | | | | 155,823 | |
Eli Lilly & Co. | | | 19,287 | | | | 801,568 | |
| | | | | | | | |
| | | Shares | | | Value | |
Express Scripts, Inc.* | | | 9,149 | | | $ | 408,869 | |
Forest Laboratories, Inc.* | | | 5,187 | | | | 156,959 | |
Gilead Sciences, Inc.* | | | 14,278 | | | | 584,399 | |
Hospira, Inc.* | | | 3,221 | | | | 97,822 | |
Humana, Inc. | | | 3,117 | | | | 273,080 | |
Intuitive Surgical, Inc.* | | | 732 | | | | 338,923 | |
Johnson & Johnson | | | 51,877 | | | | 3,402,094 | |
Laboratory Corporation of America Holdings* | | | 1,921 | | | | 165,148 | |
Life Technologies Corporation* | | | 3,431 | | | | 133,500 | |
McKesson Corporation | | | 4,706 | | | | 366,644 | |
Medco Health Solutions, Inc.* | | | 7,417 | | | | 414,610 | |
Medtronic, Inc. | | | 19,962 | | | | 763,547 | |
Merck & Co., Inc.D | | | 57,977 | | | | 2,185,733 | |
Mylan, Inc.* | | | 7,944 | | | | 170,478 | |
Patterson Cos., Inc.D | | | 1,850 | | | | 54,612 | |
PerkinElmer, Inc. | | | 2,160 | | | | 43,200 | |
Perrigo Co. | | | 1,800 | | | | 175,140 | |
Pfizer, Inc.D | | | 146,159 | | | | 3,162,881 | |
Quest Diagnostics, Inc.D | | | 3,019 | | | | 175,283 | |
St. Jude Medical, Inc. | | | 6,016 | | | | 206,349 | |
Stryker Corporation | | | 6,196 | | | | 308,003 | |
Tenet Healthcare CorporationD* | | | 7,097 | | | | 36,408 | |
Thermo Fisher Scientific, Inc.* | | | 7,135 | | | | 320,861 | |
UnitedHealth Group, Inc. | | | 20,198 | | | | 1,023,635 | |
Varian Medical Systems, Inc.* | | | 2,049 | | | | 137,549 | |
Watson Pharmaceuticals, Inc.* | | | 2,430 | | | | 146,626 | |
WellPoint, Inc. | | | 6,601 | | | | 437,316 | |
Zimmer Holdings, Inc. | | | 3,364 | | | | 179,705 | |
| | | | | | | | |
| | | | | | | 24,875,539 | |
| | | | | | | | |
Materials & Processing — 3.8% | |
Air Products & Chemicals, Inc. | | | 3,963 | | | | 337,608 | |
Airgas, Inc.D | | | 1,340 | | | | 104,627 | |
Alcoa, Inc. | | | 20,431 | | | | 176,728 | |
Allegheny Technologies, Inc. | | | 2,039 | | | | 97,464 | |
Ball Corporation | | | 3,212 | | | | 114,701 | |
Bemis Co., Inc.D | | | 1,810 | | | | 54,445 | |
CF Industries Holdings, Inc. | | | 1,261 | | | | 182,820 | |
Cliffs Natural Resources, Inc. | | | 2,575 | | | | 160,551 | |
Dow Chemical Co. (The) | | | 22,592 | | | | 649,746 | |
Eastman Chemical Co. | | | 2,724 | | | | 106,399 | |
Ecolab, Inc. | | | 5,598 | | | | 323,620 | |
EI du Pont de Nemours & Co.D | | | 17,594 | | | | 805,453 | |
Fastenal Co.D | | | 5,653 | | | | 246,527 | |
FMC Corporation | | | 1,372 | | | | 118,047 | |
Freeport-McMoRan Copper & Gold, Inc. | | | 17,897 | | | | 658,431 | |
International Flavors & Fragrances, Inc. | | | 1,535 | | | | 80,465 | |
International Paper Co. | | | 8,374 | | | | 247,870 | |
Masco Corporation | | | 6,420 | | | | 67,282 | |
MeadWestvaco Corporation | | | 3,222 | | | | 96,499 | |
Monsanto Co. | | | 10,192 | | | | 714,153 | |
Mosaic Co. (The) | | | 5,733 | | | | 289,115 | |
Newmont Mining Corporation | | | 9,519 | | | | 571,235 | |
Nucor CorporationD | | | 6,111 | | | | 241,812 | |
Owens-Illinois, Inc.* | | | 2,896 | | | | 56,125 | |
PPG Industries, Inc. | | | 2,912 | | | | 243,123 | |
Praxair, Inc. | | | 5,707 | | | | 610,078 | |
Precision Castparts Corporation | | | 2,698 | | | | 444,603 | |
Sealed Air Corporation | | | 3,252 | | | | 55,967 | |
Sherwin-Williams Co. (The) | | | 1,595 | | | | 142,386 | |
|
| See Notes to Financial Statements. |
148 |
EQUITY INDEX FUND
SCHEDULE OF INVESTMENTS (Continued)
| | | | | | | | |
| | | Shares | | | Value | |
Sigma-Aldrich CorporationD | | | 2,332 | | | $ | 145,657 | |
Titanium Metals Corporation | | | 1,727 | | | | 25,871 | |
United States Steel CorporationD | | | 2,762 | | | | 73,083 | |
Vulcan Materials Co.D | | | 2,491 | | | | 98,021 | |
| | | | | | | | |
| | | | | | | 8,340,512 | |
| | | | | | | | |
Producer Durables — 10.3% | |
3M Co. | | | 13,302 | | | | 1,087,172 | |
Agilent Technologies, Inc.* | | | 6,683 | | | | 233,437 | |
Automatic Data Processing, Inc. | | | 9,390 | | | | 507,154 | |
Avery Dennison CorporationD | | | 2,140 | | | | 61,375 | |
Boeing Co. (The) | | | 14,134 | | | | 1,036,729 | |
C.H. Robinson Worldwide, Inc. | | | 3,124 | | | | 217,993 | |
Caterpillar, Inc. | | | 12,305 | | | | 1,114,833 | |
Cintas Corporation | | | 2,141 | | | | 74,528 | |
Cooper Industries PLC | | | 2,881 | | | | 156,006 | |
CSX Corporation | | | 19,705 | | | | 414,987 | |
Cummins, Inc. | | | 3,651 | | | | 321,361 | |
Danaher Corporation | | | 10,723 | | | | 504,410 | |
Deere & Co. | | | 7,895 | | | | 610,678 | |
Dover Corporation | | | 3,576 | | | | 207,587 | |
Eaton Corporation | | | 6,237 | | | | 271,497 | |
Emerson Electric Co. | | | 14,029 | | | | 653,611 | |
Expeditors International of Washington, Inc. | | | 4,070 | | | | 166,707 | |
FedEx Corporation | | | 6,058 | | | | 505,904 | |
FLIR Systems, Inc. | | | 3,049 | | | | 76,438 | |
Flowserve Corporation | | | 1,067 | | | | 105,974 | |
Fluor Corporation | | | 3,142 | | | | 157,886 | |
General Dynamics Corporation | | | 6,815 | | | | 452,584 | |
General Electric Co. | | | 201,087 | | | | 3,601,468 | |
Goodrich Corporation | | | 2,400 | | | | 296,880 | |
Honeywell International, Inc. | | | 14,591 | | | | 793,021 | |
Illinois Tool Works, Inc. | | | 9,157 | | | | 427,723 | |
Iron Mountain, Inc. | | | 3,504 | | | | 107,923 | |
Jacobs Engineering Group, Inc.D* | | | 2,431 | | | | 98,650 | |
Joy Global, Inc. | | | 2,010 | | | | 150,690 | |
L-3 Communications Holdings, Inc.D | | | 1,883 | | | | 125,558 | |
Lexmark International, Inc. Class A | | | 1,212 | | | | 40,081 | |
Lockheed Martin Corporation | | | 5,053 | | | | 408,788 | |
Norfolk Southern Corporation | | | 6,335 | | | | 461,568 | |
Northrop Grumman Corporation | | | 5,055 | | | | 295,616 | |
PACCAR, Inc.D | | | 6,699 | | | | 251,012 | |
Pall CorporationD | | | 2,222 | | | | 126,987 | |
Parker Hannifin Corporation | | | 2,764 | | | | 210,755 | |
Paychex, Inc. | | | 6,174 | | | | 185,899 | |
Pitney Bowes, Inc.D | | | 3,922 | | | | 72,714 | |
Quanta Services, Inc.* | | | 4,125 | | | | 88,853 | |
Raytheon Co. | | | 6,613 | | | | 319,937 | |
Republic Services, Inc. | | | 5,784 | | | | 159,349 | |
Robert Half International, Inc. | | | 2,613 | | | | 74,366 | |
Rockwell Automation, Inc. | | | 2,638 | | | | 193,550 | |
Rockwell Collins, Inc.D | | | 2,956 | | | | 163,674 | |
Roper Industries, Inc. | | | 1,836 | | | | 159,493 | |
RR Donnelley & Sons Co.D | | | 3,600 | | | | 51,948 | |
Ryder System, Inc. | | | 987 | | | | 52,449 | |
Southwest Airlines Co. | | | 15,189 | | | | 130,018 | |
Stericycle, Inc.* | | | 1,646 | | | | 128,256 | |
Textron, Inc.D | | | 5,310 | | | | 98,182 | |
| | | | | | | | |
| | | Shares | | | Value | |
Union Pacific Corporation | | | 9,223 | | | $ | 977,085 | |
United Parcel Service, Inc. Class B | | | 18,337 | | | | 1,342,085 | |
United Technologies Corporation | | | 17,196 | | | | 1,256,856 | |
W.W. Grainger, Inc. | | | 1,130 | | | | 211,525 | |
Waste Management, Inc.D | | | 8,786 | | | | 287,390 | |
Waters Corporation* | | | 1,759 | | | | 130,254 | |
Xerox Corporation | | | 26,905 | | | | 214,164 | |
| | | | | | | | |
| | | | | | | 22,633,618 | |
| | | | | | | | |
Technology — 16.7% | |
Adobe Systems, Inc.D* | | | 9,253 | | | | 261,582 | |
Advanced Micro Devices, Inc.D* | | | 10,882 | | | | 58,763 | |
Akamai Technologies, Inc.* | | | 3,587 | | | | 115,788 | |
Altera Corporation | | | 6,189 | | | | 229,612 | |
American Tower Corporation Class A | | | 7,441 | | | | 446,534 | |
Amphenol Corporation Class A | | | 3,142 | | | | 142,615 | |
Analog Devices, Inc. | | | 5,749 | | | | 205,699 | |
Apple, Inc.* | | | 17,676 | | | | 7,158,780 | |
Applied Materials, Inc. | | | 24,332 | | | | 260,596 | |
Autodesk, Inc.* | | | 4,438 | | | | 134,605 | |
BMC Software, Inc.* | | | 3,093 | | | | 101,389 | |
Broadcom Corporation Class A* | | | 9,168 | | | | 269,172 | |
CA, Inc. | | | 6,776 | | | | 136,977 | |
Cisco Systems, Inc. | | | 102,137 | | | | 1,846,637 | |
Citrix Systems, Inc.* | | | 3,612 | | | | 219,321 | |
Cognizant Technology Solutions Corporation Class A* | | | 5,692 | | | | 366,052 | |
Computer Sciences Corporation | | | 2,971 | | | | 70,413 | |
Corning, Inc. | | | 30,180 | | | | 391,736 | |
Dell, Inc.* | | | 29,142 | | | | 426,347 | |
Electronic Arts, Inc.* | | | 6,387 | | | | 131,572 | |
EMC Corporation* | | | 38,915 | | | | 838,229 | |
F5 Networks, Inc.* | | | 1,459 | | | | 154,829 | |
Google, Inc. Class A* | | | 4,801 | | | | 3,100,966 | |
Harris CorporationD | | | 2,146 | | | | 77,342 | |
Hewlett-Packard Co. | | | 37,614 | | | | 968,937 | |
Intel Corporation | | | 96,759 | | | | 2,346,406 | |
International Business Machines Corporation | | | 22,399 | | | | 4,118,728 | |
Intuit, Inc. | | | 5,659 | | | | 297,607 | |
Jabil Circuit, Inc. | | | 3,496 | | | | 68,731 | |
JDS Uniphase Corporation* | | | 4,366 | | | | 45,581 | |
Juniper Networks, Inc.* | | | 10,243 | | | | 209,060 | |
KLA-Tencor Corporation | | | 3,228 | | | | 155,751 | |
Linear Technology Corporation | | | 4,371 | | | | 131,261 | |
LSI Corporation* | | | 9,748 | | | | 58,001 | |
Microchip Technology, Inc.D | | | 3,659 | | | | 134,029 | |
Micron Technology, Inc.D* | | | 19,571 | | | | 123,102 | |
Microsoft Corporation | | | 142,279 | | | | 3,693,563 | |
Molex, Inc.D | | | 2,666 | | | | 63,611 | |
Motorola Mobility Holdings, Inc.* | | | 5,066 | | | | 196,561 | |
Motorola Solutions, Inc. | | | 5,384 | | | | 249,225 | |
NetApp, Inc.* | | | 6,766 | | | | 245,403 | |
Novellus Systems, Inc.* | | | 1,339 | | | | 55,287 | |
NVIDIA Corporation* | | | 11,538 | | | | 159,917 | |
Oracle Corporation | | | 74,978 | | | | 1,923,186 | |
QUALCOMM, Inc. | | | 31,956 | | | | 1,747,993 | |
Red Hat, Inc.* | | | 3,707 | | | | 153,062 | |
SAIC, Inc.D* | | | 5,321 | | | | 65,395 | |
|
See Notes to Financial Statements. 149 |
| | | | | | | | |
| | | Shares | | | Value | |
Salesforce.com, Inc.* | | | 2,628 | | | $ | 266,637 | |
SanDisk Corporation* | | | 4,586 | | | | 225,677 | |
Symantec Corporation* | | | 13,868 | | | | 217,034 | |
Teradata Corporation* | | | 3,237 | | | | 157,027 | |
Teradyne, Inc.* | | | 3,577 | | | | 48,754 | |
Texas Instruments, Inc. | | | 21,571 | | | | 627,932 | |
VeriSign, Inc.D* | | | 2,937 | | | | 104,910 | |
Western Digital Corporation* | | | 4,459 | | | | 138,006 | |
Xilinx, Inc. | | | 5,102 | | | | 163,570 | |
Yahoo!, Inc.* | | | 23,684 | | | | 382,023 | |
| | | | | | | | |
| | | | | | | 36,687,523 | |
| | | | | | | | |
Utilities — 6.8% | |
AES Corporation (The)* | | | 12,613 | | | | 149,338 | |
AGL Resources, Inc. | | | 2,247 | | | | 94,958 | |
Ameren Corporation | | | 4,649 | | | | 154,021 | |
American Electric Power Co., Inc. | | | 9,306 | | | | 384,431 | |
AT&T, Inc. | | | 112,759 | | | | 3,409,832 | |
CenterPoint Energy, Inc. | | | 8,168 | | | | 164,095 | |
CenturyLink, Inc.D | | | 11,800 | | | | 438,960 | |
CMS Energy CorporationD | | | 4,874 | | | | 107,618 | |
Consolidated Edison, Inc.D | | | 5,655 | | | | 350,780 | |
Constellation Energy Group, Inc. | | | 3,874 | | | | 153,682 | |
Dominion Resources, Inc. | | | 10,854 | | | | 576,130 | |
DTE Energy Co. | | | 3,255 | | | | 177,235 | |
Duke Energy CorporationD | | | 25,121 | | | | 552,662 | |
Edison International | | | 6,309 | | | | 261,193 | |
Entergy Corporation | | | 3,276 | | | | 239,312 | |
Exelon CorporationD | | | 12,492 | | | | 541,778 | |
FirstEnergy Corporation | | | 8,014 | | | | 355,020 | |
Frontier Communications CorporationD | | | 19,145 | | | | 98,597 | |
Integrys Energy Group, Inc. | | | 1,404 | | | | 76,069 | |
MetroPCS Communications, Inc.* | | | 6,080 | | | | 52,774 | |
NextEra Energy, Inc.D | | | 7,932 | | | | 482,900 | |
NiSource, Inc.D | | | 5,375 | | | | 127,979 | |
Northeast Utilities | | | 3,403 | | | | 122,746 | |
NRG Energy, Inc.* | | | 4,048 | | | | 73,350 | |
ONEOK, Inc. | | | 1,935 | | | | 167,745 | |
Pepco Holdings, Inc. | | | 4,317 | | | | 87,635 | |
PG&E Corporation | | | 7,634 | | | | 314,673 | |
Pinnacle West Capital Corporation | | | 2,095 | | | | 100,937 | |
PPL Corporation | | | 11,037 | | | | 324,709 | |
Progress Energy, Inc. | | | 5,680 | | | | 318,194 | |
Public Service Enterprise Group, Inc. | | | 9,699 | | | | 320,164 | |
SCANA CorporationD | | | 2,190 | | | | 98,681 | |
Sempra Energy | | | 4,590 | | | | 252,450 | |
Southern Co. (The) | | | 16,372 | | | | 757,860 | |
Sprint Nextel Corporation* | | | 57,575 | | | | 134,726 | |
TECO Energy, Inc.D | | | 3,986 | | | | 76,292 | |
Verizon Communications, Inc. | | | 53,870 | | | | 2,161,264 | |
Windstream CorporationD | | | 10,675 | | | | 125,324 | |
Wisconsin Energy Corporation | | | 4,484 | | | | 156,761 | |
Xcel Energy, Inc. | | | 9,302 | | | | 257,107 | |
Xylem, Inc. | | | 3,570 | | | | 91,713 | |
| | | | | | | | |
| | | | | | | 14,891,695 | |
| | | | | | | | |
Total Common Stocks
(Cost $174,158,093) | | | | 208,156,747 | |
| | | | | | | | |
| | | | | | | | |
| | | Shares | | | Value | |
FOREIGN COMMON STOCKS — 1.2% | |
Bermuda — 0.0% | |
Nabors Industries, Ltd.* | | | 5,522 | | | $ | 95,751 | |
| | | | | | | | |
Ireland — 0.6% | |
Accenture PLC Class A | | | 12,199 | | | | 649,353 | |
Covidien PLC | | | 9,285 | | | | 417,918 | |
Ingersoll-Rand PLC | | | 5,821 | | | | 177,366 | |
Xl Group PLC | | | 5,999 | | | | 118,600 | |
| | | | | | | | |
| | | | | | | 1,363,237 | |
| | | | | | | | |
Switzerland — 0.6% | |
ACE, Ltd. | | | 6,467 | | | | 453,466 | |
Noble Corporation | | | 4,840 | | | | 146,265 | |
TE Connectivity, Ltd. | | | 8,049 | | | | 247,990 | |
Tyco International, Ltd. | | | 8,751 | | | | 408,759 | |
| | | | | | | | |
| | | | | | | 1,256,480 | |
| | | | | | | | |
Total Foreign Common Stocks
(Cost $2,852,980) | | | | 2,715,468 | |
| | | | | | | | |
PREFERRED STOCK — 0.0% | |
Orchard Supply Hardware Stores Corporation+ | | | | | | | | |
(Cost $131) | | | 30 | | | | — | |
| | | | | | | | |
RIGHTS/WARRANTS — 0.0% | |
American International Group Fractional Warrants+ | | | | | | | | |
(Cost $0) | | | 65,600 | | | | — | |
| | | | | | | | |
MONEY MARKET FUNDS — 11.9% | |
GuideStone Money Market Fund (GS4 Class)¥ | | | 7,806,447 | | | | 7,806,447 | |
Northern Institutional Liquid Assets Portfolio§ | | | 18,335,064 | | | | 18,335,064 | |
| | | | | | | | |
Total Money Market Funds
(Cost $26,141,511) | | | | 26,141,511 | |
| | | | | | | | |
| | |
| | | Par | | | | |
U.S. TREASURY OBLIGATIONS — 0.3% | |
U.S. Treasury Bills | | | | | | | | |
0.01%, 05/03/12‡‡ | | $ | 280,000 | | | | 279,992 | |
0.01%, 05/03/12‡‡ | | | 20,000 | | | | 19,999 | |
0.02%, 05/03/12‡‡ | | | 10,000 | | | | 9,999 | |
0.02%, 05/03/12‡‡ | | | 205,000 | | | | 204,984 | |
0.03%, 05/03/12‡‡ | | | 20,000 | | | | 19,985 | |
| | | | | | | | |
Total U.S. Treasury Obligations
(Cost $534,974) | | | | 534,959 | |
| | | | | | | | |
| |
TOTAL INVESTMENTS — 108.1%
(Cost $203,687,689) | | | | 237,548,685 | |
Liabilities in Excess of Other Assets — (8.1)% | | | | | | | (17,752,191 | ) |
| | | | | | | | |
NET ASSETS — 100.0% | | | $ | 219,796,494 | |
| | | | | | | | |
Please see abbreviation and footnote definitions beginning on page 200.
|
| See Notes to Financial Statements. |
150 |
EQUITY INDEX FUND
SCHEDULE OF INVESTMENTS (Continued)
PORTFOLIO SUMMARY (based on net assets)
| | | | |
| | | % | |
Technology | | | 16.7 | |
Financial Services | | | 14.1 | |
Energy | | | 12.0 | |
Consumer Discretionary | | | 11.9 | |
Money Market Funds | | | 11.9 | |
Healthcare | | | 11.3 | |
Producer Durables | | | 10.3 | |
Consumer Staples | | | 7.8 | |
Utilities | | | 6.8 | |
Futures Contracts | | | 3.9 | |
Materials & Processing | | | 3.8 | |
Foreign Common Stocks | | | 1.2 | |
U.S. Treasury Obligations | | | 0.3 | |
Preferred Stock | | | — | ** |
Rights/Warrants | | | — | ** |
| | | | |
| | | 112.0 | |
| | | | |
| ** | Rounds to less than 0.005%. |
VALUATION HIERARCHY
The following is a summary of the inputs used, as of December 31, 2011, in valuing the Fund’s investments carried at fair value:
| | | | | | | | | | | | | | | | |
| | | Total Value | | | Level 1
Quoted Prices | | | Level 2
Other
Significant
Observable
Inputs | | | Level 3
Significant
Unobservable
Inputs | |
Assets: | | | | | | | | | | | | | | | | |
Investments in Securities: | | | | | | | | | | | | | | | | |
Common Stocks | | $ | 208,156,747 | | | $ | 208,156,747 | | | $ | — | | | $ | — | |
Foreign Common Stocks | | | 2,715,468 | | | | 2,715,468 | | | | — | | | | — | |
Money Market Funds | | | 26,141,511 | | | | 26,141,511 | | | | — | | | | — | |
Preferred Stocks | | | — | | | | — | | | | — | | | | — | |
Rights/Warrants | | | — | | | | — | | | | — | | | | — | |
U.S. Treasury Obligations | | | 534,959 | | | | — | | | | 534,959 | | | | — | |
| | | | | | | | | | | | | | | | |
Total Assets — Investments in Securities | | $ | 237,548,685 | | | $ | 237,013,726 | | | $ | 534,959 | | | $ | — | |
| | | | | | | | | | | | | | | | |
Other Financial Instruments*** | | | | | | | | | | | | | | | | |
Futures Contracts | | $ | 254,558 | | | $ | 254,558 | | | $ | — | | | $ | — | |
| | | | | | | | | | | | | | | | |
Total Assets — Other Financial Instruments | | $ | 254,558 | | | $ | 254,558 | | | $ | — | | | $ | — | |
| | | | | | | | | | | | | | | | |
| *** | Other financial instruments are derivative instruments not reflected in the Schedule of Investments, such as futures, forwards and swap contracts, which are valued at the unrealized appreciation (depreciation) on the investment. Details of these investments can be found in the Notes to Schedules of Investments. |
|
See Notes to Financial Statements. 151 |
Real Estate Securities Fund
The Fund provides exposure to real estate by investing in public real estate securities with strong cash flow growth potential that provides the capacity for sustained dividend increases. The Fund is diversified among property sectors and geographical locations. The Fund became a registered mutual fund on December 29, 2006, but prior to that, it was offered as a private fund that operated from 2000 to 2006.
With continued economic uncertainty and volatility, U.S. property stocks outperformed the broader equity market in 2011 supported by well capitalized balance sheets, limited supply and relatively attractive dividend yields. The Fund slightly underperformed its benchmark, the Dow Jones U.S. Select Real Estate Securities IndexSM, (8.51% versus 8.87%) in 2011. Stock selection was strong in a number of sectors, including regional malls, office, apartments, retail and self-storage. Positive selection in these sectors was slightly offset by poor selection in the healthcare and industrial sectors during the year. Sector allocation was slightly detractive to portfolio performance, the prominent driver being the minimal overweight to the hotel and industrial sectors on average throughout the year which were the worst performing sectors.
This Fund may be suitable for investors who seek the potential for current income and long-term capital appreciation. Investors should be willing to accept significant short-term fluctuations in account value and want to diversify their portfolio through exposure to publicly traded real estate securities.
This Fund invests substantial assets in Real Estate Investment Trusts (“REITs”) that involve equity market risks as well as risks linked directly to the real estate market. Risks include declines in the value of real estate, general and economic conditions, changes in the value of the underlying property and defaults by borrowers. The value of assets in the real estate industry may go through cycles of relative underperformance and outperformance in comparison to equity securities markets in general.
Please see page 157 for information regarding specific portfolio allocations. Portfolio holdings are subject to change and risk at any time.
152
Real Estate Securities Fund
| | | | | | | | |
Average Annual Total Returns as of 12/31/11 | |
| | | GS4
Class* | | | Benchmark** | |
One Year | | | 8.51 | % | | | 8.87 | % |
Five Year | | | -1.73 | % | | | -2.22 | % |
Since Inception | | | -1.65 | % | | | -2.15 | % |
Inception Date | | | 12/29/06 | | | | | |
Total Fund Operating Expenses (April 30, 2011 Prospectus, as amended on September 1, 2011)(1) | | | 1.11 | % | | | | |
| (1) | Current information regarding the Fund’s Operating Expenses can be found in the Financial Highlights. |
The performance data quoted represents past performance and does not guarantee future results. Current performance may be lower or higher. Performance data current to the most recent month-end may be obtained at www.GuideStoneFunds.org. The investment return and principal value of an investment will fluctuate so that shares, when redeemed, may be worth more or less than their original cost.
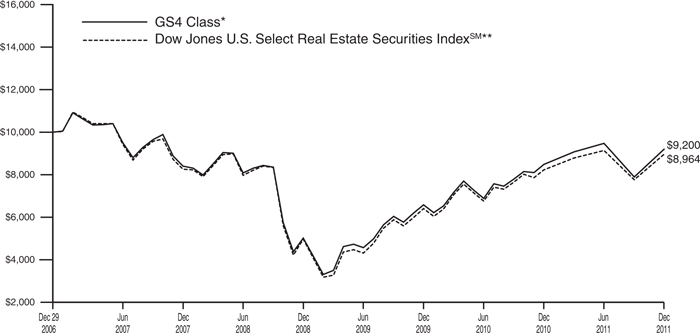
The graph compares the results of a hypothetical $10,000 investment in the GS4 Class of the Fund since December 29, 2006 (commencement of operations), with all dividends and capital gains reinvested, with the Dow Jones Wilshire Real Estate Securities Index.
| * | These returns reflect expense waivers by the Fund’s investment adviser. Without these waivers, returns would have been lower. Returns shown do not reflect the deduction of taxes that a shareholder would pay on Fund distributions or the redemption of Fund shares. |
| ** | The Dow Jones U.S. Select Real Estate Securities IndexSM is an unmanaged, broad-based, market capitalization-weighted index comprised of publicly traded REITs and real estate operating companies, not including special purpose or healthcare REITs. It is comprised of major companies engaged in the equity ownership and operation of commercial real estate. |
Unlike a mutual fund, the performance of an index assumes no taxes, transaction costs, management fees or other expenses.
153
| | |
| REAL ESTATE SECURITIES FUND | | |
| SCHEDULE OF INVESTMENTS | | December 31, 2011 |
| | | | | | | | |
| | | Shares | | | Value | |
COMMON STOCKS — 96.5% | |
Financial Services — 95.4% | |
Alexander’s, Inc. REITD | | | 2,125 | | | $ | 786,314 | |
Apartment Investment & Management Co. Class A REIT | | | 78,950 | | | | 1,808,744 | |
Associated Estates Realty Corporation REIT | | | 10,900 | | | | 173,855 | |
AvalonBay Communities, Inc. REITD | | | 48,385 | | | | 6,319,081 | |
Boston Properties, Inc. REIT | | | 71,542 | | | | 7,125,583 | |
BRE Properties, Inc. REITD | | | 88,000 | | | | 4,442,240 | |
Camden Property Trust REIT | | | 95,850 | | | | 5,965,704 | |
Chesapeake Lodging Trust REITD | | | 31,650 | | | | 489,309 | |
Colonial Properties Trust REITD | | | 67,650 | | | | 1,411,179 | |
DDR Corporation REIT | | | 401,500 | | | | 4,886,255 | |
Digital Realty Trust, Inc. REITD | | | 45,900 | | | | 3,060,153 | |
Douglas Emmett, Inc. REIT | | | 26,550 | | | | 484,272 | |
DuPont Fabros Technology, Inc. REITD | | | 80,000 | | | | 1,937,600 | |
Equity Lifestyle Properties, Inc. REIT | | | 38,650 | | | | 2,577,569 | |
Equity Residential REIT | | | 38,150 | | | | 2,175,694 | |
Extra Space Storage, Inc. REITD | | | 23,950 | | | | 580,308 | |
Federal Realty Investment Trust REITD | | | 34,150 | | | | 3,099,113 | |
General Growth Properties, Inc. REITD | | | 183,650 | | | | 2,758,423 | |
Glimcher Realty Trust REIT | | | 240,100 | | | | 2,208,920 | |
HCP, Inc. REITD | | | 144,650 | | | | 5,992,850 | |
Health Care REIT, Inc.D | | | 131,050 | | | | 7,146,156 | |
Home Properties, Inc. REITD | | | 40,200 | | | | 2,314,314 | |
Host Hotels & Resorts, Inc. REIT | | | 267,490 | | | | 3,950,827 | |
Liberty Property Trust REITD | | | 113,300 | | | | 3,498,704 | |
LTC Properties, Inc. REITD | | | 58,400 | | | | 1,802,224 | |
Mack-Cali Realty Corporation REITD | | | 48,550 | | | | 1,295,800 | |
Pebblebrook Hotel Trust REITD | | | 124,450 | | | | 2,386,951 | |
Post Properties, Inc. REITD | | | 24,850 | | | | 1,086,442 | |
ProLogis, Inc. REITD | | | 209,723 | | | | 5,995,981 | |
PS Business Parks, Inc. REITD | | | 18,950 | | | | 1,050,398 | |
Public Storage REIT | | | 76,730 | | | | 10,317,116 | |
Ramco-Gershenson Properties Trust REITD | | | 59,100 | | | | 580,953 | |
Senior Housing Properties Trust REIT | | | 127,185 | | | | 2,854,031 | |
Simon Property Group, Inc. REIT | | | 150,850 | | | | 19,450,599 | |
| | | | | | | | |
| | | Shares | | | Value | |
SL Green Realty Corporation REITD | | | 78,600 | | | $ | 5,237,904 | |
Strategic Hotels & Resorts, Inc. REITD* | | | 357,150 | | | | 1,917,896 | |
Sunstone Hotel Investors, Inc. REIT* | | | 74,250 | | | | 605,138 | |
Tanger Factory Outlet Centers REITD | | | 114,300 | | | | 3,351,276 | |
Taubman Centers, Inc. REITD | | | 30,450 | | | | 1,890,945 | |
UDR, Inc. REIT | | | 48,050 | | | | 1,206,055 | |
Vornado Realty Trust REIT | | | 92,150 | | | | 7,082,649 | |
| | | | | | | | |
| | | | | | | 143,305,525 | |
| | | | | | | | |
Healthcare — 1.1% | | | | | | | | |
Brookdale Senior Living, Inc.* | | | 94,100 | | | | 1,636,399 | |
| | | | | | | | |
Total Common Stocks
(Cost $126,638,896) | | | | 144,941,924 | |
| | | | | | | | |
MONEY MARKET FUNDS — 22.7% | |
GuideStone Money Market Fund (GS4 Class)¥ | | | 4,739,183 | | | | 4,739,183 | |
Northern Institutional Liquid Assets Portfolio§ | | | 29,423,155 | | | | 29,423,155 | |
| | | | | | | | |
Total Money Market Funds
(Cost $34,162,338) | | | | 34,162,338 | |
| | | | | | | | |
TOTAL INVESTMENTS — 119.2%
(Cost $160,801,234) | | | | 179,104,262 | |
| | |
Liabilities in Excess of Other Assets — (19.2)% | | | | | | | (28,877,400 | ) |
| | | | | | | | |
NET ASSETS — 100.0% | | | $ | 150,226,862 | |
| | | | | | | | |
Please see abbreviation and footnote definitions beginning on page 200.
PORTFOLIO SUMMARY (based on net assets)
| | | | |
| | | % | |
Financial Services | | | 95.4 | |
Money Market Funds | | | 22.7 | |
Futures Contracts | | | 3.4 | |
Healthcare | | | 1.1 | |
| | | | |
| | | 122.6 | |
| | | | |
|
| See Notes to Financial Statements. |
154 |
REAL ESTATE SECURITIES FUND
SCHEDULE OF INVESTMENTS (Continued)
VALUATION HIERARCHY
The following is a summary of the inputs used, as of December 31, 2011, in valuing the Fund’s investments carried at fair value:
| | | | | | | | | | | | | | | | |
| | | Total Value | | | Level 1
Quoted Prices | | | Level 2
Other
Significant
Observable
Inputs | | | Level 3
Significant
Unobservable
Inputs | |
Assets: | | | | | | | | | | | | | | | | |
Investments in Securities: | | | | | | | | | | | | | | | | |
Common Stocks | | $ | 144,941,924 | | | $ | 144,941,924 | | | $ | — | | | $ | — | |
Money Market Funds | | | 34,162,338 | | | | 34,162,338 | | | | — | | | | — | |
| | | | | | | | | | | | | | | | |
Total Assets — Investments in Securities | | $ | 179,104,262 | | | $ | 179,104,262 | | | $ | — | | | $ | — | |
| | | | | | | | | | | | | | | | |
| | | | |
Other Financial Instruments*** | | | | | | | | | | | | | | | | |
Futures Contract | | $ | 53,620 | | | $ | 53,620 | | | $ | — | | | $ | — | |
| | | | | | | | | | | | | | | | |
Total Assets — Other Financial Instruments | | $ | 53,620 | | | $ | 53,620 | | | $ | — | | | $ | — | |
| | | | | | | | | | | | | | | | |
See Notes to Financial Statements.
155
Value Equity Fund
Familiar themes such as the sovereign debt crisis in Europe, recession fears and moderating growth expectations in China continued to dominate headlines during 2011. The U.S. equity market showed resilience in the final quarter of the year as it overcame a dismal third quarter and ended the year in positive territory. The S&P 500® Index posted a fourth quarter return of 11.82%, bringing the return to a positive 2.11% for the one-year period ended December 31, 2011. The broader U.S. market, as measured by the Russell 3000® Index, gained 12.12% for the fourth quarter and 1.03% for the calendar year of 2011.
From a sector perspective, performance was mixed as five of the nine sectors within the Russell 3000® Index advanced during a year in which volatility prevailed. Defensive sectors such as utilities, consumer staples and healthcare were the best performers and experienced double-digit gains; whereas, the weakest performer was the financial services sector, which posted a double-digit loss for the year.
In terms of the underlying dynamics of equity market performance, low beta (or lower risk), high quality stocks generally outperformed during the year. Regarding market capitalization, large-cap companies outperformed their small-cap counterparts as the Russell 1000® Index posted a one-year return of 1.50%, while the Russell 2000® Index returned -4.18%. Style differentiation was evident as growth-oriented stocks outperformed value-oriented stocks across most market capitalization segments. In the large capitalization segment, the Russell 1000® Growth Index outpaced the Russell 1000® Value Index and posted one-year returns of 2.64% and 0.39%, respectively.
The Fund invests in a diversified portfolio of large- and medium-sized U.S. companies whose stocks are considered to be attractive from a valuation perspective. The GS4 Class of the Fund posted positive performance but slightly underperformed its benchmark, the Russell 1000® Value Index, for the one-year period ended December 31, 2011 (0.27% versus 0.39%). The Russell 1000® Value Index underperformed the Russell 1000® Growth Index during the year as value benchmarks were weighed down by the lagging financials sector. Underweight exposure and security selection to the utilities sector detracted from benchmark-relative returns, while underweight exposure and security selection to the financials sector contributed to benchmark-relative performance for the year.
This Fund may be suitable for investors who seek higher, long-term rates of return, can accept significant short-term fluctuations in account value and want to diversify their portfolio by adding a potentially higher return, higher risk option of value stocks. This Fund is subject to value investing risk. This involves the risk that an investment in companies whose securities are believed to be undervalued, relative to their underlying profitability, will not appreciate in value as anticipated.
Please see page 163 for information regarding specific portfolio allocations. Portfolio holdings are subject to change and risk at any time.
156
Value Equity Fund
| | | | | | | | | | | | |
Average Annual Total Returns as of 12/31/11 | |
| | | GS2
Class* | | | GS4
Class* | | | Benchmark** | |
One Year | | | 0.57 | % | | | 0.27 | % | | | 0.39 | % |
Five Year | | | -2.77 | % | | | -2.95 | % | | | -2.64 | % |
Ten Year | | | 3.55 | % | | | 3.36 | % | | | 3.89 | % |
Since Inception | | | 3.13 | % | | | 2.86 | % | | | 3.44 | % |
Inception Date | | | 08/27/01 | | | | 08/27/01 | | | | | |
Total Fund Operating Expenses (April 30, 2011 Prospectus, as amended on September 1, 2011)(1) | | | 0.68 | % | | | 0.92 | % | | | | |
| (1) | Current information regarding the Fund’s Operating Expenses can be found in the Financial Highlights. |
The performance data quoted represents past performance and does not guarantee future results. Current performance may be lower or higher. Performance data current to the most recent month-end may be obtained at www.GuideStoneFunds.org. The investment return and principal value of an investment will fluctuate so that shares, when redeemed, may be worth more or less than their original cost.
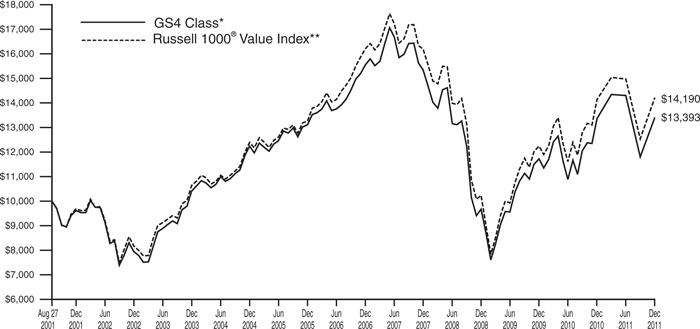
The graph compares the results of a hypothetical $10,000 investment in the GS4 Class of the Fund since August 27, 2001 (commencement of operations), with all dividends and capital gains reinvested, with the Russell 1000® Value Index.
| * | These returns reflect expense waivers by the Fund’s investment adviser. Without these waivers, returns would have been lower. Returns shown do not reflect the deduction of taxes that a shareholder would pay on Fund distributions or the redemption of Fund shares. |
| ** | The Russell 1000® Value Index is a large-cap index consisting of those Russell 1000® Index securities with a less-than-average growth orientation. Companies in this index tend to exhibit lower price-to-book and price-to-earnings ratios, higher dividend yields and lower forecasted growth values than the growth universe. |
Unlike a mutual fund, the performance of an index assumes no taxes, transaction costs, management fees or other expenses.
157
| | | | |
| VALUE EQUITY FUND | | | | |
| SCHEDULE OF INVESTMENTS | | | December 31, 2011 | |
| | | | | | | | |
| | | Shares | | | Value | |
COMMON STOCKS — 92.2% | |
Consumer Discretionary — 10.0% | |
Apollo Group, Inc. Class A* | | | 62,500 | | | $ | 3,366,875 | |
AutoZone, Inc.* | | | 5,300 | | | | 1,722,341 | |
Bed Bath & Beyond, Inc.* | | | 20,100 | | | | 1,165,197 | |
Best Buy Co., Inc.D | | | 46,900 | | | | 1,096,053 | |
Carnival CorporationD | | | 269,876 | | | | 8,808,753 | |
CBS Corporation Class B | | | 314,868 | | | | 8,545,518 | |
Coach, Inc. | | | 49,200 | | | | 3,003,168 | |
Comcast Corporation Class A | | | 510,790 | | | | 12,110,831 | |
Dana Holding Corporation* | | | 208,400 | | | | 2,532,060 | |
DIRECTV, Class AD* | | | 75,900 | | | | 3,245,484 | |
eBay, Inc.* | | | 20,352 | | | | 617,276 | |
Family Dollar Stores, Inc. | | | 14,400 | | | | 830,304 | |
Ford Motor Co. | | | 63,597 | | | | 684,304 | |
Gap, Inc. (The)D | | | 236,800 | | | | 4,392,640 | |
General Motors Co.D* | | | 29,557 | | | | 599,120 | |
Goodyear Tire & Rubber Co. (The)* | | | 258,700 | | | | 3,665,779 | |
Home Depot, Inc. (The) | | | 209,881 | | | | 8,823,397 | |
Johnson Controls, Inc. | | | 19,709 | | | | 616,103 | |
Kohl’s CorporationD | | | 24,806 | | | | 1,224,176 | |
Lennar Corporation Class AD | | | 267,251 | | | | 5,251,482 | |
Lowe’s Cos., Inc. | | | 50,817 | | | | 1,289,736 | |
News Corporation | | | 89,544 | | | | 1,597,465 | |
Nu Skin Enterprises, Inc. Class AD | | | 25,800 | | | | 1,253,106 | |
Stanley Black & Decker, Inc. | | | 163,300 | | | | 11,039,080 | |
Target CorporationD | | | 99,065 | | | | 5,074,109 | |
Time Warner Cable, Inc. | | | 42,500 | | | | 2,701,725 | |
Time Warner, Inc. | | | 128,488 | | | | 4,643,556 | |
Wal-Mart Stores, Inc. | | | 16,663 | | | | 995,781 | |
Walt Disney Co. (The) | | | 73,686 | | | | 2,763,225 | |
Wyndham Worldwide Corporation | | | 48,000 | | | | 1,815,840 | |
| | | | | | | | |
| | | | | | | 105,474,484 | |
| | | | | | | | |
Consumer Staples — 5.7% | |
Archer-Daniels-Midland Co. | | | 26,274 | | | | 751,436 | |
Colgate-Palmolive Co. | | | 1,881 | | | | 173,786 | |
CVS Caremark Corporation | | | 171,347 | | | | 6,987,531 | |
Energizer Holdings, Inc.* | | | 61,900 | | | | 4,796,012 | |
General Mills, Inc. | | | 6,099 | | | | 246,460 | |
Kellogg Co. | | | 647 | | | | 32,719 | |
Kimberly-Clark Corporation | | | 85,784 | | | | 6,310,271 | |
Kraft Foods, Inc. Class A | | | 274,502 | | | | 10,255,395 | |
Kroger Co. (The) | | | 148,912 | | | | 3,606,649 | |
Procter & Gamble Co. (The) | | | 183,196 | | | | 12,221,005 | |
Safeway, Inc.D | | | 89,400 | | | | 1,880,976 | |
Tyson Foods, Inc. Class A | | | 58,600 | | | | 1,209,504 | |
Walgreen Co. | | | 345,157 | | | | 11,410,890 | |
| | | | | | | | |
| | | | | | | 59,882,634 | |
| | | | | | | | |
Energy — 12.3% | |
Anadarko Petroleum Corporation | | | 54,375 | | | | 4,150,444 | |
Apache Corporation | | | 10,674 | | | | 966,851 | |
Baker Hughes, Inc. | | | 106,874 | | | | 5,198,351 | |
Chesapeake Energy Corporation | | | 25,566 | | | | 569,866 | |
Chevron Corporation | | | 296,077 | | | | 31,502,593 | |
ConocoPhillips | | | 317,231 | | | | 23,116,623 | |
Devon Energy Corporation | | | 88,430 | | | | 5,482,660 | |
Exxon Mobil Corporation | | | 123,193 | | | | 10,441,839 | |
| | | | | | | | |
| | | Shares | | | Value | |
Hess Corporation | | | 11,794 | | | $ | 669,899 | |
Kinder Morgan, Inc.D | | | 2,052 | | | | 66,013 | |
Marathon Oil Corporation | | | 329,183 | | | | 9,635,186 | |
Marathon Petroleum Corporation | | | 66,028 | | | | 2,198,072 | |
Murphy Oil Corporation | | | 52,300 | | | | 2,915,202 | |
National Oilwell Varco, Inc. | | | 16,527 | | | | 1,123,671 | |
Occidental Petroleum Corporation | | | 135,863 | | | | 12,730,363 | |
Spectra Energy Corporation | | | 253,050 | | | | 7,781,288 | |
Tesoro CorporationD* | | | 137,800 | | | | 3,219,008 | |
Valero Energy Corporation | | | 329,900 | | | | 6,944,395 | |
Williams Cos., Inc. (The) | | | 23,018 | | | | 760,054 | |
| | | | | | | | |
| | | | | | | 129,472,378 | |
| | | | | | | | |
Financial Services — 19.4% | |
Aflac, Inc. | | | 46,187 | | | | 1,998,050 | |
Allstate Corporation (The) | | | 20,330 | | | | 557,245 | |
American Express Co. | | | 350,937 | | | | 16,553,698 | |
American Financial Group, Inc. | | | 84,100 | | | | 3,102,449 | |
American International Group, Inc.D* | | | 17,184 | | | | 398,669 | |
Ameriprise Financial, Inc. | | | 158,600 | | | | 7,872,904 | |
Assurant, Inc. | | | 65,100 | | | | 2,673,006 | |
Bank of America Corporation | | | 1,355,455 | | | | 7,536,330 | |
Bank of New York Mellon Corporation (The)D | | | 48,553 | | | | 966,690 | |
BB&T Corporation | | | 27,081 | | | | 681,629 | |
Berkshire Hathaway, Inc.* | | | 68,218 | | | | 5,205,033 | |
BlackRock, Inc. | | | 1,681 | | | | 299,622 | |
Capital One Financial CorporationD | | | 295,752 | | | | 12,507,352 | |
Chubb Corporation (The) | | | 40,974 | | | | 2,836,220 | |
Citigroup, Inc. | | | 604,608 | | | | 15,907,236 | |
CME Group, Inc. | | | 2,608 | | | | 635,491 | |
Discover Financial Services | | | 146,100 | | | | 3,506,400 | |
Fifth Third Bancorp | | | 249,700 | | | | 3,176,184 | |
Goldman Sachs Group, Inc. (The) | | | 20,189 | | | | 1,825,691 | |
Huntington Bancshares, Inc. | | | 528,900 | | | | 2,903,661 | |
JPMorgan Chase & Co. | | | 882,736 | | | | 29,350,972 | |
KeyCorp | | | 477,800 | | | | 3,674,282 | |
Lincoln National Corporation | | | 48,800 | | | | 947,696 | |
Loews Corporation | | | 12,319 | | | | 463,810 | |
MetLife, Inc. | | | 32,098 | | | | 1,000,816 | |
Morgan Stanley | | | 60,388 | | | | 913,670 | |
NASDAQ OMX Group, Inc. (The)* | | | 63,400 | | | | 1,553,934 | |
PNC Financial Services Group, Inc. | | | 105,557 | | | | 6,087,472 | |
Prudential Financial, Inc. | | | 19,004 | | | | 952,481 | |
Public Storage REITD | | | 331 | | | | 44,506 | |
Regions Financial Corporation | | | 338,700 | | | | 1,456,410 | |
Reinsurance Group of America, Inc. | | | 22,800 | | | | 1,191,300 | |
Simon Property Group, Inc. REIT | | | 2,076 | | | | 267,680 | |
SLM Corporation | | | 461,000 | | | | 6,177,400 | |
State Street Corporation | | | 308,399 | | | | 12,431,564 | |
Thomson Reuters Corporation | | | 7,676 | | | | 204,719 | |
Torchmark Corporation | | | 40,500 | | | | 1,757,295 | |
Travelers Cos., Inc. (The) | | | 170,875 | | | | 10,110,674 | |
US Bancorp | | | 219,213 | | | | 5,929,712 | |
Visa, Inc. Class A | | | 32,320 | | | | 3,281,450 | |
Wells Fargo & Co. | | | 809,796 | | | | 22,317,978 | |
See Notes to Financial Statements.
158
VALUE EQUITY FUND
SCHEDULE OF INVESTMENTS (Continued)
| | | | | | | | |
| | | Shares | | | Value | |
Western Union Co. (The) | | | 158,500 | | | $ | 2,894,210 | |
| | | | | | | | |
| | | | | | | 204,153,591 | |
| | | | | | | | |
Healthcare — 14.8% | |
Abbott Laboratories | | | 3,650 | | | | 205,240 | |
Aetna, Inc. | | | 119,048 | | | | 5,022,635 | |
AmerisourceBergen Corporation | | | 61,500 | | | | 2,287,185 | |
Amgen, Inc.D | | | 34,268 | | | | 2,200,348 | |
Baxter International, Inc. | | | 112,997 | | | | 5,591,092 | |
Bristol-Myers Squibb Co. | | | 66,482 | | | | 2,342,826 | |
Cardinal Health, Inc. | | | 169,615 | | | | 6,888,065 | |
CIGNA Corporation | | | 30,700 | | | | 1,289,400 | |
Eli Lilly & Co. | | | 26,713 | | | | 1,110,192 | |
Gilead Sciences, Inc.* | | | 63,000 | | | | 2,578,590 | |
HCA Holdings, Inc.* | | | 1,772 | | | | 39,037 | |
Health Net, Inc.* | | | 105,800 | | | | 3,218,436 | |
Hologic, Inc.D* | | | 259,850 | | | | 4,549,973 | |
Humana, Inc. | | | 27,800 | | | | 2,435,558 | |
Johnson & Johnson | | | 272,656 | | | | 17,880,780 | |
McKesson Corporation | | | 19,100 | | | | 1,488,081 | |
Medtronic, Inc. | | | 306,155 | | | | 11,710,429 | |
Merck & Co., Inc.D | | | 235,524 | | | | 8,879,255 | |
Mylan, Inc.* | | | 167,000 | | | | 3,583,820 | |
Pfizer, Inc.D | | | 1,757,095 | | | | 38,023,536 | |
Tenet Healthcare CorporationD* | | | 596,800 | | | | 3,061,584 | |
Thermo Fisher Scientific, Inc.* | | | 57,018 | | | | 2,564,099 | |
UnitedHealth Group, Inc. | | | 289,040 | | | | 14,648,547 | |
WellPoint, Inc. | | | 211,767 | | | | 14,029,564 | |
| | | | | | | | |
| | | | | | | 155,628,272 | |
| | | | | | | | |
Materials & Processing — 2.0% | |
Alcoa, Inc. | | | 417,058 | | | | 3,607,552 | |
Cliffs Natural Resources, Inc. | | | 38,800 | | | | 2,419,180 | |
Dow Chemical Co. (The) | | | 45,904 | | | | 1,320,199 | |
Eastman Chemical Co. | | | 34,600 | | | | 1,351,476 | |
EI du Pont de Nemours & Co.D | | | 84,100 | | | | 3,850,098 | |
Freeport-McMoRan Copper & Gold, Inc. | | | 87,000 | | | | 3,200,730 | |
Huntsman Corporation | | | 93,000 | | | | 930,000 | |
MeadWestvaco Corporation | | | 104,500 | | | | 3,129,775 | |
Newmont Mining Corporation | | | 18,995 | | | | 1,139,890 | |
| | | | | | | | |
| | | | | | | 20,948,900 | |
| | | | | | | | |
Producer Durables — 10.2% | |
3M Co. | | | 3,225 | | | | 263,579 | |
Boeing Co. (The)D | | | 3,239 | | | | 237,581 | |
CSX Corporation | | | 58,300 | | | | 1,227,798 | |
Delta Air Lines, Inc.* | | | 151,900 | | | | 1,228,871 | |
Emerson Electric Co. | | | 146,400 | | | | 6,820,776 | |
FedEx Corporation | | | 11,630 | | | | 971,221 | |
Fluor Corporation | | | 23,300 | | | | 1,170,825 | |
General Dynamics Corporation | | | 39,033 | | | | 2,592,182 | |
General Electric Co. | | | 1,636,941 | | | | 29,317,613 | |
Honeywell International, Inc. | | | 316,000 | | | | 17,174,600 | |
Illinois Tool Works, Inc. | | | 201,801 | | | | 9,426,125 | |
KBR, Inc. | | | 98,000 | | | | 2,731,260 | |
Lockheed Martin CorporationD | | | 33,798 | | | | 2,734,258 | |
Norfolk Southern Corporation | | | 30,604 | | | | 2,229,807 | |
Northrop Grumman Corporation | | | 63,710 | | | | 3,725,761 | |
Raytheon Co.D | | | 262,283 | | | | 12,689,252 | |
Ryder System, Inc. | | | 40,800 | | | | 2,168,112 | |
Terex CorporationD* | | | 226,400 | | | | 3,058,664 | |
Textron, Inc.D | | | 292,900 | | | | 5,415,721 | |
| | | | | | | | |
| | | Shares | | | Value | |
Union Pacific Corporation | | | 16,016 | | | $ | 1,696,735 | |
United Technologies Corporation | | | 1,931 | | | | 141,137 | |
Waste Management, Inc.D | | | 18,434 | | | | 602,976 | |
| | | | | | | | |
| | | | | | | 107,624,854 | |
| | | | | | | | |
Technology — 8.5% | |
Activision Blizzard, Inc. | | | 298,600 | | | | 3,678,751 | |
Applied Materials, Inc. | | | 528,913 | | | | 5,664,657 | |
CA, Inc. | | | 193,700 | | | | 3,915,645 | |
Cisco Systems, Inc. | | | 689,813 | | | | 12,471,818 | |
Corning, Inc. | | | 61,429 | | | | 797,349 | |
Dell, Inc.* | | | 400,731 | | | | 5,862,695 | |
Hewlett-Packard Co. | | | 223,781 | | | | 5,764,599 | |
Intel Corporation | | | 825,703 | | | | 20,023,298 | |
International Business Machines Corporation | | | 46,100 | | | | 8,476,868 | |
Microsoft Corporation | | | 483,500 | | | | 12,551,660 | |
Motorola Solutions, Inc. | | | 11,701 | | | | 541,639 | |
Symantec Corporation* | | | 391,400 | | | | 6,125,410 | |
Texas Instruments, Inc. | | | 16,475 | | | | 479,587 | |
Yahoo!, Inc.* | | | 181,801 | | | | 2,932,450 | |
| | | | | | | | |
| | | | | | | 89,286,426 | |
| | | | | | | | |
Utilities — 9.3% | |
AES Corporation (The)* | | | 290,700 | | | | 3,441,888 | |
Ameren Corporation | | | 29,700 | | | | 983,961 | |
American Electric Power Co., Inc. | | | 212,358 | | | | 8,772,509 | |
AT&T, Inc. | | | 1,001,511 | | | | 30,285,693 | |
CenturyLink, Inc.D | | | 23,786 | | | | 884,839 | |
Constellation Energy Group, Inc. | | | 59,300 | | | | 2,352,431 | |
Dominion Resources, Inc. | | | 22,490 | | | | 1,193,769 | |
Duke Energy CorporationD | | | 51,998 | | | | 1,143,956 | |
Edison International | | | 93,200 | | | | 3,858,480 | |
Entergy Corporation | | | 133,600 | | | | 9,759,480 | |
Exelon Corporation | | | 65,871 | | | | 2,856,825 | |
FirstEnergy Corporation | | | 16,260 | | | | 720,318 | |
MetroPCS Communications, Inc.* | | | 80,400 | | | | 697,872 | |
NextEra Energy, Inc.D | | | 16,496 | | | | 1,004,277 | |
NV Energy, Inc. | | | 123,700 | | | | 2,022,495 | |
PG&E Corporation | | | 15,474 | | | | 637,838 | |
Public Service Enterprise Group, Inc. | | | 132,172 | | | | 4,362,998 | |
Sempra Energy | | | 43,600 | | | | 2,398,000 | |
Southern Co. (The) | | | 33,133 | | | | 1,533,727 | |
Sprint Nextel Corporation* | | | 1,347,585 | | | | 3,153,349 | |
Verizon Communications, Inc. | | | 405,478 | | | | 16,267,777 | |
| | | | | | | | |
| | | | | | | 98,332,482 | |
| | | | | | | | |
Total Common Stocks
(Cost $979,895,922) | | | | | | | 970,804,021 | |
| | | | | | | | |
FOREIGN COMMON STOCKS — 5.7% | |
Bermuda — 0.3% | |
Nabors Industries, Ltd.* | | | 165,900 | | | | 2,876,706 | |
| | | | | | | | |
Canada — 0.2% | |
Agrium, Inc. | | | 16,300 | | | | 1,093,893 | |
Domtar CorporationD | | | 16,400 | | | | 1,311,344 | |
| | | | | | | | |
| | | | | | | 2,405,237 | |
| | | | | | | | |
Cayman Islands — 0.2% | |
Herbalife, Ltd. | | | 31,700 | | | | 1,637,939 | |
| | | | | | | | |
|
See Notes to Financial Statements. 159 |
| | | | | | | | |
| | | Shares | | | Value | |
France — 0.6% | |
Sanofi-Aventis ADR | | | 170,800 | | | $ | 6,241,032 | |
| | | | | | | | |
Ireland — 0.5% | |
Covidien PLC | | | 8,978 | | | | 404,100 | |
Warner Chilcott PLC Class A* | | | 86,200 | | | | 1,304,206 | |
Xl Group PLC | | | 200,900 | | | | 3,971,793 | |
| | | | | | | | |
| | | | | | | 5,680,099 | |
| | | | | | | | |
Netherlands — 0.6% | |
LyondellBasell Industries N.V. Class A | | | 11,343 | | | | 368,534 | |
Royal Dutch Shell PLC ADRD | | | 82,000 | | | | 5,993,380 | |
| | | | | | | | |
| | | | | | | 6,361,914 | |
| | | | | | | | |
Switzerland — 1.9% | |
ACE, Ltd. | | | 77,821 | | | | 5,456,809 | |
TE Connectivity, Ltd. | | | 174,475 | | | | 5,375,575 | |
Tyco International, Ltd. | | | 144,022 | | | | 6,727,268 | |
Weatherford International, Ltd.* | | | 157,500 | | | | 2,305,800 | |
| | | | | | | | |
| | | | | | | 19,865,452 | |
| | | | | | | | |
United Kingdom — 1.4% | |
BP PLC ADR | | | 100,000 | | | | 4,274,000 | |
Ensco PLC ADR | | | 141,800 | | | | 6,653,256 | |
Vodafone Group PLC ADR | | | 132,400 | | | | 3,711,172 | |
| | | | | | | | |
| | | | | | | 14,638,428 | |
| | | | | | | | |
Total Foreign Common Stocks
(Cost $63,927,909) | | | | | | | 59,706,807 | |
| | | | | | | | |
MONEY MARKET FUNDS — 9.2% | |
GuideStone Money Market Fund (GS4 Class)¥ | | | 19,757,157 | | | | 19,757,157 | |
Northern Institutional Liquid Assets Portfolio§ | | | 77,433,427 | | | | 77,433,427 | |
| | | | | | | | |
Total Money Market Funds
(Cost $97,190,584) | | | | | | | 97,190,584 | |
| | | | | | | | |
| | |
| | | Par | | | | |
U.S. TREASURY OBLIGATIONS — 0.0% | |
U.S. Treasury Bills | | | | | | | | |
0.02%, 05/03/12‡‡ | | $ | 390,000 | | | | 389,971 | |
0.06%, 05/03/12‡‡ | | | 260,000 | | | | 259,980 | |
| | | | | | | | |
Total U.S. Treasury Obligations
(Cost $649,965) | | | | 649,951 | |
| | | | | | | | |
TOTAL INVESTMENTS — 107.1%
(Cost $1,141,664,380) | | | | 1,128,351,363 | |
Liabilities in Excess of Other Assets — (7.1)% | | | | | | | (75,084,890 | ) |
| | | | | | | | |
Net Assets — 100.0% | | | | | | $ | 1,053,266,473 | |
| | | | | | | | |
Please see abbreviation and footnote definitions beginning on page 200.
PORTFOLIO SUMMARY (based on net assets)
| | | | |
| | | % | |
Financial Services | | | 19.4 | |
Healthcare | | | 14.8 | |
Energy | | | 12.3 | |
Producer Durables | | | 10.2 | |
Consumer Discretionary | | | 10.0 | |
Utilities | | | 9.3 | |
Money Market Funds | | | 9.2 | |
Technology | | | 8.5 | |
Consumer Staples | | | 5.7 | |
Foreign Common Stocks | | | 5.7 | |
Futures Contracts | | | 2.0 | |
Materials & Processing | | | 2.0 | |
U.S. Treasury Obligations | | | — | ** |
| | | | |
| | | 109.1 | |
| | | | |
| ** | Rounds to less than 0.005%. |
|
| See Notes to Financial Statements. |
160 |
VALUE EQUITY FUND
SCHEDULE OF INVESTMENTS (Continued)
VALUATION HIERARCHY
The following is a summary of the inputs used, as of December 31, 2011, in valuing the Fund’s investments carried at fair value:
| | | | | | | | | | | | | | | | |
| | | Total Value | | | Level 1
Quoted Prices | | | Level 2
Other
Significant
Observable
Inputs | | | Level 3
Significant
Unobservable
Inputs | |
Assets: | | | | | | | | | | | | | | | | |
Investments in Securities: | | | | | | | | | | | | | | | | |
Common Stocks | | $ | 970,804,021 | | | $ | 970,804,021 | | | $ | — | | | $ | — | |
Foreign Common Stocks | | | 59,706,807 | | | | 59,706,807 | | | | — | | | | — | |
Money Market Funds | | | 97,190,584 | | | | 97,190,584 | | | | — | | | | — | |
U.S. Treasury Obligations | | | 649,951 | | | | — | | | | 649,951 | | | | — | |
| | | | | | | | | | | | | | | | |
Total Assets — Investments in Securities | | $ | 1,128,351,363 | | | $ | 1,127,701,412 | | | $ | 649,951 | | | $ | — | |
| | | | | | | | | | | | | | | | |
| | | | |
Other Financial Instruments*** | | | | | | | | | | | | | | | | |
Futures Contracts | | $ | 713,686 | | | $ | 713,686 | | | $ | — | | | $ | — | |
| | | | | | | | | | | | | | | | |
Total Assets — Other Financial Instruments | | $ | 713,686 | | | $ | 713,686 | | | $ | — | | | $ | — | |
| | | | | | | | | | | | | | | | |
| *** | Other financial instruments are derivative instruments not reflected in the Schedule of Investments, such as futures, forwards and swap contracts, which are valued at the unrealized appreciation (depreciation) on the investment. Details of these investments can be found in the Notes to Schedules of Investments. |
The following is a reconciliation of assets in which significant unobservable inputs (Level 3) were used in determining fair value:
| | | | | | | | |
| | | Total
Value | | | Common
Stocks | |
Balance, 12/31/10 | | $ | 1,209 | | | $ | 1,209 | |
Accrued discounts/premiums | | | — | | | | — | |
Realized gain (loss)(1) | | | — | | | | — | |
Change in unrealized appreciation (depreciation)(2) | | | 1,116 | | | | 1,116 | |
Purchases | | | — | | | | — | |
Sales | | | (2,325 | ) | | | (2,325 | ) |
Transfers in and/or out of Level 3 | | | — | | | | — | |
| | | | | | | | |
Balance, 12/31/11 | | $ | — | | | $ | — | |
| | | | | | | | |
| (1) | Realized gain (loss) from the sale of Level 3 securities can be found on the Statement of Operations in Net realized gain (loss) from Investment securities and securities sold short. |
| (2) | Change in unrealized appreciation (depreciation) can be found on the Statement of Operations in Net change in unrealized appreciation (depreciation) on Investment securities and securities sold short. |
See Notes to Financial Statements.
161
Growth Equity Fund
Familiar themes such as the sovereign debt crisis in Europe, recession fears and moderating growth expectations in China continued to dominate headlines during 2011. The U.S. equity market showed resilience in the final quarter of the year as it overcame a dismal third quarter and ended the year in positive territory. The S&P 500® Index posted a fourth quarter return of 11.82%, bringing the return to a positive 2.11% for the one-year period ended December 31, 2011. The broader U.S. market, as measured by the Russell 3000® Index, gained 12.12% for the fourth quarter and 1.03% for the calendar year of 2011.
From a sector perspective, performance was mixed as five of the nine sectors within the Russell 3000® Index advanced during a year in which volatility prevailed. Defensive sectors such as utilities, consumer staples and healthcare were the best performers and experienced double-digit gains; whereas, the weakest performer was the financial services sector, which posted a double-digit loss for the year.
In terms of the underlying dynamics of equity market performance, low beta (or lower risk), high quality stocks generally outperformed during the year. Regarding market capitalization, large-cap companies outperformed their small-cap counterparts as the Russell 1000® Index posted a one-year return of 1.50%, while the Russell 2000® Index returned -4.18%. Style differentiation was evident as growth-oriented stocks outperformed value-oriented stocks across most market capitalization segments. In the large capitalization segment, the Russell 1000® Growth Index outpaced the Russell 1000® Value Index and posted one-year returns of 2.64% and 0.39%, respectively.
The Fund invests in a diversified portfolio of large- and medium-sized U.S. companies whose stocks are considered to have above average potential for growth in revenue and earnings. The GS4 Class of the Fund underperformed its benchmark, the Russell 1000® Growth Index, for the one-year period ended December 31, 2011 (-1.43% versus 2.64%). The Russell 1000® Growth Index outperformed the Russell 1000® Value Index during the year as value benchmarks were weighted down by the lagging financials sector. Security selection within the technology and energy sectors detracted from benchmark-relative returns, while security selection within the consumer discretionary and healthcare sectors contributed to benchmark-relative performance during the year.
This Fund may be suitable for investors who seek high, long-term rates of return, can accept significant short-term fluctuations in account value, want to invest in growth-oriented stocks and would like to diversify their portfolio by adding a potentially higher return, higher risk option of stocks. The Fund will not concentrate in any particular industry, but at times, it may be heavily invested in a particular economic sector. This may result in greater short-term price volatility.
Please see page 169 for information regarding specific portfolio allocations. Portfolio holdings are subject to change and risk at any time.
162
Growth Equity Fund
| | | | | | | | | | | | |
Average Annual Total Returns as of 12/31/11 | |
| | | GS2
Class* | | | GS4
Class* | | | Benchmark** | |
One Year | | | -1.26 | % | | | -1.43 | % | | | 2.64 | % |
Five Year | | | 1.15 | % | | | 1.03 | % | | | 2.50 | % |
Ten Year | | | 1.92 | % | | | 1.81 | % | | | 2.60 | % |
Since Inception | | | 1.69 | % | | | 1.56 | % | | | 2.33 | % |
Inception Date | | | 08/27/01 | | | | 08/27/01 | | | | | |
Total Fund Operating Expenses (April 30, 2011 Prospectus, as amended on September 1, 2011)(1) | | | 0.90 | % | | | 1.14 | % | | | | |
| (1) | Current information regarding the Fund’s Operating Expenses can be found in the Financial Highlights. |
The performance data quoted represents past performance and does not guarantee future results. Current performance may be lower or higher. Performance data current to the most recent month-end may be obtained at www.GuideStoneFunds.org. The investment return and principal value of an investment will fluctuate so that shares, when redeemed, may be worth more or less than their original cost.
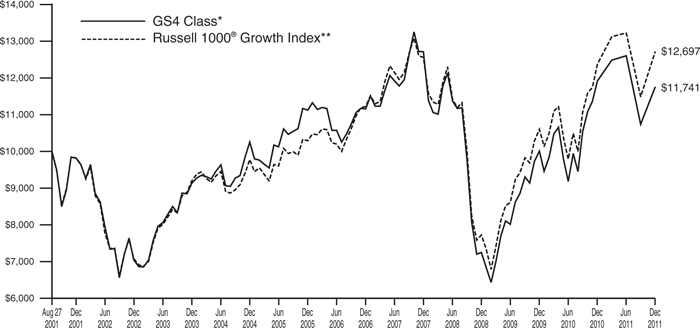
The graph compares the results of a hypothetical $10,000 investment in the GS4 Class of the Fund since August 27, 2001 (commencement of operations), with all dividends and capital gains reinvested, with the Russell 1000® Growth Index.
| * | These returns reflect expense waivers by the Fund’s investment adviser. Without these waivers, returns would have been lower. Returns shown do not reflect the deduction of taxes that a shareholder would pay on Fund distributions or the redemption of Fund shares. |
| ** | The Russell 1000® Growth Index is a large-cap index consisting of those Russell 1000® Index securities with greater-than-average growth orientation. Companies in this index tend to exhibit higher price-to-book and price-to-earnings-ratios, lower dividend yields and higher forecasted growth values than the value universe. |
Unlike a mutual fund, the performance of an index assumes no taxes, transaction costs, management fees or other expenses.
163
| | | | |
| GROWTH EQUITY FUND | | | | |
| SCHEDULE OF INVESTMENTS | | | December 31, 2011 | |
| | | | | | | | |
| | | Shares | | | Value | |
COMMON STOCKS — 88.2% | |
Consumer Discretionary — 20.8% | |
Amazon.com, Inc.* | | | 150,360 | | | $ | 26,027,316 | |
AutoZone, Inc.* | | | 2,754 | | | | 894,967 | |
Bed Bath & Beyond, Inc.* | | | 73,083 | | | | 4,236,621 | |
BorgWarner, Inc.D* | | | 21,090 | | | | 1,344,277 | |
Coach, Inc. | | | 243,319 | | | | 14,852,192 | |
Costco Wholesale Corporation | | | 84,810 | | | | 7,066,369 | |
Deckers Outdoor CorporationD* | | | 9,603 | | | | 725,699 | |
Dick’s Sporting Goods, Inc.D | | | 50,660 | | | | 1,868,341 | |
DIRECTV, Class A* | | | 121,320 | | | | 5,187,643 | |
Dollar Tree, Inc.* | | | 12,874 | | | | 1,069,958 | |
eBay, Inc.* | | | 70,500 | | | | 2,138,265 | |
Estee Lauder Cos., Inc. (The) Class AD | | | 124,243 | | | | 13,954,974 | |
Ford Motor Co.D | | | 518,794 | | | | 5,582,223 | |
Home Depot, Inc. (The) | | | 212,557 | | | | 8,935,896 | |
Limited Brands, Inc.D | | | 146,320 | | | | 5,904,012 | |
Macy’s, Inc. | | | 60,060 | | | | 1,932,731 | |
McDonald’s Corporation | | | 138,896 | | | | 13,935,436 | |
Netflix, Inc.D* | | | 37,500 | | | | 2,598,375 | |
NIKE, Inc. Class BD | | | 280,841 | | | | 27,064,647 | |
Nordstrom, Inc. | | | 57,260 | | | | 2,846,395 | |
O’Reilly Automotive, Inc.D* | | | 36,523 | | | | 2,920,014 | |
priceline.com, Inc.D* | | | 46,010 | | | | 21,519,337 | |
Ralph Lauren Corporation | | | 32,090 | | | | 4,430,987 | |
Sotheby’sD | | | 11,680 | | | | 333,230 | |
Starbucks Corporation | | | 554,475 | | | | 25,511,395 | |
Tiffany & Co.D | | | 16,513 | | | | 1,094,151 | |
Time Warner, Inc. | | | 178,986 | | | | 6,468,554 | |
TJX Cos., Inc.D | | | 154,863 | | | | 9,996,407 | |
Tractor Supply Co.D | | | 14,100 | | | | 989,115 | |
Ulta Salon Cosmetics & Fragrance, Inc.D* | | | 16,700 | | | | 1,084,164 | |
Yum! Brands, Inc.D | | | 100,751 | | | | 5,945,317 | |
| | | | | | | | |
| | | | | | | 228,459,008 | |
| | | | | | | | |
Consumer Staples — 3.5% | |
Church & Dwight Co., Inc.D | | | 21,180 | | | | 969,197 | |
Coca-Cola Co. (The)D | | | 194,350 | | | | 13,598,670 | |
Coca-Cola Enterprises, Inc. | | | 43,920 | | | | 1,132,258 | |
Hansen Natural Corporation* | | | 38,680 | | | | 3,563,975 | |
Hershey Co. (The) | | | 41,700 | | | | 2,576,226 | |
Kraft Foods, Inc. Class A | | | 123,970 | | | | 4,631,519 | |
Mead Johnson Nutrition Co. | | | 81,667 | | | | 5,612,973 | |
Whole Foods Market, Inc.D | | | 100,900 | | | | 7,020,622 | |
| | | | | | | | |
| | | | | | | 39,105,440 | |
| | | | | | | | |
Energy — 9.0% | |
Anadarko Petroleum CorporationD | | | 52,420 | | | | 4,001,219 | |
Apache Corporation | | | 39,700 | | | | 3,596,026 | |
Baker Hughes, Inc. | | | 89,130 | | | | 4,335,283 | |
Cabot Oil & Gas CorporationD | | | 52,227 | | | | 3,964,029 | |
Chevron Corporation | | | 78,620 | | | | 8,365,168 | |
Continental Resources, Inc.D* | | | 13,029 | | | | 869,165 | |
FMC Technologies, Inc.D* | | | 180,000 | | | | 9,401,400 | |
Halliburton Co. | | | 167,663 | | | | 5,786,050 | |
National Oilwell Varco, Inc. | | | 247,551 | | | | 16,830,992 | |
Noble Energy, Inc. | | | 52,590 | | | | 4,963,970 | |
Occidental Petroleum Corporation | | | 102,613 | | | | 9,614,838 | |
Plains Exploration & Production Co.* | | | 74,150 | | | | 2,722,788 | |
Schlumberger, Ltd. | | | 259,050 | | | | 17,695,706 | |
| | | | | | | | |
| | | Shares | | | Value | |
SM Energy Co.D | | | 20,220 | | | $ | 1,478,082 | |
Southwestern Energy Co.D* | | | 172,000 | | | | 5,493,680 | |
| | | | | | | | |
| | | | | | | 99,118,396 | |
| | | | | | | | |
Financial Services — 10.5% | |
Affiliated Managers Group, Inc.* | | | 12,800 | | | | 1,228,160 | |
American Express Co. | | | 210,630 | | | | 9,935,417 | |
Ameriprise Financial, Inc. | | | 45,510 | | | | 2,259,116 | |
Capital One Financial Corporation | | | 51,505 | | | | 2,178,147 | |
CBRE Group, Inc.* | | | 108,820 | | | | 1,656,240 | |
Charles Schwab Corporation (The) | | | 463,000 | | | | 5,213,380 | |
CME Group, Inc. | | | 6,860 | | | | 1,671,576 | |
Discover Financial Services | | | 169,191 | | | | 4,060,584 | |
Fifth Third Bancorp | | | 144,850 | | | | 1,842,492 | |
IntercontinentalExchange, Inc.* | | | 101,320 | | | | 12,214,126 | |
Invesco, Ltd. | | | 112,150 | | | | 2,253,094 | |
JPMorgan Chase & Co. | | | 179,670 | | | | 5,974,028 | |
Mastercard, Inc. Class A | | | 31,250 | | | | 11,650,625 | |
MetLife, Inc. | | | 42,950 | | | | 1,339,181 | |
PNC Financial Services Group, Inc. | | | 47,870 | | | | 2,760,663 | |
US Bancorp | | | 146,470 | | | | 3,962,014 | |
Visa, Inc. Class AD | | | 420,992 | | | | 42,743,318 | |
Wells Fargo & Co. | | | 77,847 | | | | 2,145,463 | |
| | | | | | | | |
| | | | | | | 115,087,624 | |
| | | | | | | | |
Healthcare — 10.0% | |
Alexion Pharmaceuticals, Inc.* | | | 199,850 | | | | 14,289,275 | |
Allergan, Inc. | | | 279,080 | | | | 24,486,479 | |
AmerisourceBergen CorporationD | | | 55,580 | | | | 2,067,020 | |
Biogen Idec, Inc.* | | | 91,287 | | | | 10,046,134 | |
Bristol-Myers Squibb Co. | | | 98,463 | | | | 3,469,836 | |
Celgene Corporation* | | | 44,710 | | | | 3,022,396 | |
Cerner CorporationD* | | | 61,630 | | | | 3,774,838 | |
CIGNA Corporation | | | 35,860 | | | | 1,506,120 | |
Cooper Cos., Inc. (The)D | | | 28,760 | | | | 2,028,155 | |
Express Scripts, Inc.* | | | 44,470 | | | | 1,987,364 | |
Gilead Sciences, Inc.* | | | 58,800 | | | | 2,406,684 | |
Illumina, Inc.D* | | | 198,000 | | | | 6,035,040 | |
Intuitive Surgical, Inc.* | | | 26,190 | | | | 12,126,232 | |
McKesson Corporation | | | 29,540 | | | | 2,301,462 | |
Merck & Co., Inc.D | | | 37,270 | | | | 1,405,079 | |
Perrigo Co.D | | | 42,730 | | | | 4,157,629 | |
Pfizer, Inc.D | | | 267,700 | | | | 5,793,028 | |
Regeneron Pharmaceuticals, Inc.D* | | | 50,000 | | | | 2,771,500 | |
SXC Health Solutions Corporation* | | | 28,690 | | | | 1,620,411 | |
Watson Pharmaceuticals, Inc.* | | | 78,500 | | | | 4,736,690 | |
| | | | | | | | |
| | | | | | | 110,031,372 | |
| | | | | | | | |
Materials & Processing — 5.3% | |
Airgas, Inc.D | | | 12,980 | | | | 1,013,478 | |
Allegheny Technologies, Inc. | | | 43,060 | | | | 2,058,268 | |
Dow Chemical Co. (The)D | | | 85,067 | | | | 2,446,527 | |
Ecolab, Inc. | | | 75,430 | | | | 4,360,608 | |
EI du Pont de Nemours & Co.D | | | 53,100 | | | | 2,430,918 | |
Monsanto Co. | | | 184,708 | | | | 12,942,490 | |
PPG Industries, Inc. | | | 25,375 | | | | 2,118,559 | |
Praxair, Inc. | | | 163,168 | | | | 17,442,659 | |
|
| See Notes to Financial Statements. |
164 |
GROWTH EQUITY FUND
SCHEDULE OF INVESTMENTS (Continued)
| | | | | | | | |
| | | Shares | | | Value | |
Precision Castparts Corporation | | | 85,420 | | | $ | 14,076,362 | |
| | | | | | | | |
| | | | | | | 58,889,869 | |
| | | | | | | | |
Producer Durables — 8.0% | |
Agilent Technologies, Inc.* | | | 111,010 | | | | 3,877,578 | |
AMETEK, Inc. | | | 68,250 | | | | 2,873,325 | |
BE Aerospace, Inc.* | | | 37,430 | | | | 1,448,915 | |
C.H. Robinson Worldwide, Inc.D | | | 68,000 | | | | 4,745,040 | |
Caterpillar, Inc. | | | 67,300 | | | | 6,097,380 | |
CSX Corporation | | | 340,870 | | | | 7,178,722 | |
Cummins, Inc. | | | 76,103 | | | | 6,698,586 | |
Danaher Corporation | | | 84,072 | | | | 3,954,747 | |
Deere & Co.D | | | 61,763 | | | | 4,777,368 | |
Eaton Corporation | | | 182,697 | | | | 7,952,800 | |
Expeditors International of Washington, Inc. | | | 99,010 | | | | 4,055,450 | |
FedEx CorporationD | | | 41,400 | | | | 3,457,314 | |
Fluor Corporation | | | 53,350 | | | | 2,680,838 | |
Gardner Denver, Inc. | | | 22,420 | | | | 1,727,685 | |
Joy Global, Inc. | | | 69,360 | | | | 5,199,919 | |
Rockwell Automation, Inc. | | | 30,823 | | | | 2,261,483 | |
Trimble Navigation, Ltd.* | | | 65,020 | | | | 2,821,868 | |
Union Pacific Corporation | | | 61,141 | | | | 6,477,278 | |
Verisk Analytics, Inc. Class A* | | | 14,620 | | | | 586,701 | |
W.W. Grainger, Inc. | | | 47,500 | | | | 8,891,525 | |
| | | | | | | | |
| | | | | | | 87,764,522 | |
| | | | | | | | |
Technology — 20.4% | |
Altera CorporationD | | | 73,270 | | | | 2,718,317 | |
American Tower Corporation Class A | | | 117,910 | | | | 7,075,779 | |
Apple, Inc.* | | | 152,441 | | | | 61,738,605 | |
Autodesk, Inc.* | | | 94,540 | | | | 2,867,398 | |
Citrix Systems, Inc.* | | | 39,660 | | | | 2,408,155 | |
Cognizant Technology Solutions Corporation Class A* | | | 89,660 | | | | 5,766,035 | |
Electronic Arts, Inc.* | | | 98,500 | | | | 2,029,100 | |
EMC Corporation* | | | 279,170 | | | | 6,013,322 | |
F5 Networks, Inc.* | | | 110,720 | | | | 11,749,606 | |
Google, Inc. Class A* | | | 59,743 | | | | 38,588,004 | |
Informatica Corporation* | | | 29,080 | | | | 1,073,924 | |
Intuit, Inc. | | | 80,550 | | | | 4,236,124 | |
NetApp, Inc.D* | | | 54,504 | | | | 1,976,860 | |
OpenTable, Inc.D* | | | 43,500 | | | | 1,702,155 | |
Oracle Corporation | | | 324,430 | | | | 8,321,630 | |
Polycom, Inc.D* | | | 82,210 | | | | 1,340,023 | |
QUALCOMM, Inc. | | | 643,157 | | | | 35,180,688 | |
Riverbed Technology, Inc.D* | | | 122,080 | | | | 2,868,880 | |
Rovi CorporationD* | | | 33,497 | | | | 823,356 | |
Salesforce.com, Inc.D* | | | 189,740 | | | | 19,251,020 | |
SanDisk Corporation* | | | 50,267 | | | | 2,473,639 | |
Teradata CorporationD* | | | 39,700 | | | | 1,925,847 | |
VMware, Inc.* | | | 22,900 | | | | 1,905,051 | |
Zynga, Inc. Class AD* | | | 8,516 | | | | 80,136 | |
| | | | | | | | |
| | | | | | | 224,113,654 | |
| | | | | | | | |
Utilities — 0.7% | |
AES Corporation (The)* | | | 87,150 | | | | 1,031,856 | |
ITC Holdings CorporationD | | | 38,900 | | | | 2,951,732 | |
NiSource, Inc. | | | 64,430 | | | | 1,534,079 | |
Xcel Energy, Inc.D | | | 84,930 | | | | 2,347,465 | |
| | | | | | | | |
| | | | | | | 7,865,132 | |
| | | | | | | | |
| | |
Total Common Stocks
(Cost $782,694,117) | | | | | | | 970,435,017 | |
| | | | | | | | |
| | | | | | | | |
| | | Shares | | | Value | |
FOREIGN COMMON STOCKS — 6.9% | |
Canada — 1.3% | | | | | | | | |
Barrick Gold CorporationD | | | 30,790 | | | $ | 1,393,248 | |
Lululemon Athletica, Inc.D* | | | 48,842 | | | | 2,278,968 | |
Potash Corporation of Saskatchewan, Inc. | | | 135,950 | | | | 5,612,016 | |
Valeant Pharmaceuticals International, Inc.D* | | | 71,700 | | | | 3,347,673 | |
Yamana Gold, Inc.D | | | 158,480 | | | | 2,328,071 | |
| | | | | | | | |
| | | | | | | 14,959,976 | |
| | | | | | | | |
China — 0.9% | |
Baidu, Inc. ADR* | | | 74,101 | | | | 8,630,543 | |
Youku, Inc. ADRD* | | | 53,355 | | | | 836,073 | |
| | | | | | | | |
| | | | | | | 9,466,616 | |
| | | | | | | | |
Hong Kong — 0.1% | |
Li & Fung, Ltd. | | | 826,000 | | | | 1,529,354 | |
Michael Kors Holdings, Ltd.* | | | 2,099 | | | | 57,197 | |
| | | | | | | | |
| | | | | | | 1,586,551 | |
| | | | | | | | |
Ireland — 1.6% | |
Accenture PLC Class A | | | 241,396 | | | | 12,849,509 | |
Shire PLC ADR | | | 42,150 | | | | 4,379,385 | |
| | | | | | | | |
| | | | | | | 17,228,894 | |
| | | | | | | | |
Israel — 0.5% | |
Check Point Software Technologies, Ltd.D* | | | 98,139 | | | | 5,156,223 | |
| | | | | | | | |
Netherlands — 0.7% | |
ASML Holding N.V.D | | | 190,000 | | | | 7,940,100 | |
| | | | | | | | |
Singapore — 0.6% | |
Avago Technologies, Ltd. | | | 157,350 | | | | 4,541,121 | |
Hutchison Port Holdings Trust | | | 3,282,000 | | | | 2,034,840 | |
| | | | | | | | |
| | | | | | | 6,575,961 | |
| | | | | | | | |
Switzerland — 0.4% | |
Compagnie Financiere Richemont SA ADR | | | 828,094 | | | | 4,157,032 | |
| | | | | | | | |
United Kingdom — 0.8% | |
British Sky Broadcasting Group PLC | | | 210,250 | | | | 2,391,728 | |
Ensco PLC ADR | | | 139,210 | | | | 6,531,733 | |
| | | | | | | | |
| | | | | | | 8,923,461 | |
| | | | | | | | |
Total Foreign Common Stocks
(Cost $74,927,351) | | | | 75,994,814 | |
| | | | | | | | |
PREFERRED STOCK — 0.1% | |
Wells Fargo & Co.* | | | | | | | | |
(Cost $678,134) | | | 35,400 | | | | 1,006,422 | |
| | | | | | | | |
RIGHT/WARRANT — 0.0% | |
Krispy Kreme Doughnuts, Inc. | | | | | | | | |
(Cost $74) | | | 7,410 | | | | 148 | |
| | | | | | | | |
MONEY MARKET FUNDS — 16.5% | |
GuideStone Money Market Fund (GS4 Class)¥ | | | 53,706,228 | | | | 53,706,228 | |
Northern Institutional Liquid Assets Portfolio§ | | | 128,085,397 | | | | 128,085,397 | |
| | | | | | | | |
Total Money Market Funds
(Cost $181,791,625) | | | | | | | 181,791,625 | |
| | | | | | | | |
See Notes to Financial Statements.
165
| | | | | | |
| | | | | Value | |
TOTAL INVESTMENTS — 111.7%
(Cost $1,040,091,301) | | $ | 1,229,228,026 | |
Liabilities in Excess of Other Assets — (11.7)% | | | | | (128,849,913 | ) |
| | | | | | |
NET ASSETS — 100.0% | | $ | 1,100,378,113 | |
| | | | | | |
Please see abbreviation and footnote definitions beginning on page 200.
PORTFOLIO SUMMARY (based on net assets)
| | | | |
| | | % | |
Consumer Discretionary | | | 20.8 | |
Technology | | | 20.4 | |
Money Market Funds | | | 16.5 | |
Financial Services | | | 10.5 | |
Healthcare | | | 10.0 | |
Energy | | | 9.0 | |
Producer Durables | | | 8.0 | |
Foreign Common Stocks | | | 6.9 | |
Materials & Processing | | | 5.3 | |
Futures Contracts | | | 5.1 | |
Consumer Staples | | | 3.5 | |
Utilities | | | 0.7 | |
Preferred Stock | | | 0.1 | |
Right/Warrant | | | — | ** |
| | | | |
| | | 116.8 | |
| | | | |
| ** | Rounds to less than 0.005%. |
VALUATION HIERARCHY
The following is a summary of the inputs used, as of December 31, 2011, in valuing the Fund’s investments carried at fair value:
| | | | | | | | | | | | | | | | |
| | | Total Value | | | Level 1
Quoted Prices | | | Level 2
Other
Significant
Observable
Inputs | | | Level 3
Significant
Unobservable
Inputs | |
Assets: | | | | | | | | | | | | | | | | |
Investments in Securities: | | | | | | | | | | | | | | | | |
Common Stocks | | $ | 970,435,017 | | | $ | 970,435,017 | | | $ | — | | | $ | — | |
Foreign Common Stocks | | | 75,994,814 | | | | 75,994,814 | | | | — | | | | — | |
Money Market Funds | | | 181,791,625 | | | | 181,791,625 | | | | — | | | | — | |
Preferred Stock | | | 1,006,422 | | | | 1,006,422 | | | | — | | | | — | |
Right/Warrant | | | 148 | | | | 148 | | | | — | | | | — | |
| | | | | | | | | | | | | | | | |
Total Assets — Investments in Securities | | $ | 1,229,228,026 | | | $ | 1,229,228,026 | | | $ | — | | | $ | — | |
| | | | | | | | | | | | | | | | |
| | | | |
Other Financial Instruments*** | | | | | | | | | | | | | | | | |
Futures Contracts | | $ | 754,084 | | | $ | 754,084 | | | $ | — | | | $ | — | |
| | | | | | | | | | | | | | | | |
Total Assets — Other Financial Instruments | | $ | 754,084 | | | $ | 754,084 | | | $ | — | | | $ | — | |
| | | | | | | | | | | | | | | | |
| | | | |
| Liabilities: | | | | | | | | | | | | | | | | |
| *** | Other financial instruments are derivative instruments not reflected in the Schedule of Investments, such as futures, forwards and swap contracts, which are valued at the unrealized appreciation (depreciation) on the investment. Details of these investments can be found in the Notes to Schedules of Investments. |
|
| See Notes to Financial Statements. |
166 |
Small Cap Equity Fund
Familiar themes such as the sovereign debt crisis in Europe, recession fears and moderating growth expectations in China continued to dominate headlines during 2011. The U.S. equity market showed resilience in the final quarter of the year as it overcame a dismal third quarter and ended the year in positive territory. The S&P 500® Index posted a fourth quarter return of 11.82%, bringing the return to a positive 2.11% for the one-year period ended December 31, 2011. The broader U.S. market, as measured by the Russell 3000® Index, gained 12.12% for the fourth quarter and 1.03% for the calendar year of 2011.
From a sector perspective, performance was mixed as five of the nine sectors within the Russell 3000® Index advanced during a year in which volatility prevailed. Defensive sectors such as utilities, consumer staples and healthcare were the best performers and experienced double-digit gains; whereas, the weakest performer was the financial services sector, which posted a double-digit loss for the year.
In terms of the underlying dynamics of equity market performance, low beta (or lower risk), high quality stocks generally outperformed during the year. Regarding market capitalization, large-cap companies outperformed their small-cap counterparts as the Russell 1000® Index posted a one-year return of 1.50%, while the Russell 2000® Index returned -4.18%. Style differentiation was evident as growth-oriented stocks outperformed value-oriented stocks across most market capitalization segments. In the large capitalization segment, the Russell 1000® Growth Index outpaced the Russell 1000® Value Index and posted one-year returns of 2.64% and 0.39%, respectively.
The Fund is comprised of domestic, small-cap stocks with both value- and growth-style orientations. Small-cap companies underperformed the broader market in 2011. The GS4 Class of the Fund outperformed its benchmark, the Russell 2000® Index, for the one-year period ended December 31, 2011 (1.22% versus -4.18%). Security selection within the technology and consumer discretionary sectors contributed to benchmark-relative returns, while underweight exposure within the healthcare sector detracted slightly from benchmark-relative performance during the year. The Fund’s relative performance further benefited from a portable alpha strategy, where stock index futures contracts are used to gain small cap equity beta exposure and the underlying cash is invested in fixed income securities. Within this portion of the Fund, the fixed income securities’ performance outpaced the futures contracts’ financing costs which generated excess return for the Fund. Within the fixed income portion of the portfolio, certain derivative contracts were used to manage risk and adjust exposure along the yield curve, including U.S. Treasuries futures and options, Eurodollar futures and options and Euro-Bund futures. The Fund also used currency forwards to manage foreign currency exposure. At the Fund level, overall derivative exposure had a very slight negative impact on performance over the course of the year.
This Fund may be suitable for investors who seek higher, long-term rates of return, can accept significant short-term fluctuations in account value, want to invest in stocks of small- to medium-sized U.S. companies and would like to diversify their portfolio by adding a potentially higher return, higher risk option of stocks. Small company stocks are subject to greater risk than large company stocks due to more volatility and less liquidity. To the extent that the investment advisor misjudges current market conditions, the Fund’s volatility may be amplified by its use of short sales and derivatives and by its ability to select sub-advisers to allocate assets. Short sales by a fund theoretically involve unlimited loss potential since the market price of securities sold short may continuously increase. Leverage may increase the risk of loss and cause fluctuations in the market value of the Fund’s portfolio to have disproportionately large effects or cause the NAV of the Fund generally to decline faster than it would otherwise.
Please see page 182 for information regarding specific portfolio allocations. Portfolio holdings are subject to change and risk at any time.
167
Small Cap Equity Fund
| | | | | | | | | | | | |
Average Annual Total Returns as of 12/31/11 | |
| | | GS2
Class* | | | GS4
Class* | | | Benchmark** | |
One Year | | | 1.40 | % | | | 1.22 | % | | | -4.18 | % |
Five Year | | | 1.07 | % | | | 0.92 | % | | | 0.15 | % |
Ten Year | | | 5.06 | % | | | 4.94 | % | | | 5.62 | % |
Since Inception | | | 5.01 | % | | | 4.85 | % | | | 5.64 | % |
Inception Date | | | 08/27/01 | | | | 08/27/01 | | | | | |
Total Fund Operating Expenses (April 30, 2011 Prospectus, as amended on September 1, 2011)(1) | | | 1.03 | % | | | 1.27 | % | | | | |
| (1) | Current information regarding the Fund’s Operating Expenses can be found in the Financial Highlights. |
The performance data quoted represents past performance and does not guarantee future results. Current performance may be lower or higher. Performance data current to the most recent month-end may be obtained at www.GuideStoneFunds.org. The investment return and principal value of an investment will fluctuate so that shares, when redeemed, may be worth more or less than their original cost.
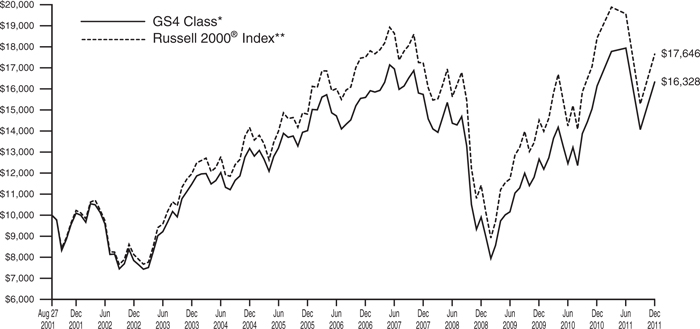
The graph compares the results of a hypothetical $10,000 investment in the GS4 Class of the Fund since August 27, 2001 (commencement of operations), with all dividends and capital gains reinvested, with the Russell 2000® Index.
| * | These returns reflect expense waivers by the Fund’s investment adviser. Without these waivers, returns would have been lower. Returns shown do not reflect the deduction of taxes that a shareholder would pay on Fund distributions or the redemption of Fund shares. |
| ** | The Russell 2000® Index is a small-cap equity index comprised of the 2,000 smallest companies in the Russell 3000® Index, which represents approximately 10% of the total market capitalization of the Russell 3000® Index. |
Unlike a mutual fund, the performance of an index assumes no taxes, transaction costs, management fees or other expenses.
168
| | |
| SMALL CAP EQUITY FUND | | |
| SCHEDULE OF INVESTMENTS | | December 31, 2011 |
| | | | | | | | |
| | | Shares | | | Value | |
COMMON STOCKS — 81.5% | |
Consumer Discretionary — 12.3% | |
Aaron’s, Inc.D* | | | 84,200 | | | $ | 2,246,456 | |
Aeropostale, Inc.* | | | 93,100 | | | | 1,419,775 | |
AMERCO, Inc.D | | | 6,900 | | | | 609,960 | |
American Eagle Outfitters, Inc. | | | 39,200 | | | | 599,368 | |
American Public Education, Inc.D* | | | 27,100 | | | | 1,172,888 | |
ANN, Inc.D* | | | 23,500 | | | | 582,330 | |
Arbitron, Inc.D | | | 37,006 | | | | 1,273,376 | |
Body Central CorporationD* | | | 12,019 | | | | 299,994 | |
Bridgepoint Education, Inc.D* | | | 25,000 | | | | 575,000 | |
Brinker International, Inc.D | | | 32,500 | | | | 869,700 | |
Capella Education Co.* | | | 30,800 | | | | 1,110,340 | |
Caribou Coffee Co., Inc.* | | | 17,190 | | | | 239,800 | |
Children’s Place Retail Stores, Inc. (The)D* | | | 8,800 | | | | 467,456 | |
Coinstar, Inc.D* | | | 12,800 | | | | 584,192 | |
Constant Contact, Inc.D* | | | 54,500 | | | | 1,264,945 | |
CROCS, Inc.* | | | 32,921 | | | | 486,243 | |
Deckers Outdoor CorporationD* | | | 4,900 | | | | 370,293 | |
Digital Generation, Inc.D* | | | 84,200 | | | | 1,003,664 | |
Domino’s Pizza, Inc.D* | | | 13,900 | | | | 471,905 | |
DSW, Inc.D | | | 15,800 | | | | 698,518 | |
Education Management CorporationD* | | | 22,600 | | | | 632,574 | |
Elizabeth Arden, Inc.D* | | | 17,150 | | | | 635,236 | |
Goodyear Tire & Rubber Co. (The)* | | | 111,700 | | | | 1,582,789 | |
Group 1 Automotive, Inc.D | | | 13,800 | | | | 714,840 | |
Guess ?, Inc.D | | | 37,400 | | | | 1,115,268 | |
H&R Block, Inc.D | | | 61,200 | | | | 999,396 | |
hhgregg, Inc.D* | | | 48,300 | | | | 697,935 | |
Hibbett Sports, Inc.D* | | | 7,050 | | | | 318,519 | |
Iconix Brand Group, Inc.D* | | | 39,300 | | | | 640,197 | |
Inter Parfums, Inc.D | | | 36,200 | | | | 563,272 | |
ITT Educational Services, Inc.D* | | | 17,100 | | | | 972,819 | |
John Wiley & Sons, Inc.D | | | 22,300 | | | | 990,120 | |
Jos. A. Bank Clothiers, Inc.D* | | | 19,300 | | | | 941,068 | |
Lear Corporation | | | 12,700 | | | | 505,460 | |
Life Time Fitness, Inc.* | | | 13,400 | | | | 626,450 | |
Meritor, Inc.D* | | | 118,400 | | | | 629,888 | |
Monro Muffler Brake, Inc.D | | | 27,000 | | | | 1,047,330 | |
Movado Group, Inc.D | | | 38,800 | | | | 704,996 | |
National American University Holdings, Inc.D | | | 54,700 | | | | 414,626 | |
Papa John’s International, Inc.D* | | | 27,700 | | | | 1,043,736 | |
Polaris Industries, Inc.D | | | 13,020 | | | | 728,860 | |
Scholastic CorporationD | | | 29,700 | | | | 890,109 | |
Select Comfort CorporationD* | | | 66,700 | | | | 1,446,723 | |
Sotheby’s | | | 13,337 | | | | 380,505 | |
Stamps.com, Inc.D* | | | 8,800 | | | | 229,944 | |
Standard Motor Products, Inc.D | | | 51,900 | | | | 1,040,595 | |
Steven Madden, Ltd.D* | | | 24,334 | | | | 839,523 | |
Strayer Education, Inc.D | | | 13,700 | | | | 1,331,503 | |
Sturm Ruger & Co., Inc. | | | 31,700 | | | | 1,060,682 | |
Tempur-Pedic International, Inc.D* | | | 16,143 | | | | 847,992 | |
Tenneco, Inc.D* | | | 33,500 | | | | 997,630 | |
True Religion Apparel, Inc.D* | | | 40,400 | | | | 1,397,032 | |
Ulta Salon Cosmetics & Fragrance, Inc.D* | | | 15,718 | | | | 1,020,413 | |
Under Armour, Inc. Class AD* | | | 6,150 | | | | 441,508 | |
| | | | | | | | |
| | | Shares | | | Value | |
Vera Bradley, Inc.D* | | | 35,000 | | | $ | 1,128,750 | |
Vitamin Shoppe, Inc.D* | | | 28,400 | | | | 1,132,592 | |
WABCO Holdings, Inc.* | | | 21,900 | | | | 950,460 | |
Wolverine World Wide, Inc.D | | | 43,200 | | | | 1,539,648 | |
Wyndham Worldwide Corporation | | | 34,000 | | | | 1,286,220 | |
Zagg, Inc.D* | | | 25,800 | | | | 182,406 | |
Zumiez, Inc.D* | | | 19,987 | | | | 554,839 | |
| | | | | | | | |
| | | | | | | 51,550,656 | |
| | | | | | | | |
Consumer Staples — 3.1% | |
Andersons, Inc. (The) | | | 12,900 | | | | 563,214 | |
Cal-Maine Foods, Inc.D | | | 17,800 | | | | 650,946 | |
Casey’s General Stores, Inc.D | | | 21,600 | | | | 1,112,616 | |
Chef’s Warehouse, Inc. (The)D* | | | 66,200 | | | | 1,182,332 | |
Dean Foods Co.* | | | 56,800 | | | | 636,160 | |
GNC Holdings, Inc. Class A* | | | 13,100 | | | | 379,245 | |
Hain Celestial Group, Inc. (The)* | | | 9,600 | | | | 351,936 | |
Hansen Natural Corporation* | | | 12,100 | | | | 1,114,894 | |
J & J Snack Foods CorporationD | | | 25,052 | | | | 1,334,771 | |
Nash Finch Co. | | | 22,900 | | | | 670,512 | |
PetMed Express, Inc.D | | | 40,500 | | | | 420,390 | |
Ruddick CorporationD | | | 27,600 | | | | 1,176,864 | |
Smart Balance, Inc.* | | | 19,000 | | | | 101,840 | |
SUPERVALU, Inc.D | | | 145,300 | | | | 1,179,836 | |
TreeHouse Foods, Inc.* | | | 8,200 | | | | 536,116 | |
United Natural Foods, Inc.D* | | | 35,600 | | | | 1,424,356 | |
| | | | | | | | |
| | | | | | | 12,836,028 | |
| | | | | | | | |
Energy — 5.7% | |
American Standard Energy Corporation@* | | | 158,702 | | | | 499,911 | |
Basic Energy Services, Inc.* | | | 26,720 | | | | 526,384 | |
Bill Barrett CorporationD* | | | 7,800 | | | | 265,746 | |
Carrizo Oil & Gas, Inc.D* | | | 46,200 | | | | 1,217,370 | |
Complete Production Services, Inc.* | | | 33,900 | | | | 1,137,684 | |
Dril-Quip, Inc.D* | | | 13,100 | | | | 862,242 | |
Gulfport Energy CorporationD* | | | 22,000 | | | | 647,900 | |
Helix Energy Solutions Group, Inc.* | | | 58,900 | | | | 930,620 | |
Hornbeck Offshore Services, Inc.D* | | | 25,500 | | | | 791,010 | |
Key Energy Services, Inc.* | | | 83,700 | | | | 1,294,839 | |
Kodiak Oil & Gas CorporationD* | | | 53,700 | | | | 510,150 | |
Newpark Resources, Inc.D* | | | 124,500 | | | | 1,182,750 | |
Oasis Petroleum, Inc.D* | | | 47,696 | | | | 1,387,477 | |
Patterson-UTI Energy, Inc. | | | 94,300 | | | | 1,884,114 | |
Pioneer Drilling Co.* | | | 30,300 | | | | 293,304 | |
Rex Energy CorporationD* | | | 40,310 | | | | 594,976 | |
Rosetta Resources, Inc.D* | | | 33,250 | | | | 1,446,375 | |
Sanchez Energy Corporation* | | | 17,100 | | | | 295,146 | |
Superior Energy Services, Inc.D* | | | 24,200 | | | | 688,248 | |
Swift Energy Co.D* | | | 38,800 | | | | 1,153,136 | |
Tesoro Corporation* | | | 86,900 | | | | 2,029,984 | |
Unit CorporationD* | | | 12,700 | | | | 589,280 | |
Vaalco Energy, Inc.D* | | | 114,400 | | | | 690,976 | |
Western Refining, Inc.D* | | | 33,300 | | | | 442,557 | |
World Fuel Services CorporationD | | | 57,800 | | | | 2,426,444 | |
| | | | | | | | |
| | | | | | | 23,788,623 | |
| | | | | | | | |
|
| See Notes to Financial Statements. |
169 |
| | | | | | | | |
| | | Shares | | | Value | |
Financial Services — 18.0% | | | | | | | | |
Advance America Cash Advance Centers, Inc.D | | | 63,300 | | | $ | 566,535 | |
American Campus Communities, Inc. REITD | | | 28,200 | | | | 1,183,272 | |
American Equity Investment Life Holding Co.D | | | 123,100 | | | | 1,280,240 | |
American Financial Group, Inc. | | | 42,200 | | | | 1,556,758 | |
Amtrust Financial Services, Inc.D | | | 48,700 | | | | 1,156,625 | |
Artio Global Investors, Inc.D | | | 81,100 | | | | 395,768 | |
Assurant, Inc. | | | 51,300 | | | | 2,106,378 | |
BOK Financial CorporationD | | | 30,000 | | | | 1,647,900 | |
Cardtronics, Inc.D* | | | 107,600 | | | | 2,911,656 | |
Cash America International, Inc.D | | | 19,600 | | | | 913,948 | |
Cathay General BancorpD | | | 40,500 | | | | 604,665 | |
CBL & Associates Properties, Inc. REITD | | | 44,600 | | | | 700,220 | |
Chemical Financial CorporationD | | | 40,500 | | | | 863,460 | |
Columbia Banking System, Inc.D | | | 38,300 | | | | 738,041 | |
Commerce Bancshares, Inc.D | | | 39,900 | | | | 1,520,988 | |
CommonWealth REIT | | | 25,400 | | | | 422,656 | |
CVB Financial CorporationD | | | 72,900 | | | | 731,187 | |
Duff & Phelps CorporationD | | | 45,500 | | | | 659,750 | |
East West Bancorp, Inc. | | | 33,900 | | | | 669,525 | |
Encore Capital Group, Inc.D* | | | 38,600 | | | | 820,636 | |
Euronet Worldwide, Inc.D* | | | 36,200 | | | �� | 668,976 | |
Evercore Partners, Inc. Class AD | | | 26,200 | | | | 697,444 | |
EZCORP, Inc. Class AD* | | | 23,700 | | | | 624,969 | |
FBL Financial Group, Inc.D | | | 19,200 | | | | 653,184 | |
First Citizens BancShares, Inc. Class A | | | 6,600 | | | | 1,154,934 | |
First Midwest Bancorp, Inc.D | | | 45,000 | | | | 455,850 | |
FleetCor Technologies, Inc.* | | | 35,900 | | | | 1,072,333 | |
Global Payments, Inc. | | | 43,100 | | | | 2,042,078 | |
Heartland Payment Systems, Inc. | | | 31,400 | | | | 764,904 | |
Higher One Holdings, Inc.D* | | | 54,700 | | | | 1,008,668 | |
Home Bancshares, Inc.D | | | 18,140 | | | | 470,007 | |
Hospitality Properties Trust REITD | | | 82,200 | | | | 1,888,956 | |
Huntington Bancshares, Inc. | | | 300,300 | | | | 1,648,647 | |
IBERIABANK CorporationD | | | 16,600 | | | | 818,380 | |
Inland Real Estate Corporation REITD | | | 79,700 | | | | 606,517 | |
Interactive Brokers Group, Inc. Class A | | | 104,000 | | | | 1,553,760 | |
Jack Henry & Associates, Inc. | | | 39,000 | | | | 1,310,790 | |
Jones Lang LaSalle, Inc. | | | 35,500 | | | | 2,174,730 | |
LaSalle Hotel Properties REITD | | | 31,000 | | | | 750,510 | |
Lincoln National Corporation | | | 32,700 | | | | 635,034 | |
Mid-America Apartment Communities, Inc. REIT | | | 19,100 | | | | 1,194,705 | |
NASDAQ OMX Group, Inc. (The)* | | | 43,900 | | | | 1,075,989 | |
National Health Investors, Inc. REITD | | | 24,300 | | | | 1,068,714 | |
NBH Holdings Corporation PIPE+@ | | | 30,300 | | | | 462,075 | |
Nelnet, Inc. Class AD | | | 25,200 | | | | 616,644 | |
Netspend Holdings, Inc.D* | | | 52,000 | | | | 421,720 | |
Ocwen Financial Corporation* | | | 97,700 | | | | 1,414,696 | |
| | | | | | | | |
| | | Shares | | | Value | |
Pacwest BancorpD | | | 82,100 | | | $ | 1,555,795 | |
Pebblebrook Hotel Trust REIT | | | 58,300 | | | | 1,118,194 | |
People’s United Financial, Inc. | | | 49,600 | | | | 637,360 | |
Portfolio Recovery Associates, Inc.D* | | | 12,800 | | | | 864,256 | |
Post Properties, Inc. REITD | | | 27,000 | | | | 1,180,440 | |
Prosperity Bancshares, Inc.D | | | 11,700 | | | | 472,095 | |
Protective Life CorporationD | | | 26,400 | | | | 595,584 | |
PS Business Parks, Inc. REITD | | | 31,300 | | | | 1,734,959 | |
Regions Financial Corporation | | | 397,200 | | | | 1,707,960 | |
Reinsurance Group of America, Inc. | | | 27,900 | | | | 1,457,775 | |
Republic Bancorp, Inc. Class AD | | | 27,600 | | | | 632,040 | |
Retail Opportunity Investments Corporation REITD | | | 69,100 | | | | 818,144 | |
RLI CorporationD | | | 15,400 | | | | 1,122,044 | |
Safety Insurance Group, Inc.D | | | 18,100 | | | | 732,688 | |
SCBT Financial CorporationD | | | 12,000 | | | | 348,120 | |
Signature Bank* | | | 22,540 | | | | 1,352,175 | |
StanCorp Financial Group, Inc.D | | | 49,300 | | | | 1,811,775 | |
Stifel Financial CorporationD* | | | 42,000 | | | | 1,346,100 | |
Torchmark Corporation | | | 27,200 | | | | 1,180,208 | |
Tower Group, Inc.D | | | 42,700 | | | | 861,259 | |
Umpqua Holdings CorporationD | | | 53,200 | | | | 659,148 | |
Urstadt Biddle Properties, Inc. Class A REITD | | | 37,200 | | | | 672,576 | |
Webster Financial CorporationD | | | 46,000 | | | | 937,940 | |
Wintrust Financial Corporation | | | 24,000 | | | | 673,200 | |
Wright Express Corporation* | | | 31,500 | | | | 1,709,820 | |
Zions Bancorporation | | | 28,700 | | | | 467,236 | |
| | | | | | | | |
| | | | | | | 75,354,313 | |
| | | | | | | | |
Healthcare — 8.2% | | | | | | | | |
Air Methods CorporationD* | | | 9,900 | | | | 836,055 | |
Align Technology, Inc.D* | | | 39,100 | | | | 927,647 | |
AVANIR Pharmaceuticals, Inc.D* | | | 103,400 | | | | 211,970 | |
BioMarin Pharmaceuticals, Inc.D* | | | 19,400 | | | | 666,972 | |
Bio-Rad Laboratories, Inc. Class A* | | | 6,300 | | | | 605,052 | |
Brookdale Senior Living, Inc.* | | | 45,900 | | | | 798,201 | |
Catalyst Health Solutions, Inc.D* | | | 46,400 | | | | 2,412,800 | |
Centene CorporationD* | | | 32,800 | | | | 1,298,552 | |
Community Health Systems, Inc.* | | | 42,500 | | | | 741,625 | |
Conventry Health Care, Inc.* | | | 17,500 | | | | 531,475 | |
Cooper Cos., Inc. (The) | | | 15,066 | | | | 1,062,454 | |
Cubist Pharmaceuticals, Inc.D* | | | 20,834 | | | | 825,443 | |
Endologix, Inc.* | | | 35,497 | | | | 407,506 | |
Five Star Quality Care, Inc.+ | | | 2,086 | | | | — | |
Gen-Probe, Inc.* | | | 7,032 | | | | 415,732 | |
Haemonetics CorporationD* | | | 16,100 | | | | 985,642 | |
Hanger Orthopedic Group, Inc.* | | | 40,800 | | | | 762,552 | |
Health Net, Inc.* | | | 50,900 | | | | 1,548,378 | |
Healthspring, Inc.D* | | | 8,699 | | | | 474,443 | |
Hill-Rom Holdings, Inc. | | | 14,100 | | | | 475,029 | |
HMS Holdings Corporation* | | | 17,417 | | | | 556,996 | |
Incyte Corporation, Ltd.D* | | | 34,300 | | | | 514,843 | |
IPC The Hospitalist Co., Inc.D* | | | 28,800 | | | | 1,316,736 | |
Magellan Health Services, Inc.D* | | | 29,500 | | | | 1,459,365 | |
|
| See Notes to Financial Statements. |
170 |
SMALL CAP EQUITY FUND
SCHEDULE OF INVESTMENTS (Continued)
| | | | | | | | |
| | | Shares | | | Value | |
MAKO Surgical CorporationD* | | | 14,978 | | | $ | 377,595 | |
Masimo Corporation* | | | 27,000 | | | | 504,495 | |
Mednax, Inc.* | | | 15,200 | | | | 1,094,552 | |
Merit Medical Systems, Inc.D* | | | 33,734 | | | | 451,361 | |
Myriad Genetics, Inc.* | | | 53,100 | | | | 1,111,914 | |
PAREXEL International CorporationD* | | | 34,000 | | | | 705,160 | |
PDL BioPharma, Inc.D | | | 228,900 | | | | 1,419,180 | |
PSS World Medical, Inc.D* | | | 40,900 | | | | 989,371 | |
Sirona Dental Systems, Inc.D* | | | 21,500 | | | | 946,860 | |
SXC Health Solutions Corporation* | | | 14,350 | | | | 810,488 | |
Techne CorporationD | | | 9,200 | | | | 627,992 | |
Thoratec Corporation* | | | 53,000 | | | | 1,778,680 | |
United Therapeutics Corporation* | | | 18,400 | | | | 869,400 | |
Volcano CorporationD* | | | 42,750 | | | | 1,017,022 | |
WellCare Health Plans, Inc.D* | | | 18,400 | | | | 966,000 | |
Zoll Medical Corporation* | | | 8,331 | | | | 526,353 | |
| | | | | | | | |
| | | | | | | 34,031,891 | |
| | | | | | | | |
Materials & Processing — 4.0% | | | | | | | | |
A. Schulman, Inc. | | | 52,600 | | | | 1,114,068 | |
Airgas, Inc.D | | | 9,700 | | | | 757,376 | |
Allied Nevada Gold CorporationD* | | | 17,122 | | | | 518,454 | |
Beacon Roofing Supply, Inc.D* | | | 22,000 | | | | 445,060 | |
Buckeye Technologies, Inc.D | | | 30,200 | | | | 1,009,888 | |
Cabot Corporation | | | 3,600 | | | | 115,704 | |
Carpenter Technology CorporationD | | | 22,100 | | | | 1,137,708 | |
Cytec Industries, Inc. | | | 16,400 | | | | 732,260 | |
Eastman Chemical Co. | | | 29,800 | | | | 1,163,988 | |
Greif, Inc. Class AD | | | 22,800 | | | | 1,038,540 | |
Haynes International, Inc.D | | | 6,847 | | | | 373,846 | |
Huntsman Corporation | | | 41,400 | | | | 414,000 | |
Innospec, Inc.* | | | 18,000 | | | | 505,260 | |
Kronos Worldwide, Inc.D | | | 59,713 | | | | 1,077,223 | |
Neenah Paper, Inc. | | | 31,300 | | | | 698,616 | |
Owens Corning* | | | 23,400 | | | | 672,048 | |
Owens-Illinois, Inc.* | | | 28,200 | | | | 546,516 | |
RBC Bearings, Inc.D* | | | 13,000 | | | | 542,100 | |
Reliance Steel & Aluminum Co.D | | | 20,900 | | | | 1,017,621 | |
RTI International Metals, Inc.D* | | | 11,200 | | | | 259,952 | |
Sensient Technologies CorporationD | | | 35,800 | | | | 1,356,820 | |
Temple-Inland, Inc. | | | 6,800 | | | | 215,628 | |
Timken Co. | | | 30,400 | | | | 1,176,784 | |
| | | | | | | | |
| | | | | | | 16,889,460 | |
| | | | | | | | |
Producer Durables — 14.4% | | | | | | | | |
A.O. Smith CorporationD | | | 54,747 | | | | 2,196,451 | |
Advisory Board Co. (The)D* | | | 16,500 | | | | 1,224,465 | |
AGCO Corporation* | | | 14,200 | | | | 610,174 | |
Alaska Air Group, Inc.D* | | | 9,400 | | | | 705,846 | |
Albany International Corporation Class AD | | | 48,200 | | | | 1,114,384 | |
Allegiant Travel Co.D* | | | 16,000 | | | | 853,440 | |
Alliant Techsystems, Inc.D | | | 31,500 | | | | 1,800,540 | |
Angie’s List, Inc.D* | | | 11,900 | | | | 191,590 | |
Applied Industrial Technologies, Inc.D | | | 23,900 | | | | 840,563 | |
Astec Industries, Inc.D* | | | 27,000 | | | | 869,670 | |
| | | | | | | | |
| | | Shares | | | Value | |
Atlas Air Worldwide Holdings, Inc.D* | | | 7,500 | | | $ | 288,225 | |
BE Aerospace, Inc.* | | | 17,900 | | | | 692,909 | |
Ceradyne, Inc.D* | | | 17,800 | | | | 476,684 | |
Chart Industries, Inc.D* | | | 20,100 | | | | 1,086,807 | |
Clean Harbors, Inc.D* | | | 34,100 | | | | 2,173,193 | |
Columbus McKinnon CorporationD* | | | 47,400 | | | | 601,506 | |
Corporate Executive Board Co. (The)D | | | 16,800 | | | | 640,080 | |
CoStar Group, Inc.* | | | 23,000 | | | | 1,534,790 | |
Darling International, Inc.* | | | 47,800 | | | | 635,262 | |
Douglas Dynamics, Inc.D | | | 24,200 | | | | 353,804 | |
EMCOR Group, Inc. | | | 77,900 | | | | 2,088,499 | |
ExlService Holdings, Inc.D* | | | 40,600 | | | | 908,222 | |
FARO Technologies, Inc.D* | | | 12,900 | | | | 593,400 | |
FTI Consulting, Inc.D* | | | 12,000 | | | | 509,040 | |
Generac Holdings, Inc.* | | | 25,200 | | | | 706,356 | |
General Cable CorporationD* | | | 39,600 | | | | 990,396 | |
Genesee & Wyoming, Inc. Class AD* | | | 44,150 | | | | 2,674,607 | |
Gulfmark Offshore, Inc. Class AD* | | | 22,100 | | | | 928,421 | |
Healthcare Services Group, Inc.D | | | 49,150 | | | | 869,464 | |
HEICO Corporation Class AD | | | 32,650 | | | | 1,661,294 | |
Herman Miller, Inc.D | | | 44,300 | | | | 817,335 | |
Huron Consulting Group, Inc.* | | | 4,300 | | | | 166,582 | |
IDEX Corporation | | | 31,111 | | | | 1,154,529 | |
Itron, Inc.D* | | | 24,400 | | | | 872,788 | |
Kaman CorporationD | | | 27,400 | | | | 748,568 | |
KBR, Inc.D | | | 56,000 | | | | 1,560,720 | |
Kennametal, Inc. | | | 23,500 | | | | 858,220 | |
Lincoln Electric Holdings, Inc. | | | 21,200 | | | | 829,344 | |
Liquidity Services, Inc.* | | | 15,130 | | | | 558,297 | |
MAXIMUS, Inc.D | | | 23,100 | | | | 955,185 | |
McGrath RentCorpD | | | 24,800 | | | | 718,952 | |
Middleby CorporationD* | | | 18,000 | | | | 1,692,720 | |
NACCO Industries, Inc. Class AD | | | 11,700 | | | | 1,043,874 | |
National Instruments CorporationD | | | 43,350 | | | | 1,124,932 | |
Old Dominion Freight Line, Inc.D* | | | 21,300 | | | | 863,289 | |
On Assignment, Inc.D* | | | 87,000 | | | | 972,660 | |
Orbital Sciences CorporationD* | | | 55,800 | | | | 810,774 | |
OSI Systems, Inc.D* | | | 10,417 | | | | 508,141 | |
PHH CorporationD* | | | 32,000 | | | | 342,400 | |
Resources Connection, Inc.D | | | 52,300 | | | | 553,857 | |
Robbins & Myers, Inc. | | | 37,984 | | | | 1,844,123 | |
Ryder System, Inc. | | | 21,800 | | | | 1,158,452 | |
Standard Parking CorporationD* | | | 36,300 | | | | 648,681 | |
Thomas & Betts Corporation* | | | 13,700 | | | | 748,020 | |
Titan Machinery, Inc.* | | | 23,500 | | | | 510,655 | |
Toro Co. (The) | | | 13,000 | | | | 788,580 | |
TransDigm Group, Inc.* | | | 16,140 | | | | 1,544,275 | |
Triumph Group, Inc.D | | | 46,300 | | | | 2,706,235 | |
URS Corporation* | | | 18,000 | | | | 632,160 | |
Watts Water Technologies, Inc.D | | | 24,200 | | | | 827,882 | |
WESCO International, Inc.* | | | 17,200 | | | | 911,772 | |
| | | | | | | | |
| | | | | | | 60,294,084 | |
| | | | | | | | |
|
See Notes to Financial Statements. 171 |
| | | | | | | | |
| | | Shares | | | Value | |
Technology — 11.5% | | | | | | | | |
Amdocs, Ltd.* | | | 38,000 | | | $ | 1,084,140 | |
Anixter International, Inc.* | | | 18,000 | | | | 1,073,520 | |
Avnet, Inc.D* | | | 44,000 | | | | 1,367,960 | |
Bankrate, Inc.D* | | | 33,500 | | | | 720,250 | |
Bottomline Technologies, Inc.D* | | | 68,900 | | | | 1,596,413 | |
BroadSoft, Inc.D* | | | 18,000 | | | | 543,600 | |
CACI International, Inc. Class AD* | | | 30,500 | | | | 1,705,560 | |
Cadence Design Systems, Inc.* | | | 111,000 | | | | 1,154,400 | |
Cavium, Inc.D* | | | 17,600 | | | | 500,368 | |
Cognex CorporationD | | | 20,300 | | | | 726,537 | |
CommVault Systems, Inc.D* | | | 46,000 | | | | 1,965,120 | |
Comtech Telecommunications CorporationD | | | 32,600 | | | | 933,012 | |
CSG Systems International, Inc.* | | | 34,400 | | | | 506,024 | |
Cymer, Inc.D* | | | 10,000 | | | | 497,600 | |
DealerTrack Holdings, Inc.D* | | | 50,000 | | | | 1,363,000 | |
DigitalGlobe, Inc.D* | | | 27,000 | | | | 461,970 | |
Ebix, Inc.D | | | 48,000 | | | | 1,060,800 | |
Hittite Microwave CorporationD* | | | 12,100 | | | | 597,498 | |
IAC/InterActiveCorp | | | 17,600 | | | | 749,760 | |
Informatica Corporation* | | | 22,000 | | | | 812,460 | |
Inphi Corporation* | | | 39,500 | | | | 472,420 | |
Kenexa CorporationD* | | | 15,700 | | | | 419,190 | |
LSI Corporation* | | | 215,400 | | | | 1,281,630 | |
Monotype Imaging Holdings, Inc.* | | | 43,500 | | | | 678,165 | |
Netlogic Microsystems, Inc.* | | | 4,400 | | | | 218,108 | |
NetSuite, Inc.* | | | 8,150 | | | | 330,483 | |
NeuStar, Inc. Class AD* | | | 26,500 | | | | 905,505 | |
NIC, Inc.D | | | 120,600 | | | | 1,605,186 | |
Novellus Systems, Inc.* | | | 11,100 | | | | 458,319 | |
Polycom, Inc.* | | | 70,800 | | | | 1,154,040 | |
Power Intergrations, Inc.D | | | 31,900 | | | | 1,057,804 | |
Progress Software CorporationD* | | | 24,600 | | | | 476,010 | |
RealPage, Inc.* | | | 4,500 | | | | 113,715 | |
Sanmina-SCI Corporation* | | | 54,000 | | | | 502,740 | |
SBA Communications Corporation Class AD* | | | 16,500 | | | | 708,840 | |
Scansource, Inc.D* | | | 39,100 | | | | 1,407,600 | |
Semtech CorporationD* | | | 62,567 | | | | 1,552,913 | |
Silicon Laboratories, Inc.D* | | | 20,600 | | | | 894,452 | |
Solera Holdings, Inc. | | | 33,500 | | | | 1,492,090 | |
SS&C Technologies Holdings, Inc.* | | | 132,000 | | | | 2,383,920 | |
SuccessFactors, Inc.* | | | 11,762 | | | | 468,951 | |
Synchronoss Technologies, Inc.D* | | | 23,313 | | | | 704,286 | |
SYNNEX Corporation* | | | 19,800 | | | | 603,108 | |
Take-Two Interactive Software, Inc.* | | | 39,900 | | | | 540,645 | |
Taleo Corporation Class AD* | | | 7,600 | | | | 294,044 | |
Tech Data Corporation* | | | 23,000 | | | | 1,136,430 | |
Ultimate Software Group, Inc.D* | | | 30,500 | | | | 1,986,160 | |
Ultratech, Inc.* | | | 21,998 | | | | 540,491 | |
Unisys CorporationD* | | | 76,400 | | | | 1,505,844 | |
United Online, Inc.D | | | 293,500 | | | | 1,596,640 | |
Universal Display CorporationD* | | | 12,325 | | | | 452,204 | |
VeriFone Systems, Inc.* | | | 10,474 | | | | 372,036 | |
| | | | | | | | |
| | | Shares | | | Value | |
Viasat, Inc.D* | | | 9,000 | | | $ | 415,080 | |
| | | | | | | | |
| | | | | | | 48,149,041 | |
| | | | | | | | |
Utilities — 4.3% | |
Alliant Energy Corporation | | | 42,000 | | | | 1,852,620 | |
American Water Works Co., Inc. | | | 52,600 | | | | 1,675,836 | |
Atmos Energy CorporationD | | | 20,500 | | | | 683,675 | |
Cbeyond, Inc.D* | | | 96,500 | | | | 772,965 | |
CMS Energy Corporation | | | 27,200 | | | | 600,576 | |
El Paso Electric Co.D | | | 17,700 | | | | 613,128 | |
General Communication, Inc. Class AD* | | | 52,400 | | | | 512,996 | |
j2 Global Communications, Inc.D | | | 34,800 | | | | 979,272 | |
Lumos Networks Corporation | | | 29,350 | | | | 450,229 | |
Neutral Tandem, Inc.D* | | | 50,300 | | | | 537,707 | |
NTELOS Holdings CorporationD | | | 23,650 | | | | 481,987 | |
NV Energy, Inc. | | | 98,200 | | | | 1,605,570 | |
OGE Energy CorporationD | | | 30,100 | | | | 1,706,971 | |
Pepco Holdings, Inc. | | | 28,100 | | | | 570,430 | |
Pinnacle West Capital Corporation | | | 28,800 | | | | 1,387,584 | |
PNM Resources, Inc.D | | | 76,500 | | | | 1,394,595 | |
Portland General Electric Co.D | | | 51,600 | | | | 1,304,964 | |
Vectren CorporationD | | | 23,700 | | | | 716,451 | |
| | | | | | | | |
| | | | | | | 17,847,556 | |
| | | | | | | | |
Total Common Stocks
(Cost $304,938,043) | | | | | | | 340,741,652 | |
| | | | | | | | |
FOREIGN COMMON STOCKS — 4.3% | |
Argentina — 0.1% | |
MercadoLibre, Inc. | | | 3,000 | | | | 238,620 | |
| | | | | | | | |
Bermuda — 0.8% | |
Maiden Holdings, Ltd.D | | | 134,400 | | | | 1,177,344 | |
Montpelier Re Holdings, Ltd.D | | | 90,500 | | | | 1,606,375 | |
Nabors Industries, Ltd.* | | | 35,800 | | | | 620,772 | |
| | | | | | | | |
| | | | | | | 3,404,491 | |
| | | | | | | | |
British Virgin Islands — 0.2% | |
UTi Worldwide, Inc.D | | | 65,000 | | | | 863,850 | |
| | | | | | | | |
Canada — 0.5% | |
Domtar CorporationD | | | 12,200 | | | | 975,512 | |
Gran Tierra Energy, Inc.* | | | 112,300 | | | | 539,040 | |
Lone Pine Resources, Inc.* | | | 87,400 | | | | 612,674 | |
| | | | | | | | |
| | | | | | | 2,127,226 | |
| | | | | | | | |
Cayman Islands — 0.2% | |
Herbalife, Ltd. | | | 12,800 | | | | 661,376 | |
| | | | | | | | |
China — 0.1% | | | | | | | | |
Lihua International, Inc.D | | | 87,600 | | | | 416,976 | |
| | | | | | | | |
Greece — 0.1% | |
Aegean Marine Petroleum Network, Inc. | | | 92,500 | | | | 377,400 | |
| | | | | | | | |
Israel — 0.2% | |
Allot Communications, Ltd.* | | | 21,300 | | | | 323,760 | |
SodaStream International, Ltd.D* | | | 15,000 | | | | 490,350 | |
| | | | | | | | |
| | | | | | | 814,110 | |
| | | | | | | | |
Luxembourg — 0.2% | |
Altisource Portfolio Solutions SA* | | | 17,900 | | | | 898,222 | |
| | | | | | | | |
|
| See Notes to Financial Statements. |
172 |
SMALL CAP EQUITY FUND
SCHEDULE OF INVESTMENTS (Continued)
| | | | | | | | |
| | | Shares | | | Value | |
Netherlands — 0.4% | |
AerCap Holdings NV* | | | 16,345 | | | $ | 184,535 | |
Chicago Bridge & Iron Co. NV | | | 41,000 | | | | 1,549,800 | |
| | | | | | | | |
| | | | | | | 1,734,335 | |
| | | | | | | | |
Panama — 0.2% | |
Banco Latinoamericano de Commercio Exterior SA, Class ED | | | 60,600 | | | | 972,630 | |
| | | | | | | | |
Puerto Rico — 0.5% | | | | | | | | |
Oriental Financial GroupD | | | 90,300 | | | | 1,093,533 | |
Popular, Inc.* | | | 629,700 | | | | 875,283 | |
| | | | | | | | |
| | | | | | | 1,968,816 | |
| | | | | | | | |
South Africa — 0.1% | |
Net 1 UEPS Technologies, Inc.* | | | 72,100 | | | | 553,007 | |
| | | | | | | | |
Switzerland — 0.2% | | | | | | | | |
Foster Wheeler AG* | | | 41,900 | | | | 801,966 | |
| | | | | | | | |
Taiwan — 0.1% | |
Silicon Motion Technology Corporation ADR* | | | 26,400 | | | | 540,672 | |
| | | | | | | | |
United Kingdom — 0.4% | | | | | | | | |
Xyratex, Ltd.D | | | 120,200 | | | | 1,601,064 | |
| | | | | | | | |
Total Foreign Common Stocks
(Cost $19,091,391) | | | | 17,974,761 | |
| | | | | | | | |
RIGHTS/WARRANTS — 0.0% | |
Asen Warrants A+ | | | 25,000 | | | | 20,500 | |
Asen Warrants B+ | | | 25,000 | | | | 13,250 | |
Asen Warrants C+ | | | 25,000 | | | | 41,750 | |
| | | | | | | | |
Total Rights/Warrants
(Cost $0) | | | | | | | 75,500 | |
| | | | | | | | |
MONEY MARKET FUNDS — 41.4% | |
GuideStone Money Market Fund (GS4 Class)¥ | | | 18,753,369 | | | | 18,753,369 | |
Northern Institutional Liquid Assets Portfolio§ | | | 154,245,790 | | | | 154,245,790 | |
| | | | | | | | |
Total Money Market Funds
(Cost $172,999,159) | | | | 172,999,159 | |
| | | | | | | | |
| | |
| | | Par | | | | |
AGENCY OBLIGATIONS — 1.8% | |
Federal Home Loan Bank | | | | | | | | |
0.32%, 02/10/12 | | $ | 330,000 | | | | 329,996 | |
3.63%, 10/18/13 | | | 30,000 | | | | 31,720 | |
5.50%, 07/15/36 | | | 120,000 | | | | 156,231 | |
Federal Home Loan Mortgage Corporation | | | | | | | | |
0.11%, 01/10/12‡‡ | | | 1,486,000 | | | | 1,485,996 | |
1.35%, 04/29/14 | | | 30,000 | | | | 30,569 | |
6.75%, 03/15/31 | | | 120,000 | | | | 180,952 | |
Federal National Mortgage Association | | | | | | | | |
0.00%, 01/04/12W | | | 900,000 | | | | 899,998 | |
0.87%, 01/12/12‡‡ | | | 3,029,000 | | | | 3,028,991 | |
0.03%, 01/18/12‡‡ | | | 30,000 | | | | 30,000 | |
0.05%, 02/01/12‡‡ | | | 49,000 | | | | 49,000 | |
5.25%, 08/01/12 | | | 110,000 | | | | 113,059 | |
0.38%, 12/28/12 | | | 150,000 | | | | 150,355 | |
5.00%, 02/13/17 | | | 230,000 | | | | 271,931 | |
4.37%, 10/09/19 | | | 90,000 | | | | 69,330 | |
6.25%, 05/15/29D | | | 110,000 | | | | 155,321 | |
| | | | | | | | |
| | | Shares | | | Value | |
Tennessee Valley Authority | | | | | | | | |
3.88%, 02/15/21D | | $ | 110,000 | | | $ | 125,744 | |
5.25%, 09/15/39 | | | 50,000 | | | | 64,083 | |
4.63%, 09/15/60 | | | 80,000 | | | | 96,038 | |
| | | | | | | | |
Total Agency Obligations
(Cost $7,122,594) | | | | | | | 7,269,314 | |
| | | | | | | | |
ASSET-BACKED SECURITIES — 0.4% | |
Ameriquest Mortgage Securities, Inc. | | | | | | | | |
0.64%, 04/25/34† | | | 41,289 | | | | 33,296 | |
Asset Backed Securities Corporation Home Equity | | | | | | | | |
1.25%, 12/15/33† | | | 28,312 | | | | 21,264 | |
Bear Stearns Asset-Backed Securities Trust | | | | | | | | |
1.19%, 10/27/32† | | | 10,235 | | | | 8,669 | |
0.74%, 12/25/33† | | | 168,852 | | | | 141,240 | |
Education Funding Capital Trust I | | | | | | | | |
2.43%, 12/15/42† | | | 100,000 | | | | 88,580 | |
1.52%, 06/15/43† | | | 100,000 | | | | 85,208 | |
EMC Mortgage Loan Trust | | | | | | | | |
0.94%, 02/25/41 144A† | | | 53,436 | | | | 43,702 | |
Greenpoint Manufactured Housing | | | | | | | | |
3.79%, 03/18/29† | | | 75,000 | | | | 58,226 | |
3.79%, 06/19/29† | | | 50,000 | | | | 38,606 | |
3.79%, 02/20/30† | | | 50,000 | | | | 38,823 | |
2.25%, 11/22/31† | | | 50,000 | | | | 42,417 | |
GSAA Trust | | | | | | | | |
0.56%, 07/25/37† | | | 200,000 | | | | 117,282 | |
Hertz Vehicle Financing LLC | | | | | | | | |
5.29%, 03/25/16 144A | | | 90,000 | | | | 97,435 | |
KeyCorporation Student Loan Trust | | | | | | | | |
0.68%, 10/25/32† | | | 58,963 | | | | 55,013 | |
Lehman XS Trust | | | | | | | | |
0.59%, 11/25/35† | | | 193,450 | | | | 128,227 | |
0.59%, 12/25/35† | | | 100,092 | | | | 28,803 | |
0.55%, 02/25/46† | | | 213,395 | | | | 110,249 | |
MASTR Specialized Loan Trust | | | | | | | | |
0.64%, 05/25/37 144A† | | | 202,167 | | | | 70,871 | |
Option One Mortgage Loan Trust | | | | | | | | |
1.09%, 11/25/32† | | | 19,128 | | | | 14,816 | |
Renaissance Home Equity Loan Trust | | | | | | | | |
1.15%, 06/25/33† | | | 23,000 | | | | 18,051 | |
Securitized Asset-Backed Receivables LLC | | | | | | | | |
0.52%, 02/25/37† | | | 218,793 | | | | 70,752 | |
SLM Student Loan Trust | | | | | | | | |
0.59%, 07/25/23† | | | 100,000 | | | | 97,080 | |
0.98%, 09/16/24† | | | 100,000 | | | | 90,311 | |
1.30%, 03/15/33 144A† | | | 92,246 | | | | 88,071 | |
| | | | | | | | |
Total Asset-Backed Securities
(Cost $2,176,878) | | | | | | | 1,586,992 | |
| | | | | | | | |
CORPORATE BONDS — 2.4% | |
AES Corporation | | | | | | | | |
7.75%, 10/15/15D | | | 30,000 | | | | 32,775 | |
8.00%, 06/01/20 | | | 190,000 | | | | 209,950 | |
Ally Financial, Inc. | | | | | | | | |
1.75%, 10/30/12 | | | 100,000 | | | | 101,310 | |
|
See Notes to Financial Statements. 173 |
| | | | | | | | |
| | | Par | | | Value | |
American Express Co. | | | | | | | | |
6.80%, 09/01/66† | | $ | 150,000 | | | $ | 149,812 | |
American International Group, Inc. | | | | | | | | |
5.85%, 01/16/18 | | | 180,000 | | | | 176,484 | |
6.40%, 12/15/20D | | | 30,000 | | | | 30,328 | |
Apache Corporation | | | | | | | | |
5.63%, 01/15/17 | | | 110,000 | | | | 130,539 | |
Arch Coal, Inc. | | | | | | | | |
7.00%, 06/15/19 144AD | | | 70,000 | | | | 71,750 | |
Aristotle Holding, Inc. | | | | | | | | |
3.50%, 11/15/16 144A | | | 150,000 | | | | 152,938 | |
AT&T, Inc. | | | | | | | | |
5.50%, 02/01/18D | | | 90,000 | | | | 104,315 | |
3.88%, 08/15/21D | | | 20,000 | | | | 21,198 | |
6.30%, 01/15/38 | | | 60,000 | | | | 73,923 | |
5.55%, 08/15/41D | | | 30,000 | | | | 35,461 | |
BAC Capital Trust XIV | | | | | | | | |
5.63%, 09/20/49† | | | 10,000 | | | | 6,075 | |
Baker Hughes, Inc. | | | | | | | | |
7.50%, 11/15/18 | | | 60,000 | | | | 79,265 | |
Bank of America Corporation | | | | | | | | |
5.42%, 03/15/17 | | | 60,000 | | | | 54,192 | |
5.75%, 12/01/17 | | | 190,000 | | | | 179,679 | |
5.00%, 05/13/21D | | | 50,000 | | | | 45,625 | |
Boeing Capital Corporation | | | | | | | | |
4.70%, 10/27/19 | | | 40,000 | | | | 45,606 | |
Boeing Co. | | | | | | | | |
4.88%, 02/15/20D | | | 60,000 | | | | 70,174 | |
Calpine Corporation | | | | | | | | |
7.88%, 01/15/23 144AD | | | 80,000 | | | | 86,400 | |
Caterpillar Financial Services Corporation | | | | | | | | |
6.20%, 09/30/13 | | | 110,000 | | | | 119,962 | |
Caterpillar, Inc. | | | | | | | | |
3.90%, 05/27/21D | | | 40,000 | | | | 44,001 | |
CCO Holdings LLC | | | | | | | | |
7.00%, 01/15/19 | | | 70,000 | | | | 73,325 | |
6.50%, 04/30/21 | | | 10,000 | | | | 10,175 | |
Cellco Partnership/Verizon Wireless Capital LLC | | | | | | | | |
8.50%, 11/15/18 | | | 60,000 | | | | 81,094 | |
Citigroup, Inc. | | | | | | | | |
6.00%, 12/13/13 | | | 110,000 | | | | 113,876 | |
6.38%, 08/12/14 | | | 30,000 | | | | 31,504 | |
5.00%, 09/15/14 | | | 170,000 | | | | 168,355 | |
5.50%, 10/15/14D | | | 50,000 | | | | 51,435 | |
3.95%, 06/15/16D | | | 70,000 | | | | 69,829 | |
5.38%, 08/09/20 | | | 50,000 | | | | 51,502 | |
6.88%, 03/05/38 | | | 90,000 | | | | 99,189 | |
Comcast Corporation | | | | | | | | |
6.50%, 01/15/17 | | | 120,000 | | | | 141,296 | |
5.15%, 03/01/20 | | | 20,000 | | | | 22,783 | |
5.65%, 06/15/35 | | | 10,000 | | | | 11,084 | |
Community Health Systems, Inc. | | | | | | | | |
8.88%, 07/15/15D | | | 30,000 | | | | 31,050 | |
Concho Resources Inc. | | | | | | | | |
6.50%, 01/15/22 | | | 33,000 | | | | 34,650 | |
ConocoPhillips Holding Co. | | | | | | | | |
6.95%, 04/15/29 | | | 100,000 | | | | 136,710 | |
Consol Energy, Inc. | | | | | | | | |
6.38%, 03/01/21 144A | | | 50,000 | | | | 50,750 | |
| | | | | | | | |
| | | Par | | | Value | |
Countrywide Financial Corporation | | | | | | | | |
6.25%, 05/15/16D | | $ | 50,000 | | | $ | 47,151 | |
CVS Caremark Corporation | | | | | | | | |
6.60%, 03/15/19 | | | 60,000 | | | | 73,242 | |
CVS Pass-Through Trust | | | | | | | | |
9.35%, 01/10/23 144A | | | 100,000 | | | | 105,965 | |
6.94%, 01/10/30 | | | 63,940 | | | | 71,060 | |
Devon Energy Corporation | | | | | | | | |
5.60%, 07/15/41 | | | 90,000 | | | | 108,632 | |
Dominion Resources, Inc. | | | | | | | | |
5.70%, 09/17/12 | | | 120,000 | | | | 124,045 | |
Duke Energy Carolinas LLC | | | | | | | | |
5.63%, 11/30/12 | | | 130,000 | | | | 135,495 | |
Ecolab, Inc. | | | | | | | | |
4.35%, 12/08/21 | | | 20,000 | | | | 21,401 | |
Energy Future Intermediate Holding Co., LLC | | | | | | | | |
10.00%, 12/01/20D | | | 270,000 | | | | 286,200 | |
Enterprise Products Operating LLC | | | | | | | | |
6.30%, 09/15/17 | | | 170,000 | | | | 199,335 | |
5.70%, 02/15/42 | | | 30,000 | | | | 32,807 | |
Farmer Mac Guaranteed Notes Trust | | | | | | | | |
5.13%, 04/19/17 144A | | | 250,000 | | | | 292,026 | |
FirstEnergy Corporation | | | | | | | | |
7.38%, 11/15/31 | | | 130,000 | | | | 160,324 | |
Ford Motor Credit Co., LLC | | | | | | | | |
12.00%, 05/15/15 | | | 140,000 | | | | 172,549 | |
Freeport-McMoRan Copper & Gold, Inc. | | | | | | | | |
8.38%, 04/01/17 | | | 145,000 | | | | 154,226 | |
Fresenius Medical Care US Finance, Inc. | | | | | | | | |
6.88%, 07/15/17 | | | 40,000 | | | | 42,750 | |
General Electric Capital Corporation | | | | | | | | |
6.00%, 08/07/19 | | | 260,000 | | | | 299,107 | |
4.63%, 01/07/21 | | | 30,000 | | | | 31,181 | |
5.30%, 02/11/21D | | | 10,000 | | | | 10,709 | |
6.38%, 11/15/67† | | | 130,000 | | | | 128,375 | |
Goldman Sachs Capital II | | | | | | | | |
5.79%, 06/01/43† | | | 10,000 | | | | 6,200 | |
Goldman Sachs Group, Inc. | | | | | | | | |
6.60%, 01/15/12 | | | 10,000 | | | | 10,013 | |
5.30%, 02/14/12D | | | 10,000 | | | | 10,034 | |
3.63%, 08/01/12D | | | 20,000 | | | | 20,123 | |
5.45%, 11/01/12 | | | 20,000 | | | | 20,344 | |
5.25%, 10/15/13 | | | 20,000 | | | | 20,415 | |
5.95%, 01/18/18 | | | 100,000 | | | | 102,551 | |
5.38%, 03/15/20 | | | 60,000 | | | | 59,318 | |
6.00%, 06/15/20 | | | 40,000 | | | | 41,042 | |
5.25%, 07/27/21 | | | 10,000 | | | | 9,773 | |
6.25%, 02/01/41 | | | 130,000 | | | | 127,955 | |
Grifols, Inc. | | | | | | | | |
8.25%, 02/01/18 | | | 10,000 | | | | 10,550 | |
Hess Corporation | | | | | | | | |
8.13%, 02/15/19 | | | 90,000 | | | | 115,693 | |
7.30%, 08/15/31 | | | 40,000 | | | | 51,477 | |
HSBC Finance Corporation | | | | | | | | |
6.68%, 01/15/21 | | | 110,000 | | | | 113,976 | |
Humana, Inc. | | | | | | | | |
7.20%, 06/15/18D | | | 60,000 | | | | 70,080 | |
|
| See Notes to Financial Statements. |
174 |
SMALL CAP EQUITY FUND
SCHEDULE OF INVESTMENTS (Continued)
| | | | | | | | |
| | | Par | | | Value | |
International Lease Finance Corporation | | | | | | | | |
6.50%, 09/01/14 144AD | | $ | 30,000 | | | $ | 30,825 | |
6.75%, 09/01/16 144A | | | 150,000 | | | | 154,500 | |
JPMorgan Chase & Co. | | | | | | | | |
6.13%, 06/27/17D | | | 200,000 | | | | 220,078 | |
4.40%, 07/22/20 | | | 60,000 | | | | 61,382 | |
4.35%, 08/15/21D | | | 10,000 | | | | 10,119 | |
Kerr-McGee Corporation | | | | | | | | |
6.95%, 07/01/24 | | | 120,000 | | | | 143,428 | |
Kinder Morgan Energy Partners LP | | | | | | | | |
6.00%, 02/01/17D | | | 70,000 | | | | 79,312 | |
Kraft Foods, Inc. | | | | | | | | |
5.38%, 02/10/20 | | | 110,000 | | | | 127,136 | |
Lehman Brothers Holdings Capital Trust VII | | | | | | | | |
5.86%, 11/29/49# | | | 10,000 | | | | 6 | |
Lehman Brothers Holdings E-Capital Trust I | | | | | | | | |
3.59%, 08/19/65# | | | 50,000 | | | | 30 | |
Lehman Brothers Holdings, Inc. | | | | | | | | |
6.50%, 07/19/17# | | | 160,000 | | | | 176 | |
6.75%, 12/28/17# | | | 120,000 | | | | 132 | |
MarkWest Energy Partners LP | | | | | | | | |
6.25%, 06/15/22 | | | 10,000 | | | | 10,500 | |
Medtronic, Inc. | | | | | | | | |
4.45%, 03/15/20 | | | 40,000 | | | | 45,216 | |
Merrill Lynch & Co., Inc. | | | | | | | | |
5.45%, 02/05/13D | | | 220,000 | | | | 221,657 | |
MetLife, Inc. | | | | | | | | |
6.75%, 06/01/16D | | | 50,000 | | | | 57,658 | |
6.40%, 12/15/66 | | | 120,000 | | | | 114,150 | |
Noble Energy, Inc. | | | | | | | | |
4.15%, 12/15/21 | | | 90,000 | | | | 93,290 | |
Occidental Petroleum Corporation | | | | | | | | |
3.13%, 02/15/22 | | | 50,000 | | | | 51,401 | |
Pacific Gas & Electric Co. | | | | | | | | |
5.63%, 11/30/17 | | | 30,000 | | | | 35,546 | |
6.05%, 03/01/34D | | | 40,000 | | | | 49,677 | |
Pemex Project Funding Master Trust | | | | | | | | |
6.63%, 06/15/35 | | | 90,000 | | | | 102,938 | |
PepsiCo, Inc. | | | | | | | | |
7.90%, 11/01/18 | | | 13,000 | | | | 17,575 | |
Pfizer, Inc. | | | | | | | | |
6.20%, 03/15/19 | | | 70,000 | | | | 86,503 | |
Qwest Communications International, Inc. | | | | | | | | |
7.50%, 02/15/14 | | | 50,000 | | | | 50,314 | |
Raytheon Co. | | | | | | | | |
3.13%, 10/15/20 | | | 30,000 | | | | 30,291 | |
Reed Elsevier Capital, Inc. | | | | | | | | |
8.63%, 01/15/19 | | | 80,000 | | | | 99,984 | |
Regency Energy Partners LP | | | | | | | | |
6.50%, 07/15/21 | | | 42,000 | | | | 43,890 | |
Roche Holdings, Inc. | | | | | | | | |
6.00%, 03/01/19 144A | | | 90,000 | | | | 109,551 | |
Safeway, Inc. | | | | | | | | |
3.95%, 08/15/20D | | | 30,000 | | | | 29,679 | |
4.75%, 12/01/21 | | | 40,000 | | | | 41,055 | |
SESI LLC | | | | | | | | |
7.13%, 12/15/21 144A | | | 10,000 | | | | 10,525 | |
| | | | | | | | |
| | | Par | | | Value | |
Sprint Capital Corporation | | | | | | | | |
6.90%, 05/01/19 | | $ | 100,000 | | | $ | 82,750 | |
State Street Corporation | | | | | | | | |
4.96%, 03/15/18 | | | 100,000 | | | | 104,080 | |
Steel Dynamics, Inc. | | | | | | | | |
7.38%, 11/01/12 | | | 25,000 | | | | 26,094 | |
Teachers Insurance & Annuity Association of America | | | | | | | | |
6.85%, 12/16/39 144A | | | 60,000 | | | | 77,276 | |
Thermo Fisher Scientific, Inc. | | | | | | | | |
3.60%, 08/15/21 | | | 20,000 | | | | 20,931 | |
Time Warner Cable, Inc. | | | | | | | | |
6.75%, 07/01/18D | | | 110,000 | | | | 130,824 | |
4.13%, 02/15/21D | | | 10,000 | | | | 10,288 | |
5.88%, 11/15/40 | | | 80,000 | | | | 86,893 | |
Time Warner, Inc. | | | | | | | | |
4.70%, 01/15/21 | | | 30,000 | | | | 32,361 | |
6.25%, 03/29/41 | | | 10,000 | | | | 12,034 | |
United Parcel Service, Inc. | | | | | | | | |
4.50%, 01/15/13 | | | 50,000 | | | | 52,072 | |
UnitedHealth Group, Inc. | | | | | | | | |
4.88%, 02/15/13D | | | 100,000 | | | | 104,160 | |
Verizon Communications, Inc. | | | | | | | | |
3.50%, 11/01/21 | | | 30,000 | | | | 31,299 | |
6.00%, 04/01/41 | | | 50,000 | | | | 62,231 | |
Wachovia Corporation | | | | | | | | |
5.63%, 10/15/16 | | | 270,000 | | | | 294,258 | |
Waste Management, Inc. | | | | | | | | |
7.38%, 05/15/29 | | | 20,000 | | | | 25,498 | |
WellPoint, Inc. | | | | | | | | |
5.88%, 06/15/17 | | | 110,000 | | | | 126,899 | |
Wells Fargo & Co. | | | | | | | | |
3.68%, 06/15/16 | | | 50,000 | | | | 52,303 | |
4.60%, 04/01/21 | | | 10,000 | | | | 10,988 | |
Williams Cos., Inc. | | | | | | | | |
7.88%, 09/01/21 | | | 24,000 | | | | 29,590 | |
7.50%, 01/15/31 | | | 15,000 | | | | 18,332 | |
7.75%, 06/15/31 | | | 24,000 | | | | 29,937 | |
8.75%, 03/15/32 | | | 5,000 | | | | 6,569 | |
Williams Partners LP | | | | | | | | |
5.25%, 03/15/20 | | | 20,000 | | | | 22,177 | |
WPX Energy, Inc. | | | | | | | | |
6.00%, 01/15/22 144A | | | 20,000 | | | | 20,575 | |
Wyeth | | | | | | | | |
5.95%, 04/01/37 | | | 10,000 | | | | 12,856 | |
| | | | | | | | |
Total Corporate Bonds
(Cost $9,684,264) | | | | | | | 10,098,292 | |
| | | | | | | | |
FOREIGN BONDS — 0.7% | |
Australia — 0.1% | |
BHP Billiton Finance (USA) Ltd. | | | | | | | | |
6.50%, 04/01/19D | | | 110,000 | | | | 136,114 | |
3.25%, 11/21/21 | | | 10,000 | | | | 10,318 | |
Commonwealth Bank of Australia | | | | | | | | |
3.75%, 10/15/14 144A | | | 60,000 | | | | 61,859 | |
5.00%, 10/15/19 144A | | | 20,000 | | | | 21,245 | |
Rio Tinto Finance USA, Ltd. | | | | | | | | |
9.00%, 05/01/19 | | | 180,000 | | | | 246,010 | |
| | | | | | | | |
| | | | | | | 475,546 | |
| | | | | | | | |
Canada — 0.1% | |
Anadarko Finance Co. | | | | | | | | |
7.50%, 05/01/31 | | | 60,000 | | | | 72,793 | |
|
See Notes to Financial Statements. 175 |
| | | | | | | | |
| | | Par | | | Value | |
Barrick Gold Corporation | | | | | | | | |
6.95%, 04/01/19 | | $ | 100,000 | | | $ | 122,986 | |
Potash Corporation of Saskatchewan, Inc. | | | | | | | | |
4.88%, 03/30/20 | | | 20,000 | | | | 23,005 | |
| | | | | | | | |
| | | | | | | 218,784 | |
| | | | | | | | |
Cayman Islands — 0.1% | | | | | | | | |
Petrobras International Finance Co. | | | | | | | | |
3.88%, 01/27/16 | | | 50,000 | | | | 51,761 | |
6.13%, 10/06/16 | | | 40,000 | | | | 44,542 | |
5.75%, 01/20/20 | | | 32,000 | | | | 34,404 | |
5.38%, 01/27/21 | | | 110,000 | | | | 116,116 | |
Resona Preferred Global Securities Cayman, Ltd. | | | | | | | | |
7.19%, 12/29/49 144A†D | | | 60,000 | | | | 59,376 | |
Vale Overseas, Ltd. | | | | | | | | |
6.88%, 11/21/36 | | | 60,000 | | | | 68,613 | |
| | | | | | | | |
| | | | | | | 374,812 | |
| | | | | | | | |
France — 0.0% | | | | | | | | |
Credit Agricole SA | | | | | | | | |
8.38%, 10/29/49 144A†D | | | 120,000 | | | | 90,600 | |
| | | | | | | | |
Iceland — 0.0% | | | | | | | | |
Glitnir Banki HF | | | | | | | | |
6.69%, 06/15/16+ 144A# | | | 130,000 | | | | 1 | |
Kaupthing Bank HF | | | | | | | | |
7.63%, 02/28/15 144A#@ | | | 310,000 | | | | 78,275 | |
| | | | | | | | |
| | | | | | | 78,276 | |
| | | | | | | | |
India — 0.0% | | | | | | | | |
ICICI Bank, Ltd. | | | | | | | | |
6.38%, 04/30/22 144A† | | | 110,000 | | | | 97,350 | |
| | | | | | | | |
Japan — 0.1% | | | | | | | | |
Japan Finance Cooperation | | | | | | | | |
2.88%, 02/02/15 | | | 200,000 | | | | 210,958 | |
Japan Finance Organization for Municipalities | | | | | | | | |
4.00%, 01/13/21 | | | 100,000 | | | | 112,222 | |
Sumitomo Mitsui Banking Corporation | | | | | | | | |
3.15%, 07/22/15 144A | | | 100,000 | | | | 104,436 | |
| | | | | | | | |
| | | | | | | 427,616 | |
| | | | | | | | |
Jersey — 0.0% | | | | | | | | |
UBM PLC | | | | | | | | |
5.75%, 11/03/20 144A | | | 30,000 | | | | 30,312 | |
| | | | | | | | |
Mexico — 0.1% | | | | | | | | |
America Movil SAB de CV | | | | | | | | |
5.63%, 11/15/17 | | | 30,000 | | | | 34,786 | |
Mexican Bonos | | | | | | | | |
8.00%, 06/11/20(M) | | | 2,100,000 | | | | 167,571 | |
Mexico Government International Bond | | | | | | | | |
6.75%, 09/27/34 | | | 40,000 | | | | 52,300 | |
6.05%, 01/11/40D | | | 10,000 | | | | 12,275 | |
| | | | | | | | |
| | | | | | | 266,932 | |
| | | | | | | �� | |
Netherlands — 0.0% | | | | | | | | |
Deutsche Telekom International Finance BV | | | | | | | | |
5.75%, 03/23/16 | | | 75,000 | | | | 83,544 | |
| | | | | | | | |
| | | Par | | | Value | |
Shell International Finance BV | | | | | | | | |
4.38%, 03/25/20 | | $ | 90,000 | | | $ | 105,257 | |
| | | | | | | | |
| | | | | | | 188,801 | |
| | | | | | | | |
Russia — 0.0% | | | | | | | | |
Russian Federation | | | | | | | | |
7.50%, 03/31/30 STEP | | | 10,855 | | | | 12,633 | |
| | | | | | | | |
Spain — 0.1% | | | | | | | | |
BBVA US Senior SAU | | | | | | | | |
3.25%, 05/16/14 | | | 100,000 | | | | 94,775 | |
Santander US Debt SA Unipersonal | | | | | | | | |
3.72%, 01/20/15 144A | | | 100,000 | | | | 90,865 | |
Telefonica Emisiones SAU | | | | | | | | |
5.88%, 07/15/19 | | | 30,000 | | | | 29,693 | |
5.46%, 02/16/21 | | | 30,000 | | | | 28,678 | |
| | | | | | | | |
| | | | | | | 244,011 | |
| | | | | | | | |
Switzerland — 0.0% | | | | | | | | |
UBS AG | | | | | | | | |
4.88%, 08/04/20D | | | 80,000 | | | | 79,592 | |
| | | | | | | | |
United Kingdom — 0.1% | | | | | | | | |
BP Capital Markets PLC | | | | | | | | |
5.25%, 11/07/13 | | | 90,000 | | | | 96,574 | |
3.88%, 03/10/15 | | | 30,000 | | | | 32,058 | |
3.56%, 11/01/21 | | | 10,000 | | | | 10,382 | |
Lloyds TSB Bank PLC | | | | | | | | |
6.38%, 01/21/21 | | | 100,000 | | | | 100,384 | |
Royal Bank of Scotland PLC | | | | | | | | |
4.88%, 03/16/15D | | | 100,000 | | | | 95,688 | |
3.95%, 09/21/15 | | | 50,000 | | | | 46,925 | |
Royal Bank of Scotland Group PLC | | | | | | | | |
7.65%, 08/29/49† | | | 10,000 | | | | 6,863 | |
WPP Finance UK | | | | | | | | |
8.00%, 09/15/14 | | | 100,000 | | | | 111,459 | |
| | | | | | | | |
| | | | | | | 500,333 | |
| | | | | | | | |
Total Foreign Bonds
(Cost $3,230,709) | | | | | | | 3,085,598 | |
| | | | | | | | |
MORTGAGE-BACKED SECURITIES — 4.3% | |
American Home Mortgage Investment Trust | | | | | | | | |
0.99%, 04/25/44† | | | 33,158 | | | | 26,322 | |
0.58%, 11/25/45† | | | 185,436 | | | | 105,709 | |
Bank of America Merrill Lynch Commercial Mortgage, Inc. | | | | | | | | |
5.63%, 07/10/46 | | | 90,000 | | | | 99,589 | |
Bear Stearns Adjustable Rate Mortgage Trust | | | | | | | | |
2.73%, 02/25/35† | | | 66,715 | | | | 46,946 | |
2.73%, 08/25/35† | | | 192,921 | | | | 105,432 | |
Bear Stearns Mortgage Funding Trust | | | | | | | | |
0.50%, 12/25/46† | | | 199,890 | | | | 39,006 | |
Commercial Mortgage Lease-Backed Certificates | | | | | | | | |
6.75%, 06/20/31 144A | | | 196,482 | | | | 209,831 | |
Countrywide Alternative Loan Trust | | | | | | | | |
0.53%, 07/25/35† | | | 176,634 | | | | 94,786 | |
0.55%, 07/25/35† | | | 238,843 | | | | 126,848 | |
|
| See Notes to Financial Statements. |
176 |
SMALL CAP EQUITY FUND
SCHEDULE OF INVESTMENTS (Continued)
| | | | | | | | |
| | | Par | | | Value | |
Credit Suisse First Boston Mortgage Securities Corporation | | | | | | | | |
6.00%, 10/25/35 | | $ | 106,323 | | | $ | 65,294 | |
Credit Suisse Mortgage Capital Certificates | | | | | | | | |
5.42%, 02/15/39† | | | 70,000 | | | | 77,468 | |
Federal Home Loan Mortgage Corporation | | | | | | | | |
5.77%, 05/01/37† | | | 12,120 | | | | 12,913 | |
5.50%, 12/01/38 | | | 288,180 | | | | 313,091 | |
5.50%, 01/01/39 TBA | | | 100,000 | | | | 108,500 | |
6.00%, 11/01/39 | | | 491,338 | | | | 541,410 | |
3.50%, 01/12/42 TBA | | | 200,000 | | | | 205,344 | |
Federal Home Loan Mortgage Corporation REMIC | | | | | | | | |
8.00%, 09/25/21 | | | 210,000 | | | | 23,430 | |
Federal National Mortgage Association | | | | | | | | |
3.00%, 01/01/26 TBA | | | 500,000 | | | | 516,328 | |
6.50%, 01/14/28 TBA | | | 100,000 | | | | 111,266 | |
6.50%, 12/01/30 | | | 565,188 | | | | 646,100 | |
4.50%, 05/01/31 | | | 91,916 | | | | 98,305 | |
5.50%, 02/01/33 | | | 11,884 | | | | 12,991 | |
5.50%, 03/01/34 | | | 56,646 | | | | 61,924 | |
2.40%, 09/01/35† | | | 65,933 | | | | 69,668 | |
5.50%, 09/01/36 | | | 126,417 | | | | 138,194 | |
5.50%, 08/01/37 | | | 86,021 | | | | 94,034 | |
6.50%, 11/01/37 | | | 108,556 | | | | 121,722 | |
5.50%, 08/01/38 | | | 89,350 | | | | 98,121 | |
6.50%, 10/01/38 | | | 283,322 | | | | 316,981 | |
6.00%, 01/01/39 TBA | | | 600,000 | | | | 660,656 | |
6.50%, 06/01/39 | | | 282,671 | | | | 315,322 | |
6.50%, 10/01/39 | | | 500,000 | | | | 555,723 | |
4.50%, 01/01/40 TBA | | | 300,000 | | | | 319,219 | |
5.00%, 01/01/40 TBA | | | 700,000 | | | | 756,219 | |
5.50%, 01/01/40 TBA | | | 1,100,000 | | | | 1,197,797 | |
6.50%, 06/01/40 | | | 188,262 | | | | 209,831 | |
3.50%, 01/01/41 TBA | | | 900,000 | | | | 925,594 | |
4.00%, 01/01/41 TBA | | | 700,000 | | | | 735,328 | |
5.50%, 07/01/41 | | | 21,517 | | | | 23,447 | |
4.00%, 09/01/41 | | | 597,550 | | | | 628,470 | |
4.00%, 11/01/41 | | | 199,356 | | | | 209,671 | |
Federal National Mortgage Association REMIC | | | | | | | | |
11.06%, 10/25/40 IOW† | | | 74,283 | | | | 10,508 | |
9.09%, 12/25/40 IOW† | | | 162,445 | | | | 20,965 | |
5.50%, 07/25/41 | | | 102,782 | | | | 120,262 | |
12.35%, 07/25/41 IOW† | | | 87,432 | | | | 11,228 | |
6.68%, 10/25/41 IOW† | | | 286,924 | | | | 49,953 | |
FHLMC Multifamily Structured Pass Through Certificates | | | | | | | | |
6.36%, 08/25/18 IOW† | | | 259,955 | | | | 27,083 | |
6.09%, 01/25/20 IOW† | | | 216,765 | | | | 13,574 | |
13.67%, 04/25/20 IOW† | | | 384,005 | | | | 27,122 | |
6.17%, 06/25/20 IOW† | | | 425,220 | | | | 42,076 | |
6.58%, 08/25/20 IOW† | | | 207,680 | | | | 17,911 | |
8.00%, 04/25/21 IOW† | | | 528,307 | | | | 44,150 | |
6.24%, 10/25/21 IOW† | | | 185,000 | | | | 20,132 | |
8.39%, 06/25/46 IOW† | | | 277,783 | | | | 23,524 | |
First Horizon Alternative Mortgage Securities | | | | | | | | |
2.33%, 02/25/36† | | | 154,529 | | | | 101,211 | |
0.66%, 02/25/37† | | | 73,662 | | | | 37,792 | |
| | | | | | | | |
| | | Par | | | Value | |
General Electric Capital Commercial Mortgage Corporation | | | | | | | | |
5.33%, 03/10/44† | | $ | 100,000 | | | $ | 109,792 | |
Government National Mortgage Association | | | | | | | | |
1.00%, 10/20/33 IOW† | | | 756,809 | | | | 73,502 | |
13.63%, 03/20/35 IOW† | | | 328,284 | | | | 39,767 | |
13.90%, 03/20/35 IOW† | | | 382,998 | | | | 46,008 | |
0.94%, 12/16/36 IOW† | | | 92,703 | | | | 14,691 | |
14.09%, 05/20/37 IOW† | | | 103,029 | | | | 14,854 | |
6.50%, 10/20/37 | | | 80,963 | | | | 92,431 | |
6.00%, 01/01/38 TBA | | | 200,000 | | | | 226,375 | |
1.00%, 10/20/38 IOW† | | | 93,669 | | | | 14,822 | |
4.65%, 11/20/38 IOW† | | | 132,139 | | | | 20,284 | |
5.09%, 11/20/38 IOW† | | | 100,000 | | | | 13,340 | |
6.00%, 01/01/39 TBA | | | 200,000 | | | | 225,875 | |
14.58%, 04/16/39 IOW† | | | 52,366 | | | | 7,307 | |
5.00%, 01/01/40 TBA | | | 300,000 | | | | 331,687 | |
5.00%, 01/15/40 | | | 428,181 | | | | 477,485 | |
12.89%, 01/20/40 IOW† | | | 90,020 | | | | 13,189 | |
5.00%, 08/20/40 | | | 170,553 | | | | 188,791 | |
6.00%, 10/20/40 | | | 87,069 | | | | 98,758 | |
4.00%, 01/01/41 TBA | | | 200,000 | | | | 213,906 | |
5.50%, 01/01/41 TBA | | | 100,000 | | | | 112,109 | |
4.50%, 01/20/41 | | | 91,700 | | | | 100,208 | |
4.50%, 02/20/41 | | | 91,472 | | | | 99,958 | |
4.50%, 03/20/41 | | | 743,015 | | | | 811,952 | |
11.50%, 10/16/41 IOW† | | | 192,699 | | | | 33,286 | |
3.50%, 01/01/42 TBA | | | 100,000 | | | | 104,078 | |
1.44%, 11/20/59† | | | 291,217 | | | | 295,586 | |
1.26%, 05/20/60† | | | 164,186 | | | | 166,797 | |
0.75%, 01/20/61† | | | 230,641 | | | | 228,812 | |
0.70%, 02/20/61† | | | 235,525 | | | | 233,264 | |
0.75%, 03/20/61† | | | 97,870 | | | | 96,926 | |
Granite Mortgages PLC | | | | | | | | |
0.91%, 07/20/43† | | | 30,157 | | | | 28,903 | |
Greenpoint Mortgage Funding Trust | | | | | | | | |
0.55%, 10/25/45† | | | 49,371 | | | | 27,851 | |
GS Mortgage Securities Corporation II | | | | | | | | |
0.00%, 03/10/44 144AW† | | | 798 | | | | 44 | |
GSMPS Mortgage Loan Trust | | | | | | | | |
0.64%, 03/25/35 144A† | | | 31,074 | | | | 25,093 | |
0.64%, 09/25/35 144A† | | | 92,505 | | | | 72,213 | |
Harborview Mortgage Loan Trust | | | | | | | | |
0.53%, 06/19/35† | | | 231,078 | | | | 140,561 | |
Homestar Mortgage Acceptance Corporation | | | | | | | | |
0.74%, 07/25/34† | | | 94,725 | | | | 81,895 | |
Impac CMB Trust | | | | | | | | |
1.09%, 03/25/33† | | | 16,237 | | | | 11,886 | |
Indymac INDA Mortgage Loan Trust | | | | | | | | |
5.74%, 11/25/37† | | | 97,623 | | | | 69,928 | |
LB-UBS Commercial Mortgage Trust | | | | | | | | |
5.86%, 07/15/40† | | | 40,000 | | | | 43,816 | |
MASTR Adjustable Rate Mortgages Trust | | | | | | | | |
2.72%, 11/21/34† | | | 200,000 | | | | 182,469 | |
1.02%, 12/25/46† | | | 253,302 | | | | 66,711 | |
See Notes to Financial Statements.
177
| | | | | | | | |
| | | Par | | | Value | |
Merrill Lynch Mortgage Investors, Inc. | | | | | | | | |
5.01%, 05/25/34† | | $ | 22,077 | | | $ | 21,607 | |
Morgan Stanley Capital I | | | | | | | | |
5.69%, 04/15/49† | | | 200,000 | | | | 211,763 | |
RBSSP Resecuritization Trust | | | | | | | | |
3.15%, 12/26/35 144A† | | | 34,978 | | | | 34,979 | |
Residential Accredit Loans, Inc. | | | | | | | | |
3.09%, 12/26/34† | | | 239,200 | | | | 151,306 | |
0.69%, 10/25/45† | | | 138,896 | | | | 70,608 | |
Structured Adjustable Rate Mortgage Loan Trust | | | | | | | | |
2.59%, 11/25/34† | | | 67,914 | | | | 47,905 | |
Structured Asset Mortgage Investments, Inc. | | | | | | | | |
0.47%, 09/25/47† | | | 277,475 | | | | 139,772 | |
Structured Asset Securities Corporation | | | | | | | | |
0.59%, 10/25/27† | | | 23,207 | | | | 19,699 | |
Washington Mutual Mortgage Pass-Through Certificates | | | | | | | | |
2.55%, 02/25/33† | | | 29,056 | | | | 25,598 | |
2.45%, 10/25/33† | | | 91,495 | | | | 86,285 | |
2.48%, 01/25/35† | | | 100,350 | | | | 90,809 | |
2.32%, 11/25/36† | | | 182,138 | | | | 120,166 | |
0.61%, 08/25/45† | | | 122,398 | | | | 89,213 | |
Wells Fargo Mortgage Loan Trust | | | | | | | | |
2.78%, 08/27/35 144A† | | | 86,184 | | | | 79,619 | |
Wells Fargo Mortgage-Backed Securities Trust | | | | | | | | |
2.70%, 04/25/36† | | | 67,437 | | | | 50,722 | |
WF-RBS Commercial Mortgage Trust | | | | | | | | |
3.67%, 11/15/44 | | | 26,000 | | | | 26,486 | |
| | | | | | | | |
Total Mortgage-Backed Securities
(Cost $19,367,140) | | | | | | | 18,116,068 | |
| | | | | | | | |
MUNICIPAL BONDS — 0.1% | | | | | | | | |
Birmingham Commercial Development Authority, Civic Center Improvements Project, Revenue Bond, Series A | | | | | | | | |
5.50%, 04/01/41 | | | 10,000 | | | | 10,708 | |
Department of Airports of the City of Los Angeles, California, Revenue Bond, Series A | | | | | | | | |
5.00%, 05/15/35 | | | 10,000 | | | | 10,653 | |
5.25%, 05/15/39 | | | 10,000 | | | | 10,803 | |
Los Angeles Department of Water & Power, Revenue Bond | | | | | | | | |
6.57%, 07/01/45 | | | 30,000 | | | | 38,116 | |
Municipal Electric Authority of Georgia, Revenue Bond, Series B | | | | | | | | |
6.64%, 04/01/57 | | | 30,000 | | | | 31,213 | |
6.66%, 04/01/57 | | | 10,000 | | | | 10,290 | |
Northstar Education Finance, Inc. Revenue Bond | | | | | | | | |
1.63%, 01/29/46† | | | 100,000 | | | | 74,819 | |
San Mateo County Community College District, Election 2005, General Obligation, Series B | | | | | | | | |
5.00%, 09/01/38 | | | 10,000 | | | | 10,369 | |
| | | | | | | | |
| | | Par | | | Value | |
Santa Clara Valley Transportation Authority, Revenue Bond | | | | | | | | |
5.88%, 04/01/32 | | $ | 50,000 | | | $ | 58,749 | |
State of California, General Obligation | | | | | | | | |
7.30%, 10/01/39 | | | 50,000 | | | | 59,172 | |
State of Illinois, General Obligation | | | | | | | | |
5.67%, 03/01/18 | | | 50,000 | | | | 53,264 | |
5.88%, 03/01/19 | | | 50,000 | | | | 53,883 | |
| | | | | | | | |
Total Municipal Bonds
(Cost $394,883) | | | | | | | 422,039 | |
| | | | | | | | |
| | |
| | | Number of
Contracts | | | | |
PURCHASED OPTION — 0.0% | |
Put Option — 0.0% | | | | | | | | |
December 2012 90-Day Euro Futures, Strike Price $98.75, Expires 12/18/12 (MFG) | | | | | | | | |
(Cost $2,673) | | | 7 | | | | 2,319 | |
| | | | | | | | |
| | |
| | | Par | | | | |
U.S. TREASURY OBLIGATIONS — 0.8% | |
U.S. Treasury Bonds | | | | | | | | |
4.75%, 02/15/41D | | $ | 1,280,000 | | | | 1,764,200 | |
4.38%, 05/15/41D | | | 30,000 | | | | 39,094 | |
3.13%, 11/15/41D | | | 110,000 | | | | 115,259 | |
| | | | | | | | |
| | | | | | | 1,918,553 | |
| | | | | | | | |
U.S. Treasury Inflationary Index Bonds | | | | | | | | |
2.00%, 04/15/12 | | | 250,000 | | | | 280,385 | |
2.38%, 01/15/27D | | | 55,000 | | | | 79,839 | |
1.75%, 01/15/28 | | | 100,000 | | | | 130,125 | |
2.50%, 01/15/29D | | | 100,000 | | | | 140,947 | |
3.88%, 04/15/29 | | | 10,000 | | | | 21,503 | |
2.13%, 02/15/41D | | | 20,000 | | | | 27,986 | |
| | | | | | | | |
| | | | | | | 680,785 | |
| | | | | | | | |
U.S. Treasury Notes | | | | | | | | |
1.88%, 02/28/14 | | | 50,000 | | | | 51,711 | |
1.00%, 08/31/16 | | | 230,000 | | | | 232,552 | |
1.00%, 09/30/16 | | | 220,000 | | | | 222,303 | |
1.25%, 12/31/18 | | | 40,000 | | | | 40,081 | |
3.13%, 05/15/21D | | | 60,000 | | | | 67,003 | |
| | | | | | | | |
| | | | | | | 613,650 | |
| | | | | | | | |
Total U.S. Treasury Obligations
(Cost $3,026,607) | | | | 3,212,988 | |
| | | | | | | | |
TOTAL INVESTMENTS — 137.7%
(Cost $542,034,341) | | | | 575,584,682 | |
| | | | | | | | |
| | |
| | | Number of
Contracts | | | | |
WRITTEN OPTION — 0.0% | |
Put Option — 0.0% | |
September 2012 90-Day Euro Futures, Strike Price $98.75, Expires 09/18/12 (MFG) | | | | | | | | |
(Premiums received $(2,015)) | | | (7 | ) | | | (1,663 | ) |
| | | | | | | | |
Liabilities in Excess of Other Assets — (37.7)% | | | | | | | (157,667,579 | ) |
| | | | | | | | |
NET ASSETS — 100.0% | | | | | | $ | 417,915,440 | |
| | | | | | | | |
Please see abbreviation and footnote definitions beginning on page 200.
|
| See Notes to Financial Statements. |
178 |
SMALL CAP EQUITY FUND
SCHEDULE OF INVESTMENTS (Continued)
PORTFOLIO SUMMARY (based on net assets)
| | | | |
| | | % | |
Money Market Funds | | | 41.4 | |
Financial Services | | | 18.0 | |
Producer Durables | | | 14.4 | |
Futures Contracts | | | 13.6 | |
Consumer Discretionary | | | 12.3 | |
Technology | | | 11.5 | |
Healthcare | | | 8.2 | |
Energy | | | 5.7 | |
Foreign Common Stocks | | | 4.3 | |
Mortgage-Backed Securities | | | 4.3 | |
Utilities | | | 4.3 | |
Materials & Processing | | | 4.0 | |
Consumer Staples | | | 3.1 | |
Corporate Bonds | | | 2.4 | |
Agency Obligations | | | 1.8 | |
U.S. Treasury Obligations | | | 0.8 | |
Foreign Bonds | | | 0.7 | |
Asset-Backed Securities | | | 0.4 | |
Municipal Bonds | | | 0.1 | |
Purchased Option | | | — | ** |
Rights/Warrants | | | — | ** |
Written Option | | | — | ** |
Forward Foreign Currency Contracts | | | (0.2 | ) |
| | | | |
| | | 151.1 | |
| | | | |
| ** | Rounds to less than 0.005%. |
See Notes to Financial Statements.
179
VALUATION HIERARCHY
The following is a summary of the inputs used, as of December 31, 2011, in valuing the Fund’s investments carried at fair value:
| | | | | | | | | | | | | | | | |
| | | Total Value | | | Level 1
Quoted Prices | | | Level 2
Other
Significant
Observable
Inputs | | | Level 3
Significant
Unobservable
Inputs | |
Assets: | | | | | | | | | | | | | | | | |
Investments in Securities: | | | | | | | | | | | | | | | | |
Agency Obligations | | $ | 7,269,314 | | | $ | — | | | $ | 7,269,314 | | | $ | — | |
Asset-Backed Securities | | | 1,586,992 | | | | — | | | | 1,586,992 | | | | — | |
Common Stocks | | | 340,741,652 | | | | 340,279,577 | | | | — | | | | 462,075 | |
Corporate Bonds | | | 10,098,292 | | | | — | | | | 10,098,292 | | | | — | |
Foreign Bonds | | | 3,085,598 | | | | — | | | | 3,085,597 | | | | 1 | |
Foreign Common Stocks | | | 17,974,761 | | | | 17,974,761 | | | | — | | | | — | |
Money Market Funds | | | 172,999,159 | | | | 172,999,159 | | | | — | | | | — | |
Mortgage-Backed Securities | | | 18,116,068 | | | | — | | | | 18,116,068 | | | | — | |
Municipal Bonds | | | 422,039 | | | | — | | | | 422,039 | | | | — | |
Purchased Option | | | 2,319 | | | | 2,319 | | | | — | | | | — | |
Rights/Warrants | | | 75,500 | | | | — | | | | — | | | | 75,500 | |
U.S. Treasury Obligations | | | 3,212,988 | | | | — | | | | 3,212,988 | | | | — | |
| | | | | | | | | | | | | | | | |
Total Assets — Investments in Securities | | $ | 575,584,682 | | | $ | 531,255,816 | | | $ | 43,791,290 | | | $ | 537,576 | |
| | | | | | | | | | | | | | | | |
Other Financial Instruments*** | | | | | | | | | | | | | | | | |
Forward Foreign Currency Contracts | | $ | 93,770 | | | $ | — | | | $ | 93,770 | | | $ | — | |
Futures Contracts | | | 1,170,877 | | | | 1,170,877 | | | | — | | | | — | |
| | | | | | | | | | | | | | | | |
Total Assets — Other Financial Instruments | | $ | 1,264,647 | | | $ | 1,170,877 | | | $ | 93,770 | | | $ | — | |
| | | | | | | | | | | | | | | | |
Liabilities: | | | | | | | | | | | | | | | | |
Investments in Securities: | | | | | | | | | | | | | | | | |
Written Option | | $ | (1,663 | ) | | $ | (1,663 | ) | | $ | — | | | $ | — | |
| | | | | | | | | | | | | | | | |
Total Liabilities — Investments in Securities | | $ | (1,663 | ) | | $ | (1,663 | ) | | $ | — | | | $ | — | |
| | | | | | | | | | | | | | | | |
| *** | Other financial instruments are derivative instruments not reflected in the Schedule of Investments, such as futures, forwards and swap contracts, which are valued at the unrealized appreciation (depreciation) on the investment. Details of these investments can be found in the Notes to Financial Statements. |
|
| See Notes to Financial Statements. |
180 |
SMALL CAP EQUITY FUND
SCHEDULE OF INVESTMENTS (Continued)
The following is a reconciliation of assets in which significant unobservable inputs (Level 3) were used in determining fair value:
| | | | | | | | | | | | | | | | |
| | | Total
Value | | | Common
Stocks | | | Foreign
Bond | | | Rights/
Warrants | |
| | | | |
Balance, 12/31/10 | | $ | 560,550 | | | $ | 560,550 | | | $ | — | | | $ | — | |
Accrued discounts/premiums | | | — | | | | — | | | | — | | | | — | |
Realized gain (loss) | | | — | | | | — | | | | — | | | | — | |
Change in unrealized appreciation (depreciation)(1) | | | (22,975 | ) | | | (98,475 | ) | | | — | | | | 75,500 | |
Purchases | | | — | | | | — | | | | — | | | | — | |
Sales | | | — | | | | — | | | | — | | | | — | |
Transfers in and/or out of Level 3(2) | | | 1 | | | | — | | | | 1 | | | | — | |
| | | | | | | | | | | | | | | | |
Balance, 12/31/11 | | $ | 537,576 | | | $ | 462,075 | | | $ | 1 | | | $ | 75,500 | |
| | | | | | | | | | | | | | | | |
| (1) | Change in unrealized appreciation (depreciation) can be found on the Statement of Operations in Net change in unrealized appreciation (depreciation) on Investment securities and securities sold short. |
| (2) | The Fund had foreign bonds valued at $1 as of December 31, 2010 that were transferred from Level 2 to Level 3 of the fair value hierarchy. The foreign bonds that transferred from Level 2 to Level 3 did so as a result of the inability of the Fund to obtain a price which was determined using observable inputs. |
|
See Notes to Financial Statements. 181 |
International Equity Fund
Familiar themes such as the sovereign debt crisis in Europe, recession fears and moderating growth expectations in China continued to dominate headlines during 2011. International equity markets advanced during the final quarter of the year but were unable to overcome the dismal results posted in the third quarter. The MSCI-EAFE Index (Net), a measure of international developed country returns, posted a positive fourth quarter return of 3.33%, bringing the one-year return to -12.14%. Emerging markets equities, as measured by the MSCI Emerging Markets Index (Net), gained 4.42% for the fourth quarter, bringing the calendar year performance to -18.42%.
From a country perspective, most of the markets within the MSCI ACWI (All Country World Index) Ex-U.S. Index (representing both developed and emerging international markets) ended the year in negative territory. Countries within the Latin American and Africa/Mideast regions experienced the largest declines. MSCI reported that the U.K. market was down 2.52%, while the Japanese market declined 14.19% for the year. A few exceptions on the positive side included markets such as Ireland, New Zealand and Indonesia. From a sector perspective, defensive sectors such as consumer staples and healthcare were the only positive performers for the year. All other sectors experienced negative results, and the weakest performers were the financial and materials sectors which posted losses of over 20% for the year.
The Fund is primarily comprised of common stocks of foreign companies and is diversified among a large number of companies across different industries and economic sectors. The GS4 Class of the Fund slightly underperformed its benchmark, the MSCI ACWI (All Country World Index) Ex-U.S., for the one-year period ended December 31, 2011 (-14.01% versus -13.71%). On a country basis, underweight exposure and security selection to Canada and security selection to Russia negatively impacted the Fund, while security selection to Japan and the United Kingdom contributed positively to performance. On a sector basis, security selection to the consumer staples and financials sectors detracted from benchmark-relative returns, while security selection to the information technology and materials sectors added value during the year. Within the Fund, certain derivatives were utilized to determine active views in currency and country selection and to manage foreign currency exposure back to the U.S. dollar. These derivative positions included forward currency exchange contracts, stock index futures and currency forwards. Overall derivative exposure had a slight negative impact on Fund performance over the course of the year.
This Fund may be suitable to investors who seek higher, long-term rates of return, can accept significant short-term fluctuations in account value and want to diversify their portfolio with international stocks. The Fund invests in foreign and emerging market securities which involve certain risks such as currency volatility, political and social instability and reduced market liquidity. To the extent that the investment advisor misjudges current market conditions, the Fund’s volatility may be amplified by its use of short sales and derivatives and by its ability to select sub-advisers to allocate assets. Short sales by a fund theoretically involve unlimited loss potential since the market price of securities sold short may continuously increase. Leverage may increase the risk of loss and cause fluctuations in the market value of the Fund’s portfolio to have disproportionately large effects or cause the NAV of the Fund generally to decline faster than it would otherwise.
Please see page 198 for information regarding specific portfolio allocations. Portfolio holdings are subject to change and risk at any time.
182
International Equity Fund
| | | | | | | | | | | | |
Average Annual Total Returns as of 12/31/11 | |
| | | GS2
Class* | | | GS4
Class* | | | Benchmark** | |
One Year | | | -13.86 | % | | | -14.01 | % | | | -13.71 | % |
Five Year | | | -4.16 | % | | | -4.35 | % | | | -2.92 | % |
Ten Year | | | 5.34 | % | | | 5.14 | % | | | 6.31 | % |
Since Inception | | | 4.67 | % | | | 4.48 | % | | | 5.49 | % |
Inception Date | | | 08/27/01 | | | | 08/27/01 | | | | | |
Total Fund Operating Expenses (April 30, 2011 Prospectus, as amended on September 1, 2011)(1) | | | 1.24 | % | | | 1.48 | % | | | | |
| (1) | Current information regarding the Fund’s Operating Expenses can be found in the Financial Highlights. |
The performance data quoted represents past performance and does not guarantee future results. Current performance may be lower or higher. Performance data current to the most recent month-end may be obtained at www.GuideStoneFunds.org. The investment return and principal value of an investment will fluctuate so that shares, when redeemed, may be worth more or less than their original cost.
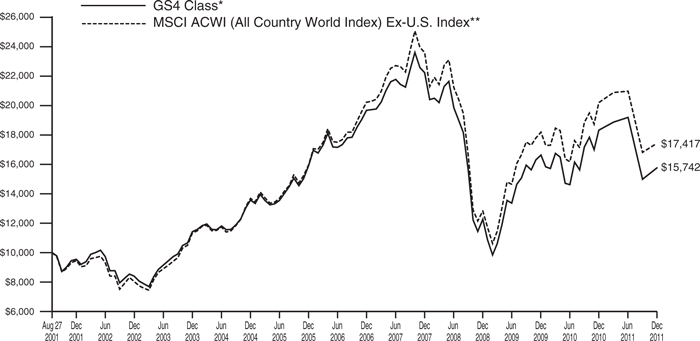
The graph compares the results of a hypothetical $10,000 investment in the GS4 Class of the Fund since August 27, 2001 (commencement of operations), with all dividends and capital gains reinvested, with the MSCI ACWI (All Country World Index) Ex-U.S. Index.
| * | These returns reflect expense waivers by the Fund’s investment adviser. Without these waivers, returns would have been lower. Returns shown do not reflect the deduction of taxes that a shareholder would pay on Fund distributions or the redemption of Fund shares. |
| ** | The MSCI ACWI (All Country World Index) Ex-U.S. Index is a free float-adjusted market capitalization index that is designed to measure equity market performance in the global developed (excluding U.S.) and emerging markets. |
Unlike a mutual fund, the performance of an index assumes no taxes, transaction costs, management fees or other expenses.
183
| | |
INTERNATIONAL EQUITY FUND SCHEDULE OF INVESTMENTS | | December 31, 2011 |
| | | | | | | | |
| | | Par | | | Value | |
FOREIGN BOND — 0.0% | | | | | | | | |
Jersey — 0.0% | | | | | | | | |
Magnolia Finance, Ltd. | | | | | | | | |
4.00%, 03/20/16 | | | | | | | | |
(Cost $167,136) | | $ | 200,000 | | | $ | 166,052 | |
| | | | | | | | |
| | |
| | | Shares | | | | |
FOREIGN COMMON STOCKS — 95.4% | |
Argentina — 0.2% | | | | | | | | |
Banco Macro SA ADRD | | | 11,958 | | | | 233,181 | |
Cresud SACIF y A ADR | | | 61,370 | | | | 699,005 | |
Pampa Energia SA ADRD | | | 46,575 | | | | 500,681 | |
Petrobras Argentina SA ADRD | | | 53,289 | | | | 672,507 | |
| | | | | | | | |
| | | | | | | 2,105,374 | |
| | | | | | | | |
Australia — 4.7% | | | | | | | | |
AGL Energy, Ltd.‡‡ | | | 25,537 | | | | 374,288 | |
Alumina, Ltd. | | | 34,920 | | | | 39,823 | |
Amcor, Ltd. | | | 574,104 | | | | 4,233,657 | |
AMP, Ltd. | | | 854,373 | | | | 3,556,574 | |
Ansell, Ltd. | | | 110 | | | | 1,636 | |
APN News & Media, Ltd. | | | 132,382 | | | | 96,134 | |
Asciano, Ltd. | | | 121,605 | | | | 559,698 | |
ASX, Ltd.‡‡ | | | 2,537 | | | | 79,350 | |
Australia & New Zealand Banking Group, Ltd.‡‡ | | | 31,536 | | | | 662,194 | |
Bendigo and Adelaide Bank, Ltd.‡‡ | | | 38,256 | | | | 314,199 | |
BHP Billiton, Ltd.‡‡ | | | 65,481 | | | | 2,305,239 | |
Billabong International, Ltd. | | | 40,309 | | | | 72,973 | |
BlueScope Steel, Ltd.D | | | 1,395,496 | | | | 578,061 | |
Brambles, Ltd.‡‡ | | | 286,107 | | | | 2,095,228 | |
Caltex Australia, Ltd.‡‡ | | | 34,969 | | | | 420,968 | |
CFS Retail Property Trust REIT‡‡ | | | 37,629 | | | | 64,850 | |
CGA Mining, Ltd.* | | | 310,575 | | | | 624,961 | |
Coca-Cola Amatil, Ltd. | | | 6,420 | | | | 75,579 | |
Cochlear, Ltd.D | | | 28,486 | | | | 1,806,396 | |
Commonwealth Bank of Australia‡‡ | | | 23,783 | | | | 1,197,287 | |
Computershare, Ltd.‡‡ | | | 6,176 | | | | 50,598 | |
CSL, Ltd.‡‡ | | | 10,097 | | | | 330,470 | |
CSR, Ltd. | | | 100,304 | | | | 201,078 | |
David Jones, Ltd. | | | 81,183 | | | | 196,790 | |
Dexus Property Group REIT | | | 84,924 | | | | 72,094 | |
Downer EDI, Ltd.‡‡ | | | 549,972 | | | | 1,800,033 | |
DUET Group | | | 132,061 | | | | 237,051 | |
Fairfax Media, Ltd. | | | 269,714 | | | | 198,621 | |
Fortescue Metals Group, Ltd.D‡‡ | | | 512,804 | | | | 2,239,593 | |
Goodman Fielder, Ltd.‡‡ | | | 206,554 | | | | 91,899 | |
Goodman Group REIT‡‡ | | | 99,079 | | | | 57,763 | |
GPT Group REIT‡‡ | | | 40,076 | | | | 125,838 | |
GPT Group REIT + | | | 63,198 | | | | — | |
GrainCorp, Ltd. | | | 14,219 | | | | 114,164 | |
Iluka Resources, Ltd. | | | 89,800 | | | | 1,423,633 | |
Incitec Pivot, Ltd.‡‡ | | | 137,785 | | | | 438,281 | |
Insurance Australia Group, Ltd. | | | 58,200 | | | | 177,390 | |
Lend Lease Group‡‡ | | | 7,753 | | | | 56,777 | |
Macquarie Group, Ltd. | | | 12,043 | | | | 293,035 | |
Mirvac Group REIT‡‡ | | | 47,808 | | | | 57,700 | |
Monadelphous Group, Ltd. | | | 4,022 | | | | 82,767 | |
Mount Gibson Iron, Ltd. | | | 1,221,863 | | | | 1,399,685 | |
National Australia Bank, Ltd.‡‡ | | | 129,161 | | | | 3,085,987 | |
| | | | | | | | |
| | | Shares | | | Value | |
Newcrest Mining, Ltd.‡‡ | | | 13,780 | | | $ | 417,187 | |
Nufarm, Ltd.*‡‡ | | | 101,090 | | | | 430,122 | |
Origin Energy, Ltd.‡‡ | | | 29,508 | | | | 402,611 | |
OZ Minerals, Ltd.‡‡ | | | 4,583 | | | | 46,922 | |
Pacific Brands, Ltd.‡‡ | | | 902,563 | | | | 507,727 | |
Paladin Energy, Ltd.*‡‡ | | | 4,238 | | | | 5,938 | |
Primary Health Care, Ltd. | | | 9,645 | | | | 30,384 | |
Qantas Airways, Ltd.* | | | 158,399 | | | | 236,535 | |
QBE Insurance Group, Ltd.D | | | 268,536 | | | | 3,556,822 | |
QR National, Ltd. | | | 23,918 | | | | 83,664 | |
Ramsay Health Care, Ltd.‡‡ | | | 12,229 | | | | 241,150 | |
Rio Tinto, Ltd.D‡‡ | | | 28,730 | | | | 1,771,915 | |
Santos, Ltd.‡‡ | | | 36,542 | | | | 457,471 | |
Sonic Healthcare, Ltd. | | | 34,559 | | | | 398,713 | |
SP AusNet | | | 157,887 | | | | 151,797 | |
Spark Infrastructure Group 144A‡‡ | | | 268,877 | | | | 378,134 | |
Stockland REIT‡‡ | | | 46,149 | | | | 150,571 | |
Suncorp Group, Ltd.‡‡ | | | 234,571 | | | | 2,010,519 | |
Telstra Corporation, Ltd.‡‡ | | | 1,942,997 | | | | 6,617,687 | |
Toll Holdings, Ltd.D | | | 314,863 | | | | 1,359,014 | |
UGL, Ltd.‡‡ | | | 3,325 | | | | 40,470 | |
Wesfarmers, Ltd.‡‡ | | | 18,770 | | | | 566,339 | |
Westfield Group REIT‡‡ | | | 43,480 | | | | 347,320 | |
Westfield Retail Trust REIT‡‡ | | | 59,197 | | | | 150,761 | |
Westpac Banking Corporation‡‡ | | | 46,607 | | | | 953,391 | |
Woodside Petroleum, Ltd. | | | 60,714 | | | | 1,901,446 | |
| | | | | | | | |
| | | | | | | 55,104,952 | |
| | | | | | | | |
Austria — 0.0% | |
Viener Versicherung Gruppe | | | 14,275 | | | | 565,716 | |
| | | | | | | | |
Belgium — 0.2% | |
Groupe Bruxelles Lambert SA‡‡ | | | 457 | | | | 30,467 | |
Mobistar SA | | | 6,700 | | | | 351,107 | |
Nyrstar | | | 38,421 | | | | 303,330 | |
Solvay SA‡‡ | | | 8,243 | | | | 679,155 | |
UCB SA | | | 16,806 | | | | 707,129 | |
| | | | | | | | |
| | | | | | | 2,071,188 | |
| | | | | | | | |
Bermuda — 0.2% | |
Catlin Group, Ltd.‡‡ | | | 33,906 | | | | 209,938 | |
Seadrill, Ltd.D | | | 41,428 | | | | 1,385,355 | |
Signet Jewelers, Ltd.D | | | 21,800 | | | | 947,605 | |
| | | | | | | | |
| | | | | | | 2,542,898 | |
| | | | | | | | |
Brazil — 3.0% | |
Amil Participacoes SA | | | 107,690 | | | | 948,584 | |
B2W Cia Global Do Varejo | | | 15,500 | | | | 74,789 | |
Banco Santander Brasil SA | | | 472,182 | | | | 3,818,382 | |
BM&FBovespa SA | | | 400,000 | | | | 2,101,595 | |
Brasil Foods SA | | | 70,500 | | | | 1,376,550 | |
BrasilAgro - Companhia Brasileira de Propriedades Agricolas* | | | 81,200 | | | | 420,529 | |
Centrais Eletricas Brasileiras SA | | | 179,200 | | | | 1,713,941 | |
Embraer SA ADR | | | 16,010 | | | | 403,772 | |
Fertilizantes Heringer SA* | | | 52,000 | | | | 309,449 | |
Gafisa SA | | | 103,900 | | | | 229,496 | |
GP Investments, Ltd.* | | | 451,706 | | | | 961,412 | |
Itau Unibanco Holding SA ADR | | | 201,117 | | | | 3,732,732 | |
Lojas Renner SA | | | 27,968 | | | | 725,871 | |
|
| See Notes to Financial Statements. |
184 |
INTERNATIONAL EQUITY FUND
SCHEDULE OF INVESTMENTS (Continued)
| | | | | | | | |
| | | Shares | | | Value | |
Magnesita Refratarios SA* | | | 52,339 | | | $ | 161,906 | |
Marfrig Alimentos SA | | | 43,367 | | | | 198,555 | |
OGX Petroleo e Gas Participacoes SA* | | | 547,620 | | | | 3,998,705 | |
Petroleo Brasileiro SA ADRD | | | 270,285 | | | | 6,448,071 | |
Profarma Distribuidora de Produtos Farmaceuticos SA | | | 95,000 | | | | 547,514 | |
SLC Agricola SA | | | 51,200 | | | | 425,466 | |
Tim Participacoes SA ADRD | | | 38,791 | | | | 1,000,808 | |
Totvs SA | | | 34,711 | | | | 618,945 | |
Tractebel Energia SA | | | 28,014 | | | | 449,966 | |
Ultrapar Participacoes SA | | | 89,268 | | | | 1,531,949 | |
Vale SA ADRD | | | 129,600 | | | | 2,669,760 | |
| | | | | | | | |
| | | | | | | 34,868,747 | |
| | | | | | | | |
Canada — 2.0% | | | | | | | | |
Bankers Petroleum, Ltd.D* | | | 322,921 | | | | 1,407,381 | |
Banro CorporationD* | | | 121,880 | | | | 452,227 | |
Canadian National Railway Co. | | | 62,700 | | | | 4,925,712 | |
Eastern Platinum, Ltd.D* | | | 686,134 | | | | 363,693 | |
Enbridge, Inc.D | | | 88,600 | | | | 3,312,662 | |
First Quantum Minerals, Ltd. | | | 199,339 | | | | 3,923,187 | |
Goldcorp, Inc. | | | 45,090 | | | | 1,995,233 | |
Gran Colombia Gold CorporationD* | | | 759,812 | | | | 387,830 | |
Ivanhoe Mines, Ltd.D* | | | 12,246 | | | | 216,999 | |
Nexen, Inc. | | | 88,627 | | | | 1,410,202 | |
Niko Resources, Ltd. | | | 24,301 | | | | 1,150,466 | |
Potash Corporation of Saskatchewan, Inc. | | | 46,010 | | | | 1,899,293 | |
Silver Standard Resources, Inc.* | | | 40,809 | | | | 563,980 | |
Suncor Energy, Inc. | | | 51,000 | | | | 1,470,803 | |
| | | | | | | | |
| | | | | | | 23,479,668 | |
| | | | | | | | |
Chile — 0.1% | | | | | | | | |
Embotelladora Andina SA ADR Class A@ | | | 9,343 | | | | 192,186 | |
Embotelladora Andina SA ADR Class BD | | | 14,241 | | | | 370,693 | |
Sociedad Quimica y Minera de Chile SA ADRD | | | 15,000 | | | | 807,450 | |
| | | | | | | | |
| | | | | | | 1,370,329 | |
| | | | | | | | |
China — 2.7% | | | | | | | | |
Anhui Conch Cement Co., Ltd. Class H | | | 503,596 | | | | 1,494,591 | |
Baidu, Inc. ADR* | | | 73,250 | | | | 8,531,428 | |
China Life Insurance Co., Ltd. Class H | | | 252,000 | | | | 622,975 | |
China Merchants Bank Co., Ltd. Class HD | | | 1,726,190 | | | | 3,489,453 | |
China Shenhua Energy Co., Ltd. Class H | | | 403,651 | | | | 1,751,479 | |
CNinsure, Inc. ADRD* | | | 15,460 | | | | 106,983 | |
CNOOC, Ltd. | | | 952,900 | | | | 1,666,158 | |
Ctrip.com International, Ltd. ADRD | | | 42,798 | | | | 1,001,473 | |
ENN Energy Holdings, Ltd.D | | | 290,433 | | | | 931,139 | |
Foxconn International Holdings, Ltd.*‡‡ | | | 16,000 | | | | 10,321 | |
Huaneng Power International, Inc. Class H | | | 1,504,000 | | | | 799,773 | |
Industrial & Commercial Bank of China Class HD | | | 2,345,750 | | | | 1,392,361 | |
Lenovo Group, Ltd. | | | 1,846,000 | | | | 1,231,205 | |
| | | | | | | | |
| | | Shares | | | Value | |
Li Ning Co, Ltd.D | | | 638,842 | | | $ | 507,514 | |
Longfor Properties Co., Ltd.D | | | 498,958 | | | | 564,063 | |
Parkson Retail Group, Ltd.D | | | 865,427 | | | | 1,060,807 | |
Tencent Holdings, Ltd. | | | 236,800 | | | | 4,759,416 | |
Trina Solar, Ltd. ADRD* | | | 31,266 | | | | 208,857 | |
Want Want China Holdings, Ltd.D | | | 1,100,283 | | | | 1,097,931 | |
West China Cement, Ltd. | | | 1,675,528 | | | | 280,456 | |
Yangzijiang Shipbuilding Holdings, Ltd.‡‡ | | | 32,800 | | | | 23,012 | |
| | | | | | | | |
| | | | | | | 31,531,395 | |
| | | | | | | | |
Colombia — 0.1% | | | | | | | | |
BanColombia SA | | | 64,300 | | | | 944,681 | |
BanColombia SA ADRD | | | 8,246 | | | | 491,132 | |
| | | | | | | | |
| | | | | | | 1,435,813 | |
| | | | | | | | |
Cyprus — 0.0% | | | | | | | | |
Eurasia Drilling Co., Ltd. GDRD | | | 15,112 | | | | 355,132 | |
| | | | | | | | |
Denmark — 0.7% | | | | | | | | |
AP Moller - Maersk A/S Class B‡‡ | | | 28 | | | | 184,870 | |
Coloplast A/S Class B‡‡ | | | 1,823 | | | | 262,183 | |
Danske Bank A/S | | | 11,411 | | | | 144,940 | |
DSV A/S‡‡ | | | 31,822 | | | | 570,694 | |
H Lundbeck A/S‡‡ | | | 13,300 | | | | 250,100 | |
Novo Nordisk A/S Class BD‡‡ | | | 38,394 | | | | 4,412,105 | |
Novozymes A/SD | | | 40,000 | | | | 1,234,830 | |
Sydbank A/S | | | 2,037 | | | | 31,956 | |
Topdanmark A/S*‡‡ | | | 2,600 | | | | 405,168 | |
Vestas Wind Systems A/SD* | | | 31,000 | | | | 334,651 | |
| | | | | | | | |
| | | | | | | 7,831,497 | |
| | | | | | | | |
Egypt — 0.3% | | | | | | | | |
Egyptian Financial Group-Hermes Holding* | | | 584,057 | | | | 969,433 | |
ElSwedy Electric Co. | | | 80,671 | | | | 277,431 | |
Orascom Construction Industries | | | 54,878 | | | | 1,830,404 | |
Oriental Weavers | | | 52,553 | | | | 261,251 | |
Telecom Egypt Co. | | | 382,342 | | | | 837,498 | |
| | | | | | | | |
| | | | | | | 4,176,017 | |
| | | | | | | | |
Estonia — 0.0% | | | | | | | | |
Tallink Group PLC* | | | 491,560 | | | | 363,906 | |
| | | | | | | | |
Finland — 0.3% | | | | | | | | |
Kesko OYJ‡‡ | | | 5,568 | | | | 187,077 | |
Metso OYJ‡‡ | | | 31,248 | | | | 1,158,681 | |
Nokia OYJ‡‡ | | | 27,337 | | | | 133,457 | |
Orion OYJ‡‡ | | | 19,300 | | | | 375,934 | |
Outotec OYJ | | | 11,519 | | | | 542,667 | |
Wartsila OYJ Abp‡‡ | | | 31,196 | | | | 901,177 | |
| | | | | | | | |
| | | | | | | 3,298,993 | |
| | | | | | | | |
France — 7.5% | | | | | | | | |
Aeroports de Paris | | | 7,485 | | | | 513,434 | |
Alcatel-Lucent* | | | 126,523 | | | | 197,649 | |
Alstom SA | | | 32,850 | | | | 996,150 | |
Arkema SA‡‡ | | | 236 | | | | 16,708 | |
AtoS‡‡ | | | 8,627 | | | | 378,621 | |
AXA SA‡‡ | | | 30,296 | | | | 393,870 | |
BNP Paribas SA‡‡ | | | 59,871 | | | | 2,351,757 | |
Bouygues SA‡‡ | | | 20,150 | | | | 634,895 | |
Cap Gemini SA | | | 39,844 | | | | 1,245,109 | |
Carrefour SA | | | 211,188 | | | | 4,814,698 | |
|
See Notes to Financial Statements. 185 |
| | | | | | | | |
| | | Shares | | | Value | |
Casino Guichard Perrachon SA | | | 15,681 | | | $ | 1,320,804 | |
Christian Dior SA‡‡ | | | 47,449 | | | | 5,625,837 | |
Cie de St-Gobain‡‡ | | | 146,479 | | | | 5,623,891 | |
Cie Generale de Geophysique- Veritas*‡‡ | | | 66,682 | | | | 1,564,673 | |
Cie Generale d’Optique Essilor International SA | | | 9,985 | | | | 704,953 | |
CNP Assurances‡‡ | | | 5,858 | | | | 72,617 | |
Credit Agricole SA‡‡ | | | 29,800 | | | | 168,159 | |
Danone | | | 95,029 | | | | 5,973,673 | |
Eramet‡‡ | | | 6,446 | | | | 788,387 | |
Faurecia‡‡ | | | 28,443 | | | | 539,300 | |
France Telecom SA‡‡ | | | 363,910 | | | | 5,715,457 | |
GDF Suez | | | 72,000 | | | | 1,968,084 | |
Hermes International‡‡ | | | 2,104 | | | | 627,265 | |
Imerys SA‡‡ | | | 52 | | | | 2,395 | |
Ipsen SA‡‡ | | | 4,800 | | | | 150,650 | |
JCDecaux SA | | | 8,454 | | | | 194,705 | |
Klepierre REIT‡‡ | | | 623 | | | | 17,771 | |
L’Oreal SA | | | 27,699 | | | | 2,893,042 | |
Natixis‡‡ | | | 44,299 | | | | 111,457 | |
Nexans SA‡‡ | | | 9,540 | | | | 495,119 | |
PPR‡‡ | | | 31,169 | | | | 4,463,664 | |
Publicis Groupe SA | | | 9,447 | | | | 434,600 | |
Safran SA‡‡ | | | 31,170 | | | | 936,129 | |
Sanofi‡‡ | | | 146,316 | | | | 10,746,694 | |
Schneider Electric SA‡‡ | | | 115,307 | | | | 6,070,910 | |
Societe BIC SA‡‡ | | | 6,764 | | | | 599,669 | |
Societe Generale SA‡‡ | | | 97,254 | | | | 2,165,605 | |
Societe Television Francaise 1‡‡ | | | 65,142 | | | | 635,865 | |
Thales SA‡‡ | | | 6,660 | | | | 210,320 | |
Total SA‡‡ | | | 179,394 | | | | 9,171,116 | |
Unibail-Rodamco SE REIT‡‡ | | | 1,611 | | | | 289,611 | |
Valeo SA‡‡ | | | 25,703 | | | | 1,021,600 | |
Vallourec SA | | | 5,762 | | | | 374,066 | |
Vinci SAD | | | 74,399 | | | | 3,250,774 | |
Vivendi SA‡‡ | | | 86,172 | | | | 1,887,051 | |
| | | | | | | | |
| | | | | | | 88,358,804 | |
| | | | | | | | |
Germany — 7.2% | | | | | | | | |
Adidas AG‡‡ | | | 37,431 | | | | 2,434,844 | |
Aixtron SE NAD | | | 71,251 | | | | 908,332 | |
Allianz SE | | | 22,111 | | | | 2,115,090 | |
Aurubis AG‡‡ | | | 16,553 | | | | 882,655 | |
Axel Springer AGD | | | 15,600 | | | | 670,417 | |
BASF SED‡‡ | | | 56,252 | | | | 3,923,407 | |
Bayer AG‡‡ | | | 124,708 | | | | 7,973,306 | |
Bayerische Motoren Werke AG | | | 34,910 | | | | 2,338,629 | |
Beiersdorf AG | | | 72,517 | | | | 4,112,722 | |
Bilfinger Berger SE‡‡ | | | 16,716 | | | | 1,425,290 | |
Continental AG | | | 6,664 | | | | 414,813 | |
Daimler AG‡‡ | | | 66,464 | | | | 2,917,827 | |
Deutsche Bank AG‡‡ | | | 43,536 | | | | 1,658,555 | |
Deutsche Boerse AG‡‡ | | | 565 | | | | 31,531 | |
Deutsche Lufthansa AG | | | 98,362 | | | | 1,169,294 | |
Deutsche Post AG‡‡ | | | 19,517 | | | | 300,087 | |
Deutsche Telekom AGD‡‡ | | | 482,591 | | | | 5,537,008 | |
Fresenius Medical Care AG & Co. KGaA | | | 29,202 | | | | 1,984,217 | |
Fresenius SE & Co KGaA‡‡ | | | 1,995 | | | | 184,563 | |
GEA Group AG | | | 74,274 | | | | 2,100,417 | |
Hannover Rueckversicherung AG | | | 52,429 | | | | 2,600,584 | |
| | | | | | | | |
| | | Shares | | | Value | |
HeidelbergCement AG | | | 21,100 | | | $ | 895,449 | |
Infineon Technologies AG‡‡ | | | 61,752 | | | | 464,828 | |
K+S AG‡‡ | | | 14,141 | | | | 639,104 | |
Kloeckner & Co. SE‡‡ | | | 22,364 | | | | 287,130 | |
Linde AG | | | 39,696 | | | | 5,905,721 | |
Merck KGaA‡‡ | | | 12,778 | | | | 1,273,914 | |
Metro AG | | | 43,230 | | | | 1,577,798 | |
NII Holdings, Inc.* | | | 47,030 | | | | 1,001,739 | |
Puma SE | | | 455 | | | | 132,499 | |
Rhoen Klinikum AG | | | 11,009 | | | | 209,736 | |
RWE AGD | | | 167,482 | | | | 5,885,118 | |
Salzgitter AG | | | 7,386 | | | | 369,276 | |
SAP AG‡‡ | | | 183,179 | | | | 9,684,672 | |
Siemens AG‡‡ | | | 47,631 | | | | 4,558,126 | |
SMA Solar Technology AGD | | | 32,645 | | | | 1,823,751 | |
Software AG‡‡ | | | 5,167 | | | | 190,958 | |
Suedzucker AGD | | | 60,213 | | | | 1,920,987 | |
TUI AGD | | | 238,705 | | | | 1,482,001 | |
Volkswagen AG | | | 8,637 | | | | 1,158,642 | |
| | | | | | | | |
| | | | | | | 85,145,037 | |
| | | | | | | | |
Greece — 0.1% | | | | | | | | |
Coca Cola Hellenic Bottling Co. SA | | | 51,722 | | | | 886,969 | |
| | | | | | | | |
Guernsey — 0.0% | | | | | | | | |
Resolution, Ltd. | | | 7,614 | | | | 29,727 | |
| | | | | | | | |
Hong Kong — 2.2% | | | | | | | | |
AIA Group, Ltd. | | | 967,600 | | | | 3,021,180 | |
ASM Pacific Technology, Ltd.D‡‡ | | | 51,057 | | | | 572,917 | |
Bank of East Asia, Ltd. | | | 6,400 | | | | 24,227 | |
Belle International Holdings, Ltd. | | | 389,000 | | | | 678,168 | |
Cheung Kong Holdings, Ltd.‡‡ | | | 49,000 | | | | 582,958 | |
Cheung Kong Infrastructure Holdings, Ltd.‡‡ | | | 7,000 | | | | 41,009 | |
China Mobile, Ltd. | | | 346,618 | | | | 3,387,365 | |
China Overseas Land & Investment, Ltd.D | | | 632,372 | | | | 1,056,857 | |
China Resources Cement Holdings, Ltd.D | | | 506,782 | | | | 377,806 | |
China Resources Gas Group, Ltd.D | | | 333,469 | | | | 476,593 | |
CLP Holdings, Ltd.‡‡ | | | 55,000 | | | | 467,740 | |
COSCO Pacific, Ltd. | | | 254,000 | | | | 296,626 | |
Esprit Holdings, Ltd. | | | 52,577 | | | | 67,832 | |
Hang Lung Group, Ltd.‡‡ | | | 15,000 | | | | 82,179 | |
Hang Seng Bank, Ltd. | | | 4,600 | | | | 54,579 | |
Hong Kong & China Gas Co., Ltd. | | | 66,000 | | | | 152,963 | |
Hong Kong Exchanges and Clearing, Ltd.D‡‡ | | | 107,200 | | | | 1,712,914 | |
Hopewell Holdings, Ltd.‡‡ | | | 105,500 | | | | 269,774 | |
Hutchison Whampoa, Ltd.‡‡ | | | 31,000 | | | | 259,644 | |
Hysan Development Co., Ltd. | | | 72,000 | | | | 236,397 | |
Jardine Matheson Holdings, Ltd. | | | 51,200 | | | | 2,408,960 | |
Kerry Properties, Ltd. | | | 100 | | | | 331 | |
Li & Fung, Ltd.D | | | 2,062,000 | | | | 3,817,830 | |
Lifestyle International Holdings, Ltd.‡‡ | | | 4,000 | | | | 8,817 | |
Link (The) REIT‡‡ | | | 39,500 | | | | 145,456 | |
Luks Group Vietnam Holdings Co., Ltd. | | | 1,626,000 | | | | 324,505 | |
Mongolia Energy Corporation Ltd.*‡‡ | | | 15,000 | | | | 1,352 | |
|
| See Notes to Financial Statements. |
186 |
INTERNATIONAL EQUITY FUND
SCHEDULE OF INVESTMENTS (Continued)
| | | | | | | | |
| | | Shares | | | Value | |
New World Department Store China, Ltd. | | | 439,337 | | | $ | 250,594 | |
New World Development Co., Ltd.‡‡ | | | 64,000 | | | | 51,585 | |
NWS Holdings, Ltd.‡‡ | | | 21,000 | | | | 30,932 | |
Orient Overseas International, Ltd. | | | 21,500 | | | | 125,541 | |
PCCW, Ltd.‡‡ | | | 68,000 | | | | 23,377 | |
Ports Design, Ltd.D | | | 134,500 | | | | 203,310 | |
Power Assets Holdings, Ltd. | | | 268,500 | | | | 1,986,110 | |
Shangri-La Asia, Ltd. | | | 1,000 | | | | 1,725 | |
Sun Hung Kai Properties, Ltd.‡‡ | | | 39,000 | | | | 488,843 | |
Swire Pacific, Ltd. Class A‡‡ | | | 13,000 | | | | 156,922 | |
Television Broadcasts, Ltd.‡‡ | | | 33,800 | | | | 204,978 | |
United Laboratories International Holdings, Ltd. (The)D | | | 2,142,000 | | | | 1,232,810 | |
Wharf Holdings, Ltd. | | | 21,000 | | | | 94,906 | |
Wheelock & Co., Ltd. | | | 74,000 | | | | 183,318 | |
Wing Hang Bank, Ltd. | | | 3,500 | | | | 28,684 | |
Yue Yuen Industrial Holdings, Ltd. | | | 74,000 | | | | 233,912 | |
| | | | | | | | |
| | | | | | | 25,824,526 | |
| | | | | | | | |
Hungary — 0.3% | | | | | | | | |
Egis Gyogyszergyar Nyrt | | | 22,297 | | | | 1,620,766 | |
MOL Hungarian Oil and Gas PLC | | | 24,409 | | | | 1,739,203 | |
| | | | | | | | |
| | | | | | | 3,359,969 | |
| | | | | | | | |
India — 1.8% | | | | | | | | |
Ambuja Cements, Ltd. | | | 472,588 | | | | 1,382,479 | |
Andhra Bank@ | | | 230,321 | | | | 346,750 | |
Asian Paints, Ltd.@ | | | 14,025 | | | | 684,638 | |
Axis Bank, Ltd. | | | 89,310 | | | | 1,359,032 | |
Bajaj Auto, Ltd. | | | 14,013 | | | | 419,928 | |
Container Corporation of India, Ltd. | | | 23,263 | | | | 367,530 | |
Dabur India, Ltd.@ | | | 311,455 | | | | 583,263 | |
Housing Development Finance Corporation | | | 107,500 | | | | 1,319,939 | |
ICICI Bank, Ltd. ADR | | | 100,500 | | | | 2,656,215 | |
India Cements, Ltd. GDR | | | 719,676 | | | | 895,277 | |
Infosys Technologies, Ltd. | | | 17,122 | | | | 892,340 | |
Infosys, Ltd. ADRD | | | 94,188 | | | | 4,839,379 | |
Lupin, Ltd.* | | | 140,325 | | | | 1,183,402 | |
NTPC, Ltd.* | | | 76,900 | | | | 232,923 | |
Opto Circuits India, Ltd.* | | | 85,458 | | | | 320,719 | |
Pantaloon Retail India, Ltd. | | | 211,223 | | | | 572,754 | |
Petronet LNG, Ltd. | | | 441,330 | | | | 1,294,778 | |
REI Agro, Ltd.* | | | 1,781,622 | | | | 553,559 | |
Reliance Capital, Ltd.* | | | 67,100 | | | | 296,931 | |
Shriram Transport Finance Co., Ltd.* | | | 115,811 | | | | 917,787 | |
SKS Microfinance, Ltd.* | | | 17,272 | | | | 30,459 | |
Tata Consultancy Services, Ltd. | | | 6,580 | | | | 143,811 | |
United Phosphorus, Ltd.* | | | 158,172 | | | | 377,969 | |
Welspun Corporation Ltd. | | | 75,572 | | | | 119,680 | |
| | | | | | | | |
| | | | | | | 21,791,542 | |
| | | | | | | | |
Indonesia — 1.0% | | | | | | | | |
PT Bank Danamon Indonesia Tbk | | | 940,050 | | | | 425,057 | |
PT Bank Rakyat Indonesia Tbk | | | 4,983,134 | | | | 3,709,529 | |
PT Indocement Tunggal Prakarsa Tbk | | | 1,125,280 | | | | 2,115,911 | |
| | | | | | | | |
| | | Shares | | | Value | |
PT Medco Energi Internasional Tbk | | | 4,134,000 | | | $ | 1,105,591 | |
PT Ramayana Lestari Sentosa Tbk | | | 2,808,500 | | | | 223,007 | |
PT Semen Gresik Persero Tbk | | | 772,637 | | | | 975,649 | |
PT Telekomunikasi Indonesia Tbk ADR | | | 39,480 | | | | 1,213,615 | |
PT Telekomunikasi Indonesia Tbk | | | 2,890,694 | | | | 2,247,521 | |
| | | | | | | | |
| | | | | | | 12,015,880 | |
| | | | | | | | |
Ireland — 0.7% | | | | | | | | |
Experian PLC‡‡ | | | 306,866 | | | | 4,172,276 | |
James Hardie Industries SE ADR | | | 107,900 | | | | 752,654 | |
Shire PLC | | | 85,460 | | | | 2,976,873 | |
WPP PLC‡‡ | | | 21,483 | | | | 225,366 | |
| | | | | | | | |
| | | | | | | 8,127,169 | |
| | | | | | | | |
Israel — 0.8% | | | | | | | | |
Check Point Software Technologies, Ltd.D* | | | 29,300 | | | | 1,539,422 | |
Teva Pharmaceutical Industries, Ltd. ADRD | | | 208,100 | | | | 8,398,916 | |
| | | | | | | | |
| | | | | | | 9,938,338 | |
| | | | | | | | |
Italy — 1.2% | | | | | | | | |
A2A SpA | | | 56,612 | | | | 53,231 | |
ACEA SpA | | | 75,579 | | | | 478,134 | |
Assicurazioni Generali SpA | | | 20,976 | | | | 315,733 | |
Banca Monte dei Paschi di Siena SpA | | | 260,700 | | | | 84,994 | |
Enel SpA‡‡ | | | 298,971 | | | | 1,216,547 | |
ENI SpA‡‡ | | | 360,653 | | | | 7,473,053 | |
Intesa Sanpaolo SpA‡‡ | | | 1,818,679 | | | | 3,045,843 | |
Prysmian SpA | | | 591 | | | | 7,339 | |
Saipem SpA | | | 7,391 | | | | 314,236 | |
Telecom Italia SpA | | | 229,524 | | | | 246,857 | |
Tod’s SpA | | | 3,544 | | | | 289,198 | |
UniCredit SpA | | | 24,469 | | | | 203,315 | |
Unione di Banche Italiane SCPA | | | 14,202 | | | | 58,194 | |
| | | | | | | | |
| | | | | | | 13,786,674 | |
| | | | | | | | |
Japan — 13.9% | | | | | | | | |
Aeon Co., Ltd. | | | 39,800 | | | | 546,558 | |
Aisin Seiki Co., Ltd. | | | 61,200 | | | | 1,744,482 | |
Ajinomoto Co., Inc. | | | 40,000 | | | | 480,187 | |
Aozora Bank, Ltd. | | | 56,600 | | | | 155,895 | |
Asahi Glass Co., Ltd.‡‡ | | | 29,200 | | | | 245,072 | |
Asahi Kasei Corporation | | | 50,200 | | | | 302,622 | |
Astellas Pharma, Inc. | | | 151,800 | | | | 6,172,977 | |
Bridgestone Corporation | | | 6,800 | | | | 154,164 | |
Brother Industries, Ltd.‡‡ | | | 48,900 | | | | 600,370 | |
Canon, Inc.D‡‡ | | | 201,350 | | | | 8,920,404 | |
Central Japan Railway Co.‡‡ | | | 39 | | | | 329,349 | |
Chiyoda Corporation | | | 40,000 | | | | 406,912 | |
Chubu Electric Power Co., Inc.‡‡ | | | 22,500 | | | | 420,066 | |
Coca-Cola West Co., Ltd. | | | 14,300 | | | | 248,025 | |
Cosmo Oil Co., Ltd.‡‡ | | | 147,000 | | | | 410,615 | |
Credit Saison Co., Ltd.‡‡ | | | 22,300 | | | | 447,043 | |
Daicel Corporation‡‡ | | | 31,000 | | | | 188,892 | |
Daido Steel Co., Ltd.‡‡ | | | 91,000 | | | | 571,041 | |
Daihatsu Motor Co., Ltd. | | | 140,000 | | | | 2,499,156 | |
See Notes to Financial Statements.
187
| | | | | | | | |
| | | Shares | | | Value | |
Dai-ichi Life Insurance Co., Ltd. (The) | | | 126 | | | $ | 123,921 | |
Daiichi Sankyo Co., Ltd. | | | 5,100 | | | | 101,112 | |
Daito Trust Construction Co., Ltd.‡‡ | | | 17,400 | | | | 1,492,010 | |
Daiwa House Industry Co., Ltd.‡‡ | | | 3,000 | | | | 35,780 | |
Dena Co., Ltd. | | | 26,400 | | | | 791,966 | |
Denso Corporation | | | 117,500 | | | | 3,245,485 | |
East Japan Railway Co.‡‡ | | | 6,000 | | | | 381,967 | |
Ebara Corporation‡‡ | | | 141,000 | | | | 485,449 | |
FamilyMart Co., Ltd.D | | | 24,700 | | | | 998,012 | |
FANUC Corporation‡‡ | | | 15,300 | | | | 2,341,614 | |
Fuji Electric Co., Ltd. | | | 83,000 | | | | 227,530 | |
Fuji Heavy Industries, Ltd.‡‡ | | | 34,900 | | | | 210,842 | |
Fuji Media Holdings, Inc. | | | 75 | | | | 113,713 | |
Fujitsu, Ltd.‡‡ | | | 343,000 | | | | 1,782,513 | |
Fukuoka Financial Group, Inc.‡‡ | | | 45,000 | | | | 188,840 | |
Gree, Inc.D | | | 48,900 | | | | 1,684,849 | |
Gunma Bank, Ltd. (The) | | | 15,000 | | | | 82,435 | |
Hakuhodo DY Holdings, Inc. | | | 5,580 | | | | 320,431 | |
Hikari Tsushin, Inc. | | | 6,000 | | | | 149,435 | |
Hino Motors, Ltd.‡‡ | | | 109,000 | | | | 661,336 | |
Hitachi High-Technologies Corporation | | | 6,000 | | | | 130,181 | |
Hitachi, Ltd.‡‡ | | | 492,000 | | | | 2,582,409 | |
Hokuhoku Financial Group, Inc.‡‡ | | | 188,000 | | | | 366,377 | |
Hokuriku Electric Power Co. | | | 4,500 | | | | 84,013 | |
Honda Motor Co., Ltd.‡‡ | | | 12,100 | | | | 369,115 | |
Hoya Corporation | | | 137,200 | | | | 2,955,406 | |
Ibiden Co., Ltd. | | | 64,200 | | | | 1,269,487 | |
Idemitsu Kosan Co., Ltd.‡‡ | | | 7,900 | | | | 814,941 | |
IHI Corporation‡‡ | | | 278,000 | | | | 675,406 | |
Inpex Corporation | | | 860 | | | | 5,418,994 | |
Isuzu Motors, Ltd.‡‡ | | | 122,100 | | | | 564,734 | |
ITOCHU Corporation‡‡ | | | 94,300 | | | | 958,069 | |
Japan Petroleum Exploration Co.‡‡ | | | 5,400 | | | | 211,173 | |
Japan Prime Realty Investment Corporation REIT | | | 9 | | | | 21,199 | |
Japan Real Estate Investment Corporation REIT | | | 7 | | | | 54,567 | |
Japan Retail Fund Investment Corporation REIT | | | 20 | | | | 29,622 | |
Japan Steel Works, Ltd. (The) | | | 2,000 | | | | 13,902 | |
JGC Corporation‡‡ | | | 92,000 | | | | 2,208,861 | |
JSR Corporation | | | 22,400 | | | | 413,252 | |
JTEKT Corporation‡‡ | | | 108,700 | | | | 1,069,065 | |
JX Holdings, Inc.‡‡ | | | 33,170 | | | | 200,390 | |
Kajima Corporation | | | 27,000 | | | | 82,786 | |
Kaneka Corporation‡‡ | | | 6,000 | | | | 31,961 | |
Kansai Electric Power Co., Inc. (The) | | | 29,700 | | | | 455,706 | |
Kao Corporation‡‡ | | | 188,100 | | | | 5,139,331 | |
Kawasaki Kisen Kaisha, Ltd. | | | 37,000 | | | | 66,818 | |
KDDI Corporation‡‡ | | | 158 | | | | 1,016,110 | |
Keisei Electric Railway Co., Ltd. | | | 4,000 | | | | 29,414 | |
Kinden Corporation‡‡ | | | 31,000 | | | | 261,790 | |
Kobe Steel, Ltd.‡‡ | | | 305,000 | | | | 471,547 | |
Koito Manufacturing Co., Ltd. | | | 22,000 | | | | 308,692 | |
Komatsu, Ltd. | | | 53,000 | | | | 1,238,755 | |
Konami Corporation | | | 39,100 | | | | 1,170,917 | |
| | | | | | | | |
| | | Shares | | | Value | |
Konica Minolta Holdings, Inc.‡‡ | | | 289,000 | | | $ | 2,155,203 | |
Kuraray Co., Ltd.‡‡ | | | 125,600 | | | | 1,786,826 | |
Kyocera Corporation | | | 7,600 | | | | 611,199 | |
Lawson, Inc. | | | 66,800 | | | | 4,170,118 | |
Leopalace21 Corporation‡‡ | | | 4,600 | | | | 9,024 | |
Marubeni Corporation | | | 78,800 | | | | 480,151 | |
Maruichi Steel Tube, Ltd.‡‡ | | | 20,400 | | | | 455,071 | |
Mazda Motor Corporation | | | 83,000 | | | | 146,655 | |
Miraca Holdings, Inc.‡‡ | | | 8,700 | | | | 346,440 | |
Mitsubishi Chemical Holdings Corporation‡‡ | | | 94,500 | | | | 520,566 | |
Mitsubishi Corporation | | | 109,800 | | | | 2,218,254 | |
Mitsubishi Electric Corporation‡‡ | | | 92,800 | | | | 889,780 | |
Mitsubishi Estate Co., Ltd.‡‡ | | | 133,000 | | | | 1,987,138 | |
Mitsubishi Heavy Industries, Ltd.‡‡ | | | 192,000 | | | | 818,189 | |
Mitsubishi Motors Corporation* | | | 25,000 | | | | 29,557 | |
Mitsubishi UFJ Financial Group, Inc.‡‡ | | | 256,900 | | | | 1,091,416 | |
Mitsubishi UFJ Lease & Finance Co., Ltd.‡‡ | | | 9,910 | | | | 392,692 | |
Mitsui & Co., Ltd.‡‡ | | | 85,200 | | | | 1,324,989 | |
Mitsui Chemicals, Inc. | | | 135,000 | | | | 412,174 | |
Mitsui Fudosan Co., Ltd.‡‡ | | | 18,000 | | | | 262,388 | |
Mitsui Mining & Smelting Co., Ltd. | | | 95,000 | | | | 245,615 | |
Mitsumi Electric Co., Ltd. | | | 30,800 | | | | 229,289 | |
Mizuho Financial Group, Inc.‡‡ | | | 148,240 | | | | 200,298 | |
NHK Spring Co., Ltd. | | | 64,000 | | | | 567,078 | |
Nikon Corporation | | | 4,900 | | | | 109,115 | |
Nintendo Co., Ltd. | | | 20,100 | | | | 2,768,091 | |
Nippon Building Fund, Inc. REIT | | | 8 | | | | 65,480 | |
Nippon Electric Glass Co., Ltd.‡‡ | | | 49,100 | | | | 486,088 | |
Nippon Kayaku Co., Ltd.‡‡ | | | 10,000 | | | | 96,401 | |
Nippon Meat Packers, Inc.‡‡ | | | 11,000 | | | | 136,625 | |
Nippon Sheet Glass Co., Ltd. | | | 178,000 | | | | 333,013 | |
Nippon Shokubai Co., Ltd.‡‡ | | | 27,000 | | | | 290,100 | |
Nippon Telegraph & Telephone Corporation‡‡ | | | 43,700 | | | | 2,234,111 | |
Nippon Yusen KK | | | 45,800 | | | | 117,222 | |
Nishi-Nippon City Bank, Ltd. (The)‡‡ | | | 110,200 | | | | 316,412 | |
Nissan Motor Co., Ltd. | | | 236,000 | | | | 2,121,762 | |
Nisshin Seifun Group, Inc.‡‡ | | | 19,500 | | | | 236,371 | |
Nitto Denko Corporation‡‡ | | | 31,100 | | | | 1,112,763 | |
NKSJ Holdings, Inc. | | | 66,250 | | | | 1,299,695 | |
Nomura Real Estate Holdings, Inc. | | | 6,800 | | | | 101,245 | |
Nomura Research Institute, Ltd. | | | 44,000 | | | | 994,673 | |
NSK, Ltd. | | | 22,000 | | | | 142,913 | |
NTT DoCoMo, Inc.‡‡ | | | 306 | | | | 562,544 | |
Ono Pharmaceutical Co., Ltd. | | | 1,400 | | | | 78,576 | |
ORIX Corporation‡‡ | | | 1,590 | | | | 131,381 | |
Osaka Gas Co., Ltd.‡‡ | | | 77,000 | | | | 304,118 | |
Otsuka Corporation | | | 4,600 | | | | 316,747 | |
Pacific Metals Co., Ltd. | | | 14,000 | | | | 67,845 | |
Rakuten, Inc. | | | 3,940 | | | | 4,238,431 | |
Rengo Co., Ltd.‡‡ | | | 4,000 | | | | 27,907 | |
Rohm Co., Ltd. | | | 13,900 | | | | 648,318 | |
Sanrio Co., Ltd.D | | | 37,400 | | | | 1,921,749 | |
|
| See Notes to Financial Statements. |
188 |
INTERNATIONAL EQUITY FUND
SCHEDULE OF INVESTMENTS (Continued)
| | | | | | | | |
| | | Shares | | | Value | |
SBI Holdings, Inc. | | | 176 | | | $ | 12,896 | |
Seino Holdings Corporation‡‡ | | | 24,000 | | | | 186,150 | |
Sekisui Chemical Co., Ltd.‡‡ | | | 74,000 | | | | 610,498 | |
Sekisui House, Ltd.‡‡ | | | 8,000 | | | | 70,989 | |
Seven & I Holdings Co., Ltd.‡‡ | | | 263,700 | | | | 7,348,792 | |
Shimadzu Corporation | | | 26,000 | | | | 220,242 | |
Shimamura Co., Ltd. | | | 20,200 | | | | 2,065,402 | |
Shin-Etsu Chemical Co., Ltd. | | | 140,400 | | | | 6,913,291 | |
Shinko Electric Industries Co., Ltd. | | | 20,000 | | | | 136,157 | |
Showa Shell Sekiyu KK | | | 52,600 | | | | 354,676 | |
SMC Corporation | | | 13,400 | | | | 2,162,245 | |
Softbank Corporation‡‡ | | | 10,700 | | | | 315,147 | |
Sojitz Corporation‡‡ | | | 4,700 | | | | 7,266 | |
Sony Corporation‡‡ | | | 20,700 | | | | 371,670 | |
Sumco Corporation | | | 13,600 | | | | 100,538 | |
Sumitomo Corporation‡‡ | | | 6,100 | | | | 82,580 | |
Sumitomo Heavy Industries, Ltd.‡‡ | | | 84,000 | | | | 490,009 | |
Sumitomo Metal Industries, Ltd. | | | 18,000 | | | | 32,740 | |
Sumitomo Metal Mining Co., Ltd. | | | 15,000 | | | | 192,737 | |
Sumitomo Mitsui Financial Group, Inc.‡‡ | | | 35,600 | | | | 991,638 | |
Sumitomo Mitsui Trust Holdings, Inc. | | | 502,900 | | | | 1,476,619 | |
Sumitomo Realty & Development Co., Ltd.‡‡ | | | 10,000 | | | | 175,133 | |
T&D Holdings, Inc. | | | 3,000 | | | | 27,946 | |
Taiheiyo Cement Corporation | | | 59,000 | | | | 112,680 | |
Taisei Corporation | | | 156,000 | | | | 395,219 | |
Taisho Pharmaceutical Holdings Co., Ltd. | | | 900 | | | | 69,456 | |
Takeda Pharmaceutical Co., Ltd.‡‡ | | | 139,100 | | | | 6,108,328 | |
TDK Corporation‡‡ | | | 2,700 | | | | 119,618 | |
Teijin, Ltd. | | | 15,000 | | | | 46,187 | |
THK Co., Ltd. | | | 11,600 | | | | 228,624 | |
Tohoku Electric Power Co., Inc. | | | 2,300 | | | | 22,083 | |
Tokai Rika Co., Ltd.‡‡ | | | 14,500 | | | | 222,106 | |
Tokio Marine Holdings, Inc. | | | 197,500 | | | | 4,374,919 | |
Tokuyama Corporation | | | 63,000 | | | | 200,533 | |
Tokyo Electric Power Co., Inc. (The) | | | 8,900 | | | | 21,160 | |
Tokyo Electron, Ltd. | | | 15,200 | | | | 773,132 | |
Tokyo Gas Co., Ltd. | | | 30,000 | | | | 137,976 | |
Tokyu Land Corporation | | | 5,000 | | | | 18,903 | |
TonenGeneral Sekiyu KK‡‡ | | | 36,000 | | | | 393,348 | |
Toshiba Corporation | | | 15,300 | | | | 62,615 | |
Tosoh Corporation | | | 56,000 | | | | 149,877 | |
Toyo Seikan Kaisha, Ltd. | | | 5,000 | | | | 68,208 | |
Toyo Suisan Kaisha, Ltd. | | | 40,000 | | | | 969,209 | |
Toyota Auto Body Co., Ltd.+ | | | 8,800 | | | | 128,279 | |
Toyota Boshoku Corporation | | | 7,500 | | | | 78,245 | |
Toyota Motor Corporation‡‡ | | | 125,540 | | | | 4,183,579 | |
Trend Micro, Inc.D | | | 29,000 | | | | 866,948 | |
Ube Industries, Ltd.‡‡ | | | 252,000 | | | | 690,815 | |
UNY Co., Ltd. | | | 45,300 | | | | 407,859 | |
USS Co., Ltd.‡‡ | | | 4,040 | | | | 365,316 | |
West Japan Railway Co.‡‡ | | | 4,000 | | | | 173,834 | |
Yamada Denki Co., Ltd.‡‡ | | | 25,540 | | | | 1,738,724 | |
Yamaguchi Financial Group, Inc. | | | 14,000 | | | | 133,688 | |
Yamaha Corporation | | | 7,900 | | | | 72,462 | |
| | | | | | | | |
| | | Shares | | | Value | |
Yamaha Motor Co., Ltd. | | | 91,100 | | | $ | 1,152,805 | |
Yamatake Corporation | | | 21,000 | | | | 456,723 | |
Yamato Holdings Co., Ltd.‡‡ | | | 61,100 | | | | 1,029,579 | |
| | | | | | | | |
| | | | | | | 163,876,264 | |
| | | | | | | | |
Jersey — 0.0% | |
Randgold Resources, Ltd. | | | 1,533 | | | | 156,771 | |
| | | | | | | | |
Kazakhstan — 0.0% | |
Kazkommertsbank ADR 144A* | | | 140,523 | | | | 379,412 | |
| | | | | | | | |
Kenya — 0.1% | |
Safaricom, Ltd. | | | 37,678,900 | | | | 1,306,143 | |
| | | | | | | | |
Lebanon — 0.1% | |
Solidere GDR 144A | | | 58,829 | | | | 845,957 | |
| | | | | | | | |
Luxembourg — 0.1% | |
Millicom International Cellular SA ADR‡‡ | | | 858 | | | | 85,961 | |
Oriflame Cosmetics SA ADRD | | | 16,100 | | | | 508,599 | |
Ternium SA ADR | | | 23,307 | | | | 428,616 | |
| | | | | | | | |
| | | | | | | 1,023,176 | |
| | | | | | | | |
Malaysia — 0.3% | |
AirAsia Bhd | | | 1,042,765 | | | | 1,240,134 | |
CIMB Group Holdings Bhd | | | 454,496 | | | | 1,066,704 | |
Faber Group Bhd | | | 507,900 | | | | 286,795 | |
KLCC Property Holdings Bhd | | | 449,700 | | | | 446,863 | |
Lafarge Malayan Cement Bhd | | | 148,480 | | | | 327,874 | |
RHB Capital Bhd | | | 323,836 | | | | 764,130 | |
| | | | | | | | |
| | | | | | | 4,132,500 | |
| | | | | | | | |
Mexico — 0.7% | |
America Movil SAB de CV | | | 764,000 | | | | 863,933 | |
America Movil SAB de CV ADRD | | | 149,312 | | | | 3,374,451 | |
Corporacion Moctezuma SAB de CV@ | | | 174,707 | | | | 357,058 | |
Genomma Lab Internacional SAB de CVD* | | | 403,014 | | | | 777,165 | |
Gruma SAB de CV* | | | 132,500 | | | | 248,864 | |
Grupo Financiero Banorte SAB de CV | | | 190,879 | | | | 577,916 | |
Grupo Financiero Inbursa SA | | | 617,286 | | | | 1,135,954 | |
Industrias Bachoco SAB de CV ADR | | | 21,095 | | | | 402,282 | |
Megacable Holdings SAB de CV* | | | 178,995 | | | | 366,848 | |
| | | | | | | | |
| | | | | | | 8,104,471 | |
| | | | | | | | |
Mongolia — 0.0% | |
Mongolian Mining CorporationD* | | | 307,680 | | | | 231,356 | |
| | | | | | | | |
Netherlands — 5.2% | |
Aalberts Industries NV‡‡ | | | 11,642 | | | | 195,578 | |
Aegon NV* | | | 56,094 | | | | 225,131 | |
Akzo Nobel NV | | | 6,111 | | | | 295,486 | |
ASML Holding NV‡‡ | | | 49,574 | | | | 2,083,629 | |
Corio NV REIT | | | 363 | | | | 15,788 | |
Delta Lloyd NV‡‡ | | | 21,926 | | | | 368,909 | |
European Aeronautic Defence and Space Co. NV‡‡ | | | 48,168 | | | | 1,505,542 | |
ING Groep NVD*‡‡ | | | 1,292,154 | | | | 9,298,358 | |
Koninklijke Ahold NV‡‡ | | | 695,813 | | | | 9,370,264 | |
Koninklijke Boskalis Westminster NV | | | 8,641 | | | | 317,502 | |
Koninklijke DSM NV‡‡ | | | 15,734 | | | | 730,038 | |
See Notes to Financial Statements.
189
| | | | | | | | |
| | | Shares | | | Value | |
Koninklijke KPN NV‡‡ | | | 83,500 | | | $ | 999,104 | |
Randstad Holding NV | | | 118,373 | | | | 3,502,241 | |
Reed Elsevier NV | | | 523,668 | | | | 6,104,546 | |
Royal Dutch Shell PLC Class A‡‡ | | | 291,014 | | | | 10,627,595 | |
Royal Dutch Shell PLC Class B‡‡ | | | 195,559 | | | | 7,452,817 | |
SBM Offshore NV | | | 112,699 | | | | 2,322,097 | |
Unilever NV‡‡ | | | 158,387 | | | | 5,446,635 | |
| | | | | | | | |
| | | | | | | 60,861,260 | |
| | | | | | | | |
Nigeria — 0.3% | |
First Bank of Nigeria PLC | | | 9,297,300 | | | | 509,834 | |
First City Monument Bank PLC@ | | | 8,010,291 | | | | 206,303 | |
Guaranty Trust Bank PLC | | | 5,500,890 | | | | 482,980 | |
Guaranty Trust Bank PLC GDR | | | 84,085 | | | | 382,587 | |
United Bank for Africa PLC | | | 10,716,911 | | | | 171,022 | |
Zenith Bank PLC | | | 17,717,316 | | | | 1,329,617 | |
| | | | | | | | |
| | | | | | | 3,082,343 | |
| | | | | | | | |
Norway — 0.4% | |
Telenor ASA | | | 117,291 | | | | 1,923,848 | |
TGS Nopec Geophysical Co. ASA | | | 63,258 | | | | 1,401,420 | |
Yara International ASA | | | 34,844 | | | | 1,398,223 | |
| | | | | | | | |
| | | | | | | 4,723,491 | |
| | | | | | | | |
Peru — 0.2% | |
Credicorp, Ltd. | | | 26,970 | | | | 2,952,406 | |
| | | | | | | | |
Philippines — 0.1% | |
International Container Terminal Services, Inc. | | | 680,650 | | | | 823,760 | |
| | | | | | | | |
Russia — 1.3% | |
Federal Grid Co. Unified Energy System JSC | | | 28,734,143 | | | | 296,824 | |
Federal Hydrogenerating Co. JSC ADR | | | 438,970 | | | | 1,332,391 | |
Gazprom OAO ADR | | | 166,903 | | | | 1,779,726 | |
Global Ports Investment, Ltd. GDR | | | 17,280 | | | | 241,920 | |
Global Ports Investment, Ltd. GDR 144A | | | 18,105 | | | | 253,470 | |
LSR Group GDR | | | 103,821 | | | | 350,084 | |
Magnit OJSC@ | | | 16,161 | | | | 1,413,059 | |
Magnit Shares Issue 6+@ | | | 6,427 | | | | 546,295 | |
NOMOS-BANK GDR 144A* | | | 21,208 | | | | 201,476 | |
NOMOS-BANK GDR* | | | 11,774 | | | | 111,853 | |
NovaTek OAO GDR | | | 28,659 | | | | 3,588,107 | |
Novorossiysk Commercial Sea Port GDRD | | | 68,934 | | | | 516,316 | |
Novorossiysk Commercial Sea Port GDR 144A | | | 10,302 | | | | 76,486 | |
OKG-3 | | | 10,343,800 | | | | 296,867 | |
Raspadskaya OAO@ | | | 214,277 | | | | 655,688 | |
Sberbank of Russia@ | | | 984,330 | | | | 2,214,742 | |
Sberbank of Russia ADRD | | | 23,762 | | | | 236,194 | |
X5 Retail Group NV GDR* | | | 47,033 | | | | 1,074,234 | |
| | | | | | | | |
| | | | | | | 15,185,732 | |
| | | | | | | | |
Singapore — 1.2% | |
Ascendas Real Estate Investment Trust REIT‡‡ | | | 30,000 | | | | 42,327 | |
CapitaLand, Ltd. | | | 88,000 | | | | 149,940 | |
CapitaMall Trust REIT‡‡ | | | 33,000 | | | | 43,252 | |
| | | | | | | | |
| | | Shares | | | Value | |
ComfortDelgro Corporation, Ltd. | | | 54,000 | | | $ | 58,911 | |
Cosco Corporation Singapore, Ltd. | | | 323,000 | | | | 217,898 | |
DBS Group Holdings, Ltd. | | | 45,000 | | | | 399,676 | |
Golden Agri-Resources, Ltd. | | | 491,300 | | | | 270,829 | |
Jardine Cycle & Carriage, Ltd.‡‡ | | | 9,000 | | | | 333,896 | |
Keppel Corporation, Ltd. | | | 17,700 | | | | 126,911 | |
Oversea-Chinese Banking Corporation, Ltd.‡‡ | | | 6,000 | | | | 36,221 | |
SembCorp Industries, Ltd.‡‡ | | | 514,300 | | | | 1,605,886 | |
Singapore Airlines, Ltd. | | | 23,000 | | | | 180,163 | |
Singapore Exchange, Ltd.‡‡ | | | 227,000 | | | | 1,072,827 | |
Singapore Press Holdings, Ltd. | | | 28,000 | | | | 79,658 | |
Singapore Technologies Engineering, Ltd.‡‡ | | | 26,000 | | | | 53,922 | |
Singapore Telecommunications, Ltd.‡‡ | | | 2,051,700 | | | | 4,887,825 | |
StarHub, Ltd.‡‡ | | | 3,000 | | | | 6,731 | |
United Overseas Bank, Ltd.‡‡ | | | 255,417 | | | | 3,006,991 | |
UOL Group, Ltd.‡‡ | | | 3,186 | | | | 9,825 | |
Wilmar International Ltd. | | | 344,000 | | | | 1,326,086 | |
| | | | | | | | |
| | | | | | | 13,909,775 | |
| | | | | | | | |
Slovenia — 0.1% | |
Krka DD Novo mesto | | | 9,604 | | | | 657,544 | |
| | | | | | | | |
South Africa — 1.3% | |
AngloGold Ashanti, Ltd. ADRD | | | 41,603 | | | | 1,766,047 | |
Bidvest Group, Ltd. | | | 91,322 | | | | 1,751,199 | |
Exxaro Resources, Ltd. | | | 85,180 | | | | 1,772,704 | |
Gold Fields, Ltd. ADR | | | 103,623 | | | | 1,580,251 | |
Impala Platinum Holdings, Ltd. | | | 62,521 | | | | 1,296,107 | |
MTN Group, Ltd. | | | 313,705 | | | | 5,585,449 | |
Murray & Roberts Holdings, Ltd. | | | 197,640 | | | | 627,988 | |
Pick’n Pay Stores, Ltd. | | | 115,848 | | | | 668,750 | |
Royal Bafokeng Platinum, Ltd.* | | | 14,696 | | | | 100,127 | |
Standard Bank Group, Ltd. | | | 64,085 | | | | 783,940 | |
| | | | | | | | |
| | | | | | | 15,932,562 | |
| | | | | | | | |
South Korea — 2.4% | |
Celltrion, Inc. | | | 20,400 | | | | 643,844 | |
Hyundai Department Store Co., Ltd. | | | 5,560 | | | | 788,010 | |
Hyundai Hysco Co., Ltd. | | | 27,440 | | | | 838,744 | |
Kia Motors Corporation | | | 28,500 | | | | 1,653,790 | |
KIWOOM Securities Co., Ltd. | | | 5,875 | | | | 279,633 | |
Korea Electric Power Corporation* | | | 136,716 | | | | 3,035,150 | |
Korea Zinc Co., Ltd. | | | 3,405 | | | | 899,165 | |
KT Corporation ADRD | | | 55,462 | | | | 867,426 | |
KTB Investment & Securities Co., Ltd.* | | | 22,929 | | | | 40,506 | |
LG Electronics, Inc. | | | 7,805 | | | | 504,073 | |
MegaStudy Co., Ltd. | | | 3,290 | | | | 314,475 | |
Mirae Asset Securities Co., Ltd. | | | 18,837 | | | | 515,892 | |
NCSoft Corporation | | | 3,955 | | | | 1,057,266 | |
Samsung Electronics Co., Ltd. | | | 12,659 | | | | 11,644,229 | |
Samsung Electronics Co., Ltd. (Non-Voting Shares) GDR 144A | | | 4,082 | | | | 1,181,725 | |
Samsung Fire & Marine Insurance Co., Ltd. | | | 7,714 | | | | 1,414,593 | |
Shinhan Financial Group Co., Ltd. | | | 56,941 | | | | 1,969,032 | |
|
| See Notes to Financial Statements. |
190 |
INTERNATIONAL EQUITY FUND
SCHEDULE OF INVESTMENTS (Continued)
| | | | | | | | |
| | | Shares | | | Value | |
SK Telecom Co., Ltd. ADRD | | | 48,255 | | | $ | 656,751 | |
| | | | | | | | |
| | | | | | | 28,304,304 | |
| | | | | | | | |
Spain — 3.3% | |
Acciona SA‡‡ | | | 10,143 | | | | 876,001 | |
Amadeus IT Holding SA‡‡ | | | 285,283 | | | | 4,628,257 | |
Banco Bilbao Vizcaya Argentaria SA‡‡ | | | 202,885 | | | | 1,754,057 | |
Banco Espanol de Credito SA‡‡ | | | 8,518 | | | | 41,066 | |
Banco Santander SA‡‡ | | | 1,168,308 | | | | 8,875,905 | |
Bolsas y Mercados Espanoles SA‡‡ | | | 1,314 | | | | 35,373 | |
Distribuidora Internacional de Alimentacion SA* | | | 129,684 | | | | 586,612 | |
Endesa SA‡‡ | | | 50,391 | | | | 1,033,712 | |
Iberdrola SA | | | 811,071 | | | | 5,079,625 | |
Inditex SA‡‡ | | | 66,076 | | | | 5,411,621 | |
Mediaset Espana Comunicacion SA | | | 2,861 | | | | 16,330 | |
Repsol YPF SA‡‡ | | | 61,936 | | | | 1,902,609 | |
Tecnicas Reunidas SAD | | | 58,185 | | | | 2,090,865 | |
Telefonica SA‡‡ | | | 356,375 | | | | 6,173,661 | |
| | | | | | | | |
| | | | | | | 38,505,694 | |
| | | | | | | | |
Sri Lanka — 0.0% | |
Dialog Axiata PLC | | | 2,452,710 | | | | 167,964 | |
| | | | | | | | |
Sweden — 2.0% | |
Alfa Laval ABD | | | 85,400 | | | | 1,618,146 | |
Atlas Copco AB Class AD | | | 245,807 | | | | 5,286,134 | |
Boliden AB‡‡ | | | 74,951 | | | | 1,094,525 | |
Getinge AB‡‡ | | | 17,175 | | | | 435,237 | |
Investor AB‡‡ | | | 3,383 | | | | 63,117 | |
JM AB‡‡ | | | 49,699 | | | | 808,812 | |
Lundin Petroleum AB*‡‡ | | | 55,366 | | | | 1,361,212 | |
NCC AB‡‡ | | | 19,639 | | | | 345,292 | |
Sandvik ABD‡‡ | | | 311,265 | | | | 3,819,549 | |
Scania AB‡‡ | | | 35,720 | | | | 529,412 | |
Securitas AB | | | 22,207 | | | | 191,672 | |
Skandinaviska Enskilda Banken AB‡‡ | | | 50,367 | | | | 293,403 | |
Skanska AB‡‡ | | | 23,336 | | | | 386,557 | |
SKF AB | | | 9,865 | | | | 208,709 | |
Svenska Cellulosa ABD‡‡ | | | 196,811 | | | | 2,916,968 | |
Svenska Handelsbanken ABD | | | 77,000 | | | | 2,025,123 | |
Swedbank AB‡‡ | | | 47,714 | | | | 618,087 | |
Telefonaktiebolaget LM Ericsson Class B‡‡ | | | 133,668 | | | | 1,367,358 | |
TeliaSonera AB‡‡ | | | 37,643 | | | | 255,820 | |
Trelleborg AB‡‡ | | | 25,547 | | | | 221,799 | |
| | | | | | | | |
| | | | | | | 23,846,932 | |
| | | | | | | | |
Switzerland — 6.4% | |
ABB, Ltd.‡‡ | | | 175,248 | | | | 3,298,610 | |
Actelion, Ltd.* | | | 7,441 | | | | 255,480 | |
Aryzta AG | | | 5,294 | | | | 255,880 | |
Cie Financiere Richemont SAD‡‡ | | | 104,624 | | | | 5,291,905 | |
Credit Suisse Group AG | | | 74,407 | | | | 1,748,283 | |
Ferrexpo PLC‡‡ | | | 89,303 | | | | 372,789 | |
Galenica AG | | | 300 | | | | 175,503 | |
Geberit AGD | | | 8,000 | | | | 1,541,574 | |
Glencore International PLC | | | 10,000 | | | | 60,877 | |
Julius Baer Group, Ltd. | | | 139,192 | | | | 5,444,388 | |
Logitech International SA* | | | 17,744 | | | | 138,563 | |
Nestle SA‡‡ | | | 187,666 | | | | 10,788,847 | |
Novartis AG‡‡ | | | 231,076 | | | | 13,210,669 | |
| | | | | | | | |
| | | Shares | | | Value | |
Orascom Development Holding AGD | | | 25,964 | | | $ | 396,661 | |
Panalpina Welttransport Holding AG‡‡ | | | 2,648 | | | | 271,199 | |
Roche Holding AG‡‡ | | | 58,071 | | | | 9,842,333 | |
Schindler Holding AG‡‡ | | | 1,099 | | | | 128,000 | |
SGS SA | | | 1,244 | | | | 2,059,427 | |
STMicroelectronics NV‡‡ | | | 7,032 | | | | 41,783 | |
Sulzer AG‡‡ | | | 6,168 | | | | 659,286 | |
Swatch Group AG (The) | | | 6,390 | | | | 2,391,233 | |
Swiss Life Holding AG‡‡ | | | 8,580 | | | | 789,218 | |
Syngenta AG‡‡ | | | 16,243 | | | | 4,755,483 | |
Synthes, Inc. 144A | | | 1,147 | | | | 192,327 | |
Transocean, Ltd.‡‡ | | | 4,575 | | | | 176,658 | |
UBS AG‡‡ | | | 146,556 | | | | 1,744,380 | |
Wolseley PLC‡‡ | | | 39,251 | | | | 1,299,589 | |
Xstrata PLC | | | 143,572 | | | | 2,180,604 | |
Zurich Financial Services AG | | | 28,128 | | | | 6,363,462 | |
| | | | | | | | |
| | | | | | | 75,875,011 | |
| | | | | | | | |
Taiwan — 1.5% | |
Cathay Financial Holding Co., Ltd. | | | 922,284 | | | | 996,026 | |
Chroma ATE, Inc. | | | 100,573 | | | | 197,300 | |
Hiwin Technologies Corporation | | | 80,340 | | | | 652,718 | |
MediaTek, Inc. | | | 71,719 | | | | 657,288 | |
Richtek Technology Corporation | | | 54,337 | | | | 225,215 | |
Taiwan Semiconductor Manufacturing Co., Ltd. | | | 3,624,011 | | | | 9,072,295 | |
Taiwan Semiconductor Manufacturing Co., Ltd. ADR | | | 448,800 | | | | 5,794,008 | |
| | | | | | | | |
| | | | | | | 17,594,850 | |
| | | | | | | | |
Thailand — 0.8% | |
Bank of Ayudhya PCL ADR | | | 1,725,948 | | | | 1,203,514 | |
Central Pattana PCLD | | | 799,966 | | | | 957,170 | |
Central Pattana PCL ADR | | | 108,300 | | | | 129,582 | |
Charoen Pokphand Foods PCL | | | 3,875,600 | | | | 4,053,718 | |
Siam Commercial Bank PCL | | | 711,026 | | | | 2,591,695 | |
| | | | | | | | |
| | | | | | | 8,935,679 | |
| | | | | | | | |
Turkey — 0.6% | |
Akfen Holding AS* | | | 46,621 | | | | 174,790 | |
Coca-Cola Icecek AS | | | 69,240 | | | | 826,309 | |
Turkcell Iletisim Hizmet AS | | | 297,584 | | | | 1,395,404 | |
Türkiye Garanti Bankasi AS | | | 958,427 | | | | 2,985,991 | |
Türkiye Halk Bankasi AS | | | 231,140 | | | | 1,208,336 | |
Yapi ve Kredi Bankasi AS* | | | 488,776 | | | | 694,288 | |
| | | | | | | | |
| | | | | | | 7,285,118 | |
| | | | | | | | |
United Kingdom — 15.8% | |
Aegis Group PLC‡‡ | | | 193,884 | | | | 434,788 | |
Anglo American PLC‡‡ | | | 243,153 | | | | 8,924,097 | |
ARM Holdings PLC | | | 351,800 | | | | 3,234,340 | |
AstraZeneca PLC‡‡ | | | 102,394 | | | | 4,730,745 | |
Aviva PLC‡‡ | | | 467,493 | | | | 2,183,841 | |
Babcock International Group PLC | | | 17,417 | | | | 198,941 | |
Barclays PLC‡‡ | | | 500,909 | | | | 1,369,503 | |
Berkeley Group Holdings PLC*‡‡ | | | 43,068 | | | | 853,441 | |
BG Group PLC | | | 402,227 | | | | 8,598,358 | |
BHP Billiton PLC‡‡ | | | 372,762 | | | | 10,868,752 | |
BP PLC‡‡ | | | 1,281,332 | | | | 9,163,458 | |
See Notes to Financial Statements.
191
| | | | | | | | |
| | | Shares | | | Value | |
British Land Co. PLC REIT‡‡ | | | 187,201 | | | $ | 1,344,584 | |
British Sky Broadcasting Group PLC | | | 101,495 | | | | 1,154,570 | |
Britvic PLC | | | 654,878 | | | | 3,271,746 | |
BT Group PLC‡‡ | | | 599,526 | | | | 1,777,387 | |
Burberry Group PLC‡‡ | | | 20,692 | | | | 380,793 | |
Cairn Energy PLC* | | | 19,660 | | | | 81,001 | |
Capital Shopping Centres Group PLC REIT | | | 3,152 | | | | 15,287 | |
Centrica PLC | | | 430,000 | | | | 1,931,901 | |
Compass Group PLC | | | 1,089,879 | | | | 10,341,597 | |
Cookson Group PLC‡‡ | | | 74,135 | | | | 586,016 | |
Daily Mail & General Trust PLC‡‡ | | | 99,163 | | | | 615,688 | |
Dixons Retail PLC* | | | 1,157,404 | | | | 176,508 | |
Drax Group PLC‡‡ | | | 21,021 | | | | 177,917 | |
easyJet PLC | | | 63,853 | | | | 389,512 | |
Eurasian Natural Resources Corporation PLC‡‡ | | | 58,960 | | | | 581,890 | |
GKN PLC‡‡ | | | 504,513 | | | | 1,433,810 | |
GlaxoSmithKline PLC‡‡ | | | 543,359 | | | | 12,416,949 | |
Hammerson PLC REIT‡‡ | | | 6,134 | | | | 34,294 | |
Hikma Pharmaceuticals PLCD | | | 11,109 | | | | 106,963 | |
HSBC Holdings PLC‡‡ | | | 1,031,662 | | | | 7,867,400 | |
Inchcape PLC‡‡ | | | 45,156 | | | | 205,752 | |
Inmarsat PLC | | | 215,369 | | | | 1,353,582 | |
Intermediate Capital Group PLC‡‡ | | | 159,352 | | | | 566,215 | |
Investec PLC | | | 19,440 | | | | 102,344 | |
ITV PLC‡‡ | | | 630,298 | | | | 667,083 | |
J Sainsbury PLC‡‡ | | | 144,927 | | | | 681,737 | |
Kazakhmys PLC | | | 85,831 | | | | 1,235,640 | |
Kesa Electricals PLC‡‡ | | | 160,297 | | | | 167,536 | |
Land Securities Group PLC REIT‡‡ | | | 10,536 | | | | 103,982 | |
Legal & General Group PLC‡‡ | | | 486,852 | | | | 777,245 | |
Lloyds Banking Group PLC* | | | 699,910 | | | | 281,575 | |
Meggitt PLC | | | 292,900 | | | | 1,604,782 | |
Misys PLC‡‡ | | | 76,635 | | | | 276,468 | |
Mondi PLC‡‡ | | | 122,170 | | | | 863,265 | |
National Grid PLC‡‡ | | | 102,853 | | | | 998,309 | |
Pearson PLC‡‡ | | | 109,868 | | | | 2,064,547 | |
Persimmon PLC‡‡ | | | 182,354 | | | | 1,331,010 | |
Polyus Gold International, Ltd. GDR* | | | 597,234 | | | | 1,791,702 | |
Provident Financial PLC | | | 1,710 | | | | 24,989 | |
Prudential PLC | | | 538,037 | | | | 5,335,083 | |
Reed Elsevier PLC‡‡ | | | 17,027 | | | | 137,238 | |
Rentokil Initial PLC*‡‡ | | | 737,515 | | | | 717,563 | |
Rexam PLC | | | 275,993 | | | | 1,512,150 | |
Rio Tinto PLC‡‡ | | | 100,681 | | | | 4,886,137 | |
Rolls-Royce Holdings PLC | | | 496,468 | | | | 5,755,581 | |
Rolls-Royce Holdings PLC+ | | | 34,256,292 | | | | 53,200 | |
Rotork PLC | | | 66,100 | | | | 1,981,193 | |
Royal Bank of Scotland Group PLC*‡‡ | | | 4,153,335 | | | | 1,301,626 | |
RSA Insurance Group PLC | | | 43,200 | | | | 70,578 | |
Sage Group PLC (The)‡‡ | | | 25,804 | | | | 117,896 | |
Segro PLC REIT | | | 12,232 | | | | 39,607 | |
Smith & Nephew PLC | | | 222,751 | | | | 2,163,790 | |
Smiths Group PLC | | | 5,400 | | | | 76,733 | |
Spirax-Sarco Engineering PLC | | | 50,600 | | | | 1,471,826 | |
SSE PLC‡‡ | | | 73,485 | | | | 1,473,306 | |
Standard Chartered PLC | | | 397,417 | | | | 8,696,120 | |
Tate & Lyle PLC‡‡ | | | 143,764 | | | | 1,572,893 | |
TESCO PLC‡‡ | | | 1,948,990 | | | | 12,211,455 | |
| | | | | | | | |
| | | Shares | | | Value | |
Thomas Cook Group PLC | | | 40,467 | | | $ | 9,270 | |
TUI Travel PLC | | | 367,910 | | | | 947,315 | |
Tullow Oil PLC‡‡ | | | 213,675 | | | | 4,652,323 | |
Unilever PLC | | | 235,063 | | | | 7,896,032 | |
Vodafone Group PLC‡‡ | | | 3,198,390 | | | | 8,886,073 | |
WM Morrison Supermarkets PLC‡‡ | | | 682,391 | | | | 3,456,888 | |
| | | | | | | | |
| | | | | | | 185,765,716 | |
| | | | | | | | |
Total Foreign Common Stocks
(Cost $1,210,213,134) | | | | 1,124,832,451 | |
| | | | | | | | |
FOREIGN PREFERRED STOCKS — 0.6% | |
Belgium — 0.0% | |
Fortis* | | | 106,120 | | | | 137 | |
| | | | | | | | |
Brazil — 0.0% | |
Itau Unibanco Holding SA | | | 11,200 | | | | 204,095 | |
| | | | | | | | |
Chile — 0.0% | |
Embotelladora Andina SA Class A | | | 38,000 | | | | 128,593 | |
Embotelladora Andina SA Class B | | | 22,900 | | | | 100,064 | |
| | | | | | | | |
| | | | | | | 228,657 | |
| | | | | | | | |
Germany — 0.3% | |
Hugo Boss AGD | | | 11,230 | | | | 827,007 | |
Porsche Automobil Holding SE‡‡ | | | 28,638 | | | | 1,532,623 | |
ProSiebenSat.1 Media AG‡‡ | | | 27,737 | | | | 506,708 | |
Volkswagen AG‡‡ | | | 2,052 | | | | 307,408 | |
| | | | | | | | |
| | | | | | | 3,173,746 | |
| | | | | | | | |
South Korea — 0.3% | |
LG Electronics, Inc. | | | 82,710 | | | | 1,723,125 | |
Samsung Electronics Co., Ltd. | | | 3,127 | | | | 1,812,296 | |
| | | | | | | | |
| | | | | | | 3,535,421 | |
| | | | | | | | |
Total Foreign Preferred Stocks
(Cost $8,083,099) | | | | 7,142,056 | |
| | | | | | | | |
WARRANT — 0.0% | |
Gran Colombia Gold Corporation | | | | | | | | |
(Cost $71,054) | | | 125,436 | | | | 19,085 | |
| | | | | | | | |
MONEY MARKET FUNDS — 12.6% | |
GuideStone Money Market Fund (GS4 Class)¥ | | | 74,576,754 | | | | 74,576,754 | |
Northern Institutional Liquid Assets Portfolio§ | | | 73,672,665 | | | | 73,672,665 | |
| | | | | | | | |
Total Money Market Funds
(Cost $148,249,419) | | | | | | | 148,249,419 | |
| | | | | | | | |
TOTAL INVESTMENTS — 108.6%
(Cost $1,366,783,842) | | | | 1,280,409,063 | |
| | | | | | | | |
| | |
| | | Shares | | | | |
SECURITIES SOLD SHORT — (5.4)% | |
Australia — (0.4)% | |
Adelaide Brighton, Ltd. | | | (28,268 | ) | | | (83,557 | ) |
AMP, Ltd. | | | (37,948 | ) | | | (157,970 | ) |
APA Group | | | (73,155 | ) | | | (335,954 | ) |
Bank of Queensland, Ltd. | | | (15,811 | ) | | | (118,213 | ) |
BlueScope Steel, Ltd. | | | (445,884 | ) | | | (184,700 | ) |
Boart Longyear, Ltd. | | | (18,910 | ) | | | (53,768 | ) |
Boral, Ltd. | | | (30,776 | ) | | | (113,319 | ) |
Bradken, Ltd. | | | (77,231 | ) | | | (564,001 | ) |
|
| See Notes to Financial Statements. |
192 |
INTERNATIONAL EQUITY FUND
SCHEDULE OF INVESTMENTS (Continued)
| | | | | | | | |
| | | Shares | | | Value | |
Challenger, Ltd. | | | (44,300 | ) | | $ | (187,130 | ) |
Energy Resources of Australia, Ltd. | | | (68,115 | ) | | | (85,343 | ) |
Flight Centre, Ltd. | | | (4,182 | ) | | | (68,951 | ) |
Harvey Norman Holdings, Ltd. | | | (22,362 | ) | | | (41,970 | ) |
Iluka Resources, Ltd. | | | (3,884 | ) | | | (61,575 | ) |
IOOF Holdings, Ltd. | | | (54,763 | ) | | | (286,779 | ) |
Leighton Holdings, Ltd. | | | (17,470 | ) | | | (340,212 | ) |
Myer Holdings, Ltd. | | | (102,760 | ) | | | (203,374 | ) |
OneSteel, Ltd. | | | (240,936 | ) | | | (172,500 | ) |
Orica, Ltd. | | | (8,004 | ) | | | (198,440 | ) |
Seek, Ltd. | | | (116,275 | ) | | | (674,310 | ) |
Seven West Media, Ltd. | | | (53,706 | ) | | | (177,974 | ) |
Sims Metal Management, Ltd. | | | (9,475 | ) | | | (122,591 | ) |
Ten Network Holdings, Ltd. | | | (226,516 | ) | | | (194,611 | ) |
Transfield Services, Ltd. | | | (155,034 | ) | | | (342,508 | ) |
Transurban Group | | | (20,500 | ) | | | (117,837 | ) |
WorleyParsons, Ltd. | | | (5,714 | ) | | | (150,022 | ) |
| | | | | | | | |
| | | | | | | (5,037,609 | ) |
| | | | | | | | |
Belgium — 0.0% | |
Dexia SA* | | | (16,388 | ) | | | (6,300 | ) |
Umicore SA | | | (10,714 | ) | | | (441,927 | ) |
| | | | | | | | |
| | | | | | | (448,227 | ) |
| | | | | | | | |
Denmark — (0.2)% | |
FLSmidth & Co. A/S | | | (18,500 | ) | | | (1,087,136 | ) |
Novozymes A/S | | | (7,895 | ) | | | (243,725 | ) |
Tryg A/S | | | (9,696 | ) | | | (538,545 | ) |
William Demant Holding A/S* | | | (3,050 | ) | | | (253,631 | ) |
| | | | | | | | |
| | | | | | | (2,123,037 | ) |
| | | | | | | | |
Finland — (0.2)% | |
Konecranes OYJ | | | (51,595 | ) | | | (970,933 | ) |
Nokian Renkaat OYJ | | | (6,449 | ) | | | (207,663 | ) |
Outokumpu OYJ | | | (62,169 | ) | | | (408,747 | ) |
Rautaruukki OYJ | | | (34,362 | ) | | | (316,425 | ) |
UPM-Kymmene OYJ | | | (3,092 | ) | | | (34,055 | ) |
YIT OYJ | | | (30,720 | ) | | | (492,220 | ) |
| | | | | | | | |
| | | | | | | (2,430,043 | ) |
| | | | | | | | |
France — (0.5)% | |
Accor SA | | | (8,163 | ) | | | (206,914 | ) |
Alstom SA | | | (16,341 | ) | | | (495,528 | ) |
EDF SA | | | (30,235 | ) | | | (735,673 | ) |
Eiffage SA | | | (7,634 | ) | | | (184,811 | ) |
Lafarge SA | | | (7,500 | ) | | | (263,638 | ) |
Neopost SA | | | (3,104 | ) | | | (209,143 | ) |
Renault SA | | | (27,258 | ) | | | (945,466 | ) |
Vallourec SA | | | (34,565 | ) | | | (2,243,940 | ) |
Veolia Environnement SA | | | (14,259 | ) | | | (156,293 | ) |
| | | | | | | | |
| | | | | | | (5,441,406 | ) |
| | | | | | | | |
Germany — (0.2)% | |
Commerzbank AG | | | (31,422 | ) | | | (52,990 | ) |
Hamburger Hafen Und Logistik AG | | | (15,437 | ) | | | (456,028 | ) |
Hochtief AG | | | (13,659 | ) | | | (790,124 | ) |
Lanxess AG | | | (4,080 | ) | | | (211,221 | ) |
MTU Aero Engines Holding AG | | | (3,859 | ) | | | (246,928 | ) |
Rheinmetall AG | | | (4,386 | ) | | | (194,337 | ) |
Symrise AG | | | (28,548 | ) | | | (761,871 | ) |
| | | | | | | | |
| | | | | | | (2,713,499 | ) |
| | | | | | | | |
| | | | | | | | |
| | | Shares | | | Value | |
Ireland — 0.0% | |
James Hardie Industries SE ADR | | | (41,155 | ) | | $ | (287,076 | ) |
| | | | | | | | |
Italy — (0.1)% | |
Mediaset SpA | | | (52,990 | ) | | | (146,628 | ) |
Mediolanum SpA | | | (36,849 | ) | | | (143,457 | ) |
Terna Rete Elettrica Nazionale SpA | | | (170,074 | ) | | | (573,187 | ) |
| | | | | | | | |
| | | | | | | (863,272 | ) |
| | | | | | | | |
Japan — (1.2)% | |
ABC-Mart, Inc. | | | (1,200 | ) | | | (45,633 | ) |
Advantest Corporation | | | (18,200 | ) | | | (173,322 | ) |
Aeon Credit Service Co., Ltd. | | | (4,500 | ) | | | (71,093 | ) |
Bank of Kyoto, Ltd. (The) | | | (9,000 | ) | | | (77,524 | ) |
Chugai Pharmaceutical Co., Ltd. | | | (12,200 | ) | | | (201,141 | ) |
Chugoku Electric Power Co., Inc. (The) | | | (8,100 | ) | | | (141,963 | ) |
Citizen Holdings Co., Ltd. | | | (44,600 | ) | | | (259,013 | ) |
Daikin Industries, Ltd. | | | (10,100 | ) | | | (276,612 | ) |
Daiwa Securities Group, Inc. | | | (52,000 | ) | | | (162,141 | ) |
Denki Kagaku Kogyo KK | | | (76,000 | ) | | | (281,408 | ) |
Denso Corporation | | | (3,800 | ) | | | (104,960 | ) |
Disco Corporation | | | (10,900 | ) | | | (568,579 | ) |
Don Quijote Co., Ltd. | | | (2,400 | ) | | | (82,349 | ) |
Dowa Holdings Co., Ltd. | | | (69,000 | ) | | | (436,573 | ) |
Fast Retailing Co., Ltd. | | | (600 | ) | | | (109,133 | ) |
Fujikura, Ltd. | | | (42,000 | ) | | | (122,775 | ) |
GS Yuasa Corporation | | | (130,000 | ) | | | (699,233 | ) |
Hirose Electric Co., Ltd. | | | (1,000 | ) | | | (87,697 | ) |
Hiroshima Bank, Ltd. (The) | | | (5,000 | ) | | | (23,256 | ) |
Hisamitsu Pharmaceutical Co., Inc. | | | (1,300 | ) | | | (55,060 | ) |
Hitachi Construction Machinery Co., Ltd. | | | (42,800 | ) | | | (720,655 | ) |
Hitachi Metals, Ltd. | | | (37,000 | ) | | | (402,352 | ) |
Isetan Mitsukoshi Holdings, Ltd. | | | (36,200 | ) | | | (379,543 | ) |
J Front Retailing Co., Ltd. | | | (25,000 | ) | | | (120,826 | ) |
Jafco Co., Ltd. | | | (17,400 | ) | | | (319,426 | ) |
Kansai Paint Co., Ltd. | | | (20,000 | ) | | | (178,511 | ) |
Kawasaki Heavy Industries, Ltd. | | | (49,000 | ) | | | (122,229 | ) |
Keikyu Corporation | | | (21,000 | ) | | | (188,528 | ) |
Komatsu, Ltd. | | | (9,000 | ) | | | (210,355 | ) |
Kubota Corporation | | | (13,000 | ) | | | (108,939 | ) |
Mabuchi Motor Co., Ltd. | | | (3,100 | ) | | | (129,083 | ) |
Matsui Securities Co., Ltd. | | | (52,400 | ) | | | (255,975 | ) |
Minebea Co., Ltd. | | | (30,000 | ) | | | (125,503 | ) |
Mitsui OSK Lines, Ltd. | | | (27,000 | ) | | | (104,534 | ) |
MS&AD Insurance Group Holdings, Inc. | | | (4,500 | ) | | | (83,370 | ) |
Murata Manufacturing Co., Ltd. | | | (4,900 | ) | | | (251,780 | ) |
NGK Insulators, Ltd. | | | (51,000 | ) | | | (605,613 | ) |
Nidec Corporation | | | (8,500 | ) | | | (738,794 | ) |
Nintendo Co., Ltd. | | | (700 | ) | | | (96,401 | ) |
Nippon Steel Corporation | | | (74,000 | ) | | | (184,591 | ) |
Nippon Television Network Corporation | | | (780 | ) | | | (119,376 | ) |
Nitori Holdings Co., Ltd. | | | (550 | ) | | | (51,592 | ) |
Oracle Corporation | | | (12,000 | ) | | | (397,090 | ) |
OSAKA Titanium Technologies Co. | | | (7,700 | ) | | | (340,633 | ) |
Rakuten, Inc. | | | (689 | ) | | | (741,187 | ) |
Ricoh Co., Ltd. | | | (65,000 | ) | | | (566,649 | ) |
See Notes to Financial Statements.
193
| | | | | | | | |
| | | Shares | | | Value | |
Sharp Corporation | | | (6,000 | ) | | $ | (52,462 | ) |
Shiseido Co., Ltd. | | | (1,800 | ) | | | (33,091 | ) |
Showa Denko KK | | | (137,000 | ) | | | (277,667 | ) |
SMC Corporation | | | (1,000 | ) | | | (161,362 | ) |
Sumitomo Chemical Co., Ltd. | | | (3,000 | ) | | | (10,952 | ) |
Sumitomo Mitsui Trust Holdings, Inc. | | | (87,000 | ) | | | (255,450 | ) |
Taiyo Nippon Sanso Corporation | | | (21,000 | ) | | | (146,512 | ) |
Takashimaya Co., Ltd. | | | (11,000 | ) | | | (79,602 | ) |
Tobu Railway Co., Ltd. | | | (48,000 | ) | | | (245,082 | ) |
Tokyo Broadcasting System Holdings, Inc. | | | (10,800 | ) | | | (138,911 | ) |
Trend Micro, Inc. | | | (1,100 | ) | | | (32,884 | ) |
Tsumura & Co. | | | (6,900 | ) | | | (203,495 | ) |
Ushio, Inc. | | | (18,200 | ) | | | (262,939 | ) |
Yahoo! Japan Corporation | | | (1,805 | ) | | | (581,343 | ) |
Yakult Honsha Co., Ltd. | | | (5,000 | ) | | | (157,529 | ) |
Yaskawa Electric Corporation | | | (41,000 | ) | | | (348,902 | ) |
| | | | | | | | |
| | | | | | | (14,511,183 | ) |
| | | | | | | | |
Luxembourg — (0.1)% | |
Oriflame Cosmetics SA ADR | | | (18,740 | ) | | | (591,986 | ) |
| | | | | | | | |
Netherlands — (0.3)% | |
Fugro NV | | | (22,605 | ) | | | (1,313,469 | ) |
Imtech NV | | | (7,441 | ) | | | (192,754 | ) |
Koninklijke Philips Electronics NV | | | (21,000 | ) | | | (442,477 | ) |
Qiagen NV* | | | (38,351 | ) | | | (528,620 | ) |
Randstad Holding NV | | | (20,309 | ) | | | (600,872 | ) |
SBM Offshore NV | | | (12,538 | ) | | | (258,338 | ) |
Wolters Kluwer NV | | | (19,353 | ) | | | (334,510 | ) |
| | | | | | | | |
| | | | | | | (3,671,040 | ) |
| | | | | | | | |
Papua New Guinea — 0.0% | |
Oil Search, Ltd. | | | (57,947 | ) | | | (370,425 | ) |
| | | | | | | | |
Spain — (0.1)% | |
Abertis Infraestructuras SA | | | (6,134 | ) | | | (97,966 | ) |
Acerinox SA | | | (4,905 | ) | | | (62,912 | ) |
ACS Actividades de Construccion y Servicios SA | | | (19,533 | ) | | | (578,924 | ) |
Grifols SA | | | (26,193 | ) | | | (440,703 | ) |
Indra Sistemas SA | | | (10,377 | ) | | | (132,115 | ) |
Obrascon Huarte Lain SA | | | (8,666 | ) | | | (217,365 | ) |
Prosegur Cia de Seguridad SA | | | (1,139 | ) | | | (49,811 | ) |
| | | | | | | | |
| | | | | | | (1,579,796 | ) |
| | | | | | | | |
Sweden — (0.4)% | |
Assa Abloy AB Class B | | | (28,821 | ) | | | (722,823 | ) |
Elekta AB | | | (12,255 | ) | | | (531,545 | ) |
Hexagon AB | | | (83,147 | ) | | | (1,243,209 | ) |
Husqvarna AB | | | (169,301 | ) | | | (780,078 | ) |
Modern Times Group AB | | | (21,414 | ) | | | (1,023,085 | ) |
SSAB AB | | | (68,885 | ) | | | (607,068 | ) |
| | | | | | | | |
| | | | | | | (4,907,808 | ) |
| | | | | | | | |
Switzerland — (0.4)% | |
Clariant AG | | | (38,598 | ) | | | (380,926 | ) |
Dufry AG | | | (2,014 | ) | | | (185,362 | ) |
Informa PLC | | | (10,822 | ) | | | (60,722 | ) |
Nobel Biocare Holding AG | | | (39,687 | ) | | | (461,388 | ) |
Sonova Holding AG | | | (13,303 | ) | | | (1,391,483 | ) |
Swiss Re AG | | | (1,886 | ) | | | (96,117 | ) |
Temenos Group AG* | | | (84,885 | ) | | | (1,391,705 | ) |
| | | | | | | | |
| | | Shares | | | Value | |
Xstrata PLC | | | (1,945 | ) | | $ | (29,541 | ) |
| | | | | | | | |
| | | | | | | (3,997,244 | ) |
| | | | | | | | |
United Kingdom — (1.3)% | |
Admiral Group PLC | | | (12,306 | ) | | | (162,826 | ) |
AMEC PLC | | | (24,900 | ) | | | (350,925 | ) |
Antofagasta PLC | | | (57,079 | ) | | | (1,077,012 | ) |
ARM Holdings PLC | | | (2,973 | ) | | | (27,333 | ) |
Britvic PLC | | | (51,658 | ) | | | (258,081 | ) |
Bunzl PLC | | | (3,666 | ) | | | (50,328 | ) |
Capita Group PLC (The) | | | (64,494 | ) | | | (629,496 | ) |
Carnival PLC | | | (14,790 | ) | | | (488,314 | ) |
Chemring Group PLC | | | (16,917 | ) | | | (105,061 | ) |
Cobham PLC | | | (99,558 | ) | | | (283,559 | ) |
Croda International PLC | | | (7,790 | ) | | | (218,244 | ) |
Electrocomponents PLC | | | (55,469 | ) | | | (162,120 | ) |
Firstgroup PLC | | | (34,191 | ) | | | (179,472 | ) |
Inmarsat PLC | | | (20,761 | ) | | | (130,482 | ) |
International Power PLC | | | (118,143 | ) | | | (618,677 | ) |
Intertek Group PLC | | | (16,341 | ) | | | (516,430 | ) |
John Wood Group PLC | | | (40,000 | ) | | | (398,186 | ) |
Johnson Matthey PLC | | | (7,256 | ) | | | (206,889 | ) |
Lonmin PLC | | | (51,844 | ) | | | (789,028 | ) |
Man Group PLC | | | (74,378 | ) | | | (145,194 | ) |
Meggitt PLC | | | (18,041 | ) | | | (98,846 | ) |
Michael Page International PLC | | | (70,466 | ) | | | (381,702 | ) |
Next PLC | | | (47,794 | ) | | | (2,031,497 | ) |
Old Mutual PLC | | | (275,127 | ) | | | (578,949 | ) |
Pennon Group PLC | | | (36,483 | ) | | | (404,536 | ) |
Reckitt Benckiser Group PLC | | | (14,404 | ) | | | (711,342 | ) |
Rolls-Royce Holdings PLC+ | | | (1,656,000 | ) | | | (2,572 | ) |
Severn Trent PLC | | | (5,844 | ) | | | (135,772 | ) |
Smith & Nephew PLC | | | (19,790 | ) | | | (192,239 | ) |
Standard Chartered PLC | | | (37,942 | ) | | | (830,232 | ) |
Standard Life PLC | | | (2,724 | ) | | | (8,727 | ) |
Travis Perkins PLC | | | (70,998 | ) | | | (877,111 | ) |
UBM PLC | | | (13,555 | ) | | | (100,496 | ) |
United Utilities Group PLC | | | (31,862 | ) | | | (299,857 | ) |
Weir Group PLC (The) | | | (35,523 | ) | | | (1,120,989 | ) |
Whitbread PLC | | | (18,796 | ) | | | (456,531 | ) |
| | | | | | | | |
| | | | | | | (15,029,055 | ) |
| | | | | | | | |
Total Securities Sold Short
(Cost $(74,462,583)) | | | | | | | (64,002,706 | ) |
| | | | | | | | |
Liabilities in Excess of Other Assets — (3.2)% | | | | | | | (37,424,067 | ) |
| | | | | | | | |
NET ASSETS — 100.0% | | | | | | $ | 1,178,982,290 | |
| | | | | | | | |
Please see abbreviation and footnote definitions beginning on page 200.
|
| See Notes to Financial Statements. |
194 |
INTERNATIONAL EQUITY FUND
SCHEDULE OF INVESTMENTS (Continued)
PORTFOLIO SUMMARY (based on net assets)
| | | | |
| | | % | |
Financial | | | 17.0 | |
Money Market Funds | | | 12.6 | |
Materials & Processing | | | 11.9 | |
Consumer Discretionary | | | 11.8 | |
Futures Contracts | | | 10.8 | |
Producer Durables | | | 10.1 | |
Energy | | | 9.6 | |
Technology | | | 9.3 | |
Consumer Staples | | | 8.7 | |
Health Care | | | 8.6 | |
Utilities | | | 8.4 | |
Foreign Preferred Stocks | | | 0.6 | |
Warrant | | | — | ** |
Foreign Bond | | | — �� | ** |
Forward Foreign Currency Contracts | | | (0.9 | ) |
Securities Sold Short | | | (5.4 | ) |
| | | | |
| | | 113.1 | |
| | | | |
| ** | Rounds to less than 0.005%. |
VALUATION HIERARCHY
The following is a summary of the inputs used, as of December 31, 2011, in valuing the Fund’s investments carried at fair value:
| | | | | | | | | | | | | | | | |
| | | Total Value | | | Level 1
Quoted Prices | | | Level 2
Other
Significant
Observable
Inputs | | | Level 3
Significant
Unobservable
Inputs | |
Assets: | | | | | | | | | | | | | | | | |
Investments in Securities: | | | | | | | | | | | | | | | | |
Foreign Bond | | $ | 166,052 | | | $ | — | | | $ | 166,052 | | | $ | — | |
Foreign Common Stocks | | | 1,124,832,451 | | | | 1,098,702,480 | | | | 25,402,198 | | | | 727,773 | |
Foreign Preferred Stocks | | | 7,142,056 | | | | 5,329,760 | | | | 1,812,296 | | | | — | |
Money Market Funds | | | 148,249,419 | | | | 148,249,419 | | | | — | | | | — | |
Warrant | | | 19,085 | | | | 19,085 | | | | — | | | | — | |
| | | | | | | | | | | | | | | | |
Total Assets — Investments in Securities | | $ | 1,280,409,063 | | | $ | 1,252,300,744 | | | $ | 27,380,546 | | | $ | 727,773 | |
| | | | | | | | | | | | | | | | |
Other Financial Instruments*** | | | | | | | | | | | | | | | | |
Forward Foreign Currency Contracts | | $ | 461,139 | | | $ | — | | | $ | 461,139 | | | $ | — | |
Futures Contracts | | | 1,187,508 | | | | 1,187,508 | | | | — | | | | — | |
| | | | | | | | | | | | | | | | |
Total Assets — Other Financial Instruments | | $ | 1,648,647 | | | $ | 1,187,508 | | | $ | 461,139 | | | $ | — | |
| | | | | | | | | | | | | | | | |
Liabilities: | | | | | | | | | | | | | | | | |
Investments in Securities: | | | | | | | | | | | | | | | | |
Securities Sold Short | | $ | (64,002,706 | ) | | $ | (64,000,134 | ) | | $ | — | | | $ | (2,572 | ) |
| | | | | | | | | | | | | | | | |
Total Liabilities — Investments in Securities | | $ | (64,002,706 | ) | | $ | (64,000,134 | ) | | $ | — | | | $ | (2,572 | ) |
| | | | | | | | | | | | | | | | |
| *** | Other financial instruments are derivative instruments not reflected in the Schedule of Investments, such as futures, forwards and swap contracts, which are valued at the unrealized appreciation (depreciation) on the investment. Details of these investments can be found in the Notes to Schedules of Investments. |
See Notes to Financial Statements.
195
The following is a reconciliation of assets in which significant unobservable inputs (Level 3) were used in determining fair value:
| | | | | | | | | | | | |
| | | Total Value | | | Foreign
Common
Stocks | | | Securities
Sold
Short | |
| | | |
Balance, 12/31/10 | | $ | 212,441 | | | $ | 212,441 | | | $ | — | |
Accrued discounts/premiums | | | — | | | | — | | | | — | |
Realized gain (loss)(1) | | | 47,919 | | | | 47,919 | | | | — | |
Change in unrealized appreciation (depreciation)(2) | | | (78,215 | ) | | | (78,278 | ) | | | 63 | |
Purchases | | | 660,397 | | | | 660,397 | | | | — | |
Sales | | | (245,619 | ) | | | (242,984 | ) | | | (2,635 | ) |
Transfers in and/or out of Level 3(3) | | | 128,278 | | | | 128,278 | | | | — | |
| | | | | | | | | | | | |
Balance, 12/31/11 | | $ | 725,201 | | | $ | 727,773 | | | $ | (2,572 | ) |
| | | | | | | | | | | | |
| (1) | Realized gain (loss) from the sale of Level 3 securities can be found on the Statement of Operations in Net Realized Gain (loss) from Investment securities and securities sold short. |
| (2) | Change in unrealized appreciation (depreciation) can be found on the Statement of Operations in Net change in unrealized appreciation (depreciation) on Investment securities and securities sold short. |
| (3) | The Fund had a security valued at $156,407 as of December 31, 2010 that was transferred from Level 2 to Level 3 of the fair value hierarchy. The securities that transferred from Level 2 to Level 3 during the year ended December 31, 2011 did so as a result of the inability of the Fund to obtain a price which was determined using observable inputs. The value of the securities as of December 31, 2011 is $128,278. |
Level 1 - 2 Transfers
The Fund had common stocks valued at $511,892,106 as of December 31, 2010 that were either sold or transferred from Level 2 to Level 1 of the fair value hierarchy. The common stocks that transferred from Level 2 to Level 1 did so as a result of foreign equities that were fair valued at December 31, 2010 that are now being valued based on quoted prices. The value of the securities that were transferred to Level 1 as of December 31, 2011 is $344,001,286.
The Fund had common stocks valued at $4,690,585 as of December 31, 2010 that were either sold or transferred from Level 1 to Level 2 of the fair value hierarchy. The common stocks that transferred from Level 1 to Level 2 did so as a result of foreign equities that were being valued based on quoted prices December 31, 2010 that are now being fair valued. The value of the securities that were transferred to Level 2 as of December 31, 2011 is $0.
|
| See Notes to Financial Statements. |
196 |
ABBREVIATIONS AND FOOTNOTES
| | |
INVESTMENT ABBREVIATIONS: |
| ADR | | —American Depository Receipt |
| AGM | | —Assured Guaranty Municipal Corporation |
| AMBAC | | —American Municipal Bond Assurance Corporation |
| CONV | | —Convertible |
| ETF | | —Exchange Traded Fund |
| ETN | | —Exchange Traded Note |
| GDR | | —Global Depository Receipt |
| IO | | —Interest Only (Principal amount shown is notional) |
| LLC | | —Limited Liability Company |
| LOC | | —Letter of Credit |
| LP | | —Limited Partnership |
| PIK | | —Payment-in-Kind Bonds |
| PIPE | | —Private Investment in Public Equity |
| PLC | | —Public Limited Company |
| PO | | —Principal Only |
| REIT | | —Real Estate Investment Trust |
| STEP | | —Stepped Coupon Bonds: Interest rates shown reflect the rates currently in effect. |
| STRIP | | —Stripped Security |
| TBA | | —To be announced. |
| TIPS | | —Treasury Inflation Protected Security. |
| 144A | | —Security was purchased pursuant to Rule 144A under the Securities Act of 1933 and may not be resold subject to that rule except to qualified institutional buyers. As of December 31, 2011, the total market values and percentages of net assets for 144A securities by fund were as follows: |
| | | | | | | | |
Fund | | Value of
144A Securities | | | Percentage of
Net Assets | |
Low-Duration Bond | | $ | 128,258,613 | | | | 17.24 | % |
Medium-Duration Bond | | | 126,400,012 | | | | 14.63 | |
Extended-Duration Bond | | | 26,008,099 | | | | 6.41 | |
Global Bond | | | 18,917,012 | | | | 11.12 | |
Defensive Market Strategies | | | 13,846,954 | | | | 4.40 | |
Small Cap Equity | | | 2,519,258 | | | | 0.60 | |
International Equity | | | 3,508,987 | | | | 0.30 | |
INVESTMENT FOOTNOTES:
| | |
| ‡‡ | | —All or a portion of the security was held as collateral for open futures, options, securities sold short and/or swap contracts. |
| @ | | —Illiquid. |
| * | | —Non-income producing security. |
| # | | —Security in default. |
| § | | —Security purchased with the cash proceeds from securities loaned. |
| † | | —Variable rate security. Interest rates shown reflect the rates currently in effect. Maturity date for money market instruments is the date of the next interest rate reset. |
| W | | —Interest rates shown reflect the effective yields as of December 31, 2011. |
| ¥ | | —Affiliated fund. |
| D | | —Security either partially or fully on loan. |
| + | | —Security is valued at fair value. As of December 31, 2011, the total market values and percentages of net assets for Fair Valued securities by fund were as follows: |
| | | | | | | | |
Fund | | Value of
Fair
Valued
Securities | | | Percentage of
Net Assets | |
Medium-Duration Bond | | $ | 14 | | | | — | % |
Global Bond | | | 138,937 | | | | 0.08 | |
Equity Index | | | — | | | | — | |
Small Cap Equity | | | 537,576 | | | | 0.13 | |
International Equity | | | 725,202 | | | | 0.06 | |
197
ABBREVIATIONS AND FOOTNOTES
FOREIGN BOND FOOTNOTES:
| | |
| (A) | | — Par is denominated in Australian Dollars (AUD). |
| (B) | | — Par is denominated in Brazilian Real (BRL). |
| (C) | | — Par is denominated in Canadian Dollars (CAD). |
| (E) | | — Par is denominated in Euro (EUR). |
| (G) | | — Par is denominated in Singapore Dollars (SGD). |
| (K) | | — Par is denominated in Norweigan Krone (NOK). |
| (M) | | — Par is denominated in Mexican Pesos (MXN). |
| (N) | | — Par is denominated in Indonesian Rupiahs (IDR). |
| (P) | | — Par is denominated in Peruvian Nuevos Soles (PEN). |
| (R) | | — Par is denominated in Malaysian Ringgits (MYR). |
| (S) | | — Par is denominated in South African Rand (ZAR). |
| (U) | | — Par is denominated in British Pounds (GBP). |
| (W) | | — Par is denominated in South Korean Won (KRW). |
| (Z) | | — Par is denominated in New Zealand Dollars (NZD). |
COUNTERPARTY ABBREVIATIONS:
| | |
| BAR | | — Counterparty to contract is Barclays Capital. |
| BNP | | — Counterparty to contract is BNP Paribas. |
| BOA | | — Counterparty to contract is Bank of America. |
| CITI | | — Counterparty to contract is Citibank NA London. |
| CITIC | | — Counterparty to contract is Citicorp. |
| CITIG | | — Counterparty to contract is Citigroup Global Markets, Inc. |
| CS | | — Counterparty to contract is Credit Suisse International. |
| DEUT | | — Counterparty to contract is Deutsche Bank AG. |
| GSC | | — Counterparty to contract is Goldman Sachs Capital Markets, LP. |
| HKSB | | — Counterparty to contract is Hong Kong & Shanghai Bank. |
| HSBC | | — Counterparty to contract is HSBC Securities. |
| JPM | | — Counterparty to contract is JPMorgan Chase Bank. |
| KS | | — Counterparty to contract is Knight Securities. |
| MFG | | — Counterparty to contract is MF Global. |
| MLCS | | — Counterparty to contract is Merrill Lynch Capital Services, Inc. |
| MSCS | | — Counterparty to contract is Morgan Stanley Capital Services. |
| NT | | — Counterparty to contract is Northern Trust Corporation. |
| RBC | | — Counterparty to contract is Royal Bank of Canada. |
| RBS | | — Counterparty to contract is Royal Bank of Scotland. |
| SG | | — Counterparty to contract is Societe Generale. |
| SS | | — Counterparty to contract is State Street Global Markets. |
| UBS | | — Counterparty to contract is UBS AG. |
| WEST | | — Counterparty to contract is Westpac Pollock. |
198
| | |
| STATEMENTS OF ASSETS AND LIABILITIES | | December 31, 2011 |
| | | | | | | | |
| | | Money
Market Fund | | | Low-Duration
Bond Fund | |
Assets | | | | | | | | |
Investments in securities of unaffiliated issuers, at value | | $ | 1,277,710,734 | | | $ | 788,806,074 | |
Investments in repurchase agreements, at value | | | — | | | | 106,500,000 | |
Investments in securities of affiliated issuers, at value | | | — | | | | 36,527,243 | |
| | | | | | | | |
Total investments (1)(2) | | | 1,277,710,734 | | | | 931,833,317 | |
Cash | | | 997 | | | | 684,100 | |
Cash collateral for derivatives | | | — | | | | 837,000 | |
Deposits with broker for securities sold short | | | — | | | | — | |
Foreign currency(3) | | | — | | | | 488,959 | |
Receivables: | | | | | | | | |
Dividends and reclaims | | | — | | | | 384 | |
Interest | | | 277,371 | | | | 4,178,603 | |
Securities lending | | | 1,298 | | | | 5,133 | |
Investment securities sold | | | — | | | | 49,893,096 | |
Maturities | | | — | | | | 21,727 | |
Fund shares sold | | | 3,767,245 | | | | 44,353 | |
Variation margin on financial futures contracts | | | — | | | | 77,840 | |
Unrealized appreciation on foreign currency exchange contracts | | | — | | | | 1,616,064 | |
Unrealized appreciation on swap agreements | | | — | | | | 2,824,411 | |
Prepaid expenses and other assets | | | 54,624 | | | | 22,518 | |
| | | | | | | | |
Total Assets | | | 1,281,812,269 | | | | 992,527,505 | |
| | | | | | | | |
Liabilities | | | | | | | | |
Cash overdraft | | | — | | | | — | |
Securities sold short, at value (4) | | | — | | | | — | |
TBA sale commitments, at value (5) | | | — | | | | 16,164,219 | |
Options written at value (6) | | | — | | | | 365 | |
Unrealized depreciation on foreign currency exchange contracts | | | — | | | | 698,550 | |
Unrealized depreciation on swap agreements | | | — | | | | 153,577 | |
Collateral held for securities on loan at value | | | — | | | | 84,233,733 | |
Collateral held for derivatives | | | — | | | | 2,250,000 | |
Payables: | | | | | | | | |
Investment securities purchased | | | — | | | | 143,949,630 | |
Dividends on short sales | | | — | | | | — | |
Fund shares redeemed | | | 3,604,305 | | | | 11,277 | |
Variation margin on exchange traded swaps | | | — | | | | 483,451 | |
Variation margin on financial futures contracts | | | — | | | | 50,297 | |
Distributions | | | 6,920 | | | | — | |
Securities lending | | | 260 | | | | 1,026 | |
Accrued expenses: | | | | | | | | |
Investment advisory fees | | | 172,883 | | | | 118,840 | |
Shareholder servicing fees | | | 67,819 | | | | 126,555 | |
Other expenses | | | 32,370 | | | | 110,842 | |
| | | | | | | | |
Total Liabilities | | | 3,884,557 | | | | 248,352,362 | |
| | | | | | | | |
Net Assets | | $ | 1,277,927,712 | | | $ | 744,175,143 | |
| | | | | | | | |
Net Assets Consist of: | | | | | | | | |
Paid-in-capital | | $ | 1,277,927,674 | | | $ | 754,494,871 | |
Undistributed (distributions in excess of) net investment income | | | 38 | | | | 1,213,905 | |
Undistributed (accumulated) net realized gain (loss) on investments, foreign currency translations and derivative transactions | | | — | | | | 722,454 | |
Net unrealized appreciation (depreciation) on investments, foreign currency translations and derivative transactions | | | — | | | | (12,256,087 | ) |
| | | | | | | | |
Net Assets | | $ | 1,277,927,712 | | | $ | 744,175,143 | |
| | | | | | | | |
Net Asset Value: | | | | | | | | |
$0.001 par value, unlimited shares authorized | | | | | | | | |
Net assets applicable to the GS2 Class | | $ | 116,297,676 | | | $ | 122,462,158 | |
| | | | | | | | |
GS2 shares outstanding | | | 116,293,551 | | | | 14,257,615 | |
| | | | | | | | |
Net asset value, offering and redemption price per GS2 share | | $ | 1.00 | | | $ | 8.59 | |
| | | | | | | | |
Net assets applicable to the GS4 Class | | $ | 1,161,630,036 | | | $ | 621,712,985 | |
| | | | | | | | |
GS4 shares outstanding | | | 1,161,599,477 | | | | 47,094,582 | |
| | | | | | | | |
Net asset value, offering and redemption price per GS4 share | | $ | 1.00 | | | $ | 13.20 | |
| | | | | | | | |
| | | | | | | | |
(1) Investments in securities of unaffiliated issuers, at cost | | $ | 1,277,710,734 | | | $ | 802,698,500 | |
Investments in repurchase agreements, at cost | | | — | | | | 106,500,000 | |
Investments in securities of affiliated issuers, at cost | | | — | | | | 36,527,243 | |
| | | | | | | | |
Total investments at cost | | $ | 1,277,710,734 | | | $ | 945,725,743 | |
| | | | | | | | |
(2) Includes securities loaned of: | | $ | 25,076,053 | | | $ | 108,310,839 | |
| | | | | | | | |
(3) Foreign currency at cost | | $ | — | | | $ | 492,811 | |
| | | | | | | | |
(4) Proceeds from securities sold short | | $ | — | | | $ | — | |
| | | | | | | | |
(5) TBA sale commitments at cost | | $ | — | | | $ | 16,011,563 | |
| | | | | | | | |
(6) Premiums received on options written | | $ | — | | | $ | 32,965 | |
| | | | | | | | |
See Notes to Financial Statements.
199
| | | | | | | | | | | | | | | | | | |
Medium-Duration
Bond Fund | | | Extended-Duration
Bond Fund | | | Inflation Protected
Bond Fund | | | Global
Bond Fund | | | Defensive Market
Strategies Fund | |
| | | | | | | | | | | | | | | | | | |
| $ | 1,104,043,740 | | | $ | 417,134,760 | | | $ | 158,139,074 | | | $ | 180,090,925 | | | $ | 279,516,124 | |
| | 114,600,000 | | | | — | | | | — | | | | — | | | | — | |
| | 38,777,740 | | | | 6,426,729 | | | | 17,068,521 | | | | 15,259,602 | | | | 20,872,320 | |
| | | | | | | | | | | | | | | | | | |
| | | | | | | | | | | | | | | | | | |
| | 1,257,421,480 | | | | 423,561,489 | | | | 175,207,595 | | | | 195,350,527 | | | | 300,388,444 | |
| | 1,001,860 | | | | 11,071 | | | | — | | | | 161,346 | | | | — | |
| | 582,966 | | | | — | | | | — | | | | 500,000 | | | | 380,000 | |
| | — | | | | — | | | | — | | | | — | | | | 43,640,456 | |
| | 510,525 | | | | — | | | | — | | | | 631,515 | | | | 19,511 | |
| | | | | | | | | | | | | | | | | | |
| | 474 | | | | 3,236 | | | | 132 | | | | 11,330 | | | | 299,999 | |
| | 6,032,920 | | | | 5,417,025 | | | | 901,986 | | | | 2,727,836 | | | | 513,154 | |
| | 4,502 | | | | 1,580 | | | | 2,056 | | | | 3,495 | | | | — | |
| | 134,387,176 | | | | — | | | | 2,189 | | | | — | | | | 8,359,133 | |
| | 369 | | | | — | | | | — | | | | — | | | | — | |
| | 119,736 | | | | 123,936 | | | | 16,557 | | | | 14,455 | | | | 33,754 | |
| | 78,200 | | | | — | | | | 1,875 | | | | 6,422 | | | | — | |
| | 1,155,666 | | | | — | | | | — | | | | 1,560,941 | | | | 20,381 | |
| | 2,709,372 | | | | — | | | | — | | | | — | | | | — | |
| | 24,108 | | | | 16,281 | | | | 17,158 | | | | 18,624 | | | | 22,794 | |
| | | | | | | | | | | | | | | | | | |
| | | | | | | | | | | | | | | | | | |
| | 1,404,029,354 | | | | 429,134,618 | | | | 176,149,548 | | | | 200,986,491 | | | | 353,677,626 | |
| | | | | | | | | | | | | | | | | | |
| | | | | | | | | | | | | | | | | | |
| | | | | | | | | | | | | | | | | | |
| | — | | | | — | | | | 2,964,792 | | | | — | | | | 41,498 | |
| | — | | | | — | | | | — | | | | — | | | | 32,471,130 | |
| | 17,140,625 | | | | — | | | | — | | | | — | | | | — | |
| | 527 | | | | — | | | | — | | | | — | | | | 840 | |
| | 1,695,160 | | | | — | | | | — | | | | 756,564 | | | | 2,486 | |
| | 1,011,861 | | | | — | | | | — | | | | — | | | | — | |
| | 111,295,148 | | | | 23,397,891 | | | | 9,341,031 | | | | 29,584,211 | | | | — | |
| | 2,515,000 | | | | — | | | | — | | | | — | | | | — | |
| | | | | | | | | | | | | | | | | | |
| | 405,253,857 | | | | — | | | | 506,493 | | | | 320,973 | | | | 5,743,278 | |
| | — | | | | — | | | | — | | | | — | | | | 1,260 | |
| | 106,363 | | | | 1,626 | | | | 73,505 | | | | — | | | | — | |
| | 231,005 | | | | — | | | | — | | | | — | | | | — | |
| | 69,156 | | | | — | | | | — | | | | 5,844 | | | | 18,960 | |
| | — | | | | — | | | | — | | | | — | | | | — | |
| | 900 | | | | 316 | | | | 412 | | | | 699 | | | | — | |
| | | | | | | | | | | | | | | | | | |
| | 209,681 | | | | 142,058 | | | | 40,391 | | | | 64,597 | | | | 244,554 | |
| | 128,566 | | | | 65,894 | | | | 33,204 | | | | 34,574 | | | | 48,366 | |
| | 129,851 | | | | 57,225 | | | | 33,991 | | | | 51,799 | | | | 60,106 | |
| | | | | | | | | | | | | | | | | | |
| | | | | | | | | | | | | | | | | | |
| | 539,787,700 | | | | 23,665,010 | | | | 12,993,819 | | | | 30,819,261 | | | | 38,632,478 | |
| | | | | | | | | | | | | | | | | | |
| | | | | | | | | | | | | | | | | | |
| $ | 864,241,654 | | | $ | 405,469,608 | | | $ | 163,155,729 | | | $ | 170,167,230 | | | $ | 315,045,148 | |
| | | | | | | | | | | | | | | | | | |
| | | | | | | | | | | | | | | | | | |
| $ | 867,951,848 | | | $ | 363,439,328 | | | $ | 151,034,025 | | | $ | 174,165,533 | | | $ | 308,895,085 | |
| | (1,003,403 | ) | | | 106,406 | | | | (33,249 | ) | | | 453,534 | | | | (19,092 | ) |
| | | | |
| | (199,551 | ) | | | 1,041,225 | | | | 1,809,913 | | | | (12,769,718 | ) | | | (2,794,593 | ) |
| | | | |
| | (2,507,240 | ) | | | 40,882,649 | | | | 10,345,040 | | | | 8,317,881 | | | | 8,963,748 | |
| | | | | | | | | | | | | | | | | | |
| | | | | | | | | | | | | | | | | | |
| $ | 864,241,654 | | | $ | 405,469,608 | | | $ | 163,155,729 | | | $ | 170,167,230 | | | $ | 315,045,148 | |
| | | | | | | | | | | | | | | | | | |
| | | | | | | | | | | | | | | | | | |
| | | | |
| $ | 228,024,062 | | | $ | 74,590,970 | | | | N/A | | | | N/A | | | $ | 74,516,440 | |
| | | | | | | | | | | | | | | | | | |
| | | | | | | | | | | | | | | | | | |
| | 31,477,798 | | | | 11,506,630 | | | | N/A | | | | N/A | | | | 7,305,225 | |
| | | | | | | | | | | | | | | | | | |
| $ | 7.24 | | | $ | 6.48 | | | | N/A | | | | N/A | | | $ | 10.20 | |
| | | | | | | | | | | | | | | | | | |
| $ | 636,217,592 | | | $ | 330,878,638 | | | $ | 163,155,729 | | | $ | 170,167,230 | | | $ | 240,528,708 | |
| | | | | | | | | | | | | | | | | | |
| | 45,210,027 | | | | 19,372,015 | | | | 14,620,775 | | | | 17,490,589 | | | | 23,582,893 | |
| | | | | | | | | | | | | | | | | | |
| $ | 14.07 | | | $ | 17.08 | | | $ | 11.16 | | | $ | 9.73 | | | $ | 10.20 | |
| | | | | | | | | | | | | | | | | | |
| | | | | | | | | | | | | | | | | | |
| $ | 1,107,125,188 | | | $ | 376,236,974 | | | $ | 147,757,422 | | | $ | 172,512,943 | | | $ | 270,477,561 | |
| | 114,600,000 | | | | — | | | | — | | | | — | | | | — | |
| | 38,777,740 | | | | 6,426,729 | | | | 17,068,521 | | | | 15,259,602 | | | | 20,872,320 | |
| | | | | | | | | | | | | | | | | | |
| $ | 1,260,502,928 | | | $ | 382,663,703 | | | $ | 164,825,943 | | | $ | 187,772,545 | | | $ | 291,349,881 | |
| | | | | | | | | | | | | | | | | | |
| $ | 109,252,029 | | | $ | 24,110,014 | | | $ | 66,981,153 | | | $ | 29,064,979 | | | $ | — | |
| | | | | | | | | | | | | | | | | | |
| $ | 531,792 | | | $ | — | | | $ | — | | | $ | 645,023 | | | $ | 19,684 | |
| | | | | | | | | | | | | | | | | | |
| $ | — | | | $ | — | | | $ | — | | | $ | — | | | $ | 32,263,518 | |
| | | | | | | | | | | | | | | | | | |
| $ | 17,081,016 | | | $ | — | | | $ | — | | | $ | — | | | $ | — | |
| | | | | | | | | | | | | | | | | | |
| $ | 48,601 | | | $ | — | | | $ | — | | | $ | — | | | $ | 4,032 | |
| | | | | | | | | | | | | | | | | | |
See Notes to Financial Statements.
200
| | |
| STATEMENTS OF ASSETS AND LIABILITIES | | December 31, 2011 |
| | | | | | | | |
| | | Equity
Index Fund | | | Real Estate
Securities Fund | |
Assets | | | | | | | | |
Investments in securities of unaffiliated issuers, at value | | $ | 229,742,238 | | | $ | 174,365,079 | |
Investments in securities of affiliated issuers, at value | | | 7,806,447 | | | | 4,739,183 | |
| | | | | | | | |
Total investments (1)(2) | | | 237,548,685 | | | | 179,104,262 | |
Cash | | | — | | | | — | |
Cash collateral for derivatives | | | 324,000 | | | | 354,250 | |
Foreign currency (3) | | | — | | | | — | |
Receivables: | | | | | | | | |
Dividends and reclaims | | | 282,066 | | | | 424,899 | |
Interest | | | — | | | | — | |
Securities lending | | | 2,228 | | | | 3,064 | |
Investment securities sold | | | 33,612 | | | | 1,848,027 | |
Deposits with brokers for securities sold short | | | — | | | | — | |
Maturities | | | — | | | | — | |
Fund shares sold | | | 112,693 | | | | 222,406 | |
Variation margin on financial futures contracts | | | — | | | | — | |
Receivable from advisor | | | 8,955 | | | | — | |
Unrealized appreciation on foreign currency exchange contracts | | | — | | | | — | |
Prepaid expenses and other assets | | | 15,523 | | | | 17,242 | |
| | | | | | | | |
Total Assets | | | 238,327,762 | | | | 181,974,150 | |
| | | | | | | | |
Liabilities | | | | | | | | |
Securities sold short, at value (4) | | | — | | | | — | |
Options written at value(5) | | | — | | | | — | |
Unrealized depreciation on foreign currency exchange contracts | | | — | | | | — | |
Collateral held for securities on loan at value | | | 18,335,064 | | | | 29,423,155 | |
Collateral held for derivatives | | | — | | | | — | |
Payables: | | | | | | | | |
Investment securities purchased | | | — | | | | 2,151,399 | |
Dividends on short sales | | | — | | | | — | |
Fund shares redeemed | | | 3,797 | | | | — | |
Variation margin on financial futures contracts | | | 32,640 | | | | 20,060 | |
Securities lending | | | 445 | | | | 612 | |
Accrued expenses: | | | | | | | | |
Investment advisory fees | | | — | | | | 86,929 | |
Shareholder servicing fees | | | 36,563 | | | | 29,625 | |
Other expenses | | | 122,759 | | | | 35,508 | |
| | | | | | | | |
Total Liabilities | | | 18,531,268 | | | | 31,747,288 | |
| | | | | | | | |
Net Assets | | $ | 219,796,494 | | | $ | 150,226,862 | |
| | | | | | | | |
Net Assets Consist of: | | | | | | | | |
Paid-in-capital | | $ | 192,377,771 | | | $ | 153,888,386 | |
Undistributed (distributions in excess of) net investment income | | | — | | | | 184,497 | |
Accumulated net realized loss on investments, foreign currency translations and derivative transactions | | | (6,696,831 | ) | | | (22,202,669 | ) |
Net unrealized appreciation (depreciation) on investments, foreign currency translations and derivative transactions | | | 34,115,554 | | | | 18,356,648 | |
| | | | | | | | |
Net Assets | | $ | 219,796,494 | | | $ | 150,226,862 | |
| | | | | | | | |
Net Asset Value: | | | | | | | | |
$0.001 par value, unlimited shares authorized | | | | | | | | |
Net assets applicable to the GS2 Class | | $ | 36,720,855 | | | | N/A | |
| | | | | | | | |
GS2 shares outstanding | | | 5,840,198 | | | | N/A | |
| | | | | | | | |
Net asset value, offering and redemption price per GS2 share | | $ | 6.29 | | | | N/A | |
| | | | | | | | |
Net assets applicable to the GS4 Class | | $ | 183,075,639 | | | $ | 150,226,862 | |
| | | | | | | | |
GS4 shares outstanding | | | 12,852,675 | | | | 16,367,020 | |
| | | | | | | | |
Net asset value, offering and redemption price per GS4 share | | $ | 14.24 | | | $ | 9.18 | |
| | | | | | | | |
| | | | | | | | |
(1) Investments in securities of unaffiliated issuers, at cost | | $ | 195,881,242 | | | $ | 156,062,051 | |
Investments in securities of affiliated issuers, at cost | | | 7,806,447 | | | | 4,739,183 | |
| | | | | | | | |
Total investments at cost | | $ | 203,687,689 | | | $ | 160,801,234 | |
| | | | | | | | |
(2) Includes securities loaned of: | | $ | 18,036,419 | | | $ | 28,500,197 | |
| | | | | | | | |
(3) Foreign currency at cost | | $ | — | | | $ | — | |
| | | | | | | | |
(4) Proceeds from securities shold short | | $ | — | | | $ | — | |
| | | | | | | | |
(5) Premiums received on options written | | $ | — | | | $ | — | |
| | | | | | | | |
(6) Net of ($15,713) accrued foreign capital gains taxes on appreciated securities | | | | | | | | |
See Notes to Financial Statements.
201
| | | | | | | | | | | | | | |
Value
Equity Fund | | | Growth
Equity Fund | | | Small Cap Equity Fund | | | International Equity Fund | |
| | | | | | | | | | | | | | |
| $ | 1,108,594,206 | | | $ | 1,175,521,798 | | | $ | 556,831,313 | | | $ | 1,205,832,309 | |
| | 19,757,157 | | | | 53,706,228 | | | | 18,753,369 | | | | 74,576,754 | |
| | | | | | | | | | | | | | |
| | 1,128,351,363 | | | | 1,229,228,026 | | | | 575,584,682 | | | | 1,280,409,063 | |
| | — | | | | — | | | | 2,564 | | | | 46,212 | |
| | 1,364,000 | | | | 3,696,000 | | | | 2,584,465 | | | | 12,772,718 | |
| | — | | | | — | | | | 27,214 | | | | 10,233,335 | |
| | | | | | | | | | | | | | |
| | 1,543,455 | | | | 574,279 | | | | 278,928 | | | | 2,813,602 | |
| | — | | | | — | | | | 298,767 | | | | 428 | |
| | 8,260 | | | | 17,175 | | | | 74,913 | | | | 54,277 | |
| | 1,626,077 | | | | 1,453,446 | | | | 4,986,001 | | | | 793,495 | |
| | — | | | | — | | | | — | | | | 10,026,301 | |
| | — | | | | — | | | | 1,098 | | | | — | |
| | 56,678 | | | | 70,274 | | | | 63,986 | | | | 37,667 | |
| | — | | | | — | | | | 466 | | | | 1,074,455 | |
| | — | | | | — | | | | — | | | | — | |
| | — | | | | — | | | | 95,012 | | | | 1,903,840 | |
| | 27,193 | | | | 29,672 | | | | 17,761 | | | | 27,442 | |
| | | | | | | | | | | | | | |
| | 1,132,977,026 | | | | 1,235,068,872 | | | | 584,015,857 | | | | 1,320,192,835 | |
| | | | | | | | | | | | | | |
| | | | | | | | | | | | | | |
| | — | | | | — | | | | — | | | | 64,002,706 | |
| | — | | | | — | | | | 1,663 | | | | — | |
| | — | | | | — | | | | 1,242 | | | | 1,442,701 | |
| | 77,433,427 | | | | 128,085,397 | | | | 154,245,790 | | | | 73,672,665 | |
| | — | | | | — | | | | — | | | | 130,000 | |
| | | | | | | | | | | | | | |
| | 1,349,576 | | | | 5,392,115 | | | | 11,126,128 | | | | 432,775 | |
| | — | | | | — | | | | — | | | | 91,517 | |
| | 33,398 | | | | 4,654 | | | | 38,969 | | | | 58,364 | |
| | 82,560 | | | | 215,040 | | | | 218,658 | | | | 166,804 | |
| | 1,652 | | | | 3,434 | | | | 14,974 | | | | 10,856 | |
| | | | | | | | | | | | | | |
| | 576,064 | | | | 739,156 | | | | 306,077 | | | | 708,656 | |
| | 174,605 | | | | 189,097 | | | | 72,259 | | | | 193,148 | |
| | 59,271 | | | | 61,866 | | | | 74,657 | | | | 300,353 | |
| | | | | | | | | | | | | | |
| | 79,710,553 | | | | 134,690,759 | | | | 166,100,417 | | | | 141,210,545 | |
| | | | | | | | | | | | | | |
| $ | 1,053,266,473 | | | $ | 1,100,378,113 | | | $ | 417,915,440 | | | $ | 1,178,982,290 | |
| | | | | | | | | | | | | | |
| | | | | | | | | | | | | | |
| $ | 1,210,681,015 | | | $ | 934,222,389 | | | $ | 399,159,732 | | | $ | 1,416,395,899 | |
| | 7,684,176 | | | | (540 | ) | | | (27,881 | ) | | | (703,735 | ) |
| | | |
| | (152,499,387 | ) | | | (23,732,639 | ) | | | (16,031,594 | ) | | | (162,406,491 | ) |
| | | |
| | (12,599,331 | ) | | | 189,888,903 | | | | 34,815,183 | | | | (74,303,383 | ) (6) |
| | | | | | | | | | | | | | |
| $ | 1,053,266,473 | | | $ | 1,100,378,113 | | | $ | 417,915,440 | | | $ | 1,178,982,290 | |
| | | | | | | | | | | | | | |
| | | | | | | | | | | | | | |
| | | | | | | | | | | | | | |
| $ | 200,308,264 | | | $ | 184,418,328 | | | $ | 63,902,602 | | | $ | 223,677,318 | |
| | | | | | | | | | | | | | |
| | 28,489,667 | | | | 15,686,634 | | | | 6,589,139 | | | | 25,797,357 | |
| | | | | | | | | | | | | | |
| $ | 7.03 | | | $ | 11.76 | | | $ | 9.70 | | | $ | 8.67 | |
| | | | | | | | | | | | | | |
| $ | 852,958,209 | | | $ | 915,959,785 | | | $ | 354,012,838 | | | $ | 955,304,972 | |
| | | | | | | | | | | | | | |
| | 60,919,714 | | | | 49,168,723 | | | | 24,212,440 | | | | 84,328,887 | |
| | | | | | | | | | | | | | |
| $ | 14.00 | | | $ | 18.63 | | | $ | 14.62 | | | $ | 11.33 | |
| | | | | | | | | | | | | | |
| | | | | | | | | | | | | | |
| $ | 1,121,907,223 | | | $ | 986,385,073 | | | $ | 523,280,972 | | | $ | 1,292,207,088 | |
| | 19,757,157 | | | | 53,706,228 | | | | 18,753,369 | | | | 74,576,754 | |
| | | | | | | | | | | | | | |
| $ | 1,141,664,380 | | | $ | 1,040,091,301 | | | $ | 542,034,341 | | | $ | 1,366,783,842 | |
| | | | | | | | | | | | | | |
| $ | 75,492,406 | | | $ | 125,870,148 | | | $ | 151,687,605 | | | $ | 77,912,445 | |
| | | | | | | | | | | | | | |
| $ | — | | | $ | — | | | $ | 27,381 | | | $ | 10,344,203 | |
| | | | | | | | | | | | | | |
| $ | — | | | $ | — | | | $ | — | | | $ | 74,462,583 | |
| | | | | | | | | | | | | | |
| $ | — | | | $ | — | | | $ | 2,015 | | | $ | — | |
| | | | | | | | | | | | | | |
See Notes to Financial Statements.
202
| | |
| STATEMENTS OF OPERATIONS | | For the Year Ended December 31, 2011 |
| | | | | | | | |
| | | Money
Market Fund | | | Low-Duration
Bond Fund | |
Investment Income | | | | | | | | |
Dividends | | $ | — | | | $ | — | |
Income distributions received from affiliated funds | | | — | | | | 4,494 | |
Interest | | | 3,729,163 | | | | 16,144,543 | |
Securities lending | | | 25,586 | | | | 87,072 | |
Less foreign taxes withheld | | | — | | | | — | |
| | | | | | | | |
Total Investment Income | | | 3,754,749 | | | | 16,236,109 | |
| | | | | | | | |
Expenses | | | | | | | | |
Investment advisory fees | | | 2,110,375 | | | | 2,522,968 | |
Transfer agent fees: | | | | | | | | |
GS2 shares | | | 3,959 | | | | 3,925 | |
GS4 shares | | | 35,997 | | | | 24,092 | |
Custodian fees | | | 27,137 | | | | 109,173 | |
Shareholder servicing fees: | | | | | | | | |
GS4 shares | | | 2,782,134 | | | | 1,364,630 | |
Accounting and administration fees | | | 289,350 | | | | 256,038 | |
Professional fees | | | 68,349 | | | | 122,934 | |
Blue sky fees: | | | | | | | | |
GS2 shares | | | 2,208 | | | | 1,571 | |
GS4 shares | | | 38,241 | | | | 24,704 | |
Shareholder reporting fees: | | | | | | | | |
GS2 shares | | | 853 | | | | 649 | |
GS4 shares | | | 42,633 | | | | 15,360 | |
Trustee expenses | | | 8,403 | | | | 4,405 | |
Line of credit facility fees | | | 16,489 | | | | 8,362 | |
Other expenses | | | 40,761 | | | | 47,366 | |
| | | | | | | | |
Total expenses | | | 5,466,889 | | | | 4,506,177 | |
Dividends on securities sold short | | | — | | | | — | |
Expenses waived/reimbursed net of amount recaptured(2) | | | (1,949,078 | ) | | | (662,153 | ) |
| | | | | | | | |
Net expenses | | | 3,517,811 | | | | 3,844,024 | |
| | | | | | | | |
Net Investment Income | | | 236,938 | | | | 12,392,085 | |
| | | | | | | | |
| | |
Realized and Unrealized Gain (Loss) | | | | | | | | |
Net realized gain (loss) from: | | | | | | | | |
Investment securities and securities sold short | | | 6,991 | | | | 4,390,658 | |
Futures transactions | | | — | | | | (751,288 | ) |
Swap agreements | | | — | | | | 6,193 | |
Option contracts written | | | — | | | | 816,215 | |
Option contracts purchased | | | — | | | | — | |
Foreign currency transactions | | | — | | | | 1,511,359 | |
| | | | | | | | |
Net realized gain (loss) | | | 6,991 | | | | 5,973,137 | |
| | | | | | | | |
| | |
Net change in unrealized appreciation (depreciation) on: | | | | | | | | |
Investment securities and securities sold short | | | — | | | | (8,717,865 | ) |
Futures | | | — | | | | (159,092 | ) |
Swap agreements | | | — | | | | 1,046,747 | |
Option contracts written | | | — | | | | (129,865 | ) |
Option contracts purchased | | | — | | | | — | |
Foreign currency translation | | | — | | | | 1,170,071 | |
| | | | | | | | |
Net change in unrealized appreciation (depreciation) | | | — | | | | (6,790,004 | ) |
| | | | | | | | |
Net Realized and Unrealized Gain (Loss) | | | 6,991 | | | | (816,867 | ) |
| | | | | | | | |
| | |
Net Increase in Net Assets Resulting from Operations | | $ | 243,929 | | | $ | 11,575,218 | |
| | | | | | | | |
| (1) | Inception date was September 1, 2011. |
| (2) | See Note 3a and 3c in Notes to Financial Statements. |
See Notes to Financial Statements.
203
| | | | | | | | | | | | | | | | | | |
Medium-Duration
Bond Fund | | | Extended-Duration
Bond Fund | | | Inflation Protected
Bond Fund | | | Global Bond
Fund | | | Defensive Market
Strategies Fund (1) | |
| | | | | | | | | | | | | | | | | | |
| $ | 180,000 | | | $ | 14,372 | | | $ | — | | | $ | 277,680 | | | $ | 1,748,383 | |
| | 7,929 | | | | 1,048 | | | | 1,303 | | | | 1,688 | | | | 1,359 | |
| | 27,751,120 | | | | 23,596,477 | | | | 4,387,251 | | | | 9,880,315 | | | | 443,862 | |
| | 94,790 | | | | 55,860 | | | | 20,143 | | | | 41,245 | | | | — | |
| | (39 | ) | | | — | | | | — | | | | (8,755 | ) | | | (12,300 | ) |
| | | | | | | | | | | | | | | | | | |
| | 28,033,800 | | | | 23,667,757 | | | | 4,408,697 | | | | 10,192,173 | | | | 2,181,304 | |
| | | | | | | | | | | | | | | | | | |
| | | | | | | | | | | | | | | | | | |
| | 3,642,255 | | | | 1,903,626 | | | | 423,252 | | | | 804,310 | | | | 869,156 | |
| | | | | | | | | | | | | | | | | | |
| | 3,943 | | | | 3,859 | | | | — | | | | — | | | | 1,064 | |
| | 25,239 | | | | 23,928 | | | | 19,755 | | | | 19,100 | | | | 6,745 | |
| | 220,718 | | | | 25,631 | | | | 20,709 | | | | 57,651 | | | | 47,047 | |
| | | | | | | | | | | | | | | | | | |
| | 1,416,520 | | | | 735,860 | | | | 301,063 | | | | 383,395 | | | | 182,449 | |
| | 350,379 | | | | 123,151 | | | | 40,652 | | | | 99,361 | | | | 31,307 | |
| | 123,326 | | | | 81,265 | | | | 71,748 | | | | 83,480 | | | | 43,787 | |
| | | | | | | | | | | | | | | | | | |
| | 1,521 | | | | 1,830 | | | | — | | | | — | | | | 450 | |
| | 24,038 | | | | 24,703 | | | | 6,223 | | | | 19,059 | | | | 5,039 | |
| | | | | | | | | | | | | | | | | | |
| | 704 | | | | 542 | | | | — | | | | — | | | | 66 | |
| | 17,807 | | | | 15,405 | | | | 6,355 | | | | 5,315 | | | | 215 | |
| | 5,420 | | | | 2,473 | | | | 844 | | | | 1,082 | | | | 1,247 | |
| | 10,014 | | | | 4,645 | | | | 1,458 | | | | 1,960 | | | | 909 | |
| | 79,226 | | | | 22,710 | | | | 14,505 | | | | 29,571 | | | | 71,692 | |
| | | | | | | | | | | | | | | | | | |
| | 5,921,110 | | | | 2,969,628 | | | | 906,564 | | | | 1,504,284 | | | | 1,261,173 | |
| | — | | | | — | | | | — | | | | — | | | | 44,373 | |
| | (913,286 | ) | | | (163,917 | ) | | | (29,704 | ) | | | (37,664 | ) | | | (60,934 | ) |
| | | | | | | | | | | | | | | | | | |
| | 5,007,824 | | | | 2,805,711 | | | | 876,860 | | | | 1,466,620 | | | | 1,244,612 | |
| | | | | | | | | | | | | | | | | | |
| | 23,025,976 | | | | 20,862,046 | | | | 3,531,837 | | | | 8,725,553 | | | | 936,692 | |
| | | | | | | | | | | | | | | | | | |
| | | | |
| | | | | | | | | | | | | | | | | | |
| | | | | | | | | | | | | | | | | | |
| | 13,293,877 | | | | 16,289,470 | | | | 5,760,656 | | | | (1,737,699 | ) | | | (439,215 | ) |
| | 3,677,230 | | | | — | | | | (2,169,115 | ) | | | (721,037 | ) | | | (2,079,639 | ) |
| | 91,088 | | | | — | | | | — | | | | — | | | | — | |
| | 625,267 | | | | — | | | | — | | | | — | | | | 6,378 | |
| | (11,016 | ) | | | — | | | | — | | | | (81,511 | ) | | | (63,232 | ) |
| | 382,349 | | | | 599,583 | | | | — | | | | (76,818 | ) | | | 201,044 | |
| | | | | | | | | | | | | | | | | | |
| | 18,058,795 | | | | 16,889,053 | | | | 3,591,541 | | | | (2,617,065 | ) | | | (2,374,664 | ) |
| | | | | | | | | | | | | | | | | | |
| | | | |
| | | | | | | | | | | | | | | | | | |
| | 13,432,508 | | | | 12,006,501 | | | | 7,863,119 | | | | 644,606 | | | | 8,862,077 | |
| | 421,581 | | | | — | | | | (33,337 | ) | | | (41,563 | ) | | | 113,467 | |
| | (129,207 | ) | | | — | | | | — | | | | — | | | | — | |
| | 67,423 | | | | — | | | | — | | | | — | | | | 3,192 | |
| | (59 | ) | | | — | | | | — | | | | — | | | | (31,125 | ) |
| | 250,906 | | | | (21,544 | ) | | | — | | | | 396,191 | | | | 16,137 | |
| | | | | | | | | | | | | | | | | | |
| | 14,043,152 | | | | 11,984,957 | | | | 7,829,782 | | | | 999,234 | | | | 8,963,748 | |
| | | | | | | | | | | | | | | | | | |
| | 32,101,947 | | | | 28,874,010 | | | | 11,421,323 | | | | (1,617,831 | ) | | | 6,589,084 | |
| | | | | | | | | | | | | | | | | | |
| | | | |
| $ | 55,127,923 | | | $ | 49,736,056 | | | $ | 14,953,160 | | | $ | 7,107,722 | | | $ | 7,525,776 | |
| | | | | | | | | | | | | | | | | | |
See Notes to Financial Statements.
204
| | |
| STATEMENTS OF OPERATIONS | | For the Year Ended December 31, 2011 |
| | | | | | | | |
| | | Equity Index
Fund | | | Real Estate
Securities Fund | |
Investment Income | | | | | | | | |
Dividends | | $ | 6,361,089 | | | $ | 2,910,973 | |
Income distributions received from affiliated funds | | | 768 | | | | 386 | |
Interest | | | 324 | | | | — | |
Securities lending | | | 55,805 | | | | 58,082 | |
Less foreign taxes withheld | | | — | | | | (2,853 | ) |
| | | | | | | | |
Total Investment Income | | | 6,417,986 | | | | 2,966,588 | |
| | | | | | | | |
Expenses | | | | | | | | |
Investment advisory fees | | | 502,118 | | | | 1,134,449 | |
Transfer agent fees: | | | | | | | | |
GS2 shares | | | 3,850 | | | | — | |
GS4 shares | | | 24,007 | | | | 23,755 | |
Custodian fees | | | 34,434 | | | | 28,955 | |
Shareholder servicing fees: | | | | | | | | |
GS4 shares | | | 599,912 | | | | 334,347 | |
Accounting and administration fees | | | 97,059 | | | | 38,616 | |
Professional fees | | | 82,338 | | | | 78,199 | |
Blue sky fees: | | | | | | | | |
GS2 shares | | | 1,980 | | | | — | |
GS4 shares | | | 26,550 | | | | 40,145 | |
Shareholder reporting fees: | | | | | | | | |
GS2 shares | | | 542 | | | | — | |
GS4 shares | | | 16,388 | | | | 14,717 | |
Trustee expenses | | | 1,620 | | | | 894 | |
Line of credit facility fees | | | 3,754 | | | | 1,608 | |
Other expenses | | | 22,991 | | | | 15,706 | |
| | | | | | | | |
Total expenses | | | 1,417,543 | | | | 1,711,391 | |
Dividends on securities sold short | | | — | | | | — | |
Expenses waived/reimbursed net of amount recaptured(1) | | | (258,531 | ) | | | (8,690 | ) |
Fees paid indirectly | | | — | | | | — | |
| | | | | | | | |
Net expenses | | | 1,159,012 | | | | 1,702,701 | |
| | | | | | | | |
Net Investment Income (Loss) | | | 5,258,974 | | | | 1,263,887 | |
| | | | | | | | |
Realized and Unrealized Gain (Loss) | | | | | | | | |
Net realized gain (loss) from: | | | | | | | | |
Investment securities and securities sold short | | | 32,286,554 | | | | 17,544,554 | |
Futures transactions | | | 705,026 | | | | (478,055 | ) |
Option contracts written | | | — | | | | — | |
Foreign currency transactions | | | — | | | | — | |
| | | | | | | | |
Net realized gain | | | 32,991,580 | | | | 17,066,499 | |
| | | | | | | | |
Net change in unrealized appreciation (depreciation) on: | | | | | | | | |
Investment securities and securities sold short (net of estimated capital gains taxes of $159,066 for International Equity) | | | (32,769,186 | ) | | | (7,120,615 | ) |
Futures | | | 24,188 | | | | 19,718 | |
Option contracts written | | | — | | | | — | |
Option contracts purchased | | | — | | | | — | |
Foreign currency translation | | | — | | | | — | |
| | | | | | | | |
Net change in unrealized appreciation (depreciation) | | | (32,744,998 | ) | | | (7,100,897 | ) |
| | | | | | | | |
Net Realized and Unrealized Gain (Loss) | | | 246,582 | | | | 9,965,602 | |
| | | | | | | | |
Net Increase (Decrease) in Net Assets Resulting from Operations | | $ | 5,505,556 | | | $ | 11,229,489 | |
| | | | | | | | |
| (1) | See Note 3a and 3c in Notes to Financial Statements. |
See Notes to Financial Statements.
205
| | | | | | | | | | | | | | |
Value Equity
Fund | | | Growth Equity
Fund | | | Small Cap
Equity Fund | | | International
Equity Fund | |
| | | | | | | | | | | | | | |
| $ | 26,362,637 | | | $ | 10,766,811 | | | $ | 3,914,786 | | | $ | 42,577,091 | |
| | 2,886 | | | | 4,876 | | | | 2,280 | | | | 5,607 | |
| | 1,373 | | | | 2,104 | | | | 1,403,024 | | | | — | |
| | 118,131 | | | | 229,629 | | | | 545,140 | | | | 1,421,133 | |
| | (44,813 | ) | | | (47,414 | ) | | | (2,095 | ) | | | (3,408,049 | ) |
| | | | | | | | | | | | | | |
| | 26,440,214 | | | | 10,956,006 | | | | 5,863,135 | | | | 40,595,782 | |
| | | | | | | | | | | | | | |
| | | | | | | | | | | | | | |
| | 7,376,311 | | | | 10,369,462 | | | | 4,238,172 | | | | 12,124,846 | |
| | | | | | | | | | | | | | |
| | 3,954 | | | | 3,914 | | | | 3,983 | | | | 4,040 | |
| | 26,537 | | | | 26,485 | | | | 28,091 | | | | 30,695 | |
| | 52,440 | | | | 83,679 | | | | 165,082 | | | | 1,361,500 | |
| | | | | | | | | | | | | | |
| | 2,074,332 | | | | 2,264,369 | | | | 865,769 | | | | 2,274,482 | |
| | 254,679 | | | | 261,736 | | | | 176,081 | | | | 632,387 | |
| | 82,058 | | | | 75,043 | | | | 79,567 | | | | 78,657 | |
| | | | | | | | | | | | | | |
| | 1,735 | | | | 1,848 | | | | 1,724 | | | | 1,712 | |
| | 29,102 | | | | 26,815 | | | | 27,679 | | | | 27,414 | |
| | | | | | | | | | | | | | |
| | 765 | | | | 529 | | | | 802 | | | | 941 | |
| | 22,023 | | | | 17,714 | | | | 25,202 | | | | 31,164 | |
| | 6,618 | | | | 6,935 | | | | 2,601 | | | | 7,435 | |
| | 13,634 | | | | 14,494 | | | | 5,186 | | | | 15,205 | |
| | 37,215 | | | | 42,645 | | | | 26,526 | | | | 340,904 | |
| | | | | | | | | | | | | | |
| | 9,981,403 | | | | 13,195,668 | | | | 5,646,465 | | | | 16,931,382 | |
| | — | | | | — | | | | — | | | | 997,899 | |
| | (92,338 | ) | | | (880,523 | ) | | | (283,090 | ) | | | (2,706,637 | ) |
| | (70,653 | ) | | | (107,493 | ) | | | (88,625 | ) | | | (35,463 | ) |
| | | | | | | | | | | | | | |
| | 9,818,412 | | | | 12,207,652 | | | | 5,274,750 | | | | 15,187,181 | |
| | | | | | | | | | | | | | |
| | 16,621,802 | | | | (1,251,646 | ) | | | 588,385 | | | | 25,408,601 | |
| | | | | | | | | | | | | | |
| | | | | | | | | | | | | | |
| | | | | | | | | | | | | | |
| | 26,639,635 | | | | 109,634,053 | | | | 58,160,229 | | | | 77,091,377 | |
| | (365,061 | ) | | | 2,417,550 | | | | (2,763,422 | ) | | | (13,935,957 | ) |
| | — | | | | — | | | | 43,364 | | | | — | |
| | — | | | | (3,565 | ) | | | (46,883 | ) | | | (7,919,765 | ) |
| | | | | | | | | | | | | | |
| | 26,274,574 | | | | 112,048,038 | | | | 55,393,288 | | | | 55,235,655 | |
| | | | | | | | | | | | | | |
| | | | | | | | | | | | | | |
| | | |
| | (40,158,679 | ) | | | (129,169,536 | ) | | | (48,976,798 | ) | | | (266,581,849 | ) |
| | 24,827 | | | | (230,106 | ) | | | 11,250 | | | | 497,246 | |
| | — | | | | — | | | | 352 | | | | — | |
| | — | | | | — | | | | (354 | ) | | | — | |
| | — | | | | (1,907 | ) | | | 101,130 | | | | (253,684 | ) |
| | | | | | | | | | | | | | |
| | (40,133,852 | ) | | | (129,401,549 | ) | | | (48,864,420 | ) | | | (266,338,287 | ) |
| | | | | | | | | | | | | | |
| | (13,859,278 | ) | | | (17,353,511 | ) | | | 6,528,868 | | | | (211,102,632 | ) |
| | | | | | | | | | | | | | |
| $ | 2,762,524 | | | $ | (18,605,157 | ) | | $ | 7,117,253 | | | $ | (185,694,031 | ) |
| | | | | | | | | | | | | | |
See Notes to Financial Statements.
206
STATEMENTS OF CHANGES IN NET ASSETS
| | | | | | | | |
| | | Money Market Fund | |
| | | For the Year Ended | |
| | | 12/31/11 | | | 12/31/10 | |
Operations: | | | | | | | | |
Net investment income | | $ | 236,938 | | | $ | 320,874 | |
Net realized gain on investment securities, foreign currency transactions and derivative transactions | | | 6,991 | | | | 20,216 | |
Net change in unrealized appreciation (depreciation) on investment securities, foreign currency translations and derivative transactions | | | — | | | | — | |
| | | | | | | | |
Net increase in net assets resulting from operations | | | 243,929 | | | | 341,090 | |
| | | | | | | | |
Dividends and Distributions to Shareholders: | | | | | | | | |
Dividends from net investment income | | | | | | | | |
GS2 shares | | | (112,938 | ) | | | (212,193 | ) |
GS4 shares | | | (124,000 | ) | | | (108,681 | ) |
Distributions from net realized capital gains | | | | | | | | |
GS2 shares | | | (1,243 | ) | | | (7,509 | ) |
GS4 shares | | | (12,969 | ) | | | (80,492 | ) |
| | | | | | | | |
Total dividends and distributions | | | (251,150 | ) | | | (408,875 | ) |
| | | | | | | | |
Capital Share Transactions: | | | | | | | | |
Proceeds from shares sold | | | | | | | | |
GS2 shares | | | 154,616,809 | | | | 94,494,393 | |
GS4 shares | | | 3,912,748,853 | | | | 4,496,591,499 | |
Reinvestment of dividends and distributions | | | | | | | | |
GS2 shares | | | 100,970 | | | | 203,577 | |
GS4 shares | | | 61,686 | | | | 136,473 | |
| | | | | | | | |
Total proceeds from shares sold and reinvested | | | 4,067,528,318 | | | | 4,591,425,942 | |
| | | | | | | | |
Value of shares redeemed | | | | | | | | |
GS2 shares | | | (157,730,463 | ) | | | (108,704,940 | ) |
GS4 shares | | | (3,931,314,442 | ) | | | (4,381,459,310 | ) |
| | | | | | | | |
Total value of shares redeemed | | | (4,089,044,905 | ) | | | (4,490,164,250 | ) |
| | | | | | | | |
Net increase (decrease) from capital share transactions(1) | | | (21,516,587 | ) | | | 101,261,692 | |
| | | | | | | | |
Total increase (decrease) in net assets | | | (21,523,808 | ) | | | 101,193,907 | |
| | | | | | | | |
Net Assets: | | | | | | | | |
Beginning of Year | | | 1,299,451,520 | | | | 1,198,257,613 | |
| | | | | | | | |
End of Year* | | $ | 1,277,927,712 | | | $ | 1,299,451,520 | |
| | | | | | | | |
*Including undistributed (distributions in excess of) net investment income | | $ | 38 | | | $ | 7,259 | |
| | | | | | | | |
| (1) | See Note 7 in Notes to Financial Statements. |
See Notes to Financial Statements.
207
| | | | | | | | | | | | | | |
Low-Duration
Bond Fund | | | Medium-Duration
Bond Fund | |
| For the Year Ended | | | For the Year Ended | |
| 12/31/11 | | | 12/31/10 | | | 12/31/11 | | | 12/31/10 | |
| | | | | | | | | | | | | | |
| $ | 12,392,085 | | | $ | 15,321,406 | | | $ | 23,025,976 | | | $ | 31,561,749 | |
| | | |
| | 5,973,137 | | | | 6,039,765 | | | | 18,058,795 | | | | 23,766,110 | |
| | | |
| | (6,790,004 | ) | | | 8,281,061 | | | | 14,043,152 | | | | 32,738,309 | |
| | | | | | | | | | | | | | |
| | 11,575,218 | | | | 29,642,232 | | | | 55,127,923 | | | | 88,066,168 | |
| | | | | | | | | | | | | | |
| | | | | | | | | | | | | | |
| | | | | | | | | | | | | | |
| | (3,504,911 | ) | | | (3,973,347 | ) | | | (11,027,359 | ) | | | (7,594,121 | ) |
| | (9,679,718 | ) | | | (11,817,267 | ) | | | (14,780,466 | ) | | | (23,828,942 | ) |
| | | | | | | | | | | | | | |
| | (435,539 | ) | | | (1,301,794 | ) | | | (4,078,282 | ) | | | (8,335,060 | ) |
| | (1,363,124 | ) | | | (3,870,062 | ) | | | (5,778,384 | ) | | | (23,494,123 | ) |
| | | | | | | | | | | | | | |
| | (14,983,292 | ) | | | (20,962,470 | ) | | | (35,664,491 | ) | | | (63,252,246 | ) |
| | | | | | | | | | | | | | |
| | | | | | | | | | | | | | |
| | | | | | | | | | | | | | |
| | 16,099,588 | | | | 19,547,765 | | | | 21,121,078 | | | | 112,777,863 | |
| | 78,836,387 | | | | 81,552,147 | | | | 64,360,174 | | | | 142,085,311 | |
| | | | | | | | | | | | | | |
| | 3,936,833 | | | | 5,270,201 | | | | 15,099,539 | | | | 15,918,518 | |
| | 11,038,772 | | | | 15,682,171 | | | | 20,555,211 | | | | 47,316,666 | |
| | | | | | | | | | | | | | |
| | 109,911,580 | | | | 122,052,284 | | | | 121,136,002 | | | | 318,098,358 | |
| | | | | | | | | | | | | | |
| | | | | | | | | | | | | | |
| | (24,039,673 | ) | | | (12,320,194 | ) | | | (44,591,542 | ) | | | (28,532,320 | ) |
| | (46,883,049 | ) | | | (94,873,974 | ) | | | (82,217,273 | ) | | | (472,646,775 | ) |
| | | | | | | | | | | | | | |
| | (70,922,722 | ) | | | (107,194,168 | ) | | | (126,808,815 | ) | | | (501,179,095 | ) |
| | | | | | | | | | | | | | |
| | 38,988,858 | | | | 14,858,116 | | | | (5,672,813 | ) | | | (183,080,737 | ) |
| | | | | | | | | | | | | | |
| | 35,580,784 | | | | 23,537,878 | | | | 13,790,619 | | | | (158,266,815 | ) |
| | | | | | | | | | | | | | |
| | | | | | | | | | | | | | |
| | 708,594,359 | | | | 685,056,481 | | | | 850,451,035 | | | | 1,008,717,850 | |
| | | | | | | | | | | | | | |
| $ | 744,175,143 | | | $ | 708,594,359 | | | $ | 864,241,654 | | | $ | 850,451,035 | |
| | | | | | | | | | | | | | |
| $ | 1,213,905 | | | $ | (82,912 | ) | | $ | (1,003,403 | ) | | $ | 281,806 | |
| | | | | | | | | | | | | | |
See Notes to Financial Statements.
208
STATEMENTS OF CHANGES IN NET ASSETS
| | | | | | | | |
| | | Extended-Duration
Bond Fund | |
| | | For the Year Ended | |
| | | 12/31/11 | | | 12/31/10 | |
Operations: | | | | | | | | |
Net investment income | | $ | 20,862,046 | | | $ | 25,292,007 | |
Net realized gain (loss) on investment securities, foreign currency transactions and derivative transactions | | | 16,889,053 | | | | 20,047,800 | |
Net change in unrealized appreciation on investment securities, foreign currency translations and derivative transactions | | | 11,984,957 | | | | 7,972,257 | |
| | | | | | | | |
Net increase in net assets resulting from operations | | | 49,736,056 | | | | 53,312,064 | |
| | | | | | | | |
Dividends and Distributions to Shareholders: | | | | | | | | |
Dividends from net investment income | | | | | | | | |
GS2 shares | | | (7,964,758 | ) | | | (7,921,317 | ) |
GS4 shares | | | (13,885,510 | ) | | | (18,424,763 | ) |
Distributions from net realized capital gains | | | | | | | | |
GS2 shares | | | (6,179,790 | ) | | | (1,150,059 | ) |
GS4 shares | | | (10,868,828 | ) | | | (2,305,386 | ) |
| | | | | | | | |
Total dividends and distributions | | | (38,898,886 | ) | | | (29,801,525 | ) |
| | | | | | | | |
Capital Share Transactions: | | | | | | | | |
Proceeds from shares sold | | | | | | | | |
GS2 shares | | | 9,682,470 | | | | 11,995,759 | |
GS4 shares | | | 58,099,153 | | | | 80,583,836 | |
Reinvestment of dividends and distributions | | | | | | | | |
GS2 shares | | | 14,128,478 | | | | 9,060,622 | |
GS4 shares | | | 24,748,569 | | | | 20,727,992 | |
| | | | | | | | |
Total proceeds from shares sold and reinvested | | | 106,658,670 | | | | 122,368,209 | |
| | | | | | | | |
Value of shares redeemed | | | | | | | | |
GS2 shares | | | (17,170,249 | ) | | | (15,032,006 | ) |
GS4 shares | | | (105,356,290 | ) | | | (181,007,812 | ) |
| | | | | | | | |
Total value of shares redeemed | | | (122,526,539 | ) | | | (196,039,818 | ) |
| | | | | | | | |
Net increase (decrease) from capital share transactions(2) | | | (15,867,869 | ) | | | (73,671,609 | ) |
| | | | | | | | |
Total increase (decrease) in net assets | | | (5,030,699 | ) | | | (50,161,070 | ) |
| | | | | | | | |
Net Assets: | | | | | | | | |
Beginning of Year | | | 410,500,307 | | | | 460,661,377 | |
| | | | | | | | |
End of Year* | | $ | 405,469,608 | | | $ | 410,500,307 | �� |
| | | | | | | | |
*Including undistributed (distributions in excess of) net investment income | | $ | 106,406 | | | $ | 494,619 | |
| | | | | | | | |
| (1) | Inception date was September 1, 2011. |
| (2) | See Note 7 in Notes to Financial Statements. |
See Notes to Financial Statements.
209
| | | | | | | | | | | | | | | | | | |
Inflation Protected
Bond Fund | | | Global
Bond Fund | | | Defensive Market
Strategies Fund | |
| | |
| | |
| For the Year Ended | | | For the Year Ended | | | For the Period
09/01/11(1) -
12/31/11 | |
| 12/31/11 | | | 12/31/10 | | | 12/31/11 | | | 12/31/10 | | |
| | | | | | | | | | | | | | | | | | |
| $ | 3,531,837 | | | $ | 1,969,404 | | | $ | 8,725,553 | | | $ | 11,663,528 | | | $ | 936,692 | |
| | | | |
| | 3,591,541 | | | | 3,238,449 | | | | (2,617,065 | ) | | | 3,321,144 | | | | (2,374,664 | ) |
| | | | |
| | 7,829,782 | | | | 462,900 | | | | 999,234 | | | | 8,641,906 | | | | 8,963,748 | |
| | | | | | | | | | | | | | | | | | |
| | 14,953,160 | | | | 5,670,753 | | | | 7,107,722 | | | | 23,626,578 | | | | 7,525,776 | |
| | | | | | | | | | | | | | | | | | |
| | | | | | | | | | | | | | | | | | |
| | | | | | | | | | | | | | | | | | |
| | — | | | | — | | | | — | | | | — | | | | (318,933 | ) |
| | (3,711,792) | | | | (2,038,102 | ) | | | (8,997,511 | ) | | | (12,273,443 | ) | | | (817,166 | ) |
| | | | | | | | | | | | | | | | | | |
| | — | | | | — | | | | — | | | | — | | | | (59,110 | ) |
| | (2,460,477) | | | | (2,718,888 | ) | | | — | | | | — | | | | (180,504 | ) |
| | | | | | | | | | | | | | | | | | |
| | (6,172,269) | | | | (4,756,990 | ) | | | (8,997,511 | ) | | | (12,273,443 | ) | | | (1,375,713 | ) |
| | | | | | | | | | | | | | | | | | |
| | | | | | | | | | | | | | | | | | |
| | | | | | | | | | | | | | | | | | |
| | — | | | | | | | | — | | | | — | | | | 79,296,691 | |
| | 75,023,418 | | | | 42,423,880 | | | | 31,454,693 | | | | 27,722,929 | | | | 237,229,968 | |
| | | | | | | | | | | | | | | | | | |
| | — | | | | — | | | | — | | | | — | | | | 377,748 | |
| | 6,171,549 | | | | 4,756,950 | | | | 8,996,898 | | | | 12,273,386 | | | | 997,670 | |
| | | | | | | | | | | | | | | | | | |
| | 81,194,967 | | | | 47,180,830 | | | | 40,451,591 | | | | 39,996,315 | | | | 317,902,077 | |
| | | | | | | | | | | | | | | | | | |
| | | | | | | | | | | | | | | | | | |
| | — | | | | — | | | | — | | | | — | | | | (6,649,396 | ) |
| | (34,645,081) | | | | (28,263,358 | ) | | | (29,464,225 | ) | | | (111,834,370 | ) | | | (2,357,596 | ) |
| | | | | | | | | | | | | | | | | | |
| | (34,645,081) | | | | (28,263,358 | ) | | | (29,464,225 | ) | | | (111,834,370 | ) | | | (9,006,992 | ) |
| | | | | | | | | | | | | | | | | | |
| | 46,549,886 | | | | 18,917,472 | | | | 10,987,366 | | | | (71,838,055 | ) | | | 308,895,085 | |
| | | | | | | | | | | | | | | | | | |
| | 55,330,777 | | | | 19,831,235 | | | | 9,097,577 | | | | (60,484,920 | ) | | | 315,045,148 | |
| | | | | | | | | | | | | | | | | | |
| | | | | | | | | | | | | | | | | | |
| | 107,824,952 | | | | 87,993,717 | | | | 161,069,653 | | | | 221,554,573 | | | | — | |
| | | | | | | | | | | | | | | | | | |
| $ | 163,155,729 | | | $ | 107,824,952 | | | $ | 170,167,230 | | | $ | 161,069,653 | | | $ | 315,045,148 | |
| | | | | | | | | | | | | | | | | | |
| $ | (33,249 | ) | | $ | — | | | $ | 453,534 | | | $ | 665,096 | | | $ | (19,092 | ) |
| | | | | | | | | | | | | | | | | | |
See Notes to Financial Statements.
210
STATEMENTS OF CHANGES IN NET ASSETS
| | | | | | | | | | | | | | | | |
| | | Equity Index Fund | | | Real Estate
Securities Fund | |
| | | For the Year Ended | | | For the Year Ended | |
| | | 12/31/11 | | | 12/31/10 | | | 12/31/11 | | | 12/31/10 | |
Operations: | | | | | | | | | | | | | | | | |
Net investment income (loss) | | $ | 5,258,974 | | | $ | 6,396,499 | | | $ | 1,263,887 | | | $ | 1,905,032 | |
Net realized gain on investment securities, foreign currency transactions and derivative transactions | | | 32,991,580 | | | | 5,274,132 | | | | 17,066,499 | | | | 26,904,560 | |
Net change in unrealized appreciation (depreciation) on investment securities, foreign currency translations and derivative transactions | | | (32,744,998 | ) | | | 41,477,736 | | | | (7,100,897 | ) | | | 4,438,375 | |
| | | | | | | | | | | | | | | | |
Net increase (decrease) in net assets resulting from operations | | | 5,505,556 | | | | 53,148,367 | | | | 11,229,489 | | | | 33,247,967 | |
| | | | | | | | | | | | | | | | |
Dividends and Distributions to Shareholders: | | | | | | | | | | | | | | | | |
Dividends from net investment income | | | | | | | | | | | | | | | | |
GS2 shares | | | (1,954,809 | ) | | | (2,079,604 | ) | | | — | | | | — | |
GS4 shares | | | (4,382,332 | ) | | | (4,864,924 | ) | | | (1,079,417 | ) | | | (2,634,670 | ) |
Distributions from net realized capital gains | | | | | | | | | | | | | | | | |
GS2 shares | | | (9,790,218 | ) | | | — | | | | — | | | | — | |
GS4 shares | | | (25,535,709 | ) | | | — | | | | — | | | | — | |
| | | | | | | | | | | | | | | | |
Total dividends and distributions | | | (41,663,068 | ) | | | (6,944,528 | ) | | | (1,079,417 | ) | | | (2,634,670 | ) |
| | | | | | | | | | | | | | | | |
Capital Share Transactions: | | | | | | | | | | | | | | | | |
Proceeds from shares sold | | | | | | | | | | | | | | | | |
GS2 shares | | | 2,712,853 | | | | 4,602,259 | | | | — | | | | — | |
GS4 shares | | | 22,558,530 | | | | 20,345,130 | | | | 43,753,345 | | | | 59,543,641 | |
Reinvestment of dividends and distributions | | | | | | | | | | | | | | | | |
GS2 shares | | | 11,720,330 | | | | 2,076,955 | | | | — | | | | — | |
GS4 shares | | | 29,913,775 | | | | 4,864,576 | | | | 1,079,272 | | | | 2,634,446 | |
| | | | | | | | | | | | | | | | |
Total proceeds from shares sold and reinvested | | | 66,905,488 | | | | 31,888,920 | | | | 44,832,617 | | | | 62,178,087 | |
| | | | | | | | | | | | | | | | |
Value of shares redeemed | | | | | | | | | | | | | | | | |
GS2 shares | | | (38,120,249 | ) | | | (8,023,576 | ) | | | — | | | | — | |
GS4 shares | | | (179,783,388 | ) | | | (49,820,804 | ) | | | (46,656,025 | ) | | | (72,424,383 | ) |
| | | | | | | | | | | | | | | | |
Total value of shares redeemed | | | (217,903,637 | ) | | | (57,844,380 | ) | | | (46,656,025 | ) | | | (72,424,383 | ) |
| | | | | | | | | | | | | | | | |
Net increase (decrease) from capital share transactions(1) | | | (150,998,149 | ) | | | (25,955,460 | ) | | | (1,823,408 | ) | | | (10,246,296 | ) |
| | | | | | | | | | | | | | | | |
Total increase (decrease) in net assets | | | (187,155,661 | ) | | | 20,248,379 | | | | 8,326,664 | | | | 20,367,001 | |
| | | | | | | | | | | | | | | | |
Net Assets: | | | | | | | | | | | | | | | | |
Beginning of Year | | | 406,952,155 | | | | 386,703,776 | | | | 141,900,198 | | | | 121,533,197 | |
| | | | | | | | | | | | | | | | |
End of Year* | | $ | 219,796,494 | | | $ | 406,952,155 | | | $ | 150,226,862 | | | $ | 141,900,198 | |
| | | | | | | | | | | | | | | | |
*Including undistributed (distributions in excess of) net investment income | | $ | — | | | $ | 1,075,513 | | | $ | 184,497 | | | $ | — | |
| | | | | | | | | | | | | | | | |
| (1) | See Note 7 in Notes to Financial Statements. |
See Notes to Financial Statements.
211
| | | | | | | | | | | | | | | | | | | | | | | | | | | | | | |
| | | |
| Value Equity Fund | | | Growth Equity Fund | | | Small Cap Equity Fund | | | International Equity Fund | |
| For the Year Ended | | | For the Year Ended | | | For the Year Ended | | | For the Year Ended | |
| 12/31/11 | | | 12/31/10 | | | 12/31/11 | | | 12/31/10 | | | 12/31/11 | | | 12/31/10 | | | 12/31/11 | | | 12/31/10 | |
| | | | | | | | | | | | | | | | | | | | | | | | | | | | | | |
| $ | 16,621,802 | | | $ | 16,020,597 | | | $ | (1,251,646 | ) | | $ | (265,820 | ) | | $ | 588,385 | | | $ | 1,264,643 | | | $ | 25,408,601 | | | $ | 21,771,274 | |
| | | | | | | |
| | 26,274,574 | | | | 21,517,725 | | | | 112,048,038 | | | | 116,443,512 | | | | 55,393,288 | | | | 63,234,872 | | | | 55,235,655 | | | | 69,378,254 | |
| | | | | | | |
| | (40,133,852) | | | | 112,791,738 | | | | (129,401,549 | ) | | | 99,460,370 | | | | (48,864,420 | ) | | | 43,094,484 | | | | (266,338,287 | ) | | | 31,319,963 | |
| | | | | | | | | | | | | | | | | | | | | | | | | | | | | | |
| | 2,762,524 | | | | 150,330,060 | | | | (18,605,157 | ) | | | 215,638,062 | | | | 7,117,253 | | | | 107,593,999 | | | | (185,694,031 | ) | | | 122,469,491 | |
| | | | | | | | | | | | | | | | | | | | | | | | | | | | | | |
| | | | | | | | | | | | | | | | | | | | | | | | | | | | | | |
| | | | | | | | | | | | | | | | | | | | | | | | | | | | | | |
| | (5,981,447) | | | | (4,566,483 | ) | | | — | | | | (40,561 | ) | | | (296,485 | ) | | | (415,040 | ) | | | (6,224,885 | ) | | | (7,250,286 | ) |
| | (10,675,839) | | | | (11,523,832 | ) | | | — | | | | (133,534 | ) | | | (407,452 | ) | | | (925,891 | ) | | | (18,014,995 | ) | | | (20,213,303 | ) |
| | | | | | | | | | | | | | | | | | | | | | | | | | | | | | |
| | — | | | | — | | | | — | | | | — | | | | — | | | | — | | | | — | | | | — | |
| | — | | | | — | | | | — | | | | — | | | | — | | | | — | | | | — | | | | — | |
| | | | | | | | | | | | | | | | | | | | | | | | | | | | | | |
| | (16,657,286) | | | | (16,090,315 | ) | | | — | | | | (174,095 | ) | | | (703,937 | ) | | | (1,340,931 | ) | | | (24,239,880 | ) | | | (27,463,589 | ) |
| | | | | | | | | | | | | | | | | | | | | | | | | | | | | | |
| | | | | | | | | | | | | | | | | | | | | | | | | | | | | | |
| | | | | | | | | | | | | | | | | | | | | | | | | | | | | | |
| | 18,209,835 | | | | 39,754,658 | | | | 12,614,849 | | | | 11,089,301 | | | | 5,576,712 | | | | 6,136,286 | | | | 34,462,759 | | | | 21,416,243 | |
| | 78,987,992 | | | | 102,300,386 | | | | 84,754,555 | | | | 97,600,498 | | | | 47,768,412 | | | | 50,387,278 | | | | 181,280,843 | | | | 72,024,528 | |
| | | | | | | | | | | | | | | | | | | | | | | | | | | | | | |
| | 5,976,208 | | | | 4,561,533 | | | | — | | | | 40,520 | | | | 296,176 | | | | 414,619 | | | | 6,222,532 | | | | 7,247,462 | |
| | 10,674,516 | | | | 11,522,839 | | | | — | | | | 133,532 | | | | 407,371 | | | | 925,723 | | | | 18,014,075 | | | | 20,212,073 | |
| | | | | | | | | | | | | | | | | | | | | | | | | | | | | | |
| | 113,848,551 | | | | 158,139,416 | | | | 97,369,404 | | | | 108,863,851 | | | | 54,048,671 | | | | 57,863,906 | | | | 239,980,209 | | | | 120,900,306 | |
| | | | | | | | | | | | | | | | | | | | | | | | | | | | | | |
| | | | | | | | | | | | | | | | | | | | | | | | | | | | | | |
| | (49,726,476) | | | | (15,449,564 | ) | | | (41,012,966 | ) | | | (27,914,876 | ) | | | (17,341,615 | ) | | | (12,770,867 | ) | | | (35,990,466 | ) | | | (24,804,983 | ) |
| | (186,250,779) | | | | (270,576,572 | ) | | | (197,296,374 | ) | | | (300,169,249 | ) | | | (99,700,166 | ) | | | (96,926,506 | ) | | | (106,493,355 | ) | | | (241,791,703 | ) |
| | | | | | | | | | | | | | | | | | | | | | | | | | | | | | |
| | (235,977,255) | | | | (286,026,136 | ) | | | (238,309,340 | ) | | | (328,084,125 | ) | | | (117,041,781 | ) | | | (109,697,373 | ) | | | (142,483,821 | ) | | | (266,596,686 | ) |
| | | | | | | | | | | | | | | | | | | | | | | | | | | | | | |
| | (122,128,704) | | | | (127,886,720 | ) | | | (140,939,936 | ) | | | (219,220,274 | ) | | | (62,993,110 | ) | | | (51,833,467 | ) | | | 97,496,388 | | | | (145,696,380 | ) |
| | | | | | | | | | | | | | | | | | | | | | | | | | | | | | |
| | (136,023,466) | | | | 6,353,025 | | | | (159,545,093 | ) | | | (3,756,307 | ) | | | (56,579,794 | ) | | | 54,419,601 | | | | (112,437,523 | ) | | | (50,690,478 | ) |
| | | | | | | | | | | | | | | | | | | | | | | | | | | | | | |
| | | | | | | | | | | | | | | | | | | | | | | | | | | | | | |
| | 1,189,289,939 | | | | 1,182,936,914 | | | | 1,259,923,206 | | | | 1,263,679,513 | | | | 474,495,234 | | | | 420,075,633 | | | | 1,291,419,813 | | | | 1,342,110,291 | |
| | | | | | | | | | | | | | | | | | | | | | | | | | | | | | |
| $ | 1,053,266,473 | | | $ | 1,189,289,939 | | | $ | 1,100,378,113 | | | $ | 1,259,923,206 | | | $ | 417,915,440 | | | $ | 474,495,234 | | | $ | 1,178,982,290 | | | $ | 1,291,419,813 | |
| | | | | | | | | | | | | | | | | | | | | | | | | | | | | | |
| $ | 7,684,176 | | | $ | 7,719,446 | | | $ | (540 | ) | | $ | — | | | $ | (27,881 | ) | | $ | 4,903 | | | $ | (703,735 | ) | | $ | (3,491,275 | ) |
| | | | | | | | | | | | | | | | | | | | | | | | | | | | | | |
See Notes to Financial Statements.
212
FINANCIAL HIGHLIGHTS
For a Share Outstanding For the Years Ending December 31, unless otherwise indicated
| | | | | | | | | | | | | | | | | | | | | | | | | | | | | | | | | | | | | | | | | | | | | | | | |
| | | | | | | | | | Ratios to Average Net Assets | | | | |
| | | Net Asset
Value,
Beginning
of Year | | | Net
Investment
Income | | | Realized
and
Unrealized
Gain
(Loss) on
Investments | | | Dividends
from Net
Investment
Income | | | Distributions
from Net
Realized
Capital
Gains | | | Net
Asset
Value,
End of
Year | | | Total
Return | | | Net Assets,
End of Year
(000) | | | Expenses,
Net | | | Expenses,
Gross(1) | | | Investment
Income,
Net(2) | | | Portfolio
Turnover
Rate | |
Money Market Fund | |
| | | | | | | | | | | | |
GS2 Class | | | | | | | | | | | | | | | | | | | | | | | | | | | | | | | | | | | | | | | | | | | | | | | | |
2011 | | $ | 1.00 | | | $ | — | †# | | $ | — | † | | $ | — | † | | $ | — | † | | $ | 1.00 | | | | 0.10 | % | | $ | 116,298 | | | | 0.18 | % | | | 0.19 | % | | | 0.09 | % | | | N/A | |
2010 | | | 1.00 | | | | — | † | | | — | † | | | — | † | | | — | † | | | 1.00 | | | | 0.18 | | | | 119,311 | | | | 0.17 | | | | 0.18 | | | | 0.17 | | | | N/A | |
2009 | | | 1.00 | | | | — | † | | | — | † | | | — | † | | | — | † | | | 1.00 | | | | 0.47 | | | | 133,323 | | | | 0.23 | (3) | | | 0.23 | (3) | | | 0.49 | | | | N/A | |
2008 | | | 1.00 | | | | 0.03 | | | | — | † | | | (0.03 | ) | | | — | | | | 1.00 | | | | 2.95 | | | | 171,739 | | | | 0.20 | | | | 0.20 | | | | 2.86 | | | | N/A | |
2007 | | | 1.00 | | | | 0.05 | | | | — | † | | | (0.05 | ) | | | — | | | | 1.00 | | | | 5.23 | | | | 112,581 | | | | 0.23 | | | | 0.23 | | | | 5.11 | | | | N/A | |
| | | | | | | | | | | | |
GS4 Class | | | | | | | | | | | | | | | | | | | | | | | | | | | | | | | | | | | | | | | | | | | | | | | | |
2011 | | $ | 1.00 | | | $ | — | †# | | $ | — | † | | $ | — | † | | $ | — | † | | $ | 1.00 | | | | 0.01 | % | | $ | 1,161,630 | | | | 0.27 | % | | | 0.42 | % | | | 0.01 | % | | | N/A | |
2010 | | | 1.00 | | | | — | † | | | — | † | | | — | † | | | — | † | | | 1.00 | | | | 0.02 | | | | 1,180,141 | | | | 0.33 | | | | 0.37 | | | | 0.01 | | | | N/A | |
2009 | | | 1.00 | | | | — | † | | | — | † | | | — | † | | | — | † | | | 1.00 | | | | 0.29 | | | | 1,064,934 | | | | 0.41 | (3) | | | 0.43 | (3) | | | 0.28 | | | | N/A | |
2008 | | | 1.00 | | | | 0.03 | | | | — | † | | | (0.03 | ) | | | — | | | | 1.00 | | | | 2.75 | | | | 970,146 | | | | 0.40 | (3) | | | 0.40 | (3) | | | 2.72 | | | | N/A | |
2007 | | | 1.00 | | | | 0.05 | | | | — | † | | | (0.05 | ) | | | — | | | | 1.00 | | | | 5.03 | | | | 939,596 | | | | 0.43 | | | | 0.43 | | | | 4.92 | | | | N/A | |
|
Low-Duration Bond Fund | |
| | | | | | | | | | | | |
GS2 Class | | | | | | | | | | | | | | | | | | | | | | | | | | | | | | | | | | | | | | | | | | | | | | | | |
2011 | | $ | 8.70 | | | $ | 0.16 | # | | $ | (0.01 | )(4) | | $ | (0.23 | ) | | $ | (0.03 | ) | | $ | 8.59 | | | | 1.77 | % | | $ | 122,462 | | | | 0.36 | % | | | 0.42 | % | | | 1.84 | % | | | 221 | % |
2010 | | | 8.70 | | | | 0.20 | # | | | 0.17 | | | | (0.28 | ) | | | (0.09 | ) | | | 8.70 | | | | 4.35 | | | | 128,143 | | | | 0.36 | | | | 0.41 | | | | 2.27 | | | | 257 | |
2009 | | | 8.11 | | | | 0.29 | # | | | 0.69 | | | | (0.39 | ) | | | — | | | | 8.70 | | | | 12.29 | | | | 115,741 | | | | 0.36 | | | | 0.42 | | | | 3.47 | | | | 322 | |
2008 | | | 8.90 | | | | 0.36 | # | | | (0.60 | ) | | | (0.55 | ) | | | — | | | | 8.11 | | | | (2.76 | ) | | | 105,223 | | | | 0.36 | | | | 0.41 | | | | 4.19 | | | | 427 | |
2007 | | | 8.89 | | | | 0.42 | # | | | 0.12 | | | | (0.53 | ) | | | — | | | | 8.90 | | | | 6.22 | | | | 133,374 | | | | 0.42 | | | | 0.45 | | | | 4.71 | | | | 248 | |
| | | | | | | | | | | | |
GS4 Class | | | | | | | | | | | | | | | | | | | | | | | | | | | | | | | | | | | | | | | | | | | | | | | | |
2011 | | $ | 13.23 | | | $ | 0.22 | # | | $ | (0.01 | )(4) | | $ | (0.21 | ) | | $ | (0.03 | ) | | $ | 13.20 | | | | 1.58 | % | | $ | 621,713 | | | | 0.55 | % | | | 0.65 | % | | | 1.64 | % | | | 221 | % |
2010 | | | 13.04 | | | | 0.28 | # | | | 0.26 | | | | (0.26 | ) | | | (0.09 | ) | | | 13.23 | | | | 4.20 | | | | 580,452 | | | | 0.52 | | | | 0.61 | | | | 2.11 | | | | 257 | |
2009 | | | 11.99 | | | | 0.42 | # | | | 1.00 | | | | (0.37 | ) | | | — | | | | 13.04 | | | | 11.97 | | | | 569,316 | | | | 0.52 | | | | 0.62 | | | | 3.30 | | | | 322 | |
2008 | | | 12.88 | | | | 0.51 | # | | | (0.87 | ) | | | (0.53 | ) | | | — | | | | 11.99 | | | | (2.84 | ) | | | 515,996 | | | | 0.52 | | | | 0.61 | | | | 4.03 | | | | 427 | |
2007 | | | 12.63 | | | | 0.58 | # | | | 0.17 | | | | (0.50 | ) | | | — | | | | 12.88 | | | | 6.11 | | | | 665,292 | | | | 0.58 | | | | 0.64 | | | | 4.54 | | | | 248 | |
| † | Amount represents less than $0.005 per share. |
| # | Calculated using the average shares outstanding method. |
| (1) | The ratio excludes expenses waived/reimbursed net of amount recaptured. |
| (2) | The ratio includes expenses waived/reimbursed net of amount recaptured and fees paid indirectly, where applicable; if expenses waived/reimbursed net of amount recaptured and fees paid indirectly were excluded, the ratio would have been lower than the ratio shown. |
| (3) | The Money Market Fund participated in the U.S. Department of the Treasury (the “Treasury”) Temporary Guarantee Program for Money Market Funds (the “Program”). The Fund bore the expense of its participation in the Program without regard to any expense limitation in effect. The Program expired on September 18, 2009. |
| (4) | Amount includes Capital Gains distributions received by the Fund from the GuideStone Money Market Fund. The amount of these distributions represents less than $0.005 per share. |
See Notes to Financial Statements.
213
| | | | | | | | | | | | | | | | | | | | | | | | | | | | | | | | | | | | | | | | | | | | | | | | | | | | |
| | | | | | | | | | | | | | | | | | | | | | | | | | | Ratios to Average Net Assets | |
| | | Net Asset
Value,
Beginning
of Year | | | Net Investment
Income | | | Realized
and
Unrealized
Gain
(Loss) on
Investments | | | Dividends
from Net
Investment
Income | | | Distributions
from Net
Realized
Capital
Gains | | | Excess
Distribution/
Return of
Capital | | | Net Asset
Value,
End of
Year | | | Total
Return | | | Net
Assets,
End of
Year
(000) | | | Expenses,
Net | | | Expenses,
Gross(1) | | | Investment
Income,
Net(2) | | | Portfolio
Turnover
Rate | |
Medium-Duration Bond Fund | |
|
GS2 Class | |
2011 | | $ | 7.25 | | | $ | 0.20 | # | | $ | 0.27 | (3) | | $ | (0.35 | ) | | $ | (0.13 | ) | | $ | — | | | $ | 7.24 | | | | 6.56 | % | | $ | 228,024 | | | | 0.48 | % | | | 0.52 | % | | | 2.76 | % | | | 609 | % |
2010 | | | 7.47 | | | | 0.25 | # | | | 0.40 | | | | (0.41 | ) | | | (0.46 | ) | | | — | | | | 7.25 | | | | 8.86 | | | | 236,369 | | | | 0.48 | | | | 0.49 | | | | 3.21 | | | | 487 | |
2009 | | | 7.13 | | | | 0.31 | # | | | 0.85 | | | | (0.51 | ) | | | (0.31 | ) | | | — | | | | 7.47 | | | | 17.07 | | | | 139,917 | | | | 0.48 | | | | 0.51 | | | | 4.17 | | | | 427 | |
2008 | | | 8.42 | | | | 0.40 | # | | | (0.72 | ) | | | (0.65 | ) | | | (0.32 | ) | | | — | | | | 7.13 | | | | (3.88 | ) | | | 112,240 | | | | 0.47 | | | | 0.48 | | | | 5.07 | | | | 566 | |
2007 | | | 8.52 | | | | 0.42 | # | | | 0.12 | | | | (0.64 | ) | | | — | † | | | — | | | | 8.42 | | | | 6.65 | | | | 151,466 | | | | 0.48 | | | | 0.49 | | | | 5.02 | | | | 428 | |
|
GS4 Class | |
2011 | | $ | 13.65 | | | $ | 0.37 | # | | $ | 0.51 | (3) | | $ | (0.33 | ) | | $ | (0.13 | ) | | $ | — | | | $ | 14.07 | | | | 6.49 | % | | $ | 636,218 | | | | 0.61 | % | | | 0.75 | % | | | 2.62 | % | | | 609 | % |
2010 | | | 13.36 | | | | 0.43 | # | | | 0.71 | | | | (0.39 | ) | | | (0.46 | ) | | | — | | | | 13.65 | | | | 8.65 | | | | 614,082 | | | | 0.58 | | | | 0.68 | | | | 3.11 | | | | 487 | |
2009 | | | 12.16 | | | | 0.53 | # | | | 1.48 | | | | (0.50 | ) | | | (0.31 | ) | | | — | | | | 13.36 | | | | 16.97 | | | | 868,800 | | | | 0.58 | | | | 0.70 | | | | 4.08 | | | | 427 | |
2008 | | | 13.64 | | | | 0.65 | # | | | (1.18 | ) | | | (0.63 | ) | | | (0.32 | ) | | | — | | | | 12.16 | | | | (3.89 | ) | | | 738,610 | | | | 0.58 | | | | 0.67 | | | | 4.96 | | | | 566 | |
2007 | | | 13.42 | | | | 0.66 | # | | | 0.18 | | | | (0.62 | ) | | | — | † | | | — | | | | 13.64 | | | | 6.46 | | | | 1,079,034 | | | | 0.61 | | | | 0.68 | | | | 4.88 | | | | 428 | |
Extended-Duration Bond Fund | |
|
GS2 Class | |
2011 | | $ | 6.93 | | | $ | 0.37 | # | | $ | 0.49 | (3) | | $ | (0.74 | ) | | $ | (0.57 | ) | | $ | — | | | $ | 6.48 | | | | 13.33 | % | | | 74,591 | | | | 0.54 | % | | | 0.55 | % | | | 5.32 | % | | | 41 | % |
2010 | | | 7.01 | | | | 0.40 | # | | | 0.43 | | | | (0.80 | ) | | | (0.11 | ) | | | — | | | | 6.93 | | | | 12.25 | | | | 72,741 | | | | 0.53 | | | | 0.53 | | | | 5.60 | | | | 39 | |
2009 | | | 6.31 | | | | 0.44 | # | | | 1.04 | | | | (0.76 | ) | | | (0.02 | ) | | | — | | | | 7.01 | | | | 25.27 | | | | 67,699 | | | | 0.53 | | | | 0.53 | | | | 6.78 | | | | 41 | |
2008 | | | 7.95 | | | | 0.47 | # | | | (1.11 | ) | | | (0.85 | ) | | | (0.15 | ) | | | — | | | | 6.31 | | | | (8.12 | ) | | | 64,834 | | | | 0.52 | | | | 0.52 | | | | 6.66 | | | | 40 | |
2007 | | | 8.13 | | | | 0.41 | # | | | 0.23 | | | | (0.69 | ) | | | (0.13 | ) | | | — | | | | 7.95 | | | | 8.45 | | | | 75,841 | | | | 0.53 | | | | 0.53 | | | | 5.21 | | | | 101 | |
|
GS4 Class | |
2011 | | $ | 16.28 | | | $ | 0.86 | # | | $ | 1.22 | (3) | | $ | (0.71 | ) | | $ | (0.57 | ) | | $ | — | | | $ | 17.08 | | | | 13.14 | % | | $ | 330,879 | | | | 0.73 | % | | | 0.78 | % | | | 5.13 | % | | | 41 | % |
2010 | | | 15.34 | | | | 0.88 | # | | | 0.94 | | | | (0.77 | ) | | | (0.11 | ) | | | — | | | | 16.28 | | | | 12.05 | | | | 337,760 | | | | 0.69 | | | | 0.72 | | | | 5.43 | | | | 39 | |
2009 | | | 12.97 | | | | 0.91 | # | | | 2.22 | | | | (0.74 | ) | | | (0.02 | ) | | | — | | | | 15.34 | | | | 24.97 | | | | 392,962 | | | | 0.69 | | | | 0.73 | | | | 6.60 | | | | 41 | |
2008 | | | 15.20 | | | | 0.90 | # | | | (2.15 | ) | | | (0.83 | ) | | | (0.15 | ) | | | — | | | | 12.97 | | | | (8.28 | ) | | | 357,073 | | | | 0.69 | | | | 0.71 | | | | 6.45 | | | | 40 | |
2007 | | | 14.81 | | | | 0.74 | # | | | 0.44 | | | | (0.66 | ) | | | (0.13 | ) | | | — | | | | 15.20 | | | | 8.29 | | | | 500,252 | | | | 0.72 | | | | 0.72 | | | | 5.02 | | | | 101 | |
|
Inflation Protected Bond Fund | |
|
GS4 Class | |
2011 | | $ | 10.43 | | | $ | 0.29 | # | | $ | 0.94 | (3) | | $ | (0.31 | ) | | $ | (0.19 | ) | | $ | — | | | $ | 11.16 | | | | 12.00 | % | | $ | 163,156 | | | | 0.66 | % | | | 0.68 | % | | | 2.65 | % | | | 114 | % |
2010 | | | 10.32 | | | | 0.20 | # | | | 0.40 | | | | (0.21 | ) | | | (0.28 | ) | | | — | | | | 10.43 | | | | 5.82 | | | | 107,825 | | | | 0.65 | | | | 0.66 | | | | 1.90 | | | | 113 | |
2009(4)(5) | | | 10.00 | | | | 0.19 | # | | | 0.32 | | | | (0.18 | ) | | | (0.01 | ) | | | — | | | | 10.32 | | | | 5.12 | | | | 87,994 | | | | 0.67 | | | | 0.70 | | | | 3.53 | | | | 55 | |
|
Global Bond Fund | |
|
GS4 Class | |
2011 | | $ | 9.83 | | | $ | 0.51 | # | | $ | (0.09 | )(3) | | $ | (0.52 | ) | | $ | — | | | $ | — | | | $ | 9.73 | | | | 4.35 | % | | $ | 170,167 | | | | 0.86 | % | | | 0.88 | % | | | 5.09 | % | | | 68 | % |
2010 | | | 9.36 | | | | 0.52 | # | | | 0.51 | | | | (0.56 | ) | | | — | | | | — | | | | 9.83 | | | | 11.29 | | | | 161,070 | | | | 0.79 | | | | 0.81 | | | | 5.40 | | | | 40 | |
2009 | | | 7.34 | | | | 0.56 | # | | | 2.07 | | | | (0.61 | ) | | | — | | | | — | | | | 9.36 | | | | 37.35 | | | | 221,555 | | | | 0.79 | | | | 0.81 | | | | 6.81 | | | | 96 | |
2008 | | | 10.14 | | | | 0.64 | # | | | (2.59 | ) | | | (0.75 | ) | | | (0.10 | ) | | | — | | | | 7.34 | | | | (20.28 | ) | | | 167,465 | | | | 0.78 | | | | 0.80 | | | | 7.20 | | | | 176 | |
2007 | | | 10.12 | | | | 0.61 | | | | 0.08 | | | | (0.64 | ) | | | (0.03 | ) | | | — | | | | 10.14 | | | | 7.00 | | | | 125,333 | | | | 0.79 | | | | 0.80 | | | | 6.07 | | | | 255 | |
| † | Amount represents less than $0.005 per share. |
| # | Calculated using the average shares outstanding method. |
| (1) | The ratio excludes expenses waived/reimbursed net of amount recaptured. |
| (2) | The ratio includes expenses waived/reimbursed net of amount recaptured and fees paid indirectly, where applicable; if expenses waived/reimbursed net of amount recaptured and fees paid indirectly were excluded, the ratio would have been lower than the ratio shown. |
| (3) | Amount includes Capital Gains distributions received by the Fund from the GuideStone Money Market Fund. The amount of these distributions represents less than $0.005 per share. |
| (4) | Inception date was June 26, 2009. |
| (5) | Total return is not annualized. Ratios are annualized. |
See Notes to Financial Statements.
214
FINANCIAL HIGHLIGHTS (Continued)
For a Share Outstanding For the Years Ending December 31, unless otherwise indicated
| | | | | | | | | | | | | | | | | | | | | | | | | | | | | | | | | | | | | | | | | | | | | | | | | | | | |
| | | | | | | Ratios to Average Net Assets | | | | |
| | | Net Asset
Value,
Beginning
of Year | | | Net Investment
Income | | | Realized
and
Unrealized
Gain
(Loss) on
Investments | | | Dividends
from Net
Investment
Income | | | Distributions
from Net
Realized
Capital
Gains | | | Excess
Distribution/
Return of
Capital | | | Net Asset
Value,
End of
Year | | | Total
Return | | | Net Assets,
End of Year
(000) | | | Expenses,
Net | | | Expenses,
Gross(1) | | | Investment
Income/
(Loss),
Net(2) | | | Portfolio
Turnover
Rate | |
Defensive Market Strategies Fund | |
|
GS2 Class | |
2011(3) | | $ | 10.00 | | | $ | 0.04 | # | | $ | 0.21 | (4) | | $ | (0.04 | ) | | $ | (0.01 | ) | | $ | — | | | $ | 10.20 | | | | 2.51 | % | | $ | 74,516 | | | | 0.99 | %(5) | | | 1.10 | % | | | 1.11 | % | | | 120 | % |
GS4 Class | |
2011(3) | | $ | 10.00 | | | $ | 0.03 | # | | $ | 0.21 | (4) | | $ | (0.03 | ) | | $ | (0.01 | ) | | $ | — | | | $ | 10.20 | | | | 2.43 | % | | $ | 240,529 | | | | 1.25 | %(5) | | | 1.35 | % | | | 0.86 | % | | | 120 | % |
|
Equity Index Fund | |
|
GS2 Class | |
2011 | | $ | 8.63 | | | $ | 0.15 | # | | $ | 0.04 | (4) | | $ | (0.31 | ) | | $ | (2.22 | ) | | $ | — | | | $ | 6.29 | | | | 3.00 | % | | $ | 36,721 | | | | 0.23 | % | | | 0.24 | % | | | 1.71 | % | | | 4 | % |
2010 | | | 7.77 | | | | 0.14 | # | | | 0.97 | | | | (0.25 | ) | | | — | | | | — | | | | 8.63 | | | | 14.57 | | | | 71,093 | | | | 0.22 | | | | 0.22 | | | | 1.77 | | | | 5 | |
2009 | | | 6.36 | | | | 0.14 | # | | | 1.49 | | | | (0.22 | ) | | | — | | | | — | | | | 7.77 | | | | 26.38 | | | | 65,217 | | | | 0.22 | | | | 0.24 | | | | 2.05 | | | | 4 | |
2008 | | | 10.57 | | | | 0.18 | # | | | (4.06 | ) | | | (0.24 | ) | | | (0.09 | ) | | | — | | | | 6.36 | | | | (37.32 | ) | | | 49,472 | | | | 0.21 | | | | 0.22 | | | | 2.11 | | | | 5 | |
2007 | | | 11.08 | | | | 0.20 | # | | | 0.39 | | | | (0.32 | ) | | | (0.78 | ) | | | — | | | | 10.57 | | | | 5.19 | | | | 81,104 | | | | 0.22 | | | | 0.22 | | | | 1.77 | | | | 5 | |
|
GS4 Class | |
2011 | | $ | 16.36 | | | $ | 0.26 | # | | $ | 0.12 | (4) | | $ | (0.28 | ) | | $ | (2.22 | ) | | $ | — | | | $ | 14.24 | | | | 2.75 | % | | $ | 183,076 | | | | 0.38 | % | | | 0.47 | % | | | 1.57 | % | | | 4 | % |
2010 | | | 14.51 | | | | 0.24 | # | | | 1.84 | | | | (0.23 | ) | | | — | | | | — | | | | 16.36 | | | | 14.45 | | | | 335,859 | | | | 0.37 | | | | 0.41 | | | | 1.60 | | | | 5 | |
2009 | | | 11.70 | | | | 0.24 | # | | | 2.77 | | | | (0.20 | ) | | | — | | | | — | | | | 14.51 | | | | 26.14 | | | | 321,486 | | | | 0.37 | | | | 0.43 | | | | 1.90 | | | | 4 | |
2008 | | | 19.07 | | | | 0.31 | # | | | (7.37 | ) | | | (0.22 | ) | | | (0.09 | ) | | | — | | | | 11.70 | | | | (37.37 | ) | | | 247,077 | | | | 0.37 | | | | 0.42 | | | | 1.95 | | | | 5 | |
2007 | | | 19.17 | | | | 0.32 | # | | | 0.64 | | | | (0.28 | ) | | | (0.78 | ) | | | — | | | | 19.07 | | | | 4.95 | | | | 429,423 | | | | 0.39 | | | | 0.42 | | | | 1.59 | | | | 5 | |
|
Real Estate Securities Fund | |
|
GS4 Class | |
2011 | | $ | 8.52 | | | $ | 0.08 | # | | $ | 0.65 | (4) | | $ | (0.07 | ) | | $ | — | | | $ | — | | | $ | 9.18 | | | | 8.51 | % | | $ | 150,227 | | | | 1.14 | % | | | 1.14 | % | | | 0.85 | % | | | 90 | % |
2010 | | | 6.74 | | | | 0.11 | # | | | 1.82 | | | | (0.15 | ) | | | — | | | | — | | | | 8.52 | | | | 28.80 | | | | 141,900 | | | | 1.19 | | | | 1.19 | | | | 1.41 | | | | 105 | |
2009 | | | 5.25 | | | | 0.12 | # | | | 1.49 | | | | (0.12 | ) | | | — | | | | — | † | | | 6.74 | | | | 31.21 | | | | 121,533 | | | | 1.27 | | | | 1.28 | | | | 2.29 | | | | 128 | |
2008 | | | 9.04 | | | | 0.18 | # | | | (3.80 | ) | | | (0.16 | ) | | | — | | | | (0.01 | ) | | | 5.25 | | | | (40.35 | ) | | | 80,579 | | | | 1.26 | | | | 1.25 | | | | 2.21 | | | | 94 | |
2007 | | | 12.55 | | | | 0.11 | # | | | (2.12 | ) | | | (0.11 | ) | | | (1.39 | ) | | | — | | | | 9.04 | | | | (16.23 | ) | | | 96,775 | | | | 1.20 | | | | 1.22 | | | | 0.94 | | | | 119 | |
|
Value Equity Fund | |
|
GS2 Class | |
2011 | | $ | 7.18 | | | $ | 0.12 | # | | $ | (0.07 | )(4) | | $ | (0.20 | ) | | $ | — | | | $ | — | | | $ | 7.03 | | | | 0.57 | % | | $ | 200,308 | | | | 0.67 | %(5) | | | 0.68 | % | | | 1.62 | % | | | 35 | % |
2010 | | | 6.46 | | | | 0.10 | # | | | 0.78 | | | | (0.16 | ) | | | — | | | | — | | | | 7.18 | | | | 14.01 | | | | 231,079 | | | | 0.67 | | | | 0.68 | | | | 1.52 | | | | 36 | |
2009 | | | 5.52 | | | | 0.11 | # | | | 1.02 | | | | (0.19 | ) | | | — | | | | — | | | | 6.46 | | | | 21.35 | | | | 181,123 | | | | 0.68 | | | | 0.69 | | | | 2.06 | | | | 32 | |
2008 | | | 9.10 | | | | 0.17 | # | | | (3.46 | ) | | | (0.22 | ) | | | (0.07 | ) | | | — | | | | 5.52 | | | | (36.81 | ) | | | 143,506 | | | | 0.66 | (5) | | | 0.67 | | | | 2.29 | | | | 52 | |
2007 | | | 10.62 | | | | 0.18 | # | | | (0.27 | ) | | | (0.28 | ) | | | (1.15 | ) | | | — | | | | 9.10 | | | | (1.18 | ) | | | 230,436 | | | | 0.69 | | | | 0.69 | | | | 1.70 | | | | 45 | |
|
GS4 Class | |
2011 | | $ | 14.12 | | | $ | 0.20 | # | | $ | (0.16 | )(4) | | $ | (0.16 | ) | | $ | — | | | $ | — | | | $ | 14.00 | | | | 0.27 | % | | $ | 852,958 | | | | 0.90 | %(5) | | | 0.91 | % | | | 1.39 | % | | | 35 | % |
2010 | | | 12.54 | | | | 0.17 | # | | | 1.56 | | | | (0.15 | ) | | | — | | | | — | | | | 14.12 | | | | 13.96 | | | | 958,211 | | | | 0.85 | (5) | | | 0.87 | | | | 1.35 | | | | 36 | |
2009 | | | 10.53 | | | | 0.20 | # | | | 1.98 | | | | (0.17 | ) | | | — | | | | — | | | | 12.54 | | | | 21.16 | | | | 1,001,814 | | | | 0.85 | (5) | | | 0.88 | | | | 1.89 | | | | 32 | |
2008 | | | 17.03 | | | | 0.30 | # | | | (6.54 | ) | | | (0.19 | ) | | | (0.07 | ) | | | — | | | | 10.53 | | | | (36.95 | ) | | | 844,459 | | | | 0.85 | (5) | | | 0.86 | | | | 2.09 | | | | 52 | |
2007 | | | 18.65 | | | | 0.29 | # | | | (0.52 | ) | | | (0.24 | ) | | | (1.15 | ) | | | — | | | | 17.03 | | | | (1.39 | ) | | | 1,407,534 | | | | 0.88 | | | | 0.88 | | | | 1.50 | | | | 45 | |
| † | Amount represents less than $0.005 per share. |
| # | Calculated using the average shares outstanding method. |
| (1) | The ratio excludes expenses waived/reimbursed net of amount recaptured and fees paid indirectly, where applicable; if expenses waived/reimbursed net of amount recaptured and fees paid indirectly were included, the ratio would have been lower than the ratio shown. The ratio for the Defensive Market Strategies Fund includes the effect of dividend expense on securities sold short which increased the ratio by 0.04% for the year 2011. |
| (2) | The ratio includes expenses waived/reimbursed net of amount recaptured and fees paid indirectly, where applicable; if expenses waived/reimbursed net of amount recaptured and fees paid indirectly were excluded, the ratio would have been lower than the ratio shown. |
| (3) | Inception date was September 1, 2011. All ratios for the period have been annualized. Total return and portfolio turnover for the period have not been annualized. |
| (4) | Amount includes Capital Gains distributions received by the Fund from the GuideStone Money Market Fund. The amount of these distributions represents less than $0.005 per share. |
| (5) | The ratio excludes the effect of expense offsets for fees paid indirectly; if expense offsets were included, the ratio would have been lower than the ratio shown. The ratio for the Defensive Market Strategies Fund excludes the effect of dividend expense on securities sold short. |
See Notes to Financial Statements.
215
| | | | | | | | | | | | | | | | | | | | | | | | | | | | | | | | | | | | | | | | | | | | | | | | | | | | |
| | | | | | | | | | | | | | | | | | | | | | | | | | | | | | Ratios to Average Net Assets | | | | |
| | | Net Asset
Value,
Beginning
of Year | | | Net Investment
Income/ (Loss) | | | Realized
and
Unrealized
Gain
(Loss) on
Investments | | | Dividends
from Net
Investment
Income | | | Distributions
from Net
Realized
Capital
Gains | | | Excess
Distribution/
Return of
Capital | | | Net Asset
Value,
End of
Year | | | Total
Return | | | Net Assets,
End of Year
(000) | | | Expenses,
Net | | | Expenses,
Gross(1) | | | Investment
Income/
(Loss),
Net(2) | | | Portfolio
Turnover
Rate | |
Growth Equity Fund | |
|
GS2 Class | |
2011 | | $ | 11.91 | | | $ | — | †# | | $ | (0.15 | )(3) | | $ | — | | | $ | — | | | $ | — | | | $ | 11.76 | | | | (1.26 | )% | | $ | 184,418 | | | | 0.88 | %(4) | | | 0.89 | % | | | 0.02 | % | | | 60 | % |
2010 | | | 10.00 | | | | — | † | | | 1.91 | | | | — | † | | | — | | | | — | | | | 11.91 | | | | 19.13 | | | | 215,863 | | | | 0.88 | (4) | | | 0.89 | | | | 0.06 | | | | 63 | |
2009 | | | 7.26 | | | | 0.02 | | | | 2.74 | | | | (0.02 | ) | | | — | | | | — | | | | 10.00 | | | | 38.14 | | | | 196,026 | | | | 0.88 | (4) | | | 0.89 | | | | 0.22 | | | | 78 | |
2008 | | | 12.76 | | | | 0.03 | | | | (5.49 | ) | | | (0.04 | ) | | | — | | | | — | | | | 7.26 | | | | (42.84 | ) | | | 141,138 | | | | 0.87 | (4) | | | 0.87 | | | | 0.26 | | | | 99 | |
2007 | | | 11.23 | | | | 0.02 | | | | 1.55 | | | | (0.04 | ) | | | — | | | | — | | | | 12.76 | | | | 13.99 | | | | 242,557 | | | | 0.89 | | | | 0.88 | | | | 0.24 | | | | 51 | |
|
GS4 Class | |
2011 | | $ | 18.90 | | | $ | (0.02 | )# | | $ | (0.25 | )(3) | | $ | — | | | $ | — | | | $ | — | | | $ | 18.63 | | | | (1.43 | )% | | $ | 915,960 | | | | 1.03 | %(4) | | | 1.11 | % | | | (0.13 | )% | | | 60 | % |
2010 | | | 15.88 | | | | (0.01 | ) | | | 3.03 | | | | — | † | | | — | | | | — | | | | 18.90 | | | | 19.03 | | | | 1,044,060 | | | | 0.97 | (4) | | | 1.08 | | | | (0.04 | ) | | | 63 | |
2009 | | | 11.52 | | | | 0.01 | | | | 4.36 | | | | (0.01 | ) | | | — | | | | — | | | | 15.88 | | | | 37.99 | | | | 1,067,654 | | | | 0.97 | (4) | | | 1.09 | | | | 0.13 | | | | 78 | |
2008 | | | 20.22 | | | | 0.02 | | | | (8.70 | ) | | | (0.02 | ) | | | — | | | | — | | | | 11.52 | | | | (42.92 | ) | | | 817,315 | | | | 0.97 | (4) | | | 1.06 | | | | 0.16 | | | | 99 | |
2007 | | | 17.77 | | | | 0.02 | | | | 2.45 | | | | (0.02 | ) | | | — | | | | — | | | | 20.22 | | | | 13.90 | | | | 1,488,091 | | | | 1.00 | | | | 1.07 | | | | 0.13 | | | | 51 | |
|
Small Cap Equity Fund | |
|
GS2 Class | |
2011 | | $ | 9.61 | | | $ | 0.03 | # | | $ | 0.11 | (3) | | $ | (0.05 | ) | | $ | — | | | $ | — | | | $ | 9.70 | | | | 1.40 | % | | $ | 63,903 | | | | 1.01 | %(4) | | | 1.03 | % | | | 0.27 | % | | | 165 | % |
2010 | | | 7.57 | | | | 0.03 | # | | | 2.06 | | | | (0.05 | ) | | | — | | | | — | | | | 9.61 | | | | 27.64 | | | | 74,424 | | | | 1.00 | (4) | | | 1.02 | | | | 0.42 | | | | 177 | |
2009 | | | 5.94 | | | | 0.03 | # | | | 1.64 | | | | (0.04 | ) | | | — | | | | — | | | | 7.57 | | | | 28.12 | | | | 64,033 | | | | 1.04 | (4) | | | 1.05 | | | | 0.44 | | | | 130 | |
2008 | | | 9.60 | | | | 0.05 | # | | | (3.61 | ) | | | (0.08 | ) | | | — | | | | (0.02 | ) | | | 5.94 | | | | (37.05 | ) | | | 48,159 | | | | 1.03 | (4) | | | 1.04 | | | | 0.66 | | | | 147 | |
2007 | | | 11.33 | | | | 0.06 | # | | | 0.09 | | | | (0.07 | ) | | | (1.81 | ) | | | — | | | | 9.60 | | | | 1.05 | | | | 76,792 | | | | 1.05 | | | | 1.05 | | | | 0.48 | | | | 119 | |
|
GS4 Class | |
2011 | | $ | 14.46 | | | $ | 0.01 | # | | $ | 0.17 | (3) | | $ | (0.02 | ) | | $ | — | | | $ | — | | | $ | 14.62 | | | | 1.22 | % | | $ | 354,013 | | | | 1.19 | %(4) | | | 1.26 | % | | | 0.10 | % | | | 165 | % |
2010 | | | 11.37 | | | | 0.03 | # | | | 3.09 | | | | (0.03 | ) | | | — | | | | — | | | | 14.46 | | | | 27.47 | | | | 400,072 | | | | 1.15 | (4) | | | 1.21 | | | | 0.27 | | | | 177 | |
2009 | | | 8.91 | | | | 0.03 | # | | | 2.46 | | | | (0.03 | ) | | | — | | | | — | | | | 11.37 | | | | 27.93 | | | | 356,043 | | | | 1.15 | (4) | | | 1.25 | | | | 0.33 | | | | 130 | |
2008 | | | 14.31 | | | | 0.07 | # | | | (5.39 | ) | | | (0.06 | ) | | | — | | | | (0.02 | ) | | | 8.91 | | | | (37.19 | ) | | | 272,588 | | | | 1.15 | (4) | | | 1.24 | | | | 0.55 | | | | 147 | |
2007 | | | 16.00 | | | | 0.06 | # | | | 0.11 | | | | (0.05 | ) | | | (1.81 | ) | | | — | | | | 14.31 | | | | 0.87 | | | | 466,522 | | | | 1.18 | | | | 1.25 | | | | 0.34 | | | | 119 | |
| † | Amount represents less than $0.005 per share. |
| # | Calculated using the average shares outstanding method. |
| (1) | The ratio excludes expenses waived/reimbursed net of amount recaptured and fees paid indirectly, where applicable; if expenses waived/reimbursed net of amount recaptured and fees paid indirectly were included, the ratio would have been lower than the ratio shown. |
| (2) | The ratio includes expenses waived/reimbursed net of amount recaptured and fees paid indirectly, where applicable; if expenses waived/reimbursed net of amount recaptured and fees paid indirectly were excluded, the ratio would have been lower than the ratio shown. |
| (3) | Amount includes Capital Gains distributions received by the Fund from the GuideStone Money Market Fund. The amount of these distributions represents less than $0.005 per share. |
| (4) | The ratio excludes the effect of expense offsets for fees paid indirectly; if expense offsets were included, the ratio would have been lower than the ratio shown. |
See Notes to Financial Statements.
216
FINANCIAL HIGHLIGHTS (Continued)
For a Share Outstanding For the Years Ended December 31, unless otherwise indicated
| | | | | | | | | | | | | | | | | | | | | | | | | | | | | | | | | | | | | | | | | | | | | | | | | | | | |
| | | | | | | | | | | | | Ratios to Average Net Assets | | | | |
| | | Net Asset
Value,
Beginning
of Period | | | Net Investment
Income | | | Realized
and
Unrealized
Gain
(Loss) on
Investments | | | Dividends
from Net
Investment
Income | | | Distributions
from Net
Realized
Capital
Gains | | | Excess
Distribution/
Return of
Capital | | | Net Asset
Value,
End of
Period | | | Total
Return | | | Net Assets,
End of Period
(000) | | | Expenses,
Net | | | Expenses,
Gross(1) | | | Investment
Income/
(Loss),
Net(2) | | | Portfolio
Turnover
Rate | |
International Equity Fund | |
|
GS2 Class | |
2011 | | $ | 10.35 | | | $ | 0.22 | # | | $ | (1.66 | )(3) | | $ | (0.24 | ) | | $ | — | | | $ | — | | | $ | 8.67 | | | | (13.86 | )% | | $ | 223,677 | | | | 0.94 | %(4) | | | 1.22 | % | | | 2.17 | % | | | 82 | % |
2010 | | | 9.64 | | | | 0.17 | # | | | 0.83 | | | | (0.29 | ) | | | — | | | | — | | | | 10.35 | | | | 10.45 | | | | 262,103 | | | | 0.94 | (4) | | | 1.19 | | | | 1.81 | | | | 56 | |
2009 | | | 7.32 | | | | 0.17 | # | | | 2.42 | | | | (0.27 | ) | | | — | † | | | — | | | | 9.64 | | | | 35.81 | | | | 240,483 | | | | 0.94 | (4) | | | 1.21 | | | | 2.12 | | | | 59 | |
2008 | | | 14.61 | | | | 0.34 | # | | | (6.89 | ) | | | (0.39 | ) | | | (0.35 | ) | | | — | | | | 7.32 | | | | (44.72 | ) | | | 193,281 | | | | 0.94 | (4) | | | 1.08 | | | | 2.92 | | | | 88 | |
2007 | | | 15.80 | | | | 0.26 | # | | | 1.79 | | | | (0.27 | ) | | | (2.97 | ) | | | — | | | | 14.61 | | | | 13.21 | | | | 279,652 | | | | 0.96 | | | | 1.07 | | | | 1.55 | | | | 66 | |
|
GS4 Class | |
2011 | | $ | 13.43 | | | $ | 0.25 | # | | $ | (2.13 | )(3) | | $ | (0.22 | ) | | $ | — | | | $ | — | | | $ | 11.33 | | | | (14.01 | )% | | $ | 955,305 | | | | 1.16 | %(4) | | | 1.45 | % | | | 1.95 | % | | | 82 | % |
2010 | | | 12.44 | | | | 0.21 | # | | | 1.05 | | | | (0.27 | ) | | | — | | | | — | | | | 13.43 | | | | 10.14 | | | | 1,029,317 | | | | 1.12 | (4) | | | 1.38 | | | | 1.67 | | | | 56 | |
2009 | | | 9.38 | | | | 0.20 | # | | | 3.11 | | | | (0.25 | ) | | | — | † | | | — | | | | 12.44 | | | | 35.61 | | | | 1,101,628 | | | | 1.12 | (4) | | | 1.40 | | | | 1.98 | | | | 59 | |
2008 | | | 18.32 | | | | 0.40 | # | | | (8.63 | ) | | | (0.36 | ) | | | (0.35 | ) | | | — | | | | 9.38 | | | | (44.81 | ) | | | 873,618 | | | | 1.12 | (4) | | | 1.28 | | | | 2.46 | | | | 88 | |
2007 | | | 19.09 | | | | 0.28 | # | | | 2.16 | | | | (0.24 | ) | | | (2.97 | ) | | | — | | | | 18.32 | | | | 12.96 | | | | 1,400,548 | | | | 1.14 | | | | 1.27 | | | | 1.11 | | | | 66 | |
| † | Amount represents less than $0.005 per share. |
| # | Calculated using the average shares outstanding method. |
| (1) | The ratio excludes expenses waived/reimbursed net of amount recaptured and fees paid indirectly, where applicable; if expenses waived/reimbursed net of amount recaptured and fees paid indirectly were included, the ratio would have been lower than the ratio shown. The effect of dividend expense on securities sold short increased the ratio by 0.04% and 0.08% for the years 2010 and 2011, respectively. |
| (2) | The ratio has been revised to include expenses waived/reimbursed net of amount recaptured and fees paid indirectly, where applicable; if expenses waived/reimbursed net of amount recaptured and fees paid indirectly were excluded, the ratio would have been lower than the ratio shown. |
| (3) | Amount includes Capital Gains distributions received by the Fund from the GuideStone Money Market Fund. The amount of these distributions represents less than $0.005 per share. |
| (4) | The ratio excludes the effect of expense offsets for fees paid indirectly; if expense offsets were included, the ratio would have been lower than the ratio shown. The ratio excludes the effect of dividend expense on securities sold short. |
See Notes to Financial Statements.
217
NOTES TO FINANCIAL STATEMENTS
1. DESCRIPTION OF THE FUNDS
GuideStone Funds (the “Trust”) was organized as a Delaware statutory trust on March 2, 2000. The Trust has established twenty-six series (each, a “Fund” and together, the “Funds”). Each Fund is a diversified, open-end management investment company, registered under the Investment Company Act of 1940, as amended (the “1940 Act”). The MyDestination 2005, MyDestination 2015, MyDestination 2025, MyDestination 2035 and MyDestination 2045 Funds, each referred to as a “Date Target Fund” and together as the “Date Target Funds.” The Conservative Allocation Fund, Balanced Allocation Fund, Growth Allocation Fund, Aggressive Allocation Fund, Conservative Allocation Fund I, Balanced Allocation Fund I, Growth Allocation Fund I and Aggressive Allocation Fund I are each referred to as an “Asset Allocation Fund” and together as the “Asset Allocation Funds.” The remaining Funds are each referred to as a “Select Fund” and are together referred to as the “Select Funds.” The Low-Duration Bond Fund, Medium-Duration Bond Fund, Extended-Duration Bond Fund, Inflation Protected Bond Fund and Global Bond Fund are together referred to as the “Bond Funds.” The Defensive Market Strategies Fund, Equity Index Fund, Real Estate Securities Fund, Value Equity Fund, Growth Equity Fund, Small Cap Equity Fund and International Equity Fund are together referred to as the “Equity Funds.” The Inflation Protected Bond Fund and the Real Estate Securities Fund may also be referenced as the “Real Return Select Fund(s).” The Money Market Fund is referred to as the “Money Market Fund.” The Defensive Market Strategies Fund commenced operations as a registered investment company on September 1, 2011.
There are two classes of shares issued by the Funds — the GS2 Class and the GS4 Class (each, a “Class” and together the “Classes”), except for the Date Target Funds, the Inflation Protected Bond Fund, the Global Bond Fund, and the Real Estate Securities Fund, which issued the GS4 Class only. The Conservative Allocation Fund I, Balanced Allocation Fund I, Growth Allocation Fund I and Aggressive Allocation Fund I issued the GS2 Class only. All Classes of shares have identical voting, dividend and liquidation rights. Income, expenses (other than class specific expenses) and realized and unrealized gains or losses on investments are allocated to each Class of shares based upon its relative net assets.
Each Fund is a separate mutual fund with its own investment objective, strategies and risks. The Select Funds invest directly in particular types of fixed-income obligations, stocks and other investments. The Asset Allocation and Date Target Funds primarily invest in a different mix of the Select Funds to meet a specified investment strategy. The Asset Allocation and Date Target Funds are commonly referred to as “Fund of Funds.”
2. SIGNIFICANT ACCOUNTING POLICIES
The following significant accounting policies are in conformity with generally accepted accounting principles (“GAAP”) in the United States of America which require management to make estimates and assumptions that affect the reported amounts of assets, liabilities, disclosures of contingent assets and liabilities at the date of the financial statements and the reported amounts of income and expenses during the reporting period. Actual results could differ from those estimates and those differences could be significant.
a. Valuation of Securities
The Funds (except the Money Market Fund) each value securities traded on national securities exchanges or included in national market systems at the last quoted sale price, or official close price, on the principal exchange on which they were traded, or, in the absence of any sale or official close price, at the closing bid price. Securities which are primarily traded on foreign exchanges are generally valued at the closing values of such securities on their respective exchanges, except that when an occurrence subsequent to the time when the foreign security is valued is likely to have changed such value, then the fair value of those securities will be determined through procedures established by or under the direction of the Board of Trustees of the Trust (the
218
“Board of Trustees”). Non-exchange traded securities for which an over-the-counter quotation is readily available are valued at the last quoted bid price.
Debt securities, excluding asset-backed and mortgage-backed securities, are valued at the mean of the last bid and ask prices available. Asset-backed and mortgage-backed securities are generally valued at the last bid price, if available. Certain debt securities may be valued on the basis of broker quotations, valuations provided by a pricing service which may use a matrix, formula or other objective methods that take into consideration market indices, matrices, yield curves and other specific adjustments or by a sub-adviser using various methodologies approved by the Board of Trustees.
Short-term securities maturing in more than 60 days from the valuation date are valued at the mean of the last bid and ask prices; those maturing in 60 days or less are generally valued at amortized cost which approximates current market value in accordance with Rule 2a-7 of the 1940 Act.
Forward foreign exchange contracts are valued based upon closing exchange rates from each respective foreign market.
Futures contracts are valued at the closing settlement price on the exchange on which they are primarily traded.
Options, rights and warrants for which the primary market is a national securities exchange are valued at the last sale price on the exchange on which they are traded, or, in the absence of any sale, at the closing bid price. Options, rights and warrants not traded on a national securities exchange are valued at the last quoted bid price.
Swap agreements are valued daily based upon the terms specific to each agreement with its counterparty.
To the extent available, valuations of portfolio securities are provided by independent pricing services approved by the Board of Trustees. Securities for which market quotations are not readily available are valued at fair value according to methods established in good faith by the Board of Trustees. Due to the potential excessive volatility at the time valuations are developed, pricing techniques may materially vary from the actual amounts realized upon sale of the securities.
For securities that principally trade on a foreign market or exchange, a significant gap in time can exist between the time of a particular security’s last trade and the time at which a Fund calculates its NAV. The closing prices of such securities may no longer reflect their market value at the time the Fund calculates its NAV if an event that could materially affect the value of those securities (a “Significant Event”) has occurred between the time of the security’s last close and the time that the Fund calculates its NAV. A Significant Event may relate to a single issuer or to an entire market sector. If a Fund becomes aware of a Significant Event that has occurred with respect to a security or group of securities after the closing of the exchange or market on which the security or securities principally trade, but before the time at which the Fund calculates its NAV, a Valuation Committee meeting may be called. The Trust uses Interactive Data Corporation (“IDC”) as a third party fair valuation vendor. IDC provides a fair value for foreign equity securities held by the Trust based on certain factors and methodologies applied by IDC in the event that there is movement in the U.S. market that exceeds a specific threshold established by the Valuation Committee in consultation with, and approved by, the Board of Trustees. Such methodologies generally involve tracking valuation correlations between the U.S. market and each non-U.S. security. As part of the valuation procedures, a “confidence interval” is used, when the threshold is exceeded, to determine the level of correlation between the value of a foreign equity security and movements in the U.S. market before a particular security will be fair valued. In the event that the threshold established by the Valuation Committee is exceeded on a specific day, the Trust will typically value non-U.S. equity securities in its portfolio that exceed the applicable confidence interval based upon the fair values provided by IDC.
The Asset Allocation and Date Target Funds value their investments in the underlying Select Funds daily at the closing NAV of each respective Select Fund.
The Financial Accounting Standards Board’s (“FASB”) “Fair Value Measurements and Disclosures” defines fair value as the price that a fund would receive to sell an asset or pay to transfer a liability in an orderly transaction between market participants
219
at the measurement date. It establishes and requires disclosure of a fair value hierarchy, separately for each major category of assets and liabilities, that segregates fair value measurements into levels (Levels 1, 2, and 3). Categorizations of fair value measurements, and the criteria used to determine each categorization, are as follows:
Level 1 – quoted prices in active markets for identical securities which include:
Equity securities, including restricted securities, for which market quotations are readily available, that are valued at the last reported sale price or official closing price as reported by an independent pricing service on the primary market or exchange on which they are traded; and
Investments in open-end mutual funds, including the GuideStone Funds and the Northern Institutional Liquid Assets Portfolio, which are valued at their closing net asset value each business day.
| | Level | 2 – prices determined using other significant observable inputs (including quoted prices for similar securities, interest rates, prepayment speeds, credit risk, etc.) which include: |
Equity securities for which there were no sales or closing prices for that day, that are valued at the last quoted bid price or that may be valued using the last available price;
Foreign equity securities for which a Significant Event has occurred and a fair value price is provided by IDC;
Debt securities, including restricted securities that are valued based on evaluated quotations received from independent pricing. For corporate bonds, pricing services that utilize matrix pricing which considers yield or price of bonds of comparable quality, coupon, maturity and type as well as dealer supplied prices; and
Short-term securities with remaining maturities of sixty days or less for which quotations are not readily available and are valued at amortized cost.
| | Level | 3 – prices determined using significant unobservable inputs (including the Fund’s own assumptions in determining the fair value of investments) which include: |
Restricted equity securities and private placements where observable inputs are limited, assumptions about market activity and risk are used; and
Debt securities, including restricted securities that are valued based on evaluated quotations received from dealers who make markets in such securities.
Valuation levels are not necessarily an indication of the risk associated with investing in those securities and changes in valuation techniques may result in transfers in or out of an assigned level within the disclosure hierarchy. For fair valuations using significant unobservable inputs, a reconciliation of the beginning to ending balances for reported market values that presents changes attributable to total realized and unrealized gains or losses, purchases and sales, and transfers in/out of the Level 3 category during the period is required. A fair value hierarchy and Level 3 reconciliation have been included in the Schedules of Investments.
Details of significant transfers between Level 1 and Level 2 have been included have been included in the Schedules of Investments.
For fair valuations using significant unobservable inputs, a reconciliation of the beginning to ending balances for reported market values that presents changes attributable to total realized and unrealized gains or losses, purchases and sales, and
220
transfers in/out of the Level 3 category during the period is required. A fair value hierarchy and Level 3 reconciliation have been included in the Schedules of Investments.
b. Equity Linked Securities
The Defensive Market Strategies Fund invests in equity-linked securities. Equity-linked securities are hybrid financial instruments that generally combine both debt and equity characteristics into a single note form. Income received from equity linked securities will be recorded as realized gains in the Statement of Operations and may be based on the performance of an underlying equity security, an equity index, or an option position. The risks of investing in equity-linked securities include unfavorable price movements in the underlying security and the credit risk of the issuing financial institution. There may be no guarantee of a return of principal with equity linked securities and the appreciation potential may be limited. Equity-linked securities may be more volatile and less liquid than other investments held by the Fund.
c. Fixed Income Securities
The Bond Funds, Defensive Market Strategies Fund and the Small Cap Equity Fund may invest in mortgage-related and other asset-backed securities. These securities include mortgage pass-through securities, collateralized mortgage obligations, commercial mortgage-backed securities, stripped mortgage-backed securities, asset-backed securities, collateralized debt obligations and other securities that directly or indirectly represent a participation in, or are secured by and payable from, mortgage loans on real property. Mortgage-related and other asset-backed securities are interests in pools of loans or other receivables. Mortgage-related securities are created from pools of residential or commercial mortgage loans, including mortgage loans made by savings and loan institutions, mortgage bankers, commercial banks and others. Asset-backed securities are created from many types of assets, including auto loans, credit card receivables, home equity loans, and student loans. These securities provide a monthly payment which consists of both interest and principal payments. Interest payments may be determined by fixed or adjustable rates. The rate of pre-payments on underlying mortgages will affect the price and volatility of a mortgage-related security and may have the effect of shortening or extending the effective duration of the security relative to what was anticipated at the time of purchase. The timely payment of principal and interest of certain mortgage-related securities is guaranteed with the full faith and credit of the United States Government. Pools created and guaranteed by non-governmental issuers, including government-sponsored corporations, may be supported by various forms of insurance or guarantees, but there can be no assurance that the private insurers or guarantors can meet their obligations under the insurance policies or guarantee arrangements.
Collateralized Mortgage Obligations (“CMOs”) are debt obligations of a legal entity that are collateralized by mortgages and divided into classes. CMOs are structured into multiple classes, often referred to as “tranches,” with each class bearing a different stated maturity and entitled to a different schedule for payments of principal and interest, including pre-payments. Commercial Mortgage-Backed Securities (“CMBS”) include securities that reflect an interest in, and are secured by, mortgage loans on commercial real property. Many of the risks of investing in CMBS reflect the risks of investing in the real estate securing the underlying mortgage loans. These risks reflect the effects of local and other economic conditions on real estate markets, the ability of tenants to make loan payments, and the ability of a property to attract and retain tenants. CMOs and CMBS may be less liquid and may exhibit greater price volatility than other types of mortgage- or asset-backed securities. Stripped Mortgage-Backed Securities (“SMBS”) are derivative multi-class mortgage securities. SMBS are usually structured with two classes that receive different proportions of the interest and principal distributions on a pool of mortgage assets. A common type of SMBS will have one class receiving some of the interest and most of the principal from the mortgage assets, while the other class will receive most of the interest and the remainder of the principal. In the most extreme case, one class will
221
receive all of the interest (the interest-only or “IO” class), while the other class will receive the entire principal (the principal-only or “PO” class). Payments received for IOs are included in interest income on the Statements of Operations. Because little to no principal will be received at the maturity of an IO, adjustments are made to the book value of the security on a monthly basis until maturity. These adjustments are included in interest income on the Statements of Operations. Payments received for POs are treated as reductions to the cost and par value of the securities.
Inflation-indexed bonds are fixed-income securities whose principal value is periodically adjusted to the rate of inflation. The interest rate on these bonds is generally fixed at issuance at a rate lower than typical bonds. Over the life of an inflation-indexed bond, however, interest will be paid based on a principal value, which is adjusted for inflation. Any increase or decrease in the principal amount of an inflation-indexed bond will be included as interest income on the Statements of Operations, even though investors do not receive their principal until maturity.
“TBA” (to be announced) purchase commitments are commitments to purchase securities for a fixed price at a future date, typically not exceeding 45 days. TBAs may be considered securities in themselves and involve a risk of loss if the value of the security to be purchased declines prior to settlement date. This risk is in addition to the risk of decline in each Fund’s other assets. Unsettled TBAs are valued at the current market value of the underlying securities, according to the procedures described in the section entitled “Valuation of Securities”.
During the year ended December 31, 2011, the Low-Duration Bond Fund and Medium-Duration Bond Fund entered into dollar roll transactions, pursuant to which they sell a mortgage-backed TBA or security and simultaneously purchase a similar, but not identical, TBA with the same issuer, rate and terms. The Funds may execute a “roll” to obtain better underlying mortgage securities or to increase yield. The Funds account for dollar roll transactions as purchases and sales, which has the effect of increasing their portfolio turnover rates. Risks associated with dollar rolls are that actual mortgages received by the Funds may be less favorable than those anticipated or that counterparties may fail to perform under the terms of the contracts.
TBA sale commitments are commitments to sell mortgage-backed securities for a fixed price at a future date. TBAs may be considered securities in themselves and involve a risk of loss if the value of the security to be sold increases prior to settlement date of the Fund’s other assets.
U.S. Government securities are obligations of and, in certain cases, guaranteed by, the U.S. Government, its agencies or instrumentalities. The U.S. Government does not guarantee the NAV of the Funds’ shares. Some U.S. Government securities, such as Treasury bills, notes and bonds, and securities guaranteed by the Government National Mortgage Association (“GNMA” or “Ginnie Mae”), are supported by the full faith and credit of the United States Government; others, such as those of the Federal Home Loan Bank, are supported by the right of the issuer to borrow from the U.S. Department of the Treasury (the “U.S. Treasury”); others, such as those of the Federal National Mortgage Association (“FNMA” or “Fannie Mae”), are supported by the discretionary authority of the U.S. Government to purchase the agency’s obligations; and still others, such as those of the Student Loan Marketing Association, are supported only by the credit of the instrumentality. U.S. Government securities may include zero coupon securities, which do not distribute interest on a current basis and tend to be subject to greater risk than interest-paying securities of similar maturities.
Government-related guarantors (i.e., not backed by the full faith and credit of the United States Government) include FNMA and the Federal Home Loan Mortgage Corporation (“FHLMC” or “Freddie Mac”). FNMA is a government-sponsored corporation, the common stock of which is owned entirely by private stockholders. FNMA purchases conventional (i.e., not insured or guaranteed by any government agency) residential mortgages from a list of approved seller/servicers which include state and federally chartered savings and loan associations, mutual savings banks, commercial banks and credit unions and mortgage bankers. Pass-through securities issued by FNMA are guaranteed as to timely payment of principal and interest by FNMA, but are not backed by the full faith and credit of the United States Government. FHLMC issues Participation Certificates (“PCs”),
222
which are pass-through securities, each representing an undivided interest in a pool of residential mortgages. FHLMC guarantees the timely payment of interest and ultimate collection of principal, but PCs are not backed by the full faith and credit of the United States Government.
The U.S. Treasury has historically had the authority to purchase obligations of Fannie Mae and Freddie Mac (collectively, the “GSEs”). However, in 2008, due to capitalization concerns, Congress provided the U.S. Treasury with additional authority to lend the GSEs emergency funds and to purchase their stock. In September 2008, those capital concerns led the U.S. Treasury and the Federal Housing Finance Authority (“FHFA”) to announce that the GSEs had been placed in conservatorship.
Since that time, the GSEs have received significant capital support through U.S. Treasury preferred stock purchases, as well as Treasury and Federal Reserve purchases, of their mortgage backed securities (“MBS”). The FHFA and the U.S. Treasury (through its agreement to purchase GSE preferred stock) have imposed strict limits on the size of their mortgage portfolios. While the MBS purchase programs ended in 2010, the U.S. Treasury announced in December 2009 that it would continue its support for the entities’ capital as necessary to prevent a negative net worth through at least 2012. While the U.S. Treasury is committed to offset negative equity at the GSEs through its preferred stock purchases through 2012, no assurance can be given that the Federal Reserve, U.S. Treasury, or FHFA initiatives will ensure that the GSEs will remain successful in meeting their obligations with respect to the debt and MBS they issue beyond that date.
The problems faced by the GSEs resulting in their being placed into federal conservatorship and receiving significant U.S. Government support have sparked serious debate among federal policy makers regarding the continued role of the U.S. Government in providing liquidity for mortgage loans. The Obama Administration produced a report to Congress on February 11, 2011 outlining a proposal to wind down the GSEs by increasing their guarantee fees, reducing their conforming loan limits (the maximum amount of each loan they are authorized to purchase), and continuing progressive limits on the size of their investment portfolio. Congress is currently considering several pieces of legislation that would reform the GSEs and possibly wind down their existence, addressing portfolio limits and guarantee fees, among other issues.
Based on quarterly loss figures, in August 2011, both GSEs requested additional support from the U.S. Treasury (Fannie Mae requested $2.8 billion and Freddie Mac requested $1.5 billion, net of dividend payments to the U.S. Treasury). In November 2011, Freddie Mac also requested an additional $6 billion in aid from the U.S. Treasury. Further, when a ratings agency down graded long-term U.S. government debt in August 2011, the agency also down graded the GSEs’ bond ratings, from AAA to AA+, based on their direct reliance on the U.S. Government (although that rating did not directly relate to their MBS). The U.S. Government’s commitment to ensure that the GSEs have sufficient capital to meet their obligations is, however, unaffected by the down grade.
Serious discussions among policymakers continue, however, as to whether the GSEs should be nationalized, privatized, restructured, or eliminated altogether. Fannie Mae and Freddie Mac also are the subject to several continuing legal actions and investigations over certain accounting, disclosure or corporate governance matters, which (along with any resulting financial restatements) may continue to have an adverse effect on the guaranteeing entities. Importantly, the future of the GSEs is in serious question as the U.S. Government considers multiple options.
Importantly, the future of the GSEs is in serious question as the U.S. Government considers multiple options.
d. Foreign Currency Translations
Investment securities and other assets and liabilities denominated in foreign currencies are translated into U.S. dollar amounts at the date of valuation. Purchases and sales of investment securities and income and expense items denominated in foreign currencies are translated into U.S. dollar amounts on the respective dates of such transactions.
223
The Funds isolate that portion of the results of operations resulting from changes in foreign exchange rates on investments from the fluctuations arising from changes in market prices of securities held.
Reported net realized foreign exchange gains or losses arise from sales of portfolio securities, sales and maturities of short-term securities, sales of foreign currencies, currency gains or losses realized between the trade and settlement dates on securities transactions, and the difference between the amounts of dividends, interest, and foreign withholding taxes recorded on the Fund’s books and the U.S. dollar equivalent of the amounts actually received or paid. Net unrealized foreign exchange gains and losses arise from changes in the values of assets and liabilities, including investments in securities at fiscal period end, resulting from changes in the exchange rate.
e. Loan Participations
The Bond Funds and the Small Cap Equity Fund may invest in direct debt instruments which are interests in amounts owed to lenders or lending syndicates by corporate borrowers. A Fund’s investments in loans may be in the form of participations in loans. A loan is often administered by a bank or other financial institution (the “lender”) that acts as agent for all holders. The agent administers the terms of the loan, as specified in the loan agreement. A Fund may invest in multiple series or tranches of a loan, which may have varying terms and carry different associated risks. A Fund generally has no right to enforce compliance with the terms of the loan agreement with the borrower. As a result, a Fund may be subject to the credit risk of both the borrower and the lender that is selling the loan agreement. When investing in a loan participation, a Fund has the right to receive payments of principal, interest and any fees to which it is entitled only from the lender selling the loan agreement and only upon receipt of payments by the lender from the borrower. A Fund may receive a commitment fee based on the undrawn portion of the underlying line of credit portion of a floating rate loan. In certain circumstances, a Fund may receive a prepayment penalty fee upon the prepayment of a floating rate loan by a borrower. Fees earned or paid are recorded as a component of interest income or interest expense on the Statements of Operations.
f. PIPEs
The Small Cap Equity Fund invests in Private Investment in Public Equity (“PIPE”) securities. PIPES involve the purchase of securities directly from a publicly traded company by a Fund. PIPES are restricted securities and cannot be immediately resold into the public markets. These investments are valued at fair value as determined in accordance with the procedures approved by the Board of Trustees. Risks include the potential decline in the value of the publicly traded company, the potential dilution of shareholder equity and the inability of the Fund to liquidate the position quickly.
g. REITs
The Real Estate Securities Fund invests substantial assets in real estate investment trusts (“REITs”) that involve risks not associated with investing in stocks. Risks include declines in the value of real estate, general and economic conditions, changes in the value of the underlying property and defaults by borrowers. The value of assets in the real estate industry may go through cycles of relative underperformance and outperformance in comparison to equity securities markets in general.
Dividend income is recorded using management’s estimate of the income included in distributions received from REIT investments. The actual amounts of income, return of capital and capital gains are only determined by each REIT after its fiscal year-end and may differ from the estimated amount. Estimates of income are adjusted in the Funds to the actual amounts when the amounts are determined.
h. Repurchase Agreements
Each Fund may agree to purchase securities from financial institutions subject to the seller’s agreement to repurchase them at a mutually agreed upon date and price. It is the Fund’s policy that repurchase agreements are fully collateralized by U.S. Treasury
224
and Government Agency securities. All collateral is held by the Fund’s custodian bank or a bank with which the custodian bank has entered into a subcustodian agreement, or is segregated in the Federal Reserve Book Entry System. In connection with transactions in repurchase agreements, if the seller defaults and the value of the collateral declines, or if the seller enters an insolvency proceeding, realization of the collateral by the Fund may be delayed or limited.
i. Short Sales
A short sale is a transaction in which a Fund sells a security it does not own. The Fund’s obligation to replace the security borrowed and sold short will be fully collateralized at all times by cash equivalents deposited in an account with the Fund’s custodian. If the price of the security sold short increases between the time of the short sale and the time the Fund replaces the borrowed security, the Fund will realize a loss; and if the price declines during the period, the Fund will realize a gain. Any realized gain will be decreased, and any realized loss increased, by the amount of transaction costs.
The Equity Funds may sell short exchange-listed equity futures contracts to reduce market exposure. The Date Target Funds, Asset Allocation Funds, Bond Funds and Small Cap Equity Fund may sell short U.S. Treasury securities and exchange-listed U.S. Treasury futures contracts to reduce market exposure. The Low-Duration Bond and Medium-Duration Bond Funds will occasionally enter into a short sale to initiate a dollar roll transaction. The Defensive Market Strategies Fund may establish short positions in stocks of companies with a market value of up to 30% of the Fund’s assets. The International Equity Fund may establish short positions in stocks of foreign companies with a market value of up to 5% of the Fund’s assets.
At December 31, 2011, the value of securities sold short in the Defensive Market Strategies and International Equity Fund amounted to $32,471,130 and $64,002,706, respectively.
j. Derivative Financial Instruments
The Funds may engage in various portfolio strategies to seek to increase its return by hedging its portfolio against adverse movements in the equity, debt and currency markets. Losses may arise due to changes in the value of the contract if the counterparty does not perform under the contract. The Funds, in their normal course of business, may enter into contracts that contain a variety of representations and warranties and which provide general indemnifications. The Funds’ exposure may include future claims that may be made against the Funds that have not yet occurred.
Financial Futures Contracts — The Funds (except the Money Market Fund) may purchase or sell financial futures contracts and the options on such futures contracts for the purpose of hedging risk on existing securities, demonstrating purchase of securities or gaining market exposure on cash balances. Financial futures contracts are contracts for the delivery of securities at a specified future date at an agreed upon price or yield. Upon entering into a contract, the Funds deposit and maintain as collateral such initial margin as required by the exchange on which the transaction is effected. Pursuant to the contract, the Funds agree to pay to or receive from the broker an amount of cash equal to the daily fluctuation in the value of the contract. Such payments or receipts are known as variation margin and are recorded by the Funds as unrealized gains or losses until the contract is closed or settled.
Risks of entering into futures contracts include the possibility that there will be an imperfect price correlation between the futures and the underlying securities. Second, it is possible that a lack of liquidity for futures contracts could exist in the secondary market, resulting in an inability to close a futures position prior to its maturity date. Third, the purchase of a futures contract involves the risk that a Fund could lose more than the original margin deposit required to initiate a futures transaction. Futures contracts involve, to varying degrees, risk of loss in excess of the variation margin disclosed on the Statements of Assets and Liabilities.
225
Foreign Currency Options and Futures — The Bond Funds, Defensive Market Strategies Fund, Small Cap Equity Fund and International Equity Fund may also enter into futures contracts on foreign currencies and related options on transactions as a short or long hedge against possible variations in foreign exchange rates.
Forward Foreign Exchange Contracts — Certain Funds may enter into forward foreign currency exchange contracts to hedge against adverse exchange rate fluctuation to the U.S. dollar or between different foreign currencies in connection with either specific security transactions or portfolio positions. Each contract is valued daily and the change in value is recorded as an unrealized gain or loss. When the contract is closed, a realized gain or loss is recorded equal to the difference between the opening value and the closing value of the contract. These contracts may involve market risk in excess of the unrealized gain or loss reflected on the Statements of Assets and Liabilities. The Funds could be exposed to risk if the counterparties to the contracts are unable to meet the terms of the contract and from unanticipated movements in the value of a foreign currency relative to the U.S. dollar.
Options — Certain Funds are authorized to write and purchase put and call options. The risk in writing a call option is that the Funds give up the opportunity for profit if the market price of the security increases. The risk in writing a put option is that the Funds may incur a loss if the market price of the security decreases and the option is exercised. The risk in purchasing an option is that the Funds pay a premium whether or not the option is exercised. The Funds also have the additional risk of being unable to enter into a closing transaction at an acceptable price if a liquid secondary market does not exist. The Funds also may write over-the-counter options where completing the obligation depends upon the credit standing of the other party and that party’s ability to perform. Option contracts also involve the risk that they may not work as intended due to unanticipated developments in market conditions or other causes.
Options purchased are recorded as an asset, and written options are recorded as liabilities to the extent of premiums paid or received. Each Fund will realize a gain or loss when the option transaction expires or closes. When an option is exercised, the proceeds on sales for a written call option, the purchase cost for a written put option or the cost of a security for a purchased put or call option is adjusted by the amount of the premium received or paid.
When a Fund writes a call or put option, an amount equal to the premium received is recorded as a liability and subsequently marked to market to reflect the current value of the option written. These liabilities are reflected as written options outstanding on the Statements of Assets and Liabilities.
Certain Funds may write swaption contracts to manage exposure to fluctuations in interest rates and to enhance portfolio yield. Swaption contracts written by the Funds represent an option that gives the purchaser the right, but not the obligation, to enter into a previously agreed upon swap contract on a future date. If a written call swaption is exercised, the writer will enter a swap and is obligated to pay the fixed-rate and receive a floating rate in exchange. If a written put swaption is exercised, the writer will enter a swap and is obligated to pay the floating rate and receive a fixed rate in exchange. Swaptions are marked-to-market daily based upon quotations from market makers. When a Fund writes a swaption, the premium received is recorded as a liability and is subsequently adjusted to the current market value of the swaption. Entering into a swaption contract involves, to varying degrees, the elements of credit, market and interest rate risk in excess of the associated option and swap contract amounts reported in the Statement of Assets and Liabilities. The Funds bear the market risk arising from any change in index values or interest rates.
Swap Agreements — Each Select Fund, except the Money Market Fund, may enter into swap agreements. The Defensive Market Strategies Fund and Equity Funds may enter into equity swap contracts and the Bond Funds and the Small Cap Equity Fund may enter into interest rate and credit default swaps. The Bond Funds and International Equity Fund may enter into cross-currency swaps, and each Select Fund may enter into total return swaps.
226
Swap agreements are privately negotiated agreements between a Fund and a counterparty to exchange or swap investment cash flows, assets, foreign currencies or market-linked returns at specified, future intervals. A swap may be entered into in order to, among other things, change the maturity of a Fund’s portfolio, to protect a Fund’s value from changes in interest rates, to expose a Fund to a different security or market, or to help a Fund achieve a strategy relative to an index or other benchmark. By entering into a swap agreement, a Fund is exposed to the risk of unanticipated movements in interest rates or in the value of an underlying security or index (or the risk that the counterparty will not fulfill its obligation under the agreement). Credit default swaps involve the payment of amounts based on a specified rate multiplied by a notional amount as well as upon an event of default. In connection with these agreements, securities are set aside as collateral by the Fund’s custodian.
Swaps are marked-to-market daily based upon values from third party vendors or quotations from market makers to the extent available and the change in value, if any, is recorded as an unrealized gain or loss on the Statements of Assets and Liabilities. In the event that market quotations are not readily available or deemed reliable, certain swap agreements may be valued pursuant to guidelines established by the Board of Trustees. In the event that market quotes are not readily available and the swap cannot be valued pursuant to one of the valuation methods, the value of the swap will be determined in good faith by the Valuation Committee of the Board of Trustees, generally based upon recommendations provided by the Fund’s sub-adviser.
Payments received or made at the beginning of the measurement period are reflected as such on the Statements of Assets and Liabilities and represent payments made or received upon entering into the swap agreement to compensate for differences between the stated terms of the swap agreement and prevailing market conditions (credit spreads, currency exchange rates, interest rates, and other relevant factors). These upfront payments are recorded as realized gains or losses on the Statements of Operations upon termination or maturity of the swap. A liquidation payment received or made at the termination of the swap is recorded as realized gain or loss on the Statements of Operations. Net periodic payments received or paid by a Fund are included as part of realized gains or losses on the Statements of Operations.
Certain of the Fund’s derivative agreements contain provisions that require the Fund to maintain a predetermined level of net assets, and/or provide limits regarding the decline of the Fund’s NAV over one-month, three-month and 12-month periods. If a Fund were to violate such provisions, the counterparties to the derivative instruments could request immediate payment or demand immediate collateralization on derivative instruments in net liability positions. For the year ended December 31, 2011, all of the Funds maintained the required level of net assets and/or the NAV of the Fund did not decline below the limits set forth in the derivative agreements.
Entering into these agreements involves, to varying degrees, elements of credit, market and documentation risk in excess of the amounts recognized on the Statements of Assets and Liabilities. Such risks involve the possibility that there will be no liquid market for these agreements, that the counterparty to the agreements may default on its obligation to perform or disagree as to the meaning of contractual terms in the agreements and that there may be unfavorable changes in interest rates.
Credit Default Swaps — Credit default swap agreements involve one party making a stream of payments (referred to as the buyer of protection) to another party (the seller of protection) in exchange for the right to receive a specified return in the event of a default or other credit event for the referenced entity, obligation or index. As a seller of protection on credit default swap agreements, a Fund will generally receive from the buyer of protection a fixed rate of income throughout the term of the swap provided that there is no credit event. As the seller, a Fund would effectively add leverage to its portfolio because, in addition to its total net assets, a Fund would be subject to investment exposure on the notional amount of the swap.
227
Any upfront payments made or received upon entering a credit default swap contract are treated as part of the cost and are reflected as part of the unrealized gain (loss) on valuation. Upon termination of the swap contract, the amount included in the cost is reversed and becomes part of the swap’s realized gain (loss).
The sub-advisers monitor a variety of factors including cash flow assumptions, market activity, market sentiment and valuation as part of its ongoing process of assessing payment and performance risk. As payment and performance risk increases, the value of a credit default swap increases, resulting in recognition of unrealized gains for long positions and unrealized losses for short positions. Conversely, as payment and performance risk decreases, unrealized gains are recognized for short positions and unrealized losses are recognized for long positions. Any current or future declines in the fair value of the swap may be partially offset by upfront payments received by the Fund as a seller of protection if applicable. The change in value is recorded within unrealized appreciation (depreciation) until the occurrence of a credit event or the termination of the swap, at which time a realized gain (loss) is recorded.
If a Fund is a seller of protection and a credit event occurs, as defined under the terms of that particular swap agreement, a Fund will either (i) pay to the buyer of protection an amount equal to the notional amount of the swap and take delivery of the referenced obligation, other deliverable obligations or underlying securities comprising the referenced index or (ii) pay a net settlement amount in the form of cash or securities equal to the notional amount of the swap less the recovery value of the referenced obligation or underlying securities comprising the referenced index. If a Fund is a buyer of protection and a credit event occurs, as defined under the terms of that particular swap agreement, a Fund will either (i) receive from the seller of protection an amount equal to the notional amount of the swap and deliver the referenced obligation, other deliverable obligations or underlying securities comprising the referenced index or (ii) receive a net settlement amount in the form of cash or securities equal to the notional amount of the swap less the recovery value of the referenced obligation or underlying securities comprising the referenced index. Recovery values are assumed by market makers considering either industry standard recovery rates or entity specific factors and considerations until a credit event occurs. If a credit event has occurred, the recovery value is determined by a facilitated auction whereby a minimum number of allowable broker bids, together with a specified valuation method, are used to calculate the settlement value.
Credit default swap agreements on corporate issues or sovereign issues of an emerging country involve one party making a stream of payments to another party in exchange for the right to receive a specified return in the event of a default or other credit event. If a credit event occurs and cash settlement is not elected, a variety of other deliverable obligations may be delivered in lieu of the specific referenced obligation. The ability to deliver other obligations may result in a cheapest-to-deliver option (the buyer of protection’s right to choose the deliverable obligation with the lowest value following a credit event). A Fund may use credit default swaps on corporate issues or sovereign issues of an emerging country to provide a measure of protection against defaults of the issuers (i.e., to reduce risk where a Fund owns or has exposure to the referenced obligation) or to take an active long or short position with respect to the likelihood of a particular issuer’s default.
Credit default swap agreements on asset-backed securities involve one party making a stream of payments to another party in exchange for the right to receive a specified return in the event of a default or other credit event. Unlike credit default swaps on corporate issues or sovereign issues of an emerging country, deliverable obligations in most instances would be limited to the specific referenced obligation as performance for asset-backed securities can vary across deals. Prepayments, principal paydowns, and other write down or loss events on the underlying mortgage loans will reduce the outstanding principal balance of the referenced obligation. These reductions may be temporary or permanent as defined under the terms of the swap agreement and the notional amount for the swap agreement will be adjusted by corresponding amounts. A Fund may use credit default swaps on asset-backed securities to provide a measure of protection against defaults of the
228
referenced obligation or to take an active long or short position with respect to the likelihood of a particular referenced obligation’s default.
Credit default swap agreements on credit indices involve one party making a stream of payments to another party in exchange for the right to receive a specified return in the event of a write-down, principal shortfall, interest shortfall or default of all or part of the referenced entities comprising the credit index. A credit index is a list of a basket of credit instruments or exposures designed to be representative of some part of the credit market as a whole. These indices are made up of reference credits that are judged by a poll of dealers to be the most liquid entities in the credit default swap market based on the sector of the index. Components of the indices may include, but are not limited to, investment grade securities, high yield securities, asset-backed securities, emerging markets, and/or various credit ratings within each sector. Credit indices are traded using credit default swaps with standardized terms including a fixed spread and standard maturity dates. An index credit default swap references all the names in the index, and if there is a default, the credit event is settled based on that name’s weight in the index. The composition of the indices changes periodically, usually every six months, and for most indices, each name has an equal weight in the index. A Fund may use credit default swaps on credit indices to hedge a portfolio of credit default swaps or bonds with a credit default swap on indices which is less expensive than it would be to buy many credit default swaps to achieve a similar effect. Credit-default swaps on indices are benchmarks for protecting investors owning bonds against default, and traders use them to speculate on changes in credit quality.
Implied credit spreads, represented in absolute terms, utilized in determining the market value of credit default swap agreements on corporate issues or sovereign issues of an emerging country as of period end are disclosed in the footnotes to the Schedules of Investments and serve as an indicator of the current status of the payment/performance risk and represent the likelihood or risk of default for the credit derivative. The implied credit spread of a particular referenced entity reflects the cost of buying/selling protection and may include upfront payments required to be made to enter into the agreement. For credit default swap agreements on asset-backed securities and credit indices, the quoted market prices and resulting values serve as the indicator of the current status of the payment/performance risk. Wider credit spreads and increasing market values, in absolute terms when compared to the notional amount of the swap, represent a deterioration of the referenced entity’s credit soundness and a greater likelihood or risk of default or other credit event occurring as defined under the terms of the agreement.
The maximum potential amount of future payments (undiscounted) that a Fund as a seller of protection could be required to make under a credit default swap agreement would be an amount equal to the notional amount of the agreement. These potential amounts would be partially offset by any recovery values of the respective referenced obligations, upfront payments received upon entering into the agreement, or net amounts received from the settlement of buy protection credit default swap agreements entered into by a Fund for the same referenced entity or entities.
Credit default swaps involve greater risks than if the Funds had invested in the referenced obligation directly. In addition to general market risks, credit default swaps are subject to liquidity risk and counterparty credit risk. The Funds enter into credit default swaps with counterparties meeting defined criteria for financial strength. A buyer also may lose its investment and recover nothing should a credit event not occur. If a credit event did occur, the value of the referenced obligation received by the seller, coupled with the periodic payments previously received, may be less than the full notional value it pays to the buyer, resulting in a loss of value.
Exchange Traded Swap Agreements — Exchange traded swaps are either interest rate or credit default swap agreements brokered by the Chicago Mercantile Exchange (the “CME”) where the CME is the counterparty to both the buyer and seller of protection. Exchange traded swaps involve a lesser degree of risk because the CME, as counterparty, monitors risk factors for the involved parties. Exchange traded swaps are subject to general market risks and to liquidity risk.
229
Pursuant to the agreement, the Funds agree to pay to or receive from the broker an amount of cash equal to the daily fluctuation in the value of the contract (the “Margin”) and daily interest on the margin. In the case of exchange traded interest rate swaps, the daily settlement also includes the daily portion of interest. Such payments are recorded by the Funds as unrealized gains or losses until the contract is closed or settled.
Exchange traded swaps require no payments at the beginning of the measurement period nor are there liquidation payments at the termination of the swap.
Cross-Currency Swap Agreements — Cross-currency swap agreements involve two parties exchanging two different currencies with an agreement to reverse the exchange at a later date at specified exchange rates. The exchange of currencies at the inception date of the contract takes place at the current spot rate. The re-exchange at maturity may take place at the same exchange rate, a specified rate, or the then current spot rate. Interest payments, if applicable, are made between the parties based on interest rates available in the two currencies at the inception of the contract. The terms of cross-currency swap contracts may extend for many years. Cross-currency swaps are usually negotiated with commercial and investment banks. Some cross-currency swaps may not provide for exchanging principal cash flows but only for exchanging interest cash flows.
Interest Rate Swap Agreements — Interest rate swap agreements involve the exchange by a Fund with another party of their respective commitments to pay or receive interest with respect to the notional amount of principal. Certain forms of interest rate swap agreements may include: (i) interest rate caps, under which, in return for a premium, one party agrees to make payments to the other to the extent that interest rates exceed a specified rate, or “cap”, (ii) interest rate floors, under which, in return for a premium, one party agrees to make payments to the other to the extent that interest rates fall below a specified rate, or “floor”, (iii) interest rate collars, under which a party sells a cap and purchases a floor or vice versa in an attempt to protect itself against interest rate movements exceeding given minimum or maximum levels, (iv) callable interest rate swaps, under which the counterparty may terminate the swap transaction in whole at zero cost by a predetermined date and time prior to the maturity date, (v) spread locks, which allow the interest rate swap users to lock in the forward differential (or spread) between the interest rate swap rate and a specified benchmark, or (vi) basis swap, under which two parties can exchange variable interest rates based on different money markets.
Total Return Swap Agreements — Total return swap agreements on commodities involve commitments where exchanged cash flows are based on the price of a commodity and in return receives either fixed or determined by floating price or rate. One party would receive payments based on the market value of the commodity involved and pay a fixed amount. Total return swap agreements on indices involve commitments to pay interest in exchange for a market-linked return. One counterparty pays out the total return of a specific reference asset, which may be an equity, index, or bond, and in return receives a regular stream of payments. To the extent the total return of the security or index underlying the transaction exceeds or falls short of the offsetting interest rate obligation, a Fund will receive a payment from or make a payment to the counterparty.
FASB “Derivatives and Hedging” includes required disclosure for (i) the nature and terms of the derivative, reasons for entering into the derivative, the events or circumstances that would require the seller to perform under the derivative, and the current status of the payment/performance risk of the derivative, (ii) the maximum potential amount of future payments (undiscounted) the seller could be required to make under the derivative, (iii) the fair value of the derivative, and (iv) the nature of any recourse provisions and assets held either as collateral or by third parties. FASB “Guarantees” require additional disclosures about the current status of the payment/performance risk of a guarantee. All of this information has been incorporated for the current period as part of the Schedules of Investments within the Swap agreements outstanding disclosure and in the Notes to Financial Statements.
230
As of December 31, 2011, the Low-Duration Bond Fund and the Medium-Duration Bond Fund are the buyers (“receiving protection”) on a total notional amount of $44,387,701 and $65,801,000, respectively, and the sellers (“providing protection”) on a total notional amount of $700,000 and $18,150,000, respectively. The notional amounts of the swaps are not recorded in the financial statements; however, the notional amount does approximate the maximum potential amount of future payments that the Funds could be required to make if the Funds were the seller of protection and a credit event were to occur. Those credit default swaps for which the Funds are providing protection at balance sheet date are summarized as follows:
| | | | | | | | | | | | | | | | | | | | |
| Written Credit Derivative Contracts | | Single Name
Credit Default Swaps | | | Credit Default
Swap Index | | | | |
| Reference Asset | | Corporate
Debt | | | Sovereign
Debt | | | Asset-Backed
Securities | | | Corporate
Debt | | | Total | |
Low-Duration Bond Fund | | | | | | | | | | | | | | | | | | | | |
Fair value of written credit derivatives | | $ | (10,232 | ) | | $ | — | | | $ | — | | | $ | — | | | $ | (10,232 | ) |
Maximum potential amount of future payments | | | 700,000 | | | | — | | | | — | | | | — | | | | 700,000 | |
Recourse provisions with third parties to recover any amounts paid under the credit derivative (including any purchased credit protection) | | | — | | | | — | | | | — | | | | — | | | | — | |
Collateral held by the Funds or other third parties which the Funds can obtain upon occurrence of triggering event | | | — | | | | — | | | | — | | | | — | | | | — | |
| | | | | |
Medium-Duration Bond Fund | | | | | | | | | | | | | | | | | | | | |
Fair value of written credit derivatives | | $ | (515,470 | ) | | $ | (27,385 | ) | | $ | (87,404 | ) | | $ | — | | | $ | (630,259 | ) |
Maximum potential amount of future payments | | | 5,000,000 | | | | 1,000,000 | | | | 12,150,000 | | | | — | | | | 18,150,000 | |
Recourse provisions with third parties to recover any amounts paid under the credit derivative (including any purchased credit protection) | | | — | | | | — | | | | — | | | | — | | | | — | |
Collateral held by the Funds or other third parties which the Funds can obtain upon occurrence of triggering event | | | — | | | | — | | | | — | | | | — | | | | — | |
231
The credit spread disclosed below for each referenced obligation where the Funds are the seller of protection is a representation of the current payment/performance risk of the swap.
| | | $000,000 | | | | $000,000 | | | | $000,000 | | | | $000,000 | | | | $000,000 | | | | $000,000 | |
| | | Maximum Potential Amount of Future Payments by Contract Term | | | | |
Current credit spread on underlying (in basis points) | | 0-6
Months | | | 6-12
Months | | | 1-5
Years | | | 5-10
Years | | | More
Than
10 Years | | | Total | |
Low-Duration Bond Fund | | | | | | | | | | | | | | | | | | | | | | | | |
0 – 100 | | $ | — | | | $ | — | | | $ | — | | | $ | — | | | $ | — | | | $ | — | |
101 – 250 | | | — | | | | — | | | | 700,000 | | | | — | | | | — | | | | 700,000 | |
251 – 500 | | | — | | | | — | | | | — | | | | — | | | | — | | | | — | |
501 – 1,000 | | | — | | | | — | | | | — | | | | — | | | | — | | | | — | |
Greater than 1,000 | | | | | | | — | | | | — | | | | — | | | | — | | | | — | |
| | | | | | | | | | | | | | | | | | | | | | | | |
Total | | $ | — | | | $ | — | | | $ | 700,000 | | | $ | — | | | $ | — | | | $ | 700,000 | |
| | | | | | | | | | | | | | | | | | | | | | | | |
| | | | | | |
Medium-Duration Bond Fund | | | | | | | | | | | | | | | | | | | | | | | | |
0 – 100 | | $ | — | | | $ | — | | | $ | 12,150,000 | | | $ | — | | | $ | — | | | $ | 12,150,000 | |
101 – 250 | | | — | | | | — | | | | 900,000 | | | | 1,000,000 | | | | — | | | | 1,900,000 | |
251 – 500 | | | — | | | | — | | | | — | | | | — | | | | — | | | | — | |
501 – 1,000 | | | — | | | | — | | | | — | | | | 4,100,000 | | | | — | | | | 4,100,000 | |
Greater than 1,000 | | | — | | | | — | | | | — | | | | — | | | | — | | | | — | |
| | | | | | | | | | | | | | | | | | | | | | | | |
Total | | $ | — | | | $ | — | | | $ | 13,050,000 | | | $ | 5,100,000 | | | $ | — | | | $ | 18,150,000 | |
| | | | | | | | | | | | | | | | | | | | | | | | |
232
Derivative Holdings Categorized by Risk Exposure
FASB “Derivatives and Hedging” also requires all companies to disclose information intended to enable financial statement users to understand how and why the entity uses derivative instruments, how derivatives are accounted for, and how derivative instruments affect the entity’s financial position, results of operations, and cash flows.
| | | | |
| | | Location on the Statements of Assets and Liabilities |
Derivative Type | | Asset Derivatives | | Liability Derivatives |
Interest rate contracts | | Investments in securities of unaffiliated issuers, at value | | Options written at value |
| | |
| | Receivables: Variation margin* | | Payables: Variation margin* |
| | |
| | Unrealized appreciation on swap agreements | | Unrealized depreciation on swap agreements |
| | |
Foreign exchange contracts | | Receivables: Variation margin* | | Payables: Variation margin* |
| | |
| | Unrealized appreciation on foreign currency exchange contracts | | Unrealized depreciation on foreign currency exchange contracts |
| | |
Credit contracts | | Unrealized appreciation on swap agreements | | Unrealized depreciation on swap agreements |
| | |
Equity contracts | | Investments in securities of unaffiliated issuers, at value | | Options written at value |
| | |
| | Receivables: Variation margin* | | Payables: Variation margin* |
| * | The variation margin shown on the Statements of Assets and Liabilities is the daily change in the unrealized appreciation (depreciation) for open futures and exchange traded swap contracts.The variation margin presented below is the cumulative change in unrealized appreciation (depreciation) from the date the contract was opened until December 31, 2011. |
| | | $000,0000 | | | | $000,0000 | | | | $000,0000 | | | | $000,0000 | | | | $000,0000 | |
| | | Asset Derivative Value | |
| Fund | | Total Value
at 12/31/11 | | | Interest Rate
Contracts | | | Foreign Exchange
Contracts | | | Credit
Contracts | | | Equity
Contracts | |
MyDestination 2005 | | | | | | | | | | | | | | | | | | | | |
Futures | | $ | 5,027 | | | $ | 2,453 | | | $ | — | | | $ | — | | | $ | 2,574 | |
| | | | | | | | | | | | | | | | | | | | |
MyDestination 2015 | | | | | | | | | | | | | | | | | | | | |
Futures | | $ | 27,567 | | | $ | 15,501 | | | $ | — | | | $ | — | | | $ | 12,066 | |
| | | | | | | | | | | | | | | | | | | | |
MyDestination 2025 | | | | | | | | | | | | | | | | | | | | |
Futures | | $ | 44,511 | | | $ | 9,751 | | | $ | — | | | $ | — | | | $ | 34,760 | |
| | | | | | | | | | | | | | | | | | | | |
MyDestination 2035 | | | | | | | | | | | | | | | | | | | | |
Futures | | $ | 26,203 | | | $ | 1,953 | | | $ | — | | | $ | — | | | $ | 24,250 | |
| | | | | | | | | | | | | | | | | | | | |
MyDestination 2045 | | | | | | | | | | | | | | | | | | | | |
Futures | | $ | 12,721 | | | $ | 484 | | | $ | — | | | $ | — | | | $ | 12,237 | |
| | | | | | | | | | | | | | | | | | | | |
Conservative Allocation | | | | | | | | | | | | | | | | | | | | |
Futures | | $ | 11,485 | | | $ | 2,251 | | | $ | — | | | $ | — | | | $ | 9,234 | |
| | | | | | | | | | | | | | | | | | | | |
Balanced Allocation | | | | | | | | | | | | | | | | | | | | |
Futures | | $ | 209,166 | | | $ | 54,898 | | | $ | — | | | $ | — | | | $ | 154,268 | |
| | | | | | | | | | | | | | | | | | | | |
Growth Allocation | | | | | | | | | | | | | | | | | | | | |
Futures | | $ | 277,548 | | | $ | 13,450 | | | $ | — | | | $ | — | | | $ | 264,098 | |
| | | | | | | | | | | | | | | | | | | | |
Aggressive Allocation | | | | | | | | | | | | | | | | | | | | |
Futures | | $ | 389,119 | | | $ | — | | | $ | — | | | $ | — | | | $ | 389,119 | |
| | | | | | | | | | | | | | | | | | | | |
Conservative Allocation I | | | | | | | | | | | | | | | | | | | | |
Futures | | $ | 4,197 | | | $ | (375 | ) | | $ | — | | | $ | — | | | $ | 4,572 | |
| | | | | | | | | | | | | | | | | | | | |
Balanced Allocation I | | | | | | | | | | | | | | | | | | | | |
Futures | | $ | 110,360 | | | $ | (2,016 | ) | | $ | — | | | $ | — | | | $ | 112,376 | |
| | | | | | | | | | | | | | | | | | | | |
233
| | | | | | | | | | | | | | | | | | | | |
| | | Asset Derivative Value | |
| Fund | | Total Value
at
12/31/11 | | | Interest Rate
Contracts | | | Foreign Exchange
Contracts | | | Credit
Contracts | | | Equity
Contracts | |
Growth Allocation I | | | | | | | | | | | | | | | | | | | | |
Futures | | $ | 95,350 | | | $ | (953 | ) | | $ | — | | | $ | — | | | $ | 96,303 | |
| | | | | | | | | | | | | | | | | | | | |
Aggressive Allocation I | | | | | | | | | | | | | | | | | | | | |
Futures | | $ | 79,143 | | | $ | — | | | $ | — | | | $ | — | | | $ | 79,143 | |
| | | | | | | | | | | | | | | | | | | | |
Low-Duration Bond | | | | | | | | | | | | | | | | | | | | |
Forwards | | $ | 1,616,064 | | | $ | — | | | $ | 1,616,064 | | | $ | — | | | $ | — | |
Futures | | | 226,781 | | | | 226,781 | | | | — | | | | — | | | | — | |
Swaps | | | 2,824,411 | | | | 590,770 | | | | — | | | | 2,233,641 | | | | — | |
| | | | | | | | | | | | | | | | | | | | |
Totals | | $ | 4,667,256 | | | $ | 817,551 | | | $ | 1,616,064 | | | $ | 2,233,641 | | | $ | — | |
| | | | | | | | | | | | | | | | | | | | |
Medium-Duration Bond | | | | | | | | | | | | | | | | | | | | |
Forwards | | $ | 1,155,666 | | | $ | — | | | $ | 1,155,666 | | | $ | — | | | $ | — | |
Futures | | | 362,298 | | | | 362,298 | | | | — | | | | — | | | | — | |
Swaps | | | 2,709,372 | | | | 1,610,728 | | | | — | | | | 1,098,644 | | | | — | |
| | | | | | | | | | | | | | | | | | | | |
Totals | | $ | 4,227,336 | | | $ | 1,973,026 | | | $ | 1,155,666 | | | $ | 1,098,644 | | | $ | — | |
| | | | | | | | | | | | | | | | | | | | |
Inflation Protected Bond | | | | | | | | | | | | | | | | | | | | |
Futures | | $ | 146,939 | | | $ | 146,939 | | | $ | — | | | $ | — | | | $ | — | |
| | | | | | | | | | | | | | | | | | | | |
Global Bond Fund | | | | | | | | | | | | | | | | | | | | |
Forwards | | $ | 1,560,941 | | | $ | — | | | $ | 1,560,941 | | | $ | — | | | $ | — | |
Futures | | | 30,971 | | | | 30,971 | | | | — | | | | — | | | | — | |
| | | | | | | | | | | | | | | | | | | | |
Total | | $ | 1,591,912 | | | $ | 30,971 | | | $ | 1,560,941 | | | $ | — | | | $ | — | |
| | | | | | | | | | | | | | | | | | | | |
Defensive Market Strategies | | | | | | | | | | | | | | | | | | | | |
Forwards | | $ | 20,381 | | | $ | — | | | $ | 20,381 | | | $ | — | | | $ | — | |
Futures | | | 113,467 | | | | — | | | | — | | | | — | | | | 113,467 | |
Purchased Options | | | 12,731 | | | | — | | | | — | | | | — | | | | 12,731 | |
| | | | | | | | | | | | | | | | | | | | |
Total | | $ | 146,579 | | | $ | — | | | $ | 20,381 | | | $ | — | | | $ | 126,198 | |
| | | | | | | | | | | | | | | | | | | | |
Equity Index | | | | | | | | | | | | | | | | | | | | |
Futures | | $ | 254,558 | | | $ | — | | | $ | — | | | $ | — | | | $ | 254,558 | |
| | | | | | | | | | | | | | | | | | | | |
Real Estate Securities | | | | | | | | | | | | | | | | | | | | |
Futures | | $ | 53,620 | | | $ | — | | | $ | — | | | $ | — | | | $ | 53,620 | |
| | | | | | | | | | | | | | | | | | | | |
Value Equity | | | | | | | | | | | | | | | | | | | | |
Futures | | $ | 713,686 | | | $ | — | | | $ | — | | | $ | — | | | $ | 713,686 | |
| | | | | | | | | | | | | | | | | | | | |
Growth Equity Fund | | | | | | | | | | | | | | | | | | | | |
Futures | | $ | 754,084 | | | $ | — | | | $ | — | | | $ | — | | | $ | 754,084 | |
| | | | | | | | | | | | | | | | | | | | |
Small Cap Equity | | | | | | | | | | | | | | | | | | | | |
Forwards | | $ | 95,012 | | | $ | — | | | $ | 95,012 | | | $ | — | | | $ | — | |
Futures | | | 1,177,749 | | | | 34,723 | | | | | | | | — | | | | 1,143,026 | |
Purchased Options | | | 2,319 | | | | 2,319 | | | | — | | | | — | | | | — | |
| | | | | | | | | | | | | | | | | | | | |
Total | | $ | 1,275,080 | | | $ | 37,042 | | | $ | 95,012 | | | $ | — | | | $ | 1,143,026 | |
| | | | | | | | | | | | | | | | | | | | |
International Equity | | | | | | | | | | | | | | | | | | | | |
Forwards | | $ | 1,903,840 | | | $ | — | | | $ | 1,903,840 | | | $ | — | | | $ | — | |
Futures | | | 895,076 | | | | — | | | | 449,879 | | | | — | | | | 445,197 | |
| | | | | | | | | | | | | | | | | | | | |
Total | | $ | 2,798,916 | | | $ | — | | | $ | 2,353,719 | | | $ | — | | | $ | 445,197 | |
| | | | | | | | | | | | | | | | | | | | |
234
| | | | | | | | | | | | | | | | | | | | |
| | | Liability Derivative Value | |
| Fund | | Total Value
at
12/31/11 | | | Interest Rate
Contracts | | | Foreign Exchange
Contracts | | | Credit
Contracts | | | Equity
Contracts | |
Low-Duration Bond | | | | | | | | | | | | | | | | | | | | |
Forwards | | $ | 698,550 | | | $ | — | | | $ | 698,550 | | | $ | — | | | $ | — | |
Futures | | | 186,661 | | | | 186,661 | | | | — | | | | — | | | | — | |
Written Options | | | 365 | | | | 365 | | | | — | | | | — | | | | — | |
Swaps | | | 153,577 | | | | 108,232 | | | | — | | | | 45,345 | | | | — | |
| | | | | | | | | | | | | | | | | | | | |
Totals | | $ | 1,039,153 | | | $ | 295,258 | | | $ | 698,550 | | | $ | 45,345 | | | $ | — | |
| | | | | | | | | | | | | | | | | | | | |
Medium-Duration Bond | | | | | | | | | | | | | | | | | | | | |
Forwards | | $ | 1,695,160 | | | $ | — | | | $ | 1,695,160 | | | $ | — | | | $ | — | |
Futures | | | 203,998 | | | | 203,998 | | | | — | | | | — | | | | — | |
Written Options | | | 527 | | | | 527 | | | | — | | | | — | | | | — | |
Swaps | | | 1,011,861 | | | | 330,985 | | | | — | | | | 680,876 | | | | — | |
| | | | | | | | | | | | | | | | | | | | |
Totals | | $ | 2,911,546 | | | $ | 535,510 | | | $ | 1,695,160 | | | $ | 680,876 | | | $ | — | |
| | | | | | | | | | | | | | | | | | | | |
Inflation Protected Bond | | | | | | | | | | | | | | | | | | | | |
Futures | | $ | 184,709 | | | $ | 184,709 | | | $ | — | | | $ | — | | | $ | — | |
| | | | | | | | | | | | | | | | | | | | |
Global Bond | | | | | | | | | | | | | | | | | | | | |
Forwards | | $ | 756,564 | | | $ | — | | | $ | 756,564 | | | $ | — | | | $ | — | |
Futures | | | 21,944 | | | | 21,944 | | | | — | | | | — | | | | — | |
| | | | | | | | | | | | | | | | | | | | |
Totals | | $ | 778,508 | | | $ | 21,944 | | | $ | 756,564 | | | $ | — | | | $ | — | |
| | | | | | | | | | | | | | | | | | | | |
Defensive Market Strategies | | | | | | | | | | | | | | | | | | | | |
Forwards | | $ | 2,486 | | | $ | — | | | $ | 2,486 | | | $ | — | | | $ | — | |
Written Options | | | 840 | | | | — | | | | — | | | | — | | | | 840 | |
| | | | | | | | | | | | | | | | | | | | |
Totals | | $ | 3,326 | | | $ | — | | | $ | 2,486 | | | $ | — | | | $ | 840 | |
| | | | | | | | | | | | | | | | | | | | |
Small Cap Equity | | | | | | | | | | | | | | | | | | | | |
Forwards | | $ | 1,242 | | | $ | — | | | $ | 1,242 | | | $ | — | | | $ | — | |
Futures | | | 6,872 | | | | 6,872 | | | | — | | | | — | | | | — | |
Written Options | | | 1,663 | | | | 1,663 | | | | — | | | | — | | | | — | |
| | | | | | | | | | | | | | | | | | | | |
Totals | | $ | 9,777 | | | $ | 8,535 | | | $ | 1,242 | | | $ | — | | | $ | — | |
| | | | | | | | | | | | | | | | | | | | |
International Equity | | | | | | | | | | | | | | | | | | | | |
Forwards | | $ | 1,442,701 | | | $ | — | | | $ | 1,442,701 | | | $ | — | | | $ | — | |
Futures | | | (292,432 | ) | | | — | | | | — | | | | — | | | | (292,432 | ) |
| | | | | | | | | | | | | | | | | | | | |
Totals | | $ | 1,150,269 | | | $ | — | | | $ | 1,442,701 | | | $ | — | | | $ | (292,432 | ) |
| | | | | | | | | | | | | | | | | | | | |
235
| | |
Derivative Type | | Location on the Statements of Operations |
Interest rate contracts | | Net realized gain (loss) from: Futures transactions |
| | Net realized gain (loss) from: Swap agreements |
| | Net realized gain (loss) from: Option contracts written |
| | Net realized gain (loss) from: Option contracts purchased |
| | Net change in unrealized appreciation (depreciation) on: Futures |
| | Net change in unrealized appreciation (depreciation) on: Swap agreements |
| | Net change in unrealized appreciation (depreciation) on: Option contracts written |
| | Net change in unrealized appreciation (depreciation) on: Option contracts purchased |
Foreign exchange contracts | | Net realized gain (loss) from: Foreign currency transactions |
| | Net realized gain (loss) from: Futures transactions |
| | Net change in unrealized appreciation (depreciation) on: Foreign currency translations |
| | Net change in unrealized appreciation (depreciation) on: Futures |
Credit contracts | | Net realized gain (loss) from: Swap agreements |
| | Net realized gain (loss) from: Option contracts written |
| | Net change in unrealized appreciation (depreciation) on: Swap agreements |
| | Net change in unrealized appreciation (depreciation) on: Option contracts written |
Equity contracts | | Net realized gain (loss) from: Futures transactions |
| | Net realized gain (loss) from: Option contracts written |
| | Net realized gain (loss) from: Option contracts purchased |
| | Net change in unrealized appreciation (depreciation) on: Futures |
| | Net change in unrealized appreciation (depreciation) on: Option contracts written |
| | Net change in unrealized appreciation (depreciation) on: Option contracts purchased |
| | | | | | | | | | | | | | | | | | | | |
| | | Realized Gain (Loss) on Derivatives Recognized in Income | |
| | | Total Value
at
12/31/11 | | | Interest Rate
Contracts | | | Foreign Exchange
Contracts | | | Credit
Contracts | | | Equity
Contracts | |
MyDestination 2005 | | | | | | | | | | | | | | | | | | | | |
Futures | | $ | (51,199 | ) | | $ | 71,516 | | | $ | — | | | $ | — | | | $ | (122,715 | ) |
| | | | | | | | | | | | | | | | | | | | |
MyDestination 2015 | | | | | | | | | | | | | | | | | | | | |
Futures | | $ | 171,780 | | | $ | 589,775 | | | $ | — | | | $ | — | | | $ | (417,995 | ) |
| | | | | | | | | | | | | | | | | | | | |
MyDestination 2025 | | | | | | | | | | | | | | | | | | | | |
Futures | | $ | 523,880 | | | $ | 955,499 | | | $ | — | | | $ | — | | | $ | (431,619 | ) |
| | | | | | | | | | | | | | | | | | | | |
MyDestination 2035 | | | | | | | | | | | | | | | | | | | | |
Futures | | $ | (63,635 | ) | | $ | 27,774 | | | $ | — | | | $ | — | | | $ | (91,409 | ) |
| | | | | | | | | | | | | | | | | | | | |
MyDestination 2045 | | | | | | | | | | | | | | | | | | | | |
Futures | | $ | 147 | | | $ | 2,018 | | | $ | — | | | $ | — | | | $ | (1,871 | ) |
| | | | | | | | | | | | | | | | | | | | |
Conservative Allocation | | | | | | | | | | | | | | | | | | | | |
Futures | | $ | (474,091 | ) | | $ | 62,559 | | | $ | — | | | $ | — | | | $ | (536,650 | ) |
| | | | | | | | | | | | | | | | | | | | |
Balanced Allocation | | | | | | | | | | | | | | | | | | | | |
Futures | | $ | 2,409,288 | | | $ | 2,465,031 | | | $ | — | | | $ | — | | | $ | (55,743 | ) |
| | | | | | | | | | | | | | | | | | | | |
Growth Allocation | | | | | | | | | | | | | | | | | | | | |
Futures | | $ | 798,906 | | | $ | 322,928 | | | $ | — | | | $ | — | | | $ | 475,978 | |
| | | | | | | | | | | | | | | | | | | | |
Aggressive Allocation | | | | | | | | | | | | | | | | | | | | |
Futures | | $ | 718,908 | | | $ | — | | | $ | — | | | $ | — | | | $ | 718,908 | |
| | | | | | | | | | | | | | | | | | | | |
Conservative Allocation I | | | | | | | | | | | | | | | | | | | | |
Futures | | $ | (166,463 | ) | | $ | 16,869 | | | $ | — | | | $ | — | | | $ | (183,332 | ) |
| | | | | | | | | | | | | | | | | | | | |
236
| | | | | | | | | | | | | | | | | | | | |
| | | Realized Gain (Loss) on Derivatives Recognized in Income | |
| | | Total Value
at
12/31/11 | | | Interest Rate
Contracts | | | Foreign Exchange
Contracts | | | Credit
Contracts | | | Equity
Contracts | |
Balanced Allocation I | | | | | | | | | | | | | | | | | | | | |
Futures | | $ | 433,480 | | | $ | 713,402 | | | $ | — | | | $ | — | | | $ | (279,922 | ) |
| | | | | | | | | | | | | | | | | | | | |
Growth Allocation I | | | | | | | | | | | | | | | | | | | | |
Futures | | $ | 129,814 | | | $ | 82,748 | | | $ | — | | | $ | — | | | $ | 47,066 | |
| | | | | | | | | | | | | | | | | | | | |
Aggressive Allocation I | | | | | | | | | | | | | | | | | | | | |
Futures | | $ | (25,826 | ) | | $ | — | | | $ | — | | | $ | — | | | $ | (25,826 | ) |
| | | | | | | | | | | | | | | | | | | | |
Low-Duration Bond | | | | | | | | | | | | | | | | | | | | |
Forwards | | $ | 366,991 | | | $ | — | | | $ | 366,991 | | | $ | — | | | $ | — | |
Futures | | | (751,288 | ) | | | (751,288 | ) | | | — | | | | — | | | | — | |
Swaps | | | 6,193 | | | | 19,988 | | | | — | | | | (13,795 | ) | | | — | |
Written Options | | | 816,215 | | | | 742,121 | | | | — | | | | 74,094 | | | | — | |
| | | | | | | | | | | | | | | | | | | | |
Totals | | $ | 438,111 | | | $ | 10,821 | | | $ | 366,991 | | | $ | 60,299 | | | $ | — | |
| | | | | | | | | | | | | | | | | | | | |
Medium-Duration Bond | | | | | | | | | | | | | | | | | | | | |
Forwards | | $ | (503,502 | ) | | $ | — | | | $ | (503,502 | ) | | $ | — | | | $ | — | |
Futures | | | 3,677,230 | | | | 3,677,230 | | | | — | | | | — | | | | — | |
Purchased Options | | | (11,016 | ) | | | (11,016 | ) | | | — | | | | — | | | | — | |
Swaps | | | 91,088 | | | | 275,673 | | | | — | | | | (184,585 | ) | | | — | |
Written Options | | | 625,267 | | | | 562,227 | | | | — | | | | 63,040 | | | | — | |
| | | | | | | | | | | | | | | | | | | | |
Totals | | $ | 3,879,067 | | | $ | 4,504,114 | | | $ | (503,502 | ) | | $ | (121,545 | ) | | $ | — | |
| | | | | | | | | | | | | | | | | | | | |
Inflation Protected Bond | | | | | | | | | | | | | | | | | | | | |
Futures | | $ | (2,169,115 | ) | | $ | (2,169,115 | ) | | $ | — | | | $ | — | | | $ | — | |
| | | | | | | | | | | | | | | | | | | | |
Global Bond | | | | | | | | | | | | | | | | | | | | |
Forwards | | $ | (63,463 | ) | | $ | — | | | $ | (63,463 | ) | | $ | — | | | $ | — | |
Futures | | | (721,037 | ) | | | (721,037 | ) | | | — | | | | — | | | | — | |
Purchased Options | | | (81,511 | ) | | | (81,511 | ) | | | — | | | | — | | | | — | |
| | | | | | | | | | | | | | | | | | | | |
Total | | $ | (866,011 | ) | | $ | (802,548 | ) | | $ | (63,463 | ) | | $ | — | | | $ | — | |
| | | | | | | | | | | | | | | | | | | | |
Defensive Market Strategies | | | | | | | | | | | | | | | | | | | | |
Forwards | | $ | 165,392 | | | $ | — | | | $ | 165,392 | | | $ | — | | | $ | — | |
Futures | | | (2,079,639 | ) | | | — | | | | — | | | | — | | | | (2,079,639 | ) |
Purchased Options | | | (63,232 | ) | | | — | | | | — | | | | — | | | | (63,232 | ) |
Written Options | | | 6,378 | | | | — | | | | — | | | | — | | | | 6,378 | |
| | | | | | | | | | | | | | | | | | | | |
Total | | $ | (1,971,101 | ) | | $ | — | | | $ | 165,392 | | | $ | — | | | $ | (2,136,493 | ) |
| | | | | | | | | | | | | | | | | | | | |
Equity Index | | | | | | | | | | | | | | | | | | | | |
Futures | | $ | 705,026 | | | $ | — | | | $ | — | | | $ | — | | | $ | 705,026 | |
| | | | | | | | | | | | | | | | | | | | |
Real Estate Securities | | | | | | | | | | | | | | | | | | | | |
Futures | | $ | (478,055 | ) | | $ | — | | | $ | — | | | $ | — | | | $ | (478,055 | ) |
| | | | | | | | | | | | | | | | | | | | |
Value Equity | | | | | | | | | | | | | | | | | | | | |
Futures | | $ | (365,061 | ) | | $ | — | | | $ | — | | | $ | — | | | $ | (365,061 | ) |
| | | | | | | | | | | | | | | | | | | | |
Growth Equity | | | | | | | | | | | | | | | | | | | | |
Futures | | $ | 2,417,550 | | | $ | — | | | $ | — | | | $ | — | | | $ | 2,417,550 | |
| | | | | | | | | | | | | | | | | | | | |
237
| | | $00000000.00 | | | | $00000000.00 | | | | $00000000.00 | | | | $00000000.00 | | | | $00000000.00 | |
| | | Realized Gain (Loss) on Derivatives Recognized in Income | |
| | | Total Value
at
12/31/11 | | | Interest Rate
Contracts | | | Foreign Exchange
Contracts | | | Credit
Contracts | | | Equity
Contracts | |
Small Cap Equity | | | | | | | | | | | | | | | | | | | | |
Forwards | | $ | (46,262 | ) | | $ | — | | | $ | (46,262 | ) | | $ | — | | | $ | — | |
Futures | | | (2,763,422 | ) | | | 426,623 | | | | — | | | | — | | | | (3,190,045 | ) |
Written Options | | | 43,364 | | | | 43,364 | | | | — | | | | — | | | | — | |
| | | | | | | | | | | | | | | | | | | | |
Total | | $ | (2,766,320 | ) | | $ | 469,987 | | | $ | (46,262 | ) | | $ | — | | | $ | (3,190,045 | ) |
| | | | | | | | | | | | | | | | | | | | |
International Equity | | | | | | | | | | | | | | | | | | | | |
Forwards | | $ | (6,212,709 | ) | | $ | — | | | $ | (6,212,709 | ) | | $ | — | | | $ | — | |
Futures | | | (13,935,957 | ) | | | — | | | | (7,968,912 | ) | | | — | | | | (5,967,045 | ) |
| | | | | | | | | | | | | | | | | | | | |
Total | | $ | (20,148,666 | ) | | $ | — | | | $ | (14,181,621 | ) | | $ | — | | | $ | (5,967,045 | ) |
| | | | | | | | | | | | | | | | | | | | |
| |
| | | Change in Unrealized Appreciation (Depreciation) on Derivatives Recognized in Income | |
| | | Total Value at
12/31/11 | | | Interest Rate
Contracts | | | Foreign Exchange
Contracts | | | Credit
Contracts | | | Equity
Contracts | |
MyDestination 2005 | | | | | | | | | | | | | | | | | | | | |
Futures | | $ | 5,027 | | | $ | 2,453 | | | $ | — | | | $ | — | | | $ | 2,574 | |
| | | | | | | | | | | | | | | | | | | | |
MyDestination 2015 | | | | | | | | | | | | | | | | | | | | |
Futures | | $ | (75,155 | ) | | $ | 15,501 | | | $ | — | | | $ | — | | | $ | (90,656 | ) |
| | | | | | | | | | | | | | | | | | | | |
MyDestination 2025 | | | | | | | | | | | | | | | | | | | | |
Futures | | $ | (18,636 | ) | | $ | 9,751 | | | $ | — | | | $ | — | | | $ | (28,387 | ) |
| | | | | | | | | | | | | | | | | | | | |
MyDestination 2035 | | | | | | | | | | | | | | | | | | | | |
Futures | | $ | (5,743 | ) | | $ | 1,953 | | | $ | — | | | $ | — | | | $ | (7,696 | ) |
| | | | | | | | | | | | | | | | | | | | |
MyDestination 2045 | | | | | | | | | | | | | | | | | | | | |
Futures | | $ | (23,615 | ) | | $ | 484 | | | $ | — | | | $ | — | | | $ | (24,099 | ) |
| | | | | | | | | | | | | | | | | | | | |
Conservative Allocation | | | | | | | | | | | | | | | | | | | | |
Futures | | $ | (47,086 | ) | | $ | 2,251 | | | $ | — | | | $ | — | | | $ | (49,337 | ) |
| | | | | | | | | | | | | | | | | | | | |
Balanced Allocation | | | | | | | | | | | | | | | | | | | | |
Futures | | $ | (246,347 | ) | | $ | 54,898 | | | $ | — | | | $ | — | | | $ | (301,245 | ) |
| | | | | | | | | | | | | | | | | | | | |
Growth Allocation | | | | | | | | | | | | | | | | | | | | |
Futures | | $ | (130,695 | ) | | $ | 13,450 | | | $ | — | | | $ | — | | | $ | (144,145 | ) |
| | | | | | | | | | | | | | | | | | | | |
Aggressive Allocation | | | | | | | | | | | | | | | | | | | | |
Futures | | $ | (96,556 | ) | | $ | — | | | $ | — | | | $ | — | | | $ | (96,556 | ) |
| | | | | | | | | | | | | | | | | | | | |
Conservative Allocation I | | | | | | | | | | | | | | | | | | | | |
Futures | | $ | 4,197 | | | $ | (375 | ) | | $ | — | | | $ | — | | | $ | 4,572 | |
| | | | | | | | | | | | | | | | | | | | |
Balanced Allocation I | | | | | | | | | | | | | | | | | | | | |
Futures | | $ | 52,372 | | | $ | (2,016 | ) | | $ | — | | | $ | — | | | $ | 54,388 | |
| | | | | | | | | | | | | | | | | | | | |
Growth Allocation I | | | | | | | | | | | | | | | | | | | | |
Futures | | $ | 44,662 | | | $ | (953 | ) | | $ | — | | | $ | — | | | $ | 45,615 | |
| | | | | | | | | | | | | | | | | | | | |
Aggressive Allocation I | | | | | | | | | | | | | | | | | | | | |
Futures | | $ | 17,799 | | | $ | — | | | $ | — | | | $ | — | | | $ | 17,799 | |
| | | | | | | | | | | | | | | | | | | | |
238
| | | | | | | | | | | | | | | | | | | | |
| | | Change in Unrealized Appreciation (Depreciation) on Derivatives Recognized in Income | |
| | | Total Value
at
12/31/11 | | | Interest Rate
Contracts | | | Foreign Exchange
Contracts | | | Credit
Contracts | | | Equity
Contracts | |
Low-Duration Bond | | | | | | | | | | | | | | | | | | | | |
Forwards | | $ | 1,190,280 | | | $ | — | | | $ | 1,190,280 | | | $ | — | | | $ | — | |
Futures | | | (159,092 | ) | | | (159,092 | ) | | | — | | | | — | | | | — | |
Swaps | | | 1,046,747 | | | | 608,706 | | | | — | | | | 438,041 | | | | — | |
Written Options | | | (129,865 | ) | | | (65,713 | ) | | | — | | | | (64,152 | ) | | | — | |
| | | | | | | | | | | | | | | | | | | | |
Totals | | $ | 1,948,070 | | | $ | 383,901 | | | $ | 1,190,280 | | | $ | 373,889 | | | $ | — | |
| | | | | | | | | | | | | | | | | | | | |
Medium-Duration Bond | | | | | | | | | | | | | | | | | | | | |
Forwards | | $ | 287,786 | | | $ | — | | | $ | 287,786 | | | $ | — | | | $ | — | |
Futures | | | 421,581 | | | | 421,581 | | | | — | | | | — | | | | — | |
Purchased Options | | | (59 | ) | | | (59 | ) | | | — | | | | — | | | | — | |
Swaps | | | (129,207 | ) | | | 725,148 | | | | — | | | | (854,355 | ) | | | — | |
Written Options | | | 67,423 | | | | 70,745 | | | | — | | | | (3,322 | ) | | | — | |
| | | | | | | | | | | | | | | | | | | | |
Totals | | $ | 647,524 | | | $ | 1,217,415 | | | $ | 287,786 | | | $ | (857,677 | ) | | $ | — | |
| | | | | | | | | | | | | | | | | | | | |
Inflation Protected Bond | | | | | | | | | | | | | | | | | | | | |
Futures | | $ | (33,337 | ) | | $ | (33,337 | ) | | $ | — | | | $ | — | | | $ | — | |
| | | | | | | | | | | | | | | | | | | | |
Global Bond | | | | | | | | | | | | | | | | | | | | |
Forwards | | $ | 482,176 | | | $ | — | | | $ | 482,176 | | | $ | — | | | $ | — | |
Futures | | | (41,563 | ) | | | (41,563 | ) | | | — | | | | — | | | | — | |
| | | | | | | | | | | | | | | | | | | | |
Total | | $ | 440,613 | | | $ | (41,563 | ) | | $ | 482,176 | | | $ | — | | | $ | — | |
| | | | | | | | | | | | | | | | | | | | |
Defensive Market Strategies | | | | | | | | | | | | | | | | | | | | |
Forwards | | $ | 17,895 | | | $ | — | | | $ | 17,895 | | | $ | — | | | $ | — | |
Futures | | | 113,467 | | | | — | | | | — | | | | — | | | | 113,467 | |
Purchased Options | | | (31,125 | ) | | | — | | | | — | | | | — | | | | (31,125 | ) |
Written Options | | | 3,192 | | | | — | | | | — | | | | — | | | | 3,192 | |
| | | | | | | | | | | | | | | | | | | | |
Total | | $ | 103,429 | | | $ | — | | | $ | 17,895 | | | $ | — | | | $ | 85,534 | |
| | | | | | | | | | | | | | | | | | | | |
Equity Index | | | | | | | | | | | | | | | | | | | | |
Futures | | $ | 24,188 | | | $ | — | | | $ | — | | | $ | — | | | $ | 24,188 | |
| | | | | | | | | | | | | | | | | | | | |
Real Estate Securities | | | | | | | | | | | | | | | | | | | | |
Futures | | $ | 19,718 | | | $ | — | | | $ | — | | | $ | — | | | $ | 19,718 | |
| | | | | | | | | | | | | | | | | | | | |
Value Equity | | | | | | | | | | | | | | | | | | | | |
Futures | | $ | 24,827 | | | $ | — | | | $ | — | | | $ | — | | | $ | 24,827 | |
| | | | | | | | | | | | | | | | | | | | |
Growth Equity | | | | | | | | | | | | | | | | | | | | |
Futures | | $ | (230,106 | ) | | $ | — | | | $ | — | | | $ | — | | | $ | (230,106 | ) |
| | | | | | | | | | | | | | | | | | | | |
Small Cap Equity | | | | | | | | | | | | | | | | | | | | |
Forwards | | $ | 101,334 | | | $ | — | | | $ | 101,334 | | | $ | — | | | $ | — | |
Futures | | | 11,250 | | | | (30,718 | ) | | | — | | | | — | | | | 41,968 | |
Purchased Options | | | (354 | ) | | | (354 | ) | | | — | | | | — | | | | — | |
Written Options | | | 352 | | | | 352 | | | | — | | | | — | | | | — | |
| | | | | | | | | | | | | | | | | | | | |
Total | | $ | 112,582 | | | $ | (30,720 | ) | | $ | 101,334 | | | $ | — | | | $ | 41,968 | |
| | | | | | | | | | | | | | | | | | | | |
International Equity | | | | | | | | | | | | | | | | | | | | |
Forwards | | $ | (58,703 | ) | | $ | — | | | $ | (58,703 | ) | | $ | — | | | $ | — | |
Futures | | | 497,246 | | | | — | | | | 449,879 | | | | — | | | | 47,367 | |
| | | | | | | | | | | | | | | | | | | | |
Total | | $ | 438,543 | | | $ | — | | | $ | 391,176 | | | $ | — | | | $ | 47,367 | |
| | | | | | | | | | | | | | | | | | | | |
239
Volume of Derivative Transactions
The table below summarizes the average balance of derivative holdings by fund during the year ended December 31, 2011. The
average balance of derivatives held is indicative of the trading volume of each Fund.
| | | | | | | | | | | | | | | | |
| | | Asset Derivative Volume | |
| | | Forward Foreign
Currency
Contracts
(Average Cost) | | | Futures
Contracts
(Average Notional Value) | | | Purchased
Option
Contracts
(Average Notional Cost) | | | Swap
Contracts
(Average Notional Amount) | |
MyDestination 2005 | | $ | — | | | $ | 2,179,715 | | | $ | — | | | $ | — | |
MyDestination 2015 | | | — | | | | 10,316,542 | | | | — | | | | — | |
MyDestination 2025 | | | — | | | | 9,942,942 | | | | — | | | | — | |
MyDestination 2035 | | | — | | | | 2,601,896 | | | | — | | | | — | |
MyDestination 2045 | | | — | | | | 1,914,151 | | | | — | | | | — | |
Conservative Allocation | | | — | | | | 6,551,707 | | | | — | | | | — | |
Balanced Allocation | | | — | | | | 32,153,925 | | | | — | | | | — | |
Growth Allocation | | | — | | | | 15,389,031 | | | | — | | | | — | |
Aggressive Allocation | | | — | | | | 15,301,002 | | | | — | | | | — | |
Conservative Allocation I | | | — | | | | 2,260,589 | | | | — | | | | — | |
Balanced Allocation I | | | — | | | | 8,927,270 | | | | — | | | | — | |
Growth Allocation I | | | — | | | | 3,824,190 | | | | — | | | | — | |
Aggressive Allocation I | | | — | | | | 2,749,227 | | | | — | | | | — | |
Low-Duration Bond | | | 67,980,265 | | | | 679,135,087 | | | | — | | | | 182,702,290 | |
Medium-Duration Bond | | | 41,417,747 | | | | 272,239,996 | | | | 4,737 | | | | 168,238,227 | |
Inflation Protected Bond | | | — | | | | 33,182,253 | | | | — | | | | — | |
Global Bond | | | 116,444,398 | | | | 6,859,291 | | | | 94,984 | | | | — | |
Defensive Market Strategies | | | 2,218,992 | | | | 12,087,493 | | | | 77,071 | | | | — | |
Equity Index | | | — | | | | 20,641,558 | | | | — | | | | — | |
Real Estate Securities | | | — | | | | 8,656,645 | | | | — | | | | — | |
Value Equity | | | — | | | | 66,665,363 | | | | — | | | | — | |
Growth Equity | | | — | | | | 105,868,103 | | | | — | | | | — | |
Small Cap Equity | | | 2,232,410 | | | | 193,216,782 | | | | 8,016 | | | | — | |
International Equity | | | 119,834,661 | | | | 87,536,172 | | | | — | | | | — | |
| | | | | | | | | | | | | | | | |
| | | Liability Derivative Volume | |
| | | Forward Foreign
Currency
Contracts
(Average Cost) | | | Futures
Contracts
(Average Notional Value) | | | Written
Option
Contracts
(Average Notional Cost) | | | Swap
Contracts
(Average Notional Amount) | |
MyDestination 2005 | | $ | — | | | | $ (83,007) | | | $ | — | | | $ | — | |
MyDestination 2015 | | | — | | | | (833,097 | ) | | | — | | | | — | |
MyDestination 2025 | | | — | | | | (916,104 | ) | | | — | | | | — | |
MyDestination 2035 | | | — | | | | (584,074 | ) | | | — | | | | — | |
MyDestination 2045 | | | — | | | | (501,066 | ) | | | — | | | | — | |
Conservative Allocation | | | — | | | | (222,360 | ) | | | — | | | | — | |
Balanced Allocation | | | — | | | | (3,753,469 | ) | | | — | | | | — | |
Growth Allocation | | | — | | | | (4,088,520 | ) | | | — | | | | — | |
Aggressive Allocation | | | — | | | | (4,503,558 | ) | | | — | | | | — | |
Conservative Allocation I | | | — | | | | (83,007 | ) | | | — | | | | — | |
Balanced Allocation I | | | — | | | | (1,111,803 | ) | | | — | | | | — | |
Growth Allocation | | | — | | | | (945,788 | ) | | | — | | | | — | |
Aggressive Allocation I | | | — | | | | (889,442 | ) | | | — | | | | — | |
Low-Duration Bond | | | (262,489,092 | ) | | | (114,067,936 | ) | | | (764,710 | ) | | | — | |
Medium-Duration Bond | | | (70,865,238 | ) | | | (58,114,370 | ) | | | (303,584 | ) | | | — | |
Inflation Protected Bond | | | — | | | | (54,214,394 | ) | | | — | | | | — | |
240
| | | | | | | | | | | | | | | | |
| | | Liability Derivative Volume | |
| | | Forward
Foreign
Currency
Contracts
(Average Cost) | | | Futures
Contracts
(Average Notional Value) | | | Written
Option
Contracts
(Average Notional Cost) | | | Swap
Contracts
(Average Notional Amount) | |
Global Bond | | $ | (131,394,356 | ) | | $ | (33,425,267 | ) | | $ | — | | | $ | — | |
Defensive Market Strategies | | | (11,861,647 | ) | | | — | | | | (11,933 | ) | | | — | |
Small Cap Equity | | | (4,952,236 | ) | | | (21,531,921 | ) | | | (42,427 | ) | | | — | |
International Equity | | | (129,531,981 | ) | | | (10,772,583 | ) | | | — | | | | — | |
k. Dividends and Distributions to Shareholders
Dividends from net investment income for the Money Market Fund are declared daily and paid monthly. Dividends from net investment income for the Bond Funds are declared and paid monthly. Dividends from net investment income, if any, for the Defensive Market Strategies Fund, Equity Index Fund, Real Estate Securities Fund, Value Equity Fund and Growth Equity Fund are declared and paid semi-annually. Dividends from net investment income, if any, for the Small Cap Equity Fund, International Equity Fund, the Asset Allocation Funds and the Date Target Funds are declared and paid annually. Net realized capital gains, if any, will be distributed at least annually by each of the Funds. Dividends and distributions to shareholders are recorded on the ex-dividend date.
l. Expenses
Expenses arising in connection with a Fund are charged directly to that Fund. Expenses common to all Funds are generally allocated to each Fund in proportion to their relative net assets. Each Class of shares bears its pro-rata portion of expenses attributable to its Class, except that each Class separately bears expenses related specifically to that Class, such as shareholder reporting, registration, transfer agent, shareholder servicing and distribution fees.
m. Security Transactions, Income and Realized Gains and Losses
Security transactions are accounted for on the date securities are purchased or sold (the trade date). Dividend income is recognized on the ex-dividend date, except certain dividends from foreign securities where the ex-date may have passed, which are recorded as soon as the Fund is informed of the ex-dividend date. Interest income is accrued daily, including the amortization of market premium and the accretion of market discount. Realized gains and losses from security transactions are on an identified cost basis.
3. FEES AND OTHER TRANSACTIONS WITH AFFILIATES
a. Investment Advisory Fees
Pursuant to a separate investment advisory agreement, GuideStone Capital Management (“GSCM” or “Adviser”) acts as the Adviser to the Funds. As Adviser, it supervises the investments of the Funds and for such services is paid a fee. GSCM and the Trust have entered into sub-advisory agreements with various sub-advisers to manage each Select Fund’s investments. Under the general supervision of GSCM, the sub-advisers make the day-to-day investment decisions for the Select Funds, and for such services, each sub-adviser receives a fee from the Funds.
241
The advisory fees paid to GSCM and aggregate sub-advisory fees paid to the sub-advisers, listed at the end of this report, are computed daily based upon the net assets of each Fund. The actual advisory fees accrued and the sub-advisory fees accrued during the year ended December 31, 2011, based upon average daily net assets, were as follows:
| | | | |
Fund | | Advisory Fees | | Sub-Adviser Fees |
MyDestination 2005 | | 0.10% | | 0.00% |
MyDestination 2015 | | 0.10% | | 0.00% |
MyDestination 2025 | | 0.10% | | 0.00% |
MyDestination 2035 | | 0.10% | | 0.00% |
MyDestination 2045 | | 0.10% | | 0.00% |
Conservative Allocation | | 0.10% | | 0.00% |
Balanced Allocation | | 0.10% | | 0.00% |
Growth Allocation | | 0.10% | | 0.00% |
Aggressive Allocation | | 0.10% | | 0.00% |
Conservative Allocation I | | 0.10% | | 0.00% |
Balanced Allocation I | | 0.10% | | 0.00% |
Growth Allocation I | | 0.10% | | 0.00% |
Aggressive Allocation I | | 0.10% | | 0.00% |
Money Market | | 0.09% | | 0.07% |
Low-Duration Bond | | 0.13% | | 0.21% |
Medium-Duration Bond | | 0.21% | | 0.21% |
Extended-Duration Bond | | 0.25% | | 0.22% |
Inflation Protected Bond | | 0.20% | | 0.12% |
Global Bond | | 0.21% | | 0.26% |
Defensive Market Strategies | | 0.37% | | 0.49% |
Equity Index | | 0.13% | | 0.02% |
Real Estate Securities | | 0.28% | | 0.48% |
Value Equity | | 0.40% | | 0.24% |
Growth Equity | | 0.45% | | 0.40% |
Small Cap Equity | | 0.27% | | 0.65% |
International Equity | | 0.47% | | 0.48% |
For the year ended December 31, 2011, advisory fees (excluding sub-advisory fees) and waivers for each Fund were as follows:
| | | | | | | | | | | | |
| | | Gross
Advisory Fee | | | Waiver/
Reimbursements | | | Net Advisory Fee
(Reimbursement) | |
MyDestination 2005 | | $ | 59,383 | | | $ | (91,223 | ) | | $ | (31,840 | ) |
MyDestination 2015 | | | 263,620 | | | | — | | | | 263,620 | |
MyDestination 2025 | | | 262,159 | | | | — | | | | 262,159 | |
MyDestination 2035 | | | 123,614 | | | | (40,727 | ) | | | 82,887 | |
MyDestination 2045 | | | 83,398 | | | | (74,220 | ) | | | 9,178 | |
Conservative Allocation | | | 277,572 | | | | (148,927 | ) | | | 128,645 | |
Balanced Allocation | | | 1,123,502 | | | | (157,363 | ) | | | 966,139 | |
Growth Allocation | | | 829,002 | | | | (133,967 | ) | | | 695,035 | |
Aggressive Allocation | | | 728,707 | | | | (129,580 | ) | | | 599,127 | |
Conservative Allocation I | | | 75,252 | | | | (66,248 | ) | | | 9,004 | |
Balanced Allocation I | | | 345,383 | | | | — | | | | 345,383 | |
Growth Allocation I | | | 229,376 | | | | (2,458 | ) | | | 226,918 | |
Aggressive Allocation I | | | 151,479 | | | | (38,072 | ) | | | 113,407 | |
Money Market | | | 1,225,379 | | | | — | | | | 1,225,379 | |
Low-Duration Bond | | | 961,344 | | | | (662,153 | ) | | | 299,191 | |
Medium-Duration Bond | | | 1,820,430 | | | | (913,286 | ) | | | 907,144 | |
Extended-Duration Bond | | | 1,009,401 | | | | (163,917 | ) | | | 845,484 | |
Inflation Protected Bond | | | 266,498 | | | | (29,704 | ) | | | 236,794 | |
Global Bond | | | 359,740 | | | | (37,664 | ) | | | 322,076 | |
Defensive Market Strategies | | | 374,710 | | | | (60,934 | ) | | | 313,776 | |
242
| | | | | | | | | | | | |
| | | Gross | | | Waiver/ | | | Net Advisory Fee | |
| | | Advisory Fee | | | Reimbursements | | | (Reimbursement) | |
Equity Index | | $ | 429,361 | | | $ | (258,531 | ) | | $ | 170,830 | |
Real Estate Securities | | | 418,712 | | | | (8,690 | ) | | | 410,022 | |
Value Equity | | | 4,630,051 | | | | (92,338 | ) | | | 4,537,713 | |
Growth Equity | | | 5,525,227 | | | | (880,523 | ) | | | 4,644,704 | |
Small Cap Equity | | | 1,246,863 | | | | (283,090 | ) | | | 963,773 | |
International Equity | | | 5,992,284 | | | | (2,706,637 | ) | | | 3,285,647 | |
b. Distribution and Shareholder Servicing Fees
The Board of Trustees has adopted a Shareholder Service Plan for the GS4 Class of each Select Fund. Under this Plan, the GS4 Class of each Select Fund is authorized to pay fees to parties that provide services for and maintain shareholder accounts. The GS4 Class of each Select Fund was authorized to pay service fees of 0.19% of average daily net assets for the period January 1, 2011 to April 30, 2011. As of May 1, 2011, the GS4 Class of each Select Fund is authorized to pay service fees of 0.24% of average daily net assets.
The Board of Trustees voluntarily agreed to waive shareholder servicing fees and/or reimburse expenses for the GS4 Class of the Money Market Fund to the extent necessary to maintain a minimum daily net yield of at least 0.01%. This voluntary shareholder servicing fee waiver and expense reimbursement may be changed or terminated by the Board of Trustees at any time.
c. Expense Limitation
GSCM has agreed, through April 30, 2012, to waive fees and reimburse expenses of the GS2 Class and GS4 Class of each Fund (excluding interest, taxes, brokerage commissions, dividend expense on securities sold short and extraordinary expenses) which exceed, in the aggregate, the annual percentage rate of each Class’s average daily net assets as follows:
| | | | | | | | | | | | | | | | | | | | |
| | | For the Period
January 1, 2011
to
April 30, 2011 | | For the Period
May 1, 2011
to
December 31, 2011 |
Fund | | GS2 Class | | GS4 Class | | GS2 Class | | GS4 Class |
MyDestination 2005 | | | | NA | | | | | 0.20 | % | | | | NA | | | | | 0.20 | % |
MyDestination 2015 | | | | NA | | | | | 0.20 | % | | | | NA | | | | | 0.20 | % |
MyDestination 2025 | | | | NA | | | | | 0.20 | % | | | | NA | | | | | 0.20 | % |
MyDestination 2035 | | | | NA | | | | | 0.20 | % | | | | NA | | | | | 0.20 | % |
MyDestination 2045 | | | | NA | | | | | 0.20 | % | | | | NA | | | | | 0.20 | % |
Conservative Allocation | | | | NA | | | | | 0.12 | % | | | | NA | | | | | 0.12 | % |
Balanced Allocation | | | | NA | | | | | 0.12 | % | | | | NA | | | | | 0.12 | % |
Growth Allocation | | | | NA | | | | | 0.12 | % | | | | NA | | | | | 0.12 | % |
Aggressive Allocation | | | | NA | | | | | 0.12 | % | | | | NA | | | | | 0.12 | % |
Conservative Allocation I | | | | 0.15 | % | | | | NA | | | | | 0.15 | % | | | | NA | |
Balanced Allocation I | | | | 0.15 | % | | | | NA | | | | | 0.15 | % | | | | NA | |
Growth Allocation I | | | | 0.15 | % | | | | NA | | | | | 0.15 | % | | | | NA | |
Aggressive Allocation I | | | | 0.15 | % | | | | NA | | | | | 0.15 | % | | | | NA | |
Money Market | | | | 0.20 | % | | | | 0.39 | % | | | | 0.20 | % | | | | 0.39 | % |
Low-Duration Bond | | | | 0.36 | % | | | | 0.52 | % | | | | 0.36 | % | | | | 0.57 | % |
Medium-Duration Bond | | | | 0.48 | % | | | | 0.58 | % | | | | 0.48 | % | | | | 0.63 | % |
Extended-Duration Bond | | | | 0.63 | % | | | | 0.69 | % | | | | 0.63 | % | | | | 0.75 | % |
Inflation Protected Bond | | | | NA | | | | | 0.67 | % | | | | NA | | | | | 0.67 | % |
Global Bond | | | | NA | | | | | 1.02 | % | | | | NA | | | | | 1.02 | % |
Defensive Market Strategies | | | | NA | | | | | NA | | | | | 0.99 | % | | | | 1.25 | % |
Equity Index | | | | 0.23 | % | | | | 0.37 | % | | | | 0.23 | % | | | | 0.38 | % |
Real Estate Securities | | | | NA | | | | | 1.29 | % | | | | NA | | | | | 1.29 | % |
Value Equity | | | | 0.74 | % | | | | 0.85 | % | | | | 0.74 | % | | | | 0.94 | % |
243
| | | | | | | | | | | | | | | | |
| | | For the Period
January 1, 2011
to
April 30, 2011 | | | For the Period
May 1, 2011
to
December 31, 2011 | |
Fund | | GS2 Class | | | GS4 Class | | | GS2 Class | | | GS4 Class | |
Growth Equity | | | 0.88 | % | | | 0.97 | % | | | 0.88 | % | | | 1.06 | % |
Small Cap Equity | | | 1.12 | % | | | 1.15 | % | | | 1.12 | % | | | 1.21 | % |
International Equity | | | 0.94 | % | | | 1.12 | % | | | 0.94 | % | | | 1.18 | % |
Each Fund in turn agrees to reimburse GSCM for any operating expenses in excess of the expense limitation paid, waived or assumed by GSCM for that Fund during the limitation period, provided GSCM would not be entitled to reimbursement for any amount that would cause operating expenses to exceed the expense limitation during the year in which the reimbursement would be made, and provided further that no amount will be reimbursed by the Fund more than three years after the year in which it was incurred or waived by GSCM.
At December 31, 2011, the amounts subject to possible future reimbursement under the expense limitation agreement are as follows:
| | | | | | | | | | | | | | | | | | | | | | | | |
| | | GS2 Class | | | GS4 Class | |
| | | 2009 | | | 2010 | | | 2011 | | | 2009 | | | 2010 | | | 2011 | |
MyDestination 2005 | | | NA | | | | NA | | | | NA | | | $ | 34,663 | | | $ | 37,982 | | | $ | 91,223 | |
MyDestination 2015 | | | NA | | | | NA | | | | NA | | | | NA | | | | NA | | | | NA | |
MyDestination 2025 | | | NA | | | | NA | | | | NA | | | | NA | | | | NA | | | | NA | |
MyDestination 2035 | | | NA | | | | NA | | | | NA | | | | 42,923 | | | | 29,344 | | | | 40,727 | |
MyDestination 2045 | | | NA | | | | NA | | | | NA | | | | 60,981 | | | | 53,661 | | | | 74,220 | |
Conservative Allocation | | | NA | | | | NA | | | | NA | | | | 94,137 | | | | 85,986 | | | | 148,927 | |
Balanced Allocation | | | NA | | | | NA | | | | NA | | | | 97,716 | | | | 44,858 | | | | 157,363 | |
Growth Allocation | | | NA | | | | NA | | | | NA | | | | 102,990 | | | | 65,662 | | | | 133,967 | |
Aggressive Allocation | | | NA | | | | NA | | | | NA | | | | 116,674 | | | | 59,666 | | | | 129,580 | |
Conservative Allocation I | | $ | 41,261 | | | $ | 33,009 | | | $ | 66,248 | | | | NA | | | | NA | | | | NA | |
Balanced Allocation I | | | NA | | | | NA | | | | NA | | | | NA | | | | NA | | | | NA | |
Growth Allocation I | | | NA | | | | NA | | | | 2,458 | | | | NA | | | | NA | | | | NA | |
Aggressive Allocation I | | | 14,709 | | | | 7,100 | | | | 38,072 | | | | NA | | | | NA | | | | NA | |
Money Market | | | NA | | | | NA | | | | NA | | | | NA | | | | NA | | | | NA | |
Low-Duration Bond | | | 62,697 | | | | 55,742 | | | | 59,610 | | | | 480,368 | | | | 468,377 | | | | 501,417 | |
Medium-Duration Bond | | | 21,118 | | | | 962 | | | | 34,814 | | | | 829,796 | | | | 799,436 | | | | 701,423 | |
Extended-Duration Bond | | | NA | | | | NA | | | | NA | | | | 112,701 | | | | 108,124 | | | | 141,631 | |
Inflation Protected Bond | | | NA | | | | NA | | | | NA | | | | NA | | | | NA | | | | NA | |
Global Bond | | | NA | | | | NA | | | | NA | | | | NA | | | | NA | | | | NA | |
Defensive Market Strategies | | | NA | | | | NA | | | | 8,654 | | | | NA | | | | NA | | | | 20,289 | |
Equity Index | | | NA | | | | NA | | | | 963 | | | | 152,180 | | | | 128,840 | | | | 240,739 | |
Real Estate Securities | | | NA | | | | NA | | | | NA | | | | NA | | | | NA | | | | NA | |
Value Equity | | | NA | | | | NA | | | | NA | | | | 233,562 | | | | 159,664 | | | | 28,595 | |
Growth Equity | | | 4,179 | | | | NA | | | | NA | | | | 990,164 | | | | 1,049,330 | | | | 775,619 | |
Small Cap Equity | | | NA | | | | NA | | | | NA | | | | 244,965 | | | | 188,066 | | | | 232,755 | |
International Equity | | | 451,372 | | | | 483,790 | | | | 494,427 | | | | 2,302,219 | | | | 2,260,849 | | | | 2,083,992 | |
During the year ended December 31, 2011, GSCM recaptured the following amounts:
| | | | | | | | |
| | | GS2
Class | | | GS4
Class | |
Growth Equity | | $ | 4,216 | | | | N/A | |
244
d. Brokerage Service Arrangements
The Adviser directs the sub-advisers to place a certain percentage of security trades (if feasible) with designated brokers who have agreed to pay certain custody, transfer agency or other operating expenses through the use of Brokerage Service Arrangements on behalf of the Funds shown below.
| | | | |
Fund | | Expenses Paid
Through Brokerage
Service Arrangements | |
Value Equity | | $ | 70,653 | |
Growth Equity | | | 107,493 | |
Small Cap Equity | | | 88,625 | |
International Equity | | | 35,463 | |
e. Administrator, Transfer Agent and Distributor
For its services as Administrator, BNY Mellon Investment Servicing (US) Inc. (“BNY Mellon”) is entitled to receive fees, computed daily and paid monthly, based upon the average daily net assets of each Fund. The fees, excluding out of pocket expenses, currently range between 0.004% and 0.02% of average daily net assets. For its services as Transfer Agent, BNY Mellon receives a fee based mainly upon the number of accounts serviced. Certain minimum fees and transaction charges may apply. For the year ended December 31, 2011, BNY Mellon received $3,381,800 in aggregate fees and expenses for services rendered under the various agreements described above.
Certain employees of BNY Mellon are officers of the Funds. BNY Mellon serves as Administrator and Transfer Agent of the Funds.
BNY Mellon Distributors, Inc. serves as the Underwriter and does not receive any fees in its capacity as Underwriter from GuideStone Funds. The fees are paid by GSCM.
f. Investments in Affiliates
A summary of the Fund of Fund’s total long-term and short-term purchases and sales of the shares of the underlying Select Funds during the year ended December 31, 2011 is as follows:
| | | | | | | | | | | | | | | | | | | | | | | | |
| | | Balance
at
12/31/10 | | | Balance
at
12/31/11 | | | Purchases | | | Sales Proceeds | | | Dividend
Income | | | Distributions
of Realized
Gains | |
MyDestination 2005 | | | | | | | | | | | | | | | | | | | | | | | | |
Money Market | | $ | 1,446,944 | | | $ | 1,386,612 | | | $ | 28,537,103 | | | $ | 28,597,436 | | | $ | 205 | | | $ | 14 | |
Low-Duration Bond | | | 11,993,701 | | | | 16,235,367 | | | | 5,635,470 | | | | 1,608,450 | | | | 232,995 | | | | 35,754 | |
Medium-Duration Bond | | | 9,809,284 | | | | 11,308,110 | | | | 2,710,810 | | | | 1,888,500 | | | | 251,919 | | | | 103,615 | |
Extended-Duration Bond | | | 41,460 | | | | — | | | | — | | | | 41,521 | | | | 237 | | | | — | |
Inflation Protected Bond | | | 8,088,222 | | | | 9,377,236 | | | | 2,733,764 | | | | 2,470,000 | | | | 252,441 | | | | 154,433 | |
Global Bond | | | 539,551 | | | | 52,899 | | | | 14,500 | | | | 526,780 | | | | 17,367 | | | | — | |
Defensive Market Strategies | | | — | | | | 9,038,741 | | | | 8,994,390 | | | | 158,400 | | | | 30,733 | | | | 6,795 | |
Equity Index | | | 1,194,173 | | | | — | | | | 138,500 | | | | 1,327,144 | | | | 8,081 | | | | 5,729 | |
Real Estate Securities | | | 1,612,846 | | | | 1,702,039 | | | | 537,500 | | | | 618,500 | | | | 11,828 | | | | — | |
Value Equity | | | 6,121,558 | | | | 4,541,842 | | | | 1,533,300 | | | | 3,128,500 | | | | 62,821 | | | | — | |
Growth Equity | | | 6,105,156 | | | | 4,431,783 | | | | 1,341,200 | | | | 2,933,500 | | | | — | | | | — | |
Small Cap Equity | | | 1,612,667 | | | | 1,126,770 | | | | 461,470 | | | | 979,500 | | | | 1,293 | | | | — | |
International Equity | | | 6,456,267 | | | | 5,341,531 | | | | 1,987,810 | | | | 2,335,780 | | | | 100,696 | | | | — | |
| | | | | | | | | | | | | | | | | | | | | | | | |
| | $ | 55,021,829 | | | $ | 64,542,930 | | | $ | 54,625,817 | | | $ | 46,614,011 | | | $ | 970,616 | | | $ | 306,340 | |
| | | | | | | | | | | | | | | | | | | | | | | | |
245
| | | | | | | | | | | | | | | | | | | | | | | | |
| | | Balance
at
12/31/10 | | | Balance
at
12/31/11 | | | Purchases | | | Sales Proceeds | | | Dividend
Income | | | Distributions
of Realized
Gains | |
MyDestination 2015 | | | | | | | | | | | | | | | | | | | | | | | | |
Money Market | | $ | 4,387,484 | | | $ | 4,844,410 | | | $ | 86,424,311 | | | $ | 85,967,384 | | | $ | 1,002 | | | $ | 44 | |
Low-Duration Bond | | | 17,164,782 | | | | 21,071,512 | | | | 5,853,000 | | | | 2,249,500 | | | | 316,372 | | | | 46,515 | |
Medium-Duration Bond | | | 27,311,201 | | | | 32,459,757 | | | | 7,606,000 | | | | 4,415,500 | | | | 728,266 | | | | 297,615 | |
Extended-Duration Bond | | | 10,190,119 | | | | 11,127,277 | | | | 1,294,000 | | | | 1,728,500 | | | | 460,002 | | | | 362,310 | |
Inflation Protected Bond | | | 26,156,179 | | | | 31,725,979 | | | | 10,776,950 | | | | 8,684,000 | | | | 859,024 | | | | 509,016 | |
Global Bond | | | 10,702,898 | | | | 11,504,217 | | �� | | 1,471,500 | | | | 1,158,000 | | | | 600,625 | | | | — | |
Defensive Market Strategies | | | — | | | | 52,836,889 | | | | 51,581,900 | | | | — | | | | 179,655 | | | | 39,721 | |
Equity Index | | | 6,630,569 | | | | — | | | | 569,860 | | | | 7,131,763 | | | | 46,891 | | | | 33,242 | |
Real Estate Securities | | | 13,706,233 | | | | 15,453,303 | | | | 4,114,500 | | | | 3,884,000 | | | | 110,464 | | | | — | |
Value Equity | | | 38,315,149 | | | | 27,702,598 | | | | 4,535,500 | | | | 14,974,500 | | | | 397,549 | | | | — | |
Growth Equity | | | 37,854,982 | | | | 26,610,921 | | | | 5,463,100 | | | | 16,063,500 | | | | — | | | | — | |
Small Cap Equity | | | 10,812,318 | | | | 7,117,321 | | | | 1,749,000 | | | | 5,628,000 | | | | 8,169 | | | | — | |
International Equity | | | 39,170,524 | | | | 31,421,274 | | | | 7,825,009 | | | | 10,632,500 | | | | 592,342 | | | | — | |
| | | | | | | | | | | | | | | | | | | | | | | | |
| | $ | 242,402,438 | | | $ | 273,875,458 | | | $ | 189,264,630 | | | $ | 162,517,147 | | | $ | 4,300,361 | | | $ | 1,288,463 | |
| | | | | | | | | | | | | | | | | | | | | | | | |
MyDestination 2025 | | | | | | | | | | | | | | | | | | | | | | | | |
Money Market | | $ | 3,800,041 | | | $ | 4,563,617 | | | $ | 74,511,866 | | | $ | 73,748,290 | | | $ | 899 | | | $ | 50 | |
Low-Duration Bond | | | 2,286,679 | | | | 3,907,553 | | | | 1,997,000 | | | | 422,000 | | | | 53,146 | | | | 8,435 | |
Medium-Duration Bond | | | 17,831,697 | | | | 22,775,602 | | | | 7,788,550 | | | | 4,197,000 | | | | 502,204 | | | | 207,677 | |
Extended-Duration Bond | | | 16,886,834 | | | | 18,932,605 | | | | 3,645,000 | | | | 3,937,500 | | | | 777,506 | | | | 616,906 | |
Inflation Protected Bond | | | 2,296,373 | | | | 5,127,095 | | | | 3,305,500 | | | | 925,000 | | | | 105,974 | | | | 70,180 | |
Global Bond | | | 16,204,972 | | | | 18,375,272 | | | | 3,921,000 | | | | 2,491,500 | | | | 939,148 | | | | — | |
Defensive Market Strategies | | | — | | | | 42,253,683 | | | | 42,416,466 | | | | 1,128,000 | | | | 143,670 | | | | 31,765 | |
Equity Index | | | 7,476,167 | | | | — | | | | 931,500 | | | | 8,314,279 | | | | 55,105 | | | | 39,066 | |
Real Estate Securities | | | 15,487,104 | | | | 18,463,641 | | | | 4,213,500 | | | | 2,838,000 | | | | 127,534 | | | | — | |
Value Equity | | | 44,925,330 | | | | 41,020,132 | | | | 6,131,680 | | | | 9,802,500 | | | | 513,424 | | | | — | |
Growth Equity | | | 44,322,232 | | | | 39,763,711 | | | | 8,317,200 | | | | 12,049,000 | | | | — | | | | — | |
Small Cap Equity | | | 15,170,770 | | | | 12,987,798 | | | | 3,137,000 | | | | 5,539,500 | | | | 14,907 | | | | — | |
International Equity | | | 47,547,848 | | | | 49,595,383 | | | | 13,651,870 | | | | 4,286,500 | | | | 934,953 | | | | — | |
| | | | | | | | | | | | | | | | | | | | | | | | |
| | $ | 234,236,047 | | | $ | 277,766,092 | | | $ | 173,968,132 | | | $ | 129,679,069 | | | $ | 4,168,470 | | | $ | 974,079 | |
| | | | | | | | | | | | | | | | | | | | | | | | |
MyDestination 2035 | | | | | | | | | | | | | | | | | | | | | | | | |
Money Market | | $ | 2,254,225 | | | $ | 3,087,962 | | | $ | 35,657,651 | | | $ | 34,823,914 | | | $ | 261 | | | $ | 26 | |
Medium-Duration Bond | | | 2,685,978 | | | | 2,765,813 | | | | 1,140,000 | | | | 1,252,000 | | | | 64,966 | | | | 25,165 | |
Extended-Duration Bond | | | 2,716,597 | | | | 2,903,731 | | | | 955,000 | | | | 1,147,500 | | | | 121,898 | | | | 95,510 | |
Global Bond | | | 4,859,225 | | | | 8,136,904 | | | | 3,315,000 | | | | 260,000 | | | | 354,332 | | | | — | |
Equity Index | | | 4,003,220 | | | | — | | | | 649,000 | | | | 4,597,510 | | | | 30,175 | | | | 21,392 | |
Real Estate Securities | | | 7,808,060 | | | | 9,369,933 | | | | 1,968,000 | | | | 1,229,000 | | | | 64,863 | | | | — | |
Value Equity | | | 24,439,112 | | | | 29,263,689 | | | | 4,921,120 | | | | 16,500 | | | | 314,459 | | | | — | |
Growth Equity | | | 24,472,766 | | | | 28,653,926 | | | | 5,212,650 | | | | 604,000 | | | | — | | | | — | |
Small Cap Equity | | | 9,584,676 | | | | 10,461,907 | | | | 1,848,500 | | | | 1,114,000 | | | | 12,008 | | | | — | |
International Equity | | | 26,840,516 | | | | 36,407,178 | | | | 15,907,995 | | | | 1,331,500 | | | | 683,277 | | | | — | |
| | | | | | | | | | | | | | | | | | | | | | | | |
| | $ | 109,664,375 | | | $ | 131,051,043 | | | $ | 71,574,916 | | | $ | 46,375,924 | | | $ | 1,646,239 | | | $ | 142,093 | |
| | | | | | | | | | | | | | | | | | | | | | | | |
246
| | | | | | | | | | | | | | | | | | | | | | | | |
| | | Balance
at
12/31/10 | | | Balance
at
12/31/11 | | | Purchases | | | Sales Proceeds | | | Dividend
Income | | | Distributions
of Realized
Gains | |
MyDestination 2045 | | | | | | | | | | | | | | | | | | | | | | | | |
Money Market | | $ | 2,192,973 | | | $ | 2,134,540 | | | $ | 23,305,851 | | | $ | 23,364,284 | | | $ | 188 | | | $ | — | |
Extended-Duration Bond | | | — | | | | 823,344 | | | | 1,325,400 | | | | 540,000 | | | | 10,470 | | | | 23,628 | |
Global Bond | | | — | | | | 4,414,133 | | | | 4,474,500 | | | | 47,500 | | | | 73,016 | | | | — | |
Equity Index | | | 3,597,917 | | | | — | | | | 819,500 | | | | 4,376,563 | | | | 27,134 | | | | 19,236 | |
Real Estate Securities | | | 7,480,868 | | | | 7,964,747 | | | | 2,159,500 | | | | 2,414,000 | | | | 59,302 | | | | — | |
Value Equity | | | 17,371,474 | | | | 20,375,280 | | | | 6,465,840 | | | | 3,308,000 | | | | 230,278 | | | | 18 | |
Growth Equity | | | 17,253,914 | | | | 20,022,846 | | | | 6,318,350 | | | | 3,206,500 | | | | — | | | | — | |
Small Cap Equity | | | 7,258,225 | | | | 7,707,387 | | | | 3,938,500 | | | | 3,674,500 | | | | 8,847 | | | | — | |
International Equity | | | 19,774,485 | | | | 26,136,474 | | | | 12,704,071 | | | | 2,747,000 | | | | 483,111 | | | | — | |
| | | | | | | | | | | | | | | | | | | | | | | | |
| | $ | 74,929,856 | | | $ | 89,578,751 | | | $ | 61,511,512 | | | $ | 43,678,347 | | | $ | 892,346 | | | $ | 42,882 | |
| | | | | | | | | | | | | | | | | | | | | | | | |
Conservative Allocation | | | | | | | | | | | | | | | | | | | | | | | | |
Money Market | | $ | 9,896,880 | | | $ | 6,146,479 | | | $ | 52,525,711 | | | $ | 56,276,112 | | | $ | 799 | | | $ | 70 | |
Low-Duration Bond | | | 151,420,411 | | | | 171,140,785 | | | | 19,762,430 | | | | 2,513,728 | | | | 2,604,931 | | | | 374,896 | |
Inflation Protected Bond | | | 37,948,411 | | | | 42,477,796 | | | | 4,875,000 | | | | 5,016,657 | | | | 1,166,947 | | | | 696,055 | |
Defensive Market Strategies | | | — | | | | 21,686,756 | | | | 21,166,000 | | | | — | | | | 73,739 | | | | 16,303 | |
Equity Index | | | 3,979,058 | | | | — | | | | 122,000 | | | | 4,056,039 | | | | 27,851 | | | | 19,744 | |
Value Equity | | | 17,850,550 | | | | 15,809,176 | | | | 2,345,000 | | | | 4,494,241 | | | | 193,748 | | | | — | |
Growth Equity | | | 17,783,462 | | | | 15,024,688 | | | | 2,495,000 | | | | 5,141,203 | | | | — | | | | — | |
Small Cap Equity | | | 4,371,878 | | | | 3,594,583 | | | | 373,000 | | | | 1,287,042 | | | | 4,126 | | | | — | |
International Equity | | | 19,379,706 | | | | 17,324,412 | | | | 2,698,000 | | | | 2,261,127 | | | | 326,593 | | | | — | |
| | | | | | | | | | | | | | | | | | | | | | | | |
| | $ | 262,630,356 | | | $ | 293,204,675 | | | $ | 106,362,141 | | | $ | 81,046,149 | | | $ | 4,398,734 | | | $ | 1,107,068 | |
| | | | | | | | | | | | | | | | | | | | | | | | |
Balanced Allocation | | | | | | | | | | | | | | | | | | | | | | | | |
Money Market | | $ | 15,760,681 | | | $ | 27,644,304 | | | $ | 179,401,003 | | | $ | 167,517,380 | | | $ | 3,268 | | | $ | 257 | |
Low-Duration Bond | | | 159,599,982 | | | | 158,119,436 | | | | 4,237,000 | | | | 8,290,000 | | | | 2,533,367 | | | | 346,859 | |
Medium-Duration Bond | | | 230,733,468 | | | | 224,775,387 | | | | 3,950,000 | | | | 24,775,000 | | | | 5,370,723 | | | | 2,035,991 | |
Extended-Duration Bond | | | 91,023,291 | | | | 91,687,129 | | | | 4,980,000 | | | | 16,127,000 | | | | 3,962,575 | | | | 3,016,001 | |
Global Bond | | | 53,160,144 | | | | 52,881,287 | | | | 2,355,000 | | | | 5,027,000 | | | | 2,883,736 | | | | — | |
Defensive Market Strategies | | | — | | | | 108,238,087 | | | | 106,350,000 | | | | 660,000 | | | | 368,029 | | | | 81,369 | |
Equity Index | | | 34,267,563 | | | | — | | | | 500,000 | | | | 34,526,911 | | | | 233,050 | | | | 165,216 | |
Value Equity | | | 158,863,675 | | | | 130,871,501 | | | | 7,670,000 | | | | 36,199,000 | | | | 1,661,531 | | | | — | |
Growth Equity | | | 155,709,280 | | | | 126,729,193 | | | | 4,800,000 | | | | 31,470,000 | | | | — | | | | — | |
Small Cap Equity | | | 37,898,076 | | | | 29,331,011 | | | | 2,630,000 | | | | 11,927,000 | | | | 33,666 | | | | — | |
International Equity | | | 165,142,915 | | | | 146,063,033 | | | | 15,957,000 | | | | 12,600,000 | | | | 2,753,523 | | | | — | |
| | | | | | | | | | | | | | | | | | | | | | | | |
| | $ | 1,102,159,075 | | | $ | 1,096,340,368 | | | $ | 332,830,003 | | | $ | 349,119,291 | | | $ | 19,803,468 | | | $ | 5,645,693 | |
| | | | | | | | | | | | | | | | | | | | | | | | |
247
| | | | | | | | | | | | | | | | | | | | | | | | |
| | | Balance
at
12/31/10 | | | Balance
at
12/31/11 | | | Purchases | | | Sales Proceeds | | | Dividend
Income | | | Distributions
of Realized
Gains | |
Growth Allocation | | | | | | | | | | | | | | | | | | | | | | | | |
Money Market | | $ | 15,088,874 | | | $ | 19,900,650 | | | $ | 60,469,192 | | | $ | 55,657,416 | | | $ | 1,486 | | | $ | 135 | |
Low-Duration Bond | | | 58,594,392 | | | | 56,051,733 | | | | 2,956,000 | | | | 6,456,000 | | | | 924,726 | | | | 123,664 | |
Medium-Duration Bond | | | 85,978,945 | | | | 79,774,068 | | | | 1,000,000 | | | | 12,698,000 | | | | 1,962,499 | | | | 728,101 | |
Extended-Duration Bond | | | 33,698,549 | | | | 31,171,733 | | | | 2,700,000 | | | | 9,524,000 | | | | 1,443,114 | | | | 1,040,591 | |
Global Bond | | | 19,930,270 | | | | 18,983,314 | | | | 600,000 | | | | 2,451,000 | | | | 1,062,969 | | | | — | |
Equity Index | | | 38,863,303 | | | | — | | | | — | | | | 39,155,600 | | | | 258,185 | | | | 183,035 | |
Value Equity | | | 179,562,544 | | | | 173,231,995 | | | | 12,709,000 | | | | 19,700,000 | | | | 1,999,886 | | | | — | |
Growth Equity | | | 176,092,878 | | | | 167,612,841 | | | | 12,610,000 | | | | 18,400,000 | | | | — | | | | — | |
Small Cap Equity | | | 42,821,695 | | | | 39,738,385 | | | | 1,000,000 | | | | 4,992,000 | | | | 45,612 | | | | — | |
International Equity | | | 184,994,524 | | | | 195,689,851 | | | | 41,434,000 | | | | 1,300,000 | | | | 3,689,069 | | | | — | |
| | | | | | | | | | | | | | | | | | | | | | | | |
| | $ | 835,625,974 | | | $ | 782,154,570 | | | $ | 135,478,192 | | | $ | 170,334,016 | | | $ | 11,387,546 | | | $ | 2,075,526 | |
| | | | | | | | | | | | | | | | | | | | | | | | |
Aggressive Allocation | | | | | | | | | | | | | | | | | | | | | | | | |
Money Market | | $ | 17,614,735 | | | $ | 16,535,540 | | | $ | 53,254,201 | | | $ | 54,333,396 | | | $ | 1,351 | | | $ | 94 | |
Equity Index | | | 45,524,758 | | | | — | | | | — | | | | 45,226,959 | | | | 301,887 | | | | 214,016 | |
Value Equity | | | 207,607,061 | | | | 197,124,381 | | | | 4,807,000 | | | | 16,028,000 | | | | 2,332,194 | | | | — | |
Growth Equity | | | 202,007,163 | | | | 192,888,334 | | | | 8,445,000 | | | | 14,223,000 | | | | — | | | | — | |
Small Cap Equity | | | 51,156,592 | | | | 44,228,930 | | | | 142,000 | | | | 8,258,000 | | | | 50,766 | | | | — | |
International Equity | | | 219,098,245 | | | | 225,653,215 | | | | 50,143,000 | | | | 10,000,000 | | | | 4,253,927 | | | | — | |
| | | | | | | | | | | | | | | | | | | | | | | | |
| | $ | 743,008,554 | | | $ | 676,430,400 | | | $ | 116,791,201 | | | $ | 148,069,355 | | | $ | 6,940,125 | | | $ | 214,110 | |
| | | | | | | | | | | | | | | | | | | | | | | | |
Conservative Allocation I | | | | | | | | | | | | | | | | | | | | | | | | |
Money Market | | $ | 1,137,030 | | | $ | 859,133 | | | $ | 24,748,691 | | | $ | 25,026,587 | | | $ | 1,486 | | | $ | 29 | |
Low-Duration Bond | | | 42,348,640 | | | | 43,559,455 | | | | 8,146,587 | | | | 7,701,000 | | | | 1,204,664 | | | | 154,877 | |
Inflation Protected Bond | | | 10,610,228 | | | | 10,807,705 | | | | 2,264,657 | | | | 3,330,000 | | | | 319,463 | | | | 189,316 | |
Defensive Market Strategies | | | — | | | | 5,515,960 | | | | 5,900,000 | | | | 520,000 | | | | 23,005 | | | | 4,392 | |
Equity Index | | | 1,113,015 | | | | — | | | | 78,035 | | | | 1,196,714 | | | | 16,046 | | | | 10,409 | |
Value Equity | | | 4,992,861 | | | | 4,017,696 | | | | 998,263 | | | | 2,028,000 | | | | 125,613 | | | | — | |
Growth Equity | | | 4,971,544 | | | | 3,819,314 | | | | 1,124,193 | | | | 2,274,000 | | | | — | | | | — | |
Small Cap Equity | | | 1,225,339 | | | | 911,766 | | | | 199,048 | | | | 554,000 | | | | 4,220 | | | | — | |
International Equity | | | 5,423,583 | | | | 4,406,763 | | | | 1,245,123 | | | | 1,605,000 | | | | 119,853 | | | | — | |
| | | | | | | | | | | | | | | | | | | | | | | | |
| | $ | 71,822,240 | | | $ | 73,897,792 | | | $ | 44,704,597 | | | $ | 44,235,301 | | | $ | 1,814,350 | | | $ | 359,023 | |
| | | | | | | | | | | | | | | | | | | | | | | | |
248
| | | | | | | | | | | | | | | | | | | | | | | | |
| | | Balance
at
12/31/10 | | | Balance
at
12/31/11 | | | Purchases | | | Sales Proceeds | | | Dividend
Income | | | Distributions
of Realized
Gains | |
Balanced Allocation I | | | | | | | | | | | | | | | | | | | | | | | | |
Money Market | | $ | 2,747,513 | | | $ | 7,010,111 | | | $ | 69,803,436 | | | $ | 65,540,837 | | | $ | 5,865 | | | $ | 48 | |
Low-Duration Bond | | | 50,122,605 | | | | 44,791,872 | | | | 2,272,000 | | | | 8,492,000 | | | | 1,335,028 | | | | 162,490 | |
Medium-Duration Bond | | | 72,518,533 | | | | 63,623,363 | | | | 1,336,000 | | | | 14,876,000 | | | | 3,339,636 | | | | 1,191,434 | |
Extended-Duration Bond | | | 28,558,045 | | | | 25,954,308 | | | | 1,668,000 | | | | 7,961,000 | | | | 3,103,134 | | | | 2,288,189 | |
Global Bond | | | 16,685,078 | | | | 14,982,036 | | | | 1,032,000 | | | | 3,469,000 | | | | 892,251 | | | | — | |
Defensive Market Strategies | | | — | | | | 30,655,348 | | | | 32,968,000 | | | | 3,072,000 | | | | 128,691 | | | | 24,848 | |
Equity Index | | | 10,753,267 | | | | — | | | | 204,000 | | | | 10,894,132 | | | | 149,334 | | | | 96,872 | |
Value Equity | | | 49,869,304 | | | | 37,077,070 | | | | 2,896,000 | | | | 15,900,000 | | | | 1,198,158 | | | | — | |
Growth Equity | | | 48,872,324 | | | | 35,923,504 | | | | 1,992,000 | | | | 14,236,000 | | | | — | | | | — | |
Small Cap Equity | | | 11,898,428 | | | | 8,320,866 | | | | 880,000 | | | | 4,684,000 | | | | 38,510 | | | | — | |
International Equity | | | 51,884,281 | | | | 41,343,318 | | | | 5,322,000 | | | | 8,916,000 | | | | 1,134,763 | | | | — | |
| | | | | | | | | | | | | | | | | | | | | | | | |
| | $ | 343,909,378 | | | $ | 309,681,796 | | | $ | 120,373,436 | | | $ | 158,040,969 | | | $ | 11,325,370 | | | $ | 3,763,881 | |
| | | | | | | | | | | | | | | | | | | | | | | | |
Growth Allocation I | | | | | | | | | | | | | | | | | | | | | | | | |
Money Market | | $ | 2,983,368 | | | $ | 3,847,733 | | | $ | 26,164,109 | | | $ | 25,299,743 | | | $ | 3,362 | | | $ | 30 | |
Low-Duration Bond | | | 16,346,241 | | | | 14,239,026 | | | | 1,115,000 | | | | 3,519,000 | | | | 438,548 | | | | 51,998 | |
Medium-Duration Bond | | | 24,007,290 | | | | 20,245,166 | | | | 1,024,000 | | | | 6,332,000 | | | | 1,097,460 | | | | 382,616 | |
Extended-Duration Bond | | | 9,393,510 | | | | 7,916,608 | | | | 1,004,000 | | | | 3,688,000 | | | | 1,016,713 | | | | 707,795 | |
Global Bond | | | 5,555,730 | | | | 4,821,627 | | | | 312,000 | | | | 1,293,000 | | | | 295,689 | | | | — | |
Equity Index | | | 10,837,035 | | | | — | | | | 212,000 | | | | 11,137,136 | | | | 148,230 | | | | 96,156 | |
Value Equity | | | 50,083,969 | | | | 44,000,680 | | | | 4,488,000 | | | | 10,692,000 | | | | 1,296,218 | | | | — | |
Growth Equity | | | 49,105,636 | | | | 42,565,649 | | | | 4,196,000 | | | | 9,928,000 | | | | — | | | | — | |
Small Cap Equity | | | 11,945,987 | | | | 10,088,993 | | | | 588,000 | | | | 2,672,000 | | | | 46,693 | | | | — | |
International Equity | | | 51,638,527 | | | | 49,669,938 | | | | 13,536,000 | | | | 7,232,000 | | | | 1,363,306 | | | | — | |
| | | | | | | | | | | | | | | | | | | | | | | | |
| | $ | 231,897,293 | | | $ | 197,395,420 | | | $ | 52,639,109 | | | $ | 81,792,879 | | | $ | 5,706,219 | | | $ | 1,238,595 | |
| | | | | | | | | | | | | | | | | | | | | | | | |
Aggressive Allocation I | | | | | | | | | | | | | | | | | | | | | | | | |
Money Market | | $ | 2,697,371 | | | $ | 2,463,786 | | | $ | 20,377,982 | | | $ | 20,611,567 | | | $ | 2,410 | | | $ | 19 | |
Equity Index | | | 9,675,471 | | | | — | | | | 92,000 | | | | 9,713,710 | | | | 131,744 | | | | 85,462 | |
Value Equity | | | 44,137,128 | | | | 37,889,295 | | | | 1,776,000 | | | | 8,136,000 | | | | 1,151,533 | | | | — | |
Growth Equity | | | 42,940,300 | | | | 37,068,247 | | | | 1,912,000 | | | | 7,068,000 | | | | — | | | | — | |
Small Cap Equity | | | 10,879,974 | | | | 8,495,806 | | | | 180,000 | | | | 2,792,000 | | | | 39,320 | | | | — | |
International Equity | | | 46,619,540 | | | | 43,344,744 | | | | 10,048,000 | | | | 6,316,000 | | | | 1,189,696 | | | | — | |
| | | | | | | | | | | | | | | | | | | | | | | | |
| | $ | 156,949,784 | | | $ | 129,261,878 | | | $ | 34,385,982 | | | $ | 54,637,277 | | | $ | 2,514,703 | | | $ | 85,481 | |
| | | | | | | | | | | | | | | | | | | | | | | | |
249
4. SECURITIES LENDING
Through an agreement with The Northern Trust Company (“Northern Trust”) (the Funds’ custodian) the Select Funds may lend portfolio securities to certain brokers, dealers and other financial institutions that pay the Select Funds a negotiated fee. The Select Funds receive cash or U.S. government securities as collateral against the loaned securities in an amount at least equal to the market value of the loaned securities. The Funds continue to own the loaned securities and the securities remain in the investment portfolio. However, in the event of default or bankruptcy by the other party to the agreement, realization and/or retention of the collateral may be subject to legal proceedings. Cash collateral has been invested in a short-term money market fund of Northern Trust, an affiliate of the Funds, that invests in securities that satisfy the quality requirements of Rule 2a-7 and have short maturities. At December 31, 2011, the market values of loaned securities and collateral received were as follows:
| | | | | | | | | | | | | | | | |
Fund | | Value of
Securities Loaned | | | Value of
Cash
Collateral | | | Value of
Non-cash
Collateral | | | Total
Value of
Collateral | |
Money Market | | $ | 25,076,053 | | | $ | — | | | $ | 25,577,521 | | | $ | 25,577,521 | |
Low-Duration Bond | | | 108,310,839 | | | | 84,233,733 | | | | 26,429,031 | | | | 110,662,764 | |
Medium-Duration Bond | | | 109,252,029 | | | | 111,295,148 | | | | — | | | | 111,295,148 | |
Extended-Duration Bond | | | 24,110,014 | | | | 23,397,891 | | | | 1,162,149 | | | | 24,560,040 | |
Inflation Protected Bond | | | 66,981,153 | | | | 9,341,031 | | | | 58,932,330 | | | | 68,273,361 | |
Global Bond | | | 29,064,979 | | | | 29,584,211 | | | | 336,535 | | | | 29,920,746 | |
Equity Index | | | 18,036,419 | | | | 18,335,064 | | | | 204,449 | | | | 18,539,513 | |
Real Estate Securities | | | 28,500,197 | | | | 29,423,155 | | | | — | | | | 29,423,155 | |
Value Equity | | | 75,492,406 | | | | 77,433,427 | | | | — | | | | 77,433,427 | |
Growth Equity | | | 125,870,148 | | | | 128,085,397 | | | | 1,464,998 | | | | 129,550,395 | |
Small Cap Equity | | | 151,687,605 | | | | 154,245,790 | | | | 2,228,863 | | | | 156,474,653 | |
International Equity | | | 77,912,445 | | | | 73,672,665 | | | | 6,966,257 | | | | 80,638,922 | |
5. 10% SHAREHOLDERS
The Date Target and Asset Allocation Funds do not invest in the underlying Select Funds for the purpose of exercising management or control; however, investments made by each Date Target and Asset Allocation Fund within each of its principal investment strategies may represent a significant portion of an underlying Select Fund’s net assets. At December 31, 2011, the Date Target and Asset Allocation Funds were the owner of record of the following approximate percentages of the total outstanding shares of the underlying Select Funds as detailed below:
| | | | | | | | | | | | | | | | | | | | | | | | | | | | | | | | | | | | | | | | | | | | |
Fund | | Low-
Duration
Bond | | | Medium-
Duration
Bond | | | Extended-
Duration
Bond | | | Inflation
Protected
Bond | | | Global
Bond | | | Defensive
Market
Strategies | | | Real
Estate
Securities | | | Value
Equity | | | Growth
Equity | | | Small
Cap
Equity | | | International
Equity | |
MyDestination 2005 | | | 2.00 | % | | | 1.05 | % | | | — | | | | 5.75 | % | | | 0.03 | % | | | 2.87 | % | | | 1.13 | % | | | 0.36 | % | | | 0.37 | % | | | 0.25 | % | | | 0.43 | % |
MyDestination 2015 | | | 2.60 | | | | 3.01 | | | | 2.11 | % | | | 19.44 | | | | 6.76 | | | | 16.77 | | | | 10.29 | | | | 2.21 | | | | 2.20 | | | | 1.58 | | | | 2.52 | |
MyDestination 2025 | | | 0.48 | | | | 2.11 | | | | 3.59 | | | | 3.14 | | | | 10.80 | | | | 13.41 | | | | 12.29 | | | | 3.28 | | | | 3.29 | | | | 2.88 | | | | 3.97 | |
MyDestination 2035 | | | — | | | | 0.26 | | | | 0.55 | | | | — | | | | 4.78 | | | | — | | | | 6.24 | | | | 2.34 | | | | 2.37 | | | | 2.32 | | | | 2.92 | |
MyDestination 2045 | | | — | | | | — | | | �� | 0.16 | | | | — | | | | 2.59 | | | | — | | | | 5.30 | | | | 1.63 | | | | 1.66 | | | | 1.71 | | | | 2.09 | |
Conservative Allocation | | | 21.13 | | | | — | | | | — | | | | 26.03 | | | | — | | | | 6.88 | | | | — | | | | 1.26 | | | | 1.24 | | | | 0.80 | | | | 1.39 | |
Balanced Allocation | | | 19.52 | | | | 20.83 | | | | 17.38 | | | | — | | | | 31.07 | | | | 34.35 | | | | — | | | | 10.46 | | | | 10.49 | | | | 6.51 | | | | 11.71 | |
Growth Allocation | | | 6.92 | | | | 7.39 | | | | 5.91 | | | | — | | | | 11.15 | | | | — | | | | — | | | | 13.84 | | | | 13.87 | | | | 8.82 | | | | 15.68 | |
Aggressive Allocation | | | — | | | | — | | | | — | | | | — | | | | — | | | | — | | | | — | | | | 15.75 | | | | 15.96 | | | | 9.82 | | | | 18.09 | |
Conservative Allocation I | | | 8.27 | | | | — | | | | — | | | | 6.62 | | | | — | | | | 1.75 | | | | — | | | | 0.64 | | | | 0.50 | | | | 0.31 | | | | 0.46 | |
Balanced Allocation I | | | 8.50 | | | | 11.46 | | | | 12.97 | | | | — | | | | 8.80 | | | | 9.73 | | | | — | | | | 5.90 | | | | 4.71 | | | | 2.78 | | | | 4.33 | |
Growth Allocation I | | | 2.70 | | | | 3.65 | | | | 3.96 | | | | — | | | | 2.83 | | | | — | | | | — | | | | 7.00 | | | | 5.58 | | | | 3.38 | | | | 5.20 | |
Aggressive Allocation I | | | — | | | | — | | | | — | | | | — | | | | — | | | | — | | | | — | | | | 6.03 | | | | 4.86 | | | | 2.84 | | | | 4.54 | |
250
6. INVESTMENT TRANSACTIONS
For the year ended December 31, 2011, the cost of purchases and proceeds from sales and maturities for each Fund were as follows:
| | | | | | | | | | | | | | | | |
| | | Cost of Purchases and
Proceeds from Sales and Maturities
of Long-Term Securities
(other than U.S. Government Obligations) | | | Cost of Purchases and
Proceeds from Sales and Maturities
of Long-Term U.S. Government Obligations | |
| | | Purchases | | | Sale and Maturity
Proceeds | | | Purchases | | | Sale and Maturity
Proceeds | |
MyDestination 2005 | | $ | 27,366,049 | | | $ | 18,016,575 | | | $ | — | | | $ | — | |
MyDestination 2015 | | | 102,840,319 | | | | 76,549,763 | | | | 5,220,805 | | | | 8,068,837 | |
MyDestination 2025 | | | 99,456,266 | | | | 55,930,779 | | | | 4,175,902 | | | | 5,408,354 | |
MyDestination 2035 | | | 35,917,265 | | | | 11,552,010 | | | | 826,853 | | | | 1,039,284 | |
MyDestination 2045 | | | 39,140,682 | | | | 20,314,063 | | | | — | | | | — | |
Conservative Allocation | | | 59,341,971 | | | | 24,770,038 | | | | — | | | | — | |
Balanced Allocation | | | 153,429,000 | | | | 181,601,911 | | | | 20,937,154 | | | | 38,941,511 | |
Growth Allocation | | | 75,009,000 | | | | 114,676,600 | | | | 8,946,798 | | | | 14,522,086 | |
Aggressive Allocation | | | 63,537,000 | | | | 93,735,959 | | | | — | | | | — | |
Conservative Allocation I | | | 19,955,907 | | | | 19,208,714 | | | | — | | | | — | |
Balanced Allocation I | | | 50,570,000 | | | | 92,500,132 | | | | 8,497,155 | | | | 11,701,740 | |
Growth Allocation I | | | 26,475,000 | | | | 56,493,136 | | | | 2,904,695 | | | | 3,987,740 | |
Aggressive Allocation I | | | 14,008,000 | | | | 34,025,710 | | | | — | | | | — | |
Low-Duration Bond | | | 1,031,231,153 | | | | 951,763,328 | | | | 513,744,750 | | | | 479,862,024 | |
Medium-Duration Bond | | | 5,061,613,100 | | | | 5,061,839,015 | | | | 437,249,025 | | | | 395,009,368 | |
Extended-Duration Bond | | | 128,937,518 | | | | 163,521,072 | | | | 31,347,118 | | | | 31,535,725 | |
Inflation Protected Bond | | | — | | | | — | | | | 168,462,534 | | | | 137,702,575 | |
Global Bond | | | 102,805,859 | | | | 100,352,163 | | | | 1,745,213 | | | | 4,389,403 | |
Defensive Market Strategies | | | 596,448,616 | | | | 360,223,839 | | | | — | | | | — | |
Equity Index | | | 11,796,463 | | | | 197,871,511 | | | | — | | | | — | |
Real Estate Securities | | | 132,771,496 | | | | 134,967,000 | | | | — | | | | — | |
Value Equity | | | 391,179,295 | | | | 501,901,964 | | | | — | | | | — | |
Growth Equity | | | 711,105,877 | | | | 859,684,099 | | | | — | | | | — | |
Small Cap Equity | | | 695,882,341 | | | | 751,079,684 | | | | 42,205,112 | | | | 49,508,386 | |
International Equity | | | 1,070,127,873 | | | | 1,055,245,594 | | | | — | | | | — | |
Financial Futures Contracts
Investments as of December 31, 2011, included cash and securities that were valued and pledged as collateral to cover initial margin deposits. The market value of the open futures contracts is as follows:
| | | | | | | | | | | | | | | | |
Fund/Future Type | | Expiration Date | | Open Long
(Short) Contracts | | | Notional
Market Value
of Contracts | | | Counter-
party | | Net Unrealized
Appreciation
(Depreciation)
on Futures | |
| | | | | |
MyDestination 2005 | | | | | | | | | | | | | | | | |
MSCI EAFE Index E-Mini | | 03/2012 | | | 2 | | | $ | 140,940 | | | GSC | | $ | (2,144 | ) |
MSCI Emerging Markets E-Mini | | 03/2012 | | | 1 | | | | 46,075 | | | GSC | | | (1,127 | ) |
S&P 500® E-Mini | | 03/2012 | | | 6 | | | | 375,780 | | | GSC | | | 5,845 | |
5-Year U.S. Treasury Note | | 04/2012 | | | 7 | | | | 862,805 | | | GSC | | | 2,453 | |
| | | | | | | | | | | | | | | | |
| | | | | | | | $ | 1,425,600 | | | | | $ | 5,027 | |
| | | | | | | | | | | | | | | | |
MyDestination 2015 | | | | | | | | | | | | | | | | |
MSCI EAFE Index E-Mini | | 03/2012 | | | 12 | | | $ | 845,640 | | | GSC | | $ | (9,692 | ) |
MSCI Emerging Markets E-Mini | | 03/2012 | | | 4 | | | | 184,300 | | | GSC | | | (4,510 | ) |
S&P 500® E-Mini | | 03/2012 | | | 31 | | | | 1,941,530 | | | GSC | | | 26,268 | |
10-Year U.S. Treasury Note | | 03/2012 | | | 14 | | | | 1,835,750 | | | GSC | | | 15,501 | |
| | | | | | | | | | | | | | | | |
| | | | | | | | $ | 4,807,220 | | | | | $ | 27,567 | |
| | | | | | | | | | | | | | | | |
251
| | | | | | | | | | | | | | | | |
Fund/Future Type | | Expiration Date | | Open Long
(Short) Contracts | | | Notional
Market Value
of Contracts | | | Counter-
party | | Net Unrealized
Appreciation
(Depreciation)
on Futures | |
MyDestination 2025 | | | | | | | | | | | | | | | | |
MSCI EAFE Index E-Mini | | 03/2012 | | | 12 | | | $ | 845,640 | | | GSC | | $ | (4,448 | ) |
MSCI Emerging Markets E-Mini | | 03/2012 | | | 5 | | | | 230,375 | | | GSC | | | (5,637 | ) |
S&P 500® E-Mini | | 03/2012 | | | 38 | | | | 2,379,940 | | | GSC | | | 44,845 | |
10-Year U.S. Treasury Note | | 03/2012 | | | 10 | | | | 1,311,250 | | | GSC | | | 9,751 | |
| | | | | | | | | | | | | | | | |
| | | | | | | | $ | 4,767,205 | | | | | $ | 44,511 | |
| | | | | | | | | | | | | | | | |
MyDestination 2035 | | | | | | | | | | | | | | | | |
MSCI EAFE Index E-Mini | | 03/2012 | | | 9 | | | $ | 634,230 | | | GSC | | $ | (9,647 | ) |
MSCI Emerging Markets E-Mini | | 03/2012 | | | 4 | | | | 184,300 | | | GSC | | | (4,510 | ) |
S&P 500® E-Mini | | 03/2012 | | | 30 | | | | 1,878,900 | | | GSC | | | 38,407 | |
10-Year U.S. Treasury Note | | 03/2012 | | | 3 | | | | 393,375 | | | GSC | | | 1,953 | |
| | | | | | | | | | | | | | | | |
| | | | | | | | $ | 3,090,805 | | | | | $ | 26,203 | |
| | | | | | | | | | | | | | | | |
MyDestination 2045 | | | | | | | | | | | | | | | | |
MSCI EAFE Index E-Mini | | 03/2012 | | | 8 | | | $ | 563,760 | | | GSC | | $ | (4,971 | ) |
MSCI Emerging Markets E-Mini | | 03/2012 | | | 3 | | | | 138,225 | | | GSC | | | (3,382 | ) |
S&P 500® E-Mini | | 03/2012 | | | 21 | | | | 1,315,230 | | | GSC | | | 20,590 | |
10-Year U.S. Treasury Note | | 03/2012 | | | 1 | | | | 131,125 | | | GSC | | | 484 | |
| | | | | | | | | | | | | | | | |
| | | | | | | | $ | 2,148,340 | | | | | $ | 12,721 | |
| | | | | | | | | | | | | | | | |
Conservative Allocation | | | | | | | | | | | | | | | | |
MSCI EAFE Index E-Mini | | 03/2012 | | | 6 | | | $ | 422,820 | | | GSC | | $ | (6,431 | ) |
MSCI Emerging Markets E-Mini | | 03/2012 | | | 2 | | | | 92,150 | | | GSC | | | (2,255 | ) |
S&P 500® E-Mini | | 03/2012 | | | 16 | | | | 1,002,080 | | | GSC | | | 17,920 | |
2-Year U.S. Treasury Note | | 04/2012 | | | 21 | | | | 4,631,484 | | | GSC | | | 2,251 | |
| | | | | | | | | | | | | | | | |
| | | | | | | | $ | 6,148,534 | | | | | $ | 11,485 | |
| | | | | | | | | | | | | | | | |
Balanced Allocation | | | | | | | | | | | | | | | | |
MSCI EAFE Index E-Mini | | 03/2012 | | | 52 | | | $ | 3,664,440 | | | GSC | | $ | (11,857 | ) |
MSCI Emerging Markets E-Mini | | 03/2012 | | | 25 | | | | 1,151,875 | | | GSC | | | (14,197 | ) |
S&P 500® E-Mini | | 03/2012 | | | 149 | | | | 9,331,870 | | | GSC | | | 180,322 | |
10-Year U.S. Treasury Note | | 03/2012 | | | 13 | | | | 1,704,625 | | | GSC | | | 15,237 | |
Long U.S. Treasury Bond | | 03/2012 | | | 19 | | | | 2,751,438 | | | GSC | | | 15,356 | |
5-Year U.S. Treasury Note | | 04/2012 | | | 54 | | | | 6,655,922 | | | GSC | | | 24,305 | |
| | | | | | | | | | | | | | | | |
| | | | | | | | $ | 25,260,170 | | | | | $ | 209,166 | |
| | | | | | | | | | | | | | | | |
Growth Allocation | | | | | | | | | | | | | | | | |
MSCI EAFE Index E-Mini | | 03/2012 | | | 60 | | | $ | 4,228,200 | | | GSC | | $ | 23,447 | |
MSCI Emerging Markets E-Mini | | 03/2012 | | | 28 | | | | 1,290,100 | | | GSC | | | (1,258 | ) |
S&P 500® E-Mini | | 03/2012 | | | 161 | | | | 10,083,430 | | | GSC | | | 241,909 | |
10-Year U.S. Treasury Note | | 03/2012 | | | 5 | | | | 655,625 | | | GSC | | | 3,360 | |
Long U.S. Treasury Bond | | 03/2012 | | | 7 | | | | 1,013,688 | | | GSC | | | 3,535 | |
5-Year U.S. Treasury Note | | 04/2012 | | | 20 | | | | 2,465,156 | | | GSC | | | 6,555 | |
| | | | | | | | | | | | | | | | |
| | | | | | | | $ | 19,736,199 | | | | | $ | 277,548 | |
| | | | | | | | | | | | | | | | |
Aggressive Allocation | | | | | | | | | | | | | | | | |
MSCI EAFE Index E-Mini | | 03/2012 | | | 56 | | | $ | 3,946,320 | | | GSC | | $ | 85,045 | |
MSCI Emerging Markets E-Mini | | 03/2012 | | | 29 | | | | 1,336,175 | | | GSC | | | 20,517 | |
S&P 500® E-Mini | | 03/2012 | | | 155 | | | | 9,707,650 | | | GSC | | | 283,557 | |
| | | | | | | | | | | | | | | | |
| | | | | | | | $ | 14,990,145 | | | | | $ | 389,119 | |
| | | | | | | | | | | | | | | | |
Conservative Allocation I | | | | | | | | | | | | | | | | |
MSCI EAFE Index E-Mini | | 03/2012 | | | 1 | | | $ | 70,470 | | | GSC | | $ | 2,585 | |
S&P 500® E-Mini | | 03/2012 | | | 1 | | | | 62,630 | | | GSC | | | 1,987 | |
2-Year U.S. Treasury Note | | 04/2012 | | | 3 | | | | 661,641 | | | GSC | | | (375 | ) |
| | | | | | | | | | | | | | | | |
| | | | | | | | $ | 794,741 | | | | | $ | 4,197 | |
| | | | | | | | | | | | | | | | |
252
| | | | | | | | | | | | | | | | |
Fund/Future Type | | Expiration Date | | Open Long
(Short) Contracts | | | Notional
Market Value
of Contracts | | | Counter-
party | | Net Unrealized
Appreciation
(Depreciation)
on Futures | |
Balanced Allocation I | | | | | | | | | | | | | | | | |
MSCI EAFE Index E-Mini | | 03/2012 | | | 13 | | | $ | 916,110 | | | GSC | | $ | 33,602 | |
MSCI Emerging Markets E-Mini | | 03/2012 | | | 6 | | | | 276,450 | | | GSC | | | 7,225 | |
S&P 500® E-Mini | | 03/2012 | | | 36 | | | | 2,254,680 | | | GSC | | | 71,549 | |
10-Year U.S. Treasury Note | | 03/2012 | | | 3 | | | | 393,375 | | | GSC | | | (234 | ) |
Long U.S. Treasury Bond | | 03/2012 | | | 5 | | | | 724,063 | | | GSC | | | (563 | ) |
5-Year U.S. Treasury Note | | 04/2012 | | | 13 | | | | 1,602,352 | | | GSC | | | (1,219 | ) |
| | | | | | | | | | | | | | | | |
| | | | | | | | $ | 6,167,030 | | | | | $ | 110,360 | |
| | | | | | | | | | | | | | | | |
Growth Allocation Fund I | | | | | | | | | | | | | | | | |
MSCI EAFE Index E-Mini | | 03/2012 | | | 12 | | | $ | 845,640 | | | GSC | | $ | 29,313 | |
MSCI Emerging Markets E-Mini | | 03/2012 | | | 5 | | | | 230,375 | | | GSC | | | 6,021 | |
S&P 500® E-Mini | | 03/2012 | | | 32 | | | | 2,004,160 | | | GSC | | | 60,969 | |
10-Year U.S. Treasury Note | | 03/2012 | | | 1 | | | | 131,125 | | | GSC | | | (78 | ) |
Long U.S. Treasury Bond | | 03/2012 | | | 1 | | | | 144,813 | | | GSC | | | (406 | ) |
5-Year U.S. Treasury Note | | 04/2012 | | | 5 | | | | 616,289 | | | GSC | | | (469 | ) |
| | | | | | | | | | | | | | | | |
| | | | | | | | $ | 3,972,402 | | | | | $ | 95,350 | |
| | | | | | | | | | | | | | | | |
Aggressive Allocation Fund I | | | | | | | | | | | | | | | | |
MSCI EAFE Index E-Mini | | 03/2012 | | | 9 | | | $ | 634,230 | | | GSC | | $ | 21,559 | |
MSCI Emerging Markets E-Mini | | 03/2012 | | | 6 | | | | 276,450 | | | GSC | | | 7,225 | |
S&P 500® E-Mini | | 03/2012 | | | 26 | | | | 1,628,380 | | | GSC | | | 50,359 | |
| | | | | | | | | | | | | | | | |
| | | | | | | | $ | 2,539,060 | | | | | $ | 79,143 | |
| | | | | | | | | | | | | | | | |
| | | | | |
Low-Duration Bond | | | | | | | | | | | | | | | | |
Euro Schatz | | 03/2012 | | | (80 | ) | | $ | (11,424,578 | ) | | GSC | | $ | (515 | ) |
90-Day Euro | | 03/2012 | | | (6 | ) | | | (1,490,325 | ) | | CITI | | | (4,842 | ) |
10-Year U.S. Treasury Note | | 03/2012 | | | (155 | ) | | | (20,324,375 | ) | | CITI | | | (156,431 | ) |
2-Year U.S. Treasury Note | | 04/2012 | | | 142 | | | | 31,317,656 | | | CITI | | | 18,220 | |
2-Year U.S. Treasury Note | | 04/2012 | | | 60 | | | | 13,232,813 | | | CS | | | 10,214 | |
2-Year U.S. Treasury Note | | 04/2012 | | | 40 | | | | 8,821,875 | | | CS | | | 4,309 | |
2-Year U.S. Treasury Note | | 04/2012 | | | 13 | | | | 2,867,109 | | | GSC | | | 1,172 | |
2-Year U.S. Treasury Note | | 04/2012 | | | 26 | | | | 5,734,219 | | | UBS | | | 2,299 | |
5-Year U.S. Treasury Note | | 04/2012 | | | 25 | | | | 3,081,445 | | | CITI | | | 17,908 | |
5-Year U.S. Treasury Note | | 04/2012 | | | 42 | | | | 5,176,828 | | | GSC | | | 22,818 | |
5-Year U.S. Treasury Note | | 04/2012 | | | 46 | | | | 5,669,859 | | | MLCS | | | 34,053 | |
5-Year U.S. Treasury Note | | 04/2012 | | | (39 | ) | | | (4,807,055 | ) | | CITI | | | (21,595 | ) |
90-Day Euro | | 06/2012 | | | (1 | ) | | | (248,238 | ) | | CITI | | | 135 | |
90-Day Euro | | 09/2012 | | | (1 | ) | | | (248,163 | ) | | CITI | | | 160 | |
90-Day Euro | | 12/2012 | | | (2 | ) | | | (496,225 | ) | | CITI | | | 345 | |
90-Day Euro | | 06/2013 | | | 2 | | | | 496,175 | | | CITI | | | 9,007 | |
90-Day Euro | | 03/2014 | | | 213 | | | | 52,754,775 | | | GSC | | | 77,017 | |
90-Day Euro | | 03/2014 | | | (2 | ) | | | (495,350 | ) | | CITI | | | (1,006 | ) |
90-Day Euro | | 06/2014 | | | 53 | | | | 13,108,888 | | | GSC | | | 29,764 | |
90-Day Euro | | 06/2014 | | | (2 | ) | | | (494,675 | ) | | CITI | | | (1,331 | ) |
90-Day Euro | | 09/2014 | | | (2 | ) | | | (493,900 | ) | | CITI | | | (1,581 | ) |
| | | | | | | | | | | | | | | | |
| | | | | | | | $ | 101,738,758 | | | | | $ | 40,120 | |
| | | | | | | | | | | | | | | | |
| | | | | |
Medium-Duration Bond | | | | | | | | | | | | | | | | |
10-Year U.S. Treasury Note | | 03/2012 | | | 43 | | | $ | 5,638,375 | | | CITI | | $ | 62,607 | |
10-Year U.S. Treasury Note | | 03/2012 | | | 12 | | | | 1,573,500 | | | JPM | | | 6,195 | |
10-Year U.S. Treasury Note | | 03/2012 | | | 59 | | | | 7,736,375 | | | MLCS | | | 68,043 | |
10-Year U.S. Treasury Note | | 03/2012 | | | (26 | ) | | | (3,409,250 | ) | | JPM | | | (26,240 | ) |
253
| | | | | | | | | | | | | | | | |
Fund/Future Type | | Expiration Date | | Open Long
(Short) Contracts | | | Notional
Market Value
of Contracts | | | Counter-
party | | Net Unrealized
Appreciation
(Depreciation)
on Futures | |
Long U.S. Treasury Bond | | 03/2012 | | | (6 | ) | | $ | (868,875 | ) | | BAR | | $ | (10,707 | ) |
Long U.S. Treasury Bond | | 03/2012 | | | (23 | ) | | | (3,330,688 | ) | | CITI | | | (42,802 | ) |
Long U.S. Treasury Bond | | 03/2012 | | | (25 | ) | | | (3,620,313 | ) | | GSC | | | (11,019 | ) |
Long U.S. Treasury Bond | | 03/2012 | | | (7 | ) | | | (1,013,688 | ) | | JPM | | | (8,335 | ) |
Long U.S. Treasury Bond | | 03/2012 | | | (6 | ) | | | (868,875 | ) | | MLCS | | | (7,051 | ) |
Long U.S. Treasury Bond | | 03/2012 | | | (54 | ) | | | (7,819,875 | ) | | MSCS | | | 19,075 | |
Long U.S. Treasury Bond | | 03/2012 | | | (1 | ) | | | (144,813 | ) | | UBS | | | (1,503 | ) |
Ultra Long U.S. Treasury Bond | | 03/2012 | | | 60 | | | | 9,611,250 | | | CITI | | | 154,661 | |
Ultra Long U.S. Treasury Bond | | 03/2012 | | | 23 | | | | 3,684,313 | | | JPM | | | 21,042 | |
Ultra Long U.S. Treasury Bond | | 03/2012 | | | 2 | | | | 320,375 | | | MSCS | | | 3,306 | |
2-Year U.S. Treasury Note | | 04/2012 | | | 27 | | | | 5,954,766 | | | DEUT | | | 2,065 | |
2-Year U.S. Treasury Note | | 04/2012 | | | (79 | ) | | | (17,423,203 | ) | | MLCS | | | (8,007 | ) |
5-Year U.S. Treasury Note | | 04/2012 | | | 91 | | | | 11,216,461 | | | CITI | | | 44,379 | |
5-Year U.S. Treasury Note | | 04/2012 | | | (2 | ) | | | (246,516 | ) | | BAR | | | (210 | ) |
5-Year U.S. Treasury Note | | 04/2012 | | | (147 | ) | | | (18,118,898 | ) | | GSC | | | (73,454 | ) |
5-Year U.S. Treasury Note | | 04/2012 | | | (61 | ) | | | (7,518,727 | ) | | JPM | | | (33,745 | ) |
| | | | | | | | | | | | | | | | |
| | | | | | | | $ | (18,648,306 | ) | | | | $ | 158,300 | |
| | | | | | | | | | | | | | | | |
Inflation Protected Bond | | | | | | | | | | | | | | | | |
10-Year U.S. Treasury Note | | 03/2012 | | | 93 | | | $ | 12,194,625 | | | UBS | | $ | 109,590 | |
Long U.S. Treasury Bond | | 03/2012 | | | (48 | ) | | | (6,951,000 | ) | | UBS | | | (107,566 | ) |
Ultra Long U.S. Treasury Bond | | 03/2012 | | | (50 | ) | | | (8,009,375 | ) | | UBS | | | (76,048 | ) |
2-Year U.S. Treasury Note | | 04/2012 | | | (17 | ) | | | (3,749,297 | ) | | UBS | | | (1,095 | ) |
5-Year U.S. Treasury Note | | 04/2012 | | | 97 | | | | 11,956,008 | | | UBS | | | 37,349 | |
| | | | | | | | | | | | | | | | |
| | | | | | | | $ | 5,440,961 | | | | | $ | (37,770 | ) |
| | | | | | | | | | | | | | | | |
Global Bond | | | | | | | | | | | | | | | | |
10-Year U.S. Treasury Note | | 03/2012 | | | 7 | | | $ | 917,875 | | | GSC | | $ | 10,204 | |
10-Year U.S. Treasury Note | | 03/2012 | | | 18 | | | | 2,360,250 | | | MLCS | | | 20,613 | |
Long U.S. Treasury Bond | | 03/2012 | | | 3 | | | | 434,438 | | | MLCS | | | 154 | |
5-Year U.S. Treasury Note | | 04/2012 | | | (43 | ) | | | (5,300,086 | ) | | GSC | | | (21,944 | ) |
| | | | | | | | | | | | | | | | |
| | | | | | | | $ | (1,587,523 | ) | | | | $ | 9,027 | |
| | | | | | | | | | | | | | | | |
Defensive Market Strategies | | | | | | | | | | | | | | | | |
S&P 500® E-Mini | | 03/2012 | | | 79 | | | $ | 4,947,770 | | | GSC | | $ | 113,467 | |
| | | | | | | | | | | | | | | | |
Equity Index | | | | | | | | | | | | | | | | |
S&P 500® E-Mini | | 03/2012 | | | 81 | | | $ | 5,073,030 | | | GSC | | $ | 133,955 | |
S&P 500® | | 03/2012 | | | 11 | | | | 3,444,650 | | | GSC | | | 120,603 | |
| | | | | | | | | | | | | | | | |
| | | | | | | | $ | 8,517,680 | | | | | $ | 254,558 | |
| | | | | | | | | | | | | | | | |
Real Estate Securities | | | | | | | | | | | | | | | | |
S&P 500® MidCap 400 | | 03/2012 | | | 59 | | | $ | 5,176,070 | | | GSC | | $ | 53,620 | |
| | | | | | | | | | | | | | | | |
Value Equity | | | | | | | | | | | | | | | | |
S&P 500® E-Mini | | 03/2012 | | | 344 | | | $ | 21,544,720 | | | GSC | | $ | 713,686 | |
| | | | | | | | | | | | | | | | |
Growth Equity | | | | | | | | | | | | | | | | |
S&P 500® E-Mini | | 03/2012 | | | 896 | | | $ | 56,116,480 | | | GSC | | $ | 754,084 | |
| | | | | | | | | | | | | | | | |
Small Cap Equity | | | | | | | | | | | | | | | | |
Euro-Bund | | 03/2012 | | | 3 | | | $ | 539,856 | | | GSC | | $ | 14,839 | |
Russell 2000® IMM-Mini | | 03/2012 | | | 792 | | | | 58,512,960 | | | GSC | | | 1,143,026 | |
10-Year U.S. Treasury Note | | 03/2012 | | | 13 | | | | 1,704,625 | | | GSC | | | 11,536 | |
Long U.S. Treasury Bond | | 03/2012 | | | 2 | | | | 289,625 | | | GSC | | | 3,744 | |
Ultra Long U.S. Treasury Bond | | 03/2012 | | | 4 | | | | 640,750 | | | GSC | | | 4,604 | |
2-Year U.S. Treasury Note | | 04/2012 | | | (15 | ) | | | (3,308,203 | ) | | GSC | | | (1,564 | ) |
5-Year U.S. Treasury Note | | 04/2012 | | | (13 | ) | | | (1,602,352 | ) | | GSC | | | (5,308 | ) |
| | | | | | | | | | | | | | | | |
| | | | | | | | $ | 56,777,261 | | | | | $ | 1,170,877 | |
| | | | | | | | | | | | | | | | |
254
| | | | | | | | | | | | | | | | |
Fund/Future Type | | Expiration Date | | Open Long
(Short) Contracts | | | Notional
Market Value
of Contracts | | | Counter-
party | | Net Unrealized
Appreciation
(Depreciation)
on Futures | |
International Equity | | | | | | | | | | | | | | | | |
AEX Index | | 01/2012 | | | (8 | ) | | $ | (648,677 | ) | | BAR | | $ | (37,479 | ) |
OMX 30 Index | | 01/2012 | | | (99 | ) | | | (1,422,701 | ) | | BAR | | | (54,802 | ) |
CAC40 Index | | 01/2012 | | | 289 | | | | 11,840,154 | | | BAR | | | 466,848 | |
IBEX 35 | | 01/2012 | | | 21 | | | | 2,303,708 | | | BAR | | | 67,536 | |
MSCI Singapore Index | | 01/2012 | | | 10 | | | | 463,051 | | | BAR | | | (7,871 | ) |
TOPIX Index® | | 03/2012 | | | 14 | | | | 1,324,152 | | | BAR | | | (15,820 | ) |
ASX SPI 200 Index | | 03/2012 | | | (149 | ) | | | (15,312,079 | ) | | BAR | | | 634,979 | |
FTSE MIB Index | | 03/2012 | | | 67 | | | | 6,552,585 | | | BAR | | | 108,378 | |
MSCI EAFE Index E-Mini | | 03/2012 | | | 511 | | | | 36,010,170 | | | GSC | | | (339,444 | ) |
MSCI Emerging Markets E-Mini | | 03/2012 | | | 274 | | | | 12,624,550 | | | GSC | | | (230,380 | ) |
S&P/TSE 60 Index | | 03/2012 | | | 248 | | | | 33,053,683 | | | GSC | | | (105,504 | ) |
S&P/TSE 60 Index | | 03/2012 | | | (38 | ) | | | (5,064,677 | ) | | BAR | | | (70,834 | ) |
Canadian Dollar | | 03/2012 | | | 295 | | | | 28,971,950 | | | GSC | | | 449,879 | |
Swiss Market Index Future | | 03/2012 | | | (76 | ) | | | (4,476,400 | ) | | JPM | | | (179,432 | ) |
DAX Index | | 03/2012 | | | 4 | | | | 763,606 | | | BAR | | | 21,869 | |
FTSE 100 Index® | | 03/2012 | | | 242 | | | | 20,805,567 | | | BAR | | | 479,585 | |
| | | | | | | | | | | | | | | | |
| | | | | | | | $ | 127,788,642 | | | | | $ | 1,187,508 | |
| | | | | | | | | | | | | | | | |
Forward Foreign Currency Contracts
As of December 31, 2011, the following Funds have forward foreign currency exchange contracts that obligate them to deliver currencies at specified future dates. The unrealized appreciation and/or depreciation on these contracts is included in the accompanying financial statements. The terms of the open contracts are as follows:
| | | | | | | | | | | | | | | | | | | | |
Fund/ Expiration Date | | Currency Purchased | | Amount
of Currency
Purchased | | | Currency Sold | | Amount
of Currency
Sold | | | Counter-
party | | | Net Unrealized
Appreciation
(Depreciation) | |
Low-Duration Bond | | | | | | | | | | | | | | | | | | | | |
01/04/12 | | Brazilian Reals | | | 398,465 | | | U.S. Dollars | | | 222,428 | | | | UBS | | | $ | (9,133 | ) |
01/04/12 | | U.S. Dollars | | | 207,880 | | | Brazilian Reals | | | 398,465 | | | | HKSB | | | | (5,469 | ) |
01/04/12 | | U.S. Dollars | | | 2,168,717 | | | United Kingdom Pounds | | | 1,383,000 | | | | BAR | | | | 21,031 | |
01/04/12 | | United Kingdom Pounds | | | 1,383,000 | | | U.S. Dollars | | | 2,165,778 | | | | RBC | | | | (18,093 | ) |
01/10/12 | | Canadian Dollars | | | 84,000 | | | U.S. Dollars | | | 82,315 | | | | RBS | | | | 118 | |
01/10/12 | | Euro | | | 42,000 | | | U.S. Dollars | | | 54,811 | | | | CITI | | | | (448 | ) |
01/10/12 | | U.S. Dollars | | | 6,908,044 | | | Canadian Dollars | | | 7,010,000 | | | | RBS | | | | 28,808 | |
01/10/12 | | U.S. Dollars | | | 7,834,121 | | | Euro | | | 5,819,000 | | | | MLCS | | | | 302,329 | |
01/10/12 | | U.S. Dollars | | | 2,359,194 | | | United Kingdom Pounds | | | 1,506,000 | | | | HKSB | | | | 20,627 | |
01/10/12 | | U.S. Dollars | | | 1,161,268 | | | Norwegian Krone | | | 6,681,000 | | | | RBS | | | | 44,630 | |
01/11/12 | | Taiwan Dollars | | | 36,726,480 | | | U.S. Dollars | | | 1,281,454 | | | | BAR | | | | (68,190 | ) |
01/17/12 | | Euro | | | 90,000 | | | U.S. Dollars | | | 123,443 | | | | JPM | | | | (6,946 | ) |
01/17/12 | | Euro | | | 367,000 | | | U.S. Dollars | | | 496,245 | | | | BAR | | | | (21,197 | ) |
01/17/12 | | U.S. Dollars | | | 8,623,060 | | | Euro | | | 6,342,000 | | | | JPM | | | | 413,931 | |
01/17/12 | | U.S. Dollars | | | 9,655 | | | Euro | | | 7,000 | | | | UBS | | | | 594 | |
01/17/12 | | U.S. Dollars | | | 2,961,792 | | | Euro | | | 2,263,000 | | | | MSCS | | | | 32,549 | |
01/18/12 | | U.S. Dollars | | | 8,438,498 | | | United Kingdom Pounds | | | 5,414,500 | | | | CITI | | | | 31,292 | |
01/18/12 | | U.S. Dollars | | | 405,541 | | | United Kingdom Pounds | | | 264,000 | | | | CITI | | | | (4,377 | ) |
01/18/12 | | U.S. Dollars | | | 271,927 | | | United Kingdom Pounds | | | 177,000 | | | | UBS | | | | (2,905 | ) |
01/18/12 | | United Kingdom Pounds | | | 400,000 | | | U.S. Dollars | | | 626,279 | | | | RBS | | | | (5,191 | ) |
255
| | | | | | | | | | | | | | | | | | | | |
Fund/Expiration Date | | Currency Purchased | | Amount
of Currency
Purchased | | | Currency Sold | | Amount
of Currency
Sold | | | Counter-
party | | | Net Unrealized
Appreciation
(Depreciation) | |
01/25/12 | | Euro | | | 500,000 | | | U.S. Dollars | | | 673,322 | | | | RBS | | | $ | (26,083 | ) |
01/25/12 | | Euro | | | 370,000 | | | U.S. Dollars | | | 500,028 | | | | CITI | | | | (21,072 | ) |
01/25/12 | | U.S. Dollars | | | 453,113 | | | Euro | | | 320,000 | | | | RBS | | | | 38,880 | |
01/25/12 | | U.S. Dollars | | | 454,013 | | | Euro | | | 348,000 | | | | CITI | | | | 3,535 | |
01/25/12 | | U.S. Dollars | | | 7,989,438 | | | Euro | | | 5,810,500 | | | | CITI | | | | 467,875 | |
01/25/12 | | U.S. Dollars | | | 963,480 | | | Euro | | | 738,000 | | | | RBS | | | | 8,155 | |
02/02/12 | | U.S. Dollars | | | 2,165,232 | | | United Kingdom Pounds | | | 1,383,000 | | | | RBC | | | | 18,118 | |
02/09/12 | | U.S. Dollars | | | 4,642,421 | | | Canadian Dollars | | | 4,730,000 | | | | RBC | | | | 3,848 | |
02/09/12 | | U.S. Dollars | | | 15,840,395 | | | Canadian Dollars | | | 16,217,000 | | | | BAR | | | | (63,143 | ) |
02/10/12 | | Singapore Dollars | | | 17,277 | | | U.S. Dollars | | | 13,254 | | | | JPM | | | | 64 | |
02/13/12 | | Chinese Yuan Renminbi | | | 5,083,996 | | | U.S. Dollars | | | 789,747 | | | | CITI | | | | 17,266 | |
02/13/12 | | Chinese Yuan Renminbi | | | 2,482,791 | | | U.S. Dollars | | | 385,347 | | | | DEUT | | | | 8,761 | |
02/13/12 | | Chinese Yuan Renminbi | | | 2,619,822 | | | U.S. Dollars | | | 406,300 | | | | BAR | | | | 9,560 | |
02/13/12 | | Chinese Yuan Renminbi | | | 2,496,098 | | | U.S. Dollars | | | 387,172 | | | | CITI | | | | 9,048 | |
02/13/12 | | Chinese Yuan Renminbi | | | 8,799,062 | | | U.S. Dollars | | | 1,367,801 | | | | BAR | | | | 28,926 | |
02/13/12 | | Chinese Yuan Renminbi | | | 3,029,001 | | | U.S. Dollars | | | 471,000 | | | | JPM | | | | 9,811 | |
02/13/12 | | Chinese Yuan Renminbi | | | 7,223,298 | | | U.S. Dollars | | | 1,124,074 | | | | CITI | | | | 22,523 | |
02/13/12 | | Chinese Yuan Renminbi | | | 2,526,343 | | | U.S. Dollars | | | 392,076 | | | | JPM | | | | 8,945 | |
02/13/12 | | Chinese Yuan Renminbi | | | 2,388,307 | | | U.S. Dollars | | | 370,654 | | | | DEUT | | | | 8,456 | |
02/13/12 | | Chinese Yuan Renminbi | | | 1,994,287 | | | U.S. Dollars | | | 309,696 | | | | UBS | | | | 6,869 | |
02/13/12 | | Chinese Yuan Renminbi | | | 567,800 | | | U.S. Dollars | | | 87,461 | | | | DEUT | | | | 2,669 | |
02/23/12 | | U.S. Dollars | | | 10,391,154 | | | Australian Dollars | | | 10,575,000 | | | | JPM | | | | (356,283 | ) |
02/27/12 | | South Korean Won | | | 2,172,283,300 | | | U.S. Dollars | | | 1,940,838 | | | | CITI | | | | (62,884 | ) |
02/27/12 | | U.S. Dollars | | | 411,000 | | | South Korean Won | | | 473,019,900 | | | | CITI | | | | 2,071 | |
02/27/12 | | U.S. Dollars | | | 530,000 | | | South Korean Won | | | 611,355,000 | | | | GSC | | | | 1,479 | |
02/27/12 | | U.S. Dollars | | | 95,000 | | | South Korean Won | | | 109,221,500 | | | | UBS | | | | 577 | |
02/27/12 | | U.S. Dollars | | | 379,000 | | | South Korean Won | | | 435,698,400 | | | | UBS | | | | 2,336 | |
02/27/12 | | U.S. Dollars | | | 475,000 | | | South Korean Won | | | 546,107,500 | | | | UBS | | | | 2,886 | |
02/27/12 | | U.S. Dollars | | | 692,131 | | | Brazilian Reals | | | 1,263,000 | | | | HKSB | | | | 23,910 | |
03/02/12 | | U.S. Dollars | | | 219,928 | | | Brazilian Reals | | | 398,465 | | | | UBS | | | | 9,281 | |
03/08/12 | | Norwegian Krone | | | 3,585,000 | | | U.S. Dollars | | | 618,760 | | | | BAR | | | | (20,857 | ) |
03/15/12 | | Mexican Pesos | | | 1,168,232 | | | U.S. Dollars | | | 86,110 | | | | HKSB | | | | (2,904 | ) |
06/01/12 | | Chinese Yuan Renminbi | | | 2,490,150 | | | U.S. Dollars | | | 391,749 | | | | BNP | | | | 3,027 | |
02/01/13 | | Chinese Yuan Renminbi | | | 3,309,368 | | | U.S. Dollars | | | 522,229 | | | | DEUT | | | | 1,279 | |
02/01/13 | | Chinese Yuan Renminbi | | | 2,090,196 | | | U.S. Dollars | | | 332,146 | | | | DEUT | | | | (1,498 | ) |
02/01/13 | | Chinese Yuan Renminbi | | | 1,254,600 | | | U.S. Dollars | | | 200,000 | | | | GSC | | | | (1,535 | ) |
02/01/13 | | Chinese Yuan Renminbi | | | 319,176 | | | U.S. Dollars | | | 50,832 | | | | JPM | | | | (342 | ) |
| | | | | | | | | | | | | | | | | | | | |
| | | | | | | | | | | | | | | | | | $ | 917,514 | |
| | | | | | | | | | | | | | | | | | | | |
| | | | | |
Medium-Duration Bond | | | | | | | | | | | | | | | | | | |
01/04/12 | | Brazilian Reals | | | 1,876,778 | | | U.S. Dollars | | | 1,047,894 | | | | UBS | | | $ | (43,015 | ) |
01/04/12 | | U.S. Dollars | | | 979,120 | | | Brazilian Reals | | | 1,876,778 | | | | HKSB | | | | (25,758 | ) |
01/04/12 | | U.S. Dollars | | | 1,870,773 | | | United Kingdom Pounds | | | 1,193,000 | | | | BAR | | | | 18,142 | |
01/04/12 | | United Kingdom Pounds | | | 1,193,000 | | | U.S. Dollars | | | 1,868,238 | | | | RBC | | | | (15,607 | ) |
01/11/12 | | Taiwan Dollars | | | 48,062,980 | | | U.S. Dollars | | | 1,677,006 | | | | BAR | | | | (89,239 | ) |
01/13/12 | | U.S. Dollars | | | 1,533,880 | | | Japanese Yen | | | 117,763,000 | | | | CITI | | | | 3,562 | |
01/17/12 | | Euro | | | 457,000 | | | U.S. Dollars | | | 617,939 | | | | BAR | | | | (26,395 | ) |
01/17/12 | | Euro | | | 219,000 | | | U.S. Dollars | | | 297,559 | | | | RBC | | | | (14,083 | ) |
01/17/12 | | U.S. Dollars | | | 4,892,257 | | | Euro | | | 3,738,000 | | | | MSCS | | | | 53,764 | |
01/17/12 | | U.S. Dollars | | | 8,238,272 | | | Euro | | | 6,059,000 | | | | JPM | | | | 395,459 | |
01/20/12 | | U.S. Dollars | | | 372,772 | | | Euro | | | 287,411 | | | | JPM | | | | 738 | |
256
| | | | | | | | | | | | | | | | | | | | |
Fund/Expiration Date | | Currency Purchased | | Amount
of Currency
Purchased | | | Currency Sold | | Amount
of Currency
Sold | | | Counter-
party | | | Net Unrealized
Appreciation
(Depreciation) | |
01/30/12 | | U.S. Dollars | | | 1,107,240 | | | Mexican Pesos | | | 15,878,381 | | | | DEUT | | | $ | (27,434 | ) |
02/02/12 | | Australian Dollars | | | 196,000 | | | U.S. Dollars | | | 195,704 | | | | DEUT | | | | 3,340 | |
02/02/12 | | U.S. Dollars | | | 27,394,868 | | | Australian Dollars | | | 27,829,000 | | | | WEST | | | | (950,513 | ) |
02/02/12 | | U.S. Dollars | | | 1,867,767 | | | United Kingdom Pounds | | | 1,193,000 | | | | BAR | | | | 15,629 | |
02/09/12 | | Canadian Dollars | | | 3,018,000 | | | U.S. Dollars | | | 2,955,691 | | | | UBS | | | | 3,973 | |
02/09/12 | | U.S. Dollars | | | 2,125,857 | | | South African Rand | | | 17,671,185 | | | | JPM | | | | (48,135 | ) |
02/09/12 | | U.S. Dollars | | | 2,332,988 | | | Canadian Dollars | | | 2,377,000 | | | | RBC | | | | 1,934 | |
02/09/12 | | U.S. Dollars | | | 7,960,734 | | | Canadian Dollars | | | 8,150,000 | | | | BAR | | | | (31,733 | ) |
02/10/12 | | U.S. Dollars | | | 4,987 | | | Singapore Dollars | | | 6,371 | | | | CITI | | | | 75 | |
02/13/12 | | Chinese Yuan Renminbi | | | 6,402,937 | | | U.S. Dollars | | | 994,631 | | | | CITI | | | | 21,745 | |
02/13/12 | | Chinese Yuan Renminbi | | | 3,324,821 | | | U.S. Dollars | | | 515,636 | | | | BAR | | | | 12,132 | |
02/13/12 | | Chinese Yuan Renminbi | | | 3,167,798 | | | U.S. Dollars | | | 491,360 | | | | CITI | | | | 11,483 | |
02/13/12 | | Chinese Yuan Renminbi | | | 3,150,917 | | | U.S. Dollars | | | 489,045 | | | | DEUT | | | | 11,119 | |
02/13/12 | | Chinese Yuan Renminbi | | | 9,097,230 | | | U.S. Dollars | | | 1,415,691 | | | | CITI | | | | 28,366 | |
02/13/12 | | Chinese Yuan Renminbi | | | 11,081,793 | | | U.S. Dollars | | | 1,722,648 | | | | BAR | | | | 36,431 | |
02/13/12 | | Chinese Yuan Renminbi | | | 3,839,307 | | | U.S. Dollars | | | 597,000 | | | | JPM | | | | 12,436 | |
02/13/12 | | Chinese Yuan Renminbi | | | 3,032,686 | | | U.S. Dollars | | | 470,658 | | | | DEUT | | | | 10,738 | |
02/13/12 | | Chinese Yuan Renminbi | | | 3,207,965 | | | U.S. Dollars | | | 497,861 | | | | JPM | | | | 11,359 | |
02/13/12 | | Chinese Yuan Renminbi | | | 2,532,357 | | | U.S. Dollars | | | 393,254 | | | | UBS | | | | 8,722 | |
02/13/12 | | Chinese Yuan Renminbi | | | 821,640 | | | U.S. Dollars | | | 126,562 | | | | DEUT | | | | 3,862 | |
02/15/12 | | Brazilian Reals | | | 2,414,270 | | | U.S. Dollars | | | 1,356,331 | | | | JPM | | | | (76,104 | ) |
02/16/12 | | Canadian Dollars | | | 3,084,000 | | | U.S. Dollars | | | 3,027,299 | | | | CITIC | | | | (3,392 | ) |
02/16/12 | | U.S. Dollars | | | 5,081,285 | | | Euro | | | 3,674,701 | | | | CITIC | | | | 323,497 | |
02/16/12 | | U.S. Dollars | | | 1,138,761 | | | Euro | | | 824,514 | | | | UBS | | | | 71,229 | |
02/27/12 | | South Korean Won | | | 3,818,195,500 | | | U.S. Dollars | | | 3,411,388 | | | | CITI | | | | (110,530 | ) |
02/27/12 | | U.S. Dollars | | | 724,000 | | | South Korean Won | | | 833,251,600 | | | | CITI | | | | 3,648 | |
02/27/12 | | U.S. Dollars | | | 935,000 | | | South Korean Won | | | 1,078,522,500 | | | | GSC | | | | 2,610 | |
02/27/12 | | U.S. Dollars | | | 167,000 | | | South Korean Won | | | 191,999,900 | | | | UBS | | | | 1,015 | |
02/27/12 | | U.S. Dollars | | | 667,000 | | | South Korean Won | | | 766,783,200 | | | | UBS | | | | 4,110 | |
02/27/12 | | U.S. Dollars | | | 837,000 | | | South Korean Won | | | 962,298,900 | | | | UBS | | | | 5,086 | |
03/02/12 | | U.S. Dollars | | | 1,035,864 | | | Brazilian Reals | | | 1,876,778 | | | | UBS | | | | 43,713 | |
03/08/12 | | Norwegian Krone | | | 1,133,000 | | | U.S. Dollars | | | 195,552 | | | | BAR | | | | (6,592 | ) |
03/15/12 | | Mexican Pesos | | | 74,599 | | | U.S. Dollars | | | 5,499 | | | | HSBC | | | | (185 | ) |
03/21/12 | | Canadian Dollars | | | 54,352 | | | U.S. Dollars | | | 53,044 | | | | DEUT | | | | 210 | |
03/21/12 | | Canadian Dollars | | | 63,293 | | | U.S. Dollars | | | 61,479 | | | | RBC | | | | 536 | |
03/21/12 | | Canadian Dollars | | | 55,483 | | | U.S. Dollars | | | 53,552 | | | | WEST | | | | 810 | |
03/21/12 | | Canadian Dollars | | | 107,924 | | | U.S. Dollars | | | 104,938 | | | | DEUT | | | | 806 | |
03/21/12 | | Canadian Dollars | | | 109,760 | | | U.S. Dollars | | | 107,000 | | | | RBC | | | | 543 | |
03/21/12 | | Canadian Dollars | | | 54,077 | | | U.S. Dollars | | | 53,000 | | | | RBS | | | | (15 | ) |
03/21/12 | | Euro | | | 40,000 | | | U.S. Dollars | | | 52,190 | | | | CITI | | | | (381 | ) |
03/21/12 | | Euro | | | 40,000 | | | U.S. Dollars | | | 53,032 | | | | JPM | | | | (1,223 | ) |
03/21/12 | | Euro | | | 40,000 | | | U.S. Dollars | | | 52,806 | | | | UBS | | | | (997 | ) |
03/21/12 | | Euro | | | 40,000 | | | U.S. Dollars | | | 52,905 | | | | JPM | | | | (1,096 | ) |
03/21/12 | | Euro | | | 41,000 | | | U.S. Dollars | | | 53,655 | | | | MSCS | | | | (550 | ) |
03/21/12 | | Euro | | | 41,000 | | | U.S. Dollars | | | 53,212 | | | | DEUT | | | | (108 | ) |
03/21/12 | | Euro | | | 41,000 | | | U.S. Dollars | | | 53,290 | | | | BAR | | | | (185 | ) |
03/21/12 | | Euro | | | 41,000 | | | U.S. Dollars | | | 53,290 | | | | RBS | | | | (185 | ) |
03/21/12 | | Euro | | | 41,000 | | | U.S. Dollars | | | 53,290 | | | | JPM | | | | (185 | ) |
03/21/12 | | Euro | | | 41,000 | | | U.S. Dollars | | | 53,551 | | | | JPM | | | | (447 | ) |
03/21/12 | | Euro | | | 41,000 | | | U.S. Dollars | | | 53,413 | | | | UBS | | | | (309 | ) |
03/21/12 | | Euro | | | 41,000 | | | U.S. Dollars | | | 53,489 | | | | JPM | | | | (385 | ) |
03/21/12 | | Euro | | | 41,000 | | | U.S. Dollars | | | 53,374 | | | | JPM | | | | (269 | ) |
257
| | | | | | | | | | | | | | | | | | | | |
Fund/Expiration Date | | Currency Purchased | | Amount
of Currency
Purchased | | | Currency Sold | | Amount
of Currency
Sold | | | Counter-
party | | | Net Unrealized
Appreciation
(Depreciation) | |
03/21/12 | | Euro | | | 43,002 | | | U.S. Dollars | | | 56,107 | | | | BAR | | | $ | (410 | ) |
03/21/12 | | Euro | | | 40,000 | | | U.S. Dollars | | | 52,746 | | | | JPM | | | | (937 | ) |
03/21/12 | | Euro | | | 33,000 | | | U.S. Dollars | | | 43,115 | | | | JPM | | | | (372 | ) |
03/21/12 | | Euro | | | 79,000 | | | U.S. Dollars | | | 105,165 | | | | JPM | | | | (2,842 | ) |
03/21/12 | | Euro | | | 41,000 | | | U.S. Dollars | | | 53,081 | | | | JPM | | | | 24 | |
03/21/12 | | Euro | | | 40,000 | | | U.S. Dollars | | | 53,530 | | | | UBS | | | | (1,721 | ) |
03/21/12 | | Japanese Yen | | | 9,869,941 | | | U.S. Dollars | | | 127,108 | | | | HSBC | | | | 1,320 | |
03/21/12 | | Japanese Yen | | | 4,088,360 | | | U.S. Dollars | | | 52,432 | | | | CITI | | | | 766 | |
03/21/12 | | New Zealand Dollars | | | 43,725 | | | U.S. Dollars | | | 32,567 | | | | WEST | | | | 1,279 | |
03/21/12 | | New Zealand Dollars | | | 60,000 | | | U.S. Dollars | | | 46,306 | | | | DEUT | | | | 137 | |
03/21/12 | | Swedish Kronor | | | 363,736 | | | U.S. Dollars | | | 52,241 | | | | BAR | | | | 416 | |
03/21/12 | | Switzerland Francs | | | 40,278 | | | U.S. Dollars | | | 43,025 | | | | CITI | | | | (68 | ) |
03/21/12 | | U.S. Dollars | | | 211,287 | | | Australian Dollars | | | 215,000 | | | | WEST | | | | (6,608 | ) |
03/21/12 | | U.S. Dollars | | | 53,081 | | | Canadian Dollars | | | 54,387 | | | | RBS | | | | (209 | ) |
03/21/12 | | U.S. Dollars | | | 53,530 | | | Canadian Dollars | | | 54,433 | | | | UBS | | | | 196 | |
03/21/12 | | U.S. Dollars | | | 23,000 | | | Switzerland Francs | | | 21,301 | | | | UBS | | | | 282 | |
03/21/12 | | U.S. Dollars | | | 71,633 | | | Switzerland Francs | | | 67,052 | | | | CITI | | | | 121 | |
03/21/12 | | U.S. Dollars | | | 53,290 | | | Switzerland Francs | | | 50,135 | | | | UBS | | | | (180 | ) |
03/21/12 | | U.S. Dollars | | | 53,290 | | | Switzerland Francs | | | 50,320 | | | | DEUT | | | | (377 | ) |
03/21/12 | | U.S. Dollars | | | 53,290 | | | Switzerland Francs | | | 50,320 | | | | JPM | | | | (377 | ) |
03/21/12 | | U.S. Dollars | | | 43,115 | | | Switzerland Francs | | | 40,310 | | | | JPM | | | | 124 | |
03/21/12 | | U.S. Dollars | | | 52,432 | | | Euro | | | 40,000 | | | | CITI | | | | 623 | |
03/21/12 | | U.S. Dollars | | | 104,939 | | | Euro | | | 80,000 | | | | SS | | | | 1,321 | |
03/21/12 | | U.S. Dollars | | | 53,290 | | | Euro | | | 40,000 | | | | BAR | | | | 1,481 | |
03/21/12 | | U.S. Dollars | | | 53,044 | | | Euro | | | 40,000 | | | | JPM | | | | 1,235 | |
03/21/12 | | U.S. Dollars | | | 224,836 | | | Euro | | | 172,688 | | | | SS | | | | 1,166 | |
03/21/12 | | U.S. Dollars | | | 53,463 | | | Euro | | | 41,000 | | | | MSCS | | | | 359 | |
03/21/12 | | U.S. Dollars | | | 53,445 | | | Euro | | | 41,000 | | | | HSBC | | | | 341 | |
03/21/12 | | U.S. Dollars | | | 53,552 | | | Euro | | | 41,000 | | | | RBC | | | | 448 | |
03/21/12 | | U.S. Dollars | | | 53,668 | | | Euro | | | 41,000 | | | | JPM | | | | 564 | |
03/21/12 | | U.S. Dollars | | | 43,025 | | | Euro | | | 33,000 | | | | CITI | | | | 283 | |
03/21/12 | | U.S. Dollars | | | 106,020 | | | Euro | | | 81,000 | | | | JPM | | | | 1,107 | |
03/21/12 | | U.S. Dollars | | | 105,913 | | | Euro | | | 81,000 | | | | DEUT | | | | 1,000 | |
03/21/12 | | U.S. Dollars | | | 199,498 | | | United Kingdom Pounds | | | 128,047 | | | | SS | | | | 800 | |
03/21/12 | | U.S. Dollars | | | 56,107 | | | United Kingdom Pounds | | | 35,976 | | | | BAR | | | | 282 | |
03/21/12 | | U.S. Dollars | | | 52,190 | | | Japanese Yen | | | 4,059,600 | | | | CITI | | | | (634 | ) |
03/21/12 | | U.S. Dollars | | | 52,241 | | | Norwegian Krone | | | 309,000 | | | | BAR | | | | 729 | |
03/21/12 | | U.S. Dollars | | | 26,336 | | | Norwegian Krone | | | 158,214 | | | | CITI | | | | (39 | ) |
03/21/12 | | U.S. Dollars | | | 207,752 | | | New Zealand Dollars | | | 272,000 | | | | SS | | | | (2,787 | ) |
03/21/12 | | U.S. Dollars | | | 105,165 | | | Swedish Kronor | | | 716,293 | | | | JPM | | | | 1,468 | |
03/21/12 | | U.S. Dollars | | | 187,000 | | | Swedish Kronor | | | 1,276,273 | | | | HSBC | | | | 2,236 | |
03/21/12 | | U.S. Dollars | | | 157,061 | | | Swedish Kronor | | | 1,101,076 | | | | HSBC | | | | (2,340 | ) |
03/21/12 | | U.S. Dollars | | | 53,374 | | | Swedish Kronor | | | 368,856 | | | | DEUT | | | | (25 | ) |
03/21/12 | | U.S. Dollars | | | 47,000 | | | Swedish Kronor | | | 323,282 | | | | HSBC | | | | 199 | |
04/23/12 | | Malaysian Ringgits | | | 8,484 | | | U.S. Dollars | | | 2,797 | | | | JPM | | | | (134 | ) |
06/01/12 | | Chinese Yuan Renminbi | | | 76,812 | | | U.S. Dollars | | | 12,000 | | | | JPM | | | | 177 | |
06/01/12 | | Chinese Yuan Renminbi | | | 160,062 | | | U.S. Dollars | | | 25,000 | | | | JPM | | | | 375 | |
06/01/12 | | Chinese Yuan Renminbi | | | 2,900,436 | | | U.S. Dollars | | | 455,614 | | | | CITI | | | | 4,207 | |
06/01/12 | | Chinese Yuan Renminbi | | | 5,139,925 | | | U.S. Dollars | | | 808,609 | | | | BNP | | | | 6,248 | |
07/12/12 | | Indian Rupees | | | 56,916,480 | | | U.S. Dollars | | | 1,224,537 | | | | JPM | | | | (186,909 | ) |
02/01/13 | | Chinese Yuan Renminbi | | | 3,959,304 | | | U.S. Dollars | | | 624,792 | | | | DEUT | | | | 1,530 | |
258
| | | | | | | | | | | | | | | | | | | | |
Fund/Expiration Date | | Currency Purchased | | Amount
of Currency
Purchased | | | Currency Sold | | Amount
of Currency
Sold | | | Counter-
party | | | Net Unrealized
Appreciation
(Depreciation) | |
02/01/13 | | Chinese Yuan Renminbi | | | 4,127,477 | | | U.S. Dollars | | | 655,884 | | | | DEUT | | | $ | (2,959 | ) |
02/01/13 | | Chinese Yuan Renminbi | | | 6,583,005 | | | U.S. Dollars | | | 1,048,750 | | | | CITI | | | | (7,385 | ) |
08/05/13 | | Chinese Yuan Renminbi | | | 3,364,650 | | | U.S. Dollars | | | 532,803 | | | | UBS | | | | (1,155 | ) |
08/15/13 | | Chinese Yuan Renminbi | | | 1,000,000 | | | U.S. Dollars | | | 159,642 | | | | DEUT | | | | (1,642 | ) |
| | | | | | | | | | | | | | | | | | | | |
| | | | | | | | | | | | | | | | | | $ | (539,494 | ) |
| | | | | | | | | | | | | | | | | | | | |
Global Bond | | | | | | | | | | | | | | | | | | |
02/16/12 | | Australian Dollars | | | 745,608 | | | U.S. Dollars | | | 768,402 | | | | DEUT | | | $ | (10,076 | ) |
02/16/12 | | Australian Dollars | | | 630,000 | | | U.S. Dollars | | | 639,198 | | | | CS | | | | 1,547 | |
02/16/12 | | Australian Dollars | | | 587,221 | | | U.S. Dollars | | | 602,947 | | | | MSCS | | | | (5,710 | ) |
02/16/12 | | Canadian Dollars | | | 191,315 | | | U.S. Dollars | | | 189,468 | | | | DEUT | | | | (1,881 | ) |
02/16/12 | | Canadian Dollars | | | 1,005,536 | | | U.S. Dollars | | | 990,539 | | | | JPM | | | | (4,596 | ) |
02/16/12 | | Canadian Dollars | | | 640,962 | | | U.S. Dollars | | | 632,000 | | | | JPM | | | | (3,528 | ) |
02/16/12 | | Euro | | | 2,096,003 | | | U.S. Dollars | | | 2,880,537 | | | | CS | | | | (166,755 | ) |
02/16/12 | | Euro | | | 390,000 | | | U.S. Dollars | | | 539,892 | | | | BAR | | | | (34,943 | ) |
02/16/12 | | Euro | | | 1,320,000 | | | U.S. Dollars | | | 1,823,092 | | | | UBS | | | | (114,033 | ) |
02/16/12 | | Euro | | | 370,000 | | | U.S. Dollars | | | 500,758 | | | | CS | | | | (21,704 | ) |
02/16/12 | | Euro | | | 300,000 | | | U.S. Dollars | | | 401,833 | | | | JPM | | | | (13,410 | ) |
02/16/12 | | Euro | | | 633,945 | | | U.S. Dollars | | | 857,725 | | | | JPM | | | | (36,931 | ) |
02/16/12 | | Japanese Yen | | | 279,428,760 | | | U.S. Dollars | | | 3,595,188 | | | | DEUT | | | | 38,094 | |
02/16/12 | | Japanese Yen | | | 59,000,000 | | | U.S. Dollars | | | 757,576 | | | | CS | | | | 9,574 | |
02/16/12 | | Japanese Yen | | | 235,120,000 | | | U.S. Dollars | | | 3,018,229 | | | | UBS | | | | 38,927 | |
02/16/12 | | Japanese Yen | | | 736,299,570 | | | U.S. Dollars | | | 9,454,283 | | | | GSC | | | | 119,475 | |
02/16/12 | | Mexican Pesos | | | 4,650,275 | | | U.S. Dollars | | | 344,024 | | | | GSC | | | | (12,146 | ) |
02/16/12 | | Mexican Pesos | | | 11,636,000 | | | U.S. Dollars | | | 838,782 | | | | DEUT | | | | (8,352 | ) |
02/16/12 | | Polish Zloty | | | 3,181,297 | | | U.S. Dollars | | | 1,005,276 | | | | JPM | | | | (87,654 | ) |
02/16/12 | | South African Rand | | | 988,065 | | | U.S. Dollars | | | 122,781 | | | | GSC | | | | (1,343 | ) |
02/16/12 | | U.S. Dollars | | | 648,035 | | | Australian Dollars | | | 631,336 | | | | CITIC | | | | 5,931 | |
02/16/12 | | U.S. Dollars | | | 760,909 | | | Australian Dollars | | | 739,802 | | | | JPM | | | | 8,489 | |
02/16/12 | | U.S. Dollars | | | 4,199,386 | | | Euro | | | 3,046,552 | | | | SG | | | | 254,889 | |
02/16/12 | | U.S. Dollars | | | 426,788 | | | Euro | | | 309,451 | | | | RBS | | | | 26,128 | |
02/16/12 | | U.S. Dollars | | | 2,055,572 | | | Euro | | | 1,500,000 | | | | BAR | | | | 113,459 | |
02/16/12 | | U.S. Dollars | | | 4,844,725 | | | Euro | | | 3,503,624 | | | | CITIC | | | | 308,437 | |
02/16/12 | | U.S. Dollars | | | 1,960,712 | | | Euro | | | 1,415,952 | | | | JPM | | | | 127,420 | |
02/16/12 | | U.S. Dollars | | | 2,495,853 | | | Euro | | | 1,808,255 | | | | MSCS | | | | 154,630 | |
02/16/12 | | U.S. Dollars | | | 2,684,262 | | | Euro | | | 1,947,319 | | | | GSC | | | | 162,988 | |
02/16/12 | | U.S. Dollars | | | 1,253,658 | | | United Kingdom Pounds | | | 787,510 | | | | BAR | | | | 31,214 | |
02/16/12 | | U.S. Dollars | | | 1,035,840 | | | United Kingdom Pounds | | | 650,000 | | | | CS | | | | 26,851 | |
02/16/12 | | U.S. Dollars | | | 321,270 | | | United Kingdom Pounds | | | 200,000 | | | | GSC | | | | 10,812 | |
02/16/12 | | U.S. Dollars | | | 765,981 | | | Japanese Yen | | | 59,645,180 | | | | SG | | | | (9,557 | ) |
02/16/12 | | U.S. Dollars | | | 1,643,847 | | | Japanese Yen | | | 128,025,470 | | | | CITIC | | | | (20,808 | ) |
02/16/12 | | U.S. Dollars | | | 5,959,806 | | | Japanese Yen | | | 464,261,748 | | | | JPM | | | | (76,773 | ) |
02/16/12 | | U.S. Dollars | | | 1,854,899 | | | Mexican Pesos | | | 25,608,000 | | | | DEUT | | | | 27,326 | |
02/16/12 | | U.S. Dollars | | | 857,725 | | | Polish Zloty | | | 2,835,000 | | | | JPM | | | | 39,990 | |
02/16/12 | | United Kingdom Pounds | | | 1,277,800 | | | U.S. Dollars | | | 2,037,337 | | | | SG | | | | (53,820 | ) |
02/16/12 | | United Kingdom Pounds | | | 1,288,000 | | | U.S. Dollars | | | 2,061,405 | | | | JPM | | | | (62,055 | ) |
02/22/12 | | South Korean Won | | | 590,596,400 | | | U.S. Dollars | | | 521,222 | | | | DEUT | | | | (10,489 | ) |
02/22/12 | | U.S. Dollars | | | 1,139,931 | | | Brazilian Reals | | | 2,049,140 | | | | JPM | | | | 54,760 | |
| | | | | | | | | | | | | | | | | | | | |
| | | | | | | | | | | | | | | | | | $ | 804,377 | |
| | | | | | | | | | | | | | | | | | | | |
259
| | | | | | | | | | | | | | | | | | | | |
Fund/Expiration Date | | Currency Purchased | | Amount
of Currency
Purchased | | | Currency Sold | | Amount
of Currency
Sold | | | Counter-
party | | | Net Unrealized
Appreciation
(Depreciation) | |
Defensive Market Strategies | | | | | | | | | | | | | | | | | | |
01/31/12 | | U.S. Dollars | | | 95,653 | | | Switzerland Francs | | | 89,336 | | | | CS | | | $ | 488 | |
01/31/12 | | U.S. Dollars | | | 1,625,748 | | | Euro | | | 1,243,136 | | | | UBS | | | | 16,459 | |
01/31/12 | | U.S. Dollars | | | 49,834 | | | Euro | | | 38,555 | | | | UBS | | | | (77 | ) |
01/31/12 | | U.S. Dollars | | | 365,865 | | | United Kingdom Pounds | | | 233,668 | | | | CS | | | | 3,088 | |
01/31/12 | | U.S. Dollars | | | 11,289 | | | United Kingdom Pounds | | | 7,271 | | | | CS | | | | 1 | |
01/31/12 | | U.S. Dollars | | | 220,627 | | | Japanese Yen | | | 17,158,500 | | | | CS | | | | (2,409 | ) |
01/31/12 | | U.S. Dollars | | | 128,186 | | | Swedish Kronor | | | 881,328 | | | | CS | | | | 345 | |
| | | | | | | | | | | | | | | | | | | | |
| | | | | | | | | | | | | | | | | | $ | 17,895 | |
| | | | | | | | | | | | | | | | | | | | |
| | | | | | |
Small Cap Equity | | | | | | | | | | | | | | | | | | | | |
02/16/12 | | Canadian Dollars | | | 409,000 | | | U.S. Dollars | | | 401,480 | | | | CITIG | | | $ | (450 | ) |
02/16/12 | | Japanese Yen | | | 4,882,000 | | | U.S. Dollars | | | 62,685 | | | | CITIG | | | | 793 | |
02/16/12 | | U.S. Dollars | | | 495,982 | | | Euro | | | 359,341 | | | | MSCS | | | | 30,729 | |
02/16/12 | | U.S. Dollars | | | 997,257 | | | Euro | | | 721,200 | | | | CITIG | | | | 63,490 | |
02/16/12 | | U.S. Dollars | | | 62,687 | | | Japanese Yen | | | 4,882,084 | | | | GSC | | | | (792 | ) |
| | | | | | | | | | | | | | | | | | | | |
| | | | | | | | | | | | | | | | | | $ | 93,770 | |
| | | | | | | | | | | | | | | | | | | | |
| | | | | | |
International Equity | | | | | | | | | | | | | | | | | | | | |
01/31/12 | | U.S. Dollars | | | 10,740,136 | | | Australian Dollars | | | 10,165,000 | | | | NT | | | $ | 384,345 | |
01/31/12 | | U.S. Dollars | | | 4,661,368 | | | Switzerland Francs | | | 4,173,000 | | | | NT | | | | 216,114 | |
03/21/12 | | Australian Dollars | | | 51,000 | | | U.S. Dollars | | | 50,842 | | | | RBS | | | | 844 | |
03/21/12 | | Australian Dollars | | | 1,521,000 | | | U.S. Dollars | | | 1,500,344 | | | | RBS | | | | 41,138 | |
03/21/12 | | Australian Dollars | | | 98,000 | | | U.S. Dollars | | | 96,244 | | | | RBS | | | | 3,076 | |
03/21/12 | | Australian Dollars | | | 3,440,000 | | | U.S. Dollars | | | 3,464,073 | | | | RBS | | | | 22,252 | |
03/21/12 | | Canadian Dollars | | | 1,881,000 | | | U.S. Dollars | | | 1,813,855 | | | | RBS | | | | 29,165 | |
03/21/12 | | Canadian Dollars | | | 4,792,000 | | | U.S. Dollars | | | 4,697,464 | | | | RBS | | | | (2,221 | ) |
03/21/12 | | Danish Kroner | | | 213,000 | | | U.S. Dollars | | | 38,283 | | | | RBS | | | | (1,159 | ) |
03/21/12 | | Danish Kroner | | | 5,223,000 | | | U.S. Dollars | | | 917,027 | | | | RBS | | | | (6,718 | ) |
03/21/12 | | Danish Kroner | | | 339,000 | | | U.S. Dollars | | | 59,683 | | | | RBS | | | | (599 | ) |
03/21/12 | | Euro | | | 676,000 | | | U.S. Dollars | | | 880,750 | | | | RBS | | | | (5,179 | ) |
03/21/12 | | Euro | | | 1,672,000 | | | U.S. Dollars | | | 2,177,407 | | | | RBS | | | | (11,792 | ) |
03/21/12 | | Hong Kong Dollars | | | 3,102,000 | | | U.S. Dollars | | | 398,648 | | | | RBS | | | | 890 | |
03/21/12 | | Hong Kong Dollars | | | 318,000 | | | U.S. Dollars | | | 40,862 | | | | RBS | | | | 97 | |
03/21/12 | | Hong Kong Dollars | | | 226,000 | | | U.S. Dollars | | | 29,061 | | | | RBS | | | | 47 | |
03/21/12 | | Israeli Shekels | | | 4,692,000 | | | U.S. Dollars | | | 1,244,397 | | | | RBS | | | | (14,860 | ) |
03/21/12 | | Israeli Shekels | | | 241,000 | | | U.S. Dollars | | | 63,376 | | | | RBS | | | | (222 | ) |
03/21/12 | | Israeli Shekels | | | 42,000 | | | U.S. Dollars | | | 11,072 | | | | RBS | | | | (66 | ) |
03/21/12 | | Japanese Yen | | | 100,871,000 | | | U.S. Dollars | | | 1,297,375 | | | | RBS | | | | 15,165 | |
03/21/12 | | Japanese Yen | | | 140,523,000 | | | U.S. Dollars | | | 1,809,221 | | | | RBS | | | | 19,272 | |
03/21/12 | | Japanese Yen | | | 10,174,000 | | | U.S. Dollars | | | 130,838 | | | | RBS | | | | 1,546 | |
03/21/12 | | Japanese Yen | | | 6,074,000 | | | U.S. Dollars | | | 78,181 | | | | RBS | | | | 855 | |
03/21/12 | | New Zealand Dollars | | | 3,535,000 | | | U.S. Dollars | | | 2,665,858 | | | | RBS | | | | 70,378 | |
03/21/12 | | New Zealand Dollars | | | 3,634,000 | | | U.S. Dollars | | | 2,740,289 | | | | RBS | | | | 72,577 | |
03/21/12 | | New Zealand Dollars | | | 371,000 | | | U.S. Dollars | | | 285,655 | | | | RBS | | | | 1,514 | |
03/21/12 | | Norwegian Krone | | | 8,021,000 | | | U.S. Dollars | | | 1,369,908 | | | | RBS | | | | (32,771 | ) |
03/21/12 | | Norwegian Krone | | | 123,155,000 | | | U.S. Dollars | | | 21,040,094 | | | | RBS | | | | (509,591 | ) |
03/21/12 | | Singapore Dollars | | | 629,000 | | | U.S. Dollars | | | 481,364 | | | | RBS | | | | 3,598 | |
03/21/12 | | Singapore Dollars | | | 4,000 | | | U.S. Dollars | | | 3,068 | | | | RBS | | | | 17 | |
260
| | | | | | | | | | | | | | | | | | | | |
Fund/Expiration Date | | Currency Purchased | | Amount
of Currency
Purchased | | | Currency Sold | | Amount
of Currency
Sold | | | Counter-
party | | | Net Unrealized
Appreciation
(Depreciation) | |
03/21/12 | | Singapore Dollars | | | 30,000 | | | U.S. Dollars | | | 23,125 | | | | RBS | | | $ | 5 | |
03/21/12 | | Swedish Kronor | | | 152,270,000 | | | U.S. Dollars | | | 22,173,280 | | | | RBS | | | | (129,375 | ) |
03/21/12 | | Swedish Kronor | | | 27,982,000 | | | U.S. Dollars | | | 4,073,880 | | | | RBS | | | | (22,967 | ) |
03/21/12 | | Switzerland Francs | | | 228,000 | | | U.S. Dollars | | | 244,129 | | | | RBS | | | | (964 | ) |
03/21/12 | | Switzerland Francs | | | 4,553,000 | | | U.S. Dollars | | | 4,856,114 | | | | RBS | | | | (276 | ) |
03/21/12 | | U.S. Dollars | | | 1,418,414 | | | Australian Dollars | | | 1,426,000 | | | | RBS | | | | (26,789 | ) |
03/21/12 | | U.S. Dollars | | | 1,918,341 | | | Australian Dollars | | | 1,952,000 | | | | RBS | | | | (59,945 | ) |
03/21/12 | | U.S. Dollars | | | 10,561,358 | | | Canadian Dollars | | | 10,828,000 | | | | RBS | | | | (48,008 | ) |
03/21/12 | | U.S. Dollars | | | 397,649 | | | Canadian Dollars | | | 409,000 | | | | RBS | | | | (3,092 | ) |
03/21/12 | | U.S. Dollars | | | 47,359 | | | Canadian Dollars | | | 49,000 | | | | RBS | | | | (652 | ) |
03/21/12 | | U.S. Dollars | | | 15,314,356 | | | Switzerland Francs | | | 14,157,000 | | | | RBS | | | | 215,721 | |
03/21/12 | | U.S. Dollars | | | 706,184 | | | Switzerland Francs | | | 660,000 | | | | RBS | | | | 2,285 | |
03/21/12 | | U.S. Dollars | | | 2,681,581 | | | Switzerland Francs | | | 2,509,000 | | | | RBS | | | | 5,698 | |
03/21/12 | | U.S. Dollars | | | 1,142,141 | | | Switzerland Francs | | | 1,066,000 | | | | RBS | | | | 5,238 | |
03/21/12 | | U.S. Dollars | | | 1,135,206 | | | Danish Kroner | | | 6,350,000 | | | | RBS | | | | 28,474 | |
03/21/12 | | U.S. Dollars | | | 27,551 | | | Danish Kroner | | | 155,000 | | | | RBS | | | | 536 | |
03/21/12 | | U.S. Dollars | | | 112,403 | | | Danish Kroner | | | 641,000 | | | | RBS | | | | 684 | |
03/21/12 | | U.S. Dollars | | | 32,434 | | | Danish Kroner | | | 185,000 | | | | RBS | | | | 190 | |
03/21/12 | | U.S. Dollars | | | 29,366 | | | Euro | | | 22,000 | | | | RBS | | | | 871 | |
03/21/12 | | U.S. Dollars | | | 146,686 | | | Euro | | | 111,000 | | | | RBS | | | | 2,916 | |
03/21/12 | | U.S. Dollars | | | 33,260,128 | | | Euro | | | 25,193,000 | | | | RBS | | | | 629,539 | |
03/21/12 | | U.S. Dollars | | | 15,709,820 | | | Euro | | | 12,049,000 | | | | RBS | | | | 103,660 | |
03/21/12 | | U.S. Dollars | | | 608,019 | | | Euro | | | 465,000 | | | | RBS | | | | 5,740 | |
03/21/12 | | U.S. Dollars | | | 2,706,192 | | | United Kingdom Pounds | | | 1,741,000 | | | | RBS | | | | 4,589 | |
03/21/12 | | U.S. Dollars | | | 11,178 | | | Hong Kong Dollars | | | 87,000 | | | | RBS | | | | (27 | ) |
03/21/12 | | U.S. Dollars | | | 3,985 | | | Hong Kong Dollars | | | 31,000 | | | | RBS | | | | (8 | ) |
03/21/12 | | U.S. Dollars | | | 29,946 | | | Hong Kong Dollars | | | 233,000 | | | | RBS | | | | (64 | ) |
03/21/12 | | U.S. Dollars | | | 30,643 | | | Israeli Shekels | | | 116,000 | | | | RBS | | | | 245 | |
03/21/12 | | U.S. Dollars | | | 22,095,645 | | | Japanese Yen | | | 1,718,997,000 | | | | RBS | | | | (272,044 | ) |
03/21/12 | | U.S. Dollars | | | 223,842 | | | Japanese Yen | | | 17,441,000 | | | | RBS | | | | (3,102 | ) |
03/21/12 | | U.S. Dollars | | | 2,207,788 | | | Japanese Yen | | | 171,524,000 | | | | RBS | | | | (24,092 | ) |
03/21/12 | | U.S. Dollars | | | 273,011 | | | Norwegian Krone | | | 1,627,000 | | | | RBS | | | | 1,782 | |
03/21/12 | | U.S. Dollars | | | 4,779,404 | | | Norwegian Krone | | | 28,595,000 | | | | RBS | | | | 12,486 | |
03/21/12 | | U.S. Dollars | | | 2,209,824 | | | New Zealand Dollars | | | 2,877,000 | | | | RBS | | | | (17,093 | ) |
03/21/12 | | U.S. Dollars | | | 564,649 | | | Swedish Kronor | | | 3,900,000 | | | | RBS | | | | 52 | |
03/21/12 | | U.S. Dollars | | | 1,307,441 | | | Swedish Kronor | | | 9,136,000 | | | | RBS | | | | (15,165 | ) |
03/21/12 | | U.S. Dollars | | | 114,683 | | | Swedish Kronor | | | 796,000 | | | | RBS | | | | (552 | ) |
03/21/12 | | U.S. Dollars | | | 14,610 | | | Singapore Dollars | | | 19,000 | | | | RBS | | | | (40 | ) |
03/21/12 | | U.S. Dollars | | | 40,563 | | | Singapore Dollars | | | 53,000 | | | | RBS | | | | (300 | ) |
03/21/12 | | U.S. Dollars | | | 5,358 | | | Singapore Dollars | | | 7,000 | | | | RBS | | | | (39 | ) |
03/21/12 | | United Kingdom Pounds | | | 2,092,000 | | | U.S. Dollars | | | 3,260,295 | | | | RBS | | | | (14,026 | ) |
03/21/12 | | United Kingdom Pounds | | | 21,902,000 | | | U.S. Dollars | | | 34,175,929 | | | | RBS | | | | (189,417 | ) |
03/21/12 | | United Kingdom Pounds | | | 2,679,000 | | | U.S. Dollars | | | 4,156,910 | | | | RBS | | | | 239 | |
03/21/12 | | United Kingdom Pounds | | | 2,135,000 | | | U.S. Dollars | | | 3,342,481 | | | | RBS | | | | (29,486 | ) |
| | | | | | | | | | | | | | | | | | | | |
| | | | | | | | | | | | | | | | | | $ | 461,139 | |
| | | | | | | | | | | | | | | | | | | | |
Please see abbreviation and footnote definitions beginning on page 200.
261
Options Written
Transactions in options written during the year ended December 31, 2011 were as follows:
| | | | | | | | | | | | |
Fund | | Number of
Contracts | | | Notional
Amount | | | Premiums
Received | |
Low-Duration Bond | | | | | | | | | | | | |
Options written, 12/31/10 | | | 60 | | | $ | 89,500,000 | | | $ | 728,747 | |
| | | | | | | | | | | | |
Options written | | | 590 | | | | 18,600,000 | | | | 322,251 | |
Options expired | | | (650 | ) | | | (65,600,000 | ) | | | (732,394 | ) |
Options closed | | | — | | | | (37,200,000 | ) | | | (285,639 | ) |
| | | | | | | | | | | | |
Options written, 12/31/11 | | | — | | | $ | 5,300,000 | | | $ | 32,965 | |
| | | | | | | | | | | | |
Medium-Duration Bond | | | | | | | | | | | | |
Options written, 12/31/10 | | | 36 | | | $ | 80,100,000 | | | $ | 652,009 | |
| | | | | | | | | | | | |
Options written | | | 467 | | | | 17,000,000 | | | | 252,533 | |
Options expired | | | (455 | ) | | | (44,700,000 | ) | | | (504,766 | ) |
Options closed | | | (48 | ) | | | (44,600,000 | ) | | | (351,175 | ) |
| | | | | | | | | | | | |
Options written, 12/31/11 | | | — | | | $ | 7,800,000 | | | $ | 48,601 | |
| | | | | | | | | | | | |
Defensive Market Strategies | | | | | | | | | | | | |
Options written, 09/01/11(1) | | | — | | | $ | — | | | $ | — | |
| | | | | | | | | | | | |
Options written | | | 585 | | | | — | | | | 11,670 | |
Options expired | | | (109 | ) | | | — | | | | (4,469 | ) |
Options closed | | | (308 | ) | | | — | | | | (3,169 | ) |
| | | | | | | | | | | | |
Options written, 12/31/11 | | | 168 | | | $ | — | | | $ | 4,032 | |
| | | | | | | | | | | | |
| | | |
(1) Inception date was September 1, 2011. | | | | | | | | | | | | |
| | | |
Small Cap Equity | | | | | | | | | | | | |
Options written, 12/31/10 | | | — | | | $ | — | | | $ | — | |
| | | | | | | | | | | | |
Options written | | | 130 | | | | — | | | | 60,760 | |
Options expired | | | (49 | ) | | | — | | | | (26,320 | ) |
Options closed | | | (74 | ) | | | — | | | | (32,425 | ) |
| | | | | | | | | | | | |
Options written, 12/31/11 | | | 7 | | | $ | — | | | $ | 2,015 | |
| | | | | | | | | | | | |
262
7. CAPITAL SHARE TRANSACTIONS
Transactions in shares of capital stock were as follows:
| | | | | | | | | | | | |
| | | Year Ended December 31, 2011 | | | Year Ended December 31, 2010 | |
| | | GS2 | | GS4 | | | GS2 | | GS4 | |
| | | | |
MyDestination 2005 | | | | | | | | | | | | |
Shares sold | | | | | 2,593,793 | | | | | | 1,782,281 | |
Shares reinvested | | | | | 116,996 | | | | | | 145,545 | |
Shares redeemed | | | | | (1,716,136 | ) | | | | | (3,748,045 | ) |
| | | | | | | | | | | | |
Net increase (decrease) | | | | | 994,653 | | | | | | (1,820,219 | ) |
| | | | | | | | | | | | |
MyDestination 2015 | | | | | | | | | | | | |
Shares sold | | | | | 5,730,134 | | | | | | 5,359,331 | |
Shares reinvested | | | | | 497,753 | | | | | | 547,026 | |
Shares redeemed | | | | | (3,226,397 | ) | | | | | (5,686,881 | ) |
| | | | | | | | | | | | |
Net increase | | | | | 3,001,490 | | | | | | 219,476 | |
| | | | | | | | | | | | |
MyDestination 2025 | | | | | | | | | | | | |
Shares sold | | | | | 6,560,758 | | | | | | 6,117,622 | |
Shares reinvested | | | | | 466,906 | | | | | | 425,744 | |
Shares redeemed | | | | | (1,915,678 | ) | | | | | (1,598,263 | ) |
| | | | | | | | | | | | |
Net increase | | | | | 5,111,986 | | | | | | 4,945,103 | |
| | | | | | | | | | | | |
MyDestination 2035 | | | | | | | | | | | | |
Shares sold | | | | | 3,815,906 | | | | | | 3,628,903 | |
Shares reinvested | | | | | 270,804 | | | | | | 152,793 | |
Shares redeemed | | | | | (889,088 | ) | | | | | (1,024,122 | ) |
| | | | | | | | | | | | |
Net increase | | | | | 3,197,622 | | | | | | 2,757,574 | |
| | | | | | | | | | | | |
MyDestination 2045 | | | | | | | | | | | | |
Shares sold | | | | | 3,205,647 | | | | | | 3,312,450 | |
Shares reinvested | | | | | 342,765 | | | | | | 101,676 | |
Shares redeemed | | | | | (1,142,646 | ) | | | | | (501,015 | ) |
| | | | | | | | | | | | |
Net increase | | | | | 2,405,766 | | | | | | 2,913,111 | |
| | | | | | | | | | | | |
263
| | | | | | | | | | | | | | | | |
| | | Year Ended December 31, 2011 | | | Year Ended December 31, 2010 | |
| | | GS2 | | | GS4 | | | GS2 | | | GS4 | |
Conservative Allocation | | | | | | | | | | | | | | | | |
Shares sold | | | | | | | 4,736,842 | | | | | | | | 3,187,360 | |
Shares reinvested | | | | | | | 774,598 | | | | | | | | 615,888 | |
Shares redeemed | | | | | | | (2,522,493 | ) | | | | | | | (6,746,128 | ) |
| | | | | | | | | | | | | | | | |
Net increase (decrease) | | | | | | | 2,988,947 | | | | | | | | (2,942,880 | ) |
| | | | | | | | | | | | | | | | |
Balanced Allocation | | | | | | | | | | | | | | | | |
Shares sold | | | | | | | 4,925,459 | | | | | | | | 3,835,756 | |
Shares reinvested | | | | | | | 3,591,708 | | | | | | | | 2,548,485 | |
Shares redeemed | | | | | | | (7,775,874 | ) | | | | | | | (15,601,452 | ) |
| | | | | | | | | | | | | | | | |
Net increase (decrease) | | | | | | | 741,293 | | | | | | | | (9,217,211 | ) |
| | | | | | | | | | | | | | | | |
Growth Allocation | | | | | | | | | | | | | | | | |
Shares sold | | | | | | | 2,685,458 | | | | | | | | 2,474,913 | |
Shares reinvested | | | | | | | 2,175,136 | | | | | | | | 1,888,651 | |
Shares redeemed | | | | | | | (5,925,560 | ) | | | | | | | (11,457,649 | ) |
| | | | | | | | | | | | | | | | |
Net decrease | | | | | | | (1,064,966 | ) | | | | | | | (7,094,085 | ) |
| | | | | | | | | | | | | | | | |
Aggressive Allocation | | | | | | | | | | | | | | | | |
Shares sold | | | | | | | 2,783,580 | | | | | | | | 3,255,212 | |
Shares reinvested | | | | | | | 1,630,524 | | | | | | | | 1,206,218 | |
Shares redeemed | | | | | | | (5,718,840 | ) | | | | | | | (11,200,914 | ) |
| | | | | | | | | | | | | | | | |
Net decrease | | | | | | | (1,304,736 | ) | | | | | | | (6,739,484 | ) |
| | | | | | | | | | | | | | | | |
Conservative Allocation I | | | | | | | | | | | | | | | | |
Shares sold | | | 1,923,738 | | | | | | | | 1,241,966 | | | | | |
Shares reinvested | | | 206,197 | | | | | | | | 232,413 | | | | | |
Shares redeemed | | | (1,832,819 | ) | | | | | | | (930,456 | ) | | | | |
| | | | | | | | | | | | | | | | |
Net increase | | | 297,116 | | | | | | | | 543,923 | | | | | |
| | | | | | | | | | | | | | | | |
Balanced Allocation I | | | | | | | | | | | | | | | | |
Shares sold | | | 2,078,500 | | | | | | | | 2,147,224 | | | | | |
Shares reinvested | | | 1,356,300 | | | | | | | | 1,582,934 | | | | | |
Shares redeemed | | | (6,285,739 | ) | | | | | | | (3,979,021 | ) | | | | |
| | | | | | | | | | | | | | | | |
Net decrease | | | (2,850,939 | ) | | | | | | | (248,863 | ) | | | | |
| | | | | | | | | | | | | | | | |
Growth Allocation I | | | | | | | | | | | | | | | | |
Shares sold | | | 1,070,053 | | | | | | | | 1,349,275 | | | | | |
Shares reinvested | | | 622,547 | | | | | | | | 663,740 | | | | | |
Shares redeemed | | | (4,153,900 | ) | | | | | | | (1,755,410 | ) | | | | |
| | | | | | | | | | | | | | | | |
Net increase (decrease) | | | (2,461,300 | ) | | | | | | | 257,605 | | | | | |
| | | | | | | | | | | | | | | | |
Aggressive Allocation I | | | | | | | | | | | | | | | | |
Shares sold | | | 669,885 | | | | | | | | 906,542 | | | | | |
Shares reinvested | | | 247,967 | | | | | | | | 243,843 | | | | | |
Shares redeemed | | | (2,692,430 | ) | | | | | | | (1,640,107 | ) | | | | |
| | | | | | | | | | | | | | | | |
Net decrease | | | (1,774,578 | ) | | | | | | | (489,722 | ) | | | | |
| | | | | | | | | | | | | | | | |
264
| | | | | | | | | | | | | | | | |
| | | Year Ended December 31, 2011 | | | Year Ended December 31, 2010 | |
| | | GS2 | | | GS4 | | | GS2 | | | GS4 | |
Money Market | | | | | | | | | | | | | | | | |
Shares sold | | | 154,616,809 | | | | 3,912,748,853 | | | | 94,494,393 | | | | 4,496,591,499 | |
Shares reinvested | | | 100,970 | | | | 61,686 | | | | 203,577 | | | | 136,473 | |
Shares redeemed | | | (157,730,463 | ) | | | (3,931,314,442 | ) | | | (108,704,940 | ) | | | (4,381,459,309 | ) |
| | | | | | | | | | | | | | | | |
Net increase (decrease) | | | (3,012,684 | ) | | | (18,503,903 | ) | | | (14,006,970 | ) | | | 115,268,663 | |
| | | | | | | | | | | | | | | | |
Low-Duration Bond | | | | | | | | | | | | | | | | |
Shares sold | | | 1,843,874 | | | | 5,924,041 | | | | 2,213,591 | | | | 6,135,841 | |
Shares reinvested | | | 453,647 | | | | 831,464 | | | | 600,976 | | | | 1,182,586 | |
Shares redeemed | | | (2,767,300 | ) | | | (3,520,556 | ) | | | (1,397,531 | ) | | | (7,123,322 | ) |
| | | | | | | | | | | | | | | | |
Net increase (decrease) | | | (469,779 | ) | | | 3,234,949 | | | | 1,417,036 | | | | 195,105 | |
| | | | | | | | | | | | | | | | |
Medium-Duration Bond | | | | | | | | | | | | | | | | |
Shares sold | | | 2,860,917 | | | | 4,602,896 | | | | 15,423,343 | | | | 10,208,086 | |
Shares reinvested | | | 2,063,646 | | | | 1,463,559 | | | | 2,148,938 | | | | 3,449,151 | |
Shares redeemed | | | (6,053,161 | ) | | | (5,830,313 | ) | | | (3,689,932 | ) | | | (33,721,553 | ) |
| | | | | | | | | | | | | | | | |
Net increase (decrease) | | | (1,128,598 | ) | | | 236,142 | | | | 13,882,349 | | | | (20,064,316 | ) |
| | | | | | | | | | | | | | | | |
Extended-Duration Bond | | | | | | | | | | | | | | | | |
Shares sold | | | 1,402,230 | | | | 3,436,087 | | | | 1,659,903 | | | | 4,938,166 | |
Shares reinvested | | | 2,118,633 | | | | 1,472,133 | | | | 1,280,612 | | | | 1,288,882 | |
Shares redeemed | | | (2,508,010 | ) | | | (6,281,134 | ) | | | (2,100,789 | ) | | | (11,095,823 | ) |
| | | | | | | | | | | | | | | | |
Net increase (decrease) | | | 1,012,853 | | | | (1,372,914 | ) | | | 839,726 | | | | (4,868,775 | ) |
| | | | | | | | | | | | | | | | |
Inflation Protected Bond | | | | | | | | | | | | | | | | |
Shares sold | | | | | | | 6,870,551 | | | | | | | | 4,018,816 | |
Shares reinvested | | | | | | | 571,192 | | | | | | | | 454,380 | |
Shares redeemed | | | | | | | (3,163,833 | ) | | | | | | | (2,653,937 | ) |
| | | | | | | | | | | | | | | | |
Net increase | | | | | | | 4,277,910 | | | | | | | | 1,819,259 | |
| | | | | | | | | | | | | | | | |
Global Bond | | | | | | | | | | | | | | | | |
Shares sold | | | | | | | 3,165,430 | | | | | | | | 2,860,387 | |
Shares reinvested | | | | | | | 909,471 | | | | | | | | 1,274,719 | |
Shares redeemed | | | | | | | (2,970,896 | ) | | | | | | | (11,423,859 | ) |
| | | | | | | | | | | | | | | | |
Net increase (decrease) | | | | | | | 1,104,005 | | | | | | | | (7,288,753 | ) |
| | | | | | | | | | | | | | | | |
Defensive Market Strategies (1) | | | | | | | | | | | | | | | | |
Shares sold | | | 7,926,676 | | | | 23,725,418 | | | | | | | | | |
Shares reinvested | | | 37,096 | | | | 98,014 | | | | | | | | | |
Shares redeemed | | | (658,547 | ) | | | (240,539 | ) | | | | | | | | |
| | | | | | | | | | | | | | | | |
Net increase | | | 7,305,225 | | | | 23,582,893 | | | | | | | | | |
| | | | | | | | | | | | | | | | |
|
(1) Inception date was September 1, 2011. | |
| | | | |
Equity Index | | | | | | | | | | | | | | | | |
Shares sold | | | 317,917 | | | | 1,368,781 | | | | 585,990 | | | | 1,370,881 | |
Shares reinvested | | | 1,795,569 | | | | 2,092,530 | | | | 258,866 | | | | 322,192 | |
Shares redeemed | | | (4,509,217 | ) | | | (11,137,054 | ) | | | (1,003,321 | ) | | | (3,317,757 | ) |
| | | | | | | | | | | | | | | | |
Net decrease | | | (2,395,731 | ) | | | (7,675,743 | ) | | | (158,465 | ) | | | (1,624,684 | ) |
| | | | | | | | | | | | | | | | |
265
| | | | | | | | | | | | | | | | |
| | | Year Ended December 31, 2011 | | | Year Ended December 31, 2010 | |
| | | GS2 | | | GS4 | | | GS2 | | | GS4 | |
Real Estate Securities | | | | | | | | | | | | | | | | |
Shares sold | | | | | | | 4,891,242 | | | | | | | | 7,796,557 | |
Shares reinvested | | | | | | | 116,999 | | | | | | | | 327,689 | |
Shares redeemed | | | | | | | (5,295,002 | ) | | | | | | | (9,499,201 | ) |
| | | | | | | | | | | | | | | | |
Net decrease | | | | | | | (286,761 | ) | | | | | | | (1,374,955 | ) |
| | | | | | | | | | | | | | | | |
Value Equity | | | | | | | | | | | | | | | | |
Shares sold | | | 2,589,631 | | | | 5,616,574 | | | | 5,728,105 | | | | 7,904,174 | |
Shares reinvested | | | 826,519 | | | | 741,275 | | | | 714,341 | | | | 918,154 | |
Shares redeemed | | | (7,091,548 | ) | | | (13,316,054 | ) | | | (2,327,670 | ) | | | (20,837,377 | ) |
| | | | | | | | | | | | | | | | |
Net increase (decrease) | | | (3,675,398 | ) | | | (6,958,205 | ) | | | 4,114,776 | | | | (12,015,049 | ) |
| | | | | | | | | | | | | | | | |
Growth Equity | | | | | | | | | | | | | | | | |
Shares sold | | | 1,066,279 | | | | 4,475,293 | | | | 1,101,945 | | | | 5,750,705 | |
Shares reinvested | | | — | | | | — | | | | 4,036 | | | | 8,372 | |
Shares redeemed | | | (3,506,557 | ) | | | (10,551,276 | ) | | | (2,591,161 | ) | | | (17,764,875 | ) |
| | | | | | | | | | | | | | | | |
Net decrease | | | (2,440,278 | ) | | | (6,075,983 | ) | | | (1,485,180 | ) | | | (12,005,798 | ) |
| | | | | | | | | | | | | | | | |
Small Cap Equity | | | | | | | | | | | | | | | | |
Shares sold | | | 570,932 | | | | 3,248,230 | | | | 751,626 | | | | 4,013,808 | |
Shares reinvested | | | 30,315 | | | | 27,656 | | | | 42,800 | | | | 63,528 | |
Shares redeemed | | | (1,756,626 | ) | | | (6,727,792 | ) | | | (1,509,442 | ) | | | (7,727,717 | ) |
| | | | | | | | | | | | | | | | |
Net decrease | | | (1,155,379 | ) | | | (3,451,906 | ) | | | (715,016 | ) | | | (3,650,381 | ) |
| | | | | | | | | | | | | | | | |
International Equity | | | | | | | | | | | | | | | | |
Shares sold | | | 3,565,561 | | | | 14,411,184 | | | | 2,244,270 | | | | 6,022,331 | |
Shares reinvested | | | 719,368 | | | | 1,592,756 | | | | 706,621 | | | | 1,518,407 | |
Shares redeemed | | | (3,823,440 | ) | | | (8,324,290 | ) | | | (2,551,588 | ) | | | (19,455,495 | ) |
| | | | | | | | | | | | | | | | |
Net increase (decrease) | | | 461,489 | | | | 7,679,650 | | | | 399,303 | | | | (11,914,757 | ) |
| | | | | | | | | | | | | | | | |
8. BANK BORROWINGS
On October 28, 2011, the Board of Trustees approved the renewal of a credit agreement with Bank of America, N.A. dated December 2, 2011 through December 1, 2012. The agreement permits up to $50 million, collectively. Interest is charged to each Fund based on its borrowings at a rate equal to the Bank Prime plus 0.60% or the Wall Street Journal LIBOR One Month Floating Rate plus 1.00%. Each Fund also pays a facility fee equal to its pro rata share of the amount of the credit facility at a rate of 0.30% per annum.
On March 25, 2011, the Inflation Protected Bond Fund borrowed $250,000 at rate of 1.2495%. The Inflation Protected Bond Fund repaid the loan in the amount of $250,026, which represents principal and three days of accrued interest, on March 28, 2011.
On August 9, the Real Estate Securities Fund borrowed $1,750,000 at rate of 1.206%. The Real Estate Securities Fund repaid the loan in the amount of $1,750,059, which represents principal and one day of accrued interest, on August 10, 2011.
No other Funds borrowed for the period ended December 31, 2011, and there were no outstanding loans at December 31, 2011.
266
9. FEDERAL INCOME TAXES
Each Fund’s policy is to comply with all sections of the Internal Revenue Code of 1986, as amended, that apply to regulated investment companies and to distribute substantially all of its taxable income and capital gains to shareholders. No provision for income or excise taxes is thus required. Each Fund is treated as a separate entity for federal income tax purposes.
The Funds may be subject to taxes imposed by countries in which they invest in issuers existing or operating in such countries. Such taxes are generally based on income earned. The Funds accrue such taxes when the related income is earned. Dividend and interest income is recorded net of non-U.S. taxes paid. Gains realized by the Funds on the sale of securities in certain countries are subject to non-U.S. taxes. The Funds record a liability based on unrealized gains to provide for potential non-U.S. taxes payable upon the sale of these securities. For year ended December 31, 2011, the International Equity Fund accrued non-U.S. taxes on unrealized gains of $15,713.
Management has analyzed the Funds’ tax positions and has concluded that no provision for income tax is required in the Funds’ financial statements. The Funds are not aware of any tax positions for which it is reasonably possible that the total amounts of unrecognized tax benefits will significantly change in the next twelve months. However, management’s conclusions may be subject to review and adjustment at a later date based on factors including, but not limited to new tax laws, regulations and administrative interpretations (including court decisions). Each of the Funds’ federal tax returns for the prior three fiscal years remains subject to examination by the Internal Revenue Service.
The character of distributions made during the year from net investment income or net realized gains may differ from their ultimate characterization for federal income tax purposes. Also, due to the timing of dividend distributions, the fiscal year in which amounts are distributed may differ from the year that the income or realized gains (losses) were recorded by the Funds. Income dividends and capital gain distributions are determined in accordance with federal income tax regulations, which may differ from GAAP. These differences are primarily due to differing treatments for futures and options transactions, foreign currency transactions, paydowns, losses deferred due to wash sales, straddles and investments in Passive Foreign Investment Companies (“PFIC’s”). Distributions during the year ended December 31, 2011, were characterized as follows for tax purposes:
267
| | | | | | | | | | | | | | | | | | | | |
Fund | | | | | Ordinary
Income | | | Long-Term
Capital Gain | | | Return
of Capital | | | Total
Distribution | |
MyDestination 2005 | | | 2011 | | | $ | 1,118,885 | | | $ | — | | | $ | — | | | | 1,118,885 | |
| | | 2010 | | | | 1,382,009 | | | | — | | | | — | | | | 1,382,009 | |
MyDestination 2015 | | | 2011 | | | | 4,639,060 | | | | — | | | | — | | | | 4,639,060 | |
| | | 2010 | | | | 5,104,591 | | | | — | | | | — | | | | 5,104,591 | |
MyDestination 2025 | | | 2011 | | | | 4,085,427 | | | | — | | | | — | | | | 4,085,427 | |
| | | 2010 | | | | 3,787,639 | | | | — | | | | — | | | | 3,787,639 | |
MyDestination 2035 | | | 2011 | | | | 1,557,736 | | | | 641,898 | | | | — | | | | 2,199,634 | |
| | | 2010 | | | | 1,312,038 | | | | — | | | | — | | | | 1,312,038 | |
MyDestination 2045 | | | 2011 | | | | 778,529 | | | | 1,902,435 | | | | — | | | | 2,680,964 | |
| | | 2010 | | | | 774,737 | | | | 86,307 | | | | — | | | | 861,044 | |
Conservative Allocation | | | 2011 | | | | 4,849,965 | | | | 4,252,565 | | | | — | | | | 9,102,530 | |
| | | 2010 | | | | 6,148,217 | | | | 1,177,999 | | | | — | | | | 7,326,216 | |
Balanced Allocation | | | 2011 | | | | 24,215,019 | | | | 18,074,022 | | | | — | | | | 42,289,041 | |
| | | 2010 | | | | 30,794,116 | | | | — | | | | — | | | | 30,794,116 | |
Growth Allocation | | | 2011 | | | | 12,007,052 | | | | 13,021,185 | | | | — | | | | 25,028,237 | |
| | | 2010 | | | | 17,932,584 | | | | 5,229,092 | | | | — | | | | 23,161,676 | |
Aggressive Allocation | | | 2011 | | | | 7,015,783 | | | | 10,439,039 | | | | — | | | | 17,454,822 | |
| | | 2010 | | | | 7,735,097 | | | | 6,394,992 | | | | — | | | | 14,130,089 | |
Conservative Allocation I | | | 2011 | | | | 1,925,326 | | | | — | | | | — | | | | 1,925,326 | |
| | | 2010 | | | | 2,200,764 | | | | — | | | | — | | | | 2,200,764 | |
Balanced Allocation I | | | 2011 | | | | 12,643,249 | | | | — | | | | — | | | | 12,643,249 | |
| | | 2010 | | | | 15,332,084 | | | | — | | | | — | | | | 15,332,084 | |
Growth Allocation I | | | 2011 | | | | 5,922,267 | | | | — | | | | — | | | | 5,922,267 | |
| | | 2010 | | | | 6,706,135 | | | | — | | | | — | | | | 6,706,135 | |
Aggressive Allocation I | | | 2011 | | | | 2,389,446 | | | | — | | | | — | | | | 2,389,446 | |
| | | 2010 | | | | 2,510,802 | | | | — | | | | — | | | | 2,510,802 | |
Money Market | | | 2011 | | | | 251,150 | | | | — | | | | — | | | | 251,150 | |
| | | 2010 | | | | 408,875 | | | | — | | | | — | | | | 408,875 | |
Low-Duration Bond | | | 2011 | | | | 14,375,468 | | | | 607,824 | | | | — | | | | 14,983,292 | |
| | | 2010 | | | | 19,384,900 | | | | 1,577,570 | | | | — | | | | 20,962,470 | |
Medium-Duration Bond | | | 2011 | | | | 35,664,491 | | | | — | | | | — | | | | 35,664,491 | |
| | | 2010 | | | | 56,868,924 | | | | 6,383,322 | | | | — | | | | 63,252,246 | |
Extended-Duration Bond | | | 2011 | | | | 22,914,621 | | | | 15,984,265 | | | | — | | | | 38,898,886 | |
| | | 2010 | | | | 26,346,080 | | | | 3,455,445 | | | | — | | | | 29,801,525 | |
Inflation Protected Bond | | | 2011 | | | | 5,135,441 | | | | 1,036,828 | | | | — | | | | 6,172,269 | |
| | | 2010 | | | | 4,258,151 | | | | 498,839 | | | | — | | | | 4,756,990 | |
Global Bond | | | 2011 | | | | 8,997,511 | | | | — | | | | — | | | | 8,997,511 | |
| | | 2010 | | | | 12,273,443 | | | | — | | | | — | | | | 12,273,443 | |
Defensive Market Strategies | | | 2011 | | | | 1,375,713 | | | | — | | | | — | | | | 1,375,713 | |
Equity Index | | | 2011 | | | | 6,801,014 | | | | 34,862,054 | | | | — | | | | 41,663,068 | |
| | | 2010 | | | | 6,944,528 | | | | — | | | | — | | | | 6,944,528 | |
Real Estate Securities | | | 2011 | | | | 1,079,417 | | | | — | | | | — | | | | 1,079,417 | |
| | | 2010 | | | | 2,634,670 | | | | — | | | | — | | | | 2,634,670 | |
Value Equity | | | 2011 | | | | 16,657,286 | | | | — | | | | — | | | | 16,657,286 | |
| | | 2010 | | | | 16,090,315 | | | | — | | | | — | | | | 16,090,315 | |
Growth Equity | | | 2011 | | | | — | | | | — | | | | — | | | | — | |
| | | 2010 | | | | 174,095 | | | | — | | | | — | | | | 174,095 | |
Small Cap Equity | | | 2011 | | | | 703,937 | | | | — | | | | — | | | | 703,937 | |
| | | 2010 | | | | 1,340,931 | | | | — | | | | — | | | | 1,340,931 | |
International Equity | | | 2011 | | | | 24,239,880 | | | | — | | | | — | | | | 24,239,880 | |
| | | 2010 | | | | 27,463,589 | | | | — | | | | — | | | | 27,463,589 | |
268
At December 31, 2011, the components of distributable earnings on a tax basis were as follows:
| | | | | | | | | | | | | | | | |
Fund | | Undistributed
Ordinary
Income | | | Undistributed
Long-Term
Capital
Gain/ (Capital
Loss
Carryforward) | | | Late Year
Loss
Deferrals | | | Net
Unrealized
Appreciation
(Depreciation)
on Investments | |
MyDestination 2005 | | $ | 101,776 | | | $ | (3,901,075 | ) | | $ | (4,204 | ) | | $ | (643,039 | ) |
MyDestination 2015 | | | 1,380,630 | | | | (14,160,461 | ) | | | — | | | | 5,398,440 | |
MyDestination 2025 | | | 607,362 | | | | (2,461,097 | ) | | | (9,889 | ) | | | (821,681 | ) |
MyDestination 2035 | | | — | | | | — | | | | (19,797 | ) | | | (1,158,886 | ) |
MyDestination 2045 | | | — | | | | 134,417 | | | | (15,860 | ) | | | 2,774,840 | |
Conservative Allocation | | | — | | | | 247,642 | | | | (4,648 | ) | | | 13,988,022 | |
Balanced Allocation | | | 50,914 | | | | 2,939,626 | | | | — | | | | 26,588,163 | |
Growth Allocation | | | 45,039 | | | | 1,322,301 | | | | — | | | | (14,515,819 | ) |
Aggressive Allocation | | | 42,648 | | | | 1,409,043 | | | | — | | | | (42,399,775 | ) |
Conservative Allocation I | | | 710,653 | | | | (3,828,995 | ) | | | (1,003 | ) | | | (1,748,740 | ) |
Balanced Allocation I | | | 5,272,598 | | | | (20,642,924 | ) | | | (2,950,881 | ) | | | (28,420,598 | ) |
Growth Allocation I | | | 1,464,387 | | | | (7,718,852 | ) | | | (4,551,784 | ) | | | (29,838,522 | ) |
Aggressive Allocation I | | | 2,287,519 | | | | (9,405,198 | ) | | | (2,406,803 | ) | | | (31,644,360 | ) |
Money Market | | | 38 | | | | — | | | | — | | | | — | |
Low-Duration Bond | | | 3,023,788 | | | | 430,869 | | | | — | | | | (13,774,385 | ) |
Medium-Duration Bond | | | 3,888,726 | | | | — | | | | — | | | | (7,598,920 | ) |
Extended-Duration Bond | | | 220,138 | | | | 1,194,165 | | | | — | | | | 40,615,977 | |
Inflation Protected Bond | | | 1,768,527 | | | | 36,045 | | | | — | | | | 10,317,132 | |
Global Bond | | | 1,370,849 | | | | (11,694,277 | ) | | | (970,419 | ) | | | 7,295,544 | |
Defensive Market Strategies | | | 1,019,123 | | | | — | | | | (2,201 | ) | | | 5,133,141 | |
Equity Index | | | 73,937 | | | | 619,636 | | | | — | | | | 26,725,150 | |
Real Estate Securities | | | 184,497 | | | | (18,541,454 | ) | | | — | | | | 14,695,433 | |
Value Equity | | | 7,684,176 | | | | (115,825,440 | ) | | | (2,706,046 | ) | | | (46,567,232 | ) |
Growth Equity | | | — | | | | — | | | | (1,718,911 | ) | | | 167,874,635 | |
Small Cap Equity | | | 65,981 | | | | (9,852,173 | ) | | | (3,110,962 | ) | | | 31,652,862 | |
International Equity | | | — | | | | (111,653,443 | ) | | | (12,118,261 | ) | | | (113,641,905 | ) |
For Federal income tax purposes, realized capital losses may be carried forward and applied against future realized capital gains.
Capital loss carryovers and their expiration dates, were as follows as of December 31, 2011:
| | | | | | | | | | | | | | | | | | | | |
| Expiring December 31, | | 2016 | | | 2017 | | | 2018 | | | Unlimited | | | Total | |
| | | | | |
MyDestination 2005 | | $ | — | | | $ | 2,332,745 | | | $ | 1,568,330 | | | $ | — | | | $ | 3,901,075 | |
MyDestination 2015 | | | 889,637 | | | | 3,304,014 | | | | 3,056,941 | | | | 6,909,869 | | | | 14,160,461 | |
MyDestination 2025 | | | — | | | | 1,284,239 | | | | — | | | | 1,176,858 | | | | 2,461,097 | |
Conservative Allocation I | | | 574,891 | | | | 2,885,574 | | | | 368,530 | | | | — | | | | 3,828,995 | |
Balanced Allocation I | | | 4,262,186 | | | | 5,929,663 | | | | 3,461,879 | | | | 6,989,196 | | | | 20,642,924 | |
Growth Allocation I | | | 412,556 | | | | 2,508,443 | | | | 1,253,278 | | | | 3,544,575 | | | | 7,718,852 | |
Aggressive Allocation I | | | 3,489,043 | | | | 902,289 | | | | 2,119,350 | | | | 2,894,516 | | | | 9,405,198 | |
Global Bond | | | — | | | | 9,635,041 | | | | — | | | | 2,059,236 | | | | 11,694,277 | |
Real Estate Securities | | | — | | | | 18,541,454 | | | | — | | | | — | | | | 18,541,454 | |
Value Equity | | | 12,474,679 | | | | 103,350,761 | | | | — | | | | — | | | | 115,825,440 | |
Small Cap Equity | | | — | | | | 9,852,173 | | | | — | | | | — | | | | 9,852,173 | |
International Equity | | | — | | | | 111,653,443 | | | | — | | | | — | | | | 111,653,443 | |
Under the recently enacted Regulated Investment Company Modernization Act of 2010, Funds will be permitted to carry forward capital losses incurred in taxable years beginning after December 22, 2010, for an unlimited period. Such losses are
269
presented in the table above under the column heading “Unlimited.” However, any losses incurred during those future taxable years will be required to be utilized prior to the losses incurred in pre-enactment taxable years. As a result of this ordering rule, pre-enactment capital loss carryforwards may be more likely to expire unused. Additionally, post-enactment capital losses that are carried forward will retain their character as either short-term or long-term capital losses rather than being considered all short-term losses as under previous law.
During the year ended December 31, 2011, the following Funds utilized capital loss carryforwards to offset capital gains:
| | | | |
| | | Carryforward | |
| | | Utilized | |
MyDestination 2005 | | $ | 891,358 | |
Conservative Allocation I | | | 75,514 | |
Real Estate Securities | | | 12,380,168 | |
Value Equity | | | 35,777,259 | |
Growth Equity | | | 101,927,562 | |
Small Cap Equity | | | 57,620,420 | |
International Equity | | | 64,189,909 | |
For federal income tax purposes, late year loss deferrals, which will reverse in 2012, were as follows as of December 31, 2011:
| | | | | | | | | | | | |
| | | | | | Ordinary | | | | |
| | | Capital | | | Income | | | Total | |
MyDestination 2005 | | $ | 4,204 | | | $ | — | | | $ | 4,204 | |
MyDestination 2025 | | | 9,889 | | | | — | | | | 9,889 | |
MyDestination 2035 | | | 19,797 | | | | — | | | | 19,797 | |
MyDestination 2045 | | | 15,860 | | | | — | | | | 15,860 | |
Conservative Allocation | | | 4,648 | | | | — | | | | 4,648 | |
Conservative Allocation I | | | 1,003 | | | | — | | | | 1,003 | |
Balanced Allocation I | | | 2,950,881 | | | | — | | | | 2,950,881 | |
Growth Allocation I | | | 4,551,784 | | | | — | | | | 4,551,784 | |
Aggressive Allocation I | | | 2,406,803 | | | | — | | | | 2,406,803 | |
Global Bond | | | 970,419 | | | | — | | | | 970,419 | |
Defensive Market Strategies | | | — | | | | 2,201 | | | | 2,201 | |
Value Equity | | | 2,706,046 | | | | — | | | | 2,706,046 | |
Growth Equity | | | 1,718,371 | | | | 540 | | | | 1,718,911 | |
Small Cap Equity | | | 3,110,962 | | | | — | | | | 3,110,962 | |
International Equity | | | 12,070,205 | | | | 48,056 | | | | 12,118,261 | |
At December 31, 2011, the aggregate cost of investment securities for federal income tax purposes (excluding foreign currency, securities sold short and derivative related items) and the net unrealized appreciation from investments for those securities having an excess of value over cost and net unrealized depreciation from investments for those securities having an excess of cost over value (based on cost for federal income tax purposes) were as follows:
| | | | | | | | | | | | | | | | |
Fund | | Federal Tax Cost | | | Net Unrealized
Appreciation
(Depreciation) | | | Appreciated
Securities | | | Depreciated
Securities | |
MyDestination 2005 | | $ | 65,185,969 | | | $ | (643,039 | ) | | $ | 3,668,653 | | | $ | (4,311,692 | ) |
MyDestination 2015 | | | 268,477,018 | | | | 5,398,440 | | | | 18,135,764 | | | | (12,737,324 | ) |
MyDestination 2025 | | | 278,587,774 | | | | (821,682 | ) | | | 18,609,358 | | | | (19,431,040 | ) |
MyDestination 2035 | | | 132,209,928 | | | | (1,158,885 | ) | | | 8,263,533 | | | | (9,422,418 | ) |
MyDestination 2045 | | | 86,803,911 | | | | 2,774,840 | | | | 8,031,273 | | | | (5,256,433 | ) |
Conservative Allocation | | | 279,216,653 | | | | 13,988,022 | | | | 16,770,827 | | | | (2,782,805 | ) |
Balanced Allocation | | | 1,069,752,206 | | | | 26,588,162 | | | | 64,141,854 | | | | (37,553,692 | ) |
Growth Allocation | | | 796,670,388 | | | | (14,515,818 | ) | | | 40,668,084 | | | | (55,183,902 | ) |
Aggressive Allocation | | | 718,830,176 | | | | (42,399,776 | ) | | | 33,710,638 | | | | (76,110,414 | ) |
Conservative Allocation I | | | 75,646,532 | | | | (1,748,740 | ) | | | 2,729,912 | | | | (4,478,652 | ) |
270
| | | | | | | | | | | | | | | | |
Fund | | Federal Tax Cost | | | Net Unrealized
Appreciation
(Depreciation) | | | Appreciated
Securities | | | Depreciated
Securities | |
Balanced Allocation I | | $ | 338,102,394 | | | $ | (28,420,598 | ) | | $ | 9,106,088 | | | $ | (37,526,686 | ) |
Growth Allocation I | | | 227,233,942 | | | | (29,838,522 | ) | | | 5,339,554 | | | | (35,178,076 | ) |
Aggressive Allocation I | | | 160,906,238 | | | | (31,644,360 | ) | | | 3,067,960 | | | | (34,712,320 | ) |
Money Market | | | 1,277,710,734 | | | | — | | | | — | | | | — | |
Low-Duration Bond | | | 946,217,766 | | | | (14,384,449 | ) | | | 10,910,151 | | | | (25,294,600 | ) |
Medium-Duration Bond | | | 1,265,697,531 | | | | (8,276,051 | ) | | | 33,399,908 | | | | (41,675,959 | ) |
Extended-Duration Bond | | | 382,930,375 | | | | 40,631,114 | | | | 48,768,099 | | | | (8,136,985 | ) |
Inflation Protected Bond | | | 164,858,372 | | | | 10,349,223 | | | | 13,509,374 | | | | (3,160,151 | ) |
Global Bond | | | 187,981,478 | | | | 7,369,049 | | | | 11,747,865 | | | | (4,378,816 | ) |
Defensive Market Strategies | | | 294,973,521 | | | | 5,414,923 | | | | 12,841,569 | | | | (7,426,646 | ) |
Equity Index | | | 210,823,535 | | | | 26,725,150 | | | | 54,092,776 | | | | (27,367,626 | ) |
Real Estate Securities | | | 164,408,829 | | | | 14,695,433 | | | | 20,408,139 | | | | (5,712,706 | ) |
Value Equity | | | 1,174,918,595 | | | | (46,567,232 | ) | | | 114,783,147 | | | | (161,350,379 | ) |
Growth Equity | | | 1,061,351,485 | | | | 167,876,541 | | | | 234,170,415 | | | | (66,293,874 | ) |
Small Cap Equity | | | 543,946,764 | | | | 31,637,918 | | | | 53,961,072 | | | | (22,323,154 | ) |
International Equity | | | 1,405,814,527 | | | | (125,405,464 | ) | | | 91,766,172 | | | | (217,171,636 | ) |
The differences between book basis and tax-basis unrealized appreciation (depreciation) is attributable primarily to the tax deferral of losses on wash sales and investments in PFIC’s.
At December 31, 2011, capital contributions, accumulated undistributed net investment income and accumulated net realized gain (loss) from investments have been adjusted for current period permanent book/tax differences which arose principally from differing book/tax treatments of PFICs, paydown losses, net operating losses, swaps, foreign currency transactions, distributions received from regulated investment companies, defaulted bonds, reclassifications of dividends paid and non-deductible expenses.
The following amounts were reclassified within the capital accounts:
| | | | | | | | | | | | |
Fund | | Paid in
Capital | | | Undistributed
Net Investment
Income | | | Accumulated
Net Realized
Gain (Loss) on
Investments,
Currency Translations
and Derivative
Transactions | |
| | | |
MyDestination 2005 | | $ | (746 | ) | | $ | 219,485 | | | $ | (218,739 | ) |
MyDestination 2015 | | | (149 | ) | | | 669,804 | | | | (669,655 | ) |
MyDestination 2025 | | | — | | | | 326,670 | | | | (326,670 | ) |
MyDestination 2035 | | | (825 | ) | | | 31,033 | | | | (30,208 | ) |
MyDestination 2045 | | | — | | | | 1,504 | | | | (1,504 | ) |
Conservative Allocation | | | — | | | | 643,918 | | | | (643,918 | ) |
Balanced Allocation | | | — | | | | 2,533,832 | | | | (2,533,832 | ) |
Growth Allocation | | | — | | | | 875,345 | | | | (875,345 | ) |
Aggressive Allocation | | | — | | | | 94 | | | | (94 | ) |
Conservative Allocation I | | | — | | | | 209,688 | | | | (209,688 | ) |
Balanced Allocation I | | | (37 | ) | | | 1,466,233 | | | | (1,466,196 | ) |
Growth Allocation I | | | — | | | | 460,458 | | | | (460,458 | ) |
Aggressive Allocation I | | | — | | | | 19 | | | | (19 | ) |
Money Market | | | — | | | | (7,221 | ) | | | 7,221 | |
Low-Duration Bond | | | — | | | | 2,089,361 | | | | (2,089,361 | ) |
Medium-Duration Bond | | | — | | | | 1,496,640 | | | | (1,496,640 | ) |
Extended-Duration Bond | | | — | | | | 600,009 | | | | (600,009 | ) |
Inflation Protected Bond | | | — | | | | 146,706 | | | | (146,706 | ) |
Global Bond | | | — | | | | 60,396 | | | | (60,396 | ) |
Defensive Market Strategies | | | — | | | | 180,315 | | | | (180,315 | ) |
Equity Index | | | — | | | | 2,654 | | | | (2,654 | ) |
271
| | | | | | | | | | | | |
Fund | | Paid in
Capital | | | Undistributed
Net Investment
Income | | | Accumulated
Net Realized
Gain (Loss) on
Investments,
Currency Translations
and Derivative
Transactions | |
Real Estate Securities | | $ | — | | | $ | 27 | | | $ | (27 | ) |
Value Equity | | | — | | | | 214 | | | | (214 | ) |
Growth Equity | | | (1,254,162 | ) | | | 1,251,106 | | | | 3,056 | |
Small Cap Equity | | | — | | | | 82,768 | | | | (82,768 | ) |
International Equity | | | (401,193 | ) | | | 1,618,819 | | | | (1,217,626 | ) |
Net investment income, net realized gain (loss) on investments and net assets were not affected by these reclassifications.
10. MARKET AND CREDIT RISK
In the normal course of business, the Funds trade financial instruments and enter into financial transactions where the risk of potential loss exists due to changes in the market (market risk) or due to the failure of the other party to a transaction to perform (credit and counterparty risks).
Market Risks — A Fund’s investments in derivatives and other financial instruments expose the Fund to various risks such as, but not limited to, interest rate, foreign currency, equity and commodity risks.
Interest rate risk is the risk that fixed income securities will decline in value because of changes in interest rates. As nominal interest rates rise, the value of certain fixed income securities held by a Fund is likely to decrease. A nominal interest rate can be described as the sum of a real interest rate and an expected inflation rate. Fixed income securities with longer durations tend to be more sensitive to changes in interest rates, usually making them more volatile than securities with shorter durations. Duration is useful primarily as a measure of the sensitivity of a fixed income’s market price to interest rate (i.e. yield) movements.
If a Fund invests directly in foreign currencies or in securities that trade in, and receive revenues in, foreign currencies, or in derivatives that provide exposure to foreign currencies, it will be subject to the risk that those currencies will decline in value relative to the base currency of the Fund, or, in the case of hedging positions, that the Fund’s base currency will decline in value relative to the currency being hedged. Currency rates in foreign countries may fluctuate significantly over short periods of time for a number of reasons, including changes in interest rates, intervention (or the failure to intervene) by U.S. or foreign governments, central banks or supranational entities such as the International Monetary Fund, or by the imposition of currency controls or other political developments in the United States or abroad. As a result, a Fund’s investments in foreign currency denominated securities may reduce the returns of the Fund.
The market values of equities, such as common stocks and preferred stocks, or equity related investments such as futures and options, may decline due to general market conditions which are not specifically related to a particular company, such as real or perceived adverse economic conditions, changes in the general outlook for corporate earnings, changes in interest or currency rates or adverse investor sentiment. Market values may also decline due to factors which affect a particular industry or industries, such as labor shortages or increased production costs and competitive conditions within an industry. Equity securities and equity related investments generally have greater market price volatility than fixed income securities.
A Fund’s investments in commodity-linked derivative instruments may subject the Fund to greater market price volatility than investments in traditional securities. The value of commodity-linked derivative instruments may be affected by changes in overall
272
market movements, commodity index volatility, changes in interest rates, or factors affecting a particular industry or commodity, such as drought, floods, weather, livestock disease, embargoes, tariffs and international economic, political and regulatory developments.
Credit and Counterparty Risks — A Fund will be exposed to credit risk on parties with whom it trades and will also bear the risk of settlement default. A Fund minimizes concentrations of credit risk by undertaking transactions with a large number of customers and counterparties on recognized and reputable exchanges. A Fund could lose money if the issuer or guarantor of a fixed income security, or the counterparty to a derivatives contract, repurchase agreement or a loan of portfolio securities, is unable or unwilling to make timely principal and/or interest payments, or to otherwise honor its obligations. Securities are subject to varying degrees of credit risk, which are often reflected in credit ratings.
Similar to credit risk, a Fund may be exposed to counterparty risk, or the risk that an institution or other entity with which the Fund has unsettled or open transactions will default. Financial assets, which potentially expose a Fund to counterparty risk, consist principally of cash due from counterparties and investments. The investment advisers minimize counterparty risks to the Funds by performing extensive reviews of each counterparty and obtaining approval from the Counterparty Risk Committee prior to entering into transactions with a third party. All transactions in listed securities are settled/paid for upon delivery using approved counterparties. The risk of default is considered minimal, as delivery of securities sold is only made once a Fund has received payment. Payment is made on a purchase once the securities have been delivered by the counterparty. The trade will fail if either party fails to meet its obligation.
The Low-Duration Bond Fund, Medium-Duration Bond Fund and International Equity Fund are parties to ISDA (International Swap and Derivatives Association, Inc.) Master Agreements (“Master Agreements”) with certain counterparties that govern over the counter derivative and foreign exchange contracts entered into from time to time. The Master Agreements may contain provisions regarding, among other things, the parties’ general obligations, representations, agreements, collateral requirements, events of default and early termination. With respect to certain counterparties, in accordance with the terms of the Master Agreements, collateral posted to the Funds is held in a segregated account by the Fund’s custodian and with respect to those amounts which can be sold or repledged, are presented in the Fund’s portfolio or Statements of Assets and Liabilities. Collateral posted to the Funds which can not be sold or repledged totaled $2,250,000, $2,515,000 and $130,000 in the Low-Duration Bond Fund, Medium-Duration Bond Fund and International Equity Fund, respectively, at December 31, 2011. Collateral can be in the form of cash, debt securities, equities or other securities as agreed to by the Fund and the applicable counterparty. Collateral requirements are determined based on the Fund’s net position with each counterparty.
11. LEHMAN BROTHERS
On September 15, 2008, Lehman Brothers Holdings Inc. filed for protection under Chapter 11 of the United States Bankruptcy Code. On September 19, 2008, a proceeding under the Securities Investor Protection Act (SIPA) was commenced with respect to Lehman Brothers Inc., a broker-dealer. A trustee appointed under SIPA is administering the bankruptcy estate of Lehman Brothers Inc. Lehman Brothers International (Europe) was placed in administration under the UK Insolvency Act on September 15, 2008. Lehman Brothers Special Financing Inc. filed for protection under Chapter 11 of the United States Bankruptcy Code on October 3, 2008. In connection with these filings, the Lehman Brothers group of companies (collectively “Lehman Brothers”) will be reorganized and/or liquidated in an orderly fashion, subject to court approval. Each Lehman Brothers entity is a separate legal entity that is subject to its own bankruptcy proceeding.
The Low-Duration Bond, Medium-Duration Bond, Global Bond and Small Cap Equity Funds had select holdings, credit default swap agreements, and securities and derivatives transactions outstanding with Lehman Brothers entities as issuer, referenced
273
entity, counterparty or guarantor at the time the relevant Lehman Brothers entity filed for protection or was placed in administration. The security holdings, credit default swap agreements, and securities and derivatives transactions associated with Lehman Brothers have been written down to their estimated recoverable values. Anticipated losses for securities and derivatives transactions associated with Lehman Brothers have been incorporated as components of other receivables on the Statement of Assets and Liabilities and net changes in unrealized appreciation (depreciation) on the Statement of Operations. A facilitated auction occurred on October 10, 2008, comprising multiple pre-approved brokerage agencies to determine the estimated recovery rate for holdings and credit default swap agreements with Lehman Brothers Holdings Inc. as referenced entity. These recovery rates have been utilized in determining estimated recovery values. Claims against Lehman Brothers have been filed on behalf of GuideStone Funds in accordance with the filing requirements.
The Funds’ Sub-Advisers, on behalf of GSCM, have delivered notices of default to the relevant Lehman Brothers entities in accordance with the terms of the applicable agreements. For transactions with Lehman Brothers’ counterparties, the Sub-Advisers have terminated the trades, have obtained quotations from brokers for replacement trades and, where deemed appropriate, have re-opened positions with new counterparties.
There have been no changes in the status of the Claims against Lehman Brothers as of December 31, 2011.
12. NEW ACCOUNTING PROUNCEMENTS
In April 2011, the Financial Accounting Standards Board (“FASB”) issued Accounting Standards Update (“ASU”) No. 2011-03 “Reconsideration of Effective Control for Repurchase Agreements.” ASU No. 2011-03 changes the assessment of effective control for repurchase agreements including dollar roll transactions. The new and revised accounting and disclosures are effective for interim and annual reporting periods beginning after December 15, 2011. At this time, management is evaluating the implications of ASU No. 2011-03 and its impact on the financial statements.
In May 2011, the Financial Accounting Standards Board (“FASB”) issued Accounting Standards Update (“ASU”) No. 2011-04 “Amendments to Achieve Common Fair Value Measurement and Disclosure Requirements in U.S. GAAP and International Financial Reporting Standards (“IFRSs”).” ASU 2011-04 includes common requirements for measurement of and disclosure about fair value between U.S. GAAP and IFRSs. ASU 2011-04 will require reporting entities to disclose quantitative information about the unobservable inputs used in the fair value measurements categorized within Level 3 of the fair value hierarchy. In addition, ASU 2011-04 will require reporting entities to make disclosures about amounts and reasons for all transfers in and out of Level 1 and Level 2 fair value measurements. The new and revised disclosures are effective for interim and annual reporting periods beginning after December 15, 2011. At this time, management is evaluating the implications of ASU No. 2011-04 and its impact on the financial statements has not been determined.
13. SUBSEQUENT EVENTS
Subsequent events have been evaluated through the date that the financial statements were available to be issued. All subsequent events determined to be relevant and material to the financial statements have been appropriately recorded or disclosed.
The Bank of New York Mellon Corporation recently announced that it has agreed to sell BNY Mellon Distributors LLC and its four subsidiaries (“Distributor”) to Foreside Distributors, a subsidiary of Foreside Financial Group (the “Transaction”). Subject to any necessary approvals, the Transaction is anticipated to close in the first half of 2012. Upon the closing of the Transaction, Distributor will become an indirect, wholly owned subsidiary of Foreside Financial Group, and it is anticipated that the Distributor will be named Foreside Funds Distributors LLC.
274
REPORT OF INDEPENDENT REGISTERED PUBLIC ACCOUNTING FIRM
To the Board of Trustees and
Shareholders of GuideStone Funds:
In our opinion, the accompanying statements of assets and liabilities, including the schedules of investments, and the related statements of operations and of changes in net assets and the financial highlights present fairly, in all material respects, the financial position of MyDestination 2005 Fund, MyDestination 2015 Fund, MyDestination 2025 Fund, MyDestination 2035 Fund, MyDestination 2045 Fund, Conservative Allocation Fund, Balanced Allocation Fund, Growth Allocation Fund, Aggressive Allocation Fund, Conservative Allocation Fund I, Balanced Allocation Fund I, Growth Allocation Fund I, Aggressive Allocation Fund I, Money Market Fund, Low-Duration Bond Fund, Medium-Duration Bond Fund, Extended-Duration Bond Fund, Inflation Protected Bond Fund, Global Bond Fund, Defensive Market Strategies Fund, Equity Index Fund, Real Estate Securities Fund, Value Equity Fund, Growth Equity Fund, Small Cap Equity Fund, and International Equity Fund (constituting GuideStone Funds, hereafter referred to as the “Trust”) at December 31, 2011, the results of each of their operations for the period then ended, the changes in each of their net assets and the financial highlights for each of the periods indicated, in conformity with accounting principles generally accepted in the United States of America. These financial statements and financial highlights (hereafter referred to as “financial statements”) are the responsibility of the Trust’s management; our responsibility is to express an opinion on these financial statements based on our audits. We conducted our audits of these financial statements in accordance with the standards of the Public Company Accounting Oversight Board (United States). Those standards require that we plan and perform the audit to obtain reasonable assurance about whether the financial statements are free of material misstatement. An audit includes examining, on a test basis, evidence supporting the amounts and disclosures in the financial statements, assessing the accounting principles used and significant estimates made by management, and evaluating the overall financial statement presentation. We believe that our audits, which included confirmation of securities at December 31, 2011 by correspondence with the custodian, brokers and transfer agent of the investee funds, provide a reasonable basis for our opinion.

PricewaterhouseCoopers LLP
Philadelphia, Pennsylvania
February 28, 2012
275
NOTICE TO SHAREHOLDERS (Unaudited)
Each Fund is required by Subchapter M of the Internal Revenue Code of 1986, as amended, to advise its shareholders of the federal tax status of distributions received by each Fund’s shareholders. During the year ended December 31, 2011, the Funds hereby designate the following dividends and distributions paid by each of the Funds:
| | | | | | | | | | | | |
Fund | | Ordinary
Income | | | Long-Term
Capital Gain | | | Return
of Capital | |
| | | |
MyDestination 2005 | | $ | 1,118,885 | | | $ | — | | | $ | — | |
MyDestination 2015 | | | 4,639,060 | | | | — | | | | — | |
MyDestination 2025 | | | 4,085,427 | | | | — | | | | — | |
MyDestination 2035 | | | 1,557,736 | | | | 641,898 | | | | — | |
MyDestination 2045 | | | 778,529 | | | | 1,902,435 | | | | — | |
Conservative Allocation | | | 4,849,965 | | | | 4,252,565 | | | | — | |
Balanced Allocation | | | 24,215,019 | | | | 18,074,022 | | | | — | |
Growth Allocation | | | 12,007,052 | | | | 13,021,185 | | | | — | |
Aggressive Allocation | | | 7,015,783 | | | | 10,439,039 | | | | — | |
Conservative Allocation I | | | 1,925,326 | | | | — | | | | — | |
Balanced Allocation I | | | 12,643,249 | | | | — | | | | — | |
Growth Allocation I | | | 5,922,267 | | | | — | | | | — | |
Aggressive Allocation I | | | 2,389,446 | | | | — | | | | — | |
Money Market | | | 251,150 | | | | — | | | | — | |
Low-Duration Bond | | | 14,375,468 | | | | 607,824 | | | | — | |
Medium-Duration Bond | | | 35,664,491 | | | | — | | | | — | |
Extended-Duration Bond | | | 22,914,621 | | | | 15,984,265 | | | | — | |
Inflation Protected Bond | | | 5,135,441 | | | | 1,036,828 | | | | — | |
Global Bond | | | 8,997,511 | | | | — | | | | — | |
Defensive Market Strategies | | | 1,375,713 | | | | — | | | | — | |
Equity Index | | | 6,801,014 | | | | 34,862,054 | | | | — | |
Real Estate Securities | | | 1,079,417 | | | | — | | | | — | |
Value Equity | | | 16,657,286 | | | | — | | | | — | |
Small Cap Equity | | | 703,937 | | | | — | | | | — | |
International Equity | | | 24,239,880 | | | | — | | | | — | |
Dividends from net investment income and short-term capital gains are treated as ordinary income dividends for federal income tax purposes. Long-term capital gain distributions are taxable as capital gain dividends.
276
NOTICE TO SHAREHOLDERS (Continued)
The following percentages of ordinary income dividends paid for the year ended December 31, 2011, have been designated as qualified for the reduced tax rate under The Job and Growth Tax Relief Reconciliation Act of 2003.
| | | | |
Fund | | | |
MyDestination 2005 | | | 16.80 | % |
MyDestination 2015 | | | 25.68 | % |
MyDestination 2025 | | | 38.30 | % |
MyDestination 2035 | | | 60.97 | % |
MyDestination 2045 | | | 87.78 | % |
Conservative Allocation | | | 12.49 | % |
Balanced Allocation | | | 20.09 | % |
Growth Allocation | | | 46.94 | % |
Aggressive Allocation | | | 91.95 | % |
Conservative Allocation I | | | 14.36 | % |
Balanced Allocation I | | | 20.21 | % |
Growth Allocation I | | | 45.60 | % |
Aggressive Allocation I | | | 99.64 | % |
Defensive Market Strategies | | | 97.28 | % |
Equity Index | | | 78.46 | % |
Value Equity | | | 100.00 | % |
Small Cap Equity | | | 100.00 | % |
International Equity | | | 93.18 | % |
All above designations are based on financial information available as of the date of this annual report, and accordingly, are subject to change. It is the intention of the Funds to designate the maximum amount permitted under the Internal Revenue Code and the regulations thereunder. Shareholders are advised to consult their own tax advisers with respect to the tax consequences of their investment in the Funds.
277
FUND MANAGEMENT (Unaudited)
Information pertaining to the Trustees and officers of the Trust is set forth below. The statement of additional information (SAI) includes additional information about the Trustees and is available without charge, upon request, by calling 1-888-98-GUIDE (1-888-984-8433).
| | | | | | | | |
Name, (DOB), Address and Position(s) with Trust | | Term of Office
and Length of
Time Served1 | | Principal Occupation(s) During Past 5 Years | | Number of
Portfolios
in Fund
Complex
Overseen
by Trustee | | Other Trusteeships/ Directorships Held by Trustee |
| DISINTERESTED TRUSTEES2 |
| | | | |
Michael R. Buster (1957) 2401 Cedar Springs Road Dallas, TX 75201-1407 Trustee | | Since 2005 | | Executive Pastor, Prestonwood Baptist Church, 1989 - present. | | 26 | | Ouachita Baptist University - Board of Trustees Member. |
| | | | |
Peter L. Chamberlain, Ph.D. (1951) 2401 Cedar Springs Road Dallas, TX 75201-1407 Trustee | | Since 2008 | | Retired - Senior Financial Analyst, Summit Wealth Management, Inc., 2007 - 2010; President, B.R. Chamberlain & Sons, Inc., 1990 - 2006 Registered Investment Adviser. | | 26 | | First Baptist Church of Orlando — Board of Trustees Member and Strategy Team; Rollins College Board of Overseers/Corporate Council — Member; The B.R. Chamberlain Foundation for Public Entertainment — President |
| | | | |
Carson L. Eddy (1943) 2401 Cedar Springs Road Dallas, TX 75201-1407 Trustee | | Since 2011 | | Partner in Charge (Orlando office), Carr, Riggs & Ingram, LLC, 2007 - present – Certified Public Accountants; President, Quantum Consulting Group LLC, 2000 - present; Managing Partner, Cuthill & Eddy LLC, 1993 - 2007 - Certified Public Accountants. | | 26 | | N/A |
| | | | |
William Craig George (1958) 2401 Cedar Springs Road Dallas, TX 75201-1407 Trustee | | Since 2004 | | Chief Credit Officer, CapStone Bank, 2012 - present; Executive Vice President/ Regional Credit Officer, SunTrust Bank, 1995 - 2011. | | 26 | | N/A |
| | | | |
Grady R. Hazel (1947) 2401 Cedar Springs Road Dallas, TX 75201-1407 Trustee | | Since 2011 | | Executive Director, Society of Louisiana CPAs, 1995 - present. | | 26 | | Neighbors Federal Credit Union — Board of Directors Member and Chairman of Audit Committee; Stonetrust Commercial Insurance Company — Board of Directors Member and Member of Audit Committee |
| | | | |
Joseph A. Mack (1939) 2401 Cedar Springs Road Dallas, TX 75201-1407 Trustee | | Since 2002 | | Retired - Director, Office of Public Policy, South Carolina Baptist Convention, 1999 - 2010. | | 26 | | N/A |
| | | | |
Franklin R. Morgan (1943) 2401 Cedar Springs Road Dallas, TX 75201-1407 Trustee | | Since 2005 | | Retired - Senior Vice President, Director of International Administration, Prudential Securities, Inc., January 1962 - May 2003. | | 26 | | N/A |
| | | | |
William T. Patterson (1939) 2401 Cedar Springs Road Dallas, TX 75201-1407 Trustee | | Since 2009 | | Managing Partner, Patterson Capital, LLC, October 2007 – present; Senior Vice President, Wachovia Securities LLC, July 2003 – January 2007; Senior Vice President, Prudential Financial Inc., October 2000 – July 2003. | | 26 | | Therizo Capital Management — Director and Chairman of Audit Committee |
|
| INTERESTED TRUSTEES2,3 |
| | | | |
Barry D. Hartis (1945) 2401 Cedar Springs Road Dallas, TX 75201-1407 Trustee | | Since 2005 | | Certified Public Accountant, 1976 - present; Vice President of Business and Finance, Greensboro College, January 1998 - June 30, 2005. | | 26 | | N/A |
| | | | |
James W. Hixson (1931) 2401 Cedar Springs Road Dallas, TX 75201-1407 Trustee | | Since 2010 | | Retired | | 26 | | N/A |
278
FUND MANAGEMENT (Continued)
| | | | | | | | |
Name, (DOB), Address and Position(s) with Trust | | Term of Office
and Length of
Time Served1 | | Principal Occupation(s) During Past 5 Years | | Number of
Portfolios
in Fund
Complex
Overseen
by Trustee | | Other Trusteeships/ Directorships Held by Trustee |
|
| OFFICERS WHO ARE NOT TRUSTEES4 |
| | | | |
Ron W. Bass (1966) 2401 Cedar Springs Road Dallas, TX 75201-1407 Chief Compliance Officer and AML Officer. | | Since 2009 | | Director of Broker/Dealer and RIA Compliance, GuideStone Financial Resources of the Southern Baptist Convention, June 2009 – present; Manager of Broker/Dealer and RIA Compliance, GuideStone Financial Resources of the Southern Baptist Convention, 2008 – May 2009; Marketing Compliance Manager, GuideStone Financial Resources of the Southern Baptist Convention, 2005 - present; Compliance Specialist, GuideStone Financial Resources of the Southern Baptist Convention, 2004 - 2005. | | N/A | | N/A |
| | | | |
Jeffrey P. Billinger (1946) 2401 Cedar Springs Road Dallas, TX 75201-1407 Vice President and Treasurer | | Since 2000 | | Executive Officer and Treasurer, GuideStone Financial Resources of the Southern Baptist Convention, 1995 - present. | | N/A | | N/A |
| | | | |
Rodric E. Cummins (1957) 2401 Cedar Springs Road Dallas, TX 75201-1407 Vice President and Investment Officer | | Since 2000 | | Executive Officer and Chief Investment Officer, GuideStone Financial Resources of the Southern Baptist Convention, 1998 - present. | | N/A | | N/A |
| | | | |
John R. Jones (1953) 2401 Cedar Springs Road Dallas, TX 75201-1407 President | | Since 2000 | | Executive Vice President and Chief Operating Officer, GuideStone Financial Resources of the Southern Baptist Convention, 1995 - present. | | N/A | | N/A |
| | | | |
Rodney R. Miller (1953) 2401 Cedar Springs Road Dallas, TX 75201-1407 Vice President, Secretary and Chief Legal Officer | | Since 2000 | | General Counsel, Legal and Compliance, GuideStone Financial Resources of the Southern Baptist Convention, 1995 - present. | | N/A | | N/A |
| | | | |
Patricia A. Weiland (1959) 2401 Cedar Springs Road Dallas, TX 75201-1407 Vice President — Fund Operations and Sales | | Since 2000 | | Executive Officer, Financial Solutions and Services, GuideStone Financial Resources of the Southern Baptist Convention, 2006 - present; Director, Mutual Funds, GuideStone Financial Resources of the Southern Baptist Convention, 2000 - 2006. | | N/A | | N/A |
| 1 | Each Trustee serves for an indefinite term, until his successor is elected. Officers serve at the pleasure of the Board of Trustees. |
| 2 | The Trust pays no compensation to the Trustees. The Trust reimburses the Trustees for any expenses incurred in attending meetings. The Trust does not compensate the officers for the services they provide to the Funds. |
| 3 | Messrs. Hartis and Hixson are “interested persons” of the Trust as the term is defined in Section 2(a)19 of the Investment Company Act of 1940, due to their positions on the Board of Trustees of GuideStone Financial Resources of the Southern Baptist Convention. In addition, Mr. Hixson may also be deemed an “Interested person” of the Trust due to his positions on the Boards of Trustees of GuideStone Advisors and GuideStone Financial Services. |
| 4 | The executive officers of the Trust may be deemed to be affiliates of the Adviser due to their positions with the Adviser and/or GuideStone Financial Resources. |
279
PROXY VOTING
A description of the policies and procedures that GuideStone Funds uses to determine how to vote proxies relating to their portfolio securities as well as information regarding how GuideStone Funds voted proxies during the most recent 12-month period ended June 30 is available without charge by calling 1-888-98-GUIDE (1-888-984-8433), by visiting our website at www.GuideStoneFunds.org or by visiting the SEC’s website at www.sec.gov.
FORM N-MFP
Beginning December 2009, the GuideStone Money Market Fund began filing Form N-MFP with the SEC. Form N-MFP is filed on a monthly basis by money market mutual funds and includes detailed information about a money market fund’s investments and the market-based price of its portfolio known as its “shadow NAV“ or mark-to-market valuation. The portfolio holdings information is posted on our website, www.GuideStoneFunds.org within five business days after the end of the month. Form N-MFP is made available online with a 60-day delay at www.sec.gov.
QUARTERLY SCHEDULES OF INVESTMENTS
In addition to the semi-annual and annual reports that GuideStone Funds delivers to shareholders and makes available through its website, GuideStone Funds files a complete schedule of portfolio holdings with the SEC for each Fund’s first and third fiscal quarters on Form N-Q. GuideStone Funds does not deliver the schedule for the first and third fiscal quarters to shareholders, however the schedule is posted to our website, www.GuideStoneFunds.org. You may also obtain the Form N-Q filings by accessing the SEC’s website at www.sec.gov or copy them at the SEC’s Public Reference Room in Washington, DC. Information on the operation of the SEC’s Public Reference Room may be obtained by calling the SEC at (800) 732-0330. You can also request copies of this information, upon payment of a fee for duplication, at the SEC’s email address (publicinfo@sec.gov) or by writing the Public Reference section of the SEC, Washington, DC 20549-0102.
280
BOARD REVIEW OF ADVISORY AGREEMENTS (Unaudited)
As required by the Investment Company Act of 1940, as amended (the “1940 Act”), the Board of Trustees (the “Board”) of GuideStone Funds (the “Trust”), including all of the Trustees who are not “interested persons” of the Trust, as that term is defined in Section 2(a)(19) of the 1940 Act (the “Independent Trustees”), recently considered the renewal of (i) the investment advisory agreement between GuideStone Capital Management (the “Adviser” or “GSCM”) and the Trust on behalf of the Date Target, Asset Allocation and Select Funds (each a “Fund” and together, the “Funds”) of the Trust (the “Advisory Agreement”); and (ii) the sub-advisory agreements among the Adviser, each sub-adviser and the Trust on behalf of each Select Fund (the “Sub-Advisory Agreements”), with the exception of (1) American Century Investment Management, Inc., AQR Capital Management, LLC, Shenkman Capital Management, Inc. and Turner Investment Partners, Inc. with respect to the Defensive Market Strategies Fund; (2) Baillie Gifford Overseas Limited, Tradewinds Global Investors, LLC and Mondrian Investment Partners Ltd. (“Mondrian”) with respect to the International Equity Fund; and (3) The Clifton Group Investment Management Company (“Clifton”) with respect to all Funds for the cash overlay program and the International Equity Fund. The Advisory Agreement and the applicable Sub-Advisory Agreements presented for renewal (collectively, the “Agreements”) were approved for an additional one-year term at a meeting of the Board held on September 8-9, 2011. The Board’s decision to approve the Agreements reflects the exercise of its business judgment to continue each existing arrangement. In approving the Agreements, the Board considered information provided by the Adviser, each applicable sub-adviser and a consulting firm engaged by the Adviser with the assistance and advice of counsel to the Independent Trustees and counsel to the Trust.
The Board’s consideration of various factors and its conclusions with respect to such factors formed the basis for the Board’s determination to continue the Agreements. The factors considered by the Board included, but were not limited to: (i) the resources of the Adviser or sub-adviser; (ii) the experience and expertise of the Adviser or sub-adviser; (iii) the financial capabilities of the Adviser or sub-adviser; (iv) the compliance procedures and history of the Adviser or sub-adviser; (v) the performance of the Fund or portfolio account in comparison to relevant benchmarks, similarly managed funds and the Adviser’s or sub-adviser’s other clients; (vi) the costs of the services to be provided by the Adviser or sub-adviser; (vii) the amount of the contractual advisory fee in comparison to similarly managed funds and the Adviser’s or sub-adviser’s other clients and the effect of any fee waiver and expense reimbursement arrangement; (viii) the total expenses of the Fund in comparison to similarly managed funds and the use of past and anticipated expense caps; (ix) the profitability of the Adviser or sub-adviser with respect to the Fund or portfolio account and its overall business as well as the effect of fee waivers and expense caps on profitability; (x) the extent of any economies of scale and whether the fee structure reflects such economies of scale through breakpoints; (xi) the existence of any collateral benefits realized by the Adviser or sub-adviser; and (xii) the existence of any collateral benefits realized by the Fund. In its decision to renew the Agreements, the Board was also mindful of the potential disruptions of the Trust’s operations and various risks, uncertainties and other effects that could occur as a result of a decision to terminate or not renew an Agreement. The Board also evaluated whether the approval of an Agreement is in the best interests of each Fund and its shareholders. No one factor was determinative in the Board’s consideration of the Agreements.
The Board undertook a review of the terms of the Agreements and the nature, extent and quality of the services provided by the Adviser and each applicable sub-adviser. The Board conducted its analysis on a fund-by-fund basis with respect to the Adviser and each applicable sub-adviser. The Adviser provided the Board with substantial detailed information in the form of reports about each Date Target Fund, Asset Allocation Fund, Select Fund, applicable sub-advisory firm and the Adviser prior to and during the meeting, which addressed most, if not all, of the factors listed above. The Adviser also provided additional information about the Adviser and each sub-adviser in presentations made during the meeting and responded to questions from the Trustees. In addition, the Independent Trustees met separately in executive session with counsel to the Independent Trustees to discuss and consider information presented in connection with the continuation of the Agreements as well as the Trustees’ responsibilities and duties in approving the Agreements.
BOARD APPROVAL OF CONTINUATION OF ADVISORY AGREEMENT
In considering the renewal of the existing Advisory Agreement with GSCM, the Board took into account all the materials provided prior to and during the meeting, the presentations made during the meeting and the comprehensive discussions during the meeting, including the discussions between the Independent Trustees and their independent legal counsel during the
281
executive session. More specifically, the Board examined the nature, extent and quality of the services to be provided by the Adviser to the Funds. The Board evaluated the Adviser’s experience in serving as an investment adviser, including overseeing and managing the allocation of each Fund’s assets among the sub-advisers. The Board considered the experience of key personnel at the Adviser in providing investment management and administrative services and the systems used by such persons and the ability of the Adviser to attract and retain capable personnel. The Board considered the reputation, compliance history, compliance program and financial condition of the Adviser. The Board also considered the terms of the Agreements and the responsibilities that the Adviser has as investment adviser to the Funds, including oversight of sub-adviser compliance with each Fund’s policies and objectives, oversight of general Fund compliance, including compliance with social restrictions and the implementation of Board directives as they relate to the Funds. The Board concluded that each Fund is likely to benefit from the extent and quality of these services as a result of the Adviser’s experience, personnel, operations and resources.
The Board also reviewed a memorandum prepared by a consulting firm engaged by the Adviser for, among other things, supplying research on expense comparisons and investment performance of other similar funds. The memorandum compared each Date Target, Asset Allocation and Select Fund with other funds having the same investment style or objective, based primarily on Morningstar’s style-based investment categories, and compared the share class of each Fund with other funds in the same distribution channel. The Board analyzed the comparative expense information for each Fund and the performance information for each Select Fund in the memorandum, including comparative expense information for each Fund based on a sampling of funds similar in asset size. The Board considered the comparative fee and expense information that had been provided in its evaluation of the management fees charged to each Fund. The Board evaluated the annualized performance results comparing the Select Funds against their peers.
The Board examined fee and expense information for the Select Funds, as compared to other funds in the Funds’ asset-stratified peer groups for the GS4 Class as of June 30, 2011. The Board determined that the management fees (combined advisory and sub-advisory fees) net of any fee waiver or expense reimbursement, for each Select Fund were the same or lower than the median management fees for other mutual funds in the Fund’s asset-stratified peer group, except for the Growth Equity, Small Cap Equity and International Equity Funds. The Board took into account that the management fees, net of any fee waiver or expense reimbursement, for the Medium-Duration Bond, Extended-Duration Bond, Equity Index, Real Estate Securities and Value Equity Funds ranked in the second quartile, and the Money Market, Low-Duration Bond, Inflation Protected Bond and Global Bond Funds ranked in the first quartile among similar funds at similar asset levels. The Board also considered that the management fees, net of any fee waiver or expense reimbursement, for the Small Cap Equity Fund ranked in the third quartile and for the Growth Equity and International Equity Funds ranked in the fourth quartile, among similar funds at similar asset levels. The Board also evaluated the total expense ratios for other funds in the Funds’ asset-stratified peer groups and determined that each Fund’s total expense ratio, with the exception of the Money Market Fund, was lower than the median total expense ratio for such other funds.
The Board also examined fee and expense information for the Select Funds, as compared to other funds in the peer groups for the GS2 Class as of June 30, 2011. The Board determined that the management fees, net of any fee waiver or expense reimbursement, for each Select Fund were the same or lower than the median management fees for other mutual funds in each Fund’s peer group, except for the Money Market, Equity Index, Growth Equity, Small Cap Equity and International Equity Funds. The Board noted that the management fees, net of any fee waiver or expense reimbursement, for the Low-Duration Bond, Medium-Duration Bond, Extended-Duration Bond and Value Equity Funds ranked in the second quartile; the Money Market and Equity Index Funds ranked in the third quartile; and the Growth Equity, Small Cap Equity and International Equity Funds ranked in the fourth quartile, among similar funds. The Board also evaluated the total expense ratios for other funds in the Funds’ peer groups and determined that each Fund’s total expense ratio was the same as or lower than the median total expense ratio for such other funds, except for the Small Cap Equity Fund.
The Board also examined fee and expense information for the Date Target Funds and the Asset Allocation Funds, as compared to other funds in the Funds’ asset-stratified peer groups for the GS4 Class of the Date Target Funds and the GS2 and GS4 Classes of the Asset Allocation Funds as of June 30, 2011. The Board determined that the management fees, net of any fee waiver or expense reimbursement, for each Date Target Fund were above the median management fees for other mutual funds in each Fund’s asset-stratified peer group and that the total expense ratios for each Date Target Fund were lower than the median total
282
expense ratio for such other funds. For the Asset Allocation Funds, the Board determined that the management fees, net of any fee waiver or expense reimbursement, for each Asset Allocation Fund for both the GS2 and GS4 Classes were lower than the median management fees for other mutual funds in each Fund’s asset-stratified peer group and that the total expense ratios for each Asset Allocation Fund for both the GS2 and GS4 Classes were lower than the median total expense ratio for such other funds. The Board concluded that the level of the management fees for each Select Fund, Date Target Fund and Asset Allocation Fund was reasonable and compared fairly to that of comparable mutual funds.
The Board examined the performance information for the GS4 Class of the Select Funds compared to Morningstar peers, specifically for the three- and five-year average annual total returns for the period ended June 30, 2011. The Board noted that the average annual total returns for the three- and five-year periods ended June 30, 2011, for the Money Market, Medium-Duration Bond and Extended-Duration Bond Funds ranked in the first quartile, and the Low-Duration Bond and International Equity Funds ranked in the second quartile. For the period ended June 30, 2011, the Board noted that the Value Equity, Growth Equity and Small Cap Equity Funds ranked in the second quartile for their three-year average annual total returns and the third quartile for their five-year average annual total returns. For the period ended June 30, 2011, the Board noted that the Global Bond and Real Estate Securities Funds ranked in the second quartile for their three-year average annual total returns. The Board noted that the Inflation Protected Bond Fund had commenced operations in 2009 and that three- and five-year average annual total return information for the Fund was not available. For the period ended June 30, 2011, however, the Board noted that the Inflation Protected Bond Fund ranked in the fourth quartile among comparable peers for one-year average annual total returns.
The Board examined the performance information for the GS4 Class of each Asset Allocation Fund compared to the relevant benchmark and to Lipper peer rankings for the three- and five-year periods ended June 30, 2011, and for the Date Target Funds for the three-year period ended June 30, 2011. The Board noted that the Balanced Allocation Fund ranked in the first quartile among Lipper peers for the three- and five-year periods ended June 30, 2011; the Growth Allocation and the Aggressive Allocation Funds ranked in the second quartile among Lipper peers for the three- and five-year periods ended June 30, 2011; and the Conservative Allocation Fund ranked in the third quartile among Lipper peers for the three- and five-year periods ended June 30, 2011. The Board also noted that the MyDestination 2015 and 2025 Funds each ranked in the first quartile among Lipper peers for the three-year period ended June 30, 2011, while the MyDestination 2005, 2035 and 2045 Funds each ranked in the second quartile among Lipper peers for the same period.
The Board considered the costs to GSCM of serving as the Adviser to the Funds, including the costs associated with the personnel, systems and equipment necessary to manage the Funds in accordance with the existing Advisory Agreement. The Board considered the anticipated revenues that GSCM expected to receive for serving as the Adviser to the Funds, the fact that any profit realized by the Adviser is forwarded to its affiliate GuideStone Financial Resources, which historically has operated at a deficit with respect to the Trust. The Board also considered the profitability estimates for the Adviser, first without taking into account sub-advisory fees and second, taking into account sub-advisory fees. The Board then considered whether any direct or indirect collateral benefits inured to either the Adviser or the Trust as a result of their affiliation with one another. In light of these considerations, the Board concluded that any profits realized in connection with the Adviser’s services appeared reasonable.
The Board considered the extent to which the advisory fee to be paid to the Adviser reflected economies of scale. The Board again noted that the management fees for each Fund net of any fee waiver and expense reimbursement were below the median fee for other similar funds at the same asset levels for the GS4 Class, except for the Growth Equity, Small Cap Equity and International Equity Funds. The Board also noted the contractual waiver and expense reimbursement undertaken by the Adviser with regard to the Funds. Based on their review, the Board concluded that each Fund’s advisory fee was reasonable.
Based on all of the information presented to the Board and its consideration of relevant factors, the Board concluded that the fee paid to the Adviser by each Fund was reasonable, and in the exercise of its business judgment, determined to approve the continuation of the Advisory Agreement for each Fund. The Board also determined that approval of the continuation of each Advisory Agreement is in the best interests of each Fund and its shareholders.
283
BOARD APPROVAL OF CONTINUATION OF SUB-ADVISORY AGREEMENTS
In considering the existing Sub-Advisory Agreements with each of the applicable sub-advisers, the Board took into account the materials provided prior to and during the meeting, the presentations made during the meeting and the extensive discussions during the meeting, including the discussions the Independent Trustees had during their executive session with their independent legal counsel. The Board also took into account the Investment Management Committee’s (the “Committee”) review of information related to the Trust’s sub-advisers, questions submitted by the Committee to Trust management regarding various sub-advisers, Trust management’s responses to those questions and recommendations made by the Committee. More specifically, the Board examined the nature, extent and quality of the services to be provided by the sub-advisers to the Select Funds. The Board evaluated each sub-adviser’s experience in serving as a sub-adviser to a Select Fund. The Board noted that each sub-adviser currently provides investment advice to various clients, including, in some cases, other pooled investment vehicles. The Board noted the experience of key personnel at each sub-adviser in providing investment management services and the systems used by such persons and the ability of each sub-adviser to attract and retain capable personnel. The Board noted the reputation, compliance history, compliance program and financial condition of each sub-adviser. The Board also noted the terms of the existing Sub-Advisory Agreements and the responsibilities that each sub-adviser has towards a Select Fund, including the responsibility of the day-to-day management of the investment portfolio of each Fund, compliance with each Fund’s policies and objectives and the implementation of Board directives as they relate to the Funds. The Board also noted that market conditions presented extraordinary challenges for active management. The Board concluded that each Fund is likely to benefit from the extent and quality of these services as a result of each sub-adviser’s experience, personnel, operations and resources.
The Board examined performance information for each segment of a Select Fund managed by a sub-adviser. The Board noted that, for many of the sub-advisers, the performance record of the segment of the Select Fund managed by the sub-adviser compared favorably to the relevant Fund’s benchmark, the composite performance for the sub-adviser’s clients (on a gross fee basis) and the peer universe of similarly managed funds for the period of time the sub-adviser performed advisory services on behalf of the Select Fund. In cases where the sub-adviser’s performance lagged behind the Fund’s benchmark, the Board also considered more recent investment performance, performance measured against other relevant benchmarks and any reductions in the sub-advisory fee.
The Board also noted that, in certain cases, market trends due to the economic downturn have contributed to the underperformance of some of the sub-advisers. The Board concluded that, although past performance is no guarantee of future performance, the performance of each Select Fund was satisfactory and the Funds were likely to benefit from each sub-adviser continuing to serve as sub-adviser to the Trust’s Funds.
The Board examined the fee schedule for each sub-adviser, noting how the fee levels charged to the Trust compared with available information about fees charged by the sub-advisers to their other similarly situated clients, which in many cases include separately managed accounts, as well as how the sub-adviser fee levels for each Select Fund compared to the median sub-advisory fee for the peer universe of similarly managed funds.
The Board also took into account the profitability and the financial capability of each sub-adviser in light of information presented at the meeting. In light of these considerations, the Board concluded that the profits realized by each sub-adviser who completed a profitability questionnaire appeared reasonable. For those sub-advisers that did not provide profitability information, the Board relied upon other relevant information, particularly the independent negotiation of the fee schedules, the level of the fees and the sub-adviser’s performance history. The Board noted that, based on the Adviser’s representations, the financial statements of the sub-advisers did not appear to raise any concerns regarding the financial capability of those sub-advisers. The Board also considered the Adviser’s representations in the materials prepared for this meeting that no sub-adviser experienced any material change in its financial condition since the date of its most recent audited financial statements.
The Board considered the extent to which sub-adviser fees to be paid to each sub-adviser reflected economies of scale. The Board noted that each sub-adviser fee schedule either reflected economies of scale by reducing the fee on assets in excess of certain stated breakpoints or the fee level negotiated was below or on par with the standard fee level for the sub-adviser.
In evaluating the benefits that are expected to accrue to each sub-adviser through its relationship as sub-adviser to a Select Fund, the Board noted that certain sub-advisers allocate portfolio brokerage to affiliated broker-dealers that receive commissions from
284
the execution of Fund trades. The Board also noted that certain sub-advisers expect to benefit from “soft dollar” arrangements by which brokers will provide research and other services to the sub-adviser in exchange for commissions on trades of the portfolio securities of the Select Fund. The Board considered whether any direct or indirect collateral benefits inured to the Trust as a result of its affiliation with each sub-adviser.
Based on all of the information presented to the Board and its consideration of relevant factors, the Board, in the exercise of its reasonable business judgment, determined to approve the continuation of each Sub-Advisory Agreement. The Board also determined that approval of the continuation of each Sub-Advisory Agreement is in the best interests of each Fund and its shareholders.
BOARD REVIEW OF NEW SUB-ADVISORY AGREEMENTS FOR INTERNATIONAL EQUITY FUND
As required by the 1940 Act, the Board, including all of the Independent Trustees, considered the approval of the following new sub-advisory agreements among: (i) Mondrian, the Adviser and the Trust on behalf of the International Equity Fund; and (ii) Clifton, the Adviser and the Trust on behalf of the International Equity Fund. The Board approved the new sub-advisory agreements with Mondrian and Clifton for a two-year term at an in-person meeting of the Board held on September 8-9, 2011 (the “New Sub-Advisory Agreements”).
The Board’s decision to approve the New Sub-Advisory Agreements reflects the exercise of its business judgment to enter into new or amended sub-advisory arrangements. In approving the New Sub-Advisory Agreements, the Board considered information provided by the Adviser and each of the aforementioned sub-advisers with the assistance and advice of counsel to the Independent Trustees and counsel to the Trust.
The Board’s consideration of various factors and its conclusions with respect to such factors formed the basis for the Board’s determination to approve the New Sub-Advisory Agreements. The factors considered by the Board included, but were not limited to: (i) the resources of each sub-adviser; (ii) the experience and expertise of each sub-adviser; (iii) the financial capability of each sub-adviser; (iv) the compliance procedures and history of each sub-adviser; (v) the performance of similarly managed funds and accounts in comparison to relevant benchmarks for the International Equity Fund; (vi) the costs of the services to be provided by each sub-adviser; (vii) the amount of the contractual sub-advisory fee in comparison to similarly managed funds and any available information for each sub-adviser’s other similarly situated clients and the effect of any fee waiver and expense reimbursement arrangement; (viii) the total expenses of the International Equity Fund in comparison to similarly managed funds and the use of any anticipated expense caps; (ix) to the extent available, the anticipated profitability of each sub-adviser with respect to the International Equity Fund and its overall business; (x) the extent of any economies of scale and whether the fee structure reflects such economies of scale; (xi) the existence of any collateral benefits to be realized by each sub-adviser; and (xii) the existence of any collateral benefits to be realized by the International Equity Fund. The Board also evaluated whether the approval of the New Sub-Agreements is in the best interests of the Fund and its shareholders. No one factor was determinative in the Board’s consideration of the New Sub-Advisory Agreements.
The Board undertook a review of the terms of the New Sub-Advisory Agreements and the nature, extent and quality of the services to be provided by each sub-adviser. The Adviser provided the Board with information in the form of reports about each sub-adviser prior to the meeting which addressed most, if not all, of the factors listed previously.
The Independent Trustees met separately in executive session with counsel to the Independent Trustees to discuss and consider information presented in connection with the approval of the New Sub-Advisory Agreements, including the Board’s responsibilities and duties in approving the agreements.
BOARD APPROVAL OF NEW SUB-ADVISORY AGREEMENTS FOR INTERNATIONAL EQUITY FUND
In considering the approval of the New Sub-Advisory Agreements, the Board took into account the materials provided prior to and during the meeting, the presentations made during the meeting and the extensive discussions during the meeting, including the discussions the Independent Trustees had during their executive session with independent legal counsel. The Board considered its responsibilities with respect to reviewing and approving the terms of the New Sub-Advisory Agreements, the investment management teams at Mondrian and Clifton, the reasonableness of the sub-advisory fees and whether the appointment of each sub-adviser would be in the best interests of the shareholders of the International Equity Fund. The Board
285
reviewed the above factors in evaluating whether to approve the New Sub-Advisory Agreements and the materials provided to support each factor.
The Board considered the reputation, compliance history, compliance program and financial condition of Mondrian and Clifton. The Board also considered the experience of key personnel at each sub-adviser in providing investment management services to the International Equity Fund, the systems and resources used by such persons to implement and manage the strategy and the ability of each sub-adviser to attract and retain capable personnel. The Board also noted the terms of the New Sub-Advisory Agreements and the responsibilities that each sub-adviser has to the International Equity Fund, including the responsibility of day-to-day management and compliance with the Fund’s policies and objective. The Board concluded that the International Equity Fund is likely to benefit from the nature, extent and quality of the services with respect to each sub-adviser’s experience, personnel, operations and resources.
The Board noted that Mondrian had been a sub-adviser to the International Equity Fund since September 2001 and because Mondrian recently underwent a change in control resulting in Mondrian being 100% employee owned and operated, the Board was being asked to consider the approval of the New Sub-Advisory Agreement with Mondrian. In considering the approval of the New Sub-Advisory Agreement, the Board examined the nature, extent and quality of the services to be provided by Mondrian on behalf of the International Equity Fund. The Board noted that Mondrian has outperformed the benchmark, net of fees, for the three-, five- and seven-year and since inception periods ended June 30, 2011, straddling the second and third quartiles among comparable peers during those periods. The Board noted that Mondrian slightly underperformed the benchmark, net of fees, for the one-year period ended June 30, 2011, straddling the second and third quartiles among comparable peers during that period, and significantly outperformed the benchmark, net of fees, for the year-to-date period ended June 30, 2011, ranking in the first quartile among comparable peers for that period. The Board also noted that the Fund benefits from breakpoints in its fee schedule with Mondrian and that Mondrian maintains the least expensive fee in the International Equity Fund’s sub-adviser composite.
The Board noted that Clifton had managed a small portion of the Canadian exposure within the International Equity Fund under the existing sub-advisory agreement for cash overlay services and was being asked to consider the approval of the New Sub-Advisory Agreement with Clifton to memorialize those services under a separate agreement. The Board examined the nature, extent and quality of the services provided by Clifton. The Board noted the experience of Clifton in managing a portion of Canadian exposure within the International Equity Fund. The Board noted that although Clifton’s fee schedule did not provide for any future breakpoints, GSCM had been able to negotiate fees that were favorable to the Trust’s Funds. The Board also noted the ability of Clifton to attract and retain capable personnel as well as Clifton’s reputation, compliance history and financial condition.
The Board noted the terms of the New Sub-Advisory Agreements and the responsibilities of each sub-adviser, including oversight of general fund compliance and compliance with the Trust’s social restrictions. The Board considered the Adviser’s assessment of each sub-adviser’s financial condition. The Board noted that the Adviser, after reviewing certain financial information provided by each sub-adviser, felt comfortable that each sub-adviser was financially sound.
Based on all the information presented to the Board and its consideration of relevant factors, the Board, in the exercise of its reasonable business judgment, concluded that the International Equity Fund is likely to benefit from the extent and quality of each sub-adviser’s services, and the Board determined to approve the New Sub-Advisory Agreements. The Board also determined that approval of the New Sub-Advisory Agreement is in the best interests of the Fund and its shareholders.
286
INVESTMENT SUB-ADVISERS (Assets under management as of December 31, 2011) (Unaudited)
GuideStone Funds employs a broad array of proven investment managers for the benefit of their investors. Each manager is distinctive in its investment management process and business approach.
| | | | | | | | |
Fund | | Sub-Adviser | | Firm
Established | | Total Assets
Managed | |
Money Market | | BlackRock Advisors, LLC | | 1994 | | $ | 3.5Tr | |
Low-Duration Bond | | BlackRock Financial Management, Inc. | | 1988 | | $ | 3.5Tr | |
| | Payden & Rygel | | 1983 | | $ | 62.1B | |
| | PIMCO (Pacific Investment Management Company LLC) | | 1971 | | $ | 1.4Tr | |
Medium-Duration Bond | | Goldman Sachs Asset Management, L.P. | | 1984 | | $ | 705.8B | |
| | PIMCO (Pacific Investment Management Company LLC) | | 1971 | | $ | 1.4Tr | |
| | Western Asset Management Company | | 1971 | | $ | 337.7B | |
| | Western Asset Management Company Limited | | 1971 | | $ | 42.6B | |
Extended-Duration Bond | | Loomis, Sayles & Company, L.P. | | 1926 | | $ | 162.6B | |
| | STW Fixed Income Management Ltd. | | 1977 | | $ | 11.4B | |
Inflation Protected Bond | | BlackRock Financial Management, Inc. | | 1988 | | $ | 3.5Tr | |
Global Bond | | Loomis, Sayles & Company, L.P. | | 1926 | | $ | 162.6B | |
| | Western Asset Management Company | | 1971 | | $ | 337.7B | |
| | Western Asset Management Company Limited | | 1971 | | $ | 42.6B | |
Defensive Market Strategies | | American Century Investment Management, Inc. | | 1958 | | $ | 109.5B | |
| | AQR Capital Management, LLC | | 1998 | | $ | 44.2B | |
| | Shenkman Capital Management, Inc. | | 1985 | | $ | 17.8B | |
| | Turner Investments, L.P. | | 1990 | | $ | 13.4B | |
Equity Index | | Northern Trust Investments, Inc. | | 1889 | | $ | 662.9B | |
Real Estate Securities | | RREEF America L.L.C. | | 1975 | | $ | 27.6B | |
Value Equity | | Aronson Johnson Ortiz, LP | | 1984 | | $ | 19.5B | |
| | Barrow, Hanley, Mewhinney & Straus, LLC | | 1979 | | $ | 59.7B | |
| | Northern Trust Investments, Inc. | | 1889 | | $ | 662.9B | |
| | TCW Investment Management Company | | 1971 | | $ | 117.8B | |
Growth Equity | | Columbus Circle Investors | | 1975 | | $ | 14.3B | |
| | Marsico Capital Management, LLC | | 1997 | | $ | 37.3B | |
| | Rainier Investment Management, Inc.® | | 1991 | | $ | 15.4B | |
| | Sands Capital Management, LLC | | 1992 | | $ | 18.8B | |
Small Cap Equity | | Aronson Johnson Ortiz, LP | | 1984 | | $ | 19.5B | |
| | Columbus Circle Investors | | 1975 | | $ | 14.3B | |
| | Lord, Abbett & Co. LLC | | 1929 | | $ | 107.4B | |
| | TimesSquare Capital Management, LLC | | 2000 | | $ | 13.2B | |
| | Western Asset Management Company | | 1971 | | $ | 337.7B | |
| | Western Asset Management Company Limited | | 1971 | | $ | 42.6B | |
International Equity | | AQR Capital Management, LLC | | 1998 | | $ | 44.2B | |
| | Baillie Gifford Overseas Limited | | 1908 | | $ | 108.6B | |
| | Genesis Asset Managers, LLP | | 1989 | | $ | 28.8B | |
| | McKinley Capital Management, LLC | | 1990 | | $ | 8.6B | |
| | MFS Institutional Advisors, Inc. | | 1970 | | $ | 251B | |
| | Mondrian Investment Partners Ltd. | | 1990 | | $ | 65.9B | |
| | Philadelphia International Advisors, L.P. | | 1956 | | $ | 3.8B | |
| | The Clifton Group Investment Management Company | | 1992 | | $ | 30.9B | |
| | Tradewinds Global Investors, LLC | | 1990 | | $ | 34.3B | |
Custodian for GuideStone Funds Assets | | The Northern Trust Company | | 1889 | | $ | 4.3Tr | |
Cash Overlay for Date Target, Asset Allocation, Bond and Equity Funds | | The Clifton Group Investment Management Company | | 1992 | | $ | 30.9B | |
287
| | | | |
 | | 2401 Cedar Springs Road, Dallas, TX 75201-1498 1-888-98-GUIDE — www.GuideStoneFunds.org | | Funds distributed by BNY Mellon Distributors Inc. 760 Moore Road, King of Prussia, PA 19406 |
| | |
| 19452 | | | | 2/12 2233 |
Item 2. Code of Ethics.
The registrant, as of the end of the period covered by this report, has adopted a code of ethics for the Principal Executive and Senior Financial Officers (“Supplemental Code of Ethics”). Such Supplemental Code of Ethics is attached as an exhibit to this Form N-CSR.
There have been no amendments or waivers, during the period covered by this report, to a provision of the code of ethics that applies to the registrant’s principal executive officer, principal financial officer, principal accounting officer or controller, or persons performing similar functions, regardless of whether these individuals are employed by the registrant or a third party, and that relates to any element of the code of ethics description.
Item 3. Audit Committee Financial Expert.
As of the end of the period covered by the report, the registrant’s board of directors has determined that Carson L. Eddy is qualified to serve as an audit committee financial expert serving on its audit committee and that he is “independent,” as defined by Item 3 of Form N-CSR.
Item 4. Principal Accountant Fees and Services.
Audit Fees
| | (a) | The aggregate fees billed for each of the last two fiscal years for professional services rendered by the principal accountant for the audit of the registrant’s annual financial statements or services that are normally provided by the accountant in connection with statutory and regulatory filings or engagements for those fiscal years are $494,558 and $572,558 for 2010 and 2011, respectively. |
Audit-Related Fees
| | (b) | The aggregate fees billed in each of the last two fiscal years for assurance and related services by the principal accountant that are reasonably related to the performance of the audit of the registrant’s financial statements and are not reported under paragraph (a) of this Item are $37,842 and $37,842 for 2010 and 2011, respectively. Audit-related fees are related to procedures performed and the issuance of the auditors’ reports in connection with the Funds’ 17F-2 security counts. |
Tax Fees
| | (c) | The aggregate fees billed in each of the last two fiscal years for professional services rendered by the principal accountant for tax compliance, tax advice, and tax planning are $94,200 and $94,200 for 2010 and 2011, respectively. Tax fees are related to tax services in connection with Funds’ excise tax calculations and review of the Funds’ applicable tax returns. |
All Other Fees
| | (d) | The aggregate fees billed in each of the last two fiscal years for products and services provided by the principal accountant, other than the services reported in paragraphs (a) through (c) of this Item are $0 and $0 for 2010 and 2011, respectively. |
| | (e)(1) | Disclose the audit committee’s pre-approval policies and procedures described in paragraph (c)(7) of Rule 2-01 of Regulation S-X. |
GuideStone
Non-Audit Services Provided to the Company, Advisor, and Others
The Audit Committee shall pre-approve all permissible non-audit services (e.g., tax services) to be provided to the Company by the Auditors, including the fees therefor;
provided, that if the Committee chooses to delegate the authority to grant pre-approvals to one or more Committee members, each acting on behalf of the Committee, then the Committee shall adopt policies and procedures detailed as to the particular service and designed to safeguard the continued independence of the auditors, consistent with the requirements of the Sarbanes-Oxley Act of 2002 (the “S-O Act”) and related SEC regulations, which shall then be used in making such pre-approvals; and,
further provided, that each delegated pre-approval shall be reported to the Committee during its next regularly scheduled meeting.
The pre-approval requirement for a permitted non-audit service may be waived if:
| | (1) | the aggregate amount of all such non-audit services provided constitutes not more than 5% of the total revenues paid by the Company to the Auditors in the fiscal year in which the non-audit services are provided; |
| | (2) | such services were not recognized by the Company at the time of the engagement to be non-audit services; and |
| | (3) | such services are promptly brought to the attention of, and approved by, the Audit Committee or by a member of the Audit Committee to whom the Committee has delegated the authority to grant such approvals, if any, prior to the Auditors’ completion of the Company’s audit. |
Additionally, if the Auditors’ engagement relates directly to the operations and financial reporting of the Company, to the extent required by Rule 2-01 of Regulation S-X, the Audit Committee shall pre-approve their engagements for non-audit services with:
| | (1) | the Advisor (excluding any subadviser whose role is primarily portfolio management and is sub-contracted or overseen by the Advisor), and |
| | (2) | any entity controlling, controlled by, or under common control with such Advisor that provides ongoing services to the Company (each, a “Control Entity”) |
in accordance with the foregoing paragraph, unless the aggregate amount of all services provided constitutes no more than 5% of the total amount of revenues paid to the Auditors by the Company, the Advisor and any such Control Entity during the fiscal year in which the services are provided that would have to be pre-approved by the Audit Committee pursuant to this paragraph (in the absence of this exception). The Auditors may not perform contemporaneously any prohibited non-audit services for the Company, which currently include the following:
| | 1. | bookkeeping or other services related to the accounting records or financial statements of the Company; |
| | 2. | financial information systems design and implementation; |
| | 3. | appraisal or valuation services, fairness opinions, or contribution-in-kind reports; |
| | 5. | internal audit outsourcing services; |
| | 6. | management functions or human resources; |
| | 7. | broker or dealer, investment adviser, or investment banking services; |
| | 8. | legal services and expert services unrelated to the audit; and |
| | 9. | any other service that the Public Company Accounting Oversight Board determines, by regulation, is impermissible. |
| | (e)(2) | The percentage of services described in each of paragraphs (b) through (d) of this Item that were approved by the audit committee pursuant to paragraph (c)(7)(i)(C) of Rule 2-01 of Regulation S-X are as follows: |
(b) 0%
(c) 0%
(d) 0%
| | (f) | The percentage of hours expended on the principal accountant’s engagement to audit the registrant’s financial statements for the most recent fiscal year that were attributed to work performed by persons other than the principal accountant’s full-time, permanent employees was 0%. |
| | (g) | The aggregate non-audit fees billed by the registrant’s accountant for services rendered to the registrant, and rendered to the registrant’s investment adviser (not including any sub-adviser whose role is primarily portfolio management and is subcontracted with or overseen by another investment adviser), and any entity controlling, controlled by, or under common control with the |
| | adviser that provides ongoing services to the registrant for each of the last two fiscal years of the registrant was $0 and $0 for 2010 and 2011, respectively. |
| | (h) | The registrant’s audit committee of the board of directors has considered whether the provision of non-audit services that were rendered to the registrant’s investment adviser (not including any sub-adviser whose role is primarily portfolio management and is subcontracted with or overseen by another investment adviser), and any entity controlling, controlled by, or under common control with the investment adviser that provides ongoing services to the registrant that were not pre-approved pursuant to paragraph (c)(7)(ii) of Rule 2-01 of Regulation S-X is compatible with maintaining the principal accountant’s independence. |
Item 5. Audit Committee of Listed registrants.
Not applicable.
Item 6. Investments.
| (a) | Schedule of Investments in securities of unaffiliated issuers as of the close of the reporting period is included as part of the report to shareholders filed under Item 1 of this form. |
Item 7. Disclosure of Proxy Voting Policies and Procedures for Closed-End Management Investment Companies.
Not applicable.
Item 8. Portfolio Managers of Closed-End Management Investment Companies.
Not applicable.
Item 9. Purchases of Equity Securities by Closed-End Management Investment Company and Affiliated Purchasers.
Not applicable.
Item 10. Submission of Matters to a Vote of Security Holders.
There have been no material changes to the procedures by which the shareholders may recommend nominees to the registrant’s board of directors, where those changes were implemented after the
registrant last provided disclosure in response to the requirements of Item 407(c)(2)(iv) of Regulation S-K (17 CFR 229.407) (as required by Item 22(b)(15) of Schedule 14A (17 CFR 240.14a-101)), or this Item.
Item 11. Controls and Procedures.
| | (a) | The registrant’s principal executive and principal financial officers, or persons performing similar functions, have concluded that the registrant’s disclosure controls and procedures (as defined in Rule 30a-3(c) under the Investment Company Act of 1940, as amended (the “1940 Act”) (17 CFR 270.30a-3(c))) are effective, as of a date within 90 days of the filing date of the report that includes the disclosure required by this paragraph, based on their evaluation of these controls and procedures required by Rule 30a-3(b) under the 1940 Act (17 CFR 270.30a-3(b)) and Rules 13a-15(b) or 15d-15(b) under the Securities Exchange Act of 1934, as amended (17 CFR 240.13a-15(b) or 240.15d-15(b)). |
| | (b) | There were no changes in the registrant’s internal control over financial reporting (as defined in Rule 30a-3(d) under the 1940 Act (17 CFR 270.30a-3(d)) that occurred during the registrant’s second fiscal quarter of the period covered by this report that has materially affected, or is reasonably likely to materially affect, the registrant’s internal control over financial reporting. |
Item 12. Exhibits.
| | (a)(1) | Code of ethics, or any amendment thereto, that is the subject of disclosure required by Item 2 is attached hereto. |
| | (a)(2) | Certifications pursuant to Rule 30a-2(a) under the 1940 Act and Section 302 of the Sarbanes-Oxley Act of 2002 are attached hereto. |
| | (b) | Certifications pursuant to Rule 30a-2(b) under the 1940 Act and Section 906 of the Sarbanes-Oxley Act of 2002 are attached hereto. |
SIGNATURES
Pursuant to the requirements of the Securities Exchange Act of 1934 and the Investment Company Act of 1940, the registrant has duly caused this report to be signed on its behalf by the undersigned, thereunto duly authorized.
| | |
| (registrant) | | GuideStone Funds |
| | | | |
| By (Signature and Title)* | | | | /s/ John R. Jones |
| | | | John R. Jones, President |
| | | | (principal executive officer) |
Pursuant to the requirements of the Securities Exchange Act of 1934 and the Investment Company Act of 1940, this report has been signed below by the following persons on behalf of the registrant and in the capacities and on the dates indicated.
| | | | |
| By (Signature and Title)* | | | | /s/ John R. Jones |
| | | | John R. Jones, President |
| | | | (principal executive officer) |
| | | | |
| By (Signature and Title)* | | | | /s/ Jeffrey P. Billinger |
| | | | Jeffrey P. Billinger, Vice President and Treasurer |
| | | | (principal financial officer) |
| * | Print the name and title of each signing officer under his or her signature. |