UNITED STATES
SECURITIES AND EXCHANGE COMMISSION
Washington, D.C. 20549
FORMN-CSR
CERTIFIED SHAREHOLDER REPORT OF REGISTERED
MANAGEMENT INVESTMENT COMPANIES
Investment Company Act file number811-10263
GuideStone Funds
(Exact name of registrant as specified in charter)
5005 Lyndon B. Johnson Freeway, Suite 2200
Dallas, TX 75244-6152
(Address of principal executive offices) (Zip code)
Matthew A. Wolfe, Esq.
GuideStone Financial Resources of the Southern Baptist Convention
5005 Lyndon B. Johnson Freeway, Suite 2200
Dallas, TX 75244-6152
(Name and address of agent for service)
Registrant’s telephone number, including area code:214-720-4640
Date of fiscal year end: December 31
Date of reporting period: December 31, 2019
Item 1. Reports to Stockholders.
| | (a) | The following is a copy of the report transmitted to shareholders pursuant to Rule30e-1 under the Investment Company Act of 1940 (17 CFR270.30e-1) |

0
GuideStone Funds
Privacy Notice
NOTICE CONCERNING OUR PRIVACY PRACTICES
This notice provides you with information concerning our policies with respect to non-public personal information that we collect about you in connection with the following financial products and services provided and/or serviced by the entities listed below: Individual Retirement Accounts (“IRAs”), personal mutual fund accounts and/or GuideStone Personal Advisory Services.
The confidentiality of your information is important to us as we recognize that you depend on us to keep your information confidential, as described in this notice.
We collect non-public personal information about you with regard to the products and services listed above from the following sources:
| • | Information we receive from you on applications or other forms |
| • | Information about your transactions with us, our affiliates or others (including our third-party service providers) |
| • | Information we receive from others, such as service providers, broker-dealers and your personal agents or representatives |
| • | Information you and others provide to us in correspondence sent to us, whether written, electronic or by telephone |
We may disclose such non-public personal financial information about you to one or more of our affiliates as permitted by law. An affiliate of an organization means any entity that controls, is controlled by or is under common control with that organization. GuideStone Funds, GuideStone Financial Resources of the Southern Baptist Convention, GuideStone Capital Management, LLC, GuideStone Resource Management, Inc., GuideStone Investment Services, GuideStone Trust Services, GuideStone Financial Services, GuideStone Advisors and GuideStone Advisors, LLC (collectively “GuideStone”) are affiliates of one another. GuideStone does not sell your personal information to non-affiliated third parties.
We may also disclose any of the personal information that we collect about you to non-affiliated third parties as permitted by law. For example, we may provide your information to non-affiliated companies that provide account services or that perform marketing services on our behalf. We restrict access to non-public personal information about you to those of our employees who need to know that information in order for us to provide products and services to you. We also maintain physical, electronic and procedural safeguards to guard your personal information.
We may continue to maintain and disclose non-public personal information about you after you cease to receive financial products and services from us.
If you have any questions concerning our customer information policy, please contact a customer solutions specialist at 1-888-GS-FUNDS (1-888-473-8637).
This report has been prepared for shareholders of GuideStone Funds. It is not authorized for distribution to prospective investors unless accompanied or preceded by a current prospectus, which contains more complete information about the Funds. Investors are reminded to read the prospectus carefully before investing.The performance data quoted represents past performance and does not guarantee future results. Current performance may be lower or higher than the performance quoted. Performance data current to the most recent month-end may be obtained at www.GuideStoneFunds.com. The investment return and principal value of an investment will fluctuate so that shares, when redeemed, may be worth more or less than their original cost. Fund shares are distributed by Foreside Funds Distributors LLC.
LETTER FROM THE PRESIDENT
Dear Shareholder:
We are pleased to present you with the2019 GuideStone Funds Annual Report. This report reflects our unwavering commitment to integrity in financial reporting so you may stay fully informed of your investments. We trust that you will find this information valuable when making investment decisions.
2019 was a historic year for GuideStone Funds. The entire GuideStone Funds family was awarded the Lipper Fund Award from Refinitiv as the 2019 Best Overall Small Fund Family over three years on Thursday, March 7, 2019 (out of 29 eligible as of November 30, 2018), based on risk-adjusted total return1. Of the 222 small fund families with up to $76.8 billion in assets, only 29 met the standards to be considered for the prestigious Best Overall Small Fund Family award. This marks the second time in less than a decade that GuideStone Funds was honored with this top award.
It is a tremendous honor to be recognized by the peers in our industry for this prestigious accolade: We believe we once again proved that performance plus values can and does win. We give thanks to the Lord, first and foremost, for His leadership of GuideStone Funds and offer our thanks to the hard-working employees at GuideStone and the managers we have assembled to invest on behalf of our participants and investors.
As the largest faith-based mutual fund family, GuideStone is often asked, “Why screening?” Our answer is simple: because we know it’s of increased importance for investors to feel that they can align their personal values with their financial investment choices without necessarily compromising performance. We believe our biblical values do impact the world for the better.
We invite you to learn more about GuideStone Funds and the various investment options available by visiting our website, GuideStoneFunds.com, or contacting us at1-888-GS-FUNDS (1-888-473-8637). Thank you for choosing to invest in GuideStone Funds.
Sincerely,
John R. Jones, CFA
President
(1)Past performance is no guarantee of future results.
FROM THE CHIEF INVESTMENT OFFICER
As 2019 began, most investors saw little to be excited about. The Federal Reserve (the “Fed”) had recently raised the Fed funds rate for the fourth time in 12 months, prompting concern of a policy overreach. The midterm election cycle had just concluded, resulting in a divided government that many feared would hinder the president’s ability to accomplish his legislative agenda. Financial markets had just endured a quarter-long sell-off, with the S&P 500® Index closing the year with its worst December performance since the Great Depression.
As it turned out, investors did not remain apprehensive for long. “Risk-on” sentiment returned to equity markets in January, and this renewed a sense of investor optimism, which largely defined the entirety of 2019. Despite ongoing trade war tensions, slowing global growth and weakening fundamentals, investors actively sought reasons to remain positive throughout the year. Markets rewarded this hopefulness, delivering strong across-the-board performance. All major asset classes posted gains in 2019, and the equity bull market extended to a record 10 years (and counting).
Market Recap
2019 was an incredibly strong year for the financial markets. Propelled by the Fed’s accommodative pivot early in the year and subsequent rate cuts later in the year, the S&P 500® Index hit 35 record-closing highs in 2019 and delivered its strongest annual performance in six years. The Fed’s actions this past year allayed the market’s fear of a recession, resulting in significant price-to-earnings (P/E) multiple expansion despite weak earnings growth. Every S&P® sector was positive for the year, with all sectors except energy producing double-digit one-year returns. Notably, technology stocks — which account for a nearly 25% weight of the entire S&P 500® Index — roared back in favor after slumping at the end of 2018.
The resurgence of investor risk appetite was not limited to U.S. equity markets, as 2019 also saw a healthy rebound in the performance of international equities. Geopolitical uncertainties — namely, China trade and Brexit — lingered for much of the past 12 months but appeared to ease in the latter part of the year, boosting returns across non-U.S. markets. The U.S. dollar was generally stronger in 2019 but weakened to end the year at a five-month low, which helped to further prop-up returns for U.S. investors in global investments.
Fixed income markets also had a solid year, with spread compression driving the majority of returns in 2019. The primary story in fixed income, however, was falling U.S. Treasury yields throughout the first eight months of the year — a surprising development considering the pronounced return to risk across financial markets. The three-month/10-year Treasury yield curve inverted this year for the first time since 2007 and remained so for nearly six months, which heightened investor concerns about a forthcoming economic recession. Fears subsided considerably in the fourth quarter, however, with the Treasury yield curve fully un-inverting and closing the year on a steepening trend.
The table below summarizes the 2019 third quarter, fourth quarter and calendar year returns for each major market broad-based index, or market indicator.
| Index | 3rd Quarter
2019 Return | 4th Quarter
2019 Return | 2019 Calendar Year Return |
| U.S. Equities |
| S&P 500® | 1.70% | 9.07% | 31.49% |
| Dow Jones Industrial Average | 1.83% | 6.67% | 25.34% |
| NASDAQ | 0.18% | 12.47% | 36.69% |
| International Equities |
| MSCI EAFE | -1.07% | 8.17% | 22.01% |
| MSCI Emerging Markets | -4.25% | 11.84% | 18.42% |
| U.S. Fixed Income |
| Bloomberg Barclays US Aggregate Bond | 2.27% | 0.18% | 8.72% |
| Bloomberg Barclays US High Yield Corporate | 1.33% | 2.61% | 14.32% |
| Global Fixed Income |
| Bloomberg Barclays Global Aggregate Bond | 0.72% | 0.49% | 6.84% |
Tariffs and Trade
Tariffs and trade continued to be in the spotlight throughout most of 2019, with the bulk of the news dedicated to the escalating tensions between the United States and China. While the year started off with a trade ceasefire and apparent progress in negotiations, talks hit a major roadblock in May when the United States increased tariffs on $200 billion of Chinese goods and threatened additional tariffs on nearly all remaining goods shipped to the United States from China (approximately $325 billion). China retaliated by increasing tariffs on certain imported U.S. goods.
Trade discussions resumed in July and hostilities gradually eased over the remainder of the year. 2019 ended on a positive note, with the two nations agreeing in December to a “Phase One” trade deal. As part of the accord, China will purchase approximately $200 billion of additional U.S. goods over the next two years, while the United States will scale back certain tariffs previously imposed on Chinese goods. This agreement is a step in the right direction, but there continue to be significant obstacles to the sweeping trade overhaul that President Trump seeks. Despite leaders from both countries emphasizing the high priority of continued negotiations, we are dubious that a meaningful “Phase Two” trade deal will be reached before the November 2020 elections.
Monetary Policy
This year’s return to favor of risk assets was driven almost entirely by a marked reversal in the Fed’s policy stance. After raising the Fed funds rate four times in 2018 — and forecasting two additional hikes in 2019 — the central bank signaled after its January meeting that it would take a more patient, data-dependent approach to interest rate adjustments. This “Fed pause” — and ensuing rate cuts of 0.25% in each of July, September and October — alleviated fear of a “too tight Fed” in an environment of slowing global economic growth and muted inflationary pressures.
At a press conference in December, Chairman Powell praised the Fed’s actions in 2019 as helping to “support the economy and keep the outlook on track.” He also reinforced the central bank’s stance that current monetary policy is likely to remain appropriate for the foreseeable future. In fact, the central bank’s current projections indicate that Fed officials generally expect no rate changes during the next 12 months. Although these are positive developments, we are concerned that investors are putting too much faith in the ability of lower rates to offset economic weakness and trade uncertainty. Our primary concern is this: the more the Fed cuts rates to prolong the current expansion, the less ammunition they will have in their arsenal to effectively respond in a recessionary environment. While we believe the Fed’s actions have reduced the risk of a near-term recession, we are keeping a close eye on the central bank’s willingness and ability to respond to changing economic conditions.
U.S. Economic Overview
The U.S. economy added jobs each month during the year, marking 110 consecutive months of job gains. The unemployment rate ended the year at 3.5% — its lowest level since May 1969 — and has persisted at or below 4% for the last 22 months. Wage growth, however, continued to disappoint given the tightness of the labor market. Importantly, monthly job growth slowed materially in 2019 compared to the year before. This is a trend that bears watching, as such slowdowns have historically been indicative of a late cycle economy and maturing bull market.
The 2010s marked the first decade in recorded U.S. economic history in which a recession did not begin or end. As of December, the U.S. economy has expanded for a record 126 consecutive months. While the current economic expansion is the longest on record, U.S. gross domestic product (“GDP”) growth has been relatively weak compared to previous booms. Despite first quarter growth coming in at a solid 3.1% year-over-year, GDP growth declined to an annualized rate of 2.0% in the second quarter and 2.1% in the third quarter, with current forecasts projecting fourth quarter growth of 2.3%. Somewhat surprisingly, inflation has remained firmly in check for the past decade, leading many to believe that the Fed will fail to hit its prescribed inflation targets in 2020 — and so will remain largely accommodative during the next 12 months. While inflation has been subdued during this extended period of economic growth, we think the near-term risk of inflation is being overlooked by investors. If the labor market remains tight and wages finally begin to accelerate, the economy could see a higher level of inflation than what is currently priced into markets.
Conclusion
There is a considerable amount of bullishness amongst investors going into 2020, as many of the major risks facing global economic growth appear to have eased. There is even talk about the return of a “Goldilocks” market environment - one with a strong increase in financial asset prices driven by steady economic growth and low levels of unemployment, interest rates, inflation and volatility. This has led some financial pundits to predict that a “risk asset melt-up” (a dramatic and unexpected improvement in the investment performance of risk assets driven partly by a stampede of investors who don't want to miss out on its rise rather than by fundamental improvements in the economy) will occur in the first quarter of the new year. While we agree that conditions have generally become more favorable over recent months, fundamentals remain largely unsupportive of equity market valuations. Without a specific growth-inducing catalyst (e.g., a comprehensive, long-term trade agreement with China), we are skeptical that stocks can sustain a material move higher.
In our opinion, the positive sentiment permeating financial markets today is potentially fragile. We are closely watching multiple possible risks — including corporate earnings, China trade negotiations, impeachment proceedings and the upcoming presidential election — as negative and/or unexpected headlines could quickly reverse market optimism. While our outlook remains cautious, we encourage investors to avoid overreacting to individual market events. At all times — and especially during periods of uncertainty — it is important for investors to remain appropriately diversified and committed to their long-term asset allocation strategy. As always, we do not recommend trying to time the market.
Thank you for your continued confidence in GuideStone Funds. Please feel free to contact us if you have any comments, questions or concerns.
Sincerely,
Matt L. Peden, CFA
Vice President - Chief Investment Officer
GuideStone Capital Management, LLC
Past performance does not guarantee future results and the Funds may experience negative performance.There can be no guarantee that any strategy (risk management or otherwise) will be successful. All investing involves risk, including potential loss of principal. One cannot invest directly into an index.
The Lipper Awards for Best Overall Small Fund Family are based on a review of 29 fund families for 2019 and based on risk-adjusted performance for the three-year period ending November 30, 2018. Award for U.S. Region Only.
The Refinitiv Lipper Fund Awards are based on Overall/Small fund family groups will need to have at least three distinct portfolios in one of the asset classes — equity, bond or mixed asset. The lowest average decile rank of the three years' Consistent Return measure of the eligible funds per asset class and group will determine the asset class group award winner over the three-year period. The Lipper Leader for Consistent Return rating, which is a risk-adjusted performance measure calculated over 36, 60 and 120 months. The fund with the highest Lipper Leader for Consistent Return (Effective Return) value in each eligible classification wins the Lipper Fund Award. The Lipper Fund Awards, granted annually, highlight funds and fund companies that have excelled in delivering consistently strong risk-adjusted performance relative to their peers. Additional information is available at www.lipperfundawards.com.
Our first recognition as the Best Overall Small Fund Family came in 2012 for the Best Overall Small Company Award (out of 26 eligible fund families as of November 30, 2011). Of the 182 Small fund families, only 26 met the standards to be considered for the Best Overall Small Fund Family with up to $40 billion in assets under management. At that time, fund groups with at least three equity, three bond and three mixed-asset classes were eligible for a group award, with the lowest average decile rank of the three years' consistent return measure of the eligible funds per asset class and group determining the award winner over the 3-year period ended 11/30/2011. In case of identical results, the lower average percentile rank was determined the winner.
Group Methodology: For the 2019 Refinitiv Lipper Fund Awards (based on three-year period ending November 30, 2018), a small fund family is defined as having assets of $76.8 billion or less.
From Refinitiv Lipper Awards, ©2019 Refinitiv. All rights reserved. Used by permission and protected by the Copyright Laws of the United States. The printing, copying, redistribution, or retransmission of this Content without express written permission is prohibited.
Asset Class Performance Comparison
The following graph illustrates the performance of the major assets classes during 2019.
1The Bloomberg Barclays US Aggregate Bond Index is a broad-based flagship benchmark that measures the investment grade, US dollar-denominated, fixed-rate taxable bond market. The index includes Treasuries, government-related and corporate securities, MBS (agency fixed-rate and hybrid ARM pass-throughs), ABS and CMBS (agency and non-agency).
2The MSCI EAFE Index (Europe, Australasia, Far East) is a free float-adjusted market capitalization index that is designed to measure equity market performance of developed markets, excluding the U.S. & Canada. The index consists of the following 21 developed market country indices: Australia, Austria, Belgium, Denmark, Finland, France, Germany, Hong Kong, Ireland, Israel, Italy, Japan, the Netherlands, New Zealand, Norway, Portugal, Singapore, Spain, Sweden, Switzerland and the United Kingdom.
3The MSCI Emerging Markets Index is a free float-adjusted market capitalization index that is designed to measure equity market performance of emerging markets. The index consists of the following 24 emerging market country indices: Brazil, Chile, China, Colombia, Czech Republic, Egypt, Greece, Hungary, India, Indonesia, Korea, Malaysia, Mexico, Pakistan, Peru, Philippines, Poland, Qatar, Russia, South Africa, Taiwan, Thailand, Turkey, and United Arab Emirates.
4The Russell 2000® Index measures the performance of the small-cap segment of the U.S. equity universe. The Russell 2000® Index is a subset of the Russell 3000® Index representing approximately 10% of the total market capitalization of that index. It includes approximately 2,000 of the smallest securities based on a combination of their market cap and current index membership. The Russell 2000® Index is constructed to provide a comprehensive and unbiased small-cap barometer and is completely reconstituted annually to ensure that larger stocks do not distort the performance and characteristics of the actual small-cap opportunity set.
5The S&P 500® Index is a market capitalization-weighted equity index composed of approximately 500 U.S. companies, representing all major industries and captures approximately 80% coverage of available market capitalization. The index is designed to measure performance of the broad domestic economy through changes in the aggregate market value of its constituents.
S&P 500® Index Returns
The U.S. large-cap equity market, as measured by the S&P 500® Index, finished the year up 31.49%; its strongest annual performance return figure since 2013. After a dismal end to 2018, “risk-on” sentiment returned to the equity markets in January, and this renewed sense of investor optimism largely defined the entirety of 2019. The return of investors to risk assets, which was primarily a result of the Federal Reserve’s (the Fed”) accommodative pivot early in the year, propelled the S&P 500® Index to 35 record-closing highs during 2019. The Fed’s subsequent rate cuts of 0.25% in each of July, September and October Federal Reserve meetings alleviated the market’s fear of a “too tight Fed” and resulted in significant price-to-earning (P/E) multiple expansion, despite very weak earnings growth. Trade tensions between the United States and China continued to be volatile throughout most of the year. The fourth quarter ended on a positive note, as the two nations agreed in December to a “phase one” trade deal. Every sector in the index was positive for the year. The technology (48.2%) and financial services (33.9%) sectors paved the way for the “risk-on” environment in 2019, while the energy sector (11.67%) continued to lag all sectors for the year. Crude oil rallied for the year up over 34% but was not enough for energy sector to keep pace with the other sectors.

The S&P 500® Index is a market capitalization-weighted equity index composed of approximately 500 U.S. companies, representing all major industries and captures approximately 80% coverage of available market capitalization. The index is designed to measure performance of the broad domestic economy through changes in the aggregate market value of its constituents.
Data Source: Dow Jones Indices LLC
Russell 2000® Index Returns
The U.S. small cap equity market, as measured by the Russell 2000® Index, rose by 25.52% in 2019; the steepest annual appreciation in the index since 2013. Throughout the year, investor demand for smaller capitalization stocks lagged for most of 2019 versus their larger capitalization brethren. The Russell 2000® Index finished roughly -6% below the S&P 500® Index for the year. Small capitalization stocks underperformed large capitalization stocks but still posted meaningful double-digit gains during a period where the market rewarded higher beta, higher price-to-earnings (P/E) and lower dividend yielding names within the index. For the year, all sectors were positive with the exception of energy (-7.34%), a sector regarded as sensitive due to the fluctuations in demand for oil and natural gas. The technology (35.14%), materials and processing (30.41%) and producer durables (30.27%) sectors rebounded nicely during the year and were the largest positive performers for the Index in 2019.
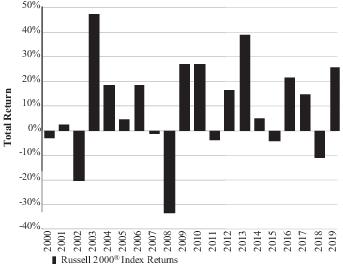
The Russell 2000® Index measures the performance of the small capitalization segment of the U.S. equity universe. The Russell 2000® Index is a subset of the Russell 3000® Index representing approximately 10% of the total market capitalization of that index. It includes approximately 2,000 of the smallest securities based on a combination of their market cap and current index membership. The Russell 2000® Index is constructed to provide a comprehensive and unbiased small capitalization barometer and is completely reconstituted annually to ensure that larger stocks do not distort the performance and characteristics of the actual small capitalization opportunity set.
Data Source: Russell Investments, Bloomberg
MSCI EAFE Index Returns
In 2019, developed-country international stocks posted strong returns, reversing 2018’s year-end selloff. The MSCI EAFE Index was up 22.0% for the year after a -13.8% return in 2018. Despite the healthy recovery in equity markets, international investors saw an eventful year, with many political and economic concerns to contend with. Germany’s economy, long considered the “engine” of the Eurozone, slowed considerably during the year as global bond yields plummeted and the increasing pervasion of negative interest rates led investors to question the limits of monetary policy. Toward the end of the year, as economic data proved better than feared, talk of a global recession dissipated and investors instead began pricing in a cyclical upswing for 2020. In addition to the constant overhang of the US and China trade dispute, other political events included several months of pro-democratic protests in Hong Kong and further parliamentary spats regarding the U.K.’s pending exit from the European Union. All countries in the MSCI EAFE Index posted positive returns in 2019, with Ireland, New Zealand and Switzerland posting the largest gains and Finland, Israel and Hong Kong gaining the least.

The MSCI EAFE Index (Europe, Australasia, Far East) is a free float-adjusted market capitalization index that is designed to measure equity market performance of developed markets, excluding the U.S. & Canada. The index consists of the following 21 developed market country indices: Australia, Austria, Belgium, Denmark, Finland, France, Germany, Hong Kong, Ireland, Israel, Italy, Japan, the Netherlands, New Zealand, Norway, Portugal, Singapore, Spain, Sweden, Switzerland and the United Kingdom.
Data Source; Factset
MSCI Emerging Markets Index Returns
After a sharp decline at the end of 2018, emerging markets equities rebounded in 2019, posting an annual return of 18.4%, as investor concerns around tightening monetary policy, the Chinese economy and the U.S. and China trade dispute were eased throughout the year. While 2018 saw a steady tightening of global financial conditions, much of this tightening was unwound throughout 2019 as the Federal Reserve and many emerging markets policymakers reduced policy rates. Index performance was driven by large technology companies including Alibaba, Taiwan Semiconductor and Samsung. China was the biggest country-level contributor to index performance, benefitting from multiple sources of government accommodation and a better-than-feared economic impact from its trade war with the United States. In Brazil, pro-business deregulation and fiscal policy improvements by the Bolsonaro government gave investors hope for a recovery from the country’s long and severe recession. Meanwhile, in neighboring Argentina, voters dashed investors’ hopes for fiscal austerity by unseating the country’s conservative president in favor of a center-left candidate, causing the local stock market to plummet 31% in a single day. 2019 also saw the addition of Saudi Arabia to the MSCI Emerging Markets Index, as well as the long-awaited initial public offering of its state-owned oil producer, Saudi Aramco. Emerging markets currencies strengthened slightly against the dollar during the year, benefitting U.S.-based investors.

The MSCI Emerging Markets Index is a free float-adjusted market capitalization index that is designed to measure equity market performance of emerging markets. The index consists of the following 26 emerging market country indices: Argentina, Brazil, Chile, China, Colombia, Czech Republic, Egypt, Greece, Hungary, India, Indonesia, Korea, Malaysia, Mexico, Pakistan, Peru, Philippines, Poland, Qatar, Russia, Saudi Arabia, South Africa, Taiwan, Thailand, Turkey and United Arab Emirates.
Data Source; Factset
Bloomberg Barclays US Aggregate Bond Index Returns
The broad U.S. bond market, as measured by the Bloomberg Barclays US Aggregate Bond Index, was up 8.72% for 2019. After a mediocre 2018, where the index was up by a single basis point (0.01%), lower rates and a generally risk-on tone within credit set the stage for a rally in the index. This was the sixth consecutive annual period of positive performance. A falling rate environment was supportive for high quality credit where duration is longer than recent past. Rates were also supportive of U.S. Treasuries and all maturities posted positive returns for the year with longer-dated debt outperforming shorter-dated debt. Investment grade bond spreads tightened by 15 basis points (0.15%) for the year and, within the corporate bond segment, BBB-rated issues outperformed higher quality assets by a significant margin led by the industrials sector. Concerns surrounding the leverage on corporate balance sheets and the growth of the BBBs as a percent of the index dissipated throughout the year as companies pledged to deleverage. In the yield-starved environment, investors continued to favor credit in a search for income. Mortgages were the relative laggards for the year posting only mid-single digit returns.
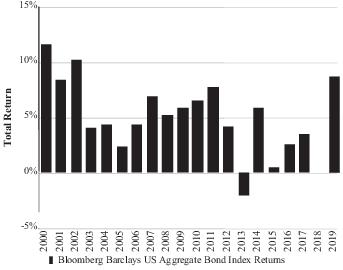
The Bloomberg Barclays US Aggregate Bond Index is a broad-based flagship benchmark that measures the investment grade, US dollar-denominated, fixed-rate taxable bond market. The index includes Treasuries, government-related and corporate securities, mortgage-backed securities (agency fixed-rate and hybrid adjustable-rate mortgage pass-throughs), asset-backed securities and commercial mortgage-backed securities (agency and non-agency).
Data Source:Factset
Federal Reserve
After a volatile end to 2018, the Federal Reserve (“Fed”) reversed course and implemented three rate cuts in 2019. Fed Chairman Powell described this current round of monetary-policy easing as a mid-cycle adjustment, a strategy that has been implemented in the past to preempt economic slowdowns. The Federal Open Market Committee’s decision to decrease interest rates resulted in a year-end Fed funds rate range of 1.50% to 1.75%. In May, the central bank announced it would begin tapering the amount of proceeds it allowed to roll off its balance sheet each month and ended the reduction completely in September. The Fed began to inject additional liquidity into the money markets shortly thereafter in an effort to prevent quarter- and year-end volatility in the overnight rates, effectively expanding their balance sheet. Fed Chairman Powell stated that monetary policy is in a good place to keep the economy growing moderately, the jobs market strong and inflation near the central bank’s 2% goal, suggesting that rates are on hold for a potentially protracted period.

The Federal Reserve (“Fed”) is the central bank of the United States. It was created by Congress to provide the nation with a safer, more flexible, and more stable monetary and financial system. The Federal Funds Rate is the interest rate at which depository institutions lend balances at the Fed to other depository institutions overnight. The rate is one tool the Fed can use in their efforts of controlling the supply of money. Changes in the Federal Funds Rate trigger a chain of events that affect other short-term interest rates, foreign exchange rates, long-term interest rates, the amount of money and credit, and, ultimately, a range of economic variables, including employment, output and prices of goods and services.
Data Source:Bloomberg, Federal Reserve
U.S. Treasury Yield Curve
The Federal Reserve lowered rates throughout the year, and the U.S. Treasury yield curve flattened on a year-over-year basis as the spread between short-dated and long-dated U.S. Treasuries narrowed. The benchmark 10-year U.S. Treasury began the year at 2.69% and ended lower at 1.92%. In May, the three-month T-Bill yield exceeded the 10-year yield for the first time since 2007, but the inversion corrected itself by the end of the year. Historically, an inversion of the two-year and 10-year U.S. Treasury yields, a much more widely followed gauge, has been an indicator of a future recession, and the two did invert for short periods of time in August. By the end of the year, the spread between the two was 0.37%, steeper than the beginning of the year.

The Treasury yield curve illustrates the relationship between yields on short-term, intermediate-term and long-term Treasury securities. Normally, the shape of the yield curve is upward sloping with rates increasing from the short end of the curve moving higher to the long end. The short end of the curve is impacted more by monetary policy (demand for money) while inflationary expectations and market forces impact the long end of the curve.
Data Source:Bloomberg
About Your Expenses(Unaudited)
As a shareholder of the Funds, you incur ongoing costs, including advisory fees and to the extent applicable, shareholder services fees, as well as other Fund expenses. This example is intended to help you to understand your ongoing costs (in dollars) of investing in the Funds and to compare these costs with the ongoing costs of investing in other mutual funds. It is based on an investment of $1,000 invested at the beginning of the period and held for the entire period from July 1, 2019 to December 31, 2019. The Annualized Expense Ratio may be different from the expense ratio in the Financial Highlights which is for the fiscal year ended December 31, 2019.
Actual Expenses
The first section of the table below provides information about actual account values and actual expenses. You may use the information in this section, together with the amount you invested, toestimate the expenses that you incurred over the period. Simply divide your account value by $1,000 (for example, an $8,600 account value divided by $1,000 = 8.6), then multiply the result by the number in the first section under the heading entitled “Expenses Paid During Period” to estimate the expenses attributable to your investment during this period.
Hypothetical Example for Comparison Purposes
The second section of the table below provides information about hypothetical account values and hypothetical expenses based on the Fund’s actual expense ratio and anassumedrate of return of 5% per year before expenses, which is not the Fund’s actual return. Thus, you shouldnotuse the hypothetical account values and expenses to estimate the actual ending account balance or your expenses for the period. Rather, these figures are provided to enable you to compare the ongoing costs of investing in the Fund and other funds. To do so, compare this 5% hypothetical example with the 5% hypothetical examples that appear in the shareholder reports of the other funds. Please note that the expenses shown in the table are meant to highlight your ongoing costs only. Therefore, the second section of the table is useful in comparing ongoing costs only and will not help you determine the relative total costs of owning different funds.
| Actual |
| Fund | | Class | | Beginning
Account Value
07/01/19 | | Ending
Account Value
12/31/19 | | Annualized
Expense
Ratio (1) | | Expenses
Paid During
Period (2) |
MyDestination 2015
| | Institutional | | $1,000.00 | | $ 1,048.30 | | 0.07% | | $ 0.34 |
| | | Investor | | 1,000.00 | | 1,047.30 | | 0.32 | | 1.63 |
MyDestination 2025
| | Institutional | | 1,000.00 | | 1,059.50 | | 0.09 | | 0.47 |
| | | Investor | | 1,000.00 | | 1,058.20 | | 0.34 | | 1.78 |
MyDestination 2035
| | Institutional | | 1,000.00 | | 1,073.30 | | 0.13 | | 0.68 |
| | | Investor | | 1,000.00 | | 1,071.70 | | 0.41 | | 2.12 |
MyDestination 2045
| | Institutional | | 1,000.00 | | 1,081.10 | | 0.14 | | 0.71 |
| | | Investor | | 1,000.00 | | 1,079.40 | | 0.43 | | 2.25 |
MyDestination 2055
| | Institutional | | 1,000.00 | | 1,083.50 | | 0.17 | | 0.90 |
| | | Investor | | 1,000.00 | | 1,082.20 | | 0.42 | | 2.23 |
Conservation Allocation
| | Institutional | | 1,000.00 | | 1,034.00 | | 0.12 | | 0.60 |
| | | Investor | | 1,000.00 | | 1,032.30 | | 0.39 | | 2.00 |
Balanced Allocation
| | Institutional | | 1,000.00 | | 1,051.70 | | 0.12 | | 0.61 |
| | | Investor | | 1,000.00 | | 1,050.90 | | 0.38 | | 1.95 |
Growth Allocation
| | Institutional | | 1,000.00 | | 1,066.50 | | 0.12 | | 0.62 |
| | | Investor | | 1,000.00 | | 1,065.70 | | 0.38 | | 1.98 |
| | | | | | | | | | | |
| Actual |
| Fund | | Class | | Beginning
Account Value
07/01/19 | | Ending
Account Value
12/31/19 | | Annualized
Expense
Ratio (1) | | Expenses
Paid During
Period (2) |
Aggressive Allocation
| | Institutional | | $1,000.00 | | $ 1,080.10 | | 0.12% | | $ 0.62 |
| | | Investor | | 1,000.00 | | 1,078.00 | | 0.38 | | 2.00 |
Money Market
| | Institutional | | 1,000.00 | | 1,009.60 | | 0.15 | | 0.75 |
| | | Investor | | 1,000.00 | | 1,008.20 | | 0.42 | | 2.13 |
Low-Duration Bond
| | Institutional | | 1,000.00 | | 1,013.00 | | 0.35 | | 1.79 |
| | | Investor | | 1,000.00 | | 1,010.70 | | 0.62 | | 3.14 |
Medium-Duration Bond
| | Institutional | | 1,000.00 | | 1,028.40 | | 0.39 | | 2.01 |
| | | Investor | | 1,000.00 | | 1,027.60 | | 0.66 | | 3.39 |
Extended-Duration Bond
| | Institutional | | 1,000.00 | | 1,036.70 | | 0.57 | | 2.93 |
| | | Investor | | 1,000.00 | | 1,035.20 | | 0.83 | | 4.27 |
Global Bond
| | Institutional | | 1,000.00 | | 1,023.90 | | 0.54 | | 2.77 |
| | | Investor | | 1,000.00 | | 1,022.40 | | 0.83 | | 4.22 |
Defensive Market Strategies
| | Institutional | | 1,000.00 | | 1,061.60 | | 0.67 | | 3.50 |
| | | Investor | | 1,000.00 | | 1,059.40 | | 0.93 | | 4.85 |
Equity Index
| | Institutional | | 1,000.00 | | 1,110.90 | | 0.13 | | 0.70 |
| | | Investor | | 1,000.00 | | 1,109.30 | | 0.39 | | 2.08 |
Value Equity
| | Institutional | | 1,000.00 | | 1,090.80 | | 0.63 | | 3.33 |
| | | Investor | | 1,000.00 | | 1,090.00 | | 0.89 | | 4.71 |
Growth Equity
| | Institutional | | 1,000.00 | | 1,085.70 | | 0.71 | | 3.72 |
| | | Investor | | 1,000.00 | | 1,084.30 | | 0.97 | | 5.07 |
Small Cap Equity
| | Institutional | | 1,000.00 | | 1,043.90 | | 1.02 | | 5.25 |
| | | Investor | | 1,000.00 | | 1,042.90 | | 1.28 | | 6.57 |
International Equity Index
| | Institutional | | 1,000.00 | | 1,065.70 | | 0.22 | | 1.14 |
International Equity (3)
| | Institutional | | 1,000.00 | | 1,071.20 | | 0.98 | | 5.12 |
| | | Investor | | 1,000.00 | | 1,070.10 | | 1.25 | | 6.50 |
Emerging Markets Equity
| | Institutional | | 1,000.00 | | 1,078.10 | | 1.11 | | 5.81 |
| | | Investor | | 1,000.00 | | 1,075.50 | | 1.57 | | 8.21 |
Global Real Estate Securities
| | Institutional | | 1,000.00 | | 1,078.10 | | 0.85 | | 4.44 |
| | | Investor | | 1,000.00 | | 1,077.20 | | 1.12 | | 5.87 |
Strategic Alternatives (3)
| | Institutional | | 1,000.00 | | 1,017.40 | | 1.16 | | 5.89 |
| | | Investor | | 1,000.00 | | 1,016.40 | | 1.53 | | 7.79 |
| Hypothetical (assuming a 5% return before expenses) |
| Fund | | Class | | Beginning
Account Value
07/01/19 | | Ending
Account Value
12/31/19 | | Annualized
Expense
Ratio (1) | | Expenses
Paid During
Period (2) |
MyDestination 2015
| | Institutional | | $1,000.00 | | $1,024.88 | | 0.07% | | $0.33 |
| | | Investor | | 1,000.00 | | 1,023.61 | | 0.32 | | 1.61 |
MyDestination 2025
| | Institutional | | 1,000.00 | | 1,024.75 | | 0.09 | | 0.46 |
| | | Investor | | 1,000.00 | | 1,023.48 | | 0.34 | | 1.75 |
| | | | | | | | | | | |
About Your Expenses(Unaudited) (Continued)
| Hypothetical (assuming a 5% return before expenses) |
| Fund | | Class | | Beginning
Account Value
07/01/19 | | Ending
Account Value
12/31/19 | | Annualized
Expense
Ratio (1) | | Expenses
Paid During
Period (2) |
MyDestination 2035
| | Institutional | | $1,000.00 | | $1,024.55 | | 0.13% | | $0.66 |
| | | Investor | | 1,000.00 | | 1,023.16 | | 0.41 | | 2.07 |
MyDestination 2045
| | Institutional | | 1,000.00 | | 1,024.52 | | 0.14 | | 0.69 |
| | | Investor | | 1,000.00 | | 1,023.04 | | 0.43 | | 2.19 |
MyDestination 2055
| | Institutional | | 1,000.00 | | 1,024.34 | | 0.17 | | 0.88 |
| | | Investor | | 1,000.00 | | 1,023.07 | | 0.42 | | 2.16 |
Conservation Allocation
| | Institutional | | 1,000.00 | | 1,024.61 | | 0.12 | | 0.60 |
| | | Investor | | 1,000.00 | | 1,023.24 | | 0.39 | | 1.99 |
Balanced Allocation
| | Institutional | | 1,000.00 | | 1,024.61 | | 0.12 | | 0.60 |
| | | Investor | | 1,000.00 | | 1,023.30 | | 0.38 | | 1.93 |
Growth Allocation
| | Institutional | | 1,000.00 | | 1,024.61 | | 0.12 | | 0.61 |
| | | Investor | | 1,000.00 | | 1,023.29 | | 0.38 | | 1.94 |
Aggressive Allocation
| | Institutional | | 1,000.00 | | 1,024.61 | | 0.12 | | 0.61 |
| | | Investor | | 1,000.00 | | 1,023.28 | | 0.38 | | 1.95 |
Money Market
| | Institutional | | 1,000.00 | | 1,024.46 | | 0.15 | | 0.75 |
| | | Investor | | 1,000.00 | | 1,023.08 | | 0.42 | | 2.15 |
Low-Duration Bond
| | Institutional | | 1,000.00 | | 1,023.43 | | 0.35 | | 1.80 |
| | | Investor | | 1,000.00 | | 1,022.09 | | 0.62 | | 3.15 |
Medium-Duration Bond
| | Institutional | | 1,000.00 | | 1,023.22 | | 0.39 | | 2.01 |
| | | Investor | | 1,000.00 | | 1,021.86 | | 0.66 | | 3.38 |
Extended-Duration Bond
| | Institutional | | 1,000.00 | | 1,022.33 | | 0.57 | | 2.91 |
| | | Investor | | 1,000.00 | | 1,021.01 | | 0.83 | | 4.24 |
Global Bond
| | Institutional | | 1,000.00 | | 1,022.47 | | 0.54 | | 2.76 |
| | | Investor | | 1,000.00 | | 1,021.03 | | 0.83 | | 4.21 |
Defensive Market Strategies
| | Institutional | | 1,000.00 | | 1,021.81 | | 0.67 | | 3.43 |
| | | Investor | | 1,000.00 | | 1,020.50 | | 0.93 | | 4.75 |
Equity Index
| | Institutional | | 1,000.00 | | 1,024.54 | | 0.13 | | 0.67 |
| | | Investor | | 1,000.00 | | 1,023.23 | | 0.39 | | 2.00 |
Value Equity
| | Institutional | | 1,000.00 | | 1,022.02 | | 0.63 | | 3.22 |
| | | Investor | | 1,000.00 | | 1,020.70 | | 0.89 | | 4.55 |
Growth Equity
| | Institutional | | 1,000.00 | | 1,021.64 | | 0.71 | | 3.60 |
| | | Investor | | 1,000.00 | | 1,020.34 | | 0.97 | | 4.91 |
Small Cap Equity
| | Institutional | | 1,000.00 | | 1,020.07 | | 1.02 | | 5.19 |
| | | Investor | | 1,000.00 | | 1,018.78 | | 1.28 | | 6.49 |
International Equity Index
| | Institutional | | 1,000.00 | | 1,024.10 | | 0.22 | | 1.12 |
International Equity (3)
| | Institutional | | 1,000.00 | | 1,020.26 | | 0.98 | | 4.99 |
| | | Investor | | 1,000.00 | | 1,018.93 | | 1.25 | | 6.34 |
Emerging Markets Equity
| | Institutional | | 1,000.00 | | 1,019.61 | | 1.11 | | 5.65 |
| | | Investor | | 1,000.00 | | 1,017.29 | | 1.57 | | 7.98 |
Global Real Estate Securities
| | Institutional | | 1,000.00 | | 1,020.93 | | 0.85 | | 4.32 |
| | | Investor | | 1,000.00 | | 1,019.56 | | 1.12 | | 5.70 |
| | | | | | | | | | | |
| Hypothetical (assuming a 5% return before expenses) |
| Fund | | Class | | Beginning
Account Value
07/01/19 | | Ending
Account Value
12/31/19 | | Annualized
Expense
Ratio (1) | | Expenses
Paid During
Period (2) |
Strategic Alternatives (3)
| | Institutional | | $1,000.00 | | $1,019.37 | | 1.16% | | $5.89 |
| | | Investor | | 1,000.00 | | 1,017.48 | | 1.53 | | 7.80 |
(1) Expenses include the effect of contractual waivers by GuideStone Capital Management, LLC. The Target Date Funds’ and Target Risk Funds’ proportionate share of the operating expenses of the Select Funds is not reflected in the tables above.
(2) Expenses are equal to the Fund’s annualized expense ratios for the period July 1, 2019 through December 31, 2019, multiplied by the average account value over the period, multiplied by 184/365 (to reflect the one-half year period).
(3) The expense ratios for the International Equity Fund and the Strategic Alternatives Fund include the impact of dividend and interest expense on securities sold short.
ABBREVIATIONS, FOOTNOTES AND INDEX DEFINITIONS
| INVESTMENT ABBREVIATIONS: |
| 10Y | — | 10 Year |
| 1M | — | 1 Month |
| 1Y | — | 1 Year |
| 3M | — | 3 Month |
| 5Y | — | 5 Year |
| 6M | — | 6 Month |
| ACES | — | Alternative Credit Enhancement Securities |
| ADR | — | American Depositary Receipt |
| ASX | — | Australian Securities Exchange |
| BBR FRA | — | Bank Bill Rate FRA |
| BBSW | — | Bank Bill Swap Rate |
| BUBOR | — | Budapest Interbank Offered Rate |
| CDI | — | Crest Depository Interest |
| CDOR | — | Canadian Dollar Offered Rate |
| CDX | — | A series of indexes that track North American and emerging market credit derivative indexes. |
| CFETS | — | China Foreign Exchange Trade System |
| CLO | — | Collateralized Loan Obligation |
| CMBX | — | A group of indexes made up of 25 tranches of commercial mortgage-backed securities (CMBS), each with different credit ratings. |
| CMT | — | Constant Maturity |
| COF | — | Cost of Funds |
| CONV | — | Convertible |
| CVA | — | Dutch Certificate |
| ETF | — | Exchange Traded Fund |
| EURIBOR | — | Euro Interbank Offered Rate |
| GDR | — | Global Depositary Receipt |
| HIBOR | — | Hong Kong Interbank Offered Rate |
| ICE LIBOR | — | Intercontinental Exchange London Interbank Offered Rate |
| IO | — | Interest Only (Principal amount shown is notional) |
| JIBAR | — | Johannesburg Interbank Average Rate |
| KWCDC | — | KRW Certificates of Deposits |
| LIBOR | — | London Interbank Offered Rate |
| LLC | — | Limited Liability Company |
| LP | — | Limited Partnership |
| NIBOR | — | Norwegian Interbank Offered Rate |
| NSA | — | Not Seasonally Adjusted |
| NVDR | — | Non-Voting Depository Receipt |
| PCL | — | Public Company Limited |
| PIK | — | Payment-in-Kind Bonds |
| PLC | — | Public Limited Company |
| PRIBOR | — | Prague Interbank Offered Rate |
| REIT | — | Real Estate Investment Trust |
| REMIC | — | Real Estate Mortgage Investment Conduit |
| SDR | — | Special Drawing Rights |
| SONIA | — | Sterling Overnight Index Average Rate |
| SOFR | — | Secured Overnight Financing Rate |
| SPDR | — | Standard and Poor's Depositary |
| STEP | — | Stepped Coupon Bonds: Interest rates shown reflect the rates currently in effect. |
| STIBOR | — | Stockholm Interbank Offered Rate |
| STRIP | — | Stripped Security |
| TBA | — | To be announced |
| TELBOR | — | Tel Aviv Interbank Offered Rate |
| TIIE | — | The Equilibrium Interbank Interest Rate |
| US CPI | — | U.S. Consumer Price Index |
| UK RPI | — | UK Retail Price Index |
| WIBOR | — | Warsaw Interbank Offered Rate |
| 144A | — | Security was purchased pursuant to Rule 144A under the Securities Act of 1933 and may not be resold subject to that rule except to qualified institutional buyers. As of December 31, 2019, the total market values and percentages of net assets for 144A securities by fund were as follows: |
| Fund | | Value of
144A Securities | | Percentage of
Net Assets |
| Low-Duration Bond | | $263,537,797 | | 26.49% |
| Medium-Duration Bond | | 269,528,494 | | 15.11 |
| Extended-Duration Bond | | 14,650,156 | | 5.71 |
| Global Bond | | 91,075,127 | | 14.93 |
| Defensive Market Strategies | | 95,150,764 | | 7.54 |
| International Equity Index | | 6,683,477 | | 0.94 |
| International Equity | | 3,261,489 | | 0.25 |
| Emerging Markets Equity | | 10,650,098 | | 2.00 |
| Global Real Estate Securities | | 806,571 | | 0.31 |
| Strategic Alternatives | | 45,828,105 | | 11.87 |
| | | | |
| INVESTMENT FOOTNOTES: |
| π | — | Century bond maturing in 2115. |
| ‡‡ | — | All or a portion of the security was held as collateral for open futures, options, securities sold short and/or swap agreements. |
| ‡ | — | Security represents underlying investment on open options contracts. |
| * | — | Non-income producing security. |
| # | — | Security in default. |
| § | — | Security purchased with the cash proceeds from securities loaned. |
| ^ | — | Variable rate security. Security issued at a fixed coupon rate, which converts to a variable rate at a specified date. Rate shown is the rate in effect as of period end. |
| † | — | Variable rate security. Rate shown reflects the rate in effect as of December 31, 2019. |
| γ | — | Variable or floating rate security, the interest rate of which adjusts periodically based on changes in current interest rates and prepayments on the underlying pool of assets. |
| Ω | — | Rate shown reflects the effective yield as of December 31, 2019. |
| ∞ | — | Affiliated fund. |
| Δ | — | Security either partially or fully on loan. |
| Σ | — | All or a portion of this position has not settled. Full contract rates do not take effect until settlement date. |
| ††† | — | Security is a Level 3 investment (see Note 2 in Notes to Financial Statements). |
| Ø | — | 7-day current yield as of December 31, 2019 is disclosed. |
| ρ | — | Perpetual bond. Maturity date represents the next call date. |
| Ψ | — | Security is valued at fair value by the Valuation Committee (see Note 2 in Notes to Financial Statements). As of December 31, 2019, the total market values and percentages of net assets for Fair Valued securities by fund were as follows: |
| Fund | | Value of
Fair
Valued
Securities | | Percentage of
Net Assets |
| Medium-Duration Bond(1) | | $ — | | —% |
| Global Bond | | 47,636 | | 0.01 |
| Small Cap Equity | | 1,956,000 | | 0.33 |
| International Equity(1) | | (2,589) | | — |
| Strategic Alternatives | | 1,325,889 | | 0.34 |
| | | | |
(1) Value of securities and percentage of net assets was zero at December 31, 2019.
ABBREVIATIONS, FOOTNOTES AND INDEX DEFINITIONS
| FOREIGN BOND FOOTNOTES: |
| (A) | — | Par is denominated in Australian Dollars (AUD). |
| (B) | — | Par is denominated in Brazilian Reals (BRL). |
| (C) | — | Par is denominated in Canadian Dollars (CAD). |
| (E) | — | Par is denominated in Euro (EUR). |
| (I) | — | Par is denominated in Indonesian Rupiahs (IDR). |
| (J) | — | Par is denominated in Japanese Yen (JPY). |
| (K) | — | Par is denominated in Norwegian Kroner (NOK). |
| (M) | — | Par is denominated in Mexican Pesos (MXN). |
| (P) | — | Par is denominated in Polish Zloty (PLN). |
| (Q) | — | Par is denominated in Russian Rubles (RUB). |
| (S) | — | Par is denominated in South African Rand (ZAR). |
| (U) | — | Par is denominated in British Pounds (GBP). |
| (X) | — | Par is denominated in Colombian Pesos (COP). |
| (Y) | — | Par is denominated in Chinese Yuan (CNY). |
| (ZA) | — | Par is denominated in Argentine Pesos (ARS). |
| | | |
| COUNTERPARTY ABBREVIATIONS: |
| BAR | — | Counterparty to contract is Barclays Capital. |
| BNP | — | Counterparty to contract is BNP Paribas. |
| BOA | — | Counterparty to contract is Bank of America. |
| BOFA | — | Counterparty to contract is Bank of America. |
| CIBC | — | Counterparty to contract is Canadian Imperial Bank of Commerce. |
| CITI | — | Counterparty to contract is Citibank NA London. |
| CS | — | Counterparty to contract is Credit Suisse International. |
| DEUT | — | Counterparty to contract is Deutsche Bank AG. |
| GSC | — | Counterparty to contract is Goldman Sachs Capital Markets, LP. |
| HSBC | — | Counterparty to contract is HSBC Securities. |
| JPM | — | Counterparty to contract is JPMorgan Chase Bank. |
| MSCS | — | Counterparty to contract is Morgan Stanley Capital Services. |
| NAB | — | Counterparty to contract is National Australia Bank. |
| NT | — | Counterparty to contract is Northern Trust. |
| RBC | — | Counterparty to contract is Royal Bank of Canada. |
| RBS | — | Counterparty to contract is Royal Bank of Scotland. |
| SC | — | Counterparty to contract is Standard Chartered PLC. |
| SS | — | Counterparty to contract is State Street Global Markets. |
| TD | — | Counterparty to contract is Toronto-Dominion Bank. |
| UBS | — | Counterparty to contract is UBS AG. |
| WEST | — | Counterparty to contract isWest Banc. |
ABBREVIATIONS, FOOTNOTES AND INDEX DEFINITIONS
INDEX DEFINITIONS:
The Bloomberg Barclays Global Aggregate Bond Index is a flagship measure of global investment grade debt from twenty-four local currency markets. This multi-currency benchmark includes treasury, government-related, corporate and securitized fixed-rate bonds from both developed and emerging markets issuers.
The Bloomberg Barclays US Aggregate Bond Index is a broad-based flagship benchmark that measures the investment grade, US dollar-denominated, fixed-rate taxable bond market. The index includes Treasuries, government-related and corporate securities, MBS (agency fixed-rate and hybrid ARM pass-throughs), ABS and CMBS (agency and non-agency).
The Bloomberg Barclays US Corporate High Yield 2% Issuer Capped Bond Index is an issuer-constrained version of the flagship US Corporate High Yield Index, which measures the USD-denominated, high yield, fixed-rate corporate bond market. The index follows the same rules as the uncapped version, but limits the exposure of each issuer to 2% of the total market value and redistributes any excess market value index-wide on a pro rata basis.
The Bloomberg Barclays US Long Government/Credit Bond Index is a long maturity constrained version of the Bloomberg Barclays US Government/Credit Bond Index which is a broad-based benchmark that measures the non-securitized component of the US Aggregate Index. It includes investment grade, US dollar-denominated, fixed-rate Treasuries, government-related and corporate securities.
The Bloomberg Barclays US Intermediate Government/Credit Bond Index is an intermediate maturity constrained version of the Bloomberg Barclays US Government/Credit Bond Index which is a broad-based benchmark that measures the non-securitized component of the US Aggregate Index. It includes investment grade, US dollar-denominated, fixed-rate Treasuries, government-related and corporate securities.
The FTSE 3-Month Treasury Bill Index measures monthly return equivalents of yield averages that are not marked to market, consisting of the last three three-month Treasury bill issues.
The FTSE EPRA/NAREIT Developed Index is designed to track the performance of listed real estate companies and REITS worldwide. By making the index constituents free-float adjusted, liquidity, size and revenue screened, the series is suitable for use as the basis for investment products.
The ICE BofAML 0-3 Month U.S. Treasury Bill Index is a subset of ICE BofAML U.S. Treasury Bill Index including all securities with a remaining term to final maturity less than 3 months.
The ICE BofAML 1-3 Year U.S. Treasury Index is a subset of the ICE BofAML U.S. Treasury Index including all securities with a remaining term to final maturity less than 3 years.
The ICE BofAML U.S. 3-Month Treasury Bill Index is comprised of a single issue purchased at the beginning of the month and held for a full month. At the end of the month that issue is sold and rolled into a newly selected issue. The issue selected at each month-end rebalancing is the outstanding Treasury Bill that matures closest to, but not beyond, three months from the rebalancing date. To qualify for selection, an issue must have settled on or before the month-end rebalancing date.
The J.P. Morgan Emerging Markets Bond Index (EMBI) Plus is a traditional, market-capitalization weighted index comprised of U.S. dollar denominated Brady bonds, Eurobonds and traded loans issued by sovereign entities.
The MSCI ACWI (All Country World Index) ex USA Index is a free float-adjusted market capitalization index that is designed to measure equity market performance in the global developed (excluding U.S.) and emerging markets.
The MSCI EAFE Index is a free float-adjusted market capitalization index that is designed to measure equity market performance of developed markets, excluding the U.S. & Canada. The index consists of the following 21 developed market country indexes: Australia, Austria, Belgium, Denmark, Finland, France, Germany, Hong Kong, Ireland, Israel, Italy, Japan, the Netherlands, New Zealand, Norway, Portugal, Singapore, Spain, Sweden, Switzerland, and the United Kingdom.
The MSCI Emerging Markets Index is a free float-adjusted market capitalization index that is designed to measure equity market performance of emerging markets. The index consists of the following 26 emerging market country indexes: Argentina, Brazil, Chile, China, Colombia, Czech Republic, Egypt, Greece, Hungary, India, Indonesia, Korea, Malaysia, Mexico, Pakistan, Peru, Philippines, Poland, Qatar, Russia, Saudi Arabia, South Africa, Taiwan, Thailand, Turkey, and United Arab Emirates.
The Russell 1000® Growth Index is a large-cap index consisting of those Russell 1000® Index securities with greater-than-average growth orientation. Companies in this index tend to exhibit higher price-to-book and price-to-earnings-ratios, lower dividend yields and higher forecasted growth values than the value universe.
ABBREVIATIONS, FOOTNOTES AND INDEX DEFINITIONS
The Russell 1000® Value Index is a large-cap index consisting of those Russell 1000® Index securities with a less-than-average growth orientation. Companies in this index tend to exhibit lower price-to-book and price-to-earnings ratios, higher dividend yields and lower forecasted growth values than the growth universe.
The Russell 2000® Index measures the performance of the small-cap segment of the U.S. equity universe. The Russell 2000® Index is a subset of the Russell 3000® Index representing approximately 10% of the total market capitalization of that index. It includes approximately 2,000 of the smallest securities based on a combination of their market cap and current index membership. The Russell 2000® Index is constructed to provide a comprehensive and unbiased small-cap barometer and is completely reconstituted annually to ensure that larger stocks do not distort the performance and characteristics of the actual small-cap opportunity set.
The Russell 3000® Index is composed of approximately 3,000 large U.S. companies. This portfolio of securities represents approximately 98% of the investable U.S. equity market.
The S&P 500® Index is a market capitalization-weighted equity index composed of approximately 500 U.S. companies representing all major industries. The index is designed to measure performance of the broad domestic economy through changes in the aggregate market value of its constituents.
BLOOMBERG® is a trademark and service mark of Bloomberg Finance L.P. and its affiliates (collectively “Bloomberg”). BARCLAYS® is a trademark and service mark of Barclays Bank Plc (collectively with its affiliates, “Barclays”), used under license. Bloomberg or Bloomberg’s licensors, including Barclays, own all proprietary rights in the Bloomberg Barclays Indices. Neither Bloomberg nor Barclays approves or endorses this material, or guarantees the accuracy or completeness of any information herein, or makes any warranty, express or implied, as to the results to be obtained therefrom and, to the maximum extent allowed by law, neither shall have any liability or responsibility for injury or damages arising in connection therewith.
GuideStone Funds are not in any way connected to or sponsored, endorsed, sold or promoted by the London Stock Exchange Group plc and its group undertakings, including FTSE International Limited (collectively, the “LSE Group”), European Public Real Estate Association (“EPRA”), or the National Association of Real Estate Investments Trusts (Nareit) (and together the “Licensor Parties”). FTSE Russell is a trading name of certain of the LSE Group Companies. All rights in the FTSE Russell Indexes vest in the Licensor Parties. “FTSE®” and “FTSE Russell®” are a trade mark(s) of the relevant LSE Group company and are used by any other LSE Group company under license. “Nareit®” is a trade mark of Nareit, “EPRA®” is a trade mark of EPRA and all are used by the LSE Group under license. The FTSE Russell Indexes are calculated by or on behalf of FTSE International Limited or its affiliate, agent or partner. The Licensor Parties do not accept any liability whatsoever to any person arising out of (a) the use of, reliance on or any error in the FTSE Russell Indexes or (b) investment in or operation of the GuideStone Funds. The Licensor Parties make no claim, prediction, warranty or representation either as to the results to be obtained from the GuideStone Funds or the suitability of the FTSE Russell Indexes for the purpose to which it is being put by GuideStone Funds.
The funds or securities referred to herein are not sponsored, endorsed, or promoted by MSCI, and MSCI bears no liability with respect to any such funds or securities or any index on which such funds or securities are based. The prospectus contains a more detailed description of the limited relationship MSCI has with GuideStone Funds. Neither MSCI nor any other party involved in or related to compiling, computing or creating the MSCI data makes any express or implied warranties or representations with respect to such data (or the results to be obtained by the use thereof), and all such parties hereby expressly disclaim all warranties of originality, accuracy, completeness, merchantability or fitness for a particular purpose with respect to any of such data. Without limiting any of the foregoing, in no event shall MSCI, any of its affiliates or any third party involved in or related to compiling, computing or creating the data have any liability for any direct, indirect, special, punitive, consequential or any other damages (including lost profits) even if notified of the possibility of such damages. No further distribution or dissemination of the MSCI data is permitted without MSCI’s express written consent.
“Standard & Poor’s®”, “S&P®”, and “S&P 500®” are trademarks of The McGraw-Hill Companies, Inc. and have been licensed for use by GuideStone Funds. The Funds are not sponsored, endorsed, sold or promoted by Standard & Poor’s and Standard & Poor’s makes no representation regarding the advisability of investing in the Funds.
MyDestination 2015 Fund(Unaudited)
The Fund, through investments primarily in the Select Funds, combined a greater percentage of exposure to fixed-income securities with smaller percentages allocated to equity and alternative investments. The Fund followed an allocation glide path designed to become more conservative over time, and the targeted allocations were approximately 52.00% fixed-income securities, 43.00% equity securities and 5.00% alternative investments as of December 31, 2019.
As a fund of funds, the Fund’s performance was based on the performance of the underlying investments. The Investor Class of the Fund generated a return of 15.09% for the one-year period ended December 31, 2019. Contribution to absolute performance from all major asset classes was positive, with exposure to U.S. equity securities producing relatively stronger performance than funds with primarily non-U.S. equity securities exposure. An appreciating U.S. dollar, slowing global economic growth and idiosyncratic circumstances (such as Brexit concerns, country-specific fiscal issues and increased tariffs) contributed to additional performance headwinds faced by companies outside of the United States. The Equity Index Fund, which was the largest equity contributor to Fund performance, benefited from acting as a passive exposure, broadly exposed to the strength of stocks in the S&P 500® Index this year. The Fund’s fixed-income securities allocation also performed well as 2019 saw one of the best years for fixed income performance. The Medium-Duration Bond Fund, the Fund’s largest fixed-income holding, was also the largest fixed-income contributor to overall performance. The contribution to absolute performance by the Fund’s exposure to real assets was also positive, via exposure to the Global Real Estate Securities Fund. The Strategic Alternatives Fund exposure was a positive contributor to Fund performance as well. For more information on a Select Fund’s performance, please refer to the section of that Select Fund in this Annual Report.
Certain derivatives were utilized to provide market exposure for the cash positions held in the Fund. These derivative positions primarily included stock index futures and fixed-income futures. Overall, derivative exposure had a positive impact on Fund performance for the year.
The Fund attempted to achieve its objective by investing in a diversified portfolio of primarily the Select Funds that represent various asset classes. The Fund is managed to the specific year included in its name (“Target Date”) and assumes a retirement age of 65. The Target Date refers to the approximate year an investor in the Fund would plan to retire and likely stop making any new investments in the Fund. The Fund is designed for an investor who anticipates retiring at or near the Target Date and who plans to withdraw the value of the account in the Fund gradually after retirement. Over time, the allocation to asset classes will change according to a predetermined “glide path,” which adjusts the percentage of fixed-income securities and equity securities to become more conservative each year until 15 years after Target Date. The Fund’s value will fluctuate due to changes in interest rates. There is a risk that the issuer of a fixed-income investment may fail to pay interest or even principal due in a timely manner or at all. The Fund’s value will fluctuate due to business developments concerning a particular issuer, industry or country, as well as general market and economic conditions. Securities of foreign issuers may be negatively impacted by political events, economic conditions or inefficient, illiquid or unregulated markets in foreign countries, and they also may be subject to inadequate regulatory or accounting standards, which may increase investment risk. By investing in this Fund, you will incur the expenses of the Fund in addition to those of the underlying Select Funds. You may directly invest in the Select Funds. The Fund’s value will go up and down in response to changes in the share prices of the investments that it owns. The amount invested in the Fund is not guaranteed to increase, is not guaranteed against loss nor is the amount of the original investment guaranteed at the Target Date. It is possible to lose money by investing in the Fund.
At December 31, 2019, the portfolio holdings of the Fund, as a percentage of net assets, is shown in the following table. Portfolio holdings are subject to risk and may change at any time.
| | % |
| Fixed Income Select Funds | 51.8 |
| U.S. Equity Select Funds | 29.7 |
| Non-U.S. Equity Select Funds | 12.6 |
| Alternative Select Funds | 4.8 |
| Real Assets Select Funds | 0.9 |
| U.S. Treasury Obligation | —** |
| | 99.8 |
| **Rounds to less than 0.1% |
MyDestination 2015 Fund(Unaudited)
| Average Annual Total Returns as of 12/31/19 | |
| | | Institutional Class* | | Investor Class* | |
| One Year | | 15.32% | | 15.09% | |
| Five Year | | N/A | | 5.35% | |
| Ten year | | N/A | | 6.73% | |
| Since Inception(1) | | 6.81% | | 4.70% | |
| Inception Date | | 05/01/17 | | 12/29/06 | |
| Total Fund Operating Expenses (April 30, 2019 Prospectus)(2) | | 0.58% | | 0.82% | |
(1)The Since Inception benchmark performance is based on the start date of December 29, 2006, which corresponds with the inception date of the Investor Class, the longest operating class of the Fund.
(2)The Fund’s shareholders indirectly bear the expenses of the Institutional Class shares of the Select Funds in which the Fund invests. Current information regarding the Fund’s Operating Expenses can be found in the Financial Highlights.
The performance data quoted represents past performance and does not guarantee future results. Current performance may be lower or higher. Performance data current to the most recent month-end may be obtained at GuideStoneFunds.com. The investment return and principal value of an investment will fluctuate so that shares, when redeemed, may be worth more or less than their original cost.
The Adviser has agreed to waive fees and/or reimburse expenses to the extent needed to limit total annual operating expenses to 0.50% for the Institutional Class and 0.75% for the Investor Class. This contractual waiver and reimbursement applies to Fund operating expenses only and will remain in place until April 30, 2020. Institutional Class Net Expense Ratio - 0.50% and Investor Class Net Expense Ratio - 0.75%.
The graph illustrates the results of a hypothetical $10,000 investment in the Investor Class of the Fund for the 10-year period from December 31, 2009 to December 31, 2019, with all dividends and capital gains reinvested.
*These returns reflect investment advisory and shareholder servicing fee waivers, if applicable, during the reported time periods.
Unlike a mutual fund, the performance of an index assumes no taxes, transaction costs, management fees or other expenses.
| | | Shares | | Value |
| MUTUAL FUNDS — 99.8% |
GuideStone Money Market Fund, 1.53%
(Institutional Class)Ø∞ | 7,928,513 | | $7,928,513 |
GuideStone Low-Duration Bond Fund
(Institutional Class)∞ | 7,574,008 | | 101,491,706 |
GuideStone Medium-Duration Bond Fund
(Institutional Class)∞ | 11,218,452 | | 168,837,709 |
GuideStone Global Bond Fund
(Institutional Class)∞ | 6,750,985 | | 67,577,359 |
GuideStone Defensive Market Strategies Fund
(Institutional Class)∞ | 5,523,247 | | 73,293,485 |
GuideStone Equity Index Fund
(Institutional Class)∞ | 3,201,400 | | 113,489,621 |
GuideStone Small Cap Equity Fund
(Institutional Class)∞ | 726,674 | | 11,423,317 |
GuideStone International Equity Index Fund
(Institutional Class)∞ | 5,929,598 | | 64,454,727 |
GuideStone Emerging Markets Equity Fund
(Institutional Class)∞ | 1,967,975 | | 20,053,661 |
| | | Shares | | Value |
GuideStone Global Real Estate Securities Fund
(Institutional Class)∞ | 565,202 | | $5,770,713 |
GuideStone Strategic Alternatives Fund
(Institutional Class)∞ | 3,138,134 | | 31,789,300 |
Total Mutual Funds
(Cost $636,724,372) | | 666,110,111 |
| | | Par | |
| U.S. TREASURY OBLIGATION — 0.0% |
| U.S. Treasury Bill | | | |
1.52%, 05/07/20Ω‡‡
(Cost $198,923) | $200,000 | 198,937 |
TOTAL INVESTMENTS —99.8%
(Cost $636,923,295) | | 666,309,048 |
Other Assets in Excess of
Liabilities — 0.2% | | 1,286,681 |
| NET ASSETS — 100.0% | | $667,595,729 |
Futures Contracts outstanding at December 31, 2019:
| Future Type | | Expiration Date | | Open Long
(Short) Contracts | | Notional
Market Value
of Contracts | | Value and
Unrealized
Appreciation
(Depreciation) |
| 10-Year U.S. Treasury Note | | 03/2020 | | 32 | | $4,109,500 | | $(27,930) |
| MSCI EAFE Index E-Mini | | 03/2020 | | 11 | | 1,120,075 | | 3,256 |
| MSCI Emerging Markets E-mini | | 03/2020 | | 6 | | 336,060 | | 8,909 |
| S&P 500® E-Mini | | 03/2020 | | 13 | | 2,100,215 | | 33,231 |
| Total Futures Contracts outstanding at December 31, 2019 | | | | | | $7,665,850 | | $17,466 |
See Notes to Financial Statements.
SCHEDULE OF INVESTMENTS (Continued)
VALUATION HIERARCHY
The following is a summary of the inputs used, as of December 31, 2019, in valuing the Fund’s investments carried at fair value:
| | Total
Value | | Level 1
Quoted Prices | | Level 2
Other Significant
Observable Inputs | | Level 3
Significant
Unobservable Inputs |
| Assets: | | | | | | | |
| Investments in Securities: | | | | | | | |
| Mutual Funds | $666,110,111 | | $666,110,111 | | $— | | $— |
| U.S. Treasury Obligation | 198,937 | | — | | 198,937 | | — |
| Total Assets - Investments in Securities | $666,309,048 | | $666,110,111 | | $198,937 | | $ — |
| Other Financial Instruments*** | | | | | | | |
| Futures Contracts | $45,396 | | $45,396 | | $— | | $— |
| Total Assets - Other Financial Instruments | $45,396 | | $45,396 | | $ — | | $ — |
| Liabilities: | | | | | | | |
| Other Financial Instruments*** | | | | | | | |
| Futures Contracts | $(27,930) | | $(27,930) | | $— | | $— |
| Total Liabilities - Other Financial Instruments | $(27,930) | | $(27,930) | | $ — | | $ — |
| *** | Other financial instruments are derivative instruments, such as futures contracts, which are valued at the unrealized appreciation (depreciation) on the investment. Further details regarding the value of these investments can be found in the preceding "Futures Contracts outstanding" disclosure. |
See Notes to Financial Statements.
MyDestination 2025 Fund(Unaudited)
The Fund, through investments primarily in the Select Funds, combined a greater percentage of exposure to equity securities with smaller percentages allocated to fixed-income securities, real assets and alternative investments. The Fund followed an allocation glide path designed to become more conservative over time, and the targeted allocations were approximately 40.00% fixed income securities, 56.00% equity securities, 1.00% real assets and 3.00% alternative investments as of December 31, 2019.
As a fund of funds, the Fund’s performance was based on the performance of the underlying investments. The Investor Class of the Fund generated a return of 18.18% for the one-year period ended December 31, 2019. Contribution to absolute performance from all major asset classes was positive, with exposure to U.S. equity securities producing relatively stronger performance than funds with primarily non-U.S. equity securities exposure. An appreciating U.S. dollar, slowing global economic growth and idiosyncratic circumstances (such as Brexit concerns, country-specific fiscal issues and increased tariffs) contributed to additional performance headwinds faced by companies outside of the United States. The Equity Index Fund, which was the largest equity contributor to Fund performance, benefited from acting as a passive exposure, broadly exposed to the strength of stocks in the S&P 500® Index this year. The Medium-Duration Bond Fund, the Fund’s largest fixed-income holding, was also the largest fixed-income contributor to overall performance. The contribution to absolute performance by the Fund’s exposure to real assets was slightly positive, via exposure to the Global Real Estate Securities Fund. The Strategic Alternatives Fund exposure was essentially a flat contributor to Fund performance. For more information on a Select Fund’s performance, please refer to the section of that Select Fund in this Annual Report.
Certain derivatives were utilized to provide market exposure for the cash positions held in the Fund. These derivative positions primarily included stock index futures and fixed-income futures. Overall, derivative exposure had a positive impact on Fund performance for the year.
The Fund attempted to achieve its objective by investing in a diversified portfolio of primarily the Select Funds that represent various asset classes. The Fund is managed to the specific year included in its name (“Target Date”) and assumes a retirement age of 65. The Target Date refers to the approximate year an investor in the Fund would plan to retire and likely stop making any new investments in the Fund. The Fund is designed for an investor who anticipates retiring at or near the Target Date and who plans to withdraw the value of the account in the Fund gradually after retirement. Over time, the allocation to asset classes will change according to a predetermined “glide path,” which adjusts the percentage of fixed-income securities and equity securities to become more conservative each year until 15 years after Target Date. The Fund’s value will fluctuate due to changes in interest rates. There is a risk that the issuer of a fixed-income investment may fail to pay interest or even principal due in a timely manner or at all. The Fund’s value will fluctuate due to business developments concerning a particular issuer, industry or country, as well as general market and economic conditions. Securities of foreign issuers may be negatively impacted by political events, economic conditions or inefficient, illiquid or unregulated markets in foreign countries, and they also may be subject to inadequate regulatory or accounting standards, which may increase investment risk. By investing in this Fund, you will incur the expenses of the Fund in addition to those of the underlying Select Funds. You may directly invest in the Select Funds. The Fund’s value will go up and down in response to changes in the share prices of the investments that it owns. The amount invested in the Fund is not guaranteed to increase, is not guaranteed against loss nor is the amount of the original investment guaranteed at the Target Date. It is possible to lose money by investing in the Fund.
At December 31, 2019, the portfolio holdings of the Fund, as a percentage of net assets, is shown in the following table. Portfolio holdings are subject to risk and may change at any time.
| | % |
| Fixed Income Select Funds | 40.6 |
| U.S. Equity Select Funds | 37.9 |
| Non-U.S. Equity Select Funds | 17.8 |
| Alternative Select Funds | 2.6 |
| Real Assets Select Funds | 1.1 |
| U.S. Treasury Obligation | —** |
| | 100.0 |
| **Rounds to less than 0.1% |
See Notes to Financial Statements.
MyDestination 2025 Fund(Unaudited)
| Average Annual Total Returns as of 12/31/19 | |
| | | Institutional Class* | | Investor Class* | |
| One Year | | 18.45% | | 18.18% | |
| Five Year | | N/A | | 6.26% | |
| Ten year | | N/A | | 7.85% | |
| Since Inception(1) | | 8.11% | | 5.04% | |
| Inception Date | | 05/01/17 | | 12/29/06 | |
| Total Fund Operating Expenses (April 30, 2019 Prospectus)(2) | | 0.54% | | 0.79% | |
(1)The Since Inception benchmark performance is based on the start date of December 29, 2006, which corresponds with the inception date of the Investor Class, the longest operating class of the Fund.
(2)The Fund’s shareholders indirectly bear the expenses of the Institutional Class shares of the Select Funds in which the Fund invests. Current information regarding the Fund’s Operating Expenses can be found in the Financial Highlights.
The performance data quoted represents past performance and does not guarantee future results. Current performance may be lower or higher. Performance data current to the most recent month-end may be obtained at GuideStoneFunds.com. The investment return and principal value of an investment will fluctuate so that shares, when redeemed, may be worth more or less than their original cost.
The Adviser has agreed to waive fees and/or reimburse expenses to the extent needed to limit total annual operating expenses to 0.50% for the Institutional Class and 0.75% for the Investor Class. This contractual waiver and reimbursement applies to Fund operating expenses only and will remain in place until April 30, 2020. Institutional Class Net Expense Ratio - 0.50% and Investor Class Net Expense Ratio - 0.75%.
The graph illustrates the results of a hypothetical $10,000 investment in the Investor Class of the Fund for the 10-year period from December 31, 2009 to December 31, 2019, with all dividends and capital gains reinvested.
*These returns reflect investment advisory and shareholder servicing fee waivers, if applicable, during the reported time periods.
Unlike a mutual fund, the performance of an index assumes no taxes, transaction costs, management fees or other expenses.
See Notes to Financial Statements.
| | | Shares | | Value |
| MUTUAL FUNDS — 100.0% |
| GuideStone Money Market Fund, 1.53%Ø∞ | 23,192,204 | | $23,192,204 |
GuideStone Low-Duration Bond Fund
(Institutional Class)∞ | 5,989,398 | | 80,257,928 |
GuideStone Medium-Duration Bond Fund
(Institutional Class)∞ | 23,825,474 | | 358,573,386 |
GuideStone Global Bond Fund
(Institutional Class)∞ | 10,909,460 | | 109,203,694 |
GuideStone Defensive Market Strategies Fund
(Institutional Class)∞ | 11,775,569 | | 156,261,802 |
GuideStone Equity Index Fund
(Institutional Class)∞ | 9,703,711 | | 343,996,549 |
GuideStone Small Cap Equity Fund
(Institutional Class)∞ | 2,178,180 | | 34,240,991 |
GuideStone International Equity Index Fund
(Institutional Class)∞ | 17,769,003 | | 193,149,061 |
GuideStone Emerging Markets Equity Fund
(Institutional Class)∞ | 5,660,581 | | 57,681,323 |
| | | Shares | | Value |
GuideStone Global Real Estate Securities Fund
(Institutional Class)∞ | 1,551,115 | | $15,836,883 |
GuideStone Strategic Alternatives Fund
(Institutional Class)∞ | 3,605,555 | | 36,524,273 |
Total Mutual Funds
(Cost $1,328,222,462) | | 1,408,918,094 |
| | | Par | |
| U.S. TREASURY OBLIGATION — 0.0% |
| U.S. Treasury Bill | | | |
1.52%, 05/07/20Ω‡‡
(Cost $596,770) | $600,000 | 596,811 |
TOTAL INVESTMENTS —100.0%
(Cost $1,328,819,232) | | 1,409,514,905 |
Other Assets in Excess of
Liabilities — 0.0% | | 33,305 |
| NET ASSETS — 100.0% | | $1,409,548,210 |
Futures Contracts outstanding at December 31, 2019:
| Future Type | | Expiration Date | | Open Long
(Short) Contracts | | Notional
Market Value
of Contracts | | Value and
Unrealized
Appreciation
(Depreciation) |
| 10-Year U.S. Treasury Note | | 03/2020 | | 62 | | $7,962,156 | | $(67,919) |
| MSCI EAFE Index E-Mini | | 03/2020 | | 35 | | 3,563,875 | | 12,833 |
| MSCI Emerging Markets E-mini | | 03/2020 | | 19 | | 1,064,190 | | 36,953 |
| S&P 500® E-Mini | | 03/2020 | | 41 | | 6,623,755 | | 123,279 |
| Total Futures Contracts outstanding at December 31, 2019 | | | | | | $19,213,976 | | $105,146 |
See Notes to Financial Statements.
SCHEDULE OF INVESTMENTS (Continued)
VALUATION HIERARCHY
The following is a summary of the inputs used, as of December 31, 2019, in valuing the Fund’s investments carried at fair value:
| | Total
Value | | Level 1
Quoted Prices | | Level 2
Other Significant
Observable Inputs | | Level 3
Significant
Unobservable Inputs |
| Assets: | | | | | | | |
| Investments in Securities: | | | | | | | |
| Mutual Funds | $1,408,918,094 | | $1,408,918,094 | | $— | | $— |
| U.S. Treasury Obligation | 596,811 | | — | | 596,811 | | — |
| Total Assets - Investments in Securities | $1,409,514,905 | | $1,408,918,094 | | $596,811 | | $ — |
| Other Financial Instruments*** | | | | | | | |
| Futures Contracts | $173,065 | | $173,065 | | $— | | $— |
| Total Assets - Other Financial Instruments | $173,065 | | $173,065 | | $ — | | $ — |
| Liabilities: | | | | | | | |
| Other Financial Instruments*** | | | | | | | |
| Futures Contracts | $(67,919) | | $(67,919) | | $— | | $— |
| Total Liabilities - Other Financial Instruments | $(67,919) | | $(67,919) | | $ — | | $ — |
| *** | Other financial instruments are derivative instruments, such as futures contracts, which are valued at the unrealized appreciation (depreciation) on the investment. Further details regarding the value of these investments can be found in the preceding "Futures Contracts outstanding" disclosure. |
See Notes to Financial Statements.
MyDestination 2035 Fund(Unaudited)
The Fund, through investments primarily in the Select Funds, combined a greater percentage of exposure to equity securities with smaller percentages allocated to fixed-income securities and real assets. The Fund followed an allocation glide path designed to become more conservative over time, and the targeted allocations were approximately 23.00% fixed-income securities, 75.00% equity securities and 2.00% real assets as of December 31, 2019.
As a fund of funds, the Fund’s performance was based on the performance of the underlying investments. The Investor Class of the Fund generated a return of 22.16% for the one-year period ended December 31, 2019. Contribution to absolute performance from all major asset classes was positive, with exposure to U.S. equity securities producing relatively stronger performance than funds with primarily non-U.S. equity securities exposure. An appreciating U.S. dollar, slower global economic growth and idiosyncratic circumstances (such as Brexit concerns, country-specific fiscal issues and increased tariffs) contributed to additional performance headwinds faced by companies outside of the United States. The Equity Index Fund, which was the largest equity contributor to Fund performance, benefited from acting as a passive exposure, broadly exposed to the strength of stocks in the S&P 500® Index this year. The Medium-Duration Bond Fund, the Fund’s largest fixed-income holding, was also the largest fixed-income contributor to overall performance. The contribution to absolute performance by the Fund’s exposure to real assets was marginally additive, via exposure to the Global Real Estate Securities Fund. For more information on a Select Fund’s performance, please refer to the section of that Select Fund in this Annual Report.
Certain derivatives were utilized to provide market exposure for the cash positions held in the Fund. These derivative positions primarily included stock index futures and fixed-income futures. Overall, derivative exposure had a positive impact on Fund performance for the year.
The Fund attempted to achieve its objective by investing in a diversified portfolio of primarily the Select Funds that represent various asset classes. The Fund is managed to the specific year included in its name (“Target Date”) and assumes a retirement age of 65. The Target Date refers to the approximate year an investor in the Fund would plan to retire and likely stop making any new investments in the Fund. The Fund is designed for an investor who anticipates retiring at or near the Target Date and who plans to withdraw the value of the account in the Fund gradually after retirement. Over time, the allocation to asset classes will change according to a predetermined “glide path,” which adjusts the percentage of fixed-income securities and equity securities to become more conservative each year until 15 years after Target Date. The Fund’s value will fluctuate due to changes in interest rates. There is a risk that the issuer of a fixed-income investment may fail to pay interest or even principal due in a timely manner or at all. The Fund’s value will fluctuate due to business developments concerning a particular issuer, industry or country, as well as general market and economic conditions. Securities of foreign issuers may be negatively impacted by political events, economic conditions or inefficient, illiquid or unregulated markets in foreign countries, and they also may be subject to inadequate regulatory or accounting standards, which may increase investment risk. By investing in this Fund, you will incur the expenses of the Fund in addition to those of the underlying Select Funds. You may directly invest in the Select Funds. The Fund’s value will go up and down in response to changes in the share prices of the investments that it owns. The amount invested in the Fund is not guaranteed to increase, is not guaranteed against loss nor is the amount of the original investment guaranteed at the Target Date. It is possible to lose money by investing in the Fund.
At December 31, 2019, the portfolio holdings of the Fund, as a percentage of net assets, is shown in the following table. Portfolio holdings are subject to risk and may change at any time.
| | % |
| U.S. Equity Select Funds | 46.7 |
| Non-U.S. Equity Select Funds | 27.3 |
| Fixed Income Select Funds | 24.8 |
| Real Assets Select Funds | 1.5 |
| U.S. Treasury Obligation | 0.1 |
| | 100.4 |
See Notes to Financial Statements.
MyDestination 2035 Fund(Unaudited)
| Average Annual Total Returns as of 12/31/19 | |
| | | Institutional Class* | | Investor Class* | |
| One Year | | 22.47% | | 22.16% | |
| Five Year | | N/A | | 6.96% | |
| Ten year | | N/A | | 8.61% | |
| Since Inception(1) | | 9.53% | | 5.16% | |
| Inception Date | | 05/01/17 | | 12/29/06 | |
| Total Fund Operating Expenses (April 30, 2019 Prospectus)(2) | | 0.50% | | 0.75% | |
(1)The Since Inception benchmark performance is based on the start date of December 29, 2006, which corresponds with the inception date of the Investor Class, the longest operating class of the Fund.
(2)The Fund’s shareholders indirectly bear the expenses of the Institutional Class shares of the Select Funds in which the Fund invests. Current information regarding the Fund’s Operating Expenses can be found in the Financial Highlights.
The performance data quoted represents past performance and does not guarantee future results. Current performance may be lower or higher. Performance data current to the most recent month-end may be obtained at GuideStoneFunds.com. The investment return and principal value of an investment will fluctuate so that shares, when redeemed, may be worth more or less than their original cost.
The graph illustrates the results of a hypothetical $10,000 investment in the Investor Class of the Fund for the 10-year period from December 31, 2009 to December 31, 2019, with all dividends and capital gains reinvested.
*These returns reflect investment advisory and shareholder servicing fee waivers, if applicable, during the reported time periods.
Unlike a mutual fund, the performance of an index assumes no taxes, transaction costs, management fees or other expenses.
See Notes to Financial Statements.
| | | Shares | | Value |
| MUTUAL FUNDS — 100.3% |
GuideStone Money Market Fund, 1.53%
(Institutional Class)Ø∞ | 23,190,594 | | $23,190,594 |
GuideStone Medium-Duration Bond Fund
(Institutional Class)∞ | 11,018,026 | | 165,821,289 |
GuideStone Global Bond Fund
(Institutional Class)∞ | 4,140,827 | | 41,449,679 |
GuideStone Defensive Market Strategies Fund
(Institutional Class)∞ | 4,210,540 | | 55,873,859 |
GuideStone Equity Index Fund
(Institutional Class)∞ | 9,704,953 | | 344,040,592 |
GuideStone Small Cap Equity Fund
(Institutional Class)∞ | 2,145,442 | | 33,726,345 |
GuideStone International Equity Index Fund
(Institutional Class)∞ | 18,018,040 | | 195,856,101 |
GuideStone Emerging Markets Equity Fund
(Institutional Class)∞ | 5,655,622 | | 57,630,784 |
| | | Shares | | Value |
GuideStone Global Real Estate Securities Fund
(Institutional Class)∞ | 1,370,495 | | $13,992,755 |
Total Mutual Funds
(Cost $862,561,954) | | 931,581,998 |
| | | Par | |
| U.S. TREASURY OBLIGATION — 0.1% |
| U.S. Treasury Bill | | | |
1.52%, 05/07/20Ω‡‡
(Cost $745,962) | $750,000 | 746,013 |
TOTAL INVESTMENTS —100.4%
(Cost $863,307,916) | | 932,328,011 |
Liabilities in Excess of Other
Assets — (0.4)% | | (3,505,713) |
| NET ASSETS — 100.0% | | $928,822,298 |
Futures Contracts outstanding at December 31, 2019:
| Future Type | | Expiration Date | | Open Long
(Short) Contracts | | Notional
Market Value
of Contracts | | Value and
Unrealized
Appreciation
(Depreciation) |
| 10-Year U.S. Treasury Note | | 03/2020 | | 34 | | $4,366,344 | | $(23,215) |
| MSCI EAFE Index E-Mini | | 03/2020 | | 47 | | 4,785,775 | | 5,146 |
| MSCI Emerging Markets E-mini | | 03/2020 | | 25 | | 1,400,250 | | 38,899 |
| S&P 500® E-Mini | | 03/2020 | | 55 | | 8,885,525 | | 132,997 |
| Total Futures Contracts outstanding at December 31, 2019 | | | | | | $19,437,894 | | $153,827 |
See Notes to Financial Statements.
SCHEDULE OF INVESTMENTS (Continued)
VALUATION HIERARCHY
The following is a summary of the inputs used, as of December 31, 2019, in valuing the Fund’s investments carried at fair value:
| | Total
Value | | Level 1
Quoted Prices | | Level 2
Other Significant
Observable Inputs | | Level 3
Significant
Unobservable Inputs |
| Assets: | | | | | | | |
| Investments in Securities: | | | | | | | |
| Mutual Funds | $931,581,998 | | $931,581,998 | | $— | | $— |
| U.S. Treasury Obligation | 746,013 | | — | | 746,013 | | — |
| Total Assets - Investments in Securities | $932,328,011 | | $931,581,998 | | $746,013 | | $ — |
| Other Financial Instruments*** | | | | | | | |
| Futures Contracts | $177,042 | | $177,042 | | $— | | $— |
| Total Assets - Other Financial Instruments | $177,042 | | $177,042 | | $ — | | $ — |
| Liabilities: | | | | | | | |
| Other Financial Instruments*** | | | | | | | |
| Futures Contracts | $(23,215) | | $(23,215) | | $— | | $— |
| Total Liabilities - Other Financial Instruments | $(23,215) | | $(23,215) | | $ — | | $ — |
| *** | Other financial instruments are derivative instruments, such as futures contracts, which are valued at the unrealized appreciation (depreciation) on the investment. Further details regarding the value of these investments can be found in the preceding "Futures Contracts outstanding" disclosure. |
See Notes to Financial Statements.
MyDestination 2045 Fund(Unaudited)
The Fund, through investments primarily in the Select Funds, combined a high percentage of exposure to equity securities with only modest percentages allocated to fixed-income securities and real assets. The Fund followed an allocation glide path designed to become more conservative over time, and the targeted allocations were approximately 10.00% fixed-income securities, 88.00% equity securities and 2.00% real assets as of December 31, 2019.
As a fund of funds, the Fund’s performance was based on the performance of the underlying investments. The Investor Class of the Fund generated a return of 24.24% for the one-year period ended December 31, 2019. Contribution to absolute performance from all major asset classes was positive, with exposure to U.S. equity securities producing relatively stronger performance than funds with primarily non-U.S. equity securities exposure. An appreciating U.S. dollar, slowing global economic growth and idiosyncratic circumstances (such as Brexit concerns, country-specific fiscal issues and increased tariffs) contributed to additional performance headwinds faced by companies outside of the United States. The Equity Index Fund, which was the largest equity contributor to Fund performance, benefited from acting as a passive exposure, broadly exposed to the strength in stocks of the S&P 500® Index this year. The Medium-Duration Bond Fund, the Fund’s largest fixed-income holding, was also the largest fixed-income contributor to overall performance. The contribution to absolute performance by the Fund’s exposure to real assets was additive, via exposure to the Global Real Estate Securities Fund. For more information on a Select Fund’s performance, please refer to the section of that Select Fund in this Annual Report.
Certain derivatives were utilized to provide market exposure for the cash positions held in the Fund. These derivative positions primarily included stock index futures and fixed-income futures. Overall, derivative exposure had a positive impact on Fund performance for the year.
The Fund attempted to achieve its objective by investing in a diversified portfolio of primarily the Select Funds that represent various asset classes. The Fund is managed to the specific year included in its name (“Target Date”) and assumes a retirement age of 65. The Target Date refers to the approximate year an investor in the Fund would plan to retire and likely stop making any new investments in the Fund. The Fund is designed for an investor who anticipates retiring at or near the Target Date and who plans to withdraw the value of the account in the Fund gradually after retirement. Over time, the allocation to asset classes will change according to a predetermined “glide path,” which adjusts the percentage of fixed-income securities and equity securities to become more conservative each year until 15 years after Target Date. The Fund’s value will fluctuate due to changes in interest rates. There is a risk that the issuer of a fixed-income investment may fail to pay interest or even principal due in a timely manner or at all. The Fund’s value will fluctuate due to business developments concerning a particular issuer, industry or country, as well as general market and economic conditions. Securities of foreign issuers may be negatively impacted by political events, economic conditions or inefficient, illiquid or unregulated markets in foreign countries, and they also may be subject to inadequate regulatory or accounting standards, which may increase investment risk. By investing in this Fund, you will incur the expenses of the Fund in addition to those of the underlying Select Funds. You may directly invest in the Select Funds. The Fund’s value will go up and down in response to changes in the share prices of the investments that it owns. The amount invested in the Fund is not guaranteed to increase, is not guaranteed against loss nor is the amount of the original investment guaranteed at the Target Date. It is possible to lose money by investing in the Fund.
At December 31, 2019, the portfolio holdings of the Fund, as a percentage of net assets, is shown in the following table. Portfolio holdings are subject to risk and may change at any time.
| | % |
| U.S. Equity Select Funds | 53.6 |
| Non-U.S. Equity Select Funds | 32.3 |
| Fixed Income Select Funds | 12.7 |
| Real Assets Select Funds | 1.8 |
| U.S. Treasury Obligation | 0.1 |
| | 100.5 |
See Notes to Financial Statements.
MyDestination 2045 Fund(Unaudited)
| Average Annual Total Returns as of 12/31/19 | |
| | | Institutional Class* | | Investor Class* | |
| One Year | | 24.56% | | 24.24% | |
| Five Year | | N/A | | 7.51% | |
| Ten year | | N/A | | 9.05% | |
| Since Inception(1) | | 10.31% | | 5.22% | |
| Inception Date | | 05/01/17 | | 12/29/06 | |
| Total Fund Operating Expenses (April 30, 2019 Prospectus)(2) | | 0.50% | | 0.75% | |
(1)The Since Inception benchmark performance is based on the start date of December 29, 2006, which corresponds with the inception date of the Investor Class, the longest operating class of the Fund.
(2)The Fund’s shareholders indirectly bear the expenses of the Institutional Class shares of the Select Funds in which the Fund invests. Current information regarding the Fund’s Operating Expenses can be found in the Financial Highlights.
The performance data quoted represents past performance and does not guarantee future results. Current performance may be lower or higher. Performance data current to the most recent month-end may be obtained at GuideStoneFunds.com. The investment return and principal value of an investment will fluctuate so that shares, when redeemed, may be worth more or less than their original cost.
The graph illustrates the results of a hypothetical $10,000 investment in the Investor Class of the Fund for the 10-year period from December 31, 2009 to December 31, 2019, with all dividends and capital gains reinvested.
*These returns reflect investment advisory and shareholder servicing fee waivers, if applicable, during the reported time periods.
Unlike a mutual fund, the performance of an index assumes no taxes, transaction costs, management fees or other expenses.
See Notes to Financial Statements.
| | | Shares | | Value |
| MUTUAL FUNDS — 100.4% |
GuideStone Money Market Fund, 1.53%
(Institutional Class)Ø∞ | 17,535,781 | | $17,535,781 |
GuideStone Medium-Duration Bond Fund
(Institutional Class)∞ | 3,806,131 | | 57,282,270 |
GuideStone Global Bond Fund
(Institutional Class)∞ | 1,432,553 | | 14,339,854 |
GuideStone Defensive Market Strategies Fund
(Institutional Class)∞ | 2,594,675 | | 34,431,336 |
GuideStone Equity Index Fund
(Institutional Class)∞ | 8,763,480 | | 310,665,387 |
GuideStone Small Cap Equity Fund
(Institutional Class)∞ | 1,952,187 | | 30,688,375 |
GuideStone International Equity Index Fund
(Institutional Class)∞ | 16,251,399 | | 176,652,707 |
GuideStone Emerging Markets Equity Fund
(Institutional Class)∞ | 4,888,768 | | 49,816,542 |
| | | Shares | | Value |
GuideStone Global Real Estate Securities Fund
(Institutional Class)∞ | 1,208,392 | | $12,337,685 |
Total Mutual Funds
(Cost $644,567,039) | | 703,749,937 |
| | | Par | |
| U.S. TREASURY OBLIGATION — 0.1% |
| U.S. Treasury Bill | | | |
1.52%, 05/07/20Ω‡‡
(Cost $646,501) | $650,000 | 646,545 |
TOTAL INVESTMENTS —100.5%
(Cost $645,213,540) | | 704,396,482 |
Liabilities in Excess of Other
Assets — (0.5)% | | (3,305,952) |
| NET ASSETS — 100.0% | | $701,090,530 |
Futures Contracts outstanding at December 31, 2019:
| Future Type | | Expiration Date | | Open Long
(Short) Contracts | | Notional
Market Value
of Contracts | | Value and
Unrealized
Appreciation
(Depreciation) |
| 10-Year U.S. Treasury Note | | 03/2020 | | 12 | | $1,541,063 | | $(10,849) |
| MSCI EAFE Index E-Mini | | 03/2020 | | 38 | | 3,869,350 | | 2,800 |
| MSCI Emerging Markets E-mini | | 03/2020 | | 21 | | 1,176,210 | | 29,105 |
| S&P 500® E-Mini | | 03/2020 | | 47 | | 7,593,085 | | 108,030 |
| Total Futures Contracts outstanding at December 31, 2019 | | | | | | $14,179,708 | | $129,086 |
See Notes to Financial Statements.
SCHEDULE OF INVESTMENTS (Continued)
VALUATION HIERARCHY
The following is a summary of the inputs used, as of December 31, 2019, in valuing the Fund’s investments carried at fair value:
| | Total
Value | | Level 1
Quoted Prices | | Level 2
Other Significant
Observable Inputs | | Level 3
Significant
Unobservable Inputs |
| Assets: | | | | | | | |
| Investments in Securities: | | | | | | | |
| Mutual Funds | $703,749,937 | | $703,749,937 | | $— | | $— |
| U.S. Treasury Obligation | 646,545 | | — | | 646,545 | | — |
| Total Assets - Investments in Securities | $704,396,482 | | $703,749,937 | | $646,545 | | $ — |
| Other Financial Instruments*** | | | | | | | |
| Futures Contracts | $139,935 | | $139,935 | | $— | | $— |
| Total Assets - Other Financial Instruments | $139,935 | | $139,935 | | $ — | | $ — |
| Liabilities: | | | | | | | |
| Other Financial Instruments*** | | | | | | | |
| Futures Contracts | $(10,849) | | $(10,849) | | $— | | $— |
| Total Liabilities - Other Financial Instruments | $(10,849) | | $(10,849) | | $ — | | $ — |
| *** | Other financial instruments are derivative instruments, such as futures contracts, which are valued at the unrealized appreciation (depreciation) on the investment. Further details regarding the value of these investments can be found in the preceding "Futures Contracts outstanding" disclosure. |
See Notes to Financial Statements.
MyDestination 2055 Fund(Unaudited)
The Fund, through investments primarily in the Select Funds, combined a high percentage of exposure to equity securities with only modest percentages allocated to fixed-income securities and real assets. The Fund followed an allocation glide path designed to become more conservative over time, and the targeted allocations were approximately 7.00% fixed-income investments, 91.00% equity investments and 2.00% real assets as of December 31, 2019.
As a fund of funds, the Fund’s performance was based on the performance of the underlying investments. The Investor Class of the Fund generated a return of 24.92% for the one-year period ended December 31, 2019. Contribution to absolute performance from all major asset classes was positive, with exposure to U.S. equity securities producing relatively stronger performance than funds with primarily non-U.S. equity securities exposure. An appreciating U.S. dollar, slowing global economic growth and idiosyncratic circumstances (such as Brexit concerns, country-specific fiscal issues and increased tariffs) contributed to additional performance headwinds faced by companies outside of the United States. The Equity Index Fund, which was the largest equity contributor to Fund performance, benefited from acting as a passive exposure, broadly exposed to the strength in stocks of the S&P 500® Index this year. The Medium-Duration Bond Fund, the Fund’s largest fixed-income holding, was also the largest fixed-income contributor to overall performance. The contribution to absolute performance by the Fund’s exposure to real assets was additive, via exposure to the Global Real Estate Securities Fund. For more information on a Select Fund’s performance, please refer to the section of that Select Fund in this Annual Report.
Certain derivatives were utilized to provide market exposure for the cash positions held in the Fund. These derivative positions primarily included stock index futures and fixed-income futures. Overall, derivative exposure had a positive impact on Fund performance for the year.
The Fund attempted to achieve its objective by investing in a diversified portfolio of primarily the Select Funds that represent various asset classes. The Fund is managed to the specific year included in the its name (“Target Date”) and assumes a retirement age of 65. The Target Date refers to the approximate year an investor in the Fund would plan to retire and likely stop making any new investments in the Fund. The Fund is designed for an investor who anticipates retiring at or near the Target Date and who plans to withdraw the value of the account in the Fund gradually after retirement. Over time, the allocation to asset classes will change according to a predetermined “glide path,” which adjusts the percentage of fixed-income securities and equity securities to become more conservative each year until 15 years after Target Date. The Fund’s value will fluctuate due to changes in interest rates. There is a risk that the issuer of a fixed-income investment may fail to pay interest or even principal due in a timely manner or at all. The Fund’s value will fluctuate due to business developments concerning a particular issuer, industry or country, as well as general market and economic conditions. Securities of foreign issuers may be negatively impacted by political events, economic conditions or inefficient, illiquid or unregulated markets in foreign countries, and they also may be subject to inadequate regulatory or accounting standards, which may increase investment risk. By investing in this Fund, you will incur the expenses of the Fund in addition to those of the underlying Select Funds. You may directly invest in the Select Funds. The Fund’s value will go up and down in response to changes in the share prices of the investments that it owns. The amount invested in the Fund is not guaranteed to increase, is not guaranteed against loss nor is the amount of the original investment guaranteed at the Target Date. It is possible to lose money by investing in the Fund.
At December 31, 2019, the portfolio holdings of the Fund, as a percentage of net assets, is shown in the following table. Portfolio holdings are subject to risk and may change at any time.
| | % |
| U.S. Equity Select Funds | 55.5 |
| Non-U.S. Equity Select Funds | 33.6 |
| Fixed Income Select Funds | 9.4 |
| Real Assets Select Funds | 1.8 |
| U.S. Treasury Obligation | 0.1 |
| | 100.4 |
See Notes to Financial Statements.
MyDestination 2055 Fund(Unaudited)
| Average Annual Total Returns as of 12/31/19 | |
| | | Institutional Class* | | Investor Class* | |
| One Year | | 25.15% | | 24.92% | |
| Five Year | | N/A | | 7.77% | |
| Ten year | | N/A | | N/A | |
| Since Inception(1) | | 10.56% | | 9.68% | |
| Inception Date | | 05/01/17 | | 01/01/12 | |
| Total Fund Operating Expenses (April 30, 2019 Prospectus)(2) | | 0.59% | | 0.84% | |
(1)The Since Inception benchmark performance is based on the start date of December 29, 2006, which corresponds with the inception date of the Investor Class, the longest operating class of the Fund.
(2)The Fund’s shareholders indirectly bear the expenses of the Institutional Class shares of the Select Funds in which the Fund invests. Current information regarding the Fund’s Operating Expenses can be found in the Financial Highlights.
The performance data quoted represents past performance and does not guarantee future results. Current performance may be lower or higher. Performance data current to the most recent month-end may be obtained at GuideStoneFunds.com. The investment return and principal value of an investment will fluctuate so that shares, when redeemed, may be worth more or less than their original cost.
The Adviser has agreed to waive fees and/or reimburse expenses to the extent needed to limit total annual operating expenses to 0.50% for the Institutional Class and 0.75% for the Investor Class. This contractual waiver and reimbursement applies to Fund operating expenses only and will remain in place until April 30, 2020. Institutional Class Net Expense Ratio - 0.50% and Investor Class Net Expense Ratio - 0.75%.
The graph illustrates the results of a hypothetical $10,000 investment in the Investor Class of the Fund since January 1, 2012 (commencement of operations), with all dividends and capital gains reinvested.
*These returns reflect investment advisory and shareholder servicing fee waivers, if applicable, during the reported time periods.
Unlike a mutual fund, the performance of an index assumes no taxes, transaction costs, management fees or other expenses.
See Notes to Financial Statements.
| | | Shares | | Value |
| MUTUAL FUNDS — 100.3% |
GuideStone Money Market Fund, 1.53%
(Institutional Class)Ø∞ | 5,502,685 | | $5,502,685 |
GuideStone Medium-Duration Bond Fund
(Institutional Class)∞ | 801,099 | | 12,056,546 |
GuideStone Global Bond Fund
(Institutional Class)∞ | 301,514 | | 3,018,155 |
GuideStone Defensive Market Strategies Fund
(Institutional Class)∞ | 817,700 | | 10,850,884 |
GuideStone Equity Index Fund
(Institutional Class)∞ | 2,868,329 | | 101,682,265 |
GuideStone Small Cap Equity Fund
(Institutional Class)∞ | 638,959 | | 10,044,432 |
GuideStone International Equity Index Fund
(Institutional Class)∞ | 5,319,138 | | 57,819,025 |
GuideStone Emerging Markets Equity Fund
(Institutional Class)∞ | 1,600,159 | | 16,305,624 |
| | | Shares | | Value |
GuideStone Global Real Estate Securities Fund
(Institutional Class)∞ | 394,692 | | $4,029,801 |
Total Mutual Funds
(Cost $205,430,807) | | 221,309,417 |
| | | Par | |
| U.S. TREASURY OBLIGATION — 0.1% |
| U.S. Treasury Bill | | | |
2.00%, 01/16/20Ω‡‡
(Cost $199,832) | $200,000 | 199,892 |
TOTAL INVESTMENTS —100.4%
(Cost $205,630,639) | | 221,509,309 |
Liabilities in Excess of Other
Assets — (0.4)% | | (880,005) |
| NET ASSETS — 100.0% | | $220,629,304 |
Futures Contracts outstanding at December 31, 2019:
| Future Type | | Expiration Date | | Open Long
(Short) Contracts | | Notional
Market Value
of Contracts | | Value and
Unrealized
Appreciation
(Depreciation) |
| 10-Year U.S. Treasury Note | | 03/2020 | | 3 | | $385,266 | | $(1,115) |
| MSCI EAFE Index E-Mini | | 03/2020 | | 12 | | 1,221,900 | | (181) |
| MSCI Emerging Markets E-Mini | | 03/2020 | | 7 | | 392,070 | | 10,701 |
| S&P 500® E-Mini | | 03/2020 | | 15 | | 2,423,325 | | 32,505 |
| Total Futures Contracts outstanding at December 31, 2019 | | | | | | $4,422,561 | | $41,910 |
See Notes to Financial Statements.
SCHEDULE OF INVESTMENTS (Continued)
VALUATION HIERARCHY
The following is a summary of the inputs used, as of December 31, 2019, in valuing the Fund’s investments carried at fair value:
| | Total
Value | | Level 1
Quoted Prices | | Level 2
Other Significant
Observable Inputs | | Level 3
Significant
Unobservable Inputs |
| Assets: | | | | | | | |
| Investments in Securities: | | | | | | | |
| Mutual Funds | $221,309,417 | | $221,309,417 | | $— | | $— |
| U.S. Treasury Obligation | 199,892 | | — | | 199,892 | | — |
| Total Assets - Investments in Securities | $221,509,309 | | $221,309,417 | | $199,892 | | $ — |
| Other Financial Instruments*** | | | | | | | |
| Futures Contracts | $43,206 | | $43,206 | | $— | | $— |
| Total Assets - Other Financial Instruments | $43,206 | | $43,206 | | $ — | | $ — |
| Liabilities: | | | | | | | |
| Other Financial Instruments*** | | | | | | | |
| Futures Contracts | $(1,296) | | $(1,296) | | $— | | $— |
| Total Liabilities - Other Financial Instruments | $(1,296) | | $(1,296) | | $ — | | $ — |
| *** | Other financial instruments are derivative instruments, such as futures contracts, which are valued at the unrealized appreciation (depreciation) on the investment. Further details regarding the value of these investments can be found in the preceding "Futures Contracts outstanding" disclosure. |
See Notes to Financial Statements.
(This page intentionally left blank)
| STATEMENTS OF ASSETS AND LIABILITIES | December 31, 2019 |
| | MyDestination
2015 Fund | | MyDestination
2025 Fund |
| Assets | | | |
| Investments in securities of unaffiliated issuers, at value | $198,937 | | $596,811 |
| Investments in securities of affiliated issuers, at value | 666,110,111 | | 1,408,918,094 |
| Total investments, at value(1) | 666,309,048 | | 1,409,514,905 |
| Cash | — | | — |
| Deposits with broker for futures contracts | — | | — |
| Receivables: | | | |
| Dividends | 11,005 | | 30,071 |
| From advisor | — | | — |
| Investment securities sold | 1,400,000 | | — |
| Fund shares sold | 140,093 | | 426,320 |
| Variation margin on futures contracts | 8,415 | | 29,799 |
| Prepaid expenses and other assets | 8,211 | | 14,299 |
| Total Assets | 667,876,772 | | 1,410,015,394 |
| Liabilities | | | |
| Cash Overdraft | — | | 116 |
| Payables: | | | |
| Investment securities purchased | — | | — |
| Fund shares redeemed | 136,305 | | 140,302 |
| Accrued expenses: | | | |
| Investment advisory fees | 7,368 | | 55,465 |
| Shareholder servicing fees | 110,311 | | 219,348 |
| Trustee fees | 439 | | 132 |
| Other expenses | 26,620 | | 51,821 |
| Total Liabilities | 281,043 | | 467,184 |
| Net Assets | $667,595,729 | | $1,409,548,210 |
| Net Assets Consist of: | | | |
| Paid-in-capital | $632,853,604 | | $1,319,221,066 |
| Distributable earnings (loss) | 34,742,125 | | 90,327,144 |
| Net Assets | $667,595,729 | | $1,409,548,210 |
| Net Asset Value: | | | |
| $0.001 par value, unlimited shares authorized | | | |
| Net assets applicable to the Institutional Class | $142,900,125 | | $361,407,999 |
| Institutional shares outstanding | 13,744,977 | | 34,696,960 |
| Net asset value, offering and redemption price per Institutional share | $10.40 | | $10.42 |
| Net assets applicable to the Investor Class | $524,695,604 | | $1,048,140,211 |
| Investor shares outstanding | 50,471,948 | | 100,537,529 |
| Net asset value, offering and redemption price per Investor share | $10.40 | | $10.43 |
| | | |
| (1)Investments in securities of unaffiliated issuers, at cost | $198,923 | | $596,770 |
| Investments in securities of affiliated issuers, at cost | 636,724,372 | | 1,328,222,462 |
| Total investments, at cost | $636,923,295 | | $1,328,819,232 |
See Notes to Financial Statements.
MyDestination
2035 Fund | | MyDestination
2045 Fund | | MyDestination
2055 Fund |
| | | | | |
| $746,013 | | $646,545 | | $199,892 |
| 931,581,998 | | 703,749,937 | | 221,309,417 |
| 932,328,011 | | 704,396,482 | | 221,509,309 |
| 2,547 | | 4,055 | | 758 |
| — | | 36,000 | | — |
| | | | | |
| 27,343 | | 20,362 | | 6,126 |
| — | | — | | 7,188 |
| — | | 711,356 | | 86,748 |
| 364,947 | | 456,188 | | 240,766 |
| 45,301 | | 39,418 | | 12,652 |
| 9,222 | | 6,909 | | 3,387 |
| 932,777,371 | | 705,670,770 | | 221,866,934 |
| | | | | |
| — | | — | | — |
| | | | | |
| 3,700,000 | | 4,211,356 | | 1,186,748 |
| 4,116 | | 180,817 | | 4,365 |
| | | | | |
| 77,818 | | 58,121 | | — |
| 137,684 | | 97,690 | | 29,602 |
| 159 | | 314 | | 238 |
| 35,296 | | 31,942 | | 16,677 |
| 3,955,073 | | 4,580,240 | | 1,237,630 |
| $928,822,298 | | $701,090,530 | | $220,629,304 |
| | | | | |
| $855,300,423 | | $639,026,291 | | $203,835,692 |
| 73,521,875 | | 62,064,239 | | 16,793,612 |
| $928,822,298 | | $701,090,530 | | $220,629,304 |
| | | | | |
| | | | | |
| $266,012,122 | | $230,294,875 | | $77,155,950 |
| 26,024,629 | | 23,327,234 | | 5,602,549 |
| $10.22 | | $9.87 | | $13.77 |
| $662,810,176 | | $470,795,655 | | $143,473,354 |
| 64,824,451 | | 47,699,478 | | 10,429,585 |
| $10.22 | | $9.87 | | $13.76 |
| | | | | |
| $745,962 | | $646,501 | | $199,832 |
| 862,561,954 | | 644,567,039 | | 205,430,807 |
| $863,307,916 | | $645,213,540 | | $205,630,639 |
See Notes to Financial Statements.
| STATEMENTS OF OPERATIONS | For the Year Ended December 31, 2019 |
| | MyDestination
2015 Fund |
| Investment Income | |
| Dividends | $686 |
| Income distributions received from affiliated funds | 15,645,075 |
| Interest | 4,727 |
| Total Investment Income | 15,650,488 |
| Expenses | |
| Investment advisory fees | 643,375 |
| Transfer agent fees: | |
| Institutional shares | 4,282 |
| Investor shares | 21,508 |
| Custodian fees | 25,732 |
| Shareholder servicing fees: | |
| Investor shares | 1,309,283 |
| Accounting and administration fees | 28,377 |
| Professional fees | 71,666 |
| Shareholder reporting fees: | |
| Institutional shares | 862 |
| Investor shares | 9,813 |
| Trustees expenses | 6,624 |
| Line of credit facility fees | 7,452 |
| Other expenses | 37,969 |
| Recoupment of prior expenses reduced by the Advisor | — |
| Total Expenses | 2,166,943 |
| Expenses waived/reimbursed(1) | (442,188) |
| Net Expenses | 1,724,755 |
| Net Investment Income | 13,925,733 |
| Realized and Unrealized Gain (Loss) | |
| Capital gain distributions received from affiliated funds | 6,698,864 |
| Net realized gain on investment securities of affiliated issuers | 6,844,576 |
| Net realized gain on futures transactions | 752,870 |
| Net realized gain | 14,296,310 |
| Change in unrealized appreciation (depreciation) on investment securities of affiliated issuers | 60,977,835 |
| Change in unrealized appreciation (depreciation) on investment securities of unaffiliated issuers | (45) |
| Change in unrealized appreciation (depreciation) on futures | 53,306 |
| Net change in unrealized appreciation (depreciation) | 61,031,096 |
| Net Realized and Unrealized Gain | 75,327,406 |
| Net Increase in Net Assets Resulting from Operations | $89,253,139 |
| |
| (1) | See Note 3c in Notes to Financial Statements. |
See Notes to Financial Statements.
MyDestination
2025 Fund | | MyDestination
2035 Fund | | MyDestination
2045 Fund | | MyDestination
2055 Fund |
| | | | | | | |
| $343 | | $713 | | $101 | | $17 |
| 31,196,886 | | 19,782,939 | | 14,547,994 | | 4,464,671 |
| 8,838 | | 13,006 | | 9,252 | | 1,053 |
| 31,206,067 | | 19,796,658 | | 14,557,347 | | 4,465,741 |
| | | | | | | |
| 1,286,951 | | 811,586 | | 611,727 | | 183,330 |
| | | | | | | |
| 5,097 | | 5,201 | | 5,389 | | 5,165 |
| 31,789 | | 22,001 | | 19,607 | | 15,967 |
| 33,118 | | 30,521 | | 27,105 | | 29,114 |
| | | | | | | |
| 2,475,987 | | 1,497,130 | | 1,053,701 | | 300,584 |
| 56,767 | | 35,800 | | 26,984 | | 8,713 |
| 83,630 | | 74,960 | | 71,264 | | 68,700 |
| | | | | | | |
| 1,272 | | 1,572 | | 1,321 | | 1,224 |
| 15,414 | | 9,335 | | 7,428 | | 4,127 |
| 11,845 | | 7,772 | | 6,351 | | 3,910 |
| 11,243 | | 6,625 | | 5,342 | | 3,147 |
| 57,714 | | 49,751 | | 42,608 | | 32,009 |
| — | | 61,692 | | 92,273 | | — |
| 4,070,827 | | 2,613,946 | | 1,971,100 | | 655,990 |
| (459,693) | | — | | — | | (62,544) |
| 3,611,134 | | 2,613,946 | | 1,971,100 | | 593,446 |
| 27,594,933 | | 17,182,712 | | 12,586,247 | | 3,872,295 |
| | | | | | | |
| 15,040,921 | | 7,992,558 | | 5,373,399 | | 1,631,507 |
| 9,702,691 | | 3,446,277 | | 2,331,860 | | 2,606,026 |
| 2,611,689 | | 2,586,853 | | 2,290,448 | | 799,691 |
| 27,355,301 | | 14,025,688 | | 9,995,707 | | 5,037,224 |
| 155,687,935 | | 127,927,630 | | 107,585,951 | | 30,799,694 |
| (106) | | (155) | | (118) | | 66 |
| 336,249 | | 484,544 | | 451,770 | | 107,109 |
| 156,024,078 | | 128,412,019 | | 108,037,603 | | 30,906,869 |
| 183,379,379 | | 142,437,707 | | 118,033,310 | | 35,944,093 |
| $210,974,312 | | $159,620,419 | | $130,619,557 | | $39,816,388 |
See Notes to Financial Statements.
| STATEMENTS OF CHANGES IN NET ASSETS |
| | MyDestination 2015 Fund | | MyDestination 2025 Fund |
| | For the Year Ended | | For the Year Ended |
| | 12/31/19 | | 12/31/18 | | 12/31/19 | | 12/31/18 |
| | | | | | | | |
| Operations: | | | | | | | |
| Net investment income | $13,925,733 | | $10,846,431 | | $27,594,933 | | $18,066,593 |
| Net realized gain on investment securities and futures transactions | 14,296,310 | | 17,611,538 | | 27,355,301 | | 43,698,728 |
| Net change in unrealized appreciation (depreciation) on investment securities and futures | 61,031,096 | | (50,445,913) | | 156,024,078 | | (120,607,296) |
| Net increase (decrease) in net assets resulting from operations | 89,253,139 | | (21,987,944) | | 210,974,312 | | (58,841,975) |
| Distributions to Shareholders: | | | | | | | |
| Institutional shares | (5,862,578) | | (6,604,455) | | (13,988,165) | | (16,350,338) |
| Investor shares | (20,450,729) | | (30,285,425) | | (38,484,767) | | (55,692,414) |
| Total distributions | (26,313,307) | | (36,889,880) | | (52,472,932) | | (72,042,752) |
| Capital Share Transactions: | | | | | | | |
| Proceeds from shares sold | | | | | | | |
| Institutional shares | 53,645,758 | | 16,426,731 | | 112,767,546 | | 56,134,192 |
| Investor shares | 49,464,244 | | 78,979,838 | | 111,058,235 | | 112,982,675 |
| Reinvestment of dividends and distributions | | | | | | | |
| Institutional shares | 5,862,578 | | 6,604,455 | | 13,988,165 | | 16,350,338 |
| Investor shares | 20,446,948 | | 30,278,786 | | 38,483,178 | | 55,690,937 |
| Total proceeds from shares sold and reinvested | 129,419,528 | | 132,289,810 | | 276,297,124 | | 241,158,142 |
| Value of shares redeemed | | | | | | | |
| Institutional shares | (31,768,802) | | (17,508,898) | | (50,659,250) | | (15,193,743) |
| Investor shares | (93,504,464) | | (85,707,539) | | (112,946,892) | | (57,333,646) |
| Total value of shares redeemed | (125,273,266) | | (103,216,437) | | (163,606,142) | | (72,527,389) |
| Net increase from capital share transactions(1) | 4,146,262 | | 29,073,373 | | 112,690,982 | | 168,630,753 |
| Total increase (decrease) in net assets | 67,086,094 | | (29,804,451) | | 271,192,362 | | 37,746,026 |
| Net Assets: | | | | | | | |
| Beginning of Year | 600,509,635 | | 630,314,086 | | 1,138,355,848 | | 1,100,609,822 |
| End of Year | $667,595,729 | | $600,509,635 | | $1,409,548,210 | | $1,138,355,848 |
| |
| (1) | See Note 6 in Notes to Financial Statements. |
See Notes to Financial Statements.
| MyDestination 2035 Fund | | MyDestination 2045 Fund | | MyDestination 2055 Fund |
| For the Year Ended | | For the Year Ended | | For the Year Ended |
| 12/31/19 | | 12/31/18 | | 12/31/19 | | 12/31/18 | | 12/31/19 | | 12/31/18 |
| | | | | | | | | | | |
| | | | | | | | | | | |
| $17,182,712 | | $9,161,754 | | $12,586,247 | | $6,153,336 | | $3,872,295 | | $1,647,212 |
| 14,025,688 | | 33,087,247 | | 9,995,707 | | 30,163,206 | | 5,037,224 | | 9,328,162 |
| 128,412,019 | | (93,205,222) | | 108,037,603 | | (80,537,920) | | 30,906,869 | | (24,338,304) |
| 159,620,419 | | (50,956,221) | | 130,619,557 | | (44,221,378) | | 39,816,388 | | (13,362,930) |
| | | | | | | | | | | |
| (9,403,983) | | (12,321,756) | | (8,040,317) | | (12,439,781) | | (3,200,893) | | (4,137,262) |
| (21,796,700) | | (35,422,853) | | (15,261,033) | | (26,848,548) | | (5,664,596) | | (7,020,293) |
| (31,200,683) | | (47,744,609) | | (23,301,350) | | (39,288,329) | | (8,865,489) | | (11,157,555) |
| | | | | | | | | | | |
| | | | | | | | | | | |
| 85,294,170 | | 42,767,692 | | 60,147,102 | | 35,535,113 | | 29,732,533 | | 23,647,962 |
| 88,866,340 | | 74,504,056 | | 65,328,746 | | 56,272,089 | | 39,108,697 | | 30,548,502 |
| | | | | | | | | | | |
| 9,403,983 | | 12,321,756 | | 8,040,317 | | 12,439,781 | | 3,200,894 | | 4,137,262 |
| 21,796,029 | | 35,422,853 | | 15,260,906 | | 26,848,548 | | 5,664,445 | | 7,020,226 |
| 205,360,522 | | 165,016,357 | | 148,777,071 | | 131,095,531 | | 77,706,569 | | 65,353,952 |
| | | | | | | | | | | |
| (35,182,892) | | (8,920,967) | | (31,741,269) | | (6,748,975) | | (20,917,032) | | (2,598,836) |
| (58,018,044) | | (20,380,091) | | (40,840,087) | | (12,750,653) | | (15,829,240) | | (5,701,187) |
| (93,200,936) | | (29,301,058) | | (72,581,356) | | (19,499,628) | | (36,746,272) | | (8,300,023) |
| 112,159,586 | | 135,715,299 | | 76,195,715 | | 111,595,903 | | 40,960,297 | | 57,053,929 |
| 240,579,322 | | 37,014,469 | | 183,513,922 | | 28,086,196 | | 71,911,196 | | 32,533,444 |
| | | | | | | | | | | |
| 688,242,976 | | 651,228,507 | | 517,576,608 | | 489,490,412 | | 148,718,108 | | 116,184,664 |
| $928,822,298 | | $688,242,976 | | $701,090,530 | | $517,576,608 | | $220,629,304 | | $148,718,108 |
See Notes to Financial Statements.
| For a Share Outstanding For the Years Ending December 31, unless otherwise indicated | | | | | | Ratios to Average Net Assets | |
| | Net Asset
Value,
Beginning
of Year | Net Investment
Income#(1) | Realized
and
Unrealized
Gain
(Loss) on
Investments | Total Income
From Investment
Operations | Dividends
from Net
Investment
Income | Distributions
from Net
Realized
Capital
Gains | Total
Distributions
Paid | Net Asset
Value,
End of
Year | Total
Return | Net Assets,
End of Year
(000) | Expenses,
Net(2) | Expenses,
Gross(2) | Investment
Income,
Net
(1) | Portfolio
Turnover
Rate |
| MyDestination 2015 Fund |
| Institutional Class |
| 2019 | $9.40 | $0.25 | $1.19 | $1.44 | $(0.28) | $(0.16) | $(0.44) | $10.40 | 15.32% | $142,900 | 0.06% | 0.13% | 2.48% | 7% |
| 2018 | 10.37 | 0.20 | (0.54) | (0.34) | (0.38) | (0.25) | (0.63) | 9.40 | (3.33) | 104,300 | 0.13 | 0.15 | 1.91 | 32 |
| 2017(3) | 9.97 | 0.12 | 0.58 | 0.70 | (0.06) | (0.24) | (0.30) | 10.37 | 6.99 | 108,975 | 0.16 | 0.16 | 1.78 | 17 |
| Investor Class |
| 2019 | $9.40 | $0.21 | $1.21 | $1.42 | $(0.26) | $(0.16) | $(0.42) | $10.40 | 15.09% | $524,696 | 0.31% | 0.38% | 2.09% | 7% |
| 2018 | 10.38 | 0.17 | (0.55) | (0.38) | (0.35) | (0.25) | (0.60) | 9.40 | (3.66) | 496,209 | 0.37 | 0.39 | 1.67 | 32 |
| 2017 | 9.54 | 0.12 | 1.00 | 1.12 | (0.04) | (0.24) | (0.28) | 10.38 | 11.67 | 521,339 | 0.38 | 0.39 | 1.21 | 17 |
| 2016 | 9.19 | 0.16 | 0.48 | 0.64 | (0.11) | (0.18) | (0.29) | 9.54 | 6.99 | 535,401 | 0.35 | 0.40 | 1.65 | 16 |
| 2015 | 10.84 | 0.15 | (0.38) | (0.23) | (0.14) | (1.28) | (1.42) | 9.19 | (2.06) | 479,512 | 0.28 | 0.31 | 1.41 | 108(4) |
| |
| MyDestination 2025 Fund |
| Institutional Class |
| 2019 | $9.15 | $0.25 | $1.44 | $1.69 | $(0.27) | $(0.15) | $(0.42) | $10.42 | 18.45% | $361,408 | 0.09% | 0.12% | 2.43% | 5% |
| 2018 | 10.25 | 0.18 | (0.66) | (0.48) | (0.28) | (0.34) | (0.62) | 9.15 | (4.64) | 250,202 | 0.12 | 0.13 | 1.80 | 37 |
| 2017(3) | 9.79 | 0.13 | 0.75 | 0.88 | (0.12) | (0.30) | (0.42) | 10.25 | 9.08 | 222,031 | 0.14 | 0.14 | 1.82 | 15 |
| Investor Class |
| 2019 | $9.16 | $0.21 | $1.45 | $1.66 | $(0.24) | $(0.15) | $(0.39) | $10.43 | 18.18% | $1,048,140 | 0.34% | 0.37% | 2.06% | 5% |
| 2018 | 10.26 | 0.15 | (0.65) | (0.50) | (0.26) | (0.34) | (0.60) | 9.16 | (4.87) | 888,153 | 0.36 | 0.38 | 1.51 | 37 |
| 2017 | 9.28 | 0.11 | 1.27 | 1.38 | (0.10) | (0.30) | (0.40) | 10.26 | 14.92 | 878,579 | 0.38 | 0.38 | 1.12 | 15 |
| 2016 | 8.88 | 0.16 | 0.55 | 0.71 | (0.09) | (0.22) | (0.31) | 9.28 | 8.01 | 855,171 | 0.35 | 0.39 | 1.70 | 17 |
| 2015 | 10.66 | 0.16 | (0.48) | (0.32) | (0.13) | (1.33) | (1.46) | 8.88 | (2.91) | 707,698 | 0.28 | 0.31 | 1.46 | 110(4) |
| |
| MyDestination 2035 Fund |
| Institutional Class |
| 2019 | $8.65 | $0.24 | $1.70 | $1.94 | $(0.24) | $(0.13) | $(0.37) | $10.22 | 22.47% | $266,012 | 0.13% | 0.13% | 2.41% | 4% |
| 2018 | 9.95 | 0.15 | (0.80) | (0.65) | (0.29) | (0.36) | (0.65) | 8.65 | (6.56) | 173,573 | 0.13 | 0.14 | 1.54 | 50 |
| 2017(3) | 9.29 | 0.13 | 0.93 | 1.06 | (0.07) | (0.33) | (0.40) | 9.95 | 11.51 | 152,421 | 0.15 | 0.15 | 1.99 | 35 |
| Investor Class |
| 2019 | $8.65 | $0.20 | $1.72 | $1.92 | $(0.22) | $(0.13) | $(0.35) | $10.22 | 22.16% | $662,810 | 0.39% | 0.39% | 2.01% | 4% |
| 2018 | 9.96 | 0.12 | (0.80) | (0.68) | (0.27) | (0.36) | (0.63) | 8.65 | (6.89) | 514,670 | 0.38 | 0.39 | 1.25 | 50 |
| 2017 | 8.72 | 0.11 | 1.51 | 1.62 | (0.05) | (0.33) | (0.38) | 9.96 | 18.66 | 498,807 | 0.38 | 0.39 | 1.16 | 35 |
| 2016 | 8.36 | 0.14 | 0.57 | 0.71 | (0.07) | (0.28) | (0.35) | 8.72 | 8.38 | 479,051 | 0.35 | 0.40 | 1.65 | 16 |
| 2015 | 10.49 | 0.15 | (0.62) | (0.47) | (0.12) | (1.54) | (1.66) | 8.36 | (4.30) | 391,279 | 0.28 | 0.32 | 1.41 | 120(4) |
| | | | | | | | | | | | | | | |
| # | Calculated using the average shares outstanding method. |
| (1) | Recognition of net investment income by the Fund is affected by the timing of the declaration of dividends by the underlying investment companies in which the Fund invests. |
| (2) | Does not include expenses of the investment companies in which the Fund invests. The acquired fund fees which are incurred directly by the underlying funds for the MyDestination 2015 Fund, MyDestination 2025 Fund, MyDestination 2035 Fund, MyDestination 2045 Fund and MyDestination 2055 Fund were 0.44%, 0.41%, 0.36%, 0.34% and 0.34%, respectively for 2019, and are deducted from the value of the funds in which each Fund invests and is included in each Fund’s total return. |
| (3) | Inception date was May 1, 2017. All ratios for the period have been annualized. Total return and portfolio turnover for the period have not been annualized. |
| (4) | The portfolio turnover rate for the year ended December 31, 2015 reflects rebalancing of holdings in the Funds and is not representative of a change in investment strategy for the Funds. |
See Notes to Financial Statements.
| For a Share Outstanding For the Years Ending December 31, unless otherwise indicated | | | | | | Ratios to Average Net Assets | |
| | Net Asset
Value,
Beginning
of Year | Net Investment
Income#(1) | Realized
and
Unrealized
Gain
(Loss) on
Investments | Total Income
From Investment
Operations | Dividends
from Net
Investment
Income | Distributions
from Net
Realized
Capital
Gains | Total
Distributions
Paid | Net Asset
Value,
End of
Year | Total
Return | Net Assets,
End of Year
(000) | Expenses,
Net(2) | Expenses,
Gross(2) | Investment
Income,
Net
(1) | Portfolio
Turnover
Rate |
| MyDestination 2045 Fund |
| Institutional Class |
| 2019 | $8.21 | $0.22 | $1.79 | $2.01 | $(0.22) | $(0.13) | $(0.35) | $9.87 | 24.56% | $230,295 | 0.13% | 0.13% | 2.31% | 4% |
| 2018 | 9.60 | 0.13 | (0.84) | (0.71) | (0.26) | (0.42) | (0.68) | 8.21 | (7.50) | 160,533 | 0.14 | 0.15 | 1.36 | 58 |
| 2017(3) | 8.90 | 0.13 | 1.01 | 1.14 | (0.07) | (0.37) | (0.44) | 9.60 | 12.85 | 145,343 | 0.16 | 0.16 | 1.99 | 10 |
| Investor Class |
| 2019 | $8.21 | $0.18 | $1.80 | $1.98 | $(0.19) | $(0.13) | $(0.32) | $9.87 | 24.24% | $470,796 | 0.41% | 0.41% | 1.94% | 4% |
| 2018 | 9.60 | 0.10 | (0.83) | (0.73) | (0.24) | (0.42) | (0.66) | 8.21 | (7.73) | 357,044 | 0.39 | 0.40 | 1.08 | 58 |
| 2017 | 8.29 | 0.10 | 1.63 | 1.73 | (0.05) | (0.37) | (0.42) | 9.60 | 20.90 | 344,147 | 0.38 | 0.40 | 1.06 | 10 |
| 2016 | 7.95 | 0.12 | 0.56 | 0.68 | (0.04) | (0.30) | (0.34) | 8.29 | 8.45 | 354,271 | 0.35 | 0.41 | 1.50 | 16 |
| 2015 | 10.00 | 0.12 | (0.59) | (0.47) | (0.09) | (1.49) | (1.58) | 7.95 | (4.46) | 281,718 | 0.29 | 0.34 | 1.22 | 124(4) |
| |
| MyDestination 2055 Fund |
| Institutional Class |
| 2019 | $11.48 | $0.30 | $2.58 | $2.88 | $(0.30) | $(0.29) | $(0.59) | $13.77 | 25.15% | $77,156 | 0.16% | 0.20% | 2.26% | 10% |
| 2018 | 13.45 | 0.19 | (1.23) | (1.04) | (0.31) | (0.62) | (0.93) | 11.48 | (7.77) | 54,326 | 0.18 | 0.24 | 1.40 | 62 |
| 2017(3) | 12.43 | 0.18 | 1.47 | 1.65 | (0.02) | (0.61) | (0.63) | 13.45 | 13.33 | 38,161 | 0.20 | 0.33 | 2.04 | 9 |
| Investor Class |
| 2019 | $11.47 | $0.27 | $2.58 | $2.85 | $(0.27) | $(0.29) | $(0.56) | $13.76 | 24.92% | $143,473 | 0.41% | 0.44% | 2.03% | 10% |
| 2018 | 13.45 | 0.15 | (1.22) | (1.07) | (0.29) | (0.62) | (0.91) | 11.47 | (8.02) | 94,392 | 0.39 | 0.49 | 1.08 | 62 |
| 2017 | 11.56 | 0.14 | 2.37 | 2.51 | (0.01) | (0.61) | (0.62) | 13.45 | 21.73 | 78,024 | 0.38 | 0.55 | 1.12 | 9 |
| 2016 | 11.05 | 0.18 | 0.80 | 0.98 | (0.13) | (0.34) | (0.47) | 11.56 | 8.81 | 62,973 | 0.35 | 0.65 | 1.62 | 27 |
| 2015 | 12.60 | 0.16 | (0.73) | (0.57) | (0.13) | (0.85) | (0.98) | 11.05 | (4.48) | 38,465 | 0.30 | 0.65 | 1.29 | 124(4) |
| | | | | | | | | | | | | | | |
| # | Calculated using the average shares outstanding method. |
| (1) | Recognition of net investment income by the Fund is affected by the timing of the declaration of dividends by the underlying investment companies in which the Fund invests. |
| (2) | Does not include expenses of the investment companies in which the Fund invests. The acquired fund fees which are incurred directly by the underlying funds for the MyDestination 2015 Fund, MyDestination 2025 Fund, MyDestination 2035 Fund, MyDestination 2045 Fund and MyDestination 2055 Fund were 0.44%, 0.41%, 0.36%, 0.34% and 0.34%, respectively for 2019, and are deducted from the value of the funds in which each Fund invests and is included in each Fund’s total return. |
| (3) | Inception date was May 1, 2017. All ratios for the period have been annualized. Total return and portfolio turnover for the period have not been annualized. |
| (4) | The portfolio turnover rate for the year ended December 31, 2015 reflects rebalancing of holdings in the Funds and is not representative of a change in investment strategy for the Funds. |
See Notes to Financial Statements.
Conservative Allocation Fund(Unaudited)
The Fund, through investments primarily in the Select Funds, combined a greater percentage of exposure to fixed-income securities with a smaller percentage to equity securities, real assets and alternative investments. The Fund had a target asset allocation of 65.00% Fixed Income Select Funds, 20.00% U.S. Equity Select Funds, 9.00% Non-U.S. Equity Select Funds, 1.00% Real Assets Select Fund and 5.00% Alternatives Select Fund as of December 31, 2019.
As a fund of funds, the Fund’s performance was based on the performance of the underlying investments. The Investor Class of the Fund generated a return of 10.73% for the one-year period ended December 31, 2019. All major asset class groupings experienced positive performance contribution, with equity outperforming fixed-income, and U.S. equity exposure outperforming non-U.S. equity exposure. The Fund’s largest fixed-income exposure, the Low-Duration Bond Fund, provided supportive and conservative fixed income exposure as a ballast to its conservative orientation. The Growth Equity Fund contributed positively due to exposure to the strong momentum behind technology and consumer discretionary stocks that drove most of the U.S. equities’ performance for the year. The Fund’s allocation to the International Equity Fund also proved to be a strong driver of Fund performance. The contribution to absolute performance by the Fund’s exposure to real assets was marginally additive, via exposure to the Global Real Estate Securities Fund. The Strategic Alternatives Fund exposure was also marginally accretive to the Fund’s relative performance.
The Investor Class of the Fund underperformed its composite benchmark in 2019 (10.73% versus 11.43%). The performance difference between the Fund and composite benchmark is due to the performance differences of the underlying Select Funds versus their respective benchmarks. For more information on a Select Fund’s performance, please refer to the section of that Select Fund in this Annual Report.
Certain derivatives were utilized to provide market exposure for the cash positions held in the Fund. These derivative positions primarily included stock index futures and fixed-income futures. Overall, derivative exposure had a positive impact on Fund performance for the year.
The Fund attempted to achieve its objective, through investments primarily in the Select Funds, by combining a greater percentage of fixed-income securities with a smaller percentage of equity securities. By investing in the Fund, you will also incur the expenses and risks of the underlying Select Funds. You may directly invest in the Select Funds. The Fund’s value will go up and down in response to changes in the share prices of the investments that it owns. The Fund may be suitable for investors who have a short- to medium-term investment horizon, possess a relatively low tolerance for risk and want some exposure to the growth potential of the equity market tempered by a larger allocation to short-term, fixed-income securities. This Fund is subject to interest rate risk. Meaning, when interest rates rise, the value of the existing bonds decrease and vice versa. Changes in interest rates have a bigger impact on long duration holdings than on short duration holdings. It is possible to lose money by investing in the Fund.
At December 31, 2019, the portfolio holdings of the Fund, as a percentage of net assets, is shown in the following table. Portfolio holdings are subject to risk and may change at any time.
| | % |
| Fixed Income Select Funds | 65.4 |
| U.S. Equity Select Funds | 20.1 |
| Non-U.S. Equity Select Funds | 8.5 |
| Alternative Select Funds | 4.9 |
| Real Assets Select Funds | 1.2 |
| U.S. Treasury Obligation | —** |
| | 100.1 |
| **Rounds to less than 0.1% |
Conservative Allocation Fund(Unaudited)
| Average Annual Total Returns as of 12/31/19 | |
| | | Institutional Class* | | Investor Class* | | Benchmark** | |
| One Year | | 11.01% | | 10.73% | | 11.43% | |
| Five Year | | N/A | | 3.64% | | 4.20% | |
| Ten year | | N/A | | 3.91% | | 4.28% | |
| Since Inception(1) | | 4.88% | | 3.79% | | 4.16% | |
| Inception Date | | 11/23/15 | | 08/27/01 | | | |
| Total Fund Operating Expenses (April 30, 2019 Prospectus)(2) | | 0.69% | | 0.92% | | | |
| (1) | The Since Inception benchmark performance is based on the start date of August 27, 2001, which corresponds with the inception date of the Investor Class, the longest operating class of the Fund. |
| (2) | The Fund’s shareholders indirectly bear the expenses of the Institutional Class shares of the Select Funds in which the Fund invests. Current information regarding the Fund’s Operating Expenses can be found in the Financial Highlights. |
The performance data quoted represents past performance and does not guarantee future results. Current performance may be lower or higher. Performance data current to the most recent month-end may be obtained at GuideStoneFunds.com. The investment return and principal value of an investment will fluctuate so that shares, when redeemed, may be worth more or less than their original cost.
The graph illustrates the results of a hypothetical $10,000 investment in the Investor Class of the Fund for the 10-year period from December 31, 2009 to December 31, 2019, with all dividends and capital gains reinvested, with the Fund's composite benchmark index.
*These returns reflect investment advisory and shareholder servicing fee waivers, if applicable, during the reported time periods.
**The Composite Index shows how the Fund's performance compares with the returns of an index constructed by the Adviser as a composite of various broad-based market indexes to reflect the market sectors in which the Fund invests. The percentage allocations to the broad-based market indexes comprising the Composite Index are intended to correspond to the Fund's investment allocation, as represented by the Fund's investment in Select Funds and other investments. As changes may occur over time to the percentage allocations to the underlying investments due to changes in the Fund's asset allocation targets, the percentage allocations of the Composite Index, as well as the indexes included in the Composite Index, may change. As of December 2019, the Composite Index consisted of the ICE BofAML 1-3 Year U.S. Treasury Index, the ICE BofAML U.S. 3-Month Treasury Bill Index, the Bloomberg Barclays US Aggregate Bond Index, the Russell 3000® Index, the FTSE EPRA/NAREIT Developed Index, and the MSCI ACWI (All Country World Index) ex USA Index, weighted 49.00%, 5.00%, 16.00%, 21.00%, 1.00%, and 8.00%, respectively. The composition of the Composite Index for periods prior to December 31, 2019, may have been different.
Unlike a mutual fund, the performance of an index assumes no taxes, transaction costs, management fees or other expenses.
CONSERVATIVE ALLOCATION FUND
| | | Shares | | Value |
| MUTUAL FUNDS — 100.1% |
GuideStone Money Market Fund, 1.53%
(Institutional Class)Ø∞ | 7,507,672 | | $7,507,672 |
GuideStone Low-Duration Bond Fund
(Institutional Class)∞ | 18,891,635 | | 253,147,904 |
GuideStone Medium-Duration Bond Fund
(Institutional Class)∞ | 4,487,596 | | 67,538,326 |
GuideStone Global Bond Fund
(Institutional Class)∞ | 1,690,207 | | 16,918,976 |
GuideStone Defensive Market Strategies Fund
(Institutional Class)∞ | 2,942,078 | | 39,041,380 |
GuideStone Value Equity Fund
(Institutional Class)∞ | 1,593,932 | | 30,316,592 |
GuideStone Growth Equity Fund
(Institutional Class)∞ | 1,158,493 | | 30,387,261 |
GuideStone Small Cap Equity Fund
(Institutional Class)∞ | 379,632 | | 5,967,819 |
GuideStone International Equity Fund
(Institutional Class)∞ | 2,511,418 | | 34,607,337 |
GuideStone Emerging Markets Equity Fund
(Institutional Class)∞ | 962,772 | | 9,810,642 |
| | | Shares | | Value |
GuideStone Global Real Estate Securities Fund
(Institutional Class)∞ | 621,140 | | $6,341,837 |
GuideStone Strategic Alternatives Fund
(Institutional Class)∞ | 2,561,214 | | 25,945,094 |
Total Mutual Funds
(Cost $520,925,536) | | 527,530,840 |
| | | Par | |
| U.S. TREASURY OBLIGATION — 0.0% |
| U.S. Treasury Bill | | | |
1.52%, 05/07/20Ω‡‡
(Cost $99,462) | $100,000 | 99,468 |
TOTAL INVESTMENTS —100.1%
(Cost $521,024,998) | | 527,630,308 |
Liabilities in Excess of Other
Assets — (0.1)% | | (276,018) |
| NET ASSETS — 100.0% | | $527,354,290 |
Futures Contracts outstanding at December 31, 2019:
| Future Type | | Expiration Date | | Open Long
(Short) Contracts | | Notional
Market Value
of Contracts | | Value and
Unrealized
Appreciation
(Depreciation) |
| 2-Year U.S. Treasury Note | | 03/2020 | | 35 | | $7,542,500 | | $474 |
| MSCI EAFE Index E-Mini | | 03/2020 | | 5 | | 509,125 | | (434) |
| MSCI Emerging Markets E-mini | | 03/2020 | | 3 | | 168,030 | | 4,732 |
| S&P 500® E-Mini | | 03/2020 | | 6 | | 969,330 | | 18,041 |
| Total Futures Contracts outstanding at December 31, 2019 | | | | | | $9,188,985 | | $22,813 |
See Notes to Financial Statements.
VALUATION HIERARCHY
The following is a summary of the inputs used, as of December 31, 2019, in valuing the Fund’s investments carried at fair value:
| | Total
Value | | Level 1
Quoted Prices | | Level 2
Other Significant
Observable Inputs | | Level 3
Significant
Unobservable Inputs |
| Assets: | | | | | | | |
| Investments in Securities: | | | | | | | |
| Mutual Funds | $527,530,840 | | $527,530,840 | | $— | | $— |
| U.S. Treasury Obligation | 99,468 | | — | | 99,468 | | — |
| Total Assets - Investments in Securities | $527,630,308 | | $527,530,840 | | $99,468 | | $ — |
| Other Financial Instruments*** | | | | | | | |
| Futures Contracts | $23,247 | | $23,247 | | $— | | $— |
| Total Assets - Other Financial Instruments | $23,247 | | $23,247 | | $ — | | $ — |
| Liabilities: | | | | | | | |
| Other Financial Instruments*** | | | | | | | |
| Futures Contracts | $(434) | | $(434) | | $— | | $— |
| Total Liabilities - Other Financial Instruments | $(434) | | $(434) | | $ — | | $ — |
| *** | Other financial instruments are derivative instruments, such as futures contracts, which are valued at the unrealized appreciation (depreciation) on the investment. Further details regarding the value of these investments can be found in the preceding "Futures Contracts outstanding" disclosure. |
See Notes to Financial Statements.
Balanced Allocation Fund(Unaudited)
The Fund, through investments primarily in the Select Funds, combined approximately equal percentages to equity securities and fixed-income securities in addition to smaller allocations to real assets and alternative investments. The Fund had a target asset allocation of 44.00% Fixed Income Select Funds, 34.00% U.S. Equity Select Funds, 16.00% Non-U.S. Equity Select Funds, 2.00% Real Assets Select Fund and 4.00% Alternatives Select Fund as of December 31, 2019.
As a fund of funds, the Fund’s performance was based on the performance of the underlying investments. The Investor Class of the Fund generated a return of 17.33% for the one-year period ended December 31, 2019. All major asset class groupings experienced positive performance contribution, with equity outperforming fixed income, and U.S. equity exposure outperforming non-U.S. equity exposure. The Growth Equity Fund contributed positively due to exposure to the strong momentum behind technology and consumer discretionary stocks that drove most of the U.S. equities’ performance for the year. The Fund’s allocation to the International Equity Fund also proved to be a strong driver of Fund performance. The contribution to absolute performance by the Fund’s exposure to real assets was positive, via exposure to the Global Real Estate Securities Fund. The Strategic Alternatives Fund exposure was marginally accretive to the Fund’s relative performance.
The Investor Class of the Fund underperformed its composite benchmark in 2019 (17.33% versus 18.35%). The performance difference between the Fund and composite benchmark is due to the performance differences of the underlying Select Funds versus their respective benchmarks. For more information on a Select Fund’s performance, please refer to the section of that Select Fund in this Annual Report.
Certain derivatives were utilized to provide market exposure for the cash positions held in the Fund. These derivative positions primarily included stock index futures and fixed-income futures. Overall, derivative exposure had a positive impact on Fund performance for the year.
The Fund attempted to achieve its objective, through investments primarily in the Select Funds, by combining approximately equal percentages of fixed-income securities and equity securities. By investing in the Fund, you will also incur the expenses and risks of the underlying Select Funds. You may directly invest in the Select Funds. The Fund’s value will go up and down in response to changes in the share prices of the investments that it owns. This Fund may be suitable for investors who have a medium- to long-term investment horizon, possess a moderate tolerance for risk and seek to participate in the return potential of equities but want to achieve this result more slowly and with less volatility through a balanced allocation of fixed-income and equity investments. This Fund is subject to interest rate risk. Meaning, when interest rates rise, the value of the existing bonds decrease and vice versa. Changes in interest rates have a bigger impact on long duration holdings than on short duration holdings. It is possible to lose money by investing in the Fund.
At December 31, 2019, the portfolio holdings of the Fund, as a percentage of net assets, is shown in the following table. Portfolio holdings are subject to risk and may change at any time.
| | % |
| Fixed Income Select Funds | 44.1 |
| U.S. Equity Select Funds | 34.1 |
| Non-U.S. Equity Select Funds | 15.9 |
| Alternative Select Funds | 3.8 |
| Real Assets Select Funds | 2.0 |
| U.S. Treasury Obligation | 0.1 |
| | 100.0 |
See Notes to Financial Statements.
Balanced Allocation Fund(Unaudited)
| Average Annual Total Returns as of 12/31/19 | |
| | | Institutional Class* | | Investor Class* | | Benchmark** | |
| One Year | | 17.62% | | 17.33% | | 18.35% | |
| Five Year | | N/A | | 5.31% | | 6.07% | |
| Ten year | | N/A | | 6.43% | | 7.12% | |
| Since Inception(1) | | 7.21% | | 5.48% | | 6.05% | |
| Inception Date | | 11/23/15 | | 08/27/01 | | | |
| Total Fund Operating Expenses (April 30, 2019 Prospectus)(2) | | 0.76% | | 1.01% | | | |
| (1) | The Since Inception benchmark performance is based on the start date of August 27, 2001, which corresponds with the inception date of the Investor Class, the longest operating class of the Fund. |
| (2) | The Fund’s shareholders indirectly bear the expenses of the Institutional Class shares of the Select Funds in which the Fund invests. Current information regarding the Fund’s Operating Expenses can be found in the Financial Highlights. |
The performance data quoted represents past performance and does not guarantee future results. Current performance may be lower or higher. Performance data current to the most recent month-end may be obtained at GuideStoneFunds.com. The investment return and principal value of an investment will fluctuate so that shares, when redeemed, may be worth more or less than their original cost.
The graph illustrates the results of a hypothetical $10,000 investment in the Investor Class of the Fund for the 10-year period from December 31, 2009 to December 31, 2019, with all dividends and capital gains reinvested, with the Fund's composite benchmark index.
*These returns reflect investment advisory and shareholder servicing fee waivers, if applicable, during the reported time periods.
**The Composite Index shows how the Fund's performance compares with the returns of an index constructed by the Adviser as a composite of various broad-based market indexes to reflect the market sectors in which the Fund invests. The percentage allocations to the broad-based market indexes comprising the Composite Index are intended to correspond to the Fund's investment allocation, as represented by the Fund's investment in Select Funds and other investments. As changes may occur over time to the percentage allocations to the underlying investments due to changes in the Fund's asset allocation targets, the percentage allocations of the Composite Index, as well as the indexes included in the Composite Index, may change. As of December 2019, the Composite Index consisted of the ICE BofAML 1-3 Year U.S. Treasury Index, the Bloomberg Barclays US Aggregate Bond Index, the Russell 3000® Index, the FTSE EPRA/NAREIT Developed Index, and the MSCI ACWI (All Country World Index) ex USA Index, weighted 4.00%, 43.50%, 34.50%, 2.00%, and 16.00%, respectively. The composition of the Composite Index for periods prior to December 31, 2019, may have been different.
Unlike a mutual fund, the performance of an index assumes no taxes, transaction costs, management fees or other expenses.
See Notes to Financial Statements.
| | | Shares | | Value |
| MUTUAL FUNDS — 99.9% |
GuideStone Money Market Fund, 1.53%
(Institutional Class)Ø∞ | 32,552,864 | | $32,552,864 |
GuideStone Low-Duration Bond Fund
(Institutional Class)∞ | 7,532,647 | | 100,937,463 |
GuideStone Medium-Duration Bond Fund
(Institutional Class)∞ | 24,817,344 | | 373,501,032 |
GuideStone Extended-Duration Bond Fund
(Institutional Class)∞ | 3,714,167 | | 67,709,271 |
GuideStone Global Bond Fund
(Institutional Class)∞ | 13,706,689 | | 137,203,956 |
GuideStone Defensive Market Strategies Fund
(Institutional Class)∞ | 12,533,572 | | 166,320,499 |
GuideStone Value Equity Fund
(Institutional Class)∞ | 9,113,477 | | 173,338,330 |
GuideStone Growth Equity Fund
(Institutional Class)∞ | 6,800,767 | | 178,384,124 |
GuideStone Small Cap Equity Fund
(Institutional Class)∞ | 2,205,230 | | 34,666,221 |
GuideStone International Equity Fund
(Institutional Class)∞ | 14,400,190 | | 198,434,619 |
| | | Shares | | Value |
GuideStone Emerging Markets Equity Fund
(Institutional Class)∞ | 5,627,297 | | $57,342,152 |
GuideStone Global Real Estate Securities Fund
(Institutional Class)∞ | 3,231,076 | | 32,989,282 |
GuideStone Strategic Alternatives Fund
(Institutional Class)∞ | 6,070,126 | | 61,490,380 |
Total Mutual Funds
(Cost $1,602,623,365) | | 1,614,870,193 |
| | | Par | |
| U.S. TREASURY OBLIGATION — 0.1% |
| U.S. Treasury Bill | | | |
1.52%, 05/07/20Ω‡‡
(Cost $994,616) | $1,000,000 | 994,685 |
TOTAL INVESTMENTS —100.0%
(Cost $1,603,617,981) | | 1,615,864,878 |
Liabilities in Excess of Other
Assets — (0.0)% | | (278,051) |
| NET ASSETS — 100.0% | | $1,615,586,827 |
Futures Contracts outstanding at December 31, 2019:
| Future Type | | Expiration Date | | Open Long
(Short) Contracts | | Notional
Market Value
of Contracts | | Value and
Unrealized
Appreciation
(Depreciation) |
| 10-Year U.S. Treasury Note | | 03/2020 | | 22 | | $2,825,281 | | $(24,100) |
| MSCI EAFE Index E-Mini | | 03/2020 | | 47 | | 4,785,775 | | 14,635 |
| MSCI Emerging Markets E-mini | | 03/2020 | | 27 | | 1,512,270 | | 52,110 |
| S&P 500® E-Mini | | 03/2020 | | 60 | | 9,693,300 | | 180,409 |
| U.S. Treasury Long Bond | | 03/2020 | | 21 | | 3,274,031 | | (66,975) |
| 5-Year U.S. Treasury Note | | 03/2020 | | 46 | | 5,456,031 | | (17,306) |
| Total Futures Contracts outstanding at December 31, 2019 | | | | | | $27,546,688 | | $138,773 |
See Notes to Financial Statements.
VALUATION HIERARCHY
The following is a summary of the inputs used, as of December 31, 2019, in valuing the Fund’s investments carried at fair value:
| | Total
Value | | Level 1
Quoted Prices | | Level 2
Other Significant
Observable Inputs | | Level 3
Significant
Unobservable Inputs |
| Assets: | | | | | | | |
| Investments in Securities: | | | | | | | |
| Mutual Funds | $1,614,870,193 | | $1,614,870,193 | | $— | | $— |
| U.S. Treasury Obligation | 994,685 | | — | | 994,685 | | — |
| Total Assets - Investments in Securities | $1,615,864,878 | | $1,614,870,193 | | $994,685 | | $ — |
| Other Financial Instruments*** | | | | | | | |
| Futures Contracts | $247,154 | | $247,154 | | $— | | $— |
| Total Assets - Other Financial Instruments | $247,154 | | $247,154 | | $ — | | $ — |
| Liabilities: | | | | | | | |
| Other Financial Instruments*** | | | | | | | |
| Futures Contracts | $(108,381) | | $(108,381) | | $— | | $— |
| Total Liabilities - Other Financial Instruments | $(108,381) | | $(108,381) | | $ — | | $ — |
| *** | Other financial instruments are derivative instruments, such as futures contracts, which are valued at the unrealized appreciation (depreciation) on the investment. Further details regarding the value of these investments can be found in the preceding "Futures Contracts outstanding" disclosure. |
See Notes to Financial Statements.
Growth Allocation Fund(Unaudited)
The Fund, through investments primarily in the Select Funds, combined a greater percentage of exposure to equity securities with a smaller percentage to fixed-income securities, real assets and alternatives investments. The Fund had a target asset allocation of 20.00% Fixed Income Select Funds, 47.00% U.S. Equity Select Funds, 28.00% Non-U.S. Equity Select Funds, 3.00% Real Assets Select Fund and 2.00% Alternatives Select Fund as of December 31, 2019.
As a fund of funds, the Fund’s performance was based on the performance of the underlying investments. The Investor Class of the Fund generated a return of 22.33% for the one-year period ended December 31, 2019. All major asset class groupings experienced positive performance contribution, with equity outperforming fixed income, and U.S. equity exposure outperforming non-U.S. equity exposure. The Growth Equity Fund contributed positively due to exposure to the strong momentum behind technology and consumer discretionary stocks that drove most of the U.S. equities’ performance for the year. The Fund’s allocation to the International Equity Fund also proved to be a strong driver of Fund performance. The contribution to absolute performance by the Fund’s exposure to real assets was positive, via exposure to the Global Real Estate Securities Fund. The Strategic Alternatives Fund exposure was marginally accretive to the Fund’s relative performance.
The Investor Class of the Fund underperformed its composite benchmark in 2019 (22.33% versus 22.94%). The performance difference between the Fund and composite benchmark is due to the performance differences of the underlying Select Funds versus their respective benchmarks. For more information on a Select Fund’s performance, please refer to the section of that Select Fund in this Annual Report.
Certain derivatives were utilized to provide market exposure for the cash positions held in the Fund. These derivative positions primarily included stock index futures and fixed-income futures. Overall, derivative exposure had a positive impact on Fund performance for the year.
The Fund attempted to achieve its objective, through investments primarily in the Select Funds, by combining a greater percentage of equity securities with a small percentage of fixed-income securities. By investing in the Fund, you will also incur the expenses and risks of the underlying Select Funds. The Fund’s value will go up and down in response to changes in the share prices of the investments that it owns. This Fund may be suitable for investors who have a long-term investment horizon, possess a relatively high tolerance for risk and seek to participate in the return potential of stocks at a slightly lower risk level than an all stock portfolio. Securities of foreign issuers may be negatively impacted by political events, economic conditions or inefficient, illiquid or unregulated markets in foreign countries, and they also may be subject to inadequate regulatory or accounting standards, which may increase investment risk. Small company stocks are subject to greater risk than large company stocks due to more volatility and less liquidity. This Fund is subject to interest rate risk. Meaning, when interest rates rise, the value of the existing bonds decrease and vice versa. Changes in interest rates have a bigger impact on long duration holdings than on short duration holdings. It is possible to lose money by investing in the Fund.
At December 31, 2019, the portfolio holdings of the Fund, as a percentage of net assets, is shown in the following table. Portfolio holdings are subject to risk and may change at any time.
| | % |
| U.S. Equity Select Funds | 46.2 |
| Non-U.S. Equity Select Funds | 27.9 |
| Fixed Income Select Funds | 20.5 |
| Real Assets Select Funds | 3.0 |
| Alternative Select Funds | 2.3 |
| U.S. Treasury Obligation | 0.1 |
| | 100.0 |
See Notes to Financial Statements.
Growth Allocation Fund(Unaudited)
| Average Annual Total Returns as of 12/31/19 | |
| | | Institutional Class* | | Investor Class* | | Benchmark** | |
| One Year | | 22.62% | | 22.33% | | 22.94% | |
| Five Year | | N/A | | 6.68% | | 7.35% | |
| Ten year | | N/A | | 7.94% | | 8.50% | |
| Since Inception(1) | | 8.85% | | 5.88% | | 6.49% | |
| Inception Date | | 11/23/15 | | 08/27/01 | | | |
| Total Fund Operating Expenses (April 30, 2019 Prospectus)(2) | | 0.87% | | 1.12% | | | |
| (1) | The Since Inception benchmark performance is based on the start date of August 27, 2001, which corresponds with the inception date of the Investor Class, the longest operating class of the Fund. |
| (2) | The Fund’s shareholders indirectly bear the expenses of the Institutional Class shares of the Select Funds in which the Fund invests. Current information regarding the Fund’s Operating Expenses can be found in the Financial Highlights. |
The performance data quoted represents past performance and does not guarantee future results. Current performance may be lower or higher. Performance data current to the most recent month-end may be obtained at GuideStoneFunds.com. The investment return and principal value of an investment will fluctuate so that shares, when redeemed, may be worth more or less than their original cost.
The graph illustrates the results of a hypothetical $10,000 investment in the Investor Class of the Fund for the 10-year period from December 31, 2009 to December 31, 2019, with all dividends and capital gains reinvested, with the Fund's composite benchmark index.
*These returns reflect investment advisory and shareholder servicing fee waivers, if applicable, during the reported time periods.
**The Composite Index shows how the Fund's performance compares with the returns of an index constructed by the Adviser as a composite of various broad-based market indexes to reflect the market sectors in which the Fund invests. The percentage allocations to the broad-based market indexes comprising the Composite Index are intended to correspond to the Fund's investment allocation, as represented by the Fund's investment in Select Funds and other investments. As changes may occur over time to the percentage allocations to the underlying investments due to changes in the Fund's asset allocation targets, the percentage allocations of the Composite Index, as well as the indexes included in the Composite Index, may change. As of December 2019, the Composite Index consisted of the ICE BofAML 1-3 Year U.S. Treasury Index, the Bloomberg Barclays US Aggregate Bond Index, the Russell 3000® Index, the FTSE EPRA/NAREIT Developed Index, and the MSCI ACWI (All Country World Index) ex USA Index, weighted 2.50%, 19.50%, 47.00%, 3.00%, and 28.00%, respectively. The composition of the Composite Index for periods prior to December 31, 2019, may have been different.
Unlike a mutual fund, the performance of an index assumes no taxes, transaction costs, management fees or other expenses.
See Notes to Financial Statements.
| | | Shares | | Value |
| MUTUAL FUNDS — 99.9% |
GuideStone Money Market Fund, 1.53%
(Institutional Class)Ø∞ | 24,106,367 | | $24,106,367 |
GuideStone Low-Duration Bond Fund
(Institutional Class)∞ | 2,597,917 | | 34,812,088 |
GuideStone Medium-Duration Bond Fund
(Institutional Class)∞ | 8,440,640 | | 127,031,634 |
GuideStone Extended-Duration Bond Fund
(Institutional Class)∞ | 1,263,126 | | 23,026,790 |
GuideStone Global Bond Fund
(Institutional Class)∞ | 4,625,666 | | 46,302,914 |
GuideStone Defensive Market Strategies Fund
(Institutional Class)∞ | 4,313,665 | | 57,242,332 |
GuideStone Value Equity Fund
(Institutional Class)∞ | 12,397,607 | | 235,802,477 |
GuideStone Growth Equity Fund
(Institutional Class)∞ | 9,048,743 | | 237,348,535 |
GuideStone Small Cap Equity Fund
(Institutional Class)∞ | 2,960,672 | | 46,541,762 |
GuideStone International Equity Fund
(Institutional Class)∞ | 19,648,510 | | 270,756,472 |
| | | Shares | | Value |
GuideStone Emerging Markets Equity Fund
(Institutional Class)∞ | 7,554,354 | | $76,978,868 |
GuideStone Global Real Estate Securities Fund
(Institutional Class)∞ | 3,679,992 | | 37,572,722 |
GuideStone Strategic Alternatives Fund
(Institutional Class)∞ | 2,856,561 | | 28,936,962 |
Total Mutual Funds
(Cost $1,266,826,882) | | 1,246,459,923 |
| | | Par | |
| U.S. TREASURY OBLIGATION — 0.1% |
| U.S. Treasury Bill | | | |
1.52%, 05/07/20Ω‡‡
(Cost $895,155) | $900,000 | 895,216 |
TOTAL INVESTMENTS —100.0%
(Cost $1,267,722,037) | | 1,247,355,139 |
Other Assets in Excess of
Liabilities — 0.0% | | 76,508 |
| NET ASSETS — 100.0% | | $1,247,431,647 |
Futures Contracts outstanding at December 31, 2019:
| Future Type | | Expiration Date | | Open Long
(Short) Contracts | | Notional
Market Value
of Contracts | | Value and
Unrealized
Appreciation
(Depreciation) |
| 10-Year U.S. Treasury Note | | 03/2020 | | 8 | | $1,027,375 | | $(8,799) |
| MSCI EAFE Index E-Mini | | 03/2020 | | 57 | | 5,804,025 | | 17,445 |
| MSCI Emerging Markets E-Mini | | 03/2020 | | 31 | | 1,736,310 | | 56,212 |
| S&P 500® E-Mini | | 03/2020 | | 71 | | 11,470,405 | | 198,612 |
| U.S. Treasury Long Bond | | 03/2020 | | 8 | | 1,247,250 | | (20,981) |
| 5-Year U.S. Treasury Note | | 03/2020 | | 18 | | 2,134,969 | | (6,179) |
| Total Futures Contracts outstanding at December 31, 2019 | | | | | | $23,420,334 | | $236,310 |
See Notes to Financial Statements.
VALUATION HIERARCHY
The following is a summary of the inputs used, as of December 31, 2019, in valuing the Fund’s investments carried at fair value:
| | Total
Value | | Level 1
Quoted Prices | | Level 2
Other Significant
Observable Inputs | | Level 3
Significant
Unobservable Inputs |
| Assets: | | | | | | | |
| Investments in Securities: | | | | | | | |
| Mutual Funds | $1,246,459,923 | | $1,246,459,923 | | $— | | $— |
| U.S. Treasury Obligation | 895,216 | | — | | 895,216 | | — |
| Total Assets - Investments in Securities | $1,247,355,139 | | $1,246,459,923 | | $895,216 | | $ — |
| Other Financial Instruments*** | | | | | | | |
| Futures Contracts | $272,269 | | $272,269 | | $— | | $— |
| Total Assets - Other Financial Instruments | $272,269 | | $272,269 | | $ — | | $ — |
| Liabilities: | | | | | | | |
| Other Financial Instruments*** | | | | | | | |
| Futures Contracts | $(35,959) | | $(35,959) | | $— | | $— |
| Total Liabilities - Other Financial Instruments | $(35,959) | | $(35,959) | | $ — | | $ — |
| *** | Other financial instruments are derivative instruments, such as futures contracts, which are valued at the unrealized appreciation (depreciation) on the investment. Further details regarding the value of these investments can be found in the preceding "Futures Contracts outstanding" disclosure. |
See Notes to Financial Statements.
Aggressive Allocation Fund(Unaudited)
The Fund, through investments primarily in the Select Funds, combined a greater percentage of exposure to U.S. equity securities with a smaller percentage to non-U.S. equity securities. The Fund had a target asset allocation of 60.00% U.S. Equity Select Funds and 40.00% Non-U.S. Equity Select Funds as of December 31, 2019.
As a fund of funds, its performance was based on the performance of the underlying investments. The Investor Class of the Fund generated a return of 26.86% for the one-year period ended December 31, 2019. An allocation to both the U.S. Equity Select Funds and Non-U.S. Equity Select Funds generated positive performance with all of the underlying Equity Select Funds positively contributing to absolute performance. The largest positive contributor was the Growth Equity Fund, due to exposure to the strong momentum behind technology and consumer discretionary stocks that drove most of the U.S. performance for the year. The Fund’s allocated weight to the International Equity Fund also proved to be a positive driver to absolute return.
The Investor Class of the Fund underperformed its composite benchmark in 2019 (26.86% versus 27.17%). The performance difference between the Fund and composite benchmark is due to the performance differences of the underlying Select Funds versus their respective benchmarks. For more information on a Select Fund’s performance, please refer to the section of that Select Fund in this Annual Report.
Certain derivatives were utilized to provide market exposure for the cash positions held in the Fund. These derivative positions primarily included stock index futures. Overall, derivative exposure had a positive impact on Fund performance for the year.
The Fund attempted to achieve its objective, through investments primarily in the Select Funds, by combining a greater percentage of U.S. equity securities with a smaller percentage of non-U.S. equity securities. By investing in the Fund, you will also incur the expenses and risks of the underlying Select Funds. You may directly invest in the Select Funds. The Fund’s value will go up and down in response to changes in the share prices of the investments that it owns. This Fund may be suitable for investors who have a long-term investment horizon, possess a relatively high tolerance for risk and want to diversify by adding an aggressive investment option that combines U.S. and non-U.S. stocks. Securities of foreign issuers may be negatively impacted by political events, economic conditions or inefficient, illiquid or unregulated markets in foreign countries, and they also may be subject to inadequate regulatory or accounting standards, which may increase investment risk. Small company stocks are subject to greater risk than large company stocks due to more volatility and less liquidity. It is possible to lose money by investing in the Fund.
At December 31, 2019, the portfolio holdings of the Fund, as a percentage of net assets, is shown in the following table. Portfolio holdings are subject to risk and may change at any time.
| | % |
| U.S. Equity Select Funds | 59.1 |
| Non-U.S. Equity Select Funds | 39.1 |
| Fixed Income Select Funds | 1.8 |
| U.S. Treasury Obligation | 0.1 |
| | 100.1 |
See Notes to Financial Statements.
Aggressive Allocation Fund(Unaudited)
| Average Annual Total Returns as of 12/31/19 | |
| | | Institutional Class* | | Investor Class* | | Benchmark** | |
| One Year | | 27.25% | | 26.86% | | 27.17% | |
| Five Year | | N/A | | 8.23% | | 8.98% | |
| Ten year | | N/A | | 9.61% | | 10.21% | |
| Since Inception(1) | | 10.25% | | 6.25% | | 7.01% | |
| Inception Date | | 11/23/15 | | 08/27/01 | | | |
| Total Fund Operating Expenses (April 30, 2019 Prospectus)(2) | | 0.97% | | 1.21% | | | |
| (1) | The Since Inception benchmark performance is based on the start date of August 27, 2001, which corresponds with the inception date of the Investor Class, the longest operating class of the Fund. |
| (2) | The Fund’s shareholders indirectly bear the expenses of the Institutional Class shares of the Select Funds in which the Fund invests. Current information regarding the Fund’s Operating Expenses can be found in the Financial Highlights. |
The performance data quoted represents past performance and does not guarantee future results. Current performance may be lower or higher. Performance data current to the most recent month-end may be obtained at GuideStoneFunds.com. The investment return and principal value of an investment will fluctuate so that shares, when redeemed, may be worth more or less than their original cost.
The graph illustrates the results of a hypothetical $10,000 investment in the Investor Class of the Fund for the 10-year period from December 31, 2009 to December 31, 2019, with all dividends and capital gains reinvested, with the Fund's composite benchmark index.
*These returns reflect investment advisory and shareholder servicing fee waivers, if applicable, during the reported time periods.
**The Composite Index shows how the Fund's performance compares with the returns of an index constructed by the Adviser as a composite of various broad-based market indexes to reflect the market sectors in which the Fund invests. The percentage allocations to the broad-based market indexes comprising the Composite Index are intended to correspond to the Fund's investment allocation, as represented by the Fund's investment in Select Funds and other investments. As changes may occur over time to the percentage allocations to the underlying investments due to changes in the Fund's asset allocation targets, the percentage allocations of the Composite Index, as well as the indexes included in the Composite Index, may change. As of December 2019, the Composite Index consisted of the Russell 3000® Index and the MSCI ACWI (All Country World Index) ex USA Index, weighted 60.00% and 40.00%, respectively. The composition of the Composite Index for periods prior to December 31, 2019, may have been different.
Unlike a mutual fund, the performance of an index assumes no taxes, transaction costs, management fees or other expenses.
See Notes to Financial Statements.
AGGRESSIVE ALLOCATION FUND
| | | Shares | | Value |
| MUTUAL FUNDS — 100.0% |
GuideStone Money Market Fund, 1.53%
(Institutional Class)Ø∞ | 18,929,563 | | $18,929,563 |
GuideStone Value Equity Fund
(Institutional Class)∞ | 15,124,310 | | 287,664,375 |
GuideStone Growth Equity Fund
(Institutional Class)∞ | 11,169,797 | | 292,983,780 |
GuideStone Small Cap Equity Fund
(Institutional Class)∞ | 3,653,930 | | 57,439,783 |
GuideStone International Equity Fund
(Institutional Class)∞ | 23,824,219 | | 328,297,732 |
GuideStone Emerging Markets Equity Fund
(Institutional Class)∞ | 9,241,598 | | 94,171,880 |
Total Mutual Funds
(Cost $1,116,124,209) | | 1,079,487,113 |
| | | Par | | Value |
| U.S. TREASURY OBLIGATION — 0.1% |
| U.S. Treasury Bill | | | | |
1.52%, 05/07/20Ω‡‡
(Cost $1,094,078) | $1,100,000 | | $1,094,153 |
TOTAL INVESTMENTS —100.1%
(Cost $1,117,218,287) | | | 1,080,581,266 |
Liabilities in Excess of Other
Assets — (0.1)% | | | (607,045) |
| NET ASSETS — 100.0% | | | $1,079,974,221 |
Futures Contracts outstanding at December 31, 2019:
| Future Type | | Expiration Date | | Open Long
(Short) Contracts | | Notional
Market Value
of Contracts | | Value and
Unrealized
Appreciation
(Depreciation) |
| MSCI EAFE Index E-Mini | | 03/2020 | | 60 | | $6,109,500 | | $15,647 |
| MSCI Emerging Markets E-Mini | | 03/2020 | | 31 | | 1,736,310 | | 54,190 |
| S&P 500® E-Mini | | 03/2020 | | 72 | | 11,631,960 | | 206,576 |
| Total Futures Contracts outstanding at December 31, 2019 | | | | | | $19,477,770 | | $276,413 |
See Notes to Financial Statements.
VALUATION HIERARCHY
The following is a summary of the inputs used, as of December 31, 2019, in valuing the Fund’s investments carried at fair value:
| | Total
Value | | Level 1
Quoted Prices | | Level 2
Other Significant
Observable Inputs | | Level 3
Significant
Unobservable Inputs |
| Assets: | | | | | | | |
| Investments in Securities: | | | | | | | |
| Mutual Funds | $1,079,487,113 | | $1,079,487,113 | | $— | | $— |
| U.S. Treasury Obligation | 1,094,153 | | — | | 1,094,153 | | — |
| Total Assets - Investments in Securities | $1,080,581,266 | | $1,079,487,113 | | $1,094,153 | | $ — |
| Other Financial Instruments*** | | | | | | | |
| Futures Contracts | $276,413 | | $276,413 | | $— | | $— |
| Total Assets - Other Financial Instruments | $276,413 | | $276,413 | | $ — | | $ — |
| *** | Other financial instruments are derivative instruments, such as futures contracts, which are valued at the unrealized appreciation (depreciation) on the investment. Further details regarding the value of these investments can be found in the preceding "Futures Contracts outstanding" disclosure. |
See Notes to Financial Statements.
| STATEMENTS OF ASSETS AND LIABILITIES | December 31, 2019 |
| | Conservative
Allocation Fund | | Balanced
Allocation Fund | | Growth
Allocation Fund | | Aggressive
Allocation Fund |
| Assets | | | | | | | |
| Investments in securities of unaffiliated issuers, at value | $99,468 | | $994,685 | | $895,216 | | $1,094,153 |
| Investments in securities of affiliated issuers, at value | 527,530,840 | | 1,614,870,193 | | 1,246,459,923 | | 1,079,487,113 |
| Total investments, at value(1) | 527,630,308 | | 1,615,864,878 | | 1,247,355,139 | | 1,080,581,266 |
| Receivables: | | | | | | | |
| Dividends from affiliated funds | 8,685 | | 40,258 | | 29,398 | | 24,331 |
| Fund shares sold | 40,910 | | 145,037 | | 344,035 | | 85,470 |
| Variation margin on futures contracts | 6,966 | | 40,552 | | 57,163 | | 63,125 |
| Prepaid expenses and other assets | 13,706 | | 22,885 | | 16,636 | | 13,577 |
| Total Assets | 527,700,575 | | 1,616,113,610 | | 1,247,802,371 | | 1,080,767,769 |
| Liabilities | | | | | | | |
| Cash Overdraft | — | | — | | — | | 716 |
| Payables: | | | | | | | |
| Fund shares redeemed | 163,364 | | 30,362 | | 4,953 | | 487,829 |
| Accrued expenses: | | | | | | | |
| Investment advisory fees | 44,451 | | 135,365 | | 103,785 | | 89,469 |
| Shareholder servicing fees | 87,756 | | 259,237 | | 194,368 | | 174,007 |
| Trustee fees | 1,992 | | 1,349 | | 913 | | 684 |
| Other expenses | 48,722 | | 100,470 | | 66,705 | | 40,843 |
| Total Liabilities | 346,285 | | 526,783 | | 370,724 | | 793,548 |
| Net Assets | $527,354,290 | | $1,615,586,827 | | $1,247,431,647 | | $1,079,974,221 |
| Net Assets Consist of: | | | | | | | |
| Paid-in-capital | $516,820,455 | | $1,579,648,842 | | $1,230,826,209 | | $1,068,036,843 |
| Distributable earnings (loss) | 10,533,835 | | 35,937,985 | | 16,605,438 | | 11,937,378 |
| Net Assets | $527,354,290 | | $1,615,586,827 | | $1,247,431,647 | | $1,079,974,221 |
| Net Asset Value: | | | | | | | |
| $0.001 par value, unlimited shares authorized | | | | | | | |
| Net assets applicable to the Institutional Class | $111,611,437 | | $377,831,973 | | $312,346,717 | | $239,577,528 |
| Institutional shares outstanding | 9,688,379 | | 30,991,226 | | 25,367,579 | | 19,969,885 |
| Net asset value, offering and redemption price per Institutional share | $11.52 | | $12.19 | | $12.31 | | $12.00 |
| Net assets applicable to the Investor Class | $415,742,853 | | $1,237,754,854 | | $935,084,930 | | $840,396,693 |
| Investor shares outstanding | 36,093,969 | | 101,546,026 | | 75,989,627 | | 70,322,412 |
| Net asset value, offering and redemption price per Investor share | $11.52 | | $12.19 | | $12.31 | | $11.95 |
| | | | | | | |
| (1)Investments in securities of unaffiliated issuers, at cost | $99,462 | | $994,616 | | $895,155 | | $1,094,078 |
| Investments in securities of affiliated issuers, at cost | 520,925,536 | | 1,602,623,365 | | 1,266,826,882 | | 1,116,124,209 |
| Total investments, at cost | $521,024,998 | | $1,603,617,981 | | $1,267,722,037 | | $1,117,218,287 |
See Notes to Financial Statements.
| STATEMENTS OF OPERATIONS | For the Year Ended December 31, 2019 |
| | Conservative
Allocation Fund | | Balanced
Allocation Fund | | Growth
Allocation Fund | | Aggressive
Allocation Fund |
| Investment Income | | | | | | | |
| Dividends | $48 | | $1,537 | | $2,079 | | $734 |
| Income distributions received from affiliated funds | 11,646,172 | | 34,042,331 | | 22,772,960 | | 15,380,604 |
| Interest | 2,870 | | 23,622 | | 29,611 | | 29,390 |
| Total Investment Income | 11,649,090 | | 34,067,490 | | 22,804,650 | | 15,410,728 |
| Expenses | | | | | | | |
| Investment advisory fees | 514,103 | | 1,557,451 | | 1,191,220 | | 1,015,377 |
| Transfer agent fees: | | | | | | | |
| Institutional shares | 3,634 | | 3,857 | | 3,611 | | 3,552 |
| Investor shares | 32,194 | | 52,643 | | 39,380 | | 32,671 |
| Custodian fees | 18,344 | | 39,664 | | 36,027 | | 29,897 |
| Shareholder servicing fees: | | | | | | | |
| Investor shares | 1,038,626 | | 3,039,878 | | 2,277,781 | | 2,012,745 |
| Accounting and administration fees | 22,675 | | 68,693 | | 52,539 | | 44,783 |
| Professional fees | 72,170 | | 89,754 | | 82,522 | | 79,071 |
| Shareholder reporting fees: | | | | | | | |
| Institutional shares | 226 | | 394 | | 261 | | 172 |
| Investor shares | 14,198 | | 23,522 | | 17,447 | | 14,401 |
| Trustees expenses | 12,925 | | 17,994 | | 13,684 | | 11,449 |
| Line of credit facility fees | 10,899 | | 17,676 | | 12,855 | | 10,114 |
| Other expenses | 22,625 | | 75,322 | | 62,245 | | 51,716 |
| Total Expenses | 1,762,619 | | 4,986,848 | | 3,789,572 | | 3,305,948 |
| Net Investment Income | 9,886,471 | | 29,080,642 | | 19,015,078 | | 12,104,780 |
| Realized and Unrealized Gain (Loss) | | | | | | | |
| Capital gain distributions received from affiliated funds | 9,759,253 | | 53,264,322 | | 57,771,930 | | 64,401,858 |
| Net realized loss on investment securities of affiliated issuers | (1,991,435) | | (11,303,756) | | (12,414,940) | | (9,760,868) |
| Net realized gain on futures transactions | 319,497 | | 3,338,210 | | 2,715,714 | | 2,584,657 |
| Net realized gain | 8,087,315 | | 45,298,776 | | 48,072,704 | | 57,225,647 |
| Change in unrealized appreciation (depreciation) on investment securities of affiliated issuers | 34,219,735 | | 172,350,552 | | 170,170,912 | | 167,970,589 |
| Change in unrealized appreciation (depreciation) on investment securities of unaffiliated issuers | (23) | | (166) | | (189) | | (219) |
| Change in unrealized appreciation (depreciation) on futures | 63,520 | | 395,756 | | 717,200 | | 953,003 |
| Net change in unrealized appreciation (depreciation) | 34,283,232 | | 172,746,142 | | 170,887,923 | | 168,923,373 |
| Net Realized and Unrealized Gain | 42,370,547 | | 218,044,918 | | 218,960,627 | | 226,149,020 |
| Net Increase in Net Assets Resulting from Operations | $52,257,018 | | $247,125,560 | | $237,975,705 | | $238,253,800 |
See Notes to Financial Statements.
| STATEMENTS OF CHANGES IN NET ASSETS |
| | Conservative Allocation Fund | | Balanced Allocation Fund |
| | For the Year Ended | | For the Year Ended |
| | 12/31/19 | | 12/31/18 | | 12/31/19 | | 12/31/18 |
| | | | | | | | |
| Operations: | | | | | | | |
| Net investment income | $9,886,471 | | $9,281,324 | | $29,080,642 | | $27,344,795 |
| Net realized gain on investment securities and futures transactions | 8,087,315 | | 13,521,251 | | 45,298,776 | | 75,823,197 |
| Net change in unrealized appreciation (depreciation) on investment securities and futures | 34,283,232 | | (33,102,035) | | 172,746,142 | | (177,957,127) |
| Net increase (decrease) in net assets resulting from operations | 52,257,018 | | (10,299,460) | | 247,125,560 | | (74,789,135) |
| Distributions to Shareholders: | | | | | | | |
| Institutional shares | (5,095,548) | | (2,972,759) | | (24,389,522) | | (13,477,706) |
| Investor shares | (18,041,539) | | (12,862,446) | | (76,908,025) | | (49,835,500) |
| Total distributions | (23,137,087) | | (15,835,205) | | (101,297,547) | | (63,313,206) |
| Capital Share Transactions: | | | | | | | |
| Proceeds from shares sold | | | | | | | |
| Institutional shares | 26,042,462 | | 16,045,556 | | 73,921,673 | | 15,120,577 |
| Investor shares | 47,469,039 | | 45,071,229 | | 57,180,119 | | 45,373,813 |
| Reinvestment of dividends and distributions | | | | | | | |
| Institutional shares | 5,077,191 | | 2,959,667 | | 24,290,995 | | 13,403,701 |
| Investor shares | 18,032,064 | | 12,839,159 | | 76,871,367 | | 49,814,872 |
| Total proceeds from shares sold and reinvested | 96,620,756 | | 76,915,611 | | 232,264,154 | | 123,712,963 |
| Value of shares redeemed | | | | | | | |
| Institutional shares | (11,877,607) | | (12,430,684) | | (46,362,952) | | (38,100,646) |
| Investor shares | (79,429,062) | | (58,396,787) | | (177,611,078) | | (100,441,597) |
| Total value of shares redeemed | (91,306,669) | | (70,827,471) | | (223,974,030) | | (138,542,243) |
| Net increase (decrease) from capital share transactions(1) | 5,314,087 | | 6,088,140 | | 8,290,124 | | (14,829,280) |
| Total increase (decrease) in net assets | 34,434,018 | | (20,046,525) | | 154,118,137 | | (152,931,621) |
| Net Assets: | | | | | | | |
| Beginning of Year | 492,920,272 | | 512,966,797 | | 1,461,468,690 | | 1,614,400,311 |
| End of Year | $527,354,290 | | $492,920,272 | | $1,615,586,827 | | $1,461,468,690 |
| |
| (1) | See Note 6 in Notes to Financial Statements. |
See Notes to Financial Statements.
| Growth Allocation Fund | | Aggressive Allocation Fund |
| For the Year Ended | | For the Year Ended |
| 12/31/19 | | 12/31/18 | | 12/31/19 | | 12/31/18 |
| | | | | | | |
| | | | | | | |
| $19,015,078 | | $17,243,746 | | $12,104,780 | | $10,350,533 |
| 48,072,704 | | 98,545,323 | | 57,225,647 | | 113,880,286 |
| 170,887,923 | | (205,234,045) | | 168,923,373 | | (226,239,328) |
| 237,975,705 | | (89,444,976) | | 238,253,800 | | (102,008,509) |
| | | | | | | |
| (28,008,711) | | (10,661,534) | | (26,653,779) | | (6,776,974) |
| (81,549,805) | | (34,763,236) | | (91,797,764) | | (28,239,358) |
| (109,558,516) | | (45,424,770) | | (118,451,543) | | (35,016,332) |
| | | | | | | |
| | | | | | | |
| 41,999,339 | | 7,299,692 | | 45,256,536 | | 5,814,021 |
| 39,313,198 | | 33,074,873 | | 30,691,082 | | 26,325,550 |
| | | | | | | |
| 27,969,231 | | 10,644,712 | | 26,641,062 | | 6,774,126 |
| 81,515,470 | | 34,754,218 | | 91,783,316 | | 28,234,382 |
| 190,797,238 | | 85,773,495 | | 194,371,996 | | 67,148,079 |
| | | | | | | |
| (30,570,472) | | (22,129,719) | | (21,076,702) | | (16,481,653) |
| (138,835,487) | | (83,535,607) | | (122,548,098) | | (64,716,255) |
| (169,405,959) | | (105,665,326) | | (143,624,800) | | (81,197,908) |
| 21,391,279 | | (19,891,831) | | 50,747,196 | | (14,049,829) |
| 149,808,468 | | (154,761,577) | | 170,549,453 | | (151,074,670) |
| | | | | | | |
| 1,097,623,179 | | 1,252,384,756 | | 909,424,768 | | 1,060,499,438 |
| $1,247,431,647 | | $1,097,623,179 | | $1,079,974,221 | | $909,424,768 |
See Notes to Financial Statements.
| For a Share Outstanding For the Years Ending December 31, unless otherwise indicated | | | | | | Ratios to Average Net Assets | |
| | Net Asset
Value,
Beginning
of Year | Net Investment
Income#(1) | Realized
and
Unrealized
Gain
(Loss) on
Investments | Total Income
From Investment
Operations | Dividends
from Net
Investment
Income | Distributions
from Net
Realized
Capital
Gains | Total
Distributions
Paid | Net Asset
Value,
End of
Year | Total
Return | Net Assets,
End of Year
(000) | Expenses,
Net(2) | Expenses,
Gross(2) | Investment
Income,
Net
(1) | Portfolio
Turnover
Rate |
| Conservative Allocation Fund |
| Institutional Class |
| 2019 | $10.87 | $0.25 | $0.95 | $1.20 | $(0.27) | $(0.28) | $(0.55) | $11.52 | 11.01% | $111,611 | 0.13% | 0.13% | 2.19% | 7% |
| 2018 | 11.47 | 0.23 | (0.45) | (0.22) | (0.37) | (0.01) | (0.38) | 10.87 | (1.90) | 87,409 | 0.17 | 0.17 | 2.01 | 12 |
| 2017 | 10.88 | 0.16 | 0.64 | 0.80 | (0.05) | (0.16) | (0.21) | 11.47 | 7.33 | 85,482 | 0.19 | 0.19 | 1.40 | 19 |
| 2016 | 10.62 | 0.18 | 0.35 | 0.53 | (0.13) | (0.14) | (0.27) | 10.88 | 5.07 | 75,333 | 0.14 | 0.15 | 1.61 | 5 |
| 2015(3) | 11.51 | 0.05 | (0.17) | (0.12) | (0.12) | (0.65) | (0.77) | 10.62 | (0.99) | 70,895 | 0.18 | 0.20 | 4.36 | 92(4) |
| Investor Class |
| 2019 | $10.87 | $0.21 | $0.96 | $1.17 | $(0.24) | $(0.28) | $(0.52) | $11.52 | 10.73% | $415,743 | 0.39% | 0.39% | 1.86% | 7% |
| 2018 | 11.47 | 0.20 | (0.44) | (0.24) | (0.35) | (0.01) | (0.36) | 10.87 | (2.13) | 405,512 | 0.40 | 0.40 | 1.76 | 12 |
| 2017 | 10.88 | 0.13 | 0.64 | 0.77 | (0.02) | (0.16) | (0.18) | 11.47 | 7.11 | 427,485 | 0.42 | 0.42 | 1.19 | 19 |
| 2016 | 10.62 | 0.15 | 0.36 | 0.51 | (0.11) | (0.14) | (0.25) | 10.88 | 4.82 | 306,300 | 0.39 | 0.42 | 1.36 | 5 |
| 2015 | 11.59 | 0.14 | (0.34) | (0.20) | (0.12) | (0.65) | (0.77) | 10.62 | (1.69) | 294,997 | 0.27 | 0.33 | 1.22 | 92(4) |
| |
| Balanced Allocation Fund |
| Institutional Class |
| 2019 | $11.07 | $0.26 | $1.69 | $1.95 | $(0.29) | $(0.54) | $(0.83) | $12.19 | 17.62% | $377,832 | 0.12% | 0.12% | 2.12% | 9% |
| 2018 | 12.16 | 0.23 | (0.80) | (0.57) | (0.49) | (0.03) | (0.52) | 11.07 | (4.63) | 296,530 | 0.13 | 0.13 | 1.93 | 13 |
| 2017 | 11.09 | 0.19 | 1.20 | 1.39 | (0.16) | (0.16) | (0.32) | 12.16 | 12.57 | 334,114 | 0.12 | 0.13 | 1.57 | 19 |
| 2016 | 10.70 | 0.22 | 0.56 | 0.78 | (0.08) | (0.31) | (0.39) | 11.09 | 7.27 | 326,164 | 0.11 | 0.13 | 1.97 | 4 |
| 2015(3) | 12.67 | 0.09 | (0.32) | (0.23) | (0.16) | (1.58) | (1.74) | 10.70 | (1.73) | 332,327 | 0.12 | 0.14 | 7.28 | 95(4) |
| Investor Class |
| 2019 | $11.07 | $0.22 | $1.70 | $1.92 | $(0.26) | $(0.54) | $(0.80) | $12.19 | 17.33% | $1,237,755 | 0.38% | 0.38% | 1.79% | 9% |
| 2018 | 12.16 | 0.20 | (0.80) | (0.60) | (0.46) | (0.03) | (0.49) | 11.07 | (4.89) | 1,164,939 | 0.38 | 0.38 | 1.68 | 13 |
| 2017 | 11.09 | 0.16 | 1.20 | 1.36 | (0.13) | (0.16) | (0.29) | 12.16 | 12.30 | 1,280,286 | 0.37 | 0.38 | 1.34 | 19 |
| 2016 | 10.70 | 0.19 | 0.56 | 0.75 | (0.05) | (0.31) | (0.36) | 11.09 | 7.00 | 1,156,865 | 0.37 | 0.38 | 1.71 | 4 |
| 2015 | 12.89 | 0.20 | (0.65) | (0.45) | (0.16) | (1.58) | (1.74) | 10.70 | (3.43) | 1,191,878 | 0.28 | 0.30 | 1.56 | 95(4) |
| | | | | | | | | | | | | | | |
| # | Calculated using the average shares outstanding method. |
| (1) | Recognition of net investment income by the Fund is affected by the timing of the declaration of dividends by the underlying investment companies in which the Fund invests. |
| (2) | Does not include expenses of the investment companies in which the Fund invests. The estimated acquired fund fees which are incurred directly by the underlying funds for the Conservative Allocation Fund, Balanced Allocation Fund, Growth Allocation Fund and Aggressive Allocation Fund were 0.52%, 0.63%, 0.74% and 0.83%, respectively for 2019, and are deducted from the value of the funds in which each Fund invests and is included in each Fund’s total return. |
| (3) | Inception date was November 23, 2015. All ratios for the period have been annualized. Total return and portfolio turnover for the period have not been annualized. |
| (4) | The portfolio turnover rate for the year ended December 31, 2015 reflects rebalancing of holdings in the Funds and is not representative of a change in investment strategy for the Funds. |
See Notes to Financial Statements.
| For a Share Outstanding For the Years Ending December 31, unless otherwise indicated | | | | | | Ratios to Average Net Assets | |
| | Net Asset
Value,
Beginning
of Year | Net Investment
Income#(1) | Realized
and
Unrealized
Gain
(Loss) on
Investments | Total Income
From Investment
Operations | Dividends
from Net
Investment
Income | Distributions
from Net
Realized
Capital
Gains | Total
Distributions
Paid | Net Asset
Value,
End of
Year | Total
Return | Net Assets,
End of Year
(000) | Expenses,
Net(2) | Expenses,
Gross(2) | Investment
Income,
Net
(1) | Portfolio
Turnover
Rate |
| Growth Allocation Fund |
| Institutional Class |
| 2019 | $11.02 | $0.23 | $2.25 | $2.48 | $(0.22) | $(0.97) | $(1.19) | $12.31 | 22.62% | $312,347 | 0.12% | 0.12% | 1.86% | 10% |
| 2018 | 12.43 | 0.20 | (1.11) | (0.91) | (0.46) | (0.04) | (0.50) | 11.02 | (7.32) | 244,900 | 0.13 | 0.13 | 1.60 | 9 |
| 2017 | 10.97 | 0.17 | 1.90 | 2.07 | (0.11) | (0.50) | (0.61) | 12.43 | 18.94 | 279,148 | 0.13 | 0.13 | 1.38 | 17 |
| 2016 | 10.83 | 0.19 | 0.61 | 0.80 | (0.10) | (0.56) | (0.66) | 10.97 | 7.34 | 244,873 | 0.12 | 0.13 | 1.72 | 4 |
| 2015(3) | 13.23 | 0.11 | (0.44) | (0.33) | (0.14) | (1.93) | (2.07) | 10.83 | (2.36) | 247,746 | 0.14 | 0.14 | 8.37 | 97(4) |
| Investor Class |
| 2019 | $11.02 | $0.19 | $2.26 | $2.45 | $(0.19) | $(0.97) | $(1.16) | $12.31 | 22.33% | $935,085 | 0.38% | 0.38% | 1.51% | 10% |
| 2018 | 12.42 | 0.17 | (1.10) | (0.93) | (0.43) | (0.04) | (0.47) | 11.02 | (7.50) | 852,723 | 0.38 | 0.38 | 1.35 | 9 |
| 2017 | 10.97 | 0.14 | 1.89 | 2.03 | (0.08) | (0.50) | (0.58) | 12.42 | 18.59 | 973,237 | 0.37 | 0.37 | 1.14 | 17 |
| 2016 | 10.83 | 0.16 | 0.61 | 0.77 | (0.07) | (0.56) | (0.63) | 10.97 | 7.08 | 842,779 | 0.38 | 0.39 | 1.46 | 4 |
| 2015 | 13.43 | 0.17 | (0.71) | (0.54) | (0.13) | (1.93) | (2.06) | 10.83 | (3.83) | 867,203 | 0.29 | 0.30 | 1.26 | 97(4) |
| |
| Aggressive Allocation Fund |
| Institutional Class |
| 2019 | $10.61 | $0.18 | $2.69 | $2.87 | $(0.15) | $(1.33) | $(1.48) | $12.00 | 27.25% | $239,577 | 0.12% | 0.12% | 1.48% | 9% |
| 2018 | 12.28 | 0.15 | (1.37) | (1.22) | (0.40) | (0.05) | (0.45) | 10.61 | (9.95) | 167,013 | 0.14 | 0.14 | 1.18 | 9 |
| 2017 | 10.48 | 0.12 | 2.58 | 2.70 | (0.13) | (0.77) | (0.90) | 12.28 | 25.88 | 195,991 | 0.14 | 0.14 | 0.98 | 7 |
| 2016 | 10.77 | 0.14 | 0.57 | 0.71 | — | (1.00) | (1.00) | 10.48 | 6.55 | 166,293 | 0.13 | 0.13 | 1.28 | 2 |
| 2015(3) | 14.13 | 0.12 | (0.57) | (0.45) | (0.09) | (2.82) | (2.91) | 10.77 | (2.85) | 169,302 | 0.15 | 0.15 | 8.75 | 103(4) |
| Investor Class |
| 2019 | $10.58 | $0.14 | $2.68 | $2.82 | $(0.12) | $(1.33) | $(1.45) | $11.95 | 26.86% | $840,397 | 0.38% | 0.38% | 1.12% | 9% |
| 2018 | 12.24 | 0.12 | (1.36) | (1.24) | (0.37) | (0.05) | (0.42) | 10.58 | (10.15) | 742,412 | 0.38 | 0.38 | 0.94 | 9 |
| 2017 | 10.46 | 0.09 | 2.57 | 2.66 | (0.11) | (0.77) | (0.88) | 12.24 | 25.49 | 864,508 | 0.38 | 0.38 | 0.75 | 7 |
| 2016 | 10.77 | 0.10 | 0.59 | 0.69 | — | (1.00) | (1.00) | 10.46 | 6.38 | 708,104 | 0.39 | 0.39 | 0.96 | 2 |
| 2015 | 14.06 | 0.12 | (0.50) | (0.38) | (0.09) | (2.82) | (2.91) | 10.77 | (2.39) | 797,043 | 0.29 | 0.30 | 0.85 | 103(4) |
| | | | | | | | | | | | | | | |
| # | Calculated using the average shares outstanding method. |
| (1) | Recognition of net investment income by the Fund is affected by the timing of the declaration of dividends by the underlying investment companies in which the Fund invests. |
| (2) | Does not include expenses of the investment companies in which the Fund invests. The estimated acquired fund fees which are incurred directly by the underlying funds for the Conservative Allocation Fund, Balanced Allocation Fund, Growth Allocation Fund and Aggressive Allocation Fund were 0.52%, 0.63%, 0.74% and 0.83%, respectively for 2019, and are deducted from the value of the funds in which each Fund invests and is included in each Fund’s total return. |
| (3) | Inception date was November 23, 2015. All ratios for the period have been annualized. Total return and portfolio turnover for the period have not been annualized. |
| (4) | The portfolio turnover rate for the year ended December 31, 2015 reflects rebalancing of holdings in the Funds and is not representative of a change in investment strategy for the Funds. |
See Notes to Financial Statements.
Money Market Fund(Unaudited)
The Federal Open Market Committee ended its post-crisis balance sheet unwind and cut rates three times by 0.25% each (for a total of 0.75%) to a target range of 1.50% to 1.75% by the end of 2019. Short-term rates decreased with the federal funds rate, and investors were able to generate a positive return for the year.
As short-term rates fell throughout 2019, money market funds (which are lenders to borrowers at short-term interest rates) experienced a year of moderate positive returns. At the end of 2019, the three-month U.S. Treasury Bill was yielding 1.53%. The falling rate environment helped money market funds across the industry post positive total returns for the year, but limits performance going forward.
The Fund is a government money market fund and invested no less than 99.5% of its total assets in eligible government money market fund securities. The Fund maintained a stable per share price of $1.00, while declaring dividends daily and paying them monthly based on its daily value. The Investor Class of the Fund returned 1.85% for the one-year period ended December 31, 2019, as compared to a 2.21% return for its benchmark, the ICE BofAML 0-3 Month U.S. T-Bill Index. Income opportunities continue to be scarce and stretching for yield in this environment produced an asymmetrical payoff, providing little upside while increasing the potential for a material negative return event. At year-end, the Fund’s weighted average maturity was 42 days, compared to 32 days at the end of 2018. In the midst of a declining interest rate environment, the management of the Fund remained true and steadfast to its investment objective to maximize current income to the extent consistent with the preservation of capital and liquidity, and the maintenance of a stable per share price of $1.00.
This Fund may be suitable for investors who have a short-term investment horizon, seek to maintain a stable dollar value for their investment and can accept a long-term rate of return that may be lower than other fixed-income and equity investments.
You could lose money by investing in the Fund. Although the Fund seeks to preserve the value of your investment at $1.00 per share, it cannot guarantee it will do so. An investment in the Fund is not insured or guaranteed by the Federal Depository Insurance Corporation or any other governmental agency. The Fund’s sponsor has no legal obligation to provide financial support to the Fund, and you should not expect that the sponsor will provide financial support to the Fund at any time. Yield for the Fund represents the annualization of the Fund’s declared dividends over the period indicated, excluding capital gains distributions.
At December 31, 2019, the portfolio holdings of the Fund, as a percentage of net assets, is shown in the following table. Portfolio holdings are subject to risk and may change at any time.
| | % |
| Agency Obligations | 55.7 |
| Repurchase Agreements | 30.8 |
| U.S. Treasury Obligations | 14.0 |
| Money Market Funds | 0.1 |
| | 100.6 |
Money Market Fund(Unaudited)
| Average Annual Total Returns as of 12/31/19 | |
| | | Institutional Class* | | Investor Class* | | Benchmark** | |
| One Year | | 2.13% | | 1.85% | | 2.21% | |
| Five Year | | 0.99% | | 0.78% | | 1.02% | |
| Ten year | | 0.54% | | 0.40% | | 0.55% | |
| Since Inception | | 1.44% | | 1.31% | | 1.35% | |
| Inception Date | | 08/27/01 | | 08/27/01 | | | |
| Total Fund Operating Expenses (April 30, 2019 Prospectus)(1) | | 0.15% | | 0.40% | | | |
| Yield as of 12/31/19(2) | |
| | | Institutional Class* | | Investor Class* | |
| 7-Day Annualized Yield (Net) | | 1.53% | | 1.29% | |
| 7-Day Annualized Yield (Gross) | | 1.70% | | 1.70% | |
| (1) | Current information regarding the Fund’s Operating Expenses can be found in the Financial Highlights. |
| (2) | Yield for the Money Market Fund represents the annualization of the Fund’s declared dividends over the period indicated, excluding capital gains distributions. The yield more closely reflects the current earnings of the Fund than the total return. Gross Yield reflects the yield without expenses. |
The performance data quoted represents past performance and does not guarantee future results. Current performance may be lower or higher. Performance data current to the most recent month-end may be obtained at GuideStoneFunds.com. The investment return and principal value of an investment will fluctuate so that shares, when redeemed, may be worth more or less than their original cost. The yield for the Money Market Fund represents annualization of the Fund’s declared dividends over the period indicated, excluding capital gains distributions. The 7-day annualized yield more closely reflects the current earnings of the Fund than the total return.
The graph illustrates the results of a hypothetical $10,000 investment in the Investor Class of the Fund for the 10-year period from December 31, 2009 to December 31, 2019, with all dividends and capital gains reinvested, with the ICE BofAML 0-3 Month U.S. T-Bill Index.
*These returns reflect investment advisory and shareholder servicing fee waivers, if applicable, during the reported time periods.
**Unlike a mutual fund, the performance of an index assumes no taxes, transaction costs, management fees or other expenses.
| | | Par | | Value |
| AGENCY OBLIGATIONS — 55.7% |
| Federal Farm Credit Bank Discount Notes | | | | |
| 2.42%, 01/17/20 | $9,610,000 | | $9,599,664 |
| 2.08%, 01/23/20 | 3,140,000 | | 3,136,009 |
| 2.08%, 01/29/20 | 2,200,000 | | 2,196,441 |
| 2.36%, 02/04/20 | 5,880,000 | | 5,866,839 |
| 2.34%, 02/21/20 | 6,055,000 | | 6,034,842 |
| 2.02%, 03/03/20 | 5,420,000 | | 5,401,144 |
| 2.29%, 03/10/20 | 11,540,000 | | 11,489,349 |
| 2.31%, 03/24/20 | 9,480,000 | | 9,429,511 |
| 1.79%, 05/14/20 | 285,000 | | 283,101 |
| 1.78%, 06/12/20 | 400,000 | | 396,776 |
| 1.84%, 06/26/20 | 14,175,000 | | 14,046,763 |
| 1.81%, 06/30/20 | 5,005,000 | | 4,959,453 |
| 1.76%, 07/07/20 | 285,000 | | 282,381 |
| 1.60%, 08/14/20 | 5,505,000 | | 5,449,705 |
| 1.60%, 09/28/20 | 3,020,000 | | 2,983,626 |
| Federal Farm Credit Banks Funding Corporation | | | | |
| (Floating, ICE LIBOR USD 3M - 0.12%), 1.82%, 01/27/20† | 16,100,000 | | 16,100,391 |
| (Floating, ICE LIBOR USD 1M - 0.05%), 1.68%, 02/04/20† | 18,000,000 | | 18,000,000 |
| (Floating, ICE LIBOR USD 1M - 0.05%), 1.66%, 02/07/20† | 13,700,000 | | 13,699,986 |
| (Floating, ICE LIBOR USD 1M - 0.01%), 1.74%, 06/18/20† | 1,685,000 | | 1,684,984 |
| (Floating, ICE LIBOR USD 1M + 0.00%), 1.76%, 06/19/20† | 11,000,000 | | 11,002,386 |
| (Floating, ICE LIBOR USD 1M - 0.05%), 1.69%, 08/17/20† | 4,255,000 | | 4,255,000 |
| (Floating, ICE LIBOR USD 1M - 0.04%), 1.68%, 09/11/20† | 5,475,000 | | 5,474,887 |
| (Floating, ICE LIBOR USD 1M + 0.03%), 1.76%, 12/14/20† | 6,300,000 | | 6,299,755 |
| (Floating, U.S. SOFR + 0.11%), 1.66%, 01/15/21† | 4,515,000 | | 4,515,000 |
| (Floating, ICE LIBOR USD 1M + 0.00%), 1.76%, 03/17/21† | 3,865,000 | | 3,864,703 |
| (Floating, ICE LIBOR USD 1M + 0.05%), 1.78%, 04/16/21† | 7,620,000 | | 7,620,000 |
| (Floating, U.S. Treasury 3M Bill MMY + 0.26%), 1.79%, 06/17/21† | 5,795,000 | | 5,794,163 |
| (Floating, ICE LIBOR USD 1M + 0.16%), 1.94%, 07/01/21† | 4,705,000 | | 4,705,000 |
| (Floating, U.S. Treasury 3M Bill MMY + 0.23%), 1.75%, 07/08/21† | 3,240,000 | | 3,240,000 |
| (Floating, ICE LIBOR USD 1M + 0.10%), 1.84%, 07/16/21† | 5,000,000 | | 5,000,000 |
| (Floating, ICE LIBOR USD 1M + 0.09%), 1.89%, 08/30/21† | 8,000,000 | | 8,000,000 |
| (Floating, ICE LIBOR USD 1M + 0.11%), 1.85%, 11/12/21† | 1,600,000 | | 1,600,000 |
| | | Par | | Value |
| (Floating, U.S. SOFR + 0.19%), 1.74%, 11/18/21† | $2,680,000 | | $2,680,000 |
| Federal Home Loan Bank | | | | |
| (Floating, ICE LIBOR USD 1M - 0.04%), 1.71%, 01/14/20† | 3,175,000 | | 3,175,000 |
| (Floating, U.S. SOFR + 0.01%), 1.56%, 01/17/20† | 6,385,000 | | 6,385,000 |
| (Floating, U.S. SOFR + 0.05%), 1.60%, 01/17/20† | 610,000 | | 610,000 |
| (Floating, U.S. SOFR + 0.05%), 1.60%, 01/17/20† | 5,880,000 | | 5,880,000 |
| (Floating, U.S. SOFR + 0.01%), 1.56%, 01/24/20† | 5,495,000 | | 5,495,000 |
| (Floating, U.S. SOFR + 0.01%), 1.56%, 02/21/20† | 3,325,000 | | 3,325,000 |
| (Floating, ICE LIBOR USD 1M - 0.06%), 1.72%, 02/24/20† | 10,755,000 | | 10,755,000 |
| (Floating, ICE LIBOR USD 1M - 0.04%), 1.75%, 02/25/20† | 5,825,000 | | 5,825,000 |
| (Floating, ICE LIBOR USD 1M - 0.04%), 1.70%, 04/17/20† | 10,825,000 | | 10,824,070 |
| 1.56%, 05/01/20 | 8,325,000 | | 8,323,535 |
| 1.76%, 05/08/20† | 5,885,000 | | 5,885,000 |
| 1.60%, 05/13/20 | 5,400,000 | | 5,399,850 |
| 1.59%, 05/14/20 | 3,780,000 | | 3,779,685 |
| (Floating, U.S. SOFR + 0.02%), 1.57%, 05/22/20† | 3,185,000 | | 3,185,000 |
| (Floating, ICE LIBOR USD 1M - 0.02%), 1.77%, 06/01/20† | 13,000,000 | | 13,000,000 |
| (Floating, U.S. SOFR + 0.04%), 1.59%, 06/19/20† | 2,955,000 | | 2,955,000 |
| (Floating, ICE LIBOR USD 1M + 0.01%), 1.72%, 07/10/20† | 11,860,000 | | 11,860,000 |
| (Floating, U.S. SOFR + 0.08%), 1.63%, 07/24/20† | 1,710,000 | | 1,710,000 |
| (Floating, ICE LIBOR USD 1M - 0.03%), 1.70%, 08/04/20† | 3,570,000 | | 3,570,000 |
| (Floating, U.S. SOFR + 0.03%), 1.58%, 08/21/20† | 1,725,000 | | 1,725,000 |
| (Floating, U.S. SOFR + 0.11%), 1.66%, 10/01/20† | 6,460,000 | | 6,460,000 |
| 2.63%, 10/01/20 | 3,555,000 | | 3,580,636 |
| (Floating, U.S. SOFR + 0.12%), 1.67%, 10/07/20† | 3,600,000 | | 3,600,000 |
| (Floating, ICE LIBOR USD 3M - 0.13%), 1.80%, 12/21/20† | 8,000,000 | | 8,000,000 |
| (Floating, U.S. SOFR + 0.05%), 1.60%, 01/22/21† | 2,225,000 | | 2,225,000 |
| (Floating, U.S. SOFR + 0.04%), 1.59%, 02/09/21† | 2,160,000 | | 2,160,000 |
| (Floating, U.S. SOFR + 0.12%), 1.67%, 03/12/21† | 5,725,000 | | 5,725,000 |
| (Floating, U.S. SOFR + 0.08%), 1.63%, 07/08/21† | 4,720,000 | | 4,720,000 |
| (Floating, U.S. SOFR + 0.08%), 1.63%, 07/23/21† | 3,035,000 | | 3,035,000 |
See Notes to Financial Statements.
| | | Par | | Value |
| (Floating, U.S. SOFR + 0.09%), 1.64%, 09/10/21† | $5,880,000 | | $5,880,000 |
| Federal Home Loan Bank Discount Notes | | | | |
| 1.58%, 01/03/20 | 23,645,000 | | 23,642,891 |
| 1.90%, 01/08/20 | 18,315,000 | | 18,308,212 |
| 1.66%, 01/10/20 | 6,090,000 | | 6,087,442 |
| 1.66%, 01/15/20 | 11,575,000 | | 11,567,438 |
| 1.54%, 01/17/20 | 1,080,000 | | 1,079,247 |
| 1.62%, 01/21/20 | 10,160,000 | | 10,150,659 |
| 1.75%, 01/22/20 | 27,205,000 | | 27,176,934 |
| 1.63%, 01/24/20 | 3,275,000 | | 3,271,552 |
| 1.55%, 01/31/20 | 7,535,000 | | 7,525,173 |
| 1.54%, 02/05/20 | 9,445,000 | | 9,430,834 |
| 1.58%, 02/06/20 | 7,420,000 | | 7,408,276 |
| 1.65%, 02/07/20 | 18,350,000 | | 18,318,569 |
| 1.81%, 02/13/20 | 2,620,000 | | 2,614,289 |
| 1.55%, 02/14/20 | 7,785,000 | | 7,770,071 |
| 1.55%, 02/19/20 | 4,580,000 | | 4,570,219 |
| 1.55%, 02/21/20 | 1,665,000 | | 1,661,294 |
| 1.57%, 03/04/20 | 7,455,000 | | 7,434,309 |
| 1.58%, 03/11/20 | 2,295,000 | | 2,287,927 |
| 1.85%, 03/13/20 | 8,205,000 | | 8,174,543 |
| 1.62%, 03/18/20 | 10,890,000 | | 10,851,834 |
| 1.88%, 03/20/20 | 16,825,000 | | 16,755,218 |
| 1.87%, 03/25/20 | 7,075,000 | | 7,043,997 |
| 1.53%, 04/03/20 | 1,560,000 | | 1,553,653 |
| 1.59%, 04/06/20 | 4,155,000 | | 4,137,383 |
| 1.68%, 04/08/20 | 9,310,000 | | 9,267,296 |
| 1.63%, 04/15/20 | 8,190,000 | | 8,150,872 |
| 1.61%, 04/24/20 | 4,475,000 | | 4,452,072 |
| 1.56%, 05/06/20 | 25,180,000 | | 25,041,724 |
| 1.55%, 05/13/20 | 12,770,000 | | 12,696,261 |
| 1.56%, 05/20/20 | 7,690,000 | | 7,643,078 |
| 1.58%, 06/03/20 | 6,670,000 | | 6,624,804 |
| 1.55%, 06/05/20 | 7,470,000 | | 7,419,535 |
| 1.56%, 06/25/20 | 5,620,000 | | 5,576,863 |
| 1.59%, 06/26/20 | 925,000 | | 917,746 |
| 1.58%, 07/06/20 | 2,080,000 | | 2,062,875 |
| 1.58%, 08/14/20 | 8,565,000 | | 8,479,507 |
| Federal Home Loan Mortgage Corporation Discount Notes | | | | |
| 1.78%, 01/17/20 | 2,360,000 | | 2,358,039 |
| 1.54%, 02/20/20 | 1,675,000 | | 1,671,324 |
| 1.53%, 03/10/20 | 4,165,000 | | 4,152,627 |
| 1.59%, 03/18/20 | 19,870,000 | | 19,800,300 |
| 1.52%, 05/19/20 | 4,675,000 | | 4,647,202 |
| Federal National Mortgage Association | | | | |
| (Floating, U.S. SOFR + 0.01%), 1.56%, 05/22/20† | 3,230,000 | | 3,230,000 |
| | | Par | | Value |
| Federal National Mortgage Association Discount Note | | | | |
| 1.43%, 01/24/20 | $4,870,000 | | $4,865,240 |
Total Agency Obligations
(Cost $722,023,964) | | | 722,023,964 |
| U.S. TREASURY OBLIGATIONS — 14.0% |
| U.S. Treasury Bills | | | | |
| 2.00%, 01/02/20Ω | 3,000,000 | | 2,999,830 |
| 1.58%, 01/23/20Ω | 1,845,000 | | 1,843,162 |
| 1.71%, 02/13/20Ω | 36,125,000 | | 36,049,708 |
| 1.84%, 02/20/20Ω | 800,000 | | 797,944 |
| 1.81%, 02/27/20Ω | 14,185,000 | | 14,143,674 |
| 1.66%, 04/09/20Ω | 9,515,000 | | 9,470,939 |
| 2.35%, 04/23/20Ω | 23,065,000 | | 22,894,140 |
| 1.51%, 05/07/20Ω | 10,005,000 | | 9,950,822 |
| 1.54%, 05/28/20Ω | 8,015,000 | | 7,963,169 |
| 1.73%, 09/10/20Ω | 3,305,000 | | 3,264,585 |
| | | | | 109,377,973 |
| U.S. Treasury Floating Rate Notes | | | | |
| (Floating, U.S. Treasury 3M Bill MMY + 0.04%), 1.57%, 07/31/20† | 13,630,000 | | 13,627,792 |
| (Floating, U.S. Treasury 3M Bill MMY + 0.05%), 1.57%, 10/31/20† | 12,000,000 | | 11,989,593 |
| (Floating, U.S. Treasury 3M Bill MMY + 0.14%), 1.66%, 04/30/21† | 1,240,000 | | 1,238,660 |
| (Floating, U.S. Treasury 3M Bill MMY + 0.22%), 1.75%, 07/31/21† | 12,000,000 | | 12,000,000 |
| (Floating, U.S. Treasury 3M Bill MMY + 0.30%), 1.83%, 10/31/21† | 4,215,000 | | 4,219,590 |
| | | | | 43,075,635 |
| U.S. Treasury Notes | | | | |
| 2.25%, 03/31/20 | 2,785,000 | | 2,786,344 |
| 2.38%, 04/30/20 | 5,860,000 | | 5,869,855 |
| 1.50%, 05/15/20 | 2,740,000 | | 2,734,748 |
| 3.50%, 05/15/20 | 8,840,000 | | 8,894,172 |
| 1.50%, 05/31/20 | 2,725,000 | | 2,721,099 |
| 1.63%, 06/30/20 | 335,000 | | 334,616 |
| 2.63%, 11/15/20 | 3,685,000 | | 3,716,093 |
| 1.63%, 11/30/20 | 1,470,000 | | 1,469,461 |
| 2.00%, 11/30/20 | 870,000 | | 872,661 |
| | | | | 29,399,049 |
Total U.S. Treasury Obligations
(Cost $181,852,657) | | | 181,852,657 |
See Notes to Financial Statements.
SCHEDULE OF INVESTMENTS (Continued)
| | | Shares | | Value |
| MONEY MARKET FUNDS — 0.1% |
Northern Institutional Funds - U.S. Government Select Portfolio (Shares), 1.51%Ø
(Cost $424,016) | 424,016 | | $424,016 |
| | | Par | |
| REPURCHASE AGREEMENTS �� 30.8% |
| Bank of Nova Scotia | | |
| 1.55% (dated 12/31/19, due 01/02/20, repurchase price $48,004,133, collateralized by U.S. Treasury Bills, U.S. Treasury Bonds and U.S. Treasury Notes, 0.000% to 2.875%, due 01/02/20 to 02/15/44, total market value $48,964,239) | $48,000,000 | 48,000,000 |
| BNP Paribas | | |
| 1.56% (dated 12/31/19, due 01/02/20, repurchase price $95,008,233, collateralized by U.S. Treasury Bonds and U.S. Treasury Notes, 0.000% to 2.500%, due 11/15/21 to 08/15/49, total market value $96,900,000) | 95,000,000 | 95,000,000 |
| | | |
| 1.58% (dated 12/31/19, due 01/02/20, repurchase price $10,000,878, collateralized by Government National Mortgage Association, U.S. Treasury Bonds and U.S. Treasury Notes, 1.625% to 4.000%, due 04/15/21 to 07/20/49, total market value $10,200,000) | 10,000,000 | 10,000,000 |
| Citigroup Global Markets, Inc. | | |
| 1.57% (dated 12/31/19, due 01/02/20, repurchase price $10,000,872, collateralized by Federal Home Loan Mortgage Corporation, Federal National Mortgage Association, U.S. Treasury Bills and U.S. Treasury Notes, 0.000% to 6.500%, due 01/30/20 to 03/01/57, total market value $10,299,816) | 10,000,000 | 10,000,000 |
| Goldman Sachs & Co. | | |
| 1.57% (dated 12/31/19, due 01/02/20, repurchase price $20,001,744, collateralized by Government National Mortgage Association, 3.500% to 4.500%, due 12/15/35 to 04/15/54, total market value $20,400,000) | 20,000,000 | 20,000,000 |
| | | Par | | Value |
| | | | |
| 1.58% (dated 12/31/19, due 01/02/20, repurchase price $23,002,019, collateralized by Government National Mortgage Association, 3.500%, due 08/20/49, total market value $23,460,001) | $23,000,000 | | $23,000,000 |
| HSBC Securities USA, Inc. | | | |
| 1.57% (dated 12/31/19, due 01/02/20, repurchase price $5,000,436, collateralized by U.S. Treasury Bills and U.S. Treasury Notes, 0.000% to 1.750%, due 05/21/20 to 07/15/22, total market value $5,100,007) | 5,000,000 | | 5,000,000 |
| Mitsubishi UFJ Securities USA, Inc. | | | |
| 1.57% (dated 12/31/19, due 01/02/20, repurchase price $30,002,617, collateralized by Government National Mortgage Association, 2.000% to 4.400%, due 09/20/29 to 02/15/61, total market value $30,600,000) | 30,000,000 | | 30,000,000 |
| Mizuho Securities USA, Inc. | | | |
| 1.57% (dated 12/31/19, due 01/02/20, repurchase price $42,003,663, collateralized by Federal Home Loan Mortgage Corporation, 3.000%, due 12/01/49, total market value $43,260,000) | 42,000,000 | | 42,000,000 |
| Natixis S.A. | | | |
| 1.55% (dated 12/31/19, due 01/02/20, repurchase price $22,001,894, collateralized by U.S. Treasury Bonds and U.S. Treasury Notes, 0.750% to 6.125%, due 03/31/21 to 04/15/32, total market value $22,440,000) | 22,000,000 | | 22,000,000 |
| | | | |
| 1.57% (dated 12/31/19, due 01/02/20, repurchase price $4,000,349, collateralized by Federal Home Loan Mortgage Corporation, Federal National Mortgage Association, U.S. Treasury Bonds and U.S. Treasury Notes, 0.000% to 4.750%, due 07/15/21 to 09/01/49, total market value $4,081,955) | 4,000,000 | | 4,000,000 |
See Notes to Financial Statements.
| | | Par | | Value |
| TD Securities USA LLC | | | |
| 1.57% (dated 12/31/19, due 01/02/20, repurchase price $90,007,850, collateralized by Federal Home Loan Mortgage Corporation, 3.000%, due 12/01/49, total market value $92,700,000) | $90,000,000 | | $90,000,000 |
Total Repurchase Agreements
(Cost $399,000,000) | | | 399,000,000 |
TOTAL INVESTMENTS —100.6%
(Cost $1,303,300,637) | | | 1,303,300,637 |
Liabilities in Excess of Other
Assets — (0.6)% | | | (7,132,169) |
| NET ASSETS — 100.0% | | | $1,296,168,468 |
VALUATION HIERARCHY
The following is a summary of the inputs used, as of December 31, 2019, in valuing the Fund’s investments carried at fair value:
| | Total
Value | | Level 1
Quoted Prices | | Level 2
Other Significant
Observable Inputs | | Level 3
Significant
Unobservable Inputs |
| Assets: | | | | | | | |
| Investments in Securities: | | | | | | | |
| Agency Obligations | $722,023,964 | | $— | | $722,023,964 | | $— |
| Money Market Funds | 424,016 | | 424,016 | | — | | — |
| Repurchase Agreements | 399,000,000 | | — | | 399,000,000 | | — |
| U.S. Treasury Obligations | 181,852,657 | | — | | 181,852,657 | | — |
| Total Assets - Investments in Securities | $1,303,300,637 | | $424,016 | | $1,302,876,621 | | $ — |
See Notes to Financial Statements.
Low-Duration Bond Fund(Unaudited)
The Fund invested in a diversified portfolio composed primarily of investment grade fixed-income securities with a dollar-weighted effective duration (a calculation that measures the price sensitivity of a bond or bond fund to changes in interest rates taking into account embedded options and floating interest rates) normally between one to three years. The average dollar weighted effective duration at the end of the reporting period was 1.99 years. The Investor Class of the Fund outperformed its all-U.S. Treasury benchmark, the ICE BofAML 1-3 Year U.S. Treasury Index, for the one-year period ended December 31, 2019 (3.71% versus 3.55%). In an effort to outpace its benchmark, the Fund tactically utilized spread sectors (such as high yield and investment grade corporates, mortgage-backed securities, emerging markets U.S. dollar-denominated securities and asset-backed securities) that traded at a yield premium relative to U.S. Treasuries. The strategy of overweighting non-U.S. Treasury sectors, particularly investment grade corporate bonds, was a source of outperformance for the year, partially offset by an underweight to U.S. Treasury duration early in the year.
Other strategies involving derivatives were utilized during the year, resulting in an overall negative impact to performance. U.S. Treasury futures and swap contracts were used for both duration management and yield curve positioning strategies. Over the course of 2019, these positions detracted from relative performance. Options strategies used for duration management were neutral to performance for the year. Credit default swaps were purchased and detracted from the Fund’s relative performance during the year, as spreads narrowed within the corporate bond sector during the period the positions were held. Swaptions were used to adjust relative duration credit exposure and were additive to performance. In an effort to gain exposure to U.S. and non-U.S. interest rates and duration, interest rate swaps were utilized and detracted from performance. Currency forward contracts were used to hedge certain non-U.S. dollar positions and were additive to relative performance.
During the year, the Fund remained true to its overall objective of seeking current income consistent with preservation of capital.
This Fund may be suitable for investors who have a short-term investment horizon, seek an investment return that is relatively stable and want to diversify their portfolio with a fixed-income investment option. This Fund is subject to interest rate risk, meaning, when interest rates rise, the value of the existing fixed-income securities decrease and vice versa. Changes in interest rates have a bigger impact on long duration holdings than on short duration holdings. To the extent that the investment adviser or sub-adviser misjudge current market conditions, the Fund’s volatility may be amplified by its use of derivatives and by its ability to select sub-advisers to allocate assets. Derivatives involve different risks from, and in some respects greater risks than, those associated with investing directly in securities, currencies or other instruments. Derivatives may be illiquid or less liquid, volatile, difficult to price and leverage, so small changes in the value of the underlying instruments may produce disproportionate losses to the Fund. It is possible to lose money by investing in the Fund.
At December 31, 2019, the portfolio holdings of the Fund, as a percentage of net assets, is shown in the following table. Portfolio holdings are subject to risk and may change at any time.
| | % |
| Mortgage-Backed Securities | 26.8 |
| Corporate Bonds | 22.9 |
| U.S. Treasury Obligations | 22.5 |
| Asset-Backed Securities | 15.4 |
| Foreign Bonds | 15.4 |
| Money Market Funds | 7.8 |
| Repurchase Agreements | 1.2 |
| Agency Obligations | 1.1 |
| Municipal Bonds | 0.4 |
| Written Options | —** |
| TBA Sale Commitment | (0.6) |
| | 112.9 |
| **Rounds to less than 0.1% | |
See Notes to Financial Statements.
Low-Duration Bond Fund(Unaudited)
| Average Annual Total Returns as of 12/31/19 | |
| | | Institutional Class* | | Investor Class* | | Benchmark** | |
| One Year | | 3.99% | | 3.71% | | 3.55% | |
| Five Year | | 1.91% | | 1.63% | | 1.39% | |
| Ten year | | 2.11% | | 1.88% | | 1.22% | |
| Since Inception | | 2.90% | | 2.72% | | 2.37% | |
| Inception Date | | 08/27/01 | | 08/27/01 | | | |
| Total Fund Operating Expenses (April 30, 2019 Prospectus)(1) | | 0.35% | | 0.61% | | | |
| (1) | Current information regarding the Fund’s Operating Expenses can be found in the Financial Highlights. |
The performance data quoted represents past performance and does not guarantee future results. Current performance may be lower or higher. Performance data current to the most recent month-end may be obtained at GuideStoneFunds.com. The investment return and principal value of an investment will fluctuate so that shares, when redeemed, may be worth more or less than their original cost.
The graph illustrates the results of a hypothetical $10,000 investment in the Investor Class of the Fund for the 10-year period from December 31, 2009 to December 31, 2019, with all dividends and capital gains reinvested, with the ICE BofAML 1-3 Year U.S. Treasury Index.
*These returns reflect investment advisory and shareholder servicing fee waivers, if applicable, during the reported time periods.
**Unlike a mutual fund, the performance of an index assumes no taxes, transaction costs, management fees or other expenses.
See Notes to Financial Statements.
| | | Par | | Value |
| AGENCY OBLIGATIONS — 1.1% |
| Federal Home Loan Bank Discount Notes | | | | |
| 1.53%, 02/19/20Ω | $2,000,000 | | $1,995,680 |
| 1.53%, 03/16/20Ω | 1,400,000 | | 1,395,389 |
| Federal Home Loan Mortgage Corporation | | | | |
| 2.30%, 07/29/22 | 3,000,000 | | 3,001,188 |
| Federal National Mortgage Association | | | | |
| 2.75%, 06/22/21Δ | 2,980,000 | | 3,030,835 |
| 1.38%, 09/06/22 | 1,875,000 | | 1,863,152 |
Total Agency Obligations
(Cost $11,239,743) | | | 11,286,244 |
| ASSET-BACKED SECURITIES — 15.4% |
| Adams Mill CLO, Ltd., Series 2014-1A, Class A2R | | | |
| (Floating, ICE LIBOR USD 3M + 1.10%), 3.10%, 07/15/26 144A † | 575,240 | | 575,477 |
| Ally Auto Receivables Trust, Series 2018-3, Class A2 | | | |
| 2.72%, 05/17/21 | 79,213 | | 79,226 |
| Ally Auto Receivables Trust, Series 2019-1, Class A3 | | | |
| 2.91%, 09/15/23 | 1,680,000 | | 1,701,295 |
| Ally Auto Receivables Trust, Series 2019-3, Class A3 | | | |
| 1.93%, 05/15/24 | 1,000,000 | | 1,000,179 |
| ALM XII, Ltd., Series 2015-12A, Class A1R2 | | | |
| (Floating, ICE LIBOR USD 3M + 0.89%, 0.89% Floor), 2.89%, 04/16/27 144A † | 364,042 | | 363,958 |
| AmeriCredit Automobile Receivables Trust, Series 2016-2, Class C | | | |
| 2.87%, 11/08/21 | 159,539 | | 159,834 |
| AmeriCredit Automobile Receivables Trust, Series 2017-1, Class A3 | | | |
| 1.87%, 08/18/21 | 7,722 | | 7,721 |
| AmeriCredit Automobile Receivables Trust, Series 2017-2, Class A3 | | | |
| 1.98%, 12/20/21 | 135,134 | | 135,114 |
| Americredit Automobile Receivables Trust, Series 2018-1, Class A3 | | | |
| 3.07%, 12/19/22 | 650,000 | | 654,056 |
| Americredit Automobile Receivables Trust, Series 2019-1, Class A3 | | | |
| 2.97%, 11/20/23 | 410,000 | | 415,019 |
| Americredit Automobile Receivables Trust, Series 2019-2, Class A3 | | | |
| 2.28%, 01/18/24 | 5,000,000 | | 5,024,543 |
| AMMC CLO XIII, Ltd., Series 2013-13A, Class A1LR | | | |
| (Floating, ICE LIBOR USD 3M + 1.26%), 3.20%, 07/24/29 144A † | 2,000,000 | | 2,009,460 |
| | | Par | | Value |
| Anchorage Capital CLO 7, Ltd., Series 2015-7A, Class CR | | | |
| (Floating, ICE LIBOR USD 3M + 1.70%), 3.70%, 10/15/27 144A † | $450,000 | | $449,089 |
| Apidos CLO XXI, Series 2015-21A, Class A1R | | | |
| (Floating, ICE LIBOR USD 3M + 0.93%, 0.93% Floor), 2.93%, 07/18/27 144A † | 3,215,000 | | 3,217,384 |
| Ascentium Equipment Receivables Trust, Series 2018-2A, Class A3 | | | |
| 3.51%, 04/10/24 144A | 1,940,000 | | 1,977,457 |
| Bank of The West Auto Trust, Series 2018-1, Class A2 | | | |
| 3.09%, 04/15/21 144A | 538,841 | | 539,299 |
| Barings CLO, Ltd., Series 2013-IA, Class AR | | | |
| (Floating, ICE LIBOR USD 3M + 0.80%, 0.80% Floor), 2.77%, 01/20/28 144A † | 1,200,000 | | 1,196,460 |
| Bear Stearns Asset Backed Securities I Trust, Series 2007-HE7, Class 1A1 | | | |
| (Floating, ICE LIBOR USD 1M + 1.00%, 1.00% Floor), 2.79%, 10/25/37† | 309,876 | | 311,695 |
| Bear Stearns Asset Backed Securities Trust, Series 2004-SD1, Class A2 | | | |
| (Floating, ICE LIBOR USD 1M + 0.45%, 0.45% Floor, 11.00% Cap), 2.24%, 12/25/42† | 33,723 | | 33,642 |
| Benefit Street Partners CLO II, Ltd., Series 2013-IIA, Class A2R | | | |
| (Floating, ICE LIBOR USD 3M + 1.75%), 3.75%, 07/15/29 144A † | 300,000 | | 299,650 |
| Black Diamond CLO, Ltd., Series 2013-1A, Class A2R | | | |
| (Floating, ICE LIBOR USD 3M + 1.45%), 3.45%, 02/06/26 144A † | 250,000 | | 249,859 |
| BMW Vehicle Lease Trust, Series 2018-1, Class A4 | | | |
| 3.36%, 03/21/22 | 550,000 | | 558,137 |
| BSPRT Issuer, Ltd., Series 2018-FL3, Class A | | | |
| (Floating, ICE LIBOR USD 1M + 1.05%, 1.05% Floor), 2.79%, 03/15/28 144A † | 950,000 | | 951,425 |
| BSPRT Issuer, Ltd., Series 2018-FL4 , Class AS | | | |
| (Floating, ICE LIBOR USD 1M + 1.30%, 1.30% Floor), 3.04%, 09/15/35 144A † | 1,520,000 | | 1,521,788 |
| Capital Auto Receivables Asset Trust, Series 2016-2, Class B | | | |
| 2.11%, 03/22/21 | 30,535 | | 30,532 |
| Capital One Multi-Asset Execution Trust, Series 2019-A1, Class A1 | | | |
| 2.84%, 12/15/24 | 1,150,000 | | 1,173,847 |
See Notes to Financial Statements.
| | | Par | | Value |
| Carmax Auto Owner Trust, Series 2018-4, Class A3 | | | |
| 3.36%, 09/15/23 | $1,560,000 | | $1,591,886 |
| Carmax Auto Owner Trust, Series 2019-2, Class A3 | | | |
| 2.68%, 03/15/24 | 2,140,000 | | 2,169,540 |
| Carmax Auto Owner Trust, Series 2019-3, Class A3 | | | |
| 2.18%, 08/15/24 | 3,010,000 | | 3,018,885 |
| Chesapeake Funding II LLC, Series 2017-4A, Class A1 | | | |
| 2.12%, 11/15/29 144A | 826,523 | | 826,861 |
| Chesapeake Funding II LLC, Series 2018-1A, Class A1 | | | |
| 3.04%, 04/15/30 144A | 606,966 | | 614,591 |
| Chesapeake Funding II LLC, Series 2019-1A, Class B | | | |
| 3.11%, 04/15/31 144A | 240,000 | | 244,875 |
| Chesapeake Funding II LLC, Series 2019-1A, Class C | | | |
| 3.36%, 04/15/31 144A | 230,000 | | 234,908 |
| Chesapeake Funding II LLC, Series 2019-1A, Class D | | | |
| 3.80%, 04/15/31 144A | 370,000 | | 377,778 |
| CIFC Funding, Ltd., Series 2014-4RA, Class A1A | | | |
| (Floating, ICE LIBOR USD 3M + 1.13%, 1.13% Floor), 3.13%, 10/17/30 144A † | 345,000 | | 344,000 |
| CIFC Funding, Ltd., Series 2015-2A, Class AR | | | |
| (Floating, ICE LIBOR USD 3M + 0.78%, 0.78% Floor), 2.78%, 04/15/27 144A † | 875,553 | | 874,557 |
| CLNC, Ltd., Series 2019-FL1, Class A | | | |
| (Floating, ICE LIBOR USD 1M + 1.25%, 1.25% Floor), 2.98%, 08/20/35 144A † | 1,290,000 | | 1,294,515 |
| CNH Equipment Trust, Series 2018-B, Class A3 | | | |
| 3.19%, 11/15/23 | 1,030,000 | | 1,046,196 |
| CNH Equipment Trust, Series 2019-A, Class A3 | | | |
| 3.01%, 04/15/24 | 1,350,000 | | 1,375,422 |
| Credit Acceptance Auto Loan Trust, Series 2017-1A, Class A | | | |
| 2.56%, 10/15/25 144A | 30,016 | | 30,019 |
| Credit Acceptance Auto Loan Trust, Series 2018-1A, Class A | | | |
| 3.01%, 02/16/27 144A | 1,380,000 | | 1,385,388 |
| Credit Acceptance Auto Loan Trust, Series 2018-2A, Class A | | | |
| 3.47%, 05/17/27 144A | 1,800,000 | | 1,823,096 |
| Credit Acceptance Auto Loan Trust, Series 2018-3A, Class A | | | |
| 3.55%, 08/15/27 144A | 800,000 | | 812,901 |
| Credit Acceptance Auto Loan Trust, Series 2019-1A, Class A | | | |
| 3.33%, 02/15/28 144A | 1,160,000 | | 1,181,089 |
| | | Par | | Value |
| Credit Acceptance Auto Loan Trust, Series 2019-3A, Class A | | | |
| 2.38%, 11/15/28 144A | $580,000 | | $579,930 |
| CSAB Mortgage-Backed Trust, Series 2006-2, Class A6A | | | |
| (Step to 6.22% on 02/25/20), 5.72%, 09/25/36 STEP | 308,436 | | 165,523 |
| CWABS, Inc. Asset-Backed Certificates Trust, Series 2004-6, Class 1A1 | | | |
| (Floating, ICE LIBOR USD 1M + 0.54%, 0.27% Floor), 2.33%, 12/25/34† | 941,439 | | 941,373 |
| Dell Equipment Finance Trust, Series 2018-2, Class A3 | | | |
| 3.37%, 10/22/23 144A | 1,130,000 | | 1,145,775 |
| DLL LLC, Series 2018-ST2, Class A3 | | | |
| 3.46%, 01/20/22 144A | 1,700,000 | | 1,716,496 |
| Drive Auto Receivables Trust, Series 2018-4, Class B | | | |
| 3.36%, 10/17/22 | 493,572 | | 494,330 |
| Drive Auto Receivables Trust, Series 2019-2, Class A3 | | | |
| 3.04%, 03/15/23 | 810,000 | | 814,871 |
| Drive Auto Receivables Trust, Series 2019-4, Class A3 | | | |
| 2.16%, 05/15/23 | 340,000 | | 339,866 |
| Drive Auto Receivables Trust, Series 2019-4, Class C | | | |
| 2.51%, 11/17/25 | 1,950,000 | | 1,952,978 |
| Drug Royalty II LP 2, Series 2014-1, Class A1 | | | |
| (Floating, ICE LIBOR USD 3M + 2.85%, 2.85% Floor), 5.15%, 07/15/23 144A † | 9,102 | | 9,107 |
| Dryden XXV Senior Loan Fund, Series 2012-25A, Class ARR | | | |
| (Floating, ICE LIBOR USD 3M + 0.90%), 2.89%, 10/15/27 144A † | 1,680,000 | | 1,678,831 |
| Dryden XXVI Senior Loan Fund, Series 2013-26A, Class AR | | | |
| (Floating, ICE LIBOR USD 3M + 0.90%), 2.90%, 04/15/29 144A † | 1,000,000 | | 997,132 |
| Eaton Vance CLO, Ltd., Series 2013-1A, Class A1RR | | | |
| (Floating, ICE LIBOR USD 3M + 1.16%), 3.16%, 01/15/28 144A † | 305,000 | | 303,616 |
| EDvestinU Private Education Loan Issue No. 1 LLC, Series 2019-A, Class A | | | |
| 3.58%, 11/25/38 144A | 450,109 | | 458,921 |
| Enterprise Fleet Financing LLC, Series 2016-2, Class A3 | | | |
| 2.04%, 02/22/22 144A | 476,694 | | 476,526 |
| Enterprise Fleet Financing LLC, Series 2017-1, Class A2 | | | |
| 2.13%, 07/20/22 144A | 33,779 | | 33,780 |
See Notes to Financial Statements.
SCHEDULE OF INVESTMENTS (Continued)
| | | Par | | Value |
| Enterprise Fleet Financing LLC, Series 2017-1, Class A3 | | | |
| 2.60%, 07/20/22 144A | $250,000 | | $250,558 |
| Enterprise Fleet Financing LLC, Series 2017-3, Class A2 | | | |
| 2.13%, 05/22/23 144A | 389,713 | | 389,630 |
| Enterprise Fleet Financing LLC, Series 2018-2, Class A2 | | | |
| 3.14%, 02/20/24 144A | 2,226,611 | | 2,244,422 |
| Enterprise Fleet Financing LLC, Series 2019-1, Class A2 | | | |
| 2.98%, 10/20/24 144A | 950,000 | | 960,327 |
| Enterprise Fleet Financing LLC, Series 2019-2, Class A3 | | | |
| 2.38%, 02/20/25 144A | 630,000 | | 633,415 |
| FHLMC Structured Pass-Through Certificates, Series T-32 | | | |
| (Floating, ICE LIBOR USD 1M + 0.13%, 0.13% Floor), 1.92%, 08/25/31† | 260,333 | | 259,382 |
| First Investors Auto Owner Trust, Series 2018-2A, Class A2 | | | |
| 3.56%, 06/15/23 144A | 840,000 | | 851,434 |
| Flatiron CLO, Ltd., Series 2015-1A, Class AR | | | |
| (Floating, ICE LIBOR USD 3M + 0.89%), 2.89%, 04/15/27 144A † | 1,525,818 | | 1,524,879 |
| Ford Credit Auto Lease Trust, Series 2019-A, Class A2A | | | |
| 2.84%, 09/15/21 | 2,690,443 | | 2,698,423 |
| Ford Credit Floorplan Master Owner Trust A, Series 2019-2, Class A | | | |
| 3.06%, 04/15/26 | 1,475,000 | | 1,524,927 |
| Ford Credit Floorplan Master Owner Trust, Series 2017-2, Class A1 | | | |
| 2.16%, 09/15/22 | 1,600,000 | | 1,601,916 |
| Ford Credit Floorplan Master Owner Trust, Series 2019-4, Class A | | | |
| 2.44%, 09/15/26 | 1,770,000 | | 1,776,766 |
| GM Financial Automobile Leasing Trust, Series 2018-2, Class A3 | | | |
| 3.06%, 06/21/21 | 706,303 | | 708,611 |
| GM Financial Automobile Leasing Trust, Series 2018-3, Class A4 | | | |
| 3.30%, 07/20/22 | 310,000 | | 314,046 |
| GM Financial Consumer Automobile Receivables Trust, Series 2018-4, Class A3 | | | |
| 3.21%, 10/16/23 | 2,080,000 | | 2,115,868 |
| GM Financial Consumer Automobile Receivables Trust, Series 2019-2, Class A3 | | | |
| 2.65%, 02/16/24 | 3,810,000 | | 3,846,790 |
| GMF Floorplan Owner Revolving Trust, Series 2019-1, Class A | | | |
| 2.70%, 04/15/24 144A | 920,000 | | 926,334 |
| | | Par | | Value |
| Great American Auto Leasing, Inc., Series 2019-1, Class A3 | | | |
| 3.05%, 09/15/22 144A | $1,140,000 | | $1,156,181 |
| Greystone CRE Notes, Ltd., Series 2019-FL2, Class A | | | |
| (Floating, ICE LIBOR USD 1M + 1.18%, 1.18% Floor), 3.44%, 09/15/37 144A † | 1,770,000 | | 1,775,098 |
| Hyundai Auto Lease Securitization Trust, Series 2019-A, Class A2 | | | |
| 2.92%, 07/15/21 144A | 585,354 | | 588,106 |
| Hyundai Auto Receivables Trust, Series 2016-B, Class D | | | |
| 2.68%, 09/15/23 | 680,000 | | 683,629 |
| KKR Clo, Ltd., Series 16, Class A2R | | | |
| (Floating, ICE LIBOR USD 3M + 1.80%, 1.80% Floor), 3.77%, 01/20/29 144A † | 480,000 | | 478,991 |
| KREF, Ltd., Series 2018-FL1, Class A | | | |
| (Floating, ICE LIBOR USD 1M + 1.10%, 1.10% Floor), 2.84%, 06/15/36 144A † | 1,360,000 | | 1,366,884 |
| LA Arena Funding LLC, Series 1, Class A | | | |
| 7.66%, 12/15/26 144A | 72,435 | | 76,511 |
| LCM XX LP, Series 20A, Class AR | | | |
| (Floating, ICE LIBOR USD 3M + 1.04%, 1.04% Floor), 3.01%, 10/20/27 144A † | 1,220,000 | | 1,221,839 |
| Lendmark Funding Trust, Series 2018-1A, Class A | | | |
| 3.81%, 12/21/26 144A | 960,000 | | 973,178 |
| Lendmark Funding Trust, Series 2019-2A, Class A | | | |
| 2.78%, 04/20/28 144A | 350,000 | | 349,129 |
| LoanCore Issuer, Ltd., Series 2018-CRE1, Class A | | | |
| (Floating, ICE LIBOR USD 1M + 1.13%, 1.13% Floor), 2.87%, 05/15/28 144A † | 630,000 | | 630,278 |
| Madison Park Funding XIII, Ltd., Series 2014-13A, Class CR2 | | | |
| (Floating, ICE LIBOR USD 3M + 1.90%), 3.87%, 04/19/30 144A † | 400,000 | | 389,158 |
| Madison Park Funding XIX, Ltd., Series 2015-19A, Class A2R | | | |
| (Floating, ICE LIBOR USD 3M + 1.75%, 1.75% Floor), 3.70%, 01/22/28 144A † | 600,000 | | 598,906 |
| Magnetite VII, Ltd., Series 2012-7A, Class A1R2 | | | |
| (Floating, ICE LIBOR USD 3M + 0.80%), 2.80%, 01/15/28 144A † | 2,890,000 | | 2,870,026 |
See Notes to Financial Statements.
| | | Par | | Value |
| Magnetite VIII, Ltd., Series 2014-8A, Class AR2 | | | |
| (Floating, ICE LIBOR USD 3M + 0.98%, 0.98% Floor), 2.98%, 04/15/31 144A † | $530,000 | | $526,912 |
| Marathon CRE, Ltd., Series 2018-FL1, Class A | | | |
| (Floating, ICE LIBOR USD 1M + 1.15%, 1.15% Floor), 2.89%, 06/15/28† | 290,000 | | 290,347 |
| Mariner Finance Issuance Trust, Series 2019-AA, Class A | | | |
| 2.96%, 07/20/32 144A | 308,000 | | 309,840 |
| Mercedes-Benz Master Owner Trust, Series 2017-BA, Class A | | | |
| (Floating, ICE LIBOR USD 1M + 0.42%), 2.16%, 05/16/22 144A † | 1,750,000 | | 1,751,890 |
| Mercedes-Benz Master Owner Trust, Series 2019-BA, Class A | | | |
| 2.61%, 05/15/24 144A | 1,310,000 | | 1,327,632 |
| Mill City Mortgage Loan Trust, Series 2016-1, Class A1 | | | |
| 2.50%, 04/25/57 144A | 629,614 | | 630,016 |
| MVW Owner Trust, Series 2017-1A, Class A | | | |
| 2.42%, 12/20/34 144A | 437,017 | | 438,210 |
| Navient Private Education Loan Trust, Series 2014-CTA, Class A | | | |
| (Floating, ICE LIBOR USD 1M + 0.70%, 0.70% Floor), 2.44%, 09/16/24 144A † | 10,771 | | 10,771 |
| Navient Private Education Refi Loan Trust, Series 2019-A, Class A1 | | | |
| 3.03%, 01/15/43 144A | 194,804 | | 195,707 |
| Navient Private Education Refi Loan Trust, Series 2019-CA, Class A2 | | | |
| 3.13%, 02/15/68 144A | 410,000 | | 412,583 |
| Navient Private Education Refi Loan Trust, Series 2019-EA, Class A2B | | | |
| (Floating, ICE LIBOR USD 1M + 0.92%, 0.92% Floor), 2.66%, 05/15/68 144A † | 700,000 | | 692,945 |
| Navient Private Education Refi Loan Trust, Series 2019-FA, Class A1 | | | |
| 2.18%, 08/15/68 144A | 741,612 | | 742,133 |
| Navient Student Loan Trust, Series 2016-6A, Class A2 | | | |
| (Floating, ICE LIBOR USD 1M + 0.75%), 2.54%, 03/25/66 144A † | 1,109,164 | | 1,111,024 |
| Navient Student Loan Trust, Series 2017-2A, Class A | | | |
| (Floating, ICE LIBOR USD 1M + 1.05%), 2.84%, 12/27/66 144A † | 943,716 | | 939,181 |
| Navient Student Loan Trust, Series 2017-5A, Class A | | | |
| (Floating, ICE LIBOR USD 1M + 0.80%), 2.59%, 07/26/66 144A † | 1,027,631 | | 1,011,058 |
| | | Par | | Value |
| Navient Student Loan Trust, Series 2018-EA, Class A2 | | | |
| 4.00%, 12/15/59 144A | $143,000 | | $148,235 |
| Navient Student Loan Trust, Series 2019-BA, Class A2A | | | |
| 3.39%, 12/15/59 144A | 390,000 | | 400,915 |
| Nelnet Student Loan Trust, Series 2016-1A, Class A | | | |
| (Floating, ICE LIBOR USD 1M + 0.80%), 2.59%, 09/25/65 144A † | 1,065,550 | | 1,064,820 |
| Neuberger Berman CLO, Ltd., Series 2017-16SA, Class A | | | |
| (Floating, ICE LIBOR USD 3M + 0.85%), 2.85%, 01/15/28 144A † | 1,145,000 | | 1,145,190 |
| Nissan Auto Receivables Owner Trust, Series 2019-A, Class A3 | | | |
| 2.90%, 10/16/23 | 1,820,000 | | 1,848,965 |
| Nissan Master Owner Receivables Trust, Series 2019-A, Class A | | | |
| (Floating, ICE LIBOR USD 1M + 0.56%, 0.56% Floor), 2.30%, 02/15/24† | 1,200,000 | | 1,205,121 |
| NLY Commercial Mortgage Trust, Series 2019-FL2, Class A | | | |
| (Floating, ICE LIBOR USD 1M + 1.30%, 1.30% Floor), 3.04%, 02/15/36 144A † | 256,000 | | 256,398 |
| NP SPE II LLC, Series 2019-2A, Class A1 | | | |
| 2.86%, 11/19/49 144A | 1,624,743 | | 1,623,529 |
| OFSI Fund VI, Ltd., Series 2014-6A, Class BR | | | |
| (Floating, ICE LIBOR USD 3M + 1.50%), 3.50%, 03/20/25 144A † | 295,000 | | 291,353 |
| OneMain Direct Auto Receivables Trust, Series 2018-1A, Class A | | | |
| 3.43%, 12/16/24 144A | 1,150,000 | | 1,165,521 |
| Onemain Financial Issuance Trust, Series 2018-1A, Class A | | | |
| 3.30%, 03/14/29 144A | 220,000 | | 223,369 |
| Palmer Square Loan Funding, Ltd., Series 2017-1A, Class A1 | | | |
| (Floating, ICE LIBOR USD 3M + 0.74%), 2.74%, 10/15/25 144A † | 383,444 | | 383,476 |
| PFS Financing Corp, Series 2019-B, Class A | | | |
| (Floating, ICE LIBOR USD 1M + 0.55%), 2.29%, 09/15/23 144A † | 1,400,000 | | 1,401,141 |
| PFS Financing Corporation, Series 2018-B, Class A | | | |
| 2.89%, 02/15/23 144A | 2,330,000 | | 2,348,546 |
| PFS Financing Corporation, Series 2019-A, Class A1 | | | |
| (Floating, ICE LIBOR USD 1M + 0.55%), 2.29%, 04/15/24 144A † | 390,000 | | 391,108 |
See Notes to Financial Statements.
SCHEDULE OF INVESTMENTS (Continued)
| | | Par | | Value |
| PFS Financing Corporation, Series 2019-A, Class A2 | | | |
| 2.86%, 04/15/24 144A | $1,500,000 | | $1,521,261 |
| Santander Drive Auto Receivables Trust, Series 2016-2, Class C | | | |
| 2.66%, 11/15/21 | 117,961 | | 118,013 |
| Santander Drive Auto Receivables Trust, Series 2018-3, Class A3 | | | |
| 3.03%, 02/15/22 | 2,451 | | 2,452 |
| Santander Drive Auto Receivables Trust, Series 2019-1, Class A2A | | | |
| 2.91%, 01/18/22 | 281,755 | | 281,887 |
| Santander Retail Auto Lease Trust, Series 2019-B, Class A3 | | | |
| 2.30%, 01/20/23 144A | 1,150,000 | | 1,154,458 |
| Securitized Term Auto Receivables Trust, Series 2019-1A, Class A3 | | | |
| 2.99%, 02/27/23 144A | 700,000 | | 708,520 |
| SLC Student Loan Trust, Series 2006-2, Class A5 | | | |
| (Floating, ICE LIBOR USD 3M + 0.10%), 1.99%, 09/15/26† | 350,272 | | 349,393 |
| SLM Private Credit Student Loan Trust, Series 2004-A, Class A3 | | | |
| (Floating, ICE LIBOR USD 3M + 0.40%, 0.40% Floor), 2.29%, 06/15/33† | 460,531 | | 456,557 |
| SLM Private Credit Student Loan Trust, Series 2005-A, Class A3 | | | |
| (Floating, ICE LIBOR USD 3M + 0.20%), 2.09%, 06/15/23† | 414,311 | | 413,354 |
| SLM Private Credit Student Loan Trust, Series 2007-A, Class A4A | | | |
| (Floating, ICE LIBOR USD 3M + 0.24%, 0.24% Floor), 2.13%, 12/16/41† | 316,672 | | 307,843 |
| SLM Student Loan Trust, Series 2003-5, Class A5 | | | |
| (Floating, 0.27% - Euribor 3M), 0.00%, 06/17/24(E) † | 151,388 | | 169,317 |
| SLM Student Loan Trust, Series 2004-2, Class A5 | | | |
| (Floating, 0.18% - Euribor 3M), 0.00%, 01/25/24(E) † | 849,826 | | 951,441 |
| SLM Student Loan Trust, Series 2004-3, Class A5 | | | |
| (Floating, ICE LIBOR USD 3M + 0.17%, 0.17% Floor), 2.11%, 07/25/23† | 67,998 | | 67,993 |
| SLM Student Loan Trust, Series 2005-8, Class A4 | | | |
| (Floating, ICE LIBOR USD 3M + 0.55%), 2.49%, 01/25/28† | 1,055,675 | | 1,056,506 |
| SMB Private Education Loan Trust, Series 2015-C, Class A2A | | | |
| 2.75%, 07/15/27 144A | 303,708 | | 305,250 |
| SMB Private Education Loan Trust, Series 2016-A, Class A2A | | | |
| 2.70%, 05/15/31 144A | 284,005 | | 285,034 |
| | | Par | | Value |
| SMB Private Education Loan Trust, Series 2016-B, Class A2A | | | |
| 2.43%, 02/17/32 144A | $185,346 | | $184,551 |
| SMB Private Education Loan Trust, Series 2018-A, Class A2A | | | |
| 3.50%, 02/15/36 144A | 1,105,000 | | 1,146,587 |
| SMB Private Education Loan Trust, Series 2018-B, Class A2B | | | |
| (Floating, ICE LIBOR USD 1M + 0.72%), 2.46%, 01/15/37 144A † | 640,000 | | 635,707 |
| SMB Private Education Loan Trust, Series 2019-A, Class A2A | | | |
| 3.44%, 07/15/36 144A | 280,000 | | 284,672 |
| SoFi Professional Loan Program LLC, Series 2015-A, Class A1 | | | |
| (Floating, ICE LIBOR USD 1M + 1.20%, 1.20% Floor), 2.99%, 03/25/33 144A † | 132,914 | | 133,087 |
| SoFi Professional Loan Program LLC, Series 2015-D, Class A2 | | | |
| 2.72%, 10/27/36 144A | 704,954 | | 707,428 |
| Sofi Professional Loan Program LLC, Series 2016-A, Class A2 | | | |
| 2.76%, 12/26/36 144A | 241,251 | | 242,153 |
| SoFi Professional Loan Program LLC, Series 2016-C, Class A2B | | | |
| 2.36%, 12/27/32 144A | 128,882 | | 128,430 |
| SoFi Professional Loan Program LLC, Series 2016-D, Class A2B | | | |
| 2.34%, 04/25/33 144A | 129,098 | | 129,208 |
| Sofi Professional Loan Program LLC, Series 2016-F, Class A2 | | | |
| 3.02%, 02/25/40 144A | 855,919 | | 866,781 |
| SoFi Professional Loan Program LLC, Series 2017-E, Class A2A | | | |
| 1.86%, 11/26/40 144A | 803,417 | | 802,132 |
| Sofi Professional Loan Program LLC, Series 2019-B, Class A2FX | | | |
| 3.09%, 08/17/48 144A | 210,000 | | 213,934 |
| Sofi Professional Loan Program Trust, Series 2018-C, Class A2FX | | | |
| 3.59%, 01/25/48 144A | 245,000 | | 251,011 |
| Sofi Professional Loan Program, Series 2018-B, Class A2FX | | | |
| 3.34%, 08/25/47 144A | 805,000 | | 819,096 |
| Sound Point CLO XIV, Ltd., Series 2016-3A, Class AR | | | |
| (Floating, ICE LIBOR USD 3M + 1.15%), 3.08%, 01/23/29 144A † | 345,000 | | 344,998 |
| SpringCastle Funding Asset-Backed Notes, Series 2019-AA, Class A | | | |
| 3.20%, 05/27/36 144A | 591,575 | | 594,218 |
| Springleaf Funding Trust, Series 2015-BA, Class A | | | |
| 3.48%, 05/15/28 144A | 315,000 | | 315,815 |
See Notes to Financial Statements.
| | | Par | | Value |
| Springleaf Funding Trust, Series 2017-AA, Class A | | | |
| 2.68%, 07/15/30 144A | $400,000 | | $400,348 |
| Starwood Waypoint Homes Trust, Series 2017-1, Class A | | | |
| (Floating, ICE LIBOR USD 1M + 0.95%, 0.95% Floor), 2.69%, 01/17/35 144A † | 1,905,438 | | 1,903,566 |
| Structured Asset Securities Corporation Mortgage Loan Trust, Series 2005-7XS, Class 2A1A | | | |
| (Floating, ICE LIBOR USD 1M + 1.50%, 1.50% Floor), 3.19%, 04/25/35† | 194,389 | | 192,412 |
| STWD, Ltd., Series 2019-FL1, Class A | | | |
| (Floating, ICE LIBOR USD 1M + 1.08%), 2.82%, 07/15/38 144A † | 1,330,000 | | 1,331,225 |
| TICP CLO VI, Ltd., Series 2016-6A, Class AR | | | |
| (Floating, ICE LIBOR USD 3M + 1.20%, 1.20% Floor), 3.20%, 01/15/29 144A † | 285,000 | | 285,693 |
| Towd Point Mortgage Trust, Series 2016-3, Class A1 | | | |
| 2.25%, 04/25/56 144A | 402,879 | | 402,878 |
| Towd Point Mortgage Trust, Series 2019-MH1, Class A1 | | | |
| 3.00%, 11/25/58 144A | 838,456 | | 844,459 |
| Towd Point Mortgage Trust, Series 2019-SJ3, Class A1 | | | |
| 3.00%, 11/25/59 144A | 1,854,849 | | 1,860,389 |
| Toyota Auto Receivables Owner Trust, Series 2019-A, Class A3 | | | |
| 2.91%, 07/17/23 | 1,890,000 | | 1,918,488 |
| Transportation Finance Equipment Trust, Series 2019-1, Class A3 | | | |
| 1.85%, 04/24/23 144A | 610,000 | | 606,742 |
| TRESTLES CLO, Ltd. Series 2017-1A, Class A1A | | | |
| (Floating, ICE LIBOR USD 3M + 1.29%), 3.23%, 07/25/29 144A † | 550,000 | | 552,183 |
| TRTX Issuer, Ltd., Series 2019-FL3, Class A | | | |
| (Floating, ICE LIBOR USD 1M + 1.15%, 1.15% Floor), 2.89%, 10/15/34 144A † | 1,870,000 | | 1,875,376 |
| Tryon Park CLO, Ltd., Series 2013-1A, Class A1SR | | | |
| (Floating, ICE LIBOR USD 3M + 0.89%), 2.89%, 04/15/29 144A † | 3,070,000 | | 3,059,792 |
| Venture XVII CLO, Ltd., Series 2014-17A, Class ARR | | | |
| (Floating, ICE LIBOR USD 3M + 0.88%), 2.88%, 04/15/27 144A † | 360,000 | | 357,300 |
| Verizon Owner Trust, Series 2019-B, Class A1A | | | |
| 2.33%, 12/20/23 | 3,690,000 | | 3,718,072 |
| | | Par | | Value |
| Volvo Financial Equipment LLC, Series 2019-1A, Class A3 | | | |
| 3.00%, 03/15/23 144A | $1,500,000 | | $1,522,269 |
| Westlake Automobile Receivables Trust, Series 2017-1A, Class C | | | |
| 2.70%, 10/17/22 144A | 145,977 | | 146,063 |
| Westlake Automobile Receivables Trust, Series 2018-3A, Class D | | | |
| 4.00%, 10/16/23 144A | 300,000 | | 307,228 |
| Westlake Automobile Receivables Trust, Series 2019-3A, Class A2 | | | |
| 2.15%, 02/15/23 144A | 380,000 | | 380,492 |
| Wheels SPV 2 LLC, Series 2017-1A, Class A2 | | | |
| 1.88%, 04/20/26 144A | 25,818 | | 25,843 |
Total Asset-Backed Securities
(Cost $152,874,450) | | | 153,705,191 |
| CORPORATE BONDS — 22.9% |
| 3M Co. | | | |
| 0.95%, 05/15/23(E) | 160,000 | | 185,961 |
| ADT Security Corporation (The) | | | |
| 6.25%, 10/15/21 | 150,000 | | 158,523 |
| 4.13%, 06/15/23 | 180,000 | | 186,000 |
| AES Corporation | | | |
| 4.00%, 03/15/21 | 850,000 | | 863,600 |
| AIG Global Funding | | | |
| 2.30%, 07/01/22 144A | 330,000 | | 331,957 |
| Air Lease Corporation | | | |
| 2.63%, 07/01/22 | 150,000 | | 151,792 |
| 2.25%, 01/15/23Δ | 1,645,000 | | 1,647,747 |
| 2.75%, 01/15/23 | 275,000 | | 278,812 |
| Aircastle, Ltd. | | | |
| 5.13%, 03/15/21 | 2,000,000 | | 2,066,673 |
| Alliant Energy Finance LLC | | | |
| 3.75%, 06/15/23 144A | 415,000 | | 433,484 |
| Ally Financial, Inc. | | | |
| 3.88%, 05/21/24 | 400,000 | | 419,834 |
| Ameren Corporation | | | |
| 2.50%, 09/15/24 | 610,000 | | 613,386 |
| American Electric Power Co., Inc. | | | |
| 3.65%, 12/01/21 | 490,000 | | 505,700 |
| American Express Co. | | | |
| 2.75%, 05/20/22 | 1,230,000 | | 1,252,935 |
| American Express Credit Corporation | | | |
| 2.38%, 05/26/20 | 1,550,000 | | 1,551,964 |
| American Honda Finance Corporation | | | |
| 2.05%, 01/10/23 | 915,000 | | 918,906 |
| 0.55%, 03/17/23(E) | 215,000 | | 245,155 |
| American Tower Corporation REIT | | | |
| 2.25%, 01/15/22 | 2,700,000 | | 2,709,637 |
| 3.50%, 01/31/23 | 95,000 | | 98,510 |
| 3.00%, 06/15/23 | 400,000 | | 409,101 |
| 3.38%, 05/15/24 | 500,000 | | 518,669 |
| Analog Devices, Inc. | | | |
| 2.85%, 03/12/20 | 110,000 | | 110,156 |
See Notes to Financial Statements.
SCHEDULE OF INVESTMENTS (Continued)
| | | Par | | Value |
| Antero Resources Corporation | | | |
| 5.13%, 12/01/22 | $1,130,000 | | $1,010,536 |
| Anthem, Inc. | | | |
| 3.13%, 05/15/22 | 165,000 | | 169,202 |
| Aon Corporation | | | |
| 2.20%, 11/15/22 | 855,000 | | 859,619 |
| Apache Corporation | | | |
| 3.63%, 02/01/21 | 26,000 | | 26,271 |
| 3.25%, 04/15/22 | 122,000 | | 124,351 |
| Apple, Inc. | | | |
| 1.70%, 09/11/22 | 435,000 | | 434,865 |
| 1.00%, 11/10/22(E) | 300,000 | | 347,688 |
| Ares Capital Corporation | | | |
| 3.63%, 01/19/22 | 1,325,000 | | 1,348,892 |
| Arizona Public Service Co. | | | |
| 2.20%, 01/15/20 | 944,000 | | 944,010 |
| Assurant, Inc. | | | |
| (Floating, ICE LIBOR USD 3M + 1.25%), 3.20%, 03/26/21† | 226,000 | | 226,028 |
| AT&T, Inc. | | | |
| (Floating, ICE LIBOR USD 3M + 0.75%), 2.66%, 06/01/21† | 2,300,000 | | 2,314,228 |
| 3.80%, 03/15/22 | 1,200,000 | | 1,245,991 |
| 3.00%, 06/30/22 | 500,000 | | 510,929 |
| 3.60%, 02/17/23 | 115,000 | | 120,104 |
| 4.45%, 04/01/24 | 350,000 | | 379,637 |
| (Floating, ICE LIBOR USD 3M + 1.18%), 3.07%, 06/12/24† | 1,200,000 | | 1,221,607 |
| Athene Global Funding | | | |
| 2.75%, 04/20/20 144A | 1,445,000 | | 1,448,090 |
| Aviation Capital Group LLC | | | |
| 2.88%, 01/20/22 144A | 1,000,000 | | 1,007,501 |
| Bank of America Corporation | | | |
| (Variable, ICE LIBOR USD 3M + 0.66%), 2.37%, 07/21/21^ | 1,840,000 | | 1,843,951 |
| (Variable, ICE LIBOR USD 3M + 0.63%), 2.33%, 10/01/21Δ ^ | 765,000 | | 767,267 |
| (Floating, ICE LIBOR USD 3M + 0.38%), 2.31%, 01/23/22† Δ | 900,000 | | 901,199 |
| (Variable, ICE LIBOR USD 3M + 0.37%), 2.74%, 01/23/22^ | 600,000 | | 604,467 |
| (Variable, ICE LIBOR USD 3M + 0.63%), 3.50%, 05/17/22^ | 425,000 | | 433,620 |
| (Floating, ICE LIBOR USD 3M + 0.65%), 2.60%, 06/25/22† | 750,000 | | 754,239 |
| 2.50%, 10/21/22 | 175,000 | | 176,742 |
| 3.30%, 01/11/23 | 335,000 | | 346,555 |
| (Variable, ICE LIBOR USD 3M + 0.93%), 2.82%, 07/21/23^ | 700,000 | | 711,519 |
| Bank of New York Mellon Corporation (The) | | | |
| 1.95%, 08/23/22Δ | 640,000 | | 641,661 |
| BBVA USA | | | |
| 3.50%, 06/11/21 | 1,600,000 | | 1,628,126 |
| Becton Dickinson Euro Finance S.a.r.l. | | | |
| 0.63%, 06/04/23(E) | 100,000 | | 113,402 |
| Becton, Dickinson and Co. | | | |
| 2.40%, 06/05/20 | 325,000 | | 325,371 |
| 1.40%, 05/24/23(E) | 100,000 | | 116,113 |
| | | Par | | Value |
| BGC Partners, Inc. | | | |
| 5.13%, 05/27/21 | $1,400,000 | | $1,446,403 |
| BMW US Capital LLC | | | |
| (Floating, ICE LIBOR USD 3M + 0.50%), 2.40%, 08/13/21 144A † | 3,000,000 | | 3,008,461 |
| Bristol-Myers Squibb Co. | | | |
| 2.60%, 05/16/22 144A | 875,000 | | 889,863 |
| 2.75%, 02/15/23 144A | 110,000 | | 112,159 |
| Broadcom Corporation | | | |
| 2.38%, 01/15/20 | 3,275,000 | | 3,275,174 |
| Broadcom, Inc. | | | |
| 3.13%, 04/15/21 144A | 1,465,000 | | 1,483,149 |
| 3.13%, 10/15/22 144A | 3,000,000 | | 3,057,408 |
| Cantor Fitzgerald LP | | | |
| 6.50%, 06/17/22 144A | 750,000 | | 811,626 |
| Capital One Financial Corporation | | | |
| 3.75%, 04/24/24 | 135,000 | | 142,271 |
| Capital One NA | | | |
| 2.15%, 09/06/22 | 1,955,000 | | 1,959,056 |
| Centene Corporation | | | |
| 4.75%, 05/15/22 | 210,000 | | 214,574 |
| 4.75%, 01/15/25 144A | 395,000 | | 411,122 |
| CenterPoint Energy Resources Corporation | | | |
| 3.55%, 04/01/23 | 200,000 | | 207,186 |
| CenterPoint Energy, Inc. | | | |
| 3.60%, 11/01/21 | 445,000 | | 456,780 |
| CenturyLink, Inc. | | | |
| 5.63%, 04/01/20 | 530,000 | | 533,943 |
| Charter Communications Operating LLC | | | |
| 4.46%, 07/23/22 | 540,000 | | 567,799 |
| 4.50%, 02/01/24 | 2,700,000 | | 2,907,579 |
| Cheniere Corpus Christi Holdings LLC | | | |
| 5.88%, 03/31/25 | 630,000 | | 709,723 |
| Cigna Corporation | | | |
| 3.20%, 09/17/20 | 1,360,000 | | 1,370,821 |
| (Floating, ICE LIBOR USD 3M + 0.65%), 2.55%, 09/17/21† | 860,000 | | 860,052 |
| CIT Bank NA | | | |
| (Variable, U.S. SOFR + 1.72%), 2.97%, 09/27/25^ | 440,000 | | 439,725 |
| CIT Group, Inc. | | | |
| 4.13%, 03/09/21 | 1,030,000 | | 1,051,300 |
| 5.00%, 08/15/22 | 750,000 | | 796,870 |
| Citigroup, Inc. | | | |
| 2.90%, 12/08/21 | 1,700,000 | | 1,728,450 |
| 2.75%, 04/25/22 | 1,100,000 | | 1,117,962 |
| (Variable, ICE LIBOR USD 3M + 0.72%), 3.14%, 01/24/23^ | 1,850,000 | | 1,887,019 |
| 0.75%, 10/26/23(E) | 190,000 | | 217,749 |
| (Floating, ICE LIBOR USD 3M + 1.02%), 2.93%, 06/01/24† | 1,000,000 | | 1,012,196 |
| Citizens Bank NA | | | |
| 2.25%, 03/02/20Δ | 285,000 | | 285,028 |
| 2.20%, 05/26/20 | 370,000 | | 370,207 |
| 3.25%, 02/14/22 | 430,000 | | 440,796 |
See Notes to Financial Statements.
| | | Par | | Value |
| Cleveland-Cliffs, Inc. | | | |
| 4.88%, 01/15/24 144A | $225,000 | | $230,426 |
| CNH Industrial Capital LLC | | | |
| 3.88%, 10/15/21 | 145,000 | | 149,211 |
| Coca-Cola Co. (The) | | | |
| 1.13%, 09/22/22(E) | 340,000 | | 394,582 |
| Comcast Corporation | | | |
| 3.45%, 10/01/21 | 605,000 | | 622,937 |
| Conagra Brands, Inc. | | | |
| (Floating, ICE LIBOR USD 3M + 0.75%), 2.70%, 10/22/20† | 905,000 | | 905,093 |
| 3.80%, 10/22/21 | 1,125,000 | | 1,161,262 |
| Continental Resources, Inc. | | | |
| 3.80%, 06/01/24 | 110,000 | | 113,881 |
| CoreCivic, Inc. REIT | | | |
| 4.63%, 05/01/23Δ | 365,000 | | 361,806 |
| Cox Communications, Inc. | | | |
| 3.15%, 08/15/24 144A | 290,000 | | 298,404 |
| Crown Castle Towers LLC | | | |
| 3.22%, 05/15/22 144A | 1,500,000 | | 1,518,369 |
| CVS Health Corporation | | | |
| 3.35%, 03/09/21 | 903,000 | | 918,226 |
| 4.30%, 03/25/28 | 290,000 | | 317,067 |
| D.R. Horton, Inc. | | | |
| 4.00%, 02/15/20 | 1,100,000 | | 1,102,488 |
| Daimler Finance North America LLC | | | |
| 2.20%, 05/05/20 144A | 230,000 | | 230,132 |
| 2.30%, 02/12/21 144A | 1,455,000 | | 1,458,092 |
| 2.88%, 03/10/21 144A Δ | 1,000,000 | | 1,008,924 |
| 3.35%, 05/04/21 144A | 230,000 | | 233,644 |
| DCP Midstream Operating LP | | | |
| 5.35%, 03/15/20 144A | 275,000 | | 276,847 |
| Dell International LLC | | | |
| 4.42%, 06/15/21 144A | 2,525,000 | | 2,599,110 |
| 5.88%, 06/15/21 144A | 356,000 | | 362,009 |
| 5.45%, 06/15/23 144A | 2,065,000 | | 2,241,239 |
| Delta Air Lines, Inc. | | | |
| 2.88%, 03/13/20 | 465,000 | | 465,095 |
| 3.63%, 03/15/22 | 2,100,000 | | 2,151,770 |
| DH Europe Finance II S.a.r.l. | | | |
| 0.20%, 03/18/26(E) | 180,000 | | 199,698 |
| DH Europe Finance S.a.r.l. | | | |
| (Floating, Euribor 3M + 0.30%), 0.00%, 06/30/22(E) † | 270,000 | | 303,151 |
| Discover Bank | | | |
| 3.35%, 02/06/23 | 1,840,000 | | 1,898,740 |
| Discovery Communications LLC | | | |
| 4.38%, 06/15/21 | 220,000 | | 227,287 |
| 3.30%, 05/15/22 | 375,000 | | 384,824 |
| DISH DBS Corporation | | | |
| 6.75%, 06/01/21 | 700,000 | | 737,989 |
| Dollar Tree, Inc. | | | |
| 3.70%, 05/15/23Δ | 1,100,000 | | 1,146,927 |
| Dominion Energy Gas Holdings LLC | | | |
| (Floating, ICE LIBOR USD 3M + 0.60%), 2.49%, 06/15/21† | 1,800,000 | | 1,807,519 |
| Dominion Energy, Inc. | | | |
| 2.58%, 07/01/20 | 335,000 | | 335,731 |
| | | Par | | Value |
| 2.72%, 08/15/21 STEP | $480,000 | | $483,870 |
| 2.45%, 01/15/23 144A | 1,430,000 | | 1,436,042 |
| DTE Energy Co. | | | |
| 2.60%, 06/15/22 | 375,000 | | 377,853 |
| 2.25%, 11/01/22 | 1,065,000 | | 1,065,645 |
| Duke Energy Corporation | | | |
| 3.95%, 10/15/23 | 430,000 | | 456,542 |
| Elanco Animal Health, Inc. | | | |
| 3.91%, 08/27/21 | 295,000 | | 302,721 |
| Energy Transfer Operating LP | | | |
| 4.15%, 10/01/20 | 1,115,000 | | 1,126,997 |
| 3.60%, 02/01/23 | 105,000 | | 107,616 |
| 4.25%, 03/15/23 | 1,630,000 | | 1,703,740 |
| Energy Transfer Partners LP | | | |
| 5.75%, 09/01/20 | 230,000 | | 233,262 |
| EQT Corporation | | | |
| 2.50%, 10/01/20 | 395,000 | | 394,978 |
| Equinix, Inc. REIT | | | |
| 2.63%, 11/18/24 | 1,515,000 | | 1,520,977 |
| Evergy, Inc. | | | |
| 2.45%, 09/15/24 | 1,020,000 | | 1,027,172 |
| Exelon Corporation | | | |
| 2.45%, 04/15/21Δ | 175,000 | | 175,835 |
| Fidelity National Information Services, Inc. | | | |
| 0.40%, 01/15/21(E) | 415,000 | | 467,920 |
| 0.13%, 12/03/22(E) | 300,000 | | 337,194 |
| 0.75%, 05/21/23(E) | 380,000 | | 435,193 |
| FirstEnergy Corporation | | | |
| 2.85%, 07/15/22 | 2,357,000 | | 2,396,180 |
| Florida Power & Light Co. | | | |
| (Floating, ICE LIBOR USD 3M + 0.40%), 2.31%, 05/06/22† | 420,000 | | 420,017 |
| Ford Motor Credit Co. LLC | | | |
| 2.68%, 01/09/20 | 900,000 | | 900,073 |
| 2.43%, 06/12/20 | 1,135,000 | | 1,134,397 |
| 3.16%, 08/04/20 | 225,000 | | 225,919 |
| 3.34%, 03/18/21 | 300,000 | | 302,327 |
| (Floating, ICE LIBOR USD 3M + 0.81%), 2.71%, 04/05/21† | 500,000 | | 497,791 |
| (Floating, ICE LIBOR USD 3M + 1.27%), 3.23%, 03/28/22† | 235,000 | | 233,352 |
| 4.14%, 02/15/23 | 345,000 | | 355,173 |
| 5.58%, 03/18/24 | 300,000 | | 324,960 |
| Freeport-McMoRan, Inc. | | | |
| 3.55%, 03/01/22 | 495,000 | | 502,069 |
| FS KKR Capital Corporation | | | |
| 4.75%, 05/15/22 | 1,000,000 | | 1,035,501 |
| GATX Corporation | | | |
| (Floating, ICE LIBOR USD 3M + 0.72%), 2.61%, 11/05/21† | 500,000 | | 502,275 |
| General Motors Financial Co., Inc. | | | |
| 2.65%, 04/13/20 | 460,000 | | 460,595 |
| (Floating, ICE LIBOR USD 3M + 0.93%), 2.92%, 04/13/20† | 1,010,000 | | 1,011,634 |
| 2.45%, 11/06/20 | 605,000 | | 606,542 |
| 3.70%, 11/24/20 | 2,790,000 | | 2,823,601 |
| 3.20%, 07/06/21 | 46,000 | | 46,646 |
See Notes to Financial Statements.
SCHEDULE OF INVESTMENTS (Continued)
| | | Par | | Value |
| 4.20%, 11/06/21 | $395,000 | | $409,641 |
| (Floating, ICE LIBOR USD 3M + 1.55%), 3.54%, 01/14/22† | 895,000 | | 904,293 |
| (Floating, ICE LIBOR USD 3M + 1.31%), 3.27%, 06/30/22† Δ | 614,000 | | 617,128 |
| Goldman Sachs Group, Inc. (The) | | | |
| 3.00%, 04/26/22 | 1,040,000 | | 1,053,325 |
| (Floating, ICE LIBOR USD 3M + 0.78%), 2.71%, 10/31/22† | 2,000,000 | | 2,014,233 |
| (Variable, ICE LIBOR USD 3M + 0.82%), 2.88%, 10/31/22^ | 580,000 | | 588,355 |
| Harley-Davidson Financial Services, Inc. | | | |
| 2.15%, 02/26/20 144A | 260,000 | | 260,008 |
| Honeywell International, Inc. | | | |
| 1.30%, 02/22/23(E) | 500,000 | | 582,875 |
| Hyundai Capital America | | | |
| 2.55%, 04/03/20 144A | 315,000 | | 315,144 |
| Illinois Tool Works, Inc. | | | |
| 0.25%, 12/05/24(E) | 200,000 | | 225,474 |
| International Business Machines Corporation | | | |
| 0.38%, 01/31/23(E) | 190,000 | | 215,554 |
| International Lease Finance Corporation | | | |
| 8.25%, 12/15/20 | 800,000 | | 845,926 |
| 8.63%, 01/15/22Δ | 1,200,000 | | 1,350,634 |
| Interpublic Group of Cos., Inc. (The) | | | |
| 3.50%, 10/01/20 | 230,000 | | 232,493 |
| 3.75%, 10/01/21 | 80,000 | | 82,250 |
| Iron Mountain, Inc. REIT | | | |
| 4.38%, 06/01/21 144A Δ | 635,000 | | 642,810 |
| iStar, Inc. REIT | | | |
| 4.75%, 10/01/24 | 150,000 | | 155,750 |
| Jackson National Life Global Funding | | | |
| 3.30%, 02/01/22 144A | 1,125,000 | | 1,157,212 |
| JPMorgan Chase & Co. | | | |
| (Floating, ICE LIBOR USD 3M + 0.68%), 2.59%, 06/01/21† | 1,265,000 | | 1,267,351 |
| (Floating, ICE LIBOR USD 3M + 0.61%), 2.51%, 06/18/22† Δ | 540,000 | | 542,245 |
| (Variable, ICE LIBOR USD 3M + 0.70%), 3.21%, 04/01/23^ | 1,270,000 | | 1,300,835 |
| JPMorgan Chase Bank NA | | | |
| (Variable, ICE LIBOR USD 3M + 0.28%), 2.60%, 02/01/21^ | 1,850,000 | | 1,851,008 |
| (Variable, ICE LIBOR USD 3M + 0.35%), 3.09%, 04/26/21^ | 525,000 | | 526,834 |
| Kinder Morgan Energy Partners LP | | | |
| 5.00%, 10/01/21 | 300,000 | | 312,787 |
| 4.25%, 09/01/24 | 500,000 | | 535,847 |
| Kinder Morgan, Inc. | | | |
| (Floating, ICE LIBOR USD 3M + 1.28%), 3.28%, 01/15/23† | 660,000 | | 669,673 |
| Kraft Heinz Foods Co. | | | |
| (Floating, ICE LIBOR USD 3M + 0.82%), 2.72%, 08/10/22† Δ | 400,000 | | 401,393 |
| Lam Research Corporation | | | |
| 3.75%, 03/15/26 | 290,000 | | 311,158 |
| | | Par | | Value |
| Lear Corporation | | | |
| 5.25%, 01/15/25 | $2,300,000 | | $2,364,486 |
| Lehman Escrow Bonds | | | |
| 0.00%, 01/18/12# | 600,000 | | 7,500 |
| Lennar Corporation | | | |
| 4.13%, 01/15/22 | 1,250,000 | | 1,280,350 |
| Level 3 Financing, Inc. | | | |
| 5.13%, 05/01/23 | 200,000 | | 201,667 |
| Mack-Cali Realty LP REIT | | | |
| 3.15%, 05/15/23Δ | 160,000 | | 157,313 |
| Marriott International, Inc. | | | |
| 2.13%, 10/03/22 | 630,000 | | 631,631 |
| Marsh & McLennan Cos., Inc. | | | |
| 3.50%, 03/10/25 | 415,000 | | 438,384 |
| Masco Corporation | | | |
| 5.95%, 03/15/22 | 683,000 | | 734,088 |
| Mastercard, Inc. | | | |
| 1.10%, 12/01/22(E) | 280,000 | | 324,048 |
| McCormick & Co., Inc. | | | |
| 2.70%, 08/15/22 | 200,000 | | 203,248 |
| McDonald’s Corporation | | | |
| 1.13%, 05/26/22(E) | 200,000 | | 231,004 |
| 1.00%, 11/15/23(E) | 100,000 | | 116,184 |
| Medtronic Global Holdings SCA | | | |
| 0.00%, 12/02/22(E) | 475,000 | | 533,577 |
| 0.38%, 03/07/23(E) | 180,000 | | 204,243 |
| Metropolitan Life Global Funding I | | | |
| 2.38%, 01/11/23(E) | 100,000 | | 120,012 |
| 0.38%, 04/09/24(E) | 100,000 | | 113,175 |
| Midwest Connector Capital Co. LLC | | | |
| 3.63%, 04/01/22 144A | 675,000 | | 691,343 |
| Morgan Stanley | | | |
| (Floating, ICE LIBOR USD 3M + 0.55%), 2.45%, 02/10/21† | 1,500,000 | | 1,500,747 |
| 2.75%, 05/19/22Δ | 600,000 | | 611,277 |
| 3.13%, 01/23/23 | 1,000,000 | | 1,028,699 |
| (Variable, U.S. SOFR + 1.15%), 2.72%, 07/22/25^ | 790,000 | | 800,499 |
| MPLX LP | | | |
| (Floating, ICE LIBOR USD 3M + 0.90%), 2.79%, 09/09/21† | 335,000 | | 336,060 |
| 6.25%, 10/15/22 144A | 199,000 | | 203,053 |
| 3.50%, 12/01/22 144A | 265,000 | | 273,028 |
| MUFG Union Bank NA | | | |
| 2.10%, 12/09/22 | 1,000,000 | | 1,003,223 |
| National Rural Utilities Cooperative Finance Corporation | | | |
| 2.30%, 09/15/22 | 1,200,000 | | 1,211,215 |
| Navient Corporation | | | |
| 8.00%, 03/25/20 | 132,000 | | 133,589 |
| 6.63%, 07/26/21 | 575,000 | | 609,356 |
| NextEra Energy Capital Holdings, Inc. | | | |
| 2.40%, 09/01/21 | 1,135,000 | | 1,143,651 |
| 3.20%, 02/25/22 | 100,000 | | 102,582 |
| 2.90%, 04/01/22 | 925,000 | | 944,365 |
| 1.95%, 09/01/22 | 1,900,000 | | 1,907,249 |
See Notes to Financial Statements.
| | | Par | | Value |
| NextEra Energy Operating Partners LP | | | |
| 4.25%, 07/15/24 144A | $405,000 | | $422,551 |
| Nissan Motor Acceptance Corporation | | | |
| 2.25%, 01/13/20 144A | 310,000 | | 309,992 |
| 2.15%, 09/28/20 144A | 515,000 | | 514,052 |
| 3.65%, 09/21/21 144A | 5,000,000 | | 5,105,535 |
| Northwest Airlines Pass-Through Trust, Series 2002-1, Class G2 | | | |
| 6.26%, 11/20/21 | 42,957 | | 44,307 |
| NuStar Logistics LP | | | |
| 6.75%, 02/01/21 | 250,000 | | 260,100 |
| Occidental Petroleum Corporation | | | |
| 2.60%, 08/13/21 | 660,000 | | 665,093 |
| 2.70%, 08/15/22 | 820,000 | | 828,837 |
| (Floating, ICE LIBOR USD 3M + 1.45%), 3.36%, 08/15/22† | 1,900,000 | | 1,910,330 |
| ONEOK, Inc. | | | |
| 4.25%, 02/01/22 | 1,300,000 | | 1,349,410 |
| PayPal Holdings, Inc. | | | |
| 2.20%, 09/26/22 | 700,000 | | 704,446 |
| Pennsylvania Electric Co. | | | |
| 5.20%, 04/01/20 | 500,000 | | 503,606 |
| Penske Truck Leasing Co. LP | | | |
| 3.05%, 01/09/20 144A | 760,000 | | 760,103 |
| 3.38%, 02/01/22 144A | 325,000 | | 332,013 |
| 4.25%, 01/17/23 144A | 165,000 | | 174,026 |
| 3.45%, 07/01/24 144A | 1,500,000 | | 1,559,324 |
| 2.70%, 11/01/24 144A | 1,250,000 | | 1,260,343 |
| Phillips 66 | | | |
| (Floating, ICE LIBOR USD 3M + 0.60%), 2.52%, 02/26/21† | 595,000 | | 595,040 |
| Protective Life Global Funding | | | |
| 2.16%, 09/25/20 144A | 425,000 | | 425,681 |
| 2.62%, 08/22/22 144A | 575,000 | | 581,777 |
| QEP Resources, Inc. | | | |
| 6.88%, 03/01/21 | 543,000 | | 563,580 |
| Qwest Corporation | | | |
| 6.75%, 12/01/21 | 350,000 | | 376,987 |
| Regions Financial Corporation | | | |
| 2.75%, 08/14/22 | 1,700,000 | | 1,731,288 |
| Reliance Standard Life Global Funding II | | | |
| 2.63%, 07/22/22 144A | 595,000 | | 603,556 |
| Ryder System, Inc. | | | |
| 2.88%, 06/01/22Δ | 3,050,000 | | 3,097,865 |
| Sabine Pass Liquefaction LLC | | | |
| 5.63%, 02/01/21 | 1,170,000 | | 1,202,840 |
| 6.25%, 03/15/22 | 1,100,000 | | 1,182,193 |
| 5.75%, 05/15/24 | 130,000 | | 145,121 |
| Santander Holdings USA, Inc. | | | |
| 2.65%, 04/17/20 | 1,230,000 | | 1,231,441 |
| 4.45%, 12/03/21 | 475,000 | | 493,916 |
| 3.70%, 03/28/22 | 1,115,000 | | 1,146,397 |
| Sempra Energy | | | |
| 2.40%, 02/01/20 | 290,000 | | 290,025 |
| (Floating, ICE LIBOR USD 3M + 0.50%), 2.50%, 01/15/21† | 630,000 | | 630,116 |
| | | Par | | Value |
| Simon International Finance SCA REIT | | | |
| 1.38%, 11/18/22(E) | $105,000 | | $121,822 |
| Sirius XM Radio, Inc. | | | |
| 3.88%, 08/01/22 144A | 1,250,000 | | 1,279,679 |
| SLM Corporation | | | |
| 5.13%, 04/05/22 | 404,000 | | 419,150 |
| Smithfield Foods, Inc. | | | |
| 2.65%, 10/03/21 144A | 495,000 | | 492,266 |
| Southern California Edison Co. | | | |
| 2.90%, 03/01/21 | 1,000,000 | | 1,010,760 |
| 1.85%, 02/01/22 | 535,714 | | 529,291 |
| Southern Co. (The) | | | |
| 2.35%, 07/01/21 | 800,000 | | 804,241 |
| Spectra Energy Partners LP | | | |
| 4.75%, 03/15/24 | 90,000 | | 98,059 |
| Sprint Spectrum Co. LLC | | | |
| 3.36%, 09/20/21 144A | 818,125 | | 826,429 |
| Sprint Spectrum Co., LLC | | | |
| 4.74%, 03/20/25 144A | 445,000 | | 472,543 |
| Starwood Property Trust, Inc. REIT | | | |
| 3.63%, 02/01/21 | 270,000 | | 272,470 |
| 5.00%, 12/15/21 | 275,000 | | 285,931 |
| Sterling Bancorp | | | |
| 3.50%, 06/08/20 | 480,000 | | 481,429 |
| Stryker Corporation | | | |
| 0.25%, 12/03/24(E) | 100,000 | | 112,130 |
| Sunoco Logistics Partners Operations LP | | | |
| 5.50%, 02/15/20 | 130,000 | | 130,429 |
| Synchrony Bank | | | |
| (Floating, ICE LIBOR USD 3M + 0.63%), 2.59%, 03/30/20† | 1,700,000 | | 1,701,383 |
| Synchrony Financial | | | |
| (Floating, ICE LIBOR USD 3M + 1.23%), 3.13%, 02/03/20† | 250,000 | | 250,200 |
| 2.85%, 07/25/22 | 840,000 | | 850,684 |
| Taylor Morrison Communities, Inc. | | | |
| 5.63%, 03/01/24 144A | 200,000 | | 216,083 |
| Toll Brothers Finance Corporation | | | |
| 4.38%, 04/15/23 | 200,000 | | 209,583 |
| Toyota Motor Credit Corporation | | | |
| 0.00%, 07/21/21(E) | 180,000 | | 202,563 |
| 2.38%, 02/01/23(E) | 170,000 | | 205,425 |
| TRI Pointe Group, Inc. | | | |
| 4.88%, 07/01/21 | 300,000 | | 308,370 |
| Truist Bank | | | |
| (Variable, ICE LIBOR USD 3M + 0.30%), 2.59%, 01/29/21^ | 1,515,000 | | 1,518,658 |
| 2.80%, 05/17/22 | 1,555,000 | | 1,585,073 |
| Truist Financial Corporation | | | |
| 2.20%, 03/16/23 | 1,185,000 | | 1,193,408 |
| United Technologies Corporation | | | |
| 3.35%, 08/16/21Δ | 915,000 | | 937,195 |
| 1.13%, 12/15/21(E) | 125,000 | | 142,859 |
| 1.15%, 05/18/24(E) | 275,000 | | 319,813 |
See Notes to Financial Statements.
SCHEDULE OF INVESTMENTS (Continued)
| | | Par | | Value |
| Ventas Realty LP REIT | | | |
| 2.65%, 01/15/25 | $905,000 | | $912,459 |
| Verizon Communications, Inc. | | | |
| 0.50%, 06/02/22(E) | 105,000 | | 119,367 |
| (Floating, ICE LIBOR USD 3M + 1.10%), 3.01%, 05/15/25† | 1,900,000 | | 1,945,040 |
| 3.88%, 02/08/29 | 140,000 | | 154,564 |
| Vistra Energy Corporation | | | |
| 5.88%, 06/01/23 | 150,000 | | 153,830 |
| Volkswagen Group of America Finance LLC | | | |
| 2.50%, 09/24/21 144A | 410,000 | | 413,750 |
| 2.70%, 09/26/22 144A | 2,000,000 | | 2,024,181 |
| WEC Energy Group, Inc. | | | |
| 3.38%, 06/15/21Δ | 555,000 | | 566,409 |
| 3.10%, 03/08/22 | 550,000 | | 561,952 |
| Wells Fargo & Co. | | | |
| 2.50%, 03/04/21 | 510,000 | | 513,786 |
| 2.63%, 07/22/22 | 2,000,000 | | 2,030,538 |
| 3.07%, 01/24/23 | 50,000 | | 51,053 |
| 3.75%, 01/24/24 | 220,000 | | 232,749 |
| Wells Fargo Bank NA | | | |
| (Variable, ICE LIBOR USD 3M + 0.49%), 3.33%, 07/23/21^ | 1,320,000 | | 1,330,460 |
| (Variable, ICE LIBOR USD 3M + 0.65%), 2.08%, 09/09/22^ | 1,730,000 | | 1,733,109 |
| Westinghouse Air Brake Technologies Corporation | | | |
| 4.40%, 03/15/24 | 800,000 | | 849,964 |
| Williams Cos., Inc. (The) | | | |
| 4.00%, 11/15/21 | 175,000 | | 179,970 |
| 3.70%, 01/15/23 | 80,000 | | 82,907 |
| Wisconsin Electric Power Co. | | | |
| 2.05%, 12/15/24 | 200,000 | | 200,051 |
| WR Grace & Co-Conn | | | |
| 5.13%, 10/01/21 144A | 135,000 | | 140,998 |
| WRKCo, Inc. | | | |
| 3.75%, 03/15/25 | 115,000 | | 121,385 |
| Xerox Corporation | | | |
| 3.50%, 08/20/20 | 270,000 | | 272,508 |
| Zimmer Biomet Holdings, Inc. | | | |
| 2.70%, 04/01/20 | 190,000 | | 190,129 |
| Zions Bancorp NA | | | |
| 3.35%, 03/04/22Δ | 590,000 | | 605,584 |
| Zoetis, Inc. | | | |
| 3.45%, 11/13/20 | 300,000 | | 303,274 |
Total Corporate Bonds
(Cost $224,878,804) | | | 227,332,739 |
| FOREIGN BONDS — 15.4% |
| Australia — 0.9% | | |
| Macquarie Group, Ltd. | | | |
| (Floating, ICE LIBOR USD 3M + 1.02%), 2.93%, 11/28/23 144A † Δ | 1,435,000 | | 1,446,740 |
| National Australia Bank, Ltd. | | | |
| 2.25%, 03/16/21 144A | 1,500,000 | | 1,506,257 |
| Scentre Group Trust 1 REIT | | | |
| 2.38%, 04/28/21 144A | 1,500,000 | | 1,502,925 |
| | | Par | | Value |
| Suncorp-Metway, Ltd. | | | |
| 2.38%, 11/09/20 144A | $785,000 | | $787,274 |
| Telstra Corporation, Ltd. | | | |
| 3.50%, 09/21/22(E) | 200,000 | | 246,216 |
| Westpac Banking Corporation | | | |
| 3.15%, 01/16/24 144A | 1,275,000 | | 1,334,318 |
| Woodside Finance, Ltd. | | | |
| 4.60%, 05/10/21 144A | 1,300,000 | | 1,332,137 |
| 3.70%, 09/15/26 144A | 400,000 | | 416,730 |
| | | | | 8,572,597 |
| Belgium — 0.0% | | |
| KBC Group NV | | | |
| 1.13%, 01/25/24(E) | 200,000 | | 232,526 |
| Bermuda — 0.0% | | |
| Enstar Group, Ltd. | | | |
| 4.50%, 03/10/22 | 275,000 | | 285,233 |
| Canada — 1.6% | | |
| Bank of Montreal | | | |
| 2.90%, 03/26/22 | 1,105,000 | | 1,126,993 |
| Bank of Nova Scotia (The) | | | |
| 2.00%, 11/15/22Δ | 1,335,000 | | 1,337,712 |
| 2.38%, 01/18/23Δ | 715,000 | | 726,108 |
| Bausch Health Cos., Inc. | | | |
| 6.50%, 03/15/22 144A | 300,000 | | 307,125 |
| Canadian Government Bond | | | |
| 1.00%, 09/01/22(C) | 11,300,000 | | 8,547,945 |
| Encana Corporation | | | |
| 3.90%, 11/15/21 | 1,200,000 | | 1,229,292 |
| Husky Energy, Inc. | | | |
| 3.95%, 04/15/22 | 756,000 | | 782,154 |
| National Bank of Canada | | | |
| 2.15%, 10/07/22 144A | 630,000 | | 630,283 |
| Toronto-Dominion Bank (The) | | | |
| 0.38%, 04/25/24(E) | 305,000 | | 345,213 |
| TransCanada PipeLines, Ltd. | | | |
| 3.75%, 10/16/23 | 45,000 | | 47,450 |
| WestJet Airlines, Ltd. | | | |
| 3.50%, 06/16/21 144A | 600,000 | | 609,583 |
| | | | | 15,689,858 |
| Chile — 0.1% | | |
| Banco del Estado de Chile | | | |
| 2.67%, 01/08/21 144A | 725,000 | | 727,544 |
| Banco Santander Chile | | | |
| 2.50%, 12/15/20 144A | 635,000 | | 635,572 |
| | | | | 1,363,116 |
| China — 0.4% | | |
| Avolon Holdings Funding, Ltd. | | | |
| 3.63%, 05/01/22 144A | 350,000 | | 359,048 |
| 5.50%, 01/15/23 144A | 900,000 | | 972,895 |
| Baidu, Inc. | | | |
| 2.88%, 07/06/22Δ | 235,000 | | 236,924 |
| Park Aerospace Holdings, Ltd. | | | |
| 3.63%, 03/15/21 144A | 700,000 | | 710,367 |
| 5.25%, 08/15/22 144A | 800,000 | | 854,570 |
See Notes to Financial Statements.
| | | Par | | Value |
| Sinopec Group Overseas Development 2017, Ltd. | | | |
| 2.38%, 04/12/20 144A | $970,000 | | $970,398 |
| | | | | 4,104,202 |
| Denmark — 0.1% | | |
| Danske Bank A/S | | | |
| (Variable, ICE LIBOR USD 3M + 1.25%), 3.00%, 09/20/22 144A ^ | 745,000 | | 751,791 |
| Finland — 0.0% | | |
| Nokia OYJ | | | |
| 3.38%, 06/12/22 | 185,000 | | 187,774 |
| France — 0.6% | | |
| Air Liquide Finance SA | | | |
| 0.38%, 04/18/22(E) | 100,000 | | 113,559 |
| Autoroutes du Sud de la France SA | | | |
| 2.95%, 01/17/24(E) | 100,000 | | 124,800 |
| Banque Federative du Credit Mutuel | | | |
| 0.13%, 02/05/24(E) | 200,000 | | 224,027 |
| Banque Federative du Credit Mutuel SA | | | |
| 2.13%, 11/21/22 144A | 1,195,000 | | 1,197,181 |
| 0.75%, 06/15/23(E) | 100,000 | | 114,794 |
| Credit Agricole SA | | | |
| 3.38%, 01/10/22 144A | 1,600,000 | | 1,637,803 |
| 0.88%, 01/19/22(E) | 200,000 | | 229,016 |
| 0.75%, 12/01/22(E) | 100,000 | | 114,852 |
| Dassault Systemes SE | | | |
| 0.00%, 09/16/22(E) | 300,000 | | 337,194 |
| Engie SA | | | |
| 0.38%, 02/28/23(E) | 200,000 | | 227,053 |
| HSBC France SA | | | |
| 0.25%, 05/17/24(E) | 200,000 | | 225,357 |
| Orange SA | | | |
| 0.50%, 01/15/22(E) | 100,000 | | 113,445 |
| 0.75%, 09/11/23(E) | 500,000 | | 573,991 |
| Schneider Electric SE | | | |
| 0.25%, 09/09/24(E) | 200,000 | | 226,473 |
| Societe Generale SA | | | |
| 0.00%, 05/27/22(E) | 300,000 | | 336,714 |
| Total Capital International SA | | | |
| 2.13%, 03/15/23(E) | 100,000 | | 120,262 |
| 0.25%, 07/12/23(E) | 100,000 | | 113,461 |
| Veolia Environnement SA | | | |
| 0.67%, 03/30/22(E) | 200,000 | | 227,439 |
| | | | | 6,257,421 |
| Germany — 0.4% | | |
| BASF SE | | | |
| 2.00%, 12/05/22(E) | 195,000 | | 232,219 |
| Deutsche Bank AG | | | |
| 3.15%, 01/22/21 | 1,405,000 | | 1,411,717 |
| 4.25%, 02/04/21 | 410,000 | | 416,651 |
| E.ON SE | | | |
| 0.00%, 10/24/22(E) | 240,000 | | 269,143 |
| | | Par | | Value |
| SAP SE | | | |
| 0.25%, 03/10/22(E) | $200,000 | | $226,328 |
| Volkswagen Bank GmbH | | | |
| 1.88%, 01/31/24(E) | 300,000 | | 354,267 |
| Volkswagen Leasing GmbH | | | |
| (Floating, 0.45% - Euribor 3M), 0.06%, 08/02/21(E) † | 300,000 | | 336,656 |
| 1.00%, 02/16/23(E) Δ | 460,000 | | 526,267 |
| | | | | 3,773,248 |
| India — 0.3% | | |
| Export-Import Bank of India | | | |
| 2.75%, 04/01/20 | 1,300,000 | | 1,301,942 |
| ICICI Bank, Ltd. | | | |
| 3.13%, 08/12/20 | 1,000,000 | | 1,003,561 |
| State Bank of India | | | |
| (Floating, ICE LIBOR USD 3M + 0.95%), 2.85%, 04/06/20† | 1,000,000 | | 1,000,900 |
| | | | | 3,306,403 |
| Indonesia — 0.1% | | |
| Pelabuhan Indonesia III Persero PT | | | |
| 4.50%, 05/02/23 144A | 1,175,000 | | 1,242,856 |
| Ireland — 0.6% | | |
| Abbott Ireland Financing DAC | | | |
| 0.88%, 09/27/23(E) | 200,000 | | 231,616 |
| 0.10%, 11/19/24(E) | 170,000 | | 190,595 |
| AerCap Ireland Capital DAC | | | |
| 5.00%, 10/01/21 | 900,000 | | 943,941 |
| 3.50%, 05/26/22 | 460,000 | | 473,033 |
| 4.63%, 07/01/22 | 300,000 | | 317,118 |
| 3.30%, 01/23/23 | 155,000 | | 158,985 |
| 2.88%, 08/14/24 | 150,000 | | 151,510 |
| 3.50%, 01/15/25 | 550,000 | | 567,433 |
| Eaton Capital Unlimited Co. | | | |
| 0.02%, 05/14/21(E) | 275,000 | | 308,922 |
| ESB Finance DAC | | | |
| 3.49%, 01/12/24(E) | 100,000 | | 127,593 |
| Shire Acquisitions Investments Ireland DAC | | | |
| 2.40%, 09/23/21 | 740,000 | | 744,400 |
| 2.88%, 09/23/23 | 200,000 | | 203,927 |
| SMBC Aviation Capital Finance DAC | | | |
| 2.65%, 07/15/21 144A | 390,000 | | 392,841 |
| 3.00%, 07/15/22 144A | 540,000 | | 549,814 |
| 3.55%, 04/15/24 144A | 800,000 | | 831,552 |
| Willis Towers Watson PLC | | | |
| 5.75%, 03/15/21 | 131,000 | | 136,576 |
| | | | | 6,329,856 |
| Italy — 1.1% | | |
| Italy Buoni Ordinari del Tesoro BOT | | | |
| 0.00%, 01/31/20(E) Ω | 4,004,000 | | 4,492,380 |
| 0.00%, 02/14/20(E) Ω | 4,596,000 | | 5,157,264 |
See Notes to Financial Statements.
SCHEDULE OF INVESTMENTS (Continued)
| | | Par | | Value |
| Republic of Italy Government International Bond | | | |
| 2.38%, 10/17/24 | $890,000 | | $873,246 |
| | | | | 10,522,890 |
| Japan — 2.5% | | |
| Central Nippon Expressway Co., Ltd. | | | |
| (Floating, ICE LIBOR USD 3M + 0.85%), 2.74%, 09/14/21† | 1,000,000 | | 1,006,430 |
| (Floating, ICE LIBOR USD 3M + 0.56%), 2.45%, 11/02/21† | 1,000,000 | | 1,001,451 |
| 2.85%, 03/03/22 | 2,000,000 | | 2,024,855 |
| Japan Treasury Discount Bill | | | |
| 0.00%, 02/10/20(J) Ω | 669,600,000 | | 6,163,712 |
| Mitsubishi UFJ Financial Group, Inc. | | | |
| 3.54%, 07/26/21 | 65,000 | | 66,546 |
| 3.22%, 03/07/22 | 2,030,000 | | 2,080,707 |
| 2.62%, 07/18/22 | 1,635,000 | | 1,657,964 |
| 2.67%, 07/25/22Δ | 2,000,000 | | 2,030,283 |
| Mitsubishi UFJ Lease & Finance Co., Ltd. | | | |
| 2.25%, 09/07/21 | 500,000 | | 499,739 |
| Mizuho Financial Group, Inc. | | | |
| (Variable, ICE LIBOR USD 3M + 0.84%), 2.72%, 07/16/23^ | 1,190,000 | | 1,204,737 |
| 0.52%, 06/10/24(E) | 100,000 | | 113,173 |
| NTT Finance Corporation | | | |
| 1.90%, 07/21/21 | 500,000 | | 498,762 |
| ORIX Corporation | | | |
| 3.20%, 01/19/22 | 700,000 | | 713,121 |
| Sumitomo Mitsui Financial Group, Inc. | | | |
| 2.93%, 03/09/21 | 1,600,000 | | 1,617,646 |
| 2.06%, 07/14/21 | 1,100,000 | | 1,101,878 |
| 2.85%, 01/11/22 | 1,600,000 | | 1,625,498 |
| Takeda Pharmaceutical Co., Ltd. | | | |
| 4.00%, 11/26/21 | 1,100,000 | | 1,138,063 |
| | | | | 24,544,565 |
| Mexico — 0.8% | | |
| Mexico Cetes | | | |
| 6.62%, 01/16/20(M) Ω | 154,200,000 | | 8,129,328 |
| Netherlands — 1.7% | | |
| Allianz Finance II BV | | | |
| 0.25%, 06/06/23(E) | 200,000 | | 226,731 |
| BMW Finance NV | | | |
| 2.25%, 08/12/22 144A | 1,270,000 | | 1,275,569 |
| BNG Bank NV | | | |
| 2.50%, 02/28/20 144A | 2,000,000 | | 2,001,938 |
| 1.50%, 09/06/22 144A Δ | 1,450,000 | | 1,441,483 |
| Cooperatieve Rabobank UA | | | |
| 3.13%, 04/26/21Δ | 1,570,000 | | 1,595,128 |
| Daimler International Finance BV | | | |
| 0.25%, 08/09/21(E) | 25,000 | | 28,183 |
| 0.25%, 11/06/23(E) | 90,000 | | 100,947 |
| Enel Finance International NV | | | |
| 2.88%, 05/25/22 144A | 1,715,000 | | 1,737,715 |
| 4.25%, 09/14/23 144A | 400,000 | | 423,815 |
| | | Par | | Value |
| 0.00%, 06/17/24(E) | $300,000 | | $333,234 |
| Iberdrola International BV | | | |
| 3.50%, 02/01/21(E) | 200,000 | | 233,326 |
| ING Bank NV | | | |
| 0.00%, 04/08/22(E) | 100,000 | | 112,392 |
| (Floating, 0.40% - Euribor 3M), 0.00%, 04/08/22(E) † | 200,000 | | 225,565 |
| ING Groep NV | | | |
| 1.00%, 09/20/23(E) | 200,000 | | 230,999 |
| innogy Finance BV | | | |
| 0.75%, 11/30/22(E) | 50,000 | | 57,118 |
| LeasePlan Corporation NV | | | |
| 2.88%, 10/24/24 144A | 1,400,000 | | 1,401,088 |
| Mylan NV | | | |
| 3.15%, 06/15/21 | 2,000,000 | | 2,026,773 |
| Nederlandse Waterschapsbank NV | | | |
| 1.50%, 08/27/21 144A | 1,810,000 | | 1,803,969 |
| NXP BV | | | |
| 4.13%, 06/01/21 144A | 500,000 | | 512,819 |
| Roche Finance Europe BV | | | |
| 0.50%, 02/27/23(E) | 80,000 | | 91,484 |
| Schlumberger Finance BV | | | |
| 0.00%, 10/15/24(E) | 200,000 | | 223,129 |
| Siemens Financieringsmaatschappij NV | | | |
| 0.00%, 09/05/21(E) | 376,000 | | 423,728 |
| 0.38%, 09/06/23(E) | 235,000 | | 268,092 |
| Vonovia Finance BV | | | |
| 0.13%, 04/06/23(E) | 200,000 | | 223,718 |
| | | | | 16,998,943 |
| New Zealand — 0.2% | | |
| ANZ New Zealand International, Ltd. | | | |
| 2.88%, 01/25/22 144A | 740,000 | | 752,387 |
| BNZ International Funding, Ltd. | | | |
| 2.10%, 09/14/21 144A | 1,415,000 | | 1,417,368 |
| | | | | 2,169,755 |
| Norway — 0.0% | | |
| Telenor ASA | | | |
| 0.00%, 09/25/23(E) | 100,000 | | 112,080 |
| Peru — 0.1% | | |
| Fondo MIVIVIENDA SA | | | |
| 3.50%, 01/31/23 144A | 690,000 | | 706,681 |
| Qatar — 0.3% | | |
| QNB Finance, Ltd. | | | |
| (Floating, ICE LIBOR USD 3M + 1.00%), 2.90%, 05/02/22† | 3,000,000 | | 3,007,503 |
| Singapore — 0.1% | | |
| BOC Aviation, Ltd. | | | |
| 3.00%, 05/23/22 | 700,000 | | 706,040 |
| DBS Group Holdings, Ltd. | | | |
| 2.85%, 04/16/22 144A | 595,000 | | 604,718 |
| | | | | 1,310,758 |
See Notes to Financial Statements.
| | | Par | | Value |
| South Korea — 0.3% | | |
| Industrial Bank of Korea | | | |
| 2.13%, 10/23/24 144A | $3,100,000 | | $3,091,938 |
| Spain — 0.1% | | |
| Amadeus Capital Markets SAU | | | |
| 1.63%, 11/17/21(E) | 100,000 | | 115,302 |
| Banco de Sabadell SA | | | |
| (Variable, 0.97% - EUR Swap Rate 1Y), 0.63%, 11/07/25(E) ^ | 100,000 | | 111,360 |
| Banco Santander SA | | | |
| 2.71%, 06/27/24 | 400,000 | | 405,952 |
| | | | | 632,614 |
| Sweden — 0.2% | | |
| Atlas Copco AB | | | |
| 2.50%, 02/28/23(E) | 255,000 | | 309,476 |
| Stadshypotek AB | | | |
| 2.50%, 04/05/22 144A | 1,000,000 | | 1,013,473 |
| Telefonaktiebolaget LM Ericsson | | | |
| 4.13%, 05/15/22 | 155,000 | | 161,491 |
| Volvo Treasury AB | | | |
| (Floating, 0.65% - Euribor 3M), 0.26%, 09/13/21(E) † | 200,000 | | 225,789 |
| | | | | 1,710,229 |
| Switzerland — 0.4% | | |
| Credit Suisse Group AG | | | |
| 3.57%, 01/09/23 144A | 750,000 | | 770,977 |
| Credit Suisse Group Funding Guernsey, Ltd. | | | |
| 3.80%, 09/15/22 | 1,650,000 | | 1,718,444 |
| UBS Group AG | | | |
| (Floating, ICE LIBOR USD 3M + 1.78%), 3.77%, 04/14/21 144A † Δ | 900,000 | | 917,107 |
| (Variable, ICE LIBOR USD 3M + 0.95%), 2.86%, 08/15/23 144A ^ | 365,000 | | 371,026 |
| | | | | 3,777,554 |
| United Arab Emirates — 0.1% | | |
| Abu Dhabi Government International Bond | | | |
| 2.50%, 10/11/22 144A | 655,000 | | 663,931 |
| United Kingdom — 2.4% | | |
| Aon PLC | | | |
| 2.80%, 03/15/21Δ | 225,000 | | 227,458 |
| Barclays Bank PLC | | | |
| 2.65%, 01/11/21 | 700,000 | | 704,726 |
| Barclays PLC | | | |
| 3.25%, 01/12/21 | 725,000 | | 732,570 |
| (Variable, ICE LIBOR USD 3M + 1.40%), 4.61%, 02/15/23^ | 600,000 | | 626,961 |
| (Variable, ICE LIBOR USD 3M + 1.36%), 4.34%, 05/16/24^ | 900,000 | | 949,437 |
| BG Energy Capital PLC | | | |
| 4.00%, 10/15/21 144A | 1,000,000 | | 1,033,333 |
| | | Par | | Value |
| BP Capital Markets PLC | | | |
| 1.53%, 09/26/22(E) | $360,000 | | $421,255 |
| 1.11%, 02/16/23(E) | 170,000 | | 197,144 |
| CK Hutchison International 17 II, Ltd. | | | |
| 2.25%, 09/29/20 144A Δ | 990,000 | | 989,725 |
| HSBC Holdings PLC | | | |
| (Variable, ICE LIBOR USD 3M + 1.06%), 3.26%, 03/13/23^ | 270,000 | | 276,289 |
| 3.60%, 05/25/23 | 3,000,000 | | 3,131,756 |
| (Variable, ICE LIBOR USD 3M + 0.99%), 3.95%, 05/18/24^ | 350,000 | | 368,436 |
| Lloyds Banking Group PLC | | | |
| (Variable, ICE LIBOR USD 3M + 1.25%), 2.86%, 03/17/23^ | 2,500,000 | | 2,535,359 |
| Motability Operations Group PLC | | | |
| 1.63%, 06/09/23(E) | 240,000 | | 284,340 |
| Nationwide Building Society | | | |
| (Variable, ICE LIBOR USD 3M + 1.18%), 3.62%, 04/26/23 144A ^ | 1,500,000 | | 1,543,670 |
| NatWest Markets PLC | | | |
| 3.63%, 09/29/22 144A | 635,000 | | 658,078 |
| Royal Bank of Scotland Group PLC | | | |
| (Floating, ICE LIBOR USD 3M + 1.47%), 3.38%, 05/15/23† | 1,810,000 | | 1,830,749 |
| 3.88%, 09/12/23 | 240,000 | | 251,684 |
| Santander UK Group Holdings PLC | | | |
| 2.88%, 08/05/21 | 3,500,000 | | 3,536,813 |
| 3.57%, 01/10/23 | 350,000 | | 358,489 |
| (Variable, ICE LIBOR USD 3M + 1.08%), 3.37%, 01/05/24^ | 215,000 | | 220,396 |
| Santander UK PLC | | | |
| 3.75%, 11/15/21 | 525,000 | | 543,186 |
| Sky, Ltd. | | | |
| 1.50%, 09/15/21(E) | 100,000 | | 115,294 |
| Standard Chartered PLC | | | |
| (Variable, ICE LIBOR USD 3M + 1.20%), 2.74%, 09/10/22 144A ^ | 2,300,000 | | 2,316,073 |
| | | | | 23,853,221 |
Total Foreign Bonds
(Cost $151,698,027) | | 153,328,871 |
| MORTGAGE-BACKED SECURITIES — 26.8% |
| 280 Park Avenue Mortgage Trust, Series 2017-280P, Class D | | | |
| (Floating, ICE LIBOR USD 1M + 1.54%, 1.54% Floor), 3.28%, 09/15/34 144A † | 315,000 | | 315,899 |
| American Home Mortgage Assets Trust, Series 2006-5, Class A1 | | | |
| (Floating, Federal Reserve U.S. 12 1Y CMT + 0.92%, 0.92% Floor), 3.16%, 11/25/46† | 649,645 | | 317,256 |
| American Home Mortgage Investment Trust, Series 2004-3, Class 5A | | | |
| (Floating, ICE LIBOR USD 1Y + 1.50%, 1.50% Floor, 11.00% Cap), 3.48%, 10/25/34† | 7,405 | | 7,413 |
See Notes to Financial Statements.
SCHEDULE OF INVESTMENTS (Continued)
| | | Par | | Value |
| Americold LLC, Series 2010-ARTA, Class A1 | | | |
| 3.85%, 01/14/29 144A | $225,319 | | $226,865 |
| AOA Mortgage Trust, Series 2015-1177, Class A | | | |
| 2.96%, 12/13/29 144A | 1,330,000 | | 1,335,748 |
| Aventura Mall Trust, Series 2013-AVM, Class A | | | |
| 3.74%, 12/05/32 144A † γ | 1,770,000 | | 1,782,602 |
| Aventura Mall Trust, Series 2013-AVM, Class B | | | |
| 3.74%, 12/05/32 144A † γ | 1,410,000 | | 1,419,678 |
| Banc of America Funding Trust, Series 2006-J, Class 4A1 | | | |
| 4.32%, 01/20/47† γ | 173,271 | | 168,891 |
| Banc of America Mortgage Trust, Series 2003-L, Class 3A1 | | | |
| 4.40%, 01/25/34† γ | 80,057 | | 80,961 |
| Banc of America Mortgage Trust, Series 2004-2, Class 5A1 | | | |
| 6.50%, 10/25/31 | 26,525 | | 27,524 |
| Bancorp Commercial Mortgage Trust, Series 2019-CRE6, Class A | | | |
| (Floating, ICE LIBOR USD 1M + 1.05%, 1.05% Floor), 2.82%, 09/15/36 144A † | 397,461 | | 398,009 |
| BANK, Series 2019-BN18, Class A2 | | | |
| 3.47%, 05/15/62 | 610,000 | | 634,673 |
| BANK, Series 2019-BN24, Class A3 | | | |
| 2.96%, 11/15/62 | 270,000 | | 277,836 |
| BBCMS Trust, Series 2013-TYSN, Class E | | | |
| 3.71%, 09/05/32 144A | 200,000 | | 200,626 |
| Bear Stearns ALT-A Trust, Series 2004-10, Class 2A1 | | | |
| (Floating, ICE LIBOR USD 1M + 0.66%, 0.33% Floor, 11.50% Cap), 2.45%, 09/25/34† | 206,943 | | 206,514 |
| Bear Stearns ARM Trust, Series 2003-8, Class 4A1 | | | |
| 4.28%, 01/25/34† γ | 102,434 | | 105,346 |
| Bear Stearns ARM Trust, Series 2004-5, Class 2A | | | |
| 4.37%, 07/25/34† γ | 96,391 | | 97,165 |
| Bear Stearns Commercial Mortgage Securities Trust, Series 2007-T26, Class AM | | | |
| 5.45%, 01/12/45† γ | 121,836 | | 121,076 |
| Benchmark, Series 2019-B15, Class A5 | | | |
| 2.93%, 12/15/72 | 930,000 | | 949,187 |
| Brass No. 8 PLC, Class A1 | | | |
| (Floating, ICE LIBOR USD 3M + 0.70%), 2.81%, 11/16/66 144A † | 300,000 | | 300,199 |
| BX Commercial Mortgage Trust, Series 2019-XL, Class A | | | |
| (Floating, ICE LIBOR USD 1M + 0.92%, 0.92% Floor), 2.66%, 10/15/36 144A † | 1,790,000 | | 1,793,611 |
| | | Par | | Value |
| BX Commercial Mortgage Trust, Series 2019-XL, Class B | | | |
| (Floating, ICE LIBOR USD 1M + 1.08%, 1.08% Floor), 2.82%, 10/15/36 144A † | $670,000 | | $671,655 |
| BX Commercial Mortgage Trust, Series 2019-XL, Class D | | | |
| (Floating, ICE LIBOR USD 1M + 1.45%, 1.45% Floor), 3.19%, 10/15/36 144A † | 785,000 | | 786,979 |
| Cantor Commercial Real Estate Lending, Series 2019-CF3, Class A4 | | | |
| 3.01%, 01/15/53 | 1,020,000 | | 1,050,045 |
| CFCRE Commercial Mortgage Trust, Series 2017-C8, Class ASB | | | |
| 3.37%, 06/15/50 | 1,500,000 | | 1,555,439 |
| CGBAM Commercial Mortgage Trust, Series 2015-SMRT, Class B | | | |
| 3.21%, 04/10/28 144A | 850,000 | | 849,528 |
| Chase Home Lending Mortgage Trust, Series 2019-ATR2, Class A11 | | | |
| (Floating, ICE LIBOR USD 1M + 0.90%, 0.90% Floor), 2.69%, 07/25/49 144A † | 219,456 | | 218,793 |
| Chase Home Lending Mortgage Trust, Series 2019-ATR2, Class A3 | | | |
| 3.50%, 07/25/49 144A † γ | 448,326 | | 456,382 |
| CHC Commercial Mortgage Trust, Series 2019-CHC, Class D | | | |
| (Floating, ICE LIBOR USD 1M + 2.05%, 2.05% Floor), 3.79%, 06/15/34 144A † | 1,610,000 | | 1,612,100 |
| CHL Mortgage Pass-Through Trust, Series 2004-29, Class 1A1 | | | |
| (Floating, ICE LIBOR USD 1M + 0.54%, 0.27% Floor, 11.50% Cap), 2.33%, 02/25/35† | 62,933 | | 61,321 |
| Citigroup Commercial Mortgage Trust, Series 2016-P5, Class AAB | | | |
| 2.84%, 10/10/49 | 1,010,000 | | 1,028,051 |
| COMM Mortgage Trust, Series 2012-CR4, Class ASB | | | |
| 2.44%, 10/15/45 | 413,442 | | 413,440 |
| COMM Mortgage Trust, Series 2013-300P, Class A1 | | | |
| 4.35%, 08/10/30 144A | 515,000 | | 545,593 |
| COMM Mortgage Trust, Series 2013-CR12, Class A2 | | | |
| 2.90%, 10/10/46 | 71,678 | | 71,630 |
| COMM Mortgage Trust, Series 2013-CR8, Class A5 | | | |
| 3.61%, 06/10/46 | 750,000 | | 781,847 |
| COMM Mortgage Trust, Series 2013-SFS, Class A1 | | | |
| 1.87%, 04/12/35 144A | 286,068 | | 284,737 |
| COMM Mortgage Trust, Series 2014-CR17, Class ASB | | | |
| 3.60%, 05/10/47 | 1,348,442 | | 1,386,905 |
See Notes to Financial Statements.
| | | Par | | Value |
| COMM Mortgage Trust, Series 2014-UBS3, Class ASB | | | |
| 3.37%, 06/10/47 | $933,563 | | $955,519 |
| COMM Mortgage Trust, Series 2014-UBS5, Class ASB | | | |
| 3.55%, 09/10/47 | 367,382 | | 377,334 |
| COMM Mortgage Trust, Series 2015-CR24, Class ASB | | | |
| 3.45%, 08/10/48 | 480,000 | | 494,797 |
| COMM Mortgage Trust, Series 2015-CR25, Class ASB | | | |
| 3.54%, 08/10/48 | 1,160,000 | | 1,201,858 |
| COMM Trust, Series 2013-GAM, Class A1 | | | |
| 1.71%, 02/10/28 144A | 229,457 | | 228,423 |
| COMM, Series 2015-PC1, Class A4 | | | |
| 3.62%, 07/10/50 | 585,000 | | 614,150 |
| Connecticut Avenue Securities Trust, Series 2019-R07, Class 1M1 | | | |
| (Floating, ICE LIBOR USD 1M + 0.77%), 2.56%, 10/25/39 144A † | 2,287,298 | | 2,288,989 |
| CSAIL Commercial Mortgage Trust, Series 2015-C1, Class A4 | | | |
| 3.51%, 04/15/50 | 280,000 | | 294,165 |
| CSAIL Commercial Mortgage Trust, Series 2016-C6, Class XA | | | |
| 1.90%, 01/15/49† IO γ | 757,253 | | 64,652 |
| CSAIL Commercial Mortgage Trust, Series 2019-C15, Class A1 | | | |
| 2.99%, 03/15/52 | 923,274 | | 939,173 |
| Deutsche Alt-B Securities Mortgage Loan Trust Series, Series 2006-AB4, Class A6A1 | | | |
| (Step to 5.50% on 02/25/20), 5.87%, 10/25/36 STEP | 173,746 | | 165,952 |
| Deutsche Alt-B Securities Mortgage Loan Trust Series, Series 2006-AB4, Class A6A2 | | | |
| (Step to 5.50% on 02/25/20), 5.89%, 10/25/36 STEP | 173,746 | | 165,950 |
| Exantas Capital Corporation, Ltd., Series 2018-RSO6, Class A | | | |
| (Floating, ICE LIBOR USD 1M + 0.83%, 0.83% Floor), 2.57%, 06/15/35 144A † | 103,901 | | 103,408 |
| Fannie Mae Connecticut Avenue Securities, Series 2017-C02 | | | |
| (Floating, ICE LIBOR USD 1M + 1.15%), 2.94%, 09/25/29† | 110,736 | | 110,833 |
| Fannie Mae Connecticut Avenue Securities, Series 2017-C04 | | | |
| (Floating, ICE LIBOR USD 1M + 0.85%), 2.64%, 11/25/29† | 205,480 | | 205,558 |
| Federal Home Loan Mortgage Corporation | | | |
| 5.50%, 05/01/22 | 18,878 | | 19,071 |
| (Floating, U.S. Treasury Yield Curve Rate CMT 1Y + 2.36%, 2.36% Floor, 13.13% Cap), 4.76%, 07/01/27† | 3,627 | | 3,739 |
| | | Par | | Value |
| 2.50%, 11/01/27 | $1,100,004 | | $1,119,298 |
| (Floating, U.S. Treasury Yield Curve Rate CMT 1Y + 2.25%, 2.25% Floor, 11.02% Cap), 4.03%, 11/01/31† | 22,977 | | 24,163 |
| (Floating, U.S. Treasury Yield Curve Rate CMT 1Y + 2.25%, 2.25% Floor, 10.96% Cap), 4.76%, 04/01/32† | 5,065 | | 5,332 |
| (Floating, U.S. Treasury Yield Curve Rate CMT 1Y + 2.04%, 2.04% Floor, 9.69% Cap), 4.57%, 06/01/33† | 351,041 | | 368,504 |
| (Floating, U.S. Treasury Yield Curve Rate CMT 1Y + 2.25%, 2.25% Floor, 9.48% Cap), 4.03%, 10/01/34† | 62,275 | | 65,972 |
| (Floating, ICE LIBOR USD 1Y + 1.75%, 1.75% Floor, 10.73% Cap), 4.59%, 08/01/35† | 182,763 | | 191,932 |
| (Floating, ICE LIBOR USD 1Y + 1.35%, 1.35% Floor, 10.37% Cap), 3.76%, 09/01/35† | 113,884 | | 117,950 |
| (Floating, ICE LIBOR USD 1Y + 1.63%, 1.63% Floor, 10.82% Cap), 3.92%, 10/01/35† | 123,102 | | 128,779 |
| 4.50%, 07/01/47 | 94,233 | | 102,705 |
| 4.50%, 03/01/49 | 7,336,351 | | 8,096,390 |
| 2.50%, 01/01/50 | 6,000,000 | | 5,935,772 |
| Federal Home Loan Mortgage Corporation REMIC, Series 3228 | | | |
| (Floating, ICE LIBOR USD 1M + 0.50%, 0.50% Floor, 6.50% Cap), 2.24%, 10/15/36† | 1,429,174 | | 1,429,226 |
| Federal Home Loan Mortgage Corporation REMIC, Series 3710 | | | |
| 4.00%, 08/15/25 STEP | 94,589 | | 100,377 |
| Federal Home Loan Mortgage Corporation REMIC, Series 3959 | | | |
| 4.50%, 11/15/41 | 254,832 | | 271,911 |
| Federal Home Loan Mortgage Corporation REMIC, Series 3986 | | | |
| 4.50%, 09/15/41 | 306,956 | | 321,679 |
| Federal Home Loan Mortgage Corporation REMIC, Series 4459 | | | |
| 3.00%, 08/15/43 | 529,217 | | 544,033 |
| Federal Home Loan Mortgage Corporation REMIC, Series 4493 | | | |
| 3.00%, 02/15/44 | 407,913 | | 418,243 |
| Federal Home Loan Mortgage Corporation REMIC, Series 4494 | | | |
| 3.75%, 10/15/42 | 459,001 | | 475,723 |
| Federal Home Loan Mortgage Corporation REMIC, Series 4904 | | | |
| (Floating, ICE LIBOR USD 1M + 0.45%, 0.45% Floor, 6.50% Cap), 2.19%, 06/15/49† | 1,774,475 | | 1,773,774 |
See Notes to Financial Statements.
SCHEDULE OF INVESTMENTS (Continued)
| | | Par | | Value |
| Federal Home Loan Mortgage Corporation STACR REMIC Trust, Series 2019-HQA4 | | | |
| (Floating, ICE LIBOR USD 1M + 0.77%), 2.56%, 11/25/49 144A † | $1,520,000 | | $1,520,945 |
| Federal Home Loan Mortgage Corporation STACR Trust, Series 2019-DNA4 | | | |
| (Floating, ICE LIBOR USD 1M + 1.95%), 3.74%, 10/25/49 144A † | 800,000 | | 802,114 |
| Federal National Mortgage Association | | | |
| 5.00%, 05/01/21 | 388 | | 401 |
| 5.00%, 11/01/21 | 552 | | 571 |
| (Floating, Federal Reserve U.S. 12 1Y CMT + 2.03%, 2.03% Floor, 10.74% Cap), 4.50%, 12/01/24 CONV † | 5,235 | | 5,306 |
| 2.50%, 12/01/27 | 684,303 | | 693,663 |
| 2.50%, 05/01/28 | 1,211,018 | | 1,227,255 |
| 3.00%, 09/01/30 | 313,592 | | 323,561 |
| 3.00%, 02/01/31 | 1,658,195 | | 1,707,478 |
| 3.00%, 04/01/31 | 27,556 | | 28,416 |
| (Floating, U.S. Treasury Yield Curve Rate CMT 1Y + 2.22%, 2.22% Floor, 11.69% Cap), 4.24%, 09/01/31† | 35,689 | | 37,033 |
| 2.50%, 10/01/31 | 699,630 | | 709,245 |
| 2.50%, 11/01/31 | 1,388,123 | | 1,408,449 |
| 2.50%, 01/01/32 | 12,898 | | 13,074 |
| 3.00%, 03/01/32 | 1,054,253 | | 1,087,797 |
| 3.00%, 05/01/32 | 2,381,020 | | 2,447,822 |
| (Floating, ICE LIBOR USD 1M + 1.31%, 1.31% Floor, 11.27% Cap), 3.31%, 08/01/32† | 296,789 | | 301,220 |
| 3.00%, 11/01/32 | 95,017 | | 97,748 |
| 3.00%, 12/01/32 | 1,404,824 | | 1,443,588 |
| (Floating, U.S. Treasury Yield Curve Rate CMT 1Y + 2.25%, 2.25% Floor, 9.73% Cap), 4.78%, 12/01/32† | 271,561 | | 286,299 |
| 3.00%, 02/01/33 | 3,280,989 | | 3,373,252 |
| (Floating, U.S. Treasury Yield Curve Rate CMT 1Y + 2.41%, 2.41% Floor, 9.37% Cap), 4.86%, 06/01/33† | 9,864 | | 10,277 |
| 4.00%, 09/01/33 | 3,808,578 | | 3,984,665 |
| 4.00%, 03/01/34 | 87,833 | | 91,830 |
| 4.00%, 05/01/34 | 942,424 | | 1,010,047 |
| 3.00%, 10/01/34 | 1,646,321 | | 1,688,865 |
| 3.00%, 11/01/34 | 1,738,020 | | 1,801,255 |
| (Floating, ICE LIBOR USD 1Y + 1.66%, 1.66% Floor, 10.09% Cap), 4.65%, 02/01/35† | 142,979 | | 149,729 |
| (Floating, ICE LIBOR USD 1Y + 1.61%, 1.61% Floor, 11.11% Cap), 3.86%, 09/01/35† | 25,151 | | 25,851 |
| | | Par | | Value |
| (Floating, ICE LIBOR USD 1Y + 1.74%, 1.74% Floor, 11.11% Cap), 4.74%, 12/01/35† | $4,801 | | $4,856 |
| (Floating, ICE LIBOR USD 1Y + 1.73%, 1.73% Floor, 9.51% Cap), 4.40%, 05/01/38† | 1,005,259 | | 1,054,330 |
| 3.53%, 08/01/42† | 226,929 | | 228,792 |
| (Floating, ICE LIBOR USD 1Y + 1.73%, 1.73% Floor, 8.41% Cap), 3.32%, 09/01/42† | 541,882 | | 555,204 |
| (Floating, ICE LIBOR USD 1Y + 1.70%, 1.70% Floor, 7.72% Cap), 2.71%, 07/01/43† | 869,893 | | 886,597 |
| (Floating, Federal Reserve U.S. 12 1Y CMT + 1.20%, 1.20% Floor, 8.48% Cap), 3.53%, 07/01/44† | 118,250 | | 119,280 |
| (Floating, Federal Reserve U.S. 12 1Y CMT + 1.20%, 1.20% Floor, 9.64% Cap), 3.53%, 10/01/44† | 82,222 | | 82,891 |
| (Floating, ICE LIBOR USD 1Y + 1.59%, 1.59% Floor, 7.67% Cap), 2.67%, 06/01/45† | 1,074,859 | | 1,094,946 |
| 4.50%, 03/01/47 | 322,474 | | 345,740 |
| 4.50%, 05/01/47 | 1,077,667 | | 1,159,004 |
| 4.50%, 07/01/47 | 108,461 | | 116,809 |
| 4.50%, 11/01/47 | 1,204,317 | | 1,295,555 |
| 4.50%, 06/01/48 | 125,958 | | 139,295 |
| 4.50%, 11/01/48 | 404,559 | | 447,390 |
| 4.50%, 02/01/49 | 1,073,677 | | 1,196,749 |
| 4.50%, 04/01/49 | 283,935 | | 315,650 |
| Federal National Mortgage Association ACES, Series 2015-M4 | | | |
| 0.39%, 07/25/22† IO γ | 16,785,877 | | 117,098 |
| Federal National Mortgage Association REMIC, Series 2006-98 | | | |
| (Floating, ICE LIBOR USD 1M + 0.43%, 0.43% Floor, 7.00% Cap), 2.22%, 10/25/36† | 188,591 | | 188,519 |
| Federal National Mortgage Association REMIC, Series 2007-100 | | | |
| (Floating, ICE LIBOR USD 1M + 0.55%, 0.55% Floor, 7.00% Cap), 2.34%, 10/25/37† | 316,138 | | 317,626 |
| Federal National Mortgage Association REMIC, Series 2011-48 | | | |
| 4.00%, 06/25/26 STEP | 164,471 | | 175,139 |
| Federal National Mortgage Association REMIC, Series 2012-79 | | | |
| (Floating, ICE LIBOR USD 1M + 0.45%, 0.45% Floor, 6.50% Cap), 2.24%, 07/25/42† | 246,131 | | 245,299 |
See Notes to Financial Statements.
| | | Par | | Value |
| Federal National Mortgage Association REMIC, Series 2015-38 | | | |
| (Floating, ICE LIBOR USD 1M + 0.31%, 0.31% Floor), 2.09%, 06/25/55† | $294,747 | | $293,277 |
| Federal National Mortgage Association REMIC, Series 2016-11 | | | |
| (Floating, ICE LIBOR USD 1M + 0.50%, 0.50% Floor), 2.28%, 03/25/46† | 1,386,455 | | 1,385,479 |
| Federal National Mortgage Association REMIC, Series 2016-40 | | | |
| (Floating, ICE LIBOR USD 1M + 0.45%, 0.45% Floor), 2.23%, 07/25/46† | 1,828,236 | | 1,824,589 |
| Federal National Mortgage Association REMIC, Series 2019-30 | | | |
| (Floating, ICE LIBOR USD 1M + 0.50%, 0.50% Floor, 6.50% Cap), 2.29%, 07/25/49† | 1,785,341 | | 1,782,989 |
| Federal National Mortgage Association REMIC, Series 2019-41 | | | |
| (Floating, ICE LIBOR USD 1M + 0.50%, 0.50% Floor, 6.50% Cap), 2.29%, 08/25/59† | 919,925 | | 920,091 |
| Federal National Mortgage Association REMIC, Series 2019-53 | | | |
| (Floating, ICE LIBOR USD 1M + 0.40%, 0.40% Floor), 2.18%, 09/25/49† | 2,493,358 | | 2,491,841 |
| FHLMC Multifamily Structured Pass-Through Certificates, Series KIR2 | | | |
| 2.75%, 03/25/27 | 394,957 | | 403,624 |
| FHLMC Multifamily Structured Pass-Through Certificates, Series KJ18 | | | |
| 3.07%, 08/25/22 | 390,000 | | 398,623 |
| FHLMC Multifamily Structured Pass-Through Certificates, Series T-61 | | | |
| (Floating, Federal Reserve U.S. 12 1Y CMT + 1.40%, 1.40% Floor), 3.64%, 07/25/44† | 481,661 | | 491,074 |
| FHLMC Structured Pass-Through Certificates, Series T-56 | | | |
| (Floating, ICE LIBOR USD 1M + 1.00%, 1.00% Floor, 8.50% Cap), 2.79%, 05/25/43† | 433,636 | | 443,554 |
| First Horizon Alternative Mortgage Securities Trust, Series 2004-AA1, Class A1 | | | |
| 3.84%, 06/25/34† γ | 148,023 | | 149,659 |
| Flagstar Mortgage Trust, Series 2018-4, Class A4 | | | |
| 4.00%, 07/25/48 144A | 863,022 | | 865,111 |
| | | Par | | Value |
| FNBA Mortgage Loan Trust, Series 2004-AR1, Class A2 | | | |
| (Floating, ICE LIBOR USD 1M + 0.40%, 0.40% Floor, 10.50% Cap), 2.16%, 08/19/34† | $292,242 | | $293,056 |
| Gosforth Funding PLC, Series 2018-1A, Class A1 | | | |
| (Floating, ICE LIBOR USD 3M + 0.45%), 2.36%, 08/25/60 144A † | 528,922 | | 528,234 |
| Government National Mortgage Association | | | |
| (Floating, U.S. Treasury Yield Curve Rate CMT 1Y + 1.50%, 2.00% Floor, 12.00% Cap), 3.88%, 06/20/21† | 357 | | 359 |
| 4.00%, 03/20/22† | 24,950 | | 25,193 |
| (Floating, U.S. Treasury Yield Curve Rate CMT 1Y + 1.50%, 1.50% Floor, 11.50% Cap), 4.00%, 01/20/23† | 6,075 | | 6,093 |
| (Floating, U.S. Treasury Yield Curve Rate CMT 1Y + 1.50%, 1.50% Floor, 10.00% Cap), 3.88%, 05/20/24† | 15,362 | | 15,711 |
| (Floating, U.S. Treasury Yield Curve Rate CMT 1Y + 1.50%, 1.50% Floor, 11.50% Cap), 3.25%, 07/20/25† | 20,201 | | 20,784 |
| (Floating, U.S. Treasury Yield Curve Rate CMT 1Y + 1.50%, 1.50% Floor, 11.00% Cap), 3.25%, 08/20/25† | 6,878 | | 7,079 |
| (Floating, U.S. Treasury Yield Curve Rate CMT 1Y + 1.50%, 1.50% Floor, 11.00% Cap), 4.13%, 11/20/25† | 22,384 | | 22,939 |
| (Floating, U.S. Treasury Yield Curve Rate CMT 1Y + 1.50%, 1.50% Floor, 11.50% Cap), 4.13%, 12/20/26† | 33,836 | | 34,778 |
| (Floating, U.S. Treasury Yield Curve Rate CMT 1Y + 1.50%, 1.50% Floor, 11.00% Cap), 3.25%, 07/20/27† | 783 | | 810 |
| (Floating, U.S. Treasury Yield Curve Rate CMT 1Y + 1.50%, 1.50% Floor, 10.00% Cap), 4.13%, 10/20/27† | 13,335 | | 13,730 |
| 8.50%, 10/15/29 | 19,218 | | 19,546 |
| 8.50%, 04/15/30 | 2,781 | | 2,789 |
| 8.50%, 05/15/30 | 52,631 | | 54,417 |
| (Floating, U.S. Treasury Yield Curve Rate CMT 1Y + 1.50%, 1.50% Floor, 11.50% Cap), 3.88%, 05/20/30† | 19,052 | | 19,759 |
| 8.50%, 07/15/30 | 38,593 | | 40,311 |
| 8.50%, 11/15/30 | 6,065 | | 6,300 |
| 8.50%, 12/15/30 | 16,948 | | 18,116 |
| 8.50%, 02/15/31 | 14,123 | | 14,615 |
See Notes to Financial Statements.
SCHEDULE OF INVESTMENTS (Continued)
| | | Par | | Value |
| Government National Mortgage Association, Series 2007-30 | | | |
| (Floating, ICE LIBOR USD 1M + 0.30%, 0.30% Floor, 6.50% Cap), 2.06%, 05/20/37† | $98,640 | | $98,551 |
| Government National Mortgage Association, Series 2011-H08 | | | |
| (Floating, ICE LIBOR USD 1M + 0.60%, 0.60% Floor, 10.50% Cap), 2.37%, 02/20/61† | 846,605 | | 847,576 |
| Government National Mortgage Association, Series 2012-102 | | | |
| 3.50%, 08/20/39 | 1,129,077 | | 1,145,880 |
| Government National Mortgage Association, Series 2013-H13 | | | |
| (Floating, U.S. Treasury Yield Curve Rate CMT 1Y + 0.45%, 0.45% Floor, 15.00% Cap), 2.02%, 05/20/63† | 1,416,341 | | 1,414,899 |
| Government National Mortgage Association, Series 2016-H07 | | | |
| (Floating, ICE LIBOR USD 1M + 0.77%, 0.77% Floor), 2.54%, 02/20/66† | 270,796 | | 271,188 |
| Government National Mortgage Association, Series 2016-H22 | | | |
| (Floating, ICE LIBOR USD 1M + 0.77%, 0.77% Floor, 7.50% Cap), 2.54%, 10/20/66† | 2,136,309 | | 2,147,655 |
| Government National Mortgage Association, Series 2017-H09 | | | |
| (Floating, ICE LIBOR USD 1Y + 0.75%, 0.75% Floor, 7.50% Cap), 3.63%, 04/20/67† | 2,777,902 | | 2,817,094 |
| Government National Mortgage Association, Series 2017-H10 | | | |
| (Floating, ICE LIBOR USD 1Y + 0.75%, 0.75% Floor, 7.50% Cap), 3.63%, 04/20/67† | 3,157,850 | | 3,198,977 |
| GPMT, Ltd., Series 2018-FL1, Class A | | | |
| (Floating, ICE LIBOR USD 1M + 0.90%, 0.90% Floor), 2.66%, 11/21/35 144A † | 477,693 | | 477,255 |
| GRACE Mortgage Trust, Series 2014-GRCE, Class A | | | |
| 3.37%, 06/10/28 144A | 1,850,000 | | 1,870,245 |
| GreenPoint Mortgage Funding Trust, Series 2005-AR5, Class 1A1 | | | |
| (Floating, ICE LIBOR USD 1M + 0.54%, 0.27% Floor, 10.50% Cap), 2.33%, 11/25/45† | 120,789 | | 107,258 |
| GreenPoint Mortgage Funding Trust, Series 2006-OH1, Class A1 | | | |
| (Floating, ICE LIBOR USD 1M + 0.18%, 0.18% Floor), 1.97%, 01/25/37† | 352,494 | | 341,920 |
| | | Par | | Value |
| GS Mortgage Securities Corporation Trust, Series 2012-ALOH, Class A | | | |
| 3.55%, 04/10/34 144A | $680,000 | | $695,588 |
| GS Mortgage Securities Corporation Trust, Series 2017-500K, Class A | | | |
| (Floating, ICE LIBOR USD 1M + 0.70%, 0.70% Floor), 2.44%, 07/15/32 144A † | 1,500,000 | | 1,499,430 |
| GS Mortgage Securities Corporation Trust, Series 2019-SOHO, Class A | | | |
| (Floating, ICE LIBOR USD 1M + 0.90%, 0.90% Floor), 2.64%, 06/15/36 144A † | 536,000 | | 536,603 |
| GS Mortgage Securities Trust, Series 2011-GC5, Class AS | | | |
| 5.21%, 08/10/44 144A | 410,000 | | 425,397 |
| GS Mortgage Securities Trust, Series 2013-GC12, Class A3 | | | |
| 2.86%, 06/10/46 | 1,342,000 | | 1,363,934 |
| GS Mortgage Securities Trust, Series 2013-GC13, Class AAB | | | |
| 3.72%, 07/10/46 | 1,860,557 | | 1,905,933 |
| GS Mortgage Securities Trust, Series 2013-GC14, Class A3 | | | |
| 3.53%, 08/10/46 | 23,017 | | 23,103 |
| GS Mortgage Securities Trust, Series 2019-GC38, Class A2 | | | |
| 3.87%, 02/10/52 | 373,644 | | 395,073 |
| GSR Mortgage Loan Trust, Series 2004-11, Class 5A1 | | | |
| 4.77%, 09/25/34† γ | 176,783 | | 184,808 |
| GSR Mortgage Loan Trust, Series 2005-AR6, Class 2A1 | | | |
| 4.27%, 09/25/35† γ | 72,197 | | 74,321 |
| Hawaii Hotel Trust, Series 2019-MAUI, Class A | | | |
| (Floating, ICE LIBOR USD 1M + 1.15%, 1.15% Floor), 2.89%, 05/15/38 144A † | 859,000 | | 859,593 |
| Hawksmoor Mortgages, Series 2019-1A, Class A | | | |
| (Floating, SONIA Deposit Rates Swap 3M + 1.05%), 1.76%, 05/25/53(U) 144A † | 1,341,674 | | 1,783,750 |
| Holmes Master Issuer PLC, Series 2018-2A, Class A2 | | | |
| (Floating, ICE LIBOR USD 3M + 0.42%), 2.42%, 10/15/54 144A † | 2,948,263 | | 2,948,133 |
| Impac CMB Trust, Series 2003-1, Class 1A1 | | | |
| (Floating, ICE LIBOR USD 1M + 0.80%, 0.40% Floor, 11.95% Cap), 2.59%, 03/25/33† | 40,526 | | 40,498 |
See Notes to Financial Statements.
| | | Par | | Value |
| IndyMac INDX Mortgage Loan Trust, Series 2006-AR12, Class A1 | | | |
| (Floating, ICE LIBOR USD 1M + 0.19%, 0.19% Floor), 1.98%, 09/25/46† | $447,912 | | $430,424 |
| IndyMac INDX Mortgage Loan Trust, Series 2007-FLX3, Class A2 | | | |
| (Floating, ICE LIBOR USD 1M + 0.27%, 0.27% Floor), 2.06%, 06/25/37† | 193,306 | | 190,261 |
| JP Morgan Chase Commercial Mortgage Securities Trust, Series 2012-CBX, Class A4 | | | |
| 3.48%, 06/15/45 | 1,263,294 | | 1,288,449 |
| JP Morgan Chase Commercial Mortgage Securities Trust, Series 2012-CBX, Class A4FX | | | |
| 3.48%, 06/15/45 144A | 771,477 | | 786,839 |
| JP Morgan Chase Commercial Mortgage Securities Trust, Series 2012-HSBC, Class D | | | |
| 4.52%, 07/05/32 144A † γ | 610,000 | | 635,950 |
| JP Morgan Chase Commercial Mortgage Securities Trust, Series 2013-LC11, Class ASB | | | |
| 2.55%, 04/15/46 | 891,371 | | 897,020 |
| JP Morgan Chase Commercial Mortgage Securities Trust, Series 2018-WPT, Class AFX | | | |
| 4.25%, 07/05/33 144A | 190,000 | | 202,274 |
| JP Morgan Chase Commercial Mortgage Securities Trust, Series 2019-MFP, Class A | | | |
| (Floating, ICE LIBOR USD 1M + 0.96%, 0.96% Floor), 2.70%, 07/15/36 144A † | 1,710,000 | | 1,711,394 |
| JP Morgan Mortgage Trust, Series 2005-A1, Class 6T1 | | | |
| 4.61%, 02/25/35† γ | 28,442 | | 28,738 |
| JP Morgan Mortgage Trust, Series 2016-2, Class A1 | | | |
| 2.83%, 06/25/46 144A † γ | 660,448 | | 662,528 |
| JP Morgan Mortgage Trust, Series 2017-1, Class A4 | | | |
| 3.50%, 01/25/47 144A | 790,601 | | 800,447 |
| JP Morgan Mortgage Trust, Series 2017-1, Class A5 | | | |
| 3.50%, 01/25/47 144A | 684,438 | | 692,928 |
| JP Morgan Mortgage Trust, Series 2017-3, Class 1A6 | | | |
| 3.00%, 08/25/47 144A | 1,680,476 | | 1,696,689 |
| JP Morgan Mortgage Trust, Series 2017-5, Class A1A | | | |
| 3.00%, 10/26/48 144A | 1,554,038 | | 1,560,782 |
| JP Morgan Mortgage Trust, Series 2017-6, Class A6 | | | |
| 3.00%, 12/25/48 144A | 288,653 | | 291,785 |
| JPMBB Commercial Mortgage Securities Trust, Series 2014-C23, Class ASB | | | |
| 3.66%, 09/15/47 | 342,324 | | 353,395 |
| | | Par | | Value |
| JPMCC Commercial Mortgage Securities Trust, Series 2017-JP7, Class A3 | | | |
| 3.38%, 09/15/50 | $1,500,000 | | $1,557,051 |
| KNDL Mortgage Trust, Series 2019-KNSQ, Class A | | | |
| (Floating, ICE LIBOR USD 1M + 0.80%, 0.80% Floor), 2.54%, 05/15/36 144A † | 409,000 | | 409,197 |
| KNDL Mortgage Trust, Series 2019-KNSQ, Class D | | | |
| (Floating, ICE LIBOR USD 1M + 1.35%, 1.35% Floor), 3.09%, 05/15/36 144A † | 136,000 | | 136,073 |
| Lanark Master Issuer PLC, Series 2018-2A, Class 1A | | | |
| (Floating, ICE LIBOR USD 3M + 0.42%), 2.32%, 12/22/69† | 931,600 | | 930,977 |
| Lanark Master Issuer PLC, Series 2019-1A, Class 1A1 | | | |
| (Floating, ICE LIBOR USD 3M + 0.77%), 2.67%, 12/22/69 144A † | 1,681,333 | | 1,686,437 |
| LSTAR Commercial Mortgage Trust, Series 2017-5, Class A1 | | | |
| 2.42%, 03/10/50 144A | 642,234 | | 641,608 |
| Luminent Mortgage Trust, Series 2006-7, Class 2A1 | | | |
| (Floating, ICE LIBOR USD 1M + 0.17%, 0.17% Floor, 10.50% Cap), 1.96%, 12/25/36† | 422,621 | | 414,215 |
| MASTR Adjustable Rate Mortgages Trust, Series 2003-6, Class 3A1 | | | |
| 3.81%, 12/25/33† γ | 100,013 | | 102,285 |
| Merrill Lynch Mortgage Investors Trust, Series 2006-1, Class 2A1 | | | |
| 4.00%, 02/25/36† γ | 189,864 | | 192,155 |
| MF1, Ltd., Series 2019-FL2, Class A | | | |
| (Floating, ICE LIBOR USD 1M + 1.13%, 1.13% Floor), 2.92%, 12/25/34 144A † | 1,900,000 | | 1,905,328 |
| Morgan Stanley Bank of America Merrill Lynch Trust, Series 2013-C12, Class ASB | | | |
| 3.82%, 10/15/46 | 1,065,918 | | 1,095,586 |
| Morgan Stanley Bank of America Merrill Lynch Trust, Series 2013-C13, Class A3 | | | |
| 3.77%, 11/15/46 | 545,000 | | 571,357 |
| Morgan Stanley Bank of America Merrill Lynch Trust, Series 2013-C9, Class AAB | | | |
| 2.66%, 05/15/46 | 201,802 | | 203,304 |
| Morgan Stanley Bank of America Merrill Lynch Trust, Series 2014-C18, Class ASB | | | |
| 3.62%, 10/15/47 | 503,976 | | 518,497 |
| Morgan Stanley Bank of America Merrill Lynch Trust, Series 2015-C22, Class ASB | | | |
| 3.04%, 04/15/48 | 2,000,000 | | 2,040,729 |
See Notes to Financial Statements.
SCHEDULE OF INVESTMENTS (Continued)
| | | Par | | Value |
| Morgan Stanley Bank of America Merrill Lynch Trust, Series 2015-C25, Class ASB | | | |
| 3.38%, 10/15/48 | $825,000 | | $853,722 |
| Morgan Stanley Bank of America Merrill Lynch Trust, Series 2016-C32, Class XA | | | |
| 0.73%, 12/15/49† IO γ | 1,941,920 | | 78,266 |
| Morgan Stanley Capital I Trust, Series 2014-CPT, Class A | | | |
| 3.35%, 07/13/29 144A | 815,000 | | 827,164 |
| Morgan Stanley Capital I Trust, Series 2018-H4, Class A4 | | | |
| 4.31%, 12/15/51 | 249,000 | | 280,873 |
| National Rmbs Trust, Series 2012-2, Class A1 | | | |
| (Floating, Australian BBSW 1M + 1.10%), 1.95%, 06/20/44(A) † | 106,643 | | 75,158 |
| NCUA Guaranteed Notes Trust, Series 2011-C1, Class 2A | | | |
| (Floating, ICE LIBOR USD 1M + 0.53%, 0.53% Floor, 8.00% Cap), 2.24%, 03/09/21† | 482,523 | | 483,869 |
| New Residential Mortgage Loan Trust, Series 2017-3A, Class A1 | | | |
| 4.00%, 04/25/57 144A | 1,494,126 | | 1,561,657 |
| New Residential Mortgage Loan Trust, Series 2017-4A, Class A1 | | | |
| 4.00%, 05/25/57 144A | 1,504,653 | | 1,578,393 |
| New Residential Mortgage Loan Trust, Series 2018-1A, Class A1A | | | |
| 4.00%, 12/25/57 144A † γ | 1,801,074 | | 1,877,314 |
| New Residential Mortgage Loan Trust, Series 2019-RPL3, Class A1 | | | |
| 2.75%, 07/25/59 144A | 1,851,423 | | 1,864,772 |
| Permanent Master Issuer PLC, Series 2018-1A, Class 1A1 | | | |
| (Floating, ICE LIBOR USD 3M + 0.38%), 2.37%, 07/15/58 144A † | 830,000 | | 830,103 |
| PFP, Ltd., Series 2019-5, Class A | | | |
| (Floating, ICE LIBOR USD 1M + 0.97%, 0.97% Floor), 2.71%, 04/14/36 144A † | 314,471 | | 315,571 |
| PFP, Ltd., Series 2019-6, Class A | | | |
| (Floating, ICE LIBOR USD 1M + 1.05%, 1.05% Floor), 2.96%, 04/14/37 144A † | 2,000,000 | | 2,003,002 |
| RFMSI Trust, Series 2003-S9, Class A1 | | | |
| 6.50%, 03/25/32 | 5,062 | | 5,253 |
| Ripon Mortgages PLC, Series 1X, Class A2 | | | |
| (Floating, ICE LIBOR GBP 3M + 0.80%), 1.60%, 08/20/56(U) † | 875,608 | | 1,162,591 |
| Seasoned Credit Risk Transfer Trust Series, Series 2019-4, Class MA | | | |
| 3.00%, 02/25/59 | 1,099,673 | | 1,121,674 |
| Seasoned Credit Risk Transfer Trust, Series 2018-2, Class MA | | | |
| 3.50%, 11/25/57 | 542,090 | | 562,234 |
| | | Par | | Value |
| Sequoia Mortgage Trust 2017-CH1 A2 | | | |
| 3.50%, 08/25/47 144A | $497,265 | | $503,510 |
| Sequoia Mortgage Trust, Series 2017-CH2, Class A10 | | | |
| 4.00%, 12/25/47 144A | 194,904 | | 196,505 |
| Silverstone Master Issuer PLC, Series 2019-1A, Class 1A | | | |
| (Floating, ICE LIBOR USD 3M + 0.57%), 2.54%, 01/21/70 144A † | 183,000 | | 183,130 |
| STACR Trust, Series 2018-DNA2, Class M1 | | | |
| (Floating, ICE LIBOR USD 1M + 0.80%), 2.59%, 12/25/30 144A † | 902,084 | | 902,862 |
| STACR Trust, Series 2018-HRP1, Class M2 | | | |
| (Floating, ICE LIBOR USD 1M + 1.65%), 3.44%, 04/25/43 144A † | 1,561,941 | | 1,567,489 |
| STACR Trust, Series 2018-HRP2, Class M2 | | | |
| (Floating, ICE LIBOR USD 1M + 1.25%), 3.04%, 02/25/47 144A † | 2,200,000 | | 2,204,219 |
| Structured Adjustable Rate Mortgage Loan Trust, Series 2004-13, Class A2 | | | |
| 0.49%, 09/25/34 | 62,813 | | 60,087 |
| Structured Asset Mortgage Investments II Trust, Series 2005-AR5, Class A1 | | | |
| (Floating, ICE LIBOR USD 1M + 0.25%, 0.25% Floor, 11.00% Cap), 2.01%, 07/19/35† | 43,789 | | 43,568 |
| Structured Asset Mortgage Investments II Trust, Series 2005-AR8, Class A1A | | | |
| (Floating, ICE LIBOR USD 1M + 0.28%, 0.28% Floor, 10.50% Cap), 2.07%, 02/25/36† | 332,111 | | 321,390 |
| TBW Mortgage-Backed Trust, Series 2007-2, Class A6A | | | |
| (Step to 4.73% on 02/25/20), 6.01%, 07/25/37 STEP | 241,940 | | 161,592 |
| TORRENS Trust, Series 2013-1, Class A | | | |
| (Floating, Australian BBSW 1M + 0.95%), 1.79%, 04/12/44(A) † | 543,459 | | 381,206 |
| Towd Point Mortgage Funding PLC, Series 2019-GR4A, Class A1 | | | |
| (Floating, ICE LIBOR GBP 3M + 1.03%), 1.81%, 10/20/51(U) 144A † | 1,777,854 | | 2,364,617 |
| UBS Commercial Mortgage Trust, Series 2017-C1, Class A4 | | | |
| 3.46%, 06/15/50 | 500,000 | | 530,724 |
| UBS Commercial Mortgage Trust, Series 2019-C18, Class A4 | | | |
| 3.04%, 12/15/52 | 330,000 | | 339,414 |
See Notes to Financial Statements.
| | | Par | | Value |
| Uniform Mortgage Backed Securities | | | |
| 2.50%, 01/01/35 TBA | $4,350,000 | | $4,390,102 |
| 4.00%, 01/01/35 TBA | 545,000 | | 568,503 |
| 4.50%, 01/01/35 TBA | 510,000 | | 526,376 |
| 4.00%, 01/01/50 TBA | 10,500,000 | | 10,921,641 |
| 3.00%, 02/01/50 TBA | 14,300,000 | | 14,490,876 |
| 4.00%, 02/01/50 TBA | 38,980,000 | | 40,562,040 |
| 4.00%, 03/01/50 TBA | 5,000,000 | | 5,201,486 |
| Washington Mutual Mortgage Pass-Through Certificates Trust, Series 2002-AR6, Class A | | | |
| (Floating, Federal Reserve U.S. 12 1Y CMT + 1.40%, 1.40% Floor), 3.64%, 06/25/42† | 6,821 | | 6,796 |
| Washington Mutual Mortgage Pass-Through Certificates Trust, Series 2003-AR8, Class A | | | |
| 4.41%, 08/25/33† γ | 134,891 | | 137,679 |
| Washington Mutual Mortgage Pass-Through Certificates Trust, Series 2005-AR2, Class 2A1A | | | |
| (Floating, ICE LIBOR USD 1M + 0.31%, 0.31% Floor, 10.50% Cap), 2.10%, 01/25/45† | 277,008 | | 273,173 |
| Washington Mutual Mortgage Pass-Through Certificates Trust, Series 2006-AR19, Class 1A | | | |
| (Floating, Federal Reserve U.S. 12 1Y CMT + 0.74%, 0.74% Floor), 2.98%, 01/25/47† | 280,940 | | 274,643 |
| Washington Mutual Mortgage Pass-Through Certificates Trust, Series 2006-AR5, Class A12A | | | |
| (Floating, Federal Reserve U.S. 12 1Y CMT + 0.98%, 0.98% Floor), 3.22%, 06/25/46† | 563,773 | | 564,900 |
| Washington Mutual Mortgage Pass-Through Certificates Trust, Series 2007-HY1, Class 1A1 | | | |
| 3.87%, 02/25/37† γ | 215,466 | | 201,646 |
| Washington Mutual Mortgage Pass-Through Certificates Trust, Series 2007-HY5, Class 2A1 | | | |
| 3.44%, 05/25/37† γ | 235,414 | | 200,246 |
| Washington Mutual Mortgage Pass-Through Certificates Trust, Series 2007-HY7, Class 2A1 | | | |
| 3.61%, 07/25/37† γ | 673,109 | | 616,651 |
| Washington Mutual Mortgage Pass-Through Certificates Trust, Series 2007-OA5, Class A1B | | | |
| (Floating, Federal Reserve U.S. 12 1Y CMT + 0.84%, 0.84% Floor), 3.08%, 05/25/47† | 44,698 | | 4,332 |
| Wells Fargo Commercial Mortgage Trust, Series 2014-LC16, Class ASB | | | |
| 3.48%, 08/15/50 | 926,236 | | 951,206 |
| Wells Fargo Commercial Mortgage Trust, Series 2015-C26, Class A4 | | | |
| 3.17%, 02/15/48 | 500,000 | | 518,613 |
| | | Par | | Value |
| Wells Fargo Commercial Mortgage Trust, Series 2016-NXS5, Class A6FL | | | |
| (Floating, ICE LIBOR USD 1M + 1.55%, 1.55% Floor), 3.29%, 01/15/59 144A † | $2,000,000 | | $2,048,444 |
| WFRBS Commercial Mortgage Trust, Series 2011-C4, Class AFL | | | |
| (Floating, ICE LIBOR USD 1M + 1.45%, 1.45% Floor), 3.19%, 06/15/44 144A † | 2,574,338 | | 2,593,722 |
| WFRBS Commercial Mortgage Trust, Series 2011-C5, Class A4 | | | |
| 3.67%, 11/15/44 | 1,000,000 | | 1,018,487 |
| WFRBS Commercial Mortgage Trust, Series 2012-C8, Class AFL | | | |
| (Floating, ICE LIBOR USD 1M + 1.00%, 1.00% Floor), 2.74%, 08/15/45 144A † | 527,493 | | 529,857 |
| WFRBS Commercial Mortgage Trust, Series 2014-C21, Class ASB | | | |
| 3.39%, 08/15/47 | 708,367 | | 722,905 |
| WFRBS Commercial Mortgage Trust, Series 2014-LC14, Class ASB | | | |
| 3.52%, 03/15/47 | 585,522 | | 599,920 |
Total Mortgage-Backed Securities
(Cost $265,809,018) | | | 266,501,450 |
| MUNICIPAL BONDS — 0.4% |
| North Texas Higher Education Authority, Inc. | | | |
| (Floating, ICE LIBOR USD 3M + 1.10%, 1.10% Floor, 15.00% Cap), 3.01%, 04/01/40† | 1,479,576 | | 1,488,387 |
| South Carolina Public Service Authority | | | |
| 2.39%, 12/01/23 | 385,000 | | 385,993 |
| 3.72%, 12/01/23 | 326,000 | | 340,400 |
| State of California, General Obligation, Series C | | | |
| (Floating, ICE LIBOR USD 1M + 0.00%), 2.54%, 04/01/47† | 1,500,000 | | 1,505,880 |
Total Municipal Bonds
(Cost $3,655,918) | | | 3,720,660 |
| U.S. TREASURY OBLIGATIONS — 22.5% |
| U.S. Treasury Bills | | | | |
| 1.88%, 01/23/20Ω | 4,300,000 | | 4,296,325 |
| 1.50%, 02/20/20Ω | 395,000 | | 394,188 |
| 1.91%, 05/21/20Ω | 9,000,000 | | 8,946,756 |
| 1.56%, 07/16/20Ω | 1,100,000 | | 1,090,830 |
| 1.71%, 08/13/20Ω | 2,000,000 | | 1,981,053 |
| 1.49%, 12/03/20Ω | 2,750,000 | | 2,712,048 |
| | | | | 19,421,200 |
| U.S. Treasury Inflationary Index Bonds | | | | |
| 0.63%, 04/15/23Δ | 8,342,040 | | 8,491,190 |
| 0.38%, 07/15/25 | 3,798,165 | | 3,876,258 |
See Notes to Financial Statements.
SCHEDULE OF INVESTMENTS (Continued)
| | | Par | | Value |
| 0.75%, 07/15/28 | $7,689,150 | | $8,091,494 |
| 0.88%, 01/15/29‡‡ | 3,159,458 | | 3,356,050 |
| | | | | 23,814,992 |
| U.S. Treasury Notes | | | | |
| 1.38%, 10/31/20 | 2,405,000 | | 2,399,645 |
| 2.50%, 01/31/21‡‡ | 1,000,000 | | 1,009,297 |
| 1.75%, 07/31/21 | 63,600,000 | | 63,763,969 |
| 1.50%, 11/30/21Δ | 48,851,000 | | 48,792,799 |
| 1.50%, 08/15/22‡‡ | 13,700,000 | | 13,672,439 |
| 1.50%, 09/15/22 | 13,149,644 | | 13,121,400 |
| 1.38%, 10/15/22 | 20,400,000 | | 20,278,875 |
| 1.63%, 11/15/22 | 14,655,000 | | 14,667,880 |
| 1.50%, 10/31/24 | 850,000 | | 843,061 |
| 1.50%, 11/30/24Δ | 1,595,000 | | 1,582,352 |
| | | | | 180,131,717 |
Total U.S. Treasury Obligations
(Cost $222,375,793) | | | 223,367,909 |
| | | Shares | |
| MONEY MARKET FUNDS — 7.8% |
GuideStone Money Market Fund, 1.53%
(Institutional Class)Ø ∞ | 21,271,649 | 21,271,649 |
| Northern Institutional Liquid Assets Portfolio (Shares), 1.57%Ø § | 55,958,919 | 55,958,919 |
| Northern Institutional U.S. Government Portfolio (Shares), 1.48%Ø | 605,846 | 605,846 |
Total Money Market Funds
(Cost $77,836,414) | | 77,836,414 |
| | | Par | |
| REPURCHASE AGREEMENTS — 1.2% |
| Citigroup Global Markets, Inc. | | |
| 1.55% (dated 12/31/19, due 1/02/2020, repurchase price $5,900,508, collateralized by U.S. Treasury Notes, 2.000%, due 8/15/2025, total market value $6,019,694) | $5,900,000 | 5,900,000 |
| | | |
| 1.59% (dated 12/31/19, due 1/03/2020, repurchase price $6,000,795, collateralized by U.S. Treasury Notes, 2.500%, due 8/15/2023, total market value $6,127,623) | 6,000,000 | 6,000,000 |
Total Repurchase Agreements
(Cost $11,900,000) | | 11,900,000 |
TOTAL INVESTMENTS —113.5%
(Cost $1,122,268,167) | | 1,128,979,478 |
| | Number of
Contracts | | Notional
Amount | | Value |
| WRITTEN OPTIONS — (0.0)% |
| Call Swaptions — (0.0)% |
Sell Protection on Markit CDX.NA.IG.33 Index; Receive 1.00% (Quarterly): Credit Default Swap Maturing 12/20/2024 USD, Strike Price
$0.45, Expires
01/15/20 (CS) | 1 | | $(29,000,000) | | $(14,715) |
Sell Protection on Markit CDX.NA.IG.33 Index; Receive 1.00% (Quarterly): Credit Default Swap Maturing 12/20/2024 USD, Strike Price
$0.48, Expires
01/15/20 (DEUT) | 1 | | (17,300,000) | | (22,137) |
Sell Protection on Markit CDX.NA.IG.33 Index; Receive 1.00% (Quarterly): Credit Default Swap Maturing 12/20/2024 USD, Strike Price
$0.48, Expires
02/19/20 (BNP) | 1 | | (1,400,000) | | (2,280) |
| | | | | | (39,132) |
| Put Swaptions — (0.0)% |
Sell Protection on Markit CDX.NA.IG.33 Index; Receive 1.00% (Quarterly): Credit Default Swap Maturing 12/20/2024 USD, Strike Price
$0.80, Expires
02/19/20 (BNP) | 1 | | (1,400,000) | | (175) |
See Notes to Financial Statements.
| | Number of
Contracts | | Notional
Amount | | Value |
Sell Protection on Markit CDX.NA.IG.33 Index; Receive 1.00% (Quarterly): Credit Default Swap Maturing 12/20/2024 USD, Strike Price
$0.90, Expires
01/15/20 (CS) | 1 | | $(5,600,000) | | $(69) |
| | | | | | (244) |
Total Written Options
(Premiums received $ (20,692)) | | | | (39,376) |
| | | Par | | Value |
| TBA SALE COMMITMENT — (0.6)% |
Uniform Mortgage Backed Securities
2.50%, 01/01/50 TBA
(Proceeds $(5,924,063)) | (6,000,000) | | $(5,933,203) |
Liabilities in Excess of Other
Assets — (12.9)% | | | (128,303,137) |
| NET ASSETS — 100.0% | | | $994,703,762 |
Futures Contracts outstanding at December 31, 2019:
| Future Type | | Expiration Date | | Open Long
(Short) Contracts | | Notional
Market Value
of Contracts | | Value and
Unrealized
Appreciation
(Depreciation) |
| Euro-Bobl | | 03/2020 | | (65) | | $(9,743,031) | | $50,031 |
| Euro-Bund | | 03/2020 | | (9) | | (1,721,148) | | 10,464 |
| Euro-Schatz | | 03/2020 | | 37 | | 4,644,382 | | (2,897) |
| 10-Year Commonwealth Treasury Bond | | 03/2020 | | 137 | | 13,743,962 | | (272,628) |
| 10-Year U.S. Treasury Note | | 03/2020 | | (28) | | (3,595,813) | | 37,119 |
| U.S. Treasury Long Bond | | 03/2020 | | 3 | | 467,719 | | (10,475) |
| Ultra 10-Year U.S. Treasury Note | | 03/2020 | | (52) | | (7,316,562) | | 83,140 |
| Ultra Long U.S. Treasury Bond | | 03/2020 | | (25) | | (4,541,406) | | 129,879 |
| Long GILT | | 03/2020 | | (32) | | (5,568,831) | | 32,986 |
| 2-Year U.S. Treasury Note | | 03/2020 | | 1,321 | | 284,675,500 | | (105,311) |
| 5-Year U.S. Treasury Note | | 03/2020 | | (467) | | (55,390,578) | | 107,198 |
| 90-Day Bank Acceptance | | 12/2020 | | 107 | | 20,195,112 | | (40,962) |
| Total Futures Contracts outstanding at December 31, 2019 | | | | | | $235,849,306 | | $18,544 |
Forward Foreign Currency Contracts outstanding at December 31, 2019:
| Expiration Date | | Currency
Purchased | | Amount
of Currency
Purchased | | Currency
Sold | | Amount
of Currency
Sold | | Counter-
party | | Net Unrealized
Appreciation
(Depreciation) |
| 01/10/20 | | Euro | | 2,083,000 | | U.S. Dollars | | 2,312,059 | | BNP | | $25,942 |
| 02/10/20 | | U.S. Dollars | | 6,196,299 | | Japanese Yen | | 669,600,000 | | MSCS | | 19,357 |
| 03/18/20 | | Norwegian Kroner | | 7,225,050 | | Canadian Dollars | | 1,050,000 | | BOA | | 14,337 |
| 03/18/20 | | Norwegian Kroner | | 7,196,233 | | Canadian Dollars | | 1,050,000 | | JPM | | 11,053 |
| 03/18/20 | | New Zealand Dollars | | 1,226,824 | | Australian Dollars | | 1,170,000 | | JPM | | 4,192 |
| 03/18/20 | | Norwegian Kroner | | 7,130,996 | | Canadian Dollars | | 1,050,000 | | MSCS | | 3,621 |
| 03/18/20 | | Canadian Dollars | | 1,050,000 | | Norwegian Kroner | | 7,076,580 | | MSCS | | 2,578 |
| 01/10/20 | | Japanese Yen | | 347,100,000 | | U.S. Dollars | | 3,196,133 | | UBS | | 190 |
| Subtotal Appreciation | | | | | | | | | | $81,270 |
| 02/14/20 | | U.S. Dollars | | 182 | | Euro | | 163 | | CIBC | | $(2) |
| 01/16/20 | | U.S. Dollars | | 53,625 | | Mexican Pesos | | 1,035,165 | | HSBC | | (985) |
| 03/18/20 | | Australian Dollars | | 2,330,000 | | New Zealand Dollars | | 2,434,279 | | BOA | | (2,362) |
| 02/05/20 | | U.S. Dollars | | 186,054 | | Euro | | 168,000 | | RBS | | (2,823) |
| 02/05/20 | | U.S. Dollars | | 187,133 | | Euro | | 169,000 | | HSBC | | (2,868) |
| 02/05/20 | | U.S. Dollars | | 232,660 | | Euro | | 210,000 | | MSCS | | (3,437) |
See Notes to Financial Statements.
SCHEDULE OF INVESTMENTS (Continued)
| Expiration Date | | Currency
Purchased | | Amount
of Currency
Purchased | | Currency
Sold | | Amount
of Currency
Sold | | Counter-
party | | Net Unrealized
Appreciation
(Depreciation) |
| 02/05/20 | | U.S. Dollars | | 100,443 | | Australian Dollars | | 148,000 | | NAB | | $(3,512) |
| 01/10/20 | | U.S. Dollars | | 235,373 | | Australian Dollars | | 343,000 | | RBS | | (5,391) |
| 01/10/20 | | U.S. Dollars | | 314,921 | | Canadian Dollars | | 417,000 | | HSBC | | (6,224) |
| 02/05/20 | | U.S. Dollars | | 906,111 | | Euro | | 818,000 | | TD | | (13,540) |
| 02/05/20 | | U.S. Dollars | | 1,125,095 | | Euro | | 1,015,000 | | JPM | | (16,037) |
| 03/18/20 | | Canadian Dollars | | 2,100,000 | | Norwegian Kroner | | 14,344,473 | | JPM | | (16,640) |
| 01/31/20 | | U.S. Dollars | | 4,457,543 | | Euro | | 4,004,000 | | NAB | | (42,665) |
| 02/14/20 | | U.S. Dollars | | 5,121,438 | | Euro | | 4,595,837 | | MSCS | | (48,327) |
| 02/05/20 | | U.S. Dollars | | 4,837,956 | | Euro | | 4,363,000 | | CIBC | | (67,225) |
| 01/10/20 | | U.S. Dollars | | 5,421,956 | | British Pounds | | 4,187,000 | | BNP | | (125,791) |
| 01/16/20 | | U.S. Dollars | | 7,935,517 | | Mexican Pesos | | 153,164,835 | | UBS | | (144,760) |
| 01/10/20 | | U.S. Dollars | | 12,909,946 | | Euro | | 11,681,000 | | GSC | | (201,042) |
| 03/23/20 | | U.S. Dollars | | 8,399,898 | | Canadian Dollars | | 11,168,000 | | HSBC | | (202,944) |
| 02/05/20 | | U.S. Dollars | | 11,713,512 | | Euro | | 10,601,000 | | CITI | | (204,853) |
| Subtotal Depreciation | | | | | | | | | | $(1,111,428) |
| Total Forward Foreign Currency Contracts outstanding at December 31, 2019 | | | | $(1,030,158) |
Swap Agreements outstanding at December 31, 2019:
| Reference Obligation | | Fixed
Deal
(Pay) Rate | | Maturity
Date | | Counterparty | | Currency | | Notional
Amount | | Market Value | | Upfront
Premiums
Paid/
(Received) | | Unrealized
Appreciation
(Depreciation) |
| Credit Default Swaps on Sovereign Issuers—Buy Protection | | | | | | | | | | | | | | | | |
| Peoples Republic of China, 7.5% due 10/28/2027 (Pay Quarterly) | | (1.00)% | | 6/20/2024 | | MS | | USD | | 1,600,000 | | $(50,530) | | $(35,993) | | $(14,537) |
| | | $(50,530) | | $(35,993) | | $(14,537) |
| Reference Obligation | | Fixed
Deal
(Pay) Rate | | Maturity
Date | | Currency | | Notional
Amount | | Market Value | | Upfront
Premiums
Paid/
(Received) | | Unrealized
Appreciation
(Depreciation) |
| Centrally Cleared Credit Default Swaps on Credit Indexes—Buy Protection | | | | | | | | | | | | | | |
| Markit CDX.NA.IG.32 Index (Pay Quarterly) | | (1.00)% | | 6/20/2024 | | USD | | 17,100,000 | | $(451,422) | | $(334,704) | | $(116,718) |
| | | $(451,422) | | $(334,704) | | $(116,718) |
| Pay Rate Index/Pay Rate | | Receive
Rate/Receive
Rate Index | | Maturity
Date | | Currency | | Notional
Amount | | Market Value | | Upfront
Premiums
Paid/
(Received) | | Unrealized
Appreciation
(Depreciation) |
| Centrally Cleared Interest Rate Swaps | | | | | | | | | | | | |
| 1.56% (Semiannually) | | 3-Month LIBOR (Quarterly) | | 11/22/2021 | | USD | | 7,300,000 | | $20,473 | | $— | | $20,473 |
| 1.63% (Semiannually) | | 3-Month LIBOR (Quarterly) | | 1/6/2030 | | USD | | 3,400,000 | | 89,059 | | (17,827) | | 106,886 |
| Subtotal Appreciation | | | | | | | | | | $109,532 | | $(17,827) | | $127,359 |
| 3-Month CDOR (Semiannually) | | 1.77% (Semiannually) | | 11/20/2021 | | CAD | | 9,000,000 | | $(30,468) | | $— | | $(30,468) |
| 3-Month LIBOR (Quarterly) | | 1.65% (Semiannually) | | 12/24/2024 | | USD | | 5,700,000 | | (24,786) | | — | | (24,786) |
| 3-Month CDOR (Semiannually) | | 2.50% (Semiannually) | | 6/19/2029 | | CAD | | 8,700,000 | | 205,312 | | 569,244 | | (363,932) |
| 2.75% (Semiannually) | | 3-Month LIBOR (Quarterly) | | 12/18/2029 | | USD | | 12,500,000 | | (970,991) | | (878,595) | | (92,396) |
| Subtotal Depreciation | | | | | | | | | | $(820,933) | | $(309,351) | | $(511,582) |
| Net Centrally Cleared Interest Rate Swaps outstanding at December 31, 2019 | | $(711,401) | | $(327,178) | | $(384,223) |
See Notes to Financial Statements.
VALUATION HIERARCHY
The following is a summary of the inputs used, as of December 31, 2019, in valuing the Fund’s investments carried at fair value:
| | Total
Value | | Level 1
Quoted Prices | | Level 2
Other Significant
Observable Inputs | | Level 3
Significant
Unobservable Inputs |
| Assets: | | | | | | | |
| Investments in Securities: | | | | | | | |
| Agency Obligations | $11,286,244 | | $— | | $11,286,244 | | $— |
| Asset-Backed Securities | 153,705,191 | | — | | 153,705,191 | | — |
| Corporate Bonds | 227,332,739 | | — | | 227,332,739 | | — |
| Foreign Bonds | 153,328,871 | | — | | 153,328,871 | | — |
| Money Market Funds | 77,836,414 | | 77,836,414 | | — | | — |
| Mortgage-Backed Securities | 266,501,450 | | — | | 266,501,450 | | — |
| Municipal Bonds | 3,720,660 | | — | | 3,720,660 | | — |
| Repurchase Agreements | 11,900,000 | | — | | 11,900,000 | | — |
| U.S. Treasury Obligations | 223,367,909 | | — | | 223,367,909 | | — |
| Total Assets - Investments in Securities | $1,128,979,478 | | $77,836,414 | | $1,051,143,064 | | $ — |
| Other Financial Instruments*** | | | | | | | |
| Forward Foreign Currency Contracts | $81,270 | | $— | | $81,270 | | $— |
| Futures Contracts | 450,817 | | 450,817 | | — | | — |
| Swap Agreements | 127,359 | | — | | 127,359 | | — |
| Total Assets - Other Financial Instruments | $659,446 | | $450,817 | | $208,629 | | $ — |
| Liabilities: | | | | | | | |
| Investments in Securities: | | | | | | | |
| TBA Sale Commitment | $(5,933,203) | | $— | | $(5,933,203) | | $— |
| Written Options: | | | | | | | |
| Call Swaptions | (39,132) | | — | | (39,132) | | — |
| Put Swaptions | (244) | | — | | (244) | | — |
| Total Written Options | (39,376) | | — | | (39,376) | | — |
| Total Liabilities - Investments in Securities | $(5,972,579) | | $ — | | $(5,972,579) | | $ — |
| Other Financial Instruments*** | | | | | | | |
| Forward Foreign Currency Contracts | $(1,111,428) | | $— | | $(1,111,428) | | $— |
| Futures Contracts | (432,273) | | (432,273) | | — | | — |
| Swap Agreements | (642,837) | | — | | (642,837) | | — |
| Total Liabilities - Other Financial Instruments | $(2,186,538) | | $(432,273) | | $(1,754,265) | | $ — |
| *** | Other financial instruments are derivative instruments, such as futures contracts, forwards contracts and swap agreements, which are valued at the unrealized appreciation (depreciation) on the investment. Further details regarding the value of these investments can be found in the preceding "Futures Contracts outstanding", "Forwards Foreign Currency Contracts outstanding" and "Swap Agreements outstanding" disclosures. |
See Notes to Financial Statements.
Medium-Duration Bond Fund(Unaudited)
The Fund invested in a diversified portfolio composed primarily of investment grade fixed-income securities with a dollar-weighted effective duration (a calculation that measures the sensitivity of a bond or bond fund to changes in interest rates taking into account embedded options and floating interest rates) that normally varies, in years, between +/- 30% of the duration of the Fund’s benchmark index, the Bloomberg Barclays US Aggregate Bond Index. The average dollar weighted effective duration at the end of the reporting period was 6.46 years. The Investor Class of the Fund outperformed its benchmark for the one-year period ended December 31, 2019 (9.58% versus 8.72%).
The Fund maintained an overweight to credit, both high yield and investment grade and local currency emerging markets debt throughout the year, all of which were additive to performance. Credit spreads narrowed after widening in the fourth quarter of 2019, and rates in select emerging markets fell thus supporting local debt markets. Tactical U.S. yield curve positioning contributed as well, and the Fund maintained a yield advantage versus its benchmark, which was beneficial. Outperformance was partially offset by an overweight to mortgages and exposure to out of benchmark asset-backed securities both of which lagged the more traditional risk-on sectors and U.S. Treasuries, which benefited from lower rates.
Other strategies involving derivatives were utilized during 2019. U.S. Treasury futures contracts, options on U.S. Treasuries, euro-futures and interest rate swaps were used for the common purposes of managing both U.S. and non-U.S. duration, implementing yield curve positioning strategies and expressing cross-sector views. Overall, on a net basis, these positions had a positive impact on performance. In an effort to better manage credit risks from a synthetic perspective, credit default swaps were utilized on a very modest basis and were a positive contributor to performance. Currency forward and futures contracts were included in the Fund to hedge foreign currency risk and to express active currency views. Both were additive to performance. Interest rate swaps were used to express interest rate views during the year and were a detractor to the performance of the Fund. Swaptions were also used to manage portfolio duration along with credit risk and were a positive contributor to performance. German Bund futures and options were used to adjust exposure to non-U.S. developed market yield curves. In aggregate, these positions detracted during the period.
During the year, the Fund remained focused on its objective of seeking maximum total return consistent with preservation of capital.
This Fund may be suitable for investors who have a short- to medium-term investment horizon, seek higher returns than those offered by a shorter maturity bond fund, can accept some short-term fluctuations in account value and want to diversify their portfolio with a fixed-income investment option. This Fund is subject to interest rate risk, meaning, when interest rates rise, the value of the existing fixed-income securities decrease and vice versa. Changes in interest rates have a bigger impact on long duration holdings than on short duration holdings. To the extent that the investment adviser or sub-advisers misjudge current market conditions, the Fund’s volatility may be amplified by its use of derivatives and by its ability to select sub-advisers to allocate assets. Derivatives involve different risks from, and in some respects greater risks than, those associated with investing directly in securities, currencies or other instruments. Derivatives may be illiquid or less liquid, volatile, difficult to price and leverage, so small changes in value of the underlying instruments may produce disproportionate losses to the Fund. It is possible to lose money by investing in the Fund.
See Notes to Financial Statements.
Medium-Duration Bond Fund(Unaudited)
At December 31, 2019, the portfolio holdings of the Fund, as a percentage of net assets, is shown in the following table. Portfolio holdings are subject to risk and may change at any time.
| | % |
| Mortgage-Backed Securities | 45.0 |
| Corporate Bonds | 25.0 |
| U.S. Treasury Obligations | 15.1 |
| Foreign Bonds | 14.4 |
| Asset-Backed Securities | 5.7 |
| Money Market Funds | 4.4 |
| Repurchase Agreements | 1.5 |
| Agency Obligations | 0.8 |
| Loan Agreements | 0.7 |
| Municipal Bonds | 0.6 |
| Purchased Options | —** |
| Written Options | (0.1) |
| TBA Sale Commitments | (4.6) |
| | 108.5 |
| **Rounds to less than 0.1% | |
See Notes to Financial Statements.
Medium-Duration Bond Fund(Unaudited)
| Average Annual Total Returns as of 12/31/19 | |
| | | Institutional Class* | | Investor Class* | | Benchmark** | |
| One Year | | 9.81% | | 9.58% | | 8.72% | |
| Five Year | | 3.30% | | 3.02% | | 3.05% | |
| Ten year | | 4.35% | | 4.14% | | 3.74% | |
| Since Inception | | 4.99% | | 4.85% | | 4.50% | |
| Inception Date | | 08/27/01 | | 08/27/01 | | | |
| Total Fund Operating Expenses (April 30, 2019 Prospectus)(1) | | 0.39% | | 0.66% | | | |
| (1) | Current information regarding the Fund’s Operating Expenses can be found in the Financial Highlights. |
The performance data quoted represents past performance and does not guarantee future results. Current performance may be lower or higher. Performance data current to the most recent month-end may be obtained at GuideStoneFunds.com. The investment return and principal value of an investment will fluctuate so that shares, when redeemed, may be worth more or less than their original cost.
The graph illustrates the results of a hypothetical $10,000 investment in the Investor Class of the Fund for the 10-year period from December 31, 2009 to December 31, 2019, with all dividends and capital gains reinvested, with the Bloomberg Barclays US Aggregate Bond Index.
*These returns reflect investment advisory and shareholder servicing fee waivers, if applicable, during the reported time periods.
**Unlike a mutual fund, the performance of an index assumes no taxes, transaction costs, management fees or other expenses.
See Notes to Financial Statements.
MEDIUM-DURATION BOND FUND
| | | Par | | Value |
| AGENCY OBLIGATIONS — 0.8% |
| Federal Home Loan Bank | | | | |
| 2.13%, 02/11/20 | $270,000 | | $270,145 |
| 3.38%, 12/08/23 | 200,000 | | 212,534 |
| Federal Home Loan Bank Discount Notes | | | | |
| 1.54%, 01/29/20Ω | 2,400,000 | | 2,397,060 |
| 1.54%, 02/07/20Ω | 100,000 | | 99,838 |
| 1.54%, 02/10/20Ω | 5,300,000 | | 5,290,784 |
| 1.54%, 02/14/20Ω | 1,000,000 | | 998,079 |
| 1.56%, 03/18/20Ω | 900,000 | | 896,958 |
| Federal National Mortgage Association | | | | |
| 1.88%, 09/24/26 | 1,500,000 | | 1,498,258 |
| 6.25%, 05/15/29 | 500,000 | | 676,705 |
| 6.63%, 11/15/30 | 670,000 | | 955,927 |
| Tennessee Valley Authority | | | | |
| 3.88%, 02/15/21 | 1,000,000 | | 1,022,337 |
Total Agency Obligations
(Cost $14,118,863) | | | 14,318,625 |
| ASSET-BACKED SECURITIES — 5.7% |
| Academic Loan Funding Trust, Series 2012-1A, Class A2 | | | |
| (Floating, ICE LIBOR USD 1M + 1.10%), 2.89%, 12/27/44 144A † | 230,983 | | 232,118 |
| Access Group, Inc., Series 2015-1, Class A | | | |
| (Floating, ICE LIBOR USD 1M + 0.70%, 0.70% Floor), 2.49%, 07/25/56 144A † | 232,201 | | 227,337 |
| Ameriquest Mortgage Securities, Inc. Asset-Backed Pass-Through Certificates, Series 2005-R10, Class M3 | | | |
| (Floating, ICE LIBOR USD 1M + 0.45%, 0.45% Floor), 2.24%, 01/25/36† | 2,900,000 | | 2,867,321 |
| AMMC CLO XI, Ltd., Series 2012-11A, Class A1R2 | | | |
| (Floating, ICE LIBOR USD 3M + 1.01%), 2.95%, 04/30/31 144A † | 710,000 | | 704,583 |
| Ballyrock CLO, Ltd., Series 2018-1A, Class C | | | |
| (Floating, ICE LIBOR USD 3M + 3.15%), 5.12%, 04/20/31 144A † | 750,000 | | 730,266 |
| Ballyrock CLO, Ltd., Series 2019-2A, Class A1B | | | |
| (Floating, ICE LIBOR USD 3M + 1.75%, 1.75% Floor), 3.65%, 11/20/30 144A † | 500,000 | | 500,369 |
| Bear Stearns Asset Backed Securities Trust, Series 2007-SD1, Class 1A2A | | | |
| 6.00%, 10/25/36 | 1,008,349 | | 748,223 |
| | | Par | | Value |
| Bear Stearns Asset Backed Securities Trust, Series 2007-SD1, Class 1A3A | | | |
| 6.50%, 10/25/36 | $2,095,192 | | $1,575,636 |
| Benefit Street Partners CLO II, Ltd., Series 2013-IIA, Class A1R | | | |
| (Floating, ICE LIBOR USD 3M + 1.25%), 3.25%, 07/15/29 144A † | 1,400,000 | | 1,400,351 |
| BlueMountain CLO, Ltd., Series 2015-1A, Class A1R | | | |
| (Floating, ICE LIBOR USD 3M + 1.33%), 3.33%, 04/13/27 144A † | 347,171 | | 347,286 |
| BlueMountain CLO, Ltd., Series 2016-1A, Class CR | | | |
| (Floating, ICE LIBOR USD 3M + 1.85%), 3.82%, 04/20/27 144A † | 800,000 | | 760,646 |
| BSPRT Issuer, Ltd., Series 2018-FL4, Class A | | | |
| (Floating, ICE LIBOR USD 1M + 1.05%, 1.05% Floor), 2.79%, 09/15/35 144A † | 2,600,000 | | 2,603,068 |
| Capital Auto Receivables Asset Trust, Series 2017-1, Class A3 | | | |
| 2.02%, 08/20/21 144A | 1,366,533 | | 1,366,326 |
| CarMax Auto Owner Trust, Series 2017-2, Class A3 | | | |
| 1.93%, 03/15/22 | 1,406,831 | | 1,406,419 |
| Carrington Mortgage Loan Trust, Series 2005-OPT2, Class M4 | | | |
| (Floating, ICE LIBOR USD 1M + 0.98%, 0.65% Floor), 2.77%, 05/25/35† | 2,700,000 | | 2,710,874 |
| Catamaran CLO, Ltd., Series 2013-1A, Class AR | | | |
| (Floating, ICE LIBOR USD 3M + 0.85%), 2.79%, 01/27/28 144A † | 1,600,000 | | 1,594,968 |
| Chapel BV, Series 2007, Class A2 | | | |
| (Floating, 0.36% - Euribor 3M), 0.00%, 07/17/66(E) † | 102,636 | | 115,291 |
| Citibank Credit Card Issuance Trust, Series 2018-A7, Class A7 | | | |
| 3.96%, 10/13/30 | 850,000 | | 944,541 |
| Community Funding CLO, Series 2015-1A, Class A | | | |
| 5.75%, 11/01/27 144A STEP | 846,785 | | 858,965 |
| Countrywide Asset-Backed Certificates, Series 2006-1, Class AV3 | | | |
| (Floating, ICE LIBOR USD 1M + 0.30%, 0.30% Floor), 2.09%, 07/25/36† | 476,219 | | 476,835 |
| Credit Suisse European Mortgage Capital, Ltd., Series 2019-1OTF, Class A | | | |
| (Floating, ICE LIBOR USD 3M + 2.90%), 5.00%, 08/09/24 144A † | 1,000,000 | | 999,343 |
See Notes to Financial Statements.
MEDIUM-DURATION BOND FUND
SCHEDULE OF INVESTMENTS (Continued)
| | | Par | | Value |
| CWABS, Inc. Asset-Backed Certificates, Series 2004-1, Class M1 | | | |
| (Floating, ICE LIBOR USD 1M + 0.75%, 0.50% Floor), 2.54%, 03/25/34† | $311,408 | | $313,482 |
| CWHEQ Revolving Home Equity Loan Trust, Series 2005-F, Class 2A | | | |
| (Floating, ICE LIBOR USD 1M + 0.24%, 0.24% Floor, 16.00% Cap), 1.98%, 12/15/35† | 47,452 | | 46,203 |
| CWHEQ Revolving Home Equity Loan Trust, Series 2006-E, Class 2A | | | |
| (Floating, ICE LIBOR USD 1M + 0.14%, 0.14% Floor, 16.00% Cap), 1.88%, 07/15/36† | 146,424 | | 141,273 |
| Drive Auto Receivables Trust, Series 2019-2, Class A2A | | | |
| 2.93%, 03/15/22 | 1,583,073 | | 1,584,783 |
| Drive Auto Receivables Trust, Series 2019-2, Class A2B | | | |
| (Floating, ICE LIBOR USD 1M + 0.28%, 0.28% Floor), 2.02%, 03/15/22† | 1,583,073 | | 1,583,112 |
| Dryden 75 CLO, Ltd., Series 2019-75A, Class AR | | | |
| (Floating, ICE LIBOR USD 3M + 1.20%, 1.20% Floor), 3.20%, 07/15/30 144A † | 250,000 | | 249,418 |
| ECMC Group Student Loan Trust, Series 2017-1A, Class A | | | |
| (Floating, ICE LIBOR USD 1M + 1.20%), 2.99%, 12/27/66 144A † | 1,494,416 | | 1,493,157 |
| ECMC Group Student Loan Trust, Series 2018-1A, Class A | | | |
| (Floating, ICE LIBOR USD 1M + 0.75%), 2.54%, 02/27/68 144A † | 2,664,133 | | 2,619,752 |
| Edsouth Indenture No. 7 LLC, Series 2014-3, Class A | | | |
| (Floating, ICE LIBOR USD 1M + 0.60%), 2.39%, 02/25/36 144A † | 602,505 | | 590,569 |
| EFS Volunteer No. 3 LLC, Series 2012-1, Class A3 | | | |
| (Floating, ICE LIBOR USD 1M + 1.00%, 1.00% Floor), 2.79%, 04/25/33 144A † | 1,154,497 | | 1,149,673 |
| Federal National Mortgage Association Grantor Trust, Series 2017-T1 | | | |
| 2.90%, 06/25/27 | 99,805 | | 102,627 |
| Financial Asset Securities Corporation AAA Trust, Series 2005-1A, Class 1A3B | | | |
| (Floating, ICE LIBOR USD 1M + 0.41%, 0.41% Floor), 2.21%, 02/27/35 144A † | 505,733 | | 487,654 |
| | | Par | | Value |
| Ford Credit Floorplan Master Owner Trust, Series 2018-4, Class A | | | |
| 4.06%, 11/15/30 | $700,000 | | $763,920 |
| GMACM Home Equity Loan Trust, Series 2007-HE3, Class 1A1 | | | |
| 7.00%, 09/25/37† γ | 2,600 | | 2,584 |
| GMACM Home Equity Loan Trust, Series 2007-HE3, Class 2A1 | | | |
| 7.00%, 09/25/37 | 57,330 | | 57,712 |
| Golden Credit Card Trust, Series 2017-2A, Class A | | | |
| 1.98%, 04/15/22 144A | 500,000 | | 499,978 |
| Golub Capital Partners CLO 45M, Ltd., Series 2019-45A, Class A | | | |
| (Floating, ICE LIBOR USD 3M + 1.72%, 1.72% Floor), 3.85%, 10/20/31 144A † | 250,000 | | 250,197 |
| GSAMP Trust, Series 2007-HS1, Class A1 | | | |
| (Floating, ICE LIBOR USD 1M + 0.85%, 0.85% Floor), 2.64%, 02/25/47† | 49,810 | | 49,958 |
| Halcyon Loan Advisors Funding, Ltd., Series 2015-2A, Class AR | | | |
| (Floating, ICE LIBOR USD 3M + 1.08%, 1.08% Floor), 3.02%, 07/25/27 144A † | 611,419 | | 610,734 |
| Halsey Point CLO I, Ltd., Series 2019-1A, Class A1A1 | | | |
| (Floating, ICE LIBOR USD 3M + 1.35%, 1.35% Floor), 3.26%, 01/20/33 144A † | 820,000 | | 824,634 |
| Hertz Vehicle Financing II LP, Series 2018-1A, Class A | | | |
| 3.29%, 02/25/24 144A | 1,550,000 | | 1,587,580 |
| Higher Education Funding I, Series 2014-1, Class A | | | |
| (Floating, ICE LIBOR USD 3M + 1.05%, 1.05% Floor), 2.96%, 05/25/34 144A † | 940,450 | | 940,066 |
| Jackson Mill CLO, Ltd., Series 2015-1A, Class DR | | | |
| (Floating, ICE LIBOR USD 3M + 2.80%, 2.80% Floor), 4.80%, 04/15/27 144A † | 750,000 | | 750,994 |
| KKR CLO, Ltd., Series 21, Class A | | | |
| (Floating, ICE LIBOR USD 3M + 1.00%), 3.00%, 04/15/31 144A † | 550,000 | | 545,404 |
| KREF, Ltd., Series 2018-FL1, Class A | | | |
| (Floating, ICE LIBOR USD 1M + 1.10%, 1.10% Floor), 2.84%, 06/15/36 144A † | 1,450,000 | | 1,457,340 |
| LCM XXIII, Ltd., Series 23A, Class A1 | | | |
| (Floating, ICE LIBOR USD 3M + 1.40%), 3.37%, 10/20/29 144A † | 1,000,000 | | 1,001,333 |
See Notes to Financial Statements.
| | | Par | | Value |
| LP Credit Card ABS Master Trust, Series 2018-1, Class A | | | |
| (Floating, ICE LIBOR USD 1M + 1.55%), 3.82%, 08/20/24 144A † | $1,474,931 | | $1,460,022 |
| Madison Park Funding XXX, Ltd., Series 2018-30A, Class A | | | |
| (Floating, ICE LIBOR USD 3M + 0.75%, 0.75% Floor), 2.75%, 04/15/29 144A † | 2,750,000 | | 2,717,136 |
| Magnetite VIII, Ltd., Series 2014-8A, Class CR2 | | | |
| (Floating, ICE LIBOR USD 3M + 1.85%, 1.85% Floor), 3.85%, 04/15/31 144A † | 500,000 | | 485,160 |
| Marlette Funding Trust, Series 2018-2A, Class A | | | |
| 3.06%, 07/17/28 144A | 296,845 | | 297,033 |
| Midocean Credit Clo VII, Series 2017-7A, Class B | | | |
| (Floating, ICE LIBOR USD 3M + 1.90%), 3.90%, 07/15/29 144A † | 1,500,000 | | 1,501,648 |
| Mill City Mortgage Loan Trust, Series 2017-2, Class A3 | | | |
| 2.88%, 07/25/59 144A † γ | 377,678 | | 381,307 |
| Mississippi Higher Education Assistance Corporation, Series 2014-1, Class A1 | | | |
| (Floating, ICE LIBOR USD 1M + 0.68%, 0.68% Floor), 2.47%, 10/25/35† | 458,295 | | 451,696 |
| Montana Higher Education Student Assistance Corporation, Series 2012-1, Class A3 | | | |
| (Floating, ICE LIBOR USD 1M + 1.05%, 1.05% Floor), 2.81%, 07/20/43† | 300,000 | | 299,005 |
| NADG NNN Operating LP, Series 2019-1, Class A | | | |
| 3.37%, 12/28/49 144A | 890,000 | | 890,000 |
| Navient Student Loan Trust, Series 2016-6A, Class A3 | | | |
| (Floating, ICE LIBOR USD 1M + 1.30%), 3.09%, 03/25/66 144A † | 6,000,000 | | 6,053,402 |
| Navient Student Loan Trust, Series 2016-7A, Class A | | | |
| (Floating, ICE LIBOR USD 1M + 1.15%), 2.95%, 03/25/66 144A † | 422,258 | | 421,432 |
| Navient Student Loan Trust, Series 2017-1A, Class A3 | | | |
| (Floating, ICE LIBOR USD 1M + 1.15%), 2.94%, 07/26/66 144A † | 520,000 | | 520,794 |
| Navient Student Loan Trust, Series 2017-2A, Class A | | | |
| (Floating, ICE LIBOR USD 1M + 1.05%), 2.84%, 12/27/66 144A † | 1,415,574 | | 1,408,771 |
| | | Par | | Value |
| Octagon Investment Partners 36, Ltd., Series 2018-1A, Class A1 | | | |
| (Floating, ICE LIBOR USD 3M + 0.97%), 2.97%, 04/15/31 144A † | $700,000 | | $693,278 |
| OHA Loan Funding, Ltd., Series 2015-1A, Class A1R2 | | | |
| (Floating, ICE LIBOR USD 3M + 1.34%, 1.34% Floor), 3.19%, 11/15/32 144A † | 1,170,000 | | 1,169,652 |
| Orec, Ltd., Series 2018-CRE1, Class A | | | |
| (Floating, ICE LIBOR USD 1M + 1.18%, 1.18% Floor), 2.92%, 06/15/36 144A † | 750,000 | | 750,655 |
| OZLM VII, Ltd., Series 2014-7RA, Class A2R | | | |
| (Floating, ICE LIBOR USD 3M + 1.60%, 1.60% Floor), 3.60%, 07/17/29 144A † | 1,250,000 | | 1,231,464 |
| OZLM XV, Ltd., Series 2016-15A, Class B | | | |
| (Floating, ICE LIBOR USD 3M + 2.70%), 4.67%, 01/20/29 144A † | 1,000,000 | | 991,121 |
| Panhandle-Plains Higher Education Authority, Inc., Series 2010-2, Class A1 | | | |
| (Floating, ICE LIBOR USD 3M + 1.13%, 18.00% Cap), 3.23%, 10/01/35† | 219,053 | | 218,560 |
| Park Place Securities, Inc. Asset-Backed Pass-Through Trust Certificates, Series 2005-WCH1, Class M3 | | | |
| (Floating, ICE LIBOR USD 1M + 0.84%, 0.56% Floor), 2.63%, 01/25/36† | 10,319 | | 10,349 |
| Penarth Master Issuer PLC, Series 2018-2A, Class A1 | | | |
| (Floating, ICE LIBOR USD 1M + 0.45%), 2.19%, 09/18/22 144A † | 1,600,000 | | 1,600,558 |
| PHEAA Student Loan Trust, Series 2012-1A, Class A1 | | | |
| (Floating, ICE LIBOR USD 1M + 0.55%), 2.34%, 05/25/57 144A † | 601,344 | | 589,972 |
| PHEAA Student Loan Trust, Series 2016-1A, Class A | | | |
| (Floating, ICE LIBOR USD 1M + 1.15%, 1.15% Floor), 2.94%, 09/25/65 144A † | 556,425 | | 556,032 |
| PHEAA Student Loan Trust, Series 2016-2A, Class A | | | |
| (Floating, ICE LIBOR USD 1M + 0.95%), 2.74%, 11/25/65 144A † | 1,186,748 | | 1,175,944 |
See Notes to Financial Statements.
MEDIUM-DURATION BOND FUND
SCHEDULE OF INVESTMENTS (Continued)
| | | Par | | Value |
| RAMP Trust, Series 2005-EFC6, Class M2 | | | |
| (Floating, ICE LIBOR USD 1M + 0.65%, 0.43% Floor, 14.00% Cap), 2.44%, 11/25/35† | $1,151,292 | | $1,154,928 |
| Ready Capital Mortgage Financing, Series 2018-FL2, Class A | | | |
| (Floating, ICE LIBOR USD 1M + 0.85%), 2.64%, 06/25/35 144A † | 204,998 | | 205,189 |
| Saxon Asset Securities Trust, Series 2004-1, Class M1 | | | |
| (Floating, ICE LIBOR USD 1M + 0.80%, 0.53% Floor, 10.28% Cap), 2.59%, 03/25/35† | 263,387 | | 257,270 |
| SBA Small Business Investment Cos., Series 2018-10B, Class 1 | | | |
| 3.55%, 09/10/28 | 195,727 | | 203,787 |
| SBA Small Business Investment Cos., Series 2019-10A, Class 1 | | | |
| 3.11%, 03/10/29 | 445,178 | | 462,264 |
| Scholar Funding Trust, Series 2010-A, Class A | | | |
| (Floating, ICE LIBOR USD 3M + 0.75%), 2.69%, 10/28/41 144A † | 223,578 | | 220,091 |
| SLC Student Loan Trust, Series 2005-3, Class A3 | | | |
| (Floating, ICE LIBOR USD 3M + 0.12%), 2.01%, 06/15/29† | 538,400 | | 533,745 |
| SLM Student Loan EDC Repackaging Trust, Series 2013-M1, Class M1 | | | |
| 3.50%, 10/28/29 144A | 54,357 | | 54,108 |
| SLM Student Loan Trust, Series 2003-10A, Class A3 | | | |
| (Floating, ICE LIBOR USD 3M + 0.47%), 2.36%, 12/15/27 144A † | 1,905,703 | | 1,904,138 |
| SLM Student Loan Trust, Series 2003-7A, Class A5A | | | |
| (Floating, ICE LIBOR USD 3M + 1.20%, 1.20% Floor), 3.09%, 12/15/33 144A † | 722,243 | | 713,430 |
| SLM Student Loan Trust, Series 2005-4, Class A3 | | | |
| (Floating, ICE LIBOR USD 3M + 0.12%), 2.06%, 01/25/27† | 93,877 | | 93,144 |
| SLM Student Loan Trust, Series 2005-5, Class A4 | | | |
| (Floating, ICE LIBOR USD 3M + 0.14%, 0.14% Floor), 2.08%, 10/25/28† | 635,515 | | 629,141 |
| SLM Student Loan Trust, Series 2007-1, Class A5 | | | |
| (Floating, ICE LIBOR USD 3M + 0.09%), 2.03%, 01/26/26† | 1,749,236 | | 1,744,086 |
| SoFi Consumer Loan Program, Series 2017-4, Class A | | | |
| 2.50%, 05/26/26 144A | 272,392 | | 272,899 |
| Sound Point Clo XX, Ltd., Series 2018-2A, Class A | | | |
| (Floating, ICE LIBOR USD 3M + 1.10%), 3.04%, 07/26/31 144A † | 500,000 | | 495,863 |
| | | Par | | Value |
| Soundview Home Loan Trust, Series 2006-OPT2, Class A3 | | | |
| (Floating, ICE LIBOR USD 1M + 0.18%, 0.18% Floor), 1.97%, 05/25/36† | $209,854 | | $210,210 |
| Specialty Underwriting & Residential Finance Trust, Series 2004-BC3, Class M1 | | | |
| (Floating, ICE LIBOR USD 1M + 0.93%, 0.62% Floor), 2.72%, 07/25/35† | 1,441,575 | | 1,441,754 |
| Structured Asset Investment Loan Trust, Series 2005-1, Class M3 | | | |
| (Floating, ICE LIBOR USD 1M + 0.78%, 0.52% Floor), 2.57%, 02/25/35 144A † | 2,700,000 | | 2,714,884 |
| TIAA CLO II, Ltd., Series 2017-1A, Class A | | | |
| (Floating, ICE LIBOR USD 3M + 1.28%), 3.25%, 04/20/29 144A † | 3,950,000 | | 3,954,029 |
| TPG Real Estate Finance Issuer, Ltd., Series 2018-FL2, Class A | | | |
| (Floating, ICE LIBOR USD 1M + 1.13%), 2.87%, 11/15/37 144A † | 1,150,000 | | 1,151,006 |
| Tralee CLO VI, Ltd., Series 2019-6A, Class AS | | | |
| (Floating, ICE LIBOR USD 3M + 1.30%), 3.32%, 10/25/32 144A † | 620,000 | | 618,853 |
| Tryon Park CLO, Ltd., Series 2013-1A, Class A1SR | | | |
| (Floating, ICE LIBOR USD 3M + 0.89%), 2.89%, 04/15/29 144A † | 2,690,000 | | 2,681,055 |
| United States Small Business Administration, Series 2019-20D, Class 1 | | | |
| 2.98%, 04/01/39 | 223,594 | | 229,767 |
| United States Small Business Administration, Series 2019-25G, Class 1 | | | |
| 2.69%, 07/01/44 | 216,631 | | 219,942 |
| Utah State Board of Regents, Series 2015-1, Class A | | | |
| (Floating, ICE LIBOR USD 1M + 0.60%, 0.60% Floor), 2.31%, 02/25/43† | 371,551 | | 372,004 |
| Vibrant CLO VI, Ltd., Series 2017-6A, Class A | | | |
| (Floating, ICE LIBOR USD 3M + 1.24%), 3.15%, 06/20/29 144A † | 2,750,000 | | 2,747,968 |
| Voya CLO, Ltd., Series 2015-1A, Class A1R | | | |
| (Floating, ICE LIBOR USD 3M + 0.90%, 0.90% Floor), 2.90%, 01/18/29 144A † | 500,000 | | 497,400 |
| Voya CLO, Ltd., Series 2017-3A, Class A1A | | | |
| (Floating, ICE LIBOR USD 3M + 1.23%), 3.20%, 07/20/30 144A † | 4,150,000 | | 4,158,292 |
See Notes to Financial Statements.
| | | Par | | Value |
| Voya CLO, Ltd., Series 2018-3A, Class A1A | | | |
| (Floating, ICE LIBOR USD 3M + 1.15%, 1.15% Floor), 3.15%, 10/15/31 144A † | $1,500,000 | | $1,500,370 |
| Westlake Automobile Receivables Trust, Series 2018-3A, Class A2A | | | |
| 2.98%, 01/18/22 144A | 721,949 | | 723,229 |
| Whitehorse XII, Ltd., Series 2018-12A, Class D | | | |
| (Floating, ICE LIBOR USD 3M + 3.65%, 3.65% Floor), 5.65%, 10/15/31 144A † | 750,000 | | 724,826 |
| Zais CLO 13, Ltd., Series 2019-13A, Class A1A | | | |
| (Floating, ICE LIBOR USD 3M + 1.49%), 3.57%, 07/15/32 144A † | 250,000 | | 249,214 |
Total Asset-Backed Securities
(Cost $102,337,245) | | | 101,888,780 |
| CORPORATE BONDS — 25.0% |
| 3M Co. | | | |
| 2.38%, 08/26/29 | 210,000 | | 207,476 |
| ABB Finance USA, Inc. | | | |
| 4.38%, 05/08/42 | 40,000 | | 48,087 |
| Abbott Laboratories | | | |
| 3.75%, 11/30/26 | 148,000 | | 161,837 |
| 4.75%, 11/30/36 | 170,000 | | 213,500 |
| 4.90%, 11/30/46 | 210,000 | | 276,378 |
| Acadia Healthcare Co., Inc. | | | |
| 5.63%, 02/15/23 | 634,000 | | 645,624 |
| Aetna, Inc. | | | |
| 2.80%, 06/15/23 | 260,000 | | 264,383 |
| Air Lease Corporation | | | |
| 3.75%, 06/01/26 | 875,000 | | 915,629 |
| 3.25%, 10/01/29 | 45,000 | | 44,859 |
| Aircastle, Ltd. | | | |
| 5.13%, 03/15/21Δ | 764,000 | | 789,469 |
| 5.50%, 02/15/22 | 1,300,000 | | 1,383,420 |
| 4.13%, 05/01/24 | 25,000 | | 26,284 |
| 4.25%, 06/15/26 | 45,000 | | 47,689 |
| Alexandria Real Estate Equities, Inc. REIT | | | |
| 3.80%, 04/15/26 | 900,000 | | 962,986 |
| 2.75%, 12/15/29 | 1,400,000 | | 1,385,337 |
| 3.38%, 08/15/31 | 360,000 | | 374,749 |
| Allegion US Holding Co., Inc. | | | |
| 3.20%, 10/01/24 | 400,000 | | 411,657 |
| Alliant Energy Finance LLC | | | |
| 3.75%, 06/15/23 144A | 275,000 | | 287,248 |
| 4.25%, 06/15/28 144A | 75,000 | | 80,766 |
| Amazon.com, Inc. | | | |
| 3.15%, 08/22/27 | 370,000 | | 392,443 |
| 3.88%, 08/22/37 | 160,000 | | 182,122 |
| 4.95%, 12/05/44 | 220,000 | | 288,650 |
| 4.05%, 08/22/47 | 790,000 | | 931,080 |
| Ambac LSNI LLC | | | |
| (Floating, ICE LIBOR USD 3M + 5.00%), 6.94%, 02/12/23 144A † | 1,685,872 | | 1,711,148 |
| | | Par | | Value |
| American Airlines Pass-Through Trust, Series 2013-1, Class A | | | |
| 4.00%, 07/15/25 | $873,552 | | $916,501 |
| American Campus Communities Operating Partnership LP REIT | | | |
| 3.75%, 04/15/23 | 525,000 | | 547,429 |
| American Express Credit Corporation | | | |
| 2.38%, 05/26/20 | 310,000 | | 310,393 |
| American Homes 4 Rent LP REIT | | | |
| 4.90%, 02/15/29 | 434,000 | | 486,509 |
| American Honda Finance Corporation | | | |
| (Floating, ICE LIBOR USD 3M + 0.45%), 2.36%, 02/15/22† | 3,200,000 | | 3,211,395 |
| American International Group, Inc. | | | |
| 3.90%, 04/01/26 | 825,000 | | 886,837 |
| 4.20%, 04/01/28 | 1,850,000 | | 2,038,165 |
| 4.25%, 03/15/29 | 60,000 | | 66,849 |
| 6.25%, 03/15/37 | 278,000 | | 303,463 |
| American Tower Corporation REIT | | | |
| 3.38%, 05/15/24 | 825,000 | | 855,803 |
| 3.38%, 10/15/26 | 1,500,000 | | 1,560,919 |
| American Tower Trust #1 REIT | | | |
| 3.07%, 03/15/23 144A | 940,000 | | 953,042 |
| Amgen, Inc. | | | |
| 2.13%, 05/01/20 | 70,000 | | 70,030 |
| 3.63%, 05/22/24 | 50,000 | | 52,866 |
| 2.60%, 08/19/26 | 45,000 | | 45,627 |
| 4.66%, 06/15/51 | 34,000 | | 40,123 |
| Anthem, Inc. | | | |
| 2.95%, 12/01/22 | 390,000 | | 399,231 |
| 3.35%, 12/01/24 | 130,000 | | 135,782 |
| 3.65%, 12/01/27 | 250,000 | | 264,969 |
| 4.10%, 03/01/28 | 30,000 | | 32,625 |
| Apache Corporation | | | |
| 3.25%, 04/15/22 | 24,000 | | 24,462 |
| 4.38%, 10/15/28 | 50,000 | | 52,342 |
| 5.10%, 09/01/40 | 180,000 | | 183,605 |
| 4.25%, 01/15/44 | 800,000 | | 739,117 |
| Apple, Inc. | | | |
| 2.00%, 11/13/20 | 260,000 | | 260,700 |
| 1.55%, 08/04/21 | 230,000 | | 229,196 |
| 2.75%, 01/13/25 | 685,000 | | 708,293 |
| 2.50%, 02/09/25 | 30,000 | | 30,579 |
| 3.20%, 05/13/25 | 30,000 | | 31,725 |
| 2.45%, 08/04/26 | 1,620,000 | | 1,644,433 |
| 3.00%, 06/20/27 | 25,000 | | 26,229 |
| 2.90%, 09/12/27 | 600,000 | | 625,207 |
| Applied Materials, Inc. | | | |
| 3.30%, 04/01/27 | 30,000 | | 31,842 |
| Arch Capital Finance LLC | | | |
| 4.01%, 12/15/26 | 600,000 | | 659,565 |
| Arch Capital Group, Ltd. | | | |
| 7.35%, 05/01/34 | 175,000 | | 248,722 |
| Ares Capital Corporation | | | |
| 4.20%, 06/10/24 | 65,000 | | 68,122 |
| Arrow Electronics, Inc. | | | |
| 4.50%, 03/01/23 | 1,200,000 | | 1,267,415 |
See Notes to Financial Statements.
MEDIUM-DURATION BOND FUND
SCHEDULE OF INVESTMENTS (Continued)
| | | Par | | Value |
| AT&T, Inc. | | | |
| 4.45%, 05/15/21 | $80,000 | | $82,613 |
| 3.00%, 02/15/22 | 170,000 | | 173,462 |
| 3.00%, 06/30/22 | 475,000 | | 485,383 |
| 4.45%, 04/01/24 | 725,000 | | 786,392 |
| 3.40%, 05/15/25 | 2,280,000 | | 2,389,576 |
| 3.60%, 07/15/25 | 325,000 | | 344,444 |
| 4.13%, 02/17/26 | 1,050,000 | | 1,138,969 |
| 4.25%, 03/01/27Δ | 1,400,000 | | 1,538,941 |
| 5.25%, 03/01/37 | 225,000 | | 269,217 |
| 4.90%, 08/15/37 | 255,000 | | 294,071 |
| 4.85%, 03/01/39 | 1,400,000 | | 1,617,774 |
| 6.10%, 07/15/40 | 140,000 | | 179,046 |
| 4.35%, 06/15/45 | 360,000 | | 389,327 |
| 4.75%, 05/15/46 | 150,000 | | 170,039 |
| 5.15%, 11/15/46 | 200,000 | | 239,839 |
| 5.45%, 03/01/47 | 575,000 | | 715,349 |
| 4.50%, 03/09/48 | 605,000 | | 669,499 |
| Aviation Capital Group LLC | | | |
| 2.88%, 01/20/22 144A | 1,000,000 | | 1,007,501 |
| 3.88%, 05/01/23 144A | 500,000 | | 516,959 |
| AXA Equitable Holdings, Inc. | | | |
| 4.35%, 04/20/28 | 1,330,000 | | 1,445,628 |
| 5.00%, 04/20/48 | 40,000 | | 43,119 |
| Bank of America Corporation | | | |
| 3.30%, 01/11/23 | 120,000 | | 124,139 |
| (Variable, ICE LIBOR USD 3M + 1.16%), 3.12%, 01/20/23^ | 30,000 | | 30,599 |
| (Variable, ICE LIBOR USD 3M + 0.93%), 2.82%, 07/21/23^ | 40,000 | | 40,658 |
| (Variable, ICE LIBOR USD 3M + 0.79%), 3.00%, 12/20/23^ | 329,000 | | 336,842 |
| (Floating, ICE LIBOR USD 3M + 0.79%), 2.68%, 03/05/24† | 1,500,000 | | 1,507,804 |
| (Variable, ICE LIBOR USD 3M + 0.78%), 3.55%, 03/05/24^ | 530,000 | | 550,327 |
| 4.00%, 04/01/24 | 420,000 | | 450,128 |
| (Floating, ICE LIBOR USD 3M + 0.96%), 2.89%, 07/23/24† | 900,000 | | 909,632 |
| (Variable, ICE LIBOR USD 3M + 0.94%), 3.86%, 07/23/24^ | 875,000 | | 921,294 |
| 4.20%, 08/26/24 | 1,190,000 | | 1,278,624 |
| (Variable, ICE LIBOR USD 3M + 3.71%), 6.25%, 09/05/24ρ ^ | 300,000 | | 333,589 |
| (Variable, ICE LIBOR USD 3M + 4.17%), 6.50%, 10/23/24ρ ^ | 150,000 | | 170,357 |
| 4.00%, 01/22/25 | 440,000 | | 469,648 |
| (Variable, ICE LIBOR USD 3M + 1.09%), 3.09%, 10/01/25^ | 2,200,000 | | 2,272,108 |
| (Variable, ICE LIBOR USD 3M + 0.81%), 3.37%, 01/23/26^ | 35,000 | | 36,635 |
| 4.45%, 03/03/26 | 420,000 | | 461,641 |
| 3.50%, 04/19/26 | 2,010,000 | | 2,139,433 |
| 4.25%, 10/22/26 | 440,000 | | 480,356 |
| (Variable, ICE LIBOR USD 3M + 1.06%), 3.56%, 04/23/27^ | 30,000 | | 31,735 |
| 3.25%, 10/21/27 | 875,000 | | 912,846 |
| 4.18%, 11/25/27 | 825,000 | | 895,342 |
| (Variable, ICE LIBOR USD 3M + 1.58%), 3.82%, 01/20/28^ | 55,000 | | 59,098 |
| | | Par | | Value |
| (Variable, ICE LIBOR USD 3M + 1.37%), 3.59%, 07/21/28^ | $1,360,000 | | $1,442,804 |
| (Variable, ICE LIBOR USD 3M + 1.04%), 3.42%, 12/20/28^ | 694,000 | | 729,385 |
| (Variable, ICE LIBOR USD 3M + 1.31%), 4.27%, 07/23/29^ | 525,000 | | 583,989 |
| (Variable, ICE LIBOR USD 3M + 0.01%), 2.88%, 10/22/30^ | 500,000 | | 505,037 |
| 6.11%, 01/29/37 | 500,000 | | 676,766 |
| 5.00%, 01/21/44 | 790,000 | | 1,031,822 |
| (Variable, ICE LIBOR USD 3M + 1.19%), 3.95%, 01/23/49Δ ^ | 270,000 | | 307,171 |
| (Variable, ICE LIBOR USD 3M + 1.52%), 4.33%, 03/15/50^ | 170,000 | | 205,253 |
| Barrick North America Finance LLC | | | |
| 5.70%, 05/30/41 | 150,000 | | 185,336 |
| Bausch Health Americas, Inc. | | | |
| 9.25%, 04/01/26 144A | 200,000 | | 230,090 |
| BBVA USA | | | |
| 5.50%, 04/01/20 | 300,000 | | 302,438 |
| Becton, Dickinson and Co. | | | |
| (Floating, ICE LIBOR USD 3M + 0.88%), 2.84%, 12/29/20† | 600,000 | | 600,305 |
| 2.89%, 06/06/22 | 425,000 | | 432,209 |
| 3.36%, 06/06/24 | 830,000 | | 865,011 |
| 3.73%, 12/15/24 | 171,000 | | 181,400 |
| 3.70%, 06/06/27 | 285,000 | | 303,546 |
| 4.69%, 12/15/44 | 270,000 | | 316,444 |
| 4.67%, 06/06/47 | 575,000 | | 686,521 |
| Berkshire Hathaway Energy Co. | | | |
| 3.25%, 04/15/28 | 400,000 | | 423,284 |
| Berkshire Hathaway Finance Corporation | | | |
| 4.25%, 01/15/49 | 460,000 | | 546,593 |
| Berkshire Hathaway, Inc. | | | |
| 2.75%, 03/15/23 | 65,000 | | 66,691 |
| Blue Racer Midstream LLC | | | |
| 6.13%, 11/15/22 144A | 120,000 | | 117,814 |
| BMW US Capital LLC | | | |
| 3.10%, 04/12/21 144A | 1,300,000 | | 1,319,831 |
| 1.85%, 09/15/21 144A | 60,000 | | 59,889 |
| Boeing Co. (The) | | | |
| 4.88%, 02/15/20Δ | 50,000 | | 50,151 |
| 2.70%, 02/01/27 | 70,000 | | 71,041 |
| 2.80%, 03/01/27 | 110,000 | | 111,878 |
| 3.25%, 02/01/35 | 510,000 | | 522,888 |
| 6.63%, 02/15/38 | 210,000 | | 295,395 |
| 3.75%, 02/01/50 | 140,000 | | 149,300 |
| Booking Holdings, Inc. | | | |
| 3.60%, 06/01/26 | 65,000 | | 69,444 |
| Boston Properties LP REIT | | | |
| 4.50%, 12/01/28Δ | 930,000 | | 1,055,456 |
| BP Capital Markets America, Inc. | | | |
| 3.22%, 11/28/23 | 370,000 | | 385,753 |
| 3.80%, 09/21/25 | 45,000 | | 48,738 |
| 3.12%, 05/04/26 | 570,000 | | 596,106 |
| 4.23%, 11/06/28 | 1,875,000 | | 2,122,427 |
| Brighthouse Financial, Inc. | | | |
| 3.70%, 06/22/27 | 1,200,000 | | 1,198,287 |
See Notes to Financial Statements.
| | | Par | | Value |
| 4.70%, 06/22/47 | $75,000 | | $69,635 |
| Bristol-Myers Squibb Co. | | | |
| 2.25%, 08/15/21 144A | 270,000 | | 271,753 |
| 2.60%, 05/16/22 144A | 300,000 | | 305,096 |
| 3.55%, 08/15/22 144A | 170,000 | | 176,748 |
| 2.90%, 07/26/24 144A | 540,000 | | 557,954 |
| 3.88%, 08/15/25 144A | 1,975,000 | | 2,136,580 |
| 3.20%, 06/15/26 144A | 420,000 | | 441,599 |
| 3.90%, 02/20/28 144A | 150,000 | | 165,527 |
| 3.40%, 07/26/29 144A | 200,000 | | 214,225 |
| 5.00%, 08/15/45 144A | 110,000 | | 141,438 |
| Brixmor Operating Partnership LP REIT | | | |
| 4.13%, 05/15/29 | 65,000 | | 69,894 |
| Broadcom Corporation | | | |
| 3.00%, 01/15/22 | 550,000 | | 558,305 |
| 2.65%, 01/15/23 | 35,000 | | 35,221 |
| 3.63%, 01/15/24 | 2,175,000 | | 2,255,604 |
| 3.13%, 01/15/25 | 625,000 | | 633,043 |
| 3.88%, 01/15/27 | 925,000 | | 961,681 |
| Broadcom, Inc. | | | |
| 3.13%, 10/15/22 144A | 2,750,000 | | 2,802,624 |
| 3.63%, 10/15/24 144A | 985,000 | | 1,024,954 |
| 4.25%, 04/15/26 144A | 675,000 | | 717,527 |
| Camden Property Trust REIT | | | |
| 3.15%, 07/01/29 | 65,000 | | 67,789 |
| Cameron LNG LLC | | | |
| 2.90%, 07/15/31 144A | 90,000 | | 90,341 |
| 3.30%, 01/15/35 144A | 180,000 | | 182,115 |
| Capital One Financial Corporation | | | |
| 3.80%, 01/31/28Δ | 65,000 | | 69,963 |
| Catalent Pharma Solutions, Inc. | | | |
| 5.00%, 07/15/27 144A | 130,000 | | 136,416 |
| CenterPoint Energy, Inc. | | | |
| 4.25%, 11/01/28 | 700,000 | | 760,761 |
| CH Robinson Worldwide, Inc. | | | |
| 4.20%, 04/15/28 | 1,500,000 | | 1,639,366 |
| Charles Schwab Corporation (The) | | | |
| 3.25%, 05/22/29 | 65,000 | | 68,882 |
| Charter Communications Operating LLC | | | |
| 3.58%, 07/23/20 | 120,000 | | 120,776 |
| 4.91%, 07/23/25 | 5,110,000 | | 5,631,119 |
| 3.75%, 02/15/28 | 1,800,000 | | 1,868,750 |
| 4.20%, 03/15/28 | 710,000 | | 757,541 |
| 5.05%, 03/30/29 | 460,000 | | 522,364 |
| 6.38%, 10/23/35 | 40,000 | | 50,417 |
| 6.48%, 10/23/45 | 90,000 | | 111,736 |
| Chevron Corporation | | | |
| 2.95%, 05/16/26 | 350,000 | | 366,120 |
| Choice Hotels International, Inc. | | | |
| 3.70%, 12/01/29 | 1,500,000 | | 1,514,685 |
| Chubb INA Holdings, Inc. | | | |
| 2.30%, 11/03/20 | 90,000 | | 90,330 |
| 3.35%, 05/03/26Δ | 120,000 | | 127,718 |
| Cigna Corporation | | | |
| 3.40%, 09/17/21 | 240,000 | | 245,780 |
| 3.75%, 07/15/23 | 4,840,000 | | 5,080,282 |
| | | Par | | Value |
| 4.13%, 11/15/25 | $245,000 | | $266,224 |
| 4.38%, 10/15/28 | 460,000 | | 510,546 |
| 4.90%, 12/15/48 | 175,000 | | 209,901 |
| Cimarex Energy Co. | | | |
| 3.90%, 05/15/27 | 500,000 | | 519,133 |
| 4.38%, 03/15/29Δ | 180,000 | | 191,098 |
| Cintas Corporation No. 2 | | | |
| 2.90%, 04/01/22 | 180,000 | | 183,679 |
| 3.70%, 04/01/27 | 190,000 | | 206,297 |
| Cisco Systems, Inc. | | | |
| 5.50%, 01/15/40 | 75,000 | | 102,622 |
| Citibank NA | | | |
| (Floating, ICE LIBOR USD 3M + 0.60%), 2.50%, 05/20/22† | 1,500,000 | | 1,506,093 |
| Citigroup, Inc. | | | |
| (Floating, ICE LIBOR USD 3M + 1.19%), 3.09%, 08/02/21† Δ | 1,300,000 | | 1,317,851 |
| 2.75%, 04/25/22 | 1,600,000 | | 1,626,127 |
| 2.70%, 10/27/22 | 975,000 | | 991,567 |
| (Variable, ICE LIBOR USD 3M + 4.07%), 5.95%, 01/30/23ρ ^ | 170,000 | | 180,118 |
| 3.50%, 05/15/23 | 220,000 | | 229,122 |
| (Variable, ICE LIBOR USD 3M + 1.02%), 4.04%, 06/01/24^ | 1,700,000 | | 1,799,335 |
| (Variable, ICE LIBOR USD 3M + 3.91%), 5.95%, 05/15/25ρ ^ | 690,000 | | 753,552 |
| 4.40%, 06/10/25 | 450,000 | | 489,560 |
| 5.50%, 09/13/25 | 290,000 | | 331,851 |
| 3.40%, 05/01/26 | 2,075,000 | | 2,181,884 |
| (Variable, ICE LIBOR USD 3M + 4.52%), 6.25%, 08/15/26ρ ^ | 150,000 | | 170,573 |
| 3.20%, 10/21/26 | 500,000 | | 519,223 |
| 4.30%, 11/20/26 | 1,675,000 | | 1,825,467 |
| 4.45%, 09/29/27 | 1,480,000 | | 1,631,983 |
| (Variable, ICE LIBOR USD 3M + 1.56%), 3.89%, 01/10/28^ | 65,000 | | 70,103 |
| (Variable, ICE LIBOR USD 3M + 1.39%), 3.67%, 07/24/28^ | 150,000 | | 160,043 |
| 4.13%, 07/25/28 | 1,325,000 | | 1,447,140 |
| (Variable, ICE LIBOR USD 3M + 1.19%), 4.08%, 04/23/29^ | 35,000 | | 38,342 |
| (Variable, U.S. SOFR + 1.42%), 2.98%, 11/05/30^ | 550,000 | | 559,268 |
| 6.63%, 06/15/32Δ | 50,000 | | 67,386 |
| (Variable, ICE LIBOR USD 3M + 1.17%), 3.88%, 01/24/39^ | 30,000 | | 32,928 |
| 8.13%, 07/15/39 | 20,000 | | 33,431 |
| 6.68%, 09/13/43 | 10,000 | | 14,618 |
| 5.30%, 05/06/44 | 24,000 | | 30,661 |
| 4.65%, 07/30/45 | 894,000 | | 1,109,315 |
| 4.75%, 05/18/46 | 40,000 | | 47,918 |
| CNOOC Finance 2015 USA LLC | | | |
| 3.50%, 05/05/25 | 1,820,000 | | 1,903,455 |
| Coca-Cola Co. (The) | | | |
| 2.88%, 10/27/25Δ | 65,000 | | 67,832 |
| Comcast Corporation | | | |
| 3.70%, 04/15/24 | 825,000 | | 880,472 |
| 3.38%, 08/15/25 | 275,000 | | 292,108 |
| 3.95%, 10/15/25 | 975,000 | | 1,064,909 |
See Notes to Financial Statements.
MEDIUM-DURATION BOND FUND
SCHEDULE OF INVESTMENTS (Continued)
| | | Par | | Value |
| 3.30%, 02/01/27 | $344,000 | | $364,746 |
| 3.15%, 02/15/28 | 950,000 | | 996,797 |
| 4.15%, 10/15/28 | 2,395,000 | | 2,699,753 |
| 2.65%, 02/01/30 | 875,000 | | 879,885 |
| 4.25%, 10/15/30 | 810,000 | | 927,289 |
| 5.65%, 06/15/35 | 420,000 | | 553,485 |
| 3.20%, 07/15/36 | 380,000 | | 389,708 |
| 3.90%, 03/01/38 | 30,000 | | 33,292 |
| CommonSpirit Health | | | |
| 4.35%, 11/01/42 | 40,000 | | 41,161 |
| Commonwealth Edison Co. | | | |
| 3.80%, 10/01/42 | 300,000 | | 324,560 |
| Conagra Brands, Inc. | | | |
| 3.25%, 09/15/22 | 1,300,000 | | 1,332,037 |
| 4.60%, 11/01/25 | 60,000 | | 66,338 |
| Concho Resources, Inc. | | | |
| 4.38%, 01/15/25 | 70,000 | | 72,365 |
| 3.75%, 10/01/27Δ | 80,000 | | 84,216 |
| 4.30%, 08/15/28 | 320,000 | | 349,213 |
| ConocoPhillips Co. | | | |
| 4.95%, 03/15/26 | 25,000 | | 28,790 |
| ConocoPhillips Holding Co. | | | |
| 6.95%, 04/15/29 | 220,000 | | 299,392 |
| Continental Resources, Inc. | | | |
| 4.50%, 04/15/23 | 1,765,000 | | 1,845,458 |
| 3.80%, 06/01/24 | 120,000 | | 124,234 |
| 4.38%, 01/15/28 | 510,000 | | 543,221 |
| 4.90%, 06/01/44 | 20,000 | | 21,287 |
| Cox Communications, Inc. | | | |
| 3.50%, 08/15/27 144A | 35,000 | | 36,551 |
| CRH America Finance, Inc. | | | |
| 3.95%, 04/04/28 144A Δ | 500,000 | | 540,303 |
| Crown Castle International Corporation REIT | | | |
| 5.25%, 01/15/23 | 525,000 | | 570,637 |
| 3.15%, 07/15/23 | 725,000 | | 748,575 |
| 3.10%, 11/15/29 | 70,000 | | 71,044 |
| CVS Health Corporation | | | |
| 3.35%, 03/09/21 | 112,000 | | 113,889 |
| 2.75%, 12/01/22 | 210,000 | | 213,531 |
| 3.70%, 03/09/23 | 755,000 | | 787,425 |
| 4.00%, 12/05/23 | 800,000 | | 847,135 |
| 2.63%, 08/15/24Δ | 25,000 | | 25,240 |
| 4.10%, 03/25/25 | 590,000 | | 633,854 |
| 3.88%, 07/20/25 | 788,000 | | 839,928 |
| 4.30%, 03/25/28 | 2,870,000 | | 3,137,866 |
| 4.78%, 03/25/38 | 25,000 | | 28,467 |
| 5.13%, 07/20/45 | 250,000 | | 297,047 |
| 5.05%, 03/25/48 | 550,000 | | 652,805 |
| CVS Pass-Through Trust | | | |
| 6.94%, 01/10/30 | 571,804 | | 670,264 |
| CyrusOne LP REIT | | | |
| 2.90%, 11/15/24 | 1,500,000 | | 1,508,887 |
| D.R. Horton, Inc. | | | |
| 4.38%, 09/15/22 | 800,000 | | 838,966 |
| DAE Funding LLC | | | |
| 5.00%, 08/01/24 144A | 700,000 | | 736,701 |
| | | Par | | Value |
| Daimler Finance North America LLC | | | |
| 3.40%, 02/22/22 144A | $1,700,000 | | $1,742,433 |
| 2.70%, 06/14/24 144A Δ | 1,900,000 | | 1,918,204 |
| 8.50%, 01/18/31 | 25,000 | | 37,232 |
| DCP Midstream Operating LP | | | |
| 6.45%, 11/03/36 144A | 60,000 | | 63,206 |
| Dell International LLC | | | |
| 4.42%, 06/15/21 144A | 2,520,000 | | 2,593,963 |
| 5.45%, 06/15/23 144A | 2,800,000 | | 3,038,968 |
| 6.02%, 06/15/26 144A | 400,000 | | 460,819 |
| 8.35%, 07/15/46 144A | 200,000 | | 275,954 |
| Delta Air Lines Pass-Through Trust, Series 2007-1, Class A | | | |
| 6.82%, 08/10/22 | 251,346 | | 273,022 |
| Depository Trust & Clearing Corporation (The) | | | |
| (Variable, ICE LIBOR USD 3M + 3.17%), 4.88%, 06/15/20 144A ρ ^ | 750,000 | | 757,661 |
| Devon Energy Corporation | | | |
| 5.85%, 12/15/25 | 492,000 | | 583,832 |
| 5.60%, 07/15/41 | 312,000 | | 380,054 |
| 4.75%, 05/15/42 | 340,000 | | 382,147 |
| 5.00%, 06/15/45 | 910,000 | | 1,057,722 |
| DH Europe Finance II S.a.r.l. | | | |
| 2.20%, 11/15/24 | 675,000 | | 676,674 |
| 2.60%, 11/15/29 | 225,000 | | 224,670 |
| Diamond Sports Group LLC | | | |
| 5.38%, 08/15/26 144A | 405,000 | | 410,438 |
| Discover Financial Services | | | |
| 3.75%, 03/04/25Δ | 450,000 | | 476,992 |
| Discovery Communications LLC | | | |
| 4.90%, 03/11/26 | 45,000 | | 50,264 |
| 3.95%, 03/20/28 | 35,000 | | 37,395 |
| DISH DBS Corporation | | | |
| 5.88%, 11/15/24 | 630,000 | | 645,095 |
| Dollar Tree, Inc. | | | |
| 4.00%, 05/15/25 | 390,000 | | 417,570 |
| 4.20%, 05/15/28 | 400,000 | | 429,453 |
| Dominion Energy, Inc. | | | |
| 3.07%, 08/15/24 STEP | 675,000 | | 696,110 |
| Duke Energy Corporation | | | |
| 3.75%, 04/15/24Δ | 200,000 | | 212,106 |
| 3.15%, 08/15/27 | 550,000 | | 567,307 |
| Duke Energy Ohio, Inc. | | | |
| 3.65%, 02/01/29 | 350,000 | | 380,698 |
| DuPont de Nemours, Inc. | | | |
| 4.21%, 11/15/23 | 550,000 | | 588,823 |
| 4.49%, 11/15/25 | 350,000 | | 385,760 |
| 4.73%, 11/15/28 | 350,000 | | 397,718 |
| 5.42%, 11/15/48Δ | 75,000 | | 92,666 |
| Eaton Corporation | | | |
| 2.75%, 11/02/22 | 710,000 | | 724,722 |
| 4.15%, 11/02/42 | 200,000 | | 224,229 |
| eBay, Inc. | | | |
| 3.60%, 06/05/27 | 65,000 | | 68,226 |
See Notes to Financial Statements.
| | | Par | | Value |
| Ecolab, Inc. | | | |
| 3.95%, 12/01/47 | $68,000 | | $76,071 |
| Elanco Animal Health, Inc. | | | |
| 3.91%, 08/27/21 | 550,000 | | 564,395 |
| 4.27%, 08/28/23 | 225,000 | | 237,802 |
| Enable Midstream Partners LP | | | |
| 4.95%, 05/15/28 | 900,000 | | 912,425 |
| Energizer Holdings, Inc. | | | |
| 7.75%, 01/15/27 144A | 425,000 | | 475,745 |
| Energy Transfer Operating LP | | | |
| 4.65%, 06/01/21 | 150,000 | | 154,605 |
| 4.20%, 09/15/23 | 625,000 | | 656,698 |
| 4.50%, 04/15/24 | 230,000 | | 245,013 |
| 4.05%, 03/15/25 | 65,000 | | 68,381 |
| 5.50%, 06/01/27 | 525,000 | | 591,119 |
| 4.95%, 06/15/28 | 70,000 | | 76,770 |
| 5.25%, 04/15/29 | 615,000 | | 691,637 |
| 5.30%, 04/15/47 | 225,000 | | 240,583 |
| 6.00%, 06/15/48 | 250,000 | | 292,134 |
| 6.25%, 04/15/49 | 20,000 | | 24,170 |
| Energy Transfer Partners LP | | | |
| 4.50%, 11/01/23 | 310,000 | | 328,647 |
| Entercom Media Corporation | | | |
| 6.50%, 05/01/27 144A | 175,000 | | 187,748 |
| Entergy Louisiana LLC | | | |
| 5.40%, 11/01/24 | 1,200,000 | | 1,375,228 |
| Enterprise Products Operating LLC | | | |
| 4.15%, 10/16/28 | 600,000 | | 664,694 |
| 3.13%, 07/31/29 | 100,000 | | 103,108 |
| 7.55%, 04/15/38 | 50,000 | | 72,628 |
| 5.70%, 02/15/42 | 60,000 | | 77,553 |
| 4.85%, 03/15/44 | 50,000 | | 57,940 |
| 4.80%, 02/01/49 | 30,000 | | 35,295 |
| 4.20%, 01/31/50 | 130,000 | | 140,154 |
| (Variable, ICE LIBOR USD 3M + 2.78%), 4.68%, 06/01/67† | 455,000 | | 430,917 |
| EOG Resources, Inc. | | | |
| 4.15%, 01/15/26 | 140,000 | | 154,004 |
| EPR Properties REIT | | | |
| 4.75%, 12/15/26 | 1,200,000 | | 1,310,761 |
| 3.75%, 08/15/29 | 65,000 | | 65,974 |
| EQM Midstream Partners LP | | | |
| 4.75%, 07/15/23 | 1,225,000 | | 1,229,645 |
| 4.13%, 12/01/26 | 1,800,000 | | 1,699,331 |
| 5.50%, 07/15/28 | 300,000 | | 295,118 |
| ERAC USA Finance LLC | | | |
| 4.50%, 08/16/21 144A | 709,000 | | 736,506 |
| ERP Operating LP REIT | | | |
| 4.63%, 12/15/21 | 150,000 | | 156,761 |
| Exelon Corporation | | | |
| 5.63%, 06/15/35 | 415,000 | | 514,708 |
| Expedia Group, Inc. | | | |
| 3.80%, 02/15/28 | 300,000 | | 307,123 |
| Exxon Mobil Corporation | | | |
| 3.04%, 03/01/26 | 280,000 | | 293,986 |
| 4.11%, 03/01/46 | 230,000 | | 270,415 |
| FedEx Corporation | | | |
| 4.55%, 04/01/46 | 30,000 | | 30,908 |
| | | Par | | Value |
| FirstEnergy Corporation | | | |
| 4.25%, 03/15/23 | $290,000 | | $305,917 |
| 3.90%, 07/15/27 | 690,000 | | 738,685 |
| 7.38%, 11/15/31 | 1,800,000 | | 2,543,543 |
| Fiserv, Inc. | | | |
| 3.80%, 10/01/23 | 225,000 | | 237,821 |
| 2.75%, 07/01/24 | 1,130,000 | | 1,151,152 |
| 3.20%, 07/01/26 | 725,000 | | 751,918 |
| 4.20%, 10/01/28 | 375,000 | | 416,298 |
| Florida Power & Light Co. | | | |
| 3.80%, 12/15/42 | 425,000 | | 464,440 |
| Ford Motor Credit Co. LLC | | | |
| 2.46%, 03/27/20 | 800,000 | | 800,304 |
| 3.16%, 08/04/20 | 225,000 | | 225,919 |
| 3.20%, 01/15/21 | 200,000 | | 201,164 |
| 5.75%, 02/01/21 | 200,000 | | 206,503 |
| 3.34%, 03/18/21 | 1,850,000 | | 1,864,350 |
| 5.88%, 08/02/21 | 570,000 | | 596,897 |
| 2.98%, 08/03/22 | 1,800,000 | | 1,803,376 |
| Fortive Corporation | | | |
| 3.15%, 06/15/26 | 65,000 | | 66,572 |
| Fox Corporation | | | |
| 4.03%, 01/25/24 144A | 480,000 | | 511,817 |
| 4.71%, 01/25/29 144A | 470,000 | | 536,392 |
| 5.48%, 01/25/39 144A | 300,000 | | 367,691 |
| 5.58%, 01/25/49 144A | 80,000 | | 102,057 |
| Freeport-McMoRan, Inc. | | | |
| 3.55%, 03/01/22 | 20,000 | | 20,286 |
| 3.88%, 03/15/23 | 10,000 | | 10,203 |
| 4.55%, 11/14/24 | 10,000 | | 10,592 |
| 5.45%, 03/15/43 | 192,000 | | 199,219 |
| General Electric Co. | | | |
| 5.50%, 01/08/20 | 40,000 | | 40,015 |
| 4.38%, 09/16/20 | 198,000 | | 201,093 |
| 5.30%, 02/11/21 | 104,000 | | 107,324 |
| 4.65%, 10/17/21 | 1,540,000 | | 1,606,034 |
| 3.15%, 09/07/22 | 230,000 | | 234,937 |
| 2.70%, 10/09/22 | 75,000 | | 76,062 |
| 3.10%, 01/09/23 | 250,000 | | 255,592 |
| 6.75%, 03/15/32 | 80,000 | | 102,854 |
| 6.88%, 01/10/39 | 525,000 | | 702,802 |
| General Mills, Inc. | | | |
| 4.20%, 04/17/28Δ | 640,000 | | 713,987 |
| General Motors Co. | | | |
| 4.00%, 04/01/25 | 200,000 | | 210,989 |
| 5.15%, 04/01/38 | 50,000 | | 51,236 |
| General Motors Financial Co., Inc. | | | |
| 3.20%, 07/13/20 | 1,000,000 | | 1,004,671 |
| 2.45%, 11/06/20 | 130,000 | | 130,331 |
| 4.38%, 09/25/21 | 400,000 | | 414,578 |
| 3.45%, 04/10/22 | 230,000 | | 235,298 |
| 3.70%, 05/09/23 | 30,000 | | 30,948 |
| 4.15%, 06/19/23 | 30,000 | | 31,534 |
| 4.30%, 07/13/25 | 300,000 | | 320,926 |
| 5.25%, 03/01/26 | 45,000 | | 49,943 |
| 4.35%, 01/17/27 | 560,000 | | 589,201 |
| 5.65%, 01/17/29 | 100,000 | | 113,170 |
See Notes to Financial Statements.
MEDIUM-DURATION BOND FUND
SCHEDULE OF INVESTMENTS (Continued)
| | | Par | | Value |
| Genesis Energy LP | | | |
| 6.50%, 10/01/25 | $400,000 | | $387,996 |
| Gilead Sciences, Inc. | | | |
| 2.55%, 09/01/20 | 80,000 | | 80,351 |
| 3.70%, 04/01/24 | 230,000 | | 244,062 |
| 3.50%, 02/01/25 | 25,000 | | 26,553 |
| 3.65%, 03/01/26 | 55,000 | | 59,279 |
| 4.50%, 02/01/45 | 275,000 | | 320,162 |
| 4.75%, 03/01/46 | 20,000 | | 24,087 |
| GlaxoSmithKline Capital, Inc. | | | |
| 3.88%, 05/15/28Δ | 45,000 | | 49,748 |
| Glencore Funding LLC | | | |
| 2.88%, 04/16/20 144A | 90,000 | | 90,125 |
| 3.00%, 10/27/22 144A | 10,000 | | 10,084 |
| 4.13%, 05/30/23 144A | 20,000 | | 20,855 |
| 4.13%, 03/12/24 144A | 1,225,000 | | 1,283,860 |
| 4.63%, 04/29/24 144A | 658,000 | | 699,388 |
| 4.00%, 03/27/27 144A | 545,000 | | 566,956 |
| 3.88%, 10/27/27 144A | 430,000 | | 447,768 |
| 4.88%, 03/12/29 144A | 30,000 | | 32,624 |
| Global Payments, Inc. | | | |
| 2.65%, 02/15/25 | 400,000 | | 402,292 |
| 3.20%, 08/15/29 | 225,000 | | 229,785 |
| Goldman Sachs Capital II | | | |
| (Variable, ICE LIBOR USD 3M + 0.77%), 4.00%, 02/10/20† ρ | 3,000 | | 2,630 |
| Goldman Sachs Group, Inc. (The) | | | |
| 5.38%, 03/15/20 | 200,000 | | 201,368 |
| 6.00%, 06/15/20 | 540,000 | | 549,575 |
| 5.25%, 07/27/21 | 2,060,000 | | 2,162,345 |
| 3.20%, 02/23/23 | 250,000 | | 257,182 |
| 3.85%, 07/08/24 | 150,000 | | 158,748 |
| 3.50%, 01/23/25 | 1,700,000 | | 1,785,787 |
| 4.25%, 10/21/25 | 1,470,000 | | 1,598,004 |
| 3.50%, 11/16/26 | 700,000 | | 737,260 |
| (Variable, ICE LIBOR USD 3M + 1.16%), 3.81%, 04/23/29^ | 690,000 | | 740,868 |
| (Variable, ICE LIBOR USD 3M + 1.30%), 4.22%, 05/01/29^ | 880,000 | | 971,026 |
| 6.75%, 10/01/37 | 110,000 | | 152,998 |
| 6.25%, 02/01/41 | 750,000 | | 1,050,295 |
| 5.15%, 05/22/45 | 330,000 | | 406,237 |
| 4.75%, 10/21/45Δ | 530,000 | | 647,951 |
| Goodman US Finance Three LLC REIT | | | |
| 3.70%, 03/15/28 144A | 1,000,000 | | 1,027,758 |
| Great-West Lifeco Finance 2018 LP | | | |
| 4.05%, 05/17/28 144A Δ | 225,000 | | 248,789 |
| Halliburton Co. | | | |
| 3.80%, 11/15/25 | 675,000 | | 720,613 |
| 5.00%, 11/15/45 | 230,000 | | 263,317 |
| Hartford Financial Services Group, Inc. (The) | | | |
| 2.80%, 08/19/29 | 35,000 | | 35,482 |
| HCA, Inc. | | | |
| 5.00%, 03/15/24 | 30,000 | | 32,826 |
| 5.38%, 02/01/25 | 600,000 | | 664,749 |
| 5.25%, 04/15/25 | 165,000 | | 184,835 |
| 5.25%, 06/15/26 | 10,000 | | 11,218 |
| | | Par | | Value |
| 5.38%, 09/01/26 | $1,600,000 | | $1,786,040 |
| 5.50%, 06/15/47 | 50,000 | | 57,561 |
| Healthcare Trust of America Holdings LP REIT | | | |
| 3.10%, 02/15/30 | 1,500,000 | | 1,491,656 |
| Healthpeak Properties, Inc. REIT | | | |
| 3.50%, 07/15/29 | 65,000 | | 67,884 |
| Herc Holdings, Inc. | | | |
| 5.50%, 07/15/27 144A | 670,000 | | 706,867 |
| Hewlett Packard Enterprise Co. | | | |
| 2.25%, 04/01/23 | 1,000,000 | | 999,773 |
| 4.90%, 10/15/25 | 945,000 | | 1,051,187 |
| 6.35%, 10/15/45 | 155,000 | | 186,921 |
| HollyFrontier Corporation | | | |
| 5.88%, 04/01/26 | 60,000 | | 67,736 |
| Home Depot, Inc. (The) | | | |
| 2.13%, 09/15/26 | 1,175,000 | | 1,175,444 |
| 3.90%, 12/06/28 | 250,000 | | 280,991 |
| Honeywell International, Inc. | | | |
| 2.50%, 11/01/26 | 35,000 | | 35,647 |
| Humana, Inc. | | | |
| 3.15%, 12/01/22 | 70,000 | | 71,880 |
| 3.95%, 03/15/27 | 150,000 | | 161,575 |
| 4.63%, 12/01/42 | 60,000 | | 67,671 |
| 4.95%, 10/01/44 | 70,000 | | 82,820 |
| 4.80%, 03/15/47 | 10,000 | | 11,739 |
| Huntington Bancshares, Inc. | | | |
| 4.00%, 05/15/25Δ | 550,000 | | 594,803 |
| Huntsman International LLC | | | |
| 4.50%, 05/01/29 | 390,000 | | 414,775 |
| Hyundai Capital America | | | |
| 2.85%, 11/01/22 144A | 1,600,000 | | 1,618,864 |
| IHS Markit, Ltd. | | | |
| 4.00%, 03/01/26 144A | 1,125,000 | | 1,188,349 |
| Ingersoll-Rand Luxembourg Finance SA | | | |
| 3.80%, 03/21/29 | 25,000 | | 26,872 |
| Intel Corporation | | | |
| 3.70%, 07/29/25 | 80,000 | | 86,600 |
| 3.73%, 12/08/47 | 76,000 | | 83,807 |
| International Business Machines Corporation | | | |
| 3.00%, 05/15/24 | 990,000 | | 1,027,993 |
| International Lease Finance Corporation | | | |
| 8.63%, 01/15/22 | 420,000 | | 472,722 |
| JetBlue Pass-Through Trust, Series 2019-1, Class AA | | | |
| 2.75%, 05/15/32Δ | 2,100,000 | | 2,117,397 |
| John Deere Capital Corporation | | | |
| 1.70%, 01/15/20 | 80,000 | | 79,993 |
| Johnson & Johnson | | | |
| 2.45%, 03/01/26 | 560,000 | | 569,160 |
| 3.63%, 03/03/37 | 390,000 | | 431,475 |
| JPMorgan Chase & Co. | | | |
| (Variable, ICE LIBOR USD 3M + 3.80%), 5.30%, 05/01/20ρ ^ | 550,000 | | 554,298 |
| 4.40%, 07/22/20 | 230,000 | | 233,194 |
| 2.40%, 06/07/21 | 1,100,000 | | 1,107,518 |
See Notes to Financial Statements.
| | | Par | | Value |
| 4.35%, 08/15/21 | $70,000 | | $72,715 |
| 2.97%, 01/15/23Δ | 30,000 | | 30,581 |
| (Variable, ICE LIBOR USD 3M + 0.73%), 3.56%, 04/23/24^ | 800,000 | | 834,074 |
| (Variable, ICE LIBOR USD 3M + 0.89%), 3.80%, 07/23/24^ | 1,600,000 | | 1,687,322 |
| 3.88%, 09/10/24 | 860,000 | | 921,268 |
| (Variable, ICE LIBOR USD 3M + 1.00%), 4.02%, 12/05/24^ | 4,000,000 | | 4,268,062 |
| 3.13%, 01/23/25Δ | 900,000 | | 939,860 |
| (Variable, U.S. SOFR + 1.16%), 2.30%, 10/15/25^ | 950,000 | | 949,571 |
| 2.95%, 10/01/26 | 700,000 | | 721,993 |
| (Variable, ICE LIBOR USD 3M + 1.25%), 3.96%, 01/29/27^ | 940,000 | | 1,020,930 |
| 4.25%, 10/01/27 | 780,000 | | 864,321 |
| 3.63%, 12/01/27 | 900,000 | | 951,607 |
| (Variable, ICE LIBOR USD 3M + 0.95%), 3.51%, 01/23/29^ | 1,550,000 | | 1,648,793 |
| (Variable, ICE LIBOR USD 3M + 1.26%), 4.20%, 07/23/29^ | 380,000 | | 424,514 |
| (Variable, ICE LIBOR USD 3M + 1.33%), 4.45%, 12/05/29^ | 170,000 | | 193,620 |
| (Variable, ICE LIBOR USD 3M + 1.36%), 3.88%, 07/24/38^ | 205,000 | | 227,275 |
| 4.95%, 06/01/45 | 400,000 | | 509,866 |
| Keurig Dr. Pepper, Inc. | | | |
| 4.06%, 05/25/23 | 510,000 | | 538,215 |
| 5.09%, 05/25/48Δ | 400,000 | | 483,900 |
| KeyCorp | | | |
| 2.55%, 10/01/29 | 70,000 | | 68,543 |
| Keysight Technologies, Inc. | | | |
| 3.00%, 10/30/29 | 475,000 | | 477,567 |
| Kilroy Realty LP REIT | | | |
| 3.80%, 01/15/23 | 400,000 | | 414,799 |
| 4.75%, 12/15/28 | 1,750,000 | | 1,987,523 |
| Kinder Morgan Energy Partners LP | | | |
| 3.95%, 09/01/22 | 520,000 | | 542,144 |
| 4.25%, 09/01/24 | 980,000 | | 1,050,260 |
| Kinder Morgan, Inc. | | | |
| 4.30%, 03/01/28 | 60,000 | | 65,478 |
| KKR Group Finance Co. II LLC | | | |
| 5.50%, 02/01/43 144A | 30,000 | | 36,757 |
| Kraft Heinz Foods Co. | | | |
| (Floating, ICE LIBOR USD 3M + 0.57%), 2.47%, 02/10/21† Δ | 1,000,000 | | 1,001,650 |
| 3.95%, 07/15/25 | 145,000 | | 153,655 |
| 3.00%, 06/01/26 | 320,000 | | 320,362 |
| 5.00%, 07/15/35 | 30,000 | | 33,384 |
| Kroger Co. (The) | | | |
| 6.15%, 01/15/20 | 360,000 | | 360,492 |
| L3Harris Technologies, Inc. | | | |
| 5.05%, 04/27/45 | 110,000 | | 135,901 |
| Lear Corporation | | | |
| 3.80%, 09/15/27 | 50,000 | | 50,549 |
| Legg Mason, Inc. | | | |
| 5.63%, 01/15/44 | 30,000 | | 34,122 |
| Lehman Escrow Bonds | | | |
| 0.00%, 01/18/12# | 200,000 | | 2,500 |
| | | Par | | Value |
| 0.00%, 01/24/13# | $2,300,000 | | $29,210 |
| 0.00%, 07/19/17Ψ ††† # | 150,000 | | — |
| 0.00%, 12/28/17Ψ ††† # | 3,340,000 | | — |
| 0.00%, 02/07/20Ψ ††† # | 2,330,000 | | — |
| Level 3 Financing, Inc. | | | |
| 5.63%, 02/01/23 | 1,050,000 | | 1,055,764 |
| Life Storage LP REIT | | | |
| 3.88%, 12/15/27 | 900,000 | | 950,182 |
| Lincoln National Corporation | | | |
| 3.05%, 01/15/30 | 70,000 | | 70,397 |
| Lockheed Martin Corporation | | | |
| 3.10%, 01/15/23 | 40,000 | | 41,289 |
| 3.55%, 01/15/26 | 310,000 | | 332,830 |
| 4.50%, 05/15/36 | 50,000 | | 59,388 |
| Marathon Oil Corporation | | | |
| 4.40%, 07/15/27Δ | 175,000 | | 190,481 |
| Marathon Petroleum Corporation | | | |
| 5.13%, 12/15/26 | 60,000 | | 68,023 |
| 3.80%, 04/01/28 | 250,000 | | 263,391 |
| Marriott International, Inc. | | | |
| 2.13%, 10/03/22 | 1,500,000 | | 1,503,884 |
| Mars, Inc. | | | |
| 2.70%, 04/01/25 144A | 400,000 | | 409,608 |
| 3.20%, 04/01/30 144A | 475,000 | | 503,564 |
| Marsh & McLennan Cos., Inc. | | | |
| 3.75%, 03/14/26 | 1,100,000 | | 1,183,101 |
| 4.38%, 03/15/29Δ | 500,000 | | 570,520 |
| McDonald’s Corporation | | | |
| 3.70%, 01/30/26 | 240,000 | | 259,161 |
| 3.50%, 03/01/27 | 410,000 | | 438,381 |
| 3.80%, 04/01/28 | 90,000 | | 98,507 |
| Medtronic, Inc. | | | |
| 3.50%, 03/15/25 | 14,000 | | 15,017 |
| 4.63%, 03/15/45 | 36,000 | | 45,406 |
| MetLife Capital Trust IV | | | |
| 7.88%, 12/15/37 144A | 300,000 | | 400,978 |
| MetLife, Inc. | | | |
| 6.40%, 12/15/36 | 50,000 | | 61,330 |
| Metropolitan Life Global Funding I | | | |
| 3.45%, 12/18/26 144A | 1,700,000 | | 1,826,439 |
| Microchip Technology, Inc. | | | |
| 3.92%, 06/01/21 | 350,000 | | 358,061 |
| Microsoft Corporation | | | |
| 2.88%, 02/06/24 | 470,000 | | 487,990 |
| 2.70%, 02/12/25 | 120,000 | | 124,083 |
| 2.40%, 08/08/26 | 2,040,000 | | 2,065,799 |
| 3.30%, 02/06/27Δ | 800,000 | | 855,808 |
| 3.45%, 08/08/36 | 10,000 | | 10,977 |
| 4.10%, 02/06/37 | 50,000 | | 59,235 |
| 3.95%, 08/08/56 | 130,000 | | 154,309 |
| MidAmerican Energy Co. | | | |
| 3.65%, 04/15/29 | 350,000 | | 383,058 |
| Moody’s Corporation | | | |
| 4.50%, 09/01/22 | 800,000 | | 846,216 |
| Morgan Stanley | | | |
| 5.50%, 07/24/20 | 550,000 | | 561,160 |
See Notes to Financial Statements.
MEDIUM-DURATION BOND FUND
SCHEDULE OF INVESTMENTS (Continued)
| | | Par | | Value |
| (Floating, ICE LIBOR USD 3M + 1.40%), 3.37%, 04/21/21† | $100,000 | | $101,521 |
| (Variable, ICE LIBOR USD 3M + 0.85%), 3.74%, 04/24/24^ | 500,000 | | 522,701 |
| 3.70%, 10/23/24 | 1,150,000 | | 1,222,404 |
| (Variable, U.S. SOFR + 1.15%), 2.72%, 07/22/25^ | 725,000 | | 734,636 |
| 3.63%, 01/20/27 | 1,475,000 | | 1,571,923 |
| 3.95%, 04/23/27 | 725,000 | | 778,501 |
| (Variable, ICE LIBOR USD 3M + 1.34%), 3.59%, 07/22/28^ | 30,000 | | 31,924 |
| (Variable, ICE LIBOR USD 3M + 1.14%), 3.77%, 01/24/29^ | 520,000 | | 560,185 |
| (Variable, ICE LIBOR USD 3M + 1.63%), 4.43%, 01/23/30^ | 945,000 | | 1,069,675 |
| Motorola Solutions, Inc. | | | |
| 4.60%, 05/23/29 | 60,000 | | 65,553 |
| MPLX LP | | | |
| 4.88%, 12/01/24 | 230,000 | | 250,201 |
| 4.88%, 06/01/25 | 100,000 | | 109,322 |
| 4.25%, 12/01/27 144A | 35,000 | | 36,912 |
| 4.00%, 03/15/28 | 85,000 | | 88,116 |
| 4.80%, 02/15/29 | 250,000 | | 274,620 |
| 4.50%, 04/15/38 | 530,000 | | 540,205 |
| 5.20%, 03/01/47 | 15,000 | | 16,242 |
| 4.70%, 04/15/48 | 1,170,000 | | 1,194,109 |
| 5.50%, 02/15/49 | 595,000 | | 676,950 |
| MPT Operating Partnership LP REIT | | | |
| 4.63%, 08/01/29 | 865,000 | | 892,572 |
| National Retail Properties, Inc. REIT | | | |
| 3.60%, 12/15/26 | 250,000 | | 262,831 |
| Newell Brands, Inc. | | | |
| 3.85%, 04/01/23 | 132,000 | | 137,255 |
| 4.20%, 04/01/26 | 150,000 | | 156,537 |
| Niagara Mohawk Power Corporation | | | |
| 4.28%, 12/15/28 144A | 2,000,000 | | 2,232,982 |
| NIKE, Inc. | | | |
| 2.38%, 11/01/26 | 35,000 | | 35,615 |
| NiSource, Inc. | | | |
| 3.65%, 06/15/23 | 400,000 | | 416,932 |
| 3.49%, 05/15/27Δ | 925,000 | | 973,920 |
| Nissan Motor Acceptance Corporation | | | |
| (Floating, ICE LIBOR USD 3M + 0.89%), 2.89%, 01/13/22 144A † | 1,900,000 | | 1,909,849 |
| Noble Energy, Inc. | | | |
| 3.85%, 01/15/28 | 440,000 | | 465,338 |
| 3.25%, 10/15/29 | 425,000 | | 431,652 |
| 6.00%, 03/01/41 | 10,000 | | 12,055 |
| 5.25%, 11/15/43 | 5,000 | | 5,642 |
| 4.95%, 08/15/47 | 110,000 | | 122,444 |
| Northrop Grumman Corporation | | | |
| 2.93%, 01/15/25 | 1,620,000 | | 1,671,603 |
| 3.25%, 01/15/28 | 670,000 | | 699,852 |
| 4.75%, 06/01/43 | 200,000 | | 242,158 |
| Northwell Healthcare, Inc. | | | |
| 6.15%, 11/01/43 | 375,000 | | 501,618 |
| | | Par | | Value |
| Northwestern Mutual Life Insurance Co. (The) | | | |
| 6.06%, 03/30/40 144A | $300,000 | | $409,905 |
| 3.85%, 09/30/47 144A | 250,000 | | 263,922 |
| NRG Energy, Inc. | | | |
| 3.75%, 06/15/24 144A | 625,000 | | 646,801 |
| Nuveen LLC | | | |
| 4.00%, 11/01/28 144A | 225,000 | | 250,768 |
| Oasis Petroleum, Inc. | | | |
| 6.88%, 03/15/22Δ | 50,000 | | 48,250 |
| Occidental Petroleum Corporation | | | |
| 4.85%, 03/15/21 | 231,000 | | 238,001 |
| 2.60%, 08/13/21 | 180,000 | | 181,389 |
| 3.13%, 02/15/22 | 100,000 | | 101,795 |
| 2.70%, 08/15/22 | 250,000 | | 252,694 |
| 2.70%, 02/15/23Δ | 20,000 | | 20,171 |
| 6.95%, 07/01/24 | 290,000 | | 341,850 |
| 2.90%, 08/15/24 | 2,665,000 | | 2,711,413 |
| 5.55%, 03/15/26 | 845,000 | | 958,988 |
| 3.40%, 04/15/26 | 500,000 | | 512,753 |
| 3.20%, 08/15/26 | 260,000 | | 263,352 |
| 3.00%, 02/15/27 | 150,000 | | 150,411 |
| 7.88%, 09/15/31 | 280,000 | | 375,961 |
| 6.45%, 09/15/36 | 430,000 | | 528,909 |
| 4.63%, 06/15/45 | 130,000 | | 134,748 |
| 6.60%, 03/15/46 | 470,000 | | 606,669 |
| 4.40%, 04/15/46Δ | 60,000 | | 60,876 |
| 4.10%, 02/15/47 | 260,000 | | 253,221 |
| 4.20%, 03/15/48Δ | 80,000 | | 79,598 |
| Office Properties Income Trust REIT | | | |
| 3.60%, 02/01/20 | 125,000 | | 125,000 |
| Omega Healthcare Investors, Inc. REIT | | | |
| 3.63%, 10/01/29 | 1,600,000 | | 1,603,896 |
| Omnicom Group, Inc. | | | |
| 3.60%, 04/15/26 | 30,000 | | 31,634 |
| Oracle Corporation | | | |
| 4.00%, 07/15/46 | 375,000 | | 418,100 |
| PayPal Holdings, Inc. | | | |
| 2.65%, 10/01/26Δ | 2,775,000 | | 2,818,212 |
| Penske Truck Leasing Co. LP | | | |
| 3.38%, 02/01/22 144A | 1,000,000 | | 1,021,578 |
| Phillips 66 | | | |
| 3.90%, 03/15/28Δ | 475,000 | | 518,630 |
| Physicians Realty LP REIT | | | |
| 3.95%, 01/15/28 | 2,400,000 | | 2,515,363 |
| Pioneer Natural Resources Co. | | | |
| 3.95%, 07/15/22 | 75,000 | | 77,864 |
| Plains All American Pipeline LP | | | |
| 3.65%, 06/01/22Δ | 200,000 | | 205,260 |
| Post Holdings, Inc. | | | |
| 5.50%, 12/15/29 144A | 350,000 | | 373,852 |
| Progress Energy, Inc. | | | |
| 7.75%, 03/01/31Δ | 350,000 | | 493,225 |
See Notes to Financial Statements.
| | | Par | | Value |
| QUALCOMM, Inc. | | | |
| 3.45%, 05/20/25 | $30,000 | | $31,754 |
| Range Resources Corporation | | | |
| 5.00%, 03/15/23Δ | 430,000 | | 396,593 |
| 4.88%, 05/15/25Δ | 10,000 | | 8,575 |
| Raytheon Co. | | | |
| 3.13%, 10/15/20 | 200,000 | | 201,949 |
| Regency Centers LP REIT | | | |
| 2.95%, 09/15/29 | 775,000 | | 775,536 |
| Reinsurance Group of America, Inc. | | | |
| 3.90%, 05/15/29 | 65,000 | | 69,416 |
| Reliance Standard Life Global Funding II | | | |
| 2.50%, 01/15/20 144A | 100,000 | | 100,006 |
| RELX Capital, Inc. | | | |
| 3.50%, 03/16/23 | 1,300,000 | | 1,350,691 |
| Republic Services, Inc. | | | |
| 2.50%, 08/15/24 | 190,000 | | 192,381 |
| Rockwell Collins, Inc. | | | |
| 3.50%, 03/15/27 | 550,000 | | 584,667 |
| Roper Technologies, Inc. | | | |
| 4.20%, 09/15/28 | 500,000 | | 548,452 |
| Ryder System, Inc. | | | |
| 2.50%, 09/01/24Δ | 70,000 | | 70,406 |
| Sabine Pass Liquefaction LLC | | | |
| 6.25%, 03/15/22 | 475,000 | | 510,492 |
| 5.63%, 04/15/23 | 400,000 | | 435,599 |
| 5.63%, 03/01/25 | 450,000 | | 507,125 |
| 5.88%, 06/30/26 | 30,000 | | 34,509 |
| 5.00%, 03/15/27 | 425,000 | | 468,184 |
| Sabra Health Care LP REIT | | | |
| 3.90%, 10/15/29 | 1,500,000 | | 1,512,821 |
| salesforce.com, Inc. | | | |
| 3.25%, 04/11/23 | 300,000 | | 312,247 |
| 3.70%, 04/11/28 | 100,000 | | 109,796 |
| Santander Holdings USA, Inc. | | | |
| 4.50%, 07/17/25 | 60,000 | | 64,820 |
| 3.24%, 10/05/26 144A | 1,100,000 | | 1,113,828 |
| 4.40%, 07/13/27 | 65,000 | | 70,249 |
| Schlumberger Holdings Corporation | | | |
| 4.00%, 12/21/25 144A | 220,000 | | 237,127 |
| 3.90%, 05/17/28 144A | 252,000 | | 268,713 |
| 4.30%, 05/01/29 144A | 30,000 | | 32,968 |
| Seagate HDD Cayman | | | |
| 4.75%, 01/01/25 | 45,000 | | 48,142 |
| Sempra Energy | | | |
| (Floating, ICE LIBOR USD 3M + 0.50%), 2.50%, 01/15/21† | 625,000 | | 625,115 |
| 2.90%, 02/01/23 | 1,125,000 | | 1,148,048 |
| 3.40%, 02/01/28 | 275,000 | | 285,332 |
| Sherwin-Williams Co. (The) | | | |
| 2.75%, 06/01/22 | 57,000 | | 58,016 |
| 3.13%, 06/01/24 | 75,000 | | 77,585 |
| 3.45%, 06/01/27 | 415,000 | | 439,491 |
| 2.95%, 08/15/29 | 475,000 | | 480,743 |
| Simon Property Group LP REIT | | | |
| 2.45%, 09/13/29 | 1,600,000 | | 1,577,196 |
| | | Par | | Value |
| Southern California Edison Co. | | | |
| 3.70%, 08/01/25 | $1,800,000 | | $1,908,053 |
| 4.20%, 03/01/29 | 400,000 | | 443,219 |
| Southern Co. (The) | | | |
| 3.25%, 07/01/26 | 1,400,000 | | 1,459,762 |
| Southern Co. Gas Capital Corporation | | | |
| 3.25%, 06/15/26 | 300,000 | | 312,653 |
| Southern Copper Corporation | | | |
| 5.25%, 11/08/42 | 2,520,000 | | 2,909,160 |
| Southern Natural Gas Co. LLC | | | |
| 8.00%, 03/01/32 | 400,000 | | 580,955 |
| Spirit AeroSystems, Inc. | | | |
| 3.95%, 06/15/23 | 1,500,000 | | 1,547,436 |
| Spirit Airlines Pass-Through Trust, Series 2015-1, Class A | | | |
| 4.10%, 04/01/28 | 1,147,733 | | 1,199,435 |
| Spirit Realty LP REIT | | | |
| 4.45%, 09/15/26 | 1,200,000 | | 1,290,695 |
| 4.00%, 07/15/29 | 750,000 | | 790,806 |
| Springleaf Finance Corporation | | | |
| 7.75%, 10/01/21 | 1,600,000 | | 1,740,912 |
| Sprint Communications, Inc. | | | |
| 6.00%, 11/15/22 | 875,000 | | 919,214 |
| Sprint Spectrum Co. LLC | | | |
| 3.36%, 09/20/21 144A | 87,500 | | 88,388 |
| 5.15%, 03/20/28 144A | 1,100,000 | | 1,202,132 |
| Starbucks Corporation | | | |
| 3.80%, 08/15/25 | 625,000 | | 673,996 |
| State Street Corporation | | | |
| 3.30%, 12/16/24Δ | 30,000 | | 31,669 |
| Stryker Corporation | | | |
| 2.63%, 03/15/21 | 125,000 | | 126,091 |
| Sunoco Logistics Partners Operations LP | | | |
| 4.25%, 04/01/24 | 100,000 | | 105,231 |
| 5.95%, 12/01/25 | 300,000 | | 342,540 |
| 5.40%, 10/01/47 | 125,000 | | 136,121 |
| Synchrony Financial | | | |
| 2.70%, 02/03/20 | 200,000 | | 200,072 |
| 5.15%, 03/19/29 | 60,000 | | 68,331 |
| Targa Resources Partners LP | | | |
| 5.88%, 04/15/26 | 350,000 | | 372,531 |
| 6.50%, 07/15/27 144A | 355,000 | | 389,382 |
| 5.50%, 03/01/30 144A | 120,000 | | 123,450 |
| Teachers Insurance & Annuity Association of America | | | |
| 6.85%, 12/16/39 144A | 46,000 | | 67,058 |
| 4.90%, 09/15/44 144A | 655,000 | | 805,718 |
| Thermo Fisher Scientific, Inc. | | | |
| 3.00%, 04/15/23 | 100,000 | | 102,887 |
| 3.65%, 12/15/25 | 200,000 | | 213,979 |
| Time Warner Cable LLC | | | |
| 4.13%, 02/15/21 | 400,000 | | 406,547 |
| 7.30%, 07/01/38 | 620,000 | | 809,915 |
| 5.88%, 11/15/40 | 100,000 | | 114,992 |
| Time Warner Entertainment Co. LP | | | |
| 8.38%, 03/15/23 | 975,000 | | 1,151,472 |
See Notes to Financial Statements.
MEDIUM-DURATION BOND FUND
SCHEDULE OF INVESTMENTS (Continued)
| | | Par | | Value |
| 8.38%, 07/15/33 | $390,000 | | $547,408 |
| TJX Cos, Inc. (The) | | | |
| 2.25%, 09/15/26Δ | 40,000 | | 40,229 |
| Toyota Motor Credit Corporation | | | |
| (Floating, ICE LIBOR USD 3M + 0.29%), 2.19%, 10/07/21† | 1,600,000 | | 1,603,742 |
| Transcontinental Gas Pipe Line Co. LLC | | | |
| 7.85%, 02/01/26 | 350,000 | | 445,106 |
| TransDigm, Inc. | | | |
| 6.50%, 05/15/25 | 50,000 | | 52,104 |
| 6.38%, 06/15/26 | 350,000 | | 371,861 |
| 7.50%, 03/15/27 | 300,000 | | 328,695 |
| Truist Bank | | | |
| (Variable, ICE LIBOR USD 3M + 0.30%), 2.59%, 01/29/21^ | 875,000 | | 877,113 |
| Truist Financial Corporation | | | |
| 3.75%, 12/06/23 | 30,000 | | 31,844 |
| Tyson Foods, Inc. | | | |
| 4.00%, 03/01/26 | 65,000 | | 70,414 |
| U.S. Bancorp | | | |
| 3.38%, 02/05/24 | 65,000 | | 68,299 |
| UDR, Inc. REIT | | | |
| 3.20%, 01/15/30 | 1,200,000 | | 1,228,992 |
| Union Pacific Corporation | | | |
| 3.75%, 07/15/25 | 210,000 | | 225,337 |
| 3.95%, 09/10/28 | 710,000 | | 785,182 |
| 3.84%, 03/20/60 144A | 600,000 | | 611,926 |
| United Airlines Pass-Through Trust, Series 2016-2, Class A | | | |
| 3.10%, 10/07/28 | 715,421 | | 726,129 |
| United Airlines Pass-Through Trust, Series 2016-2, Class AA | | | |
| 2.88%, 10/07/28Δ | 715,421 | | 726,718 |
| United Parcel Service, Inc. | | | |
| 3.05%, 11/15/27 | 65,000 | | 68,433 |
| United Technologies Corporation | | | |
| (Floating, ICE LIBOR USD 3M + 0.65%), 2.55%, 08/16/21† | 250,000 | | 250,034 |
| 3.35%, 08/16/21 | 225,000 | | 230,458 |
| 3.95%, 08/16/25 | 730,000 | | 796,691 |
| 2.65%, 11/01/26 | 895,000 | | 917,123 |
| 4.13%, 11/16/28 | 725,000 | | 816,352 |
| 4.50%, 06/01/42 | 90,000 | | 108,096 |
| 4.05%, 05/04/47 | 175,000 | | 201,077 |
| 4.63%, 11/16/48 | 250,000 | | 313,752 |
| UnitedHealth Group, Inc. | | | |
| 2.70%, 07/15/20 | 280,000 | | 281,195 |
| 2.88%, 12/15/21Δ | 180,000 | | 183,668 |
| 3.75%, 07/15/25 | 270,000 | | 291,890 |
| 3.85%, 06/15/28 | 35,000 | | 38,653 |
| 3.88%, 12/15/28 | 90,000 | | 99,735 |
| 4.63%, 07/15/35 | 150,000 | | 182,471 |
| 3.70%, 08/15/49 | 220,000 | | 237,119 |
| 3.88%, 08/15/59Δ | 190,000 | | 205,850 |
| US Bank NA | | | |
| 3.15%, 04/26/21 | 300,000 | | 304,856 |
| | | Par | | Value |
| Valero Energy Corporation | | | |
| 6.63%, 06/15/37 | $45,000 | | $59,624 |
| Ventas Realty LP REIT | | | |
| 3.00%, 01/15/30 | 1,700,000 | | 1,687,671 |
| VEREIT Operating Partnership LP REIT | | | |
| 4.63%, 11/01/25 | 600,000 | | 657,541 |
| 3.95%, 08/15/27 | 150,000 | | 157,870 |
| Verizon Communications, Inc. | | | |
| 3.50%, 11/01/24 | 1,205,000 | | 1,278,627 |
| 3.38%, 02/15/25 | 2,845,000 | | 3,015,649 |
| 2.63%, 08/15/26 | 980,000 | | 996,098 |
| 4.33%, 09/21/28 | 2,018,000 | | 2,292,223 |
| 3.88%, 02/08/29 | 360,000 | | 397,451 |
| 4.50%, 08/10/33 | 230,000 | | 268,706 |
| 5.25%, 03/16/37 | 680,000 | | 855,214 |
| 4.13%, 08/15/46 | 160,000 | | 181,138 |
| 4.86%, 08/21/46 | 190,000 | | 236,208 |
| 5.50%, 03/16/47 | 40,000 | | 54,389 |
| 5.01%, 04/15/49 | 541,000 | | 694,627 |
| Visa, Inc. | | | |
| 3.15%, 12/14/25 | 700,000 | | 740,626 |
| 4.30%, 12/14/45 | 460,000 | | 566,274 |
| Vistra Operations Co. LLC | | | |
| 3.55%, 07/15/24 144A | 1,150,000 | | 1,166,163 |
| VMware, Inc. | | | |
| 2.95%, 08/21/22 | 1,100,000 | | 1,121,211 |
| 3.90%, 08/21/27 | 535,000 | | 560,518 |
| Volkswagen Group of America Finance LLC | | | |
| 3.88%, 11/13/20 144A | 2,400,000 | | 2,439,518 |
| (Floating, ICE LIBOR USD 3M + 0.86%), 2.79%, 09/24/21 144A † | 1,600,000 | | 1,611,599 |
| 4.75%, 11/13/28 144A Δ | 1,600,000 | | 1,805,054 |
| Voya Financial, Inc. | | | |
| 5.70%, 07/15/43 | 170,000 | | 213,292 |
| Wachovia Capital Trust III | | | |
| (Variable, ICE LIBOR USD 3M + 0.93%), 5.57%, 02/07/20† ρ | 560,000 | | 565,051 |
| Walgreens Boots Alliance, Inc. | | | |
| 4.80%, 11/18/44 | 20,000 | | 20,300 |
| Walmart, Inc. | | | |
| 3.70%, 06/26/28 | 620,000 | | 683,649 |
| 4.05%, 06/29/48 | 250,000 | | 296,756 |
| Walt Disney Co. (The) | | | |
| 3.70%, 09/15/24 | 625,000 | | 669,376 |
| 6.65%, 11/15/37 | 150,000 | | 223,377 |
| Washington Prime Group LP REIT | | | |
| 6.45%, 08/15/24Δ | 1,700,000 | | 1,571,794 |
| Waste Management, Inc. | | | |
| 3.50%, 05/15/24 | 140,000 | | 147,267 |
| 3.20%, 06/15/26 | 110,000 | | 115,334 |
| 3.45%, 06/15/29 | 220,000 | | 235,806 |
| 4.00%, 07/15/39 | 30,000 | | 33,677 |
| 4.15%, 07/15/49 | 150,000 | | 171,894 |
See Notes to Financial Statements.
| | | Par | | Value |
| WEA Finance LLC REIT | | | |
| 3.75%, 09/17/24 144A | $770,000 | | $811,195 |
| 3.50%, 06/15/29 144A Δ | 50,000 | | 51,887 |
| Wells Fargo & Co. | | | |
| 4.60%, 04/01/21 | 70,000 | | 72,288 |
| 3.07%, 01/24/23 | 70,000 | | 71,474 |
| 3.45%, 02/13/23 | 200,000 | | 207,253 |
| (Floating, ICE LIBOR USD 3M + 1.23%), 3.16%, 10/31/23† | 600,000 | | 610,963 |
| 4.48%, 01/16/24 | 396,000 | | 427,943 |
| 3.75%, 01/24/24 | 960,000 | | 1,015,633 |
| 3.55%, 09/29/25 | 1,500,000 | | 1,589,607 |
| 3.00%, 04/22/26 | 900,000 | | 926,560 |
| 4.10%, 06/03/26 | 440,000 | | 474,862 |
| 3.00%, 10/23/26 | 2,210,000 | | 2,266,984 |
| 4.30%, 07/22/27 | 3,240,000 | | 3,553,563 |
| 4.15%, 01/24/29 | 645,000 | | 719,096 |
| (Variable, ICE LIBOR USD 3M + 1.17%), 2.88%, 10/30/30^ | 410,000 | | 413,378 |
| 5.38%, 11/02/43 | 190,000 | | 244,362 |
| 4.65%, 11/04/44 | 70,000 | | 82,455 |
| 4.90%, 11/17/45 | 370,000 | | 453,257 |
| 4.40%, 06/14/46 | 70,000 | | 79,967 |
| 4.75%, 12/07/46 | 260,000 | | 312,690 |
| Wells Fargo Bank NA | | | |
| (Floating, ICE LIBOR USD 3M + 0.51%), 2.46%, 10/22/21† Δ | 1,600,000 | | 1,607,374 |
| (Floating, ICE LIBOR USD 3M + 0.62%), 2.54%, 05/27/22† | 2,400,000 | | 2,410,801 |
| Wells Fargo Capital X | | | |
| 5.95%, 12/15/36 | 140,000 | | 171,110 |
| Welltower, Inc. REIT | | | |
| 4.00%, 06/01/25 | 65,000 | | 70,034 |
| 4.25%, 04/01/26 | 898,000 | | 978,609 |
| Western Midstream Operating LP | | | |
| 3.95%, 06/01/25 | 200,000 | | 202,143 |
| 5.45%, 04/01/44 | 75,000 | | 66,563 |
| 5.30%, 03/01/48 | 75,000 | | 65,686 |
| 5.50%, 08/15/48 | 20,000 | | 17,620 |
| WestRock RKT LLC | | | |
| 4.00%, 03/01/23 | 30,000 | | 31,337 |
| Weyerhaeuser Co. REIT | | | |
| 7.38%, 03/15/32 | 50,000 | | 69,189 |
| Williams Cos., Inc. (The) | | | |
| 5.25%, 03/15/20 | 140,000 | | 140,831 |
| 3.60%, 03/15/22 | 155,000 | | 159,425 |
| 4.30%, 03/04/24 | 30,000 | | 32,037 |
| 4.55%, 06/24/24 | 30,000 | | 32,409 |
| 3.90%, 01/15/25 | 300,000 | | 316,132 |
| 7.50%, 01/15/31 | 100,000 | | 130,601 |
| 7.75%, 06/15/31 | 585,000 | | 780,777 |
| 8.75%, 03/15/32 | 181,000 | | 260,518 |
| 5.10%, 09/15/45 | 55,000 | | 61,422 |
| Willis North America, Inc. | | | |
| 2.95%, 09/15/29 | 70,000 | | 69,527 |
| WP Carey, Inc. REIT | | | |
| 3.85%, 07/15/29 | 900,000 | | 951,675 |
| | | Par | | Value |
| WPX Energy, Inc. | | | |
| 5.25%, 10/15/27 | $30,000 | | $31,706 |
| WRKCo, Inc. | | | |
| 3.75%, 03/15/25 | 500,000 | | 527,760 |
| 4.00%, 03/15/28Δ | 1,100,000 | | 1,183,831 |
Total Corporate Bonds
(Cost $423,294,361) | | | 445,724,033 |
| FOREIGN BONDS — 14.4% |
| Argentina — 0.1% | | |
| Argentina POM Politica Monetaria | | | |
| (Floating, Argentina Blended Historical Policy Rate + 0.00%), 56.61%, 06/21/20(ZA) † | 1,110,000 | | 12,292 |
| Argentine Bonos del Tesoro | | | |
| 18.20%, 10/03/21(ZA) | 13,930,000 | | 91,378 |
| Argentine Republic Government International Bond | | | |
| 5.63%, 01/26/22 | 1,410,000 | | 733,640 |
| 7.13%, 07/06/36 | 720,000 | | 344,480 |
| (Step to 5.25% on 03/31/29), 3.75%, 12/31/38 STEP | 810,000 | | 397,666 |
| Provincia de Buenos Aires | | | |
| 6.50%, 02/15/23 144A | 230,000 | | 97,175 |
| 7.88%, 06/15/27 144A | 180,000 | | 77,850 |
| | | | | 1,754,481 |
| Australia — 0.2% | | |
| BHP Billiton Finance (USA), Ltd. | | | |
| 2.88%, 02/24/22 | 20,000 | | 20,395 |
| 5.00%, 09/30/43 | 170,000 | | 217,999 |
| (Variable, USD Swap 5Y + 5.09%), 6.75%, 10/19/75 144A ^ | 880,000 | | 1,034,607 |
| CNOOC Finance 2015 Australia Proprietary, Ltd. | | | |
| 2.63%, 05/05/20 | 1,300,000 | | 1,301,511 |
| Commonwealth Bank of Australia | | | |
| 3.90%, 07/12/47 144A | 110,000 | | 120,407 |
| Westpac Banking Corporation | | | |
| 2.30%, 05/26/20 | 50,000 | | 50,070 |
| 2.60%, 11/23/20 | 310,000 | | 311,749 |
| (Variable, USD ICE Swap Rate 5Y + 2.24%), 4.32%, 11/23/31^ | 175,000 | | 185,422 |
| (Variable, U.S. Treasury Yield Curve Rate CMT 5Y + 2.00%), 4.11%, 07/24/34Δ ^ | 550,000 | | 577,274 |
| | | | | 3,819,434 |
| Brazil — 0.3% | | |
| Brazil Notas do Tesouro Nacional Serie F | | | |
| 10.00%, 01/01/21(B) | 2,892,000 | | 755,382 |
| 10.00%, 01/01/23(B) | 7,128,000 | | 1,968,922 |
| 10.00%, 01/01/27(B) | 1,013,000 | | 297,344 |
| Brazilian Government International Bond | | | |
| 4.63%, 01/13/28Δ | 480,000 | | 516,360 |
See Notes to Financial Statements.
MEDIUM-DURATION BOND FUND
SCHEDULE OF INVESTMENTS (Continued)
| | | Par | | Value |
| 5.63%, 01/07/41Δ | $340,000 | | $381,968 |
| 5.00%, 01/27/45 | 350,000 | | 364,782 |
| Vale Overseas, Ltd. | | | |
| 6.25%, 08/10/26 | 105,000 | | 123,443 |
| 6.88%, 11/21/36 | 284,000 | | 370,176 |
| | | | | 4,778,377 |
| Canada — 0.4% | | |
| Alimentation Couche-Tard, Inc. | | | |
| 2.70%, 07/26/22 144A | 275,000 | | 278,110 |
| 3.55%, 07/26/27 144A | 75,000 | | 77,212 |
| Bank of Montreal | | | |
| (Variable, USD Swap 5Y + 1.43%), 3.80%, 12/15/32^ | 100,000 | | 104,385 |
| Bank of Nova Scotia (The) | | | |
| 1.88%, 04/26/21Δ | 1,600,000 | | 1,601,139 |
| 2.70%, 08/03/26Δ | 25,000 | | 25,469 |
| Barrick Gold Corporation | | | |
| 5.25%, 04/01/42 | 560,000 | | 669,540 |
| Bausch Health Cos., Inc. | | | |
| 9.00%, 12/15/25 144A | 600,000 | | 683,820 |
| Bombardier, Inc. | | | |
| 7.50%, 03/15/25 144A | 250,000 | | 258,435 |
| Brookfield Finance, Inc. | | | |
| 4.85%, 03/29/29 | 30,000 | | 34,381 |
| Canadian Imperial Bank of Commerce | | | |
| (Variable, ICE LIBOR USD 3M + 0.79%), 2.61%, 07/22/23^ | 70,000 | | 70,807 |
| Canadian Natural Resources, Ltd. | | | |
| 6.25%, 03/15/38Δ | 50,000 | | 65,154 |
| Cenovus Energy, Inc. | | | |
| 4.25%, 04/15/27 | 275,000 | | 291,593 |
| Export Development Canada | | | |
| 2.63%, 02/21/24 | 2,380,000 | | 2,458,755 |
| Nutrien, Ltd. | | | |
| 4.88%, 03/30/20 | 110,000 | | 110,725 |
| Royal Bank of Canada | | | |
| 2.15%, 10/26/20 | 270,000 | | 270,552 |
| 3.20%, 04/30/21 | 300,000 | | 305,432 |
| Teck Resources, Ltd. | | | |
| 6.00%, 08/15/40 | 10,000 | | 11,184 |
| Toronto-Dominion Bank (The) | | | |
| 3.25%, 06/11/21 | 370,000 | | 377,981 |
| 3.50%, 07/19/23 | 30,000 | | 31,597 |
| TransCanada PipeLines, Ltd. | | | |
| 4.63%, 03/01/34 | 60,000 | | 68,541 |
| | | | | 7,794,812 |
| Chile — 0.0% | | |
| Latam Airlines Pass-Through Trust, Series 2015-1, Class A | | | |
| 4.20%, 11/15/27 | 702,616 | | 725,524 |
| China — 0.2% | | |
| Avolon Holdings Funding, Ltd. | | | |
| 3.95%, 07/01/24 144A | 445,000 | | 464,291 |
| | | Par | | Value |
| China Government Bond | | | |
| 3.31%, 11/30/25(Y) | $1,000,000 | | $147,214 |
| Global Aircraft Leasing Co., Ltd. | | | |
| Cash Coupon 6.50% or PIK 7.25%, 6.50%, 09/15/24 144A | 350,000 | | 366,083 |
| Huarong Finance 2019 Co., Ltd. | | | |
| 3.75%, 05/29/24 | 200,000 | | 204,498 |
| Huarong Finance II Co., Ltd. | | | |
| 5.50%, 01/16/25 | 200,000 | | 220,814 |
| 4.88%, 11/22/26 | 200,000 | | 217,029 |
| Park Aerospace Holdings, Ltd. | | | |
| 5.25%, 08/15/22 144A | 1,227,000 | | 1,310,696 |
| 4.50%, 03/15/23 144A | 20,000 | | 20,998 |
| 5.50%, 02/15/24 144A | 60,000 | | 65,950 |
| Scenery Journey, Ltd. | | | |
| 13.00%, 11/06/22 | 200,000 | | 204,965 |
| Sinopec Group Overseas Development 2014, Ltd. | | | |
| 4.38%, 04/10/24 144A | 390,000 | | 421,446 |
| | | | | 3,643,984 |
| Colombia — 0.1% | | |
| Colombia Government International Bond | | | |
| 5.63%, 02/26/44 | 480,000 | | 598,049 |
| Ecopetrol SA | | | |
| 5.88%, 05/28/45 | 1,500,000 | | 1,773,277 |
| | | | | 2,371,326 |
| Denmark — 0.1% | | |
| Danske Bank A/S | | | |
| 5.00%, 01/12/22 144A | 540,000 | | 567,382 |
| (Variable, ICE LIBOR USD 3M + 1.25%), 3.00%, 09/20/22 144A ^ | 290,000 | | 292,644 |
| 5.38%, 01/12/24 144A | 340,000 | | 372,399 |
| (Variable, ICE LIBOR USD 3M + 1.59%), 3.24%, 12/20/25 144A ^ | 220,000 | | 222,814 |
| | | | | 1,455,239 |
| Dominican Republic — 0.0% | | |
| Dominican Republic International Bond | | | |
| 6.40%, 06/05/49 144A | 540,000 | | 593,830 |
| Ecuador — 0.0% | | |
| Ecuador Government International Bond | | | |
| 7.88%, 01/23/28 144A | 370,000 | | 329,895 |
| Egypt — 0.0% | | |
| Egypt Government International Bond | | | |
| 5.58%, 02/21/23 144A | 410,000 | | 429,721 |
| Finland — 0.0% | | |
| Nokia OYJ | | | |
| 4.38%, 06/12/27 | 9,000 | | 9,399 |
See Notes to Financial Statements.
| | | Par | | Value |
| Nordea Bank Abp | | | |
| 4.88%, 05/13/21 144A | $640,000 | | $663,767 |
| | | | | 673,166 |
| France — 0.5% | | |
| BNP Paribas SA | | | |
| 3.50%, 03/01/23 144A | 925,000 | | 957,832 |
| (Variable, USD Swap 5Y + 4.15%), 6.63%, 03/25/24 144A ρ ^ | 200,000 | | 216,143 |
| 3.38%, 01/09/25 144A | 450,000 | | 467,699 |
| (Variable, ICE LIBOR USD 3M + 2.24%), 4.71%, 01/10/25 144A ^ | 880,000 | | 954,013 |
| 4.40%, 08/14/28 144A | 1,340,000 | | 1,490,348 |
| (Variable, ICE LIBOR USD 3M + 2.57%), 5.20%, 01/10/30 144A ^ | 380,000 | | 447,230 |
| (Variable, USD Swap 5Y + 1.48%), 4.38%, 03/01/33 144A Δ ^ | 440,000 | | 475,760 |
| BPCE SA | | | |
| 4.00%, 09/12/23 144A | 750,000 | | 791,645 |
| 4.63%, 09/12/28 144A Δ | 375,000 | | 422,068 |
| Credit Agricole SA | | | |
| (Variable, USD Swap 5Y + 4.32%), 6.88%, 09/23/24 144A ρ ^ | 300,000 | | 330,590 |
| 4.38%, 03/17/25 | 275,000 | | 295,694 |
| 4.13%, 01/10/27 144A Δ | 450,000 | | 486,708 |
| (Variable, USD Swap 5Y + 1.64%), 4.00%, 01/10/33 144A ^ | 250,000 | | 264,036 |
| Danone SA | | | |
| 2.59%, 11/02/23 144A | 650,000 | | 660,710 |
| 2.95%, 11/02/26 144A | 310,000 | | 316,958 |
| Total Capital International SA | | | |
| 3.75%, 04/10/24 | 30,000 | | 32,153 |
| 3.46%, 07/12/49Δ | 300,000 | | 316,528 |
| XLIT, Ltd. | | | |
| 4.45%, 03/31/25 | 349,000 | | 380,506 |
| | | | | 9,306,621 |
| Germany — 0.7% | | |
| Deutsche Bank AG | | | |
| 3.15%, 01/22/21 | 1,600,000 | | 1,607,649 |
| 4.25%, 10/14/21 | 1,500,000 | | 1,543,193 |
| 5.00%, 02/14/22 | 1,400,000 | | 1,462,833 |
| 3.95%, 02/27/23 | 1,900,000 | | 1,949,776 |
| (Variable, U.S. SOFR + 2.58%), 3.96%, 11/26/25^ | 3,500,000 | | 3,578,660 |
| Volkswagen Bank GmbH | | | |
| 1.25%, 08/01/22(E) | 1,500,000 | | 1,728,410 |
| | | | | 11,870,521 |
| Hong Kong — 0.1% | | |
| AIA Group, Ltd. | | | |
| 3.90%, 04/06/28 144A | 200,000 | | 214,504 |
| CNAC HK Finbridge Co., Ltd. | | | |
| 3.13%, 06/19/22 | 440,000 | | 443,462 |
| | | Par | | Value |
| 4.63%, 03/14/23 | $200,000 | | $210,549 |
| | | | | 868,515 |
| India — 0.0% | | |
| Reliance Industries, Ltd. | | | |
| 3.67%, 11/30/27 144A | 250,000 | | 259,254 |
| Indonesia — 0.2% | | |
| Indonesia Government International Bond | | | |
| 4.88%, 05/05/21 | 570,000 | | 593,156 |
| 3.85%, 07/18/27 144A | 500,000 | | 533,390 |
| 3.50%, 01/11/28 | 450,000 | | 470,404 |
| 5.13%, 01/15/45 144A | 200,000 | | 238,774 |
| 5.25%, 01/08/47 144A | 200,000 | | 246,387 |
| 4.35%, 01/11/48 | 500,000 | | 551,491 |
| 3.70%, 10/30/49Δ | 580,000 | | 596,698 |
| | | | | 3,230,300 |
| Ireland — 0.9% | | |
| AerCap Ireland Capital DAC | | | |
| 5.00%, 10/01/21 | 150,000 | | 157,323 |
| 4.63%, 07/01/22 | 550,000 | | 581,384 |
| 3.30%, 01/23/23 | 1,625,000 | | 1,666,779 |
| 4.88%, 01/16/24 | 350,000 | | 379,669 |
| 2.88%, 08/14/24Δ | 3,100,000 | | 3,131,203 |
| 3.50%, 01/15/25 | 600,000 | | 619,017 |
| 4.45%, 10/01/25 | 800,000 | | 860,892 |
| AIB Group PLC | | | |
| 4.75%, 10/12/23 144A | 950,000 | | 1,021,959 |
| Ardagh Packaging Finance PLC | | | |
| 6.00%, 02/15/25 144A | 200,000 | | 210,250 |
| Bank of Ireland | | | |
| (Variable, EUR Swap Rate 5Y + 6.96%), 7.38%, 06/18/20(E) ρ ^ | 1,000,000 | | 1,158,840 |
| GE Capital International Funding Co. Unlimited Co. | | | |
| 2.34%, 11/15/20 | 1,723,000 | | 1,724,752 |
| 3.37%, 11/15/25Δ | 2,772,000 | | 2,890,699 |
| 4.42%, 11/15/35 | 250,000 | | 267,881 |
| Shire Acquisitions Investments Ireland DAC | | | |
| 2.40%, 09/23/21 | 1,000,000 | | 1,005,946 |
| 3.20%, 09/23/26 | 35,000 | | 36,099 |
| SMBC Aviation Capital Finance DAC | | | |
| 4.13%, 07/15/23 144A | 900,000 | | 947,612 |
| | | | | 16,660,305 |
| Isle of Man — 0.0% | | |
| Sasol Financing International, Ltd. | | | |
| 4.50%, 11/14/22 | 370,000 | | 382,266 |
| Israel — 0.1% | | |
| Israel Government AID Bond | | | |
| 5.50%, 09/18/23 | 1,200,000 | | 1,357,281 |
| 5.50%, 12/04/23 | 200,000 | | 227,974 |
| 5.50%, 04/26/24 | 500,000 | | 576,461 |
| | | | | 2,161,716 |
See Notes to Financial Statements.
MEDIUM-DURATION BOND FUND
SCHEDULE OF INVESTMENTS (Continued)
| | | Par | | Value |
| Italy — 0.5% | | |
| Intesa Sanpaolo SpA | | | |
| 3.13%, 07/14/22 144A | $580,000 | | $587,968 |
| 3.38%, 01/12/23 144A | 220,000 | | 223,847 |
| 5.02%, 06/26/24 144A | 1,310,000 | | 1,377,453 |
| 3.25%, 09/23/24 144A | 1,400,000 | | 1,409,025 |
| 5.71%, 01/15/26 144A | 200,000 | | 216,672 |
| UniCredit SpA | | | |
| 6.57%, 01/14/22 144A | 530,000 | | 569,403 |
| 7.83%, 12/04/23 144A | 3,100,000 | | 3,617,215 |
| | | | | 8,001,583 |
| Japan — 0.7% | | |
| Development Bank of Japan, Inc. | | | |
| 1.63%, 09/01/21 144A | 1,300,000 | | 1,294,400 |
| Japan Finance Organization for Municipalities | | | |
| 2.13%, 10/25/23 144A | 2,200,000 | | 2,207,303 |
| Mitsubishi UFJ Financial Group, Inc. | | | |
| 2.95%, 03/01/21 | 250,000 | | 252,800 |
| 3.00%, 02/22/22 | 180,000 | | 183,518 |
| 3.74%, 03/07/29Δ | 65,000 | | 70,208 |
| 3.75%, 07/18/39 | 700,000 | | 769,052 |
| Mitsubishi UFJ Lease & Finance Co., Ltd. | | | |
| 3.41%, 02/28/22 144A | 1,500,000 | | 1,533,427 |
| Panasonic Corporation | | | |
| 2.54%, 07/19/22 144A | 1,302,000 | | 1,314,096 |
| Sumitomo Mitsui Financial Group, Inc. | | | |
| 2.06%, 07/14/21 | 260,000 | | 260,444 |
| 4.44%, 04/02/24 144A | 350,000 | | 373,162 |
| 2.45%, 09/27/24 | 1,600,000 | | 1,605,159 |
| 2.63%, 07/14/26 | 35,000 | | 35,061 |
| Takeda Pharmaceutical Co., Ltd. | | | |
| 4.40%, 11/26/23 | 1,700,000 | | 1,826,727 |
| | | | | 11,725,357 |
| Kazakhstan — 0.0% | | |
| KazMunayGas National Co. JSC | | | |
| 5.38%, 04/24/30 144A | 200,000 | | 232,370 |
| Kuwait — 0.1% | | |
| Kuwait International Government Bond | | | |
| 3.50%, 03/20/27 144A | 1,490,000 | | 1,603,940 |
| Luxembourg — 0.1% | | |
| ArcelorMittal SA | | | |
| 6.25%, 02/25/22 | 50,000 | | 53,911 |
| 3.60%, 07/16/24Δ | 300,000 | | 307,957 |
| 6.13%, 06/01/25 | 410,000 | | 471,415 |
| 4.55%, 03/11/26Δ | 200,000 | | 212,554 |
| 7.00%, 10/15/39 | 70,000 | | 85,463 |
| | | | | 1,131,300 |
| Mexico — 0.8% | | |
| America Movil SAB de CV | | | |
| 5.00%, 03/30/20 | 100,000 | | 100,626 |
| | | Par | | Value |
| Banco Actinver SA | | | |
| 4.80%, 12/18/32 144A ††† | $1,530,000 | | $1,535,064 |
| Mexican Bonos | | | |
| 8.00%, 06/11/20(M) | 5,120,000 | | 272,493 |
| 10.00%, 12/05/24(M) | 25,130,000 | | 1,509,847 |
| 8.50%, 11/18/38(M) | 31,010,000 | | 1,871,375 |
| 7.75%, 11/13/42(M) | 40,935,200 | | 2,298,152 |
| 8.00%, 11/07/47(M) | 72,150,000 | | 4,183,741 |
| Mexico City Airport Trust | | | |
| 3.88%, 04/30/28 144A | 360,000 | | 368,679 |
| 5.50%, 07/31/47Δ | 200,000 | | 206,939 |
| 5.50%, 07/31/47 144A | 270,000 | | 279,368 |
| Mexico Government International Bond | | | |
| 4.50%, 04/22/29 | 200,000 | | 219,600 |
| 4.50%, 01/31/50Δ | 270,000 | | 292,410 |
| Petroleos Mexicanos | | | |
| 5.13%, 03/15/23(E) | 110,000 | | 138,081 |
| 4.50%, 01/23/26 | 270,000 | | 269,635 |
| 6.88%, 08/04/26 | 200,000 | | 220,303 |
| 6.50%, 03/13/27 | 230,000 | | 244,851 |
| 6.63%, 06/15/35 | 29,000 | | 29,810 |
| 5.50%, 06/27/44 | 170,000 | | 153,074 |
| 6.38%, 01/23/45 | 370,000 | | 357,751 |
| 5.63%, 01/23/46 | 30,000 | | 26,906 |
| 6.75%, 09/21/47 | 20,000 | | 20,106 |
| 6.35%, 02/12/48 | 70,000 | | 67,790 |
| 7.69%, 01/23/50 144A | 269,000 | | 294,494 |
| | | | | 14,961,095 |
| Morocco & Antilles — 0.0% | | |
| OCP SA | | | |
| 4.50%, 10/22/25 144A | 450,000 | | 482,539 |
| Netherlands — 1.4% | | |
| ABN AMRO Bank NV | | | |
| 4.75%, 07/28/25 144A | 200,000 | | 218,342 |
| Cooperatieve Rabobank UA | | | |
| 4.75%, 01/15/20 144A Δ | 540,000 | | 540,473 |
| (Variable, EUR Swap Rate 5Y + 5.25%), 5.50%, 06/29/20(E) ρ ^ | 500,000 | | 574,871 |
| 4.63%, 12/01/23 | 400,000 | | 433,834 |
| 4.38%, 08/04/25 | 920,000 | | 999,159 |
| 5.25%, 08/04/45 | 370,000 | | 474,147 |
| Deutsche Telekom International Finance BV | | | |
| 8.75%, 06/15/30 | 25,000 | | 36,854 |
| Enel Finance International NV | | | |
| 4.25%, 09/14/23 144A | 1,500,000 | | 1,589,305 |
| Equate Petrochemical BV | | | |
| 4.25%, 11/03/26 144A | 520,000 | | 557,008 |
| ING Bank NV | | | |
| 5.80%, 09/25/23 144A | 340,000 | | 377,596 |
| ING Groep NV | | | |
| 4.10%, 10/02/23 | 1,100,000 | | 1,170,345 |
| 4.63%, 01/06/26 144A | 1,600,000 | | 1,781,175 |
See Notes to Financial Statements.
| | | Par | | Value |
| Mylan NV | | | |
| 2.25%, 11/22/24(E) | $1,500,000 | | $1,794,574 |
| 3.95%, 06/15/26 | 1,765,000 | | 1,841,570 |
| NXP BV | | | |
| 3.88%, 09/01/22 144A | 950,000 | | 986,277 |
| 3.88%, 06/18/26 144A | 65,000 | | 69,050 |
| Petrobras Global Finance BV | | | |
| 6.13%, 01/17/22 | 51,000 | | 54,580 |
| 6.25%, 03/17/24 | 380,000 | | 426,791 |
| 5.30%, 01/27/25 | 1,036,000 | | 1,131,928 |
| 7.38%, 01/17/27 | 120,000 | | 146,622 |
| 6.00%, 01/27/28Δ | 550,000 | | 628,590 |
| 5.75%, 02/01/29 | 210,000 | | 237,248 |
| 6.90%, 03/19/49 | 40,000 | | 46,991 |
| 6.85%, 06/05/15π | 550,000 | | 630,407 |
| Prosus NV | | | |
| 4.85%, 07/06/27 144A | 420,000 | | 458,980 |
| Shell International Finance BV | | | |
| 4.38%, 03/25/20 | 320,000 | | 321,711 |
| 2.88%, 05/10/26 | 1,210,000 | | 1,256,600 |
| 4.55%, 08/12/43 | 120,000 | | 146,546 |
| 4.38%, 05/11/45 | 230,000 | | 274,979 |
| 4.00%, 05/10/46 | 190,000 | | 216,856 |
| Stichting AK Rabobank Certificaten | | | |
| 6.50%, 03/29/18(E) ρ Δ | 700,000 | | 1,001,141 |
| Syngenta Finance NV | | | |
| 3.70%, 04/24/20 144A | 565,000 | | 566,814 |
| 3.93%, 04/23/21 144A | 2,350,000 | | 2,390,646 |
| 4.44%, 04/24/23 144A | 1,075,000 | | 1,123,349 |
| 5.18%, 04/24/28 144A | 200,000 | | 215,746 |
| | | | | 24,721,105 |
| Nigeria — 0.0% | | |
| Nigeria Government International Bond | | | |
| 8.75%, 01/21/31 | 210,000 | | 232,539 |
| Norway — 0.1% | | |
| Equinor ASA | | | |
| 2.45%, 01/17/23 | 30,000 | | 30,491 |
| Yara International ASA | | | |
| 4.75%, 06/01/28 144A | 1,100,000 | | 1,196,660 |
| | | | | 1,227,151 |
| Peru — 0.0% | | |
| Peruvian Government International Bond | | | |
| 5.63%, 11/18/50Δ | 330,000 | | 483,349 |
| Poland — 0.1% | | |
| Republic of Poland Government International Bond | | | |
| 4.00%, 01/22/24 | 780,000 | | 840,744 |
| Qatar — 0.3% | | |
| Qatar Government International Bond | | | |
| 3.38%, 03/14/24 144A | 560,000 | | 586,894 |
| 3.38%, 03/14/24Δ | 1,700,000 | | 1,781,642 |
| 4.00%, 03/14/29 144A | 460,000 | | 514,281 |
| 4.82%, 03/14/49 144A | 1,220,000 | | 1,513,347 |
| | | | | 4,396,164 |
| | | Par | | Value |
| Russia — 0.6% | | |
| Gazprom PJSC Via Gaz Capital SA | | | |
| 5.15%, 02/11/26 144A | $340,000 | | $379,049 |
| 7.29%, 08/16/37 | 100,000 | | 140,494 |
| Russian Federal Bond - OFZ | | | |
| 7.00%, 01/25/23(Q) | 34,070,000 | | 570,892 |
| 7.00%, 08/16/23(Q) | 52,440,000 | | 879,363 |
| 7.75%, 09/16/26(Q) | 9,710,000 | | 170,803 |
| 8.15%, 02/03/27(Q) | 63,930,000 | | 1,151,521 |
| 7.05%, 01/19/28(Q) | 150,011,000 | | 2,552,903 |
| 6.90%, 05/23/29(Q) | 194,060,000 | | 3,297,093 |
| 7.25%, 05/10/34(Q) | 48,570,000 | | 843,981 |
| 7.70%, 03/16/39(Q) | 78,400,000 | | 1,430,542 |
| | | | | 11,416,641 |
| Saudi Arabia — 0.1% | | |
| Saudi Arabian Oil Co. | | | |
| 2.75%, 04/16/22 144A | 1,800,000 | | 1,820,906 |
| South Korea — 0.1% | | |
| Export-Import Bank of Korea | | | |
| 5.00%, 04/11/22 | 900,000 | | 959,560 |
| Spain — 0.6% | | |
| Banco Santander SA | | | |
| (Floating, ICE LIBOR USD 3M + 1.12%), 3.12%, 04/12/23† | 200,000 | | 201,409 |
| 3.85%, 04/12/23 | 400,000 | | 417,540 |
| 4.38%, 04/12/28 | 600,000 | | 657,458 |
| 3.31%, 06/27/29 | 400,000 | | 412,758 |
| Spain Government Bond | | | |
| 0.60%, 10/31/29(E) 144A | 4,000,000 | | 4,548,165 |
| 1.85%, 07/30/35(E) 144A | 3,100,000 | | 3,981,057 |
| Telefonica Emisiones SA | | | |
| 4.57%, 04/27/23 | 500,000 | | 538,388 |
| 5.21%, 03/08/47 | 400,000 | | 475,502 |
| | | | | 11,232,277 |
| Supranational — 1.1% | | |
| African Development Bank | | | |
| (Floating, ICE LIBOR USD 3M + 0.19%), 2.08%, 06/15/20† | 2,700,000 | | 2,702,226 |
| 2.63%, 03/22/21 | 5,530,000 | | 5,594,045 |
| 2.31%, 07/14/21 | 6,000,000 | | 6,034,002 |
| International Bank for Reconstruction & Development | | | |
| 1.63%, 09/04/20 | 5,210,000 | | 5,206,197 |
| | | | | 19,536,470 |
| Sweden — 0.2% | | |
| Skandinaviska Enskilda Banken AB | | | |
| (Floating, ICE LIBOR USD 3M + 0.43%), 2.33%, 05/17/21 144A † | 2,900,000 | | 2,907,598 |
| Svenska Handelsbanken AB | | | |
| 3.35%, 05/24/21 | 250,000 | | 254,996 |
| | | | | 3,162,594 |
| Switzerland — 0.8% | | |
| Credit Suisse AG | | | |
| 6.50%, 08/08/23 144A | 225,000 | | 251,420 |
See Notes to Financial Statements.
MEDIUM-DURATION BOND FUND
SCHEDULE OF INVESTMENTS (Continued)
| | | Par | | Value |
| Credit Suisse Group AG | | | |
| (Variable, U.S. SOFR + 1.56%), 2.59%, 09/11/25 144A ^ | $250,000 | | $250,881 |
| (Variable, USD Swap 5Y + 4.33%), 7.25%, 09/12/25 144A ρ ^ | 400,000 | | 446,842 |
| 4.28%, 01/09/28 144A | 1,800,000 | | 1,960,082 |
| (Variable, ICE LIBOR USD 3M + 1.41%), 3.87%, 01/12/29 144A ^ | 1,625,000 | | 1,732,936 |
| Credit Suisse Group Funding Guernsey, Ltd. | | | |
| 3.45%, 04/16/21 | 800,000 | | 813,898 |
| 3.80%, 09/15/22 | 1,300,000 | | 1,353,926 |
| 4.55%, 04/17/26 | 2,440,000 | | 2,710,987 |
| UBS Group AG | | | |
| 3.00%, 04/15/21 144A | 1,500,000 | | 1,519,901 |
| 2.65%, 02/01/22 144A | 300,000 | | 303,180 |
| (Floating, ICE LIBOR USD 3M + 1.53%), 3.44%, 02/01/22 144A † | 200,000 | | 204,760 |
| 3.49%, 05/23/23 144A | 480,000 | | 494,202 |
| (Variable, USD Swap 5Y + 4.34%), 7.00%, 01/31/24 144A ρ ^ | 840,000 | | 918,750 |
| 4.13%, 09/24/25 144A | 440,000 | | 479,097 |
| 4.25%, 03/23/28 144A | 1,490,000 | | 1,629,692 |
| | | | | 15,070,554 |
| Turkey — 0.1% | | |
| Turkish Airlines Pass-Through Trust, Series 2015-1, Class A | | | |
| 4.20%, 03/15/27 144A | 1,149,732 | | 1,084,253 |
| United Arab Emirates — 0.1% | | |
| Abu Dhabi Government International Bond | | | |
| 2.50%, 10/11/22 144A | 610,000 | | 618,317 |
| 3.13%, 10/11/27 144A | 500,000 | | 524,714 |
| DP World PLC | | | |
| 5.63%, 09/25/48 144A | 620,000 | | 718,356 |
| | | | | 1,861,387 |
| United Kingdom — 2.7% | | |
| Anglo American Capital PLC | | | |
| 3.63%, 09/11/24 144A Δ | 700,000 | | 726,683 |
| 4.00%, 09/11/27 144A | 220,000 | | 230,747 |
| Barclays Bank PLC | | | |
| (Floating, ICE LIBOR USD 3M + 0.45%), 2.37%, 10/15/20† | 2,700,000 | | 2,700,309 |
| 7.63%, 11/21/22 | 1,700,000 | | 1,911,591 |
| Barclays PLC | | | |
| (Floating, ICE LIBOR USD 3M + 2.11%), 4.01%, 08/10/21† | 1,600,000 | | 1,638,304 |
| (Variable, ICE LIBOR USD 3M + 1.40%), 4.61%, 02/15/23^ | 950,000 | | 992,688 |
| (Variable, ICE LIBOR USD 3M + 1.36%), 4.34%, 05/16/24^ | 1,400,000 | | 1,476,901 |
| (Variable, ICE LIBOR USD 3M + 1.90%), 4.97%, 05/16/29^ | 1,060,000 | | 1,196,180 |
| | | Par | | Value |
| (Variable, ICE LIBOR USD 3M + 3.05%), 5.09%, 06/20/30^ | $750,000 | | $837,235 |
| BP Capital Markets PLC | | | |
| 3.56%, 11/01/21 | 30,000 | | 30,946 |
| 3.81%, 02/10/24 | 330,000 | | 352,771 |
| 3.54%, 11/04/24 | 60,000 | | 63,945 |
| 3.51%, 03/17/25 | 330,000 | | 351,594 |
| British Telecommunications PLC | | | |
| 9.63%, 12/15/30 | 25,000 | | 38,472 |
| GlaxoSmithKline Capital PLC | | | |
| 2.85%, 05/08/22 | 20,000 | | 20,447 |
| 5.25%, 12/19/33(U) | 100,000 | | 186,587 |
| Hammerson PLC REIT | | | |
| 3.50%, 10/27/25(U) | 100,000 | | 136,387 |
| HSBC Bank PLC | | | |
| 4.75%, 01/19/21 144A | 200,000 | | 205,543 |
| HSBC Holdings PLC | | | |
| 3.40%, 03/08/21 | 610,000 | | 619,835 |
| (Floating, ICE LIBOR USD 3M + 0.60%), 2.50%, 05/18/21† | 400,000 | | 400,435 |
| (Floating, ICE LIBOR USD 3M + 1.50%), 3.40%, 01/05/22† | 400,000 | | 408,041 |
| (Variable, ICE LIBOR USD 3M + 1.06%), 3.26%, 03/13/23^ | 525,000 | | 537,229 |
| (Variable, USD ICE Swap Rate 5Y + 3.45%), 6.25%, 03/23/23ρ Δ ^ | 280,000 | | 297,350 |
| 4.25%, 03/14/24 | 240,000 | | 254,832 |
| (Floating, ICE LIBOR USD 3M + 1.00%), 2.90%, 05/18/24† | 300,000 | | 302,592 |
| (Variable, ICE LIBOR USD 3M + 1.21%), 3.80%, 03/11/25^ | 625,000 | | 656,472 |
| 4.25%, 08/18/25Δ | 220,000 | | 235,482 |
| (Variable, ICE LIBOR USD 3M + 1.55%), 4.04%, 03/13/28^ | 700,000 | | 749,541 |
| (Variable, USD ICE Swap Rate 5Y + 3.61%), 6.50%, 03/23/28ρ ^ | 540,000 | | 594,486 |
| (Variable, ICE LIBOR USD 3M + 1.53%), 4.58%, 06/19/29^ | 800,000 | | 895,260 |
| (Variable, ICE LIBOR USD 3M + 1.61%), 3.97%, 05/22/30^ | 610,000 | | 658,321 |
| 6.50%, 09/15/37 | 500,000 | | 692,156 |
| Lloyds Bank Corporate Markets PLC | | | |
| (Floating, ICE LIBOR USD 3M + 0.50%), 2.51%, 10/26/20† | 1,600,000 | | 1,603,433 |
| Lloyds Bank PLC | | | |
| (Step to 0.00% on 04/02/22), 7.50%, 04/02/32 STEP | 2,000,000 | | 1,672,281 |
| Lloyds Banking Group PLC | | | |
| (Variable, ICE LIBOR USD 3M + 1.25%), 2.86%, 03/17/23^ | 1,900,000 | | 1,926,873 |
| 3.90%, 03/12/24 | 210,000 | | 221,902 |
| 4.50%, 11/04/24 | 240,000 | | 256,858 |
| 4.38%, 03/22/28 | 800,000 | | 883,129 |
| 4.55%, 08/16/28 | 230,000 | | 257,898 |
| (Variable, ICE LIBOR USD 3M + 1.21%), 3.57%, 11/07/28^ | 200,000 | | 209,149 |
See Notes to Financial Statements.
| | | Par | | Value |
| Nationwide Building Society | | | |
| (Variable, ICE LIBOR USD 3M + 1.06%), 3.77%, 03/08/24 144A ^ | $2,000,000 | | $2,071,695 |
| (Variable, ICE LIBOR USD 3M + 1.39%), 4.36%, 08/01/24 144A ^ | 1,300,000 | | 1,379,912 |
| (Variable, ICE LIBOR USD 3M + 1.86%), 3.96%, 07/18/30 144A ^ | 1,875,000 | | 2,016,818 |
| Reckitt Benckiser Treasury Services PLC | | | |
| 2.75%, 06/26/24 144A | 600,000 | | 612,368 |
| Royal Bank of Scotland Group PLC | | | |
| 6.13%, 12/15/22Δ | 180,000 | | 197,143 |
| 2.50%, 03/22/23(E) | 1,400,000 | | 1,679,016 |
| (Floating, ICE LIBOR USD 3M + 1.47%), 3.38%, 05/15/23† | 1,300,000 | | 1,314,902 |
| (Variable, ICE LIBOR USD 3M + 1.48%), 3.50%, 05/15/23^ | 429,000 | | 439,688 |
| 3.88%, 09/12/23 | 579,000 | | 607,187 |
| 6.00%, 12/19/23 | 110,000 | | 122,414 |
| 5.13%, 05/28/24 | 280,000 | | 303,573 |
| (Variable, ICE LIBOR USD 3M + 1.55%), 4.52%, 06/25/24^ | 2,205,000 | | 2,343,702 |
| (Variable, ICE LIBOR USD 3M + 1.76%), 4.27%, 03/22/25^ | 1,215,000 | | 1,291,580 |
| (Variable, ICE LIBOR USD 3M + 1.75%), 4.89%, 05/18/29^ | 400,000 | | 452,835 |
| (Variable, U.S. Treasury Yield Curve Rate CMT 5Y + 2.10%), 3.75%, 11/01/29^ | 200,000 | | 204,400 |
| Santander UK PLC | | | |
| 2.38%, 03/16/20 | 160,000 | | 160,095 |
| 2.88%, 06/18/24 | 925,000 | | 946,688 |
| Severn Trent Utilities Finance PLC | | | |
| 6.25%, 06/07/29(U) | 100,000 | | 181,749 |
| Society of Lloyd's | | | |
| 4.75%, 10/30/24(U) | 100,000 | | 147,732 |
| Standard Chartered PLC | | | |
| (Variable, ICE LIBOR USD 3M + 1.15%), 4.25%, 01/20/23 144A ^ | 1,000,000 | | 1,036,382 |
| Vodafone Group PLC | | | |
| 3.75%, 01/16/24 | 2,525,000 | | 2,672,615 |
| 4.38%, 05/30/28 | 480,000 | | 532,639 |
| 6.15%, 02/27/37 | 45,000 | | 58,199 |
| 5.00%, 05/30/38 | 30,000 | | 34,799 |
| | | | | 48,239,016 |
Total Foreign Bonds
(Cost $249,207,806) | | 257,532,181 |
| LOAN AGREEMENTS — 0.7% |
| 1011778 B.C. Unlimited Liability Company Term B-4 Loan | | | |
| (Floating, ICE LIBOR USD 1M+ 1.75%), 3.55%, 11/19/26† | 120,000 | | 120,284 |
| Air Medical Group Holdings, Inc. 2018 Term Loan | | | |
| (Floating, ICE LIBOR USD 1M + 3.25%, 1.00% Floor), 5.04%, 04/28/22† | 458,278 | | 450,330 |
| | | Par | | Value |
| Allied Universal Holdco LLC Delayed Draw Term Loan | | | |
| 0.00%, 07/10/26† Σ | $18,015 | | $18,147 |
| (Floating, ICE LIBOR USD 1M+ 4.25%), 6.05%, 07/10/26† | 18,016 | | 18,147 |
| Allied Universal Holdco LLC Initial Term Loan | | | |
| (Floating, ICE LIBOR USD 1M+ 4.25%), 6.05%, 07/10/26† | 181,956 | | 183,283 |
| APi Group DE, Inc. Initial Term Loan | | | |
| (Floating, ICE LIBOR USD 1M+ 2.50%), 4.30%, 10/01/26† | 230,000 | | 232,203 |
| Asurion LLC New B-7 Term Loan | | | |
| 0.00%, 11/03/24† Σ | 59,848 | | 60,265 |
| (Floating, ICE LIBOR USD 1M+ 3.00%), 4.80%, 11/03/24† | 208,064 | | 209,513 |
| athenahealth, Inc. Term B Loan | | | |
| (Floating, ICE LIBOR USD 3M+ 4.50%), 6.40%, 02/11/26† | 267,975 | | 269,761 |
| Atlantic Aviation FBO, Inc. Term Loan | | | |
| (Floating, ICE LIBOR USD 1M+ 3.75%), 5.55%, 12/06/25† | 89,100 | | 90,270 |
| Avolon TLB Borrower 1 (US) LLC Term B-3 Loan | | | |
| (Floating, ICE LIBOR USD 1M+ 1.75%, 0.75% Floor), 3.51%, 01/15/25† | 694,801 | | 700,012 |
| Brookfield WEC Holdings, Inc. Initial Term Loan | | | |
| (Floating, ICE LIBOR USD 1M+ 3.50%, 0.75% Floor), 5.30%, 08/01/25† | 89,773 | | 90,530 |
| Charter Communications Operating LLC Term B-1 Loan | | | |
| (Floating, ICE LIBOR USD 1M+ 1.75%), 3.55%, 04/30/25† | 156,894 | | 158,169 |
| DCert Buyer, Inc. Initial Term Loan | | | |
| (Floating, ICE LIBOR USD 1M+ 4.00%), 5.80%, 10/16/26† | 440,000 | | 442,200 |
| Delos Finance S.a r.l. New Loan | | | |
| (Floating, ICE LIBOR USD 3M+ 1.75%), 3.69%, 10/06/23† | 847,000 | | 851,324 |
| Diamond Sports Group LLC Term Loan | | | |
| (Floating, ICE LIBOR USD 1M+ 3.25%), 5.03%, 08/24/26† | 109,725 | | 109,817 |
| Flying Fortress Holdings LLC New Loan | | | |
| (Floating, ICE LIBOR USD 3M+ 1.75%), 3.69%, 10/30/22† | 74,667 | | 75,040 |
| Focus Financial Partners LLC Tranche B-2 Term Loan | | | |
| (Floating, ICE LIBOR USD 1M+ 2.50%), 4.30%, 07/03/24† | 269,316 | | 271,529 |
| Four Seasons Holdings, Inc. Term Loan 2013 | | | |
| 0.00%, 11/30/23† Σ | 49,871 | | 50,333 |
| Genesee & Wyoming, Inc. Term Loan | | | |
| 0.00%, 12/30/26† Σ | 60,000 | | 60,653 |
| HCA, Inc. Tranche B-12 Term Loan | | | |
| 0.00%, 03/13/25† Σ | 995,124 | | 1,002,030 |
See Notes to Financial Statements.
MEDIUM-DURATION BOND FUND
SCHEDULE OF INVESTMENTS (Continued)
| | | Par | | Value |
| (Floating, ICE LIBOR USD 1M+ 1.75%), 3.55%, 03/13/25† | $63,185 | | $63,624 |
| Hilton Worldwide Finance LLC Refinanced Series B-2 Term Loan | | | |
| (Floating, ICE LIBOR USD 1M+ 1.75%), 3.54%, 06/22/26† | 658,355 | | 663,609 |
| iHeartCommunications, Inc. Initial Term Loan | | | |
| 0.00%, 05/01/26† Σ | 24,560 | | 24,800 |
| (Floating, ICE LIBOR USD 1M+ 4.00%), 5.69%, 05/01/26† | 174,279 | | 175,985 |
| Intelsat Jackson Holdings S.A. Tranche B-3 Term Loan | | | |
| (Floating, ICE LIBOR USD 3M+ 3.75%, 1.00% Floor), 5.68%, 11/27/23† | 130,000 | | 130,452 |
| Jane Street Group LLC Dollar Term Loan | | | |
| (Floating, ICE LIBOR USD 1M+ 3.00%), 4.80%, 08/25/22† | 296,839 | | 297,395 |
| Level 3 Financing, Inc. Tranche B 2027 Term Loan | | | |
| (Floating, ICE LIBOR USD 1M+ 1.75%), 3.55%, 03/01/27† | 107,945 | | 108,451 |
| LPL Holdings, Inc. Tranche B-1 Term Loan | | | |
| (Floating, ICE LIBOR USD 1M+ 1.75%), 3.54%, 11/12/26† | 43,342 | | 43,613 |
| McAfee LLC Term B USD Loan | | | |
| 0.00%, 09/30/24† Σ | 89,773 | | 90,278 |
| (Floating, ICE LIBOR USD 1M+ 3.75%), 5.55%, 09/30/24† | 547,109 | | 550,186 |
| Michaels Stores, Inc. 2018 New Replacement Term B Loan | | | |
| (Floating, ICE LIBOR USD 1M+ 2.50%, 1.00% Floor), 4.29%, 01/30/23† | 182,222 | | 176,710 |
| (Floating, ICE LIBOR USD 1M+ 2.50%, 1.00% Floor), 4.30%, 01/30/23† | 505,438 | | 490,149 |
| MPH Acquisition Holdings LLC Initial Term Loan | | | |
| (Floating, ICE LIBOR USD 3M+ 2.75%, 1.00% Floor), 4.69%, 06/07/23† | 606,397 | | 599,357 |
| Nexstar Broadcasting, Inc. Term B-4 Loan | | | |
| (Floating, ICE LIBOR USD 1M+ 2.75%), 4.45%, 09/18/26† | 500,000 | | 503,495 |
| Option Care Health, Inc. Term B Loan | | | |
| (Floating, ICE LIBOR USD 1M+ 4.50%), 6.30%, 08/06/26† | 270,000 | | 269,268 |
| Panther BF Aggregator 2 L P Term Loan B | | | |
| (Floating, ICE LIBOR USD 1M+ 3.50%), 5.30%, 04/30/26† | 369,075 | | 371,037 |
| Regionalcare Hospital Partners Holdings, Inc. Term B Loan | | | |
| (Floating, ICE LIBOR USD 1M+ 4.50%), 6.30%, 11/16/25† | 179,246 | | 180,926 |
| (Floating, ICE PRIME USD 3M+ 3.50%), 8.25%, 11/16/25† | 453 | | 457 |
| | | Par | | Value |
| RPI Finance Trust Initial Term Loan B-6 | | | |
| (Floating, ICE LIBOR USD 1M+ 2.00%), 3.80%, 03/27/23† | $951,663 | | $960,737 |
| Univision Communications, Inc. 2017 Replacement Repriced First-Lien Term Loan | | | |
| (Floating, ICE LIBOR USD 1M+ 2.75%, 1.00 Floor), 4.55%, 03/15/24† | 121,593 | | 120,336 |
| VFH Parent LLC Initial Term Loan | | | |
| (Floating, ICE LIBOR USD 1M+ 3.50%), 5.20%, 03/01/26† | 175,443 | | 176,342 |
Total Loan Agreements
(Cost $11,456,411) | | | 11,461,047 |
| MORTGAGE-BACKED SECURITIES — 45.0% |
| 280 Park Avenue Mortgage Trust, Series 2017-280P, Class A | | | |
| (Floating, ICE LIBOR USD 1M + 0.88%, 0.88% Floor), 2.62%, 09/15/34 144A † | 1,200,000 | | 1,201,517 |
| Aggregator of Loans Backed by Assets PLC, Series 2015-1, Class A | | | |
| (Floating, ICE LIBOR GBP 1M + 1.25%), 1.96%, 04/24/49(U) † | 532,854 | | 707,291 |
| Alba PLC, Series 2007-1, Class A3 | | | |
| (Floating, ICE LIBOR GBP 3M + 0.17%), 0.96%, 03/17/39(U) † | 675,752 | | 856,124 |
| Alternative Loan Trust, Series 2006-OA11, Class A1B | | | |
| (Floating, ICE LIBOR USD 1M + 0.19%, 0.19% Floor), 1.98%, 09/25/46† | 344,141 | | 326,828 |
| American Home Mortgage Investment Trust, Series 2005-2, Class 4A1 | | | |
| (Floating, ICE LIBOR USD 6M + 1.50%, 1.50% Floor, 11.00% Cap), 3.41%, 09/25/45† | 326,492 | | 330,839 |
| Banc of America Funding Trust, Series 2005-D, Class A1 | | | |
| 4.67%, 05/25/35† γ | 399,250 | | 408,506 |
| Banc of America Mortgage Trust, Series 2004-F, Class 1A1 | | | |
| 4.70%, 07/25/34† γ | 45,029 | | 47,011 |
| Bancorp Commercial Mortgage, Series 2018-CRE4, Class A | | | |
| (Floating, ICE LIBOR USD 1M + 0.90%, 0.95% Floor), 2.64%, 09/15/35 144A † | 661,562 | | 662,105 |
| BANK, Series 2017-BNK9, Class XA | | | |
| 0.81%, 11/15/54† IO γ | 9,915,406 | | 512,400 |
| BBCCRE Trust, Series 2015-GTP, Class A | | | |
| 3.97%, 08/10/33 144A | 1,600,000 | | 1,707,335 |
| BBCCRE Trust, Series 2015-GTP, Class D | | | |
| 4.56%, 08/10/33 144A † γ | 390,000 | | 391,384 |
| BBCMS Trust, Series 2015-STP, Class A | | | |
| 3.32%, 09/10/28 144A | 878,023 | | 882,328 |
See Notes to Financial Statements.
| | | Par | | Value |
| BCAP LLC, Series 2014-RR2, Class 7A1 | | | |
| (Floating, ICE LIBOR USD 1M + 0.20%, 0.20% Floor), 1.91%, 01/26/38 144A † | $741,367 | | $720,939 |
| Bear Stearns ALT-A Trust, Series 2005-4, Class 23A2 | | | |
| 4.41%, 05/25/35† γ | 139,428 | | 142,025 |
| Bear Stearns ARM Trust, Series 2002-11, Class 1A1 | | | |
| 4.54%, 02/25/33† γ | 6,774 | | 6,949 |
| Bear Stearns ARM Trust, Series 2004-2, Class 24A | | | |
| 2.41%, 05/25/34 | 18,403 | | 17,780 |
| Bear Stearns Structured Products, Inc. Trust, Series 2007-R6, Class 1A1 | | | |
| 4.00%, 01/26/36† γ | 391,968 | | 356,048 |
| Brunel Residential Mortgage Securitisation No. 1 PLC, Series 2007-1X, Class A4B | | | |
| (Floating, ICE LIBOR GBP 3M + 0.22%), 1.01%, 01/13/39(U) † | 249,421 | | 326,757 |
| BX Commercial Mortgage Trust, Series 2018-IND, Class H | | | |
| (Floating, ICE LIBOR USD 1M + 3.00%, 3.00% Floor), 4.74%, 11/15/35 144A † | 2,534,000 | | 2,541,690 |
| BX Commercial Mortgage Trust, Series 2019-XL, Class F | | | |
| (Floating, ICE LIBOR USD 1M + 2.00%, 2.00% Floor), 3.74%, 10/15/36 144A † | 1,470,000 | | 1,472,907 |
| CHL Mortgage Pass-Through Trust, Series 2003-58, Class 2A2 | | | |
| 4.08%, 02/19/34† γ | 223,635 | | 229,863 |
| CHL Mortgage Pass-Through Trust, Series 2004-HYB5, Class 2A1 | | | |
| 4.18%, 04/20/35† γ | 280,135 | | 282,954 |
| CHT Mortgage Trust, Series 2017-CSMO, Class A | | | |
| (Floating, ICE LIBOR USD 1M + 0.93%, 0.93% Floor), 2.67%, 11/15/36 144A † | 310,000 | | 310,519 |
| Citigroup Commercial Mortgage Trust, Series 2019-GC41, Class A5 | | | |
| 2.87%, 08/10/56 | 1,450,000 | | 1,481,469 |
| COMM Mortgage Trust, Series 2013-CR12, Class AM | | | |
| 4.30%, 10/10/46 | 50,000 | | 52,985 |
| COMM Mortgage Trust, Series 2013-CR12, Class B | | | |
| 4.76%, 10/10/46 | 40,000 | | 41,702 |
| COMM Mortgage Trust, Series 2013-CR12, Class C | | | |
| 5.08%, 10/10/46† γ | 20,000 | | 20,204 |
| COMM Mortgage Trust, Series 2013-CR6, Class B | | | |
| 3.40%, 03/10/46 144A | 390,000 | | 398,510 |
| COMM Mortgage Trust, Series 2014-277P, Class A | | | |
| 3.61%, 08/10/49 144A † γ | 160,000 | | 168,720 |
| | | Par | | Value |
| COMM Mortgage Trust, Series 2015-DC1, Class C | | | |
| 4.34%, 02/10/48† γ | $80,000 | | $81,798 |
| Connecticut Avenue Securities Trust, Series 2018-R07, Class 1M2 | | | |
| (Floating, ICE LIBOR USD 1M + 2.40%), 4.19%, 04/25/31 144A † | 565,003 | | 572,023 |
| Connecticut Avenue Securities Trust, Series 2019-R02, Class 1M2 | | | |
| (Floating, ICE LIBOR USD 1M + 2.30%, 2.30% Floor), 4.09%, 08/25/31 144A † | 820,000 | | 828,288 |
| CSMC Trust, Series 2010-16, Class B9 | | | |
| 4.08%, 06/25/50 144A † γ | 2,149,467 | | 1,788,718 |
| CSMC Trust, Series 2018-J1, Class A2 | | | |
| 3.50%, 02/25/48 144A † γ | 3,602,406 | | 3,687,939 |
| CSMC Trust, Series 2018-PLUM, Class A | | | |
| (Floating, ICE LIBOR USD 1M + 3.23%, 3.23% Floor), 4.97%, 08/15/20 144A † | 107,583 | | 107,716 |
| CSMC, Series 2017-TIME, Class A | | | |
| 3.65%, 11/13/39 144A | 530,000 | | 552,956 |
| Deutsche Alt-A Securities, Inc. Mortgage Loan Trust Series, Series 2006-AR1, Class 3A1 | | | |
| 3.75%, 02/25/36† γ | 678,795 | | 651,438 |
| Exantas Capital Corporation, Ltd., Series 2018-RSO6, Class A | | | |
| (Floating, ICE LIBOR USD 1M + 0.83%, 0.83% Floor), 2.57%, 06/15/35 144A † | 338,282 | | 336,678 |
| Fannie Mae Connecticut Avenue Securities, Series 2018-C01 | | | |
| (Floating, ICE LIBOR USD 1M + 2.25%, 2.25% Floor), 4.04%, 07/25/30† | 200,000 | | 202,829 |
| Fannie Mae Connecticut Avenue Securities, Series 2018-C03 | | | |
| (Floating, ICE LIBOR USD 1M + 2.15%, 2.15% Floor), 3.94%, 10/25/30† | 190,000 | | 191,638 |
| Federal Home Loan Mortgage Corporation | | | |
| 8.00%, 08/01/24 | 471 | | 501 |
| 4.00%, 10/01/25 | 102,237 | | 106,735 |
| 5.50%, 02/01/27 | 20,076 | | 21,639 |
| 4.50%, 10/01/29 | 1,713 | | 1,827 |
| 7.50%, 11/01/29 | 2,818 | | 3,229 |
| 7.50%, 12/01/29 | 2,998 | | 3,406 |
| 7.50%, 02/01/31 | 4,021 | | 4,196 |
| (Floating, U.S. Treasury Yield Curve Rate CMT 1Y + 2.23%, 2.23% Floor, 11.36% Cap), 4.61%, 07/01/31† | 2,728 | | 2,812 |
| 7.50%, 11/01/31 | 7,537 | | 7,553 |
| (Floating, ICE LIBOR USD 1Y + 1.98%, 1.98% Floor, 10.50% Cap), 4.85%, 04/01/32† | 1,021 | | 1,065 |
See Notes to Financial Statements.
MEDIUM-DURATION BOND FUND
SCHEDULE OF INVESTMENTS (Continued)
| | | Par | | Value |
| 3.00%, 12/01/32 | $913,171 | | $941,757 |
| 3.00%, 06/01/33 | 577,726 | | 595,131 |
| 3.50%, 06/01/33 | 38,132 | | 39,563 |
| 3.50%, 08/01/33 | 632,516 | | 657,573 |
| 5.00%, 08/01/33 | 3,643 | | 4,019 |
| 5.00%, 09/01/33 | 719 | | 793 |
| 5.00%, 10/01/33 | 1,880 | | 2,068 |
| (Floating, U.S. Treasury Yield Curve Rate CMT 1Y + 2.37%, 2.37% Floor, 9.17% Cap), 5.04%, 03/01/34† | 816 | | 864 |
| 5.00%, 12/01/34 | 60,251 | | 66,397 |
| 5.50%, 05/01/35 | 176,319 | | 189,897 |
| 5.00%, 07/01/35 | 3,080 | | 3,400 |
| 5.00%, 11/01/35 | 86,560 | | 95,247 |
| 5.50%, 11/01/35 | 22,441 | | 25,240 |
| 5.00%, 12/01/35 | 8,429 | | 9,355 |
| 6.00%, 02/01/36 | 188,239 | | 207,346 |
| 5.00%, 02/01/37 | 8,321 | | 9,177 |
| 5.50%, 07/01/37 | 22,967 | | 25,819 |
| 3.00%, 02/01/38 | 251,390 | | 257,051 |
| 3.00%, 04/01/38 | 164,138 | | 167,962 |
| 5.50%, 04/01/38 | 5,713 | | 6,421 |
| 7.00%, 03/01/39 | 13,077 | | 15,009 |
| 4.50%, 06/01/39 | 69,467 | | 75,496 |
| 6.50%, 09/01/39 | 28,361 | | 32,353 |
| 4.00%, 02/01/41 | 49,836 | | 53,493 |
| 5.00%, 06/01/41 | 2,360 | | 2,560 |
| 3.50%, 10/01/42 | 105,763 | | 111,320 |
| 4.00%, 10/01/42 | 42,165 | | 44,924 |
| 3.50%, 11/01/42 | 223,917 | | 235,607 |
| 3.50%, 12/01/42 | 63,240 | | 66,556 |
| 3.50%, 01/01/43 | 323,828 | | 340,535 |
| 3.50%, 02/01/43 | 218,621 | | 230,063 |
| 3.50%, 03/01/43 | 540,650 | | 568,873 |
| 4.00%, 04/01/43 | 103,480 | | 110,332 |
| 3.50%, 05/01/43 | 375,905 | | 398,077 |
| 4.00%, 05/01/43 | 45,936 | | 50,123 |
| 4.00%, 06/01/43 | 59,644 | | 65,080 |
| 4.00%, 07/01/43 | 184,372 | | 200,439 |
| 4.00%, 08/01/43 | 99,501 | | 106,061 |
| 4.50%, 12/01/43 | 695,054 | | 751,030 |
| 3.50%, 02/01/44 | 54,695 | | 57,551 |
| 4.50%, 02/01/44 | 572,107 | | 617,929 |
| 4.50%, 03/01/44 | 165,312 | | 178,529 |
| 3.50%, 03/01/45 | 586,244 | | 616,796 |
| 4.00%, 12/01/45 | 391,747 | | 415,538 |
| 3.50%, 06/01/46 | 66,557 | | 70,185 |
| 4.00%, 09/01/46 | 1,268,637 | | 1,340,436 |
| 4.50%, 01/01/47 | 633,010 | | 672,745 |
| 3.50%, 04/01/47 | 10,475,537 | | 11,043,206 |
| 3.50%, 06/01/47 | 75,785 | | 79,513 |
| 4.00%, 07/01/47 | 603,838 | | 635,783 |
| 5.00%, 07/01/47 | 366,635 | | 393,121 |
| 4.00%, 08/01/47 | 144,421 | | 153,755 |
| 3.00%, 09/01/47 | 1,105,792 | | 1,134,537 |
| | | Par | | Value |
| 3.50%, 09/01/47 | $1,221,995 | | $1,270,692 |
| 3.50%, 02/01/48 | 319,053 | | 332,198 |
| 4.00%, 03/01/48 | 1,745,279 | | 1,837,967 |
| 3.50%, 04/01/48 | 1,748,536 | | 1,814,642 |
| 4.00%, 04/01/48 | 2,371,732 | | 2,491,987 |
| 4.00%, 05/01/48 | 1,457,241 | | 1,523,667 |
| 3.50%, 06/01/48 | 516,750 | | 542,508 |
| 4.00%, 06/01/48 | 336,864 | | 351,502 |
| 4.50%, 08/01/48 | 1,736,689 | | 1,887,222 |
| 5.00%, 08/01/48 | 360,658 | | 386,413 |
| 3.00%, 09/01/48 | 178,478 | | 183,892 |
| 4.00%, 09/01/48 | 5,168,025 | | 5,384,810 |
| 4.50%, 09/01/48 | 723,245 | | 762,945 |
| 3.50%, 10/01/48 | 75,592 | | 77,868 |
| 4.00%, 10/01/48 | 1,469,503 | | 1,568,679 |
| 5.00%, 10/01/48 | 299,392 | | 320,991 |
| 4.00%, 11/01/48 | 1,206,299 | | 1,260,834 |
| 5.00%, 11/01/48 | 206,797 | | 221,453 |
| 4.00%, 01/01/49 | 936,059 | | 998,038 |
| 5.00%, 01/01/49 | 1,164,846 | | 1,245,605 |
| 3.50%, 02/01/49 | 724,425 | | 745,667 |
| 3.00%, 03/01/49 | 164,191 | | 166,774 |
| 3.50%, 03/01/49 | 2,450,024 | | 2,527,384 |
| 3.00%, 04/01/49 | 5,820,625 | | 5,912,291 |
| 3.50%, 04/01/49 | 1,124,608 | | 1,157,155 |
| 4.00%, 05/01/49 | 2,196,808 | | 2,283,326 |
| 3.00%, 07/01/49 | 486,591 | | 496,608 |
| 3.00%, 08/01/49 | 961,097 | | 977,106 |
| 3.50%, 08/01/49 | 94,944 | | 97,607 |
| 3.00%, 09/01/49 | 9,249,962 | | 9,414,972 |
| 3.00%, 10/01/49 | 1,071,856 | | 1,094,875 |
| 5.00%, 10/01/49 | 19,374,300 | | 20,695,643 |
| 2.50%, 11/01/49 | 3,000,000 | | 2,967,886 |
| 3.50%, 11/01/49 | 996,857 | | 1,034,238 |
| 4.00%, 11/01/49 | 583,179 | | 608,102 |
| 2.50%, 12/01/49 | 11,498,852 | | 11,375,762 |
| 3.00%, 12/01/49 | 15,998,400 | | 16,240,250 |
| 3.50%, 12/01/49 | 397,087 | | 411,000 |
| 3.00%, 01/01/50 | 2,292,121 | | 2,341,422 |
| Federal Home Loan Mortgage Corporation Reference REMIC, Series R007 | | | |
| 6.00%, 05/15/36 | 139,091 | | 159,598 |
| Federal Home Loan Mortgage Corporation REMIC, Series 3325 | | | |
| (Floating, ICE LIBOR USD 1M + 0.50%, 0.50% Floor, 6.75% Cap), 2.24%, 06/15/37† | 93,959 | | 94,197 |
| Federal Home Loan Mortgage Corporation REMIC, Series 3621 | | | |
| (Floating, 6.23% - ICE LIBOR USD 1M, 6.23% Cap), 4.49%, 01/15/40† IO | 191,368 | | 31,143 |
See Notes to Financial Statements.
| | | Par | | Value |
| Federal Home Loan Mortgage Corporation REMIC, Series 3947 | | | |
| (Floating, 5.95% - ICE LIBOR USD 1M, 5.95% Cap), 4.21%, 10/15/41† IO | $130,289 | | $20,115 |
| Federal Home Loan Mortgage Corporation REMIC, Series 3973 | | | |
| (Floating, 6.49% - ICE LIBOR USD 1M, 6.49% Cap), 4.75%, 12/15/41† IO | 243,819 | | 51,394 |
| Federal Home Loan Mortgage Corporation REMIC, Series 4099 | | | |
| (Floating, 6.00% - ICE LIBOR USD 1M, 6.00% Cap), 4.26%, 08/15/42† IO | 200,856 | | 33,161 |
| Federal Home Loan Mortgage Corporation REMIC, Series 4194 | | | |
| 3.50%, 04/15/43 IO | 351,190 | | 52,406 |
| Federal Home Loan Mortgage Corporation REMIC, Series 4210 | | | |
| 3.00%, 05/15/43 | 357,840 | | 356,590 |
| Federal Home Loan Mortgage Corporation REMIC, Series 4239 | | | |
| 3.50%, 06/15/27 IO | 235,180 | | 18,099 |
| Federal Home Loan Mortgage Corporation REMIC, Series 4298 | | | |
| 4.00%, 04/15/43 IO | 203,294 | | 17,334 |
| Federal Home Loan Mortgage Corporation REMIC, Series 4310 | | | |
| (Floating, 5.95% - ICE LIBOR USD 1M, 5.95% Cap), 4.21%, 02/15/44† IO | 95,609 | | 16,148 |
| Federal Home Loan Mortgage Corporation REMIC, Series 4335 | | | |
| (Floating, 6.00% - ICE LIBOR USD 1M, 6.00% Cap), 4.26%, 05/15/44† IO | 100,990 | | 16,710 |
| Federal Home Loan Mortgage Corporation REMIC, Series 4415 | | | |
| 2.27%, 04/15/41† IO γ | 118,076 | | 6,495 |
| Federal Home Loan Mortgage Corporation REMIC, Series 4638 | | | |
| (Floating, ICE LIBOR USD 1M + 0.44%, 9999.00% Cap), 2.22%, 07/15/40† | 319,480 | | 318,957 |
| Federal Home Loan Mortgage Corporation REMIC, Series 4793 | | | |
| 3.00%, 05/15/48 | 1,036,174 | | 1,056,635 |
| 3.00%, 06/15/48 | 758,931 | | 766,919 |
| Federal Home Loan Mortgage Corporation REMIC, Series 4813 | | | |
| 3.00%, 08/15/48 | 810,442 | | 810,910 |
| Federal Home Loan Mortgage Corporation STRIP, Series 353 | | | |
| (Floating, 6.00% - ICE LIBOR USD 1M, 6.00% Cap), 4.26%, 12/15/46† IO | 359,352 | | 61,864 |
| Federal National Mortgage Association | | | |
| 9.50%, 05/01/22 | 47 | | 48 |
| | | Par | | Value |
| (Floating, COF 11th District San Francisco + 1.25%, 1.25% Floor, 12.75% Cap), 2.41%, 07/01/22† | $791 | | $788 |
| 5.50%, 09/01/23 | 12,480 | | 12,913 |
| 5.50%, 10/01/23 | 3,009 | | 3,105 |
| 5.00%, 06/01/24 | 74,392 | | 79,422 |
| 9.50%, 07/01/24 | 31 | | 31 |
| 2.81%, 04/01/25 | 50,000 | | 51,431 |
| 5.50%, 05/01/25 | 2,978 | | 3,036 |
| (Floating, COF 11th District San Francisco + 1.25%, 1.25% Floor, 12.05% Cap), 2.38%, 07/01/27† | 7,288 | | 7,228 |
| (Floating, U.S. Treasury Yield Curve Rate CMT 1Y + 2.13%, 2.13% Floor, 11.81% Cap), 4.50%, 08/01/27† | 11,298 | | 11,794 |
| (Floating, COF 11th District San Francisco + 1.25%, 1.25% Floor, 10.62% Cap), 2.38%, 11/01/27 CONV † | 8,289 | | 8,214 |
| 2.84%, 01/01/28 | 820,000 | | 848,690 |
| 3.08%, 01/01/28 | 140,000 | | 146,854 |
| 3.64%, 11/01/28 | 200,000 | | 216,026 |
| 3.07%, 01/01/29 | 100,000 | | 105,062 |
| 3.30%, 04/01/29 | 100,000 | | 106,355 |
| 3.16%, 05/01/29 | 148,917 | | 157,048 |
| 3.19%, 05/01/29 | 99,088 | | 104,661 |
| 3.24%, 05/01/29 | 280,000 | | 297,408 |
| 3.26%, 05/01/29 | 110,000 | | 116,922 |
| 3.35%, 05/01/29 | 60,000 | | 64,028 |
| 3.16%, 06/01/29 | 5,900,000 | | 6,232,462 |
| 2.74%, 08/01/29 | 200,000 | | 205,481 |
| 2.79%, 08/01/29 | 500,000 | | 515,910 |
| 2.52%, 10/01/29 | 60,000 | | 60,564 |
| (Floating, U.S. Treasury Yield Curve Rate CMT 1Y + 2.64%, 2.64% Floor, 12.39% Cap), 5.01%, 02/01/30† | 60,834 | | 62,467 |
| (Floating, U.S. Treasury Yield Curve Rate CMT 1Y + 2.38%, 2.38% Floor, 10.65% Cap), 4.41%, 06/01/30 CONV † | 10,878 | | 11,030 |
| 8.00%, 10/01/30 | 8,417 | | 9,946 |
| (Floating, U.S. Treasury Yield Curve Rate CMT 1Y + 2.51%, 2.51% Floor, 12.62% Cap), 4.38%, 12/01/30 CONV † | 3,253 | | 3,297 |
| (Floating, COF 11th District San Francisco + 1.25%, 1.25% Floor, 10.55% Cap), 2.38%, 01/01/31† | 4,620 | | 4,555 |
| 4.50%, 04/01/31 | 39,291 | | 42,239 |
| 3.31%, 05/01/31 | 100,000 | | 106,675 |
| 4.50%, 05/01/31 | 139,976 | | 150,483 |
| 4.50%, 06/01/31 | 42,790 | | 46,009 |
| 2.87%, 07/01/31 | 100,000 | | 102,915 |
| 2.77%, 08/01/31 | 700,000 | | 713,277 |
See Notes to Financial Statements.
MEDIUM-DURATION BOND FUND
SCHEDULE OF INVESTMENTS (Continued)
| | | Par | | Value |
| 2.80%, 08/01/31 | $200,000 | | $204,441 |
| 2.81%, 08/01/31 | 200,000 | | 204,627 |
| 2.84%, 08/01/31 | 100,000 | | 102,622 |
| 2.85%, 08/01/31 | 200,000 | | 205,432 |
| 2.86%, 08/01/31 | 100,000 | | 102,820 |
| 2.87%, 08/01/31 | 200,000 | | 206,555 |
| 2.92%, 08/01/31 | 100,000 | | 102,916 |
| 2.67%, 09/01/31 | 200,000 | | 202,425 |
| 4.50%, 11/01/31 | 62,064 | | 66,701 |
| 6.00%, 11/01/31 | 1,687 | | 1,927 |
| 4.50%, 12/01/31 | 98,268 | | 105,639 |
| 6.00%, 01/01/32 | 51,383 | | 56,663 |
| 6.00%, 03/01/32 | 2,258 | | 2,493 |
| 6.00%, 04/01/32 | 99,960 | | 110,468 |
| (Floating, COF 11th District San Francisco + 1.25%, 1.25% Floor, 10.95% Cap), 2.38%, 06/01/32† | 6,313 | | 6,219 |
| 3.00%, 07/01/32 | 266,664 | | 273,787 |
| 3.50%, 07/01/32 | 81,449 | | 84,892 |
| (Floating, COF 11th District San Francisco + 1.25%, 1.25% Floor, 12.22% Cap), 2.41%, 08/01/32† | 6,418 | | 6,325 |
| (Floating, U.S. Treasury Yield Curve Rate CMT 1Y + 2.13%, 2.13% Floor, 9.75% Cap), 4.88%, 02/01/33† | 865 | | 876 |
| (Floating, COF 11th District San Francisco + 1.25%, 1.25% Floor, 11.95% Cap), 2.41%, 05/01/33† | 9,578 | | 9,465 |
| 5.00%, 07/01/33 | 18,284 | | 20,156 |
| 3.50%, 09/01/33 | 72,774 | | 75,395 |
| 5.00%, 09/01/33 | 22,423 | | 24,723 |
| 3.50%, 05/01/34 | 119,401 | | 125,347 |
| 4.00%, 05/01/34 | 91,389 | | 96,554 |
| 3.50%, 09/01/34 | 1,640,895 | | 1,712,806 |
| 2.67%, 10/01/34 | 100,000 | | 100,002 |
| 3.50%, 10/01/34 | 1,148,487 | | 1,196,953 |
| 6.00%, 10/01/34 | 25,512 | | 28,082 |
| (Floating, ICE LIBOR USD 1Y + 1.55%, 1.55% Floor, 9.67% Cap), 4.55%, 12/01/34† | 12,652 | | 13,118 |
| 6.00%, 05/01/35 | 323,437 | | 362,807 |
| 6.00%, 07/01/35 | 68,593 | | 77,087 |
| 5.50%, 09/01/35 | 51,941 | | 55,900 |
| 5.00%, 10/01/35 | 62,750 | | 69,195 |
| 6.00%, 10/01/35 | 13,834 | | 15,762 |
| (Floating, COF 11th District San Francisco + 1.25%, 1.25% Floor, 10.54% Cap), 2.38%, 11/01/35† | 3,020 | | 3,021 |
| (Floating, Federal Reserve U.S. 12 1Y CMT + 1.96%, 1.96% Floor, 9.00% Cap), 4.29%, 11/01/35† | 30,171 | | 31,311 |
| 6.00%, 11/01/35 | 194,021 | | 214,118 |
| 5.50%, 04/01/36 | 3,242 | | 3,536 |
| | | Par | | Value |
| (Floating, COF 11th District San Francisco + 1.25%, 3.89% Floor, 12.92% Cap), 4.13%, 05/01/36† | $25,414 | | $26,671 |
| 5.50%, 11/01/36 | 50,684 | | 57,058 |
| 5.50%, 03/01/37 | 3,118 | | 3,512 |
| 6.00%, 07/01/37 | 499,448 | | 572,057 |
| 6.50%, 10/01/37 | 41,756 | | 46,385 |
| 7.00%, 10/01/37 | 1,297 | | 1,444 |
| 7.00%, 11/01/37 | 4,899 | | 5,411 |
| (Floating, COF 11th District San Francisco + 1.25%, 1.25% Floor, 10.65% Cap), 2.38%, 12/01/37† | 20,306 | | 20,027 |
| 3.00%, 12/01/37 | 162,339 | | 166,689 |
| 7.00%, 12/01/37 | 3,236 | | 3,828 |
| (Floating, COF 11th District San Francisco + 1.25%, 1.25% Floor, 10.53% Cap), 2.38%, 01/01/38† | 11,811 | | 11,733 |
| 7.00%, 02/01/38 | 1,697 | | 1,889 |
| 4.50%, 03/01/38 | 3,431 | | 3,649 |
| 4.50%, 04/01/38 | 60,189 | | 65,304 |
| 5.00%, 04/01/38 | 60,356 | | 66,444 |
| 5.00%, 06/01/38 | 68,757 | | 75,574 |
| 5.50%, 08/01/38 | 36,316 | | 40,817 |
| 7.00%, 11/01/38 | 13,281 | | 15,376 |
| 7.00%, 02/01/39 | 5,961 | | 6,847 |
| 6.00%, 12/01/39 | 211,015 | | 241,646 |
| (Floating, Federal Reserve U.S. 12 1Y CMT + 1.40%, 1.40% Floor, 9.69% Cap), 3.73%, 06/01/40† | 24,822 | | 25,507 |
| 3.73%, 10/01/40† | 84,811 | | 84,523 |
| (Floating, COF 11th District San Francisco + 1.25%, 1.25% Floor, 10.25% Cap), 2.38%, 11/01/40† | 7,363 | | 7,279 |
| 4.50%, 04/01/41 | 92,830 | | 100,837 |
| 4.50%, 08/01/41 | 48,910 | | 53,145 |
| 4.50%, 11/01/41 | 258,042 | | 280,388 |
| 4.00%, 06/01/42 | 33,565 | | 35,914 |
| 3.50%, 09/01/42 | 44,749 | | 47,054 |
| 2.50%, 10/01/42 | 335,135 | | 333,110 |
| 4.00%, 10/01/42 | 155,430 | | 164,734 |
| 2.50%, 11/01/42 | 19,971 | | 19,881 |
| 4.00%, 11/01/42 | 1,463,066 | | 1,576,968 |
| 2.50%, 12/01/42 | 14,825 | | 14,758 |
| 3.00%, 12/01/42 | 14,462 | | 14,969 |
| 3.50%, 12/01/42 | 69,285 | | 73,055 |
| 4.00%, 12/01/42 | 102,173 | | 109,354 |
| 2.50%, 01/01/43 | 14,785 | | 14,718 |
| 3.00%, 01/01/43 | 271,027 | | 279,413 |
| 3.50%, 01/01/43 | 1,384,680 | | 1,455,999 |
| 2.50%, 02/01/43 | 18,954 | | 18,869 |
| 2.50%, 03/01/43 | 1,334,986 | | 1,328,966 |
| 3.00%, 03/01/43 | 170,477 | | 176,366 |
| 3.50%, 03/01/43 | 588,213 | | 620,827 |
See Notes to Financial Statements.
| | | Par | | Value |
| 2.50%, 04/01/43 | $1,106,688 | | $1,101,697 |
| 3.00%, 04/01/43 | 256,524 | | 265,511 |
| 4.00%, 04/01/43 | 48,097 | | 52,062 |
| 2.50%, 05/01/43 | 24,191 | | 24,082 |
| 3.00%, 05/01/43 | 165,252 | | 171,038 |
| 2.50%, 06/01/43 | 21,549 | | 21,451 |
| 3.00%, 06/01/43 | 50,037 | | 51,790 |
| 4.00%, 06/01/43 | 435,472 | | 469,085 |
| 3.00%, 07/01/43 | 442,587 | | 458,096 |
| 4.00%, 07/01/43 | 457,399 | | 491,296 |
| 2.50%, 08/01/43 | 813,580 | | 809,760 |
| 4.00%, 08/01/43 | 150,036 | | 159,785 |
| 4.50%, 09/01/43 | 433,128 | | 463,717 |
| 2.50%, 10/01/43 | 26,062 | | 25,832 |
| 4.50%, 10/01/43 | 158,396 | | 170,924 |
| 4.50%, 11/01/43 | 104,978 | | 113,334 |
| 4.50%, 12/01/43 | 149,809 | | 161,762 |
| 4.50%, 01/01/44 | 93,002 | | 100,405 |
| 4.50%, 02/01/44 | 641,954 | | 686,471 |
| 4.50%, 10/01/44 | 356,281 | | 388,156 |
| 4.00%, 01/01/45 | 145,348 | | 156,283 |
| 4.50%, 02/01/45 | 949,887 | | 1,059,483 |
| 3.50%, 04/01/45 | 1,201,920 | | 1,260,871 |
| 4.50%, 04/01/45 | 516,249 | | 572,643 |
| 4.50%, 05/01/45 | 58,858 | | 65,288 |
| 3.50%, 06/01/45 | 548,083 | | 572,438 |
| 4.50%, 06/01/45 | 658,623 | | 708,290 |
| 3.00%, 11/01/45 | 1,335,019 | | 1,367,675 |
| 3.50%, 12/01/45 | 196,354 | | 206,930 |
| 3.50%, 01/01/46 | 385,492 | | 407,111 |
| 3.00%, 05/01/46 | 496,827 | | 509,622 |
| 3.00%, 07/01/46 | 580,326 | | 595,810 |
| 3.00%, 08/01/46 | 1,074,947 | | 1,102,071 |
| 3.00%, 09/01/46 | 464,721 | | 476,434 |
| 3.00%, 10/01/46 | 75,001 | | 76,840 |
| 3.00%, 11/01/46 | 2,792,279 | | 2,863,858 |
| 4.50%, 11/01/46 | 625,787 | | 665,556 |
| 5.00%, 11/01/46 | 870,461 | | 953,432 |
| 3.50%, 12/01/46 | 783,143 | | 825,601 |
| 3.00%, 01/01/47 | 320,640 | | 328,406 |
| 3.50%, 02/01/47 | 4,922,498 | | 5,137,803 |
| 4.50%, 03/01/47 | 749,734 | | 806,538 |
| 4.00%, 04/01/47 | 622,453 | | 662,806 |
| 4.00%, 05/01/47 | 149,403 | | 159,095 |
| 4.50%, 06/01/47 | 698,715 | | 764,334 |
| 4.50%, 07/01/47 | 1,315,067 | | 1,412,748 |
| 3.00%, 09/01/47 | 1,276,910 | | 1,310,912 |
| 3.50%, 09/01/47 | 18,303,252 | | 19,317,632 |
| 3.50%, 10/01/47 | 18,714,802 | | 19,751,994 |
| 3.50%, 11/01/47 | 23,565,759 | | 24,871,785 |
| 4.50%, 11/01/47 | 302,071 | | 324,520 |
| 3.50%, 12/01/47 | 24,320,435 | | 25,660,357 |
| 4.00%, 12/01/47 | 505,285 | | 541,664 |
| 4.00%, 01/01/48 | 522,218 | | 559,055 |
| 3.50%, 02/01/48 | 2,124,715 | | 2,206,011 |
| 4.00%, 02/01/48 | 1,741,640 | | 1,861,482 |
| 4.00%, 03/01/48 | 1,444,385 | | 1,540,908 |
| | | Par | | Value |
| 4.00%, 05/01/48 | $848,354 | | $905,049 |
| 5.00%, 05/01/48 | 315,083 | | 337,133 |
| 3.50%, 06/01/48 | 1,746,842 | | 1,812,401 |
| 4.00%, 06/01/48 | 876,747 | | 938,287 |
| 3.50%, 07/01/48 | 1,427,825 | | 1,486,269 |
| 4.00%, 07/01/48 | 1,757,885 | | 1,877,964 |
| 3.50%, 08/01/48 | 9,679,076 | | 10,210,001 |
| 4.00%, 08/01/48 | 5,325,264 | | 5,627,134 |
| 4.00%, 09/01/48 | 1,633,030 | | 1,699,974 |
| 4.50%, 09/01/48 | 850,834 | | 925,048 |
| 5.00%, 10/01/48 | 989,871 | | 1,058,278 |
| 4.00%, 11/01/48 | 3,416,276 | | 3,558,531 |
| 5.00%, 11/01/48 | 5,385,778 | | 5,892,513 |
| 4.00%, 12/01/48 | 1,262,110 | | 1,313,613 |
| 4.50%, 12/01/48 | 285,398 | | 301,309 |
| 5.00%, 12/01/48 | 1,007,475 | | 1,076,633 |
| 4.00%, 01/01/49 | 914,917 | | 952,692 |
| 3.50%, 02/01/49 | 90,444 | | 95,008 |
| 4.00%, 03/01/49 | 5,021,435 | | 5,239,074 |
| 3.50%, 04/01/49 | 2,027,162 | | 2,093,740 |
| 3.50%, 05/01/49 | 1,105,541 | | 1,146,930 |
| 4.50%, 05/01/49 | 938,091 | | 1,006,726 |
| 3.00%, 06/01/49 | 200,001 | | 203,036 |
| 3.50%, 06/01/49 | 5,679,071 | | 5,846,894 |
| 3.00%, 07/01/49 | 2,096,524 | | 2,129,195 |
| 3.00%, 08/01/49 | 1,562,701 | | 1,588,621 |
| 3.50%, 08/01/49 | 386,240 | | 398,660 |
| 3.00%, 09/01/49 | 11,305,233 | | 11,525,291 |
| 2.50%, 10/01/49 | 1,499,851 | | 1,485,178 |
| 3.00%, 10/01/49 | 891,306 | | 909,694 |
| 3.50%, 10/01/49 | 1,579,829 | | 1,646,946 |
| 3.00%, 11/01/49 | 2,585,788 | | 2,626,142 |
| 3.50%, 11/01/49 | 495,411 | | 513,984 |
| 3.00%, 12/01/49 | 1,195,890 | | 1,220,826 |
| 3.50%, 12/01/49 | 299,343 | | 312,918 |
| 2.50%, 01/01/50 | 8,000,000 | | 7,914,362 |
| 3.00%, 01/01/50 | 798,294 | | 812,093 |
| 4.00%, 02/01/56 | 487,188 | | 522,330 |
| 4.50%, 04/01/56 | 758,132 | | 822,515 |
| 5.50%, 09/01/56 | 706,261 | | 771,144 |
| 4.00%, 01/01/57 | 293,916 | | 315,118 |
| 3.50%, 03/01/57 | 2,190,722 | | 2,305,791 |
| 4.00%, 06/01/57 | 532,649 | | 570,951 |
| 4.50%, 09/01/57 | 867,811 | | 941,284 |
| Federal National Mortgage Association ACES, Series 2015-M1 | | | |
| 0.54%, 09/25/24† IO γ | 3,388,847 | | 72,583 |
| Federal National Mortgage Association ACES, Series 2016-M11 | | | |
| 2.94%, 07/25/39 | 185,219 | | 186,476 |
| Federal National Mortgage Association ACES, Series 2018-M15 | | | |
| 3.70%, 01/25/36 | 100,000 | | 109,124 |
See Notes to Financial Statements.
MEDIUM-DURATION BOND FUND
SCHEDULE OF INVESTMENTS (Continued)
| | | Par | | Value |
| Federal National Mortgage Association ACES, Series 2019-M23 | | | |
| 2.72%, 10/25/31 | $299,989 | | $302,658 |
| Federal National Mortgage Association ACES, Series 2019-M27 | | | |
| 2.70%, 11/25/40 | 200,000 | | 198,227 |
| Federal National Mortgage Association ACES, Series 2019-M4 | | | |
| 3.61%, 02/25/31 | 260,000 | | 283,623 |
| Federal National Mortgage Association ACES, Series 2019-M5 | | | |
| 3.27%, 01/25/29 | 500,000 | | 531,017 |
| Federal National Mortgage Association ACES, Series 2019-M6 | | | |
| 3.45%, 01/01/29 | 550,000 | | 591,815 |
| Federal National Mortgage Association Interest STRIP, Series 409 | | | |
| 3.00%, 04/25/27 IO | 203,584 | | 13,871 |
| 4.50%, 11/25/39 IO | 37,570 | | 8,354 |
| 3.50%, 11/25/41 IO | 149,438 | | 25,487 |
| 4.00%, 11/25/41 IO | 182,671 | | 32,441 |
| 4.00%, 04/25/42 IO | 338,532 | | 54,933 |
| Federal National Mortgage Association REMIC, Series 1991-137 | | | |
| 868.32%, 10/25/21 IO | 11 | | 71 |
| Federal National Mortgage Association REMIC, Series 1991-97 | | | |
| 1,009.25%, 08/25/21 IO | 5 | | 33 |
| Federal National Mortgage Association REMIC, Series 2000-32 | | | |
| (Floating, ICE LIBOR USD 1M + 0.45%, 0.45% Floor, 9.00% Cap), 2.19%, 10/18/30† | 5,875 | | 5,875 |
| Federal National Mortgage Association REMIC, Series 2005-29 | | | |
| 5.50%, 04/25/35 | 340,779 | | 388,815 |
| Federal National Mortgage Association REMIC, Series 2007-24 | | | |
| (Floating, 6.75% - ICE LIBOR USD 1M, 6.75% Cap), 4.96%, 03/25/37† IO | 435,717 | | 84,857 |
| Federal National Mortgage Association REMIC, Series 2011-52 | | | |
| 5.00%, 06/25/41 | 261,779 | | 290,146 |
| Federal National Mortgage Association REMIC, Series 2011-59 | | | |
| 5.50%, 07/25/41 | 797,671 | | 893,380 |
| | | Par | | Value |
| Federal National Mortgage Association REMIC, Series 2011-96 | | | |
| (Floating, 6.55% - ICE LIBOR USD 1M, 6.55% Cap), 4.76%, 10/25/41† IO | $323,830 | | $55,138 |
| Federal National Mortgage Association REMIC, Series 2012-101 | | | |
| 4.00%, 09/25/27 IO | 113,451 | | 7,878 |
| Federal National Mortgage Association REMIC, Series 2012-111 | | | |
| 7.00%, 10/25/42 | 21,301 | | 24,705 |
| Federal National Mortgage Association REMIC, Series 2012-118 | | | |
| 3.50%, 12/25/39 IO | 180,100 | | 11,267 |
| Federal National Mortgage Association REMIC, Series 2012-133 | | | |
| (Floating, 6.15% - ICE LIBOR USD 1M, 6.15% Cap), 4.36%, 12/25/42† IO | 113,851 | | 21,310 |
| Federal National Mortgage Association REMIC, Series 2012-153 | | | |
| 7.00%, 07/25/42 | 75,537 | | 89,011 |
| Federal National Mortgage Association REMIC, Series 2012-28 | | | |
| 6.50%, 06/25/39 | 7,175 | | 7,745 |
| Federal National Mortgage Association REMIC, Series 2012-35 | | | |
| (Floating, 6.50% - ICE LIBOR USD 1M, 6.50% Cap), 4.71%, 04/25/42† IO | 108,356 | | 18,239 |
| Federal National Mortgage Association REMIC, Series 2012-46 | | | |
| 6.00%, 05/25/42 | 108,771 | | 124,052 |
| Federal National Mortgage Association REMIC, Series 2012-70 | | | |
| (Floating, 6.65% - ICE LIBOR USD 1M, 6.65% Cap), 4.86%, 02/25/41† IO | 18,084 | | 1,558 |
| Federal National Mortgage Association REMIC, Series 2012-74 | | | |
| (Floating, 6.65% - ICE LIBOR USD 1M, 6.65% Cap), 4.86%, 03/25/42† IO | 135,213 | | 19,029 |
| Federal National Mortgage Association REMIC, Series 2012-75 | | | |
| (Floating, 6.60% - ICE LIBOR USD 1M, 6.60% Cap), 4.81%, 07/25/42† IO | 39,205 | | 6,992 |
See Notes to Financial Statements.
| | | Par | | Value |
| Federal National Mortgage Association REMIC, Series 2013-124 | | | |
| (Floating, 5.95% - ICE LIBOR USD 1M, 5.95% Cap), 4.16%, 12/25/43† IO | $427,212 | | $79,060 |
| Federal National Mortgage Association REMIC, Series 2013-14 | | | |
| 4.00%, 03/25/43 IO | 165,392 | | 25,071 |
| Federal National Mortgage Association REMIC, Series 2013-17 | | | |
| 3.00%, 03/25/28 IO | 783,224 | | 60,571 |
| Federal National Mortgage Association REMIC, Series 2013-29 | | | |
| 4.00%, 04/25/43 IO | 474,647 | | 66,420 |
| Federal National Mortgage Association REMIC, Series 2013-54 | | | |
| (Floating, 6.15% - ICE LIBOR USD 1M, 6.15% Cap), 4.36%, 06/25/43† IO | 191,246 | | 39,954 |
| Federal National Mortgage Association REMIC, Series 2013-9 | | | |
| 5.50%, 04/25/42 | 475,538 | | 528,395 |
| 6.50%, 07/25/42 | 191,273 | | 223,352 |
| Federal National Mortgage Association REMIC, Series 2014-47 | | | |
| 2.23%, 08/25/44† IO γ | 347,136 | | 20,582 |
| Federal National Mortgage Association REMIC, Series 2015-55 | | | |
| 2.11%, 08/25/55† IO γ | 121,314 | | 6,427 |
| Federal National Mortgage Association REMIC, Series 2015-56 | | | |
| (Floating, 6.15% - ICE LIBOR USD 1M, 6.15% Cap), 4.36%, 08/25/45† IO | 59,545 | | 13,674 |
| Federal National Mortgage Association REMIC, Series 2017-76 | | | |
| (Floating, 6.10% - ICE LIBOR USD 1M, 6.10% Cap), 4.31%, 10/25/57† IO | 818,000 | | 164,522 |
| Federal National Mortgage Association REMIC, Series 2017-85 | | | |
| (Floating, 6.20% - ICE LIBOR USD 1M, 6.20% Cap), 4.41%, 11/25/47† IO | 271,434 | | 44,264 |
| FHLMC Multifamily Structured Pass-Through Certificates, Series K016 | | | |
| 1.48%, 10/25/21† IO γ | 173,784 | | 3,894 |
| FHLMC Multifamily Structured Pass-Through Certificates, Series K068 | | | |
| 0.43%, 08/25/27† IO γ | 2,426,259 | | 71,587 |
| | | Par | | Value |
| FHLMC Multifamily Structured Pass-Through Certificates, Series K091 | | | |
| 0.56%, 03/25/29† IO γ | $1,419,093 | | $65,589 |
| 3.51%, 03/25/29 | 450,000 | | 488,111 |
| FHLMC Multifamily Structured Pass-Through Certificates, Series K093 | | | |
| 0.95%, 05/25/29† IO γ | 1,998,236 | | 150,989 |
| FHLMC Multifamily Structured Pass-Through Certificates, Series K094 | | | |
| 0.88%, 06/25/29† IO γ | 999,723 | | 71,027 |
| FHLMC Multifamily Structured Pass-Through Certificates, Series K095 | | | |
| 0.95%, 06/25/29† IO γ | 1,198,614 | | 88,668 |
| FHLMC Multifamily Structured Pass-Through Certificates, Series K099, Class X1 | | | |
| 1.01%, 09/25/29† IO γ | 1,089,703 | | 79,200 |
| FHLMC Multifamily Structured Pass-Through Certificates, Series K723 | | | |
| 0.95%, 08/25/23† IO γ | 3,245,453 | | 91,070 |
| FHLMC Multifamily Structured Pass-Through Certificates, Series K735 | | | |
| 0.97%, 05/25/26† IO γ | 899,644 | | 48,468 |
| FHLMC Multifamily Structured Pass-Through Certificates, Series K736 | | | |
| 1.31%, 07/25/26† IO γ | 1,999,843 | | 142,847 |
| FHLMC Multifamily Structured Pass-Through Certificates, Series KF11 | | | |
| (Floating, ICE LIBOR USD 1M + 0.65%), 2.35%, 09/25/25† | 92,905 | | 92,846 |
| FHLMC Multifamily Structured Pass-Through Certificates, Series T-61 | | | |
| (Floating, Federal Reserve U.S. 12 1Y CMT + 1.40%, 1.40% Floor), 3.64%, 07/25/44† | 485,962 | | 495,458 |
| FHLMC Structured Agency Credit Risk Debt Notes, Series 2016-DNA4 | | | |
| (Floating, ICE LIBOR USD 1M + 3.80%, 3.80% Floor), 5.59%, 03/25/29† | 250,000 | | 266,154 |
| First Horizon Alternative Mortgage Securities Trust, Series 2004-AA1, Class A1 | | | |
| 3.84%, 06/25/34† γ | 197,364 | | 199,546 |
| FREMF Mortgage Trust, Series 2012-K20, Class X2A | | | |
| 0.20%, 05/25/45 144A IO | 5,093,435 | | 20,117 |
| Government National Mortgage Association | | | |
| 7.00%, 01/15/26 | 2,355 | | 2,513 |
| 7.00%, 07/15/27 | 21,242 | | 23,621 |
| 7.00%, 01/15/28 | 10,931 | | 11,059 |
See Notes to Financial Statements.
MEDIUM-DURATION BOND FUND
SCHEDULE OF INVESTMENTS (Continued)
| | | Par | | Value |
| 7.00%, 03/15/28 | $27,959 | | $31,614 |
| 7.00%, 07/15/28 | 3,419 | | 3,686 |
| 7.50%, 07/15/28 | 9,524 | | 9,671 |
| 6.50%, 08/15/28 | 2,027 | | 2,237 |
| 7.00%, 08/15/28 | 5,691 | | 6,156 |
| 7.50%, 08/15/28 | 6,303 | | 6,951 |
| 6.50%, 09/15/28 | 3,703 | | 4,147 |
| 7.00%, 10/15/28 | 10,946 | | 11,024 |
| 7.50%, 03/15/29 | 9,919 | | 11,425 |
| (Floating, U.S. Treasury Yield Curve Rate CMT 1Y + 1.50%, 1.50% Floor, 11.00% Cap), 4.13%, 11/20/29† | 18,010 | | 18,606 |
| 8.50%, 08/15/30 | 444 | | 457 |
| 8.50%, 11/20/30 | 5,014 | | 5,814 |
| 6.50%, 08/15/31 | 29,025 | | 32,804 |
| 7.50%, 08/15/31 | 6,600 | | 7,137 |
| 6.50%, 10/15/31 | 33,287 | | 37,107 |
| 6.00%, 11/15/31 | 86,475 | | 96,670 |
| 6.50%, 11/15/31 | 55,383 | | 61,110 |
| 6.00%, 12/15/31 | 17,181 | | 19,599 |
| 6.00%, 01/15/32 | 63,333 | | 70,338 |
| 6.00%, 02/15/32 | 76,387 | | 84,154 |
| 6.50%, 02/15/32 | 32,955 | | 36,380 |
| 6.00%, 04/15/32 | 37,288 | | 41,080 |
| 7.50%, 04/15/32 | 8,002 | | 8,501 |
| 6.50%, 06/15/32 | 51,572 | | 56,963 |
| 6.50%, 08/15/32 | 67,164 | | 74,137 |
| 6.50%, 09/15/32 | 77,719 | | 87,433 |
| 6.00%, 10/15/32 | 66,076 | | 75,515 |
| 5.50%, 11/15/32 | 8,904 | | 9,649 |
| 6.00%, 11/15/32 | 54,044 | | 59,996 |
| 6.00%, 12/15/32 | 25,886 | | 28,820 |
| 6.50%, 12/15/32 | 8,278 | | 9,138 |
| 5.50%, 01/15/33 | 5,650 | | 6,125 |
| 6.00%, 01/15/33 | 24,641 | | 27,592 |
| 5.50%, 02/15/33 | 11,224 | | 12,526 |
| 6.00%, 02/15/33 | 22,806 | | 26,059 |
| 5.50%, 03/15/33 | 13,112 | | 14,578 |
| 6.50%, 04/15/33 | 144,462 | | 168,329 |
| 6.00%, 06/15/33 | 17,813 | | 19,624 |
| 5.50%, 07/15/33 | 14,257 | | 15,746 |
| 5.50%, 08/15/33 | 4,890 | | 5,318 |
| 5.50%, 09/15/33 | 2,901 | | 3,155 |
| 6.00%, 10/15/33 | 34,101 | | 37,569 |
| 6.50%, 10/15/33 | 65,516 | | 72,983 |
| 5.50%, 04/15/34 | 8,391 | | 9,086 |
| 5.50%, 05/15/34 | 2,527 | | 2,712 |
| 6.50%, 08/15/34 | 102,106 | | 115,273 |
| 5.50%, 09/15/34 | 58,809 | | 66,002 |
| 5.50%, 12/15/34 | 57,993 | | 65,091 |
| 5.50%, 01/15/35 | 41,859 | | 46,966 |
| 6.00%, 09/20/38 | 129,564 | | 148,067 |
| 5.00%, 07/20/40 | 11,021 | | 12,179 |
| 5.00%, 09/20/40 | 48,736 | | 53,841 |
| 4.00%, 10/20/40 | 6,351 | | 6,738 |
| 6.00%, 10/20/40 | 19,663 | | 22,189 |
| 6.00%, 01/20/41 | 16,032 | | 18,311 |
| | | Par | | Value |
| 4.50%, 04/20/41 | $214,710 | | $232,031 |
| 3.00%, 09/15/42 | 497,264 | | 513,109 |
| 3.00%, 10/15/42 | 217,855 | | 224,797 |
| 3.00%, 11/15/42 | 96,422 | | 99,494 |
| 4.00%, 08/20/43 | 363,310 | | 385,798 |
| 3.50%, 06/20/44 | 147,747 | | 154,592 |
| 4.00%, 10/20/44 | 179,975 | | 190,794 |
| 3.00%, 01/15/45 | 3,436,722 | | 3,539,804 |
| 4.00%, 01/20/45 | 285,660 | | 302,676 |
| 3.50%, 03/20/45 | 68,799 | | 71,747 |
| 3.50%, 04/15/45 | 599,014 | | 623,925 |
| 4.00%, 05/20/45 | 32,430 | | 34,322 |
| 4.00%, 10/20/45 | 275,194 | | 288,762 |
| 3.50%, 09/20/46 | 2,354,583 | | 2,460,546 |
| 4.00%, 06/20/47 | 3,570,529 | | 3,736,378 |
| 3.00%, 09/20/47 | 39,384 | | 40,622 |
| 4.00%, 09/20/47 | 1,411,731 | | 1,480,991 |
| 3.50%, 10/20/47 | 975,284 | | 1,012,828 |
| 3.50%, 11/20/47 | 75,623 | | 78,510 |
| 4.00%, 11/20/47 | 856,921 | | 895,103 |
| 4.00%, 12/20/47 | 396,316 | | 413,996 |
| 3.00%, 02/20/48 | 203,069 | | 208,987 |
| 3.50%, 02/20/48 | 924,046 | | 960,025 |
| 4.00%, 02/20/48 | 270,659 | | 282,169 |
| 4.00%, 03/20/48 | 466,381 | | 487,230 |
| 4.00%, 04/20/48 | 329,407 | | 342,332 |
| 4.50%, 05/20/48 | 2,952,979 | | 3,102,864 |
| 3.50%, 06/15/48 | 242,504 | | 254,817 |
| 4.50%, 06/20/48 | 894,893 | | 943,045 |
| 4.00%, 07/20/48 | 1,241,014 | | 1,289,799 |
| 4.50%, 07/20/48 | 59,615 | | 62,799 |
| 4.50%, 08/20/48 | 9,082,528 | | 9,561,458 |
| 4.50%, 09/20/48 | 4,292,329 | | 4,513,285 |
| 5.00%, 09/20/48 | 628,441 | | 666,520 |
| 5.00%, 10/20/48 | 2,178,791 | | 2,293,130 |
| 5.00%, 11/20/48 | 3,754,593 | | 3,971,743 |
| 5.00%, 12/20/48 | 928,656 | | 980,548 |
| 4.50%, 01/20/49 | 14,418,970 | | 15,145,160 |
| 5.00%, 01/20/49 | 12,704,044 | | 13,412,890 |
| 3.50%, 02/20/49 | 229,272 | | 236,597 |
| 4.50%, 02/20/49 | 1,420,275 | | 1,484,054 |
| 5.00%, 02/20/49 | 307,874 | | 324,569 |
| 4.50%, 03/20/49 | 296,630 | | 309,991 |
| 5.00%, 03/20/49 | 1,983,162 | | 2,086,203 |
| 4.50%, 04/20/49 | 537,667 | | 561,767 |
| 4.00%, 05/20/49 | 576,335 | | 597,786 |
| 5.00%, 05/20/49 | 191,130 | | 201,927 |
| 4.50%, 06/20/49 | 4,276,764 | | 4,484,868 |
| 2.50%, 09/20/49 | 197,859 | | 195,601 |
| 3.50%, 09/20/49 | 3,052,535 | | 3,163,554 |
| 2.50%, 10/20/49 | 99,455 | | 98,320 |
| 3.50%, 10/20/49 | 2,290,909 | | 2,357,301 |
| 4.00%, 10/20/49 | 99,720 | | 104,821 |
| 2.50%, 11/20/49 | 99,800 | | 98,661 |
| 4.00%, 11/20/49 | 99,862 | | 105,512 |
| 3.00%, 12/20/49 | 3,700,000 | | 3,804,111 |
| 2.50%, 01/01/50 TBA | 5,000,000 | | 5,021,680 |
See Notes to Financial Statements.
| | | Par | | Value |
| 3.00%, 01/01/50 TBA | $41,100,000 | | $42,228,644 |
| 3.50%, 01/01/50 TBA | 20,600,000 | | 21,231,680 |
| 4.00%, 01/01/50 TBA | 7,000,000 | | 7,245,547 |
| 5.00%, 01/01/50 TBA | 20,000,000 | | 21,059,375 |
| 4.00%, 02/01/50 TBA | 5,000,000 | | 5,179,922 |
| 4.50%, 02/01/50 TBA | 12,000,000 | | 12,570,000 |
| Government National Mortgage Association, Series 2007-30 | | | |
| (Floating, ICE LIBOR USD 1M + 0.30%, 0.30% Floor, 6.50% Cap), 2.06%, 05/20/37† | 101,822 | | 101,730 |
| Government National Mortgage Association, Series 2007-51 | | | |
| (Floating, 6.58% - ICE LIBOR USD 1M, 6.58% Cap), 4.82%, 08/20/37† IO | 926,056 | | 133,312 |
| Government National Mortgage Association, Series 2010-31 | | | |
| (Floating, 6.50% - ICE LIBOR USD 1M, 6.50% Cap), 4.74%, 03/20/39† IO | 9,350 | | 283 |
| Government National Mortgage Association, Series 2010-85 | | | |
| (Floating, 6.65% - ICE LIBOR USD 1M, 6.65% Cap), 4.89%, 01/20/40† IO | 29,913 | | 2,623 |
| Government National Mortgage Association, Series 2010-H28 | | | |
| (Floating, ICE LIBOR USD 1M + 0.40%, 0.40% Floor, 10.50% Cap), 2.17%, 12/20/60† | 210,196 | | 209,542 |
| Government National Mortgage Association, Series 2011-H08 | | | |
| (Floating, ICE LIBOR USD 1M + 0.48%, 0.48% Floor, 10.50% Cap), 2.25%, 03/20/61† | 264,684 | | 264,337 |
| Government National Mortgage Association, Series 2011-H09 | | | |
| (Floating, ICE LIBOR USD 1M + 0.50%, 0.50% Floor, 10.50% Cap), 2.27%, 03/20/61† | 187,804 | | 187,650 |
| Government National Mortgage Association, Series 2012-144 | | | |
| 0.40%, 01/16/53† IO γ | 7,177,325 | | 169,840 |
| Government National Mortgage Association, Series 2012-34 | | | |
| (Floating, 6.05% - ICE LIBOR USD 1M, 6.05% Cap), 4.29%, 03/20/42† IO | 34,050 | | 6,752 |
| Government National Mortgage Association, Series 2012-66 | | | |
| 3.50%, 02/20/38 IO | 102,246 | | 4,588 |
| Government National Mortgage Association, Series 2012-H27 | | | |
| 1.78%, 10/20/62† IO γ | 643,903 | | 29,024 |
| Government National Mortgage Association, Series 2012-H30 | | | |
| (Floating, ICE LIBOR USD 1M + 0.35%, 0.35% Floor, 10.50% Cap), 2.12%, 12/20/62† | 978,584 | | 974,926 |
| | | Par | | Value |
| Government National Mortgage Association, Series 2013-53 | | | |
| 3.50%, 04/20/43 IO | $101,186 | | $14,331 |
| Government National Mortgage Association, Series 2014-117 | | | |
| (Floating, 5.60% - ICE LIBOR USD 1M, 5.60% Cap), 3.84%, 08/20/44† IO | 72,507 | | 11,873 |
| Government National Mortgage Association, Series 2014-118 | | | |
| (Floating, 6.20% - ICE LIBOR USD 1M, 6.20% Cap), 4.44%, 08/20/44† IO | 200,470 | | 40,130 |
| Government National Mortgage Association, Series 2014-17 | | | |
| 2.55%, 06/16/48† γ | 41,391 | | 42,399 |
| Government National Mortgage Association, Series 2014-93 | | | |
| 0.73%, 11/16/55† IO γ | 2,815,368 | | 106,678 |
| Government National Mortgage Association, Series 2015-167 | | | |
| 4.00%, 04/16/45 IO | 105,081 | | 19,223 |
| Government National Mortgage Association, Series 2015-H11 | | | |
| (Floating, ICE LIBOR USD 1M + 0.55%, 0.55% Floor, 7.50% Cap), 2.32%, 05/20/65† | 2,250,048 | | 2,243,806 |
| Government National Mortgage Association, Series 2015-H14 | | | |
| (Floating, ICE LIBOR USD 1M + 0.43%, 0.43% Floor, 11.00% Cap), 2.20%, 05/20/65† | 2,356,362 | | 2,350,456 |
| (Floating, ICE LIBOR USD 1M + 0.57%, 0.57% Floor, 7.50% Cap), 2.34%, 06/20/65† | 3,747,074 | | 3,739,456 |
| Government National Mortgage Association, Series 2015-H15 | | | |
| (Floating, ICE LIBOR USD 1M + 0.58%, 0.58% Floor, 7.50% Cap), 2.35%, 06/20/65† | 1,465,365 | | 1,462,650 |
| (Floating, ICE LIBOR USD 1M + 0.60%, 0.60% Floor, 7.50% Cap), 2.37%, 06/20/65† | 3,622,448 | | 3,618,641 |
| Government National Mortgage Association, Series 2015-H16 | | | |
| (Floating, ICE LIBOR USD 1M + 0.60%, 0.60% Floor), 2.37%, 07/20/65† | 3,507,679 | | 3,503,825 |
| Government National Mortgage Association, Series 2015-H17 | | | |
| (Floating, ICE LIBOR USD 1M + 0.46%, 0.46% Floor), 2.46%, 06/20/65† | 543,934 | | 542,873 |
| Government National Mortgage Association, Series 2015-H18 | | | |
| (Floating, ICE LIBOR USD 1M + 0.60%, 0.60% Floor, 7.50% Cap), 2.37%, 07/20/65† | 520,548 | | 520,010 |
See Notes to Financial Statements.
MEDIUM-DURATION BOND FUND
SCHEDULE OF INVESTMENTS (Continued)
| | | Par | | Value |
| Government National Mortgage Association, Series 2015-H19 | | | |
| (Floating, ICE LIBOR USD 1M + 0.60%, 0.60% Floor), 2.37%, 08/20/65† | $571,639 | | $571,041 |
| Government National Mortgage Association, Series 2015-H22 | | | |
| (Floating, ICE LIBOR USD 1M + 0.60%, 0.60% Floor, 7.50% Cap), 2.37%, 09/20/65† | 574,459 | | 573,822 |
| Government National Mortgage Association, Series 2015-H23 | | | |
| (Floating, ICE LIBOR USD 1M + 0.62%, 0.62% Floor, 7.50% Cap), 2.39%, 09/20/65† | 654,101 | | 653,868 |
| Government National Mortgage Association, Series 2015-H26 | | | |
| (Floating, ICE LIBOR USD 1M + 0.52%, 0.52% Floor, 11.00% Cap), 2.29%, 10/20/65† | 1,272,374 | | 1,271,398 |
| Government National Mortgage Association, Series 2015-H30 | | | |
| (Floating, ICE LIBOR USD 1M + 0.68%, 0.68% Floor), 2.45%, 08/20/61† | 11,671 | | 11,693 |
| Government National Mortgage Association, Series 2016-152 | | | |
| 0.88%, 08/15/58† IO γ | 4,886,707 | | 331,563 |
| Government National Mortgage Association, Series 2017-190 | | | |
| 0.69%, 03/16/60† IO γ | 7,113,888 | | 417,062 |
| Government National Mortgage Association, Series 2017-H15 | | | |
| 2.36%, 07/20/67† IO γ | 568,564 | | 75,392 |
| (Floating, ICE LIBOR USD 1Y + 0.80%, 0.80% Floor, 7.50% Cap), 3.31%, 07/20/67† | 1,809,456 | | 1,837,216 |
| Government National Mortgage Association, Series 2017-H18 | | | |
| 1.76%, 09/20/67† IO γ | 4,463,624 | | 403,987 |
| Government National Mortgage Association, Series 2017-H20 | | | |
| 2.22%, 10/20/67† IO γ | 192,726 | | 20,606 |
| Government National Mortgage Association, Series 2017-H22 | | | |
| 2.85%, 11/20/67† IO γ | 1,545,228 | | 165,985 |
| Government National Mortgage Association, Series 2018-H07 | | | |
| (Floating, ICE LIBOR USD 1M + 0.30%, 0.30% Floor, 11.00% Cap), 2.07%, 05/20/68† | 1,008,821 | | 1,002,655 |
| Government National Mortgage Association, Series 2019-123 | | | |
| 3.00%, 10/20/49 | 300,000 | | 303,148 |
| Government National Mortgage Association, Series 2019-28 | | | |
| 3.15%, 06/16/60 | 229,559 | | 233,351 |
| GPMT, Ltd., Series 2018-FL1, Class A | | | |
| (Floating, ICE LIBOR USD 1M + 0.90%, 0.90% Floor), 2.66%, 11/21/35 144A † | 875,770 | | 874,968 |
| | | Par | | Value |
| GreenPoint Mortgage Funding Trust, Series 2006-OH1, Class A1 | | | |
| (Floating, ICE LIBOR USD 1M + 0.18%, 0.18% Floor), 1.97%, 01/25/37† | $446,492 | | $433,099 |
| GS Mortgage Securities Corporation II, Series 2018-SRP5, Class A | | | |
| (Floating, ICE LIBOR USD 1M + 1.30%, 1.30% Floor), 3.04%, 09/15/31 144A † | 1,530,000 | | 1,526,954 |
| GS Mortgage Securities Trust, Series 2013-GC16, Class B | | | |
| 5.16%, 11/10/46 | 130,000 | | 141,744 |
| GS Mortgage Securities Trust, Series 2015-GC30, Class AS | | | |
| 3.78%, 05/10/50 | 370,000 | | 388,187 |
| GSR Mortgage Loan Trust, Series 2005-AR6, Class 2A1 | | | |
| 4.27%, 09/25/35† γ | 348,246 | | 358,488 |
| Harben Finance PLC, Series 2017-1X, Class A | | | |
| (Floating, ICE LIBOR GBP 3M + 0.80%), 1.60%, 08/20/56(U) † | 532,498 | | 707,241 |
| Hawksmoor Mortgages, Series 2019-1A, Class A | | | |
| (Floating, SONIA Deposit Rates Swap 3M + 1.05%), 1.76%, 05/25/53(U) 144A † | 5,654,197 | | 7,517,232 |
| Impac CMB Trust, Series 2004-8, Class 1A | | | |
| (Floating, ICE LIBOR USD 1M + 0.72%, 0.36% Floor, 11.00% Cap), 2.51%, 10/25/34† | 31,214 | | 31,332 |
| IndyMac ARM Trust, Series 2001-H2, Class A1 | | | |
| 3.70%, 01/25/32† γ | 5,443 | | 5,272 |
| JP Morgan Alternative Loan Trust, Series 2005-A2, Class 1A1 | | | |
| (Floating, ICE LIBOR USD 1M + 0.52%, 0.26% Floor, 11.50% Cap), 2.31%, 01/25/36† | 91,378 | | 91,809 |
| JP Morgan Chase Commercial Mortgage Securities Trust, Series 2012-C6, Class D | | | |
| 5.16%, 05/15/45† γ | 280,000 | | 283,737 |
| JP Morgan Mortgage Trust, Series 2005-A1, Class 6T1 | | | |
| 4.61%, 02/25/35† γ | 37,331 | | 37,718 |
| JP Morgan Mortgage Trust, Series 2018-3, Class A1 | | | |
| 3.50%, 09/25/48 144A † γ | 2,423,329 | | 2,476,641 |
| JP Morgan Mortgage Trust, Series 2018-4, Class A1 | | | |
| 3.50%, 10/25/48 144A † γ | 930,482 | | 950,533 |
| JPMBB Commercial Mortgage Securities Trust, Series 2013-C17, Class B | | | |
| 4.89%, 01/15/47† γ | 50,000 | | 54,276 |
See Notes to Financial Statements.
| | | Par | | Value |
| JPMBB Commercial Mortgage Securities Trust, Series 2014-C25, Class ASB | | | |
| 3.41%, 11/15/47 | $814,341 | | $836,226 |
| JPMBB Commercial Mortgage Securities Trust, Series 2015-C32, Class ASB | | | |
| 3.36%, 11/15/48 | 800,000 | | 825,972 |
| Kensington Mortgage Securities PLC, Series 2007-1X, Class A3C | | | |
| (Floating, ICE LIBOR USD 3M + 0.17%), 2.06%, 06/14/40† | 801,171 | | 781,881 |
| London Wall Mortgage Capital PLC, Series 2017-FL1, Class A | | | |
| (Floating, ICE LIBOR GBP 3M + 0.85%), 1.64%, 11/15/49(U) † | 557,822 | | 741,257 |
| Ludgate Funding PLC, Series 2007-1, Class A2A | | | |
| (Floating, ICE LIBOR GBP 3M + 0.16%), 0.92%, 01/01/61(U) † | 702,974 | | 877,019 |
| Ludgate Funding PLC, Series 2008-W1X, Class A1 | | | |
| (Floating, ICE LIBOR GBP 3M + 0.60%), 1.36%, 01/01/61(U) † | 570,186 | | 734,080 |
| Mansard Mortgages PLC, Series 2007-1X, Class A2 | | | |
| (Floating, ICE LIBOR GBP 3M + 0.18%), 0.97%, 04/15/47(U) † | 699,511 | | 882,793 |
| MASTR Adjustable Rate Mortgages Trust, Series 2004-13, Class 3A7 | | | |
| 4.70%, 11/21/34† γ | 174,909 | | 179,826 |
| MASTR Adjustable Rate Mortgages Trust, Series 2004-4, Class 4A1 | | | |
| 3.91%, 05/25/34† γ | 80,631 | | 81,460 |
| Morgan Stanley Bank of America Merrill Lynch Trust, Series 2013-C9, Class A4 | | | |
| 3.10%, 05/15/46 | 300,000 | | 307,676 |
| Morgan Stanley Bank of America Merrill Lynch Trust, Series 2013-C9, Class AS | | | |
| 3.46%, 05/15/46 | 140,000 | | 144,654 |
| Morgan Stanley Bank of America Merrill Lynch Trust, Series 2014-C19, Class B | | | |
| 4.00%, 12/15/47 | 370,000 | | 389,980 |
| Morgan Stanley Bank of America Merrill Lynch Trust, Series 2015-C22, Class AS | | | |
| 3.56%, 04/15/48 | 480,000 | | 496,390 |
| Morgan Stanley Bank of America Merrill Lynch Trust, Series 2015-C25, Class A4 | | | |
| 3.37%, 10/15/48 | 1,400,000 | | 1,468,004 |
| Morgan Stanley Bank of America Merrill Lynch Trust, Series 2015-C27, Class ASB | | | |
| 3.56%, 12/15/47 | 800,000 | | 832,141 |
| | | Par | | Value |
| Morgan Stanley Capital I Trust, Series 2014-CPT, Class B | | | |
| 3.45%, 07/13/29 144A † γ | $800,000 | | $809,862 |
| Morgan Stanley Capital I Trust, Series 2019-BPR, Class A | | | |
| (Floating, ICE LIBOR USD 1M + 1.40%, 1.40% Floor), 3.14%, 05/15/36 144A † | 1,050,000 | | 1,049,223 |
| MortgageIT Trust, Series 2005-4, Class A1 | | | |
| (Floating, ICE LIBOR USD 1M + 0.28%, 0.28% Floor, 11.50% Cap), 2.07%, 10/25/35† | 238,632 | | 239,361 |
| MSCG Trust, Series 2015-ALDR, Class A2 | | | |
| 3.46%, 06/07/35 144A † γ | 580,000 | | 593,405 |
| MSCG Trust, Series 2016-SNR, Class C | | | |
| 5.21%, 11/15/34 144A | 331,500 | | 338,315 |
| Nomura Resecuritization Trust, Series 2014-7R, Class 2A3 | | | |
| (Floating, ICE LIBOR USD 1M + 0.20%, 0.20% Floor), 1.91%, 12/26/35 144A † | 193,815 | | 193,514 |
| OBX Trust, Series 2018-1, Class A2 | | | |
| (Floating, ICE LIBOR USD 1M + 0.65%), 2.44%, 06/25/57 144A † | 618,979 | | 617,195 |
| ResLoc UK PLC, Series 2007-1X, Class A3A | | | |
| (Floating, 0.16% - Euribor 3M), 0.00%, 12/15/43(E) † | 990,703 | | 1,064,675 |
| (Floating, ICE LIBOR GBP 3M + 0.16%), 0.96%, 12/15/43(U) † | 247,676 | | 312,959 |
| Ripon Mortgages PLC, Series 1X, Class A1 | | | |
| (Floating, ICE LIBOR GBP 3M + 0.80%), 1.60%, 08/20/56(U) † | 153,231 | | 203,453 |
| Ripon Mortgages PLC, Series 1X, Class A2 | | | |
| (Floating, ICE LIBOR GBP 3M + 0.80%), 1.60%, 08/20/56(U) † | 2,977,068 | | 3,952,810 |
| Rosslyn Portfolio Trust, Series 2017-ROSS, Class A | | | |
| (Floating, ICE LIBOR USD 1M + 0.95%, 1.94% Floor), 2.69%, 06/15/33 144A † | 450,000 | | 450,090 |
| Sequoia Mortgage Trust, Series 2003-4, Class 1A2 | | | |
| (Floating, ICE LIBOR USD 6M + 0.66%, 0.33% Floor, 11.50% Cap), 2.68%, 07/20/33† | 54,494 | | 52,609 |
| Sequoia Mortgage Trust, Series 6, Class A | | | |
| (Floating, ICE LIBOR USD 1M + 0.64%, 0.32% Floor, 11.00% Cap), 2.40%, 04/19/27† | 217,495 | | 215,222 |
See Notes to Financial Statements.
MEDIUM-DURATION BOND FUND
SCHEDULE OF INVESTMENTS (Continued)
| | | Par | | Value |
| Shops at Crystals Trust, Series 2016-CSTL, Class A | | | |
| 3.13%, 07/05/36 144A | $340,000 | | $344,222 |
| Structured Adjustable Rate Mortgage Loan Trust, Series 2005-19XS, Class 2A1 | | | |
| (Floating, ICE LIBOR USD 1M + 0.30%, 0.30% Floor), 2.09%, 10/25/35† | 473,886 | | 477,906 |
| Structured Asset Mortgage Investments II Trust, Series 2005-AR5, Class A1 | | | |
| (Floating, ICE LIBOR USD 1M + 0.25%, 0.25% Floor, 11.00% Cap), 2.01%, 07/19/35† | 57,472 | | 57,183 |
| Thornburg Mortgage Securities Trust, Series 2003-4, Class A1 | | | |
| (Floating, ICE LIBOR USD 1M + 0.64%, 0.32% Floor, 11.50% Cap), 2.43%, 09/25/43† | 6,037 | | 6,118 |
| Thornburg Mortgage Securities Trust, Series 2005-1, Class A3 | | | |
| 4.46%, 04/25/45† γ | 42,835 | | 43,049 |
| Towd Point Mortgage Funding PLC, Series 2019-GR4A, Class A1 | | | |
| (Floating, ICE LIBOR GBP 3M + 1.03%), 1.81%, 10/20/51(U) 144A † | 1,777,854 | | 2,364,617 |
| Tower Bridge Funding No. 1 PLC, Class A | | | |
| (Floating, ICE LIBOR GBP 3M + 1.00%), 1.80%, 03/20/56(U) † | 340,464 | | 452,549 |
| Tower Bridge Funding No. 2 PLC, Class A | | | |
| (Floating, ICE LIBOR GBP 3M + 0.90%), 1.70%, 03/20/56(U) † | 973,089 | | 1,291,021 |
| Trinity Square PLC, Series 2015-1A, Class A | | | |
| (Floating, ICE LIBOR GBP 3M + 1.15%), 1.94%, 07/15/51(U) 144A † | 194,872 | | 259,611 |
| UBS-Barclays Commercial Mortgage Trust, Series 2012-C4, Class D | | | |
| 4.48%, 12/10/45 144A † γ | 320,000 | | 317,032 |
| Uniform Mortgage Backed Securities | | | |
| 2.50%, 01/01/50 TBA | 5,000,000 | | 4,944,336 |
| 3.00%, 01/01/50 TBA | 29,200,000 | | 29,617,469 |
| 3.50%, 01/01/50 TBA | 8,400,000 | | 8,641,828 |
| 4.00%, 01/01/50 TBA | 11,000,000 | | 11,441,719 |
| 4.50%, 01/01/50 TBA | 7,000,000 | | 7,371,055 |
| 3.00%, 02/01/50 TBA | 39,100,000 | | 39,621,905 |
| VNDO Mortgage Trust, Series 2012-6AVE, Class A | | | |
| 3.00%, 11/15/30 144A | 100,000 | | 101,845 |
| Washington Mutual Mortgage Pass-Through Certificates Trust, Series 2002-AR19, Class A7 | | | |
| 4.28%, 02/25/33† γ | 2,830 | | 2,881 |
| | | Par | | Value |
| Washington Mutual Mortgage Pass-Through Certificates Trust, Series 2002-AR6, Class A | | | |
| (Floating, Federal Reserve U.S. 12 1Y CMT + 1.40%, 1.40% Floor), 3.64%, 06/25/42† | $8,100 | | $8,070 |
| Washington Mutual Mortgage Pass-Through Certificates Trust, Series 2005-AR1, Class A1B | | | |
| (Floating, ICE LIBOR USD 1M + 0.78%, 0.39% Floor, 10.50% Cap), 2.57%, 01/25/45† | 1,050,026 | | 1,045,342 |
| Washington Mutual Mortgage Pass-Through Certificates Trust, Series 2005-AR13, Class A1A1 | | | |
| (Floating, ICE LIBOR USD 1M + 0.29%, 0.29% Floor, 10.50% Cap), 2.08%, 10/25/45† | 747,224 | | 737,575 |
| Washington Mutual Mortgage Pass-Through Certificates Trust, Series 2007-HY1, Class 1A1 | | | |
| 3.87%, 02/25/37† γ | 215,716 | | 201,880 |
| Washington Mutual Mortgage Pass-Through Certificates Trust, Series 2007-HY1, Class 2A3 | | | |
| 3.97%, 02/25/37† γ | 135,161 | | 134,135 |
| Washington Mutual Mortgage Pass-Through Certificates Trust, Series 2007-OA3, Class 2A1A | | | |
| (Floating, Federal Reserve U.S. 12 1Y CMT + 0.76%, 0.76% Floor), 3.00%, 04/25/47† | 522,434 | | 525,565 |
| Washington Mutual Mortgage Pass-Through Certificates, Series 2005-AR8, Class 1A1A | | | |
| (Floating, ICE LIBOR USD 1M + 0.54%, 0.27% Floor, 10.50% Cap), 2.33%, 07/25/45† | 498,303 | | 490,087 |
| Washington Mutual Mortgage Pass-Through Certificates, Series 2005-AR8, Class 2A1A | | | |
| (Floating, ICE LIBOR USD 1M + 0.58%, 0.29% Floor, 10.50% Cap), 2.37%, 07/25/45† | 103,564 | | 102,731 |
| Waterfall Commercial Mortgage Trust, Series 2015-SBC5, Class A | | | |
| 4.10%, 09/14/22 144A | 139,068 | | 142,774 |
| Wells Fargo Alternative Loan Trust, Series 2007-PA6, Class A1 | | | |
| 4.48%, 12/28/37† γ | 369,610 | | 368,333 |
| Wells Fargo Commercial Mortgage Trust, Series 2013-LC12, Class B | | | |
| 4.28%, 07/15/46† γ | 20,000 | | 20,705 |
| WFRBS Commercial Mortgage Trust, Series 2012-C7, Class XA | | | |
| 1.35%, 06/15/45 144A † IO γ | 264,025 | | 6,387 |
| WFRBS Commercial Mortgage Trust, Series 2013-C13, Class XA | | | |
| 1.20%, 05/15/45 144A † IO γ | 2,298,963 | | 76,619 |
See Notes to Financial Statements.
| | | Par | | Value |
| WFRBS Commercial Mortgage Trust, Series 2014-C19, Class XA | | | |
| 1.03%, 03/15/47† IO γ | $907,010 | | $28,959 |
| WFRBS Commercial Mortgage Trust, Series 2014-C21, Class XA | | | |
| 1.04%, 08/15/47† IO γ | 2,919,706 | | 112,183 |
| WFRBS Commercial Mortgage Trust, Series 2014-C24, Class AS | | | |
| 3.93%, 11/15/47 | 290,000 | | 305,252 |
| WFRBS Commercial Mortgage Trust, Series 2014-C24, Class C | | | |
| 4.29%, 11/15/47 | 300,000 | | 302,155 |
Total Mortgage-Backed Securities
(Cost $790,555,611) | | | 802,614,706 |
| MUNICIPAL BONDS — 0.6% |
| American Municipal Power, Inc., Hydroelectric Projects, Revenue Bond, Series B | | | |
| 8.08%, 02/15/50 | 600,000 | | 1,028,727 |
| American Municipal Power, Inc., Revenue Bond, Series E | | | |
| 6.27%, 02/15/50 | 250,000 | | 334,375 |
| Chicago Transit Authority, Revenue Bond, Series A | | | |
| 6.90%, 12/01/40 | 700,000 | | 946,561 |
| Chicago Transit Authority, Revenue Bond, Series B | | | |
| 6.90%, 12/01/40 | 300,000 | | 405,669 |
| City of Chicago IL, General Obligation | | | |
| 7.75%, 01/01/42 | 2,177,000 | | 2,732,070 |
| Northstar Education Finance, Inc. | | | |
| (Floating, ICE LIBOR USD 3M + 0.10%, 0.10% Floor), 2.04%, 04/28/30† | 63,471 | | 63,348 |
| Port Authority of New York & New Jersey, Revenue Bond, Series 192 | | | |
| 4.81%, 10/15/65 | 300,000 | | 378,615 |
| State of California, General Obligation | | | |
| 7.95%, 03/01/36 | 265,000 | | 267,511 |
| 7.55%, 04/01/39 | 410,000 | | 658,446 |
| State of Illinois, General Obligation | | | |
| 5.10%, 06/01/33 | 1,115,000 | | 1,202,929 |
| 6.63%, 02/01/35 | 495,000 | | 580,813 |
| 7.35%, 07/01/35 | 465,000 | | 564,803 |
| Utah State Board of Regents, Series 2016-1A | | | |
| (Floating, ICE LIBOR USD 1M + 0.75%, 25.00% Cap), 2.54%, 09/25/56† | 1,099,347 | | 1,091,349 |
Total Municipal Bonds
(Cost $9,488,910) | | | 10,255,216 |
| | Number of
Contracts | | Notional
Amount | | Value |
| PURCHASED OPTIONS — 0.0% |
| Call Options — 0.0% |
10-Year U.S. Treasury Note Future expiration date 2/2020, Strike Price
$128.50, Expires
01/24/20 (GSC) | 94 | | $12,070,540 | | $44,062 |
5-Year U.S. Treasury Note Future expiration date 2/2020, Strike Price
$118.50, Expires
01/24/20 (GSC) | 197 | | 23,362,230 | | 67,719 |
Long U.S. Treasury Bond Future expiration date 2/2020, Strike Price
$156.50, Expires
01/24/20 (GSC) | 17 | | 2,650,470 | | 15,672 |
Long U.S. Treasury Bond Future expiration date 2/2020, Strike Price
$157.00, Expires
01/24/20 (GSC) | 28 | | 4,365,480 | | 20,562 |
Long U.S. Treasury Bond Future expiration date 2/2020, Strike Price
$167.00, Expires
01/24/20 (GSC) | 252 | | 39,289,320 | | 3,939 |
| | | | | | 151,954 |
| Put Options — 0.0% |
10-Year U.S. Treasury Note Future expiration date 2/2020, Strike Price
$128.00, Expires
01/24/20 (GSC) | 36 | | 4,622,760 | | 11,813 |
5-Year U.S. Treasury Note Future expiration date 3/2020, Strike Price
$114.25, Expires
02/21/20 (GSC) | 338 | | 40,083,420 | | 2,641 |
5-Year U.S. Treasury Note Future expiration date 3/2020, Strike Price
$114.50, Expires
02/21/20 (GSC) | 216 | | 25,615,440 | | 1,688 |
See Notes to Financial Statements.
MEDIUM-DURATION BOND FUND
SCHEDULE OF INVESTMENTS (Continued)
| | Number of
Contracts | | Notional
Amount | | Value |
Long U.S. Treasury Bond Future expiration date 2/2020, Strike Price
$155.00, Expires
01/24/20 (GSC) | 25 | | $3,897,750 | | $20,312 |
Long U.S. Treasury Bond Future expiration date 2/2020, Strike Price
$158.00, Expires
01/24/20 (GSC) | 26 | | 4,053,660 | | 65,812 |
| | | | | | 102,266 |
Total Purchased Options
(Premiums paid $263,990) | | | | 254,220 |
| | | Par | |
| U.S. TREASURY OBLIGATIONS — 15.1% |
| U.S. Treasury Bonds | | | |
| 4.38%, 02/15/38 | $10,000 | 13,326 |
| 4.25%, 05/15/39 | 4,300,000 | 5,670,037 |
| 4.38%, 11/15/39 | 200,000 | 268,199 |
| 2.75%, 08/15/42 | 600,000 | 642,422 |
| 2.75%, 11/15/42 | 700,000 | 748,904 |
| 2.88%, 05/15/43 | 3,200,000 | 3,495,188 |
| 3.38%, 05/15/44‡‡ | 19,690,000 | 23,359,955 |
| 3.13%, 08/15/44 | 3,300,000 | 3,763,611 |
| 3.00%, 11/15/44 | 1,800,000 | 2,011,746 |
| 2.88%, 08/15/45 | 3,640,000 | 3,989,781 |
| 2.75%, 08/15/47 | 7,940,000 | 8,539,377 |
| 3.00%, 02/15/48 | 6,170,000 | 6,956,193 |
| 3.13%, 05/15/48 | 5,380,000 | 6,212,534 |
| 3.00%, 08/15/48 | 30,000 | 33,885 |
| 3.00%, 02/15/49 | 80,000 | 90,514 |
| 2.88%, 05/15/49 | 13,460,000 | 14,880,135 |
| 2.25%, 08/15/49Δ | 6,380,000 | 6,208,662 |
| 2.38%, 11/15/49 | 2,110,000 | 2,109,506 |
| | | | 88,993,975 |
| U.S. Treasury Inflationary Index Bonds | | | |
| 0.13%, 07/15/22 | 783,356 | 786,688 |
| 0.38%, 07/15/25 | 3,711,350 | 3,787,658 |
| 0.63%, 01/15/26 | 4,732,929 | 4,879,001 |
| 0.13%, 07/15/26 | 429,444 | 430,896 |
| 0.38%, 07/15/27 | 2,945,684 | 3,005,473 |
| 0.50%, 01/15/28 | 4,590,520 | 4,710,445 |
| 0.88%, 01/15/29 | 13,249,340 | 14,073,757 |
| 2.13%, 02/15/40 | 1,095,398 | 1,432,564 |
| 0.75%, 02/15/42 | 239,169 | 248,581 |
| 1.38%, 02/15/44 | 4,284,335 | 5,056,088 |
| 0.75%, 02/15/45 | 874,280 | 907,401 |
| 1.00%, 02/15/46 | 2,400,281 | 2,641,753 |
| 0.88%, 02/15/47 | 2,025,571 | 2,172,415 |
| | | Par | | Value |
| 1.00%, 02/15/48 | $6,971,181 | | $7,720,419 |
| 1.00%, 02/15/49 | 5,461,165 | | 6,073,904 |
| | | | | 57,927,043 |
| U.S. Treasury Notes | | | | |
| 2.00%, 12/31/21‡‡ | 1,500,000 | | 1,512,305 |
| 1.88%, 03/31/22‡‡ | 1,900,000 | | 1,912,506 |
| 2.13%, 05/15/22 | 60,000 | | 60,754 |
| 1.88%, 09/30/22‡‡ | 3,000,000 | | 3,023,496 |
| 2.00%, 10/31/22‡‡ | 2,700,000 | | 2,730,164 |
| 1.63%, 11/15/22 | 6,300,000 | | 6,305,537 |
| 1.75%, 06/30/24 | 3,900,000 | | 3,913,025 |
| 2.25%, 11/15/24 | 260,000 | | 266,886 |
| 1.50%, 11/30/24Δ | 210,000 | | 208,335 |
| 1.75%, 12/31/24 | 820,000 | | 822,675 |
| 2.00%, 02/15/25 | 9,760,000 | | 9,904,112 |
| 2.88%, 07/31/25 | 2,070,000 | | 2,195,534 |
| 2.25%, 11/15/25 | 11,680,000 | | 12,001,428 |
| 2.63%, 01/31/26 | 3,120,000 | | 3,273,319 |
| 2.25%, 03/31/26 | 3,160,000 | | 3,247,764 |
| 2.13%, 05/31/26 | 6,320,000 | | 6,448,992 |
| 1.63%, 09/30/26 | 7,930,000 | | 7,837,070 |
| 1.63%, 10/31/26 | 7,990,000 | | 7,891,842 |
| 1.63%, 11/30/26 | 4,900,000 | | 4,838,846 |
| 2.25%, 02/15/27 | 6,618,000 | | 6,805,553 |
| 2.25%, 08/15/27 | 8,000,000 | | 8,230,312 |
| 2.75%, 02/15/28‡‡ | 1,400,000 | | 1,492,914 |
| 2.88%, 05/15/28 | 800,000 | | 861,828 |
| 2.88%, 08/15/28‡‡ | 4,130,000 | | 4,455,237 |
| 3.13%, 11/15/28 | 8,180,000 | | 9,002,154 |
| 2.63%, 02/15/29 | 1,000,000 | | 1,060,762 |
| 1.63%, 08/15/29 | 1,990,000 | | 1,940,561 |
| 1.75%, 11/15/29Δ | 530,000 | | 522,495 |
| | | | | 112,766,406 |
| U.S. Treasury Strips | | | | |
| 2.26%, 02/15/40Ω ‡‡ | 8,060,000 | | 4,964,697 |
| 2.23%, 11/15/40Ω ‡‡ | 4,030,000 | | 2,427,460 |
| 2.21%, 08/15/41Ω ‡‡ | 4,030,000 | | 2,376,419 |
| | | | | 9,768,576 |
Total U.S. Treasury Obligations
(Cost $263,466,753) | | | 269,456,000 |
| | | Shares | |
| MONEY MARKET FUNDS — 4.4% |
GuideStone Money Market Fund, 1.53%
(Institutional Class)Ø ∞ | 56,396,537 | 56,396,537 |
| Northern Institutional Liquid Assets Portfolio (Shares), 1.57%Ø § | 20,002,584 | 20,002,584 |
See Notes to Financial Statements.
| | | Shares | | Value |
| Northern Institutional U.S. Government Portfolio (Shares), 1.48%Ø | 2,697,542 | | $2,697,542 |
Total Money Market Funds
(Cost $79,096,663) | | | 79,096,663 |
| | | Par | |
| REPURCHASE AGREEMENTS — 1.5% |
| Citigroup Global Markets, Inc. | | |
| 1.82% (dated 12/31/19, due 01/02/20, repurchase price $13,001,314, collateralized by U.S. Treasury Note, 1.750%, due 07/31/24, total market value $13,272,944) | $13,000,000 | 13,000,000 |
| | | |
| 1.59% (dated 12/31/19, due 01/03/20, repurchase price $12,901,709, collateralized by U.S. Treasury Note, 2.500%, due 08/15/23, total market value $13,173,091) | 12,900,000 | 12,900,000 |
Total Repurchase Agreements
(Cost $25,900,000) | | 25,900,000 |
TOTAL INVESTMENTS —113.2%
(Cost $1,969,186,613) | | 2,018,501,471 |
| | Number of
Contracts | | Notional
Amount | |
| WRITTEN OPTIONS — (0.1)% |
| Call Options — (0.0)% |
10-Year U.S. Treasury Note Future expiration date 2/2020, Strike Price
$129.00, Expires
01/24/20 (GSC) | (17) | | $(2,182,970) | (4,516) |
10-Year U.S. Treasury Note Future expiration date 2/2020, Strike Price
$129.50, Expires
01/24/20 (GSC) | (17) | | (2,182,970) | (2,391) |
10-Year U.S. Treasury Note Future expiration date 2/2020, Strike Price
$130.00, Expires
01/24/20 (GSC) | (50) | | (6,420,500) | (3,906) |
10-Year U.S. Treasury Note Future expiration date 2/2020, Strike Price
$130.00, Expires
01/24/20 (MSCS) | (57) | | (7,319,370) | (4,453) |
10-Year U.S. Treasury Note Future expiration date 2/2020, Strike Price
$130.50, Expires
01/24/20 (GSC) | (52) | | (6,677,320) | (2,438) |
| | Number of
Contracts | | Notional
Amount | | Value |
10-Year U.S. Treasury Note Future expiration date 2/2020, Strike Price
$131.00, Expires
01/24/20 (GSC) | (70) | | $(8,988,700) | | $(2,187) |
10-Year U.S. Treasury Note Future expiration date 2/2020, Strike Price
$131.50, Expires
01/24/20 (GSC) | (237) | | (30,433,170) | | (3,704) |
10-Year U.S. Treasury Note Future expiration date 2/2020, Strike Price
$132.00, Expires
01/24/20 (GSC) | (50) | | (6,420,500) | | (782) |
10-Year U.S. Treasury Note Future expiration date 2/2020, Strike Price
$132.50, Expires
01/24/20 (GSC) | (50) | | (6,420,500) | | (50) |
10-Year U.S. Treasury Note Future expiration date 3/2020, Strike Price
$130.00, Expires
02/21/20 (GSC) | (78) | | (10,015,980) | | (19,500) |
10-Year U.S. Treasury Note Future expiration date 3/2020, Strike Price
$131.50, Expires
02/21/20 (GSC) | (101) | | (12,969,410) | | (9,469) |
10-Year U.S. Treasury Note Future expiration date 3/2020, Strike Price
$133.00, Expires
02/21/20 (GSC) | (130) | | (16,693,300) | | (4,062) |
5-Year U.S. Treasury Note Future expiration date 2/2020, Strike Price
$118.75, Expires
01/24/20 (GSC) | (53) | | (6,285,270) | | (11,594) |
5-Year U.S. Treasury Note Future expiration date 2/2020, Strike Price
$119.00, Expires
01/24/20 (GSC) | (61) | | (7,233,990) | | (8,102) |
5-Year U.S. Treasury Note Future expiration date 2/2020, Strike Price
$119.50, Expires
01/24/20 (GSC) | (86) | | (10,198,740) | | (4,031) |
See Notes to Financial Statements.
MEDIUM-DURATION BOND FUND
SCHEDULE OF INVESTMENTS (Continued)
| | Number of
Contracts | | Notional
Amount | | Value |
5-Year U.S. Treasury Note Future expiration date 2/2020, Strike Price
$120.00, Expires
01/24/20 (GSC) | (104) | | $(12,333,360) | | $(1,625) |
5-Year U.S. Treasury Note Future expiration date 3/2020, Strike Price
$119.00, Expires
02/21/20 (GSC) | (74) | | (8,775,660) | | (20,234) |
5-Year U.S. Treasury Note Future expiration date 3/2020, Strike Price
$119.75, Expires
02/21/20 (GSC) | (28) | | (3,320,520) | | (2,844) |
Long U.S. Treasury Bond Future expiration date 2/2020, Strike Price
$161.00, Expires
01/24/20 (GSC) | (32) | | (4,989,120) | | (3,000) |
Long U.S. Treasury Bond Future expiration date 3/2020, Strike Price
$160.00, Expires
02/21/20 (GSC) | (34) | | (5,300,940) | | (16,469) |
| | | | | | (125,357) |
| Call Swaptions — (0.1)% |
Pay (.1)% (Annually); Receive 6-Month EURIBOR (Semiannually): Interest Rate Swap Maturing 5/29/2025 EUR, Strike Price
$(0.10), Expires
05/27/20 (BOA) | 1 | | (17,540,000) | | (91,661) |
Pay (.1)% (Annually); Receive 6-Month EURIBOR (Semiannually): Interest Rate Swap Maturing 5/29/2025 EUR, Strike Price
$(0.10), Expires
05/27/20 (JPM) | 1 | | (8,640,000) | | (45,151) |
Pay .065% (Annually); Receive 6-Month EURIBOR (Semiannually): Interest Rate Swap Maturing 9/16/2030 EUR, Strike Price
$0.07, Expires
09/14/20 (JPM) | 1 | | (1,190,000) | | (37,598) |
| | Number of
Contracts | | Notional
Amount | | Value |
Pay .065% (Annually); Receive 6-Month EURIBOR (Semiannually): Interest Rate Swap Maturing 9/16/2030 EUR, Strike Price
$0.07, Expires
09/14/20 (JPM) | 1 | | $(1,190,000) | | $(37,598) |
Pay .065% (Annually); Receive 6-Month EURIBOR (Semiannually): Interest Rate Swap Maturing 9/16/2030 EUR, Strike Price
$0.07, Expires
09/14/20 (JPM) | 1 | | (1,370,000) | | (43,285) |
Pay .065% (Annually); Receive 6-Month EURIBOR (Semiannually): Interest Rate Swap Maturing 9/16/2030 EUR, Strike Price
$0.07, Expires
09/14/20 (BOA) | 1 | | (1,380,000) | | (43,601) |
Pay .065% (Annually); Receive 6-Month EURIBOR (Semiannually): Interest Rate Swap Maturing 9/16/2030 EUR, Strike Price
$0.07, Expires
09/14/20 (BOA) | 1 | | (990,000) | | (31,279) |
Pay .065% (Annually); Receive 6-Month EURIBOR (Semiannually): Interest Rate Swap Maturing 9/16/2030 EUR, Strike Price
$0.07, Expires
09/14/20 (BOA) | 1 | | (1,380,000) | | (43,601) |
Pay .065% (Annually); Receive 6-Month EURIBOR (Semiannually): Interest Rate Swap Maturing 9/16/2030 EUR, Strike Price
$0.07, Expires
09/14/20 (DEUT) | 1 | | (1,790,000) | | (56,555) |
See Notes to Financial Statements.
| | Number of
Contracts | | Notional
Amount | | Value |
Pay .065% (Annually); Receive 6-Month EURIBOR (Semiannually): Interest Rate Swap Maturing 9/16/2030 EUR, Strike Price
$0.07, Expires
09/14/20 (BOA) | 1 | | $(1,790,000) | | $(56,555) |
Pay .065% (Annually); Receive 6-Month EURIBOR (Semiannually): Interest Rate Swap Maturing 9/16/2030 EUR, Strike Price
$0.07, Expires
09/14/20 (BOA) | 1 | | (1,930,000) | | (60,978) |
Pay .065% (Annually); Receive 6-Month LIBOR (Semiannually): Interest Rate Swap Maturing 9/16/2030 EUR, Strike Price
$0.07, Expires
09/14/20 (DEUT) | 1 | | (1,900,000) | | (52,320) |
Pay .33% (Annually); Receive 6-Month EURIBOR (Semiannually): Interest Rate Swap Maturing 5/12/2031 EUR, Strike Price
$0.33, Expires
05/10/21 (BOA) | 1 | | (3,190,000) | | (81,525) |
Pay .33% (Annually); Receive 6-Month EURIBOR (Semiannually): Interest Rate Swap Maturing 5/12/2031 EUR, Strike Price
$0.33, Expires
05/10/21 (BOA) | 1 | | (1,960,000) | | (50,090) |
| | | | | | (731,797) |
| Put Options — (0.0)% |
10-Year U.S. Treasury Note Future expiration date 2/2020, Strike Price
$127.00, Expires
01/24/20 (GSC) | (142) | | (18,234,220) | | (13,312) |
| | Number of
Contracts | | Notional
Amount | | Value |
10-Year U.S. Treasury Note Future expiration date 2/2020, Strike Price
$127.50, Expires
01/24/20 (GSC) | (35) | | $(4,494,350) | | $(6,563) |
5-Year U.S. Treasury Note Future expiration date 2/2020, Strike Price
$118.00, Expires
01/24/20 (GSC) | (200) | | (23,718,000) | | (15,625) |
5-Year U.S. Treasury Note Future expiration date 3/2020, Strike Price
$118.00, Expires
02/21/20 (GSC) | (28) | | (3,320,520) | | (5,469) |
| | | | | | (40,969) |
| Put Swaptions — (0.0)% |
Pay 6-Month EURIBOR (Semiannually); Receive (.35)% (Annually): Interest Rate Swap Maturing 5/29/2025 EUR, Strike Price
$(0.35), Expires
05/27/20 (BOA) | 1 | | (17,540,000) | | (11,828) |
Pay 6-Month EURIBOR (Semiannually); Receive (.35)% (Annually): Interest Rate Swap Maturing 5/29/2025 EUR, Strike Price
$(0.35), Expires
05/27/20 (JPM) | 1 | | (8,640,000) | | (5,826) |
Pay 6-Month EURIBOR (Semiannually); Receive .065% (Annually): Interest Rate Swap Maturing 9/16/2030 EUR, Strike Price
$0.07, Expires
09/14/20 (JPM) | 1 | | (1,190,000) | | (9,424) |
See Notes to Financial Statements.
MEDIUM-DURATION BOND FUND
SCHEDULE OF INVESTMENTS (Continued)
| | Number of
Contracts | | Notional
Amount | | Value |
Pay 6-Month EURIBOR (Semiannually); Receive .065% (Annually): Interest Rate Swap Maturing 9/16/2030 EUR, Strike Price
$0.07, Expires
09/14/20 (JPM) | 1 | | $(1,190,000) | | $(9,424) |
Pay 6-Month EURIBOR (Semiannually); Receive .065% (Annually): Interest Rate Swap Maturing 9/16/2030 EUR, Strike Price
$0.07, Expires
09/14/20 (JPM) | 1 | | (1,370,000) | | (10,850) |
Pay 6-Month EURIBOR (Semiannually); Receive .065% (Annually): Interest Rate Swap Maturing 9/16/2030 EUR, Strike Price
$0.07, Expires
09/14/20 (BOA) | 1 | | (1,380,000) | | (10,929) |
Pay 6-Month EURIBOR (Semiannually); Receive .065% (Annually): Interest Rate Swap Maturing 9/16/2030 EUR, Strike Price
$0.07, Expires
09/14/20 (DEUT) | 1 | | (1,790,000) | | (14,176) |
Pay 6-Month EURIBOR (Semiannually); Receive .065% (Annually): Interest Rate Swap Maturing 9/16/2030 EUR, Strike Price
$0.07, Expires
09/14/20 (DEUT) | 1 | | (1,900,000) | | (15,047) |
| | Number of
Contracts | | Notional
Amount | | Value |
Pay 6-Month EURIBOR (Semiannually); Receive .065% (Annually): Interest Rate Swap Maturing 9/16/2030 EUR, Strike Price
$0.07, Expires
09/14/20 (BOA) | 1 | | $(1,380,000) | | $(10,929) |
Pay 6-Month EURIBOR (Semiannually); Receive .065% (Annually): Interest Rate Swap Maturing 9/16/2030 EUR, Strike Price
$0.07, Expires
09/14/20 (BOA) | 1 | | (1,930,000) | | (15,284) |
Pay 6-Month EURIBOR (Semiannually); Receive .065% (Annually): Interest Rate Swap Maturing 9/16/2030 EUR, Strike Price
$0.07, Expires
09/14/20 (BOA) | 1 | | (1,790,000) | | (14,176) |
Pay 6-Month EURIBOR (Semiannually); Receive .33% (Annually): Interest Rate Swap Maturing 5/12/2031 EUR, Strike Price
$0.33, Expires
05/10/21 (BOA) | 1 | | (3,190,000) | | (73,387) |
Pay 6-Month EURIBOR (Semiannually); Receive .33% (Annually): Interest Rate Swap Maturing 5/12/2031 EUR, Strike Price
$0.33, Expires
05/10/21 (BOA) | 1 | | (1,960,000) | | (45,091) |
See Notes to Financial Statements.
| | Number of
Contracts | | Notional
Amount | | Value |
Pay 6-Month LIBOR (Semiannually); Receive .065% (Annually): Interest Rate Swap Maturing 9/16/2030 EUR, Strike Price
$0.07, Expires
09/14/20 (BOA) | 1 | | $(990,000) | | $(9,535) |
| | | | | | (255,906) |
Total Written Options
(Premiums received $ (1,439,289)) | | | | (1,154,029) |
| | | Par | |
| TBA SALE COMMITMENTS — (4.6)% |
Government National Mortgage Association
3.00%, 01/01/50 TBA | $(1,000,000) | (1,027,461) |
Government National Mortgage Association
4.50%, 01/01/50 TBA | (7,000,000) | (7,319,375) |
| | | Par | | Value |
Uniform Mortgage Backed Securities
3.50%, 02/01/50 TBA | $(8,000,000) | | $(8,226,410) |
Uniform Mortgage Backed Securities
5.00%, 01/01/50 TBA | (5,000,000) | | (5,346,094) |
Uniform Mortgage Backed Securities
4.00%, 02/01/50 TBA | (6,400,000) | | (6,659,750) |
Uniform Mortgage Backed Securities
3.00%, 02/01/50 TBA | (8,000,000) | | (8,106,784) |
Uniform Mortgage Backed Securities
3.50%, 01/01/50 TBA | (34,900,000) | | (35,904,738) |
Uniform Mortgage Backed Securities
3.00%, 01/01/50 TBA | (9,100,000) | | (9,230,101) |
Total TBA Sale Commitments
(Proceeds $(81,674,500)) | | | (81,820,713) |
Liabilities in Excess of Other
Assets — (8.5)% | | | (151,328,635) |
| NET ASSETS — 100.0% | | | $1,784,198,094 |
Futures Contracts outstanding at December 31, 2019:
| Future Type | | Expiration Date | | Open Long
(Short) Contracts | | Notional
Market Value
of Contracts | | Value and
Unrealized
Appreciation
(Depreciation) |
| 30-Day Federal Fund | | 12/2019 | | (4) | | $(1,640,923) | | $(42) |
| 30-Day Federal Fund | | 01/2020 | | (6) | | (2,461,384) | | (187) |
| 30-Day Federal Fund | | 02/2020 | | (6) | | (2,461,197) | | 501 |
| 30-Year Euro Buxl | | 03/2020 | | (12) | | (2,670,274) | | 65,055 |
| Euro-Bobl | | 03/2020 | | (33) | | (4,946,462) | | 14,217 |
| Euro-Bund | | 03/2020 | | (351) | | (67,124,765) | | 644,676 |
| Euro-Bund | | 03/2020 | | 254 | | 48,574,617 | | (758,059) |
| Euro-Schatz | | 03/2020 | | (45) | | (5,648,573) | | 5,159 |
| Euro-BTP | | 03/2020 | | 293 | | 46,820,636 | | (281,896) |
| Euro-OAT | | 03/2020 | | (84) | | (15,336,646) | | 190,734 |
| 10-Year Japanese Treasury Bond | | 03/2020 | | (9) | | (12,605,218) | | 18,901 |
| 10-Year Japanese Treasury Bond | | 03/2020 | | 7 | | 9,804,059 | | (2,878) |
| 10-Year Commonwealth Treasury Bond | | 03/2020 | | (3) | | (300,963) | | (121) |
| 3-Year Australian Bond | | 03/2020 | | (7) | | (564,976) | | (79) |
| 90-Day Eurodollar | | 03/2020 | | (735) | | (180,561,937) | | 9,487 |
| 3-Month SOFR | | 03/2020 | | 29 | | 7,136,900 | | 97 |
| 10-Year U.S. Treasury Note | | 03/2020 | | 1,094 | | 140,493,531 | | (1,001,419) |
| U.S. Treasury Long Bond | | 03/2020 | | (538) | | (83,877,563) | | 1,894,138 |
| Ultra 10-Year U.S. Treasury Note | | 03/2020 | | 3 | | 422,109 | | 10,389 |
| Ultra Long U.S. Treasury Bond | | 03/2020 | | 688 | | 124,979,500 | | (3,751,588) |
| Long GILT | | 03/2020 | | (119) | | (20,709,091) | | 157,955 |
| 2-Year U.S. Treasury Note | | 03/2020 | | 596 | | 128,438,000 | | (100,946) |
| 2-Year U.S. Treasury Note | | 03/2020 | | (19) | | (4,094,500) | | (4,649) |
| 30-Day Federal Fund | | 03/2020 | | (3) | | (1,230,598) | | 437 |
| 5-Year U.S. Treasury Note | | 03/2020 | | 3,137 | | 372,077,609 | | (1,199,974) |
| 90-Day Eurodollar | | 06/2020 | | 190 | | 46,697,250 | | 435,825 |
| 3-Month Euro Euribor | | 09/2020 | | (128) | | (36,029,007) | | 96,624 |
| 3-Month Euro Euribor | | 12/2020 | | (182) | | (51,223,640) | | 114,970 |
| 90-Day Eurodollar | | 12/2020 | | 235 | | 57,798,250 | | (73,510) |
| 90-Day Eurodollar | | 03/2021 | | 317 | | 78,013,700 | | 42,847 |
See Notes to Financial Statements.
MEDIUM-DURATION BOND FUND
SCHEDULE OF INVESTMENTS (Continued)
| Future Type | | Expiration Date | | Open Long
(Short) Contracts | | Notional
Market Value
of Contracts | | Value and
Unrealized
Appreciation
(Depreciation) |
| 90-Day Eurodollar | | 06/2021 | | (91) | | $(22,395,100) | | $53,475 |
| Total Futures Contracts outstanding at December 31, 2019 | | | | | | $545,373,344 | | $(3,419,861) |
Forward Foreign Currency Contracts outstanding at December 31, 2019:
| Expiration Date | | Currency
Purchased | | Amount
of Currency
Purchased | | Currency
Sold | | Amount
of Currency
Sold | | Counter-
party | | Net Unrealized
Appreciation
(Depreciation) |
| 01/17/20 | | Mexican Pesos | | 86,939,366 | | U.S. Dollars | | 4,334,982 | | BAR | | $250,816 |
| 01/17/20 | | Brazilian Reals | | 16,965,148 | | U.S. Dollars | | 4,054,340 | | CITI | | 160,936 |
| 01/28/20 | | Mexican Pesos | | 53,435,000 | | U.S. Dollars | | 2,653,112 | | GSC | | 160,519 |
| 01/17/20 | | Indonesian Rupiahs | | 53,935,795,049 | | U.S. Dollars | | 3,745,021 | | BAR | | 142,293 |
| 01/22/20 | | Mexican Pesos | | 27,412,000 | | U.S. Dollars | | 1,364,019 | | JPM | | 80,740 |
| 04/22/20 | | Mexican Pesos | | 63,864,000 | | U.S. Dollars | | 3,246,541 | | BNP | | 74,904 |
| 03/18/20 | | Norwegian Kroner | | 10,935,720 | | U.S. Dollars | | 1,196,566 | | UBS | | 49,344 |
| 01/17/20 | | Canadian Dollars | | 3,789,664 | | U.S. Dollars | | 2,872,010 | | CITI | | 46,638 |
| 03/18/20 | | Norwegian Kroner | | 10,935,720 | | Euro | | 1,073,919 | | JPM | | 35,361 |
| 01/17/20 | | Australian Dollars | | 935,862 | | U.S. Dollars | | 628,991 | | CITI | | 28,042 |
| 03/18/20 | | Euro | | 2,088,943 | | U.S. Dollars | | 2,331,263 | | BOA | | 23,449 |
| 01/17/20 | | Euro | | 2,260,000 | | U.S. Dollars | | 2,521,501 | | CITI | | 16,308 |
| 03/18/20 | | Euro | | 2,088,943 | | U.S. Dollars | | 2,340,671 | | UBS | | 14,040 |
| 01/17/20 | | Indian Rupees | | 175,367,400 | | U.S. Dollars | | 2,447,983 | | BAR | | 7,981 |
| 03/18/20 | | Australian Dollars | | 409,277 | | U.S. Dollars | | 280,297 | | DEUT | | 7,471 |
| 03/18/20 | | Canadian Dollars | | 734,326 | | U.S. Dollars | | 558,593 | | RBC | | 7,059 |
| 01/10/20 | | Euro | | 622,000 | | U.S. Dollars | | 691,101 | | BAR | | 7,044 |
| 03/18/20 | | New Zealand Dollars | | 505,906 | | U.S. Dollars | | 334,068 | | BOA | | 6,895 |
| 02/12/20 | | British Pounds | | 478,000 | | U.S. Dollars | | 627,091 | | UBS | | 6,843 |
| 02/20/20 | | Euro | | 334,952 | | U.S. Dollars | | 370,913 | | SS | | 6,005 |
| 01/22/20 | | Mexican Pesos | | 63,864,000 | | U.S. Dollars | | 3,359,972 | | BNP | | 6,000 |
| 01/17/20 | | U.S. Dollars | | 283,049 | | Japanese Yen | | 30,087,237 | | BAR | | 5,876 |
| 01/10/20 | | British Pounds | | 655,000 | | U.S. Dollars | | 862,187 | | BNP | | 5,684 |
| 01/16/20 | | Mexican Pesos | | 2,111,000 | | U.S. Dollars | | 106,882 | | BNP | | 4,485 |
| 03/18/20 | | Swiss Francs | | 216,944 | | U.S. Dollars | | 222,028 | | JPM | | 3,387 |
| 03/18/20 | | Swiss Francs | | 352,033 | | Euro | | 322,033 | | UBS | | 2,776 |
| 03/18/20 | | New Zealand Dollars | | 168,020 | | U.S. Dollars | | 110,896 | | DEUT | | 2,344 |
| 03/18/20 | | Canadian Dollars | | 291,099 | | U.S. Dollars | | 222,051 | | JPM | | 2,183 |
| 03/18/20 | | Euro | | 199,945 | | U.S. Dollars | | 223,297 | | DEUT | | 2,086 |
| 03/18/20 | | New Zealand Dollars | | 168,008 | | U.S. Dollars | | 111,151 | | SS | | 2,081 |
| 03/18/20 | | Australian Dollars | | 321,071 | | U.S. Dollars | | 223,725 | | SS | | 2,025 |
| 03/18/20 | | Australian Dollars | | 163,008 | | U.S. Dollars | | 112,630 | | WEST | | 1,984 |
| 03/18/20 | | Swedish Kronor | | 1,052,790 | | U.S. Dollars | | 111,035 | | DEUT | | 1,791 |
| 03/18/20 | | Swiss Francs | | 218,528 | | Euro | | 200,069 | | JPM | | 1,538 |
| 03/18/20 | | Australian Dollars | | 162,047 | | U.S. Dollars | | 112,466 | | JPM | | 1,471 |
| 03/18/20 | | Canadian Dollars | | 146,958 | | U.S. Dollars | | 111,930 | | BOA | | 1,271 |
| 03/18/20 | | Canadian Dollars | | 145,725 | | U.S. Dollars | | 111,000 | | DEUT | | 1,252 |
| 03/18/20 | | Swiss Francs | | 444,357 | | British Pounds | | 347,147 | | CITI | | 886 |
| 03/18/20 | | Swiss Francs | | 109,956 | | Japanese Yen | | 12,267,424 | | JPM | | 842 |
| 03/18/20 | | New Zealand Dollars | | 170,070 | | Canadian Dollars | | 147,830 | | CITI | | 747 |
| 03/18/20 | | Canadian Dollars | | 147,240 | | Euro | | 99,963 | | RBC | | 739 |
| 03/18/20 | | Japanese Yen | | 12,068,194 | | U.S. Dollars | | 110,932 | | SS | | 633 |
| 01/16/20 | | U.S. Dollars | | 111,764 | | Mexican Pesos | | 2,111,000 | | RBS | | 398 |
| 03/18/20 | | Canadian Dollars | | 296,140 | | Euro | | 202,048 | | DEUT | | 363 |
See Notes to Financial Statements.
| Expiration Date | | Currency
Purchased | | Amount
of Currency
Purchased | | Currency
Sold | | Amount
of Currency
Sold | | Counter-
party | | Net Unrealized
Appreciation
(Depreciation) |
| 03/18/20 | | British Pounds | | 83,024 | | U.S. Dollars | | 109,952 | | RBC | | $259 |
| 03/18/20 | | Norwegian Kroner | | 83,865 | | Euro | | 8,278 | | UBS | | 224 |
| 03/18/20 | | Canadian Dollars | | 145,007 | | Swiss Francs | | 107,378 | | JPM | | 128 |
| 03/18/20 | | Australian Dollars | | 162,152 | | Euro | | 101,043 | | JPM | | 114 |
| 03/18/20 | | New Zealand Dollars | | 104,706 | | U.S. Dollars | | 70,458 | | JPM | | 110 |
| 03/18/20 | | Euro | | 42,505 | | Canadian Dollars | | 62,156 | | JPM | | 34 |
| Subtotal Appreciation | | | | | | | | | | $1,186,399 |
| 03/18/20 | | Euro | | 100,028 | | British Pounds | | 84,996 | | JPM | | $(74) |
| 02/12/20 | | Mexican Pesos | | 754,000 | | U.S. Dollars | | 39,750 | | RBS | | (133) |
| 01/22/20 | | Mexican Pesos | | 1,357,000 | | U.S. Dollars | | 71,775 | | RBS | | (254) |
| 03/18/20 | | Swedish Kronor | | 1,924,166 | | Euro | | 183,235 | | UBS | | (337) |
| 03/18/20 | | Australian Dollars | | 161,019 | | Canadian Dollars | | 147,428 | | RBC | | (349) |
| 03/18/20 | | U.S. Dollars | | 113,438 | | Euro | | 101,049 | | CITI | | (467) |
| 03/18/20 | | Swedish Kronor | | 1,047,393 | | Euro | | 100,027 | | SS | | (505) |
| 03/18/20 | | Japanese Yen | | 23,950,819 | | U.S. Dollars | | 221,978 | | SS | | (562) |
| 03/18/20 | | U.S. Dollars | | 74,812 | | British Pounds | | 56,892 | | SS | | (710) |
| 03/18/20 | | British Pounds | | 84,208 | | Euro | | 100,010 | | CITI | | (951) |
| 03/18/20 | | Japanese Yen | | 68,008,113 | | U.S. Dollars | | 629,765 | | UBS | | (1,058) |
| 03/18/20 | | U.S. Dollars | | 142,255 | | British Pounds | | 107,972 | | UBS | | (1,073) |
| 03/18/20 | | Swedish Kronor | | 2,091,279 | | Euro | | 199,979 | | JPM | | (1,302) |
| 03/18/20 | | U.S. Dollars | | 92,833 | | British Pounds | | 71,006 | | BOA | | (1,425) |
| 03/18/20 | | Japanese Yen | | 12,036,076 | | Euro | | 100,023 | | DEUT | | (1,480) |
| 03/18/20 | | Euro | | 202,035 | | British Pounds | | 172,692 | | UBS | | (1,503) |
| 03/18/20 | | Canadian Dollars | | 146,053 | | Norwegian Kroner | | 1,000,708 | | CITI | | (1,506) |
| 03/18/20 | | U.S. Dollars | | 291,561 | | Euro | | 260,004 | | UBS | | (1,523) |
| 03/18/20 | | Euro | | 100,042 | | Norwegian Kroner | | 1,004,069 | | UBS | | (1,625) |
| 03/18/20 | | British Pounds | | 83,612 | | Euro | | 99,954 | | UBS | | (1,679) |
| 03/18/20 | | Japanese Yen | | 12,041,752 | | Australian Dollars | | 160,971 | | DEUT | | (1,860) |
| 03/18/20 | | British Pounds | | 84,039 | | U.S. Dollars | | 113,575 | | CITI | | (2,017) |
| 03/18/20 | | U.S. Dollars | | 224,541 | | Euro | | 201,033 | | JPM | | (2,068) |
| 03/18/20 | | British Pounds | | 85,450 | | U.S. Dollars | | 115,544 | | BOA | | (2,113) |
| 03/18/20 | | U.S. Dollars | | 112,393 | | Australian Dollars | | 162,983 | | CITI | | (2,202) |
| 03/18/20 | | U.S. Dollars | | 111,877 | | British Pounds | | 85,952 | | RBC | | (2,221) |
| 03/18/20 | | British Pounds | | 84,046 | | Canadian Dollars | | 147,962 | | WEST | | (2,407) |
| 03/18/20 | | Euro | | 100,008 | | Norwegian Kroner | | 1,012,210 | | SS | | (2,589) |
| 03/18/20 | | U.S. Dollars | | 224,443 | | British Pounds | | 171,043 | | DEUT | | (2,610) |
| 03/18/20 | | U.S. Dollars | | 449,304 | | Euro | | 400,935 | | BOA | | (2,641) |
| 03/18/20 | | Swedish Kronor | | 1,046,560 | | Norwegian Kroner | | 1,013,980 | | CITI | | (3,365) |
| 03/18/20 | | British Pounds | | 84,027 | | Swiss Francs | | 110,681 | | BOA | | (3,461) |
| 03/18/20 | | U.S. Dollars | | 137,481 | | Australian Dollars | | 200,951 | | JPM | | (3,810) |
| 03/18/20 | | U.S. Dollars | | 221,959 | | Swiss Francs | | 217,304 | | SS | | (3,830) |
| 03/18/20 | | Swedish Kronor | | 1,043,953 | | Norwegian Kroner | | 1,018,034 | | JPM | | (4,106) |
| 03/18/20 | | U.S. Dollars | | 223,529 | | Australian Dollars | | 324,024 | | UBS | | (4,297) |
| 04/22/20 | | U.S. Dollars | | 3,316,146 | | Mexican Pesos | | 63,864,000 | | BNP | | (5,299) |
| 03/18/20 | | U.S. Dollars | | 222,337 | | Australian Dollars | | 323,944 | | BOA | | (5,432) |
| 03/18/20 | | U.S. Dollars | | 332,802 | | Swiss Francs | | 325,598 | | DEUT | | (5,511) |
| 03/18/20 | | Euro | | 199,975 | | Norwegian Kroner | | 2,045,291 | | JPM | | (7,604) |
| 01/17/20 | | U.S. Dollars | | 631,399 | | Euro | | 570,000 | | BAR | | (8,668) |
| 01/17/20 | | U.S. Dollars | | 413,468 | | Chinese Offshore Yuan | | 2,957,482 | | CITI | | (11,224) |
| 03/18/20 | | U.S. Dollars | | 958,724 | | Swedish Kronor | | 9,071,961 | | UBS | | (13,507) |
| 03/18/20 | | U.S. Dollars | | 956,569 | | Swedish Kronor | | 9,071,961 | | SS | | (15,661) |
| 01/17/20 | | U.S. Dollars | | 231,134 | | British Pounds | | 188,429 | | CITI | | (18,586) |
| 03/18/20 | | U.S. Dollars | | 936,713 | | Canadian Dollars | | 1,241,491 | | RBC | | (19,609) |
| 03/18/20 | | U.S. Dollars | | 1,049,880 | | Canadian Dollars | | 1,388,722 | | CITI | | (19,853) |
| 03/18/20 | | U.S. Dollars | | 763,615 | | New Zealand Dollars | | 1,162,603 | | DEUT | | (19,938) |
See Notes to Financial Statements.
MEDIUM-DURATION BOND FUND
SCHEDULE OF INVESTMENTS (Continued)
| Expiration Date | | Currency
Purchased | | Amount
of Currency
Purchased | | Currency
Sold | | Amount
of Currency
Sold | | Counter-
party | | Net Unrealized
Appreciation
(Depreciation) |
| 03/18/20 | | U.S. Dollars | | 762,945 | | New Zealand Dollars | | 1,162,603 | | CITI | | $(20,607) |
| 03/18/20 | | U.S. Dollars | | 1,463,575 | | Swiss Francs | | 1,437,040 | | CITI | | (29,583) |
| 02/14/20 | | Japanese Yen | | 2,611,700,000 | | U.S. Dollars | | 24,128,008 | | HSBC | | (30,063) |
| 03/18/20 | | U.S. Dollars | | 1,684,235 | | Swiss Francs | | 1,655,014 | | UBS | | (35,409) |
| 01/22/20 | | U.S. Dollars | | 1,397,659 | | Mexican Pesos | | 27,412,000 | | HSBC | | (47,100) |
| 01/17/20 | | U.S. Dollars | | 12,648,503 | | Euro | | 11,307,307 | | CITI | | (48,744) |
| 01/17/20 | | U.S. Dollars | | 2,270,345 | | Chinese Yuan Renminbi | | 16,228,427 | | CITI | | (59,436) |
| 01/17/20 | | U.S. Dollars | | 2,706,683 | | Chinese Yuan Renminbi | | 19,300,000 | | BAR | | (64,059) |
| 01/17/20 | | U.S. Dollars | | 2,962,739 | | Mexican Pesos | | 57,432,696 | | CITI | | (66,668) |
| 01/22/20 | | U.S. Dollars | | 3,356,566 | | Mexican Pesos | | 65,221,000 | | GSC | | (80,928) |
| 01/28/20 | | U.S. Dollars | | 2,721,499 | | Mexican Pesos | | 53,435,000 | | HSBC | | (92,132) |
| 01/17/20 | | U.S. Dollars | | 4,594,798 | | Philippine Pesos | | 238,833,000 | | CITI | | (116,524) |
| 02/12/20 | | U.S. Dollars | | 6,373,964 | | British Pounds | | 4,927,966 | | DEUT | | (161,613) |
| 03/18/20 | | U.S. Dollars | | 5,778,422 | | Chinese Offshore Yuan | | 41,630,640 | | DEUT | | (191,216) |
| 01/17/20 | | U.S. Dollars | | 5,362,003 | | Russian Rubles | | 346,272,014 | | CITI | | (204,953) |
| 01/10/20 | | U.S. Dollars | | 18,934,441 | | Euro | | 17,132,000 | | GSC | | (294,860) |
| 03/18/20 | | U.S. Dollars | | 9,891,384 | | Chinese Offshore Yuan | | 71,339,632 | | RBS | | (338,384) |
| 01/10/20 | | U.S. Dollars | | 17,165,859 | | British Pounds | | 13,256,000 | | BNP | | (398,255) |
| Subtotal Depreciation | | | | | | | | | | $(2,495,539) |
| Total Forward Foreign Currency Contracts outstanding at December 31, 2019 | | | | $(1,309,140) |
Swap Agreements outstanding at December 31, 2019:
| Reference Obligation | | Fixed
Deal
(Pay) Rate | | Maturity
Date | | Counterparty | | Currency | | Notional
Amount | | Market Value | | Upfront
Premiums
Paid/
(Received) | | Unrealized
Appreciation
(Depreciation) |
| Credit Default Swaps on Sovereign Issuers—Buy Protection | | | | | | | | | | | | | | | | |
| Credit Suisse (USA), Inc. 6.5% due 1/15/18 (Pay Quarterly) | | (1.00)% | | 9/20/2020 | | GSC | | USD | | 300,000 | | $(1,973) | | $6,900 | | $(8,873) |
| Peoples Republic of China, 4.25% due 10/28/14 (Pay Quarterly) | | (1.00)% | | 12/20/2020 | | JPM | | USD | | 590,000 | | (5,719) | | 2,495 | | (8,214) |
| Peoples Republic of China, 4.25% due 10/28/14 (Pay Quarterly) | | (1.00)% | | 12/20/2020 | | CITI | | USD | | 330,000 | | (3,199) | | 2,663 | | (5,862) |
| Peoples Republic of China, 4.25% due 10/28/14 (Pay Quarterly) | | (1.00)% | | 12/20/2020 | | BOA | | USD | | 300,000 | | (2,908) | | 1,691 | | (4,599) |
| Peoples Republic of China, 4.25% due 10/28/14 (Pay Quarterly) | | (1.00)% | | 6/20/2021 | | CITI | | USD | | 920,000 | | (12,912) | | 6,695 | | (19,607) |
| Peoples Republic of China, 4.25% due 10/28/14 (Pay Quarterly) | | (1.00)% | | 6/20/2021 | | BOA | | USD | | 520,000 | | (7,298) | | 6,077 | | (13,375) |
| Peoples Republic of China, 4.25% due 10/28/14 (Pay Quarterly) | | (1.00)% | | 6/20/2021 | | DEUT | | USD | | 360,000 | | (5,052) | | 2,602 | | (7,654) |
| Peoples Republic of China, 4.25% due 10/28/14 (Pay Quarterly) | | (1.00)% | | 6/20/2021 | | JPM | | USD | | 320,000 | | (4,492) | | 1,224 | | (5,716) |
| Peoples Republic of China, 4.25% due 10/28/14 (Pay Quarterly) | | (1.00)% | | 12/20/2021 | | DEUT | | USD | | 430,000 | | (7,898) | | 1,639 | | (9,537) |
| Peoples Republic of China, 4.25% due 10/28/14 (Pay Quarterly) | | (1.00)% | | 12/20/2021 | | JPM | | USD | | 220,000 | | (4,041) | | 846 | | (4,887) |
| Peoples Republic of China, 7.5% due 10/28/27 (Pay Quarterly) | | (1.00)% | | 6/20/2022 | | JPM | | USD | | 810,000 | | (17,783) | | (10,263) | | (7,520) |
| Peoples Republic of China, 7.5% due 10/28/27 (Pay Quarterly) | | (1.00)% | | 6/20/2022 | | CITI | | USD | | 130,000 | | (2,854) | | (2,277) | | (577) |
| | | $(76,129) | | $20,292 | | $(96,421) |
See Notes to Financial Statements.
| Reference Obligation | | Implied
Credit
Spread | | Fixed
Deal
(Pay) Rate | | Maturity
Date | | Currency | | Notional
Amount | | Market Value | | Upfront
Premiums
Paid/
(Received) | | Unrealized
Appreciation
(Depreciation) |
| Centrally Cleared Credit Default Swaps on Corporate and Sovereign Issuers—Sell Protection | | | | | | | | | | | | | | | | |
| Ford Motor Credit Company LLC, 3.81% due 01/9/24 (Receive Quarterly) | | 1.18% | | 5.00% | | 12/20/2023 | | USD | | 1,600,000 | | $234,187 | | $222,127 | | $12,060 |
| General Electric Company, 2.70% due 10/9/22 (Receive Quarterly) | | 0.65% | | 1.00% | | 12/20/2023 | | USD | | 600,000 | | 8,186 | | (25,420) | | 33,606 |
| General Electric Co., 2.70% due 10/9/22 (Receive Quarterly) | | 0.77% | | 1.00% | | 6/20/2024 | | USD | | 1,000,000 | | 10,310 | | (20,253) | | 30,563 |
| General Electric Company, 2.70% due 10/9/22 (Receive Quarterly) | | 0.77% | | 1.00% | | 6/20/2024 | | USD | | 1,150,000 | | 11,856 | | (14,613) | | 26,469 |
| Prudential Financial Inc., 3.50% due 05/15/24 (Receive Quarterly) | | 0.46% | | 1.00% | | 6/20/2024 | | USD | | 1,075,000 | | 25,406 | | 18,590 | | 6,816 |
| Republic of Colombia, 10.38% due 01/28/33 (Receive Quarterly) | | 0.63% | | 1.00% | | 6/20/2024 | | USD | | 1,000,000 | | 16,213 | | 5,985 | | 10,228 |
| Republic of Indonesia, 5.88% due 03/13/20 (Receive Quarterly) | | 0.56% | | 1.00% | | 6/20/2024 | | USD | | 3,470,000 | | 67,323 | | 4,023 | | 63,300 |
| General Electric Company, 2.70% due 10/9/22 (Receive Quarterly) | | 0.86% | | 1.00% | | 12/20/2024 | | USD | | 600,000 | | 4,234 | | (9,660) | | 13,894 |
| Republic of Peru 8.75% 11/21/33 (Receive Quarterly) | | 0.42% | | 1.00% | | 12/20/2024 | | USD | | 1,000,000 | | 28,059 | | 21,212 | | 6,847 |
| Subtotal Appreciation | | | | | | | | | | | | $405,774 | | $201,991 | | $203,783 |
| The Boeing Company, 8.75% due 08/15/21 (Receive Quarterly) | | 0.48% | | 1.00% | | 6/20/2024 | | USD | | 475,000 | | $10,791 | | $11,979 | | $(1,188) |
| Subtotal Depreciation | | | | | | | | | | | | $10,791 | | $11,979 | | $(1,188) |
Net Centrally Cleared Credit Default Swaps on Corporate and Sovereign Issuers—Sell Protection outstanding at
December 31, 2019 | | $416,565 | | $213,970 | | $202,595 |
| Reference Obligation | | Implied
Credit
Spread | | Fixed
Deal
(Pay) Rate | | Maturity
Date | | Counterparty | | Currency | | Notional
Amount | | Market Value | | Upfront
Premiums
Paid/
(Received) | | Unrealized
Appreciation
(Depreciation) |
Credit Default Swaps on Credit
Indexes—Sell Protection | | | | | | | | | | | | | | | | | | |
| Markit CMBX.NA.AAA.7 Index (Receive Monthly) | | 17.70% | | 0.50% | | 1/17/2047 | | GSC | | USD | | 1,692,340 | | $19,950 | | $(75,337) | | $95,287 |
| Markit CMBX.NA.AAA.8 Index (Receive Monthly) | | 21.51% | | 0.50% | | 10/17/2057 | | DEUT | | USD | | 1,700,000 | | 22,227 | | (116,926) | | 139,153 |
| Markit CMBX.NA.AAA.8 Index (Receive Monthly) | | 21.51% | | 0.50% | | 10/17/2057 | | GSC | | USD | | 1,700,000 | | 22,227 | | (102,781) | | 125,008 |
| | | $64,404 | | $(295,044) | | $359,448 |
| Reference Obligation | | Implied
Credit
Spread | | Fixed
Deal
(Pay) Rate | | Maturity
Date | | Currency | | Notional
Amount | | Market Value | | Upfront
Premiums
Paid/
(Received) | | Unrealized
Appreciation
(Depreciation) |
| Centrally Cleared Credit Default Swaps on Credit Indexes—Sell Protection | | | | | | | | | | | | | | | | |
| Markit CDX.NA.IG.31 Index (Receive Quarterly) | | 0.34% | | 1.00% | | 12/20/2023 | | USD | | 1,100,000 | | $28,158 | | $13,698 | | $14,460 |
| Markit CDX.NA.IG.32 Index (Receive Quarterly) | | 0.39% | | 1.00% | | 6/20/2024 | | USD | | 19,400,000 | | 512,140 | | 410,346 | | 101,794 |
| Markit CDX.NA.HY.33 Index (Receive Quarterly) | | 2.80% | | 5.00% | | 12/20/2024 | | USD | | 594,000 | | 58,229 | | 44,402 | | 13,827 |
| Markit CDX.NA.IG.33 Index (Receive Quarterly) | | 0.45% | | 1.00% | | 12/20/2024 | | USD | | 51,520,000 | | 1,353,208 | | 1,014,562 | | 338,646 |
| | | $1,951,735 | | $1,483,008 | | $468,727 |
See Notes to Financial Statements.
MEDIUM-DURATION BOND FUND
SCHEDULE OF INVESTMENTS (Continued)
| Pay Rate Index/Pay Rate | | Receive
Rate/Receive
Rate Index | | Maturity
Date | | Counterparty | | Currency | | Notional
Amount | | Market Value | | Upfront
Premiums
Paid/
(Received) | | Unrealized
Appreciation
(Depreciation) |
| Interest Rate Swaps | | | | | | | | | | | | | | | | |
| 1-Day Brazil Cetip DI Interbank Deposit Rate (Upon termination) | | 8.41% (Upon termination) | | 1/2/2020 | | CITI | | BRL | | 78,587,424 | | $790,913 | | $26,940 | | $763,973 |
| 1-Day Brazil Cetip DI Interbank Deposit Rate (Upon termination) | | 7.02% (Upon termination) | | 1/4/2027 | | CITI | | BRL | | 15,744,748 | | 268,266 | | 10,600 | | 257,666 |
| | | | | | | | | | | $1,059,179 | | $37,540 | | $1,021,639 |
| Pay Rate Index/Pay Rate | | Receive
Rate/Receive
Rate Index | | Maturity
Date | | Currency | | Notional
Amount | | Market Value | | Upfront
Premiums
Paid/
(Received) | | Unrealized
Appreciation
(Depreciation) |
| Centrally Cleared Interest Rate Swaps | | | | | | | | | | | | |
| 1-Day Brazil Cetip DI Interbank Deposit Rate (Upon termination) | | 7.25% (Upon Termination) | | 1/2/2020 | | BRL | | 5,846,182 | | $19,179 | | $1,688 | | $17,491 |
| 0.78% (Semiannually) | | 6-Month ASX BBSW (Semiannually) | | 6/17/2021 | | AUD | | 46,370,000 | | 66,297 | | 23,053 | | 43,244 |
| 1.35% (Annually) | | 1-Day US Federal Fund Effective Rate (Annually) | | 9/15/2021 | | USD | | 16,642,000 | | 31,529 | | (3,165) | | 34,694 |
| 28-Day Mexico Interbank TIIE (Lunar) | | 6.60% (Lunar) | | 3/16/2022 | | MXN | | 61,910,000 | | 3,334 | | (1,092) | | 4,426 |
| 1.50% (Semiannually) | | 3-Month LIBOR (Quarterly) | | 3/18/2022 | | USD | | 3,040,000 | | 8,931 | | 4,305 | | 4,626 |
| 1.75% (Semiannually) | | 3-Month LIBOR (Quarterly) | | 3/18/2022 | | USD | | 18,210,000 | | (35,599) | | (60,068) | | 24,469 |
| 3-Month KWCDC (Quarterly) | | 1.50% (Quarterly) | | 3/18/2022 | | KRW | | 14,428,650,000 | | 48,253 | | 42,455 | | 5,798 |
| 1-Day Brazil Cetip DI Interbank Deposit Rate (Upon termination) | | 6.66% (Upon termination) | | 1/2/2023 | | BRL | | 2,430,906 | | 20,610 | | 6,512 | | 14,098 |
| 1-Day Brazil Cetip DI Interbank Deposit Rate (Upon termination) | | 5.75% (Upon termination) | | 1/2/2023 | | BRL | | 1,874,767 | | 657 | | — | | 657 |
| 6.26% (Upon termination) | | 1-Day Brazil Cetip DI Interbank Deposit Rate (Upon termination) | | 1/2/2025 | | BRL | | 1,103,247 | | 143 | | 44 | | 99 |
| 1.75% (Semiannually) | | 3-Month LIBOR (Quarterly) | | 3/18/2025 | | USD | | 7,280,000 | | (7,477) | | (31,672) | | 24,195 |
| 2.00% (Annually) | | 6-Month NIBOR (Semiannually) | | 3/18/2025 | | NOK | | 23,330,000 | | 902 | | (7,589) | | 8,491 |
| 1.55% (Semiannually) | | 3-Month LIBOR (Quarterly) | | 6/30/2026 | | USD | | 90,481,000 | | 1,323,759 | | 269,259 | | 1,054,500 |
| 1.52% (Semiannually) | | 3-Month LIBOR (Quarterly) | | 7/31/2026 | | USD | | 27,559,000 | | 459,216 | | 100,854 | | 358,362 |
| 1.33% (Annually) | | 1-Day US Federal Fund Effective Rate (Annually) | | 11/16/2026 | | USD | | 11,340,000 | | 163,211 | | (11,706) | | 174,917 |
| 3.00% (Semiannually) | | 3-Month LIBOR (Quarterly) | | 6/19/2029 | | USD | | 2,940,000 | | (126,337) | | (154,599) | | 28,262 |
| 28-Day Mexico Interbank TIIE (Lunar) | | 7.45% (Lunar) | | 7/18/2029 | | MXN | | 165,770,000 | | 417,749 | | 68,836 | | 348,913 |
| 0.50% (Annually) | | 3-Month STIBOR (Quarterly) | | 3/18/2030 | | SEK | | 40,780,000 | | 90,035 | | 36,224 | | 53,811 |
| 0.75% (Semiannually) | | 6-Month LIBOR (Semiannually) | | 3/18/2030 | | GBP | | 7,700,000 | | 271,989 | | 79,664 | | 192,325 |
| 1.00% (Semiannually) | | 6-Month LIBOR (Semiannually) | | 3/18/2030 | | GBP | | 1,590,000 | | 5,482 | | (2,804) | | 8,286 |
| 2.00% (Annually) | | 6-Month NIBOR (Semiannually) | | 3/18/2030 | | NOK | | 16,270,000 | | 11,976 | | (8,031) | | 20,007 |
| 0.00% (Annually) | | 6-Month EURIBOR (Semiannually) | | 9/16/2030 | | EUR | | 7,360,000 | | 227,015 | | 195,991 | | 31,024 |
| 1.81% (Semiannually) | | 3-Month LIBOR (Quarterly) | | 11/15/2044 | | USD | | 1,972,000 | | 116,219 | | 2,639 | | 113,580 |
| 1.85% (Semiannually) | | 3-Month LIBOR (Quarterly) | | 11/15/2044 | | USD | | 18,289,000 | | 929,066 | | 31,208 | | 897,858 |
| 1.84% (Semiannually) | | 3-Month LIBOR (Quarterly) | | 5/15/2045 | | USD | | 7,870,000 | | 388,778 | | 17,181 | | 371,597 |
| 1.00% (Semiannually) | | 6-Month LIBOR (Semiannually) | | 6/17/2050 | | GBP | | 1,200,000 | | 47,348 | | 22,024 | | 25,324 |
| Subtotal Appreciation | | | | | | | | | | $4,482,265 | | $621,211 | | $3,861,054 |
| 8.36% (Lunar) | | 28-Day Mexico Interbank TIIE (Lunar) | | 3/18/2020 | | MXN | | 120,475,000 | | $(11,125) | | $(1,952) | | $(9,173) |
| 1-Day US Federal Fund Effective Rate (Annually) | | 1.26% (Annually) | | 12/15/2021 | | USD | | 10,770,000 | | (31,941) | | (370) | | (31,571) |
See Notes to Financial Statements.
| Pay Rate Index/Pay Rate | | Receive
Rate/Receive
Rate Index | | Maturity
Date | | Currency | | Notional
Amount | | Market Value | | Upfront
Premiums
Paid/
(Received) | | Unrealized
Appreciation
(Depreciation) |
| 1-Day Brazil Cetip DI Interbank Deposit Rate (Upon termination) | | 5.44% (Upon termination) | | 1/3/2022 | | BRL | | 4,734,117 | | $5,899 | | $6,757 | | $(858) |
| 3-Month CDOR (Semiannually) | | 1.75% (Semiannually) | | 3/18/2022 | | CAD | | 27,530,000 | | (96,747) | | (90,803) | | (5,944) |
| 6-Month LIBOR (Semiannually) | | 0.10% (Semiannually) | | 3/20/2024 | | JPY | | 800,000,000 | | 29,038 | | 42,931 | | (13,893) |
| 1-Month LIBOR + .09% (Quarterly) | | 3-Month LIBOR (Quarterly) | | 7/25/2024 | | USD | | 25,000,000 | | 273 | | 406 | | (133) |
| 3-Month CDOR (Semiannually) | | 1.75% (Semiannually) | | 3/18/2025 | | CAD | | 6,420,000 | | (72,933) | | (48,977) | | (23,956) |
| 6-Month ASX BBSW (Semiannually) | | 1.50% (Semiannually) | | 3/18/2025 | | AUD | | 5,150,000 | | 51,975 | | 59,273 | | (7,298) |
| 6-Month EURIBOR (Semiannually) | | 0.00% (Annually) | | 3/18/2025 | | EUR | | 1,990,000 | | 12,024 | | 20,148 | | (8,124) |
| 1.55% (Annually) | | 1-Day US Federal Fund Effective Rate (Annually) | | 11/15/2026 | | USD | | 19,443,000 | | 12,928 | | 25,179 | | (12,251) |
| 6-Month ASX BBSW (Semiannually) | | 1.20% (Semiannually) | | 6/17/2027 | | AUD | | 5,920,000 | | (50,229) | | (22,343) | | (27,886) |
| 3-Month CDOR (Semiannually) | | 3.00% (Semiannually) | | 6/19/2029 | | CAD | | 3,900,000 | | 98,319 | | 152,196 | | (53,877) |
| 3-Month LIBOR (Quarterly) | | 1.65% (Semiannually) | | 8/15/2029 | | USD | | 6,940,000 | | (135,613) | | (4,859) | | (130,754) |
| 3-Month CDOR (Semiannually) | | 2.00% (Semiannually) | | 3/18/2030 | | CAD | | 1,620,000 | | (19,861) | | (5,116) | | (14,745) |
| 3-Month LIBOR (Quarterly) | | 2.00% (Semiannually) | | 3/18/2030 | | USD | | 1,800,000 | | 16,575 | | 40,064 | | (23,489) |
| 6-Month ASX BBSW (Semiannually) | | 1.75% (Semiannually) | | 3/18/2030 | | AUD | | 1,470,000 | | 19,421 | | 42,227 | | (22,806) |
| 6-Month EURIBOR (Semiannually) | | 0.50% (Annually) | | 3/18/2030 | | EUR | | 3,010,000 | | 96,781 | | 123,239 | | (26,458) |
| 6-Month LIBOR (Semiannually) | | 0.25% (Semiannually) | | 3/19/2030 | | JPY | | 169,770,000 | | 1,794 | | 4,346 | | (2,552) |
| 6-Month NIBOR (Semiannually) | | 2.00% (Annually) | | 3/19/2030 | | NOK | | 17,160,000 | | (11,974) | | 467 | | (12,441) |
| 0.33% (Annually) | | 6-Month EURIBOR (Semiannually) | | 5/12/2031 | | EUR | | 210,000 | | 536 | | 1,073 | | (537) |
| 2.04% (Semiannually) | | 6-Month LIBOR (Semiannually) | | 2/1/2037 | | GBP | | 2,100,000 | | (201,380) | | (28,177) | | (173,203) |
| 2.05% (Semiannually) | | 6-Month LIBOR (Semiannually) | | 2/1/2037 | | GBP | | 3,300,000 | | (320,411) | | (55,813) | | (264,598) |
| 0.75% (Semiannually) | | 6-Month LIBOR (Semiannually) | | 3/20/2038 | | JPY | | 1,469,200,000 | | (1,136,936) | | 13,013 | | (1,149,949) |
| 6-Month EURIBOR (Semiannually) | | 0.75% (Annually) | | 3/18/2040 | | EUR | | 410,000 | | 13,816 | | 23,207 | | (9,391) |
| Subtotal Depreciation | | | | | | | | | | $(1,729,771) | | $296,116 | | $(2,025,887) |
| Net Centrally Cleared Interest Rate Swaps outstanding at December 31, 2019 | | $2,752,494 | | $917,327 | | $1,835,167 |
| Pay Rate Index/Pay Rate | | Receive
Rate/Receive
Rate Index | | Maturity
Date | | Currency | | Notional
Amount | | Market Value | | Upfront
Premiums
Paid/
(Received) | | Unrealized
Appreciation
(Depreciation) |
| Centrally Cleared Inflation Swaps | | | | | | | | | | | | | | |
| 1-Day UK RPI (Upon termination) | | 3.47% (Upon termination) | | 11/15/2025 | | GBP | | 5,560,000 | | $162,967 | | $(10,647) | | $173,614 |
| 1-Day UK RPI (Upon termination) | | 3.57% (Upon termination) | | 11/15/2028 | | GBP | | 1,200,000 | | 51,355 | | (11,878) | | 63,233 |
| 2.19% (Upon termination) | | US CPI Urban Consumers NSA Index (Upon termination) | | 11/26/2028 | | USD | | 1,920,000 | | (43,125) | | (63,232) | | 20,107 |
| Subtotal Appreciation | | | | | | | | | | $171,197 | | $(85,757) | | $256,954 |
| 3.29% (Upon termination) | | 1-Day UK RPI (Upon termination) | | 11/15/2020 | | GBP | | 6,990,000 | | $(186,098) | | $(25,031) | | $(161,067) |
| Subtotal Depreciation | | | | | | | | | | $(186,098) | | $(25,031) | | $(161,067) |
| Net Centrally Cleared Inflation Swaps outstanding at December 31, 2019 | | $(14,901) | | $(110,788) | | $95,887 |
See Notes to Financial Statements.
MEDIUM-DURATION BOND FUND
SCHEDULE OF INVESTMENTS (Continued)
VALUATION HIERARCHY
The following is a summary of the inputs used, as of December 31, 2019, in valuing the Fund’s investments carried at fair value:
| | Total
Value | | Level 1
Quoted Prices | | Level 2
Other Significant
Observable Inputs | | Level 3
Significant
Unobservable Inputs |
| Assets: | | | | | | | |
| Investments in Securities: | | | | | | | |
| Agency Obligations | $14,318,625 | | $— | | $14,318,625 | | $— |
| Asset-Backed Securities | 101,888,780 | | — | | 101,888,780 | | — |
| Corporate Bonds | 445,724,033 | | — | | 445,724,033 | | —** |
| Foreign Bonds: | | | | | | | |
| Mexico | 14,961,095 | | — | | 13,426,031 | | 1,535,064 |
| Other | 242,571,086 | | — | | 242,571,086 | | — |
| Total Foreign Bonds | 257,532,181 | | — | | 255,997,117 | | 1,535,064 |
| Loan Agreements | 11,461,047 | | — | | 11,461,047 | | — |
| Money Market Funds | 79,096,663 | | 79,096,663 | | — | | — |
| Mortgage-Backed Securities | 802,614,706 | | — | | 802,614,706 | | — |
| Municipal Bonds | 10,255,216 | | — | | 10,255,216 | | — |
| Purchased Options: | | | | | | | |
| Call Options | 151,954 | | 151,954 | | — | | — |
| Put Options | 102,266 | | 102,266 | | — | | — |
| Total Purchased Options | 254,220 | | 254,220 | | — | | — |
| Repurchase Agreements | 25,900,000 | | — | | 25,900,000 | | — |
| U.S. Treasury Obligations | 269,456,000 | | — | | 269,456,000 | | — |
| Total Assets - Investments in Securities | $2,018,501,471 | | $79,350,883 | | $1,937,615,524 | | $1,535,064 |
| Other Financial Instruments*** | | | | | | | |
| Forward Foreign Currency Contracts | $1,186,399 | | $— | | $1,186,399 | | $— |
| Futures Contracts | 3,755,487 | | 3,755,487 | | — | | — |
| Swap Agreements | 6,171,605 | | — | | 6,171,605 | | — |
| Total Assets - Other Financial Instruments | $11,113,491 | | $3,755,487 | | $7,358,004 | | $ — |
| | | | | | | | |
See Notes to Financial Statements.
| | Total
Value | | Level 1
Quoted Prices | | Level 2
Other Significant
Observable Inputs | | Level 3
Significant
Unobservable Inputs |
| Liabilities: | | | | | | | |
| Investments in Securities: | | | | | | | |
| TBA Sale Commitments | $(81,820,713) | | $— | | $(81,820,713) | | $— |
| Written Options: | | | | | | | |
| Call Options | (125,357) | | (125,357) | | — | | — |
| Call Swaptions | (731,797) | | — | | (731,797) | | — |
| Put Options | (40,969) | | (40,969) | | — | | — |
| Put Swaptions | (255,906) | | — | | (255,906) | | — |
| Total Written Options | (1,154,029) | | (166,326) | | (987,703) | | — |
| Total Liabilities - Investments in Securities | $(82,974,742) | | $(166,326) | | $(82,808,416) | | $ — |
| Other Financial Instruments*** | | | | | | | |
| Forward Foreign Currency Contracts | $(2,495,539) | | $— | | $(2,495,539) | | $— |
| Futures Contracts | (7,175,348) | | (7,175,348) | | — | | — |
| Swap Agreements | (2,284,563) | | — | | (2,284,563) | | — |
| Total Liabilities - Other Financial Instruments | $(11,955,450) | | $(7,175,348) | | $(4,780,102) | | $ — |
| ** | Level 3 security has zero value. |
| *** | Other financial instruments are derivative instruments, such as futures contracts, forwards contracts and swap agreements, which are valued at the unrealized appreciation (depreciation) on the investment. Further details regarding the value of these investments can be found in the preceding "Futures Contracts outstanding", "Forwards Foreign Currency Contracts outstanding" and "Swap Agreements outstanding" disclosures. |
Management has determined that the amount of Level 3 securities compared to total net assets is not material; therefore, the reconciliation of Level 3 securities and assumptions is not shown for the year ended December 31, 2019.
See Notes to Financial Statements.
Extended-Duration Bond Fund(Unaudited)
The Fund invested in a diversified portfolio composed primarily of investment grade fixed-income securities with a dollar-weighted effective duration (a calculation that measures the sensitivity of a bond or bond fund to changes in interest rates taking into account embedded options and floating interest rates) normally greater than or equal to seven years. The average dollar weighted effective duration at the end of the reporting period was 9.36 years. The Investor Class of the Fund outperformed its composite benchmark, 50% Bloomberg Barclays US Long Government/Credit Bond Index and 50% Bloomberg Barclays US Intermediate Government Credit Bond Index, for the one-year period ended December 31, 2019 (13.14% versus 13.10%).
An overweight to longer maturity investment grade bonds was additive as the sector benefited from both falling rates and steeper yield curves. The Fund also benefited from specific emerging markets country exposures, which outperformed credit sectors. Out of benchmark exposure to mortgages in lieu of U.S. Treasuries detracted as falling rates provided more of a tailwind to government bonds. The Fund did not invest in derivative investments in 2019.
During the year, the Fund remained focused on its objective of seeking maximum total return consistent with preservation of capital.
This Fund may be suitable for investors who are seeking higher returns without investing in equities, can accept short-term fluctuations in account value and want to diversify their portfolio with a fixed-income investment option. This Fund is subject to interest rate risk, meaning, when interest rates rise, the value of the existing fixed-income securities decrease and vice versa. Changes in interest rates have a bigger impact on long duration holdings than on short duration holdings. To the extent that the investment adviser or sub-advisers misjudge current market conditions, the Fund’s volatility may be amplified by its use of derivatives and by its ability to select sub-advisers to allocate assets. Derivatives involve different risks from, and in some respects greater risks than, those associated with investing directly in securities, currencies or other instruments. Derivatives may be illiquid or less liquid, volatile, difficult to price and leverage, so small changes in value of the underlying instruments may produce disproportionate losses to the Fund. It is possible to lose money by investing in the Fund.
At December 31, 2019, the portfolio holdings of the Fund, as a percentage of net assets, is shown in the following table. Portfolio holdings are subject to risk and may change at any time.
| | % |
| U.S. Treasury Obligations | 42.2 |
| Corporate Bonds | 36.2 |
| Money Market Funds | 13.2 |
| Foreign Bonds | 11.3 |
| Mortgage-Backed Securities | 6.9 |
| Asset-Backed Security | 0.2 |
| Preferred Stocks | 0.1 |
| Municipal Bond | 0.1 |
| | 110.2 |
See Notes to Financial Statements.
Extended-Duration Bond Fund(Unaudited)
| Average Annual Total Returns as of 12/31/19 | |
| | | Institutional Class* | | Investor Class* | | Benchmark** | |
| One Year | | 13.51% | | 13.14% | | 13.10% | |
| Five Year | | 4.43% | | 4.11% | | 4.71% | |
| Ten year | | 7.35% | | 7.09% | | 7.25% | |
| Since Inception | | 7.58% | | 7.38% | | 6.93% | |
| Inception Date | | 08/27/01 | | 08/27/01 | | | |
| Total Fund Operating Expenses (April 30, 2019 Prospectus)(1) | | 0.56% | | 0.83% | | | |
| (1) | Current information regarding the Fund’s Operating Expenses can be found in the Financial Highlights. |
The performance data quoted represents past performance and does not guarantee future results. Current performance may be lower or higher. Performance data current to the most recent month-end may be obtained at GuideStoneFunds.com. The investment return and principal value of an investment will fluctuate so that shares, when redeemed, may be worth more or less than their original cost.
The graph illustrates the results of a hypothetical $10,000 investment in the Investor Class of the Fund for the 10-year period from December 31, 2009 to December 31, 2019, with all dividends and capital gains reinvested, with the Fund's composite benchmark index.
*These returns reflect investment advisory and shareholder servicing fee waivers, if applicable, during the reported time periods.
**Represents a weighted composite benchmark index consisting of 50% Bloomberg Barclays US Long Government/Credit Bond Index and 50% Bloomberg Barclays US Intermediate Government/Credit Bond Index.
Unlike a mutual fund, the performance of an index assumes no taxes, transaction costs, management fees or other expenses.
See Notes to Financial Statements.
EXTENDED-DURATION BOND FUND
| | | Par | | Value |
| ASSET-BACKED SECURITY — 0.2% |
| Towd Point Mortgage Trust, Series 2016-4, Class A1 | | | |
2.25%, 07/25/56 144A
(Cost $412,002) | $415,473 | | $414,034 |
| CORPORATE BONDS — 36.2% |
| Abbott Laboratories | | | |
| 3.75%, 11/30/26 | 1,613,000 | | 1,763,805 |
| 4.90%, 11/30/46 | 436,000 | | 573,814 |
| AES Corporation | | | |
| 4.88%, 05/15/23 | 123,000 | | 125,101 |
| Aflac, Inc. | | | |
| 6.45%, 08/15/40 | 328,000 | | 453,811 |
| Allison Transmission, Inc. | | | |
| 4.75%, 10/01/27 144A | 85,000 | | 88,430 |
| Ally Financial, Inc. | | | |
| 8.00%, 11/01/31 | 177,000 | | 246,021 |
| Alta Wind Holdings LLC | | | |
| 7.00%, 06/30/35 144A | 320,149 | | 357,475 |
| American Airlines Group, Inc. | | | |
| 5.00%, 06/01/22 144A | 305,000 | | 319,488 |
| American Airlines Pass-Through Trust, Series 2016-1, Class B | | | |
| 5.25%, 01/15/24 | 513,005 | | 543,928 |
| American Airlines Pass-Through Trust, Series 2016-3, Class B | | | |
| 3.75%, 10/15/25 | 230,505 | | 233,338 |
| American Airlines Pass-Through Trust, Series 2017-1, Class B | | | |
| 4.95%, 02/15/25 | 106,245 | | 112,382 |
| American Airlines Pass-Through Trust, Series 2017-2, Class B | | | |
| 3.70%, 10/15/25 | 84,834 | | 85,864 |
| American International Group, Inc. | | | |
| 3.90%, 04/01/26 | 1,800,000 | | 1,934,918 |
| Antares Holdings LP | | | |
| 6.00%, 08/15/23 144A | 255,000 | | 268,459 |
| Antero Resources Corporation | | | |
| 5.38%, 11/01/21 | 125,000 | | 119,251 |
| 5.13%, 12/01/22 | 35,000 | | 31,300 |
| Apple, Inc. | | | |
| 3.00%, 06/20/27 | 480,000 | | 503,602 |
| AT&T, Inc. | | | |
| 4.30%, 02/15/30 | 2,000,000 | | 2,224,281 |
| 4.50%, 05/15/35 | 529,000 | | 590,392 |
| 4.30%, 12/15/42 | 1,242,000 | | 1,333,305 |
| 4.75%, 05/15/46 | 1,153,000 | | 1,307,031 |
| 4.50%, 03/09/48 | 105,000 | | 116,194 |
| 4.55%, 03/09/49 | 115,000 | | 127,922 |
| AXA Equitable Holdings, Inc. | | | |
| 5.00%, 04/20/48 | 577,000 | | 621,990 |
| Bank of America Corporation | | | |
| 3.50%, 04/19/26 | 964,000 | | 1,026,076 |
| 6.11%, 01/29/37 | 900,000 | | 1,218,179 |
| Bank of America NA | | | |
| 6.00%, 10/15/36 | 1,315,000 | | 1,801,927 |
| Booking Holdings, Inc. | | | |
| 0.90%, 09/15/21 CONV Δ | 110,000 | | 127,036 |
| | | Par | | Value |
| Boston Properties LP REIT | | | |
| 3.40%, 06/21/29 | $1,218,000 | | $1,274,247 |
| Boston Scientific Corporation | | | |
| 4.70%, 03/01/49 | 386,000 | | 470,414 |
| Brighthouse Financial, Inc. | | | |
| 4.70%, 06/22/47 | 40,000 | | 37,139 |
| Bristol-Myers Squibb Co. | | | |
| 4.25%, 10/26/49 144A | 880,000 | | 1,046,386 |
| Burlington Northern Santa Fe LLC | | | |
| 4.15%, 04/01/45 | 879,000 | | 999,460 |
| Campbell Soup Co. | | | |
| 4.80%, 03/15/48Δ | 428,000 | | 496,616 |
| Chesapeake Energy Corporation | | | |
| 4.88%, 04/15/22Δ | 70,000 | | 55,497 |
| 5.75%, 03/15/23 | 20,000 | | 13,588 |
| 5.50%, 09/15/26 CONV | 5,000 | | 2,432 |
| 8.00%, 06/15/27Δ | 665,000 | | 413,979 |
| Cigna Corporation | | | |
| 4.90%, 12/15/48 | 437,000 | | 524,152 |
| Cincinnati Bell, Inc. | | | |
| 8.00%, 10/15/25 144A | 20,000 | | 21,258 |
| Citigroup, Inc. | | | |
| 8.13%, 07/15/39 | 858,000 | | 1,434,205 |
| (Variable, ICE LIBOR USD 3M + 1.84%), 4.28%, 04/24/48Δ ^ | 533,000 | | 634,708 |
| Comcast Corporation | | | |
| 3.70%, 04/15/24 | 995,000 | | 1,061,903 |
| 2.65%, 02/01/30 | 1,311,000 | | 1,318,319 |
| 3.97%, 11/01/47 | 236,000 | | 260,410 |
| Continental Airlines Pass-Through Trust, Series 1999-2, Class B | | | |
| 7.57%, 03/15/20 | 45 | | 45 |
| Continental Resources, Inc. | | | |
| 4.50%, 04/15/23 | 40,000 | | 41,823 |
| 3.80%, 06/01/24 | 125,000 | | 129,410 |
| Cox Communications, Inc. | | | |
| 4.60%, 08/15/47 144A | 255,000 | | 283,630 |
| Crown Castle International Corporation REIT | | | |
| 3.20%, 09/01/24 | 517,000 | | 535,151 |
| CSC Holdings LLC | | | |
| 5.38%, 02/01/28 144A | 200,000 | | 213,715 |
| Cummins, Inc. | | | |
| 5.65%, 03/01/98 | 1,620,000 | | 2,055,097 |
| CVS Health Corporation | | | |
| 5.13%, 07/20/45 | 240,000 | | 285,165 |
| 5.05%, 03/25/48 | 514,000 | | 610,076 |
| DCP Midstream Operating LP | | | |
| 6.45%, 11/03/36 144A | 490,000 | | 516,183 |
| Dell International LLC | | | |
| 6.02%, 06/15/26 144A | 140,000 | | 161,287 |
| 8.10%, 07/15/36 144A | 180,000 | | 237,005 |
| 8.35%, 07/15/46 144A | 130,000 | | 179,370 |
| Dillard's Inc | | | |
| 7.00%, 12/01/28 | 500,000 | | 556,289 |
| DISH DBS Corporation | | | |
| 7.75%, 07/01/26 | 105,000 | | 111,430 |
See Notes to Financial Statements.
| | | Par | | Value |
| DISH Network Corporation | | | |
| 2.38%, 03/15/24 CONV | $1,080,000 | | $990,198 |
| Dow Chemical Co. (The) | | | |
| 9.40%, 05/15/39 | 374,000 | | 612,761 |
| Enable Midstream Partners LP | | | |
| 5.00%, 05/15/44 | 445,000 | | 409,172 |
| Enbridge Energy Partners LP | | | |
| 7.38%, 10/15/45 | 305,000 | | 456,166 |
| Energy Transfer Operating LP | | | |
| 5.25%, 04/15/29 | 628,000 | | 706,257 |
| 5.15%, 03/15/45 | 446,000 | | 470,300 |
| Enterprise Products Operating LLC | | | |
| 5.10%, 02/15/45 | 595,000 | | 714,346 |
| 4.20%, 01/31/50 | 612,000 | | 659,802 |
| EQT Corporation | | | |
| 3.90%, 10/01/27Δ | 2,168,000 | | 2,018,898 |
| ERP Operating LP REIT | | | |
| 3.00%, 07/01/29 | 970,000 | | 1,005,650 |
| Ford Motor Co. | | | |
| 6.38%, 02/01/29 | 1,255,000 | | 1,353,877 |
| General Electric Co. | | | |
| 3.10%, 01/09/23 | 248,000 | | 253,548 |
| 5.88%, 01/14/38 | 150,000 | | 182,603 |
| General Motors Co. | | | |
| 5.20%, 04/01/45 | 1,085,000 | | 1,097,702 |
| General Motors Financial Co., Inc. | | | |
| 5.25%, 03/01/26 | 250,000 | | 277,461 |
| Gilead Sciences, Inc. | | | |
| 4.15%, 03/01/47 | 958,000 | | 1,068,958 |
| Goldman Sachs Group, Inc. (The) | | | |
| 3.50%, 11/16/26 | 1,824,000 | | 1,921,090 |
| 6.75%, 10/01/37 | 225,000 | | 312,951 |
| 4.75%, 10/21/45Δ | 451,000 | | 551,370 |
| Goodyear Tire & Rubber Co. (The) | | | |
| 4.88%, 03/15/27Δ | 355,000 | | 368,082 |
| HCA, Inc. | | | |
| 5.38%, 09/01/26 | 140,000 | | 156,279 |
| 7.05%, 12/01/27 | 500,000 | | 593,125 |
| Healthpeak Properties, Inc. REIT | | | |
| 3.25%, 07/15/26 | 300,000 | | 311,427 |
| Hewlett Packard Enterprise Co. | | | |
| 6.35%, 10/15/45 | 135,000 | | 162,802 |
| Home Depot, Inc. (The) | | | |
| 5.88%, 12/16/36 | 200,000 | | 276,438 |
| Iron Mountain, Inc. REIT | | | |
| 4.88%, 09/15/29 144A | 265,000 | | 269,802 |
| iStar, Inc. REIT | | | |
| 3.13%, 09/15/22 CONV | 175,000 | | 196,670 |
| Jefferies Group LLC | | | |
| 6.45%, 06/08/27Δ | 50,000 | | 58,702 |
| 6.25%, 01/15/36 | 185,000 | | 221,367 |
| JELD-WEN, Inc. | | | |
| 4.88%, 12/15/27 144A Δ | 255,000 | | 261,464 |
| JPMorgan Chase & Co. | | | |
| 5.60%, 07/15/41 | 1,813,000 | | 2,486,775 |
| Kinder Morgan Energy Partners LP | | | |
| 5.80%, 03/15/35 | 280,000 | | 339,488 |
| | | Par | | Value |
| Kroger Co. (The) | | | |
| 5.40%, 01/15/49Δ | $548,000 | | $670,468 |
| Liberty Mutual Group, Inc. | | | |
| 3.95%, 10/15/50 144A | 1,400,000 | | 1,461,442 |
| Lockheed Martin Corporation | | | |
| 4.70%, 05/15/46 | 903,000 | | 1,149,816 |
| Marathon Petroleum Corporation | | | |
| 3.63%, 09/15/24 | 2,048,000 | | 2,152,593 |
| Masco Corporation | | | |
| 7.75%, 08/01/29 | 129,000 | | 167,542 |
| 6.50%, 08/15/32 | 15,000 | | 18,430 |
| McDonald’s Corporation | | | |
| 4.88%, 12/09/45 | 625,000 | | 754,561 |
| MetLife, Inc. | | | |
| 6.40%, 12/15/36 | 310,000 | | 380,244 |
| 5.88%, 02/06/41 | 300,000 | | 409,232 |
| Michaels Stores, Inc. | | | |
| 8.00%, 07/15/27 144A Δ | 45,000 | | 43,058 |
| Microchip Technology, Inc. | | | |
| 1.63%, 02/15/25 CONV | 85,000 | | 183,069 |
| Microsoft Corporation | | | |
| 4.45%, 11/03/45 | 595,000 | | 746,091 |
| 3.70%, 08/08/46 | 594,000 | | 672,657 |
| Morgan Stanley | | | |
| 3.13%, 08/05/21(C) | 235,000 | | 183,617 |
| 3.63%, 01/20/27 | 1,500,000 | | 1,598,566 |
| MPLX LP | | | |
| 4.00%, 03/15/28 | 200,000 | | 207,331 |
| 4.50%, 04/15/38 | 1,038,000 | | 1,057,987 |
| Mutual of Omaha Insurance Co. | | | |
| 6.80%, 06/15/36 144A | 100,000 | | 130,908 |
| Nationstar Mortgage Holdings, Inc. | | | |
| 9.13%, 07/15/26 144A | 175,000 | | 194,031 |
| Navient Corporation | | | |
| 5.63%, 08/01/33 | 1,460,000 | | 1,258,991 |
| NGL Energy Partners LP | | | |
| 7.50%, 11/01/23 | 100,000 | | 100,249 |
| 6.13%, 03/01/25 | 220,000 | | 207,991 |
| Noble Energy, Inc. | | | |
| 3.85%, 01/15/28 | 444,000 | | 469,568 |
| 5.05%, 11/15/44 | 600,000 | | 668,232 |
| Northrop Grumman Corporation | | | |
| 3.25%, 01/15/28 | 1,000,000 | | 1,044,555 |
| Nuance Communications, Inc. | | | |
| 1.25%, 04/01/25 CONV | 60,000 | | 66,948 |
| 1.00%, 12/15/35 CONV | 85,000 | | 85,797 |
| Old Republic International Corporation | | | |
| 4.88%, 10/01/24 | 230,000 | | 252,385 |
| ON Semiconductor Corporation | | | |
| 1.00%, 12/01/20 CONV | 85,000 | | 115,727 |
| ONEOK Partners LP | | | |
| 6.20%, 09/15/43 | 5,000 | | 6,341 |
| Owens Corning | | | |
| 4.40%, 01/30/48 | 210,000 | | 203,535 |
| Penn Mutual Life Insurance Co. (The) | | | |
| 7.63%, 06/15/40 144A | 440,000 | | 633,905 |
See Notes to Financial Statements.
EXTENDED-DURATION BOND FUND
SCHEDULE OF INVESTMENTS (Continued)
| | | Par | | Value |
| PepsiCo, Inc. | | | |
| 2.63%, 07/29/29Δ | $1,200,000 | | $1,226,326 |
| Prudential Financial, Inc. | | | |
| 6.63%, 06/21/40 | 548,000 | | 771,460 |
| PulteGroup, Inc. | | | |
| 6.38%, 05/15/33 | 1,000,000 | | 1,170,721 |
| Quicken Loans, Inc. | | | |
| 5.75%, 05/01/25 144A | 60,000 | | 62,150 |
| 5.25%, 01/15/28 144A | 70,000 | | 72,613 |
| Qwest Corporation | | | |
| 7.25%, 09/15/25 | 410,000 | | 472,073 |
| Radian Group, Inc. | | | |
| 4.50%, 10/01/24Δ | 55,000 | | 58,323 |
| 4.88%, 03/15/27 | 35,000 | | 36,937 |
| Seagate HDD Cayman | | | |
| 4.88%, 06/01/27 | 100,000 | | 106,367 |
| Sempra Energy | | | |
| 6.00%, 10/15/39 | 991,000 | | 1,288,663 |
| SM Energy Co. | | | |
| 1.50%, 07/01/21 CONV | 80,000 | | 76,535 |
| 5.00%, 01/15/24 | 15,000 | | 14,331 |
| 6.75%, 09/15/26Δ | 30,000 | | 29,485 |
| 6.63%, 01/15/27Δ | 85,000 | | 83,740 |
| Southern Co. (The) | | | |
| 4.40%, 07/01/46Δ | 1,356,000 | | 1,506,182 |
| Springleaf Finance Corporation | | | |
| 6.88%, 03/15/25 | 170,000 | | 193,798 |
| Sprint Capital Corporation | | | |
| 6.88%, 11/15/28 | 1,025,000 | | 1,106,334 |
| Tenet Healthcare Corporation | | | |
| 5.13%, 05/01/25 | 335,000 | | 345,887 |
| Textron, Inc. | | | |
| 6.63%, 04/07/20(U) | 160,000 | | 214,684 |
| Time Warner Cable LLC | | | |
| 5.50%, 09/01/41 | 25,000 | | 27,982 |
| 4.50%, 09/15/42 | 45,000 | | 46,108 |
| Toro Co. (The) | | | |
| 6.63%, 05/01/37 | 300,000 | | 385,922 |
| Transcontinental Gas Pipe Line Co. LLC | | | |
| 7.85%, 02/01/26 | 455,000 | | 578,637 |
| Transocean, Inc. | | | |
| 5.80%, 10/15/22Δ | 205,000 | | 198,401 |
| 6.80%, 03/15/38 | 20,000 | | 14,252 |
| Tyson Foods, Inc. | | | |
| 4.55%, 06/02/47 | 357,000 | | 409,405 |
| 5.10%, 09/28/48 | 288,000 | | 363,204 |
| United Airlines Pass-Through Trust, Series 2014-1, Class A | | | |
| 4.00%, 04/11/26 | 86,364 | | 92,027 |
| United Airlines Pass-Through Trust, Series 2016-2, Class B | | | |
| 3.65%, 10/07/25 | 70,440 | | 71,493 |
| United Rentals North America, Inc. | | | |
| 6.50%, 12/15/26 | 85,000 | | 93,578 |
| 4.88%, 01/15/28 | 30,000 | | 31,292 |
| United States Steel Corporation | | | |
| 6.65%, 06/01/37Δ | 85,000 | | 69,142 |
| | | Par | | Value |
| United Technologies Corporation | | | |
| 3.95%, 08/16/25 | $400,000 | | $436,543 |
| Unum Group | | | |
| 5.75%, 08/15/42 | 800,000 | | 905,679 |
| Verizon Communications, Inc. | | | |
| 4.27%, 01/15/36 | 1,700,000 | | 1,928,318 |
| 5.25%, 03/16/37 | 999,000 | | 1,256,410 |
| 5.50%, 03/16/47 | 1,000,000 | | 1,359,726 |
| Visa, Inc. | | | |
| 4.30%, 12/14/45 | 700,000 | | 861,722 |
| Walmart, Inc. | | | |
| 3.63%, 12/15/47 | 381,000 | | 424,719 |
| Walt Disney Co. (The) | | | |
| 4.75%, 09/15/44 | 623,000 | | 780,096 |
| Western Digital Corporation | | | |
| 1.50%, 02/01/24 CONV | 140,000 | | 137,813 |
| WestRock MWV LLC | | | |
| 7.55%, 03/01/47 | 335,000 | | 461,878 |
| Weyerhaeuser Co. REIT | | | |
| 6.88%, 12/15/33 | 580,000 | | 769,616 |
Total Corporate Bonds
(Cost $81,266,252) | | | 92,837,679 |
| FOREIGN BONDS — 11.3% |
| Australia — 0.3% | | |
| Barrick PD Australia Finance Proprietary, Ltd. | | | |
| 5.95%, 10/15/39 | 571,000 | | 725,573 |
| Brazil — 0.3% | | |
| Brazilian Government International Bond | | | |
| 10.25%, 01/10/28(B) | 2,525,000 | | 739,369 |
| Canada — 3.6% | | |
| Bombardier, Inc. | | | |
| 6.00%, 10/15/22 144A | 515,000 | | 516,133 |
| 7.88%, 04/15/27 144A | 50,000 | | 51,564 |
| Canadian Government Bond Residual STRIP | | | |
| 3.47%, 06/01/25(C) Ω | 3,685,000 | | 2,597,052 |
| Enbridge, Inc. | | | |
| 5.50%, 12/01/46Δ | 549,000 | | 706,476 |
| MEG Energy Corporation | | | |
| 7.00%, 03/31/24 144A Δ | 340,000 | | 342,834 |
| Province of Ontario Generic Residual STRIP | | | |
| 2.98%, 03/08/29(C) Ω | 4,600,000 | | 2,850,544 |
| Province of Saskatchewan Residual STRIP | | | |
| 3.49%, 02/04/22(C) Ω | 3,000,000 | | 2,222,594 |
| | | | | 9,287,197 |
| Ireland — 0.5% | | |
| GE Capital International Funding Co. Unlimited Co. | | | |
| 3.37%, 11/15/25Δ | 975,000 | | 1,016,750 |
| Johnson Controls International PLC | | | |
| 4.50%, 02/15/47 | 160,000 | | 173,345 |
| | | | | 1,190,095 |
See Notes to Financial Statements.
| | | Par | | Value |
| Italy — 0.3% | | |
| Telecom Italia Capital SA | | | |
| 6.00%, 09/30/34 | $785,000 | | $843,736 |
| Jersey — 0.1% | | |
| Delphi Technologies PLC | | | |
| 5.00%, 10/01/25 144A Δ | 395,000 | | 366,362 |
| Luxembourg — 0.5% | | |
| ArcelorMittal SA | | | |
| 6.75%, 03/01/41 | 975,000 | | 1,163,268 |
| Mexico — 0.9% | | |
| America Movil SAB de CV | | | |
| 6.45%, 12/05/22(M) | 2,600,000 | | 133,730 |
| 8.46%, 12/18/36(M) | 12,000,000 | | 626,716 |
| Mexican Bonos | | | |
| 8.00%, 12/07/23(M) | 21,300,000 | | 1,174,516 |
| 10.00%, 12/05/24(M) | 3,500,000 | | 210,285 |
| 7.50%, 06/03/27(M) | 3,500,000 | | 192,429 |
| 8.50%, 05/31/29(M) | 500,000 | | 29,455 |
| 7.75%, 05/29/31(M) | 1,000,000 | | 56,472 |
| | | | | 2,423,603 |
| Netherlands — 1.3% | | |
| Cooperatieve Rabobank UA | | | |
| 3.75%, 07/21/26 | 493,000 | | 514,116 |
| 5.25%, 05/24/41Δ | 632,000 | | 865,291 |
| Embraer Netherlands Finance BV | | | |
| 5.40%, 02/01/27 | 80,000 | | 90,269 |
| Enel Finance International NV | | | |
| 6.00%, 10/07/39 144A | 500,000 | | 631,077 |
| Shell International Finance BV | | | |
| 4.00%, 05/10/46 | 1,060,000 | | 1,209,826 |
| | | | | 3,310,579 |
| Norway — 0.0% | | |
| Norway Government Bond | | | |
| 3.75%, 05/25/21(K) 144A | 196,000 | | 23,071 |
| Spain — 0.3% | | |
| Telefonica Emisiones SA | | | |
| 7.05%, 06/20/36 | 524,000 | | 734,421 |
| Switzerland — 0.5% | | |
| Credit Suisse Group AG | | | |
| (Variable, ICE LIBOR USD 3M + 1.41%), 3.87%, 01/12/29 144A ^ | 1,188,000 | | 1,266,909 |
| United Kingdom — 2.7% | | |
| Barclays PLC | | | |
| 4.38%, 01/12/26 | 865,000 | | 937,091 |
| HSBC Holdings PLC | | | |
| (Variable, ICE LIBOR USD 3M + 1.14%), 2.63%, 11/07/25^ | 1,208,000 | | 1,213,642 |
| (Variable, ICE LIBOR USD 3M + 1.53%), 4.58%, 06/19/29^ | 645,000 | | 721,804 |
| Lloyds Banking Group PLC | | | |
| 4.34%, 01/09/48 | 1,056,000 | | 1,145,461 |
| Royal Bank of Scotland Group PLC | | | |
| 3.88%, 09/12/23 | 1,761,000 | | 1,846,731 |
| | | Par | | Value |
| Vodafone Group PLC | | | |
| (Floating, ICE LIBOR USD 3M + 0.99%), 2.99%, 01/16/24† | $962,000 | | $974,559 |
| | | | | 6,839,288 |
Total Foreign Bonds
(Cost $28,312,359) | | 28,913,471 |
| MORTGAGE-BACKED SECURITIES — 6.9% |
| Federal Home Loan Mortgage Corporation | | | |
| 4.50%, 09/01/48 | 1,457,218 | | 1,539,708 |
| Federal National Mortgage Association | | | |
| 4.50%, 12/01/47 | 853,110 | | 901,198 |
| 3.50%, 01/01/48 | 6,659,348 | | 6,918,749 |
| 4.50%, 08/01/48 | 1,398,310 | | 1,477,852 |
| 4.50%, 11/01/48 | 1,370,435 | | 1,446,465 |
| Government National Mortgage Association | | | |
| 4.50%, 10/20/48 | 1,207,735 | | 1,270,997 |
| JP Morgan Mortgage Trust, Series 2017-1, Class A4 | | | |
| 3.50%, 01/25/47 144A | 1,987,271 | | 2,012,018 |
| JP Morgan Trust, Series 2015-6, Class A5 | | | |
| 3.50%, 10/25/45 144A † γ | 2,169,445 | | 2,189,620 |
Total Mortgage-Backed Securities
(Cost $17,456,322) | | | 17,756,607 |
| MUNICIPAL BOND — 0.1% |
| State of Illinois, General Obligation | | | |
5.10%, 06/01/33
(Cost $190,867) | 235,000 | | 253,532 |
| U.S. TREASURY OBLIGATIONS — 42.2% |
| U.S. Treasury Bills | | | | |
| 1.43%, 02/27/20Ω | 500,000 | | 498,829 |
| 1.58%, 04/02/20Ω Δ | 880,000 | | 876,619 |
| | | | | 1,375,448 |
| U.S. Treasury Bonds | | | | |
| 4.50%, 02/15/36 | 3,556,000 | | 4,722,465 |
| 5.00%, 05/15/37 | 215,000 | | 304,847 |
| 4.63%, 02/15/40 | 504,000 | | 698,217 |
| 4.38%, 05/15/40 | 3,551,800 | | 4,778,836 |
| 2.88%, 05/15/43 | 12,692,000 | | 13,862,787 |
| 2.50%, 05/15/46 | 4,500,000 | | 4,607,490 |
| 2.75%, 08/15/47 | 15,577,000 | | 16,752,881 |
| 2.75%, 11/15/47 | 657,300 | | 706,918 |
| 3.38%, 11/15/48 | 890,000 | | 1,076,935 |
| 3.00%, 02/15/49 | 115,000 | | 130,114 |
| 2.25%, 08/15/49Δ | 2,487,000 | | 2,420,211 |
| | | | | 50,061,701 |
| U.S. Treasury Notes | | | | |
| 2.25%, 03/31/20 | 3,425,000 | | 3,429,883 |
| 1.50%, 11/30/21Δ | 16,424,000 | | 16,404,432 |
| 2.00%, 11/30/22 | 7,421,000 | | 7,506,370 |
| 2.88%, 11/30/23 | 1,000,000 | | 1,046,172 |
See Notes to Financial Statements.
EXTENDED-DURATION BOND FUND
SCHEDULE OF INVESTMENTS (Continued)
| | | Par | | Value |
| 2.63%, 12/31/23 | $2,132,000 | | $2,211,950 |
| 2.25%, 04/30/24 | 7,423,000 | | 7,602,921 |
| 1.50%, 11/30/24Δ | 11,400,000 | | 11,309,602 |
| 1.63%, 11/30/26 | 2,756,000 | | 2,721,604 |
| 2.75%, 02/15/28 | 465,600 | | 496,501 |
| 2.88%, 08/15/28 | 1,149,000 | | 1,239,484 |
| 2.63%, 02/15/29 | 165,400 | | 175,450 |
| 2.38%, 05/15/29 | 1,651,000 | | 1,717,556 |
| 1.63%, 08/15/29 | 191,700 | | 186,937 |
| 1.75%, 11/15/29Δ | 1,001,000 | | 986,826 |
| | | | | 57,035,688 |
Total U.S. Treasury Obligations
(Cost $105,473,035) | | | 108,472,837 |
| | | Shares | |
| PREFERRED STOCKS — 0.1% |
| Chesapeake Energy Corporation | | |
| 5.00%, 10/31/19 CONV Δ | 620 | 12,555 |
| | | Shares | | Value |
| 5.75%, 10/31/19 144A CONV | 80 | | $14,475 |
| El Paso Energy Capital Trust I | | | |
| 4.75%, 12/12/19 CONV | 5,350 | | 275,311 |
Total Preferred Stocks
(Cost $354,717) | | | 302,341 |
| MONEY MARKET FUNDS — 13.2% |
| GuideStone Money Market Fund, 1.53%Ø | 7,809,354 | | 7,809,354 |
| Northern Institutional Liquid Assets Portfolio (Shares), 1.57%Ø § | 26,030,692 | | 26,030,692 |
Total Money Market Funds
(Cost $33,840,046) | | | 33,840,046 |
TOTAL INVESTMENTS —110.2%
(Cost $267,305,600) | | | 282,790,547 |
Liabilities in Excess of Other
Assets — (10.2)% | | | (26,105,692) |
| NET ASSETS — 100.0% | | | $256,684,855 |
VALUATION HIERARCHY
The following is a summary of the inputs used, as of December 31, 2019, in valuing the Fund’s investments carried at fair value:
| | Total
Value | | Level 1
Quoted Prices | | Level 2
Other Significant
Observable Inputs | | Level 3
Significant
Unobservable Inputs |
| Assets: | | | | | | | |
| Investments in Securities: | | | | | | | |
| Asset-Backed Security | $414,034 | | $— | | $414,034 | | $— |
| Corporate Bonds | 92,837,679 | | — | | 92,837,679 | | — |
| Foreign Bonds | 28,913,471 | | — | | 28,913,471 | | — |
| Money Market Funds | 33,840,046 | | 33,840,046 | | — | | — |
| Mortgage-Backed Securities | 17,756,607 | | — | | 17,756,607 | | — |
| Municipal Bond | 253,532 | | — | | 253,532 | | — |
| Preferred Stocks | 302,341 | | 287,866 | | 14,475 | | — |
| U.S. Treasury Obligations | 108,472,837 | | — | | 108,472,837 | | — |
| Total Assets - Investments in Securities | $282,790,547 | | $34,127,912 | | $248,662,635 | | $ — |
See Notes to Financial Statements.
Global Bond Fund(Unaudited)
The Fund is actively managed and invests in a diversified portfolio composed of global fixed-income securities with a dollar-weighted effective duration (a calculation that measures the sensitivity of a bond or bond fund to changes in interest rates taking into account embedded options and floating interest rates) normally between three to 10 years. The Fund maintained its global focus, seeking investment opportunities across a wide array of economies, credits, yield curves and currencies. For the one-year period ended December 31, 2019, the Investor Class of the Fund outperformed its composite benchmark, 50% Bloomberg Barclays Global Aggregate Bond Index, 25% J.P. Morgan Emerging Markets Bond Index (EMBI) Plus and 25% Bloomberg Barclays US Corporate High Yield 2% Issuer Capped Bond Index (11.03% versus 10.16%).
Outperformance within the Fund was driven by several factors. Holding longer maturity U.S. Treasuries over non-U.S. developed sovereign bonds was additive as rates came in more domestically than abroad. An overweight to the more interest rate sensitive investment grade bond sector over high yield debt was additive as well. Select country exposures within emerging markets debt, both U.S. dollar denominated and non-U.S. local currency were an additional source of outperformance. An allocation to cash weighed on returns as most fixed-income sectors were positive for the year.
U.S. Treasury futures contracts and options on U.S. Treasuries were used for the common purpose of implementing yield curve positioning strategies within the Fund and added to performance. German Bund futures were used to adjust exposure to the front portion of the yield curve and detracted from performance for the year. Currency options and forward contracts were used to adjust exposure to various currency markets and/or to hedge against foreign currency fluctuations. The forwards detracted while the options were additive. In aggregate, currency derivatives were a detractor from performance.
During the year, the Fund remained focused on its objective of seeking to maximize total return through capital gains and current income while preserving principal value.
This Fund may be suitable for investors who have a medium- to long-term investment horizon, seek higher returns than those offered by a shorter maturity bond fund, can accept short-term fluctuations in account value and want to diversify their portfolio with a globally diversified fixed-income investment option. This Fund may invest, to a large extent, in high yield securities (junk bonds). These securities involve greater risks of default, are more volatile than bonds rated investment grade and are inherently speculative. Obligations of foreign issuers may be negatively impacted by political events, economic conditions or inefficient, illiquid or unregulated markets in foreign countries, and they also may be subject to inadequate regulatory or accounting standards, which may increase investment risk. Investing in emerging markets may involve greater risks than investing in more developed foreign markets because, among other things, emerging markets often have more political and economic instability. This Fund is subject to interest rate risk, meaning, when interest rates rise, the value of the existing bonds decrease and vice versa. Changes in interest rates have a bigger impact on long duration holdings than on short duration holdings. To the extent that the investment adviser or sub-advisers misjudge current market conditions, the Fund’s volatility may be amplified by its use of derivatives and by its ability to select sub-advisers to allocate assets. Derivatives involve different risks from, and in some respects greater risks than, those associated with investing directly in securities, currencies or other instruments. Derivatives may be illiquid or less liquid, volatile, difficult to price and leverage, so small changes in value of the underlying instruments may produce disproportionate losses to the Fund. It is possible to lose money by investing in the Fund.
See Notes to Financial Statements.
Global Bond Fund(Unaudited)
At December 31, 2019, the portfolio holdings of the Fund, as a percentage of net assets, is shown in the following table. Portfolio holdings are subject to risk and may change at any time.
| | % |
| Foreign Bonds | 36.2 |
| U.S. Treasury Obligations | 25.9 |
| Corporate Bonds | 22.0 |
| Money Market Funds | 11.1 |
| Mortgage-Backed Securities | 7.0 |
| Loan Agreements | 2.3 |
| Asset-Backed Securities | 0.6 |
| Foreign Government Inflation-Linked Bond | 0.3 |
| Communication Services | 0.3 |
| Information Technology | 0.2 |
| Health Care | 0.1 |
| Energy | 0.1 |
| Consumer Discretionary | 0.1 |
| Financials | 0.1 |
| Municipal Bond | —** |
| | 106.3 |
| **Rounds to less than 0.1% | |
See Notes to Financial Statements.
Global Bond Fund(Unaudited)
| Average Annual Total Returns as of 12/31/19 | |
| | | Institutional Class* | | Investor Class* | | Benchmark** | |
| One Year | | 11.31% | | 11.03% | | 10.16% | |
| Five Year | | N/A | | 3.50% | | 4.02% | |
| Ten year | | N/A | | 4.82% | | 4.68% | |
| Since Inception(1) | | 3.64% | | 4.96% | | 5.21% | |
| Inception Date | | 05/01/15 | | 12/29/06 | | | |
| Total Fund Operating Expenses (April 30, 2019 Prospectus)(2) | | 0.56% | | 0.83% | | | |
| (1) | The Since Inception benchmark performance is based on the start date of December 29, 2006, which corresponds with the inception date of the Investor Class, the longest operating class of the Fund. |
| (2) | Current information regarding the Fund’s Operating Expenses can be found in the Financial Highlights. |
The performance data quoted represents past performance and does not guarantee future results. Current performance may be lower or higher. Performance data current to the most recent month-end may be obtained at GuideStoneFunds.com. The investment return and principal value of an investment will fluctuate so that shares, when redeemed, may be worth more or less than their original cost.
The graph illustrates the results of a hypothetical $10,000 investment in the Investor Class of the Fund for the 10-year period from December 31, 2009 to December 31, 2019, with all dividends and capital gains reinvested, with the Fund's composite benchmark index.
*These returns reflect investment advisory and shareholder servicing fee waivers, if applicable, during the reported time periods.
**Represents a weighted composite benchmark index consisting of 25% J.P. Morgan Emerging Markets Bond Index (EMBI) Plus, 50% Bloomberg Barclays Global Aggregate Bond Index and 25% Bloomberg Barclays US Corporate High Yield 2% Issuer Capped Bond Index.
Unlike a mutual fund, the performance of an index assumes no taxes, transaction costs, management fees or other expenses.
See Notes to Financial Statements.
| | | Par | | Value |
| ASSET-BACKED SECURITIES — 0.6% |
| Bravo Mortgage Asset Trust, Series 2006-1A, Class M1 | | | |
| (Floating, ICE LIBOR USD 1M + 0.40%, 0.40% Floor), 2.19%, 07/25/36 144A † | $630,000 | | $578,262 |
| PFCA Home Equity Investment Trust, Series 2003-IFC5, Class A | | | |
| 4.24%, 01/22/35 144A † γ | 586,025 | | 585,543 |
| SLM Student Loan Trust, Series 2003-4, Class A5E | | | |
| (Floating, ICE LIBOR USD 3M + 0.75%), 2.64%, 03/15/33 144A † | 220,040 | | 213,564 |
| SLM Student Loan Trust, Series 2006-10, Class A6 | | | |
| (Floating, ICE LIBOR USD 3M + 0.15%), 2.09%, 03/25/44† | 480,000 | | 450,707 |
| Washington Mutual Asset-Backed Certificates Trust, Series 2007-HE4, Class 1A | | | |
| (Floating, ICE LIBOR USD 1M + 0.17%, 0.17% Floor), 1.96%, 07/25/47† | 1,971,340 | | 1,588,052 |
Total Asset-Backed Securities
(Cost $3,133,964) | | | 3,416,128 |
| CORPORATE BONDS — 22.0% |
| Abbott Laboratories | | | |
| 3.75%, 11/30/26 | 280,000 | | 306,178 |
| Allison Transmission, Inc. | | | |
| 5.00%, 10/01/24 144A | 300,000 | | 307,872 |
| 4.75%, 10/01/27 144A | 110,000 | | 114,438 |
| Ally Financial, Inc. | | | |
| 8.00%, 03/15/20 | 120,000 | | 121,110 |
| 5.13%, 09/30/24 | 465,000 | | 513,767 |
| 8.00%, 11/01/31 | 175,000 | | 243,241 |
| Amazon.com, Inc. | | | |
| 3.88%, 08/22/37 | 620,000 | | 705,723 |
| American Airlines Group, Inc. | | | |
| 5.00%, 06/01/22 144A | 440,000 | | 460,900 |
| American Airlines Pass-Through Trust, Series 2013-1, Class B | | | |
| 5.63%, 01/15/21 144A | 116,675 | | 118,895 |
| American Airlines Pass-Through Trust, Series 2016-1, Class B | | | |
| 5.25%, 01/15/24 | 650,986 | | 690,227 |
| American Airlines Pass-Through Trust, Series 2016-3, Class B | | | |
| 3.75%, 10/15/25 | 284,016 | | 287,506 |
| American Airlines Pass-Through Trust, Series 2017-2, Class B | | | |
| 3.70%, 10/15/25 | 101,800 | | 103,036 |
| American Express Co. | | | |
| 3.70%, 11/05/21 | 180,000 | | 185,547 |
| Antero Resources Corporation | | | |
| 5.38%, 11/01/21 | 185,000 | | 176,491 |
| 5.13%, 12/01/22 | 235,000 | | 210,156 |
| 5.63%, 06/01/23 | 75,000 | | 60,375 |
| Apple, Inc. | | | |
| 1.55%, 02/07/20 | 85,000 | | 84,968 |
| | | Par | | Value |
| 4.65%, 02/23/46 | $325,000 | | $408,356 |
| Ashtead Capital, Inc. | | | |
| 4.13%, 08/15/25 144A | 274,000 | | 282,334 |
| AT&T, Inc. | | | |
| 4.00%, 01/15/22 | 40,000 | | 41,600 |
| 0.25%, 03/04/26(E) | 650,000 | | 714,787 |
| 4.35%, 03/01/29 | 135,000 | | 150,313 |
| 4.90%, 08/15/37 | 135,000 | | 155,684 |
| 5.35%, 09/01/40 | 85,000 | | 102,776 |
| 5.45%, 03/01/47 | 125,000 | | 155,511 |
| 4.50%, 03/09/48 | 515,000 | | 569,904 |
| 4.55%, 03/09/49 | 275,000 | | 305,900 |
| Avon Products, Inc. | | | |
| 8.95%, 03/15/43 | 60,000 | | 75,006 |
| AXA Equitable Holdings, Inc. | | | |
| 5.00%, 04/20/48 | 300,000 | | 323,391 |
| Bank of America Corporation | | | |
| (Variable, ICE LIBOR USD 3M + 0.37%), 2.74%, 01/23/22^ | 225,000 | | 226,675 |
| 1.38%, 03/26/25(E) | 595,000 | | 706,778 |
| 4.25%, 10/22/26 | 55,000 | | 60,044 |
| (Variable, ICE LIBOR USD 3M + 1.51%), 3.71%, 04/24/28^ | 350,000 | | 374,528 |
| (Variable, ICE LIBOR USD 3M + 1.04%), 3.42%, 12/20/28^ | 435,000 | | 457,179 |
| (Variable, ICE LIBOR USD 3M + 1.07%), 3.97%, 03/05/29^ | 275,000 | | 299,919 |
| 6.11%, 01/29/37 | 1,000,000 | | 1,353,532 |
| Barrick North America Finance LLC | | | |
| 5.75%, 05/01/43 | 505,000 | | 644,105 |
| Bausch Health Americas, Inc. | | | |
| 9.25%, 04/01/26 144A | 460,000 | | 529,207 |
| 8.50%, 01/31/27 144A Δ | 50,000 | | 57,033 |
| Belden, Inc. | | | |
| 3.38%, 07/15/27(E) | 950,000 | | 1,120,739 |
| Blue Cube Spinco LLC | | | |
| 10.00%, 10/15/25 | 765,000 | | 847,509 |
| Blue Racer Midstream LLC | | | |
| 6.13%, 11/15/22 144A | 140,000 | | 137,449 |
| Booking Holdings, Inc. | | | |
| 0.90%, 09/15/21 CONV Δ | 290,000 | | 334,914 |
| Braskem America Finance Co. | | | |
| 7.13%, 07/22/41 | 1,640,000 | | 1,883,433 |
| Brighthouse Financial, Inc. | | | |
| 4.70%, 06/22/47 | 65,000 | | 60,351 |
| Bristol-Myers Squibb Co. | | | |
| 5.00%, 08/15/45 144A | 1,120,000 | | 1,440,100 |
| California Resources Corporation | | | |
| 8.00%, 12/15/22 144A | 695,000 | | 300,587 |
| Cameron LNG LLC | | | |
| 3.30%, 01/15/35 144A | 225,000 | | 227,644 |
| CCO Holdings LLC | | | |
| 5.38%, 05/01/25 144A | 270,000 | | 279,338 |
| Centene Corporation | | | |
| 4.75%, 05/15/22 | 390,000 | | 398,494 |
| 6.13%, 02/15/24 | 140,000 | | 145,425 |
| 4.75%, 01/15/25 144A | 30,000 | | 31,224 |
| 5.38%, 06/01/26 144A | 150,000 | | 159,465 |
See Notes to Financial Statements.
| | | Par | | Value |
| 4.63%, 12/15/29 144A | $700,000 | | $737,240 |
| CenturyLink, Inc. | | | |
| 5.63%, 04/01/20 | 150,000 | | 151,116 |
| 6.75%, 12/01/23 | 430,000 | | 480,884 |
| 5.63%, 04/01/25Δ | 50,000 | | 53,232 |
| Charter Communications Operating LLC | | | |
| 6.48%, 10/23/45 | 210,000 | | 260,717 |
| 5.75%, 04/01/48 | 720,000 | | 842,218 |
| Chesapeake Energy Corporation | | | |
| 4.88%, 04/15/22Δ | 1,285,000 | | 1,018,763 |
| 5.75%, 03/15/23 | 125,000 | | 84,923 |
| 5.50%, 09/15/26 CONV | 25,000 | | 12,160 |
| Cigna Corporation | | | |
| 4.80%, 08/15/38 | 300,000 | | 351,029 |
| Cincinnati Bell, Inc. | | | |
| 8.00%, 10/15/25 144A | 155,000 | | 164,752 |
| CIT Group, Inc. | | | |
| 5.00%, 08/15/22 | 300,000 | | 318,748 |
| 5.00%, 08/01/23 | 480,000 | | 518,201 |
| 5.25%, 03/07/25 | 540,000 | | 595,126 |
| Citigroup, Inc. | | | |
| 3.50%, 05/15/23 | 655,000 | | 682,158 |
| (Variable, ICE LIBOR USD 3M + 3.42%), 6.30%, 05/15/24ρ Δ ^ | 950,000 | | 1,030,071 |
| (Variable, ICE LIBOR USD 3M + 3.91%), 5.95%, 05/15/25ρ ^ | 180,000 | | 196,579 |
| (Variable, ICE LIBOR USD 3M + 1.56%), 3.89%, 01/10/28^ | 485,000 | | 523,077 |
| (Variable, ICE LIBOR USD 3M + 1.15%), 3.52%, 10/27/28^ | 200,000 | | 210,745 |
| CME Group, Inc. | | | |
| 5.30%, 09/15/43 | 620,000 | | 831,823 |
| Comcast Corporation | | | |
| 3.15%, 03/01/26 | 720,000 | | 755,419 |
| 4.70%, 10/15/48 | 900,000 | | 1,112,890 |
| 4.95%, 10/15/58 | 625,000 | | 815,713 |
| Concho Resources, Inc. | | | |
| 4.88%, 10/01/47 | 190,000 | | 222,301 |
| ConocoPhillips | | | |
| 6.50%, 02/01/39 | 10,000 | | 14,594 |
| Continental Airlines Pass-Through Trust, Series 2007-1, Class A | | | |
| 5.98%, 04/19/22 | 174,746 | | 183,978 |
| Continental Resources, Inc. | | | |
| 5.00%, 09/15/22 | 27,000 | | 27,211 |
| 4.50%, 04/15/23 | 265,000 | | 277,080 |
| 3.80%, 06/01/24 | 160,000 | | 165,645 |
| 4.90%, 06/01/44 | 270,000 | | 287,376 |
| Covey Park Energy LLC | | | |
| 7.50%, 05/15/25 144A | 720,000 | | 621,299 |
| CTR Partnership LP REIT | | | |
| 5.25%, 06/01/25 | 570,000 | | 594,462 |
| Cummins, Inc. | | | |
| 5.65%, 03/01/98 | 435,000 | | 551,832 |
| CVS Health Corporation | | | |
| 4.10%, 03/25/25 | 1,290,000 | | 1,385,884 |
| | | Par | | Value |
| 5.05%, 03/25/48 | $345,000 | | $409,487 |
| D.R. Horton, Inc. | | | |
| 4.38%, 09/15/22 | 705,000 | | 739,339 |
| DAE Funding LLC | | | |
| 4.50%, 08/01/22 144A | 8,000 | | 8,140 |
| DaVita, Inc. | | | |
| 5.00%, 05/01/25Δ | 10,000 | | 10,308 |
| DCP Midstream Operating LP | | | |
| 6.75%, 09/15/37 144A | 500,000 | | 526,717 |
| Dell International LLC | | | |
| 4.42%, 06/15/21 144A | 440,000 | | 452,914 |
| 5.88%, 06/15/21 144A | 240,000 | | 244,051 |
| 5.45%, 06/15/23 144A | 525,000 | | 569,807 |
| 7.13%, 06/15/24 144A | 270,000 | | 285,187 |
| 6.02%, 06/15/26 144A | 260,000 | | 299,532 |
| 8.10%, 07/15/36 144A | 225,000 | | 296,257 |
| 8.35%, 07/15/46 144A | 125,000 | | 172,471 |
| Delta Air Lines Pass-Through Trust, Series 2007-1, Class B | | | |
| 8.02%, 08/10/22 | 29,571 | | 32,362 |
| Diamondback Energy, Inc. | | | |
| 5.38%, 05/31/25 | 320,000 | | 336,010 |
| Dillard's, Inc. | | | |
| 7.75%, 07/15/26 | 450,000 | | 508,608 |
| DISH DBS Corporation | | | |
| 5.88%, 07/15/22 | 430,000 | | 456,565 |
| 5.00%, 03/15/23Δ | 490,000 | | 503,887 |
| 5.88%, 11/15/24 | 735,000 | | 752,611 |
| 7.75%, 07/01/26Δ | 1,545,000 | | 1,639,616 |
| DISH Network Corporation | | | |
| 2.38%, 03/15/24 CONV | 900,000 | | 825,165 |
| DTE Electric Co. | | | |
| 3.95%, 03/01/49 | 200,000 | | 229,268 |
| DTE Energy Co. | | | |
| 2.25%, 11/01/22 | 505,000 | | 505,306 |
| 3.40%, 06/15/29 | 445,000 | | 459,730 |
| El Paso Natural Gas Co. LLC | | | |
| 8.63%, 01/15/22 | 60,000 | | 67,449 |
| 8.38%, 06/15/32 | 50,000 | | 69,938 |
| Enable Midstream Partners LP | | | |
| 5.00%, 05/15/44 | 130,000 | | 119,533 |
| Enbridge Energy Partners LP | | | |
| 7.38%, 10/15/45 | 90,000 | | 134,606 |
| Endeavor Energy Resources LP | | | |
| 5.75%, 01/30/28 144A | 330,000 | | 347,523 |
| Energy Transfer Operating LP | | | |
| 4.95%, 06/15/28 | 200,000 | | 219,342 |
| 6.25%, 04/15/49 | 250,000 | | 302,123 |
| Energy Transfer Partners LP | | | |
| 5.88%, 03/01/22 | 240,000 | | 254,809 |
| 5.00%, 10/01/22 | 60,000 | | 63,667 |
| EnLink Midstream Partners LP | | | |
| 4.15%, 06/01/25 | 235,000 | | 221,390 |
| Enterprise Products Operating LLC | | | |
| 4.25%, 02/15/48 | 300,000 | | 322,826 |
See Notes to Financial Statements.
SCHEDULE OF INVESTMENTS (Continued)
| | | Par | | Value |
| ERAC USA Finance LLC | | | |
| 7.00%, 10/15/37 144A | $535,000 | | $757,733 |
| Evergy, Inc. | | | |
| 2.90%, 09/15/29 | 400,000 | | 398,959 |
| Evolent Health, Inc. | | | |
| 2.00%, 12/01/21 CONV | 50,000 | | 44,941 |
| Extraction Oil & Gas, Inc. | | | |
| 5.63%, 02/01/26 144A | 1,170,000 | | 705,332 |
| Fidelity & Guaranty Life Holdings, Inc. | | | |
| 5.50%, 05/01/25 144A | 430,000 | | 459,021 |
| Fidelity National Information Services, Inc. | | | |
| 1.00%, 12/03/28(E) | 635,000 | | 715,527 |
| FirstEnergy Corporation | | | |
| 7.38%, 11/15/31 | 130,000 | | 183,700 |
| Ford Motor Co. | | | |
| 6.63%, 10/01/28 | 430,000 | | 479,403 |
| Ford Motor Credit Co. LLC | | | |
| 4.39%, 01/08/26 | 1,550,000 | | 1,576,683 |
| Fox Corporation | | | |
| 5.58%, 01/25/49 144A | 860,000 | | 1,097,113 |
| Freeport-McMoRan, Inc. | | | |
| 3.55%, 03/01/22 | 270,000 | | 273,856 |
| 5.45%, 03/15/43 | 1,200,000 | | 1,245,120 |
| Fresenius Medical Care US Finance II, Inc. | | | |
| 5.88%, 01/31/22 144A | 540,000 | | 578,025 |
| General Electric Co. | | | |
| 3.15%, 09/07/22 | 70,000 | | 71,503 |
| 6.75%, 03/15/32 | 20,000 | | 25,714 |
| 6.88%, 01/10/39 | 120,000 | | 160,641 |
| 4.50%, 03/11/44Δ | 70,000 | | 76,825 |
| General Motors Co. | | | |
| 5.20%, 04/01/45 | 110,000 | | 111,288 |
| General Motors Financial Co., Inc. | | | |
| 3.45%, 04/10/22 | 155,000 | | 158,571 |
| 5.10%, 01/17/24 | 150,000 | | 162,942 |
| 5.25%, 03/01/26 | 315,000 | | 349,601 |
| Genesis Energy LP | | | |
| 5.63%, 06/15/24 | 90,000 | | 87,112 |
| GEO Group, Inc. (The) REIT | | | |
| 5.88%, 10/15/24 | 290,000 | | 264,745 |
| Georgia-Pacific LLC | | | |
| 8.88%, 05/15/31 | 305,000 | | 474,331 |
| Gilead Sciences, Inc. | | | |
| 4.00%, 09/01/36 | 670,000 | | 742,990 |
| Global Marine, Inc. | | | |
| 7.00%, 06/01/28 | 25,000 | | 22,438 |
| Goldman Sachs Capital II | | | |
| (Variable, ICE LIBOR USD 3M + 0.77%), 4.00%, 02/10/20† ρ | 40,000 | | 35,061 |
| Goldman Sachs Group, Inc. (The) | | | |
| (Variable, ICE LIBOR USD 3M + 1.51%), 3.69%, 06/05/28^ | 325,000 | | 346,065 |
| (Variable, ICE LIBOR USD 3M + 1.16%), 3.81%, 04/23/29^ | 340,000 | | 365,066 |
| 6.75%, 10/01/37 | 355,000 | | 493,767 |
| | | Par | | Value |
| 5.15%, 05/22/45 | $810,000 | | $997,127 |
| Goodyear Tire & Rubber Co. (The) | | | |
| 4.88%, 03/15/27Δ | 420,000 | | 435,477 |
| 7.00%, 03/15/28 | 350,000 | | 393,655 |
| Hanesbrands, Inc. | | | |
| 4.63%, 05/15/24 144A | 110,000 | | 116,233 |
| 4.88%, 05/15/26 144A | 560,000 | | 593,936 |
| HCA, Inc. | | | |
| 5.00%, 03/15/24 | 40,000 | | 43,768 |
| 8.36%, 04/15/24 | 50,000 | | 61,000 |
| 5.38%, 02/01/25 | 20,000 | | 22,158 |
| 7.69%, 06/15/25 | 140,000 | | 169,108 |
| 7.58%, 09/15/25 | 360,000 | | 433,800 |
| 5.88%, 02/15/26 | 8,000 | | 9,112 |
| 5.25%, 06/15/26 | 360,000 | | 403,841 |
| 5.38%, 09/01/26 | 20,000 | | 22,326 |
| 4.50%, 02/15/27 | 320,000 | | 345,613 |
| 7.05%, 12/01/27 | 15,000 | | 17,794 |
| 5.63%, 09/01/28 | 440,000 | | 502,238 |
| 4.13%, 06/15/29 | 335,000 | | 356,145 |
| 7.50%, 11/06/33 | 105,000 | | 132,599 |
| 7.75%, 07/15/36 | 65,000 | | 77,675 |
| 5.25%, 06/15/49 | 370,000 | | 414,905 |
| Healthcare Trust of America Holdings LP REIT | | | |
| 3.10%, 02/15/30 | 275,000 | | 273,470 |
| Hercules LLC | | | |
| 6.50%, 06/30/29 | 130,000 | | 137,800 |
| Hewlett Packard Enterprise Co. | | | |
| 3.60%, 10/15/20 | 175,000 | | 177,008 |
| Hilton Worldwide Finance LLC | | | |
| 4.63%, 04/01/25 | 180,000 | | 185,475 |
| 4.88%, 04/01/27 | 520,000 | | 553,462 |
| Intelsat Jackson Holdings SA | | | |
| 5.50%, 08/01/23 | 110,000 | | 94,724 |
| International Business Machines Corporation | | | |
| 1.63%, 05/15/20 | 365,000 | | 364,909 |
| 4.15%, 05/15/39 | 150,000 | | 169,517 |
| 4.25%, 05/15/49 | 400,000 | | 458,511 |
| International Lease Finance Corporation | | | |
| 4.63%, 04/15/21 | 155,000 | | 159,882 |
| IQVIA, Inc. | | | |
| 2.25%, 01/15/28(E) | 800,000 | | 929,627 |
| Iron Mountain, Inc. REIT | | | |
| 4.88%, 09/15/29 144A | 395,000 | | 402,158 |
| iStar, Inc. REIT | | | |
| 3.13%, 09/15/22 CONV | 220,000 | | 247,242 |
| J.C. Penney Corporation, Inc. | | | |
| 6.38%, 10/15/36 | 240,000 | | 79,200 |
| 7.63%, 03/01/97 | 405,000 | | 113,400 |
| Jefferies Group LLC | | | |
| 5.13%, 01/20/23 | 155,000 | | 167,492 |
| 6.45%, 06/08/27Δ | 20,000 | | 23,481 |
| 6.25%, 01/15/36 | 570,000 | | 682,049 |
| 6.50%, 01/20/43Δ | 260,000 | | 310,441 |
See Notes to Financial Statements.
| | | Par | | Value |
| JELD-WEN, Inc. | | | |
| 4.88%, 12/15/27 144A Δ | $380,000 | | $389,632 |
| JPMorgan Chase & Co. | | | |
| (Variable, ICE LIBOR USD 3M + 3.33%), 6.13%, 04/30/24ρ ^ | 190,000 | | 207,711 |
| (Variable, Euribor 3M + 0.84%), 1.64%, 05/18/28(E) ^ | 250,000 | | 301,561 |
| Kinder Morgan Energy Partners LP | | | |
| 4.15%, 02/01/24 | 375,000 | | 397,935 |
| 6.50%, 02/01/37 | 40,000 | | 49,963 |
| 6.95%, 01/15/38 | 50,000 | | 66,330 |
| Kinder Morgan, Inc. | | | |
| 4.30%, 03/01/28 | 95,000 | | 103,674 |
| 7.75%, 01/15/32 | 560,000 | | 772,481 |
| 5.55%, 06/01/45 | 400,000 | | 476,722 |
| Kraft Heinz Foods Co. | | | |
| 4.88%, 02/15/25 144A | 80,000 | | 82,199 |
| 3.75%, 04/01/30 144A | 350,000 | | 360,963 |
| 5.20%, 07/15/45 | 50,000 | | 54,384 |
| 4.88%, 10/01/49 144A | 130,000 | | 137,433 |
| Kroger Co. (The) | | | |
| 5.40%, 01/15/49 | 75,000 | | 91,761 |
| Kronos International, Inc. | | | |
| 3.75%, 09/15/25(E) | 455,000 | | 520,581 |
| L3Harris Technologies, Inc. | | | |
| 5.05%, 04/27/45 | 620,000 | | 765,987 |
| Lamb Weston Holdings, Inc. | | | |
| 4.63%, 11/01/24 144A | 320,000 | | 340,267 |
| 4.88%, 11/01/26 144A | 1,020,000 | | 1,083,087 |
| Lennar Corporation | | | |
| 4.75%, 11/15/22 | 160,000 | | 168,285 |
| 4.75%, 11/29/27 | 720,000 | | 777,132 |
| LHMC Finco 2 S.a.r.l. | | | |
| Cash Coupon 7.25% or PIK 8.00%, 7.25%, 10/02/25(E) Δ | 550,000 | | 642,384 |
| Lions Gate Capital Holdings LLC | | | |
| 5.88%, 11/01/24 144A | 360,000 | | 362,849 |
| Lockheed Martin Corporation | | | |
| 3.80%, 03/01/45 | 780,000 | | 867,732 |
| Marathon Oil Corporation | | | |
| 4.40%, 07/15/27Δ | 340,000 | | 370,077 |
| Masco Corporation | | | |
| 7.75%, 08/01/29 | 62,000 | | 80,524 |
| 6.50%, 08/15/32 | 27,000 | | 33,174 |
| Match Group, Inc. | | | |
| 5.00%, 12/15/27 144A Δ | 690,000 | | 721,290 |
| Mauser Packaging Solutions Holding Co. | | | |
| 4.75%, 04/15/24(E) | 900,000 | | 1,048,917 |
| MBIA Insurance Corporation | | | |
| 13.26%, 01/15/33 144A | 215,000 | | 147,738 |
| Michaels Stores, Inc. | | | |
| 8.00%, 07/15/27 144A Δ | 70,000 | | 66,980 |
| Microchip Technology, Inc. | | | |
| 4.33%, 06/01/23 | 375,000 | | 396,476 |
| 1.63%, 02/15/25 CONV | 145,000 | | 312,294 |
| Midas Intermediate Holdco II LLC | | | |
| 7.88%, 10/01/22 144A | 505,000 | | 462,233 |
| | | Par | | Value |
| MMS USA Financing, Inc. | | | |
| 1.75%, 06/13/31(E) | $600,000 | | $684,794 |
| Morgan Stanley | | | |
| 5.75%, 01/25/21 | 105,000 | | 109,074 |
| 3.13%, 08/05/21(C) | 535,000 | | 418,021 |
| 4.10%, 05/22/23 | 190,000 | | 200,753 |
| 6.25%, 08/09/26 | 205,000 | | 249,870 |
| 4.35%, 09/08/26 | 475,000 | | 519,989 |
| 3.95%, 04/23/27 | 65,000 | | 69,797 |
| (Variable, ICE LIBOR USD 3M + 1.34%), 3.59%, 07/22/28^ | 625,000 | | 665,078 |
| MPLX LP | | | |
| 4.50%, 07/15/23 | 15,000 | | 15,951 |
| 6.38%, 05/01/24 144A | 140,000 | | 146,634 |
| 4.88%, 06/01/25 | 40,000 | | 43,729 |
| 4.70%, 04/15/48 | 350,000 | | 357,212 |
| MPT Operating Partnership LP REIT | | | |
| 2.55%, 12/05/23(U) | 350,000 | | 472,420 |
| 5.25%, 08/01/26 | 240,000 | | 254,103 |
| 5.00%, 10/15/27 | 1,000,000 | | 1,062,525 |
| Mutual of Omaha Insurance Co. | | | |
| 6.80%, 06/15/36 144A | 605,000 | | 791,994 |
| Nationstar Mortgage Holdings, Inc. | | | |
| 9.13%, 07/15/26 144A | 210,000 | | 232,838 |
| Navient Corporation | | | |
| 8.00%, 03/25/20 | 140,000 | | 141,685 |
| 5.88%, 03/25/21 | 230,000 | | 238,108 |
| 5.50%, 01/25/23 | 865,000 | | 925,550 |
| 6.13%, 03/25/24 | 750,000 | | 815,617 |
| 5.88%, 10/25/24 | 245,000 | | 262,760 |
| 6.75%, 06/15/26Δ | 170,000 | | 187,162 |
| Netflix, Inc. | | | |
| 3.63%, 05/15/27(E) | 900,000 | | 1,083,801 |
| Newell Brands, Inc. | | | |
| 3.85%, 04/01/23 | 320,000 | | 332,740 |
| Newfield Exploration Co. | | | |
| 5.63%, 07/01/24 | 480,000 | | 528,203 |
| Newmont Goldcorp Corporation | | | |
| 4.88%, 03/15/42 | 290,000 | | 340,190 |
| NGL Energy Partners LP | | | |
| 7.50%, 11/01/23 | 165,000 | | 165,411 |
| 6.13%, 03/01/25 | 375,000 | | 354,531 |
| NGPL PipeCo LLC | | | |
| 4.38%, 08/15/22 144A | 430,000 | | 446,905 |
| 7.77%, 12/15/37 144A | 200,000 | | 258,928 |
| Noble Holding International, Ltd. | | | |
| 7.88%, 02/01/26 144A | 105,000 | | 76,424 |
| NRG Energy, Inc. | | | |
| 7.25%, 05/15/26 | 160,000 | | 175,096 |
| Nuance Communications, Inc. | | | |
| 1.25%, 04/01/25 CONV Δ | 80,000 | | 89,264 |
| 1.00%, 12/15/35 CONV | 720,000 | | 726,749 |
| Oasis Petroleum, Inc. | | | |
| 6.88%, 01/15/23Δ | 50,000 | | 49,000 |
| Occidental Petroleum Corporation | | | |
| 3.20%, 08/15/26 | 375,000 | | 379,834 |
| 3.50%, 08/15/29Δ | 665,000 | | 679,420 |
See Notes to Financial Statements.
SCHEDULE OF INVESTMENTS (Continued)
| | | Par | | Value |
| 4.50%, 07/15/44 | $215,000 | | $217,549 |
| Old Republic International Corporation | | | |
| 4.88%, 10/01/24 | 265,000 | | 290,791 |
| ON Semiconductor Corporation | | | |
| 1.00%, 12/01/20 CONV | 325,000 | | 442,485 |
| ONEOK Partners LP | | | |
| 4.90%, 03/15/25 | 35,000 | | 38,572 |
| 6.20%, 09/15/43 | 15,000 | | 19,022 |
| Oracle Corporation | | | |
| 4.00%, 07/15/46 | 85,000 | | 94,769 |
| Owens Corning | | | |
| 7.00%, 12/01/36 | 523,000 | | 652,489 |
| Owens-Brockway Glass Container, Inc. | | | |
| 5.38%, 01/15/25 144A | 755,000 | | 779,851 |
| Pactiv LLC | | | |
| 8.38%, 04/15/27 | 140,000 | | 156,499 |
| Penn Mutual Life Insurance Co. (The) | | | |
| 7.63%, 06/15/40 144A | 345,000 | | 497,039 |
| Plains All American Pipeline LP | | | |
| 3.55%, 12/15/29 | 290,000 | | 286,679 |
| Prime Security Services Borrower LLC | | | |
| 5.25%, 04/15/24 144A | 1,430,000 | | 1,515,922 |
| PulteGroup, Inc. | | | |
| 7.88%, 06/15/32 | 755,000 | | 972,607 |
| 6.38%, 05/15/33 | 240,000 | | 280,973 |
| 6.00%, 02/15/35 | 95,000 | | 106,409 |
| QEP Resources, Inc. | | | |
| 5.38%, 10/01/22 | 160,000 | | 161,250 |
| 5.25%, 05/01/23 | 755,000 | | 749,337 |
| Quicken Loans, Inc. | | | |
| 5.75%, 05/01/25 144A | 1,335,000 | | 1,382,840 |
| 5.25%, 01/15/28 144A | 90,000 | | 93,359 |
| Radian Group, Inc. | | | |
| 4.50%, 10/01/24Δ | 75,000 | | 79,531 |
| 4.88%, 03/15/27 | 45,000 | | 47,491 |
| Range Resources Corporation | | | |
| 5.00%, 08/15/22Δ | 265,000 | | 260,362 |
| 5.00%, 03/15/23Δ | 795,000 | | 733,236 |
| 4.88%, 05/15/25Δ | 120,000 | | 102,900 |
| Reliance Holding USA, Inc. | | | |
| 4.50%, 10/19/20 144A | 540,000 | | 548,709 |
| Reynolds Group Issuer, Inc. | | | |
| 5.75%, 10/15/20 | 38,764 | | 38,861 |
| 5.13%, 07/15/23 144A | 670,000 | | 687,309 |
| Rovi Corporation | | | |
| 0.50%, 03/01/20 CONV | 495,000 | | 492,166 |
| Seagate HDD Cayman | | | |
| 4.88%, 06/01/27 | 125,000 | | 132,959 |
| Sealed Air Corporation | | | |
| 4.88%, 12/01/22 144A Δ | 15,000 | | 15,923 |
| Sensata Technologies, Inc. | | | |
| 4.38%, 02/15/30 144A | 720,000 | | 735,800 |
| | | Par | | Value |
| ServiceMaster Co. LLC (The) | | | |
| 7.45%, 08/15/27 | $600,000 | | $679,708 |
| SM Energy Co. | | | |
| 1.50%, 07/01/21 CONV | 120,000 | | 114,803 |
| 5.00%, 01/15/24Δ | 25,000 | | 23,885 |
| 6.75%, 09/15/26Δ | 40,000 | | 39,314 |
| 6.63%, 01/15/27Δ | 135,000 | | 132,999 |
| Southern Copper Corporation | | | |
| 5.25%, 11/08/42 | 870,000 | | 1,004,353 |
| Southwestern Energy Co. | | | |
| 6.20%, 01/23/25 | 145,000 | | 133,355 |
| Spectrum Brands, Inc. | | | |
| 5.75%, 07/15/25 | 570,000 | | 596,368 |
| 5.00%, 10/01/29 144A | 90,000 | | 93,181 |
| Springleaf Finance Corporation | | | |
| 6.13%, 05/15/22 | 585,000 | | 629,606 |
| 8.25%, 10/01/23 | 30,000 | | 35,037 |
| 6.88%, 03/15/25 | 265,000 | | 302,097 |
| Sprint Capital Corporation | | | |
| 6.88%, 11/15/28 | 1,440,000 | | 1,554,264 |
| 8.75%, 03/15/32 | 550,000 | | 668,580 |
| Sprint Communications, Inc. | | | |
| 11.50%, 11/15/21 | 410,000 | | 469,171 |
| Sprint Corporation | | | |
| 7.88%, 09/15/23 | 490,000 | | 541,653 |
| Synchrony Financial | | | |
| 2.85%, 07/25/22 | 640,000 | | 648,140 |
| Targa Resources Partners LP | | | |
| 4.25%, 11/15/23 | 310,000 | | 313,746 |
| 6.75%, 03/15/24 | 530,000 | | 550,532 |
| 5.13%, 02/01/25 | 40,000 | | 41,600 |
| 5.88%, 04/15/26 | 620,000 | | 659,912 |
| 5.38%, 02/01/27 | 40,000 | | 41,574 |
| Tenet Healthcare Corporation | | | |
| 6.75%, 06/15/23 | 145,000 | | 159,615 |
| 5.13%, 05/01/25 | 515,000 | | 531,737 |
| 6.88%, 11/15/31 | 160,000 | | 163,656 |
| Textron, Inc. | | | |
| 6.63%, 04/07/20(U) | 70,000 | | 93,924 |
| Time Warner Cable LLC | | | |
| 5.50%, 09/01/41 | 35,000 | | 39,175 |
| 4.50%, 09/15/42 | 55,000 | | 56,354 |
| TransDigm, Inc. | | | |
| 6.50%, 07/15/24 | 104,000 | | 107,477 |
| 6.50%, 05/15/25 | 100,000 | | 104,209 |
| Transocean Proteus, Ltd. | | | |
| 6.25%, 12/01/24 144A | 560,000 | | 578,432 |
| Transocean, Inc. | | | |
| 5.80%, 10/15/22Δ | 220,000 | | 212,919 |
| 7.50%, 04/15/31Δ | 30,000 | | 23,326 |
| 6.80%, 03/15/38Δ | 215,000 | | 153,209 |
| UAL Pass-Through Trust, Series 2007-1 | | | |
| 6.64%, 07/02/22 | 60,289 | | 64,167 |
See Notes to Financial Statements.
| | | Par | | Value |
| UGI International LLC | | | |
| 3.25%, 11/01/25(E) | $425,000 | | $504,887 |
| United Airlines Pass-Through Trust, Series 2014-1, Class A | | | |
| 4.00%, 04/11/26 | 93,875 | | 100,030 |
| United Airlines Pass-Through Trust, Series 2014-2, Class B | | | |
| 4.63%, 09/03/22 | 56,396 | | 58,213 |
| United Airlines Pass-Through Trust, Series 2016-2, Class B | | | |
| 3.65%, 10/07/25 | 82,871 | | 84,110 |
| United Rentals North America, Inc. | | | |
| 4.63%, 10/15/25 | 110,000 | | 113,320 |
| 6.50%, 12/15/26 | 110,000 | | 121,100 |
| 5.50%, 05/15/27 | 250,000 | | 268,449 |
| 3.88%, 11/15/27 | 390,000 | | 398,892 |
| 4.88%, 01/15/28 | 300,000 | | 312,924 |
| 5.25%, 01/15/30Δ | 410,000 | | 442,041 |
| United States Steel Corporation | | | |
| 6.65%, 06/01/37Δ | 325,000 | | 264,366 |
| United Technologies Corporation | | | |
| 4.63%, 11/16/48 | 370,000 | | 464,354 |
| UnitedHealth Group, Inc. | | | |
| 3.88%, 08/15/59Δ | 270,000 | | 292,524 |
| US Airways Pass-Through Trust, Series 2012-1, Class A | | | |
| 5.90%, 10/01/24 | 96,528 | | 107,390 |
| US Airways Pass-Through Trust, Series 2012-2, Class A | | | |
| 4.63%, 06/03/25 | 79,663 | | 86,117 |
| Valvoline, Inc. | | | |
| 5.50%, 07/15/24 | 190,000 | | 197,679 |
| 4.38%, 08/15/25 | 470,000 | | 486,354 |
| Verizon Communications, Inc. | | | |
| 4.52%, 09/15/48 | 375,000 | | 450,676 |
| Viking Cruises, Ltd. | | | |
| 5.88%, 09/15/27 144A | 90,000 | | 96,354 |
| Vine Oil & Gas LP | | | |
| 9.75%, 04/15/23 144A | 30,000 | | 15,150 |
| VOC Escrow, Ltd. | | | |
| 5.00%, 02/15/28 144A | 280,000 | | 293,818 |
| Volkswagen Group of America Finance LLC | | | |
| 2.70%, 09/26/22 144A | 475,000 | | 480,743 |
| Walmart, Inc. | | | |
| 3.70%, 06/26/28 | 275,000 | | 303,231 |
| Wells Fargo & Co. | | | |
| 4.48%, 01/16/24 | 90,000 | | 97,260 |
| (Variable, ICE LIBOR USD 3M + 3.99%), 5.88%, 06/15/25ρ ^ | 170,000 | | 189,270 |
| 1.00%, 02/02/27(E) | 400,000 | | 463,094 |
| Western Digital Corporation | | | |
| 1.50%, 02/01/24 CONV | 170,000 | | 167,344 |
| Westlake Chemical Corporation | | | |
| 1.63%, 07/17/29 | 200,000 | | 224,112 |
| WestRock MWV LLC | | | |
| 8.20%, 01/15/30 | 75,000 | | 103,541 |
| | | Par | | Value |
| 7.95%, 02/15/31 | $25,000 | | $34,512 |
| Weyerhaeuser Co. REIT | | | |
| 8.50%, 01/15/25 | 205,000 | | 259,518 |
| 6.95%, 10/01/27 | 30,000 | | 37,871 |
| 7.38%, 03/15/32 | 190,000 | | 262,920 |
| 6.88%, 12/15/33 | 250,000 | | 331,731 |
| Whiting Petroleum Corporation | | | |
| 5.75%, 03/15/21 | 215,000 | | 203,874 |
| 6.25%, 04/01/23Δ | 470,000 | | 394,800 |
| 6.63%, 01/15/26Δ | 365,000 | | 249,662 |
| William Lyon Homes, Inc. | | | |
| 7.00%, 08/15/22 | 2,000 | | 2,006 |
| Williams Cos., Inc. (The) | | | |
| 7.50%, 01/15/31 | 40,000 | | 52,241 |
| 5.75%, 06/24/44 | 320,000 | | 379,773 |
| Windstream Services LLC | | | |
| 10.50%, 06/30/24 144A # | 35,000 | | 13,752 |
| 9.00%, 06/30/25 144A # | 265,000 | | 101,472 |
| WMG Acquisition Corporation | | | |
| 3.63%, 10/15/26(E) | 635,000 | | 755,907 |
| WPX Energy, Inc. | | | |
| 8.25%, 08/01/23 | 310,000 | | 357,404 |
| XPO Logistics, Inc. | | | |
| 6.50%, 06/15/22 144A | 10,000 | | 10,208 |
| 6.13%, 09/01/23 144A | 350,000 | | 362,035 |
Total Corporate Bonds
(Cost $125,980,928) | | | 134,445,597 |
| FOREIGN BONDS — 36.2% |
| Angola — 0.1% | | |
| Angolan Government International Bond | | | |
| 9.50%, 11/12/25 | 200,000 | | 234,673 |
| 9.38%, 05/08/48 | 200,000 | | 220,001 |
| | | | | 454,674 |
| Argentina — 0.6% | | |
| Argentina Bonar Bonds | | | |
| (Floating, Argentina Deposit Rates Badlar Private Banks 30-35 Days + 3.25%), 45.14%, 03/01/20(ZA) † | 8,300,000 | | 113,322 |
| (Floating, Argentina Deposit Rates Badlar Private Banks 30-35 Days + 2.00%), 42.37%, 04/03/22(ZA) † ††† | 22,940,000 | | 247,654 |
| Argentina POM Politica Monetaria | | | |
| (Floating, Argentina Blended Historical Policy Rate + 0.00%), 56.61%, 06/21/20(ZA) † | 20,760,000 | | 229,893 |
| Argentine Bonos del Tesoro | | | |
| 18.20%, 10/03/21(ZA) | 65,390,000 | | 428,899 |
| Argentine Republic Government International Bond | | | |
| 6.88%, 04/22/21 | 310,000 | | 168,299 |
| 7.50%, 04/22/26 | 610,000 | | 318,937 |
| 5.88%, 01/11/28 | 930,000 | | 439,748 |
See Notes to Financial Statements.
SCHEDULE OF INVESTMENTS (Continued)
| | | Par | | Value |
| 7.63%, 04/22/46 | $680,000 | | $344,036 |
| Pampa Energia SA | | | |
| 7.50%, 01/24/27 144A | 1,300,000 | | 1,112,187 |
| Provincia de Buenos Aires | | | |
| 7.88%, 06/15/27 144A | 560,000 | | 242,200 |
| YPF SA | | | |
| 16.50%, 05/09/22(ZA) | 450,000 | | 3,758 |
| | | | | 3,648,933 |
| Armenia — 0.1% | | |
| Republic of Armenia International Bond | | | |
| 3.95%, 09/26/29 144A | 500,000 | | 496,636 |
| 3.95%, 09/26/29 | 200,000 | | 198,654 |
| | | | | 695,290 |
| Australia — 0.1% | | |
| Commonwealth Bank of Australia | | | |
| 3.74%, 09/12/39 144A | 450,000 | | 452,359 |
| Austria — 0.1% | | |
| Suzano Austria GmbH | | | |
| 5.75%, 07/14/26 144A Δ | 370,000 | | 414,529 |
| Azerbaijan — 0.2% | | |
| Southern Gas Corridor CJSC | | | |
| 6.88%, 03/24/26 | 510,000 | | 605,602 |
| State Oil Co. of the Azerbaijan Republic | | | |
| 4.75%, 03/13/23 | 400,000 | | 421,316 |
| | | | | 1,026,918 |
| Belgium — 0.3% | | |
| House of Finance NV (The) | | | |
| 4.38%, 07/15/26(E) | 340,000 | | 393,573 |
| Solvay SA | | | |
| (Variable, EUR Swap Rate 5Y + 3.92%), 4.25%, 12/04/23(E) ρ Δ ^ | 900,000 | | 1,124,314 |
| | | | | 1,517,887 |
| Bermuda — 0.1% | | |
| Bermuda Government International Bond | | | |
| 3.72%, 01/25/27 | 200,000 | | 210,572 |
| 4.75%, 02/15/29 | 200,000 | | 226,319 |
| | | | | 436,891 |
| Brazil — 1.2% | | |
| Brazil Minas SPE via State of Minas Gerais | | | |
| 5.33%, 02/15/28 | 180,000 | | 193,474 |
| Brazil Notas do Tesouro Nacional Serie F | | | |
| 10.00%, 01/01/23(B) | 10,300,000 | | 2,845,104 |
| 10.00%, 01/01/27(B) | 927,000 | | 272,101 |
| Brazilian Government International Bond | | | |
| 10.25%, 01/10/28(B) | 2,630,000 | | 770,115 |
| 4.63%, 01/13/28Δ | 720,000 | | 774,540 |
| | | Par | | Value |
| CSN Resources SA | | | |
| 7.63%, 04/17/26 | $200,000 | | $213,369 |
| Itau Unibanco Holding SA | | | |
| (Variable, U.S. Treasury Yield Curve Rate CMT 5Y + 3.98%), 6.13%, 12/12/22 144A ρ ^ | 760,000 | | 794,398 |
| Ultrapar International SA | | | |
| 5.25%, 10/06/26 144A | 420,000 | | 452,175 |
| Vale Overseas, Ltd. | | | |
| 6.88%, 11/21/36 | 200,000 | | 260,687 |
| Vale SA | | | |
| 3.75%, 01/10/23(E) | 570,000 | | 695,378 |
| | | | | 7,271,341 |
| Canada — 2.1% | | |
| 1011778 BC ULC | | | |
| 5.00%, 10/15/25 144A | 20,000 | | 20,692 |
| 3.88%, 01/15/28 144A | 720,000 | | 723,132 |
| Bausch Health Cos., Inc. | | | |
| 5.50%, 11/01/25 144A | 270,000 | | 282,713 |
| 9.00%, 12/15/25 144A | 40,000 | | 45,588 |
| 7.25%, 05/30/29 144A | 210,000 | | 240,313 |
| Baytex Energy Corporation | | | |
| 5.13%, 06/01/21 144A | 60,000 | | 59,574 |
| 5.63%, 06/01/24 144A | 60,000 | | 54,775 |
| Bombardier, Inc. | | | |
| 6.13%, 05/15/21(E) | 300,000 | | 354,177 |
| 6.00%, 10/15/22 144A | 605,000 | | 606,331 |
| 7.88%, 04/15/27 144A | 230,000 | | 237,193 |
| Canadian Government Bond | | | |
| 1.00%, 06/01/27(C) | 5,000,000 | | 3,658,658 |
| Canadian Natural Resources, Ltd. | | | |
| 4.95%, 06/01/47Δ | 115,000 | | 140,047 |
| First Quantum Minerals, Ltd. | | | |
| 7.25%, 04/01/23 144A Δ | 300,000 | | 311,209 |
| 7.50%, 04/01/25 144A | 350,000 | | 358,605 |
| 6.88%, 03/01/26 144A Δ | 300,000 | | 304,305 |
| Glencore Finance Canada, Ltd. | | | |
| 6.00%, 11/15/41 | 340,000 | | 380,729 |
| Hudbay Minerals, Inc. | | | |
| 7.63%, 01/15/25 144A | 870,000 | | 920,099 |
| MEG Energy Corporation | | | |
| 6.38%, 01/30/23 144A | 25,000 | | 25,115 |
| 7.00%, 03/31/24 144A Δ | 290,000 | | 292,417 |
| 6.50%, 01/15/25 144A | 20,000 | | 20,844 |
| Province of Ontario Generic Residual STRIP | | | |
| 1.93%, 07/13/22(C) Ω | 2,600,000 | | 1,910,591 |
| 2.36%, 03/08/29(C) Ω | 2,400,000 | | 1,487,240 |
| Rogers Communications, Inc. | | | |
| 3.70%, 11/15/49 | 200,000 | | 202,809 |
| Teine Energy, Ltd. | | | |
| 6.88%, 09/30/22 144A | 40,000 | | 40,112 |
| | | | | 12,677,268 |
See Notes to Financial Statements.
| | | Par | | Value |
| Chile — 0.0% | | |
| Corporation Nacional del Cobre de Chile | | | |
| 3.63%, 08/01/27 144A | $220,000 | | $229,106 |
| China — 0.6% | | |
| Avolon Holdings Funding, Ltd. | | | |
| 3.95%, 07/01/24 144A | 350,000 | | 365,172 |
| China Minmetals Corporation | | | |
| (Variable, 4.72% - U.S. Treasury Yield Curve Rate CMT 5Y), 3.75%, 11/13/22ρ ^ | 250,000 | | 253,502 |
| Chinalco Capital Holdings, Ltd. | | | |
| (Variable, 5.79% - U.S. Treasury Yield Curve Rate CMT 5Y), 4.10%, 09/11/24ρ Δ ^ | 200,000 | | 202,775 |
| Dianjian International Finance, Ltd. | | | |
| (Variable, 6.93% - U.S. Treasury Yield Curve Rate CMT 5Y), 4.60%, 03/13/23ρ ^ | 200,000 | | 206,791 |
| Huarong Finance 2017 Co., Ltd. | | | |
| (Variable, 7.77% - U.S. Treasury Yield Curve Rate CMT 5Y), 4.50%, 01/24/22ρ ^ | 200,000 | | 203,500 |
| Park Aerospace Holdings, Ltd. | | | |
| 5.25%, 08/15/22 144A | 220,000 | | 235,007 |
| 4.50%, 03/15/23 144A | 190,000 | | 199,484 |
| 5.50%, 02/15/24 144A | 830,000 | | 912,303 |
| Sinopec Group Overseas Development 2015, Ltd. | | | |
| 3.25%, 04/28/25 | 250,000 | | 258,309 |
| Sinopec Group Overseas Development 2018, Ltd. | | | |
| 2.50%, 08/08/24 | 200,000 | | 200,898 |
| Swissport Financing S.a.r.l. | | | |
| 5.25%, 08/15/24(E) | 300,000 | | 358,720 |
| 9.00%, 02/15/25(E) | 325,000 | | 389,160 |
| | | | | 3,785,621 |
| Colombia — 1.0% | | |
| Colombia Government International Bond | | | |
| 4.50%, 03/15/29 | 300,000 | | 333,554 |
| 5.63%, 02/26/44 | 3,170,000 | | 3,949,614 |
| 5.00%, 06/15/45 | 200,000 | | 232,987 |
| Colombian TES | | | |
| 10.00%, 07/24/24(X) | 23,100,000 | | 8,336 |
| Ecopetrol SA | | | |
| 5.88%, 09/18/23Δ | 140,000 | | 155,314 |
| Millicom International Cellular SA | | | |
| 5.13%, 01/15/28 144A Δ | 1,300,000 | | 1,366,765 |
| | | | | 6,046,570 |
| Costa Rica — 0.1% | | |
| Costa Rica Government International Bond | | | |
| 7.16%, 03/12/45 | 340,000 | | 363,268 |
| Croatia — 0.1% | | |
| Croatia Government International Bond | | | |
| 6.00%, 01/26/24 | 200,000 | | 229,517 |
| | | Par | | Value |
| 1.13%, 06/19/29(E) Δ | $200,000 | | $232,065 |
| | | | | 461,582 |
| Denmark — 0.2% | | |
| Danske Bank A/S | | | |
| (Variable, EUR Swap Rate 6Y + 4.64%), 5.75%, 04/06/20(E) ρ ^ | 570,000 | | 647,057 |
| DKT Finance ApS | | | |
| 7.00%, 06/17/23(E) | 530,000 | | 631,206 |
| | | | | 1,278,263 |
| Dominican Republic — 0.1% | | |
| Dominican Republic International Bond | | | |
| 6.85%, 01/27/45 | 220,000 | | 251,831 |
| Ecuador — 0.2% | | |
| Ecuador Government International Bond | | | |
| 8.88%, 10/23/27 | 460,000 | | 423,360 |
| 7.88%, 01/23/28 | 1,060,000 | | 945,104 |
| | | | | 1,368,464 |
| Egypt — 0.3% | | |
| Egypt Government International Bond | | | |
| 7.60%, 03/01/29 144A | 360,000 | | 394,675 |
| 7.60%, 03/01/29 | 600,000 | | 657,792 |
| 6.38%, 04/11/31(E) | 350,000 | | 421,310 |
| 7.90%, 02/21/48 | 200,000 | | 210,458 |
| | | | | 1,684,235 |
| El Salvador — 0.0% | | |
| El Salvador Government International Bond | | | |
| 7.12%, 01/20/50Δ | 150,000 | | 160,172 |
| France — 1.9% | | |
| 3AB Optique Developpement SAS | | | |
| 4.00%, 10/01/23(E) 144A | 100,000 | | 115,971 |
| Altice France SA | | | |
| 7.38%, 05/01/26 144A | 790,000 | | 849,637 |
| 3.38%, 01/15/28(E) Δ | 1,700,000 | | 1,970,136 |
| Arkema SA | | | |
| (Variable, 2.87% - EUR Swap Rate 5Y), 2.75%, 06/17/24(E) ρ ^ | 400,000 | | 477,844 |
| BNP Paribas SA | | | |
| (Variable, Euribor 3M + 1.80%), 2.13%, 01/23/27(E) ^ | 600,000 | | 735,406 |
| (Variable, USD Swap 5Y + 3.98%), 7.00%, 08/16/28 144A ρ ^ | 300,000 | | 348,270 |
| Burger King France SAS | | | |
| (Floating, 5.25% - Euribor 3M), 5.25%, 05/01/23(E) 144A † | 130,000 | | 148,616 |
| 6.00%, 05/01/24(E) 144A | 120,000 | | 141,670 |
| Casino Guichard Perrachon SA | | | |
| 4.05%, 08/05/26(E) | 700,000 | | 670,033 |
| Constellium SE | | | |
| 4.25%, 02/15/26(E) | 430,000 | | 504,036 |
See Notes to Financial Statements.
SCHEDULE OF INVESTMENTS (Continued)
| | | Par | | Value |
| Credit Agricole SA | | | |
| (Variable, EUR Swap Rate 5Y + 5.12%), 6.50%, 06/23/21(E) ρ ^ | $300,000 | | $364,238 |
| Crown European Holdings SA | | | |
| 2.88%, 02/01/26(E) Δ | 630,000 | | 768,717 |
| Europcar Mobility Group | | | |
| 4.00%, 04/30/26(E) | 480,000 | | 524,013 |
| Hercule Debtco S.a.r.l. | | | |
| Cash Coupon 6.75% or PIK 7.5%, 6.75%, 06/30/24(E) 144A | 590,000 | | 580,732 |
| La Financiere Atalian SASU | | | |
| 4.00%, 05/15/24(E) | 285,000 | | 259,731 |
| Loxam SAS | | | |
| 5.75%, 07/15/27(E) | 695,000 | | 824,174 |
| Novafives SAS | | | |
| 5.00%, 06/15/25(E) Δ | 640,000 | | 646,853 |
| Orange SA | | | |
| 0.50%, 09/04/32(E) | 700,000 | | 740,492 |
| Orano SA | | | |
| 3.38%, 04/23/26(E) | 600,000 | | 724,409 |
| Paprec Holding SA | | | |
| 4.00%, 03/31/25(E) | 385,000 | | 417,387 |
| | | | | 11,812,365 |
| Germany — 1.6% | | |
| Bundesrepublik Deutschland Bundesanleihe | | | |
| 1.00%, 08/15/24(E) | 780,000 | | 936,480 |
| CeramTec BondCo GmbH | | | |
| 5.25%, 12/15/25(E) | 860,000 | | 1,011,545 |
| EnBW Energie Baden-Wuerttemberg AG | | | |
| (Variable, 3.63% - EUR Swap Rate 5Y), 3.38%, 04/05/77(E) ^ | 135,000 | | 160,218 |
| IHO Verwaltungs GmbH | | | |
| PIK 4.63%, 3.88%, 05/15/27(E) | 325,000 | | 386,881 |
| Infineon Technologies AG | | | |
| (Variable, 4.00% - EUR Swap Rate 5Y), 3.63%, 01/01/28(E) ρ Δ ^ | 500,000 | | 587,490 |
| KME SE | | | |
| 6.75%, 02/01/23(E) 144A | 480,000 | | 433,425 |
| Nidda BondCo GmbH | | | |
| 5.00%, 09/30/25(E) | 890,000 | | 1,048,104 |
| Platin 1426 GmbH | | | |
| 5.38%, 06/15/23(E) 144A | 340,000 | | 385,688 |
| 5.38%, 06/15/23(E) Δ | 800,000 | | 907,500 |
| SGL Carbon SE | | | |
| 4.63%, 09/30/24(E) | 725,000 | | 796,968 |
| Techem Verwaltungsgesellschaft 674 mbH | | | |
| 6.00%, 07/30/26(E) | 1,035,000 | | 1,257,464 |
| Volkswagen Bank GmbH | | | |
| 1.25%, 06/10/24(E) | 100,000 | | 115,319 |
| | | Par | | Value |
| 1.25%, 12/15/25(E) | $1,660,000 | | $1,919,554 |
| | | | | 9,946,636 |
| Ghana — 0.2% | | |
| Ghana Government International Bond | | | |
| 7.63%, 05/16/29 144A Δ | 640,000 | | 654,078 |
| 10.75%, 10/14/30 | 200,000 | | 256,574 |
| 10.75%, 10/14/30 144A | 340,000 | | 436,175 |
| | | | | 1,346,827 |
| Greece — 0.0% | | |
| Navios Maritime Acquisition Corporation | | | |
| 8.13%, 11/15/21 144A | 60,000 | | 47,535 |
| Guatemala — 0.1% | | |
| Guatemala Government Bond | | | |
| 4.38%, 06/05/27 144A | 540,000 | | 560,438 |
| Honduras — 0.2% | | |
| Honduras Government International Bond | | | |
| 7.50%, 03/15/24 | 460,000 | | 513,091 |
| 6.25%, 01/19/27 144A Δ | 440,000 | | 481,403 |
| | | | | 994,494 |
| Indonesia — 1.9% | | |
| Indonesia Government International Bond | | | |
| 5.88%, 01/15/24 144A | 400,000 | | 453,253 |
| 4.75%, 02/11/29 | 200,000 | | 229,239 |
| 5.25%, 01/17/42 144A | 1,940,000 | | 2,341,078 |
| 5.25%, 01/17/42 | 460,000 | | 555,101 |
| Indonesia Treasury Bond | | | |
| 7.00%, 05/15/27(I) | 21,835,000,000 | | 1,570,607 |
| 8.25%, 05/15/29(I) | 76,029,000,000 | | 5,916,105 |
| Perusahaan Listrik Negara PT | | | |
| 5.45%, 05/21/28 | 200,000 | | 230,375 |
| | | | | 11,295,758 |
| Ireland — 0.4% | | |
| AerCap Ireland Capital DAC | | | |
| 3.50%, 05/26/22 | 150,000 | | 154,250 |
| 4.45%, 10/01/25 | 400,000 | | 430,446 |
| Ardagh Packaging Finance PLC | | | |
| 6.00%, 02/15/25 144A | 500,000 | | 525,625 |
| 4.75%, 07/15/27(U) | 460,000 | | 641,762 |
| GE Capital International Funding Co. Unlimited Co. | | | |
| 3.37%, 11/15/25 | 246,000 | | 256,534 |
| 4.42%, 11/15/35 | 369,000 | | 395,392 |
| | | | | 2,404,009 |
| Israel — 0.2% | | |
| Summit Properties, Ltd. | | | |
| 2.00%, 01/31/25(E) | 800,000 | | 880,355 |
See Notes to Financial Statements.
| | | Par | | Value |
| Italy — 2.7% | | |
| Intesa Sanpaolo SpA | | | |
| (Variable, EUR Swap Rate 5Y + 6.88%), 7.00%, 01/19/21(E) ρ ^ | $550,000 | | $653,514 |
| Italy Buoni Poliennali Del Tesoro | | | |
| 2.05%, 08/01/27(E) | 2,870,000 | | 3,446,799 |
| 3.45%, 03/01/48(E) 144A | 3,700,000 | | 5,056,603 |
| Rossini S.a.r.l. | | | |
| 6.75%, 10/30/25(E) | 705,000 | | 883,718 |
| Telecom Italia Capital SA | | | |
| 6.38%, 11/15/33 | 360,000 | | 400,266 |
| 6.00%, 09/30/34 | 105,000 | | 112,856 |
| Telecom Italia Finance SA | | | |
| 7.75%, 01/24/33(E) Δ | 650,000 | | 1,093,970 |
| Telecom Italia SpA | | | |
| 5.30%, 05/30/24 144A | 1,290,000 | | 1,389,962 |
| 3.63%, 05/25/26(E) | 1,400,000 | | 1,739,832 |
| UniCredit SpA | | | |
| (Variable, EUR Swap Rate 5Y + 6.39%), 6.63%, 06/03/23(E) ρ ^ | 1,120,000 | | 1,362,809 |
| | | | | 16,140,329 |
| Ivory Coast — 0.2% | | |
| Ivory Coast Government International Bond | | | |
| 5.25%, 03/22/30(E) | 150,000 | | 171,994 |
| 5.75%, 12/31/32Δ STEP | 171,000 | | 176,318 |
| 5.75%, 12/31/32 144A STEP | 418,950 | | 419,729 |
| 6.13%, 06/15/33 | 200,000 | | 202,241 |
| | | | | 970,282 |
| Japan — 0.2% | | |
| Japan Government Thirty Year Bond | | | |
| 0.70%, 12/20/48(J) | 45,000,000 | | 447,740 |
| SoftBank Group Corporation | | | |
| 5.00%, 04/15/28(E) | 805,000 | | 999,423 |
| | | | | 1,447,163 |
| Jersey — 0.6% | | |
| Avis Budget Finance Plc | | | |
| 4.75%, 01/30/26(E) | 425,000 | | 512,477 |
| Delphi Technologies PLC | | | |
| 5.00%, 10/01/25 144A Δ | 780,000 | | 723,450 |
| Glencore Finance Europe, Ltd. | | | |
| 2.75%, 04/01/21(E) | 505,000 | | 581,443 |
| LHC3 PLC | | | |
| Cash Coupon 4.13% or PIK 4.88%, 4.13%, 08/15/24(E) | 540,000 | | 627,827 |
| TVL Finance PLC | | | |
| (Floating, ICE LIBOR GBP 3M + 5.38%), 6.16%, 07/15/25(U) † | 800,000 | | 1,066,303 |
| | | | | 3,511,500 |
| Kazakhstan — 0.3% | | |
| Kazakhstan Government International Bond | | | |
| 6.50%, 07/21/45 | 200,000 | | 295,534 |
| | | Par | | Value |
| KazMunayGas National Co. JSC | | | |
| 5.38%, 04/24/30 144A | $500,000 | | $580,926 |
| 5.38%, 04/24/30 | 300,000 | | 348,555 |
| KazTransGas JSC | | | |
| 4.38%, 09/26/27 144A | 630,000 | | 662,116 |
| | | | | 1,887,131 |
| Kenya — 0.0% | | |
| Kenya Government International Bond | | | |
| 8.00%, 05/22/32 | 200,000 | | 218,433 |
| Luxembourg — 0.6% | | |
| Altice Finco SA | | | |
| 4.75%, 01/15/28(E) | 450,000 | | 511,453 |
| Altice Luxembourg SA | | | |
| 8.00%, 05/15/27(E) | 1,115,000 | | 1,405,469 |
| ArcelorMittal SA | | | |
| 7.00%, 10/15/39 | 260,000 | | 317,434 |
| 6.75%, 03/01/41 | 350,000 | | 417,584 |
| Eurofins Scientific SE | | | |
| (Variable, 7.01% - Euribor 3M), 4.88%, 04/29/23(E) ρ ^ | 560,000 | | 660,750 |
| Vivion Investments S.a.r.l. | | | |
| 3.00%, 08/08/24(E) | 500,000 | | 573,833 |
| | | | | 3,886,523 |
| Mexico — 3.0% | | |
| Banco Mercantil del Norte SA | | | |
| (Variable, U.S. Treasury Yield Curve Rate CMT 5Y + 5.04%), 6.88%, 07/06/22 144A ρ ^ | 260,000 | | 272,596 |
| (Variable, U.S. Treasury Yield Curve Rate CMT 10Y + 5.47%), 7.50%, 06/27/29 144A ρ ^ | 325,000 | | 347,347 |
| BBVA Bancomer SA | | | |
| (Variable, U.S. Treasury Yield Curve Rate CMT 5Y + 2.65%), 5.13%, 01/18/33 144A ^ | 630,000 | | 637,110 |
| Cemex SAB de CV | | | |
| 2.75%, 12/05/24(E) Δ | 440,000 | | 505,941 |
| Mexican Bonos | | | |
| 6.50%, 06/09/22(M) | 32,810,000 | | 1,726,926 |
| 8.00%, 12/07/23(M) | 20,808,900 | | 1,147,436 |
| 10.00%, 12/05/24(M) | 15,794,700 | | 948,968 |
| 7.50%, 06/03/27(M) | 139,360,700 | | 7,662,019 |
| 8.50%, 05/31/29(M) | 1,002,900 | | 59,080 |
| 7.75%, 05/29/31(M) | 1,504,300 | | 84,951 |
| 7.75%, 11/13/42(M) | 45,250,000 | | 2,540,390 |
| Mexico City Airport Trust | | | |
| 5.50%, 07/31/47 | 200,000 | | 206,939 |
| Mexico Government International Bond | | | |
| 5.75%, 10/12/10« | 360,000 | | 427,117 |
| Orbia Advance Corp SAB de CV | | | |
| 5.88%, 09/17/44 144A | 1,100,000 | | 1,162,915 |
See Notes to Financial Statements.
SCHEDULE OF INVESTMENTS (Continued)
| | | Par | | Value |
| Petroleos Mexicanos | | | |
| 7.69%, 01/23/50 | $390,000 | | $426,962 |
| | | | | 18,156,697 |
| Mongolia — 0.0% | | |
| Mongolia Government International Bond | | | |
| 8.75%, 03/09/24 | 200,000 | | 227,488 |
| Morocco & Antilles — 0.1% | | |
| OCP SA | | | |
| 5.63%, 04/25/24 144A | 350,000 | | 387,895 |
| 4.50%, 10/22/25 144A | 320,000 | | 343,139 |
| | | | | 731,034 |
| Netherlands — 3.7% | | |
| ABN AMRO Bank NV | | | |
| 7.13%, 07/06/22(E) | 540,000 | | 709,879 |
| Alcoa Nederland Holding BV | | | |
| 6.75%, 09/30/24 144A | 380,000 | | 400,740 |
| 7.00%, 09/30/26 144A | 250,000 | | 273,287 |
| CBR Fashion Finance BV | | | |
| 5.13%, 10/01/22(E) | 640,000 | | 739,848 |
| Cooperatieve Rabobank UA | | | |
| (Variable, EUR Swap Rate 5Y + 4.10%), 4.63%, 12/29/25(E) ρ ^ | 600,000 | | 742,445 |
| 5.75%, 12/01/43 | 630,000 | | 834,675 |
| Darling Global Finance BV | | | |
| 3.63%, 05/15/26(E) | 425,000 | | 504,730 |
| E.ON International Finance BV | | | |
| 6.38%, 06/07/32(U) | 155,000 | | 294,913 |
| EDP Finance BV | | | |
| 4.13%, 01/15/20 144A | 275,000 | | 275,042 |
| Embraer Netherlands Finance BV | | | |
| 5.40%, 02/01/27 | 130,000 | | 146,686 |
| Equate Petrochemical BV | | | |
| 4.25%, 11/03/26 144A | 380,000 | | 407,045 |
| LeasePlan Corporation NV | | | |
| (Variable, 7.56% - EURIBOR ICE Swap Rate 5Y +), 7.38%, 05/29/24(E) ρ ^ | 515,000 | | 647,401 |
| Lincoln Financing S.a.r.l. | | | |
| 3.63%, 04/01/24(E) | 325,000 | | 379,317 |
| LKQ European Holdings BV | | | |
| 4.13%, 04/01/28(E) | 700,000 | | 875,930 |
| Maxeda DIY Holding BV | | | |
| 6.13%, 07/15/22(E) Δ | 470,000 | | 513,998 |
| Petrobras Global Finance BV | | | |
| 6.25%, 03/17/24 | 2,770,000 | | 3,111,084 |
| 4.75%, 01/14/25(E) | 1,000,000 | | 1,296,124 |
| 6.88%, 01/20/40 | 80,000 | | 94,016 |
| 6.90%, 03/19/49 | 380,000 | | 446,414 |
| Prosus NV | | | |
| 4.85%, 07/06/27 144A | 1,200,000 | | 1,311,371 |
| Repsol International Finance BV | | | |
| (Variable, EUR Swap Rate 10Y + 4.20%), 4.50%, 03/25/75(E) ^ | 800,000 | | 1,036,855 |
| | | Par | | Value |
| Starfruit Finco BV | | | |
| 6.50%, 10/01/26(E) Δ | $325,000 | | $391,894 |
| Summer BidCo BV | | | |
| Cash Coupon 9.00% or PIK 9.75%, 9.00%, 11/15/25(E) | 430,000 | | 516,664 |
| Sunshine Mid BV | | | |
| 6.50%, 05/15/26(E) | 430,000 | | 517,702 |
| Syngenta Finance NV | | | |
| 4.44%, 04/24/23 144A | 660,000 | | 689,684 |
| Telefonica Europe BV | | | |
| (Variable, EUR Swap Rate 8Y + 2.97%), 3.88%, 06/22/26(E) ρ ^ | 1,000,000 | | 1,222,893 |
| Teva Pharmaceutical Finance Netherlands II BV | | | |
| 1.88%, 03/31/27(E) | 300,000 | | 278,967 |
| Trivium Packaging Finance BV | | | |
| 3.75%, 08/15/26(E) | 735,000 | | 875,854 |
| 5.50%, 08/15/26 144A | 540,000 | | 570,037 |
| UPC Holding BV | | | |
| 5.50%, 01/15/28 144A | 310,000 | | 314,836 |
| 3.88%, 06/15/29(E) | 600,000 | | 706,197 |
| UPCB Finance IV, Ltd. | | | |
| 5.38%, 01/15/25 144A | 250,000 | | 257,521 |
| Ziggo BV | | | |
| 4.25%, 01/15/27(E) | 950,000 | | 1,151,464 |
| | | | | 22,535,513 |
| Nigeria — 0.3% | | |
| Nigeria Government International Bond | | | |
| 7.14%, 02/23/30 144A | 440,000 | | 449,429 |
| 7.63%, 11/28/47 144A | 1,310,000 | | 1,280,073 |
| 9.25%, 01/21/49 | 310,000 | | 347,267 |
| | | | | 2,076,769 |
| Norway — 0.0% | | |
| Norway Government Bond | | | |
| 3.75%, 05/25/21(K) 144A | 64,000 | | 7,533 |
| Oman — 0.0% | | |
| Oman Government International Bond | | | |
| 6.75%, 01/17/48 | 200,000 | | 201,567 |
| Panama — 0.2% | | |
| Panama Government International Bond | | | |
| 3.75%, 03/16/25 | 860,000 | | 916,257 |
| 6.70%, 01/26/36 | 202,000 | | 283,748 |
| | | | | 1,200,005 |
| Paraguay — 0.0% | | |
| Paraguay Government International Bond | | | |
| 6.10%, 08/11/44 | 200,000 | | 245,987 |
| Peru — 0.5% | | |
| Peruvian Government International Bond | | | |
| 3.75%, 03/01/30(E) | 150,000 | | 216,923 |
See Notes to Financial Statements.
| | | Par | | Value |
| 6.55%, 03/14/37Δ | $640,000 | | $938,198 |
| Transportadora de Gas del Peru SA | | | |
| 4.25%, 04/30/28 144A | 1,670,000 | | 1,789,585 |
| | | | | 2,944,706 |
| Philippines — 0.0% | | |
| Philippine Government International Bond | | | |
| 4.00%, 01/15/21Δ | 100,000 | | 102,275 |
| Poland — 0.3% | | |
| Republic of Poland Government Bond | | | |
| 2.75%, 04/25/28(P) | 5,370,000 | | 1,484,410 |
| Qatar — 0.1% | | |
| Ooredoo International Finance, Ltd. | | | |
| 4.75%, 02/16/21 144A | 200,000 | | 206,321 |
| Qatar Government International Bond | | | |
| 4.00%, 03/14/29Δ | 200,000 | | 223,600 |
| 4.82%, 03/14/49 | 200,000 | | 248,090 |
| | | | | 678,011 |
| Russia — 1.9% | | |
| Gazprom PJSC Via Gaz Capital SA | | | |
| 5.15%, 02/11/26 | 250,000 | | 278,713 |
| Russian Federal Bond - OFZ | | | |
| 7.00%, 01/25/23(Q) | 189,690,000 | | 3,178,531 |
| 7.05%, 01/19/28(Q) | 449,500,000 | | 7,649,638 |
| Russian Foreign Bond - Eurobond | | | |
| 4.75%, 05/27/26 | 400,000 | | 447,096 |
| 5.10%, 03/28/35 | 200,000 | | 239,948 |
| | | | | 11,793,926 |
| Saudi Arabia — 0.1% | | |
| Saudi Arabian Oil Co. | | | |
| 4.25%, 04/16/39 | 410,000 | | 440,062 |
| Senegal — 0.0% | | |
| Senegal Government International Bond | | | |
| 6.75%, 03/13/48Δ | 200,000 | | 201,787 |
| Serbia — 0.1% | | |
| Serbia International Bond | | | |
| 7.25%, 09/28/21 | 400,000 | | 436,260 |
| 1.50%, 06/26/29(E) | 200,000 | | 228,728 |
| | | | | 664,988 |
| Singapore — 0.1% | | |
| BOC Aviation, Ltd. | | | |
| 3.00%, 03/30/20 144A | 720,000 | | 720,841 |
| South Africa — 0.9% | | |
| Republic of South Africa Government Bond | | | |
| 6.25%, 03/31/36(S) Δ | 2,140,000 | | 109,504 |
| 6.50%, 02/28/41(S) Δ | 49,220,000 | | 2,449,324 |
| Republic of South Africa Government International Bond | | | |
| 4.88%, 04/14/26 | 400,000 | | 417,091 |
| 5.88%, 06/22/30 | 2,270,000 | | 2,459,477 |
| | | | | 5,435,396 |
| | | Par | | Value |
| South Korea — 0.0% | | |
| Hanwha Life Insurance Co., Ltd. | | | |
| (Variable, U.S. Treasury Yield Curve Rate CMT 5Y + 2.00%), 4.70%, 04/23/23ρ ^ | $200,000 | | $204,230 |
| Spain — 1.0% | | |
| Grupo Antolin-Irausa SA | | | |
| 3.38%, 04/30/26(E) Δ | 515,000 | | 546,163 |
| Iberdrola Finanzas SA | | | |
| 7.38%, 01/29/24(U) | 100,000 | | 163,929 |
| Spain Government Bond | | | |
| 1.95%, 07/30/30(E) 144A | 2,830,000 | | 3,640,177 |
| Tasty Bondco 1 SA | | | |
| 6.25%, 05/15/26(E) | 750,000 | | 883,949 |
| Telefonica Emisiones SA | | | |
| 5.13%, 04/27/20 | 40,000 | | 40,381 |
| Tendam Brands SAU | | | |
| 5.00%, 09/15/24(E) 144A | 510,000 | | 589,258 |
| (Floating, 5.25% - Euribor 3M), 5.25%, 09/15/24(E) 144A † | 160,000 | | 181,154 |
| | | | | 6,045,011 |
| Sri Lanka — 0.2% | | |
| Sri Lanka Government International Bond | | | |
| 5.88%, 07/25/22 | 640,000 | | 641,711 |
| 6.85%, 11/03/25 | 200,000 | | 200,984 |
| 6.75%, 04/18/28 | 500,000 | | 479,969 |
| | | | | 1,322,664 |
| Supranational — 0.0% | | |
| Banque Ouest Africaine de Developpement | | | |
| 5.00%, 07/27/27 | 200,000 | | 212,500 |
| Switzerland — 0.2% | | |
| Credit Suisse Group AG | | | |
| (Variable, USD Swap 5Y + 4.60%), 7.50%, 07/17/23 144A ρ ^ | 330,000 | | 361,371 |
| UBS Group AG | | | |
| (Variable, USD Swap 5Y + 4.34%), 7.00%, 01/31/24 144A ρ ^ | 400,000 | | 437,500 |
| (Variable, EUR Swap Rate 1Y + 0.75%), 1.25%, 04/17/25(E) ^ | 400,000 | | 467,301 |
| | | | | 1,266,172 |
| Tunisia — 0.0% | | |
| Banque Centrale de Tunisie International Bond | | | |
| 6.38%, 07/15/26(E) Δ | 150,000 | | 167,379 |
| Turkey — 0.8% | | |
| Export Credit Bank of Turkey | | | |
| 5.38%, 10/24/23 | 200,000 | | 199,456 |
| Turk Telekomunikasyon AS | | | |
| 4.88%, 06/19/24 144A | 1,890,000 | | 1,887,638 |
| Turkey Government International Bond | | | |
| 4.88%, 10/09/26 | 300,000 | | 287,251 |
See Notes to Financial Statements.
SCHEDULE OF INVESTMENTS (Continued)
| | | Par | | Value |
| 6.00%, 03/25/27 | $1,570,000 | | $1,594,889 |
| 6.00%, 01/14/41 | 200,000 | | 186,995 |
| 4.88%, 04/16/43 | 500,000 | | 413,500 |
| | | | | 4,569,729 |
| Ukraine — 0.5% | | |
| Ukraine Government International Bond | | | |
| 6.75%, 06/20/26(E) | 200,000 | | 252,468 |
| 9.75%, 11/01/28 | 550,000 | | 670,244 |
| 7.38%, 09/25/32 | 1,790,000 | | 1,913,898 |
| | | | | 2,836,610 |
| United Arab Emirates — 0.3% | | |
| Abu Dhabi Crude Oil Pipeline LLC | | | |
| 4.60%, 11/02/47 | 400,000 | | 463,250 |
| DP World Crescent, Ltd. | | | |
| 3.88%, 07/18/29 | 200,000 | | 205,512 |
| DP World PLC | | | |
| 5.63%, 09/25/48 144A | 970,000 | | 1,123,880 |
| | | | | 1,792,642 |
| United Kingdom — 3.3% | | |
| Anglo American Capital PLC | | | |
| 4.75%, 04/10/27 144A | 200,000 | | 218,959 |
| 3.38%, 03/11/29(U) | 500,000 | | 695,644 |
| Barclays Bank PLC | | | |
| 7.63%, 11/21/22 | 1,190,000 | | 1,338,113 |
| Barclays PLC | | | |
| (Variable, EUR Swap Rate 5Y + 2.45%), 2.63%, 11/11/25(E) ^ | 200,000 | | 228,538 |
| 4.38%, 01/12/26 | 225,000 | | 243,752 |
| (Variable, EUR Swap Rate 1Y + 0.78%), 1.38%, 01/24/26(E) ^ | 300,000 | | 347,128 |
| British Telecommunications PLC | | | |
| 3.25%, 11/08/29 144A | 475,000 | | 475,645 |
| eG Global Finance PLC | | | |
| 4.38%, 02/07/25(E) | 660,000 | | 743,561 |
| HSBC Holdings PLC | | | |
| (Variable, USD ICE Swap Rate 5Y + 4.37%), 6.38%, 03/30/25ρ Δ ^ | 400,000 | | 435,286 |
| (Variable, GBP Swap Rate 1Y + 1.04%), 2.26%, 11/13/26(U) ^ | 300,000 | | 403,965 |
| (Variable, USD ICE Swap Rate 5Y + 3.75%), 6.00%, 05/22/27ρ ^ | 400,000 | | 426,608 |
| INEOS Finance PLC | | | |
| 2.88%, 05/01/26(E) Δ | 950,000 | | 1,104,244 |
| Iron Mountain UK PLC REIT | | | |
| 3.88%, 11/15/25(U) | 570,000 | | 773,924 |
| Jerrold Finco PLC | | | |
| 6.13%, 01/15/24(U) 144A | 270,000 | | 370,830 |
| Lloyds Bank PLC | | | |
| 6.50%, 03/24/20(E) | 230,000 | | 261,735 |
| Lloyds Banking Group PLC | | | |
| 4.34%, 01/09/48 | 796,000 | | 863,435 |
| | | Par | | Value |
| Miller Homes Group Holdings PLC | | | |
| 5.50%, 10/15/24(U) Δ | $1,530,000 | | $2,110,420 |
| Next Group PLC | | | |
| 4.38%, 10/02/26(U) | 150,000 | | 223,620 |
| NGG Finance PLC | | | |
| (Variable, GBP Swap Rate 12Y + 3.48%), 5.63%, 06/18/73(U) ^ | 400,000 | | 601,368 |
| Orange SA | | | |
| 3.63%, 05/18/28(U) | 150,000 | | 212,818 |
| Pinnacle Bidco PLC | | | |
| 6.38%, 02/15/25(U) 144A | 580,000 | | 806,682 |
| Premier Foods Finance PLC | | | |
| 6.25%, 10/15/23(U) | 460,000 | | 640,330 |
| Principality Building Society | | | |
| 2.38%, 11/23/23(U) | 100,000 | | 134,762 |
| Rio Tinto Finance USA PLC | | | |
| 4.13%, 08/21/42Δ | 75,000 | | 86,191 |
| Royal Bank of Scotland Group PLC | | | |
| 6.10%, 06/10/23 | 945,000 | | 1,041,104 |
| 6.00%, 12/19/23 | 140,000 | | 155,799 |
| (Variable, Euribor 3M + 1.74%), 2.00%, 03/04/25(E) ^ | 100,000 | | 118,659 |
| Santander UK Group Holdings PLC | | | |
| (Variable, GBP Swap Rate 5Y + 5.54%), 7.38%, 06/24/22(U) ρ ^ | 820,000 | | 1,186,507 |
| Southern Gas Networks PLC | | | |
| 4.88%, 12/21/20(U) | 190,000 | | 260,734 |
| Tesco Property Finance 6 PLC | | | |
| 5.41%, 07/13/44(U) | 391,278 | | 659,042 |
| United Kingdom Gilt | | | |
| 4.50%, 09/07/34(U) | 220,000 | | 426,890 |
| Virgin Media Secured Finance PLC | | | |
| 5.50%, 08/15/26 144A | 200,000 | | 210,465 |
| 5.25%, 05/15/29(U) | 890,000 | | 1,277,348 |
| Virgin Money UK PLC | | | |
| (Variable, UK Government Bonds 1 Year Note Generic Bid Yield + 3.75%), 4.00%, 09/03/27(U) ^ | 300,000 | | 414,568 |
| Vodafone Group PLC | | | |
| (Variable, GBP Swap Rate 5Y + 3.27%), 4.88%, 10/03/78(U) ^ | 535,000 | | 769,517 |
| | | | | 20,268,191 |
| Uruguay — 0.0% | | |
| Uruguay Government International Bond | | | |
| 4.38%, 01/23/31Δ | 200,000 | | 224,050 |
| Uzbekistan — 0.0% | | |
| Republic of Uzbekistan Bond | | | |
| 5.38%, 02/20/29Δ | 200,000 | | 222,758 |
Total Foreign Bonds
(Cost $222,175,945) | | 220,555,911 |
See Notes to Financial Statements.
| | | Par | | Value |
| FOREIGN GOVERNMENT INFLATION-LINKED BOND — 0.3% |
| Japan — 0.3% | | |
| Japanese Government CPI Linked Bond | | | |
0.10%, 03/10/29(J)
(Cost $2,004,730) | $212,369,390 | | $2,008,521 |
| LOAN AGREEMENTS — 2.3% |
| Air Medical Group Holdings, Inc. 2018 Term Loan | | | |
| (Floating, ICE LIBOR USD 1M + 3.25%, 1.00% Floor), 5.04%, 04/28/22† | 289,545 | | 284,523 |
| Allied Universal Holdco LLC Delayed Draw Term Loan | | | |
| 0.00%, 07/10/26Σ | 45,045 | | 45,373 |
| Allied Universal Holdco LLC Initial Term Loan | | | |
| (Floating, ICE LIBOR USD 1M + 4.25%), 6.05%, 07/10/26† | 454,955 | | 458,272 |
| Asurion LLC New B-7 Term Loan | | | |
| 0.00%, 11/03/24† Σ | 528,658 | | 532,340 |
| Avolon TLB Borrower 1 (US) LLC Term B-3 Loan | | | |
| (Floating, ICE LIBOR USD 1M + 1.75%, 0.75% Floor), 3.51%, 01/15/25† | 187,810 | | 189,219 |
| Bausch Health Companies, Inc. Initial Term Loan | | | |
| (Floating, ICE LIBOR USD 1M + 3.00%), 4.74%, 06/02/25† | 303,782 | | 305,902 |
| Berry Global, Inc. Term W Loan | | | |
| (Floating, ICE LIBOR USD 1M + 2.00%), 3.72%, 10/01/22† | 142,322 | | 143,034 |
| Brookfield WEC Holdings, Inc. Initial Term Loan | | | |
| (Floating, ICE LIBOR USD 1M + 3.50%, 0.75% Floor), 5.30%, 08/01/25† | 349,118 | | 352,063 |
| Change Healthcare Holdings, Inc. Closing Date Term Loan | | | |
| (Floating, ICE LIBOR USD 1M + 2.50%, 1.00% Floor), 4.30%, 03/01/24† | 967,281 | | 1,006,199 |
| Charter Communications Operating LLC Term B-1 Loan | | | |
| (Floating, ICE LIBOR USD 1M + 1.75%), 3.55%, 04/30/25† | 597,442 | | 602,296 |
| Entercom Media Corporation Term B-2 Loan | | | |
| (Floating, ICE LIBOR USD 1M + 2.50%), 4.30%, 11/18/24† | 184,267 | | 185,994 |
| Equinox Holdings, Inc. Incremental Term B-1 Loan | | | |
| 0.00%, 03/08/24† Σ | 508,699 | | 511,515 |
| Flying Fortress Holdings LLC New Loan | | | |
| (Floating, ICE LIBOR USD 3M + 1.75%), 3.69%, 10/30/22† | 177,333 | | 178,220 |
| Focus Financial Partners LLC Tranche B-2 Term Loan | | | |
| (Floating, ICE LIBOR USD 1M + 2.50%), 4.30%, 07/03/24† | 279,291 | | 281,586 |
| | | Par | | Value |
| Four Seasons Holdings, Inc. Term Loan 2013 | | | |
| 0.00%, 11/30/23† Σ | $229,409 | | $231,532 |
| Garda World Security Corporation Initial Term Loan | | | |
| (Floating, ICE LIBOR USD 3M + 4.75%), 6.66%, 10/30/26† | 590,000 | | 594,797 |
| Genesee & Wyoming, Inc. Term Loan | | | |
| 0.00%, 12/30/26† Σ | 180,000 | | 181,960 |
| Grifols Worldwide Operations, Ltd. Dollar Tranche B Term Loan | | | |
| 0.00%, 11/15/27† Σ | 520,000 | | 525,065 |
| Hilton Worldwide Finance LLC Refinanced Series B-2 Term Loan | | | |
| 0.00%, 06/22/26† Σ | 300,000 | | 302,394 |
| (Floating, ICE LIBOR USD 1M + 1.75%), 3.54%, 06/22/26† | 339,605 | | 342,315 |
| Jaguar Holding Co. I LLC 2018 Term Loan | | | |
| (Floating, ICE LIBOR USD 1M + 2.50%, 1.00% Floor), 4.30%, 08/18/22† | 244,994 | | 246,636 |
| Level 3 Financing, Inc. Tranche B 2027 Term Loan | | | |
| (Floating, ICE LIBOR USD 1M + 1.75%), 3.55%, 03/01/27† | 74,212 | | 74,560 |
| McAfee LLC Term B USD Loan | | | |
| 0.00%, 09/30/24† Σ | 329,167 | | 331,018 |
| Nexstar Broadcasting, Inc. Term B-4 Loan | | | |
| 0.00%, 09/18/26† Σ | 119,700 | | 120,537 |
| Option Care Health, Inc. Term B Loan | | | |
| (Floating, ICE LIBOR USD 1M + 4.50%), 6.30%, 08/06/26† | 590,000 | | 588,401 |
| Party City Holdings, Inc. 2018 Replacement Term Loan | | | |
| (Floating, ICE LIBOR USD 1M + 2.50%, 0.75% Floor), 4.30%, 08/19/22† | 132,476 | | 123,568 |
| Petco Animal Supplies, Inc. Term Loan | | | |
| (Floating, ICE LIBOR USD 3M + 3.25%, 1.00% Floor), 5.18%, 01/26/23† | 396,608 | | 338,852 |
| Prime Security Services Borrower LLC 2019 Refinancing Term B-1 Loan | | | |
| (Floating, ICE LIBOR USD 1M + 3.25%, 1.00% Floor), 4.94%, 09/23/26† | 454,236 | | 456,196 |
| Radnet Management, Inc. Term B-1 Loan | | | |
| (Floating, ICE LIBOR USD 1M + 3.50%, 1.00% Floor), 5.51%, 06/30/23† | 591,176 | | 595,241 |
| Reynolds Group Holdings, Inc. Incremental U.S. Term Loan | | | |
| (Floating, ICE LIBOR USD 1M + 2.75%), 4.55%, 02/05/23† | 362,169 | | 363,755 |
| RPI Finance Trust Initial Term Loan B-6 | | | |
| 0.00%, 03/27/23† Σ | 168,528 | | 170,135 |
See Notes to Financial Statements.
SCHEDULE OF INVESTMENTS (Continued)
| | | Par | | Value |
| Sedgwick Claims Management Services, Inc. Initial Term Loan | | | |
| (Floating, ICE LIBOR USD 1M + 3.25%), 5.05%, 12/31/25† | $259,345 | | $259,831 |
| Sotera Health Holdings LLC Initial Term Loan | | | |
| (Floating, ICE LIBOR USD 3M + 4.50%, 1.00% Floor), 6.29%, 12/11/26† | 570,000 | | 573,030 |
| TDC A/S Facility B3 | | | |
| (Floating, EURIBOR USD 1M + 2.75%), 2.75%, 06/04/25† | 820,000 | | 925,902 |
| Trans Union LLC 2019 Replacement Term B-5 Loan | | | |
| (Floating, ICE LIBOR USD 1M + 1.75%), 3.55%, 11/16/26† | 85,374 | | 85,825 |
| UFC Holdings LLC Term Loan | | | |
| 0.00%, 04/29/26† Σ | 119,691 | | 120,646 |
| Univision Communications, Inc. 2017 Replacement Repriced Term Loan | | | |
| (Floating, ICE LIBOR USD 1M + 2.75%, 1.00% Floor), 4.55%, 03/15/24† | 588,812 | | 582,724 |
| VFH Parent LLC Initial Term Loan | | | |
| (Floating, ICE LIBOR USD 1M + 3.50%), 5.20%, 03/01/26† | 600,000 | | 603,075 |
| Virgin Media Bristol LLC N Facility | | | |
| 0.00%, 01/31/28† Σ | 370,000 | | 372,799 |
Total Loan Agreements
(Cost $14,221,587) | | | 14,187,330 |
| MORTGAGE-BACKED SECURITIES — 7.0% |
| Connecticut Avenue Securities Trust, Series 2019-R07, Class 1M2 | | | |
| (Floating, ICE LIBOR USD 1M + 2.10%), 3.89%, 10/25/39 144A † | 700,000 | | 707,426 |
| Credit Suisse Commercial Mortgage Trust Series, Series 2006-C5, Class AJ | | | |
| 5.37%, 12/15/39 | 92,328 | | 50,088 |
| Credit Suisse Commercial Mortgage Trust Series, Series 2007-C5, Class AM | | | |
| 5.87%, 09/15/40 | 87,749 | | 56,160 |
| Credit Suisse Commercial Mortgage Trust Series, Series 2014-USA, Class F | | | |
| 4.37%, 09/15/37 144A | 1,610,000 | | 1,459,885 |
| Credit Suisse Commercial Mortgage Trust Series, Series 2019-RIO | | | |
| 8.74%, 12/15/21 | 1,120,000 | | 1,124,993 |
| Fannie Mae Connecticut Avenue Securities, Series 2017-C02 | | | |
| (Floating, ICE LIBOR USD 1M + 3.65%), 5.44%, 09/25/29† | 1,700,000 | | 1,792,265 |
| | | Par | | Value |
| Fannie Mae Connecticut Avenue Securities, Series 2017-C04 | | | |
| (Floating, ICE LIBOR USD 1M + 2.85%), 4.64%, 11/25/29† | $1,700,000 | | $1,759,601 |
| Fannie Mae Connecticut Avenue Securities, Series 2017-C06 | | | |
| (Floating, ICE LIBOR USD 1M + 2.65%, 2.65% Floor), 4.44%, 02/25/30† | 1,650,000 | | 1,694,678 |
| (Floating, ICE LIBOR USD 1M + 2.80%, 2.80% Floor), 4.59%, 02/25/30† | 1,590,671 | | 1,635,007 |
| Fannie Mae Connecticut Avenue Securities, Series 2018-C05 | | | |
| (Floating, ICE LIBOR USD 1M + 2.35%, 2.35% Floor), 4.14%, 01/25/31† | 1,700,000 | | 1,725,854 |
| Federal National Mortgage Association | | | |
| 3.00%, 07/01/49 | 543,884 | | 552,158 |
| 3.50%, 07/01/49 | 973,423 | | 1,000,888 |
| 3.00%, 08/01/49 | 556,668 | | 565,490 |
| 3.50%, 08/01/49 | 977,834 | | 1,005,805 |
| 4.00%, 08/01/49 | 739,006 | | 769,288 |
| 3.00%, 09/01/49 | 538,901 | | 546,867 |
| 3.50%, 09/01/49 | 1,611,904 | | 1,658,553 |
| 3.00%, 10/01/49 | 543,235 | | 551,354 |
| 3.50%, 10/01/49 | 983,365 | | 1,012,397 |
| 4.00%, 10/01/49 | 736,496 | | 769,312 |
| 3.00%, 11/01/49 | 546,207 | | 554,281 |
| 3.50%, 11/01/49 | 644,373 | | 664,187 |
| FHLMC Structured Agency Credit Risk Debt Notes, Series 2017-DNA1 | | | |
| (Floating, ICE LIBOR USD 1M + 4.95%, 4.95% Floor), 6.74%, 07/25/29† | 760,000 | | 864,902 |
| FHLMC Structured Agency Credit Risk Debt Notes, Series 2017-DNA2 | | | |
| (Floating, ICE LIBOR USD 1M + 5.15%), 6.94%, 10/25/29† | 310,000 | | 358,696 |
| FHLMC Structured Agency Credit Risk Debt Notes, Series 2017-DNA3 | | | |
| (Floating, ICE LIBOR USD 1M + 2.50%), 4.29%, 03/25/30† | 1,650,000 | | 1,690,305 |
| Government National Mortgage Association | | | |
| 4.00%, 04/20/49 | 106,110 | | 109,925 |
| 3.50%, 10/20/49 | 1,824 | | 1,887 |
| 3.00%, 11/20/49 | 399,066 | | 410,338 |
| 4.00%, 11/20/49 | 499,398 | | 521,075 |
| 3.00%, 01/01/50 TBA | 475,000 | | 488,044 |
See Notes to Financial Statements.
| | | Par | | Value |
| GS Mortgage Securities Corporation II, Series 2018-SRP5, Class C | | | |
| (Floating, ICE LIBOR USD 1M + 3.75%, 3.75% Floor), 5.49%, 09/15/31 144A † | $2,220,000 | | $2,222,618 |
| Impac Secured Assets Trust, Series 2006-2, Class 2M3 | | | |
| (Floating, ICE LIBOR USD 1M + 1.10%, 1.10% Floor, 11.50% Cap), 2.89%, 08/25/36† | 373,301 | | 372,478 |
| JP Morgan Chase Commercial Mortgage Securities Trust, Series 2007-LD12, Class AJ | | | |
| 6.44%, 02/15/51† γ | 2,777 | | 2,652 |
| JP Morgan Chase Commercial Mortgage Securities Trust, Series 2018-PHMZ, Class M | | | |
| (Floating, ICE LIBOR USD 1M + 8.21%, 8.21% Floor), 9.95%, 06/15/35 144A † | 1,500,000 | | 1,498,901 |
| Lone Star Portfolio Trust, Series 2015-LSMZ, Class M | | | |
| (Floating, ICE LIBOR USD 1M + 7.22%, 7.22% Floor), 8.96%, 09/15/20 144A † | 285,733 | | 285,045 |
| Lone Star Portfolio Trust, Series 2015-LSP, Class F | | | |
| (Floating, ICE LIBOR USD 1M + 7.15%, 6.90% Floor), 8.89%, 09/15/28 144A † | 588,724 | | 593,057 |
| Seasoned Credit Risk Transfer Trust, Series 2017-2, Class M1 | | | |
| 4.00%, 08/25/56 144A † γ | 440,000 | | 445,883 |
| Seasoned Credit Risk Transfer Trust, Series 2017-2, Class M2 | | | |
| 4.00%, 08/25/56 144A | 570,000 | | 565,791 |
| STACR Trust, Series 2018-DNA2, Class M2 | | | |
| (Floating, ICE LIBOR USD 1M + 2.15%), 3.94%, 12/25/30 144A † | 1,650,000 | | 1,667,750 |
| Uniform Mortgage Backed Securities | | | |
| 2.50%, 01/01/35 TBA | 735,000 | | 741,776 |
| 3.00%, 01/01/50 TBA | 1,735,000 | | 1,759,805 |
| 3.50%, 01/01/50 TBA | 4,400,000 | | 4,526,672 |
| 4.00%, 01/01/50 TBA | 1,800,000 | | 1,872,281 |
Total Mortgage-Backed Securities
(Cost $42,448,993) | | | 42,656,418 |
| MUNICIPAL BOND — 0.0% |
| State of Illinois, General Obligation | | | |
5.10%, 06/01/33
(Cost $69,035) | 85,000 | | 91,703 |
| U.S. TREASURY OBLIGATIONS — 25.9% |
| U.S. Treasury Bills | | | | |
| 1.57%, 01/30/20Ω | 830,000 | | 829,064 |
| 1.82%, 02/27/20Ω | 3,510,000 | | 3,501,783 |
| 1.57%, 03/26/20Ω | 6,795,000 | | 6,771,174 |
| 1.40%, 04/02/20Ω Δ | 17,695,000 | | 17,627,012 |
| 1.47%, 04/09/20Ω | 5,075,000 | | 5,053,997 |
| | | Par | | Value |
| 1.51%, 04/30/20Ω | $1,700,000 | | $1,691,450 |
| 1.52%, 06/25/20Ω | 2,685,000 | | 2,665,017 |
| | | | | 38,139,497 |
| U.S. Treasury Bonds | | | | |
| 3.50%, 02/15/39 | 860,000 | | 1,032,789 |
| 4.25%, 05/15/39 | 30,000 | | 39,558 |
| 3.88%, 08/15/40 | 20,000 | | 25,263 |
| 2.75%, 08/15/42 | 90,000 | | 96,363 |
| 3.13%, 02/15/43 | 6,960,000 | | 7,912,922 |
| 2.88%, 05/15/43 | 2,220,000 | | 2,424,786 |
| 3.00%, 05/15/45 | 30,000 | | 33,581 |
| 3.00%, 11/15/45 | 920,000 | | 1,031,981 |
| 2.50%, 05/15/46 | 820,000 | | 839,587 |
| 2.25%, 08/15/46 | 960,000 | | 935,700 |
| 2.88%, 11/15/46 | 1,520,000 | | 1,671,941 |
| 3.00%, 05/15/47 | 60,000 | | 67,602 |
| 2.75%, 08/15/47 | 90,000 | | 96,794 |
| 3.13%, 05/15/48 | 40,000 | | 46,190 |
| 3.00%, 08/15/48 | 2,365,000 | | 2,671,249 |
| 3.38%, 11/15/48 | 770,000 | | 931,730 |
| | | | | 19,858,036 |
| U.S. Treasury Inflationary Index Bonds | | | | |
| 0.13%, 04/15/22 | 15,608,303 | | 15,586,298 |
| 2.13%, 02/15/40 | 2,381,300 | | 3,114,270 |
| 1.38%, 02/15/44 | 2,760,525 | | 3,257,789 |
| | | | | 21,958,357 |
| U.S. Treasury Notes | | | | |
| 3.63%, 02/15/21 | 10,420,000 | | 10,649,159 |
| 1.50%, 09/30/21 | 2,500,000 | | 2,496,582 |
| 1.50%, 10/31/21 | 1,000,000 | | 998,789 |
| 1.50%, 11/30/21Δ | 2,665,000 | | 2,661,825 |
| 1.88%, 01/31/22 | 710,000 | | 714,313 |
| 2.00%, 02/15/22 | 90,000 | | 90,788 |
| 1.75%, 03/31/22 | 7,100,000 | | 7,128,150 |
| 1.63%, 08/15/22 | 12,590,000 | | 12,604,508 |
| 2.88%, 10/31/23 | 2,975,000 | | 3,110,095 |
| 2.75%, 02/15/24 | 6,650,000 | | 6,938,080 |
| 2.38%, 02/29/24 | 10,000 | | 10,287 |
| 1.50%, 10/31/24 | 570,000 | | 565,346 |
| 2.25%, 11/15/24 | 20,520,000 | | 21,063,459 |
| 2.00%, 02/15/25 | 70,000 | | 71,034 |
| 2.88%, 05/31/25 | 315,000 | | 333,734 |
| 1.63%, 02/15/26 | 7,180,000 | | 7,118,718 |
| 1.63%, 05/15/26 | 470,000 | | 465,373 |
| 2.00%, 11/15/26 | 1,220,000 | | 1,234,392 |
| | | | | 78,254,632 |
Total U.S. Treasury Obligations
(Cost $154,315,252) | | | 158,210,522 |
See Notes to Financial Statements.
SCHEDULE OF INVESTMENTS (Continued)
| | | Shares | | Value |
| COMMON STOCKS — 0.7% |
| Communication Services — 0.3% | | |
| AT&T, Inc. | 39,385 | | $1,539,166 |
| Consumer Discretionary — 0.1% | | |
| Ford Motor Co. | 48,562 | | 451,627 |
| Energy — 0.0% | | |
| Berry Petroleum CorporationΔ | 2,492 | | 23,500 |
| Hercules Offshore, Inc.Ψ ††† Δ * | 46,644 | | 47,636 |
| Montage Resources CorporationΔ * | 7,129 | | 56,604 |
| | | | | 127,740 |
| Health Care — 0.1% | | |
| Bristol-Myers Squibb Co. | 11,549 | | 741,330 |
| Information Technology — 0.2% | | |
| Corning, Inc. | 39,882 | | 1,160,965 |
Total Common Stocks
(Cost $5,689,353) | | | 4,020,828 |
| PREFERRED STOCKS — 0.2% |
| Bank of America Corporation | | | |
| 7.25%, 12/30/19 CONV | 302 | | 437,598 |
| Chesapeake Energy Corporation | | | |
| 5.00%, 10/31/19 CONV Δ | 2,119 | | 42,910 |
| | | Shares | | Value |
| 5.75%, 10/31/19 CONV Δ | 16 | | $3,216 |
| 5.75%, 10/31/19 CONV | 392 | | 78,400 |
| 5.75%, 10/31/19 144A CONV | 27 | | 4,885 |
| 4.50%, 11/27/19 CONV Δ | 617 | | 12,649 |
| El Paso Energy Capital Trust I | | | |
| 4.75%, 12/12/19 CONV | 5,674 | | 291,984 |
Total Preferred Stocks
(Cost $921,634) | | | 871,642 |
| MONEY MARKET FUNDS — 11.1% |
GuideStone Money Market Fund, 1.53%
(Institutional Class)Ø ∞ | 28,764,556 | | 28,764,556 |
| Northern Institutional Liquid Assets Portfolio (Shares), 1.57%Ø § | 39,008,103 | | 39,008,103 |
Total Money Market Funds
(Cost $67,772,659) | | | 67,772,659 |
TOTAL INVESTMENTS —106.3%
(Cost $638,734,080) | | | 648,237,259 |
Liabilities in Excess of Other
Assets — (6.3)% | | | (38,147,534) |
| NET ASSETS — 100.0% | | | $610,089,725 |
Futures Contracts outstanding at December 31, 2019:
| Future Type | | Expiration Date | | Open Long
(Short) Contracts | | Notional
Market Value
of Contracts | | Value and
Unrealized
Appreciation
(Depreciation) |
| 30-Year Euro Buxl | | 03/2020 | | (3) | | $(667,569) | | $16,051 |
| Euro-Bobl | | 03/2020 | | (58) | | (8,693,781) | | 41,442 |
| Euro-Bund | | 03/2020 | | (104) | | (19,888,819) | | 208,402 |
| Euro-BTP | | 03/2020 | | (30) | | (4,793,922) | | 58,944 |
| 10-Year Japanese E-Mini | | 03/2020 | | 227 | | 31,740,932 | | (138,149) |
| 10-Year Commonwealth Treasury Bond | | 03/2020 | | 49 | | 4,915,724 | | (96,618) |
| 10-Year U.S. Treasury Note | | 03/2020 | | (47) | | (6,035,828) | | 38,882 |
| 10-Year U.S. Treasury Note | | 03/2020 | | 70 | | 8,989,531 | | (82,022) |
| U.S. Treasury Long Bond | | 03/2020 | | (30) | | (4,677,188) | | 69,387 |
| Ultra 10-Year U.S. Treasury Note | | 03/2020 | | (248) | | (34,894,375) | | 309,789 |
| Ultra Long U.S. Treasury Bond | | 03/2020 | | (62) | | (11,262,687) | | 339,020 |
| Long GILT | | 03/2020 | | 31 | | 5,394,805 | | (19,466) |
| 2-Year U.S. Treasury Note | | 03/2020 | | 234 | | 50,427,000 | | (19,056) |
| 5-Year U.S. Treasury Note | | 03/2020 | | 2 | | 237,219 | | (879) |
| Total Futures Contracts outstanding at December 31, 2019 | | | | | | $10,791,042 | | $725,727 |
Forward Foreign Currency Contracts outstanding at December 31, 2019:
| Expiration Date | | Currency
Purchased | | Amount
of Currency
Purchased | | Currency
Sold | | Amount
of Currency
Sold | | Counter-
party | | Net Unrealized
Appreciation
(Depreciation) |
| 01/17/20 | | Euro | | 23,217,940 | | U.S. Dollars | | 25,633,886 | | CITI | | $438,097 |
| 01/22/20 | | Norwegian Kroner | | 65,000,000 | | U.S. Dollars | | 7,196,828 | | RBC | | 207,725 |
| 01/22/20 | | Norwegian Kroner | | 57,863,019 | | U.S. Dollars | | 6,406,271 | | CITI | | 185,264 |
| 01/17/20 | | Brazilian Reals | | 9,722,000 | | U.S. Dollars | | 2,300,076 | | CITI | | 115,518 |
| 01/22/20 | | Japanese Yen | | 948,656,995 | | U.S. Dollars | | 8,684,120 | | RBC | | 57,659 |
See Notes to Financial Statements.
| Expiration Date | | Currency
Purchased | | Amount
of Currency
Purchased | | Currency
Sold | | Amount
of Currency
Sold | | Counter-
party | | Net Unrealized
Appreciation
(Depreciation) |
| 01/17/20 | | Mexican Pesos | | 42,747,103 | | U.S. Dollars | | 2,205,596 | | BAR | | $49,189 |
| 01/22/20 | | Brazilian Reals | | 14,621,202 | | U.S. Dollars | | 3,585,385 | | CITI | | 46,971 |
| 01/22/20 | | Australian Dollars | | 2,776,992 | | U.S. Dollars | | 1,906,569 | | RBC | | 43,305 |
| 01/22/20 | | Japanese Yen | | 666,738,791 | | U.S. Dollars | | 6,103,744 | | CITI | | 40,187 |
| 01/17/20 | | U.S. Dollars | | 13,213,460 | | Japanese Yen | | 1,430,027,000 | | CITI | | 39,628 |
| 01/17/20 | | Indonesian Rupiahs | | 24,157,204,000 | | U.S. Dollars | | 1,707,223 | | CITI | | 33,859 |
| 01/17/20 | | U.S. Dollars | | 740,586 | | Turkish Lira | | 4,332,800 | | CITI | | 15,544 |
| 01/17/20 | | Indian Rupees | | 271,487,535 | | U.S. Dollars | | 3,789,740 | | BAR | | 12,356 |
| 01/22/20 | | U.S. Dollars | | 737,759 | | British Pounds | | 550,090 | | CITI | | 8,634 |
| 01/22/20 | | U.S. Dollars | | 2,455,474 | | Japanese Yen | | 265,856,884 | | CITI | | 5,629 |
| 01/22/20 | | Euro | | 452,219 | | U.S. Dollars | | 504,187 | | RBC | | 3,784 |
| 01/22/20 | | U.S. Dollars | | 357,682 | | Turkish Lira | | 2,119,037 | | RBC | | 3,559 |
| 01/22/20 | | New Zealand Dollars | | 232,188 | | U.S. Dollars | | 152,930 | | RBC | | 3,432 |
| 01/22/20 | | Czech Republic Koruna | | 16,348,854 | | U.S. Dollars | | 718,320 | | RBC | | 2,844 |
| 01/22/20 | | Swedish Kronor | | 6,703,052 | | U.S. Dollars | | 713,991 | | RBC | | 2,451 |
| 01/17/20 | | Euro | | 200,000 | | U.S. Dollars | | 222,364 | | BAR | | 2,221 |
| 01/17/20 | | Polish Zloty | | 120,000 | | U.S. Dollars | | 30,003 | | BAR | | 1,629 |
| 01/22/20 | | Euro | | 160,000 | | U.S. Dollars | | 178,290 | | CITI | | 1,436 |
| Subtotal Appreciation | | | | | | | | | | $1,320,921 |
| 01/22/20 | | U.S. Dollars | | 168,016 | | Norwegian Kroner | | 1,475,225 | | CITI | | $(36) |
| 01/22/20 | | Euro | | 257,649 | | U.S. Dollars | | 289,679 | | CITI | | (266) |
| 01/22/20 | | U.S. Dollars | | 107,293 | | Japanese Yen | | 11,720,885 | | CITI | | (714) |
| 01/22/20 | | Turkish Lira | | 2,119,559 | | U.S. Dollars | | 355,511 | | RBC | | (1,301) |
| 01/22/20 | | U.S. Dollars | | 1,774,994 | | Mexican Pesos | | 33,722,744 | | RBC | | (2,374) |
| 01/22/20 | | U.S. Dollars | | 718,838 | | South Korean Won | | 837,446,432 | | CITI | | (6,004) |
| 01/17/20 | | U.S. Dollars | | 455,622 | | British Pounds | | 350,000 | | BAR | | (8,222) |
| 01/22/20 | | U.S. Dollars | | 681,172 | | British Pounds | | 520,489 | | RBC | | (8,718) |
| 01/17/20 | | U.S. Dollars | | 1,140,801 | | Indian Rupees | | 82,286,000 | | CITI | | (11,588) |
| 01/17/20 | | Turkish Lira | | 4,332,800 | | U.S. Dollars | | 738,566 | | CITI | | (13,525) |
| 01/17/20 | | U.S. Dollars | | 336,049 | | Australian Dollars | | 500,000 | | CITI | | (14,982) |
| 01/22/20 | | U.S. Dollars | | 2,239,946 | | Canadian Dollars | | 2,947,644 | | RBC | | (30,273) |
| 01/22/20 | | U.S. Dollars | | 8,037,845 | | Euro | | 7,184,252 | | RBC | | (32,111) |
| 01/22/20 | | U.S. Dollars | | 9,815,610 | | British Pounds | | 7,435,672 | | CITI | | (40,116) |
| 01/22/20 | | U.S. Dollars | | 1,601,742 | | Norwegian Kroner | | 14,440,186 | | RBC | | (43,228) |
| 01/17/20 | | U.S. Dollars | | 991,574 | | Russian Rubles | | 64,370,000 | | CITI | | (43,292) |
| 01/17/20 | | U.S. Dollars | | 973,642 | | British Pounds | | 793,751 | | CITI | | (78,291) |
| 01/17/20 | | U.S. Dollars | | 935,650 | | South African Rand | | 14,380,000 | | CITI | | (88,664) |
| 01/22/20 | | U.S. Dollars | | 6,766,299 | | Swiss Francs | | 6,623,618 | | CITI | | (88,714) |
| 01/22/20 | | U.S. Dollars | | 3,681,244 | | Australian Dollars | | 5,370,504 | | RBC | | (89,673) |
| 01/22/20 | | U.S. Dollars | | 5,488,339 | | Canadian Dollars | | 7,246,858 | | CITI | | (93,053) |
| 01/22/20 | | U.S. Dollars | | 8,818,983 | | Swiss Francs | | 8,631,768 | | RBC | | (114,334) |
| 01/17/20 | | U.S. Dollars | | 7,713,635 | | Euro | | 6,979,000 | | CITI | | (123,252) |
| 01/22/20 | | U.S. Dollars | | 5,948,334 | | New Zealand Dollars | | 9,047,487 | | CITI | | (144,492) |
| 01/17/20 | | U.S. Dollars | | 2,796,015 | | Mexican Pesos | | 56,074,921 | | BAR | | (161,773) |
| 01/17/20 | | U.S. Dollars | | 5,834,982 | | Indonesian Rupiahs | | 84,035,410,000 | | BAR | | (221,702) |
| 01/22/20 | | U.S. Dollars | | 59,313,104 | | Euro | | 53,309,344 | | CITI | | (568,435) |
| 01/17/20 | | Japanese Yen | | 5,095,425,000 | | U.S. Dollars | | 47,935,737 | | BAR | | (995,173) |
| Subtotal Depreciation | | | | | | | | | | $(3,024,306) |
| Total Forward Foreign Currency Contracts outstanding at December 31, 2019 | | | | $(1,703,385) |
See Notes to Financial Statements.
SCHEDULE OF INVESTMENTS (Continued)
Swap Agreements outstanding at December 31, 2019:
| Reference Obligation | | Fixed
Deal
(Pay) Rate | | Maturity
Date | | Currency | | Notional
Amount | | Market Value | | Upfront
Premiums
Paid/
(Received) | | Unrealized
Appreciation
(Depreciation) |
| Centrally Cleared Credit Default Swaps on Credit Indexes—Buy Protection | | | | | | | | | | | | | | |
| Markit ITRAXX.XO.32 Index (Pay Quarterly) | | (5.00)% | | 12/20/2024 | | EUR | | 23,760,000 | | $(3,675,606) | | $(3,680,828) | | $5,222 |
| | | $(3,675,606) | | $(3,680,828) | | $5,222 |
VALUATION HIERARCHY
The following is a summary of the inputs used, as of December 31, 2019, in valuing the Fund’s investments carried at fair value:
| | Total
Value | | Level 1
Quoted Prices | | Level 2
Other Significant
Observable Inputs | | Level 3
Significant
Unobservable Inputs |
| Assets: | | | | | | | |
| Investments in Securities: | | | | | | | |
| Asset-Backed Securities | $3,416,128 | | $— | | $3,416,128 | | $— |
| Common Stocks: | | | | | | | |
| Energy | 127,740 | | 80,104 | | — | | 47,636 |
| Other^^ | 3,893,088 | | 3,893,088 | | — | | — |
| Total Common Stocks | 4,020,828 | | 3,973,192 | | — | | 47,636 |
| Corporate Bonds | 134,445,597 | | — | | 134,445,597 | | — |
| Foreign Bonds: | | | | | | | |
| Argentina | 3,648,933 | | — | | 3,401,279 | | 247,654 |
| Other^^ | 216,906,978 | | — | | 216,906,978 | | — |
| Total Foreign Bonds | 220,555,911 | | — | | 220,308,257 | | 247,654 |
| Foreign Government Inflation-Linked Bond | 2,008,521 | | — | | 2,008,521 | | — |
| Loan Agreements | 14,187,330 | | — | | 14,187,330 | | — |
| Money Market Funds | 67,772,659 | | 67,772,659 | | — | | — |
| Mortgage-Backed Securities | 42,656,418 | | — | | 42,656,418 | | — |
| Municipal Bond | 91,703 | | — | | 91,703 | | — |
| Preferred Stocks: | | | | | | | |
| Energy | 434,044 | | 350,759 | | 83,285 | | — |
| Financials | 437,598 | | 437,598 | | — | | — |
| Total Preferred Stocks | 871,642 | | 788,357 | | 83,285 | | — |
| U.S. Treasury Obligations | 158,210,522 | | — | | 158,210,522 | | — |
| Total Assets - Investments in Securities | $648,237,259 | | $72,534,208 | | $575,407,761 | | $295,290 |
| Other Financial Instruments*** | | | | | | | |
| Forward Foreign Currency Contracts | $1,320,921 | | $— | | $1,320,921 | | $— |
| Futures Contracts | 1,081,917 | | 1,081,917 | | — | | — |
| Swap Agreements | 5,222 | | — | | 5,222 | | — |
| Total Assets - Other Financial Instruments | $2,408,060 | | $1,081,917 | | $1,326,143 | | $ — |
See Notes to Financial Statements.
| | Total
Value | | Level 1
Quoted Prices | | Level 2
Other Significant
Observable Inputs | | Level 3
Significant
Unobservable Inputs |
| Liabilities: | | | | | | | |
| Other Financial Instruments*** | | | | | | | |
| Forward Foreign Currency Contracts | $(3,024,306) | | $— | | $(3,024,306) | | $— |
| Futures Contracts | (356,190) | | (356,190) | | — | | — |
| Total Liabilities - Other Financial Instruments | $(3,380,496) | | $(356,190) | | $(3,024,306) | | $ — |
| ^^ | Classifications as defined in the Schedule of Investments. |
| *** | Other financial instruments are derivative instruments, such as futures contracts, forwards contracts and swap agreements, which are valued at the unrealized appreciation (depreciation) on the investment. Further details regarding the value of these investments can be found in the preceding "Futures Contracts outstanding", "Forwards Foreign Currency Contracts outstanding" and "Swap Agreements outstanding" disclosures. |
There were no transfers to or from Level 3 during the year ended December 31, 2019.
Management has determined that the amount of Level 3 securities compared to total net assets is not material; therefore, the reconciliation of Level 3 securities and assumptions is not shown for the year ended December 31, 2019.
See Notes to Financial Statements.
| STATEMENTS OF ASSETS AND LIABILITIES | December 31, 2019 |
| | Money
Market Fund | | Low-Duration
Bond Fund |
| Assets | | | |
| Investments in securities of unaffiliated issuers, at value | $904,300,637 | | $1,095,807,829 |
| Investments in repurchase agreements, at value | 399,000,000 | | 11,900,000 |
| Investments in securities of affiliated issuers, at value | — | | 21,271,649 |
| Total investments, at value(1), (2) | 1,303,300,637 | | 1,128,979,478 |
| Cash | 35,508 | | — |
| Cash collateral for derivatives | — | | 2,065,101 |
| Deposits with broker for futures contracts | — | | 1,301,465 |
| Foreign currency(3) | — | | 955,640 |
| Upfront premiums paid from swap agreements | — | | 569,244 |
| Receivables: | | | |
| Dividends and reclaims | — | | 35,548 |
| Interest | 721,431 | | 4,523,967 |
| Securities lending | — | | 12,438 |
| Investment securities sold | — | | 101,641,890 |
| Fund shares sold | 13,873,583 | | 191,303 |
| Variation margin on centrally cleared swaps | — | | — |
| Variation margin on futures contracts | — | | 15,248 |
| Unrealized appreciation on foreign currency exchange contracts | — | | 81,270 |
| Unrealized appreciation on swap agreements | — | | — |
| Prepaid expenses and other assets | 15,823 | | 6,278 |
| Total Assets | 1,317,946,982 | | 1,240,378,870 |
| Liabilities | | | |
| Cash Overdraft | — | | — |
| TBA sale commitments, at value(4) | — | | 5,933,203 |
| Options written, at value(5) | — | | 39,376 |
| Upfront premiums received from swap agreements | — | | 1,267,119 |
| Unrealized depreciation on foreign currency exchange contracts | — | | 1,111,428 |
| Unrealized depreciation on swap agreements | — | | 14,537 |
| Collateral held for securities on loan, at value | — | | 55,958,919 |
| Collateral from counterparty | — | | 808,300 |
| Payables: | | | |
| Investment securities purchased | — | | 178,098,925 |
| Fund shares redeemed | 20,561,621 | | 2,027,207 |
| Variation margin on centrally cleared swaps | — | | 18,108 |
| Variation margin on futures contracts | — | | — |
| Distributions | 920,285 | | — |
| Accrued expenses: | | | |
| Investment advisory fees | 123,677 | | 248,201 |
| Shareholder servicing fees | 84,979 | | 49,637 |
| Trustee fees | 17 | | 936 |
| Other expenses | 87,935 | | 99,212 |
| Total Liabilities | 21,778,514 | | 245,675,108 |
| Net Assets | $1,296,168,468 | | $994,703,762 |
| Net Assets Consist of: | | | |
| Paid-in-capital | $1,296,140,868 | | $1,000,994,753 |
| Distributable earnings (loss) | 27,600 | | (6,290,991) |
| Net Assets | $1,296,168,468 | | $994,703,762 |
| Net Asset Value: | | | |
| $0.001 par value, unlimited shares authorized | | | |
| Net assets applicable to the Institutional Class | $904,202,206 | | $761,736,678 |
| Institutional shares outstanding | 904,186,789 | | 56,856,559 |
| Net asset value, offering and redemption price per Institutional share | $1.00 | | $13.40 |
| Net assets applicable to the Investor Class | $391,966,262 | | $232,967,084 |
| Investor shares outstanding | 391,919,643 | | 17,380,887 |
| Net asset value, offering and redemption price per Investor share | $1.00 | | $13.40 |
| | | |
| (1)Investments in securities of unaffiliated issuers, at cost | $904,300,637 | | $1,089,096,518 |
| Investments in repurchase agreements, at cost | 399,000,000 | | 11,900,000 |
| Investments in securities of affiliated issuers, at cost | — | | 21,271,649 |
| Total investments, at cost | $1,303,300,637 | | $1,122,268,167 |
| (2)Includes securities loaned of: | $— | | $66,802,675 |
| (3)Foreign currency, at cost | $— | | $947,841 |
| (4)TBA sale commitments, at cost | $— | | $5,924,063 |
| (5)Premiums received on options written | $— | | $20,692 |
See Notes to Financial Statements.
Medium-Duration
Bond Fund | | Extended-Duration
Bond Fund | | Global
Bond Fund |
| | | | | |
| $1,936,204,934 | | $274,981,193 | | $619,472,703 |
| 25,900,000 | | — | | — |
| 56,396,537 | | 7,809,354 | | 28,764,556 |
| 2,018,501,471 | | 282,790,547 | | 648,237,259 |
| — | | — | | — |
| 11,881,004 | | — | | 4,480,726 |
| 4,102,435 | | — | | 1,769,815 |
| 6,153,949 | | — | | 4,454,940 |
| 3,294,009 | | — | | — |
| | | | | |
| 201,542 | | 11,632 | | 79,196 |
| 10,522,305 | | 1,816,213 | | 5,740,177 |
| 7,637 | | 7,725 | | 4,246 |
| 269,835,914 | | 38 | | 1,706,513 |
| 3,445,583 | | 24,447 | | 1,433,447 |
| 388,767 | | — | | — |
| — | | — | | 111,589 |
| 1,186,399 | | — | | 1,320,921 |
| 1,381,087 | | — | | — |
| 17,116 | | 2,574 | | 2,658 |
| 2,330,919,218 | | 284,653,176 | | 669,341,487 |
| | | | | |
| — | | — | | 176,701 |
| 81,820,713 | | — | | — |
| 1,154,029 | | — | | — |
| 1,027,704 | | — | | 3,680,828 |
| 2,495,539 | | — | | 3,024,306 |
| 96,421 | | — | | — |
| 20,002,584 | | 26,030,692 | | 39,008,103 |
| 5,998,585 | | — | | — |
| | | | | |
| 432,466,969 | | 1,730,368 | | 12,814,676 |
| 18,409 | | 41,128 | | 202,055 |
| — | | — | | 21,206 |
| 932,019 | | — | | — |
| — | | — | | — |
| | | | | |
| 478,335 | | 100,615 | | 240,101 |
| 65,327 | | 27,862 | | 25,825 |
| 2,833 | | 606 | | 565 |
| 161,657 | | 37,050 | | 57,396 |
| 546,721,124 | | 27,968,321 | | 59,251,762 |
| $1,784,198,094 | | $256,684,855 | | $610,089,725 |
| | | | | |
| $1,748,834,149 | | $239,912,744 | | $606,084,554 |
| 35,363,945 | | 16,772,111 | | 4,005,171 |
| $1,784,198,094 | | $256,684,855 | | $610,089,725 |
| | | | | |
| | | | | |
| $1,476,285,594 | | $127,884,215 | | $486,864,879 |
| 98,064,633 | | 7,016,279 | | 48,651,991 |
| $15.05 | | $18.23 | | $10.01 |
| $307,912,500 | | $128,800,640 | | $123,224,846 |
| 20,448,076 | | 7,064,375 | | 12,324,830 |
| $15.06 | | $18.23 | | $10.00 |
| | | | | |
| $1,886,890,076 | | $259,496,246 | | $609,969,524 |
| 25,900,000 | | — | | — |
| 56,396,537 | | 7,809,354 | | 28,764,556 |
| $1,969,186,613 | | $267,305,600 | | $638,734,080 |
| $30,778,152 | | $32,274,377 | | $45,404,474 |
| $6,136,676 | | $— | | $4,340,599 |
| $81,674,500 | | $— | | $— |
| $1,439,289 | | $— | | $— |
See Notes to Financial Statements.
| STATEMENTS OF OPERATIONS | For the Year Ended December 31, 2019 |
| | Money
Market Fund | | Low-Duration
Bond Fund |
| Investment Income | | | |
| Dividends | $— | | $22,059 |
| Income distributions received from affiliated funds | — | | 579,089 |
| Interest | 30,828,422 | | 25,675,684 |
| Securities lending, net | — | | 88,929 |
| Less foreign taxes withheld | — | | (16,750) |
| Total Investment Income | 30,828,422 | | 26,349,011 |
| Expenses | | | |
| Investment advisory fees | 1,508,249 | | 2,840,827 |
| Transfer agent fees: | | | |
| Institutional shares | 4,571 | | 4,632 |
| Investor shares | 36,100 | | 19,631 |
| Custodian fees | 17,725 | | 179,107 |
| Shareholder servicing fees: | | | |
| Investor shares | 991,454 | | 631,964 |
| Accounting and administration fees | 262,642 | | 198,904 |
| Professional fees | 86,804 | | 79,262 |
| Shareholder reporting fees: | | | |
| Institutional shares | 802 | | 925 |
| Investor shares | 15,587 | | 3,695 |
| Trustees expenses | 13,510 | | 4,251 |
| Line of credit facility fees | 10,039 | | 1,560 |
| Other expenses | 112,237 | | 63,215 |
| Total Expenses | 3,059,720 | | 4,027,973 |
| Net Investment Income | 27,768,702 | | 22,321,038 |
| Realized and Unrealized Gain (Loss) | | | |
| Net realized gain (loss) from: | | | |
| Investment securities | 22,056 | | 7,261,654 |
| Investment securities sold short | — | | (205,007) |
| Futures transactions | — | | (2,584,507) |
| Swap agreements | — | | (1,980,939) |
| Option contracts written | — | | 467,081 |
| Option contracts purchased | — | | 27,094 |
| Forward foreign currency contracts | — | | 1,211,575 |
| Foreign currency | — | | (244,571) |
| Net realized gain (loss) | 22,056 | | 3,952,380 |
| Net change in unrealized appreciation (depreciation) on: | | | |
| Investment securities | — | | 11,760,429 |
| Investment securities sold short | — | | 28,123 |
| Futures | — | | 71,646 |
| Swap agreements | — | | (463,404) |
| Option contracts written | — | | 337,404 |
| Option contracts purchased | — | | (468,489) |
| Forward foreign currency contracts | — | | (909,167) |
| Foreign currency | — | | 14,205 |
| Net change in unrealized appreciation (depreciation) | — | | 10,370,747 |
| Net Realized and Unrealized Gain | 22,056 | | 14,323,127 |
| Net Increase in Net Assets Resulting from Operations | $27,790,758 | | $36,644,165 |
See Notes to Financial Statements.
Medium-Duration
Bond Fund | | Extended-Duration
Bond Fund | | Global
Bond Fund |
| | | | | |
| $68,386 | | $20,893 | | $536,335 |
| 2,083,024 | | 170,376 | | 917,821 |
| 51,859,381 | | 8,278,714 | | 25,772,359 |
| 113,278 | | 30,523 | | 173,189 |
| (10,045) | | (7,552) | | (105,282) |
| 54,114,024 | | 8,492,954 | | 27,294,422 |
| | | | | |
| 5,275,823 | | 1,129,256 | | 2,654,797 |
| | | | | |
| 4,740 | | 4,019 | | 4,484 |
| 24,794 | | 18,179 | | 17,343 |
| 567,817 | | 30,049 | | 114,406 |
| | | | | |
| 717,175 | | 311,534 | | 275,341 |
| 342,109 | | 50,470 | | 116,978 |
| 96,184 | | 93,546 | | 103,969 |
| | | | | |
| 1,547 | | 474 | | 1,063 |
| 7,060 | | 5,043 | | 4,039 |
| 3,394 | | 4,808 | | 2,511 |
| 134 | | 4,727 | | 1,444 |
| 88,446 | | 54,958 | | 56,865 |
| 7,129,223 | | 1,707,063 | | 3,353,240 |
| 46,984,801 | | 6,785,891 | | 23,941,182 |
| | | | | |
| | | | | |
| 21,489,834 | | 4,752,160 | | 330,514 |
| (549,432) | | — | | — |
| 36,196,191 | | — | | (1,601,175) |
| (16,958,656) | | — | | (332,608) |
| 2,922,007 | | — | | — |
| (2,084,358) | | — | | (195,528) |
| (805,050) | | — | | (1,334,774) |
| 264,334 | | 2,124 | | (861,259) |
| 40,474,870 | | 4,754,284 | | (3,994,830) |
| | | | | |
| 68,943,423 | | 18,228,448 | | 41,159,483 |
| 21,568 | | — | | — |
| (12,124,728) | | — | | 543,663 |
| 7,427,740 | | — | | 5,222 |
| 2,360,058 | | — | | — |
| (1,415,044) | | — | | — |
| (172,575) | | — | | (2,792,350) |
| 141,936 | | 1,234 | | 179,657 |
| 65,182,378 | | 18,229,682 | | 39,095,675 |
| 105,657,248 | | 22,983,966 | | 35,100,845 |
| $152,642,049 | | $29,769,857 | | $59,042,027 |
See Notes to Financial Statements.
| STATEMENTS OF CHANGES IN NET ASSETS |
| | Money Market Fund |
| | For the Year Ended |
| | 12/31/19 | | 12/31/18 |
| | | | |
| Operations: | | | |
| Net investment income | $27,768,702 | | $18,097,193 |
| Net realized gain (loss) on investment securities, foreign currency and derivatives | 22,056 | | 3,419 |
| Net change in unrealized appreciation (depreciation) on investment securities, foreign currency and derivatives | — | | — |
| Net increase (decrease) in net assets resulting from operations | 27,790,758 | | 18,100,612 |
| Distributions to Shareholders: | | | |
| Institutional shares | (20,503,404) | | (5,076,945) |
| Investor shares | (7,265,298) | | (13,020,248) |
| Total distributions | (27,768,702) | | (18,097,193) |
| Capital Share Transactions: | | | |
| Proceeds from shares sold | | | |
| Institutional shares | 4,301,371,522 | | 1,748,822,489 |
| Investor shares | 372,222,654 | | 4,746,224,687 |
| Reinvestment of dividends and distributions | | | |
| Institutional shares | 4,362,064 | | 2,208,188 |
| Investor shares | 7,235,378 | | 5,445,866 |
| Total proceeds from shares sold and reinvested | 4,685,191,618 | | 6,502,701,230 |
| Value of shares redeemed | | | |
| Institutional shares | (4,243,079,203) | | (1,178,447,349) |
| Investor shares | (395,729,388) | | (5,238,005,117) |
| Total value of shares redeemed | (4,638,808,591) | | (6,416,452,466) |
| Net increase from capital share transactions(1) | 46,383,027 | | 86,248,764 |
| Total increase in net assets | 46,405,083 | | 86,252,183 |
| Net Assets: | | | |
| Beginning of Year | 1,249,763,385 | | 1,163,511,202 |
| End of Year | $1,296,168,468 | | $1,249,763,385 |
| |
| (1) | See Note 6 in Notes to Financial Statements. |
See Notes to Financial Statements.
| Low-Duration Bond Fund | | Medium-Duration Bond Fund |
| For the Year Ended | | For the Year Ended |
| 12/31/19 | | 12/31/18 | | 12/31/19 | | 12/31/18 |
| | | | | | | |
| | | | | | | |
| $22,321,038 | | $20,568,605 | | $46,984,801 | | $41,137,326 |
| 3,952,380 | | (4,046,761) | | 40,474,870 | | (22,983,840) |
| 10,370,747 | | (4,789,726) | | 65,182,378 | | (25,818,861) |
| 36,644,165 | | 11,732,118 | | 152,642,049 | | (7,665,375) |
| | | | | | | |
| (17,790,895) | | (15,019,892) | | (56,907,805) | | (34,879,820) |
| (5,457,648) | | (6,577,258) | | (11,258,355) | | (6,688,627) |
| (23,248,543) | | (21,597,150) | | (68,166,160) | | (41,568,447) |
| | | | | | | |
| | | | | | | |
| 167,454,014 | | 99,252,756 | | 201,720,715 | | 245,602,344 |
| 33,889,114 | | 34,391,035 | | 70,098,535 | | 47,923,137 |
| | | | | | | |
| 17,570,330 | | 14,827,815 | | 56,765,981 | | 34,717,112 |
| 5,450,732 | | 6,574,660 | | 11,047,637 | | 6,583,119 |
| 224,364,190 | | 155,046,266 | | 339,632,868 | | 334,825,712 |
| | | | | | | |
| (35,643,763) | | (96,844,338) | | (93,164,235) | | (137,487,888) |
| (115,855,201) | | (42,427,351) | | (57,821,223) | | (44,988,883) |
| (151,498,964) | | (139,271,689) | | (150,985,458) | | (182,476,771) |
| 72,865,226 | | 15,774,577 | | 188,647,410 | | 152,348,941 |
| 86,260,848 | | 5,909,545 | | 273,123,299 | | 103,115,119 |
| | | | | | | |
| 908,442,914 | | 902,533,369 | | 1,511,074,795 | | 1,407,959,676 |
| $994,703,762 | | $908,442,914 | | $1,784,198,094 | | $1,511,074,795 |
See Notes to Financial Statements.
| STATEMENTS OF CHANGES IN NET ASSETS |
| | Extended-Duration Bond Fund | | Global Bond Fund |
| | For the Year Ended | | For the Year Ended |
| | 12/31/19 | | 12/31/18 | | 12/31/19 | | 12/31/18 |
| | | | | | | | |
| Operations: | | | | | | | |
| Net investment income | $6,785,891 | | $7,040,440 | | $23,941,182 | | $24,114,261 |
| Net realized gain (loss) on investment securities, foreign currency and derivatives | 4,754,284 | | (437,384) | | (3,994,830) | | (6,067,877) |
| Net change in unrealized appreciation (depreciation) on investment securities, foreign currency and derivatives | 18,229,682 | | (14,553,984) | | 39,095,675 | | (43,656,161) |
| Net increase (decrease) in net assets resulting from operations | 29,769,857 | | (7,950,928) | | 59,042,027 | | (25,609,777) |
| Distributions to Shareholders: | | | | | | | |
| Institutional shares | (4,926,054) | | (4,610,373) | | (16,524,236) | | (13,546,563) |
| Investor shares | (4,865,967) | | (4,032,031) | | (3,697,240) | | (3,687,399) |
| Total distributions | (9,792,021) | | (8,642,404) | | (20,221,476) | | (17,233,962) |
| Capital Share Transactions: | | | | | | | |
| Proceeds from shares sold | | | | | | | |
| Institutional shares | 20,612,237 | | 7,774,517 | | 70,146,932 | | 73,567,800 |
| Investor shares | 38,819,908 | | 13,477,007 | | 39,444,364 | | 24,463,013 |
| Reinvestment of dividends and distributions | | | | | | | |
| Institutional shares | 4,921,573 | | 4,584,780 | | 16,514,524 | | 13,429,011 |
| Investor shares | 4,851,622 | | 4,024,823 | | 3,666,832 | | 3,675,912 |
| Total proceeds from shares sold and reinvested | 69,205,340 | | 29,861,127 | | 129,772,652 | | 115,135,736 |
| Value of shares redeemed | | | | | | | |
| Institutional shares | (15,737,574) | | (18,238,669) | | (40,079,129) | | (49,971,832) |
| Investor shares | (37,177,678) | | (22,210,332) | | (42,099,782) | | (27,176,135) |
| Total value of shares redeemed | (52,915,252) | | (40,449,001) | | (82,178,911) | | (77,147,967) |
| Net increase (decrease) from capital share transactions(1) | 16,290,088 | | (10,587,874) | | 47,593,741 | | 37,987,769 |
| Total increase (decrease) in net assets | 36,267,924 | | (27,181,206) | | 86,414,292 | | (4,855,970) |
| Net Assets: | | | | | | | |
| Beginning of Year | 220,416,931 | | 247,598,137 | | 523,675,433 | | 528,531,403 |
| End of Year | $256,684,855 | | $220,416,931 | | $610,089,725 | | $523,675,433 |
| |
| (1) | See Note 6 in Notes to Financial Statements. |
See Notes to Financial Statements.
| For a Share Outstanding For the Years Ending December 31, unless otherwise indicated | | | | | | Ratios to Average Net Assets | |
| | Net Asset
Value,
Beginning
of Year | Net Investment
Income# | Realized
and
Unrealized
Gain
(Loss) on
Investments | Total Income
From Investment
Operations | Dividends
from Net
Investment
Income | Distributions
from Net
Realized
Capital
Gains | Total
Distributions
Paid | Net Asset
Value,
End of
Year | Total
Return | Net Assets,
End of Year
(000) | Expenses,
Net | Expenses,
Gross | Investment
Income,
Net
| Portfolio
Turnover
Rate |
| Money Market Fund |
| Institutional Class |
| 2019 | $1.00 | $0.02 | $—† | $0.02 | $(0.02) | $— | $(0.02) | $1.00 | 2.13% | $904,202 | 0.14% | 0.14% | 2.10% | N/A |
| 2018 | 1.00 | 0.02 | —† | 0.02 | (0.02) | — | (0.02) | 1.00 | 1.74 | 841,532 | 0.15 | 0.15 | 1.74 | N/A |
| 2017 | 1.00 | 0.01 | —† | 0.01 | (0.01) | —† | (0.01) | 1.00 | 0.76 | 268,948 | 0.17 | 0.17 | 0.77 | N/A |
| 2016 | 1.00 | —† | —† | — | —† | —† | — | 1.00 | 0.28 | 251,639 | 0.17 | 0.18 | 0.27 | N/A |
| 2015 | 1.00 | —† | —† | — | —† | —† | — | 1.00 | 0.08 | 245,882 | 0.17 | 0.18 | 0.08 | N/A |
| Investor Class |
| 2019 | $1.00 | $0.02 | $—† | $0.02 | $(0.02) | $— | $(0.02) | $1.00 | 1.85% | $391,966 | 0.42% | 0.42% | 1.83% | N/A |
| 2018 | 1.00 | 0.01 | —† | 0.01 | (0.01) | — | (0.01) | 1.00 | 1.48 | 408,231 | 0.40 | 0.40 | 1.47 | N/A |
| 2017 | 1.00 | 0.01 | —† | 0.01 | (0.01) | —† | (0.01) | 1.00 | 0.51 | 894,563 | 0.42 | 0.42 | 0.52 | N/A |
| 2016 | 1.00 | —† | —† | — | —† | —† | — | 1.00 | 0.04 | 950,663 | 0.41 | 0.42 | 0.03 | N/A |
| 2015 | 1.00 | —† | —† | — | —† | —† | — | 1.00 | 0.02 | 1,041,421 | 0.24 | 0.43 | 0.01 | N/A |
| |
| Low-Duration Bond Fund |
| Institutional Class |
| 2019 | $13.21 | $0.32 | $0.20 | $0.52 | $(0.33) | $— | $(0.33) | $13.40 | 3.99% | $761,737 | 0.35% | 0.35% | 2.39% | 525% |
| 2018 | 13.35 | 0.30 | (0.12) | 0.18 | (0.32) | — | (0.32) | 13.21 | 1.36 | 602,968 | 0.35 | 0.35 | 2.30 | 513 |
| 2017 | 13.34 | 0.21 | 0.01 | 0.22 | (0.21) | — | (0.21) | 13.35 | 1.69 | 592,325 | 0.35 | 0.36 | 1.60 | 102 |
| 2016 | 13.30 | 0.19 | 0.05(1) | 0.24 | (0.20) | — | (0.20) | 13.34 | 1.74 | 585,590 | 0.37 | 0.38 | 1.46 | 398 |
| 2015 | 13.41 | 0.21 | (0.10)(1) | 0.11 | (0.22) | — | (0.22) | 13.30 | 0.79 | 617,698 | 0.37 | 0.38 | 1.52 | 746 |
| Investor Class |
| 2019 | $13.21 | $0.29 | $0.20 | $0.49 | $(0.30) | $— | $(0.30) | $13.40 | 3.71% | $232,967 | 0.62% | 0.62% | 2.16% | 525% |
| 2018 | 13.35 | 0.27 | (0.13) | 0.14 | (0.28) | — | (0.28) | 13.21 | 1.10 | 305,475 | 0.61 | 0.61 | 2.03 | 513 |
| 2017 | 13.34 | 0.18 | 0.01 | 0.19 | (0.18) | — | (0.18) | 13.35 | 1.42 | 310,208 | 0.62 | 0.63 | 1.33 | 102 |
| 2016 | 13.27 | 0.16 | 0.03(1) | 0.19 | (0.12) | — | (0.12) | 13.34 | 1.47 | 280,701 | 0.64 | 0.65 | 1.18 | 398 |
| 2015 | 13.31 | 0.16 | (0.09)(1) | 0.07 | (0.11) | — | (0.11) | 13.27 | 0.49 | 242,325 | 0.60 | 0.65 | 1.17 | 746 |
| |
| Medium-Duration Bond Fund |
| Institutional Class |
| 2019 | $14.28 | $0.43 | $0.96 | $1.39 | $(0.42) | $(0.20) | $(0.62) | $15.05 | 9.81% | $1,476,286 | 0.39% | 0.39% | 2.90% | 433% |
| 2018 | 14.75 | 0.40 | (0.47) | (0.07) | (0.40) | — | (0.40) | 14.28 | (0.46) | 1,240,967 | 0.37 | 0.38 | 2.76 | 431 |
| 2017 | 14.46 | 0.34 | 0.26 | 0.60 | (0.31) | — | (0.31) | 14.75 | 4.13 | 1,138,597 | 0.39 | 0.40 | 2.32 | 387 |
| 2016 | 14.44 | 0.37 | 0.08(1) | 0.45 | (0.39) | (0.04) | (0.43) | 14.46 | 3.21 | 815,430 | 0.45 | 0.46 | 2.50 | 337 |
| 2015 | 15.18 | 0.37 | (0.35)(1) | 0.02 | (0.54) | (0.22) | (0.76) | 14.44 | 0.03 | 706,760 | 0.45 | 0.47 | 2.46 | 346 |
| Investor Class |
| 2019 | $14.28 | $0.39 | $0.97 | $1.36 | $(0.38) | $(0.20) | $(0.58) | $15.06 | 9.58% | $307,912 | 0.65% | 0.65% | 2.63% | 433% |
| 2018 | 14.75 | 0.36 | (0.47) | (0.11) | (0.36) | — | (0.36) | 14.28 | (0.72) | 270,107 | 0.64 | 0.65 | 2.49 | 431 |
| 2017 | 14.46 | 0.30 | 0.26 | 0.56 | (0.27) | — | (0.27) | 14.75 | 3.93 | 269,362 | 0.66 | 0.67 | 2.05 | 387 |
| 2016 | 14.31 | 0.33 | 0.08(1) | 0.41 | (0.22) | (0.04) | (0.26) | 14.46 | 2.88 | 215,783 | 0.72 | 0.73 | 2.24 | 337 |
| 2015 | 14.65 | 0.28 | (0.31)(1) | (0.03) | (0.21) | (0.10) | (0.31) | 14.31 | (0.22) | 187,863 | 0.66 | 0.75 | 1.92 | 346 |
| | | | | | | | | | | | | | | |
| # | Calculated using the average shares outstanding method. |
| † | Amount represents less than $0.005 per share. |
| (1) | Amount includes Capital Gains distributions received by the Fund from the GuideStone Money Market Fund. The amount of these distributions represents less than $0.005 per share. |
See Notes to Financial Statements.
FINANCIAL HIGHLIGHTS(Continued)
| For a Share Outstanding For the Years Ending December 31, unless otherwise indicated | | | | | | Ratios to Average Net Assets | |
| | Net Asset
Value,
Beginning
of Year | Net Investment
Income# | Realized
and
Unrealized
Gain
(Loss) on
Investments | Total Income
From Investment
Operations | Dividends
from Net
Investment
Income | Distributions
from Net
Realized
Capital
Gains | Total
Distributions
Paid | Net Asset
Value,
End of
Year | Total
Return | Net Assets,
End of Year
(000) | Expenses,
Net | Expenses,
Gross | Investment
Income,
Net
| Portfolio
Turnover
Rate |
| Extended-Duration Bond Fund |
| Institutional Class |
| 2019 | $16.73 | $0.52 | $1.72 | $2.24 | $(0.51) | $(0.23) | $(0.74) | $18.23 | 13.51% | $127,884 | 0.57% | 0.57% | 2.93% | 39% |
| 2018 | 17.94 | 0.54 | (1.09) | (0.55) | (0.53) | (0.13) | (0.66) | 16.73 | (3.07) | 108,206 | 0.55 | 0.56 | 3.16 | 45 |
| 2017 | 16.90 | 0.59 | 1.13 | 1.72 | (0.56) | (0.12) | (0.68) | 17.94 | 10.38 | 122,526 | 0.57 | 0.58 | 3.37 | 93 |
| 2016 | 17.37 | 0.70 | 0.63(1) | 1.33 | (0.98) | (0.82) | (1.80) | 16.90 | 7.65 | 115,558 | 0.56 | 0.57 | 3.81 | 50 |
| 2015 | 21.26 | 0.78 | (1.74)(1) | (0.96) | (1.42) | (1.51) | (2.93) | 17.37 | (5.01) | 148,920 | 0.60 | 0.60 | 4.09 | 42 |
| Investor Class |
| 2019 | $16.74 | $0.48 | $1.70 | $2.18 | $(0.46) | $(0.23) | $(0.69) | $18.23 | 13.14% | $128,801 | 0.83% | 0.83% | 2.66% | 39% |
| 2018 | 17.95 | 0.49 | (1.09) | (0.60) | (0.48) | (0.13) | (0.61) | 16.74 | (3.34) | 112,211 | 0.82 | 0.83 | 2.89 | 45 |
| 2017 | 16.90 | 0.54 | 1.15 | 1.69 | (0.52) | (0.12) | (0.64) | 17.95 | 10.13 | 125,072 | 0.85 | 0.85 | 3.09 | 93 |
| 2016 | 16.76 | 0.64 | 0.56(1) | 1.20 | (0.34) | (0.72) | (1.06) | 16.90 | 7.23 | 119,443 | 0.84 | 0.85 | 3.51 | 50 |
| 2015 | 18.30 | 0.66 | (1.60)(1) | (0.94) | (0.27) | (0.33) | (0.60) | 16.76 | (5.30) | 106,918 | 0.82 | 0.85 | 3.65 | 42 |
| |
| Global Bond Fund |
| Institutional Class |
| 2019 | $9.32 | $0.42 | $0.62 | $1.04 | $(0.35) | $— | $(0.35) | $10.01 | 11.31% | $486,865 | 0.54% | 0.54% | 4.30% | 59% |
| 2018 | 10.08 | 0.43 | (0.88) | (0.45) | (0.31) | — | (0.31) | 9.32 | (4.51) | 409,257 | 0.53 | 0.55 | 4.50 | 23 |
| 2017 | 9.68 | 0.42 | 0.35 | 0.77 | (0.37) | — | (0.37) | 10.08 | 8.09 | 405,411 | 0.56 | 0.58 | 4.18 | 31 |
| 2016 | 9.08 | 0.45 | 0.56(1) | 1.01 | (0.41) | — | (0.41) | 9.68 | 11.24 | 338,475 | 0.59 | 0.60 | 4.73 | 28 |
| 2015(2) | 10.09 | 0.27 | (1.02)(1) | (0.75) | (0.26) | — | (0.26) | 9.08 | (7.54) | 311,374 | 0.59 | 0.62 | 4.15 | 30 |
| Investor Class |
| 2019 | $9.31 | $0.40 | $0.62 | $1.02 | $(0.33) | $— | $(0.33) | $10.00 | 11.03% | $123,225 | 0.82% | 0.82% | 4.02% | 59% |
| 2018 | 10.07 | 0.41 | (0.88) | (0.47) | (0.29) | — | (0.29) | 9.31 | (4.73) | 114,418 | 0.80 | 0.82 | 4.22 | 23 |
| 2017 | 9.68 | 0.39 | 0.35 | 0.74 | (0.35) | — | (0.35) | 10.07 | 7.69 | 123,120 | 0.83 | 0.85 | 3.89 | 31 |
| 2016 | 9.08 | 0.42 | 0.56(1) | 0.98 | (0.38) | — | (0.38) | 9.68 | 10.91 | 89,412 | 0.88 | 0.89 | 4.42 | 28 |
| 2015 | 10.03 | 0.33 | (0.92)(1) | (0.59) | (0.36) | — | (0.36) | 9.08 | (6.00) | 78,636 | 0.82 | 0.84 | 3.35 | 30 |
| | | | | | | | | | | | | | | |
| # | Calculated using the average shares outstanding method. |
| (1) | Amount includes Capital Gains distributions received by the Fund from the GuideStone Money Market Fund. The amount of these distributions represents less than $0.005 per share. |
| (2) | Inception date was May 1, 2015. All ratios for the period have been annualized. Total return and portfolio turnover for the period have not been annualized. |
See Notes to Financial Statements.
Defensive Market Strategies® Fund(Unaudited)
The Fund combines multiple investment strategies that in aggregate seek to provide long-term capital appreciation with reduced volatility compared to the equity markets.
The Investor Class of the Fund outperformed its composite benchmark of 50% S&P 500® Index and 50% FTSE 3-Month Treasury Bill Index (19.38% versus 16.25%). In a banner year for U.S. equities, the Fund underperformed the S&P 500® Index by 12.11%, net of fees. The Fund’s relative underperformance to the S&P 500® Index was due to the Fund’s materially lower market sensitivity and volatility compared to the S&P 500® Index.
The Fund allocated its assets among three of its four principal investment strategies – long only equity, options equity and convertible bond. For the calendar year of 2019, all three contributed positively to absolute performance. The Fund did not allocate to its long-short equity strategy.
The long only equity strategy was the largest contributor to benchmark-relative outperformance, as it had a higher equity beta and risk profile than the Fund’s benchmark. While contributing to the benchmark-relative outperformance, the long only equity strategy underperformed the S&P 500® Index for the year due to its higher quality and lower beta orientation.
The options equity strategy detracted from the Fund’s benchmark-relative performance, as the strategy had a lower risk profile than the Fund’s benchmark and will typically underperform in very strong equity markets, as was 2019. However, the strategy fulfilled its role in the Fund and delivered positive returns primarily derived from collecting option premiums by selling fully covered, exchange listed put options on the S&P 500® Index.
The convertible bond strategy outperformed the Fund’s benchmark and was able to deliver a strong positive absolute return due in part to its exposure to the technology sector, which was the best performing equity sector in 2019.
During 2019, the Fund sold equity options in order to hedge (reduce) equity exposure and/or to collect the option premium from selling fully covered options. The selling of equity put options contributed positively to absolute performance in 2019, while selling call options detracted from performance. Short positions in exchange listed equity index futures were used to hedge market exposure and detracted from absolute performance. In addition, currency forwards were used to hedge foreign currency exposure back to the U.S. dollar and slightly detracted from the Fund’s absolute performance.
This Fund may be suitable for investors who have a medium- to long-term investment horizon, possess a moderate tolerance for risk and seek to participate in the return potential of equities at a slightly lower risk level than an all equity portfolio. In addition to the interest and credit rate risks associated with fixed-income securities, a convertible security’s market value also tends to reflect the market price of the common stock of the issuing company when that stock price approaches or is greater than the convertible security’s “conversion price.” This Fund is subject to interest rate risk, meaning, when interest rates rise, the value of the existing fixed-income securities decrease and vice versa. Securities of foreign issuers may be negatively impacted by political events, economic conditions or inefficient, illiquid or unregulated markets in foreign countries, and they also may be subject to inadequate regulatory or accounting standards, which may increase investment risk. To the extent that the investment adviser or sub-adviser misjudge current market conditions, the Fund’s volatility may be amplified by its use of short sales and derivatives and by its ability to select sub-advisers to allocate assets. Derivatives involve different risks from, and in some respects greater risks than, those associated with investing directly in securities, currencies or other instruments. Derivatives may be illiquid or less liquid, volatile, difficult to price and leverage so small changes in value of the underlying instruments may produce disproportionate losses to the Fund. Short sales involve selling a security the Fund does not own in anticipation that the security will decline in price. Short sales expose the Fund to the risk that it will required to buy the security sold short (also known as “covering” the short position) at a time when the security has appreciated in value, thus resulting in a loss to the Fund. The Fund’s potential loss on a short position is limited only by the maximum attainable price of the security less the price at which the security was sold by the Fund. Therefore, in theory, stocks sold short have unlimited risk. The Fund's use of short sales in effect "leverages" the Fund. The use of leverage may magnify the Fund’s gains or losses, and leverage also creates interest expense that may lower the Fund’s overall returns. It is possible to lose money by investing in the Fund.
Defensive Market Strategies® Fund(Unaudited)
At December 31, 2019, the portfolio holdings of the Fund, as a percentage of net assets, is shown in the following table. Portfolio holdings are subject to risk and may change at any time.
| | % |
| Corporate Bonds | 24.6 |
| U.S. Treasury Obligations | 18.3 |
| Financials | 9.1 |
| Health Care | 7.3 |
| Information Technology | 6.7 |
| Money Market Funds | 6.7 |
| Consumer Staples | 6.6 |
| Industrials | 4.8 |
| Utilities | 4.6 |
| Consumer Discretionary | 2.6 |
| Energy | 2.3 |
| Communication Services | 2.1 |
| Foreign Bonds | 1.9 |
| Materials | 1.0 |
| Real Estate | 0.9 |
| Equity-Linked Securities | 0.8 |
| Mutual Funds | 0.8 |
| Written Options | (0.1) |
| | 101.0 |
Defensive Market Strategies® Fund(Unaudited)
| Average Annual Total Returns as of 12/31/19 | |
| | | Institutional Class* | | Investor Class* | | Benchmark** | |
| One Year | | 19.78% | | 19.38% | | 16.25% | |
| Five Year | | 8.78% | | 8.48% | | 6.43% | |
| Ten year | | N/A | | N/A | | N/A | |
| Since Inception | | 10.08% | | 9.80% | | 7.68% | |
| Inception Date | | 09/01/11 | | 09/01/11 | | | |
| Total Fund Operating Expenses (April 30, 2019 Prospectus)(1) | | 0.68% | | 0.94% | | | |
| (1) | Current information regarding the Fund’s Operating Expenses can be found in the Financial Highlights. |
The performance data quoted represents past performance and does not guarantee future results. Current performance may be lower or higher. Performance data current to the most recent month-end may be obtained at GuideStoneFunds.com. The investment return and principal value of an investment will fluctuate so that shares, when redeemed, may be worth more or less than their original cost.
The graph illustrates the results of a hypothetical $10,000 investment in the Investor Class of the Fund since September 1, 2011 (commencement of operations), with all dividends and capital gains reinvested, with the Fund's composite benchmark index.
*These returns reflect investment advisory and shareholder servicing fee waivers, if applicable, during the reported time periods.
**Represents a weighted composite benchmark index as a reference benchmark consisting of 50% S&P 500® Index and 50% FTSE 3-Month Treasury Bill Index.
Unlike a mutual fund, the performance of an index assumes no taxes, transaction costs, management fees or other expenses.
DEFENSIVE MARKET STRATEGIES®FUND
| | | Shares | | Value |
| COMMON STOCKS — 41.3% |
| Communication Services — 2.1% | | |
| Activision Blizzard, Inc. | 1,269 | | $75,404 |
| Alphabet, Inc. Class A* | 3,213 | | 4,303,460 |
| Alphabet, Inc. Class C* | 558 | | 746,057 |
| AT&T, Inc. | 21,689 | | 847,606 |
| CenturyLink, Inc. | 2,552 | | 33,712 |
| Charter Communications, Inc. Class A* | 343 | | 166,382 |
| Comcast Corporation Class A | 7,920 | | 356,162 |
| Discovery, Inc. Class A* | 454 | | 14,864 |
| Discovery, Inc. Class C* | 631 | | 19,239 |
| DISH Network Corporation Class A* | 393 | | 13,940 |
| Electronic Arts, Inc.* | 559 | | 60,098 |
| Facebook, Inc. Class A* | 14,617 | | 3,000,139 |
| Fox Corporation Class A | 935 | | 34,661 |
| Fox Corporation Class B | 437 | | 15,907 |
| Interpublic Group of Cos., Inc. (The) | 849 | | 19,612 |
| Netflix, Inc.* | 1,661 | | 537,450 |
| News Corporation Class A | 567 | | 8,017 |
| Omnicom Group, Inc. | 506 | | 40,996 |
| Take-Two Interactive Software, Inc.* | 254 | | 31,097 |
| T-Mobile US, Inc.* | 14,538 | | 1,140,070 |
| Twitter, Inc.* | 1,378 | | 44,165 |
| Verizon Communications, Inc. | 196,487 | | 12,064,302 |
| ViacomCBS, Inc. Class B | 817 | | 34,290 |
| Walt Disney Co. (The) | 19,954 | | 2,885,947 |
| | | | | 26,493,577 |
| Consumer Discretionary — 2.2% | | |
| Advance Auto Parts, Inc. | 122 | | 19,540 |
| Amazon.com, Inc.* | 1,671 | | 3,087,741 |
| AutoZone, Inc.* | 38 | | 45,270 |
| Best Buy Co., Inc. | 458 | | 40,212 |
| Booking Holdings, Inc.* | 631 | | 1,295,904 |
| BorgWarner, Inc. | 232 | | 10,064 |
| Capri Holdings, Ltd.* | 6,065 | | 231,380 |
| CarMax, Inc.* | 253 | | 22,180 |
| Carnival Corporation | 789 | | 40,105 |
| Chipotle Mexican Grill, Inc.* | 46 | | 38,507 |
| D.R. Horton, Inc. | 870 | | 45,892 |
| Darden Restaurants, Inc. | 14,168 | | 1,544,454 |
| Dollar General Corporation | 398 | | 62,080 |
| Dollar Tree, Inc.* | 447 | | 42,040 |
| eBay, Inc. | 1,476 | | 53,298 |
| Expedia Group, Inc. | 332 | | 35,902 |
| Ford Motor Co. | 8,102 | | 75,349 |
| Gap, Inc. (The) | 723 | | 12,783 |
| General Motors Co. | 2,563 | | 93,806 |
| Genuine Parts Co. | 31,379 | | 3,333,391 |
| H&R Block, Inc. | 1,036 | | 24,325 |
| Hanesbrands, Inc. | 827 | | 12,281 |
| Hasbro, Inc. | 196 | | 20,700 |
| Hilton Worldwide Holdings, Inc. | 491 | | 54,457 |
| Home Depot, Inc. (The) | 14,647 | | 3,198,612 |
| Kohl’s Corporation | 339 | | 17,272 |
| L Brands, Inc. | 562 | | 10,183 |
| | | Shares | | Value |
| Leggett & Platt, Inc. | 240 | | $12,199 |
| Lennar Corporation Class A | 374 | | 20,865 |
| LKQ Corporation* | 551 | | 19,671 |
| Lowe’s Cos., Inc. | 7,501 | | 898,320 |
| Lululemon Athletica, Inc.* | 5,326 | | 1,233,874 |
| Macy’s, Inc. | 1,010 | | 17,170 |
| Marriott International, Inc. Class A | 528 | | 79,955 |
| McDonald’s Corporation | 17,306 | | 3,419,839 |
| Mohawk Industries, Inc.* | 105 | | 14,320 |
| Newell Brands, Inc. | 1,473 | | 28,311 |
| NIKE, Inc. Class B | 18,461 | | 1,870,284 |
| Nordstrom, Inc. | 287 | | 11,747 |
| Norwegian Cruise Line Holdings, Ltd.* | 381 | | 22,254 |
| NVR, Inc.* | 6 | | 22,850 |
| O’Reilly Automotive, Inc.* | 141 | | 61,795 |
| PulteGroup, Inc. | 555 | | 21,534 |
| PVH Corporation | 138 | | 14,511 |
| Ralph Lauren Corporation | 137 | | 16,059 |
| Ross Stores, Inc. | 12,133 | | 1,412,524 |
| Royal Caribbean Cruises, Ltd. | 3,304 | | 441,117 |
| Starbucks Corporation | 19,166 | | 1,685,075 |
| Tapestry, Inc. | 641 | | 17,288 |
| Target Corporation | 1,052 | | 134,877 |
| Tiffany & Co. | 210 | | 28,066 |
| TJX Cos., Inc. (The) | 20,877 | | 1,274,750 |
| Tractor Supply Co. | 240 | | 22,426 |
| Ulta Beauty, Inc.* | 135 | | 34,174 |
| Under Armour, Inc. Class A* | 210 | | 4,536 |
| Under Armour, Inc. Class C* | 211 | | 4,047 |
| VF Corporation | 555 | | 55,311 |
| Whirlpool Corporation | 160 | | 23,605 |
| Yum! Brands, Inc. | 9,914 | | 998,637 |
| | | | | 27,389,719 |
| Consumer Staples — 5.5% | | |
| Archer-Daniels-Midland Co. | 1,013 | | 46,953 |
| Campbell Soup Co. | 418 | | 20,658 |
| Casey’s General Stores, Inc. | 4,599 | | 731,195 |
| Church & Dwight Co., Inc. | 655 | | 46,073 |
| Clorox Co. (The) | 3,232 | | 496,241 |
| Coca-Cola Co. (The) | 71,063 | | 3,933,337 |
| Colgate-Palmolive Co. | 135,373 | | 9,319,077 |
| Conagra Brands, Inc. | 599 | | 20,510 |
| Costco Wholesale Corporation | 11,654 | | 3,425,344 |
| Coty, Inc. Class A | 1,645 | | 18,506 |
| Estee Lauder Cos., Inc. (The) Class A | 10,551 | | 2,179,204 |
| General Mills, Inc. | 1,073 | | 57,470 |
| Hershey Co. (The) | 6,550 | | 962,719 |
| Hormel Foods CorporationΔ | 36,910 | | 1,665,010 |
| Ingredion, Inc. | 12,083 | | 1,123,115 |
| J.M. Smucker Co. (The) | 250 | | 26,033 |
| Kellogg Co. | 694 | | 47,997 |
| Kimberly-Clark Corporation | 53,809 | | 7,401,428 |
| Kraft Heinz Co. (The) | 1,765 | | 56,709 |
| Kroger Co. (The) | 1,673 | | 48,500 |
| Lamb Weston Holdings, Inc. | 14,882 | | 1,280,298 |
See Notes to Financial Statements.
| | | Shares | | Value |
| McCormick & Co., Inc. (Non-Voting Shares) | 9,412 | | $1,597,499 |
| Mondelez International, Inc. Class A | 8,006 | | 440,970 |
| Monster Beverage Corporation* | 15,423 | | 980,132 |
| PepsiCo, Inc. | 94,785 | | 12,954,266 |
| Procter & Gamble Co. (The) | 78,876 | | 9,851,612 |
| Sysco Corporation | 33,026 | | 2,825,044 |
| Tyson Foods, Inc. Class A | 450 | | 40,968 |
| Walgreens Boots Alliance, Inc. | 1,543 | | 90,975 |
| Walmart, Inc. | 69,676 | | 8,280,296 |
| | | | | 69,968,139 |
| Energy — 1.1% | | |
| Apache Corporation | 581 | | 14,868 |
| Baker Hughes Co. | 990 | | 25,374 |
| Cabot Oil & Gas Corporation | 765 | | 13,319 |
| Chevron Corporation | 63,514 | | 7,654,072 |
| Cimarex Energy Co. | 158 | | 8,293 |
| Concho Resources, Inc. | 317 | | 27,760 |
| ConocoPhillips | 34,084 | | 2,216,483 |
| Devon Energy Corporation | 701 | | 18,205 |
| Diamondback Energy, Inc. | 209 | | 19,408 |
| EOG Resources, Inc. | 1,122 | | 93,979 |
| Exxon Mobil Corporation | 37,627 | | 2,625,612 |
| Halliburton Co. | 989 | | 24,201 |
| Helmerich & Payne, Inc. | 341 | | 15,492 |
| Hess Corporation | 541 | | 36,144 |
| HollyFrontier Corporation | 313 | | 15,872 |
| Kinder Morgan, Inc. | 3,804 | | 80,531 |
| Marathon Oil Corporation | 1,211 | | 16,445 |
| Marathon Petroleum Corporation | 1,446 | | 87,121 |
| Noble Energy, Inc. | 607 | | 15,078 |
| Occidental Petroleum Corporation | 1,992 | | 82,090 |
| ONEOK, Inc. | 5,323 | | 402,791 |
| Phillips 66 | 752 | | 83,780 |
| Pioneer Natural Resources Co. | 361 | | 54,645 |
| Valero Energy Corporation | 1,830 | | 171,379 |
| Williams Cos., Inc. (The) | 2,342 | | 55,552 |
| | | | | 13,858,494 |
| Financials — 7.9% | | |
| Aflac, Inc. | 35,828 | | 1,895,301 |
| Alleghany Corporation* | 1,248 | | 997,863 |
| Allstate Corporation (The) | 27,618 | | 3,105,644 |
| American Express Co. | 13,985 | | 1,740,993 |
| American Financial Group, Inc. | 8,676 | | 951,323 |
| American International Group, Inc. | 1,388 | | 71,246 |
| Ameriprise Financial, Inc. | 269 | | 44,810 |
| Arch Capital Group, Ltd.* | 18,444 | | 791,063 |
| Arthur J. Gallagher & Co. | 451 | | 42,949 |
| Assurant, Inc. | 75 | | 9,831 |
| Assured Guaranty, Ltd. | 3,251 | | 159,364 |
| Bank of America Corporation | 31,022 | | 1,092,595 |
| Bank of Hawaii Corporation | 7,533 | | 716,840 |
| Bank of New York Mellon Corporation (The) | 56,765 | | 2,856,983 |
| Berkshire Hathaway, Inc. Class B* | 3,602 | | 815,853 |
| BlackRock, Inc. | 6,859 | | 3,448,019 |
| Capital One Financial Corporation | 901 | | 92,722 |
| | | Shares | | Value |
| Capitol Federal Financial, Inc. | 290,200 | | $3,984,446 |
| Cboe Global Markets, Inc. | 264 | | 31,680 |
| Charles Schwab Corporation (The) | 2,229 | | 106,011 |
| Cincinnati Financial Corporation | 334 | | 35,120 |
| Citigroup, Inc. | 4,568 | | 364,938 |
| Citizens Financial Group, Inc. | 836 | | 33,950 |
| CME Group, Inc. | 16,945 | | 3,401,200 |
| Comerica, Inc. | 81,402 | | 5,840,594 |
| Commerce Bancshares, Inc.Δ | 15,318 | | 1,040,736 |
| Credit Acceptance CorporationΔ* | 4,827 | | 2,135,127 |
| Cullen/Frost Bankers, Inc. | 4,208 | | 411,458 |
| Discover Financial Services | 9,426 | | 799,513 |
| E*TRADE Financial Corporation | 326 | | 14,791 |
| East West Bancorp, Inc.Δ | 13,129 | | 639,382 |
| Erie Indemnity Co. Class AΔ | 861 | | 142,926 |
| Everest Re Group, Ltd. | 3,806 | | 1,053,653 |
| Fidelity National Financial, Inc. | 25,344 | | 1,149,350 |
| Fifth Third Bancorp | 1,381 | | 42,452 |
| First Citizens BancShares, Inc. Class A | 249 | | 132,520 |
| First Republic Bank | 214 | | 25,134 |
| Franklin Resources, Inc. | 636 | | 16,523 |
| Globe Life, Inc. | 219 | | 23,050 |
| Goldman Sachs Group, Inc. (The) | 615 | | 141,407 |
| Hartford Financial Services Group, Inc. (The) | 633 | | 38,467 |
| Huntington Bancshares, Inc. | 1,877 | | 28,305 |
| Intercontinental Exchange, Inc. | 14,595 | | 1,350,767 |
| Invesco, Ltd. | 816 | | 14,672 |
| JPMorgan Chase & Co. | 59,181 | | 8,249,831 |
| KeyCorp | 1,880 | | 38,051 |
| Lincoln National Corporation | 388 | | 22,896 |
| Loews Corporation | 373 | | 19,579 |
| M&T Bank Corporation | 6,802 | | 1,154,640 |
| Markel Corporation* | 1,365 | | 1,560,427 |
| MarketAxess Holdings, Inc. | 74 | | 28,054 |
| Marsh & McLennan Cos., Inc. | 81,472 | | 9,076,796 |
| MetLife, Inc. | 2,122 | | 108,158 |
| Moody’s Corporation | 247 | | 58,640 |
| Morgan Stanley | 2,337 | | 119,468 |
| MSCI, Inc. | 120 | | 30,982 |
| Nasdaq, Inc. | 251 | | 26,882 |
| Northern Trust Corporation | 23,771 | | 2,525,431 |
| People’s United Financial, Inc. | 674 | | 11,391 |
| PNC Financial Services Group, Inc. (The) | 68,083 | | 10,868,089 |
| Popular, Inc. | 2,906 | | 170,728 |
| Principal Financial Group, Inc. | 556 | | 30,580 |
| Progressive Corporation (The) | 39,290 | | 2,844,203 |
| Prudential Financial, Inc. | 758 | | 71,055 |
| Raymond James Financial, Inc. | 240 | | 21,470 |
| Regions Financial Corporation | 2,436 | | 41,802 |
| RenaissanceRe Holdings, Ltd. | 2,135 | | 418,503 |
| S&P Global, Inc. | 1,008 | | 275,234 |
| SEI Investments Co. | 5,739 | | 375,790 |
| State Street Corporation | 18,084 | | 1,430,444 |
| SVB Financial Group* | 13,662 | | 3,429,709 |
| Synchrony Financial | 1,366 | | 49,190 |
See Notes to Financial Statements.
DEFENSIVE MARKET STRATEGIES®FUND
SCHEDULE OF INVESTMENTS (Continued)
| | | Shares | | Value |
| T. Rowe Price Group, Inc. | 9,945 | | $1,211,699 |
| TFS Financial CorporationΔ | 4,867 | | 95,783 |
| Travelers Cos., Inc. (The) | 17,895 | | 2,450,720 |
| Truist Financial Corporation | 6,527 | | 367,591 |
| U.S. Bancorp | 48,270 | | 2,861,928 |
| Unum Group | 295 | | 8,602 |
| W.R. Berkley Corporation | 6,554 | | 452,881 |
| Wells Fargo & Co. | 131,164 | | 7,056,623 |
| Zions Bancorp NA | 159 | | 8,255 |
| | | | | 99,403,676 |
| Health Care — 5.3% | | |
| Abbott Laboratories | 15,592 | | 1,354,321 |
| ABIOMED, Inc.* | 79 | | 13,477 |
| Agilent Technologies, Inc. | 6,483 | | 553,065 |
| Alexion Pharmaceuticals, Inc.* | 526 | | 56,887 |
| Align Technology, Inc.* | 3,814 | | 1,064,258 |
| Amgen, Inc. | 3,151 | | 759,612 |
| Anthem, Inc. | 1,752 | | 529,157 |
| Baxter International, Inc. | 5,622 | | 470,112 |
| Becton, Dickinson and Co. | 3,267 | | 888,526 |
| Biogen, Inc.* | 5,605 | | 1,663,172 |
| Bio-Techne Corporation | 525 | | 115,243 |
| Boston Scientific Corporation* | 2,122 | | 95,957 |
| Bristol-Myers Squibb Co. | 7,212 | | 462,938 |
| Cardinal Health, Inc. | 793 | | 40,110 |
| Centene Corporation* | 791 | | 49,730 |
| Cerner Corporation | 12,527 | | 919,356 |
| Chemed Corporation | 2,596 | | 1,140,319 |
| Cigna Corporation | 707 | | 144,574 |
| CVS Health Corporation | 2,605 | | 193,525 |
| Danaher Corporation | 10,863 | | 1,667,253 |
| DaVita, Inc.* | 265 | | 19,883 |
| DENTSPLY SIRONA, Inc. | 472 | | 26,710 |
| Edwards Lifesciences Corporation* | 1,799 | | 419,689 |
| Eli Lilly & Co. | 37,044 | | 4,868,693 |
| Gilead Sciences, Inc. | 35,811 | | 2,326,999 |
| HCA Healthcare, Inc. | 500 | | 73,905 |
| Henry Schein, Inc.Δ* | 29,656 | | 1,978,648 |
| Hologic, Inc.* | 508 | | 26,523 |
| Humana, Inc. | 232 | | 85,033 |
| IDEXX Laboratories, Inc.* | 111 | | 28,985 |
| Illumina, Inc.* | 2,309 | | 765,988 |
| Incyte Corporation* | 400 | | 34,928 |
| Intuitive Surgical, Inc.* | 5,772 | | 3,412,118 |
| IQVIA Holdings, Inc.* | 750 | | 115,882 |
| Johnson & Johnson | 138,618 | | 20,220,208 |
| Laboratory Corporation of America Holdings* | 195 | | 32,988 |
| McKesson Corporation | 281 | | 38,868 |
| Mettler-Toledo International, Inc.* | 2,046 | | 1,623,051 |
| PerkinElmer, Inc. | 318 | | 30,878 |
| Quest Diagnostics, Inc. | 63,402 | | 6,770,700 |
| Regeneron Pharmaceuticals, Inc.* | 176 | | 66,084 |
| ResMed, Inc. | 287 | | 44,476 |
| Stryker Corporation | 8,748 | | 1,836,555 |
| Teleflex, Inc. | 72 | | 27,104 |
| Thermo Fisher Scientific, Inc. | 8,862 | | 2,878,998 |
| | | Shares | | Value |
| UnitedHealth Group, Inc. | 13,247 | | $3,894,353 |
| Universal Health Services, Inc. Class B | 174 | | 24,962 |
| Varian Medical Systems, Inc.* | 4,223 | | 599,708 |
| Vertex Pharmaceuticals, Inc.* | 540 | | 118,233 |
| Waters Corporation* | 589 | | 137,620 |
| WellCare Health Plans, Inc.* | 76 | | 25,096 |
| West Pharmaceutical Services, Inc. | 3,639 | | 547,051 |
| Zimmer Biomet Holdings, Inc. | 334 | | 49,993 |
| Zoetis, Inc. | 7,630 | | 1,009,830 |
| | | | | 66,342,332 |
| Industrials — 4.6% | | |
| 3M Co. | 15,974 | | 2,818,133 |
| A.O. Smith Corporation | 278 | | 13,244 |
| Alaska Air Group, Inc. | 219 | | 14,837 |
| American Airlines Group, Inc. | 534 | | 15,315 |
| AMETEK, Inc. | 278 | | 27,728 |
| Arconic, Inc. | 1,067 | | 32,832 |
| Boeing Co. (The) | 3,556 | | 1,158,403 |
| C.H. Robinson Worldwide, Inc. | 2,618 | | 204,728 |
| Caterpillar, Inc. | 11,320 | | 1,671,738 |
| Cintas Corporation | 4,601 | | 1,238,037 |
| Copart, Inc.* | 6,027 | | 548,095 |
| CoStar Group, Inc.* | 830 | | 496,589 |
| CSX Corporation | 1,370 | | 99,133 |
| Cummins, Inc. | 740 | | 132,430 |
| Deere & Co. | 525 | | 90,962 |
| Delta Air Lines, Inc. | 1,190 | | 69,591 |
| Dover Corporation | 192 | | 22,130 |
| Emerson Electric Co. | 132,540 | | 10,107,500 |
| Equifax, Inc. | 234 | | 32,788 |
| Expeditors International of Washington, Inc. | 8,970 | | 699,839 |
| Fastenal Co. | 1,603 | | 59,231 |
| FedEx Corporation | 6,676 | | 1,009,478 |
| Flowserve Corporation | 291 | | 14,483 |
| Fortive Corporation | 3,950 | | 301,741 |
| Fortune Brands Home & Security, Inc. | 191 | | 12,480 |
| General Dynamics Corporation | 4,890 | | 862,351 |
| General Electric Co. | 16,053 | | 179,151 |
| Honeywell International, Inc. | 15,689 | | 2,776,953 |
| Hubbell, Inc. | 39,089 | | 5,778,136 |
| Huntington Ingalls Industries, Inc. | 90 | | 22,579 |
| IDEX Corporation | 1,433 | | 246,476 |
| IHS Markit, Ltd.* | 500 | | 37,675 |
| Illinois ToolWorks, Inc. | 20,860 | | 3,747,082 |
| J.B. Hunt Transport Services, Inc. | 166 | | 19,385 |
| Jacobs Engineering Group, Inc. | 178 | | 15,990 |
| Kansas City Southern | 154 | | 23,587 |
| L3Harris Technologies, Inc. | 371 | | 73,410 |
| Landstar System, Inc. | 7,744 | | 881,809 |
| Lincoln Electric Holdings, Inc. | 1,523 | | 147,320 |
| Lockheed Martin Corporation | 2,760 | | 1,074,689 |
| Masco Corporation | 401 | | 19,244 |
| Norfolk Southern Corporation | 9,456 | | 1,835,693 |
| Northrop Grumman Corporation | 317 | | 109,038 |
| PACCAR, Inc. | 1,036 | | 81,948 |
See Notes to Financial Statements.
| | | Shares | | Value |
| Parker-Hannifin Corporation | 254 | | $52,278 |
| Quanta Services, Inc. | 139 | | 5,659 |
| Raytheon Co. | 518 | | 113,825 |
| Republic Services, Inc. | 76,028 | | 6,814,390 |
| Robert Half International, Inc. | 7,443 | | 470,025 |
| Rockwell Automation, Inc. | 3,263 | | 661,312 |
| Rollins, Inc. | 37,608 | | 1,247,081 |
| Roper Technologies, Inc. | 165 | | 58,448 |
| Snap-on, Inc. | 112 | | 18,973 |
| Southwest Airlines Co. | 14,199 | | 766,462 |
| Stanley Black & Decker, Inc. | 824 | | 136,570 |
| Teledyne Technologies, Inc.* | 3,940 | | 1,365,368 |
| Textron, Inc. | 272 | | 12,131 |
| TransDigm Group, Inc. | 70 | | 39,200 |
| Union Pacific Corporation | 7,248 | | 1,310,366 |
| United Airlines Holdings, Inc.* | 286 | | 25,194 |
| United Parcel Service, Inc. Class B | 23,617 | | 2,764,606 |
| United Rentals, Inc.* | 123 | | 20,513 |
| United Technologies Corporation | 1,452 | | 217,452 |
| Verisk Analytics, Inc. | 1,068 | | 159,495 |
| W.W. Grainger, Inc. | 77 | | 26,066 |
| Waste Management, Inc. | 30,051 | | 3,424,612 |
| Westinghouse Air Brake Technologies Corporation | 214 | | 16,649 |
| Xylem, Inc. | 293 | | 23,085 |
| | | | | 58,573,741 |
| Information Technology — 6.4% | | |
| Adobe, Inc.* | 9,183 | | 3,028,645 |
| Advanced Micro Devices, Inc.* | 2,022 | | 92,729 |
| Akamai Technologies, Inc.* | 16,388 | | 1,415,595 |
| Alliance Data Systems Corporation | 101 | | 11,332 |
| Amdocs, Ltd. | 1,249 | | 90,165 |
| Amphenol Corporation Class A | 6,664 | | 721,245 |
| Analog Devices, Inc. | 634 | | 75,345 |
| ANSYS, Inc.* | 1,329 | | 342,098 |
| Apple, Inc. | 15,905 | | 4,670,503 |
| Applied Materials, Inc. | 13,484 | | 823,063 |
| Arista Networks, Inc.* | 84 | | 17,086 |
| Autodesk, Inc.* | 417 | | 76,503 |
| Automatic Data Processing, Inc. | 49,993 | | 8,523,806 |
| Broadcom, Inc. | 1,745 | | 551,455 |
| Broadridge Financial Solutions, Inc. | 168 | | 20,755 |
| Cadence Design Systems, Inc.* | 408 | | 28,299 |
| CDW Corporation | 133 | | 18,998 |
| Cisco Systems, Inc. | 157,769 | | 7,566,601 |
| Citrix Systems, Inc. | 271 | | 30,054 |
| Cognex Corporation | 16,412 | | 919,728 |
| Cognizant Technology Solutions Corporation Class A | 12,364 | | 766,815 |
| Corning, Inc. | 1,580 | | 45,994 |
| DXC Technology Co. | 631 | | 23,719 |
| F5 Networks, Inc.* | 7,316 | | 1,021,679 |
| Fidelity National Information Services, Inc. | 926 | | 128,797 |
| Fiserv, Inc.* | 916 | | 105,917 |
| FleetCor Technologies, Inc.* | 152 | | 43,733 |
| FLIR Systems, Inc. | 145 | | 7,550 |
| | | Shares | | Value |
| Fortinet, Inc.* | 195 | | $20,818 |
| Gartner, Inc.* | 125 | | 19,263 |
| Global Payments, Inc. | 411 | | 75,032 |
| Hewlett Packard Enterprise Co. | 2,988 | | 47,390 |
| HP, Inc. | 2,972 | | 61,075 |
| Intel Corporation | 31,305 | | 1,873,604 |
| International Business Machines Corporation | 8,328 | | 1,116,285 |
| Intuit, Inc. | 12,656 | | 3,314,986 |
| Jack Henry & Associates, Inc. | 7,078 | | 1,031,052 |
| Juniper Networks, Inc. | 751 | | 18,497 |
| Keysight Technologies, Inc.* | 264 | | 27,094 |
| KLA Corporation | 277 | | 49,353 |
| Lam Research Corporation | 290 | | 84,796 |
| Leidos Holdings, Inc. | 268 | | 26,235 |
| Mastercard, Inc. Class A | 13,935 | | 4,160,852 |
| Maxim Integrated Products, Inc. | 105,592 | | 6,494,964 |
| Microchip Technology, Inc. | 461 | | 48,276 |
| Micron Technology, Inc.* | 2,018 | | 108,528 |
| Microsoft Corporation | 77,842 | | 12,275,683 |
| Motorola Solutions, Inc. | 226 | | 36,418 |
| National Instruments Corporation | 4,818 | | 203,994 |
| NetApp, Inc. | 478 | | 29,756 |
| NortonLifeLock, Inc. | 1,116 | | 28,480 |
| NVIDIA Corporation | 4,452 | | 1,047,556 |
| Oracle Corporation | 21,050 | | 1,115,229 |
| Paychex, Inc. | 28,216 | | 2,400,053 |
| PayPal Holdings, Inc.* | 4,127 | | 446,418 |
| Qorvo, Inc.* | 254 | | 29,522 |
| QUALCOMM, Inc. | 2,282 | | 201,341 |
| salesforce.com, Inc.* | 1,620 | | 263,477 |
| ServiceNow, Inc.* | 330 | | 93,166 |
| Skyworks Solutions, Inc. | 3,393 | | 410,146 |
| Synopsys, Inc.* | 179 | | 24,917 |
| Texas Instruments, Inc. | 62,891 | | 8,068,286 |
| VeriSign, Inc.* | 180 | | 34,682 |
| Visa, Inc. Class AΔ | 22,215 | | 4,174,199 |
| Western Digital Corporation | 561 | | 35,607 |
| Western Union Co. (The) | 1,569 | | 42,018 |
| Xerox Holdings Corporation | 523 | | 19,283 |
| Xilinx, Inc. | 6,231 | | 609,205 |
| | | | | 81,335,745 |
| Materials — 0.7% | | |
| Air Products & Chemicals, Inc. | 4,769 | | 1,120,667 |
| Albemarle Corporation | 215 | | 15,704 |
| Ball Corporation | 452 | | 29,231 |
| Celanese Corporation | 213 | | 26,225 |
| CF Industries Holdings, Inc. | 450 | | 21,483 |
| Chemours Co. (The) | 8,686 | | 157,130 |
| Corteva, Inc. | 1,360 | | 40,202 |
| Dow, Inc. | 1,455 | | 79,632 |
| DuPont de Nemours, Inc. | 14,660 | | 941,172 |
| Eastman Chemical Co. | 225 | | 17,834 |
| Ecolab, Inc. | 17,904 | | 3,455,293 |
| FMC Corporation | 211 | | 21,062 |
| Freeport-McMoRan, Inc. | 2,892 | | 37,943 |
See Notes to Financial Statements.
DEFENSIVE MARKET STRATEGIES®FUND
SCHEDULE OF INVESTMENTS (Continued)
| | | Shares | | Value |
| International Flavors & Fragrances, Inc.Δ | 260 | | $33,545 |
| International Paper Co. | 727 | | 33,478 |
| Martin Marietta Materials, Inc. | 107 | | 29,921 |
| Mosaic Co. (The) | 608 | | 13,157 |
| Newmont Goldcorp Corporation | 12,607 | | 547,774 |
| Nucor Corporation | 652 | | 36,695 |
| Packaging Corporation of America | 176 | | 19,710 |
| PPG Industries, Inc. | 6,306 | | 841,788 |
| Royal Gold, Inc. | 689 | | 84,230 |
| Sealed Air Corporation | 346 | | 13,781 |
| Sherwin-Williams Co. (The) | 1,986 | | 1,158,910 |
| Vulcan Materials Co. | 294 | | 42,333 |
| Westrock Co. | 468 | | 20,082 |
| | | | | 8,838,982 |
| Real Estate — 0.9% | | |
| Alexandria Real Estate Equities, Inc. REIT | 172 | | 27,792 |
| American Tower Corporation REIT | 763 | | 175,353 |
| Apartment Investment & Management Co. Class A REIT | 480 | | 24,792 |
| AvalonBay Communities, Inc. REIT | 351 | | 73,605 |
| Boston Properties, Inc. REIT | 257 | | 35,430 |
| CBRE Group, Inc. Class A* | 534 | | 32,729 |
| Crown Castle International Corporation REIT | 826 | | 117,416 |
| Digital Realty Trust, Inc. REIT | 362 | | 43,346 |
| Equinix, Inc. REIT | 132 | | 77,048 |
| Equity Residential REIT | 647 | | 52,355 |
| Essex Property Trust, Inc. REIT | 109 | | 32,794 |
| Extra Space Storage, Inc. REIT | 205 | | 21,652 |
| Federal Realty Investment Trust REIT | 105 | | 13,517 |
| Healthpeak Properties, Inc. REIT | 1,300 | | 44,811 |
| Host Hotels & Resorts, Inc. REIT | 1,879 | | 34,855 |
| Iron Mountain, Inc. REIT | 1,187 | | 37,830 |
| Kimco Realty Corporation REIT | 1,844 | | 38,189 |
| Mid-America Apartment Communities, Inc. REIT | 202 | | 26,636 |
| Prologis, Inc. REIT | 1,007 | | 89,764 |
| Public Storage REIT | 262 | | 55,796 |
| Realty Income Corporation REIT | 709 | | 52,204 |
| Regency Centers Corporation REIT | 625 | | 39,431 |
| SBA Communications Corporation REIT | 150 | | 36,148 |
| Simon Property Group, Inc. REIT | 700 | | 104,272 |
| SL Green Realty Corporation REIT | 174 | | 15,987 |
| UDR, Inc. REIT | 300 | | 14,010 |
| Ventas, Inc. REIT | 810 | | 46,769 |
| Vornado Realty Trust REIT | 299 | | 19,883 |
| Welltower, Inc. REIT | 87,142 | | 7,126,473 |
| Weyerhaeuser Co. REIT | 86,907 | | 2,624,591 |
| | | | | 11,135,478 |
| Utilities — 4.6% | | |
| AES Corporation | 1,420 | | 28,258 |
| Alliant Energy Corporation | 300 | | 16,416 |
| Ameren Corporation | 39,442 | | 3,029,146 |
| | | Shares | | Value |
| American Electric Power Co., Inc. | 30,043 | | $2,839,364 |
| American Water Works Co., Inc. | 19,819 | | 2,434,764 |
| Aqua America, Inc. | 5,637 | | 264,601 |
| Atmos Energy Corporation | 66,844 | | 7,477,170 |
| CenterPoint Energy, Inc. | 1,091 | | 29,752 |
| CMS Energy Corporation | 4,647 | | 292,017 |
| Consolidated Edison, Inc. | 18,667 | | 1,688,803 |
| Dominion Energy, Inc. | 26,724 | | 2,213,282 |
| DTE Energy Co. | 13,486 | | 1,751,427 |
| Duke Energy Corporation | 28,351 | | 2,585,895 |
| Edison International | 24,862 | | 1,874,843 |
| Entergy Corporation | 480 | | 57,504 |
| Evergy, Inc. | 32,489 | | 2,114,709 |
| Eversource EnergyΔ | 19,578 | | 1,665,500 |
| Exelon Corporation | 6,555 | | 298,842 |
| FirstEnergy Corporation | 1,116 | | 54,238 |
| IDACORP, Inc. | 6,421 | | 685,763 |
| NextEra Energy, Inc. | 16,191 | | 3,920,812 |
| NiSource, Inc. | 539 | | 15,006 |
| NRG Energy, Inc. | 483 | | 19,199 |
| OGE Energy Corporation | 3,485 | | 154,978 |
| ONE Gas, Inc. | 63,242 | | 5,917,554 |
| Pinnacle West Capital Corporation | 32,049 | | 2,882,167 |
| PPL Corporation | 27,835 | | 998,720 |
| Public Service Enterprise Group, Inc. | 11,028 | | 651,203 |
| Sempra Energy | 14,683 | | 2,224,181 |
| Southern Co. (The) | 18,676 | | 1,189,661 |
| Spire, Inc. | 76,522 | | 6,375,048 |
| UGI Corporation | 11,545 | | 521,372 |
| WEC Energy Group, Inc.Δ | 13,353 | | 1,231,547 |
| Xcel Energy, Inc.Δ | 10,724 | | 680,867 |
| | | | | 58,184,609 |
Total Common Stocks
(Cost $387,375,889) | | 521,524,492 |
| FOREIGN COMMON STOCKS — 5.8% |
| Curacao — 0.5% | | |
| Schlumberger, Ltd. | 163,434 | | 6,570,047 |
| France — 1.0% | | |
| Sodexo SAΔ | 28,300 | | 3,353,765 |
| TOTAL SA | 170,023 | | 9,383,169 |
| | | | | 12,736,934 |
| Ireland — 1.9% | | |
| Accenture PLC Class A | 18,331 | | 3,859,959 |
| Allegion PLC | 156 | | 19,428 |
| Eaton Corporation PLC | 837 | | 79,281 |
| Ingersoll-Rand PLC | 431 | | 57,288 |
| Johnson Controls International PLC | 1,943 | | 79,099 |
| Linde PLC | 13,439 | | 2,861,163 |
| Medtronic PLC | 150,208 | | 17,041,098 |
| Pentair PLC | 294 | | 13,486 |
| Seagate Technology PLC | 660 | | 39,270 |
| Willis Towers Watson PLC | 205 | | 41,398 |
| | | | | 24,091,470 |
See Notes to Financial Statements.
| | | Shares | | Value |
| Japan — 0.1% | | |
| Honda Motor Co., Ltd. | 26,500 | | $749,991 |
| Jersey — 0.1% | | |
| Amcor PLC | 4,160 | | 45,094 |
| Aptiv PLC | 496 | | 47,105 |
| Janus Henderson Group PLCΔ | 41,300 | | 1,009,785 |
| | | | | 1,101,984 |
| Netherlands — 0.4% | | |
| Akzo Nobel NV | 12,100 | | 1,230,218 |
| Koninklijke Ahold Delhaize NV | 122,053 | | 3,052,339 |
| LyondellBasell Industries NV Class A | 640 | | 60,467 |
| Mylan NV* | 6,053 | | 121,665 |
| | | | | 4,464,689 |
| Sweden — 0.0% | | |
| Atlas Copco AB, B Shares | 13,200 | | 458,318 |
| Switzerland — 1.7% | | |
| Chubb, Ltd. | 62,209 | | 9,683,453 |
| Garmin, Ltd. | 2,476 | | 241,559 |
| Nestle SA | 89,700 | | 9,711,395 |
| Novartis AG | 3,800 | | 359,820 |
| Roche Holding AG | 5,600 | | 1,820,016 |
| TE Connectivity, Ltd. | 617 | | 59,133 |
| | | | | 21,875,376 |
| United Kingdom — 0.1% | | |
| Aon PLC | 5,570 | | 1,160,175 |
| Nielsen Holdings PLC | 758 | | 15,387 |
| TechnipFMC PLC | 1,083 | | 23,220 |
| | | | | 1,198,782 |
Total Foreign Common Stocks
(Cost $62,181,376) | | 73,247,591 |
| PREFERRED STOCKS — 0.9% |
| Bank of America Corporation, 7.25%, 12/30/19 CONVΔ | 723 | | 1,047,627 |
| Becton, Dickinson and Co., 6.13%, 10/11/19 CONVΔ | 87,600 | | 5,734,296 |
| Stanley Black & Decker, Inc., 5.38%, 01/30/20 CONVΔ | 28,605 | | 3,121,664 |
| Wells Fargo & Co., 7.50%, 11/27/19 CONV | 636 | | 922,200 |
Total Preferred Stocks
(Cost $9,791,594) | | 10,825,787 |
| MUTUAL FUNDS — 0.8% |
iShares Russell 1000 Value ETFΔ
(Cost $9,633,560) | 72,792 | | 9,934,652 |
| | | Par | |
| CORPORATE BONDS — 24.6% |
| Advanced Micro Devices, Inc. | | | |
| 2.13%, 09/01/26 CONV | $200,000 | 1,159,388 |
| Akamai Technologies, Inc. | | | |
| 0.13%, 05/01/25 CONV | 3,978,000 | 4,414,572 |
| | | Par | | Value |
| 0.38%, 09/01/27 144A CONV | $3,131,000 | | $3,097,168 |
| Allscripts Healthcare Solutions, Inc. | | | | |
| 1.25%, 07/01/20 CONV | 2,397,000 | | 2,379,178 |
| 0.88%, 01/01/27 144A CONV | 2,345,000 | | 2,305,463 |
| Altair Engineering, Inc. | | | | |
| 0.25%, 06/01/24 CONV | 603,000 | | 619,582 |
| Alteryx, Inc. | | | | |
| 0.50%, 08/01/24 144A CONV | 2,360,000 | | 2,260,144 |
| 1.00%, 08/01/26 144A CONV | 1,193,000 | | 1,120,930 |
| Ares Capital Corporation | | | | |
| 3.75%, 02/01/22 CONV | 3,802,000 | | 3,950,461 |
| 4.63%, 03/01/24 CONV | 1,758,000 | | 1,873,501 |
| Atlassian, Inc. | | | | |
| 0.63%, 05/01/23 CONV | 514,000 | | 813,557 |
| Bank of America Corporation | | | | |
| (Variable, ICE LIBOR USD 3M + 2.93%), 5.88%, 03/15/28ρ^ | 3,116,000 | | 3,457,825 |
| Bank of New York Mellon Corporation (The) | | | | |
| (Variable, ICE LIBOR USD 3M + 3.42%), 4.95%, 06/20/20ρ^ | 582,000 | | 587,954 |
| BioMarin Pharmaceutical, Inc. | | | | |
| 0.60%, 08/01/24 CONVΔ | 5,841,000 | | 6,185,612 |
| Blackline, Inc. | | | | |
| 0.13%, 08/01/24 144A CONV | 2,051,000 | | 2,052,282 |
| Blackstone Mortgage Trust, Inc. REIT | | | | |
| 4.75%, 03/15/23 CONV | 6,556,000 | | 7,044,620 |
| BofA Finance LLC | | | | |
| 0.25%, 05/01/23 CONV | 1,443,000 | | 1,522,294 |
| Booking Holdings, Inc. | | | | |
| 0.35%, 06/15/20 CONV | 1,879,000 | | 2,920,677 |
| Carbonite, Inc. | | | | |
| 2.50%, 04/01/22 CONV | 788,000 | | 835,648 |
| Charles Schwab Corporation (The) | | | | |
| (Variable, ICE LIBOR USD 3M + 2.58%), 5.00%, 12/01/27ρ^ | 1,119,000 | | 1,179,448 |
| Chart Industries, Inc. | | | | |
| 1.00%, 11/15/24 144A CONV | 998,000 | | 1,316,459 |
| Chegg, Inc. | | | | |
| 0.13%, 03/15/25 144A CONV | 2,875,000 | | 2,964,149 |
| Citigroup, Inc. | | | | |
| (Variable, ICE LIBOR USD 3M + 4.07%), 5.95%, 01/30/23ρ^ | 2,288,000 | | 2,424,170 |
| (Variable, U.S. SOFR + 3.81%), 5.00%, 09/12/24ρ^ | 1,594,000 | | 1,670,711 |
| CONMED Corporation | | | | |
| 2.63%, 02/01/24 144A CONV | 1,438,000 | | 1,991,701 |
| Coupa Software, Inc. | | | | |
| 0.13%, 06/15/25 144A CONV | 660,000 | | 782,009 |
See Notes to Financial Statements.
DEFENSIVE MARKET STRATEGIES®FUND
SCHEDULE OF INVESTMENTS (Continued)
| | | Par | | Value |
| Cypress Semiconductor Corporation | | | | |
| 2.00%, 02/01/23 CONV | $1,834,000 | | $2,231,509 |
| DexCom, Inc. | | | | |
| 0.75%, 12/01/23 CONV | 2,976,000 | | 4,415,483 |
| DISH Network Corporation | | | | |
| 3.38%, 08/15/26 CONV | 7,379,000 | | 7,116,308 |
| DocuSign, Inc. | | | | |
| 0.50%, 09/15/23 CONVΔ | 2,725,000 | | 3,397,220 |
| Dominion Energy, Inc. | | | | |
| (Variable, U.S. Treasury Yield Curve Rate CMT 5Y + 2.99%), 4.65%, 12/15/24ρ^ | 1,857,000 | | 1,896,777 |
| Duke Energy Corporation | | | | |
| (Variable, U.S. Treasury Yield Curve Rate CMT 5Y + 3.39%), 4.88%, 09/16/24ρ^ | 2,719,000 | | 2,855,426 |
| Dycom Industries, Inc. | | | | |
| 0.75%, 09/15/21 CONV | 2,664,000 | | 2,595,190 |
| Envestnet, Inc. | | | | |
| 1.75%, 06/01/23 CONV | 1,834,000 | | 2,203,823 |
| Etsy, Inc. | | | | |
| 0.13%, 10/01/26 144A CONV | 3,524,000 | | 3,187,259 |
| Euronet Worldwide, Inc. | | | | |
| 0.75%, 03/15/49 144A CONVΔ | 548,000 | | 655,017 |
| Exact Sciences Corporation | | | | |
| 1.00%, 01/15/25 CONV | 490,000 | | 708,662 |
| 0.38%, 03/15/27 CONV | 2,964,000 | | 3,365,992 |
| Extra Space Storage LP REIT | | | | |
| 3.13%, 10/01/35 144A CONV | 2,801,000 | | 3,294,676 |
| FireEye, Inc. | | | | |
| 0.88%, 06/01/24 CONV | 2,608,000 | | 2,634,502 |
| Five9, Inc. | | | | |
| 0.13%, 05/01/23 CONV | 631,000 | | 1,067,342 |
| Fortive Corporation | | | | |
| 0.88%, 02/15/22 144A CONV | 1,884,000 | | 1,909,858 |
| FTI Consulting, Inc. | | | | |
| 2.00%, 08/15/23 CONV | 1,559,000 | | 1,958,270 |
| Greenbrier Cos., Inc. (The) | | | | |
| 2.88%, 02/01/24 CONV | 1,399,000 | | 1,360,977 |
| Guess?, Inc. | | | | |
| 2.00%, 04/15/24 144A CONV | 1,584,000 | | 1,741,410 |
| Herbalife Nutrition, Ltd. | | | | |
| 2.63%, 03/15/24 CONV | 2,019,000 | | 2,099,420 |
| IAC Financeco 3, Inc. | | | | |
| 2.00%, 01/15/30 144A CONV | 1,380,000 | | 1,615,428 |
| IH Merger Sub LLC REIT | | | | |
| 3.50%, 01/15/22 CONV | 2,353,000 | | 3,177,289 |
| Illumina, Inc. | | | | |
| 0.50%, 06/15/21 CONVΔ | 612,000 | | 853,944 |
| | | Par | | Value |
| 0.00%, 08/15/23Ω CONVΔ | $2,943,000 | | $3,257,920 |
| Insight Enterprises, Inc. | | | | |
| 0.75%, 02/15/25 144A CONV | 2,716,000 | | 3,215,168 |
| Insulet Corporation | | | | |
| 1.38%, 11/15/24 CONV | 2,000 | | 3,809 |
| 0.38%, 09/01/26 144A CONV | 3,065,000 | | 3,193,696 |
| InterDigital, Inc. | | | | |
| 2.00%, 06/01/24 144A CONV | 1,327,000 | | 1,326,137 |
| Ionis Pharmaceuticals, Inc. | | | | |
| 0.13%, 12/15/24 144A CONV | 1,161,000 | | 1,185,419 |
| Ironwood Pharmaceuticals, Inc. | | | | |
| 0.75%, 06/15/24 144A CONV | 745,000 | | 883,941 |
| 1.50%, 06/15/26 144A CONV | 720,000 | | 864,840 |
| j2 Global, Inc. | | | | |
| 1.75%, 11/01/26 144A CONV | 2,005,000 | | 2,044,078 |
| Jazz Investments I, Ltd. | | | | |
| 1.88%, 08/15/21 CONV | 861,000 | | 888,659 |
| 1.50%, 08/15/24 CONVΔ | 3,785,000 | | 3,825,216 |
| JPMorgan Chase & Co. | | | | |
| (Variable, ICE LIBOR USD 3M + 3.47%), 5.41%, 04/30/20†ρ | 1,292,000 | | 1,305,592 |
| (Variable, U.S. SOFR + 3.38%), 5.00%, 08/01/24ρ^ | 4,279,000 | | 4,455,509 |
| KBR, Inc. | | | | |
| 2.50%, 11/01/23 144A CONV | 2,220,000 | | 2,949,825 |
| Liberty Interactive LLC | | | | |
| 1.75%, 09/30/46 144A CONV | 1,854,000 | | 2,726,479 |
| Liberty Media Corp-Liberty Formula One | | | | |
| 1.00%, 01/30/23 CONV | 1,207,000 | | 1,608,572 |
| Liberty Media Corporation | | | | |
| 1.38%, 10/15/23 CONV | 628,000 | | 846,607 |
| 2.25%, 09/30/46 CONV | 1,187,000 | | 689,043 |
| 2.13%, 03/31/48 144A CONV | 4,587,000 | | 4,848,459 |
| Ligand Pharmaceuticals, Inc. | | | | |
| 0.75%, 05/15/23 CONV | 1,127,000 | | 975,463 |
| Live Nation Entertainment, Inc. | | | | |
| 2.50%, 03/15/23 CONV | 5,943,000 | | 7,261,752 |
| Lumentum Holdings, Inc. | | | | |
| 0.50%, 12/15/26 144A CONV | 3,100,000 | | 3,371,250 |
| Macquarie Infrastructure Corporation | | | | |
| 2.00%, 10/01/23 CONVΔ | 2,299,000 | | 2,204,290 |
| Marriott Vacations Worldwide Corporation | | | | |
| 1.50%, 09/15/22 CONV | 4,957,000 | | 5,310,876 |
See Notes to Financial Statements.
| | | Par | | Value |
| Meritor, Inc. | | | | |
| 3.25%, 10/15/37 CONV | $5,310,000 | | $5,790,512 |
| Microchip Technology, Inc. | | | | |
| 1.63%, 02/15/27 CONVΔ | 5,376,000 | | 7,674,240 |
| National Health Investors, Inc. REIT | | | | |
| 3.25%, 04/01/21 CONV | 218,000 | | 262,888 |
| Neurocrine Biosciences, Inc. | | | | |
| 2.25%, 05/15/24 CONV | 804,000 | | 1,235,175 |
| New Relic, Inc. | | | | |
| 0.50%, 05/01/23 CONV | 4,719,000 | | 4,597,645 |
| NextEra Energy Partners LP | | | | |
| 1.50%, 09/15/20 144A CONV | 3,396,000 | | 3,549,569 |
| Nice Systems, Inc. | | | | |
| 1.25%, 01/15/24 CONV | 463,000 | | 884,619 |
| Nuance Communications, Inc. | | | | |
| 1.25%, 04/01/25 CONV | 2,852,000 | | 3,182,268 |
| 1.00%, 12/15/35 CONV | 853,000 | | 860,996 |
| NuVasive, Inc. | | | | |
| 2.25%, 03/15/21 CONV | 1,635,000 | | 2,182,418 |
| Oil States International, Inc. | | | | |
| 1.50%, 02/15/23 CONVΔ | 727,000 | | 656,190 |
| Okta, Inc. | | | | |
| 0.13%, 09/01/25 144A CONV | 2,470,000 | | 2,401,128 |
| ON Semiconductor Corporation | | | | |
| 1.00%, 12/01/20 CONV | 3,124,000 | | 4,253,303 |
| 1.63%, 10/15/23 CONV | 967,000 | | 1,335,669 |
| OSI Systems, Inc. | | | | |
| 1.25%, 09/01/22 CONV | 944,000 | | 1,034,190 |
| Palo Alto Networks, Inc. | | | | |
| 0.75%, 07/01/23 CONV | 3,560,000 | | 3,935,548 |
| Pandora Media LLC | | | | |
| 1.75%, 12/01/23 CONV | 1,505,000 | | 1,868,289 |
| PDC Energy, Inc. | | | | |
| 1.13%, 09/15/21 CONV | 851,000 | | 803,294 |
| Plains All American Pipeline LP | | | | |
| (Variable, ICE LIBOR USD 3M + 4.11%), 6.13%, 11/15/22ρ^ | 2,661,000 | | 2,485,427 |
| Progressive Corporation (The) | | | | |
| (Variable, ICE LIBOR USD 3M + 2.54%), 5.38%, 03/15/23ρ^ | 603,000 | | 634,645 |
| Proofpoint, Inc. | | | | |
| 0.25%, 08/15/24 144A CONV | 2,300,000 | | 2,374,523 |
| Pure Storage, Inc. | | | | |
| 0.13%, 04/15/23 CONV | 2,707,000 | | 2,697,937 |
| Q2 Holdings, Inc. | | | | |
| 0.75%, 06/01/26 144A CONV | 1,029,000 | | 1,187,764 |
| | | Par | | Value |
| Repligen Corporation | | | | |
| 0.38%, 07/15/24 CONV | $581,000 | | $629,545 |
| RH | | | | |
| 1.93%, 06/15/23Ω CONVΔ | 1,753,000 | | 2,228,600 |
| RingCentral, Inc. | | | | |
| 0.00%, 03/15/23Ω CONV | 478,000 | | 1,004,899 |
| SailPoint Technologies Holding, Inc. | | | | |
| 0.13%, 09/15/24 144A CONV | 1,858,000 | | 2,008,016 |
| ServiceNow, Inc. | | | | |
| 0.00%, 06/01/22Ω CONV | 159,000 | | 335,833 |
| Silicon Laboratories, Inc. | | | | |
| 1.38%, 03/01/22 CONV | 3,161,000 | | 4,209,094 |
| SM Energy Co. | | | | |
| 1.50%, 07/01/21 CONV | 822,000 | | 786,398 |
| Snap, Inc. | | | | |
| 0.75%, 08/01/26 144A CONV | 2,968,000 | | 3,095,297 |
| Splunk, Inc. | | | | |
| 0.50%, 09/15/23 CONV | 4,126,000 | | 4,976,987 |
| Square, Inc. | | | | |
| 0.50%, 05/15/23 CONV | 2,112,000 | | 2,365,393 |
| Starwood Property Trust, Inc. REIT | | | | |
| 4.38%, 04/01/23 CONV | 4,426,000 | | 4,616,871 |
| Supernus Pharmaceuticals, Inc. | | | | |
| 0.63%, 04/01/23 CONV | 2,074,000 | | 1,887,694 |
| Tabula Rasa HealthCare, Inc. | | | | |
| 1.75%, 02/15/26 144A CONV | 877,000 | | 880,837 |
| Teradyne, Inc. | | | | |
| 1.25%, 12/15/23 CONV | 844,000 | | 1,853,115 |
| Tesla, Inc. | | | | |
| 2.00%, 05/15/24 CONV | 3,375,000 | | 5,110,838 |
| Transocean, Inc. | | | | |
| 0.50%, 01/30/23 CONVΔ | 1,092,000 | | 1,093,365 |
| Tutor Perini Corporation | | | | |
| 2.88%, 06/15/21 CONVΔ | 1,555,000 | | 1,484,852 |
| Twilio, Inc. | | | | |
| 0.25%, 06/01/23 CONV | 491,000 | | 750,707 |
| Twitter, Inc. | | | | |
| 0.25%, 06/15/24 CONV | 4,032,000 | | 3,906,000 |
| Two Harbors Investment Corporation REIT | | | | |
| 6.25%, 01/15/22 CONV | 2,092,000 | | 2,176,144 |
| U.S. Bancorp | | | | |
| (Variable, ICE LIBOR USD 3M + 2.91%), 5.30%, 04/15/27ρ^ | 3,599,000 | | 3,975,635 |
| Verint Systems, Inc. | | | | |
| 1.50%, 06/01/21 CONV | 3,896,000 | | 4,211,705 |
| Vonage Holdings Corporation | | | | |
| 1.75%, 06/01/24 144A CONV | 730,000 | | 655,464 |
See Notes to Financial Statements.
DEFENSIVE MARKET STRATEGIES®FUND
SCHEDULE OF INVESTMENTS (Continued)
| | | Par | | Value |
| Wayfair, Inc. | | | | |
| 1.13%, 11/01/24 CONV | $503,000 | | $522,589 |
| 1.00%, 08/15/26 144A CONV | 3,935,000 | | 3,480,208 |
| Wells Fargo & Co. | | | | |
| (Variable, ICE LIBOR USD 3M + 3.77%), 5.66%, 03/15/20†ρΔ | 3,576,000 | | 3,625,170 |
| Western Digital Corporation | | | | |
| 1.50%, 02/01/24 CONV | 1,905,000 | | 1,875,234 |
| Workday, Inc. | | | | |
| 0.25%, 10/01/22 CONV | 964,000 | | 1,236,262 |
| Workiva, Inc. | | | | |
| 1.13%, 08/15/26 144A CONV | 870,000 | | 782,348 |
| Wright Medical Group, Inc. | | | | |
| 1.63%, 06/15/23 CONV | 3,036,000 | | 3,214,465 |
| Zendesk, Inc. | | | | |
| 0.25%, 03/15/23 CONV | 1,398,000 | | 1,911,980 |
| Zillow Group, Inc. | | | | |
| 2.00%, 12/01/21 CONV | 1,461,000 | | 1,638,012 |
| 0.75%, 09/01/24 144A CONV | 1,440,000 | | 1,759,223 |
| Zynga, Inc. | | | | |
| 0.25%, 06/01/24 144A CONV | 3,182,000 | | 3,249,617 |
Total Corporate Bonds
(Cost $284,787,175) | | 309,940,519 |
| FOREIGN BONDS — 1.9% |
| France — 1.1% | | |
| AXA SA | | | | |
| 7.25%, 05/15/21 144A CONV | 646,000 | | 746,049 |
| Cie Generale des Etablissements Michelin SCA | | | | |
| 0.62%, 01/10/22Ω CONV | 1,400,000 | | 1,418,144 |
| TOTAL SA | | | | |
| 0.50%, 12/02/22 CONVΔ | 4,000,000 | | 4,246,840 |
| Valeo SA | | | | |
| 0.33%, 06/16/21Ω CONV | 3,400,000 | | 3,287,800 |
| Vinci SA | | | | |
| 0.38%, 02/16/22 CONV | 3,200,000 | | 3,894,848 |
| | | | | 13,593,681 |
| Israel — 0.3% | | |
| CyberArk Software, Ltd. | | | | |
| 0.00%, 11/15/24 144AΩ CONV | 2,050,000 | | 2,127,222 |
| Wix.com, Ltd. | | | | |
| 0.00%, 07/01/23Ω CONVΔ | 2,027,000 | | 2,315,847 |
| | | | | 4,443,069 |
| | | Par | | Value |
| Netherlands — 0.5% | | |
| QIAGEN NV | | | | |
| 0.88%, 03/19/21 CONV | $200,000 | | $249,796 |
| 1.00%, 11/13/24 CONV | 2,800,000 | | 2,855,138 |
| STMicroelectronics NV | | | | |
| 0.25%, 07/03/24 CONV | 2,000,000 | | 2,857,480 |
| | | | | 5,962,414 |
Total Foreign Bonds
(Cost $22,268,025) | | 23,999,164 |
| | | Shares | |
| EQUITY-LINKED SECURITIES — 0.8% |
| Berkshire Hathaway, Inc., Issued by Citigroup Global Markets, Inc., Maturity Date 01/14/20 144A††† | 7,500 | 1,667,025 |
| Berkshire Hathaway, Inc., Issued by Royal Bank of Canada, Maturity Date 01/23/20 144A CONV | 2,400 | 535,560 |
| Cerner Corporation, Issued by Credit Suisse AG, Maturity Date 04/20/20 144A††† | 10,600 | 730,372 |
| Cerner Corporation, Issued by Credit Suisse AG, Maturity Date 06/22/20 144A††† | 9,000 | 644,868 |
| Cerner Corporation, Issued by Merrill Lynch International & Co. CV, Maturity Date 05/29/20 144A | 16,700 | 1,195,865 |
| Cerner Corporation, Issued by Morgan Stanley BV, Maturity Date 04/28/20 144A††† | 12,600 | 882,252 |
| Cerner Corporation, Issued by Royal Bank of Canada, Maturity Date 02/10/20 144A CONV††† | 8,400 | 607,572 |
| Emerson Electric Co., Issued by Credit Suisse AG, Maturity Date 04/30/20 144A††† | 7,300 | 528,016 |
| Ralph Lauren Corporation, Issued by UBS AG, Maturity Date 01/23/20 144A††† | 7,300 | 845,450 |
| Raytheon Co., Issued by UBS AG, Maturity Date 06/24/20 144A††† | 5,600 | 1,202,376 |
| Southwest Airlines Co., Issued by Citigroup Global Markets Holdings, Inc., Maturity Date 03/16/2020 144A††† | 10,000 | 550,900 |
| Southwest Airlines Co., Issued by UBS AG, Maturity Date 02/06/20 144A††† | 10,600 | 559,998 |
Total Equity-Linked Securities
(Cost $9,722,566) | 9,950,254 |
See Notes to Financial Statements.
| | | Shares | | Value |
| MONEY MARKET FUNDS — 6.7% |
GuideStone Money Market Fund, 1.53%
(Institutional Class)Ø∞ | 68,295,332 | | $68,295,332 |
| Northern Institutional Liquid Assets Portfolio (Shares), 1.57%ا | 15,051,560 | | 15,051,560 |
| Northern Institutional U.S. Government Portfolio (Shares), 1.48%Ø | 1,497,777 | | 1,497,777 |
Total Money Market Funds
(Cost $84,844,669) | | 84,844,669 |
| | | Par | |
| U.S. TREASURY OBLIGATIONS — 18.3% |
| U.S. Treasury Bills | | | |
| 1.70%, 04/02/20Ω‡‡ | $1,000,000 | 996,158 |
| 2.32%, 04/23/20Ω | 33,225,000 | 33,067,081 |
| 1.87%, 07/16/20Ω | 48,989,000 | 48,580,588 |
| 1.58%, 10/08/20Ω | 37,970,000 | 37,524,802 |
| U.S. Treasury Notes | | | |
| 1.50%, 06/15/20 | 29,344,000 | 29,334,830 |
| 1.38%, 08/31/20 | 34,300,000 | 34,244,397 |
| 1.38%, 10/31/20 | 24,957,300 | 24,901,731 |
| 2.00%, 11/30/20 | 22,880,000 | 22,956,416 |
Total U.S. Treasury Obligations
(Cost $231,301,296) | 231,606,003 |
TOTAL INVESTMENTS —101.1%
(Cost $1,101,906,150) | | 1,275,873,131 |
| | Number of
Contracts | | Notional
Amount | |
| WRITTEN OPTIONS — (0.1)% |
| Call Options — (0.0)% | | |
| S&P 500®, Strike Price $3,190.00, Expires 01/03/20 (MSCS) | (13) | | $(4,200,014) | (60,580) |
| S&P 500®, Strike Price $3,200.00, Expires 01/06/20 (MSCS) | (12) | | (3,876,936) | (47,400) |
| S&P 500®, Strike Price $3,210.00, Expires 01/08/20 (MSCS) | (13) | | (4,200,014) | (45,110) |
| S&P 500®, Strike Price $3,230.00, Expires 01/10/20 (MSCS) | (13) | | (4,200,014) | (31,135) |
| S&P 500®, Strike Price $3,255.00, Expires 01/13/20 (MSCS) | (12) | | (3,876,936) | (15,060) |
| S&P 500®, Strike Price $3,260.00, Expires 01/15/20 (MSCS) | (12) | | (3,876,936) | (15,540) |
| | Number of
Contracts | | Notional
Amount | | Value |
| S&P 500®, Strike Price $3,285.00, Expires 01/17/20 (MSCS) | (14) | | $(4,523,092) | | $(10,360) |
| S&P 500®, Strike Price $3,285.00, Expires 01/22/20 (MSCS) | (13) | | (4,200,014) | | (12,025) |
| S&P 500®, Strike Price $3,290.00, Expires 01/21/20 (MSCS) | (13) | | (4,200,014) | | (9,295) |
| S&P 500®, Strike Price $3,295.00, Expires 01/27/20 (MSCS) | (14) | | (4,523,092) | | (12,880) |
| S&P 500®, Strike Price $3,295.00, Expires 01/29/20 (MSCS) | (14) | | (4,523,092) | | (15,540) |
| S&P 500®, Strike Price $3,310.00, Expires 01/24/20 (MSCS) | (13) | | (4,200,014) | | (6,760) |
| | | | | | (281,685) |
| Put Options — (0.1)% | | |
| S&P 500®, Strike Price $3,015.00, Expires 01/08/20 (MSCS) | (63) | | (20,353,914) | | (7,686) |
| S&P 500®, Strike Price $3,080.00, Expires 01/10/20 (MSCS) | (63) | | (20,353,914) | | (18,743) |
| S&P 500®, Strike Price $3,095.00, Expires 01/29/20 (MSCS) | (60) | | (19,384,680) | | (74,100) |
| S&P 500®, Strike Price $3,105.00, Expires 01/15/20 (MSCS) | (61) | | (19,707,758) | | (35,380) |
| S&P 500®, Strike Price $3,110.00, Expires 01/13/20 (MSCS) | (63) | | (20,353,914) | | (28,980) |
| S&P 500®, Strike Price $3,110.00, Expires 01/27/20 (MSCS) | (61) | | (19,707,758) | | (73,505) |
| S&P 500®, Strike Price $3,125.00, Expires 01/22/20 (MSCS) | (62) | | (20,030,836) | | (67,270) |
| S&P 500®, Strike Price $3,130.00, Expires 01/21/20 (MSCS) | (62) | | (20,030,836) | | (64,170) |
See Notes to Financial Statements.
DEFENSIVE MARKET STRATEGIES®FUND
SCHEDULE OF INVESTMENTS (Continued)
| | Number of
Contracts | | Notional
Amount | | Value |
| S&P 500®, Strike Price $3,135.00, Expires 01/17/20 (MSCS) | (58) | | $(18,738,524) | | $(55,390) |
| S&P 500®, Strike Price $3,135.00, Expires 01/24/20 (MSCS) | (62) | | (20,030,836) | | (84,630) |
| | | | | | (509,854) |
Total Written Options
(Premiums received $(1,015,797)) | | | | (791,539) |
Liabilities in Excess of Other
Assets — (1.0)% | | | | (12,560,720) |
| NET ASSETS — 100.0% | | | | $1,262,520,872 |
Futures Contracts outstanding at December 31, 2019:
| Future Type | | Expiration Date | | Open Long
(Short) Contracts | | Notional
Market Value
of Contracts | | Value and
Unrealized
Appreciation
(Depreciation) |
| S&P 500® E-Mini | | 03/2020 | | (155) | | $(25,041,025) | | $(466,502) |
Forward Foreign Currency Contracts outstanding at December 31, 2019:
| Expiration Date | | Currency
Purchased | | Amount
of Currency
Purchased | | Currency
Sold | | Amount
of Currency
Sold | | Counter-
party | | Net Unrealized
Appreciation
(Depreciation) |
| 03/31/20 | | Japanese Yen | | 40,506,240 | | U.S. Dollars | | 372,573 | | BOA | | $2,176 |
| 03/31/20 | | Swedish Kronor | | 1,933,184 | | U.S. Dollars | | 206,484 | | GSC | | 825 |
| 03/31/20 | | Swiss Francs | | 315,778 | | U.S. Dollars | | 328,268 | | UBS | | 160 |
| Subtotal Appreciation | | | | | | | | | | $3,161 |
| 03/31/20 | | Swedish Kronor | | 123,552 | | U.S. Dollars | | 13,286 | | GSC | | $(37) |
| 03/31/20 | | U.S. Dollars | | 588,227 | | Swedish Kronor | | 5,490,848 | | GSC | | (596) |
| 03/31/20 | | U.S. Dollars | | 990,094 | | Japanese Yen | | 107,710,240 | | BOA | | (6,403) |
| 03/31/20 | | U.S. Dollars | | 13,714,646 | | Euro | | 12,216,423 | | CS | | (67,686) |
| 03/31/20 | | U.S. Dollars | | 9,784,366 | | Swiss Francs | | 9,520,886 | | UBS | | (117,935) |
| Subtotal Depreciation | | | | | | | | | | $(192,657) |
| Total Forward Foreign Currency Contracts outstanding at December 31, 2019 | | | | $(189,496) |
See Notes to Financial Statements.
VALUATION HIERARCHY
The following is a summary of the inputs used, as of December 31, 2019, in valuing the Fund’s investments carried at fair value:
| | Total
Value | | Level 1
Quoted Prices | | Level 2
Other Significant
Observable Inputs | | Level 3
Significant
Unobservable Inputs |
| Assets: | | | | | | | |
| Investments in Securities: | | | | | | | |
| Common Stocks | $521,524,492 | | $521,524,492 | | $— | | $— |
| Corporate Bonds | 309,940,519 | | — | | 309,940,519 | | — |
| Equity-Linked Securities | 9,950,254 | | — | | 1,731,425 | | 8,218,829 |
| Foreign Bonds | 23,999,164 | | — | | 23,999,164 | | — |
| Foreign Common Stocks: | | | | | | | |
| Japan | 749,991 | | — | | 749,991 | | — |
| Sweden | 458,318 | | — | | 458,318 | | — |
| Switzerland | 21,875,376 | | 9,984,145 | | 11,891,231 | | — |
| Other^^ | 50,163,906 | | 50,163,906 | | — | | — |
| Total Foreign Common Stocks | 73,247,591 | | 60,148,051 | | 13,099,540 | | — |
| Money Market Funds | 84,844,669 | | 84,844,669 | | — | | — |
| Mutual Funds | 9,934,652 | | 9,934,652 | | — | | — |
| Preferred Stocks | 10,825,787 | | 10,825,787 | | — | | — |
| U.S. Treasury Obligations | 231,606,003 | | — | | 231,606,003 | | — |
| Total Assets - Investments in Securities | $1,275,873,131 | | $687,277,651 | | $580,376,651 | | $8,218,829 |
| Other Financial Instruments*** | | | | | | | |
| Forward Foreign Currency Contracts | $3,161 | | $— | | $3,161 | | $— |
| Total Assets - Other Financial Instruments | $3,161 | | $ — | | $3,161 | | $ — |
| Liabilities: | | | | | | | |
| Investments in Securities: | | | | | | | |
| Written Options: | | | | | | | |
| Call Options | $(281,685) | | $(281,685) | | $— | | $— |
| Put Options | (509,854) | | (509,854) | | — | | — |
| Total Written Options | (791,539) | | (791,539) | | — | | — |
| Total Liabilities - Investments in Securities | $(791,539) | | $(791,539) | | $ — | | $ — |
| Other Financial Instruments*** | | | | | | | |
| Forward Foreign Currency Contracts | $(192,657) | | $— | | $(192,657) | | $— |
| Futures Contracts | (466,502) | | (466,502) | | — | | — |
| Total Liabilities - Other Financial Instruments | $(659,159) | | $(466,502) | | $(192,657) | | $ — |
| ^^ | Classifications as defined in the Schedule of Investments. |
| *** | Other financial instruments are derivative instruments, such as futures contracts and forwards contracts, which are valued at the unrealized appreciation (depreciation) on the investment. Further details regarding the value of these investments can be found in the preceding "Futures Contracts outstanding" and "Forwards Foreign Currency Contracts outstanding" disclosures. |
There were no transfers to or from Level 3 during the year ended December 31, 2019.
Management has determined that the amount of Level 3 securities compared to total net assets is not material; therefore, the reconciliation of Level 3 securities and assumptions is not shown for the year ended December 31, 2019.
See Notes to Financial Statements.
Equity Index Fund(Unaudited)
The Fund was passively managed and attempted to replicate the performance of its benchmark, the S&P 500® Index. The Fund was comprised of domestic, large-cap equity stocks with both value- and growth-style orientations. The objective of the Fund is to provide investment results approximating the aggregate price and dividend performance of the securities included in the S&P 500® Index. However, it could be lower in certain market environments and also due to the exclusion of certain securities from the Fund’s portfolio because of faith-based investment policies and restrictions (100% would indicate perfect correlation).
The Investor Class of the Fund returned +31.33% for the one-year period ended December 31, 2019, as compared to a return of +31.49% for the S&P 500® Index. The return differential was primarily a result of faith-based investment restrictions and expenses of the Fund.
In 2019, exchange listed equity index futures contracts were utilized to provide market exposure to the cash positions held in the Fund. Overall, derivative exposure had a positive impact on Fund performance for the year.
This Fund may be suitable for investors who seek higher, long-term rates of return, can accept significant short-term fluctuations in account value and want to diversify their portfolio by adding a potentially higher return, higher risk option of equity securities. It is possible to lose money by investing in the Fund.
At December 31, 2019, the portfolio holdings of the Fund, as a percentage of net assets, is shown in the following table. Portfolio holdings are subject to risk and may change at any time.
| | % |
| Information Technology | 22.6 |
| Health Care | 13.5 |
| Financials | 13.0 |
| Communication Services | 10.2 |
| Consumer Discretionary | 9.4 |
| Industrials | 8.9 |
| Consumer Staples | 6.9 |
| Energy | 4.2 |
| Utilities | 3.3 |
| Real Estate | 2.9 |
| Money Market Funds | 2.7 |
| Materials | 2.5 |
| U.S. Treasury Obligation | 0.1 |
| | 100.2 |
See Notes to Financial Statements.
Equity Index Fund(Unaudited)
| Average Annual Total Returns as of 12/31/19 | |
| | | Institutional Class* | | Investor Class* | | Benchmark** | |
| One Year | | 31.68% | | 31.33% | | 31.49% | |
| Five Year | | 11.72% | | 11.42% | | 11.69% | |
| Ten year | | 13.57% | | 13.33% | | 13.55% | |
| Since Inception | | 7.59% | | 7.44% | | 7.76% | |
| Inception Date | | 08/27/01 | | 08/27/01 | | | |
| Total Fund Operating Expenses (April 30, 2019 Prospectus)(1) | | 0.13% | | 0.38% | | | |
| (1) | Current information regarding the Fund’s Operating Expenses can be found in the Financial Highlights. |
The performance data quoted represents past performance and does not guarantee future results. Current performance may be lower or higher. Performance data current to the most recent month-end may be obtained at GuideStoneFunds.com. The investment return and principal value of an investment will fluctuate so that shares, when redeemed, may be worth more or less than their original cost.
The graph illustrates the results of a hypothetical $10,000 investment in the Investor Class of the Fund for the 10-year period from December 31, 2009 to December 31, 2019, with all dividends and capital gains reinvested, with the S&P 500® Index.
*These returns reflect investment advisory and shareholder servicing fee waivers, if applicable, during the reported time periods.
**Unlike a mutual fund, the performance of an index assumes no taxes, transaction costs, management fees or other expenses.
See Notes to Financial Statements.
| | | Shares | | Value |
| COMMON STOCKS — 94.1% |
| Communication Services — 10.2% | | |
| Activision Blizzard, Inc. | 54,306 | | $3,226,862 |
| Alphabet, Inc. Class A* | 22,325 | | 29,901,882 |
| Alphabet, Inc. Class C* | 24,147 | | 32,285,022 |
| AT&T, Inc. | 574,447 | | 22,449,389 |
| CenturyLink, Inc. | 121,774 | | 1,608,634 |
| Charter Communications, Inc. Class A* | 13,277 | | 6,440,407 |
| Comcast Corporation Class A | 365,905 | | 16,454,748 |
| Discovery, Inc. Class AΔ* | 27,796 | | 910,041 |
| Discovery, Inc. Class C* | 15,921 | | 485,431 |
| DISH Network Corporation Class A* | 18,408 | | 652,932 |
| Electronic Arts, Inc.* | 25,211 | | 2,710,435 |
| Facebook, Inc. Class A* | 184,041 | | 37,774,415 |
| Fox Corporation Class A | 31,129 | | 1,153,952 |
| Fox Corporation Class B | 9,099 | | 331,204 |
| Interpublic Group of Cos., Inc. (The) | 47,139 | | 1,088,911 |
| Live Nation Entertainment, Inc.* | 10,940 | | 781,882 |
| Netflix, Inc.* | 34,494 | | 11,161,223 |
| News Corporation Class A | 13,865 | | 196,051 |
| News Corporation Class B | 13,984 | | 202,908 |
| Omnicom Group, Inc. | 24,095 | | 1,952,177 |
| Take-Two Interactive Software, Inc.* | 10,102 | | 1,236,788 |
| T-Mobile US, Inc.* | 23,800 | | 1,866,396 |
| Twitter, Inc.* | 52,713 | | 1,689,452 |
| Verizon Communications, Inc. | 327,119 | | 20,085,106 |
| ViacomCBS, Inc. Class B | 28,606 | | 1,200,594 |
| Walt Disney Co. (The) | 142,641 | | 20,630,168 |
| | | | | 218,477,010 |
| Consumer Discretionary — 9.3% | | |
| Advance Auto Parts, Inc. | 6,948 | | 1,112,792 |
| Amazon.com, Inc.* | 32,122 | | 59,356,316 |
| AutoZone, Inc.* | 2,011 | | 2,395,724 |
| Best Buy Co., Inc. | 15,833 | | 1,390,137 |
| Booking Holdings, Inc.* | 3,419 | | 7,021,703 |
| BorgWarner, Inc. | 6,279 | | 272,383 |
| Capri Holdings, Ltd.* | 14,032 | | 535,321 |
| CarMax, Inc.* | 16,274 | | 1,426,742 |
| Carnival Corporation | 37,542 | | 1,908,260 |
| Chipotle Mexican Grill, Inc.* | 1,449 | | 1,212,972 |
| D.R. Horton, Inc. | 20,166 | | 1,063,756 |
| Darden Restaurants, Inc. | 9,727 | | 1,060,340 |
| Dollar General Corporation | 23,558 | | 3,674,577 |
| Dollar Tree, Inc.* | 18,243 | | 1,715,754 |
| eBay, Inc. | 59,500 | | 2,148,545 |
| Expedia Group, Inc. | 10,462 | | 1,131,361 |
| Ford Motor Co. | 395,246 | | 3,675,788 |
| Gap, Inc. (The) | 36,887 | | 652,162 |
| General Motors Co. | 106,950 | | 3,914,370 |
| Genuine Parts Co. | 12,313 | | 1,308,010 |
| H&R Block, Inc.Δ | 32,961 | | 773,924 |
| Hanesbrands, Inc. | 14,216 | | 211,108 |
| Harley-Davidson, Inc.Δ | 8,982 | | 334,041 |
| Hasbro, Inc. | 10,784 | | 1,138,898 |
| Hilton Worldwide Holdings, Inc. | 25,822 | | 2,863,918 |
| | | Shares | | Value |
| Home Depot, Inc. (The) | 82,780 | | $18,077,496 |
| Kohl’s Corporation | 15,822 | | 806,131 |
| L Brands, Inc. | 34,382 | | 623,002 |
| Leggett & Platt, Inc.Δ | 4,991 | | 253,692 |
| Lennar Corporation Class A | 21,185 | | 1,181,911 |
| LKQ Corporation* | 18,658 | | 666,091 |
| Lowe’s Cos., Inc. | 58,190 | | 6,968,834 |
| Macy’s, Inc.Δ | 57,763 | | 981,971 |
| Marriott International, Inc. Class A | 24,143 | | 3,655,974 |
| McDonald’s Corporation | 60,328 | | 11,921,416 |
| Mohawk Industries, Inc.* | 2,387 | | 325,539 |
| Newell Brands, Inc. | 39,118 | | 751,848 |
| NIKE, Inc. Class B | 94,490 | | 9,572,782 |
| Nordstrom, Inc.Δ | 18,747 | | 767,315 |
| Norwegian Cruise Line Holdings, Ltd.* | 15,478 | | 904,070 |
| NVR, Inc.* | 266 | | 1,013,037 |
| O’Reilly Automotive, Inc.* | 5,716 | | 2,505,094 |
| PulteGroup, Inc. | 11,415 | | 442,902 |
| PVH Corporation | 2,959 | | 311,139 |
| Ralph Lauren Corporation | 2,058 | | 241,239 |
| Ross Stores, Inc. | 25,592 | | 2,979,421 |
| Royal Caribbean Cruises, Ltd. | 15,182 | | 2,026,949 |
| Starbucks Corporation | 94,517 | | 8,309,935 |
| Tapestry, Inc. | 24,199 | | 652,647 |
| Target Corporation | 41,380 | | 5,305,330 |
| Tiffany & Co. | 9,641 | | 1,288,520 |
| TJX Cos., Inc. (The) | 90,590 | | 5,531,425 |
| Tractor Supply Co. | 7,490 | | 699,866 |
| Ulta Beauty, Inc.* | 3,840 | | 972,058 |
| Under Armour, Inc. Class AΔ* | 20,379 | | 440,186 |
| Under Armour, Inc. Class CΔ* | 9,410 | | 180,484 |
| VF Corporation | 27,573 | | 2,747,925 |
| Whirlpool CorporationΔ | 2,806 | | 413,969 |
| Yum! Brands, Inc. | 23,522 | | 2,369,371 |
| | | | | 198,188,471 |
| Consumer Staples — 6.9% | | |
| Archer-Daniels-Midland Co. | 58,262 | | 2,700,444 |
| Campbell Soup Co.Δ | 28,952 | | 1,430,808 |
| Church & Dwight Co., Inc. | 27,416 | | 1,928,441 |
| Clorox Co. (The)Δ | 12,213 | | 1,875,184 |
| Coca-Cola Co. (The) | 369,705 | | 20,463,172 |
| Colgate-Palmolive Co. | 85,113 | | 5,859,179 |
| Conagra Brands, Inc.Δ | 41,499 | | 1,420,926 |
| Costco Wholesale Corporation | 32,613 | | 9,585,613 |
| Coty, Inc. Class A | 22,378 | | 251,752 |
| Estee Lauder Cos., Inc. (The) Class A | 18,085 | | 3,735,276 |
| General Mills, Inc. | 62,909 | | 3,369,406 |
| Hershey Co. (The) | 15,496 | | 2,277,602 |
| Hormel Foods CorporationΔ | 43,964 | | 1,983,216 |
| J.M. Smucker Co. (The) | 15,075 | | 1,569,760 |
| Kellogg Co. | 29,100 | | 2,012,556 |
| Kimberly-Clark Corporation | 31,736 | | 4,365,287 |
| Kraft Heinz Co. (The) | 75,933 | | 2,439,727 |
| Kroger Co. (The) | 64,489 | | 1,869,536 |
| Lamb Weston Holdings, Inc. | 17,029 | | 1,465,005 |
See Notes to Financial Statements.
| | | Shares | | Value |
| McCormick & Co., Inc. (Non-Voting Shares) | 12,700 | | $2,155,571 |
| Mondelez International, Inc. Class A | 128,715 | | 7,089,622 |
| Monster Beverage Corporation* | 46,680 | | 2,966,514 |
| PepsiCo, Inc. | 124,871 | | 17,066,120 |
| Procter & Gamble Co. (The) | 203,972 | | 25,476,103 |
| Sysco Corporation | 34,878 | | 2,983,464 |
| Tyson Foods, Inc. Class A | 35,391 | | 3,221,997 |
| Walgreens Boots Alliance, Inc. | 61,239 | | 3,610,651 |
| Walmart, Inc. | 109,781 | | 13,046,374 |
| | | | | 148,219,306 |
| Energy — 4.0% | | |
| Apache CorporationΔ | 23,559 | | 602,875 |
| Archrock, Inc. | 13 | | 131 |
| Baker Hughes Co. | 33,215 | | 851,300 |
| Cabot Oil & Gas Corporation | 29,892 | | 520,420 |
| Chevron Corporation | 148,265 | | 17,867,415 |
| Cimarex Energy Co. | 3,553 | | 186,497 |
| Concho Resources, Inc. | 15,869 | | 1,389,648 |
| ConocoPhillips | 89,387 | | 5,812,837 |
| Devon Energy Corporation | 38,557 | | 1,001,325 |
| Diamondback Energy, Inc. | 10,890 | | 1,011,245 |
| EOG Resources, Inc. | 40,407 | | 3,384,490 |
| Exterran Corporation* | 6 | | 47 |
| Exxon Mobil Corporation | 332,330 | | 23,189,987 |
| Halliburton Co. | 74,621 | | 1,825,976 |
| Helmerich & Payne, Inc. | 4,961 | | 225,378 |
| Hess CorporationΔ | 18,891 | | 1,262,108 |
| HollyFrontier Corporation | 10,771 | | 546,197 |
| Kinder Morgan, Inc. | 146,006 | | 3,090,947 |
| Marathon Oil Corporation | 69,854 | | 948,617 |
| Marathon Petroleum Corporation | 50,234 | | 3,026,599 |
| National Oilwell Varco, Inc. | 32,684 | | 818,734 |
| Noble Energy, Inc. | 40,915 | | 1,016,329 |
| Occidental Petroleum Corporation | 79,090 | | 3,259,299 |
| ONEOK, Inc. | 32,556 | | 2,463,513 |
| Phillips 66 | 31,961 | | 3,560,775 |
| Pioneer Natural Resources Co. | 11,479 | | 1,737,576 |
| Valero Energy Corporation | 31,110 | | 2,913,452 |
| Williams Cos., Inc. (The) | 96,309 | | 2,284,449 |
| | | | | 84,798,166 |
| Financials — 12.4% | | |
| Aflac, Inc. | 66,659 | | 3,526,261 |
| Allstate Corporation (The) | 28,840 | | 3,243,058 |
| American Express Co. | 47,721 | | 5,940,787 |
| American International Group, Inc. | 67,569 | | 3,468,317 |
| Ameriprise Financial, Inc. | 10,894 | | 1,814,723 |
| Arthur J. Gallagher & Co. | 15,093 | | 1,437,306 |
| Assurant, Inc. | 2,341 | | 306,858 |
| Bank of America Corporation | 683,906 | | 24,087,169 |
| Bank of New York Mellon Corporation (The) | 72,967 | | 3,672,429 |
| Berkshire Hathaway, Inc. Class B* | 156,738 | | 35,501,157 |
| BlackRock, Inc. | 9,421 | | 4,735,937 |
| Capital One Financial Corporation | 34,907 | | 3,592,279 |
| Cboe Global Markets, Inc. | 8,664 | | 1,039,680 |
| Charles Schwab Corporation (The) | 92,054 | | 4,378,088 |
| | | Shares | | Value |
| Cincinnati Financial CorporationΔ | 10,988 | | $1,155,388 |
| Citigroup, Inc. | 179,525 | | 14,342,252 |
| Citizens Financial Group, Inc. | 37,570 | | 1,525,718 |
| CME Group, Inc. | 28,081 | | 5,636,418 |
| Comerica, Inc. | 10,547 | | 756,747 |
| Discover Financial Services | 17,665 | | 1,498,345 |
| E*TRADE Financial Corporation | 10,478 | | 475,387 |
| Everest Re Group, Ltd. | 3,173 | | 878,413 |
| Fifth Third Bancorp | 52,084 | | 1,601,062 |
| First Republic Bank | 11,885 | | 1,395,893 |
| Franklin Resources, Inc. | 23,495 | | 610,400 |
| Globe Life, Inc. | 4,186 | | 440,577 |
| Goldman Sachs Group, Inc. (The) | 27,330 | | 6,283,987 |
| Hartford Financial Services Group, Inc. (The) | 28,747 | | 1,746,955 |
| Huntington Bancshares, Inc.Δ | 83,830 | | 1,264,156 |
| Intercontinental Exchange, Inc. | 43,068 | | 3,985,944 |
| Invesco, Ltd.Δ | 43,478 | | 781,735 |
| JPMorgan Chase & Co. | 250,114 | | 34,865,892 |
| KeyCorp | 64,549 | | 1,306,472 |
| Lincoln National Corporation | 19,455 | | 1,148,040 |
| Loews Corporation | 12,502 | | 656,230 |
| M&T Bank Corporation | 10,059 | | 1,707,515 |
| MarketAxess Holdings, Inc. | 2,840 | | 1,076,672 |
| Marsh & McLennan Cos., Inc. | 39,915 | | 4,446,930 |
| MetLife, Inc. | 79,589 | | 4,056,651 |
| Moody’s Corporation | 11,483 | | 2,726,179 |
| Morgan Stanley | 104,741 | | 5,354,360 |
| MSCI, Inc. | 5,076 | | 1,310,522 |
| Nasdaq, Inc.Δ | 9,140 | | 978,894 |
| Northern Trust Corporation | 16,617 | | 1,765,390 |
| People’s United Financial, Inc. | 11,480 | | 194,012 |
| PNC Financial Services Group, Inc. (The) | 34,137 | | 5,449,289 |
| Principal Financial Group, Inc. | 22,421 | | 1,233,155 |
| Progressive Corporation (The) | 45,104 | | 3,265,079 |
| Prudential Financial, Inc. | 36,128 | | 3,386,639 |
| Raymond James Financial, Inc. | 9,228 | | 825,537 |
| Regions Financial Corporation | 83,579 | | 1,434,216 |
| S&P Global, Inc. | 17,423 | | 4,757,350 |
| State Street Corporation | 30,870 | | 2,441,817 |
| SVB Financial Group* | 2,215 | | 556,054 |
| Synchrony Financial | 55,655 | | 2,004,137 |
| T. Rowe Price Group, Inc. | 15,490 | | 1,887,302 |
| Travelers Cos., Inc. (The) | 21,004 | | 2,876,498 |
| Truist Financial Corporation | 104,235 | | 5,870,512 |
| U.S. Bancorp | 117,801 | | 6,984,421 |
| Unum Group | 8,642 | | 252,001 |
| W.R. Berkley Corporation | 11,267 | | 778,550 |
| Wells Fargo & Co. | 318,305 | | 17,124,809 |
| Zions Bancorp NA | 7,446 | | 386,596 |
| | | | | 264,231,147 |
| Health Care — 12.8% | | |
| Abbott Laboratories | 139,563 | | 12,122,442 |
| ABIOMED, Inc.* | 6,766 | | 1,154,212 |
| Agilent Technologies, Inc. | 32,843 | | 2,801,836 |
| Alexion Pharmaceuticals, Inc.* | 24,651 | | 2,666,006 |
See Notes to Financial Statements.
SCHEDULE OF INVESTMENTS (Continued)
| | | Shares | | Value |
| Align Technology, Inc.* | 8,080 | | $2,254,643 |
| Amgen, Inc. | 55,832 | | 13,459,420 |
| Anthem, Inc. | 21,194 | | 6,401,224 |
| Baxter International, Inc. | 41,154 | | 3,441,298 |
| Becton, Dickinson and Co. | 21,279 | | 5,787,250 |
| Biogen, Inc.* | 18,945 | | 5,621,550 |
| Boston Scientific Corporation* | 120,221 | | 5,436,394 |
| Bristol-Myers Squibb Co. | 237,755 | | 15,261,494 |
| Cardinal Health, Inc. | 27,527 | | 1,392,316 |
| Centene Corporation* | 42,096 | | 2,646,576 |
| Cerner Corporation | 28,126 | | 2,064,167 |
| Cigna Corporation | 29,323 | | 5,996,260 |
| CVS Health Corporation | 104,298 | | 7,748,298 |
| Danaher Corporation | 49,319 | | 7,569,480 |
| DaVita, Inc.* | 13,768 | | 1,033,013 |
| DENTSPLY SIRONA, Inc. | 26,241 | | 1,484,978 |
| Edwards Lifesciences Corporation* | 19,109 | | 4,457,939 |
| Eli Lilly & Co. | 106,010 | | 13,932,894 |
| Gilead Sciences, Inc. | 142,431 | | 9,255,166 |
| HCA Healthcare, Inc. | 23,088 | | 3,412,637 |
| Henry Schein, Inc.Δ* | 11,738 | | 783,159 |
| Hologic, Inc.* | 29,305 | | 1,530,014 |
| Humana, Inc. | 11,904 | | 4,363,054 |
| IDEXX Laboratories, Inc.* | 8,626 | | 2,252,507 |
| Illumina, Inc.* | 11,930 | | 3,957,658 |
| Incyte Corporation* | 24,596 | | 2,147,723 |
| Intuitive Surgical, Inc.* | 9,533 | | 5,635,433 |
| IQVIA Holdings, Inc.* | 14,217 | | 2,196,669 |
| Johnson & Johnson | 231,991 | | 33,840,527 |
| Laboratory Corporation of America Holdings* | 7,436 | | 1,257,948 |
| McKesson Corporation | 16,930 | | 2,341,758 |
| Mettler-Toledo International, Inc.* | 2,187 | | 1,734,903 |
| PerkinElmer, Inc. | 11,320 | | 1,099,172 |
| Quest Diagnostics, Inc. | 16,017 | | 1,710,456 |
| Regeneron Pharmaceuticals, Inc.* | 9,873 | | 3,707,114 |
| ResMed, Inc. | 11,820 | | 1,831,745 |
| Stryker Corporation | 26,037 | | 5,466,208 |
| Teleflex, Inc. | 3,399 | | 1,279,520 |
| Thermo Fisher Scientific, Inc. | 34,174 | | 11,102,107 |
| UnitedHealth Group, Inc. | 74,142 | | 21,796,265 |
| Universal Health Services, Inc. Class B | 9,989 | | 1,433,022 |
| Varian Medical Systems, Inc.* | 9,565 | | 1,358,326 |
| Vertex Pharmaceuticals, Inc.* | 27,353 | | 5,988,939 |
| Waters CorporationΔ* | 6,921 | | 1,617,092 |
| WellCare Health Plans, Inc.* | 4,802 | | 1,585,668 |
| Zimmer Biomet Holdings, Inc. | 21,341 | | 3,194,321 |
| Zoetis, Inc. | 78,966 | | 10,451,150 |
| | | | | 273,063,951 |
| Industrials — 8.4% | | |
| 3M Co. | 48,160 | | 8,496,387 |
| A.O. Smith Corporation | 16,217 | | 772,578 |
| Alaska Air Group, Inc. | 10,021 | | 678,923 |
| American Airlines Group, Inc.Δ | 38,478 | | 1,103,549 |
| AMETEK, Inc. | 16,745 | | 1,670,146 |
| Arconic, Inc. | 16,474 | | 506,905 |
| | | Shares | | Value |
| Boeing Co. (The) | 41,191 | | $13,418,380 |
| C.H. Robinson Worldwide, Inc. | 12,459 | | 974,294 |
| Caterpillar, Inc. | 44,540 | | 6,577,667 |
| Cintas Corporation | 6,438 | | 1,732,337 |
| Copart, Inc.* | 8,500 | | 772,990 |
| CSX Corporation | 65,253 | | 4,721,707 |
| Cummins, Inc. | 10,680 | | 1,911,293 |
| Deere & Co. | 24,563 | | 4,255,785 |
| Delta Air Lines, Inc. | 56,365 | | 3,296,225 |
| Dover Corporation | 13,712 | | 1,580,445 |
| Emerson Electric Co. | 55,944 | | 4,266,290 |
| Equifax, Inc. | 8,312 | | 1,164,677 |
| Expeditors International of Washington, Inc. | 6,818 | | 531,940 |
| Fastenal Co.Δ | 36,004 | | 1,330,348 |
| FedEx Corporation | 21,581 | | 3,263,263 |
| Flowserve Corporation | 4,858 | | 241,783 |
| Fortive Corporation | 28,093 | | 2,146,024 |
| Fortune Brands Home & Security, Inc. | 18,870 | | 1,232,966 |
| General Dynamics Corporation | 20,407 | | 3,598,775 |
| General Electric Co. | 659,185 | | 7,356,505 |
| Honeywell International, Inc. | 55,553 | | 9,832,881 |
| Huntington Ingalls Industries, Inc. | 2,805 | | 703,718 |
| IDEX Corporation | 5,716 | | 983,152 |
| IHS Markit, Ltd.* | 26,223 | | 1,975,903 |
| Illinois ToolWorks, Inc. | 22,337 | | 4,012,395 |
| J.B. Hunt Transport Services, Inc. | 3,269 | | 381,754 |
| Jacobs Engineering Group, Inc. | 4,647 | | 417,440 |
| Kansas City Southern | 10,006 | | 1,532,519 |
| L3Harris Technologies, Inc. | 16,801 | | 3,324,414 |
| Lockheed Martin Corporation | 19,185 | | 7,470,255 |
| Masco Corporation | 31,887 | | 1,530,257 |
| Norfolk Southern Corporation | 19,839 | | 3,851,345 |
| Northrop Grumman Corporation | 12,728 | | 4,378,050 |
| Old Dominion Freight Line, Inc. | 4,952 | | 939,791 |
| PACCAR, Inc. | 22,794 | | 1,803,005 |
| Parker-Hannifin Corporation | 8,815 | | 1,814,303 |
| Quanta Services, Inc. | 5,431 | | 221,096 |
| Raytheon Co. | 22,977 | | 5,048,966 |
| Republic Services, Inc. | 19,655 | | 1,761,678 |
| Robert Half International, Inc. | 4,920 | | 310,698 |
| Rockwell Automation, Inc. | 8,494 | | 1,721,479 |
| Rollins, Inc. | 14,250 | | 472,530 |
| Roper Technologies, Inc. | 6,043 | | 2,140,612 |
| Snap-on, Inc.Δ | 5,899 | | 999,291 |
| Southwest Airlines Co. | 36,781 | | 1,985,438 |
| Stanley Black & Decker, Inc. | 10,352 | | 1,715,741 |
| Textron, Inc. | 19,700 | | 878,620 |
| TransDigm Group, Inc. | 3,870 | | 2,167,200 |
| Union Pacific Corporation | 55,813 | | 10,090,432 |
| United Airlines Holdings, Inc.* | 19,397 | | 1,708,682 |
| United Parcel Service, Inc. Class B | 50,421 | | 5,902,282 |
| United Rentals, Inc.* | 7,513 | | 1,252,943 |
| United Technologies Corporation | 63,362 | | 9,489,093 |
| Verisk Analytics, Inc. | 12,729 | | 1,900,949 |
| W.W. Grainger, Inc. | 3,321 | | 1,124,225 |
| Waste Management, Inc. | 33,085 | | 3,770,367 |
See Notes to Financial Statements.
| | | Shares | | Value |
| Westinghouse Air Brake Technologies Corporation | 11,295 | | $878,751 |
| Xylem, Inc. | 6,524 | | 514,026 |
| | | | | 178,608,463 |
| Information Technology — 21.9% | | |
| Adobe, Inc.* | 35,347 | | 11,657,794 |
| Advanced Micro Devices, Inc.Δ* | 82,934 | | 3,803,353 |
| Akamai Technologies, Inc.* | 6,606 | | 570,626 |
| Alliance Data Systems Corporation | 2,399 | | 269,168 |
| Amphenol Corporation Class A | 18,535 | | 2,006,043 |
| Analog Devices, Inc. | 29,267 | | 3,478,090 |
| ANSYS, Inc.* | 9,168 | | 2,359,935 |
| Apple, Inc. | 334,672 | | 98,276,433 |
| Applied Materials, Inc. | 77,376 | | 4,723,031 |
| Arista Networks, Inc.* | 4,638 | | 943,369 |
| Autodesk, Inc.* | 15,847 | | 2,907,291 |
| Automatic Data Processing, Inc. | 33,997 | | 5,796,488 |
| Broadcom, Inc. | 31,170 | | 9,850,343 |
| Broadridge Financial Solutions, Inc. | 6,807 | | 840,937 |
| Cadence Design Systems, Inc.* | 14,000 | | 971,040 |
| CDW Corporation | 11,000 | | 1,571,240 |
| Cisco Systems, Inc. | 338,843 | | 16,250,910 |
| Citrix Systems, Inc. | 9,508 | | 1,054,437 |
| Cognizant Technology Solutions Corporation Class A | 43,559 | | 2,701,529 |
| Corning, Inc. | 59,799 | | 1,740,749 |
| DXC Technology Co. | 18,725 | | 703,873 |
| F5 Networks, Inc.* | 2,480 | | 346,332 |
| Fidelity National Information Services, Inc. | 46,186 | | 6,424,011 |
| Fiserv, Inc.* | 41,181 | | 4,761,759 |
| FleetCor Technologies, Inc.* | 6,254 | | 1,799,401 |
| FLIR Systems, Inc. | 5,180 | | 269,723 |
| Fortinet, Inc.* | 9,885 | | 1,055,323 |
| Gartner, Inc.Δ* | 5,295 | | 815,959 |
| Global Payments, Inc. | 22,769 | | 4,156,709 |
| Hewlett Packard Enterprise Co. | 113,804 | | 1,804,931 |
| HP, Inc. | 132,336 | | 2,719,505 |
| Intel Corporation | 342,984 | | 20,527,592 |
| International Business Machines Corporation | 72,240 | | 9,683,050 |
| Intuit, Inc. | 17,914 | | 4,692,214 |
| Jack Henry & Associates, Inc. | 5,530 | | 805,555 |
| Juniper Networks, Inc. | 15,019 | | 369,918 |
| Keysight Technologies, Inc.* | 13,420 | | 1,377,295 |
| KLA Corporation | 9,794 | | 1,744,997 |
| Lam Research Corporation | 10,705 | | 3,130,142 |
| Leidos Holdings, Inc. | 10,893 | | 1,066,316 |
| Mastercard, Inc. Class A | 68,771 | | 20,534,333 |
| Maxim Integrated Products, Inc. | 19,970 | | 1,228,355 |
| Microchip Technology, Inc.Δ | 16,977 | | 1,777,831 |
| Micron Technology, Inc.* | 84,017 | | 4,518,434 |
| Microsoft Corporation | 589,388 | | 92,946,488 |
| Motorola Solutions, Inc. | 13,048 | | 2,102,555 |
| NetApp, Inc. | 21,788 | | 1,356,303 |
| NortonLifeLock, Inc. | 47,298 | | 1,207,045 |
| NVIDIA Corporation | 46,907 | | 11,037,217 |
| | | Shares | | Value |
| Oracle Corporation | 205,823 | | $10,904,502 |
| Paychex, Inc. | 27,668 | | 2,353,440 |
| PayPal Holdings, Inc.* | 89,390 | | 9,669,316 |
| Qorvo, Inc.* | 4,807 | | 558,718 |
| QUALCOMM, Inc. | 91,816 | | 8,100,926 |
| salesforce.com, Inc.* | 66,214 | | 10,769,045 |
| ServiceNow, Inc.* | 14,510 | | 4,096,463 |
| Skyworks Solutions, Inc. | 15,074 | | 1,822,145 |
| Synopsys, Inc.* | 15,492 | | 2,156,486 |
| Texas Instruments, Inc. | 69,952 | | 8,974,142 |
| VeriSign, Inc.* | 7,867 | | 1,515,814 |
| Visa, Inc. Class AΔ | 130,994 | | 24,613,773 |
| Western Digital Corporation | 24,973 | | 1,585,036 |
| Western Union Co. (The)Δ | 39,393 | | 1,054,945 |
| Xerox Holdings Corporation | 11,464 | | 422,678 |
| Xilinx, Inc. | 18,364 | | 1,795,448 |
| Zebra Technologies Corporation Class A* | 4,187 | | 1,069,527 |
| | | | | 468,198,376 |
| Materials — 2.0% | | |
| Air Products & Chemicals, Inc. | 16,602 | | 3,901,304 |
| Albemarle CorporationΔ | 5,038 | | 367,975 |
| Avery Dennison Corporation | 3,272 | | 428,043 |
| Ball Corporation | 26,240 | | 1,696,941 |
| Celanese Corporation | 9,582 | | 1,179,736 |
| CF Industries Holdings, Inc. | 17,082 | | 815,495 |
| Corteva, Inc. | 55,219 | | 1,632,274 |
| Dow, Inc. | 55,219 | | 3,022,136 |
| DuPont de Nemours, Inc. | 62,802 | | 4,031,888 |
| Eastman Chemical Co. | 14,389 | | 1,140,472 |
| Ecolab, Inc. | 18,944 | | 3,656,003 |
| FMC Corporation | 5,397 | | 538,729 |
| Freeport-McMoRan, Inc.Δ | 112,863 | | 1,480,763 |
| International Flavors & Fragrances, Inc.Δ | 8,221 | | 1,060,673 |
| International Paper Co. | 43,581 | | 2,006,905 |
| Martin Marietta Materials, Inc. | 5,969 | | 1,669,171 |
| Mosaic Co. (The) | 26,057 | | 563,873 |
| Newmont Goldcorp Corporation | 61,126 | | 2,655,925 |
| Nucor Corporation | 32,443 | | 1,825,892 |
| Packaging Corporation of America | 6,567 | | 735,438 |
| PPG Industries, Inc. | 18,443 | | 2,461,956 |
| Sealed Air CorporationΔ | 10,710 | | 426,579 |
| Sherwin-Williams Co. (The) | 6,348 | | 3,704,312 |
| Vulcan Materials Co. | 11,222 | | 1,615,856 |
| Westrock Co. | 21,818 | | 936,210 |
| | | | | 43,554,549 |
| Real Estate — 2.9% | | |
| Alexandria Real Estate Equities, Inc. REIT | 3,214 | | 519,318 |
| American Tower Corporation REIT | 32,883 | | 7,557,171 |
| Apartment Investment & Management Co. Class A REIT | 5,953 | | 307,472 |
| AvalonBay Communities, Inc. REIT | 11,730 | | 2,459,781 |
| Boston Properties, Inc. REIT | 11,272 | | 1,553,958 |
| CBRE Group, Inc. Class A* | 26,915 | | 1,649,620 |
See Notes to Financial Statements.
SCHEDULE OF INVESTMENTS (Continued)
| | | Shares | | Value |
| Crown Castle International Corporation REIT | 32,487 | | $4,618,027 |
| Digital Realty Trust, Inc. REITΔ | 16,030 | | 1,919,432 |
| Duke Realty Corporation REIT | 32,547 | | 1,128,405 |
| Equinix, Inc. REIT | 5,188 | | 3,028,236 |
| Equity Residential REIT | 36,341 | | 2,940,714 |
| Essex Property Trust, Inc. REIT | 5,627 | | 1,692,939 |
| Extra Space Storage, Inc. REIT | 8,534 | | 901,361 |
| Federal Realty Investment Trust REIT | 2,600 | | 334,698 |
| Healthpeak Properties, Inc. REIT | 46,597 | | 1,606,199 |
| Host Hotels & Resorts, Inc. REIT | 47,435 | | 879,919 |
| Iron Mountain, Inc. REIT | 32,755 | | 1,043,902 |
| Kimco Realty Corporation REITΔ | 56,971 | | 1,179,869 |
| Mid-America Apartment Communities, Inc. REIT | 7,607 | | 1,003,059 |
| Prologis, Inc. REIT | 48,593 | | 4,331,580 |
| Public Storage REIT | 13,141 | | 2,798,507 |
| Realty Income Corporation REIT | 28,647 | | 2,109,279 |
| Regency Centers Corporation REIT | 15,104 | | 952,911 |
| SBA Communications Corporation REIT | 9,082 | | 2,188,671 |
| Simon Property Group, Inc. REIT | 28,493 | | 4,244,317 |
| SL Green Realty Corporation REIT | 7,249 | | 666,038 |
| UDR, Inc. REIT | 16,995 | | 793,667 |
| Ventas, Inc. REIT | 33,547 | | 1,937,004 |
| Vornado Realty Trust REIT | 15,993 | | 1,063,535 |
| Welltower, Inc. REIT | 31,626 | | 2,586,374 |
| Weyerhaeuser Co. REIT | 66,786 | | 2,016,937 |
| | | | | 62,012,900 |
| Utilities — 3.3% | | |
| AES Corporation | 56,201 | | 1,118,400 |
| Alliant Energy Corporation | 6,500 | | 355,680 |
| Ameren Corporation | 19,884 | | 1,527,091 |
| American Electric Power Co., Inc. | 43,060 | | 4,069,601 |
| American Water Works Co., Inc. | 16,565 | | 2,035,010 |
| Atmos Energy Corporation | 8,640 | | 966,470 |
| CenterPoint Energy, Inc. | 50,231 | | 1,369,799 |
| CMS Energy Corporation | 24,417 | | 1,534,364 |
| Consolidated Edison, Inc. | 33,879 | | 3,065,033 |
| Dominion Energy, Inc. | 78,841 | | 6,529,612 |
| DTE Energy Co. | 20,230 | | 2,627,270 |
| Duke Energy Corporation | 63,450 | | 5,787,275 |
| Edison International | 25,039 | | 1,888,191 |
| Entergy Corporation | 9,511 | | 1,139,418 |
| Evergy, Inc. | 17,247 | | 1,122,607 |
| Eversource EnergyΔ | 22,827 | | 1,941,893 |
| Exelon Corporation | 79,694 | | 3,633,250 |
| FirstEnergy Corporation | 31,999 | | 1,555,151 |
| NextEra Energy, Inc. | 35,828 | | 8,676,109 |
| NiSource, Inc. | 23,079 | | 642,519 |
| NRG Energy, Inc. | 19,377 | | 770,236 |
| Pinnacle West Capital Corporation | 4,108 | | 369,432 |
| PPL Corporation | 73,784 | | 2,647,370 |
| Public Service Enterprise Group, Inc. | 46,751 | | 2,760,647 |
| | | Shares | | Value |
| Sempra Energy | 20,984 | | $3,178,656 |
| Southern Co. (The) | 81,308 | | 5,179,320 |
| WEC Energy Group, Inc.Δ | 28,327 | | 2,612,599 |
| Xcel Energy, Inc.Δ | 35,982 | | 2,284,497 |
| | | | | 71,387,500 |
Total Common Stocks
(Cost $1,378,047,455) | | 2,010,739,839 |
| FOREIGN COMMON STOCKS — 3.3% |
| Curacao — 0.2% | | |
| Schlumberger, Ltd. | 121,737 | | 4,893,827 |
| Ireland — 2.1% | | |
| Accenture PLC Class A | 46,917 | | 9,879,313 |
| Allegion PLC | 11,277 | | 1,404,437 |
| Eaton Corporation PLC | 34,612 | | 3,278,449 |
| Ingersoll-Rand PLC | 16,206 | | 2,154,101 |
| Johnson Controls International PLCΔ | 75,803 | | 3,085,940 |
| Linde PLC | 41,176 | | 8,766,370 |
| Medtronic PLC | 104,997 | | 11,911,910 |
| Pentair PLC | 6,692 | | 306,962 |
| Seagate Technology PLC | 24,342 | | 1,448,349 |
| STERIS PLC | 6,583 | | 1,003,381 |
| Willis Towers Watson PLC | 8,889 | | 1,795,045 |
| | | | | 45,034,257 |
| Jersey — 0.1% | | |
| Amcor PLCΔ | 120,129 | | 1,302,199 |
| Aptiv PLC | 15,022 | | 1,426,639 |
| | | | | 2,728,838 |
| Netherlands — 0.2% | | |
| LyondellBasell Industries NV Class A | 27,312 | | 2,580,438 |
| Mylan NV* | 84,301 | | 1,694,450 |
| | | | | 4,274,888 |
| Switzerland — 0.4% | | |
| Chubb, Ltd. | 35,583 | | 5,538,850 |
| Garmin, Ltd. | 8,253 | | 805,163 |
| TE Connectivity, Ltd. | 28,610 | | 2,741,982 |
| | | | | 9,085,995 |
| United Kingdom — 0.3% | | |
| Aon PLC | 19,060 | | 3,970,007 |
| Nielsen Holdings PLC | 40,749 | | 827,205 |
| TechnipFMC PLC | 23,072 | | 494,664 |
| | | | | 5,291,876 |
Total Foreign Common Stocks
(Cost $58,284,706) | | 71,309,681 |
| MONEY MARKET FUNDS — 2.7% |
| GuideStone Money Market Fund, 1.53%Ø | 53,884,078 | | 53,884,078 |
See Notes to Financial Statements.
| | | Shares | | Value |
| Northern Institutional Liquid Assets Portfolio (Shares), 1.57%ا | 3,543,423 | | $3,543,423 |
Total Money Market Funds
(Cost $57,427,501) | | 57,427,501 |
| | | Par | |
| U.S. TREASURY OBLIGATION — 0.1% |
| U.S. Treasury Bill | | | |
1.52%, 05/07/20Ω‡‡
(Cost $1,293,001) | $1,300,000 | 1,293,089 |
TOTAL INVESTMENTS —100.2%
(Cost $1,495,052,663) | | 2,140,770,110 |
Liabilities in Excess of Other
Assets — (0.2)% | | (5,116,182) |
| NET ASSETS — 100.0% | | $2,135,653,928 |
Futures Contracts outstanding at December 31, 2019:
| Future Type | | Expiration Date | | Open Long
(Short) Contracts | | Notional
Market Value
of Contracts | | Value and
Unrealized
Appreciation
(Depreciation) |
| S&P 500® E-Mini | | 03/2020 | | 332 | | $53,636,260 | | $736,473 |
VALUATION HIERARCHY
The following is a summary of the inputs used, as of December 31, 2019, in valuing the Fund’s investments carried at fair value:
| | Total
Value | | Level 1
Quoted Prices | | Level 2
Other Significant
Observable Inputs | | Level 3
Significant
Unobservable Inputs |
| Assets: | | | | | | | |
| Investments in Securities: | | | | | | | |
| Common Stocks | $2,010,739,839 | | $2,010,739,839 | | $— | | $— |
| Foreign Common Stocks | 71,309,681 | | 71,309,681 | | — | | — |
| Money Market Funds | 57,427,501 | | 57,427,501 | | — | | — |
| U.S. Treasury Obligation | 1,293,089 | | — | | 1,293,089 | | — |
| Total Assets - Investments in Securities | $2,140,770,110 | | $2,139,477,021 | | $1,293,089 | | $ — |
| Other Financial Instruments*** | | | | | | | |
| Futures Contracts | $736,473 | | $736,473 | | $— | | $— |
| Total Assets - Other Financial Instruments | $736,473 | | $736,473 | | $ — | | $ — |
| *** | Other financial instruments are derivative instruments, such as futures contracts, which are valued at the unrealized appreciation (depreciation) on the investment. Further details regarding the value of these investments can be found in the preceding "Futures Contracts outstanding" disclosure. |
See Notes to Financial Statements.
Value Equity Fund(Unaudited)
The Fund invested in a diversified portfolio of large- and medium-sized U.S. companies whose stocks were considered to be attractive from a valuation perspective. The Investor Class of the Fund outperformed its benchmark, the Russell 1000® Value Index, for the one-year period ended December 31, 2019 (+26.80% versus +26.54%). The Fund underperformed in the first quarter, outperformed during the second and third quarters and experienced underperformance in the final quarter of the year. Large capitalization value stocks underperformed large capitalization growth stocks but still posted meaningful double-digit positive returns across all sectors in 2019. The Fund remained diversified, with a modest underweight to the financial services and utilities sectors and modest overweight to the producer durables sector. Security selection within the financial services and energy sectors contributed to benchmark-relative returns, while underweight exposure and selection within the utilities sector detracted from benchmark-relative returns during the year.
In 2019, exchange listed equity index futures contracts were utilized to provide market exposure to the cash positions held in the Fund. In addition, currency forwards were used to hedge modest foreign currency exposure back to the U.S. dollar. Overall, derivative exposure had a positive impact on Fund performance for the year.
This Fund may be suitable for investors who seek higher, long-term rates of return, can accept significant short-term fluctuations in account value and want to diversify their portfolio by adding a potentially higher return, higher risk option of value equity securities. This Fund is subject to value investing risk. This involves the risk that an investment in companies whose securities are believed to be undervalued, relative to their underlying profitability, will not appreciate in value as anticipated. It is possible to lose money by investing in the Fund.
At December 31, 2019, the portfolio holdings of the Fund, as a percentage of net assets, is shown in the following table. Portfolio holdings are subject to risk and may change at any time.
| | % |
| Financials | 22.6 |
| Health Care | 15.6 |
| Industrials | 13.1 |
| Energy | 9.2 |
| Information Technology | 8.4 |
| Consumer Discretionary | 6.1 |
| Consumer Staples | 5.8 |
| Communication Services | 4.9 |
| Materials | 4.8 |
| Utilities | 4.4 |
| Real Estate | 2.6 |
| Money Market Funds | 2.4 |
| U.S. Treasury Obligation | 0.1 |
| | 100.0 |
See Notes to Financial Statements.
Value Equity Fund(Unaudited)
| Average Annual Total Returns as of 12/31/19 | |
| | | Institutional Class* | | Investor Class* | | Benchmark** | |
| One Year | | 27.14% | | 26.80% | | 26.54% | |
| Five Year | | 7.58% | | 7.31% | | 8.28% | |
| Ten year | | 11.30% | | 11.04% | | 11.79% | |
| Since Inception | | 7.07% | | 6.79% | | 7.44% | |
| Inception Date | | 08/27/01 | | 08/27/01 | | | |
| Total Fund Operating Expenses (April 30, 2019 Prospectus)(1) | | 0.61% | | 0.87% | | | |
| (1) | Current information regarding the Fund’s Operating Expenses can be found in the Financial Highlights. |
The performance data quoted represents past performance and does not guarantee future results. Current performance may be lower or higher. Performance data current to the most recent month-end may be obtained at GuideStoneFunds.com. The investment return and principal value of an investment will fluctuate so that shares, when redeemed, may be worth more or less than their original cost.
The graph illustrates the results of a hypothetical $10,000 investment in the Investor Class of the Fund for the 10-year period from December 31, 2009 to December 31, 2019, with all dividends and capital gains reinvested, with the Fund's composite benchmark index.
*These returns reflect investment advisory and shareholder servicing fee waivers, if applicable, during the reported time periods.
**Unlike a mutual fund, the performance of an index assumes no taxes, transaction costs, management fees or other expenses.
See Notes to Financial Statements.
| | | Shares | | Value |
| COMMON STOCKS — 82.9% |
| Communication Services — 4.9% | | |
| Activision Blizzard, Inc. | 4,616 | | $274,283 |
| Alphabet, Inc. Class A* | 579 | | 775,507 |
| AMC Networks, Inc. Class A* | 1,991 | | 78,644 |
| AT&T, Inc. | 189,046 | | 7,387,918 |
| Charter Communications, Inc. Class A* | 418 | | 202,763 |
| Comcast Corporation Class A | 353,408 | | 15,892,758 |
| Discovery, Inc. Class AΔ* | 95,700 | | 3,133,218 |
| Electronic Arts, Inc.* | 21,968 | | 2,361,780 |
| Facebook, Inc. Class A* | 3,195 | | 655,774 |
| Take-Two Interactive Software, Inc.* | 18,139 | | 2,220,758 |
| Telephone & Data Systems, Inc. | 52,119 | | 1,325,386 |
| T-Mobile US, Inc.* | 610 | | 47,836 |
| Verizon Communications, Inc. | 347,308 | | 21,324,711 |
| ViacomCBS, Inc. Class B | 46,125 | | 1,935,866 |
| Walt Disney Co. (The) | 11,107 | | 1,606,405 |
| | | | | 59,223,607 |
| Consumer Discretionary — 5.6% | | |
| Advance Auto Parts, Inc. | 43,371 | | 6,946,299 |
| Aramark | 254,523 | | 11,046,298 |
| AutoNation, Inc.* | 7,390 | | 359,376 |
| AutoZone, Inc.* | 322 | | 383,602 |
| Bed Bath & Beyond, Inc.Δ | 64,700 | | 1,119,310 |
| Best Buy Co., Inc. | 949 | | 83,322 |
| Booking Holdings, Inc.* | 609 | | 1,250,722 |
| Carnival Corporation | 3,147 | | 159,962 |
| D.R. Horton, Inc. | 12,341 | | 650,988 |
| Dana, Inc. | 89,975 | | 1,637,545 |
| Deckers Outdoor Corporation* | 5,760 | | 972,634 |
| Dick's Sporting Goods, Inc. | 4,727 | | 233,939 |
| Dollar General Corporation | 76,065 | | 11,864,619 |
| eBay, Inc. | 60,375 | | 2,180,141 |
| Foot Locker, Inc. | 3,851 | | 150,151 |
| Ford Motor Co. | 27,968 | | 260,102 |
| General Motors Co. | 7,797 | | 285,370 |
| Graham Holdings Co. Class B | 495 | | 316,300 |
| Home Depot, Inc. (The) | 2,888 | | 630,681 |
| Lennar Corporation Class A | 120,869 | | 6,743,282 |
| Lowe’s Cos., Inc. | 98,442 | | 11,789,414 |
| McDonald’s Corporation | 4,148 | | 819,686 |
| Norwegian Cruise Line Holdings, Ltd.* | 9,928 | | 579,894 |
| PulteGroup, Inc. | 55,374 | | 2,148,511 |
| Starbucks Corporation | 15,051 | | 1,323,284 |
| Tapestry, Inc. | 52,462 | | 1,414,900 |
| Target Corporation | 13,223 | | 1,695,321 |
| Toll Brothers, Inc. | 14,463 | | 571,433 |
| Wyndham Destinations, Inc. | 10,379 | | 536,491 |
| Yum! Brands, Inc. | 440 | | 44,321 |
| | | | | 68,197,898 |
| Consumer Staples — 5.2% | | |
| Coca-Cola Co. (The) | 11,287 | | 624,736 |
| Colgate-Palmolive Co. | 166,887 | | 11,488,501 |
| Conagra Brands, Inc. | 74,268 | | 2,542,936 |
| General Mills, Inc. | 6,126 | | 328,109 |
| | | Shares | | Value |
| Ingredion, Inc. | 20,435 | | $1,899,433 |
| Keurig Dr. Pepper, Inc.Δ | 3,041 | | 88,037 |
| Kimberly-Clark Corporation | 2,726 | | 374,961 |
| Kraft Heinz Co. (The) | 8,709 | | 279,820 |
| Mondelez International, Inc. Class A | 199,651 | | 10,996,777 |
| PepsiCo, Inc. | 117,413 | | 16,046,835 |
| Pilgrim’s Pride Corporation* | 19,589 | | 640,854 |
| Procter & Gamble Co. (The) | 116,646 | | 14,569,085 |
| Tyson Foods, Inc. Class A | 26,711 | | 2,431,770 |
| Walgreens Boots Alliance, Inc. | 5,647 | | 332,947 |
| Walmart, Inc. | 9,035 | | 1,073,719 |
| | | | | 63,718,520 |
| Energy — 6.9% | | |
| Baker Hughes Co. | 156,589 | | 4,013,376 |
| Chevron Corporation | 229,685 | | 27,679,339 |
| ConocoPhillips | 23,622 | | 1,536,139 |
| EOG Resources, Inc. | 114,374 | | 9,579,966 |
| Exxon Mobil Corporation | 26,474 | | 1,847,356 |
| Hess Corporation | 122,841 | | 8,207,007 |
| HollyFrontier Corporation | 43,073 | | 2,184,232 |
| Kinder Morgan, Inc. | 12,038 | | 254,845 |
| Marathon Petroleum Corporation | 54,524 | | 3,285,071 |
| Occidental Petroleum Corporation | 6,304 | | 259,788 |
| PBF Energy, Inc. Class A | 24,659 | | 773,553 |
| Phillips 66 | 126,396 | | 14,081,778 |
| Valero Energy Corporation | 109,537 | | 10,258,140 |
| | | | | 83,960,590 |
| Financials — 21.1% | | |
| Aflac, Inc. | 4,527 | | 239,478 |
| Alleghany Corporation* | 1,760 | | 1,407,243 |
| Allstate Corporation (The) | 2,015 | | 226,587 |
| Ally Financial, Inc. | 73,036 | | 2,231,980 |
| American Express Co. | 65,470 | | 8,150,360 |
| American International Group, Inc. | 290,285 | | 14,900,329 |
| Ameriprise Financial, Inc. | 11,762 | | 1,959,314 |
| Arch Capital Group, Ltd.* | 24,702 | | 1,059,469 |
| AXA Equitable Holdings, Inc. | 97,540 | | 2,417,041 |
| Bank of America Corporation | 52,142 | | 1,836,441 |
| Bank of New York Mellon Corporation (The) | 228,108 | | 11,480,676 |
| BankUnited, Inc. | 9,424 | | 344,541 |
| Berkshire Hathaway, Inc. Class B* | 146,255 | | 33,126,758 |
| BlackRock, Inc. | 689 | | 346,360 |
| Capital One Financial Corporation | 10,830 | | 1,114,515 |
| Charles Schwab Corporation (The) | 2,949 | | 140,254 |
| Citigroup, Inc. | 137,952 | | 11,020,985 |
| Citizens Financial Group, Inc. | 63,093 | | 2,562,207 |
| CME Group, Inc. | 2,251 | | 451,821 |
| Comerica, Inc. | 4,850 | | 347,988 |
| First Citizens BancShares, Inc. Class A | 314 | | 167,114 |
| First Hawaiian, Inc. | 40,260 | | 1,161,501 |
| Goldman Sachs Group, Inc. (The) | 2,044 | | 469,977 |
| Hanover Insurance Group, Inc. (The) | 5,199 | | 710,547 |
| Hartford Financial Services Group, Inc. (The) | 66,564 | | 4,045,094 |
| Intercontinental Exchange, Inc. | 52,606 | | 4,868,685 |
See Notes to Financial Statements.
| | | Shares | | Value |
| JPMorgan Chase & Co. | 210,831 | | $29,389,841 |
| Lincoln National Corporation | 1,701 | | 100,376 |
| Marsh & McLennan Cos., Inc. | 317 | | 35,317 |
| MetLife, Inc. | 126,054 | | 6,424,972 |
| MGIC Investment Corporation | 144,047 | | 2,041,146 |
| Morgan Stanley | 39,964 | | 2,042,960 |
| Navient Corporation | 88,650 | | 1,212,732 |
| New York Community Bancorp, Inc.Δ | 326,476 | | 3,924,242 |
| Northern Trust Corporation | 55,343 | | 5,879,640 |
| Old Republic International Corporation | 73,809 | | 1,651,107 |
| PNC Financial Services Group, Inc. (The) | 107,395 | | 17,143,464 |
| Popular, Inc. | 31,192 | | 1,832,530 |
| Principal Financial Group, Inc. | 18,236 | | 1,002,980 |
| Progressive Corporation (The) | 2,335 | | 169,031 |
| Prudential Financial, Inc. | 2,938 | | 275,408 |
| Radian Group, Inc. | 38,979 | | 980,712 |
| Reinsurance Group of America, Inc. | 91,316 | | 14,889,987 |
| TD Ameritrade Holding Corporation | 121 | | 6,014 |
| Travelers Cos., Inc. (The) | 1,449 | | 198,441 |
| Truist Financial Corporation | 157,699 | | 8,881,608 |
| U.S. Bancorp | 363,580 | | 21,556,658 |
| Voya Financial, Inc. | 39,207 | | 2,390,843 |
| Wells Fargo & Co. | 426,996 | | 22,972,385 |
| Wintrust Financial Corporation | 24,003 | | 1,701,813 |
| Zions Bancorp NA | 59,300 | | 3,078,856 |
| | | | | 256,570,328 |
| Health Care — 10.5% | | |
| Abbott Laboratories | 6,592 | | 572,581 |
| Alexion Pharmaceuticals, Inc.* | 711 | | 76,895 |
| Amgen, Inc. | 719 | | 173,329 |
| Anthem, Inc. | 32,133 | | 9,705,130 |
| Baxter International, Inc. | 1,977 | | 165,317 |
| Becton, Dickinson and Co. | 1,687 | | 458,813 |
| Biogen, Inc.* | 1,055 | | 313,050 |
| Bristol-Myers Squibb Co. | 55,141 | | 3,539,501 |
| Bruker Corporation | 18,430 | | 939,377 |
| Centene Corporation* | 37,502 | | 2,357,751 |
| Cerner Corporation | 138,300 | | 10,149,837 |
| Cigna Corporation | 1,870 | | 382,396 |
| CVS Health Corporation | 160,283 | | 11,907,424 |
| Danaher Corporation | 3,783 | | 580,615 |
| Eli Lilly & Co. | 17,925 | | 2,355,883 |
| Exelixis, Inc.* | 117,627 | | 2,072,588 |
| Gilead Sciences, Inc. | 72,990 | | 4,742,890 |
| HCA Healthcare, Inc. | 850 | | 125,639 |
| Hologic, Inc.* | 141,644 | | 7,395,233 |
| Humana, Inc. | 617 | | 226,143 |
| Johnson & Johnson | 186,130 | | 27,150,783 |
| McKesson Corporation | 36,556 | | 5,056,426 |
| Molina Healthcare, Inc.* | 24,089 | | 3,268,636 |
| Quest Diagnostics, Inc. | 77,000 | | 8,222,830 |
| Regeneron Pharmaceuticals, Inc.* | 576 | | 216,277 |
| Thermo Fisher Scientific, Inc. | 919 | | 298,556 |
| UnitedHealth Group, Inc. | 26,745 | | 7,862,495 |
| Varian Medical Systems, Inc.* | 14,329 | | 2,034,861 |
| | | Shares | | Value |
| Zimmer Biomet Holdings, Inc. | 99,796 | | $14,937,465 |
| | | | | 127,288,721 |
| Industrials — 10.2% | | |
| 3M Co. | 943 | | 166,364 |
| Allison Transmission Holdings, Inc. | 25,547 | | 1,234,431 |
| Carlisle Cos., Inc. | 568 | | 91,925 |
| Caterpillar, Inc. | 3,127 | | 461,795 |
| Crane Co. | 7,004 | | 605,006 |
| CSX Corporation | 2,995 | | 216,718 |
| Curtiss-Wright Corporation | 13,606 | | 1,916,949 |
| Deere & Co. | 48,225 | | 8,355,464 |
| Delta Air Lines, Inc. | 3,021 | | 176,668 |
| EMCOR Group, Inc. | 16,925 | | 1,460,628 |
| Emerson Electric Co. | 147,255 | | 11,229,666 |
| FedEx Corporation | 1,579 | | 238,761 |
| Fortune Brands Home & Security, Inc. | 11,087 | | 724,425 |
| General Dynamics Corporation | 1,529 | | 269,639 |
| General Electric Co. | 1,392,051 | | 15,535,289 |
| HD Supply Holdings, Inc.* | 4,627 | | 186,098 |
| Honeywell International, Inc. | 2,234 | | 395,418 |
| Hubbell, Inc. | 62,875 | | 9,294,182 |
| J.B. Hunt Transport Services, Inc. | 70,401 | | 8,221,429 |
| Jacobs Engineering Group, Inc. | 97,061 | | 8,718,990 |
| JetBlue Airways Corporation* | 118,556 | | 2,219,368 |
| ManpowerGroup, Inc. | 23,824 | | 2,313,310 |
| Masco Corporation | 16,136 | | 774,367 |
| Norfolk Southern Corporation | 1,348 | | 261,687 |
| Oshkosh Corporation | 9,200 | | 870,780 |
| Owens Corning | 4,756 | | 309,711 |
| PACCAR, Inc. | 27,364 | | 2,164,492 |
| Raytheon Co. | 635 | | 139,535 |
| Regal Beloit Corporation | 1,586 | | 135,777 |
| Roper Technologies, Inc. | 430 | | 152,319 |
| Southwest Airlines Co. | 194,440 | | 10,495,871 |
| Spirit AeroSystems Holdings, Inc. Class A | 102,649 | | 7,481,059 |
| Terex Corporation | 46,760 | | 1,392,513 |
| Textron, Inc. | 70,333 | | 3,136,852 |
| Uber Technologies, Inc.* | 4,695 | | 139,629 |
| United Airlines Holdings, Inc.* | 25,968 | | 2,287,521 |
| United Parcel Service, Inc. Class B | 26,635 | | 3,117,893 |
| United Technologies Corporation | 59,556 | | 8,919,107 |
| Waste Management, Inc. | 593 | | 67,578 |
| Westinghouse Air Brake Technologies Corporation | 95,437 | | 7,424,999 |
| | | | | 123,304,213 |
| Information Technology — 7.5% | | |
| Amdocs, Ltd. | 10,778 | | 778,064 |
| Analog Devices, Inc. | 1,759 | | 209,040 |
| Applied Materials, Inc. | 2,012 | | 122,812 |
| Arrow Electronics, Inc.* | 2,180 | | 184,733 |
| Autodesk, Inc.* | 155 | | 28,436 |
| Avnet, Inc. | 11,120 | | 471,933 |
| Broadcom, Inc. | 24,795 | | 7,835,716 |
| Cadence Design Systems, Inc.* | 32,241 | | 2,236,236 |
| Cisco Systems, Inc. | 249,727 | | 11,976,907 |
See Notes to Financial Statements.
SCHEDULE OF INVESTMENTS (Continued)
| | | Shares | | Value |
| Citrix Systems, Inc. | 544 | | $60,330 |
| Cognizant Technology Solutions Corporation Class A | 3,431 | | 212,791 |
| Corning, Inc. | 122,975 | | 3,579,802 |
| Cypress Semiconductor Corporation | 120,279 | | 2,806,109 |
| Dell Technologies, Inc. Class C* | 387 | | 19,888 |
| Fidelity National Information Services, Inc. | 1,290 | | 179,426 |
| Fiserv, Inc.* | 8,100 | | 936,603 |
| Genpact, Ltd. | 2,114 | | 89,147 |
| HP, Inc. | 135,767 | | 2,790,012 |
| Intel Corporation | 51,304 | | 3,070,544 |
| International Business Machines Corporation | 28,090 | | 3,765,184 |
| Jabil, Inc. | 25,524 | | 1,054,907 |
| Maxim Integrated Products, Inc. | 84,900 | | 5,222,199 |
| Micron Technology, Inc.* | 14,110 | | 758,836 |
| Microsoft Corporation | 78,062 | | 12,310,377 |
| ON Semiconductor Corporation* | 55,100 | | 1,343,338 |
| Oracle Corporation | 239,387 | | 12,682,723 |
| QUALCOMM, Inc. | 96,804 | | 8,541,017 |
| Synopsys, Inc.* | 15,337 | | 2,134,910 |
| Texas Instruments, Inc. | 46,031 | | 5,905,317 |
| | | | | 91,307,337 |
| Materials — 4.0% | | |
| Air Products & Chemicals, Inc. | 59,823 | | 14,057,807 |
| Cabot Corporation | 10,068 | | 478,431 |
| Corteva, Inc. | 531,585 | | 15,713,653 |
| Domtar Corporation | 5,122 | | 195,865 |
| Dow, Inc. | 4,898 | | 268,067 |
| DuPont de Nemours, Inc. | 125,673 | | 8,068,207 |
| Freeport-McMoRan, Inc.Δ | 219,472 | | 2,879,473 |
| Huntsman Corporation | 96,506 | | 2,331,585 |
| NewMarket Corporation | 1,026 | | 499,169 |
| PPG Industries, Inc. | 931 | | 124,279 |
| Reliance Steel & Aluminum Co. | 14,929 | | 1,787,897 |
| Silgan Holdings, Inc. | 10,008 | | 311,049 |
| Southern Copper CorporationΔ | 587 | | 24,936 |
| Steel Dynamics, Inc. | 39,087 | | 1,330,521 |
| | | | | 48,070,939 |
| Real Estate — 2.6% | | |
| American Campus Communities, Inc. REIT | 29,371 | | 1,381,318 |
| Brandywine Realty Trust REIT | 9,323 | | 146,837 |
| CBRE Group, Inc. Class A* | 41,240 | | 2,527,600 |
| Corporate Office Properties Trust REIT | 39,350 | | 1,156,103 |
| Cousins Properties, Inc. REITΔ | 42,725 | | 1,760,270 |
| Douglas Emmett, Inc. REIT | 38,081 | | 1,671,756 |
| Hudson Pacific Properties, Inc. REIT | 8,987 | | 338,361 |
| Jones Lang LaSalle, Inc. | 19,220 | | 3,346,010 |
| Prologis, Inc. REIT | 3,910 | | 348,537 |
| Public Storage REIT | 313 | | 66,657 |
| Retail Properties of America, Inc. Class A REIT | 3,986 | | 53,412 |
| Simon Property Group, Inc. REIT | 25,773 | | 3,839,146 |
| Welltower, Inc. REIT | 106,000 | | 8,668,680 |
| | | Shares | | Value |
| Weyerhaeuser Co. REIT | 212,500 | | $6,417,500 |
| | | | | 31,722,187 |
| Utilities — 4.4% | | |
| AES Corporation | 327,400 | | 6,515,260 |
| American Electric Power Co., Inc. | 4,103 | | 387,774 |
| Dominion Energy, Inc. | 56,379 | | 4,669,309 |
| DTE Energy Co. | 6,187 | | 803,506 |
| Duke Energy Corporation | 5,419 | | 494,267 |
| Edison International | 52,689 | | 3,973,277 |
| Exelon Corporation | 65,081 | | 2,967,043 |
| IDACORP, Inc. | 4,757 | | 508,048 |
| NextEra Energy, Inc. | 3,291 | | 796,949 |
| NRG Energy, Inc. | 2,547 | | 101,243 |
| Pinnacle West Capital Corporation | 166,700 | | 14,991,331 |
| PNM Resources, Inc. | 9,648 | | 489,250 |
| Portland General Electric Co. | 28,490 | | 1,589,457 |
| Public Service Enterprise Group, Inc. | 29,615 | | 1,748,766 |
| Sempra Energy | 10,638 | | 1,611,444 |
| Southern Co. (The) | 6,960 | | 443,352 |
| Xcel Energy, Inc.Δ | 184,700 | | 11,726,603 |
| | | | | 53,816,879 |
Total Common Stocks
(Cost $855,208,634) | | 1,007,181,219 |
| FOREIGN COMMON STOCKS — 14.6% |
| Curacao — 1.1% | | |
| Schlumberger, Ltd. | 334,402 | | 13,442,960 |
| France — 1.7% | | |
| Sanofi ADRΔ | 114,529 | | 5,749,356 |
| TOTAL SA ADR | 265,400 | | 14,676,620 |
| | | | | 20,425,976 |
| Germany — 0.8% | | |
| Siemens AG | 73,535 | | 9,612,711 |
| Ireland — 4.7% | | |
| Eaton Corporation PLC | 2,764 | | 261,806 |
| Jazz Pharmaceuticals PLC* | 15,317 | | 2,286,522 |
| Johnson Controls International PLC | 265,593 | | 10,812,291 |
| Linde PLC | 3,260 | | 694,054 |
| Medtronic PLC | 315,094 | | 35,747,414 |
| nVent Electric PLC | 274,522 | | 7,022,273 |
| | | | | 56,824,360 |
| Japan — 0.5% | | |
| Honda Motor Co., Ltd. ADRΔ | 221,000 | | 6,256,510 |
| Netherlands — 0.3% | | |
| Koninklijke Philips NVΔ | 62,200 | | 3,035,360 |
| LyondellBasell Industries NV Class A | 1,867 | | 176,394 |
| | | | | 3,211,754 |
| Singapore — 0.1% | | |
| Flex, Ltd.* | 152,200 | | 1,920,764 |
| Switzerland — 4.1% | | |
| Chubb, Ltd. | 117,732 | | 18,326,163 |
| Nestle SA | 69,214 | | 7,493,535 |
| Novartis AG ADR | 155,570 | | 14,730,923 |
See Notes to Financial Statements.
| | | Shares | | Value |
| TE Connectivity, Ltd. | 101,500 | | $9,727,760 |
| | | | | 50,278,381 |
| United Kingdom — 1.3% | | |
| Mondi PLC | 367,800 | | 8,635,406 |
| Nielsen Holdings PLC | 336,507 | | 6,831,092 |
| | | | | 15,466,498 |
Total Foreign Common Stocks
(Cost $164,386,190) | | 177,439,914 |
| MONEY MARKET FUNDS — 2.4% |
GuideStone Money Market Fund, 1.53%
(Institutional Class)Ø∞ | 28,844,651 | | 28,844,651 |
| Northern Institutional Liquid Assets Portfolio (Shares), 1.57%ا | 993,789 | | 993,789 |
Total Money Market Funds
(Cost $29,838,439) | | 29,838,440 |
| | | Par | | Value |
| U.S. TREASURY OBLIGATION — 0.1% |
| U.S. Treasury Bill | | | | |
1.52%, 05/07/20Ω‡‡
(Cost $696,232) | $700,000 | | $696,279 |
TOTAL INVESTMENTS —100.0%
(Cost $1,050,129,495) | | | 1,215,155,852 |
Liabilities in Excess of Other
Assets — (0.0)% | | | (260,238) |
| NET ASSETS — 100.0% | | | $1,214,895,614 |
Futures Contracts outstanding at December 31, 2019:
| Future Type | | Expiration Date | | Open Long
(Short) Contracts | | Notional
Market Value
of Contracts | | Value and
Unrealized
Appreciation
(Depreciation) |
| Micro S&P 500® E-Mini | | 03/2020 | | 19 | | $306,955 | | $2,800 |
| S&P 500® E-Mini | | 03/2020 | | 109 | | 17,609,495 | | 325,041 |
| Total Futures Contracts outstanding at December 31, 2019 | | | | | | $17,916,450 | | $327,841 |
Forward Foreign Currency Contracts outstanding at December 31, 2019:
| Expiration Date | | Currency
Purchased | | Amount
of Currency
Purchased | | Currency
Sold | | Amount
of Currency
Sold | | Counter-
party | | Net Unrealized
Appreciation
(Depreciation) |
| 03/31/20 | | Swiss Francs | | 828,276 | | U.S. Dollars | | 850,941 | | UBS | | $10,516 |
| 03/31/20 | | British Pounds | | 292,036 | | U.S. Dollars | | 381,366 | | JPM | | 6,439 |
| Subtotal Appreciation | | | | | | | | | | $16,955 |
| 03/31/20 | | U.S. Dollars | | 6,176,034 | | Japanese Yen | | 671,877,803 | | BOA | | $(39,939) |
| 03/31/20 | | U.S. Dollars | | 8,676,748 | | British Pounds | | 6,588,956 | | JPM | | (72,955) |
| 03/31/20 | | U.S. Dollars | | 23,747,489 | | Euro | | 21,156,422 | | CS | | (120,776) |
| 03/31/20 | | U.S. Dollars | | 22,649,067 | | Swiss Francs | | 22,038,599 | | UBS | | (272,417) |
| Subtotal Depreciation | | | | | | | | | | $(506,087) |
| Total Forward Foreign Currency Contracts outstanding at December 31, 2019 | | | | $(489,132) |
See Notes to Financial Statements.
SCHEDULE OF INVESTMENTS (Continued)
VALUATION HIERARCHY
The following is a summary of the inputs used, as of December 31, 2019, in valuing the Fund’s investments carried at fair value:
| | Total
Value | | Level 1
Quoted Prices | | Level 2
Other Significant
Observable Inputs | | Level 3
Significant
Unobservable Inputs |
| Assets: | | | | | | | |
| Investments in Securities: | | | | | | | |
| Common Stocks | $1,007,181,219 | | $1,007,181,219 | | $— | | $— |
| Foreign Common Stocks: | | | | | | | |
| Germany | 9,612,711 | | — | | 9,612,711 | | — |
| Switzerland | 50,278,381 | | 42,784,846 | | 7,493,535 | | — |
| Other | 117,548,822 | | 117,548,822 | | — | | — |
| Total Foreign Common Stocks | 177,439,914 | | 160,333,668 | | 17,106,246 | | — |
| Money Market Funds | 29,838,440 | | 29,838,440 | | — | | — |
| U.S. Treasury Obligation | 696,279 | | — | | 696,279 | | — |
| Total Assets - Investments in Securities | $1,215,155,852 | | $1,197,353,327 | | $17,802,525 | | $ — |
| Other Financial Instruments*** | | | | | | | |
| Forward Foreign Currency Contracts | $16,955 | | $— | | $16,955 | | $— |
| Futures Contracts | 327,841 | | 327,841 | | — | | — |
| Total Assets - Other Financial Instruments | $344,796 | | $327,841 | | $16,955 | | $ — |
| Liabilities: | | | | | | | |
| Other Financial Instruments | | | | | | | |
| Forward Foreign Currency Contracts | $(506,087) | | $— | | $(506,087) | | $— |
| Total Liabilities - Other Financial Instruments | $(506,087) | | $ — | | $(506,087) | | $ — |
| *** | Other financial instruments are derivative instruments, such as futures contracts and forwards contracts, which are valued at the unrealized appreciation (depreciation) on the investment. Further details regarding the value of these investments can be found in the preceding "Futures Contracts outstanding" and "Forwards Foreign Currency Contracts outstanding" disclosures. |
See Notes to Financial Statements.
Growth Equity Fund(Unaudited)
The Fund invested in a diversified portfolio of large- and medium-sized U.S. companies whose stocks were considered to have above average potential for growth in revenue and earnings. The Investor Class of the Fund underperformed its benchmark, the Russell 1000® Growth Index, for the one-year period ended December 31, 2019 (+34.42% versus +36.39%). The Fund outperformed in the first half of the year but experienced underperformance in the second half of the year, particularly in the third quarter. Large capitalization growth stocks significantly outperformed large capitalization value stocks during 2019 as the market rewarded stocks with higher beta, higher price-to-earnings (P/E) ratios and higher quality characteristics within the benchmark index. The Fund remained diversified, with a modest underweight to the technology and producer durables sectors and modest overweight to the healthcare and consumer staples sectors. Underweight exposure and selection within technology was the primary detractor from benchmark-relative performance, while security selection within the health care sector benefited benchmark-relative returns during the year.
In 2019, exchange listed equity index futures contracts were utilized to provide market exposure to the cash positions held in the Fund. In addition, currency forwards were used to hedge foreign currency exposure back to the U.S. dollar. Overall, derivative exposure had a positive impact on Fund performance for the year.
This Fund may be suitable for investors who seek high, long-term rates of return, can accept significant short-term fluctuations in account value, want to invest in growth-oriented equities and would like to diversify their portfolio by adding a potentially higher return, higher risk option of equity securities. The Fund will not concentrate in any particular industry, but at times, it may be heavily invested in a particular economic sector. This may result in greater short-term price volatility. It is possible to lose money by investing in the Fund.
At December 31, 2019, the portfolio holdings of the Fund, as a percentage of net assets, is shown in the following table. Portfolio holdings are subject to risk and may change at any time.
| | % |
| Information Technology | 33.3 |
| Health Care | 15.2 |
| Consumer Discretionary | 14.0 |
| Communication Services | 12.7 |
| Industrials | 8.1 |
| Consumer Staples | 6.6 |
| Money Market Funds | 4.0 |
| Financials | 2.8 |
| Materials | 1.8 |
| Real Estate | 1.3 |
| Energy | 1.0 |
| U.S. Treasury Obligation | 0.1 |
| | 100.9 |
See Notes to Financial Statements.
Growth Equity Fund(Unaudited)
| Average Annual Total Returns as of 12/31/19 | |
| | | Institutional Class* | | Investor Class* | | Benchmark** | |
| One Year | | 34.79% | | 34.42% | | 36.39% | |
| Five Year | | 13.59% | | 13.29% | | 14.62% | |
| Ten year | | 14.51% | | 14.27% | | 15.21% | |
| Since Inception | | 7.73% | | 7.56% | | 8.36% | |
| Inception Date | | 08/27/01 | | 08/27/01 | | | |
| Total Fund Operating Expenses (April 30, 2019 Prospectus)(1) | | 0.72% | | 0.98% | | | |
| (1) | Current information regarding the Fund’s Operating Expenses can be found in the Financial Highlights. |
The performance data quoted represents past performance and does not guarantee future results. Current performance may be lower or higher. Performance data current to the most recent month-end may be obtained at GuideStoneFunds.com. The investment return and principal value of an investment will fluctuate so that shares, when redeemed, may be worth more or less than their original cost.
The graph illustrates the results of a hypothetical $10,000 investment in the Investor Class of the Fund for the 10-year period from December 31, 2009 to December 31, 2019, with all dividends and capital gains reinvested, with the Russell 1000® Index.
*These returns reflect investment advisory and shareholder servicing fee waivers, if applicable, during the reported time periods.
**Unlike a mutual fund, the performance of an index assumes no taxes, transaction costs, management fees or other expenses.
See Notes to Financial Statements.
| | | Shares | | Value |
| COMMON STOCKS — 89.2% |
| Communication Services — 12.7% | | |
| Activision Blizzard, Inc. | 58,900 | | $3,499,838 |
| Alphabet, Inc. Class A* | 26,684 | | 35,740,283 |
| Alphabet, Inc. Class C* | 33,896 | | 45,319,630 |
| Comcast Corporation Class A | 254,239 | | 11,433,128 |
| Electronic Arts, Inc.* | 92,971 | | 9,995,312 |
| Facebook, Inc. Class A* | 352,426 | | 72,335,436 |
| Match Group, Inc.Δ* | 136,100 | | 11,175,171 |
| Netflix, Inc.* | 31,179 | | 10,088,589 |
| Sea, Ltd. ADRΔ* | 28,500 | | 1,146,270 |
| Walt Disney Co. (The) | 104,177 | | 15,067,120 |
| | | | | 215,800,777 |
| Consumer Discretionary — 10.5% | | |
| Advance Auto Parts, Inc. | 56,520 | | 9,052,243 |
| Amazon.com, Inc.* | 54,968 | | 101,572,069 |
| Booking Holdings, Inc.* | 7,472 | | 15,345,471 |
| Floor & Decor Holdings, Inc. Class A* | 90,030 | | 4,574,424 |
| Home Depot, Inc. (The) | 50,216 | | 10,966,170 |
| Starbucks Corporation | 132,488 | | 11,648,345 |
| TJX Cos., Inc. (The) | 140,679 | | 8,589,860 |
| Yum China Holdings, Inc. | 147,146 | | 7,064,479 |
| Yum! Brands, Inc. | 94,793 | | 9,548,499 |
| | | | | 178,361,560 |
| Consumer Staples — 5.9% | | |
| Coca-Cola Co. (The) | 235,030 | | 13,008,911 |
| Colgate-Palmolive Co. | 257,492 | | 17,725,749 |
| Costco Wholesale Corporation | 57,032 | | 16,762,845 |
| Estee Lauder Cos., Inc. (The) Class A | 49,503 | | 10,224,350 |
| McCormick & Co., Inc. (Non-Voting Shares) | 34,758 | | 5,899,475 |
| Monster Beverage Corporation* | 358,476 | | 22,781,150 |
| Procter & Gamble Co. (The) | 113,754 | | 14,207,875 |
| | | | | 100,610,355 |
| Energy — 0.4% | | |
| Pioneer Natural Resources Co. | 46,666 | | 7,063,832 |
| Financials — 2.8% | | |
| American Express Co. | 92,361 | | 11,498,021 |
| BlackRock, Inc. | 5,724 | | 2,877,455 |
| Charles Schwab Corporation (The) | 233,928 | | 11,125,616 |
| FactSet Research Systems, Inc.Δ | 35,272 | | 9,463,478 |
| SEI Investments Co. | 194,147 | | 12,712,745 |
| | | | | 47,677,315 |
| Health Care — 13.5% | | |
| ABIOMED, Inc.* | 11,050 | | 1,885,019 |
| Alexion Pharmaceuticals, Inc.* | 74,282 | | 8,033,598 |
| Align Technology, Inc.* | 17,400 | | 4,855,296 |
| Amgen, Inc. | 46,015 | | 11,092,836 |
| BioMarin Pharmaceutical, Inc.* | 71,027 | | 6,005,333 |
| Cerner Corporation | 154,802 | | 11,360,919 |
| Danaher Corporation | 56,170 | | 8,620,972 |
| DexCom, Inc.* | 47,996 | | 10,498,645 |
| Edwards Lifesciences Corporation* | 68,238 | | 15,919,243 |
| Illumina, Inc.* | 45,434 | | 15,072,275 |
| | | Shares | | Value |
| Intuitive Surgical, Inc.* | 18,716 | | $11,063,963 |
| Johnson & Johnson | 71,096 | | 10,370,774 |
| Mirati Therapeutics, Inc.Δ* | 20,753 | | 2,674,232 |
| Regeneron Pharmaceuticals, Inc.* | 43,429 | | 16,306,721 |
| Sarepta Therapeutics, Inc.Δ* | 25,214 | | 3,253,615 |
| Thermo Fisher Scientific, Inc. | 85,796 | | 27,872,547 |
| UnitedHealth Group, Inc. | 68,425 | | 20,115,581 |
| Varian Medical Systems, Inc.* | 44,484 | | 6,317,173 |
| Zoetis, Inc. | 281,164 | | 37,212,055 |
| | | | | 228,530,797 |
| Industrials — 8.1% | | |
| BWX Technologies, Inc. | 85,112 | | 5,283,753 |
| C.H. Robinson Worldwide, Inc. | 51,323 | | 4,013,459 |
| Cintas Corporation | 35,537 | | 9,562,296 |
| CoStar Group, Inc.* | 17,941 | | 10,734,100 |
| Deere & Co. | 79,368 | | 13,751,300 |
| Expeditors International of Washington, Inc. | 197,302 | | 15,393,502 |
| Fortive Corporation | 119,578 | | 9,134,563 |
| Honeywell International, Inc. | 67,744 | | 11,990,688 |
| IHS Markit, Ltd.* | 141,770 | | 10,682,369 |
| L3Harris Technologies, Inc. | 25,570 | | 5,059,536 |
| Roper Technologies, Inc. | 31,683 | | 11,223,069 |
| Uber Technologies, Inc.* | 236,990 | | 7,048,083 |
| United Parcel Service, Inc. Class B | 108,322 | | 12,680,173 |
| W.W. Grainger, Inc. | 34,815 | | 11,785,574 |
| | | | | 138,342,465 |
| Information Technology — 32.7% | | |
| Adobe, Inc.* | 104,559 | | 34,484,604 |
| Akamai Technologies, Inc.* | 127,981 | | 11,054,999 |
| Amphenol Corporation Class A | 82,654 | | 8,945,642 |
| Apple, Inc. | 173,840 | | 51,048,116 |
| Autodesk, Inc.* | 197,992 | | 36,323,612 |
| Automatic Data Processing, Inc. | 33,884 | | 5,777,222 |
| Cisco Systems, Inc. | 264,238 | | 12,672,855 |
| Fidelity National Information Services, Inc. | 60,920 | | 8,473,363 |
| Genpact, Ltd. | 211,223 | | 8,907,274 |
| Intuit, Inc. | 68,832 | | 18,029,166 |
| Microsoft Corporation | 490,110 | | 77,290,347 |
| Nutanix, Inc. Class A* | 152,092 | | 4,754,396 |
| NVIDIA Corporation | 113,538 | | 26,715,491 |
| Oracle Corporation | 637,462 | | 33,772,737 |
| Palo Alto Networks, Inc.* | 39,440 | | 9,120,500 |
| PayPal Holdings, Inc.* | 90,586 | | 9,798,688 |
| QUALCOMM, Inc. | 319,357 | | 28,176,868 |
| salesforce.com, Inc.* | 137,752 | | 22,403,985 |
| ServiceNow, Inc.* | 47,700 | | 13,466,664 |
| Splunk, Inc.* | 67,385 | | 10,092,251 |
| Texas Instruments, Inc. | 100,970 | | 12,953,441 |
| TiVo Corporation | 7 | | 59 |
| Twilio, Inc. Class AΔ* | 22,200 | | 2,181,816 |
| Visa, Inc. Class AΔ | 513,685 | | 96,521,412 |
| VMware, Inc. Class A | 55,174 | | 8,374,861 |
| Workday, Inc. Class A* | 19,700 | | 3,239,665 |
| | | | | 554,580,034 |
See Notes to Financial Statements.
SCHEDULE OF INVESTMENTS (Continued)
| | | Shares | | Value |
| Materials — 1.3% | | |
| Ecolab, Inc. | 48,850 | | $9,427,561 |
| Sherwin-Williams Co. (The) | 20,246 | | 11,814,351 |
| | | | | 21,241,912 |
| Real Estate — 1.3% | | |
| Equinix, Inc. REIT | 17,211 | | 10,046,061 |
| SBA Communications Corporation REIT | 52,378 | | 12,622,574 |
| | | | | 22,668,635 |
Total Common Stocks
(Cost $980,336,796) | | 1,514,877,682 |
| FOREIGN COMMON STOCKS — 7.6% |
| China — 3.5% | | |
| Alibaba Group Holding, Ltd. ADR* | 281,487 | | 59,703,393 |
| Curacao — 0.6% | | |
| Schlumberger, Ltd. | 236,701 | | 9,515,380 |
| France — 0.7% | | |
| Danone SA ADR | 721,417 | | 11,896,166 |
| Ireland — 0.5% | | |
| Linde PLC | 40,582 | | 8,639,908 |
| Netherlands — 0.5% | | |
| NXP Semiconductor NV | 61,267 | | 7,796,839 |
| Switzerland — 1.7% | | |
| Alcon, Inc.* | 1,524 | | 86,212 |
| Novartis AG ADR | 133,401 | | 12,631,741 |
| Roche Holding AG ADRΔ | 393,303 | | 15,991,700 |
| | | | | 28,709,653 |
| | | Shares | | Value |
| United Kingdom — 0.1% | | |
| Atlassian Corporation PLC Class A* | 20,400 | | $2,454,936 |
Total Foreign Common Stocks
(Cost $99,566,883) | | 128,716,275 |
| MONEY MARKET FUNDS — 4.0% |
GuideStone Money Market Fund, 1.53%
(Institutional Class)Ø∞ | 52,530,177 | | 52,530,177 |
| Northern Institutional Liquid Assets Portfolio (Shares), 1.57%ا | 13,382,687 | | 13,382,687 |
| Northern Institutional U.S. Government Portfolio (Shares), 1.48%Ø | 2,306,677 | | 2,306,677 |
Total Money Market Funds
(Cost $68,219,541) | | 68,219,541 |
| | | Par | |
| U.S. TREASURY OBLIGATION — 0.1% |
| U.S. Treasury Bill | | | |
1.52%, 05/07/20Ω‡‡
(Cost $2,387,080) | $2,400,000 | 2,387,243 |
TOTAL INVESTMENTS —100.9%
(Cost $1,150,510,300) | | 1,714,200,741 |
Liabilities in Excess of Other
Assets — (0.9)% | | (16,051,189) |
| NET ASSETS — 100.0% | | $1,698,149,552 |
Futures Contracts outstanding at December 31, 2019:
| Future Type | | Expiration Date | | Open Long
(Short) Contracts | | Notional
Market Value
of Contracts | | Value and
Unrealized
Appreciation
(Depreciation) |
| S&P 500® E-Mini | | 03/2020 | | 204 | | $32,957,220 | | $609,921 |
See Notes to Financial Statements.
VALUATION HIERARCHY
The following is a summary of the inputs used, as of December 31, 2019, in valuing the Fund’s investments carried at fair value:
| | Total
Value | | Level 1
Quoted Prices | | Level 2
Other Significant
Observable Inputs | | Level 3
Significant
Unobservable Inputs |
| Assets: | | | | | | | |
| Investments in Securities: | | | | | | | |
| Common Stocks | $1,514,877,682 | | $1,514,877,682 | | $— | | $— |
| Foreign Common Stocks | 128,716,275 | | 128,716,275 | | — | | — |
| Money Market Funds | 68,219,541 | | 68,219,541 | | — | | — |
| U.S. Treasury Obligation | 2,387,243 | | — | | 2,387,243 | | — |
| Total Assets - Investments in Securities | $1,714,200,741 | | $1,711,813,498 | | $2,387,243 | | $ — |
| Other Financial Instruments*** | | | | | | | |
| Futures Contracts | $609,921 | | $609,921 | | $— | | $— |
| Total Assets - Other Financial Instruments | $609,921 | | $609,921 | | $ — | | $ — |
| *** | Other financial instruments are derivative instruments, such as futures contracts, which are valued at the unrealized appreciation (depreciation) on the investment. Further details regarding the value of these investments can be found in the preceding "Futures Contracts outstanding" disclosure. |
See Notes to Financial Statements.
Small Cap Equity Fund(Unaudited)
The Fund invested in a diversified portfolio of domestic, small capitalization stocks with both value- and growth-style orientations. The Investor Class of the Fund modestly underperformed its benchmark, the Russell 2000® Index, for the one-year period ended December 31, 2019 (+24.97 versus +25.52%). The Fund outperformed in the first half of the year but experienced underperformance in the second half of the year. Small capitalization stocks underperformed large capitalization stocks but still posted meaningful double-digit gains during a period where the market rewarded higher beta, higher price-to-earnings (P/E) and lower dividend yielding names within the benchmark index. The Fund maintained an allocation across all sectors, with a modest overweight to the producer durables sector and modest underweights to the health care and financial services sectors. Security selection within the consumer discretionary and health care sectors detracted from benchmark-relative returns, while security selection within the producer durables sector benefited benchmark-relative returns for the one-year period.
In 2019, exchange listed equity index futures contracts were utilized to provide market exposure to the cash positions held in the Fund. Overall, derivative exposure had a positive impact on Fund performance for the year.
This Fund may be suitable for investors who seek higher, long-term rates of return, can accept significant short-term fluctuations in account value, want to invest in stocks of small- to medium-sized U.S. companies and would like to diversify their portfolio by adding a potentially higher return, higher risk option of equity securities. Small capitalization stocks are subject to greater risk than large capitalization stocks due to more volatility and less liquidity. It is possible to lose money by investing in the Fund.
At December 31, 2019, the portfolio holdings of the Fund, as a percentage of net assets, is shown in the following table. Portfolio holdings are subject to risk and may change at any time.
| | % |
| Information Technology | 18.8 |
| Financials | 16.5 |
| Industrials | 15.9 |
| Health Care | 14.0 |
| Consumer Discretionary | 9.6 |
| Real Estate | 7.1 |
| Money Market Funds | 4.7 |
| Materials | 4.5 |
| Utilities | 3.3 |
| Energy | 3.0 |
| Communication Services | 2.6 |
| Consumer Staples | 2.0 |
| U.S. Treasury Obligation | 0.1 |
| | 102.1 |
See Notes to Financial Statements.
Small Cap Equity Fund(Unaudited)
| Average Annual Total Returns as of 12/31/19 | |
| | | Institutional Class* | | Investor Class* | | Benchmark** | |
| One Year | | 25.29% | | 24.97% | | 25.52% | |
| Five Year | | 6.66% | | 6.38% | | 8.22% | |
| Ten year | | 11.48% | | 11.23% | | 11.82% | |
| Since Inception | | 7.55% | | 7.34% | | 8.46% | |
| Inception Date | | 08/27/01 | | 08/27/01 | | | |
| Total Fund Operating Expenses (April 30, 2019 Prospectus)(1) | | 1.00% | | 1.26% | | | |
| (1) | Current information regarding the Fund’s Operating Expenses can be found in the Financial Highlights. |
The performance data quoted represents past performance and does not guarantee future results. Current performance may be lower or higher. Performance data current to the most recent month-end may be obtained at GuideStoneFunds.com. The investment return and principal value of an investment will fluctuate so that shares, when redeemed, may be worth more or less than their original cost.
The graph illustrates the results of a hypothetical $10,000 investment in the Investor Class of the Fund for the 10-year period from December 31, 2009 to December 31, 2019, with all dividends and capital gains reinvested, with the Russell 2000® Index.
*These returns reflect investment advisory and shareholder servicing fee waivers, if applicable, during the reported time periods.
**Unlike a mutual fund, the performance of an index assumes no taxes, transaction costs, management fees or other expenses.
See Notes to Financial Statements.
| | | Shares | | Value |
| COMMON STOCKS — 93.3% |
| Communication Services — 2.1% | | |
| AMC Networks, Inc. Class A* | 7,748 | | $306,046 |
| ATN International, Inc.Δ | 15,404 | | 853,228 |
| Care.com, Inc.* | 1,007 | | 15,135 |
| Cogent Communications Holdings, Inc.Δ | 29,000 | | 1,908,490 |
| comScore, Inc.Δ* | 120,581 | | 595,670 |
| DHI Group, Inc.* | 54,461 | | 163,928 |
| Emerald Expositions Events, Inc. | 8,490 | | 89,569 |
| Liberty Latin America, Ltd. Class C* | 45,148 | | 878,580 |
| Liberty TripAdvisor Holdings, Inc. Class AΔ* | 4,369 | | 32,112 |
| Madison Square Garden Co. (The) Class A* | 930 | | 273,597 |
| Marchex, Inc. Class BΔ* | 63,168 | | 238,775 |
| Meet Group, Inc. (The)Δ* | 145,288 | | 727,893 |
| MSG Networks, Inc. Class AΔ* | 23,879 | | 415,495 |
| Nexstar Media Group, Inc. Class AΔ | 6,768 | | 793,548 |
| Scholastic Corporation | 15,992 | | 614,892 |
| Shenandoah Telecommunications Co.Δ | 54,885 | | 2,283,765 |
| Telephone & Data Systems, Inc. | 37,446 | | 952,252 |
| Tribune Publishing Co. | 7,850 | | 103,306 |
| TrueCar, Inc.* | 68,983 | | 327,669 |
| Yelp, Inc.* | 26,698 | | 929,891 |
| Zynga, Inc. Class A* | 37,871 | | 231,771 |
| | | | | 12,735,612 |
| Consumer Discretionary — 9.6% | | |
| Adtalem Global Education, Inc.* | 3,800 | | 132,886 |
| American Axle & Manufacturing Holdings, Inc.Δ* | 95,654 | | 1,029,237 |
| American Eagle Outfitters, Inc. | 100,072 | | 1,471,058 |
| American Public Education, Inc.* | 21,003 | | 575,272 |
| Asbury Automotive Group, Inc.* | 9,431 | | 1,054,291 |
| AutoNation, Inc.* | 6,697 | | 325,675 |
| Bassett Furniture Industries, Inc. | 4,291 | | 71,574 |
| BBX Capital Corporation | 61,563 | | 293,656 |
| Big Lots, Inc.Δ | 2,630 | | 75,534 |
| Callaway Golf Co. | 95,600 | | 2,026,720 |
| Carriage Services, Inc.Δ | 24,686 | | 631,962 |
| Cheesecake Factory, Inc. (The)Δ | 35,077 | | 1,363,092 |
| Chegg, Inc.* | 93,358 | | 3,539,202 |
| Chuy's Holdings, Inc.* | 17,586 | | 455,829 |
| Collectors Universe, Inc. | 8,702 | | 200,581 |
| Cooper-Standard Holdings, Inc.* | 30,203 | | 1,001,531 |
| Deckers Outdoor Corporation* | 5,074 | | 856,796 |
| Dick's Sporting Goods, Inc.Δ | 23,955 | | 1,185,533 |
| Fiesta Restaurant Group, Inc.Δ* | 37,977 | | 375,593 |
| Five Below, Inc.* | 7,955 | | 1,017,126 |
| Floor & Decor Holdings, Inc. Class A* | 39,900 | | 2,027,319 |
| GoPro, Inc. Class AΔ* | 101,400 | | 440,076 |
| Green Brick Partners, Inc.* | 33,914 | | 389,333 |
| Group 1 Automotive, Inc. | 8,463 | | 846,300 |
| H&R Block, Inc.Δ | 4,795 | | 112,587 |
| | | Shares | | Value |
| Habit Restaurants, Inc. (The) Class AΔ* | 21,341 | | $222,587 |
| Hibbett Sports, Inc.Δ* | 22,928 | | 642,901 |
| Hilton Grand Vacations, Inc.* | 45,100 | | 1,550,989 |
| Hooker Furniture CorporationΔ | 14,735 | | 378,542 |
| Houghton Mifflin Harcourt Co.Δ* | 93,986 | | 587,413 |
| Hudson, Ltd. Class A* | 146,200 | | 2,242,708 |
| J.C. Penney Co., Inc.Δ* | 302,820 | | 339,158 |
| Jack in the Box, Inc.Δ | 23,400 | | 1,825,902 |
| K12, Inc.* | 9,266 | | 188,563 |
| Lithia Motors, Inc. Class A | 2,341 | | 344,127 |
| M/I Homes, Inc.* | 24,307 | | 956,480 |
| Malibu Boats, Inc. Class A* | 58,988 | | 2,415,559 |
| MarineMax, Inc.* | 4,000 | | 66,760 |
| Meritage Homes Corporation* | 12,197 | | 745,359 |
| Modine Manufacturing Co.* | 46,200 | | 355,740 |
| Monro, Inc.Δ | 28,150 | | 2,201,330 |
| National Vision Holdings, Inc.Δ* | 89,100 | | 2,889,513 |
| Nautilus, Inc.Δ* | 33,300 | | 58,275 |
| Office Depot, Inc. | 109,752 | | 300,720 |
| Ollie's Bargain Outlet Holdings, Inc.Δ* | 26,700 | | 1,743,777 |
| OneSpaWorld Holdings, Ltd.Δ* | 120,600 | | 2,030,904 |
| Potbelly Corporation* | 35,910 | | 151,540 |
| PulteGroup, Inc. | 17,406 | | 675,353 |
| Quotient Technology, Inc.Δ* | 46,259 | | 456,114 |
| Regis CorporationΔ* | 34,305 | | 613,030 |
| Rocky Brands, Inc. | 4,140 | | 121,840 |
| Sally Beauty Holdings, Inc.Δ* | 11,772 | | 214,839 |
| Signet Jewelers, Ltd.Δ | 2,205 | | 47,937 |
| Steven Madden, Ltd. | 62,949 | | 2,707,436 |
| Strategic Education, Inc.Δ | 22,300 | | 3,543,470 |
| Taylor Morrison Home Corporation Class A* | 103,013 | | 2,251,864 |
| Tenneco, Inc. Class AΔ | 45,300 | | 593,430 |
| TRI Pointe Group, Inc.* | 4,640 | | 72,291 |
| Vista Outdoor, Inc.* | 131,603 | | 984,390 |
| Wendy's Co. (The) | 46,251 | | 1,027,235 |
| Wingstop, Inc. | 1,100 | | 94,853 |
| | | | | 57,141,692 |
| Consumer Staples — 2.0% | | |
| BJ's Wholesale Club Holdings, Inc.* | 101,800 | | 2,314,932 |
| Central Garden & Pet Co. Class A* | 20,154 | | 591,721 |
| Edgewell Personal Care Co.* | 17,500 | | 541,800 |
| Farmer Brothers, Co.Δ* | 11,403 | | 171,729 |
| Flowers Foods, Inc. | 53,912 | | 1,172,047 |
| Fresh Del Monte Produce, Inc. | 15,462 | | 540,861 |
| Ingles Markets, Inc. Class AΔ | 17,161 | | 815,319 |
| Ingredion, Inc. | 13,686 | | 1,272,114 |
| J&J Snack Foods Corporation | 8,654 | | 1,594,672 |
| Lifevantage Corporation* | 21,752 | | 339,549 |
| Post Holdings, Inc.* | 800 | | 87,280 |
| Simply Good Foods Co. (The)* | 72,900 | | 2,080,566 |
| SpartanNash Co.Δ | 21,700 | | 309,008 |
| | | | | 11,831,598 |
See Notes to Financial Statements.
| | | Shares | | Value |
| Energy — 3.0% | | |
| Amplify Energy CorporationΔ | 9,326 | | $61,645 |
| Apergy CorporationΔ* | 43,800 | | 1,479,564 |
| Arch Coal, Inc. Class AΔ | 17,580 | | 1,261,189 |
| Berry Petroleum Corporation | 86,808 | | 818,600 |
| Cactus, Inc. Class A | 30,300 | | 1,039,896 |
| Callon Petroleum Co.Δ* | 56,306 | | 271,959 |
| CONSOL Energy, Inc.Δ* | 21,883 | | 317,522 |
| Delek US Holdings, Inc. | 59,043 | | 1,979,712 |
| DHT Holdings, Inc.Δ | 4,668 | | 38,651 |
| Dorian LPG, Ltd.* | 4,828 | | 74,738 |
| Exterran Corporation* | 20,245 | | 158,518 |
| Forum Energy Technologies, Inc.* | 1,844 | | 3,098 |
| Gran Tierra Energy, Inc.Δ* | 132,517 | | 170,947 |
| Green Plains, Inc.Δ | 54,672 | | 843,589 |
| Gulf Island Fabrication, Inc.* | 2,060 | | 10,444 |
| Gulfport Energy CorporationΔ* | 23,801 | | 72,355 |
| Hallador Energy Co. | 2,900 | | 8,613 |
| HollyFrontier Corporation | 11,986 | | 607,810 |
| International Seaways, Inc.* | 3,837 | | 114,189 |
| Matador Resources Co.Δ* | 78,800 | | 1,416,036 |
| Matrix Service Co.* | 19,400 | | 443,872 |
| NexTier Oilfield Solutions, Inc.* | 74,842 | | 501,441 |
| Overseas Shipholding Group, Inc. Class A* | 138,146 | | 317,736 |
| Par Pacific Holdings, Inc.* | 52,918 | | 1,229,814 |
| Parker Drilling Co.Δ* | 1,400 | | 31,500 |
| Patterson-UTI Energy, Inc.Δ | 48,672 | | 511,056 |
| Peabody Energy CorporationΔ | 39,000 | | 355,680 |
| Renewable Energy Group, Inc.Δ* | 26,300 | | 708,785 |
| SEACOR Holdings, Inc.* | 10,900 | | 470,335 |
| SFL Corporation, Ltd.Δ | 3,237 | | 47,066 |
| Southwestern Energy Co.Δ* | 81,232 | | 196,582 |
| SRC Energy, Inc.* | 21,502 | | 88,588 |
| Talos Energy, Inc.* | 18,498 | | 557,715 |
| Teekay Tankers, Ltd. Class A* | 8,532 | | 204,512 |
| World Fuel Services Corporation | 34,965 | | 1,518,180 |
| | | | | 17,931,937 |
| Financials — 16.5% | | |
| 1st Source Corporation | 15,402 | | 799,056 |
| Alleghany Corporation* | 1,224 | | 978,674 |
| Amalgamated Bank Class A | 9,600 | | 186,720 |
| American Equity Investment Life Holding Co. | 77,867 | | 2,330,559 |
| AMERISAFE, Inc.Δ | 11,100 | | 732,933 |
| Assured Guaranty, Ltd. | 24,417 | | 1,196,921 |
| Athene Holding, Ltd. Class A* | 22,930 | | 1,078,398 |
| Atlantic Capital Bancshares, Inc.* | 9,400 | | 172,490 |
| AXA Equitable Holdings, Inc. | 22,029 | | 545,879 |
| BancFirst CorporationΔ | 9,100 | | 568,204 |
| Bancorp, Inc. (The)* | 98,989 | | 1,283,887 |
| Bank of Commerce Holdings | 2,061 | | 23,846 |
| Bank of Marin BancorpΔ | 6,260 | | 282,013 |
| BankFinancial Corporation | 3,900 | | 51,012 |
| Banner Corporation | 14,600 | | 826,214 |
| BCB Bancorp, Inc. | 18,439 | | 254,274 |
| Bridge Bancorp, Inc. | 16,536 | | 554,452 |
| | | Shares | | Value |
| Bridgewater Bancshares, Inc.* | 10,414 | | $143,505 |
| Brighthouse Financial, Inc.* | 33,177 | | 1,301,534 |
| Bryn Mawr Bank Corporation | 19,661 | | 810,820 |
| C&F Financial Corporation | 2,822 | | 156,141 |
| Capital City Bank Group, Inc.Δ | 4,100 | | 125,050 |
| Capstar Financial Holdings, Inc. | 5,547 | | 92,358 |
| Carter Bank & TrustΔ* | 2,598 | | 61,625 |
| CBTX, Inc. | 2,700 | | 84,024 |
| CenterState Bank Corporation | 68,959 | | 1,722,596 |
| Central Pacific Financial Corporation | 52,882 | | 1,564,250 |
| Central Valley Community Bancorp | 5,300 | | 114,851 |
| Century Bancorp, Inc. Class A | 3,277 | | 294,799 |
| Chemung Financial Corporation | 736 | | 31,280 |
| CIT Group, Inc. | 4,900 | | 223,587 |
| City Holding Co.Δ | 12,917 | | 1,058,548 |
| Civista Bancshares, Inc. | 5,887 | | 141,288 |
| Coastal Financial CorporationΔ* | 1,289 | | 21,230 |
| Community Trust Bancorp, Inc. | 6,200 | | 289,168 |
| Cowen, Inc. Class AΔ* | 7,391 | | 116,408 |
| Customers Bancorp, Inc.* | 30,529 | | 726,895 |
| Donegal Group, Inc. Class A | 1,700 | | 25,194 |
| Donnelley Financial Solutions, Inc.Δ* | 25,277 | | 264,650 |
| Eagle Bancorp, Inc. | 26,704 | | 1,298,616 |
| East West Bancorp, Inc.Δ | 12,600 | | 613,620 |
| eHealth, Inc.* | 13,500 | | 1,297,080 |
| Enova International, Inc.* | 2,700 | | 64,962 |
| Enterprise Financial Services Corporation | 14,800 | | 713,508 |
| Essent Group, Ltd. | 37,224 | | 1,935,276 |
| Evercore, Inc. Class A | 25,700 | | 1,921,332 |
| FB Financial CorporationΔ | 5,446 | | 215,607 |
| FedNat Holding Co. | 6,279 | | 104,420 |
| Financial Institutions, Inc. | 23,991 | | 770,111 |
| First American Financial Corporation | 1,770 | | 103,226 |
| First Bancorp | 41,405 | | 1,652,474 |
| First BanCorp (New York Exchange) | 115,400 | | 1,222,086 |
| First Business Financial Services, Inc.Δ | 4,500 | | 118,485 |
| First Citizens BancShares, Inc. Class AΔ | 1,270 | | 675,907 |
| First Commonwealth Financial Corporation | 35,100 | | 509,301 |
| First Defiance Financial CorporationΔ | 9,800 | | 308,602 |
| First Financial Bancorp | 71,931 | | 1,829,925 |
| First Financial Corporation | 3,100 | | 141,732 |
| First Hawaiian, Inc. | 800 | | 23,080 |
| First Interstate BancSystem, Inc. Class A | 31,561 | | 1,323,037 |
| First Merchants Corporation | 5,100 | | 212,109 |
| First Midwest Bancorp, Inc. | 27,300 | | 629,538 |
| Flagstar Bancorp, Inc.Δ | 29,724 | | 1,136,943 |
| Focus Financial Partners, Inc. Class A* | 124,600 | | 3,671,962 |
| Great Southern Bancorp, Inc. | 3,800 | | 240,616 |
| Great Western Bancorp, Inc. | 53,073 | | 1,843,756 |
| Green Dot Corporation Class A* | 26,500 | | 617,450 |
| Guaranty Bancshares, Inc.Δ | 1,600 | | 52,608 |
| Hallmark Financial Services, Inc.* | 45,980 | | 807,869 |
See Notes to Financial Statements.
SCHEDULE OF INVESTMENTS (Continued)
| | | Shares | | Value |
| Hamilton Lane, Inc. Class A | 54,858 | | $3,269,537 |
| Hancock Whitney Corporation | 17,800 | | 781,064 |
| Hanover Insurance Group, Inc. (The) | 9,318 | | 1,273,491 |
| HCI Group, Inc.Δ | 10,620 | | 484,803 |
| Heartland Financial USA, Inc. | 4,900 | | 243,726 |
| Heritage Financial CorporationΔ | 5,300 | | 149,990 |
| Heritage Insurance Holdings, Inc. | 24,800 | | 328,600 |
| Home Bancorp, Inc. | 500 | | 19,595 |
| HomeStreet, Inc.* | 20,601 | | 700,434 |
| HomeTrust Bancshares, Inc. | 7,260 | | 194,786 |
| Houlihan Lokey, Inc. | 48,400 | | 2,365,308 |
| IBERIABANK Corporation | 7,100 | | 531,293 |
| Independent Bank Corporation | 17,414 | | 1,449,715 |
| Independent Bank Corporation (Berlin Exchange) | 18,032 | | 408,425 |
| Independent Bank Group, Inc. | 30,733 | | 1,703,837 |
| Kemper Corporation | 7,365 | | 570,787 |
| LendingClub Corporation* | 64,257 | | 810,923 |
| LendingTree, Inc.Δ* | 1,977 | | 599,901 |
| Macatawa Bank CorporationΔ | 7,300 | | 81,249 |
| Marlin Business Services Corporation | 2,100 | | 46,158 |
| Mercantile Bank Corporation | 200 | | 7,294 |
| Merchants Bancorp | 6,686 | | 131,781 |
| Meridian Bancorp, Inc. | 11,200 | | 225,008 |
| Metropolitan Bank Holding Corporation* | 3,089 | | 148,982 |
| MGIC Investment Corporation | 147,084 | | 2,084,180 |
| Mid Penn Bancorp, Inc. | 5,310 | | 152,928 |
| MidWestOne Financial Group, Inc. | 5,929 | | 214,808 |
| National General Holdings Corporation | 26,800 | | 592,280 |
| Navient Corporation | 85,039 | | 1,163,334 |
| Nelnet, Inc. Class A | 7,876 | | 458,698 |
| Nicolet Bankshares, Inc.Δ* | 3,500 | | 258,475 |
| Northrim BanCorp, Inc. | 5,551 | | 212,603 |
| OFG Bancorp | 16,518 | | 389,990 |
| Old National BancorpΔ | 100,549 | | 1,839,041 |
| Old Republic International Corporation | 16,512 | | 369,373 |
| Old Second Bancorp, Inc. | 1,300 | | 17,511 |
| OP Bancorp | 3,100 | | 32,147 |
| Opus Bank | 13,222 | | 342,053 |
| Pacific Premier Bancorp, Inc. | 5,317 | | 173,361 |
| Park National Corporation | 3,766 | | 385,563 |
| Peapack Gladstone Financial Corporation | 10,348 | | 319,753 |
| Peoples Bancorp, Inc. | 2,400 | | 83,184 |
| People's Utah BancorpΔ | 3,400 | | 102,408 |
| Popular, Inc. | 20,262 | | 1,190,392 |
| Primerica, Inc. | 4,035 | | 526,810 |
| Protective Insurance Corporation Class BΔ | 2,100 | | 33,789 |
| QCR Holdings, Inc. | 9,799 | | 429,784 |
| Radian Group, Inc. | 50,569 | | 1,272,316 |
| Regional Management CorporationΔ* | 4,133 | | 124,114 |
| Reinsurance Group of America, Inc. | 4,738 | | 772,578 |
| Republic First Bancorp, Inc.* | 9,729 | | 40,667 |
| Riverview Bancorp, Inc. | 23,049 | | 189,232 |
| | | Shares | | Value |
| Santander Consumer USA Holdings, Inc. | 39,520 | | $923,582 |
| Selective Insurance Group, Inc. | 21,595 | | 1,407,778 |
| Shore Bancshares, Inc. | 2,900 | | 50,344 |
| Sierra Bancorp | 19,397 | | 564,841 |
| SmartFinancial, Inc. | 3,500 | | 82,775 |
| South State CorporationΔ | 2,000 | | 173,500 |
| State Auto Financial CorporationΔ | 2,000 | | 62,040 |
| Stewart Information Services CorporationΔ | 27,180 | | 1,108,672 |
| Stifel Financial Corporation | 34,248 | | 2,077,141 |
| Territorial Bancorp, Inc.Δ | 1,900 | | 58,786 |
| Texas Capital Bancshares, Inc.* | 3,100 | | 175,987 |
| Third Point Reinsurance, Ltd.* | 50,277 | | 528,914 |
| TriCo Bancshares | 14,000 | | 571,340 |
| TriState Capital Holdings, Inc.Δ* | 4,945 | | 129,163 |
| TrustCo Bank Corporation | 57,000 | | 494,190 |
| UMB Financial CorporationΔ | 12,600 | | 864,864 |
| Umpqua Holdings Corporation | 66,278 | | 1,173,121 |
| United Community Banks, Inc. | 44,395 | | 1,370,918 |
| United Community Financial Corporation | 9,993 | | 116,518 |
| United Insurance Holdings Corporation | 12,926 | | 162,997 |
| Valley National Bancorp | 153,784 | | 1,760,827 |
| Voya Financial, Inc. | 27,853 | | 1,698,476 |
| Waddell & Reed Financial, Inc. Class AΔ | 74,100 | | 1,238,952 |
| Washington Federal, Inc. | 21,000 | | 769,650 |
| WesBanco, Inc. | 20,707 | | 782,518 |
| Wintrust Financial Corporation | 4,200 | | 297,780 |
| WisdomTree Investments, Inc. | 209,700 | | 1,014,948 |
| WSFS Financial Corporation | 22,040 | | 969,540 |
| | | | | 98,218,792 |
| Health Care — 12.5% | | |
| Acceleron Pharma, Inc.* | 39,200 | | 2,078,384 |
| Acorda Therapeutics, Inc.* | 103,000 | | 210,120 |
| Adamas Pharmaceuticals, Inc.Δ* | 65,016 | | 246,411 |
| Adaptive Biotechnologies CorporationΔ* | 54,600 | | 1,633,632 |
| Addus HomeCare Corporation* | 39,400 | | 3,830,468 |
| Aduro Biotech, Inc.* | 2,500 | | 2,950 |
| Agios Pharmaceuticals, Inc.Δ* | 24,548 | | 1,172,167 |
| Akorn, Inc.* | 29,491 | | 44,237 |
| Allscripts Healthcare Solutions, Inc.* | 123,864 | | 1,215,725 |
| AMAG Pharmaceuticals, Inc.Δ* | 35,342 | | 430,112 |
| Anika Therapeutics, Inc.* | 18,653 | | 967,158 |
| Applied Genetic Technologies CorporationΔ* | 6,200 | | 28,024 |
| Aptinyx, Inc.Δ* | 10,500 | | 35,910 |
| Assertio Therapeutics, Inc.Δ* | 138,900 | | 173,625 |
| Beyondspring, Inc.Δ* | 4,906 | | 76,043 |
| BioCryst Pharmaceuticals, Inc.Δ* | 69,158 | | 238,595 |
| BioSpecifics Technologies Corporation* | 5,771 | | 328,601 |
| Blueprint Medicines Corporation* | 30,900 | | 2,475,399 |
| Bridgebio Pharma, Inc.Δ* | 25,300 | | 886,765 |
See Notes to Financial Statements.
| | | Shares | | Value |
| Brookdale Senior Living, Inc.* | 51,800 | | $376,586 |
| Chimerix, Inc.Δ* | 45,100 | | 91,553 |
| Cidara Therapeutics, Inc.Δ* | 11,216 | | 43,069 |
| Coherus Biosciences, Inc.Δ* | 10,100 | | 181,851 |
| Computer Programs & Systems, Inc. | 14,715 | | 388,476 |
| Concert Pharmaceuticals, Inc.Δ* | 22,053 | | 203,439 |
| CONMED Corporation | 18,249 | | 2,040,786 |
| Cross Country Healthcare, Inc.* | 23,600 | | 274,232 |
| CryoLife, Inc.* | 46,914 | | 1,270,900 |
| CryoPort, Inc.Δ* | 75,300 | | 1,239,438 |
| Cyclerion Therapeutics, Inc.* | 5,700 | | 15,504 |
| Cytokinetics, Inc.Δ* | 13,461 | | 142,821 |
| DaVita, Inc.* | 4,301 | | 322,704 |
| Deciphera Pharmaceuticals, Inc.* | 12,500 | | 778,000 |
| Eagle Pharmaceuticals, Inc.Δ* | 16,600 | | 997,328 |
| Enanta Pharmaceuticals, Inc.* | 9,744 | | 601,984 |
| Endologix, Inc.Δ* | 22,807 | | 36,035 |
| Exelixis, Inc.* | 63,967 | | 1,127,099 |
| Five Prime Therapeutics, Inc.* | 20,738 | | 95,187 |
| HealthEquity, Inc.* | 33,000 | | 2,444,310 |
| ImmunoGen, Inc.* | 9,800 | | 50,029 |
| Inspire Medical Systems, Inc.* | 27,100 | | 2,011,091 |
| Intercept Pharmaceuticals, Inc.Δ* | 13,373 | | 1,657,182 |
| Intra-Cellular Therapies, Inc.Δ* | 4,700 | | 161,257 |
| Intrexon CorporationΔ* | 76,490 | | 419,165 |
| iRhythm Technologies, Inc.Δ* | 25,300 | | 1,722,677 |
| Jounce Therapeutics, Inc.* | 3,600 | | 31,428 |
| Kezar Life Sciences, Inc.Δ* | 4,800 | | 19,248 |
| Lannett Co., Inc.Δ* | 31,518 | | 277,989 |
| LHC Group, Inc.* | 7,700 | | 1,060,752 |
| Ligand Pharmaceuticals, Inc.Δ* | 15,553 | | 1,622,022 |
| Magellan Health, Inc.* | 17,340 | | 1,356,855 |
| Medicines Co. (The)Δ* | 21,756 | | 1,847,955 |
| Menlo Therapeutics, Inc.* | 6,000 | | 27,840 |
| Meridian Bioscience, Inc. | 27,206 | | 265,803 |
| Merit Medical Systems, Inc.Δ* | 45,342 | | 1,415,577 |
| Minerva Neurosciences, Inc.Δ* | 17,691 | | 125,783 |
| Molina Healthcare, Inc.* | 1,850 | | 251,027 |
| NanoString Technologies, Inc.* | 41,100 | | 1,143,402 |
| Natera, Inc.* | 47,037 | | 1,584,677 |
| Neon Therapeutics, Inc.Δ* | 1,136 | | 1,340 |
| NewLink Genetics CorporationΔ* | 6,400 | | 16,192 |
| NuVasive, Inc.Δ* | 33,333 | | 2,577,974 |
| OraSure Technologies, Inc.* | 33,011 | | 265,078 |
| Orthofix Medical, Inc.* | 11,413 | | 527,052 |
| Owens & Minor, Inc.Δ | 74,100 | | 383,097 |
| Phreesia, Inc.Δ* | 56,800 | | 1,513,152 |
| Prestige Consumer Healthcare, Inc.Δ* | 60,289 | | 2,441,704 |
| Protagonist Therapeutics, Inc.* | 2,900 | | 20,445 |
| PTC Therapeutics, Inc.* | 30,934 | | 1,485,760 |
| Quidel Corporation* | 27,511 | | 2,064,150 |
| Repligen Corporation* | 24,295 | | 2,247,288 |
| Retrophin, Inc.Δ* | 82,040 | | 1,164,968 |
| Rigel Pharmaceuticals, Inc.Δ* | 49,544 | | 106,024 |
| RTI Surgical Holdings, Inc.Δ* | 5,700 | | 15,618 |
| SeaSpine Holdings Corporation* | 2,000 | | 24,020 |
| Silk Road Medical, Inc.Δ* | 30,300 | | 1,223,514 |
| Spectrum Pharmaceuticals, Inc.Δ* | 73,123 | | 266,168 |
| | | Shares | | Value |
| Spero Therapeutics, Inc.Δ* | 3,648 | | $35,076 |
| STAAR Surgical Co.Δ* | 45,000 | | 1,582,650 |
| Supernus Pharmaceuticals, Inc.* | 48,672 | | 1,154,500 |
| Sutro Biopharma, Inc.Δ* | 3,100 | | 34,100 |
| Tabula Rasa HealthCare, Inc.Δ* | 25,272 | | 1,230,241 |
| Tandem Diabetes Care, Inc.Δ* | 43,900 | | 2,616,879 |
| Teladoc Health, Inc.Δ* | 20,406 | | 1,708,390 |
| TG Therapeutics, Inc.Δ* | 8,400 | | 93,240 |
| Triple-S Management Corporation Class BΔ* | 17,855 | | 330,139 |
| Ultragenyx Pharmaceutical, Inc.Δ* | 32,691 | | 1,396,233 |
| United Therapeutics Corporation* | 1,600 | | 140,928 |
| UNITY Biotechnology, Inc.Δ* | 14,055 | | 101,337 |
| Vanda Pharmaceuticals, Inc.* | 82,810 | | 1,358,912 |
| Varex Imaging Corporation* | 21,040 | | 627,202 |
| | | | | 74,550,758 |
| Industrials — 15.8% | | |
| ABM Industries, Inc. | 39,154 | | 1,476,497 |
| AECOM* | 9,330 | | 402,403 |
| Aegion Corporation* | 21,243 | | 475,206 |
| AGCO Corporation | 8,900 | | 687,525 |
| Albany International Corporation Class A | 24,500 | | 1,860,040 |
| Apogee Enterprises, Inc.Δ | 15,513 | | 504,173 |
| Applied Industrial Technologies, Inc. | 27,080 | | 1,805,965 |
| ArcBest Corporation | 27,042 | | 746,359 |
| Armstrong Flooring, Inc.* | 32,100 | | 137,067 |
| ASGN, Inc.* | 65,382 | | 4,640,161 |
| Astec Industries, Inc. | 19,213 | | 806,946 |
| Atkore International Group, Inc.* | 24,794 | | 1,003,165 |
| Axon Enterprise, Inc.Δ* | 20,100 | | 1,472,928 |
| Barnes Group, Inc. | 17,337 | | 1,074,201 |
| Briggs & Stratton CorporationΔ | 87,409 | | 582,144 |
| BrightView Holdings, Inc.Δ* | 58,990 | | 995,161 |
| Builders FirstSource, Inc.* | 51,335 | | 1,304,422 |
| Casella Waste Systems, Inc. Class A* | 73,906 | | 3,401,893 |
| CIRCOR International, Inc.Δ* | 45,400 | | 2,099,296 |
| Clean Harbors, Inc.* | 26,700 | | 2,289,525 |
| Columbus McKinnon Corporation | 37,419 | | 1,497,883 |
| Commercial Vehicle Group, Inc.Δ* | 127,459 | | 809,365 |
| Continental Building Products, Inc.* | 52,229 | | 1,902,702 |
| Echo Global Logistics, Inc.* | 25,500 | | 527,850 |
| EMCOR Group, Inc. | 35,766 | | 3,086,606 |
| ESCO Technologies, Inc. | 13,761 | | 1,272,893 |
| Exponent, Inc. | 33,200 | | 2,291,132 |
| Federal Signal Corporation | 66,480 | | 2,143,980 |
| Foundation Building Materials, Inc.* | 30,176 | | 583,906 |
| Gibraltar Industries, Inc.* | 7,952 | | 401,099 |
| GMS, Inc.* | 24,042 | | 651,057 |
| Granite Construction, Inc.Δ | 34,997 | | 968,367 |
| Great Lakes Dredge & Dock Corporation* | 82,616 | | 936,039 |
| Hawaiian Holdings, Inc. | 9,903 | | 290,059 |
| HC2 Holdings, Inc.Δ* | 3,636 | | 7,890 |
| Herc Holdings, Inc.* | 23,472 | | 1,148,720 |
| Herman Miller, Inc. | 22,788 | | 949,120 |
| HNI Corporation | 26,244 | | 983,100 |
See Notes to Financial Statements.
SCHEDULE OF INVESTMENTS (Continued)
| | | Shares | | Value |
| Hub Group, Inc. Class A* | 28,015 | | $1,436,889 |
| Hyster-Yale Materials Handling, Inc.Δ | 5,600 | | 330,176 |
| Insteel Industries, Inc. | 1,000 | | 21,490 |
| JetBlue Airways Corporation* | 49,631 | | 929,092 |
| Kadant, Inc.Δ | 14,502 | | 1,527,641 |
| Kelly Services, Inc. Class A | 17,500 | | 395,150 |
| Kimball International, Inc. Class B | 34,737 | | 718,014 |
| Knoll, Inc. | 21,861 | | 552,209 |
| LB Foster Co. Class A* | 4,087 | | 79,206 |
| Lennox International, Inc.Δ | 1,380 | | 336,679 |
| Manitowoc Co., Inc. (The)* | 53,200 | | 931,000 |
| ManpowerGroup, Inc. | 4,950 | | 480,645 |
| MasTec, Inc.Δ* | 25,297 | | 1,623,056 |
| Mobile Mini, Inc. | 21,549 | | 816,923 |
| MRC Global, Inc.Δ* | 4,702 | | 64,135 |
| MYR Group, Inc.* | 39,083 | | 1,273,715 |
| Navistar International Corporation* | 20,100 | | 581,694 |
| Orion Group Holdings, Inc.* | 8,876 | | 46,066 |
| Oshkosh Corporation | 4,982 | | 471,546 |
| Park-Ohio Holdings Corporation | 2,800 | | 94,220 |
| Parsons Corporation* | 55,600 | | 2,295,168 |
| Patrick Industries, Inc.Δ | 24,200 | | 1,268,806 |
| Pitney Bowes, Inc.Δ | 184,300 | | 742,729 |
| Powell Industries, Inc. | 6,400 | | 313,536 |
| Proto Labs, Inc.* | 21,200 | | 2,152,860 |
| Quanex Building Products Corporation | 23,984 | | 409,647 |
| R.R. Donnelley & Sons Co.Δ | 144,200 | | 569,590 |
| RBC Bearings, Inc.* | 7,300 | | 1,155,882 |
| Resideo Technologies, Inc.* | 10,776 | | 128,558 |
| REV Group, Inc. | 28,019 | | 342,672 |
| Rexnord Corporation* | 157,352 | | 5,132,822 |
| Simpson Manufacturing Co., Inc. | 13,128 | | 1,053,259 |
| Spartan Motors, Inc. | 3,354 | | 60,640 |
| Steelcase, Inc. Class A | 4,856 | | 99,354 |
| Sterling Construction Co., Inc.Δ* | 66,284 | | 933,279 |
| Terex Corporation | 41,320 | | 1,230,510 |
| Tetra Tech, Inc. | 23,115 | | 1,991,588 |
| Titan International, Inc. | 35,649 | | 129,049 |
| TriNet Group, Inc.* | 63,900 | | 3,617,379 |
| TrueBlue, Inc.* | 29,290 | | 704,717 |
| US Ecology, Inc. | 26,668 | | 1,544,344 |
| Veritiv CorporationΔ* | 10,800 | | 212,436 |
| Viad Corporation | 27,700 | | 1,869,750 |
| Wabash National Corporation | 61,131 | | 898,014 |
| Werner Enterprises, Inc. | 11,923 | | 433,878 |
| WESCO International, Inc.* | 6,560 | | 389,598 |
| Willdan Group, Inc.Δ* | 35,900 | | 1,140,902 |
| WillScot Corporation* | 100,100 | | 1,850,849 |
| Woodward, Inc. | 4,183 | | 495,435 |
| XPO Logistics, Inc.Δ* | 1,800 | | 143,460 |
| | | | | 94,237,102 |
| Information Technology — 17.2% | | |
| 2U, Inc.Δ* | 49,200 | | 1,180,308 |
| ACI Worldwide, Inc.* | 72,000 | | 2,727,720 |
| ADTRAN, Inc. | 33,000 | | 326,370 |
| Alpha & Omega Semiconductor, Ltd.* | 13,288 | | 180,983 |
| | | Shares | | Value |
| Amkor Technology, Inc.* | 70,373 | | $914,849 |
| Anixter International, Inc.* | 7,102 | | 654,094 |
| Arlo Technologies, Inc.* | 77,708 | | 327,151 |
| Arrow Electronics, Inc.* | 800 | | 67,792 |
| Avnet, Inc. | 34,435 | | 1,461,421 |
| Bel Fuse, Inc. Class B | 6,615 | | 135,608 |
| Belden, Inc. | 22,307 | | 1,226,885 |
| Benchmark Electronics, Inc. | 37,400 | | 1,285,064 |
| Bill.Com Holdings, Inc.* | 22,100 | | 840,905 |
| Blackbaud, Inc.Δ | 7,961 | | 633,696 |
| Booz Allen Hamilton Holding Corporation | 5,060 | | 359,918 |
| Bottomline Technologies de, Inc.* | 41,400 | | 2,219,040 |
| Brooks Automation, Inc. | 67,995 | | 2,853,070 |
| Cabot Microelectronics CorporationΔ | 12,000 | | 1,731,840 |
| Calix, Inc.* | 19,958 | | 159,664 |
| Casa Systems, Inc.* | 24,500 | | 100,205 |
| Cirrus Logic, Inc.* | 26,100 | | 2,150,901 |
| CSG Systems International, Inc. | 19,093 | | 988,636 |
| Daktronics, Inc. | 18,400 | | 112,056 |
| DASAN Zhone Solutions, Inc.* | 9,416 | | 83,426 |
| Diebold Nixdorf, Inc.Δ* | 13,500 | | 142,560 |
| Digi International, Inc.* | 16,900 | | 299,468 |
| EMCORE CorporationΔ* | 7,100 | | 21,584 |
| Envestnet, Inc.* | 44,400 | | 3,091,572 |
| Evo Payments, Inc. Class A* | 62,700 | | 1,655,907 |
| ExlService Holdings, Inc.* | 69,629 | | 4,836,430 |
| Harmonic, Inc.* | 80,300 | | 626,340 |
| I3 Verticals, Inc. Class A* | 63,200 | | 1,785,400 |
| II-VI, Inc.Δ* | 48,628 | | 1,637,305 |
| Infinera CorporationΔ* | 96,300 | | 764,622 |
| Insight Enterprises, Inc.Δ* | 16,045 | | 1,127,803 |
| Instructure, Inc.* | 34,700 | | 1,672,887 |
| Intevac, Inc.* | 5,163 | | 36,451 |
| j2 Global, Inc.Δ | 66,828 | | 6,262,452 |
| Jabil, Inc. | 40,085 | | 1,656,713 |
| KBR, Inc. | 7,518 | | 229,299 |
| Kopin CorporationΔ* | 9,500 | | 3,810 |
| Kulicke & Soffa Industries, Inc. | 17,810 | | 484,432 |
| Littelfuse, Inc.Δ | 16,200 | | 3,099,060 |
| MACOM Technology Solutions Holdings, Inc.* | 9,833 | | 261,558 |
| Manhattan Associates, Inc.* | 6,768 | | 539,748 |
| MaxLinear, Inc.Δ* | 65,474 | | 1,389,358 |
| Medallia, Inc.Δ* | 23,400 | | 727,974 |
| MicroStrategy, Inc. Class A* | 7,072 | | 1,008,679 |
| MKS Instruments, Inc. | 21,400 | | 2,354,214 |
| NeoPhotonics Corporation* | 13,000 | | 114,660 |
| NETGEAR, Inc.* | 41,269 | | 1,011,503 |
| NetScout Systems, Inc.* | 49,680 | | 1,195,798 |
| New Relic, Inc.* | 30,600 | | 2,010,726 |
| nLight, Inc.* | 54,000 | | 1,095,120 |
| Paylocity Holding Corporation* | 46,144 | | 5,575,118 |
| Pegasystems, Inc. | 16,500 | | 1,314,225 |
| Pixelworks, Inc.* | 23,269 | | 91,214 |
| Plantronics, Inc. | 24,321 | | 664,936 |
| Pluralsight, Inc. Class AΔ* | 99,100 | | 1,705,511 |
See Notes to Financial Statements.
| | | Shares | | Value |
| Priority Technology Holdings, Inc.Δ* | 122,900 | | $301,105 |
| Progress Software Corporation | 13,751 | | 571,354 |
| Q2 Holdings, Inc.* | 76,892 | | 6,234,403 |
| Rapid7, Inc.* | 30,325 | | 1,698,806 |
| RealPage, Inc.* | 45,600 | | 2,451,000 |
| Repay Holdings CorporationΔ* | 97,300 | | 1,425,445 |
| Ribbon Communications, Inc.* | 30,667 | | 95,068 |
| Rogers Corporation* | 14,400 | | 1,796,112 |
| Rosetta Stone, Inc.Δ* | 116,915 | | 2,120,838 |
| SailPoint Technologies Holding, Inc.Δ* | 72,700 | | 1,715,720 |
| ScanSource, Inc.* | 1,602 | | 59,194 |
| Semtech Corporation* | 32,326 | | 1,710,045 |
| Silicon Laboratories, Inc.* | 12,848 | | 1,490,111 |
| SMART Global Holdings, Inc.* | 5,013 | | 190,193 |
| Smartsheet, Inc. Class A* | 38,800 | | 1,742,896 |
| Synaptics, Inc.* | 28,358 | | 1,865,106 |
| Synchronoss Technologies, Inc.Δ* | 43,900 | | 208,525 |
| Telenav, Inc.* | 23,484 | | 114,132 |
| Teradata Corporation* | 17,428 | | 466,548 |
| TiVo Corporation | 96,500 | | 818,320 |
| Unisys CorporationΔ* | 126,334 | | 1,498,321 |
| Veeco Instruments, Inc.* | 26,300 | | 386,216 |
| Vishay Precision Group, Inc.* | 2,837 | | 96,458 |
| Western Union Co. (The)Δ | 8,184 | | 219,168 |
| | | | | 102,491,123 |
| Materials — 4.5% | | |
| AdvanSix, Inc.* | 51,215 | | 1,022,251 |
| Ashland Global Holdings, Inc. | 5,400 | | 413,262 |
| Balchem Corporation | 11,776 | | 1,196,795 |
| Boise Cascade Co. | 79,805 | | 2,915,277 |
| Cabot Corporation | 10,639 | | 505,565 |
| CF Industries Holdings, Inc. | 3,500 | | 167,090 |
| Chemours Co. (The)Δ | 9,678 | | 175,075 |
| Coeur Mining, Inc.* | 75,569 | | 610,598 |
| Element Solutions, Inc.* | 11,300 | | 131,984 |
| Flotek Industries, Inc.Δ* | 13,601 | | 27,202 |
| Huntsman Corporation | 14,217 | | 343,483 |
| Kaiser Aluminum Corporation | 18,187 | | 2,016,756 |
| Kraton Corporation* | 21,788 | | 551,672 |
| Louisiana-Pacific Corporation | 39,365 | | 1,167,960 |
| Minerals Technologies, Inc. | 30,406 | | 1,752,298 |
| Neenah, Inc. | 27,429 | | 1,931,824 |
| O-I Glass, Inc.* | 20,800 | | 248,144 |
| Olympic Steel, Inc. | 9,196 | | 164,792 |
| PH Glatfelter Co. | 20,888 | | 382,250 |
| PolyOne Corporation | 52,000 | | 1,913,080 |
| Quaker Chemical CorporationΔ | 8,160 | | 1,342,483 |
| Reliance Steel & Aluminum Co. | 8,015 | | 959,876 |
| Ryerson Holding Corporation* | 2,500 | | 29,575 |
| Schnitzer Steel Industries, Inc. Class AΔ | 29,799 | | 646,042 |
| Steel Dynamics, Inc. | 3,360 | | 114,374 |
| Stepan Co. | 12,717 | | 1,302,730 |
| TimkenSteel Corporation* | 3,132 | | 24,618 |
| Tredegar Corporation | 8,840 | | 197,574 |
| | | Shares | | Value |
| Trinseo SAΔ | 50,369 | | $1,874,231 |
| Valvoline, Inc. | 11,800 | | 252,638 |
| Verso Corporation Class A* | 4,400 | | 79,332 |
| Warrior Met Coal, Inc. | 51,816 | | 1,094,872 |
| Worthington Industries, Inc. | 39,061 | | 1,647,593 |
| | | | | 27,203,296 |
| Real Estate — 6.8% | | |
| Alexander & Baldwin, Inc. REIT | 2,500 | | 52,400 |
| Altisource Portfolio Solutions SAΔ* | 4,514 | | 87,256 |
| American Assets Trust, Inc. REITΔ | 23,653 | | 1,085,673 |
| Armada Hoffler Properties, Inc. REIT | 60,450 | | 1,109,258 |
| Bluerock Residential Growth REIT, Inc.Δ | 33,400 | | 402,470 |
| Braemar Hotels & Resorts, Inc. REIT | 30,068 | | 268,507 |
| Brandywine Realty Trust REIT | 58,321 | | 918,556 |
| Brixmor Property Group, Inc. REIT | 50,958 | | 1,101,202 |
| Camden Property Trust REIT | 3,700 | | 392,570 |
| Cedar Realty Trust, Inc. REIT | 75,047 | | 221,389 |
| Chatham Lodging Trust REITΔ | 31,624 | | 579,984 |
| City Office REIT, Inc. | 64,947 | | 878,083 |
| Consolidated-Tomoka Land Co. | 6,402 | | 386,169 |
| CorePoint Lodging, Inc. REIT | 60,300 | | 644,004 |
| Corporate Office Properties Trust REIT | 34,912 | | 1,025,715 |
| Cousins Properties, Inc. REIT | 24,496 | | 1,009,235 |
| DiamondRock Hospitality Co. REIT | 67,400 | | 746,792 |
| EastGroup Properties, Inc. REIT | 18,521 | | 2,457,181 |
| Equity Commonwealth REIT | 8,803 | | 289,002 |
| First Industrial Realty Trust, Inc. REIT | 57,116 | | 2,370,885 |
| Forestar Group, Inc.* | 3,900 | | 81,315 |
| Franklin Street Properties Corporation REIT | 16,800 | | 143,808 |
| Getty Realty Corporation REIT | 5,200 | | 170,924 |
| Hudson Pacific Properties, Inc. REIT | 29,859 | | 1,124,191 |
| Industrial Logistics Properties Trust REIT | 17,894 | | 401,183 |
| Investors Real Estate Trust REIT | 11,102 | | 804,895 |
| iStar, Inc. REITΔ | 15,038 | | 218,201 |
| Jones Lang LaSalle, Inc. | 7,250 | | 1,262,153 |
| Kennedy-Wilson Holdings, Inc. | 132,625 | | 2,957,537 |
| Kite Realty Group Trust REIT | 92,613 | | 1,808,732 |
| Life Storage, Inc. REIT | 800 | | 86,624 |
| Mack-Cali Realty Corporation REIT | 53,342 | | 1,233,800 |
| Marcus & Millichap, Inc.Δ* | 19,459 | | 724,848 |
| National Storage Affiliates Trust REIT | 30,000 | | 1,008,600 |
| New Senior Investment Group, Inc. REITΔ | 59,372 | | 454,196 |
| Office Properties Income Trust REITΔ | 7,092 | | 227,937 |
| Paramount Group, Inc. REIT | 14,200 | | 197,664 |
| Pebblebrook Hotel Trust REITΔ | 50,245 | | 1,347,068 |
| Physicians Realty Trust REIT | 79,881 | | 1,512,946 |
| Piedmont Office Realty Trust, Inc. Class A REIT | 44,919 | | 998,999 |
| RE/MAX Holdings, Inc. Class A | 22,275 | | 857,365 |
See Notes to Financial Statements.
SCHEDULE OF INVESTMENTS (Continued)
| | | Shares | | Value |
| Retail Properties of America, Inc. Class A REIT | 88,667 | | $1,188,138 |
| Retail Value, Inc. REITΔ | 15,897 | | 585,010 |
| RPT Realty REITΔ | 113,286 | | 1,703,821 |
| SITE Centers Corporation REIT | 28,200 | | 395,364 |
| SL Green Realty Corporation REIT | 5,600 | | 514,528 |
| Spirit Realty Capital, Inc. REIT | 5,600 | | 275,408 |
| Sunstone Hotel Investors, Inc. REIT | 95,992 | | 1,336,209 |
| Urban Edge Properties REIT | 48,754 | | 935,102 |
| Xenia Hotels & Resorts, Inc. REIT | 12,600 | | 272,286 |
| | | | | 40,855,183 |
| Utilities — 3.3% | | |
| ALLETE, Inc. | 10,180 | | 826,311 |
| Avista Corporation | 21,900 | | 1,053,171 |
| Genie Energy, Ltd. Class BΔ | 7,481 | | 57,828 |
| Hawaiian Electric Industries, Inc. | 3,721 | | 174,366 |
| Northwest Natural Holding Co.Δ | 7,760 | | 572,145 |
| NorthWestern Corporation | 49,544 | | 3,550,818 |
| NRG Energy, Inc. | 30,324 | | 1,205,379 |
| ONE Gas, Inc. | 7,800 | | 729,846 |
| PNM Resources, Inc. | 12,500 | | 633,875 |
| Portland General Electric Co. | 45,460 | | 2,536,213 |
| South Jersey Industries, Inc.Δ | 81,379 | | 2,683,879 |
| Southwest Gas Holdings, Inc. | 14,400 | | 1,093,968 |
| Spire, Inc. | 36,828 | | 3,068,141 |
| Vistra Energy Corporation | 57,829 | | 1,329,489 |
| | | | | 19,515,429 |
Total Common Stocks
(Cost $523,319,609) | | 556,712,522 |
| FOREIGN COMMON STOCKS — 3.7% |
| Canada — 0.6% | | |
| Colliers International Group, Inc.Δ | 21,400 | | 1,668,558 |
| IMAX Corporation* | 47,800 | | 976,554 |
| Masonite International Corporation* | 11,387 | | 822,255 |
| | | | | 3,467,367 |
| France — 0.1% | | |
| Talend SA ADRΔ* | 17,400 | | 680,514 |
| Germany — 0.2% | | |
| MorphoSys AG ADR* | 36,700 | | 1,309,089 |
| Ireland — 0.2% | | |
| Jazz Pharmaceuticals PLC* | 7,499 | | 1,119,451 |
| Osmotica Pharmaceuticals PLCΔ* | 1,000 | | 6,990 |
| Prothena Corporation PLC* | 24,201 | | 383,102 |
| | | | | 1,509,543 |
| Israel — 0.3% | | |
| Stratasys, Ltd.Δ* | 26,700 | | 540,007 |
| Tufin Software Technologies, Ltd.Δ* | 60,600 | | 1,065,954 |
| | | | | 1,605,961 |
| Jersey — 1.4% | | |
| Mimecast, Ltd.* | 15,240 | | 661,111 |
| Novocure, Ltd.* | 13,000 | | 1,095,510 |
| Quotient, Ltd.Δ* | 100,300 | | 953,853 |
| WNS Holdings, Ltd. ADRΔ* | 83,918 | | 5,551,176 |
| | | | | 8,261,650 |
| | | Shares | | Value |
| Netherlands — 0.7% | | |
| Argenx SE ADR* | 5,600 | | $898,912 |
| InterXion Holding NV* | 15,907 | | 1,333,166 |
| Wright Medical Group NV* | 56,482 | | 1,721,571 |
| | | | | 3,953,649 |
| United Kingdom — 0.2% | | |
| LivaNova PLC* | 13,400 | | 1,010,762 |
Total Foreign Common Stocks
(Cost $18,662,161) | | 21,798,535 |
| PREFERRED STOCK — 0.3% |
CuriosityStream LLC0.00 CONVΨ†††*
(Cost $1,956,000) | 195,600 | | 1,956,000 |
| MONEY MARKET FUNDS — 4.7% |
GuideStone Money Market Fund, 1.53%
(Institutional Class)Ø∞ | 14,895,149 | | 14,895,149 |
| Northern Institutional Liquid Assets Portfolio (Shares), 1.57%ا | 13,044,167 | | 13,044,167 |
Total Money Market Funds
(Cost $27,939,316) | | 27,939,316 |
| | | Par | |
| U.S. TREASURY OBLIGATION — 0.1% |
| U.S. Treasury Bill | | | |
1.52%, 05/07/20Ω‡‡
(Cost $795,694) | $800,000 | 795,747 |
TOTAL INVESTMENTS —102.1%
(Cost $572,672,780) | | 609,202,120 |
Liabilities in Excess of Other
Assets — (2.1)% | | (12,744,315) |
| NET ASSETS — 100.0% | | $596,457,805 |
See Notes to Financial Statements.
Futures Contracts outstanding at December 31, 2019:
| Future Type | | Expiration Date | | Open Long
(Short) Contracts | | Notional
Market Value
of Contracts | | Value and
Unrealized
Appreciation
(Depreciation) |
| CME Russell 2000 Index E-Mini | | 03/2020 | | 79 | | $6,598,870 | | $85,961 |
VALUATION HIERARCHY
The following is a summary of the inputs used, as of December 31, 2019, in valuing the Fund’s investments carried at fair value:
| | Total
Value | | Level 1
Quoted Prices | | Level 2
Other Significant
Observable Inputs | | Level 3
Significant
Unobservable Inputs |
| Assets: | | | | | | | |
| Investments in Securities: | | | | | | | |
| Common Stocks | $556,712,522 | | $556,712,522 | | $— | | $— |
| Foreign Common Stocks | 21,798,535 | | 21,798,535 | | — | | — |
| Money Market Funds | 27,939,316 | | 27,939,316 | | — | | — |
| Preferred Stock | 1,956,000 | | — | | — | | 1,956,000 |
| U.S. Treasury Obligation | 795,747 | | — | | 795,747 | | — |
| Total Assets - Investments in Securities | $609,202,120 | | $606,450,373 | | $795,747 | | $1,956,000 |
| Other Financial Instruments*** | | | | | | | |
| Futures Contracts | $85,961 | | $85,961 | | $— | | $— |
| Total Assets - Other Financial Instruments | $85,961 | | $85,961 | | $ — | | $ — |
| *** | Other financial instruments are derivative instruments, such as futures contracts, which are valued at the unrealized appreciation (depreciation) on the investment. Further details regarding the value of these investments can be found in the preceding "Futures Contracts outstanding" disclosure. |
There were no transfers to or from Level 3 during the year ended December 31, 2019.
Management has determined that the amount of Level 3 securities compared to total net assets is not material; therefore, the reconciliation of Level 3 securities and assumptions is not shown for the year ended December 31, 2019.
See Notes to Financial Statements.
International Equity Index Fund(Unaudited)
With an annual return of 22.01%, developed non-U.S. markets (represented by the MSCI EAFE Index) saw strong performance in 2019, yet underperformed their U.S. counterparts. Broad investor concerns regarding tightening global financial conditions, trade disputes and the U.K.’s impending exit from the European Union pressured foreign stocks into the end of 2018. As 2019 progressed, these concerns were never fully alleviated, but were met with easier monetary policy by global central banks, as well as some incremental progress in the U.S. and China trade dispute. As the perceived uncertainties fell toward the end of the year, markets began pricing in a cyclical upswing, causing the industrials sector to be the biggest contributor to index returns for the year, followed closely by financials and health care sectors. Remarkably, all sectors and all countries in the MSCI EAFE Index posted positive returns in 2019.
The Fund was passively managed and attempted to replicate the performance of its benchmark, the MSCI EAFE Index. The objective of the Fund is to provide investment results approximating the aggregate price and dividend performance of the securities included in the MSCI EAFE Index. (The MSCI EAFE Index is a free-float-adjusted market capitalization index that is designed to measure the equity market performance of developed markets, excluding the United States and Canada.) The correlation between the Fund’s performance and the MSCI EAFE Index is expected to be greater than 98%. However, it could be lower in certain market environments and also due to the exclusion of certain securities from the Fund’s portfolio because of faith-based investment policies and restrictions (100% would indicate a perfect correlation). For the one-year period ended December 31, 2019, the Institutional Class of the Fund returned 21.21%. The return differential was primarily a result of the faith-based restrictions of the Fund.
In 2019, exchange listed equity index futures contracts were utilized to provide market exposure to the cash positions held in the Fund. Overall, derivative exposure had a slight positive impact on Fund performance for the year.
This Fund may be suitable to investors who seek higher, long-term rates of return, can accept significant short-term fluctuations in account value and want to diversify their portfolio with international equity securities. Securities of foreign issuers may be negatively impacted by political events, economic conditions or inefficient, illiquid or unregulated markets in foreign countries, and they also may be subject to inadequate regulatory or accounting standards, which may increase investment risk. Investing in emerging markets may involve greater risks than investing in more developed foreign markets because, among other things, emerging markets often have more political and economic instability. Derivatives involve different risks from, and in some respects greater than, those risks associated with investing directly in securities, currencies or other instruments. The derivatives may be illiquid or less liquid, volatile, difficult to price and leverage so that small changes in value of the underlying instruments may produce disproportionate losses to the Fund. It is possible to lose money by investing in the Fund.
At December 31, 2019, the portfolio holdings of the Fund, as a percentage of net assets, is shown in the following table. Portfolio holdings are subject to risk and may change at any time.
| | % |
| Financials | 17.7 |
| Industrials | 13.9 |
| Health Care | 12.2 |
| Consumer Discretionary | 10.5 |
| Consumer Staples | 9.5 |
| Information Technology | 6.8 |
| Materials | 6.7 |
| Communication Services | 5.0 |
| Energy | 4.8 |
| Money Market Funds | 4.6 |
| Utilities | 3.5 |
| Real Estate | 3.8 |
| U.S. Treasury Obligation | 0.2 |
| Rights | —** |
| | 99.2 |
| **Rounds to less than 0.1% | |
See Notes to Financial Statements.
International Equity Index Fund(Unaudited)
| Average Annual Total Returns as of 12/31/19 | |
| | | Institutional Class* | | Benchmark** | |
| One Year | | 21.21% | | 22.01% | |
| Five Year | | N/A | | N/A | |
| Ten year | | N/A | | N/A | |
| Since Inception | | 4.18% | | 4.30% | |
| Inception Date | | 06/01/15 | | | |
| Total Fund Operating Expenses (April 30, 2019 Prospectus)(1) | | 0.28% | | | |
| (1) | Current information regarding the Fund’s Operating Expenses can be found in the Financial Highlights. |
The performance data quoted represents past performance and does not guarantee future results. Current performance may be lower or higher. Performance data current to the most recent month-end may be obtained at GuideStoneFunds.com. The investment return and principal value of an investment will fluctuate so that shares, when redeemed, may be worth more or less than their original cost.
The Adviser has agreed to waive fees and/or reimburse expenses to the extent needed to limit total annual operating expenses (before expense payments by broker-dealers and excluding interest, taxes, brokerage commissions, extraordinary expenses, acquired fund fees and expenses and expenses incurred in connection with the short sales of securities) to 0.22% for the Institutional Class. This contractual waiver and reimbursement applies to Fund operating expenses only and will remain in place until April 30, 2020. Institutional Net Expense Ratio - 0.23%.
The graph illustrates the results of a hypothetical $10,000 investment in the Institutional Class of the Fund since June 1, 2015 (commencement of operations), with all dividends and capital gains reinvested, with the MSCI EAFE Index.
*These returns reflect investment advisory and shareholder servicing fee waivers, if applicable, during the reported time periods.
**Unlike a mutual fund, the performance of an index assumes no taxes, transaction costs, management fees or other expenses.
See Notes to Financial Statements.
INTERNATIONAL EQUITY INDEX FUND
| | | Shares | | Value |
| COMMON STOCK — 0.0% |
| Health Care — 0.0% | | |
BeiGene, Ltd. ADRΔ*
(Cost $230,754) | 1,505 | | $249,469 |
| FOREIGN COMMON STOCKS — 93.9% |
| Australia — 6.4% | | |
| AGL Energy, Ltd. | 36,482 | | 525,593 |
| Alumina, Ltd. | 123,227 | | 198,891 |
| AMP, Ltd. | 113,756 | | 152,871 |
| APA Group | 85,754 | | 667,974 |
| ASX, Ltd. | 12,087 | | 665,078 |
| Aurizon Holdings, Ltd. | 83,954 | | 308,124 |
| AusNet Services | 180,811 | | 215,703 |
| Australia & New Zealand Banking Group, Ltd. | 130,882 | | 2,262,178 |
| Bank of Queensland, Ltd.Δ | 154 | | 783 |
| Bendigo and Adelaide Bank, Ltd.Δ | 5,305 | | 36,409 |
| BHP Group, Ltd. | 141,389 | | 3,861,632 |
| BlueScope Steel, Ltd. | 20,263 | | 214,147 |
| Boral, Ltd. | 56,616 | | 177,992 |
| Brambles, Ltd. | 67,897 | | 558,420 |
| Caltex Australia, Ltd. | 11,404 | | 271,694 |
| Challenger, Ltd.Δ | 33,947 | | 192,722 |
| CIMIC Group, Ltd. | 2,882 | | 67,024 |
| Coca-Cola Amatil, Ltd. | 142,079 | | 1,102,726 |
| Cochlear, Ltd. | 3,288 | | 518,532 |
| Coles Group, Ltd. | 50,160 | | 522,365 |
| Commonwealth Bank of Australia | 84,407 | | 4,732,686 |
| Computershare, Ltd. | 44,623 | | 525,452 |
| CSL, Ltd. | 21,046 | | 4,072,708 |
| Dexus REIT | 36,721 | | 301,497 |
| Flight Centre Travel Group, Ltd. | 6,157 | | 190,369 |
| Fortescue Metals Group, Ltd. | 42,058 | | 315,507 |
| Goodman Group REIT | 76,569 | | 718,401 |
| GPT Group (The) REIT (Athens Exchange) | 67,147 | | 263,874 |
| Harvey Norman Holdings, Ltd. | 96,021 | | 274,248 |
| Incitec Pivot, Ltd. | 86,785 | | 193,666 |
| Insurance Australia Group, Ltd. | 151,186 | | 812,686 |
| Lendlease Group | 34,784 | | 429,610 |
| Macquarie Group, Ltd. | 16,995 | | 1,644,032 |
| Magellan Financial Group, Ltd. | 5,400 | | 215,809 |
| Medibank Pvt., Ltd. | 117,607 | | 260,797 |
| Mirvac Group REIT | 149,919 | | 334,554 |
| National Australia Bank, Ltd. | 129,758 | | 2,242,751 |
| Newcrest Mining, Ltd. | 36,206 | | 768,579 |
| Orica, Ltd. | 21,761 | | 335,652 |
| Origin Energy, Ltd. | 89,304 | | 529,554 |
| QBE Insurance Group, Ltd. | 67,446 | | 609,613 |
| Ramsay Health Care, Ltd. | 6,096 | | 310,274 |
| REA Group, Ltd.Δ | 2,055 | | 149,401 |
| Rio Tinto, Ltd. | 15,247 | | 1,074,238 |
| Santos, Ltd. | 59,995 | | 344,390 |
| Scentre Group REIT | 252,947 | | 679,846 |
| SEEK, Ltd. | 15,462 | | 244,678 |
| Sonic Healthcare, Ltd. | 25,549 | | 515,459 |
| South32, Ltd. | 201,814 | | 382,382 |
| Stockland REIT | 85,681 | | 277,785 |
| | | Shares | | Value |
| Suncorp Group, Ltd. | 85,021 | | $773,239 |
| Sydney AirportΔ | 85,801 | | 521,426 |
| Telstra Corporation, Ltd. | 216,660 | | 538,226 |
| TPG Telecom, Ltd. | 15,539 | | 73,169 |
| Transurban Group | 151,919 | | 1,589,542 |
| Unibail-Rodamco-Westfield | 10,140 | | 79,625 |
| Vicinity Centres REIT | 137,781 | | 240,753 |
| Washington H Soul Pattinson & Co., Ltd. | 1,395 | | 21,047 |
| Wesfarmers, Ltd. | 57,427 | | 1,668,395 |
| Westpac Banking Corporation | 155,825 | | 2,649,555 |
| Woodside Petroleum, Ltd. | 47,504 | | 1,146,089 |
| Worley, Ltd. | 15,221 | | 163,531 |
| | | | | 45,735,953 |
| Austria — 0.2% | | |
| ANDRITZ AG | 720 | | 30,953 |
| Erste Group Bank AG* | 12,654 | | 475,312 |
| OMV AG | 5,326 | | 298,388 |
| Raiffeisen Bank International AG | 8,197 | | 205,166 |
| Verbund AG | 1,978 | | 99,266 |
| voestalpine AGΔ | 4,506 | | 124,977 |
| | | | | 1,234,062 |
| Belgium — 0.8% | | |
| Ageas | 8,844 | | 522,602 |
| Colruyt SA | 5,111 | | 266,470 |
| Galapagos NV* | 1,973 | | 412,746 |
| Groupe Bruxelles Lambert SA | 12,096 | | 1,274,857 |
| KBC Group NV | 10,166 | | 764,699 |
| Proximus SADPΔ | 7,723 | | 221,077 |
| Solvay SA | 4,910 | | 568,930 |
| Telenet Group Holding NV | 6,213 | | 279,183 |
| UCB SA | 10,836 | | 861,771 |
| Umicore SAΔ | 9,507 | | 462,391 |
| | | | | 5,634,726 |
| Denmark — 1.4% | | |
| AP Moeller - Maersk A/S Class A | 439 | | 595,056 |
| AP Moeller - Maersk A/S Class B | 60 | | 86,535 |
| Chr. Hansen Holding A/S | 5,914 | | 469,970 |
| Coloplast A/S Class B | 9,585 | | 1,189,125 |
| Danske Bank A/S | 33,495 | | 541,892 |
| Demant A/S* | 13,113 | | 412,965 |
| DSV Panalpina A/S | 12,504 | | 1,441,127 |
| Genmab A/S* | 5,898 | | 1,311,736 |
| H Lundbeck A/S | 7,592 | | 290,246 |
| ISS A/S | 7,886 | | 189,223 |
| Novozymes A/S, B Shares | 12,803 | | 626,519 |
| Orsted A/S 144A | 13,824 | | 1,429,744 |
| Pandora A/S | 7,048 | | 306,598 |
| Tryg A/S | 14,443 | | 428,183 |
| Vestas Wind Systems A/S | 9,047 | | 913,806 |
| | | | | 10,232,725 |
| Finland — 1.0% | | |
| Elisa OYJ | 7,229 | | 399,357 |
| Fortum OYJ | 22,487 | | 555,057 |
| Kone OYJ Class B | 13,131 | | 858,608 |
See Notes to Financial Statements.
| | | Shares | | Value |
| Metso OYJΔ | 1,554 | | $61,391 |
| Neste OYJ | 18,222 | | 634,037 |
| Nokia OYJ | 282,487 | | 1,044,883 |
| Nokian Renkaat OYJ | 5,395 | | 155,170 |
| Nordea Bank Abp | 1,819 | | 14,783 |
| Nordea Bank Abp (Stockholm Exchange) | 123,780 | | 1,001,403 |
| Orion OYJ Class B | 7,634 | | 353,543 |
| Sampo OYJ, A Shares | 18,199 | | 794,625 |
| Stora Enso OYJ, R SharesΔ | 18,200 | | 264,824 |
| UPM-Kymmene OYJ | 19,161 | | 664,781 |
| Wartsila OYJ AbpΔ | 14,669 | | 162,144 |
| | | | | 6,964,606 |
| France — 10.0% | | |
| Accor SA | 11,377 | | 532,796 |
| Aeroports de Paris | 1,224 | | 241,778 |
| Air Liquide SA | 24,987 | | 3,537,123 |
| Alstom SA | 8,266 | | 391,555 |
| Amundi SA 144A | 3,229 | | 253,176 |
| Arkema SA | 2,715 | | 288,401 |
| Atos SE | 4,922 | | 410,321 |
| AXA SA | 101,488 | | 2,858,500 |
| BioMerieux | 2,764 | | 246,015 |
| BNP Paribas SA | 52,676 | | 3,121,549 |
| Bollore SA* | 311 | | 1,324 |
| Bollore SA (Euronext Paris Exchange) | 53,565 | | 233,726 |
| Bouygues SA | 11,283 | | 479,415 |
| Bureau Veritas SA | 15,449 | | 403,076 |
| Capgemini SE | 7,893 | | 964,155 |
| Carrefour SA | 29,040 | | 486,984 |
| Casino Guichard Perrachon SAΔ | 2,250 | | 105,243 |
| Cie de St-Gobain | 30,007 | | 1,228,548 |
| Cie Generale des Etablissements Michelin SCA | 7,665 | | 938,023 |
| CNP Assurances | 6,718 | | 133,606 |
| Covivio REIT | 2,833 | | 321,591 |
| Credit Agricole SA | 47,205 | | 684,377 |
| Danone SA | 35,410 | | 2,935,264 |
| Dassault Aviation SA | 92 | | 120,740 |
| Dassault Systemes SA | 7,719 | | 1,268,889 |
| Edenred | 9,445 | | 488,404 |
| Eiffage SA | 4,139 | | 473,557 |
| Electricite de France SA | 30,955 | | 344,722 |
| Engie SA | 112,687 | | 1,820,175 |
| EssilorLuxottica SA | 13,851 | | 2,109,879 |
| Eurazeo SE | 3,083 | | 210,950 |
| Eurofins Scientific SE Millicom International Cellular SA SDRΔ | 602 | | 333,715 |
| Eutelsat Communications SA | 8,399 | | 136,513 |
| Faurecia SE | 3,831 | | 206,396 |
| Gecina SA REIT | 2,894 | | 518,094 |
| Getlink SE | 19,820 | | 344,820 |
| Hermes International | 2,906 | | 2,171,586 |
| ICADE REIT | 2,606 | | 283,692 |
| Iliad SAΔ | 1,822 | | 236,154 |
| Ingenico Group | 2,895 | | 314,341 |
| | | Shares | | Value |
| Ipsen SA | 3,144 | | $278,603 |
| JCDecaux SAΔ | 3,731 | | 115,006 |
| Kering SA | 3,903 | | 2,562,003 |
| Klepierre REIT | 14,221 | | 539,965 |
| L’Oreal SA | 13,292 | | 3,936,144 |
| Legrand SA | 12,486 | | 1,017,363 |
| Natixis SA | 54,091 | | 240,147 |
| Orange SA | 111,352 | | 1,638,735 |
| Peugeot SA | 23,149 | | 553,081 |
| Publicis Groupe SA | 10,125 | | 458,377 |
| Renault SA | 7,966 | | 376,898 |
| Safran SA | 15,415 | | 2,380,107 |
| Sanofi | 55,646 | | 5,593,912 |
| Sartorius Stedim Biotech | 1,344 | | 222,667 |
| Schneider Electric SE | 28,797 | | 2,955,596 |
| SCOR SE | 5,564 | | 233,543 |
| SEB SAΔ | 1,701 | | 252,621 |
| SES SA | 12,769 | | 179,037 |
| Societe Generale SA | 34,476 | | 1,199,404 |
| Sodexo SAΔ | 5,941 | | 704,054 |
| Suez | 19,394 | | 293,356 |
| Teleperformance | 2,595 | | 632,810 |
| Thales SA | 3,928 | | 407,647 |
| TOTAL SA | 112,866 | | 6,228,809 |
| Ubisoft Entertainment SA* | 2,676 | | 184,843 |
| Valeo SA | 12,169 | | 428,745 |
| Veolia Environnement SA | 34,427 | | 915,604 |
| Vinci SA | 26,567 | | 2,950,220 |
| Vivendi SA | 46,091 | | 1,334,901 |
| Wendel SA | 1,720 | | 228,625 |
| Worldline SA 144A* | 3,482 | | 246,649 |
| | | | | 71,468,645 |
| Germany — 7.5% | | |
| adidas AG | 9,299 | | 3,022,814 |
| Allianz SE | 20,895 | | 5,119,856 |
| Aroundtown SA | 39,782 | | 357,313 |
| BASF SE | 42,548 | | 3,205,423 |
| Bayerische Motoren Werke AG | 20,141 | | 1,649,663 |
| Beiersdorf AG | 5,172 | | 618,723 |
| Brenntag AG | 4,261 | | 231,188 |
| Carl Zeiss Meditec AG | 3,097 | | 393,720 |
| Commerzbank AG | 39,511 | | 244,021 |
| Continental AG | 4,845 | | 626,121 |
| Covestro AG 144A | 8,920 | | 415,049 |
| Daimler AG | 42,316 | | 2,339,411 |
| Delivery Hero SE 144A* | 3,335 | | 264,330 |
| Deutsche Bank AG | 81,719 | | 633,201 |
| Deutsche Boerse AG | 9,353 | | 1,466,669 |
| Deutsche Lufthansa AG | 9,868 | | 181,641 |
| Deutsche Post AG | 46,342 | | 1,762,117 |
| Deutsche Telekom AG | 165,905 | | 2,711,250 |
| Deutsche Wohnen SE | 13,751 | | 559,347 |
| E.ON SE | 142,291 | | 1,520,647 |
| Evonik Industries AG | 4,379 | | 133,745 |
| Fraport AG Frankfurt Airport ServicesWorldwide | 2,669 | | 226,558 |
See Notes to Financial Statements.
INTERNATIONAL EQUITY INDEX FUND
SCHEDULE OF INVESTMENTS (Continued)
| | | Shares | | Value |
| Fresenius Medical Care AG & Co. KGaA | 9,321 | | $686,285 |
| Fresenius SE & Co. KGaA | 18,260 | | 1,027,554 |
| GEA Group AG | 7,555 | | 249,827 |
| Hannover Rueck SE | 3,483 | | 671,574 |
| HeidelbergCement AG | 7,836 | | 569,402 |
| Henkel AG & Co. KGaA | 5,645 | | 530,588 |
| HOCHTIEF AG | 586 | | 74,607 |
| Infineon Technologies AG | 55,751 | | 1,259,658 |
| KION Group AG | 3,162 | | 217,442 |
| Knorr-Bremse AG | 2,858 | | 290,928 |
| LANXESS AG | 3,845 | | 258,166 |
| METRO AG | 14,082 | | 226,596 |
| MTU Aero Engines AG | 1,893 | | 539,364 |
| Muenchener Rueckversicherungs-Gesellschaft AG | 6,484 | | 1,913,383 |
| Puma SE | 3,890 | | 298,293 |
| RWE AG | 24,199 | | 741,506 |
| SAP SE | 46,559 | | 6,266,761 |
| Siemens AG | 36,496 | | 4,766,070 |
| Siemens Healthineers AG 144A | 9,703 | | 465,133 |
| Symrise AG | 6,729 | | 707,278 |
| Telefonica Deutschland Holding AG | 56,298 | | 163,178 |
| thyssenkrupp AG | 21,536 | | 289,382 |
| TUI AG | 23,283 | | 294,158 |
| Uniper SE | 8,857 | | 292,738 |
| United Internet AG | 5,566 | | 182,282 |
| Volkswagen AG | 1,484 | | 287,429 |
| Vonovia SE | 26,657 | | 1,431,731 |
| Wirecard AG | 5,045 | | 608,340 |
| Zalando SE 144A* | 5,038 | | 254,067 |
| | | | | 53,246,527 |
| Hong Kong — 3.2% | | |
| AIA Group, Ltd. | 577,800 | | 6,065,480 |
| ASM Pacific Technology, Ltd. | 23,700 | | 328,782 |
| Bank of East Asia, Ltd. (The) | 70,050 | | 156,420 |
| BOC Hong Kong Holdings, Ltd. | 154,000 | | 534,592 |
| CK Asset Holdings, Ltd. | 142,500 | | 1,028,660 |
| CK Hutchison Holdings, Ltd. | 149,000 | | 1,420,723 |
| CK Infrastructure Holdings, Ltd. | 35,000 | | 249,060 |
| CLP Holdings, Ltd. | 91,000 | | 956,444 |
| Hang Lung Properties, Ltd. | 117,000 | | 256,753 |
| Hang Seng Bank, Ltd. | 44,300 | | 915,301 |
| Henderson Land Development Co., Ltd. | 105,275 | | 516,763 |
| HK Electric Investments & HK Electric Investments, Ltd. | 86,500 | | 85,253 |
| HKT Trust & HKT, Ltd. | 253,000 | | 356,498 |
| Hong Kong & China Gas Co., Ltd. | 453,929 | | 886,619 |
| Hong Kong Exchanges and Clearing, Ltd. | 63,422 | | 2,059,182 |
| Kerry Properties, Ltd. | 66,000 | | 209,630 |
| Link REIT | 91,500 | | 968,745 |
| MTR Corporation, Ltd. | 109,227 | | 645,497 |
| New World Development Co., Ltd. | 409,867 | | 561,757 |
| NWS Holdings, Ltd. | 21,399 | | 29,988 |
| | | Shares | | Value |
| PCCW, Ltd. | 102,000 | | $60,344 |
| Power Assets Holdings, Ltd. | 77,000 | | 563,248 |
| Sino Land Co., Ltd. | 166,604 | | 242,028 |
| Sun Hung Kai Properties, Ltd. | 71,500 | | 1,094,664 |
| Swire Pacific, Ltd. Class A | 22,500 | | 209,053 |
| Swire Properties, Ltd. | 63,800 | | 211,649 |
| Techtronic Industries Co., Ltd. | 56,000 | | 456,707 |
| Vitasoy International Holdings, Ltd.Δ | 58,000 | | 210,272 |
| WH Group, Ltd. 144A | 557,000 | | 575,421 |
| Wharf Real Estate Investment Co., Ltd. | 42,000 | | 256,291 |
| Wheelock & Co., Ltd. | 75,000 | | 500,013 |
| Yue Yuen Industrial Holdings, Ltd. | 84,000 | | 247,937 |
| | | | | 22,859,774 |
| Ireland — 0.6% | | |
| AIB Group PLC | 35,314 | | 123,034 |
| Bank of Ireland Group PLC | 40,646 | | 222,583 |
| CRH PLC | 45,968 | | 1,839,228 |
| DCC PLC | 3,336 | | 289,171 |
| James Hardie Industries PLC CDI | 16,895 | | 330,429 |
| Kerry Group PLC Class A | 9,365 | | 1,167,074 |
| Kingspan Group PLC | 5,720 | | 349,358 |
| Smurfit Kappa Group PLC | 9,229 | | 354,665 |
| | | | | 4,675,542 |
| Israel — 0.5% | | |
| Azrieli Group, Ltd. | 1,239 | | 90,594 |
| Bank Hapoalim BM | 48,532 | | 402,641 |
| Bank Leumi Le-Israel BM | 65,831 | | 479,249 |
| Check Point Software Technologies, Ltd.* | 5,794 | | 642,902 |
| CyberArk Software, Ltd.* | 1,717 | | 200,168 |
| Elbit Systems, Ltd. | 512 | | 79,707 |
| Israel Chemicals, Ltd. | 44,785 | | 210,742 |
| Israel Discount Bank, Ltd. Class A | 52,953 | | 245,498 |
| Nice, Ltd.* | 2,756 | | 427,450 |
| Teva Pharmaceutical Industries, Ltd. ADRΔ* | 47,260 | | 463,148 |
| Wix.com, Ltd.* | 1,160 | | 141,961 |
| | | | | 3,384,060 |
| Italy — 1.9% | | |
| Assicurazioni Generali SpA | 36,421 | | 751,904 |
| Atlantia SpAΔ | 20,348 | | 474,900 |
| Enel SpA | 358,493 | | 2,847,806 |
| Eni SpA | 121,501 | | 1,887,060 |
| FinecoBank Banca Fineco SpA | 27,715 | | 332,464 |
| Intesa Sanpaolo SpA | 710,538 | | 1,871,693 |
| Leonardo SpA | 20,334 | | 238,464 |
| Mediobanca Banca di Credito Finanziario SpA | 21,353 | | 235,108 |
| Moncler SpA | 14,899 | | 670,566 |
| Pirelli & C SpA 144AΔ | 23,808 | | 137,412 |
| Poste Italiane SpA 144A | 25,999 | | 295,424 |
| Prysmian SpA | 8,844 | | 213,487 |
| Recordati SpA | 8,616 | | 363,205 |
| Snam SpA | 106,584 | | 560,398 |
See Notes to Financial Statements.
| | | Shares | | Value |
| Telecom Italia SpA* | 77,209 | | $48,218 |
| Telecom Italia SpA (Borsa Italiana Exchange) | 635,892 | | 389,432 |
| Tenaris SAΔ | 20,917 | | 236,988 |
| Terna Rete Elettrica Nazionale SpA | 90,920 | | 608,065 |
| UniCredit SpA | 78,683 | | 1,150,107 |
| | | | | 13,312,701 |
| Japan — 23.1% | | |
| ABC-Mart, Inc. | 100 | | 6,826 |
| Acom Co., Ltd. | 3,200 | | 14,519 |
| Advantest Corporation | 10,700 | | 603,460 |
| Aeon Co., Ltd. | 41,800 | | 862,601 |
| AEON Financial Service Co., Ltd. | 800 | | 12,605 |
| Aeon Mall Co., Ltd. | 900 | | 15,964 |
| AGC, Inc. | 7,200 | | 257,457 |
| Aisin Seiki Co., Ltd. | 5,800 | | 214,830 |
| Ajinomoto Co., Inc. | 31,600 | | 526,055 |
| Alfresa Holdings Corporation | 4,500 | | 91,418 |
| Alps Alpine Co., Ltd. | 9,400 | | 213,374 |
| Amada Holdings Co., Ltd. | 8,700 | | 98,952 |
| ANA Holdings, Inc. | 7,400 | | 247,038 |
| Aozora Bank, Ltd. | 500 | | 13,209 |
| Asahi Intecc Co., Ltd. | 7,400 | | 216,681 |
| Asahi Kasei Corporation | 46,300 | | 519,876 |
| Astellas Pharma, Inc. | 106,900 | | 1,824,782 |
| Bandai Namco Holdings, Inc. | 8,000 | | 486,658 |
| Bank of Kyoto, Ltd. (The)Δ | 600 | | 25,585 |
| Benesse Holdings, Inc. | 7,600 | | 199,764 |
| Bridgestone Corporation | 25,700 | | 954,758 |
| Brother Industries, Ltd. | 11,600 | | 239,578 |
| Calbee, Inc. | 7,900 | | 257,392 |
| Canon, Inc.Δ | 61,400 | | 1,680,425 |
| Casio Computer Co., Ltd. | 2,100 | | 41,965 |
| Central Japan Railway Co. | 7,400 | | 1,487,909 |
| Chiba Bank, Ltd. (The) | 40,000 | | 229,998 |
| Chubu Electric Power Co., Inc. | 38,800 | | 548,471 |
| Chugai Pharmaceutical Co., Ltd. | 14,500 | | 1,335,381 |
| Chugoku Electric Power Co., Inc. (The) | 3,100 | | 40,750 |
| Coca-Cola Bottlers Japan Holdings, Inc. | 17,900 | | 457,350 |
| Concordia Financial Group, Ltd. | 55,000 | | 225,868 |
| Credit Saison Co., Ltd. | 2,000 | | 34,688 |
| CyberAgent, Inc.Δ | 5,700 | | 198,564 |
| Dai Nippon Printing Co., Ltd. | 10,500 | | 283,999 |
| Daicel Corporation | 3,100 | | 29,637 |
| Daifuku Co., Ltd.Δ | 5,500 | | 332,392 |
| Dai-ichi Life Holdings, Inc. | 44,700 | | 736,669 |
| Daiichi Sankyo Co., Ltd. | 25,000 | | 1,651,107 |
| Daikin Industries, Ltd. | 11,800 | | 1,664,860 |
| Daito Trust Construction Co., Ltd. | 3,500 | | 432,517 |
| Daiwa House Industry Co., Ltd. | 24,600 | | 761,539 |
| Daiwa House REIT Investment Corporation | 101 | | 264,098 |
| Daiwa Securities Group, Inc. | 49,000 | | 247,372 |
| Denso Corporation | 23,900 | | 1,079,380 |
| Dentsu, Inc. | 10,700 | | 368,678 |
| Disco Corporation | 1,500 | | 352,238 |
| | | Shares | | Value |
| East Japan Railway Co. | 13,000 | | $1,173,406 |
| Eisai Co., Ltd. | 11,100 | | 830,569 |
| Electric Power Development Co., Ltd. | 8,700 | | 211,171 |
| FamilyMart Co., Ltd. | 15,400 | | 368,825 |
| FANUC Corporation | 9,700 | | 1,791,250 |
| Fast Retailing Co., Ltd. | 2,900 | | 1,722,815 |
| Fuji Electric Co., Ltd. | 2,700 | | 82,019 |
| FUJIFILM Holdings Corporation | 16,000 | | 764,094 |
| Fujitsu, Ltd. | 8,700 | | 818,286 |
| Fukuoka Financial Group, Inc. | 5,700 | | 108,905 |
| GMO Payment Gateway, Inc.Δ | 4,000 | | 273,925 |
| Hakuhodo DY Holdings, Inc. | 5,300 | | 85,282 |
| Hamamatsu Photonics KK | 1,200 | | 49,177 |
| Hankyu Hanshin Holdings, Inc. | 13,100 | | 560,361 |
| Hikari Tsushin, Inc. | 1,200 | | 301,558 |
| Hino Motors, Ltd. | 2,100 | | 22,209 |
| Hirose Electric Co., Ltd. | 605 | | 77,338 |
| Hisamitsu Pharmaceutical Co., Inc. | 3,300 | | 160,715 |
| Hitachi Chemical Co., Ltd. | 1,200 | | 50,275 |
| Hitachi Construction Machinery Co., Ltd. | 7,500 | | 223,405 |
| Hitachi High-Technologies Corporation | 600 | | 42,492 |
| Hitachi Metals, Ltd. | 2,000 | | 29,439 |
| Hitachi, Ltd. | 45,600 | | 1,924,126 |
| Honda Motor Co., Ltd. | 77,400 | | 2,190,539 |
| Hoshizaki Corporation | 2,100 | | 187,236 |
| Hoya Corporation | 18,800 | | 1,794,686 |
| Hulic Co., Ltd. | 26,200 | | 315,453 |
| Idemitsu Kosan Co., Ltd. | 8,736 | | 241,391 |
| IHI CorporationΔ | 3,400 | | 79,563 |
| Iida Group Holdings Co., Ltd. | 2,500 | | 43,814 |
| Inpex Corporation | 43,600 | | 451,684 |
| Isetan Mitsukoshi Holdings, Ltd. | 12,100 | | 108,655 |
| Isuzu Motors, Ltd. | 18,100 | | 213,956 |
| ITOCHU Corporation | 54,100 | | 1,253,859 |
| J. Front Retailing Co., Ltd.Δ | 17,300 | | 241,288 |
| Japan Airlines Co., Ltd. | 6,100 | | 189,929 |
| Japan Airport Terminal Co., Ltd.Δ | 400 | | 22,194 |
| Japan Exchange Group, Inc. | 17,100 | | 301,047 |
| Japan Post Holdings Co., Ltd. | 91,500 | | 860,508 |
| Japan Prime Realty Investment Corporation REIT | 9 | | 39,572 |
| Japan Real Estate Investment Corporation REIT | 46 | | 305,279 |
| Japan Retail Fund Investment Corporation REIT | 40 | | 86,076 |
| JFE Holdings, Inc. | 23,900 | | 306,671 |
| JGC Holdings CorporationΔ | 11,500 | | 183,034 |
| JSR Corporation | 2,200 | | 40,244 |
| JTEKT Corporation | 2,600 | | 30,714 |
| JXTG Holdings, Inc. | 137,150 | | 622,466 |
| Kajima Corporation | 17,500 | | 232,666 |
| Kakaku.com, Inc. | 3,900 | | 99,579 |
| Kansai Electric Power Co., Inc. (The) | 34,300 | | 397,359 |
| Kansai Paint Co., Ltd.Δ | 12,800 | | 312,693 |
| Kao Corporation | 24,200 | | 1,995,897 |
| KDDI Corporation | 81,200 | | 2,422,713 |
See Notes to Financial Statements.
INTERNATIONAL EQUITY INDEX FUND
SCHEDULE OF INVESTMENTS (Continued)
| | | Shares | | Value |
| Keihan Holdings Co., Ltd. | 400 | | $19,423 |
| Keikyu Corporation | 14,200 | | 273,761 |
| Keio Corporation | 1,400 | | 84,713 |
| Keisei Electric Railway Co., Ltd. | 1,500 | | 58,124 |
| Keyence Corporation | 8,800 | | 3,090,019 |
| Kikkoman Corporation | 13,800 | | 675,576 |
| Kintetsu Group Holdings Co., Ltd. | 5,900 | | 320,015 |
| Kobayashi Pharmaceutical Co., Ltd. | 2,300 | | 194,813 |
| Koito Manufacturing Co., Ltd. | 4,300 | | 199,116 |
| Komatsu, Ltd. | 50,300 | | 1,207,273 |
| Konami Holdings Corporation | 5,500 | | 226,009 |
| Konica Minolta, Inc. | 23,900 | | 155,687 |
| Kose CorporationΔ | 1,400 | | 204,070 |
| Kubota Corporation | 59,800 | | 939,054 |
| Kuraray Co., Ltd. | 7,300 | | 88,460 |
| KuritaWater Industries, Ltd. | 900 | | 26,707 |
| Kyocera Corporation | 12,500 | | 851,946 |
| Kyowa Kirin Co., Ltd. | 29,300 | | 690,319 |
| Kyushu Electric Power Co., Inc. | 24,000 | | 208,224 |
| Kyushu Railway Co. | 11,000 | | 368,254 |
| Lawson, Inc.Δ | 3,900 | | 221,374 |
| LINE Corporation* | 5,200 | | 255,488 |
| Lion Corporation | 11,600 | | 225,489 |
| LIXIL Group Corporation | 11,900 | | 205,357 |
| M3, Inc. | 17,400 | | 524,708 |
| Makita Corporation | 7,900 | | 272,826 |
| Marubeni Corporation | 64,200 | | 474,334 |
| Marui Group Co., Ltd. | 6,200 | | 151,172 |
| Maruichi Steel Tube, Ltd. | 400 | | 11,241 |
| Mazda Motor Corporation | 20,700 | | 176,394 |
| McDonald’s Holdings Co. Japan, Ltd.Δ | 5,400 | | 260,165 |
| Medipal Holdings Corporation | 4,500 | | 99,317 |
| MEIJI Holdings Co., Ltd. | 8,000 | | 540,642 |
| MINEBEA MITSUMI, Inc. | 13,700 | | 282,989 |
| MISUMI Group, Inc.Δ | 9,900 | | 245,026 |
| Mitsubishi Chemical Holdings Corporation | 60,200 | | 448,561 |
| Mitsubishi Corporation | 63,100 | | 1,671,605 |
| Mitsubishi Electric Corporation | 91,900 | | 1,251,282 |
| Mitsubishi Estate Co., Ltd. | 48,200 | | 922,301 |
| Mitsubishi Gas Chemical Co., Inc. | 5,500 | | 83,788 |
| Mitsubishi Heavy Industries, Ltd. | 13,700 | | 531,243 |
| Mitsubishi Materials Corporation | 3,100 | | 84,133 |
| Mitsubishi Motors Corporation | 37,400 | | 155,893 |
| Mitsubishi Tanabe Pharma Corporation | 19,400 | | 355,895 |
| Mitsubishi UFJ Financial Group, Inc. | 578,600 | | 3,128,106 |
| Mitsubishi UFJ Lease & Finance Co., Ltd. | 38,900 | | 250,426 |
| Mitsui & Co., Ltd. | 64,700 | | 1,150,077 |
| Mitsui Chemicals, Inc. | 9,400 | | 228,978 |
| Mitsui Fudosan Co., Ltd. | 49,800 | | 1,217,108 |
| Mizuho Financial Group, Inc. | 1,187,900 | | 1,829,865 |
| MonotaRO Co., Ltd. | 4,000 | | 106,484 |
| MS&AD Insurance Group Holdings, Inc. | 18,400 | | 607,360 |
| Murata Manufacturing Co., Ltd. | 27,700 | | 1,704,896 |
| Nagoya Railroad Co., Ltd. | 1,600 | | 49,685 |
| | | Shares | | Value |
| NEC Corporation | 10,400 | | $430,398 |
| Nexon Co., Ltd.* | 18,700 | | 248,061 |
| NGK Insulators, Ltd. | 11,900 | | 207,013 |
| NGK Spark Plug Co., Ltd. | 4,500 | | 87,228 |
| NH Foods, Ltd. | 6,500 | | 269,252 |
| Nidec Corporation | 10,400 | | 1,420,472 |
| Nikon Corporation | 13,200 | | 161,431 |
| Nintendo Co., Ltd. | 5,500 | | 2,199,781 |
| Nippon Building Fund, Inc. REIT | 44 | | 322,531 |
| Nippon Express Co., Ltd. | 4,000 | | 234,476 |
| Nippon Paint Holdings Co., Ltd.Δ | 7,300 | | 375,816 |
| Nippon Prologis REIT, Inc. | 121 | | 308,176 |
| Nippon Steel Corporation | 31,000 | | 467,261 |
| Nippon Telegraph & Telephone Corporation | 57,600 | | 1,455,765 |
| Nissan Chemical Corporation | 5,900 | | 247,079 |
| Nissan Motor Co., Ltd. | 88,200 | | 511,096 |
| Nisshin Seifun Group, Inc. | 15,300 | | 266,946 |
| Nissin Foods Holdings Co., Ltd. | 4,300 | | 319,373 |
| Nitori Holdings Co., Ltd. | 3,500 | | 552,480 |
| Nitto Denko Corporation | 7,100 | | 399,217 |
| Nomura Holdings, Inc. | 160,800 | | 827,443 |
| Nomura Real Estate Master Fund, Inc. REIT | 184 | | 314,738 |
| Nomura Research Institute, Ltd. | 17,157 | | 366,920 |
| NSK, Ltd. | 22,800 | | 215,533 |
| NTT Data Corporation | 29,300 | | 391,858 |
| NTT DOCOMO, Inc. | 60,100 | | 1,674,154 |
| Obayashi Corporation | 26,400 | | 293,216 |
| Obic Co., Ltd. | 2,600 | | 350,222 |
| Odakyu Electric Railway Co., Ltd. | 9,000 | | 209,961 |
| Oji Holdings Corporation | 31,000 | | 167,648 |
| Olympus Corporation | 54,000 | | 832,286 |
| Omron Corporation | 12,000 | | 699,458 |
| Ono Pharmaceutical Co., Ltd. | 29,800 | | 680,343 |
| Oracle Corporation | 700 | | 63,531 |
| Oriental Land Co., Ltd. | 8,900 | | 1,214,328 |
| ORIX Corporation | 76,900 | | 1,274,338 |
| Orix JREIT, Inc. | 119 | | 257,938 |
| Osaka Gas Co., Ltd. | 14,000 | | 267,725 |
| Otsuka Corporation | 6,900 | | 275,551 |
| Otsuka Holdings Co., Ltd. | 22,100 | | 985,091 |
| Pan Pacific International Holdings Corporation | 18,400 | | 305,280 |
| Panasonic Corporation | 112,600 | | 1,056,097 |
| Park24 Co., Ltd. | 7,600 | | 186,094 |
| PeptiDream, Inc.* | 5,900 | | 301,510 |
| Persol Holdings Co., Ltd. | 9,400 | | 176,167 |
| Pigeon CorporationΔ | 6,500 | | 238,005 |
| Pola Orbis Holdings, Inc.Δ | 7,300 | | 173,879 |
| Rakuten, Inc.Δ | 35,400 | | 302,429 |
| Recruit Holdings Co., Ltd. | 54,000 | | 2,022,589 |
| Renesas Electronics Corporation* | 45,200 | | 308,804 |
| Resona Holdings, Inc. | 92,600 | | 403,600 |
| Ricoh Co., Ltd. | 24,800 | | 269,861 |
| Rinnai CorporationΔ | 2,600 | | 203,188 |
| Rohm Co., Ltd. | 3,100 | | 247,346 |
| Ryohin Keikaku Co., Ltd. | 11,000 | | 256,370 |
See Notes to Financial Statements.
| | | Shares | | Value |
| Santen Pharmaceutical Co., Ltd. | 34,300 | | $653,180 |
| SBI Holdings, Inc. | 9,400 | | 198,455 |
| Secom Co., Ltd. | 11,500 | | 1,026,292 |
| Seibu Holdings, Inc. | 13,200 | | 217,136 |
| Seiko Epson Corporation | 17,200 | | 259,700 |
| Sekisui Chemical Co., Ltd. | 16,800 | | 291,478 |
| Sekisui House, Ltd. | 31,600 | | 674,813 |
| Seven & i Holdings Co., Ltd. | 40,100 | | 1,469,883 |
| Seven Bank, Ltd.Δ | 4,800 | | 15,725 |
| Sharp CorporationΔ | 9,500 | | 145,184 |
| Shimadzu Corporation | 15,100 | | 472,225 |
| Shimamura Co., Ltd. | 200 | | 15,205 |
| Shimano, Inc.Δ | 3,200 | | 519,139 |
| Shimizu Corporation | 26,800 | | 273,007 |
| Shin-Etsu Chemical Co., Ltd. | 17,900 | | 1,968,519 |
| Shinsei Bank, Ltd. | 400 | | 6,103 |
| Shionogi & Co., Ltd. | 19,000 | | 1,175,369 |
| Shiseido Co., Ltd. | 19,000 | | 1,349,190 |
| Shizuoka Bank, Ltd. (The) | 5,000 | | 37,191 |
| Showa Denko KK | 5,600 | | 147,591 |
| SMC Corporation | 3,000 | | 1,371,946 |
| Softbank Corporation | 70,500 | | 945,382 |
| SoftBank Group Corporation | 78,300 | | 3,399,555 |
| Sohgo Security Services Co., Ltd. | 600 | | 32,475 |
| Sompo Holdings, Inc. | 13,600 | | 534,067 |
| Sony Corporation | 58,100 | | 3,944,857 |
| Sony Financial Holdings, Inc. | 4,600 | | 110,422 |
| Square Enix Holdings Co., Ltd. | 4,200 | | 209,134 |
| Stanley Electric Co., Ltd. | 7,300 | | 210,833 |
| Subaru Corporation | 21,900 | | 542,459 |
| SUMCO Corporation | 14,200 | | 235,277 |
| Sumitomo Chemical Co., Ltd. | 51,000 | | 231,569 |
| Sumitomo Corporation | 45,500 | | 675,827 |
| Sumitomo Dainippon Pharma Co., Ltd. | 12,500 | | 242,189 |
| Sumitomo Electric Industries, Ltd. | 34,000 | | 510,617 |
| Sumitomo Heavy Industries, Ltd. | 9,500 | | 269,846 |
| Sumitomo Metal Mining Co., Ltd. | 9,900 | | 318,780 |
| Sumitomo Mitsui Financial Group, Inc. | 59,100 | | 2,182,880 |
| Sumitomo Mitsui Trust Holdings, Inc. | 13,800 | | 545,527 |
| Sumitomo Realty & Development Co., Ltd. | 18,000 | | 628,011 |
| Sumitomo Rubber Industries, Ltd. | 15,700 | | 191,442 |
| Sundrug Co., Ltd. | 6,600 | | 238,801 |
| Suntory Beverage & Food, Ltd. | 17,700 | | 738,951 |
| Suzuken Co., Ltd. | 1,900 | | 77,440 |
| Suzuki Motor Corporation | 13,600 | | 567,691 |
| Sysmex Corporation | 7,300 | | 497,020 |
| T&D Holdings, Inc. | 22,500 | | 284,528 |
| Taiheiyo Cement Corporation | 7,100 | | 208,407 |
| Taisei Corporation | 11,000 | | 455,632 |
| Taisho Pharmaceutical Holdings Co., Ltd. | 5,400 | | 398,494 |
| Taiyo Nippon Sanso Corporation | 1,200 | | 26,561 |
| Takeda Pharmaceutical Co., Ltd. | 71,536 | | 2,829,408 |
| TDK Corporation | 5,100 | | 573,134 |
| Teijin, Ltd. | 2,600 | | 48,574 |
| | | Shares | | Value |
| Terumo Corporation | 35,700 | | $1,266,433 |
| THK Co., Ltd. | 9,100 | | 244,319 |
| Tobu Railway Co., Ltd. | 2,000 | | 72,402 |
| Toho Co., Ltd. | 2,900 | | 120,849 |
| Toho Gas Co., Ltd.Δ | 300 | | 12,250 |
| Tohoku Electric Power Co., Inc. | 19,200 | | 190,341 |
| Tokio Marine Holdings, Inc. | 32,100 | | 1,797,241 |
| Tokyo Century Corporation | 2,400 | | 127,785 |
| Tokyo Electric Power Co. Holdings, Inc.* | 56,100 | | 240,139 |
| Tokyo Electron, Ltd. | 6,600 | | 1,440,978 |
| Tokyo Gas Co., Ltd. | 20,300 | | 493,268 |
| Tokyu Corporation | 17,400 | | 321,773 |
| Tokyu Fudosan Holdings Corporation | 34,600 | | 238,924 |
| Toppan Printing Co., Ltd. | 14,000 | | 289,215 |
| Toray Industries, Inc. | 85,700 | | 580,662 |
| Toshiba Corporation | 25,300 | | 858,726 |
| Tosoh Corporation | 16,800 | | 258,817 |
| TOTO, Ltd.Δ | 6,700 | | 282,922 |
| Toyo Seikan Group Holdings, Ltd. | 2,300 | | 39,593 |
| Toyo Suisan Kaisha, Ltd. | 4,200 | | 178,356 |
| Toyoda Gosei Co., Ltd. | 500 | | 12,485 |
| Toyota Industries Corporation | 5,300 | | 304,962 |
| Toyota Motor Corporation | 105,016 | | 7,399,586 |
| Toyota Tsusho Corporation | 7,800 | | 273,996 |
| Trend Micro, Inc. | 4,300 | | 220,030 |
| Tsuruha Holdings, Inc. | 1,900 | | 243,956 |
| Unicharm Corporation | 30,400 | | 1,026,523 |
| United Urban Investment Corporation REIT | 156 | | 292,977 |
| USS Co., Ltd. | 5,700 | | 107,749 |
| Welcia Holdings Co., Ltd.Δ | 2,300 | | 146,117 |
| West Japan Railway Co. | 7,800 | | 674,650 |
| Yakult Honsha Co., Ltd. | 11,800 | | 650,328 |
| Yamada Denki Co., Ltd. | 7,600 | | 40,326 |
| Yamaha Corporation | 5,400 | | 299,395 |
| Yamaha Motor Co., Ltd. | 10,200 | | 204,336 |
| Yamato Holdings Co., Ltd. | 10,600 | | 180,726 |
| Yamazaki Baking Co., Ltd. | 7,200 | | 128,659 |
| Yaskawa Electric Corporation | 9,000 | | 339,039 |
| Yokogawa Electric Corporation | 2,500 | | 43,903 |
| Yokohama Rubber Co., Ltd. (The) | 1,000 | | 19,395 |
| Z Holdings Corporation | 146,400 | | 618,118 |
| ZOZO, Inc. | 5,700 | | 109,012 |
| | | | | 165,119,150 |
| Jersey — 0.7% | | |
| Experian PLC | 47,391 | | 1,601,996 |
| Ferguson PLC | 9,304 | | 844,200 |
| Glencore PLC* | 516,891 | | 1,611,380 |
| WPP PLC | 54,275 | | 766,735 |
| | | | | 4,824,311 |
| Netherlands — 5.0% | | |
| ABN AMRO Bank NV CVA 144A | 19,173 | | 348,833 |
| Adyen NV 144AΔ* | 426 | | 349,304 |
| Aegon NV | 91,686 | | 418,267 |
| AerCap Holdings NV* | 7,106 | | 436,806 |
See Notes to Financial Statements.
INTERNATIONAL EQUITY INDEX FUND
SCHEDULE OF INVESTMENTS (Continued)
| | | Shares | | Value |
| Airbus SE | 28,116 | | $4,115,042 |
| Akzo Nobel NV | 11,693 | | 1,188,838 |
| ArcelorMittal | 27,312 | | 479,206 |
| ASML Holding NV | 19,990 | | 5,912,888 |
| CNH Industrial NVΔ | 43,467 | | 477,263 |
| EXOR NV | 4,203 | | 325,865 |
| Ferrari NV | 4,491 | | 745,666 |
| Fiat Chrysler Automobiles NV | 41,027 | | 608,288 |
| ING Groep NV | 190,304 | | 2,281,503 |
| Koninklijke Ahold Delhaize NV | 67,756 | | 1,694,463 |
| Koninklijke DSM NV | 9,439 | | 1,229,235 |
| Koninklijke KPN NV | 130,887 | | 386,273 |
| Koninklijke Philips NV | 48,889 | | 2,386,584 |
| Koninklijke Vopak NV | 1,980 | | 107,339 |
| NN Group NV | 13,623 | | 516,801 |
| NXP Semiconductor NV | 13,293 | | 1,691,667 |
| Prosus NV* | 22,500 | | 1,679,101 |
| QIAGEN NV* | 14,497 | | 493,961 |
| Randstad NV | 7,963 | | 486,264 |
| STMicroelectronics NV | 30,848 | | 829,415 |
| Unibail-Rodamco-Westfield REIT | 6,095 | | 961,591 |
| Unilever NV | 72,311 | | 4,155,330 |
| Wolters Kluwer NV | 17,980 | | 1,311,334 |
| | | | | 35,617,127 |
| New Zealand — 0.2% | | |
| a2 Milk Co., Ltd.* | 45,565 | | 460,729 |
| Auckland International Airport, Ltd. | 67,484 | | 397,515 |
| Fisher & Paykel Healthcare Corporation, Ltd. | 24,725 | | 369,516 |
| Fletcher Building, Ltd. | 50,457 | | 172,895 |
| Meridian Energy, Ltd. | 12,874 | | 43,334 |
| Spark New Zealand, Ltd. | 86,942 | | 253,432 |
| | | | | 1,697,421 |
| Norway — 0.7% | | |
| Aker BP ASA | 5,224 | | 171,454 |
| DNB ASA | 42,506 | | 795,411 |
| Equinor ASA | 57,972 | | 1,156,094 |
| Gjensidige Forsikring ASA | 19,578 | | 410,960 |
| Mowi ASA | 26,051 | | 677,350 |
| Norsk Hydro ASA | 56,215 | | 209,042 |
| Orkla ASA | 60,619 | | 614,726 |
| Schibsted ASA, B Shares | 3,001 | | 85,760 |
| Telenor ASA | 35,082 | | 628,869 |
| Yara International ASA | 5,948 | | 247,816 |
| | | | | 4,997,482 |
| Papua New Guinea — 0.0% | | |
| Oil Search, Ltd. | 54,263 | | 276,073 |
| Portugal — 0.2% | | |
| EDP - Energias de Portugal SA | 129,216 | | 560,054 |
| Galp Energia SGPS SA | 27,004 | | 451,327 |
| Jeronimo Martins SGPS SA | 14,871 | | 244,624 |
| | | | | 1,256,005 |
| Singapore — 1.3% | | |
| Ascendas REIT | 144,607 | | 319,330 |
| | | Shares | | Value |
| CapitaLand Commercial Trust REIT | 41,879 | | $61,965 |
| CapitaLand Mall Trust REIT | 117,500 | | 214,915 |
| CapitaLand, Ltd. | 199,700 | | 556,805 |
| City Developments, Ltd.Δ | 37,300 | | 303,680 |
| ComfortDelGro Corporation, Ltd. | 29,600 | | 52,380 |
| Dairy Farm International Holdings, Ltd. | 17,300 | | 98,783 |
| DBS Group Holdings, Ltd. | 87,612 | | 1,685,861 |
| Hongkong Land Holdings, Ltd. | 42,500 | | 244,375 |
| Jardine Cycle & Carriage, Ltd. | 8,811 | | 197,190 |
| Jardine Matheson Holdings, Ltd. | 9,200 | | 511,520 |
| Jardine Strategic Holdings, Ltd. | 7,400 | | 226,810 |
| Keppel Corporation, Ltd. | 55,600 | | 279,871 |
| Oversea-Chinese Banking Corporation, Ltd. | 132,843 | | 1,084,513 |
| SATS, Ltd. | 9,200 | | 34,612 |
| Singapore Airlines, Ltd. | 30,700 | | 206,348 |
| Singapore Exchange, Ltd. | 7,800 | | 51,383 |
| Singapore Press Holdings, Ltd. | 116,700 | | 189,157 |
| Singapore Technologies Engineering, Ltd. | 16,100 | | 47,165 |
| Singapore Telecommunications, Ltd. | 353,400 | | 885,504 |
| Suntec REIT | 26,900 | | 36,801 |
| United Overseas Bank, Ltd. | 53,959 | | 1,059,562 |
| UOL Group, Ltd. | 7,561 | | 46,773 |
| Venture Corporation, Ltd. | 10,300 | | 124,064 |
| Wilmar International, Ltd. | 188,000 | | 575,902 |
| Yangzijiang Shipbuilding Holdings, Ltd. | 88,700 | | 73,864 |
| | | | | 9,169,133 |
| Spain — 2.8% | | |
| ACS Actividades de Construccion y Servicios SA | 15,925 | | 636,819 |
| Aena SME SA 144A | 3,930 | | 751,612 |
| Amadeus IT Group SAΔ | 22,411 | | 1,830,077 |
| Banco Bilbao Vizcaya Argentaria SA | 362,375 | | 2,025,470 |
| Banco de Sabadell SAΔ | 172,285 | | 200,982 |
| Banco Santander SA | 811,780 | | 3,396,440 |
| Bankia SA | 11,453 | | 24,441 |
| Bankinter SA | 24,002 | | 175,861 |
| CaixaBank SA | 130,072 | | 408,233 |
| Cellnex Telecom SA 144AΔ* | 11,970 | | 515,184 |
| Enagas SA | 10,800 | | 275,481 |
| Endesa SAΔ | 13,556 | | 361,745 |
| Ferrovial SAΔ | 27,393 | | 828,700 |
| Grifols SAΔ | 11,220 | | 395,562 |
| Iberdrola SA | 284,970 | | 2,934,395 |
| Industria de Diseno Textil SA | 55,596 | | 1,961,286 |
| Mapfre SA | 10,729 | | 28,402 |
| Naturgy Energy Group SA | 9,739 | | 244,703 |
| Red Electrica Corporation SA | 14,624 | | 294,037 |
| Repsol SA | 77,485 | | 1,210,725 |
| Siemens Gamesa Renewable Energy SAΔ | 6,866 | | 120,414 |
| Telefonica SA | 228,227 | | 1,594,126 |
| | | | | 20,214,695 |
See Notes to Financial Statements.
| | | Shares | | Value |
| Sweden — 2.5% | | |
| Alfa Laval AB | 9,705 | | $244,413 |
| Assa Abloy AB, B Shares | 55,581 | | 1,299,231 |
| Atlas Copco AB, A Shares | 37,852 | | 1,510,888 |
| Atlas Copco AB, B Shares | 15,381 | | 534,044 |
| Boliden AB | 9,794 | | 260,116 |
| Electrolux AB, Series B | 13,970 | | 343,429 |
| Epiroc AB, A SharesΔ | 8,156 | | 99,742 |
| Epiroc AB, B Shares | 46,082 | | 547,671 |
| Essity AB, B Shares | 39,754 | | 1,280,327 |
| Hennes & Mauritz AB, B SharesΔ | 37,981 | | 774,719 |
| Hexagon AB, B Shares | 9,655 | | 541,175 |
| Husqvarna AB, B Shares | 23,565 | | 188,843 |
| ICA Gruppen AB | 5,526 | | 258,130 |
| Industrivarden AB, C Shares | 8,930 | | 215,352 |
| Investor AB, B Shares | 39,998 | | 2,183,644 |
| Kinnevik AB Class B | 8,239 | | 201,897 |
| L E Lundbergforetagen AB, B Shares | 660 | | 28,973 |
| Lundin Petroleum AB | 8,084 | | 274,488 |
| Millicom International Cellular SA SDR | 3,847 | | 184,748 |
| Sandvik AB | 46,877 | | 913,041 |
| Securitas AB, B Shares | 14,981 | | 258,111 |
| Skandinaviska Enskilda Banken AB, A Shares | 63,139 | | 593,751 |
| Skanska AB, B Shares | 13,311 | | 301,116 |
| SKF AB, B Shares | 13,321 | | 269,701 |
| Svenska Handelsbanken AB, A Shares | 65,615 | | 706,690 |
| Swedbank AB, A SharesΔ | 34,481 | | 512,594 |
| Tele2 AB, B SharesΔ | 19,177 | | 278,336 |
| Telefonaktiebolaget LM Ericsson, B Shares | 152,650 | | 1,333,828 |
| Telia Co. AB | 126,527 | | 543,627 |
| Volvo AB, B Shares | 64,570 | | 1,080,979 |
| | | | | 17,763,604 |
| Switzerland — 9.3% | | |
| ABB, Ltd. | 91,674 | | 2,211,465 |
| Adecco Group AG | 4,776 | | 301,950 |
| Alcon, Inc.* | 19,678 | | 1,114,594 |
| Baloise Holding AG | 1,016 | | 183,881 |
| Barry Callebaut AG | 138 | | 304,633 |
| Chocoladefabriken Lindt & Spruengli AG | 7 | | 618,413 |
| Chocoladefabriken Lindt & Spruengli AG (Swiss Exchange) | 120 | | 931,804 |
| Cie Financiere Richemont SA | 30,015 | | 2,345,700 |
| Clariant AG* | 5,445 | | 121,687 |
| Coca-Cola HBC AG* | 37,576 | | 1,276,682 |
| Credit Suisse Group AG* | 106,526 | | 1,439,984 |
| Dufry AG* | 1,201 | | 119,093 |
| EMS-Chemie Holding AG | 209 | | 137,404 |
| Geberit AG | 1,465 | | 822,277 |
| Givaudan SAΔ | 333 | | 1,043,287 |
| Julius Baer Group, Ltd.* | 11,052 | | 569,763 |
| Kuehne + Nagel International AG | 1,638 | | 276,276 |
| LafargeHolcim, Ltd.* | 1,494 | | 82,031 |
| LafargeHolcim, Ltd. (Swiss Exchange)* | 19,045 | | 1,056,569 |
| | | Shares | | Value |
| Lonza Group AGΔ* | 3,338 | | $1,217,727 |
| Nestle SA | 145,367 | | 15,738,198 |
| Novartis AG | 101,964 | | 9,654,931 |
| Pargesa Holding SA | 251 | | 20,853 |
| Partners Group Holding AGΔ | 623 | | 570,997 |
| Roche Holding AG | 34,391 | | 11,177,172 |
| Schindler Holding AG | 838 | | 205,220 |
| Schindler Holding AG (Swiss Exchange)Δ | 1,136 | | 288,886 |
| SGS SA | 253 | | 692,884 |
| Sika AG | 4,914 | | 922,827 |
| Sonova Holding AG | 2,427 | | 554,833 |
| Straumann Holding AGΔ | 601 | | 589,540 |
| Swatch Group AG (The) | 1,344 | | 375,252 |
| Swatch Group AG (The) (Swiss Exchange) | 15,046 | | 795,930 |
| Swiss Life Holding AG | 710 | | 356,186 |
| Swiss Prime Site AG* | 4,727 | | 546,887 |
| Swiss Re AG | 11,416 | | 1,282,502 |
| Swisscom AG | 1,391 | | 736,362 |
| Temenos AG* | 3,832 | | 606,182 |
| UBS Group AG* | 161,947 | | 2,043,672 |
| Vifor Pharma AG | 2,839 | | 518,133 |
| Zurich Insurance Group AG | 6,382 | | 2,617,894 |
| | | | | 66,470,561 |
| United Kingdom — 14.6% | | |
| 3i Group PLC | 54,344 | | 790,385 |
| Admiral Group PLC | 16,537 | | 505,784 |
| Anglo American PLC | 43,454 | | 1,250,761 |
| Antofagasta PLC | 23,560 | | 286,111 |
| Ashtead Group PLC | 21,261 | | 679,839 |
| Associated British Foods PLC | 28,326 | | 974,786 |
| AstraZeneca PLC | 63,449 | | 6,393,269 |
| Auto Trader Group PLC 144A | 48,519 | | 382,139 |
| Aviva PLC | 201,169 | | 1,115,704 |
| BAE Systems PLC | 180,364 | | 1,349,365 |
| Barclays PLC | 815,678 | | 1,940,915 |
| Barratt Developments PLC | 50,118 | | 495,640 |
| Berkeley Group Holdings PLC | 6,733 | | 433,352 |
| BHP Group PLC | 100,288 | | 2,360,328 |
| BP PLC | 921,992 | | 5,759,513 |
| British Land Co. PLC (The) REIT | 38,543 | | 326,133 |
| BT Group PLC | 453,308 | | 1,155,510 |
| Bunzl PLC | 22,304 | | 610,081 |
| Burberry Group PLC | 26,208 | | 765,468 |
| Carnival PLC | 9,106 | | 439,532 |
| Centrica PLC | 288,146 | | 340,839 |
| Coca-Cola European Partners PLC | 29,712 | | 1,511,747 |
| Compass Group PLC | 87,542 | | 2,191,609 |
| Croda International PLC | 3,881 | | 263,208 |
| Direct Line Insurance Group PLC | 64,437 | | 266,729 |
| easyJet PLC | 11,091 | | 209,275 |
| Evraz PLC | 40,533 | | 216,908 |
| G4S PLC | 106,286 | | 306,915 |
| GlaxoSmithKline PLC | 271,005 | | 6,386,134 |
| Halma PLC | 16,991 | | 476,233 |
| Hargreaves Lansdown PLC | 10,678 | | 273,688 |
See Notes to Financial Statements.
INTERNATIONAL EQUITY INDEX FUND
SCHEDULE OF INVESTMENTS (Continued)
| | | Shares | | Value |
| HSBC Holdings PLC | 951,899 | | $7,463,182 |
| Informa PLC | 61,491 | | 698,035 |
| InterContinental Hotels Group PLC | 11,091 | | 765,115 |
| Intertek Group PLC | 8,134 | | 630,512 |
| ITV PLC | 231,678 | | 463,390 |
| J Sainsbury PLC | 118,172 | | 359,864 |
| JD Sports Fashion PLC | 19,923 | | 220,990 |
| Johnson Matthey PLC | 6,759 | | 268,231 |
| Kingfisher PLC | 173,177 | | 497,777 |
| Land Securities Group PLC REIT | 42,490 | | 557,194 |
| Legal & General Group PLC | 250,445 | | 1,005,171 |
| Lloyds Banking Group PLC | 3,156,523 | | 2,613,207 |
| London Stock Exchange Group PLC | 15,493 | | 1,590,457 |
| M&G PLC* | 116,852 | | 367,143 |
| Marks & Spencer Group PLC | 94,323 | | 266,748 |
| Meggitt PLC | 30,413 | | 264,592 |
| Melrose Industries PLC | 189,229 | | 601,817 |
| Micro Focus International PLC | 13,331 | | 187,848 |
| Mondi PLC | 17,953 | | 421,510 |
| National Grid PLC | 184,211 | | 2,304,148 |
| Next PLC | 7,706 | | 716,353 |
| NMC Health PLCΔ | 2,437 | | 57,040 |
| Ocado Group PLC* | 22,804 | | 386,337 |
| Pearson PLC | 41,042 | | 346,300 |
| Persimmon PLC | 14,726 | | 525,688 |
| Prudential PLC | 116,852 | | 2,242,794 |
| Reckitt Benckiser Group PLC | 37,886 | | 3,075,765 |
| RELX PLC | 105,410 | | 2,660,575 |
| Rentokil Initial PLC | 101,023 | | 606,182 |
| Rio Tinto PLC | 55,193 | | 3,292,083 |
| Rolls-Royce Holdings PLC* | 66,226 | | 599,323 |
| Royal Bank of Scotland Group PLC | 194,604 | | 619,427 |
| Royal Dutch Shell PLC, A Shares | 195,408 | | 5,785,017 |
| Royal Dutch Shell PLC, B Shares | 177,121 | | 5,254,192 |
| RSA Insurance Group PLC | 43,200 | | 323,652 |
| Sage Group PLC (The) | 46,576 | | 462,092 |
| Schroders PLC | 6,913 | | 305,293 |
| Segro PLC REIT | 55,077 | | 654,552 |
| Severn Trent PLC | 9,681 | | 322,510 |
| Smith & Nephew PLC | 37,840 | | 918,502 |
| Smiths Group PLC | 15,525 | | 346,922 |
| Spirax-Sarco Engineering PLC | 3,375 | | 397,430 |
| SSE PLC | 72,386 | | 1,379,270 |
| St. James’s Place PLC | 18,780 | | 289,681 |
| Standard Chartered PLC | 118,779 | | 1,120,852 |
| Standard Life Aberdeen PLC | 114,480 | | 497,532 |
| Taylor Wimpey PLC | 203,676 | | 521,772 |
| Tesco PLC | 462,243 | | 1,562,557 |
| Unilever PLC | 57,888 | | 3,335,896 |
| | | Shares | | Value |
| United Utilities Group PLC | 27,605 | | $344,960 |
| Vodafone Group PLC | 1,284,807 | | 2,497,643 |
| Weir Group PLC (The) | 10,978 | | 219,503 |
| Whitbread PLC | 6,176 | | 396,438 |
| Wm Morrison Supermarkets PLC | 146,161 | | 386,823 |
| | | | | 104,455,787 |
Total Foreign Common Stocks
(Cost $627,660,395) | | 670,610,670 |
| FOREIGN PREFERRED STOCKS — 0.5% |
| Germany — 0.5% | | |
| Henkel AG & Co. KGaA | | | | |
| 2.06%, 04/09/19 | 11,912 | | 1,230,516 |
| Porsche Automobil Holding SE | | | | |
| 3.35%, 06/28/19 | 4,564 | | 338,641 |
| Sartorius AG | | | | |
| 0.33%, 03/29/19 | 1,809 | | 386,695 |
| Volkswagen AG | | | | |
| 2.73%, 05/15/19 | 9,233 | | 1,817,409 |
| | | | | 3,773,261 |
Total Foreign Preferred Stocks
(Cost $3,420,464) | | 3,773,261 |
| RIGHTS — 0.0% |
Repsol SAΔ*
(Cost $36,619) | 77,485 | | 36,765 |
| MONEY MARKET FUNDS — 4.6% |
GuideStone Money Market Fund, 1.53%
(Institutional Class)Ø∞ | 30,770,243 | | 30,770,243 |
| Northern Institutional Liquid Assets Portfolio (Shares), 1.57%ا | 1,670,877 | | 1,670,877 |
Total Money Market Funds
(Cost $32,441,120) | | 32,441,120 |
| | | Par | |
| U.S. TREASURY OBLIGATION — 0.2% |
| U.S. Treasury Bill | | | |
1.52%, 05/07/20Ω‡‡
(Cost $1,193,540) | $1,200,000 | 1,193,621 |
TOTAL INVESTMENTS —99.2%
(Cost $664,982,892) | | 708,304,906 |
Other Assets in Excess of
Liabilities — 0.8% | | 5,559,053 |
| NET ASSETS — 100.0% | | $713,863,959 |
Futures Contracts outstanding at December 31, 2019:
| Future Type | | Expiration Date | | Open Long
(Short) Contracts | | Notional
Market Value
of Contracts | | Value and
Unrealized
Appreciation
(Depreciation) |
| MSCI EAFE Index E-Mini | | 03/2020 | | 386 | | $39,304,450 | | $123,577 |
See Notes to Financial Statements.
VALUATION HIERARCHY
The following is a summary of the inputs used, as of December 31, 2019, in valuing the Fund’s investments carried at fair value:
| | Total
Value | | Level 1
Quoted Prices | | Level 2
Other Significant
Observable Inputs | | Level 3
Significant
Unobservable Inputs |
| Assets: | | | | | | | |
| Investments in Securities: | | | | | | | |
| Common Stock | $249,469 | | $249,469 | | $— | | $— |
| Foreign Common Stocks: | | | | | | | |
| Austria | 1,234,062 | | — | | 1,234,062 | | — |
| Denmark | 10,232,725 | | — | | 10,232,725 | | — |
| Finland | 6,964,606 | | — | | 6,964,606 | | — |
| Germany | 53,246,527 | | 294,158 | | 52,952,369 | | — |
| Italy | 13,312,701 | | — | | 13,312,701 | | — |
| Japan | 165,119,150 | | — | | 165,119,150 | | — |
| Netherlands | 35,617,127 | | 32,966,084 | | 2,651,043 | | — |
| Norway | 4,997,482 | | — | | 4,997,482 | | — |
| Sweden | 17,763,604 | | — | | 17,763,604 | | — |
| Switzerland | 66,470,561 | | 1,358,713 | | 65,111,848 | | — |
| Other^^ | 295,652,125 | | 295,652,125 | | — | | — |
| Total Foreign Common Stocks | 670,610,670 | | 330,271,080 | | 340,339,590 | | — |
| Foreign Preferred Stocks | 3,773,261 | | — | | 3,773,261 | | — |
| Money Market Funds | 32,441,120 | | 32,441,120 | | — | | — |
| Rights | 36,765 | | — | | 36,765 | | — |
| U.S. Treasury Obligation | 1,193,621 | | — | | 1,193,621 | | — |
| Total Assets - Investments in Securities | $708,304,906 | | $362,961,669 | | $345,343,237 | | $ — |
| Other Financial Instruments*** | | | | | | | |
| Futures Contracts | $123,577 | | $123,577 | | $— | | $— |
| Total Assets - Other Financial Instruments | $123,577 | | $123,577 | | $ — | | $ — |
| ^^ | Classifications as defined in the Schedule of Investments. |
| *** | Other financial instruments are derivative instruments, such as futures contracts, which are valued at the unrealized appreciation (depreciation) on the investment. Further details regarding the value of these investments can be found in the preceding "Futures Contracts outstanding" disclosure. |
See Notes to Financial Statements.
International Equity Fund(Unaudited)
With an annual return of 22.01%, developed non-U.S. markets (represented by the MSCI EAFE Index) saw strong performance in 2019, yet underperformed their U.S. counterparts. Broad investor concerns regarding tightening global financial conditions, trade disputes and the U.K.’s impending exit from the European Union pressured foreign stocks into the end of 2018. As 2019 progressed, these concerns were never fully alleviated, but were met with easier monetary policy by global central banks, as well as some incremental progress in the U.S. and China trade dispute. As perceived uncertainties fell toward the end of the year, markets began pricing in a cyclical upswing, causing the industrials sectors to be the biggest contributor to index returns for the year, followed closely by financials and health care sectors. Remarkably, all sectors and all countries in the MSCI EAFE Index posted positive returns in 2019.
The Fund primarily invests in equity securities of foreign companies in countries having economies and markets generally considered to be developed but may also invest in equity securities of foreign companies located in emerging markets. The Fund’s portfolio is diversified among a large number of companies across different industries, economic sectors and countries. The Investor Class of the Fund outperformed its benchmark, the MSCI EAFE Index, for the one-year period ended December 31, 2019 (23.10% versus 22.01%). On a country basis, overweight exposures to the United States and Taiwan (which are not included in the benchmark) as well as an underweight to Japan, benefited the Fund’s relative performance. On a sector basis, security selection and an underweight to the financials sector contributed the most, while security selection in the materials and industrials sectors were the largest detractors from benchmark-relative performance.
Within the Fund, certain derivatives were utilized to express active views in currency and country selection. These derivative positions primarily included currency forward contracts, stock index futures and stock index future swaps. Overall, derivative exposure had a slight positive impact on Fund performance over the course of the year.
This Fund may be suitable to investors who seek higher, long-term rates of return, can accept significant short-term fluctuations in account value and want to diversify their portfolio with international equity securities. Securities of foreign issuers may be negatively impacted by political events, economic conditions or inefficient, illiquid or unregulated markets in foreign countries, and they also may be subject to inadequate regulatory or accounting standards, which may increase investment risk. Investing in emerging markets may involve greater risks than investing in more developed foreign markets because, among other things, emerging markets often have more political and economic instability. To the extent that the investment adviser misjudges current market conditions, the Fund’s volatility may be amplified by its use of short sales and derivatives and by its ability to select sub-advisers to allocate assets. Derivatives involve different risks from, and in some respects greater than, those risks associated with investing directly in securities, currencies or other instruments. Derivatives may be illiquid or less liquid, volatile, difficult to price and leverages so that small changes in the value of the underlying instruments may produce disproportionate losses to the Fund. Short sales involve selling a security the Fund does not own in anticipation that the security will decline in price. Short sales expose the Fund to the risk that it will be required to buy the security sold short (also known as “covering” the short position) at a time when the security has appreciated in value, thus resulting in a loss to the Fund. The Fund’s potential loss on a short position is limited only by the maximum attainable price of the security less the price at which the security was sold by the Fund. Therefore, in theory, stocks sold short have unlimited risk. The Fund’s use of short sales in effect “leverages” the Fund. The use of leverage may magnify the Fund’s gains or losses, and leverage also creates interest expense that may lower the Fund’s overall returns. It is possible to lose money by investing in the Fund.
See Notes to Financial Statements.
International Equity Fund(Unaudited)
At December 31, 2019, the portfolio holdings of the Fund, as a percentage of net assets, is shown in the following table. Portfolio holdings are subject to risk and may change at any time.
| | % |
| Industrials | 16.8 |
| Financials | 16.5 |
| Consumer Discretionary | 14.6 |
| Health Care | 12.9 |
| Information Technology | 11.5 |
| Consumer Staples | 7.3 |
| Communication Services | 6.6 |
| Materials | 5.3 |
| Money Market Funds | 4.6 |
| Energy | 4.4 |
| Utilities | 3.2 |
| Real Estate | 0.5 |
| U.S. Treasury Obligation | 0.1 |
| Foreign Preferred Stocks Sold Short | —** |
| Foreign Common Stocks Sold Short | (5.3) |
| | 99.0 |
| **Rounds to less than 0.1% | |
See Notes to Financial Statements.
International Equity Fund(Unaudited)
| Average Annual Total Returns as of 12/31/19 | |
| | | Institutional Class* | | Investor Class* | | Benchmark** | |
| One Year | | 23.45% | | 23.10% | | 22.01% | |
| Five Year | | 6.62% | | 6.34% | | 5.67% | |
| Ten year | | 5.56% | | 5.29% | | 5.06% | |
| Since Inception | | 5.95% | | 5.74% | | 6.12% | |
| Inception Date | | 08/27/01 | | 08/27/01 | | | |
| Total Fund Operating Expenses (April 30, 2019 Prospectus)(1) | | 1.14% | | 1.41% | | | |
| (1) | Current information regarding the Fund’s Operating Expenses can be found in the Financial Highlights. |
The performance data quoted represents past performance and does not guarantee future results. Current performance may be lower or higher. Performance data current to the most recent month-end may be obtained at GuideStoneFunds.com. The investment return and principal value of an investment will fluctuate so that shares, when redeemed, may be worth more or less than their original cost.
The graph illustrates the results of a hypothetical $10,000 investment in the Investor Class of the Fund for the 10-year period from December 31, 2009 to December 31, 2019, with all dividends and capital gains reinvested, with the MSCI EAFE Index.
*These returns reflect investment advisory and shareholder servicing fee waivers, if applicable, during the reported time periods.
**Unlike a mutual fund, the performance of an index assumes no taxes, transaction costs, management fees or other expenses.
See Notes to Financial Statements.
INTERNATIONAL EQUITY FUND
| | | Shares | | Value |
| COMMON STOCKS — 1.8% |
| Consumer Discretionary — 0.8% | | |
| Lululemon Athletica, Inc.* | 18,547 | | $4,296,783 |
| Trip.com Group, Ltd. ADR* | 14,700 | | 493,038 |
| Yum China Holdings, Inc. | 127,111 | | 6,102,599 |
| | | | | 10,892,420 |
| Health Care — 1.0% | | |
| Mettler-Toledo International, Inc.* | 6,570 | | 5,211,850 |
| ResMed, Inc. | 47,925 | | 7,426,937 |
| | | | | 12,638,787 |
Total Common Stocks
(Cost $18,130,634) | | 23,531,207 |
| FOREIGN COMMON STOCKS — 97.6% |
| Australia — 3.3% | | |
| Afterpay, Ltd.* | 41,608 | | 854,930 |
| AMP, Ltd. | 1,140,880 | | 1,533,173 |
| Ansell, Ltd. | 16,842 | | 343,102 |
| ASX, Ltd.‡‡ | 2,303 | | 126,721 |
| Aurizon Holdings, Ltd.‡‡ | 186,837 | | 685,720 |
| Australia & New Zealand Banking Group, Ltd.‡‡ | 50,494 | | 872,743 |
| Beach Energy, Ltd. | 171,599 | | 302,253 |
| BHP Group, Ltd.‡‡ | 46,115 | | 1,259,498 |
| BlueScope Steel, Ltd. | 287,237 | | 3,035,623 |
| Brambles, Ltd. | 197,297 | | 1,622,671 |
| Caltex Australia, Ltd. | 6,230 | | 148,426 |
| CIMIC Group, Ltd.‡‡ | 79,353 | | 1,845,433 |
| Coca-Cola Amatil, Ltd. | 48,542 | | 376,752 |
| CSL, Ltd. | 51,397 | | 9,946,069 |
| Dexus REIT‡‡ | 12,849 | | 105,496 |
| Evolution Mining, Ltd. | 51,594 | | 137,583 |
| Fortescue Metals Group, Ltd. | 495,472 | | 3,716,886 |
| Goodman Group REIT‡‡ | 30,218 | | 283,517 |
| GPT Group (The) REITΨ†††* | 63,198 | | — |
| GPT Group (The) REIT (Athens Exchange) | 25,055 | | 98,461 |
| Iluka Resources, Ltd. | 192,033 | | 1,253,260 |
| Lendlease Group | 28,414 | | 350,936 |
| Mirvac Group REIT‡‡ | 53,620 | | 119,657 |
| Newcrest Mining, Ltd. | 46,271 | | 982,238 |
| Northern Star Resources, Ltd. | 23,449 | | 186,110 |
| Orica, Ltd. | 107,817 | | 1,663,020 |
| QBE Insurance Group, Ltd. | 621,083 | | 5,613,684 |
| Rio Tinto, Ltd.‡‡ | 8,019 | | 564,984 |
| Santos, Ltd. | 31,440 | | 180,475 |
| Scentre Group REIT‡‡ | 93,514 | | 251,338 |
| South32, Ltd. | 1,610,096 | | 3,050,689 |
| Stockland REIT‡‡ | 41,895 | | 135,827 |
| Telstra Corporation, Ltd. | 235,342 | | 584,635 |
| Vicinity Centres REIT‡‡ | 52,810 | | 92,278 |
| Viva Energy Group, Ltd. 144A | 71,870 | | 96,835 |
| WiseTech Global, Ltd. | 32,394 | | 531,258 |
| | | | | 42,952,281 |
| Austria — 0.1% | | |
| ams AG* | 36,701 | | 1,489,987 |
| | | Shares | | Value |
| Belgium — 0.7% | | |
| Ageas‡‡ | 41,192 | | $2,434,083 |
| Galapagos NV* | 359 | | 75,102 |
| Groupe Bruxelles Lambert SA‡‡ | 415 | | 43,739 |
| KBC Group NV | 75,346 | | 5,667,617 |
| Solvay SA | 2,223 | | 257,583 |
| UCB SA | 9,319 | | 741,126 |
| | | | | 9,219,250 |
| Canada — 2.2% | | |
| Canadian National Railway Co. | 60,097 | | 5,435,773 |
| Canadian Pacific Railway, Ltd.Δ | 33,265 | | 8,480,912 |
| Cenovus Energy, Inc. | 275,699 | | 2,802,531 |
| Dollarama, Inc. | 80,105 | | 2,753,137 |
| Open Text Corporation | 28,600 | | 1,260,246 |
| Shopify, Inc. Class A* | 22,150 | | 8,806,397 |
| | | | | 29,538,996 |
| China — 0.7% | | |
| Baidu, Inc. ADR* | 20,595 | | 2,603,208 |
| Tencent Holdings, Ltd. | 144,500 | | 6,965,107 |
| | | | | 9,568,315 |
| Denmark — 1.6% | | |
| Coloplast A/S Class B | 4,777 | | 592,640 |
| Danske Bank A/S | 12,095 | | 195,676 |
| Demant A/S* | 3,754 | | 118,224 |
| DSV Panalpina A/S | 46,708 | | 5,383,250 |
| FLSmidth & Co. A/S | 6,003 | | 239,392 |
| Genmab A/S* | 1,714 | | 381,200 |
| GN Store Nord A/S | 53,268 | | 2,505,765 |
| H Lundbeck A/S | 42,292 | | 1,616,845 |
| ISS A/S | 290,443 | | 6,969,132 |
| Pandora A/S | 49,398 | | 2,148,884 |
| Rockwool International A/S, B Shares | 4,670 | | 1,107,387 |
| Vestas Wind Systems A/S | 1,761 | | 177,872 |
| | | | | 21,436,267 |
| Finland — 0.4% | | |
| Fortum OYJ | 25,918 | | 639,745 |
| Kesko OYJ, B Shares | 1,891 | | 133,853 |
| Kone OYJ Class B | 12,168 | | 795,639 |
| Nokia OYJ | 141,713 | | 524,178 |
| Orion OYJ Class B | 4,751 | | 220,027 |
| Sampo OYJ, A Shares | 14,539 | | 634,818 |
| Stora Enso OYJ, R Shares | 9,029 | | 131,379 |
| UPM-Kymmene OYJ‡‡ | 56,608 | | 1,963,986 |
| Wartsila OYJ Abp | 8,780 | | 97,050 |
| | | | | 5,140,675 |
| France — 9.6% | | |
| Accor SA | 83,000 | | 3,886,971 |
| Air France-KLM* | 41,894 | | 466,354 |
| Air Liquide SA | 42,304 | | 5,988,493 |
| Alstom SA | 1,590 | | 75,317 |
| Arkema SA | 670 | | 71,171 |
| Atos SE‡‡ | 20,873 | | 1,740,072 |
| AXA SA‡‡ | 47,103 | | 1,326,698 |
See Notes to Financial Statements.
INTERNATIONAL EQUITY FUND
SCHEDULE OF INVESTMENTS (Continued)
| | | Shares | | Value |
| BNP Paribas SA‡‡ | 137,748 | | $8,162,866 |
| Bouygues SA | 1,717 | | 72,955 |
| Bureau Veritas SA | 72,272 | | 1,885,630 |
| Capgemini SE‡‡ | 12,858 | | 1,570,645 |
| Carrefour SA | 21,588 | | 362,018 |
| Christian Dior SE | 13,709 | | 7,024,390 |
| Cie de St-Gobain | 325,342 | | 13,320,169 |
| CNP Assurances‡‡ | 22,991 | | 457,239 |
| Credit Agricole SA | 18,152 | | 263,167 |
| Danone SA | 12,071 | | 1,000,609 |
| Dassault Aviation SA | 115 | | 150,925 |
| Dassault Systemes SA | 1,157 | | 190,194 |
| Electricite de France SA | 38,669 | | 430,627 |
| Engie SA‡‡ | 241,390 | | 3,899,048 |
| EssilorLuxottica SA | 57,662 | | 8,783,472 |
| Eutelsat Communications SA | 24,863 | | 404,109 |
| Gecina SA REIT | 674 | | 120,662 |
| Hermes International‡‡ | 1,341 | | 1,002,098 |
| Ingenico Group | 3,394 | | 368,523 |
| Kering SA‡‡ | 4,036 | | 2,649,307 |
| Klepierre REIT‡‡ | 4,327 | | 164,294 |
| L’Oreal SA‡‡ | 28,606 | | 8,471,061 |
| Natixis SA | 263,605 | | 1,170,324 |
| Orange SA‡‡ | 97,089 | | 1,428,830 |
| Peugeot SA‡‡ | 134,320 | | 3,209,202 |
| Publicis Groupe SA‡‡ | 102,875 | | 4,657,338 |
| Rexel SA | 9,720 | | 129,145 |
| Sanofi‡‡ | 153,593 | | 15,440,207 |
| Schneider Electric SE | 103,021 | | 10,573,618 |
| SES SA | 31,843 | | 446,479 |
| Societe Generale SA | 238,172 | | 8,285,892 |
| SPIE SA | 7,399 | | 150,718 |
| Thales SA‡‡ | 6,487 | | 673,219 |
| TOTAL SA‡‡ | 41,883 | | 2,311,424 |
| Valeo SA | 99,261 | | 3,497,223 |
| Vinci SA | 1,202 | | 133,480 |
| | | | | 126,416,183 |
| Germany — 10.2% | | |
| adidas AG‡‡ | 23,948 | | 7,784,745 |
| Allianz SE‡‡ | 85,060 | | 20,842,065 |
| Bayerische Motoren Werke AG | 75,455 | | 6,180,197 |
| Beiersdorf AG | 57,547 | | 6,884,308 |
| Brenntag AG | 2,455 | | 133,200 |
| Carl Zeiss Meditec AG | 1,280 | | 162,726 |
| CECONOMY AG* | 85,698 | | 518,065 |
| Continental AG | 139,741 | | 18,058,768 |
| Covestro AG 144A‡‡ | 38,087 | | 1,772,193 |
| Daimler AG | 292,419 | | 16,166,183 |
| Deutsche Boerse AG | 29,796 | | 4,672,390 |
| Deutsche Lufthansa AG‡‡ | 45,262 | | 833,142 |
| Deutsche Telekom AG | 418,640 | | 6,841,493 |
| Deutsche Wohnen SE | 6,238 | | 253,742 |
| E.ON SE‡‡ | 25,218 | | 269,502 |
| Evonik Industries AG | 264,895 | | 8,090,511 |
| Fresenius Medical Care AG & Co. KGaA‡‡ | 35,993 | | 2,650,087 |
| | | Shares | | Value |
| Fresenius SE & Co. KGaA‡‡ | 5,433 | | $305,734 |
| HeidelbergCement AG | 8,368 | | 608,060 |
| Henkel AG & Co. KGaA | 4,900 | | 460,564 |
| HOCHTIEF AG | 6,514 | | 829,336 |
| HUGO BOSS AG | 9,840 | | 476,297 |
| Infineon Technologies AG‡‡ | 65,476 | | 1,479,389 |
| KION Group AG | 8,173 | | 562,036 |
| Muenchener Rueckversicherungs-Gesellschaft AG‡‡ | 8,259 | | 2,437,173 |
| ProSiebenSat.1 Media SE | 63,859 | | 996,382 |
| Rheinmetall AG‡‡ | 6,815 | | 781,422 |
| SAP SE‡‡ | 97,533 | | 13,127,773 |
| Siemens AG‡‡ | 22,949 | | 2,996,946 |
| Siemens Healthineers AG 144A | 10,385 | | 497,826 |
| Software AG | 43,198 | | 1,504,049 |
| thyssenkrupp AG | 281,872 | | 3,787,545 |
| Uniper SE | 8,589 | | 283,881 |
| Vonovia SE | 8,154 | | 437,946 |
| | | | | 133,685,676 |
| Hong Kong — 4.3% | | |
| AIA Group, Ltd. | 1,487,400 | | 15,614,045 |
| China Mobile, Ltd. | 1,008,000 | | 8,472,980 |
| CK Asset Holdings, Ltd. | 318,000 | | 2,295,535 |
| CK Hutchison Holdings, Ltd. | 1,430,500 | | 13,639,894 |
| CK Infrastructure Holdings, Ltd.‡‡ | 11,000 | | 78,276 |
| CLP Holdings, Ltd. | 15,000 | | 157,656 |
| Henderson Land Development Co., Ltd. | 82,560 | | 405,262 |
| HKT Trust & HKT, Ltd. | 65,000 | | 91,590 |
| Hong Kong Exchanges and Clearing, Ltd.‡‡ | 19,700 | | 639,619 |
| Hysan Development Co., Ltd. | 70,000 | | 274,438 |
| Kerry Properties, Ltd. | 348,000 | | 1,105,322 |
| Link REIT‡‡ | 41,000 | | 434,082 |
| New World Development Co., Ltd. | 492,000 | | 674,327 |
| PCCW, Ltd.‡‡ | 62,000 | | 36,680 |
| Sun Hung Kai Properties, Ltd. | 49,000 | | 750,189 |
| WH Group, Ltd. 144A | 11,121,825 | | 11,489,636 |
| Wheelock & Co., Ltd. | 31,000 | | 206,672 |
| Yue Yuen Industrial Holdings, Ltd. | 109,000 | | 321,728 |
| | | | | 56,687,931 |
| India — 1.2% | | |
| Axis Bank, Ltd. | 109,918 | | 1,161,268 |
| HDFC Bank, Ltd. ADR | 114,140 | | 7,233,052 |
| Tata Consultancy Services, Ltd. | 229,287 | | 6,943,997 |
| | | | | 15,338,317 |
| Indonesia — 0.1% | | |
| PT Bank Mandiri Persero Tbk | 2,550,600 | | 1,409,368 |
| Ireland — 1.4% | | |
| Accenture PLC Class A | 41,810 | | 8,803,932 |
| DCC PLC | 1,353 | | 117,280 |
| ICON PLC* | 21,440 | | 3,692,611 |
| Ryanair Holdings PLC ADR* | 64,010 | | 5,607,916 |
See Notes to Financial Statements.
| | | Shares | | Value |
| Willis Towers Watson PLC | 1,800 | | $363,492 |
| | | | | 18,585,231 |
| Italy — 2.7% | | |
| A2A SpA‡‡ | 1,176,047 | | 2,208,430 |
| Assicurazioni Generali SpA | 34,236 | | 706,795 |
| Banca Generali SpA | 2,711 | | 88,131 |
| BPER Banca | 277,069 | | 1,394,085 |
| Buzzi Unicem SpA | 2,895 | | 72,974 |
| Enel SpA | 1,347,603 | | 10,705,124 |
| Eni SpA‡‡ | 750,906 | | 11,662,495 |
| Intesa Sanpaolo SpA | 2,603,337 | | 6,857,686 |
| Leonardo SpA | 123,908 | | 1,453,111 |
| Poste Italiane SpA 144A | 36,435 | | 414,007 |
| Snam SpA | 17,220 | | 90,539 |
| Unipol Gruppo SpA | 79,536 | | 456,622 |
| | | | | 36,109,999 |
| Japan — 16.7% | | |
| ABC-Mart, Inc. | 1,300 | | 88,740 |
| Alfresa Holdings Corporation | 32,200 | | 654,144 |
| Alps Alpine Co., Ltd. | 47,700 | | 1,082,758 |
| Amada Holdings Co., Ltd. | 10,800 | | 122,837 |
| ANA Holdings, Inc. | 3,100 | | 103,489 |
| Aozora Bank, Ltd. | 14,300 | | 377,788 |
| Astellas Pharma, Inc.‡‡ | 166,900 | | 2,848,981 |
| Brother Industries, Ltd. | 53,900 | | 1,113,210 |
| Calbee, Inc. | 3,100 | | 101,002 |
| Casio Computer Co., Ltd. | 5,400 | | 107,911 |
| Chubu Electric Power Co., Inc. | 5,100 | | 72,093 |
| Coca-Cola Bottlers Japan Holdings, Inc.Δ | 348,700 | | 8,909,391 |
| Credit Saison Co., Ltd. | 9,500 | | 164,766 |
| Dai Nippon Printing Co., Ltd. | 2,700 | | 73,028 |
| Daicel Corporation | 11,700 | | 111,856 |
| Daikin Industries, Ltd. | 53,500 | | 7,548,306 |
| Daito Trust Construction Co., Ltd.‡‡ | 1,000 | | 123,576 |
| Daiwa House Industry Co., Ltd.‡‡ | 9,100 | | 281,707 |
| Ezaki Glico Co., Ltd. | 2,500 | | 111,460 |
| Fuji Electric Co., Ltd. | 22,200 | | 674,376 |
| FUJIFILM Holdings Corporation | 250,400 | | 11,958,077 |
| Fujitsu, Ltd. | 101,700 | | 9,565,478 |
| GungHo Online Entertainment, Inc. | 12,250 | | 259,521 |
| Hachijuni Bank, Ltd. (The) | 142,600 | | 620,261 |
| Haseko Corporation‡‡ | 143,400 | | 1,924,979 |
| Hitachi High-Technologies Corporation | 14,300 | | 1,012,719 |
| Hitachi, Ltd.‡‡ | 54,600 | | 2,303,888 |
| Honda Motor Co., Ltd. | 395,100 | | 11,181,938 |
| Hoshizaki Corporation | 1,000 | | 89,160 |
| Hoya Corporation‡‡ | 123,000 | | 11,741,832 |
| Isuzu Motors, Ltd. | 334,300 | | 3,951,684 |
| Izumi Co., Ltd. | 2,900 | | 104,453 |
| Japan Airlines Co., Ltd. | 83,800 | | 2,609,187 |
| Japan Post Holdings Co., Ltd. | 25,400 | | 238,873 |
| Japan Real Estate Investment Corporation REIT | 18 | | 119,457 |
| Japan Retail Fund Investment Corporation REIT | 50 | | 107,595 |
| | | Shares | | Value |
| JTEKT Corporation | 8,800 | | $103,955 |
| Kajima Corporation | 24,400 | | 324,403 |
| Kamigumi Co., Ltd. | 26,200 | | 575,925 |
| KDDI Corporation | 14,000 | | 417,709 |
| Keyence Corporation | 17,200 | | 6,039,584 |
| Koito Manufacturing Co., Ltd. | 1,400 | | 64,828 |
| Komatsu, Ltd. | 129,100 | | 3,098,588 |
| Konica Minolta, Inc. | 73,200 | | 476,831 |
| Kyocera Corporation | 167,500 | | 11,416,080 |
| Kyushu Railway Co. | 9,800 | | 328,081 |
| Mabuchi Motor Co., Ltd. | 11,900 | | 449,291 |
| Marubeni Corporation | 126,900 | | 937,585 |
| Matsumotokiyoshi Holdings Co., Ltd. | 3,200 | | 123,888 |
| Mazda Motor Corporation‡‡ | 180,800 | | 1,540,676 |
| Mebuki Financial Group, Inc. | 27,900 | | 71,133 |
| Medipal Holdings Corporation | 4,800 | | 105,938 |
| MINEBEA MITSUMI, Inc. | 28,600 | | 590,766 |
| Mitsubishi Corporation | 22,800 | | 604,003 |
| Mitsubishi Electric Corporation | 544,500 | | 7,413,744 |
| Mitsubishi Estate Co., Ltd.‡‡ | 22,000 | | 420,967 |
| Mitsubishi Gas Chemical Co., Inc. | 18,100 | | 275,739 |
| Mitsubishi Heavy Industries, Ltd. | 5,200 | | 201,640 |
| Mitsubishi UFJ Financial Group, Inc. | 243,600 | | 1,316,984 |
| Mitsui Fudosan Co., Ltd.‡‡ | 16,000 | | 391,039 |
| Mixi, Inc. | 52,400 | | 993,469 |
| MS&AD Insurance Group Holdings, Inc. | 13,000 | | 429,113 |
| Murata Manufacturing Co., Ltd. | 12,500 | | 769,358 |
| NH Foods, Ltd. | 2,000 | | 82,847 |
| Nikon Corporation | 131,100 | | 1,603,308 |
| Nintendo Co., Ltd. | 1,900 | | 759,924 |
| Nippon Building Fund, Inc. REIT | 16 | | 117,284 |
| Nippon Express Co., Ltd. | 15,200 | | 891,009 |
| Nippon Telegraph & Telephone Corporation | 267,400 | | 6,758,185 |
| Nitto Denko Corporation | 22,100 | | 1,242,634 |
| NSK, Ltd. | 13,100 | | 123,837 |
| NTT DOCOMO, Inc.‡‡ | 27,200 | | 757,687 |
| Obayashi Corporation | 24,400 | | 271,003 |
| Olympus Corporation | 549,900 | | 8,475,447 |
| Ono Pharmaceutical Co., Ltd. | 3,900 | | 89,038 |
| ORIX Corporation | 28,500 | | 472,284 |
| Otsuka Corporation | 3,200 | | 127,792 |
| Otsuka Holdings Co., Ltd. | 180,300 | | 8,036,738 |
| Persol Holdings Co., Ltd. | 45,100 | | 845,226 |
| Pola Orbis Holdings, Inc. | 28,900 | | 688,371 |
| Resona Holdings, Inc.‡‡ | 218,200 | | 951,032 |
| Rohm Co., Ltd. | 10,200 | | 813,849 |
| SCSK Corporation | 3,200 | | 165,934 |
| Secom Co., Ltd. | 14,600 | | 1,302,944 |
| Sekisui Chemical Co., Ltd. | 345,400 | | 5,992,658 |
| Shimamura Co., Ltd. | 5,000 | | 380,119 |
| Shimizu Corporation | 37,200 | | 378,950 |
| Shin-Etsu Chemical Co., Ltd. | 1,000 | | 109,973 |
| Shinsei Bank, Ltd. | 62,400 | | 952,049 |
| Shionogi & Co., Ltd.‡‡ | 20,400 | | 1,261,975 |
| Showa Denko KK | 30,300 | | 798,572 |
See Notes to Financial Statements.
INTERNATIONAL EQUITY FUND
SCHEDULE OF INVESTMENTS (Continued)
| | | Shares | | Value |
| SoftBank Group Corporation | 28,800 | | $1,250,411 |
| Sojitz Corporation‡‡ | 390,700 | | 1,259,264 |
| Sony Corporation‡‡ | 38,400 | | 2,607,272 |
| SUMCO Corporation | 9,600 | | 159,060 |
| Sumitomo Corporation | 52,800 | | 784,257 |
| Sumitomo Dainippon Pharma Co., Ltd.‡‡ | 55,200 | | 1,069,508 |
| Sumitomo Electric Industries, Ltd. | 421,900 | | 6,336,161 |
| Sumitomo Heavy Industries, Ltd. | 24,000 | | 681,715 |
| Sumitomo Mitsui Financial Group, Inc. | 28,500 | | 1,052,658 |
| Sumitomo Realty & Development Co., Ltd.‡‡ | 6,000 | | 209,337 |
| Sundrug Co., Ltd. | 13,200 | | 477,602 |
| Suzuken Co., Ltd. | 4,400 | | 179,335 |
| Sysmex Corporation | 14,700 | | 1,000,849 |
| Taiheiyo Cement Corporation | 29,600 | | 868,852 |
| Taisei Corporation | 20,400 | | 844,989 |
| Taisho Pharmaceutical Holdings Co., Ltd. | 3,500 | | 258,283 |
| Takeda Pharmaceutical Co., Ltd. | 331,300 | | 13,103,651 |
| TDK Corporation | 1,600 | | 179,807 |
| Teijin, Ltd. | 10,300 | | 192,426 |
| Terumo Corporation | 120,500 | | 4,274,656 |
| Tokio Marine Holdings, Inc. | 177,700 | | 9,949,215 |
| Tokyo Electron, Ltd.‡‡ | 10,300 | | 2,248,800 |
| Toshiba Corporation | 8,500 | | 288,505 |
| Tosoh Corporation | 16,300 | | 251,114 |
| Toyo Seikan Group Holdings, Ltd. | 5,600 | | 96,400 |
| Toyota Boshoku Corporation | 6,400 | | 102,765 |
| Toyota Motor Corporation | 37,800 | | 2,663,445 |
| Yamaguchi Financial Group, Inc. | 13,200 | | 89,271 |
| Yamazaki Baking Co., Ltd. | 4,000 | | 71,477 |
| | | | | 218,943,592 |
| Jersey — 3.2% | | |
| Experian PLC | 511,943 | | 17,305,617 |
| Ferguson PLC | 15,247 | | 1,383,438 |
| Glencore PLC* | 2,982,356 | | 9,297,335 |
| Man Group PLC‡‡ | 434,244 | | 908,816 |
| WPP PLC | 914,597 | | 12,920,384 |
| | | | | 41,815,590 |
| Mexico — 0.5% | | |
| Grupo Televisa SAB SA ADR | 165,900 | | 1,946,007 |
| Wal-Mart de Mexico SAB de CV | 1,432,900 | | 4,113,596 |
| | | | | 6,059,603 |
| Netherlands — 3.2% | | |
| Aalberts NV | 2,807 | | 125,976 |
| Airbus SE‡‡ | 2,501 | | 366,045 |
| ASM International NV | 17,226 | | 1,935,139 |
| ASML Holding NV | 6,327 | | 1,871,478 |
| ASML Holding NV (NASDAQ Exchange)Δ | 19,890 | | 5,886,246 |
| ASR Nederland NV | 42,934 | | 1,606,587 |
| CNH Industrial NV | 587,111 | | 6,446,419 |
| EXOR NV | 51,823 | | 4,017,913 |
| Fiat Chrysler Automobiles NV | 276,496 | | 4,099,478 |
| ING Groep NV‡‡ | 66,977 | | 802,969 |
| | | Shares | | Value |
| Koninklijke Ahold Delhaize NV | 208,922 | | $5,224,785 |
| Koninklijke Philips NV | 55,863 | | 2,727,030 |
| Prosus NV* | 17,607 | | 1,313,952 |
| Randstad NV | 17,730 | | 1,082,689 |
| Signify NV 144A | 27,614 | | 862,953 |
| STMicroelectronics NV | 11,487 | | 308,853 |
| Unibail-Rodamco-Westfield REIT‡‡ | 1,666 | | 262,840 |
| Unilever NV | 30,141 | | 1,732,043 |
| Wolters Kluwer NV | 21,446 | | 1,564,120 |
| | | | | 42,237,515 |
| Nigeria — 0.0% | | |
| Afriland Properties PLCΨ††† | 364,373 | | — |
| Norway — 0.3% | | |
| DNB ASA | 15,435 | | 288,834 |
| Equinor ASA | 6,897 | | 137,542 |
| Leroy Seafood Group ASA | 147,846 | | 984,212 |
| Orkla ASA | 11,123 | | 112,796 |
| Salmar ASA | 45,307 | | 2,321,813 |
| | | | | 3,845,197 |
| Portugal — 0.4% | | |
| EDP - Energias de Portugal SA | 96,013 | | 416,144 |
| Galp Energia SGPS SA | 293,109 | | 4,898,828 |
| | | | | 5,314,972 |
| Singapore — 2.5% | | |
| Ascendas REIT‡‡ | 45,900 | | 101,359 |
| CapitaLand Commercial Trust REIT | 69,500 | | 102,833 |
| CapitaLand Mall Trust REIT‡‡ | 58,400 | | 106,817 |
| ComfortDelGro Corporation, Ltd. | 485,400 | | 858,955 |
| DBS Group Holdings, Ltd. | 256,100 | | 4,927,966 |
| Jardine Matheson Holdings, Ltd. | 61,945 | | 3,444,142 |
| Singapore Exchange, Ltd.‡‡ | 13,600 | | 89,592 |
| Singapore Telecommunications, Ltd. | 2,305,900 | | 5,777,823 |
| Suntec REIT | 65,200 | | 89,199 |
| United Overseas Bank, Ltd. | 725,577 | | 14,247,733 |
| UOL Group, Ltd. | 14,686 | | 90,849 |
| Venture Corporation, Ltd. | 23,300 | | 280,650 |
| Wilmar International, Ltd. | 87,300 | | 267,427 |
| Yangzijiang Shipbuilding Holdings, Ltd. | 2,608,800 | | 2,172,464 |
| | | | | 32,557,809 |
| South Africa — 0.3% | | |
| Naspers, Ltd. N Shares | 21,607 | | 3,533,993 |
| South Korea — 0.4% | | |
| NAVER Corporation | 23,940 | | 3,851,825 |
| Samsung Electronics Co., Ltd. | 37,200 | | 1,792,552 |
| | | | | 5,644,377 |
| Spain — 2.7% | | |
| ACS Actividades de Construccion y Servicios SA | 24,163 | | 966,245 |
| Amadeus IT Group SA | 151,871 | | 12,401,750 |
| Banco Bilbao Vizcaya Argentaria SA | 371,989 | | 2,079,207 |
| Banco Santander SA | 3,019,833 | | 12,634,804 |
| Bankia SA | 99,355 | | 212,027 |
| Enagas SA | 43,619 | | 1,112,610 |
See Notes to Financial Statements.
| | | Shares | | Value |
| Endesa SA‡‡ | 90,158 | | $2,405,888 |
| Iberdrola SA | 256,493 | | 2,641,162 |
| Mapfre SA | 39,099 | | 103,503 |
| Mediaset Espana Comunicacion SA | 12,967 | | 82,325 |
| Red Electrica Corporation SA | 35,266 | | 709,075 |
| Repsol SA‡‡ | 5,794 | | 90,533 |
| | | | | 35,439,129 |
| Sweden — 2.8% | | |
| AAK AB | 6,297 | | 119,770 |
| Atlas Copco AB, A Shares | 125,697 | | 5,017,280 |
| Atlas Copco AB, B Shares | 6,930 | | 240,617 |
| Essity AB, B Shares | 40,079 | | 1,290,794 |
| Getinge AB, B Shares | 48,987 | | 911,020 |
| Hennes & Mauritz AB, B SharesΔ | 193,933 | | 3,955,757 |
| Investor AB, B Shares‡‡ | 8,150 | | 444,940 |
| Sandvik AB | 75,549 | | 1,471,496 |
| Securitas AB, B Shares | 16,325 | | 281,267 |
| SKF AB, B Shares | 163,739 | | 3,315,113 |
| Swedish Orphan Biovitrum AB* | 66,137 | | 1,096,272 |
| Telefonaktiebolaget LM Ericsson, B Shares | 189,014 | | 1,651,569 |
| Telia Co. AB | 2,618,170 | | 11,249,035 |
| Volvo AB, B Shares‡‡ | 313,311 | | 5,245,200 |
| | | | | 36,290,130 |
| Switzerland — 9.5% | | |
| ABB, Ltd.Δ | 471,180 | | 11,366,344 |
| Adecco Group AG‡‡ | 30,343 | | 1,918,353 |
| Alcon, Inc.* | 89,250 | | 5,055,264 |
| Chubb, Ltd. | 43,090 | | 6,707,389 |
| Cie Financiere Richemont SA | 29,317 | | 2,291,151 |
| Coca-Cola HBC AG* | 20,028 | | 680,471 |
| Credit Suisse Group AG* | 502,175 | | 6,788,240 |
| Geberit AG | 8,493 | | 4,766,963 |
| Kuehne + Nagel International AG | 4,850 | | 818,033 |
| LafargeHolcim, Ltd. (Swiss Exchange)* | 54,843 | | 3,042,551 |
| Nestle SA‡‡ | 199,810 | | 21,632,484 |
| Novartis AG‡‡ | 179,106 | | 16,959,477 |
| Roche Holding AG‡‡ | 49,565 | | 16,108,765 |
| Sika AGΔ | 47,412 | | 8,903,761 |
| Sonova Holding AG‡‡ | 7,948 | | 1,816,981 |
| Swatch Group AG (The) | 7,385 | | 2,061,932 |
| UBS Group AG* | 557,894 | | 7,040,281 |
| Zurich Insurance Group AG‡‡ | 15,688 | | 6,435,211 |
| | | | | 124,393,651 |
| Taiwan — 1.9% | | |
| Taiwan Semiconductor Manufacturing Co., Ltd. | 41,000 | | 452,714 |
| Taiwan Semiconductor Manufacturing Co., Ltd. ADR | 431,527 | | 25,071,718 |
| | | | | 25,524,432 |
| Turkey — 0.0% | | |
| Yapi ve Kredi Bankasi AS* | 1 | | — |
| United Kingdom — 14.7% | | |
| 3i Group PLC‡‡ | 15,222 | | 221,390 |
| Aggreko PLC | 24,815 | | 273,675 |
| | | Shares | | Value |
| Anglo American PLC‡‡ | 37,597 | | $1,082,175 |
| Antofagasta PLC | 33,256 | | 403,859 |
| Ashtead Group PLC | 112,473 | | 3,596,419 |
| Associated British Foods PLC | 16,223 | | 558,284 |
| AstraZeneca PLC‡‡ | 15,750 | | 1,587,007 |
| Auto Trader Group PLC 144A | 10,725 | | 84,471 |
| Avast PLC 144A | 14,593 | | 87,526 |
| Aviva PLC | 54,583 | | 302,723 |
| Babcock International Group PLC | 25,780 | | 214,929 |
| BAE Systems PLC | 51,307 | | 383,845 |
| Barclays PLC‡‡ | 540,414 | | 1,285,921 |
| Barratt Developments PLC | 79,810 | | 789,278 |
| Bellway PLC | 12,686 | | 639,724 |
| Berkeley Group Holdings PLC | 11,515 | | 741,132 |
| BHP Group PLC‡‡ | 59,423 | | 1,398,550 |
| BP PLC‡‡ | 1,781,163 | | 11,126,595 |
| Britvic PLC | 12,806 | | 153,429 |
| BT Group PLC‡‡ | 361,241 | | 920,825 |
| Bunzl PLC | 34,905 | | 954,756 |
| Burberry Group PLC‡‡ | 27,299 | | 797,334 |
| Carnival PLC | 5,589 | | 269,772 |
| Close Brothers Group PLC | 5,735 | | 121,393 |
| Compass Group PLC | 540,778 | | 13,538,346 |
| Dialog Semiconductor PLC‡‡* | 31,972 | | 1,623,769 |
| Direct Line Insurance Group PLC | 31,583 | | 130,734 |
| Dixons Carphone PLC | 319,226 | | 609,745 |
| Drax Group PLC | 96,874 | | 402,923 |
| Dunelm Group PLC | 29,230 | | 447,581 |
| Evraz PLC | 125,749 | | 672,931 |
| G4S PLC | 3,104,814 | | 8,965,549 |
| GlaxoSmithKline PLC‡‡ | 580,601 | | 13,681,652 |
| Hays PLC | 152,882 | | 367,754 |
| Howden Joinery Group PLC | 9,686 | | 86,295 |
| HSBC Holdings PLC | 250,928 | | 1,967,353 |
| Inchcape PLC‡‡ | 62,025 | | 580,038 |
| Indivior PLC* | 292,107 | | 150,901 |
| Investec PLC | 82,704 | | 485,415 |
| JD Sports Fashion PLC | 57,938 | | 642,660 |
| John Wood Group PLC | 934,751 | | 4,934,113 |
| Kingfisher PLC | 3,140,787 | | 9,027,823 |
| Liberty Global PLC Class AΔ* | 99,100 | | 2,253,534 |
| Liberty Global PLC Class C* | 51,026 | | 1,112,112 |
| Lloyds Banking Group PLC‡‡ | 23,857,232 | | 19,750,808 |
| London Stock Exchange Group PLC | 5,849 | | 600,438 |
| Marks & Spencer Group PLC | 227,826 | | 644,297 |
| Meggitt PLC | 64,632 | | 562,297 |
| Melrose Industries PLC | 27,890 | | 88,700 |
| Micro Focus International PLC | 10,361 | | 145,998 |
| Mondi PLC | 9,856 | | 231,404 |
| Moneysupermarket.com Group PLC | 139,602 | | 611,335 |
| National Grid PLC | 219,163 | | 2,741,334 |
| Next PLC | 2,311 | | 214,832 |
| Persimmon PLC | 21,823 | | 779,037 |
| Prudential PLC | 8,899 | | 170,803 |
| Reckitt Benckiser Group PLC‡‡ | 24,337 | | 1,975,793 |
| RELX PLC | 9,878 | | 249,323 |
| Rio Tinto PLC‡‡ | 28,737 | | 1,714,068 |
| Rolls-Royce Holdings PLC* | 787,700 | | 7,128,424 |
See Notes to Financial Statements.
INTERNATIONAL EQUITY FUND
SCHEDULE OF INVESTMENTS (Continued)
| | | Shares | | Value |
| Royal Bank of Scotland Group PLC | 873,250 | | $2,779,567 |
| Royal Dutch Shell PLC, A Shares‡‡ | 67,367 | | 1,994,387 |
| Royal Dutch Shell PLC, B Shares‡‡ | 532,733 | | 15,803,216 |
| Royal Mail PLC | 190,232 | | 570,234 |
| Sage Group PLC (The) | 14,651 | | 145,356 |
| Schroders PLC | 86,318 | | 3,811,990 |
| Smith & Nephew PLC‡‡ | 211,142 | | 5,125,113 |
| Smiths Group PLC | 60,896 | | 1,360,782 |
| Spectris PLC | 14,854 | | 571,773 |
| SSE PLC | 756,419 | | 14,413,090 |
| Standard Chartered PLC | 40,156 | | 378,930 |
| Standard Life Aberdeen PLC | 24,141 | | 104,917 |
| Tate & Lyle PLC | 59,644 | | 600,592 |
| Taylor Wimpey PLC | 307,080 | | 786,670 |
| Tesco PLC | 3,422,754 | | 11,570,208 |
| Travis Perkins PLC | 177,600 | | 3,768,689 |
| Unilever PLC | 23,287 | | 1,341,954 |
| Vodafone Group PLC‡‡ | 125,830 | | 244,611 |
| WH Smith PLC | 12,058 | | 415,273 |
| Whitbread PLC | 2,120 | | 136,083 |
| | | | | 193,208,566 |
Total Foreign Common Stocks
(Cost $1,178,386,402) | | 1,282,387,032 |
| FOREIGN PREFERRED STOCKS — 0.2% |
| Germany — 0.2% | | |
| Bayerische MotorenWerke AG | | | | |
| 6.01%, 05/17/19 | 9,226 | | 567,971 |
| Henkel AG & Co. KGaA | | | | |
| 2.06%, 04/09/19 | 7,250 | | 748,929 |
| Porsche Automobil Holding SE | | | | |
| 3.35%, 06/28/19‡‡ | 2,638 | | 195,735 |
| Volkswagen AG | | | | |
| 2.73%, 05/15/19 | 4,573 | | 900,142 |
| | | | | 2,412,777 |
Total Foreign Preferred Stocks
(Cost $2,627,340) | | 2,412,777 |
| MONEY MARKET FUNDS — 4.6% |
GuideStone Money Market Fund, 1.53%
(Institutional Class)Ø∞ | 56,057,536 | | 56,057,536 |
| Northern Institutional Liquid Assets Portfolio (Shares), 1.57%ا | 4,448,350 | | 4,448,350 |
| Northern Institutional U.S. Government Portfolio (Shares), 1.48%Ø | 63 | | 63 |
Total Money Market Funds
(Cost $60,505,949) | | 60,505,949 |
| | | Par | | Value |
| U.S. TREASURY OBLIGATION — 0.1% |
| U.S. Treasury Bill | | | | |
1.52%, 05/07/20Ω‡‡
(Cost $1,193,540) | $1,200,000 | | $1,193,621 |
TOTAL INVESTMENTS —104.3%
(Cost $1,260,843,865) | | | 1,370,030,586 |
| | | Shares | |
| FOREIGN COMMON STOCKS SOLD SHORT — (5.3)% |
| Australia — (0.4)% | |
| Alumina, Ltd. | (101,237) | (163,399) |
| AMP, Ltd. | (151,200) | (203,190) |
| APA Group | (13,591) | (105,866) |
| Challenger, Ltd. | (257,413) | (1,461,374) |
| Domino’s Pizza Enterprises, Ltd. | (3,418) | (125,590) |
| SEEK, Ltd. | (65,187) | (1,031,549) |
| Seven Group Holdings, Ltd. | (5,728) | (78,262) |
| TPG Telecom, Ltd. | (7,799) | (36,724) |
| Worley, Ltd. | (183,974) | (1,976,579) |
| | | | (5,182,533) |
| Belgium — (0.2)% | |
| Umicore SA | (44,481) | (2,163,419) |
| Denmark — (0.2)% | |
| AP Moeller - Maersk A/S Class B | (595) | (858,134) |
| Chr. Hansen Holding A/S | (8,299) | (659,500) |
| Dfds A/S | (14,174) | (691,482) |
| | | | (2,209,116) |
| Finland — (0.1)% | |
| Outokumpu OYJ | (269,465) | (849,250) |
| France — (0.3)% | |
| Altran Technologies SA | (10,338) | (164,201) |
| Bollore SA | (170,345) | (743,286) |
| Bollore SA (Euronext Paris Exchange)* | (1,287) | (5,477) |
| Elior Group SA 144A | (61,221) | (899,598) |
| Eurofins Scientific SE | (842) | (466,758) |
| Faurecia SE | (5,913) | (318,564) |
| Iliad SA | (4,572) | (592,588) |
| Technicolor SA* | (45,836) | (35,193) |
| Valeo SA | (35,317) | (1,244,310) |
| Worldline SA 144A* | (2,289) | (162,142) |
| | | | (4,632,117) |
| Germany — (1.0)% | |
| Aurubis AG | (2,075) | (126,848) |
| Delivery Hero SE 144A* | (35,955) | (2,849,767) |
| Deutsche Bank AG | (440,443) | (3,412,782) |
| Innogy SE 144A | (1,983) | (99,171) |
| thyssenkrupp AG | (260,562) | (3,501,200) |
See Notes to Financial Statements.
| | | Shares | | Value |
| TUI AG | (5,664) | | $(71,559) |
| United Internet AG | (34,744) | | (1,137,841) |
| Zalando SE 144A* | (29,898) | | (1,507,761) |
| | | | | (12,706,929) |
| Ireland — (0.3)% | | |
| James Hardie Industries PLC CDI | (184,463) | | (3,607,685) |
| Italy — (0.4)% | | |
| Autogrill SpA | (9,273) | | (97,075) |
| FinecoBank Banca Fineco SpA | (175,843) | | (2,109,380) |
| Freni Brembo SpA | (100,789) | | (1,251,362) |
| Pirelli & C SpA 144A | (197,819) | | (1,141,747) |
| Saipem SpA* | (180,832) | | (884,398) |
| Tenaris SA | (11,010) | | (124,743) |
| | | | | (5,608,705) |
| Japan — (0.7)% | | |
| Coca-Cola Bottlers Japan Holdings, Inc. | (12,400) | | (316,824) |
| CyberAgent, Inc. | (15,900) | | (553,889) |
| Daiichi Sankyo Co., Ltd. | (5,900) | | (389,661) |
| FamilyMart Co., Ltd. | (4,700) | | (112,563) |
| Hokuriku Electric Power Co.* | (28,200) | | (205,780) |
| Japan Airport Terminal Co., Ltd. | (9,300) | | (516,011) |
| Kansai Electric Power Co., Inc. (The) | (57,600) | | (667,285) |
| Kobe Steel, Ltd. | (22,700) | | (121,630) |
| Kyushu Electric Power Co., Inc. | (21,700) | | (188,269) |
| MonotaRO Co., Ltd. | (24,200) | | (644,228) |
| Nippon Paint Holdings Co., Ltd. | (32,000) | | (1,647,414) |
| Suzuki Motor Corporation | (48,000) | | (2,003,614) |
| Taiyo Nippon Sanso Corporation | (22,300) | | (493,587) |
| Yaskawa Electric Corporation | (19,700) | | (742,119) |
| | | | | (8,602,874) |
| Netherlands — (0.6)% | | |
| Altice Europe NV* | (285,005) | | (1,837,579) |
| ArcelorMittal | (118,272) | | (2,075,157) |
| Boskalis Westminster | (30,804) | | (787,805) |
| Koninklijke Vopak NV | (10,735) | | (581,963) |
| OCI NV* | (41,800) | | (879,133) |
| SBM Offshore NV | (46,755) | | (870,064) |
| Takeaway.com NV 144A* | (15,353) | | (1,415,604) |
| | | | | (8,447,305) |
| Norway — (0.2)% | | |
| Adevinta ASA* | (28,619) | | (339,022) |
| Norsk Hydro ASA | (24,069) | | (89,503) |
| Schibsted ASA Class A | (35,469) | | (1,073,131) |
| Subsea 7 SA | (43,704) | | (522,837) |
| | | | | (2,024,493) |
| Papua New Guinea — (0.0)% | | |
| Oil Search, Ltd. | (100,760) | | (512,635) |
| Singapore — (0.0)% | | |
| Keppel Corporation, Ltd. | (15,600) | | (78,525) |
| Spain — (0.3)% | | |
| Cellnex Telecom SA 144A* | (92,198) | | (3,968,168) |
| | | Shares | | Value |
| Sweden — (0.1)% | | |
| BillerudKorsnas AB | (16,620) | | $(196,390) |
| Millicom International Cellular SA SDR | (10,368) | | (497,912) |
| Saab AB, B Shares | (14,240) | | (477,543) |
| | | | | (1,171,845) |
| Switzerland — (0.2)% | | |
| Idorsia, Ltd.* | (16,354) | | (505,652) |
| Lonza Group AG* | (883) | | (322,125) |
| Sika AG | (4,348) | | (816,535) |
| Temenos AG* | (466) | | (73,716) |
| Vifor Pharma AG | (5,646) | | (1,030,425) |
| | | | | (2,748,453) |
| United Kingdom — (0.3)% | | |
| ASOS PLC* | (14,650) | | (654,544) |
| Capita PLC* | (56,613) | | (123,058) |
| Hargreaves Lansdown PLC | (6,898) | | (176,803) |
| John Wood Group PLC | (149,891) | | (791,204) |
| NMC Health PLC | (43,032) | | (1,007,193) |
| Ocado Group PLC* | (28,922) | | (489,986) |
| Severn Trent PLC | (15,550) | | (518,028) |
| SSE PLC | (4,967) | | (94,643) |
| St. James’s Place PLC | (10,242) | | (157,982) |
| Thomas Cook Group PLCΨ†††* | (56,628) | | (2,589) |
| United Utilities Group PLC | (11,243) | | (140,496) |
| Virgin Money UK PLC | (40,316) | | (100,691) |
| Weir Group PLC (The) | (11,786) | | (235,659) |
| | | | | (4,492,876) |
Total Foreign Common Stocks Sold Short
(Proceeds $(62,197,906)) | | (69,006,928) |
| FOREIGN PREFERRED STOCKS SOLD SHORT — (0.0)% |
| Germany — (0.0)% | | |
Sartorius AG 0.33%, 03/29/19
(Proceeds $(403,162)) | (2,084) | | (445,480) |
TOTAL SECURITIES SOLD SHORT —(5.3)%
(Cost $(62,601,068)) | | (69,452,408) |
Other Assets in Excess of
Liabilities — 1.0% | | | 13,591,560 |
| NET ASSETS — 100.0% | | | $1,314,169,738 |
See Notes to Financial Statements.
INTERNATIONAL EQUITY FUND
SCHEDULE OF INVESTMENTS (Continued)
Futures Contracts outstanding at December 31, 2019:
| Future Type | | Expiration Date | | Open Long
(Short) Contracts | | Notional
Market Value
of Contracts | | Value and
Unrealized
Appreciation
(Depreciation) |
| CAC 40 Index | | 01/2020 | | 349 | | $23,370,958 | | $7,421 |
| IBEX 35 Index | | 01/2020 | | 106 | | 11,329,169 | | (85,862) |
| OMXS30 Index | | 01/2020 | | (198) | | (3,737,993) | | 41,964 |
| Hang Seng Index | | 01/2020 | | 10 | | 1,813,970 | | 15,404 |
| AEX Index | | 01/2020 | | (49) | | (6,646,492) | | 35,781 |
| Topix Index® | | 03/2020 | | 84 | | 13,304,864 | | (30,702) |
| ASX SPI 200 Index | | 03/2020 | | (75) | | (8,688,104) | | 238,194 |
| S&P/TSX 60 Index | | 03/2020 | | (80) | | (12,474,221) | | 3,455 |
| DAX Index | | 03/2020 | | 17 | | 6,314,905 | | (16,353) |
| FTSE 100 Index® | | 03/2020 | | (119) | | (11,820,480) | | (9,124) |
| FTSE/MIB Index | | 03/2020 | | 160 | | 21,007,199 | | (62,162) |
| MSCI EAFE Index E-Mini | | 03/2020 | | 196 | | 19,957,700 | | 49,989 |
| Total Futures Contracts outstanding at December 31, 2019 | | | | | | $53,731,475 | | $188,005 |
Forward Foreign Currency Contracts outstanding at December 31, 2019:
| Expiration Date | | Currency
Purchased | | Amount
of Currency
Purchased | | Currency
Sold | | Amount
of Currency
Sold | | Counter-
party | | Net Unrealized
Appreciation
(Depreciation) |
| 03/18/20 | | Australian Dollars | | 63,859,000 | | U.S. Dollars | | 43,574,657 | | CITI | | $1,325,504 |
| 03/18/20 | | Canadian Dollars | | 36,175,000 | | U.S. Dollars | | 27,260,947 | | CITI | | 604,686 |
| 03/18/20 | | British Pounds | | 20,907,000 | | U.S. Dollars | | 27,172,021 | | CITI | | 581,190 |
| 03/18/20 | | Euro | | 10,871,000 | | U.S. Dollars | | 12,100,770 | | CITI | | 153,304 |
| 03/18/20 | | New Zealand Dollars | | 3,041,000 | | U.S. Dollars | | 1,992,970 | | CITI | | 56,555 |
| 03/18/20 | | Norwegian Kroner | | 6,536,000 | | U.S. Dollars | | 712,472 | | CITI | | 32,177 |
| 03/18/20 | | Danish Kroner | | 2,824,000 | | U.S. Dollars | | 421,705 | | CITI | | 4,512 |
| 03/18/20 | | Israeli Shekels | | 4,212,250 | | U.S. Dollars | | 1,220,524 | | CITI | | 4,475 |
| 03/18/20 | | Swedish Kronor | | 1,079,000 | | U.S. Dollars | | 112,677 | | CITI | | 2,958 |
| 03/18/20 | | Japanese Yen | | 109,179,000 | | U.S. Dollars | | 1,008,229 | | CITI | | 1,085 |
| 03/18/20 | | Singapore Dollars | | 151,000 | | U.S. Dollars | | 111,353 | | CITI | | 1,006 |
| 03/18/20 | | Swiss Francs | | 22,000 | | U.S. Dollars | | 22,405 | | CITI | | 453 |
| 03/18/20 | | Hong Kong Dollars | | 2,337,000 | | U.S. Dollars | | 299,337 | | CITI | | 389 |
| Subtotal Appreciation | | | | | | | | | | $2,768,294 |
| 03/18/20 | | U.S. Dollars | | 87,072 | | Israeli Shekels | | 300,000 | | CITI | | $(173) |
| 03/18/20 | | Israeli Shekels | | 1,344,750 | | U.S. Dollars | | 391,464 | | CITI | | (386) |
| 03/18/20 | | U.S. Dollars | | 16,696 | | New Zealand Dollars | | 26,000 | | CITI | | (825) |
| 03/18/20 | | U.S. Dollars | | 815,944 | | Hong Kong Dollars | | 6,393,000 | | CITI | | (3,979) |
| 03/18/20 | | Japanese Yen | | 211,256,000 | | U.S. Dollars | | 1,958,332 | | CITI | | (5,360) |
| 03/18/20 | | U.S. Dollars | | 738,930 | | Singapore Dollars | | 1,004,000 | | CITI | | (8,144) |
| 03/18/20 | | U.S. Dollars | | 1,781,264 | | Euro | | 1,597,000 | | CITI | | (18,916) |
| 06/17/20 | | U.S. Dollars | | 1,368,059 | | Swiss Francs | | 1,330,000 | | NT | | (22,824) |
| 03/18/20 | | U.S. Dollars | | 2,299,630 | | Danish Kroner | | 15,398,000 | | CITI | | (24,343) |
| 03/18/20 | | U.S. Dollars | | 2,331,810 | | Canadian Dollars | | 3,070,000 | | CITI | | (33,014) |
| 03/18/20 | | U.S. Dollars | | 9,323,378 | | Swedish Kronor | | 89,085,000 | | CITI | | (223,750) |
| 03/18/20 | | U.S. Dollars | | 14,814,485 | | Australian Dollars | | 21,561,000 | | CITI | | (345,357) |
| 03/18/20 | | U.S. Dollars | | 19,879,304 | | British Pounds | | 15,355,000 | | CITI | | (503,848) |
| 03/18/20 | | U.S. Dollars | | 14,849,217 | | Norwegian Kroner | | 135,389,000 | | CITI | | (575,704) |
| 03/18/20 | | U.S. Dollars | | 42,174,974 | | Swiss Francs | | 41,562,000 | | CITI | | (1,010,055) |
| Subtotal Depreciation | | | | | | | | | | $(2,776,678) |
| Total Forward Foreign Currency Contracts outstanding at December 31, 2019 | | | | $(8,384) |
See Notes to Financial Statements.
Swap Agreements outstanding at December 31, 2019:
| Pay Rate Index/Pay Rate | | Receive
Rate/Receive
Rate Index | | Maturity
Date | | Counterparty | | Currency | | Notional
Amount | | Market Value | | Upfront
Premiums
Paid/
(Received) | | Unrealized
Appreciation
(Depreciation) |
| Total Return Swaps | | | | | | | | | | | | | | | | |
| Financing Index: 1-Month EURIBOR + 0.05% (Monthly) | | MSCI Spain Net Return EUR Index | | 3/18/2020 | | GSC | | EUR | | 66,007 | | $1,899 | | $— | | $1,899 |
| Financing Index: 1-Month EURIBOR + 0.10% (Monthly) | | MSCI Italy Net Return EUR Index | | 3/18/2020 | | GSC | | EUR | | 8,845,253 | | 164,369 | | — | | 164,369 |
| MSCI Australia Net Return AUD Index | | Financing Index: 1-Month ASX BBSW + 0.20% (Monthly) | | 3/18/2020 | | GSC | | AUD | | 2,282,569 | | 6,438 | | — | | 6,438 |
| Subtotal Appreciation | | | | | | | | | | | | $172,706 | | $ — | | $172,706 |
| MSCI Canada Net Return CAD Index | | Financing Index: 1-Month CDOR - 0.60% (Monthly) | | 3/18/2020 | | GSC | | CAD | | 458,726 | | $(2,275) | | $— | | $(2,275) |
| MSCI Netherlands Net Return EUR Index | | Financing Index: 1-Month EURIBOR + 0.14% (Monthly) | | 3/18/2020 | | GSC | | EUR | | 2,674,875 | | (49,898) | | — | | (49,898) |
| MSCI Sweden Net Return SEK Index | | Financing Index: 1-Month STIBOR + 0.20% (Monthly) | | 3/18/2020 | | GSC | | SEK | | 93,389,149 | | (230,577) | | — | | (230,577) |
| MSCI Switzerland Net Return CHF Index | | Financing Index: 1-Month ICE LIBOR CHF - 0.35% (Monthly) | | 3/18/2020 | | GSC | | CHF | | 3,140,657 | | (71,184) | | — | | (71,184) |
| Increase in total return of Swiss Market Index (At Termination) | | Decreases in total return of Swiss Market Index (At Termination) | | 3/20/2020 | | CITI | | CHF | | 3,472,260 | | (24,994) | | — | | (24,994) |
| Increase in total return of Swiss Market Index (At Termination) | | Decreases in total return of Swiss Market Index (At Termination) | | 3/20/2020 | | JPM | | CHF | | 315,660 | | (1,510) | | — | | (1,510) |
| Subtotal Depreciation | | | | | | | | | | | | $(380,438) | | $ — | | $(380,438) |
| Net Total Return Swaps outstanding at December 31, 2019 | | $(207,732) | | $ — | | $(207,732) |
See Notes to Financial Statements.
INTERNATIONAL EQUITY FUND
SCHEDULE OF INVESTMENTS (Continued)
VALUATION HIERARCHY
The following is a summary of the inputs used, as of December 31, 2019, in valuing the Fund’s investments carried at fair value:
| | Total
Value | | Level 1
Quoted Prices | | Level 2
Other Significant
Observable Inputs | | Level 3
Significant
Unobservable Inputs |
| Assets: | | | | | | | |
| Investments in Securities: | | | | | | | |
| Common Stocks | $23,531,207 | | $23,531,207 | | $— | | $— |
| Foreign Common Stocks: | | | | | | | |
| Austria | 1,489,987 | | — | | 1,489,987 | | — |
| Denmark | 21,436,267 | | — | | 21,436,267 | | — |
| Finland | 5,140,675 | | — | | 5,140,675 | | — |
| Germany | 133,685,676 | | — | | 133,685,676 | | — |
| Indonesia | 1,409,368 | | — | | 1,409,368 | | — |
| Italy | 36,109,999 | | — | | 36,109,999 | | — |
| Japan | 218,943,592 | | — | | 218,943,592 | | — |
| Netherlands | 42,237,515 | | 27,673,705 | | 14,563,810 | | — |
| Norway | 3,845,197 | | — | | 3,845,197 | | — |
| South Korea | 5,644,377 | | — | | 5,644,377 | | — |
| Sweden | 36,290,130 | | — | | 36,290,130 | | — |
| Switzerland | 124,393,651 | | 7,387,860 | | 117,005,791 | | — |
| United Kingdom | 193,208,566 | | 191,584,797 | | 1,623,769 | | — |
| Other^^ | 458,552,032 | | 458,552,032 | | — | | —** |
| Total Foreign Common Stocks | 1,282,387,032 | | 685,198,394 | | 597,188,638 | | — |
| Foreign Preferred Stocks | 2,412,777 | | — | | 2,412,777 | | — |
| Money Market Funds | 60,505,949 | | 60,505,949 | | — | | — |
| U.S. Treasury Obligation | 1,193,621 | | — | | 1,193,621 | | — |
| Total Assets - Investments in Securities | $1,370,030,586 | | $769,235,550 | | $600,795,036 | | $ — |
| Other Financial Instruments*** | | | | | | | |
| Forward Foreign Currency Contracts | $2,768,294 | | $— | | $2,768,294 | | $— |
| Futures Contracts | 392,208 | | 392,208 | | — | | — |
| Swap Agreements | 172,706 | | — | | 172,706 | | — |
| Total Assets - Other Financial Instruments | $3,333,208 | | $392,208 | | $2,941,000 | | $ — |
See Notes to Financial Statements.
| | Total
Value | | Level 1
Quoted Prices | | Level 2
Other Significant
Observable Inputs | | Level 3
Significant
Unobservable Inputs |
| Liabilities: | | | | | | | |
| Investments in Securities: | | | | | | | |
| Foreign Common Stocks Sold Short: | | | | | | | |
| Denmark | $(2,209,116) | | $— | | $(2,209,116) | | $— |
| Finland | (849,250) | | — | | (849,250) | | — |
| Germany | (12,706,929) | | (71,559) | | (12,635,370) | | — |
| Italy | (5,608,705) | | — | | (5,608,705) | | — |
| Japan | (8,602,874) | | — | | (8,602,874) | | — |
| Norway | (2,024,493) | | — | | (2,024,493) | | — |
| Sweden | (1,171,845) | | — | | (1,171,845) | | — |
| Switzerland | (2,748,453) | | — | | (2,748,453) | | — |
| United Kingdom | (4,492,876) | | (4,490,287) | | — | | (2,589) |
| Other^^ | (28,592,387) | | (28,592,387) | | — | | — |
| Total Foreign Common Stocks Sold Short | (69,006,928) | | (33,154,233) | | (35,850,106) | | (2,589) |
| Foreign Preferred Stocks Sold Short | (445,480) | | — | | (445,480) | | — |
| Total Liabilities - Investments in Securities | $(69,452,408) | | $(33,154,233) | | $(36,295,586) | | $(2,589) |
| Other Financial Instruments*** | | | | | | | |
| Forward Foreign Currency Contracts | $(2,776,678) | | $— | | $(2,776,678) | | $— |
| Futures Contracts | (204,203) | | (204,203) | | — | | — |
| Swap Agreements | (380,438) | | — | | (380,438) | | — |
| Total Liabilities - Other Financial Instruments | $(3,361,319) | | $(204,203) | | $(3,157,116) | | $ — |
| ^^ | Classifications as defined in the Schedule of Investments. |
| ** | Level 3 security has zero value. |
| *** | Other financial instruments are derivative instruments, such as futures contracts, forwards contracts and swap agreements, which are valued at the unrealized appreciation (depreciation) on the investment. Further details regarding the value of these investments can be found in the preceding "Futures Contracts outstanding", "Forwards Foreign Currency Contracts outstanding" and "Swap Agreements outstanding" disclosures. |
Management has determined that the amount of Level 3 securities compared to total net assets is not material; therefore, the reconciliation of Level 3 securities and assumptions is not shown for the year ended December 31, 2019.
See Notes to Financial Statements.
Emerging Markets Equity Fund(Unaudited)
Despite an annual return of 18.42% (measured by the MSCI Emerging Markets Index), emerging markets equity securities underperformed their developed markets counterparts during 2019. China, Taiwan and Brazil were the largest contributors to index returns, and U.S.-based investors benefited from a rebound in emerging markets currencies. Technology and consumer discretionary were the best performing sectors during the year, while the health care and materials sectors were the worst performers.
The Fund is actively managed and invests mainly in equity securities that are economically tied to emerging markets. In addition, the Fund’s portfolio is diversified among a large number of companies across different industries and economic sectors. The Investor Class of the Fund outperformed its benchmark, the MSCI Emerging Markets Index, for the one-year period ended December 31, 2019 (19.64% versus 18.42%). On a country basis, security selection in South Korea and the avoidance of Saudi Arabian stocks contributed to benchmark-relative performance. Security selection in India and an underweight to the Russian equity market were the largest detractors. The technology sector was by far the strongest contributor to relative performance, driven by strong stock selection, and was followed closely by the health care sector. On the detractors’ front, security selection within real estate and consumer discretionary sectors acted as headwinds to Fund performance.
Within the Fund, certain derivatives were utilized to express active views in currency and country selection. These derivative positions primarily included currency forward contracts, stock index futures and stock index future swaps. Overall, derivative exposure had a slight positive impact on Fund performance over the course of the year.
This Fund may be suitable to investors who seek higher, long-term rates of return, can accept significant short-term fluctuations in account value and want to diversify their portfolio with emerging markets equity securities. Securities of foreign issuers may be negatively impacted by political events, economic conditions or inefficient, illiquid or unregulated markets in foreign countries, and they also may be subject to inadequate regulatory or accounting standards, which may increase investment risk. Investing in emerging markets may involve greater risks than investing in more developed foreign markets because, among other things, emerging markets often have more political and economic instability. Medium- and small-sized companies’ stocks have historically been subject to more investment risk and more volatile and less liquid than large company stocks, respectively. To the extent that the investment adviser misjudges current market conditions, the Fund’s volatility may be amplified by its use of derivatives, and by its ability to select sub-advisers to allocate assets. Derivatives involve different risks from, and in some respects greater risks than, those associated with investing directly in securities, currencies or other instruments. Derivatives may be illiquid or less liquid, volatile, difficult to price and leveraged so that small changes in the value of the underlying instruments may produce disproportionate losses to the Fund. It is possible to lose money by investing in the Fund.
At December 31, 2019, the portfolio holdings of the Fund, as a percentage of net assets, is shown in the following table. Portfolio holdings are subject to risk and may change at any time.
| | % |
| Financials | 21.2 |
| Information Technology | 20.6 |
| Consumer Discretionary | 15.0 |
| Communication Services | 8.5 |
| Consumer Staples | 8.3 |
| Money Market Funds | 5.7 |
| Materials | 5.0 |
| Energy | 4.2 |
| Industrials | 3.6 |
| Utilities | 2.8 |
| Health Care | 2.6 |
| Real Estate | 1.9 |
| U.S. Treasury Obligation | 0.3 |
| | 99.7 |
See Notes to Financial Statements.
Emerging Markets Equity Fund(Unaudited)
| Average Annual Total Returns as of 12/31/19 | |
| | | Institutional Class* | | Investor Class* | | Benchmark** | |
| One Year | | 20.06% | | 19.64% | | 18.42% | |
| Five Year | | 3.64% | | 3.34% | | 5.61% | |
| Ten year | | N/A | | N/A | | N/A | |
| Since Inception | | 1.82% | | 1.54% | | 3.66% | |
| Inception Date | | 10/31/13 | | 10/31/13 | | | |
| Total Fund Operating Expenses (April 30, 2019 Prospectus)(1) | | 1.24% | | 1.55% | | | |
| (1) | Current information regarding the Fund’s Operating Expenses can be found in the Financial Highlights. |
The performance data quoted represents past performance and does not guarantee future results. Current performance may be lower or higher. Performance data current to the most recent month-end may be obtained at GuideStoneFunds.com. The investment return and principal value of an investment will fluctuate so that shares, when redeemed, may be worth more or less than their original cost.
The Adviser has agreed to waive fees and/or reimburse expenses to the extent needed to limit total annual operating expenses (before expense payments by broker-dealers and excluding interest, taxes, brokerage commissions, extraordinary expenses, acquired fund fees and expenses and expenses incurred in connection with the short sales of securities) to 1.32% for the Institutional Class and 1.57% for the Investor Class. This contractual waiver and reimbursement applies to Fund operating expenses only and will remain in place until April 30, 2020. Institutional Net Expense Ratio - 1.28% and Investor Net Expense Ratio - 1.57%.
The graph illustrates the results of a hypothetical $10,000 investment in the Investor Class of the Fund since October 31, 2013 (commencement of operations), with all dividends and capital gains reinvested, with the MSCI Emerging Markets Index.
*These returns reflect investment advisory and shareholder servicing fee waivers, if applicable, during the reported time periods.
**Unlike a mutual fund, the performance of an index assumes no taxes, transaction costs, management fees or other expenses.
See Notes to Financial Statements.
EMERGING MARKETS EQUITY FUND
| | | Shares | | Value |
| COMMON STOCKS — 3.1% |
| Communication Services — 0.1% | | |
| Autohome, Inc. ADRΔ* | 1,273 | | $101,853 |
| JOYY, Inc. ADR* | 1,059 | | 55,904 |
| Momo, Inc. ADR | 2,542 | | 85,157 |
| Sea, Ltd. ADR* | 9,803 | | 394,277 |
| | | | | 637,191 |
| Consumer Discretionary — 1.3% | | |
| GSX Techedu, Inc. ADR* | 26,446 | | 578,110 |
| Huazhu Group, Ltd. ADR | 3,029 | | 121,372 |
| MercadoLibre, Inc.* | 3,412 | | 1,951,459 |
| Pinduoduo, Inc. ADR* | 5,417 | | 204,871 |
| Trip.com Group, Ltd. ADR* | 57,546 | | 1,930,093 |
| Yum China Holdings, Inc. | 43,994 | | 2,112,152 |
| | | | | 6,898,057 |
| Financials — 0.3% | | |
| Intercorp Financial Services, Inc.Δ* | 11,122 | | 459,338 |
| LexinFintech Holdings, Ltd. ADRΔ* | 32,845 | | 456,217 |
| XP, Inc. Class A* | 9,840 | | 379,037 |
| | | | | 1,294,592 |
| Health Care — 0.2% | | |
| Zai Lab, Ltd. ADR* | 30,074 | | 1,250,778 |
| Industrials — 0.3% | | |
| Copa Holdings SA Class A | 13,897 | | 1,501,988 |
| ZTO Express Cayman, Inc. ADR | 8,419 | | 196,583 |
| | | | | 1,698,571 |
| Information Technology — 0.9% | | |
| Globant SA* | 9,961 | | 1,056,364 |
| Huami Corporation ADR* | 29,004 | | 348,628 |
| Pagseguro Digital, Ltd. Class AΔ* | 47,070 | | 1,607,912 |
| StoneCo, Ltd. Class AΔ* | 36,553 | | 1,458,099 |
| | | | | 4,471,003 |
| Materials — 0.0% | | |
| Southern Copper CorporationΔ | 2,441 | | 103,694 |
Total Common Stocks
(Cost $14,658,158) | | 16,353,886 |
| FOREIGN COMMON STOCKS — 89.4% |
| Argentina — 0.1% | | |
| YPF SA ADR | 56,178 | | 650,541 |
| Brazil — 6.4% | | |
| Atacadao SA* | 115,100 | | 668,105 |
| B3 SA - Brasil Bolsa Balcao | 498,700 | | 5,327,054 |
| Banco BTG Pactual SA* | 55,200 | | 1,044,666 |
| Banco do Brasil SA* | 344,200 | | 4,519,513 |
| Banco Pan SA* | 21,170 | | 55,731 |
| BB Seguridade Participacoes SA | 15,300 | | 143,389 |
| BRF SA* | 41,500 | | 363,139 |
| CCR SA | 313,100 | | 1,477,276 |
| Cia de Saneamento Basico do Estado de Sao Paulo ADR* | 79,852 | | 1,201,773 |
| | | Shares | | Value |
| Cielo SA | 426,700 | | $887,831 |
| Embraer SA ADR | 4,479 | | 87,296 |
| IRB Brasil Resseguros SA | 85,800 | | 830,763 |
| JBS SA | 270,000 | | 1,731,673 |
| Localiza Rent a Car SA | 106,575 | | 1,256,052 |
| Lojas Renner SA* | 224,829 | | 3,140,463 |
| Minerva SA* | 164,100 | | 523,789 |
| Notre Dame Intermedica Participacoes SA | 30,300 | | 514,076 |
| Petrobras Distribuidora SA | 119,600 | | 894,019 |
| Petroleo Brasileiro SA ADR* | 150,362 | | 2,396,770 |
| Raia Drogasil SA* | 61,400 | | 1,704,004 |
| Sao Martinho SA | 116,300 | | 685,767 |
| TIM Participacoes SA ADRΔ* | 84,822 | | 1,620,948 |
| TOTVS SA* | 18,300 | | 293,650 |
| Wiz Solucoes e Corretagem de Seguros SA | 142,800 | | 501,239 |
| YDUQS Part | 172,455 | | 2,036,347 |
| | | | | 33,905,333 |
| Canada — 0.2% | | |
| Parex Resources, Inc.* | 70,409 | | 1,309,443 |
| Chile — 0.5% | | |
| Aguas Andinas SA Class A | 437,204 | | 185,475 |
| Banco de Chile ADRΔ | 7,668 | | 160,952 |
| Banco de Credito e Inversiones SA | 1,824 | | 82,716 |
| Banco Santander Chile ADRΔ | 3,609 | | 83,260 |
| Cencosud SA | 530,602 | | 699,185 |
| Empresas CMPC SA | 31,139 | | 76,319 |
| Enel Americas SA ADR | 93,692 | | 1,028,738 |
| Enel Chile SA ADR | 30,848 | | 146,528 |
| | | | | 2,463,173 |
| China — 17.1% | | |
| 58.com, Inc. ADR* | 10,999 | | 711,965 |
| Agricultural Bank of China, Ltd. Class A | 571,300 | | 302,824 |
| Alibaba Group Holding, Ltd. ADR* | 111,063 | | 23,556,462 |
| Anhui Conch Cement Co., Ltd. Class A | 16,900 | | 133,036 |
| Anhui Conch Cement Co., Ltd. Class H | 112,500 | | 820,040 |
| BAIC Motor Corporation, Ltd. Class H 144A | 495,500 | | 281,061 |
| Baidu, Inc. ADR* | 6,128 | | 774,579 |
| Bank of Beijing Co., Ltd. Class A | 89,700 | | 73,188 |
| Bank of China, Ltd. Class A | 203,500 | | 107,868 |
| Bank of China, Ltd. Class H | 194,000 | | 82,905 |
| Bank of Communications Co., Ltd. Class A | 110,200 | | 89,123 |
| Bank of Ningbo Co., Ltd. Class A | 27,000 | | 109,180 |
| Bank of Shanghai Co., Ltd. Class A | 49,180 | | 67,043 |
| Baoshan Iron & Steel Co., Ltd. Class A | 60,900 | | 50,215 |
| Beijing Capital International Airport Co., Ltd. Class H | 478,000 | | 463,137 |
See Notes to Financial Statements.
| | | Shares | | Value |
| BOE Technology Group Co., Ltd. Class A | 182,300 | | $118,889 |
| China CITIC Bank Corporation, Ltd. Class H | 1,186,000 | | 710,781 |
| China Communications Services Corporation, Ltd. Class H | 1,114,000 | | 812,022 |
| China Construction Bank Corporation Class H | 2,342,000 | | 2,022,722 |
| China Everbright Bank Co., Ltd. Class A | 78,900 | | 49,982 |
| China Evergrande Group* | 224,785 | | 623,097 |
| China Fortune Land Development Co., Ltd. Class A | 18,753 | | 77,313 |
| China International Travel Service Corporation, Ltd. Class A | 102,312 | | 1,307,293 |
| China Medical System Holdings, Ltd. | 972,000 | | 1,399,566 |
| China Mengniu Dairy Co., Ltd.* | 130,000 | | 525,519 |
| China Merchants Bank Co., Ltd. Class A | 37,756 | | 203,818 |
| China Merchants Bank Co., Ltd. Class H | 312,000 | | 1,603,583 |
| China Merchants Securities Co., Ltd. Class A | 30,100 | | 79,083 |
| China Minsheng Banking Corporation, Ltd. Class A | 83,400 | | 75,595 |
| China National Building Material Co., Ltd. Class H | 1,420,000 | | 1,585,411 |
| China Oilfield Services, Ltd. Class H | 815,805 | | 1,279,357 |
| China Pacific Insurance Group Co., Ltd. Class A | 21,100 | | 114,692 |
| China Petroleum & Chemical Corporation Class A | 100,700 | | 73,918 |
| China Railway Construction Corporation, Ltd. Class A | 52,100 | | 75,889 |
| China Shipbuilding Industry Co., Ltd. Class A | 102,700 | | 77,304 |
| China State Construction Engineering Corporation, Ltd. Class A | 89,300 | | 72,092 |
| China Telecom Corporation, Ltd. Class H | 600,000 | | 247,167 |
| China Tower Corporation, Ltd. Class H 144A | 9,089,900 | | 2,006,420 |
| China United Network Communications, Ltd. Class A | 133,600 | | 113,037 |
| China Vanke Co., Ltd. Class H | 52,150 | | 222,526 |
| China Yangtze Power Co., Ltd. Class A | 101,550 | | 268,118 |
| CITIC Securities Co., Ltd. Class A | 29,000 | | 105,395 |
| Contemporary Amperex Technology Co., Ltd. Class A | 36,999 | | 565,499 |
| Country Garden Holdings Co., Ltd. | 207,632 | | 332,540 |
| CRRC Corporation, Ltd. Class A | 92,300 | | 94,667 |
| Daqin Railway Co., Ltd. Class A | 134,400 | | 158,505 |
| Foshan Haitian Flavouring & Food Co., Ltd. Class A | 13,700 | | 211,578 |
| Gree Electric Appliances, Inc. of Zhuhai Class A | 209,600 | | 1,974,527 |
| Guotai Junan Securities Co., Ltd. Class A | 33,500 | | 88,978 |
| Haier Smart Home Co., Ltd. Class A | 31,100 | | 87,115 |
| | | Shares | | Value |
| Haitong Securities Co., Ltd. Class A | 23,900 | | $53,077 |
| Haitong Securities Co., Ltd. Class H | 1,379,791 | | 1,630,825 |
| Hangzhou Hikvision Digital Technology Co., Ltd. Class A | 34,000 | | 159,904 |
| Huaneng Renewables Corporation, Ltd. Class H | 3,926,000 | | 1,526,607 |
| Huatai Securities Co., Ltd. Class A | 26,736 | | 78,002 |
| Huaxia Bank Co., Ltd. Class A | 66,807 | | 73,607 |
| Industrial & Commercial Bank of China, Ltd. Class A | 169,700 | | 143,337 |
| Industrial Bank Co., Ltd. Class A | 40,800 | | 116,045 |
| Inner Mongolia Yili Industrial Group Co., Ltd. Class A | 26,909 | | 119,596 |
| JD.com, Inc. ADR* | 18,849 | | 664,050 |
| Jiangsu Hengrui Medicine Co., Ltd. Class A | 17,928 | | 225,393 |
| Luxshare Precision Industry Co., Ltd. Class A | 29,565 | | 155,014 |
| Midea Group Co., Ltd. Class A | 14,609 | | 122,241 |
| NARI Technology Co., Ltd. Class A | 170,251 | | 517,984 |
| NetEase, Inc. ADR | 1,533 | | 470,079 |
| New China Life Insurance Co., Ltd. Class A | 10,500 | | 74,133 |
| New China Life Insurance Co., Ltd. Class H | 109,400 | | 470,323 |
| New Oriental Education & Technology Group, Inc. ADR* | 9,412 | | 1,141,205 |
| PetroChina Co., Ltd. Class A | 88,200 | | 73,865 |
| Pharmaron Beijing Co., Ltd. Class H 144A* | 65,087 | | 363,344 |
| PICC Property & Casualty Co., Ltd. Class H | 1,043,803 | | 1,257,820 |
| Ping An Bank Co., Ltd. Class A | 36,900 | | 87,195 |
| Ping An Insurance Group Co. of China, Ltd. Class A | 20,100 | | 246,751 |
| Ping An Insurance Group Co. of China, Ltd. Class H | 704,500 | | 8,326,739 |
| Sany Heavy Industry Co., Ltd. Class A | 53,000 | | 129,808 |
| Shandong Weigao Group Medical Polymer Co., Ltd. Class H | 312,000 | | 373,969 |
| Shanghai International Airport Co., Ltd. Class A | 40,700 | | 460,411 |
| Shanghai Pudong Development Bank Co., Ltd. Class A | 60,200 | | 106,971 |
| Shenwan Hongyuan Group Co., Ltd. Class A | 160,100 | | 117,750 |
| Sinopec Engineering Group Co., Ltd. Class H | 259,000 | | 154,889 |
| Sinopharm Group Co., Ltd. Class H | 192,000 | | 701,000 |
| Sunac China Holdings, Ltd. | 67,859 | | 405,379 |
| Suning.com Co., Ltd. Class A | 70,175 | | 101,914 |
| Sunny Optical Technology Group Co., Ltd. | 48,100 | | 832,705 |
| TAL Education Group ADR* | 8,608 | | 414,906 |
| Tencent Holdings, Ltd. | 436,030 | | 21,017,269 |
| Vipshop Holdings, Ltd. ADR* | 8,678 | | 122,967 |
| Weichai Power Co., Ltd. Class H | 219,000 | | 462,041 |
| WuXi AppTec Co., Ltd. Class H 144A | 46,620 | | 578,240 |
See Notes to Financial Statements.
EMERGING MARKETS EQUITY FUND
SCHEDULE OF INVESTMENTS (Continued)
| | | Shares | | Value |
| Yonghui Superstores Co., Ltd. Class A | 87,700 | | $94,989 |
| Zhejiang Expressway Co., Ltd. Class H | 58,000 | | 52,847 |
| | | | | 91,211,815 |
| Czech Republic — 0.1% | | |
| Moneta Money Bank AS 144A | 201,708 | | 756,840 |
| Egypt — 0.1% | | |
| Commercial International Bank Egypt SAE GDR | 67,806 | | 345,811 |
| Greece — 0.4% | | |
| JUMBO SA | 74,048 | | 1,540,756 |
| Sarantis SA | 49,653 | | 474,528 |
| | | | | 2,015,284 |
| Hong Kong — 10.2% | | |
| AAC Technologies Holdings, Inc.Δ | 92,500 | | 807,207 |
| AIA Group, Ltd. | 1,010,625 | | 10,609,079 |
| ANTA Sports Products, Ltd. | 185,000 | | 1,655,962 |
| Beijing Enterprises Holdings, Ltd. | 19,500 | | 89,463 |
| Bosideng International Holdings, Ltd. | 1,418,000 | | 511,348 |
| China Jinmao Holdings Group, Ltd. | 122,000 | | 95,035 |
| China Lesso Group Holdings, Ltd. | 36,000 | | 46,153 |
| China Mobile, Ltd. | 357,496 | | 3,005,016 |
| China Overseas Land & Investment, Ltd. | 614,633 | | 2,393,916 |
| China Resources Cement Holdings, Ltd. | 56,398 | | 71,798 |
| China Resources Land, Ltd. | 781,997 | | 3,893,778 |
| China Resources Power Holdings Co., Ltd. | 636,000 | | 892,912 |
| CITIC, Ltd. | 336,000 | | 449,305 |
| CNOOC, Ltd. | 2,698,361 | | 4,487,861 |
| Country Garden Services Holdings Co., Ltd. | 244,000 | | 821,965 |
| CSPC Pharmaceutical Group, Ltd. | 1,403,124 | | 3,345,616 |
| Dali Foods Group Co., Ltd. 144A | 429,000 | | 317,664 |
| ENN Energy Holdings, Ltd. | 179,400 | | 1,960,385 |
| Far East Horizon, Ltd. | 66,000 | | 61,830 |
| FIT Hon Teng, Ltd. 144A | 1,065,000 | | 358,084 |
| Guangdong Investment, Ltd. | 22,000 | | 46,020 |
| Haier Electronics Group Co., Ltd. | 241,000 | | 753,096 |
| Hansoh Pharmaceutical Group Co., Ltd. 144A* | 18,000 | | 59,828 |
| Hengan International Group Co., Ltd. | 204,600 | | 1,457,246 |
| Hong Kong Exchanges and Clearing, Ltd. | 47,072 | | 1,528,331 |
| Hua Hong Semiconductor, Ltd. 144AΔ | 305,000 | | 693,582 |
| IMAX China Holding, Inc. 144A | 67,000 | | 141,355 |
| Innovent Biologics, Inc. 144A* | 275,000 | | 936,983 |
| Kingboard Laminates Holdings, Ltd. | 842,074 | | 1,043,907 |
| Kunlun Energy Co., Ltd. | 1,024,000 | | 904,113 |
| Li Ning Co., Ltd. | 315,000 | | 943,913 |
| Longfor Group Holdings, Ltd. 144A | 38,884 | | 182,137 |
| Meituan Dianping Class BΔ* | 112,488 | | 1,471,007 |
| Minth Group, Ltd.Δ | 174,000 | | 614,068 |
| Nexteer Automotive Group, Ltd.Δ | 559,000 | | 506,467 |
| Shenzhou International Group Holdings, Ltd. | 46,100 | | 673,843 |
| | | Shares | | Value |
| Shimao Property Holdings, Ltd. | 33,000 | | $127,896 |
| Sino Biopharmaceutical, Ltd. | 434,000 | | 607,086 |
| Sinotruk Hong Kong, Ltd. | 620,500 | | 1,323,449 |
| SSY Group, Ltd. | 1,058,050 | | 856,781 |
| Sun Art Retail Group, Ltd. | 45,500 | | 55,179 |
| Techtronic Industries Co., Ltd. | 55,000 | | 448,552 |
| Topsports International Holdings, Ltd. 144A | 283,000 | | 342,115 |
| Uni-President China Holdings, Ltd. | 680,000 | | 713,833 |
| Vitasoy International Holdings, Ltd. | 446,000 | | 1,616,917 |
| Xinyi Solar Holdings, Ltd. | 488,000 | | 346,321 |
| | | | | 54,268,402 |
| Hungary — 0.5% | | |
| OTP Bank Nyrt PLC | 53,978 | | 2,826,288 |
| India — 9.4% | | |
| Abbott India, Ltd. | 1,136 | | 208,100 |
| Aditya Birla Fashion and Retail, Ltd.* | 88,482 | | 287,221 |
| AIA Engineering, Ltd. | 21,709 | | 501,680 |
| Amber Enterprises India, Ltd. | 21,805 | | 341,273 |
| Ambuja Cements, Ltd. | 16,840 | | 46,301 |
| Apollo Hospitals Enterprise, Ltd. | 77,976 | | 1,575,291 |
| Atul, Ltd. | 4,035 | | 228,991 |
| Axis Bank, Ltd. | 119,365 | | 1,261,074 |
| Bajaj Finance, Ltd. | 9,225 | | 547,304 |
| Bharat Petroleum Corporation, Ltd. | 42,497 | | 292,658 |
| Coal India, Ltd. | 376,339 | | 1,114,336 |
| Colgate-Palmolive India, Ltd. | 3,446 | | 70,626 |
| Crompton Greaves Consumer Electricals, Ltd. | 93,591 | | 314,491 |
| Dalmia Bharat, Ltd. | 27,350 | | 306,651 |
| Divi's Laboratories, Ltd. | 25,006 | | 646,641 |
| Dr. Reddy's Laboratories, Ltd. | 3,981 | | 160,323 |
| Eicher Motors, Ltd. | 1,118 | | 352,658 |
| Emami, Ltd. | 170,142 | | 738,699 |
| GAIL India, Ltd. | 1,002,654 | | 1,700,398 |
| Godrej Consumer Products, Ltd. | 5,614 | | 53,841 |
| Godrej Industries, Ltd. | 103,245 | | 614,091 |
| HCL Technologies, Ltd. | 254,412 | | 2,024,870 |
| HDFC Bank, Ltd. | 131,888 | | 2,350,505 |
| Hero MotoCorp, Ltd. | 4,696 | | 160,729 |
| Hindalco Industries, Ltd. | 329,015 | | 996,336 |
| Hindustan Petroleum Corporation, Ltd. | 28,273 | | 104,769 |
| Hindustan Unilever, Ltd. | 24,930 | | 671,640 |
| Housing Development Finance Corporation, Ltd. | 214,816 | | 7,260,686 |
| ICICI Bank, Ltd. ADR | 68,562 | | 1,034,601 |
| ICICI Lombard General Insurance Co., Ltd. 144A | 34,942 | | 678,885 |
| Info Edge India, Ltd. | 18,122 | | 642,347 |
| Infosys, Ltd. | 71,564 | | 733,054 |
| Infosys, Ltd. ADR | 253,606 | | 2,617,214 |
| InterGlobe Aviation, Ltd. 144A | 16,125 | | 301,262 |
| Larsen & Toubro Infotech, Ltd. 144A | 12,609 | | 309,227 |
| LIC Housing Finance, Ltd. | 32,307 | | 196,504 |
| Mahindra & Mahindra, Ltd. | 428,033 | | 3,187,543 |
| Marico, Ltd. | 661,591 | | 3,166,228 |
| Maruti Suzuki India, Ltd. | 11,204 | | 1,156,626 |
See Notes to Financial Statements.
| | | Shares | | Value |
| MRF, Ltd. | 265 | | $246,259 |
| Navin Fluorine International, Ltd. | 25,014 | | 352,879 |
| NTPC, Ltd. | 139,633 | | 232,891 |
| Oil & Natural Gas Corporation, Ltd. | 901,446 | | 1,626,636 |
| Power Grid Corporation of India, Ltd. | 570,232 | | 1,519,886 |
| Prestige Estates Projects, Ltd. | 72,927 | | 345,692 |
| Procter & Gamble Hygiene & Health Care, Ltd. | 1,538 | | 246,651 |
| SBI Life Insurance Co., Ltd. 144A | 26,142 | | 352,183 |
| Tata Consultancy Services, Ltd. | 159,329 | | 4,825,307 |
| TeamLease Services, Ltd.* | 13,941 | | 484,344 |
| Tech Mahindra, Ltd. | 22,438 | | 239,632 |
| Thermax, Ltd. | 17,656 | | 267,790 |
| Wipro, Ltd. | 29,957 | | 103,161 |
| Zee Entertainment Enterprises, Ltd. | 124,792 | | 510,860 |
| | | | | 50,309,845 |
| Indonesia — 1.6% | | |
| PT Adaro Energy Tbk | 5,228,900 | | 584,337 |
| PT Bank Central Asia Tbk | 754,916 | | 1,815,578 |
| PT Bank Mandiri Persero Tbk | 4,047,752 | | 2,236,640 |
| PT Bank Negara Indonesia Persero Tbk | 643,531 | | 363,284 |
| PT BFI Finance Indonesia Tbk | 5,778,700 | | 233,104 |
| PT Bukit Asam Tbk | 302,800 | | 57,917 |
| PT Indofood CBP Sukses Makmur Tbk | 63,200 | | 50,751 |
| PT Indofood Sukses Makmur Tbk | 577,236 | | 329,131 |
| PT Link Net Tbk | 2,576,500 | | 734,950 |
| PT Map Aktif Adiperkasa* | 583,300 | | 222,690 |
| PT Perusahaan Gas Negara Tbk | 247,900 | | 38,653 |
| PT Semen Indonesia Persero Tbk | 511,600 | | 441,174 |
| PT Telekomunikasi Indonesia Persero Tbk | 2,148,900 | | 615,611 |
| PT United Tractors Tbk | 334,960 | | 518,618 |
| | | | | 8,242,438 |
| Isle of Man — 0.0% | | |
| NEPI Rockcastle PLC | 10,920 | | 96,546 |
| Malaysia — 0.8% | | |
| AirAsia Group Bhd | 1,105,540 | | 459,459 |
| DiGi.Com Bhd | 323,500 | | 352,722 |
| Hong Leong Bank Bhd. | 60,200 | | 254,605 |
| Malayan Banking Bhd | 456,316 | | 963,836 |
| Malaysia Airports Holdings | 261,300 | | 485,486 |
| MISC Bhd | 111,300 | | 227,198 |
| Petronas Chemicals Group Bhd | 82,699 | | 148,598 |
| Petronas Gas Bhd | 52,800 | | 214,530 |
| Public Bank Bhd | 91,716 | | 435,878 |
| RHB Bank Bhd | 336,200 | | 475,061 |
| Sime Darby Bhd | 154,000 | | 83,579 |
| Tenaga Nasional Bhd | 17,600 | | 57,053 |
| | | | | 4,158,005 |
| Mexico — 1.8% | | |
| Alfa SAB de CV Series A | 329,500 | | 272,906 |
| Alpek SAB de CV | 1,097,300 | | 1,215,837 |
| Arca Continental SAB de CV | 49,400 | | 261,298 |
| | | Shares | | Value |
| Bolsa Mexicana de Valores SAB de CV | 169,100 | | $371,872 |
| Fibra Uno Administracion SA de CV REIT | 123,161 | | 190,726 |
| Fomento Economico Mexicano SAB de CV ADR | 39,000 | | 3,685,890 |
| Gruma SAB de CV Series B | 13,650 | | 139,904 |
| Grupo Cementos de Chihuahua SAB de CV | 120,300 | | 642,300 |
| Grupo Financiero Banorte SAB de CV Series O | 69,310 | | 386,956 |
| Grupo Mexico SAB de CV Series B | 50,400 | | 138,558 |
| Kimberly-Clark de Mexico SAB de CV Series A* | 249,100 | | 495,763 |
| Unifin Financiera SAB de CV SOFOM ENR | 156,600 | | 256,755 |
| Wal-Mart de Mexico SAB de CV | 604,413 | | 1,735,160 |
| | | | | 9,793,925 |
| Netherlands — 0.6% | | |
| Prosus NV* | 21,582 | | 1,610,593 |
| Yandex NV Class A* | 40,075 | | 1,742,862 |
| | | | | 3,353,455 |
| Peru — 1.2% | | |
| Alicorp SAA Class C | 122,838 | | 341,114 |
| Banco BBVA Peru SA | 253,856 | | 262,821 |
| Credicorp, Ltd. | 24,965 | | 5,320,791 |
| Intercorp Financial Services, Inc. | 7,526 | | 307,813 |
| | | | | 6,232,539 |
| Philippines — 0.7% | | |
| Ayala Land, Inc. | 1,725,100 | | 1,547,261 |
| Bank of the Philippine Islands | 580,350 | | 1,007,262 |
| BDO Unibank, Inc. | 34,770 | | 108,474 |
| International Container Terminal Services, Inc. | 157,270 | | 398,576 |
| JG Summit Holdings, Inc. | 34,530 | | 55,032 |
| Jollibee Foods Corporation | 110,860 | | 472,354 |
| SM Prime Holdings, Inc. | 203,800 | | 169,156 |
| | | | | 3,758,115 |
| Poland — 0.9% | | |
| Bank Polska Kasa Opieki SA | 41,592 | | 1,100,670 |
| CD Projekt SA | 10,386 | | 765,861 |
| Cyfrowy Polsat SA | 35,091 | | 257,977 |
| Dino Polska SA 144A* | 15,721 | | 596,498 |
| PGE Polska Grupa Energetyczna SA* | 121,911 | | 255,461 |
| Polski Koncern Naftowy ORLEN SA | 18,708 | | 423,167 |
| Powszechna Kasa Oszczednosci Bank Polski SA | 139,607 | | 1,267,444 |
| Powszechny Zaklad Ubezpieczen SA | 24,620 | | 260,023 |
| | | | | 4,927,101 |
| Portugal — 0.2% | | |
| Galp Energia SGPS SA | 62,255 | | 1,040,488 |
| Qatar — 0.1% | | |
| Industries Qatar QSC | 17,530 | | 49,494 |
| Qatar Islamic Bank SAQ | 6,620 | | 27,873 |
See Notes to Financial Statements.
EMERGING MARKETS EQUITY FUND
SCHEDULE OF INVESTMENTS (Continued)
| | | Shares | | Value |
| Qatar National Bank QPSC | 108,220 | | $611,988 |
| | | | | 689,355 |
| Russia — 2.1% | | |
| Gazprom PJSC ADR | 134,246 | | 1,104,576 |
| LUKOIL PJSC ADR | 22,858 | | 2,267,057 |
| LUKOIL PJSC ADR (OTC Exchange) | 18,259 | | 1,802,346 |
| MMC Norilsk Nickel PJSC ADR | 8,622 | | 263,402 |
| Mobile TeleSystems PJSC ADR | 66,182 | | 671,747 |
| Novatek PJSC GDR | 1,991 | | 404,173 |
| Novolipetsk Steel PJSC GDR | 13,678 | | 315,141 |
| Rosneft Oil Co. PJSC GDR | 16,843 | | 121,404 |
| Sberbank of Russia PJSC ADR | 224,035 | | 3,683,135 |
| Sberbank of Russia PJSC ADR (OTC Exchange) | 14,170 | | 232,388 |
| Severstal PJSC GDR | 27,255 | | 412,641 |
| Surgutneftegas PJSC ADR | 19,506 | | 157,316 |
| | | | | 11,435,326 |
| Saudi Arabia — 0.0% | | |
| United Electronics Co. | 2,154 | | 43,008 |
| Singapore — 0.0% | | |
| Silverlake Axis, Ltd. | 490,500 | | 149,526 |
| Slovenia — 0.2% | | |
| Nova Ljubljanska Banka dd GDR | 74,601 | | 1,009,180 |
| South Africa — 5.7% | | |
| Absa Group, Ltd. | 60,135 | | 641,022 |
| AngloGold Ashanti, Ltd. ADR | 21,780 | | 486,565 |
| Aspen Pharmacare Holdings, Ltd.* | 5,526 | | 47,038 |
| Bid Corporation, Ltd. | 19,642 | | 463,086 |
| Clicks Group, Ltd. | 130,440 | | 2,389,662 |
| Discovery, Ltd. | 230,263 | | 1,983,195 |
| Foschini Group, Ltd. (The) | 7,775 | | 82,985 |
| Gold Fields, Ltd. ADR | 251,107 | | 1,657,306 |
| Growthpoint Properties, Ltd. REIT | 120,580 | | 190,349 |
| Harmony Gold Mining Co., Ltd. ADR* | 356,805 | | 1,295,202 |
| Impala Platinum Holdings, Ltd.* | 26,504 | | 271,587 |
| Investec, Ltd. | 125,707 | | 744,585 |
| JSE, Ltd. | 335,067 | | 2,859,289 |
| Kumba Iron Ore, Ltd. | 11,138 | | 331,651 |
| Liberty Holdings, Ltd. | 19,318 | | 152,616 |
| Momentum Metropolitan Holdings | 230,699 | | 359,736 |
| Mr Price Group, Ltd. | 47,781 | | 622,593 |
| MultiChoice Group, Ltd.* | 124,921 | | 1,039,076 |
| Nampak, Ltd.* | 171,782 | | 83,769 |
| Naspers, Ltd. N Shares | 62,918 | | 10,290,727 |
| Netcare, Ltd. | 59,961 | | 83,310 |
| Northam Platinum, Ltd.* | 5,135 | | 45,323 |
| Pick n Pay Stores, Ltd.Δ | 38,646 | | 176,288 |
| Redefine Properties, Ltd. REIT | 106,866 | | 57,683 |
| Remgro, Ltd. | 6,798 | | 94,646 |
| RMB Holdings, Ltd. | 49,872 | | 286,427 |
| Santam, Ltd. | 20,494 | | 424,542 |
| Sasol, Ltd. | 67,429 | | 1,461,042 |
| SPAR Group, Ltd. (The) | 12,450 | | 175,568 |
| Transaction Capital, Ltd. | 353,371 | | 532,352 |
| | | Shares | | Value |
| Truworths International, Ltd. | 277,611 | | $975,186 |
| | | | | 30,304,406 |
| South Korea — 11.5% | | |
| BGF retail Co., Ltd. | 2,930 | | 429,448 |
| BNK Financial Group, Inc. | 93,275 | | 616,527 |
| CJ ENM Co., Ltd. | 3,369 | | 464,457 |
| Daelim Industrial Co., Ltd. | 5,655 | | 442,388 |
| Hana Financial Group, Inc. | 31,760 | | 1,010,222 |
| Hankook Tire & Technology Co., Ltd. | 17,930 | | 519,239 |
| Hyundai Department Store Co., Ltd. | 879 | | 63,033 |
| Hyundai Glovis Co., Ltd. | 3,100 | | 382,496 |
| Hyundai Marine & Fire Insurance Co., Ltd. | 17,242 | | 401,306 |
| KCC Corporation | 227 | | 45,759 |
| Kia Motors Corporation | 78,603 | | 3,001,889 |
| Koh Young Technology, Inc. | 18,670 | | 1,701,331 |
| Kolmar Korea Co., Ltd. | 5,816 | | 236,607 |
| Korea Investment Holdings Co., Ltd. | 14,649 | | 914,852 |
| Korea Zinc Co., Ltd. | 2,002 | | 735,686 |
| Kumho Petrochemical Co., Ltd. | 14,407 | | 963,492 |
| LG Chem, Ltd. | 7,989 | | 2,189,420 |
| LG Electronic, Inc. | 28,221 | | 1,753,010 |
| LG Household & Health Care, Ltd. | 1,119 | | 1,215,516 |
| LG Uplus Corporation | 13,101 | | 160,687 |
| NAVER Corporation | 6,377 | | 1,026,027 |
| NCSoft Corporation | 7,541 | | 3,518,669 |
| Orion Corporation | 4,735 | | 431,836 |
| Pearl Abyss Corporation* | 1,948 | | 312,084 |
| Posco International Corporation | 3,587 | | 57,704 |
| Samsung Electro-Mechanics Co., Ltd. | 22,375 | | 2,406,681 |
| Samsung Electronics Co., Ltd. | 417,415 | | 20,113,927 |
| Samsung Fire & Marine Insurance Co., Ltd. | 16,736 | | 3,518,501 |
| SK Hynix, Inc. | 151,288 | | 12,305,426 |
| SK Telecom Co., Ltd. | 561 | | 115,593 |
| Woori Financial Group, Inc. | 12,882 | | 128,975 |
| | | | | 61,182,788 |
| Taiwan — 11.9% | | |
| Advantech Co., Ltd. | 114,000 | | 1,148,481 |
| ASE Technology Holding Co., Ltd. | 33,000 | | 91,590 |
| Catcher Technology Co., Ltd. | 195,000 | | 1,476,632 |
| Chailease Holding Co., Ltd. | 176,572 | | 812,854 |
| China Airlines, Ltd. | 456,000 | | 137,818 |
| China Life Insurance Co., Ltd.* | 720,249 | | 615,084 |
| Chroma ATE, Inc. | 179,000 | | 865,830 |
| Chunghwa Telecom Co., Ltd. | 20,000 | | 73,390 |
| CTBC Financial Holding Co., Ltd. | 529,423 | | 395,606 |
| E.Sun Financial Holding Co., Ltd. | 2,195,000 | | 2,042,916 |
| Eva Airways Corporation | 365,504 | | 167,651 |
| First Financial Holding Co., Ltd. | 963,142 | | 761,466 |
| Fubon Financial Holding Co., Ltd. | 64,406 | | 99,691 |
| Hon Hai Precision Industry Co., Ltd. | 120,000 | | 363,479 |
| Inventec Corporation | 84,000 | | 64,029 |
| Kingpak Technology, Inc. | 43,069 | | 255,739 |
| Largan Precision Co., Ltd. | 34,500 | | 5,754,412 |
See Notes to Financial Statements.
| | | Shares | | Value |
| Lite-On Technology Corporation | 206,000 | | $339,130 |
| MediaTek, Inc. | 208,000 | | 3,077,293 |
| Nanya Technology Corporation | 515,000 | | 1,432,799 |
| Nien Made Enterprise Co., Ltd. | 64,000 | | 591,387 |
| Novatek Microelectronics Corporation | 73,000 | | 533,309 |
| Phison Electronics Corporation | 65,000 | | 738,316 |
| Pou Chen Corporation | 138,000 | | 180,458 |
| Powertech Technology, Inc. | 103,763 | | 345,450 |
| President Chain Store Corporation | 631,000 | | 6,399,039 |
| Silergy Corporation | 77,000 | | 2,440,204 |
| Taiwan Business Bank | 486,150 | | 204,340 |
| Taiwan Cooperative Financial Holding Co., Ltd. | 393,593 | | 272,444 |
| Taiwan Semiconductor Manufacturing Co., Ltd. | 1,549,000 | | 17,103,746 |
| Taiwan Semiconductor Manufacturing Co., Ltd. ADR | 209,313 | | 12,161,085 |
| Taiwan Union Technology Corporation | 12,000 | | 59,245 |
| Uni-President Enterprises Corporation | 114,000 | | 282,176 |
| United Microelectronics Corporation | 2,162,000 | | 1,186,406 |
| Wistron Corporation | 591,000 | | 558,924 |
| Zhen Ding Technology Holding, Ltd. | 66,000 | | 314,841 |
| | | | | 63,347,260 |
| Thailand — 2.1% | | |
| Advanced Info Service PCL NVDR | 226,300 | | 1,606,921 |
| Airports of Thailand PCL | 385,500 | | 959,627 |
| Bangkok Bank PCL NVDR | 215,970 | | 1,152,391 |
| Bangkok Dusit Medical Services PCL NVDR | 146,900 | | 127,319 |
| Bumrungrad Hospital PCL NVDR | 9,400 | | 46,081 |
| Central Pattana PCL NVDR | 24,400 | | 50,571 |
| CP ALL PCL | 424,400 | | 1,027,618 |
| Kasikornbank PCL NVDR | 560,100 | | 2,819,629 |
| Krung Thai Bank PCL NVDR | 1,762,100 | | 964,218 |
| PTT Exploration & Production PCL | 230,300 | | 971,246 |
| PTT Global Chemical PCL NVDR | 238,733 | | 453,614 |
| Ratch Group PCL NVDR | 206,400 | | 473,760 |
| Thai Union Group PCL NVDR | 279,900 | | 125,919 |
| TMB Bank PCL NVDR | 4,975,400 | | 278,651 |
| | | | | 11,057,565 |
| Turkey — 0.4% | | |
| Arcelik AS* | 91,300 | | 319,834 |
| Enerjisa Enerji AS 144A | 696,696 | | 865,454 |
| Ford Otomotiv Sanayi AS | 3,951 | | 47,055 |
| Sok Marketler Ticaret AS* | 164,079 | | 296,771 |
| TAV Havalimanlari Holding AS | 58,380 | | 286,355 |
| Türkiye Is Bankasi AS Class C* | 42,265 | | 45,540 |
| | | | | 1,861,009 |
| United Kingdom — 2.6% | | |
| Anglo American PLC | 57,021 | | 1,641,268 |
| Antofagasta PLC | 303,042 | | 3,680,122 |
| Ferrexpo PLC | 246,247 | | 518,461 |
| Network International Holdings PLC 144A* | 62,296 | | 528,936 |
| | | Shares | | Value |
| TCS Group Holding PLC GDR | 75,268 | | $1,618,262 |
| Unilever PLC | 97,415 | | 5,613,708 |
| | | | | 13,600,757 |
Total Foreign Common Stocks
(Cost $428,772,914) | | 476,345,567 |
| FOREIGN PREFERRED STOCKS — 1.2% |
| Brazil — 1.2% | | |
| Azul SA | | | | |
| 0.00%, * | 15,200 | | 220,214 |
| Azul SA ADR | | | | |
| 0.00%, * | 22,797 | | 975,712 |
| Banco Bradesco SA | | | | |
| 0.00%, 02/04/20 | 173,220 | | 1,557,503 |
| Banco Pan SA | | | | |
| 0.00%, 02/17/20* | 21,170 | | 55,784 |
| Cia Brasileira de Distribuicao | | | | |
| 0.00%, 06/28/19* | 12,700 | | 276,719 |
| Cia Energetica de Minas Gerais | | | | |
| 3.28%, 12/26/19 | 240,900 | | 825,816 |
| Gerdau SA | | | | |
| 0.78%, 11/12/19 | 316,000 | | 1,571,084 |
| Itausa - Investimentos Itau SA | | | | |
| 0.57%, 03/02/20 | 246,909 | | 864,829 |
| | | | | 6,347,661 |
| Colombia — 0.0% | | |
| Banco Davivienda SA | | | | |
| 1.85%, 09/12/19 | 21,252 | | 297,261 |
Total Foreign Preferred Stocks
(Cost $5,509,929) | | 6,644,922 |
| MONEY MARKET FUNDS — 5.7% |
GuideStone Money Market Fund, 1.53%
(Institutional Class)Ø∞ | 14,969,072 | | 14,969,072 |
| Northern Institutional Liquid Assets Portfolio (Shares), 1.57%ا | 880,827 | | 880,827 |
| Northern Institutional U.S. Government Portfolio (Shares), 1.48%Ø | 14,311,422 | | 14,311,422 |
Total Money Market Funds
(Cost $30,161,321) | | 30,161,321 |
| | | Par | |
| U.S. TREASURY OBLIGATION — 0.3% |
| U.S. Treasury Bill | | | |
1.52%, 05/07/20Ω‡‡
(Cost $1,591,387) | $1,600,000 | 1,591,495 |
TOTAL INVESTMENTS —99.7%
(Cost $480,693,709) | | 531,097,191 |
Other Assets in Excess of
Liabilities — 0.3% | | 1,842,424 |
| NET ASSETS — 100.0% | | $532,939,615 |
See Notes to Financial Statements.
EMERGING MARKETS EQUITY FUND
SCHEDULE OF INVESTMENTS (Continued)
Futures Contracts outstanding at December 31, 2019:
| Future Type | | Expiration Date | | Open Long
(Short) Contracts | | Notional
Market Value
of Contracts | | Value and
Unrealized
Appreciation
(Depreciation) |
| Hang Seng Index | | 01/2020 | | (6) | | $(431,619) | | $(5,018) |
| MSCI Singapore Index | | 01/2020 | | (167) | | (4,612,848) | | (2,560) |
| MSCI Taiwan Index | | 01/2020 | | 16 | | 735,360 | | (5,532) |
| SGX Nifty 50 Index | | 01/2020 | | (97) | | (2,375,530) | | 16,197 |
| FTSE Bursa Malaysia KLCI Index | | 01/2020 | | (15) | | (292,446) | | 4,149 |
| KOSPI 200 Index | | 03/2020 | | 9 | | 574,344 | | 4,972 |
| FTSE/JSE Top 40 Index | | 03/2020 | | (68) | | (2,493,560) | | 11,566 |
| MSCI Emerging Markets E-mini | | 03/2020 | | 370 | | 20,723,700 | | 496,769 |
| SET50 Index | | 03/2020 | | (430) | | (3,063,169) | | (3,288) |
| Mexican Bolsa Index | | 03/2020 | | 43 | | 1,005,983 | | (21,061) |
| Total Futures Contracts outstanding at December 31, 2019 | | | | | | $9,770,215 | | $496,194 |
Forward Foreign Currency Contracts outstanding at December 31, 2019:
| Expiration Date | | Currency
Purchased | | Amount
of Currency
Purchased | | Currency
Sold | | Amount
of Currency
Sold | | Counter-
party | | Net Unrealized
Appreciation
(Depreciation) |
| 03/18/20 | | Mexican Pesos | | 608,535,000 | | U.S. Dollars | | 30,982,922 | | CITI | | $829,436 |
| 03/18/20 | | Russian Rubles | | 668,317,000 | | U.S. Dollars | | 10,313,443 | | CITI | | 352,867 |
| 03/18/20 | | South African Rand | | 120,306,000 | | U.S. Dollars | | 8,201,356 | | CITI | | 300,004 |
| 03/18/20 | | Colombian Pesos | | 22,080,000,000 | | U.S. Dollars | | 6,436,345 | | CITI | | 255,000 |
| 03/18/20 | | Indian Rupees | | 1,011,430,000 | | U.S. Dollars | | 13,969,688 | | CITI | | 115,370 |
| 03/18/20 | | Polish Zloty | | 19,453,000 | | U.S. Dollars | | 5,013,774 | | CITI | | 114,660 |
| 03/18/20 | | Chinese Offshore Yuan | | 54,958,000 | | U.S. Dollars | | 7,804,900 | | CITI | | 75,817 |
| 03/18/20 | | Brazilian Reals | | 18,469,000 | | U.S. Dollars | | 4,501,000 | | CITI | | 75,226 |
| 03/18/20 | | Chilean Pesos | | 1,021,466,000 | | U.S. Dollars | | 1,301,499 | | CITI | | 58,154 |
| 03/18/20 | | Philippine Pesos | | 561,093,000 | | U.S. Dollars | | 10,988,886 | | CITI | | 50,392 |
| 03/18/20 | | Hong Kong Dollars | | 67,731,000 | | U.S. Dollars | | 8,647,593 | | CITI | | 39,123 |
| 03/18/20 | | Indonesian Rupiahs | | 19,414,865,788 | | U.S. Dollars | | 1,361,604 | | CITI | | 32,809 |
| 03/18/20 | | Czech Republic Koruna | | 44,300,000 | | U.S. Dollars | | 1,928,877 | | CITI | | 25,624 |
| 03/18/20 | | South Korean Won | | 1,477,526,000 | | U.S. Dollars | | 1,257,635 | | CITI | | 23,413 |
| 03/18/20 | | Singapore Dollars | | 2,350,000 | | U.S. Dollars | | 1,726,757 | | CITI | | 21,873 |
| 03/18/20 | | Hungarian Forint | | 442,000,000 | | U.S. Dollars | | 1,486,897 | | CITI | | 16,986 |
| 03/18/20 | | Taiwan Dollars | | 24,477,000 | | U.S. Dollars | | 809,421 | | CITI | | 13,788 |
| 03/18/20 | | Euro | | 513,000 | | U.S. Dollars | | 571,219 | | CITI | | 7,046 |
| 03/18/20 | | Thai Baht | | 19,200,000 | | U.S. Dollars | | 635,716 | | CITI | | 6,463 |
| 03/18/20 | | Peruvian Nuevo Soles | | 689,874 | | U.S. Dollars | | 203,021 | | CITI | | 4,646 |
| 03/18/20 | | U.S. Dollars | | 454,360 | | Chilean Pesos | | 340,000,000 | | CITI | | 1,793 |
| 03/18/20 | | U.S. Dollars | | 1,949,229 | | Philippine Pesos | | 99,000,000 | | CITI | | 1,445 |
| 03/18/20 | | U.S. Dollars | | 1,036,428 | | Israeli Shekels | | 3,559,375 | | CITI | | 1,298 |
| 03/18/20 | | Saudi Riyals | | 15,160,000 | | U.S. Dollars | | 4,041,373 | | CITI | | 754 |
| 03/18/20 | | U.S. Dollars | | 863,074 | | Hong Kong Dollars | | 6,726,000 | | CITI | | 443 |
| 03/18/20 | | Israeli Shekels | | 25,000 | | U.S. Dollars | | 7,228 | | CITI | | 43 |
| 03/18/20 | | U.S. Dollars | | 383 | | Russian Rubles | | 24,000 | | CITI | | — |
| Subtotal Appreciation | | | | | | | | | | $2,424,473 |
| 03/18/20 | | Chilean Pesos | | 259,000 | | U.S. Dollars | | 346 | | CITI | | $(1) |
| 03/18/20 | | U.S. Dollars | | 159,956 | | Saudi Riyals | | 600,000 | | CITI | | (22) |
| 03/18/20 | | Saudi Riyals | | 1,500,000 | | U.S. Dollars | | 399,976 | | CITI | | (30) |
| 03/18/20 | | Hong Kong Dollars | | 1,300,000 | | U.S. Dollars | | 166,777 | | CITI | | (49) |
| 03/18/20 | | Indian Rupees | | 10,885,000 | | U.S. Dollars | | 151,746 | | CITI | | (162) |
| 03/18/20 | | U.S. Dollars | | 89,390 | | Euro | | 80,000 | | CITI | | (787) |
See Notes to Financial Statements.
| Expiration Date | | Currency
Purchased | | Amount
of Currency
Purchased | | Currency
Sold | | Amount
of Currency
Sold | | Counter-
party | | Net Unrealized
Appreciation
(Depreciation) |
| 10/10/23 | | U.S. Dollars | | 1,196,266 | | Chinese Offshore Yuan | | 8,649,000 | | SC | | $(1,057) |
| 03/18/20 | | Colombian Pesos | | 1,400,000,000 | | U.S. Dollars | | 425,660 | | CITI | | (1,391) |
| 03/18/20 | | U.S. Dollars | | 65,042 | | Indonesian Rupiahs | | 928,075,000 | | CITI | | (1,615) |
| 03/18/20 | | U.S. Dollars | | 88,496 | | Peruvian Nuevo Soles | | 300,000 | | CITI | | (1,810) |
| 03/18/20 | | U.S. Dollars | | 274,911 | | Polish Zloty | | 1,058,000 | | CITI | | (4,013) |
| 03/18/20 | | U.S. Dollars | | 996,598 | | Indian Rupees | | 71,974,000 | | CITI | | (5,703) |
| 03/18/20 | | U.S. Dollars | | 588,128 | | Taiwan Dollars | | 17,769,000 | | CITI | | (9,476) |
| 03/18/20 | | U.S. Dollars | | 576,535 | | Hungarian Forint | | 173,344,000 | | CITI | | (13,257) |
| 03/18/20 | | U.S. Dollars | | 3,467,729 | | Philippine Pesos | | 176,958,000 | | CITI | | (13,848) |
| 03/18/20 | | U.S. Dollars | | 1,544,100 | | Thai Baht | | 46,615,000 | | CITI | | (15,021) |
| 03/18/20 | | U.S. Dollars | | 3,412,295 | | Hong Kong Dollars | | 26,726,000 | | CITI | | (15,398) |
| 03/18/20 | | U.S. Dollars | | 1,176,673 | | South African Rand | | 17,153,000 | | CITI | | (35,434) |
| 03/18/20 | | U.S. Dollars | | 3,248,380 | | Czech Republic Koruna | | 74,900,000 | | CITI | | (56,184) |
| 03/18/20 | | U.S. Dollars | | 11,266,789 | | Israeli Shekels | | 38,950,625 | | CITI | | (60,753) |
| 03/18/20 | | U.S. Dollars | | 5,994,014 | | Mexican Pesos | | 118,415,000 | | CITI | | (196,363) |
| 03/18/20 | | U.S. Dollars | | 17,248,132 | | Chinese Offshore Yuan | | 121,773,188 | | CITI | | (213,570) |
| 03/18/20 | | U.S. Dollars | | 24,656,089 | | South Korean Won | | 29,035,462,000 | | CITI | | (518,325) |
| 03/18/20 | | U.S. Dollars | | 16,616,503 | | Brazilian Reals | | 69,974,000 | | CITI | | (721,573) |
| 03/18/20 | | U.S. Dollars | | 19,030,510 | | Chilean Pesos | | 15,005,146,000 | | CITI | | (942,556) |
| Subtotal Depreciation | | | | | | | | | | $(2,828,398) |
| Total Forward Foreign Currency Contracts outstanding at December 31, 2019 | | | | $(403,925) |
Swap Agreements outstanding at December 31, 2019:
| Pay Rate Index/Pay Rate | | Receive
Rate/Receive
Rate Index | | Maturity
Date | | Counterparty | | Currency | | Notional
Amount | | Market Value | | Upfront
Premiums
Paid/
(Received) | | Unrealized
Appreciation
(Depreciation) |
| Total Return Swaps | | | | | | | | | | | | | | | | |
| Decreases in total return of HSCEI Index (At Termination) | | Increases in total return of HSCEI Index (At Termination) | | 1/30/2020 | | GS | | HKD | | 96,414,600 | | $143,482 | | $— | | $143,482 |
| Decreases in total return of HSCEI Index (At Termination) | | Increases in total return of HSCEI Index (At Termination) | | 1/30/2020 | | CITI | | HKD | | 7,847,700 | | 10,579 | | — | | 10,579 |
| Increases in total retun of SGX Nifty 50 Index (At Termination) | | Decreases in total return of Increases in total retun of SGX Nifty 50 Index (At Termination) | | 1/30/2020 | | CITI | | USD | | 1,077,560 | | 6,783 | | — | | 6,783 |
| Decreases in total return of Bovespa Index (At Termination) | | Increases in total return of Bovespa Index (At Termination) | | 2/12/2020 | | CITI | | BRL | | 4,638,080 | | 19,179 | | — | | 19,179 |
| Decreases in total return of BIST 30 Index (At Termination) | | Increases in total return of BIST 30 Index (At Termination) | | 2/28/2020 | | CITI | | TRY | | 7,276,950 | | 17,596 | | — | | 17,596 |
| Decreases in total return of KOSPI 200 Index (At Termination) | | Increases in total return of KOSPI 200 Index (At Termination) | | 3/12/2020 | | GS | | KRW | | 10,405,800,000 | | 593,629 | | — | | 593,629 |
| Decreases in total return of KOSPI 200 Index (At Termination) | | Increases in total return of KOSPI 200 Index (At Termination) | | 3/12/2020 | | CITI | | KRW | | 2,952,000,000 | | 166,546 | | — | | 166,546 |
| Financing Index: 1-Month ICE LIBOR USD + 0.20% | | MSCI Emerging Markets Korea Net Total Return USD Index | | 3/13/2020 | | GS | | USD | | 460,651 | | 40,883 | | — | | 40,883 |
| Financing Index: 1-Month HIBOR - 0.15% | | MSCI China Net Return HKD Index | | 3/18/2020 | | GS | | HKD | | 11,983,081 | | 93,002 | | — | | 93,002 |
See Notes to Financial Statements.
EMERGING MARKETS EQUITY FUND
SCHEDULE OF INVESTMENTS (Continued)
| Pay Rate Index/Pay Rate | | Receive
Rate/Receive
Rate Index | | Maturity
Date | | Counterparty | | Currency | | Notional
Amount | | Market Value | | Upfront
Premiums
Paid/
(Received) | | Unrealized
Appreciation
(Depreciation) |
| Financing Index: 1-Month ICE LIBOR USD + 0.45% | | MSCI Daily TR Net Israel Index | | 3/18/2020 | | GS | | USD | | 255,204 | | $1,296 | | $— | | $1,296 |
| Financing Index: Brazil Cetip Di Interbank Deposit Rate - 0.30% | | MSCI Brazil Net Return BRL Index | | 3/18/2020 | | GS | | BRL | | 1,558,778 | | 5,760 | | — | | 5,760 |
| Increases in total retun of FTSE/JSE Shareholder Weighted Top 40 Index (At Termination) | | Decreases in total return of FTSE/JSE Shareholder Weighted Top 40 Index (At Termination) | | 3/19/2020 | | GS | | ZAR | | 4,132,500 | | 3,700 | | — | | 3,700 |
| Subtotal Appreciation | | | | | | | | | | | | $1,102,435 | | $ — | | $1,102,435 |
| Decreases in total return of TAIEX Index (At Termination) | | Increases in total return of TAIEX Index (At Termination) | | 1/15/2020 | | CITI | | TWD | | 43,178,400 | | $(6,829) | | $— | | $(6,829) |
| Decreases in total return of Tel Aviv 35 Index (At Termination) | | Increases in total return of Tel Aviv 35 Index (At Termination) | | 1/31/2020 | | GS | | ILS | | 2,861,593 | | (2,931) | | — | | (2,931) |
| Financing Index: 28-Day Mexico Interbank TIIE + 0.15% | | MSCI Mexico Net MXN Index | | 3/18/2020 | | GS | | MXN | | 1,284,323 | | (2,305) | | — | | (2,305) |
| MSCI Emerging Markets Thailand Net Total Return USD Index | | 1-Month ICE LIBOR USD + 0.20% | | 3/18/2020 | | GS | | USD | | 170,437 | | (5,610) | | — | | (5,610) |
| MSCI Poland Net Return PLN Index | | Financing Index: 1-Month WIBOR + 0.20% | | 3/18/2020 | | GS | | PLN | | 1,227,702 | | (13,824) | | — | | (13,824) |
| MSCI Singapore Net Return SGD Index | | Financing Index: 1-Month SIBOR | | 3/18/2020 | | GS | | SGD | | 3,726,264 | | (61,766) | | — | | (61,766) |
| MSCI South Africa Net Return ZAR Index | | Financing Index: 1-Month SAFE South Africa JIBAR - 0.15% | | 3/18/2020 | | GS | | ZAR | | 37,240,978 | | (126,339) | | — | | (126,339) |
| Increases in total retun of WIG 20 Index (At Termination) | | Decreases in total return of WIG 20 Index (At Termination) | | 3/20/2020 | | CITI | | PLN | | 2,114,840 | | (4,825) | | — | | (4,825) |
| MSCI Emerging Markets Korea Net Total Return USD Index | | Financing Index: 1-Month ICE LIBOR USD + 0.10% | | 3/20/2020 | | GS | | USD | | 199,772 | | (17,730) | | — | | (17,730) |
| Subtotal Depreciation | | | | | | | | | | | | $(242,159) | | $ — | | $(242,159) |
| Net Total Return Swaps outstanding at December 31, 2019 | | $860,276 | | $ — | | $860,276 |
See Notes to Financial Statements.
VALUATION HIERARCHY
The following is a summary of the inputs used, as of December 31, 2019, in valuing the Fund’s investments carried at fair value:
| | Total
Value | | Level 1
Quoted Prices | | Level 2
Other Significant
Observable Inputs | | Level 3
Significant
Unobservable Inputs |
| Assets: | | | | | | | |
| Investments in Securities: | | | | | | | |
| Common Stocks | $16,353,886 | | $16,353,886 | | $— | | $— |
| Foreign Common Stocks: | | | | | | | |
| Chile | 2,463,173 | | 1,419,478 | | 1,043,695 | | — |
| Czech Republic | 756,840 | | — | | 756,840 | | — |
| Hungary | 2,826,288 | | — | | 2,826,288 | | — |
| Indonesia | 8,242,438 | | — | | 8,242,438 | | — |
| Philippines | 3,758,115 | | — | | 3,758,115 | | — |
| Poland | 4,927,101 | | — | | 4,927,101 | | — |
| South Korea | 61,182,788 | | — | | 61,182,788 | | — |
| Thailand | 11,057,565 | | — | | 11,057,565 | | — |
| Other^^ | 381,131,259 | | 381,131,259 | | — | | — |
| Total Foreign Common Stocks | 476,345,567 | | 382,550,737 | | 93,794,830 | | — |
| Foreign Preferred Stocks | 6,644,922 | | 6,644,922 | | — | | — |
| Money Market Funds | 30,161,321 | | 30,161,321 | | — | | — |
| U.S. Treasury Obligation | 1,591,495 | | — | | 1,591,495 | | — |
| Total Assets - Investments in Securities | $531,097,191 | | $435,710,866 | | $95,386,325 | | $ — |
| Other Financial Instruments*** | | | | | | | |
| Forward Foreign Currency Contracts | $2,424,473 | | $— | | $2,424,473 | | $— |
| Futures Contracts | 533,653 | | 533,653 | | — | | — |
| Swap Agreements | 1,102,435 | | — | | 1,102,435 | | — |
| Total Assets - Other Financial Instruments | $4,060,561 | | $533,653 | | $3,526,908 | | $ — |
| Liabilities: | | | | | | | |
| Other Financial Instruments*** | | | | | | | |
| Forward Foreign Currency Contracts | $(2,828,398) | | $— | | $(2,828,398) | | $— |
| Futures Contracts | (37,459) | | (37,459) | | — | | — |
| Swap Agreements | (242,159) | | — | | (242,159) | | — |
| Total Liabilities - Other Financial Instruments | $(3,108,016) | | $(37,459) | | $(3,070,557) | | $ — |
| ^^ | Classifications as defined in the Schedule of Investments. |
| *** | Other financial instruments are derivative instruments, such as futures contracts, forwards contracts and swap agreements, which are valued at the unrealized appreciation (depreciation) on the investment. Further details regarding the value of these investments can be found in the preceding "Futures Contracts outstanding", "Forwards Foreign Currency Contracts outstanding" and "Swap Agreements outstanding" disclosures. |
See Notes to Financial Statements.
| STATEMENTS OF ASSETS AND LIABILITIES | December 31, 2019 |
| | Defensive Market
Strategies® Fund | | Equity Index
Fund |
| Assets | | | |
| Investments in securities of unaffiliated issuers, at value | $1,207,577,799 | | $2,086,886,032 |
| Investments in securities of affiliated issuers, at value | 68,295,332 | | 53,884,078 |
| Total investments, at value(1), (2) | 1,275,873,131 | | 2,140,770,110 |
| Cash | — | | — |
| Cash collateral for derivatives | — | | — |
| Deposits with broker for futures contracts | — | | 884,200 |
| Foreign currency(3) | 1 | | — |
| Receivables: | | | |
| Dividends and reclaims | 1,122,597 | | 1,862,503 |
| Interest | 1,698,904 | | — |
| Securities lending | 10,151 | | 6,236 |
| From advisor | — | | — |
| Investment securities sold | 658,299 | | — |
| Fund shares sold | 1,822,382 | | 1,685,105 |
| Variation margin on futures contracts | — | | 127,820 |
| Unrealized appreciation on foreign currency exchange contracts | 3,161 | | — |
| Unrealized appreciation on swap agreements | — | | — |
| Prepaid expenses and other assets | 6,598 | | 11,737 |
| Total Assets | 1,281,195,224 | | 2,145,347,711 |
| Liabilities | | | |
| Cash Overdraft | — | | 3,364 |
| Securities sold short, at value(4) | — | | — |
| Options written, at value(5) | 791,539 | | — |
| Unrealized depreciation on foreign currency exchange contracts | 192,657 | | — |
| Unrealized depreciation on swap agreements | — | | — |
| Collateral held for securities on loan, at value | 15,051,560 | | 3,543,423 |
| Collateral from counterparty | — | | — |
| Payables: | | | |
| Investment securities purchased | 1,503,402 | | — |
| Dividends on short sales | — | | — |
| Fund shares redeemed | 175,188 | | 5,661,099 |
| Variation margin on futures contracts | 59,675 | | — |
| Foreign capital gains taxes | — | | — |
| Accrued expenses: | | | |
| Investment advisory fees | 647,876 | | 155,656 |
| Shareholder servicing fees | 96,393 | | 133,667 |
| Trustee fees | 1,097 | | 1,652 |
| Other expenses | 154,965 | | 194,922 |
| Total Liabilities | 18,674,352 | | 9,693,783 |
| Net Assets | $1,262,520,872 | | $2,135,653,928 |
| Net Assets Consist of: | | | |
| Paid-in-capital | $1,085,560,645 | | $1,488,691,523 |
| Distributable earnings (loss) | 176,960,227 | | 646,962,405 |
| Net Assets | $1,262,520,872 | | $2,135,653,928 |
| Net Asset Value: | | | |
| $0.001 par value, unlimited shares authorized | | | |
| Net assets applicable to the Institutional Class | $803,696,158 | | $1,501,075,914 |
| Institutional shares outstanding | 60,578,854 | | 42,346,761 |
| Net asset value, offering and redemption price per Institutional share | $13.27 | | $35.45 |
| Net assets applicable to the Investor Class | $458,824,714 | | $634,578,014 |
| Investor shares outstanding | 34,575,538 | | 17,890,127 |
| Net asset value, offering and redemption price per Investor share | $13.27 | | $35.47 |
| | | |
| (1)Investments in securities of unaffiliated issuers, at cost | $1,033,610,818 | | $1,441,168,585 |
| Investments in securities of affiliated issuers, at cost | 68,295,332 | | 53,884,078 |
| Total investments, at cost | $1,101,906,150 | | $1,495,052,663 |
| (2)Includes securities loaned of: | $28,866,008 | | $62,105,161 |
| (3)Foreign currency, at cost | $1 | | $— |
| (4)Proceeds from securities sold short | $— | | $— |
| (5)Premiums received on options written | $1,015,797 | | $— |
| (6)Net of $(584,051) and $(108,973) accrued foreign capital gains taxed on appreciated securities for International Equity Fund and Emerging Markets Equity Fund. |
See Notes to Financial Statements.
Value Equity
Fund | | Growth Equity
Fund | | Small Cap
Equity Fund | | International Equity
Index Fund | | International
Equity Fund | | Emerging Markets
Equity Fund |
| | | | | | | | | | | |
| $1,186,311,201 | | $1,661,670,564 | | $594,306,971 | | $677,534,663 | | $1,313,973,050 | | $516,128,119 |
| 28,844,651 | | 52,530,177 | | 14,895,149 | | 30,770,243 | | 56,057,536 | | 14,969,072 |
| 1,215,155,852 | | 1,714,200,741 | | 609,202,120 | | 708,304,906 | | 1,370,030,586 | | 531,097,191 |
| — | | 5,530 | | 3,458 | | 3,457 | | 24,465 | | — |
| — | | — | | — | | — | | 932,550 | | 879,964 |
| 24,578 | | — | | — | | 553,500 | | 6,459,348 | | 892,186 |
| — | | — | | — | | 2,173,608 | | 5,903,301 | | 1,228,405 |
| | | | | | | | | | | |
| 1,577,675 | | 667,883 | | 591,581 | | 1,814,860 | | 6,204,409 | | 1,245,437 |
| — | | — | | — | | — | | — | | 268,033 |
| 4,914 | | 30,323 | | 29,577 | | 5,301 | | 22,168 | | 1,090 |
| — | | — | | — | | 23,480 | | — | | — |
| 43,897 | | 2,835,226 | | 269,110 | | — | | 506,920 | | 293,225 |
| 308,509 | | 353,959 | | 352,339 | | 2,659,854 | | 186,853 | | 106,302 |
| 42,620 | | 78,540 | | 8,690 | | 193,454 | | 262,039 | | 166,720 |
| 16,955 | | — | | — | | — | | 2,768,294 | | 2,424,473 |
| — | | — | | — | | — | | 172,706 | | 1,102,435 |
| 8,619 | | 13,044 | | 9,115 | | 233 | | 6,866 | | 14,293 |
| 1,217,183,619 | | 1,718,185,246 | | 610,465,990 | | 715,732,653 | | 1,393,480,505 | | 539,719,754 |
| | | | | | | | | | | |
| — | | — | | — | | — | | — | | — |
| — | | — | | — | | — | | 69,452,408 | | — |
| — | | — | | — | | — | | — | | — |
| 506,087 | | — | | — | | — | | 2,776,678 | | 2,828,398 |
| — | | — | | — | | — | | 380,438 | | 242,159 |
| 993,789 | | 13,382,687 | | 13,044,167 | | 1,670,877 | | 4,448,350 | | 880,827 |
| — | | — | | — | | — | | — | | 1,085,511 |
| | | | | | | | | | | |
| — | | 5,355,095 | | 378,290 | | — | | 334,475 | | 418,426 |
| — | | — | | — | | — | | 23,851 | | — |
| 11,200 | | 69,013 | | 2,183 | | 3,905 | | 86,077 | | 714,771 |
| — | | — | | — | | — | | — | | — |
| — | | — | | — | | — | | 584,051 | | 108,973 |
| | | | | | | | | | | |
| 589,600 | | 936,920 | | 461,726 | | 66,765 | | 846,113 | | 381,991 |
| 79,723 | | 158,082 | | 54,463 | | — | | 73,157 | | 15,030 |
| 965 | | 492 | | 865 | | 1,759 | | 854 | | 308 |
| 106,641 | | 133,405 | | 66,491 | | 125,388 | | 304,315 | | 103,745 |
| 2,288,005 | | 20,035,694 | | 14,008,185 | | 1,868,694 | | 79,310,767 | | 6,780,139 |
| $1,214,895,614 | | $1,698,149,552 | | $596,457,805 | | $713,863,959 | | $1,314,169,738 | | $532,939,615 |
| | | | | | | | | | | |
| $1,056,889,383 | | $1,112,933,955 | | $556,982,396 | | $675,244,371 | | $1,233,423,875 | | $497,481,032 |
| 158,006,231 | | 585,215,597 | | 39,475,409 | | 38,619,588 | | 80,745,863(6) | | 35,458,583(6) |
| $1,214,895,614 | | $1,698,149,552 | | $596,457,805 | | $713,863,959 | | $1,314,169,738 | | $532,939,615 |
| | | | | | | | | | | |
| | | | | | | | | | | |
| $831,854,154 | | $934,296,682 | | $338,439,679 | | $713,863,959 | | $963,045,551 | | $457,074,071 |
| 43,728,345 | | 35,621,080 | | 21,529,888 | | 65,651,114 | | 69,875,565 | | 44,866,209 |
| $19.02 | | $26.23 | | $15.72 | | $10.87 | | $13.78 | | $10.19 |
| $383,041,460 | | $763,852,870 | | $258,018,126 | | N/A | | $351,124,187 | | $75,865,544 |
| 20,118,659 | | 29,356,253 | | 16,479,502 | | N/A | | 25,423,263 | | 7,440,731 |
| $19.04 | | $26.02 | | $15.66 | | N/A | | $13.81 | | $10.20 |
| | | | | | | | | | | |
| $1,021,284,844 | | $1,097,980,123 | | $557,777,631 | | $634,212,649 | | $1,204,786,329 | | $465,724,637 |
| 28,844,651 | | 52,530,177 | | 14,895,149 | | 30,770,243 | | 56,057,536 | | 14,969,072 |
| $1,050,129,495 | | $1,150,510,300 | | $572,672,780 | | $664,982,892 | | $1,260,843,865 | | $480,693,709 |
| $18,773,934 | | $123,220,330 | | $65,077,582 | | $14,802,477 | | $15,991,103 | | $6,851,796 |
| $— | | $— | | $— | | $2,141,346 | | $5,890,287 | | $1,226,525 |
| $— | | $— | | $— | | $— | | $62,601,068 | | $— |
| $— | | $— | | $— | | $— | | $— | | $— |
| | | | | | | | | | | |
See Notes to Financial Statements.
| STATEMENTS OF OPERATIONS | For the Year Ended December 31, 2019 |
| | Defensive Market
Strategies® Fund | | Equity Index
Fund |
| Investment Income | | | |
| Dividends | $13,406,719 | | $35,518,057 |
| Non Cash Dividends | — | | — |
| Income distributions received from affiliated funds | 1,424,033 | | 1,161,514 |
| Interest | 7,559,480 | | 62,213 |
| Securities lending, net | 237,687 | | 209,753 |
| Less foreign taxes withheld | (82,898) | | (11,976) |
| Total Investment Income | 22,545,021 | | 36,939,561 |
| Expenses | | | |
| Investment advisory fees | 7,046,944 | | 1,657,604 |
| Transfer agent fees: | | | |
| Institutional shares | 4,664 | | 4,938 |
| Investor shares | 26,530 | | 33,779 |
| Custodian fees | 80,157 | | 56,036 |
| Shareholder servicing fees: | | | |
| Investor shares | 1,023,167 | | 1,446,556 |
| Accounting and administration fees | 238,804 | | 391,534 |
| Professional fees | 178,891 | | 103,657 |
| Shareholder reporting fees: | | | |
| Institutional shares | 1,245 | | 1,966 |
| Investor shares | 10,082 | | 13,324 |
| Trustees expenses | 5,829 | | 10,190 |
| Line of credit facility fees | 4,298 | | 9,392 |
| S&P license fees | — | | 215,760 |
| Dividends on securities sold short | — | | — |
| Other expenses | 155,284 | | 96,151 |
| Recoupment of prior expenses reduced by the Advisor | — | | — |
| Total Expenses | 8,775,895 | | 4,040,887 |
| Expenses waived/reimbursed(1) | — | | — |
| Fees paid indirectly | — | | — |
| Net Expenses | 8,775,895 | | 4,040,887 |
| Net Investment Income | 13,769,126 | | 32,898,674 |
| Realized and Unrealized Gain (Loss) | | | |
| Net realized gain (loss) from: | | | |
Investment securities
(net of capital gains taxes of $(50,042) and $(64,175) for International Equity Fund and Emerging Markets Equity Fund, respectively) | 45,163,075 | | 3,792,113 |
| Investment securities sold short | — | | — |
| Futures transactions | (2,176,112) | | 13,099,932 |
| Swap agreements | — | | — |
| Option contracts written | 10,300,735 | | — |
| Forward foreign currency contracts | 1,027,704 | | — |
| Foreign currency | (218,444) | | — |
| Net realized gain | 54,096,958 | | 16,892,045 |
| Net change in unrealized appreciation (depreciation) on: | | | |
Investment securities
(net of estimated capital gains taxes of $(584,051) and $(108,973) for International Equity Fund and Emerging Markets Equity Fund, respectively) | 133,764,731 | | 456,515,562 |
| Investment securities sold short | — | | — |
| Futures | (466,502) | | 2,157,945 |
| Swap agreements | — | | — |
| Option contracts written | 353,272 | | — |
| Forward foreign currency contracts | (50,254) | | — |
| Foreign currency | 2,526 | | — |
| Net change in unrealized appreciation (depreciation) | 133,603,773 | | 458,673,507 |
| Net Realized and Unrealized Gain | 187,700,731 | | 475,565,552 |
| Net Increase in Net Assets Resulting from Operations | $201,469,857 | | $508,464,226 |
| |
| (1) | See Note 3c in Notes to Financial Statements. |
See Notes to Financial Statements.
Value Equity
Fund | | Growth Equity
Fund | | Small Cap
Equity Fund | | International Equity
Index Fund | | International
Equity Fund | | Emerging Markets
Equity Fund |
| | | | | | | | | | | |
| $27,614,082 | | $11,870,328 | | $5,964,766 | | $21,051,778 | | $40,460,623 | | $12,352,266 |
| — | | — | | — | | — | | 2,209,525 | | 3,279,916 |
| 647,621 | | 1,168,912 | | 470,781 | | 607,375 | | 1,228,959 | | 421,068 |
| 38,155 | | 63,966 | | 27,551 | | 29,043 | | 67,442 | | 129,307 |
| 103,953 | | 329,049 | | 299,815 | | 206,882 | | 342,270 | | 61,678 |
| (370,291) | | (241,695) | | (4,969) | | (1,151,129) | | (3,092,958) | | (1,451,704) |
| 28,033,520 | | 13,190,560 | | 6,757,944 | | 20,743,949 | | 41,215,861 | | 14,792,531 |
| | | | | | | | | | | |
| 6,660,047 | | 10,607,857 | | 5,257,536 | | 717,348 | | 9,296,336 | | 4,147,644 |
| | | | | | | | | | | |
| 4,395 | | 4,487 | | 4,626 | | 3,800 | | 4,638 | | 4,441 |
| 21,874 | | 32,761 | | 22,584 | | — | | 21,670 | | 14,792 |
| 89,706 | | 51,655 | | 128,154 | | 202,527 | | 698,295 | | 1,043,172 |
| | | | | | | | | | | |
| 912,414 | | 1,801,288 | | 646,802 | | — | | 804,317 | | 168,455 |
| 238,731 | | 328,899 | | 117,203 | | 131,760 | | 252,507 | | 98,907 |
| 102,326 | | 91,264 | | 89,947 | | 90,728 | | 101,154 | | 113,003 |
| | | | | | | | | | | |
| 851 | | 784 | | 957 | | 2,858 | | 1,719 | | 911 |
| 14,717 | | 12,755 | | 9,459 | | — | | 13,903 | | 3,458 |
| 5,565 | | 9,138 | | 7,758 | | — | | 5,712 | | 2,751 |
| 2,011 | | 4,679 | | 7,096 | | — | | 1,680 | | 2,415 |
| — | | — | | — | | — | | — | | — |
| — | | — | | — | | — | | 2,275,917 | | — |
| 100,309 | | 124,672 | | 63,855 | | 327,461 | | 423,507 | | 125,555 |
| — | | — | | — | | — | | — | | 217,789 |
| 8,152,946 | | 13,070,239 | | 6,355,977 | | 1,476,482 | | 13,901,355 | | 5,943,293 |
| — | | — | | — | | (79,832) | | — | | — |
| (15,665) | | (20,700) | | (45,109) | | — | | — | | (924) |
| 8,137,281 | | 13,049,539 | | 6,310,868 | | 1,396,650 | | 13,901,355 | | 5,942,369 |
| 19,896,239 | | 141,021 | | 447,076 | | 19,347,299 | | 27,314,506 | | 8,850,162 |
| | | | | | | | | | | |
| | | | | | | | | | | |
| 122,044,539 | | 153,564,448 | | 24,720,392 | | (3,611,939) | | 33,909,154 | | (8,968,173) |
| — | | — | | — | | — | | 1,873,513 | | — |
| 6,033,037 | | 9,771,247 | | 1,911,826 | | 4,891,251 | | 7,228,295 | | 3,744,545 |
| — | | — | | — | | — | | (1,821,444) | | 1,594,906 |
| — | | — | | — | | — | | — | | — |
| 1,047,284 | | — | | — | | — | | (938,281) | | 6,002,574 |
| (428,777) | | — | | — | | 37,468 | | 50,409 | | (382,082) |
| 128,696,083 | | 163,335,695 | | 26,632,218 | | 1,316,780 | | 40,301,646 | | 1,991,770 |
| | | | | | | | | | | |
| 122,914,236 | | 295,835,839 | | 94,928,729 | | 99,593,441 | | 194,942,349 | | 75,877,916 |
| — | | — | | — | | — | | (14,019,976) | | — |
| 1,255,987 | | 2,661,905 | | 567,676 | | 558,622 | | 1,896,059 | | 1,189,618 |
| — | | — | | — | | — | | 47,742 | | 1,009,819 |
| — | | — | | — | | — | | — | | — |
| (489,132) | | — | | — | | — | | 3,016,141 | | (921,965) |
| — | | — | | — | | 31,748 | | 37,206 | | (1,603) |
| 123,681,091 | | 298,497,744 | | 95,496,405 | | 100,183,811 | | 185,919,521 | | 77,153,785 |
| 252,377,174 | | 461,833,439 | | 122,128,623 | | 101,500,591 | | 226,221,167 | | 79,145,555 |
| $272,273,413 | | $461,974,460 | | $122,575,699 | | $120,847,890 | | $253,535,673 | | $87,995,717 |
See Notes to Financial Statements.
| STATEMENTS OF CHANGES IN NET ASSETS |
| | Defensive Market Strategies® Fund |
| | For the Year Ended |
| | 12/31/19 | | 12/31/18 |
| | | | |
| Operations: | | | |
| Net investment income | $13,769,126 | | $11,172,250 |
| Net realized gain on investment securities, foreign currency and derivatives | 54,096,958 | | 46,184,984 |
| Net change in unrealized appreciation (depreciation) on investment securities, foreign currency and derivatives | 133,603,773 | | (75,833,346) |
| Net increase (decrease) in net assets resulting from operations | 201,469,857 | | (18,476,112) |
| Distributions to Shareholders: | | | |
| Institutional shares | (44,168,777) | | (41,477,892) |
| Investor shares | (24,120,475) | | (21,575,912) |
| Total distributions | (68,289,252) | | (63,053,804) |
| Capital Share Transactions: | | | |
| Proceeds from shares sold | | | |
| Institutional shares | 76,644,154 | | 109,896,688 |
| Investor shares | 133,164,309 | | 93,697,336 |
| Reinvestment of dividends and distributions | | | |
| Institutional shares | 44,116,263 | | 41,301,785 |
| Investor shares | 23,830,888 | | 21,410,733 |
| Total proceeds from shares sold and reinvested | 277,755,614 | | 266,306,542 |
| Value of shares redeemed | | | |
| Institutional shares | (56,912,886) | | (47,118,657) |
| Investor shares | (103,760,712) | | (87,943,221) |
| Total value of shares redeemed | (160,673,598) | | (135,061,878) |
| Net increase (decrease) from capital share transactions(1) | 117,082,016 | | 131,244,664 |
| Total increase (decrease) in net assets | 250,262,621 | | 49,714,748 |
| Net Assets: | | | |
| Beginning of Year | 1,012,258,251 | | 962,543,503 |
| End of Year | $1,262,520,872 | | $1,012,258,251 |
| |
| (1) | See Note 6 in Notes to Financial Statements. |
See Notes to Financial Statements.
| Equity Index Fund | | Value Equity Fund | | Growth Equity Fund |
| For the Year Ended | | For the Year Ended | | For the Year Ended |
| 12/31/19 | | 12/31/18 | | 12/31/19 | | 12/31/18 | | 12/31/19 | | 12/31/18 |
| | | | | | | | | | | |
| | | | | | | | | | | |
| $32,898,674 | | $20,634,348 | | $19,896,239 | | $23,791,378 | | $141,021 | | $1,596,489 |
| 16,892,045 | | 7,660,660 | | 128,696,083 | | 158,026,172 | | 163,335,695 | | 253,211,115 |
| 458,673,507 | | (165,447,916) | | 123,681,091 | | (292,630,683) | | 298,497,744 | | (180,215,472) |
| 508,464,226 | | (137,152,908) | | 272,273,413 | | (110,813,133) | | 461,974,460 | | 74,592,132 |
| | | | | | | | | | | |
| (32,906,901) | | (17,859,884) | | (91,183,177) | | (131,704,586) | | (86,626,597) | | (123,354,704) |
| (12,882,091) | | (9,476,926) | | (40,942,447) | | (60,559,704) | | (70,501,782) | | (103,435,086) |
| (45,788,992) | | (27,336,810) | | (132,125,624) | | (192,264,290) | | (157,128,379) | | (226,789,790) |
| | | | | | | | | | | |
| | | | | | | | | | | |
| 171,099,288 | | 838,342,777 | | 34,148,825 | | 50,727,891 | | 68,743,901 | | 66,628,943 |
| 90,260,475 | | 81,414,824 | | 29,718,622 | | 29,434,018 | | 70,435,756 | | 109,117,426 |
| | | | | | | | | | | |
| 32,447,882 | | 17,801,303 | | 91,139,115 | | 131,533,865 | | 86,582,221 | | 123,205,758 |
| 12,851,729 | | 9,464,086 | | 40,832,597 | | 60,490,792 | | 70,461,720 | | 103,357,365 |
| 306,659,374 | | 947,022,990 | | 195,839,159 | | 272,186,566 | | 296,223,598 | | 402,309,492 |
| | | | | | | | | | | |
| (132,040,161) | | (102,133,596) | | (91,784,085) | | (407,490,599) | | (155,258,516) | | (525,109,319) |
| (100,097,652) | | (59,989,419) | | (68,010,299) | | (48,591,948) | | (135,778,291) | | (72,422,871) |
| (232,137,813) | | (162,123,015) | | (159,794,384) | | (456,082,547) | | (291,036,807) | | (597,532,190) |
| 74,521,561 | | 784,899,975 | | 36,044,775 | | (183,895,981) | | 5,186,791 | | (195,222,698) |
| 537,196,795 | | 620,410,257 | | 176,192,564 | | (486,973,404) | | 310,032,872 | | (347,420,356) |
| | | | | | | | | | | |
| 1,598,457,133 | | 978,046,876 | | 1,038,703,050 | | 1,525,676,454 | | 1,388,116,680 | | 1,735,537,036 |
| $2,135,653,928 | | $1,598,457,133 | | $1,214,895,614 | | $1,038,703,050 | | $1,698,149,552 | | $1,388,116,680 |
See Notes to Financial Statements.
| STATEMENTS OF CHANGES IN NET ASSETS |
| | Small Cap Equity Fund |
| | For the Year Ended |
| | 12/31/19 | | 12/31/18 |
| | | | |
| Operations: | | | |
| Net investment income | $447,076 | | $412,150 |
| Net realized gain (loss) on investment securities, foreign currency and derivatives | 26,632,218 | | 84,996,200 |
| Net change in unrealized appreciation (depreciation) on investment securities, foreign currency and derivatives | 95,496,405 | | (152,257,719) |
| Net increase (decrease) in net assets resulting from operations | 122,575,699 | | (66,849,369) |
| Distributions to Shareholders: | | | |
| Institutional shares | (12,633,420) | | (50,319,903) |
| Investor shares | (9,433,184) | | (47,116,445) |
| Total distributions | (22,066,604) | | (97,436,348) |
| Capital Share Transactions: | | | |
| Proceeds from shares sold | | | |
| Institutional shares | 42,279,164 | | 32,659,834 |
| Investor shares | 27,788,978 | | 43,700,940 |
| Reinvestment of dividends and distributions | | | |
| Institutional shares | 12,609,876 | | 50,169,090 |
| Investor shares | 9,422,258 | | 47,072,948 |
| Total proceeds from shares sold and reinvested | 92,100,276 | | 173,602,812 |
| Value of shares redeemed | | | |
| Institutional shares | (26,618,910) | | (37,720,650) |
| Investor shares | (57,230,474) | | (39,794,698) |
| Total value of shares redeemed | (83,849,384) | | (77,515,348) |
| Net increase (decrease) from capital share transactions(1) | 8,250,892 | | 96,087,464 |
| Total increase (decrease) in net assets | 108,759,987 | | (68,198,253) |
| Net Assets: | | | |
| Beginning of Year | 487,697,818 | | 555,896,071 |
| End of Year | $596,457,805 | | $487,697,818 |
| |
| (1) | See Note 6 in Notes to Financial Statements. |
See Notes to Financial Statements.
| International Equity Index Fund | | International Equity Fund | | Emerging Markets Equity Fund |
| For the Year Ended | | For the Year Ended | | For the Year Ended |
| 12/31/19 | | 12/31/18 | | 12/31/19 | | 12/31/18 | | 12/31/19 | | 12/31/18 |
| | | | | | | | | | | |
| | | | | | | | | | | |
| $19,347,299 | | $7,905,629 | | $27,314,506 | | $30,003,060 | | $8,850,162 | | $5,708,889 |
| 1,316,780 | | (3,445,905) | | 40,301,646 | | 84,387,658 | | 1,991,770 | | (11,644,743) |
| 100,183,811 | | (74,920,710) | | 185,919,521 | | (314,160,718) | | 77,153,785 | | (97,245,669) |
| 120,847,890 | | (70,460,986) | | 253,535,673 | | (199,770,000) | | 87,995,717 | | (103,181,523) |
| | | | | | | | | | | |
| (20,799,847) | | (7,738,165) | | (47,643,999) | | (100,665,310) | | (11,628,885) | | (2,466,292) |
| — | | — | | (16,556,051) | | (35,179,908) | | (1,621,711) | | (189,742) |
| (20,799,847) | | (7,738,165) | | (64,200,050) | | (135,845,218) | | (13,250,596) | | (2,656,034) |
| | | | | | | | | | | |
| | | | | | | | | | | |
| 76,342,779 | | 437,966,963 | | 60,770,646 | | 112,243,308 | | 42,650,660 | | 72,827,933 |
| — | | — | | 49,956,440 | | 33,374,437 | | 20,347,806 | | 42,361,289 |
| | | | | | | | | | | |
| 20,640,274 | | 7,736,564 | | 47,413,821 | | 100,254,048 | | 11,623,106 | | 2,464,528 |
| — | | — | | 16,496,111 | | 35,077,508 | | 1,620,358 | | 189,500 |
| 96,983,053 | | 445,703,527 | | 174,637,018 | | 280,949,301 | | 76,241,930 | | 117,843,250 |
| | | | | | | | | | | |
| (28,593,664) | | (10,199,496) | | (80,087,916) | | (446,987,290) | | (21,076,236) | | (31,715,518) |
| — | | — | | (50,451,367) | | (42,245,013) | | (22,140,113) | | (54,108,446) |
| (28,593,664) | | (10,199,496) | | (130,539,283) | | (489,232,303) | | (43,216,349) | | (85,823,964) |
| 68,389,389 | | 435,504,031 | | 44,097,735 | | (208,283,002) | | 33,025,581 | | 32,019,286 |
| 168,437,432 | | 357,304,880 | | 233,433,358 | | (543,898,220) | | 107,770,702 | | (73,818,271) |
| | | | | | | | | | | |
| 545,426,527 | | 188,121,647 | | 1,080,736,380 | | 1,624,634,600 | | 425,168,913 | | 498,987,184 |
| $713,863,959 | | $545,426,527 | | $1,314,169,738 | | $1,080,736,380 | | $532,939,615 | | $425,168,913 |
See Notes to Financial Statements.
| For a Share Outstanding For the Years Ending December 31, unless otherwise indicated | | | | | | Ratios to Average Net Assets | |
| | Net Asset
Value,
Beginning
of Year | Net Investment
Income# | Realized
and
Unrealized
Gain
(Loss) on
Investments | Total Income
From Investment
Operations | Dividends
from Net
Investment
Income | Distributions
from Net
Realized
Capital
Gains | Total
Distributions
Paid | Net Asset
Value,
End of
Year | Total
Return | Net Assets,
End of Year
(000) | Expenses,
Net | Expenses,
Gross | Investment
Income,
Net
| Portfolio
Turnover
Rate |
| Defensive Market Strategies® Fund |
| Institutional Class |
| 2019 | $11.73 | $0.17 | $2.13 | $2.30 | $(0.17) | $(0.59) | $(0.76) | $13.27 | 19.78% | $803,696 | 0.67% | 0.67% | 1.29% | 55% |
| 2018 | 12.68 | 0.15 | (0.32) | (0.17) | (0.17) | (0.61) | (0.78) | 11.73 | (1.51) | 653,481 | 0.67 | 0.67 | 1.17 | 65 |
| 2017 | 11.90 | 0.09 | 1.42 | 1.51 | (0.08) | (0.65) | (0.73) | 12.68 | 12.74 | 602,011 | 0.67(1) | 0.68 | 0.70 | 60 |
| 2016 | 11.21 | 0.17 | 1.15(2) | 1.32 | (0.16) | (0.47) | (0.63) | 11.90 | 11.80 | 547,132 | 0.69 | 0.70 | 1.42 | 78 |
| 2015 | 11.61 | 0.17 | 0.11(2) | 0.28 | (0.17) | (0.51) | (0.68) | 11.21 | 2.43 | 443,499 | 0.72(1) | 0.73 | 1.46 | 55 |
| Investor Class |
| 2019 | $11.74 | $0.13 | $2.13 | $2.26 | $(0.14) | $(0.59) | $(0.73) | $13.27 | 19.38% | $458,825 | 0.93% | 0.93% | 1.02% | 55% |
| 2018 | 12.68 | 0.12 | (0.32) | (0.20) | (0.13) | (0.61) | (0.74) | 11.74 | (1.69) | 358,777 | 0.93 | 0.93 | 0.90 | 65 |
| 2017 | 11.91 | 0.05 | 1.41 | 1.46 | (0.04) | (0.65) | (0.69) | 12.68 | 12.35 | 360,533 | 0.95(1) | 0.96 | 0.43 | 60 |
| 2016 | 11.22 | 0.14 | 1.15(2) | 1.29 | (0.13) | (0.47) | (0.60) | 11.91 | 11.53 | 276,104 | 0.97 | 0.98 | 1.15 | 78 |
| 2015 | 11.60 | 0.13 | 0.12(2) | 0.25 | (0.12) | (0.51) | (0.63) | 11.22 | 2.16 | 167,117 | 0.99(1) | 1.00 | 1.12 | 55 |
| |
| Equity Index Fund |
| Institutional Class |
| 2019 | $27.56 | $0.59 | $8.11 | $8.70 | $(0.58) | $(0.23) | $(0.81) | $35.45 | 31.68% | $1,501,076 | 0.13% | 0.13% | 1.82% | 2% |
| 2018 | 29.43 | 0.55 | (1.79) | (1.24) | (0.48) | (0.15) | (0.63) | 27.56 | (4.29) | 1,107,944 | 0.12 | 0.13 | 1.81 | 3 |
| 2017 | 24.68 | 0.47 | 4.92 | 5.39 | (0.46) | (0.18) | (0.64) | 29.43 | 21.97 | 483,275 | 0.19 | 0.20 | 1.72 | 2 |
| 2016 | 22.81 | 0.46 | 2.27(2) | 2.73 | (0.56) | (0.30) | (0.86) | 24.68 | 12.16 | 355,404 | 0.15 | 0.16 | 1.97 | 3 |
| 2015 | 23.99 | 0.48 | (0.26)(2) | 0.22 | (0.61) | (0.79) | (1.40) | 22.81 | 0.92 | 276,599 | 0.17 | 0.18 | 1.94 | 6 |
| Investor Class |
| 2019 | $27.58 | $0.50 | $8.11 | $8.61 | $(0.49) | $(0.23) | $(0.72) | $35.47 | 31.33% | $634,578 | 0.39% | 0.39% | 1.56% | 2% |
| 2018 | 29.44 | 0.47 | (1.78) | (1.31) | (0.40) | (0.15) | (0.55) | 27.58 | (4.55) | 490,513 | 0.37 | 0.38 | 1.56 | 3 |
| 2017 | 24.70 | 0.40 | 4.91 | 5.31 | (0.39) | (0.18) | (0.57) | 29.44 | 21.65 | 494,771 | 0.45 | 0.46 | 1.46 | 2 |
| 2016 | 22.58 | 0.39 | 2.27(2) | 2.66 | (0.29) | (0.25) | (0.54) | 24.70 | 11.84 | 386,796 | 0.42 | 0.42 | 1.70 | 3 |
| 2015 | 22.90 | 0.37 | (0.21)(2) | 0.16 | (0.18) | (0.30) | (0.48) | 22.58 | 0.70 | 332,005 | 0.41 | 0.44 | 1.62 | 6 |
| | | | | | | | | | | | | | | |
| # | Calculated using the average shares outstanding method. |
| (1) | The ratio for the Defensive Market Strategies Fund includes the effect of fees paid indirectly which decreased the ratio by 0.00% and 0.00% for the years 2015 and 2017. |
| (2) | Amount includes Capital Gains distributions received by the Fund from the GuideStone Money Market Fund. The amount of these distributions represents less than $0.005 per share. |
See Notes to Financial Statements.
| For a Share Outstanding For the Years Ending December 31, unless otherwise indicated | | | | | | Ratios to Average Net Assets | |
| | Net Asset
Value,
Beginning
of Year | Net Investment
Income/ (Loss)# | Realized
and
Unrealized
Gain
(Loss) on
Investments | Total Income
From Investment
Operations | Dividends
from Net
Investment
Income | Distributions
from Net
Realized
Capital
Gains | Total
Distributions
Paid | Net Asset
Value,
End of
Year | Total
Return | Net Assets,
End of Year
(000) | Expenses,
Net | Expenses,
Gross | Investment
Income/
(Loss),
Net | Portfolio
Turnover
Rate |
| Value Equity Fund |
| Institutional Class |
| 2019 | $16.79 | $0.35 | $4.16 | $4.51 | $(0.34) | $(1.94) | $(2.28) | $19.02 | 27.14% | $831,854 | 0.62%(1) | 0.62% | 1.81% | 92% |
| 2018 | 22.76 | 0.39 | (2.75) | (2.36) | (0.40) | (3.21) | (3.61) | 16.79 | (10.97) | 703,135 | 0.56(1) | 0.57 | 1.75 | 38 |
| 2017 | 21.18 | 0.39 | 2.85 | 3.24 | (0.37) | (1.29) | (1.66) | 22.76 | 15.54 | 1,128,445 | 0.57(1) | 0.58 | 1.78 | 38 |
| 2016 | 19.75 | 0.41 | 2.30(2) | 2.71 | (0.46) | (0.82) | (1.28) | 21.18 | 14.11 | 920,433 | 0.59(1) | 0.60 | 2.05 | 36 |
| 2015 | 23.56 | 0.39 | (1.20)(2) | (0.81) | (0.44) | (2.56) | (3.00) | 19.75 | (3.44) | 917,208 | 0.61(1) | 0.62 | 1.73 | 32 |
| Investor Class |
| 2019 | $16.81 | $0.30 | $4.16 | $4.46 | $(0.29) | $(1.94) | $(2.23) | $19.04 | 26.80% | $383,041 | 0.89%(1) | 0.89% | 1.55% | 92% |
| 2018 | 22.78 | 0.34 | (2.75) | (2.41) | (0.35) | (3.21) | (3.56) | 16.81 | (11.19) | 335,568 | 0.83(1) | 0.84 | 1.50 | 38 |
| 2017 | 21.20 | 0.34 | 2.85 | 3.19 | (0.32) | (1.29) | (1.61) | 22.78 | 15.25 | 397,231 | 0.83(1) | 0.84 | 1.52 | 38 |
| 2016 | 19.46 | 0.35 | 2.33(2) | 2.68 | (0.26) | (0.68) | (0.94) | 21.20 | 13.84 | 370,589 | 0.86(1) | 0.87 | 1.78 | 36 |
| 2015 | 21.31 | 0.27 | (1.06)(2) | (0.79) | (0.08) | (0.98) | (1.06) | 19.46 | (3.70) | 324,440 | 0.89(1) | 0.89 | 1.26 | 32 |
| |
| Growth Equity Fund |
| Institutional Class |
| 2019 | $21.47 | $0.03 | $7.36 | $7.39 | $(0.03) | $(2.60) | $(2.63) | $26.23 | 34.79% | $934,297 | 0.71%(3) | 0.71% | 0.13% | 21% |
| 2018 | 25.18 | 0.05 | 0.41 | 0.46 | (0.01) | (4.16) | (4.17) | 21.47 | 1.22 | 765,738 | 0.70(3) | 0.71 | 0.18 | 19 |
| 2017 | 21.08 | 0.03 | 6.80 | 6.83 | (0.02) | (2.71) | (2.73) | 25.18 | 32.43 | 1,150,773 | 0.72(3) | 0.73 | 0.12 | 41 |
| 2016 | 22.25 | —† | (0.22)(2) | (0.22) | — | (0.95) | (0.95) | 21.08 | (0.98) | 890,530 | 0.75(3) | 0.76 | 0.01 | 24 |
| 2015 | 25.80 | 0.02 | 1.38(2) | 1.40 | — | (4.95) | (4.95) | 22.25 | 5.67 | 932,232 | 0.77(3) | 0.78 | 0.09 | 79 |
| Investor Class |
| 2019 | $21.35 | $(0.03) | $7.30 | $7.27 | $— | $(2.60) | $(2.60) | $26.02 | 34.42% | $763,853 | 0.96%(3) | 0.96% | (0.13)% | 21% |
| 2018 | 25.11 | (0.02) | 0.42 | 0.40 | — | (4.16) | (4.16) | 21.35 | 0.99 | 622,379 | 0.96(3) | 0.97 | (0.06) | 19 |
| 2017 | 21.07 | (0.04) | 6.79 | 6.75 | — | (2.71) | (2.71) | 25.11 | 32.06 | 584,764 | 0.98(3) | 0.99 | (0.14) | 41 |
| 2016 | 22.02 | (0.05) | (0.24)(2) | (0.29) | — | (0.66) | (0.66) | 21.07 | (1.30) | 424,210 | 1.01(3) | 1.02 | (0.26) | 24 |
| 2015 | 22.92 | (0.05) | 1.27(2) | 1.22 | — | (2.12) | (2.12) | 22.02 | 5.44 | 483,385 | 1.04(3) | 1.06 | (0.21) | 79 |
| | | | | | | | | | | | | | | |
| # | Calculated using the average shares outstanding method. |
| † | Amount represents less than $0.005 per share. |
| (1) | The ratio for the Value Equity Fund includes the effect of fees paid indirectly which decreased the ratio by 0.00% for the years 2015, 2016, 2017, 2018 and 2019. |
| (2) | Amount includes Capital Gains distributions received by the Fund from the GuideStone Money Market Fund. The amount of these distributions represents less than $0.005 per share. |
| (3) | The ratio for the Growth Equity Fund includes the effect of fees paid indirectly which decreased the ratio by 0.00% for the years 2015, 2016, 2017, 2018, and 2019. |
See Notes to Financial Statements.
FINANCIAL HIGHLIGHTS(Continued)
| For a Share Outstanding For the Years Ending December 31, unless otherwise indicated | | | | | | Ratios to Average Net Assets | |
| | Net Asset
Value,
Beginning
of Year | Net Investment
Income/ (Loss)# | Realized
and
Unrealized
Gain
(Loss) on
Investments | Total Income
From Investment
Operations | Dividends
from Net
Investment
Income | Distributions
from Net
Realized
Capital
Gains | Total
Distributions
Paid | Net Asset
Value,
End of
Year | Total
Return | Net Assets,
End of Year
(000) | Expenses,
Net | Expenses,
Gross | Investment
Income/
(Loss),
Net | Portfolio
Turnover
Rate |
| Small Cap Equity Fund |
| Institutional Class |
| 2019 | $13.04 | $0.03 | $3.26 | $3.29 | $(0.02) | $(0.59) | $(0.61) | $15.72 | 25.29% | $338,440 | 1.00%(1) | 1.01% | 0.20% | 84% |
| 2018 | 18.36 | 0.04 | (2.13)(2) | (2.09) | — | (3.23)(3) | (3.23) | 13.04 | (12.01) | 256,242 | 0.98(1) | 0.99 | 0.20 | 172 |
| 2017 | 17.53 | 0.02 | 2.24 | 2.26 | (0.03) | (1.40) | (1.43) | 18.36 | 12.98 | 293,953 | 0.98(1) | 1.00 | 0.09 | 80 |
| 2016 | 15.14 | 0.06 | 2.59(4) | 2.65 | (0.07) | (0.19) | (0.26) | 17.53 | 17.48 | 265,627 | 1.01(1) | 1.03 | 0.36 | 77 |
| 2015 | 18.05 | 0.08 | (1.13)(4) | (1.05) | (0.06) | (1.80) | (1.86) | 15.14 | (5.66) | 264,962 | 1.00(1) | 1.03 | 0.45 | 74 |
| Investor Class |
| 2019 | $13.01 | $(0.01) | $3.25 | $3.24 | $— | $(0.59) | $(0.59) | $15.66 | 24.97% | $258,018 | 1.26%(1) | 1.27% | (0.06)% | 84% |
| 2018 | 18.37 | (0.01) | (2.12)(2) | (2.13) | — | (3.23)(3) | (3.23) | 13.01 | (12.22) | 231,456 | 1.24(1) | 1.25 | (0.06) | 172 |
| 2017 | 17.56 | (0.03) | 2.24 | 2.21 | — | (1.40) | (1.40) | 18.37 | 12.67 | 261,943 | 1.25(1) | 1.27 | (0.17) | 80 |
| 2016 | 15.17 | 0.02 | 2.59(4) | 2.61 | (0.03) | (0.19) | (0.22) | 17.56 | 17.17 | 266,994 | 1.27(1) | 1.30 | 0.11 | 77 |
| 2015 | 17.08 | 0.02 | (1.04)(4) | (1.02) | — | (0.89) | (0.89) | 15.17 | (5.91) | 236,850 | 1.24(1) | 1.27 | 0.13 | 74 |
| |
| International Equity Index Fund |
| Institutional Class |
| 2019 | $9.24 | $0.31 | $1.65 | $1.96 | $(0.33) | $— | $(0.33) | $10.87 | 21.21% | $713,864 | 0.22% | 0.23% | 3.05% | 5% |
| 2018 | 10.76 | 0.27 | (1.66) | (1.39) | (0.13) | — | (0.13) | 9.24 | (12.86) | 545,427 | 0.27 | 0.27 | 2.64 | 4 |
| 2017 | 8.86 | 0.25 | 1.93 | 2.18 | (0.25) | (0.03) | (0.28) | 10.76 | 24.69 | 188,122 | 0.41 | 0.35 | 2.45 | 4 |
| 2016 | 8.94 | 0.23 | (0.09)(4) | 0.14 | (0.22) | — | (0.22) | 8.86 | 1.63 | 133,021 | 0.57 | 0.65 | 2.61 | 6 |
| 2015(5) | 10.00 | 0.07 | (1.06)(4) | (0.99) | (0.07) | — | (0.07) | 8.94 | (9.88) | 111,025 | 0.57 | 0.66 | 1.33 | 4 |
| | | | | | | | | | | | | | | |
| # | Calculated using the average shares outstanding method. |
| (1) | The ratio for the Small Cap Equity Fund includes the effect of fees paid indirectly which decreased the ratio by 0.02%, 0.01%, 0.01%, and 0.01% for the years 2015, 2016, 2017, and 2019. For the year ended December 31, 2018, the effect of fees paid indirectly decreased the ratio by 0.00% and 0.01% for Institutional and Investor Class, respectively. |
| (2) | The amount previously reported in the Funds’ 2018 Annual Report has been revised due to a misstatement. The misstatement was not considered material to the prior period Annual Report. In the Funds’ 2018 Annual Report, the Small Cap Equity Fund reported amounts of $(8.59) and $(8.58) for the Institutional and Investor Class, respectively. |
| (3) | The amount previously reported in the Funds’ 2018 Annual Report has been revised due to a misstatement. The misstatement was not considered material to the prior period Annual Report. In the Funds’ 2018 Annual Report, the Small Cap Equity Fund reported amounts of $3.23 for both the Institutional and Investor Class. |
| (4) | Amount includes Capital Gains distributions received by the Fund from the GuideStone Money Market Fund. The amount of these distributions represents less than $0.005 per share. |
| (5) | Inception date was June 1, 2015. All ratios for the period have been annualized. Total return and portfolio turnover for the period have not been annualized. |
See Notes to Financial Statements.
| For a Share Outstanding For the Years Ending December 31, unless otherwise indicated | | | | | | Ratios to Average Net Assets | |
| | Net Asset
Value,
Beginning
of Year | Net Investment
Income# | Realized
and
Unrealized
Gain
(Loss) on
Investments | Total Income
From Investment
Operations | Dividends
from Net
Investment
Income | Distributions
from Net
Realized
Capital
Gains | Total
Distributions
Paid | Net Asset
Value,
End of
Year | Total
Return | Net Assets,
End of Year
(000) | Expenses,
Net | Expenses,
Gross | Investment
Income,
Net
| Portfolio
Turnover
Rate |
| International Equity Fund |
| Institutional Class |
| 2019 | $11.74 | $0.31(1) | $2.44 | $2.75 | $(0.31) | $(0.40) | $(0.71) | $13.78 | 23.45% | $963,046 | 1.07%(2) | 1.07%(2) | 2.31%(1) | 54% |
| 2018 | 15.72 | 0.32 | (2.65) | (2.33) | (0.32) | (1.33) | (1.65) | 11.74 | (14.90) | 795,484 | 1.07(2) | 1.08(2) | 2.08 | 73 |
| 2017 | 13.16 | 0.25 | 3.65 | 3.90 | (0.25) | (1.09) | (1.34) | 15.72 | 29.85 | 1,279,089 | 0.92(2)(3) | 0.93(2) | 1.63 | 42 |
| 2016 | 13.14 | 0.27 | 0.13(4) | 0.40 | (0.27) | (0.11) | (0.38) | 13.16 | 2.96 | 1,017,929 | 1.00(2)(3) | 1.01(2) | 2.09 | 33 |
| 2015 | 14.25 | 0.22 | (0.50)(4) | (0.28) | (0.26) | (0.57) | (0.83) | 13.14 | (1.93) | 1,030,729 | 1.03(2)(3) | 1.05(2) | 1.49 | 43 |
| Investor Class |
| 2019 | $11.77 | $0.27(1) | $2.45 | $2.72 | $(0.28) | $(0.40) | $(0.68) | $13.81 | 23.10% | $351,124 | 1.35%(2) | 1.34%(2) | 2.05%(1) | 54% |
| 2018 | 15.74 | 0.27 | (2.63) | (2.36) | (0.28) | (1.33) | (1.61) | 11.77 | (15.06) | 285,252 | 1.33(2) | 1.35(2) | 1.76 | 73 |
| 2017 | 13.18 | 0.21 | 3.66 | 3.87 | (0.22) | (1.09) | (1.31) | 15.74 | 29.50 | 345,545 | 1.18(2)(3) | 1.19(2) | 1.37 | 42 |
| 2016 | 13.18 | 0.24 | 0.11(4) | 0.35 | (0.24) | (0.11) | (0.35) | 13.18 | 2.62 | 264,295 | 1.27(2)(3) | 1.28(2) | 1.81 | 33 |
| 2015 | 14.03 | 0.24 | (0.55)(4) | (0.31) | (0.12) | (0.42) | (0.54) | 13.18 | (2.16) | 245,976 | 1.35(2)(3) | 1.39(2) | 1.68 | 43 |
| |
| Emerging Markets Equity Fund |
| Institutional Class |
| 2019 | $8.71 | $0.18(5) | $1.57 | $1.75 | $(0.27) | $— | $(0.27) | $10.19 | 20.06% | $457,074 | 1.19%(6) | 1.19% | 1.92%(5) | 92% |
| 2018 | 11.00 | 0.13 | (2.36) | (2.23) | (0.06) | — | (0.06) | 8.71 | (20.26) | 359,815 | 1.30(6) | 1.21 | 1.26 | 155 |
| 2017 | 8.18 | 0.08 | 2.85 | 2.93 | (0.11) | — | (0.11) | 11.00 | 35.80 | 404,641 | 1.30(6) | 1.31 | 0.83 | 56 |
| 2016 | 7.34 | 0.08 | 0.90(4) | 0.98 | (0.14) | — | (0.14) | 8.18 | 13.46 | 290,082 | 1.30(6) | 1.48 | 0.98 | 54 |
| 2015 | 9.09 | 0.11 | (1.83)(4) | (1.72) | (0.03) | — | (0.03) | 7.34 | (18.93) | 272,123 | 1.28(6) | 1.50 | 1.36 | 39 |
| Investor Class |
| 2019 | $8.72 | $0.14(5) | $1.57 | $1.71 | $(0.23) | $— | $(0.23) | $10.20 | 19.64% | $75,866 | 1.57%(6) | 1.57% | 1.48%(5) | 92% |
| 2018 | 11.00 | 0.10 | (2.35) | (2.25) | (0.03) | — | (0.03) | 8.72 | (20.49) | 65,354 | 1.56(6) | 1.52 | 0.96 | 155 |
| 2017 | 8.19 | 0.06 | 2.84 | 2.90 | (0.09) | — | (0.09) | 11.00 | 35.37 | 94,346 | 1.57(6) | 1.66 | 0.57 | 56 |
| 2016 | 7.35 | 0.06 | 0.91(4) | 0.97 | (0.13) | — | (0.13) | 8.19 | 13.20 | 45,106 | 1.56(6) | 1.87 | 0.73 | 54 |
| 2015 | 9.09 | 0.05 | (1.79)(4) | (1.74) | — | — | — | 7.35 | (19.14) | 25,659 | 1.51(6) | 1.83 | 0.58 | 39 |
| | | | | | | | | | | | | | | |
| # | Calculated using the average shares outstanding method. |
| (1) | Net investment income per share and the ratio of net investment income to average net assets include $0.01 and 0.09% for the Institutional Class and $0.01 and 0.09% for the Investor Class, respectively, resulting from a special dividend from Naspers Ltd. in September 2019. |
| (2) | The ratio for the International Equity Fund includes the effect of dividend expense on securities sold short which increased the ratio by 0.17%, 0.14% and 0.08% for the years 2015, 2016 and 2017. For the year ended December 31, 2018, the effect of dividend expense on securities sold short increased the ratio by 0.23% and 0.29% for Institutional Class and Investor Class, respectively. For the year ended December 31, 2019, the effect of dividend expense on securities sold short increased the ratio by 0.19%. |
| (3) | The ratio for the International Equity Fund includes the effect of fees paid indirectly which decreased the ratio by 0.00% for the years 2015, 2016 and 2017. |
| (4) | Amount includes Capital Gains distributions received by the Fund from the GuideStone Money Market Fund. The amount of these distributions represents less than $0.005 per share. |
| (5) | Net investment income per share and the ratio of net investment income to average net assets include $0.06 and 0.68% for the Institutional Class and $0.06 and 0.62% for the Investor Class, respectively, resulting from a special dividend from Naspers Ltd. in September 2019. |
| (6) | The ratio for the Emerging Markets Equity Fund includes the effect of fees paid indirectly which decreased the ratio by 0.00% for the years 2015, 2016, 2017, 2018 and 2019. |
See Notes to Financial Statements.
Global Real Estate Securities Fund(Unaudited)
Global real estate securities pushed higher in 2019 alongside broader equity markets, driven by falling interest rates and an outlook for accommodative monetary policy. The Fund provides exposure to real estate by investing in equity securities of real estate investment trusts (“REITs”) and other real estate related companies. The Fund was diversified among property sectors and geographical locations. The Investor Class of the Fund outperformed its benchmark, the FTSE EPRA/NAREIT Developed Index, for the one-year period ended December 31, 2019 (24.42% versus 21.91%). Stock selection in the retail, health care and industrial sectors was particularly strong but partially offset by stock selection in the diversified and mixed-use (office/industrial) sectors.
In 2019, exchange listed equity index futures contracts were utilized to provide market exposure to the cash positions held in the Fund. Overall, derivative exposure had a slight positive impact on Fund performance for the year.
This Fund may be suitable for investors who seek the potential for current income and long-term capital appreciation. Investors should be willing to accept significant short-term fluctuations in account value and want to diversify their portfolio through exposure to publicly traded, global real estate securities. This Fund invests substantial assets in REITs that involve equity market risks as well as risks linked directly to the real estate market. Risks include declines in the value of real estate, general and economic conditions, changes in the value of the underlying property and defaults by borrowers. The value of assets in the real estate industry may go through cycles of relative underperformance and outperformance in comparison to equity securities markets in general. Securities of foreign issuers may be negatively impacted by political events, economic conditions or inefficient, illiquid or unregulated markets in foreign countries, and they also may be subject to inadequate regulatory or accounting standards, which may increase investment risk. Investing in emerging markets may involve greater risks than investing in more developed foreign markets because, among other things, emerging markets often have more political and economic instability. It is possible to lose money by investing in the Fund.
At December 31, 2019, the portfolio holdings of the Fund, as a percentage of net assets, is shown in the following table. Portfolio holdings are subject to risk and may change at any time.
| | % |
| Real Estate | 96.1 |
| Money Market Funds | 2.8 |
| Information Technology | 0.5 |
| Consumer Discretionary | 0.1 |
| U.S. Treasury Obligation | 0.1 |
| | 99.6 |
Global Real Estate Securities Fund(Unaudited)
| Average Annual Total Returns as of 12/31/19 | |
| | | Institutional Class* | | Investor Class* | | Benchmark** | |
| One Year | | 24.87% | | 24.42% | | 21.91% | |
| Five Year | | N/A | | 6.42% | | 5.56% | |
| Ten year | | N/A | | 10.16% | | 9.64% | |
| Since Inception(1) | | 6.62% | | 4.32% | | 3.71% | |
| Inception Date | | 05/01/15 | | 12/29/06 | | | |
| Total Fund Operating Expenses (April 30, 2019 Prospectus)(2) | | 0.87% | | 1.15% | | | |
| (1) | The Since Inception benchmark performance is based on the start date of December 29, 2006, which corresponds with the inception date of the Investor Class, the longest operating class of the Fund. |
| (2) | Current information regarding the Fund’s Operating Expenses can be found in the Financial Highlights. |
The performance data quoted represents past performance and does not guarantee future results. Current performance may be lower or higher. Performance data current to the most recent month-end may be obtained at GuideStoneFunds.com. The investment return and principal value of an investment will fluctuate so that shares, when redeemed, may be worth more or less than their original cost.
The graph illustrates the results of a hypothetical $10,000 investment in the Investor Class of the Fund for the 10-year period from December 31, 2009 to December 31, 2019, with all dividends and capital gains reinvested, with the FTSE EPRA/NAREIT Developed Index.
*These returns reflect investment advisory and shareholder servicing fee waivers, if applicable, during the reported time periods.
**Unlike a mutual fund, the performance of an index assumes no taxes, transaction costs, management fees or other expenses.
GLOBAL REAL ESTATE SECURITIES FUND
| | | Shares | | Value |
| COMMON STOCKS — 52.7% |
| Real Estate — 52.7% | | |
| Agree Realty Corporation REIT | 43,258 | | $3,035,414 |
| Alexandria Real Estate Equities, Inc. REIT | 21,637 | | 3,496,106 |
| American Assets Trust, Inc. REIT | 21,233 | | 974,595 |
| American Tower Corporation REIT | 7,620 | | 1,751,228 |
| Americold Realty Trust REIT | 75,072 | | 2,632,024 |
| Apartment Investment & Management Co. Class A REIT | 53,395 | | 2,757,852 |
| AvalonBay Communities, Inc. REIT | 4,230 | | 887,031 |
| Boston Properties, Inc. REIT | 15,410 | | 2,124,423 |
| Brixmor Property Group, Inc. REIT | 107,620 | | 2,325,668 |
| Camden Property Trust REIT | 17,683 | | 1,876,166 |
| CoreSite Realty Corporation REIT | 5,813 | | 651,754 |
| Cousins Properties, Inc. REIT | 44,788 | | 1,845,266 |
| CyrusOne, Inc. REIT | 54,481 | | 3,564,692 |
| DiamondRock Hospitality Co. REIT | 197,290 | | 2,185,973 |
| Douglas Emmett, Inc. REIT | 52,612 | | 2,309,667 |
| Duke Realty Corporation REIT | 58,099 | | 2,014,292 |
| EastGroup Properties, Inc. REIT | 12,257 | | 1,626,136 |
| Equinix, Inc. REIT | 2,142 | | 1,250,285 |
| Equity LifeStyle Properties, Inc. REIT | 72,207 | | 5,082,651 |
| Equity Residential REIT | 77,321 | | 6,256,815 |
| Essential Properties Realty Trust, Inc. REIT | 64,622 | | 1,603,272 |
| Essex Property Trust, Inc. REIT | 7,330 | | 2,205,304 |
| Extra Space Storage, Inc. REIT | 41,634 | | 4,397,383 |
| Federal Realty Investment Trust REIT | 7,663 | | 986,458 |
| Four Corners Property Trust, Inc. REIT | 34,269 | | 966,043 |
| Healthpeak Properties, Inc. REIT | 163,706 | | 5,642,946 |
| Highwoods Properties, Inc. REIT | 28,705 | | 1,403,962 |
| Host Hotels & Resorts, Inc. REIT | 24,360 | | 451,878 |
| Hudson Pacific Properties, Inc. REIT | 36,771 | | 1,384,428 |
| Invitation Homes, Inc. REIT | 190,453 | | 5,707,876 |
| Kilroy Realty Corporation REIT | 35,610 | | 2,987,679 |
| Kimco Realty Corporation REIT | 138,747 | | 2,873,450 |
| Liberty Property Trust REIT | 26,181 | | 1,572,169 |
| Life Storage, Inc. REIT | 33,350 | | 3,611,138 |
| Medical Properties Trust, Inc. REIT | 149,371 | | 3,153,222 |
| Mid-America Apartment Communities, Inc. REIT | 40,353 | | 5,320,947 |
| New Senior Investment Group, Inc. REIT | 46,606 | | 356,536 |
| Omega Healthcare Investors, Inc. REIT | 49,533 | | 2,097,723 |
| Pebblebrook Hotel Trust REITΔ | 45,384 | | 1,216,745 |
| Physicians Realty Trust REIT | 67,354 | | 1,275,685 |
| Prologis, Inc. REIT | 113,630 | | 10,128,978 |
| QTS Realty Trust, Inc. Class A REIT | 13,310 | | 722,334 |
| Realty Income Corporation REIT | 65,829 | | 4,846,989 |
| Retail Properties of America, Inc. Class A REIT | 6,086 | | 81,552 |
| Rexford Industrial Realty, Inc. REIT | 70,489 | | 3,219,233 |
| Ryman Hospitality Properties, Inc. REIT | 22,031 | | 1,909,206 |
| Simon Property Group, Inc. REIT | 33,289 | | 4,958,729 |
| SITE Centers Corporation REIT | 59,846 | | 839,041 |
| | | Shares | | Value |
| SL Green Realty Corporation REIT | 14,470 | | $1,329,504 |
| Spirit Realty Capital, Inc. REIT | 25,758 | | 1,266,778 |
| STORE Capital Corporation REIT | 79,882 | | 2,974,806 |
| Ventas, Inc. REIT | 20,591 | | 1,188,924 |
| Weingarten Realty Investors REITΔ | 70,920 | | 2,215,541 |
| Welltower, Inc. REIT | 50,282 | | 4,112,062 |
| Weyerhaeuser Co. REIT | 47,633 | | 1,438,517 |
| | | | | 139,095,076 |
Total Common Stocks
(Cost $129,341,144) | | 139,095,076 |
| FOREIGN COMMON STOCKS — 44.0% |
| Australia — 3.4% | | |
| Cromwell Property Group REIT | 354,142 | | 292,010 |
| Dexus REIT | 97,933 | | 804,076 |
| Goodman Group REIT | 182,986 | | 1,716,847 |
| GPT Group (The) REIT (Athens Exchange) | 565,006 | | 2,220,361 |
| Ingenia Communities Group REIT | 93,105 | | 324,069 |
| Mirvac Group REIT | 1,126,033 | | 2,512,816 |
| Scentre Group REIT | 362,904 | | 975,378 |
| Stockland REIT | 65,045 | | 210,881 |
| | | | | 9,056,438 |
| Austria — 0.2% | | |
| CA Immobilien Anlagen AG | 11,747 | | 493,464 |
| Belgium — 0.9% | | |
| Aedifica SA REIT | 8,439 | | 1,071,554 |
| VGP NV | 2,472 | | 243,456 |
| Warehouses De Pauw CVA REIT | 3,002 | | 546,183 |
| Xior Student Housing NV REIT | 10,531 | | 596,538 |
| | | | | 2,457,731 |
| Canada — 3.0% | | |
| Canadian Apartment Properties REIT | 51,371 | | 2,097,091 |
| Dream Office REIT | 49,623 | | 1,189,607 |
| First Capital REIT | 42,911 | | 683,047 |
| Granite REIT | 38,151 | | 1,938,472 |
| InterRent REIT | 126,332 | | 1,521,568 |
| Minto Apartment REIT | 30,100 | | 536,610 |
| | | | | 7,966,395 |
| France — 1.8% | | |
| Gecina SA REIT | 14,131 | | 2,529,779 |
| Klepierre REIT | 54,262 | | 2,060,303 |
| | | | | 4,590,082 |
| Germany — 4.0% | | |
| ADLER Real Estate AG* | 26,584 | | 405,542 |
| alstria office REIT-AG | 48,209 | | 905,774 |
| Aroundtown SA | 32,707 | | 293,767 |
| Deutsche Wohnen SE | 60,079 | | 2,443,823 |
| Godewind Immobilien AG 144A* | 98,926 | | 525,976 |
| Vonovia SE | 110,699 | | 5,945,573 |
| | | | | 10,520,455 |
| Hong Kong — 5.6% | | |
| Champion REIT | 376,288 | | 248,692 |
| CK Asset Holdings, Ltd. | 110,959 | | 800,976 |
See Notes to Financial Statements.
| | | Shares | | Value |
| Hysan Development Co., Ltd. | 84,069 | | $329,596 |
| Link REIT | 359,532 | | 3,806,500 |
| New World Development Co., Ltd. | 3,092,461 | | 4,238,477 |
| Sino Land Co., Ltd. | 704,000 | | 1,022,712 |
| Sun Hung Kai Properties, Ltd. | 95,977 | | 1,469,406 |
| Swire Properties, Ltd. | 854,336 | | 2,834,155 |
| | | | | 14,750,514 |
| Japan — 11.2% | | |
| Activia Properties, Inc. REIT | 704 | | 3,528,113 |
| AEON REIT Investment Corporation | 396 | | 542,227 |
| Comforia Residential REIT, Inc. | 154 | | 487,562 |
| Daibiru Corporation | 51,400 | | 616,338 |
| Frontier Real Estate Investment Corporation REIT | 265 | | 1,113,698 |
| Fukuoka REIT Corporation | 306 | | 521,161 |
| Global One Real Estate Investment Corporation REIT | 653 | | 844,985 |
| Hulic Reit, Inc. | 640 | | 1,161,548 |
| Invesco Office J-REIT, Inc. | 3,631 | | 752,117 |
| Invincible Investment Corporation REIT | 932 | | 530,954 |
| Japan Real Estate Investment Corporation REIT | 219 | | 1,453,392 |
| Japan Rental Housing Investments, Inc. REIT | 1,481 | | 1,448,901 |
| LaSalle Logiport REIT | 396 | | 588,644 |
| Mitsubishi Estate Co., Ltd. | 183,559 | | 3,512,379 |
| Mitsui Fudosan Co., Ltd. | 200,396 | | 4,897,664 |
| Mori Hills Investment Corporation REIT | 952 | | 1,582,250 |
| Mori Trust Hotel Reit, Inc. | 284 | | 393,610 |
| Mori Trust Sogo REIT, Inc. | 532 | | 953,786 |
| NIPPON REIT Investment Corporation | 110 | | 483,917 |
| Orix JREIT, Inc. | 321 | | 695,781 |
| Premier Investment Corporation REIT | 512 | | 724,455 |
| Sumitomo Realty & Development Co., Ltd. | 50,400 | | 1,758,430 |
| Tokyu Fudosan Holdings Corporation | 80,380 | | 555,049 |
| XYMAX REIT Investment Corporation | 381 | | 483,638 |
| | | | | 29,630,599 |
| Netherlands — 1.0% | | |
| InterXion Holding NV* | 17,538 | | 1,469,860 |
| Unibail-Rodamco-Westfield REIT | 7,660 | | 1,208,496 |
| | | | | 2,678,356 |
| Singapore — 3.3% | | |
| CapitaLand, Ltd. | 910,957 | | 2,539,937 |
| City Developments, Ltd. | 166,300 | | 1,353,943 |
| Frasers Centrepoint Trust REITΔ | 646,394 | | 1,350,509 |
| Keppel DC REIT | 303,269 | | 469,013 |
| Mapletree Industrial Trust REIT | 311,353 | | 601,894 |
| | | Shares | | Value |
| Mapletree Logistics Trust REITΔ | 1,914,700 | | $2,477,102 |
| | | | | 8,792,398 |
| Spain — 1.1% | | |
| Arima Real Estate SOCIMI SA REIT* | 39,726 | | 503,535 |
| Lar Espana Real Estate Socimi SA REIT | 22,570 | | 179,749 |
| Merlin Properties Socimi SA REIT | 142,945 | | 2,050,767 |
| | | | | 2,734,051 |
| Sweden — 2.1% | | |
| Castellum AB | 58,830 | | 1,381,819 |
| Fabege AB | 139,909 | | 2,324,052 |
| Fastighets AB Balder, B Shares* | 32,691 | | 1,512,970 |
| Nyfosa AB* | 48,155 | | 416,444 |
| | | | | 5,635,285 |
| Switzerland — 0.9% | | |
| PSP Swiss Property AG | 3,420 | | 472,215 |
| Swiss Prime Site AG* | 17,031 | | 1,970,388 |
| | | | | 2,442,603 |
| United Kingdom — 5.5% | | |
| Assura PLC REIT | 622,472 | | 641,482 |
| Big Yellow Group PLC REIT | 43,208 | | 686,800 |
| British Land Co. PLC (The) REIT | 294,792 | | 2,494,396 |
| Derwent London PLC REIT | 30,818 | | 1,636,943 |
| Grainger PLC | 250,405 | | 1,038,842 |
| Great Portland Estates PLC REIT | 90,759 | | 1,033,887 |
| Hammerson PLC REIT | 78,316 | | 320,237 |
| Intu Properties PLC REIT | 119,723 | | 53,919 |
| Picton Property Income, Ltd. (The) REIT | 205,913 | | 264,570 |
| PPHE Hotel Group, Ltd. | 12,638 | | 309,695 |
| Primary Health Properties PLC REIT | 216,439 | | 458,712 |
| PRS REIT PLC (The) | 378,544 | | 461,306 |
| Safestore Holdings PLC REIT | 30,959 | | 330,527 |
| Segro PLC REIT | 207,747 | | 2,468,930 |
| Tritax EuroBox PLC 144A | 225,362 | | 280,595 |
| UNITE Group PLC (The) REIT | 95,579 | | 1,595,210 |
| Urban & Civic PLC | 89,453 | | 408,789 |
| | | | | 14,484,840 |
Total Foreign Common Stocks
(Cost $103,774,819) | | 116,233,211 |
| MONEY MARKET FUNDS — 2.8% |
GuideStone Money Market Fund, 1.53%
(Institutional Class)Ø∞ | 7,060,944 | | 7,060,944 |
| Northern Institutional Liquid Assets Portfolio (Shares), 1.57%ا | 255,671 | | 255,671 |
See Notes to Financial Statements.
GLOBAL REAL ESTATE SECURITIES FUND
SCHEDULE OF INVESTMENTS (Continued)
| | | Shares | | Value |
| Northern Institutional U.S. Government Portfolio (Shares), 1.48%Ø | 14 | | $14 |
Total Money Market Funds
(Cost $7,316,629) | | 7,316,629 |
| | | Par | |
| U.S. TREASURY OBLIGATION — 0.1% |
| U.S. Treasury Bill | | | |
1.52%, 05/07/20Ω‡‡
(Cost $248,654) | $250,000 | 248,671 |
TOTAL INVESTMENTS —99.6%
(Cost $240,681,246) | | 262,893,587 |
Other Assets in Excess of
Liabilities — 0.4% | | 941,909 |
| NET ASSETS — 100.0% | | $263,835,496 |
Futures Contracts outstanding at December 31, 2019:
| Future Type | | Expiration Date | | Open Long
(Short) Contracts | | Notional
Market Value
of Contracts | | Value and
Unrealized
Appreciation
(Depreciation) |
| S&P MidCap 400 Index E-Mini | | 03/2020 | | 41 | | $8,465,680 | | $96,580 |
See Notes to Financial Statements.
VALUATION HIERARCHY
The following is a summary of the inputs used, as of December 31, 2019, in valuing the Fund’s investments carried at fair value:
| | Total
Value | | Level 1
Quoted Prices | | Level 2
Other Significant
Observable Inputs | | Level 3
Significant
Unobservable Inputs |
| Assets: | | | | | | | |
| Investments in Securities: | | | | | | | |
| Common Stocks | $139,095,076 | | $139,095,076 | | $— | | $— |
| Foreign Common Stocks: | | | | | | | |
| Austria | 493,464 | | — | | 493,464 | | — |
| Germany | 10,520,455 | | — | | 10,520,455 | | — |
| Japan | 29,630,599 | | — | | 29,630,599 | | — |
| Sweden | 5,635,285 | | — | | 5,635,285 | | — |
| Switzerland | 2,442,603 | | — | | 2,442,603 | | — |
| Other^^ | 67,510,805 | | 67,510,805 | | — | | — |
| Total Foreign Common Stocks | 116,233,211 | | 67,510,805 | | 48,722,406 | | — |
| Money Market Funds | 7,316,629 | | 7,316,629 | | — | | — |
| U.S. Treasury Obligation | 248,671 | | — | | 248,671 | | — |
| Total Assets - Investments in Securities | $262,893,587 | | $213,922,510 | | $48,971,077 | | $ — |
| Other Financial Instruments*** | | | | | | | |
| Futures Contracts | $96,580 | | $96,580 | | $— | | $— |
| Total Assets - Other Financial Instruments | $96,580 | | $96,580 | | $ — | | $ — |
| ^^ | Classifications as defined in the Schedule of Investments. |
| *** | Other financial instruments are derivative instruments, such as futures contracts, which are valued at the unrealized appreciation (depreciation) on the investment. Further details regarding the value of these investments can be found in the preceding "Futures Contracts outstanding" disclosure. |
See Notes to Financial Statements.
| STATEMENTS OF ASSETS AND LIABILITIES | December 31, 2019 |
| | Global
Real Estate
Securities Fund |
| Assets | |
| Investments in securities of unaffiliated issuers, at value | $255,832,643 |
| Investments in securities of affiliated issuers, at value | 7,060,944 |
| Total investments, at value(1), (2) | 262,893,587 |
| Cash | 1,487 |
| Deposits with broker for futures contracts | 86,000 |
| Foreign currency(3) | 491,446 |
| Receivables: | |
| Dividends and reclaims | 1,158,719 |
| Securities lending | 1,397 |
| Investment securities sold | 509,022 |
| Fund shares sold | 163,162 |
| Variation margin on futures contracts | 7,790 |
| Prepaid expenses and other assets | 16,541 |
| Total Assets | 265,329,151 |
| Liabilities | |
| Collateral held for securities on loan, at value | 255,671 |
| Payables: | |
| Investment securities purchased | 723,549 |
| Fund shares redeemed | 281,387 |
| Accrued expenses: | |
| Investment advisory fees | 149,588 |
| Shareholder servicing fees | 21,988 |
| Trustee fees | 820 |
| Other expenses | 60,652 |
| Total Liabilities | 1,493,655 |
| Net Assets | $263,835,496 |
| Net Assets Consist of: | |
| Paid-in-capital | $251,389,054 |
| Distributable earnings (loss) | 12,446,442 |
| Net Assets | $263,835,496 |
| Net Asset Value: | |
| $0.001 par value, unlimited shares authorized | |
| Net assets applicable to the Institutional Class | $159,523,086 |
| Institutional shares outstanding | 15,617,285 |
| Net asset value, offering and redemption price per Institutional share | $10.21 |
| Net assets applicable to the Investor Class | $104,312,410 |
| Investor shares outstanding | 10,172,434 |
| Net asset value, offering and redemption price per Investor share | $10.25 |
| |
| (1)Investments in securities of unaffiliated issuers, at cost | $233,620,302 |
| Investments in securities of affiliated issuers, at cost | 7,060,944 |
| Total investments, at cost | $240,681,246 |
| (2)Includes securities loaned of: | $745,279 |
| (3)Foreign currency, at cost | $489,010 |
See Notes to Financial Statements.
| STATEMENTS OF OPERATIONS | For the Year Ended December 31, 2019 |
| | Global
Real Estate
Securities Fund |
| Investment Income | |
| Dividends | $7,418,194 |
| Income distributions received from affiliated funds | 154,228 |
| Interest | 13,981 |
| Securities lending, net | 37,298 |
| Less foreign taxes withheld | (339,058) |
| Total Investment Income | 7,284,643 |
| Expenses | |
| Investment advisory fees | 1,673,046 |
| Transfer agent fees: | |
| Institutional shares | 4,334 |
| Investor shares | 18,436 |
| Custodian fees | 135,756 |
| Shareholder servicing fees: | |
| Investor shares | 250,191 |
| Accounting and administration fees | 51,140 |
| Professional fees | 101,180 |
| Shareholder reporting fees: | |
| Institutional shares | 815 |
| Investor shares | 4,545 |
| Trustees expenses | 4,490 |
| Line of credit facility fees | 4,397 |
| Other expenses | 64,663 |
| Total Expenses | 2,312,993 |
| Fees paid indirectly | (22,894) |
| Net Expenses | 2,290,099 |
| Net Investment Income | 4,994,544 |
| Realized and Unrealized Gain (Loss) | |
| Net realized gain (loss) from: | |
| Investment securities | 15,200,657 |
| Futures transactions | 1,323,101 |
| Forward foreign currency contracts | (7,392) |
| Foreign currency | (9,503) |
| Net realized gain | 16,506,863 |
| Net change in unrealized appreciation (depreciation) on: | |
| Investment securities | 30,775,794 |
| Futures | 302,495 |
| Foreign currency | 13,281 |
| Net change in unrealized appreciation (depreciation) | 31,091,570 |
| Net Realized and Unrealized Gain | 47,598,433 |
| Net Increase in Net Assets Resulting from Operations | $52,592,977 |
See Notes to Financial Statements.
| STATEMENTS OF CHANGES IN NET ASSETS |
| | Global Real Estate Securities Fund |
| | For the Year Ended |
| | 12/31/19 | | 12/31/18 |
| | | | |
| Operations: | | | |
| Net investment income | $4,994,544 | | $4,869,259 |
| Net realized gain on investment securities, foreign currency and derivatives | 16,506,863 | | 2,116,895 |
| Net change in unrealized appreciation (depreciation) on investment securities, foreign currency and derivatives | 31,091,570 | | (17,670,799) |
| Net increase (decrease) in net assets resulting from operations | 52,592,977 | | (10,684,645) |
| Distributions to Shareholders: | | | |
| Institutional shares | (11,663,016) | | (6,105,053) |
| Investor shares | (7,460,096) | | (3,599,717) |
| Total distributions | (19,123,112) | | (9,704,770) |
| Capital Share Transactions: | | | |
| Proceeds from shares sold | | | |
| Institutional shares | 21,320,503 | | 12,654,254 |
| Investor shares | 30,357,678 | | 9,990,178 |
| Reinvestment of dividends and distributions | | | |
| Institutional shares | 11,610,021 | | 6,034,893 |
| Investor shares | 7,408,256 | | 3,571,808 |
| Total proceeds from shares sold and reinvested | 70,696,458 | | 32,251,133 |
| Value of shares redeemed | | | |
| Institutional shares | (26,971,710) | | (6,697,484) |
| Investor shares | (28,833,472) | | (21,086,951) |
| Total value of shares redeemed | (55,805,182) | | (27,784,435) |
| Net increase from capital share transactions(1) | 14,891,276 | | 4,466,698 |
| Total increase (decrease) in net assets | 48,361,141 | | (15,922,717) |
| Net Assets: | | | |
| Beginning of Year | 215,474,355 | | 231,397,072 |
| End of Year | $263,835,496 | | $215,474,355 |
| |
| (1) | See Note 6 in Notes to Financial Statements. |
See Notes to Financial Statements.
| For a Share Outstanding For the Years Ending December 31, unless otherwise indicated | | | | | | Ratios to Average Net Assets | |
| | Net Asset
Value,
Beginning
of Year | Net Investment
Income# | Realized
and
Unrealized
Gain
(Loss) on
Investments | Total Income
From Investment
Operations | Dividends
from Net
Investment
Income | Distributions
from Net
Realized
Capital
Gains | Total
Distributions
Paid | Net Asset
Value,
End of
Year | Total
Return | Net Assets,
End of Year
(000) | Expenses,
Net | Expenses,
Gross | Investment
Income,
Net
| Portfolio
Turnover
Rate |
| Global Real Estate Securities Fund |
| Institutional Class |
| 2019 | $8.83 | $0.22 | $1.95 | $2.17 | $(0.61) | $(0.18) | $(0.79) | $10.21 | 24.87% | $159,523 | 0.82%(1) | 0.83% | 2.13% | 118% |
| 2018 | 9.69 | 0.21 | (0.65) | (0.44) | (0.42) | — | (0.42) | 8.83 | (4.70) | 133,341 | 0.86(1) | 0.87 | 2.26 | 128 |
| 2017 | 9.10 | 0.27 | 0.73 | 1.00 | (0.41) | — | (0.41) | 9.69 | 11.05 | 133,656 | 0.87(1) | 0.88 | 2.86 | 138 |
| 2016 | 9.46 | 0.20 | 0.18(2) | 0.38 | (0.50) | (0.24) | (0.74) | 9.10 | 4.07 | 123,574 | 0.88(1) | 0.90 | 2.07 | 130 |
| 2015(3) | 10.50 | 0.12 | (0.33) | (0.21) | (0.27) | (0.56) | (0.83) | 9.46 | (1.89) | 159,196 | 0.93(1) | 0.94 | 1.83 | 137 |
| Investor Class |
| 2019 | $8.87 | $0.19 | $1.95 | $2.14 | $(0.58) | $(0.18) | $(0.76) | $10.25 | 24.42% | $104,312 | 1.09%(1) | 1.10% | 1.87% | 118% |
| 2018 | 9.72 | 0.19 | (0.65) | (0.46) | (0.39) | — | (0.39) | 8.87 | (4.86) | 82,133 | 1.14(1) | 1.15 | 1.97 | 128 |
| 2017 | 9.13 | 0.24 | 0.73 | 0.97 | (0.38) | — | (0.38) | 9.72 | 10.72 | 97,741 | 1.12(1) | 1.13 | 2.56 | 138 |
| 2016 | 9.49 | 0.16 | 0.19(2) | 0.35 | (0.47) | (0.24) | (0.71) | 9.13 | 3.78 | 100,810 | 1.14(1) | 1.19 | 1.68 | 130 |
| 2015 | 10.26 | 0.16 | (0.13) | 0.03 | (0.24) | (0.56) | (0.80) | 9.49 | 0.34 | 99,357 | 1.12(1) | 1.17 | 1.50 | 137 |
| | | | | | | | | | | | | | | |
| # | Calculated using the average shares outstanding method. |
| (1) | The ratio for the Global Real Estate Securities Fund includes the effect of fees paid indirectly which decreased the ratio by 0.01% for the years 2015, 2016, 2017, 2018 and 2019. |
| (2) | Amount includes Capital Gains distributions received by the Fund from the GuideStone Money Market Fund. The amount of these distributions represents less than $0.005 per share. |
| (3) | Inception date was May 1, 2015. All ratios for the period have been annualized. Total return and portfolio turnover for the period have not been annualized. |
See Notes to Financial Statements.
Strategic Alternatives Fund(Unaudited)
The Fund combines multiple strategies that, in aggregate, seek to provide absolute returns with both lower volatility than and low correlation to traditional equity and fixed-income markets. The Investor Class of the Fund outperformed its benchmark, the ICE BofAML U.S. 3-Month Treasury Bill Index for the one-year period ended December 31, 2019 (4.62% versus 2.28%).
The Fund allocated its assets between five principal investment strategies – short duration high yield, long-short equity, options equity, currency trading and global macro. For the calendar year 2019, the short duration high yield, option equity, global macro and long-short equity strategies contributed to benchmark-relative outperformance while the currency trading strategy detracted.
The dedicated currency trading strategy underperformed the Fund’s benchmark. Short positions in the euro and Swiss franc were the top-performing contributors, while long positions in the Norwegian krone and Swedish krona were the primary detractors from performance. With the backdrop of global central banks providing accommodative monetary policy, both economic growth and inflation remained low and stable. This combination led to strong performance across the major asset classes and a continued fall in implied volatility. This environment caused the major currencies to trade in extremely narrow ranges, which led to a difficult currency trading environment.
The options selling strategy delivered stronger than usual positive returns and outperformed the Fund’s benchmark, with excess returns derived primarily from collecting option premium from the selling of fully-covered, exchange listed put options, as the year experienced very little downside volatility. That is, the strategy continued to benefit from selling options priced on implied volatility, while realized volatility came in on average, consistently lower than the implied volatility over the year.
The short duration high yield bond strategy provided strong, positive absolute performance in 2019, outperforming the Fund’s benchmark. The strategy performance benefited both from collecting coupons as well as rising bond prices due primarily from credit spreads narrowing throughout the year. In addition, the positive performance was impacted by industry positioning and active credit selection. In particular, sector allocation to, and positive security selection within, the real estate sector was additive to performance.
The long-short equity strategy outperformed the Fund’s benchmark for the year. Within the long-short equity strategy, the event-driven sub-strategy contributed strong returns as high profile, large mergers were completed during the year. The long-short equity sub-strategy generated low but positive returns as the sub-strategy was impacted by negative security selection, particularly within the financials sector, which reduced the absolute return.
The global macro strategy outperformed the Fund’s benchmark in 2019. The outperformance was largely driven by relative value interest rate positioning throughout the year. Within developed markets, gains from long European interest rates versus short interest rate positions in Japan, Sweden, Norway and Australia were among the largest contributors to performance. Emerging markets debt exposure was also additive to the Fund’s relative performance, with gains primarily coming from long exposure to the Thailand and South Korea local markets.
During 2019, the Fund sold equity options to collect the option premium. Equity options and equity futures were also used to hedge equity exposure and to provide synthetic beta exposure to the Fund. Overall, the use of equity options contributed positively to the performance of the Fund, while equity futures detracted from the Fund’s absolute performance. In addition, currency forwards, options and swaps were used to take advantage of dislocations in the currency markets and in aggregate contributed negatively to absolute performance. U.S. Treasury futures and interest rate swaps were used for hedging and to express interest rate views, and in aggregate, were additive to absolute performance. Mortgage-backed securities derivatives were utilized to implement views on prepayment speeds and contributed positively to the Fund’s absolute performance.
This Fund may be suitable for investors who have a short- to medium-term investment horizon, can accept short-term fluctuations in account value and would like to diversify their portfolio with an alternatives investment option. The alternative investment strategies that the Fund pursues are complex and may involve greater risk than traditional investments (stocks, bonds and cash). The performance of alternative investments is not expected to correlate closely with more traditional investments; however, it is possible that alternative investments will decline in value along with equity or fixed-income markets, or both, or that they may not otherwise perform in accordance with expectations. Alternative investments can be highly volatile, are often less liquid, particularly in periods of stress, are generally more complex and less transparent and may have more complicated tax profiles than traditional investments. In addition, the performance of alternative investments may be more dependent on a sub-adviser’s experience and skill than traditional investments. The use of alternative investments may not achieve the desired effect. Securities of foreign issuers may be negatively impacted by political events, economic conditions or inefficient, illiquid or unregulated
Strategic Alternatives Fund(Unaudited)
markets in foreign countries, and they also may be subject to inadequate regulatory or accounting standards, which may increase investment risk. Derivatives involve different risks from, and in some respects greater risks than, those associated with investing directly in securities, currencies or other instruments. Derivatives may be illiquid or less liquid, volatile, difficult to price and leverages so that small changes in value of the underlying instruments may produce disproportionate losses to the Fund. Short sales involve selling a security the Fund does not own in anticipation that the security will decline in price. Short sales expose the Fund to the risk that it will required to buy the security sold short (also known as “covering” the short position) at a time when the security has appreciated in value, thus resulting in a loss to the Fund. The Fund’s potential loss on a short position is limited only by the maximum attainable price of the security less the price at which the security was sold by the Fund. Therefore, in theory, stocks sold short have unlimited risk. The Fund’s use of short sales in effect “leverages” the Fund. The use of leverage may magnify the Fund’s gains or losses, and leverage also creates interest expense that may lower the Fund’s overall returns.The Fund’s currency investment strategy may be impacted by currency exchange rates, which can fluctuate significantly over short or extended periods of time. These changes may be caused by governmental or political factors that affect the value of what the Fund owns and its share price. It is possible to lose money by investing in the Fund.
At December 31, 2019, the portfolio holdings of the Fund, as a percentage of net assets, is shown in the following table. Portfolio holdings are subject to risk and may change at any time.
| | % |
| Money Market Funds | 27.7 |
| Corporate Bonds | 24.6 |
| U.S. Treasury Obligations | 19.0 |
| Foreign Bonds | 4.9 |
| Asset-Backed Securities | 3.4 |
| Information Technology | 3.2 |
| Health Care | 2.5 |
| Mortgage-Backed Securities | 2.3 |
| Communication Services | 1.8 |
| Consumer Discretionary | 1.5 |
| Loan Agreements | 1.4 |
| Financials | 1.3 |
| Industrials | 1.2 |
| Energy | 1.1 |
| Materials | 0.9 |
| Mutual Funds | 0.8 |
| Consumer Staples | 0.3 |
| Certificates Of Deposit | 0.3 |
| Real Estate | 0.2 |
| Utilities | 0.1 |
| Rights | —** |
| Purchased Option | —** |
| Written Options | (0.1) |
| Foreign Common Stocks Sold Short | (0.2) |
| Mutual Funds Sold Short | (3.0) |
| Common Stocks Sold Short | (4.1) |
| | 91.1 |
| **Rounds to less than 0.1% | |
Strategic Alternatives Fund(Unaudited)
| Average Annual Total Returns as of 12/31/19 | |
| | | Institutional Class* | | Investor Class* | | Benchmark** | |
| One Year | | 4.93% | | 4.62% | | 2.28% | |
| Five Year | | N/A | | N/A | | N/A | |
| Ten year | | N/A | | N/A | | N/A | |
| Since Inception | | 2.57% | | 2.28% | | 1.88% | |
| Inception Date | | 06/30/17 | | 06/30/17 | | | |
| Total Fund Operating Expenses (April 30, 2019 Prospectus)(1) | | 1.03% | | 1.38% | | | |
| (1) | Current information regarding the Fund’s Operating Expenses can be found in the Financial Highlights. |
The performance data quoted represents past performance and does not guarantee future results. Current performance may be lower or higher. Performance data current to the most recent month-end may be obtained at GuideStoneFunds.com. The investment return and principal value of an investment will fluctuate so that shares, when redeemed, may be worth more or less than their original cost.
The graph illustrates the results of a hypothetical $10,000 investment in the Investor Class of the Fund since June 30, 2017 (commencement of operations), with all dividends and capital gains reinvested, with the ICE BofAML U.S. 3 Month Treasury Bill Index.
*These returns reflect investment advisory and shareholder servicing fee waivers, if applicable, during the reported time periods.
**Unlike a mutual fund, the performance of an index assumes no taxes, transaction costs, management fees or other expenses.
STRATEGIC ALTERNATIVES FUND
| | | Par | | Value |
| ASSET-BACKED SECURITIES — 3.4% |
| American Express Credit Account Master Trust, Series 2017-2, Class A | | | |
| (Floating, ICE LIBOR USD 1M + 0.45%), 2.19%, 09/16/24† | $1,165,000 | | $1,171,159 |
| Capital One Multi-Asset Execution Trust, Series 2016-A7, Class A7 | | | |
| (Floating, ICE LIBOR USD 1M + 0.51%), 2.25%, 09/16/24† | 791,000 | | 796,388 |
| Capital One Prime Auto Receivables Trust, Series 2019-1, Class A2 | | | |
| 2.58%, 04/15/22 | 1,085,252 | | 1,089,815 |
| CARDS II Trust, Series 2019-1A, Class A | | | |
| (Floating, ICE LIBOR USD 1M + 0.39%), 2.13%, 05/15/24 144A † | 370,000 | | 370,972 |
| Chase Issuance Trust, Series 2016-A3, Class A3 | | | |
| (Floating, ICE LIBOR USD 1M + 0.55%), 2.29%, 06/15/23† | 500,000 | | 503,221 |
| Chase Issuance Trust, Series 2017-A2, Class A | | | |
| (Floating, ICE LIBOR USD 1M + 0.40%), 2.14%, 03/15/24† | 1,125,000 | | 1,129,354 |
| Citibank Credit Card Issuance Trust, Series 2016-A3, Class A3 | | | |
| (Floating, ICE LIBOR USD 1M + 0.49%), 2.20%, 12/07/23† | 1,125,000 | | 1,132,092 |
| Evergreen Credit Card Trust, Series 2019-1, Class A | | | |
| (Floating, ICE LIBOR USD 1M + 0.48%), 2.22%, 01/15/23 144A † | 1,080,000 | | 1,083,035 |
| Ford Credit Auto Lease Trust, Series 2019-B, Class A2B | | | |
| (Floating, ICE LIBOR USD 1M + 0.26%), 2.00%, 02/15/22† | 500,000 | | 499,940 |
| Ford Credit Auto Owner Trust, Series 2019-A, Class A2A | | | |
| 2.78%, 02/15/22 | 384,273 | | 385,617 |
| Ford Credit Auto Owner Trust, Series 2019-B, Class A2B | | | |
| (Floating, ICE LIBOR USD 1M + 0.24%), 1.98%, 02/15/22† | 343,096 | | 343,212 |
| Golden Credit Card Trust, Series 2019-2A, Class A | | | |
| (Floating, ICE LIBOR USD 1M + 0.35%, 0.35% Floor), 2.09%, 10/15/23 144A † | 380,000 | | 379,767 |
| Navient Private Education Loan Trust, Series 2017-A, Class A1 | | | |
| (Floating, ICE LIBOR USD 1M + 0.40%), 2.14%, 12/16/58 144A † | 24,918 | | 24,915 |
| Navient Student Loan Trust, Series 2019-1A, Class A1 | | | |
| (Floating, ICE LIBOR USD 1M + 0.33%), 2.12%, 12/27/67 144A † | 344,532 | | 344,536 |
| | | Par | | Value |
| Navient Student Loan Trust, Series 2019-4A, Class A1 | | | |
| (Floating, ICE LIBOR USD 1M + 0.28%, 0.28% Floor), 2.07%, 07/25/68 144A † | $562,399 | | $561,697 |
| Navient Student Loan Trust, Series 2019-7A, Class A1 | | | |
| (Floating, ICE LIBOR USD 1M + 0.50%, 0.50% Floor), 2.17%, 01/25/68 144A † | 600,000 | | 600,320 |
| Nissan Auto Receivables Owners Trust, Series 2019-C, Class A2B | | | |
| (Floating, ICE LIBOR USD 1M + 0.24%), 1.98%, 09/15/22† | 470,000 | | 470,464 |
| USAA Auto Owner Trust, Series 2019-1, Class A2 | | | |
| 2.26%, 02/15/22 | 500,000 | | 500,824 |
| Verizon Owner Trust, Series 2017-3A, Class A1A | | | |
| 2.06%, 04/20/22 144A | 471,209 | | 471,953 |
| Verizon Owner Trust, Series 2019-A, Class A1B | | | |
| (Floating, ICE LIBOR USD 1M + 0.33%), 2.09%, 09/20/23† | 605,000 | | 605,464 |
| Verizon Owner Trust, Series 2019-B, Class A1B | | | |
| (Floating, ICE LIBOR USD 1M + 0.45%), 2.21%, 12/20/23† | 525,000 | | 526,638 |
Total Asset-Backed Securities
(Cost $12,972,862) | | | 12,991,383 |
| CERTIFICATES OF DEPOSIT — 0.3% |
| US Bank NA | | | |
(Floating, ICE LIBOR USD 3M + 0.40%), 2.29%, 12/09/22†
(Cost $1,100,000) | 1,100,000 | | 1,102,261 |
| CORPORATE BONDS — 24.6% |
| AES Corporation | | | |
| 4.50%, 03/15/23 | 500,000 | | 513,543 |
| 4.88%, 05/15/23 | 860,000 | | 874,693 |
| Allison Transmission, Inc. | | | |
| 5.00%, 10/01/24 144A | 500,000 | | 513,120 |
| AMC Networks, Inc. | | | |
| 4.75%, 12/15/22 | 500,000 | | 505,265 |
| 5.00%, 04/01/24 | 1,500,000 | | 1,533,750 |
| American Honda Finance Corporation | | | |
| (Floating, ICE LIBOR USD 3M + 0.35%), 2.24%, 11/05/21† | 1,379,000 | | 1,381,525 |
| AmeriGas Partners LP | | | |
| 5.63%, 05/20/24 | 750,000 | | 811,868 |
| 5.50%, 05/20/25 | 1,250,000 | | 1,353,112 |
| APX Group, Inc. | | | |
| 7.88%, 12/01/22 | 1,400,000 | | 1,415,741 |
| 8.50%, 11/01/24 144A | 1,500,000 | | 1,549,372 |
| Aramark Services, Inc. | | | |
| 5.13%, 01/15/24 | 750,000 | | 771,214 |
See Notes to Financial Statements.
STRATEGIC ALTERNATIVES FUND
SCHEDULE OF INVESTMENTS (Continued)
| | | Par | | Value |
| AT&T, Inc. | | | |
| (Floating, ICE LIBOR USD 3M + 0.95%), 2.95%, 07/15/21† | $1,400,000 | | $1,413,685 |
| (Floating, ICE LIBOR USD 3M + 0.89%), 2.80%, 02/15/23† | 40,000 | | 40,347 |
| Bank of America Corporation | | | |
| (Floating, ICE LIBOR USD 3M + 0.65%), 2.60%, 06/25/22† | 505,000 | | 507,855 |
| (Floating, ICE LIBOR USD 3M + 1.18%), 3.15%, 10/21/22† | 170,000 | | 172,529 |
| (Floating, ICE LIBOR USD 3M + 1.16%), 3.13%, 01/20/23† | 830,000 | | 842,380 |
| Berry Global, Inc. | | | |
| 5.50%, 05/15/22 | 542,000 | | 549,449 |
| BMW US Capital LLC | | | |
| (Floating, ICE LIBOR USD 3M + 0.37%), 2.28%, 08/14/20 144A † | 800,000 | | 801,107 |
| (Floating, ICE LIBOR USD 3M + 0.50%), 2.40%, 08/13/21 144A † | 500,000 | | 501,410 |
| Bristol-Myers Squibb Co. | | | |
| (Floating, ICE LIBOR USD 3M + 0.38%), 2.28%, 05/16/22 144A † | 1,000,000 | | 1,003,556 |
| CalAtlantic Group, Inc. | | | |
| 6.63%, 05/01/20 | 1,250,000 | | 1,260,938 |
| Capital One Financial Corporation | | | |
| (Floating, ICE LIBOR USD 3M + 0.95%), 2.84%, 03/09/22† | 535,000 | | 540,677 |
| Capital One NA | | | |
| (Floating, ICE LIBOR USD 3M + 1.15%), 3.09%, 01/30/23† | 800,000 | | 809,279 |
| Caterpillar Financial Services Corporation | | | |
| (Floating, ICE LIBOR USD 3M + 0.28%), 2.17%, 09/07/21† | 1,250,000 | | 1,250,617 |
| CCO Holdings LLC | | | |
| 5.25%, 09/30/22 | 1,500,000 | | 1,519,545 |
| Cedar Fair LP | | | |
| 5.38%, 06/01/24 | 250,000 | | 257,604 |
| Central Garden & Pet Co. | | | |
| 6.13%, 11/15/23 | 300,000 | | 310,625 |
| Choice Hotels International, Inc. | | | |
| 5.75%, 07/01/22 | 395,000 | | 427,464 |
| Cigna Corporation | | | |
| (Floating, ICE LIBOR USD 3M + 0.65%), 2.55%, 09/17/21† | 700,000 | | 700,043 |
| CIT Group, Inc. | | | |
| 5.00%, 08/15/22 | 500,000 | | 531,247 |
| Citigroup, Inc. | | | |
| (Floating, ICE LIBOR USD 3M + 0.96%), 2.90%, 04/25/22† | 1,080,000 | | 1,094,545 |
| (Floating, ICE LIBOR USD 3M + 0.69%), 2.63%, 10/27/22† | 420,000 | | 423,438 |
| Clear Channel Outdoor Holdings, Inc. | | | |
| 9.25%, 02/15/24 144A | 638,000 | | 707,915 |
| CNH Industrial Capital LLC | | | |
| 4.38%, 04/05/22 | 1,000,000 | | 1,046,752 |
| Colfax Corporation | | | |
| 6.00%, 02/15/24 144A | 500,000 | | 532,293 |
| | | Par | | Value |
| Credit Acceptance Corporation | | | |
| 5.13%, 12/31/24 144A | $250,000 | | $260,240 |
| Crown Americas LLC | | | |
| 4.50%, 01/15/23 | 450,000 | | 474,183 |
| CVS Health Corporation | | | |
| (Floating, ICE LIBOR USD 3M + 0.72%), 2.61%, 03/09/21† | 1,000,000 | | 1,006,366 |
| Daimler Finance North America LLC | | | |
| (Floating, ICE LIBOR USD 3M + 0.45%), 2.35%, 02/22/21 144A † | 1,250,000 | | 1,250,780 |
| Dell International LLC | | | |
| 5.88%, 06/15/21 144A | 330,000 | | 335,570 |
| 7.13%, 06/15/24 144A | 1,250,000 | | 1,320,313 |
| DISH DBS Corporation | | | |
| 5.13%, 05/01/20 | 2,000,000 | | 2,014,880 |
| Dollar Tree, Inc. | | | |
| 3.70%, 05/15/23 | 500,000 | | 521,330 |
| Dominion Energy Gas Holdings LLC | | | |
| (Floating, ICE LIBOR USD 3M + 0.60%), 2.49%, 06/15/21† | 985,000 | | 989,115 |
| Duke Energy Florida LLC | | | |
| (Floating, ICE LIBOR USD 3M + 0.25%), 2.17%, 11/26/21† | 350,000 | | 350,325 |
| Enterprise Products Operating LLC | | | |
| 5.25%, 01/31/20 | 1,110,000 | | 1,112,535 |
| ESH Hospitality, Inc. REIT | | | |
| 5.25%, 05/01/25 144A | 350,000 | | 362,542 |
| Florida Power & Light Co. | | | |
| (Floating, ICE LIBOR USD 3M + 0.40%), 2.31%, 05/06/22† | 900,000 | | 900,037 |
| Ford Motor Credit Co. LLC | | | |
| 2.68%, 01/09/20 | 1,735,000 | | 1,735,141 |
| Fresenius US Finance II, Inc. | | | |
| 4.50%, 01/15/23 144A | 1,000,000 | | 1,054,232 |
| GameStop Corporation | | | |
| 6.75%, 03/15/21 144A | 300,000 | | 295,500 |
| General Electric Co. | | | |
| 5.50%, 01/08/20 | 545,000 | | 545,199 |
| (Floating, ICE LIBOR USD 3M + 0.80%), 2.80%, 04/15/20† | 139,000 | | 139,184 |
| Goldman Sachs Group, Inc. (The) | | | |
| (Floating, ICE LIBOR USD 3M + 0.75%), 2.66%, 02/23/23† | 1,005,000 | | 1,011,254 |
| Group 1 Automotive, Inc. | | | |
| 5.00%, 06/01/22 | 1,000,000 | | 1,016,243 |
| Honeywell International, Inc. | | | |
| (Floating, ICE LIBOR USD 3M + 0.37%), 2.27%, 08/08/22† | 535,000 | | 538,163 |
| Hughes Satellite Systems Corporation | | | |
| 7.63%, 06/15/21 | 1,000,000 | | 1,070,270 |
| Iron Mountain, Inc. REIT | | | |
| 6.00%, 08/15/23 | 1,500,000 | | 1,535,002 |
| John Deere Capital Corporation | | | |
| (Floating, ICE LIBOR USD 3M + 0.40%), 2.29%, 06/07/21† | 355,000 | | 356,341 |
| (Floating, ICE LIBOR USD 3M + 0.48%), 2.37%, 09/08/22† | 250,000 | | 251,301 |
See Notes to Financial Statements.
| | | Par | | Value |
| JPMorgan Chase & Co. | | | |
| (Floating, ICE LIBOR USD 3M + 1.00%), 3.00%, 01/15/23† | $1,450,000 | | $1,466,197 |
| KAR Auction Services, Inc. | | | |
| 5.13%, 06/01/25 144A | 500,000 | | 521,043 |
| KGA Escrow LLC | | | |
| 7.50%, 08/15/23 144A | 1,500,000 | | 1,590,622 |
| Kinder Morgan, Inc. | | | |
| 3.15%, 01/15/23 | 1,000,000 | | 1,023,317 |
| Lamar Media Corporation | | | |
| 5.00%, 05/01/23 | 1,000,000 | | 1,019,990 |
| Lennar Corporation | | | |
| 4.75%, 04/01/21 | 1,000,000 | | 1,024,320 |
| Level 3 Financing, Inc. | | | |
| 5.38%, 08/15/22 | 210,000 | | 210,830 |
| LSB Industries, Inc. | | | |
| 9.63%, 05/01/23 144A | 750,000 | | 772,339 |
| Morgan Stanley | | | |
| (Floating, ICE LIBOR USD 3M + 0.93%), 2.88%, 07/22/22† | 1,490,000 | | 1,504,399 |
| MPLX LP | | | |
| (Floating, ICE LIBOR USD 3M + 0.90%), 2.79%, 09/09/21† | 925,000 | | 927,926 |
| NBCUniversal Enterprise, Inc. | | | |
| (Floating, ICE LIBOR USD 3M + 0.40%), 2.31%, 04/01/21 144A † | 1,275,000 | | 1,278,494 |
| NCR Corporation | | | |
| 6.38%, 12/15/23 | 1,100,000 | | 1,129,794 |
| New York Life Global Funding | | | |
| (Floating, ICE LIBOR USD 3M + 0.44%), 2.44%, 07/12/22 144A † | 815,000 | | 818,452 |
| Newmark Group, Inc. | | | |
| 6.13%, 11/15/23 | 500,000 | | 551,742 |
| NGPL PipeCo LLC | | | |
| 4.38%, 08/15/22 144A | 1,029,000 | | 1,069,455 |
| Nielsen Co Luxembourg S.a.r.l. (The) | | | |
| 5.50%, 10/01/21 144A | 1,755,000 | | 1,765,530 |
| Occidental Petroleum Corporation | | | |
| (Floating, ICE LIBOR USD 3M + 1.25%), 3.15%, 08/13/21† | 980,000 | | 985,293 |
| Owens-Brockway Glass Container, Inc. | | | |
| 5.00%, 01/15/22 144A | 500,000 | | 519,885 |
| Party City Holdings, Inc. | | | |
| 6.13%, 08/15/23 144A | 3,000,000 | | 2,633,745 |
| PBF Logistics LP | | | |
| 6.88%, 05/15/23 | 250,000 | | 258,123 |
| Penske Automotive Group, Inc. | | | |
| 5.75%, 10/01/22 | 2,250,000 | | 2,286,547 |
| 5.38%, 12/01/24 | 400,000 | | 412,666 |
| Prime Security Services Borrower LLC | | | |
| 9.25%, 05/15/23 144A | 2,602,000 | | 2,733,726 |
| PulteGroup, Inc. | | | |
| 4.25%, 03/01/21 | 1,000,000 | | 1,020,400 |
| | | Par | | Value |
| Realogy Group LLC | | | |
| 5.25%, 12/01/21 144A | $2,675,000 | | $2,707,769 |
| Reynolds Group Issuer, Inc. | | | |
| 5.75%, 10/15/20 | 484,554 | | 485,765 |
| Sabine Pass Liquefaction LLC | | | |
| 5.63%, 02/01/21 | 250,000 | | 257,017 |
| SBA Communications Corporation REIT | | | |
| 4.88%, 07/15/22 | 1,500,000 | | 1,521,420 |
| Starwood Property Trust, Inc. REIT | | | |
| 3.63%, 02/01/21 | 1,250,000 | | 1,261,438 |
| Suburban Propane Partners LP | | | |
| 5.50%, 06/01/24 | 546,000 | | 562,375 |
| Sunoco LP | | | |
| 4.88%, 01/15/23 | 1,000,000 | | 1,025,435 |
| T-Mobile USA, Inc. | | | |
| 6.50%, 01/15/24 | 2,500,000 | | 2,578,150 |
| Toyota Motor Credit Corporation | | | |
| (Floating, ICE LIBOR USD 3M + 0.54%), 2.57%, 01/08/21† | 1,350,000 | | 1,355,819 |
| UnitedHealth Group, Inc. | | | |
| (Floating, ICE LIBOR USD 3M + 0.26%), 2.15%, 06/15/21† | 1,000,000 | | 1,001,499 |
| Univision Communications, Inc. | | | |
| 6.75%, 09/15/22 144A | 400,000 | | 407,125 |
| Verizon Communications, Inc. | | | |
| (Floating, ICE LIBOR USD 3M + 1.00%), 2.89%, 03/16/22† | 1,400,000 | | 1,423,842 |
| Wells Fargo & Co. | | | |
| (Floating, ICE LIBOR USD 3M + 1.11%), 3.05%, 01/24/23† | 1,400,000 | | 1,418,866 |
| Wolverine Escrow LLC | | | |
| 8.50%, 11/15/24 144A | 1,000,000 | | 1,037,085 |
| 9.00%, 11/15/26 144A | 750,000 | | 787,001 |
| XPO Logistics, Inc. | | | |
| 6.75%, 08/15/24 144A | 500,000 | | 544,218 |
Total Corporate Bonds
(Cost $94,618,392) | | | 94,814,208 |
| FOREIGN BONDS — 4.9% |
| Australia — 0.3% | | |
| National Australia Bank, Ltd. | | | |
| (Floating, ICE LIBOR USD 3M + 1.00%), 3.00%, 07/12/21 144A † | 1,000,000 | | 1,012,394 |
| Canada — 1.3% | | |
| 1011778 BC ULC | | | |
| 4.25%, 05/15/24 144A | 1,000,000 | | 1,027,085 |
| Bausch Health Cos., Inc. | | | |
| 7.00%, 03/15/24 144A | 2,500,000 | | 2,605,212 |
| Quebecor Media, Inc. | | | |
| 5.75%, 01/15/23 | 250,000 | | 272,084 |
| Royal Bank of Canada | | | |
| (Floating, ICE LIBOR USD 3M + 0.73%), 2.64%, 02/01/22† | 1,000,000 | | 1,010,448 |
| | | | | 4,914,829 |
See Notes to Financial Statements.
STRATEGIC ALTERNATIVES FUND
SCHEDULE OF INVESTMENTS (Continued)
| | | Par | | Value |
| China — 0.7% | | |
| Global Aircraft Leasing Co., Ltd. | | | |
| Cash coupon 6.50% or PIK 7.25%, 09/15/24 144A | $1,500,000 | | $1,568,925 |
| Park Aerospace Holdings, Ltd. | | | |
| 5.25%, 08/15/22 144A | 1,000,000 | | 1,068,212 |
| | | | | 2,637,137 |
| Ireland — 0.4% | | |
| Fly Leasing, Ltd. | | | |
| 6.38%, 10/15/21 | 1,500,000 | | 1,530,937 |
| Mexico — 0.1% | | |
| Mexican Bonos | | | |
| 7.50%, 06/03/27(M) | 4,131,600 | | 227,154 |
| 8.50%, 11/18/38(M) | 2,135,500 | | 128,872 |
| | | | | 356,026 |
| Netherlands — 0.3% | | |
| ABN AMRO Bank NV | | | |
| (Floating, ICE LIBOR USD 3M + 0.57%), 2.49%, 08/27/21 144A † | 500,000 | | 502,157 |
| OCI NV | | | |
| 5.25%, 11/01/24 144A | 500,000 | | 521,250 |
| | | | | 1,023,407 |
| Russia — 0.5% | | |
| Russian Federal Bond - OFZ | | | |
| 7.65%, 04/10/30(Q) | 106,610,000 | | 1,897,196 |
| 7.25%, 05/10/34(Q) | 11,660,000 | | 202,611 |
| | | | | 2,099,807 |
| United Kingdom — 1.3% | | |
| BP Capital Markets PLC | | | |
| (Floating, ICE LIBOR USD 3M + 0.25%), 2.16%, 11/24/20† | 905,000 | | 906,429 |
| Connect Finco S.a.r.l. | | | |
| 6.75%, 10/01/26 144A | 2,000,000 | | 2,132,500 |
| eG Global Finance PLC | | | |
| 8.50%, 10/30/25 144A | 1,500,000 | | 1,595,003 |
| GlaxoSmithKline Capital PLC | | | |
| (Floating, ICE LIBOR USD 3M + 0.35%), 2.26%, 05/14/21† | 580,000 | | 581,269 |
| | | | | 5,215,201 |
Total Foreign Bonds
(Cost $18,350,717) | | 18,789,738 |
| LOAN AGREEMENTS — 1.4% |
| APX Group, Inc., Initial Loan | | | |
| (Floating, ICE LIBOR USD 2M+ 5.00%), 6.84%, 04/01/24† | 986,420 | | 989,192 |
| (Floating, ICE PRIME USD 3M+ 4.00%), 8.75%, 04/01/24† | 1,080 | | 1,083 |
| Asurion LLC Replacement B-2 Term Loan | | | |
| (Floating, ICE LIBOR USD 1M+ 6.50%), 8.30%, 08/04/25† | 3,000,000 | | 3,043,875 |
| | | Par | | Value |
| PetSmart, Inc. Amended Loan | | | |
| (Floating, ICE LIBOR USD 1M+ 4.00%), 5.74%, 03/11/22† | $802,052 | | $795,074 |
| Whatabrands LLC Term B Loan | | | |
| (Floating, ICE LIBOR USD 1M+ 3.25%), 4.94%, 08/02/26† | 498,750 | | 502,224 |
Total Loan Agreements
(Cost $5,261,024) | | | 5,331,448 |
| MORTGAGE-BACKED SECURITIES — 2.3% |
| DBUBS, Series 2011-LC1A, Class A3 | | | |
| 5.00%, 11/10/46 144A | 279,542 | | 283,733 |
| Federal Home Loan Mortgage Corporation REMIC, Series 4248 | | | |
| (Floating, 6.00% - ICE LIBOR USD 1M, 6.00% Cap), 4.26%, 09/15/43† IO | 588,242 | | 90,470 |
| Federal Home Loan Mortgage Corporation REMIC, Series 4286 | | | |
| (Floating, 6.00% - ICE LIBOR USD 1M, 6.00% Cap), 4.26%, 12/15/43† IO | 349,323 | | 48,870 |
| Federal Home Loan Mortgage Corporation REMIC, Series 4320 | | | |
| (Floating, 6.10% - ICE LIBOR USD 1M, 6.10% Cap), 4.36%, 07/15/39† IO | 1,686,827 | | 283,063 |
| Federal Home Loan Mortgage Corporation REMIC, Series 4468 | | | |
| (Floating, 6.10% - ICE LIBOR USD 1M, 6.10% Cap), 4.36%, 05/15/45† IO | 585,842 | | 102,905 |
| Federal Home Loan Mortgage Corporation REMIC, Series 4583 | | | |
| (Floating, 6.00% - ICE LIBOR USD 1M, 6.00% Cap), 4.26%, 05/15/46† IO | 1,444,135 | | 263,071 |
| Federal Home Loan Mortgage Corporation REMIC, Series 4792 | | | |
| (Floating, 6.20% - ICE LIBOR USD 1M, 6.20% Cap), 4.46%, 05/15/48† IO | 1,671,183 | | 219,606 |
| Federal Home Loan Mortgage Corporation REMIC, Series 4936 | | | |
| 4.26%, 12/25/49† IO | 1,548,458 | | 293,720 |
| Federal National Mortgage Association REMIC, Series 2012-115 | | | |
| (Floating, 6.10% - ICE LIBOR USD 1M, 6.10% Cap), 4.31%, 10/25/42† IO | 654,039 | | 113,338 |
| Federal National Mortgage Association REMIC, Series 2015-34 | | | |
| (Floating, 6.10% - ICE LIBOR USD 1M, 6.10% Cap), 4.31%, 06/25/45† IO | 895,156 | | 170,780 |
See Notes to Financial Statements.
| | | Par | | Value |
| Federal National Mortgage Association REMIC, Series 2016-69 | | | |
| (Floating, 6.10% - ICE LIBOR USD 1M, 6.10% Cap), 4.31%, 10/25/46† IO | $760,283 | | $119,434 |
| Federal National Mortgage Association REMIC, Series 2018-38 | | | |
| (Floating, 6.20% - ICE LIBOR USD 1M, 6.20% Cap), 4.41%, 06/25/48† IO | 824,027 | | 124,530 |
| Federal National Mortgage Association REMIC, Series 2018-8 | | | |
| (Floating, 6.15% - ICE LIBOR USD 1M, 6.15% Cap), 4.36%, 02/25/48† IO | 713,456 | | 106,759 |
| Federal National Mortgage Association STRIP, Series 405 | | | |
| (Floating, 5.05% - ICE LIBOR USD 1M, 5.05% Cap), 3.26%, 10/25/40† IO | 630,634 | | 88,161 |
| Government National Mortgage Association, Series 2010-101 | | | |
| (Floating, 6.00% - ICE LIBOR USD 1M, 6.00% Cap), 4.24%, 08/20/40† IO | 294,619 | | 53,026 |
| Government National Mortgage Association, Series 2010-85 | | | |
| (Floating, 5.94% - ICE LIBOR USD 1M, 5.94% Cap), 4.18%, 07/20/40† IO | 243,112 | | 45,533 |
| Government National Mortgage Association, Series 2015-110 | | | |
| (Floating, 5.70% - ICE LIBOR USD 1M, 5.70% Cap), 3.94%, 08/20/45† IO | 334,373 | | 50,589 |
| (Floating, 5.71% - ICE LIBOR USD 1M, 5.71% Cap), 3.95%, 08/20/45† IO | 2,407,782 | | 369,720 |
| Government National Mortgage Association, Series 2015-57 | | | |
| (Floating, 5.60% - ICE LIBOR USD 1M, 5.60% Cap), 3.84%, 04/20/45† IO | 1,455,464 | | 207,038 |
| Government National Mortgage Association, Series 2016-109 | | | |
| 4.00%, 10/20/45 IO | 286,150 | | 37,211 |
| Government National Mortgage Association, Series 2018-72 | | | |
| 4.00%, 04/20/46 IO | 1,260,234 | | 196,324 |
| Government National Mortgage Association, Series 2019-110 | | | |
| 4.34%, 09/20/49† IO | 1,657,780 | | 243,940 |
| Government National Mortgage Association, Series 2019-128 | | | |
| 4.00%, 10/20/49 IO | 1,292,915 | | 211,580 |
| Government National Mortgage Association, Series 2019-129 | | | |
| 3.50%, 10/20/49 IO | 1,093,663 | | 195,062 |
| | | Par | | Value |
| Government National Mortgage Association, Series 2019-98 | | | |
| (Floating, 6.05% - ICE LIBOR USD 1M, 6.05% Cap), 4.29%, 08/20/49† IO | $1,287,567 | | $209,598 |
| UBS Commercial Mortgage Trust, Series 2012-C1, Class AAB | | | |
| 3.00%, 05/10/45 | 720,492 | | 724,752 |
| Uniform Mortgage Backed Securities | | | |
| 3.00%, 01/01/50 TBA | 4,000,000 | | 4,057,187 |
Total Mortgage-Backed Securities
(Cost $8,583,715) | | | 8,910,000 |
| | Number of
Contracts | | Notional
Amount | |
| PURCHASED OPTION — 0.0% |
| Call Option — 0.0% |
Walgreens Boots Alliance, Inc., Strike Price $65.00, Expires 04/17/20 (CITI)
(Premiums paid $16,185) | 75 | | $442,200 | 8,100 |
| | | Par | |
| U.S. TREASURY OBLIGATIONS — 19.0% |
| U.S. Treasury Bills | | | |
| 2.29%, 04/23/20Ω | $15,408,000 | 15,334,766 |
| 1.82%, 07/16/20Ω | 15,374,000 | 15,245,830 |
| 1.58%, 10/08/20Ω | 15,377,000 | 15,196,704 |
| 1.46%, 12/03/20Ω | 10,718,000 | 10,570,082 |
| | | | 56,347,382 |
| U.S. Treasury Notes | | | |
| (Floating, U.S. Treasury 3M Bill MMY + 0.00%), 1.53%, 01/31/20† | 2,500,000 | 2,499,940 |
| 2.00%, 11/30/20 | 14,434,000 | 14,482,208 |
| | | | 16,982,148 |
Total U.S. Treasury Obligations
(Cost $73,258,473) | | 73,329,530 |
| | | Shares | |
| COMMON STOCKS — 12.7% |
| Communication Services — 1.8% | |
| AT&T, Inc. | 23,090 | 902,357 |
| Discovery, Inc. Class A‡ * | 24,098 | 788,969 |
| NII Holdings, Inc.* | 76,167 | 165,282 |
| T-Mobile US, Inc.* | 8,027 | 629,477 |
| ViacomCBS, Inc. Class B | 6,058 | 254,254 |
| Zayo Group Holdings, Inc.* | 118,293 | 4,098,853 |
| | | | 6,839,192 |
| Consumer Discretionary — 1.4% | |
| Best Buy Co., Inc. | 1,576 | 138,373 |
See Notes to Financial Statements.
STRATEGIC ALTERNATIVES FUND
SCHEDULE OF INVESTMENTS (Continued)
| | | Shares | | Value |
| Capri Holdings, Ltd.* | 17,781 | | $678,345 |
| Hilton Grand Vacations, Inc.* | 8,749 | | 300,878 |
| Lennar Corporation Class A | 4,660 | | 259,981 |
| NIKE, Inc. Class B‡ | 11,126 | | 1,127,175 |
| O’Reilly Automotive, Inc.* | 1,413 | | 619,261 |
| Tiffany & Co. | 10,353 | | 1,383,679 |
| Wyndham Hotels & Resorts, Inc. | 11,849 | | 744,236 |
| | | | | 5,251,928 |
| Consumer Staples — 0.3% | | |
| Procter & Gamble Co. (The) | 10,659 | | 1,331,309 |
| Energy — 1.1% | | |
| EOG Resources, Inc. | 3,245 | | 271,801 |
| Marathon Petroleum Corporation‡ | 10,929 | | 658,472 |
| Occidental Petroleum Corporation | 14,130 | | 582,297 |
| Tallgrass Energy LP Class A | 105,329 | | 2,329,878 |
| Valero Energy Corporation | 3,864 | | 361,864 |
| | | | | 4,204,312 |
| Financials — 1.3% | | |
| Alberton Acquisition Corporation* | 33,070 | | 342,274 |
| Boxwood Merger Corporation Class A* | 42,034 | | 424,543 |
| Citigroup, Inc.‡‡ | 18,947 | | 1,513,676 |
| Fellazo, Inc.* | 16,530 | | 164,639 |
| GS Acquisition Holdings Corporation Class A* | 15,977 | | 176,226 |
| Legacy Acquisition Corporation Class A* | 47,513 | | 487,958 |
| Mosaic Acquisition Corporation Class A* | 22,828 | | 234,786 |
| Pure Acquisition Corporation* | 35,349 | | 366,923 |
| TD Ameritrade Holding Corporation | 29,284 | | 1,455,415 |
| Truist Financial Corporation | 1 | | 46 |
| | | | | 5,166,486 |
| Health Care — 1.7% | | |
| Achillion Pharmaceuticals, Inc.* | 11,702 | | 70,563 |
| Audentes Therapeutics, Inc.* | 12,058 | | 721,551 |
| Bristol-Myers Squibb Co.‡‡ | 12,410 | | 796,598 |
| Diplomat Pharmacy, Inc.* | 15,607 | | 62,428 |
| Elanco Animal Health, Inc.* | 26,915 | | 792,647 |
| Envista Holdings Corporation‡ * | 33,628 | | 996,747 |
| Hologic, Inc.* | 4,154 | | 216,880 |
| Johnson & Johnson‡‡ | 7,713 | | 1,125,095 |
| Medicines Co. (The)* | 19,915 | | 1,691,580 |
| | | | | 6,474,089 |
| Industrials — 1.0% | | |
| Aircastle, Ltd. | 27,208 | | 870,928 |
| Boeing Co. (The) | 1,540 | | 501,671 |
| Continental Building Products, Inc.* | 7,855 | | 286,158 |
| FedEx Corporation | 2,020 | | 305,444 |
| Jacobs Engineering Group, Inc. | 9,377 | | 842,336 |
| L3Harris Technologies, Inc. | 3,574 | | 707,187 |
| WESCO International, Inc.* | 3,718 | | 220,812 |
| | | | | 3,734,536 |
| Information Technology — 3.0% | | |
| Apple, Inc. | 2,698 | | 792,268 |
| | | Shares | | Value |
| Cypress Semiconductor Corporation | 100,433 | | $2,343,102 |
| Fitbit, Inc. Class A* | 99,840 | | 655,949 |
| HP, Inc. | 64,316 | | 1,321,694 |
| Instructure, Inc.* | 4,973 | | 239,748 |
| LiveRamp Holdings, Inc.* | 5,767 | | 277,220 |
| Mastercard, Inc. Class A | 807 | | 240,962 |
| Microsoft Corporation‡‡ | 8,177 | | 1,289,513 |
| NortonLifeLock, Inc. | 14,135 | | 360,725 |
| PayPal Holdings, Inc.‡ * | 13,218 | | 1,429,791 |
| QUALCOMM, Inc.‡‡ ‡ | 28,089 | | 2,478,292 |
| | | | | 11,429,264 |
| Materials — 0.8% | | |
| Allegheny Technologies, Inc.* | 7,681 | | 158,689 |
| Berry Global Group, Inc.* | 8,801 | | 417,960 |
| Crown Holdings, Inc.* | 4,217 | | 305,901 |
| Freeport-McMoRan, Inc. | 32,671 | | 428,644 |
| Huntsman Corporation | 56,874 | | 1,374,076 |
| Westrock Co. | 14,111 | | 605,503 |
| | | | | 3,290,773 |
| Real Estate — 0.2% | | |
| Equinix, Inc. REIT | 458 | | 267,335 |
| Weyerhaeuser Co. REIT | 21,259 | | 642,022 |
| | | | | 909,357 |
| Utilities — 0.1% | | |
| El Paso Electric Co. | 8,051 | | 546,582 |
Total Common Stocks
(Cost $47,326,728) | | | 49,177,828 |
| FOREIGN COMMON STOCKS — 1.4% |
| Canada — 0.1% | | |
| Canfor Corporation* | 7,499 | | 70,107 |
| Continental Gold, Inc.* | 94,121 | | 387,777 |
| | | | | 457,884 |
| Germany — 0.2% | | |
| Siemens AG | 4,632 | | 607,899 |
| Netherlands — 1.1% | | |
| Fiat Chrysler Automobiles NV | 21,982 | | 322,915 |
| Mylan NV* | 22,169 | | 445,597 |
| NXP Semiconductor NV‡‡ | 7,136 | | 908,127 |
| QIAGEN NV* | 8,852 | | 299,198 |
| Wright Medical Group NV* | 77,485 | | 2,361,743 |
| | | | | 4,337,580 |
Total Foreign Common Stocks
(Cost $5,203,631) | | | 5,403,363 |
| RIGHTS — 0.0% |
| Alder Biopharmaceuticals, Inc.††† * | 3,505 | | 7,010 |
| Bristol-Myers Squibb Co.‡‡ * | 52,140 | | 156,941 |
Total Rights
(Cost $127,993) | | | 163,951 |
| MUTUAL FUNDS — 0.8% |
| Altaba, Inc.Ψ ††† * | 67,544 | | 1,325,889 |
| SPDR S&P Regional Banking ETF | 27,338 | | 1,592,438 |
Total Mutual Funds
(Cost $2,868,148) | | | 2,918,327 |
See Notes to Financial Statements.
| | | Shares | | Value |
| MONEY MARKET FUNDS — 27.7% |
GuideStone Money Market Fund, 1.53%
(Institutional Class)Ø ∞ | 48,154,387 | | $48,154,387 |
| Northern Institutional U.S. Government Portfolio (Shares), 1.48%Ø | 58,823,299 | | 58,823,299 |
Total Money Market Funds
(Cost $106,977,686) | | | 106,977,686 |
TOTAL INVESTMENTS —98.5%
(Cost $376,665,554) | | | 379,917,823 |
| COMMON STOCKS SOLD SHORT — (4.1)% |
| Communication Services — (0.4)% | | |
| Comcast Corporation Class A | (11,961) | | (537,886) |
| Facebook, Inc. Class A * | (3,442) | | (706,470) |
| Roku, Inc. * | (1,984) | | (265,658) |
| | | | | (1,510,014) |
| Consumer Discretionary — (0.4)% | | |
| Lear Corporation | (2,572) | | (352,878) |
| Marriott International, Inc. Class A | (3,060) | | (463,376) |
| Starbucks Corporation | (7,217) | | (634,519) |
| | | | | (1,450,773) |
| Consumer Staples — (0.2)% | | |
| Clorox Co. (The) | (1,714) | | (263,167) |
| Coca-Cola Co. (The) | (5,671) | | (313,890) |
| | | | | (577,057) |
| Financials — (0.4)% | | |
| Charles Schwab Corporation (The) | (31,410) | | (1,493,860) |
| Health Care — (0.5)% | | |
| CVS Health Corporation | (11,168) | | (829,671) |
| Danaher Corporation | (4,238) | | (650,448) |
| Humana, Inc. ‡‡ | (699) | | (256,197) |
| Thermo Fisher Scientific, Inc. | (1,148) | | (372,951) |
| | | | | (2,109,267) |
| Industrials — (0.4)% | | |
| Deere & Co. | (1,800) | | (311,868) |
| General Electric Co. | (32,564) | | (363,414) |
| IDEX Corporation | (1,314) | | (226,008) |
| Illinois ToolWorks, Inc. | (2,957) | | (531,166) |
| United Parcel Service, Inc. Class B | (2,188) | | (256,127) |
| | | | | (1,688,583) |
| Information Technology — (1.1)% | | |
| Applied Materials, Inc. | (8,558) | | (522,380) |
| Fiserv, Inc. * | (7,501) | | (867,341) |
| Intel Corporation | (21,515) | | (1,287,673) |
| Oracle Corporation | (9,770) | | (517,615) |
| Square, Inc. Class A * | (4,126) | | (258,122) |
| Texas Instruments, Inc. | (5,761) | | (739,079) |
| | | | | (4,192,210) |
| Materials — (0.3)% | | |
| Dow, Inc. | (13,713) | | (750,513) |
| International Paper Co. | (6,699) | | (308,489) |
| | | | | (1,059,002) |
| | | Shares | | Value |
| Real Estate — (0.4)% | | |
| American Tower Corporation REIT | (5,177) | | $(1,189,778) |
| Kimco Realty Corporation REIT | (17,276) | | (357,786) |
| | | | | (1,547,564) |
Total Common Stocks Sold Short
(Proceeds $(15,360,357)) | | | (15,628,330) |
| FOREIGN COMMON STOCKS SOLD SHORT — (0.2)% |
| China — (0.1)% | | |
| Alibaba Group Holding, Ltd. ADR * | (1,678) | | (355,904) |
| Ireland — (0.1)% | | |
| Johnson Controls International PLC | (7,271) | | (296,002) |
| Taiwan — (0.0)% | | |
| Taiwan Semiconductor Manufacturing Co., Ltd. ADR | (4,203) | | (244,194) |
Total Foreign Common Stocks Sold Short
(Proceeds $(891,884)) | | | (896,100) |
| MUTUAL FUNDS SOLD SHORT — (3.0)% |
| Consumer Staples Select SPDR Fund | (23,007) | | (1,448,981) |
| Energy Select Sector SPDR Fund | (6,058) | | (363,722) |
| Health Care Select Sector SPDR Fund | (8,840) | | (900,442) |
| Industrial Select Sector SPDR Fund | (22,948) | | (1,869,574) |
| iShares Expanded Tech-Software Sector ETF | (3,192) | | (743,864) |
| iShares Russell 2000 ETF | (1,635) | | (270,870) |
| iShares U.S. Real Estate ETF | (8,164) | | (759,905) |
| SPDR S&P500 ETF Trust | (15,757) | | (5,071,548) |
Total Mutual Funds Sold Short
(Proceeds $(11,218,405)) | | | (11,428,906) |
TOTAL SECURITIES SOLD SHORT —(7.3)%
(Cost $(27,470,646)) | | | (27,953,336) |
| | Number of
Contracts | | Notional
Amount | |
| WRITTEN OPTIONS — (0.1)% |
| Call Options — (0.0)% |
QUALCOMM, Inc., Strike Price
$90.00, Expires
01/17/20 (CITI) | (273) | | $(2,408,679) | (32,214) |
Discovery, Inc., Strike Price
$32.50, Expires
01/17/20 (CITI) | (241) | | (789,034) | (20,967) |
Envista Holdings Corporation, Strike Price
$29.00, Expires
01/17/20 (CITI) | (98) | | (290,472) | (11,515) |
Marathon Petroleum Corporation, Strike Price
$62.50, Expires
01/17/20 (CITI) | (52) | | (313,300) | (3,900) |
NIKE, Inc., Strike Price
$100.00, Expires
01/17/20 (CITI) | (111) | | (1,124,541) | (25,919) |
See Notes to Financial Statements.
STRATEGIC ALTERNATIVES FUND
SCHEDULE OF INVESTMENTS (Continued)
| | Number of
Contracts | | Notional
Amount | | Value |
Paypal Holdings, Inc., Strike Price
$105.00, Expires
01/17/20 (CITI) | (83) | | $(897,811) | | $(34,445) |
Walgreens Boots Alliance, Inc., Strike Price
$75.00, Expires
04/17/20 (CITI) | (75) | | (442,200) | | (450) |
| | | | | | (129,410) |
| Put Options — (0.1)% |
S&P 500®, Strike Price
$3,015.00, Expires
01/08/20 (MSCS) | (21) | | (6,784,638) | | (2,562) |
S&P 500®, Strike Price
$3,080.00, Expires
01/10/20 (MSCS) | (20) | | (6,461,560) | | (5,950) |
S&P 500®, Strike Price
$3,095.00, Expires
01/29/20 (MSCS) | (19) | | (6,138,482) | | (23,465) |
S&P 500®, Strike Price
$3,105.00, Expires
01/15/20 (MSCS) | (16) | | (5,169,248) | | (9,280) |
S&P 500®, Strike Price
$3,110.00, Expires
01/13/20 (MSCS) | (19) | | (6,138,482) | | (8,740) |
| | Number of
Contracts | | Notional
Amount | | Value |
S&P 500®, Strike Price
$3,110.00, Expires
01/27/20 (MSCS) | (21) | | $(6,784,638) | | $(25,305) |
S&P 500®, Strike Price
$3,125.00, Expires
01/22/20 (MSCS) | (19) | | (6,138,482) | | (20,615) |
S&P 500®, Strike Price
$3,130.00, Expires
01/21/20 (MSCS) | (18) | | (5,815,404) | | (18,630) |
S&P 500®, Strike Price
$3,135.00, Expires
01/17/20 (MSCS) | (17) | | (5,492,326) | | (16,235) |
S&P 500®, Strike Price
$3,135.00, Expires
01/24/20 (MSCS) | (19) | | (6,138,482) | | (25,935) |
| | | | | | (156,717) |
Total Written Options
(Premiums received $ (423,569)) | | | | (286,127) |
Other Assets in Excess of
Liabilities — 8.9% | | | | 34,414,288 |
| NET ASSETS — 100.0% | | | | $386,092,648 |
Futures Contracts outstanding at December 31, 2019:
| Future Type | | Expiration Date | | Open Long
(Short) Contracts | | Notional
Market Value
of Contracts | | Value and
Unrealized
Appreciation
(Depreciation) |
| Euro-Bobl | | 03/2020 | | (1) | | $(149,893) | | $382 |
| 10-Year Japanese Treasury Bond | | 03/2020 | | 3 | | 4,201,739 | | (1,233) |
| 10-Year Commonwealth Treasury Bond | | 03/2020 | | 1 | | 100,321 | | (606) |
| 3-Year Australian Bond | | 03/2020 | | 1 | | 80,711 | | (113) |
| 10-Year U.S. Treasury Note | | 03/2020 | | 164 | | 21,061,188 | | (100,791) |
| U.S. Treasury Long Bond | | 03/2020 | | 6 | | 935,438 | | (15,414) |
| Ultra 10-Year U.S. Treasury Note | | 03/2020 | | (61) | | (8,582,891) | | 127,270 |
| Ultra Long U.S. Treasury Bond | | 03/2020 | | 45 | | 8,174,531 | | (241,488) |
| 2-Year U.S. Treasury Note | | 03/2020 | | (208) | | (44,824,000) | | 27,334 |
| 5-Year U.S. Treasury Note | | 03/2020 | | 8 | | 948,875 | | 2,628 |
| Total Futures Contracts outstanding at December 31, 2019 | | | | | | $(18,053,981) | | $(202,031) |
Forward Foreign Currency Contracts outstanding at December 31, 2019:
| Expiration Date | | Currency
Purchased | | Amount
of Currency
Purchased | | Currency
Sold | | Amount
of Currency
Sold | | Counter-
party | | Net Unrealized
Appreciation
(Depreciation) |
| 01/22/20 | | Swedish Kronor | | 365,733,259 | | U.S. Dollars | | 37,297,539 | | SS | | $1,793,117 |
| 01/22/20 | | New Zealand Dollars | | 40,460,047 | | U.S. Dollars | | 25,642,708 | | GSC | | 1,604,194 |
| 01/22/20 | | British Pounds | | 16,018,571 | | U.S. Dollars | | 19,654,450 | | JPM | | 1,577,612 |
See Notes to Financial Statements.
| Expiration Date | | Currency
Purchased | | Amount
of Currency
Purchased | | Currency
Sold | | Amount
of Currency
Sold | | Counter-
party | | Net Unrealized
Appreciation
(Depreciation) |
| 01/22/20 | | Australian Dollars | | 52,088,947 | | U.S. Dollars | | 35,249,514 | | GSC | | $1,324,913 |
| 01/22/20 | | New Zealand Dollars | | 27,319,443 | | U.S. Dollars | | 17,306,903 | | CITI | | 1,090,757 |
| 01/22/20 | | Norwegian Kroner | | 220,968,580 | | U.S. Dollars | | 24,200,170 | | GSC | | 971,728 |
| 01/22/20 | | British Pounds | | 6,699,645 | | U.S. Dollars | | 8,209,417 | | RBC | | 670,731 |
| 01/22/20 | | Norwegian Kroner | | 141,030,073 | | U.S. Dollars | | 15,448,609 | | CITI | | 617,000 |
| 01/22/20 | | Swedish Kronor | | 100,239,643 | | U.S. Dollars | | 10,198,588 | | RBC | | 515,323 |
| 01/22/20 | | Canadian Dollars | | 29,669,394 | | U.S. Dollars | | 22,342,649 | | GSC | | 508,156 |
| 01/22/20 | | Euro | | 29,291,208 | | U.S. Dollars | | 32,420,505 | | JPM | | 481,842 |
| 01/22/20 | | British Pounds | | 5,411,393 | | U.S. Dollars | | 6,713,042 | | SS | | 459,573 |
| 01/22/20 | | Canadian Dollars | | 24,126,242 | | U.S. Dollars | | 18,199,654 | | CITI | | 381,921 |
| 01/22/20 | | Norwegian Kroner | | 71,431,464 | | U.S. Dollars | | 7,823,123 | | RBC | | 314,077 |
| 01/22/20 | | Swedish Kronor | | 67,785,753 | | U.S. Dollars | | 6,933,977 | | SC | | 311,165 |
| 01/22/20 | | Australian Dollars | | 17,828,291 | | U.S. Dollars | | 12,238,082 | | CITI | | 280,112 |
| 01/22/20 | | Swiss Francs | | 12,300,093 | | U.S. Dollars | | 12,503,013 | | CITI | | 226,781 |
| 01/22/20 | | South African Rand | | 43,207,022 | | U.S. Dollars | | 2,861,863 | | GSC | | 213,742 |
| 01/22/20 | | U.S. Dollars | | 9,796,183 | | Japanese Yen | | 1,040,188,090 | | RBC | | 210,954 |
| 03/18/20 | | Norwegian Kroner | | 43,369,076 | | U.S. Dollars | | 4,742,402 | | MSCS | | 198,654 |
| 01/22/20 | | Brazilian Reals | | 30,293,297 | | U.S. Dollars | | 7,349,203 | | GSC | | 176,584 |
| 01/22/20 | | Mexican Pesos | | 75,694,576 | | U.S. Dollars | | 3,821,878 | | SS | | 167,629 |
| 01/22/20 | | Euro | | 9,404,476 | | U.S. Dollars | | 10,405,549 | | SC | | 158,350 |
| 01/27/20 | | Russian Rubles | | 241,116,315 | | U.S. Dollars | | 3,761,886 | | MSCS | | 109,537 |
| 01/22/20 | | U.S. Dollars | | 4,964,800 | | Japanese Yen | | 526,901,776 | | JPM | | 109,452 |
| 01/22/20 | | South African Rand | | 16,957,298 | | U.S. Dollars | | 1,098,769 | | CITI | | 108,302 |
| 01/03/20 | | Brazilian Reals | | 8,427,724 | | U.S. Dollars | | 2,017,523 | | MSCS | | 77,336 |
| 03/18/20 | | Mexican Pesos | | 60,251,852 | | U.S. Dollars | | 3,073,782 | | MSCS | | 76,001 |
| 01/22/20 | | Mexican Pesos | | 65,642,807 | | U.S. Dollars | | 3,383,987 | | GSC | | 75,738 |
| 03/05/20 | | Egyptian Pounds | | 7,312,805 | | U.S. Dollars | | 379,000 | | MSCS | | 71,747 |
| 01/22/20 | | New Zealand Dollars | | 1,853,058 | | U.S. Dollars | | 1,176,241 | | SC | | 71,659 |
| 01/22/20 | | British Pounds | | 1,589,776 | | U.S. Dollars | | 2,036,864 | | GSC | | 70,329 |
| 03/18/20 | | Norwegian Kroner | | 24,758,317 | | Euro | | 2,440,105 | | MSCS | | 70,175 |
| 01/22/20 | | South Korean Won | | 2,698,242,451 | | U.S. Dollars | | 2,265,907 | | CITI | | 69,527 |
| 01/22/20 | | Polish Zloty | | 6,573,235 | | U.S. Dollars | | 1,668,630 | | CITI | | 64,084 |
| 01/22/20 | | Swedish Kronor | | 20,985,988 | | U.S. Dollars | | 2,180,260 | | GSC | | 62,784 |
| 01/22/20 | | Euro | | 6,439,706 | | U.S. Dollars | | 7,171,017 | | CITI | | 62,603 |
| 03/18/20 | | Polish Zloty | | 12,782,613 | | U.S. Dollars | | 3,312,076 | | MSCS | | 57,830 |
| 01/22/20 | | Czech Republic Koruna | | 40,386,343 | | U.S. Dollars | | 1,724,144 | | SS | | 57,338 |
| 01/22/20 | | Hungarian Forint | | 683,679,523 | | U.S. Dollars | | 2,266,228 | | GSC | | 53,468 |
| 02/25/20 | | South Korean Won | | 2,320,746,455 | | U.S. Dollars | | 1,962,017 | | MSCS | | 47,895 |
| 03/18/20 | | Czech Republic Koruna | | 78,646,124 | | U.S. Dollars | | 3,427,504 | | MSCS | | 42,336 |
| 01/22/20 | | U.S. Dollars | | 3,089,761 | | Japanese Yen | | 330,935,771 | | SS | | 40,221 |
| 01/22/20 | | Czech Republic Koruna | | 27,372,394 | | U.S. Dollars | | 1,167,266 | | CITI | | 40,157 |
| 01/22/20 | | Euro | | 6,308,821 | | U.S. Dollars | | 7,046,554 | | SS | | 40,044 |
| 02/20/20 | | Euro | | 2,159,400 | | U.S. Dollars | | 2,391,235 | | MSCS | | 38,712 |
| 01/22/20 | | Swedish Kronor | | 17,466,842 | | U.S. Dollars | | 1,829,813 | | CITI | | 37,095 |
| 01/22/20 | | U.S. Dollars | | 1,681,123 | | Turkish Lira | | 9,870,378 | | RBC | | 31,633 |
| 03/18/20 | | Euro | | 2,821,683 | | U.S. Dollars | | 3,155,121 | | MSCS | | 25,552 |
| 01/22/20 | | U.S. Dollars | | 4,707,391 | | Japanese Yen | | 508,097,026 | | CITI | | 25,327 |
| 01/22/20 | | Swiss Francs | | 1,248,462 | | U.S. Dollars | | 1,267,940 | | SS | | 24,137 |
| 03/18/20 | | Canadian Dollars | | 2,739,055 | | U.S. Dollars | | 2,085,831 | | MSCS | | 24,065 |
| 01/22/20 | | Euro | | 1,529,971 | | U.S. Dollars | | 1,698,109 | | GSC | | 20,483 |
| 03/18/20 | | New Zealand Dollars | | 1,651,259 | | U.S. Dollars | | 1,092,465 | | MSCS | | 20,426 |
| 02/03/20 | | Indian Rupees | | 175,647,549 | | U.S. Dollars | | 2,437,893 | | MSCS | | 20,335 |
| 03/18/20 | | Australian Dollars | | 1,709,516 | | U.S. Dollars | | 1,181,972 | | MSCS | | 20,014 |
| 02/14/20 | | Swedish Kronor | | 12,550,416 | | U.S. Dollars | | 1,323,012 | | MSCS | | 19,878 |
| 03/18/20 | | Hungarian Forint | | 498,526,426 | | U.S. Dollars | | 1,677,693 | | MSCS | | 18,520 |
| 03/18/20 | | Chinese Offshore Yuan | | 17,697,286 | | U.S. Dollars | | 2,520,661 | | MSCS | | 17,047 |
See Notes to Financial Statements.
STRATEGIC ALTERNATIVES FUND
SCHEDULE OF INVESTMENTS (Continued)
| Expiration Date | | Currency
Purchased | | Amount
of Currency
Purchased | | Currency
Sold | | Amount
of Currency
Sold | | Counter-
party | | Net Unrealized
Appreciation
(Depreciation) |
| 02/12/20 | | British Pounds | | 521,507 | | U.S. Dollars | | 675,725 | | MSCS | | $15,910 |
| 01/22/20 | | Australian Dollars | | 889,242 | | U.S. Dollars | | 611,307 | | RBC | | 13,078 |
| 02/04/20 | | Colombian Pesos | | 2,381,972,959 | | U.S. Dollars | | 710,794 | | MSCS | | 12,861 |
| 01/22/20 | | Canadian Dollars | | 677,210 | | U.S. Dollars | | 509,238 | | SC | | 12,336 |
| 01/29/20 | | New Zealand Dollars | | 306,327 | | U.S. Dollars | | 194,336 | | MSCS | | 11,975 |
| 02/04/20 | | Brazilian Reals | | 4,157,317 | | U.S. Dollars | | 1,022,163 | | MSCS | | 10,166 |
| 03/18/20 | | Singapore Dollars | | 1,640,890 | | U.S. Dollars | | 1,211,322 | | MSCS | | 9,660 |
| 01/29/20 | | South African Rand | | 2,257,049 | | U.S. Dollars | | 150,861 | | MSCS | | 9,648 |
| 03/18/20 | | U.S. Dollars | | 678,825 | | Turkish Lira | | 4,068,704 | | MSCS | | 8,233 |
| 01/22/20 | | Japanese Yen | | 135,933,280 | | U.S. Dollars | | 1,244,514 | | CITI | | 8,098 |
| 03/18/20 | | Swiss Francs | | 1,035,067 | | Euro | | 947,158 | | MSCS | | 7,826 |
| 03/18/20 | | Swiss Francs | | 394,799 | | U.S. Dollars | | 404,051 | | MSCS | | 6,164 |
| 01/22/20 | | Czech Republic Koruna | | 25,939,491 | | U.S. Dollars | | 1,139,096 | | GSC | | 5,121 |
| 01/16/20 | | Polish Zloty | | 1,409,464 | | U.S. Dollars | | 366,426 | | MSCS | | 5,103 |
| 03/18/20 | | Israeli Shekels | | 1,843,385 | | U.S. Dollars | | 531,021 | | MSCS | | 5,068 |
| 02/06/20 | | Swiss Francs | | 232,010 | | U.S. Dollars | | 235,473 | | MSCS | | 4,896 |
| 01/29/20 | | Australian Dollars | | 328,095 | | U.S. Dollars | | 225,788 | | MSCS | | 4,627 |
| 01/13/20 | | Czech Republic Koruna | | 8,339,741 | | U.S. Dollars | | 363,349 | | MSCS | | 4,525 |
| 02/14/20 | | Norwegian Kroner | | 1,254,507 | | U.S. Dollars | | 138,466 | | MSCS | | 4,453 |
| 01/21/20 | | U.S. Dollars | | 1,872,545 | | Indian Rupees | | 133,434,435 | | MSCS | | 4,001 |
| 01/22/20 | | Japanese Yen | | 319,219,823 | | U.S. Dollars | | 2,937,670 | | SS | | 3,909 |
| 01/22/20 | | Turkish Lira | | 3,231,531 | | U.S. Dollars | | 536,220 | | SS | | 3,818 |
| 03/18/20 | | South African Rand | | 4,361,306 | | U.S. Dollars | | 304,397 | | MSCS | | 3,792 |
| 01/22/20 | | South Korean Won | | 1,370,634,721 | | U.S. Dollars | | 1,183,009 | | GSC | | 3,328 |
| 03/18/20 | | Swedish Kronor | | 1,916,073 | | U.S. Dollars | | 202,063 | | MSCS | | 3,280 |
| 01/22/20 | | U.S. Dollars | | 2,309,384 | | South Korean Won | | 2,664,523,220 | | GSC | | 3,135 |
| 01/22/20 | | Turkish Lira | | 3,309,827 | | U.S. Dollars | | 550,171 | | GSC | | 2,952 |
| 01/21/20 | | Indian Rupees | | 40,559,611 | | U.S. Dollars | | 565,417 | | MSCS | | 2,559 |
| 01/22/20 | | U.S. Dollars | | 57,279 | | Chilean Pesos | | 41,320,643 | | GSC | | 2,312 |
| 03/18/20 | | Swiss Francs | | 761,866 | | British Pounds | | 594,670 | | MSCS | | 2,217 |
| 01/22/20 | | U.S. Dollars | | 1,044,357 | | Japanese Yen | | 113,103,502 | | GSC | | 2,119 |
| 03/18/20 | | Canadian Dollars | | 766,425 | | Euro | | 522,015 | | MSCS | | 1,950 |
| 01/21/20 | | U.S. Dollars | | 532,583 | | Chilean Pesos | | 398,944,167 | | MSCS | | 1,887 |
| 03/18/20 | | Swiss Francs | | 185,925 | | Japanese Yen | | 20,743,100 | | MSCS | | 1,424 |
| 03/18/20 | | New Zealand Dollars | | 308,127 | | Canadian Dollars | | 267,833 | | MSCS | | 1,354 |
| 03/18/20 | | Japanese Yen | | 21,959,234 | | U.S. Dollars | | 201,877 | | MSCS | | 1,127 |
| 01/21/20 | | Indonesian Rupiahs | | 1,337,887,381 | | U.S. Dollars | | 95,427 | | MSCS | | 1,011 |
| 03/18/20 | | Euro | | 180,109 | | Hungarian Forint | | 59,415,391 | | MSCS | | 865 |
| 01/29/20 | | Singapore Dollars | | 103,302 | | U.S. Dollars | | 76,044 | | MSCS | | 781 |
| 03/18/20 | | Hungarian Forint | | 92,090,471 | | Euro | | 277,316 | | MSCS | | 735 |
| 03/18/20 | | U.S. Dollars | | 189,917 | | Mexican Pesos | | 3,619,485 | | MSCS | | 701 |
| 03/18/20 | | British Pounds | | 152,044 | | U.S. Dollars | | 201,178 | | MSCS | | 654 |
| 02/04/20 | | U.S. Dollars | | 188,586 | | Colombian Pesos | | 618,898,369 | | MSCS | | 561 |
| 03/18/20 | | Canadian Dollars | | 249,012 | | Swiss Francs | | 184,393 | | MSCS | | 220 |
| 03/18/20 | | Australian Dollars | | 274,535 | | Euro | | 171,072 | | MSCS | | 192 |
| 01/13/20 | | U.S. Dollars | | 184,060 | | Hungarian Forint | | 54,216,000 | | MSCS | | 191 |
| 02/04/20 | | U.S. Dollars | | 89,679 | | Brazilian Reals | | 360,600 | | MSCS | | 136 |
| 02/05/20 | | Japanese Yen | | 11,440,110 | | U.S. Dollars | | 105,384 | | MSCS | | 119 |
| 03/18/20 | | Euro | | 72,258 | | Canadian Dollars | | 105,666 | | MSCS | | 57 |
| 02/25/20 | | U.S. Dollars | | 122,495 | | South Korean Won | | 141,396,013 | | MSCS | | 37 |
| Subtotal Appreciation | | | | | | | | | | $16,287,874 |
| 03/18/20 | | U.S. Dollars | | 190,036 | | Turkish Lira | | 1,153,936 | | MSCS | | $(152) |
| 01/13/20 | | Hungarian Forint | | 56,351,309 | | U.S. Dollars | | 191,310 | | MSCS | | (199) |
| 03/18/20 | | Chinese Offshore Yuan | | 2,802,634 | | U.S. Dollars | | 402,146 | | MSCS | | (262) |
| 01/29/20 | | U.S. Dollars | | 69,037 | | Hong Kong Dollars | | 540,474 | | MSCS | | (300) |
See Notes to Financial Statements.
| Expiration Date | | Currency
Purchased | | Amount
of Currency
Purchased | | Currency
Sold | | Amount
of Currency
Sold | | Counter-
party | | Net Unrealized
Appreciation
(Depreciation) |
| 02/05/20 | | U.S. Dollars | | 153,803 | | Japanese Yen | | 16,710,338 | | MSCS | | $(302) |
| 01/22/20 | | Euro | | 1,137,408 | | U.S. Dollars | | 1,277,958 | | CITI | | (325) |
| 03/18/20 | | Australian Dollars | | 272,032 | | Canadian Dollars | | 249,070 | | MSCS | | (590) |
| 03/18/20 | | Hungarian Forint | | 120,364,654 | | Euro | | 363,942 | | MSCS | | (710) |
| 01/22/20 | | New Zealand Dollars | | 653,815 | | U.S. Dollars | | 441,090 | | CITI | | (793) |
| 01/21/20 | | U.S. Dollars | | 201,049 | | Indian Rupees | | 14,427,451 | | MSCS | | (986) |
| 01/29/20 | | U.S. Dollars | | 67,442 | | Australian Dollars | | 98,000 | | MSCS | | (1,382) |
| 01/22/20 | | Turkish Lira | | 3,329,840 | | U.S. Dollars | | 557,884 | | RBC | | (1,417) |
| 03/18/20 | | Euro | | 726,190 | | Polish Zloty | | 3,111,497 | | MSCS | | (1,710) |
| 01/13/20 | | U.S. Dollars | | 80,555 | | Israeli Shekels | | 284,000 | | MSCS | | (1,740) |
| 03/18/20 | | Australian Dollars | | 607,576 | | Norwegian Kroner | | 3,766,588 | | MSCS | | (1,934) |
| 01/21/20 | | Indian Rupees | | 27,858,433 | | U.S. Dollars | | 392,106 | | MSCS | | (1,992) |
| 03/18/20 | | U.S. Dollars | | 201,988 | | Hungarian Forint | | 59,994,992 | | MSCS | | (2,143) |
| 01/22/20 | | Chilean Pesos | | 41,327,274 | | U.S. Dollars | | 57,377 | | CITI | | (2,401) |
| 02/14/20 | | U.S. Dollars | | 55,479 | | Norwegian Kroner | | 509,143 | | MSCS | | (2,525) |
| 03/18/20 | | Euro | | 512,106 | | British Pounds | | 436,872 | | MSCS | | (2,669) |
| 03/18/20 | | Japanese Yen | | 21,905,660 | | Euro | | 182,042 | | MSCS | | (2,694) |
| 03/18/20 | | Canadian Dollars | | 266,096 | | Norwegian Kroner | | 1,823,207 | | MSCS | | (2,745) |
| 01/21/20 | | U.S. Dollars | | 202,121 | | Chilean Pesos | | 154,158,243 | | MSCS | | (2,948) |
| 03/18/20 | | Euro | | 1,000,408 | | Czech Republic Koruna | | 25,635,478 | | MSCS | | (3,342) |
| 03/18/20 | | Japanese Yen | | 194,703,218 | | U.S. Dollars | | 1,803,321 | | MSCS | | (3,372) |
| 03/18/20 | | Japanese Yen | | 21,970,063 | | Australian Dollars | | 293,946 | | MSCS | | (3,574) |
| 03/18/20 | | Swedish Kronor | | 8,982,109 | | Euro | | 857,381 | | MSCS | | (3,861) |
| 02/06/20 | | Turkish Lira | | 883,326 | | U.S. Dollars | | 151,019 | | MSCS | | (3,956) |
| 03/18/20 | | U.S. Dollars | | 311,599 | | Thai Baht | | 9,437,100 | | MSCS | | (4,041) |
| 01/13/20 | | U.S. Dollars | | 307,731 | | Czech Republic Koruna | | 7,072,950 | | MSCS | | (4,264) |
| 03/18/20 | | British Pounds | | 154,085 | | Canadian Dollars | | 271,212 | | MSCS | | (4,374) |
| 02/06/20 | | U.S. Dollars | | 216,180 | | Swiss Francs | | 213,000 | | MSCS | | (4,495) |
| 01/29/20 | | U.S. Dollars | | 70,775 | | South African Rand | | 1,058,865 | | MSCS | | (4,526) |
| 03/18/20 | | British Pounds | | 305,432 | | Euro | | 363,934 | | MSCS | | (4,786) |
| 01/16/20 | | U.S. Dollars | | 369,664 | | Polish Zloty | | 1,421,355 | | MSCS | | (4,999) |
| 01/22/20 | | Japanese Yen | | 111,937,221 | | U.S. Dollars | | 1,037,404 | | RBC | | (5,914) |
| 01/30/20 | | U.S. Dollars | | 396,566 | | Canadian Dollars | | 522,813 | | MSCS | | (6,112) |
| 01/29/20 | | U.S. Dollars | | 101,611 | | New Zealand Dollars | | 160,167 | | MSCS | | (6,262) |
| 03/18/20 | | British Pounds | | 153,049 | | Swiss Francs | | 201,689 | | MSCS | | (6,399) |
| 03/18/20 | | British Pounds | | 309,729 | | U.S. Dollars | | 418,699 | | MSCS | | (7,547) |
| 02/04/20 | | U.S. Dollars | | 923,516 | | Brazilian Reals | | 3,751,368 | | MSCS | | (8,009) |
| 01/22/20 | | U.S. Dollars | | 480,302 | | Canadian Dollars | | 636,213 | | SC | | (9,697) |
| 01/22/20 | | U.S. Dollars | | 621,871 | | Swedish Kronor | | 5,913,681 | | SC | | (10,201) |
| 02/25/20 | | U.S. Dollars | | 1,185,853 | | South Korean Won | | 1,381,486,052 | | MSCS | | (10,600) |
| 03/18/20 | | U.S. Dollars | | 1,928,957 | | Euro | | 1,721,811 | | MSCS | | (11,912) |
| 02/14/20 | | U.S. Dollars | | 339,959 | | Mexican Pesos | | 6,726,746 | | MSCS | | (13,387) |
| 03/18/20 | | Swedish Kronor | | 3,792,165 | | Norwegian Kroner | | 3,686,025 | | MSCS | | (13,548) |
| 03/18/20 | | U.S. Dollars | | 1,125,003 | | British Pounds | | 858,061 | | MSCS | | (14,037) |
| 01/22/20 | | U.S. Dollars | | 574,745 | | Hungarian Forint | | 173,640,910 | | SS | | (14,411) |
| 01/22/20 | | U.S. Dollars | | 1,141,718 | | Czech Republic Koruna | | 26,220,703 | | SS | | (14,903) |
| 02/12/20 | | U.S. Dollars | | 654,881 | | British Pounds | | 506,301 | | MSCS | | (16,586) |
| 03/18/20 | | U.S. Dollars | | 1,155,618 | | Mexican Pesos | | 22,423,013 | | MSCS | | (16,588) |
| 03/18/20 | | U.S. Dollars | | 3,679,032 | | Israeli Shekels | | 12,708,825 | | MSCS | | (16,923) |
| 01/22/20 | | U.S. Dollars | | 572,745 | | South Korean Won | | 682,482,511 | | SS | | (17,971) |
| 01/22/20 | | U.S. Dollars | | 499,977 | | Mexican Pesos | | 9,852,541 | | SC | | (19,305) |
| 03/18/20 | | Euro | | 717,039 | | Norwegian Kroner | | 7,283,210 | | MSCS | | (21,513) |
| 01/22/20 | | U.S. Dollars | | 1,481,485 | | Canadian Dollars | | 1,951,685 | | CITI | | (21,666) |
| 02/14/20 | | U.S. Dollars | | 1,344,867 | | Swedish Kronor | | 12,771,935 | | MSCS | | (21,725) |
| 03/18/20 | | U.S. Dollars | | 1,268,406 | | Singapore Dollars | | 1,734,570 | | MSCS | | (22,284) |
| 01/22/20 | | U.S. Dollars | | 2,337,743 | | Canadian Dollars | | 3,067,446 | | GSC | | (24,745) |
See Notes to Financial Statements.
STRATEGIC ALTERNATIVES FUND
SCHEDULE OF INVESTMENTS (Continued)
| Expiration Date | | Currency
Purchased | | Amount
of Currency
Purchased | | Currency
Sold | | Amount
of Currency
Sold | | Counter-
party | | Net Unrealized
Appreciation
(Depreciation) |
| 02/24/20 | | U.S. Dollars | | 1,905,263 | | Taiwan Dollars | | 57,512,253 | | MSCS | | $(25,626) |
| 01/22/20 | | U.S. Dollars | | 1,043,315 | | Mexican Pesos | | 20,306,049 | | RBC | | (26,921) |
| 01/22/20 | | U.S. Dollars | | 1,803,476 | | Czech Republic Koruna | | 41,538,136 | | GSC | | (28,812) |
| 03/18/20 | | U.S. Dollars | | 767,027 | | South African Rand | | 11,330,832 | | MSCS | | (33,661) |
| 01/22/20 | | U.S. Dollars | | 2,184,527 | | Euro | | 1,974,908 | | RBC | | (33,856) |
| 02/20/20 | | U.S. Dollars | | 2,192,166 | | Euro | | 1,979,631 | | MSCS | | (35,489) |
| 01/22/20 | | U.S. Dollars | | 740,656 | | New Zealand Dollars | | 1,154,119 | | GSC | | (36,559) |
| 03/18/20 | | U.S. Dollars | | 3,011,226 | | Chinese Offshore Yuan | | 21,262,559 | | MSCS | | (37,725) |
| 01/22/20 | | U.S. Dollars | | 1,731,287 | | Brazilian Reals | | 7,130,347 | | GSC | | (40,111) |
| 01/22/20 | | U.S. Dollars | | 2,582,898 | | Canadian Dollars | | 3,407,273 | | RBC | | (41,319) |
| 01/22/20 | | U.S. Dollars | | 1,684,463 | | Hungarian Forint | | 510,055,302 | | CITI | | (46,133) |
| 03/18/20 | | Turkish Lira | | 12,027,943 | | U.S. Dollars | | 2,032,777 | | MSCS | | (50,371) |
| 01/22/20 | | U.S. Dollars | | 545,357 | | South African Rand | | 8,384,475 | | SS | | (51,475) |
| 01/22/20 | | U.S. Dollars | | 1,741,295 | | South Korean Won | | 2,072,967,745 | | GSC | | (52,939) |
| 03/18/20 | | U.S. Dollars | | 3,514,076 | | Swedish Kronor | | 33,289,490 | | MSCS | | (53,517) |
| 01/03/20 | | U.S. Dollars | | 2,040,879 | | Brazilian Reals | | 8,427,724 | | MSCS | | (53,982) |
| 01/22/20 | | U.S. Dollars | | 1,114,512 | | Swedish Kronor | | 10,954,941 | | JPM | | (56,384) |
| 03/05/20 | | U.S. Dollars | | 393,479 | | Egyptian Pounds | | 7,312,805 | | MSCS | | (57,269) |
| 01/22/20 | | Japanese Yen | | 550,851,094 | | U.S. Dollars | | 5,134,361 | | SS | | (58,323) |
| 01/22/20 | | U.S. Dollars | | 3,097,286 | | Swiss Francs | | 3,051,876 | | SC | | (61,206) |
| 02/04/20 | | U.S. Dollars | | 1,145,583 | | Colombian Pesos | | 3,974,917,074 | | MSCS | | (62,016) |
| 01/22/20 | | U.S. Dollars | | 1,826,224 | | Mexican Pesos | | 35,873,659 | | GSC | | (64,508) |
| 01/22/20 | | U.S. Dollars | | 1,668,029 | | Polish Zloty | | 6,572,869 | | GSC | | (64,588) |
| 01/22/20 | | U.S. Dollars | | 3,912,866 | | Swiss Francs | | 3,846,969 | | RBC | | (68,497) |
| 03/18/20 | | U.S. Dollars | | 2,983,628 | | Australian Dollars | | 4,341,505 | | MSCS | | (68,944) |
| 01/22/20 | | Japanese Yen | | 597,299,102 | | U.S. Dollars | | 5,574,351 | | GSC | | (70,300) |
| 01/22/20 | | U.S. Dollars | | 2,688,616 | | Norwegian Kroner | | 24,257,392 | | GSC | | (74,694) |
| 01/22/20 | | U.S. Dollars | | 4,428,092 | | Swiss Francs | | 4,354,462 | | JPM | | (78,492) |
| 01/22/20 | | U.S. Dollars | | 2,453,181 | | Norwegian Kroner | | 22,249,279 | | CITI | | (81,372) |
| 01/27/20 | | U.S. Dollars | | 2,967,743 | | Russian Rubles | | 190,293,779 | | MSCS | | (87,662) |
| 03/18/20 | | U.S. Dollars | | 4,645,139 | | Canadian Dollars | | 6,145,481 | | MSCS | | (88,730) |
| 01/22/20 | | U.S. Dollars | | 3,728,338 | | Swedish Kronor | | 35,719,499 | | SS | | (89,469) |
| 03/18/20 | | U.S. Dollars | | 3,657,439 | | New Zealand Dollars | | 5,574,312 | | MSCS | | (99,446) |
| 01/22/20 | | U.S. Dollars | | 3,545,740 | | Australian Dollars | | 5,220,396 | | SS | | (119,778) |
| 03/18/20 | | U.S. Dollars | | 6,713,788 | | Swiss Francs | | 6,591,228 | | MSCS | | (134,835) |
| 01/22/20 | | U.S. Dollars | | 6,806,529 | | Swiss Francs | | 6,710,288 | | CITI | | (138,183) |
| 01/22/20 | | U.S. Dollars | | 8,585,081 | | Swiss Francs | | 8,432,855 | | GSC | | (142,373) |
| 01/22/20 | | U.S. Dollars | | 11,922,664 | | Euro | | 10,746,752 | | GSC | | (148,992) |
| 01/22/20 | | Japanese Yen | | 812,124,564 | | U.S. Dollars | | 7,646,332 | | SC | | (162,685) |
| 01/22/20 | | U.S. Dollars | | 5,195,530 | | Australian Dollars | | 7,672,394 | | SC | | (191,667) |
| 01/22/20 | | U.S. Dollars | | 3,485,206 | | South African Rand | | 51,775,129 | | GSC | | (200,303) |
| 01/22/20 | | U.S. Dollars | | 9,656,287 | | Australian Dollars | | 14,072,456 | | GSC | | (224,734) |
| 01/22/20 | | U.S. Dollars | | 9,258,847 | | Canadian Dollars | | 12,315,693 | | JPM | | (226,466) |
| 01/22/20 | | U.S. Dollars | | 11,468,719 | | Swiss Francs | | 11,302,691 | | SS | | (228,829) |
| 01/22/20 | | U.S. Dollars | | 6,228,484 | | Norwegian Kroner | | 56,895,728 | | JPM | | (252,861) |
| 01/22/20 | | U.S. Dollars | | 6,488,082 | | Norwegian Kroner | | 59,292,465 | | SC | | (266,290) |
| 01/22/20 | | U.S. Dollars | | 7,535,951 | | New Zealand Dollars | | 11,594,709 | | CITI | | (272,243) |
| 01/22/20 | | U.S. Dollars | | 18,974,791 | | Euro | | 17,137,071 | | CITI | | (275,008) |
| 01/22/20 | | U.S. Dollars | | 9,056,118 | | Australian Dollars | | 13,313,189 | | CITI | | (291,783) |
| 01/22/20 | | Japanese Yen | | 2,502,951,596 | | U.S. Dollars | | 23,357,125 | | CITI | | (292,676) |
| 01/22/20 | | U.S. Dollars | | 6,543,200 | | Mexican Pesos | | 129,889,055 | | CITI | | (302,645) |
| 01/22/20 | | U.S. Dollars | | 8,239,000 | | Australian Dollars | | 12,183,544 | | RBC | | (315,716) |
| 01/22/20 | | U.S. Dollars | | 29,430,018 | | Euro | | 26,571,034 | | SS | | (416,801) |
| 01/22/20 | | U.S. Dollars | | 5,404,000 | | British Pounds | | 4,411,753 | | SC | | (443,626) |
| 01/22/20 | | U.S. Dollars | | 11,313,114 | | Norwegian Kroner | | 103,265,880 | | SS | | (450,542) |
| 01/22/20 | | U.S. Dollars | | 8,719,646 | | New Zealand Dollars | | 13,672,189 | | SS | | (487,579) |
See Notes to Financial Statements.
| Expiration Date | | Currency
Purchased | | Amount
of Currency
Purchased | | Currency
Sold | | Amount
of Currency
Sold | | Counter-
party | | Net Unrealized
Appreciation
(Depreciation) |
| 01/22/20 | | U.S. Dollars | | 15,202,812 | | Australian Dollars | | 22,477,696 | | JPM | | $(579,977) |
| 01/22/20 | | U.S. Dollars | | 11,030,772 | | British Pounds | | 8,817,768 | | CITI | | (656,875) |
| 01/22/20 | | U.S. Dollars | | 28,417,378 | | Canadian Dollars | | 37,761,183 | | SS | | (665,569) |
| 01/22/20 | | U.S. Dollars | | 10,996,305 | | New Zealand Dollars | | 17,352,919 | | RBC | | (689,626) |
| 01/22/20 | | U.S. Dollars | | 16,176,932 | | Swedish Kronor | | 158,139,736 | | CITI | | (725,511) |
| 01/22/20 | | U.S. Dollars | | 12,384,956 | | New Zealand Dollars | | 19,544,711 | | JPM | | (776,987) |
| 01/22/20 | | U.S. Dollars | | 13,055,347 | | New Zealand Dollars | | 20,628,471 | | SC | | (836,430) |
| 01/22/20 | | U.S. Dollars | | 22,232,253 | | British Pounds | | 18,093,462 | | GSC | | (1,750,007) |
| 01/22/20 | | U.S. Dollars | | 35,750,573 | | Swedish Kronor | | 350,878,461 | | GSC | | (1,752,357) |
| Subtotal Depreciation | | | | | | | | | | $(16,735,104) |
| Total Forward Foreign Currency Contracts outstanding at December 31, 2019 | | | | $(447,230) |
Swap Agreements outstanding at December 31, 2019:
| Reference Obligation | | Payment Frequency | | Maturity
Date | | Counterparty | | Currency | | Notional
Amount | | Market Value | | Upfront
Premiums
Paid/
(Received) | | Unrealized
Appreciation
(Depreciation) |
| Currency Swaps | | | | | | | | | | | | | | | | |
| Receive 3-Month LIBOR | | Quarterly | | | | | | USD | | 540,000 | | | | | | |
| Pay Fixed 11.30% | | Annually | | 6/17/2025 | | BOA | | TRY | | 3,115,800 | | $4,988 | | $— | | $4,988 |
| | | $4,988 | | $ — | | $4,988 |
| Pay Rate Index/Pay Rate | | Receive
Rate/Receive
Rate Index | | Maturity
Date | | Counterparty | | Currency | | Notional
Amount | | Market Value | | Upfront
Premiums
Paid/
(Received) | | Unrealized
Appreciation
(Depreciation) |
| Interest Rate Swaps | | | | | | | | | | | | | | | | |
| 6-Month THB FIX (Semiannually) | | 1.75% (Semiannually) | | 3/20/2021 | | MSCS | | THB | | 102,030,000 | | $26,280 | | $304 | | $25,976 |
| 6-Month THB FIX (Semiannually) | | 1.75% (Semiannually) | | 3/20/2021 | | BNP | | THB | | 78,320,000 | | 20,173 | | 1,167 | | 19,006 |
| 6-Month THB FIX (Semiannually) | | 1.25% (Semiannually) | | 6/18/2021 | | CITI | | THB | | 126,010,000 | | 6,947 | | 1,685 | | 5,262 |
| 6-Month THB FIX (Semiannually) | | 1.75% (Semiannually) | | 6/19/2021 | | BNP | | THB | | 224,180,000 | | 67,679 | | 4,641 | | 63,038 |
| 6-Month THB FIX (Semiannually) | | 1.75% (Semiannually) | | 6/19/2021 | | DEUT | | THB | | 55,870,000 | | 16,867 | | — | | 16,867 |
| 6-Month THB FIX (Semiannually) | | 1.75% (Semiannually) | | 6/19/2021 | | MSCS | | THB | | 55,250,000 | | 16,680 | | 341 | | 16,339 |
| 6-Month THB FIX (Semiannually) | | 1.75% (Semiannually) | | 6/20/2021 | | MSCS | | THB | | 49,950,000 | | 15,053 | | (139) | | 15,192 |
| 6-Month THB FIX (Semiannually) | | 1.75% (Semiannually) | | 6/19/2024 | | BOA | | THB | | 5,460,000 | | 4,116 | | (346) | | 4,462 |
| 6-Month THB FIX (Semiannually) | | 1.50% (Semiannually) | | 12/18/2024 | | DEUT | | THB | | 15,780,000 | | 6,454 | | 1,300 | | 5,154 |
| 6-Month THB FIX (Semiannually) | | 1.50% (Semiannually) | | 3/18/2025 | | DEUT | | THB | | 17,130,000 | | 6,507 | | 4,975 | | 1,532 |
| 6-Month THB FIX (Semiannually) | | 1.50% (Semiannually) | | 3/18/2025 | | BNP | | THB | | 14,520,000 | | 5,515 | | 2,128 | | 3,387 |
| 6-Month THB FIX (Semiannually) | | 1.50% (Semiannually) | | 3/18/2025 | | CITI | | THB | | 14,510,000 | | 5,511 | | 4,257 | | 1,254 |
| 3-Month TELBOR (Quarterly) | | 1.41% (Annually) | | 12/18/2029 | | DEUT | | ILS | | 3,165,000 | | 47,245 | | — | | 47,245 |
| 3-Month TELBOR (Quarterly) | | 1.34% (Annually) | | 12/18/2029 | | BAR | | ILS | | 2,560,000 | | 33,689 | | — | | 33,689 |
See Notes to Financial Statements.
STRATEGIC ALTERNATIVES FUND
SCHEDULE OF INVESTMENTS (Continued)
| Pay Rate Index/Pay Rate | | Receive
Rate/Receive
Rate Index | | Maturity
Date | | Counterparty | | Currency | | Notional
Amount | | Market Value | | Upfront
Premiums
Paid/
(Received) | | Unrealized
Appreciation
(Depreciation) |
| 3-Month TELBOR (Quarterly) | | 1.02% (Annually) | | 3/18/2030 | | BOA | | ILS | | 7,945,000 | | $23,706 | | $1,998 | | $21,708 |
| Subtotal Appreciation | | | | | | | | | | | | $302,422 | | $22,311 | | $280,111 |
| 3-Month TELBOR (Quarterly) | | 1.02% (Annually) | | 3/18/2030 | | CITI | | ILS | | 2,230,000 | | $6,654 | | $9,843 | | $(3,189) |
| Subtotal Depreciation | | | | | | | | | | | | $6,654 | | $9,843 | | $(3,189) |
| Net Interest Rate Swaps outstanding at December 31, 2019 | | | | | | | | | | $309,076 | | $32,154 | | $276,922 |
| Pay Rate Index/Pay Rate | | Receive
Rate/Receive
Rate Index | | Maturity
Date | | Currency | | Notional
Amount | | Market Value | | Upfront
Premiums
Paid/
(Received) | | Unrealized
Appreciation
(Depreciation) |
| Centrally Cleared Interest Rate Swaps | | | | | | | | | | | | |
| 1-Day Brazil Cetip DI Interbank Deposit Rate (Upon termination) | | 7.25% (Upon termination) | | 1/2/2020 | | BRL | | 15,471,421 | | $50,757 | | $10,966 | | $39,791 |
| 1-Day Brazil Cetip DI Interbank Deposit Rate (Upon termination) | | 5.56% (Upon termination) | | 1/4/2021 | | BRL | | 3,931,276 | | 10,356 | | — | | 10,356 |
| 6-Month CLP-TNA (Semiannually) | | 3.60% (Semiannually) | | 3/20/2021 | | CLP | | 1,566,750,000 | | 58,572 | | 6,095 | | 52,477 |
| 6-Month THB FIX (Semiannually) | | 1.75% (Semiannually) | | 3/20/2021 | | THB | | 52,420,000 | | 13,502 | | 345 | | 13,157 |
| 0.78% (Semiannually) | | 6-Month ASX BBSW (Semiannually) | | 6/17/2021 | | AUD | | 73,770,000 | | 105,472 | | 36,683 | | 68,789 |
| 1-Day Brazil Cetip DI Interbank Deposit Rate (Upon termination) | | 5.44% (Upon termination) | | 1/3/2022 | | BRL | | 14,189,027 | | 17,680 | | 10,148 | | 7,532 |
| 28-Day Mexico Interbank TIIE (Lunar) | | 6.60% (Lunar) | | 3/16/2022 | | MXN | | 99,330,000 | | 5,349 | | (1,752) | | 7,101 |
| 1.50% (Semiannually) | | 3-Month LIBOR (Quarterly) | | 3/18/2022 | | USD | | 6,780,000 | | 19,918 | | 9,602 | | 10,316 |
| 1.75% (Semiannually) | | 3-Month LIBOR (Quarterly) | | 3/18/2022 | | USD | | 21,510,000 | | (42,050) | | (71,619) | | 29,569 |
| 2.00% (Annually) | | 6-Month PRIBOR (Semiannually) | | 3/18/2022 | | CZK | | 134,100,000 | | 30,586 | | 1,975 | | 28,611 |
| 3-Month KWCDC (Quarterly) | | 1.50% (Quarterly) | | 3/18/2022 | | KRW | | 29,551,260,000 | | 98,826 | | 88,814 | | 10,012 |
| 1-Day Brazil Cetip DI Interbank Deposit Rate (Upon termination) | | 5.75% (Upon termination) | | 1/2/2023 | | BRL | | 12,529,341 | | 4,391 | | (3,591) | | 7,982 |
| 1-Day Brazil Cetip DI Interbank Deposit Rate (Upon termination) | | 6.66% (Upon termination) | | 1/2/2023 | | BRL | | 9,927,725 | | 84,172 | | 38,989 | | 45,183 |
| 28-Day Mexico Interbank TIIE (Lunar) | | 6.49% (Lunar) | | 3/15/2023 | | MXN | | 54,850,000 | | (1,587) | | (3,353) | | 1,766 |
| 1.75% (Semiannually) | | 3-Month LIBOR (Quarterly) | | 3/18/2025 | | USD | | 10,180,000 | | (10,455) | | (50,746) | | 40,291 |
| 2.00% (Annually) | | 6-Month NIBOR (Semiannually) | | 3/18/2025 | | NOK | | 85,730,000 | | 3,314 | | (25,376) | | 28,690 |
| 7-Day CFETS Repo Rate (Quarterly) | | 3.00% (Quarterly) | | 3/18/2025 | | CNY | | 15,150,000 | | 3,804 | | 3,310 | | 494 |
| 1.51% (Annually) | | 6-Month PRIBOR (Semiannually) | | 9/16/2026 | | CZK | | 30,350,000 | | 28,351 | | (1,543) | | 29,894 |
| 1.33% (Annually) | | 1-Day US Federal Fund Effective Rate (Annually) | | 11/16/2026 | | USD | | 20,020,000 | | 288,138 | | (12,483) | | 300,621 |
| 3.00% (Semiannually) | | 3-Month LIBOR (Quarterly) | | 6/19/2029 | | USD | | 2,440,000 | | (104,851) | | (130,599) | | 25,748 |
| 6.70% (Lunar) | | 28-Day Mexico Interbank TIIE (Lunar) | | 3/6/2030 | | MXN | | 20,580,000 | | 7,805 | | 1,659 | | 6,146 |
| 0.50% (Annually) | | 3-Month STIBOR (Quarterly) | | 3/18/2030 | | SEK | | 40,510,000 | | 89,439 | | 35,984 | | 53,455 |
| 1.50% (Quarterly) | | 3-Month KWCDC (Quarterly) | | 3/18/2030 | | KRW | | 1,247,270,000 | | (11,576) | | (15,767) | | 4,191 |
| 1.75% (Quarterly) | | 3-Month HIBOR (Quarterly) | | 3/18/2030 | | HKD | | 6,790,000 | | 22,714 | | 8,815 | | 13,899 |
| 1-Day COP-IBR-OIS (Quarterly) | | 5.60% (Quarterly) | | 3/18/2030 | | COP | | 1,630,380,000 | | 1,469 | | (565) | | 2,034 |
| 2.00% (Annually) | | 6-Month NIBOR (Semiannually) | | 3/18/2030 | | NOK | | 34,230,000 | | 25,196 | | (11,984) | | 37,180 |
| 2.00% (Semiannually) | | 3-Month LIBOR (Quarterly) | | 3/18/2030 | | USD | | 480,000 | | (4,420) | | (9,793) | | 5,373 |
| 1.50% (Annually) | | 6-Month PRIBOR (Semiannually) | | 6/17/2030 | | CZK | | 53,040,000 | | 43,026 | | (17,082) | | 60,108 |
| 1.75% (Annually) | | 6-Month WIBOR (Semiannually) | | 6/17/2030 | | PLN | | 6,230,000 | | 18,969 | | (7,467) | | 26,436 |
| 3-Month JIBAR (Quarterly) | | 8.00% (Quarterly) | | 6/17/2030 | | ZAR | | 11,230,000 | | 11,286 | | — | | 11,286 |
| 1.84% (Semiannually) | | 3-Month LIBOR (Quarterly) | | 5/15/2045 | | USD | | 9,410,000 | | 464,853 | | 20,034 | | 444,819 |
| Subtotal Appreciation | | | | | | | | | | $1,333,006 | | $(90,301) | | $1,423,307 |
See Notes to Financial Statements.
| Pay Rate Index/Pay Rate | | Receive
Rate/Receive
Rate Index | | Maturity
Date | | Currency | | Notional
Amount | | Market Value | | Upfront
Premiums
Paid/
(Received) | | Unrealized
Appreciation
(Depreciation) |
| 8.36% (Lunar) | | 28-Day Mexico Interbank TIIE (Lunar) | | 3/18/2020 | | MXN | | 202,000,000 | | $(18,653) | | $(1,615) | | $(17,038) |
| 1-Day US Federal Fund Effective Rate (Annually) | | 1.26% (Annually) | | 12/15/2021 | | USD | | 16,890,000 | | (50,091) | | (3,168) | | (46,923) |
| 1-Day CLP-TNA (Semiannually) | | 1.80% (Semiannually) | | 3/18/2022 | | CLP | | 523,250,000 | | 421 | | 464 | | (43) |
| 3-Month CDOR (Semiannually) | | 1.75% (Semiannually) | | 3/18/2022 | | CAD | | 30,550,000 | | (107,360) | | (99,971) | | (7,389) |
| 4.50% (Quarterly) | | 1-Day COP-IBR-OIS (Quarterly) | | 3/18/2022 | | COP | | 21,848,990,000 | | (2,923) | | 1,544 | | (4,467) |
| 6-Month BUBOR (Semiannually) | | 0.50% (Annually) | | 3/18/2022 | | HUF | | 1,255,600,000 | | (3,608) | | 6,091 | | (9,699) |
| 6-Month PRIBOR (Semiannually) | | 1.85% (Annually) | | 9/16/2022 | | CZK | | 89,275,000 | | (28,026) | | 945 | | (28,971) |
| 1-Month LIBOR + .09% (Quarterly) | | 3-Month LIBOR (Quarterly) | | 7/25/2024 | | USD | | 40,700,000 | | 445 | | 651 | | (206) |
| 6.26% (Upon termination) | | 1-Day Brazil Cetip DI Interbank Deposit Rate (Upon termination) | | 1/2/2025 | | BRL | | 6,656,254 | | 866 | | 1,252 | | (386) |
| 3-Month CDOR (Semiannually) | | 1.75% (Semiannually) | | 3/18/2025 | | CAD | | 6,760,000 | | (76,796) | | (51,571) | | (25,225) |
| 3-Month New Zealand BBR FRA (Quarterly) | | 1.50% (Semiannually) | | 3/18/2025 | | NZD | | 3,610,000 | | 3,957 | | 11,898 | | (7,941) |
| 6-Month ASX BBSW (Semiannually) | | 1.50% (Semiannually) | | 3/18/2025 | | AUD | | 11,380,000 | | 114,848 | | 169,079 | | (54,231) |
| 6-Month EURIBOR (Semiannually) | | 0.00% (Annually) | | 3/18/2025 | | EUR | | 5,510,000 | | 33,294 | | 48,315 | | (15,021) |
| 6-Month ASX BBSW (Semiannually) | | 1.20% (Semiannually) | | 6/17/2027 | | AUD | | 9,430,000 | | (80,009) | | (35,628) | | (44,381) |
| 3-Month CDOR (Semiannually) | | 3.00% (Semiannually) | | 6/19/2029 | | CAD | | 3,170,000 | | 79,916 | | 97,570 | | (17,654) |
| 3-Month LIBOR (Quarterly) | | 1.65% (Semiannually) | | 8/15/2029 | | USD | | 7,540,000 | | (147,335) | | (5,279) | | (142,056) |
| 3-Month CDOR (Semiannually) | | 2.00% (Semiannually) | | 3/18/2030 | | CAD | | 3,520,000 | | (43,154) | | (13,124) | | (30,030) |
| 6-Month ASX BBSW (Semiannually) | | 1.75% (Semiannually) | | 3/18/2030 | | AUD | | 2,390,000 | | 31,575 | | 68,655 | | (37,080) |
| 6-Month EURIBOR (Semiannually) | | 0.50% (Annually) | | 3/18/2030 | | EUR | | 4,480,000 | | 144,046 | | 183,993 | | (39,947) |
| 6-Month LIBOR (Semiannually) | | 0.25% (Semiannually) | | 3/19/2030 | | JPY | | 146,410,000 | | 1,548 | | 4,121 | | (2,573) |
| 6-Month NIBOR (Semiannually) | | 2.00% (Annually) | | 3/19/2030 | | NOK | | 16,820,000 | | (11,737) | | 3,332 | | (15,069) |
| 6-Month BUBOR (Semiannually) | | 1.50% (Annually) | | 6/17/2030 | | HUF | | 168,840,000 | | (9,247) | | 7,088 | | (16,335) |
| Subtotal Depreciation | | | | | | | | | | $(168,023) | | $394,642 | | $(562,665) |
| Net Centrally Cleared Interest Rate Swaps outstanding at December 31, 2019 | | $1,164,983 | | $304,341 | | $860,642 |
| Pay Rate Index/Pay Rate | | Receive
Rate/Receive
Rate Index | | Maturity
Date | | Counterparty | | Currency | | Notional
Amount | | Market Value | | Upfront
Premiums
Paid/
(Received) | | Unrealized
Appreciation
(Depreciation) |
| Total Return Swaps | | | | | | | | | | | | | | | | |
| Financing Index: 1-Month EURIBOR + .45% (Monthly) | | Airbus SE | | 11/5/2020 | | CITI | | EUR | | 987,290 | | $58,662 | | $— | | $58,662 |
| Peugeot Citroen SA | | Financing Index:1-Month EURIBOR - .45% (Monthly) | | 11/5/2020 | | CITI | | EUR | | 262,378 | | 22,085 | | — | | 22,085 |
| | | $80,747 | | $ — | | $80,747 |
See Notes to Financial Statements.
STRATEGIC ALTERNATIVES FUND
SCHEDULE OF INVESTMENTS (Continued)
VALUATION HIERARCHY
The following is a summary of the inputs used, as of December 31, 2019, in valuing the Fund’s investments carried at fair value:
| | Total
Value | | Level 1
Quoted Prices | | Level 2
Other Significant
Observable Inputs | | Level 3
Significant
Unobservable Inputs |
| Assets: | | | | | | | |
| Investments in Securities: | | | | | | | |
| Asset-Backed Securities | $12,991,383 | | $— | | $12,991,383 | | $— |
| Certificates Of Deposit | 1,102,261 | | — | | 1,102,261 | | — |
| Common Stocks: | | | | | | | |
| Financials | 5,166,486 | | 4,741,943 | | 424,543 | | — |
| Other^^ | 44,011,342 | | 44,011,342 | | — | | — |
| Total Common Stocks | 49,177,828 | | 48,753,285 | | 424,543 | | — |
| Corporate Bonds | 94,814,208 | | — | | 94,814,208 | | — |
| Foreign Bonds | 18,789,738 | | — | | 18,789,738 | | — |
| Foreign Common Stocks | 5,403,363 | | 5,403,363 | | — | | — |
| Loan Agreements | 5,331,448 | | — | | 5,331,448 | | — |
| Money Market Funds | 106,977,686 | | 106,977,686 | | — | | — |
| Mortgage-Backed Securities | 8,910,000 | | — | | 8,910,000 | | — |
| Mutual Funds | 2,918,327 | | 1,592,438 | | — | | 1,325,889 |
| Purchased Option: | | | | | | | |
| Call Option | 8,100 | | 8,100 | | — | | — |
| Rights | 163,951 | | — | | 156,941 | | 7,010 |
| U.S. Treasury Obligations | 73,329,530 | | — | | 73,329,530 | | — |
| Total Assets - Investments in Securities | $379,917,823 | | $162,734,872 | | $215,850,052 | | $1,332,899 |
| Other Financial Instruments*** | | | | | | | |
| Forward Foreign Currency Contracts | $16,287,874 | | $— | | $16,287,874 | | $— |
| Futures Contracts | 157,614 | | 157,614 | | — | | — |
| Swap Agreements | 1,789,153 | | — | | 1,789,153 | | — |
| Total Assets - Other Financial Instruments | $18,234,641 | | $157,614 | | $18,077,027 | | $ — |
| | | | | | | | |
See Notes to Financial Statements.
| | Total
Value | | Level 1
Quoted Prices | | Level 2
Other Significant
Observable Inputs | | Level 3
Significant
Unobservable Inputs |
| Liabilities: | | | | | | | |
| Investments in Securities: | | | | | | | |
| Common Stocks Sold Short | $(15,628,330) | | $(15,628,330) | | $— | | $— |
| Foreign Common Stocks Sold Short | (896,100) | | (896,100) | | — | | — |
| Mutual Funds Sold Short | (11,428,906) | | (11,428,906) | | — | | — |
| Written Options: | | | | | | | |
| Call Options | (129,410) | | (129,410) | | — | | — |
| Put Options | (156,717) | | (156,717) | | — | | — |
| Total Written Options | (286,127) | | (286,127) | | — | | — |
| Total Liabilities - Investments in Securities | $(28,239,463) | | $(28,239,463) | | $ — | | $ — |
| Other Financial Instruments*** | | | | | | | |
| Forward Foreign Currency Contracts | $(16,735,104) | | $— | | $(16,735,104) | | $— |
| Futures Contracts | (359,645) | | (359,645) | | — | | — |
| Swap Agreements | (565,854) | | — | | (565,854) | | — |
| Total Liabilities - Other Financial Instruments | $(17,660,603) | | $(359,645) | | $(17,300,958) | | $ — |
| ^^ | Classifications as defined in the Schedule of Investments. |
| *** | Other financial instruments are derivative instruments, such as futures contracts, forwards contracts and swap agreements, which are valued at the unrealized appreciation (depreciation) on the investment. Further details regarding the value of these investments can be found in the preceding "Futures Contracts outstanding", "Forwards Foreign Currency Contracts outstanding" and "Swap Agreements outstanding" disclosures. |
Management has determined that the amount of Level 3 securities compared to total net assets is not material; therefore, the reconciliation of Level 3 securities and assumptions is not shown for the year ended December 31, 2019.
See Notes to Financial Statements.
| STATEMENTS OF ASSETS AND LIABILITIES | December 31, 2019 |
| | Strategic Alternatives Fund |
| Assets | |
| Investments in securities of unaffiliated issuers, at value | $331,763,436 |
| Investments in securities of affiliated issuers, at value | 48,154,387 |
| Total investments, at value(1) | 379,917,823 |
| Cash | 35,218,102 |
| Cash collateral for derivatives | 4,063,340 |
| Deposits with broker for futures contracts | 516,064 |
| Upfront premiums paid from swap agreements | 911,101 |
| Receivables: | |
| Dividends and reclaims | 173,888 |
| Interest | 1,512,200 |
| Investment securities sold | 2,036,901 |
| Fund shares sold | 46,769 |
| Variation margin on centrally cleared swaps | 116,391 |
| Unrealized appreciation on foreign currency exchange contracts | 16,287,874 |
| Unrealized appreciation on swap agreements | 365,846 |
| Prepaid expenses and other assets | 22 |
| Total Assets | 441,166,321 |
| Liabilities | |
| Foreign currency overdraft(2) | 931,775 |
| Securities sold short, at value(3) | 27,953,336 |
| Options written, at value(4) | 286,127 |
| Upfront premiums received from swap agreements | 574,606 |
| Unrealized depreciation on foreign currency exchange contracts | 16,735,104 |
| Unrealized depreciation on swap agreements | 3,189 |
| Collateral from counterparty | 1,699,055 |
| Payables: | |
| Investment securities purchased | 6,206,989 |
| Dividends on short sales | 50,754 |
| Fund shares redeemed | 122,284 |
| Variation margin on futures contracts | 93,721 |
| Accrued expenses: | |
| Investment advisory fees | 285,360 |
| Shareholder servicing fees | 11,867 |
| Trustee fees | 315 |
| Other expenses | 119,191 |
| Total Liabilities | 55,073,673 |
| Net Assets | $386,092,648 |
| Net Assets Consist of: | |
| Paid-in-capital | $382,986,372 |
| Distributable earnings (loss) | 3,106,276 |
| Net Assets | $386,092,648 |
| Net Asset Value: | |
| $0.001 par value, unlimited shares authorized | |
| Net assets applicable to the Institutional Class | $330,016,677 |
| Institutional shares outstanding | 32,567,459 |
| Net asset value, offering and redemption price per Institutional share | $10.13 |
| Net assets applicable to the Investor Class | $56,075,971 |
| Investor shares outstanding | 5,537,574 |
| Net asset value, offering and redemption price per Investor share | $10.13 |
| |
| (1)Investments in securities of unaffiliated issuers, at cost | $328,511,167 |
| Investments in securities of affiliated issuers, at cost | 48,154,387 |
| Total investments, at cost | $376,665,554 |
| (2)Foreign currency overdraft, at cost | $910,626 |
| (3)Proceeds from securities sold short | $27,470,646 |
| (4)Premiums received on options written | $423,569 |
See Notes to Financial Statements.
| STATEMENTS OF OPERATIONS | For the Year Ended December 31, 2019 |
| | Strategic Alternatives Fund |
| Investment Income | |
| Dividends | $773,436 |
| Income distributions received from affiliated funds | 534,204 |
| Interest | 8,329,233 |
| Less foreign taxes withheld | (3,958) |
| Total Investment Income | 9,632,915 |
| Expenses | |
| Investment advisory fees | 3,424,822 |
| Transfer agent fees: | |
| Institutional shares | 4,203 |
| Investor shares | 14,223 |
| Custodian fees | 381,862 |
| Shareholder servicing fees: | |
| Investor shares | 141,867 |
| Accounting and administration fees | 76,804 |
| Professional fees | 106,084 |
| Shareholder reporting fees: | |
| Institutional shares | 12,438 |
| Investor shares | 31,113 |
| Trustees expenses | 1,829 |
| Line of credit facility fees | 1,056 |
| Dividends on securities sold short | 372,973 |
| Other expenses | 46,195 |
| Total Expenses | 4,615,469 |
| Net Investment Income | 5,017,446 |
| Realized and Unrealized Gain (Loss) | |
| Net realized gain (loss) from: | |
| Investment securities | 9,155,841 |
| Investment securities sold short | (4,236,348) |
| Futures transactions | (36,597) |
| Swap agreements | 145,472 |
| Option contracts written | 5,621,582 |
| Option contracts purchased | (2,725,691) |
| Forward foreign currency contracts | (1,901,860) |
| Foreign currency | 686,744 |
| Net realized gain | 6,709,143 |
| Net change in unrealized appreciation (depreciation) on: | |
| Investment securities | 8,969,090 |
| Investment securities sold short | (2,641,974) |
| Futures | 236,031 |
| Swap agreements | 939,911 |
| Option contracts written | 38,459 |
| Option contracts purchased | (259,751) |
| Forward foreign currency contracts | (42,462) |
| Foreign currency | 16,657 |
| Net change in unrealized appreciation (depreciation) | 7,255,961 |
| Net Realized and Unrealized Gain | 13,965,104 |
| Net Increase in Net Assets Resulting from Operations | $18,982,550 |
See Notes to Financial Statements.
| STATEMENTS OF CHANGES IN NET ASSETS |
| | Strategic Alternatives Fund |
| | For the Year Ended |
| | 12/31/19 | | 12/31/18 |
| | | | |
| Operations: | | | |
| Net investment income | $5,017,446 | | $7,301,918 |
| Net realized gain (loss) on investment securities, foreign currency and derivatives | 6,709,143 | | (3,222,245) |
| Net change in unrealized appreciation (depreciation) on investment securities, foreign currency and derivatives | 7,255,961 | | (4,164,335) |
| Net increase (decrease) in net assets resulting from operations | 18,982,550 | | (84,662) |
| Distributions to Shareholders: | | | |
| Institutional shares | (7,274,105) | | (6,830,775) |
| Investor shares | (1,068,756) | | (1,229,603) |
| Total distributions | (8,342,861) | | (8,060,378) |
| Capital Share Transactions: | | | |
| Proceeds from shares sold | | | |
| Institutional shares | 34,914,160 | | 35,043,876 |
| Investor shares | 12,428,155 | | 24,057,205 |
| Reinvestment of dividends and distributions | | | |
| Institutional shares | 7,273,111 | | 6,830,607 |
| Investor shares | 1,068,187 | | 1,225,449 |
| Total proceeds from shares sold and reinvested | 55,683,613 | | 67,157,137 |
| Value of shares redeemed | | | |
| Institutional shares | (41,587,776) | | (17,291,395) |
| Investor shares | (25,699,257) | | (15,855,027) |
| Total value of shares redeemed | (67,287,033) | | (33,146,422) |
| Net increase (decrease) from capital share transactions(1) | (11,603,420) | | 34,010,715 |
| Total increase (decrease) in net assets | (963,731) | | 25,865,675 |
| Net Assets: | | | |
| Beginning of Year | 387,056,379 | | 361,190,704 |
| End of Year | $386,092,648 | | $387,056,379 |
| |
| (1) | See Note 6 in Notes to Financial Statements. |
See Notes to Financial Statements.
| For a Share Outstanding For the Years Ending December 31, unless otherwise indicated | | | | | | Ratios to Average Net Assets | |
| | Net Asset
Value,
Beginning
of Year | Net Investment
Income# | Realized
and
Unrealized
Gain
(Loss) on
Investments | Total Income
From Investment
Operations | Dividends
from Net
Investment
Income | Distributions
from Net
Realized
Capital
Gains | Total
Distributions
Paid | Net Asset
Value,
End of
Year | Total
Return | Net Assets,
End of Year
(000) | Expenses,
Net | Expenses,
Gross | Investment
Income,
Net
| Portfolio
Turnover
Rate |
| Strategic Alternatives Fund |
| Institutional Class |
| 2019 | $9.87 | $0.13 | $0.36 | $0.49 | $(0.19) | $(0.04) | $(0.23) | $10.13 | 4.93% | $330,017 | 1.12%(1) | 1.12%(1) | 1.32% | 364% |
| 2018 | 10.07 | 0.20 | (0.19) | 0.01 | (0.18) | (0.03) | (0.21) | 9.87 | 0.15 | 320,404 | 1.01(1) | 1.02(1) | 1.96 | 172 |
| 2017(2) | 10.00 | 0.04 | 0.10 | 0.14 | (0.05) | (0.02) | (0.07) | 10.07 | 1.40 | 302,592 | 1.26(1) | 1.28(1) | 0.69 | 88 |
| Investor Class |
| 2019 | $9.87 | $0.10 | $0.36 | $0.46 | $(0.16) | $(0.04) | $(0.20) | $10.13 | 4.62% | $56,076 | 1.46%(1) | 1.46%(1) | 0.99% | 364% |
| 2018 | 10.07 | 0.17 | (0.19) | (0.02) | (0.15) | (0.03) | (0.18) | 9.87 | (0.17) | 66,652 | 1.36(1) | 1.37(1) | 1.65 | 172 |
| 2017(2) | 10.00 | 0.01 | 0.12 | 0.13 | (0.04) | (0.02) | (0.06) | 10.07 | 1.31 | 58,599 | 1.63(1) | 1.65(1) | 0.25 | 88 |
| | | | | | | | | | | | | | | |
| # | Calculated using the average shares outstanding method. |
| (1) | The ratio for the Strategic Alternatives Fund includes the effect of dividend expense on securities sold short which increased the ratio by 0.11%, 0.14% and 0.10% for the period ended December 31, 2017 and for the years 2018 and 2019. |
| (2) | Inception date was June 30, 2017. All ratios for the period have been annualized. Total return and portfolio turnover for the period have not been annualized. |
See Notes to Financial Statements.
NOTES TO FINANCIAL STATEMENTS
1. DESCRIPTION OF THE FUNDS
GuideStone Funds (the “Trust”) was organized as a Delaware statutory trust on March 2, 2000. The Trust has established 24 series (each, a “Fund” and together, the “Funds”). Each Fund is a diversified, open-end management investment company, registered under the Investment Company Act of 1940, as amended (the “1940 Act”).
The MyDestination 2015 Fund, MyDestination 2025 Fund, MyDestination 2035 Fund, MyDestination 2045 Fund and MyDestination 2055 Fund are each referred to as a “Target Date Fund” and together as the “Target Date Funds.”
The Conservative Allocation Fund, Balanced Allocation Fund, Growth Allocation Fund and Aggressive Allocation Fund are each referred to as a “Target Risk Fund” and together as the “Target Risk Funds.”
The remaining Funds are each referred to as a “Select Fund” and are together referred to as the “Select Funds.” The Money Market Fund is referred to as the “Money Market Fund.” The Low-Duration Bond Fund, Medium-Duration Bond Fund, Extended-Duration Bond Fund and Global Bond Fund are together referred to as the “Fixed Income Funds.”
The Defensive Market Strategies Fund, Equity Index Fund, Value Equity Fund, Growth Equity Fund, Small Cap Equity Fund, International Equity Index Fund, International Equity Fund and Emerging Markets Equity Fund are together referred to as the “Equity Funds.”
The Global Real Estate Securities Fund is referred to as the “Real Assets Fund.”
The Strategic Alternatives Fund is referred to as the “Strategic Alternatives Fund.”
There are two classes of shares issued by the Funds — the Institutional Class and the Investor Class (each, a “Class” and together the “Classes”). The International Equity Index Fund issued the Institutional Class only. All Classes of shares have identical voting, dividend and liquidation rights. Income, expenses (other than class specific expenses) and realized and unrealized gains or losses on investments are allocated to each Class of shares based upon its relative net assets.
Each Fund is a separate mutual fund with its own investment objective, strategies and risks. The Select Funds invest directly in particular types of fixed-income obligations, stocks and other investments. The Target Date and Target Risk Funds primarily invest in a different mix of the Select Funds to meet a specified investment strategy. The Target Date and Target Risk Funds are commonly referred to as “Fund of Funds.”
2. SUMMARY OF SIGNIFICANT ACCOUNTING POLICIES
The following is a summary of significant accounting policies followed by the Funds in the accounting and the preparation of their financial statements. The Funds are investment companies and follow accounting and reporting guidance in the Financial Accounting Standards Board ("FASB") Accounting Standards Codification Topic 946 (“ASC 946”). The policies are in conformity with accounting principles generally accepted in the United States of America (“U.S. GAAP”), including but not limited to ASC 946. The preparation of financial statements requires the Funds’ management to make estimates and assumptions that affect the reported amounts of assets and liabilities, the disclosure of contingent assets and liabilities at the date of the financial statements, and the reported amounts of income and expenses for the period. The Funds utilize various methods to measure the value of their investments on a recurring basis. Amounts received upon the sale of such investments could differ from estimated values and those differences could be significant.
a. Valuation of Securities
Each Fund, except the Money Market Fund, values securities traded on national securities exchanges or included in national market systems at the last quoted sale price, or official close price, on the principal exchange on which they were traded, or, in the absence of any sale or official close price, at the closing bid price. Non-exchange traded securities for which an over-the-counter quotation is readily available are valued at the last quoted bid price.
Debt securities, excluding asset-backed and mortgage-backed securities, are valued at the mean of the last bid and ask prices available, which approximates fair value. Asset-backed and mortgage-backed securities are generally valued at the last bid price, if available.
Short-term securities maturing in more than 60 days from the valuation date are valued at the mean of the last bid and ask prices; those maturing in 60 days or less are generally valued at amortized cost which approximates current market value.
Forward foreign exchange contracts are valued based upon closing exchange rates from each respective foreign market.
Futures contracts are valued at the closing settlement price on the exchange on which they are primarily traded.
Options, rights and warrants for which the primary market is a national securities exchange are valued at the last sale price on the exchange on which they are traded, or, in the absence of any sale, at the closing bid price. Options, rights and warrants not traded on a national securities exchange are valued at the last quoted bid price.
Swap agreements are valued daily based upon the terms specific to each agreement with its counterparty. (Please see Note 2.i., “Derivative Financial Instruments” for additional information regarding the valuation of swap agreements).
To the extent available, valuations of portfolio securities are provided by independent pricing services approved by the Board of Trustees. Securities for which market quotations are not readily available are valued at fair value according to methods established in good faith by the Board of Trustees. Due to the potential excessive volatility at the time valuations are developed, pricing may materially vary from the actual amounts realized upon sale of the securities.
For securities that principally trade on a foreign market or exchange, a significant gap in time can exist between the time of a particular security’s last trade and the time at which a Fund calculates its Net Asset Value ("NAV"). The closing prices of such securities may no longer reflect their market value at the time the Fund calculates its NAV if an event that could materially affect the value of those securities (a “Significant Event”) has occurred between the time of the security’s last close and the time that the Fund calculates its NAV. A Significant Event may relate to a single issuer or to an entire market sector. If management becomes aware of a Significant Event that has occurred with respect to a security or group of securities after the closing of the exchange or market on which the security or securities principally trade, but before the time at which the Fund calculates its NAV, a Valuation Committee meeting may be called. The Funds use Intercontinental Exchange (“ICE”) as a third party fair valuation vendor. ICE provides a fair value for foreign equity securities held by the Funds based on certain factors and methodologies applied by ICE in the event that there is movement in the U.S. market that exceeds a specific threshold established by the Valuation Committee in consultation with, and approved by, the Board of Trustees. Such methodologies generally involve tracking valuation correlations between the U.S. market and each non-U.S. security. As part of the valuation procedures, a “confidence interval” is used, when the threshold is exceeded, to determine the level of correlation between the value of a foreign equity security and movements in the U.S. market before a particular security will be fair valued. In the event that the threshold established by the valuation procedures is exceeded on a specific day, the Funds will typically value non-U.S. equity securities in its portfolio that exceed the applicable confidence interval based upon the fair values provided by ICE.
The Target Date and Target Risk Funds value their investments in the underlying Select Funds daily at the closing NAV of each respective Fund.
The Financial Accounting Standards Board’s “Fair Value Measurements and Disclosures” defines fair value as the price that a fund would receive to sell an asset or pay to transfer a liability in an orderly transaction between market participants at the measurement date. It establishes and requires disclosure of a fair value hierarchy, separately for each major category of assets and liabilities, that segregates fair value measurements into levels (Levels 1, 2, and 3). Categorizations of fair value measurements, and the criteria used to determine each categorization, are as follows:
Level 1 – quoted prices in active markets for identical securities
Level 2 – prices determined using other significant observable inputs (including quoted prices for similar securities, interest rates, prepayment speeds, credit risk, etc.)
Level 3 – prices determined using significant unobservable inputs (including the valuation committee’s own assumptions in determining the fair value of investments)
Valuation levels are not necessarily an indication of the risk associated with investing in those securities. Changes in valuation techniques may result in transfers into or out of an assigned level within the disclosure hierarchy. In accordance with the requirements of U.S. GAAP, the amounts of transfers in and out of level 3, if material, are disclosed in the Note to Schedule of Investments for each respective fund.
b. Fixed Income Securities
The Fixed Income Funds and the Strategic Alternatives Fund may invest in mortgage-related and other asset-backed securities. These securities include mortgage pass-through securities, collateralized mortgage obligations, commercial mortgage-backed securities, stripped mortgage-backed securities, asset-backed securities, collateralized debt obligations and/or other securities that directly or indirectly represent a participation in, or are secured by and payable from, mortgage loans on real property. Mortgage-related and other asset-backed securities are interests in pools of loans or other receivables. Mortgage-related securities are created from pools of residential or commercial mortgage loans, including mortgage loans made by savings and loan institutions, mortgage bankers, commercial banks and others. Asset-backed securities are created from many types of assets, including auto loans, credit card receivables, home equity loans and student loans. These securities provide a monthly payment which consists of both interest and principal payments. Interest payments may be determined by fixed or adjustable rates. The rate of pre-payments on underlying mortgages will affect the price and volatility of a mortgage-related security and may have the effect of shortening or extending the effective duration of the security relative to what was anticipated at the time of purchase. The timely payment of principal and interest of certain mortgage-related securities is guaranteed with the full faith and credit of the U.S. government. Pools created and guaranteed by non-governmental issuers, including government-sponsored corporations, may be supported by various forms of insurance or guarantees, but there can be no assurance that the private insurers or guarantors can meet their obligations under the insurance policies or guarantee arrangements.
Collateralized Mortgage Obligations (“CMOs”) are debt obligations of a legal entity that are collateralized by mortgages and divided into classes. CMOs are structured into multiple classes, often referred to as “tranches,” with each class bearing a different stated maturity and entitled to a different schedule for payments of principal and interest, including pre-payments. Commercial Mortgage-Backed Securities (“CMBS”) include securities that reflect an interest in, and are secured by, mortgage loans on commercial real property. Many of the risks of investing in CMBS reflect the risks of investing in the real estate securing the underlying mortgage loans. These risks reflect the effects of local and other economic conditions on real estate markets, the ability
of tenants to make loan payments and the ability of a property to attract and retain tenants. CMOs and CMBS may be less liquid and may exhibit greater price volatility than other types of mortgage- or asset-backed securities.
Stripped Mortgage-Backed Securities (“SMBS”) are derivative multi-class mortgage securities. SMBS are usually structured with two classes that receive different proportions of the interest and principal distributions on a pool of mortgage assets. A common type of SMBS will have one class receiving some of the interest and most of the principal from the mortgage assets, while the other class will receive most of the interest and the remainder of the principal. In the most extreme case, one class will receive all of the interest (the interest-only or “IO” class), while the other class will receive the entire principal (the principal-only or “PO” class). Payments received for IOs are included in interest income on the Statements of Operations. Because little to no principal will be received at the maturity of an IO, adjustments are made to the book value of the security on a monthly basis until maturity. These adjustments are included in interest income on the Statements of Operations. Payments received for POs are treated as reductions to the cost and par value of the securities.
Inflation-indexed bonds are fixed-income securities whose principal value is periodically adjusted to the rate of inflation. The interest rate on these bonds is generally fixed at issuance at a rate lower than typical bonds. Over the life of an inflation-indexed bond, however, interest will be paid based on a principal value, which is adjusted for inflation. Any increase or decrease in the principal amount of an inflation-indexed bond will be included as interest income on the Statements of Operations, even though investors do not receive their principal until maturity.
“TBA” (to be announced) commitments are commitments to purchase or sell mortgage-backed securities for a fixed price at a future date, typically not exceeding 45 days. TBAs may be considered securities in themselves and involve a risk of loss if the value of the security to be purchased declines prior to settlement date. This risk is in addition to the risk of decline in each Fund’s other assets. Unsettled TBAs are valued at the current market value of the underlying securities, according to the procedures described in the section entitled “Valuation of Securities”.
The Fixed Income Funds may enter into dollar roll transactions, pursuant to which they sell a mortgage-backed TBA or security and simultaneously purchase a similar, but not identical, TBA with the same issuer, rate and terms. The Funds may execute a “roll” to obtain better underlying mortgage securities or to increase yield. The Funds account for dollar roll transactions as purchases and sales, which has the effect of increasing their portfolio turnover rates. Risks associated with dollar rolls are that actual mortgages received by the Funds may be less favorable than those anticipated or that counterparties may fail to perform under the terms of the contracts.
U.S. government securities are obligations of and, in certain cases, guaranteed by, the U.S. government, its agencies or instrumentalities. The U.S. government does not guarantee the NAV of the Funds’ shares. Some U.S. government securities, such as Treasury bills, notes and bonds and securities guaranteed by the Government National Mortgage Association (“GNMA” or “Ginnie Mae”), are supported by the full faith and credit of the U.S. government; others, such as those of the Federal Home Loan Bank, are supported by the right of the issuer to borrow from the U.S. Department of the Treasury (the “U.S. Treasury”); others, such as those of the Federal National Mortgage Association (“FNMA” or “Fannie Mae”), are supported by the discretionary authority of the U.S. government to purchase the agency’s obligations; and still others, such as those of the Student Loan Marketing Association, are supported only by the credit of the instrumentality. U.S. government securities may include zero coupon securities, which do not distribute interest on a current basis and tend to be subject to greater risk than interest-paying securities of similar maturities.
Government-related guarantors (i.e., not backed by the full faith and credit of the U.S. government) include FNMA and the Federal Home Loan Mortgage Corporation (“FHLMC” or “Freddie Mac”). FNMA is a government-sponsored corporation, the common stock of which is owned entirely by private stockholders. FNMA purchases conventional (i.e., not insured or guaranteed by any government agency) residential mortgages from a list of approved seller/servicers which include state and federally chartered savings and loan associations, mutual savings banks, commercial banks and credit unions and mortgage bankers.
Pass-through securities issued by FNMA are guaranteed as to timely payment of principal and interest by FNMA, but are not backed by the full faith and credit of the U.S. government. FHLMC issues Participation Certificates (“PCs”), which are pass-through securities, each representing an undivided interest in a pool of residential mortgages. FHLMC guarantees the timely payment of interest and ultimate collection of principal, but PCs are not backed by the full faith and credit of the U.S. government.
c. Foreign Currency Translations
Investment securities and other assets and liabilities denominated in foreign currencies are translated into U.S. dollar amounts at the date of valuation. Purchases and sales of investment securities and income and expense items denominated in foreign currencies are translated into U.S. dollar amounts on the respective dates of such transactions.
The Funds isolate that portion of the results of operations resulting from changes in foreign exchange rates on investments from the fluctuations arising from changes in market prices of securities held.
Reported net realized foreign exchange gains or losses arise from sales of portfolio securities, sales and maturities of short-term securities, sales of foreign currencies, currency gains or losses realized between the trade and settlement dates on securities transactions and the difference between the amounts of dividends, interest, and foreign withholding taxes recorded on the Fund’s books and the U.S. dollar equivalent of the amounts actually received or paid. Net unrealized foreign exchange gains and losses arise from changes in the values of assets and liabilities, including investments in securities at fiscal period end, resulting from changes in the exchange rate.
d. Loan Participations
The Fixed Income Funds, Defensive Market Strategies Fund and Strategic Alternatives Fund may invest in direct debt instruments which are interests in amounts owed to lenders or lending syndicates by corporate borrowers. Investments in loans may be in the form of participations in loans. A loan is often administered by a bank or other financial institution (the “lender”) that acts as agent for all holders. The agent administers the terms of the loan, as specified in the loan agreement. The holder may invest in multiple series of a loan, which may have varying terms and carry different associated risks. The holder generally has no right to enforce compliance with the terms of the loan agreement with the borrower. As a result, these instruments may be subject to the credit risk of both the borrower and the lender that is selling the loan agreement. When investing in a loan participation, the holder has the right to receive payments of principal, interest and any fees to which it is entitled only from the lender selling the loan agreement and only upon receipt of payments by the lender from the borrower.
The Fixed Income Funds, Defensive Market Strategies Fund, and Strategic Alternatives Fund may invest in floating rate loans, some of which may be unfunded corporate loan commitments (“commitments”). Commitments may obligate the holder to furnish temporary financing to a borrower until permanent financing can be arranged. The holder may receive a commitment fee based on the undrawn portion of the underlying line of credit portion of a floating rate loan. In certain circumstances, the holder may receive a prepayment penalty fee upon the prepayment of a floating rate loan by a borrower. Fees earned or paid are recorded as a component of interest income or interest expense on the Statements of Operations.
e. REITs
The Fixed Income Funds, Real Assets Fund and the Equity Funds may invest in real estate investment trusts (“REITs”) that involve risks not associated with investing in stocks. Risks include declines in the value of real estate, general and economic conditions, changes in the value of the underlying property and defaults by borrowers. The value of assets in the real estate industry may go through cycles of relative underperformance and outperformance in comparison to equity securities markets in general.
Dividend income from REITs is recorded using management’s estimate of the income included in distributions received from REIT investments. The actual amounts of income, return of capital and capital gains are only determined by each REIT after its fiscal year-end and may differ from the estimated amount. Estimates of income are adjusted in the Funds to the actual amounts when the amounts are determined.
f. Repurchase Agreements
Each Fund may agree to purchase securities from financial institutions subject to the seller’s agreement to repurchase them at a mutually agreed upon date and price. It is the Fund’s policy that repurchase agreements are fully collateralized by U.S. Treasury and Government Agency securities. All collateral is held by the Fund’s custodian bank or a bank with which the custodian bank has entered into a subcustodian agreement, or is segregated in the Federal Reserve Book Entry System. In connection with transactions in repurchase agreements, if the seller defaults and the value of the collateral declines, or if the seller enters an insolvency proceeding, realization of the collateral by the Fund may be delayed or limited.
Repurchase transactions are entered into by the Funds under Master Repurchase Agreements (“MRA”) which permit the Funds, under certain circumstances including an event of default (such as bankruptcy or insolvency), to offset payables and/or receivables under the MRA with collateral held and/or posted to the counterparty and create one single net payment due to or from the Fund.
At December 31, 2019, the open repurchase agreements by counterparty which are subject to an MRA on a net payment basis are as follows:
| Fund/Counterparty | | Repurchase
Agreements | | Fair Value of
Non-cash
Collateral
Received(1) | | Cash
Collateral
Received | | Net Amount(2) |
| Money Market | | | | | | | | |
| Bank of Nova Scotia | | $48,000,000 | | $(48,000,000) | | $— | | $— |
| BNP Paribas | | 105,000,000 | | (105,000,000) | | — | | — |
| Citigroup Global Markets, Inc. | | 10,000,000 | | (10,000,000) | | — | | — |
| Goldman Sachs & Co. | | 43,000,000 | | (43,000,000) | | — | | — |
| HSBC Securities USA, Inc. | | 5,000,000 | | (5,000,000) | | — | | — |
| Mitsubishi UFJ Securities USA, Inc. | | 30,000,000 | | (30,000,000) | | — | | — |
| Mizuho Securities USA, Inc. | | 42,000,000 | | (42,000,000) | | — | | — |
| Natixis S.A. | | 26,000,000 | | (26,000,000) | | — | | — |
| TD Securities USA LLC | | 90,000,000 | | (90,000,000) | | — | | — |
| Total Repurchase Agreements | | $399,000,000 | | $(399,000,000) | | $— | | $— |
| Low-Duration Bond | | | | | | | | |
| Citigroup Global Markets, Inc. | | $11,900,000 | | $(11,900,000) | | $— | | $— |
| Medium-Duration Bond | | | | | | | | |
| Citigroup Global Markets, Inc. | | $25,900,000 | | $(25,900,000) | | $— | | $— |
(1) The value of the related collateral received exceeded the value of the repurchase agreement as of December 31, 2019.
(2) Net amount represents the net amount of receivable due from (payable to) the counterparty in the event of a default.
Additional information about netting arrangements under the Master Agreements can be found in the Derivative Financial Instruments and Securities Lending sections of the Notes to Financial Statements.
g. Short Sales
A short sale is a transaction in which a Fund sells a security it does not own. The Fund’s obligation to replace the security borrowed and sold short will be collateralized by cash equivalents maintained in a segregated account with the broker. Cash deposited with the broker is recorded as an asset on the Statements of Assets and Liabilities. If the price of the security sold short
increases between the time of the short sale and the time the Fund replaces the borrowed security, the Fund will realize a loss; and if the price declines during the period, the Fund will realize a gain. Any realized gain will be decreased, and any realized loss increased, by the amount of transaction costs.
The Fixed Income Funds and Strategic Alternatives Fund may sell short U.S. Treasury securities and derivatives such as, but not limited to, swaps, futures contracts and currency forwards to manage risk (e.g., duration, currency, credit, etc.). The Fixed Income Funds may occasionally enter into a short sale to initiate a dollar roll transaction. The Low-Duration Bond Fund may be involved in dollar roll transactions with U.S. Treasury securities throughout the year. The Strategic Alternatives Fund may establish short positions in stocks of companies with a market value of up to 40% of the Fund's assets. The Defensive Market Strategies Fund may establish short positions in stocks of companies with a market value of up to 30% of the Fund’s assets. The International Equity Fund may establish short positions in stocks of foreign companies with a market value of up to 10% of the Fund’s assets.
At December 31, 2019, the values of securities sold short in the International Equity Fund and Strategic Alternatives Fund amounted to $69,452,408 and $27,953,336, respectively.
h. Synthetic Convertible Instruments
The Defensive Market Strategies Fund establishes synthetic convertible instruments. Synthetic convertible instruments combine fixed-income securities (which may be convertible or non-convertible) with the right to acquire equity securities. In establishing a synthetic instrument, a basket of fixed-income securities are pooled with a basket of options or warrants that produce the characteristics similar to a convertible security. The risks of investing in synthetic convertible instruments include unfavorable price movements in the underlying security and the credit risk of the issuing financial institution. There may be no guarantee of a return of principal with synthetic convertible instruments and the appreciation potential may be limited. Synthetic convertible instruments may be more volatile and less liquid than other investments held by the Fund.
i. Derivative Financial Instruments
The Funds may engage in various portfolio strategies to seek to increase their return by hedging their portfolios against adverse movements in the equity, debt and currency markets. Losses may arise due to changes in the value of the contract if the counterparty does not perform under the contract. The Funds, in their normal course of business, may enter into contracts that contain a variety of representations and warranties and which provide general indemnifications. The Funds’ exposure may include future claims that may be made against the Funds that have not yet occurred.
FASB “Derivatives and Hedging” includes required disclosure for (i) the nature and terms of the derivative, reasons for entering into the derivative, the events or circumstances that would require the seller to perform under the derivative, and the current status of the payment/performance risk of the derivative, (ii) the maximum potential amount of future payments (undiscounted) the seller could be required to make under the derivative, (iii) the fair value of the derivative and (iv) the nature of any recourse provisions and assets held either as collateral or by third parties. FASB “Guarantees” require additional disclosures about the current status of the payment/performance risk of a guarantee. All of this information has been incorporated for the current period as part of the Schedules of Investments within the Swap agreements outstanding disclosure and in the Notes to Financial Statements.
Financial Futures Contracts — The Funds (except the Money Market Fund) may purchase or sell financial futures contracts and the options on such futures contracts for the purpose of hedging risk on existing securities, demonstrating purchase of securities or gaining market exposure on cash balances. Financial futures contracts are contracts for the delivery of securities at a specified future date at an agreed upon price or yield. Upon entering into a contract, the Funds deposit and maintain as collateral such initial margin as required by the exchange on which the transaction is effected.
Pursuant to the contract, the Funds agree to pay to or receive from the broker an amount of cash equal to the daily fluctuation in the value of the contract. Such payments or receipts are known as variation margin and are recorded by the Funds as unrealized gains or losses until the contract is closed or settled.
Risks of entering into futures contracts include the possibility that there will be an imperfect price correlation between the futures and the underlying securities. Second, it is possible that a lack of liquidity for futures contracts could exist in the secondary market, resulting in an inability to close a futures position prior to its maturity date. Third, the purchase of a futures contract involves the risk that a Fund could lose more than the original margin deposit required to initiate a futures transaction. Futures contracts involve, to varying degrees, risk of loss in excess of the variation margin disclosed on the Statements of Assets and Liabilities.
Foreign Currency Options and Futures — The Fixed Income Funds, Strategic Alternatives Fund and Defensive Market Strategies Fund may also enter into futures contracts on foreign currencies and related options on transactions as a short or long hedge against possible variations in foreign exchange rates.
Forward Foreign Exchange Contracts — Certain Funds may enter into forward foreign currency exchange contracts to hedge against adverse exchange rate fluctuation to the U.S. dollar or between different foreign currencies in connection with either specific security transactions or portfolio positions. Each contract is valued daily and the change in value is recorded as an unrealized gain or loss. When the contract is closed, a realized gain or loss is recorded equal to the difference between the opening value and the closing value of the contract. These contracts may involve market risk in excess of the unrealized gain or loss reflected on the Statements of Assets and Liabilities. The Funds could be exposed to risk if the counterparties to the contracts are unable to meet the terms of the contract and from unanticipated movements in the value of a foreign currency relative to the U.S. dollar.
Options — Certain Funds are authorized to write and purchase put and call options. The risk in writing a call option is that the Funds give up the opportunity for profit if the market price of the security increases. The risk in writing a put option is that the Funds may incur a loss if the market price of the security decreases and the option is exercised. The risk in purchasing an option is that the Funds pay a premium whether or not the option is exercised. The Funds also have the additional risk of being unable to enter into a closing transaction at an acceptable price if a liquid secondary market does not exist. The Funds also may write over-the-counter options where completing the obligation depends upon the credit standing of the other party and that party’s ability to perform. Option contracts also involve the risk that they may not work as intended due to unanticipated developments in market conditions or other causes.
Options purchased are recorded as an asset and written options are recorded as liabilities to the extent of premiums paid or received. Each Fund will realize a gain or loss when the option transaction expires or closes. When an option is exercised, the proceeds on sales for a written call option, the purchase cost for a written put option or the cost of a security for a purchased put or call option is adjusted by the amount of the premium received or paid.
When a Fund writes a call or put option, an amount equal to the premium received is recorded as a liability and subsequently marked to market to reflect the current value of the option written. These liabilities are reflected as written options on the Statements of Assets and Liabilities.
Certain Funds may write swaption contracts to manage exposure to fluctuations in interest rates and to enhance portfolio yield. Swaption contracts written by the Funds represent an option that gives the purchaser the right, but not the obligation, to enter into a previously agreed upon swap agreement on a future date. If a written call swaption is exercised, the writer will enter a swap and is obligated to pay the fixed-rate and receive a floating rate in exchange. If a written put swaption is exercised, the writer will enter a swap and is obligated to pay the floating rate and receive a fixed rate in exchange.
Swaptions are marked-to-market daily based upon quotations from market makers. When a Fund writes a swaption, the premium received is recorded as a liability and is subsequently adjusted to the current market value of the swaption.
Entering into a swaption contract involves, to varying degrees, the elements of credit, market and interest rate risk in excess of the associated option and swap agreement amounts reported in the Statements of Assets and Liabilities. The Funds bear the market risk arising from any change in index values or interest rates.
Swap Agreements — Each Select Fund, except the Money Market Fund, may enter into swap agreements, such as total return swaps. The Equity Funds may enter into equity swap agreements, and the International Equity Fund and Emerging Markets Equity Fund may also enter into cross-currency swap agreements. The Fixed Income Funds may enter into interest rate, credit default, and cross-currency swap agreements. The Strategic Alternatives Fund may enter into equity and interest rate swap agreements.
Swap agreements are privately negotiated agreements between a Fund and a counterparty to exchange or swap investment cash flows, assets, foreign currencies or market-linked returns at specified, future intervals. A swap may be entered into in order to, among other things, change the maturity of a Fund’s portfolio, to protect a Fund’s value from changes in interest rates, to expose a Fund to a different security or market or to help a Fund achieve a strategy relative to an index or other benchmark. By entering into a swap agreement, a Fund is exposed to the risk of unanticipated movements in interest rates or in the value of an underlying security or index (or the risk that the counterparty will not fulfill its obligation under the agreement).
Swaps are marked-to-market daily based upon values from third party vendors or quotations from market makers to the extent available; and the change in value, if any, is recorded as an unrealized gain or loss on the Statements of Assets and Liabilities. In the event that market quotations are not readily available or deemed reliable, certain swap agreements may be valued pursuant to guidelines established by the Board of Trustees. In the event that market quotes are not readily available and the swap cannot be valued pursuant to one of the valuation methods, the value of the swap will be determined in good faith by the Valuation Committee, generally based upon recommendations provided by the Fund’s sub-adviser.
Payments received or made at the beginning of the measurement period are reflected as such on the Statements of Assets and Liabilities and represent payments made or received upon entering into the swap agreement to compensate for differences between the stated terms of the swap agreement and prevailing market conditions (credit spreads, currency exchange rates, interest rates, and other relevant factors). These upfront payments are recorded as realized gains or losses on the Statements of Operations upon termination or maturity of the swap. A liquidation payment received or made at the termination of the swap is recorded as realized gain or loss on the Statements of Operations. Net periodic payments received or paid by a Fund are included as part of realized gains or losses on the Statements of Operations.
Certain of the Funds’ derivative agreements contain provisions that require the Fund to maintain a predetermined level of net assets, and/or provide limits regarding the decline of the Fund’s NAV over one-month, three-month and 12-month periods. If a Fund were to violate such provisions, the counterparties to the derivative instruments could request immediate payment or demand immediate collateralization on derivative instruments in net liability positions. For the year ended December 31, 2019, all of the Funds maintained the required level of net assets and/or the NAVs of the Funds did not decline below the limits set forth in the derivative agreements.
Entering into these agreements involves, to varying degrees, elements of credit, market and documentation risk in excess of the amounts recognized on the Statements of Assets and Liabilities. Such risks involve the possibility that there will be no liquid market for these agreements, that the counterparty to the agreements may default on its obligation to perform or disagree as to the meaning of contractual terms in the agreements and that there may be unfavorable changes in interest rates.
Credit Default Swaps — Credit default swap (“CDS”) agreements involve one party making a stream of payments (referred to as the buyer of protection) to another party (the seller of protection) in exchange for the right to receive a specified return in the event of a default or other credit event for the referenced entity, obligation or index. As a seller of protection on CDS agreements, a Fund will generally receive from the buyer of protection a fixed rate of income throughout the term of the swap provided that there is no credit event. As the seller, a Fund would effectively add leverage to its portfolio because, in addition to its total net assets, a Fund would be subject to investment exposure on the notional amount of the swap. In connection with these agreements, securities are set aside as collateral by the Fund’s custodian.
Upfront payments made or received in connection with CDS agreements are amortized over the expected life of the CDS agreements as unrealized gains or losses on swap agreements. The change in value of the CDS agreements is recorded daily as unrealized appreciation or depreciation. A realized gain or loss is recorded upon a credit event (as defined in the CDS agreement) or the maturity or termination of the agreement.
The sub-advisers monitor a variety of factors including cash flow assumptions, market activity, market sentiment and valuation as part of their ongoing process of assessing payment and performance risk. As payment and performance risk increases, the value of a CDS increases, resulting in recognition of unrealized gains for long positions and unrealized losses for short positions. Conversely, as payment and performance risk decreases, unrealized gains are recognized for short positions and unrealized losses are recognized for long positions. Any current or future declines in the fair value of the swap may be partially offset by upfront payments received by the Fund as a seller of protection if applicable. The change in value is recorded within unrealized appreciation (depreciation) until the occurrence of a credit event or the termination of the swap, at which time a realized gain (loss) is recorded.
If a Fund is a seller of protection and a credit event occurs, as defined under the terms of that particular swap agreement, a Fund will either (i) pay to the buyer of protection an amount equal to the notional amount of the swap and take delivery of the referenced obligation, other deliverable obligations or underlying securities comprising the referenced index or (ii) pay a net settlement amount in the form of cash or securities equal to the notional amount of the swap less the recovery value of the referenced obligation or underlying securities comprising the referenced index. If a Fund is a buyer of protection and a credit event occurs, as defined under the terms of that particular swap agreement, a Fund will either (i) receive from the seller of protection an amount equal to the notional amount of the swap and deliver the referenced obligation, other deliverable obligations or underlying securities comprising the referenced index or (ii) receive a net settlement amount in the form of cash or securities equal to the notional amount of the swap less the recovery value of the referenced obligation or underlying securities comprising the referenced index. Recovery values are assumed by market makers considering either industry standard recovery rates or entity specific factors and considerations until a credit event occurs. If a credit event has occurred, the recovery value is determined by a facilitated auction whereby a minimum number of allowable broker bids, together with a specified valuation method, are used to calculate the settlement value.
CDS agreements on corporate issues or sovereign issues of an emerging country involve one party making a stream of payments to another party in exchange for the right to receive a specified return in the event of a default or other credit event. If a credit event occurs and cash settlement is not elected, a variety of other deliverable obligations may be delivered in lieu of the specific referenced obligation. The ability to deliver other obligations may result in a cheapest-to-deliver
option (the buyer of protection’s right to choose the deliverable obligation with the lowest value following a credit event). A Fund may use CDS on corporate issues or sovereign issues of an emerging country to provide a measure of protection against defaults of the issuers (i.e., to reduce risk where a Fund owns or has exposure to the referenced obligation) or to take an active long or short position with respect to the likelihood of a particular issuer’s default.
CDS agreements on asset-backed securities involve one party making a stream of payments to another party in exchange for the right to receive a specified return in the event of a default or other credit event. Unlike CDS on corporate issues or sovereign issues of an emerging country, deliverable obligations in most instances would be limited to the specific referenced obligation as performance for asset-backed securities can vary across deals. Prepayments, principal paydowns, and other write down or loss events on the underlying loans will reduce the outstanding principal balance of the referenced obligation. These reductions may be temporary or permanent as defined under the terms of the swap agreement and the notional amount for the swap agreement will be adjusted by corresponding amounts. A Fund may use CDS on asset-backed securities to provide a measure of protection against defaults of the referenced obligation or to take an active long or short position with respect to the likelihood of a particular referenced obligation's default.
CDS agreements on credit indexes involve one party making a stream of payments to another party in exchange for the right to receive a specified return in the event of a write-down, principal shortfall, interest shortfall or default of all or part of the referenced entities comprising the credit index. A credit index is a list of a basket of credit instruments or exposures designed to be representative of some part of the credit market as a whole. These indexes are made up of reference credits that are judged by a poll of dealers to be the most liquid entities in the CDS market based on the sector of the index. Components of the indexes may include, but are not limited to, investment grade securities, high yield securities, asset-backed securities, emerging markets, and/or various credit ratings within each sector. Credit indexes are traded using CDS with standardized terms including a fixed spread and standard maturity dates. An index CDS references all the names in the index, and if there is a default, the credit event is settled based on that name’s weight in the index. The composition of the indexes changes periodically, usually every six months, and for most indexes, each name has an equal weight in the index. A Fund may use CDS on credit indexes to hedge a portfolio of CDS or bonds with a CDS on indexes which is less expensive than it would be to buy many CDS to achieve a similar effect. CDS on indexes are benchmarks for protecting investors owning bonds against default, and traders use them to speculate on changes in credit quality.
Implied credit spreads, represented in absolute terms, utilized in determining the market value of CDS agreements on corporate issues or sovereign issues of an emerging country as of period end are disclosed in the Schedules of Investments and serve as an indicator of the current status of the payment/performance risk and represent the likelihood or risk of default for the credit derivative. The implied credit spread of a particular referenced entity reflects the cost of buying/selling protection and may include upfront payments required to be made to enter into the agreement. For CDS agreements on asset-backed securities and credit indexes, the quoted market prices and resulting values serve as the indicator of the current status of the payment/performance risk. Wider credit spreads and increasing market values, in absolute terms when compared to the notional amount of the swap, represent a deterioration of the referenced entity’s credit soundness and a greater likelihood or risk of default or other credit event occurring as defined under the terms of the agreement.
The maximum potential amount of future payments (undiscounted) that a Fund as a seller of protection could be required to make under a CDS agreement would be an amount equal to the notional amount of the agreement. These potential amounts would be partially offset by any recovery values of the respective referenced obligations, upfront payments received upon entering into the agreement, or net amounts received from the settlement of buy protection CDS agreements entered into by a Fund for the same referenced entity or entities.
CDS involve greater risks than if the Funds had invested in the referenced obligation directly. In addition to general market risks, CDS are subject to liquidity risk and counterparty credit risk. The Funds enter into CDS with counterparties meeting defined criteria for financial strength. A buyer also may lose its investment and recover nothing should a credit event not occur. If a credit event did occur, the value of the referenced obligation received by the seller, coupled with the periodic payments previously received, may be less than the full notional value it pays to the buyer, resulting in a loss of value.
The maximum potential amount of future payments (undiscounted) that a Fund as a seller of protection could be required to make under a credit default swap agreement equals the notional amount of the agreement. Notional amounts of each individual credit default swap agreement outstanding as of period end for which a Fund is the seller of protection are disclosed in the Schedules of Investments. These potential amounts would be partially offset by any recovery values of the respective referenced obligations, upfront payments received upon entering into the agreement, or net amounts received from the settlement of buy protection credit default swap agreements entered into by a Fund for the same referenced entity or entities.
Centrally Cleared Swap Agreements — Centrally cleared swaps are either interest rate or CDS agreements brokered by the Chicago Mercantile Exchange, London Clearing House or the Intercontinental Exchange (the “Exchanges”) where the Exchanges are the counterparty to both the buyer and seller of protection. Centrally cleared swaps involve a lesser degree of risk because the Exchanges, as counterparties, monitor risk factors for the involved parties. Centrally cleared swaps are subject to general market risks and to liquidity risk. Pursuant to the agreement, the Funds agree to pay to or receive from the broker an amount of cash equal to the daily fluctuation in the value of the contract (the “margin”) and daily interest on the margin. In the case of centrally cleared interest rate swaps, the daily settlement also includes the daily portion of interest. Such payments are recorded by the Funds as unrealized gains or losses until the contract is closed or settled.
Centrally cleared swaps require no payments at the beginning of the measurement period nor are there liquidation payments at the termination of the swap.
Cross-Currency Swap Agreements — Cross-currency swap agreements involve two parties exchanging two different currencies with an agreement to reverse the exchange at a later date at specified exchange rates. The exchange of currencies at the inception date of the contract takes place at the current spot rate. The re-exchange at maturity may take place at the same exchange rate, a specified rate, or the then current spot rate. Interest payments, if applicable, are made between the parties based on interest rates available in the two currencies at the inception of the contract. The terms of cross-currency swap agreements may extend for many years. Cross-currency swaps are usually negotiated with commercial and investment banks. Some cross-currency swaps may not provide for exchanging principal cash flows but only for exchanging interest cash flows.
Interest Rate Swap Agreements — Interest rate swap agreements involve the exchange by a Fund with another party of their respective commitments to pay or receive interest with respect to the notional amount of principal. Certain forms of interest rate swap agreements may include: (i) interest rate caps, under which, in return for a premium, one party agrees to make payments to the other to the extent that interest rates exceed a specified rate, or “cap”, (ii) interest rate floors, under which, in return for a premium, one party agrees to make payments to the other to the extent that interest rates fall below a specified rate, or “floor”, (iii) interest rate collars, under which a party sells a cap and purchases a floor or vice versa in an attempt to protect itself against interest rate movements exceeding given minimum or maximum levels, (iv) callable interest rate swaps, under which the counterparty may terminate the swap transaction in whole at zero cost by a predetermined date and time prior to the maturity date, (v) spread locks, which allow the interest rate swap users to lock in the forward
differential (or spread) between the interest rate swap rate and a specified benchmark or (vi) basis swap, under which two parties can exchange variable interest rates based on different money markets.
Total Return Swap Agreements — Total return swap agreements on commodities involve commitments where exchanged cash flows are based on the price of a commodity and in return a Fund receives either fixed or determined by floating price rate. One party would receive payments based on the market value of the commodity involved and pay a fixed amount. Total return swap agreements on indexes involve commitments to pay interest in exchange for a market-linked return. One counterparty pays out the total return of a specific reference asset, which may be an equity, index or bond, and in return receives a regular stream of payments. To the extent the total return of the security or index underlying the transaction exceeds or falls short of the offsetting interest rate obligation, a Fund will receive a payment from or make a payment to the counterparty.
Forward Rate Agreements — Forward rate agreements represent an agreement between counterparties to exchange cash flows based on the difference between two interest rates, applied to a notional principal amount on a fixed future date. The Funds enter into forward rate agreements to gain yield exposure based on anticipated market conditions at the specified termination date of the agreement.
Variance Swap Agreements — Variance swap agreements involve two parties exchanging cash payments based on the difference between the stated level of variance (“Variance Strike Price”) and the actual variance realized on an underlying asset or index. As a receiver of the realized price variance, a Fund would receive the payoff amount when the realized price variance of the underlying asset is greater than the strike price and would owe the payoff amount when the variance is less than the strike price. As a payer of the realized price variance, a Fund would owe the payoff amount when the realized price variance of the underlying asset is greater than the strike price and would receive the payoff amount when the variance is less than the strike. A Fund may enter into variance swaps in an attempt to hedge market risk or adjust exposure to the markets.
Offsetting of Financial and Derivative Assets and Liabilities
Certain Funds are parties to International Swap and Derivatives Association, Inc. (“ISDA”) Master Agreements (“MA”) with various counterparties that govern over-the-counter derivative and foreign exchange contracts entered into from time to time. The ISDA MA may contain provisions regarding, among other things, the parties’ general obligations, representations, agreements, collateral requirements, events of default and early termination. With respect to certain counterparties, in accordance with the terms of the ISDA MA, collateral posted to the Fund is held in a segregated account by the Fund’s custodian and with respect to those amounts which can be sold or repledged, are presented in the Fund’s portfolio or Statements of Assets and Liabilities. For financial reporting purposes, the Funds do not offset derivative assets and derivative liabilities that are subject to an ISDA MA in the Statements of Assets and Liabilities.
At December 31, 2019, derivative assets and liabilities (by type) held by the Funds are as follows:
| Fund | | Assets | | Liabilities |
| MyDestination 2015 | | | | |
| Derivative Financial Instruments: | | | | |
| Futures contracts | | $8,415 | | $— |
| Total derivative assets and liabilities in the Statements of Assets and Liabilities | | 8,415 | | — |
| Derivatives not subject to an ISDA MA or similar agreement | | 8,415 | | — |
| Total assets and liabilities subject to an ISDA MA | | $— | | $— |
| Fund | | Assets | | Liabilities |
| MyDestination 2025 | | | | |
| Derivative Financial Instruments: | | | | |
| Futures contracts | | $29,799 | | $— |
| Total derivative assets and liabilities in the Statements of Assets and Liabilities | | 29,799 | | — |
| Derivatives not subject to an ISDA MA or similar agreement | | 29,799 | | — |
| Total assets and liabilities subject to an ISDA MA | | $— | | $— |
| MyDestination 2035 | | | | |
| Derivative Financial Instruments: | | | | |
| Futures contracts | | $45,301 | | $— |
| Total derivative assets and liabilities in the Statements of Assets and Liabilities | | 45,301 | | — |
| Derivatives not subject to an ISDA MA or similar agreement | | 45,301 | | — |
| Total assets and liabilities subject to an ISDA MA | | $— | | $— |
| MyDestination 2045 | | | | |
| Derivative Financial Instruments: | | | | |
| Futures contracts | | $39,418 | | $— |
| Total derivative assets and liabilities in the Statements of Assets and Liabilities | | 39,418 | | — |
| Derivatives not subject to an ISDA MA or similar agreement | | 39,418 | | — |
| Total assets and liabilities subject to an ISDA MA | | $— | | $— |
| MyDestination 2055 | | | | |
| Derivative Financial Instruments: | | | | |
| Futures contracts | | $12,652 | | $— |
| Total derivative assets and liabilities in the Statements of Assets and Liabilities | | 12,652 | | — |
| Derivatives not subject to an ISDA MA or similar agreement | | 12,652 | | — |
| Total assets and liabilities subject to an ISDA MA | | $— | | $— |
| Conservative Allocation | | | | |
| Derivative Financial Instruments: | | | | |
| Futures contracts | | $6,966 | | $— |
| Total derivative assets and liabilities in the Statements of Assets and Liabilities | | 6,966 | | — |
| Derivatives not subject to an ISDA MA or similar agreement | | 6,966 | | — |
| Total assets and liabilities subject to an ISDA MA | | $— | | $— |
| Balanced Allocation | | | | |
| Derivative Financial Instruments: | | | | |
| Futures contracts | | $40,552 | | $— |
| Total derivative assets and liabilities in the Statements of Assets and Liabilities | | 40,552 | | — |
| Derivatives not subject to an ISDA MA or similar agreement | | 40,552 | | — |
| Total assets and liabilities subject to an ISDA MA | | $— | | $— |
| Fund | | Assets | | Liabilities |
| Growth Allocation | | | | |
| Derivative Financial Instruments: | | | | |
| Futures contracts | | $57,163 | | $— |
| Total derivative assets and liabilities in the Statements of Assets and Liabilities | | 57,163 | | — |
| Derivatives not subject to an ISDA MA or similar agreement | | 57,163 | | — |
| Total assets and liabilities subject to an ISDA MA | | $— | | $— |
| Aggressive Allocation | | | | |
| Derivative Financial Instruments: | | | | |
| Futures contracts | | $63,125 | | $— |
| Total derivative assets and liabilities in the Statements of Assets and Liabilities | | 63,125 | | — |
| Derivatives not subject to an ISDA MA or similar agreement | | 63,125 | | — |
| Total assets and liabilities subject to an ISDA MA | | $— | | $— |
| Low-Duration Bond | | | | |
| Derivative Financial Instruments: | | | | |
| Futures contracts | | $15,248 | | $— |
| Forward foreign exchange contracts | | 81,270 | | 1,111,428 |
| Options | | — | | 39,376 |
| Centrally cleared swaps | | — | | 18,108 |
| Swap agreements | | — | | 14,537 |
| Total derivative assets and liabilities in the Statements of Assets and Liabilities | | 96,518 | | 1,183,449 |
| Derivatives not subject to an ISDA MA or similar agreement | | 15,248 | | 18,108 |
| Total assets and liabilities subject to an ISDA MA | | $81,270 | | $1,165,341 |
| Medium-Duration Bond | | | | |
| Derivative Financial Instruments: | | | | |
| Futures contracts | | $— | | $932,019 |
| Forward foreign exchange contracts | | 1,186,399 | | 2,495,539 |
| Options | | 254,220 | | 1,154,029 |
| Centrally cleared swaps | | 388,767 | | — |
| Swap agreements | | 1,381,087 | | 96,421 |
| Total derivative assets and liabilities in the Statements of Assets and Liabilities | | 3,210,473 | | 4,678,008 |
| Derivatives not subject to an ISDA MA or similar agreement | | 642,987 | | 1,093,893 |
| Total assets and liabilities subject to an ISDA MA | | $2,567,486 | | $3,584,115 |
| Global Bond | | | | |
| Derivative Financial Instruments: | | | | |
| Futures contracts | | $111,589 | | $— |
| Forward foreign exchange contracts | | 1,320,921 | | 3,024,306 |
| Centrally cleared swaps | | — | | 21,206 |
| Total derivative assets and liabilities in the Statements of Assets and Liabilities | | 1,432,510 | | 3,045,512 |
| Derivatives not subject to an ISDA MA or similar agreement | | 111,589 | | 21,206 |
| Total assets and liabilities subject to an ISDA MA | | $1,320,921 | | $3,024,306 |
| Fund | | Assets | | Liabilities |
| Defensive Market Strategies | | | | |
| Derivative Financial Instruments: | | | | |
| Futures contracts | | $— | | $59,675 |
| Forward foreign exchange contracts | | 3,161 | | 192,657 |
| Options | | — | | 791,539 |
| Total derivative assets and liabilities in the Statements of Assets and Liabilities | | 3,161 | | 1,043,871 |
| Derivatives not subject to an ISDA MA or similar agreement | | 3,161 | | 1,043,871 |
| Total assets and liabilities subject to an ISDA MA | | $— | | $— |
| Equity Index | | | | |
| Derivative Financial Instruments: | | | | |
| Futures contracts | | $127,820 | | $— |
| Total derivative assets and liabilities in the Statements of Assets and Liabilities | | 127,820 | | — |
| Derivatives not subject to an ISDA MA or similar agreement | | 127,820 | | — |
| Total assets and liabilities subject to an ISDA MA | | $— | | $— |
| Value Equity | | | | |
| Derivative Financial Instruments: | | | | |
| Futures contracts | | $42,620 | | $— |
| Forward foreign exchange contracts | | 16,955 | | 506,087 |
| Total derivative assets and liabilities in the Statements of Assets and Liabilities | | 59,575 | | 506,087 |
| Derivatives not subject to an ISDA MA or similar agreement | | 59,575 | | 506,087 |
| Total assets and liabilities subject to an ISDA MA | | $— | | $— |
| Growth Equity | | | | |
| Derivative Financial Instruments: | | | | |
| Futures contracts | | $78,540 | | $— |
| Total derivative assets and liabilities in the Statements of Assets and Liabilities | | 78,540 | | — |
| Derivatives not subject to an ISDA MA or similar agreement | | 78,540 | | — |
| Total assets and liabilities subject to an ISDA MA | | $— | | $— |
| Small Cap Equity | | | | |
| Derivative Financial Instruments: | | | | |
| Futures contracts | | $8,690 | | $— |
| Total derivative assets and liabilities in the Statements of Assets and Liabilities | | 8,690 | | — |
| Derivatives not subject to an ISDA MA or similar agreement | | 8,690 | | — |
| Total assets and liabilities subject to an ISDA MA | | $— | | $— |
| International Equity Index | | | | |
| Derivative Financial Instruments: | | | | |
| Futures contracts | | $193,454 | | $— |
| Total derivative assets and liabilities in the Statements of Assets and Liabilities | | 193,454 | | — |
| Derivatives not subject to an ISDA MA or similar agreement | | 193,454 | | — |
| Total assets and liabilities subject to an ISDA MA | | $— | | $— |
| Fund | | Assets | | Liabilities |
| International Equity | | | | |
| Derivative Financial Instruments: | | | | |
| Futures contracts | | $262,039 | | $— |
| Forward foreign exchange contracts | | 2,768,294 | | 2,776,678 |
| Swap agreements | | 172,706 | | 380,438 |
| Total derivative assets and liabilities in the Statements of Assets and Liabilities | | 3,203,039 | | 3,157,116 |
| Derivatives not subject to an ISDA MA or similar agreement | | 262,039 | | — |
| Total assets and liabilities subject to an ISDA MA | | $2,941,000 | | $3,157,116 |
| Emerging Markets Equity | | | | |
| Derivative Financial Instruments: | | | | |
| Futures contracts | | $166,720 | | $— |
| Forward foreign exchange contracts | | 2,424,473 | | 2,828,398 |
| Swap agreements | | 1,102,435 | | 242,159 |
| Total derivative assets and liabilities in the Statements of Assets and Liabilities | | 3,693,628 | | 3,070,557 |
| Derivatives not subject to an ISDA MA or similar agreement | | 166,720 | | — |
| Total assets and liabilities subject to an ISDA MA | | $3,526,908 | | $3,070,557 |
| Global Real Estate Securities | | | | |
| Derivative Financial Instruments: | | | | |
| Futures contracts | | $7,790 | | $— |
| Total derivative assets and liabilities in the Statements of Assets and Liabilities | | 7,790 | | — |
| Derivatives not subject to an ISDA MA or similar agreement | | 7,790 | | — |
| Total assets and liabilities subject to an ISDA MA | | $— | | $— |
| Strategic Alternatives | | | | |
| Derivative Financial Instruments: | | | | |
| Futures contracts | | $— | | $93,721 |
| Forward foreign exchange contracts | | 16,287,874 | | 16,735,104 |
| Options | | 8,100 | | 286,127 |
| Centrally cleared swaps | | 116,391 | | — |
| Swap agreements | | 365,846 | | 3,189 |
| Total derivative assets and liabilities in the Statements of Assets and Liabilities | | 16,778,211 | | 17,118,141 |
| Derivatives not subject to an ISDA MA or similar agreement | | 124,491 | | 379,848 |
| Total assets and liabilities subject to an ISDA MA | | $16,653,720 | | $16,738,293 |
The futures contracts and centrally cleared swap agreements shown above represent the variation margin shown on the Statements of Assets and Liabilities, which is the daily change in the unrealized appreciation (depreciation) for open futures and centrally cleared swap agreements.
At December 31, 2019, derivative assets and liabilities by counterparty net of amounts available for offset under an MA and net of the related collateral (received)/pledged by the Trust are as follows:
| Fund/Sub-adviser/Counterparty | | Derivative Assets
Subject to
an ISDA MA | | Derivative Liabilities
Subject to
an ISDA MA | | Value of
Derivatives Subject to
an ISDA MA | | Collateral
(Received)/
Pledged | | Net Exposure |
| Low-Duration Bond | | | | | | | | | | |
| Sub-adviser A | | | | | | | | | | |
| Other Counterparties* | | $35,781 | | $(584,573) | | $(548,792) | | $10,000 | | $(538,792) |
| Sub-adviser B | | | | | | | | | | |
| Other Counterparties* | | 45,489 | | (377,824) | | (332,335) | | — | | (332,335) |
| Sub-adviser C | | | | | | | | | | |
| Other Counterparties* | | — | | (202,944) | | (202,944) | | — | | (202,944) |
| Total Derivatives | | $81,270 | | $(1,165,341) | | $(1,084,071) | | $10,000 | | $(1,074,071) |
| Medium-Duration Bond | | | | | | | | | | |
| Sub-adviser A | | | | | | | | | | |
| Other Counterparties* | | $187,735 | | $(1,493,303) | | $(1,305,568) | | $678,217 | | $(627,351) |
| Sub-adviser B | | | | | | | | | | |
| Other Counterparties* | | 699,222 | | (1,491,950) | | (792,728) | | 169,295 | | (623,433) |
| Sub-adviser C | | | | | | | | | | |
| Other Counterparties* | | 1,680,529 | | (598,862) | | 1,081,667 | | (334,239) | | 747,428 |
| Total Derivatives | | $2,567,486 | | $(3,584,115) | | $(1,016,629) | | $513,273 | | $(503,356) |
| Global Bond | | | | | | | | | | |
| Sub-adviser A | | | | | | | | | | |
| BAR | | $65,395 | | $(1,386,870) | | $(1,321,475) | | $— | | $(1,321,475) |
| Other Counterparties* | | 642,645 | | (373,593) | | 269,052 | | — | | 269,052 |
| | | 708,040 | | (1,760,463) | | (1,052,423) | | — | | (1,052,423) |
| Sub-adviser B | | | | | | | | | | |
| CITI | | 288,122 | | (941,830) | | (653,708) | | — | | (653,708) |
| Other Counterparties* | | 324,759 | | (322,013) | | 2,746 | | — | | 2,746 |
| | | 612,881 | | (1,263,843) | | (650,962) | | — | | (650,962) |
| Total Derivatives | | $1,320,921 | | $(3,024,306) | | $(1,703,385) | | $— | | $(1,703,385) |
| International Equity | | | | | | | | | | |
| Sub-adviser A | | | | | | | | | | |
| Other Counterparties* | | $2,941,000 | | $(3,134,292) | | $(193,292) | | $193,292 | | $— |
| Sub-adviser B | | | | | | | | | | |
| Other Counterparties* | | — | | (22,824) | | (22,824) | | — | | (22,824) |
| Total Derivatives | | $2,941,000 | | $(3,157,116) | | $(216,116) | | $193,292 | | $(22,824) |
| Emerging Markets Equity | | | | | | | | | | |
| Sub-adviser A | | | | | | | | | | |
| Other Counterparties* | | $3,526,908 | | $(3,070,557) | | $456,351 | | $(456,351) | | $— |
| Total Derivatives | | $3,526,908 | | $(3,070,557) | | $456,351 | | $(456,351) | | $— |
| Fund/Sub-adviser/Counterparty | | Derivative Assets
Subject to
an ISDA MA | | Derivative Liabilities
Subject to
an ISDA MA | | Value of
Derivatives Subject to
an ISDA MA | | Collateral
(Received)/
Pledged | | Net Exposure |
| Strategic Alternatives | | | | | | | | | | |
| Sub-adviser A | | | | | | | | | | |
| SC | | $553,510 | | $(2,001,108) | | $(1,447,598) | | $1,240,000 | | $(207,598) |
| Other Counterparties* | | 14,627,337 | | (13,553,717) | | 1,073,620 | | (846,675) | | 226,945 |
| | | 15,180,847 | | (15,554,825) | | (373,978) | | 393,325 | | 19,347 |
| Sub-adviser B | | | | | | | | | | |
| Other Counterparties* | | 1,392,125 | | (1,183,468) | | 208,657 | | (3,327) | | 205,330 |
| Sub-adviser D | | | | | | | | | | |
| Other Counterparties* | | 80,748 | | — | | 80,748 | | — | | 80,748 |
| Total Derivatives | | $16,653,720 | | $(16,738,293) | | $(84,573) | | $389,998 | | $305,425 |
*Other Counterparties represent amounts that are held with counterparties where the absolute value of the total net exposure is less than 0.05% of the net assets of the respective Fund. Those holdings are deemed individually immaterial to the respective Fund and are listed collectively.
Additional information about netting arrangements under the Master Agreements can be found in the Derivative Financial Instruments and Securities Lending sections of the Notes to Financial Statements.
Derivative Holdings Categorized by Risk Exposure
FASB “Derivatives and Hedging” also requires all companies to disclose information intended to enable financial statement users to understand how and why the entity uses derivative instruments, how derivatives are accounted for, and how derivative instruments affect the entity’s financial position, results of operations, and cash flows.
| | | Location on the Statements of Assets and Liabilities |
| Derivative Type | | Asset Derivatives | | Liability Derivatives |
| Interest rate contracts | | Investments in securities of unaffiliated issuers, at value | | Options written, at value |
| | | Receivables: Variation margin* | | Payables: Variation margin* |
| | | Unrealized appreciation on swap agreements | | Unrealized depreciation on swap agreements |
| Foreign exchange contracts | | Investments in securities of unaffiliated issuers, at value | | Options written, at value |
| | | Unrealized appreciation on foreign currency exchange contracts | | Unrealized depreciation on foreign currency exchange contracts |
| Credit contracts | | Unrealized appreciation on swap agreements | | Unrealized depreciation on swap agreements |
| Equity contracts | | Investments in securities of unaffiliated issuers, at value | | Options written, at value |
| | | Receivables: Variation margin* | | Payables: Variation margin* |
*The variation margin shown on the Statements of Assets and Liabilities is the daily change in the unrealized appreciation (depreciation) for open futures and centrally cleared swap agreements. The variation margin presented below is the cumulative change in unrealized appreciation (depreciation) from the date the contract was opened until December 31, 2019.
| | | Asset Derivative Value |
| Fund | | Total Value
at
12/31/19 | | Interest Rate
Contracts | | Foreign
Exchange
Contracts | | Credit
Contracts | | Equity
Contracts |
| MyDestination 2015 | | | | | | | | | | |
| Futures | | $45,396 | | $— | | $— | | $— | | $45,396 |
| | | Asset Derivative Value |
| Fund | | Total Value
at
12/31/19 | | Interest Rate
Contracts | | Foreign
Exchange
Contracts | | Credit
Contracts | | Equity
Contracts |
| MyDestination 2025 | | | | | | | | | | |
| Futures | | $173,065 | | $— | | $— | | $— | | $173,065 |
| MyDestination 2035 | | | | | | | | | | |
| Futures | | $177,042 | | $— | | $— | | $— | | $177,042 |
| MyDestination 2045 | | | | | | | | | | |
| Futures | | $139,935 | | $— | | $— | | $— | | $139,935 |
| MyDestination 2055 | | | | | | | | | | |
| Futures | | $43,206 | | $— | | $— | | $— | | $43,206 |
| Conservative Allocation | | | | | | | | | | |
| Futures | | $23,247 | | $474 | | $— | | $— | | $22,773 |
| Balanced Allocation | | | | | | | | | | |
| Futures | | $247,154 | | $— | | $— | | $— | | $247,154 |
| Growth Allocation | | | | | | | | | | |
| Futures | | $272,269 | | $— | | $— | | $— | | $272,269 |
| Aggressive Allocation | | | | | | | | | | |
| Futures | | $276,413 | | $— | | $— | | $— | | $276,413 |
| Low-Duration Bond | | | | | | | | | | |
| Forwards | | $81,270 | | $— | | $81,270 | | $— | | $— |
| Futures | | 450,817 | | 450,817 | | — | | — | | — |
| Swaps | | 127,359 | | 127,359 | | — | | — | | — |
| Totals | | $659,446 | | $578,176 | | $81,270 | | $— | | $— |
| Medium-Duration Bond | | | | | | | | | | |
| Forwards | | $1,186,399 | | $— | | $1,186,399 | | $— | | $— |
| Futures | | 3,755,487 | | 3,755,487 | | — | | — | | — |
| Purchased Options | | 254,220 | | 254,220 | | — | | — | | — |
| Swaps | | 6,171,605 | | 5,139,647 | | — | | 1,031,958 | | — |
| Totals | | $11,367,711 | | $9,149,354 | | $1,186,399 | | $1,031,958 | | $— |
| Global Bond | | | | | | | | | | |
| Forwards | | $1,320,921 | | $— | | $1,320,921 | | $— | | $— |
| Futures | | 1,081,917 | | 1,081,917 | | — | | — | | — |
| Swaps | | 5,222 | | — | | — | | 5,222 | | — |
| Totals | | $2,408,060 | | $1,081,917 | | $1,320,921 | | $5,222 | | $— |
| Defensive Market Strategies | | | | | | | | | | |
| Forwards | | $3,161 | | $— | | $3,161 | | $— | | $— |
| Equity Index | | | | | | | | | | |
| Futures | | $736,473 | | $— | | $— | | $— | | $736,473 |
| Value Equity | | | | | | | | | | |
| Forwards | | $16,955 | | $— | | $16,955 | | $— | | $— |
| Futures | | 327,841 | | — | | — | | — | | 327,841 |
| Totals | | $344,796 | | $— | | $16,955 | | $— | | $327,841 |
| | | Asset Derivative Value |
| Fund | | Total Value
at
12/31/19 | | Interest Rate
Contracts | | Foreign
Exchange
Contracts | | Credit
Contracts | | Equity
Contracts |
| Growth Equity | | | | | | | | | | |
| Futures | | $609,921 | | $— | | $— | | $— | | $609,921 |
| Small Cap Equity | | | | | | | | | | |
| Futures | | $85,961 | | $— | | $— | | $— | | $85,961 |
| International Equity Index | | | | | | | | | | |
| Futures | | $123,577 | | $— | | $— | | $— | | $123,577 |
| International Equity | | | | | | | | | | |
| Forwards | | $2,768,294 | | $— | | $2,768,294 | | $— | | $— |
| Futures | | 392,208 | | — | | — | | — | | 392,208 |
| Swaps | | 172,706 | | — | | — | | — | | 172,706 |
| Totals | | $3,333,208 | | $— | | $2,768,294 | | $— | | $564,914 |
| Emerging Markets Equity | | | | | | | | | | |
| Forwards | | $2,424,473 | | $— | | $2,424,473 | | $— | | $— |
| Futures | | 533,653 | | — | | — | | — | | 533,653 |
| Swaps | | 1,102,435 | | — | | — | | — | | 1,102,435 |
| Totals | | $4,060,561 | | $— | | $2,424,473 | | $— | | $1,636,088 |
| Global Real Estate Securities | | | | | | | | | | |
| Futures | | $96,580 | | $— | | $— | | $— | | $96,580 |
| Strategic Alternatives | | | | | | | | | | |
| Forwards | | $16,287,874 | | $— | | $16,287,874 | | $— | | $— |
| Futures | | 157,614 | | 157,614 | | — | | — | | — |
| Purchased Options | | 8,100 | | — | | — | | — | | 8,100 |
| Swaps | | 1,789,153 | | 1,703,418 | | 4,988 | | — | | 80,747 |
| Totals | | $18,242,741 | | $1,861,032 | | $16,292,862 | | $— | | $88,847 |
| | | Liabilities Derivative Value |
| Fund | | Total Value
at
12/31/19 | | Interest Rate
Contracts | | Foreign
Exchange
Contracts | | Credit
Contracts | | Equity
Contracts |
| MyDestination 2015 | | | | | | | | | | |
| Futures | | $27,930 | | $27,930 | | $— | | $— | | $— |
| MyDestination 2025 | | | | | | | | | | |
| Futures | | $67,919 | | $67,919 | | $— | | $— | | $— |
| MyDestination 2035 | | | | | | | | | | |
| Futures | | $23,215 | | $23,215 | | $— | | $— | | $— |
| MyDestination 2045 | | | | | | | | | | |
| Futures | | $10,849 | | $10,849 | | $— | | $— | | $— |
| MyDestination 2055 | | | | | | | | | | |
| Futures | | $1,296 | | $1,115 | | $— | | $— | | $181 |
| Conservative Allocation | | | | | | | | | | |
| Futures | | $434 | | $— | | $— | | $— | | $434 |
| | | Liabilities Derivative Value |
| Fund | | Total Value
at
12/31/19 | | Interest Rate
Contracts | | Foreign
Exchange
Contracts | | Credit
Contracts | | Equity
Contracts |
| Balanced Allocation | | | | | | | | | | |
| Futures | | $108,381 | | $108,381 | | $— | | $— | | $— |
| Growth Allocation | | | | | | | | | | |
| Futures | | $35,959 | | $35,959 | | $— | | $— | | $— |
| Low-Duration Bond | | | | | | | | | | |
| Forwards | | $1,111,428 | | $— | | $1,111,428 | | $— | | $— |
| Futures | | 432,273 | | 432,273 | | — | | — | | — |
| Written Options | | 39,376 | | — | | — | | 39,376 | | ��� |
| Swaps | | 642,837 | | 511,582 | | — | | 131,255 | | — |
| Totals | | $2,225,914 | | $943,855 | | $1,111,428 | | $170,631 | | $— |
| Medium-Duration Bond | | | | | | | | | | |
| Forwards | | $2,495,539 | | $— | | $2,495,539 | | $— | | $— |
| Futures | | 7,175,348 | | 7,175,348 | | — | | — | | — |
| Written Options | | 1,154,029 | | 1,154,029 | | — | | — | | — |
| Swaps | | 2,284,563 | | 2,186,954 | | — | | 97,609 | | — |
| Totals | | $13,109,479 | | $10,516,331 | | $2,495,539 | | $97,609 | | $— |
| Global Bond | | | | | | | | | | |
| Forwards | | $3,024,306 | | $— | | $3,024,306 | | $— | | $— |
| Futures | | 356,190 | | 356,190 | | — | | — | | — |
| Totals | | $3,380,496 | | $356,190 | | $3,024,306 | | $— | | $— |
| Defensive Market Strategies | | | | | | | | | | |
| Forwards | | $192,657 | | $— | | $192,657 | | $— | | $— |
| Futures | | 466,502 | | — | | — | | — | | 466,502 |
| Written Options | | 791,539 | | — | | — | | — | | 791,539 |
| Totals | | $1,450,698 | | $— | | $192,657 | | $— | | $1,258,041 |
| Value Equity | | | | | | | | | | |
| Forwards | | $506,087 | | $— | | $506,087 | | $— | | $— |
| International Equity | | | | | | | | | | |
| Forwards | | $2,776,678 | | $— | | $2,776,678 | | $— | | $— |
| Futures | | 204,203 | | — | | — | | — | | 204,203 |
| Swaps | | 380,438 | | — | | — | | — | | 380,438 |
| Totals | | $3,361,319 | | $— | | $2,776,678 | | $— | | $584,641 |
| Emerging Markets Equity | | | | | | | | | | |
| Forwards | | $2,828,398 | | $— | | $2,828,398 | | $— | | $— |
| Futures | | 37,459 | | — | | — | | — | | 37,459 |
| Swaps | | 242,159 | | — | | — | | — | | 242,159 |
| Totals | | $3,108,016 | | $— | | $2,828,398 | | $— | | $279,618 |
| | | Liabilities Derivative Value |
| Fund | | Total Value
at
12/31/19 | | Interest Rate
Contracts | | Foreign
Exchange
Contracts | | Credit
Contracts | | Equity
Contracts |
| Strategic Alternatives | | | | | | | | | | |
| Forwards | | $16,735,104 | | $— | | $16,735,104 | | $— | | $— |
| Futures | | 359,645 | | 359,645 | | — | | — | | — |
| Written Options | | 286,127 | | — | | — | | — | | 286,127 |
| Swaps | | 565,854 | | 565,854 | | — | | — | | — |
| Totals | | $17,946,730 | | $925,499 | | $16,735,104 | | $— | | $286,127 |
| Derivative Type | | Location on the Statements of Operations |
| Interest rate contracts | | Net realized gain (loss) from: Futures transactions |
| | | Net realized gain (loss) from: Swap agreements |
| | | Net realized gain (loss) from: Option contracts written |
| | | Net realized gain (loss) from: Option contracts purchased |
| | | Net change in unrealized appreciation (depreciation) on: Futures |
| | | Net change in unrealized appreciation (depreciation) on: Swap agreements |
| | | Net change in unrealized appreciation (depreciation) on: Option contracts written |
| | | Net change in unrealized appreciation (depreciation) on: Option contracts purchased |
| Foreign exchange contracts | | Net realized gain (loss) from: Foreign currency |
| | | Net realized gain (loss) from: Option contracts written |
| | | Net realized gain (loss) from: Option contracts purchased |
| | | Net change in unrealized appreciation (depreciation) on: Foreign currency |
| | | Net change in unrealized appreciation (depreciation) on: Option contracts written |
| | | Net change in unrealized appreciation (depreciation) on: Option contracts purchased |
| Credit contracts | | Net realized gain (loss) from: Swap agreements |
| | | Net change in unrealized appreciation (depreciation) on: Swap agreements |
| Equity contracts | | Net realized gain (loss) from: Futures transactions |
| | | Net realized gain (loss) from: Option contracts written |
| | | Net realized gain (loss) from: Option contracts purchased |
| | | Net unrealized appreciation (depreciation) on: Futures |
| | | Net unrealized appreciation (depreciation) on: Option contracts written |
| | | Net unrealized appreciation (depreciation) on: Option contracts purchased |
| | | Realized Gain (Loss) on Derivatives Recognized in Income |
| Fund | | Total Value
at
12/31/19 | | Interest Rate
Contracts | | Foreign
Exchange
Contracts | | Credit
Contracts | | Equity
Contracts |
| MyDestination 2015 | | | | | | | | | | |
| Futures | | $752,870 | | $222,890 | | $— | | $— | | $529,980 |
| MyDestination 2025 | | | | | | | | | | |
| Futures | | $2,611,689 | | $515,300 | | $— | | $— | | $2,096,389 |
| MyDestination 2035 | | | | | | | | | | |
| Futures | | $2,586,853 | | $268,032 | | $— | | $— | | $2,318,821 |
| MyDestination 2045 | | | | | | | | | | |
| Futures | | $2,290,448 | | $79,503 | | $— | | $— | | $2,210,945 |
| MyDestination 2055 | | | | | | | | | | |
| Futures | | $799,691 | | $14,967 | | $— | | $— | | $784,724 |
| | | Realized Gain (Loss) on Derivatives Recognized in Income |
| Fund | | Total Value
at
12/31/19 | | Interest Rate
Contracts | | Foreign
Exchange
Contracts | | Credit
Contracts | | Equity
Contracts |
| Conservative Allocation | | | | | | | | | | |
| Futures | | $319,497 | | $83,821 | | $— | | $— | | $235,676 |
| Balanced Allocation | | | | | | | | | | |
| Futures | | $3,338,210 | | $1,056,106 | | $— | | $— | | $2,282,104 |
| Growth Allocation | | | | | | | | | | |
| Futures | | $2,715,714 | | $448,543 | | $— | | $— | | $2,267,171 |
| Aggressive Allocation | | | | | | | | | | |
| Futures | | $2,584,657 | | $— | | $— | | $— | | $2,584,657 |
| Low-Duration Bond | | | | | | | | | | |
| Forwards | | $1,211,575 | | $— | | $1,211,575 | | $— | | $— |
| Futures | | (2,584,507) | | (2,584,507) | | — | | — | | — |
| Purchased Options | | 27,094 | | 27,094 | | — | | — | | — |
| Swaps | | (1,980,939) | | (1,980,939) | | — | | — | | — |
| Written Options | | 467,081 | | 400,933 | | — | | 66,148 | | — |
| Totals | | $(2,859,696) | | $(4,137,419) | | $1,211,575 | | $66,148 | | $— |
| Medium-Duration Bond | | | | | | | | | | |
| Forwards | | $(805,050) | | $— | | $(805,050) | | $— | | $— |
| Futures | | 36,196,191 | | 36,196,191 | | — | | — | | — |
| Purchased Options | | (2,084,358) | | (1,952,574) | | (131,784) | | — | | — |
| Swaps | | (16,958,656) | | (18,126,775) | | — | | 1,168,119 | | — |
| Written Options | | 2,922,007 | | 2,526,736 | | 380,232 | | 15,039 | | — |
| Totals | | $19,270,134 | | $18,643,578 | | $(556,602) | | $1,183,158 | | $— |
| Global Bond | | | | | | | | | | |
| Forwards | | $(1,334,774) | | $— | | $(1,334,774) | | $— | | $— |
| Futures | | (1,601,175) | | (1,585,527) | | — | | — | | (15,648) |
| Purchased Options | | (195,528) | | (70,634) | | (124,894) | | — | | — |
| Swaps | | (332,608) | | — | | — | | (332,608) | | — |
| Totals | | $(3,464,085) | | $(1,656,161) | | $(1,459,668) | | $(332,608) | | $(15,648) |
| Defensive Market Strategies | | | | | | | | | | |
| Forwards | | $1,027,704 | | $— | | $1,027,704 | | $— | | $— |
| Futures | | (2,176,112) | | — | | — | | — | | (2,176,112) |
| Written Options | | 10,300,735 | | — | | — | | — | | 10,300,735 |
| Totals | | $9,152,327 | | $— | | $1,027,704 | | $— | | $8,124,623 |
| Equity Index | | | | | | | | | | |
| Futures | | $13,099,932 | | $— | | $— | | $— | | $13,099,932 |
| Value Equity | | | | | | | | | | |
| Forwards | | $1,047,284 | | $— | | $1,047,284 | | $— | | $— |
| Futures | | 6,033,037 | | — | | — | | — | | 6,033,037 |
| Totals | | $7,080,321 | | $— | | $1,047,284 | | $— | | $6,033,037 |
| | | Realized Gain (Loss) on Derivatives Recognized in Income |
| Fund | | Total Value
at
12/31/19 | | Interest Rate
Contracts | | Foreign
Exchange
Contracts | | Credit
Contracts | | Equity
Contracts |
| Growth Equity | | | | | | | | | | |
| Futures | | $9,771,247 | | $— | | $— | | $— | | $9,771,247 |
| Small Cap Equity | | | | | | | | | | |
| Futures | | $1,911,826 | | $— | | $— | | $— | | $1,911,826 |
| International Equity Index | | | | | | | | | | |
| Futures | | $4,891,251 | | $— | | $— | | $— | | $4,891,251 |
| International Equity | | | | | | | | | | |
| Forwards | | $(938,281) | | $— | | $(938,281) | | $— | | $— |
| Futures | | 7,228,295 | | — | | — | | — | | 7,228,295 |
| Swaps | | (1,821,444) | | — | | — | | — | | (1,821,444) |
| Totals | | $4,468,570 | | $— | | $(938,281) | | $— | | $5,406,851 |
| Emerging Markets Equity | | | | | | | | | | |
| Forwards | | $6,002,574 | | $— | | $6,002,574 | | $— | | $— |
| Futures | | 3,744,545 | | — | | — | | — | | 3,744,545 |
| Swaps | | 1,594,906 | | — | | — | | — | | 1,594,906 |
| Totals | | $11,342,025 | | $— | | $6,002,574 | | $— | | $5,339,451 |
| Global Real Estate Securities | | | | | | | | | | |
| Forwards | | $(7,392) | | $— | | $(7,392) | | $— | | $— |
| Futures | | 1,323,101 | | — | | — | | — | | 1,323,101 |
| Totals | | $1,315,709 | | $— | | $(7,392) | | $— | | $1,323,101 |
| Strategic Alternatives | | | | | | | | | | |
| Forwards | | $(1,901,860) | | $— | | $(1,901,860) | | $— | | $— |
| Futures | | (36,597) | | (36,597) | | — | | — | | — |
| Purchased Options | | (2,725,691) | | (2,001,399) | | — | | — | | (724,292) |
| Swaps | | 145,472 | | 83,974 | | (178,164) | | 989 | | 238,673 |
| Written Options | | 5,621,582 | | 3,273,839 | | — | | — | | 2,347,743 |
| Totals | | $1,102,906 | | $1,319,817 | | $(2,080,024) | | $989 | | $1,862,124 |
| | | Change in Unrealized Appreciation (Depreciation) on Derivatives Recognized in Income |
| Fund | | Total Value
at
12/31/19 | | Interest Rate
Contracts | | Foreign
Exchange
Contracts | | Credit
Contracts | | Equity
Contracts |
| MyDestination 2015 | | | | | | | | | | |
| Futures | | $53,306 | | $(96,073) | | $— | | $— | | $149,379 |
| MyDestination 2025 | | | | | | | | | | |
| Futures | | $336,249 | | $(191,024) | | $— | | $— | | $527,273 |
| MyDestination 2035 | | | | | | | | | | |
| Futures | | $484,544 | | $(89,587) | | $— | | $— | | $574,131 |
| MyDestination 2045 | | | | | | | | | | |
| Futures | | $451,770 | | $(31,952) | | $— | | $— | | $483,722 |
| MyDestination 2055 | | | | | | | | | | |
| Futures | | $107,109 | | $(4,129) | | $— | | $— | | $111,238 |
| | | Change in Unrealized Appreciation (Depreciation) on Derivatives Recognized in Income |
| Fund | | Total Value
at
12/31/19 | | Interest Rate
Contracts | | Foreign
Exchange
Contracts | | Credit
Contracts | | Equity
Contracts |
| Conservative Allocation | | | | | | | | | | |
| Futures | | $63,520 | | $(22,296) | | $— | | $— | | $85,816 |
| Balanced Allocation | | | | | | | | | | |
| Futures | | $395,756 | | $(392,512) | | $— | | $— | | $788,268 |
| Growth Allocation | | | | | | | | | | |
| Futures | | $717,200 | | $(143,490) | | $— | | $— | | $860,690 |
| Aggressive Allocation | | | | | | | | | | |
| Futures | | $953,003 | | $— | | $— | | $— | | $953,003 |
| Low-Duration Bond | | | | | | | | | | |
| Forwards | | $(909,167) | | $— | | $(909,167) | | $— | | $— |
| Futures | | 71,646 | | 71,646 | | — | | — | | — |
| Purchased Options | | (468,489) | | (468,489) | | — | | — | | — |
| Swaps | | (463,404) | | (323,584) | | — | | (139,820) | | — |
| Written Options | | 337,404 | | 466,781 | | — | | (129,377) | | — |
| Totals | | $(1,432,010) | | $(253,646) | | $(909,167) | | $(269,197) | | $— |
| Medium-Duration Bond | | | | | | | | | | |
| Forwards | | $(172,575) | | $— | | $(172,575) | | $— | | $— |
| Futures | | (12,124,728) | | (12,124,728) | | — | | — | | — |
| Purchased Options | | (1,415,044) | | (1,418,406) | | 3,362 | | — | | — |
| Swaps | | 7,427,740 | | 5,645,853 | | — | | 1,781,887 | | — |
| Written Options | | 2,360,058 | | 2,367,394 | | (7,336) | | — | | — |
| Totals | | $(3,924,549) | | $(5,529,887) | | $(176,549) | | $1,781,887 | | $— |
| Global Bond | | | | | | | | | | |
| Forwards | | $(2,792,350) | | $— | | $(2,792,350) | | $— | | $— |
| Futures | | 543,663 | | 543,663 | | — | | — | | — |
| Swaps | | 5,222 | | — | | — | | 5,222 | | — |
| Totals | | $(2,243,465) | | $543,663 | | $(2,792,350) | | $5,222 | | $— |
| Defensive Market Strategies | | | | | | | | | | |
| Forwards | | $(50,254) | | $— | | $(50,254) | | $— | | $— |
| Futures | | (466,502) | | — | | — | | — | | (466,502) |
| Written Options | | 353,272 | | — | | — | | — | | 353,272 |
| Totals | | $(163,484) | | $— | | $(50,254) | | $— | | $(113,230) |
| Equity Index | | | | | | | | | | |
| Futures | | $2,157,945 | | $— | | $— | | $— | | $2,157,945 |
| Value Equity | | | | | | | | | | |
| Forwards | | $(489,132) | | $— | | $(489,132) | | $— | | $— |
| Futures | | 1,255,987 | | — | | — | | — | | 1,255,987 |
| Totals | | $766,855 | | $— | | $(489,132) | | $— | | $1,255,987 |
| Growth Equity | | | | | | | | | | |
| Futures | | $2,661,905 | | $— | | $— | | $— | | $2,661,905 |
| | | Change in Unrealized Appreciation (Depreciation) on Derivatives Recognized in Income |
| Fund | | Total Value
at
12/31/19 | | Interest Rate
Contracts | | Foreign
Exchange
Contracts | | Credit
Contracts | | Equity
Contracts |
| Small Cap Equity | | | | | | | | | | |
| Futures | | $567,676 | | $— | | $— | | $— | | $567,676 |
| International Equity Index | | | | | | | | | | |
| Futures | | $558,622 | | $— | | $— | | $— | | $558,622 |
| International Equity | | | | | | | | | | |
| Forwards | | $3,016,141 | | $— | | $3,016,141 | | $— | | $— |
| Futures | | 1,896,059 | | — | | — | | — | | 1,896,059 |
| Swaps | | 47,742 | | — | | — | | — | | 47,742 |
| Totals | | $4,959,942 | | $— | | $3,016,141 | | $— | | $1,943,801 |
| Emerging Markets Equity | | | | | | | | | | |
| Forwards | | $(921,965) | | $— | | $(921,965) | | $— | | $— |
| Futures | | 1,189,618 | | — | | — | | — | | 1,189,618 |
| Swaps | | 1,009,819 | | — | | — | | — | | 1,009,819 |
| Totals | | $1,277,472 | | $— | | $(921,965) | | $— | | $2,199,437 |
| Global Real Estate Securities | | | | | | | | | | |
| Futures | | $302,495 | | $— | | $— | | $— | | $302,495 |
| Strategic Alternatives | | | | | | | | | | |
| Forwards | | $(42,462) | | $— | | $(42,462) | | $— | | $— |
| Futures | | 236,031 | | — | | — | | — | | 236,031 |
| Purchased Options | | (259,751) | | — | | — | | — | | (259,751) |
| Swaps | | 939,911 | | 896,090 | | (12,098) | | — | | 55,919 |
| Written Options | | 38,459 | | — | | — | | — | | 38,459 |
| Totals | | $912,188 | | $896,090 | | $(54,560) | | $— | | $70,658 |
Volume of Derivative Transactions
The table below summarizes the average balance of derivative holdings by Fund during the year ended December 31, 2019. The average balance of derivatives held is indicative of the trading volume of each Fund.
| | | Long Derivative Volume |
| Fund | | Forward Foreign
Currency
Contracts | | Financial
Futures
Contracts | | Purchased
Option
Contracts | | Swap
Contracts |
| MyDestination 2015 | | $ — | | $6,078,272 | | $ — | | $ — |
| MyDestination 2025 | | — | | 19,371,006 | | — | | — |
| MyDestination 2035 | | — | | 18,174,883 | | — | | — |
| MyDestination 2045 | | — | | 12,682,200 | | — | | — |
| MyDestination 2055 | | — | | 3,951,573 | | — | | — |
| Conservative Allocation | | — | | 7,870,875 | | — | | — |
| Balanced Allocation | | — | | 26,731,439 | | — | | — |
| Growth Allocation | | — | | 22,388,321 | | — | | — |
| Aggressive Allocation | | — | | 18,902,224 | | — | | — |
| Low-Duration Bond | | 52,443,002 | | 542,156,829 | | 86,027 | | 119,213,356 |
| Medium-Duration Bond | | 152,828,025 | | 957,711,030 | | 1,871,984 | | 674,445,610 |
| | | Long Derivative Volume |
| Fund | | Forward Foreign
Currency
Contracts | | Financial
Futures
Contracts | | Purchased
Option
Contracts | | Swap
Contracts |
| Global Bond | | $58,638,945 | | $25,436,281 | | $73,433 | | $— |
| Defensive Market Strategies | | 24,036,474 | | — | | — | | — |
| Equity Index | | — | | 63,207,552 | | — | | — |
| Value Equity | | 60,172,183 | | 30,866,108 | | — | | — |
| Growth Equity | | — | | 48,511,545 | | — | | — |
| Small Cap Equity | | — | | 17,057,022 | | — | | — |
| International Equity Index | | — | | 32,595,631 | | — | | — |
| International Equity | | 141,396,684 | | 96,331,550 | | — | | 14,970,424 |
| Emerging Markets Equity | | 103,668,622 | | 44,272,506 | | — | | 110,151,607 |
| Global Real Estate Securities | | — | | 8,795,900 | | — | | — |
| Strategic Alternatives | | 593,203,069 | | 46,255,881 | | 276,104 | | 199,200,640 |
| | | Short Derivative Volume |
| Fund | | Forward Foreign
Currency
Contracts | | Financial
Futures
Contracts | | Written
Option
Contracts | | Swap
Contracts |
| Low-Duration Bond | | $ 10,774,815 | | $ 245,099,407 | | $ 204,081 | | $ 106,834,668 |
| Medium-Duration Bond | | 100,747,038 | | 564,004,522 | | 2,503,129 | | 329,136,782 |
| Global Bond | | 80,172,808 | | 40,838,871 | | — | | 26,651,621 |
| Defensive Market Strategies | | 741,040 | | 23,647,317 | | 1,243,294 | | — |
| Value Equity | | 1,232,307 | | — | | — | | — |
| International Equity | | 140,442,869 | | 36,438,000 | | — | | 19,235,376 |
| Emerging Markets Equity | | 114,881,954 | | 9,457,091 | | — | | 8,767,888 |
| Strategic Alternatives | | 600,956,833 | | 69,181,516 | | 716,178 | | 240,529,198 |
j. Dividends and Distributions to Shareholders
The Low-Duration Bond Fund, Medium-Duration Bond Fund, Extended-Duration Bond Fund and Global Bond Fund declare and pay dividends from net investment income monthly. The Money Market Fund declares income dividends daily and pays them monthly. Each of the Defensive Market Strategies Fund, Equity Index Fund, Global Real Estate Securities Fund, Value Equity Fund and Growth Equity Fund declares and pays dividends from net investment income semi-annually. Each of the other Funds (including all the Target Date Funds and Target Risk Funds) declares and pays dividends from net investment income annually. Each Fund also distributes to its shareholders at least annually any realized net capital gains and net gains, if any, from certain foreign currency transactions. Dividends and distributions to shareholders are recorded on the ex-dividend date.
k. Expenses
Expenses arising in connection with a Fund are charged directly to that Fund. Expenses common to all Funds are generally allocated to each Fund in proportion to their relative net assets. Each Class of shares bears its pro-rata portion of expenses attributable to its Class, except that each Class separately bears expenses related specifically to that Class, such as shareholder reporting, registration, transfer agent and shareholder servicing fees.
l. Security Transactions, Income and Realized Gains and Losses
Security transactions are accounted for on the date securities are purchased or sold (the trade date). Dividend income is recognized on the ex-dividend date, except certain dividends from foreign securities where the ex-date may have passed, which are recorded as soon as the Fund is informed of the ex-dividend date. Interest income is accrued daily, including the amortization of
market premium and the accretion of market discount using the effective interest method. Realized gains and losses from security transactions are on an identified cost basis.
3. FEES AND OTHER TRANSACTIONS
a. Investment Advisory Fees (Affiliate)
Pursuant to a separate investment advisory agreement, GSCM acts as the Adviser to the Funds. As the Adviser, it provides an investment program for the Funds and for such services is paid a fee. GSCM and the Trust have entered into sub-advisory agreements with various sub-advisers to manage each Select Fund’s investments. Under the asset allocation and general supervision of GSCM, the sub-advisers make the day-to-day investment decisions for the Select Funds, and for such services, each sub-adviser receives a fee from the Funds. The aggregate advisory fees and sub-adviser fees are included in the Statements of Assets and Liabilities and Statements of Operations under “Investment advisory fees”.
The advisory fees paid to GSCM and aggregate sub-advisory fees paid to the sub-advisers are computed daily based upon the net assets of each Fund. The actual advisory fees accrued and the sub-advisory fees accrued during the year ended December 31, 2019, based upon average daily net assets, were as follows:
| Fund | | Advisory Fees | | Sub-Adviser Fees |
| MyDestination 2015 | | 0.10% | | N/A |
| MyDestination 2025 | | 0.10% | | N/A |
| MyDestination 2035 | | 0.10% | | N/A |
| MyDestination 2045 | | 0.10% | | N/A |
| MyDestination 2055 | | 0.10% | | N/A |
| Conservative Allocation | | 0.10% | | N/A |
| Balanced Allocation | | 0.10% | | N/A |
| Growth Allocation | | 0.10% | | N/A |
| Aggressive Allocation | | 0.10% | | N/A |
| Money Market | | 0.07% | | 0.04% |
| Low-Duration Bond | | 0.11% | | 0.19% |
| Medium-Duration Bond | | 0.13% | | 0.19% |
| Extended-Duration Bond | | 0.25% | | 0.21% |
| Global Bond | | 0.25% | | 0.22% |
| Defensive Market Strategies | | 0.33% | | 0.28% |
| Equity Index | | 0.08% | | 0.01% |
| Value Equity | | 0.33% | | 0.25% |
| Growth Equity | | 0.33% | | 0.34% |
| Small Cap Equity | | 0.33% | | 0.60% |
| International Equity Index | | 0.10% | | 0.01% |
| International Equity | | 0.33% | | 0.43% |
| Emerging Markets Equity | | 0.33% | | 0.54% |
| Global Real Estate Securities | | 0.30% | | 0.38% |
| Strategic Alternatives | | 0.40% | | 0.47% |
b. Shareholder Servicing Fees (Affiliate)
The Board of Trustees has adopted a Shareholder Service Plan for the Investor Class of each Fund. Under this Plan, the Investor Class of each Fund was authorized to pay fees of 0.25% of average daily net assets to parties that provide services for and maintain shareholder accounts.
GuideStone Financial Resources (or its affiliate) voluntarily agreed to waive shareholder servicing fees and/or reimburse expenses for the Investor Class of the Money Market Fund to the extent necessary to maintain a minimum daily net yield of at least 0.01%. This voluntary shareholder servicing fee waiver and expense reimbursement may be changed or terminated with the consent of the Board of Trustees at any time.
GSCM and/or its affiliates agreed to waive shareholder service fees attributable to the Funds’ investment of cash balances in the Money Market Fund through April 30, 2019. This agreement was not renewed after April 30, 2019. The waived shareholder service fees are not available for recapture.
c. Expense Limitation (Affiliate)
The Equity Index Fund, International Equity Index Fund, and the Emerging Markets Equity Fund have entered into expense cap agreements with GSCM, pursuant to which GSCM has agreed to pay, waive or assume expenses of the Class(es) of the Fund (excluding interest, taxes, brokerage commissions, acquired fund fees and expenses, expenses on securities sold short, and extraordinary expenses) which exceed, in the aggregate, the annual percentage rate of that Class’ average daily net assets as indicated below through April 30, 2020.
The Target Date Funds have entered into an expense cap agreement with GSCM, pursuant to which GSCM has agreed to pay, waive, or assume expenses of the Class(es) of the Fund (excluding extraordinary expenses) which exceed, in the aggregate, the annual percentage rate of that Class’ average daily net assets as indicated below through April 30, 2020.
In addition, the Adviser agreed to pay, waive or assume expenses to the extent needed to limit total annual Fund operating expenses (excluding interest, taxes, brokerage commissions, acquired fund fees and expenses, expenses on securities sold short, and extraordinary expenses) to 1.28% for the Institutional Class and 1.53% for the Investor Class of the Strategic Alternatives Fund through April 30, 2019. The Expense Caps were as follows:
| | | For the Period
January 1, 2019
to
April 30, 2019 | | For the Period
May 1, 2019
to
December 31, 2019 |
| Fund | | Institutional
Class | | Investor
Class | | Institutional
Class | | Investor
Class |
| MyDestination 2015 | | 0.50% | | 0.75% | | 0.50% | | 0.75% |
| MyDestination 2025 | | 0.50% | | 0.75% | | 0.50% | | 0.75% |
| MyDestination 2035 | | 0.50% | | 0.75% | | 0.50% | | 0.75% |
| MyDestination 2045 | | 0.50% | | 0.75% | | 0.50% | | 0.75% |
| MyDestination 2055 | | 0.50% | | 0.75% | | 0.50% | | 0.75% |
| Equity Index | | 0.15% | | N/A | | 0.15% | | N/A |
| International Equity Index | | 0.22% | | N/A | | 0.22% | | N/A |
| Emerging Markets Equity | | 1.32% | | 1.57% | | 1.32% | | 1.57% |
| Strategic Alternatives | | 1.28% | | 1.53% | | N/A | | N/A |
Each Fund in turn agreed to reimburse GSCM for any operating expenses in excess of the expense limitation paid, waived or assumed by GSCM for that Fund during the limitation period, provided GSCM would not be entitled to reimbursement for any amount that would cause operating expenses to exceed the expense limitation in place during the year in which (1) GSCM incurred or waived the operating expenses, or (2) during the year in which the reimbursement would be made, whichever is lower, and provided further that no amount will be reimbursed by the respective class of that Fund more than three years after the year in which it was incurred or waived.
For those funds that had operating expenses in excess of the expense limitation paid, waived or assumed by GSCM during the limitation period, the amounts subject to possible future reimbursement under the expense limitation agreement and the expiration schedule at December 31, 2019 are as follows:
| | | Institutional Class | | Investor Class |
| Fund | | 2020 | | 2021 | | 2022 | | 2020 | | 2021 | | 2022 |
| MyDestination 2015 | | $ — | | $23,338 | | $85,750 | | $30,638 | | $106,157 | | $356,438 |
| | | Institutional Class | | Investor Class |
| Fund | | 2020 | | 2021 | | 2022 | | 2020 | | 2021 | | 2022 |
| MyDestination 2025 | | $— | | $34,998 | | $107,568 | | $— | | $139,632 | | $352,125 |
| MyDestination 2035 | | — | | 13,410 | | 4,396 | | 24,128 | | 39,969 | | — |
| MyDestination 2045 | | — | | 6,432 | | 1,806 | | 59,007 | | 26,433 | | — |
| MyDestination 2055 | | 28,120 | | 27,146 | | 22,333 | | 110,489 | | 90,006 | | 40,211 |
| Equity Index | | — | | — | | — | | N/A | | N/A | | N/A |
| International Equity Index | | — | | — | | 79,832 | | N/A | | N/A | | N/A |
| Emerging Markets Equity | | — | | — | | — | | 77,711 | | — | | — |
d. Brokerage Service Arrangements
Subject to best execution, the Adviser directs the sub-advisers to place a certain percentage of security trades with designated brokers who have agreed to pay certain custody, transfer agency or other operating expenses through the use of Brokerage Service Arrangements on behalf of the Funds. These payments can be found on the Statement of Operations under the heading “Fees Paid Indirectly.”
| Fund | | Expenses Paid
Through Brokerage
Service Agreements |
| Value Equity | | $15,665 |
| Growth Equity | | 20,700 |
| Small Cap Equity | | 45,109 |
| Emerging Markets Equity | | 924 |
| Global Real Estate Securities | | 22,894 |
e. Administrator, Transfer Agent and Distributor
The Northern Trust Company (“Northern Trust”) provides administrative and accounting services to the Funds. For its services as Administrator, Northern Trust is entitled to receive fees, computed daily and paid monthly, based upon the average daily net assets of each Fund. The fees, excluding out of pocket expenses, range between 0.004% and 0.0225% of average daily net assets. For its services as Transfer Agent, BNY Mellon Investment Servicing (US) Inc. (“BNY Mellon”) receives a fee based mainly upon the number of accounts serviced. Certain minimum fees and transaction charges may apply.
Foreside Funds Distributors LLC serves as the Underwriter and does not receive any fees in its capacity as Underwriter from GuideStone Funds. The fees are paid by GSCM.
f. Investments in Affiliates
The Target Date and Target Risk Funds do not invest in the underlying Select Funds for the purpose of exercising management or control; however, investments made by each Target Date and Target Risk Fund within each of its principal investment strategies may represent a significant portion of an underlying Select Fund’s net assets. At December 31, 2019, the Target Date and Target Risk Funds were the owner of record of the following approximate percentages of the total outstanding shares of the underlying Select Funds as detailed below:
| Fund | | | | MyDestination
2015 Fund | | MyDestination
2025 Fund | | MyDestination
2035 Fund | | MyDestination
2045 Fund | | MyDestination
2055 Fund |
| Money Market | | | | 0.61% | | 1.79% | | 1.79% | | 1.35% | | 0.42% |
| Low-Duration Bond | | | | 10.20 | | 8.07 | | — | | — | | — |
| Medium-Duration Bond | | | | 9.47 | | 20.10 | | 9.30 | | 3.21 | | 0.68 |
| Global Bond | | | | 11.07 | | 17.89 | | 6.79 | | 2.35 | | 0.49 |
| Defensive Market Strategies | | | | 5.80 | | 12.38 | | 4.42 | | 2.73 | | 0.86 |
| Equity Index | | | | 5.31 | | 16.11 | | 16.11 | | 14.55 | | 4.76 |
| Small Cap Equity | | | | 1.91 | | 5.73 | | 5.64 | | 5.14 | | 1.68 |
| International Equity Index | | | | 9.03 | | 27.07 | | 27.45 | | 24.75 | | 8.10 |
| Emerging Markets Equity | | | | 3.76 | | 10.82 | | 10.81 | | 9.35 | | 3.06 |
| Global Real Estate Securities | | | | 2.19 | | 6.01 | | 5.31 | | 4.69 | | 1.53 |
| Strategic Alternatives | | | | 8.24 | | 9.46 | | — | | — | | — |
| Fund | | | | Conservative
Allocation Fund | | Balanced
Allocation Fund | | Growth
Allocation Fund | | Aggressive
Allocation Fund |
| Money Market | | | | 0.58% | | 2.51% | | 1.86% | | 1.46% |
| Low-Duration Bond | | | | 25.45 | | 10.15 | | 3.50 | | — |
| Medium-Duration Bond | | | | 3.79 | | 20.94 | | 7.12 | | — |
| Extended-Duration Bond | | | | — | | 26.38 | | 8.97 | | — |
| Global Bond | | | | 2.77 | | 22.48 | | 7.59 | | — |
| Defensive Market Strategies | | | | 3.09 | | 13.17 | | 4.53 | | — |
| Value Equity | | | | 2.50 | | 14.27 | | 19.42 | | 23.69 |
| Growth Equity | | | | 1.78 | | 10.47 | | 13.93 | | 17.19 |
| Small Cap Equity | | | | 1.00 | | 5.80 | | 7.79 | | 9.61 |
| International Equity | | | | 2.64 | | 15.11 | | 20.62 | | 25.00 |
| Emerging Markets Equity | | | | 1.84 | | 10.76 | | 14.44 | | 17.67 |
| Global Real Estate Securities | | | | 2.41 | | 12.53 | | 14.27 | | — |
| Strategic Alternatives | | | | 6.72 | | 15.93 | | 7.50 | | — |
A summary of the Funds' total long-term and short-term purchases and sales of the shares of the underlying Select Funds during the year ended December 31, 2019 is as follows (amounts in thousands):
| | Total Value
at
12/31/18 | | Purchases | | Sales Proceeds | | Net Realized
Gains/(Losses) | | Change in
Unrealized
Appreciation/
(Depreciation) | | Total Value
at
12/31/19 | | Dividend
Income | | Distributions
of Realized
Gains |
| MyDestination 2015 | | | | | | | | | | | | | | | |
| Money Market | $7,501 | | $58,662 | | $58,235 | | $— | | $— | | $7,928 | | $178 | | $— |
| Low-Duration Bond | 90,929 | | 12,268 | | 3,060 | | (10) | | 1,365 | | 101,492 | | 2,410 | | — |
| Medium-Duration Bond | 152,347 | | 15,264 | | 7,191 | | (57) | | 8,475 | | 168,838 | | 4,556 | | 2,187 |
| Global Bond | 61,290 | | 3,034 | | 1,299 | | (45) | | 4,597 | | 67,577 | | 2,347 | | — |
| Defensive Market Strategies | 64,969 | | 4,154 | | 4,322 | | 413 | | 8,079 | | 73,293 | | 914 | | 3,140 |
| Equity Index | 105,430 | | 3,659 | | 23,836 | | 6,142 | | 22,095 | | 113,490 | | 1,914 | | 743 |
| Small Cap Equity | 9,515 | | 425 | | 475 | | (91) | | 2,049 | | 11,423 | | 14 | | 412 |
| International Equity Index | 57,916 | | 3,851 | | 7,650 | | 538 | | 9,800 | | 64,455 | | 1,895 | | — |
| Emerging Markets Equity | 16,267 | | 1,279 | | 334 | | — | | 2,842 | | 20,054 | | 508 | | — |
| Global Real Estate Securities | 5,779 | | 428 | | 1,331 | | (48) | | 943 | | 5,771 | | 331 | | 97 |
| Strategic Alternatives | 28,651 | | 2,676 | | 274 | | 3 | | 733 | | 31,789 | | 578 | | 120 |
| | $600,594 | | $105,700 | | $108,007 | | $6,845 | | $60,978 | | $666,110 | | $15,645 | | $6,699 |
| MyDestination 2025 | | | | | | | | | | | | | | | |
| Money Market | $15,958 | | $112,000 | | $104,766 | | $— | | $— | | $23,192 | | $482 | | $— |
| Low-Duration Bond | 50,703 | | 28,756 | | — | | — | | 799 | | 80,258 | | 1,657 | | — |
| Medium-Duration Bond | 299,142 | | 56,087 | | 13,367 | | (89) | | 16,800 | | 358,573 | | 9,209 | | 4,566 |
| Global Bond | 86,074 | | 17,515 | | 1,025 | | (39) | | 6,679 | | 109,204 | | 3,612 | | — |
| Defensive Market Strategies | 123,041 | | 18,131 | | 1,368 | | 104 | | 16,354 | | 156,262 | | 1,911 | | 6,662 |
| Equity Index | 287,215 | | 14,954 | | 37,783 | | 9,195 | | 70,416 | | 343,997 | | 5,579 | | 2,174 |
| Small Cap Equity | 26,073 | | 3,026 | | 307 | | (64) | | 5,513 | | 34,241 | | 40 | | 1,236 |
| International Equity Index | 160,147 | | 13,278 | | 9,000 | | 646 | | 28,078 | | 193,149 | | 5,679 | | — |
| Emerging Markets Equity | 45,929 | | 4,636 | | 1,000 | | (2) | | 8,118 | | 57,681 | | 1,462 | | — |
| Global Real Estate Securities | 13,664 | | 1,168 | | 1,117 | | (51) | | 2,173 | | 15,837 | | 902 | | 265 |
| Strategic Alternatives | 29,991 | | 6,074 | | 302 | | 3 | | 758 | | 36,524 | | 664 | | 138 |
| | $1,137,937 | | $275,625 | | $170,035 | | $9,703 | | $155,688 | | $1,408,918 | | $31,197 | | $15,041 |
| MyDestination 2035 | | | | | | | | | | | | | | | |
| Money Market | $15,961 | | $100,185 | | $92,955 | | $— | | $— | | $23,191 | | $389 | | $— |
| Medium-Duration Bond | 119,714 | | 44,864 | | 5,572 | | (76) | | 6,891 | | 165,821 | | 3,935 | | 2,070 |
| Global Bond | 28,323 | | 11,503 | | 662 | | (25) | | 2,311 | | 41,450 | | 1,299 | | — |
| Defensive Market Strategies | 39,779 | | 11,619 | | 892 | | 68 | | 5,300 | | 55,874 | | 654 | | 2,319 |
| Equity Index | 258,945 | | 25,387 | | 15,445 | | 3,669 | | 71,484 | | 344,040 | | 5,458 | | 2,159 |
| Small Cap Equity | 23,638 | | 6,297 | | 1,459 | | (284) | | 5,534 | | 33,726 | | 40 | | 1,217 |
| International Equity Index | 148,258 | | 23,229 | | 2,700 | | 122 | | 26,947 | | 195,856 | | 5,758 | | — |
| Emerging Markets Equity | 42,125 | | 8,435 | | 658 | | 1 | | 7,728 | | 57,631 | | 1,461 | | — |
| Global Real Estate Securities | 10,924 | | 2,529 | | 1,164 | | (29) | | 1,733 | | 13,993 | | 789 | | 228 |
| | $687,667 | | $234,048 | | $121,507 | | $3,446 | | $127,928 | | $931,582 | | $19,783 | | $7,993 |
| | Total Value
at
12/31/18 | | Purchases | | Sales Proceeds | | Net Realized
Gains/(Losses) | | Change in
Unrealized
Appreciation/
(Depreciation) | | Total Value
at
12/31/19 | | Dividend
Income | | Distributions
of Realized
Gains |
| MyDestination 2045 | | | | | | | | | | | | | | | |
| Money Market | $10,350 | | $75,272 | | $68,086 | | $— | | $— | | $17,536 | | $290 | | $— |
| Medium-Duration Bond | 43,484 | | 16,643 | | 5,283 | | (32) | | 2,470 | | 57,282 | | 1,372 | | 714 |
| Global Bond | 10,869 | | 3,261 | | 616 | | (16) | | 842 | | 14,340 | | 449 | | — |
| Defensive Market Strategies | 25,602 | | 6,679 | | 1,235 | | (9) | | 3,394 | | 34,431 | | 407 | | 1,423 |
| Equity Index | 227,554 | | 27,101 | | 10,385 | | 2,395 | | 64,000 | | 310,665 | | 4,887 | | 1,935 |
| Small Cap Equity | 21,162 | | 5,892 | | 957 | | (211) | | 4,802 | | 30,688 | | 36 | | 1,102 |
| International Equity Index | 131,106 | | 25,133 | | 3,583 | | 163 | | 23,834 | | 176,653 | | 5,131 | | — |
| Emerging Markets Equity | 37,403 | | 7,133 | | 1,557 | | 75 | | 6,763 | | 49,817 | | 1,280 | | — |
| Global Real Estate Securities | 9,536 | | 2,325 | | 971 | | (33) | | 1,481 | | 12,338 | | 696 | | 199 |
| | $517,066 | | $169,439 | | $92,673 | | $2,332 | | $107,586 | | $703,750 | | $14,548 | | $5,373 |
| MyDestination 2055 | | | | | | | | | | | | | | | |
| Money Market | $3,632 | | $51,226 | | $49,355 | | $— | | $— | | $5,503 | | $87 | | $— |
| Medium-Duration Bond | 8,270 | | 5,247 | | 1,943 | | 43 | | 439 | | 12,056 | | 281 | | 149 |
| Global Bond | 2,129 | | 1,104 | | 379 | | (3) | | 167 | | 3,018 | | 93 | | — |
| Defensive Market Strategies | 7,266 | | 3,554 | | 961 | | (11) | | 1,003 | | 10,851 | | 124 | | 443 |
| Equity Index | 68,222 | | 20,864 | | 7,853 | | 1,926 | | 18,523 | | 101,682 | | 1,543 | | 622 |
| Small Cap Equity | 6,448 | | 3,594 | | 1,448 | | 47 | | 1,403 | | 10,044 | | 12 | | 354 |
| International Equity Index | 38,702 | | 15,452 | | 3,671 | | 365 | | 6,971 | | 57,819 | | 1,685 | | — |
| Emerging Markets Equity | 11,022 | | 4,856 | | 1,693 | | 206 | | 1,915 | | 16,306 | | 414 | | — |
| Global Real Estate Securities | 2,739 | | 1,612 | | 733 | | 33 | | 379 | | 4,030 | | 226 | | 64 |
| | $148,430 | | $107,509 | | $68,036 | | $2,606 | | $30,800 | | $221,309 | | $4,465 | | $1,632 |
| Conservative Allocation | | | | | | | | | | | | | | | |
| Money Market | $5,148 | | $53,889 | | $51,529 | | $— | | $— | | $7,508 | | $150 | | $— |
| Low-Duration Bond | 238,265 | | 15,607 | | 4,191 | | (39) | | 3,506 | | 253,148 | | 6,108 | | — |
| Medium-Duration Bond | 65,251 | | 3,145 | | 4,312 | | (118) | | 3,572 | | 67,538 | | 1,857 | | 869 |
| Global Bond | 16,437 | | 683 | | 1,379 | | (60) | | 1,238 | | 16,919 | | 600 | | — |
| Defensive Market Strategies | 35,770 | | 2,587 | | 3,996 | | 399 | | 4,281 | | 39,041 | | 498 | | 1,706 |
| Value Equity | 27,727 | | 4,211 | | 5,401 | | (1,267) | | 5,047 | | 30,317 | | 538 | | 2,910 |
| Growth Equity | 27,943 | | 3,595 | | 7,268 | | (138) | | 6,255 | | 30,387 | | 30 | | 2,866 |
| Small Cap Equity | 4,874 | | 460 | | 380 | | (69) | | 1,083 | | 5,968 | | 7 | | 223 |
| International Equity | 31,119 | | 2,744 | | 4,642 | | (663) | | 6,049 | | 34,607 | | 763 | | 983 |
| Emerging Markets Equity | 8,964 | | 1,053 | | 1,765 | | 22 | | 1,537 | | 9,811 | | 268 | | — |
| Global Real Estate Securities | 6,156 | | 478 | | 1,228 | | (64) | | 1,000 | | 6,342 | | 362 | | 106 |
| Strategic Alternatives | 25,384 | | 1,131 | | 1,228 | | 6 | | 652 | | 25,945 | | 465 | | 96 |
| | $493,038 | | $89,583 | | $87,319 | | $(1,991) | | $34,220 | | $527,531 | | $11,646 | | $9,759 |
| | Total Value
at
12/31/18 | | Purchases | | Sales Proceeds | | Net Realized
Gains/(Losses) | | Change in
Unrealized
Appreciation/
(Depreciation) | | Total Value
at
12/31/19 | | Dividend
Income | | Distributions
of Realized
Gains |
| Balanced Allocation | | | | | | | | | | | | | | | |
| Money Market | $25,803 | | $119,020 | | $112,270 | | $— | | $— | | $32,553 | | $650 | | $— |
| Low-Duration Bond | 94,385 | | 7,603 | | 2,427 | | (15) | | 1,392 | | 100,938 | | 2,431 | | — |
| Medium-Duration Bond | 349,379 | | 26,959 | | 21,913 | | (153) | | 19,229 | | 373,501 | | 10,174 | | 4,785 |
| Extended-Duration Bond | 61,768 | | 7,511 | | 7,225 | | (727) | | 6,382 | | 67,709 | | 1,861 | | 833 |
| Global Bond | 127,339 | | 8,530 | | 8,025 | | (234) | | 9,594 | | 137,204 | | 4,730 | | — |
| Defensive Market Strategies | 149,057 | | 9,275 | | 11,470 | | 1,100 | | 18,359 | | 166,321 | | 2,097 | | 7,178 |
| Value Equity | 154,535 | | 22,575 | | 24,706 | | (5,857) | | 26,791 | | 173,338 | | 3,054 | | 16,270 |
| Growth Equity | 156,698 | | 25,153 | | 37,865 | | (1,402) | | 35,800 | | 178,384 | | 171 | | 16,632 |
| Small Cap Equity | 27,916 | | 3,483 | | 2,620 | | (478) | | 6,365 | | 34,666 | | 42 | | 1,287 |
| International Equity | 174,342 | | 16,193 | | 22,348 | | (3,328) | | 33,576 | | 198,435 | | 4,368 | | 5,495 |
| Emerging Markets Equity | 46,256 | | 5,714 | | 2,800 | | 31 | | 8,141 | | 57,342 | | 1,454 | | — |
| Global Real Estate Securities | 31,879 | | 3,045 | | 6,848 | | (240) | | 5,153 | | 32,989 | | 1,892 | | 553 |
| Strategic Alternatives | 60,704 | | 1,350 | | 2,132 | | (1) | | 1,569 | | 61,490 | | 1,118 | | 231 |
| | $1,460,061 | | $256,411 | | $262,649 | | $(11,304) | | $172,351 | | $1,614,870 | | $34,042 | | $53,264 |
| Growth Allocation | | | | | | | | | | | | | | | |
| Money Market | $18,201 | | $106,531 | | $100,626 | | $— | | $— | | $24,106 | | $524 | | $— |
| Low-Duration Bond | 31,837 | | 3,501 | | 1,000 | | 1 | | 473 | | 34,812 | | 837 | | — |
| Medium-Duration Bond | 120,582 | | 13,317 | | 13,400 | | (79) | | 6,612 | | 127,032 | | 3,470 | | 1,645 |
| Extended-Duration Bond | 20,717 | | 2,921 | | 2,520 | | (283) | | 2,192 | | 23,027 | | 632 | | 287 |
| Global Bond | 42,864 | | 3,120 | | 2,864 | | (58) | | 3,241 | | 46,303 | | 1,621 | | — |
| Defensive Market Strategies | 50,494 | | 3,175 | | 3,034 | | (4) | | 6,611 | | 57,242 | | 719 | | 2,457 |
| Value Equity | 204,933 | | 28,833 | | 25,944 | | (5,625) | | 33,605 | | 235,802 | | 4,101 | | 21,632 |
| Growth Equity | 207,087 | | 24,100 | | 39,189 | | (1,556) | | 46,907 | | 237,349 | | 228 | | 21,873 |
| Small Cap Equity | 38,361 | | 4,384 | | 4,269 | | (783) | | 8,849 | | 46,542 | | 55 | | 1,679 |
| International Equity | 233,648 | | 20,209 | | 23,512 | | (3,569) | | 43,980 | | 270,756 | | 5,961 | | 7,460 |
| Emerging Markets Equity | 63,802 | | 5,001 | | 2,963 | | 68 | | 11,071 | | 76,979 | | 1,951 | | — |
| Global Real Estate Securities | 36,475 | | 3,779 | | 8,045 | | (525) | | 5,889 | | 37,573 | | 2,148 | | 630 |
| Strategic Alternatives | 28,127 | | 1,221 | | 1,150 | | (2) | | 741 | | 28,937 | | 526 | | 109 |
| | $1,097,128 | | $220,092 | | $228,516 | | $(12,415) | | $170,171 | | $1,246,460 | | $22,773 | | $57,772 |
| Aggressive Allocation | | | | | | | | | | | | | | | |
| Money Market | $18,449 | | $81,320 | | $80,840 | | $— | | $— | | $18,929 | | $404 | | $— |
| Value Equity | 243,737 | | 33,304 | | 22,301 | | (5,067) | | 37,991 | | 287,664 | | 5,014 | | 26,390 |
| Growth Equity | 247,815 | | 33,178 | | 42,452 | | (1,535) | | 55,978 | | 292,984 | | 280 | | 26,867 |
| Small Cap Equity | 48,708 | | 3,140 | | 4,259 | | (1,057) | | 10,908 | | 57,440 | | 68 | | 2,073 |
| International Equity | 273,047 | | 22,300 | | 14,740 | | (2,090) | | 49,781 | | 328,298 | | 7,227 | | 9,072 |
| Emerging Markets Equity | 77,058 | | 6,150 | | 2,337 | | (12) | | 13,313 | | 94,172 | | 2,388 | | — |
| | $908,814 | | $179,392 | | $166,929 | | $(9,761) | | $167,971 | | $1,079,487 | | $15,381 | | $64,402 |
| Low-Duration Bond | | | | | | | | | | | | | | | |
| Money Market | $8,110 | | $416,864 | | $403,702 | | $— | | $— | | $21,272 | | $579 | | $— |
| Medium-Duration Bond | | | | | | | | | | | | | | | |
| Money Market | $28,981 | | $786,108 | | $758,692 | | $— | | $— | | $56,397 | | $2,083 | | $— |
| | Total Value
at
12/31/18 | | Purchases | | Sales Proceeds | | Net Realized
Gains/(Losses) | | Change in
Unrealized
Appreciation/
(Depreciation) | | Total Value
at
12/31/19 | | Dividend
Income | | Distributions
of Realized
Gains |
| Extended-Duration Bond | | | | | | | | | | | | | | | |
| Money Market | $4,270 | | $81,978 | | $78,439 | | $— | | $— | | $7,809 | | $170 | | $— |
| Global Bond | | | | | | | | | | | | | | | |
| Money Market | $30,916 | | $284,386 | | $286,537 | | $— | | $— | | $28,765 | | $918 | | $— |
| Defensive Market Strategies | | | | | | | | | | | | | | | |
| Money Market | $31,395 | | $394,247 | | $357,347 | | $— | | $— | | $68,295 | | $1,424 | | $— |
| Equity Index | | | | | | | | | | | | | | | |
| Money Market | $83,664 | | $320,814 | | $350,594 | | $— | | $— | | $53,884 | | $1,162 | | $— |
| Value Equity | | | | | | | | | | | | | | | |
| Money Market | $45,945 | | $526,772 | | $543,872 | | $— | | $— | | $28,845 | | $648 | | $— |
| Growth Equity | | | | | | | | | | | | | | | |
| Money Market | $56,037 | | $523,268 | | $526,775 | | $— | | $— | | $52,530 | | $1,169 | | $— |
| Small Cap Equity | | | | | | | | | | | | | | | |
| Money Market | $16,995 | | $237,209 | | $239,309 | | $— | | $— | | $14,895 | | $471 | | $— |
| International Equity Index | | | | | | | | | | | | | | | |
| Money Market | $25,574 | | $171,449 | | $166,253 | | $— | | $— | | $30,770 | | $607 | | $— |
| International Equity | | | | | | | | | | | | | | | |
| Money Market | $60,810 | | $357,401 | | $362,153 | | $— | | $— | | $56,058 | | $1,229 | | $— |
| Emerging Markets Equity | | | | | | | | | | | | | | | |
| Money Market | $15,609 | | $160,706 | | $161,346 | | $— | | $— | | $14,969 | | $421 | | $— |
| Global Real Estate Securities | | | | | | | | | | | | | | | |
| Money Market | $4,154 | | $85,497 | | $82,590 | | $— | | $— | | $7,061 | | $154 | | $— |
| Strategic Alternatives | | | | | | | | | | | | | | | |
| Money Market | $10,994 | | $285,209 | | $248,049 | | $— | | $— | | $48,154 | | $534 | | $— |
4. SECURITIES LENDING
Through an agreement with Northern Trust (the Funds’ custodian) the Select Funds may lend portfolio securities to certain brokers, dealers and other financial institutions that pay the Select Funds a negotiated fee. When loaning securities, the Select Funds retain the benefits of owning the securities, including the economic equivalent of dividends or interest generated by the security. The Select Funds also have the ability to terminate the loans at any time and can do so in order to vote proxies or sell the securities. The Select Funds receive cash or U.S. government securities, such as U.S. Treasury Bills and U.S. Treasury Notes, as collateral against the loaned securities in an amount at least equal to the market value of the loaned securities. The adequacy of the collateral is monitored on a daily basis and the market value of the securities loaned is determined at the close of each business day. However, in the event of default or bankruptcy by the other party to the agreement, realization and/or retention of the collateral may be subject to legal proceedings. Cash collateral has been invested in a short-term government money market fund managed by an affiliate of Northern Trust, which invests 99.5% or more of its total assets in U.S. government securities. This investment is presented on the Funds’ Schedules of Investments. The Funds do not have control of non-cash securities lending collateral, as such, this amount is not presented on the Funds’ Schedules of Investments.
Securities lending transactions are entered into by the Funds under a Securities Lending Authorization Agreement which permits the Funds, under certain circumstances including an event of default (such as bankruptcy or insolvency), to offset amounts payable by the Fund to the same counterparty against amounts to be received and create one single net payment due to or from the Fund. Securities lending transactions pose certain risks to the Funds. There is a risk that a borrower may default on its obligations to return loaned securities. A Fund will be responsible for the risks associated with the investment of cash collateral, including any collateral invested in an unaffiliated or affiliated money market fund. A Fund may lose money on its investment of cash collateral or may fail to earn sufficient income on its investment to meet obligations to the borrower. In addition, delays may occur in the recovery of securities from borrowers, which could interfere with a Fund’s ability to vote proxies or to settle transactions.
At December 31, 2019, the market values of loaned securities and collateral received were as follows:
| Fund | | Value of
Securities Loaned | | Value of
Non-cash
Collateral | | Value of
Cash
Collateral | | Total
Value of
Collateral * |
| Low-Duration Bond | | $66,802,675 | | $12,747,091 | | $55,958,919 | | $68,706,010 |
| Medium-Duration Bond | | 30,778,152 | | 11,821,310 | | 20,002,584 | | 31,823,894 |
| Extended-Duration Bond | | 32,274,377 | | 7,106,622 | | 26,030,692 | | 33,137,314 |
| Global Bond | | 45,404,474 | | 7,984,024 | | 39,008,103 | | 46,992,127 |
| Defensive Market Strategies | | 28,866,008 | | 14,427,331 | | 15,051,560 | | 29,478,891 |
| Equity Index | | 62,105,161 | | 59,966,350 | | 3,543,423 | | 63,509,773 |
| Value Equity | | 18,773,934 | | 18,153,514 | | 993,789 | | 19,147,303 |
| Growth Equity | | 123,220,330 | | 112,445,068 | | 13,382,687 | | 125,827,755 |
| Small Cap Equity | | 65,077,582 | | 53,417,191 | | 13,044,167 | | 66,461,358 |
| International Equity Index | | 14,802,477 | | 14,220,656 | | 1,670,877 | | 15,891,533 |
| International Equity | | 15,991,103 | | 12,159,436 | | 4,448,350 | | 16,607,786 |
| Emerging Markets Equity | | 6,851,796 | | 6,116,778 | | 880,827 | | 6,997,605 |
| Global Real Estate Securities | | 745,279 | | 519,230 | | 255,671 | | 774,901 |
*As of the end of the reporting period, the value of the collateral pledged from the counterparty exceeded the value of the securities out on loan resulting in a net amount of $0. Refer to the Fund’s Schedule of Investments for details on the securities out on loan. Additional information about master netting arrangements can be found in the Repurchase Agreements and Derivative Financial Instruments sections of the Notes to Financial Statements.
The Funds’ securities lending transactions are accounted for as secured borrowings and have an overnight and continuous contractual maturity. The gross amounts of recognized liabilities for securities lending transactions outstanding as of December 31, 2019 are disclosed as “Collateral held for securities on loan, at value” on the Statements of Assets and Liabilities, where applicable.
5. INVESTMENT TRANSACTIONS
For the year ended December 31, 2019, the cost of purchases and proceeds from sales and maturities for each Fund were as follows:
| | | Cost of Purchases and
Proceeds from Sales and Maturities
of Long-Term Securities
(other than U.S. Government Obligations) | | Cost of Purchases and
Proceeds from Sales and Maturities
of Long-Term U.S Government Obligations |
| Fund | | Purchases | | Sale and Maturity
Proceeds | | Purchases | | Sale and Maturity
Proceeds |
| MyDestination 2015 | | $47,037,632 | | $49,771,215 | | $— | | $— |
| MyDestination 2025 | | 163,624,860 | | 65,268,605 | | — | | — |
| MyDestination 2035 | | 133,863,963 | | 28,552,443 | | — | | — |
| MyDestination 2045 | | 94,166,985 | | 24,586,788 | | — | | — |
| MyDestination 2055 | | 56,283,736 | | 18,611,720 | | — | | — |
| Conservative Allocation | | 35,695,884 | | 35,790,617 | | — | | — |
| Balanced Allocation | | 137,391,470 | | 150,379,570 | | — | | — |
| Growth Allocation | | 113,560,655 | | 127,889,283 | | — | | — |
| Aggressive Allocation | | 98,072,834 | | 86,089,365 | | — | | — |
| Money Market | | — | | — | | — | | — |
| Low-Duration Bond | | 406,260,036 | | 356,807,839 | | 4,758,552,278 | | 4,674,659,745 |
| Medium-Duration Bond | | 385,427,133 | | 278,540,457 | | 7,455,718,056 | | 7,415,773,234 |
| Extended-Duration Bond | | 29,255,045 | | 23,358,044 | | 74,244,727 | | 66,461,056 |
| Global Bond | | 220,853,526 | | 239,088,982 | | 95,938,216 | | 46,110,518 |
| Defensive Market Strategies | | 496,482,626 | | 473,045,120 | | — | | — |
| Equity Index | | 143,559,939 | | 30,370,864 | | — | | — |
| Value Equity | | 1,025,375,525 | | 1,082,363,494 | | — | | — |
| Growth Equity | | 324,852,955 | | 458,654,488 | | — | | — |
| Small Cap Equity | | 450,929,755 | | 459,424,512 | | — | | — |
| International Equity Index | | 93,122,852 | | 29,144,463 | | — | | — |
| International Equity | | 677,857,857 | | 677,192,919 | | — | | — |
| Emerging Markets Equity | | 441,912,065 | | 403,845,258 | | — | | — |
| Global Real Estate Securities | | 279,517,966 | | 279,693,166 | | — | | — |
| Strategic Alternatives | | 800,397,054 | | 788,079,575 | | 57,038,273 | | 52,330,576 |
6. CAPITAL SHARE TRANSACTIONS
Transactions in shares of capital stock were as follows:
| Year Ended 12/31/19 | | Year Ended 12/31/18 | |
| Fund | | Institutional
Class | | Investor
Class | | Institutional
Class | | Investor
Class |
| MyDestination 2015 | | | | | | | | |
| Shares sold | | 5,158,213 | | 4,844,500 | | 1,592,802 | | 7,664,541 |
| Shares reinvested | | 559,684 | | 1,952,980 | | 691,890 | | 3,169,737 |
| Shares redeemed | | (3,068,691) | | (9,086,967) | | (1,692,956) | | (8,305,598) |
| Net increase (decrease) | | 2,649,206 | | (2,289,487) | | 591,736 | | 2,528,680 |
| Year Ended 12/31/19 | | Year Ended 12/31/18 | |
| Fund | | Institutional
Class | | Investor
Class | | Institutional
Class | | Investor
Class |
| MyDestination 2025 | | | | | | | | |
| Shares sold | | 10,994,862 | | 10,950,754 | | 5,435,507 | | 11,013,083 |
| Shares reinvested | | 1,334,327 | | 3,668,881 | | 1,750,073 | | 5,958,892 |
| Shares redeemed | | (4,977,012) | | (11,030,457) | | (1,496,924) | | (5,621,517) |
| Net increase (decrease) | | 7,352,177 | | 3,589,178 | | 5,688,656 | | 11,350,458 |
| MyDestination 2035 | | | | | | | | |
| Shares sold | | 8,627,301 | | 9,078,117 | | 4,259,575 | | 7,435,946 |
| Shares reinvested | | 915,016 | | 2,121,864 | | 1,389,913 | | 3,995,826 |
| Shares redeemed | | (3,590,511) | | (5,865,794) | | (893,295) | | (2,044,306) |
| Net increase (decrease) | | 5,951,806 | | 5,334,187 | | 4,756,193 | | 9,387,466 |
| MyDestination 2045 | | | | | | | | |
| Shares sold | | 6,343,932 | | 6,961,249 | | 3,644,133 | | 5,819,518 |
| Shares reinvested | | 810,936 | | 1,540,878 | | 1,471,382 | | 3,176,096 |
| Shares redeemed | | (3,384,656) | | (4,302,572) | | (694,206) | | (1,337,921) |
| Net increase (decrease) | | 3,770,212 | | 4,199,555 | | 4,421,309 | | 7,657,693 |
| MyDestination 2055 | | | | | | | | |
| Shares sold | | 2,254,239 | | 2,980,112 | | 1,735,905 | | 2,251,547 |
| Shares reinvested | | 231,456 | | 410,459 | | 349,702 | | 593,894 |
| Shares redeemed | | (1,614,674) | | (1,187,683) | | (190,603) | | (421,124) |
| Net increase (decrease) | | 871,021 | | 2,202,888 | | 1,895,004 | | 2,424,317 |
| Conservative Allocation | | | | | | | | |
| Shares sold | | 2,236,774 | | 4,113,153 | | 1,397,312 | | 3,933,200 |
| Shares reinvested | | 436,752 | | 1,552,451 | | 272,742 | | 1,183,139 |
| Shares redeemed | | (1,024,764) | | (6,872,227) | | (1,084,008) | | (5,097,960) |
| Net increase (decrease) | | 1,648,762 | | (1,206,623) | | 586,046 | | 18,379 |
| Balanced Allocation | | | | | | | | |
| Shares sold | | 6,029,393 | | 4,653,123 | | 1,247,657 | | 3,732,737 |
| Shares reinvested | | 1,971,376 | | 6,248,266 | | 1,212,231 | | 4,504,896 |
| Shares redeemed | | (3,789,186) | | (14,563,358) | | (3,145,614) | | (8,296,634) |
| Net increase (decrease) | | 4,211,583 | | (3,661,969) | | (685,726) | | (59,001) |
| Growth Allocation | | | | | | | | |
| Shares sold | | 3,334,747 | | 3,143,548 | | 584,203 | | 2,640,443 |
| Shares reinvested | | 2,260,314 | | 6,601,445 | | 966,710 | | 3,155,813 |
| Shares redeemed | | (2,451,859) | | (11,164,910) | | (1,781,797) | | (6,724,880) |
| Net increase (decrease) | | 3,143,202 | | (1,419,917) | | (230,884) | | (928,624) |
| Aggressive Allocation | | | | | | | | |
| Shares sold | | 3,720,629 | | 2,481,588 | | 472,057 | | 2,132,753 |
| Shares reinvested | | 2,225,911 | | 7,719,037 | | 638,095 | | 2,666,545 |
| Shares redeemed | | (1,717,716) | | (10,063,469) | | (1,333,609) | | (5,264,693) |
| Net increase (decrease) | | 4,228,824 | | 137,156 | | (223,457) | | (465,395) |
| Year Ended 12/31/19 | | Year Ended 12/31/18 | |
| Fund | | Institutional
Class | | Investor
Class | | Institutional
Class | | Investor
Class |
| Money Market | | | | | | | | |
| Shares sold | | 4,301,371,523 | | 372,222,653 | | 1,748,822,489 | | 4,746,224,687 |
| Shares reinvested | | 4,362,064 | | 7,235,378 | | 2,208,187 | | 5,445,866 |
| Shares redeemed | | (4,243,079,202) | | (395,729,389) | | (1,178,447,349) | | (5,238,005,118) |
| Net increase (decrease) | | 62,654,385 | | (16,271,358) | | 572,583,327 | | (486,334,565) |
| Low-Duration Bond | | | | | | | | |
| Shares sold | | 12,551,013 | | 2,530,141 | | 7,598,064 | | 2,461,282 |
| Shares reinvested | | 1,315,187 | | 408,076 | | 1,120,581 | | 496,739 |
| Shares redeemed | | (2,665,469) | | (8,680,164) | | (7,437,019) | | (3,068,194) |
| Net increase (decrease) | | 11,200,731 | | (5,741,947) | | 1,281,626 | | (110,173) |
| Medium-Duration Bond | | | | | | | | |
| Shares sold | | 13,540,278 | | 4,682,843 | | 16,940,380 | | 3,332,425 |
| Shares reinvested | | 3,796,051 | | 738,258 | | 2,434,579 | | 461,492 |
| Shares redeemed | | (6,207,432) | | (3,889,971) | | (9,644,859) | | (3,137,711) |
| Net increase (decrease) | | 11,128,897 | | 1,531,130 | | 9,730,100 | | 656,206 |
| Extended-Duration Bond | | | | | | | | |
| Shares sold | | 1,144,874 | | 2,164,773 | | 449,708 | | 796,153 |
| Shares reinvested | | 273,186 | | 268,885 | | 270,425 | | 237,241 |
| Shares redeemed | | (869,183) | | (2,073,902) | | (1,081,183) | | (1,297,143) |
| Net increase (decrease) | | 548,877 | | 359,756 | | (361,050) | | (263,749) |
| Global Bond | | | | | | | | |
| Shares sold | | 7,165,911 | | 3,993,143 | | 7,558,859 | | 2,522,405 |
| Shares reinvested | | 1,668,672 | | 370,923 | | 1,386,648 | | 379,119 |
| Shares redeemed | | (4,101,504) | | (4,325,191) | | (5,259,775) | | (2,836,189) |
| Net increase (decrease) | | 4,733,079 | | 38,875 | | 3,685,732 | | 65,335 |
| Defensive Market Strategies | | | | | | | | |
| Shares sold | | 5,887,780 | | 10,224,002 | | 8,509,401 | | 7,339,280 |
| Shares reinvested | | 3,346,366 | | 1,808,567 | | 3,377,339 | | 1,751,027 |
| Shares redeemed | | (4,354,794) | | (8,025,323) | | (3,671,181) | | (6,948,280) |
| Net increase (decrease) | | 4,879,352 | | 4,007,246 | | 8,215,559 | | 2,142,027 |
| Equity Index | | | | | | | | |
| Shares sold | | 5,273,559 | | 2,798,001 | | 26,415,319 | | 2,666,638 |
| Shares reinvested | | 950,842 | | 376,640 | | 635,988 | | 329,987 |
| Shares redeemed | | (4,085,318) | | (3,070,984) | | (3,267,111) | | (2,013,706) |
| Net increase (decrease) | | 2,139,083 | | 103,657 | | 23,784,196 | | 982,919 |
| Value Equity | | | | | | | | |
| Shares sold | | 1,776,842 | | 1,533,095 | | 2,427,541 | | 1,334,212 |
| Shares reinvested | | 4,805,181 | | 2,153,966 | | 7,299,082 | | 3,388,630 |
| Shares redeemed | | (4,726,326) | | (3,533,365) | | (17,432,247) | | (2,197,442) |
| Net increase (decrease) | | 1,855,697 | | 153,696 | | (7,705,624) | | 2,525,400 |
| Year Ended 12/31/19 | | Year Ended 12/31/18 | |
| Fund | | Institutional
Class | | Investor
Class | | Institutional
Class | | Investor
Class |
| Growth Equity | | | | | | | | |
| Shares sold | | 2,648,920 | | 2,755,516 | | 2,611,117 | | 3,989,703 |
| Shares reinvested | | 3,361,800 | | 2,756,872 | | 5,525,364 | | 4,664,964 |
| Shares redeemed | | (6,050,380) | | (5,306,239) | | (18,178,641) | | (2,790,036) |
| Net increase (decrease) | | (39,660) | | 206,149 | | (10,042,160) | | 5,864,631 |
| Small Cap Equity | | | | | | | | |
| Shares sold | | 2,806,216 | | 1,842,795 | | 1,854,040 | | 2,279,150 |
| Shares reinvested | | 813,704 | | 611,340 | | 3,707,989 | | 3,486,885 |
| Shares redeemed | | (1,738,011) | | (3,764,720) | | (1,926,065) | | (2,234,624) |
| Net increase (decrease) | | 1,881,909 | | (1,310,585) | | 3,635,964 | | 3,531,411 |
| International Equity Index | | | | | | | | |
| Shares sold | | 7,423,012 | | | | 41,656,032 | | |
| Shares reinvested | | 1,904,082 | | | | 856,762 | | |
| Shares redeemed | | (2,703,988) | | | | (973,357) | | |
| Net increase (decrease) | | 6,623,106 | | | | 41,539,437 | | |
| International Equity | | | | | | | | |
| Shares sold | | 4,636,440 | | 3,794,260 | | 7,425,117 | | 2,175,172 |
| Shares reinvested | | 3,415,346 | | 1,187,097 | | 8,296,428 | | 2,899,478 |
| Shares redeemed | | (5,939,356) | | (3,802,408) | | (29,345,787) | | (2,778,019) |
| Net increase (decrease) | | 2,112,430 | | 1,178,949 | | (13,624,242) | | 2,296,631 |
| Emerging Markets Equity | | | | | | | | |
| Shares sold | | 4,547,780 | | 2,102,847 | | 7,175,778 | | 4,062,973 |
| Shares reinvested | | 1,150,802 | | 160,273 | | 290,286 | | 22,294 |
| Shares redeemed | | (2,152,678) | | (2,318,633) | | (2,936,797) | | (5,166,585) |
| Net increase (decrease) | | 3,545,904 | | (55,513) | | 4,529,267 | | (1,081,318) |
| Global Real Estate Securities | | | | | | | | |
| Shares sold | | 2,054,553 | | 2,974,207 | | 1,352,089 | | 1,058,826 |
| Shares reinvested | | 1,142,558 | | 726,106 | | 656,128 | | 386,397 |
| Shares redeemed | | (2,674,346) | | (2,791,652) | | (713,302) | | (2,238,944) |
| Net increase (decrease) | | 522,765 | | 908,661 | | 1,294,915 | | (793,721) |
| Strategic Alternatives | | | | | | | | |
| Shares sold | | 3,452,292 | | 1,225,099 | | 3,454,216 | | 2,383,652 |
| Shares reinvested | | 716,595 | | 105,265 | | 694,201 | | 124,486 |
| Shares redeemed | | (4,070,510) | | (2,549,140) | | (1,713,511) | | (1,568,326) |
| Net increase (decrease) | | 98,377 | | (1,218,776) | | 2,434,906 | | 939,812 |
7. BANK BORROWINGS
On November 23, 2016, the Funds entered into a Line of Credit Agreement with Northern Trust. The terms of the credit agreement permitted the Funds to borrow cash from Northern Trust up to a limit of $50 million, collectively. Each Fund was individually, and not jointly, liable for its particular advances, if any, under the line of credit. Interest was charged to each Fund
based on its borrowings at a rate equal to the greater of the Federal Funds Rate plus 1.00% or 1.50%. Each Fund also paid a facility fee equal to its pro rata share of the amount of the credit facility, based on average net assets, at a rate of 0.20% per annum.
On November 20, 2019, the Funds renewed their Line of Credit Agreement with Northern Trust. The terms of the credit agreement are the same as those above, and the agreement will expire on November 18, 2020.
No Funds borrowed for the year ended December 31, 2019, and there were no outstanding loans at December 31, 2019.
8. FEDERAL INCOME TAXES
Each Fund has elected to be treated as and intends to qualify as a regulated investment company each year by complying with all sections of the Internal Revenue Code of 1986, as amended, that apply to regulated investment companies and to distribute substantially all of its taxable income and capital gains to shareholders. No provision for income or excise taxes is thus required. Each Fund is treated as a separate entity for federal income tax purposes.
The Funds may be subject to taxes imposed by countries in which they invest in issuers existing or operating in such countries. Such taxes are generally based on income earned. The Funds accrue such taxes when the related income is earned. Gains realized by the Funds on the sale of securities in certain countries are subject to non-U.S. taxes. The Funds record a liability based on unrealized gains to provide for potential non-U.S. taxes payable upon the sale of these securities.
Management has analyzed the Funds’ tax positions and has concluded that no provision for income tax is required in the Funds’ financial statements except as noted above. The Funds are not aware of any tax positions for which it is reasonably possible that the total amounts of unrecognized tax benefits will significantly change in the next twelve months. However, management’s conclusions may be subject to review and adjustment at a later date based on factors including, but not limited to new tax laws, regulations and administrative interpretations (including court decisions). Each of the Funds’ federal tax returns for the prior three fiscal years and the current year (year ended December 31, 2016 through year ended December 31, 2019) remains subject to examination by the Internal Revenue Service. In regard to foreign taxes only, certain Funds have open tax years in certain foreign countries they invest in that may date back to the inception of the Funds.
The character of distributions made during the year from net investment income or net realized gains may differ from their ultimate characterization for federal income tax purposes. Also, due to the timing of dividend distributions, the fiscal year in which amounts are distributed may differ from the year that the income or realized gains (losses) were recorded by the Funds. Income dividends and capital gain distributions are determined in accordance with federal income tax regulations, which may differ from U.S. GAAP. These differences are primarily due to differing treatments for futures and options transactions, foreign currency transactions, paydowns, losses deferred due to wash sales, straddles and investments in Passive Foreign Investment Companies (“PFIC’s”). Distributions during the years ended December 31, 2019 and December 31, 2018, were characterized as follows for tax purposes:
| Fund | | Year | | Ordinary
Income | | Long-Term
Capital Gain | | Return
of Capital | | Total
Distribution |
| MyDestination 2015 | | 2019 | | $16,670,062 | | $9,643,245 | | $— | | $26,313,307 |
| 2018 | | 22,803,959 | | 14,085,921 | | — | | 36,889,880 |
| MyDestination 2025 | | 2019 | | 33,763,974 | | 18,708,958 | | — | | 52,472,932 |
| 2018 | | 33,986,791 | | 38,055,961 | | — | | 72,042,752 |
| MyDestination 2035 | | 2019 | | 20,667,946 | | 10,532,737 | | — | | 31,200,683 |
| 2018 | | 22,165,480 | | 25,579,129 | | — | | 47,744,609 |
| Fund | | Year | | Ordinary
Income | | Long-Term
Capital Gain | | Return
of Capital | | Total
Distribution |
| MyDestination 2045 | | 2019 | | $14,714,829 | | $8,586,521 | | $— | | $23,301,350 |
| 2018 | | 15,798,135 | | 23,490,194 | | — | | 39,288,329 |
| MyDestination 2055 | | 2019 | | 4,672,156 | | 4,193,333 | | — | | 8,865,489 |
| 2018 | | 4,222,783 | | 6,934,772 | | — | | 11,157,555 |
| Conservative Allocation | | 2019 | | 10,900,966 | | 12,236,121 | | — | | 23,137,087 |
| 2018 | | 15,397,717 | | 437,488 | | — | | 15,835,205 |
| Balanced Allocation | | 2019 | | 34,502,761 | | 66,794,786 | | — | | 101,297,547 |
| 2018 | | 59,404,751 | | 3,908,455 | | — | | 63,313,206 |
| Growth Allocation | | 2019 | | 19,999,040 | | 89,559,476 | | — | | 109,558,516 |
| 2018 | | 41,898,996 | | 3,525,774 | | — | | 45,424,770 |
| Aggressive Allocation | | 2019 | | 11,003,181 | | 107,448,362 | | — | | 118,451,543 |
| 2018 | | 31,324,625 | | 3,691,707 | | — | | 35,016,332 |
| Money Market | | 2019 | | 27,768,702 | | — | | — | | 27,768,702 |
| 2018 | | 18,097,193 | | — | | — | | 18,097,193 |
| Low-Duration Bond | | 2019 | | 23,248,543 | | — | | — | | 23,248,543 |
| 2018 | | 21,597,150 | | — | | — | | 21,597,150 |
| Medium-Duration Bond | | 2019 | | 59,270,742 | | 8,895,418 | | — | | 68,166,160 |
| 2018 | | 41,568,447 | | — | | — | | 41,568,447 |
| Extended-Duration Bond | | 2019 | | 7,545,607 | | 2,246,414 | | — | | 9,792,021 |
| 2018 | | 6,878,837 | | 1,763,567 | | — | | 8,642,404 |
| Global Bond | | 2019 | | 20,221,476 | | — | | — | | 20,221,476 |
| 2018 | | 17,233,962 | | — | | — | | 17,233,962 |
| Defensive Market Strategies | | 2019 | | 29,152,022 | | 39,137,230 | | — | | 68,289,252 |
| 2018 | | 23,181,404 | | 39,872,400 | | — | | 63,053,804 |
| Equity Index | | 2019 | | 36,174,047 | | 9,614,945 | | — | | 45,788,992 |
| 2018 | | 21,300,972 | | 6,035,838 | | — | | 27,336,810 |
| Value Equity | | 2019 | | 20,124,546 | | 112,001,078 | | — | | 132,125,624 |
| 2018 | | 38,627,518 | | 153,636,772 | | — | | 192,264,290 |
| Growth Equity | | 2019 | | 5,232,310 | | 151,896,069 | | — | | 157,128,379 |
| 2018 | | 5,401,351 | | 221,388,439 | | — | | 226,789,790 |
| Small Cap Equity | | 2019 | | 746,585 | | 21,320,019 | | — | | 22,066,604 |
| 2018 | | 16,705,821 | | 80,730,527 | | — | | 97,436,348 |
| International Equity Index | | 2019 | | 20,799,847 | | — | | — | | 20,799,847 |
| 2018 | | 7,738,165 | | — | | — | | 7,738,165 |
| International Equity | | 2019 | | 28,005,024 | | 36,195,026 | | — | | 64,200,050 |
| 2018 | | 27,909,942 | | 107,935,276 | | — | | 135,845,218 |
| Emerging Markets Equity | | 2019 | | 13,250,595 | | — | | — | | 13,250,595 |
| 2018 | | 2,656,034 | | — | | — | | 2,656,034 |
| Global Real Estate Securities | | 2019 | | 19,123,112 | | — | | — | | 19,123,112 |
| 2018 | | 9,704,770 | | — | | — | | 9,704,770 |
| Strategic Alternatives | | 2019 | | 6,848,636 | | 1,494,225 | | — | | 8,342,861 |
| 2018 | | 7,693,005 | | 367,373 | | — | | 8,060,378 |
At December 31, 2019, the components of distributable earnings on a tax basis were as follows:
| Fund | | Undistributed
Ordinary
Income | | Undistributed
Long-Term
Capital Gain/ (Capital
Loss
Carryforward) | | Qualified
Late Year
Losses | | Net Unrealized
Appreciation
Depreciation |
| MyDestination 2015 | | $197,110 | | $6,052,434 | | $— | | $28,492,581 |
| MyDestination 2025 | | 516,652 | | 10,983,516 | | — | | 78,826,976 |
| MyDestination 2035 | | 446,256 | | 5,652,789 | | — | | 67,422,830 |
| MyDestination 2045 | | 373,477 | | 3,968,517 | | — | | 57,722,245 |
| MyDestination 2055 | | 181,517 | | 1,318,807 | | — | | 15,293,288 |
| Conservative Allocation | | 391,964 | | 7,759,497 | | — | | 2,382,374 |
| Balanced Allocation | | 2,582,277 | | 41,308,540 | | — | | (7,952,832) |
| Growth Allocation | | 3,670,726 | | 46,298,051 | | — | | (33,363,339) |
| Aggressive Allocation | | 3,405,012 | | 56,670,525 | | — | | (48,138,159) |
| Money Market | | 27,605 | | — | | — | | — |
| Low-Duration Bond | | 574,297 | | (11,833,764) | | — | | 5,018,412 |
| Medium-Duration Bond | | 965,559 | | — | | (15,200,232) | | 49,607,755 |
| Extended-Duration Bond | | 201,269 | | 1,233,111 | | — | | 15,337,731 |
| Global Bond | | 595,912 | | 3,452,155 | | (7,368,945) | | 7,326,049 |
| Defensive Market Strategies | | 3,272,758 | | 3,028,972 | | — | | 170,706,701 |
| Equity Index | | 1,915,955 | | 5,047,222 | | — | | 639,999,229 |
| Value Equity | | 10,359,660 | | 5,328,149 | | — | | 142,318,422 |
| Growth Equity | | 1,828,089 | | 26,326,334 | | — | | 557,061,174 |
| Small Cap Equity | | 137,676 | | 7,359,532 | | — | | 31,978,201 |
| International Equity Index | | 521,207 | | (2,197,388) | | — | | 40,295,769 |
| International Equity | | 959,069 | | 1,905,316 | | — | | 77,881,477 |
| Emerging Markets Equity | | 1,986,484 | | (9,186,630) | | — | | 42,658,732 |
| Global Real Estate Securities | | 3,177,936 | | — | | — | | 9,268,507 |
| Strategic Alternatives | | 433,684 | | 39,191 | | — | | 2,709,205 |
For Federal income tax purposes, realized capital losses may be carried forward and applied against future realized capital gains. Capital loss carryovers were as follows as of December 31, 2019:
| Fund | | Unlimited |
| Low-Duration Bond | | $11,833,764 |
| International Equity Index | | 2,197,388 |
| Emerging Markets Equity | | 9,186,630 |
During the year ended December 31, 2019, the following Fund utilized capital loss carryforwards to offset capital gains:
| Fund | | Carryforward
Utilized |
| Low-Duration Bond | | $3,025,178 |
| Medium-Duration Bond | | 21,420,689 |
| Global Bond | | 4,096,517 |
| International Equity Index | | 1,772,616 |
| Global Real Estate Securities | | 4,140,771 |
| | | |
The Funds have elected to defer qualified late-year losses in accordance with the federal income tax rules. These losses are treated as having arisen on the first day of the following year. Capital losses were incurred from November 1, 2019 through December 31, 2019. The deferral amount impacting ordinary income were from specified losses incurred from November 1, 2019 through December 31, 2019.
| Fund | | Capital | | Ordinary
Income | | Total |
| Medium-Duration Bond | | $15,200,232 | | $ — | | $15,200,232 |
| Global Bond | | — | | 7,368,945 | | 7,368,945 |
At December 31, 2019, the aggregate cost of investments for federal income tax purposes (including securities sold short and derivative related items) and the net unrealized appreciation from investments for those securities having an excess of value over cost and net unrealized depreciation from investments for those securities having an excess of cost over value (based on cost for federal income tax purposes) were as follows:
| Fund | | Federal Tax
Cost | | Net Unrealized
Appreciation
(Depreciation) | | Appreciated
Securities | | Depreciated
Securities |
| MyDestination 2015 | | $637,816,467 | | $28,492,581 | | $28,891,381 | | $(398,800) |
| MyDestination 2025 | | 1,330,687,929 | | 78,826,976 | | 80,535,656 | | (1,708,680) |
| MyDestination 2035 | | 864,905,179 | | 67,422,832 | | 68,320,670 | | (897,838) |
| MyDestination 2045 | | 646,674,237 | | 57,722,245 | | 58,505,105 | | (782,860) |
| MyDestination 2055 | | 206,216,020 | | 15,293,289 | | 15,681,103 | | (387,814) |
| Conservative Allocation | | 525,247,931 | | 2,382,377 | | 5,355,820 | | (2,973,443) |
| Balanced Allocation | | 1,623,817,707 | | (7,952,829) | | 21,372,516 | | (29,325,345) |
| Growth Allocation | | 1,280,718,477 | | (33,363,338) | | 26,542,206 | | (59,905,544) |
| Aggressive Allocation | | 1,128,719,424 | | (48,138,158) | | 26,363,468 | | (74,501,626) |
| Money Market | | 1,303,300,637 | | — | | — | | — |
| Low-Duration Bond | | 1,117,330,738 | | 4,847,093 | | 7,655,131 | | (2,808,038) |
| Medium-Duration Bond | | 1,890,189,666 | | 49,177,803 | | 61,840,231 | | (12,662,428) |
| Extended-Duration Bond | | 267,453,638 | | 15,336,909 | | 18,081,986 | | (2,745,077) |
| Global Bond | | 640,640,212 | | 7,179,659 | | 25,940,763 | | (18,761,104) |
| Defensive Market Strategies | | 1,105,126,659 | | 170,704,472 | | 176,746,988 | | (6,042,516) |
| Equity Index | | 1,500,770,882 | | 639,999,228 | | 679,406,383 | | (39,407,155) |
| Value Equity | | 1,072,837,430 | | 142,318,422 | | 162,921,242 | | (20,602,820) |
| Growth Equity | | 1,157,139,567 | | 557,061,174 | | 571,188,996 | | (14,127,822) |
| Small Cap Equity | | 577,223,920 | | 31,978,200 | | 64,814,365 | | (32,836,165) |
| International Equity Index | | 668,062,068 | | 40,242,838 | | 75,975,174 | | (35,732,336) |
| International Equity | | 1,222,092,325 | | 78,411,058 | | 158,573,319 | | (80,162,261) |
| Emerging Markets Equity | | 489,290,227 | | 42,777,128 | | 57,621,769 | | (14,844,641) |
| Global Real Estate Securities | | 253,632,285 | | 9,261,302 | | 12,121,328 | | (2,860,026) |
| Strategic Alternatives | | 350,379,774 | | 2,650,331 | | 4,778,819 | | (2,128,488) |
The differences between book basis and tax-basis unrealized appreciation (depreciation) is attributable primarily to the tax deferral of losses on wash sales, the deferral of losses on straddles, gains on constructive sales and investments in PFIC’s, partnerships, swaps and other securities with book and tax cost differences.
At December 31, 2019, paid-in-capital, accumulated undistributed net investment income and accumulated net realized gain (loss) from investments have been adjusted for current period permanent book/tax differences which arose principally from differing book/tax treatments of PFICs, paydown losses, net operating losses, swaps, foreign currency transactions, distributions received from regulated investment companies, defaulted bonds, reclassifications of dividends paid and non-deductible expenses. The following amounts were reclassified within the capital accounts:
| Fund | | Paid in
Capital | | Undistributed
Net Investment
Income | | Accumulated
Net Realized
Gain (Loss) on
Investments,
Currency Translations
and Derivative
Transactions |
| MyDestination 2015 | | $ — | | $2,501,262 | | $(2,501,262) |
| MyDestination 2025 | | — | | 5,501,564 | | (5,501,564) |
| MyDestination 2035 | | — | | 2,758,133 | | (2,758,133) |
| MyDestination 2045 | | — | | 1,589,974 | | (1,589,974) |
| MyDestination 2055 | | — | | 460,678 | | (460,678) |
| Conservative Allocation | | — | | 1,185,141 | | (1,185,141) |
| Balanced Allocation | | — | | 6,164,395 | | (6,164,395) |
| Growth Allocation | | — | | 3,026,249 | | (3,026,249) |
| Aggressive Allocation | | — | | 781,914 | | (781,914) |
| Money Market | | — | | 22,056 | | (22,056) |
| Low-Duration Bond | | — | | 1,592,380 | | (1,592,380) |
| Medium-Duration Bond | | — | | (1,468,433) | | 1,468,433 |
| Extended-Duration Bond | | — | | (79,995) | | 79,995 |
| Global Bond | | 850 | | (10,902,840) | | 10,901,990 |
| Defensive Market Strategies | | — | | 795,827 | | (795,827) |
| Equity Index | | — | | 251,453 | | (251,453) |
| Value Equity | | (39,192) | | 911,551 | | (872,359) |
| Growth Equity | | — | | 553,786 | | (553,786) |
| Small Cap Equity | | — | | 88,607 | | (88,607) |
| International Equity Index | | — | | 37,468 | | (37,468) |
| International Equity | | — | | (642,212) | | 642,212 |
| Emerging Markets Equity | | — | | 6,090,604 | | (6,090,604) |
| Global Real Estate Securities | | — | | 5,970,825 | | (5,970,825) |
| Strategic Alternatives | | 1,022 | | 488,957 | | (489,979) |
Net investment income, net realized gain (loss) on investments and net assets were not affected by these reclassifications.
9. MARKET AND CREDIT RISK
In the normal course of business, the Funds trade financial instruments and enter into financial transactions where the risk of potential loss exists due to changes in the market (market risk) or due to the failure of the other party to a transaction to perform (credit and counterparty risks).
Market Risks — A Fund’s investments in derivatives and other financial instruments expose the Fund to various risks such as, but not limited to, interest rate, foreign currency, equity and commodity risks.
Interest rate risk is the risk that fixed income securities will decline in value because of changes in interest rates. As nominal interest rates rise, the value of certain fixed income securities held by a Fund is likely to decrease. A nominal interest rate can be described as the sum of a real interest rate and an expected inflation rate. Fixed income securities with longer durations tend to be more sensitive to changes in interest rates, usually making them more volatile than securities with shorter durations. Duration is useful primarily as a measure of the sensitivity of a fixed income’s market price to interest rate (i.e. yield) movements.
If a Fund invests directly in foreign currencies or in securities that trade in, and receive revenues in, foreign currencies, or in derivatives that provide exposure to foreign currencies, it will be subject to the risk that those currencies will decline in value relative to the base currency of the Fund, or, in the case of hedging positions, that the Fund’s base currency will decline in value relative to the currency being hedged. Currency rates in foreign countries may fluctuate significantly over short periods of time for a number of reasons, including changes in interest rates, intervention (or the failure to intervene) by U.S. or foreign governments, central banks or supranational entities such as the International Monetary Fund, or by the imposition of currency controls or other political developments in the United States or abroad. As a result, a Fund’s investments in foreign currency denominated securities may reduce the returns of the Fund.
The market values of equities, such as common stocks and preferred stocks, or equity related investments such as futures and options, may decline due to general market conditions which are not specifically related to a particular company, such as real or perceived adverse economic conditions, changes in the general outlook for corporate earnings, changes in interest or currency rates or adverse investor sentiment. Market values may also decline due to factors which affect a particular industry or industries, such as labor shortages or increased production costs and competitive conditions within an industry. Equity securities and equity related investments generally have greater market price volatility than fixed income securities.
A Fund’s investments in commodity-linked derivative instruments may subject the Fund to greater market price volatility than investments in traditional securities. The value of commodity-linked derivative instruments may be affected by changes in overall market movements, commodity index volatility, changes in interest rates, or factors affecting a particular industry or commodity, such as drought, floods, weather, livestock disease, embargoes, tariffs and international economic, political and regulatory developments.
In countries with limited or developing markets, investments may present greater risks than in more developed markets and the prices of such investments may be volatile. The consequences of political, social or economic changes in these markets may have disruptive effects on the market prices of these investments and the income they generate, as well as the Fund’s ability to repatriate such amounts.
Credit and Counterparty Risks — A Fund will be exposed to credit risk on parties with whom it trades and will also bear the risk of settlement default. A Fund minimizes concentrations of credit risk by undertaking transactions with a large number of customers and counterparties on recognized and reputable exchanges. A Fund could lose money if the issuer or guarantor of a fixed income security, or the counterparty to a derivatives contract, repurchase agreement or a loan of portfolio securities, is unable or unwilling to make timely principal and/or interest payments, or to otherwise honor its obligations. Securities are subject to varying degrees of credit risk, which are often reflected in credit ratings.
Similar to credit risk, a Fund may be exposed to counterparty risk, or the risk that an institution or other entity with which the Fund has unsettled or open transactions will default. Financial assets, which potentially expose a Fund to counterparty risk, consist principally of cash due from counterparties and investments. The investment advisers minimize counterparty risks to the Funds by performing extensive reviews of each counterparty and obtaining approval from the Counterparty Risk Committee prior to entering into transactions with a third party. All transactions in listed securities are settled/paid for upon delivery using approved counterparties. The risk of default is considered minimal, as delivery of securities sold is only made once a Fund has received payment. Payment is made on a purchase once the securities have been delivered by the counterparty. The trade will fail if either party fails to meet its obligation.
Each Fund may face potential risks associated with the United Kingdom’s decision to leave the European Union (the “EU”). In June 2016, the United Kingdom approved a referendum to leave the EU, commonly referred to as “Brexit,” which sparked depreciation in the value of the British Pound, short-term declines in global stock markets, and heightened risk of continued worldwide economic volatility. The United Kingdom officially left the EU on January 31, 2020, with a transitional period set to end on December 31, 2020. Brexit created and may continue to create an uncertain political and economic environment in the United Kingdom and other EU countries. This long-term uncertainty may affect other countries in the EU and elsewhere. Further, the UK’s departure from the EU may cause volatility within the EU, triggering prolonged economic downturns in certain European countries or sparking additional member states to contemplate departing the EU. Any of these events may have a significant adverse effect on global markets and economies, which in turn could negatively impact the value of each Fund’s investments.
The United Kingdom’s Financial Conduct Authority, which regulates LIBOR, has announced plans to phase out the use of LIBOR by the end of 2021. There remains uncertainty regarding the future use of LIBOR and the nature of any replacement rate. The transition process away from LIBOR may involve, among other things, increased volatility or illiquidity in markets for instruments that currently rely on LIBOR. The transition process may also result in a reduction in the value of certain instruments held by a Fund or reduce the effectiveness of related Fund transactions such as hedges. Volatility, the potential reduction in value, and/or the hedge effectiveness of financial instruments may be heightened for financial instruments that do not include fallback provisions that address the cessation of LIBOR. Any potential effects of the transition away from LIBOR on any of the Funds or on financial instruments in which a Fund invests, as well as other unforeseen effects, could result in losses to a Fund.
10. RECENT PRONOUNCEMENTS
In March 2017, the FASB issued Accounting Standards Update ("ASU") 2017-08 ("ASU 2017-08"), "Premium Amortization on Purchased Callable Debt Securities", which shortens the premium amortization period for purchased non-contingently callable debt securities. ASU 2017-08 specifies that the premium amortization period ends at the earliest call date, for purchased non-contingently callable debt securities. ASU 2018-08 is effective for fiscal years, and interim periods within those fiscal years, beginning after December 15, 2018. Management has evaluated the implications of ASU 2019-08 and there is no material impact to the financial statements.
In August 2018, the FASB issued ASU 2018-13 (“ASU 2018-13”), "Disclosure Framework -- Changes to the Disclosure Requirements for Fair Value Measurement," which amends the fair value measurement disclosure requirements of the Accounting Standards Codification 820 ("ASC 820"). The amendments of ASU 2018-13 include new, eliminated, and modified disclosure requirements of the ASC 820. In addition, the amendments clarify that materiality is an appropriate consideration of entities when evaluating disclosure requirements. The ASU is effective for all entities for fiscal years beginning after December 15, 2019, including interim periods therein. Early adoption is permitted for any eliminated or modified disclosures upon issuance of this ASU. The Funds have early adopted ASU 2018-13 for these financial statements.
11. REGULATORY EXAMINATIONS
Federal and state regulatory authorities from time to time make inquiries and conduct examinations regarding compliance by the Trust and its affiliates with securities and other laws and regulations affecting the Funds. There are currently no such matters which the Trust and its affiliates believe will be material to these financial statements.
12. SUBSEQUENT EVENTS
Subsequent events have been evaluated through the date that the financial statements were available to be issued. All subsequent events determined to be relevant and material to the financial statements have been appropriately recorded or disclosed.
REPORT OF INDEPENDENT REGISTERED PUBLIC ACCOUNTING FIRM
To the Board of Trustees of GuideStone Funds and Shareholders of MyDestination 2015 Fund, MyDestination 2025 Fund, MyDestination 2035 Fund, MyDestination 2045 Fund, MyDestination 2055 Fund, Conservative Allocation Fund, Balanced Allocation Fund, Growth Allocation Fund, Aggressive Allocation Fund, Money Market Fund, Low-Duration Bond Fund, Medium-Duration Bond Fund, Extended-Duration Bond Fund, Global Bond Fund, Defensive Market Strategies Fund, Equity Index Fund, Value Equity Fund, Growth Equity Fund, Small Cap Equity Fund, International Equity Index Fund, International Equity Fund, Emerging Markets Equity Fund, Global Real Estate Securities Fund and Strategic Alternatives Fund
Opinions on the Financial Statements
We have audited the accompanying statements of assets and liabilities, including the schedules of investments, of MyDestination 2015 Fund, MyDestination 2025 Fund, MyDestination 2035 Fund, MyDestination 2045 Fund, MyDestination 2055 Fund, Conservative Allocation Fund, Balanced Allocation Fund, Growth Allocation Fund, Aggressive Allocation Fund, Money Market Fund, Low-Duration Bond Fund, Medium-Duration Bond Fund, Extended-Duration Bond Fund, Global Bond Fund, Defensive Market Strategies Fund, Equity Index Fund, Value Equity Fund, Growth Equity Fund, Small Cap Equity Fund, International Equity Index Fund, International Equity Fund, Emerging Markets Equity Fund, Global Real Estate Securities Fund and Strategic Alternatives Fund (constituting GuideStone Funds, hereafter collectively referred to as the "Funds") as of December 31, 2019, the related statements of operations for the year ended December 31, 2019, the statements of changes in net assets for each of the two years in the period ended December 31, 2019, including the related notes, and the financial highlights for each of the periods indicated therein (collectively referred to as the “financial statements”). In our opinion, the financial statements present fairly, in all material respects, the financial position of each of the Funds as of December 31, 2019, the results of each of their operations for the year then ended, the changes in each of their net assets for each of the two years in the period ended December 31, 2019 and each of the financial highlights for each of the periods indicated therein in conformity with accounting principles generally accepted in the United States of America.
Basis for Opinions
These financial statements are the responsibility of the Funds’ management. Our responsibility is to express an opinion on the Funds’ financial statements based on our audits. We are a public accounting firm registered with the Public Company Accounting Oversight Board (United States) (PCAOB) and are required to be independent with respect to the Funds in accordance with the U.S. federal securities laws and the applicable rules and regulations of the Securities and Exchange Commission and the PCAOB.
We conducted our audits of these financial statements in accordance with the standards of the PCAOB. Those standards require that we plan and perform the audit to obtain reasonable assurance about whether the financial statements are free of material misstatement, whether due to error or fraud.
Our audits included performing procedures to assess the risks of material misstatement of the financial statements, whether due to error or fraud, and performing procedures that respond to those risks. Such procedures included examining, on a test basis, evidence regarding the amounts and disclosures in the financial statements. Our audits also included evaluating the accounting principles used and significant estimates made by management, as well as evaluating the overall presentation of the financial statements. Our procedures included confirmation of securities owned as of December 31, 2019 by correspondence with the custodian, transfer agent and brokers; when replies were not received from brokers, we performed other auditing procedures. We believe that our audits provide a reasonable basis for our opinions.
/s/ PricewaterhouseCoopers LLP
Chicago, Illinois
February 27, 2020
We have served as the auditor of one or more investment companies in GuideStone Funds since 2001.
NOTICE TO SHAREHOLDERS(Unaudited)
Each Fund is required by Subchapter M of the Internal Revenue Code of 1986, as amended, to advise its shareholders of the federal tax status of distributions received by each Fund’s shareholders. During the year ended December 31, 2019, the Funds hereby designate the following dividends and distributions paid by each of the Funds:
| Fund | | Ordinary
Income | | Long-Term
Capital Gain
(20% rate) | | Return
of Capital |
| MyDestination 2015 | | $16,670,062 | | $9,643,245 | | $— |
| MyDestination 2025 | | 33,763,974 | | 18,708,958 | | — |
| MyDestination 2035 | | 20,667,946 | | 10,532,737 | | — |
| MyDestination 2045 | | 14,714,829 | | 8,586,521 | | — |
| MyDestination 2055 | | 4,672,156 | | 4,193,333 | | — |
| Conservative Allocation | | 10,900,966 | | 12,236,121 | | — |
| Balanced Allocation | | 34,502,761 | | 66,794,786 | | — |
| Growth Allocation | | 19,999,040 | | 89,559,476 | | — |
| Aggressive Allocation | | 11,003,181 | | 107,448,362 | | — |
| Money Market | | 27,768,702 | | — | | — |
| Low-Duration Bond | | 23,248,543 | | — | | — |
| Medium-Duration Bond | | 59,270,742 | | 8,895,418 | | — |
| Extended-Duration Bond | | 7,545,607 | | 2,246,414 | | — |
| Global Bond | | 20,221,476 | | — | | — |
| Defensive Market Strategies | | 29,152,022 | | 39,137,230 | | — |
| Equity Index | | 36,174,047 | | 9,614,945 | | — |
| Value Equity | | 20,124,546 | | 112,001,078 | | — |
| Growth Equity | | 5,232,310 | | 151,896,069 | | — |
| Small Cap Equity | | 746,585 | | 21,320,019 | | — |
| International Equity Index | | 20,799,847 | | — | | — |
| International Equity | | 28,005,024 | | 36,195,026 | | — |
| Emerging Markets Equity | | 13,250,595 | | — | | — |
| Global Real Estate Securities | | 19,123,112 | | — | | — |
| Strategic Alternatives | | 6,848,636 | | 1,494,225 | | — |
| | | | | | | |
| | | | | | | |
Dividends from net investment income and short-term capital gains are treated as ordinary income dividends for federal income tax purposes. Long-term capital gain distributions are taxable as capital gain dividends.
NOTICE TO SHAREHOLDERS (Continued)
The following percentages of ordinary income dividends paid for the year ended December 31, 2019, have been designated as qualified for the reduced tax rate under The Job and Growth Tax Relief Reconciliation Act of 2003.
| Fund | | Qualified
Dividend
Income | | Qualified
Short Term |
| MyDestination 2015 | | 30.23 % | | — % |
| MyDestination 2025 | | 41.87 % | | — % |
| MyDestination 2035 | | 62.41 % | | — % |
| MyDestination 2045 | | 77.22 % | | — % |
| MyDestination 2055 | | 78.02 % | | — % |
| Conservative Allocation | | 18.98 % | | — % |
| Balanced Allocation | | 31.97 % | | — % |
| Growth Allocation | | 64.53 % | | — % |
| Aggressive Allocation | | 100.00 % | | — % |
| Global Bond | | 2.52 % | | — % |
| Defensive Market Strategies | | 84.40 % | | — % |
| Equity Index | | 100.00 % | | 17.69 % |
| Value Equity | | 100.00 % | | — % |
| Growth Equity | | 100.00 % | | 100.00 % |
| Small Cap Equity | | 100.00 % | | 100.00 % |
| International Equity Index | | 90.87 % | | — % |
| International Equity | | 100.00 % | | — % |
| Emerging Markets Equity | | 74.50 % | | — % |
| Global Real Estate Securities | | 7.56 % | | — % |
| Strategic Alternatives | | 8.21 % | | — % |
| | | | | |
| | | | | |
All above designations are based on financial information available as of the date of this annual report, and accordingly, are subject to change. It is the intention of the Funds to designate the maximum amount permitted under the Internal Revenue Code and the regulations thereunder. Shareholders are advised to consult their own tax advisers with respect to the tax consequences of their investment in the Funds.
NOTICE TO SHAREHOLDERS (Continued)
The following Funds made capital gain distributions in the year ended December 31, 2019, and hereby designated these long-term capital gain distributions as follows:
| Fund | Long Term
Capital
Gain Rate |
| MyDestination 2015 | $0.1560 |
| MyDestination 2025 | 0.1440 |
| MyDestination 2035 | 0.1208 |
| MyDestination 2045 | 0.1259 |
| MyDestination 2055 | 0.2758 |
| Conservative Allocation | 0.2786 |
| Balanced Allocation | 0.5363 |
| Growth Allocation | 0.9673 |
| Aggressive Allocation | 1.3349 |
| Medium-Duration Bond | 0.0772 |
| Extended-Duration Bond | 0.1613 |
| Defensive Market Strategies | 0.3552 |
| Equity Index | 0.1287 |
| Value Equity | 1.9414 |
| Growth Equity | 2.1707 |
| Small Cap Equity | 0.5801 |
| International Equity | 0.3993 |
| Strategic Alternatives | 0.0390 |
| | |
GuideStone Financial Resources of the Southern Baptist Convention (“GuideStone Financial Resources”) at all times during the six-months ended December 31, 2019, directly or indirectly controlled the vote of at least 60% of the outstanding shares of GuideStone Funds (the “Trust”). This means that GuideStone Financial Resources, which is an affiliate of the Trust’s investment adviser, GuideStone Capital Management, LLC, controls the vote on any matter that requires shareholder approval.
During the six-months ended December 31, 2019, GuideStone Financial Resources approved by written consent in lieu of a shareholder meeting, dated September 25, 2019, the election of Ronald D. Murff as an Independent Trustee of the Trust.
FUND MANAGEMENT(Unaudited)
Information pertaining to the Trustees and officers of the Trust is set forth below. This information is current as of January 1, 2020. The statement of additional information (SAI) includes additional information about the Trustees and is available without charge, upon request, by calling 1-888-GS-FUNDS(1-888-473-8637).
Name, (Year of Birth), Address
and Position(s) with Trust | Term of Office
and Length of
Time Served1 | Principal Occupation(s)
During Past 5 Years | Number of
Portfolios
in Fund
Complex
Overseen
by Trustee | Other Trusteeships/
Directorships
Held by Trustee2 |
| INDEPENDENT TRUSTEES |
William Craig George (1958)
5005 Lyndon B. Johnson
Freeway Suite 2200
Dallas, TX 75244-6152
Trustee | Since 2004 | Senior Credit Officer, First National Bank of
PA, 2014 – present. | 24 | None |
Barry D. Hartis (1945)
5005 Lyndon B. Johnson
Freeway Suite 2200
Dallas, TX 75244-6152
Trustee | Since 2014 | Certified Public Accountant, 1987 – present. | 24 | None |
Grady R. Hazel (1947)
5005 Lyndon B. Johnson
Freeway Suite 2200
Dallas, TX 75244-6152
Trustee | Since 2011 | Chief Financial Officer, The Dunham School,
2016 – present; Certified Public Accountant,
2015 – present; G400 Relations Manager,
American Institute of Certified Public
Accountants, 2012 – 2015. | 24 | None |
David B. McMillan (1957)
5005 Lyndon B. Johnson
Freeway Suite 2200
Dallas, TX 75244-6152
Trustee | Since 2019 | Chief Executive Officer and Founder, Peridot
Energy LLC, 2008 – present; Chief Executive
Officer, INEA International/VHSC Cement,
2015 – 2017. | 24 | None |
Franklin R. Morgan (1943)
5005 Lyndon B. Johnson
Freeway Suite 2200
Dallas, TX 75244-6152
Trustee | Since 2005 | Retired – Senior Vice President, Director of
International Administration, Prudential
Securities, Inc., 1960 – 2003. | 24 | None |
Ronald D. Murff (1953)
5005 Lyndon B. Johnson
Freeway Suite 2200
Dallas, TX 75244-6152
Trustee | Since 2019 | President, JKL Group, LLC, 2010 – present;
Principal, Dalcor Companies, 2012 –
present. | 24 | None |
| INTERESTED TRUSTEES3 |
Randall T. Hahn, D.Min. (1965)
5005 Lyndon B. Johnson
Freeway Suite 2200
Dallas, TX 75244-6152
Trustee | Since 2018 | Senior Pastor, The Heights Baptist
Church, 2002 – present. | 24 | None |
John R. Morris (1938)
5005 Lyndon B. Johnson
Freeway Suite 2200
Dallas, TX 75244-6152
Trustee | Since 2017 | Vice President and Broker-in-Charge,
Hound Ears Club, Inc., 2010 – present. | 24 | None |
FUND MANAGEMENT (Continued)
Name, (Year of Birth), Address
and Position(s) with Trust | Term of Office
and Length of
Time Served1 | Principal Occupation(s)
During Past 5 Years | Number of
Portfolios
in Fund
Complex
Overseen
by Trustee | Other Trusteeships/
Directorships
Held by Trustee2 |
| OFFICERS WHO ARE NOT TRUSTEES4 |
Ron W. Bass (1966)
5005 Lyndon B. Johnson
Freeway Suite 2200
Dallas, TX 75244-6152
Chief Compliance Officer and
AML Officer | Since 2009 | Director of Asset Management
Compliance, GuideStone Financial Resources,
June 2009 – present. | N/A | N/A |
Melanie Childers (1971)
5005 Lyndon B. Johnson
Freeway Suite 2200
Dallas, TX 75244-6152
Vice President – Fund
Operations | Since 2014 | Managing Director, Fund Operations,
GuideStone Financial Resources, 2014 –
present. | N/A | N/A |
John R. Jones (1953)
5005 Lyndon B. Johnson
Freeway Suite 2200
Dallas, TX 75244-6152
President | Since 2000 | Executive Vice President and Chief Operating
Officer, GuideStone Financial Resources, 1997
– present. | N/A | N/A |
Patrick Pattison (1974)
5005 Lyndon B. Johnson
Freeway Suite 2200
Dallas, TX 75244-6152
Vice President and Treasurer | Since 2008 | Chief Accounting Officer, GuideStone
Financial Resources, 2015 – present; Director
of Financial Reporting & Process Review,
GuideStone Financial Resources, 2008 – 2015. | N/A | N/A |
Matt L. Peden (1967)
5005 Lyndon B. Johnson
Freeway Suite 2200
Dallas, TX 75244-6152
Vice President and Investment
Officer | Since 2001 | Vice President and Chief Investment Officer,
GuideStone Financial Resources, 2015 –
present; Director of Portfolio Management,
GuideStone Financial Resources, 2010 – 2015. | N/A | N/A |
David S. Spika (1964)
5005 Lyndon B. Johnson
Freeway Suite 2200
Dallas, TX 75244-6152
Executive Vice President | Since 2019 | Vice President and Chief Strategic Investment
Officer, GuideStone Financial Resources, 2016
– present; Global Investment Strategist,
GuideStone Financial Resources, 2015 – 2016;
Investment Strategist, Westwood Holdings
Group, 2003 – 2015. | N/A | N/A |
Matthew A. Wolfe (1982)
5005 Lyndon B. Johnson
Freeway Suite 2200
Dallas, TX 75244-6152
Chief Legal Officer and
Secretary | Since 2017 | Associate Counsel – Investment and
Corporate Services, GuideStone Financial
Resources, 2015 – present; Vice
President and Assistant General Counsel,
Goldman Sachs & Co., 2012 – 2015. | N/A | N/A |
Erin Wynne (1981)
5005 Lyndon B. Johnson
Freeway Suite 2200
Dallas, TX 75244-6152
Assistant Treasurer | Since 2016 | Director, Financial Reporting & Analysis,
GuideStone Financial Resources, 2015 –
present; Manager, Financial Reporting &
Analysis, GuideStone Financial Resources,
2010 – 2015. | N/A | N/A |
1 Each Independent Trustee serves until his or her resignation, removal or mandatory retirement. Each Interested Trustee serves until his or her resignation, removal or mandatory retirement or until he or she ceases to be a member of the Board of Trustees of GuideStone Financial Resources. All Trustees must retire at the end of the calendar year in which they attain the age of 80 or after achieving 10 years of service, whichever occurs last. Officers serve at the pleasure of the Board.
2 Directorships not included in the GuideStone Funds complex that are held by a director in any company with a class of securities registered pursuant to section 12 of the Securities Exchange Act of 1934 or any company registered as an investment company under the 1940 Act.
3 Dr. Hahn and Mr. Morris are Interested Trustees of the Trust due to their positions on the Board of Trustees of GuideStone Financial Resources. In addition, Mr. Morris serves on the Board of GuideStone Investment Services and GuideStone Resource Management, Inc., the manager/member and member, respectively, of the Adviser.
4 The officers of the Trust are affiliates of the Adviser due to their positions with the Adviser, GuideStone Financial Resources, GuideStone Investment Services and/or GuideStone Resource Management, Inc.
PROXY VOTING
A description of the policies and procedures that GuideStone Funds uses to determine how to vote proxies relating to their portfolio securities as well as information regarding how GuideStone Funds voted proxies during the most recent 12-month period ended June 30 is available without charge by calling 1-888-GS-FUNDS (1-888-473-8637), by visiting our website atGuideStoneFunds.com or by visiting the SEC’s website athttp://www.sec.gov.
FORM N-MFP
Beginning December 2009, the GuideStone Money Market Fund began filing Form N-MFP with the SEC. Form N-MFP is filed on a monthly basis by money market mutual funds and includes detailed information about a money market fund’s investments and the market-based price of its portfolio known as its "shadow NAV" or mark-to-market valuation. The portfolio holdings information is posted on our website,GuideStoneFunds.com within five business days after the end of the month. Form N-MFP is made available online with a 60-day delay athttp://www.sec.gov.
QUARTERLY SCHEDULES OF INVESTMENTS
In addition to the semi-annual and annual reports that GuideStone Funds delivers to shareholders and makes available through its website, GuideStone Funds files a complete schedule of portfolio holdings with the SEC for each Fund’s first and third fiscal quarters on Form N-Q (or as an exhibit to its reports on Form N-Q's successor form, Form N-PORT). GuideStone Funds does not deliver the schedule for the first and third fiscal quarters to shareholders; however, the schedule is posted to our website,GuideStoneFunds.com. You may also obtain the Form N-Q and Form N-PORT filings by accessing the SEC’s website athttp://www.sec.gov.
BOARD REVIEW OF EXISTING ADVISORY AGREEMENT AND SUB-ADVISORY AGREEMENTS(Unaudited)
As required by the Investment Company Act of 1940, as amended (the “1940 Act”), the Board of Trustees (the “Board”) of GuideStone Funds (the “Trust”), including the Trustees who are not “interested persons” of the Trust (the “Independent Trustees”), as that term is defined in Section 2(a)(19) of the 1940 Act, recently considered the renewal of (i) the investment advisory agreement between GuideStone Capital Management, LLC (the “Adviser” or “GSCM”) and the Trust on behalf of the Target Date, Target Risk (formerly referred to as, “Asset Allocation Funds”) and Select Funds (each, a “Fund,” and together, the “Funds”) (the “Advisory Agreement”); (ii) the existing sub-advisory agreements among the Adviser, each sub-adviser and the Trust on behalf of each Select Fund (except as noted below); and (iii) the sub-advisory agreement among the Adviser, Parametric Portfolio Associates LLC (“Parametric”) and the Trust on behalf of each Fund participating in the cash overlay program (“Cash Overlay Program”) (the agreements covered by items ii and iii referred to collectively as the “Sub-Advisory Agreements”). The Advisory Agreement and the Sub-Advisory Agreements (each, an “Agreement,” and collectively, the “Agreements”) were approved for an additional one-year term, at a meeting of the Board held on September 12-13, 2019 (the “September Meeting”). The Board’s decision to approve the Agreements reflects the exercise of its reasonable business judgment to continue each Agreement. In approving the continuation of the Agreements, the Board considered with the assistance and advice of counsel to the Independent Trustees (“Independent Counsel”) and counsel to the Trust, information provided by the Adviser, each applicable sub-adviser and a consulting firm engaged by the Trust. Because the Board had approved them for an initial two-year term within the last two years, the following agreements were not subject to annual renewal at the September Meeting: (i) the sub-advisory agreement with Weiss Multi-Strategy Advisers LLC on behalf of the Strategic Alternatives Fund (“SAF”); (ii) the sub-advisory agreement with American Century Investment Management, Inc. on behalf of the Value Equity Fund (“VEF”); (iii) the sub-advisory agreement with Jacobs Levy Equity Management, Inc. on behalf of the Small Cap Equity Fund (“SCEF”); (iv) the sub-advisory agreement with Delaware Investments Fund Advisers on behalf of the SCEF; and (v) the sub-advisory agreement with WCM Investment Management, LLC on behalf of the International Equity Fund (“IEF”).
The Board’s consideration of various factors and its conclusions with respect to such factors formed the basis for the Board’s determination to continue the Agreements. The factors considered by the Board included, but were not limited to: (i) the personnel resources of the Adviser and sub-advisers; (ii) the experience and expertise of the Adviser and sub-advisers; (iii) the financial capabilities and resources of the Adviser and sub-advisers; (iv) the compliance procedures and histories of the Adviser and sub-advisers; (v) the performance of the Funds or portfolio accounts in comparison to relevant benchmarks, peer universes of similarly managed funds and/or the sub-advisers’ other clients; (vi) the amount of the contractual advisory fees in comparison to similarly managed funds and/or the sub-advisers’ other clients and the effect of any fee waiver and expense reimbursement arrangements; (vii) the total expenses of the Funds in comparison to similarly managed funds and the use of past and anticipated expense caps; (viii) the profitability of the Adviser and, to the extent available, of sub-advisers with respect to the Funds or portfolio accounts and their overall businesses, as well as the effect of fee waivers and expense caps on profitability levels; (ix) the extent of any economies of scale and whether the fee structures reflect such economies of scale through breakpoints or effectively do so as a result of recent reductions in fee levels; (x) the existence of any collateral benefits realized by the Adviser or sub-advisers, such as affiliated brokerage arrangements or the use of soft dollars; and (xi) the existence of any collateral benefits realized by the Funds resulting from relationships with the Adviser or sub-advisers. In addition, with respect to the Funds that utilize a multi-manager approach (i.e., the Fund is advised by multiple sub-advisers), the Board considered the ongoing role each sub-adviser plays in the overall structure of the Fund’s portfolio, including how each sub-adviser’s strategy complements the strategies of the other sub-advisers.
In its decision to renew the Agreements, the Board was also mindful of the potential disruptions of the Trust’s operations and various risks, uncertainties and other effects that could occur as a result of a decision to terminate or not renew an Agreement. The Board also evaluated whether the approval of each Agreement is in the best interests of the applicable Fund and its shareholders. No one factor was determinative in the Board’s consideration of the Agreements.
The Board undertook a review of the terms of the Agreements and the nature, extent and quality of the services provided by the Adviser and each applicable sub-adviser. The Board conducted its analysis on a Fund-by-Fund basis with respect to the Adviser and then each applicable sub-adviser. The Adviser provided the Board with substantial detailed information in the form of reports about itself and each Target Date Fund, Target Risk Fund, Select Fund and applicable sub-advisory firm prior to and during the September Meeting, which addressed the factors listed previously. The Adviser also provided additional information about the Adviser and each sub-adviser in presentations made during the September Meeting and responded to questions from the Trustees. In addition, the Independent Trustees met separately in executive session with Independent Counsel, as did the Investment Management Committee of the Board (“IMC”), to discuss and consider information presented in connection with the continuation of the Agreements as well as the Trustees’ responsibilities and duties in approving the Agreements.
BOARD APPROVAL OF CONTINUATION OF THE ADVISORY AGREEMENT WITH GSCM
In considering the renewal of the existing Advisory Agreement with GSCM, the Board took into account all the materials provided prior to and during the September Meeting, the presentations made during the September Meeting and the comprehensive discussions during the September Meeting, including the discussions between the Independent Trustees and Independent Counsel during executive sessions. The Board also considered the IMC’s review of information related to the Advisory Agreement, questions submitted by the IMC to the Adviser and Trust management regarding GSCM, GSCM’s and/or Trust Management’s responses to those questions and recommendations made by the IMC.
The Board examined the nature, extent and quality of the services to be provided by GSCM to each of the Funds. The Board evaluated GSCM’s experience serving as the investment adviser to the Trust and each of its Funds, including GSCM’s experience overseeing and managing the allocation of each Fund’s assets among the Trust’s sub-advisers, continually reviewing the investment performance of each Fund, continually reviewing the nature and quality of the services provided by the Trust’s sub-advisers and recommending changes to the Trust’s sub-advisers and the allocation of each Select Fund’s assets among their applicable sub-advisers, as and when appropriate, and potentially directly managing Fund investments. With respect to the Target Date Funds and the Target Risk Funds, the Board evaluated the nature, extent and quality of the services that GSCM provides that are in addition to, rather than duplicative of, services provided to any underlying Select Fund. Specifically, the Board evaluated GSCM’s services in determining the glide path or the asset mix for each Fund and selecting the specific underlying Select Funds in which to invest, as well as rebalancing services. The Board considered the experience of key personnel at GSCM providing investment management services to the Trust and to each Fund as well as the administrative services provided to the Trust, the systems used by such persons and the ability of GSCM to attract and retain capable personnel. The Board considered the reputation, compliance history, compliance program and financial condition of GSCM. The Board also considered the terms of the Advisory Agreement and the responsibilities that GSCM has as investment adviser to each of the Funds, including oversight of sub-adviser compliance with each Fund’s policies and objectives and oversight of general Fund compliance, including compliance with the faith-based investing (“FBI”) policies and restrictions and Board directives. The Board concluded that each Fund is likely to benefit from the nature, extent and quality of GSCM’s services based on its experience, personnel, operations and resources. During their deliberations, the Trustees did not identify any particular information that was all-important or controlling, and each Trustee may have attributed different weights to the various factors deliberated upon, among others.
The Board considered the advisory fees for each of the Funds under the Advisory Agreement, as well as each Fund’s total management fees. The Board examined fee information for each Select Fund, as compared to other funds in each Select Fund’s asset-stratified peer group for the Investor Class, based on information provided by an outside consulting firm as of June 30, 2019. The Board took into account that this comparison of the management fees, not inclusive of any fee waiver or expense reimbursements, ranked the Global Real Estate Securities (“GRESF”), Money Market (“MMF”), Low-Duration Bond (“LDBF”), Medium-Duration Bond (“MDBF”), Global Bond (“GBF”) and Equity Index (“EIF”) Funds in the first quartile; the Strategic Alternatives (“SAF”), Value Equity (“VEF”), Growth Equity (“GEF”) and Emerging Markets Equity (“EMEF”) Funds in the
second quartile; the Extended-Duration Bond (“EDBF”), International Equity (“IEF”) and Defensive Market Strategies (“DMSF”) Funds in the third quartile; and the SCEF in the fourth quartile.
The Board also evaluated the total expense ratios for other funds in each Select Fund’s asset-stratified peer group for the Investor Class based on information provided by an outside consulting firm as of June 30, 2019, and determined that each Select Fund’s total expense ratio, net of any fee waiver or expense reimbursement and acquired fund fees and expenses, was lower than the median total expense ratio for such other funds, with the exception of the EDBF, SCEF, IEF and EMEF. The Board considered that the total expense ratio for the SCEF, IEF and EMEF ranked in the third quartile, and that the EDBF ranked in the fourth quartile, among similar funds at similar asset levels.
The Board also examined the fee information for each Select Fund, as compared to other funds in each Select Fund’s broad peer group for the Investor Class, based on information provided by an outside consulting firm as of June 30, 2019. The Board determined that this comparison of the management fees, not inclusive of any fee waiver or expense reimbursement, ranked the MMF and GRESF in the first quartile; the LDBF, MDBF, GBF, SAF, EIF, VEF, GEF and EMEF in the second quartile; the EDBF, DMSF, IEF and SCEF in the third quartile; and no Select Fund in the fourth quartile.
The Board also evaluated the total expense ratios for other funds in each Select Fund’s broad peer group for the Institutional Class and determined that each Select Fund’s total expense ratio, net of any fee waiver or expense reimbursement and acquired fund fees and expenses, was lower than the median total expense ratio for such other funds, except for the SCEF, International Equity Index Fund, IEF and EMEF. The Board considered that the total expense ratios for the SCEF, International Equity Index Fund and IEF ranked in the third quartile and the EMEF ranked in the fourth quartile.
The Board also examined fee and expense information for the Target Date Funds and the Target Risk Funds, as compared to other funds in these Funds’ asset-stratified peer groups for both the Institutional and Investor Classes, based on information provided by an outside consulting firm as of June 30, 2019. The Board determined that the management fees, not inclusive of any fee waiver or expense reimbursement, and the total expense ratios, net of any fee waiver or reimbursement and acquired fund fees and expenses, for each Target Date Fund were lower than the median for the Investor Class and higher than the median for the Institutional Class for such other mutual funds with similar asset levels. For the Target Risk Funds, the Board determined that the management fees, and the total expense ratios, net of acquired fund fees and expenses, for each Target Risk Fund for the Institutional and Investor Classes were lower than the median for other mutual funds in each Target Risk Fund’s respective asset-stratified peer group.
The Board examined the performance information for the Investor Class of the actively managed Select Funds compared to Morningstar peers based on information provided by an outside consulting firm, specifically the average annual total returns for the three-, five- and 10-year periods ended June 30, 2019. For the three-year average annual total returns for the period ended June 30, 2019, the Board noted that the GBF, GEF, DMSF and IEF ranked in the first quartile; the MMF, SCEF and MDBF ranked in the second quartile; the LDBF, VEF and GRESF ranked in the third quartile; and that the EDBF and EMEF ranked in the fourth quartile.
For the five-year average annual total returns for the period ended June 30, 2019, the Board noted that the EDBF, GBF, DMSF and IEF ranked in the first quartile; the MMF, GRESF, MDBF, SCEF and GEF ranked in the second quartile; the LDBF and VEF ranked in the third quartile; and the EMEF ranked in the fourth quartile.
For the 10-year average annual total returns for the period ended June 30, 2019, the Board noted that the EDBF, GEF, GBF and GRESF ranked in the first quartile; the MMF, SCEF, MDBF, VEF and IEF ranked in the second quartile; the LDBF ranked in the third quartile; and no Select Fund ranked in the fourth quartile.
The Board examined the performance information included in the meeting materials for the Investor Class of each Target Date Fund and Target Risk Fund compared to Morningstar peers based on information provided by an outside consulting firm, specifically the average annual total returns for the three-, five- and 10-year periods ended June 30, 2019. Among Morningstar
peers, the Board noted that the Conservative Allocation Fund ranked in the second quartile for the three-year period and in the fourth quartile for the five- and 10-year periods; the Balanced Allocation Fund ranked in the first quartile for the three-year period, the second quartile for the 10-year period and the third quartile for the five-year period; the Growth Allocation Fund ranked in the second quartile for the three-year period, the third quartile for the five-year period and the fourth quartile for the 10-year period; and the Aggressive Allocation Fund ranked in the second quartile for the three-, five- and 10-year periods.
The Board also noted that among Morningstar peers, the MyDestination 2015 Fund ranked in the third quartile for the 10-year period and the fourth quartile for the three- and five-year periods; the MyDestination 2025 Fund ranked in the second quartile for the three- and 10-year periods and in the third quartile for the five-year period; the MyDestination 2035 Fund ranked in the second quartile for the three-year period, the third quartile for the 10-year period and in the fourth quartile for the five-year period; the MyDestination 2045 Fund ranked in the second quartile for the three- and 10-year periods and in the fourth quartile for the five-year period; and the MyDestination 2055 Fund ranked in the first quartile for the three-year period and in the fourth quartile for the five-year period. The Board recognized that the inception date of the MyDestination 2055 Fund was in 2012, and therefore the Fund did not have a 10-year performance history.
The Board considered the costs to GSCM of serving as the investment adviser to the Funds, including the costs associated with the personnel, systems and equipment necessary to manage the Funds in accordance with the existing Advisory Agreement. The Board considered the revenues that GSCM received for serving as the investment adviser to the Funds and the fact that any profit realized by GSCM is forwarded to GuideStone Financial Resources of the Southern Baptist Convention, which for many years had operated at a deficit with respect to the Trust. The Board also considered the profitability information for GSCM, first, without taking into account sub-advisory fees, and second, taking into account sub-advisory fees. The Board considered whether any direct or indirect collateral benefits inured to either GSCM or the Trust as a result of their affiliation with one another. In light of these considerations, the Board concluded that any profits realized in connection with GSCM’s services appeared reasonable.
The Board also considered the extent to which the advisory fees to be paid to the Adviser reflected economies of scale, taking into account the nature and extent of the services provided by the Adviser, including multi-manager structure of the Funds. The Board noted that only certain Funds are subject to an expense cap. The Board considered the amount of any fees waived by GSCM for each applicable Fund and the total amount of fees waived for the Trust as a whole during the past year. The Board also noted that the total expense ratios for the EDBF, SCEF, IEF and EMEF, net of any fee waiver and expense reimbursement and acquired fund fees and expenses, if applicable, were higher than the median total expense ratio for other similar funds at the same asset levels for the Investor Class as of June 30, 2019.
Based on all of the information presented to the Board and its consideration of relevant factors, the Board concluded that the fee paid to GSCM by each Fund was fair and reasonable in light of the services to be performed, and in the exercise of its business judgment, determined to approve the continuation of the Advisory Agreement for each Fund. The Board also determined that approval of the continuation of the Advisory Agreement for each Fund is in the best interests of each Fund and its shareholders.
BOARD APPROVAL OF CONTINUATION OF SUB-ADVISORY AGREEMENTS FOR THE SELECT FUNDS AND THE FUNDS PARTICIPATING IN THE CASH OVERLAY PROGRAM
In considering the existing Sub-Advisory Agreements being presented for renewal, the Board took into account the materials provided prior to and during the September Meeting, the presentations made during the September Meeting and the extensive discussions during the September Meeting, including the discussions the Independent Trustees had during their executive sessions with Independent Counsel. The Board also took into account the IMC’s review of information related to the Trust’s sub-advisers, questions submitted by the IMC to GSCM regarding various sub-advisers, GSCM’s responses to those questions and recommendations made by the IMC.
The Board examined the nature, extent and quality of the services to be provided by each sub-adviser. The Board evaluated each sub-adviser’s experience serving as a sub-adviser to the applicable Fund. The Board noted that each sub-adviser currently provides investment advice to various clients, including, in some cases, other pooled investment vehicles. The Board noted the experience
of key personnel at each sub-adviser providing investment management services, the systems used by such persons and the ability of each sub-adviser to attract and retain capable personnel. The Board noted the reputation, compliance history, compliance program and financial condition of each sub-adviser. The Board also noted the terms of the existing Sub-Advisory Agreements and the responsibilities that each sub-adviser has with respect to the applicable Fund, including the responsibility of the day-to-day management of the investment portfolio of such Fund, compliance with such Fund’s policies and objectives and the implementation of FBI restrictions and Board directives as they relate to such Fund. The Board also took into account the overall structure of each Fund and the particular role each sub-adviser plays in that structure and in achieving each Fund’s overall investment objective. The Board concluded that each Fund is likely to benefit from the nature, extent and quality of these services as a result of each sub-adviser’s experience, personnel, operations and resources. During their deliberations, the Trustees did not identify any particular information that was all-important or controlling, and each Trustee may have attributed different weights to the various factors deliberated upon, among others.
The Board examined performance information for each segment of a Fund managed by a sub-adviser. The Board noted that, for many of the sub-advisers, the performance record of the segment of the Fund managed by the sub-adviser compared favorably to the relevant benchmark, the composite performance for the sub-adviser’s clients (on a gross fee basis) and/or the peer universe of similarly managed funds. In cases where the sub-adviser’s performance lagged, the Board also considered historical and recent investment performance, whether and how the sub-adviser’s strategy deviated from the composition of the benchmark, the sub-adviser’s role within a Fund and the outlook for future performance. The Board also noted that, in certain cases, market trends may have contributed to the underperformance of some sub-advisers. The Board also considered whether a sub-adviser’s underperformance was within the expected tracking error for the sub-adviser’s investment strategy. The Board concluded that, although past performance is no guarantee of future performance, the performance of each sub-adviser’s segment was satisfactory in light of all relevant considerations and the applicable Funds were likely to benefit from each sub-adviser continuing to serve as sub-adviser to the Trust.
The Board examined the fee schedule for each sub-adviser, noting how the fee levels charged to each applicable Fund compared with available information about fees charged by the sub-advisers to their other similarly situated clients, which in many cases include separately managed accounts, as well as how sub-adviser fee levels for each Select Fund compared to the median sub-advisory fee for the peer universe of similarly managed funds. The Board determined that the fees to be charged by each sub-adviser were reasonable in relation to the nature, extent and quality of the services to be provided.
The Board also took into account the profitability and the financial capability of each sub-adviser in light of information presented at the September Meeting. In light of these considerations, the Board concluded that the profits realized by each sub-adviser who completed a profitability questionnaire appeared reasonable. For the limited number of sub-advisers that did not provide profitability information, the Board relied upon other relevant information, particularly the independent negotiation of the fee schedules, the level of the fees, each sub-adviser’s performance history and feedback received from the sub-advisers regarding the firm’s inability of their firm to estimate profitability. The Board noted that based on the Adviser’s representations, the financial statements of the sub-advisers did not appear to raise any significant concerns regarding the financial capability of those sub-advisers. The Board also considered the Adviser’s representations in the materials prepared for the September Meeting, and the discussions earlier in the September Meeting, that no sub-adviser experienced any material adverse change in its financial condition since the date of its most recent audited financial statements, and took into account the Adviser’s representation that it would continue to monitor the financial condition of each sub-adviser.
The Board considered the extent to which sub-adviser fees to be paid to each sub-adviser reflected economies of scale. The Board noted that each sub-adviser’s fee schedule either reflected economies of scale by reducing the fee on assets in excess of certain stated breakpoints or the fee level negotiated was below or on par with the standard fee level for the sub-adviser.
In evaluating the benefits that are expected to accrue to each sub-adviser through its relationship as sub-adviser to a Select Fund, the Board noted that certain sub-advisers allocate portfolio brokerage to affiliated broker-dealers that receive commissions from the execution of Fund trades. The Board also noted that certain sub-advisers expect to benefit from “soft dollar” arrangements by which brokers will provide research and other services to the sub-adviser in exchange for commissions on trades of the portfolio securities of a Select Fund. The Board considered whether any direct or indirect collateral benefits inured to the Trust because of its affiliation with each sub-adviser.
Based on all of the information presented to the Board and its consideration of relevant factors, the Board, in the exercise of its reasonable business judgment, determined to approve the continuation of each Sub-Advisory Agreement that was presented for renewal. The Board also determined that approval of the continuation of each Sub-Advisory Agreement presented for renewal is in the best interest of each Select Fund and each Fund participating in the Cash Overlay Program and their respective shareholders.
BOARD REVIEW OF NEW SUB-ADVISORY AGREEMENTS FOR CERTAIN SELECT FUNDS
As required by the 1940 Act, the Board, including a majority of the Independent Trustees, considered the approval of four new sub-advisory agreements (the “New Sub-Advisory Agreements”) among the Adviser, the Trust and respectively: (i) Parametric Portfolio Associates LLC (“Parametric”) on behalf of the VEF, GEF, SCEF, IEF, LDBF, MDBF and the EDBF (the EDBF, and collectively, with the VEF, GEF, SCEF, IEF, LDBF and MDBF, the “Designated Funds”) (the “Parametric Agreement”), (ii) RBC Global Asset Management (UK) Limited (“RBC GAM UK”) on behalf of the EMEF (the “RBC GAM UK Agreement”), (iii) Neuberger Berman Investment Advisers LLC (“Neuberger”) on behalf of the GBF (the “Neuberger Agreement”) and (iv) Schroder Investment Management North America Limited (”SIMNA Ltd”) on behalf of the EDBF (the “SIMNA Ltd Agreement”) (and together with Parametric, RBC GAM UK and Neuberger, the “New Sub-Advisers”). The Board approved the New Sub-Advisory Agreements for Parametric and RBC GAM UK at the September Meeting and the New Sub-Advisory Agreements for Neuberger and SIMNA Ltd at the November 7, 2019 Board meeting (the “November Meeting”).
The Board’s decision to approve the New Sub-Advisory Agreements reflects the exercise of the Board’s business judgement and the Board’s consideration of its fiduciary duties to the Funds and their shareholders. Prior to approving the New Sub-Advisory Agreements, the Board requested and received information from the Adviser and the New Sub-Advisers, and considered such information with the assistance and advice of Independent Counsel and counsel to the Trust.
The Board’s consideration of various factors, and its conclusions with respect to such factors, formed the basis for the Board’s determination to approve the New Sub-Advisory Agreements. The factors considered by the Board included, but were not limited to: (i) the nature, extent and quality of the services to be provided by each New Sub-Adviser; (ii) the personnel resources of each New Sub-Adviser; (iii) the experience and expertise of each New Sub-Adviser; (iv) the financial capabilities and financial resources of each New Sub-Adviser; (v) the compliance program and compliance history of each New Sub-Adviser; (vi) the composite performance history of each New Sub-Adviser’s proposed investment strategy in comparison to relevant benchmarks; (vii) the amount of the contractual sub-advisory fee proposed to be paid to each New Sub-Adviser in comparison to available fee information for the New Sub-Adviser’s other clients and similar funds; (viii) the expected profitability of each New Sub-Adviser with respect to the Funds and their overall business; (ix) the extent of any economies of scale and whether the fee structure for each New Sub-Adviser reflects such economies of scale; (x) the existence of any collateral benefits that may be realized by each New Sub-Adviser, such as affiliate brokerage arrangements or the use of soft dollars; and (xi) any collateral benefits that may be realized by the Funds. With respect to each New Sub-Advisory Agreement, the Board also evaluated whether the approval of the New Sub-Advisory Agreement was in the best interest of the Funds and their respective shareholders. No one factor was determinative in the Board’s consideration of the New Sub-Advisory Agreements, and each Trustee may have attributed different weights to the factors considered.
The Board undertook a review of the terms of each New Sub-Advisory Agreement, as well as the nature, extent and quality of the services to be provided by the New Sub-Advisers under the New Sub-Advisory Agreements and the proposed fees in exchange for such services. The Adviser provided the Board with information in the form of reports about the New Sub-Advisers prior to and
during the September Meeting or the November Meeting, as applicable, which addressed the factors listed previously. During the September Meeting or November Meeting, as applicable, the Adviser also gave a presentation to the Board during which the Adviser provided additional information about the New Sub-Advisers, discussed the comprehensive review process used by the Adviser to recommend the New Sub-Advisers as new sub-advisers and responded to questions from the Board.
In addition, the Independent Trustees met separately in executive session with Independent Counsel, as did the IMC (except with regard to the SIMNA Ltd Agreement), to discuss and consider the information presented in connection with the approval of the New Sub-Advisory Agreements, as well as the Trustees’ responsibilities and duties in approving the agreements.
BOARD APPROVAL OF NEW SUB-ADVISORY AGREEMENT FOR SELECT FUNDS PARTICIPATING IN THE COMPLETION PORTFOLIO PROGRAM
In considering the approval of the Parametric Agreement on behalf of the Designated Funds, the Board took into account the materials provided prior to and during the September Meeting, the presentations made, and the extensive discussions during the September Meeting, including the discussion the Independent Trustees had during their executive session with Independent Counsel, and the report of the IMC. The Board also took into account the IMC’s review of information related to the Parametric Agreement and recommendations made by the IMC. The Board considered its responsibilities with respect to reviewing and approving the terms of the Parametric Agreement, the investment management team at Parametric, the reasonableness of the sub-advisory fees and whether the appointment of Parametric would be reasonable and fair to the Designated Funds and their respective shareholders. The Board reviewed the factors that it should consider in evaluating whether to approve the Parametric Agreement and the materials provided to support each factor.
In making its determination to approve the selection of Parametric as a sub-adviser to the Designated Funds, the Board, including the Independent Trustees advised by Independent Counsel, considered a number of factors. Such factors included the nature, extent and quality of the services to be provided by Parametric under the Parametric Agreement; the fees charged by Parametric for its completion portfolio services; and information regarding Parametric’s ownership structure, investment management experience, personnel, clients, assets under management (“AUM”), legal and regulatory history, compliance policies and procedures, brokerage and soft dollar practices and investment philosophies and processes. The Board also reviewed presentations by the Adviser regarding the comprehensive review process it used to recommend Parametric’s completion portfolio services and regarding the circumstances under which the Adviser expects to use completion portfolios. Among other things, the Board recognized that a completion portfolio is a custom solution designed to temporarily complement the Designated Funds’ active sub-adviser composite. The Board considered that the Adviser believed Parametric’s stated fee schedule for such services to be competitive.
Because this engagement with Parametric for completion portfolio services would be new, there was no relevant historical profitability information for the Board to assess. The Board noted, however, that Parametric did provide an estimate of profitability for providing its services to the Designated Funds. The Trustees considered the Adviser’s assessment of Parametric’s financial condition. The Trustees noted that the Adviser, after reviewing certain financial information provided by Parametric, believed that Parametric was financially sound.
The Board considered the fees to be paid to Parametric under the Parametric Agreement, as well as the overall fee structure under the Parametric Agreement, in light of the nature, extent and quality of the services to be provided. Further, the Board considered that a Designated Fund would pay Parametric a fee for completion portfolio services only when a completion portfolio is being utilized by that Designated Fund. The Board also considered the fees charged by other investment advisers that offer similar services. The Board noted that the Designated Funds’ stated overall management and advisory fees would remain the same because a completion portfolio solution would be implemented on a limited or short-term basis and that during the deployment of a completion portfolio, a Fund’s actual overall management and advisory fees may decrease for a period of time due to the low-cost structure of the Parametric completion portfolios as compared to the fees paid to a Fund’s other sub-advisers. The Board also noted there would be no impact to the Adviser’s profitability as a result of the utilization of a completion portfolio.
The Board considered potential “fall-out” or ancillary benefits anticipated to be received by Parametric and its affiliates as a result of its arrangements with the Designated Funds. The Board concluded that any potential benefits to be derived by Parametric included potential access to additional research resources, increased AUM and reputational benefits, which were consistent with those generally derived by sub-advisers offering similar services to mutual funds.
The Board observed that the purpose of the Parametric completion portfolio engagement is to provide the Adviser with additional flexibility to manage a Designated Fund’s risk/return profile. The Adviser reminded the Board that Parametric currently serves as sub-adviser to the Trust’s Cash Overlay Program, the DMSF and the SAF. The Board considered the Adviser’s representation that Parametric would be comfortable implementing completion portfolios in accordance with the Designated Funds’ FBI restrictions.
Based on all of the information provided to the Board and its consideration of relevant factors, the Board determined that Parametric would provide completion portfolio services that are appropriate in scope and that the fees to be paid to Parametric by the Designated Funds under the Parametric Agreement would be fair and reasonable in light of the nature, extent and quality of services to be provided. In their deliberations, the Trustees did not identify any particular information that was all-important or controlling, and each Trustee may have attributed different weights to the various factors deliberated upon, among others.
BOARD APPROVAL OF NEW SUB-ADVISORY AGREEMENT FOR THE EMERGING MARKETS EQUITY FUND
In considering the approval of the RBC GAM UK Agreement for the EMEF, the Board took into account the materials provided prior to and during the September Meeting, the presentations made, and the extensive discussions during the September Meeting, including the discussion the Independent Trustees had during their executive session with Independent Counsel, and the report of the IMC. The Board also took into account the IMC’s review of information related to the RBC GAM UK Agreement and recommendations made by the IMC. The Board considered its responsibilities with respect to reviewing and approving the terms of the RBC GAM UK Agreement, the investment management team at RBC GAM UK, the reasonableness of the sub-advisory fees and whether the appointment of RBC GAM UK would be reasonable and fair to the EMEF and its respective shareholders. The Board reviewed the factors that it should consider in evaluating whether to approve the RBC GAM UK Agreement and the materials provided to support each factor.
In making its determination to approve the selection of RBC GAM UK as a sub-adviser to the EMEF, the Board, including the Independent Trustees advised by Independent Counsel, considered a number of factors. Such factors included the nature, extent and quality of the services to be provided by RBC GAM UK; composite back-tested performance history and composite live performance history for RBC GAM UK’s Emerging Markets Equity Focus Strategy (the “Focus Strategy”); the fees to be charged by RBC GAM UK for its Focus Strategy; and information regarding RBC GAM UK’s ownership structure, investment management experience, personnel, clients, AUM, legal and regulatory history, compliance policies and procedures, brokerage and soft dollar practices and investment philosophies and processes. The Board also reviewed presentations by the Adviser regarding the comprehensive review process it used to recommend RBC GAM UK. The Board considered that the Adviser had been able to negotiate fees that were favorable compared to RBC GAM UK’s stated fee schedule.
Because this engagement with RBC GAM UK would be new, there was no relevant historical profitability information for the Board to assess. The Board noted, however, that RBC GAM UK did provide an estimate of profitability for providing its services to the EMEF. The Trustees considered the Adviser’s assessment of RBC GAM UK’s financial condition. The Trustees noted that the Adviser, after reviewing certain financial information provided by RBC GAM UK, believed that RBC GAM UK was financially sound.
The Board considered the fees to be paid to RBC GAM UK under the RBC GAM UK Agreement, as well as the overall fee structure under the RBC GAM UK Agreement, in light of the nature, extent and quality of the services to be provided. The Board also considered the fees charged by other investment advisers that employ similar strategies. The Board noted that the EMEF’s overall management and advisory fees would remain the same following the appointment of RBC GAM UK, but may increase if the assets in the RBC GAM UK portfolio account fall below a pre-determined level. The Board also noted that the EMEF, and not
the Adviser, would pay fees to RBC GAM UK directly, and that, as a result, the appointment of RBC GAM UK would not be expected to affect the Adviser’s profitability with respect to the EMEF.
The Board considered potential “fall-out” or ancillary benefits anticipated to be received by RBC GAM UK and its affiliates as a result of its arrangements with the EMEF. The Board concluded that any potential benefits to be derived by RBC GAM UK included potential access to additional research resources, increased AUM and reputational benefits, which were consistent with those generally derived by sub-advisers to mutual funds.
The Board noted the Adviser’s representation that RBC GAM UK would be comfortable managing the RBC GAM UK’s strategy in accordance with the EMEF’s FBI restrictions.
While noting that past performance does not indicate future results, the Board noted the inception date of the Focus Strategy (November 2018) and considered that the Focus Strategy’s composite back-tested performance since April 2010, gross of fees as of June 30, 2019, versus its benchmark, the MSCI Emerging Markets Index, had been favorable over historical time periods. The Board also noted that based on the back-tested performance, the Focus Strategy outperformed the benchmark index over the one-, three-, five- and seven-year periods ended June 30, 2019.
Recognizing the Focus Strategy’s inception date, the Board considered that while the Focus Strategy has a limited performance record, it is a derivative of and has an approximately 85% overlap of portfolio holdings with RBC GAM UK’s flagship Emerging Markets Equity Strategy (the “Flagship Strategy”), which has an inception date of April 2010. The Board considered that the Focus Strategy uses the same portfolio management team as the Flagship Strategy. The Board considered that the Flagship Strategy had experienced attractive performance outcomes relative to its benchmark, also the MSCI Emerging Markets Index, gross of fees, over the one-, three-, five- and seven-year periods ended June 30, 2019. Further, the Board took into account the Adviser’s expectations for the Focus Strategy to perform well versus its benchmark over long-term periods based on the historical performance of the Flagship Strategy.
The Board considered the Adviser’s plan to re-allocate portions of the EMEF’s assets to RBC GAM UK, including the use of a transition manager. The Board also reviewed the Adviser’s estimate of the costs of the transition of assets.
Based on all of the information provided to the Board and its consideration of relevant factors, the Board determined that RBC GAM UK would provide investment management services that are appropriate in scope and that the fees to be paid to RBC GAM UK by the EMEF under the RBC GAM UK Agreement would be fair and reasonable in light of the nature, extent and quality of services to be provided. In their deliberations, the Trustees did not identify any particular information that was all-important or controlling, and each Trustee may have attributed different weights to the various factors deliberated upon, among others.
BOARD APPROVAL OF NEW SUB-ADVISORY AGREEMENT FOR THE GLOBAL BOND FUND
In considering the approval of the Neuberger Agreement for the GBF, the Board took into account the materials provided prior to and during the November Meeting, the presentations made and the extensive discussions during the November Meeting, including the discussion the Independent Trustees had during their executive session with Independent Counsel, and the report of the IMC. The Board also took into account the IMC’s review of information related to the Neuberger Agreement and recommendations made by the IMC. The Board considered its responsibilities with respect to reviewing and approving the terms of the Neuberger Agreement, the investment management team at Neuberger, the reasonableness of the sub-advisory fees and whether the appointment of Neuberger would be reasonable and fair to the GBF and its respective shareholders. The Board reviewed the factors that it should consider in evaluating whether to approve the Neuberger Agreement and the materials provided to support each factor.
In making its determination to approve the selection of Neuberger as a sub-adviser to the GBF, the Board, including the Independent Trustees advised by Independent Counsel, considered a number of factors. Such factors included the nature, extent and quality of the services to be provided by Neuberger; the composite performance history of the Neuberger Global Opportunistic Fixed Income Strategy (“the “Neuberger Strategy”); the fees charged by Neuberger for its services; and information
regarding Neuberger’s ownership structure, investment management experience, personnel, clients, AUM, legal and regulatory history, compliance policies and procedures, brokerage and soft dollar practices and investment philosophies and processes. The Board also reviewed presentations by the Adviser regarding the comprehensive review process it used to recommend Neuberger’s services. The Board considered that the Adviser believed Neuberger’s stated fee schedule for such services to be competitive.
Because this engagement with Neuberger for sub-advisory services for the GBF would be new, there was no relevant historical profitability information for the Board to assess. The Board noted, however, that Neuberger did provide an estimate of profitability for providing its services to the GBF. The Trustees considered the Adviser’s assessment of Neuberger’s financial condition. The Trustees noted that the Adviser, after reviewing certain financial information provided by Neuberger, believed that Neuberger was financially sound.
The Board considered the fees to be paid to Neuberger under the Neuberger Agreement, as well as the overall fee structure under the Neuberger Agreement, in light of the nature, extent and quality of the services to be provided. The Board also considered the fees charged by other investment advisers that offer similar services. The Board noted that the GBF’s overall management and advisory fee would remain the same. The Board also noted there would be no impact to GSCM’s profitability as a result of the hiring of Neuberger.
The Board considered potential “fall-out” or ancillary benefits anticipated to be received by Neuberger and its affiliates as a result of its arrangements with the GBF. The Board concluded that any potential benefits to be derived by Neuberger included potential access to additional research resources, increased AUM and reputational benefits, which were consistent with those generally derived by sub-advisers offering similar services to mutual funds.
The Board noted the Adviser’s statement that it has a positive working relationship with Neuberger in its role as a sub-adviser to the SAF. The Board considered the Adviser’s representation that Neuberger would be comfortable managing the strategy in accordance with the GBF’s FBI restrictions.
While acknowledging that past performance does not indicate future results, the Board considered the historical performance of the Neuberger Strategy. The Board noted the Neuberger Strategy’s performance history versus its benchmark, the Bloomberg Barclays Global Aggregate Bond Index (U.S. Dollar Hedged), had been favorable over historical time periods. The Board further noted the Neuberger Strategy, gross of fees, outperformed its benchmark by 1.04% annualized and the GBF benchmark, the Bloomberg Barclays Global Aggregate Bond Index, by 1.92% annualized since its inception (October 2012) period ended September 30, 2019. In addition, the Board noted that the Neuberger Strategy, gross of fees, had outperformed its benchmark index over the three-, five- and seven-year periods ended September 30, 2019.
Based on all of the information provided to the Board and its consideration of relevant factors, the Board determined that Neuberger would provide investment management services that are appropriate in scope and that the fees to be paid to Neuberger by the GBF under the Neuberger Agreement would be fair and reasonable in light of the nature, extent and quality of services to be provided. In their deliberations, the Trustees did not identify any particular information that was all-important or controlling, and each Trustee may have attributed different weights to the various factors deliberated upon, among others.
BOARD APPROVAL OF NEW SUB-ADVISORY AGREEMENT FOR THE EXTENDED-DURATION BOND FUND
In considering the approval of the SIMNA Ltd Agreement for the EDBF, the Board took into account the materials provided prior to and during the November Meeting, the presentations made and the extensive discussions during the November Meeting, including the discussion the Independent Trustees had during their executive session with Independent Counsel. The Board considered its responsibilities with respect to reviewing and approving the terms of the SIMNA Ltd Agreement, the investment management team at SIMNA Ltd, the reasonableness of SIMNA Ltd’s sub-advisory fees and whether the appointment of SIMNA Ltd would be responsible and fair to the EDBF and its respective shareholders. The Board noted that a sub-advisory agreement was already in place on behalf of the EDBF with the Trust, the Adviser and Schroder Investment Management North America Inc.
(“SIMNA Inc.”) and that this new SIMNA Ltd Agreement was being entered into to ensure continuity of portfolio management services as the EDBF portfolio account’s primary portfolio manager relocated to London, England and joined SIMNA Ltd.
In making its determination to approve the selection of SIMNA Ltd as a sub-adviser to the EDBF, the Board, including the Independent Trustees advised by Independent Counsel, considered a number of factors. Such factors included the nature, extent and quality of the services to be provided by SIMNA Ltd; the fees charged by SIMNA Ltd for its services; and information regarding SIMNA Ltd’s ownership structure, investment management experience, personnel, clients, AUM, legal and regulatory history, compliance policies and procedures, brokerage and soft dollar practices and investment philosophies and processes. The Board also reviewed presentations by the Adviser regarding the comprehensive review process it used to recommend SIMNA Ltd’s services. The Board considered that the Adviser believed SIMNA Ltd’s stated fee schedule for such services to be competitive.
The Board noted that SIMNA Ltd provided an estimate of profitability for providing its services to the EDBF, which was based on the current relationship with SIMNA Inc. The Trustees considered the Adviser’s assessment of SIMNA Ltd’s financial condition. The Trustees noted that the Adviser, after reviewing certain financial information provided by SIMNA Ltd, believed that SIMNA Ltd was financially sound.
The Board considered the fees to be paid to SIMNA Ltd under the SIMNA Ltd Agreement, as well as the overall fee structure under the SIMNA Ltd Agreement, in light of the nature, extent and quality of the services to be provided. The Board noted that the sub-advisory fees would be paid to SIMNA Ltd from the sub-advisory fees received by SIMNA Inc., with no proposed changes to the sub-advisory fees paid to SIMNA Inc. The Board also considered the fees charged by other investment advisers that offer similar services. The Board noted that the EDBF’s overall management and advisory fee would remain the same. The Board further noted there would be no impact to GSCM’s profitability as a result of the hiring of SIMNA Ltd.
The Board considered potential “fall-out” or ancillary benefits anticipated to be received by SIMNA Ltd and its affiliates as a result of its arrangements with the EDBF. The Board concluded that any potential benefits to be derived by SIMNA Ltd included potential access to additional research resources, increased AUM and reputational benefits, which were consistent with those generally derived by sub-advisers offering similar services to mutual funds.
The Board considered that the current allocation to SIMNA Inc. would remain the same with the addition of SIMNA Ltd, an allocation of approximately 77% of the EDBF’s assets. The Board considered the Adviser’s representation that SIMNA Ltd would continue to manage the EDBF within the FBI restrictions.
While acknowledging that past performance does not indicate future results, the Board considered the historical performance of SIMNA Inc.’s Value Long Duration Strategy (the “SIMNA Inc. Strategy”). The Board noted the SIMNA Inc. Strategy’s performance history versus its benchmark, 50% Bloomberg Barclays US Long Government/Credit Bond Index and 50% Bloomberg Barclays US Intermediate Government/Credit Bond Index, had, net of fees, been favorable over historical time periods. The Board further noted that the SIMNA Inc. Strategy outperformed the benchmark for the three-, five- and seven-year and analysis periods and underperformed against the benchmark for the year-to-date and one-year periods ended September 30, 2019.
Based on all of the information provided to the Board and its consideration of relevant factors, the Board determined that SIMNA Ltd would provide services that are appropriate in scope and that the fees to be paid to SIMNA Ltd by the EDBF under the SIMNA Ltd Agreement would be fair and reasonable in light of the nature, extent and quality of services to be provided. In their deliberations, the Trustees did not identify any particular information that was all-important or controlling, and each Trustee may have attributed different weights to the various factors deliberated upon, among others.
INVESTMENT SUB-ADVISERS (Assets under management as of December 31, 2019)(Unaudited)
GuideStone Funds employs a broad array of proven investment managers for the benefit of their investors. Each manager is distinctive in its investment management process and business approach.
| Fund | | Sub-Adviser | | Firm
Established | | Total Assets
Managed |
| Money Market | | BlackRock Advisors, LLC | | 1994 | | $7.4Tr |
| Low-Duration Bond | | BlackRock Financial Management, Inc. | | 1988 | | $7.4Tr |
| | | Pacific Investment Management Company LLC | | 1971 | | $1.9Tr |
| | | Parametric Portfolio Associates LLC | | 1992 | | $279.5B |
| | | Payden & Rygel | | 1983 | | $119.1B |
| Medium-Duration Bond | | Goldman Sachs Asset Management, L.P. | | 1984 | | $1.7Tr |
| | | Pacific Investment Management Company LLC | | 1971 | | $1.9Tr |
| | | Parametric Portfolio Associates LLC | | 1992 | | $279.5B |
| | | Western Asset Management Company and
Western Asset Management Company Limited | | 1971 | | $460.1B |
| Extended-Duration Bond | | Loomis, Sayles & Company, L.P. | | 1926 | | $297.2B |
| | | Parametric Portfolio Associates LLC | | 1992 | | $279.5B |
| | | Schroder Investment Management North America Inc. and Schroder Investment Management North America Limited¹ | | 1804 | | $159.2B |
| Global Bond | | Loomis, Sayles & Company, L.P. | | 1926 | | $297.2B |
| | | Neuberger Berman Investment Advisers LLC | | 2002 | | $356.0B |
| | | Western Asset Management Company and
Western Asset Management Company Limited | | 1971 | | $460.1B |
| Defensive Market Strategies | | American Century Investment Management, Inc. | | 1958 | | $178.1B |
| | | AQR Capital Management, LLC | | 1998 | | $186.0B |
| | | Parametric Portfolio Associates LLC | | 1992 | | $279.5B |
| | | Shenkman Capital Management, Inc. | | 1985 | | $25.4B |
| Equity Index | | Legal & General Investment Management America, Inc. | | 2006 | | $218.8B |
| Value Equity | | AJO, LP | | 1984 | | $18.8B |
| | | American Century Investment Management, Inc. | | 1958 | | $178.1B |
| | | Barrow, Hanley, Mewhinney & Strauss, LLC | | 1979 | | $51.7B |
| | | Legal & General Investment Management America, Inc. | | 2006 | | $218.8B |
| | | Parametric Portfolio Associates LLC | | 1992 | | $279.5B |
| | | TCW Investment Management Company LLC | | 1971 | | $217.0B |
| Growth Equity | | Brown Advisory, LLC | | 1993 | | $42.4B |
| | | ClearBridge Investments, LLC | | 2005 | | $154.6B |
| | | Loomis, Sayles & Company, L.P. | | 1926 | | $297.2B |
| | | Parametric Portfolio Associates LLC | | 1992 | | $279.5B |
| | | Sands Capital Management, LLC | | 1992 | | $44.6B |
| Small Cap Equity | | AJO, LP | | 1984 | | $18.8B |
| | | Delaware Investments Fund Advisers | | 1929 | | $258.7B |
| | | Jacobs Levy Equity Management, Inc. | | 1986 | | $13.1B |
| | | Parametric Portfolio Associates LLC | | 1992 | | $279.5B |
| | | TimesSquare Capital Management, LLC | | 2000 | | $15.4B |
| International Equity Index | | Legal & General Investment Management America, Inc. | | 2006 | | $218.8B |
| International Equity | | AQR Capital Management, LLC | | 1998 | | $186.0B |
| | | Harris Associates L.P. | | 1976 | | $119.8B |
| | | MFS Institutional Advisors, Inc. | | 1970 | | $526.3B |
| | | Mondrian Investment Partners Ltd. | | 1990 | | $54.4B |
| | | Parametric Portfolio Associates LLC | | 1992 | | $279.5B |
| | | WCM Investment Management, LLC | | 1976 | | $49.0B |
| Emerging Markets Equity | | AQR Capital Management, LLC | | 1998 | | $186.0B |
| | | Goldman Sachs Asset Management, L.P. | | 1984 | | $1.7Tr |
| | | RBC Global Asset Management (UK) Limited | | 2013 | | $38.0B |
| | | Wellington Management Company LLP | | 1928 | | $1.2Tr |
| Global Real Estate Securities | | Heitman Real Estate Securities, LLC and
Heitman International Real Estate Securities HK Limited | | 1989 | | $45.5B |
| Fund | | Sub-Adviser | | Firm
Established | | Total Assets
Managed |
| | | RREEF America L.L.C.,
DWS Investments Australia Limited and
DWS Alternatives Global Limited | | 1975 | | $72.4B |
| Strategic Alternatives | | Allianz Global Investors U.S. LLC | | 1895 | | $122.3B |
| | | Goldman Sachs Asset Management, L.P. | | 1984 | | $1.7Tr |
| | | Neuberger Berman Investment Advisers LLC | | 2002 | | $356.0B |
| | | Parametric Portfolio Associates LLC | | 1992 | | $279.5B |
| | | Weiss Multi-Strategy Advisers LLC | | 2010 | | $2.7B |
| Custodian for GuideStone Funds Assets | | The Northern Trust Company | | 1889 | | $9.2Tr |
Cash Overlay for Target Date, Target Risk,
Fixed Income, Equity and Real Assets Select Funds | | Parametric Portfolio Associates LLC | | 1992 | | $279.5B |
| | | | | | | |
Item 1. Reports to Stockholders (cont.).
Item 2. Code of Ethics.
| | (a) | The registrant, as of the end of the period covered by this report, has adopted a code of ethics that applies to the registrant’s principal executive officer, principal financial officer, principal accounting officer or controller, or persons performing similar functions, regardless of whether these individuals are employed by the registrant or a third party. |
| | (c) | There have been no amendments, during the period covered by this report, to a provision of the code of ethics that applies to the registrant’s principal executive officer, principal financial officer, principal accounting officer or controller, or persons performing similar functions, regardless of whether these individuals are employed by the registrant or a third party, and that relates to any element of the code of ethics description. |
| | (d) | The registrant has not granted any waivers, including an implicit waiver, from a provision of the code of ethics that applies to the registrant’s principal executive officer, principal financial officer, principal accounting officer or controller, or persons performing similar functions, regardless of whether these individuals are employed by the registrant or a third party, that relates to one or more of the items set forth in paragraph (b) of this item’s instructions. |
Item 3. Audit Committee Financial Expert.
As of the end of the period covered by the report, the registrant’s board of directors has determined that Grady R. Hazel is qualified to serve as an audit committee financial expert serving on its audit committee and that he is “independent,” as defined by Item 3 of FormN-CSR.
Item 4. Principal Accountant Fees and Services.
Audit Fees
| | (a) | The aggregate fees billed for each of the last two fiscal years for professional services rendered by the principal accountant for the audit of the registrant’s annual financial statements or services that are normally provided by the accountant in connection with statutory and regulatory filings or engagements for those fiscal years are $694,000 and $745,325 for 2018 and 2019, respectively. |
Audit-Related Fees
| | (b) | The aggregate fees billed in each of the last two fiscal years for assurance and related services by the principal accountant that are reasonably related to the performance of the audit of the registrant’s financial statements and are not reported under paragraph (a) of this Item are $0 and $0 for 2018 and 2019, respectively. |
Tax Fees
| | (c) | The aggregate fees billed in each of the last two fiscal years for professional services rendered by the principal accountant for tax compliance, tax advice, and tax planning are $131,000 and $120,020 for 2018 and 2019, respectively. Tax fees are related to tax services in connection with Funds’ excise tax calculations and review of the Funds’ applicable tax returns. |
All Other Fees
| | (d) | The aggregate fees billed in each of the last two fiscal years for products and services provided by the principal accountant, other than the services reported in paragraphs (a) through (c) of this Item are $0 and $55,025 for 2018 and 2019, respectively. $55,025 of fees were related to the Form 3115 Application for Change in Accounting Method filing for GuideStone Funds Defensive Market Strategies Fund. |
The policy of the registrant’s Audit Committee is topre-approve all permissible non-audit services (e.g., tax services) to be provided to the registrant by the Auditors, including the fees therefor; provided, that if the Committee chooses to delegate the authority to grantpre-approvals to one or more Committee members, each acting on behalf of the Committee, then the Committee shall adopt policies and procedures detailed as to the particular service and designed to safeguard the continued independence of the auditors, consistent with the requirements of the Sarbanes-Oxley Act of 2002 and related SEC regulations, which shall then be used in making suchpre-approvals; and, further provided, that each delegatedpre-approval shall be reported to the Committee during its next regularly scheduled meeting.
Thepre-approval requirement for a permittednon-audit service may be waived if:
| | (1) | the aggregate amount of all suchnon-audit services provided constitutes not more than 5% of the total revenues paid by the registrant to the Auditors in the fiscal year in which thenon-audit services are provided; |
| | (2) | such services were not recognized by the registrant at the time of the engagement to benon-audit services; and |
| | (3) | such services are promptly brought to the attention of, and approved by, the Audit Committee or by a member of the Audit Committee to whom the Committee has delegated the authority to grant such approvals, if any, prior to the Auditors’ completion of the registrant’s audit. |
Additionally, if the Auditors’ engagement relates directly to the operations and financial reporting of the registrant, to the extent required by Rule2-01 of RegulationS-X, the Audit Committee shallpre-approve their engagements fornon-audit services with:
| | (1) | the registrant’s investment adviser (the “Adviser”) (excluding any subadviser whose role is primarily portfolio management and issub-contracted or overseen by the Adviser), and |
| | (2) | any entity controlling, controlled by, or under common control with the Adviser that provides ongoing services to the registrant (each, a “Control Entity”), |
in accordance with the foregoing paragraph, unless the aggregate amount of all services provided constitutes no more than 5% of the total amount of revenues paid to the Auditors by the registrant, the Adviser and any such Control Entity during the fiscal year in which the services are provided that would have to bepre-approved by the Audit Committee pursuant to this paragraph (in the absence of this exception). The Auditors may not perform contemporaneously any prohibitednon-audit services for the registrant, which currently include the following:
1. bookkeeping or other services related to the accounting records or financial statements of the registrant;
2. financial information systems design and implementation;
3. appraisal or valuation services, fairness opinions, orcontribution-in-kind reports;
4. actuarial services;
5. internal audit outsourcing services;
6. management functions or human resources;
7. broker or dealer, investment adviser, or investment banking services;
8. legal services and expert services unrelated to the audit; and
9. any other service that the Public Company Accounting Oversight Board determines, by regulation, is impermissible.
| (e)(2) | The percentage of services described in each of paragraphs (b) through (d) of this Item that were approved by the audit committee pursuant to paragraph (c)(7)(i)(C) of Rule2-01 of RegulationS-X are as follows: |
| | (f) | The percentage of hours expended on the principal accountant’s engagement to audit the registrant’s financial statements for the most recent fiscal year that were attributed to work performed by persons other than the principal accountant’s full-time, permanent employees was less than fifty percent. |
| | (g) | The aggregate non-audit fees billed by the registrant’s accountant for services rendered to the registrant was $131,000 and $175,045 for 2018 and 2019, respectively; for services rendered to the registrant’s investment adviser (not including any sub-adviser whose role is primarily portfolio management and is subcontracted with or overseen by another investment adviser) was $0 and $0 for 2018 and 2019, respectively, and for services rendered to GuideStone Financial Resources was $63,000 and $80,000 for 2018 and 2019, respectively. |
| | (h) | The registrant’s audit committee of the board of directors has not considered whether the provision of non-audit services that were rendered to any entity controlling, controlled by, or under common control with the investment adviser that provides ongoing services to the registrant that were not pre-approved pursuant to paragraph (c)(7)(ii) of Rule 2-01 of Regulation S-X is compatible with maintaining the principal accountant’s independence. |
Item 5. Audit Committee of Listed Registrants.
Not applicable.
Item 6. Investments.
| | (a) | Schedule of Investments in securities of unaffiliated issuers as of the close of the reporting period is included as part of the report to shareholders filed under Item 1 of this form. |
Item 7. Disclosure of Proxy Voting Policies and Procedures forClosed-End Management Investment Companies.
Not applicable.
Item 8. Portfolio Managers ofClosed-End Management Investment Companies.
Not applicable.
Item 9. Purchases of Equity Securities byClosed-End Management Investment Company and Affiliated Purchasers.
Not applicable.
Item 10. Submission of Matters to a Vote of Security Holders.
There have been no material changes to the procedures by which the shareholders may recommend nominees to the registrant’s board of directors, where those changes were implemented after the registrant last provided disclosure in response to the requirements of Item 407(c)(2)(iv) of RegulationS-K (17 CFR 229.407) (as required by Item 22(b)(15) of Schedule 14A (17 CFR240.14a-101)), or this Item.
Item 11. Controls and Procedures.
| | (a) | The registrant’s principal executive and principal financial officers, or persons performing similar functions, have concluded that the registrant’s disclosure controls and procedures (as defined in Rule30a-3(c) under the Investment Company Act of 1940, as amended (the “1940 Act”) (17 CFR270.30a-3(c))) are effective, as of a date within 90 days of the filing date of the report that includes the disclosure required by this paragraph, based on their evaluation of these controls and procedures required by Rule30a-3(b) under the 1940 Act (17 CFR270.30a-3(b)) and Rules13a-15(b) or15d-15(b) under the Securities Exchange Act of 1934, as amended (17 CFR240.13a-15(b) or240.15d-15(b)). |
| | (b) | There were no changes in the registrant’s internal control over financial reporting (as defined in Rule30a-3(d) under the 1940 Act) that occurred during the period covered by this report that has materially affected, or is reasonably likely to materially affect, the registrant’s internal control over financial reporting. |
Item 12. Disclosure of Securities Lending Activities forClosed-End Management Investment Companies.
Item 13. Exhibits.
| | (a)(1) | The Supplemental Code of Ethics for Principal Executive and Senior Financial Officers of the registrant is filed herewith. |
| | (a)(2) | Certifications pursuant to Rule30a-2(a) under the 1940 Act and Section 302 of the Sarbanes-Oxley Act of 2002 are filed herewith. |
| | (a)(3) | Not applicable to open-end investment companies. |
| | (b) | Certifications pursuant to Rule30a-2(b) under the 1940 Act and Section 906 of the Sarbanes-Oxley Act of 2002 are filed herewith. |
SIGNATURES
Pursuant to the requirements of the Securities Exchange Act of 1934 and the Investment Company Act of 1940, the registrant has duly caused this report to be signed on its behalf by the undersigned, thereunto duly authorized.
| | |
| (Registrant) | | GuideStone Funds |
| | |
| By (Signature and Title)* | | /s/ John R. Jones |
| | John R. Jones, President |
| | (Principal Executive Officer) |
Pursuant to the requirements of the Securities Exchange Act of 1934 and the Investment Company Act of 1940, this report has been signed below by the following persons on behalf of the registrant and in the capacities and on the dates indicated.
| | |
| By (Signature and Title)* | | /s/ John R. Jones |
| | John R. Jones, President |
| | (Principal Executive Officer) |
| | |
| By (Signature and Title)* | | /s/ Patrick Pattison |
| | Patrick Pattison, Vice President and Treasurer |
| | (Principal Financial Officer) |
| * | Print the name and title of each signing officer under his or her signature. |